
Energy Technologies & the Environment - UNT Digital Library
459
___.- -_--- - r/ DOEIEH-0077 Dist. Category: UC-11, 96, 101, _- d * 201, 402, & 602 DOE/EH--OO77 DE89 003779 Energy Technologies & the Environment Environmental Information Handbook October 1988 U.S. Department of Energy Assistant Secretary for Environment, Safety, and Health Office of Environmental Analysis Washington, DC 20545 Prepared for the Department of Energy by Argonne National Laboratory under Contract W-3 1 - 109-Eng-38
-
Upload
khangminh22 -
Category
Documents
-
view
0 -
download
0
Transcript of Energy Technologies & the Environment - UNT Digital Library

___.- -_--- - r/ DOEIEH-0077
Dist. Category: UC-11, 96, 101,
_- d *
201, 402, & 602 DOE/EH--OO77
DE89 003779
Energy Technologies & the Environment Environmental Information Handbook
October 1988
U.S. Department of Energy Assistant Secretary for Environment, Safety, and Health Office of Environmental Analysis Washington, DC 20545
Prepared for the Department of Energy by Argonne National Laboratory under Contract W-3 1 - 109-Eng-38

DISCLAIMER
This report was prepared as an account of work sponsored by an agency of the United States Government. Neither the United States Government nor any agency Thereof, nor any of their employees, makes any warranty, express or implied, or assumes any legal liability or responsibility for the accuracy, completeness, or usefulness of any information, apparatus, product, or process disclosed, or represents that its use would not infringe privately owned rights. Reference herein to any specific commercial product, process, or service by trade name, trademark, manufacturer, or otherwise does not necessarily constitute or imply its endorsement, recommendation, or favoring by the United States Government or any agency thereof. The views and opinions of authors expressed herein do not necessarily state or reflect those of the United States Government or any agency thereof.

DISCLAIMER Portions of this document may be illegible in electronic image products. Images are produced from the best available original document.

Foreword
This revision of Energy Technologies & the Environ- ment assembles information on the environmental consequences of energy technologies that will be in use in the United States during the next 20 years. The Office of Environmental Analysis, which sponsored this report, hopes that it will prove useful to planners, policy- makers, legislators, researchers, and environmentalists. The information on environmental issues, control technologies, and energy production and conservation processes should also be a convenient starting point for further exploration. References are given for the state- ments, data, and conclusions so that the interested reader can obtain more detailed information.
This report is part of the Department of Energy’s Environmental Information Handbook series, which presents the environmental aspects of energy technol- ogies in a form suitable for government and public use.
The series is intended to provide decision-makers, researchers, and the public with basic information that can be relied upon through changing energy policies and costs.
21 current and developing technologies that are expected to contribute significantly to the production or conserva- tion of energy through the first decade of the 21st century. Future publications will explore the environ- mental implications of longer-term technologies.
New research findings and directions may modify the technologies and environmental issues discussed in this report. Your comments, corrections, or suggestions for improving future editions can be sent Mr. David 0. Moses, Deputy Director, under whose supervision this revision was prepared.
Energy Technologies & the Environment addresses
Z/&& Ted Williams, Director Office of Environmental Analysis U.S. Department of Energy
iii

Acknowledgments
Argonne National Laboratory prepared the revision of this handbook under Contract W-31-109-ENG-38 with the U.S. Department of Energy (DOE). Brookhaven National Laboratory contributed revisions to the chap- ters on light-water-reactor nuclear power plants and alcohol fuels from biomass and drafted the new chapter on photovoltaic energy systems. EA-Mueller, Inc., contributed revisions to the chapter on wood biomass combustion and drafted the new chapters on fuel cells
and used oil. Argonne revised or drafted the remaining chapters. All three organizations reviewed the revisions and additions, and technical staff from the DOE Office of Environmental Analysis provided overall technical direction and coordination.
1980, was prepared by the Aerospace Corp., with assistance from the Radian Corp. and the International Research and Technology Corp.
The original version of this handbook, issued in
PHOTO CREDITS
Figure Source
2.1 3.1 3.4 4.1 5.1 7.1 12.1 13.1 14.1 14.3 17.1 18.1 20.1 21.1
U.S. Department of Energy PPG Industries, Fiber Glass Division U.S. Department of Energy Argonne National Laboratory American Natural Gas Co. and U.S. Department of Energy U.S. Department of Energy Gas Research Institute Baltimore Gas & Electric Co. and U.S. Department of Energy U.S. Department of Energy U.S. Department of Energy Eugene Water and Electric Board A. Smith Bowman Distillery U.S. Army Tank and Automotive Command and C u d s Evergreen Oil, Inc.
iv

Contents
Page
Chapter 1 . Chapter 2 . Chapter 3 . Chapter 4 . Chapter 5 . Chapter 6 . Chapter 7 . Chapter 8 . Chapter 9 . Chapter 10 . Chapter 11 . Chapter 12 . Chapter 13 . Chapter 14 . Chapter 15 . Chapter 16 . Chapter 17 . Chapter 18 . Chapter 19 . Chapter 20 . Chapter 21 . Appendix A .
Appendix B .
Introduction ..................................................................................................................
Conventional Coal-Fired Power Plants ........................................................................ Fluidized-Bed Combustion .......................................................................................... Coal Gasification ..........................................................................................................
Oil Shale ....................................................................................................................... Combined-Cycle Power Plants .....................................................................................
Coal Mining and Preparation .......................................................................................
Coal Liquefaction .........................................................................................................
Coal-Liquid Mixtures ................................................................................................... Petroleum Refining ...................................................................................................... Environmental Control Technologies for FossiVEnergy Systems ............................... Fuel Cells ...................................................................................................................... Light-Water-Reactor Nuclear Power Plants .................................................................
Liquid-Metal Fast Breeder Reactor Power Plants ........................................................ Deuterium-Tritium Fusion Power Plants ..................................................................... Wood Biomass Combustion ......................................................................................... Alcohol Fuels from Biomass ........................................................................................ Photovoltaic Energy Systems ....................................................................................... Low-Heat-Rejection Diesel Engines ............................................................................ Used Oil ........................................................................................................................ Summary of Environmental Laws and Regulations Affecting Energy Technologies ..................................................................................................
Units of Measure ..........................................................................................................
Nuclear Waste Management .........................................................................................
1 3
27 45 67 81 97
117 129 145 171 217 239 267 295 307 325 343 367 383 397
423 457
V

The U.S. Department of Energy (DOE) includes national environmental protection goals in the formulation and implementation of its energy programs. These goals include restoring, protecting, and enhancing environ- mental quality and ensuring public health and safety. The DOE Office of Environmental Analysis (OEA) contributes to achieving these goals by analyzing en- vironmental issues that affect national energy supply, demand, and prices. One major component of the OEA program is to develop and maintain data that charac- terize the technical and environmental performance of energy systems. This revision of Energy Technologies & fhe Environment reflects the changes in energy supply and demand, focus of environmental concern, and emphasis of energy research and development that have occurred since publication of the earlier edition in 1980.
The increase in availability of oil and natural gas, at least for the near term, is responsible in part for a re- duced emphasis on development of replacement fuels and technologies. Trends in energy development also have been influenced by an increased reliance on private industry initiatives, and a correspondingly reduced government involvement, in demonstrating more devel- oped technologies. Environmental concerns related to acid rain and waste management continue to increase the demand for development of innovative energy systems.
RATIONALE FOR SELECTED TECHNOLOGIES
The basic criteria for including a technology in this report are that (1) the technology is a major current or potential future energy supply and (2) significant changes in employing or understanding the technology have occurred since publication of the 1980 edition. Coal is seen to be a continuing major source of energy
Chapter I
Introduction
supply, and thus chapters pertaining to the principal coal technologies have been revised from the 1980 edition (those on coal mining and preparation, conventional coal-fired power plants, fluidized-bed combustion, coal gasification, and coal liquefaction) or added as necessary to include emerging technologies (those on oil shale, combined-cycle power plants, coal-liquid mixtures, and fuel cells).
Because of a growing importance to a number of fossil fuel technologies, a separate chapter on environ- mental control technologies for fossil energy systems has been included to provide a more detailed description and discussion of the applicable control technologies. Although not included in the 1980 edition, a chapter on petroleum refining is included because of the continuing importance of this energy technology and the range of atmospheric, hazardous waste, and other environmental issues that must be considered in designing and operat- ing these facilities.
Two chapters on nuclear power were updated from the 1980 versions: the chapter on light-water-reactor nuclear power plants, which continue to be a major energy option, and the chapter on nuclear waste manage- ment, because of the critical role of resolving that issue to maintain the viability of nuclear power. Chapters on liquid-metal fast breeder reactor power plants and deuterium-tritium fusion power plants were added because of the potential for these technologies to be important energy supply contributors in the long term.
Wood biomass combustion, alcohol fuels from biomass, and photovoltaic energy systems were consid- ered the major renewable energy technologies for which significant recent advances or changes in development trends have occurred; the two chapters on biomass were revised from the earlier edition, and photovoltaics is the topic of a new chapter reflecting recent advances in this technology. Omission of other solar and renewable energy technologies from this edition is not necessarily
1

intended to indicate a reduced role of these technologies in future energy supplies; rather, developments and environmental concerns are essentially the same as described in the earlier edition, to which the interested reader is referred. Many of these technologies (for example, solar heating and cooling of buildings) have become widely used.
Of the two energy conservation technologies included in this edition, the chapter on adiabatic diesels is a more focused discussion of the earlier edition’s chapter on light-duty diesel vehicles, and the chapter on used oil discusses a recycling option brought about in part by new requirements for waste management.
or the 1980 edition may play a significant role in future national energy supplies as those technologies are further developed or as economic, environmental, or resource availability factors affect the viability of the technologies. For example, extensive efforts are under- way to develop technologies for coal use that eliminate or reduce environmental concerns related to acid precipitation and waste management. As appropriate, these technologies will be included in future editions of this handbook.
Additional technologies not included in this revision
ORGANIZATION
Each of the chapters describing a technology follows a similar five-part format background, technology, environmental issues, environmental controls, and environmental constraints. The topics included in each are summarized as follows:
The background section presents a short definition of the technology, a brief history of the technology and any related environmental developments, and a summary of government and industry efforts to commercialize or improve the technology.
The technology section describes the processes used, environmentally important process flow and waste streams, and resource needs.
Environmental issues are discussed next. To the extent possible, the main environmental issues for the processes are related to the process streams. The environmental issues section also gives estimated or measured pollutant data for a typical plant using the technology.
The environmental controls section discusses envi- ronmental control techniques applicable to the technology, especially controls that appear promising or are now being employed. The section also pre- sents available control cost estimates.
The final section of each chapter presents an overall summary of the environmental constraints and regional implications arising from the issues and the probabilities of their mitigation.
Each chapter refers to most of the regulations specific to the technology &scribed. Appendix A presents a general summary of the important federal environmental, health, and safety legislation and regula- tions applicable to energy technologies. Appendix B defines the abbreviations for the units of measure used in this handbook.
2

BACKGROUND
Coal is by far the most abundant fossil fuel in the United States, accounting for over 85% of all recoverable fossil fuels. Identified U.S. coal resources total 1.7 trillion tons, and about 240 billion tons are estimated to be recoverable with current mining techniques. With current production levels at about 800 million tons/yr, or over 20% of the total energy currently consumed in the United States, coal can continue to be a major energy source well into the 21st century.1
However, coal production has generally been limited by demand, since it is normally not chosen as a fuel unless it offers a large cost advantage. Despite higher prices, oil and natural gas are often preferred because of their greater convenience and lower capital investment requirements. Continued technological advances in coal production, such as in the longwall mining method illustrated in Fig. 2.1, are thus important factors in keeping coal competitive with other fuels.
Concern for environmental, health, and safety issues is another major factor that could have a significant effect on future coal production levels. New programs, practices, and legislation have addressed many of these issues; however, their adequacy and effectiveness, in particular at much higher production levels, remain the object of close scrutiny. Further advances in technolo- gies and procedures for complying with environmental, health, and safety guidelines can also be important in improving the cost-competitiveness of coal.
History
Total US. Production
Historically, there have been three major periods of coal development in the United States: the emergence of coal from the late 1800s to 1947, the decline of coal
Chapter 2
Coal Mining and Preparation
from 1948 to 1973, and the reemergence of coal from 1974 to the present2
During the first period, U.S. coal production grew from 15 million tons/yr in 1860 to 270 million tons/yr by 1900. At the end of World War I, annual production peaked in 1918 at 678 million tons. During the expand- ing World War I1 economy, the demand for coal and other energy products increased significantly and annual production reached 683 million tons in 1944 and 688 million tons in 1947.2 Coal met nearly 50% of the U.S. requirements for primary energy in the early 1940s.
As shown in Fig. 2.2, from 1949 to 1959, annual coal production declined by 48 million tons.1 From 1960 to 1973, coal production increased at a modest average annual rate of 2.5%. During this period, the quantity of coal produced from underground mines increased by 58 million tons while production from surface mines increased by nearly 159 million tons. The reduction in coal consumption between 1949 and 1959 and slow growth from 1960 to 1973 resulted from industrial, transportation, and residential users switching from coal to oil and natural gas for fuel. These factors, combined with the tripling in labor productivity as a result of increased mechanization and transition to surface mining, were significant in the drop in coal- mining employment from more than 415,000 in 1950 to less than 125,000 in 1969.3.4 Coal was providing only about 17% of the U.S. energy consumption at the time of the oil embargo in 1973, while 77% of the energy consumption was provided by oil and natural gas.
domestic energy production followed the 1973 oil embargo. Coal production increased at an average annual rate of 2.7% from 1973 to 1983, even though the total energy consumption dropped by 5% during this period. In 1983,22% of total U.S. energy consumption was supplied by coal. From 1973 to 1983, annual production from surface mines increased by 176 million
A major reappraisal of the contribution of coal to
3

Figure 2.1 Coal Face and Longwall Panel-Mining Equipment
4
I

800
Figure 2.2 Domestic Coal Production, Consumption, and Exports, 1949-1984 (Source: Adapted from Ref. 1)
...... ... : . . - . .
tons while production at underground mines increased by 10 million tons.1 Coal production of 890 million tons and consumption of 790 million tons set new records during 1984 (see Fig. 2.3). In 1984, coal constituted about 54% of the energy source for electricity.5
In addition to the oil embargo in 1973, other factors contributed to the reemergence of coal in the 1970s: the uncertainties of the nuclear industry, an oil shortage in 1979 due to the Mideast crisis, the rising cost of oil, the availability of vast U.S. coal resources, and a long experience with coal extraction methods and consump- tion patterns. As a result of these factors, the total number of coal miners increased continuously from about 140,000 in 1970 to 223,300 in 1978.2
given by the Energy Information Administration, are shown in Table 2.1.5 Major developments in energy patterns in the mid-l980s, such as the drop in oil and gas prices and continued concern about the safety of nuclear power plants, may have a significant effect on the future trends in coal use; however, the full extent of these developments remains to be seen.
Projections of coal consumption through 1995, as
0 .- - - .- r
300
200
100
0
Table 2.1 Historical and Projected U.S. Coal Consumption by Sector (millions of tons)
-
-
z
0 \ e
" ~ " " ' " ' ' ' ~ ' ' ~
- 0 - - - - - 0
- - - / - - - - \ 0 \
- / . . 0
Consuming Sector 1974 1984 1985 1990 1995
Residential and commercial 11 9 8 7 I Industrial 65 74 77 83 87 Coking plants 90 44 40 37 32 Electric utilities 392 664 693 764 882 Total consumption 558 791 818 891 1,008
Source: Ref. 5 .
Underground Mining
The history of underground mining has been shaped by the loss of traditional coal markets, increased mecha- nization, and expanded regulatory programs to protect miners' safety and health. During the period of falling coal demand, producers tended to neglect mine safety
5

Exports 81.5
Lignite hthraule 60.6 4.0
Residential and Changes in Stocks,
Losses, and Unaccounted For
16.9 Other Industry and Miscellaneous
Figure 2 3 Coal Production and Disposition, 1984 (Source: Adapted from Ref. 1)
and environmental protection. Increased awareness of coal-worker pneumoconiosis (the most severe of the various respiratory problems called "black lung"), con- tinuing mine fatalities, and labor unrest led to the pas- sage of the Coal Mine Health and Safety Act (CMHSA) of 1969 to regulate mine conditions and provide medical benefits to black-lung victims. Underground mine productivity dropped from a peak of 15.6 tons/worker- day in 1969 to a low of 8.3 tons/ worker-day in 1978.1 Although the CMHSA is frequently cited as the cause of falling productivity, other factors -- such as a leveling off in mechanization, rapidly growing demand, an influx of young unskilled miners, and increased attention to environmental concerns -- have also contributed to the decline. Underground-mine productivity increased to 11.3 tondworker-day in 1983 as the industry made adjustments to these factors.1
Surface Mining
Surface mining has also been affected by major changes in mechanization and regulatory activity. In 1925, the
largest shovels for moving overburden had capacities of 10 yd3; today, draglines with capacities of 220 yd3 are in use.3 Concern over environmental impacts, particularly in Appalachia and arid western lands, led to the passage of the Surface Mining Control and Reclamation Act (SMCRA) of 1977. Surface-mine labor productivity peaked at about 36 tondworker-day in the early 1970s, decreased to 25.8 tondworker-day in 1978, and then increased to about 31.0 tons/worker-day in 1983.1
Coal Preparation
The primary purpose of coal preparation -- sometimes called "coal cleaning" or "coal washing" -- is to increase the quality of coal and its heating value by lowering the level of pyritic sulfur and ash-forming constituents. Preparing coal also reduces transportation costs and improves the performance of power plant boilers. However, only 20-50% of the sulfur in coal is removed by conventional coal-washing methods. This reduction may not be enough to meet a sulfur emission standard for combustion by a coal-fired power plant, depending
6

Table 2.2 Mechanically Cleaned Bituminous Coal and Lignite
Total Total Production Cleaned % of Total % Refuse (million (million Production from
Year tons) tons) Cleaned Raw Coal
1940 461 1945 578 1950 516 1955 465 1960 416 1965 512 1970 603 1975 648
102 22.2 148 25.6 199 38.5
273 65.7 332 64.9 323 53.6 267 41.2
273 58.7
11.6 14.5 16.6 13.7 19.4 20.1 24.2 28.6
Source: Ref. 3.
on the original sulfur content of the coal and the emis- sion standard.
The preparation of coal to meet consumer require- ments for size and moisture, ash, sulfur, and heat content has gone through three distinct phases in the past 40 years, although the basic technology has undergone little change. From roughly 1940 to 1960, the use of physical cleaning increased significantly as a result of automation in mining, which resulted in full-seam min- ing, reduced selectivity at the coal face, and, therefore, the production of coal containing more rock (Table 2.2). The second phase, which began in 1960, was a decline in the use of coal cleaning; it resulted from the increased construction of power plants at the mine mouth, so that cleaning was not needed to save transportation costs, and from the increased production of western coal, which typically has fewer impurities and thus less need for physical cleaning. The third phase, which began in the late 1960s, was manifested in efforts to remove more impurities before use to meet air quality requirements (trading off solid waste disposal problems against air quality problems). Air quality regulations have also re- sulted in efforts to develop systems for cleaning coal by chemical means, primarily for removing organic sulfur.
Transportation
Throughout the 20th century, the large-scale transporta- tion of coal has depended heavily on railroads and barges. About two-thirds of annual coal shipments are transported by railroads.3 Coal transportation is the main source of railroad company revenues. The growth of larger coal-buming facilities during the 1950s brought the use of unit trains for more efficient and economical
movement of coal; unit trains are dedicated to haul coal from one point to another. Major changes have occurred in the rail transportation industry since the passage of the Staggers Rail Act of 1980, which allows the opera- tion of railroads in a free-market system.2 While coal- slurry pipelines for use in specific situations were also developed during this time, their use to date has been limited. Although normally restricted to coal shipments of relatively short distances and small tonnages, trucks have also been an important mode of coal transportation.
Government and Industry Programs
Despite national policies designed to increase its use, coal use is limited by demand. Coal accounted for about 22% of domestic energy consumption in 1983, nearly the same proportion as over the previous several years.1 Production capacity, however, exceeds demand by over 100 million tonslyr.
In 1985, the Energy Information Administration projected, in its base-case scenario, an increase in 1995 coal consumption of 27%, or 217 million tons, over 1984 levels2 (See Table 2.1; the base-case scenario assumes that the real gross national product will grow at an average annual rate of 2.7%.) Electric utilities account for most of the projected change in total coal consumption.
The major incentives for increasing coal use and developing improved mining and preparation tech- nologies are directly tied to expanding the use of coal as an alternative to imported oil. Although the U.S. coal resource base (at a depth of less than 3,000 ft) is about 1.7 trillion tons and has the energy equivalent of roughly 600 times the nation’s current annual use of all energy forms, it is estimated that only 15% of this total can be recovered under current economic and technological conditions.1 Government programs therefore emphasize developing technology for extracting more coal while lowering production costs, protecting the environment, and maintaining occupational and public health and safety.
Several factors will affect the outlook for the domestic coal industry: leasing, transportation rates, exports, oil and gas prices, and labor productivity. Ad- ditionally, recent environmental legislation and related regulations, such as those related to the Resource Con- servation and Recovery Act, may significantly alter the patterns of coal production and consumption. Coal extraction is mainly governed by the CMHSA and SMCRA, while the Clean Air Act and other major en- vironmental acts regulate the use of coal in power plants. Factors affecting industrial coal use are industrial
7

growth and energy intensity, the economics of fuel choice, technological change, and environmental stand- ards for specific industries.
primary government responsibility for developing the technology to accomplish these objectives is vested in the U.S. Department of Energy (DOE). The majority of DOE’S efforts are directed at improving underground mining systems. Environmental, health, and safety research is conducted by the U.S. Department of the Interior’s Bureau of Mines. The Department of the Interior’s Office of Surface Mining, the U.S. Department of Labor’s Mine Safety and Health Administration, and the US. Environmental Protection Agency (EPA) have regulatory and enforcement authority over coal-mining activities.
Mining-technology research and development pro- grams are also conducted by various equipment manu- facturers. Industry efforts are limited by regulatory risks, competition, and high commercialization costs. Industries are also researching coal preparation, espe- cially chemical cleaning. Congress has recently pro- vided funding to the DOE for the Clean Coal Technol- ogy program. Under this program, the DOE will share with industry the costs of building and operating facili- ties to demonstrate the commercial feasibility of tech- nologies that reduce the environmental residuals now associated with coal combustion and conversion. The DOE funding could total as much as $2.5 billion over the next five years.
TECHNOLOGY
Coal mining, preparation, and transportation are the first three steps in the process of converting coal from a re- source into a final product such as electricity, syn- thetic-liquid or gaseous fuels, or metallurgical coke. These three activities are distinct, sequential oper5tions. Depending on the location of the preparation plant and the final use, large quantities of coal may need to be transported over land or water. The relative percentages of major modes within the three steps are shown in Fig. 2.4.4
The selection of surface versus underground pro- duction depends primarily on how far below the surface the coal seam lies and on the terrain and other charac- teristics of the overlying material (overburden). Al- though surface mining is currently the predominant production method in the United States, only under- ground mining can recover 68% of the country’s demon- strated reserve.1 The technology used, and its environ- mental impact, will vary considerably by region.
8
Because of the importance of labor productivity for production economics and occupational safety, factors affecting productivity are also of significance in the review of mining technologies and impacts.
Underground Mining
Coal seams deeper than about 200 ft usually require underground mining. The three types of underground mines are (1) the drift mine, which has a level access tunnel, (2) the slope mine, which has an inclined access tunnel, and (3) the shaft mine, which has a vertical access tunnel (see Fig. 2.5).
The major underground mining methods currently used in the United States are room-and-pillar and long- wall panel mining. Room-and-pillar methods are used in approximately 96% of all underground mines.6 Hydraulic and advanced panel mining techniques, as well as improved coal-hauling equipment, are being investigated.
Room-and-Pillar Mining
In room-and-pillar mining, coal is removed from inter- secting tunnels in the coal seam; coal pillars are left in a checkerboard pattern to provide roof support and reduce subsidence. Recovery of in-place reserves from room-and-pillar mines averages 62%.7 As mining depth increases, the size of the support pillars must also increase. In such cases, or where seams exceed 10 ft in thickness, resource recovery can be as low as 2O%J
Conventional mining, the oldest method of under- ground production, consists of four steps: undercutting the seam, drilling holes for blasting, blasting, and removing coal (see Fig. 2.6). Roof bolts are installed to maintain the structural integrity of the roof, ventilation is extended, and the cycle is then repeated. Until the 1930s, when mine mechanization began to increase, these tasks were accomplished by hand.
Beginning in the 1950s, the use of continuous mining equipment increased rapidly. The continuous miner incorporated the four sequential conventional mining steps into a single machine that uses a rotating drum or head with replaceable cutting teeth to dig the coal from the seam (see Fig. 2.7). Roof bolting and ventilation extension are the same as in conventional mining. The DOE has supported efforts to integrate roof bolting and the continuous miner. The production fmm continuous miners typically averages only 350-400 tons/ shift because of limitations imposed by equipment operation, coal hauling, and mine safety.7

100
90
80
70
60 c C Q)
Q) 2 50 a
40
30
20
10
0
Other* \
Production Preparation
'Includes crushed and screen coal. "Includes slurry pipeline and coal used at mine mouth.
Shipments
Figure 2.4 Percentage of Coal Production, Preparation, and Shipment by Mode, 1983 (Source: Adapted from Ref. 4)
Panel Mining into a coal seam. These tunnels, which are up to 1 mi
Panel mining is distinct from room-and-pillar methods because it eliminates the need to retain coal pillars for roof support. Although panel mining can be used only where geological conditions are favorable and sub- sidence can be tolerated, resource recovery can be increased to about 85% of the in-place reserves.7
panel mining. In longwall mining, continuous mining equipment is used to cut two parallel operating tunnels
Longwall mining is the predominant method of
long and 600 ft apart, are used for mine access, coal removal, and ventilation. Typically, the panel of coal between the two tunnels is removed by a shearing machine that cuts a slice of coal up to 30 in. thick from the face of the panel. The coal is transported out of the mine by conveyor. Self-advancing hydraulic roof supports move forward to the new face as the shearing machine transverses the coal seam, which allows the unsupported roof to collapse (see Fig. 2.8).
9

Mainshaft Airshaft
Sandstone Shale Sandstone Limestone Shale Coal Shale
Shaft mine Limestone '
--Coal
Coal
Slope mine Drift mine
Figure 2.5 Types of Underground Coal Mines (Source: Adapted from Ref. 4)
Coal removal
Figure 2.6 Conventional Underground Mining (Source: Adapted from Ref. 3)
Continuous mining and loading
1 1
Figure 2.7 Continuous Underground Mining (Source: Adapted from Ref. 3)
10

r Elevation view Overburden
Mining ' Conveyor I machine
Figure 2.8 Longwall Mining System (Source: Adapted from Ref. 3)
Althoug.. a g w a l l mining is widely used in Europe, its introduction into the United States has been slowed by high capital costs and the different U.S. geological conditions. While productivity rates in excess of 2,000 tonslshift have been recorded, equipment limita- tions and geological conditions limit production to about 1,OOO tondshift7 (roughly three times the productivity for continuous mom-and-pillar mining). The DOE has supported efforts to extend longwall mining to multiple, steeply dipping, and thick seams. If these efforts succeed, longwall production could increase to 60% of the U.S. underground production.
Shortwall mining, which is named for its shorter panel-face length (typically 150 ft), uses continuous- mining equipment in conjunction with hydraulic roof supports. Shortwall mining is less capital intensive than longwall mining because the same equipment is used for both tunnel development and mining. Productivity is lower than that for longwall mining, however, because shuttle cars are used rather than conveyors.7
Advanced Mining Systems
Research is underway on hydraulic mining to recover coal from thick, steeply dipping seams. In hydraulic mining, remotely controlled water jets are used to break coal loose. The resulting slurry is then pumped to the surface through pipes. While hydraulic mining has been used in other countries, it is currently unclear whether the technique is suitable for U.S. conditions.
hauling systems for room-and-pillar mines. Currently, electrically powered shuttle cars are used to transport coal in almost 90% of such mines. The current design of these shuttle systems forces continuous miners to operate at substantially less than design capacity. These systems can also be a hazard to workers. Development of alternative transportation systems, or alternative
Research is also underway to develop improved
power systems for shuttle cars, woulc mitigate these problems.
Surface Mining
Surface production of coal is accomplished by area, contour, auger, and pit mining, of which area and contour mining are the predominant modes. The major advances in surface-mining technologies are expected to come in the areas of overburden handling and coal hauling rather than in actual coal extraction.
Area Mining
In area or strip mining, which is used predominantly on the flat terrains of the West and Midwest, topsoil and overburden are removed by cutting successive trenches (typically 100-200 ft wide and one-quarter to several miles long) to expose the top of the coal seam (see Fig. 2.9). Following coal extraction, another trench is cut to expose more coal; the new overburden (referred to as "spoil") is used to fill the mined-out trench. Spoil piles are then graded, topsoil (if segregated) is replaced, and the land is revegetated The principal equipment used in area mining includes bulldozers and loaders for removing topsoil; drills for making blasting holes to loosen the overburden; shovels, draglines, or bucket- wheel excavators for handling overburden; shovels and loaders for extracting coal; and bulldozers for leveling spoil piles. Up to 40 tons of overburden may be handled for each ton of coal recovered. The lowest overburden ratios are generally found in the western states.
Area mining recovers 80-90% of the in-place reserves.8 Depending on geological characteristics, a single area mine can yield up to 18 million tons/yr. In 1977, area mining accounted for 64% of the U.S. surface-mine production.
11

Reclaimed area
ne Drilling and blasting
/a1 loading
Figure 2.9 Area Surface Mining (Source: Adapted from Ref. 4)
Contour Mining
Jn contour mining, coal is removed from outcrops on the side of a mountain or hill, primarily in Appalachia. Beginning at the outcrop, the overburden above the seam is removed by a bulldozer, scraper, or front-end loader. As the coal is removed, additional cuts are made into the hill- or mountainside until the thickness of the overburden makes further mining uneconomical.
Resource recovery with contour mining is typically 80%.9 Contour mines are smaller than area mines; they seldom produce more than 1 million tondyr.6 In 1977, contour mining accounted for 35% of the U.S. surface- mine production.
There are several types of contour inining practices that are based on the method of spoil disposal. These practices involve depositing spoil over the side of the hill; depositing spoil in hollow fills; and haulback mining (returning the spoil to the mined-out area). The first practice has been virtually e!iminatcd by the SMCRA because of difficulties in reclaiming the high- wall (the cliff-like structure that remains after the coal is removed), while haulback mining is a successful mining technique in Appalachian regions.
Auger Mining
Auger mining is usually employed in conjunction with contour mining to recover coal from the areas of seams for which overburden removal is no longer economical. Auger machines, consisting of one or more drill bits up to 7 ft in diameter, cut hoIes up to 200 ft into the seam to recover additional coal.3 While primarily a surface- mining technique, auger mining can be used under- ground when poor roof conditions or other factors preclude the use of standard techniques.
Resource recovery rates for this type of mining are 30-50%.8 Auger mining accounts for about 2.5% of the total U.S. production.10 The auger method is used exclusively in some mines, especially in Kentucky. Low-cost production and the need to mine thin, dirty, or isolated coal reserves that are economically unrecover- able by any other means warrant the use of auger mining, in spite of the relatively low coal recovery.
Open Pit Mining
Open pit mining is used in areas, such as the Northern Plains, where thick or steeply dipping seams occur. In such cases, the ratio of overburden thickness to
12

coal-seam thickness is small, and the emphasis is on coal handling rather than on overburden handling. Pits are large (1,OOO by 2,OOO ft), and shovels are commonly used.3 Because relatively large amounts of coal are removed from such mines, pit mining is preferred to area mining because of greater flexibility in the placement and reclamation use of the overburden.
Mountaintop and Finger-Ridge Mining
Mountaintop mining and finger-ridge mining minimize the adverse effects of mining on steep slopes. The entire hilltop or mountaintop above a coal seam or multiple coal seams is removed when the mountaintop mining method is used. Some of the overburden is retained for final reclamation of the "tabletop" landscape while most of the overburden is placed in hollow fills. Only the ridges or incremental parts of the mountain above coal seams are removed during the use of the finger-ridge mining technique.
Coal Preparation
Coal preparation technologies are divided into three categories: physical preparation, physical cleaning, and chemical cleaning. The primary function of a coal preparation facility is to upgrade the characteristics of raw coal to meet a customer's coal quality requirements, such as sulfur and ash content. About 700 coal prepara- tion plants are operating in the United States,4 with capacities ranging from 200 tons/d to about 20,000 tons/d.
Physical Preparation
The physical preparation of coal consists of crushing, to reduce the size of the coal lumps coming from the mine, and screening, to remove small coal particles (fines) and sort coal to size requirements (Fig. 2.10). Nearly all coal produced in the United States is physically prepared. Crushing and screening technologies are well developed; costs are generally less that $l.OO/ton.ll New technologies for crushing coal to one-thousandth of an inch, such as grinding coal with high-frequency sound waves, have been pursued by DOE.12
Physical Cleaning
Physical coal-cleaning processes remove impurities, such as shale, clay, and pyrites. Physical cleaning technologies are mature and widely used in the eastern United States; about 50% of underground-mined coal and 25% of surface-mined coal are physically cleaned (Fig. 2.4).4 Physical cleaning processes primarily use
differences in specific gravity, but may also use differ- ences in surface properties, magnetic and electrical characteristics, or other attributes to separate impurities that are physically bound within the coal (Fig. 2.10). Depending on its physical and chemical composition, the specific gravity of coal ranges between 1.23 and 1.72, whereas most mineral impurities are roughly twice as dense. Wetcleaning methods account for about 98% of physical cleaning activities and dry or pneumatic methods account for the remaining 2%.11 Wet cleaning was developed before 1940 and has undergone refine- ment since then. (See the chapter on Environmental Control Technologies for Fossil Energy Systems for further discussion of technology developments.)
The principal difficulty encountered in evaluating coal-cleaning effectiveness is the highly heterogeneous nature of coal, which can change from mine to mine and even within a given seam. Typically, 30-70% of the pyritic sulfur can be removed by physical cleaning. One recent study of physical coal cleaning for coals burned in the Midwest found that the average sulfur reduction from raw coal was about 30% (within a range of 0-50%), using the most advanced commercial techniques.13 Physical coal cleaning costs are $3.50-16.00/ton, de- pending on the coal characteristics, level of cleaning, plant size, region, and other factors.14
Advanced coal-cleaning methods include fine grinding, froth flotation, oil agglomeration, and high- gradient magnetic separation, which rely on the surface properties of coal or its behavior in a magnetic field. The use of flocculating agents and other coal binders for reconstituting the fine coal particles from the dewatering process into a denser mass that could be transported more economically have also been considered.
Chemical Cleaning
The demand for more thoroughly cleaned coal to meet air quality requirements has prompted research into more sophisticated technologies for removing additional pollutants, such as ash, sodium, and organic sulfur, that are chemically bound in coal. These processes remove impurities by reacting them with chemicals. Processes for sulfur removal are capable of eliminating essentially all of the pyritic sulfur and some of the organic sulfur. However, their estimated costs of $14-224011 are much higher than those of physical processes.11 Combined physical and chemical processes for removing sodium and other alkali salts and oxides by ion exchange, which would improve the operation of coal-burning equipment, also have been investigated.
The General Electric Company and TRW, Inc., were successful in testing methods that could remove up
13

1 Rawcoal I
Wet methods
crushers, breakers,
Screening and sizing (sieves, screens)
Drv methods
I I
1 Hydraulic Dense medium Flotation Pneumatic
Dewatering (principal method) (Vibrating screens, centrifuges, filters)
Cyclones,
separators Jigs, ‘Oncentrating I static-bath I F 1 ~ ~ ~ ~ n 1 Air-flow separators classifiers, launders
Thermal drying
(Rotary kilns, fluidized-bed dryers, cascade dryers, entrainment dryers)
I I
1 I Drying I
I I
1 Storage and shipments to consumers
Figure 2.10 Coal Preparation and Physical Cleaning Methods
to 90% of the total impurities in coal.5 One such ap- proach includes the use of microwaves, which can enhance the effectiveness of chemical cleaning methods. None of these processes are expected to be commer- cially used before the late 1990s.
Coal Transportation
The distance to move coal and the availability of the specific means of transport between the mine and coal destination determine the method of shipping coal. The economically viable modes of coal transportation over
14
long distances (over 100 mi) are rail, water, and slurry pipeline.
About 60% of the total coal produced each year is transported by unit trains (Fig. 2.4), which are the most popular and least expensive means of overland transport. Large unit trains can haul more than 15,000 tons of coal.6 Barges and ships, which are the most economical mode of transport, move about 15% of the coal sent to domestic markets. The waterway system used for coal transport is composed of the inland river system of the Midwest, the Gulf and Atlantic intracoastal waterways, and the Great Lakes waterways. Coal-slurry pipelines are expensive, consume water, and require rights of

way. The only coal-slurry pipeline in operation in the United States is the 273-mi Black Mesa pipeline in Arizona. Locating a power plant near the minemouth makes short-haul transport necessary.
economically used for short-haul coal transport. About 14% of the total coal produced is moved by trucks (generally over intermediate distances of 50-75 mi), which is relatively expensive. Conveyors and pneumatic pipelines deliver smaller amounts of coal over shorter distances (less than 10 mi).
Trucks, conveyor belts, and pneumatic pipelines are
ENVIRONMENTAL ISSUES
Coal mining, preparation, and transportation encompass a range of environmental issues: air, water, solid waste, noise, health and safety, and land use (see Table 2.3).15,16 Since the late 1360s, efforts have been made to deal with many of these concerns through regulatory initiatives. These issues have particular significance because great increases in coal production are anticipated before the end of this century.
Air Quality
Coal extraction, coal and waste storage, coal transfer and transportation, and coal preparation and cleaning all produce some level of atmospheric emissions. Table 2.4 shows estimates of the type and amount of atmospheric emissions generated by three representative surface and underground mines with preparation plants.Wg Diesel- powered mining equipment is the primary source of nitrogen oxides, sulfur compounds, hydrocarbons, and carbon dioxide. Thermal dryers, if not controlled properly, can also produce significant emissions. Because these various emissions are released from short stacks, their impact is normally limited to the local area.
Most of the atmospheric emissions from surface mines are fugitive dusts from access and haul roads and from coal loading, transfer, processing, and storage operations. Underground mining, because of the lower exposure of activities to surface winds and greater use of electrical equipment, generally produces fewer atmos- pheric emissions than does surface mining.
Although existing technology for coal mining and preparation affects air quality only locally, surface mining in those parts of the West that are in or near pristine air quality areas (Class I) may be significantly constrained by the statutory Prevention of Significant Deterioration increments.17 In October 1984, EPA proposed that surface coal mines be added to the list of
stationary sources for which fugitive emissions must be included for threshold applicability determinations under preconstruction review and permit programs (Fed. Reg., 49:43210). At this time, no final action has been taken on this proposed rule.
Uncontrolled fires resulting from spontaneous combustion in abandoned mines and waste piles contain- ing carbonaceous materials can smolder for years, producing noxious gases. Because such fires bum under oxygen-deficient conditions, the emissions differ from those generated during oxygen-rich combustion, such as that in a coal-fired power plant boiler (see Table 2.5).3
Water Quality
Historically, water quality degradation has been one of the major environmental concerns associated with coal mining and preparation. Adverse impacts can result from water drainage from mines, leaching and erosion of solid wastes from mining and cleaning plants, slurry dewatering, and modifications of aquifers during mining. The water quality factors of greatest concern are alkalinity or acidity (pH), dissolved and suspended solids, and the concentrations of various metals. Many of these concerns have been addressed by the effluent standards for coal mining and preparation shown in Table 2.6.1920 No discharge of process water from new coal preparation plants is allowed under the New Source Performance Standards.19 Recent studies indicated that, at the national level, effluent volume cannot be directly related to types of coal mining and production. How- ever, a coarse relationship between effluent volume and production of coal does exist at the regional level, as demonstrated in Table 2.7.21
mines and from coal and refuse storage piles is a poten- tially severe environmental problem where the coal seams and overburden are rich in pyrites (sulfide im- purities). During mining, pyrites may be exposed to air and water and oxidized to form sulfuric acid. The resulting lower pH increases the solubility of com- pounds containing toxic heavy metals -- such as arsenic, cadmium, chromium, lead, mercury, and nickel.22 The acidity and heavy metals may be toxic to aquatic life and can render water unfit for municipal and domestic use. Although effluent limitations exist to control acid drainage from new mines, drainage from abandoned mines is a lingering problem. Data collected during the 1960s indicated that about 10,OOO mi of streams, primar- ily in Appalachia, had been degraded by acid drainage and sedimentation. Three-fourths of the total acidity was attributable to abandoned mines.323
Acid drainage from both underground and surface
15

Table 2.3 Coal Mining and Preparation Issues
Issue Comments Source of Risk Environmental Risk
Air quality
Water quality
Water quantity
Land use
Waste disposal
Noise
Health and safety
Emissions of particulates, nitrogen oxides, sulfur compounds, hydrocar- bons, and carbon monoxide, which can be harmful to human health and terrestrial ecology.
Discharges from mines, preparation plants, and slurry pipelines; runoff from storage and waste piles and reclaimed land; and groundwater changes during mining can affect pH and levels of pollutants, harming water quality and aquatic life.
Surface water and groundwater supplies can be reduced and redirected, affecting water avail- ability for terrestrial and aquatic ecologies and other uses.
Restoration and protection of land uses before mining will require reclamation and subsidence control. Temporary to permanent loss of wildlife habitat.
Mine and preparation plant waste will require operation of disposal sites.
Temporary or permanent loss in hear- ing sensitivity, physical and psycho- logical disorders, interference with speech communications, and changes in cardiovascular, neurologic, and other functions can result from noise from machinery or blasting.
Impacts include fatalities and disabling injuries from mining, preparation plant, and transporta- tion accidents; respiratory illness from mining; exposure to hazardous materials in coal cleaning plants; and socioeconomic effects from increased transportation.
Surface mining Uncontrolled fires from abandoned mines and storage and waste piles
thermal dryers)
ically cleaned coal
Preparation plant (especially
Combustion products from chem-
Surface-mine discharge Underground mine discharge Storage and waste pile runoff Preparation plant discharge Aquifer modification
Surface-mine drainage modifi-
Aquifer modification Consumptive uses
cation
Surface-mine reclamation Wildlife habitat destruction Subsidence
Waste disposal from mines and preparation plants
Surface mining Underground mining Transportation Coal preparation plant
surface mining Underground mining Preparation plant operation
Transportation
Lows Low to mediumb
Lowc
Mediumd
Mediuma Mediums Mediuma Lows Low to highw
Lows
Low to highw Low to highas
Low to mediumw Low to mediums Lows
Lows
Low to mediumb Low to mediumb Lowb Low
Low0 Lows Lowa (physical
Mediuma (chemical
Lowa
cleaning)
cleaning)
OFrom Ref. 15.
bFrom Ref. 3.
cFrom Ref. 16.
dIndicates area of major uncertainty in current knowledge; from Ref. 15.
eRisks are site specific.
16

Table 2.4 Annual Atmospheric Emissions from Representative Coal Mining and Preparation Plants (tonslmillion tons of coal)
Table 25 Gases Emitted from Burning Coal Mine Refuse Banks in 1968
Eastern Eastern Western Pollutant Underground Surface Surface
Particulates 0.48 33 4.0 Hydrocarbons 0.48 42 4.8 Sulfur dioxide 0.59 47 4.9 Carbon monoxide 6.3 135 15 Nitrogen oxides b 648 76
Fugitive dust b 1,870~ l,&7@ Aldehydes b 10 1.2
aAdapted from Ref. 18 by scaling the annual productions of the following mines and preparation plants to an annual mine production of 1 million tons: (1) for eastern underground, 1.5 million tons mined and 470,000 tons prepared, (2) for eastern surface, 470,000 tons mined and 340,750 tons prepared, and (3) for western surface, 9.7 million tons mined and 8.73 million tons prepared.
bunquantified or negligible.
cBased on estimates (from Ref. 17) for an Illinois surface mine with the following controls: paved access roads, (99% control), watered unpaved haul roads (50% control), and enclosed coal dumps with baghouse (85% control). Without these controls the fugitive dust emissions are estimated at 3,030 tondyr.
Sedimentation from surface-mining operations is another important issue, particularly in Appalachia where hilly terrain and high rainfall make erosion control difficult. Heavy siltation adversely affects aquatic life and reduces the useful life of man-made reservoirs. With the application of control technology, sediment loadings are declining sharply in most areas.
Discharges of "black water," from coal-slurry pipelines at the dewatering site, can present a significant environmental problem unless the water is recycled or reused. Black water contains fine coal particles, organic materials, and trace elements leached from the coal during transportation. Slurry may also be released from pipe ruptures or pipeline system malfunctions. Pipe- lines, dewatering plants, and water treatment facilities must be designed to minimize these potential problems.
Aquifer modification is another source of potential water quality degradation. Water quality can be modi- fied through the interconnection of vertically adjacent aquifers and by seepage of contaminants from spoil or waste disposal piles. Adjacent aquifers can be con- taminated by drainage through joints and fractures created during blasting or intrusion into the aquifers
Emissions 8 of (thousand Total U.S.
Emissions Pollutant tons)
Carbon monoxide 1.2 1.2 Sulfur oxides 0.6 1.8 Hydrocarbons 0.2 0.6
Fine particulates 0.4 1.4 Nitrogen oxides 0.2 1.0
Source: Ref. 3.
during mining. Measurements of water quality in such instances have shown high local effects but extremely variable impacts at some distance from the mine.16
Groundwater impacts from mining in or near aquifers and recharge areas are site specific. Diversion of local surface water drainage may affect both regional hydrology and erosion patterns, which in some cases results in unacceptable levels of sedimentation and stream flows that are inadequate to sustain aquatic life. Where a mine is located below the water table, seepage of water into the mine can lower the water table and dry up wells in the area. The permeability and recharge capability of postreclamation soil may be significantly different from that of virgin soil; altered groundwater recharge and surface flooding are the potential results.
Concentrations of pollutants in treated effluents from coal preparation plants can be comparable to those in effluents from active mines. The volume of dis- charges per ton of coal can also be similar. Therefore, the quantity of a pollutant that is discharged to a stream from cleaning a ton of coal will be about the same as the quantity from mining a ton of coal. The types of efflu- ents will depend on factors such as coal characteristics, the type of cleaning technology, control practices, and rainfall. The actual occurrence and extent of these potential water quality impacts depend on the degree of compliance with and effectiveness of recent regulations, such as those listed in Table 2.6.
Water Use
Water requirements associated with mining are small compared to many end uses of coal. Competition for water supplies is most likely to become a major con- straint in the West, where water requirements for coal-
17

Table 2.6 Eftluent Limitation Guidelines and New Source Performance Standards for the Coal Mining Point-Source Category
~~
Effluent Concentration (mglL except where noted)b
Best Best Best New Source Practicable Available Conventional Performance Technology Technology Technologyc Standards
Wastewater Sourcea Pollutant Avg. Max. Avg. Max. Avg. Max. Avg. Max.
Coal preparation plants and associated areas
Acid discharged
Alkaline discharged
Acid mine drainage
Alkaline mine drainage
Postmining areas (reclamation)
Underground mine drainage
Acid mines
Alkaline mines
Total iron Total manganese Total suspended solids
Total iron Total manganese Total suspended solids
Total iron Total manganese Total suspended solids
Total iron Total suspended solids
Settleable solids
Total iron Total manganese Total suspended solids
Total iron Total suspended solids
3.5 2.0
35
3.5
35
3.5 2.0
3.5
3.5 35
3.5 2.0
35
3.5 35
7.0 4.0
70
7.0
70
7.0 4.0
70
7.0 70
0 . 3
7.0 4.0
70
7.0 70
3.5 2.0
3.5
3.5 2.0
3.5
3.5 2.0
3.5
7.0 4.0
35
7.0
35
7.0 4.0
35
7.0 35
0 . 3
7.0 4.0
35
7.0 35
70
70
70
70
70
70
3.0 2.0
35
3.0 2.0
35
3.0 2.0
3.5
3.0 35
3.0 2.0
35
3.0 35
6.0 4.0
70
6.0 4.0
70
6.0 4.0
70
6.0 70
0 . 3
6.0 4.0
70
6.0 70
~
aFor all sources, the pH of effluents must be between 6.0 and 9.0 at all times.
bAverage daily value is computed for 30 consecutive days and the maximum value is for any one day.
proposed standards; see Ref. 20.
Wnder New Source Performance Standards, concentrations listed are only for areas associated with coal preparation plants; discharge of plant process water is not allowed.
practicable technology are proposed. cSettleable solids are measured in milliliters per liter. Limits apply until performance bond has been released; limits for best
Sources: Refs. 19 and 20.
18

Table 2.7 Typical Flow Rates for Effluent Streams by Coal Supply Region
Unit Flow Rates (L/ton of coal)
Under- Refuse Plant Typeof ground Surface Pile Process
Region Drainage Mine Mine Runoff Discharge
Northern Appalachia acid 2,500 3,300 30 800-1,800 45 800-1,800 Central Appalachia acid 2,500 3,300 40 800-1,800 Southern Appalachia SO%acid 2,500 3,300
Interior Midwest8 50% acid 1,700 1,100 30 800- 1,800 Interior Central Westb 50% acid 1,700 1,100 30 80@1,800 Fort Unionc alkaline 530 30 10 od Northwest Great Plains alkaline 530 30 10 od
IIllinois, Indiana, and western Kentucky.
bIowa, Kansas, Missouri, and Oklahoma.
CNorth Dakota, South Dakota, and eastern Montana.
dAssumes existing coal preparation plants in these regions operate on a 100% recycling
ewestern Montana, Wyoming, and northeastern Colorado.
Source: Ref. 21.
basis. Very little coal is cleaned in these regions.
slurry pipelines may directly conflict with municipal and agricultural needs. Existing state legal doctrines that cover water appropriation will play a major role in determining the quantities of water available to specific mines.
The annual water requirements for mining and preparing 1 million tons of raw coal by eastern under- ground and surface mining are shown in Table 2.8. About 10% of the water used to suppress dust is lost to evaporation or absorbed by the coal and needs to be made up.
Land Use
The effects of coal mining on land use are direct and site specific; surface disruption, subsidence from under- ground mining, and disposal of wastes are the major impacts. The estimated land requirements for mining and preparing 1 million tons of raw coal by both eastern underground and surface coal mines with preparation plants are shown in Table 2.8.
particularly in the West, will substantially affect land use. Because of variations in coal seam thickness, heating value, and mining technique, levels of coal
Increases in surface mining during the next decade,
Table 2.8 Estimated Land, Water, and Energy Required per Million Tons of Coal Mined and Cleaned
Eastern Eastern Resource, Use Underground Surface
Land (acres) Surface construction (once only) Strip mining (per year) Waste storage (per year)
Water (million gaVyr) Dust control, used Dust control, consumed Coal preparation Total consumed
Energy Diesel fuel (thousand gal/yr) Electricity (million M W y r ) Mine equipment Coal preparation
4.0
1 .o
73.3 7.3
21.3 34.6
38.1
35.0 4.3
4.3 20.0 2.6
20.0 20.0
3,021
2.0 4.3
Source: Ref. 18.
19

production and land-use impacts will vary. For ex- ample, because of significantly thicker seams, mining western coal resemes will affect fewer acres per ton of coal than mining elsewhere in the country. The most obvious impact of surface mining is the temporary removal of land from its use as farmland, forest, or rangeland. Contour mining can create severe environ- mental problems if not properly performed. Spoil from improperly controlled mines can result in erosion and landslides, and unreclaimed highwalls are a major esthetic problem. Noise, visual, and hydrologic impacts beyond the mine boundary affect wildlife habitat and recreational activities in a larger area. Experience in most coal-producing regions suggests that once the coal has been extracted, the land can be successfully reclaimed to support its former uses. In some of the more ecologically fragile areas (e.g., arid western lands or prime farmland), necessary experience is still being gained that will ensure successful reclamation. Protec- tion of these lands is provided for in the SMCRA.
Although less conspicuous than the results of surface mining, subsidence from underground mines can have severe impacts on roads, water and gas lines, buildings, and local hydrology. The extent, severity, and timing of subsidence depend on the overburden composition and thickness, mining technique, and other factors. It has been estimated that about 25% of the 8 million acres of undermined lands in the eastern United States have subsided323 Because of the complex nature and uncertainty of subsidence, the impacts on adjacent lands may increase the area affected by a factor of five.23 The area affected by an underground mine is thus greater than that affected by a surface mine with the same production capacity. Subsidence can occur during the operating phase of a mine; however, with certain mining techniques, such as room-and-pillar, it is more likely to occur many years later as pillars collapse. Procedures that minimize subsidence from underground mining are also required under the SMCRA.
Another major land-use impact from coal mining and preparation results from disposing of mining wastes. In 1979, there were an estimated 3,OOO-5,OOO waste piles in the eastern United States that together contained over 3 billion tons of waste? In addition to degrading air and water quality, mine wastes can be a blight on property values and a visual affront, unless they are properly disposed of and the land is reclaimed. In 1971, improper disposal of such wastes was dramatized in Buffalo Creek, West Virginia, where a water impoundment that was constructed of mine wastes broke during a heavy rainstorm, killing more than 125 people and causing millions of dollars of damage. A follow-up study
indicated that numerous other such impoundments in the East presented similar dangers2
The Resource Conservation and Recovery Act (RCRA) of 1976 provides for the regulation and man- agement of solid and hazardous waste disposal. In order to avoid duplication and confusion with respect to jurisdictional responsibilities, the RCRA integrates statutes from other laws, such as the Clean Air Act, the Clean Water Act, the Safe Drinking Water Act, the SMCRA, and the Marine Protection, Research, and Sanctuaries Act.
Coal-mining wastes are classified as "other mining wastes" in the RCRA and therefore are regulated under solid waste regulations (subtitle D). However, this classification could change in the future, depending on the conclusions of ongoing studies of the flammability of coal mining wastes and their tendency to fonn acidic and toxic leachates.
Coal preparation plants are by far the largest pro- ducers of solid waste from underground mining. This waste consists of shale, pyrites, coal fines, and im- purities. About 25% of the raw coal from both surface and underground mines that is cleaned becomes solid waste. Surface mines also generate large amounts of material from overburden removal. However, most of this material is returned during the mine-area reclama- tion, with little net solid waste generation.
The fraction of coal that results in solid waste during cleaning and preparation has increased over the years. One reason for this is that the mining equipment digs less selectively than the previous manual-mining methods. Also, the coal seams currently being mined tend to contain larger amounts of impurities.
Noise
The coal preparation crusher and other mining and transportation equipment are the major sources of noise from both surface and underground mining. Blasting, which is normally carried out intermittently at strip mines, results in a sharp peak superimposed on the normal background noise level. Heavy construction equipment typically generates noise at a level of 80- 100 dB at 50 ft.24 This noise level would be reduced to 60-80 dB about 1,500-2,OOO ft from the noise source.1 The American Conference of Governmental Industrial Hygienists has recommended maximum duration for noise exposure at various levels. For example, the recommended maximum daily exposure at the 85-dB level is 8 h, and a maximum of 15 min is recommended for the 105-dB level.=
20

Health and Safety
Coal mining has historically been ii hazardous occupa- tion. Federal efforts since 1952 have resulted in major improvements in miner safety and health; the primary legislation was the CMHSA. The incidence of injuries and deaths due to accidents in underground and surface coal mines and their associated coal preparation plants is shown in Table 2.9.
The primary safety goal of the CMHSA is to reduce the occurrence of major underground mine disasters by establishing standards for dust control, ventilation, and roof support. In this regard, the law has been successful by reducing fatality rates from 0.60 per million tons in 1967-1969 to 0.36 per million tons in 1980-1981. During the same period, reported disabling injuries have increased from 23.7 to 43.9 per million tons326 The increase of injury rates in underground mines probably has a variety of causes. First, the CMHSA focused on fatalities rather than on injuries. For example, little attention is given to reducing injury rates in coal han- dling and machinery operation, the most common causes of injury. Second, it is argued that increased safety requirements have lowered labor productivity, resulting in the employment of more miners per ton of production and, given relatively constant injury rates per hour of exposure, in increased injuries per ton of production. Third, more stringent reporting requirements may have contributed to an increase in injury reporting. Fourth,
Table 2.9 Incidence of Injuries and Deaths Due to Accidents in Coal Mines and Preparation Plants (per million tons of coal)
Item Underground Surface
Personnel required Mines 45 1 150 Preparation plantb 8 32
Deaths Mines 0.36 0.046 Preparation plantb 0.0057 0.023
Disabling injuries Mine8 43.9 4.79 Preparation plantb 0.75 3.0
~~
SSource: Ref. 26 for U.S. average in 1980-1981.
bbource: Ref. 18 for eastern mines.
the expansion of coal production in the 1970s resulted in the employment of new and inexperienced workers who were inadequately trained in operating equipment safely and safe mining practices. Furthermore, this rapid influx of new miners also resulted in insufficient numbers of qualified supervisors.3
pneumoconiosis. The incidence and severity of this disease is believed to be related to the levels of dust present in mines. Respirable dust standards were established by the CMHSA, so the incidence of illness is expected to decrease. Other occupational health problems, such as loss of hearing, nonrespiratory illness from coal exposure, and hypertension, are suggested from epidemiological studies, but the extent of these problems is not well known.3
An emerging concern is the impact that new chemical-cleaning technologies may have on occupa- tional and public health. Cleaning may release chemi- cals such as iron pentacarbonyl, hydrogen sulfide, and organic solvents, which have health effects ranging from eye irritation to serious illness or death, depending on exposure levels. The handling and combustion of coal that contains residual amounts of cleaning agents may present both occupational and public health concerns.
The prime health concern for miners is coal-worker
Energy Requirements
For eastern underground mining, the primary energy source is diesel fuel, which is consumed during explora- tion, resource assessment, and mine and associated facility construction. Electricity is needed to operate the mine and coal preparation equipment. For eastern surface mining, considerably more energy is needed for handling large volumes of material during cleanup and grubbing, topsoil removal, overburden removal, coal removal, backfilling, and topsoiling. The yearly energy needs for mining and preparing 1 million tons of raw coal by eastern underground and surface mining are also shown in Table 2.8.
ENVIRONMENTAL CONTROLS
Many environmental impacts of coal mining and prepa- ration are unavoidable. For instance, short-term loss of wildlife habitat and agricultural production is inherent in surface mining. In many instances, effective application of existing control techniques and procedures will mitigate the impacts. New control technologies are needed mainly to allow productivity to be improved while meeting recognized environmental objectives.
21

Air Quality
Sources of fugitive dust -- including coal and overbur- den handling, drilling, blasting, and wind erosion -- can be controlled by spraying the coal with chemicals or water during loading and unloading, wetting haul roads, and covering hauling equipment.3 Cyclones and water sprays can be used with drills, and proper placement of explosive delays in blasting rounds can reduce dust by efficient fragmentation. Dust problems at transfer points may be reduced by the use of electrostatic precipitators, fabric filters, or even well-designed buffer zones. Emissions from conveyors are effectively eliminated by covers. Windbreaks can effectively reduce visible dust emissions from wind erosion of coal and overburden.
Accidental fires (possibly resulting from spontane- ous combustion) and natural releases from refuse banks, mines, and coal piles may cause gaseous emissions. Fires can be prevented by controlling air circulation, the concentration of combustible material, and temperature.3 For preventing fires in abandoned mines, the best tech- niques include removing excess combustible material and sealing openings to reduce air circulation. Air can be eliminated from refuse piles by compacting and burying them.
Gaseous emissions from the accidental burning of refuse piles or abandoned mines are partially regulated by the Office of Surface Mining. The SMCRA requires that combustible material that is exposed, used, or produced in underground mining, including exposed coal seams, be treated (if necessary) and covered. In addition, all openings to the surface must be capped, sealed, or backfilled when no longer needed for mining.15 Coal-pile fires are actively controlled by operators because they represent a loss of product.
sealing the mine to reduce air flow are the most common ways to minimize formation of acidic water. Controlling water flow is also helpful, but it is not practical in most cases. There is no effective way to control acid formation in abandoned mines. Alternatives for treatment of mine drainage after its formation are chemical precipitation of dissolved solids, usually by pH adjustment; aeration (spraying to entrain air); removal of suspended solids (chemically by flocculation or natu- rally in settling ponds); neutralization through chemical pH adjustment; and filtration through local soiI.3
poses the more serious problems and requires extensive treatment. Alkaline mine drainage, which is produced by the majority of U.S. coal mines, is actually neutral or slightly alkaline and is usually low in toxic metals. Alkaline mine drainage may require only settling, to remove suspended solids, and often requires no treat- ment before being discharged.
use extensive wastewater recycling, which often requires only removal of suspended solids.11 Wastewater from chemical cleaning plants may require extensive treat- ment (by activated carbon, chemical precipitation, aeration, settling, neutralization, or filtration) to remove toxic pollutants.
refuse and coal storage piles may require more than settling to remove suspended solids if some of the pollutants are dissolved. Procedures similar to those employed at sanitary landfills are applicable to refuse piles. Leachate from coal piles can be controlled by site management techniques, such as containment and settling.1 1
Mine drainage that is categorized as acidic generally
Preparation plants using a nonchemical water wash
Rainwater runoff from mine and preparation plant
Water Use Water Quality
The potential sources of water pollution from conven- tional technologies for coal extraction and preparation are mine drainage, preparation plant wastewater, and rainwater runoff (including refuse- and coal-pile leachate). Several treatment alternatives apply to all of these sources, although the technique selected and the degree of treatment required depend on the level of contamination.
Ideally, the best treatment for acid water is to inhibit its formation by preventing oxygen flow to the pyrites in coal. Removing pillars so that the roof can collapse (where subsidence is acceptable) and backfilling and
The two aspects of water use that are of primary interest are water consumption by various mining activities and the impact of mining on surface water or groundwater supplies. Water consumption may be reduced by using mine water in the preparation plant, recycling prepara- tion-plant or slurry-pipeline water, substituting other liquids for water, and carefully controlling dust- generating activities so that wetting will be minimized. Long-term drainage-pattern modifications can usually be avoided, but aquifer modifications by drawdown from mine water pumpage or by blockage caused by sub- sidence or surface mining is often more difficult to mitigate; the alternatives are highly site specific.
22

Land Use
Land is affected by subsidence of underground mines, inadequate reclamation of surface mines, and improper waste disposal. Alternatives that may reduce subsidence include leaving more or larger pillars, backfilling with preparation plant refuse, and promoting more controlled subsidence through panel mining.
Inadequate reclamation of surface-mine areas may leave the land unable to support desirable plant species and result in the loss of important farmland or wildlife habitat. Measures to mitigate these potential impacts will vary with the site but can include segregatian of topsoil and overburden, better compaction of refuse, revegetation with native species, combination planting, and soil enrichment. The accepted practice is to sand- wich compacted layers of refuse between impermeable clay layers. This technique often prevents the refuse from leaching or igniting spontaneously and provides needed soil stability. In some cases, wastes can be used for backfill in abandoned mines, manufacture of aggre- gate products, construction of roads, or low-grade fuel.
The SMCRA has reduced the impacts from surface mining on land use by requiring (1) restoration of mined land to approximately its original contours, (2) protec- tion of soil, with particular restrictions for prime farm- lands and alluvial valleys, (3) restoration of mined land to conditions permitting its premining use or better, and (4) designation of lands as unfit for mining if successful reclamation is not feasible or if resources that should be protected are present. These requirements may prohibit mining in some areas of the arid western states. Recla- mation costs vary between $0.01 and $OSWton of coal.15
Subsidence due to unstable underground mines is site specific. In inhabited areas where subsidence can damage structures, pillars of coal are left to reduce subsidence potential. Frequently, coal is best removed from beneath less-developed land, using panel mining, because subsidence is less injurious to ultimate land use than the consequences of alternative mining methods. Subsidence control research has estimated costs of subsidence reclamation at $1.50/ton of coal.15
Health and Safety
Barring unforeseen technological advances that would significantly increase productivity and lower the number of miners, the key occupational health and safety objec- tives are to improve miner training, promote safe work- ing practices, and develop equipment that is safer in design and operation. The primary risks in underground
mines are roof collapse, explosion, and respiratory disease. Development of new types of equipment or safer designs for existing equipment could lower the number of injuries and deaths. Venting methane from coal seams may reduce the risk of explosion while recovering a significant energy resource; dust suppres- sion and increased ventilation could reduce respiratory illness.
To reduce disruptions, delays, and accidents in communities from unit trains, grade separations or rerouting tracks around populated areas are alternatives. Moving tracks away from communities will also result in reduced noise exposure.
The Mine Safety and Health Administration has promulgated extensive regulations to protect miners, particularly in underground mines. Primary attention has been focused on the prevention of fatalities from roof collapse and mine explosions and on the occupa- tional health effects of inhaling respirable dust. The major initiatives of the CMHSA were improved roof support, increased ventilation, and decreased dust levels. The current respirable dust standard is 2 mglm3. Electri- cal standards and lighting and equipment design require- ments also exist.
ENVIRONMENTAL CONSTRAINTS
Current technologies for the mining, preparation, and transport of coal reflect the evolution of the U.S. coal industry over the past 200 years. During this evolution, the efficiency and reliability of techniques have im- proved, but the basic nature of these activities and their effects on the environment are essentially unchanged. Disturbances to land and the generation of solid, liquid, and gaseous wastes are inherent in coal mining and preparation. With the exception of chemical cleaning, new technologies do not create any environmental impacts that significantly differ from those of existing techniques.
Improved mining practices, the availability of pollution controls, and the enforcement of environmen- tal protection requirements can prevent much of the environmental damage that accompanied coal produc- tion in the past. However, despite these advances, large-scale coal mining and preparation will not be without consequences. The magnitude of these environ- mental costs will vary regionally; they will depend on the total demand, the implementation of regulations that respond to the environmental effects of coal develop- ment activities, the effectiveness of pollution control at
23

both existing and new mines and preparation plants, and the production economics of coal.
New procedures and technologies can diminish the environmental impacts of new mines but cannot elimi- nate them. Environmental, safety, and health analyses should be made routinely on new and modified technol- ogies to establish a balance between associated environ- mental and economic costs. Chemical coal cleaning is one emerging technology in which potential environ- mental problems have been recognized. The magnitude of such potential problems must be better assessed during technology development, so that they may be adequately characterized and controls developed.
Even though the rate at which U.S. coal consump- tion is projected to increase from 1985 to 1995 (2.1%) is somewhat less than the rate of expansion from 1974 to 1984 (3.5%), annual consumption is still expected to reach 1.0 billion tons in 1995.5 Significant trends within this national growth are the continued regional shift in production from the East to the West and the growth in underground mining, which will partially reverse the declines of the past 35 years. These trends could have significant environmental, health, and safety implica- tions in certain regions.
Air Quality
Air quality impacts from coal mining and preparation are expected to be of local rather than national sig- nificance. A continuing need to reduce fugitive dust and gaseous emissions will require the application of avail- able technologies and the development of new process- es. If better controls are not available, mining may be inhibited near areas designated as Class I or nonattain- ment under the Prevention of Significant Deterioration regulations. In addition, some constraints on mine size could result if surface mines are added to the list of major sources for fugitive dust control under these regulations.17
Water Quality
The major impacts on water quality will be acid drain- age from abandoned mines in the East and increased alkalinity and suspended solids in the West, especially when water levels fall. Effluent guidelines for acid and alkaline drainage from new mines and for nonprocess water from preparation plants are generally sufficient to protect water quality. However, existing processes and emerging chemical cleaning techniques may generate wastewaters with toxic pollutants that will require further investigation on the adequacy of controls.
Drainage from abandoned mines and increased underground mining will contribute to water pollution in certain areas, especially in West Virginia and Pennsylva- nia.3J6 The major problem will be from total dissolved solids, as measured by sulfate releases. Current control strategies, particularly for abandoned mines, are often considered inadequate,3 and better controls are being developed.
Water Use
The SMCRA requires that the groundwater and surface waters within and near mine sites be protected from adverse effects and that all water rights be protected. To ensure this protection, particularly in the western states, new alternatives for aquifer protection may need to be developed, and site-specific studies will be necessary. Compared with other coal-related activities, however, water use in mining is small, and it is not expected to be a major constraint on mine development.
Land Use
Future subsidence is expected to be reduced by the application of SMCRA rules, which set general perform- ance standards for underground mining. The demonstra- tion of revegetation on arid western lands will be of major significance in permitting the increased mining needed to meet national production goals. With the exception of some operations in Colorado, Wyoming, and Utah, essentially all underground mining occurs east of the Mississippi River. Strict enforcement of the SMCRA and detailed cataloging of abandoned mine sites will aid in efficient land-use planning and lessen any damage caused by subsidence.
Solid waste from mines and preparation plants will increase with increased production and the mining of less-desirable seams. Most mining wastes are generated from eastern underground mines, but the quantity of waste generated at preparation plants is increasing even more rapidly. (This projected rapid growth is based on the assumption that control technology for removing suspended solids will significantly increase solid wastes.) The majority of preparation plant wastes will also be associated with eastern bituminous coal mines. Because of the high pyritic sulfur content of eastern mining and preparation plant wastes, waste disposal standards that are imposed by the RCRA may require additional treatment of these wastes.
24

Health and Safety
Coal mining, particularly underground mining, will remain a high-risk occupation despite continued regula- tory initiatives. Respirable dust levels in underground mines have decreased as a result of the CMHSA, but respiratory disease has not been eliminated. Without further regulatory mandates or technological improve- ments in mine safety, recent rates of fatalities and injuries are not expected to decline significantly.
many new and inexperienced miners. Thorough training of new workers in mining practices and equipment operation, and an emphasis on safety among supervisory personnel, will be necessary to protect the health and safety of these new personnel.
reduced in the past decade, injury rates remain high. New equipment, engineered for safety as well as produc- tivity, can significantly contribute to improved mine safety and reduce injury rates. An example of such equipment is the "miner-bolter," which integrates continuous mining and roof bolting into a single ma- chine and thus reduces the potential for roof collapse. Safety analysis of the design and operation of existing mining and hauling equipment also may be appropriate.
The potential health and safety effects of the chemi- cal cleaning processes being developed are unknown. The development of these processes should be carefully monitored, and appropriate regulations should be adopted.
The expanded use of coal will require the hiring of
Although mining fatalities have been significantly
REFERENCES
1.
2.
3.
4.
5.
Annual Energy Review 1984, Energy Information Administration, U.S. Dept. of Energy Report
Annual Outlook for US. Coal 1985, with Projec- tions to 1995, Energy Information Administration, U.S. Dept. of Energy Report DOE/EIA-0333(85) (May 1985).
The Direct Use of Coal, Office of Technology Assessment, U.S. Congress (April 1979).
Slatick, E.R., Coal Data: A Reference, Energy Information Administration, U.S. Dept. of Energy Report DOE/EIA-0064(84) (Jan. 1985).
Annual Energy Outlook, 1985, with Projections to 1995, Energy Information Administration, U.S.
DOE/EIA-0384(84) (April 1985).
6.
7.
8.
9.
10.
11.
12.
13.
14.
15.
16.
Dept. of Energy Report DOE/EIA-0383(85) (Feb. 1985).
1983 Keystone Coal Industry Manual, Mining International Services, McGraw-Hill Mining Publication, New York (1983).
An Assessment of Development and Production Potential of Federal Coal Leases, Office of Technology Assessment, U.S. Congress (198 1).
Energy From the West: Energy Resource Develop- ment Systems Report, Vol. II: Coal, U.S. Environ- mental Protection Agency Report EPA-600/7-79- 0606 (March 1979).
Energy Alternatives: A Comparative Analysis, Science and Public Policy Program, University of Oklahoma, Government Printing Office Document 041-011-oOo25 (April 1975).
Development Document for Efluent Limitations Guidelines and Standards for the Coal Mining Point Source Category, Proposed Effluent Guidelines, U.S. Environmental Protection Agency Report EPA-440/1-81/057-6 (Jan. 1981).
Environmental Control Implications of Generating Electric Power from Coal, 1977 Technology Status Report, Appendix A , Part 1 , Coal Prepara- tion and Cleaning Assessment Study, Bechtel Corp., San Francisco, Argonne National Labora- tory Report ANL/ECT-3 @ec. 1977).
New Technologies for Burning Coal, Office of the Assistant Secretary for Fossil Energy, U.S. Dept. of Energy (Dec. 1982).
Doctor, R.D., et al., The Impact of Coal Cleaning as a Sulfur Reduction Strategy in the Midwest, Argonne National Laboratory Report ANLECT- TM-7 (June 1983).
Onursal, B., Versar, Inc., Springfield, Va., un- published information submitted to Argonne National Laboratory under Contract No. 41932401 (Sept. 1984).
Environmental Readiness Document: Coal Extrac- tion and Preparation Technology, U.S. Dept. of Energy Report DOE/ERD-0024 (July 1979).
An Assessment of National Consequences of Increased Coal Utilization, Executive Summary for Vol. I I , U.S. Dept. of Energy Report TID- 29425 (Feb. 1979).
25

17.
18.
19.
20.
21.
26
Assessment of Impacts on the Surface Coal Mine Industry Resulting from Possible Changes to PSD and Ambient Air Quality Standards, prepared for the U.S. Dept. of Energy by PEDCo Environmen- tal, Inc. (June 1984).
Energy Technology Characterizations Handbook -- Environmental Pollution and Control Factors, U.S. Dept. of Energy Report DOE/EP-0093,3rd Ed. (March 1983).
Coal Mining Point Source Category: Efluent Limitations Guidelines for Existing Sources, Standards of Pegormance for New Sources and Pretreatment Standards, final rule, Federal Register, 50( 196) (Oct. 9, 1985).
Coal Mining Point Source Category: Efluent Limitations Guidelines for Existing Sources, proposed d e , Federal Register, 46(3) (Jan. 15, 1981).
Davis, MJ., and R.D. Doctor, The Water-Quality Significance of Zero-Discharge Requirements for
22.
23.
24.
25.
26.
Energy Industry, Argonne National Laboratory Report ANUEES-TM-234 (March 1982).
Comparative Assessment of Health and Safety Impacts of Coal Use, U.S. Dept. of Energy Report
Environmental Development Plan, Coal Extrac- tion and Preparation, US. Dept. of Energy Report DOEEDP-0050 (Sept. 1979).
Alternative Fuels Demonstration Program -- Final Environmental Impact Statement, Energy Re- search and Development Administration Report ERDA-1547, Vol. 1 (Sept. 1977).
Threshold Limit Values and Biological Exposure Indices for 1985-86, American Conf. of Governmental Industrial Hygienists (1985).
Injury Experience in Coal Mining, 1981, U.S. Department of Labor Report MSHAIIR-1138 (1982).
DOEEV-0069 (March 1980).

Chapter 3
BACKGROUND
Coal has been burned in utility boiler furnaces for steam-electric power generation since the early 19OOs, and modem coal-fired power plants (Fig. 3.1) continue to make a major contribution to U.S. energy supplies. According to estimates prepared for the U.S. Depart- ment of Energy (DOE), about 55% of electricity was generated from coal combustion in 1984, and power generation accounted for aboq/81% of US. coal consumption.12 coal continues to capture an increasing share of the electricity generation market. The DOE estimates that coal-fred electricity generation grew from 12.1 to 14.1 quadrillion Btu, or quads, between 1980 and 1984, and it is projected to increase to 22.6 quads by the year 2000.13 Figure 3.2 compares the historical and projected use of coal and other fuels for electricity generation.
Modem coal-fired power plants operate on the same principles as those of the early twentieth century, but the equipment has changed significantly. A new type of boiler, using the pulverized-coal furnace, was commer- cialized in 1920. Since then, many design changes have made it possible to tailor individual units to specific coal types and plant requirements. One significant advance was the cyclone furnace, which reduces the fly ash con- tent of the flue gas, saves fuel preparation costs, and permits the use of smaller furnaces, although it generates more nitrogen oxides (NO,) emissions than older fur- nace types. Modem low-NO, burners minimize emis- sions of NO, through carefully designed burner configu- rations and controlled combustion conditions.3 Rela- tively recent developments in the art of coal combustion include fluidized-bed combustion, integrated gasifica- tion combined cycle, and coal-liquid mixtures, which potentially offer both greater efficiency and lower emissions.43 These new technologies are described in detail in other chapters of this book.
Conventional Coal-Fired Power Plants
The DOE and other agencies have identified envi- ronmental concerns resulting from the use of coal,Ga and these concerns have resulted in significant design changes in modem coal-fired power plants. Of major concern are increased emissions of certain air pollutants, including NO,, sulfur dioxide (Sq), and volatile organ- ic compounds, that may exacerbate existing problems arising from acid rain and ozone. Other issues of con- cern include projected increases in both carbon dioxide (C02) and radionuclide emissions; the land requirements for, and seepage from, additional solid waste disposal; and control of various liquid effluents. Extensive pro- grams addressing these issues are being conducted by both DOE and the U.S. Environmental Protection Agency (EPA). Congress has recently provided funding to the DOE for the Clean Coal Technology program. Under this program, the DOE will share with industry the costs of building and operating facilities to demon- strate the commercial feasibility of technologies that reduce the environmental residuals now associated with coal combustion and conversion. The DOE funding could total as much as $2.5 billion over the next five years.
TECHNOLOGY
Conventional coal-fired power plants generate electricity through a series of conversion stages: coal is burned in boilers to produce high-pressure steam, the steam ex- pands and drives a turbine, and the mechanical energy of the turbine is converted to electrical energy by a gener- ator. A modern coal-fued power plant also includes auxiliary systems for the control of gaseous, liquid, and solid wastes. The elecmcal generating capacities of coal-fired power plants can vary from less than lo0 to more than 2,000 M W , and utility boilers bum various types of coal to serve base- and intermediate-load needs.
27

Figure 3.1 Nucla Station, a 39-MW Coal-Fired Electric Generating Station in Southwestern Colorado. Its three generating units are equipped with baghouses.
The environmentally significant areas of coal-fired power production include coal handling and storage, coal combustion, steam generation, condenser cooling, electricity generation, flue-gas cleaning, solid waste handling and disposal, and wastewater treatment. The inputs, stream flows, and residuals for a typical 500- W e plant are shown in Fig. 3.3.9 The techniques for flue-gas and wastewater treatment, solid waste handling, and condenser cooling discussed below are representa- tive of modem plants. However, many variations exist, depending on plant age and location.
Coal Preparation and Combustion
Coal is stored in a silo or open piles and conveyed as necessruy to a crusher. In crushing operations, double- roll or impact crushers reduce coal size and increase surface area for better firing efficiency. Double-roll crushers use teeth or cones to pulverize the coal as it passes under the rolIer;10 impact crushers use crushing tools on a rotating shaft. Residuals from handling and storage include storage-pile runoff and fugitive dust.

3.5
3.0
-0 5 2.5 (I) > 0
V
c ._ ._ L c
a, 2.0 W 0 3
c
lii
& 1.5 a 3 Q C
v)
c
- 3 1 .o I5
0.5
0.0
1960 1965 1970 1975 1980 1984 1990 1995 2000 2005 2010
Year
Figure 3.2 Relative Contributions of Coal and Other Fuels to Historical and Projected Electrical Generation
Coal is fired by pulverizing and burning in suspen- sion, by combustion in cyclone furnaces, or by stoking. In pulverized-coal boilers, which are the type preferred by utilities today, the coal is blown into the furnace.11 As much as 80% of the incombustible fines leave with combustion gases as fly ash; the remainder is collected at a bottom grate as slag or bottom ash. In cyclone fur- naces, coal is fed into the top, where it immediately encounters the turbulence of the "cyclone," which pro- motes a long residence time and thorough combustion. In stoker-fired boilers, the coal enters the firebox on moving grates. The volatile gases ignite immediately,
and the combustible solids burn as they are conveyed through the furnace toward the ash hopper at the end of the grate.
Heat Transfer and Cooling
Heat from the combustion gases is transferred to water circulating in the boiler tubes. The water is heated to near boiling point at high pressure; it then flows through a series of drums and tubes where it is vaporized to saturated steam. This saturated steam is further heated
29

_- 1
0 Drih and Flue
evaporation gas 0
Cooling Makeup Stack
Blowdown
SO2 1 ' Particulate
Coal- control control
t 0
Controlled -4- 8
+ Limestone Solid waste
runoff
treatment disposal and recycling water
Excess treated water
Plant Parameters
5 0 0 M W e 80% capacity factor 35% overall plant efficiency
Resource Requiremenrs (annual) @ Eastern bituminous coal
(tons) 1.43 million @ Makeup water (gal) 2.7 billion
Product @ Limestone (tons) 146,ooO
@ Electricity (MWh/yr) 3.5 million
Residuals (tonslyr) 0 Gaseous
Sulfur dioxide Oxides of nitrogen Total suspended
particulates Hydrocarbons Carbon monoxide Carbon dioxide
Bottom ash Fly ash Sludge
8 Solid
10,Mo lo.m 500 220 720
37.m
25,000 100,000 195,000
Figure 3.3 Process Flow Streams for a Coal-Fired Electric Plant Using Eastern Bituminous Coal to Generate 500 MWe (Source: Ref. 9)
in the superheater. Flue gases pass through a preheater to heat feedwater entering the boiler.
Turbines convert the heat energy contained in the steam to mechanical energy for turning generators. As steam expands in a turbine, its velocity increases and its temperature and pressure decrease. The high-velocity steam impinges on the turbine blades, causing rotation. The mechanical energy from the turbine is converted io electrical energy by the generator. Steam leaving the turbines is condensed to water with condensers.
Several alternative technologies exist for the dispos- al of waste heat from electric power generation: once- through cooling systems (for power plants located on the shores of either natural bodies of water or man-made impoundments), cooling ponds, spray systems, evapora- tive cooling towers, dry towers, and hybrid combina- tions of these systems. In each case, waste heat is removed from the power system by passing large quan- tities of cooling water through condensers. The heat absorbed by the cooling water must eventually be trans- ferred to the atmosphere by evaporation, conduction, or radiation.
A 1978 survey of power plant cooling systems indicated that, of the old generating capacity (defined as on line before 1970, or less than 500 W e and on line before 1974), 85% used open-cycle or once-through cooling systems and 15% used closed-cycle or recir- culating systems.12 These older cooling systems are largely exempt from requirements of the Clean Water Act. For power plants coming on line between 1969 and 1977 (if greater than 500 h4We capacity) or between 1973 and 1977 (if less than 500 W e ) , the percentage of closed-cycle cooling systems is nearly 50%. Environ- mental guidelines were cited as the primary reason for the shift to closed-cycle systems.13 For plants planned or under construction in 1977, closed-cycle systems account for 84% of the total.12
ENVIRONMENTAL ISSUES
The following sections address the environmental issues related to coal-fired power plants. Emission levels or input requirements are based on a 5 0 0 - W e
30

representative plant burning eastern bituminous coal containing 3.3% sulfur and 8.8% ash.9 The plant is assumed to be equipped with an electrostatic precipitator (ESP) for particulate emission control (99.5% efficient), a limdlimestone wet scrubber for SO2 control (90% efficient), and a wet, mechanical-draft cooling tower. On-site solid waste disposal and water treatment or recirculation to minimize discharge are assumed, and an 80% capacity factor has been used.
Atmospheric Emissions
Estimates of atmospheric emissions from the repre- sentative plant are based on control levels required by current New Source Performance Standards (NSPS). Overall, State Implementation Plans governing emis- sions from older sources are less stringent than NSPS, thereby permitting higher levels of emissions from these sources.
Particulate Emissions
Microscopic solid particles (particulates) and liquid droplets comprise about 10% of the mass of combustion products from coal. Particulates are emitted in the boiler stack gas at a rate of about 0.03 lb/million Btu after controls. The representative plant, which employs a 99.5%-efficient ESP, would emit 500 tons/yr of particulates.9
vary in size from 0.01 to 10 pm in diameter. While large particulates are efficiently removed by the emis- sion control system, particulates less than a few micro- meters in diameter are difficult to capture. These small particulates, many in the range of 0.1- 1 .O tun, are easily respirable and may have adverse effects on human health.1415
usually deposited in the respiratory system, those with a diameter of about 0.01-3.0 pm may be deposited in the alveoli of the pulmonary region, and those larger than 1.0 pm tend to be deposited in the nasopharyngeal and tracheobronchial regions. These particulates can remain in the respiratory system for 2-6 ~k.14~15 Because par- ticulates adsorb Sot, trace elements, and polynuclear aromatic hydrocarbons, they can magnify the effects of these substances by holding them in the lungs. The major areas of concern include effects on respiratory mechanisms, aggravation of existing respiratory and cardiovascular diseases, and effects on the clearance mechanisms and immune systems of the body.14,15 To focus control on small particulates, the EPA has revised the National Ambient Air Quality Standards (NAAQS)
Particulates formed during coal combustion usually
Particulates less than 0.01 pm in diameter are not
Table 3.1 Control of Trace Elements and Ash from Conventional Combustor Flue Gas
Overall Plant Removal Efficiency (%)b
Amount in Hot-Side Cold-Side Element Coal (ppm)" ESP ESP
Arsenic Beryllium Cadmium Chromium
Fluorine Mercury Manganese Nickel Selenium Zinc Ash (%)
Copper
14.02 1.61 2.52
13.75 15.16 60.94 0.20
49.40 21.07
2.08 272.29 11.44
90.0 99.0 97.8 97.6 95.7 83.5 85.7 98.2 96.4 83.3 %.9 91.4
99.3 99.4 99.3 99.2 92.9 66.1 77.7 99.3 98.7 99.1 81.2 99.1
Gource: Ref. 17. The values presented are averages of 101 coal samples.
bSource: Ref. 18. Overall plant removal efficiency is defined as (1 - mass emitted from the stack)/(mass in coal feed). Values are for two plants, one with the ESP preceding the air preheater (hot side) and one with the ESP following the preheater (cold side).
to include a standard specific to particulates less than 10 pm in diameter: ambient concentrations of less than 150 pg/m3 for the annual maximum 24-h average and less than 50 pg/m3 for the annual geometric mean.16
Table 3.1 presents typical concentrations of trace elements in coal and plant removal effi~iencies.17~18 Emissions from coal combustion in power plants have not been demonstrated to be an important source of trace elements .19
Sulfur Dioxide Emissions
When coal is burned, the sulfur in the coal is converted to SO2 and small quantities of primary sulfate. The representative plant would produce 10,200 tons/yr of SO2 after control.9 The SO2 that escapes into the atmos- phere is either deposited locally or converted to sulfuric acid or sulfate in the atmosphere20 The possible im- pacts of SO2 and its transformation products include human health effects, crop and forest damage, acid rain (pH less than 5.6), materials corrosion and erosion, and visibility degradation (Le., haze).
agents in air pollution, it has received more extensive Because SO2 was one of the earliest suspected toxic
31

study than other pollutants. The primary NAAQS for SO2 have been set at 365 pg/m3 for the annual maxi- mum 24-h average and 80 pg/m3 for the annual mean. Recent scientific studies provide additional support that these standards are necessary to protect human health; however, there is increasing evidence that short-term peaks in concentration not necessarily controlled by existing standards may also have a negative health impact.14S It has been suggested that a 1-h standard of about 1,300 pg/m3 may be necessary to protect sensitive individuals, such as exercising asthmatics21
near the emission source, particularly under meteorolog- ical conditions that cause the plume from the stack to touch the ground. Damage may result when SO2 reacts with other pollutants, which usually happens farther from the power plant, These effects, however, are not expected to increase nationally because SO;? emissions are likely to be somewhat constant for the next several decades .6
These sulfates, together with NO,, are believed to be responsible for acid rain, which can affect aquatic re- sources in regions with poor buffering capacity. Forest ecosystems may also be damaged at high elevations where the forest is at or above cloud level for significant periods of time. Researchers have found it difficult to separate the effects of acid rain from those of cloud water contaminants, aerosols, ozone, and other species22 Acid rain is considered an environmental problem in the northeastern United States, southeastern Canada, and, to a lesser extent, the upper Great Lakes region and the Southwest.22 Sulfate aerosol is a major factor in decreasing visibility throughout the United States. With growing coal use, visibility could decrease further; ef- fects will be particularly obvious in the West and South- west, where skies still are relatively clear.23
Sulfur dioxide may also damage crops and forests
Sulfur dioxide in the atmosphere oxidizes to sulfate.
Nitrogen Oxide Emissions
Nitrogen oxides are released from the boiler stack when coal is burned. They are produced by the oxidation of nitrogen compounds in the coal and nitrogen in the at- mosphere. The federal standard emission rate for new sources of 0.6 lb/million Btu can be met with combus- tion modification techniques. At this rate, NO, emis- sions from the representative plant would be 10,200 tons/yr.9
The environmentally important species of NO, are nitric oxide (NO) and nitrogen dioxide (NOz), which is the most common atmospheric nitrogen oxide. Various adverse health effects have been observed at NO2 con- centrations above 1.0 ppm (about 2,000 pg/m3).
However, specific human health effects due to NO2 concentrations at or near ambient concentration levels have not been conclusively documented. Typical long- term ambient concentrations of NO2 range from 0.001 ppm (about 2 pglm3) in isolated rural areas to a maximum annual average concentration of about 0.08 ppm (about 160 pg/m3) in the nation's most popu- lated urban areas. Short-term peak concentrations (1-h average) rarely exceed 0.5 ppm (about 1 mg/m3).24
through the products of atmospheric reactions involving NO,. These products include nitrogenous compounds such as nitric acid, nitrates, peroxyacetylnitrate (PAN), and nonnitrogenous by-products, such as ozone. Reac- tion products and their successors typically are trans- formed into fine particulates (aerosols) and dissolved in precipitation before deposition to the earth.24
Nitrogen oxides can damage crops and forests and can, along with sulfur oxides, form acid rain.22 Photo- chemical oxidants, such as ozone and PAN formed from NO, precursors, are among the most damaging air pol- lutants to agriculture and forestry. Because the relation- ship between NO, emissions and oxidant formation is not completely understood, the severity of ecosystem damage caused by these emissions remains uncertain.
In addition, adverse effects may be caused indirectly
Carbon Dioxide Emissions
For every 1,OOO Btu released by the combustion of coal, 0.21 lb of COz is emitted. The total amount of CO2 released to the atmosphere from the representative plant would be 3.7 million tons/yr.9
bility of climate changes brought about by increasing COz levels in the atmosphere.6 Because COZ absorbs infrared radiation from the earth, high levels of C02 in the earth's atmosphere may produce a "greenhouse ef- fect," thus increasing the global temperature. Although considerable uncertainties remain, most numerical mod- els predict that a doubling of the COZ level will lead to a rise in the average global temperature of 1.54SoC.2S Although the effects of such a rise in temperature cannot be predicted completely, changes in rainfall amounts and higher sea levels from melting of the polar ice caps are among the expected consequencesP
In recent years, concern has grown over the possi-
Solid Waste Disposal
Three solid waste products of coal combustion -- fly ash, bottom ash, and scrubber sludge -- pose major waste disposal problems, if only because of their quantity. In the representative plant using eastern coal, 80% of the
32

ash (lO0,OOO tons/yr) would be fly ash? Of this, 99.5% would be captured, and the remainder (500 tons/yr) would be emitted. The other 20% (25,000 tons/yr) of the ash from combustion would be bottom ash. The amount of scrubber sludge produced from the repre- sentative plant with an 88%-efficient limdlimestone scrubber would be 193,000 tons/yr.g
The adverse effects of these solid waste products on the environment depend on their chemical composition, the manner of disposal, and the location of the disposal site. The composition of the coal essentially determines the nature and quantity of ash produced. Western sub- bituminous coal, for example, produces less ash and sludge per kilowatt-hour than does eastern bituminous coal.
problems, but they are relatively minor and easily con- trolled. In a recent series of tests, none of the leachate from bottom ash and fly ash from various coals ex- hibited concentrations exceeding the limits mandated by the Resource Conservation and Recovery Act (RCRA) for hazardous waste (100 times the drinking water standards).W7 Concentrations of trace elements from fly ash were, however, consistently higher than those in bottom ash from the same coal.
Disposing of scrubber sludge from flue-gas desul- furization (FGD) systems is somewhat more difficult than disposing of dry solid wastes. The sludge can be composed primarily of calcium sulfite hydrates, which prevent the physical dewatering of the sludge and in- crease the amounts of land required for ponding. Chemical treatment, however, can change the properties of sludge, making possible its disposal by landfill. Also, FGD systems can be operated in the forced-oxidation mode, producing a sulfate sludge that is more easily dewatered than sulfite sludge. Water associated with FGD sludge typically has high solids concentrations, but tests have not shown these wastes to be hazardous by
Ash disposal presents some environmental
RCRA ~tandards.28-30
Water Pollution
Wastewater discharges from coal-fiied power plants, if not controlled, can adversely effect aquatic ecosystems. The principal waste streams from steam-electric power plants are associated with cooling water, ash handling, boiler blowdown, metal cleaning, coal pile runoff, and other low-volume wastes. Of the 126 priority pollutants required to be considered under the Clean Water Act, 47 have been detected in the uncontrolled effluents from steam-electric plants, including those not fueled by coal.31
Cooling System
The large quantity of water used in once-through sys- tems is not normally treated. Intermittent chemical treatment of condenser surfaces, however, is often nec- essary to control the growth of algae or slime (called biofouling). Chlorination is the most widely used method of biofouling control, and the properties that make it effective are the same properties that cause environmental concern. Adding chlorine to water causes the formation of toxic compounds and chlorinated organics; some of these compounds may be priority pollutants.3 1
by evaporating some of it. Dissolved, nonvolatile impurities and contaminants entering the system with makeup water are therefore concentrated, and a blow- down stream must be withdrawn to prevent their build- up. Various chemicals are added to control scaling and corrosion; chromium and zinc, two inorganic priority pollutants, are the active components in most additives. These additives ultimately appear in the blowdown stream. The mean blowdown stream discharge rate for 82 coal-fired plants surveyed by the EPA in 1976 was 3,000 gaVd.MW.31 Many plants do not discharge blow- down directly to receiving water, but use it for scrubber makeup, ash sluice water, and other in-plant purposes.
Cooling water captures particulate matter and soluble gases from the air. Airborne solids captured by the cooling water can contribute significantly to the solids that accumulate in the cooling system. In dusty regions, up to 80% of the suspended solids in recirculat- ing systems enter the system as airborne particulates.
The fill material in natural-draft cooling towers is frequently asbestos cement, which, when it erodes, can be discharged in the cooling water blowdown. A set- tling pond or lagoon interposed between the cooling towers and the receiving water removes asbestos21
Recirculating cooling systems cool water primarily
Thermal Pollution
Coal-fired power plants using once-through cooling systems release waste heat into water systems. The temperature increases in the receiving water average about 9OC (16OF).31 Organisms may become acclimated to higher water temperatures, which then raises both the upper and lower lethal temperatures for the organisms. Fluctuations in effluent temperature may cause more stress for aquatic life than constant high temperatures. If a plant is shut down or a thermal plume is displaced, acclimated fish may d i e 9 The elevated temperatures may alter the aquatic ecosystem and adversely affect individual species. Changes may also occur in proper- ties such as salinity and dissolved oxygen content.
35

Other impacts on organisms of increased water temperatures include elevated metabolic rates (which influence oxygen demand) and higher total energy needs. Effects may also include elimination of food sources, inability of organisms to catch available food, lowering of reproductive potential, and increased sus- ceptibility to disease.32
Pollution Control Waste Streams
Bottom and fly ash are conveyed either with dry (pneumatic) or wet (sluicing) systems. Handling sys- tems for wet ash produce wastewaters that are dis- charged either as blowdown from recycling systems or directly to a receiving stream from a once-through sys- tem. The chemical characteristics of sluicing waste- water are a function of the inlet or makeup water, the composition of the fuel burned, and the composition of other wastewaters that may also be discharged into the ash settling ponds. Data obtained from ash pond over- flows indicate that priority pollutants are present in varying concentrations in sluicing water and warrant concern.31 Pollutants can enter groundwater or surface waters and may then be ingested by aquatic organisms or may contaminate crops irrigated with the water.
water effluent, especially with nonregenerable systems. The primary characteristic of these effluents is a high level of dissolved solids, which include a large number of trace elements in varying quantities, depending primarily on the type of system used and coal characteristics.31
Wet flue-gas cleaning is a potential source of waste-
Other Wastewater Streams
Metal cleaning wastes include wastewater from chemi- cal cleaning of boiler tubes, air preheater washwater, and boiler fire-side washwater. A major constituent in these wastewaters is the boiler metals, which are primarily iron, copper, and, in some cases, zinc and nickel. Other waste parameters include pH, dissolved solids, oil and grease, and cleaning agents.31
Runoff from coal piles stored outside may contain many of the compounds and metal constituents found in the coal. The concentration in the runoff of these con- stituents and the volume of the runoff depends on the coal pile size, rainfall amounts, temperature, acid- forming nature of the constituents, and physical and chemical preprocessing of the coal. The metals present in the greatest concentration in the runoff are typically cqpper, iron, aluminum, and nickel. Others present in trace amounts include chromium, cadmium, mercury, arsenic, selenium, and beryllium.31
Other low-volume wastes include effluents from water treatment and floor and yard drains. Boiler feed- water is treated for the removal of suspended and dis- solved solids to prevent scale formation. The effluents from these processes contain high levels of dissolved and suspended solids and oil and grease; however, prior- ity pollutants are not typically present in significant quantities.31 The pollutant parameters that may be of concern from floor and yard drains are oil and grease, pH, and suspended solids.
Land Use
Although there is no strong correlation between power plant capacity and land requirements, some relationship does exist. For plants in the 5 0 0 - W e range, typical site sizes vary from about 500 to 1,OOO acres. Sludge disposal ponds represent a long-term commitment of the land. Ponding of untreated sludge, and perhaps even of some sludge that has been treated, prevents future devel- opment on the site. The solid waste disposal area for a 500-MWe plant is estimated at 370 acres for the 30-yr lifetime of the plant. A typical 500-MWe plant that does not have on-site solid waste disposal may have a site size of about 400 acres. Accordingly, 800 acres is a typical size when lifetime waste disposal is included9 Finding adequate tracts of land near existing power plants for waste disposal may be difficult in many cases.
Water Use
Cooling systems of power plants are the largest water users in the coal combustion cycle. For the representa- tive plant, about 2.2 billion gal/yr would be needed to make up cooling tower losses.9 The consumption rate of water for once-through opencycle cooling is 5040% of evaporative tower consumption.
One of the effects of massive water consumption by cooling systems is a reduction in the amount of water available for diluting downstream discharges. Another effect is a reduction in stream flow, which can be critical during times of drought. Therefore, conflicts may develop over water rights and quality.
ENVIRONMENTAL CONTROLS
Technologies to minimize the environmental impacts of effluents and waste generated are a significant part of a modem coal-fired power plant. Fly ash is removed from flue gas by ESPs or fabric filters. Sulfur dioxide and
34

NO, can be removed by flue-gas cleaning systems. Nitrogen oxides, carbon monoxide, and organic emis- sions are reduced by burner design and control of operat- ing conditions. Solid wastes, including fly ash, bottom ash or slag, and flue-gas cleaning sludge, may be handled by wet or dry systems and are disposed of pri- marily by ponding or landfill. Wastewaters requiring control include blowdown (liquids from flushing sys- tems) and streams from ash handling, flue gas cleaning, boiler water treatment systems, coal pile runoff, and other low-volume wastes.
gies for Fossil Energy Systems reviews in detail the costs and performance of control technologies for air pollutants, solid wastes, and liquid effluents. An over- view is presented here.
The chapter on Environmental Control Technolo-
Atmospheric Emissions
The current practice at coal-fired utilities is to treat boiler flue gas to remove particulates and, at some installations, S02. For installations subject to NSPS or stringent local standards, NO, is controlled through combustion modification techniques.
Particulate Control
Particulate emissions are controlled with ESPs, bag- houses, and scrubbers. Electrostatic precipitators have been used for particulate control in coal-fired boiler applications for over 40 yr (Fig. 3.4), but baghouses are now being considered for small boilers, low-sulfur-coal applications, and future applications in which a 10% opacity limit must be met. Conventional scrubbers are economically less attractive because of high energy requirements and operating costs23
equipped with ESPs, which collect over 90% of the fly ash in flue gas.33 The use of baghouses (fabric filters) has received recent attention for low-sulfur-coal applica- tions, for which ESPs are less efficient. Performance data are limited, but baghouses are generally considered to be over 99% efficient. A third method is wet scrub- bing, which may be used to remove only particulates but is more commonly used to remove both particulates and s02.
Approximately three-fourths of all power plants are
Sulfur Dioxide Control
In 1980, about 2.7 million tons (dry weight) of FGD waste were produced in the control of SO2 emissions at coal-fired power plants.6 This quantity is expected to increase dramatically, to about 100 million tons in 2010,
because of the revised NSPS requirements for new coal-fired boilers. Although there are a number of com- mercially available processes for SO2 control, most planned and active coal-fired power plants use throw- away (nonregenerable) scrubbing processes employing limestone or lime for high-sulfur-coal applications.34
The principle of operation of a limeflimestone FGD system is that SO2 is absorbed and reacts with dissolved alkaline species from limestone or lime. The reaction product, calcium sulfite or sulfate, is separated as a wet sludge that must be dewatered and further treated to stabilize it before disposal. Limdlimestone FGD sys- tems can remove more than 90% of the S a . Greater efficiency can be obtained with additives such as mag- nesium oxide and organic acids. One advantage of this process is that more than 99% of the particulates are also removed.
sodium alkali process. It uses either dry sodium alkali or a wet scrubbing solution. The wet process uses sodium hydroxide, sodium carbonate, or sodium bicar- bonate in a wet scrubber or spray dryer; the dry process uses sodium bicarbonate alone or with sodium carbon- ate. Wet scrubbing is up to 99% efficient, and dry scrubbing is 60-9596 efficient, depending on the alkali and SO2 temperatures and the duration of their contact. Both processes are simple and use little energy. The major disadvantage is the generation of waste products that contain high amounts of sodium salts3
The sludge disposal problems of throwaway sys- tems have led to the development of "second-genera- tion" regenerable processes, in which sulfur is recovered as a usable by-product and the reactant is recycled to the scrubbing system. These processes include the double alkali (in which the sorbent is regenerated), magnesium oxide, sodium sulfite (Wellman-Lord), aqueous carbon- ate, and citrate processes.
The double alkali process achieves removal eff- ciencies greater than 95% by using a sodium alkali solu- tion (sodium hydroxide and sodium sulfite) to absorb SO?. The Sot-rich effluent liquor is reacted with cal- cium hydroxide to precipitate calcium sulfite, calcium sulfate, and mixed crystals for disposal and to regenerate the sodium alkali. The main disadvantage of this proc- ess is the volume of soluble solid wastes produced. An advantage is that particulates may be removed simul- taneously with S a .
The magnesium oxide process uses a solution of magnesium hydroxide to absorb SO2 and produces sulfuric acid as a by-product. Some of the sulfite is oxidized to sulfate, and the magnesium sulfite and sul- fate are dried and calcined to produce solid magnesium
A second throwaway process currently in use is the

Figure 3.4 Electrostatic Precipitators in Operation at the Power Facility of the Portsmouth Gas Diffusion Plant in Piketown, Ohio
oxide and a gas stream containing 7-9% SO2. h e mag- nesium oxide is recycled, while the SO2 is sent to a sulfuric acid plant. This process can remove up to 97% of the SO2 from flue gas. Although it has fewer disposal problems than the double alkali process, it produces a 15% stream of SOz and needs fuel oil to supply heat for absorbent regeneration.
In the Wellman-Lord process, sodium sulfite solu- tion reacts with SO2 to form sodium bisulfite. This decomposes to produce a concentrated SO2 stream that can be further processed to yield either sulfuric acid or sulfur. Removal rates are 95-99%. The buffered citrate absorption process uses an aqueous solution of sodium citrate to absorb SOz, which is subsequently converted to sulfur by reaction with hydrogen sulfide.10
Dry "scrubbing" processes are a much more recent development. Three major types are being built today:
spray drying, dry injection, and combustion of fuel/ limestone mixtures. Of these systems, spray drying is the only one currently being developed on a commercial scale.
Nitrogen Oxide Controllo3
The oxidation of nitrogen compounds in coal produces "fuel" NO,, which account for 50-90% of the total NO, produced by coal combustion. The remainder is produced by oxidation of nitrogen in the air. Most of the advanced combustion concepts and modification techniques are directed toward preventing the formation of fuel NO,. A fuel-rich combustion zone is established in which the fuel nitrogen can be oxidized to molecular nitrogen, rather than to nitric oxide. Thus, all of the combus tion modification techniques except flue-gas
36

recirculation (FGR) depend on reducing the availability of oxygen in the primary combustion zone.
Combustion modification techniques such as low- excess-air firing and staged combustion have been shown to be effective in reducing NO, emissions from coal combustion. In low-excess-air firing, the unit oper- ates at a reduced level of total :ombustion air flow while maintaining acceptable flame and furnace conditions. The three methods of staged combustion are biased firing, burners-out-of-service firing, and overfire-air ports. In biased (or off-stoichiometric) firing, the air- fuel mixture in the boiler is stratified and part of the combustion air is diverted outside of the initial fuel-air mixing zone. In burners-out-of-service operations, the fuel flow to an individual burner is cut while maintain- ing the air flow. By using overfire air ports, part of the combustion air enters by ports above the burner to gen- erate fuel-rich conditions at the burner.
In FGR, gas is taken from the exhaust stream and reintroduced in the furnace. This technique has often been used for steam temperature control; however, few coal-fired units use FGR.10
Both NO, production and the effect of combustion modifications in reducing it depend on how the furnace is fired. While modification techniques can significantly reduce NOx emissions, more advanced concepts, such as new burner designs (which can be retrofitted onto exist- ing units) or flue-gas treatment, are required to achieve very low NO, emissions. Table 3.2 shows that combus- tion mdfication can reduce NO, emissions by up to 60%.10
Solid Waste Controls
The handling and disposal practices for the significant solid waste streams from a coal-fired power plant are listed in Table 3.3. They are summarized for each waste stream in the following.
Fly Ash Disposal
Both wet and dry methods are used for collecting and disposing of fly ash. It may be collected dry with ESPs or baghouses and disposed of directly or added to scrub- ber sludge to stabilize it. If the fly ash is collected with a wet collection device, such as a venturi scrubber or an FGD scrubber, it is pumped to a pond as a slurry or with scrubber sludge.
One of the difficulties that may arise from fly ash disposal in ponds or landfills is the leaching of soluble alkali metal salts and trace elements into groundwater and surface waters. Leaching can be managed by careful monitoring, the use of pond liners, and proper site selec- tion (e.g., locating sites away from aquifers used for drinking water). Unlike fly ash, bottom ash normally does not leach, so ponds used for bottom ash alone do not require liners. Bottom ash sluicing and dewatering systems, as well as pond systems, can be operated in a "closed-cycle'' configuration, in which ash sluice water is sent to collecting hoppers for reuse in sluicing.
FGD Sludge Disposal
Scrubber sludge from FGD systems can be ponded or dewatered and landfilled. In either method, the sludge
Table 3.2 NO, Control Efficiencies for Selected Combustion Modifications and Firing Methods ('36)
Efficiency with Firing Method
Single-Face Horizontally Opposed Tangential Combustion Modification Typical Maximum Typical Maximum Typical Maximum
Low excess air 0-15 15 0-15 15 0-10 10 Biased tiring 5 7 5 8 Burners-out-of- 30 35 25 35 30 45
Overiire air 15 30 30 58 30 35 Recirculation 14 17 New burners 30 60
service
Source: Ref. 10.
37

Table 33 Summary of Solid Waste Handling and Disposal Practices
Solid Waste Handling and Treatment Methods Ultimate Disposal
Bottom ash Sluicing (5-10% solids) Closed-cycle.sluicing (zero
discharge)
R Y d Sluicing and ponds for settling
Dry handling (vacuum or blower)
Direct disposal of 15% solids sluny
and dewatering
FGD scrubber sludge Dewatering or chemical futation
and stabilization Oxidation of sulfite to sulfate
Pond ing Ponding, landfill,
or reuse
Ponding or landfill
Landfill or reuse
Ponding Ponding or landfill
Ponding, landfill, or reuse
can be mixed with fly ash, fly ash and lime, or other materials used in commercial fixation processes. If the sludge is predominantly sulfite, it can be oxidized to gypsum before ponding or dewatering. In the case of mixed fly ash and scrubber sludge from a combined particulate and SO;? scrubber, the options for disposal are ponding, dewatering, and fixation or oxidation to gyp- sum. Both processes are followed by ponding or landfdling.
With simple ponding of sludges, reclamation of the land is not possible, because it is virtually impossible to physically dewater the sludge to the extent required to support weight. Thus, large areas of land are lost for future development.35
Scrubber slurries can be ma& into harder, more stable materials by physical treatment (compaction and moisture content control) and chemical treatment (addi- tion of lime, fly ash, or other fixation chemicals). Ash from western coals is sufficiently alkaline to stabilize scrubber sludge without the addition of lime or other fmation additives.35
concentrations of chloride, calcium, and sulfate. If the sludge is combined with fly ash, the latter adds a sub- stantial load of trace elements to the mixture. Leaching problems can be alleviated by lining the pond with clay, cement, or synthetics. The sludge can be mated to reduce its porosity and permeability; chemical additives can be used to increase the compressive strength and decrease the permeability of sludge-ash mixtures. The disposal site can be reclaimed by covering the stabilized
Leachate from FGD scrubber sludge contains large
38
wastes with a protective layer of clay and soil and estab- lishing a vegetative cover3
Regenerable SO2 removal processes can reduce the amount of sludge while producing marketable by- products, either sulfur or sulfuric acid. These may not be marketable, however, because of other low-cost sul- fur supplies.30
The use of calcium sulfite and sulfate sludge has been much more limited than that of ash. Possible uses of sludge are in the recovery of chemicals, the manufac- ture of building materials, soil stabilization, paving, and structural fill. The only significant possible uses for sludge in the near future are converting it to gypsum for the production of gypsum wallboard and using it as an additive in portland cement35
Water Pollution Controls
Wastewater handling and treatment practices vary from plant to plant. They depend on local regulations and are closely tied to solid waste handling practices. The fed- eral effluent limitations guidelines and current NSPS for steam-electric power plants are listed in Table 3.4.37.38
Cooling Water
Available technologies for controlling chlorine in cool- ing water discharges are chlorine minimization (for once-through systems) and dechlorination. Chlorine minimization involves a set of studies to determine the minimum combination of dose, duration, and frequency

Table 3.4 Effluent Limitations Guidelines and NSPS for Steam-Electric Power Plantsl
Effluent Concentration (mg/L, except for pH)
pwc=d BPT BAT B C I
Standard Standard Standard NSPS
Wastewater Source Waste Constituent Avg. Max. Avg. Max. Avg. Max. Avg. Max.
Once-through cooling water systems
Free available chlorineb Total residual chlorineb
0.2
0.2
30 15
30 15
30 15
30 15 1.0 1.0
0.5
0.5
100 20
100 20
100 20
100 20
1 .o 1 .o
SCB
ic d 0.2
d - 0.2
0.2 0.5
No dischargee
No dischargef No discharger
30 100 15 20
30 100 1s 20
30 100 15 20
- 0.14
1 .o 1 .o 1 .o 1 .o
50h
No discharge
6-9
Cooling tower blowdown
Free available chlorineb Total residual chlorineb Maintenance chemicals
0.2 0.5 0.14
No dischargee
Fly ash transport water
Total suspended solids Oil and grease
30 100 15 20
Bottom ash transport water
Total suspended solids Oil and grease
30 100 15 20
Low-volume wastesg Total suspended solids Oil and grease
Total suspended solids Oil and grease Total copper Total iron
30 100 15 20
Metal cleaning wastes
30 100 15 20
1.0 1.0 1.0 1.0
Coal pile runoff
AI1 waste streams
Total suspended solids
Polychlorinated biphenyls No discharge No discharge No discharge
PH (range) 6-9 6 9 6-9 All waste streams except once-through cooling water
Gources: Ref. 37 for best practicable control technology currently available 0, best available control technology economically achievable (BAT), and NSPS and Ref. 38 for best conventional pollutant control technology (BCT). Average daily value is computed for 30 consecutive days and the maximum value is for any one day. With the exception of coal pile mnoff, limitations are actually expressed as "shall not exceed quantity determined by multiplying the flow [of the waste stream] times the concentration [given]."
bNeither free available nor total residual chlorine may be discharged from any unit for more than two hours in any one day, and not more than one unit in any plant may discharge free available or total residual chlorine at one time unless a variance is obtained.
%Standard does not apply to this effluent.
dFor any plant with a total rated capacity greater than 25 MW. For plants with a capacity less than 25 MW, the maximum is 0.5 mg/L
eNo discharge of cooling tower maintenance chemicals that contain any of the 129 priority pollutants.
N o discharge of fly ash water.
gBlowdown from FGD systems is now regulated under the subcategory of low-volume waste on an interim basis.
hThis limitation is not applied to the untreated overflow from facilities designed, constructed, and operated to treat the volume of coal
and the average is 0.2 mg/L.
pile runoff from a 10-yr, 24-h maximum rainfall event.
39

of chlorination that will prevent biofouling. Dechlorina- tion is the process of adding a chemical agent to the cooling water that reduces the chlorine to chloride, a nontoxic agent. The use of ferrous sulfate, ammonia, activated carbon, and hydrogen peroxide have been found to be feasible for this purpose.31 The feasibility of substituting other nonpollutant biocides (alternative oxidizing chemicals) for chlorine is also being studied31
The only practical approach to eliminating priority pollutants from corrosion and scaling control chemicals in cooling tower blowdown is the use of alternative chemicals.31 Replacing the asbestos cement fill in cool- ing towers with another type of fill eliminates the release of asbestos fibers in cooling tower blowdown.
Thermal pollution from once-through cooling water can be reduced by "helper" systems, which remove a portion of the heat before the effluent is discharged to a receiving stream. Two examples are long discharge canals and ponds with floating powered spray mod- ules.31 The problem can be eliminated by the use of closed (recirculating) systems employing cooling towers or ponds.
Pollution Control Waste Streams
The federal guidelines and standards (Table 3.4) place limitations on suspended solids in bottom ash and fly ash wastewaters. The treatment and control technolo- gies applicable to achieving the fly ash wastewater limits are dry ash handling, partial recirculation of sluicing waters, and physical and chemical treatment of ash pond overflows, including screening, sedimentation, and filtration.3 1
Although federal standards do not regulate dis- solved solids, state requirements may restrict the levels of dissolved solids permitted in the discharges. Remov- ing dissolved solids from wastewater can be difficult and expensive. Available methods include pH adjustment, ion exchange, reverse osmosis, electrodialysis, and vapor-compression evaporation.
Other Wastewater Streams
Because metal cleaning wastes are generated only peri- odically, many plants have them removed by a contrac- tor. Another common practice is to discharge them to an ash pond. The pH values of metal cleaning wastes may be extreme, and the wastes may contain suspended solids. They may also contain dissolved and complexed phosphorus, copper, zinc, nickel, iron, and ammonia, which may be treated by incineration (evaporation) or physical and chemical treatment.
Coal pile runoff contains suspended solids and dissolved inorganic salts and heavy metals, and it can be highly alkaline orhighly acidic. Coal pile drainage with a pH from 6 to 9 and low dissolved solids is frequently pumped to an ash pond along with other waste streams.31 In dry areas, coal pile runoff is often directed to a lined storage pond. Suspended solids may be removed by conventional sedimentation, pH extremes may be treated by neutralization processes, and dis- solved inorganic salts and heavy metals may be control- led by chemical precipitation and sedimentation.
Low-volume wastes contain suspended and dis- solved solids from water treatment, boiler blowdown, and floor and laboratory drains. The most common method of control is discharge to storage basins or ash ponds where low-volume wastes are neutralized, causing the precipitation of less-soluble compounds. After draining, the solids are removed31 Vapor-compression evaporation is another technology for treating low- volume wastes, but it may be too costly for typical applications.
ENVIRONMENTAL CONSTRAINTS
The NAAQS set maximum allowable ambient con- centrations for seven pollutants: S02, particulates, NO,, carbon monoxide, photochemical oxidants (such as ozone), nonmethane hydrocarbons, and lead. The NAAQS that most affect coal-fired power plants are those for S02, particulates, and NO,.
Although SO2 emissions from new plants are gener- ally considered to be sufficiently controlled, concern still exists as a result of noncompliance with State Imple- mentation Plans, leading to nonattainment of the NAAQS, as well as the contribution of SO2 emissions from existing plants to the acid rain problem. Projected increases in fine particulate and NO, emissions under current regulations and increases in unregulated atmos- pheric emissions of toxic metals and CO2 are of growing concern.
Particulate emissions, which are expected to decrease before 2000 as older plants install control tech- nology, are still of concern. Available control technol- ogy can reduce the total mass emissions of particulate matter, but it may not adequately control fine particulate emissions. These fine particles, carrying toxic trace elements (including lead), may come under more strin- gent regulations. Setting a 1oo/o opacity standard or a
40

fine-particulate control standard would require many plants to change their control technology. Under present emission regulations, ESPs are used more commonly than baghouses, but only baghouses can produce a "clean stack' and therefore would be needed to meet new regulations.
Increasing NO, levels in the atmosphere have led to recent research on NO, control technology and to the possibility of more stringent control in the future. Direct methods that prevent formation are more cost-effective than removal from stack gases. Of these methods, staged combustion has been shown to achieve the great- est success. It offers significant reductions, but since little is known about how it works, further study is needed to determine whether a process may be devel- oped to limit NO, formation or whether emissions are limited by decomposition.10 Better reductions than those yielded by combustion mohfication might be obtained by supplementing this method with flue-gas treatment systems under development.10
Carbon dioxide emissions are not currently regu- lated. Atmospheric COz is increasing, and studies of its effects suggest a need for controls. Currently, there are no viable methods for reducing C02 emissions from coal-fired power plants.
The major problem with disposal of solid wastes from coal-fired power plants is the large volumes involved, which may constrain siting because of the commitment of land to disposal sites. With proper man- agement and controls, the bottom and fly ash waste leachates do not appear to be a significant problem based on current RCRA hazardous waste criteria. Sludge fixation and pond lining techniques are currently available to manage FGD wastes.
Power plants contain numerous potential sources of water effluents containing priority pollutants. These can, however, be effectively controlled with current technology. Additional development of nonpolluting chemicals for use as biocides and scaling inhibitors would be beneficial.
REFERENCES
1. National Energy Policy Plan Projections to 2010, US. Dept. of Energy Report DOE/PE-0029/3 (Dec. 1985).
The National Energy Policy Plan, U.S. Dept. of Energy Report DOE/S-0040 (1985).
2.
3.
4.
5.
6.
7.
8.
9.
10.
11.
12.
13.
Control Techniques for Nitrogen Oxides Emis- sions from Stationary Sources, 2nd Ed., U.S. Environmental Protection Agency Report EPA-450/3-8 3 -002 (Jan. 198 3).
America's Clean Coal Comm'iment, U.S. Dept. of Energy Report DOE/FE-0083 (Feb. 1987).
New Electric Power Technologies: Problems and Prospects for the 1990s, Office of Technology Assessment Report OTA-E-246 (1985).
Placet, M., D.G. Streets, and E.R. Williams, Environmental Trends Associated with the Fifh National Energy Policy Plan, Argonne National Laboratory Report ANUEES-TM-323 (Aug. 1986).
Environmental Outlook 1980, U.S. Environmental Protection Agency Report EPA-600/8-80-003 (July 1980).
Cleaning Up the Environment: Progress Achieved But Major Unresolved Issues Remain, U.S. Gen- eral Accounting Office Report GAO/CED-82-72 (July 1982).
Energy Technology Characterizations Handbook; Environmental, Pollution and Control Factors, U.S. Dept. of Energy Report DOE/EP-0093 (March 1983).
Environmental Control Implications of Generating Electric Power from Coal, 1977 Technology Status Report, Argonne National Laboratory Report ANUECT-3 (Dec. 1977).
Design of Advanced Fossil Fuel Systems (DAFFS), Pulverized Coal-Fired Power Plant with a Wet-Limestone Flue Gas Desulfurization System, Argonne National Laboratory Report -43-10 (June 1983).
National Economic Research Associates, Inc., Status of Present and Planned Water Intake and Discharge Systems for the Electric Utility Industry, prepared for the Utility Water Act Group (May 1978).
Paddock, R.A., and D.L McCown, A Review of the Effects of the Clean Water Act on Cooling System Selection by the Steam-Electric Industry, Argonne National Laboratory Report ANL/EES-TM-210 (June 1982).
41

14.
15.
16.
17.
18.
19.
20.
21.
22.
23.
24.
25.
42
Review of the National Air Quality Standards for Particulate Matter: Assessment of Scientific and Technical Ir$ormation, OAQPS staff paper, US. Environmental Protection Agency Report EPA-
Second Addendum to Air Quality Criteria for Particulates and Sulfur Dioxide, U.S. Environ- mental Protection Agency Report EPA-600/8-86/ 020A (Sept. 1986).
Environmental Reporter, Current Developments, Bureau of National Affairs, Inc., Washington, D.C., p. 493 (June 5, 1987).
Ruch, R.R., H.J. Gluskoter, andN.F. Shimp, Occurrence and Distribution of Potentially Volatile Trace Elements in Coal: A Final Report, Illinois State Geological Survey, Environmental Geological Notes 72 (1974).
Trace Elements of Fly Ash: Emissions from Coal Fired Steam Plants Equipped with Hotside and Coldside Electrostatic Precipitators for Particu- late Control, U.S. Environmental Protection Agency Report EPA-908/4-78-008 (Dec. 1978).
Gasper, J.R., P.A. Dauzvardis, and T.G. Surles, Projection of Body Burdens to Assess the Relative Risk from Exposure to Trace Elements from Coal Combustion, Drinking Water, and Diet, Argonne National Laboratory Report ANIJAA-23 (Dec. 1979).
The EnergytEnvironment Fact Book, U.S. En- vironmental Protection Agency Report EPA-600/
Environmental Reporter, Current Developments, Bureau of National Affairs, Inc., Washington, D.C., p. 865 (Sept. 13,1985).
The Causes and Eflects of Acidic Deposition, Interim Assessment by the National Acid Precipitation Assessment Program (Sept. 1987).
Protecting Visibility: An EPA Report to Congress, U.S. Environmental Protection Agency Report
NO, Information Book, U.S. Dept. of Energy Report DOWNBB-0044 (March 1983).
Changing Climate, Report of the Carbon Dioxide Assessment Committee, National Research Coun- cil, National Academy Press, Washington, D.C. (1983).
450/5-82-001 (Jan. 1982).
9-77-041 (March 1978).
EPA-450/5-79-008 (1979).
26.
27.
28,
29.
30.
31.
32.
33.
34.
35.
Jackson, L., and F. Moore, Analytical Aspects of the Fossil Energy Waste Sampling and Charac- terization Project, U.S. Dept. of Energy Report
Thompson, C.Y., and B.F. Jones, Determination of Hazardousness of Refuse Products Utilizing Low-Rank Western Coal Fly AsWBottom Ash, U.S. Dept. of Energy Report DOE/FC/10229-1 (Aug. 1981).
Groenewold, G.H., and O.E. Manz, Disposal of Fly Ash and Fly Ash Alkali FGD Waste in a West- ern Decoaled Strip Mine - Interim Report, pre- pared for U.S. Department of Energy, Grand Forks Energy Technology Center (May 1982).
Thompson, C.M., Chemical and Physical Charac- terization of Western Low-Rank Coal Waste Materials, Part 1: By-products from Sodium- Based Dry-Scrubbing System, U.S. Dept. of En- ergy Report DOE/FC/10200-T2 (Aug. 1982).
Murawczyk, C., J.S. MacKenzie, and R. Bitsko, Regenerative Magnesium Oxide Flue Gas Desul- furization, A Growing Byproduct Sulfur Source, Roc. AIChE National Meeting, Atlanta (March 1984).
Development Document for Proposed Efluent Limitations Guidelines and Standards and Pretreatment Standards for the Steam Electric Power Generating Point Source Category, U.S. Environmental Protection Agency Report EPA-
Wright, J.H., and S.J. Dea, Water Pollution Con- trol in the Power Generation Industry, in Indus- trial Wastewater Management Handbook, H.S. Azad, ed., McGraw-Hill (1976).
Control Technology for Fine-Particulate Emis- sions, Argonne National Laboratory Report ANU
DeVitt, T.W., B.A. Laseke, and N. Kaplan, Utility Flue Gas Desulfurization in the U S . , Chemical Engineering Progress, pp. 45-47 (May 1980).
Flue-Gas Desulfurization in the United States -- 1977, Argonne National Laboratory Report
DOE/LC/00022-1599 (March 1984).
440/1-821029 (Nov. 1982).
ECT-5 ( a t . 1978).
ANL/ECT-3, App. F (March 1982).

36.
37.
Martin, J.B., R.E. Hall, and J.S. Bowen, Nitrogen Oxides Control Technology for Stationary Area and Point Sources and Related Implementation Costs, presented at ESRL and HERL Technical Symp. on Implication of a Low NO, Vehicle Emission Standard, Rest@, Va. (May 24, 1979).
Efluent Limitations Guidelines, Pretreatment Standards and New Source Performance Stand- ards Under the Clean Air Act; Steam Electric
Power Generating Point Source Category, final rule, Federal Register, 47(224) (Nov. 19, 1982).
38. Efluent Limitations Guidelines, Pretreatment Standards and New Source Performance Stand- ards Under the Clean Air Act; Steam Electric Power Generating Point Source Category, pro- posed rule, Federal Register, 45(68) ( a t . 14, 1980).
43

/ Fluidized combustion
bed
Crushed
Flue gas (depleted in sulfur dioxide)
fly ash I
Steam coils
9 3
Air distributor
plate
Figure 4.1 Principle of Fluidized-Bed Combustion (Source: Argonne National Laboratory)
44

Chapter 4
Fluidized-Bed Combustion
BACKGROUND
In fluidized-bed combustion (FBC), fuel bums in a bed of rapidly moving solid particles suspended (i.e., fluidized) by an upward flow of air and combustion gases that exerts a force on the particles equal to that exerted by gravity. The particles move freely in patterns determined by the hydrodynamics of the bed, which takes on the large-scale characteristics of a homoge- neous fluid. Thus, the contact between particles and the suspending gas in fluidized beds is more uniform than in a static bed, a fact that has been exploited in the control of heat and mass flow in fluidized beds of catalyst or reacting solids. Fluidized-bed combustion is a commer- cial technology for industrial steam generation, but it is just entering the electric-utility market (Fig. 4.1).
In an FBC combustion chamber, crushed coal and a sulfur dioxide (SO2) sorbent are fluidized by the flow of combustion air. Fresh coal and sorbent enter the cham- ber while ash and spent sorbent are removed. Fluidized-bed-combustion units may operate at atmos- pheric pressure (atmospheric fluidized-bed combustion, or AFBC), or they may be pressurized (pressurized fluidized-bed combustion, or PFBC).
Energy is removed from both types of units as heat -- hot combustion gas, steam, or air -- for heating process materials and buildings or driving engines. The combus tion gas from PFBC can be expanded through a gas turbogenerator system, while steam from the cooling coils is used for process heating or driving a steam tur- bogenerator. These heat removal methods can be em- ployed singly or in combinations; a design incorporating all of them is called a combined-cycle cogeneration plant.1 Combined-cycle power plants employing FBC and coal gasifiers are discussed in the chapter on Combined-Cycle Power Plants.
est in FBC are concerns that the oil crises of the 1970s Among the reasons for the sustained national inter-
could be repeated, the greater accessibility of domestic coal deposits compared with petroleum deposits, the adverse environmental impacts of conventional fossil fuel combustion, and a perception that FBC can cleanly and efficiently combust coal and other fossil fuels. For coal combustion, boilers employing FBC have several advantages over conventional boilers employing flue- gas desulfurization (FGD): SO2 removal during com- bustion, producing a dry, inert spent sorbent rather than a sludge (as with FGD); a low level of nitrogen oxides (NO,) in the flue gas; enhanced heat transfer in the boiler tubes; adaptability to low-grade fuels; and a sig- nificantly smaller boiler.
History
The FBC concept was first applied to the Winkler coal gasification process in Germany over 60 yr ago? Ten years later, ESSO (now Exxon) applied the technique to the regeneration of petroleum cracking catalysts by combusting a fluidized mixture of coke and catalyst (by 1942, ESSO was operating a commercial-scale fluidized-bed catalytic cracker). During the early 1950s, la SociCtd Activit de France developed the Ignifluid fluidized-bed burner, principally as a retrofit device, for generating steam on a small commercial scale in coal- fiied boilers.
By the 1960s, basic investigations of FBC were under way in England, the United States, and China. In both England and the United States, the initial emphasis was on AFBC, although PFBC programs began soon after. In the United States, facilities for AFBC research have been sponsored or built by various federal agencies, national laboratories, and private industrial process and engineering fms.3-6 Facilities for PFBC research have also been built and tested by some of these organizations.7.8
45

The technology for AFBC is commercially estab- lished for industrial heating and is approaching commer- cialization for electric-utility applications. The technol- ogy for PFBC, which has its principal potential in combined-cycled utility applications, is still in the devel- opment stage. It is likely to reach commercialization no earlier than the mid-1990s.
Government and Industry Programs
Although U.S. energy consumption in 1986 was about the same as in 1974,9 the planning of U.S. utilities in- dicates that U.S. electricity production is expected to increase by 20% in the 1986-1995 period. Of the 3 mil- lion GWh predicted to be consumed in 1995,53% is expected to be derived from coal. This increase will require the construction of 72 GW of generating capac- ity, including 28 GW of coal-fired capacity.10 Accord- ing to the U.S. Department of Energy (DOE), 46% of U.S. energy consumption will be derived from coal by 2010, which would result in coal consumption of about 2 billion tons/yr (with an energy content of 45.7 qua- drillion Btu).ll
Because FBC technologies can bum coal cleanly and efficiently, FBC research is actively promoted by the governments of China, England, France, Sweden, the United States, and West Germany. In the United States, the DOE currently funds FBC research, while the par- ticipation of utilities has been largely coordinated by the Electric Power Research Institute (EPRI).
The commercialization of AFBC was achieved through several pilot-plant programs that were funded jointly by government and industry: the FluiDyne Engi- neering Corp./Oak Ridge National Laboratory air heater,W3 the Great Lakes Naval Training Station/ Combustion Engineering steam boilerp and the Monon- gahela PowerPope, Evans, and Robbins Rivesville 1etrofit.ls Table 4.1 lists representative experimental, industrial, and utility AFBC facilities that are being designed, built, or operated. Many of these are cogener- ation units, which are encouraged by the Public Utility Regulatory Policies Act of 1978.10
completed include the Exxon miniplants the Curtiss- Wright SGT experimental unit16 the Wood-Ridge pilot plant17 materials testing by General Electric Compa- ny,ls three experimental PFBC units at the Coal Utiliza- tion Research Laboratory (CURL) in England,LlS-21 and an experimental facility at Grimethorpe, England, which was sponsored by the International Energy Agency.2223 Table 4.2 lists PFBC projects that are being designed or operated.
Notable PFBC research programs that were recently
TECHNOLOGY
Figure 4.2 shows the basic components of an FBC boiler. Combustion air from a fan or compressor nor- mally is preheated by the flue gas; it then enters the plenum, an air chamber under the air distributor that acts as a surge tank to temper flow and pressure fluctuations. The distributor plate spreads the air flow uniformly over the bed area, and the air passes upward between the particles of the bed at velocities of 0.8-5 mls , depending principally on the size and density of the particles. This is the region of the bubbling bed (also called dense fluidization). Depending on the type of coal and sorbent used, their ratio, and the combustor design, temperatures range from about 790 to 87OoC for AFBC and 870 to 950°C for PFBC. The fluidized bed, which normally consists of particles up to 6.4 mm in diameter, is com- posed of ash, inert material, reacted and unreacted sor- bent (usually limestone in AFBC and dolomite in PFBC), and small quantities (less than 3%) of unburned coa1.u Coal and sorbent are injected into the combustor by screw feeders or pneumatic conveyors. The position of the injectors may be within the bed (underbed nozzles), above the bed (spreader-stokers), or both. The coal’s volatile components bum above the feed point, and the remaining solids (char) burn throughout the bed.
The air and combustion gases that pass through the bed cause vigorous agitation and mixing. Some parti- cles are thrown from the bed into the empty space above (called the freeboard). Larger, heavier particles fall back into the bed, and smaller, lighter particles are carried out by the gases. Although much of the ash formed is sepa- rated from the bed and entrained by the combustion gases, larger ash particles and agglomerates can accumu- late, requiring their removal from the stream of sorbent and spent sorbent leaving the bed through a drain.
fluidized bed and downstream from it. They are cooled by water, steam, or air. Within the bed, tube bundles or waterwalls may be used. Surfaces located near the com- bustion gas exit include enclosure waterwalls and a convective, heat-recovery section downstream from the combustion zone. The arrangement of heat-transfer surfaces and the circulation scheme for water and steam depend on the specific boiler.
At high fluidization velocities, a significant amount of incompletely burned smaller particles can be carried into the flue-gas ducts. Secondary overbed air injection can be used to increase combustion efficiency and bum more of these small particles. Those particles carried into the flue gas are commonly collected by cyclones and a secondary or tertiary particle recovery system, which may be either a bag filter or an electrostatic
Heat-transfer surfaces are located both within the
46

Table 4.1 Experimental and Commercial AFBC Facilities
Application Bed CoalFeed Steam Electrical Start-up and AM. Rate Capacity Output Date and
Facility and Location Bed Mode (mz) ( W b (kg/h) (MW) DesigneF Comments
Rocketdynel Argonne National Laboratory Experimental Air Heater, El Segundo, Calif.
Keeler/Dom-Oliver Pilot Plant, Williamsport, Penn.
Wilkes Barre Steam Heat Authority, Wilkes Barn, Penn.
Idaho National Energy Laboratory Steam Generators, Idaho Falls, Idaho
Anderson Clayton Foods Plant, Amarillo, Texas
Iowa Beef Processors Plant, Amarillo, Texas
Georgetown University, Washington, D.C.
Tennessee Valley Authority (TVA) Shawnee Station Pilot Plant, Paducah, Ky.
Midwest Grain Products Plant, Pekin, Ill.
Quaker State Refinery, Newell, Nev.
B.F. Goodrich Chemical Group Plant, Henry, Ill.
Ashland Petroleum Refinery, Catlettsburg, Ky.
Foster Wheeler Cogeneration Boiler, M t Carmel, Penn.
Pennsylvania State Prison Power Plant, Frackville, Penn.
Experimental, bubbling
Experimental, circulating
Industrial,e bubbling
Industrial, bubbling
Industrial, bubbling
Cogeneration, bubbling
Industrial, bubbling
Experimental, bubbling
Cogeneration, bubbling
Industrial, bubbling
Industrial, circulating
Industrial, bubbling
Cogeneration, circulating
Cogeneration, circulating
3.30.6NAdNA1982, RDNone.
NA
16.7
18.6
15.8
19.8
20.1
27.7
NA
123.6
NA
NA
14 million
4.7
2.7
4.6
4.3
6.8
7.2
5.1
NA
78.0
4,09 1
27,273
30,682
31,818
31,818
45,455
50,545
54,545
54545
56,8 18
147,727
174,545
186,364
NA
NA
NA
NA
1.25
NA
20f
3.5
NA
NA
NA
40
42
1985, KDO
1984, KDO
1984, FW
1986, WE
1982, WE
1979, FW
1982, BW
1984, FW
1985, KDO
1985, PA
1983, FW
1989, FW
1987, KDO
May be fired with a variety of fuels; used as Btuh needed for testing.
Fueled by anthracite culm.
Duplicate units of the same size.
Two duplicate units in series to provide two- stage combustion and desulfurization.
Anderson Clayton Foods boiler design adapted to cogeneration.
Installation and testing funded by W E ; conversion to cogeneration is planned.
Funded by DOE and EPRI.
Installation funded by the state of Illinois.
Duplicate units of the same size.
Installation funded by the state of Illinois.
Duplicate units of the same size; fueled by low-value, high-temperature refinery gas.
Fueled by anthracite culm; steam used to heat greenhouses for year-round vegetable growing; electricity sold to public utility.
Fueled by anthracite culm.

Table 4.1 (Cont’d)
Application Bed Coal Feed Steam Electrical Start-up and A r e a 8 Rate Capacity Output Date and
Facility and Location Bed Mode (m2) ( W b (kg/h) (MW) DesigneF Comments
Archer Daniels Midland Plant, Decatur, 111.
Archer Daniels Midland Plant, Cedar Rapids, Iowa
Scott Paper Company Mill, Chester, Penn.
Schuylkill Resources St. Nicholas Plant, Mahanoy City, Penn.
Colorado-Ute Electrical Assn. Nucla Station, Nucla, Colo.
Northern States Power Black Dog Station, Bumsville, Maine
TVA Shawnee Station Demon- stration Unit, Paducah, Ky.
Cogeneration, circulating
Cogeneration, circulating
Cogeneration, circulating
Cogeneration, circulating
Utility, circulating
Utility, bubbling
Utility, bubbling
NA
NA
NA
NA
NA
169.5
230.8
193,182 30
216,818 46
695 mil- 295,455 65 lion BtWh
192 375,000 80
552 420,455
67.4 472,273
55
130
81.8 500,ooo 160
1986, KDO
1988, KDO
1986, CEL
1990, CEL
1987, PA
1986, F W
1989, CE
Five units of the same size.
Duplicate units of the same size.
Largest U.S. single-train circulating-bed unit; designed to bum alternative solid, liquid, and gaseous fuels.
Fueled by anthracite coal.
Duplicate beds of the same size replacing a 110-MW pulverized-coal boiler; EPRI will fund a two-year test phase.
Replacement of one of four parallel pulverized- coal boilers; electrical output will increase from 125 to 131 MW when turbine is replaced in 1987. EPRI will fund test phase until 1990.
Design, installation, and testing funded by TVA, EPRI, Kentucky, Combustion Engineering, Fluor Constructors, 7 utilities, 3 coal companies, and 2 railroads.
~~
UFor bubbling-bed units only.
bExcept as noted otherwise.
cKey to abbreviations: BW = Babcock and Wilcox Co.; CE = Combustion Engineering, Inc.; CEL = Combustion EngineeringLurgi; FW = Foster Wheeler Energy Corp.; KDO = Keeler/Dorr-Oliver; PA = Pyropower Corp./Alstrom Pyroflow@; RD = Rocketdyne Div., Rockwell International; and WE = Wormser Engineering, Inc.
dNot applicable.
eThe category “industrial” includes space-heating applications.
No electricity is generated; 20 MW is the equivalent of the steam condensed

Table 4.2 Principal PFBC Projects and Facilities
Coal Operating Bed Feed Thermal
Installation and Pressure Area Rate Rating Location (MP4 (mz) ( W 0 Comments
Argonne National Laboratory PDU, Argonne, Ill.
NCBa CURUCRE High Pressure Test Rig, Cheltenham, England
New York Univ. Experimental Facility, Westbury, N.Y.
ASEA PFBC Component Test Facility, Finspang, Sweden
Aachen Technical Univ. Utility Boiler, Germany
Grimethorpe Experimental Facility, England
Tidd Station Pilot Plant, Brilliant, Ohio
1.1 0.00016
2.0 0.09
1 .o
1.6
0.4
1.2
1.2
0.5
1.25-2.0
12.0
3.9
25-40
0.0091
0.9
2.3
7.9
7.7
0.15
1.1
7.0
15.0
40.0
85.0
C
Started up in 1983; currently used as test demands dictate.
Operated at Leatherhead from 198 1 through 1984, when CURL closed; now reinstalled at Cheltenham; used as test demands dictate.
Present combustor started up in 1982; currently used as research programs dictate.
Started up in 1983 at Malmo, Sweden; moved to Finspang in 1986; tapered outward from bottom to top.
Started up in 1986; EPRI has contracted for a test program; construction funded by the German and North Rhinel Westphalia governments; can be operated at atmosphere pressure for 20-Mw thermal OUtplt.
Started up in 1981; Interna- tional Energy Agency program completed in 1984; now operated by CEGBb and NCB.
Construction start scheduled for mid-1987 and completion scheduled for 1989, depending on DOE funding; tapered verti- cally; scale-up of ASEA facility.
aU.K. National Coal Board.
bU.K. Central Electricity Generating Board.
CNO thermal rating is available; the electrical output will be 70 MW.
49

* Cyclone
Overbed heating surface
Feed water } Fre:Erd
I Overbed - In-bed air heating injection surface
*- I Solid fuel and sulfur absorbent Distributor I Reinjection
I 11111-11-
Spent bed material
l-[-F- preheater Air
Fines
I) Discard
Figure 4.2 Basic Components of an FBC Boiler
precipitator (ESP) in AFBC or a ceramic or granular-bed filter in PFBC. Small particles captured by the primary cyclones usually are recycled to the fluidized bed to improve the combustion efficiency. Particles that are discharged from particle recovery stages are collected for disposal with the solid bed discharge.
If the flow of fluidizing air is gradually increased beyond that corresponding to the maximum fluidizing velocity characteristic of the bubbling bed, increasingly larger particles will be carried over into the freeboard. At airflow velocities of about 5-15 m/s, all of the parti- cles will be suspended, resulting in fast fluidization. If the suspended particles pass into an enlarged section that causes their effective velocity to return to the bubbling range, the larger particles will settle to the bottom to form a bubbling bed. Returning them from this new bed to the original "fast bed will cause them to be reen- trained. This pattern is the basis of circulating
fluidized-bed combustion, which is adaptable to atmos- pheric or pressurized modes. It is attractive, particularly for AFBC, because of its potential for staged combus- tion and high capacity, as well as high-efficiency com- bustion and sulfur capture.
The uppermost portion of the bubbling velocity range (about 3-6 mls), which slightly overlaps the fast range, is considered by some as a separate region called turbulent fluidization because of the violent agitation of the partially unstable bed. At fluidizing velocities of 15-50 mls, the particle suspension takes on the charac- teristics of an entrainment reactor, which is used in coal gasification.
AFBC boilers for industrial heating can be purchased with a warranty comparable to that for conventional pulverized-coal designs25 They are available from about 50 companies in 25 countries. Units for AFBC
The technology for AFBC is well established, and
50

are also being developed for electric-utility applications, whereas PFBC units are considered candidates primarily for utilities and other electricity generation plants. The technology for both AFBC and PFBC is discussed fur- ther in the following sections.
Industrial AFBC
The principal application for AFBC is to supply heat for process, agricultural, or community use. The capacity of these industrial (in contrast to utility) boilers ranges from a few thousand to half a million pounds of steam produced per hour, which is equivalent to up to 150 MW thermal. In Europe and the United States, about 300 AFBC units supply heat to industrial processes, munici- palities, oil producers for secondary recovery, and farms for hay drying2 and there are reports of seven times this number in China.26
In U.S. anthracite mining regions, the popularity of industrial AFBC appears to be enhanced by its ability to accept low-quality fuel. For several years, a 60,000-lb/h bubbling-bed unit has been burning anthracite culm in a Wilkes Barre, Pennsylvania, district heating plant.27 The largest U.S. single-train atmospheric circulating-bed combustor is a cogeneration boiler in Chester, Pennsyl- vania, which produces 650,000 lb/h of steam to supply process heat and 65 MW of electricity for a paper mill. Started up in mid-1986, it bums anthracite culm or a variety of alternative fuels.28 Two additional culm-fired circulating-bed units are being designed for cogeneration operations in east-central Pennsylvania;29.30 one will deliver about 80 MW, and the other will sell 40 M W of electricity to an electric utility while generating steam to heat a commercial greenhouse for the year-round grow- ing of vegetables. Both are scheduled for start-up at the end of this decade.
Figure 4.3 shows a typical industrial steam-boiler AFBC plant. Coal from the bunkers is conveyed to a screen and double-roll crusher and then to underbed injection nozzles or spreader-stoker feeders. The num- ber of injection nozzles, which are evenly spaced, de- pends on the depth of the bed, the size of feed particles, and the rate of overhead recycling. Normally, one injec- tor is required per 0.9-3.3 m2 of bed area;W2 most de- signs call for one injector per 1.5-1.7 m2.33.34 The spreader-stokers, which are placed along the combustor wall, have rotors that throw sized and metered coal through the freeboard zone onto the bed surface. The rotor action may be supplemented by air jets. Each feeder can service up to 16 m2 of bed surface.%
fluidizing air) supplied by a forced-draft fan. Lime- The coal is burned principally by primary air (the
stone, used to capture sulfur oxides (SO,) and provide makeup inert solids, is added beneath the bed surface. The hot flue gas passes through mechanical cyclone separators that capture coarse dust, which is pneumati- cally reinjected into the boiler below the bed surface. The partially cleaned flue gas heats boiler feedwater in an economizer while being cooled to a temperature suitable for fabric filters. The advancing technology for ceramic-fiber textiles is significantly elevating this limit- ing temperature (see the subsequent discussion of par- ticulate control). A baghouse filter removes fine par- ticles, and an induced-draft fan sends the gas to the stack.
cooled by a water-cooled screw. These solids, along with fine particles from the baghouse, are pneumatically conveyed to ash silos.
Steam is generated in the waterwalls of the enclosure or in in-bed boiling-tube bundles. Dry saturated steam is separated from boiling water in a conventional steam drum and passes through either an in- or above-bed superheater. Alternatively, air may be used as the cooling fluid in the in-bed tube bank.
Coarse solids leave the bed through drains and are
Utility AFBC
Coal-fired AFBC utility boilers are fundamentally the same as those for industrial steam plants. The two most notable differences are the characteristics of the steam that is produced and the size of the boilers.
The temperature, pressure, and quality of the steam produced in a utility plant must be suitable for a steam turbine. Utility boilers are characteristically larger than the largest industrial sets: the minimum capacity of a utility design normally would be 100 MWe (equivalent to about 1 million lb/h of steam). To keep the bed size tractable, the design normally is modular, and several bed modules may be contained in a single furnace. The beds may be arranged horizontally or vertically ("ranch- style" or "stacked").
Except for handling capacity, all other systems of the utility plant will be similar to their counterparts in an industrial plant fuel and limestone handling, prepara- tion, and feed system; solid waste management; flue-gas cooling, cleaning, and ejection; and water and air s ys terns.
have been built by electric utilities. Northern States Power Company has replaced one module (100 W e ) of the four-module Black Dog Station with an AFBC boiler that is designed to deliver 131 MWe.35-37 A recently completed year of shakedown testing attained
Two demonstration-scale AFBC boilers recently
51

I
Water Coal . - I e.--- handling. and separator Economizer
preparation
Fluidized Storage. handling. and
I 'I I Baqhouse I I preparation I I 4bed, I
Limestone (when required)
Air
Fan Cooler
Conveying air silos
Figure 43 Industrial AFBC Boiler
93% of the design capacity. The new boiler was sched- uled to come on-line and begin a long-term test program by January 1988.38 The Colorado-Ute Electric Associa- tion has installed a two-module I 1 0 - W e retrofit AFBC boiler with a circulating bed at its Nucla Station. The boiler, which started up in mid-1987, will come on-line in 1988 and undergo long-term testing.39-41 The testing program for each of these boilers is sponsored by EPRI.
Utility PFBC
Figure 4.4 shows a possible design for a utility PFBC power plant. A design might incorporate two or three trains of PFBC modules and gas turbines with a single tandem-compound steam turbine. The coal and dolo- mite handling and preparation systems indicated in Fig. 4.4 are the same as for an AFBC utility plant, with the addition of dryers for coal and dolomite. Each mate- rial is dried by air heated by exchangers or direct contact with hot waste solids. The dried materials are then separately crushed and fed to injection systems consist- ing of lockhoppers, booster compressors, and pneumatic conveyors. Drying is necessary because of the difficulty of injecting the solids across the PFBC pressure barrier.
An emerging technology for transporting and inject- ing feedstock is the preparation of slurries by mixing the feed solids with water or oil (see the chapter on Coal- Liquid Mixtures). Some coals can be pulverized to
52
-200 mesh and mixed with water to form a pumpable paste containing up to 75% coal by weight.42 Injection of coal slurry into an experimental PFBC operating at 1.0-1.6 MPa has been found practicable.21 The final choice between dry feed and slurry feed appears to depend on economic rather than technical factors.
Primary air is introduced through the plenum as the fluidizing stream and, if a dry-feed system is employed, as the conveying medium for the feedstock. If secon- dary air is required (not shown in Fig. 4.4), it is intro- duced in the upper portion of the bed or the freeboard space; in a staged-combustion design, it will be the fluidizing gas of a second-stage fluidized bed. The air for both streams is delivered by a compressor; in the diagram, it is driven by a gas turbine for which the working fluid is hot, clean combustion gas.
Most of the fly ash is mechanically separated from the combustion gases in one to three stages of cyclones. The fly ash from the first stage may be reinjected. The hot combustion gases then pass through an additional particle separator that removes enough of the residual solids for the gas to expand (without damaging the tur- bine) through gas turbines, which drive air compressors and generators. This separator is indicated in Fig. 4.4 as a granular-bed filter, but consideration has been given to alternatives such as porous ceramic filters; ceramic- fabric bag filters; and hot-side, high-pressure ESPs. Returbine hot-gas cleanup is still an unresolved and difficult issue in PFBC technology.

Hot J
cyclone I t I
Coal Storage, r p handling, and * Stacked
PFBC beds
preparation V
Injection
n Storage, air 1 Injection
n Storage, air 1 - Feedwater filter
condenser To 3 I Bed drain ~ 1’ J
solid waste
compressor
Figure 4.4 Utility PFBC Process
An economizer preheats boiler feedwater to recover waste heat from the gas expelled by the turbine before it goes to the stack. If it is necessary to meet environmen- tal standards, a baghouse may be added to the gas train between the economizer and stack.
One-fourth to one-third of the net power from the PFBC system is generated by the hot, pressurized flue gas expanding through the gas turbine. The rest is gen- erated in a conventional steam-turbine cycle using su- perheated steam with intermediate- and low-pressure reheating stages. Steam is generated in the waterwall enclosure and in-bed tube bundles. In- and above-bed tube bundles reheat the steam for intermediate- and low-pressure turbine stages.
in the in-bed tube bank. In the most popular concept, the air from the heat exchanger is combined with hot, clean combustion gas in the ratio of two parts of heated air to one part of combustion gas. The mixture is ex- panded through a gas turbine that drives a generator and compressor for the combustion and cooling air. The exhaust from the air turbine enters a waste heat boiler that generates steam to drive a steam turbine. About
Instead of water, air can be used as the cooling fluid
60% of the plant’s electrical output is generated by the gas turbine, and the remaining 40% by the steam turbine.1
No demonstration-scale PFBC utility plant has been built yet, and no fully integrated pilot plant has been operated, although the Tidd Station demonstration plant in Ohio is scheduled for testing in the early 1990s. An important reason is the recognition of major unresolved questions about hot-gas cleanup, gas-turbine tolerance to particulates, ability to respond to fluctuating electric loads (especially emergency loss of load), and erosion of combustor components.
Nevertheless, the viability of both air- and steam- cooled PFBC has been demonstrated in two testing programs: (1) an air-cooled operation by Curtiss-Wright in a program involving a 2.3-MWt, 0.7-MPa process devebpment unit and a small gas turbine16 and (2) a steam-cooled operation by the International Energy Agency in an experimental facility at Grimethorpe, England, involving a large pilot-scale (85-MWt), 1.2-MPa PFBC unit (with no turbine).22.23 At the com- pletion of the Curtis-Wright program (2,700 h of coal- burning operation), a 13-MWe pilot plant was designed
53

and built but never operated because of a change in funding priorities.16 The first major program of the Grimethorpe project was completed in 1984, after about four years of operation. A new program, sponsored jointly by the U.K.’s National Coal Board and Central Electricity Generating Board, is now being undertaken.43
ENVIRONMENTAL ISSUES
Although the environmental issues of concern resulting from FBC are quite similar to those from the conven- tional combustion methods discussed in the chapter on Conventional Coal-Fired Power Plants, some warrant further discussion. The most significant environmental issues arising from FBC technology are the control of stack emissions of S 0 2 , NO,, and particulates and the disposal of solid waste (including material discharged from the bed and fly ash from the particulate control system).
Atmospheric Emissions
As in conventional boilers, the products of coal combus- tion in FBC boilers include SO,, NO,, and particulates. The rate of SO, emissions from a limestone-fed FBC boiler is expected to be comparable to that from a con- ventional coal-fired power plant with an SO2 scrubber.4 The rate of NO, emissions is expected to be somewhat less than that resulting from conventional coal-fired combustion.45 Particulate emissions from FBC, how- ever, are of more concern than SO, and NO, emissions. Particulate emissions from FBC are estimated to be comparable in quantity to those from conventional com- bustion per unit of feed energy fired4 but their size distribution, composition, and difficulty of capture make them potentially more hazardous.
The median diameter of particles from conventional combustion systems is about 20 p . 4 7 It appears to be smaller for FBC. For the Rivesville AFBC facility, which was equipped with an array of underperforming parallel single-stage cyclones, the mass median diameter of particles in the cyclone overflow was about 8 pma For the cyclone systems of the Exxon (two stages) and CURL (three stages) experimental PFBC facilities, the median size of uncaptured particles was 2 pm.L4950 Of special concern is the emission of particles that are in the 1- to 3-pm respirable range: 12% of the cyclone effluent from Rivesville was in this ranget8 33% of the Exxon effluent,1,4950 and 85% of the CURL effluent.l,4950
tially condense on smaller particles, which could in- Volatile trace metals and hydrocarbons preferen-
crease the health hazard from them. Furthermore, FBC fly ash is formed at relatively low temperatures and does not fuse like conventional fly ash; for this reason, it can release components (e.g., metals and hydrocarbons) more easily than conventional fly ash. However, the lower combustion temperature may suppress volatiliza- tion. Some evidence suggests that the volatilization of trace metals from AFBC is less than that from conven- tional combustion.51
Table 4.3 lists estimated toxic-element concentra- tions due to particulates in flue gas meeting current New Source Performance Standards (NSPS) for utilities. The table shows that the concentrations of arsenic, beryllium, and selenium exceed the minimum acute toxicity efflu- ent (MATE) values for air. The gas from a properly designed stack, however, will be significantly diluted in the atmosphere before reaching ground level (the extent of dilution depends on the weather); therefore, the de- gree of hazard cannot be easily assessed.47
Table 4.3 Toxic-Element Concentra- tions in Flue Gas at NSPS Particulate Matter Limit (1- to 3-pm fraction)
Average MATE for Concentrationa Aifi
Element (clg/m3) W m 3 )
Arsenic Beryllium Cadmium Mercury Lead Antimony Selenium Tellurium
20 7 1 <0.01 20 2
12 <0.2
2 2 8.2
50 150 500
100 10.8
.Assuming the gas carries 0.03 Ib of fly-ash particles per million Btu of the coal’s heating value (Le., the NSPS limit) and the fly ash contains typical amounts of the toxic materials. Toxic elements are assumed to be carried into the flue gas only as components of the particulate matter.
bThe MATE value is the lowest concentration of a contaminant in air, water, or land efflu- ents that may cause significant harmful re- sponses in humans or the ecology within 8 h. The MATE values are bpsed on threshold limit values, lethal dose concentrations, drink- ing-water regulations, water quality criteria, and other toxicity data.
Source: Ref.45.

Because of lower operating temperatures and in- complete combustion, FBC is expected to have a higher hydrocarbon emission rate than that for conventional combustion. Although little information is available on the health effects of hydrocarbons from FBC, one study found that the levels of hydrocarbon emissions were less than the MATE values for air.47 Other research has demonstrated, however, that hydrocarbons extracted from particulate matter collected at about 15O-17O0C have appreciable mutagenic activity in microbial bioas- says. The findings indicated, unaccountably, that the biological activity of hydrocarbons from AFBC is lower than that of hydrocarbons from PFBC or conventional combustion.52
Solid Waste
As with FBC particulate emissions, little information is available on the potential impact of solid waste from FBC. However, the mass of the solid waste produced by an FBC plant achieving 90% sulfur capture can be two to four times that produced by a conventional boiler without FGD.53 The mass of solid waste from an FBC plant may be only 30% greater than the mass of dry solids from a pulverized-coal boiler with FGD and high-efficiency fly-ash removal. The mass of dewatered but wet solids (about 50% moisture) constituting the stream that actually must be handled from a pulverized- coal boiler with FGD can be substantially greater than the mass of dry waste from a PFBC unit (see the chapter on Combined-Cycle Power Plants) and can equal that from an AFBC unit. The exact amounts for any specific application depend on the fractional use of the sorbent, the composition of the sorbent, and the sulfur and ash content of the coal. A 1,Oo-MWe PFBC plant may produce up to 1.5 million tons/yr of dry waste (spent sorbent and ash) when burning coal containing 3.5% sulfur and 12% ash. In spite of its ability to accommo- date a lower sorbent-to-coal ratio than AFBC will allow, PFBC may produce almost as much spent sorbent be- cause dolomite typically contains 45% magnesium car- bonate, which calcines but does not react with SQ. Thus, a major consideration is the amount of land required for the disposal of waste solids from an advanced-technology coal-burning power plant, whether the technology used to control SO, emissions is FBC or FGD.
up to 6 mm. Spent bed material generally consists of relatively large amounts of the sulfates, carbonates, and oxides of calcium and magnesium and lesser amounts of silica, hematite, and spinel. Carryover fines usually
The FBC residue consists of dry grains with sizes of
contain silica, hematite, and calcium sulfate, with lesser proportions of calcium carbonate and lime and a small amount of free carbon. Inorganic constituents of re- jected bed material, along with their MATE values for land, are listed in Table 4.4.
coal-fired power plants is that rain may leach some components from the waste and contaminate ground- water and surface waters. Table 4.5 presents the environmental characteristics of leachate from repre- sentative bed and canyover materials from AFBC and PFBC.54 These data show that it is not the trace metals and hydrocarbons but the calcium, sulfate, total dis- solved solids, and pH levels in the leachate that are the major concerns. Calcium and sulfate concentrations in leachate have been found to exceed drinking water standards. Leaching characteristics of AFBC and PFBC bed materials have been found to be similar, with the exception that AFBC material exhibits a higher heat release upon contact with water.w
A primary issue in the disposal of solid waste from
Table 4.4 Analysis dhorganics in FBC Bed Reject Material
Detected. MATEfor Value Land
Substance W g ) W g )
Volatile and toxic elements
Arsenic Beryllium Cadmium Mercury Lead Selenium Antimony Tellurium
21 27 0.44
CO.02 8.0 0.8 0.5
COS
0.1 0.03 0.004 0.02 0.i 0.05 0.4 3.0
Major elements Aluminum 15,Ooo 2.0 Iron l0,Ooo 0.5 Silicon 15,Ooo 300
Carbonb 1,600
Potassium 10.000 1,720 Calcium 200,000 32.4
SAtomic adsorption spectroscopy method used, except for arsenic. which was determined colorimetrically.
bExcluding carbonates.
Source: Ref. 45.
55

Table 45 Preliminary Indications of the Environmental Impacts of FBC Solid Waste Leachate
Environmental Parameters that Exceeded Standards
Heat Release Gypsum
Sample Process Sorbent ( O C P Drinking Water Leachate
Bed material
Bed material
Bed material
Bed material
Carryover material
Carryover material
Unprocessed bed and carryover materials
Processed bed and carryover materials
Natural gypsume
PFBC, once-through
PFBC, once-through
PFBC, regenerative
AFBC, once-through
AFBC, once-through
PFBC, once-through
PFBC, once-through
PFBC, once-through
PFBC, once-through
Limestone
Dolomite
Dolomite or limestone
Limestone
Limestone
Dolomite or limestone
Dolomite or limestone
Dolomite or limestone
Dolomite or limestone
<0.2
<0.2
0-3
5-15
0-3
<0.2
<0.2
<0.2
<0.2
Specific conductance, pH, calcium, sulfate
Specific conductance, pH, calcium, sulfate
Heat release, specific conductance, pH, calcium, sulfate
Heat release, specific conductance, pH, calcium. sulfate
Heat release, trace metals$ specific conductance, pH, calcium, sulfate
Specific conductance, pH, calcium, sulfate, magnesiumd
Specific conductance, pH, calcium, sulfate
Specific conductance pH, calcium, sulfate
Specific conductance, calcium, sulfate
Specific conductance, pH, calcium
PH
Heat release, specific conductance, pH, calcium
Heat release, specific conductance, pH, calcium
Heat release, specific conductance, pH, calcium
PH
PH
PH
None
aBased on data from FBC residues available in 1978.
bHeat release, the spontaneous temperature rise as the sample becomes hydrated, is regulated for FBC
cAll samples passed the drinking water and gypsum leachate standards for sulfide and total organic carbon.
dOnly one sample failed to pass the standard.
ePresented for comparison.
Source: Ref. 49.
residues only in the context of the drinking water and gypsum leachate standards.
56

ENVIRONMENTAL CONTROLS
Growing interest in FBC has resulted largely from envi- ronmental issues raised by conventional coal combus- tion. Fluidized-bed combustion is viewed as a viable method for controlling SO, and NO, emissions during combustion, but the particulate matter normally entrained in FBC flue gas poses special environmental and operational problems requiring both conventional and innovative control methods. Furthermore, the large amount of solid waste that results from using non- regenerable sulfur sorbents to control stack emissions from high-sulfur fuel calls for new disposal and reuse options, or for innovative alternatives for capturing the sulfur (a challenge shared both by FBC and pulverized- coal FGD).
Atmospheric emissions from utility boilers with heat input capacities of 250 million Btdh (about 25 MW electrical output) or greater are regulated under the NSPS for electric-utility steam generating units (CFR Title 40, Part 60, Subpart Da) established by the Clean Air Act as amended in 1979;459 these regulations are summarized in Table 4.6. Although power plants using FBC are subject to the emission limitations and reduc- tion requirements of the SO2 standards and to the par- ticulate matter and NO, standards, the standards for a smaller (demonstration-scale) plant are less stringent. Plants with equivalent capacities of 400-1,300 MWe for AFBC and 200-1,200 MWe for PFBC are permitted to operate with 85% sulfur capture (instead of %%), based on a 30-d rolling average.
In late 1986, the U.S. Environmental Protection Agency issued NSPS to limit emissions of NO, and particulates from industrial boilers (heat input rates of 100-250 million Btdh) for which construction or modi- fication was started after June 19, 1984.5637 The NO, limit depends on the fuel fired and the type of furnace; for coal-burning FBC, it is the same as for utility boilers (0.6 lb/million Btu fmd). The particulate matter limit also depends on the fuel; for coal, it is 0.05 lb/million Btu fired. Sulfur dioxide limits will be announced and enforced in November 1987. Some states have emission standards for industrial and utility boilers that are more stringent than the NSPS.
Conservation and Recovery Act of 1976. Bed discharge and fly ash from FBC are classified as nonhazardous materials.
The technologies proposed for controlling particu- late emissions from AFBC are conventional. Control methods used in PFBC, however, are still in the devel-
Solid waste disposal is regulated by the Resource
Table 4.6 NSBS for Electric-Utility Steam Generating Units (commencing construction after Sept. 18,1978)
Pollutant Standard
(Ib/million Btu)
Particulate matter 0.03
Sulfur dioxide 1.20s
Nitrogen oxides Solid fuels
Coal-derived fuels Any fuel containing more than 25%
by weight coal refuse Any fuel containing more than 25%
by weight lignite if the lignite is mined in N o h Dakota or Montana and is combined in a slag tap furnace
Other lignite and lignitic coals Subbituminous coal Bituminous coal Anthracite coal
All other fuels
0.50 b
0.80
0.60 0.50 0.60 0.60 0 .60
*Or a 90% redudion, whichever is more stringent; when emissions fall to 0.6 Ib/million Btu, this level, or a 70% reduction, is a maximum, whichever is more stringent.
bExempt from NO, standards and monitoring requirements.
Source: Ref. 50.
opment stage, and information regarding their effi- ciencies and operating problems is limited.
Emissions Control
Sulfur Dioxide Control
Sulfur is absorbed in fluidized beds by natural ash alkalis and added limestone or dolomite. Limestone is typically used as a sorbent in AFBC, but its reactivity decreases as pressure increases; therefore, it is typically not used in PFBC.1 Many dolomites contain calcium and magnesium carbonates in about equal proportions. They are favored for use in PFBC because magnesium carbonate decomposes, even under high partial pressures of carbon dioxide, to form magnesium oxide and carbon dioxide, making the dolomite particles more porous and improving the ability of limestone to absorb SO2 by sulfation.ss The calcium-to-sulfur ratio required is about 2.5, or 3 to 1, for 90% sulfur capture in AFBC systems with recycling. Similar sulfur retention can be achieved
57

in PFBC systems1 using dolomite at a calcium-to-sulfur ratio of 1.5, or 2 to 1. Because dolomite contains a smaller fraction of calcium than does limestone and magnesium oxide does not sulfate under PFBC condi- tions, the weights of limestone used in AFBC and dolomite used in PFBC are about the same, providing incentive for further research on ways to employ lime- stone efficiently in a PFBC environment. Circulating beds show promise of more effective limestone use than bubbling beds.25.59
It has been demonstrated in experimental units that greater than 90% SO2 reduction can be achieved in both AFBC and PFBC with a sufficiently high proportion of sorbent to coal.
Nitrogen Oxides Control
Nitrogen oxides emissions are inherently controlled by the low combustion temperatures used in FBC. In general, these emissions for PFBC in low-excess-air applications are less than those for AFBC. The forma- tion of NO, results from both the high-temperature reac- tion of atmospheric nitrogen and oxygen in the combus- tion zone and the oxidation of nitrogen compounds in the coal. Although the low combustion temperatures in FBC reduce the formation of NO,, their concentrations for both AFBC and PFBC are slightly higher than might be expected. This may result from hot spots in the fluidized bed. Above the bed, reduced temperatures and vigorous mixing reduce NO, concentrations to average- temperature equilibrium values. Because of the higher partial pressures of the components of a PFBC atmos- phere, the reaction rate is higher than in AFBC systems.58 In a circulating bed, the strong turbulence and inherent staged combustion further restrain the for- mation of NO,.
FBC can be kept well within current NSPS for new utility and industrial boilers. Also, it has been reported that emissions from FBC are below those of conven- tional boilers using modified combustion systems to reduce NO, emissions.47 Operation of the Exxon PFBC miniplant demonstrated that, at an excess-air level as high as 20%, NO, emissions were only 0.1-0.2 lb/mil- lion Btu. Even at excess-air levels of &loo%, emis- sions were less than 0.4 lb/million Btu, a value that is well within the NSPS limit.8
If the emission standard is made so strict that the NOx concentration in emissions from normal bubbling FBC operation is unacceptable, NO, reduction methods that have been applied successfully to higher-temper- ature furnaces promise to eliminate the problem.
Several studies c o n f m that NO, emissions from
58
Examples are staged combustion, flue-gas recirculation, and use of the circulating fluidized bed. These and other techniques are discussed in the chapter on Environmen- tal Contro1.Technologies for Fossil Energy Systems.
Particulate Control
The primary control device used for removing particu- late matter from FBC combustion gases is the mechani- cal cyclone. A cyclone uses centrifugal force generated in a whirling gas-solids mixture to separate the solids from the gas stream. Unburned carbon, ash, and bed material removed by the cyclone are either reinjected into the main bed or disposed of as solid waste. The cleaned gas stream is sent to a secondary collector -- a baghouse or ESP in AFBC and a granular or ceramic filter in PFBC -- for further particulate removal. In PFBC technology, two or three stages of cyclones of increasing efficiency have been proposed, after which still another collector may be added before the hot gas goes to the turbines. A baghouse may be required as a final stage (after the turbines, economizer, and possibly another heat-recovery device) to keep particulate emis- sions below the NSPS maximum of 0.03 Ib/million Btu (about 28 ppm).
the state-of-the-art techniques and devices used with conventional boilers, but the high pressure and tempera- ture of the combustion gas stream leaving a PFBC com- bustion chamber require more rugged and effective devices. Several promising technologies are being pursued, but none have yet been fully developed.
Cyclones and secondary separators are discussed in the subsections that follow. Because cyclones, ESPs, and baghouses are described in the chapter on Environ- mental Control Technologies for Fossil Energy Systems, their description here is kept very brief. All of these separators are discussed as accessories to PFBC units in Refs. 1 and 11.
Particles can be collected from AFBC systems by
Cyclones, ESPs, and Bughouses. Mechanical cyclones are the expedient choice for primary particulate removal for a number of reasons: they facilitate the reinjection of elutriated coal and sorbent fines, thus increasing boiler efficiency and sorbent use; they reduce the particulate content of the gas entering the air heater, which im- proves its performance; and they reduce the particulate loading on the baghouse and other secondary or tertiary separators, which reduces operating costs. Furthermore, they are rugged and dependable in the harsh environ- ment of the PFBC flue-gas stream. Their principal limi- tation is their low efficiency with respect to particles smaller than 5 p.

In ESPs, particles in the flue gas are charged electri- cally by a series of wire or frame-type discharge electrodes and are then attracted to plate-type collecting electrodes. When ESPs are used with conventional boiler furnaces, they can remove 99% or more of the particulates, but the efficiencies associated with hot-side ESPs in FBC are lower. Experiments in the Exxon PFBC miniplant show that, after primary collection with a cyclone train, an ESP removal efficiency of 87% was achieved? This lower efficiency is associated with the smaller size of particles associated with FBC and the difficulty of fine-particulate control with ESPs at the conditions of the hot gas emerging from a PFBC unit.
Baghouses, like ESPs, have been used by industry for many years to remove dust from process gases@ A baghouse is arranged so that dusty flue gas enters a fabric filter, which captures dust and allows clean gas to pass through. The dust captured on the fabric builds up to form a filter cake, increasing collection efficiency. Baghouses typically remove more than 99% of the par- ticulate mass from the gas stream passing through them; the Exxon miniplant’s baghouse, which was combined with a primary cyclone train, had a 99.3% removal efficiency.8 Until recently, the temperature of the flue gas had been too high for baghouse use, but the develop- ment of advanced-technology , ceramic-filter textiles now offers promise of this application to hot-gas cleanup.
Granular-Bed Filters. Like ESPs and baghouses, granular-bed filters have been used in a variety of indus- trial applications. Because they can be readily designed and constructed to withstand the temperature, pressure, and corrosive and erosive nature of the combustion gas, and because their collection efficiency for small particles increases with increasing temperature, granular-bed filters are being considered as a method of collecting particles before the flue gas enters the turbine in a PFBC plant.@ Granular-bed filters used upstream from the turbine can help both in meeting the NSPS particulate levels and in preventing degradation of the turbine blades.47
Granular-bed filters are of three general types: fixed, moving, and intermittently moving.61.62 A filter unit consists of several small beds packed with a granular medium, such as alumina or quartz. In a fixed- bed filter, a stack of these beds forms a single filter element. Dusty gases pass through screen sections down into the filter beds immediately below, and a manifold in the interior of the elements collects clean gas and passes it to an outlet. As filtered particulates accumulate, the pressure drop across the bed increases until the element must be cleaned by reversing the flow of gas.63
A fixed bed has the lowest capital and operating costs but may become clogged. A moving bed operates on the same principle as a fixed bed, except that the dust particles are separated from the filter-medium granules outside the bed. This keeps the bed free from particle buildup but increases the operating costs and filter- medium attrition. The intermittently moving bed is an attempt to reduce attrition while maintaining the advan- tages of the moving bed.
Ceramic Filters. Another secondary separator being tested for PFBC hot-gas filtering is the ceramic barrier fiter. The available filter media are of four general types: fabrics woven from long-filament yams of ceramic fibers; papers produced from short-filament fibers, generally held together with binders; felts formed as mats of relatively long fibers;G and rigid, porous monolithic elements.65-68 A filter assembly consists of a housing containing one or more elements made from the selected ceramic medium. Hot gas enters the housing below the elements and strikes a plate on the ash hopper. Heavy particles fall into the hopper, while lighter parti- cles travel upward to be caught by an element. After passing through the filter medium, the hot, clean gas exits through the top of the vessel. Ceramic filters for PFBC must be housed in a pressure vessel.
Solid Waste Control
Three options are available to manage the stream of dry, solid waste that would result from U.S. utilities adopting coal-fired FBC boilers. It may be discarded by sea dumping, mine filling, or land spreading and filling; it may be sold for a limited number of uses; or it may be processed to separate the ash from the sorbent compo- nent, which can be regenerated and reused. Each of these options has its difficulties and uncertainties. Addi- tional research is needed to establish better, more eco- nomical methods for using spent bed material, regenerat- ing spent sorbent to recycle it and recover sulfur, and controlling leaching from landfills.
Solid Waste Disposal
Land disposal is the most viable option. Although ocean disposal of wastes has been employed for centuries by individuals and industries all over the world, the Marine Protection and Sanctuaries Act of 1972 establishes crite- ria that make the disposal of FGD (or FBC) waste on the continental shelf or in the deep ocean inadvisable.4 It is generally accepted that the solid wastes produced from early-generation FBC boilers will be disposed of by on-site impoundment or off-site landfill or minefill.
59

The disposal of FBC waste presents fewer difficul- ties than the disposal of waste from conventional boilers using FGD. Unlike FGD wastes, which contain about 50% water and require costly dewatering techniques, FBC waste is dry. In addition, it contains calcium sul- fate rather than calcium sulfite and is thus more stable.
The control of leaching from FBC solid waste is highly site-specific. Potential problems may be avoided by careful site selection, design, and management based on the hydrology, geology, climate, and soil composi- tion of the area considered for disposal. In addition, leaching may be reduced by processing the wastes be- fore disposal. An example is the production of compact solids by the blending of spent sorbent, fly ash, and water, followed by air curing. If the spent sorbent is highly sulfated, extra lime may be added to promote pozzolanic reactions. The economic viability of this process has not been determined.
Uses of Solid Waste
Several alternatives to the disposal of FBC solid wastes as landfill or minefill have been explored. These include their use in soil conditioning, the manufacture of ag- gregate for concrete and refractory brick, mineral recovery, treatment of acidic mine drainage and munici- pal waste, and gypsum substitution. But the large vol- ume of wastes generated in comparison with the market, the cost of transportation, and the availability of other raw materials are major obstacles to FBC waste use. Historically, fly and bottom ash from conventional coal-fired boilers has been used in a number of ways, but only about 20% of the available material is currently being used, primarily in construction.ll.,
The most attractive use of FBC solid waste appears to be in construction applications.47 Preliminary tests show that concrete mixtures containing about 5% FBC residue display improved strength characteristics. High strength has been exhibited also by road-base composi- tions containing FBC waste. The strength obtained in these compositions indicates that other products, such as masonry block, could be made from FBC solid waste. Furthermore, solid compacts made from a blend of spent sorbent and fly ash have a compressive strength compa- rable to that of low-strength concrete, making them suitable for use in underground mine roof supports or in controlling subsidence in longwall mining (see the chap- ter on Coal Mining and Preparation).
Use in agriculture appears at this time to be another likely market for FBC solid waste. Greenhouse experi- ments show that FBC waste, when added to soil, in- creases the pH level as well as the level of essential plant numents, including magnesium and sulfur.47 One
study has demonstrated the benefits of using spent sor- bent as a source of calcium for peanuts. Yields in- creased by 11% and no toxic effects were observed.
Treatment of the acidic drainage from mines is a third potential use of FBC waste. Fresh limestone is typically used to neutralize mine drainage, but it has been found that the use of about twice as much spent sorbent will control acidic mine drainage as well as fresh limestone does.
Spent Sorbent Regeneration
First-generation FBC plants use a once-through, calcium-based sorbent for SO2 reduction, but sorbent- regenerative processes have been considered since FBC began to be visualized as promising for utility applica- tions. The primary reason for interest in sorbent regeneration is that it would reduce the quantities of sorbent required and, as a result, reduce the quantities of solid waste produced. Spent sorbent will account for as much as two-thirds of the dry solid waste from a boiler firing a high-sulfur U.S. coal with a normal ash content. An appreciable fraction of the waste sorbent (up to 50% for AFBC) will remain unsulfated because it was inac- cessible to the S 0 2 . Regeneration of the sulfated sorbent could liberate this unsulfated residue. Preliminary indi- cations are that regenerating limestone or dolomite sor- bent during the combustion of low-sulfur coal may re- duce the makeup sorbent requirement for meeting utility NSPS by a factor of three to four!
The principle of calcium-based-sorbent regeneration is to convert calcium sulfate back to calcium oxide and liberate recoverable sulfur. Two one-step regeneration methods that show promise are atmospheric-pressure reduction of calcium sulfate with hydrogen and carbon monoxide to form calcium oxide and SO2 (at about 1,OSO"C) and reduction at about 1 m a . The atmos- pheric regeneration process is energy efficient for use with AFBC; this advantage disappears, however, with PFBC, where pressure is necessary for feedstock injection.
Although sorbent regeneration has been demon- strated on a pilot scale, both economical and technical uncertainties remain.47 The regeneration processes have large fuel requirements for the reducing reactions and consume auxiliary power for the sulfur recovery process, the compression of air and stack gas, and sorbent circulation.69 Pilot- and bench-scale experiments have been troubled by system plugging, difficulty with tem- perature and superficial gas velocity control, and bed agglomeration.8 Thus, the state of development of these regeneration processes is characterized by uncertainty as to performance and economic feasibility.
60

Hydration of the spent limestone sorbent from an AFBC plant offers some promise as being less compli- cated and expensive than regeneration for conserving sorbent and decreasing the rate of solid waste gener- ation. A 1981 program demonstrated that treating the bed discharge from originally decarbonated and sulfated limestone increased its activity sufficiently to use it again.70 Furthermore, hydration of the second-cycle material further increased the activity, and the process was effective for up to four recyclings of the initial sul- fation discharge. As a result, a stone-fuel combination requiring a calcium-to-sulfur ratio of 3.3 to effect ac- ceptable SO2 absorption on a once-through basis (22% use of calcium) operated satisfactorily with a ratio of 2 or less on recycling, with the ultimate sulfation of 86% of the calcium. The cost-effectiveness and engineering feasibility for this process have not been established.
ENVIRONMENTAL CONSTRAINTS
Barring any major changes in energy use trends, the electricity demand in the United States and Canada will have climbed to 3.5 million GWh by the mid-1990s, requiring 800 GW of generating capacity.10 On the basis of this prediction, and an assumption of continued FBC development, at least 4% of the US. annual coal consumption is expected to be burned in FBC units by the year 2000. By present environmental protection standards, annual national emissions of SO,, NO,, and particulates from FBC at that time are projected to be 0.5 million, 0.2 million, and 0.05 million tons, respec- tively; annual solid waste production is expected to be about 7 million tons. These levels represent less than 2% of the expected national totals.46 In general, the nationa! and regional implications of FBC are similar to those associated with conventional coal-fired power plants modified to meet state and national environmental protection standards. Costs for pollution control for an electric-utility FBC plant were estimated in the late 1970s to be 15-2496 of the total cost of busbar-delivered electricity.47
Environmental factors related to particulate emis- sions and solid waste disposal or use may retard the widespread adoptiofi of FBC. Particle size distribution and composition have yet to be adequately charac- terized, and disposal practices for FBC wastes will have to take into account the potential environmental impacts relating to leachate salinity, alkalinity, and heat release. A lack of disposal sites may also constrain FBC use (and FGD as well). Commercial use of the wastes will be
aggressively investigated, but the existence of adequate markets for the predicted large volumes is questionable. In addition, siting of any new unit, FBC or conventional, may be restricted by regulatory requirements, such as Prevention of Significant Deterioration standards, nonat- tainment standards, and the Clean Air Act.
Except for particulate emissions, the environmental constraints on FBC are generally shared by conventional boiler furnaces. The use of FBC by utilities will depend on acceptance of the relatively more efficient but more complicated pressurized mode, for which technological development is still incomplete, or acceptance of the relatively less efficient but simpler atmospheric bubbling-bed mode, which is technologically mature. Atmospheric circulating beds may provide an attractive middle ground for the utility markets as a widely demonstrated, commercially available technology that promises better combustion efficiency, sulfur-sorption efficiency, NO, control, and heat transfer than in atmos- pheric bubbling beds and avoids the unresolved techni- cal issues of PFBC. Four demonstration plants that will be operating by 1990 should provide information within the next five to ten years that will enable utilities to make rational choices among the three FBC tech- nologies and conventional boilers with FGD.
REFERENCES
1.
2.
3.
4.
5.
Miller, S.A., et al., Technical Evaluation: Pres- surized Fluidized-bed Combustion Technology, Argonne National Laboratory Report ANL/FE- 8 1-65 (April 198 1); also published in Podolski, W.F., et al., Pressurized Fluidized Bed Combus- tion Technology, Noyes Data Corp., Park Ridge, N.J., pp. 3-226 (1983).
Squires, A.M., K. Mooson, and A.A. Avidan, Fluid Beds: At Last, Challenging Two Entrenched Practices, Science, 230(4732): 1329- 1337 (Dec. 20, 1985).
Keairns, D.L., et al., Evaluation ofthe Fluidized Bed Combustion Process, U.S. Environmental Protection Agency Report EPA-650/2-73-048a (1971).
Hoke, R.C., et al., Regenerative Limestone Proc- ess for Fluidized-Bed Coal Combustion Process, U.S. Environmental Protection Agency Report EPA-650/2-74-001 (Jan. 1974).
Jonke, A.A., et al., Reduction of Atmospheric Pollution by the Application of Fluidized Bed Combustion, Annual Report, July 1968-June 1969,
61

6.
7.
8.
9.
10.
11.
12.
13.
14.
15.
16.
62
Argonne National Laboratory Report ANL/ES- CEN- 100 1 (undated).
Oliver, E., Fluidized Bed Combustion, Energy Technology Economics Program Report No. 11, SRI International, Stanford, Calif. (July 1979).
Vogel, GJ., et al., Reduction of Atmospheric Pol- lution by the Application of Fluidized Bed Com- bustion and Regeneration of SuSfur Containing Additives, Annual Report, July 1973-June 1974, U.S. Environmental Protection Agency Report EPA-650/2-74-104 (1974).
Hoke, R.C., et al., Miniplant and Bench Studies of Pressurized Fluidized-Bed Coal Combustion, U.S. Environmental Protection Agency Report EPA- 600/7-80-013 (1980).
Martin, W.F., Washington Perspective, LBL Re- search Review, 11 (4):22-23, Lawrence Berkeley National Laboratory (Winter 1986).
1986 Reliability Review, North American Electric Reliability Council, Princeton, N.J. (1986).
Physical Gas Stream Cleanup, U.S. Dept. of En- ergy Report DOE/METC-86/0239 (March 1985).
Cooper, R.H., T.G. Godfrey, and J.H. DeVan, Corrosion of High Temperature Materials in AFBC Environments -- Part 1 (1500-h Tests), Oak Ridge National Laboratory Report ORNL/TM- 7734IP1 (June 1981).
Godfrey, T.G., and J.H. DeVan, Corrosion of High Temperature Materials in AFBC Environments -- Part 2 (4500-h Tests), Oak Ridge National Laboratory Report OWTM-7734/P2 (Aug. 1981).
Dooley, M.J., and H.H. Vroom, Operational Evaluation of the Great L a k e s Fluidized-bed Demonstration Plant, Proc. 8th International Conf. on Fluidized-Bed Combustion, Vol. 11, U.S. Dept. of Energy Report DOE/METC-85/6021,
Claypoole, G.T., et al., Performance and Testing of the Rivesville 30-MWe Multicell Fluidized Bed Boiler, Proc. 6th International Conf. on Fluidized- Bed Combustion, VoI. 11, U.S. Dept. of Energy Report CONF-800428, pp. 600-610 (Aug, 1980).
Engineer, Design, Construct, Test and Evaluate a Pressurized Fluidized Bed Pilot Plant Using High Sulfur Coal or Production of Electric Power: Phase I , Preliminary Engineering; PFBlSGT
pp. 564-573 (July 1985).
17.
18.
19.
20.
21.
22.
23.
24.
25.
Technology Unit Extended Test Report, U.S. Dept. of Energy Report FE-1726-51A (April 1980).
Moskowitz, S. , W. Walker, and J. McClung, Status Report of the Wood-Ridge PFB Pilot Plant, Roc. 7th International Conf. on Fluidized-Bed Combustion, Vol. I, U.S. Dept. of Energy Report DOE/METC-83-48, pp. 58-63 (Jan. 1983).
Long Term Materials Test Program --Final Report, Vol. I -- Test Operations Report, U.S. Dept. of Energy Report DOEETI15457-1662 (Oct. 1984).
Hoy, H.R., A.G. Roberts, and P. Raven, Further Experiments on the Pilot-Plant Pressurized Com- bustor at Leatherhead, Proc. 5th International Conf. on Fluidized-Bed Combustion, Vol. 111, U.S. Dept. of Energy Report CONF-77 1272, pp. 123-133 (Dec. 1978).
Hoy, H.R., and A.G. Roberts, Investigations on the Leatherhead Pressurized Facility, Prw. 6th International Conf. on Fluidized-Bed Combustion, Vol. 11, U.S. Dept. of Energy Report CONF- 800428, pp. 241-253 (Aug. 1980).
Hoy, H.R., A.G. Roberts, andR.L. Scott, Opera- tion of a Small Combustor on Dry Coal and on Coal-Water Mixtures at Pressures up to 20 Atm, Proc. 8th International Conf. on Fluidized-Bed Combustion, Vol. I, U.S. Dept. of Energy Report
National Coal Board ( E A Grimethorpe) Ltd., Grimethorpe Pressurized Fluidized Bed Combus- tion Project -- Overall Project Review, Report GEF/U/84/2 1, Grimethorpe, Barnsley, South Yorkshire, England (May 1985); also issued as U.S. Dept. of Energy Report DoEET/10393- 1903.
Wheeldon, J.M., et al,, Experimental Results from the Grimethorpe PFBC Facility, Proc. 8th Interna- tional Conf. on Fluidized-Bed Combustion, Vol. I, U.S. Dept. of Energy Report DOEIMETC-85I
Ruth, L.A., et al., Pressurized Fluidized Bed Coal Combustion and Sorbent Regeneration, Roc. 5th International Conf. on Fluidized-Bed Combustion, Vol. 111, U.S. Dept. of Energy Report CONF-
Schweiger, B., Fluidized-Bed Boilers Achieve Commercial Status Worldwide, Power, 129(2):S.l-S.16 (Feb. 1985).
DOE/METC-85/6021, pp. 291-306 (July 1985).
6021, pp. 317-335 (July 1985).
771272, pp. 756-772 (Dw. 1978).

26.
27.
28.
29.
30.
31.
32.
33.
34.
35.
Cao, B.L., and J.K. Feng, Technology of Fluidized-Bed Combustion Boilers in China, in Fluidized Bed Combustion and Applied Technol- ogy, R.G. Schwieger, ed., Hemisphere Publishing Corp. and McGraw-Hill Publications Co., New York, pp. 1.63-1.83 (1984).
D’Acierno, JS., D.L. Carver, and B. Fisher, Design Concepts for Industrial Coal-Fired Fluidized-Bed Steam Generators, Proc. 8th Inter- national Conf. on Fluidized-Bed Combustion, Vol. I, U.S. Dept. of Energy Report DOE/METC- 8516021, pp. 406414 (July 1985).
Darling, S.L., H. Beisswenger, and A. Wechsler, The LurgilCombustion Engineering Circulating Fluidized Bed Boiler Design and Operation, Roc. 1st International Conf. on Circulating Fluidized Beds, P. Basu, ed., Pergamon Press, New York,
Culm-Fired Plant Planned for Pa., Coal & Syn- fuels Technology, 8(4):2 (Jan. 26, 1987).
Pa. Gets New Cogen. Plant, Coal & Synfuels Technology, 8(5):3 (Feb. 2, 1987).
Tignac, L.L., and S . Panico, Design and Operation of the Fuel Feed System for a 6-Foot by 6-Foot AFBC Air Heater, Proc. 7th International Conf. on Fluidized-Bed Combustion, Vol. I, U.S. Dept. of Energy Report DOE/METC-83-48, pp. 326-332 (Jan. 1983).
Castleman, J.M. 111, Process Performance of the TVA 20-MW Atmospheric Fluidized-Bed Combus- tion Pilot Plant, Roc. 8th International Conf. on Fluidized-Bed Combustion, Vol. I, U.S. Dept. of Energy Report DOE/METC-85/6021, pp. 196-207 (July 1985).
Gorrell, R.L., and J.L. Esakov, TVA 200 MW AFBC Demonstration Plant -- Fundamental De- sign Philosophy, Proc. 7th International Conf. on Fluidized-Bed Combustion, Vol. 11, U.S. Dept. of Energy Report DOE/METC-83-48, pp. 706-714 (Jan. 1983).
Benton, S.W., and S.E. Lindquist, The 20 MW(e) AFBC Demonstration Boiler, Roc. 7th Interna- tional Conf. on Fluidized-Bed Combustion, Vol. 11, U.S. Dept. of Energy Report DOE/ METC-83-48, pp. 715-724 (Jan. 1983).
Zylkowski, J.R., B.C. Krippene, and R.L. Gamble, Black Dog AFBC Retrofit for Emission Reduction, Capacity Increase, and Life Extension, Proc. 8th
pp. 297-308 (Nov. 18-20, 1986).
36.
37.
38.
39.
40.
41.
42.
43.
44.
45.
46.
47.
International Conf. on Fluidized-Bed Combustion, Vol. I, U.S. Dept. of Energy Report DOEMETC-
Black Dog Licks Limestone Problem, Coal & Synfuels Technology, 7(49): 1,8 (Dec. 22, 1986).
Follett, R.E., et al., Startup Activities at the Black Dog AFBC Conversion, Proc. 9th International Conf. on Fluidized-Bed Combustion, Vol. I, J.P. Mustonen, ed., American Society of Mechani- cal Engineers, New York, pp. 153-160 (1987).
Black Dog Due Back on Line, Coal & Synfuels Technology, 8(45):1 (Nov. 16, 1987).
Nuda Project Begins Startup Phase, Coal & Syn- fuels Technology, 8(3):1-2 (Jan. 19, 1987).
Gregory, A.H., Electric Utilities’ Largest Cir- culating Fluidized Bed Boiler -- Construction Update, Proc. 9th International Conf. on Fluidized-Bed Combustion, Vol. I, J.P. Mustonen, ed., American Society of Mechanical Engineers, New York, pp. 140-145 (1987).
Nuda Restart Readied; Air Flow Studied, Coal & Synfuels Technology, 8(44): 1,8 (Nov. 9, 1987).
Roberts, A.G., et al., Combustion of ‘Run-of-Mine’ Coal and Coal-Water Mixtures in a Small PFBC, Roc. 7th International Conf. on Fluidized-Bed Combustion, Vol. I, U.S. Dept. of Energy Report DOEMETC-83-48, pp. 482-489 (Jan. 1983).
Lawton, J., A.D. Dainton, and S.G. Dawes, The CEGBINCB Programme on PFBC, Roc. 8th In- ternational Conf. on Fluidized-Bed Combustion, Vol. 11, U.S. Dept. of Energy Report DOE/
Beek, C.R., and F.S. Jacoff, Sulur Emission: Control Technology and Waste Management, US. Environmental Protection Agency Report EPA-60019-79-019 (May 1979).
Henschel, D.B., Conclusions of the EPA Fluidized-Bed Combustion Program, Proc. 6th International Conf. on Fluidized-Bed Combus tion, Vol. I, U.S. Dept. of Energy Report CONF-
Technology Characterizations Environmental Information Handbook, U.S. Dept. of Energy Report DOWEV-0072 (June 1980).
Environmental Readiness Document, Advanced Electric Generation-Commercialization Phase 111
85/6021, pp. 350-369 (July 1985).
METC-85/6021, pp. 594-604 (July 1985).
800428, pp. 50-62 (Aug. 1980).
63

48.
49.
50.
51.
52.
53.
54.
55.
56.
57.
58.
64
Planning, U.S. Dept. of Energy Report DOE/ ERD-0014 (Sept. 1978).
Shilling, N.Z., and WJ. Moms, The Response of Hot-Side Electrostatic Precipitators and Fabric Filters to Fluidized Bed Combustors, Proc. 6th International Conf. on Fluidized-Bed Combustion, Vol. 111, U.S. Dept. of Energy Report CONF-
PFB Coal Fired Combined Cycle Development Program - Gas Cleanup Requirements Report, U.S. Dept. of Energy Report FE-235'7-66 (May 1980).
Boericke, R.R., et al., Assessment of Gas Turbine Erosion by PFB Combustion Products, ROC. 6th International Conf. on Fluidized-Bed Combustion, Vol. 11, U.S. Dept. of Energy Report CONF-
Smith, A.E., Emission Factors for Several Toxic Air Pollutants from Fluidized-Bed Combustion of Coal, Argonne National Laboratory Report
Proceedings of a Workshop on Fine Particulate Emissions from Fluidized Bed and Conventional Combustion, U.S. Dept. of Energy Report
Jones, J.E., et al., System Assessment of Atmos- pheric Fluidized Bed Combustion: Baseline Study, Oak Ridge National Laboratory Report ORNUTM-6208 (May 1978).
Sun, C.C., C.H. Peterson, andD.L. Keairns, En- vironmental Impact of the Disposal of Processed and Unprocessed FBC Bed Material and Carry- over, Proc. 5th International Conf. on Fluidized- Bed Combustion, Vol. 11, U.S. Dept. of Energy Report CONF-771272, pp. 846-872 (Dec. 1978).
New Stationary Source Performance Standards: Electric Utility Steam Generating Units, Federal Register, 44( 113):33580-33624 (June 11, 1979).
Catalano, L., Final Industry NSPS for PM, NO, Reflect Industry Comments, Power, 131 (1):7-8 (Jan. 1987).
Davidson, L.N., and D.E. Gullett, Gas Turbine Plant Emissions, Chemical Engineering Progress,
Shang, J.Y., and R.A. Chronowski, Comparison of AFBC with PFBC, Proc. 4th International Conf.
800428, pp. 1260-1273 (Aug. 1980).
800428, pp. 724-734 (Aug. 1980).
ANL/EES-TM-327 (March 1986).
CONF-7810153 (Aug. 1979)
83(3):56-59 (March 1987).
59.
60.
61.
62.
63.
64.
65.
66.
on Fluidized-Bed Combustion, MITRE Corp. Report M76-36, pp. 323-339 (May 1976).
Roeck, D.R., Technology Overview: Circulating Fluidized-Bed Combustion, U.S. Environmental Protection Agency Report EPA-600/S7-82-05 1 (Sept. 1982).
A Review of Technology for Control of Fly Ash Emissions from Coal in Electric Power Gener- ation, App. E in Environmental Control Implica- tions of Generating Electric Power from Coal, 1977 Technology Status Report, Argonne National Laboratory Report ANUECT-3 (Dec. 1977).
Young, S.C., et al., Granular Bed Filters for Par- ticulate Removal at High Temperature and Pres- sure, Proc. 5th International Conf. on Fluidized- Bed Combustion, Vol. 111, U.S Dept. of Energy Report CONF-771272, pp. 516-532 (Dec. 1978).
Ciliberti, D.F., D.L. Keairns, and D.H. Archer, Particulate Control for Pressurized Fluidized Bed Combustion Processes, Proc. 5th International Conf. on Fluidized-Bed Combustion, Vol. 11, US. Dept. of Energy Report CONF-771272, pp. 626-638 (Dec. 1978).
Nutkis, M.S., et al., Evaluation of a Granular Bed Filter for Particulate Control in Fluidized Bed Combustion, Proc. 5th International Conf. on Fluidized-Bed Combustion, Vol. 111, U.S. Dept. of Energy Report CONF-77 1272, pp. 504-51 1 (Dec. 1978).
Shackleton, M.A., Feasibility of Barrier Filtration Using Ceramic Filters, Proc. 5th International Conf. on Fluidized-Bed Combustion, Vol. 111, U.S. Dept. of Energy Report CONF-77 1272, pp. 620-639 (Dec. 1978).
Ciliberti, D.F., et al., Hot Gas Clean-up Using Ceramic Cross Flow Membrane Filters, Proc. U.S. Dept. of Energy Contractor Review Meeting on High Temperature, High hessure Particulate and Alkali Control in Coal Combustion Process Streams, U.S. Dept. of Energy Report DOE/MC- 08333-167, pp. 97-109 (Feb. 1981).
Lippert, T.E., D.F. Ciliberti, and S.G. Drenker, Hot Gas Cleaning for Pressurized Fluidized Bed Combustion, Proc. 2nd Biennial Utility Conf. on Pressurized Fluidized-Bed Combustion Power Plants, Milwaukee, Wis., June 18-20, 1986 (in press).

67. Rayner, C.C., PFBC Hot Gas Cleanup System Using Rigid Ceramic Filters, Proc, 2nd Biennial Utility Conf. on Pressurized Fluidized-Bed Com- bustion Power Plants, Milwaukee, Wis., June 18-20, 1986 (in press).
Zievers, J.F., P. Eggerstedt, and A. Lyssenko, Porous Ceramics -- Some Modifications, Roc. 2nd Biennial Utility Conf. on Pressurized Fluidized-Bed Combustion Power Plants, Mil- waukee, Wis., June 18-20, 1986 (in press).
69. Newby, R.A., S. Katta, andD.L. Keairns, Evalua- tion of Sorbent Regeneration Processes for AFBC and PFBC, Proc. 5th International Conf. on Fluidized-Bed Combustion, Vol. 11, U.S. Dept. of Energy Report CONF-771272, pp. 811-828 (Dec. 1978).
Smith, G.W., et al., Demonstration of a Hydration Process for Reactivating Partially Sulfated Lime- stone Sorbents, Argonne National Laboratory Report AhWCEN/FE-80-23 ( a t . 1981).
68. 70.
65

Figure 5.1 The Great Plains Coal Gasification Project in Beulah, North Dakota, Has Generated over 100 Billion ft3 of Substitute Natural Gas
66

INTRODUCTION
Coal gasification is an old technology that has evolved considerably in response to changing energy needs. Gasifiers were widely used, both in the United States and abroad, until the 1950s, but most were abandoned as inexpensive oil and natural gas became available. In the late 1960s, the threat of natural gas shortages in the United States and Europe stimulated interest in the development of advanced coal gasification technology for the preparation of substitute natural gas (SNG). As a result of the Arab oil embargo in 1973, interest in coal gasification intensified and spread to other developed countries and the objectives of technology development programs were broadened to include replacing fuel oil.
Despite heavy cutbacks in government funding for synthetic fuels (synfuels) technology development dur- ing the early 1980s, major successes have been achieved in the development of a versatile and technically advanced coal gasification technology, such as that used in the Great Plains coal gasification facility (Fig. 5.1 j. As indicated in Fig. 5.2, current coal gasification tech- nology can produce a spectrum of products having wide application in the industrial, transportation, and utility sectors of the U.S. economy.1
All of the more promising applications of coal gasification involve producing medium-Btu gas on a large scale, by reacting coal with steam and oxygen. In industry, the medium-Btu gas can be used for integrated generation of fuel gas, steam, and power in industrial parks and can also be converted to synthesis gas (syn- gas) for the production of chemical feedstocks or am- monia for fertilizer manufacture. The by-product carbon dioxide (C02) can be used for enhanced oil recovery. Transportation fuels that can be produced from syngas include synthetic gasoline, methanol, diesel oil, and high-density jet fuel.
Chapter 5
Coal Gasification
Development History
The gasification of coal with air and steam to produce a dust-free fuel gas was introduced more than 150 yr ago. Historically, coal gasifiers have evolved through three developmental stages: small-scale gas producers (before 1925), large-scale gasifiers (1925-1959, and advanced gasifiers (since about 1970).
In the oldest coal gasification technique, coal is gasified by hot air and steam at ambient pressure. Although these moving-bed gasifiers, called gas pro- ducers, produce a coal gas with a low energy content and have a low capacity (about 80 tons/d of coal),2 they were used worldwide during the 1800s and early 1900s to provide fuel for heating and industrial processes such as steel and glass production. Development of gas pro- ducer improvements, such as producers with water jack- ets, rotating grates, and two stages, continued into the 1900s but ceased about 1930. Gas producers are still commercially available, but their use is largely confined to China and South Africa. Their reappearance in the United States is hindered by the lack of a cost-effective gas cleanup technique.
During the second stage of gasification develop- ment, three large-scale coal gasifiers were commercial- ized the Winkler, Lurgi, and Koppers-Totzek (K-T). These gasifiers can produce medium-Btu gas at a high rate. In 1926, the Winkler fluidized-bed coal gasifier became the first large-scale commercial gasifier. It was originally designed to gasify lower-rank coals with air and steam, although oxygen was used in later models and many Winkler gasifiers were used to produce am- monia. Due to their poor carbon conversion efficiency, most have been abandoned and none have been sold for 20 yr.
In 1936, Lurgi pressurized gasifiers were intro- duced. They were widely used for producing town gas and, in 1955, were installed in the first commercial
67

I Gasification I
Methanation
Syngas production
Fischer- Methanol Tropsch
Hydrogen generation
- Gas turbine
Industrial Utility Residential Chemical Chemical Transportation Commercial Industrial Transportation Residential Industrial Transportation Residential Utility
Power Industrial
Y Ammonia synthesis
I
Figure 5.2 Versatility of Coal Gasification (Source: Adapted from Ref. 1)
M-Gasoline
I
synfuel plant by the South African Oil and Gas Corpora- tion, Ltd. (SASOL) in Sasolburg. Lurgi gasifiers are still widely used. Since the late 1970s, 86 of the largest Lurgi gasifiers have been installed in synfuel plants: 72 in SASOL I1 and I11 at Secuda, South Africa, and 14 in the Great Plains gasification plant in the United States.
In the 1940s, the K-T entrained-flow gasifier was introduced. Due to high operating costs, it was not as widely used as the Lurgi gasifier. Other technological advances introduced during the second stage of gasifier development included catalyzed production of syngas and hydrogen, the Fischer-Tropsch process for convert- ing syngas to organic products and fuels, and gasifica- tion-based energy conversion systems.
The third stage of gasifier development is charac- terized by an international effort to develop commercial coal gasification technology that meets four objectives: technical improvement, environmental acceptability, wide applicability, and economic competitiveness. Joint
68
government-industry programs in the United States, the United Kingdom, West Germany, Japan, Australia, and South Africa have accomplished all but the last objec- tive, which is expected to be achieved by the year 2000 with integrated-gasificatiordcombined-cycle (IGCC) power plants (see the chapter on Combined-Cycle Power Plants).
Government Programs
The U.S. Department of Energy (DOE) has established a broad, cooperative program with industry to develop and demonstrate advanced and environmentally acceptable coal gasification proce~ses.3~4 Pilot plants for more than a dozen gasification processes were operated during the 1970s, and parallel programs were initiated to inves- tigate the health and environmental effects associated with promising processes.s Demonstration programs for

medium- and high-Btu coal gasification technologies were planned, but did not proceed beyond plant design.
In 1982, DOE guaranteed a $2 billion loan to the Great Plains Gasification Associates (GPGA) to com- plete construction of the nation’s first commercial-scale synfuel plant.67 This plant (Fig. 5.1) was completed on time and within budget and produced pipeline-quality SNG in July 1984. However, because the recent low cost of crude oil made the facility’s product economi- cally uncompetitive, the GPGA was unable to meet its financial obligations. When the GPGA defaulted on the loan in 1985, the DOE became the legal owner of the Great Plains gasification facility and retained the American Natural Gas Company (ANG) to operate it. The DOE has requested bids from the private sector for purchase of the plant.
The technical and environmental data prepared by ANG have resolved many uncertainties concerning the environmental and socioeconomic effects of construct- ing and operating a large-scale synfuel plant.V The data acquired to date primarily establish the limitations of environmental control technologies applicable to Lurgi gasifiers, e.g., excessive emissions of particulates from the coal lockhopper vents, sulfur dioxide and nitrogen oxides from the main stack, and ammonia and phenols from the cooling towers. A comprehensive effort to forecast and monitor the socioeconomic effects estab-
Table 5.1 Recent Large-Scale Coal Gasification Projects
lished that it is possible to construct a large synfuel plant in a small, isolated rural community without serious problems. The population of Beulah, North Dakota, was 1,344 in 1970 and 2,878 in 1980; the work force size peaked at 6,117 in June 1983.
The DOE also has established cooperative develop- ment programs with the Electric Power Research In- stitute, the United Kingdom, and West Germany and has participated in several large-scale tests of advanced gasification technologies in England and Germany. Some of these tests have established the commercial readiness of the Mobil methanol-to-gasoline process, and others have demonstrated that representative U.S. coals can be accepted by a slagging gasifier recently developed by the British Gas Corp. (BGC) and Lurgi. Table 5.1 lists large-scale coal gasification facilities recently constructed in the United States and abroad. Projects that have government funding include the Allis Chalmer KILnGas project, Tennessee Valley Authority (TVA) Ammonia from Coal, Cool Water coal gasifica- tion plant, and Dow Syngas projects.l@lz Privately funded coal gasification projects include the Tennessee Eastman Chemicals from Coal plant and Shell Oil pro- ject in Te~as.13~14
Technology development efforts in West Germany have focused on tests of large-scale pilot plants for ad- vanced entrained-flow and fluidized-bed gasifiers.
Project and Location
Coal Consumption Gasifier Start-
(tondd) Type and No. Up Date Statusa Product
United States Dow Syngas, Louisiana 2,400 Shell OiVLummus, Texas 400 Great Plains, North Dakota 1,600 Cool Water, California 1 ,m Eastman Chemicals from Coal, Tennessee 900 Wood River KILnGas, Illinois 600 TVA Ammonia from Coal, Alabama 200
Other countries High-temperature Winkler, West Germany Ruhrkohle/Ruhrchemie, West Germany Sumitomo/KHD Humboldt Wedag, Sweden Ube Ammonia, Japan BGC/Lurgi, Scotland VEW Dortmund, West Germany Sasol 111, South Africa Sasol 11, South Africa
700 750 250
1,500 600 2-50
32,000 30,000
Daw (1) 1987 Shell (1) 1987 Lurgi (14) 1984 Texaco (2) 1984 Texaco (2) 1984 KILnGas (1) 1983 Texaco (1) 1980
HTW (1) 1985 Texaco (1) 1985 Sumitomo (1) 1985 Texaco (4) 1984 BGULurgi (1) 1984 VEW (1) 1984 Lurgi (36) 1982 Lurgi (36) 1980
Cogeneration Fuel gas Pipeline gas Electricity Chemicals Fuel gas Methanol
Fuel gas Oxo-chemicals Fuel gas Ammonia Electricity Electricity Liquid fuels Liquid fuels
&Development status is either demonstration (D) or commercial (C).
69

These tests have led to several demonstration programs, including the high-temperature (pressurized) Winkler in Germany and the Texaco and Shell gasifiers in the United States. In the United Kingdom, the major coal gasification project was the cooperative development of the BGC/Lurgi slagging moving-bed gasifier. In France, a demonstration program for IGT's U-Gas pressurized fluidized-bed gasifier is planned, but has not yet been initiated.15
TECHNOLOGY
Figure 5.3 shows generic designs and temperature pat- terns for the three main gasifier types -- moving-bed, fluidized-bed, and entrained-flow.1 Moving-bed gasifiers have a low gasification rate when operated at atmospheric pressure. Gasifier capacity was increased by the major changes in gasifier design that led to the Winkler fluidized-bed and K-T entrained-flow gasifiers. The Lurgi gasifier introduced the use of oxygen (rather
than air) and pressurized operation to achieve an even higher capacity.
In a fluidized-bed gasifier, shot-sized coal is intro- duced into a bed of partially gasified coal particles sus- pended by an upward flow of gases (steam, oxidant, product gas, and recycle gas). In contrast to the large temperature gradient in a moving-bed gasifier, the tem- perature in a fluidized-bed gasifier is almost uniform. Fluidized-bed gasifiers have more capacity than moving-bed gasifiers because of the higher temperature within the bed, larger surface-to-volume ratio of the coal particles, and shorter residence time. An added advan- tage is that tars formed in coal devolatilization are largely decomposed at the temperature of the bed. Some limitations of fluidized-bed gasifiers are that a pretreat- ment step may be required for coals with a tendency to form cakes (caking coals), the bed temperature must be kept below the coal's ash fusion temperature, and carbon conversion may not be complete with less-reactive coals.
A key factor in the development of large-kale gasifiers that use oxygen was the commercialization of the Linde-Frank1 process for mass-producing liquid
Coal
or air J -+ A s h
Gasifier top
Gasifier bottom
Steam, Dxygen.
500 1000 2000 25( Temperature (OF)
Moving-Bed Gasifier
r, Gas
A s h
Gasifier top
Gasifier bottom
I Steam, I -+--
0 500 1000 1500 2000 25C
oxygen ,I O y ! ! + A h l I
0 500 1000 1500 2000 25C Temperature (OF)
Fluidized-Bed Gasifier
* Slag
Gasifier top Coal - - - - - -
I
Gasifier Gas I bottom
0 500 1000 1500 2000 25 Temperature (OF)
Entrained-Flow Gasifier
Steam,
39
Figure 53 Generic Coal Gasification Reactors (Source: Adapted from Ref. 1)
70

oxygen. The use of oxygen rather than air in coal gasification provides two important benefits: continu- ous production of medium-Btu gas and an increased gasification rate. By increasing the gasifier operating pressure, which is readily accomplished using liquid oxygen and high-pressure steam, a still higher rate of gasification can be achieved.
All of these advantages were incorporated into the Lurgi pressurized gasification process. The Lurgi gasifier, which can be regarded as an upgraded rotary- grate gas producer, is continuously fed with oxygen and steam and operates at a pressure of 3.0 MPa. Until very recently, it was the only pressurized gasifier commer- cially available. The disadvantages of Lurgi gasifiers include limited tolerance for caking coals and fines, formation of tar and phenolic by-products, the need to use excess steam to avoid ash sintering, and production of a large, highly contaminated wastewater stream.
In entrained-flow gasifiers, the pulverized coal and oxidants are introduced together and flow concurrently through the reactor. The residence time is very short, and the operating temperature, typically 1,300-1,50O0C, is well above the melting point of the coal ash. The advantages of entrained-flow gasifiers include high throughput and carbon conversion, minimal formation of methane and other organic by-products, production of a chemically inert solid waste, and the absence of limita- tions on feed coal quality. Their disadvantages include high oxygen consumption and a relatively short refrac- tory lifetime. An additional disadvantage of the K-T gasifier, and the Winkler gasifier as well, is that they operate at atmospheric pressure -- a severe energy pen- alty is incurred in compressing the product gas to facilitate further processing.
Because coal gasification is an endothermic process, heat must be supplied internally or externally to main- tain the high temperatures (greater than 1,OOO"C) neces- sary to efficiently convert carbon. Although processes using external heat sources, such as molten iron baths or high-temperature nuclear reactors, have received some attention, all of the processes that have reached, or are approaching, commercial status use internal combustion as a heat source. In these processes, the coal is convert- ed to a combustible gas and a residual ash or slag by partial oxidation with steam and oxygen (or air). The principal products of the gasification are carbon monox- ide (CO), hydrogen, COz, and water vapor. When the oxidant is air, the product gas is diluted with an approxi- mately equal volume of nitrogen and classified as a low-Btu gas. The raw product gas from all moving-bed gasifiers also contains appreciable amounts of conden- sible tars and oils. Methane is an important component
of the product gas in high-pressure, moving-bed (Lurgi) gasifiers .
a sequence of complex chemical reactions and inter- related physical phenomena (e.g., heat and mass trans- fer). The rates of these reactions and the composition of the product gas depend on the coal characteristics, gasifier design, and operating conditions, but the funda- mental reactions are common to all processes. Gasifica- tion is initiated by coal devolatilization, an endothermic reaction that thermally ruptures the weaker chemical bonds in the coal molecules and produces hydrogen-rich fragments (including methane and hydrogen) and a hydrogen-depleted reactive char. The char and remain- ing volatiles are gasified in a series of reactions with steam, oxygen, C02, and hydrogen. The concentrations of the gasification products are ultimately fixed by the equilibrium of the water-gas shift reaction.
The bulk composition of the product gas is deter- mined primarily by three factors: (1) the ratios of steam and oxygen to coal, (2) the gasifier design and operating conditions, and (3) the temperature at which the equilib- rium in the water-gas shift reaction becomes fixed. The equilibrium constant for the shift reaction is temper- ature-dependent, having values greater than 1 (i.e., favoring formation of hydrogen and C02) at tempera- tures below 85OoC and less than 1 at higher temper- atures (which favors CO formation). Thus, when the major oxidant in the gasification process is oxygen, as is the case in most of the advanced high-temperature pro- cesses, CO is the predominant component in the product gas. On the other hand, hydrogen and COZ predominate when excess steam is used and the gas temperature is relatively low. The effects of oxidant ratios and gasifier characteristics on the bulk composition of product gas from Illinois No. 6 coal are shown for pressurized moving-bed (Lurgi and BGULurgi) and entrained-flow (Texaco and Shell) gasifiers in Tables 5.2 and 5.3, respectively.l~l9 The data in Table 5.2 show that the high water-tocoal ratio (needed to prevent ash sintering) in the dry-ash Lurgi gasifier produces a gas with markedly higher concentrations of C02, hydrogen, and methane than that from the slagging BGC/Lurgi gasifier. The data in Table 5.3 show that the low water-to-coal and oxygen-to-coal ratios for the dry-fed Shell gasifier produces a gas richer in CO than the slurry-fed Texaco gasifier.
During coal gasification, essentially all of the sulfur and nitrogen, and some of the trace elements, in the coal are volatilized. The predominant sulfur and nitrogen products in all gasification processes are hydrogen sul- fide (H2S) and ammonia; compounds formed in smaller
Gasification products and by-products are formed in
71

Table 5.2 Gasification of Illinois No. 6 Coal in Moving-Bed Gasifiers
Table 5.3 Gasification of Illinois No. 6 Coal in Entrained-Flow Gasifiers
Dry-Ash Slagging Characteristic Lurgi BGULurgi
Oxidant ratios (Ib/lb) Oxygen to coal 0.6 0.59 Steam to coal 2.5 0.16
Gas composition (C) Carbon monoxide 17.3 43.9 Hydrogen 39.1 24.1 Carbon dioxide 31.2 2.8 Methane 9.6 4.8
By-products (wt % of coal) Tar and oil 4.2 4.4 Keno1 0.4
Sources: Refs. 16 and 17.
amounts include carbonyl sulfide, carbon disulfide, and hydrogen cyanide. The information on trace elements is rather sparse, but it appears likely that elements such as antimony, arsenic, lead, mercury, and selenium are volatilized to some extent in all gasification processes and may remain in process condensates.20 In an environmental characterization of the entrained-flow Texaco gasifier, raw and treated wastewater was found to contain dissolved selenium at a concentration of 1 mgL.21 The stripped aqueous effluent from a Shell gasifier contained selenium at a concentration greater than 5 mgL.22 In the United States, these levels would be classified as characteristically toxic under the Re- source Conservation and Recovery Act (RCRA). The organic by-products in moving-bed gasification proc- esses will also include sulfur and nitrogen compounds (such as mercaptans, sulfides, thiophene, thiazoles, and amines), as well as polycyclic aromatics. Although these species are minor constituents in the product gas, they can be major sources of environmental concern.
ENVIRONMENTAL ISSUES
In 1980, when the Energy Security Act (Public Law 96-294) called for the deployment of synfuel plants capable of producing the energy equivalent of 2.0 mil- lion bbYd of oil by 1992, the only coal gasification tech- nology commercially available had significant draw- backs and conventional pollution control technologies
Characteristic Texaco Shell
Oxidant ratios (Ibllb) Oxygen to coal 0.92 0.85 Water to coal 0.55 0.08
Gas composition (%) Carbon monoxide 44.8 64.0 Hydrogen 38.4 31.6 Carbon dioxide 15.5 1.0 Methane 0.2
Sources: Refs. 18 and 19.
had yet to be applied to gasification process streams. The environmental issues raised at that time included degradation of air quality, contamination of surface waters and groundwater supplies, generation of solid wastes, land and water use conflicts, socioeconomic disruption, industrial hygiene and safety, and public health and safety.3.4
Coal gasification facilities produce a variety of gaseous, liquid, and solid streams that may contain toxic or otherwise harmful components. Although several of the larger effluent streams are unique to coal gasification plants, many are similar to those from other industrial sources, such as coal-fired power plants.
For example, most large coal gasification plants will have facilities to prepare, store, and handle coal; collect coal pile and stormwater runoff; treat wastewater; gener- ate steam; and handle ash and solid waste. Such units are likely to be the major sources of atmospheric emis- sions, liquid effluents, and solid wastes in the gasifica- tion plant. The characteristics of these effluents and the potential environmental problems associated with them are identical to those from conventional power plants, and the quantities likely to be discharged from coal gasification plants in the foreseeable future are dwarfed by the power plant effluents. Pollution control technolo- gies for these streams are well established.
However, some high-volume streams unique to coal gasification are potential sources of environmental con- tamination.5 All coal gasifiers discharge an ash or slag containing most of the trace elements present in the coal and produce a raw gas containing high concentrations of CO, as well as lesser amounts of other toxic species, such as H2S, carbonyl sulfide, ammonia, hydrogen cyanide, and trace elements volatilized in the gasifica-
72

tion process. In addition, the raw gas from moving-bed gasifiers contains as much as 5% by weight of conden- sible organic by-products, including toxic species such as methyl mercaptan, phenols, benzene, and polycyclic aromatic hydrocarbons. In the course of upgrading the raw gas to meet regulatory or downstream processing requirements, most of the toxic species and other by- products present in the raw gas are transferred to various gaseous and liquid streams that must be treated or in- cinerated before discharge to the environment. Most of the environmental concerns specific to coal gasification technology relate to uncertainties in the characterization of these streams and the extent of treatment needed before discharge. Specific areas of concern include (1) atmospheric emissions from the coal lockhopper vents, gas cleanup and sulfur recovery system, fuel com- bustion, and cooling towers; (2) fugitive odors, vapors, and aerosols from various sources; (3) aqueous dis- charges from wastewater treatment and other systems; and (4) solid waste disposal and the potential contamina- tion of groundwater supplies with hazardous trace elements.
applying coal gasification technology, many of the environmental problems anticipated in 1980 have been eliminated or greatly reduced. Many of the newer, advanced coal gasifiers have improved technical and environmental performance. The Texaco slagging gasifier, which is now operating successfully at two commercial-scale installations in the United States and at three facilities in other countries, can be classified as commercially available. Other advanced gasifiers that have been demonstrated at full scale, and are approach- ing commercial status, include three more slagging gasifiers (Dow, Shell, and BGC/Lurgi) and the high- temperature Winkler fluidized-bed gasifier.
The earlier concerns about the applicability and acceptability of environmental control technologies to coal gasification have been alleviated by the outstanding environmental performance of thz Tennessee Eastman Chemicals from Coal project and Cool Water coal gasification plant.133 At the Tennessee Eastman plant, 99.7% of the sulfur present in the syngas is recovered and sold to sulfuric acid manufacturers. As shown in Table 5.4, emissions of sulfur, nitrogen oxides, and particulates at Cool Water are lower than federal New Source Performance Standards by a factor of 10 or more.23 The Great Plains coal gasification plant is also an outstanding technical success, but persistent problems with its sulfur recovery system have delayed its capabil- ity to achieve the 95% sulfur removal required by the North Dakota State Department of Health.
As a result of recent progress in developing and
Table 5.4 Atmospheric Emissions from the Cool Water Plant (Ib/million Btu)
Burning Burning EPA Utah Illinois
Pollutant Permit Coal No.6Coal NSPSa
Sulfur dioxide Low-sulfur coal 0.033 0.01 8 0.24 High-sulfur coal 0.16 0.07 0.60
Nitrogen oxides 0.13 0.07 0.09 0.60
Particulates 0.01 0.031 0.03
aNew Source Performance Standards for a coal-fired power plant
Source: Ref. 23.
burning equivalent coals.
Information has also been accumulated on the occu- pational health aspects of coal gasification. A com- prehensive study of health effects at a large Lurgi coal gasification plant in Kosova, Yugoslavia, found no evi- dence of an increased disease rate in plant workers com- pared to a control group, nor of any statistically signifi- cant relationship between incidence of disease and meas- ured pollutant exposure. Although U.S. or Yugoslav 8-h exposure limits were exceeded only in a few instances (based on a time-weighted average), workers are likely to be exposed to coal tars, due to their presence on sur- faces throughout the plant.24
In the United States, personnel and area monitoring has been conducted at both the Great Plains facility and smaller gasification plants, such as that at the University of Minnesota in Duluth.3 A prospective epidemiology study also is underway at Great Plains.
The monitoring program at the Duluth facility has shown that its employees can be exposed to a number of stresses that could produce acute and chronic effects.= Carbon monoxide was found to be the major contributor to acute exposure potential, particularly during periods of abnormal operations and emergency situations, but chronic exposure levels were low. The program associ- ated high levels of dust and noise (about 100 dB) with specific process operations and pieces of equipment. Personnel exposures in such areas were reduced to ac- ceptable levels through the use of engineering controls and personal protective equipment. Although con- tamination of surfaces with coal tars was a significant problem, it was concluded that there was little acute
73

exposure hazard from these materials. However, it is not possible at this time to accurately evaluate the health risk from low-level chronic exposures to coal-derived liquids.
Area and personnel monitoring at the Great Plains facility is a continuing effort. The area monitoring pro- gram measures a range of exposure levels in both proc- ess and maintenance areas. Personnel monitoring meas- ures levels of noise, particulates, CO, HzS, hydrogen cyanide, ammonia, and organic vapors (including ben- zene, toluene, and xylene). ANG maintains a com- prehensive industrial hygiene program and uses the monitoring results to determine protection requirements for personnel. The results of the monitoring and medical surveillance programs can be found in Refs. 8 and 9.
The extensive environmental characterization and monitoring studies of the Great Plains and Cool Water plants have greatly reduced the number of environmen- tal uncertainties and will facilitate the development of more effective environmental control technology. Such studies also will be carried out at the Dow Syngas plant. However, more information is needed to address all the issues, especially the longer-term environmental con- cerns such as the eventual acceptability of current solid waste disposal practices and the potential occupational health effects of long-term exposure to coal gasification products and by-products. With respect to the latter concern, encouraging results have been obtained in the retrospective epidemiology study that was conducted in cooperation with Yugoslavian personnel at Kosova.24 However, it should be emphasized that the health and environmental effects of coal gasification can be expected to be highly site and process specific. The present data base, which is restricted to two gasifier designs and three sites, needs to be enlarged.
ENVIRONMENTAL CONTROL
The process design details, and consequently the specific environmental effects, of a commercial coal gasification plant will be determined by a chain of interrelated fac- tors. The location and size of the market for the gasifi- cation products will impose certain requirements on the plant location and the quantities of coal and water that must be conveniently available. The site location will define the characteristics of the coal that must be used, as well as the regulatory requirements that must be met. In turn, the regulatory requirements, together with the characteristics of the coal and the major product, will significantly affect the selection of both gasification and environmental control technologies.
With respect to site selection and potential resource consumption, a facility like Great Plains, which can produce the energy equivalent of 25,000 bbYd of oil, will consume about 5 million tons of coal and 7,000 acre-ft of water annually.
Coal characteristics that could affect technology selection include reactivity, sulfur and moisture content, caking properties, friability, ash fusion temperature, and the elemental composition of the coal mineral matter. For example, neither a moving-bed (Lurgi) nor fluidized-bed gasifier would be appropriate for gasifying an eastern coal with low reactivity or strong caking properties. However, both could be satisfactorily used for gasifying a reactive western lignite. On the other hand, the Texaco slagging gasifier would be satisfactory for eastern coal, but might not be ideal for a western lignite with a high moisture content.
No federal performance standards have been promulgated specifically for coal gasification, but a coal gasification plant could be subject to regulations promulgated under a number of federal laws, including the Clean Air Act Amendments of 1977, Water Pollu- tion Control Act, RCRA, and Toxic Substances Control Act. In particular, coal gasification facilities are subject to regulations enacted for the Prevention of Significant Deterioration (PSD) of air quality. The allowable emis- sion level would be determined by the ambient air qual- ity at a proposed site and the site’s proximity to Class I areas and other emission sources. A PSD preconstruc- tion review and application of the best available control technology would be required, and a construction permit would be issued only if it were determined that the plant would meet the allowed emission level.
All modem coal gasification plants will have at least four process-specific environmental control sys- tems for gasifier effluent cleanup, wastewater treatment, sulfur removal and recovery, and solid waste handing and disposal. The complexity of these systems, the units included, and the specifications of the units will vary with the gasifier design, nature of the end product, and specific environmental strategies adopted3 The overall environmental strategy in most cases will be based on two precepts: (1) to avoid the production of problem streams and resulting use of end-of-pipe controls and (2) to integrate the environmental control systems as fully as possible.
Features of the main process sequence will be con- sidered first to provide background for discussion of the environmental control systems. Because all advanced gasifiers will operate at high pressures, the coal feed system (e&, a lockhopper) must be pressurized to add coal to the gasifier and depressurized to be recharged. Typically, raw process gas is used for this purpose and,
74
because of its value, is recovered for recycling or use as a fuel. The raw process gas from all gasifiers will con- tain varying amounts of particulates (ash or char) and a number of sulfur- and nitrogen-cootaining gases (primarily H2S and ammonia) that must be removed to meet regulatory or downsmam process requirements. In addition, the raw gas from fixed-bed gasifiers will con- tain oil, tar, and phenolics that must be removed.
Because technology for hot gas cleanup is not fully proven at this time, the raw gas must be cooled and scrubbed to remove the particulates and permit desul- furization. The cooling and scrubbing produces a multi- phase gas liquor that contains the particulates, most of the ammonia, and varying fractions of any other toxic gases, volatilized trace elements, and heavy organics. Extensive treatment of the gas liquor may be required, particularly if heavy organics are present. In plants that produce synfuels, a portion of the gas may be routed to a shift reactor to provide the proper hydrogen-to-CO ratio before it enters the final cooling stage. This step is not necessary if the gas is to be used as fuel for industrial heating or an JGCC plant. After being cooled, the gas is routed to acid-gas removal and sulfur recovery units. In a synfuel plant, process requirements dictate that the acid-gas removal unit eliminate almost all C02 and sulfur species from the gas. In a plant producing fuel gas, on the other hand, it is not necessary to remove any C02 from the gas nor to reduce sulfur species below the level required by regulations or turbine specifications. Following acid-gas removal, fuel gas is ready for use; syngas is routed to the catalytic reactors used to prepare the end product.
To provide a brief indication of the range of en- vironmental control technologies that might be needed for coal gasification processes, the following discussion of the four major control systems focuses on the most demanding case, a gasification process that generates high-molecular-weight organics and produces synfuel (Fig. 5.4).27
Gasifier Effluent Control
The purpose of the gasifier effluent control system is to minimize the release of odors, particulates, hydrocar- bons, and other undesirable atmospheric emissions. The system recovers and cleans usable gas from the coal lockhoppers; cleans the lockhopper vent gases; and cleans and incinerates waste gases (including off- specification gas produced during gasifier start-up, shut- down, and disruptions), depressurization gases from the wastewater control system, and vent gases from tempo- rary storage tanks. The system can include filters and
scrubbers for gas cleanup, as well as a start-up incin- erator and backup flare capable of combusting waste gases at various pressures.
Wastewater Treatment
The purpose of the process wastewater treatment system is to recover usable or salable products and to reduce the concentrations of all organic and inorganic contaminants to levels that permit reuse or acceptable discharge to the environment. When high-molecular-weight organics are produced in gasification, the control system must in- clude a gravity separation step that removes oil and tar, a solvent extraction system that strips dissolved (phenolic) organics, an ammonia recovery system that strips acid gases (H2S and COz), and biological treatment that re- duces residual organic contamination. Because of the sequential nature of the wastewater treatment steps, the control system must also include an appropriate number of surge ponds to provide storage capacity during main- tenance and outages.
If the water is to be reused or discharged to surface waters, the concentrations of inorganic species could be reduced by the addition of lime. If the water is dis- charged to the atmosphere, as at the Great Plains plant, the wastewater system must also include cooling towers. Because the cooling tower blowdown may contain unac- ceptably high concentrations of some species, e.g., regu- lated organics and trace elements, facilities for further concentration and incineration may be needed.
Sulfur Control
In a synfuel-producing plant, the purpose of the sulfur control system is to remove sulfur from the process gas, recover C02 and elemental sulfur for sale or disposal, and limit sulfur dioxide emissions to the permitted level. These are severe requirements in view of the fact that, irrespective of the gasifier used in the process, the con- centration of C02 in the shifted process gas (over 30% when SNG is the product) is much higher than the H2S concentration. The presence of organics in the process gas further complicates the situation.28
The sulfur control technologies widely applied in natural gas and petroleum processing use two a p proaches: selective H2S removal with sulfur recovery by the Claus process or nonselective acid-gas removal with sulfur recovery by the Stretford process. Potential prob- lems in the former approach include the difficulty of sufficiently concentrating the H2S stream for sulfur recovery in a Claus reactor and the adverse effects of organics present in the stream on reactor operation. In
75

Gaseous Emissions
Sulfur-rich gas Coal Pretreatment Lockhopper dust exhaust vents Contaminated inert gas
Raw coal
I I
v Y
Steam Air or oxygen
-
Gasification reparation
Overhead Coal Pile Pretreatment Gasifier Shift runoff condensate ash condensate particulates
Ash Spent Hydrocarbons sluice catalyst water
Liquid and Solid Process Effluents
Figure 5.4 Generalized Process Emuent Flows at a Coal Gasification Complex Producing Syngas
the latter approach (the one used at Great Plains), the problems include the adverse effects of a high COz con- centration on operation of the Stretford process and the inability of the process to remove carbonyl sulfide and organic sulfur species. This dilemma clearly warrants further investigation, since a satisfactory sulfur control system for synfuel applications has not yet been fully demonstrated in the United States.
Solid Waste Disposal
The primary purpose of the solid waste control system at a large coal gasification plant is to collect the ash or slag from multiple gasifiers, to handle and treat the ash (and other plant wastes) and transport it to a long-term stor- age or disposal site, and to control all environmental contaminants during the process. In a process employ-
76

ing slagging gasifiers, the ash is likely to be discharged directly into a quench chamber. The slag is readily separated from the water, and the environmental accept- ability of slag leachates has been demonstrated for sev- eral types of coal.21.29
In a process employing Lurgi gasifiers, the bulk of the ash is discharged from the gasifier as dry ash. Poten- tial collection methods include conveyors, pneumatic transport, and sluicing. In the latter case, the ash must be dewatered prior to disposal, which can be a difficult process. In any event, the chemical characteristics of leachates from the ash must be determined and, in some cases, may raise questions about the environmental acceptability of long-term disposal. The conditions under which coal gasification solid wastes might be exempt from regulation under RCRA are being consid- ered by the U.S. Environmental Protection Agency.
CONSTRAINTS
In contrast to other energy conversion alternatives, coal gasification is currently the only fossil-fuel conversion technology in commercial use in the United States. If energy security or economic considerations again indi- cate a need to supplement or replace our current energy sources, coal gasification offers the quickest and surest path, not only because the technology is already proven, but also because the engineering, construction, and mar- keting infrastructures are more developed.
In the utility sector, the generation of electricity by lGCC power plants is projected to be more efficient, environmentally superior, and eventually less costly than coal-based power plants using either conventional or atmospheric fluidized-bedcombustion. Coal gasifiers can also be retrofitted to existing power plants as a potential acid rain mitigation strategy. Other utility applications include the production of methanol as a peaking fuel and SNG as a pipeline gas. The develop- ment of still more advanced coal gasification technology continues to be a highly active field.
promising, several environmental issues remain. Acid- gas cleanup techniques need further refinement to make them more reliable and less costly. The environmental fate of trace metals, both in process emissions and residue leachates, needs further study; also unknown are the long-term effects of occupational exposure to cod tars. If these by-products of coal gasification are found to present a hazard to workers or the environment, con- trol strategies need to be developed.
Although the outlook for coal gasification is
REFERENCES
1.
2.
3.
4.
5 .
6.
7.
8.
9.
10.
11.
12.
Coal Gasification: Technology Status Report, U.S. Dept. of Energy Report DOE/METC-86/0242 (Aug. 1986).
Simbeck, D.R., R.L. Dickenson, and A.J. Moll, Coal Gasification - An Overview, Energy Progress, 2( 1):42-46 (1982).
Environmental Development Plan, Coal Gasifica- tion Program, U.S. Dept. of Energy Report
Coal Gasijication, U.S. Dept. of Energy Environ- mental Readiness Document (Feb. 1980).
Status of Health and Environmental Research Relative to Coal Gasification, 1976 to the Present, U.S. Dept. of Energy Report DOE/ER-0149 (Oct. 1982).
Kuhn, A.K., The Great Plains Gasification Project, Chemical Engineering Progress (April 1982).
Great Plains Coal Gasification Plant Public De- sign Report, U.S. Dept. of Energy Report
Quarterly Environmental Progress Report, Great Plains Coal Gasification Project, US. Dept. of Energy Report DOEFE-55014, T20 (and earlier reports in this series) (Jan. 1987). Quarterly Technical Progress Report, Great Plains Coal Gasification Project, U S . Dept. of Energy Report DOE/FE-55014, T21 (and earlier reports in this series) (Oct. 1986).
Peterson, G., KlLnGas Coal Gasification Process: Status, Conf. on Coal Gasification Systems and Synthetic Fuels for Power Generation, Electric Power Research Institute Report EPRI-AP- 4257-SR, Palo Alto, Calif. (Dec. 1985).
Spencer, D.F., S.B. Alpert, andH.H. Gilman, Cool Water: Demonstration of a Clean and Eficient New Coal Technology, Science, 232509 (1986).
Hendry, R.L., and P.W. Pillsbury, Commercial Demonstration of the Dow Gasification Process in an Integrated Combined Cycle Cogeneration Application, presented at 49th Annual Meeting of the American Power Conf., Chicago (1987).
DOE/EDP-0043 (Oct. 1980).
DOE/CH-10088-1874 (July 1985).
77 I

13.
14.
15.
16.
17.
18.
19.
20.
21.
78
Mayfield, G.G., and V.H. Agreda, The Eastman Chemical Process for Acetic Anhydride from Coal, Energy Progress, 6(4):214 (1986).
Heitz, W.L., and M. Nager, Status of the Shell Gasifcation Process (SCGP), Pruc. 5th Annual EPRI Contractors’ Conf. on Coal Gasification, Electric Power Research Institute Report EPRI-
Shora, F., et al., Present Status of the U-Gas Process, Conf. on Coal Gasification Systems and Synthetic Fuels for Power Generation, Electric Power Research Institute Report EPRI-AP-
Trials of American Coals in a Lurgi Gasifier at Westfeld, Scotland, US. Dept. of Energy Report
AP-4680, Pal0 Alto, Calif. (July 1986).
4257-SR, Pal0 Alto, Calif. (D~C. 1985).
FE-105 (Nov. 1974).
Evaluation of the British Gas CorporationlLurgi Slagging Gasijier in Gasification-Combined Cycle Power Generation, Electric Power Research Insti- tute Report EPRI-AP-3980, Palo Alto, Calif. (March 1985).
Spencer, D., Cool Water Coal Gasification Pro- ject - Alternative Coal Test, EPRI Journal, 11(8):38 (1986).
The Shell Coal Gasification Process, Handbook of Synfuels Technology, R.A. Meyers, ed., McGraw- Hill Book Co., New York (1984).
Holt, N.A., Overview of Gasification Technology, Workshop on Environmental Control Technology for Coal Gasification, Electric Power Research Institute Report EPRI-AP-3006, Palo Alto, Calif. (April 1983).
Wetherold, R.G., et al., Environmenfal Charuc- teriration of the Texaco Coal Gasification Process at RuhrkohlelRuhrchemie in Oberhawen-Holten, Federal Republic of Germany, Electric Power Research Institute Report EPRI-AP-28 1 1, Palo Alto, Calif. (Jan. 1983).
22.
23.
24.
25.
26.
27.
28.
29.
Heitz, W.L., et al., Evaluation of US. Coal Per- formance in the Shell Coal Gasification Process (SCGP), Volume I : Texas Lignite, Electric Power Research Institute Report EPRI-AP-2844, Vol. 1, Palo Alto, Calif. (Feb. 1984).
McDaniel, J.E., N. Holt, and S.B. Alpert, The Environmental Superiority of the IGCC Coal Power Generation Demonstrated at the Cool Water Plant, presented at 49th Annual Meeting of the American Power Conf., Chicago (1987).
Morris, S.C., J.O. Jackson, andM.A. Haxhiu, Kosova Coal Gasification Plant Health Effects Study: Volume I - Summary, Brookhaven Na- tional Laboratory Report BNL-40629 (March 1987).
Dreibelbis, W.G., et al., Personnel and Plant Area Monitoring at the University of Minnesota-Duluth Gas@er, Oak Ridge National Laboratory Report ORNUTM-8551 (May 1984).
Nakles, D.V., and J.P. Fillo, Impact of Process Design on Effluent Control Technology Needs in Cod Gas$cation, Workshop on Environmental Control Technology for Coal Gasification, Electric Power Research Institute Report EPRI-AP-3006, Palo Alto, Calif. (April 1983).
Pollution Control Technical Manual for Lurgi- Based Indirect Coal Liquefaction and SNG (Substitute Natural Gas), U.S. Environmental Protection Agency Report EPA-600/8-83-006 (April 1983).
Lun, A., et al., Trace Contaminants Challenge Synfuels Acid Gas Removal, Environmental Progress, 3(3): 193 (1984).
Skarlos, L., Texaco Coal Gasification Process: Leach Characteristics of Slag, Workshop on En- vironmental Control Technology for Coal Gasification, Electric Power Research Institute Report EPRI-AP-3006, Palo Alto, Calif. (April 1983).

Chapter 6
Coal Liquefaction
BACKGROUND
Liquid products can be manufactured from coal through two basic process categories: indirect and direct lique- faction. In indirect liquefaction, the coal is f is t gasified to make a synthesis gas (syngas) and then passed over a catalyst to produce liquid hydrocarbons, such as alcohols and paraffins. Figure 6.1 shows a commercial indirect coal liquefaction plant.
solvent extraction, and catalytic hydrogenation. In pyrolysis, or hydrocarbonization, crushed coal is ther- mally decomposed in the absence of oxygen to yield solids, liquids, and gases. In solvent extraction, a sol- vent (usually process derived) is used as a hydrogen- carrying agent to promote liquefaction under high tem- perature and pressure to yield crude liquid fuels. In catalytic hydrogenation, hydrogen is added catalytically to coal in a reactor, under high pressure and temperature, to form vapors and liquids, which are cooled to separate the products, refined to remove by-products, and, de- pending on the final product, further processed. Figure 6.2 illustrates the pathways for liquefying coal.1
Direct liquefaction can be subdivided into pyrolysis,
Development of Indirect Liquefaction
The technique for producing a combustible gas by react- ing steam with coke at high temperature has been known for more than 100 yr. In the early processes, the coke was alternately reacted with air and steam; the resulting mixture consisted of carbon monoxide (CO), hydrogen, and nitrogen. The gas was known by various names: town gas, water gas, blue gas, producer gas, or coke oven gas. In the early 1920s, syngas was produced by using oxygen instead of air, and Anilin and Soda-Fabrik were the first to convert this gas to liquid fuels using a catalytic process that yielded methanol, the simplest
alcohol2 In 1925, Fischer and Tropsch described a catalytic process for indirect liquefaction that produced a complex mixture of hydrocarbons, alcohols, aldehydes, ketones, and carboxylic acids. Later modifications yielded a product that was largely composed of aliphatic hydrocarbons, ranging from methane to waxy materials. The mix of products yielded by the Fischer-Tropsch (F-T) process depends on reaction conditions as well as the catalyst used and the feedstock composition. During World War 11, nine F-T plants were built by Germany and used to produce 10,000-15,OOO bbVd of military fuel.2
Currently, the South African Coal, Oil and Gas Corp., Ltd (SASOL), operates the most well-known indirect coal liquefaction facilities. SASOL’s three plants -- SASOL I in Sasolburg and Sasol 11 and I11 in Secunda -- together produce about 125,000- 130,000 bbVd of liquid products. SASOL I, a 10,000-bbYd plant, uses 16 Lurgi high-pressure, steam- oxygen gasifiers to produce CO, tars, oils, and a crude product gas, which is cleaned and partitioned into two streams. One is adjusted to a hydrogen-to-CO ratio of 2:l and fed into a tubular fixed-bed catalytic reactor to produce straight-chain and medium-boiling-point oils, diesel oil, liquefied petroleum gas (LPG), and some alcohols.3 The second portion is combined with reformed product gas to increase the hydrogen-to-CO ratio and sent to a fluidized-bed reactor (using the Kel- logg synthesis process, Synthoil) to produce gasoline, fuel oil fractions, and various chemicals. SASOL 11, which started up in 1980, is a 40,000-tonld subbitumi- nous coal plant that produces 58,000 bbl/d of gasoline, diesel oil, and jet fuel. SASOL I1 employs the fluid- ized-bed Synthol process for purified syngas. SASOL I11 is a virtual duplicate of SASOL 11.
The Mobil methanol-to-gasoline (MTG) process resulted from an effort to produce gasoline from coal indirectly through syngas production, methanol
79

08

Oxygen
synthesis
Steam
genation
Figure 6.2 Pathway for Producing Liquid Fuels from Coal (Source: Adapted from Ref. 1)
manufacture, and the use of a synthetic zeolite catalyst to form gasoline and water from methanol.5 Although the total process has only recently become commercial, the coal-gasification and shift-conversion sections of the plant are commercially available from Lurgi. The MTG conversion process was proven in small process devel- opment units before being put into commercial operation through a joint effort of Mobil and the New Zealand government using natural gas as the feed~tock.3~4 Mobil is said to be developing a process variation capable of converting syngas directly to gasoline without inter- mediate methanol formation.5
Development of Direct Liquefaction
Coal pyrolysis, which essentially is incomplete combus- tion, has been used to obtain metallurgical coke for many years. In fact, liquid by-products of the process were reportedly used experimentally for lighting, heat- ing, and cooking as early as 1790, and the tar and oil by-products of the coking process were distilled into useful products as early as 1818. In 1913, Bergius showed that brown coal could be converted to a heavy "crude oil" at high temperatures and very high pressures. Thus, the direct liquefaction method appeared before the development of the indirect technique. The original
Bergius process did not use catalysts, unlike the later low-pressure method now associated with his name.2
Direct coal liquefaction was developed extensively in Germany during the 1920s and 1930s. In 1927, Pott and Broche developed a coal extraction process using solvents, and a combination of the Bergius process and that of Pott and Broche formed the basis for subsequent direct liquefaction development. The first commercial plant was constructed in 1927 and was designed to pro- duce 110,000 tons/yr of liquid fuels from lignite2 By the beginning of World War 11, Germany had seven Bergius-type coal-hydrogenation plants in operation, and five more were built between 1940 and 1943. These plants produced about 100,OOO bbYd of oil from coal.2
In the early 1960s, the Office of Coal Research (now part of the U.S. Department of Energy [DOE]) supported a research program for direct coal lique- faction.:! Three processes adapted from the Bergius principles emerged as likely contenders. Each mixed crushed coal with a dissolving heavy oil (made in the process, after reaching operating equilibrium) at 800- 9W°F and 1,500-3,000 psi, considerably less than the 10,OOO psi required in the Bergius process. They differ in their use of the catalyst required to promote coal's interaction with hydrogen. The solvent-refined-coal (SRC) process uses minerals contained in the coal as a catalyst and can be operated to produce a low-sulfur,
81

low-ash solid fuel (SRC I) or a liquid fuel (SRC II). The H-Coal process (derived from the H-Oil process for processing heavy oils) mixes a manufactured catalyst with the coal slurry in an ebullating liquefaction vessel. In the Exxon donor solvent (EDS) process, an oil- solvent mixture is catalytically hydrogenated in a sepa- rate vessel and the hydrogen-rich solvent is transferred to the liquefaction reactor for hydrogenating the coal. Current direct liquefaction approaches consist of several two-stage processes that control process conditions and minimize hydrogen consumption to maximize efficien- cies and reduce costs.
U.S. Research Programs2
Currently, no commercial facilities produce liquid fuels from coal in the United States. The Bureau of Mines conducted early small-scale coal liquefaction studies, which were overshadowed by the 1930 discovery of inexpensive East Texas oil reserves. Interest in liquefac- tion was rekindled in the mid-l940s, and teams of tech- nical experts visited Germany to gather information about that nation’s synthetic fuel plants. By 1949, two liquefaction pilot plants were operational: a direct Bergius-type facility and an indirect F-T facility. Shortly thereafter, Union Carbide (then Carbide and Carbon Chenlical Co.) installed a private Bergius-type pilot plant. Again, the discovery of huge Middle East reserves in 1955 made coal liquids economically unat- t-active.
The United States resumed coal liquefaction research in 1962, concentrating on the direct approaches described earlier because they appeared more efficient and economical, and thus more likely to enable coal liquids to compete economically with conventional petroleum.
In the late 1970s, interest in indirect liquefaction was renewed when world oil prices rose abruptly. In addition, the SASOL process was commercially proven and both the gasification and liquefaction processes were shown to be amenable to efficiency improvements. The gasification improvements, however, increase coal conversion efficiency but produce a gas of lower hydro- gen content, which makes the liquid product step less efficient and yields a lower-quality product. Two ap- proaches currently hold promise: the liquid-phase syn- thesis and MTG process.
The federal coal liquefaction program was substan- tially restructured in 1981. The DOE refocused its activities on generic lab and small-scale research, rather than developing and demonstrating specific processes. The objective is to improve the understanding of basic
principles of the liquefaction process while leaving commercialization to private industry. At present, com- petitive market forces relative to conventional fuels do not exist and private industry has shown little enthusi- asm for undertaking any significant projects. However, interest in coal liquefaction is likely to increase in the future as products from the finite petroleum resource become less available and more expensive.
TECHNOLOGY
Indirect Liquefaction
There are four basic steps in the indirect liquefaction process: gasification, shift conversion, purification, and liquid synthesis. The brief description that follows is applicable to a Lurgi-type gasification process leading to an F-T or MTG liquefaction synthesis.
Gasijkation, Conversion, and Purification
First, the coal is sized and charged through automatic coal locks into the gasifiers. The bed of coal dries, devolatilizes, and gasifies as it travels from the top to the bottom of the reactor. The raw gaseous product contains CO, hydrogen, and contaminants such as hydrogen sul- fide (HzS), carbon dioxide (COz), particulates, nitrogen compounds, organic sulfur, and high-molecular-weight compounds. The particulates may carry trace amounts of heavy metals.
The principal emissions from the gasification step are fugitive emissions from coal and ash lockhopper vents. Usually, the bulk of the lockhopper vent gases are reinjected just downstream of the gasifiers. The remaining solid ash is quenched with water and trans- ported to a solid waste disposal facility3 The hot gas output from the gasification reactor is quenched and scrubbed with recycle water.
A portion of the quenched gas is sent to a shift converter to adjust the ratio of hydrogen to CO. This is a critical step in determining the ultimate mix of liquid and gaseous products. In the shift converter, the ratio of hydrogen to CO is adjusted to between 1 3 1 and 3:l by catalytically reacting part of the quenched gas with steam. In addition to the shift conversion reaction, most of the unsaturated hydrocarbons, higher phenols, hydro- gen cyanide, and organic sulfur compounds are hydro- genated and the resulting tar is hydrocracked to form oil and naphtha.
step, such as the Lurgi rectisol process, where C02 and The raw syngas is sent to an acid-gas purification
82

most of the HIS are removed, and the resulting acid gases are sent to a sulfur recovery unit, such as a Stret- ford or Claus unit. Naphthas, methanol, and water are also removed. Wastewaters from the acid-gas scrubbers and gas liquors are recycled after treatment. Phenols, oil, and tars removed by the wastewater treatment plant are either burned to meet part of the process energy requirements or removed for disposal. The purification step is the predominant source of residual pollutants.
Liquid Synthesis
Fischer-Tropsch Process. In the fluidized-bed version of the F-T process, the purified syngas is reacted with a commercial catalyst, which is ma& from iron that has been promoted for activity and selectivity, at about 330 psig and O ° F . The typical F-T product is a com- plicated mixture of paraffins, mono-olefins, aromatics, aldehydes, ketones, and fatty acids, with slight amounts of di-olefins and esters. Heavy oil is withdrawn from the bottom of the reaction chamber and sent to a frac- tionator for separation into light gases, feedstock for the polymerization and hydrogenation units, and a heavy residual oil for boiler fuel. The overhead vapors are cooled, condensed, and water washed. Part of the re- maining vapor is sent for hydrocarbon recovery, while the rest is recycled. Some of the condensed liquid is recycled, and the remaining light oil product is sent to the fractionation unit after a final water wash. The used washwater contains alcohols and acids from the F-T reaction and is processed for alcohol recovery, Liquid products undergo hydrotreating, catalytic reforming, and other petroleum refining processes to yield gasoline as well as diesel fuel, heavy fuel oil, propanol, and butanol. High-Btu substitute natural gas (SNG), with an energy content of about 1,003 Btdft3, constitutes two-thirds of the energy products, with gasoline amounting to about 26%.5
Mobil MTG Process. The purified syngas is compressed to about 1,100 psig and fed into a tubular catalytic reac- tor for the production of methanol. The high-pressure liquid is expanded for degassing. Gas is sent to a methanation section for SNG production while liquid methanol is sent to the conversion unit. In the conver- sion unit, the methanol is dehydrated using a synthetic zeolite catalyst to yield 44% hydrocarbons and 56% water. The methanol is converted to an equilibrium mixture of methanol, dimethyl ether, and water in the first reactor at about 560'F and 315 psig, with outlet gas leaving at 770°F. In the MTG reactor, the entry tem- perature is about 625'F, with an exit at 750°F. The hydrocarbons are similar to gasoline in boiling range;
Table 6.1 Estimated Relative Inputs and Yields for the Fischer-Tropsch and Mobit MTG Indirect Liquefaction Processes (percent of input)
Input or Yield Fischer-Tropsch M-Gasoline
Input Coal (dry, ash-free) Fines (excess) Methanol
Total
Yield Substitute natural gas Propanol and butanol Gasolineb Diesel fuel Heavy fuel oil
Total
99.985 104.71 1 -4.7 1 1
0.015
1oO.OOO 1oO.OOO
36.8 32.8 1 .o 3.4
14.4 25.3 2.6 0.7
55.5 61.5
aBoth plants were conceptually sized to produce 42 million ftYd of dried, purified synthesis gas. Net feed to the F-T plant, including methanol, was 19,711 million Btdh (18,593 t/d). Net feed to the Mobil process, with fines deducted, was 18,511 million Btuh (17,463 t/d). Coal used was Wyoming subbituminous coal with a higher heating value of 8,509 Btu/lb and a sulfur content of 0.45% by weight.
bWith a Reid vapor pressure of 10 Ib.
Source: Ref. 5.
consist of highly branched paraffins (5 1%), highly branched olefins (13%), naphthenes (8%), and aromatics (28%); and yield gasoline with an unleaded octane rating between 90 and 100. The hydrocarbon energy product yields some 53% SNG (980 Btdft3) and 41% gasoline, with the balance as LPGs of propane and butane.5 Table 6.1 compares the Lurgi/F-T and Lurgi/MTG prod- uct yields.5
In 1983, a more efficient fluidized-bed catalytic reactor started up in Wesseling, West Germany. This 100-bbVd pilot plant is sponsored by the United States, West Germany, and an international industrial consortium. 1
Direct Li quefact ion
Direct liquefaction breaks the complex molecular struc- ture of coal into smaller segments while adding hydro- gen so that the ratio of hydrogen atoms to carbon is higher than that in the original coal. Typically, the hydrogen-to-carbon ratio for coals is between 0.8 and
83

1.0 (as mined); for crude oils and fuel oils, it is between 1.6 and 2.0.2 Direct liquefaction should yield lower-cost products than the indirect process, but also can require more extensive environmental controls. While pollut- ants from indirect liquefaction processes can be removed prior to product formation, direct liquefaction products can contain significant amounts of contaminants, such as acid-gas constituents and particulates.
Usually, coal molecules are broken up, or "cracked," at elevated temperatures (700-900'F). Three methods are used: (1) pyrolysis, which produces a hydrogen-enriched fraction consisting of liquids, gases, and a hydrogen-deficient fraction known as char; (2) catalytic hydrogenation, in which the catalyst and molecular hydrogen are both present with the coal and solvent; and (3) solvent extraction, in which the hydro- gen is furnished by a process-derived solvent that dis- solves the coal and donates hydrogen. In the third method, the "donor" solvent must undergo subsequent catalytic treatment to restore its hydrogen content. All of the direct liquefaction processes yield residual solids, liquids, and gases; solvent extraction and catalytic hydrogenation yield more liquids than does coal pyrolysis.
Each of the above direct liquefaction techniques described has certain advantages and disadvantages,
which are listed in Table 6.2. The reaction temperature is critical: below 700'F, the processes give low product yields; above 900'F, they yield more gases than liquids. The pressure requirements for both solvent extraction and catalytic hydrogenation are fairly high, generally between 300 and 4,000 psi. Other major factors deter- mining product yields are the reactivity of the coal, the catalyst, the rate of heating, and the contact time.6
Direct coal liquefaction has certain environmental advantages over direct coal combustion. Ash in the coal is retained in the solid residue, not carried over into combustion products or flue gases. The concentration of sulfur effluents can be significantly reduced, since some sulfur stays with the char and the balance exists as HzS, which can be removed by scrubbing. Some of the nitro- gen content of the coal can be removed as ammonia (a product of the hydrogen-rich atmosphere and nitrogen in the coal) and can be separated as a by-product.6
More than 20 direct liquefaction processes have been developed to various stages by industry and gov- ernment agencies (Table 6.3). Those processes at the highest relative stage of development are the SRC, H-Coal, and EDS processes, which are described more fully in the following sections.
Table 6.2 Direct Liquefaction Techniques
Technique Comparative Advantages Comparative Disadvantages
Pyrolysis Low- or atmospheric-pressure Not attractive for large-scale operation liquid fuel production; low
liquid yields; large quanti- gas not needed ties of by-product char must
be disposed of Liquids are heavy, difficult to
separate from char Liquids require hydrogenation
to produce environmentally acceptable fuels
Hydrogen, oxygen, synthesis
Solvent High liquid product yields Limited knowledge exists for extraction Flexibility of product preheating and handling of
mixes coal-solvent slurries Substantial sulfur removal
Catalytic Low operating pressures Separation of oil, catalyst, hydrogenation Short retention times and undissolved coal and ash
High degree of product difficult by filtration
catalyst due to char and trace quality control and liquid yields
Fouling and deactivation of
Substantial sulfur removal elements
84

Table 6.3 Direct Liquefaction Processes
P m s s Category Process Name Developer
Pyrolysis
Solvent extraction
Catalytic hydrogenation
Lurgi-Ruhrgas COEF Occidental
Tosccal Clean-Coke Coalcon Flash Liquefaction
Consol
SRC I and I1 SRL I1
CO-Steam Exxon Donor Solvent Extractive Coking Extraction by Super- critical Fluids
UOP Process
Bergius HCoal
Synthoil Catalytic Coal Liquids Clean Fuel from Coal University of Utah
Schroeder Process Liquid Phase Zinc Chloride Process
Dow Chemical Process
Process
FMC Corp. Occidental Coal
wsco U.S. Steel Union Carbide Rockwell
International
Research
Conoco Coal
PAMCO University of
DOE
A.D. Little, Inc. Coal Research
Establishment, England
Universal Oil Products
Development Co.
North Dakota
Exxon Corp.
Hydrocarbon
DOE Gulf Oil C-E LUIIUIIUS University of Utah
Research, Inc.
Continental Oil Co.
Dow Chemical
Solvent-Refined-Coal Process
The SRC process converts high-sulfur, high-ash coal to a low-sulfur fuel that is nearly ash free. The SRC pro- cess is a solventextraction process that can produce a solid (SRC I) or liquid fuel (SRC 11), depending on the extent of hydrogenation. A second stage of hydrogen processing has been added to the SRC-I process. In the second stage, which operates on one-third of the coal feed rate, expanded-bed catalytic hydrogenation pro- duces high-quality liquids and solids from the SRC product.7 Additionally, a Kerr-McGee critical solvent de-ashing (CSD) process is used instead of filters; it recovers about 90% of the fuel product while rejecting
minerals and unconverted coal. Figure 6.3 diagrams the process flow for the modified SRC-I process.8
bined with a process-derived solvent and hydrogen, heated to about WOOF, and pressurized to 1,OOO- 2,000 psi inside a tubular reactor. After liquid products are extracted and hydrogenated, the mixture is flash separated at reduced pressure to release gaseous materials, retaining liquid hydrocarbons and a coal- solvent slurry for further fractionation. The overhead gas is treated to remove HzS and COS. Unreacted hydro- gen is separated in a processing unit for recycling, and the fuel gas is segregated for process use or sale. The liquid products are a light distillate oil, fuel oil, and a mineral residue, which is used as gasifier feedstock to produce makeup hydrogen. Figure 6.4 illustrates the SRC-II process and lists annual resource requirements and residuals. An SRC-11 pilot plant was completed in Fort Lewis, Washington, in 1975.9
In the SRC-I1 process, crushed coal is dried, com-
H-Coal Process
The H-Coal process is a catalytic hydrogenation process in which coal is suspended in a process-derived solvent and an ebullating-bed particulate catalyst contacts the mixture (Fig. 6.5). The process can be operated to pro- duce a low-sulfur heavy fuel oil or synthetic crude oil. Feed coal is dried, pulverized, and slurried with a recycle oil for charging to the coal hydroprocessing reactor. The slurry is mixed with hydrogen, preheated, and fed to the reactor, where it flows upward through the ebullating catalyst at about 850'F and 3,000 psi.3 The coal is partly dissolved and both the coal and solvent are hydrogenated. The relative sizes of the catalyst and coal particles are such that only unconverted coal, ash, and liquid and gaseous products leave the reactor. Spent catalyst is withdrawn and fresh or regenerated catalyst is added continuously to maintain constant reactivity. The char and some coal are gasified to provide part of the hydrogen requirements for the process.
Reaction products are separated in flash drums into gas, distillate, and bottoms. The recycle gas is scrubbed to remove light hydrocarbons, ammonia, and H2S. The distillate is separated into light and heavy fractions by dstillation at atmospheric pressure, and the bottoms (containing unconverted coal, ash, and heavy oils) are processed in a liquid-solid cyclone separator. A clarified recycle stream is returned to the slurry tank. The remaining unconverted coal, ash, and heavy oil are vacuum distilled to yield a heavy distillate and a concen- trated slurry. Some of the heavy distillate may be returned to the slurry tank to control the properties of the
85

preparation
Hydrogen
t
Hydrogen
A I I b
- Gas Solvent-refined Separation + processing b + coal
I I Y Acid
gas v distillation
V I I Solidification
critical solvent
Fuel gas
LPG
Raw naphtha
Product fractionation
Fuel oil
Coked calciner
I Two-stage liquefaction SRC
I Oxygen Sulfur recovery + Sulfur
Air Gasifier plant separation
b SRC
b COP
b aggregate Air Mineral
Figure 6 3 Modifled SRC-I Process Flow (Source: Adapted from Ref. 8)
recycle stream. The concentrated slurry can be sent to a coker to recover the remaining oil.
oil, conditions are less severe and the fuel oil can be recovered using a solvent de-ashing technique, such as the Kerr-McGee CSD or Lummus antisolvent de-ashing processes .lo
When the H-Coal process is used to produce fuel
Exxon Donor Solvent Process
The EDS process liquefies coal in a hydrogen-donor solvent, separates solids and liquids with vacuum flash separation, and hydroprocesses the liquids into regenerated donor solvent and product (Fig. 6.6).6 A slurry of crushed coal and recycled donor solvent is mixed with hydrogen and fed into the liquefaction reac- tor at about 800-900T and 1,500-2,100 psi.
The product of the liquefaction step is separated by a flash vacuum distillation to produce gas, raw coal
liquids, and heavy bottoms containing the unreacted coal and mineral matter. The recycled solvent is catalytically hydrogenated over commercially available metal-sulfide hydrotreating catalysts at 500-850°F and 1,200- 3,000 psi for regeneration.
The distillation tower bottoms contain solid residue from liquefaction and some high-boiling-point hydrocar- bons, but very few hydrocarbons with boiling points below 1,000'F. The bottoms are further processed by coking or gasification to produce additional liquids and hydrogen or fuel gas for the process. In an alternative arrangement investigated for a design study, half the bottom stream from the vacuum unit is sent to the Flexicoker and the balance is gasified in a partial oxida- tion unit. The study indicated a significant improvement in yield and thermal efficiency.11
The gas generated from the EDS process can be used as fuel, but probably will be used for hydrogen manufacture after the removal of H2S and ammonia.
86

0
orvoen I Steam
Coal retuse
fuel 011
Plant Parameters 5O.ooO bbllday of fuel 081 equwakmt 90% capaclf, facro, Designed for zero water discharge On-rote power plant (not shown)
R W m e Requiraents (annual) @ Run of-mane biturnlnovr
@ Makeup w a l s lbdlm .@I
@ Gaseous and ltqupd fuels Carbon dioxide
Re.lduals (annual) @ Gaseous
Sulfur dioxide (tons) 2.403 Oxides of nitrogen
Total suspended (1O"SJ 3.300
180 4 3 0
pan!culales (tons) coal lmtllm tons1 9 8 Hydrocarbons (tons)
Carbon mononde 3 2 (tons) 180
16 4 lmill~on tons1 4.5
Product*
lmi l lm W l y r fuel od equivalent) P0l"n"clear organ,c
@ Sulfur llhwrand tonlyrl l a , maIerial (Ib) 0.03233 Trace elements (Ib):
Arsenic 0 4 Cadmium 37 4 Chromium 594.0 Lead 136.4 MW"V 6.4
ZUlC 286 0 Nickel 1798
@ On-srte waste wale, ireatmen, Dlam ("0, shown1 no direct discharge to any w a l e w a y
0 SCM wane trnritm imst Coal refuse 3 0 Slag and ash 2 3
Figure 6.4 Process Flow Streams for a Conceptual SRC-II Direct Liquefaction Plant
Depending on the ultimate product slate, the raw coal liquids may be catalytically hydrotreated to reduce sul- fur content.
ENVIRONMENTAL ISSUES
By their nature, the products of coal liquefaction tech- nologies create a number of environmental concerns. These products are generally more toxic than petroleum crudes and shale oil, which they are intended to supple- ment or replace. 12.13
The liquefaction processes also create environmen- tal concerns, in part, by their scale of operations. A
liquefaction plant equivalent to a 50,000-bbVd refinery, for example, will require about 30,000 tons/d of coal and will produce some 7,500 tons/d of ash and slag that must be disposed of in an environmentally sound fashion. The coals will contain substantial quantities of inorganic sulfur, organic sulfur compounds, halides, and nitrogen. Thus, purification of the intermediate or product streams will generate various acid-gas removal by-products, wastewater treatment sludges, and by-product tars and chars. Additionally, there will be fugitive atmospheric emissions from coal preparation and storage and stack gas emissions from process effluent streams and auxiliary combustion heaters.
87

Recompressed hydrogen
I 1
Gas
and
I) Slurry treatment
Preheater Coal
preparatiorl - preparation
- 1 separation A A
Gases Hydrogen
+ Pressure
reactor
I
Sulfur
Ammonia
Fuel gas
I Liquids/solids Solvent recycle
Hydrogen Solids Hydroclone * production removal +
J
1 I J A
3 I Fuel oil
Naphtha Dmtillation
Ash and slag
Figure 6.5 Flow Scheme for the H-Coal Liquefaction Process
Product Toxicity
The DOE has sponsored efforts to understand the poten- tial health effects and environmental fate of coal lique- faction materials and to provide information useful in the design of technology that will be environmentally acceptable.l2.14 These studies have shown that coal liquids with boiling points above 700'F (e.g., SRC-I process solvents, SRC-I1 heavy distillates, and M-Coal distillates) are mutagenic in microbial bioassays. These materials have also shown a tendency to increase fetal malformations in rats.14 On the other hand, lower- boiling-point coal liquids (e.g., SRC-I light oils and SRC-11 light and middle distillates) and H-Coal materi- als have not shown mutagenicity. The biological activ- ity of coal liquids has been correlated with concentra- tions of polycyclic primary aromatic amines, azaarenes, phenols, and other constituents. Studies have also shown that terrestrial and aquatic biota may also be more sensitive to the toxic effects of coal-derived liquids than to those of petroleum products.14
The goal of current research programs is to under- stand the synergistic and antagonistic toxic behavior of
chemicals in mixtures, the effect of mixtures on metabo- lism, the fate of toxic components in human or animal tissue, the inhalation toxicology of complex mixtures, and the transportation and fate of complex mixtures through the environment to humans.15
An advantage of indirect coal liquefaction technol- ogy appears to be that essentially all of the sulfur and nitrogen present in the coal can be separated more read- ily in the gaseous phase and, thus, eliminated before the formation of liquid products. These pollutants are often difficult and expensive to remove from intermediate or finished products in the direct liquefaction processes. The other major environmental difference between the indirect and direct processes is that direct processes produce a significant amount of the potentidly carcino- genic aromatic organic compounds.16 Process streams and products of indirect coal liquefaction include a widely varied mix of compounds. Although most of the F-T products are relatively innocuous aliphatic hydro- carbons, some of the compounds have not been studied in terms of their toxicity. A major issue relates to the protection of workers from the effects of chronic expo- sure to these materials.
88

Catalytic solvent hydrogenation conditions: 6 500-890"F.
1.000-3.000 ~~ psi . Raw Coal I) liquids
Hydrogen Catalytic
Liquid products
Clstiilation solids separation
Liquefaction reactor:
1.500-2.000 psi
Product hydrogenation
- Heavy
bottoms slurry
Hydrogen Fluid
coking
Hydrogen.)
liquids
Hydrogen or fuel gas Hydrogen or fuel gas
Water
Oxygen or air
Ash residue
Figure 6.6 Flow Scheme for the EDS Process (Source: Ref. 6)
Atmospheric Emissions 16
In general, liquefaction facilities are operated as closed systems; therefore, fugitive losses are the major source of emissions. For both direct and indirect processes, the sources of fugitive emissions include coal handling and pretreatment, plant start-up and shutdown, lockhopper operations, product storage, and leaks from equipment (e.g., valve stems, flanges, and pumps). The pollutants in fugitive emissions include sulfur and nitrogen com- pounds, CO, aromatics, aliphatic hydrocarbons (pentane through dodecane), ammonia, particulates, and trace heavy metals (e.g., antimony, arsenic, boron, cadmium, lead, mercury, and nickel).
Sources of stack emissions from both direct and indirect liquefaction plants include by-product recovery, product refining, waste treatment (e.g., acid-gas removal), sulfur recovery, catalyst regeneration, and auxiliary fuel combustion. Carbon dioxide is the major gaseous emission by weight, although other emissions include S02, NOx, and particulates. Sources of SO2 include sulfur recovery, tail-gas treatment, and fuel
combustion. The major source of NO, is in-plant fuel combustion, which also emits some particulates.
In indirect liquefaction, the syngas purification step evolves large quantities of concentrated acid gases con- taining H2S, CO, COz, carbonyl sulfide, carbon disul- fide, hydrogen cyanide, light hydrocarbons, and organic sulfur compounds (such as mercaptans and thiophenes). In addition, catalyst regeneration can produce nickel carbonyls, other metal carbonyls, CO, sulfur com- pounds, and some heavy organics (which have been burned off of the catalyst surface).
Liquid Effluents16
The primary sources of liquid pollutants from liquefac- tion processes are process waters similar to ammonia liquor from the coking industry. These contain tar, oils, phenols, ammonia, particulates, C02, HzS, halide salts (principally chlorides and fluorides with some bro- mides), cyanides, ferrocyanides, and trace amounts of heavy metals. (The trace elements and other halide salts
89

are the result of minor concentrations in coals.) These materials will require serious efforts at control, since they potentially pose a threat to the ecosystem.
Other wastewaters from liquefaction processes may have broad temperature and pH ranges and contain sus- pended solids, ammonia, toxic trace metals, phenols, aromatic hydrocarbons, mercaptans, thiophenes, aromatic amines, cyanides, cyanates, and other organics.
handling. Liquefaction plants will require careful design to comply with the standards of the Occupational Safety and Health Administration.
Table 6.4 summarizes the potentially toxic compo- nents of coal liquefaction streams and processes.17 In general, workers can be protected by proper equipment, techniques, and housekeeping practices.
Resource Requirements Solid Wastes16
Solid wastes generated by coal liquefaction processes consist of (1) ash and refuse removed from the coal and (2) sludges and solids recovered from waste treatment processes. Ash and slag will make up the biggest vol- ume of waste, and their components are expected to be similar to those generated at a coal-fired power plant, although this has not been fully demonstrated. Landfill disposal of the solid wastes generated by a 50,000-bbVd coal liquefaction plant has been estimated to require between 300 and 700 acres (to a depth of 10 ft) over a 20-yr period.
For indirect liquefaction, the secondary volume of wastes from spent catalysts and wastewater sludges will have chemical compositions and biological activities that require special handling, treatment, and disposal practices. For direct liquefaction, sources of secondary solid wastes include process controls, wastewater treat- ment, flue-gas desulfurization, and process condensates. Concern has been expressed that the leachate from these secondary solid wastes may require extensive controls.
Occupational Health and Safety
Workers in coal liquefaction plants will be exposed to the hazards present in most large industrial facilities in addition to some unique potential hazards. Initially, coal receipt, preparation, and storage create some possible contamination. Coal handling, sizing, and transport yield dust and particulate matter. Watering and enclosure for dust control and the use of applicable worker health equipment appear to be the most feasible remedies. Removal of the ash and slag for disposal can expose workers to other problems, since they will con- tain the bulk of the trace heavy metals. Although the levels of exposure will be low, there are uncertainties about the effect of repeated exposures to these materials on the long-term health of the workers. Also of concern is the noise generated during coal sizing, grinding, and
A 50,000-bbYd Lurgi/F-T or MTG processing plant will require about 27,000-30,000 tons/d of bituminous, sub- bituminous, or lignite coal. Assuming 80% mine recov- ery of coal (surface-mined), in-place coal reserves of at least 275 million tons will be necessary to operate a facility for 20 yr. Facility expansion would require proportional additions to the reserves. Assuming that the reserve consists of subbituminous coal with an aver- age apparent bulk density of 50 lb/ft3 and an average seam thickness of 10 ft, and that the feedstock require- ment is 27,500 tons/& the land required for surface mining would be about 1,100 acreslyr (or about 1.7 miYyr). Assuming 16-Wd mining operations, a coal mining capacity of about 2,550 ydVh is required, not including overburden removal.
The pattern of mineral rights ownership has typi- cally been a checkerboard arrangement, with the govern- ment holding rights on alternate sections and individuals owning the balance. Any project to install a liquefaction plant will need time to obtain rights from many owners and to arrange the scheduling, hearings, competitive bidding, awarding, authorization, and approvals neces- sary to use the government lands.
Water requirements for the liquefaction plant will amount to about 4.7 bbl of water per barrel of fuel oil. Thus, for a 50,000-bbVd liquefaction facility, require- ments for water will be 235,000 bbl/d, or about 10,500 acre-fVyr.5 Comparable high-Btu coal- gasification plants were estimated to use about 17,000 acre-ft/yr of water20 Extensive permitting will be necessary to obtain rights to the required water, par- ticularly in water-short regions of the country where adequate coal reserves exist. Water rights can be diffi- cult to obtain. For example, the water compacts for major sources in the Great Plains are intricately inter- woven so that various downstream water users must give their assent for new water use permits, and water must be reserved for future agricultural expansion upstream. In addition, the compacts protect Canadian interests in the North and Mexican interests in the South.

Table 6.4 Potential Occupational Health Effects of Constituents of Liquefaction Process Streams
Constituent
Toxic Effects
source Acute Chronic
Inorganic
Ammonia
C a h disulfide
Carbon monoxide
Carbonyl sulfide Hydrogen sulfide
Hydrogen cyanide
Mineral dust and ash
Nickel carbonyl
Trace elements
Sulfur oxides
Organic
Aliphatic h y d m c a h s
Ammatic amines
Single-ring aromatics
Aromatic nitrogen heterocyclics
Phenols
Polycyclic aromatic hydrocarbons
Gas liquor
Concentrated acid gas
Coal-lockhopper vent gas,
Concentrated acid gas Coal-lockhopper vent gas,
gasifier gas
gasifier gas, concentrated acid gas, catalyst regeneration off gas
coal-lockhopper vent gas Concentrated acid gas,
Ash or slag
Catalyst regeneration off gas
Bottom and fly ash, gasifier gas, solid waste d i s p l
Combustion flue gases
Evaporative emissions from
Coal-lockhopper vent gas produd storage
Gas liquor, coal-lockhopper vent gas
Gas liquor, coal-lockhopper vent gas
Gas liquor
Gas liquor, coal-lockhopper vent gas, gasifier gas
Respiratory edema, asphyxia,
Nausea, vomiting, convulsions death
Headache, dizziness, weakness, vomiting, collapse, death
Few data on human toxicity Collapse, coma, and death may
occur within a few seconds; may not be detected by smell
Headache, vertigo, nausea, paralysis, coma, convulsions, death
None
Highly toxic, irritation, lung
Element specific
Intense irritation of respiratory tract
edema
Most are not toxic
Cyanosis, methemoglobinemia, vertigo, headache, confusion
Initation, vomiting,
Skin and lung irritants convulsions
No evidence of ham from chronic subirritant levels
Psychological disturbances, mania with hallucinations
Low-level chronic effects not established
UnknOWn Possible cocarcinogen
Fatigue, weakness
Possible vehicle for polycyclic aromatic hydrocarbons and coarcinogens
Lung and sinus carcinogen
Element specific
Possible cocarcinogen
N-Dodecane potentiates skin tllm0l.S
Anemia, skin lesions (aniline); benzidine and beta-naphthyl- amine are powerful carcinogens
Bone-marrow depression, aplasia
Possible cocarcinogens
Possible skin and lung cocarcinogens
Skin carcinogens, possible respiratory carcinogens
aIncluding arsenic, beryllium, cadmium, lead, manganese, mercury, selenium, and vanadium.
Source: Ref. 17.
91

ENVIRONMENTAL CONTROLS
Product Toxicity
The current information on toxicity of coal liquefaction processes and products can be used to minimize risk to the workforce, potentially exposed populations, and environment. Current information indicates that coal liquids, in particular those with high boiling points, are more active biologically than shale oil and peboleum crudes and products. The fraction of high-boiling-point constituents can be reduced by processes such as hydro- treating (a m e s s that stabilizes liquid hydrocarbon products or removes objectionable elements or proper- ties through catalytic reactions with hydrogen).lz Hydrotreating, however, is expensive and may not be feasible for all products. Alternatively, the high- boiling-point fractions could be separated by distillation for selective hydroueating. Also, the products for com- mercial use could be distilled to remove the more toxic constituents.
Laboratory and demonstration units have also shown that adjusting process variables (e.g., residence time in the reactor, reaction temperature, and catalyst condition) can also reduce the toxic properties of the product.12 Identifying toxic process streams and prod- ucts can help plant operators incorporate special proce- dures to minimize risk; examples include reducing the potential for accidental spills during transport and devel- oping procedures for cleanup to localize the effects of spills.
Atmospheric Emissions16
In general, atmospheric emissions from coal liquefac- tion, such as fugitive emissions, can be controlled with technologies used in other industries (e&, petroleum refining). Table 6.5 summarizes coal liquefaction emis- sions and controls.
Controls for fugitive emissions from product stor- age consist of vapor recovery systems, floating-roof storage tanks, and vents; collected vapors are recycled or incinerated. In general, these control practices are man- dated for, and used within, the petroleum refining and bulk terminal industries. To control emissions from equipment leaks, the U.S. Environmental Protection Agency (EPA) has established a schedule for the maxi- mum allowable time between discovery and repair of an observed leak (CFR Title 40, Part 60) and has compiled data indicating that this practice significantly reduces such emissions.21
In general, process emissions can be avoided by compressing and recycling the pressurization gas and incinerating waste gases. Emissions from catalyst regeneration can be controlled through controlled com- bustion with subsequent solids capture. For controlling other poilutants in gaseous process wastes and combus- tion gases, electrostatic precipitators and flue-gas scrub- bers can remove particulates, trace elements, and S02. Control strategies for aromatics and phenols formed during direct liquefaction have not yet been determined.
can be controlled by staged combustion, low-excess-air burners, and burner revisions, which can reduce the availability of oxygen for combination with the nitrogen and/or reduce the flame temperature. Alkali scrubbers can also remove these acid rain precursors when process conditions will not tolerate changes in combustion tem- peratures or other properties. Hydrotreating the fuel also reduces the formation of NO, by removing nitrogen; hydrotreating also removes sulfur to reduce S02.
usually treated in a Claus sulfur plant, which is a cost- efficient means of control for acid gases from most coals. The Claus process fist oxidizes H2S to SO2 and water and then reacts the SO2 with H2S to produce sulfur and water (see the chapter on Environmental Control Technologies for Fossil Energy Systems). The untreated tail gas from most Claus plants, however, cannot meet air pollution regulations. Three major types of sulfur recovery pmesses are now used to reduce the concen- tration of sulfur (1% or more H2S) in Claus plant tail gases to acceptable levels.
The first technique involves continuing the Claus reaction to temperatures below the dew point of the reaction to shift the reaction equilibrium toward sulfur. It is vital to maintain the optimum H2S/S% ratio to achieve the 99% sulfur recovery possible with this process. The second method involves hydrogenating the tail gas to reduce sulfur-containing compounds to H2S. Further absorption and regeneration of the absorbent permit any residual HzS to be returned to the Claus tail gases. Alternatively, the residual sulfur-bearing gases are oxidized directly to elemental sulfur. This process often requires expensive equipment and has high operat- ing costs, due to absorbent regeneration, but can achieve 99.8% removal. The third current method uses liquid absorption of S02, after all sulfur in the tail gases is oxidized. However, carbonyl sulfide and carbon disul- fide in the tail gases must be incinerated to yield the SO2 form required. As in the above process, operational costs are high because of energy requirements.
Emissions of NOx from auxiliary fuel combustion
The acid gases produced by indirect liquefaction are
92

Table 6.5 Coal Liquefaction Gaseous Emissions and Controls
Emission Source Contaminants of Concern Expected Controls
Fugitive emissions Vent gases
Coal storage and pretreatment
Coal lockhopper
Ash lockhoppera Valves, fittings leaks Product storage
Process effluents gas purifcationa
Process emissions Preheater, liquefaction pre-
heater$ hydrogen genera- tion, hydrotreating,b and solids-liquids separation
Product fractionation
Catalyst regeneration
Water cooling drift and evaporation
.Indirect liquefaction only.
bDirect liquefaction only.
Dust, particulates, trace elements
Carbon monoxide, hydrogen sulfide, tars, oils, naphtha, cyanides, carbon disulfide
Particulates, trace elements Acid gases, other Hydrocarbon vapors, ammonia
Hydrogen sulfide, carbonyl sulfide, carbon disulfide, hydrogen cyanide, carbon monoxide, carbon dioxide, light hydrocarbons, mercaptans, thiophenes
Particulates, sulfur and nitrogen oxides
Sulfur and nitrogen oxides, hydrocarbon
Nickel and metal cahnyls , carbon vapors
monoxide, sulfur compounds, organics
Ammonia, sodium, calcium sulfides and sulfates, chlorine, phenols, fluorine, water treatment chemicals, trace elements
Water-polymer spray,
Pressurization gas recycling,
Scrubber Inspection and repair Vapors recycling, floating-
Stretford or Claw process,
baghouse, cyclone, scrubbers
incineration of waste
roof tanks
followed by tail-gas recovery process (Beavon, Stretford, MODOP, etc.)
Scrubbers, flue-gas desulfurization, eledm- static precipitators, low- excess-air burners
Scrubbers, desulfurization, incineration, afterburner
Incineration, flame-contrdled combustion
No effective controls avail- able, but design can mini- mize losses
A new process was recently announced by Mobil Oil A.G. of West Germany: the Mobil Oil direct oxida- tion process (MODOP).lW A plant is scheduled to be installed in West Germany for operation in late 1987. Tail gas from a Claus plant is heated and hydrogenated over a nickel-molybdenum or cobalt-molybdenum catalyst, at temperatures of 500-6Z°F, to form H2S; the reaction is virtually complete. The process gas is cooled, dehydrated (to a water content of about 3%), and oxidized over a new proprietary catalyst (about 80% titanium dioxide and 20% alkaline earth sulfates) at about 340°F to produce elemental sulfur.lg.19 Mobil has reported that MODOP recovers about 99.5% of the sulfur and produces no undesirable by-products when used in conjunction with a Claus plant. Mobil also has reported that energy consumption by MODOP is lower than that of the processes described above, which re- duces removal costs.
Liquid Effluents16
Coal liquefaction plants in the United States are ex- pected to use closedcirculation systems to recycle water as much as possible. However, some process effluents must be discharged to prevent the buildup of dissolved solids, requiring the periodic addition of makeup water. Table 6.6 summarizes liquefaction process effluents and strategies to control them. Most contaminants in the discharged effluent can be controlled with conventional wastewater treatment techniques, with the exception of trace metals, phenols, aromatics, and organic sulfur compounds. Due to purification before and during the shift conversion, indirect liquefaction effluents will not contain significant amounts of organic sulfur.
Because liquid effluents from coal Iiquefaction plants are essentially water-based, they will be regulated by standards promulgated for industrial discharges into
93

Table 6.6 Coal Liquefaction Liquid Waste Streams and Controls
Effluent Source Contaminants of Concern Expected Controls
Coal pile runoff Particulates, trace metals Transfer to sedimentation pond Cooling tower blowdown Boiler blowdown Calcium, sulfates Ion exchange Hydrogen generation Sour or foul wastewater, Water treatment facilities, charcoal
Acid-gas removal. Hydrogen f l i d e , cyanides, phenols Water treatment, pH adjustment,
Ammonia recoveryb Dissolved ammonia Water treatment, pH adjustment Phenol recoveryb Dissolved phenols. cresylics Water treatment, absorption Spent reagents and sohents Sulfides, sulfates, trace metals,
dissolved and suspended solids, ammonia, phenols, tars, oils, hydrogen sulfide, carbon oxides
Dissolved and suspended solids Ash quench water makeup
spantamine scrubbing solution
absorption, oxidation
Recovety from emission controls, use in ash quench slurry
Leachates from gasifier ash, desulfurization sludge, biosludge, and spent
Trace elements, organics Disposal in controlled landfill
catalysts
ahdirect liquefaction only.
bDirect liquefaction only.
muriicipal wastewater treatment systems (CFR Title 40, Part 125). It is anticipated, however, that most munici- pal treatment plants will be unable to handle the in- creased volume from the liquefaction plant and that an equivalent plant will need to be constructed on the facility site.
The pretreatment standards divide effluent con- taminants into three classes: compatible pollutants, incompatible pollutants, and prohibited wastes. Com- patible pollutants are readily removed in conventional wastewater treatment systems. When less than 30% of a contaminant can be removed by a typical municipal secondary wastewater treatment plant, it is considered an incompatible pollutant. Incompatible pollutants in liq- uefaction plant wastewaters are high levels of nitrogen and ammonia, which can be eliminated through notifi- cation.9 Prohibited wastes cannot be discharged to a municipal treatment plant.
Hydrotreating can most effectively remove con- taminants containing sulfur and nitrogen from liquid streams. In coal liquefaction facilities, hydrotreating would follow formation and preliminary separation of the crude liquid products and precede fractionation and product separation. The feedstock is mixed with hydrogen, heated, and charged to the catalytic reactor. The reactor products are cooled, and the hydrogen, im- purities, and product are separated. Sulfur content can be reduced by 90% or more, and nitrogen removal, at
94
more severe operating conditions (up to 850°F and 3,000 psig), can reach 80-90%. Hydrogen consumption is generally less than 200 ft3/bbl of chargestock.
The quantity of hydrotreating wastewaters and their contaminant concentrations depend on the process and feedstock. Ammonia, from the nitrogen content, and sulfides are the primary contaminants, but phenols may also be present if the chargestock boiling range is suffi- ciently high. Entrained particulates of all types can also be contained in the liquid effluent. See the chapter on Environmental Control Technologies for Fossil Energy Systems for techniques to remove these contaminants.
Solid Wastes
The major solid waste from coal liquefaction consists of the ash and slag from coal charged to the process. As- suming a subbituminous feedstock containing 5-10% ash, removal of the ash would entail disposal of about 70-140 tons per operating hour for a plant as conceived in the MTG/F-T comparison that uses some 27,300 tons (as mined) per stream day.5 A customary operating year estimate of 95% availability would yield between 580,000 and 1,160,000 tons/yr of ash for disposal.
Wastewater treatment sludges will be another major component of the overall solid waste disposal require- ments and will contain substantial amounts of suspended

Table 6.7 Coal Liquefaction Solid Waste Streams and Controls
Solid Waste Source Contaminants of Concern Expeded Controls
Coal pretreatment Gasificationb
Steam and power generation Filter cake, excess residues from solids-liquids separationc
Spent catalyst from h ydrotreatingc
Spent catalysts from shift conversion, synthesis, and sulfur recoveryb
Sludges from waste treatment and product purification
Slag from hydrogen generatione
Slag, trace minerals Ash, sulfides, thiocyanate,
ammonia, organics, minerals Ash, minerals, trace elements Ash, minerals, trace elements,
absorbed heavy h y d m a h n s
Metals, absorbed organics, sulfur
Metals, absorbed organics, sulfur compounds
compounds
Trace elements, polycyclic aromatic
Trace metals, sulfides, ammonia, hydrocarbons
organics, phenols, minerals
Landfill. Sedimentation pond, landfill
Landfill, sedimentation pond Energy recovery via gasification,
landfill
Shipment to manufacturer for
Sedimentation pond, landfill, catalyst regeneration
encapsulation
Incineration, mixing with ash,
Landfill other sludge to landfill
Landfills must have impermeable liners and must prevent leaching to gmndwater.
bIndirect liquefaction only.
CDirect liquefaction only.
solids, minerals, and salts. Due to recycling in the closed systems contemplated for liquefaction plants, accumulations of minerals will be substantial. Table 6.7 lists the solid waste streams, contaminants of concern, and zxpected control techniques.
CONSTRAINTS
Coal liquefaction, whether direct or indirect, will face considerable constraints as the processes become com- mercialized and plant construction begins.
The accumulation of adequate feasible coal reserves and mineral rights, with accompanying authorization and permits, is a time-consuming process. A moderate- size plant (equivalent to a 50,000-bbVd refinery) will require enormous coal reserves located within feasible transport distance of the site. Coal mines to supply this plant will have to deliver more than 9.5 million tons/yr, constituting a very large mining operation. The neces- sary water reserves and rights for the plant amount to over 11,OOO acre-ft/yr. Obtaining permits for water use from the various commissions, with strenuous objections from agricultural and ranching interests, is a long-term prospect, since most large available coal reserves seem to be located in water-short regions of the country.
When all preliminary authorization is obtained and the project is implemented, the local area must be pre- pared for an influx of construction workers, which will peak at between 10,OOO and 15,000 people. Municipal services, lodging, retail and professional services, utilities, transport, and other community services will need expansion to meet the increased needs during con- struction, altering the life styles and standard of living within the area. The probable coal mine development during this period will add another 500-1,OOO workers. Ultimately, about 2,000 permanent workers will be needed for ongoing plant operation and maintenance. The long-term requirement for workers and increased tax base can have a positive effect in communities with high unemployment. Possible negative effects include the need for supplying additional community services if a significant fraction of this work force is new to the surrounding m a .
focus on the environmental effects. Perhaps most basic is maintaining the integrity of the groundwater under solid waste disposal procedures and wastewater reten- tion and cleanup. Emissions controls will focus on fugitive emissions from coal handling, facility opera- tions, and liquid storage. Process emissions of acid rain precursors will be minimal because the technology for
During operation of the plant, primary concerns will
95

control is developed and improving. Perhaps the most serious concerns are the potential for emissions of polycyclic aromatics from the direct liquefaction process and worker exposure to particulates and trace heavy metals. Regulations under the Clean Air Act, Clean Water Act, Resource Conservation and Recovery Act, and other legislation may need to be amended to ensure environmentally safe facility operation.
REFERENCES
1. Converting Coal to Liquid Fuels, U.S. Dept. of Energy Report DOERE-0028 (July 1983).
Liquid Fuelsfrom Coal, A National Coal Board Report, Coal Research Establishment, Stoke Or- chard, Gloucestershire, England, p. 129 (Aug. 1978).
Development, U.S. Dept. of Energy Report DOE/ PE-0010 (Dec. 1978).
4. Patel, J., and J. Loeding, Institute of Gas Technol- ogy, Chicago, personal communication (May 1987).
Schreiner, M., Research Guidance Studies to Assess Gasoline from Coal by Methanol to Gaso- line and Sasol-Type Fischer-Tropsch Tech- nologies, Mobil R&D Corp. Report FE-2447-13 (Aug. 1978).
Assessment of Technology for the Liquefaction of Coal (Draft), National Research Council Commis- sion on Sociotechnical Systems, Ad Hoc Panel on Liquefaction of Coal, Washington, D.C., p. 10 (1977).
Tao, J.C., and J.P. Jones, SRC I Technology and Its Economics, Energy Progress, 3( 1):2 (March 1983).
Smith, M.R., D.A. Hubbard, and C.C. Yang, Logic Technology and Effect of Coal Liquefaction Con- ditions on Final Up-Graded Product State, Roc. 9th Annual Conf. on Coal Gasification, Liquefac- tion, and Conversion to Energy, Pittsburgh (Aug.
Part III -- Conversion of Coals to Liquid Fuels, Institute of Gas Technology, p. III-A-11 (undated).
2.
3. International Coal Technology, Summary
5.
6.
7.
8.
3-5, 1982).
9.
10.
11.
12.
13.
14.
15.
16.
17.
18.
19.
20.
21.
Eccles, R.M., and G.R. DeVaux, Current Status of H-Coal Commercialization, Chemical Engineering Progress, 77(5):80-85 (May 1981).
Epperly, W.R., and D.T. Wade, Donor Solvent Coal Liquefaction, Chemical Engineering Progress, 77(5):73-79 (May 1981).
Gray, R.H., Coal Liquefaction Process Develop- ment: Solving Potential Health and Environmen- tal Problems, Energy, 11(11/2):1337-1346 (1986).
Gray, R.H., H. Drucker, andM.J. Massey, eds., Coal Conversion Processes: Chemistry, Biology, and Engineering of Complex Mixtures, John Wiley & Sons, New York (in press).
Gray, R.H., et al., Summary of Health and En- vironmental Research: Coal Liquefaction, Syn- thetic Fossil Fuel Technology: Results of Health and Environmental Studies, Roc. 5th ORNL Life Science Symp., Butterworth Publishers, Stoneham, Mass. (1984).
Health and Environmental Effects of Complex Chemical Mixtures, Proc. 2nd Annual DOE Con- tractors Meeting, Delavan, Wis., U.S. Dept. of Energy Report CONF-8606161 (1986).
Environmental, Operational and Economic As- pects of Thirteen Selected Energy Technologies, U.S. Environmental Protection Agency Report EPA-600/7-80-173 (Sept. 1980).
Sax, N.I., et al., Dangerous Properties of Indus- trial Materials, 5th Ed., Van Nostrand Reinhold, New York (1979).
Environmental Development Plan, Coal Liquefac- tion, draft report, U.S. Dept. of Energy, p. 128 (May 1980).
New Catalytic Process Desulfurizes Tail Gases from Clam Plants, C&E News, 65(19):29-30 (May 11,1987).
Technology Characterizations Environmental Information Handbook, U.S. Dept. of Energy Report DOWEV-0072 (June 1980).
Standards of Performance for New Stationary Sources; VOC Fugitive Emission Sources; Petroleum Refineries, proposed rule, Federal Register, 48(2):279-299 (Jan. 4, 1983).

BACKGROUND
Oil shale is a fine-grained sedimentary rock charac- terized by a thinly layered mixture of dolomite, calcite, quartz, and clay. This rock is also called marlstone and is usually found near the surface or only a few hundred feet beneath. Interspersed in these layers of inorganic materials are layers of a waxy, organic material icnown as kerogen. Typical oil shale deposits in the United States contain about 10-20% by weight, organic matter.1 Typical kerogen compositions, by weight, are about 80% carbon, 10% hydrogen, 6% oxygen, 2-3% nitrogen, and 1-2% sulfur.12
Current technologies for freeing the kerogen from the host rock are based on a process known as retorting. In this process, the shale is heated to about 900°F, which decomposes the kerogen into vaporous hydrocarbons and a carbonaceous residue. Figure 7.1 shows a typical retort used for heating the oil shale. Upon cooling, the hydrocarbons condense into a heavy petroleum liquid called shale oil. This oil can be upgraded or refined into many different fuel products (e.g., gasoline, kerosene, jet fuel, or diesel fuel) or burned directly for electrical power generation. Shale oil products are often lower in sulfur than conventional petroleum products.
The development of oil shale resources in the United States has taken an irregular path due to environ- mental concerns and changing economic conditions. Disposal of the solid wastes from the retorting process, water contamination, and fugitive dust are among the environmental issues that must be managed in develop- ing a large-scale oil shale industry. Discovery of large oil resources both within and outside the United States has altered the need for large-scale development of oil shale resources, and the changing price of oil has made the economic picture very uncertain. For these and other reasons, the U.S. oil shale industry has not reached a significant size.
Chapter 7
Oil Shale
The last oil shale facility to operate in the United States was the 10,000-bbUd Union Oil plant in the Parachute Creek region of Colorado. This plant, while too small to provide accurate information on the costs of full-scale commercial facilities, provided valuable infor- mation on the problems associated with operating an oil shale plant.
History of Development
Commercial production of synthetic liquid fuels from oil shale began in France in 1838 and in Canada and the United States in the mid-1850s.3 An oil shale industry flourished in Scotland for many years and was not dis- placed by petroleum until 1962. At its height, the indus- try produced about 1.7 million bbYyr. There has been small-scale production in other countries, and in each case, except for China and Russia (combined production of about 150,000 bbllday), the industry ended because more abundant and economical oil supplies became available?
the United States. In 1850, a plant to process oil shale went into operation in Ohio, but the discovery of oil in Pennsylvania stopped this effort. Rich oil shale deposits were found in the Rocky Mountains in 1915 and interest was renewed. However, the discovery of vast oil reserves in East Texas again curtailed development of shale oil.
to further interest in oil shale as a large, domestic source of oil that could greatly reduce U.S. dependence on foreign oil supplies. However, the more recent low prices and large supplies of oil have again led to a decrease in research and development activities to the point where the industry is not likely to be commercial- ized before the year 2000.4
A similar fate has fallen on the oil shale industry in
The oil embargo and energy crisis of the 1970s led
97

Figure 7.1 Paraho Retort at Anvil Points, Colorado, that the U.S. Department of Energy Used to Demonstrate Shale Oil Extraction
Oil shale deposits are found throughout the world. The United States has the largest deposits known, and they are among the highest grade.5 These deposits occur in four general locations: (1) in Colorado (Piceance Creek Basin), Utah (Uintah Basin), and Wyoming (Green River and Washakie Basins), (2) in the central and eastern United States from Michigan and Pennsyl- vania southward through Indiana and Kentucky to
Texas, (3) in Alaska, and (4) in Montana, Nevada, Idaho, and California.1-3
Oil shale is classified by the amount of oil it yields in a standardized chemical laboratory technique, the Fischer Assay. It is generally believed that the oil shale yield must be greater than 20-25 gallton of shale before a deposit becomes commercially attractive.2.6 Its attrac- tiveness also depends on the cost of crude oil from
98

conventional petroleum sources. Most of the rich oil shale deposits in the United States are located in the Green River formation; the recoverable resource in that area is estimated to be 600 billion bb1.7.9 The estimated total deposits in this region are on the order of 1.8 tril- lion bbl.lJ However, because the technologies are unproven and certain environmental issues cannot be resolved until commercial-scale modules have been demonstrated, any forecast of actual production capabili- ties is uncertain. The other U.S. deposits are not consid- ered commercially attractive at present.
The other oil shale deposits are not as rich as the Green River formation and have therefore not received the same attention. However, a comparatively new retorting process has been developed that may create new interest in the Devonian shales in the central and eastern United States. This process, known as hydro- retorting, was developed by the Institute of Gas Tech- nology. Because it introduces hydrogen as part of the retorting process, a higher fraction of the carbon in the shale can be recovered. It is estimated that the yield from this process could be up to 2.5 times that indicated by the Fischer Assay.1.2 This level of recovery would increase the resources in this area from the currently estimated value of 400 billion bbl to about 1 trillion bbl.
Government and Industry Programs
Although U.S. industry has been involved in oil shale resemh and development for many years, it is still re- luctant to undertake full-scale commercial development because of institutional, technological, environmental, and economic barriers. A major barrier, as perceived by industry, is the great uncertainty in competing fuel costs. Technological barriers include process performance and reliability and material availability. The means to mitigate environmental problems are also important technological barriers. The commercial application of oil shale technologies will depend on the removal of these impediments.
As noted above, both government and industrial activities in oil shale have varied widely over the years. Among the government-sponsored programs was a facility set up in 1945 by the U.S. Bureau of Mines. This facility at Anvil Points, Colorado, was the prede- cessor of many of the current oil shale technologies. Much government-sponsored work has also been done in association with the Laramie Energy Technology Center (LETC), which is now called the Western Research Institute, in Laramie, Wyoming.
took additional steps to encourage industrial participa- In the middle to late 1970s, the federal government
tion in oil shale development. These steps included cooperative programs and tax incentives. The now- defunct Synthetic Fuels Corp. was also established, in part, to.aid in the development and commercialization of oil shale technologies. Such steps were successful in that industrial participation increased significantly and several oil shale processes were further developed.
Research and development activities at both the government and industrial level have declined in recent years. Federal policy in the early to middle 1980s has been to turn laboratory-proven technologies over to the private sector for development. However, the declining prices, decreased market, and excess supplies of oil have kept most oil companies from making any further signif- icant investments in the development of oil shale tech- nologies or processes. These policies have combined to limit most recent research and development activities to laboratory-scale tests, computer modeling, and equivalent-level research projects.
TECHNOLOGY
Shale oil can be produced from oil shale by three general retorting processes: surface (aboveground), true in situ (TIS), and modified in situ (MIS). In the MIS process, some raw shale is removed from the underground mine and brought to the surface where it can be retorted. The remainder of the raw shale is retorted in the mine itself. In the TIS process, all of the shale is retorted within the mine, Le., none is brought to the surface. Surface retort- ing occurs in an aboveground vessel, where process flows and operating parameters can be easily controlled. The major disadvantage of surface processes is that tremendous quantities of raw shale must be mined, transported, processed, and disposed of in an environ- mentally acceptable manner. True in-situ processes entail relatively little mining and solids handling, but require remote sensing to monitor most operating condi- tions, thus complicating retort control. Recovery with TIS processes produces relatively little waste material for aboveground disposal, but the below-ground zone of retorted shale raises serious environmental issues.
The feasibility of several different surface retorting technologies has been demonstrated at the pilot scale, but development of commercial prototypes has been delayed due to uncertain environmental, legislative, and policy barriers, as well as the changing economic pic- ture. True and modified in-situ technologies are still in the developmental stages.
Current technologies for conversion of kerogen to synthetic crude (syncrude) involve mining and crushing
99

the oil shale (for surface retorting processes) or rubbling it with explosives in place (for in-situ processes), retort- ing (i.e., pyrolysis of the organic matter in the shale at atmospheric pressure and 900'F), upgrading the hydro- carbon products, and disposing of waste products. A new process for in-situ oil extraction has been proposed. This process involves radio-frequency (E) heating, which precludes the need for shale rubbling. It is, however, in the very early stage of development, and several design and operational issues must be resolved.
Figure 7.2 shows a general process incorporating the various steps in the production of shale oil. Table 7.1 compares the resource inputs and residuals for projected 50,000-bbYd oil shale plants for surface and MIS techn010gies.3~6.8 As shown in Table 7.1, large quantities of carbon dioxide (C02) will be released as the oil shale industry becomes commercial. Large-scale development of oil shale could therefore seriously affect the greenhouse effect of C02 in the atmosphere. Several retorting processes are described in the following section.
Oil shale resource
Surface Retorting1,6.7,10
Drilling and True -+ fracturing or M in situ I
RF heating retorting
Surface processes include mining oil shale by either underground or surface methods; crushing, sizing, and retorting it; and disposing of the wastes. Two methods
for surface retorting are of industrial interest: the direct- and indirect-heating methods. In the direct-heating process, heat is supplied by combustion of part of the shale within the retort. In the indirect-heating process, combustion occurs in an external reactor and heat is transferred to the retort by recirculating gases or solids (e.g., ceramic balls). The products and residuals from these two methods differ somewhat in their chemical and physical properties.
TOSCO II Process
In the TOSCO I1 process, which is an indirect mode, crushed oil shale is preheated to 500'F and mixed in a pyrolysis drum with ceramic balls that have been heated to 1,200-1,3OO0F. The drum is rotated and the ceramic balls (about 1.5 times the mass of the shale) pulverize the oil shale and, through solid-to-solid heat transfer, simultaneously heat it to about 900°F, at which pyroly- sis occurs. The pyrolysis vapors, ceramic balls, and shale are sent to an accumulator vessel where they are separated. The vapors are collected, cooled, and frac- tionated. The spent shale and the ceramic balls are separated, and the shale is sent to a heat exchanger to produce steam for plant use, quenched in water, and moisturized for disposal. The ceramic balls are cleaned of any shale dust that may have collected and returned to the heater for recycling.
Mining and Surface crushing retorting
Product recovery P Upgrading
P Conventional oil refining
and end uses
Figure 7.2 Generalized OU Shale Energy System
100

Table 7.1 Approximate Range of Required Resource Inputs and Residuals for a Pro- jected 50,WO-bbYd Oil Shale Plant.
Surface MIS Characteristics h s s Process
Shale processed (tons/d)b
Water required (acre-Wyr)
Emissions (tons/d)c
Sulfur oxides Nitrogen oxides Carbon monoxide Hydrocarbons Total suspended
particulates Carbon dioxide
Solid waste (tons/d)
95,000
3,000-7500
2-10 6-30 1-5 1 -5 2-10
14,000
85,oood
140,000
IJoo-4,000
1 -3 5-20 1-2 1-2 1-2
15,000
3 5 , m
a'Ihe values shown were scaled upward from esti- mates for smaller plants.
each ton of oil shale. bAssumes that 25 gal of shale oil are produced from
cAll emissions except COz are controlled; the source for the COz values is Ref. 8.
dThe waste is comprised of 82,000 tons/d of retorted
eThe waste is comprised of raw shale, which can be
Sources: Refs. 3 and 6.
shale and 3,000 tons/d of shale dust and coke.
surface retorted (assumes 2.5% shale mining).
Paraho Process
The Paraho retort is a refractor-lined vertical kiln in which a moving bed of sized oil shale, flowing down- ward through the kiln, comes in contact with a counter- current flow of hot gases. These gases pyrolyze the organic constituents in the shale and convey the result- ing vapors out the top of the retort. This process can use the residual carbon in the retorted shale as the source of retorting heat (direct heating), or the retorting heat can be provided by recycling the product gas to an external furnace, where it is burned to produce heat that is then returned to the retort (indirect heating).
Hydroretorting
Another process, developed by the Institute of Gas Technology and others, introduces hydrogen into the retorting process so that a greater fraction of the carbon in the shale can be recovered. Crushed shale (with the fines removed) is fed to a high-pressure reactor where it moves downward countercurrent to hydrogen-rich gas. A small amount of oxygen is injected near the center of the reactor for heat balance. Some researchers believe that the yield with this process could be as much as 2.5 times the yield indicated by the Fischer Assay.12 This process has the potential of making low-grade oil shale competitive with shale oil produced via conventional retorting processes from a high-grade shale (Le., a higher Fischer Assay).
True In-Situ Retorting
The TIS process is most likely to be applied to shales at shallow depths (less than 1,OOO ft) in relatively thin beds, except in the thick "leached zone" of Colorado oil shales. The main advantage of this process is that it is unnecessary to mine the shale. As a result, surface dis- turbance at the site is reduced and waste disposal requi- rements are lessened. The principal disadvantages are that the technology is not very far advanced, the oil recovery efficiency is comparatively low, there is a potential for surface subsidence, and there is a potential for contaminants in the spent shale leaching into the underground water network.
After drilling and fracturing by hydraulic or explo- sive means, either the shale is ignited via a well bore to initiate retorting or a hot gas (e.g., steam or methane) is injected into the formation. The resulting liquids and gases are forced horizontally and vertically through the fracture system to production wells.
wells are bored into the oil shale formation. The shale is fractured along horizontal planes by a combination of electrofracturing (fracturing with electrical discharges), hydrofracturing (fracturing with water under pressure), or explosive-fracturing. The LETC has field-tested a process that initiates retorting by heating the edge of the shale formation with the flame formed by combustion of compressed air and propane. Heat from the combustion of the carbonaceous residue in the retorted shale decom- poses the kerogen into gases, water vapor, and shale oil mist. Pressure from the injection wells forces the oil along the fracture lines toward the production wells, through which the oil is recovered.
In the LETC process,lo injection and production
101

Modified In-Situ Retorting
The MIS process involves mining, or removing by some other'means (such as leaching out solid minerals or underreaming), 2040% of the shale to increase the void volume and permeability before retorting. The remain- ing oil shale is then explosively fractured into the void and ignited. Retorting is accomplished by the move- ment of the retorting zone horizontally, for thin shale deposits, or vertically, for thick deposits. The shale that has been removed to increase the mine's void volume can be processed in a surface retort.
The MIS process offers a greater fraction of oil recovery than does the TIS process. In addition, MIS can be used in large fields without disturbing the surface environment to the extent that would be necessary with conventional mining and aboveground retorting. However, some mining and aboveground facilities are needed and the recovery efficiency of about 60% of the Fischer Assay is not as high as that for aboveground retorting. (The yield could potentially be increased somewhat by injecting steam or hydrocarbon gases into the MIS area.3) As in the case with TIS, the burned-out MIS retorts have the potential for leaching and polluting underground water supplies.
In the Occidental Petroleum Corporation pro- cess,10-12 air is forced into the operating retorts by gas blowers located aboveground and mixed with steam piped in from surface steam boilers. Retorting is initi- ated by heating the top of the rubbled shale column with the flame formed from the combustion of an external fuel source (propane, natural gas, or raw shale oil). The kerogen or organic material in the raw shale is decom- posed by the heat to bitumen and ultimately to gas, oil, and solid residue. In the vapor condensation zone, the combustion and retorting gases are cooled by unretorted shale to condense the oil and water. The product gas, oil, and water flow out the bottom of the operating retorts and are pumped to the surface for treatment.
Product Recovery and Upgrading
The crude shale oil must be processed to remove water and other contaminants. Separation is typically per- formed in a closed-cycle unit, such as impingement or centrifugal separators, or mechanical demisters. Oil and gaseous products are separated from contaminants, such as water produced or liberated during retorting and par- ticulate matter (PM).
After product recovery, the crude shale oil requires further treatment before it can be processed by a conven- tional refinery as syncrude. Special processing, usually
hydrogenation, can remove deleterious materials (compounds containing nitrogen, sulfur, arsenic, and other elements that degrade the product). Viscosity and pour points may be altered by coking, hydrogenation, and additives. Product characteristics and yields may vary depending on the process used; thus, upgrading requirements also vary from process to process. Table 7.2 identifies pollutants released into the atmos- phere -- including PM, carbon monoxide (CO), nitrogen oxides (No,), sulfur dioxide (SOz), hydrocarbons (HC), and others -- during the upgrading process.
Although upgrading (and further refining) is re- quired for most applications, raw shale oil has been burned in an electric-utility boiler. Consumers Power Company of Michigan burned 5,000 bbl of raw shale oil that had been retorted with the Occidental process.2 The appropriate emission standards for SO2 and NO, were met when burning this raw oil.
ENVIRONMENTAL ISSUES
Air quality issues related to oil shale are (1) the produc- tion, during retorting, of criteria pollutants, such as PM, carbon, nitrogen and sulfur oxides, HC, and photochemi- cal oxidants, and noncriteria pollutants, such as hydro- gen sulfide (HzS), ammonia (NH3), carbon disulfide (CS2), trace metals, and polyaromatic hydrocarbons, (2) releases of PM and noncriteria pollutants associated with dusts from mining and crushing raw shale and resuspension of disposed spent shale, and (3) effective control or elimination of these pollutants. Table 7.2 indicates the major sources of emissions related to oil shale extraction and processing. As noted above, large amounts of C02 are also released.
Water resource issues are related to effluent control and water supply. In the Green River formation, where most of the high-quality oil shale is found, virtually all water pumped from mines or drawn for process use will be treated and recycled. This action must be taken be- cause of the limited supply of water in the area and because much of the water has already been committed to downstream uses. Effluent problems, therefore, prin- cipally involve the potential contamination of aquifers and surface waters by leaching from retorted-shale piles or from spent in-situ retorts rather than from direct dis- charges. Water supply questions arise from the potential disruption of groundwater flows (and, indirectly, the flows of surface streams fed largely by aquifers) and consequent difficulties in securing adequate supplies for retort operation.
102

Table 7.2 Sources and Nature of Atmospheric Emissions from Oil Shale Extraction and Processing
Emission- Potential Potential Non- Applicable Operation Generating Activity Criteria Pollutanm criteria Pollutants Technologyb
Extraction
Transport
Preparation
Retorting
Upgrading
Gas cleaning systems
Product storage
Solid waste disposal
Blasting
Equipment fuel use Fugitives
Equipment fuel use Fugitives
Cmshing, screening, and ore storage
Shale preheat Fuel use Shale dusts
Fuel use Heat canier reheating
Combustion of organic material in shale
Spent shale discharge, moisturizing or dry exit
Fuel use in p w s heaters
Sulfur recovery and tail-gas cleanup
Hydrogen production and COz removal
Fuel use
Tank evaporation
Equipment use Fugitives from spent shale transpoli and spreading
Raw shale disposal Transport and spreading
coke, spent catalyst, and other wastes
PM (l), CO, NO, HC
PM (2), CO, NO,, S a , HC PM (1)
PM (2), CO, NO, S@, HC PM (1)
PM (1)
PM ( 1 3 , CO, NO,, SOZ, HC HC
PM (2), CO, NO, S q , HC
PM (2). CO, NO, m, HC
PM (3),HC
PM (Z), CO, NOx, Sa, HC PM ( 1 3
.Mercury, lead, salts,
Silica and silica
Silica
Silica
Trace elements
Trace elements and
Trace elements and
HzS, NH3, volatile
organics
organics
and trace organics
Trace elements
CS2, carbonyl sulfide,
Carbonyl sulfide HIS
Trace organics
Trace metals and organics
Guspended PM, a defined criteria pollutant, is broken down into three general categories in this table: (1) raw shale and natural
bS = conventional recovery and surface retorling, M = modified in-situ retorting, and T = tme in-situ retorting.
Source: Ref. 13.
soil dusts, (2) fuel combustion ash and sooty material, and (3) spent shale dust (including dust from other solid wastes).
103

Retorted shale contains varying amounts of organic and inorganic residuals, It presents a major solid waste management and disposal problem for the surface and MIS operations. Areas are required for the storage of raw shale and the disposal of retorted shale. The result- ing potential loss of habitat for plant and animal commu- nities and natural erosion of the disposal piles by wind and water may not be fully mitigated by vegetating or physically stabilizing the disposal piles.1 Problems and uncertainties related to the vegetation of retorted-shale piles include water requirements, accumulation of toxic trace substances in the vegetation, long-term stability, and successional characteristics of the vegetation. The issue of spontaneous ignition of the raw and spent shale piles must also be closely examined. Due to the ever- present potential for subsidence and roof collapse, addi- tional concern is given to worker safety in the mine, the possibility of aquifer interruption and contamination, and local surface disturbances due to surface settling effects.
tional health and safety are closely associated, although the exposure levels will differ because the workers will be exposed to some pollutants that the general popula- tion will not be exposed to. The work force will be exposed to an environment comparable in some ways to those of the conventional mining and petroleum in- dustries. For example, exposure to diesel exhaust in the mines is an issue that must be addressed. In general, concerns of pneumoconiosis must be addressed and in- mine air quality must be kept within appropriate stand- ards. Workers in MIS mines may have unique expo- sures because of the proximity of the combustion zone. Research to determine the differences in the oil shale work environment that may result from fugitive emis- sions and effluents from crude and upgraded shale oil and by-products, raw and spent shale dusts, catalysts, and shale oil coke and sludges will be a key element in the environmental studies that will accompany commer- cial-scale testing of oil shale technologies. This research should also ascertain the potential exposure of the public to emissions from oil shale operations.
With respect to socioeconomic concerns, generic problems such as large influxes of temporary construc- tion workers, rapid population growth, and limited mu- nicipal services are fairly well understood, and potential mitigation measures have been identified. Such meas- ures include the development of plans for expansion of municipal services that are financed by state, federal, and indusmal programs. However, analysis of data relevant to specific local circumstances is still required, and the solution of these problems will require careful planning.
Health effects to the general population and occupa-
Air Quality Issues
For surface retorting, the primary sources of sulfur are retort emissions, tail gases from sulfur recovery units that treat retort emissions, and the combustion of sulfur- containing retort emissions and shale oil in boilers and other ancillary equipment. Also, if excess low-Btu retort emissions are flared, SO2 and HC emissions will be produced. Other sources of SO2 are fuel used in process heaters and equipment for oil shale extraction, raw shale transport, solid waste disposal, and upgrading and utility operations. Since about 40% of the organic sulfur in shale appears as H2S in the produced gas, untreated sulfur emissions will consist mainly of H2S but also may include other sulfur compounds, such as carbonyl sulfide and CS2.3,14 The volume and concentration of sulfur emissions will vary from one process to another.
Nitrogen oxides will be emitted primarily from the boilers, furnaces, and heaters associated with the plant. Hydrocarbon and CO emissions result from equipment and evaporation losses during the transfer and storage of shale oil products. Fugitive dust, which is the major source of PM emissions associated with surface retort- ing, results primarily from the handling, transport, and aboveground disposal of solids. Potentially hazardous emissions resulting from extraction and processing operations include silica, trace metals (mercury, cad- mium, arsenic, selenium, and possibly antimony), PM from fuel combustion, volatile organics, and toxic gases.
Tables 7.3 and 7.4 summarize the projected atmos- pheric emissions from mining and retorting for three oil shale plants, each producing 50,000 bbVd.15-17
No reliable estimates of emissions from TIS retort- ing are available, but preliminary indications are that they may be less than those of surface retorting2 The primary area of concern is fugitive emissions or acciden- tal leaks of toxic gases. Because TIS retorting does not involve mining or aboveground retorting, NO, emis- sions, spent-shale disposal, and fugitive dust emissions are not expected to be problems.
Because MIS retorting involves some mining and surface handling of oil shale, emissions generally will be lower than those from surface retorting and higher than those from TIS operations. As with TIS retorting, the primary concerns for MIS retorting are fugitive emis- sions. Overall PM emissions from MIS are likely to be less than those from surface retorting, but more than those from TIS, primarily because MIS involves some aboveground solids handling and (possibly) retorting.
104

Table 73 Summary of Mining Emissions for 50,000-bbVd Paraho, Occidental MIS, and TOSCO II Facilities
Shale Emissions (tonddp Mining Rate
Facility (tondd) SO2 NO, PM HC eo
Paraho, direct modeb 84,000 0.24 3.45 0.20 0.22 1.22
Occidental MISb M,W 0.08- 3.166 0.17 0.12- 2.70- 0.39~ 0 .62~ 25.7f
TOSCO Ilr &0oo 2.99 0.30 0.61 5.27
aAll emissions are maximum 24-h wtes unless another averaging period is noted. Sources of
bParaho emission and mining rates are scaled linearly from a 4,700-bbYd module and
emissions are mining, blasting, and diesel engines.
Occidental MIS figures from a 57,000-bbVd facility. Mining operations for both processes include mining, blasting, crushing, and mining equipment use. The Occidental MIS mining also includes rubbling. (Transfer, storage, and secondary crushing of shale are not included.)
CThis range is based on a range of 0.023-1.29 fuel sulfur content.
d h n u a l average emission rate converted to short tons per day. Maximum 2441 emissions
cThree-hour maximum and annual average emission rates, respectively, convened to short
will be greater than this.
tons per day. Maximum 24-h emissions will be within this range.
tons per day. Maximum 24-h emissions will be within this range.
these emissions are not given in the available data.
Eight-hour maximum and annual average emission rates, respectively, converted to short
rTOSC0 I1 emission estimates are for the mine vent. The specific operations contributing to
Sources: Refs. 15-17.
Table 7.4 Summary of Retorting Emissions with Controls for 50,000-bbVd Paraho, Occidental MIS, and TOSCO 11 Retorting Operations (tondd).
Facility S O 2 NOx PM HC CO
Paraho, direct modeb 0.32 5.4 0.61 NAc NA Occidental MIS$ 2.1 6.2 0.89 0.15 0.88
TOSCO I1 3.76 20.9 6.29 3.64 0.83
aFigures do not incbde emissions from mining and shale handling.
bFigures scaled linearly from a 4,730-bbVd module or "unit stream."
cNot available.
dFigures scaled linearly from a 57,000-bbVd module. Estimates based on tail-gas composition. Assumes Stretford plant emits a maximum of 15 ppm of HIS.
Sources: Refs. 15-17.
Water Requirements
The net water requirement for a surface retorting plant is about 2-5 bbl of water per barrel of oil produced, de- pending on process and plant design3 Water is used for drilling, dust suppression, equipment washing, retorting, upgradhg, and spent-shale disposal. About 40-50% of the water requirement is associated with waste disposal following surface retorting.2 Power generation consti- tutes the major use of water by ancillary facilities. Less water will be used with more-efficient designs, Le., maximum use of recycled water.
Consumptive water use for TIS retorting is less than half of that for surface processes, because less water is used for retorting and upgrading and none is required for mining and spent-shale disposal. The combustion of hydrocarbons and the release of interstitial water pro- duce about 1 bbl of water per barrel of oil recovered.
Water use in MIS aqd TIS retorting processes is similar. For TIS retorting, some of the water-consuming
105

activities of MIS operations are eliminated. Additional sources of water consumption at MIS facilities are min- ing and transport and disposal of raw shale.
Several studies have suggested that shale oil pro- duction in the range of 1.3-2 million bbVd could be supported by the water supply in the Upper Colorado River region.2418 However, issues such as increased salinity would have to be addressed on the basis of local conditions and water uses.
Water Quality Issues
Table 7.5 summarizes the sources and types of effluents emitted from an oil shale plant.14J9 The primary sources
of wastewater in mining and surface retorting oil shale are construction activities, mine dewatering, process wastewater from retorting, contaminated runoff and leachate from both raw-shale storage piles and spent- shale disposal piles, and increased erosion and sedimen- tation resulting from disturbed soil and vegetation. As shown in Table 7.5, the leachates from raw-shale fines or spent shale will have a high inorganic salt loading along with some organics. These salts represent a major issue with respect to solid waste disposal. If spent cata- lysts or sludges are codisposed with the spent shale, the treatment of these wastes may also affect the properties of the solid waste leachates. Construction, mining, and site-use activities may increase the loadings of sediment and dissolved solids in surface runoff and receiving
Table 7.5 Sources and Nature of Effluents from Oil Shale Faciiities
Pollutants source
Direct mms
Mine and retort dewatering
Retorting Water separated from crude
shale oil
Retort-gas condensates
upgrading operations Oily cooling water, spent
caustics, and process and oil-free wastewaters
Cooling and boiler-water blowdown
Water treatment Chemical sludges, backwash,
and zeolite-softener blowdown
Sanitary wastewater and domestic sewage
Indirect 6 w c e s
Leachate from retorted shale
Runoff and erosion
Mining and transport
Sodium, chlorine, fluorine, and sulfur ions; carbonyl sulfide; C&; and boron
Ammonia, sodium chlorine, calcium, magnesium, sulfur, carbonate, sulfate, and sulfur cyanide ions; dissolved or suspended organics; trace metals; and suspended shale fines
and sulfur compounds Carbonate ions, NH3, and traces of organics
Sulfur ions, NHs, carbonic acid, phenols, dissolved solids, oil, and grease
Dissolved solids and corrosion controls (e&, hexavalent chromium)
High conceutmtions of dissolved salts
Excrement, paper, soap, dirt, food wastes, unstable organics, and microorganisms
Sodium, magnesium, chlorine, and fluorine ions; sulfate; and traces of organics and metals
Sediment and dissolved solids
Sediment and dissolved solids
Sources: Refs. 14 and 19.
106

streams. This direct source of potential water pollution is not unique to oil shale extraction and processing but may require careful control because of the prevalence of a high salt content in local soil and the size of the opera- tions. Runoff will have to be collected and impounded.
Water quality impacts associated with TIS retorting differ from those associated with surface retorting. There will be no surface disposal of spent shale and therefore none of the consequent water impacts, and erosion and sedimentation arising from construction and site activities will occur on a smaller scale. The major problems associated with in-situ processes are disposal of the retort dewatering fluid and prevention of aquifer contamination. In-situ retorting may produce excess wastewater if aquifers are encountered during retorting.
The water quality impacts of MIS retorting include all those discussed for TIS retorting as well as some of those resulting from surface retorting. The greatest potential problems are impacts from dewatering (i.e., chemical contamination of groundwater or reduced surface-stream flow), subsurface leaching of the retort, and cross-aquifer contamination. As with TIS retorting, definite impacts are not known.
Solid Waste Disposal
Shalederived solid wastes come from several parts of the overall processing system. These wastes include raw oil shale (that which does not contain sufficient kerogen for economic recovery), spent oil shale, shale fines, and process wastes, such as spent catalysts and sludge from wastewater treatment facilities. Although not truly a waste product, open pit or strip mining of oil shale can create a great deal of overburden material that eventually must be handled in an environmentally acceptable man- ner. The primary concern with these solid wastes is that they have the potential for producing leachates, which could contaminate the water supply for a large area and for many people. Large surface areas for waste disposal also have the potential for causing extensive property damage and loss of life in the event of a structural fail- ure. Such failures could result from precipitation or from surface water or groundwater intrusion into the site structure.
It is anticipated that those wastes deemed hazardous -- spent catalysts and some sludges from wastewater treatment -- will be disposed of in licensed facilities. The arsenic guard-bed catalyst used in shale oil upgrading could be a special problem because of the high concentration (about 20%) of arsenic.
The quantity of spent shale depends on the grade of shale and the recovery efficiency of the retort. Most
surface retorts have recovery efficiencies of about 90- 100% of the Fischer Assay. Projections of the recovery efficiency of in-situ retorts have been on the order of 50-7096 of the Fischer Assay, but actual yields in pilot retorts have ranged from 20-70%.19,20 Therefore, to obtain 50,000 bbl of oil from an in-situ retort, more shale must be retorted than for a surface retort using the same grade of shale.
Because most of the spent shale in the MIS process and all of it in the TIS process will remain underground, the handling problems are significantly reduced as com- pared to those for surface retorting. Table 7.6 shows typical solid waste residuals for a surface plant. Most of the land committed for an oil shale facility will be for solid waste disposal and development of surface facili- ties. For example, the surface disposal of spent shale will require about 60-75 acreslyr of operation. The surface facilities (e.g., offices, maintenance buildings, retort areas, and so on) will require 100-150 acres. The huge quantities of raw shale mined and retorted shale produced create a serious potential for air and water pollution from fugitive dusts, runoff, and leachates.
Retorted shale is by far the greatest quantity of solid waste produced by a surface retort. Shale expands on retorting, a phenomenon known as the "popcorn effect." This expansion increases the volume of the spent shale by about 30%. As a result, not all of the spent shale can be returned to the mine cavity, and some will always remain for disposal by some other means. The scale of the solid waste problem can be seen by noting that a plant producing 50,000 bbl/d of shale oil must dispose of about 450 million ft3 of spent shale each year. If this spent shale were to be piled on the surface, the disposal pile at the end of 30 yr would cover an area of about 3.5 m i 2 to a depth of 150 ft. Other solid wastes, includ- ing spent catalysts, sludges, sanitary wastes, and coke, have to be disposed of properly and are usually put in the spent-shale piles. In addition, some retort water will probably be disposed of with spent shale and is therefore a potential source of pollution. If these wastes are not disposed of properly, surface waters and groundwater may be contaminated by salts, organic substances, and trace constituents as a result of erosion, runoff, and leaching.
In general, surface retorting technologies produce large quantities of raw shale for disposal. Although MIS operations involve less shale mining than do surface operations, the potential quantity of raw shale for dis- posal is still significant (about 30% of that from surface retorting). Many companies planning to use MIS proc- esses will use aboveground retorting for the raw shale mined out of MIS retorts. The most significant solid
107

Table 7.6 Summary of Solid Wastes Generated by a 50,000-bbvd TOSCO II Retorting and Upgrading Facility
Disposal Rate
source Major Components to&d tondyr
PyTdyaisUnit Processed shale and raw 54,lU). 19,aoO,oocl. and processed shaEe dust
Crushing unit Raw shale dust 425 155,100
Hydrotreating units Spent catalysts and 1.12-1.99 410-703b Poprietary solids
Hydrogen piant Spent catalysts and 2.5-2.6b 938-963 csusties
Sulfur plant Spent catatystsc 0.2Eb 77b
Gas treating unit Diatomaceous earth and 2.3 858 deactivated carbon
Coker Green& 800 29 1,500
Water treatment Floeeulants, coagulants, 0.57 229 and lime
aDry weight; shale grade = 30 gal/ton.
bAveraged ever cawst life.
Guch as bauxite, cobalt, and nickel-molybdenum.
Source: Ref. 14.
waste impact of in-situ processing is potential water contamination from the leachate of spent retorts.
There are essentially two methods of disposing of the solid waste from a shale oil facility: surface disposal or mine backfill. Subcategories would include canyon or valley fill, surface storage, open pit backfill, and underground mine backfill. The choice of these options will be based on several factors, including site topogra- phy, the availability of technologies for run-on and runoff catchment ponds, and economics. Table 7.7 summarizes key features of these options.
Health Effects
Crude shale oils, upgraded or refined shale oil products, and certain waste streams from processing may contain carcinogenic compounds and other hazardous sub- stances. Table 7.8 lists some potential health-related problems. From the experiences of foreign oil shale industries and the petroleum industry, both in the United
108
States and abroad, it would appear that the areas of con- cern for occupational exposure are carcinogenic effects on the skin and pneumoconiosis from dust inhalation. The occupational health effects of MIS technologies are potentially the most hazardous, consisting of unique exposure hazards from explosion, fire, and toxic sub- stances for miners at commercial-scale MIS facilities. Exposure to diesel exhaust also may have to be regu- lated. Operating retorts or exposure to process gases leaking to the surface could potentially affect workers and the local population. Human exposure could be expected directly through ingestion of drinking water or, secondarily, through concentration of various toxicants in animal food products. The possibility of hazards from inhalation must also be considered.
As is the case with any similar effort, a major prob- lem in establishing the human cancer potential of shale oil is that laboratory tests must be conducted on animals, and the results of such tests cannot always be readily extrapolated to humans. Some epidemiological studies have been performed on workers in foreign oil shale

Table 7.7 Key Features of S d i d Waste Disposal Approaches
Advantages Disadvantages
w i l l s place wastes an fill in a coaueuieni &ace Iocation and M r e them f m the sumundiog environment
Watively simple placrmeat and isolation of waslea; doea nol inter- fere with production
Underground Decreases subsidence and size of mine backfill parts of the mine necessary surface landfill; no
additional maintenance or recla- d o n work is required; may enhance total resource recovery
Place wastes as fill in the inactive
Dust and erosion umtrol, reclamation, and revegetation are relatively labor- intensive operations; occupies a significant amount of land surface
Difficult to isolate the wastes from the sumnding environment; phcement is relatively difficult and interferes with produdion
Source: Ref. 1.
Table 7.8 Possible Health Hazards Associated with Oil Shale Processes and Products
PWXSS
or Product Possible Hazard
Mining
Retorting
Raw and spent shale storage
Shale oil products
Combustion products
Pneumoconiosis from inhalation of rcck dust or shale pahcles; exposure to diesel exhaust
Possible exposure to fumes or pahcles by inhalation; pulmonary or skin cancer from contact with retorted shale palticles; e x p u r e to retort wastes or effluents via soil or water; hazard from particulates from mining, via inhalation or skin contact; exposure to wastewater (possibly through drink- ing water)
Contamination of drinking water; concentration in aquatic organisms; ecological damage
Skin cancer from skin contamination or pulmonary cancer from inhalation and toxicity from inhalation of volatile products
Contribution to air pollutants through chemicals of direct potentia1 toxicity, i.e., SOz. NOx, and PM, including organic carcinogens (which contribute to photochemical air pollution, resulting in oxidant and sulfate and sulfuric acid via reactive €IC and nitric oxide)
Source: Ref. 19.
109

industries, but the data are insufficient to accurately evaluate the human health effects in this industry.21 Health effects research, however, has continued and extensive animal testing has been conducted22 Many of these studies suggest that the carcinogenicity of shale oil is much less than that associated with certain coal lique- faction products.
Socioeconomics
The effectiveness of plans to control socioeconomic disturbances in the sparsely populated oil shale basins is uncertain. About 160,OOO people live and work in the Colorado-Utah-Wyoming shale areas; most towns have a population of less than 6,000. In some cases, services such as fire and police protection, educational facilities, and utilities may be inadequate for the current popula- tion. Best-guess estimates are that full-scale oil shale development would cause the population to increase by about 40%/yr in the early stages of development3 m e r e would be an employment decline after the peak construction year, but the continuing operation work force would be substantial.)
This population increase would exacerbate the ser- vice problem unless judicious community planning is initiated. Fire and police protection, educational facili- ties, and utilities are more difficult (and much more expensive) to provide to scattered sites of development than to communities with higher population densities. In addition, scattered development is associated with increased traffic and fuel use, consumption of agricul- tural land, lack of community identity, and, often, dis- regard for the goals of existing communities. Concen- trated growth in and around existing communities allows more efficient and less costly provision of public serv- ices and expansion of public infrastructure; public trans- portation services can reduce private vehicle use and children need not be bused long distances to school; and agricultural lands are more easily preserved.
Such concentrated growth, however, requires con- certed planning, coordination, and growth management on the part of state and local officials, inchding careful land use planning and development of comprehensive fscal policies. Money is required to carry out these plans; one estimate is that a 300,000-bbVd oil shale industry (exclusive of coal, oil, and gas production) plus its urban population will require about $135-190 million of capital investment over a 10-yr period to provide facilities and services to adequately compensate for the population influx.18 Another estimate is that about $4 billion would be required in a 10-yr period.23 This money would come primarily from local, state, and
federal taxes. States can apply for federal adverse- impact grants; low-cost loans are also available to fi- nance the expansion of public facilities and services.
ENVIRONMENTAL CONTROLS
The controls discussed below are not the only ones available to control pollutants generated by oil shale processing. However, they are likely candidates for use in a commercial oil shale industry. The costs of en- vironmental controls on the production of oil from shale have been estimated to range from $1 to 4/bbl, with most of the costs needed for control of atmospheric emissions .3
Control of Atmospheric Emissions
The Clean Air Act requires all new or expanded plants with the potential to emit 100 tonsly of a controlled pollutant to obtain a federal construction permit To obtain such a permit, air quality monitoring and model- ing is required to ensure that the facility does not cause ambient air quality standards or allowable air quality increments to be exceeded. Plants to be located in an attainment area are subject to Prevention of Significant Deterioration (PSD) regulations, which apply to most of the large oil shale regions.
New Source Performance Standards (NSPS) have been established for several source categories, including petroleum refineries, sulfur recovery plants, petroleum storage and transfer facilities, and fossil-fuel boilers; all of these may affect oil shale processing. Federal emis- sion standards have not been established for oil shale retorting, but may be promulgated in the future. Colo- rado has established a SO2 emission standard for oil shale plants of 0.3 lb of SOdbbl of shale oil produced.
Hydrogen SUrfide Removal
The choice of an H2S removal process is affected by the concentration of H2S in the gas stream and by economics.
The Stretford process is used to remove low con- centrations of H2S (less than 1,OOO ppm); it has an over- all efficiency of about 99%P Hydrogen sulfide is &- solved in a mixture of sodium carbonate and sodium bicarbonate and then oxidized to elemental sulfur. F’rob- lems associated with this process include absorption of C a into sodium sulfide, which diminishes the efficien- cy of H2S removal; the scrubbing solution can be con- taminated by gases containing sizable amounts of tars or
110

hydrocarbons; and hydrogen cyanide collected during the process produces thiocyanates, which cannot be decomposed. Also, large concentrations of hydrogen cyanide could seriously affect the system’s efficiency and economics. (Guard-bed reactors could prevent serious problems, however.)
Because these problems can usually be overcome by conscientious monitoring of the scrubbing solutions, the Stretford process was selected for use in several of the planned sulfur removal programs for oil shale. How- ever, the economics of the Stretford process as applied to oil shale are unknown. Estimates of the investment costs range from $100 to 130 per thousand standard cubic feet.= The operating costs would vary with the resale value of the sulfur.
It may be possible to remove H2S from process gas streams by allowing the gas to flow through a packed bed of spent shale.% If this technique proves successful at the scale required for a commercial oil shale facility, the costs of H S control could be significantly reduced.
Other possible means of H2S control include the Selexol and Claus processes. The latter is most often used when both H2S and SO2 must be removed from a gas stream.
Sulfur Dioxide Removal
Neither retort nor shale oil refinery emissions contain SO2 in quantities requiring treatment (concentrations of 10-50 ppm are typical). However, SO2 controls may be reqiiired to reduce stack gas emissions from process heaters that use untreated retort and refinery tail gases or crude shale oil as a fuel.
at industrial and electric-generation facilities. Once such process is lime/limestone wet scrubbing, in which a nonregenerative slurry of 510% calcium oxide or car- bonate is circulated through a scrubber. The slurry comes into contact with the flue gas and removes the S a as calcium sulfite or sulfate. Problems associated with this removal method include questionable reliabil- ity and the large volumes of scrubber sludge that are produced. Several other options are also available and the choice would be made on economics and site- specific conditions. Other means of SO2 control include the Wellman-Lord and double-alkali processes. The latter is most often used in industrial applications be- cause of its high removal capability and good reliability. As noted above, the Claus process can be used for the removal of both H S and S02.
This gas would be treated in ways commonly used
Nitrogen Oxide Control
Nitrogen oxides result from the combustion of conven- tional fuels in air; they are not expected to be a signifi- cant emission in any oil shale development. Control of NO, emissions can be approached in two ways: (1) combustion temperature and amount of oxygen available for reaction can be kept to a minimum, which will minimize the amount of NO, produced, and (2) the emissions can be cleaned.
Minimizing an air pollution problem at the source is more effective than using control devices. Because most systems for the oil shale industry are still in the pilot- plant phase, it is possible to design for low NO, emis- sions. If shale oil and associated retort emissions are used in process heaters and boilers, hydrotreating the shale oil and stripping N H 3 from the emissions may be the most economical control strategies. Hydrotreating will be more expensive for shale oil than for petroleum crude; the higher nitrogen content of shale oil requires more extensive hydrogenation. The use of alternative fuels low in sulfur and nitrogen is another option, but they are costly and the availability of such fuels is uncer- tain, particularly in the remote areas where oil shale is found.
Conventional NO, control techniques will be ap- plied to auxiliary equipment (e.g., boilers, furnaces, and heaters) at surface retorting facilities to meet emission requirements. Thermally produced NO, can be control- led by combustion modifications (e.g., use of low-NO, burners, staged combustion, and lowexcess-air fig). Up to a 60% reduction in both thermal and fuelderived NO, emissions has been reported for various commer- cial low-NO, burners. Staged combustion can achieve reductions in both thermal and fuel-derived NO, levels stipulated by the federal NSPS.
Carbon Monoxide and Hydrocarbon Controls
Carbon monoxide and HC emissions from external com- bustion sources can be controlled through proper design, operation, and maintenance. Emission control technolo- gies currently applied in petroleum refining might also be applied in oil shale retorting or shale oil refining. Control techniques such as direct flame incineration and catalytic incineration may be applicable for combustible HC that do not have high recovered-product market value or are too dilute to be economically recovered. Recovery and recycling control technologies are most economical for HC having a high market value. Another approach is adsorption, in which HC emissions are trapped on the surface of an adsorbent, such as activated

carbon. The last approach, conversion, is applicable only to CO; it uses the shift conversion process to react CO with steam to form C02 and hydrogen. Fugitive HC emissions will result from evaporative losses from shale oil storage tanks and transfer operations. Vapors from storage tanks and loading equipment may be collected and sent to ~ e c o v e q units for removal of condensable vapors. Noncundensable vap0l.S can be flared or routed to the fuelgas system Hydrocarbon emissions from pipe failures and equipment leaks during transfer opera- tions can best k controlled through regular maintenance procedures.
Particulate COWO~S
Particulates, many of which are fugitive dusts, are gener- ated by all phases of the oil shale industry. Control of particulates will be one of the signifzant pollution con- trol problems faced by the industry.
Water sprays can be used where evaporation is possible; if they are adjusted properly, the operation need have no mff. The efficiency of water sprays that do not contain wetting chemicals is about 80% for par- ticulates whose diameter is 5 pm or greater and 25% for particulates in the 1-jm range. The addition of a wet- ting agent will reduce the surface tension and improve the wetting, spreading, and penetrating characteristics of the water. Water sprayers are economical and easy to operate, but they can clog (or clog other machinery) and freeze.
Chemical binders are effective for the control of fugitive dust emissions. Chemical solutions sprayed over the desired area form a protective coating when they dry. The net effect is to reduce the surface area exposed to weathering and erosion, thus greatly reducing the amount of particulates released. The effectiveness of these chemical binders as an emission control device for oil shale particulates must, however, be considered un- certain at this time.
When highly efficient removal of small particles (smaller than 5-10 pm) is required for air pollution con- trol, one of the most widely used methods is the fabric filter (baghouse). The initial filtration begins to build up a layer of dust or cake on the fabric; as more contami- nated air passes through the system, the dust cake begins to act like a filter. The cloth serves mainly as a support structure; the dust is responsible for the high efficiency of removal. The efficiency of a fabric filter depends on particulate size distribution, density, chemical composi- tion, and moisture. Under most conditions, a properly designed and operated fabric filter system, or baghouse, will operate with an efflciency of 99% or better (on a mass basis) for particulates as small as 1 pm in diameter.
112
Wastewater Treat men t
Water pollution problems at a specific site will depend on the oil recovery process used, the quality and quantity of available water, and final disposal objectives. Exist- ing control technologies for water pollution may be applicable to most of the waste streams encountered in oil shale processing. However, research on process methodology will be required to ensure that high- priority poiluutmts and toxicants are removed from sev- eral of the more highly polluted wastewaters. Process wastewaters, spent-shale compaction wastewaters, and mine dewatering wastewaters may pose significant prob- lems that will have to be resolved prior to commercial- ization of the industry.
Oil shale wastewaters contain dissolved and sus- pended solids, oil, trace elements and metals, trace organics, toxic substances, dissolved gases, and sanitary wasres. The pollutants from each waste stream will have to be removed if clean water for recycling or discharge is desked. The size of the treatment units will vary, depending on wastewater volumes and the types and concentrations of pollutants to be removed. The opera- tion will be designed to concentrate the pollutants for ultimate disposal and containment and provide either clean water for total recycling (zero discharge) or water meeting criteria for discharge to the environment.
The wastewaters containing dissolved solids (greater than LOO0 mgL) and suspended solids should be relatively free of oil and trace organics; they can be collected and flow-equalized in large holding lagoons prior to treatment. The oily wastewaters (above 19 mg/L) from all wastewater sources should be col- lected and processed by an API separator prior to receiv- ing further treatment. Wastewaters contaminated with trace elements and metals should be relatively chemi- cally free of oil and dissolved solids, thereby allowing separate treatment. Trace organic wastewaters may contain highly diverse types of organic pollutants. Spe- cial toxic wastewater discharges are expected to be few, but they will need advanced treatment and controls for the concentrates collected. Wastewaters coming from scrubbers that treat common oil shale process gases, such as H2S, N H 3 , and C02, will require specific con- m l s and treatment prior to water reuse or discharge. The sewage and water-treatment wastes should be con- sidered for separate treatment and disposal systems. These separate treatment systems may be used in paral- lel or in series, depending on the raw wastewater charac- teristics and the control technology used to comply with the water reuse and disposal criteria for effluents.
oil shale could be used to remove N H 3 , C02, and certain Research has indicated that the properties of spent

organic acids and materials from the prucess waste- water.x This could prove to be cost effective for remov- ing these contaminants prior to discharge of the wastewater.
Disposal of Solid Wastes
Sulface Disposal of Oil Shale Solid Wastes
Any oil shale operation other than a TIS operation will have to dispose of some retorted shale on the surface, as disposal piles or canyon f&. Several studies have iden- tified potential problems with maintaining piles and fills, as well as ways to mitigate such problems.273 First, if retorted oil shales are to be stabilized with native vegeta- tion, they will require intensive management, including leaching controls, soil covering, nitrogen and phospho- rus fertilization, and irrigation. Nitrogen application will be required for a number of years after establish- ment. Second, the infiltration rate on fine-textured retorted shale with a low-carbon organic content appears to be very slow, and erosion may be high during heavy summer storms. Third, intermittent application of water is probably more effective than continuous use in pre- paring shale for vegetation. Fourth, grazing by deer and domestic livestock on disposal areas must be carefully controlled until a strong permanent vegetation cover has been established and several growing seasons have passed. Finally, gophers and other burrowing animals can be expected to move in? the vegetated areas.
Some leachate could be produced from any surface disposal of retorted or raw oil shale, and this leachate could adversely affect the quality of surface waters and groundwater. An impermeable lining underlying of downsmam of the disposal pile and drains to cdlect leachate for treatment or reuse will be desirable. The surface-retorling technologies are tending toward a zero-discharge concept, which would necessitate the collection, treatment, and circulation of this leachate.
Underground Disposal of Retorted Shale
A major concern is the disposal of retorted shale in a manner that is environmentally acceptable. Among the various proposed methods are surface disposal, mine backfilling with dry retorted shale, and backf'i'iing with retorted shale slurry. Because of the potential of chronic leaching, it is recommended that retorted shale not be returned to a wet mine; it is much easier to control leachate problems on the surface than below it. Ground- water is the ultimate recipient of leachate from surface disposal or mine backtill. Because of the potential leaching of organic and inorganic compounds by saline
water, an effort should be made to minimize the leachate entering the groundwater system.
Mventing pollution of groundwater and surface waters (from groundwater recharge of surface streams) by TIS or MIS retorting is an unsolved problem. Some possibilities that have been proposed include (1) using high retorting temperatures (about 1,000-1,20O0C), which may encourage the restructuring of shale minerals into insoluble material, (2) if high retorting temperatures are used and lime is finely crushed with the surface- retorted shale, injecting the mixture hydraulically into spent MIS retorts to fill void areas, thereby cementing the retorts to make them relatively impermeable to water, (3) using hydrologic barriers (e.g., barrier pillars, grout curtains, or a rubbled zone) and the retort field to exclude water from the retort area and prevent the spread of leachates from the retort area, and (4) allowing retorts to fill with groundwater, which would be continuously pumped to the surface for treatment.
ENVIRONMENTAL CONSTRAINTS
Regional Constraints 0
Table 7.9 summarizes the federal and state regulations that will influence the design and selection of emission control technologies and practices. Local ordinances and permit requirements may also affect specific opera- tions. In addition, the states of Colorado, Wyoming, and Utah have regulations and implementation policies that will present a different set of opportunities and con- straints for siting synthetic fuel plants (see Table 7.10). For example, the state of Colorado has announced a policy for oil shale development that calls for a deliber- ately phased development of the resource; the state of Colorado has developed stringent reclamation and solid waste disposal policies; and the state of Wyoming has strict industrial siting, groundwater protection, and So2 emission regulations.
Summary of Constraints
The primary unresolved problems for the large-scale development of oil shale with aboveground retorting are air quality regulations and management of solid wastes. Air quality constraints can probably be overcome by applying appropriate control technologies. Managing retorted shale to avoid resuspension of PM and prevent
113

Table 7.9 Environmental, Health, and Safety Regulations Applicable to 011 Shale Development
Legislation Pollutant or Concern
Clean Air Act, including NSPS, PSD, nonattainment areas, visibility standards, and State Implementation Plans
Federal Water Pollution Control Act
Resource Conservation and Recovery Act
Toxic Substances Control Act
Occupiitional Safety and Health Act
Retort gas (containing low concentrations of HzS), fugitive dust, NH3, combustion gas, HzS, HC emissions, PM, SOz, NO, and CO
Retort water can contain hazardous substances, such as NH3, plus dissolved solids, HzS, and organics; surface retorting will require pumps in.the mines to dewater both fresh and saline aquifers
Runoff or leachate from retort or spent shale may contain metals, organics, or salts (e.g., NH3, organic nitrogen, soda, carbonates, nitrates, sulfates, and chlorides); other pollutants include arsenic wastes, sludges from scrubbers, and spent catalysts
Crude shale oil may be toxic
Worker exposure to carcinogens, mutagens, noise, vibration. heat, dust, fumes, and danger from explosives
Sources: Refs. 3 and 6.
Table 7.10 Federal and State Legislation for Pollution Control at Synthetic Fuel Plants
Topic Governments with Applicable Legislation ~~ ~~ ~
Air quality
Water quality
Solid waste U.S., Colorado, Wyoming
Other
US., Colorado, Utah, Wyoming
U.S., Colorado, Utah, Wyoming
U.S. (Toxic Substances Control Act and National
Colorado (Mined Land Reclamation Act) Environmental Policy Act)
leachate contamination of surface and subsurface waters has been demonstrated only with isolated shale piles and sites. An approach involving compaction and vegetation may prove to be adequate, but it depends on the availability of a suitable disposal site, sufficient water, and an understanding of the physical and chemical quali- ties of piles.
Environmental concerns identified with TIS and MIS technologies include aquifer disruption or con-
114
tamination; the occupational health and safety of the work force in the underground environment (for MIS); and the lack of data on the environmental, health, and safety impacts. The possibilities of a reduction in water quality in the upper Colorado River basin, of long-term hydrologic disturbances in arid areas, or of introduction of toxic or carcinogenic materials into drinking-water aquifers are the most serious of these concerns. Should aquifer contamination prove to be a problem, MIS retorts will probably be more amenable to control than TIS retorts.
REFERENCES
1. Agarwal, A.K., Assessment of Solid Waste Characteristics and Control Technology for Oil Shale Retorting, U.S. Environmental Protection Agency Report EPA-600/7-86/019 (May 1986).
Cracking the Shale Resource, EPRI Journal, 2 pp. 6-13 (Nov. 1980).
3. An Assessment of Oil Shale Technologies, Office of Technology Assessment, Washington, D.C. (June 1980).

4.
5.
6.
7.
8.
9.
10.
11.
12.
13.
14.
15.
16.
Shale Oil Comeback Not in Near Future, Coal and Synfuels Technology, pp. 6-7 (Aug. 18, 1986).
Energy Alternatives: A Comparative Analysis, University of Oklahoma, Science and Public Pol- icy Program (May 1975).
Energy Resource Development Systems Report, Vol. HI, Oil Shale, U.S. Environmental Protection Agency Report EPA-600/7-79-060C (March 1979).
Cameron Engineers, Inc., Synthetic Fuels Data Handbook, 2nd Ed., Denver (1978).
Hessel, D., Battelle Pacific Northwest Laboratory, personal communication (Sept. 1980).
Guthrie, HD., Oil Shale Commercialization Task Force, U.S. Dept. of Energy (June 6,1978).
Shih, C.C., et al., Techmlogical Overview Reports for Eight Shale Oil Recovery Processes, U.S. En- vironmental Protection Agency Report EPA-600/
Ashland Oil, Inc., and Occidental Oil Shale, Inc., Modifications to the Detailed Development Plan for Oil Shale Tract C-b, prepared for Area Oil Shale Supervisor, U.S. Dept. of the Interior, Grand Junction, Colo. (Feb. 1977).
Chew, R.T., Operations and Environmental Con- siderations, Occidental Petroleum Corporation In-Situ Operations, in Science and Technology of Oil Shale, T.F. Yen, ed., AM Arbor Science Publishers, AM Arbor, Mich. (1976).
de Nevers, N., et al., Analysis of the Env i romn- tal Control Technology for Oil Shale Develop- ment, U.S. Dept. of Energy Report COO-4043-1 (Feb. 1978).
Crawford, K.W., et al., A Preliminary Assessment of the Environmental Impacts from Oil Shale Developments, U.S. Environmental Protection Agency Report EPA-600/7-77-069 (July 1977).
Paraho Development Corp., Air Emissions Source Cornauction and Operating Permit Application, submitted to U.S. Environmental Protection Agency and Colorado Dept. of Health (July 5, 1978).
Final Environmental Impact Statement, Proposed Development of Oil Shale Resources by the Col- ony Development Operation in Colorado, Bureau of Land Management, U.S. Dept. of the Interior (June 1977).
7-79-075 (Mach 1979).
17.
18.
19.
20.
21.
22.
23.
24.
25.
26.
27.
28.
Ashland Oil Inc., and Occidental Oil Shale, Inc., Oil Shale Tract C-6: Supplemental Material to the Detailed Development Plan Modifications, submitted to Area Oil Shale Supemisor, U.S. Dept. of the Interior, Grand Junction, Colo. (July 21, 1977).
Preliminaiy Draft: Final Report on Western Oil Shale Development: A Technology Assessment, prepared by Pacific Northwest Laboratory for Assistant Secretary for Environment, U.S. Dept. of Energy (Sept. 1980)
Cotter, J.W., et al., Confrol Technologyfor Shale Oil Recovery Processes, prepared for U.S. En- vironmental Protection Agency, Cincinnati (1978).
Pollution Control Guidelines for Oil Shale Development, U.S. Environmental Protection Agency Report EPNOFWERL-Ci (July 1979).
Costello, J., Morbidity and Mortality Study of Shale Oil Workers in the United States, Environ- mental Health Perspectives, 30 (1979).
Coffin, D.L., Proceedings of the Symposium on the Health Effects Investigation of Shale Oil Development, Ann Arbor Science Publishers, Ann Arbor, Mich. (198 1).
Oil Shale and the Environment, U.S. Environmen- tal Protection Agency Report EPA-600/9-77-033 (&t. 1977).
Fruchter, J.S., et al., Source Characterization Studies at the Paraho Semi-Works Oil Shale Retort, Pacific Northwest Laboratory Report
Denver Research Institute, Evaluation of Air Pol- lution Control Equipment for Oil Shale Recovery Processes, prepared by TRW, Inc., for U.S. En- vironmental Protection Agency (May 1977).
Hines, A.L., The Role of Spent Shale in Oil Shale Reprocessing and the Management of Environ- mental Residues, U.S. Dept. of Energy Report
Harbert, H.P., and W.A. Berg, Vegetative Stabi- lization of Spent Oil Shales, U.S. Environmental Protection Agency Report EPA-600/7-021 (1978).
Oil Shale Environmental Readiness Document, U.S. Dept. of Energy Report DOE/ERD-0016 (Sept. 1978).
PNL-2945NC-91 (1979).
DOE/LETC-10020-1 (Aug. 1980).
115

BACKGROUND
In the electric utility sector, combined-cycle technology refers to the combined use of hot-combustion-gas tur- bines and steam turbines to generate electricity. This process can significantly raise the overall thermal effi- ciency of power plants beyond that typical of conven- tional fossil-fueled plants using either type of turbine alone. The technology also allows fossil fuels to be used in a way generally believed to have less environmental impact than conventional combustion technologies, such as pdverizedcoal-fred plants.
In a combined-cycle plant, heat-recovery steam generators (sometimes called waste-heat steam gener- ators) are used to create steam from energy contained in the gas stream. Depending on the plant design, these steam generators can be placed at a point either before or after the gas has been expanded in the gas turbines. In some designs, steam is also produced through the con- ventional manner of cooling the fuel combustion zone of the plant. Electricity is then produced by both steam turbines and gas turbines.
Several types of bombined-cycle systems have been designed (at least conceptually) for various fuels. Units burning natural gas or oil have been operated in the electric utility sector, and several designs using coal have been proposed, typically involving a coal gasifica- tion facility or a coal-burning, fluidized-bed combustor. The 100-MW Cool Water plant in southern California is the only coal-based combined-cycle plant in full opera- tion: hence, much of the data in this chapter are based on detailed plant designs, rather than on actual operating experience. Other coal-based technologies that'pay someday be used in the electric utility sector include fuel cell and magnetohydrodynamic combined cycles. These technologies require more development than those that combine the use of steam and gas turbines, and are hence believed to be further away from commercializa-
Chapter 8
Combined-Cycle Power Plants
tion. Consequently, these technologies are not discussed in this chapter.
This chapter emphasizes the energy conversion portion of the combined-cycle power plant. Discussion of the fuel consumption portion (e.g., the gasification or fluidized-bed areas) is limited to its influence on the design or operation of the energy conversion portion of the plant. Detailed information on coal gasification and fluidized-bed combustion can be found in other chapters of this book.
HISTORY
The concept of a combined-cycle electric power plant has been under evaluation for several years and has been implemented in a limited number of cases. Develop- ment of this technology has been undertaken by a num- ber of organizations, including the U.S. Department of Energy (DOE) and its predecessor agencies, private companies interested in designing or selling such plants, and organizations, such as the Electric Power Research Institute, that represent potential users of the technology. Recent efforts have mostly focused on conceptual de- signs of plants that use coal as the feedstock. Most of these designs incorporate coal gasification processes or fluidized-bed coal combustion in conjunction with the combined cycle. Recently, however, the natural gas industry has conducted a number of studies on the use of natural-gas-fired combined-cycle power plants in the electric ~e~tor.1-3 The 300-kIw (electric output) gas- fired combined-cycle plant in Anadarko, Oklahoma, is often cited to illustrate some of the benefits of this technology.4
Coal gasification has been used in the United States for more than a century to supply gas for industrial and residential users. One such application was the produc- tion of "town gas" (synthetic gas produced for local
117

consumption) from the late 1800s to the 1940s. Interest in coal gasification was revived in the 1970s due to oil embargoes and rapid increases in energy prices. This revived interest prompted the development of several new gasification technologies and applications.
The combined cycle permits an efficient application of gasification technologies in the electric utility sector. The Southern California Edison Company began operat- ing its Cool Water plant in 1984 to demonstrate this application.5 In this plant, the Texaco coal gasification process is used to produce a hot gas stream that is then used in a combined cycle to produce electricity. Coal gasification combined-cycle concepts have also been examined in other countries, and facilities have been built in the Federal Republic of Germany, Scotland, and South Africa, among other places. Combined-cycle plants that incorporate a gasification technology are called integrated gasification combined-cycle (IGCC) plants.
The other type of coal-based combined-cycle plant involves fluidized-bed systems and is also under active investigation, with several design concepts already at the pilot plant or demonstration scale. Several conventional pulverized-coal-fired plants are also being converted to fluidized-bed systems.6.7 An 85-MWt steam-cooled unit is being tested in England and a 1 7 0 - W e utility-owned plant is expected to be in operation in the United States in the late 1980s.8 Fluidized-bed plants offer an addi- tional advantage over other types of coal-fiid power plants in that nitrogen oxide (NOx) emissions are gener- ally inherently low enough to enable existing standards to be met without additional pollution control devices.
TECHNOLOGY
The combined-cycle technology offers several potential advantages to electric utilities, including improved ther- mal efficiency, reduced requirements for scarce materi- als (such as water), and elimination of the calcium-based sludge produced when coal is burned in a conventional plant equipped with a flue-gas desulfurization (FGD) system using wet limestone. Another advantage is that plants can be designed modularly. For example, a modular IGCC would have multiple gasifiers and com- bustion turbines combined typically with a single steam turbine. With this design feature, plant availability can be improved and load growth requirements can be more closely matched than is often feasible with other tech- nologies.9 Modularity also helps minimize the capital outlay in the time between the beginning of construction and the initial production of power, as the combustion
turbines could be producing electricity while consmc- tion on the remainder of the plant is being completed.
Some of these advantages are shown in Table 8.1, which gives design parameters for several types of coal- based power plants: a pulverized-coal-fired plant with a wet limestone FGD system, two types of IGCC plants, and two types of pressurized fluidized-bed combustion (PFBC) plants. Unlike the IGCC and PFBC plants, the pulverized-coal-fired plant does not incorporate a com- bined cycle, but has been included for comparison. All plants are assumed to have an electrical generating ca- pacity of about 500 MW, to use high-sulfur bituminous coal from Illinois, and to be subject to the 1979 New Source Performance Standards (NSPS). The data were taken fromRefs. 10-18.
The arrangement of components in a combined- cycle power plant is different in typical IGCC and PFBC plant designs. The characteristics of the specific gasifi- cation or fluidized-bed combustion process used would also influence the plant layout. For example, Figs. 8.1 and 8.2 show conceptual layouts for two PFBC plants, which are both designed to operate at pressures in the range of 8-16 atmospheres. In the first design (Fig. 8.l), steam is used to cool the fluidized bed. This steam is then routed directly to a steam turbine/generator system that expands the steam to produce electricity. The hot gas exiting the fluidized bed passes through a cleanup system, typically consisting of a series of cyclone separators, where it is cleaned to a level necessary for reliable operation of the gas turbinelgenerator system. The cleaned gas is then expanded in the gas turbine/ generator system and ducted to an economizer, where additional heat is extracted from the gas to preheat the PFBC feedwater. The cooled gas is then sent through a second particulate control system (typically a baghouse) prior to its discharge through the stack. Of the electric- ity produced by a steam-cooled PFBC system, about 75% is typically produced by the steam turbine and the remaining 25% by the gas turbine.
The PFBC layout shown in Fig. 8.2 involves an air- cooled concept. In this version, compressed air is used not only as the combustion gas and the fluidizing medi- um, but also as the bed coolant. The combustion and fluidizing gas exits the fluidized bed and passes through a hot-gas cleanup system for particulate removal. After cleaning, this gas is combined with the coolant air and routed to the gas turbindgenerator system to produce electricity and drive the air compressor. The expended gas exiting the gas turbine is then ducted to a waste-heat steam generator to produce steam for use in a conven- tional steam turbindgenerator system. Of the electricity produced in this type of system, about 60% is produced in the gas turbine and 40% in the steam turbine.
118

Table 8.1 Summary of Data for Coal-Based Electric Power Plants
Net Sorbent Water Solid so, Data Output Heat Rate Feed Rate USe Waste Emissions Sources
Type of Plant (MWe) (Btu/kWh) (IbkWh) (gaVkWh) (IbkWh) (IbikWh) (Refs.)
Pulverized-coal- 502 9,770 0.13 0.66 0.46 7.7 10-13 fired with wet limestone FGD
IGCC with BGC4 480 9,090 0.45 0.22 7.1 10,14, Lurgi gasification 15 process
IGCC with Texaco 575 9,250 0.60 0.17 7.3 10,15, gasification process 16
Air-cooled PFBC 554 9,140 0.20 0.43 0.34 7.6 10,17 combined-cycle
Steamcooled PFBC 529 8,710 0.27 0.52 0.36 1.2 10,18 combined-cycle
.British Gas Council.
Coal Dolomite Steam Turbine Generator
handling
Air
Stack ~ .. Gas Turbine Generator
Figure 8.1 Typical Design for a Steam-Cooled PFBC Combined-Cycle Plant (Source: Adapted from Ref. 10)
119

Coal Dolomite
__
Pressurized A fluidized
I - bed Spent solids
handling
I Air
1
Steam Turbine Generator
I
Steam Steam
Waste heat ---d boiler h I
Stack Gas Turbine Generator
Figure 8.2 Typical Design for an Air-Coded PFBC Combined-Cycle Plant (Source: Adapted from Ref. IO)
A third version of &he fluidized-bed concept is at- mospheric fluidized-bed combustion (AFBC). In this version, the bed operates at atmospheric pressure rather than being pressurized as in a PFBC plant. The AFBC option is being exmined as a potential retrofit technol- ogy for use in repowering pulverized-coal-fged plants that are nearing the end of their useful operating Iife- times. Many of the PFBC design features discussed in this chapter are also applicable to AFBC.
An lGCC plant design is shown in Fig. 8.3. A number of different gasifxation processes can be used and the layout of the combined-cycle portion of the plant wouM be somewhat affected by the process used. For example, the temperature of the gaseous fueI exiting the gasifier can affect the design and operation of the hot- gas cbanup system. The gaseous fuel (having an energy content of about 300 Btu per standard cubic f a and thus referred to as “medium-Btu gas”) must be cleaned before it can be sent to the gas tubinelgenerator system. Depending on the temperature of this gas, it may also have to be cooled before it can be cleaned. For example, in the Texaco gasification process, gas is produced at a temperature of about 2,4- and must be cooled prior to cleanup. To accomplish this, convective heat ex- changers are used to lower the gas temperature to about 7WoF and, that, a€ter being superheated in the k t recovery steam
the process, to generate SatuFated steam
generators, is sent to the steam turbine/generator system to produce electricity. The fuef gas is then scrubbed to remove the solids, sulfur compounds, and ammonia that have been produced in the gasification process. The cleaned gas is sent to the gas turbine where it is burned and expanded in the turbine/generator system. The solids are recycled to the gasifier and the sulfur can be reclovered and sold
Other IGCC concepts provide for production of a lower-temperature fuel gas, which is not cooled prior to cleaning. The British Gas Council (BGC) slagging gasifier is an example. In this concept, the fuel gas exits the gasifier at about WOOF, It does, however, contain some heavy tars and ails, which are removed in the cIeaning process and recycled to the gasifier.
Still other gasifEr designs are based on a fluidized- bed concept and yield a fuel gas containing a relatively high level of particles, gartkulatly unburned char. To improve the cmversion efficiency from cod to fuel gas and ensure reliable opefation of the downstream gas turbines, multistage cyclones are used to remove these particles before the gas is cooled in the convective heat exchangers. The char is then recycled fo the gasikr. The fi-adm of power produced in the gas turbines de- pends on the gasification prwess and ranges from about half to three-quarters of the total plant output. After exiting the gas turbine, the gas is routed to the heat-

Coal
Gas Turbine Generator
Figure 8 3 Typical Design for an IGCC Plant (Source: Adapted from Ref. 10)
recovery steam generator where steam is produced for expansion in the steam turbine. In addition, some steam is bypassed to the oxygen plant to drive the compres- sors. The fraction of power produced in the steam tur- bine ranges from about 25% of the total plant output in cases where the g a m s fuel is not cooled in the heat- recovery s t e m generator to almost 50% in cases where the gas is cooled in this m n e r .
Combined-cycle power plants fueled by natural gas or distillate oil are much simpler than any of those de- scribed above because they have no gas cleanup sys- tems. The fuel is fed into the combustion turbine where it is burned to yield a hot gas that is then expanded in the turbindgenerator system. The gas exiting the turbine is sent to a heat-recovery steam generator to produce steam for the steam turbine. About two-thirds of the total power is generated in the gas turbine portion of the plant.
ENVIRONMENTAL ISSUES
The environmental emissions and control technologies in combinedcycle power plants will depend on the combustion technology and the fuel type used. Because coal-based plants are likely to have the greatest potential environmental impact associated with the combined
cycle, this section deals predominantly with this type of plant. The discussion further centers on PFBC and IGCC plants, as they represent the most probable coal- based applications of combined-cycle technology for new plants in the electric utility sector.
Solid Wastes from Coal-Based Plants
In current design concepts, solid wastes from combined- cycle power plants are produced in two areas: the coal consumption region, e.g., the fluidized-bed or gasifica- tion area, and the gas-stream particulate collection region. In WBC plant designs, the solid waste from the coal consumption region is caHed spent bed material and consists principally of partially sulfated limestone or dolomite. This material is taken from the combustor to maintain the bed height and can represent as much as 8595% of the total solid waste stream if the solids col- lected in a first-stage cyclone are recycled to the reactor bed.19 The solid material collected from the hot gas stream includes coal ash and char as well as fine parti- cles of the sulfated sorbent. The quanfity of solid waste generated in a PFBC plant would depend on several factors, including the composition of the coal, the heat rate of the piant, the required emissions levels of sulfur &oxide (SO2) and particulates, and the calcium-to-sulfur

ratio used for SO2 control. Values for this ratio would typically range from 1.3 to 2.5, depending on the initial sulfur content of the coal, the required SO2 removal efficiency, and some design features of the fluidized bed, e.g., the bed depth.183 For plants using typical high-sulfur, bituminous coals and requiring 90% SO2 removal, the quantity of solid waste from a PFBC would be about 0.35 lbkWh of electricity produced or about 0.4 lb/lb of coal used.10
IGCC plant would be a slag consisting of coal ash, unreacted coal, and limestone that has been added to promote slag formation. The material removed in the hot-gas cleanup system includes some fine, unburned coal particles but not any sorbent used for SO, control, as would be the case in a PFBC plant. In some design concepts, this material is recycled to more efficiently use the coal. Less solid waste would typically be produced in an IGCC plant than in a PFBC plant, with about 0.2 IbkWh, or 0.2 lb/lb of coal, being representative of high-sulfur coal applications.10 In comparison, the solid waste from a plant burning high-sulfur coal and equipped with a wet scrubber FGD system would be about 0.4 lbkWh.1421 This waste includes fly ash and bottom ash but mostly consists of the wet sludge pro- duced in the FGD system.
The solid waste from the gasification portion of an
Emissions from Coal-Based Plants
Gaseous emissions from combined-cycle power plants would include SO2 and NO, along with trace concentra- tions of substances such as ammonia, arsenic, fluorides, mercury, and beryllium. The level of these emissions could be controlled to within the applicable standards through the use of commercially available systems or practices. For example, in a PFBC plant design, lime- stone or dolomite injection into the fluidized bed could be used to control SO2 emissions, while a Selexol (or equivalent) system could be used for the same purpose in an IGCC plant. Emissions of NO, could be control- led in a PFBC plant by keeping the temperature in the fluidized bed at levels where NO, formation is limited and, in an IGCC plant, by injecting steam into the gas turbine, which also limits NO, formation. Other trace emissions (potentially including ammonia and some hydrocarbons) would be reduced in the gas cleanup systems or would be at levels low enough to be of no COnCern.
Emissions from Gas- or Oil-Fired Plants
Gaseous emissions from gas- or oil-fired combined- cycle power plants would be much lower than those from uncontrolled coal-fired plants. With natural-gas- fired units, the fuel would be subjected to hydrogen sulfide ( H 2 S ) removal before it enters the pipeline so that it does not contain any significant quantity of sulfur, resulting in very low SO2 emissions. The oil used in some oil-fired units might contain significant quantities of sulfur. The number of pounds of SO2 emitted per million Btu would be approximately equal to the per- centage sulfur content of the oil. For example, a plant burning oil with 3% sulfur would have SO2 emissions of about 3 lb/million Btu.22 The lack of ash in either natu- ral gas or oil would produce a particle-free gas exiting the combustion turbine, so there would be no concern about particulate emissions from these plants. Emis- sions of NO, from oil- and gas-fired plants would vary with the fuel composition and the design and operation of the facility. Representative values would be in the range of 0.5-0.6 lb/million Btu.22
ENVIRONMENTAL CONTROLS
Environmental controls would be required for air pol- lutant emissions (principally S02, NO,, and particu- lates), wastewater, and solid wastes. While the treat- ment of wastewater is generally similar in IGCC and PFBC plant designs, the treatment of atmospheric emis- sions and solid wastes differs in several respects. Each control system design is briefly discussed below.
Atmospheric Emissions
IGCC Plant Designs
Overall Approach. During the gasification process in an IGCC plant, sulfur in the coal would be converted pri- marily to H2S along with some carbonyl sulfide (COS). These gases would be carried out of the gasification chamber along with the fuel gas and would have to be removed before the gas could be released to the atmo- sphere. Although some of the design details of the gas cleanup system would depend on the gasification pro- cess, the following description is generally applicable to most IGCC designs.
122

The first step in typical gas cleanup systems would be to cool the gas in convective heat exchangers. This cooling process would produce saturated steam that would be sent, as shown in Fig. 8.3, through the heat- recovery steam generator, where it would be super- heated, to the steam turbine to produce electricity. How- ever, IGCC designs that do not yield high-temperature fuel gas do not use the convective heat exchangers for cooling. Some gasification pmcesses yield a fuel gas that contains relatively high concentrations of particulate matter (Le., soot). In these cases, a series of cyclones would be used to remove this matter before the gas en- ters the convective heat exchangers.
The next step in the gas cleanup system would be to scrub the raw gas with condensate from the power cycle. This action would remove the fine particles that have been carried along in the fuel gas. Removal of these particles would allow NSPS requirements to be met and would minimize erosion and corrosion of the gas turbine blades. Furthermore, because these fine particles would contain unburned carbon, they could be recycled back to the gasifier to maximize use of the energy in the initial coal feedstock. The scrubbing step would also minimize the oils and tars that are produced by some gasification technologies (e.g., the BGCLurgi slagging gasifier).
Removal of ammonia that has been carried along with the fuel gas is the next step in the cleaning process. This would be done by saturating the fuel gas with water vapor and then condensing the vapor. Removal of am- monia ensures that atmospheric emissions will be in compliance with regulations and that downstream equip- ment will operate properly. For example, low ammonia concentrations would be essential to ensure efficient and reliable operation of the Selexol equipment that removes sulfur compounds from the gas.
A hot-gas cleanup system that could remove solids, ammonia, and sulfur in a single process would reduce capital costs and improve operating conditions. How- ever, since such advanced systems do not currently exist, the multiple-stage systems described above must be used in sequence.
Table 8.2 presents data from tests of atmospheric emissions from the Cool Water facility. The table shows that the IGCC technology can operate with amo- spheric emissions well within limits set by the 1979 NSPS.
Sulfur. Sulfur can be removed from fuel gas streams by two basic means. The first involves the absorption of H2S by a liquid solvent and its subsequent conversion to solid sulfur by oxidation with air. The most commonly used commercial process based on this principle is the
Table 8.2 Atmospheric Emissions from the Cool Water IGCC Plant in Southern California (Iblmillion Btu)
Measured NSPS Pollutant Emissions Limit
SQ? Utah coals 0.36 0.3 Illinois c o a l b 0.13 0.6
NO, 0.06 0.6
Paiculates 0.001 0.03
Trace elements Beryllium <0.002c Fluoride 0.005 Mercury <O.O06c
@.S% sulfur.
b3.S% sulfur.
CNone detected - the values shown are the lowest detectable concentrations.
Sources: Refs. 23 and 24.
Stretford process, which is usually used to treat low- volume tail gas streams. The large size of the equip- ment, its high pumping power requirements, and its drop in efficiency under the conditions typical of the fuel gas in an IGCC plant (e.g., the carbon dioxide [COz] con- centration) combine to limit its use in large systems.
The second means of sulfur removal also involves use of a liquid solvent to absorb the hydrogen com- pounds. This solvent could be either a chemical solvent that reacts with and absorbs acid gases or a physical solvent that dissolves absorbed gases by physical ab- sorption. The sulfides removed from the fuel gas could then be regenerated by pressure reduction or heating. High concentrations of H2S and COS are desirable when they are removed from the fuel gas so that the sulfur recovery process can operate efficiently. Of the major components of fuel gas from an IGCC plant, H2S and COS are among the most highly soluble with a physical solvent. Carbon dioxide is slightly less soluble than either of these. In an IGCC plant, it would be advanta- geous to leave the C@ in the fuel gas because it could release energy as it is expanded in the gas turbine and because it could reduce the amount of steam that must be injected into the gas turbine to control NO, emis- sions. For these reasons, selective physical solvents are
123

preferred to chemical solvents, which would remove a significant fraction of the COz along with the H2S. Systems using physical solvents also use much less steam, so the overall plant efficiency can be expected to be higher with physical solvents than with chemical solvents.
the conceptual designs for IGCC plants is the Selexol process.5.14-16 This process uses the dimethyl ether of polyethylene glycol, an organic solvent that has a high molecular weight and high boiling point and that selec- tively absorbs sulfur compounds. Some absorption of COz would, however, be unavoidable. As a part of the removal system, the solvent would be regenerated and recycled.
Another possible sulfur removal process uses cold methanol as the solvent. Although this process could be expected to be similar to the Selexol process, it requires very low temperatures (about -4OOF) to minimize methanol vapor losses. If the vaporization becomes too high, significant amounts of vapor would enter the fuel gas, thereby raising its heating value beyond the design point for the gas turbines and damaging them. As a consequence, this process is not generally considered feasible for IGCC applications.
Sulfur recovery systems in IGCC conceptual designs are typically based on the Claus process by Standard Oil of Indiana.%l4-16 This process is often used to produce solid, elemental sulfur as the marketable product, but other options are possible, as evidenced by the production of liquid Sulfur in the Cool Water plant in southern California. Because Claus units are commer- cially available and often used in the petroleum refining industry, they have well-established designs. Sulfur recovery efficiencies of 90-95% are typical with this process and higher efficiencies can be achieved with certain design modifications.l4-l6
The liquid-solvent process most commonly used in
NO,. An IGCC plant would also emit NO, when fuel gas is burned in the gas turbines. These emissions could be controlled by injecting steam into the gas turbine so that the temperatures could be kept low enough to in- hibit NO, formation. The steam used for this purpose could be generated in several places, including the heat- recovery steam generator, the gas scrubbing effluent, or the Claus units. An additional benefit of steam injection is that the mass flow rate through the gas turbine can be increased, thereby increasing its electrical output.
Although steam injection is a common method of NO, control, other methods are possible, including water injection, postcombustion treatment, and staged combus- tion. The first of these options has several disadvantages
124
(compared to steam injection) in that energy would be lost in vaporizing the water and the net output from the turbine would be lower. The latter two options would require additional capital and operating expenditures and possibly additional research and development for long- term, reliable operation in a coal-based power plant.
In some IGCC concepts, the C02 quantities in the fuel gas would be sufficient to keep the temperature in the gas turbines low enough to limit NO, formation, so that an explicit conu0l process would not be needed. This situation is most likely to be the case when low- sulfur, subbituminous coal is used as the feedstock.
PFBC Plant Designs
Sulfur. Control of atmospheric emissions in a PFBC plant would begin in the combustion zone, where a sorbent (typically a calcium-based compound such as limestone or dolomite, although other materials, includ- ing sodium carbonate and sodium aluminate, have also bee11 examined8) would be added to the fluidized bed to remove the SO2 that is formed. A sorbent feed rate equivalent to a calcium-to-sulfur ratio of 1.3-2.5 would be used to limit SO2 emissions to 90% or greater of their level when uncontrolled.18.20
Particulates. The addition of sorbent to the fluidized bed, however, would cause the particulate load to in- crease. significant reductions in this load must be made for two reasons. First, particulate emissions from the plant must comply with the governing standards, and second, the particulate load in the gas that is expanded in the gas turbines must be low enough to avoid excessive erosion or corrosion of the turbine blades.
Current conceptual designs use a two-step process to reduce the particulate load. The first step typically involves multistage cyclone air cleaners. Removal effi- ciencies of 98% could be expected with a three-stage cyclone system placed between the fluidized bed and the gas turbines. The particulate load would be reduced sufficiently to allow reasonably efficient and reliable operation of the gas turbines. The second step is typi- cally a baghouse (Le., a fabric filter) placed just up- stream of the stack so that the gas is further cleaned just prior to its release to the atmosphere. These units would reduce the particulate load to the levels required by federal, state, and local standards. Other control devices such as electrostatic precipitators (ESPs) could also be used for this step in the cleaning process, but the high electrical resistivity of the particles released in a PFBC makes baghouses more cost effective.6,zO

A two-step control procedure would necessitate more capital expenditures and more electrical energy for operation than would be needed for a one-step proce- dure. For this reason, efforts are under way to develop hot-gas cleanup systems that can meet the required lev- els of particulate removal in a single step. Development of such cleanup systems could also negate the need to cool the flue gas prior to cleaning, which could in turn lead to greater overall plant efficiency. Examples of hot-gas cleanup systems that have been considered for use in PFBC plants include granular-bed filters; ad- vanced (Le., high-temperature and high-pressure) ESPs; fabric, metal, and ceramic filters; electrostatically en- hanced cyclones; and various combinations of these.8 Some of these systems may also remove trace quantities of volatile, alkali metals (e.g., sodium and potassium), which are believed to contribute to corrosion of the gas turbine blades.
NO,. In a PFBC plant, NO, emissions would also be controlled in the fluidized bed, since the temperatures there would be low enough to limit formation of thermal NO,. Furthermore, the thermal NOx formed and the fuel NO, released from the coal would be partially reduced by carbon monoxide in the fluidized bed and, in some designs, by recycled char from the gas cleanup system. Thus, NO, emissions from a PFBC plant would be in- herently within existing federal standards and no addi- tional controls would be required. If stricter standards have to be met, the PFBC plant could be designed to include a two-stage bming zone, which would lead to even lower NO, emissions.
Wastewater Control
The wastewater streams in PFBC and IGCC designs are generally treated similarly, although the size of the streams and the level of contamination differ. Five major wastewater streams are expected- water from the major process areas, cooling tower blowdown, runoff from coal piles and coal handling areas, runoff from process areas, and sanitary wastewater. Each stream must be treated to some extent before the water can be discharged.
IGCC Plant Designs
The major source of process water from an IGCC plant would be the gas scrubbing system used to remove the fine particles from the fuel gas. The effluent from this system would contain fine particles, dissolved gases (including ammonia and HIS), dissolved minerals, and
trace amounts of organic compounds. After treatment to remove these impurities, the effluent would be conven- tionally treated and then discharged.
Treatment would begin in the effluent primary treal- ment m a and include flashing of the effluent to remove most of the dissolved gases. Since these gases would contain a significant quantity of H2S, they would be sent to the sulfur recovery unit. The effluent would then be cooled to about 1 20°F and sent to an equalization pond, where it would be mixed with other wastewater streams and aerated. Effluent from the equalization pond would be subjected to lime treatment to remove any trace quan- tities of heavy metals that have been carried along. It would be fdtered and any heavy metals discharged as filter cake. Sodium hydroxide would be added to in- crease the effluent’s pH level and to facilitate the strip- ping of ammonia. This ammonia would be recovered in a dilute solution and used to recycle soot to the gasifier.
The final step in this process-water treatment design would be to remove the biochemical oxygen demand (BOD). This would be accomplished by sending the effluent from the ammonia stripping section to aeration basins and clarifiers, where the BOD would be subjected to activated-sludge, biological treatment that would consume many organic compounds that might be present. The effluent from this area would then be monitored and discharged. If the phenol content of the effluent is high (as might be the case with the Lurgi gasification process), additional flocculation, clarifica- tion, filtration, and carbon absorption steps would be used to reduce these levels before the effluent could be discharged.
other process areas would be collected in lined, earthen storage ponds where solids would be allowed to settle out. The effluent would be pumped to discharge lines if it is not contaminated or sent to a equalization pond, where it could be treated in a manner similar to that described above for the process area effluent. Cooling tower blowdown would be treated in a similar manner, although dechlorination might be required to meet the applicable standards. Sanitary wastewater would be collected in a conventional manner and treated by aera- tion and activated sludge prior to discharge.
Runoff from the coal piles, coal handling areas, and
PFBC Plant Designs
Wastewater treatment in PFBC plant designs is similar to that in IGCC plant designs, although the quantity of water treated may be less in some streams and the level of contamination may be different. Low-volume wastes would come from the waste sump and the equalization basin. These wastes would be passed through an oil
125

separator and a clarifier before being sent to a secondary treatment area for final treatment. Metabbearing wastes would be passed through an oil separator, a plate-type clarifier, and a monovalve filter where iron or copper could be recovered. The stream would then be sent to the secondary treatment area for conventional waste- water treatment techniques prior to discharge. Runoff from the coal piles and process areas would be treated in the same manner as described for the IGCC plant design. Steam generator blowdown in PFBC plants would typi- cally be reclaimed for use as boiler makeup water. Cooling tower blowdown may require dechlorination, which could be done by injecting the necessary chemi- cals directly into the blowdown stream.
Solid Wastes
The quantity of solid waste produced in either of the combined-cycle technologies considered in this chapter would be less than that produced by an equivalent pulverized-coal-fired plant with a wet limestone FGD system. As noted in Table 8.1, the solid waste from an IGCC plant would be about 0.2 lbkWh of electricity produced and that from a PFBC plant about 0.35 ibkWh for high-sulfur applications. The solid-waste handling systems for these technologies are comparatively simple and reflect the fact that these wastes are generally expected to be. nonhazardous under current regulatory definitions.
IGCC Plant Designs
The major source of solid waste from IGCC plants would be the dewatered slag from the gasifiers. This material would contain the majority of the ash from the gasified coal. Leachate tests have shown that this mate- rial is nonhazardous under current regulations20 and, as such, it can be disposed of in a landfill. The solidified slag from the Cool Water plant was certified as non- hazardous by the California Department of Health !%Mces.233 Most conceptual designs for IGCC plants use a conveyor system to move the slag from the gasifier to a loading silo, where it would be loaded onto trucks or railcars for off-site disposal in a landfill. Another source of solid waste would be the filter cake from water treatment facilities. In some instances, these filter cakes may be considered hazardous due to their potential toxicity. For example, the filter cake containing trace metals could be considered as toxic material and special disposal means may be required. In such cases, a U.S. Environmental Protection Agency (EPA) permit would be needed for the storage or disposal of this filter
126
cake. In any event, the quantity of such materials would be orders of magnitude less than the nonhazardous slag. Most other fdter cakes would contain some particulate matter that included unburned carbon and would there- fore be recycled to the gasifier to yield more-efficient coal use.
PFBC Plant Designs
The solid wastes from a PFBC plant would come prin- cipally from the fluidized bed, the cyclone, and the baghouse. The waste would consist of a mixture of ash, reacted and unreacted dolomite, and a small amount of unburned carbon and inert materials. Extensive leachate tests have led to the expectation that this material will be classified by EPA as nonhazardous and will meet current standards for landfills, including the requirement that the groundwater meet the Interim Primary Drinking Water Regulations.BJ9 One of the major findings of these tests was that the trace elements in the solid waste seem to be immobilized in the residues and thus would not present a problem.
The solid waste taken from a fluidized bed would contain a great deal of heat that could be recovered for preheating the combustion air, heating the steam cycle condensate, or other uses. Thus, this material would be cooled in heat exchangers and screw coolers as it exits the bed. It would then be pneumatically conveyed to silos where it could be stored or loaded onto bucks or railcars and shipped to a landfill. The air used in the conveying operation would be separated from the solids with cyclones or baghouses located on top of the silos. The solid wastes from the cyclones would also contain a significant quantity of heat and would therefore be handled in the same manner as the bed waste, although in some designs, this material would be recycled back to the fluidized bed so that the unburned carbon collected in the cyclones could be used. Solid waste from the baghouse would not contain significant heat, so it would be sent directly to the silos.
If the solid waste from a PFBC plant is exposed to water, heat would be generated during hydration of the lime. Although this problem is considered to be more one of handling than of long-term disposal, some addi- tional care would be required in disposing of the waste. Because PFBC waste has not yet been categorized, some uncertainty exists as to the requirements that may be imposed on its disposal. For example, if the applicable landfill regulations are made stricter by incorporating the National Secondary Drinking Water Regulations, as has been considered, problems could arise with respect to the pH of the leachate, the total dissolved solids, and the sulfate ion concentration.gJ9

APPLICABLE ENVIRONMENTAL STANDARDS
Although environmental standards specifically applica- ble to XGCC or PFBC plants have not been promulgated, it is generally believed that any such standards in the future will be essentially the same as those for other large power production facilities. Limits on atmospheric emissions are established in the Clean Air Act of 1970 and Amendments of 1977. New plants are subject to NSPS, which govern emissions of S02, NO, and par- ticulate matter and the opacity of the released gases.
A number of other standards are also expected to be applicable, including the (1) Federal Water Pollution Control Act, Le., the Water Quality Improvement Act of 1970 and the 1972 Amendments, (2) Clean Water Act Amendments of 1977, (3) Resource Conservation and Recovery Act of 1976 (probably most important with respect to PFBC plants), (4) Toxic Substance Control Act, (5) Safe Drinking Water Act, (6) National Ambient Air Quality Standards (NAAQS), which establish unac- ceptable levels for ambient air pollution, (7) Prevention of Significant Deterioration regulations, which aim to prevent air quality deterioration in areas currently meet- ing NAAQS, (8) National Emission Standards for Haz- ardous Air Pollutants, which set maximum allowable emission rates for certain highly toxic pollutants (avail- able emission data suggest that PFBC plants are not potential sources of such pollutants), and (9) Marine Prstection, Research, and Sanctuaries Act, which states additional regulations on solid wastes.
Several of these major acts also have clauses that could become applicable, depending on whether the IGCC or PFBC solid wastes are classified by EPA as hazardous or nonhazardous. Because the combined- cycle technologies are in relatively early stages of devel- opment (as compared to conventional pulverizedcoal- fired plants), some of these determinations have not yet been made, resulting in uncertainty about the applicabil- ity of some standards.
In addition to the federal standards noted above, many individual states have environmental standards requiring lower emission levels than federal standards. For example, the California standards for the Utah coal tested in the Cool Water plant are 0.2 lb/million Btu for S02,0.14 lb/million Btu for NOx, and 0.01 Ib/million Btu for particulates. The Cool Water facility met both the federal and California standards, providing confi- dence that other combined-cycle facilities will meet such standards.
REFERENCES
1.
2.
3.
4.
5.
6.
7.
8.
9.
10.
11.
12.
Hedman, B.A., and G.K. Oates, Meeting Future Electric Power Needs with Natural Gas, Public Utilities Fortnightly, pp. 24-29 (Jan. 5,1984).
Hedman, B.A., et al., Potential for Natural Gas- Fired Combined Cycle Power Generation in the United States, Proc. 1984 International Gas Re- search Conf., Washington, D.C. (Sept. 10-13,
Natural Gas-Fired Combined Cycle Electric Power Generation: An Attractive Option, American Gas Assn., Arlington, Va. (May 10, 1985).
Stieg, J., M.P. Kalejus, and R.W. Mathias, West- ern Farmers Combined-Cycle Plant: A Success Story, Roc. American Power Conf., 45:383-389
1984).
(April 18-20,1983).
Cool Water: Milestone for Clean Coal Technol- ogy, EPRI Journal, 9(10):16-25 @ec. 1984).
Achieving the Promise of FBC, EPRI Journal, 10(1):615 (JanJFeb. 1985)
Miller, S.A., et al., Technical Evaluation: Pres- surized Fluidized-Bed Combustion Technology, Argonne National Laboratory Report ANLEE- 81-65 (April 1981).
Chiu, S., An Evaluation of the Environmental and Technical Aspects of Pressurized, Fluidized-Bed Combustors, Argonne National Laboratory Report ANWEES-TM-257 ( a t . 1983).
IGCC Phased Capacity Addition, EPRI Journal, 10(10):50-52 (Dec. 1985).
Design of Advanced Fossil Fuel System (DAFFS): A Study of Three Developing Technol- ogies for Coal-Fired, Base-Load Electric Power Generation, Summary Report, Argonne National Laboratory Report ANUFE-83-9 (May 1983).
Pulverized Coal-Fired Power Plant with a Wet- Limestone Flue Gas Desulfurization System, Ar- gonne National Laboratory Report ANYFE-83- 10 (June 1983).
Pulverized Coal-Fired Power Plant with a Chiyoah Thoroughbred 121 Flue Gas Desulfuriza- tion System, Argonne National Laboratory Report -43-1 1 (June 1983).
127

13.
14.
15.
16.
17,
18.
128
Pulverized Coal-Fired Power Plant with a Lime Slurry Spray DryerlFabric Filter Flue Gas Desul- furization System, Argonne National aboratory Report ANUFE-83-12 (June 1983).
Integrated Coal GasijicationlCombined Power Plant with BGCILurgi GasGcation Process, Ar- gonne National Laboratory Report ANUFE-83-16 (June 1983).
Integrated Coal GasificationlCombined Cycle Power Plant With Westinghouse Gasification Process, Argonne National Laboratory Report ANL/FE-83-17 (June 1983).
Integrated Coal GasificationlCombined Cycle Power Plant with Texaco Gasification Process, Argonne National Laboratory Report ANLEE- 83-15 (June 1983).
Air-Cooled Pressurized Fluidized Bed Power Plant, Argonne National Laboratory Report ANLm-83-14 (June 1983).
Steam-Cooled Pressurized FIuidized Bed Power Plant, Argonne National Laboratory Report ANLEE-83-13 (June 1983).
19.
20.
21.
22.
23.
24.
Hubble, BR., Fluidized-Bed Combustion: A Re- view of Environmental Aspects, Argonne National Laboratory Report ANUECT-12 (Jan. 1982).
Cltility Solid Waste: Managing the By-products of Coal Combustion, EPRI Journal, 10(8):20-3 1 ( a t . 1985).
Gillette, J.L., and S.-Y. Chiu, Flue-Gas Desul- furization: Review of Selected Commercial and Advanced Technologies, Argonne National Labo- ratory Report ANLIFE-81-51 (Feb. 1981).
Compilation of Air Pollutant Emission Factors, U.S. Environmental Protection Agency Report AP-42, Supplement 13 (Aug. 1982).
Cool Water Project Update, EPRI Journal,
Spencer, D.F., S.B. Alpert, and H.H. Gilman, Cool Water: Demonstration of a Clean and Efficient NeH' C u d Technology, Science, 232:609-612 (May 2, 1986).
11(2):34-36 (March 1986).

Chapter 9
Coal-Liquid Mixtures
BACKGROUND
A coal-liquid mixture (CLM) consists of finely crushed coal suspended in various liquids and typically small amounts of chemical additives that improve stability and other physical properties. The primary purpose of CLMs is to convert coal from a solid to an essentially liquid form, which allows it, with certain equipment modifications, to be transported, stored, and burned in a manner similar to fuel oil. In addition to coal-oil and coal-water mixtures, CLM technology in recent years has been broadened to include mixtures of coal-metha- nol, solvent-refined coal oil, petroleum-coke oil, and other solid-fuel liquids. The discussion in this chapter is primarily limited to coa1,oil mixtures (COMs) and coal- water mixtures (CWMs), which are the more mature technologies.
History
The history and development of CLMs are presented in some detail in Ref. 1, which is based on earlier reviews of COMs2-4 and CWMs.5 The historical summary pre- sented here is based on those reviews. For a detailed historical review and listings of further references, see Refs. 1-5.
Coal-Oil Mixtiires
Renewed interest and significant development efforts in CLMs have emerged in the past 15 yr as a result of the search to find a replacement for dwindling oil supplies in the United States and other countries. The possibility of transporting liquefied coal by pipeline as an alterna- tive to transporting solid coal by rail or barge has also stimulated recent development of CWMs. However, initial development work for COMs dates back to the previous century, with the earliest known COM patent
being issued nearly 100 yr ago. During World War I, COMs were evaluated as a fuel for submarines, and during the 1930s, COMs were successfully tested as an oil substituie for locomotives and wean liners. These early applications were primarily limited to prototype testing.
More extensive COM research was undertaken in the United States in the 1940s because of the war-time constraints on oil supply, and the data collected during this period still serve as a basic source of information. A resumption of readily available oil supplies at prices competitive with coal inhibited the widespread commer- cialization of the technology at that time.
A subsequent constraint on oil supplies, initiated by the 1973 oil embargo, prompted the current era of in- creased COM research and development. A significant early development, in a program initiated by General lMotors during this period, was the discovery of low- cost, effective chemical additives for stabilizing the mixture and enhancing other physical and chemical properties.6 During the period 1977-1981, extensive utility and industrial boiler demonstrations using COMs were conducted in the United States, Japan, Sweden, England, and other countries. The total design capacity of the utility-boiler tests alone was over 2,200 MWe.1 An additional major application of COMs successfully demonstrated during this period was as a fuel for blast furnaces.
ating or have been operated in various countries. These plants use a variety of processes, including wet and dry grinding, ultrafine grinding, and coal beneficiation (removal of ash and sulfur).
mature commercial technologies. However, several areas have been identified for further research to im- prove performance, reliability, and market potential. Principal among these are advanced beneficiation of the
Over 20 COM preparation plants are currently oper-
As a result of these activities, COMs have become
129

coal to further reduce suIfur and ash content, demonstra- tion in a compact boiler designed to bum oil, and in- creased percentage (by weight) of coal in the mixture.
Coal- Water Mixtures
The development of CWMs does not have the long history of COM development. In 1961, a CWM with 67% coal, by weight, was successfully fired in a full- scale demonstration program at the Werner Station of the Jersey Central Power and Light Company.7 In the 196Os, the Germans and Russians also conducted several major CWM combustion tests. However, despite the success of these tests, no further major efforts were undertaken in this country until the major test at 1 mil- lion BWh input conducted by the Atlantic Research Corporation (ARC) in 1979 with support from the U.S. Department of Energy (DOE)!
The success of the ARC test marked the beginning of an intensive CWM program in the United States. The development of CWMs has followed a path similar to that for COMs, with emphasis on developing technolo- gies for preparing mixtures with proper physical and chemical properties, demonstrating retrofit in existing boilers, and developing specialized equipment for han- dling and transporting the slumes. The CWM technol- ogy is considered to be on the verge of commercializa- tion, and although not as mature as COM technology, CWMs are considered to have an economic edge.
Government and Industry Programs
Development of CLMs has been shared between govern- ment and industry. The COM technology is considered to be commercially available and thus current COM research and development is mostly directed at technol- ogy refinements such as process optimization, slurry rheology (flow characteristics), combustion characteris- tics, and retrofit applications. The more significant emphasis of current CLM research and development in the United States is on CWMs, and much of this is con- ducted by private industry pursuing proprietary CWM production processes. The Electric Power Research Institute (EPRI) has been a major supporter in the devel- opment of CWMs for utility applications. According to researchers at EPRI, "There are no major technical barriers remaining," and what is required to encourage commercialization is demonstration in an oil-fired utility boiler in the 100- to 500-Mw range to verify predicted operating characteristics, such as the derating that would result from the conversion.9
The coal-mixture research and development funded by DOE is characterized by a focus on high-risk-tech-
nology basic research and market assessment.10 Coop- erative programs with industry, including EPRI, have emphasized stimulation of private-sector involvement leading to commercialization. Although not normally considered part of the CLM programs, the DOE and industry efforts to develop advanced coal beneficiation technologies also are applicable to CLM technologies, which are limited to use of low-sulfur, low-ash coals as feedstock. The DOE Pittsburgh Energy Technology Center (PETC) has been a focal point for federally funded CLM research.
A significant contribution to dissemination of research and development information has been the series of International Symposiums on Coal Slurry Fuels Preparation and Utilization hosted by the PETC (see, for example, Ref. 11).
Potential Market
Although CLMs are at or near commercialization, the level of market penetration depends on many uncertain factors. Since CLMs are in large part intended as a substitute for oil, their market penetration depends heavily on oil prices. A much larger market penetration would also occur if CLMs, using ultraclean beneficiated coal, would economically surpass conventional pulver- ized coal in new plants by eliminating the need for scrubbers.
Assuming 1984 CLM technology, it has been esti- mated to be technically possible for CLMs to displace over 1 quadrillion Btu, or 1 quad, of oil use in both utility and industrial boiler applications.10 With current technology, CLMs cannot now be used economically in marine or railroad diesels; however, with sufficient technological advances not now foreseen, the CLM market potential for railroad diesels is 0.7 quad based on 1980 oil consumption in this sector.10
PROCESS AND TECHNOLOGY
The primary objective for developing CLM fuels is to produce a coal-based fuel that has many of the opera- tional characteristics of oil and can thus serve as a re- placement fuel in oil-burning applications, with only minor modifications to fuel storage, handling, and com- bustion equipment and procedures. To achieve this objective, the principal areas of technology development have been in processes for CLM preparation; slurry pumps and other equipment components for storage, handling, and transport; and retrofit modifications or new designs for burners and boilers using CLMs. The
130

Table 9.1 Cml-Liquid Mixtures, Processes, and Technologies
Represeutati ve processes Characteristics Technologies
Coal crushing and sizing
Grinding
Beneficiation
Coal-liquid mixing
Transportation and storage
Combustion
Major emphasis on eastern, medium- to high-volatility, bituminous coal
Typically 200 mesh (74 pm or finer); bimodal distribu- tions are under study for C W M S
Aiming for: 15,OOO Btunb 0.9% sulfur 4.0% ash
Additives minimize vis- cosity, increase solids loading capacity, and enhance mixture stability
CLMs are highly viscous, nonnewtonian fluids and must be stable with respect to sedimentation and subsidence
Fuel parameters Abrasiveness (nozzle and pump wear) Atomizability Carbon conversion Flame stability
Crushing Screening
Dry milling Wet milling Ultrasonic grinding
Physical cleaning Water Heavy media Froth flotation Oil agglomeration
Chemical cleaning
Proprietary preparation processes involving additives, grinding, and mixing
Heating Pumping Remixing Agitation Recirculation
Burner modification; boiler modifications to prevent fouling, reduce derating, and collect ash
major processes and technologies involved in CLM preparation and use are given in Table 9.1. The avail- able technologies and status of developments in these areas are summarized below; more detailed information can be found, for example, in Refs. 1, 10, 12, and 13.
Coal-Oil Mixtures
Preparation
The basic steps in COM preparation are finely grinding the input coal, mixing the pulverized coal with oil, and stabilizing the mixture by adding various chemical addi- tives. An additional step of beneficiating the coal to remove sulfur and ash is also typically required. Benefi- ciation may be performed as part of the preparation of the input coal before it is sent to the COM preparation
plant or, in some instances, may be integrated into the COM preparation process. Limits on viscosity and other physical properties affecting handling have limited the coal loading in the product COM to 40-50% by weight, although higher loadings are being investigated. Repre- sentative specifications for a COM are given in Table 9.2.14
ing installations, COMs are usually prepared from a bituminous coal of medium to high volatility and low ash content, since oil burners have only limited capabil- ity for ash removal. To minimize ash deposition and fouling problems, it is also desirable that the feed coal be low in moisture and have a moderate-to-high ash fusion temperature (the temperature of initial deforma- tion). A low sulfur content is also required to maintain the low sulfur emissions of the oil fuels being replaced.
In order to serve as a replacement fuel in oil-burn-
131

Table 9.2 Specifications for a Representative COM
Table 9.3 Properties of Typical Eastern Bituminous Coals Suitable for Use in COMs
Characteristic Value
Composition (% by weight), 50/43/7 coal/oiY(water & additives)
High heating value 6.2 (million Btulbbl)
Density (Iblgal) 10.1
Sulfur (96 by weight) 1.0-1.5
Ash (96 by weight) 3.0
Viscosity (maximum 30,000 Ib/ft * h at 140'F)
Source: Ref. 14.
Table 9.3 presents a range of values for these properties suitable for COM use.14
The coal particle size in a COM is dependent on the application and equipment to be used in the transporta- tion, storage, and combustion. For applications as an oil replacement in utility or industrial boilers or process heaters, where good atomization and stable flames are required, coals are typically ground to 70-80% minus 200 mesh (74 p). Ultrafine grinding to sizes as low as 10 pm can improve combustion efficiency, reduce ash deposition, and reduce or eliminate the need for stabi- lizing additives, but at a higher cost of fuel preparation. On the other hand, in applications such as blast furnaces where flame control is not as critical, COMs with coal particles as coarse as 70% minus 25 mesh have been successfully used. Pipeline and tanker transport of coal as a COM does not require fine grinding of the coal.
The coal can be ground with conventional pulver- izers using ball, roller, or bowl mills. The grinding is done either with the coal dry or premixed with oil, the latter offering a safety advantage by avoiding the need to store dry pulverized coal and combining the grinding and mixing into one operation. Mills driven by com- pressed air or superheated steam have been used to puI- verize coal to micrometer size. Because of its low cost, No. 6 oil is most frequently used in COMs. This cost advantage is offset by a lack of uniformity and high viscosity, and as a result the more costly No. 2 or 4 oils, methanol, and ethanol have been used in specialized applications. In almost all applications, except where ultrafine ground coal is used, various additives are also
132
Range of Characteristic Typical Values
Moisture (%) 4.5-9.0
Ash (%) 4.5-10.0
17-40 Volatiles (%)
Sulfur (%)
High heating value (Btdlb) 12,500-14,500
Ash fusion temperature (OF) 2,Mx)-2,8ooC
0.6-1.5
Source: Ref. 14.
included in the mixture to improve stability and prevent hard compaction of the coal particles. The additives are primarily dispersants, which keep the mixture homoge- neous; however, additives are usually adapted to the particular oil-coal characteristics in individual applica- tions. Many of the dispersants were developed commer- cially and are thus proprietary. Stability and atomization are usually also improved by the addition of a small amount of water.
Various mechanical processes are used to achieve the proper mixing of the oil, additives, and water. Wet grinding, as discussed above, is one approach to achiev- ing a high degree of mixing. A more recent develop- ment is emulsification using ultrasonic sound waves. Ultrasonic emulsification achieves mixing through (1) instabilities created at the interface of two phases of different densities under the intense acceleration pro- duced by a sound field and (2) cavitation (displacement of particles) that takes place in the liquid at high sound intensity. To achieve the desired low levels of ash and sulfur in COMs, beneficiation of the feed coal beyond the normal washing and crushing may be required. This will add considerably to the cost of the fuel, but will reduce the costs of boiler or burner modification to accept a COM. The economic trade-off between the levels of beneficiation and burner modification depends on the specifics of the application. Some advantages, however, are gained by integrating the coal beneficiation process into COM preparation. In particular, the fine grinding required in the COM preparation process is also an important step in many coal cleaning processes. (See

the chapter on Environmental Control Technologies for Fossil Energy Systems.) Also, coal beneficiation at the COM preparation plant eliminates the costly dewatering step common to beneficiation processes.
Integrating coal beneficiation and COM preparation by using an oil agglomeration procedure has also been investigated. The basic principle of this process is thet certain hydrocarbons will coat coal-rich particles pref- erentially over coal-lean particles containing ash or pyritic sulfur. Under agitation, the hydrocarbon-covered coal particles will agglomerate (cling together) and the coal-lean particles are then separated by flotation or screening.
Handling, Transportation, and Storage
A COM preparation plant must be located at the inter- section of three transportation networks: coal supply, oil supply, and product distribution. This intersection could occur at the coal mine, the oil refinery, the COM user site, or anywhere in between. The preferred siting de- pends on various factors, such as relative transportation costs of the feedstocks and COM product, site avail- ability, and environmental concerns. The COM storage and transportation requirements will in turn affect the desired characteristics for a COM. In its more typical form, with 50% coal loading mixed with No. 6 fuel oil and stabilizers, a COM has storage and handling proper- ties similar to No. 6 oil and can be transported by rail tank car, marine tanker, or tank truck. Because of their high viscosity, COMs typically require heating to facili- tate transfers. The high viscosity also prohibits pipeline transport of COMs over long distances unless a lighter oil is used in the preparation. During storage, minor recirculation is required to keep the mixture homo- geneous.
One of the most significant equipment modifica- tions required for switching from oil to a COM is in the slurry pumps. These pumps are generally used in two basic applications: transfer of a COM between the prep- aration plant or transportation unit to storage tanks and transport from storage to burners. The slurry during storage transfer is normally at moderate temperature and thus at high viscosity, and the pump discharge pressure is relatively low and the flow rate is relatively high. Screw, lobe, and progressive cavity pumps are usually selected for this purpose. The burner feed pump, in contrast, is generally operated at high pressure, high temperature, and low viscosity in order to achieve good fuel atomization. These pumps are usually internal gear screw, progressive cavity, or reciprocating types.
Existing equipment used for No. 6 oil is capable of pumping COMs; however, the pump components are
subject to accelerated erosion due to the abrasive nature of the coal particles. This erosion can be reduced by constructing exposed metallic parts from high-hardness materials and fabricating seals from elastomer materials, such as ceramics, TeflonTM, or carbodcarbide compos- ites. In general, the expected service life of slurry pumps will be less than can be expected for pumps in clean-liquid applications, and maintenance costs will be higher. Improvement in pump reliability continues as an area for COM technology development.
Combustion
To maximize the applicability of COMs, it is desirable to minimize the initial capital cost and subsequent main- tenance cost of converted burners and also to minimize any capacity derating associated with the necessary equipment modifications or burner performance changes. COMs have been used as fuel in standard oil burners in both small package boilers and large utility boilers. However, in most cases, the atomizers and nozzles were upgraded with hardened material or the design was otherwise modified to minimize wear. The service life of a nozzle modified for COM firing is as much as 1,OOO h or longer, which approaches the service life for oil-fired devices.
Many different types of COM burners have been either tested or used in commercial applications. These include, for example, the extemavair-atomized, high- pressure/steam-atomized, internal-midsteam-atomized, ultrasonic, and vortometric burners. There is no clear indication of which type is most suitable for COM firing; however, it appears that air- or steam-atomized burners are preferred over mechanically atomized burners. With appropriate minor nozzle modifications and proper mixing of fuel and air, good atomization can generally be obtained to produce stable flames. Ignition stability is also aided by the high hydrogen content (10-12%) of most oils.
One of the factors to be taken into consideration in converting an existing oil burner to COM fuel is com- bustion efficiency. The coal particles will not volatilize to the extent of oil and thus a longer residence time in the burner is required to achieve complete combustion. The combustion efficiency is aided by reducing the particle size of the coal and increasing the burner tem- peratures. However, increasing the temperatures will tend to aggravate ash deposition problems.
of COMs, which is 30-100 times that of oil, depending on ash content in the feed coal and level of beneficia- tion. Consideration must be given to addition of soot- blowing and bottom-ash removal equipment. Only
An additional factor in conversion is the ash content
133

minor deratings in boiler efficiency accompany well- designed oil-to-COM conversions. This was demon- strated in the Florida Power and Light Company 400- Mw Sanford Unit 4, which was converted from oil to COM. The loss in boiler efficiency was 0.7-1.5% in utility boilers with a 100- to 4 0 0 - W e capacity.12 The losses were attributed to lower combustion efficiency and the energy required to provide higher excess air levels.
Coal-Water Mixtures
Preparation
The basic steps for preparation of CWMs are the same as those for COMs discussed above, namely grinding input coal, mixing with a liquid (in this case water) and chemical additives for stabilization, and possibly beneficiating the coal as a separate or integrated step. Properties of a representative CWM are shown in Table 9.4.15 The grinding and mixing processes for CWMs are similar to those for COMs. Grinding of the coal particles to minus 100 mesh (147 p) is typical, although other size distributions are used in special applications.
The overall CWM preparation, however, tends to be more sophisticated and controlled than COM preparation so as to achieve a higher coal loading. Coal loadings in CWMs of 700/0 by weight (compared to about 50% in COMs) with acceptable viscosity have been achieved, due in large part to the lower viscosity of water com- pared to oil. The lower water viscosity will, however, allow more rapid settling of the particles, thus presenting a somewhat greater challenge to obtaining mixture stabi- lity. CWMs with a high solid loading and minimum viscosity also require appropriate dispersants and stabi- lizers. Characteristics that determine the suitability of stabilizing additives include (1) nonfoaminess, (2) a structure with both hydrophobic and hydrophilic (water repelling and attracting) portions, (3 ) water solubility, (4) compatibility with stabilizers, and (5 ) effectiveness at low concentrations. Gums, salts, clays, and other materials have been used as stabilizers.
The chemical and physical properties of the coal have a major influence on the characteristics of CWMs. Experience has shown that CWMs with bituminous coals allow higher coal loadings than CWMs made of subbituminous coals or lignites. Also, high-volatility bituminous coals are more desirable for CWMs because they provide favorable ignition and combustion charac- teristics. Table 9.5 summarizes coal properties impor- tant for CWM preparation. Since the fuel in CWMs is 1OC% coal, beneficiation to reduce ash and sulfur is
134
Table 9.4 Properties of a Representative CWM
Particle Size
Viscosity
100% minus 100 mesh
Less than 6,800 Ib/ft's at 113 cycleds and 77OF (Hakke method)
Volatile matter
Coal-water sluny analysis
Gross heating value (Btullb)
Proximate analysis (a) Moisture Volatile matter Fixed carbon Ash
Ultimate analysis (46) Moisture Hydrogen Carbon Sulfur Nitrogen Oxygen. Ash
Greater than 30% by weight (dry)
Total moisture = 31.0% Solids content = 69.0%
As Received Moisture Free
10,170 14,740
31.0 27.1 39.3 40.1 58.1 1.8 2.6
31.0 3.8 5.5 56.1 81.3 0.6 0.9 1.1 1.6 5.6 8.1 1.8 2.6
'Oxygen content is measured by subtracting the percentages of all other constituents from 100%.
Source: Ref. 15.
relatively more important for CWMs compared to COMs, and this is a major area of ongoing development. As with COM preparation, the elimination of the need for dewatering and other factors are promoting the inte- gration of coal beneficiation with the other CWM prepa- ration processes.
the point where commercial development is being un- dertaken by various organizations. Much of the detailed information on the processes used in these commercial ventures is proprietary.
The technology for CWM preparation has reached
Handling, lrunsportation, and Storage
As with COMs, optimal placement of a CWM prepara- tion plant relative to the coal supply and CWM user requires consideration of various economic and technical

Table 9.5 Coal Factors Significant For CWM Preparation
Coal Characteristic Impact on CWh4 Desired Range0
Energy content
Volatile content
Ash content
Ash chemistry
Sulfur content
Organic sulfur content
Surface chemistry
High energy content lowers handling and storage costs
Volatiles improve ignition and combustion
High ash concentration increases particulate emis- ions, combustor derating, and coal cleaning costs
Corrosive ash with low softening temperature can cause combustor slagging or fouling and need for derating
High sulfur content increases S o t emissions and sulfur removal coats
Organic sulfur cannot be removed by physical cleaning
Governs the effediveness and coat of additives and influences the choice of coal cleaning method
13,OOO-15,M)o BWlb
30% or higher
5% or lower
Noncorrosive, low in sodium, high softening temperature
1% or lower
Low enough to ensure 1 % total sulfur in C W M S
aRange for clean dry coal before mixing with water. CWMs are not limited to coals with characteristics within the ranges shown.
Source: Ref. 10.
factors. The CWM slurry can be transported by rail, truck, barge, or pipeline. A CWh4 prepared for an EPRI test bum was transported 1,OOO mi by rail and stored for as long as 14 wk in an agitated tank without stratifica- tion of the slurry.9 Pipeline transport of the CWM at the high 70-75% coal loading is limited to short distances (about 50 mi or less).
The pump technology for COM is generally trans- ferable to CWM; however, wear rates in CWM applica- tions are expected to be higher than with COM for two reasons: (1) CWM has higher coal loading and is there- fore more abrasive and (2) the fuel oil in COM provides lubrication during pumping. However, additional opera- tional experience with CWM pumps is needed before definitive conclusions can be drawn.
Combustion
Tests have demonstrated that heavily loaded CWMs can be successfully fired in burners designed for oil. How- ever, the tests also indicated areas needing development, including reducing air preheating requirements, extend- ing burner turndown capability, increasing carbon con- version efficiency, and extending burner lifetime by reducing effects of erosion. These development needs are related to the slower burning and abrasive charac- teristics of CWMs relative to oil. Developmental goals considered to be necessary for acceptable performance include a turndown ratio of 3: 1 or better, minimum burner-tip life of 2,000 h, air preheating of less than 300'F, maximum droplet size of 300 pm, and carbon conversion efficiencies of greater than 99%.9 Small-
135

scale tests suggest that these goals are achievable, but what is yet required is long-term demonstration in large electric-utility-size boilers in the 100- to 500-MW range.
A major issue affecting decisions to convert burners from oil to CWMs is the derating in capacity compared to the original maximum continuous rating with oil fiiing. In small-scale tests, the capacity with a CWM has been maintained at 90-100% of maximum continu- ous rating by modifications, such as adding sootblowers to minimize loss of heat transfer, changing burner-tip design, and enlarging furnace volume.1 Derating can also be minimized by using high-quality coal and ad- vanced beneficiation in the CWM preparation. Preferred trade-offs between accepting some derating versus main- taining maximum continuous rating (by various facility modifications or use of more-refined CWMs) is a site- specific problem that in most cases will require actual boiler testing.
Development Status
Because of their liquid form, COMs and C W s present significant advantages over solid coal for storing, han- dling, and transporting in many electric-utility and in- dustrial applications. Although CLMs have a potentially lower cost than coal liquefaction and gasification, their more important advantage over these technologies may be their earlier availability.
Compared to CWMs, COMs have a more mature technology and can be considered ready for commer- cialization. However, CWMs are also rapidly approach- ing commercialization and have a potential edge on cost because of the complete elimination of oil in these fuels. Table 9.6 presents a comparison of COMs and CWMs.
Increasing the use COMs depends on development in three areas. First, beneficiation to achieve combus- tion emissions at or near those of residual oil would make COMs attractive to many industrial and utility users. Second, demonstration of acceptable conversion costs and little boiler derating when compact boilers designed to bum oil are converted to COM-firing would open COMs to a large share of this market, which is considered a major potential. Finally, the cost advantage of COMs could be enhanced if the oil required to mix these fuels could be reduced below the current 40-5W0.
Increasing the use of CWMs depends on develop- ment in four areas. First, beneficiation is somewhat more important with CWMs because of their higher coal loading. Second, issues relating to stability, pumpabil- ity, and remixability of CWM slurry remain to be ad- dressed. Third, although burners and pumps for CWMs have been demonstrated in short-term tests, more
Table 9.6 Comparison of CWMs and COMsn
Value of CWM Characteristic Relative to COM
CoaUliquid ratio
Fuel cost
Erosion from fuel
Viscosity
Thermal efficiency
Derating potential Fly ash abrasion Slagging potential Fouling potential
Peak flame temperature
NO, emissions Fuel nitrogen content
(Btu basis) Thermal NO, Ability to stage-fire
at all loads
Particulate emissions
Combustion performance Ignition stability Turndown capability Carbon burnup
Higher
Lower
Higher
Lower
Lower
Higher b b
Lower
Higher
Lower More difficult
Higher
Lower Lower
b
aAssuming same coal type in both mixtures.
bDepends on coal type and additives.
Source: Ref. 10.
information is needed on long-term durability and per- formance and the costs of maintenance and replacing parts in this equipment. Finally, long,term testing in a variety of large boilers is necessary to predict reliability and derating in a range of applications.
ENVIRONMENTAL ISSUES
Preparation Plants
Very little published information is available related to environmental concerns specifically for CLM prepara-
136

tion plants. However, the nature of environmental issues can be largely inferred from the more familiar technolo- gies for preparation of coal in the solid form, since the major processes involved are similar (e& coal grinding, storage, handling, and beneficiation).
Atmospheric Emissions
The niajor air quality issue relating to CLM preparation plants is emissions of fine coal particulates, and the U.S. Environmental Protection Agency (EPA) has established New Source Performance Standards (NSPS)16 with an opacity linlit of 20% on gases emitted from any coal processing (e.g., grinding) and conveying equipment, coal storage system, or coal transfer or loading system. The NSPS also place a limit (10% opacity and 0.04 grams per dry standard cubic meter) on particulate emissions from pneumatic equipment used to segregate coal particles by size. In-plant fugitive dust also is con- trolled partially through regulations developed under the Coal Mine Health and Safety Act.
Atmospheric emissions from thermal dryers are a further area of concern in coal preparation plants and the NSPS include particulate emission standards for these sources. In this regard, the CLM preparation plants present an environmental advantage since drying the coal is not a necessary process step.
Other areas that suggest the possible existence of air quality concerns based on the nature of the process, but for which little or no evidence is available, include vola- tile organic compound emissions from oil used in COM preparation and toxic or volatile organic compound emissions from chemicals used for CLM stabilization or chemical-based beneficiation.
Water Efluents
Coal preparation by wet methods can result in a dis- charge of process water containing dissolved and sus- pended solids and various trace constituents contained in coal. These pollutants can also be contained in the run- off from coal and waste storage areas. The NSPS for coal preparation plants, however, do not allow discharge of plant process water, and runoff from areas associated with coal preparation plants is limited in maximum concentrations of three principal pollutants: iron (6 mg/L), manganese (4 mg/L), and suspended solids (70 mg/L).17
Solid Wastes
CLM preparation plants will not produce large quantities of solid waste, since the input coal is usually washed at the mine to remove the largest fraction of waste
material. However, if the coal is further beneficiated as part of the CLM preparation, significant quantities of ash and pyrites can be generated. If these wastes are finely ground in a wet beneficiation process, disposal can be difficult if the wastes are not adequately dewa- tered. Dewatering or, alternatively, building slurry impoundments can be costly.
Corn bust i on
Air Quality
Emissions. Measured emissions of fly ash from boilers firng CLMs are a function of the percentage of coal in the CLM, the ash content of the coal used, and, to some degree, the amount of ash deposited in the boiler. Al- though test data on small test boilers suggest that most of the CLM ash (75-95%) is emitted as fly ash, some combustion tests on coal slurries have shown signifi- cantly lower fly ash emissions at the cost of more ash retained in the burner.18
Emissions of sulfur dioxide (SOz) from CLM com- bustion are a direct function of fuel sulfur content. The CLM sulfur content is in turn determined by the sulfur content of the coal (and oil in COMs) used to make the CLM and the percentage of coal present in the CLM. At least 95% of the fuel sulfur is typically emitted as SO2. But CLMs made with coal that has highly alkaline ash may emit slightly less than 95% of the fuel sulfur, since the alkaline ash retains some of the fuel sulfur.18
Emissions of nitrogen oxides (NO,) from boilers firing CLMs are more difficult to quantify for all appli- cations than are SO2 and particulate emissions. For any boiler, NO, emissions can vary not only with CLM fuel composition, but also with the amount of combustion air (excess air) and, in some cases, with boiler load. Prop- erties of the CLM fuel that influence NO, emissions are the nitrogen content of the fuel(s) used to make the CLM and the percentage of fuel in the CLM. For a given fuel composition, NO, emissions can vary significantly from boiler to boiler due to differences in burner and furnace design and the use of combustion air preheating. From a limited data base, NO, emissions from COM combus- tion are 0.4-0.7 lb/million Btu for most tests, although some tests showed emissions of 1.0 Ib/million Btu or greater.19 Data also indicate several general trends, including (1) an increase in NO, emissions at increased excess air levels, (2) an increase in NO, enussions with increased COM nitrogen content, and (3) higher NO, emissions from COM combustion than from combustion of oil with the same energy content. Depending on the
137

firing system, a CWM should give lower thermal NO, concentrations than a COM because of the presence of water and lower peak flame temperatures.
Trace elements in the CLM fuel exit the boiler either with the bottom ash or the flue gas. Most of the tracp, elements emitted with the flue gas are associated with the fly ash, although some may remain in the vapor phase. Trace elements that are of environmental concern in connection with CLM combustion include arsenic, beryllium, cadmium, chromium, nickel, selenium, vanadium, and mercury.18
The amounts of trace elements emitted from a par- ticular boiler firing CLMs depend on combustion temperature, fuel feed mechanism, characteristics of the flue gas, and CLM properties (trace element concentra- tion). The combustion temperature determines the ex- tent to which trace elements may be emitted with the fly ash or flue gas. The fuel feed mechanism influences the partitioning of noncombustible trace elements between the bottom ash and the fly ash. The temperature of the flue gas affects the amounts of volatile trace elements that are emitted as vapor relative to the amounts that are emitted and then condensed on the fly ash particles.
Coal may have higher concentrations of arsenic, beryllium, chromium, mercury, and selenium than does oil. Residual oil has higher concentrations of cadmium, nickel, and vanadium. Thus, combustion of CLMs would likely result in higher emissions of arsenic, beryl- lium, chromium, mercury, and selenium, but lower emissions of cadmium, nickel, and vanadium, than would the combustion of oil alone. However, trace elements at this time have not been determined to be of large enough concern, for either coal or oil, to be regu- lated under federal standards.
combustion detected polynuclear organic material @'OM) emissions.18 Formation of POM is related to combustion efficiency, and POM transformations are related to boiler and downstream flue-gas temperatures. It also appears that, when properly fired, oil-only com- bustion would contribute almost no POM emissions to the environment, while coal-only combustion produces POM emissions in unpredictable patterns. Therefore, the POM emissions from CLMs cannot be related to the fuel content of any particular component.
Only a few of the studies that were limited to COM
Regulatory Requirements. The initial NSPS for fossil- fuel-fired steam generators with a heat input greater than 250 million Btuh were applicable to facilities con- structed after August 17,1971.20 In June 1979, EPA promulgated revised NSPS for electric-utility steam generators of this size category for which construction or modification began after September 18,1978.21 The
138
1979 NSPS in effect require sulfur and particulate con- trols on all new or modified coal-fired utility boilers. Recently, EPA proposed NSPS for industrial, commer- cial, and institutional steam generators with a heat input greater than 100 million Btulh.22 A summary of these proposed and promulgated NSPS for coal- and oil-fired steam generators is presented in Table 9.7. All these standards are based on heat inputs, and, in the case of NO, emissions by electric-utility steam generators, also on the type of coal used. Under the provisions of exist- ing regulations, precombustion removal of pollutants, through methods such as coal cleaning and oil hydro- desulfurization, may be credited toward the reduction requirement.
Modification of an existing oil-fired boiler to CLM firing does not appear to make the unit come under the recently promulgated NSPS for steam electric generating units, since that regulation specifically states: "Any
Table 9.7 Summary of NSPS for Steam Generators Firing Coal and Oil
Emission Limits (Ib/million Btu, % reduction)
Generator Type, Fuel PM so2 NO,
Steam >DO million BtUm
Coal 0.1 1.2 0.7 Oil 0.1 0.8 0.3
Electric utility 7250 million Btuh
coal 0.03,99% 1.2,90%. 0.6,65%b 0.6.70% 0.5 ,65%~
Oil 0.03,99% 0.8,90%. 0.3,30% 0.2,0%
Coalderived liquids - 0.5,30%
Industrial, commercial, or institutional 7100 million B U h d coal 1.2,90%a -
0.6,50%
0.4,50% Oil 0.1 0.8,90%. -
0.2,0%
elhere are alternate sets of emission limits for this category.
bBituminous coal or lignites.
CSubbituminous coal. dprOposed emission limits.
Sources: Refs. 20-22.

change to an existing steam generating unit originally designed to frre gaseous or liquid fossil fuels to accom- modate the use of any other fuel (fossil or nonfossil) shall not bring that unit under the applicability of this subpart [the revised NSPS]."21 In addition, steam gener- ators using or intending to use CLA4 fuels are exempt from restrictions and standards specified in the Fuel Use Act of 1978.
The federal Clean Air Act mandates that National Ambient Air Quality Standards (NAAQS) are to be promulgated and attained and maintained in each state through the development and implementation of State Implementation Plans (SIPS). If utility boilers modified to burn CLMs are exempt from NSPS as indicated above, then emission limits will in most cases be estab- lished by states under their SIPS. The need for utilities to address emission limits according to widely varying state regulations may tend to inhibit the rate at which CLh4 technologies penetrate the market.
the NAAQS are designated as nonattainment areas, and preconsmction review requirements are in effect in these areas. Of major significance in these requirements is that offsetting emissions reductions, equivalent to at least the increase in emissions from the new source, must be obtained. These offset requirements apply to each pollutant for which the area is designated to have a nonattainment status. Emissions offsets are generally achieved by installing improved controls on existing sources in the vicinity of the proposed sources.
program23 is aimed at preventing deterioration of air quality in regions that have existing air quality better than the NAAQS. In these areas, "major new or modi- fied sources" must be reviewed by EPA or the state where the source is to be located. If the source is subject to PSD review, the "best available control technology" must be applied to the source. The PSD review, which generally includes control technology review, air quality review, air quality monitoring, and development of detailed source information, has the objective of keeping the increment in area atmospheric concentration of criteria pollutants within specific limits. The allowable increments depend on the area designation, with the most restrictive limits applied to sensitive areas such as national parks.
Sources defined as "major new or modified sources" and subject to PSD review include (1) any one of 28 designated source categories having the potential to emit 100 tons/yr of any criteria pollutant or (2) any other source having the potential to emit 250 tons/yr or more of any criteria pollutant. Secondly, an existing "major" source (a source that satisfies one of the above criteria)
Areas of the country that are not in compliance with
The Prevention of Significant Deterioration (PSD)
is subject to review if it is to be modified with a resul- tant "significant" increase in emissions, which is defined to be an increase greater than the following minimal values: for particulates, 25 tons/yr; for SOz, 40 tons/yr; and for NOx, 40 tons/yr. Except for small boilers or boilers burning fuel with very low sulfur content, oil- fired boilers being considered for conversion to CLMs would satisfy the above criteria for categorization as major sources. For example, for fuel with 1% sulfur, a boiler with a heat input over 60 million Btdh would potentially exceed the 250-tons/yr emissions criterion. It is also likely that conversions from oil to CLM would result in a "significant" emissions increase as defined by the second criterion. For example, an increase of only 0.04 lb S02/million Btu would potentially increase the SO2 emissions from a 250-million-Btdh boiler by more than the 40-tons/yr minimal value.
Water Efluents
Compared to oil-fired steam generation in electric utility or industrial boilers, the only significant change in efflu- ent treatment requirements is associated with the possi- ble addition of flue-gas cleaning technologies based on wet processes. Additional treatment of ash pond over- flow may also be required if the CLM contains signifi- cant quantities of ash. On the other hand, in comparison to coal-fued units, a CLM-fired facility would eliminate the possible water quality impacts associated with runoff from coal storage.
Solid Wastes
Conversion from oil- to CLh4-fing would introduce the requirement for disposal of increased levels of ash and possibly flue-gas desulfurization (FGD) sludge. The increase in the amount of ash is dependent on the ash content of the coal; however, as discussed previously, the trend in CLM development is to have a higher level of beneficiation to improve burner performance.
ENVIRONMENTAL CONTROLS
Air Pollution
Precombustion Control of Particulate Matter and Sulfur Dioxide
Fuel cleaning, in the form of coal beneficiation and oil hydrodesulfurization, reduces both the ash and sulfur content of the fuel prior to combustion, resulting in lower particulate matter (PM) and SO2 emissions. The
139

degree of sulfur and ash reduction that cleaning can achieve depends on the properties of the uncleaned fuel and the type of cleaning process used. Physical coal cleaning and oil hydrodesulfurization are both well- established technologies. It is expected that they will be used to clean almost all fuel for CLMs. Because of the importance of beneficiation to U s , in particular CWMs, advanced beneficiation, such as chemical coal cleaning, may be a significant factor in the future market penetration of CLMs. These advanced beneficiation technologies, which are under development, are dis- cussed in the chapter on Environmental Control Tech- nologies for Fossil Energy Systems.
Fuel blending is another precombustion method for reducing PM and SO2 emissions. It involves preparing the CLMs from cleaned or naturally occurring low- sulfur coals and oils. Fuel blending for CLM prepara- tion will be influenced by the the coal and oil properties and the desired properties of the CLM.
In addition, alkaline fuel additives, such as soda ash or calcium-based alkalis, can be added to a CLM prior to combustion to reduce SO2 emissions. A recent test24 showed a 95% reduction in SO2 emissions when soda ash was added to a COM. However, there was signifi- cant ash disposition and boiler fouling during these tests. Also, carbon monoxide emissions were substantially higher during the soda-ash additive tests due to reduced combustion efficiency.
Precombustion controls alone may not reduce the ash content of coal to levels such that no postcombustion PM controls are required to meet air pollution regula- tions. In many cases, however, they can reduce the sulfur content of the coal to a level such that no addi- tional controls for Sa emissions are required. Even if precombustion control alone cannot achieve adequate PM and SO2 reduction, it can substantially reduce the amount of costly postcombustion control required. It also reduces the variability of the CLM composition, permitting tighter boiler and control design specifi- cations.
One disadvantage of coal beneficiation is that, although it reduces the quantity of fly ash, bottom ash, and FGD sludge generated at the boiler site, it has a net effect of increasing the amount of solid waste generated in the fuel cycle. In any cleaning process, some valuable combustible matter is lost as refuse along with the un- desired inorganic materials. The amount of valuable coal lost as refuse ranges from 5 to 50%, depending on the cleaning process and coal composition. Liquid waste impacts are also associated with physical coal cleaning processes; some facilities are minimizing liquid waste disposal requirements by recycling process water.
Combustion Modifications for Nitrogen Oxide Reduction
Combustion modification techniques include low- excess-air operation, staged combus tion, flue-gas recir- culation, and low-NOx burners. Limited data are avail- able on the effectiveness of these combustion modifica- tion techniques in reducing NO, emissions from CLM combustion. However, these techniques are expected to be as applicable to reducing NO, emissions from CLM combustion as they are for reducing NO, emissions from the combustion of pulverized coal.
Low-NO, burners are probably the most effective of the currently available combustion modification tech- niques mentioned above. Low-NO, burner designs typically incorporate low excess air, staged combustion, internal flue-gas recirculation, or a combination of these techniques. Low-NO, burners available for pulverized coal service can potentially reduce uncontrolled NO, emissions by 65-90%.19 Staged combustion is a rela- tively effective NO, control technology. Its effective- ness results from the formation of localized fuel-rich conditions in the primary combustion zone that mini- mize formation of both thermal and fuel NO,. Staged combustion has been shown to achieve a 40-50% reduc- tion in NO, emissions when applied to coal-fired units.19 Operation at low-excess-air levels is primarily effective in reducing thermal NO,. Low excess air is generally incorporated as a design and operating feature in new boilers, since it increases boiler efficiency and thus reduces fuel consumption. Flue-gas recirculation is most effective in reducing thermal NO, and is therefore not a very effective NOx control technique for coal f ~ n g due to the high nitrogen content of coal relative to other fuels. Flue-gas recirculation will likely be ineffective for CWMs.
Postcombustion Control of Particulate Matter
The postcombustion PM control technologies used on coal-fired boilers -- such as electrostatic precipitators, fabric filters, venturi scrubbers, stream separators, and mechanical collectors -- are applicable to controlling PM emissions from CM-fired boilers. High PM control efficiencies have been widely demonstrated with fabric filters and electrostatic precipitators. In general, these technologies can reduce fly-ash emissions to 0.1 lb/ million Btu and, in most cases, to 0.05 lb/million Btu.19 Fabric filters, which are generally more effective than electrostatic precipitators, are not as sensitive to changes in fly-ash resistivity, particle size distribution, or inlet grain loading.
140

Postcombustion Control of Sulfur Dioxide
The postcombustion Sa control techniques currently in use are wet FGD and spray drying FGD. These control technologies are used primarily for controlling Sa emissions, but they also achieve moderate to substantial reductions in PM emissions.
the systems most commonly applied to coal- and oil- fued boilers are sodium throwaway, limdlimestone, and double alkali. Wet FGD systems with proper scrubber designs and operation (usually venturi or tray-type) can remove more than 909& of the fly ash.
ing for CLM applications: spray drying FGD and dry injection of sodium-based compounds. Although these systems are not as widely demonstrated as wet FGD systems, Sa removal efficiencies of up to !X)% have been reported for coal-fired boilers.l9
There are several types of wet FGD processes, but
Two types of dry FGD systems appear to be promis-
Postcombustion Control of Nitrogen Oxides
Postcombustion control techniques for NO, emissions include ammonia injection and flue-gas treatment tech- niques. Ammonia-injection techniques are commercial- ly offered in the United States and Japan. But applying the ammonia-injection technique to boilers burning sulfur-containing fuels, including many CLMs, could present a potential problem due to the formation of ammonia sulfate or ammonia bisulfate, which can plug the air preheater or corrode boiler parts.
NO, emissions can be classified as either wet or dry. The major wet processes include absorption-reduction, absorption-oxidation, and oxidation-absorption. The major dry processes are selective catalytic reduction and electron-beam irradiation. Although these processes may reduce emissions by up to 90%, most of them are still under development19
The primary flue-gas treatment processes to control
Trace Element Control
The technologies that achieve the greatest degree of fine particulate control, such as fabric filters and electrostatic precipitators, are the most efficient for trace element collection, since many of the trace elements tend to be enriched on the smaller fly-ash particles. In addition, coal beneficiation can reduce emissions by lowering trace-element concentration in coal prior to combustion.
Water Effluents and Solid Wastes
Effluent treatment technologies required for CLM prepa- ration plants to meet NSPS may include removal of
suspended solids and dissolved organics in any runoff from coal storage areas. An integrated beneficiation process is used in advanced CLM preparation plants and this could include the use of process water. Because the NSPS for coal preparation do not permit discharge of process water, treatment to remove suspended solids, dissolved inorganics, and pyrites in the recycled process water may be required.
Technologies that can remove suspended solids include screening, dissolved air flotation, gravity sedi- mentation, and filtration. Dissolved inorganics can be removed by pH adjustment and chemical precipitation, ion exchange, reverse osmosis, electrodialysis, and thermocompression evaporation. ('Ilese technologies are discussed in the chapter on Environmental Control Technologies for Fossil Energy Systems.)
Compared to oil-frred steam generation in electric- utility or industrial boilers, the only significant change in effluent treatment requirements is the possible addition of flue-gas cleaning technologies based on wet pro- cesses. Additional treatment of ash pond overflow may also be required if the CLM contains significant quanti- ties of ash. The above methods for removing suspended solids and dissolved inorganics are also applicable to treatment of these waste waters.
The likely method for disposing of the ash, and possibly FGD wastes, that would be generated at a facility converted from burning oil to burning CLMs is landfiilling (this and other approaches, such as recovery of useful by-products, are discussed in the chapter on Environmental Control Technologies for Fossil Energy Systems). A possible constraint is the lack of available disposal sites at a facility designed for oil combustion.
ENVIRONMENTAL CONSTRAINTS
In general, existing environmental control technology is capable of meeting the regulatory requirements for both CLM preparation and combustion. However, what remains unresolved are the costs and the relative advan- tages of alternatives, such as advanced beneficiation versus the addition of FGD or other environmental con- trols for conversion from oil- to CLM-firing.
If the coal in CLMs is not beneficiated to reduce sulfur and ash content to levels nearly equal to the oil being replaced, it is likely that a converted boiler will be subject to PSD new source review and the resulting requirement for "best available control technology." In addition, CLM combustion typically has higher NO,
141

emissions compared to oil combustion, primarily because of the higher level of nitrogen in coal.
Although the modifications for converting from oil to CLMs will not require application of NSPS regula- tions, there is uncertainty as to the level of controls that will be required by individual SIPS. This uncertainty may inhibit market penetration of the CLM technology.
Water quality is not expected to be a major issue in the commercialization of CLMs. However, additional controls may be required in converted facilities to man- age effluents from ash ponds and FGD disposal sites, if additional postcombustion controls are required. This requirement would also introduce the need to dispose of solid wastes; the availability of waste disposal sites could be a problem at some facilities designed to bum Oil.
REFERENCES
1.
2.
3.
4.
5.
6.
7.
8.
142
Bienstock, D., and O.K. Foo, History and Devel- opment of Coal-Liquid Mixtures, presented at 1st European Conf. on Coal Liquid Mixtures, Chel-
Demeter, JJ., et al., Combustion of Coal-Oil Slurry in a 100-hp Firetube Boiler, Pittsburgh Energy Research Center Report RI 77/85 (May 1977).
Morrison, G.F., Conversion to Coal and CoallOil Firing, E A Coal Research Report ICTISlTRO7 @ec. 1979).
Bienstock, D., and E.M. Jamgochian, Coal-Oil Mixture Technology in the U.S., Fuel, 60:851 (Sept. 1981).
Marnell, P., Direct Firing of Coal- Water Suspen- sions, State-of-the-Art Review, presented at Coal Technology 1980, Houston (Nov. 1980).
Final Report o f the General Motors Corporation Powdered Coal-Oil Mixture (COM) Program, A. Brown, Jr., ed., U.S. Dept. of Energy Report
Kelcec, G., P.O. Olivadoti, and A.F. Duzy, Coal Slurry Firing at the Werner Station, ASME Paper
tenham, U.K. (at. 5-6,1983).
FE-2267-2 (August 1977).
62-PWR-3 (1962).
Scheffee, R.S., Development and Evaluation of Highly Loaded Coal Slurries, Phase I Summary Report, U.S. Dept. of Energy Report FE-2667 (May 1979).
9.
10.
11.
12.
13.
14.
15.
16.
17.
18.
19.
20.
Moore, T., and R. Manfred, Oil's New Rival - Coal-Water Slurry for Utility Boilers, EPRI Jour- nal, 9(6):6-13 (July/Aug. 1984).
Coal-Mixture Fuels for Utili fy and Industrial Applications, U.S. Dept. of Energy Report DOE1 FE-0038 (May 1984).
Coal Slurry Fuels Preparation and Utilization, Proc. 8th International Symp. on Coal Slurry Combustion, Orlando, Fla. (May 27-30,1986).
Foo, O.K., and E.M. Jamgochian, Assessment of Coal-Liquid Mixture in Cooperating IEA Coun- tries, Vol. III, Technology Assessment and R&D Needs, prepared by the Mitre Corp. for the Interna- tional Energy Agency, Mitre Corp. Report MTR- 83W87-03 (June 1983).
Borio, R.W., and M.J. Hargrove, Coal-Oil Mois- ture and Coal-Water Mixture Fuels for Steam Generation, Proc. 4th International Symp. on Coal Slurry Combustion, Orlando, Fla. (May 10-12, 1982).
Knell, E., et al., Commercial Production and Use of Coal-Oil Mixtures, Proc. 4th International Symp. on Coal Slurry Combus tion, Orlando, Fla. (May 10-12, 1982).
Manfred, R.K., et al., Current Progress in Coal- Water Slurry Burner Development, Proc. Ameri- can Chemical Society Symp. on Technologies of Preparation, Combustion and Commercial Appli- cation of Coal-Water Fuels, Seattle (March 20-25, 1983).
Standards of Peqormance for Coal Preparation Plants, Code of Federal Regulations Title 40, Part 60, Subpart Y. Coal Mining Point Source Category, final rule, Federal Register, 50( 196) (at. 9,1985).
Stelling, J.H.E., and S.J. Call, Control of Criteria and Non-Criteria Pollutants from CoallLiquid Mixture Combustion, U.S. Environmental Protec- tion Agency Report EPA-6Oo/S7-84-O01 (March
Kelly, M.E., R.M. Parks, and J.H.E. Stelling, Control of Criteria and Non-Criteria Pollutants from CoallOil Mixture Combustion, U.S. Environ- mental Protection Agency Report EPA-600/7-83- 40 (Aug. 1983).
Standards of Performance for Fossil-Fuels Steam Generators for Which Construction Is Commenced
1984).

21.
22.
after August 17.1971, Code of Federal Regula- tions Title 40, Part 60, Subpart D.
Standards of Performance for Fossil-Fuels Steam Generators for Which Construction Is Commenced after September 18,1978, Code of Federal Regu- lations Title 40, Part 60, Subpart Da.
Standards of Performance for New Stationary Sources; Industrial-Commercial-Institutional
23.
24.
Steam Generating Units, proposed rule, Federal Register, 51(118) (June 19,1986).
Prevention of Significant Deterioration, Code of Federal Regulations Title 40, Part 52.
Kelly, M.E., and S.A. Shareef, Third Survey of Dry SO2 Control Systems, U.S. Environmental Protection Agency Report EPA-600/7-8 1-097 (Aug. 1981).
143

BACKGROUND
Petroleum is a complex mixture of hydrocarbons that also contains dissolved solids and gases, inorganic mat- ter, and water. Petroleum refining partially separates the components of petroleum and chemically transforms the resulting fractions into a variety of intermediate and finished products, including gasoline, jet fuel, lube oil, grease, asphalt, coke, and wax. In general, crude oils do not contain either the types or amounts of hydrocarbons that are in demand, so extensive chemical processing is necessary.
Depending on the processes used, refineries can be classified as simple, complex, or fully integrated. A simple refinery employs basic refining processes and produces a relatively limited variety of products: liquid- petroleum gases, motor fuels, kerosene, gas oil (also known as heating oil), diesel fuel, and other fuel oils. A more complex refinery makes a greater variety of pro- ducts, such as high-octane gasoline and petrochemical feedstocks (raw materials), with additional processes. In addition to processing units, a fully integrated refining installation will include all necessary nonprocessing facilities: a source of electric power, material handling equipment, workshops and supplies for maintaining continuous operation, pollution control and water treat- ment facilities, product blending equipment, and ade- quate storage for crude oil and intermediate and finished products.
History1
The early petroleum refinery of the 1860s consisted of crude stills, made of wood-fired cast-iron kettles, that produced kerosene from crude oil. The first significant improvement was the development in 1870 of continu- ous distillation in Pennsylvania. In 1904, a better
Chapter 10
Petroleum Refining
method of separating fractions was attained in the shell still with a partial condensation technique permitting withdrawal of selective fractions from the same batch. (Fractions are components of petroleum, and the process of separating fractions is known as fractionation.) The continuous pipe stills, developed in 191 1 to overcome the foaming problem in the shell still, continuously separated vapors and liquids (distillation) in a complex system of partial condensers. Today’s crude distillation process still uses the basic principles of the pipe still, but the fractionation takes place in vertical towers contain- ing a series of horizontal trays where liquid is con- densed, collected, and withdrawn.
Cracking by heat, which breaks up larger com- pounds within crude oil fractions, was discovered at almost the same time that distillation went into use; this method was used for a long time to enhance kerosene production. During the early part of this century, batch pressure cracking was developed to increase the yield of gasoline. During and after World War I, several contin- uous gas-oil thermal cracking processes were developed and used. In the late 1930s, increases in the compres- sion ratios and octane requirements of automobile en- gines led to the development and use of catalytic crack- ing, which employs a catalyst to speed up the cracking process. Further needs for high-octane fuels led to an- other process, alkylation, that chemically combines petroleum fractions. In 1939, this process used sulfuric acid for a catalyst; beginning in 1942, hydrofluoric (HF) acid was also used as a catalyst.
A catalytic reforming process, which rearranges the structure of hydrocarbon molecules, was developed and introduced in 1949. Because this process used a plati- num-based catalyst that did not require regeneration, it was especially attractive to smaller refiners. In the 1950s, various hydrotreating processes, which remove impurities from petroleum fractions, were developed and adopted. In the mid-l96Os, the hydrocracking process,
145

which is catalytic cracking in a hydrogen atmosphere, was developed. Hydrocracking allows refiners to pro- duce a variety of products from a wide range of raw materials.
The U.S. Petroleum Refining Industry
Petroleum is the principal US. energy source. During 1985, about 31 quadrillion Btu (31 quads), or 41% of the total energy consumed in the United States, came from petroleum.2 Petroleum consumption, which peaked at 49% of total energy use in 1977, has continued to drop as high petroleum prices and the relatively lower costs of other fuels, such as natural gas and coal, encouraged conservation and fuel switching.
At the beginning of 1986, the operating crude- distillation capacity of U.S. petroleum refineries was 15.3 million bbVd.2 Refining capacity in the United States increased at an average rate of about 4.5%/yr between 1953 and 1981 and decreased at a rate of 3.9%/yr from 1981 to 1984.3 During 1985, petroleum
consumption in the United States was unchanged from the 1984 level of 15.7 million bbVd.2
Large refineries, with a capacity of more than 100,OOO bbVstream day, constitute 65% of the total U.S. capacity.4 (A stream day is an operating day on a pro- cess unit, which includes a calendar day plus an allow- ance for downtime.) There is a wide range in refinery sizes: the largest is the 668,000-bbVstream-day Exxon refinery at Baytown, Texas, and the smallest is the 190- bbYstream-day C&H refinery at Lusk, Wyoming.4 Refineries are located all over the United States (Table lO.l), but most of them are in Texas, California, and Louisiana2
Government and Industry Programs
Statistical data on the supply, demand, and production of the domestic petroleum-refining industry are maintained and updated by the Energy Information Agency of the U.S. Department of Energy. The other government programs relevant to the industry have primarily
Table 10.1 Number and Crude-Oil Capacity of Operating U.S. Refineries as of January 1,1986
Capacity Capacity (thousand (thousand
Location No. bbWd) Location No. bbUd)
Alabama Alaska Arkansas California Colorado Delaware Florida Georgia Hawaii Illinois Indiana Kansas Kentucky Louisiana Michigan Minnesota Mississippi Montana Nevada New Jersey New Mexico N o d Dakota
2 5 4
34 2 1 1 2 1 7 5 6 2
19 3 2 5 4 1 4 4 1
113.5 188.0 55.9
2,216.9 67.5
140.0 10.0 34.0 48.0
821.0 426.1 311.9 218.9
2,226.5 111.5 222.1 363.4 130.5
4.5 290.0 72.5 58.0
Ohio OklahOma Oregon Pennsylvania Tennessee Texas Utah Virginia Washington West Virginia Wisconsin Wyoming
Subtotal
Hawaiian Foreign Trade Zone
Puerto Rico Virgin Islands
Total
5 6 1 8 1
31 6 3 7 2 1 6
192
1
3 1
197
520.7 383.3
15.0 718.0 60.0
3,973.8 154.5 53.9
419.9 16.7 32.0
159.9
14,638.4
67.9
123.0 470.0
15,299.3
Source: Ref. 2.
146

emphasized developing technologies and information for energy conservation, environmental protection, and occupational health and safety. primary government responsibility for these programs is vested in the U.S. Department of Energy, U.S. Department of the Interior, and the U.S. Environmental Protection Agency (EPA).
Within the petroleum refining industry, many of the major oil companies have conducted extensive research in technology development, health and safety, and pollu- tion control. The American Petroleum Institute (API), the trade organization representing the domestic petro- leum industry, also sponsors research programs in nu- merous areas, such as fire prevention, health and safety, hazardous material transportation, and pollution control.
TECHNOLOGY
Properties of Petroleum
The properties of petroleum vary widely from source to source and even within the same oil field. Petroleum may be a light, mobile liquid of reddish-brown to brownish-green color or a viscous, black semisolid that must be heated to be pumped. Petroleum densities range from 50 to 62.4 lb/ft3, and high densities generally cor- respond to high viscosities. The odor of petroleum ranges from pleasant and aromatic to unpleasant and garlicky (for high-sulfur crude oils). Petroleum boils over a range of temperatures. Table 10.2 lists the per- centage of different distillates in specific boiling ranges for petroleums from five regions.5
83-87% carbon by weight and 11-14% hydrogen by weight. In general, the molecular formula of the hydro- carbons in petroleum is (CH2)n. Sulfur, oxygen, and nitrogen are present in small amounts, as are many dif- ferent metals. In general, the hydrocarbons in petroleum can be classified into three different families: paraffins, naphthenes, and aromatics.
Paraffins, or alkanes, are saturated carbon-chain compounds that have no rings. The general formula of paraffin is CnH2n+2, where n is the number of carbon atoms. Few unsaturated carbonchain compounds (alkenes or alkynes) are found in crude petroleum. (An organic compound is said to be unsaturated if there are double bonds between two or more of its carbon atoms; in a saturated compound, the double bonds have been replaced by bonds with other atoms, usually hydrogen.) Most paraffins are straight-chain (unbranched) com- pounds. Paraffins with branched molecules are known
The elemental composition of petroleum is uniform:
as isoparaffms; methyl groups are the most common branches .
Naphthenes, or cycloalkanes, are saturated carbon- ring compounds; the rings consist of five or six carbon atoms. The general formula of naphthene is CnH2n(l+r), where r is the number of rings. Between 60 and 90% of crude oil compounds contain rings.
Aromatics are made of one or more unsaturated rings of six carbon atoms with the general formula CnH(2n-6,). The simplest aromatic, benzene, consists of
weight of the gasoline fraction of U.S. crudes.
oil. Their concentrations are 0.1-7% by weight, al- though the amount is generally less than 2%.S High- density crudes tend to have a higher sulfur content than low-density crudes, and the sulfur content in a particular crude is concentrated in the heavier fractions with higher boiling points. Oxygen (less than 2%), nitrogen (less than 9%), and metals also tend to accumulate in the heavier crude fractions.6 The ash remaining after petro- leum combustion is composed of up to 0.6 lb/bbl of water-soluble inorganic salts and organic Compounds that contain metal.
one sixcarbon ring. Aromatics comprise 5-28% by
Many sulfur compounds also may be found in crude
Refinery Products
There are more than 2,300 refinery products, and most of them are used as fuels. These products can be clas- sified as in Table 10.3.2.7
Liquid-petroleum products include methane, ethane, propane, butane, and their corresponding olefins (com- pounds that have one double bond). They serve either as fuels or petrochemical feedstocks. Motor gasoline is a mixture of hydrocarbons that have 4-12 carbon atoms, a boiling range of 30-400'F, and an octane rating of 87-97. Jet fuel includes kerosene for commercial air- craft and naphtha for military aircraft. Middle distillates are used as diesel fuels and Nos. 2 and 4 heating oils. Residual fuels, including Nos. 5 and 6 heating oils, are used primarily in large power plants and for engines of large marine vessels. They are the residues of crude oil distillation with boiling points higher than 750'F. Lube oil is used to reduce friction in a wide range of applica- tions, from delicate instruments to steam turbines.
Petroleum coke, consisting of sponge and needle coke, is made by delayed coking, which removes almost all the hydrogen. Sponge coke is used as fuel by electric utilities and sometimes for industrial electrodes. Needle coke is the preferred material for making the electrodes used to produce aluminum. Asphalt is a brownish-black solid or semisolid mixture of bitumens used in paving,
147

Table 10.2 Properties of Crude Oil and Its Fractions, by Origin.
Oil Fraction, North North Middle North South PropeflY Africa Sea East America America
Crude d, dl fractions Density at 59'F (fb/ft3) Total sulfur (wt %) Viscosity at 100'~ (ftz/h) Pour point (OF) wax (wt %)
Light gasoline, 32-158'F TBP Yield (wt 46) Total sulfur (wt %) Octane number
Naphtha, 158-284'F TEiP Yield (wt %) Total sulfur (wt %) Hydrocarbons (wt %)
Paraffins Naphthenes Aromatics
Kerosene, 284-482'F Tl3P Yield (wt %) Total sulfur (wt %) Aromatics (vol %)
Diesel fuel, 482-662'F TEiP Yield (wt %) Total sulfur (wt %) Cloud point (OF) Diesel index
Residue, above 662'F TBP Yield (wl%) Total sulfur (wt %) Viscosity at 122'F ( f t z h ) pour point (OF) Metals (ppm)
Vanadium Nickel
50.4 0.1 0.54 -60 3
8.8 0.001 73
16.0 0.002
56 35 9
26.3 0.01 17
18.2 0.10
9 55
27.5 0.3 2.87 64
c2 <2
52.6 0.3
0.17 32 9
5.8 0.001
76
11.0 0.001
46 42 12
18.6 0.02 20
19.1 0.18 14 53
43.5 0.6 3.99 75
8 4
54.3 2.5
0.37 -1 1
6
4.7 0.020 72
7.9 0.020
72 19 9
16.4 0.20 17
15.3 1.40 19 58
54.4 4.1
21.12 59
50 13
55.6 1 .o
0.52 32 7
2.4 0.002 75
6.5 0.005
45 36 19
15.6 0.06 23
19.6 0.49 10 45
55.5 1.5
14.34 70
25 13
62.4 5.5
751.75 59 2
0.1 0.100
1.1 0.450
4.4 2.50
9.6 4.40 -1 1 30
84.8 6.0
4,659 108
1,415 I77
a?he origins are listed, from left to right, by increasing density of the crude oils.
bTme boilmg point.
Source: Ref.5.
roofing, coating, or fuel. It is naturally present in most petroleum in varying amounts, and is obtained as a by- product by removing all light distillates and a substantial portion of the heavier distillates from crude petroleum
Refining Processes7,8
Petroleum refineries differ widely in the processing steps they employ, with the type of products they gener-
148
ate, and also with age because process equipment normally reflects the current technology when the equip- ment was installed. Figure 10.1 illustrates the process steps that produce final products from crude oil frac tions.9
Separations
Crude oil is separated by distillation into a variety of intermediate products that are used as feedstocks for

Table 10.3 Major Petroleum Products
1985 U.S. Boiling Production Principal Range
product (vol %)a Hydrocarbons (OF) uses
Liquid- petrdeum
Motor gasoline
Jet fuel
Middle distillates
Residual fuels
Lube oils
Asphalt
Petroleum coke
3
47
9
20
6
1
3
3
Methane, ethane propane, butane
Paraffins, ole- fins, aromatics
Paraffins (C~ZHX-CMH~Z), few aromatics
Mixture (ClZHX~MH42)
Cz&z-C&162
Paraffins ( C ~ O H ~ Z - C ~ ~ H ~ O ) , naphthenes
Large molecules, low in hydrogen
Naphthenes >m carbon
-259-31
30-400
150-95Ob 350-55oc
350-700
5OO-1,200
Nonvolatile liquids
Nonvolatile solids
Nonvolatile solids
Fuel and boltled gas, feedstock
Motor fuel, solvent
Fuel for gas- turbine engines
Diesel fuel, heating oil
Boiler and marine fuel
Lubricants
Coatings, paving, fuel
Fuel, graphite feedstock
aAviation gasoline, petrochemical feedstocks, and other products accounted for the
bMilitary jet fuel.
Commercial jet fuel.
Sources: Refs. 2 and 7.
remaining 8% of production.
further (downstream) processing. Distillation is a physi- cal process in which the fractions are separated by their boiling points. The process vessel is usually a distilla- tion column where nonvolatile fractions are removed at the bottom and increasingly volatile fractions are re- moved at various levels all the way to the top (removing the most volatile fractions is hown as "topping"). The fractions obtained through crude oil distillation are known as "straight-run" products. The two types of distillation processes are atmospheric and vacuum.
atmospheric distillation unit before it can be further processed. Atmospheric distillation separates the hydro- carbon components of crude oil into fractions by distilla- tion and steam stripping, a process that uses steam to vaporize lighter fractions. Typical operating tempera-
Nearly all crude oil must pass through a refinery's
tures for atmospheric distillation range from 2509 at the top of the fractionator to 7 0 0 T at the bottom.
Vacuum distillation is used to fractionate topped crude from atmospheric distillation into a heavy residual oil and one or more heavy gas oil streams. The vacuum prevents cracking while the fractions are being sepa- rated. It is generally operated at a temperature of 750- 830% and a pressure of 0.4-0.7 psia.
Cracking
Cracking operations convert heavy petroleum fractions into lighter, more valuable products. Two processes, catalytic cracking and hydrocracking, provide a substan- tial portion of the cracking capacity in the United States. Although these processes are similar in that they crack
149

Crude
oil
b Polymerization, Gas
and hydrogenation, Naptha Catalytic - recovery alkylation,
reforming stabilization and blending
Motor and aviation gasotines +
Kerosene and Crude oil
distillation light furnace oil
Dewaxing, declorization, and blending Waxes
b
heavy fractions to produce lighter products, there are considerable differences between them in both the oper- ating principles and the pollution potential. The choice of one process over the other is usually an economic one.
In a typical refinery, heavy gas oils from the atmo- spheric and vacuum distillation columns are converted to light gases, gasoline stock, and petroleum coke by catalytic cracking. Because gasoline stock that is cata- lytically cracked contains olefins and more isoparaffins and aromatics than straight-run gasoline, it has a higher octane rating. Catalytic cracking is endothermic (heat- absorbing) and more efficient at a reduced pressure. In practice, catalytic cracking is performed at temperatures of 840-9509 and pressures of 22-44 psia. A silica- alumina or zeolite catalyst increases the rate at which the reaction proceeds. When the catalyst is kept in motion, the process is known as fluidized catalytic cracking W C ) .
Hydrocracking is a high-temperature high-pressure process for converting heavy feedstocks, such as gas oil,
Figure 10.1 Generalized Refiiery from Crude Oil to Salable Products (Source: Adapted from Ref. 9)
into lighter products in the presence of hydrogen and a catalyst or series of catalysts. This process also removes impurities. The gas oil feedstock can come from the catalytic cracker, the coker, or a crude oil distillation column. The resultant gasoline product has more naph- thenes than straight-run gasoline. Hydrocracking, which is exothermic (heat-releasing) and more efficient at an increased pressure, converts olefins to paraffins and then converts aromatics to naphthenes in another exothermic reaction, preventing the formation of petroleum coke. In practice, hydrocracking is performed at pressures of 1,OOO-2,OOO psia and at temperatures of 5W800°F.
Conversions
Conversion processes use catalyzed chemical reactions to upgrade certain refinery streams or produce valuable products from less valuable materials. Conversion pro- cesses include alkylation, catalytic reforming, and isomerization.
and isoparaffin to produce an isoparaffin with a higher Alkylation is the chemical combination of an olefin
150

molecular weight. The resulting product is usually used to upgrade the octane rating of gasoline. Almost all alkylation units use sulfuric or HF acid as a catalyst. Alkylation is an exothermic reaction and a high reactor pressure keeps the feedstock in a liquid state. When sulfuric acid is used, operating temperatures are 40-50T and the operating pressure is slightly higher than atmos- pheric pressure. When HF acid is used, operating tem- peratures are 70-100°F, while pressures range between 100 and 150 psia.
Catalytic reforming is one of the most important of all refinery processes. In catalytic reforming, relatively low-octane naphthas, heavy gasoline, and naphthene- rich feedstocks are converted to high-octane gasoline (aromatics) and isobutane, with hydrogen as a by- product. Because the overall reaction is endothermic, the mixture must be heated before it is injected into the reactor. A number of reactions occur simultaneously during the reforming processes, including dehydrogena- tion, isomerization, and hydrocracking. Dehydrogena- tion reactions, which remove hydrogen to form aromat- ics, are the most important. The catalyst in catalytic reforming is usually platinum, which is deposited 0.3- 0.75% by weight on alumina. Reactor temperatures range from 900 to 1,O2O0F.
Isomerization processes convert paraffins into isoparaffins and produce isobutane for use in alkylation units. Temperature is a critical factor in isomerization reactions. In general, the concentrations of isoparaffins are increased by reducing the reaction temperature. Solid-bed isomerization reactors, where the catalyst is stationary, are typically operated at temperatures of 200.6OO0F and pressures of 200-1,OOO psig. Fluidized systems are operated at temperatures of 150-250'F and pressures of 300-500 psig.
Hydroprocessing
In hydroprocessing, hydrogen is mixed with a variety of feedstocks and passed over a catalyst at elevated temper- ature and pressure to remove impurities. The hydrogen reacts with sulfur and nitrogen compounds in the feed- stock to form hydrogen sulfide (H2S) and ammonia (NH3). Hydroprocessing may also be used to remove heavy metals, oxygen, and halides and stabilize unsatu- rated hydrocarbons, such as olefins, by convening them to saturated compounds.
Hydroprocessing operations may be divided into three categories according to the degree of reduction in molecular weight: hydrocracking, discussed above, in which 50% or more of the feedstock is reduced in
molecular weight; hydrorefining, in which 10% or less of the feedstock is reduced in molecular weight; and hydrotreating, in which essentially no reduction in mo- lecular weight occurs.
nitrogen, or metallic content of heavy feedstocks for further processing, blending, or direct use. One hydro- refining process, hydrodesulfurization, is particularly important for catalytic cracking units. The mechanism of the hydrorefining process is similar to that of one- stage hydrocracking, except that the emphasis in hydro- refining is on the removal of H2S and N H 3 and operating conditions are less severe. Typical hydrorefining units are operated at temperatures of 390-800°F and pressures of 5OO-800 psig.
Like hydrorefining, hydrotreating is used to remove sulfur, nitrogen, and metallic compounds from the feed- stock. It is also used to saturate olefrns and aromatics and to polish and dewax lube oil stocks. The mecha- nism of hydrotreating processes is also essentially the same as that for one-stage hydrocracking, except that hydrotreating conditions are less severe. The product may be fractionated or steam-smpped to remove H2S, N H 3 , and light hydrocarbons.
Hydrorefining is used primarily to reduce the sulfur,
Thermal Operations
Thermal operations are high-temperature noncatalytic processes used to convert large-molecule low-value stocks, such as heavy gas oils, into lighter, more valu- able products. The thermal operations currently used by U S . refineries include coking and visbreaking.
Coking units thermally crack the heavy residue from atmospheric and vacuum distillation towers into gas oil, naphtha, four-carbon compounds (such as butane), aromatics, and petroleum coke. The reaction is endothermic and two general processes are employed. In one process, delayed coking, feedstock is heated to 925-1,060°F and pressure is maintained at 15-66 psia. Delayed coking is a semibatch process in which feed- stock is fractionated and poured into a drum where the coke forms and separates from the gaseous cracked products. When the drum is full, the hot feed is sent to a second drum; the coke in the first drum is cooled with water and removed.
The other process, fluid coking, is continuous. Feedstock is sprayed onto a fluidized bed of hot coke particles, where most of it vaporizes and is removed. Some feedstock clings to the fine coke particles. These particles are steam-stripped at the bottom of the reactor and passed to a burner, where some are burned and some are removed; the remainder is recycled.
151

Visbreaking (viscosity breaking) is a mild thermal cracking operation used to reduce the viscosity of materials, such as distillation residuals and pitch. This procedure reduces the amount of light heating oil that must be blended with the residuals to produce a fuel oil of acceptable viscosity. Visbreaking processes are gen- erally operated at temperatures of 850-9509 and pres- sures of 65-3 15 psia.
Lube Oil Processing
Lube oil feedstock is the fraction of the residue from vacuum distillation that has a boiling point of 700- 1 , 0 0 0 ~ . Procedures for processing lube oil into spe- cific products vary greatly, but they can be divided into four groups: deasphalting, treating, dewaxing, and finishing.
produced from vacuum distillation residues by extract- ing paraffins with propane at temperatures of 104- 140°F. At these temperatures, paraffins are soluble in propane, but asphaltic and resinous compounds, which have a high molecular weight, precipitate.
Several treating methods are used to improve the viscosity, color, and carbon-residue content of asphalt- free, lube oil stocks. Most treatment methods involve phase extraction, where solvents ( e g , furfural, phenol, nitrobenzene, chlorex, and cresol) are used to selectively remove undesirable aromatics and other contaminants.
Dewaxing is the most difficult step in lube oil pro- cessing. The oil is mixed with a solvent (usually pro- pane, urea, or a mixture of methyl ethyl ketone and benzene) and chilled, causing the wax to precipitate. The precipitated wax is separated from the mixture by filtration or centrifugation. The dewaxed oil and solvent are then separated by distillation and steam stripping. The wax is solvent-treated again under different condi- tions to remove any remaining oil.
Finishing processes remove traces of resinous mate- rials and chemically active compounds, which can dete- riorate the color and quality of the product. The com- pounds can be absorbed by passing the oil over various types of clay, activated earth, or artificial absorbents. Also, catalytic hydrogenation can remove compounds containing elements such as oxygen, nitrogen, and sulfur.
In deasphalting, a very heavy oil (brightstock) is
Asphalt Processing
Asphalt is produced by deasphalting brightstock. I n asphalt processing, the quality of asphalt is improved by blowing air through it to increase its melting tempera-
152
ture and hardness. Deasphalting can be either batch or continuous processes that sometimes employ catalysts, such as ferric chloride or phosphorus pentoxide. The operating conditions are favorable for the production of toxic polynuclear aromatic hydrocarbons (PAHs). In some refineries, air-blown units have been replaced with vessels packed with solid absorbents.
ENVIRONMENTAL ISSUES
Air Pollution
Petroleum refineries are sources of sulfur oxides (SO,), carbon monoxide (CO), nitrogen oxides (NO,), hydro- carbons, and particulates, which are primary criteria pollutants. An estimate of U.S. atmospheric emissions for 1982 is shown in Table 10.4.10 Emissions from point sources in refineries accounted for 0.6-5.1% of all criteria pollutants from sources in the United States. Hydrwarbon emissions from refinery processes account- ed for about 5.1% of all hydrocarbon emissions from man-made sources in the United States.
refineries can also emit many other hazardous air pol- lutants (Table 10.5),11 including hydrocarbons, sulfur compounds, nitrogen compounds, and trace elements. Among these substances, PAHs are of special environ- mental and health concern. Several PAHs, most notably benzo(a)pyrene, have been shown to induce cancer, while others are suspected carcinogens or may inhibit or accelerate the activity of benzo(a)pyrene.
eries on ambient air quality. In 1975, the API published the results of a study involving refinery odor control and ambient levels of pollutants from refinery operations.12 The ambient air samples were analyzed for total hydro- carbons, organic sulfur compounds, NH3, and S02. Except for organic sulfur compounds, the concentrations of pollutants 1-2 mi from the source were 2-40 times higher than background concentrations.
atmospheric emissions from an Exxon petroleum refin- exy in Benicia, California.13 The refinery plume could be tracked up to 8 mi downwind from the plant. Ele- vated levels of total hydrocarbons, nonmethane hydro- carbons, CO, and NO, within the plume were measured at distances of less than 5 mi downwind, and elevated levels of nonmethane hydrocarbons persisted as far as 8 mi downwind.
In addition to the criteria pollutants, petroleum
Several studies have examined the impact of refin-
Another study monitored ambient air to characterize

Table 10.4 Estimates of U.S. Atmospheric Emissions, 1982 (million tondyr)
Parti- SourceCategory culates S q NO, VOC CO
Idustrial processes Petroleum industry 0.05 0.63 0.22 1.02 1.18 Other processes~ 2.59 2.74 0.36 5.93 4.12
Transportation 1.51 0.96 10.60 6.63 58.81
Fuel combustionb 2.63 19.12 10.53 2.26 7.22
Solid waste and 1.46 0.04 0.34 4.30 9.88 miscellaneous
Total 8.24 23.49 22.05 20.14 81.21
.Includes emissions from refinery storage facilities.
bIncludes emissions from refinery process heaters and boilers.
Source: Ref. 10.
Table 105 Hazard Pollutants Potentially Emitted from Refinery Procesf Units
Acetaldehyde Acetic acid Aldehydes AUcyl sulfide Ammonia Anhacenes Aromatic amines Barium Benzene Benzo(a)pyrene Benzo(e)pyrene Benzo(ghi)erylene Benzoic acid Carbazoles Carbon dilsulfide Carbon monoxide Carbonyl sulfide Catalyst fines Chlorides chromates Cobalt
Coke fines cobalt carbonyl
Copper
Coronene Cresols Cresylic acid Cyanides Dibenzothiophene Diethylamine Dimethylphenol Fluoranthrene Formaldehyde Formic acid Furans Hydrogen sulfide Indoles Ketones Lead Maleic acid Mercaptans Metalloporphrins Methylethylamine Methy hercaptan Molybdenum Nickel Nickel carbonyl Nitrogen oxides
Perylene Phenanthrene Phenol Pyrene Pyridines Pyrroles Quinolines Strontium Sulfates Sulfides Sulfonates Sulfones Sulfur oxides Sulfur particulates Sulfuric acid Tetraethyl lead Thiophenes Thiosulfde Thiphenols Toluene Vanadium Xylene Zinc Zylenols
Source: Ref. 11.
The actual impact of these ambient concentrations is site specific. Sources of atmospheric pollutants in petro- leum refineries can be divided into process emission sources (or point sources) and fugitive sources.
Point-Source Emissions
Several operations within a refinery produce waste gases (Table 10.6).8 Major point sources include Claus units, catalyst regenerators, process heaters and boilers, stor- age tanks, loading facilities, flares, process drains, wastewater treatment units, and cooling towers.
Claw Units. Sulfur in crude oil occurs as H2S, mercap- tans, thiophenes, sulfides, and polysulfides. The distri- bution and concentration of sulfur compounds differ for each crude oil. Any crude oil with more than 0.5% sulfur by weight is generally considered sour and the sulfur is removed from its products. Sulfur removal from whole crude is generally not economical, but sulfur is routinely removed from various intermediate feed- stock streams by hydrodesulfurization, which produces H2S. Several means, usually absorption, can be used to remove and concentrate the H2S.
In recent years, the Claus process, which catalyti- cally reacts HIS with S o 2 to recover elemental sulfur, has been often used to minimize SO, emissions and produce elemental sulfur for sale to other industries. In general, Claus sulfur plants are unable to remove all the
153

I
Table 10.6 Point Sources and Atmospheric Emission Factors for Selected Process Units
Emission Factors (Ibkapacity unit) ,
Capacity Palti- Hydro- SOUrCe Capacitp Unit culates SO, NO, CO carbonsb
Heaters and boilers Oil fired Gas fired
6 47.7 60 5 0.6 120
5 1 17 3
36.7 x 10³ galh 2.27 x 106 ft3h
103 gal 106 ft3
FCC CO boiler 2.086 x 10³ bbVh 103 bbl 45 493 71 C 13.3
Sulfur recovery complex Claus plants plus
Wellman-Lord tail- gas treating unit
Sulfuric-acid plant
3.6 408 long tondd long tons
179 long tondd
350 x 103 bbYd
long tons
103 bbl
14.6
C 26.9 18.9 4.3 0.8 Flares
Oil-water separators Uncontrolled Controlled
160.3 x 10³ gafm 1,719 x 103 galh
103 gal 103 gal
5.0 0.2
Cooling towers 10,668 x 103 gal& 103 gal 0.006
DAF units 220.5 x 10³ gal& 103 gal 0.01 ~~ ~
a10a = 1,OOO,OOO and 103 = 1,OOO.
bExcluding methane.
CNegligible.
Source: Ref. 8.
sulfur from the waste gas stream and the tail gas from a Claus unit contains H2S, sulfur dioxide (SOz), carbon dioxide (COz), carbonyl sulfide, and CO. If not treated, the Claus-unit tail gas is often a main source of refinery emissions.
refinery and flue gases from regenerators contain par- ticulates, SO,, CO, hydrocarbons, NO,, aldehydes, and m3.
Boilers and Process Heaters. Most refineries use boilers to provide steam or heat for various processes and drive steam turbines. Process heaters are also used extensively in refining operations. Refinery boilers and heaters are fired with almost any available fuel, usually gas or oil. A simple refinery with a capacity of 5 million tondyr of crude oil can require about 200,000 tons/yr of heavy oil, or about 4% of the capacity.14 For a complex refinery, the requirement could be higher.
Flue gases released from boilers and heaters contain SO,, NO,, CO, and particulates. The quantity of emis- sions depends on the quality of fuel and combustion unit design and operation. For example, the uncontrolled S0.L emissions from a refinery with a capacity of 5 mil- lion tondyr could be as high as 15 tonsld.14 About 3% of the SO, is sulfur trioxide and the balance is S02.
Catalyst Regenerators. Several petroleum refining operations use catalysts that become coated with carbon and metals and must be regenerated to restore their ac- tivity. During regeneration, the carbon is oxidized to form CO and C02. For most processes, a catalyst must be regenerated only a few times a year. At these times, emissions, which typically contain incompletely burned wastes, may include catalyst fumes, oil mists, hydrocar- bons, N H 3 , SO,, chlorides, cyanides, NO,, CO, and aerosols; however, total emissions over the course of a year are probably not significant.
continuous process. Continuous catalyst regeneration can be a major source of emissions from a petroleum
Regenerating the catalysts for catalytic cracking is a
154

Storage Tanks and Loading Facilities. A refinery that processes 5 million tons/yr might need a storage capac- ity of 300,000 tons for crude oil and 40,000 tons for intermediate and finished products.14 Hydrocarbons can be released from storage tanks during filling and stand- ing. During filling, air containing hydrocarbon vapors can be displaced and released. During standing, changes in temperature and pressure affect the relative amounts of liquid and vapor within a tank, which can also dis- place air containing hydrocarbons (this is known as breathing loss). Factors which affect losses are vapor pressure; temperature; throughput rates; and the color, condition, and type of tank.
Products leave a refinery either by pipeline or in tanks and drums by road, rail, or ship. During product transfers, hydrocarbons can be lost to the atmosphere in much the same way as during storage. The quantity of hydrocarbons lost from loading facilities depends on the type of product and the method of transfer.
Other Point Sources. Refineries produce and use large quantities of gas for fuel and feedstock. Although pro- duction and consumption are balanced as much as pos- sible, scheduled shutdowns and process disruptions can upset this balance and overload the waste gas recovery system. To meet this eventuality, refineries have waste gas disposal systems. Such a system can consist of a manifolded pressure-relieving system, or a blowdown and blowdown-recovery system, and a system of flares for burning excess gas. Emissions from the waste gas disposal system include hydrocarbons, SO,, CO, and NO,.
Refineries use large quantities of water for pro- cesses and cooling. The effluent streams, as well as stormwater runoff, contain oil and must be treated prior to discharge. A refinery, therefore, has a complex drain- age system that leads wastewater to a treatment area. Hydrocarbons can enter the atmosphere from the drain- age system and treatment area.
Hydrocarbons can be found at low levels in nearly all water used for process cooling. If process heat ex- changers leak, the level of hydrocarbons present in the cooling water can increase substantially. Some of these hydrocarbons can be vaporized and emitted to the atmo- sphere in the cooling tower.
Fugitive Emissions
Emissions that are not released from point sources are fugitive emissions. Fugitive emissions that are of pri- mary concern in refineries are leaks from plant equip- ment, especially line valves, flanges, sampling connec- tions, open line ends, and pump and compressor seals.
Although these components can be expected to have a low leak rate per unit, a major processing facility con- tains a large number of them. A typical refinery has about 22,000 in-line valves, 660 pumps, 130 compres- sors, 84,000 flanges, 170 relief valves, and 1,100 pro- cess drains.8 Leaks from these components can be con- sidered system failures and are predictable only in terms of probability. This is in contrast to point sources, which are expected to have somewhat constant emissions.
emissions, the leak rates and effectiveness of controls for line components at refineries. The results of the studies by EPA are summarized in Table 10.7, which lists the estimated average factors of fugitive emissions and the uncertainties of the average factors.8
Although fugitive emission rates per source appear to be small, total fugitive emissions could be substantial. For a hypothetical 330,000-bbYd refinery, nonmethane hydrocarbon emissions were estimated to be 12,439 tonslyr, of which 8,767 tons/yr (70.4%) wefe from fugitive sources, 3,308 tonslyr (26.6%) from stor- age tanks, and 364 tonslyr (2.9%) from point sources. Valves were responsible for about 50-60% of the
The EPA and API have estimated, for hydrocarbon
Table 10.7 Estimated Average Factors of Fugitive Emissions and Their Uncertainties for Nonmethane Hydrocarbons from Petroleum Refineries (Ibh per source)
Estimate of 95% Confidence Average Interval Emission for Avenge
Source Categoly Factor Emission Facto-
Valves Gas-vapor streams Light liquid, two phase Heavy liquid
Open-end lines Pump seals
Light liquid Heavy liquid
Drains Flanges Relief valves Compressor seals, hydrocarbon service
0.059 0.024 0.0005 0.005
0.25 0.046 0.070 0.00056 0.19 1.4
(0.030, 0.1 10) (0.0002,0.036) (O.OOO2, 0.0015) (0.0016,0.016)
(0.16, 0.37) (0.019, 0.11) (0.023, 0.20) (0.0002,0.0025) (0.070, 0.49) (0.66, 2.9)
aFor a data sample, there is a 0.95 probability that these intervals will enclose the average factor; the ratio of high-to-low values ic the 95% confidence interval is typically between 2 and 10.
Source: Ref. 8.
155

fugitive hydrocarbon emissions. The hypothetical refinery was assumed to have covered wastewater treat- men t units .8
The EPA study attempted to correlate leak rates with process- and equipment-related characteristics. Of the variables considered, pressure apparently affects leak rates the most; temperature, age, and line size have a lesser effect. Equipment design can also significantly affect leak rates. For example, control valves were found to have a higher leak rate than block valves. For block valves, the gate type had a higher leak rate, while plug and ball types demonstrated the lowest leak rate. On-line pump seals had an overall leak rate that was over three times that of off-line seals.8
Water Pollution
Types of Wafer Pollutants15
Raw refinery wastewater contains large quantities of free and emulsified oil. In addition, water-soluble hydrocar- bons, such as phenolic compounds, that are present in the crude petroleum will also be present in the waste- water.
Crude petroleum contains a variety of sulfur com- pounds that are removed from the finished product in various amounts, depending on product specifications. Due to the contacts between oil and water at various stages of the refining operation, significant quantities of sulfur compounds enter the wastewater stream. Most of these sulfur compounds are sulfides, which are typically present in the wastewater as sulfide ions.
Since petroleum also contains a number of nitrogen compounds, refinery wastewater typically contains appreciable quantities of N H 3 . Carbonaceous and inor- ganic particulate matter from a variety of sources, such as incomplete combustion and soil, are also present in refinery wastewater, thus contributing to the level of total suspended solids (TSS).
refinery wastewater will exert a chemical oxygen de- mand (COD), In addition, some compounds are bio- degradable, which exerts a biochemical oxygen demand (BOD). Crude petroleum also contains a variety of trace heavy metals, such as mercury, cadmium, and lead, that may also contaminate process water. Corrosion inhibi- tors, such as chromate salts, that are used in cooling water can be included in wastewater discharges.
The refinery wastewaters include, depending on the individual plant characteristics, nonprocess and process wastewaters.
Because most of these pollutants can be oxidized,
Nonprocess Wastewaters.1618 Ballast water, which is produced at coastal refineries, is the water taken on by seagdnp vessels to improve their stability. Typically, ballast water is contaminated by the previous contents of the compartment that holds it. Where dumping ballast water at sea is not feasible or permitted, it is discharged to the refinery for treatment, normally by gravity separa- tion.
pollutant characteristics of domestic sewage, and it is normally treated by biological oxidation. Sanitary wastewater may also be discharged directly to a munici- pal sewage system or included in process wastewater for on-site treatment.
tation, can be contaminated by raw materials or prod- ucts, such as oil and grease. Control measures for stormwater pollution include housekeeping measures, smrm-sewer segregation, and storm retention facilities.
In a refinery, sanitary wastewater typically has the
Refinery stormwater, the plant runoff from precipi-
Process Wastewaters.16l8 The sources of process wastewater within a refinery include nonsegregated cooling water, cooling tower blowdown, boiler blow- down, oily process water, sour water, spent caustic solu- tions, and blowdown from water treatment systems and air pollution control equipment.
Nonsegregated cooling water is once-through cool- ing water that has been combined with other wastewater. It is a typical source of wastewater in older refineries, where the cooling wafer has become contaminated in the cooling process by low concentrations of oil and grease. However, because of the large volume of flow, the total amount of pollutants can be substantial. In most refin- eries, once-through cooling is being replaced by more efficient methods.
water discharge from the cooling tower water cycle, which is produced in relatively small quantities when solids that build up during evaporation are eliminated. Blowdown contains high concenaations of dissolved solids and low concentrations of water treatment chemi- cals, such as chromium, zinc, chlorine, and biocides. Cooling towers are common in the refrning industry, particularly in areas where an abundant source of fresh water for once-through cooling is not available.
Boiler blowdown is the concentrated wastewater discharge from a boiler-type heating or steam-generating system. The characteristics of boiler blowdown dis- charges are similar to those of discharges from cooling tower blowdown. However, the volume of blowdown from boilers is typically smaller than that from cooling towers.
Cooling tower blowdown is the concentrated waste-
156

Oily process wastewaters usually contain oil, sul- fides, N H 3 , and oxygenconsuming organics. A refinery typically generates oily process wastewater that is some combination of condensed blowdown from vapor cool- ing, process water, vent-scrubber water from controlling process gases, tank drainage, blowdown from the liquid seals for flares, laboratory drainage, and water Contami- nated by equipment maintenance and cleanup opera- tions.
produces sour water. Principal sources of sour water are accumulators; catalytic reformers; and cracking, hydro- cracking, coking, and distillation units. Sour water generally represents 8-18% of a refinery’s total process wastewater. In general, it is characterized by small amounts of organic acids and relatively high concentra- tions of sulfides, N H 3 , mercaptans, and phenolics.
Some wastewater streams contain spent caustic solutions, which are used to neutralize and extract acidic materials from crude fractions and by-products. Spent caustic solutions contain sulfides, mercaptans, sulfates, sulfonate, phenolates, naphthenates, and other similar organic and inorganic compounds.
Blowdown from water treatment systems is the wastewater discharged from a refinery’s fresh-water treatment facility. Blowdown from air pollution control equipment is the wastewater discharged from exhaust gas scrubbers in refineries that need to control emissions from combustion processes.
Condensing the s&am from a variety of processes
Quantify and Quality of Raw Process WastewaterslGlg
The quality of raw process wastewater can vary widely from plant to plant, depending on process characteristics and operating methods. The EPA’s Treatability Manual18 lists categories of petroleum refineries that reflect significant differences in wastewater characteris- tics and pollutant loadings (Tables 10.8-10.10).
No data are currently available to characterize the concentration of toxic pollutants in refinery wastewater. However, EPA has determined the designated priority pollutants that are likely to be detected in refinery wastewater.16 The toxic pollutants include benzene, ethylbenzene, toluene, 2,4-dimethylphenol, acenaph- thene, fluoranthene, chrysene, phenanthrene, arsenic, cyanide, copper, lead, nickel, and zinc.
Solid Wastes
Waste Streamsl9Zo
A petroleum refinery generates a wide variety of solid waste streams, of which many contain materials on the
Intermittent Solid Wastes. Sediments accumulate at the bottoms of crude oil storage tanks, which are cleaned periodically to remove the sediment. Contaminants in crude oil tank sludge, which vary with the type of crude oil and handling and shipping methods, may include a mixture of rust, clay, sand, water, and some oil and wax. Solids also settle to the bottoms of tanks for finished products, such as gasoline. The accumulated sludge is removed when the type of stored product changes, the sediment exceeds a specified limit, or the tank needs repair. The characteris tics of the deposited sludge vary with the type of product, such as leaded or unleaded gasoline, stored in the tank.
Solids that settle in the API separator, a type of primary wastewater treatment unit, are periodically removed with a vacuum truck. Refinery API separatcjrs are usually connected to the plant’s sewer for oily water. Therefore, sludges from API separators are mixtures of all chemicals that a refinery produces and uses.
and HF acid alkylation processes. In the sulfuric acid alkylation process, the spent acid is usually regenerated by an off-site producer of sulfuric acid, and it accumu- lates in storage tanks for batch transportation to the reclaimer. Sludge from these tanks contains polymer- ized hydrocarbons, tank scale, and sulfuric acid and is usually removed when the tank is either cleaned or repaired. Spent HF acid is usually neutralized with spent lime from the boiler feedwater treatment to pro- duce calcium-fluoride sludge, which is insoluble.
Alkylation sludges are produced by both the sulfuric
EPA toxic substance list. The nature and quantity of solid wastes produced by refineries are variable and still being investigated. Most solid waste streams can be divided into two main groups: those that are intermit- tently generated and those that are continuously gener- ated. Intermittent wastes result from cleaning within process areas and off-site facilities. The wastes include process vessel sludge and scale and other deposits gener- ally removed during plant turnarounds, storage tank sediments, and product treatment wastes, such as spent catalysts and filter clays.
Continuous wastes require disposal at less than 2-wk intervals. They can be further divided into two groups: process unit wastes and wastewater treatment wastes. Major process unit wastes include coking pro- cess wastes and coke spilled at unloading facilities, spent catalysts and catalyst fmes, and spent or spilled grease and wax wastes from lube oil processing. Was- tewater treatment wastes can include sludges from ac- tivated sludge (biological oxidation) units and sludges skimmed from dissolved air flotation (DAF) units.
157

Table 108 Categories of Petroleum Refineries Reflecting Significant Differences in Wastewater Characteristics
I
Category Basic Refinery Operations Included
I
Topping Topping and catalylic reforming, whether or not the facility includes any other processes. This category is not applicable to facilities that include thermal processes (such as coking and visbreaking) or catalytic cracking.
Topping and cracking, whether or not the facility includes any other processes, unless specified in one of the categories listed below.
Topping, cracking, and petrochemical operations,s whether or not the facility includes any other processes except lube oil manufacturing.
Cracking
Petrochemical
Lube Topping, cracking, and lube oil manufacturing processes, whether or not the facility includes any other processes except petrochemical operations.
Topping, cracking, lube oil manufacturing, and petrochemical operations, whether or not the facility includes any other processes.
Integrated
alhe term "petrochemical operations" means the production of second-generation petrochemi- cals, such as alcohols, ketones, and styrene, or first-generation petrochemical and isomerization products, such as benzene, toluene, xylene, olefins, and cyclohexane, when 15% or more of refinery production is as first-generation petrochemicals and isomerization products.
Source: Ref. 18.
Table 10.9 Raw Wastewater Characterization by Petroleum Refining Category (mg/L)
Topping Cracking Petrochemical Integrated Lube,
Parameter Range Median Range Median Range Median Ranges Range Median
BOD5 COD Tocb TSS NH3-nitrogen Phenols sulfides Oil and grease Total chromium
1 0-50 50-150 10-50 10-40
0.05-20 NDC-200 ND-5
10-50 ND-3
23 110 20
2.1 0.8 0.24 25 ND
30-600 150-400 50-500 10-100
0.5-200 ND-100 ND-400
15-700 ND-6
140 380 66
29 6.0 1.2
0.1 1 53
50- 800 300- 600 100- 250 50- 200 4- 300
0.5- 50 ND- 200
20- 250 N D - S
140 420 130
42 10
180 45 0.47
100-700 400-700 100-400 80-300
1-120 0.1-25
ND-40 40-400
ND-2
100-800 300-600 50-500 20-200
1-250 0.5-50
ND-60 20-500
ND-2
110 260 52
14 2.2 1.2
0.27 44
aMedian values for this category are not available.
bTotal organic compounds.
CNot detected.
Source: Ref. 18.
158

Table 10.10 Raw Wastewater Loadings by Refining Category (Ibhhousand bbl throughput).
~ ~~~~
Topping Cracking Petrochemical
Parameter Rangeb Median Rangeb Median Rangeb Median
ROW
BOD5 COD TOCd TSS NHs-nitrogen Phenols Sulfides Oil and grease Total chromium
45-3,130 0.5-77 1.2-172 0.4-23 0.2-102
0.0004-0.4 0.0007-0.5
0.4-3 1 0.00007-0.1
0.03-7
374
13 1.2
2.8 4.2 0.42 0.01 0.02 2.9 0.002
18.615,427 4.9-105 9.8-876 1.9-112 0.3-126 0.860
0.07-28 0.003--14~
1-126 0.0003-15
522 26 71 15 6.3 9.8 1.4 0.33
0.09 11
149-2,485 61 1 14-252 60 70-385 161 17-140 53
2.2-130 17 1.9-74 12 0.9-8.4 2.7
0.003-32 0.3 4.2-84 19
0.004-1.4 0.08
Lube Integrated
Parameter Rangeb Median Rangeb Median
Flowc BOD5 COD TOCd TSS NHs-ni trogen Phenols Sulfides Oil and grease Total chromium
385-4,331 22-266 60-806 11-109 6-109 2-34
1.6-19 0.00004-7
8-210 0.0007-0.4
656 77
189 39 25
8 2.9 0.004 42 0.02
224-7,686 22-211 26526 10-228 5-81
0.21-8 0.2-2.7~
7-95 0.04-0.7
1,318 70
116 49 21
1.3 0.7e
0.17 26
~ ~~~
aAfter treatment by refinery API separator; refer to Table 10.8 for descriptions of refinery categories.
bProbability of Occurrence less than or greater than 10% or 90%, respectively.
~1,000 ft3/l,OOO bbl of feedstock throughput.
dTotal organic compounds.
eSulfur.
Source: Ref. 18.
Before water is used in a once-through cooling system, it is passed through primary settling tanks, which produces sludge that is periodically removed from these tanks. In systems using cooling towers, sludge that settles in the cooling tower basin is removed during cooling tower downtime. Contaminants of cooling water sludges include those carried in the water supply and those generated as a result of water treatment.
during plant shutdown. Scale and sediment containing rust and oil resulting from such cleaning are either flushed into the process sewer system or scraped out for disposal in landfills.
Heat-exchanger bundles are periodically cleaned
For processes that use a fixed-bed catalyst, these catalysts eventually become inactive and are replaced in the reactors with fresh catalyst. Many of these catalysts contain valuable metals. Some of these metals, such as platinum and paladium, represent the active catalytic component; others are contaminants in the feedstock that adhered to the catalyst. After the valuable compounds are recovered, spent catalysts are disposed of as solid waste.
collect silt, which must be periodically removed. The quantity of silt depends on the amount of rainfall and
Some refineries have stormwater settling basins that
159

pavement at the refinery, rather than the refinery’s complexity.
Continuous Solid Wastes. In refineries, fixed-bed clay is used to remove color bodies, chemical treatment resi- dues, and traces of moisture from various products, such as gasoline, kerosene, jet fuel, and light fuel oil. Clay is also used to treat lube oils, a process in which clay is mixed with the oil and subsequently removed with a rotary vacuum filter. Depending on the specific use, spent filter clays can contain metals, ash, oil, and acidic and carbonaceous residues.
In some refineries, wastewater receives additional treatment to remove oil and solids by the DAF process. The process takes place in a circular tank, with or with- out chemicals, to bring fine particles of solids and oil to the surface, where they are skimmed off for disposal.
Skimmed oil from the API separators is usually pumped into a slop oil tank where the mixture is sepa- rated into three fractions: oil, water, and emulsion. The oil and water are recycled. The emulsion layer may be disposed of as a sludge or further treated (demulsified) by chemical or physical means. Chemical demulsifica- tion is the use of specific agents, heat, and settling. Physical treatment removes suspended solids by cen- trifugation or vacuum filtration and separates water and oil in settling tanks. In either process, the solids are disposed of, the oil is reprocessed, and the water is recycled.
In the process of biologically treating wastewater streams, excess biosludge is created that, for efficient operation, must be controlled. Biosludge contains bio- logical solids and heavy metals, has a very high water content, and is dewatered prior to disposal.
by burning the coke that forms on the catalyst during the cracking process. The flue gas from the regenerator passes through a series of cyclones that recover most of the catalyst. The recovered catalyst is then returned to the reactor vessel. Because of current and future air pollution regulations, more refineries have installed electrostatic precipitators or equivalent devices to re- move any catalyst fines that would otherwise be released to the atmosphere with the flue gas. These catalyst fines can be disposed of or sold.
Stretford units are used to remove H2S from process gas streams by reacting it with sodium carbonate to form sodium bicarbonate and sodium hydrosulfide. Elemen- tal sulfur is then removed through a catalytic reaction. The blowdown from Stretford units, called Stretford solution, contains sodium carbonate, sodium bicarbon- ate, sodium hydrosulfide, and some heavy metals, such as chromium and lead.
Catalysts from FCCs are continuously regenerated
Coke that is produced in the course of various refinery operations, especially fluid and delayed coking, is usually sold as industrial fuel. Coke fines are gener- ated intermittently and their quantity is a function of handling techniques. A certain amount of spillage and consequent contamination with dirt results during load- ing operations onto trucks and railroad cars.
Solid Waste Characteristicsl9.21
Jacobs Engineering Company has categorized refineries according to their capabilities for producing solid waste.19 The classification closely follows refinery complexity and represents some modification of the system given in Table 10.8 for wastewater generation. Four refinery types, along with their definitive process- ing steps and characteristic solid waste streams, are shown in Table 10.11.
A number of factors associated with refinery opera- tions may affect the composition and quantity of specific solid waste streams. One factor is the type of crude feedstock. The constituents of crude oil may vary wide- ly, and its heavy metal content, for example, has a sig- nificant effect on the potentially hazardous metal content of crude oil storage-tank bottoms, FCC wastes, and wastewater treatment sludges. A second factor is found in process units: differences in wastewater and air pollu- tion control processes may markedly affect the quantity as well as the composition of potentially hazardous waste material. For example, alkylation units that use HF acid produce a sludge high in fluoride, while alkyla- tion units that use sulfuric acid do not. A third impor- tant factor is the level of technology used in the process. Processing kerosene with hydrotreating, rather than clay filters, will decrease the quantity of solid waste gener- ated. A fourth factor affecting waste generation is that of operational practices and control. Reclamation of metals from spent catalysts and improved material han- dling procedures may significantly reduce the quantity of solid waste generated by a refinery.19
Table 10.12 presents estimates of the total solid wastes from the U.S. refining industry and rates of waste disposal per process unit, which are based on the 1982 survey of refinery solid wastes that was conducted for API.21 The composition and hazardous characteristics of solid waste streams in refineries are shown in Table 10.13.
Health and Safety22-26
The occupational safety hazards of petroleum refining are predominantly due to the flammable nature of the liquids and gases handled in oil installations. In air, the
160

Table 10.11 Types of Refineries According to Their Solid Waste Sh-eams
Refinery Type Pmesses Included Sdid Waste Streams
I Crude vacuum distillation Liquid-petroleum gas
recovery Hydrotreating Hydrorefining Reforming Alkylation Isomerization Visbreaking
FCC
Fluid or delayed coking
Lube oil procesaing Petrochemical operations
I1 All type I processes
111 All type I1 pl.Ocesses
IV All type tII processes
Slopoil emulsion solids; crude, leaded, and unleaded tank bottoms; sludges from once-through cooling water, heat- exchanger bundles, API separators, HF alkylation, and biological oxidation; spent lime from boiler feedwater treat- ment; DAF float; kerosene filter clays; and stormwater silt
All solid wastes included in type I and FCC catalyst fires
All solid wastes included in type I1 and coke fines
All solid wastee included in type 111 and lube-oil filter clays
Source: Ref. 19.
Table 10.12 Refinery Solid Waste Dispel Rates, 1982
EPA Refinery Unlt Dl$posal Hazardous Disposal b t e (wet
Waste Rate (wet tondmilllan Solid Waste Stream Number toos/yr)a bbl output)b
DAF float Slop-oil emulslon solids Heatexchanger bundle sludge MI separator sludge Leaded tank bouoma
waste biosludge FCC catalyst fines Unleaded tank bottoms Primary separator sludge Stretford solution
KO48 KO49 KOSO KO51 KO52
KO52 C
C C
C
308,000 144,000
1,300 393,000
9,QOo
699,000 131,000 1 17,000 69,000 38,oM)
63.0 29.4 0.21 80.4
1.02
142.9 26.8 23.9 14.1 7.77
HF alkylation sludge C 31,000 6.34 Other spent catalysts C 17,000 3.48 Cooling tower sludge C 14,000 2,116 Treating clays C 12,000 2.45 Secondary wparator Ehdge C 7,000 1.43
aRates were adjusted for temporary storage.
bEstimate based on 1982 waste dliposal rate and the U.S. total mfinery output
CNot listed a8 hazardous waste under the RCRA.
Source: Ref. 21.
(13.4 million bbUd).
161

I-. m Table 10.13 Composition and Hazardous Characteristics of SoUd Wastes from Petroleum Refineries
Mean Concentration (ppm)
Total Sele- Beryl- Cad- Phe- Igniti- Reac- Toxi- Solid Wastes Chromium Lead nium Arsenic Mercury lium Nickel Silver mium nols Cyanide bility tivity citya
DAF float 140 7.5 2.02 2.0 0.27 0.0013 0.035 0.25 0.005 6.5 0.28 Pb P P Slop-oil emulsion 525 28.1 1.0 7.4 0.59 0.0025 50.0 0.4 0.19 15 0.001 P N D C P
Heat-exchanger bundle 311 78.0 27.2 10.6 1.9 0.20 116.0 0.005 1.3 13.3 1.7 P P P
API separator sludge 253 26 0.001 6.2 0.4 0.0025 0.9 0.45 0.42 13.6 0.001 P P P Leaded tank bottoms 11.4 790 6.95 294 0.57 0.0025 314 0.88 6.3 12.6 O.ooo9 P P P Waste bio-sludge 4.w 1 .o 0.1 3.8 0.18 0.0013 0.025 0.3 0.3 4.5 0.001 ND P P FCC catalyst fines 48 72.5 0.01 1 .o O.OOO4 0.5 241 1.8 0.003 2.1 0.12 P P P Unleaded tank bottoms 2.0 4.0 12.0 0.007 0.43 0.26 26.7 0.6 0.33 1.8 7.4 P P P Primary separator 235 23.5 NAe NA NA NA NA NA NA NA NA P ND P
Stretford solution 71 79 NA NA NA NA NA NA NA NA NA ND ND P
Other spent catalysts 13 70.5 NA NA NA NA NA NA NA NA NA P P P Cooling tower sludge 13d 9 0.015 8.2 0.9 0.0013 6.8 0.28 0.3 3.5 0.1 ND ND P Treating clays NA 40,000 NA NA NA NA NA NA NA NA NA P P P
Cmde tank bottoms 1 .od 3.0 0.03 21.1 0.48 0.0026 16.2 0.19 0.31 15.8 0.0012 P P P
solids
sludge
sludge
HF alkylation sludge 28.5 33 7.1 2.3 0.07 0.07 52.2 0.19 0.07 8.9 23.1 ND ND ND
Secondary separator 1,085 875 NA NA NA NA NA NA NA NA NA ND P ND sludge
aAs measured by the EPA extraction procedure.
bPossible.
cNot detected.
dHexavalent chromium.
eNot available.
Source: Compiled from Ref. 20.

product vapors and gases form explosive mixtures. Physical contact with or inhalation of toxic com- pounds -- such as CO, H2S, NH3, hydrogen cyanide, phenols, and benzene -- could cause serious injury or death. These compounds can exist in products, by- products, and waste and process streams and can be released during process disruptions and maintenance or turnaround operations. Other, less significant occupa- tional safety hazards in petroleum refineries include exposure to high temperatures, vibration, and corrosive materials and accidents due to falls, bumps, and heavy equipment.
Many compounds present a respiratory hazard. Liquid-fuel products, such as gasoline and kerosene, produce a severe chemical pneumonitis if inhaled. The gaseous petroleum fractions and more volatile products, such as gasoline, have a mild anesthetic effect. Meth- ane, ethane, and some of the lower olefins are classified as "simple asphyxiants" and high concentrations of them could result in asphyxia. Accidental inhalation of cer- tain organic solvents could result in neuropathy; long- term exposure to them could damage the peripheral as well as the central nervous system.
The lighter fractions of oil, such as hexanes and aromatics, are all grease solvents; repeated or prolonged skin contact with them will break down the protective surface of skin, resulting in primary irritant dermatitis. Heavier, more viscous products, such as lube oil and cutting oils, could plug skin follicles and lead to der- matitis.
Benzene is an insidious toxicant that destroys blood-forming tissue. Chronic benzene exposure could lead to a progressive disease in which bone marrow function becomes increasingly depressed, resulting in anemia, leukepenia, or thrombocytopaenia in the peripheral circulatory system. Some of the heavier fractions of petroleum produce systemic intoxications. A large number of halogenated hydrocarbons, such as chlorinated naphthalene and carbon tetrachloride, are known to be liver poisons. Haemolytic anemia and hepatic and renal disorders have been reported in work- ers who have inhaled concentrated naphthalene vapors.
Certain fractions of heavy residual oils contain materials that are carcinogenic in test animals. This carcinogenic potential appears to be associated with the presence of PAHs. To date, there has been no widely accepted evidence that petroleum refinery workers expe- rience an excess risk of cancer from exposure to petro- leum. However, recent studies suggest an increased risk to the digestive system and possible cancers among various groups of refinery workers.
workers are likely to be exposed to other toxic agents In addition to the above hazards, petroleum refinery
(such as H2S, hydrogen fluoride, and lead compounds) and physical hazards (such as ionizing radiation, noise, asbestos, and silica dust).
During the past decade, several epidemiological studies have evaluated the health of refinery workers. In general, the results suggest that, while potential health hazards that exist in the petroleum industry are numer- ous and varied, the incidence of occupational disorders among refinery employees is relatively low. However, more experiments and sophisticated epidemiological studies are needed. Meanwhile, it is essential to take appropriate measures to minimize the workers' exposure with these hazardous substances and keep concentrations of these chemicals below the levels and standards set by relevant authorities.
ENVIRONMENTAL CONTROL
Atmospheric Emissions
Emission Standards
The Clean Air Act regulates the emission of particulates, SO,, NO,, CO, oxidants, lead, and hazardous com- pounds from major industries by means of the New Source Performance Standards (NSPS) and controls air quality by means of the National Ambient Air Quality Standards (NAAQS). State Implementation Plans (SIPS) specify emission rate limits for existing sources to attain and maintain NAAQS. Regional areas that have an air quality better than the NAAQS are designated Preven- tion of Significant Deterioration (PSD) areas and are allowed incremental increases in emissions for new developments, depending on the type of area. Before a new source, such as a refinery, can be operated in an area that does not meet the NAAQS, the operators are required to obtain offsets in emissions from some other source in the area.
given in Table 10.14.27 In addition to emission stan- dards for point sources, EPA has also promulgated per- formance standards for fugitive emissions in refineries. The proposed fugitive emission standards control emis- sions mainly through work practices and equipment standards rather than actual emission levels, which are used in most standards of performance28
The NSPS for the petroleum refining industry are
Point-Source Control Methods8~4
Claus Units. The tail gas from Claus units contains substantial quantities of SO, and H2S. There are a
163

Table 10.14 New Source Performance Standards for Point Sources of Atmospherlc Emissions in Refineries
Pollutant Point Source Standard
Particulates ECC catalyst regenerator (without auxiliary fuel)
FCC catalyst regenerator (with auxiliary fuel)
co FCC catalyst regenerator
so2 Flue-gas combustion
Claus sulfur recovery
Claus sulfur recovery (emissions controlled by a reduction system)
1 .O lb/thousand Ib coke bum-off,
1M) lblmillion Btu of heat input 30% opacity
attributable to auxiliary fossil fuel
Source: Ref. 21.
number of Claus gas treatment processes, such as the SulfreenTM process, the BeavonTM process, the SCOTTM process, and the Wellman-LordTM process, that can reduce the SO, content of tail gas to 250 ppm or less to meet the NSPS. Some of these are currently in use in refineries. In the absence of tail gas treating, the gas is incinerated to remove HzS.
Catalyst Regenerators. Flue gases from catalyst regen- erators generally contain significant levels of CO and particulates. In general, CO emissions are controlled by burning the flue gas in boilers, which produces COz, and recovering the heat as steam in a waste heat boiler. Particulate emissions can be controlled by cyclones, electrostatic precipitators, and wet scrubbers.
Boilers and Process Heaters. When SO, and NO, emis- sions from boilers and process heaters need to be reduced, low-sulfur fuels and high-efficiency burners can be used. Flue-gas desulfurization processes, which have been developed for the electric-utility industry, can remove SO, from combustion gases and can be used to "scrub" heater and boiler flue gases. Because most of the combustion sources in refineries are relatively small, the flue gases from several sources would have to be combined before scrubbing.
Storage Tanks and Loading Facilities. Hydrocarbon losses from storage tanks can be minimized by reducing the vapor space above the liquid with floating roofs.
164
0.05% by volume
O.oM)0144 lb/dry standard ft', of HIS in flue gas
0.025% by volume of SO2 (at 0% oxygen on a dry basis)
0.030% by volume of reduced sulfur compounds, O.Wl% by volume of HaS (at 0% oxygen on a dry basis)
Other approaches are also available. For example, inter- nal floating covers may be installed inside fixed-roof tanks.
reduced by using techniques that minimize evaporation and contact between expelled air and the incoming product. One such technique is submerged filling, in which the delivery pipe exits near the tank bottom and produces less turbulence and vapor loss than overhead splash filling. Another technique is bottom loading. In either case, vapor losses can be further reduced by col- lecting all the vapors and routing them to a recovery unit.
Other Point Sources. In a refinery, waste gas disposal systems can contain a pressure-relieving system, a blow- down recovery system, and a flare system for burning excess gas. Manual or automatic safety and relief valves are used to ensure the safe removal of gas or liquid from the process area in an emergency. Vented gas from relief valves is led to a blowdown drum where any entrained liquid is collected, and the gas is then led to a flare, where it is ignited and burned. Incomplete com- bustion in the flare can lead to hydrocarbon emissions, which can be prevented by injecting steam into the flare combustion zone to provide turbulence and entrain air.
Several techniques are available for reducing hydro- carbon emissions from process drains and wastewater separators. Process drain emissions can be controlled by covering drainage systems and reducing the amount of
Hydrocarbon losses from loading facilities can be

hydrocarbons that enters a drainage system. Emissions can also be controlled by installing U-shaped bends that trab hydrocarbons within the drain system. Numerous designs have been developed to reduce atmospheric emissions from M I separators. Among these, com- gated- and parallel-plate interceptors allow very little exposure of oil to the atmosphere and significantly reduce hydrocarbon emissions.
In many refineries, cooling tower water is frequent- ly monitored for hydrocarbon content to quickly detect leaks. This procedure, when coupled with prompt main- tenance to repair the leak, effectively maintains low emissions from cooling towers.
Transient emissions are generally associated with start-up and shutdown of equipment and with equipment failures and emergencies. The characteristics of these emissions vary with the specific types of transient condi- tion, operation, and equipment. Transient emissions can be minimized by preventive maintenance, proper design, and appropriate procedures. In current refinery practice, transient emissions are burned in flares.
Atmospheric emissions can sometimes be reduced by modifying refinery processes. For example, changes in operating practices (such as using high-temperature FCC regenerators), using alternate fuels in boilers and heaters, and hydroprocessing refinery feedstocks can reduce emissions.
Fugitive Emissions29,3Q
In general, two approaches to controlling fugitive emis- sions are available. The first approach is a leak detec- tion and repair program that locates and repairs fugitive sources at certain intervals. The second is a preventive approach that controls potential fugitive sources by installing specific controls or leakless equipment.
Leak Detection and Repair Programs. The monitoring techniques that can be used in a leak detection program include individual component surveys, unit-area (walk- through) surveys, and fHed-point monitoring systems. In individual component surveys, each component (such as a pump, valve, or compressor) is checked for leaks by spraying it with a soap solution and observing bubble formation. In unit-area surveys, the concentration of hydrocarbons is measured with a portable detector. In the fixed-point monitoring systems, several automatic hydrocarbon sampling and analysis instruments are placed at various locations in a process area. The insm- ment may sample the ambient air intermittently or con- tinuously to detect leaks. When leaks are detected by any of the methods, the leaking component can then be located by individual screening and repaired or replaced.
Preventive Programs. An alternative approach to con- trolling fugitive emissions from refinery operations is to replace components with equipment that is relatively leak-proof. In pumps, leaks can be reduced to a negli- gible level by installing improved shaft-sealing mecha- nisms (such as dual mechanical seals) or can be elimi- nated by installing pumps that do not need seals. In centrifugal and rotary compressors, fugitive emissions can be controlled by using mechanical seals with fluid- barrier systems or liquid-film seals. Reciprocating- compressor seals can be improved by inserting one or more spacer rings into the seal packing. Fugitive emis- sions from valves can be eliminated by isolating the valve stem from process fluids (sealed bellows valves are designed for this purpose).
Effluents
Discharge Standards
The effluent guidelines and standards for the petrc.;um refining industry,31 which are promulgated under the Clean Water Act, place limitations on the following wastewater parameters: BODS (the "5" refers to the number of days that a sample incubates prior to testing), TSS, COD, oil and grease, phenols, NH3, sulfide, chromium (total and hexavalent), and pH (a measure of alkalinity or acidity). Effluent limitations, with the exception of pretreatment standards, were established in terms of mass limits based on refinery throughput. The regulations were based on a mathematical flow model of the industry, which is divided for regulatory purposes into five categories: topping, cracking, petrochemical, lube, and integrated (see Table 10.8 for definitions).
Technologies to achieve proposed limitations are defined as best practicable control technology currently available (BPT), best available technology economically achievable (BAT), and best conventional pollutant con- trol technology (BCT). Effluent limitation guidelines that are based on the application of BPT, BAT, and BCT apply to existing direct dischargers. The NSPS, which are also established in terms of mass limits, apply to new facilities. Pretreatment standards for both existing and new sources, which are established in terms of pollutant concentration levels, apply to indirect dischargers.
Wastewater Control and Treatment Methods1617
Refinery wastewater control and treatment are of three types: in-plant source control, in-plant treatment, and end-of-pipe treatment. Table 10.15 summarizes removal efficiencies for wastewater treatment systems.16
165

Table 10.15 Typical Removal Efficiencies for Refinery Wastewater Treatment Processes (%)
Process BOD5 COD TOO TSS Oil Phenol N H 3 Sulfide
MI separator Clarifier DAF Oxidation pond Aerated lagoon Activated sludge Trickling filter Granular media filter Granular activated carbon Powdered activated carbon
5-40 30-60 20-70 40-95 75-95 80-99 60-85 NA 91-98 80-99
5-30 20-50 10-60 30-65 60-85 50-95 30-70 NA 8695 50-98
NAb NA NA 60 NA 40-90 NA 50-65 5 6 80 NA
10-50 50-80 50-85 20-70 40-65 60- 85 60- 85 75-95 60-90 NA
60-99 60-95 70-85 50-90 70-90 80-99 50-80 65-95 70-95 NA
0-50 9-50
10-75 60-99 90-99 95-99+ 70-98 5-20
90-99 NA
NA NA NA 9-15
10-45 33-99 15-90 NA 33-87 NA
NA NA NA 70-100 95- 100 97-100 70- 100 NA NA NA
aTotal organic compounds.
bNoi available.
Source: Ref. 16.
In-Plant Source Control. Procedures that can reduce the amount of pollutants sent to the wastewater system, reduce the amount of water discharged, and make subse- quent end-of-pipe treatment more effective are known as in-plant source control. Effective housekeeping meas- ures can reduce wastewater volume and pollutant load- ing. Such measures include installing curbs around process areas to contain spills and oily stormwater and effectively maintaining equipment and sewers to min- imize leakage and prevent shock loads at the treatment plants.
Refinery wastewaters should be properly segregated to ensure that they can receive the most effective treat- ment or reuse. A typical segregation scheme for a petro- leum refinery would provide a "clean" water sewer, an oily water sewer, and a highcontamination sewer.
The design of many new and modified refineries incorporate process techniques that reduce water use and pollutant loading. Such techniques include using air cooling for some cooling requirements, thereby reducing cooling water blowdown; using hydrocracking and hy- drotreating processes that produce less wastewater than older processes; and using improved drying, sweetening, and finishing procedures to minimize the generation of spent caustics and acids, water washes, and filter solids.
Recycling and reusing wastewater elsewhere in the refinery can also reduce wastewater discharges. Treated wastewaters that can be reused include makeup to pro- cess and pump cooling systems, washdown waters, and water from fne control systems.
166
In-Plant Treatment. Techniques for treating specific waste streams are considered in-plant control. Common in-plant treatments for sour waters are sour-water strip- ping, sour-water oxidation, or a combination of the two. Sour-water stripping is a gas-liquid separation process that uses steam or flue gas to extract sulfides and N H 3 from the wastewater. In general, sour-water oxidation involves aerating the wastewater and injecting steam into it to convert the sulfides to thiosulfides and sulfates, which reduces the oxygen demand of the wastewater stream. Some oxidation processes use peroxide and chlorine.
In many refineries, it is a common practice to neutralize spent caustics with spent acid and send the neutralized solution to a sour-water stripper. The bot- toms from sour-water stripping often have a high phenol content, which can be recovered by crude desalting. When spent acid is not available, spent caustics may be neutralized with flue gas.
Slop-oil treatment and recovery can be achieved by heating the slop oil to 195'F for 12-14 h to separate the water from it. Normally, a layer of clean oil layer forms above a middle layer of oil-water emulsion and a bottom layer of solids, water, and oil. It may sometimes be necessary to add demulsifiers to break the emulsion. In addition, treatment by centrifugation or precoat filtration using diatomaceous-earth filters may be required.
Cooling tower blowdown can be treated by remov- ing metals, such as chromium and zinc, and phosphate by precipitation and clarification at a relatively high pH

(8-10). Hexavalent chromium is first reduced to the trivalent state by adding S a , ferrous sulfate, or sodium bisulfite. The blowdown’s pH is then raised by adding lime or another caustic and flocculating and clarifying it.
End-ofpipe Treatment. Final treatment processes are classified as primary, intermediate, secondary, and ter- tiary, depending on their function. The processes used depend on the type of refinery. In primary treatment, API separators remove oil, which floats and coalesces on the surface of the water, and sludge, which settles to the bottom of the separator. Parallel-plate separators, which reduce the distance the oil droplets must travel before collection, are a relatively new technology for removing oil and sludge.
emulsions and suspended or colloidal solids, that neither float nor settle within the residence time provided in primary treatment. The processes for intermediate treat- ment include DAF, chemical coagulation and sedimenta- tion, and filtration.
Secondary treatment employs biological, physical, or chemical processes to remove dissolved organics. Physical and chemical treatments that follow biological treatment are considered advanced treatment processes. All of the biological methods for secondary wastewater involve oxidative decomposition by microorganisms. These processes -- activated sludge, trickling fiters, aerated lagoons, oxidation ponds, and rotating biological contactors -- are discussed in the chapter on Environ- mental Control Technologies for Fossil Energy Systems.
Additional treatment after secondary treatment is considered tertiary treatment. Tertiary treatment may be required in some refineries by changes in refiery efflu- ents or regulatory requirements. Tertiary treatment commonly involves the reduction of suspended solids and carbon adsorption to remove organic pollutants.
A new technology has been developed over the past several years that consists of adding powdered activated carbon to biological systems. The absorbent quality of carbon enhances the removal of soluble organic materi- als in biological treatment units. Activated carbon also enhances color removal, clarification, and system stabil- ity. Results of pilot tests indicate that using powdered activated carbon added to activated sludge systems can be a viable alternative to granular carbon systems.16
Intermediate treatment removes materials, such as
Solid Wastes
The Resource Conservation and Recovery Act (RCRA) regulates the transportation, storage, and disposal of solids, semisolids, liquids, and contained gases from the
point of generation to the point of disposal. Under the RCRA, criteria to identify hazardous wastes have been defined and requirements for treating, storing, and dis- posing of hazardous and nonhazardous wastes have been or are being specified. The hazardous solid wastes that can be generated by refineries include DAF float, slop- oil emulsion solids, sludge from heat-exchanger bun- dles, API separator sludge, and leaded gasoline tank bottoms. 3 2
Waste Management Optionsl6,19,21
In refineries, solid waste streams can be treated and disposed of by a combination of source control, treat- ment, and disposal practices. Source control is reducing or containing waste streams at their point of generation. In refineries, one approach to source control is to add or alter equipment. For instance, installing tank mixers in storage tanks minimizes the formation of bottom sludge.
Another approach to source control is implementing operational or procedural changes. In shutdown plan- ning, the amount and quality of oily wastes is predeter- mined and handled appropriately in the event of an equipment shutdown. Another control practice is the internal permit system. In such a system, an oily stream can be released to oily drains only with the approval of the plant’s environmental department. In addition, an internal charging system can motivate employees to reduce waste discharges.
In refineries, treatment options for solid waste streams include resource recovery, detoxification, vol- ume reduction, and fixation. The resource recovery option treats solid wastes with the goal of recovering materials or energy. Resource recovery is attractive because it conserves material and energy resources and reduces the quantity of wastes requiring disposal. The detoxification option makes the waste stream innocuous, thereby reducing the cost of disposal. Volume reduction simply reduces the waste volume and thus the amount of land needed for disposal. Fixation, which is applicable to liquid or semiliquid wastes, produces a more-solid material, improves the handling characteristics of the waste, and limits the solubility of pollutants contained in the waste.
Waste treatment technologies that are proven and currently used in refineries include vacuum and pressure filtration, centrifugation, dewatering lagoons, aerobic and anaerobic digestion, and chemical fixation.16 Proven treatment technologies that are potentially usable in refineries included sand drying beds, wet-air oxida- tion, and composting.16
petroleum refineries include incineration, landfarming, The disposal practices that are presently available to
167

landfiling, lagooning, deep-well injection, and Ocean disposal. Landfilling and lagooning have been the most widely used and accepted methods for disposing of solid wastes. More stringent regulations for solid waste dis- posal have forced refineries to adopt disposal practices that are more advanced and rigorous, allowing no direct contact between the waste and surface water or ground- water.
ganic materials in solid wastes. Landfarming is a treat- ment and disposal method that is relatively inexpensive and increasingly used by refineries for disposing of oil- contaminated wastes. However, the nature of the degra- dation products from landfarming, in particular the fate and impact of heavy metals and certain toxic organic compounds, is still uncertain.
Incineration is a relatively expensive method for treating solid wastes because it requires supplemental fuel, emission controls, and dewatering facilities. In- cineration appears to be confined to certain areas where hydrogeologic and climatic conditions preclude the use of other methods or land shortages or high land costs preclude land farming. However, incineration is a viable method for reducing the volume of solid wastes in areas where hauling distances are large or for reclaiming wastes that cannot be handled economically in other ways. Most refineries that operate incinerators are located in the Midwest, the Great Lakes region, and the Northeast.
that are relatively little used. In deep-well injection, weak solutions from refinery processes -- such as sour water from hydrotreating units, brines from desalting units, and sulfidic solutions from treating crude cracking and hydrotreating streams -- are neutralized, filtered, and injected into a subterranean formation. In wean dispos- al, similar wastes are dumped at sea. Deep-well injection and ocean disposal of certain hazardous wastes is pro- hibited, and permits to use these methods for less haz- ardous wastes are becoming increasingly difficult to obtain.
Landfarming uses soil bacteria to break down or-
Deep-well injection and Ocean disposal are methods
Future Trends
The solid waste management practices employed by the petroleum refining industry are changing significantly, because of increased recycling and reclamation of proc- ess materials and reduced waste generation from more efficient processes that increase product recovery. It is anticipated that, as a result, of€-site landfilling will decrease. Lagooning is expected to decrease slightly, with minor increases in incineration and other special- ized on-site disposal practices. These changes are ex-
168
pected to result from dynamic interactions between environmental regulations, the development of new technologies (particularly in landfarming and fluidized- bed incineration), conservation of materials and energy, and improvements in operational procedures and dis- posal techniques.
ENVIRONMENTAL CONSTRAINTS
Air Quality
A new refinery that employs BAT for controlling atmos- pheric emissions will generally not be significantly constrained by air quality requirements. However, an important air quality issue for the petroleum refining industry is the location of facilities in "nonattainment" areas (i.e., areas not in compliance with NAAQS). In particular, standards for ozone may pose some con- straints because many refineries are located in areas that are not in compliance with ozone standards. As a result, existing refineries may be required to further reduce hydrocarbon emissions, which are suspected of con- tributing to ozone formation.
Federal requirements would bar the construction or expansion of refineries in nonattainment areas unless emissions from existing souxes could be reduced by an amount greater than the anticipated emissions from the proposed new facilities. Regulations for PSD could also affect the siting of new refineries in areas that are in attainment of ambient standards.
Pollutants (NESHAP) emphasize increasing control of toxic pollutants and present an additional potential con- straint for refineries. Although refineries emit various toxic air pollutants (see Table 10.3, it has not been demonstrated that these emissions are at the level requir- ing control under NESHAP.
The National Emission Standards for Hazardous Air
Water Quality
As with air quality standards, existing water quality requirements can generally be met with available tech- nologies, especially if they can be incorporated into the design of a new refinery. However, control equipment is generally expensive and frequently imposes substan- tial energy penalties. In areas with restricted water sup- plies, closed-loop systems, which are even more expen- sive, are required. Concerns about the toxicity of refinery effluents and promulgation of water quality

standards for an increasing number of these effluents could potentially constrain the siting of new refineries.
Solid Waste Management
Changes in the management of both hazardous and non- hazardous solid wastes have thus far focused primarily on disposing of residuals. Historically, much of a refm- ery’s solid waste was disposed of off site, mostly in municipal sanitary landfills. The RCRA has prompted a major shift from off-site to on-site disposal, particularly by landfarming and landfilling. Lagooning is decreasing in favor of incineration and special on-site disposal practices.
The increasingly stringent goals of the RCRA could further affect solid waste management by focusing atten- tion on treating waste and reducing its volume rather than disposing of waste. Currently, EPA is considering a ban on disposing of selected hazardous wastes by land disposal methods. Such a ban would require refineries to use alternative treatment and disposal methods, such as detoxification, fixation, and volume reduction, or to further develop technologies and procedures for material recycling and reclamation. Developing alternative treat- ments that are economically feasible is one of the major challenges facing the petroleum refining industry.
REFERENCES 1.
2.
3.
4.
5.
6.
7.
Bland, W.F., and R.L. Davidson, Petroleum Pro- cessing Handbook, McGraw-Hill, New York (1967).
Petroleum Supply Annual, Energy Information Administration, U.S. Dept. of Energy Report DOE/EIA-340(85) (June 1986).
US. Industrial Outlook 1986: Prospect for Over 350 Manufacturing and Service industries, Inter- national Trade Administration, U.S. Dept. of Commerce (Jan. 1986).
Cantrell, A., Annual Refining Survey, Oil and Gas J., 78(12):130 (1980).
Our Industry Petroleum, British Petroleum Co., London (1977).
Hengstebeck, R.J., Petroleum Processing, McGraw-Hill, New York (1959).
Gaines, L.L., and A.M. Wolsky, Energy and Ma- terials Flow in Petroleum Refining, Argonne
8.
9.
10.
11.
12.
13.
14.
15.
16.
17.
National Laboratory Report ANUCNSV-10 (Feb. 1981).
Wetherald, R.G., and D.D. Rosebrook, Assessment of Atmospheric Emissions from Petroleum Refin- ing: Vol. I l’echnical Report, U.S. Environmental Protection Agency Report EPA-600/2-80-075a (April 1980).
Shreve, R.M., and J.A. Brink, Jr., Chemical Pro- cess Industries, McGraw-Hill, New York (1977).
1982 National Emissions Report, Office of Air Quality Planning and Standards, U.S. Environ- mental Protection Agency Report EPA-45014-34- 026 (Nov. 1984). Cavanaugh, G., et al., Potentially Hazardous Emissions porn the Extraction and Processing of Coal and Oil, U.S. Environmental Protection Agency Report EPA-650/2-75-038 (April 1975).
Refinery Odor Control and Ambient Levels of Emissions for Refinery Operations, prepared by Midwest Research Institute for the American Petroleum Institute, Washington, D.C. (May 1975).
Sexton, K., and H. Westberg, Ambient Air Mea- surements of Petroleum Refinery Emissions, J. Air Pollution Control Assn., 29( 11) (Nov. 1979).
Westaway, M.T., and G.J. Brokis, Petroleum Refineries, in Industrial Air Pollution Handbook, A. Parker, ed., McGraw-Hill, London (1978).
Environmental Consideration of Selected Energy- Conserving Manufacturing Process Options, Vol. IV -- Petroleum-Refining Industry Report, U.S. Environmental Protection Agency Report EPA- 60017-76-034d ( D ~ C . 1976).
Verick, A S . , et al., The Management of Waste- water from the Petroleum Refining Industry, in Surveys in Industrial Wastewater Treatment: Vol. 2, Petroleum and Organic Chemical Indus- tries, D. Barnes, C.F. Forster, and S.E. Hrudey, e&., Pitman Advanced Publishing Program, Boston (1984).
Development Docwnent for Proposed Efluent Limitations Guidelines, New Source PerJormance Standards and Pretreatmeni Standards for the Petroleum Rejxing Point Source Category, U.S. Environmental Protection Agency Report EPA- 4401 1-79/014b (1979).
169

18.
19.
20.
21.
22.
23.
24.
Treatability Manual, Vol. ]I, Industrial Descrip- tion, Office of Research and Development, U.S. Environmental Protection Agency Report EPA- 600/2-82-001b (Sept. 1981).
Rosenburg, D.G., et al., Assessment of Hazardous Waste Practices in the Petroleum Refining In- dustry, prepared by Jacobs Engineering Co. for U.S. Environmental Protection Agency, NTIS PB-259 097 (June 1976).
Characteristics of Hazardous Wastes from the Petroleum Refining Industry, Final Report Draft, prepared by Energetics, Inc., for U.S. Dept. of Energy (April 1986).
The 1982 Refinery Solid Waste Survey, prepared by Environmental Resources Management, Inc., for American Petroleum Institute, Washington, D.C. (1983).
Refining Synthetic Liquid from Coal and Shale, National Research Council, Washington, D.C. (1980).
Aryonpur, J., Health Hazards Encountered in the Petroleum Industry, Roc. 10th World Petroleum Congress, Vol. 5 , Conservation, Environment, Safety and Training, Bucharest, Romania (1979).
A Mortality Study of Petroleum Refinery Workers, Project OH-I , Medical Research Report #EA 7401, prepared by TabershawKooper Associates
25.
26.
27.
28.
29.
30.
31.
32.
for American Petroleum Institute, Washington, D.C. (1974).
A Mortality Study of Petroleum Refinery Workers: Social Security Follow-up, Project OH-], No. 129, prepared by TabershawKooper Associates for American Petroleum Institute, Washington, D.C. (1975).
Rushton, L., and M.R. Alderson, An Epidem’o- logical Survey of Eight Oil Refineries in the U.K. - Final Report, Institute of Petroleum, London (1980).
Code of Federal Regulations Title 40, Part 60.100. .,I 1. dode of Federal Regulations Title 40, Part 60.590.
Control of Volatile Organic Compound Leaks from Petroleum Refinery Equipment, Emission Standards and Engineering Division, US. Envi- ronmental Protection Agency Report EPA-45012- 78-036 (June 1978).
VOC Fugitive Emissions in Petroleum Refining Industry -- Background Znformation for Proposed Standards, Emission Standards and Engineering Division, U.S. Environmental Protection Agency Report EPA-450/3-8 1-015a (Nov. 1982).
Code of Federal Regulations Title 40, Part 419.
Code of Federal Regulations Title 40, Part 261.32.
170

BACKGROUND
All energy conversion systems have the potential to produce undesirable environmental impacts through site preparation and construction, resource extraction and processing, raw materials transportation, and the actual conversion. Environmental control technologies, ap- plied at various points in the energy system, are neces- sary to mitigate such impacts. In general, the degree of control attainable is limited by the ability to bear the costs, which for a given process always begin at some point to increase rapidly with eacb additional increment of effluent reduction. The appropriate level of control, usually expressed in a regulatory context, must therefore be determined either implicitly or explicitly through a cost-benefit tradeoff process. That process is driven by the performance of existing technology and, in turn, provides much of the impetus for developing and com- mercializing new or improved control technologies.
This chapter describes control technologies com- mon to most fossil-fuel-based systems, with an emphasis on those currently in use or expected to have significant impacts within the next 20 yr. The technologies are described in terms of their operational principles, areas of applicability, efficacy, developmental status, and any secondary impacts due to resome consumption or by- product production.
The entire system should be considered when eval- uating control technology options. The most direct approach to emissions control is to modify the resource- to-energy conversion step to reduce or eliminate the production of undesirable chemical species. This "inte- gral" control can involve a shift to a different conversion technology, measures to improve process efficiency, waste-stream recycling, or other internal measures that affect production of pollutants. A typical example of the integral approach is combustion modification to reduce the production of nitrogen oxides (NO,) in boilers.
Chapter I I
Environmental Control Technologies for Fossil
Energy Systems
Removal of pollutant precursors prior to the conver- sion step ("precombustion" control) can reduce or elimi- nate the need for any further cleanup, can shift the loca- tion for disposal of wastes, and can significantly impact fuel transportation requirements by reducing the fuel volume or changing its form. For coal, this approach ranges from cleaning it to converting it to synthetic fuel (synfuel).
If precombustion and integral measures are not available or sufficient, end-of-pipe, or "postcombus- tion," cleanup techniques must be employed. Examples include particulate matter (PM) removal, flue-gas desul- furization (FGD), and water treatment processes. How- ever, these techniques are generally not true final clean- up steps in that they usually produce additional waste stream that may require further treatment and disposal. For instance, most commercial FGD processes produce large quantities of waste solids, usually in the form of a sludge, that require costly controlled disposal facilities.
The selection of an optimal environmental control strategy for any given system is a complex process. In most cases, pollutants or their precursors are not truly eliminated. Rather, they are transformed into other species and shifted from one medium to another, i.e., from air in the form of sulfur dioxide (SOz), to land in the form of calcium sulfite and sulfate sludge, and then possibly to groundwater through leachate from a landfill. To minimize total environmental and economic impacts and prevent unforeseen secondary effects, all media must be considered in the strategy. Furthermore, con- trols applicable to all portions of the system should be evaluated to take advantage of beneficial synergistic effects. For example, a combination of precombustion coal cleaning and postcombustion FGD is likely to be the most cost-effective approach to the control of SO2 for many power plants. It also shifts some of the solid waste burden from the power plant to the cleaning site (usually near the mine), reduces the fuel transportation
171

reqtiimnent, lowers the Pull c d mquiremeM~, and may reduce bailer foaling. TIm, the total benefits caa go well beyond the primary ob-ve.
Another aspect of 3 systems approach to mvirm- mental oonaal is ttne integration ofgrocesses. This can take the form of combined control of multiple pdlutants in a single process, such as integrated S O 2 and NO, control in the fluidized-bed copper oxide pmcess under development by the US. BpaWXz~t of Energy -1, or combined S a rrnd PNI control in spray-dryer/f&&- fdter systems. IR a broader perspectSrJe, intqyation take the form of aptirnized h t e rac th of processes within a facility. For example, wastemter disC'hxge cam be reduced or eliminated by carefully evdaating water quality requirements m each process to use the waste from one unit as feedstock or makeup to another. hte- grated conmls not only reduce pollution, but o f m promote higher system availabibty thuugh greater sim- $city and usually yield higher system efficiencies. Increased efficiency is significant in that it autQniat+id@ reduces effluents through lower fuel use, and it has sec- ondary benefas in lowered ~esuurce extraction and transportation requirements.
The concept of process integration is particukmly relevant in complex systems, such as coal gasification or liquefacticm. Because the removal of product-stream impurities in such cases may actuafly be necessary to protect downstream components, the removal operations may not be primarily for environmental .xx&ol. The removal of PM from the gas s @ e m befm it enters the combus tion turbine in a combined-cycle gasification system is one example where the primary objective is protection of the t u z k e blades.
tal control technologies is by the media they treat: air, water, or land ( d i d waste). That approach is taken in this ehapter, beginnkg with te&nolagy for the control of air pol.luewts. Howewr, while this approach is use- ful, it is kmited in rhe sense that many of the technolo- gies have impacts OR ather media through resource con- sumption or control-process effluents. The need for system integri&on is important for each of the tech- niques.
The traditional approach to ClassiFying environmen-
AIR POLLUTANTS
The major air pollution concerns in fossil fuel use, as expressed in various federal, state, and local regulations, are for the control of particulate matter, sulfur com- pounds, and nitrogen oxides. Although SO2 and NO, have received most of the attention in recent years
172
(l3zmkd&y with i e g d a acid r e x PM control was the %st issue addressed due to the effects on visibility and the local deposition of PM emissions.
Particulate Matter
Parrhlae m&te caa be generated either as a product of combustion ar a fugitive emissions fim material han- dling and other industrid processes. h eiWr case, a significant number of the particles have sizes in the micrumer range. These respirable fine particles are the most dif;ficlalt~o.co€lea,~she mostdetz-immtalto visibility, and have &e gratest potentkd Eor 3Verse health impacts-1
Fugitiw E m i s ~ k ~ s Control
Fugitive emissions can arise from such sources as trucks moving on rmnpaved haul mads, windblown dust from storage piles or waste areas, crushing operations, mate- rial transfer points, and so on.2 One of the more popular control techniques is the use of water sprays. However, this is usually only temporarily effective, is subject to freezing problems in the winter, and may not be feasible in arid areas. Water sprays can be augmented through the use of surfactants (to improve wetting), foaming agents, or electrostatic charging of the droplets. For enclosed or localized sources, such as storage silos or conveyor transfer points, capture and collection systems are common. These typically involve an enclosure, a fan to move the particulate-laden air, and a collection device, such as a baghouse (fabric filter). For large sources, such as storage piles, windbeaks can be con- stnlcted to lower the wind qeed incident on & @e by as much as 75%.3
Mechanical Collectors
For moderate collection efficiencies, mechanical collec- tors use gravitational, centrZugal, or inertial forces to separate particles from a gas smm.4 The simplest type consists of an enlarged chamber, which siows the gases and allows the particles to settle. However, the most common type of mechanical collector is the cyclone, which typically consists of a vertical cylinder with a conical lower section. The gas stream enters the upper part of the cylinder tangentially and forms a vortex. The stream spirals down the wall of the cane, reversing di- rection near the bottom and flowing upward out a central exit duct (Fig. l l . l ) . S The disentrained dust flows down the wall of the cyclone and out a bottom exit.6 These devices are simple, relatively inexpensive, and nearly maintenance-free. For particle sizes above about 10 pm


Gas outlet
1 .iquid inlet
Principles of Operation
A - The contaminated gas enters the venturi and is accelerated in the converging section.
B - The scrubbing liquid is uniformly introduced at the top of the converging section and cascades by gravity and velocity pressures towards the throat. (This feature keeps the walls of the converging section wet and continuously flushed, thereby eliminating material build-up.)
C - The contaminated gas and the scrubbing liquid enter the venturi throat, where they are thoroughly mixed at high energy and extreme turbulence.
D - The scrubbed gas and entrained droplets (with contaminated entrapped) enter the diverging section where further collisions and agglomeration take place, creating larger drops.
E - The gases then proceed to the separator, where liquid drops are easily removed from the gas stream and collected.
Figure 113 Venturi Scrubber with Cyclone Separator (Source: Adapted from Ref. 1)
‘4s the ions move toward the plates, they encounter particles in the gas stream, imparting a charge to them. The charged particles are collected on the plates in a dust layer, which is periodically removed by rapping the plates, causing the dust to fall into a collecting hopper.
Key ESP design parameters include particle resis- tivity and size distribution, electrical conditions (current and voltage), reentrainment of dust, uniformity of gas flow, and total collection area.6 Precipitator size is usu- ally given in terms of square feet of collecting ?ea per 1,OOO ft3/min of gas flow, with values typically ranging between 200 and 400.6 Collection efficiencies of 99.5- 99.9% are common, with a slightly lower minimum efficiency for particles around O S p.m in diameter. The
open structure of an ESP yields a pressure drop that is quite low (less than 1 in. of water) and total energy requirements are typically less than 0.5% of the plant output.
understood, and they are not considered to have major operating problems. The major difficulty with ESPs is related to variations in the electrical properties of the PM. Precipitator designs incorporate a certain margin of excess capacity to accommodate normal fuel variations, but major switches in coal type may cause unacceptable losses in efficiency.
Specifically, the fly ash from low-sulfur coal com- bustion is usually much more resistive and difficult to
The design and operation of ESPs are generally well
174

Rapper-- high voltage electrode
, Rapper- collectiny electrode
baffle
High-voltage discharge
Grounded collecting
Figure 113 Plate-Type Electrostatic Precipitator (Source: Ref. 1)
collect than that from high-sulfur coal at typical "cold ESP operating temperatures (250-350'F). To increase the removal efficiency with low-sulfur coal and an ESP, one of four alternatives can be adopted.1 First, the precipitator can be designed to run "hot" (before the air preheater) at temperatures of about 600-800'F, at which the particle resistivity is reduced to acceptable levels. Size (and cost) of the ESP is increased due to the larger gas volume that must be handled, but this is the most common approach for new installations. Second, con- ditioning agents, such as sulfur trioxide, can be used to decrease particle resistivity. This is the most-viable retrofit option, but operating costs increase somewhat and secondary emissions of sulfur trioxide can result. Third, a much larger "cold" ESP can be used, which also results in greatly increased capital costs. Fourth, the ESP can be run at a lower temperature, where the resis- tivity decreases for all particles. However, this can lead
to significant operating problems due to the likelihood of acid condensation and subsequent corrosion.
Precipitator research in recent years has been focused primarily on improving the collection of high- resistivity fly ash from low-sulfur coal. Improvements have been realized through the use of electrodes with larger diameters, high-intensity precharging of particles in a separate unit preceding the ESP,lo internal separa- tion of the particle charging and collection stages to allow optimization of each,3 and pulse energization of the electric field.11 However, the added costs and opera- tional complexity of these measures, as well as the de- sire for maximum fuel flexibility, have led many utilities to investigate the use of baghouses.
Bughouses
Fabric filters have long been used to remove dusts from industrial process gases and can readily achieve removal
175

eff~4encies of ever 99.996, regardleas of dust composi- tion. With the deveiopment of improved high-temper- atme fat;&s, greater vaiabiIity in utility fuel suppliesj and a better anderstanding of operational issues, bag- houses are rapdly achieving aaxptance fix power plant applications. The possibility of simdtawously remv- ing gawotts p ~ i e s as &e due gss pas= through the filter e& has also been recognized and k an integral part of some current and proposed systems.
f i e fabric is generally either woven or felted fiber- glass, formed into cyiinders open at one end for attach- ment to a tubesheet. For a utility-scale baghouse, the bags may be 30 ft in length and about 1 ft in diameter. The number of bags will vary with boiler size to produce the desired ratio of gas volume to cloth area. This ratio is: nsodly t3n tlid Mdet 6fZ-3 ft3/rfdi1 of fl& gas *r sgaaft? fcbt of eloth. ?lid bags &&‘ tittkiiged iri empatt- mfs to all@ f6f “aff-line” c l e a ~ n g rtnd fnaintenance ~Siltio’fit $Ittittirig &p~n the etiitlfk system.
Dust may be collected on either the inside or outside of the bag, but the most common practice is to collect dust on the inside (Fig. 11.4)J During Gleaning, the dust cake is dislodged and falls into a bottom hoppeF. This is accomplished by reversing th air flow, shaking the bag, partially collapsing the bag, or some combination of tfiese techniques.
Collection efficiency depends upon such factors as fabric structure, th6 air-to-cloth ratio, cleaniirg method, maximum pressure drop before cleaning, and cleaning frequency. Since the deposited dust layer is actually responsible for most of the filtration, a balance must be struck betwdn cleaning freqdency and maximum anow- able pressure drop. Most utility systems operate with a maximum of 6 in. of water or less.12 Fabric filters are much like the other devices discussed previously in that the various collection mechanisms combine to give a tninimum efficiency for particles about 0.5 pm in diameter.
-- __ - - - ._ - - - . -- - _- -_ - - Oust-laden Inspection door air inlet /
Clean air to fan
Air reversal vabe shown in rlormal filtering position
This compartment
Clean air io fan
Air reversal valve in back-wash oosifion
Back-wash atr
This compartment IS being back-washed with clean air Accumulated dust drops to hopper
Figure 11.4 Typical Baghouse with Reverse-Flow Cleaning (Source: Adapted from Ref. 1)
176

Total Total Lifetime W e r
Control (millions of Requirement (96 of Coal Type Device 1978 S) (mills/kWh)b plan+
Capital CQfta Revenue USe
Low-sulfur Cold ESP 55.1 341 0.5 westemd Hot ESP 20.2 1.73 0.4
Ba- 22.1 2.29 0.4
Medium-sutfur CddESP 9.9 0.83 0.2 midwesterne Hot ESP 17.3 1.48 0.3
Baghouse 20.7 2.14 0.3
High-satfur cold ESP 14.9 1.21 0.2 eastemf Hot ESP 28.1 2.35 0.5
Baghouse 21.4 2.21 0.4
ducludes capacity charge for electricity requirements
bOne mill is equal to $0.001.
based on net etecbical output of 500 MW. dO.6046 sulfur, 7.5% ash, and 10,116 Btdlb.
e2.5896 sulfur, 7.2% ash, and 12,788 Btu/lb.
f3.2396 sulfur, 22.0% ash, and 10,912 Btu/lb.
Source: Ref. 14.
In addition to cleaning and pressure drop, operation- al c m are centered on bag durability. Care must be taken to avoid Iow flue gas temperatures that can kad to condensatian and "blinding" of the bags through &vel- opment of a solid cake on the surface. High tempera- tures from air preheater failures or other system upsets can also damage the bags, as can chemical attack, too frequent or vigorous cleaning, and mechanical damage from rough handling or inadequate bag spacing. In a well designed and maintained baghouse, hag lifetimes are usually four years or more.12
Baghouse research has been largely concerned with reducing pressure drops while maintaining OT improving efficiency, as well as extending baghouse use to high- temperature applications. Cleaning technique and fre- quency have been shown to be important (lower fre- quency is generally better) and sonic energy from horns can substantially decrease the average pressure drop.12 Electrostatic enhancement through the use of wires woven into the fabric has also been shown to be effec- tive in lowering the pressure dr0p.3~13 For high tempera- tures, woven ceramic "fabrics" are under development, as are rigid filters of cast ceramic or granular beds.8
Control Costs
TabIe 1 1.1 compares the PM control costs and energy consumption of ESPs and bagbuses for three coal types.14 A cold-side ESP is generdfy the least expen- sive option except for low-sulfur coal, for which the hot-side ESP is preferred. The baghouse is competitive with the cold-side ESP for law-sulfur coal and offers the advantage of greater fuel flexibility.
Nitrogen Oxides
Nitrogen oxides are formed during combustion and consist primarily of nitric oxide (NO) and nitrogen dioxide (NOz). In conventional coal-fixed combus tion systems, the NOx is almost entirely NO (about 95%).15 Emission levels vary considerably with coal type, boiler characteristics, and operating conditions, ranging from less than 500 to over 1,000 ppm for units with no control measures.
Most control technologies for NO, are of an "inte- gral" nature in that they seek to modify process condi- tions (combustion modification) to suppress the forma-
177

tion of the pollutant, which can arise from two sources in the flame. At combustion temperatures of about 3,000°F, a fraction of the oxygen and nitrogen present in the combustion air combine to form NO (termed "thermal NO;'). Secondly, some of the nitrogen con- tained in the coal combines with oxygen to form what is termed "fuel NO,." For natural gas and most oil, fuel NO, is unimportant, but for coal it can easily constitute 80% of the total.15 Therefore, techniques designed solely to control thermal NO, through reductions in flame temperature are inadequate for coal combustion.
If combustion modification cannot give adequate control, other techniques are available or under develop- ment to remove the NO, after it is formed. These meas- ures include chemical reduction of the NO, to nitrogen (Nz) using a portion of the fuel or an additive, such as ammonia, as reducing agents (aided in some cases by catalysts), wet scrubbing of the flue gas (perhaps in conjunction with SO2 control), and NO, capture using dry sorbents.
In addition, advanced coal technologies based on fluidized-bed combustion or gasification offer the prom- ise of reduced NO, emissions. Lower combustion tem- peratures and in-bed chemical reduction of NO, allow fluidized-bed combustion units to easily meet current standards. Gasification, which takes place under reduc- ing conditions, produces nitrogen compounds such as ammonia, which are readily removed in the fuel-gas cleanup process.
Combustion Modifications
The key variables in NO, formation are the peak flame temperature, the fuel residence time at the peak tempera- ture, the availability of oxygen in the flame region (excess air), and the postcombustion cooling of the flue gas. The latter factor is important since a rapid cooling tends to "freeze" the mix of compounds in the flue gas.4
Low-Excess-Air Firing. Lowexcess-air (LEA) firing consists of operating the combustor with a decreased amount of combustion air. This technique, while reduc- ing the availability of oxygen in the flame zone, can also increase thermal efficiency by reducing the total volume of gas that must be heated. In that respect, LEA consti- tutes good operating practice, but care must be exercised to avoid problems of incomplete combustion, corrosion, fouling, and slagging in the boiler due to localized oxygen-deficient zones. For typical utility boilers, NO, levels can be decreased by 50-100 ppm for each 1% decrease in oxygen, representing an emission-abatement potential of about 10-15%. In industrial stoker-fired
178
boilers, the potential reductions vary from about 10% to over 30%, depending on the stoker type.15
Flue-Gas Recirculation, WaterlSteam Injection, and Reduced Preheating. Both the flame temperature and the oxygen concentration can be reduced by flue-gas recirculation (FGR), which consists of recycling a por- tion of the flue gases back into the combustion zone. This approach is widely used in oil- and gas-fired boilers, as well as automobile engines. However, its effectiveness is generally less than 20% when applied to a coal-fired boiler already using LEA, and the additional capital requirements for ducting, fans, dampers, and other equipment have made FGR unattractive for most coal-fired units.15
A similar situation exists for water or steam injec- tion, which has been used for NO, control when firing gas or oil (particularly in gas-turbine combustion cham- bers). In a boiler, the additional water vapor decreases efficiency and can lead to corrosion problerns.16 How- ever, the technique may provide some benefit as an integral feature of coal-water slurry firing.
Reducing the preheating of combustion air is an- other way of reducing flame temperatures, but decreased efficiency also results. If economizers for preheating boiler feedwater are not already in use, their application can recover some of the lost efficiency.
Staged Combustion. Staged combustion is the most effective NO, control technique for existing boilers (short of major modifications). In general, staged com- bustion consists of reducing the amount of air provided with the fuel so that initial combustion takes place under fuel-rich (substoichiometric) conditions. The balance of the air required for complete combustion is added down- stream after significant heat has been removed. This can be accomplished in three ways: (1) biased burner firing, (2) burners-out-of-service (BOOS) firing, and (3) the use of overfire-air (OFA) ports.
Biased firing consists of operating the upper burners in air-rich conditions while the lower burners are oper- ated in fuel-rich conditions. If this approach is carried to the extreme where some burners are operated with air only, it becomes BOOS firing. Reductions in NO, emis- sions on the order of 25-30% can be obtained with BOOS, but it may be difficult to maintain full load under extreme staging due to limitations on the amount of fuel that can be fed through the lower burners.
Use of OFA ports located above the burner level provides more separation between the primary combus- tion region and the point of second-stage air addition, and allows for more optimization of the combustion

process. Such ports can easily be added in the design of a new boiler, but may be difficult to add to an existing unit. Potential NO, reductions for pulverizedcoal com- bustion are about the same as for extreme BOOS, but there is no loss in boiler capacity. In addition, this is the only staged combustion technique applicable to most stoker-type industrial boilers, and some tests have been conducted using out-of-service auxiliary burners for air injection, which indicated a NO, reduction potential of about 20%.
Burner Design. Burner design is one of the more impor- tant factors in determining the level of NO, emissions from a pulverized-coal-fing boiler. A number of new designs incorporate the principles of delayed fuel-air mixing, oxygen-deficient zones where initial combus- tion takes place, lower flame turbulence, and lower flame temperatures.15 These burners are inherently more complex than earlier versions, since they typically have multiple registers for secondary and tertiary air and vanes or other devices to control the swirl of fuel and air from each region (Fig. 11 3 . 1 5 In many cases, the burners are designed to be easily retrofitted to existing boilers.
Corrosion is a major concern in regions of the fur- nace where reducing conditions exist. Also, the fouling and slagging potential of ash changes under reducing conditions.17 By containing the reducing region within the flame and maintaining overall furnace stoichiometry, the new burner designs avoid those concerns as long as furnace dimensions are sufficient to prevent impinge- ment of the longer flames on the walls.18 Other opera- tional or secondary environmental effects of combustion modification have not been detected as long as good combustion efficiency is maintained.
The NO, reductions attainable through replacing old burners with those of newer designs in pulverized-coal- firing boilers vary significantly with the boiler type, coal type (e.g., greater reductions are obtained with subbitu- minous coal than with bituminous coal), and burner design.15 Reported values generally range between 40 and 70%.15-20 However, reductions of up to 80% have been observed in early tests of a slagging combustor under development primarily for converting oil- and gas-fired boilers to coal21 While NO, emissions may be further reduced by combining the techniques discussed thus far, the effects are not strictly additive and deleteri- ous effects (such as increased corrosion) may actually result.lsJ7
Adjustable air vane and register drives
~ ~~~
Figure 115 Dual-Register Pulverized-Coal Burner by Babcock and Wilcox Company (Source: Adapted from Ref. 15)
179

1
Figure 11.6 Primary-Combnstlon Furnace Proposed by Babcock and Wilcox Company (Source: Ref. 15)
In addition to burner characteristics, burner spacing, burner interactions, heat release rate, and other aspects of boiler configuration can be significant in NO, forma- tion. For example, a system involving optimized tan- gential firing from the corners of the boiler, with secon- dary air directed along the walk for staging and protec- tion from corrosion, has produced NO, reductions up to 65% lower than baseline conditions while maintaining good combustion efficiency in pilot-scale tests.ls.21
Another concept, the primary combustion furnace, physically isolates the substoichiomebic combustion zone from the injection of staging air. This separation is accomplished either with separate frst-stage combustion chambers replacing the usual pulverized-coal burners (Fig. 11.6) or by compartmentalizing the furnace by adding a venturi constriction between the zones.15 Emissions of NO, under 200 ppm have been achieved, but questions of combustion efficiency and materials have yet to be fully resolved.15 The use of fluidized-bed cornbustion, as described previously, may yield NO, levels under 200 ppm.20
being actively developed in Japan and the United States. About one-tenth of the fuel is injected above the primary combustion zone to form a reducing environment where NO, formed during combustion is chemically reduced to
A relatively new concept in combustion staging is
180
Additional air
Upper fuel injector
Overfire air
Main burner
i=." Gas booster fan
I
Figure 11.7 Reburnkg Design for a Steam Generator (Source: Ref. 22)
N2 by the fuel hydrocarbons. Additional air is then added above the reducing zone to complete combustion (Fig. 11.7).1522 Although someNO, is generated in the fmal combustion stage, overall reductions of 50% of the NO entering the reducing zone appear to be possible.22 When combined with Iow-NO, burners, final NO, levels under 100 ppm are projected for coal firing. The reducing-stage fuel may be the same as the primary fuel (Le., coal) or it can be another hydrocarbon, such as oil or natural gas, that may reduce fouling and slagging.23
Postcombustion Controls
Selective Noncatalytic Reduction. Ammonia and NO can react to form water vapor and N2 in a fairly narrow gas temperature range around 1,750'F. Removal ef- ficiencies range from 40 to 70%.24 This effect has been incorporated into a process, Thermal DeNO,, patented by the Exxon Research and Engineering Company.16 The temperature required means that the injection must take place in the upper regions of the boiler and that multiple injection points must usually be provided to accommodate varying boiler loads (with changing tem- perature distributions).
Selective Catalytic Reduction. Selective catalytic reduc- tion (Sa) also uses ammonia to reduce NO,. The reactions take place as the flue gas passes through a catalyst bed at about 7W°F (just before the boiler air

I I
Flgure 11.8 Typical Arrangement of an SCR System for a CoaI-Fited Boiler (Source: Adapted from Ref. 22)
preheater hi most cases -- See Fig. I1.8).22 Highly developed system- use catalysts such as titania 6~ vanadlum oxideZ3 and have design removal efficiencies no greater than 8os/o, although 90% is attamable with significantly increased costs. Operational concerns are centered on catalyst dmabiiity (due to high replacement cosfs) and secondary effects ML downstream Components due to amorria textion products, such as ammnidm bisulfate. Costs are much higher than those for the other techniques disct~ssed thus fat and Could constimte as much as ~II 18% increase from he base cost of the power plant. No operating data are available for SCR systems on U.S. coal-fited units, but about a dozen such plants have gone into operation in Japan since 1980.22 Another approach developed primarily for combined NOX-S02 control uses activated carbon as the catalyst at temperatures of about 250-300'F. Removal efficiencies of 80% or more have been reported.%
Wet Scrubbing. Although wet scrubbing is the most common technique for control of SO2 and is used bo control highly concentrated NO in some industrial proc- ess streams, it has not found favor for utility NO, control applications. The concentration of NO is relatively low in flue gas and NO is much less soluble than Soj! in aqueous solutions. Thus, very l a r g vessels or expensive oxidizing agents (to convert NO to the more soluble NOz) must be employed. The high costs and moderate NO, control potential have limited interest in this approach.27 A greater potential has been shown for some combined NO,-S02 scrubbing systems, which are described in the section on integrated controls.
Dry NO, Removal. In addition to SCR, NO, can be removed to some extent through adsorptior, on dry sor- bents, such as activated charcoal or coal char.27 The adsorbent 1s regenerated at high cernperatnre to reduce the NO, to N2 through reactions with the carbon. The moderate NO, removal potential le^ than 76%) and high capifid md energy requirements have discoaraged further development of this approach. Other sorbents, such as lime treated with chemical additives, are in the research stage, but no commercial processes exist.
Control Costs
Table 1 1.2 summarizes the efficiencies of the principal NO, control options, and Table 11.3 compares capital
Table 11.2 Effectiveness of NO, Controk 4% reduction).
. ..
Typical M;aimm Control Teshaobgy
0-1s 15 Low-excess air Biased firing 5 8
15-25 50 Overfire air Low-NO, burners 40-60 70
30-60 70 Selective catalytic reduction 50-80 90
Burners-out-of-service 20-25 35
?hem1 &NO,
EFor pulverized-coal utility boilers.
Table 113 Cost Comparison of NO, Controls
Capital Levelized cost cost
Control Techdobgogya ($/kwp (nhllls/kwh)c
0.2 0.006 Burners-cut-of-senice O v e f h air 1 .1 0.03
2.5 0.07 Low-NO, buhlers Thermal DeNO, Selective cutalytlc reducth 67
16 1.8 8.8
dkmovd efkiencies vary as indicated In Table 11 2.
bBased on 1982 dollars (end of year) and a new plant with
CBased on 30-yr cost levelization; one mill equals $0.001.
Sources: Refs. I5 and 28.
two SOOMW units firing &-sulfur coal.
181

and operating costs for some of these options.1528 Costs for NO, control are difficult to generalize due to the many site-specific factors involved. However, the capi- tal and operating costs for the combustion modification technologies (including low- NO, burners) are small compared to those for PM and SO2 control.
Sulfur Compounds
Various sulfur-containing products of combustion (particularly SOz) have long been known to be potential health hazards and have been implicated in environmen- tal problems, such as acid precipitation. Control of these compounds has been, and continues to be, the object of intensive research programs, with an emphasis on low- cost retrofit technologies for SO2 control and techniques that integrate control of SO2 and other pollutants. The most commonly used techniques are reviewed below.
Precombustion Controls
Low-Sulfur Coal. The most direct approach to reducing sulfur emissions is to switch to a fuel with lower sulfur content. High-quality, low-sulfur coal is available in the southern Appalachian fields, although it has generally commanded a premium price due to demand factors that have included alternative markets in the metallurgical industry (manufacture of coke). Lower quality, low- sulfur coal (generally subbituminous) is available in large quantities in the western United States, In fact, about 84% of the US. reserves with less than 1% sulfur are found west of the Mississippi River.29 Those coals are typically surface mined and sell at the mine mouth for one-fourth to one-half of the price of competitive eastern fuels, which generally come from more expen- sive underground mines. However, the long transporta- tion distances to most markets and the effects of railroad deregulation have combined to raise delivered coal prices so that market penetration has generally been limited to the Midwest.
A major switch in coal type (e.g., from high-sulfur bituminous to low-sulfur subbituminous coal) can also be a significant technical challenge for a power plant operator. Changes in the moisture content, ash composi- tion, Btu content, grindability, and combustion charac- teristics of coal can render some switches infeasible or require unit derating by as much as one-third.30 This is due to factors such as limitations in pulverizer capacity (high moisture and low Btu content) and increased slag- ging and fouling (different ash composition). In addi- tion, increases in fly-ash resistivity could require upgrading of the ESP in order to maintain compliance
with PM emission standards. Thus, fuel switching must be evaluated on a case-by-case basis that considers boiler design, the anticipated load factor, current and projected coal characteristics, and geographical location.
If only a moderate decrease in sulfur emissions is required, two or more coals of different sulfur contents can be blended together to produce the desired fuel. The same considerations noted above still pertain, but in addition some changes in fuel properties may occur that cannot be predicted by simple arithmetic averaging. For example, extreme boiler fouling may occur due to low- melting-point eutectics formed from combinations of the ash minerals in the two coals.31 Thus, a careful site- specific analysis is again needed, and it must be fol- lowed by good inventory control and regular sampling and analysis of the blended fuel. Elaborate blending protocols may also be developed, including layered stacking of stockpiles, mixing during loading and un- loading in the shipping process, multiple stockpiles, and others.32
In spite of the potential difficulties, many coal users have switched wholly or partially to low-sulfur coal as part of their SO2 control strategies. An indication of this is the fact that production of western coal grew from 7% of total U.S. production in 1970 to 32% in 1982.33
Coal Cleaning. The term coal cleaning, or coal bene- ficiation, covers a wide variety of processes designed to upgrade coal properties by removing mineral matter (and sulfur) from coal. Physical coal-cleaning processes use differences in specific gravity, surface properties, magnetic and electrical characteristics, or other attributes to separate impurities physically bound within the coal. Chemical and biological processes are designed to also attack and remove sulfur that is chemically bound within the coal macromolecule. In either case, the result is an "artificial" low- or medium-sulfur coal that is also low in ash-forming minerals and is more uniform than the raw coal feedstock. These attributes result in operating ben- efits at the power plant due to lower pulverizer loading, less fouling and slagging, reduced erosion in the boiler, and lower postcombustion pollution control require- ments.34 For example, some studies have indicated levelized cost savings of 1-4 millskWh as a result of physical coal cleaning (one mill = $0.001).35 The range in values indicates the principal difficulty encountered in evaluating coal cleaning: coal is a highly heterogeneous material with propelties that change from mine to mine and even from foot to foot within a given seam. Thus, while coal cleaning is often a cost-effective control tech- nique either alone or in combination with other technol- ogies, it does not have the same general applicability for SO2 control as postcombustion cleanup technologies.
182

Part of the limitation on the efficacy of coal clean- ing stems from the ways sulfur occurs in coal. A very small amount is present as elementary sulfur or sulfates (generally less than 0.1% by weightp The balance is either the mineral pyrite (iron sulfide) or organically bound. Pyrite occurs as discrete particles, often of microscopic size, with a specific gravity of 4.8-5.0. Coal, on the other hand, has a specific gravity of about 1.7. The fraction of total sulfur appearing as pyrite typically ranges from 30 to 70% in U.S. coals and con- stitutes a fundamental limit on the SO;? control capabili- ties of physical coal cleaning.37 One recent study of physical coal cleaning for coals burned in the Midwest found that the average sulfur reduction from run-of-mine conditions was about 30% (with a range of 0-50%), using the most advanced commercial techniques.%
In the United States, about 500 plants clean about 35% of the coal purchased by electric utilities.39 These typically consist of various combinations of four major subsystems: comminution (size reduction), screening, concentration, and dewatering. The combination is tailored to the specific coal and the desired level or de- gree of cleaning. Figure 11.9 shows the processes in a physical coal-cleaning plant that cleans all but the very finest coal fractions that result from crushing (a fraction is a portion within a specific size range).m For the max- imum reduction in sulfur, it is necessary to clean all size fractions of the coal. However, only the most sophisti- cated plants treat the finest coal particles due to handling and dewatering difficulties.
Concentration is the operation in which coal and impurities are actually separated. In general, methods can be classified as water-only, heavy-media, or dry separation. Jigs, concentrating tables, and hydro- cyclones all use specific gravity differences in coal- water slurries. Heavy-media cyclones add finely ground magnetite to increase the washwater's apparent density (e.g., to 1.3-1.8) to provide a finer "cut" on the pyritic impurities. Very fine particles do not separate rapidly through specific gravity differences, so froth flotation was developed to use the fact that the mineral compo- nent is hydrophilic (water-attracting) while the coal is hydrophobic (water-repelling). Blowing fine bubbles of air through the aqueous phase (usually enhanced by surfactants) floats the coal up to the surface for recovery.41
characteristics, percentage of material discarded as refuse, level or degree of cleaning, plant size, and loca- tion. The total capital investment for a 1,000-todh coal cleaning plant generally ranges from $20 to 80 million (January 1983 dollars); annualized costs range from $3.50 to 16.00 per ton of cleaned coal.42
The cost of coal preparation is a function of coal
Current research on advanced coal cleaning focuses on improved recovery of coal fines, dry techniques, and chemical and biological methods of extracting organic sulfur. The dry techniques include electrostatic separa- tion that uses electrostatic property differences between coal and mineral impurities and magnetic separation that uses the slightly paramagnetic nature of the mineral matter in coal. Other physical techniques include multi- stage flotation designed to improve upon the efficiency of single-stage froth flotation; true heavy-liquid cleaning using a homogeneous organic liquid that permits com- plete dispersion of coal particles, better ash and pyrite removal, and easier heavy medium recovery than with magnitite; and agglomeration that uses a water-immisci- ble liquid to clump coal particles together for easier recovery. Chemical and biological techniques include alkali leaching, in which most of the mineral matter and organic sulfur react with and are dissolved in alkali hydroxide(s) at high temperatures; oxydesulfurization, in which sulfur is oxidized to species that can be washed out of the coal; and biological treatment using specifi- cally developed bacteria to convert sulfur into easily removed forms (i.e., sulfate).
The last three processes can remove both pyritic and organic sulfur for total sulfur reductions of 90% or greater. However, high costs (typically $50 or more per ton of cleaned coal) have prevented the chemical proc- esses from challenging postcombustion cleanup (scrub- bing), and the biological techniques are still in a very early stage of development.
Sulfur Control in Coal Conversion. Sulfur can appear in several forms in the emissions from coal conversion processes. In this section, those technologies for control of "reduced' species resulting from gasification or lique- faction are discussed. Technologies for the postcombus- tion control of SO2 emissions from conventional coal- fiied boilers are described in the next section.
Coal cleaning to remove sulfur before conversion has not been extensively studied as a method for reduc- ing the load on the gas treatment and sulfur recovery sections of gasification and liquefaction processes, but this approach does appear to offer some benefits. This is true especially for coals with high sulfur contents and a high fraction of pyritic sulfur.
ily involves purification of the product gas from coal gasification and the removal of hydrogen sulfide (H2S) from gases generated in the product separation section of direct liquefaction. This purification and removal re- quires the separation from the gas stream of reduced sulfur compounds, primarily H2S and (to a lesser extent) carbonyl sulfide and carbon disulfide. The distribution
Postconversion control of sulfur compounds primar-
183

Run of-mine coal
Mine rock r Screenlkg and
crusbtng
6 in (4 in ) x 0
Storage
_ _ _ - _ - _ - --------- I I I I
f 3’8 In Wet screening
318 in x 0 I 4 I I I I I I
Figure 11.9 Process Flow in a Physical Coal-Cleaning Plant (Source: Adapted from Ref. 40)
I 28 mesh x 0
28 mesh x 0
_-- Water flow - SOlld flow
of sulfur compounds in the product gas stream of a gasification plant using Lurgi gasifiers is estimated to be 95% HzS, 2.4% carbonyl sulfide, 0.3% carbon disulfide, 2.0% mercaptans, and 0.3% thiophenes.43
The removal of sulfur and its compounds from coal-conversion plant process stream and effluents accounts for a large fraction of the total cQst of environ- mental control in such plants (taking into account gas purification, sulfur recovery, and tail-gas treatment).@ For example, of the total plant investment of $518 mil- lion required for a Synthane gasification plant
(producing 250 million ftYd), about $53 millj n was required for gas purification and $1.8 million for sulfur recovery Ps Gas purification includes removal .of borh H2S and carbon dioxide (CO2). Table 11.4 compares the composition of the acid gases for various gasification and liquefaction processes and the estimated relative costs for acid-gas treatment based on data from small- scale test units.@
plants can be grouped into three main categories: chemical absorption, physical absorption, and direct
Acid-gas treatment processes for coal conversion
184

Tnbk 11.4 Add-Gas Compadtion and Relative Removal Costs
Compssition GoaQIdlcost Acid as % 0fX0lal
-s Type Gases I& Outlet Investment
Westinghame coz 9.4% 7.7% 10-15 fluidized bed Hzs 1.7% I 2 p p
(305. 8ppm 2.2-m
-on aq 2056 BoOppm 1s Coal gxI&c&m H2S Il% 2 PPm
IGTModaedU-Gas C@ 20.62% ~20.39% 13 HzS 1.14% 1Oppm
Teaam panial Co? 29.8% 19,596 3 7 3 ox+&ttion kw 0.m C
7PPm 1 PPm
liqtlefaGbi6m H2S 0.195% TlZZ Synthoil coal COZ 28% 3OOppm 8-9
-.-
acarbonyl sulfide.
bhcludes acid gas removal, shift conversion, heat exchange, and sulfur
Not available.
recovery.
W: Ref.&.
convmwn Qr * gllmxm2& <sa& a d n a t i o n s ,of chemical aad physical dfbtxq&ca Many pacases ,are commxc&ly skvairlabk fa xid-gas msment, a d a numbex ofotkz processes aie under development and expected to be commacially availabie in he near h- ture.es-49 Table 11-5 lists a mmber of acid-gas treatment processes, .the sorbents used, seleotivity towards H2S absorption (if arty), and B e current status of ,the process.
The 12 chemical andl physical absarptioa p e s s e s in the table '(MEA, DENSNPA, TEA, AktzicI, M~idJC~acarb, Ecormomine, ADP, Seleml, Sdfinol, Rectisol., M w l , aRd Fluor) are two-step pmcesses. For example, in &e %lex01 p e s s (fig. 1 1. IO), the raw gas enters the absorber after having been cooled by heat exchange with the product gas. Almost all of the H S is absorbed as the gas flows up through the tower. Car- bmyl sulfide is about cwe-third as sduble as HIS, and only 30% of that component is removed. About 15% of the COz is removed, along with minor amounts of other gases. The absorbed gases are recovered by a combina- tion of pressure let-down and stripping. A concentrated acid-gas stream is produced that contains between 24 and 39% H2S.
Other s~ucompowds -- m&yl mercaptan, car- bon disulfide, and thiophene -- are mme soluble than H2S and will be removed if present. The solvent is not degraded by impurities in the fuel gas, which, combined with the low vapor pressure, results in very low solvent makeup.
In a direct-conversion, acid-gas treatment pmcess, such as the Stretford process that has been used m the Great Plains gasifcation plant,so the H2S is converted to elemental sulfur (Fig. 11.11). The Stretford process uses a dilute sdution eomaining soda ash (sodium car- bonate), sodium metavanadate, and anthraquinone disul- fonic acid (ADA). Hydrogen sulfide is absofied by the solution in an absorption column or contactor and then oxidized to elememal sulfur by the metavanadate ,both in the absorption column and the holding tanks where the conversion is completed. The solution i s .regenerated by passing air through the holding tanks with the ADA acting as a caralyst for the reaction. The eemental sul- fur formed is removed from the solutioR as a froth and fikered to obtain sulfur cake or removed as molten sul- fur.

Table 11.5 Acid-Gas Treatment Processes for H2S and COz Removal (all remove HIS; all are commercial except as noted)
Gas Temper- H2S COzAlso Selec-
Process (OF) Sorbent Removed tivity H2S Removal ature Range
Chemical absorption
MEA
DENSNPAa TEA Alkazid
Benfield/Catacarb
Economine
ADIP
Physical absorption
Selexol (Allied)
Sulfinol (Shell)
Rectisol (Lurgi) Purisol (Lurgi) Fluor solvent (Fluor)
Other processes
Stretford
Giammarce V e troc o k e b
Takahaxb
Iron sponge U.S. Bureau of Mines
Consol (pilot plant) Batelle Northwest
(pilot plant)
(pilot plant)
80-120
1OC-130 100-150 70-120
150-250
80-100
80-100
20-80
8C-120
<O 70-100 40-80
80-95
100-u)o
80-95
70-100 1,Ooo-1 goo
2,600-1,800 1,100- 1,700
Monoethanolamine (1 5%
Diethanolamine solution Triethanolamine solution Potassium dimethyl amino
acetate (25% in water) Hot potassium carbonate
(20-3096 in water), catalyst
Diglycolamine (50-704 in water)
Di-isopropanolamine
in water)
Dimethyl ether poly- ethylene glycol
Tetrahydrothiophene dioxide (sulfolane) plus di-isopropanolamine
Methanol n-Methyl-2-pyrolidone Propylene carbonate
Solution of sodium carbonate and anthraquinone di- sulfonic acid with sodium metavanadate activator in water
Potassium orthoarsenite
Sodium carbonate, 1,4-napthoquinone, 2-sulfonate
Iron oxide Sintered iron
Half-calcined dolomite Molten carbonate
Yes
Yes Yes
Small amounts
Yes
Yes
Yes
Yes
Yes
Yes Yes Yes
No
No
No
No No
No No
No
No Yes No
Yes
No
No
No
Yes
Yes Yes Yes
No
No
No
No No
No No
a-s at commercial stage but not in use.
bCommercia1 outside U.S.
186

Tail gas from two-stage
Claus plant
Fuel gas and air
Eeducing-gas generator
Condenser
Beavon sulfur removal
I hydrogenation reactor
Cooling water
Air Analyzer Steam
1
Pump Water 0 Heat exchanger
Cooling Sulfur water
Waste gas to incinerator
Bigure 11.10 Generalized Selexol Process for Acid-Gas Treatment in a Coal Conversion Plant
Other sulfur compounds, such as carbonyl sulfide and carbon disulfide, are not effectively removed by the Stretford process and therefore may cause problems in downstream processing. The tail gases from the Stret- ford process may require further treatment to reduce emissions of SO2 if they are flared or burned for heat recovery.
Greater plant efficiencies would be possible if sulfur removal could be performed at higher temperatures. For example, in coal-gasification combined-cycle plants, increases in overall cycle efficiency of 2-3% over the use of low-temperature, acid-gas treatment processes have been projected.49 Several processes are being developed for use at high temperatures (Table 11 S).
The H2S released in the off gases from acid-gas treatment processes has to be removed before the gases are vented or flared. Numerous sulfur recovery pro- cesses of the direct conversion type exist.47.48 The Stret- ford (liquid-phase oxidation) process has already been described. However, when the off-gas H2S concenua-
tion is greater than 20%, the Claus process is generally used. Four principal variations of the Claus process, which was originally developed in the late 1800s, are discussed below.
In the direct oxidation version, H2S is partially oxidized with air over a bauxite or iron-ore catalyst in a single reactor. Direct oxidation is currently used for dilute H2S gas streams only.
the "split flow" and "straight-through versions. In the split-flow process, one third of the H2S is burned com- pletely to produce SO2 in a waste-heat recovery boiler. The SO2 then reacts with the remainder of the H2S over a catalyst and less heat is evolved.
For treating high-concentration (50- 100%) H2S streams, the straight-through Claus process is generally used. In this variation, the acid gas is partially oxidized in a waste-heat boiler, rather than over a catalyst as in the direct oxidation process, and then the cooled gas is sent to one or more catalytic stages for the desired con-
Two improvements introduced in the 1930s were
187

I . Treated gas I
Solution recycle I Sour waste gas -
I Pump
Solution recycle
Treatedgas I I Fuel gas
b
Molten sulfur to storage
Steam Demineralizer water
Continuous autoclave Condenser
4
*
Condensate
i Repulp Centrifuge
tank
Figure 11.11 Typical Stretford Acid-Gas Treatment Process
version to elemental sulfur. A recent improvement on this variation involves the use of oxygen-enriched air to increase the sulfur-recovery capability. Some of the gas is recycled to keep combustor temperatures within ac- ceptable limits.51
For treating acid gas streams containing low con- centrations of H2S (less than 15%), the "sulfur recycle'' variation of the Claus process is used. In this variation, additional heat is derived from the combustion of the recycled sulfur. The resultant mixture is then sent to the catalytic reactor for converting SO2 to elemental sulfur. Complete conversion to sulfur is prevented hy equilib- rium limits in the reactor. Improved conversion is achieved by adding reactor stages. The products of conversion, sulfur and water vapor, condense and arc removed between stages. Conversion efficiencies are generally in the mid-90% range, but up to 98% is at- tainable with three oi faur stages (Fig. 11.12). The sulfur product is 99.9% pure and marketable.
The tail gases from the sulfur recovery section can still contain environmentally significant amounts of H2S, SOz, carbonyl sulfide, carbon disulfide, and mer- captans. Further removal of these compounds is necessary, and in some cases mandated by air pollution control regulations, to reduce the overall plant emissions of sulfur compounds. A number of treatment processes for tail-gas sulfur recovery have been developed and are in commercial use at this time.44,46-48,52
As part of the conversion of coal to synfuels, coal conversion plants normally require large quantities of steam. Therefore, a captive steam and power production utility plant usually is associated with coal conversion plants. Even though plant by-products can be used as supplementary fuel in these power plants, pulverized coal is nornidly used as the primary fuel.
To reduce overall emissions of various air pollutants to acceptable levels, these power plants generally require PM, SO2, and NO, controls. Other sections of this
188

Acid gas
1 Converter 1
High- pressure
steam
1 1 Converter 2
Reaction furnace 0 Knock -‘I Boiler
feedwafer ( B W
Air blower
pressure steam G
Condenser 1
T BFW
Low- LQW- pressure pressure
steam steam
f 4
Condenser 2 Condenser 3 Wafer
Figure 11.12 Typical Four-Stage Claw Dry Oxidation Sulfur Recovery Process
Tail
pressure steam
indenser 4
I I In 4-
. . . * . . . m . Sulfur pit
Sulfur pump
chapter describe the technologies required to control 1970s.533 Most of those tests employed limestone emissions of these pollutants.
Postcornbustion Controls
Dry Sorbent Injection. The injection of a dry sorbent into flue gas for SO2 control has long heen an attractive idea due to its inherent simplicity and the production of a dry waste product. Injecting sorbent into the combus- tion region was investigated as early as 1 9 S S p and large-scale tests were carried out in the United States, West Germany, and Japan in the late 1960s and early
- - (calcium carbonate) as a sorbent in coal-fired boilers and removed less than 30% of the S 0 2 . These relatively low removals, combined with severe boiler fouling problems resulting from high sorbent stoichiometries and sorbent- ash interactions, reduced interest in this approach.
research results obtained in the lare 1970s. The im- proved results obtained using a modem low-NO, distributed-mixing burner were attributed to relatively low combustion temperatures that prevented sorbent deactivation through deadburning (fusing), an optimum
Interest in limestone injection was revived by new
189

time and temperature profile, and fuel-rich conditions. This process is known as the limestone injection multi- stage burner (LIMB). Sulfur captures of 30-50% at sorbent stoichiometries of 2:l have been obtained for several furnace configurations, but specific boiler, fuel, and sorbent characteristics have also been shown to be very important and large-scale investigations are just beginning. The impacts on long-term boiler operability, PM control, and waste disposal are yet to be determined.
Postcombustion injection (in the upper boiler regions) of more-active sorbents, such as hydrated lime (calcium hydroxide), has emerged as the preferred ap- proach for LIMB to achieve higher removals with better sorbent use. Injection of sorbents such as lime or nah- colite (a mineral containing sodium carbonate) into the flue-gas ductwork downstream of the boiler is also being investigated. In both cases, the use of a baghouse for PM control is beneficial by providing additional gas- solid contact time. While neither of these approaches has yet achieved commercial status, it is likely that such technologies will be employed in retrofit applications within the next 10 yr.
this stage of development. One estimate for a 500-MW power plant burning high-sulfur coal put the increase in annual costs (1983 dollars) in the range of 5.6-9.7 mills/ kWh,55 but full-scale operating data are needed before comparisons with more conventional control technolo- gies can be ma&.
Sorbent (limestone) injection with the coal has also been investigated for industrial-type stoker boilers.56 Pellets of limestone and coal were formed and success- fully fired with sulfur retentions (in the ash) of about 50%. Although preliminary economic projections are favorable, this technology has not achieved commercial status.
The use of dry limestone in fluidized-bed combus- tion boilers is a commercial technology for industrial systems and will soon be demonstrated at the 160-MW utility scale by the Tennessee Valley Authority. Sulfur is retained in fluidized beds as a result of absorption by natural ash alkalis and the added limestone or dolomite. Limestone is typically used as a sorbent in atmospheric fluidized-bed combustion (AFBC) systems, but its reac- tivity decreases with increasing pressure; dolomite (a combination of calcium and magnesium carbonates) has been found to be superior in pressurized fluidized-bed combustion (PFBC). Sulfur dioxide removals of 8540% have been achieved in AFBC with calcium-to- sulfur stoichiometries of 3-4.57.58 Moreover, data for the recently developed circulating-bed AFBC design have shown 90% removals with stoichiometries of less than two. Typical values for PFBC systems are also less than
Cost estimates for LIMB are highly speculative at
two, but more solid waste is produced due to the non- reactive magnesium in the dolomite. Sulfur retention generally depends on a number of factors in addition to stoichiometry, including bed geometry, sorbent proper- ties and grind size, recycling of elutriated particles, and temperature.2 The relatively high stoichiometries (as compared to wet scrubbing systems) mean that more solid waste (on a dry basis) is produced than for conven- tional FGD systems. The ratio of the two may be as much as 2:l in some cases, although the water present in most FGD waste will usually make the two nearly equal for landfilling purposes.59
Wet Nonregenerable Scrubbers. The dominant mode of sulfur control in coal combustion (and the combustion of high-sulfur heavy oil) uses solution- or slurry-based systems commonly called "scrubbers." The scrubber brings the SO2-laden flue gases into contact with a liquid that selectively reacts with the SOz. Processes are gen- erally characterized by the sorbent: lime, limestone, magnesium oxide, sodium, or ammonia. They are also characterized as nonregenerative ("throwaway") or regenerative. In the more common throwaway process- es, a waste of little or no market value is formed and disposed of as a sludge or solid. By contrast, regener- able systems are more complex but produce a salable by-product, such as elemental sulfur or sulfuric acid. The latter systems have thus far achieved very limited commercial acceptance and will be described briefly in the next section.
The first FGD system was installed in the United States in 1968,a while the first industrial boiler applica- tion of FGD occurred in 1972.4 By early 1983, the num- ber of operating systems on utility boilers had grown to 106, with 35 more under construction and 70 planned.61 Operating systems provided control on about 17% of the total coal-fired generating capacity, with the average system size being about 400 MW. Systems based on limestone were the dominant type, constituting about 44% of the total scrubbed capacity. This was followed by lime-based systems at 28% (Table 11.6).61 On an industrial scale, over 130 FGD systems were in opera- tion by 1980, treating flue gas from boilers ranging in size from 25 to 800 million Btdh. The majority (95%) were sodium-based, throwaway systems32
A basic flow sheet for a limestone-based system is shown in Fig. 11.13.4 Limestone is wet ground and pumped to a slurry feed tank. This makeup slwry is combined with recycled scrubber liquor from the dis- posal area and fed to the absorber holding tank for blending with the partially reacted slurry draining from the absorber. Slurry is recirculated between the holding tank and absorber where it scrubs the flue gas. A bleed

Table 11.6 Summary of FGD Systems by Process
Process
% of U.S. Coal-Fired Scrubbed Capacitya
Throwaway product
Wet systems Lime Limestone Limelalkaline fly ash Limestonelalkaline fly ash
Dual alkali Sodium carbonate Spray dryer systems
Lime Sodium carbonate
Salable product
Aqueous carbonatelspray dryera Magnesium oxidec Wellman-Lo&
Total
28.0 44.0 1.4 3.9 3.1 3.2
2.0 1.1
0.3 1.9 5.1
100.0
aBased on generating capacity in megawatts as
bElemental sulfur is produced.
Csulfuric acid is produced.
Source: Ref.61
of March 1983.
stream of reaction products is pumped from the holding tank to a waste disposal system or settling pond. The outlet gas from the scrubber passes through a slurry entrainment separator ("demister") and is reheated for buoyancy before discharge to the stack. The reaction products in the waste disposal area form a sludge of calcium sulfite and sulfate that is difficult to dewater, although fixation techniques involving fly ash and proprietary additives have been developed to give the waste stability for landfilling. Another option achieving increasing acceptance is forced oxidation of the waste to produce gypsum (double-hydrated calcium sulfate), which can be dewatered and landfilled or, in some cases, sold as a by-product. Limestone systems have typically had high maintenance requirements due to scaling, plug- ging, and component wear from the abrasive slurry.
Lime scrubbing is similar except that the feed slurry is prepared by slaking lime. High SO2 removals are easier to obtain than with limestone and more complete sorbent use is realized, but the higher cost of raw sorbent
has generally given the economic edge to limestone systems.
Reductions in sorbent consumption and improve- ments in Sa removals have been obtained in lime/lime- stone systems through the addition of adipic acid and similar organic acids. These materials provide a pH buffering that increases the absorption of SO2 into the liquid phase.63 Cost savings for sorbent, as well as im- proved reliability resulting from less-severe operating conditions, have prompted several utilities to adopt this technique.
Sodium-based systems use a scrubbing solution that avoids many of the operational problems encountered in slurry systems, and they remove well over 90% of the S02. Typically, soda ash (sodium carbonate) is dis- solved in a mixing tank, insolubles are settled out in a clarifier, and the solution is pumped to the gas-contact- ing vessel. A bleed stream of scrubber effluent is treated with alkali in a settling tank and sent to an evaporation pond. Since the waste consists largely of soluble sodium compounds, groundwater contamination through leaching is a concern, and disposal by this method is acceptable only in arid climates.64 Industrial-scale sodium systems have been used in the eastern United States with other waste disposal options that vary on a site- and application-specific basis.a
An important variation on sodium scrubbing is the double-alkali process. It combines the high removal rates and good operability of the sodium process with the waste disposal characteristics of a limdlimestone scrubber. In this case, the bleed stream is pumped to a reactor tank where it is blended with slaked lime or finely ground limestone. Calcium sulfite and sulfate crystals are formed and removed for disposal while the sodium sulfite scrubbing liquor is regenerated. Some sodium is added to compensate for losses in the waste, and the solution is recycled. Several variations on this approach exist, including processes employing alumi- num sulfate (DOWA process) or ammonium su1fate.U
A relatively new FGD process employs spray drying, a well-established industrid technique for pro- ducing powders. A slurry containing lime or other sor- bent is pumped to a large-diameter spray-drying vessel, where it is atomized and mixed with the hot flue gas. The water content of the slurry is carefully controlled so that the heat of the flue gas will evaporate virtually all of the water and yet maintain the flue-gas temperature safely above the dew point. Reactions between the sorbent and SO2 take place in both the aqueous and dry phases. Dry spent sorbent and fly ash are collected in either a baghouse or ESP and sent for disposal in a landfill. In some systems, a portion of the waste is recycled to the feed slurry to improve overall reagent
191

Figure 11.13 Limestone Scrubbing System (Source: Adapted from Ref. 4)
use. Sulfur dioxide removal rates over 70% can be readily achieved in the spray dryer and, with the addition of a baghouse giving additional gas-sorbent contacting area, over 90% removal has been attained for high-sulfur coal in an industrial-scale system.66 The simplicity of spray-drying systems (Fig. 11.14), the avoidance of the exotic construction materials often required in wet scrubbing, low energy and water consumptions, and the easily handled dry waste have led to rapid acceptance of the technology by the utility industry, particularly for low-sulfur coal applications.
The subject of FGD economics, particularly when comparing different processes, has probably generated more controversy in the pollution control field than any other subject over the past 25 yr. The estimates given in Table 11.7 represent a consistent set, but should be used with caution as costs for specific installations could differ significantly (in the case of spray drying, the cost for particulate control was not included67).
Lime
Boiler flue gas
Water c Slurry - tanks and feed
Solid waste Separator
Figure 11.14 Spray-Dryer System
192

Table 11.7 FGD Process Cast Estimates
Levelized Capital Busbar Cost Cost
Process and Coal Type (mills/kWh)b (%/kW)
Throwaway, high-sulfur coal Forced-oxidation limestone slurry 16 177 Limestone dual alkali 16 162 Lime dual alkali 17 147 Conventional limestone slurry 18 175 Lime sluny 20 163
Throwaway, low-sulfur coal Lime spray drying 7.4 111 Conventional limestone sluny 7.8 109 Nahcolite injection 8.1 27
Regenerable, high-sulfur coal Magnesium oxide 19 269 Wellman-Lord 26 274
aThe estimates are based on a midwestern plant consisting of two 500-MW units firing either high-sulfur (4%) Illinois coal or low- sulfur (0.5%) Wyoming coal, meeting current New Source Per- formance Standards for emissions, and employing the Electric Power Research Institute FGD design premises; costs are given in December 1982 dollars for a start-up in January 1983.
bone mill is equal to $0.001.
Cost of PM control not included.
Source: Ref. 67.
Regenerable Systems. Tremendous quantities of solid waste are generated by throwaway FGD systems. For example, a single l,OOO-MW, coal-fired power plant with limestone FGD could produce about 800 acre-ft/yr of sludge and consume nearly 600 acres for the waste pond over a 30-yr period2 In addition, the requirements on pond and landfill construction and closure have been growing more stringent as concern over pollution of groundwater has increased. Regenerable systems pro- ducing a salable waste therefore continue to be of inter- est, although neither economic nor regulatory incentives have yet been sufficient to produce a significant number of commercial applications. Also, the systems tend to be much more complex than conventional FGD and represent an additional operating burden for the utility or industrial operator.
Nevertheless, many systems have been proposed and tested at some level. This discussion will deal only with the Wellman-Lord, aqueous carbonate, and mag- nesium oxide systems, as examples of processes that have all been demonstrated at a scale of 100 MW or greater. A typical flow diagram for the Wellman-Lord
process is given in Fig. 11.15.68 The added complexity due to sorbent regeneration is obvious. This system employs a sodium sulfite scrubbing solution that gives high SO2 removals, no scrubber plugging or scaling problems, and a low liquid-to-gas ratio. The SO2 is recovered in a concentrated stream by thermal stripping and reduced to sulfur using natural gas (sulfuric acid can also be produced). The major system disadvantage appears to be the high energy consumption for regenera- tion. The Wellman-Lord system used 11% of the boiler input energy in one full-scale (115 MW) demonstra- tion,63 while a typical throwaway system uses only 3-4% of the input energy.
The aqueous carbonate process uses a spray dryer to produce a dry product consisting of sodium sulfite, some sodium sulfate, and unreacted carbonate. The dry solids are mixed with carbon (from petroleum coke or coal) in a molten soda a h bath, where they are reduced to sodi- um sulfide. The products of reduction are carbonated to evolve H2S and regenerate soda ash for recycling. The H2S can then be converted to elemental sulfur.
The magnesium oxide process captures SO;! in a magnesium oxide slurry to form magnesium sulfite. The sulfite precipitate is dried and calcined in the presence of carbon (char) to regenerate the sorbent and evolve a stream of concentrated SO2 suitable for use in the manu- facture of sulfuric acid. Energy consumption and high losses of magnesium oxide in regeneration are concerns.
Integrated Controls
Increasing pressure to control multiple pollutants in flue-gas streams, coupled with operational problems arising from the interaction of multiple control systems, has provided the incentive for developing integrated controls. A number of technologies for the combined control of SO2, NO,, and PM are in various stages of development, and some of them are likely to see com- mercial application within the next 10-20 yr.
Two such technologies have already been men- tioned. Combined spray-dryer and fabric-filter systems integrate SO2 and PM control, as do the various furnace- and duct-injection schemes for SO;! control that use a baghouse filter for PM collection and additional sorbent residence time. In both cases, research is underway to find sorbents or sorbent additives capable of integrating NO, control into the systems, although the LIMB kch- nology significantly controls NO, through advanced burner designs, Tests of one additive -- caustic soda (sodium hydroxide) -- for spray dryers have been con- ducted at a commercial scale with moderate success (NO, removals of 30-50%).
193

Stack
flue gas
Regenerated sodium sulfate Absorption
pretreatment
Ash to Recycle disposal w
Purge treatment -
A Cooling
Sodium sulfate cake to disposal
-.- Regeneration
Makeup sodium sulfite
Water VF SO2 Steam
I
I so2 conversion
Sulfur or sulfuric acid
Figure 11.15 Wellman-Lord Process for Sodium-Based SOz Reduction (Source: Adapted from Ref. 68)
Two processes, both tested at the pilot-plant scale, The fluidized-bed, copper oxide process uses use irradiation of the flue gas by high-energy electrons to promote desired reactions. In one case, the flue gas is pretreated with ammonia to produce a dry product con- sisting of ammonium sulfates and nitrates with potentia1 for use as a fertilizer.@ In the other process, SO2 control is accomplished first in a lime-based spray dryer, with electron irradiation providing some additional SO2 re- moval and the NO, control.70 In both cases, baghouses are used for PM control. Good pollutant control (over 90% removal of SO, and 80-90% for NO,) has been achieved, but questions of economics and scale-up feasibility remain.
194
alumina spheres impregnated with copper oxide. Flue- gas contacting takes place in a fluidized bed, which facilitates sorbent withdrawal for regeneration while the system remains on-stream. Sulfur dioxide is absorbed in the formation of copper sulfate, which in turn acts as a catalyst for the reduction of NO, to Nz by ammonia. Regeneration of the catalyst involves treatment with a reducing gas to produce a concentrated SO2 stream suit- able for sulfur recovery. Simultaneous pollutant remov- als of over 90% have been achieved in small-scale tests and a pilot-scale facility is planned.71

The NOXSO process is another dry, simultaneous NOx-S02 removal technology. Gas contacting again takes place within a fluidized bed, where the sodium aluminate sorbent combines with the SO2 and NO, to form a variety of compounds. In one possible process variation, spent sorbent is heated to drive off a concen- trated NO, stream, which is then recycled to the boiler in the combustion air. The heated sorbent is treated with a reducing gas (such as methane), giving a stream of SOz suitable for processing for sulfur recovery. Pilot-scale testing is being carried Out.71
Other approaches include the use of chelating agents in conventional throwaway scrubbers to achieve NO, control,72 the use of activated carbon as an SO2 sorbent and catalyst for NO, reduction,73 and the use of an aqueous slurry of iron-sulfur compounds to absorb sulfur and chemically reduce N0,.74 However, the many other techniques under active investigation are too numerous to list here, and this area could change sig- nificantly within the next 10 yr.
WATER POLLUTANTS
Many fossil energy technologies produce wastewater streams that require treatment before discharge or reuse. The basic categories of pollutants that may require re- moval are oil and grease, suspended solids, dissolved organics, dissolved inorganics, dissolved gases, and heat. In general, wastewaters are pretreated to remove oil and gross amounts of suspended solids. Further treatment can lower the concentrations of suspended solids, biologically degradable materials, and trace con- taminants, as necessary. Not all fossil energy technolo- gies require treatment for all categories of contaminants. Table 11.8 lists the major water pollutants and applica- ble treatment technologies, and Table 11.9 associates water pollutants with fossil energy technologies.
Some fossil energy facilities operate with no aque- ous discharge. This can be accomplished by using the various processes described here to produce water suit- able for reuse, evaporation in ponds or cooling towers, deep-well injection, or disposal with solid waste.
Oil and Grease
Oily wastewaters are produced in petroleum refineries, oil shale facilities, and coal conversion plants and are pretreated using oil-water separators before treatment by other processes. Oil-water separators separate free oil
Table 11.8 Major Water Pollutants and Treatment Technologies
Pollutant Applicable Treatment
Oil and grease
Suspended solids
Dissolved organics
Dissolved inorganics
Dissolved gases
Heat
Other
Oil-water separators (API, CPI), dissolved air flotation
Screens, dissolved air flotation, sedimentation, filtration
Activated sludge, aerated lagoon, oxidation pond, trickling filter, rotating biological contactor, carbon adsorption, wet oxidation, reverse osmosis
pH adjustmentkhemical precipitation, ion exchange, reverse osmosis, electrodialysis, thermocompression evaporation
Stripping
Cooling systems (once-through, pond, and evaporative and dry towers)
Evaporation pond
but cannot remove dissolved or emulsified oil. Separa- tion is brought about by the density difference between oil and water. The units also remove suspended solids. Because of the large quantities of reusable oils that can be recovered by gravity separators in petroleum refiner- ies, such units are more properly a part of the processing operation and not the wastewater treatment process.
American Petroleum Institute (MI) separators are tanks that provide slowly flowing wastewater sufficient residence time to separate free oil with its buoyancy (Fig. 11.16).75 Oil is removed from the surface by skim- ming. API separators have been widely used by petro- leum refineries for many years. They are also used at the Great Plains coal gasification plant76 and at some power plants to treat wastewater from floor and yard drains. They typically remove 60-99% of any free oil and 10-5096 of suspended solids. The units are simple, reliable, and relatively inexpensive but produce a sludge that requires disposal; dissolved gases may be lost to the atmosphere from the units.
Corrugated-plate interceptor (CPI) separators are constructed from groups of parallel, corrugated plates with separation distances of about 1 in. When waste- water flows between the plates, oil globules float up into the top of the corrugations, coalesce, and move up the
195

I
I
I
Table 11.9 Major Water Pollutants Associated with Energy Technologies
Oil and Suspended Dissolved Dissolved Dissolved Gases Heat Energy Technology Grease Solids Organics Inorganics
X X
X
Coal mining and preparation X
Coal liquefaction X
X X X Steam-electric power plant Coal gasification
Oil shale Petroleum refining
X X X X
X X X X X X X X
X X
X X X X
x X X X
opsiyncd for insertiny rubber balloon s101)PerS lor divening f lows for cleaning separalor seclions S h c e gales or gate
may be installed i f desired ,
I I
Wood flight scraper
011 011 refentiun ~ , i - , ~ t ~ n t ~ o n Dtnusion device I s k m n e r baffle
batfle , 1vp"caI baffle]
3 _- Flow A
- J
/ Sludge hoppers
Section A-A
Figure 11.16 API Oil-Water Separator (Source: Adapted from Ref. 75)
196

plates so they can be skimmed from the surface of the tank. These separators are much smaller than API sepa- rators and can also be used for sedimentation. Oil removal efficiencies are typically 60-99.5%. They have been widely used because they are fairly simple, reli- able, and inexpensive, but a sludge requiring disposal is produced and dissolved gases may be lost to the atmos- phere.
Dissolved air flotation (DAF) removes free and emulsified oily wastes and suspended solids. Waste- water is saturated with air under pressure and held at this pressure for a short time in a pressure retention tank. It is then released to a flotation chamber at atmospheric pressure. This reduction in pressure causes microscopic air bubbles to form in the water. The bubbles attach themselves to dispersed oil globules and suspended particles to increase their buoyancy and allow them to rise to the surface, where they can be removed by skim- ming devices. Chemical flocculating agents may im- prove the effectiveness of the process and help in obtain- ing a high level of clarification. Typical oil removal is 70-85% and suspended solids removal is 5 0 4 5 % . When used for separation of oily wastes, DAF systems are generally preceded by API or CPI separators and followed by biological treatment. The units have also been used to clarify effluents from biological treatment. The process is simple and reliable and is commonly used in petroleum refineries. At the Great Plains gasification plant, a DAF unit follows the API separators and precedes sand filters.76
Suspended Solids
Suspended solids are present in a wide range of waste streams associated with many energy technologies. Large concentrations may require pretreatment before other processes are used. Suspended solids may also be removed as a tertiary treatment step before discharge or reuse.
Screens remove suspended solids that are larger than the openings in the screening. The trapped material is removed mechanically or by backwashing. Coarse screens (250- to 1,500-pm spacing) are used to remove large solids. Microscreens (15- to 60-pm spacing) are usually found on horizontal rotating drums (Fig. 11.17).77 The units have been widely used for many years. Suspended solids removal ranges from as low as 5% for some coarse-screen applications in pre- treatment to 5040% for microscreens in secondary or tertiary treatment. The units are simple, reliable (but subject to plugging), and relatively inexpensive.
Sedimentation makes use of gravitational settling to remove suspended solids from water. It may be pre- ceded by the addition of chemicals (coagulant) to ag- gregate small particles into larger, more readily settled ones. Settling ponds are commonly used to treat acid mine drainage following chemical precipitation. Clarifiers (settling tanks -- see Fig. 11.18) may be used in areas where it is difficult to construct a p0nd.78~79 For coal mines with alkaline drainage, settling ponds or mechanical clarifiers can be used to remove sediment, Drainage from coal or refuse piles requires treatment similar to that for mine drainage. Wastewater from coal preparation plants contains high levels of coal fines, and treatment at a settling facility is required prior to any discharge. The technique, in the form of ash ponds, is commonly used at coal-fired power plants. Clarifiers have been widely used for many years and, with the use of a coagulant, can reduce suspended solids concentra- tions to 20-30 mg/L. The approach produces a sludge that may require disposal. The process is simple, reli- able, and relatively inexpensive (cost and complexity are increased by the use of chemicals).
Filtration is used for removing suspended solids, precipitates from chemical processes, and biological flocculant from secondary treatment. The two general categories of filtration are surface and granular-media. The latter type contains a granular material, such as sand or gravel (Fig. 11.19).80 The filters must be backwashed periodically to regenerate the units. Such filters are simple, reliable, inexpensive, and widely used. Sus- pended solids removal is in the 45-95% range. Sand filters have been used in petroleum refineries to remove oil and solids prior to use of an activated carbon unit. Some refineries also use filtration prior to biological treatment. Filters may also be used as final polishing step. For example, multimedia filters have been used for that purpose in the treatment of coal liquefaction waste- waters.81.82 Sand filters are used at the Great Plains gasification plant prior to routing water to the cooling tower.76
Dissolved Organic Compounds
Wastewaters from petroleum refineries, coal conversion facilities, and oil shale plants can be expected to contain dissolved organic compounds. Some of these compo- nents may be worth recovering (e.g., phenol). If the dissolved organic material is not suitable for recovery and contains no biologically toxic compounds, biologi- cal treatment processes are usually used. Physical pro- cesses are used for compound recovery and for treatment
197

Figure 11.17 Typical Microscreen (Source: Ref. 77)
of toxic organics. Chemical processes may be used for tertiary treatment.
under aerobic conditions in a reaction tank. Aerobic conditions are achieved by mechanical aeration or a diffused-air system. After treatment in the reactor, the resulting biological mass is removed from the liquid by sedimentation in a settling tank. Some of the biological solids are recycled to the reactor. The process can achieve typical removal efficiencies for biochemical oxygen demand (BOD) of 80-99%. The process has been commonly used in petroleum refineries. It has also been used to treat wastewaters from coal gasification and liquefaction.76.79,8I-ss Because of variations in wastewater characteristics for synfuel facilities, pretreat- ment requirements and treatability characteristics vary. The process has shown only limited success in treating oil shale retort water8637 and appears to be limited in its performance by toxicity problems or the presence of refractory organics.87 Some success has been reported for treatment of gas condensate from oil shale after pretreatment by steam stripping to remove ammonia.88 The process is relatively simple, but it is sensitive to the
In the activated sludge process, a waste is stabilized
characteristics of the wastewater and may be upset by the presence of heavy metals, by organic and hydraulic loading, and by pH. Because of the equipment involved, it is more expensive than other biological systems.
In aerated lagoons, wastewater is also treated by biological oxidation. Mechanical aeration is used to supply oxygen; diffused, submerged, or surface aeration may be used. The method is most common in warm climates and has a long history of use for municipal and industrial wastes. The process produces a sludge. Re- moval efficiencies for BOD are typically 75-95%. La- goons are relatively simple, are less prone to upset than activated sludge, and are relatively inexpensive to con- struct.
Oxidation ponds (also called stabilization ponds) consist of relatively shallow (usually less than 6 ft deep) ponds in which aerobic conditions can be maintained without mechanical aeration. They are practical where land is inexpensive and have been widely used. Re- moval efficiencies for BOD are typically 40-95%. Oxi- dation ponds have long detention times (sometimes more than 100 d) and produce only small amounts of sludge. The process is very simple, reliable, and
198

Drive unit I
I I 1 I I i
Sludge drawoff pipe
Figure 11.18 Circular Basin Clarifier (Source: Ref. 78)
199

conduits
- Raw water in Filtrate out - Figure 11.19 Deep-Bed Filter (Source: Ref. 80)
inexpensive (if land is cheap). Such ponds are used in some petroleum refineries as the major treatment process. They may also be used as a polishing step after other processes.
Trickling filters use an aerobic biological process. They consist of large, open vessels that contain a filter medium (rock or plastic) that provides a growth site for microorganisms. If used as the major treatment process, they are usually followed by a clarifier to remove bio- mass lost from the filter media. In petroleum refineries, these systems are commonly used as roughing devices to reduce the load on an activated sludge system. Trickling filters have been widely used for many years and are reliable systems. Operating costs are less than those for activated sludge, but higher than for an oxidation pond. Removal efficiencies for BOD are typically 60-85%.
Rotating biological contactors (RBCs) generally consist of a series of large (10-12 ft in diameter), closely spaced, plastic disks mounted on horiizontal shafts that are turned slowly with about 40% of the disk immersed in a shallow tank containing wastewater. Microor- ganisms grow on the disks and remove organic matter from the wastewater. Excess biomass is sheared from the disks by the water. This material is then removed by a clarifier. These contacton have been used in a number of refineries, and BOD removal is comparable to that achieved by activated sludge systems; phenol removal of 42-97% ha.. been reported.89 Use of an RBC to remove organics from a coal gasification wastewater has also been reported.90 They are simple, reliable systems, but are sensitive to temperature and hydraulic loads.
200

High concentrations of phenol or other organics in certain coal conversion wastewaters may provide incen- tives for recovery through solvent extraction. First, the recovered material may be sold. Second, the organic loading to biological treatment processes is reduced, thereby lowering costs for those processes. Also, it may be desirable to protect biological treatment units from shock loading by phenol. In the process, solvents such as isopropyl ether or butyl acetate are brought into contact with the wastewater to attract phenols or other organics. Solvent and organics can be separated in dis- tillation columns. This approach (the Phenosolvan pro- cess) has been used for phenol removal in commercial- scale coal gasification plants (e.g., the SASOL and Great Plains plants). Overall, the process is moderately com- plex.
Activated carbon has been used for water treatment for many years. Recently, it has been used to remove dissolved organics from industrial and municipal waste- waters. Removal efficiency depends on the specific pollutant, but can be high for certain organic com- pounds. Activated carbon preferentially adsorbs large, nonpolar organic molecules. Granular activated carbon may be used in a series of columns to treat wastewater; there has been some refinery use of this approach. Pow- dered activated carbon may be added to biological treat- ment systems to increase the removal of organics. Successful pilot tests have been reported for powdered activated or granulated carbon in activated sludge sys- tems and RBCs at refineries.89 Successful use of pow- dered activated carbon for preventing toxic levels of phenol in an activated sludge system treating coal liquefaction wastewater has also been reported.81 Use of granular activated carbon has been successful in remov- ing dissolved organics in gas condensate from oil shale following the stripping, activated sludge, and filtration steps.88 For either powdered or granulated carbon, the systems involved are simple. The cost of the activated carbon, however, can be relatively high.
In wet oxidation, suspended and dissolved organic material is degraded at high pressures and moderate temperatures. Wastewater is preheated and mixed with air or oxygen. At elevated temperature and pressure, organic compounds with a high molecular weight are broken down by chemical oxidation and hydrolysis. This approach has been used for many years for munici- pal sludge treatment and for industrial applications. The approach is reliable but is more complex than most processes used to treat wastewater. It has been studied as a treatment process for coal conversion wastewaters.91
Dissolved Inorganic Compounds
Wastewaters from many fossil energy technologies, including coal mining and preparation, steam-electric power plants, petroleum refineries, and synthetic fuel facilities, contain dissolved inorganic compounds. Re- moval of dissolved inorganics is relatively expensive, and the processes described are generally for tertiary treatment. These processes also may be used to treat boiler feedwater.
to use in some processes or prior to discharge. Gener- ally an alkaline reagent is added to increase pH to the desired range. The increased pH also reduces the solu- bility of positively charged metal ions, which precipitate from solution. A variety of reagents may be used; hydrated lime is a common material. Generally a reagent is added to the wastewater in a mixing tank and the treated water is sent to a settling tank or basin. Acid drainage from coal mines is typically treated in this manner. Other less-used reagents are calcined lime, caustic soda, soda ash, and limestone. Aeration systems may also be used in treatment of acid mine drainage to supply oxygen to oxidize ferrous ions to produce insolu- ble ferric oxide. These approaches have been widely used and are reliable, simple processes. Drainage from coal or refuse piles requires treatment similar to that for mine drainage. Studies of chemical precipitation treat- ment of ash pond overflows at coal-fired power plants have reported variable removal efficiencies for metals.92
Some utilities use ash ponds to treat wastewaters from boiler cleaning. For alkaline ash, this approach is as effective as lime treatment; however, attaining opti- mum pond conditions for treatment is difficult. Direct treatment of chemical cleaning wastes (e.g., with lime) has been used also. (In some cases, spent cleaning solu- tions are incinerated in boilers.)
Ion exchange is a process in which ions held by electrostatic forces at the surface of a solid are ex- changed for similarly charged ions in solution. The process has been widely used fos water and wastewater treatment. It is capable of removing dissolved ionic species to trace levels. Ion exchange is a simple, reliable process. It is commonly used at power plants to treat boiler feedwater, and its use has been reported for treat- ment of coal conversion wastewater.82
semipermeable membranes to treat water. Application of pressure to the wastewater side of the membrane and selective transport of the water through the membrane
The pH of wastewater may require adjustment prior
Reverse osmosis is a separation process lhat uses

results in deionized water on one side and concentrated brine on the other. The process can be used to remove dissolved inorganics and low concentrations of organics. The primary application of reverse osmosis is to purify brackish water (dissolved solids content of 10,OOO mg/L). Pretreatment (removal of suspended solids, adjustment of pH, and disinfection) is generally required to prevent membrane fouling. The process is widely used, reliable, and relatively simple. Multiple stages may be used to produce very low levels of dis- solved solids. The process has been applied at power plants to treat cooling tower blowdown for reuse. It has also been reported to provide adequate removal of total dissolved solids ( T D S ) in oil shale mine watersn and to be effective in removing dissolved organics and inor- ganics from biotreated coal liquefaction wastewater93
In electrodialysis, an electric current is used to induce a partial separation of components in an ionic solution. Separation is accomplished by ion-selective membranes. Cation- and anion-selective membranes are alternatively placed across the current path. When a current is passed through thesolution, cations travel through the cation-selective membranes in one direction and anions travel through anion-selective membranes in the other direction. The result is that salinity increases in one space and decreases in the next space, alternating throughout the stack of parallel membranes. The prod- uct water and the concentrated solutions may be removed. Treated water may be passed through a num- ber of such stacks to achieve a desired reduction in salinity. Principal use of this process is in desalination of brackish water. The approach is reliable but rather complex. Likely applications would be treatment of wastewaters with high dissolved solids concentrations, and possibly, use in series with thennocompression evaporation.
Thennocompression evaporation is basically an evaporation system that produces a treated water stream and a stream of concentrated brine. Wastewater is heated and volatile organics and inorganics are vented to the atmosphere. The water is then passed through an evaporator unit. Waste streams containing 3,000- 50,000 mg/L TDS can yield a brine stream with 200,000-400,000 mg/L TDS and a water stream with TDS below 10 mgL.92 The process is proven, reliable, and relatively simple. However, it is energy intensive and has relatively high capital and operating costs. It may be most cost effective to pretreat (e.g., with reverse osmosis) wastewater before using the process. The process has been used in coal-fned power plants to achieve zero aqueous discharge, and bench-scale tests have been done with oil shale reton water.% Low- volume waste streams (e.g., boiler blowdown and floor
and laboratory drains) are suitable for treatment with this approach.92
Dissolved Gases
Dissolved volatile compounds in wastewater can be removed in a relatively simple stripping process that uses steam or gas. In a stripping tower, the wastewater enters at the top of a column containing packing material
"iiirktrays (Fig. 11.20). A stripping gas (e.g., steam, air, or flue gas) is introduced at the bottom of the column and flows upward. Volatile compounds are removed from the downward flowing wastewater. Stripping, which can femove more than 99% of the sulfides,89 is com- monly used as an in-plant process in petroleum refiner- ies for treating sour waters (waters that have been in direct contact with a hydrocarbon stream). The process also removes ammonia and volatile organics. A recov- ery process may be combined with stripping to produce ammonia of high purity. The approach can be used for similar applications in coal conversion facilities. Steam stripping is expected to have wide application in the treatment of oil shale retort waters for ammonia and H2S removal; volatile organics would also be removed.% Stripping has been successful in removing organics, ammonia, and H S from oil shale gas condensate.8738
Air out I
Contaminated water in Packing
Treated water out
I
Figure 11.20 Air Stripping of Dissolved Volatile Species
202

Use of the approach has been reported for coal conver- sion facilities.7682 At the Great Plains plant, steam stripping is used to treat condensate from the gasifiers following solvent extraction.76 The ammonia is sold and the remaining gas liquor is used as the primary makeup stream for the process cooling system.
towers may also reduce the volume of water requiring disposal.82
cooling water or other liquids transfers heat to the at- mosphere by conduction. However, these systems are only economical in areas where water supplies are very limited.
In a dry cooling tower, airflow past pipes containing
Heat Other Pollutants
Various technologies exist for disposal of low-grade waste heat from steam-electric power plants or other fossil energy systems. The approaches differ in their effects on receiving water, water consumption, and the local climate. Some water treatment may be required in association with these approaches, and combinations of approaches may be used.
In once-through cooling, cooling water is taken from a local body of water, passed through the condens- ers, and discharged directly at an elevated temperature. Because of the large flow and elevated temperature of the discharge, the potential for adverse thermal effects on the receiving water is the largest of the various approaches. The potential exists for direct adverse effects on organisms that enter the cooling system or impinge on the screens. Construction and maintenance costs are generally lowest for this system. Use of chlo- rine to control biofouling in a once-through system may discharge residual chlorine, wdLh can be reduced by a chlorine minimization program. Such efforts have been uced at a large number of steam-electric plants.92 Dechlorination with SO2 or sodium salts of sulfur has also been used at several facilities. Chemical substitu- tions for chlorine have been tested or used at a limited number of plants. Chemical substitutes are bromine chloride, chlorine dioxide, and ozone.
Cooling water also can be supplied by a man-made pond; heated water is returned to the pond, where heat dissipates to the atmosphere. Makeup water is added to maintain the pond and some water is discharged to reduce the concentration of dissolved solids. Large land mas are required for this technique.
In an evaporative cooling tower, cooling water is circulated through a cooling tower to transfer heat to the atmosphere. Makeup water is required, and some blow- down is released to reduce the buildup of dissolved solids. Compared to once-through systems, this ap- proach is expensive and reduces operating efficiencies. Chlorine and various other chemicals are used to prevent biofouling of tower elements and to prevent corrosion and scaling. The discharge of residual chlorine may be reduced through chemical substitution, improved proc- ess control, or dechlorination. Evaporation in cooling
Evaporation ponds can be used to control all pollutants except those that are volatile. Such ponds use solar energy to evaporate water and thereby concentrate sub- stances in the wastewater. The major limitations on the use of this approach are land availability and the local evaporation rate. Such ponds can be used for ultimate disposal of wastewater to achieve zero discharge. The approach is demonstrated and simple, and has been used at a number of petroleum refineries and steam-electric power plants.
SOLID WASTES
The extraction and use of fossil fuels produces solid wastes -- often in very large volumes -- that require appropriate disposal. For example, production of one barrel of oil from shale can generate 1-1.5 tons of spent sha1e.w Coal cleaning wastes may constitute 20-30% of the material actually removed from the mine; over 3 bil- lion tons of waste have accumulated at more than 4,000 sites to date. Furthermore, the removal of pol- lutants from gaseous and liquid effluent streams gener- ally results in the production of solid wastes, such as FGD sludge, fly ash, and bottom ash. Currently, these three streams account for about 90% of the 80 million tons/yr of solid wastes produced by electric utilities.95
Many other wastes are produced in smaller quan- tities, and some of these may actually pose more diffi- cult disposal problems due to the presence of hazardous materials. These wastes can include wastewater treat- ment residues, boiler blowdown, air preheater and precipitator cleaning wastes, boiler water and frre-side cleaning wastes, pulverizer rejects, storage pile runoff, cooling tower blowdown, oily wastes from floor drains, spent catalysts, and laboratory wastes.
Disposal of large-volume wastes can easily involve hundreds of acres for a large facility. Thus, the avai- lability of adequate land and concerns over the appropri- ate use of the land (i.e., landfills versus agriculture or industrial development) are often significant issues. The
203

lack of suitable disposal areas has already proven to be a strong deterrent to coal use in highly populated areas. Howeva, the most important concern is that the wastes be isolated from current or future drinking water sup- plies. Such supplies can be contaminated by either surface runoff or by percolation of water through the waste, carrying leached materials into underground aquifers.
The mineral residues from fossil fuels contain a great variety of trace elements, including many that are potentially hazardous in the environment. Many of the elements can be leached from fly and bottom ash to some degree, although the glassy slag from wet-bottom boilers is fairly inert to leaching. Sodium-based scrub- bers produce very soluble wastes that are a significant problem in all but arid climates. The wastes from wet limdlimestone FGD systems potentially contribute sulfite, sulfate, calcium, chloride, magnesium, and nu- merous trace elements to the leachate2 The wastes from fluidized-bed combustion systems are similar, except that they are dry and higher in calcium sulfate than con- ventional scrubber wastes,Ps while the wastes from dry FGD systems are usually high in sulfite and are in- timately combined with the fly ash. The physical prop- erties of gasifier solids vary with the gasifier design and coal characteristics and can range from fairly inert slag to materials that may present a hazard due to trace ele- ments or organic compounds.96 Spent oil shale is also a concern due to trace elements, and it contains organic compounds known to be toxic or carcinogenic.94
Both the land-use and water contamination prob- lems can be avoided to the extent that the wastes are used as by-products. Significant amounts of coal ash are already used, primarily in construction materials such as concrete,95 and increasing attention is being given to FGD systems that produce products such as gypsum, sulfur, sulfuric acid, and fertilizers. Resource recovery is also a likely option for the future, since waste streams such as fly ash contain significant quantities of valuable elements. Although these elements are present at trace levels, the volume of waste makes it a sizable resource.
Table 11.10 presents estimates of the major solid waste streams from a typical coal-fired power plant97 Solid wastes from other energy technologies and fuels can differ from those estimates both in the nature and quantity of wastes, but large volumes are produced in all cases. For example, about 300 tons/MW-yr of slag (ash) is produced in a coal gasifier and the total volume of dry fluidized-bed combustion waste will be about the same as the volume of wet sludge produced by a scrubber.9s
Table 11.11 gives estimates of various minor waste streams for a typical power plant98 These low-volume wastes have generally been disposed of with the high- volume wastes, thereby taking advantage of dilution and, in some cases, fixation offered by the high-volume wastes. However, the possibility that wastes (such as those resulting from boiler cleaning) may be classified as hazardous and cause the entire waste volume to be considered as hazardous could demand separate
Table 11.10 Principal Solid Wastes from a 500-MW Coal-Fired Power Plant
Annual Waste Productions Stream (thousand tons)
Bottom ash 46 Fly ash 182 Fixed sludge 622b
aBased on a 67% capacity factor, firing of high-sulfur coal, and use of a wet lime-stone FGD system.
bThis value includes the collected fly ash, which is mixed with the FGD sludge in the fixing process.
Source: Ref. 97.
Table 11.11 Minor Liquid and Solid Wastes from a 500-MW Coal-Fired Power Plant
Annual production (thousand tons)
Stream Liquid Solida
Demineralizer 67
Boiler regenerants
Water side 0.2-3 Fire side 3.4-3.8
Floor drains 22.8 Boiler blowdown 39.676.1 Air preheater cleaning 8.9-76.1
*At 25% solids content.
Source: Ref.98.
2
2-113
2 18-56
1.2-2.4 44-828
204

handling of some wastes in the future. In a regulatory context, "'solid waste' means any garbage, refuse, sludge from a waste treatment plant, water supply treat- ment plant, or air pollution control facility and other discarded material, including solid, liquid, semisolid, or contained gaseous material resulting from industrial, commercial, mining, and agricultural operations."99
Ponding
Ponding has been the most common disposal method because most of the wastes from existing systems are either liquids or are handled as slurries. Pond construc- tion is also relatively simple, assuming that adequate land is available. Natural depressions, excavations, dams or embankments, and combinations of these fea- tures have all been used.
tively inert materials and may be suitable for disposal directly on the ground, but most wastes pose at least some leaching potential and may require installation of a pond liner, as well as careful consideration of the under- lying soil properties during site evaluation. Liners can be either highly impermeable clay (up to several feet) or a synthetic membrane. Membranes provide the greatest initial barrier to leaching, but are vulnerable to punctures or rips that may be difficult to locate and repair. Clay naturally restricts water movement to about 1 inJyr, adsorbs metal ions present in leachate, and is self- repairing for minor disturbances.95
In most cases, ponds function as sedimentation basins. The waste is allowed to settle to the bottom while material that rises to the surface is recycled to the plant, treated and discharged, or evaporated. The local climate, process requirements, and regulatory constraints on discharges determine the preferred option. When the pond is filled to capacity, closure options depend on the structural properties of the waste. For ash and fixed FGD sludge, placement of a soil cover, revegetation, and diversion of surface water from the site is typical. For unfuted FGD sludge, it may be difficult or impossible to emplace a cover.2 If the pond is left uncovered, it pre- sents a continuing safety and environmental hazard with the potential for water pollution and atmospheric emis- sions of various sulfur compounds.100
To stabilize FGD waste (from limdimestone or double-alkali systems producing a calcium sulfite and sulfate waste) for either ponding or landfilling, dewater- ing and fixation are increasingly being applied. The sludge is typically 5-151 solids as it comes from the scrubber. Mechanical dewatering (such as vacuum filtration, settling, and centrifugation) can raise the
Wastes such as bottom ash or gasifier slag are rela-
solids content to 30-60%, depending on the chemical composition. However, this material still has the consis- tency of mud and is physically unstable. The addition of fly ash, cement, lime, or one of the proprietary additives commercially available can then be used to solidify the waste sufficiently for ponding with ultimate closure or for immediate landfilling.295
For coal ash, ponds are sometimes used in combina- tion systems where they are periodically drained and the ash is excavated and transported for either use or fiial disposal in a dry site.101 For FGD systems producing gypsum as a by-product, a gypsum slurry from the forced oxidation system can be piped to a pond and allowed to settle. Periodically, the gypsum is dredged and stacked around the perimeter of the pond, thereby building up the embankments. This is referred to as gypsum "stacking" (Fig. 11.21).63,102
Landfills
Landfills have long been used for many different types of wastes, including hazardous chemicals. Utility and industrial coal users are moving increasingly to dry disposal in landfills for their large-volume wastes because of increasing concerns about groundwater con- tamination, growing use of dry systems for ash handling, improved techniques for FGD sludge solidification or futation, and the advent of scrubbing systems that pro- duce dry wastes.95
In landfilling, waste is brought to the site (usually by truck) and spread on the ground to a height of 0.3- 1 m using conventional earth-moving equipment. At that point, it may be compacted to reduce the volume and improve the ultimate ability to support development after closure.63.lol Layering continues until the fill is 8-25 m deep. Closure typically involves capping with clay or some other low-permeability material, followed by planting of vegetation. Daily coverage of the fill, as practiced in municipal landfills, is unnecessary since the wastes are noncombustible and unattractive to animals .I 03
leachate problems through measures such as embank- ments and diversion ditches to prevent nearby surface water from running onto the fill and to allow precipita- tion to run off quickly rather than percolate through the wastes. Runoff is usually collected in a sedimentation pond for clarification and, if necessary, further treat- ment. The need for bottom liners €or fossil energy wastes is still a subject of considerable debate, but they are being employed with increasing frequency. A recent survey of 61 coal-fired power stations found that 40% of
Good landfill design emphasizes prevention of
205

J- layers
Cast gypsum perimeter /- dike (first lift)
Cast gypsum perimeter dike (second lift)
Figure 11.21 Construction of Gypsum Stack (Source: Adapted from Ref. 63)
them had lined impoundments, with two-thirds using compacted soil and clay and the rest using synthetic membranes.95 Some designs also employ a leachate collection system consisting of a porous layer below the liner and a system of perforated pipes (Fig. 11.22).63 Several landfiil designs that use existing terrain features are shown in Fig. 11.23.103
mine is an attractive landfill option at some sites. Sur- face mines, particularly those serving mine-mouth power plants, offer the greatest capacity and economic amactiveness for waste disposal. Research has indicated that this approach may be as much as 20-25% less ex- pensive than disposal in a managed landfill.lW Several plants in the Great Plains have practiced this tech- nique.102 Flushing of fly ash into underground mines has been proposed, partly as a control for subsidence, but has received very little application.l*
Disposal of large-volume coal wastes back in the
Ocean Disposal
The disposal of large-volume wastes from flue-gas cleaning in the ocean has been investigated, but has not
206
been practiced commercially. Research has indicated that dispersed disposal of all types of such wastes on the continental shelf or in the deep ocean may be environ- mentally acceptableJM Disposal of stabilized FGD and ash mixtures on the continental shelf also appears to be acceptable. In particular, the use of blocks of fixed wastes to construct artificial reefs in the ocean south of Long Island has been investigated.107 The blocks retained their integrity, had no adverse environmental effects, and may provide a site for increased biological productivity. Cost estimates indicate that this approach cwld be competitive with conventional landfill tech- niques for a coastal plant.
Other Technologies
Landfarming of certain coal wastes improves both physical and chemical soil characteristics. This has been suggested in particular for spent sorbent and scrubber waste from fluidized-bed combustors, which are high in calcium sulfate, but care must be taken to avoid buildup of hazardous trace elements in the soil.108

w/2 I - -
1
18-in. topsoil and seed layer I 6-in. clay layer 1 4 2 % slope
Evaluate Normal flood level I - stream level
I Leachate collection channel 7 I 12-in. sand leachate collection
~~ ~~
I zone
d i n . PVC perforated leachate collection pipe
Figure 11.22 Landfill for Nonhazardous Wastes Based on Proposed Regulations (Source: Adapted from Ref. 63)
embankment toe 15 preferred ( d ) Drdinage toward embankment lace ia) Valley-till or croswattcy landfill
ib) Cross section of placemenr by downsrreani merhod
Evaluate Normal
Diversion channel
( e ) Drdinage toward upstream end with discharge pip'
Figure 11.23 Examples of Valley-Fill Landfills (Source: Adapted from Ref. 103)
207

Deep-well injection can be used for some aqueous wastes with low solids contents, such as those from sodium-based scrubbing systems. In this technique, the wastes are injected into permeable rock formations from several hundred to several thousand feet below the sur- face. In general, the costs are much higher than those for surface techniques.108
Monitoring
Any disposal area, whether pond or landfill, should be continuously monitored. Typical areas for monitoring incIude slurry pipelines (for leaks); dike and dam smc- tural conditions; in-place density of landfilled materials; and water from runoff, underground drains, and moni- toring wells. Groundwater monitoring wells, even for nonhazardous landfills, are recommended by federal law95 and may be required by local agencies. The de- sign of a monitoring well network is determined by local aquifer characteristics and requires an extensive site investigation. A typical system is shown in Fig. 11.24.104 The " A well determines background levels, the "B" well provides early warning of leachate problems, and the "C" wells detect any leachate plume.
The monitoring program should be started prior to landfill or pond development to establish baseline condi- tions and should be continued for some time after closure. The appropriate length of postclosure monitor- ing depends on the waste materials and specific site conditions.
Flgure 11.24 Typical Groundwater Monitoring Network for Landfills (Note: A, B, and C are monitoring wells; Source: Adapted from Ref. 104.)
Table 11.12 Estimates of Waste Disposal Costs for a 500-MW Power Plant
Range of Annual Costsa
Waste Type Operation ($/dry ton)
Bottom ashb Wet handling with recycle 11.4-21 .O Dry trucking 3.1-5.7 Landfill disposal 5.2-9.7
Fly ash Dry handling 2.3-4.3 Dry trucking 1.6-3.1 Landfill disposal 6.2-1 1.6
FGD wastec Raw materials handlingd 4.1 -7.4 Wet handling 15.2-28.1 Dry trucking 2.5-4.7 Landfill 3.7-6.9
-- ERange represents variation in process configurations as well as
Koa1 with 13% ash, 20% of which becomes bottom ash.
uncertainty in estimates.
CWet lime scrubbing at a 1:l stoichiometry for a 296-sulfur coal and a 70% load factor.
dIncluding lime and fly ash.
Source: Ref. 102.
Disposal Costs
Disposal costs are highly site specific due to variations in process waste characteristics, local hydrology and geology, and regulations. One set of estimates for dis- posal of fly ash, bottom ash, and FGD waste from a typical coal-fired power plant is given in Table 11.12.102
Productive Use
The productive use of fossil energy wastes is receiving increased attention as an alternative to disposal. Such use can eliminate present and future concerns regarding management of a disposal site and can generate revenue through avoided disposal costs or income from sale of by-products. Furthermore, the huge amounts of the high-volume wastes make them a considerable national resource if suitable applications can be developed. For example, coal ash is the nation's fourth largest mineral resource, following stone, sand, and coal.109
Low-volume wastes are generally too diverse in nature and insufficient in quantity to justify development of applications. In some cases, internal uses may be
208

found, such as combustion of tars, tar oil, naphtha, and phenol by-products as supplementary fuel in a coal gasification plant.110 Catalysts used in conversion or flue-gas cleanup may have the potential for recovery of valuable metals if a sufficient number of systems use the catalysts.
Sulfur is recovered in some form in many fossil-fuel processes. Systems such as those used in gasification and liquefaction facilities and regenerable FGD produce either elemental sulfur or sulfuric acid. The elemental sulfur can be landfilled or it can be converted to sulfuric acid, for which there is a considerable industrial market. However, the ready availability of natural sulfur in the United States and the increasing recovery of sulfur from sour natural gas and heavy oil have reduced the eco- nomic incentive for recovery from coal. Another factor has been a general reduction in the U.S. demand for sulfur as a result of economic conditions and changes in the domestic industrial mix. Thus, while the total amount of sulfur potentially available through coal use is about equal to the entire U.S. sulfur market, viable markets for by-product sulfur from coal exist in only a few locations determined by the availability of compet- ing supplies to end users.111
Several FGD processes under development are designed to produce a by-product usable as a fertilizer. The information needed to assess the potential market value of these materials is insufficient, but it is unlikely that they will be of sufficient value to warrant transpor- tation over significant distances. Hence, the markets will be very site specific. 'In addition, concerns over the long-term buildup of trace elements in the soil due to the use of such coal-derived materials remain unaddressed.
The wastes from fluidized-bed combustors consist of a mixture of unreacted bed material, SO2 reaction products, and fly ash. Since there is a significant com- ponent of unreacted lime, use of the wastes as a cement supplement, agricultural additive, building material, and road aggregate have all been explored.112 Cemented wastes have exhibited excellent structural properties, making them potentially suitable for a variety of high- strength applications. Use of the wastes for agricultural soil amendment may also be a viable alternative, but more experience is needed to determine the long-term effects, particularly of trace elements?
There is very little prospect for the large-scale use of sludge from lime/limestone and double-alkali FGD systems.95 The construction of artificial reefs from blocks made of sludge was described previously, but this constitutes more of an alternative disposal option than a by-product use. However, there is an increasing trend to systems with forced oxidation of the sludge to produce gypsum. One reason for this trend is that gypsum is
relatively easy to dewater (to greater than 80% solids) for easier handling and disposal, but there are also com- mercial markets in agriculture and the manufacture of wallboard, portland cement, and plaster products.~~3 In countries without adequate supplies of natural gypsum, such as Japan and West Germany, gypsum from FGD systems is routinely produced and used However, natu- ral gypsum is plentiful in the United States and only about 13% of the power plant capacity using forced oxidation actually produces a marketable product. Such production entails careful process control to ensure adequate oxidation, additional washing of the gypsum cake to remove chlorides, and perhaps drying or agglomeration. Growth in FGD gypsum use can be expected as more scrubber systems come on-line and disposal costs increase.
The waste from spray dryer systems is a fine pow- der consisting mainly of calcium sulfite, gypsum, cal- cium carbonate, unreacted lime, and fly ash. Some of these wastes have been shown to "set up" like a low- grade concrete when mixed with water, and they may have applications in construction or as an encapsulating medium for hazardous wastes. However, the uses must be evaluated on site-specific basis, since the properties of the waste can vary significantly with changes in coal ash characteristics or system operating conditions.114 Oxidation of spray dryer waste to produce technical- grade anhydrous gypsum for use as a setting retarder in cement has been demonstrated in Europe but has not been pursued in the United States.115 This application requires that fly ash be removed from the gas before it enters the spray dryer, thus adding to the capital cost,
The only fossil energy waste used in significant quantities is the ash from coal combustion. In 1983, about 18% of the ash produced was used, which was a modest increase from the 12.1% used in 1966;2 how- ever, the growth in tonnage was significant (from 3.1 to 12.8 million tons) due to the increase in coal use. The experience in Europe, where over 50% of the ash is used in most countries, indicates that there is the potential for considerable further growth of this market.
ash in 1983.116 The greatest use was in cement and concrete products. Fly ash bonds in a manner that does not release heat, thereby reducing the temperature rise that can weaken large slabs of concrete. (The pozzo- Ionic properties of volcanic ash were recognized even in Roman times, when it was used as mortar in the Colos- seum and other structures.) Fly ash was used exten- sively in large construction projects, such as Hoover Dam, during the 1930s and 1940s and more recently has been used in projects such as the Sears Tower in Chicago. However, the potential of this market is
Table 1 1.13 gives the specific applications for fly
209

Table 11.13 Coal Ash Use and Disposal in 1983
Bottom Boiler USe Fly Ash Ash Slag
Cement and concrete Srnctural fills Road base Asphalt mix filler Snow and ice control Blasting grit and
roofing granules Grouting Mining applications Miscellaneous
Total used
Disposal
Total produced
3.62 1.39 0.53 0.09 o.ooo1
0.17 0.16 1 S6
7.52
44.83
52.35
0.43 1.11 0.34 0.006 0.42
0.45
2.76
11.24
14.00
0.32 0.28 0.06 0.008 0.23 1.56
0.01 0.06
2.53
1.41
3.94
Source: Ref. 11 6.
limited. If all cement produced in 1983 had been 20% fly ash, only 27% of the available ash would have been consumed.95
construction material in fills, embankments, pavement base courses, and soil stabilization. These uses (as well as those in cement) have been hindered by the natural variations in ash properties that can affect the suitability for specific applications. Research is being conducted to more thoroughly characterize ashes and identify key physical and chemical parameters.
Boiler slag is being used in substantial quantities in some states as a replacement for salt in deicing roads. It does not corrode metals, does not freeze up in stock- piles, improves traction, and absorbs heat due to its dark color.116 Other small-volume uses proposed for fly ash include filler material for plastics, insulators (in crystal- lized form), abrasion-resistant floor and wall tiles, and insulation. None of these are significant markets at this time.
The recovery of valuable metals and minerals from fly ash may represent a viable use in the future. Not only could there be economic benefits for the coal users involved, but there could also be national implications through reduced dependence on foreign supplies of raw materials. For example, fly ash typically contains 4-20% iron oxide, 10-29% alumina, 0.6-4.596 titania, 38-55% silica, and numerous trace elements, including
Another high-volume opportunity for ash use is as a
cobalt, chromium, copper, and vanadium. It has been estimated that recovery of minerals from the entire U.S. fly-ash output in 1978 would have provided 90% of the alumina and 100% of the titania imported that year.117 Recovery techniques have been proven technically feasi- ble in laboratory investigations and are currently under development at a larger scale.95 At the present time, disposal of fly ash in such a manner that it will be easily recoverable for later processing has been urged.116
REFERENCES
1. Control Technology for Fine-Particulate Emis- sions, Argonne National Laboratory Report ANU ECT-5 (Oct. 1978).
2. Kinsey, J.S., R.L. Kerch, and J.M. Zoller, A Review of Traditional and Non-Traditional Tech- niques for the Control of Fugitive Particulate Emissions, Roc. 73rd Annual Meeting of the Air Pollution Control Assn., Montreal (June 22-27, 1980).
3. Plaks, N., An Overview of the EPA Particulate Technology R&D Program, J. Air Pollution Con- trol Assn., 35(4):400-405 (April 1985).
4. The Direct Use of Coal: Prospects and Problem of Production and Combustion, U.S. Congress, Office of Technology Assessment Report OTA- E-86 (April 1979).
5. Danielson, J.A., ed., Air Pollution Engineering Manual, 3rd Edition, US. Environmental Protec- tion Agency Publication AP40 (May 1973).
6. A Review of Technology for Control of Fly Ash Emissionsfrom Coal in Electric Power Gener- ation, Argonne National Laboratory Report ANIf ECT-3, App. E (Dec. 1977).
7. Seward, W.H., J.R. Hollis, andR.S. Opalanko, A Survey of Environmental-Control Technologies for Industrial Coal Use, Argonne National Laboratory Report ANUECT-8 (De. 1978).
8. Selection of Flyash Filters for Pressurized Fluidized-Bed Combustors, Materials and Com- ponents, U.S. Dept. of Energy Newsletter DOE/ FE-o060/60, No. 60, pp. 1-3 (Feb. 1, 1986).
9. McDonald, J.R., and A.H. Dean, A Manual for the Use of Electrostatic Precipitators to Collect Fly Ash Particles, US. Environmental Protection Agency Report EPA-600/8-80-025 (May 1980).
210

10. Vann Bush, P., et al., Field Evaluation of the SoRIIEPA Precharger-Collector System, Paper 80-32.6, Prw. 73rd Annual Meeting of the Air Pollution Control Assn., Montreal (June 22-27, 1980).
11. Feldman, P.L., Present Status of the Research - Cottrell Pulse Energization System, Paper 80-32.2, Roc. 73rd Annual Meeting of the Air Pollution Control Assn., Montreal (June 22-27, 1980).
12. Can, R.C., and W.B. Smith, Part V: Development and Evaluation of Bag Cleaning Methods in Util- ity Baghouses, J. Air Pollution Control Assn., 34(5):584-599 (May 1984).
13. VanOsdell, D.W., and D.A. Furlong, Electrostatic Augmentation of Fabric Filtration: Reverse-Air Pilot Unit Experience, US. Environmental Protec- tion Agency Report EPA-600/57-84-085 (Sept. 1984).
14. Farber, P.S., Argonne National Laboratory, per- sonal communication (Aug. 1986)
15. Huang, H.S., Control of NO, from Coal-Fired Boilers: Combustion-Modification Techniques, Argonne National Laboratory Report ANLECT- 13 ( a t . 1981).
16. Hall, P.E., and J.S. Bowen, Jr., State-of-the-Art Combustion Modification NO, Control for Stationary Combustion Equipment, US. Environ- mental Protection Agency Report EPA-600/D-82- 326 (1983).
17. LaRue, A.D., and L.W. Rodgers, Development of Low NO, Cell Burners for Retrofit Applications, Proc. 1985 Joint Symp. on Stationary Combustion NO, Control, Boston (May 6-9, 1985).
18. Barsin, J.A., and E.J. Campobenedetto, NO, Em's- sions Control in Pulverized Coal Fired Steam Generators, F'rw. 1978 American Power Conf., Chicago (April 24-26, 1978).
19. Lisauskas, R.A., and C.E. McHale, Current Devel- opments in Low NO, Combustion Systems, Proc. 1985 Joint Symp. on Stationary Combustion NO, Control, Boston (May 6-9, 1985).
Steam Generator NO, Control Update - 1985, Proc. 1985 Joint Symp. on Stationary Combustion NO, Control, Boston (May 6-9, 1985).
20. LaRue, A.D., M.A. Acre, and P.L. Cioffi, Utility
21. Dykema, O.W., Development of a Low NOXISO, Burner, Proc. 1985 Joint Symp. on Stationary
Combustion NO, Control, Boston (May 6-9, 1985).
22. Collette, RJ., 1985 Update on NO, Emission Control Technology at Combustion Engineering, presented at 1985 Joint Symp. on Stationary Com- bustion NO, Control, Boston (May 6-9, 1985).
23. Reducing Pollutant Emissions: Gas Fin& a New Niche, Gas Research Institute Digest, 9(2):2-9 (Summer 1986).
Assessment of Needs and Options, Technical Sup- port Document, Electric Power Research Institute Report EPRI-EA-2048, Vol. 5, Palo Alto, Calif. (July 1983).
24. Muzio, L.J., et al., Control of Nitrogen Oxides:
25. Hein, K.P.G., J. Konig, and V. Hoppe, Reduction of NO, Emissions for Brown Coal Combustion Systems in the Federal Republic of Germany, Roc. 1985 Joint Symp. on Stationary Combustion NO, Control, Boston (May 6-9, 1985).
26. Ito, Y., T. Fujimoto, and 0. Nagaoko, Mitsui-BF Simultaneous SO, and NO, Removal System, Proc. 1985 Joint Symp. on Stationary Combustion NO, Control, Boston (May 6-9, 1985).
27. State-of-the-Art Review for Simultaneous Removal of Nitrogen Oxides and Sulfur Oxides from Flue Gas, Argonne National Laboratory Report ANL/ ECT-3, App. G @ec. 1977).
28. SO2 and NO, Retrofit Technologies Handbook, MJ. Miller, ed., Electric Power Research Institute Report EPRI-CS-4277-SR, Palo Alto, Calif. (Oct. 1985).
29. 1977 Keystone Coal Industry Manual, McGraw- Hill, New York (1977).
30. Environmental Control Implications of Generating Electric Power from Coal, Argonne National Laboratory Report ANJfECT-1 (Dec. 1976).
3 1. Bogot, A., and R.P. Hensel, Considerations in Blending Coals to Meet SO2 Emission Require- ments, Combustion, pp. 30-41 (July 1978).
32. Rittenhouse, R.C., Making Coal Burnable: Preparation and Use, Power Engineering, pp. 30-38 (June 185).
33. 1982 Annual Energy Review, U.S. Department of Energy Report DOE/EIA-0384(82) (April 1983).
34. Virenzio, T.A., Impact of Cleaned Coal on Power Plant Performance and Reliability, Electric Power
21 1

Research Institute Report EPRI-CS-1400, Palo Alto, Calif. (April 1980).
35. Foltz, D.J., P.O. Goodman, and L. Sybert, Impact of Coal Cleaning on the Cost of New Coal-Fired Power Generation, Electric Power Research Insti- tute Report EPRI-CS-1622, Palo Alto, Calif. (March 1981).
36. Meyers, R.A., ed., Coal Handbook, Marcel Dek- ker, Inc., New York (1981).
37. Buroff, J., et al., Technology Assessment Report for Industrial Boiler Applications: Coal Cleaning and Low Sulfur Coal, U.S. Environmental Protec- tion Agency Report EPA-60017-79-178c (Dec, 1979).
38. Doctor, R.D., et al., The Impact of Coal Cleaning as a Sulfur Reduction Strategy in the Midwest, Argonne National Laboratory Report ANLECT- TM-7 (June 1983).
39. New Perspective on Coal Cleaning, EPRI Journal,
40. Environmental Control Implications of Generating Electric Power from Coal: 1977 Technology Status Report, App. A , Part 1 , Coal Preparation and Cleaning Assessment Study Argonne National Laboratory Report ANUECT-3 (Dec. 1977).
41. Livengood, C.D., and R.D. Doctor, Coal Clean- ing: Progress and Potential, Proc. AIChE Annual Meeting, Chicago (Nov. 10-15, 1985).
42. Onursal, B., Versar, Inc., Springfield, Va., per- sonal communication (Sept. 1984).
43. Gibson, C.R., et al., Environmental Aspects of El Paso’s Burnham I Coal Gasification Complex, U.S. Environmental Protection Agency Report
44. Eickmeyer, A.G., and H.A. Gangriwala, Acid Gas Removal in Synfuels Production, Energy Progress,
10(9):14-21 (Nov. 1985).
EPA-65012-74-118 (1974).
1(1-4):9-12 @a. 1981).
45. Pelofsky, A.H., ed., Synthetic Fuels Processing,
46. Environmental, Health and Control Aspects of
Marcel Dekker, Inc., New York, p. 42 (1977).
Coal Conversion: An Information Overview, Oak Ridge National Laboratory Report ORNLEIS-94 (April 1977).
47. Ferguson, P.A., Hydrogen Sulfide Removal from Gases, Air, and Liquids, Noyes Data Corp., Park Ridge, N.J. (1975).
48. Environmental Aspects of Fuel Conversion Tech- nology III, Proc. EPA Symp., Hollywood, Fla., U.S. Environmental Protection Agency Report EPA-600/7-78-063 (Sept. 1977).
49. C;asi@ationlCombind-Cycle Power Generation: Environmental Assessment of Alternate Systems, Argonne National Laboratory Report ANLIECT-7 (Nov. 1978).
Project Office, unpublished information (July 15, 1983).
5 1. 1987 Kirkpatrick Chemical Engineering Achieve- ment Award Winner: Claus Oxygen-Based Proc- ess Expansion (COPE), Chemical Engineering, 9 4 18):76-77 (Dec. 7, 1987).
52. Fleming, D.K., and H.S. Primark, Purification Processes for Coal Conversion, in Coal Process- ing Technology, Vol. 3, American Institute of Chemical Engineers, New York, pp. 66-78 (1977).
53. Sulfur Oxide Removal from Power Plant Stack
50. Honea, F.I., U.S. Dept. of Energy, Grand Forks
Gas: Conceptual Design and Cost Study; Sorp- tion by Limestone or Lime: Dry Process, prepared by Tennessee Valley Authority for National Cen- ter for Air Pollution Control (1968).
54. Drehmel, D.C., G.B. Martin, and J.H. Abbott, SO2 Control with Limestone in Low NO, Systems: Development Status, Proc. Symp. on Flue Gas Desulfurization, Vol. 2, Electric Power Research Institute Report EPRI-2897, Palo Alto, Calif. (March 1983).
55. Gillette, J.L., Argonne National Laboratory, per- sonal communication (Nov. 3, 1983).
56, Grammar, R.D., et al., LimestonelCoal Fuel Pellet - -A Viable Method to Control SO2 Emissions from Industrial Boilers, Proc. 73rd Annual Meeting of the Air Pollution Control Assn., Montreal (June 1980).
57. Hubble, B.R., Fluidized-Bed Combustion: A Re- view of Environmental Aspects, Argonne Nationa; Laboratory Report ANUECT-12 (Jan. 1982).
parative Study of Inputs and Outputs of Fluidized Bed Coal-Fired Boilers and Pulverized Coal- Fired Boilers, Proc. American Power Conf., Chicago (April 1983).
Industrial Boilers: Analysis of Performance and
58. Hall, H.V., R.A. Kadeg, and A. Rossi, A Com-
59. Environmental-Control Strategies for Coal-Based
212

Costs, Argonne National Laboratory Report ANL/ECT-10 (June 1981).
60. McIlvaine, R.W., The Present and Future Status of FGD in the United States, Proc. 9th EPA/EPRI Symp. on Flue Gas Desulfurization, Cincinnati (June 1985).
61. Melia, M.T., R.S. McKibben, and B.W. Pelsor, Utility FGD Survey, July 1982 - March 1983, Vol. 2, Electric Power Research Institute Report
62. Dickerman, J.C., Applicability and FGD Systems
EPRI-(3-3369, Pal0 Alto, Calif. (April 1984).
to Industrial Boilers, Roc. EPA Symp. on Flue Gas Desulfurization, Houston (Oct. 1982).
63. Doctor, R.D., Utility Flue-Gas Desulfurization: Innovations and System Availability, Argonne National Laboratory Report ANLECT- 1 1 (March 1982).
Argonne National Laboratory Report ANL/ECT-3, App. F (Dec. 1977).
65. Tuttle, J., et al., EPA Industrial Boiler FGD Sur- vey: First Quarter 1979, U.S. Environmental Protection Report EPA-600/7-79-067b (April 1979).
61. Flue-Gas Desulfurization in the United States - 1977,
66. Livengood, C.D., and P.S. Farber, Performance and Economics of a Spray-Dryer FGD System Used with High-Sulfur Coal, Proc. American Power conf., Chicago (April 1986).
67. FGD Cost Update, EPRI Journal, pp. 47-50 (Dec. 1983).
68. Sulfur Oxides Control Technology Series: Flue Gas Desulfurization. Wellman-Lord Process, U.S. Environmental Protection Agency Report EPA- 625/8-79-001 (Feb. 1979).
moval Process, Proc. Integrated Environmental Controls for Fossil-Fuel Power Plants, Pittsburgh (Feb. 1986).
and NO, from Flue Gas, Proc. Integrated Environ- mental Controls for Fossil-Fuel Power Plants, Pittsburgh (Feb. 1986).
7 1. Drummond, C.J., Advanced Environmental Con- trol Technologies for the Simultaneous Removal of Sulfur Dioxide and Nitrogen Oxides from Flue Gas, Proc. Integrated Environmental Controls for Fossil-Fuel Power Plants, Pittsburgh (Feb. 1986).
69. McKnight, R.A., Integrated SO2 and NO, Re-
70. Helfritch, DJ., Electron Beam Removal of SO2
72. Harkness, J.B.L., and R.D. Doctor, Simultaneous NOJSO, Removal in Aqueous Scrubber Chem- istries, hoc. AIChE Spring National Meeting, New Orleans (April 1986).
73. Richter, E., Active Coke Processes for SO, and NO, Removal from Flue Gases, Roc. Integrated Environmental Controls for Fossil-Fuel Power Plants, Pittsburgh (Feb. 1986).
74. Blake, D.O., and E. Shapiro, The Sulf-X FGD Process, Proc. DOE Flue Gas Cleanup Contractors Review Meeting, Pittsburgh (June 1984).
75. Process Design Manual for Upgrading Existing Wastewater Treatment Plants, U.S. Environmental Protection Agency Report EPA-625/1-7 1-004a ( a t . 1974).
76. RCRA Part B Permit Application, American Natu- ral Gas Coal Gasification Co., Beulah, N.D. (1985).
77. Development Document for Efluent Limitations Guidelines and Standards for the Steam Elechic Point Source Category, U.S. Environmental Pro- tection Agency Report EPA-440/1-80/029-b (Sept. 1980).
78. American Petroleum Institute, Manual on Dis- posal of Refinery Wastes: Liquid Wastes, Washington, D.C. (1969).
79. Development Document for Final Efluent Limita- tions Guidelines, New Source Performance Stand- ards, and Pretreatment Standards for the Coal Mining Point Source Category, U.S. Environmen- tal Protection Agency Report EPA-440/1-82/057 (Oct. 1982).
80. Culp, E.L., and N.F. Heim, Field Manual for Performance Evaluation and Troubleshooting at Municipal Wastewater Treatment Facilities, U.S. Environmental Protection Agency Report EPA- 930/9-78-001 (Jan. 1978).
81. Sapp, J.B., Wmtewater Treatment at a Coal- Liquefaction Facility, Environmental Progress, 2(3):180-183 (Aug. 1983).
82. Kaczmarek, S.A., and F.L. Robertaccio, EDS Coal Liquefaction Wastewaters: Zero-Discharge Treat- ability Studies, Proc. 38th Industrial Waste Conf., Purdue Univ., Ann Arbor Science, pp. 509-517 (1984).
83. Caire, T.P., D.F. Lawler, and M.J. Humenick, Biological Treatability of Underground Coal
213

Gasification Wastewater, Proc. 38th Industrial Waste Conf., Purdue Univ., Ann Arbor Science,
84. Drummond, DJ., R.P. Noceti, and J.G. Walters, Treatment of Solvent-Rejined Coal Wastewater, Environmental Progress, I ( 1):73-78 (Feb. 1982).
85. Luthy, R.G., Treatment of Coal Coking and Coal Gasijication Wastewaters, J. Water Pollution Control Federation, 53(3):325-339 (March 1981).
86. Mercer, B.W., et al., Treatment of Retort Water for Co-Disposal with Spent Shale, in Oil Shale: The Environmental Challenges 11, K.K. Peterson, ed., Colorado School of Mines Press, Golden,
87. Fox, J.P., and T.E. Phillips, Wastewater Treatment in the Oil Shale Industry, in Oil Shale: The En- vironmental Challenges, K.K. Peterson, d., Colorado School of Mines Press, Golden, Colo.,
pp. 519-527 (1984).
CO~O., pp. 46-72 (1982).
pp. 253-284 (1981).
88. Lewis, R.S., G.D. Rawlings, and D.R. Day, Treat- ability of Oil Shale Gas Condensate Wastewater, Environmental Progress, 2(1):59-64 (Feb. 1983).
89. Development Document for Efluent Limitations Guidelines, New Source Performance Standards, and Pretreatment Standards for the Petroleum Refining Point Source Category, U.S. Environ- mental Protection Agency Report EPA-440/1-82/ 014 (Oct. 1982).
90. Strain, J., and C. Turner, Use of Rotating Biologi- cal Contactors for Treating Coal Gasifcation Wastewater, U.S. Dept. of Energy Report DOE/
91. Bogan, R.H., et al., Evaluation of Wet Oxidation
FE/60181-82 (1984).
Technology for the Treatment of Coal Conversion Wastewater, Electric Power Research Institute Report EPRI-AP-3315, Palo Alto, Calif. (Dec. 1983).
92. Development Document for Final EfSluent Limita- tions Guidelines, New Source Performance Stand- ards, and Pretreatment Standards for the Steam Electric Point Source Category, U.S. Environmen- tal Protection Agency Report EPA-440/1-82/029 (Nov. 1982).
93. Churton, B.M., H-Coal Pilot Plant: University of Kentucky Chemical Engineering Department Evaluation of Reverse-Osmosis Treatment of Treated H-Coal Wastewater, U.S. Department of Energy Report DOEET/10143-33 (May 1983).
214
94. Oil Shale and the Environment, US. Environmen- tal Protection Agency Report EPA-600/9-77-033 ( a t . 1977).
95. Utility Solid Waste, Managing the Products of Coal Combustion, EPRI Journal, 10(8):20-35 (Oct. 1985).
Jr., Disposal Characteristics of Solid Residues from Coal Gasification, Proc. 13rd Annual Meet- ing of the Air Pollution Control Assn., Montreal (June 1980).
(DAFFS), Pulverized Coal-Fired Power Plant with a Wet-Limestone Flue Gas Desulfurization System, Argonne National Laboratory Report ANLFE-83-10 (June 1983).
98. Engineering Evaluation of Projected Solid-Waste Disposal Practices, Electric Power Research Insti- tute Report EPRI-CS-2627, Vol. l , Palo Alto, Calif. (Sept. 1982).
99. Resource Conservation and Recovery Act of 1976, 94th Congress, Public Law 94-580 (Oct. 1976).
100. Adams, D.F., and S.O. Farwell, Sulfur Gas Emis- sions from Stored Flue Gas Desulfurization Sludges Roc. 73rd Annual Meeting of the Air Pollution Control Assn., Montreal (June 1980).
101. Coal Ash Disposal Manual, Electric Power Re- search Institute Report EPRI-FP-1257, Palo Alto, Calif. (Dec. 1979).
102. Jones, J.W., et al., Full-Scale Field Evaluation of Waste Disposal from Coal-Fired Electric Gener- ating Plants, Proc. 8th Symp. on Flue Gas Desul- furization, New Orleans (Nov. 1-4, 1983).
103. FGD Sludge Disposal Manual, 2nd Ed., Electric Power Research Institute Report EPRI-CS-1515, Palo Alto, Calif. (Sept. 1980).
104. Santhanam, C.J., J.R. Valentine, and A.A. Balasco, An Evaluation of the Disposal of Flue Gas Desulfurization Wastes in Coal Mines and the Ocean: Mine Disposal Demonstration Tests, U.S. Environmental Protection Agency Research Sum- mary EPA-600/57-84-099 (Jan. 1985).
105. Coal Mine Disposal of Flue Gas Cleaning Wastes, Electric Power Research Institute Report EPRI- CS-1326, Palo Alto, Calif. (June 1980).
of FGD Wastes, U.S. Environmental Protection
96. Boegly, W.J., Jr., E.C. Davis, and H.W. Wilson,
97. Design of Advanced Fossil Fuel Systems
106. Cooper, C.B., et al., Evaluation of At-Sea Disposal

Agency Project Summary EPA-600/S7-85-001 (April 1985).
107. Coal Waste Artificial Reef Program, Phase I , Electric Power Research Institute Report EPRI- FP-1252, Palo Alto, Calif. (Nov. 1979).
108. Hart, F.C., Fred C. Hart Associates, Inc., New York, personal communication (Sept. 1980).
109. Up to Our Ashes, The Energy Daily, p. 4 (March 11,1985).
110. Bogner, J.E., Solid Wastes from Coal Gasification ana' Liquefaction in the Fort Union Region: Back- ground, Properties, Environmental Aspects and Research Needs, Argonne National Laboratory Report W L R P - T M - 2 2 (Aug. 1982).
11 1. Murawczyk, C., J.S. MacKenzie, and R. Bitsko, Regenerative Magnesium 0.xide Flue Gas Desul- furization, A Growing Byproduct Sulfur Source, Proc. AIChE National Meeting, Atlanta (March 1984).
112. Fennelly, P.F., and J.M. Robinson, Fluidized-Bed Combustion: Solid Waste in Perspective with Air
Pollution Control Levels, hoc. 73rd Annual Meet- ing of the Air Pollution Control Assn., Montreal (June 1980).
113. Ellison, W., Ellison Consultants, Monrovia, Md., personal communication (Nov. 1983).
114. Recovery, Utilization, and Disposal of Solid By- Products Generated by Dry Flue Gas Desuyuriza- tion Systems: State-ofthe-Art and Research Needs, Electric Power Research Institute Report EPFU-(3-1765, Pal0 Alto, Calif. (Mach 1981).
115. Bengtsson, S., et al., Thermal Oxidation of Spray Dryer FGD Waste Product, Roc. 9th Symp. of Flue Gas Desulfurization, Cincinnati (June 1985).
116. Santhanam, CJ., et al., Stockpiling: Waste Management Option for Coal Ash and FGD Waste, Proc. Coal Technology 85, Pittsburgh (Nov. 1985).
117. The Fly Ash Route to Metals Will Get a Pilot Test, Chemical Week ( a t . 1, 1980).
215

Figure 12.1 A 40-kW Natural-Gas-Fueled Phosphoric Acid Fuel Cell Test Unit at a Vernon, Connecticut, Telephone Switching Statim
216

BACKGROUND
A fuel cell is a device that produces electricity from the chemical reaction of a fuel (such as natural gas) and an oxidant (such as air or pure oxygen). Although fuel cells represent a relatively new technology for energy conversion, they were first invented by Sir William Grove, an Englishman, in 1839.1 However, his discov- ery essentially remained a scientific curiosity until the 1950s when several different types of fuel cells were built and tested. In 1959, two British researchers demonstrated the first modern fuel cell: a 6-kW hydrogen-oxygen fuel cell.2
Fuel cells have been used in the U.S. space pro- gram, where they have proven to be reliable and effi- cient, since the late 1950s. In the 1960s, developmental work on various types of fuel cells was conducted by many industrial companies and research centers in numerous countries.3 However, with time it became clear that an extensive development program would be needed to develop technologically and economically feasible fuel ceils for electric utility use.4 Recently, a substantial effort has been made, by both private or- ganizations and national laboratories, to develop fuel cells for central-station or dispersed electricity genera- tion in the utility, industrial, residential and commercial, and transportation sectors (see Fig. 12.1).
History
The U.S. space program provided the first big incentive for significant funding of fuel cell research. The fuel cells developed for the program included the solid polymer electrolyte system of General Electric Company (GE) for the Gemini missions and the alkaline fuel cells of United Technologies Corporation (UTC) for the Apollo missions. The alkaline cells have continued to
Chapter 12
Fuel Cells
receive attention for more-recent space missions, includ- ing the Skylab missions and the space shuttle, and also for certain possible naval underwater propulsion applica- tions.5 The latest version, developed by UTC for the space shuttle program, weighs approximately the same as the GE fuel cell developed for the Gemini missions but delivers eight times as much power. The space shuttles are equipped with three fuel cell plants, each capable of supplying 16 kW of power at peak output. The reactants (pure hydrogen and oxygen) are cryogeni- cally stored. On a I-wk mission, the fuel cells consume about 1,500 Ib of hydrogen and oxygen and produce about 190 gal of potable water.6
expended in developing fuel cells for utility use. Appli- cations considered included central generating systems in base-load, load-leveling, and peak-shaving service as well as distributed power systems for small factories, apartment complexes, shopping centers, and office buildings. A joint program was conducted by UTC, the Institute of Gas Technology, and several gas and electric utilities, without government support, to develop a phos- phoric acid fuel cell for on-site residential and commer- cial applications. Under this program, named TARGET, a stand-alone, natural-gas-fueled, 12.5-kW power plant was developed. Laboratory evaluation of this system demonstrated an electrical efficiency of 28%.6
During 1972 and 1973, 65 phosphoric acid fuel cell plants were field-tested in the United States, Japan, and Canada by the TARGET group. These tests led to the development and subsequent demonstration of a 40-kW unit in 1975. Since January 1984, in an extension of the TARGET program, the U.S. Department of Energy (DOE) and the Gas Research Institute (GRI) have been field-testing a number of these preprototype 40-kW units in a variety of applications. The ultimate goal is to bring small-scale, on-site fuel cell technology to the market- place. 1
During the 1960s and 197Os, a substantial effort was
217

To date, 43 of these 40-kW units have been operat- ing in the United States and Japan. With over 200,000 h of cumulative operation, these units have demonstrated that on-site fuel cell technology is feasible in operation and that unattended fuel cells can provide reliable on- site energy service.7
Besides multikilowatt systems, a multimegawatt (initially 27-MW) electric utility generator has also been under development. This venture began in 197 1 when a group of utility companies joined the Edison Electric Institute and UTC to assess fuel cells for utility grid applications. This effort led to the formation, in 1972, of a group composed of UTC and nine utilities whose purpose was to develop a first-generation multimegawatt phosphoric acid fuel cell power plant called the Fuel Cell Generator 1 (FCG-1) for commercial use by 1980. By 1977, a 1-MW pilot plant had been demonstrated. The demonstration showed that a natural-gas- or naphtha-fueled fuel cell could provide electricity while meeting utility requirements for heat rate and load- following capability. In addition, operating data gener- ated during this test indicated that a large-scale fuel cell power plant could potentially compete with fossil-fuel- fired electricity generating sources.1
In 1976, UTCjoined the US. Energy Research and Development Administration (later merged into DOE) and the Electric Power Research Institute (EPRI) in an effort to design, build, and test a 4.5-MW alternating current (AC) FCG-1 power plant in a utility system by 1981 (this size is equivalent to 4.8 MW of direct current @ X I after accounting for parasitic losses and internal power plant consumption). Consolidated Edison Com- pany (Con Ed), a New York electric utility, was chosen to conduct the demonstration project at a site in Manhattan. The total estimated cost was $70 million (1980 dollars) with 48% of it provided by DOE and the balance by EPRI (25%), UTC (20%), and a group of utility investors headed by Con Ed1
Con Ed began to seek permission to build the demonstration plant in 1978. Although the pilot and demonstrator plants were shown to have low noise and emission levels, local residents were concerned about possible fire hazards from the on-site fuel processing and storage systems and other untested aspects of the new technology. Authorization for plant design and construction to proceed was obtained only after pro- tracted hearings. In all, three years passed of reviews, special tests, and design studies before the New York City Fire Department fully approved the installation.8 Demonstrator start-up tests began in November 1981 and were completed by mid-1983. Con Ed finally attempted to produce power on the site in April 1984. However, the plant would not start, primarily because
some of the phosphoric acid electrolyte, contained in a porous layer between the electrodes, had migrated away from the electrodes during the unexpectedly long regula- tory debate. Con Ed and UTC have recently asked Con- gress for funds to retrofit the unit with improved stacks.8
In 1980, the Tokyo Electric Power Company (TEPCO) ordered a similar 4.5-MW (AC) phosphoric acid fuel cell power plant from UTC. The TEPCO unit had the benefit of the Con Ed demonstrator's engineer- ing experiences and also used advanced fuel cell stacks that UTC had subsequently developed.8 For example, the cell stacks contained more electrolyte than the New York stacks. The TEFCO unit also had improved burner, water treatment, and water cooling systems. The experiences of the Con Ed fuel cell plant, therefore, enabled TEPCO to move its unit quickly through its critical stages. Consauction at the Goi Power Plant on Tokyo Bay was completed in early 1982, less than two years after groundbreaking. Checkout tests were com- pleted that same year, and in April 1983 the fuel cell stacks began to produce power.8 To date, the TEPCO demonstrator has been operated satisfactorily between 25% and 100% of rated capacity, producing utility-grade power with minimal emissions.8
Recent research and development (R&D) efforts on acid electrolyte fuel cells have continued to focus on commercializing the technology. The DOE Multi- Megawatt Utility Systems Program is aimed at develop- ing a design built to FCG-1 specifications and capable of producing 11 MW of power. The current timetable calls for delivery of the fmt commercial 11-MW power plant by 1988.
Westinghouse Electric Corporation has also worked on the acid electrolyte technology. Unlike UTC, Wes- tinghouse (under license from the Energy Research Corporation) has been emphasizing the use of air instead of pressurized water to cool the fuel cell stacks. Other aspects of the technology are similar to UTC's system. Current plans call for developing 7.5-MW modules for utility applications. Like the UTC power plant, this system also receives partial funding from DOE and EPM.
Research has also been conducted on advanced technologies that may provide better-quality heat, higher efficiencies, and broader application possibilities than can currently be obtained. One example is the molten carbonate fuel cell. The carbonate fuel cell R&D pro- gram began in the early 1960s and although significant progress has been made, substantial development is still needed? The present program is directed toward estab- lishing apractical stack design.10 The current timetable calls for field tests in the early 1990s and commer- cialization in the mid-1990s. Organizations involved in

this program are UTC, GE, Argonne National Labora- tory, the Institute of Gas Technology, GRI, and individ- ual utilities.
Other advanced technologies include the alkaline and the solid oxide fuel cell systems. The solid oxide technology is less developed than molten carbonate technology but, like the latter, is expected to be used in large coal-fueled power plants in the early 1990s.11 Other R&D efforts are also being conducted on such topics related to fuel cells as corrosion-resistant materi- als and improved catalysts.
Government and Industry Programs
Major participants in the overall fuel cell development program are DOE, EPRI, and GRI. Support by DOE is provided to three primary fuel cell technologies (phos- phoric acid, molten carbonate, and solid oxide) to spur continued progress, competition, and innovation. In general, DOE funding has been responsible for a large share of the nation’s fuel cell development work in the private sector. Major companies involved include GE, UTC, and Westinghouse. Substantial funding has also been provided by gas and electric utilities and their research organizations, GRI, and EPRI. Specific pro- grams in which all of these organizations are involved have been described in the previous section.
Overseas, only Japan has been involved in fuel cell R&D. The New Energy Development Organization, a federal agency similar to DOE, has helped push the fuel cell toward commercial status and is supporting the design and construction of two 1-MW pilot plants for utility system operation by 1986. The units will eventu- ally be scaled up to 10-MW demonstrators and then to full-size plants for utility service by about 1990.8 One of these pilot plants, designed for use in 30- to SO-MW settings for dispersed electricity generation and cogen- eration, is being developed by Fuji Electric Company Ltd. and Mitsubishi Electric Corporation. The second plant is being developed by Hitachi Ltd. and Toshiba Corporation and will operate at higher temperatures and pressures. It is intended for central generating stations over 50 MW.8
TECHNOLOGY
Basic Operation
A fuel cell is an electrochemical device that continu- ously converts the chemical energy of a fuel (e.g., natu-
ral gas and light distillates) and an oxidant (oxygen in air) directly into electrical energy. In construction, a fuel cell is quite similar to a drycell battery; it has an electrolyte and positive and negative terminals. Unlike a battery, a fuel cell does not run down nor does it require recharging; it operates as long as both fuel and oxidant are supplied to the electrodes. The electrodes act as reaction sites where the fuel and oxidant are electro- chemically transformed to produce DC power, thermal energy (heat), and steam. The transformation is isother- mal; that is, the fuel cell directly uses the available free energy in the fuel at its operating temperature. Conse- quently, it is not Carnot-cycle limited and can yield a high fuel-to-electricity (DC) conversion efficiency.12 This high efficiency is essentially independent of the size and load factor of the fuel cell.
As shown in Fig. 12.2, a typical fuel cell system consists of three sections: one each for fuel processing, fuel cell power, and power conditioning. The fuel pro- cessor is necessary because most fuel cells operate only on pure hydrogen or hydrogen-rich gas; they cannot use hydrocarbon fuels directly. Consequently, the fuel pro- cessor converts the hydrocarbon fuel into a hydrogen- rich fuel gas stream. It does so by using a steam reformer, and possibly a shift converter, to catalytically react the fuel with steam and generate hydrogen, carbon monoxide (CO), and carbon dioxide (C02), which are then fed with air to the fuel cell power section. (Depending on the type of fuel cell, treatment may be required to remove the CO or C02 before the fuel gas stream enters the power section.)
In the power section, the hydrogen is combined with oxygen (from air) to generate DC electricity, heat, and steam. The thermal energy is used to maintain the oper- ating temperatures of the power plant components and to supply usable heat to the end user. Steam is recovered for use in the fuel processing section and the DC power is fed to the power conditioning section, which produces AC electricity.
The electrochemical reaction between hydrogen and oxygen occurs in a cell, as shown in Fig. 12.3.13 Each cell is composed of two electrodes -- an anode and a cathode -- separated by an electrolyte. The hydrogen- rich fuel gas stream enters the cell at the anode while air is introduced at the cathode. As the fuel gas and air pass through the cell, two electrochemical reactions occur: the fuel is oxidized and the oxygen in the air is reduced. The oxidation process releases electrons, which travel through an external circuit and create DC power. The electrons returning from the external circuit then react witk oxygen and hydrogen ions (produced during the oxidation process) to produce steam.13 The discharge products are water, C02, and waste heat.
219

Fuel
(e.g., natural gas, naphtha, methyl fuel)
L
Synthesis gas
Hydrogen-rich gas
I I
Fuel - processing
section
Air
Fuel cell power section
Steam
DC I Power I AC conditioning power ~7 section
Figure 12.2 A Fuel Cell Power Plant
1 Hydrogen- H~
Anode
I I Voltmeter A
Oxygen
Water
Electrolyte Cathode
Figure 12.3 Operation of a Fuel Cell (Source: Adapted from Ref. 13)
220

A typical single fuel cell produces less than one volt; larger voltages can be achieved by connecting many individual cells in series. Such a series of cells is called a stack. Stacks of various sizes can be con- structed to produce a wide range of voltage and current levels (dependent on the cell area) for the output power.
The major types of fuel cell technologies are com- pared in Tables 12.1 and 12.2. As these tables show, their principal differences tend to be the electrolyte material and the operating temperature. The electrolytes include the following types: water-soluble acidic (phosphoric acid), water-soluble alkaline (potassium hydroxide), polymeric membrane (solid polymer), molten salt (molten carbonate), and solid ceramic (solid oxide). The optimum operating temperature for these
electrolytes varies widely, from room temperature up to about 1,800OF. In addition, each electrolyte exhibits a unique set of physical and chemical properties, so that the fuel cells that use them take on a wide range of con- figurations. As a consequence, the fabrication of fuel cells draws from a wide range of materials science and electrochemical knowledge.
Table 12.3 summarizes the progress in fuel cell stack technology. An order of magnitude increase has occurred in the size of stacks as well as in demonstrated stack durability over the past two decades. Although not shown in the table, there has also been an order of mag- nitude increase in fuel cell performance as measured by power density, and, therefore, a corresponding reduction in stack cost.14
Table 12.1 Characteristics of Phosphoric Acid Fuel Cell Systems
Characteristics Large Systems Small Systems
Size Current Proposed
Fuels
0 rating temperature ( F) 8"
Operating pressure (psis)
Anode fuel
Oxidant
Electrolyte
Catalyst
Efficiency (6)
Life (h) Present Potential
Cogeneration potential
Technology readiness
Commercial availability
Applications to date
1 or 4.5 MW 1.5 or 11 MW
Naphtha, natural gas, melhanol, hydrogen
300-425
15-120
H2-rich gas
Air
Phosphoric acid
Supported platinum
38-42
10,000 40,000
Good
1987
1988
Utilities
1.5or40kW 5,20,40,60, or 200 kW
Natural gas, methanol, hydrogen
300-425
15
Hz-rich gas
Air
Phosphoric acid
Supported platinum
35-45
10,000 40,000
Good
1986
1987- 1988
Fork lifts, U.S. Army mobile power, utilities, commercial sites
Sources: Refs. 4 and 13.
22 1

Table 12.2 Characteristics of Advanced Technology Fuel Cell Systems
Solid Polymer Molten Solid Characteristics Alkaline Electrolyte Carbonate Oxide
Size (kW) Current
Proposed
Fuels
0 rating temperature 8" (F)
Operating pressure (pia)
Anode fuel
Oxidant
Electrolyte
catalyst
Efficiency (%)
Life (h) Present Potential
Cogeneration potential
Technology readiness
Commercial availability
Applications to date
0.5,7, 10, 12 or 20 kW
14,20, or 55 kW
1
20 20,40, or more
Hydrogen
180-250
15-60
PUE Hz
Pure oxygen
Potassium hydroxide
Nickel and supported platinum
40-50
Not available 5,000-6,OOO
Low
Proven in space
Space-ready
Space power
Methanol, hydrogen
185-220
15-150
Hz-rich gas
Air
Solid polymer (Nafion)a
Platinum
40-45
Not available 60,000
Low
Proven in space
Space-ready
Space power
Natural gas, coal (gas an4 liquid)
1,100-1,300
15-150
H2- and CO-rich gas
Air
Alkali metal carbonate
Nickel
50-65
3,000 40,000- 6o,ooo+
High
1988-1990
1995-1997
None
5-10,400-800 or more
Natural gas, coal (gas and liquid)
1,800
15
Hz- and CO-rich gas
Air
Stabilized zirconium oxide
None
45-65
100-<200 b
High
1995-1998
2001-2005
None ~~
aNafion is a membrane produced by E. I. duPont de Nemours & Company.
bCurrently unknown, but appears to be excellent (greater than 50,000 h).
Sources: Refs. 4 and 13.
222

Table 123 Extent of Progress in Fuel Cell Technology, 1960s to 1980s (orders of magnitude)
Table 12.4 Impact of Various Fuels on the Cost and Efficiency of Phosphoric Acid Systems
Early 1960s 1980s
Largest Stack Largest Stack Stack Life Stack Life
Fuel Cell (kw) 01) (kW) 01)
Phosphoric acid 1 1,000 100 10,ooo
Alkaline 10 1,000 10 10,000
Solid polymer 0.1 100 10 10,ooo
Molten carbonate 0.1 100 1 1WJ Solid oxide 0.01 100 0.1 1,000
Source: Ref. 14.
Phosphoric Acid Fuel Cells
The phosphoric acid fuel cell represents the most devel- oped fuel cell technology. Extensive laboratory testing has been performed and current development now em- phasizes preprototype field testing as well as additional development to verify that the technology is competitive and to encourage commercialization.
lyte since it is the most common acid stable at the operating conditions of fuel cell systems. The system employs carbon electrodes containing finely dispersed platinum catalysts and is designed to operate at about 375'F on the average, although some units have been operated at 425OF. Operating pressures range from 15 to 120 psia.
fuel processing system to produce hydrogen, which limits the fuel choices to clean, light hydrocarbons (natural gas and light distillates) and, where available, methanol. Thus, fuel cost will preclude use of the sys- tem for most base-load applications unless, at some later time, low-sulfur coal gas is used as a fuel with larger, integrated gasifier fuel cell units.5J2 Ultimately, the system may also find a place in the transportation field. The degree of penetration in all markets will depend on competition. In general, the state-of-the-art electrical conversion efficiency of the phosphoric acid cell ranges between 35 and 4596, although the need for higher cur- rent density for greater power output per unit area can reduce this efficiency.
Table 12.4 shows the results of a recent study conducted by UTC to evaluate the cost and efficiency
Nonvolatile phosphoric acid is used as the electro-
The phosphoric acid system requires an efficient
Changes in Efficiency Cost from
Fuel (%I Baselines (%)
Baseline fuels Naphtha 41 Methane 41
Alternative fuels
coal gasb Medium-Btu 41 -1 to5
Methane 41.5 1 Hydrogen 42 -1 1
8Defined as the cost when either naphtha or methane
bEfficiency and cost impact may vary, depending on
Source: Ref. 15.
is used.
the specific gas composition.
impacts of using various fuels in a phosphoric acid sys- tem designed primarily for naphtha and natural gas. Of the fuels evaluated, hydrogen reduces costs the most, primarily because the fuel processing section would be eliminated. However, efficiency is improved only slightly, since many of the components and subsystems of the baseline system cannot be easily modified. The study found that if the phosphoric acid system were designed specifically for pure hydrogen, its efficiency would rise to 50% and its cost would drop by 25%.15
Alkaline Fuel Cells
The alkaline fuel cell system uses a strong aqueous solution of potassium hydroxide as the electrolyte. Operating pressures range between 15 and 60 psia, oper- ating temperatures between 180 and 250°F, and state-of- the-art efficiencies between 40 and 50%. Hence, per- formance is better than in the phosphoric acid system, which has efficiencies of 35-45%.
To date, only the U.S. space program has taken advantage of the alkaline fuel cell's high reliability and high power density. These cells have been used in most of the manned space missions, including Apollo and the space shuttle. The basic reason for their limited devel- opment is the sensitivity of the potassium hydroxide electrolyte to carbonaceous gases, particularly COz.
223

Carbon dioxide reacts with the potassium hydroxide to produce potassium carbonate precipitate, which signifi- cantly diminishes cell performance.l2,16 Even the 0.04% COz in air must be removed. This means that in com- mercial applications, the hydrogen derived from hydro- carbon fuels must be extensively cleaned to remove any residual C02. Tests conducted to date indicate that C02 must be removed to about 10 ppm before the fuel gas enters the fuel cell. At present, such cleaning is expensive.
Solid Polymer Electrolyte Fuel Cells
The solid polymer electrolyte fuel cell was initially developed by GE for the space program in 1958 and was used to provide on-board electrical power for the Gemini spacecraft from 1963 to 1965. It thus became the first fuel cell technology to be used in a practical application. Development of the technology by GE continued until 1984, when the company terminated the program. Work on the latest GE version of the system is being con- ducted, under license, by Siemens in West Germany and Engelhard Indusmes in the United States.
proton-conducting sulfonated fluorocarbon membrane as the electrolyte. The membrane (presently Nafion, manu- factured by DuPont) conducts protons only when it is saturated with water, and care is required to keep the cell from drying out at operating temperatures above 212'F. The electrode structures are thin films of catalyst pressed onto the membrane surface. The anode current collector is made from a commercially available carbon paper and is similar to that used at the cathode.
To date, solid polymer electrolyte fuel cells have operated for over 60,000 h at pressures up to 70 psia and temperatures up to 185'F with little performance degra- dation. High current densities have been achieved at normal operating conditions of 220'F and 150 psia.
In its present configuration, the system uses a
Molten Carbonate Fuel Cells
Molten carbonate fuel cell systems are potentially more efficient than phosphoric acid fuel cells. They operate at higher temperatures (1,100-1,300°F compared to 300- 425'F for the acid system) and under pressures of up to 150 psia. The high operating temperatures increase the tolerance of the fuel cell to certain compounds (e.g., CO), thereby enabling a wide range of fuels to be used with little adverse environmental impact. At present, the technology lags behind that of the phosphoric acid sys- tem by 5-10 yr; thus, molten carbonate fuel cells are not
224
expected to be commercially available until the middle to late 1990s.
The major advantage of the molten carbonate fuel cell over the acid cell is that it does not need a separate fuel processing section. The waste heat available in the cell can be used directly in the anode chamber for reforming desulfurized natural gas to hydrogen. The electrolyte is a molten alkali-metal carbonate in a porous ceramic matrix, and the electrodes are made of nonnoble metals (usually porous nickel or nickel alloy). Conver- sion efficiencies are typically 50-65%, although use of the high-quality waste heat allows the overall system efficiency to increase to 80-85%.
Solid Oxide Fuel Cells
Solid oxide fuel cells were first pioneered by Westing- house in the 1960s. The electrolyte used is yttria- stabilized zirconia, which operates as a solid at elevated temperatures (1,800'F) and atmospheric pressure. The electrodzs used are of nonnoble metals. For the fuel electrode (the anode), nickel cermets have been the baseline material, but sensitivity to sulfur species has been forcing a shift to cobalt cermets as the optimum choice for use with fuels where it is impractical to remove all sulfur.
requirements and, as in molten carbonate systems, per- mit light hydrocarbon fuels (e.& natural gas) to be fed directly to the cell anode.12 A separate fuel processing section, therefore, is unneeded. The high-temperature operation also produces high-quality waste heat, which can be used in cogeneration applications.
Whereas the other types of fuel cells use flat planar structures, the solid oxide system employs tubular geometry because it is extremely difficult to fabricate thin (50-pm) layers of electrolyte with large areas and no cracks.12 To date, Westinghouse is the only manu- facturer pursuing the commercial development of this technology with internal and DOE funding. Testing is being performed on laboratory-scale equipment in 1-, 3-, and 24-cell configurations. A 5-kW pilot plant genera- tor is also under construction.~7
The high temperatures reduce anode fuel gas purity
APPLICATIONS
Fuel cell systems have a number of advantages over other energy production methods. First, the low level of pollutants produced permits siting flexibility of plants in environmentally constrained areas and provides the

capability to offset emissions from other pollutant sources according to U.S. Environmental Protection Agency (EPA) bubble criteria. Second, because fuel cells have no moving parts, they are essentially noise- less. (The system, however, does include pumps and blowers.) Other positive characteristics include system modularity, short construction lead time, efficient partial-load operation, fast power response time, cogen- eration potential, and siting flexibility. The importance of these attributes for market applications is summarized below.
to energy conservation and better economics (e.g., lower electricity cost) than conventional power plants. This efficiency extends to partial-load operation as well. Because the fuel cell is almost uniformly efficient between 50 and 100% power, output can vary between half and full load with virtually no change in operating efficiency. This attribute is of particular importance to electric utilities where reserve power is constantly re- quired and load-following power generation is vital. As a related attribute, the fast power response time permits fuel cell systems operating at partial power to make a rapid transition to full power (typically 1 MW/s from minimum to maximum power). This attribute may reduce the need for other standby power sources such as on-line batteries or capacitors.
Because fuel cell systems are modular, electric utilities can closely match projected market require
The high efficiency of fuel cell systems contributes
ments by adding appropriately sized increments of gen- erating capacity as needed. Modularity also enables low emissions and the siting of fuel cell plants at load cen- ters where the cogenerated heat can be used to maximize energy use efficiencies.
Another advantage is that construction lead time is short. Fuel cell capacity can be added in less than 3 yr instead of the 10-15 yr required for large utility power plants. This short lead time between initial planning and operation reduces business risks and improves utility economics by reducing interest charges on borrowed capital.
Finally, fuel cells are compact. For example, an 11-Mw power plant site occupies about 1.2 acres, which is equivalent to about 5 ftf/kW.
The potential applications of fuel cells are quite diverse. For example, fuel cells (primarily the akaline and solid polymer electrolyte types) have been and con- tinue to be used in the manned spacecraft program. Other possible applications exist in the industrial, utility, residential, commercial, and transportation sectors.
No clear correlation exists between the type of fuel cell and the type of application. The preferred technol- ogy for a specific application will be influenced by the fuel to be used (i.e., how the fuel cell integrates with the fuel handling and processing equipment) and by trade- offs among the system’s power density, energy density, and efficiency. Some of the common trade-offs for three fuel cell systems are shown in Table 12.5.4
Table 125 Major Fuel Cell Development OptionsP
-_ Parameter Option Optiori Opion
Fuel cell technology Phosphoric acidb
Major fuel types Natural gasb
Primary user On-site
Plant size Multikilowatt
Primary use Peakingb
Generdtion system to be displaced
Natural gas and petro- leum distillate peaking gas turbinesb
Molten carbonate
Petroleum distillate or residual
Utilityb
>50 MWb
Intermediate
Variously fueled inter- mediate equipment of various types
Solid oxide
Coal
Industry
>50 MW
Base load
Coa-fired, base-load plants
aThree options are given for each palameter and are presented by row in somewhat arbitrary order. Hence, no interrelationship or correlation is necessarily implied among the options within each column.
Considered to be the primary option for near- and midterm applications.
Source: Ref. 4.

Utility Applications Table 12.6 Attractive Industrial Applications for Fuel Cells
As mentioned previously, the majority of fuel cell R&D has been directed toward electric and gas utility applica- tions. Currently, demonstration systems are being evaluated by UTC and Westinghouse with support from DOE, EPRI, and participating utilities. Of the two 4.5- MW phosphoric acid power plants built to date, one is successfully operating in Japan and has been producing utility-grade power, with minimal emissions, since 1983. The second demonstration unit, the Con Ed unit in New York, was recently placed on hold by the project spon- sors, primarily because the long licensing and plant activation period allowed the acid electrolyte to migrate away from the electrodes, preventing the plant from starting. Westinghouse and UTC are currently develop- ing designs for 7.5- and 11-Mw modules, respectively, for use in load-following applications.
Industrial Applications
Although the industrial sector has been identified as an attractive application for fuel cells, it has been far behind in establishing a program to develop, demonstrate, and commercialize the technology. Table 12.6 lists attrac- tive industrial applications for fuel cells.18 In general, the molten carbonate system is favored because its higher operating temperature (compared to that of the phosphoric acid system) offers greater cogeneration potential. It is, therefore, more useful in most industrial cogeneration applications.
Residential and Commercial Applications
Fuel cell applications for the residential and commercial sector are being evaluated primarily by UTC. With DOE, GRI, and utility sponsorship, UTC has been developing on-site systems capable of supplying the total energy needs (electricity, heat, and hot water) of apartment complexes and commercial buildings. As mentioned previously, UTC has been field-testing 43 prototype on-site units (of 40 kW each) in the United States and Japan.
In addition, Engelhard Industries has been develop- ing an on-site fuel cell that is fully integrated into heat- ing, venting, and air conditioning systems. Engelhard has developed and tested a 5-kW unit and reportedly plans to test a 100-kW unit in the late 1980s.
Molten Phosphoric Industry Carbonate Acid
Aluminaa Beet sugar Boxboard Cane sugar refining Chlor-alkali Copper Corrugated paper Cyclic crude and intermediates Distilled liquors Finishing plants, cotton Finishing plants, synthetic High-density polyethylene Malt beverages Meat packing Newsprint mills Noncellulosic fibers Nylon Paving mixtures Petroleum Polyvinyl chloride Pulp and paper mills Steel Wet corn milling Writing paper
X X X X X X X X X X X X X X X X X X X X X X X X
X X X X
X X X X
X
X
X
X X
aAlso an attractive application for high-temperature solid oxide fuel cells.
Source: Ref. 18.
Transportation Applications
Fuel cells have been considered for use in passenger cars, vans, and buses. Nonhighway transportation uses, including railroads, pipelines, and marine applications, have also been studied. Aircraft applications, too, have been addressed, but are not considered feasible due to the relatively high weight-to-power ratio of fuel cells.
for transportation indicates that fork-lift trucks are an excellent application.10 Urban delivery vans and city buses are also attractive in the short term while over the long term, fuel-cell-powered automobiles, light pickup trucks, and intercity buses appear promising. The study also indicates that, at present, fuel cell systems are not economically attractive for small and large marine crafts or for freight locomotives.
A recent assessment of fuel cell propulsion systems
226

ENVIRONMENTAL ISSUES
In general, fuel cell power plants are considered to be environmentally benign. Consequently, little attention has been given to the environmental, health, and safety impacts of fuel cell technologies. The limited informa- tion available is summarized below for multikilowatt and multimegawatt phosphoric acid units, since that technology is closest to commercialization. The impacts of the other fuel cell types are likely to be similar to those of phosphoric acid fuel cells and hence, are not identified unless they differ.
Air Pollutant Emissions
As shown in Table 12.7, fuel cell power plants emit very low levels of nitrogen oxides (NO,), sulfur dioxide (SOz), particulates, and smoke.19 The reason is primar- ily because, in their present configuration, they bum relatively clean fuels (e.g., natural gas and naphtha) and operate at a low enough temperature to limit the forma- tion of thermally produced NO,. Also, the fuel is pro- cessed before it enters the fuel processing (i.e., reformer) section, and in some cases other (e.g., combustion) reac- tions occur to remove sulfur. As is discussed later, these emissions are only a fraction of those permitted by EPA for large fossil-fueled steam- and electricity-generating stations.
The principal source of air pollutant emissions in a fuel cell power plant is the combustion process that
Table 12.7 Potential Emission Rates for an 11-MW Phosphoric Acid Fuel Cell Power Plant Using Natural Gas or Naphthaa
Natural Gas Naphtha
lb/million Ib/million Pollutant Btub Ibldc B tub lbldc
NO, 0.035 76.69 0.025 54.78
so2 0.0003 0.65 0.0015 3.29
Particulates 0.000003 0.0655 0.001 1 2.41
Smoke 0 0 0 0
aBased on a UTC plant at rated power.
bFrom Ref. 19.
CCalculated from previous column, based on an 8,300-BiulkWh heat input rate or 41% efficiency.
provides the thermal requirements of the reformer in the fuel processing section. In general, about 80% of the reformed fuel (primarily hydrogen and residual fuel) ,entering the fuel cell stack is consumed by the fuel cells while the rest is combusted in the reformer burner. Under normal operating conditions, the burner fuel is converted almost completely to C02 and water vapor. The reformer burner temperature is low enough so that little thermal NO, is produced. However, NO, is still present in the exhaust emissions as a result of bound nitrogen in the fuel. Reformers being developed to enable fuel cells to use heavy petroleum-derived fuels will likely operate at higher temperatures and require the combustion of greater amounts of fuel. Thus, propor- tionately higher levels of pollutants may be produced. Even at these elevated temperatures, however, NO, emissions should remain significantly below those of conventional fossil fuel combustion technologies.11.20
The emission rates of all the other pollutants (e.g., SO2 and particulates) are also expected to be uniformly low regardless of the fuel type and power plant size. Technology differences and future technological developments, however, will cause some variation. For example, the development of sulfur-tolerant reformer catalysts will lessen the need for sulfur removal. With- out the use of sulfur removal systems, the advanced fuel cell technologies may have higher SO2 emission rates.
Few emission tests have been performed on full- scale operating units and, therefore, their emission characteristics are not precisely known. Table 12.8 gives the results of tests performed on a 40-kW on-site
Table 12.8 Emission Rates for a 40-kW Fuel Cell Power Plant at Different Power Levels (lb/million Btu of energy input)
Emission Rates by Net Power Level
Pollutant 0 k W 20 kW 38 kW
NO, 0.0056 0.0013 0.00060
SO2 O.ooOo35 O.ooOo32 O.ooOo34
Particulates 0.0015 0.0021 os HydrocadJons 0.043 0.0065 0.0025
Smoke 0 0 0
anis result may have been due to a sampling problem.
Source: Ref. 20.
227

Table 12.9 Emission Rates for a 40-kW Fuel Cell Power Plant versus a Domestic Gas Furnace (Ibld)
Pollutant Fuel Cell Gas Furnace
NOx 0.0048 0.43
so2 0.00031 0.0034
Particulates 0.02 0.058
Hydrocarbons 0.024 0.043
aFor furnaces providing 150,oOO Btu/h (3.6 million Btu/d) of thermal energy.
Source: Ref. 20.
Table 12.10 Emission Rates for Fuel Cell Power Plants versus NSPS for Fossil-Fuel-Fired Steam-Electric Power Plants (lblmillion Btu of energy input)
NSPS for Steam- Emission Rates for Generating Units
Fired by Fossil Fuelsb
Pollutant 20kW 4 . 5 W Gas Oil Coal
Fuel Cell Unitsa
NO, 0.0013 0.0413 0.2 0.3 0.7
so2 0.000032 O.ooO1 - 0.8 1.2
Particulates 0.0021 o.oooo1 0.1 0.1 0.1
Hydrocarbons 0.0065
natural-gas-fired; sulfur content of raw natural gas unknown.
bNSPS for generators firing more than 250 million Btu/h (73.3 W).
Sources: Refs. 11 and 21.
system fueled with natural gas and operated at zero-, half-, and full-rated power. These results show that SO2 emissions are very low and stable over the load range. However, NO, emissions increase sharply as the load decreases, while particulate and hydrocarbon emissions seem to have less well-defined trends.
The emission rates of on-site power plants also compare favorably with those of a domestic gas furnace. As shown in Table 12.9, the emissions associated with a 40-kW fuel cell system are lower than those of a gas furnace supplying 150,000 Btdh of thermal energy. As
228
Table 12.11 Emission Rates for Fuel Cells versus Conventional Power Production Methods (lb/million Btu of energy output)
Conventional Methods Fuel Cell
Natural Natural Pollutant Coal Gas Naphtha Gas
NOx 1.7 1.9 0.06 0.09
SO2 1.2 0.0016 0.0036 0.0007
Particulates 0.08 0.09 0.0023 a
aNegligible.
Source: Ref. 4.
a result, the widespread use of on-site fuel cells would significantly reduce pollutant loadings relative to the dispersed and varied on-site combustion sources com- mon in the residential and commercial sectors.
Emission rates for a fossil-fuel-powered generating station depend on the type of fuel and the emission con- trol equipment used. Although these emissions may, in some instances, be below the standards that such gener- ating stations must meet, these standards can be used for comparative purposes. Hence, federal New Source Performance Standards (NSPS) for gas-, oil-, and coal- fueled generating stations are shown in Table 12.10, along with the emission rates of a 40-MW on-site fuel cell power plant at half-rated power and a 4.5-MW demonstrator.1127 The emission rates at half-rated power are shown for conservative comparison since they are greater than the emission rates at full-rated power. The emission rates for the 4.5-MW generator are based on earlier generation models, primarily the 1-MW test unit. Table 12.10 shows that the emission rates for the two fuel cell power plants would be significantly less than the emission rates for fossil-fueled units regardless of their fuel type.11
Table 12.1 1 compares air pollutant emissions for an 11-MW phosphoric acid fuel cell system and a conven- tional power plant using the same fuel -- either natural gas or naphtha. With natural gas, NO, emissions differ by a factor of about 20 and particulate emissions by far more. Emissions of SO2 are about half as much for the fuel cell system as they are for the conventional gas- fired steam electric plant. This particular comparison of low levels of SO2 should be ma& cautiously since the

Table 12.12 Emission Rates for Fuel Cells versus Gas Turbine Power Plants at Full Rated Power (Ibhnillion Btn of energy output)
Table 12.13 Emission Rates for Gas Turbines at Full and Partial Powep (ppm/MW of electricity produced)
Gas Turbines Fuel Cells
Distillate Natural Natural Pollutant Fuel Gas Naphtha Gas
NO, 2.17 1.22 0.060 0.086
so2 1.12 0.0023 0.0036 0.00072
co 0.49 0.45 a a
Hydrocarbons 0.18 0.16 a a
Particulates 0.16 0.054 0.0026 0.0000072
aNot available.
Source: Ref. 4.
sulfur content of the raw natural gas used in the fuel cell has not been specified; only the maximum permissible limits in the fuel were identified.
The integration of coal gasifiers with phosphoric acid fuel cell systems results in efficient power plants with very low emissions. A recent study showed that a 150-h4W integrated electric power plant would require 1,860 tons/d of western subbituminous coal and produce about 64 lb/d of NO, and 153 Ib/d of SO23 If a con- ventional coal-fired power plant were to use the same amount of coal, it would generate the same amount of electric power but 150 times the amount of SO2 (1 1.7 tons/d) and 230 times the amount of NO, (7.4 tondd). The integrated plant would also produce by-products of coal fines and dust (1 18 tons/d) and tar and oils (77 tons/d). If these by-products are sold for their fuel value, the net thermal efficiency of the inte- grated plant would be 35.5%.
peaking units in the near term, the systems most likely to be replaced include natural-gas- and oil-fired turbine electric plants. Emissions from these plants and from fuel cells are compared in Table 12.12. This table shows that sharp reductions in NO, and particulate emissions are possible with fuel cells. Significant reductions in SO2 emissions are also expected. It should be noted that the emission characteristics of the turbines shown in Table 12.12 reflect steady-state operation at full rated power. At less than that, the emission characteristics change, as illustrated in Table 12.13.13 The substantial
Since fuel cell power plants are expected to replace
Full Half Pollutant, Fuel Power Power
NO, Distillate fuel 2.2 3.1 Natural gas 2.1 3.1
CO: distillate fuel 0.5 13.1
aFuels are burned wet for NO, control.
Source: Ref. 23.
increases in NO, and CO result from inefficient combus- tion by the turbines at less than the rated power.
The emission characteristics of fuel cell systems during nonsteady-state conditions (eg., start-up, shut- down, and load transients) are expected to be slightly higher than during steady-state operation. For example, when the fuel cell power plant is idle or down, hydrogen and nitrogen gases are used to pack the equipment; these gases, which are purged during start-up, increase initial power plant emissions. In addition, the fuel for start-up bypasses the fuel processing section; consequently, emissions from the reformer burner have a higher con- centration of SO2. The fuel flow rate also varies during load response transients, thereby causing the emission rate to vary.
In addition to NO,, SOz, and particulate emissions, phosphoric acid may be emitted in very small quantities by acid electrolyte systems. The phosphoric acid repre- sents carryover, or leakage, from the fuel cell stack. Experience with 40-kW on-site units indicates that less than 1 ppm escapes in the exhaust.4~1,20 In addition, trace quantities of other fuel components, such as am- monia, chlorine, and lead, may pass through the system and appear in the plant exhaust.% Another possible source of emissions consists of plant construction materials, trace amounts of which may be eroded and exhausted. No estimates of these emissions have been made to date.
In summary, NO,, SOZ, and particulate emission estimates for fuel cell power plants compare favorably to those for both conventional steam-electric generators and peaking gas turbines. However, the quantity of SO2 emitted will depend on the sulfur content of the raw fuel.
229

Other air pollutant emissions have not been quantified, but are not expected to be troublesome. A small amount of phosphoric acid is expected to escape from the fuel cell power stack. Most of this acid, however, will be recovered within the plant and only small amounts will be released in the plant exhaust.
Liquid Effluents
One of the principal differences between a phosphoric acid fuel cell power plant and a conventional steam- electric generator lies in their water supply and dis- charge characteristics. In general, the fuel cell power plant is self-sufficient in terms of its water requirements. The electrochemical reactions within the fuel cell stack produce enough water to compensate for steam con- sumption in the reformer and for water vapor loss via the plant exhaust stream. This by-product water is recov- ered from the fuel cell inlet and exhaust streams, then is fed to a water storage tank and purification unit where it is cleaned, purified, and again made available to meet the plant’s cooling and fuel processing needs20 Thus, for normal power plant operation, all treated water is recycled and only a small amount of makeup water is generally required.4.20 ln contrast, conventional steam- electric power plants require large quantities of water. In 1975, for example, these plants consumed about 24,000 gaVMWh (7,000 gaYmillion Btu) of elecbicity produced.11
cially during load transients and cold weather, the fuel cell power plant can produce more water than it can consume. The excess water is allowed to overflow from the water storage tank to a sewer or other off-site dis- posal area. This process water is of high quality and its discharge would normally not create any water quality problems.420
A second wastewater stream from the fuel cell power plant is blowdown. About 450 gaVd of this waste- water are produced by the 4.5-Mw demonstrator.11 A linear extrapolation of this amount suggests that an 11-MW fuel cell power plant would produce about 1,100 gaYd. This stream, whose quality is described in Table 12.14, will require some pretreatment prior to discharge.
A third stream is released from the turbocompres- sor’s intercooler. No information on the quality of this stream is available; however, since it contains only con- densed atmospheric water vapor, no environmental impacts are expected. The stream quantity will depend on atmospheric conditions. At rated power (1 1-MW)
During certain operating conditions, however, espe-
Table 12.14 Pollutant Composition of Blowdown Water from a 4.5-MW (AC) Fuel Cell Power Planta
Federal Concen- Quantity Produced NSPS tration (Iblmillion Btu
Pollutantb (PPm) (PPm) of energy output)
Chloride 0.5 200 0.0018
Iron 1 .O 200 0.0018
Nitrate 200 0.0018
Sulfate 200 0.0018
Total dissolved 1 ,ooo 0.0090
Zinc 1 .o 16 0.00014
Chromium 0.2 4 0.000036
Phosphate 5.0 40 0.00036
solids
aPrior to pretreatment.
bSmal1 amounts of polyelectrolyte antiprecipitants and organic
Source: Ref. 11.
polymer dispersants are also present.
design conditions, this stream would amount to 2,160 gaVd.4
and cleaning system. This wastewater stream is nor- mally disposed of off-site where local regulations prohibit discharge into sewers or waterways or, where permitted, it is combined with the storage tank overflow. Depending on the source of the water supply, the flush water may require some type of treatment.
Lundblad and Cavagrotti report that the quality of wastewater produced by fuel cell systems will not be significantly different than that of wastewater generated by conventional steam electric power plants.20 This is primarily attributable to the similarity in the wastewater sources for each system. Wastewater quantities, however, would differ significantly. Due to the higher cooling water requirements, the amounts of wastewater produced by conventional steam electric systems will be much higher. As shown in Table 12.15, chlorides ap- pear to be significantly higher in the wastewater from steam generators, principally because of the high levels of chlorination. Total dissolved solids and sulfate con- centrations are also higher in the wastewater from con- ventional systems9
In general, wastewater issues associated with fuel cell power plants are of less concern than air pollutant
Finally, there is flush water from the demineralizer
230

Table 12.15 Pollutant Composition of Wastewater from Fuel Cell and Fossil-Fuel-Fired Steam-Electric Power Plants (lblmillion Btu of energy output)
Steam-Electric Power Plants
Fuel Cell,a Coal-Fired, Oil-Fired, Gas-Fired Pollutant 4.5 Mw 5mMw 8WMw 8ooMw
Chloride 0.0018 0.095 0.12
Chromium O.oooO36 O.M)062 O.ooOo62 O.ooOo20
Iron 0.001 8 0.0013 0.0013
Nitrate 0.0018 0.0012 0.0012 0.0037
Phosphate 0.00036 0.000046 O.ooOo90 0.00034
Sulfate 0.0018 0.52 0.53 0.082
Total dissolved 0.0090 0.68 0.77 1.74 solids
zinc 0.00014 0.00077 O.ooOo84 O.ooOo96
awastewater composition before pretreatment Data are based on a 4.5-MW
Source: Ref. 20.
(AC) phosphoric acid power plant
emissions and solid waste disposal. The reasons are because (1) the quantity of wastewater produced and discharged is extremely small and (2) the concentrations of the contaminants can be reduced by relatively mild treatments. Therefore, relative to conventional power systems, the use of fuel cell systems will result in sur- face water improvements. Also, because fuel cells re- quire little or no water, they can be sited in areas where surface water supplies are limited.
Solid Wastes
Several sources of solid wastes are present in a fuel cell power plant. The biggest source is the fuel processing section, which uses zinc oxide reaction beds to remove sulfur from the raw fuel feed. In the 4.5-MW (AC) demonstrator power plant, for example, 20% of the zinc oxide becomes transformed to zinc sulfide within 3-6 mo of operation.11 The zinc sulfide can be regen- erated to zinc oxide and reused. However, at present, there are no plans to regenerate the beds; consequently, they will require disposal at sanitary landfills. The quantity of reaction bed waste is a function of the sulfur content of the fuel, but in general, it will be much less than the solid waste generated by comparable coal-fired power plants. Also, because of the low hazard potential
of this waste, proper disposal should not present any significant or unusual problems.
the fuel processor section with nitrogen, an operation required upon plant shutdown. When the plant is not operating, the fuel residues must be removed from the system to prevent their condensation on, and damage to, the catalyst beds. This fuel residue waste stream, which consists of hydrocarbons, including some aromatics, is produced in extremely small quantities.
Very small quantities of liquid electrolytes are also generated as solid waste. For example, 0.13 gal of phosphoric acid is generated annually by UTC’s 40-kW on-site units as solid waste.11 Extrapolation of this rate indicates that about 35 gal of phosphoric acid would be generated annually by a 11-MW fuel cell power plant. The phosphoric acid can be either disposed of or recycled. At present, it is uneconomical to purify and recycle the phosphoric acid wastes; consequently, it must be disposed of after treatment to neutralize its corrosive properties. Some of the common techniques for neutralizing acidic solutions include mixing with lime slurries, caustic soda, or soda ash.
Table 12.16 compares the quantities of solid wastes generated by fuel cell power plants and typical fossil- fuel-fined steam power plants. The estimates in the table are based on data from an 800-MW oil-fired plant, an
The second solid waste source results from flushing
23 1

Table 12.16 Solid Wastes Generated by Fuel Cell and Fossil-Fuel- Fired Steam-Electric Power Plants (Ibhillion Btu of energy output)
Steam-Electric Power Plants
Fuel Cell, Gas-Fired, Oil-Fired, Coal-Fired, Solid Waste 4.5 m 8OOMw 8 o o M w 5ooMw
Scrubber sludge b 35.23 5.52
b 80.81 35.63 Ashc Zinc oxide 7.55
Total 7.55 b 36.04 41.15
(dry)
reaction bedd
PWih pollution controls.
bNegligible.
CIncludes fly and bottom ash.
dBased on a distillate-fuel-fired fuel cell system (with 1% sulfur).
Source: Ref. 11.
800-MW gas-fired plant, and a 500-MW coal-fired facility. The fuel cell solid waste estimate is based on the same zinc oxide technology for sulfur removal as is used in the 4.5-MW (AC) power plant.11 The table shows that the solid wastes from fuel cell power plants are significantly less than those from oil- and coal-fired facilities but are greater than those from natural-gas- fired units. It should be noted that the large central coal-fired facilities that generate the most solid wastes are those least likely to be displaced by fuel cells; there- fore, the impact of fuel cell commercialization on the production and disposal of solid wastes by electric utilities will not be as significant as the emissions data would suggest.ll.20 Nevertheless, there will be some benefits, especially in regions having difficulty locating suitable disposal sites: the small amounts of solid wastes generated by fuel cell power plants may make them an attractive energy-generating alternative.
Noise
The quiet, electrochemical nature of the fuel cell conver- sion process eliminates many of the noise sources asso- ciated with conventional mechanical-to-electrical energy conversion systems. As a result, the fuel cell power plant is ideally suited for applications adjacent to resi- dential or commercial buildings where noise emissions are of concern.
232
90 -4.8 MW ---- 40 kW
J x f 60 Q)
c
0 cn 50t 40t
Distance from Power Plant (m)
Figure 12.4 Effect of Distance on Noise Levels from a 40-MW (DC) Fuel Cell Power Plant (Source: Adapted from Ref. 20)
Figure 12.4 shows that the average noise level from operation of the 4.5-MW (AC) power plant at a distance of 30 m (98 ft) from the power plant is 55 dB.11 Operat- ing five such modules simultaneously in a 24-MW

configuration would increase the sound level to about 62 dE3 at the same distance. This figure also shows that the noise level decreases as one moves away from the power plant. At distances very close to the power plant, the noise levels may reach 82-88 dB during operation. Exposure to such high levels of noise for long periods should be avoided. Although it is not known to what extent they will be necessary or used within fuel cell power plants, noise abatement methods (e.g., use of acoustical absorbent materials and physical barriers) may need to be applied to meet U.S. Occupational Safety and Health Administration (OSHA) requirements. Current OSHA regulations set the noise standard at 90 dB, which is the recommended maximum level to which an employee can be exposed for an 8-h period. Higher noise levels are allowed for shorter periods of time.
Furthermore, EPA has identified noise standards that, if not exceeded, should protect workers against some of the worst effects of noise. These standards include a margin of safety and were derived without consideration of their technical or economic feasibility. They should be viewed as long-range environmental goals rather than EPA-recommended regulatory require- ments. To protect against hearing loss, EPA has identi- fied a 24-h average Leq exposure of 70 dB or less.25 (Leq is an energy average of sound levels and is not the same as an arithmetic average, because peak sound lev- els contain much more energy than less-intense levels.)
Figure 12.4 also shows the noise emission charac- teristics of multikilowatt phosphoric acid units. In general, these units are much quieter than the large, multimegawatt systems, but they do approach the EPA- recommended limit for protection from excessive noise levels. In addition, the noise levels were found to vary little over the output range of the power plant.21
Occupational Health and Safety
Safety codes and standards have been incorporated into the designs of fuel cell systems. The majority of the standards govern electrical systems and interfaces, fuel handling, and the operation of power plant equipment under pressure.11 These safety provisions are intended to prevent personnel hazards and minimize major equip- ment damage.
In a recent study, UTC examined the failure rates of the 40-kW system components and identified 24 compo- nents whose malfunction could create a possible human hazard. These components were estimated to have a combined failure rate of 18 failures for every million hours of operating time. This combined rate was found
to be much less than the rate of individual component failures, because, for safety, the system is designed so that simultaneous malfunctions of several components, including components of the safety features themselves, would be necessary before an endangering accident would be possible.11,20
In addition to component failures, a power plant accident could result from man-made incidents, such as sabotage or vandalism, and from natural catastrophes such as lightning strikes. The possibility of such events, however, is considered remote. Furthermore, certain hazards inherent at industrial installations are impossible to totally eliminate. For example, the storage and use of large volumes of raw and processed gas can be quite hazardous. Hydrogen forms combustible and explosive mixtures with air, as do natural gas, gasoline, and other fuels. Also, ignitions and detonations occur more easily with hydrogen than with natural gas or gasoline due to its lower critical energy for reaction. However, even though it is easier to start a fire with hydrogen than with gasoline or natural gas, the resulting damage is far less with hydrogen than with gasoline. One reason for this is that the energy of a hydrogen explosion is only one- quarter that of an explosion involving hydrocarbons on an equal volume basis.27 Also, gasoline fires bum 5-10 times longer than do hydrogen fires and radiate much more heat. In contrast, hydrogen flames radiate little energy. Another important factor is that hydrogen fires create no toxic chemicals, whereas hydrocarbon fires produce CO and other toxic materials.27 Table 12.17 compares safety information for hydrogen, natural gas, and gasoline.
its newness and the use of corrosive substances, may create unusual or additional safety problems. Overall, however, the hazard potential of fuel cell power plants is expected to be less than or equal to that of conventional energy systems and should be well within the acceptable limits for energy generation facilities.11
At present, no safety experience data (e.g., injury and death statistics) are available for fuel cell power plants. Although precommercid or demonstrator units have been operated for several thousand hours, the data base is insufficient to project the accident rates associ- ated with fuel cell operation. However, since the equip- ment and procedures are similar to those used for utility systems, it is generally expected that there will be little difference in worker health and safety statistics.
Table 12.18 presents a framework of safety experi- ence for various power generation plants into which the fuel cell power plant might be expected to fit. The automatic, no-personnel plant operation is expected to be safe; however, the lack of operating experience and
Finally, certain aspects of fuel cell technology, e.g.,
233

Table 12.17 Safety Characteristics of Hydrogen, Methane, and Gasoline
Characteristic Hydrogen Methane Gasoline
Confinement of liquida
Containment of vapor at atmospheric conditions
Dangers in fuel spill Ease of starting fire Duration of fire once
Ignitibility in presence started
of weak sources, e.g., matches
Detectability of fire Fire extinguishing
agent Health hazards by
smoke inhalation
Ease of explosion
Danger from an explosion, once OCcUrred
Safety in commercial and industrial use
Safety in transport and residential applications
Relatively difficult
Easy
Less difficult
Easy
Standard
Relatively difficult
Greatest Shortest
,%Intermediate Ltermediate
Less than methane Longest
Most easily ignited
More difficult Water
Least hazardous
Greatestc
Small if unconfined; large if confined, but less (for same volume) than for LNGd or gasoline
No special problems
More risky than methane because handling methods are not routinee
Same as gasoline
Easily detected Water
Less than gasoline
Less than hydrogen
Same as for hydrogen
Routine
--
Easily ignited
Easily detected Watela
Worst
Least, but still considerable
Same as for hydrogen
Routine
aAll done routinely in the space program.
bGasoline is relatively difficult to fight with water.
CExplosion limits are widest for hydrogen.
dLiquid natural gas.
eHowever, the long-term use of 50% hydrogen gas in European house-holds supports the safety of hydrogen use.
Source: Ref. 16.
the use of a new technology could initially be a detri- ment to safety. In addition, a leakage of natural gas after desulfurization in the fuel processing section would be particularly dangerous since the characteristic warning odor of natural gas would be absent.11 (In general, that odor is caused by the deliberate injection of an odorant by a distribution company. Gas received from a pipeline transmission company may or may not have that charac- teristic odor; pipeline-quality natural gas is commonly odor-free.)
234
The safety characteristics of four other types of fuel cell systems were examined in a recent study.5 Regard- ing alkaline systems, the study found that circulating concentrated alkali is considered a greater hazard than phosphoric acid constrained in a matrix. No safety prob- lems appear to exist with molten carbonate systems, nor with solid oxide systems. With regard to the latter sys- tem, since the operating temperature (1,800OF) is at least 700'F higher than the ignition temperature of hydrogen, any hydrogen that comes in contact with air will

Table 12.18 U.S. Safety Experience with Some Commercial Electric Power Plants (incidences per trillion Btu energy output)
~~~ ~
Power Plant Type Deaths Injuries
Plants fired by fossil fuels Western coal 0-0.0095 0.16-0.19
No. 6 fuel oil 0.00181 0.173 Natural gas 0.00175 0.01 1
Nuclear reactors Pressurized water 0 0.02-0.14 Boiling water 0 0.02-0.14
Source: Ref. 4.
immediately react. This process prevents the accumula- tion of explosive mixtures, which is the primary safety hazard with gases. Finally, for solid polymer electrolyte systems, the study found that the relatively low-tempera- ture air pressure, the separation provided by an unflawed electrolyte material, and the relatively low partial pres- sures of hydrogen and oxygen in the fuel streams greatly mitigate any potential danger.
Other Environmental Considerations
Four other environmental considerations associated with the construction and operation of fuel cell power plants involve aesthetics, exhaust height, public safety con- cerns, and the possibility of electromagnetic interfer- ences. Fuel cell power plants have a low profile. From an aesthetic viewpoint, that profile can be landscaped to enhance its appearance. However, the low profile also allows exhaust emissions to leave the plant at much lower heights than conventional plants. Under certain climatic conditions, the plant exhaust may not be com- pletely dispersed. The low height can also create a low- level, fog-like plume from the exhaust or cause ice to form on nearby roadways and structures as a result of plume water precipitation.6
power plants are being designed to meet safety codes and to operate with automatic safety sensing systems (e.g., automatic shutdown in the event of a critical out-of-limits component condition), all power plants present a certain level of risk. The extent of any risk will be higher for fuel cell power plants due to their dispersed nature relative to conventional steam electric systems. A review of the possible consequences of an
Another concern is public safety. Although fuel cell
accident with the 40-kW UTC power plant design found that there could be serious health and safety conse- quences for people immediately adjacent to the affected site. The possible consequences cited were shock waves and projectiles from explosions, asphyxiation, smoke poisoning, and CO poisoning from fires. The power plant’s combustible plastic components were also singled out as being able to produce a variety of toxic gases in a fme.20
Electromagnetic interference (EMI) refers to the degradation, misrepresentation, or loss of information resulting from unwanted electromagnetic signals (noise) upon a radio communications system or other electronic system. Electromagnetic noise is produced by many types of communication and electronic devices and can be radiated through air or conducted along an electrical supply line.4 Recent tests with the 40-kW UTC fuel cell power plant inverter show that the unit is capable of producing both radiated and conducted electromagnetic noise. This noise in turn has the potential of causing EM1 in radios, televisions, and other communication devices at or near fuel cell power plant sites. Since EM1 has also been found to interfere with one type of heart pacemaker, the fuel cell system may also have the poten- tial to affect such equipment.4
At present, the power plant inverter is being de- signed to minimize both radiated and conducted EMI- producing noise. Prior to commercialization, the power plants must conform with all Federal Communications Commission regulations restricting the production of harmful EM1 in radio communication devices.20 Presumably, the same EM1 considerations would exist on a larger scale for the 11-Mw UTC fuel cell power plant and other systems being developed.
ENVIRONMENTAL CONTROLS
Little, if any, environmental control equipment will be necessary for fuel cell power plants since the residuals from them are very low. In general, no air pollutant emissions control equipment is necessary for natural- gas- and naphtha-fiied fuel cell systems, including the fuel processing section. Liquid effluents are also not a significant concern since the amounts generated are very small; however, if large quantities are produced, they may require some treatment prior to disposal. The only solid waste that may require some control is the zinc sulfide produced by the fuel processing section. Here again, the quantities generated are small.
ment will be required to control particulate, Sol, and With respect to coal-based fuel cell systems, equip-
235

NO, emissions, as well as liquid effluents and solid waste disposal. Since the fuel processing section would contain a coal gasification unit, the techniques and equipment required to control these residuals would be similar to most coal gasification systems. A recent assessment of a coal gasification fuel cell power genera- tion concept showed a capital cost requirement of $1,616kW (in 1983 dollars) for the entire plant.28 The gasifiers and fuel cells account for 57% of the total capi- tal cost.
ENVIRONMENTAL CONSTRAINTS
In general, there are no environmental constraints to the development of natural-gas- and naphtha-fired fuel cell power plants since, in comparison to conventicnal steam electric systems, they are environmentally quite benign. They have lower air pollutant emissions and liquid effluents, consume less water, are quieter, and generate less solid waste.
Because fuel cell power plants have relatively !ow air pollutant emissions per unit of energy produced, they are especially suited for geographical areas that have been classified as nonattainment areas by EPA. Non- attainment areas are those counties or parts of counties where either the primary or secondary National Ambient Air Quality Standards have not been met for one or more criteria pollutants. In such areas, which cover most of the nation’s population, pollutant offsets can have sig- nificant value. In most instances, conventional fossil- fuel-fired (especially coal and high-sulfur fuel oil) elec- tric generation facilities have been major contributors to this poor air quality, especially with respect to particu- late and SOa emissions. Consequently, a significant level of fuel cell penetration should substantially con- tribute to improved air quality conditions in these areas.
In addition, since the operation of fuel cell power plants requires little or no water, their use in electricity generation can conserve water resources. This, in turn, reduces other impacts associated with consuming and discharging water. For example, the entrainment and impingement of aquatic organisms at the intake will be reduced along with water quality degradation from the lowered dilution capacity of the source stream.11.20
The environmental benefits of fuel cell power plants relative to coal-fired and other base-load plants are quite large. However, when compared to gas turbine peaking units, these benefits may not be as large.
REFERENCES
1.
2.
3.
4.
5.
6.
7.
8.
9.
10.
11.
12.
13.
14.
Fickett, A.P., The Fuel Cell: An Attractive Power Option for Electric Utilities, Batteries Today (Feb.-March 1980). Hammond, A.L., W.D. Metz, and T.H. Mangh, Energy and the Future, American Assn. for the Advancement of Science, Washington, D.C. (1973).
Bagotzky, U.S., and A.M. Skundin, Chemical Power Sources, Academic Press, London (1980).
Fuel Cell Power Plant: State-of-Knowledge Sur- vey of Environmental, Health, and Safety Aspects of First Generation Utility Fuel Cells, prepared by Mueller Associates, Inc., for U.S. Dept. of Energy (Jan. 1984). Fuel Cell Materials Technology in Vehicular Propulsion, National Research Council Publica- tion NMAB-411, Washington, D.C. (1983).
Raia, E., Fuel Cells Spark lililities’ Interest, Inter- national J. of Hydrogen Energy, 10(11):711-715 (Nov. 1985).
Powercell News, 2(2):2 (Oct. 1985).
Fuel Cells for the OS, EPRI Journal, 9(7):6-13 (Sept. 1984).
Pierce, R.D., and J.P. Ackerman, Molten Car- bonate Fuel Cells: Development Status, 1983 National Fuel Cell Seminar Abstracts, Orlando, Fla. (Nov. 13-16, 1983).
Cuttica, J.J., Fuel Cells: The Reality of a High Technology, Industrial Energy Conservation Tech- nology: Roc. 1984 Conf. and Exhibition, Hous- ton, NTIS DE 85004243 (April 15-18, 1984).
Cavagrotti, R.R., Phosphoric Acid F w l Cell Power Plants: Environmental Impacts of Com- mercialization, Ph.D. dissertation, University of California, Los Angeles (1982).
Benjamin, T.G., and E.H. Camara, The Fuel Cell: Key to Practically Unlimited Energy, Foote Prints, 48(2):18-38 (1985).
Altseimer, J.H., et al., An Assessment of Fuel Cell Prapulsion Systems, Los Alamos National Labora- tory Report LA-9954-MS (Nov. 1983).
Fickett, A.P., and E.A. Gillis, Status of Fuel Cell Technologies, 1985 Fuel Cell Seminar Abstracts, Tucson, Ariz. (May 19-22, 1985).
236

15. Fickett, A.P., Fuel Cell Power Plants for Electric Utilities and Hydrogen, International J. of Hydro- gen Energy, 8(8):617-622 (Aug. 1983).
Power Research Institute Report EM-1730, Palo Alto, Calif. (March 1981).
16. Advanced Technology Fuel Cell Program, Electric
17. Brown, J.T., Solid Oxide Fuel Cells: Technology and Applications, Prw. 13th Energy Technology Conf., Washington, D.C. (March 17-19, 1986).
18. Nochumson, D.H., et al., Fuel Cell Applications Literature Review, U.S. Dept. of Energy Report DOEMC/A146-1736 (March 1985).
19. Handley, L.M., Description of J Generic I1 -M W Fuel Cell Power Plant for Utiiity Applications, Electric Power Research Institute Report EM- 3161, Palo A ~ G , Calif. (Sept. 1983).
20. Lundblad, H.L., and R.R. Cavagrotti, Assessment of the Environmental Aspects of the DOE Phosphoric Acid Fuel Cell Pro,yam, 1-J.S. Dept. of Energy Report DOEINASN2701-3 (May 1983).
On-Site Phosphoric Acid Fuel Cell Power Plants, Ph.D. dissertation, University of California, Los Angeles (1982).
21. Lundblad, H.L., An Environmental Analyjis of
22. Pietrogrande, P., et al., The Coal Gasqication Fuel Cell System for Efficient Economic and Environ- mentally Acceptable Power Production from C o d , International J. of Hydrogen Energy, 11(3):161-167 (March 1986).
23. Kleinsmid, W.H., et al., Methanol Combustion in a 26-MW Gas Turbine, presented at the ASME Gas Turbine Conf. and Products Show, Houston (Mach 9-12, 1981).
24. Handley, LM., FCG-I: Power Plant Preliminary Specification, Electric Power Research Institute Report FCS-3519, Palo Alto, Calif. (July 1981).
Pipelines, U.S. Congress, Office of Technology Assessment (March 1978).
26. On-Site 40-Kilowatt Fuel Cell Power Plant: Fail- ure Mode and Effect Analysis, prepared by United Technologies Cop. for U.S. Dept. of Energy (March 14, 1980).
21. .4ssessment qfResearch Needs for Advanced Fuel Cells, 1J.S. Dept. of Energy Report DOE/ER/
28. Site Specific Assessment of a 150-MW Coal Gasification Fuel Cell Power Plant, Electric Power Research Institute Report EM-3162, Palo Alto, Calif. (Nov. 1983).
25. A Technology Assessment of Coal Slurry
30060-T1 (Nov. 1985).
237

Figure 13.1 Calvert clicts Nuclear Power Plant on the Chesapeake Bay, Maryland
238

BACKGROUND
In a nuclear power plant, fuel in the reactor undergoes nuclear fission: uranium in the fuel splits into radioac- tive fragments, and energy is released as heat. This heat is used to convert water into steam for driving turbines that produce electricity. Almost all commercial power reactors in the United States are light-water reactors (LWRs), Le., they use ordinary water instead of heavy water as the heat-transfer medium and as a moderator for the nuclear reaction. Two basic LWR designs are used in the United States: boiling-water reactors (BWRs) and pressurized-water reactors (PWRs). Figure 13.1 shows an example of a PWR nuclear power plant.
HISTORY 1-3
During the late 194Os, the U.S. Atomic Energy Commis- sion (AEC) began a program to build experimental power reactors for operation in the 1950s. The develop- ment of nuclear power for commercial utilities began with the Atomic Energy Act of 1954, which permitted private ownership of reactors, private use of nuclear fuel under leasing arrangements, and declassification of some reactor technologies. Construction of commercial nuclear power stations that were completely owned and operated by electric utilities followed. Some of these were built under a joint industry-government demonstra- tion program; others were privately financed. The first U.S. nuclear reactor to generate electricity for utility customers was a government-owned, 60-MW prototype PWR power plant, which was built at Shippingport, Pennsylvania, under a cooperative agreement with the Duquesne Light Company. The first commercial nuclear power plant was the Dresden Plant, which was
Chapter 13
Light -Water-Reactor Nuclear Power Plants
completed in 1959 by Commonwealth Edison Company in Illinois.
the early 1970s (Fig. 13.2).2.4 However, the growth rate declined in the late 1970s as a result of a decline in elec- tricity consumption, the rising cost of electricity genera- tion by any means, the regulatory climate, and, to a certain degree, issues unique to nuclear power, such as safety and nuclear waste disposal.
pronounced. Between 1978 and 1985,75 plants were canceled, including 28 already under construction. In June 1985, 88 units with a combined generating capacity of about 72,000 MW were operating commercially and 41 units (about 46,000 M W ) were under construction (an additional 8 units were completed but waiting for an operating license). Of the 41 units under construction, 33 are expected to begin commercial operation before the end of the decade.2 (The recently completed Shoreham power plant on Long Island probably will never open as a nuclear facility; in 1988, due to the lack of a workable emergency preparedness plan, the New York Governor proposed to buy, decommission, and dismantle the plant. However, the state legislature re- jected the specific terms of the proposal, and negotia- tions continue.5) Once the units under construction are completed, no further growth is currently foreseen.6 This growth slowdown has caused many electricity production forecasts to change. In 1973, it was forecast that 1,200 GW of electricity (1.2 million MW), or about 65% of all electricity generated in the United States, would come from nuclear energy by the year 2000.7 In 1980, the predictions declined to 25%, and by 1985 forecasts were even lower (see Table 13.1).8
The United States now leads the world in produc- tion of nuclear-generated electricity and has about 47% of the world’s capacity? By 1990, this is expected to
The growth of the nuclear industry was greatest in
Recently, the slowdown has become even more
239

Operating License Issue Date
- Figure 13.2 Growth of the U.S. Nuclear Power Industry, 1960-1987 (Sources: Refs. 2 and 4)
decrease to less than 30% because of the accelerated growth in nuclear power outside the United States, where 148 nuclear power plants were under construc- tion, 9 on order, and 157 in the planning stage as of 1984.3 In the early 1990s, 537 units generating 414,OO MW are expected to be operating worldwide. The United States will have 129 of the total, with an installed capacity of 129,500 MW.2
The cost of nuclear power construction in the United States has increased dramatically. Some of the 35 plants under construction at the beginning of 1984 COSC six to eight times more than originally projected and three to four times more, on average, than nuclear power plants already operating2 As a result, more than half the plants are no longer competitive with coal- or oil-fired power plants. The cost of complying with changes in safety requirements was cited as one of the reasons for the rising costs of nuclear power.3
Between 1963 and 1967, the average electrical capacity of ordered nuclear reactors increased from 550 to 850 M W . In 1972, a 1,300-MW limit was placed on the size of a single reactor for safety (based on the effec-
240
Table 13.1 Forecasts of U.S. Nuclear Energy Production, 1984-2010
Electricity Produced by % of U.S.
Nuclear Power Electricity Year Plants (MW) Produced
1984 66 10.2 1990 104 14.6 2000 110 13.2 2010 139 13.4
Source: Ref. 8.
tiveness of emergency core-cooling systems in case of cooling system failure). In 1985, the average capacity of the operating commercial units in the United States was 825 M W , while the average capacity of the 41 units under construction was about 1,130 Mw.
The March 1979 accident at Three Mile Island (TMJ) was the most serious commercial nuclear power plant accident in the United States (see also the section on nuclear safety). The damage to TMI was severe, and the loss of generating capacity resulted in great financial loss. The cleanup of TMI Unit 2 also represents a great financial loss: in 1988, the General Public Utilities Nuclear Corp. estimated that the cleanup would cost a total of $965 million and continue until 1989.9
The accident renewed the debate over the safety of nuclear power. Nuclear power opponents claimed that such a severe accident proved that nuclear plants are intrinsically unsafe, whereas others argued that it proved just the opposite, Le., that even such a severe accident had no significant health consequences and that its main safety systems functioned despite several mechanical malfunctions and human errors.
TECHNOLOGY 10,11
The fuel for the most LWRs is enriched uranium, which contains more of the fissionable uranium-235 isotope than does natural uranium. The fuel is processed into uranium dioxide, fabricated into fuel pellets, and placed in gas-tight metal tubing called cladding. The metal tubes (fuel pins or fuel rods) are grouped into clusters called fuel elements, and a reactor core contains an array of such elements.

As nuclear reactors are currently operated, 1 ton of enriched nuclear fuel produces about 180 million kwh of electricity -- enough to supply about 70,000 people for 1 yr. After a fraction of the uranium has been con- sumed, usually after about 3 yr in service, the spent fuel elements are removed from the reactor and replaced with new ones. The fuel and cladding retain unreacted uranium and the fission products (including gases) and transuranic elements (including plutonium) formed during plant operation. These spent fuel elements are currently being stored indefinitely, mostly in cooling pools at nuclear facilities, pending further disposition. The LWR fuel cycle is shown in Fig. 13.3.12
the coolant that passes through the reactor also flows through the turbine (Fig. 13.4).10 Heat generated by fission in the fuel rods is transferred to cooling water, which boils. As a mixture of steam and water flows
The BWR system is termed a “direct cycle” because
from the top of the core, the steam is separated and piped to a turbine, which drives a generator. The ex- haust from the turbine passes through a condenser, where it is cooled by an isolated cooling system, and the condensate is pumped back into the reactor inlet. Heat from the condenser is generally dissipated by evapora- tion in cooling towers or ponds, and evaporation losses are made up from local water supplies. Some older systems use water from large lakes or rivers for once- through cooling. Except in older once-through cooling systems, water that passes through the reactor is isolated from the environment.
influence the quantity and species of effluents generated. First, a PWR system employs an “indirect cycle,” in which the cooling water circulating through the core does not flow through the turbine (Fig. 13.5).10 Second, this water is heated to a higher temperature than in a
Two major differences between PWRs and BWRs
Interim spent fuel storage
Fuel
U 0 7 fuel Reprocessing I fabrication
.f Recovered uranlum I Enriched UFs
A- Enrichment
t Natural UF,
Conversion to UF,
PuO7
(U.PU)O2
aThe United States is not currently reprocessing spent fuel.
Spei
No
uel disposal
Federal waste repository
Figure 13.3 LWR Fuel Cycle (Source: Adapted from Ref. 12)
24 1

I I
I
Figure 13.4 Basic BWR Design (Source: Adapted from Ref. 10)
Containment
Steam line
Condenser cooling water
water line
Figure 13.5 Basic PWR Design (Source: Adapted from Ref. 10)
242

~~
Cooling
Turbine
canal
Figure 13.6 Typical LWR Plant (Source: Ref. 8)
BWR, but pressure prevents it from boiling. It leaves the core and passes through two or more heat ex- changers, which generate steam to drive a turbine in a manner similar to that in BWRs.13
The major buildings of BWRs and PWRs are simi- lar in function and layout (see Fig. 13.6).7 The reactor containment buildings house the nuclear reactors (and the steam generators in PWRs) and act as the primary barriers to fission product releases after an accident, The auxiliary building houses most of the emergency cooling and auxiliary support systems. In some plant designs, the fuel pool, where spent fuel is stored to allow radioactivity to decay, is also housed in the auxiliary building; in other designs, the fuel building is separate. The turbine building houses the power conversion sys- tem, including the turbine and electrical generator. The radioactive waste building houses the radioactive waste processing systems not housed elsewhere, and the make- up water treatment building houses water purification equipment (neither are shown in Fig. 13.6).
ENVIRONMENTAL ISSUES
Nuclear power plants produce radioactive isotopes, or fission products. Some of the fission products may
escape into the reactor cooling system through defects in the cladding material. Activation products, including structural materials, coolant-borne material (gases and impurities), and corrosion products, are made radio- active by the high neutron radiation produced during fission. As many as 250 activation products, 460 fission products, and 80 transuranic radionuclides are present in the nuclear fuel and cooling system during plant opera- tion,l4 but only a few of these radionuclides have any significance for public health or the environment. Gaseous fission and activation products are stripped from the reactor coolant, processed in a gaseous waste treatment system that provides residence time for the decay of short-lived gaseous radionuclides, and dis- charged in a controlled fashion. Gaseous wastes from valve and equipment leakage are processed by air filters.
Liquid radioactive wastes include excess reactor coolant, collected drainage, and leakage from valve stems and pump seals. These wastes are cleaned and as much water as possible is recycled. Low-level radioac- tive solid wastes consist of items such as used filters, evaporator residues, demineralizer resins, and contami- nated clothing and rags. These wastes are packaged in accordance with safety regulations and shipped to com- mercial burial sites. (See the chapter on Nuclear Waste Management for more detailed descriptions of nuclear wastes.)
24 3

Table 13.2 gives conservative estimates of annual gaseous and liquid releases of various radionuclides during normal operation of a PWR.15,16 Figure 13.7 shows the major environmental control processes employed in LwRs and gives the estimated annual releases of pollutants (residuals) from a typical 1,000-Mw LwR.13.17
Atmospheric Radioactive E m i s s i o n s 1 8
The normal operation of commercial LWRs releases small quantities of short-lived radioactive gases and airborne particles through ventilation systems and control systems for gaseous radioactive waste. These emissions give rise to two health concerns. The first is exposure of the local population to radioisotopes of krypton, xenon, and iodine. Krypton and xenon are inert noble gases, so only their direct radiation effects are of concern, but iodine can be concentrated in the thyroid and cause disease, including thyroid cancer. Radio- iodine can also reach the thyroid when it is deposited on grass eaten by dairy cows; this pathway is more hazard- ous to infants than adults. Under normal conditions, these gaseous releases are maintained at very low levels and pose a negligible threat to human health.
The second concern is the accumulation in the bio- sphere of the long-lived radioisotopes emitted by nuclear power plants, such as krypton-85, carbon-14, and tritium. They have been postulated to pose long-term public health risks at low global exposure levels. If spent fuel is not reprocessed, the releases are small. If it is reprocessed, releases of krypton-85 must be limited to less than 50,000 Ci/GW-yr of electricity produced.19 Effluent control systems are required to meet this limit.
Liquid and Solid Radioactive Wastes
Nuclear power plants release little radioactivity in liquid effluents, since processing facilities treat the liquid radioactive wastes generated by the plant and recycle most of the water. The waste products removed during processing are solidified, placed in drums, and shipped off-site for disposal.
Radioactive waste control systems produce low- level radioactive solid wastes, including spent deminer- alizer resins, evaporator concentrates, filters from liquid processing system, charcoal and particulate filters from gas processing systems, and contaminated rags and clothing. These are solidified, packaged for interstate transport, and eventually disposed of in federal- and state-licensed burial grounds.
244
Table 13.2 Annual Liquid and Gaseous Releases of Isotopes from Two 1,000-MWe PWRs (Ci).
Liquid Gaseous Isotope Release Release
Hydrogen-3 Chromium-5 1 Manganese-54 Manganese-56 Iron-59 Cobalt-58 Cobalt-60 Bromine-84 Krypton-85 Krypton-85mb Krypton-87 Krypton-88 Rubidium-88 Rubidium-89 Strontium-89 Strontium-90 Strontium-91 Yttrium-90 Yttrium-91 Yttrium-92 Zirconium-95 Niobium-95 Molybdenum-99 Tellurium-132 Tellurium-134 Iodine-129 Iodine-131 Iodine-1 32 Iodine-133 Iodine-134 Iodine-1 35 Xenon-I 33m Xenon-133m Xenon- 133 Xenon-135 Xenon-135m Xenon- 138 Cesium- 134 Cesium-136 Cesium- 137 Cesium-138 Barium- 140 Lanthanum-140 Cerium-144
3.50 x 10² 1.14 x 10⁻³ 1.16 x 10⁻³ 9.44 x 10⁻⁴ 1.36 x 10⁻³
1.22 x 10⁻³ 3.29 x 10⁻⁵
3.48 x 10⁻²
0 0 0 0 1.49 x 10⁻³ 3.28 x 10⁻⁵ 1.35 x 10⁻³ 5.31 x 10⁻⁵ 3.93 x 10⁻⁵ 3.97 x 10⁻⁵ 2.26 x 10⁻³ 5.83 x 10⁻⁶ 3.08 x 10⁻⁴ 3.33 x 10⁻⁴
3.24 x 10⁻⁵
5.30 x 10⁻¹ 3.07 X 10⁻²
0 5.10 x 10⁻¹ 5.39 x 10⁻² 1.58 x 10⁻¹
2.80 x 10⁻² 0 0 0 0 0 0 9.94 x 10⁻² 3.63 x 10⁻² 5.02 x 10⁻¹
6.03 x 10⁻³
6.70 x 10⁻⁴ 1.80 x 10⁻³
7.20 x 10⁻⁵ 6.18 x 10⁻⁴
Praseodymium-144 6.72 x 10⁻⁵
3.00x 10² 3.37 x I 0-7
3.16 x 10⁻⁷ 4.91 x 10⁻⁷
3.09 x 10⁻⁷
3.12 x 10³
3.92 x 10⁻⁷ 9.72 X 10⁻⁶
7.86 X 10⁻⁶
4.25 x 101 2.00 x 101 6.08 x 101 8.39 x 10⁻⁵ 5.09 x 10⁻⁵ 4.10 x 10⁻⁷ 1.46 x 10⁻⁸ 2.08 x 10⁻⁸ 1.91 x 10⁻⁶ 6.83 X. 10-7 4.28 x 10⁻⁹ 8.89 x 10⁻⁸ 8.92 x 10⁻⁸ 2.16 x 10⁻⁴ 1.27 x 10⁻⁵
6.47 x 10⁻³ 2.47 x 10⁻³ 2.93 x 10⁻³ 9.55 x 10⁻⁴ 7.55 x 10⁻⁴
6.02 x 10⁻⁵
6.35 x 10⁻⁸ 0
1.11 x 10² 6.13 x 101
1.57 x 10² 1.43 x 10² 6.69 2.79 x 10⁻⁵ 1.15 x 10⁻⁵ 1.40 x 10⁻⁴ 5.77 x 10⁴ 3.63 x 10⁻⁷ 3.14 x 10⁻⁷ 3.55 x 10⁻⁸ 3.57 x 10⁻⁸
SAssuming 0.25% of the fuel cladding fails; releases are expressed in scientific notation: 3.50 x 102 = 350, 1.14 x 10-3 = 0.00114, etc.
bThe "m" denotes an isomer.
Sources: Refs. 15 and 16.

Gaseous radioactive
waste control
Radioactive waste
0 - 1 processing
@- *o * Q Power
generation *
Plant Parameters 0 1,ooO MWe 0 70% capacity factor
Resource Requirements
~ ' ~ ~ ~ % ! oxide fuel 13.3% U-235) (tons)
@ Makeup water (gall
& ? Z c i t y IMWhl
a-
$. 8
c i d u a l s (annuall
@ See Table 13.2 @ Liquid
4 Water losses to atmosphere (gall
Total suspended solids (tons) Total dissolved solids (tons)
33 Sulfates (tons) Sodium Irons)
5.1 billion Chloride (tons) Phosphonates (tons)
Total (gal) 6.13 million
Solid
Makeup
treatment J water C 0 Cooling
system
J
3.8 billion
59.5 13.2 9.5 2.0 1.7 0.1
1.11 billion
I
@ Spent fuel 10.8% U-235) (tons) @ Low-level radioactive waste (CI)
33 5,800
(55-gal drums) 800
*t
Figure 13.7 Process Stream Flows in a 1,000-MWe LWR (Sources: Adapted from Refs. 13 and 17)
The primary concerns in low-level solid waste burial are leaching of radioactive material into under- ground drinking water supplies and migration of radioactivity to the surface environment. To reduce risks, precautions are taken to ensure that sites are dis- tant from the water table and unattractive for alternative uses in the future? (See the chapter on Nuclear Waste Management.)
A 1,000-MW LWR discharges about 33 tonslyr of spent (used) fuel. Each ton contains about 60 Ib of
radioactive fission products and about 20 lb of plutonium and other transuranic elements. Although spent fuel is currently stored in water-cooled pools, reprocessing it would separate the remaining uranium and plutonium fuel from the other high-level wastes, which would then require long-term storage. Indefinite deferral of reprocessing, which is the present policy, also requires secure long-term storage, but the spent fuel must be retrievable.
245

Release Pathways
The radioactive isotopes released from a nuclear power plant during routine operations and accidents can be transported to the environment through the atmosphere, surface waters, and underground waters.
emissions containing radioactive gases and particles. This pathway is affected by weather, dispersion pro- cesses, release heights, and release temperature. The removal mechanisms include gravitational settling, washout by rain, and dry deposition through contact with the ground, vegetation, water, and other surfaces. Figure 13.8 shows the atmospheric processes affecting airborne releasesJs
Transport in surface waters can originate from either direct discharge or indirect processes, such as dry and wet deposition from the atmosphere, runoff and soil erosion from land surfaces, and seepage from ground- water. The overall dismbution of radionuclides in surface waters is controlled by the nature of the dis- charge and four transport and transformation processes, as summarized in Table 13.3.15 Variables such as the characteristics of natural bodies of water, terrestrial and
Transport in the atmosphere is the main pathway for
Table 133 Major Mechanisms Affecting Radionuclide Migration and Fate in Surface Waters
Mechanism Description
Discharge
Direct Routine or accidental discharge directly to surface waters
Dry and wet deposition from the atmosphere, runoff and erosion, or seepage from or to groundwater
Indirect
Intermediate Adsorption, desorption, precipitation, dissolution, transfer or volatilization
Transport Sediment movement or water movement, including discharge-induced and ambient advection and diffusion
~ Degradation Radionuclide decay
Transformation Yield of secondary (daughter) products; affected by point and nonpoint sources and sinks
Rainout
Washout
Figure 13.8 Atmospheric Dispersion and Removal Processes Affecting Atmospheric Releases from Nuclear Power Plants (Source: Ref. 15)
246

atmospheric conditions, and the physicochemical prop- erties of the radionuclides affect their migration and fate in surface waters.
Groundwater flow is a major pathway for certain classes of radioactive releases from nuclear power plants. Underground transport of radionuclides is affected by processes and variables such as the media type and its porosity (e&, clay, soil, or rock), hydraulic conductivity for saturated and unsaturated flows, adsorp tion and desorption processes, and radionuclide-specific retention rates.
The U.S. Nuclear Regulatory Commission (NRC) studied the aquatic dispersion, both surface and under- ground, of radionuclides following hypothetical severe accidents at nuclear power plants located along an estuary, ocean, river, or lake or on dry land. The main conclusions were that isolation of the releases within the immediate area of the plant and temporary interdiction of water sources can limit human doses to low levels21
Radioactive materials released during normal plant operations or accidents can reach humans through a variety of mechanisms (Fig. 13.9)P In most cases, these mechanisms are relatively simple: the inhalation of radioactive material in the plume or exposure to external radiation from the plume and radioactive mate- rial deposited on the ground. In other cases, they can be complex, multistep processes: particulate radionuclides are deposited onto forage eaten by cows, contaminating milk or meat consumed by humans. Unlike atmospheric and aquatic dispersion processes, which usually lead to a dilution of the radionuclide concentrations in the environment, some of the environmental processes in Fig. 13.9 can lead to physical, chemical, or biological accumulation of radionuclides.
Decommissioning of Nuclear Facilities1 126
Nuclear power plants in the United States have an initial licensed lifetime of 40 yr; the license is renewable if continued safe operability is demonstrated. Nuclear reactors eventually must be decommissioned in a man- ner that protects the health and safety of the public.
The three primary methods for decommissioning a facility are (1) mothballing, which consists of removing all the fuel and selected radioactive components and placing the facility in protective storage, (2) entomb- ment, which consists of removing all fuel and selected components and sealing the remaining major radioactive components within the shielding structure, and (3) removal and dismantling, which consists of remov- ing all fuel components having radioactivity above predetermined levels. The Elk River Reactor in Minne- sota is an example of the third method; the facility was completely dismantled, all radioactive materials were shipped off-site, and the site is now in unrestricted use.
brought attention to special issues, which are being studied by the U.S. Department of Energy (DOE) and other organizations. These issues include acceptable levels of residual contamination for reusable resources before release for unrestricted public use, radiation doses during decommissioning, large waste volumes, sites for waste disposal or storage, records on the locations of entombed facilities and waste repositories, and the role of state and local authorities.
Recent experiences with decommissioning have
NUCLEAR POWER PLANT SAFETY
Occupational Radiation Exposure Plant Design
Radiation exposure of personnel working at nuclear power plants is limited by regulations to not more than 5 redyr to the whole body.23 Workers are exposed primarily during refueling, in-service inspections, and maintenance operations.24 Data from operating com- mercial reactors in 1983 showed that total occupational doses for all employees at a plant were 17-3,600 worker- redyr, with an average of 0.7 worker-redyr.2s The dose varied primarily with the age of the plant and the design of the shielding around potential high-exposure areas. Since 1969, the average annual radiation dose per worker has been 0.61 .O ~ m l y r . 2 5
The safety of commercial nuclear power plants has been of concern since the first plants were built in the 1950s. To e n s m safety, planners developed the concept of "defense in depth," which consists of the following steps:zO (1) providing a succession of independent bar- riers to prevent the propagation of malfunctions, (2) engineering primary safety features to mitigate mal- functions, (3) reviewing and licensing at many stages during design and construction, (4) training and licens- ing operating personnel, (5) ensuring that safety does not ultimately depend on correct personnel conduct during an accident, and (6) employing secondary safety mea- sures to mitigate the consequences of accidents.
247

Figure 13.9 Radiation Transport Pathways (Source: Adapted from Ref. 22)
Table 13.4 presents the amounts and half-lives of important radioactive nuclides in nuclear fuuel.:B Thek "importance" is determined by their potential health hazards if they are emitted from a plant. The central problem in the design of a nuclear power plant is to ensure that, insofar as possible or practical, these fission products remain safely confined at all times -- during operation, refueling, and spent fuel processing. To pre- vent radioactive releases, nuclear power plants are
designed with niuitiple barriers, including the fuel ele- men8 and cladding, primary cooling system, reactor vessel, and containment structure.27
Fissile and fissionable materials are held within solid fuel elements, such as natural or enriched uranium in an oxide or carbide form, or in a dilute alloy of a structural material, such as zirconium, aluminum, or stainless steel. Since the fission fragments are emitted as highly ionized particles, they are strongly attenuated
248

Table 13.4 Important Radionuclides
Radioactive Half-life Inventory
Radionuclide (d) (nCi)
Iodine isotopes Iodine-13 1 0.05 8.7 Iodine-132 0.0958 13 Iodine-133 0.875 18 Iodine-135 0.280 17
Noble gases Krypton-85 3.950 0.066 KIypton-85mb 0.183 3.7 Krypton-87 0.0578 5.7 Krypton-88 1.17 Xenon- 133 5.28 18 Xenon-135 0.384 3.8
Cesium isotops Cesium- 134 750 i.3 Cesium-137 1 1 : m 0.65
Actinide isotopes Plutonium-238 32,560 G.012
Plutonium-240 2,4CC,OOO 0.029
Curium-242 143 0.14 Curium-244 6,630 O.Go-34
Plutonium-239 8,9Go,OOC 0.I)X.i
Plutonium-24 1 5,350 0.52
Other fission producIs
Strontium-90 1 1,030 0.48 Ruthenium-106 360 2.9 Tellurium-132 3.25 13 Barium-140 12.8 1: Cerium-1 44 284 9.2
UBased on D 3,412-MW reactor operated ioi 3 yr.
bihe "m" denotes an isomer.
Source: Ref 18.
and, except for those fragments originating near the surface of the fuel, they remain within the fuel. Gaseous fission products -- isotopes of iodine, xenon, and kryp- ton -- can diffuse and escape from the fuel. In fuel rods, gases escaping from the surface of the uranium oxide pellets are held within the pellet cladding gap and ac- cumulate in a small plenum provided a t the end of each fuel rod.
and fission fragment$ emitted near the surface of the fuel, the fuel is surrounded by a layer of cladding. In some reactors, the cladding is bonded directly onto the
To prevent the escape of gaseous fission products
fuel; in others, the cladding consists of hollow me&! tubes into which the fuel pellets are inserted. During normal operations, small leaks can be expected to de- velop in the cladding of a few fuel elements (an LWT. of moderate size has several tens of thousands of fuel rods), despite the care with which the fuel and cladding are fabricated. If any part of the cladding reaches its melt- ing temperature, all of the accumulated fission product gases behind the cladding can escape into the coolant.
In all modem nuclear reactors, the primary coolant, Le., the coolant that comes in contact with the fuel ele- ments, moves in one or more closed loops. The primary coolant system confines fission products that have es- caped from the fuel, activation products picked up by the coolant, and activation products induced in the coolant. In most reactors, a portion of the coolant is continuoasly divered into the coolant purification system, where most of the fission and activation products arc rcmcvcd.
Reactcx vesseis ari: a barrier to rzdioactivity releases, aiid they a e required to be designed, manufac- tured, and kskd to meet the highest sta~dards of quality and reliability. All reactors must be entireiy enclosed by a stxcture that can contain radioactivity reieased from either the coolant system or from within die reacm vessel. in PYA%, this structure also houses the er.tirz steam supply system. h ia t Pi52 cofitainri~eilt SUUC-
tures are made of reinforced conirets w i h a steel iiner. Their size and thickness are dictated by the maximum tempriiture and pcessiire h a t would result if all of the pressurized water in the primary system were reieased as steam into the structure in a loss-of-codant accldant (LOCA).
Smailer-scale accidents {often called "incidiiits") can also occur in a nuclear power plat . For standard- izaticn, &he AEC divided the sptxtruni of possiblz acci- dents into nine classes in increasing order of szveiitj; (Table 13.5).:8 Although this classificaiion syseeni has been officially withdrawn, it describes the spzctruni of possible reacbr accidents. Table i3.6 iists postulated reactor accidents according to their probability of 0ccurrence.i 8
' h e main engineered safety featiues provided to mitigate consquznces of incidents diat ca11 lzad tu a LGCA are [ l) feactor rrip, which stops die fission pro- cess aiid terminates core S w e r generation, (2) emcr- gericy core cwling, which keeps the heat generation rate from exceeding the heat removal rate, (3) postaccident radioactivity reifiovd system, which removes radioac- tivity Ieieased into the containment atmosphere, (4 j psiaccident heat removal system, which removes decay heat from within the coiitainment to prevent over- pressurization, and ( 5 ) colltainnaei1t integrity, which przvents radioactivity within the containment from
249

Table 135 AEC Classification of Postulated Accidents and Occurrences at Reactor Facilities
Class Description Examples
Trivial incidents
Miscellaneous small releases outside containment
Radioactive system failures
Events that release radioactivity into the primary system
Events that release radioactivity into the secondary system
Refueling accidents inside containment
Accidents to spent fuel outside containment
Accident initiation events considered in design evaluation in the safety analysis report
Hypothetical sequences of failures more severe than Class 8
250
Small spills Small leaks inside containment
Spills Leaks and pipe breaks
Equipment failure Human error
Fuel defects during normal
Transients outside expected range operation
of variables
Class 4 event with heat exchanger leak
Dropping of a fuel element or a
Mechanical malfunction or loss of heavy object onto the fuel
cooling in transfer tube
Dropping of a fuel element or a
Dropping of a shielding cask or
Transportation incident on-site
Reactivity transient Rupture of primary piping Flow decrease or steam line break
Successive failures of multiple
heavy object onto the fuel
loss of cask cooling
bamers normally provided and maintained
being dispersed into the environment. The functions of engineered safety features are illustrated in Fig. 13.10.14
Risk Assessment
Determining risks from accidents in nuclear power plants is difficult and controversial, not only because it requires a multidisciplinary approach, but also because risk calculations are subject to large uncertainties. The modem method of calculating risks to the public (and environment) associated with nuclear accidents is a three-step process. First, the probability of releases of radioactive materials resulting from various types of accidents is determined. Second, consequences to the public and environment from such releases are evaluated
(this step can also involve probabilistic calculation). Third, release probabilities and consequences are com- bined to determine the overall risk.
Before the NRC Reactor Safety Study (RSS) was completed,l4 risk assessment focused primarily on the consequences of specific accident scenarios, regardless of their probability of occurrence. The RSS used event tree techniques to identify and calculate the probabilities of various occurrences leading to releases of radioactive material to the environment. The overall probability of each "branch" of the event tree is calculated by identify- ing plant systems at risk in various accident scenarios and assessing their probabilities of malfunctioning.1428
The RSS initiated a new field in risk assessment: probabilistic risk assessment (PRA). The PRA is an

Table 13.6 Probability Rating of Postulated Reactor Plant Accidents
Frequency Classification of Events Examples
Moderate-frequency events (no abnormal radioactive release from the facility)
Infrequent accidents of small probability (abnormal radioactive release possible, but not expeded)
Highly unlikely accidents (postulated for evaluating site acceptability)
Withdrawal of control rod at maximum speed due to
Failure of one safety rod to scrama Partial loss of normal forced reactor coolant flow Unintentional start-up of an inactive reactor
Loss of external electrical and/or turbine bip Loss of off-site electrical power Excessive load increase Loss of normal feedwater flow Inadvertent depressurization of the primary coolant
malfunction or e m r
codant loop
system
Small leaks and breaks in pipes (or minor leaks in large primary or secondary system pipes)
Loading of a fuel assembly into an improper position
Complete loss of normal forced reactor coolant flow Complete loss of all AC power (station blackout) Major leakage in radioactive waste decay tank
Major rupture of pipes containing reador coolant up to and including double-ended rupture of largest pipe in the primary coolant system ( E A )
Major secondary or steam system pipe rupture up to and including double-ended rupture of a main steam pipe
Control rod ejection Severe fuel handling accident Tornadoes, flooding, and earthquakes
a'he automatic dropping of control rcds into the core to absorb neutrons and
Source: Ref. 18.
dampen fission is called a "scram."
analysis that identifies and delineates the combination of events that can lead to an accident, estimates the fre- quency of occurrence for each combination, and esti- mates the consequences. The PRA is widely recognized as a tool for risk assessment and for regulation,28-30 but its limitations currently restrict its use as a single tool for an overall risk assessment; in many cases, other meth- ods, such as "traditional" deterministic calculations, are necessary. A full-scale PRA is also considered an effec- tive tool for identifying safety-related "weak points" in the plant and comparing risks.
Figure 13.1 1 shows some of the results of the RSS related to early and late fatalities.14 Although the RSS calculations and results were widely criticized, a review group chartered by the NRC concluded that the basic methodologies applied -- the probabilistic fault tree and
event tree methods -- are "sound and can be more widely used by NRC."31 Through application of the defense- in-depth philosophy, commercial nuclear reactors in the United States have operated for more than 1,OOO reactor- years without fatalities or serious injuries.6
The "MI accident prompted a thorough reexamina- tion of the safety of nuclear power plants. The results of the accident were analyzed in detail by the Kemeny Commission, which recommended changes in the or- ganization and practices of the NRC, the relationship between utilities and their suppliers, the training of oper- ating personnel, technical assessment techniques, prac- tices to protect worker and public health and safety, emergency response planning, and the procedures for releasing public information.32 Improvements have also been recommended by NRC and congressional studies.
25 1

Containment Integrity: Prevents dispersal of radio- activity to environment /
Drops neutron absorbers into core to rapidly shut down reactor and limit heat production
containment atmosphere with
Removes heat from *containment to
Figure 13.10 Nuclear Reactor Engineered Safety Features that Mitigate LOCAs (Source: Adapted from Ref. 14)
The Source Term Issue
An issue of major importance for both nuclear power plant risk assessment and regulations (which are strongly influenced by risk assessment33) is accident "source terms," i.e., the quantities (release fractions) of the various radionuclides expected to be emitted to the environment from various potential accidents. Follow- ing the appearance of the RSS, and especially since 1980, it has been argued that the accident source terms calculated (or assumed) in the RSS were oversimplified and, in most cases, much larger than would occur in reality.34.35
For example, arguments based on both theoretical and experimental research have asserted that iodine -- a major contributor to the overall risk in the RSS -- would
form a soluble compound with cesium (CsI) that would be released in much lower quantities than those esti- mated by the RSS, where iodine was assumed to be released as Iz under accident conditions. It has also been argued that iodine and other radionuclides would un- dergo various adsorption and scavenging processes, in both the primary coolant system and the containment, causing releases to be lower than those assumed in the RSS.
On the basis of such experimental and theoretical research data, as well as the conclusions and xemmmen- dations of s o m e term study groups formed by the American Nuclear Society36 and the American Physical Society,37 the NRC has published intermediate conclu- sions of the source term reassessment effort3 The two main conclusions are as follows. First, source terms in
252

"e I ntont
0 L cancer fatalities \
a fatalities
10-8
10-9 100 10' 102 103 1 04 105
Reactor-years
Figure 13.11 Probability Distribution for Early and Latent Fatalities from a Severe LWR Accident (Source: Adapted from Ref. 14)
the RSS were oversimplified and new source terms should consider fission product chemistry and mtchanis- tic aerosol behavior. Second, new s o m e terms for many accident sequences would be lower than those in the RSS, but some would be larger. The reduced source terms would arise mainly from assumptions about the maintenance of containment integrity and the reduction of airborne concentrations of fission products by natural processes. An NRC research program is addressing the remaining areas of uncertainty in source term assessment.
Emergency Planning40,41
Emergency planning is complementary to the design of in-plant engineered safety features, since it provides
off-site safety measures. The main objective of emer- gency response is to reduce radioactivity doses from a spectrum of accidents that could produce off-site doses in excess of approved limits, Le., the U.S. Environmen- tal Protection Agency (EPA) Protective Action Guides.19
The accident at TMI disclosed a need for better emergency planning. The Kemeny Commission recom- mended the following:32 (1) review and approval of emergency response plans by the Federal Emergency Management Agency, (2) better coordination of local, state, federal, and utility responsibilities, (3 ) technical assessment of accident scenarios to aid in emergency planning, (4) specific planning for various contin- gencies, ( 5 ) funding and technical support for local communities, (6) expanded medical research, such as on drugs to mitigate radiation exposure, (7) education of the
253

public regarding the nature of power plants and appro- priate evacuation responses, and (8) study of the "human costs" of mass evacuations and the differences between nuclear accident evacuations and other types of evacua- tions.
Emergency preparedness and response should be related to two exposure pathways: plume exposure and ingestion exposure.39Po Plume exposure includes in- halation of radioactive material and exposure to external radiation from the plume and deposited material. For this pathway, sheltering and/or evacuation would likely be the principal immediate protective actions to be taken for the public. Ingestion exposure includes exposures from ingestion of contaminated water and foods (Le., milk and vegetation). For this pathway, the planning
area for the plume exposure pathway
The response area for the ingestion exposure pathway would have the same relative shape but would be larger
Transport Of
milk to dairy processing Center
. . - Indicates variable response boundary
7 I 1
I I
I I
/ Reactor Site
/
effort entails identifying and controlling major sources of water and food contamination. The duration of poten- tial exposures from the two main pathways could be dramatically different. Plume exposure could persist from 30 minutes to days, whereas ingestion exposure could persist from hours to months and, in extreme cases, years.
The conceDt of emergency planning zones ( E m ) was developedby a joint-MC-EPA task force on emer- gency planning (Fig. 13.12).40 The EPZs around every nuclear power plant must be defined for both pathways (i.e.;for both short- and long-term periods following an accident). The guidance on the size of EPZs and the guidance on the duration of releases are summarized in Tables 13.7 and 13.8, respectively.40
~
/
Plume travel direction
ExamDle response
/ '
Figure 13.12 Emergency Planning Zones (Source: Adapted from Ref. 40)
254

Table 13.7 Guidance on the Size of EPZs Table 13.8 Guidance on the Duration of Radioactivity Releases
Approximate Exposure EPZ radius Pathway Critical Organs Affected (mi)
Plume exposure External contact Whole body 1Oa Inhalation Thyroid and d e r organs 1Oa
Ingestion Thyroid, whole body, and bone mamw 50b
aThis distance should be based on considerations of local conditions, such as demography, topography, land characteristics, access routes, and local jurisdictional boundaries.
included in emergency response plans regardless of their location. Wmcesing plants for milk produced within the EPZ should be
Source: Ref.31.
The size of the plume exposure EPZ was based on the following considerations. Projected doses from the traditional design-basis accidents (i.e., those that reactor safety systems are designed to accommodate) and most core-melt sequences would not exceed Protective Action Guide levels outside the EPZ. Doses that immediately threaten life for the worst core-melt sequences would generally not occur outside the EPZ. Detailed planning within the 10-mi EPZ should provide a basis for expand- ing response efforts if necessary.
on the following considerations. First, the downwind range within which contamination will generally not exceed the Protective Action Guides is limited to about 50 mi from a power plant to mitigate shifts in wind direction during the release and travel periods. Second, atmospheric iodine may be converted to chemical forms that do not readily enter the ingestion pathway. Third, much of the particulate matter in a radioactive plume should be deposited on the ground within about 50 mi of the facility. Fourth, the likelihood of exceeding Protec- tive Action Guide levels at 50 mi by the ingestion expo- sure pathway is comparable to the likelihood of exceed- ing them by the plume exposure pathway at 10 mi.
supportive emergency planning and preparedness ar- rangements by several levels of governmenr federal, state, and local (including counties, townships, and villages). These organizations, as well as the licensee, share the responsibility for implementing emergency measures in the event of an accident.
The size of the ingestion exposure EPZ was based
The concept of EPZs necessarily implies mutually
Time Period Duration
Initiating event to skut of release atmospheric
Entire time period over which radioactive material may be continuously released
0.5 h to 1 d
0.5 h to several days
Occurrence of the major portion of release release
05 h to 1 d after start of
Travel of release to exposure point 0.5-2 h after release for 5-mi travel; 1-4 h after release for IO-mi travel
Source: Ref. 31.
Thermal and Chemical P o l l u t i o n 4 1
Power plants that use steam turbines, regardless of the heat source, to generate electricity release certain pol- lutants, including waste heat (thermal pollution), residual chlorine, anticorrosion and antifouling chemi- cals, and increased total dissolved solids (TDS) from evaporation. If uncontrolled, these pollutants can be released to the air (e.g., from cooling towers) or to an adjacent body of water.
ENVIRONMENTAL CONTROLS
Control Systems for Gaseous Radioactive W a s t e 4 2
The principal source of gaseous radioactive waste in a BWR during normal plant operation is noncondensable gas (some of which is radioactive), which is removed by ak ejectors from the main steam condenser. Noncon- densable gas is also a source of radioactivity in a PWR if the steam generators have leaks. Most gaseous radioac- tive waste in a PWR is stripped from the stream of coolant from the primary coolant system to the chemical volume and control system and from coolant bleed to the boron control system. In modem plants, these gases flow through some or all of the following processes to minimize releases of radioactive effluents: catalytic recombination of hydrogen and oxygen to form water,
255

which is treated by a liquid radioactive waste system; delay systems that hold noble gases and allow short- lived isotopes to decay (some BWRs use cryogenic distillation systems to separate noble gases for longer storage); charcoal beds that absorb radioactive iodine; and filters that remove particles from gaseous waste S t r e a m S .
Other sources of radioactive gases that could be released into the environment from LWRs include valve-packing leaks, pump seal leaks, tank leaks and spills, and spent fuel gases that escape from storage pools. Ventilation systems in the containment, radioac- tive waste, auxiliary, and fuel buildings are monitored and provided with particle fdters and charcoal absorp- tion beds. Figures 13.13 and 13.14 show typical sys- tems for processing gaseous radioactive waste in PWRs and BWRs, respectively.14
Control Systems for Radioactive Effluents
Liquid radioactive wastes from LWRs can be classified as clean (low chemical content), dirty (moderate chemi- cal content), chemical, and laundry wastes.% The pri- mary sources for clean wastes include fluids collected from equipment drains, valve and flange leakage, and pump seal leakage. Dirty wastes are collected from floor drains. Chemical wastes include steam-generator blowdown and borated reactor coolant (for PWRs) and laboratory drains and demineralizer-regenerant wastes (for all LWRs). Laundry wastes include detergents from laundries and shower drains.20
Other than laundry wastes, which have very low radioactivity and are generally discharged after process- ing, liquid radioactive wastes at modem nuclear power plants are reused as makeup water after being processed by one or more of the following effluent treatment tech- niques: ion exchange, evaporation, reverse osmosis, oil-water separation, and filtration. These control tech- nologies are discussed at length in the chapter on Environmental Control Technologies for Fossil Energy Systems. In addition, because radionuclides in liquid wastes have short half-lives, they are stored in large tanks for up to several weeks to permit decay.
No single method is adequate to provide the high purification required before wastewaters can be reused as makeup water or discharged to the environment. In practice, combinations of methods are used, as shown in Figs. 13.15 and 13.16.18
Control Systems for Nonradioactive Effluents43
Chemical and other nonradicmtive wastes, such as ma- terials for corrosion control, can have a greater environ- mental impact than the low-level radioactive materials released into the plant’s liquid discharge line. This is particularly true in modem plants, where closed cooling systems concentrate various chemicals. A small fraction of chemical-laden coolant is periodically drained off to limit the buildup of chemicals (known as blowdown). Some of the various chemical wastes require removal, but most are simply diluted and released in concentra- tions that meet local water quality standards. Various removal methods, which are employed on a case-by-case basis, are shown in Fig. 13.17.43
Settling ponds are used to treat wastewaters contain- ing high concentrations of suspended materials, includ- ing blowdown from cooling towers, the makeup water treatment building, and other sources. Neutralization basins are used to treat liquid wastes that are excessively basic or acidic (e&, demineralizer regenerant wastes). Liquids drained from the turbine building, the diesel generator building, and other sources that collect oil or grease are sent through oil-water separators before being discharged to sewer drains. Lavatory and sanitary drain flow is treated in a sewage treatment plant before being discharged
thus avoiding the high levels of thermal effluents associ- ated with once-through cooling systems. Cooling ponds are used when land is available at a moderate price, since they occupy about 1,OOO-2,OOO acreslGW of in- stalled electrical capacity. Where land is not readily available, nuclear power plants employ wet cooling towers, which dissipate heat by evaporating some of the water being cooled. Cooling towers are also classified by their means of producing an air flow. This can be a mechanically induced draft using large fans or a natural draft using a tall, usually hyperbolic, “chimney” to pro- vide a natural updraft.
Intake structures are designed for low intake velocities and have special traveling screens that min- imize impingement of aquatic life and intake shock to the circulating water system. Diffusers mounted at the end of the common discharge pipe in the local surface water increase dilution to help reduce the effects of thermal and chemical discharges.
Cooling ponds and towers disperse heat to the air,
256

Stripped off-gases from primary coolant header
Recycle to primary
tank Vent
steam generator
.eturn to 'eactor
ejector
Legend: Ventilation exhausts
' Roughing filter from containment, 4w; ~
: Charcoal adsorber auxiliary, and fuel 4 High-energy particulate buildings
air filter
Figure 13.13 Typical PWR Cleanup System for Gaseous Radioactive Waste (Source: Ref. 18)
Gland Containment ventilation exhaust and
Steam from reactor
Gland seal
return to reactor
Legend:
P Roughing filter C Charcoal adsorber A High-energy particulate
air filter
Cryogenic still
To atmosphere via vent or stack
Figure 13.14 Typical BWR Cleanup System for Gaseous Radioactive Waste (Source: Ref. 18)
257

Clean waste from equipment drains
condensate
Demineralizer Steam generator blowdown
Recvcle h d o w n
floor drains
Chemical wastes from
drains and decontaminants
n
Recycle system flush water
Laundry and Waste
sump tank
From laundry hot shower monitor drains
Legend:
F Filter RM Radiation monitor S Solid waste to packaging I- Alternate flow paths
@ j 1 Reactor makeup water storage tank
Figure 13.15 Typical PWR Cleanup System for Liquid Radioactive Waste (Source: Ref. 18)
Future Needs
Some of the radioactive emissions released to the atmos- phere, such as krypton-85, carbon-14, and tritium, have long half-lives. They may be emitted in quantities large enough to be of concern as nuclear power expands and these isotopes accumulate in the biosphere.
of 10.7 yr. Modem reactors emit up to 100,OOO Ci of krypton-85 per reactor-year, depending on design. The krypton-85 released is a small fraction of the total gener- ated; most of it remains in the fuel. Krypton-85, which diffuses throughout the atmosphere worldwide, appears
Krypton-85 is a chemically inert gas with a half-life
to have minute health effects, if any; global health risks have been estimated to be about O.ooOo7 death per reactor-year20 Krypton-85 is therefore not collected for long-term storage at nuclear power plants.
More krypton-85 is released during fuel reprocess- ing than during plant operation. Even if reprocessing were instituted on a large scale, however, the dose from krypton-85 would remain a small fraction of the natural background radiation dose. In addition, EPA regulations require capture and storage of laypton-85 at commercial LWR fuel reprocessing plants in such a way that annual releases are limited to 50,000 Ci/GW-yr of electricity produced by nuclear power.19
258

Recycle
storage power plant
Clean waste t i from Collector
for high- equipment drains Purity
waste
- Waste sample tank
Deminer- aiizer
Filter I) + * c
Clean waste t i from Collector
for high- equipment drains Purity
waste
- Waste sample tank
Deminer- aiizer
Filter I) + * c
Dirty wastes from plant floor drains
Sample Filter Deminer- tanks
alizer
I I I W - Chemical I 1
Condensate tank
I ' .j* Evaporator .) I wastes from Chemical
waste
collector- % I I
and decon- neutralizer taminants
1 .. Laundry
(detergent) Filter laundry drain tanks drains
Cooling-tower blowdown
RM Radiation monitor S Solid waste to packaging I- Alternate f low paths
Figure 13.16 Typical BWR Cleanup System for Liquid Radioactive Waste (Source: Ref. 18)
Some carbon-14 is produced in commercial reactors by neutron-induced reactions in the cooling water and fuel. Although quantities are uncertain, it appears that 20-30 Ci/reactor-year are formed. The fraction of this amount released during reactor operation is also uncer- tain; the remainder would be released from the fuel only during reprocessing.
The release of about one-third of the carbon-14 produced during reactor operation (as carbon dioxide gas) would result in a population whole-body dose of about 50 person-rem per reactor-year, which has been equated to about 0.01 latent cancer fatality per reactor- year.17 The radioactivity of carbon-14 is of concern, however, since it has a half-life of 5,730 yr and is incor-
porated into living matter. The amount of reactor- generated carbon-14 is minute compared with the 220 million Ci of carbon- 14 in the stratosphere from cosmic rays and the 6 million Ci from atmospheric nuclear weapons tests. Carbon-14 releases from reactors could be reduced using existing technology if it is deter- mined that the hazard justifies the effort9
Most mtium from an LWR is released in water and rapidly becomes diluted and dispersed. The discharge rate of tritium, which has a half-life of 12.3 yr, increases roughly in proportion to the total power generated. Several assessments, however, have concluded that the quantities of tritium likely to be released present no significant hazard to the public.21 For the next two
259

I
I
Neutralization basin
Demineralizer regeneration backwash
Oily drains-j separators 1' bl ~
Storm drains
disposal
treatment
Sludge Eva p o rat i o n and drift losses
Lavatory and sanitary drains
Cooling .) tower or
Makeup pond Blowdown
' B
water i 1 8
r a
Makeup water Optional treatment * settling b system Sludge basin
blowdown Sludge
Local surface water
Discharge
ChMMN
Diffusers
Figure 13.17 Typical Process Flows and Technologies for Nonradioactive Liquid Waste (Source: Ref. 43)
decades, it is expected that most tritium in the environ- ment will be the result of nuclear weapons testing and that the total inventory will decline during this period.
CONSTRAINTS
Licensing
The Energy Reorganization Act of 1974 protects the public from excessive exposure to radiation hazards by giving the NRC authority over the licensing of atomic energy facilities. As an aid in fulfilling this respon- sibility, NRC has developed the regulations in Title 10
of the Code of Federal Regulations (CFR). Those parts of Title 10 most frequently encountered in connection with nuclear power plants are described in Table 13.9.23.44-50
Under the Act and regulations in Title 10, NRC must make certain safety findings before either a con- struction permit or an operating license for a facility can be issued. These are based on extensive technical analy- ses and environmental assessments that are carefully reviewed by NRC staff. The safety evaluation of a nuclear power plant is also reviewed by the Advisory Committee on Reactor Safeguards (ACRS). In addition, a public hearing is required at the construction permit stage and is also held at the operating license stage if requested by anyone whose interest might be affected.
260

Table 13.9 Most Frequently Used Parts of CFR Title 10
PiUt Name Applicability
1
2
20
50
51
55
70
100
Statement of Organizatisn and General Information
Rules of Practice
Standards for Protection Against Radiation
Licensing of Production and Utilization Facilities
Licensing and Regulatory Policy and Procedures for Environmental Protection
Operators' Licenses
Special Nuclear Materid
Reactor Site Criteria
Describes the organization of the NRC.
Governs the conduct of proceedings for granting, revoking, amending, or taking other actions regarding an NRC license; the imposition of civil fines; rulemaking procedures; patent matters.
Establishes standards and regulations for protection from radiation.
Gives the requirements for obtaining a construction permit or operating license for a reactor, including the information that must be supplied by an applicant.
Gives the procedures to be followed by an applicant for an NRC license to satisfy the National Environmental Policy Act.
Gives procedures and criteria for the issuance of reactor operating licenses.
Establishes regulations and criteria for issuing licenses to own and use special nuclear material (in general, any fissile or uranium235enriched material).
Defines the NRC criteria for evaluating proposed sites for nuclear power reactors.
Construction Permit27
The process begins with a determination of whether an environmental assessment or an environmental impact statement (EIS) is required and a scoping process in which the significant issues are established. An infor- mal site review by regulatory staff before formal appli- cation for a license is encouraged, but not required.
extensive technical information in two large documents: a preliminary safety analysis report and an environmen- tal report. A preliminary safety analysis report contains comprehensive data on the proposed site, a description of the proposed facility with special consideration of safety-related features, a discussion of hypothetical accident situations and their consequences, a preliminary plan for organizing personnel at the facility and conduct- ing operations, and plans for coping with emergencies. An environmental report describes the environmental
Applicants for a construction permit must submit
impacts of the proposed facility, alternative sites and facilities, relationships between local short-term uses of the environment and enhancement of long-term produc- tivity, irreversible commitments of resources, and meas- ures to comply with various environmental standards and regulations.
A regulatory staff reviews the environmental report and issues a safety evaluation report, which summarizes the staff's findings on public health and safety. The regulatory staff then reviews the environmental impacts and issues &aft and final EISs, which summarize the staff's findings. These reports are reviewed by the ACRS, which issues a supplement to the safety evalua- tion report to address safety issues raised by the ACRS and any new information available since issuance of the safety evaluation report.
and Licensing Board to consider issuing a construction Public hearings are held before an Atomic Szfety
26 1

permit. These are held in the vicinity of the proposed site and full public notice is required. Following the hearings the Board issues an "initial decision." If the Board decides in favor of construction, the construction permit must be issued within ten days. Appeals may be filed by anyone not agreeing with the initial decision. These are heard by an Atomic Safety and Licensing Appeal Board, which can consider only those issues the appellant contends are in error in fact or law. The deci- sion of the Appeal Board may be appealed directly to the NRC or a federal court.
Operating License21
Many of the operating license procedures repeat the construction permit procedures. A final safety analysis report and an updated environmental report are filed with the NRC by the applicant; these reports are re- viewed by NRC staff and the ACRS. After the reviews, the operating license is issued, although it can be ap- pealed by any dissatisfied party.
Major Radiation Regulations
Standards for protecting workers and the public from radiation from operation of a nuclear power plant are contained in five federal regulations. 1923,46,4720 Occupa-
Table 13.10 Summary of Environmental Radiation Protection Standards for Nuclear Power Operators (CFR Title 40, Part 190)
Provision Description
Applicability Uranium mills, uranium hexafluoride production, uranium fuel production and reprocessing, and uranium-fueled LWRs.
Exclusions Uranium mining, waste disposal, transportation, radon, and radon decay products.
25 mrem to the whole body, 75 m m to the thyroid, and 25 mrem to any other organ.
For krypton-85, S0,oOO Ci/GW-yc for iodine-129, 5 mCi/GW-yr; and for plutonium-2% add other long-lived transuranics, 0.5 mCi/GW-yr.
Annual plblic dose limits
Release limits
Effective dates Dec. 1, 1980, for uranium mills; Jan. 1, 1983, for krypton-85 and iodine-129; and Dec. 1, 1979, for all other cases.
tional doses (Le., doses to workers) are regulated in CFR Title 10, Part 20.23 The maximum permissible doses a worker may receive in a restricted radiation area during my p e s of one calendar quarter, are 1.25 rem to the whole body, head and trunk, blood-forming organs, lens of the eye, and gonads; 18.75 rem to the hands, forearms, feet, and ankles; and 7.5 rem to the skin.
higher doses if the total occupational whole-body dose does not exceed 3 rem during any calendar quarter and the dose to the whole body, when added to the accumu- lated occupational dose to the whole body, does not exceed 5 x (N - 18) rem, where N equals the individual's age in years. The concept of "whole-body dose" includes any dose to the whole body, gonads, blood- forming organs, head and trunk, or lens of the eye.
are regulated in CFR Title 40, Part 190 (Table 13.10)P These standards are published by the EPA, and all NRC licensees and DOE facilities must comply with them.
In addition to limitations on releases of airborne material to the environment, CFR Title 10, Part 20, states that releases of radioactive materials should be "as low as reasonably achievable" (known as the ALARA principle).23 A qualitative approach describing dose- reducing considerations is normally used to implement the A L M A principle. For nuclear power plants, however, the NRC has developed specific quantitative ALARA criteria in CFR Title 10, Part 50, Appendix 1.4 These regulations are not operating limits: they are design objectives (Table 13.1 l).46 Actual doses are
A licensee may permit a radiation worker to receive
Doses to members of the public and release limits
Table 13.11 Numerical Guides for Defining the ALARA Principle for LWR Power Plant Effluents
Design Objective (annual release
Exposure Mode per reactor)
Liquid effluents (all pathways) Dose to the whole body Dose to any organ
3 mrem 10 mrem
Gaseous effluents Gamma dose in air Beta dose in air Dose to the whole body Dose to the skin
10 mrd 20 mrd 5 mrem
15 mrem
Radionuclides and particulates released to the atmosphere, dose to any organ
15 mrem
Source: Ref.46.
262
Source: Appendix I of Ref. 46.

allowed to be twice as high as the design objectives before corrective action is required. Licensees also are required to augment their effluent control systems to reduce actual doses below the design objective whenever this is justified by a cost-benefit analysis (the suggested value is $1,000/person-rem saved).
licensee’s responsibility to notify the NRC of incidents that might have caused or might threaten to cause specified doses.23.4 The regulations require immediate, 24-h, and 30-d notifications, depending on the dose. For example, NRC must be notified within 24 h of any inci- dent that might have caused or threatens to cause indi- vidual doses in excess of 5 rem to the whole body; 30 rem to the skin; or 75 rem to the feet, ankles, hands, or forearms.13
CFR Title 10, Part 100, defines the radii of exclu- sion areas, low-population zones, and allowable dis- tances to nearby population centers in terms of maxi- mum doses to the whole body and thyroid from major accidents.50 For example, the size of an exclusion area is determined such that “an individual located at any point on its boundary for two hours immediately follow- ing onset of the postulated fission product release, would not receive a total dose to the whole body in excess of 25 rem or total dose to the thyroid in excess of 300 rem.”
CFR Title 10 also contains provisions for transport- ing and packaging fuel and other nuclear materials in Parts 20,70 (Table 13.9), 71, and 73.23,49.551.52
The health and environmental assessment require- ments for nuclear power plant licensing are specified in CFR Title 10, Part 51.47 These regulations outline a series of descriptions, evaluations, and assessments that must be completed at various stages, including a final EIS, to comply with the National Environmental Policy Act.
Parts 20 and 50 of CFR Title 10 also describe the
REFERENCES
1. Fission Energy Program of the US. Department of Energy, U.S. Dept. of Energy Report DOE/NE- O006 (March 1980).
2. Nuclear News, American Nuclear Society, 28( 10) (1985).
Cook, J., Nuclear Follies, Forbes (Feb. 11, 1985).
Program Summary Report, US. Nuclear Regulatory Commission Report NUREG-0380, Vol. 4, No. 5 (May 1980).
Shoreham: A Deal Undone?, The Energy Daily,
3.
4.
5. 16(140):1-2 (July 22, 1988).
6.
7.
8.
9.
10.
11.
12.
13.
14.
15.
16.
17.
18.
19.
20.
Mulheim, MD., andE.G. Silver, Operating US. Power Reactors, Nuclear Safety, 26(2) (March/ April 1985).
Environmental Analysis of the Uranium Fuel Cycle, Part II, Nuclear Power Reactors, U.S. Environmental Protection Agency Report EPA-
National Energy Policy Plan Projections to 2010, U.S. Dept. of Energy Report DOEVPE-0029/3 @ec. 1985).
GPU and the Costs of Three Mile Island, The Energy Daily, 16(137):2 (July 19,1988).
Energy Alternatives: A Comparative Analysis, The Science and Public Policy Program, Univer- sity of Oklahoma, Norman (May 1975).
Nuclear Power and the Environment, International Atomic Energy Agency, Vienna (1973).
Fuel Cycle Cost Projection, U.S. Nuclear Regula- tory Commission Report NUREG/CR-1041 (Dec. 1979).
Environmental Characterization Information Report: Pressurized Water Nuclear Power Plant, U.S. Dept. of Energy Report DOELEP-0012 (1981).
Reactor Safety Study, U.S. Nuclear Regulatory Commission Report WASH-1400 (Dec. 1975).
Radiological Assessment: A Textbook on Environ- mental Dose Assessment, US. Nuclear Regulatory Commission Report NUREGICR-3332 (Sept. 1983).
Final Environmental Statement: Sequoyah Nu- clear Plant l and 2, Tennessee Valley Authority, Chattanooga (1974).
Environmental Report: Hartmille Nuclear Sta- tion, Tennessee Valley Authority, Knoxville (Aug. 1974).
The Sajety of Nuclear Power Reactors and Related Facilities, U.S. Atomic Energy Commission Report WASH-1250 (July 1973).
Environmental Radiation Protection Standards for Nuclear Power Operations, Code of Federal Regulations Title 40, Part 190.
Ford Foundation, Nuclear Power Issues and Choices, Ballinger Publishing Co., Cambridge, Mass. (1977).
520/9-73-003-C (Nov. 1973).
263

21.
22.
23.
24.
25.
26.
27.
28.
29.
30.
31.
32.
33.
34.
35.
264
Liquid Pathway Generic Study, U.S. Nuclear Regulatory Commission Report NUREG-0440 (Feb. 1978).
Nero, A.V., Jr., A Guidebook to Nuclear Reactors, University of California Press, Los Angeles (1979).
Standards for Protection Against Radiation, Code of Federal Regulations Title 10, Part 20.
Occupational Radiation Exposure, U S . Nuclear Regulatory Commission Report NUREG-0594 (1978).
Brooks, B.G., Occupational Radiation Exposure at Commercial Nuclear Power Reactors, 1983, U.S. Nuclear Regulatory Commission Report
Environmental Development Plan: Decontamina- tion and Decommissioning, U.S. Dept. of Energy Report DOEEDP-0028 (July 1978).
Lamrash, J.R., Introduction to Nuclear Engineer- ing, Addison Wesley Publishing Co., Reading, Mass. (1975).
PRA Procedures Guide, U.S. Nuclear Regulatory Commission Report NUREG/CR-2300 (Jan. 1983).
Probabilistic Risk Assessment (PRA) Reference Document, U.S. Nuclear Regulatory Commission Report NUREG-1050 (Sept. 1984).
PRA Status Report and Regulatory Guide, W.R. Costo, e d , Nuclear Safety, 25(4) (JulylAug. 1984).
Risk Assessment Review Group Report to the U.S. NRC, U.S. Nuclear Regulatory Commission Re- port NUREG/CR-0400 (Sept. 1978).
Report of the President's Commission on the Acci- dent at Three Mile Island, US. Government Print- ing Office, Washington, D.C. (at. 1979).
Regulatory Impact of Nuclear Reactor Accident Source Term Assumptions, U.S. Nuclear Regulatory Commission Report NUREG-0771 (Sept. 1983).
Levenson, M., and P. Rahn, Realistic Estimates of the Consequences of Nuclear Accidents, presented at American Nuclear Society Meeting, Washing- ton, D.C. (Nov. 1980).
Technical Basis for Estimating Fission Product Behavior During LWR Accidents, U.S. Nuclear
NUREG-0713, Vol. 5 (1985).
36.
37.
38.
39.
40.
41.
42.
43.
44.
45.
46.
47.
~~
Regulatory Commission Report NUREG-0772 (1982).
Report of the Special Committee on Source Terms, American Nuclear Society, Hinsdale, Ill. (Sept. 1984).
Wilson, R., et al., Radionuclide Releases from Severe Accident at Nuclear Power Plants, draft report to the American Physical Society, New York (Feb. 1985).
Reassessment of the Technical Basis for Estimat- ing Source Terms, U.S. Nuclear Regulatory Com- mission Report NUREG-0956 (May 1984).
Planning Basis for the Development of State and Local Government Radiological Emergency Response Plans in Support of Light Water Nuclear Power Plants, U.S. Nuclear Regulatory Commis- sion Report NUREG-0396 (Dec. 1978).
Criteria for Preparation and Evaluation of Radiological Emergency Response Plans and Preparedness in Support of Nuclear Power Plants, U.S. Nuclear Regulatory Commission Report
Zittle, H.E., Chemical Discharges and Sanitary Effluents Sections in Environmental Impact State- ments for Nuclear Power Plants, in Environmental Impact of Nuclear Power Plants, Pergamon Press, Inc., New York (1976).
Ron, T.H., Radioactive Waste Systems and Radioactive Efluents, in Environmental Impact of Nuclear Power Plants, Pergamon Press, Inc., New York (1976).
Eichholz, G.G., Environmental Aspects of Nuclear Power, Ann Arbor Science Publishers, Ann Arbor, Mich. (1976).
Statement of Organization and General Informa- tion, Code of Federal Regulations Title 10, Part l.
Rules of Practice for Domestic Licensing Proceed- ings, Code of Federal Regulations Title 10, Part 2.
Domestic Licensing of Production and Utilization Facilities, Code of Federal Regulations Title 10, Part 50.
Jnvironmental Protection Regulations for Domes- tic Licensing and Related Regulatory Functions, Code of Federal Regulations Title 10, Part 5 1.
NUREG-0654 (Nov. 1980).
48. Operators' Licenses, Code of Federal Regulations Title 10, Part 55.

49. Domestic Licensing of Special Nuclear Material, 5 1. Packaging and Transportation of Radioactive
50.
Code of Federal Regulations Title 10, Part 70.
Reactor Site Criteriu, Code of Federal Regulations Title 10, Part 100.
Material, Code of Federal Regulations Tide 10, Part71.
Physical Protection of Plants and Materials, Code of Federal Regulations Title 10, Part 73.
52.
265

Figure 14.1 Handling Transuranic Wastes
266

Chapter 14
Nuclear Waste
BACKGROUND
Broadly defined, the management of radioactive wastes encompasses the handling, sprage, treatment, transpor- tation, and permanent dispogfal of all radioactive wastes. This chapter discusses the management of the various types of waste produced in the fuel cycle of commercial nuclear power plants: high-level waste, transuranic (TRU) waste (Fig. 14.1), low-level waste, spent fuel, and uranium mill tailings. Large quantities of low-level waste are also produced in defense programs, industrial and research programs, decontamination and decommis- sioning programs, and medical applications.] Defense programs generate TRU and high-level wastes as well. M i l e the primary focus of this chapter is on wastes from commercial nuclear power, defense wastes are discussed in the context of the Nuclear Waste Policy Act (NWPA) of 1982 (Public Law 97425) and the Nuclear Waste Policy Amendments Act (NWPA Amendments) of 1987 (Public Law 100-203).
History
The U.S. Department of Energy (DOE) and its predeces- sors have been involved in the management of radioac- tive wastes since 1943, when such wastes were first generated in significant quantities as by-products of nuclear weapons production. Since then, thousands of person-years of experience have been gained through the management of defense-related wastes at various sites around the country. The volume of defense wastes far exceeds that of commercial wastes generated to date, though commercial wastes now exceed defense wastes in cumulative radi0activity.z
long-term management of high-level and TRU wastes, because their radioactivity persists for long periods.
Of greatest concern to public health and safety is the
Management
Since 1957, when a committee of the National Academy of Sciences fmt proposed placing these wastes in deep, geologically stable rock formations, a great deal of evi- dence has accumulated to support the technical feasibil- ity, economic practicality, and safety of such an approach. From 1965 to 1972, the U.S. Atomic Energy Commission studied the feasibility of constructing such a waste repository in a salt mine near Lyons, Kansas. Although studies of salt’s suitability as a repository medium yielded favorable results, the project was canceled when researchers discovered that the mine’s integrity had been compromised by previous oil and gas exploration and nearby salt-mining operations.3
After a brief period of research into an interim solu- tion (retrievable surface storage), the US. Energy Re- search and Development Administration (ERDA) in 1976 began an expanded program to identify sites suit- able for one or more repositories. Under U.S. policy from 1977 to 1981, commercial reprocessing of spent fuel was suspended because of concern about the proliferation of nuclear weapon materials, thus spumng the development of a spent fuel storage program to par- allel the waste disposal program. In 1981, the Reagan administration reversed the suspension, but private in- dustry has been unwilling to invest in reprocessing facilities.
In March 1978, the Interagency Review Group (IRG) on Nuclear Waste Management was established to make recommendations about long-term waste- management policy and programs to implement and support the policy. The IRG outlined four possible technical strategies for high-level-waste disposal, specifying the range of technologies and the number of alternative rock types to be considered.2 In 1980, Presi- dent Carter announced a national policy and program for the management of radioactive waste. It defined an interim planning strategy focused on the use of mined geologic repositories pending a decision based on the
267

generic environmental impact statement4 comparing disposal technologies. The Low-Level Radioactive Waste Policy Act (LLRWPA) of 1980 (Public Law 96-573) addressed the responsibilities of states in dis- posing of low-level waste.
The NWPA of 1982 set forth a comprehensive strategy for resolving technical and institutional issues concerning the disposal and storage of radioactive wastes. The purpose of the act is "to provide for the development of repositories for the disposal of high- level radioactive waste and spent nuclear fuel [and] establish a program of research, development, and demonstration regarding the disposal of high-level radio- active waste and spent nuclear fuel." In response to the Act, DOE continued investigations to identify candidate repository sites and, in June 1985, developed a mission plans detailing future activities. In May 1986, DOE recommended and the President approved three candi- date sites for further site characterization. In 1987, the NWPA Amendments further limited first-repository site characterization to the Yucca Mountain site in Nevada.
Government Programs
Federal Responsibilitiess
The DOE is the primary federal agency responsible for radioactive waste management. The four areas of DOE involvement in commercial waste management are (1) research and development related to long-term isola- tion from the human environment, (2) interim storage of spent fuel from nuclear power plants pending the avail- ability of permanent repositories, (3) development of waste treatment technology, and (4) management of uranium mill tailings and contaminated facilities.
The US. Nuclear Regulatory Commission (NRC) and the U.S. Environmental Protection Agency (EPA) have major supporting roles in both technical and regulatory areas. The NRC will license DOE reposi- tories for commercial nuclear waste and facilities for the interim storage of commercial spent fuel. The NRC issues regulations specifying the information to be supplied in license applications and establishing the standards that must be met7 The EPA provides environ- mental criteria and standards that will serve as the basis for NRC regulations and DOE operations. The EPA work relates to general environmental protection criteria and to standards for high-level wastes, uranium mill tailings, TRU wastes, low-level wastes, and the wastes generated in decommissioning nuclear facilities.
are involved through their technical, policy, regulatory, A number of other federal departments and agencies
or oversight functions: the U.S. Department of the Inte- rior (US. Geological Survey and Bureau of Land Management), U.S. Department of Transportation, Army Corps of Engineers, Council on Environmental Quality, U.S. Department of Agriculture, Office of Sci- ence and Technology Policy, U.S. Department of State, and US. General Accounting Office. In addition, the NWPA Amendments established the Office of the Nuclear Waste Negotiator to aid in identifying disposal and storage sites and the Nuclear Waste Technical Review Board to provide waste management oversight.
State Participation
In a 1981 report to the President, the State Planning Council on Radioactive Waste Management recom- mended legislation to ensure cooperation among federal, state, and local governments and Indian tribes on the radioactive waste disposal issue. The LLRWPA of 1980 made states responsible for developing interstate com- pacts for establishing low-level-waste disposal sites. Under the NWPA, DOE is to notify affected states and mbes of nominations for repository sites and hold local public hearings. The affected states and tribes have veto power, subject to an overturning vote by Congress.
Sources and Types of Nuclear Waste
Each step in the nuclear fuel cycle (Fig. 14.2) produces one or more types of radioactive waste. Table 14.1 summarizes the radioactive wastes produced annually by typical boiling-water-reactor (BWR) and pressurized- water-reactor (PWR) power plants.8 From process to process, waste products may vary significantly in their physical, chemical, and radiological characteristics. Thus, treatment and disposal requirements also vary.
Uranium Milling
Processing mined uranium ore at a mill can produce radioactive atmospheric emissions and large quantities of sand and slimes (fine-grained material), known as tailings. The tailings contain low concentrations of the uranium-238 decay chain: uranium-238, uranium-234, thorium-230, radium-226, radon-222, and the radioac- tive decay products of radon-222. They retain about 85% of the total radioactivity of the uranium ore from which they were produced. Radium concentrations range from 26 to 600 pCi/g and thorium concentrations range from 70 to 600 pCi/g, depending on the ore, the process used, and the distribution of tailings particle sizes considered9
268

Low-level waste (LLW) storage
spent-fuel storage
- Fuel cycle steps currently
--- Steps currently not implemented operational
pending operation of reprocessing plants and approval of recycling of mixed oxides as fuel
pending ultimate disposal of spent fuel
- - - Step currently not implemented
Figure 14.2 The Light-Water-Reactor Fuel Cycle
Low-Level Waste
Low-level waste is defined as radioactive waste that is not spent fuel, high-level waste, TRU waste, or mill tailings.lo.11 It exceeds all other radioactive wastes m variety of form and quantity. Its radioactivity is usually low level and relatively innocuous, but some low-level waste is sufficiently radioactive to require shielding. Most of the radionuclides in low-level waste are rela- tively short-lived emitters of beta and gamma radiation. In addition to the waste generated by commercial nuclear power plants, low-level radioactive waste is produced by the medical profession.
Low-level waste is generated in all phases of the commercial fuel cycle, but most of it comes from power plants. It can consist of general trash (such as cleaning rags, protective clothing and gloves, discarded tools and equipment, and pieces of pipe and lumber), ion-ex- change resins, process sludges, or the solid residue left by the evaporation of liquid wastes. All low-level waste is solidified before it is shipped off site.
Other sources of low-level waste are sites that were used in the early years of nuclear weapons work and nuclear energy development. In 1974, DOE initiated the Formerly Utilized Sites Remedial Action Program (FUSRAP) to identify the sites used by the Atomic
269

Table 14.1 Annual Radioactive Wastes from a 1,OOO-MW Light-Water Reactor with a Capacity Factor of 70%
Waste Type PWR BWR
Gases (Ci) Noble gases 1,850 3.100 Iodine 0.077 0.600 Tritium 800 15
Liquids (Ci) TlitiUm 300 25 Activation and 0.120 0.015
fission proaucts
solids spent fueb (tons) 33 33 Low-level wastea (Ci) 5,800 5,800
Contains 0.8% uranium-235.
bAbout 800 5Sgd dnuns. Source: Ref. 8.
Energy Commission and the Army Corps of Engineers’ Manhattan Engineering District.12 These sites, which were both privately and federally owned, were used primarily for research, processing uranium or thorium ores, and storing radioactive ores or residues; the Trinity bomb-test site and the plutoniumdevelopment program site at Los A l m , New Mexico, are also included.
The materials, equipment, buildings, and land at formerly used sites were contaminated primarily with natural radioactive nuclides. While the sites were decontaminated in ;accordance with the standards and methods in use at that time, their level of radioactivity does not always conform to today’s more stringent standards. The FUSRAP evaluates the radiological status of the sites against current guidelines for mleasing such sites for unrestricted use. When a site is designated as requiring remedial action, one of several options is selected. The most extensive option is removal of all contaminated mil, construction materials, and equip- ment This option may be necessary at several sites identified by FUSRAP.
Low-level wastes are also produced by decon- taminating and decommissioning nuclear facilities. The wastes may typically collsist of reactor vessels and piping, building maferials, and soil. About 18,000 m3 of low-level waste rn estimated to result from dismantling a typical full-size light-water reactor.13 This quantity may be significantly reduced by placing the facility in
safe storage or entombment for 30-200 yr, rather than dismantling it soon after shutdown, as most short-lived isotopes will then decay.14
A few small demonstration nuclear power plants have already been decontaminated and decommissioned. The DOE has about 500 facilities at over 20 locations that are contaminated with radioactive material and plans to decontaminate and decommission the facilities by the year 2000.15 The Shippingport Atomic Power Station, a 60-MW power plant in Pennsylvania, is among the largest of these facilities.16 This effort, together with FUSRAP, will produce 20-30 million ft3 of low-level waste. Large volumes of low-level waste also will be generated by commercial decontamination programs, such as the cleanup of the accident at Three Mile Island.
Spent Fuel Md High-Level Waste
High-level waste includes spent fuel removed from nuclear reactors as well as high-level wastes from reprocessing spent fuel. Spent fuel contains uranium, fssion products (fragments of split uranium-235 and plutonium-239 nuclei), TRU elements (elements, with an atomic number higher than that of uranium, that are formed through successive neutron capture by uranium-238). and activation products (material result- ing from neutron capture by elements in the fuel and metal tubes that hold the fuel pellets). Reprocessing the spent fuel recovers reusable uranium and plutonium fuel and produces high-level liquid waste that contains more than W% of the fission products in the spent fuel, but only 0.5% each of the reusable uranium and plum- nium.17 All high-level waste is highly radioactive and thus requires shielding. In addition, the waste generates a large amount of heat, necessitating cooling.
The only high-level waste now produced by the commercial nuclear power industry is spent reactor fuel. Projections for cumulative spent-fuel discharge by the year 1995 vary considerably, depending on the assump tions made about the growth of nuclear power. Spent- fuel inventories from currently operatirtg and planned reactors are expected to total about 77,800 metric tons (t) by 2 0 . 1 8
Because spent fuel is highly radioactive and its radioactivity persists for a very long time, it requires permanent isolation from the human environment. pending development of permanent geologic reposi- tories, spent fuel is now stored in water-fded cooling pools at the power plant that generates it. A small amount of spent fuel has been shipped to storage in pools at other power plants M at the nonoperating reprocessing plants at Morris, Illinois, and West Valley,
no

New York. About 600,OOO gal of high-level liquid waste was produced and stored at the West Valley plant during the early 1970s. Because the plant is not sched- uled for further operation, plans are being made to solidify and remove the waste.
Defense-related high-level waste results from pro- ducing nuclear weapons and reprocessing spent fuel from naval reactors. This waste is generated and stored at three DOE sites: the Savannah River Plant in South Carolina, the Idaho National Engineering Laboratory, and the Hanford site in Washington. The NWPA requires the President to evaluate storing defense high- level waste either at one or more of the civilian reposi- tories or a repository consrructed for defense waste only. An evaluation by DOE concluded that there were no compelling reasons for a repository dedicated to defense waste and there was a significant cost advantage offered by disposal in a combined repository.19 This recommen- dation was made to the President and approved by him in April 1985. An appropriate fee for disposing of defense-related high-level waste is currently being determined.
Transuranic Waste
Transuranic waste is solid material contaminated with TRU elements to a level exceeding lo0 nCi/g.Wo Most TRU waste has low levels of radioactivity and emits primarily alpha radiation, which has little penetrating power. However, because TRU nuclides are very toxic (botil chemically and radiologically) and because many of them have long half-lives, they are generally consid- ered to require isolation similar in degree and duration to that for high-level waste.
Under normal circumstances, little TRU waste is produced in the once-through commercial fuel cycle. If fuel is not reprocessed and the uranium and plutonium are not refabricated into new reactor fuel, TRU elements remain trapped in the spent fuel, except for small amounts that may be released by fuel cladding failure. The small amount of commercial TRU waste that was produced in the past came from the reprocessing and fabrication of mixed-oxide fuel. It consisted chiefly of absorbent tissues, protective clothing, gloves, plastic bags, discarded tools and equipment, fuel cladding hulls, and filters from effluent treatment systems. Defense and DOE research programs produce larger quantities of TRU waste.
ENVIRONMENTAL ISSUES
Nuclear waste generation gives rise to two broad en- vironmental concerns: exposure of the population to radioactive materials and long-term radioactive con- tamination of large areas of land. The concerns stem from the very high radioactivity of some wastes and the large quantities of other wastes.
tive waste has been minimal. High-level wastes are produced in very small quantities compared to most other toxic and hazardous wastes produced by our society; these quantities have been readily managed. Low-level wastes, while comparable in quantity to other typical industrial wastes, present a much smaller risk. Moreover, the technologies required to manage nuclear wastes are largely understood and are sufficiently devel- oped to proceed with permanent and safe disposal, al- though some technical uncertainties exist. Many difi- cult institutional, political, and economic issues remain to be resolved, but these are largely beyond the scope of this chapter.
To date, the actual environmental impact of radioac-
Uranium Milling and Tailings
Radioactive releases from existing mills constitute the largest routine releases from the nuclear fuel cycle. Four major milling activities produce radioactive particles and gases: ore stockpiling, ore crushing and grinding, yellow-cake drying and packaging, and tailings disposal. The primary mill product, called yellow cake w308), is highly refmed uranium ore that is ready for conversion and enrichment facilities. It presents substantial poten- tial for occupational exposure to radiation.
Uranium mill tailings, which are estimated to total 130 million m3, or over 150 million tons, make up the single greatest volume of nuclear waste. The tailings piles are located in several western states at more than 20 sites, which are generally remote from population centers.20 Emissions of radon-222 gas appear to be the most likely cause of radiation exposure from the piles, although other radionuclides are present. Health hazards of equal or greater importance may also exist from toxic nonradioactive elements -- such as arsenic, selenium, molybdenum, cadmium, and lead -- that are commonly found in tailings.21
27 1

Piles at active mills are kept wet to reduce radon release. Greater risk comes from inactive mills where the piles have dried out and may be dispersed by wind. Local groundwater may also be affected by rain water leaching radioactive and toxic materials. The radioac- tivity and toxicity of the tailings are no greater than those of the original ore, but since the ore was brought to the surface of the earth and processed into more- dispersible forms, it now poses some hazard.
Low-Level Waste
In 1982, over 75,000 m3 of low-level waste was dis- posed of commercially; to date over 2.5 million m3 have been disposed of20 Because of its short-lived, generally low radioactivity, low-level waste is usually disposed of by shallow land burial in licensed commercial disposal sites. At these sites, the waste is emplaced in pits or trenches and covered with several feet of soil. Six such sites have been in operation in the United States in Barnwell, South Carolina; Beatty, Nevada; Hanford, Washington; Maxey Flats, Kentucky; Sheffield, Illinois; and West Valley, New York. The latter three are now closed, and the first three accept only commercially generated low-level waste.22 The DOE operates 14 sites for disposal of low-level waste generated in its own facilities.
Because the number of commercial sites is so limited and the annual volume of low-level waste has mpled in the last decade, there is a critical need for new commercial sites. In response to this need, Congress passed the LLRWPA, which authorizes all states to enter into regional compacts to establish new sites for disposal of low-level wastes generated within the region. Under the original Act, the remaining commercial sites in Washington, South Carolina, and Nevada could have stopped accepting the full burden of low-level waste after 1986. In 1985, Congress extended the deadline for states to form regional compacts and establish new dis- posal sites through 1992; however, Congress also amended the act to allocate remaining capacity at current sites and set progressive disposal surcharges, which are based on waste volumes and the degree of progress of individual states in establishing new sites.23
Transporting Wastes
There is some concern that transporting wastes to repositories over public highways may pose hazards to public health and safety. However, both spent fuel and TRU wastes have been transported for many years, and
the safety record of the nuclear industry in transporting radioactive wastes has been excellent. About 2 million packages of radioactive materials are shipped in the United States each year, representing about 2% of all domestic shipments of hazardous materials. During the period 1971-1975, there were 32,000 incidents involving hazardous-materials transportation. However, only 144 of them (0.45%) involved radioactive materials, and of those, only 36 (0.1 1%) resulted in any release of con- tents.24 Studies by DOE and other groups, such as EPA and NRC, have concluded that the nonradiological risks of accidents are by far the major portion of the total ris~25.26
The most-hazardous waste shipped by the commer- cial nuclear power industry is spent fuel. Prior to 1998, the year that the NWPA mandates that a repository be in operation, a maximum of 1,900 t of spent fuel is allowed by the Act to be transported to all federal interim-storage facilities. Additionally, less than a few hundred metric tons of spent fuel will be transported to federal research and development locations. Probably not more than a few hundred metric tons for all types of shipments will actually be transported, requiring fewer than ten casks. However, the use of available commercial casks for intra-utility shipments could cause a shortage of casks for repository needs. Consequently, the NWPA requires DOE to monitor cask inventories to ensure availability for transport needs.
Potentially Toxic Nonnuclear Materials
The industrial chemicals used to process radioactive wastes are commonly used in other industrial plants and do not pose any unique or uncontrollable health hazards to workers or the public. Nevertheless, the potential risks associated with some of the chemicals and com- pounds may not be fully understood at present. It is necessary to continue evaluating toxicity and other risks from such materials and to take into account any new information developed about their hazards.27
Threshold limit values have not been established for some chemicals used in waste facility operations. For such chemicals, the potential health risks associated with their use must be evaluated. Chemicals in common use in industrial as well as waste management operations ate controlled by regulations and criteria governing indus- trial hygiene, occupational safety, and environmental protection. The environmental standards that regulate their disposal will be compatible with those issued by EPA under the Resource Conservation and Recovery Act ( U . S . Code Title 42, Section 6901).27
272

High-Level and Transuranic Wastes Long-Term Surveillance
Interim Storage of Spent Fuel
One of the most pressing problems in the management of radioactive waste is the accumulation of spent fuel at commercial power plants across the country. Some power plants no longer have enough storage space to unload all the fuel in the reactor core should such un- loading become necessary for maintenm.28 Hktori- cally, power plants have been designed with only a mod- est amount of spent-fuel storage space in the expectation that the fuel would eventually be shipped away to repm- cessing facilities. Because of uncertainties about spent- fuel reprocessing policies, industry has been reluctant to invest the necessary capital to construct and operate new facilities. As a result, utilities have been continually increasing their on-site inventories of spent fuel, and most plants will reach their storage limit in the 19!&.28
Long-Term Isolation6
Before the passage of the NWPA, DOE selected mined geologic repositories as the preferred means for per- manently disposing of spent fuel and commercially generated high-level radioactive waste. After evaluating various means for disposing of these materials, DOE issued an environmental impact statement concluding that geologic disposal is safe, environmentally sound, and achievable with current technology.4 To carry out this decision, DOE has been conducting research and development and performing siting studies as part of the geologic repository program.
The principal concept of geologic disposal is to isolate the waste from the human environment without long-term dependence on the continued existence of contemporary institutions. A geologic repository would therefore be excavated deep below the surface of the earth in a suitable host rock.
If the completion of a repository is delayed, a mechanism would be required to provide safe, extended storage of spent fuel and high-level waste. The NWPA provides such a mechanism by authorizing DOE to study the feasibility of "long-term storage of high-level radioactive waste or spent nuclear fuel in monitored retrievable storage F I R S ] facilities." The NWPA also directs DOE to submit a proposal to Congress for con- structing such a facility. With an MRS system, the federal government could store spent fuel or high-level waste in facilities that are continuously monitored to ensure the safe containment of the stored materials.
The primary objective of nuclear waste management is to prevent exposure of the public to radioactive wastes. In the case of waste repositories, plarmers must consider the population living near the repositories both now and thousands of years in the future.
Long-term isolation of high-level radioactive waste xiquires that the repository be safe from human intru- sion. Future societies might knowingly or unknowingly engage in activities that could compromise the effective- ness of a waste repository. The DOE'S position is that the current generation bears the responsibility for protecting future generations from the waste it creates, but future generations must assume responsibility for any risks that arise from deliberate and informed acts they choose to perform.29
Impacts from Repository Construction and Operations
Health, Safety, and Environmental Impacts
The primary health concern posed by the large quantities of high-level and TRU wastes generated by commercial reactors is the magnitude and duration of their hazard. The method to be used in isolating these wastes must be both safe and environmentally acceptable. Long-term risks can be minimized by carefully siting, &signing, constructing, operating, and closing a permanent repository.
In addition, these wastes must be handled, pack- aged, and emplaced in a manner that protects both work- ers and the public. Near-term health concerns are not limited to occupational and public exposures to radioac- tive materials; they also include exposures to toxic chemicals and hazardous operating conditions. For example, dust generated by mining a repository could pose an occupational and public health hazard. Safe levels for exposure to such dust would have to be deter- mined and maintained by control technologies or protec- tive equipment for workers.
Concern about long-term radiological health effects also applies to biological impacts on ecosystems. However, near-term ecological impacts are somewhat different, The major near-tern concerns are the proper control of mining residues (such as salts) to prevent the deterioration of land, air, and water quality and prevent- ing the migration of hazardous and toxic substances to people. Treatment, handling, and disposition of mined
273

wastes must be considered. Specific studies are needed to determine and mitigate local impacts on the environment .
Calculated Health Risks30
The EPA has recently assessed the long-term population risks from projected releases of radioactive waste from a geologic repository.30 Calculated risks are derived from models that simulate the ways the source pollutant travels through the soil, air, and water to expose an esti- mated population. The exposure is then translated to a dose equivalent and an estimate of risk.
The EPA identified four ways that radionuclides might be released to environmental pathways: to surface water (e.g., a river) through groundwater, to an ocean through surface water, to a land surface directly, or to multiple pathways after disruption by a volcano or meteorite. Total health effects (fatal cancers and serious genetic effects) were calculated for the entire population exposed to the releases from a repository, rather than terminating the calculation at some arbitrary distance from the repository. The study calculated health risks from the time the repository is sealed until l0,OOO yr after disposal.
and serious genetic effects of all generations from the radioisotopes of 19 elements: carbon (C), nickel (Ni), strontium (Sr), zirconium (Zr), technetium (Tc), tin (Sn), iodine (I), cesium (Cs), samarium (Sm), lead (Pb), I i
radium (Ra), actinium (Ac), thorium (Th), protactinium (Pa), uranium (U), neptunium (Np), plutonium (Pu), americium (Ac), and curium (Cm). In general, the EPA study found that the risk of fatal cancers is greater than that of genetic effects. For Sn-126, Cs-135, Cs-137, Ra-228, and Th-232, the risk of genetic effects is about 50% of that for fatal cancers. For Ni-59, Ra-226, Ac-227, Th-229, Th-230, and Pa-231, the risk of genetic effects is 25-50% of that for fatal cancers. For Pb-210, Np-237, and all isotopes of Pu, Am, and Cm, the risk of genetic effects is 1525% of that for fatal cancers. For all the other radioisotopes, the risk of genetic effects is less than 15% of that for fatal cancers.
The EPA study considered only the health risks after a repository closed- A preclosure risk assessment is necessary for a more complete understanding of the health risks associated with a geologic repository.
Table 14.2 lists EPA estimates for both fatal cancers
Socioeconomic Impacts
The impacts of managing a radioactive waste-handling system, i.e., selecting a repository site, processing waste material, or disposing of the waste, can be separated into
two general types: traditional and special. Traditional impacts result from exposure to the waste: the presence of the waste or its by-products causes a direct impact in the form of cancer incidence or contamination of the environment. The particular impact depends on the characteristics of the waste, such as solubility, carcino- genic potential, or chemical composition. Special impacts include those that result from actions taken or knowledge of the wastes: community satisfaction, per- ception of quality of life, and impacts on institutions, economy, employment, land use and value, utilities, population distribution, housing, and transportationY
Examples of potential short-term and long-term socioeconomic impacts from radioactive waste manage- ment are shown in Table 14.3. Some impacts would be only short term (during the planning and operational phase of a waste facility), whether from the action on the wastes or exposure to the hazard; others would be long- lasting or appear only in the long term (after a waste facility has ceased operation), such as an increased incidence of cancer.31
Differences in duration of the impact may exist between the risk that is calculated by the waste manag- ers and decision makers and the risk that is perceived by the population. Calculated risks are determined by tech- nical characteristics of the wastes, location of the wastes, proximity and size of the affected population, and effec- tiveness of the control measures. Perceived risks are those that the public believes exist or will likely exist -- whether they are less than, equal to, or greater than the calculated risks. Public perception of potential risks is different from public perception of calculated risks and the regulations and standards on which they are based3
For example, the major health impact of perceived risk is most likely stress-related. If the public perceives a significant health effect in the absence of a calculated effect (assuming that the calculated effect approximates the actual effect fairly closely), it would expect higher incidences of diseases such as cancer, even though this will probably not occur. This increased concern about health effects (and other impacts) may result in stress- related health effects in the short term, such as insomnia or psychological and heart problems. Such health ef- fects are what were called "psychological" impacts in the case of the accident at the nuclear power plant at Three Mile Island. Although the limited research on the existence of such effects is inconclusive, the impacts caused by public perception of risk are real and the potential consequences are substantial. A need exists to ensure that the potential impacts related to perceived risks are recognized and are dealt with in the decision- making process.
214

Table 143 Risks of Fatal Cancers and Genetic Effects from Releases from a Geologic Repasitory to the Environment (per CI released).
Releases due to Release to River Release to Ocean Release to Land Surface Violent Interactionsb
Radio- Fatal Genetic Fatal Genetic Fatal Genetic Fatal Genetic Nuclide Cancers Effects Ci3DCeIS EffKtS Cancers Effeds Cancers Effects
C-14 Ni-59 Sr-90 2-93 Tc-99 Sn- 126 1-129 cs- 135 cs-137 Sm-151 Pb-210 Ra-226 Ra-228 Ac-227 n-229 Th 230 Th-232 Pa-231 U-233 U-234 U-235 u-236 U-238 Np237 Pu-238 Pu-239 Pu-240 Pu-241 Pu-242 Am-24 1 Am-243 Cm-245 Cm-246
5.83 x 1 0 2 4.61 x 1 0 s 2.25 x 10² 1.51 x 10⁴ 3.65 x 10⁴
7.73 x 1 0 3
1.05 x 10² 8.07 x 1 0 2
1.07 x 1 0 2 9.38 x 1 0 6 1.18 x 101 1.63 x 101 241 x 102
6.67 x 1 0 2 3.49 x 1 0 2 5.38 x 101 3.40 x 101 1.48 x 101 215 x 1 0 2
l.% x 1 0 2 217 x 1 0 2 1.85 x 1 0 2 2.06 x 1 0 2 7.95 x 1 0 2 4.23 x 1 0 2 4.97 x 1 0 2 4.84 x 1 0 2 217 x 1 0 3 4.79 x 10² 5.42 x 1 0 2 5.72 x 10² 1.01 x 101 4.99 x 1 0 2
3.03 x 1 0 2 1.55 x 1 0 s 4.40 x 1 0 4
9.36 x 1 0 6 1.74 x 1 0 s 4.22 x 1 0 3 1.82 x 10.4 3.91 x 1 0 3 4.13 x 1 0 3 1.24 x 1 0 9 1.91 x 1 0 2 3.54 x 1 0 2 1.11 x 1 0 2 1.57 x 1 0 2 8.31 x 10³ 1.35 x 101
1.36 x 101 2.33 x 10² 2.03 x 1 0 3
1 . 6 6 ~ 103 2.06 x 1 0 3 1.57 x 1 0 3 1.50 x 1 0 3 1.29 x 1 0 2 7.23 x 10³ 8.05 x 1 0 3 7.85 x 10³ 3.20 x 1 0 4
7.71 x 1 0 3 8.89 x 10³ 9.45 x 1 0 3 1.64 x 10² 8.08 x 10²
5.83 x 1 0 2 1.70 x 10⁶ 6.14 x 10⁶ 8.59 x 10⁶ 3.17 x 1 0 6
1.43 x 1 0 4
2.61 x 10s 228 x 1 0 5 4.01 x 1 0 7 6.80 x 10³
2.07 x 1 0 3
5.40 x 1 0 3 1.07 x 1 0 4
1.94 x 10³ 271 x 1 0 2 1.87 x 101 4.32 x 1 0 2 1.67 x 10³ 1.90 x 1 0 4
1.73 x l W 1.89 x 10⁴ 1.64 x 1 0 4
1.83 x 10⁴ 7.03 x 1 0 3
4.06 x 10⁴ 2.19 x 1 6 3 1.91 x 10³ 9.24 x 1 0 6 218 x 103 3.74 x 10² 1.09 x 10² 2.29 x 10² 1.01 x 1 0 2
3.03 x 1 0 2 5.74 x 10⁷ 1.20 x 10⁷ 5.31 x 1 0 7 1.51 x 10⁷ 6.57 x 10⁴ 3.19 x 1 0 7 1.07 x 10s
5.28 x 10¹¹ 8.77 x 1 0 6
1.11 x 1 0 3
1.10 x 1 0 3
4.53 x 10⁴ 4.91 x 1 0 s
5.09 x 10³ 3.64 x 1 0 2
1.65 x 1 0 2 2.38 x 10⁴ 1.77 x 1 0 s 1.46 x 1 0 s 1.68 x 10s 1.39 x 1 0 s 1.32 x 10s 1.14 x 1 0 3
6.94 x 1 0 s 3.54 x 1 0 4
3.10 x 1 0 4 1.36 x 10⁶ 3.52 x 10⁴ 6.13 x 1 0 4 1.75 x 10³ 3.69 x 10³ 1.63 x 10³
5.83 x 10² 6.79 x 1 0 7 3.76 x 1 0 s 2.26 x 10s 5.65 x 1 0 8
1.38 x 1 0 3 3.96 x 1 0 3
5.75 x 10⁴ 219 x 1 0 s 6.71 x 1 0 9 1.52 x 1 0 4
5.62 x 1 0 3 1.57 x 1 0 s 1.24 x 10⁴ 1.90 x 1 0 2 3.86 x 101 3.76 x 101 2.36 x 1 0 2
7.51 x 1 0 4
6.54 x 1 0 4
8.42 x 10⁴ 6.18 x 1 0 4 6.90 x IO4 1.21 x 1 0 4
3.10 x 1 0 4 6.23 x 1 0 3 5.22 x 10³ 2.50 x 10⁶ 6.34 x 1 0 3 1.05 x 1 0 3
245 x 103 8.08 x 10³ 3.54 x 1 0 3
3.03 x 1 0 2 2.29 x 10⁷
1.44 x 1 0 6 266 x 1 0 9 6.01 x 1 0 4 9.79 x 1 0 6
237 x 104 8.83 x 1 0 6
6.45 x 10¹² 242 x 1 0 s 1.69 x 1 0 3 4.70 x 1 0 6 2.61 x 10⁻⁵ 6.13 x 1 0 3 1.42 x 101 1.57 x 101 5.57 x 1 0 3 6.78 x 1 0 s 5.19 x 1 0 s 1.11 x 1 0 4
4.91 x 1 0 5 5.02 x 1 0 s 1.93 x 1 0 s 5.12 x 1 0 s 9.76 x 10⁴ 8.21 x 1 0 4 3.61 x 10⁷ 9.92 x 10⁴ 1.67 x 10⁴ 4.62 x 10⁴ 1.35 x 10³ 5.55 x 1 0 4
7.34 x 10⁷
5.83 x 1 0 2 2.89 x 1 0 s 1.16 x 1 0 3 1.22 x 1 0 4
1.99 x 1 0 4 273 x 1 0 2 5.57 x 1 0 2
4.91 X 1 0 3 3.39 x 1 0 3 4.72 x 1 0 6 4.31 x 10² 7.20 x 1 0 2 2.78 x 1 0 2
3.82 x 1 0 2 5.06 x 10² 1.26 3.73 x 101 1.28 x 101 7.75 x 1 0 3
5.94 x 1 0 3 8.27 x 1 0 3 5.62 x 1 0 3 5.67 x 1 0 3 2.83 x 10² 2.07 x 1 0 2 1.2ox 102 1.15 x 10²
1.09 x 1 0 2 2.54 x 10² 3.40 x 1 0 2 6.09 x 10² 2.89 x 1 0 2
9.36 x 10⁴
3.03 x 1 0 2 9.73 x 1 0 6 8.40 x 1 0 6 7.23 x 10⁶ 9.37 x 10⁶ 1.17 x 1 0 2 1.34 x 1 0 4
2.02 x 1 0 3 1.36 x 10³ 4.59 x 10¹⁰
6.01 x 10³ 1.26 x 1 0 2 3.08 x 1 0 3
5.13 x 1 0 3 7.26 x 1 0 3 4.32 x 101 1.37 x 101 2.38 x 1 0 2
9 . 1 0 ~ 1 0 6 7.47 x 1 0 4
8.08 x 1 0 6
4.98 x 1 0 s 3.63 x 1 0 3
2.42 x 1 0 3 7.08 x 10⁴ 6.73 x 1 0 4
6.50 x 1 0 4
1.81 x 10⁴
1.06 x 10⁴
3.06 x 10³ 5.04 x 1 0 3
3.54 x 10³ 7.56 x 1 0 3
aRisks are expressed in scientific notation: 5.83 x 102 = 0.0583,4.61 x 10s = 0.0000461, and so on.
bFor example, a meteorite strikes a repositoly.
Source: Ref.30.
low-level wastes, and uranium mill tailings during operation, transport, and ultimate disposal. Control costs are also discussed.
Uranium M i l l i n p . 3 2
Uranium ore milling, like any commercial ore milling, requires environmental controls for dusts and emissions of various toxic chemicals. However, in addition to dust
ENVIRONMENTAL CONTROLS
Environmental controls on nuclear waste rely on the principle of containment to provide baniers between the various waste forms and the biosphere. Nuclear wastes have a wide range of radioactivity, physical form, and quantities, and no single containment technology is adequate for all wastes. The following sections describe various technologies for controlling high-level wastes,
275

Table 143 Examples of Potential Impacts from Radioactive Waste Management
Factor Short-Tern Long-Term
Stress-related illness Human health
Biotic health
Water quality
Increased cancer incidence
Increased cancer incidence
Toxic materials leaching into groundwater
Dispersion of contaminants from erosion or intnrsion
Cohesiveness among residents from handling adversity; continued dissatis- faction if people leave community
Continued percepion of lower quality of life
Acute ailments
Contamination of water supply via discharges
Dispersion of contaminants during site action
Dissatisfaction of residents with certain aspects of community as as other factors are affected
Lowering of quality of life indicators related to health, environment, com- unity satisfaction, etc.
Formation of new citizens' action groups; turnover in elected oftkials
Air quality
Community satisfaction
Quality of life
Institutions Reorganization of local government; new laws to regulate waste manage- ment; loss of institutions if population disperses
Changes in zoning and settlement planning; population dispersion
Changes in planning and development patterns
Development patterns change; low property values
Business failures
Population distribution
Housing
Couples with young children may leave community
Slowing or stopping of home building in area
Decrease in property values Land use and Value
Economy and employ meat
Community SeNiCeS
Utilities
Employees refuse to work near site; nearby businesses lose clients
Nearby schools lose services Changes in treatment of gahage and sewage to avoid new waste problems
Development of new water supplies Loss of new water supplies as development slows and fear of contamination grows
Disruption of traffic patterns TranspoJlation New road systems designed to avoid waste site
Source: Ref.31.
and toxic chemicals, uranium milling produces radioac- tive emissions, both during the active milling phase and the inactive phase after tailings have been disposed of. Operations at active uranium mills, including manage- ment of the tailings, are regulated by NRC. The two major concerns with respect to radioactive emissions are atmospheric emissions during active milling operations and disposal and isolation of tailings piles.
Atmospheric Emissions during Milling Operations
Many simple and well-developed technologies are suit- able for controlling atmospheric emissions from uranium milling activities. The natural moisture content of uranium ore usually keeps dust emissions to a mini- mum, but dust probIems arise as the ore dries. "he major controls for dust from ore piles are windbreaks designed to minimize ore drying, wetting the ore with
276

water, and wetring the ore with chemical agents. Fugi- tive dust control methods are estimated to reduce emis- sions by 20-9096.
During ore crushing, 97-10096 of emissions can be eliminated by using stack controls, such as wet impinge- ment scrubbers and bag filters, and modifying processes, such as replacing dry crushing with wet semiautogenws grinding. Emissions from yellow cake can be virtually eliminated by using wet scrubbers on the stacks; impiigement or venturi scrubbers and &misters are currently used. Wet scrubbers remove particles by spraying them with water droplets. Cost estimates, in 1985 dollars, for controlling atmospheric emissions at uranium mills are presented in Table 14.4.9
The tailings are pumped as slurries into earthen impoundments, which represent the single largest source of radioactive emissions at a mill. While the disposal area is being used, emissions can be reduced by keeping the piles wet with tailings solution or water. This con- trol method can be supplemented with chemical stabi- lizers, such as resinous adhesives, lignosulfates, electrometric polymers, milk of lime, wax, tar, pitch, asphalt, potassium and sodium silicates, and neoprene emulsions. Annual or more frequent maintenance is generally required because considerable crust breakage and erosion occurs over time. Tailings-pile control methods can reduce emissions by 38-9W.
Progressive reclamation of active tailings involves dividing a large tailings area into smaller cells with sequential construction, filling, and reclamation. Thus
the surface area of exposed tailings is substantially reduced, resulting in up to 85% lower emissions.
in 1985 dollars, for various operations used in progres- sive reclamation.9 In one approach, an initial basin would be formed by building low earthen embankments on the four sides of a square. Mill tailings would be slurried into the basin; as the basin filled, coarse frac- tions of the tailings (sands) would be used to raise and broaden the embankments. The embankments would be compacted on the outer side for strength. The cost of constructing the basin would be $250,000, and the cost of compaction would be $66,000/yr; after 15 yr, when the basin would be full, the total cost for the basin reclamation method would be about $1.17 million.9
Disposal and Isolation of Tailings Piles
Reclamation efforts follow the termination of milling operations.9 The Uranium Mill Tailings Radiation Control Act of 1978 (Public Law 95-604) directed EPA to set standards for protection of public health at mill tailings sites and gave DOE authority to apply remedial actions to abandoned mill tailings. The major objectives of controlling tailings piles are to provide effective long- term stabilization and isolation from the biosphere, control random radon and gamma emissions from the tailings, and protect local water quality. Active and passive control technologies are available to meet these objectives. Active controls require that some institution,
Table 14.5 shows some typical estimated unit costs,
Table 14.4 Costs of Selected Alternatives to Control Atmaspheric Emissions at Uranium Mills
Cost (thousands of 1985 $)
Operating SOUrCe Control Capital (peryr) Lifetime
22.1 22.1 Ore storage Windbreak 11.7 1.95 41.6 Water spray
Cmshing and Bag filter 403 43.2 1,050 grinding Semiautogenous 488 1,180 18,174
process
Yellow-ke High-energy venturi 92.3 30.9 556 dryer Wet shipment
Tailings pond Sprinkler system 45.5 683
Source: Ref. 9.
277

Table 145 Unit Costs of Selected Operations to Control Emissions from Tailing Piles
Operation
Estimated Cost
(1985 $1
Excavating, loading, hauling I; 1 lan. 1.56 and depositing (per m3)
Truck transpolling, 1 1 km (per m 3 h )
Cover and fill spreading and compacting
0.35
0.59 (per m3)
Liner and dam spreading and controlled compacting (per m3)
Compacting in-place soil (per ha)
Installing clay liner (per m3)
Installing cover material (per m3)
1.63
3,380
3.32
2.28
8.97
6.37
Installing 0.03-in. Hypalon liner (per I@)
Resurfacing and revegetation (per ha)
Installing 0.03-in. PVC liner (per m*)
6,500
Source: Ref.9.
usually a government agency, continually monitor and maintain the stabilized and isolated pile. However, it is unlikely that active control methods could be maintained for longer than a few hundred years. Passive controls are designed to maintain tailings pile integrity over long periods with little or no active involvement by human agencies.
Current and potential control technologies that represent a complete tailings disposal and isolation pro- gram fall into four groups: uranium ore process altema- tives, disposal area location, tailings area preparation, and tailings stabilization and covering.
Basic uranium ore processing consists of grinding raw ore and mixing it with sulfuric acid to dissolve the uranium. Uranium in the form of u308 is then separated out with solvent extraction techniques. Alternative processes can remove substantial fractions of the radium and thorium during processing, thereby reducing the radiological hazard of the tailings. The alternatives include nimc acid leaching; separating the slimes, which contain the bulk of the radioactivity, from the sands in the tailings; neutralizing the tailings with lime to pre-
278
cipitate radioactive and toxic elements; treating the tailings with barium chloride; and using ion-exchange treatment for slurries. The alternative methods all cost substantially more than current processes and are not generally developed to a commercial level. Combining the tailings with asphalt or cement at the conclusion of ore processing has been suggested to decrease leachabil- ity and reduce diffusion of radon. Another suggested alternative involves dewatering tailings piles by appro- priate drainage construction to prevent seepage of drain water into the groundwater.
The conventional location for a disposal area has been above grade near the mill; the area is surrounded by 10- to 30-m embankments. However, tailings couId also be disposed of below grade in open mine pits or special excavations. Similarly, tailings could be moved to abandoned deep mines. Both methods substantially reduce erosion and emissions but entail greater cost. Groundwater contamination can occur in any below- grade disposal.
existing techniques can prepare disposal areas to min- imize seepage into groundwater. The techniques include compacting the soil to reduce permeability and using clay or synthetic liners as sealants.
Remedial actions at tailings sites consist of stabi- lizing and covering the tailings to separate them from the environment. A cover of soil or combined soil and clay can protect piles from erosion and reduce radon emissions, depending on the moisture content of the cover. Gravel, rock, and riprap can also provide sub- stantial resistance to wind erosion and water infiltration, thus minimizing radon diffusion. Finally, artificial covers, such as asphalt or synthetic membranes, can be used. However, thin artificial covers appear to have questionable long-term integrity because of mechanical breakdowns and other deterioration.
The most important regulatory issue concerning mill tailings is resolution of the present debate over standards for radon release. The EPA initially proposed a radon flux standard of 2 pCilm2.s.33 On the basis of that standard, NRC issued a requirement that tailings piles be covered with 3 m of earth (Code of Federal Regulations [CFR] Title 10, Part 40)3 Considerable controversy developed over the ability to meet this re- quirement. Subsequently, EPA issued a frnal radon flux standard of 20 pcilrnz-s, with an alternative radon con- centration standard of 0.5 pCi/L at the edge of inactive tailings piles.3S96 In 1983, the NRC suspended its regu- lations that were based on the earlier EPA standard and also urged EPA to adopt a ccncentration standard as an alternative standard for active sites.37
If above-grade or near-surface disposal is selected,

Processing Nuclear Wastes
Most types of nuclear wastes require some type of treat- ment to facilitate ultimate disposal and isolation. The processes for treatment generally fall into three broad categories: storage to allow radioactivity to decay; volume reduction to reduce shipping, handling, and disposal costs; and immobilization to minimize the spread of radioactivity.
Storage
Storage is needed primarily for high-level wastes and spent fuel. The half-lives of fssion products in spent fuel range from fractions of a second to many thousands of years. Thus, storing spent fuel for some time reduces the radioactivity substantially before further processing. After 1 yr of storage, the heat and radioactivity decrease to about 1% of their initial levels (following removal from the reactor). Somewhat slower reductions continue with longer storage.
Conventional storage technology consists of lower- ing he1 elements into 40 A of water in basins with rein- forced concrete walls 6 ft thick that are lined with stain- less steel. The water both shields workers and cools the fuel. Some spent fuel elements have been stored as long as 25 yr without harm to the elements or the environ- ment. Each power plant has a storage basin; away-from- reactor basins are also available.
also been investigated and may prove useful. These approaches consist of storing fuel in heavy concrete vaults, casks, or caissons and cooling it with air or inert gas through forced or natural convection. Such tech- niques have been used successfully in other counmes and are believed to be applicable in the United States-3s
Other techniques for dry storage of spent fuel have
Volume Reduction
Volume reduction is defined as physically processing a waste stream to produce a smaller volume of waste that is more concentrated or more radioactive. Common volume reduction techniques include filtration, evapora- tion, demineralization, and compaction. Advanced techniques for reducing the volume of evaporation con- centrates, combustible and noncombustible solids, and wet sludges and resins include fluidized-bed drying or calcination and incineration. Volume reduction is generally applied to low-level waste from a variety of industries.39
A variation of volume reduction is separating and concentrating long-lived radioisotopes from a mixture of wastes. Shorter-lived materials can then be isolated in
d special long-term geologic repositories. Such tech- niques are generally applicable to high-level and TRU wastes generated in fuel reprocessing (nitric acid leach- ing of uranium mill tailings is a similar technology).
immobilization^
Both low- and high-level wastes can be treated to immo- bilize or solidify the radioactive materials for subsequent storage and fmal disposal. Low-level waste, either “as generated” or reduced in volume, can be solidified in a variety of ways: mixing it with asphalt, bitumen, con- crete, polymers, or dry salt; incorporating it into a ceramic; or vitrifying it into glass.
High-level waste from past commercial reprocess- ing operations, defense programs, and any future repro- cessing must be solidified before it can be transported to a geologic repitory.41 The final waste form must meet a number of different requirements at various stages of the waste disposal process, including processing that is safe and practical at acceptable cost and unaffected by small variations in waste composition and process con- ditions; a final form that can withstand handling, short- term corrosion, and coolant loss or sabotage without dispersing its contents; and a final form that can resist transportation accidents, such as impacts and fues. In addition, the final form must meet requirements for emplacement in a repository; the requirements include structural integrity, resistance to surface contamination and fire, dimensions, weight, remevability, low leachability under both static and flowing water condi- tions, compatibility with the host rock, and resistance to dispersal after accidents or deliberate intrusion.
To date, borosilicate glass has been the most- studied waste form; alternative forms are also being evaluated. Waste can be fued to form a mixture of oxides (calcine) at 3oO-7OO0C. Waste can be solidified by mixing it with clay to absorb water; the mixture can also be fired to form a ceramic. Waste can be mixed with concrete; the mixme can be hot-pressed to elimi- nate excess water. Calcine can be agglomerated with additives to reduce water solubility, or treated to form supercalcines, which are highly stable, leach-resistant, silicate minerals. Titanate and zirconate minerals simi- lar to natural minerals are known to have been stable in a wide range of geologic and geochemical environments for billions of years. Vimfied wastes can be converted to a more stable crystalline form (partial devitrification); high-temperature glasses are also being studied. Pellets of glass, supercalcine, or other waste forms can be incor- porated into a metal binder (matrix); a similar alternative is to form small waste particles in-situ in the metal matrix (this is known as cermet). Waste can also be
279

coated with carbon, aluminum oxide, or other imper- vious materials before encapsulation in metal to form mu1 tiple barriers.
As discussed in the chapter on Light-Water-Reactor Nuclear Power Flants, it may become necessary to col- lect and dispose of krypton-85 and iodine-129. Various techniques are being investigated for their collection, immobilization, and disposal. Krypton-85, with a half- life of less than 5 h, can be stored until its radioactivity has decayed.
Although many of the final forms for immobilizing high-level wastes may prove suitable for TRU wastes as well, the large volume of these wastes and their present containment status will probably necessitate further treatment. The technology used will vary with the type of waste. Low-density materials can be compacted, and large metal objects can usually be cut into pieces. Better volume reduction for many types of wastes may be obtained with some form of incineration. Sophisticated incineration processes usually produce an ash, fine pow- der, or sludge. Decontamination of metallic surfaces can also reduce waste quantities. Immobilizing ashes, residues, and sludges would be the final treatment step.
Transportation Controls
Nuclear wastes and other radioactive materials are usu- ally shipped by truck or train. Packaging technologies are such that no special transportation handling is necessary; the package protects shipping personnel and the public.
The most-serious radioactive waste transportation incidents have involved low-level waste. Two commer- cial low-level-waste disposal facilities were closed tem- porarily during 1979 after receiving shipments that violated packaging standards and transportation safety regulations. Some packages arrived with leaking con- tents or with higher-than-permissible dose rates at the package surface. Other incidents involved poorly main- tained vehicles. Since that time, NRC has amended its regu€ations on packaging and transportation. Certain types of waste packaging, which in the past had been inspected only by DOE, are now inspected by both DOE and NRC. The operators of the disposal facilities have also begun rejecting improperly shipped wastes and denying further services to the shipper, thus encouraging adherence to safety regulations. In addition, Congress has passed legislation (CFR Title 40, Parts 100-199) that authorizes the U.S. Department of Transportation to promulgate federal regulations to ensure maximum public safety during all shipments of radioactive and hazardous wastes.
Low-level waste is generally packaged in tightly sealed cardboard boxes, wooden boxes, or steel drums. Referred to as Type A containers, they are designed to prevent loss or dispersion of their contents during nor- mal transportation. Type A containers must be able to survive a series of tests that subject the container to a broad temperature range, water sprays, free fall, and objects falling onto it. The package may release its contents in an accident because the hazard is relatively low. Statis tics on transportation accidents demonstrate that the packages provide ample protection.24.26
High-level and TRU wastes, as well as spent fuel, are packaged in containers specially designed to prevent loss or dispersion of contents in hypothetical accident conditions. Type B containers provide radiation shield- ing, heat dissipation, and impact resistance.
Spent fuel is the most hazardous material currently shipped by the nuclear power industry. It is transported in massive stainless-steel casks. Lead or depleted uranium is used to shield the environment from penetrat- ing radiation and design requirements are severe. A cask must be able to withstand a free fall from a height of 30 ft onto an unyielding surface, which is equivalent to a drop from much greater heights onto a hard surface (such as concrete or hard-packed soil); a free fall from a height of 40 in. onto a 6-in.dameter steel bar at least 8 in. long; exposure for 30 min to a fire with a temperature of at least 1,475'F; and total immersion in water for 8 h. The cask must also be able to withstand the pressure of 50 ft of water without leakage. These accident test con- ditions represent the damage that a package might incur in a severe transportation accident -- for example, an accident in which a truck collides with a bridge pier, crashes through a guardrail, rolls down a rocky embank- ment, and falls into a river or an accident in which a train derails, rail cars tumble, several tank can catch fire, a propane tank car explodes, and firefighters pump water into the burning debris.25
In 1975, ERDA began full-scale crash-tests of ship- ping containers under actual accident conditions. Two shielded casks were dropped from a helicopter at a height of 2,000 ft onto a hard desert floor. Despite an impact velocity of more than 24C d h , the casks were practically undamaged and did not leak. In early 1977, two truck-crash tests were conducted at speeds of 60 and 80 M h , with the trucks and casks crashing head-on into concrete barriers. The test results fully support the be- lief that all similarly constructed casks will withstand severe accidents without leakage. In another 1977 test, a locomotive traveling at over 80 mi/h smashed into the side of a spent fuel cask on a truck trailer. Although the locomotive was demolished, the cask was only slightly dented (see Fig. 14.3).25
280


Disposal of Low-Level Wastes42
Solid low-level radioactive wastes have been disposed of by shallow land burial since the early 1940s. Until recently, burial technology consisted largely of excavat- ing a trench, randomly dumping the materkds, and loosely backfilling. Doubts have been raised about the effectiveness of this technique in preventing dispersal of radionuclides. Recent burial techniques provide a more methodical approach and ensure that radioactive materi- als will remain isolated.
C o m n problems with shallow land burial are subsidence and erosion of the cover, burrowing animals, deeprooted plants, and accumulation of water in the completed trench. Current burial techniques attempt to prevent problems through a site-specific analysis of the various elements required to provide proper isolation. To begin such an analysis, a potential site is charac- terized in terms of the types and characteristics of its soils, water tables, topography, biotic factors, and frost depths. Knowledge of these characteristics allows an analyst to evaluate demands on a burial trench and en- sure that the subsequent trench design will be effective.
Trench layout relative to local topography is de- signed to minimize problems with the water table and later burial operations. The trench itself is designed to drain off any penetrating water and to allow monitoring through wells. Once frnal bacHill is placed over the waste containers, a number of other barriers may be added, including a hydraulic barrier, a drainage layer, a biotic barrier, an intrusion barrier, and a final layer of cover soil.
In 1985, the cost of low-level-waste disposal at the three operating sites (Barnwell, South Carolina; Beatty, Nevada; and Hanford, Washington) was $30/ft3.15 Table 14.6 shows the costs in 1985 dollars for three alternative techniques -- enhanced shallow land burial, concrete containerization, and above- or below-grade vaults -- for low-level-waste disposal both prior to and after v6@&ie reduction.lS
Disposal of Spent Fuel and High-Level and Transuranic Wastes
The principal goal of the civilian radioactive waste man- agement program is to develop and safely operate one or more mined geologic repositories for the permanent isolation of nuclear wastes. Until such a repository is built, nuclear waste must be effectively isolated from people and the environment.
Most commercial TRU waste was disposed of by shallow land burial at licensed commercial disposal sites.2 The small quantities of commercial TRU waste that are generated at present will be disposed of in geologic repositories when they become available.
In the 1950s and 1960s, the TRU waste produced by defense and DOE research programs was buried in shal- low pits and trenches at various govemment-owned sites. The DOE is currently evaluating various alterna- tives for the long-term management of this waste. Con- cern about the long-lived radioactivity caused DOE'S predecessors to halt land burial of TRU waste in 1970. All defense-related TRU waste is now retrievably stored
Table 14.6 Summary of Costs for Disposal of Low-Level wastes ($lrn)
Enhanced shallow
original Land Burial Vdume
(thwsand No fwy) VRI VR
concrete conlain- erization Vaults
No No V R V R V R VR
200 101.8 1oQ.9
400 520 55.1
1 ,OOo 22.2 25.3
113.6 110.8 135.1 132.3
65.3 625 81.1 14.2
36.4 335 48.1 41.8
.vohune redudion.
Source: Ref. 15.
282

on concrete or asphalt pads under a cover of soil, pend- ing the availability of a geologic repository for perma- nent disposal.43 In 1980, Congress authorized construc- tion and operation of the Waste Isolation Pilot Plant (WIPP) near Carlsbad, New Mexico, for disposal of defense-related TRU wastes. Construction of WIPP began in 198 1 and it is scheduled to start accepting TRU waste in 1988. Technical information from WIPP will be used by DOE to study the disposal of commercial TRU waste.
Interim Storage
Utilities can almost double their spent-fuel storage ca- pacity by changing the configuration of the racks that hold spent fuel in storage pools (reracking) and adding neutron-absorbing material. A utility may also "transship" fuel to another power plant in its system that has unused capacity. However, there is a limit to the amount of relief these methods can provide. Although estimates of the requirements for near-term spent-fuel storage have declined because of reracking and innova- tive fuel cycles that reuse previously discharged fuel assemblies, significant requirements for additional stor- age capacity are projected over the next decade.4
The NWPA addresses the problem by providing for research to expand existing on-site storage and by pro- viding the federal interim storage needed before utilities can expand on-site storage. Specifically, the NWPA assigns utilities the primary responsibility for storing their spent fuel and effectively using available or addi- tional storage capacity. Moreover, the federal govern- ment is responsible for encouraging and expediting the effective use and expansion of on-site storage; if these efforts are insufficient and continued orderly operation of commercial nuclear power plants is threatened, then the federal government must provide up to 1,900 t of interim storage capacity.
New technologies for storing spent fuel include dry wells, casks, silos, and vaults; also, fuel rods can be consolidated into more densely packed arrays (rod con- solidation differs from reracking in that rod consolida- tion involves dismantling, rather than rearranging, the fuel assemblies and placing them in canisters). Cur- rently, DOE, the Tennessee Valley Authority, the Virginia Electric Power Company (VEPCO), and the Carolina Power and Light Company are testing a dry- fuel storage facility at VEPCO's Surry Nuclear Power Station3 The NRC issued a license in July 1986 and tests are expected to be completed in 1988.38 Although DOE has tested and used dry storage for over 20 yr in its Nevada facilities, VEX0 was the first to receive a commercial license for the technology.&
In 1981, DOE successfully completed a "cold (nonradioactive) demonstration of prototypical rod- consolidation equipment. The DOE has also entered into a cooperative agreement for an in-pool rod- consolidation demonstration project with Northeast Utilities Services Company of Hartford, Connecticut. Upon completion of the project, DOE expects to assem- ble a data base that will provide sufficient data for the utilities to apply for rod consolidation licenses.38 A project to test the feasibility of dry rod consolidation is planned for demonstration in 1989.38 A project to test volume reduction of residual nonfuel hardware and other parts and another project to test welding techniques for spent-fuel rod canisters will be initiated in 1989.38
If spent reactor is not reprocessed, the federal government will provide interim storage; the DOE has identified four techniques for consideration: metal casks, dry wells (below grade), silos (above grade), and existing water basins at government sites.5 The federal government will recover the costs by charging industry for processing. The NWPA established a fee for DOE nuclear waste management activities of O.Ol$kWh of electricity generated by nuclear fuel. Recent analysis indicates that moderate inflation and program costs could require indexing of the fee by the year 2000.45
in unacceptable environmental impacts or endanger public health and safety. No major health and safety consequences associated with delaying the opening of a repository until as late as the year 2000 have been identified.41
Interim-storage activities are not expected to result
Monitored Retrievable Storages.19
The DOE initially evaluated four basic storage tech- nologies -- metal casks, concrete casks, dry wells, and vaults -- for use in a MRS facility. Representative draw- ings of a concrete cask and field drywell system are shown in Figs. 14.4 and 14.5, respectively.
transportation casks. They are constructed primarily of lead and steel or ductile iron, and their contents are surrounded by water or other materials to provide addi- tional radiation shielding. Cooling is provided by heat conduction through the metal walls and natural convec- tion to the atmosphere. Dual-purpose transport and storage casks are being used in Europe, but none have yet been licensed for use in the United States.
'Concrete casks or silos are similar to metal casks, although the designs differ because of the different con- struction materials. The cask-in-trench concept is an adaptation of the basic aboveground silo design. Earth
Metal storage casks are very similar to spent-fuel
283

B I -
Diameter: 12 h Weight: 200 tons (empty)
220 tons (loaded)
Figure 14.4 Proposed Concrete Cask for Monitored Retrievable Storage (Source: Ref. 19)
is used to provide additional radiation shielding and physically protect the cask.
Dry wells are cylindrical holes into which sealed metal canisters containing spent fuel or high-level waste are placed. This concept has two variations: in field dry wells, the canisters are inserted into sealed metal con- tainers in the ground, and in tunnel dry wells, the entire installation is in mined tunnels. The surrounding over- pack material and earth provide radiation shielding and a heat-transfer medium.
284
Vaults are large structures (or caverns) where spent fuel packages aa stored. Mmy different types of vault designs exist for spent fuel and high-level waste storage. In an open-cycle surface vault, canisters of spent fuel or waste ffgm reprocessing are stored in large, shielded, warehouse-type structures through which cooling air circulates by natural convection. In a closed-cycle sur- face vault, canisters of Spent fuel or high-level waste are cooled by a passive, secondary heat transfer mechanism. In a "atnnd rxk," which is an underground open-cycle vault, canisters of spent fuel or waste from reprocessing are stu& in latge upen racks in tunnels and emplaced with remote-controlled equipment. The waste is cooled by natural convection, and the surrounding media pro- vide radiation shielding.
As directed by the M A , DOE comprehensively evaluated M R S system. The study concluded that an MRS facility could improve overall performance if it were designed not as just a backup facility but as an integral part of the entite waste-management system.46 The facility could prepare atld package spent fuel at a central location before shipment to a repository for pet- manmt disposal. Performance of these functions at an MRS facility that is centrally located to the majority of commetcial generators of spent fuel could contribute significantly to overall system efficiency and timeliness.
Flexibility was considered especially appropriate in performance areas such as receipt rate, storage capacity, and waste package configuration. Orr the basis of stud- ies of MRS conceptual systems completed in 1984 and earlier, the DOE Office of Civilian Radioactive Waste Management (OCRWM) selected dry storage of spent fuel canisters in sealed storage casks or field dry wells as the two storage concepts that should be further designed for the MRS proposal to Congress. The technologies were selected on the basis of their technical maturity, safety, and economics. Both h4RS designs provide multiple barriers against releases of radioactive materials, can be readily monitored to ensure safe isola- tion of the stored radioactive materials, and, because they are modular, can efficiently accommodate changes in storage requirements.
Geologic Repositories
Rock formations that are geologically stable and have limited potential for groundwater infiltration are be- lieved to be suitable for permanmtly isolating radioac- tive waste. A mined geologic disposal system would provide both natural and man-made barriers between the emplaced waste and the human environment. Natural barriers consist of the host rock and the geologic and hydrologic features of its environment. Man-made

Figure 14.5 Conceptual Field Drywell MRS System (Source: Ref. 19)
barriers consist of the waste package and the engineered design of the repository, including the buffer zone, depth below the surface, size and configuration of disposal rooms, and spacing between waste packages. Before the repository is closed and sealed, the waste package and form will protect the repository workers and the general public by containing the waste and limiting thegotential for dispersal if the waste package is breached.
The waste package (Fig. 14.6) will include the waste form, a stabilizer material, a canister, and one or more layers of protective materials selected to minimize interactions among the waste, the host rock, and ground- water and to ensure retrievability for a prescribed period. The design, construction, and operation of a repository will restore the isolation capabilities of the geological -- system.
A geologic repository will resemble a conventional mine and will consist of both surface and underground facilities. Surface facilities will receive the waste, pre- pare it for emplacement, and transfer it to underground facilities. The surface facilities will be similar to those for handling radioactive materials in nuclear power
plants and other nuclear facilities. Underground facili- ties will include a receiving area for waste packages lowered down the shafts, transfer vehicles to move waste packages to the emplacement area and into the emplacement holes, and equipment to emplace auxiliary barriers, backfill, and other shielding as required.
The repository will be constructed with conven- tional mining techniques. In soft rocks like salt, con- tinuous mining machines will be used. In hard-rock repositories, drilling and blasting will be required to construct shafts and tunnels. Waste packages will be emplaced in holes or trenches in a series of rooms cut into the host rock.
In the conceptual designs for repositories, the emplacement rooms are separated by pillars of undis- turbed material. Several vertical shafts provide surface access, pathways for removal of excavated rock, and ventilation of the excavation areas. Figure 14.7 shows a typical repository system.
In accordance with the NWPA, DOE formally iden- tified, in February 1983, nine sites as being potentially suitable for a geologic repository. This concluded the
285

The “package”
Approximately 2,000 ft below surface
Fuel assembly
us geologic medium y impervious strata
Stabilizer, within assembly
Stabilizer, outside assembly
Canister wall
Gap
Overpack
Gap
Hole sleeve
Sleeve coating
Backfill
Geologic medium
The “repositow”
Figure 14.6 The Multibarrier Concept for Terminal Isolation
Figure 14.7 Artist’s Conception of a Geologic Repository
286

site screening portion of the first-repository program. The nine sites are shown in Fig. 14.8. In May 1986, the DOE Secretary announced his nomination of five sites and recommended three of them to the President for site characterization. The President approved the recom- mendation in May 1986. The three candidate host rocks and sites for the first repository were tuff, at Yucca Mountain, Nevada; salt, in Deaf Smith County, Texas; and basalt, at Hanford, Washington. The NWPA Amendments limited site characterization to the Yucca Mountain site.
The site characterization phase of the geologic repository program includes two kinds of activities: a program of extensive field and laboratory testing and studies to collect and evaluate geologic, hydrologic, and geochemical information and environmental and socio- economic studies that assess the potential impacts of repository development and operation. The site charac- terization phase is expected to last about 5 yr and cost as much as $1 billion (in 1985 dollars). As many as 200- 500 people will be employed at the peak of site charac- terization activities.
The objectives of site characterization are to deter- mine the geologic, hydrologic, and geochemical condi- tions at a candidate site; provide information needed to design a package for the disposal of spent fuel and high-level radioactive waste that will meet the NRC licensing requirements; provide information for design- ing the repository facility; and evaluate whether the site can meet NRC and EPA requirements.
It is expected that exploratory shafts will be con- structed after DOE (1) issues the site characterization plan (expected in late 1988) for review by the NRC and state of Nevada and (2) holds public hearings near the site. Once the Yucca Mountain or another site proves suitable for a repository, DOE plans to build it in two phases to accept waste at the earliest possible date; phase 1 will permit waste acceptance and phase 2 will include surface facilities for waste processing. Initial projections are that the earliest date of repository startup (phase 1) will be during 2003.18
BASALT
Figure 14.8 Regions that Have Been Studied for Possible Storage of Radioactive Wastes (Source: Ref. 19)
287

Long-Range Alternatives47
Alternative Host Media. In order to consider additional potential host rocks with characteristics favorable for waste isolation and different from those investigated for the Fist repository (i.e., basalt, salt, and tuff), DOE focused its second-repository siting program on crystal- line rocks (granite and high-grade metamorphic rocks similar in composition to granite). In 1979, DOE re- sponded to recommendations that additional host rocks be considered for the first repository by initiating a na- tional survey to identify regions with suitable crystalline rock formations. The survey identified three regions (north-central, northeastern, and southeastern) as being more likely to contain large bodies of suitable rock, and subsequent regional studies indicated nearly 250 crystal- line rock bodies as potentially suitable. In addition, DOE started a program of international cooperation and exchange to benefit from studies performed by other countries that are considering crystalline rock formations for disposing of radioactive waste.
In January 1986, DOE issued a &aft area-recom- mendation report that identified potentially acceptable crystalline rock sites in 12 areas in 7 states and an additional 8 "backup" candidate areas in the same 7 states. However, in May 1986, the Secretary of DOE announced the postponement of site-specific work for the second repository. Among the reasons that the DOE Secretary cited for the decision were continuing progress in siting the first repository, confidence in the suitability of the three sites approved by the President for site characterization, forecasts showing declines in the quan- tities and rates at which spent fuel will be discharged from reactors, estimates that the second repository will be needed at a time later than was previously thought, fiscal management and responsibility, and anticipated congressional approval for developing an MRS facility. Furthermore, the NWPA Amendments prohibited site- specific activities for a second repository. Instead, the Secretary of DOE is required to report to Congress on the need for a second repository between January 1, 2007, and January 1,2010.
Because of the postponement of site-specific activities, no work other than cataloging of comments is planned for the draft report, and the areas identified in the report are no longer under active consideration. Generic studies of potential host rocks, not specific to any site, will continue. These studies can be based on scientific literature, information collected by private companies, and data collected in studies performed for the same type of rock in other countries.
Subseabed Disposal. The subseabed disposal concept involves placing solidified waste in canisters and bury- ing them in ocean floor sediments in tectonically stable regions. Difficulties in implementing this concept include canister emplacement, was te-sediment inter- actions, and effective international control and monitoring.48
From 1974 to 1986, DOE participated in joint research with other federal agencies and international organizations. In fiscal year 1986, DOE terminated its participation (due to reduced budget appropriations for generic research that are not funded from the Nuclear Waste Fund), but the NWPA Amendments require DOE to establish an Office of Subseabed Disposal Research within the Office of Energy Research. Its mission, which will be implemented through a university-based consortium, will be subseabed-disposal research, development, and demonstration.
Institritional Controls
Although long-term surveillance of radioactive wastes may impose a burden on our descendants, studies that have quantified the risks of intrusion have concluded otherwise. One such study estimated that the two most likely modes of intrusion carry risks smaller than those associated with natural radiation releases and concluded that an elaborate and expensive surveillance program would be neither necessary nor cost-effective.49 Further- more, the need for surveillance decreases with time as the radionuclides decay.
One way of minimizing the likelihood of human- induced releases is to select repository sites carefully. Avoiding natural resources and future land use conflicts (e.g., dam construction) will provide a substantial meas- ure of protection.29
Because future generations may decide to use the wastes as a resource, the types, quantities, and exact locations of the wastes should be recorded. Efforts to develop such records are under way or planned; how- ever, the exact location of wastes cannot be guaranteed beyond the time of emplacements
Institutional mechanisms offer a means to mitigate long-term waste concerns, but it is unlikely that any known institutional mechanism alone could ensure proper safeguards over the period of potential hazard. Therefore, a combination of engineered barriers and institutional mechanisms must be identified, evaluated, and selected for implementation. Institutional mecha- nisms can complement engineered barriers but cannot serve as the primary mitigating measure for the long
288

term.6 Protective measures against future human activi- ties are shown in Table 14.7.
289
Health and Safety
-
For a number of years, considerable effort has been spent in developing safe techniques for handling radioactive materials in environments potentially more hazardous than a waste repository (e.g., nuclear fuel reprocessing facilities). Radiation exposure to workers in nuclear facilities is limited by regulation to 5 rem/yr to the whole body. In addition, NRC requires that radia- tion exposures be as low as reasonably achievable, com- monly well below the 5-rem annual limit9
The nuclear industry has been attempting to im- prove normal operating conditions, shielding, remote operating techniques, and safe job practices. Experience has been gained in the safe handling of packaged spent fuel and casks in the commercial reactor program and
high-level wastes in defense nuclear programs. This experience wiU be examined and refined specifically in the waste repository context and will be discussed in the safety analysis report prepared for each facility.
The EPA promulgates generally applicable stand- ards for protecting the public from radioactive materials. The EPA standards are implemented and enforced by the NRC, which issues technical criteria for that purpose. Both agencies have been developing the criteria for several years and have developed regulations for preventing undue exposure of the public from operating nuclear facilities and for protecting future populations from repository releases.
In CFR Title 10, Part 20, the NRC specifies (1) maximum permissible concentrations of radioiso- topes in air and water to which the general public may be exposed and (2) allowed dose limits for the general public, which are 0.5 rem/yr to individuals and 0.17 rerdyr to an average public group. The NRC also requires that NRC licensees apply the "as low as is
Table 14.7 General Levels d Defense Against Future Human Activities
Type of Control Description purpose
Active institutional controls
Public awareness
Permanent markers
Waste annunciation
Engineered barriers
Near- and far-field system barriers
Positive protection for duration of stable governments
Long-lasting indicator of reposi- tory existence not uniquely tied to repository site or to government stability
Visible on-site warning of repository existence
Indication of repository due to off- normal conditions that would be apparent to future inve3stigators and would curtail further actions
Engineered measures to protect safety of future explorers and public during and for some time after exploration of system
System performance character- istics designed to protect public if system integrity should be decreased by any mechanism
Institutional management of activities within site boundaries
Accessible public records, library/town hall records, time capsules, international and national archives, and word of mouth/legend passing on of information relative to potential dangers
Variety of highly visible, highly durable markers chosen to ensure long-term survival of one or more markers
Physical and chemical tracers implanted in host rock and system having a lifetime until intrusion, a long postintrusion life- time, and thermallradiation signatures
Physical and chemical barriers designed to exist throughout intrusion and for a long time thereafter
Repository system chosen to mitigate releases to biosphere regardless of whether initiating event is of natural or man-made origin

reasonably achievable" principle to radiation exposures to the public.
The EPA proposes radiation protection standards (CFR Title 40, Pari 191) for both the management and disposal of spent fuel, high-level waste, and TRU waste. The standards restrict projected releases from high- level-waste disposal systems -- for 10,OOO yr after disposal -- to levels that should keep the risks to future generations lower than the risks they would have been exposed to from the unmined ore if these wastes had not been created. The NRC regulations (CFR Title 10, Part 60) specify that the performance of repositories after permanent closure conform to these EPA standards.
The health risks associated with a permanent repository can be mitigated by operational safety prac- tices. Operating safety involves the use of both engi- neering design and operating procedures to avoid haz- ardous conditions and accidents. It also emphasizes planning to mitigate the consequences of accidents that occur despite precautions. A comprehensive set of con- tingency actions and monitoring capabilities is being developed by DOE to detect hazardous conditions and accidents and to isolate and mitigate their consequences. Measures will be taken to reduce the probability of acci- dents to the lowest levels achievable and to ensure that, if accidents do occur, all reasonable efforts are made to minimize occupational exposures and releases to the environment. Ventilation and waste treatment facilities will be designed to handle releases in the event of equip- ment failure. A systematic approach will be used to coordinate the waste cycle from reactor to repository and avoid unnecessary waste handling or repacking that would increase the risks of accidents or occupational exposures.
ENVIRONMENTAL CONSTRAINTS
Radioactive wastes have been managed in the United States since the early 1940s, and the subject has been studied extensively. However, among the public, there remains a general perception that disposal of radioactive waste is a problem that cannot be solved at present. Governmental and institutional constraints on solving the problem are addressed by two major pieces of legis- lation, the LLRWPA and NWPA (as amended). Some technical constraints remain; that is, information is still needed in some areas to resolve present uncertainties. However, these areas do not appear to be major hindrances to achieving fully adequate technical solutions.
Government and Institutional Constraints
Historically, an important institutional constraint on disposing of low-level wastes was the reluctance of host states to accept increasing amounts of waste from out- side their boundaries. The LLRWPA addressed this issue by authorizing states to form interstate compacts and agree on disposing of wastes at a site within the compact borders. Several compacts have been formed under the law, and some states have negotiated and ratified agreements and sent them to Congress. Some states have yet to decide which compact to join. Some regions are also encountering legislative problems and difficulties in working out technical solutions.
Although the NWPA established a system for dis- posing of radioactive wastes and brought 25 yr of politi- cal indecision to an end, disagreement persists. In May 1985, OCRWM issued a report to the Congress on the status of the MRS proposal that was then in prepara- tion.19 In this status report, O C R W explained that because of the change in the M R S concept (from a backup facility to an integral component of the waste- management system), it would not be possible to meet the June 1, 1985, deadline in the Act and that it planned to provide the Congress with the MRS proposal in early 1986. On August 20,1985, the state of Tennessee filed suit in U.S. District Court in Nashville alleging that any DOE proposal to request authority to construct an MRS facility in Tennessee would violate the NWPA. Although the courts eventually ruled in DOE'S favors1 and DOE submitted a proposal in March 1987 to build an MRS facility near Oak Ridge, Tennessee,52 the NWPA Amendments nullified the proposal. Instead, the NWPA Amendments established an MRS Review Commission to report on the need for an MRS facility by June 1989. If the commission recommends an MRS facility, DOE will restart the site selection process.
Because no commercial fuel in the United States is now reprocessed, virtually all TRU waste being gener- ated in the United States is from defense or other gov- ernment operations and hence is outside the scope of this chapter. Future commercial generation of TRU waste depends strongly on the stability of federal policy on spent fuel reprocessing and the response of industry to such policy.
Technical Constraints53
Technical constraints to radioactive waste disposal com- prise areas of investigation where further research is needed to resolve unknowns or uncertainties. Despite the presence of such areas, the technical information
290

now in hand or expected to be forthcoming is likely to be sufficient for selecting one or more candidate sites for in-situ testing. After a site is selected, detailed explora- tion and underground testing are likely to provide suffi- cient technical information to proceed with detailed design and construction of a repository. Among the further technical investigations needed are laboratory and field experiments for determining releases from waste packages; studies of the effects of solubility on release rates to groundwater; studies of the performance of solid backfill surrounding a waste canister and over- pack; studies of the interactions among the waste form, waste package, and backfill material; field evaluations of the performance of sealing and plugging systems; and continuing research into alternative waste forms and packages.
REFERENCES
1.
2.
3
4.
5 .
6.
7.
Final Generic Environmental Impact Statement on Handling and Storage of Spent Light Water Power Reactor Fuel, U.S. Nuclear Regulatory Commis- sion Report NUREG-0575 (Aug. 1979).
Report of the Interagency Review Group on Nuclear Waste Management, Interagency Review Group on Nuclear Waste Management, TID-29442 (March 1979).
General Accounting Office, Nuclear Energy's Dilemma: Disposing of Hazardous Radioactive Waste Safety, Comptroller General o f the United States Report to the Congress, EMD-7741 (Sept. 9, 1977).
Final Environmental Impact Statement, Manage- ment of Commercially Generated Radioactive Waste, Vols. 1 ,2 , and 3, U.S. Dept. of Energy Report DOFVEIS-0046 (Nov. 1980).
Mission Plan for the Civilian Radioactive Waste Management Program, Vol. 1, U.S. Dept. of Energy Report DOWRW-0005 (June 1985).
Environmental Development Plan for LWR Commercial Waste Management, U S . Dept. of Energy Report DOEIEDP-0063 (Aug. 1980).
Technical Criteria for Regulating Geologic Dis- posal of High-Level Radioactive Waste: Ad- vanced Notice of Proposed Rulemaking, U.S. Nuclear Regulatory Commission, Federal Register, 45(94):31393-31408 (May 13, 1980).
a.
9.
10.
11.
12.
13.
14.
15.
16.
17.
18.
19.
20.
Light-Water-Reactor Nuclear Power Plants, Chapter 11 in Energy Technologies and the Environment, U.S. Dept. of Energy Report DOE/ EP-0026 (1980).
Final Generic Environmental Impact Statement on Uranium Milling, Vol. I , U.S. Nuclear Regulatory Commission Report NUREG-0706 (Sept. 1980).
Radioactive Waste Management, Interim Draft, U.S. Dept. of Energy Order 5820 (July 29, 1983).
Licensing Requirements for Land Disposal of Radioactive Waste, 10 CFR Part 61, U.S. Nuclear Regulatory Commission, Federal Register, 475744657482 (Dec. 27,1982).
A Background Report for the Formerly Utilized Manhattan Engineer DistrictlAtom'c Energy Com- mission Sites Program, U.S. Dept. of Energy Report DOEJEV-0097 (Sept. 1980).
Draft Generic Environmental Impact Statement on Decommissioning of Nuclear Facilities, US. Nu- clear Regulatory Commission Report NUREG- 0586 (Jan. 1981).
Manion, WJ., and T.S. LaGuardia, Decommis- sioning Handbook, U.S. Dept. of Energy Report
Kupp, R.W., The Suboptimum Optimization of LLR W TreatmentlDisposal, in Waste Management '86: Waste Isolation in the U.S., Technical Pro- grams and Public Education, Vol. 3, R.G. Post and M.E. Wacks, eds., pp. 439-444 (1986).
Final Environmental Impact Statement: Decommissioning of the Shippingport Atomic Power Station, U.S. Dept. of Energy Report DOE/EIS-0080F (May 1982).
Alternatives for Managing Wastes from Reactors and Post-Fission Operations in the LWR Fuel Cycle, Energy Research and Development Admin. Report ERDA-76-43 (May 1976).
Draft 1988 Mission Plan Amendment, Office of Civilian Radioactive Waste Management, U.S. Dept. of Energy Report DOEIRW-0187 (June 1988).
Annual Report to Congress, Office of Civilian Radioactive Waste Management, U.S. Dept. of Energy Report DOEIRW-000412 (March 1986).
Spent Fuel and Radioactive Waste Inventories, Projections and Characteristics, U.S. Dept. of Energy Report DOE/NE-0017-1 (Oct. 1982).
DOEEV-10128-1 (Nov. 1980).
29 1

21.
22.
23.
24.
25.
26.
27.
28.
29.
30.
31.
32.
292
Dressen, D.R., et al., Research on the Charac- terization and Conditioning of Uranium Mill Tail- ings, Vols. I-III, Los Alamos National Laboratory Report LA-9660-UMT (June 1983).
Jordan,B., U.S. Department of Energy, Defense Programs, Germantown, Md., personal com- munication (Aug. 1988).
EPRI Journal, 11(4):23 (June 1986).
Final Environmental Impact Statement on Trans- portation of Radioactive Material by Air and Other Modes, U.S. Nuclear Regulatory Commis- sion Report NUREG-0170 (Dec. 1977).
Everything You Always Wanted to Know About Shipping High-Level Nuclear Wastes, U.S. Dept. of Energy Report DOWEV-0003 (Jan. 1978).
Transportation Accident Risks in the Nuclear Power Industry, U.S. Environmental Protection Agency Report EPA-520-3-75-023 (Nov. 1974).
Environmental Development Plan for Defense Waste Management, U.S. Dept. of Energy Report DOEEDP-0064 (Sept. 1980).
Licensed Operating Reactors: Status Summary Report, Data as of 05-31-88, U.S. Nuclear Regula- tory Commission Report NUREG-0020, Vol. 12, No. 6 (June 1988).
Statement of Position of the United States Depart- ment of Energy in the Matter of Proposed Rule Making on the Storage and Disposal of Nuclear Waste (Waste Confidence Rule Making), US. Dept. of Energy Report DOWNE-007 (April 1980).
Smith, J.M., T.W. Fowler, and A.S. Goldin, Environmental Pathway Models for Estimating Population Health Effects from Disposal of High- Level Radioactive Waste in Geologic Repositories, U.S. Environmental Protection Agency Report EP A- 520/5 - 8 5 -026 (May 19 86).
Payne, B.A., and R.G. Williams, Perceived and Calculated Health Risks: Do the Impacts Differ?, in Waste Management '86: Waste Isolation in the U.S., Technical Programs and Public Education, Vol. 1, R.G. Post and M.E. Wacks, eds., pp. 173- 177 (1986).
Final Environmental Impact Statement for Reme- dial Action Standards for Inactive Uranium Pro- cessing Sites, Vol. I , U.S. Environmental Protec-
33.
34 *
35.
36.
37.
38.
39.
40.
41.
42.
43.
tion Agency Report EPA-520/4-82-013-1 (Oct. 1982).
Proposed Disposal Standards for Inactive Uranium Processing Sites; Invitation for Com- ment, 40 CFR Part 192, U.S. Environmental Pro- tection Agency, Federal Register, 462556-2563 (Jan. 9, 1981).
Uranium Mill Licensing Requirements, 10 CFR Part 40, U.S. Nuclear Regulatory Commission, Federal Register, 45:65521-65538 ( a t . 3,1980).
Standards for Remedial Actions at Inactive Uranium Processing Sites, 40 CFR Part 192, U.S. Environmental Protection Agency, Federal Register, 48590-606 (Jan. 5, 1983).
Environmental Standards for Uranium and Thorium Mill Tailings at Licensed Commercial Processing Sites, 40 CFR Part 192, U.S. Environ- mental Protection Agency, Federal Register,
Uranium Mill Tailings; Suspension of Selected Provisions, 10 CFR Part 40, U.S. Nuclear Regula- tory Commission, Federal Register, 48:35350- 35356 (Aug. 4,1983).
Cooperative Demonstration Projects for Spent Nuclear Fuel, OCRWM Backgrounder, U.S. Dept. of Energy Report DOWRW-0138 (April 1987).
Volume Reduction Techniques in Low-Level Radioactive Waste Management, U.S. Nuclear Regulatory Commission Report NUREG/CR-2206 (Sept. 1981).
Final Environmental Impact Statement, Long- Term Management of Defense High-Level Radio- active Wastes, Savannah River Plant, Aiken, South Carolina, U.S. Dept. of Energy Report DOWEIS- 0023 (Nov. 1979).
Packaging Configurations and Handling Require- ments for Nuclear Materials, Sandia National Laboratory Report SAND-81-1237C (1981).
Trench Design and Construction Techniques for Low-Land Radioactive Waste Disposal, U.S. Nuclear Regulatory Commission Report NUREG/ CR-3 144 (Feb. 1984).
Final Environmental Impact Statement, Waste Management Operations, Savannah River Plant, Aiken, South Carolina, U.S. Energy Research and Development Admin. Report ERDA-1537 (Sept. 1977).
48~45926-45947 ( a t . 7, 1983).

44.
45.
46.
47.
48.
49.
Spent Fuel Storage Requirements, US. Dept. of Energy Report DOE/RL-86-5 (Oct. 1986).
Nuclear Waste Fund Fee Adequacy: An Assess- ment, U.S. Dept. of Energy Report DOE/RW-0020 (June 1987):
The Need for and FeasibiLty of Monitored Retrievable Storage -- A Preliminary Analysis, Office of Civilian Radioactive Waste Manage- ment, US. Dept. of Energy Report DOE/RW- 0022 (April 1985).
Draft Mission Plan Amendment, Office of Civilian Radioactive Waste Management, U.S. Dept. of Energy Report DOJ3RW-0128 (Jan. 1987).
Studies of Alternative Methods of Radioactive Waste Disposal, OCRWM Backgrounder, U.S. Dept. of Energy Report DOWRW-0139 (April 1987).
Cohen, B.L., Radioactive Wastefrom Light Water Reactors, Reviews of Modern Physics, 49( 1) (Jan. 1977).
50.
51.
52.
53.
Standards - --_ for Protection Against Radiation, Code of Federal Regulations, Title 10, Chapter 1, Part20, Nuclear RegulCiiy Commission.
U p b - e on Litigation, OCRWM Bulletin, U.S. Dept. of Energy Report DOWRW-0115 (Dec. 1986).
DOE Sends Proposal to Congress for Monitored Retrievable Storage Facility in Tennessee, OCRWM Bulletin, U.S. Dept. of Energy Report
A Study of the Isolation System for Geologic Dis- posal of Radioactive Wastes, Waste Isolation Systems Panel, Board on Radioactive Waste Management, Commission on Physical Sciences, Mathematics, and Resources, National Research Council, National Academy Press, Washington, D.C. (1983).
DOERW-0130 (April 1987).
a
293

Chapter 15
Liquid-Metal Fast Breeder Reactor Power Plants
BACKGROUND
As in all nuclear reactors, a fission chain reaction is maintained in a breeder reactor by the absorption of neutrons in the fuel and the subsequent fissioning of the fuel accompanied by the release of additional neutrons. Some of the excess neutrons not absorbed in the fission- able fuel can be absorbed in material, referred to as ”fertile” material, that has the characteristic of being converted to fissile fuel upon absorption of a neutron. If more fissionable fuel is produced than consumed, the reactor is referred to as a breeder.
Two basic kinds of breeder reactors exist: fast and thermal. The latter uses low-energy (thermal) neutrons to sustain the fission reaction, with uranium-233 as the fissionable fuel and thorium-232 as the fertile material. Breeding is possible to a lesser extent than in fast breed- ers, which use high-energy neutrons both to sustain the fission reaction and to produce plutonium-239 from fertile uranium-238. The plutonium produced can be made into fuel for either breeder reactors or light-water reactors (LWRs), which make up the bulk of commer- cial nuclear power plants in the United States. Fast breeders that are cooled with liquid metal are called liquid-metal fast breeder reactors (LMFBRs).
History
One of the earliest steps in the development of the breeder reactor was the construction and operation of the experimental fast reactor, Clementine, at Los Alamos, New Mexico. From March 1946 to December 1953, this reactor was used to test operation with fast neutrons, plutonium fuel, and a liquid-metal coolant, in this case mercury. Clementine provided an intense source of fast neutrons and proved for the first time that a fast reactor could operate reliably.l
On December 20, 1951, the Experimental Breeder Reactor I (EBR-I), located at the National Reactor Test- ing Station (MTS) in Idaho, generated electricity from nuclear energy for the fiist time in the world. It used a liquid-metal coolant. Its operation demonstrated that breeding was a feasible concept, that effective instru- mentation and control could be achieved,l and that fast breeder reactors can be designed to be inherently stable.;! In 1955, an operator error caused a substantial amount of fuel to melt, but no widespread plant damage occurred. The facility was temporarily shut down for inspection, but no measurable effects were detected off-site.3
was the design and construction of the EBR-I1 at NRTS.4 Construction began in 1958, and criticality (a self-sustaining chain reaction) was achieved on Novem- ber 11, 1963. The original purposes of the facility were to (1) determine the feasibility of using a fast reactor to produce power and (2) demonstrate the integrated fast reactor (EX) concept -- a design that would incorporate the fuel reprocessing facility in the same facility as the reactor. From 1965 to 1969, EBR-I1 was used to dem- onstrate this concept.5 However, in the mid-l960s, structural and operational changes were made so that EBR-I1 could serve as a test reactor for the Atomic Energy Commission’s priority fuels and materials pro- gram. As of March 1985, the reactor’s total thermal output was 204,584 MW-d.
Construction of the Enrico Fermi Fast Breeder Reactor at Lagoona Beach, Michigan, began in 1956. The Power Reactor Development Co., established by the Federal Power Reactor Demonstration Program, owned and operated the reactorp Detroit-Edison Co. owned and operated the turbine-generator portion of the plant. In December 1965, the Atomic Energy Commission licensed the reactor to operate at its full thermal power potential of 200 MW. While it was operating at a ther- mal power level of 34 MW on October 5, 1966, two fuel
The next significant step in reactor development
295

subassemblies partially melted because a loose segment of zirconium blocked the coolant flow in the primary coolant system.7 A small amount of radioactivity leaked from the primary system but was kept within the con- tainment building. The segment was retrieved and, after a fuel reloading, the reactor resumed operation in July 1970.
Due primarily to a lack of ensured funds for future operations, the Power Reactor Development Co. an- nounced on November 29,1972, that the Fermi project was being terminated.8 By that time, the Fermi reactor had generated about 32 million kwh of electricity.
Design of the Fast Flux Test Facility, located in Richland, Washington, and now called the Fast Test Reactor (FTR), began in 1967. The FTR achieved criti- cality in February 1980 and now operates at full reactor thermal power of 400 M W . 9 The heat produced is transported through a heat exchanger to the atmosphere. No electricity is produced from the energy released. The primary objective of this plant is to investigate the behavior of fuels, materials, and components in sodium- cooled reactors that use mixed-oxide fuel. It is also used for other development programs that require fast-neutron irradiation and for some reactor safety experiments.
The Clinch River Breeder Reactor Project in Ten- nessee was intended to demonstrate the feasibility of a full-scale LMFBR electric power plant. The reactor was originally designed to have a thermal power capacity of 975 M W , with the potential for expansion to 1,121 MW, and it would have generated electricity for commercial use. Specific objectives of this type of reactor were to demonstrate (1) its technical performance, safety and reliability, maintainability, environmental acceptability, and economic feasibility and (2) its value for conserving important nonrenewable natural resources. The design incorporated much of the experience gained in the con- struction and operation of the FTR. Although the plant was well under construction, funding was discontinued in 1985 due to lack of support in Congress. Construc- tion permit proceedings were dismissed by the U.S. Nuclear Regulatory Commission (NRC) on March 27, 1985.10
Because no other large-scale LMFBR design has proceeded to a similar extent, the Clinch River design is the basis for many of the environmental control concepts discussed in this chapter. Figure 15.1 is a cutaway of the Clinch River plant.
Government Programs
Despite cancellation of the Clinch River project, re- search continues on fast-reactor technology and its fuel
cycle. Research by the U.S. Department of Energy (DOE) has concentrated on (1) developing a technology base, (2) developing and testing such components as large steam generators, primary coolant pumps, fuel- handling equipment, intermediate heat exchangers, small valves, and instrumentation and controls, (3) preparing guidelines for high-temperature and seismic design conditions, sodium system design, and nondestructive testing of components and systems, (4) providing criti- cality measurements, nuclear data, and computational methods for use in plant design and operation, and (5 ) developing fuel, blanket, and control-core compo- nents and materials.
The development of equipment, processes, and facilities to reprocess and fabricate fuel, so that the fuel cycle can be self-sufficient, is another focus of current research and development efforts. The IFR, which would include fuel reprocessing and possibly fuel fabrication steps in the same containment facility as the reactor core, is one facet of this work. The proximity of reactor and reprocessing facilities would also help pro- tect against diversion and sabotage of nuclear fuels.
T E C H N O L O G Y 1 1 - 1 6
The cormf an LMFBR consists of stainless-steel-clad fuel assemblies containing plutonium-239, uranium-235, or mixed plutonium-uranium oxide fuel. The concentra- tion of plutonium oxide in the mixed fuel varies from 15 to 30%, depending on the fuel’s location in the core. This mixed fuel is of primary interest in the develop- ment of LMFBRs because it has already been estab- lished for use with LWRs and is part of the IFR. Car- bide and nitride fissile fuels have also been examined.
Reactor cores are classified as homogeneous or heterogeneous. In a homogeneous core, all of the core fuel elements contain fissile material and the core is surrounded by stainless-steel-clad blanket assemblies containing nonfissionable, fertile uranium-238. In a heterogeneous core, some fertile assemblies are also located in the core. The uranium-238 is partly converted to fissionable plutonium-239 as it captures fast neutrons produced in the active core during fission. This concept is known as breeding.
After a period of operation, the LMFBR needs to be refueled. The used fuel assemblies and blanket assem- blies are removed and the spent fuel is processed to recover the remaining plutonium and fissile uranium. A typical stand-alone fuel reprocessing plant might process 5 metric tons (t) of heavy metal (uranium plus plutoni- um) per day, a rate that would meet the periodic refuel- ing requirements of about 80 1,OOO-MW (electrical
296

Intermediate and primary system sodium pump drives
/ Primary system sodium pump ward vessels
\ guard vessel
Reactor vessel and guard vessel
-
Figure 15.1 Cutaway of the Clinch River Plant (Source: Ref. 11)

output) LMFBR power plants. Recovered plutonium and uranium-235 could be used for fissile material in LMFBRs or LWRs. Recovered uranium-238 could be used for fertile material in LMFBRs.
Fundamental differences exist between LMFBRs and LWRs. In LMFBRs, high-energy (fast) neutrons are used to produce the fission reactions, whereas LWRs use low-energy (thermal) neutrons. Also, instead of water, LMFBRs use a liquid metal to cool the reactor. Unlike water, liquid metal does not slow down the fission- producing neutrons below the energy range required to breed plutonium-239 from uranium-238. Finally, the core of an LMFBR is more compact than that of an LWR. Fast neutrons react more quickly and over shorter distances than thermal neutrons, thus producing higher power densities and necessitating higher coolant temper- atures and shorter fuel regions than in an LWR. Blanket material can be placed above and below the shorter core in an LMFBR to prevent the escape of neutrons by re- flecting them back to the fuel, and thus enhance the breeding potential.
are suitable coolants for breeders using fast neutrons. Liquid metals transfer heat better than does pressurized helium, but helium reduces neutron energies less rapidly than liquid metals. Over the years, liquid metals (i.e., mercury, mixed sodium-potassium, and sodium) have been the only coolants used in fast breeder reactors, both in the United States and abroad, so experience has accu- mulated in their favor.
Of the various liquid-metal coolants avidable, sodium has the most advantages for fast breeder reac- tors. Sodium is a waxy, lustrous, silvery metal that melts at about 210'F and boils at about 1,640'F. This high boiling point is a favorable thermodynamic charac- teristic because sodium coolant is heated by the reactor to about 1,000'F. Other favorable characteristics of sodium include its metallic nature, extended liquid range, high thermal conductivity, and low vapor pres- sure at LMFBR operating temperatures, allowing the design of high-temperature, low-pressure systems that can convert thermal energy more efficiently than LWRs. Because of these operating characteristics, the coolant is unlikely to vaporize suddenly if the primary system ruptures. Sodium also requires low pumping power and system pressure; it can absorb considerable energy under emergency conditions; and it can react with, dissolve, and retain many fission products if they happen to be released to the coolant system in the event of a fuel element failure. Finally, sodium has a low potential for capturing (removing) or moderating (slowing down) fast neutrons.
Only certain liquid metals or pressurized helium gas
298
Sodium also has some disadvantages, such as (1) its chemical reactivity, which can lead to almost explosive reactions with water, (2) its opacity, (3) its relatively high melting point, (4) its absorption of neutrons under irradiation, causing formation of the radioactive isotopes sodium-24 and sodium-22 (with half-lives of 15 h and 2.6 yr, respectively), and ( 5 ) the difficulty of disposing of sodium-containing wastes. Although not a major maintenance problem, the potential radiological conse- quences of a sodium spill or fire must be considered.
Two heat transport systems for LMFBRs have been proposed pool-type and loop-type systems (see Fig. 15.2). In the pool-type LMFBR, the reactor vessel, primary system pumps, and intermediate heat exchanger are all submerged in a large pool of liquid metal. This design was used in early U.S. experimental reactors, has been adopted for demonstration reactors in Europe, and is a feature of the IFR. In the loop-type reactor, the primary system pumps coolant through the reactor and to and from the intermediate heat exchanger in pipes, much like in a pressurized-water reactor. This design was used in early European experimental reactors and the FTR in Washington, and was planned for the Clinch River breeder reactor.
Because of sodium's explosive chemical reactivity with water and activation under irradiation, as men- tioned above, both the pool-type and loop-type systems employ an intermediate or secondary sodium coolant loop (see Fig. 15.3). The secondary loop indirectly transports the thermal energy from the primary radioac- tive sodium loop, which passes directly through the reactor, to a water-steam loop, which is outside the reac- tor containment and shielding. This design has the ad- vantages that (1) the reactor containment structure can be designed for lower pressure since it does not have to protect against the energy release of a sodium-water reaction, (2) leakage of radioactive sodium into the steam system is minimized, and (3) water or other hydrogenous material is kept out of the vicinity of the reactor, minimizing the danger of increased reactivity leading to power excursions.
Special designs have been developed to preclude leakage from sodium systems. The welded stainless- steel piping and vessels containing sodium are fabricated in accordance with high construction and quality assur- ance standards, and low-pressure operation reduces the consequences of pipe failure or leakage. In a loop-type system, the reactor, pumps, heat exchangers, and other components are enclosed within guard tanks to catch the sodium if the system leaks.
The primary sodium system operates at a lower pressure than the secondary system. Thus, if the inter-
-

Reactor vessel
Secondary containment
vessel
Low pressure Pump
I
core
Pool Loop - Figure 15.2 Pool- and Loop-Type LMFBRs (Source: Adapted from Ref. 17)
Steam
Water-stream - Turbine erator
Reactor \ loop
I < I generator $ lheat eyhanger
Containment and shielding
~~
:eedwater pump
Figure 153 LMFBR Heat Transport System with Primary, Intermediate, and Water-Steam Loops
mediate heat exchanger between these two systems leaks or fails, leakage should progress from the nonradioactive secondary system into the radioactive primary system. Even though leakage should not result in a radiological problem in the secondary system, the intermediate heat exchanger can be designed to facilitate repair or replace- ment of leaky tubes.
In the secondary system, sodium at about 950'F is pumped through a steam generator and superheater where it transfers its heat to water, converting the water to superheated steam at about 9W°F and a pressure of
1,450-1,800 psi. This steam passes through a turbine that drives a generator to produce electricity.
Steam generators have been tested in both sodium and water environments to assess leakage mechanisms and limit the extent of damage. Pressures in the steam generator that result from sodium leaks and sodium- water reactions can be relieved by venting through rup- ture discs into a system that separates the reactants and releases the hydrogen produced to the atmosphere. The intermediate heat exchanger must be designed to with- stand pressure pulses in the secondary system that could
299

result from sodium-water reactions in the steam gener- ator. Sodium-water steam generators have operated successfully in several reactor systems in the United States and abroad. Previous experience with sodium components lends confidence that sodium-water heat exchangers can be designed to minimize the potential for violent reactions.
The overall steam cycle is similar to that of conven- tional steam-electric power plants. Normally, exhaust steam from the turbine, at about lW°F, is condensed by transferring its heat energy through the walls of metal tubes to water flowing on the other side. The condensed steam is then pumped back to the steam generator in the form of high-pressure water. The specific method for condensing the exhaust steam depends in large measure on the reactor site and the availability of cooling water. The electricity generation efficiency of the Lh4FBR is expected to be in the range of 35-41%, which compares favorably to the 30-33% efficiency currently obtained with LWRs.
Modem LMFBR designs take a two-barrier ap- proach to containment. The reactor core, primary coolant, and intermediate heat exchanger are enclosed in an inert, concrete-shielded vault that forms part of a low-leakage inner barrier against accidental releases. The inner barrier is in turn surrounded by a gas-tight secondary containment building.
ENVIRONMENTAL ISSUES
Nuclear power plants produce radioactive isotopes (fission products) during fission. Some of these fission products may escape into the sodium coolant through defects in the cladding material. The coolant is also made radioactive, along with structural materials, by the high neutron radiation produced during fission. The gaseous portions of these fission and activation prod- ucts, along with liquid and solid radioactive wastes, are among the environmental issues discussed in this sec- tion. Figure 15.4 shows the major environmental parameters associated with an Lh4FBR based on the Clinch River breeder reactor design.
Liquid and Solid Radioactive Wastes19
Liquid wastes are generated from the washing of con- taminated plant components and from floor, shower, and laboratory drainage. Other sources include excess sodi- um and water coolants, leaky valve stems, and pump seals. These wastes are processed and, as much as pos- sible, recycled. Processing includes storage to permit
300
decay of radioactivity, filtration, demineralization, and evaporation of the liquid components of materials col- lected from filters or settling basins. About 90% of the liquid from component washing is recycled and the remaining 10% is released to the environment through a low-radioactivity monitoring and discharge system. Nearly all of the low-radioactivity processed drainage liquid is also discharged in controlled releases to the environment. Concentrated bottoms fiom the evapo- rators are processed as solid wastes for disposal.
the liquid waste processing systems, (2) tools, spent demineralizer resins, filters, discarded metal compo- nents, and other noncompactible solids, (3) contami- nated clothes, rags, papers, seals, and other compactible solids, (4) metallic sodium generated from fuel handling operations, and ( 5 ) sodium-contaminated components. These wastes are packaged and stored or disposed of in accordance with safety regulations and procedures. Procedures and regulations for off-site disposal of radioactive solid waste are discussed in the Nuclear Waste Management chapter.
Radioactive solid wastes include (1) residuals from
Gaseous Wastes
The volatile radioactive gases produced in a nuclear power plant consist of noble gas radionuclides and tritium. Xenon and krypton result from fission in the fuel and can be released into the sodium coolant by failure of fuel elements. Argon and neon are produced by neutron activation of potassium (an impurity in the sodium coolant) and of sodium itself. Tritium has sev- eral sources: ternary fission in fuel, neutron interaction with boron-10 in the control rods, and neutron interac- tion with lithium contaminant in the primary sodium. Gaseous radionuclides released from failed fuel ele- ments migrate to the reactor cover-gas space. Some nongaseous isotopes from the liquid sodium may also vaporize into the reactor cover gas. The cover gas is then processed in a gaseous waste treatment system consisting of two vapor traps that remove essentially all nongaseous isotopes, including any trace quantities of sodium iodide. Gases processed through the vapor traps are continuously monitored and are discharged in a controlled fashion.
Thermal and Chemical Pollution
Power plants that use steam turbines to generate electric- ity characteristically release certain pollutants, regard- less of whether the heat to make the steam comes from burning coal or fissioning uranium. These pollutants

Gaseous
control radwaste 0 t 0 n
@-
"7 Power 1-w 0 A Radwaste processing
generation
Cooling Makeup
treatment system water C 0
@ Liquid effluents 1 Plant Parameten
Chemical (tonslyr) 350 MW (electrical output) 68.7% capacity factor
@ Fissile fuel W2-yr period)
109 1,245
168
Total suspended solids
Sulfates Resource Requirements Total dissolved solids
5.3 -
Product Fuel
Initial @ Breeding ratio*
Equilibrium
Residuals
@ Makeup water Igallmin) 5,835 Sodium Chloride Phosphates
Radioactive (Ci/yr) 1 .B Tritium 1.24 Other
._
36 39
0.4
330 0.016
@ Water loss to atmosphere
@ Gases (Ci/yr)
Solids
4.4
10.4
Igal/min) 3,584 @ Spent fuel (t/2-yr period)
0 Blanket assemblies (t/yr) Noble gases Iodine Tritium
Low-level radwaste m -__ 155gal drumslyr) 0
3.1 320
'Fissile fuel producted per unit of fissile fuel consumed.
Figure 15.4 Process Flow Streams for an LMFBR Nuclear Power Plant (Sources: Adapted from Refs. 11, 18, and 19)
301

include waste heat (thermal pollution), residual chemi- cals, and dissolved solids from evaporation. They may be released to the air (e.g., from cooling towers) or to an adjacent body of water. These matters are discussed at length in the chapter on Environmental Control Tech- nologies for Fossil Energy Systems.
Safeguards
Plutonium is produced as a by-product in commercial LWRs and will be used as a fuel for fast-breeder reac- tors. The potential diversion of plutonium to unautho- rized uses is a significant concern. Consequently, DOE has established a program to guard against the possible theft, diversion, or sabotage of plutonium. This program covers all special nuclear materials (plutonium and enriched uranium) owned by DOE.
The safeguards program consists of three types of control measures: physical protection, surveillance (in- cluding process control), and accountability measures. Physical protection involves the use of exclusionary zones and physical barriers to limit personnel access to nuclear material. Surveillance includes administrative and technical restrictions on the handling of nuclear materials and in-situ measurements made with tech- niques such as nondestructive assay. Accountability measures include detailed record-keeping on the form, use, and location of nuclear materials at all stages during processing, storage, and shipping. The inventory in each processing area is to be verified at the beginning and end of each materials accounting period. If all material has been accurately accounted for, then the physical protec- tion and other safeguards will be deemed to have been effective during that accounting period.
The use of accountability measures in assessing the effectiveness of physical protection is limited by two factors: (1) the need to measure all material and (2) the quality of the measurements. Therefore, to improve the safeguards program, DOE has launched an intensive research program. Specific objectives are to evaluate new physical protection barriers, develop new measure- ment methods, improve accounting methods, and incor- porate these accounting methods economically and effi- ciently into the program. These developments will apply to both LWRs and LMFBRs.
Safety
As with all nuclear reactors, future LMFBR plants must be built, tested, and documented to minimize accidents and any environmental impacts from normal or abnor- mal operation. The "defense-in-depth" concept has
302
evolved in the U.S. nuclear power program to accom- plish this task.
must be designed for quality, redundancy, testability, and inspectability. The plant as a whole must be de- signed to be safe in normal operation and to have maxi- mum tolerance for mechanical and human errors, abnor- mal operation, and component malfunction. Analyses and tests must be conducted to find malfunctions or faults that could affect safety. These measures protect the utility owner (whose investment would bejeopard- ized,by an accident), the operating staff, and the public.
Some incidents, such as partial loss of flow, reactiv- ity insertions, failure of a portion of the safety system, or fuel-handling errors, could occur in spite of careful design, construction, and operation. Consequently, the LMFBR designs include fault detection equipment and backup systems to enable aberrances to be arrested or deterred safely. Conservative practices and adequate safety margins are also part of the reactor protection design. The detection and backup systems can be read- ily inspected and tested to ensure that they will operate reliably when activated.
A number of LMFBR design characteristics are intended to mitigate the effects of accidents even under worst-case assumptions. First, decay heat can be re- moved from the core despite severe system disruptions and backup system failures. Because the thermal con- ductivity and thermal capacity of sodium are high, the cooling system can temporarily lose its sodium pumping power and still remove decay heat from the reactor core after a forced reactor shutdown. Second, because sodi- um systems operate at low pressure, small leaks are less likely to become larger. Third, the low amount of stored heat allows the use of a low-pressure containment build- ing, which has simpler design and fabrication require- ments than a higher-pressure building.
Another intrinsic safety feature of oxide-fueled LMFBRs is the Doppler effect, a neutronics phenome- non that limits the effect of an inadvertent large increase in reactivity. If a rapid unanticipated rise in power level were to occur, the fuel temperature would also rise, causing the Doppler coefficient to increase and the num- ber of fissions occurring before a neutron is captured (removed) to decrease. This effect limits the rise in power. The Doppler effect is enhanced by the low ther- mal conductivity of the mixed-oxide reactor fuel but would still contribute to safety in a metal fuel reactor.
major rupture of the coolant system is virtually elimi- nated in sodium-cooled reactors. The excellent heat- convection characteristics of sodium ensure that core cooling can be provided by natural circulation in the
In accordance with this concept, reactor components
The possibility of rapid coolant loss resulting from a

primary heat-transfer loops. Thus, no separate primary loop for emergency cooling is required.
A principal safety issue associated with the reactor core is the potential for a positive reactivity effect of voids in the sodium (referred to as the sodium void coefficient) on the power level. Such voids could theo- retically occur in the core as a result of a major over- power transient or reduced sodium coolant flow due to blockage of flow through the fuel element. Since such voids could increase the power level and possibly dam- age the fuel, engineering solutions have been found to prevent them.
Another problem is that sodium reacts with most nonmetals (although not with the most common struc- tural materials used in system containment and compo- nent fabrication). Special precautions must be taken to prevent exposure of sodium to air and water. Sodium readily oxidizes in air and reacts vigorously with water, forming hydroxides and hydrides and releasing hydro- gen gas, which in turn can react explosively with oxy- gen. The LMFBR design includes features to prevent sodium-water reactions and to mitigate their effects if they occur. For example, all equipment or pipelines containing radioactive sodium are placed in inert-gas- filed cells that exclude or reduce the normal atmos- pheric level of oxygen. Furthermore, in loop-type reac- tors, the water used in steam-generating systems inter- faces only with nonradioactive secondary-system sodi- um coolant. In pool systems, the secondary sodium will be slightly radioactive, depending on the design and location of the intermediate heat exchanger in the pool. Damage can be minimized by prompt shutdown in the event of a sodium-water interaction. Leak detection and warning systems can quickly detect leaks.
The likelihood of a hydrogen explosion following a sodium-water reaction is limited by several factors. Spontaneous hydrogen explosions do not occur unless the reactants are present in proper proportions and cer- tain other conditions exist. There would be little oxygen present, and several other reaction products would be present in addition to hydrogen. To further preclude hydrogen explosions, the pressure relief systems would separate and retain the sodium and particulate reaction products and vent the hydrogen to the atmosphere.
ENVIRONMENTAL CONTROL19
As noted earlier, the information in this section is based on the proposed design of the Clinch River breeder reactor, since it is the most thorough design available for operation at commercial power levels.
Gas Processing Systems
The system for processing radioactive waste gases involves two subsystems: (1) the radioactive argon processing system (RAPS) and (2) the cell atmosphere processing system (CAPS). The RAPS is a decontami- nating and recycling system that controls radioactivity in the cover gas for the reactor and primary heat-transport system. The RAPS also treats radioactive gases from the sodium vapor trap system. Monitoring the RAPS gives a preliminary indication of a fuel-element failure.
In both pool- and loop-type LMFBRs, the upper surface of the sodium is covered with an inert gas (usually argon). This cover gas is located between the sodium and the cover of the tank that encloses the sodi- um in pool-type reactors, and between the sodium and the reactor vessel cover in loop-type reactors. The inert gas helps prevent sodium interactions and sodium fires. The RAPS decontaminates the cover gas primarily with a cryogenic distillation column (cryostill) but can also use charcoal absorption beds. Krypton, xenon, and isotopes of iodine that accumulate in the cryos till are periodically removed by transferring them to the noble- gas storage vessel. Af’ter the short-lived radionuclides decay, the remaining gases in the noble-gas storage vessel are slowly transferred to the CAPS.
that any radioactivity escaping from the argon cover gas is contained and processed. Processing includes tritiated water removal and charcoal bed absorption. Radioactive releases caused by fuel failure, failure of the secondary cooling system, and other piping and equipment failures also are processed by the CAPS. If a high level of radio- activity is detected in the CAPS exhaust, the exhaust line is automatically closed to prevent excess releases to the environment.
The CAPS is a final treatment system that ensures
Liquid Processing Systems
Both contaminated sodium and water streams must be processed before reuse or release into the environment. The basic process essentially removes all of the radioac- tivity from the liquid and contains it in solid material.
Radioactive sodium is present in the fuel-handling cell as a result of (1) fuel-handling operations and (2) accidental leakages from the reactor’s primary and secondary systems. Radioactive sodium is also a by- product that results when contaminated equipment is flushed with nitrogen. The sodium stream can be decon- taminated with a cold trap system and then reused or prepared for radioactive storage. Currently, no burial sites accept sodium. It is anticipated that, while this
303

constraint exists, the sodium will be kept in suitable containers for interim storage on-site until environmen- tally acceptable disposal techniques can be developed.
Water-based liquids with intermediate- or low-level radioactivities are decontaminated by removing the sodium, collecting the liquids, and processing them through one or more cycles of evaporation, filtration, and demineralization. Condensate from the evaporator and effluent from the filter-resin system are pumped to a storage or monitoring tank before solidification, reuse, or discharge to a dilution stream when environmentally acceptable. Evaporator and cryostill bottoms, filter cartridges, and demineralization resins, which contain essentially all of the radioactivity, are transferred to the solid waste system for solidification and processing.
Solid Processing Systems
Solid-waste processing systems are designed for concen- trated liquids and both compactible and noncompactible solids. Components that are contaminated with sodium will be stored on-site or processed to a disposal form that has not yet been determined.
Concentrated liquids and spent bead-type resins from the liquid waste system are solidified with concrete or other suitable material. Compactible solids such as rags, paper, and rubber seals, which are potentially radioactive, are collected, placed in 55-gal drums, and compacted by a hydraulic compacting machine. These ivastes are transported to an approved disposal site after a suitable number of drums are accumulated.
The low-radioactivity noncompactible solids, such as metal parts, tools, and spent resins, are placed in %-gal drums, capped, decontaminated, monitored, and placed into temporary storage prior to off-site disposal.
Sodium Cleanup Systems
Due to its chemical characteristics, sodium in the pri- mary system captures some of the fission products released through defects in the fuel cladding. Gaseous radioisotopes (particularly xenon and krypton) that are not held by the sodium escape to the cover gas, where they are removed by the charcoal filter delay bed and the purification and recovery systems discussed above. Some of the metals and halogens normally become deposited on metal surfaces. However, some contami- nants, such as tritium, iodine isotopes, and alkabmetal isotopes, must be removed from the primary system sodium by the sodium cold-trap purification system, A similar cold-trap purification system can be used to
304
decontaminate the liquid nitrogen wash used to remove sodium from equipment.
ENVIRONMENTAL CONSTRAINTS
Title 10 of the Code of Federal Regulations (CFR), Part 50, contains the bulk of the NRC regulations concerning the licensing of nuclear power plants. It describes (1) prwedures for filing for a license to construct and operate a nuclear facility, (2) general criteria that must be met by all plant designs, (3) quality assurance re- quirements, (4) required plant safety procedures for normal operation, and (5) emergency planning require- ments. Operating procedures for LMFBRs can be modi- fied in technical specifications for the NRC.
ing the suitability of sites proposed for reactors. Site size must be determined on the basis of public protection from radiation exposure, as well as on seismic and geologic considerations.
Parts 70 and 73 of CFR Title 10 provide standards for the handling and for physical protection of special nuclear materials, such as plutonium and uranium-235. Safeguarding nuclear materials, a significant task in the LMFBR fuel cycle, will be accomplished by adherence to those regulations.
Packaging and transportation of radioactive materi- als are covered in CFR Title 10, Part 71, and CFR Title 49, Subchapter C (Parts 170-179). Various state and local regulations also apply to the transportation of such IIWterialS.
Radiological protection standards and radioactive emission standards are included in CFR Title 10, Part 20; Title 40, Subpart H; and Title 40, Subpart I.
Part 109 of CFR Title 10 gives criteria for evaluat-
REFERENCES
1, Civilian Power Reactor Program Status Report on Fast Reactors as of 1959, U.S. Atomic Energy Commission Publication TID-8518(1) (1960).
2. Bethe, H.A., Reactor Safety and Oscillator Tests, Atomic Power Development Associates, Inc., Report APDA-117 (Ckt. 15,1956).
3. Thompson, T.J., and J.G. Beckerley, eds., The Technology ofNuclear Reactor Safety, Vol. 1, Massachusetts Institute of Technology Press, Cambridge, Mass., pp. 625-633 (1964).

4.
5.
6.
7.
8.
9.
10. 11.
Yevick, J.G., and A. A m m i , Fast Reactor Tech- nology: Plant Design, Massachusetts Institute of Technology Press, Cambridge, p. 4 (1966).
Proceedings of Symposium on Sodium Reactors Technology, U.S. Atomic Energy Commission Report TID-7623, p. 9 (May 24-25, 1961).
AEC Announces Demonstration Program Opening Way for Industrial Power Reactor Development, U.S. Atomic Energy Commission Press Release 589 (Jan. 10, 1959).
McCa~thy, WJ., and W.H. Jens, A Review of the Fermi Reactor Damage Incident and a Prelim'- nary Assessment of Its Significance to the Design and Operaion of Sodium Cooled Reactors, PNX. of the International Conf. on the Safety of Fast Reactors, Aix-en-Provence, France (Sept. 19-22, 1967).
Power Reactor Development Co., Detroit, Mich., press release (Nov. 29, 1972).
Nuclear News, p. 43 (Feb. 1981).
Nuclear News, 28(7):52 (May 1985).
Clinch River Breeder Reactor Plant Project 1980, Westinghouse Electric Corp. Technical Progress Report CRBRP-ARD-0270 (1980).
12.
13.
14.
5 .
6.
7.
18.
19.
Breeder Background: Handbook on the Clinch River Breeder Reactor Project, Breeder Reactor Project Management Corp. (July 1974).
Glasstone, S., and A. Sesanske, Nuclear Reactor Engineering, D. Van Nostrand Co. (1963).
Preliminary Safety and Environmental Informa- h ~ l Document. Vol. V: Liquid Metal Fast- Breeder, U.S. Dept. of Energy (Jan. 1980).
American Nuclear Society, hoc. of the Executive Conf. on Safeguards, Cape Cod, Mass. (1977).
Nh, A., A Guidebook to Nuclear Reactors, Uni- versity of California Press (1979).
LMFBR Demonstration Plant Program, Roc. of the Senior Utility Steering Committee and Senior Utility Technical Advisory Panel for the Period 1971-January 1972, U.S. Atomic Energy Commis- sion (March 1972).
Clinch River Breeder Reactor Plant Environmen- tal Report, Breeder Reactor Project Management Cop. (July 1982).
Final Environmental Statement Related to the Construction and Operation of Clinch River, US. Nuclear Regulatory Commission Report NUREG-0139 (Feb. 1977).
305

Pipure 16.1 Reference Conceptual Design for the STARFIRE Tokamak Fusion Power Plant (Source: Ref. 1)
306

Chapter 16
Deuterium-Tritium Fusion Power Plants
4 - BACKGROUND
Fusion power results from the release of energy through the combination of light elements into heavier ones. The heart of a fusion reactor would be the plasma, a hot gas of charged particles in which the fusion reaction takes place. The plasma will be surrounded by a "fiist wall," the innermost wall of the plasma chamber; a "blanket" to convert plasma energy into a useful form and produce more fuel; and a "shield to protect the rest of the reactor from plasma radiation (see Fig. 16.1). The first commercial use of fusion power will probably be the reaction with the lowest ignition temperature, which is the combination of deuterium and tritium to produce a helium atom and a neutron. The neutrons that are formed deposit their energy as heat in the blanket and combine with lithium atoms in the blanket to form the tritium needed as fuel in a deuterium-tritium (D-T) reactor, i.e., tritium is bred.
converted to electricity is the major factor in determin- ing the overall economic value of a electricity-generat- ing fusion plant. This overall efficiency depends on the separate efficiencies of each of the chemical processing systems needed to convert heat to electricity and recover and contain the bred tritium. Because tritium is radioac- tive, its confinement, recovery, and processing are con- sidered critically important in the operation of a fusion reactor. A simple schematic of some of these processing streams is shown in Fig. 16.2.
While the following discussion focuses on magnetic fusion reactors, it also applies to inertial confinement systems (in a fusion reactor, the powerful natural forces that separate particles must be overcome by a confine- ment system, which can be either a magnetic field or inertial). Fusion-fission hybrids are not considered here. Much of the material in this chapter was derived from Refs. 2 and 3, which considered a 4,000-MW conceptual
The efficiency with which the heat in the blanket is
reactor, STARFIRE. Current conceptual designs assume smaller commercial reactors, of no more than 1,OOO Mw, but the systems are the same. Therefore, the environmental considerations will be approximately the same.
HISTORY
U.S. Program
The development of magnetic fusion energy is an ele- ment of the U.S. National Energy Policy Plan to foster an adequate supply of energy at a reasonable cost. The goal of the U.S. Department of Energy W E ) program in magnetic fusion research and development is to devel- op fusion's highest potential as a virtually inexhaustible energy source by establishing the scientific and techno- logical base required for fusion energy.4 Four key tech- nical issues have been identified magnetic confinement systems, properties of burning plasmas, materials for fusion systems, and nuclear technology of fusion sys- tems. The federal program seeks to show that fusion power systems are feasible from three perspectives: scientific, technological and engineering, and economic. The final stage will involve construction and operation of a demonstration power plant.
ly achieving, in an experimental test reactor, the condi- tions of plasma temperature, density, and confinement time needed to produce an amount of energy equal to the energy required to produce and maintain the plasma (the scientific break-even point). Technological and engi- neering feasibility can be shown by building and operat- ing an advanced device that produces as much usable energy as is required to continuously operate the entire power plant. Such a device would incorporate
Scientific feasibility can be shown by simultaneous-
3 07

Fuel injection * d -
Plasma exhaust
Blanket tritium processing
- 7
- r
Blanket
Energy conversion
Workina fluid 7
"Denotes processing or energy conversion system.
Figure 16.2 Essential Processing Streams and Energy Conversion Systems in a Fusion Reactor
sophisticated fuel-handling and energy-conversion equipment that is not needed to demonstrate scientific feasibility. Economic, or commercial, feasibility can be shown by building and operating a demonstration fusion power plant that can continuously and reliably produce electricity at a cost competitive with other energy sources.
Magnetic fusion research focuses on the use of carefully shaped magnetic fields to contain the plasma. Two confinement systems are under study: the toka- mak, a closed system with a doughnut-shaped (toroidal) configuration, and the magnetic mirror, an open system with a linear configuration (see Fig. 16.3). Many of the systems required for a fusion reactor are beyond present technological capabilities and can be produced only through significant scientific and engineering advances.
Recent Developments
At least seven ion-pair combinations of the first five elements in the periodic table can be fused to yield a net energy release. Of these, isotopes of hydrogen (deuteri- um and tritium) are expected to be the fuels for first- generation fusion devices, since the physical conditions required for the D-T fusion reaction are less stringent
308
than those for other fusion reactions. For the D-T reac- tion, the physical conditions that indicate scientific feasibility are a plasma temperature (T) of 10 keV and a volume-averaged product (nz) of plasma density (n) and confinement time (2) of about 100 aillion dcm3. (One kiloelectronvolt is equal to a temperature of 11.6 mil- lion K.) These conditions have not been achieved simul- taneously in a single experimental device; however, recent results give confidence that devices in operation will achieve these conditions.5-7
The status of the current tokamak experiments is shown in Table 16.1. The gain (Q), which is the ratio of fusion power released to the power needed to heat the plasma, measures the approach to fusion break-even conditions. Beta (p), the ratio of the plasma particle pressure to the pressure from the magnetic field, is a measure of the engineering efficiency of the use of mag- netic fields. The parameter nzT is convenient for char- acterizing the fusion plasma, since it combines tempera- ture T, density n, and Confinement time 2. It is a defined term, not a product of nz and T.
The results for the U.S. Tokamak Fusion Test Reac- tor (TFTR)6 and the European Community's Joint European Torus (JET)7 are expected to improve since these major tokamak projects were built to demonstrate

Magnetic transformer
Poloidal field
Toroidal field
Metal wall
Toroidal Axial field coil current Resulting
field (a1
Coil current
field lines
lb)
Figure 163 Confinement Alternatives: (a) Tokamak Device and (b) Simple Magnetic Mirror (Source: Adapted from Ref. 4)
Table 16.1 Status of Fusion Parameters in Tokamak Experiments
Highest Estimated Value Requirement Goal for
Parameter Achieved Deviw for Break-Even Reactors
Q, gainb 0.02 PLT, TFTR 1 .O >IO P> beta 0.053 PBX 0.03 0.06-0.10 z (SI 0.4 TlTR 1-2
n% (dcm3) 1 x 10¹⁴ Alcator 1 x io14 2 x 10¹⁴
n f l (dcm3.keV)d 3 x 101% Alcator 2 x 10¹⁴ 2.5 x 10¹⁵
0.8 JET
T (keV) 7.9. PLT 10 7-10
.These tokamak experiments were conducted at Princeton (PLT,5 PBX,5 and TFTR6), MIT (Alcators), and Europe (JET).’ Tbe values listed were achieved independently for each palameter.
bThe gains shown are calculated based on substituting a 50-50 D-T mixture for the pure deuterium actually used in the experiments. Since D-T mixtures have a yield about 100 times higher than that of deuterium, actual measured values are lower than those shown.
cThese values refer to conditions at the plasma center.
dFor a generic D-T fusion reactor, both a temperature of 10 keV and a density 21014 dcm3 are needed. This is defined as a nrT of -2.5 x 10¹⁵ dcm3,keV.
309

the scientific feasibility of magnetic fusion power sys- tems. They will be the f i s t devices to bum D-T fuel. Equivalent plasma conditions are expected in the hydro- gen plasmas in the JT-60 device in Japan, which became operational in 1985.6 The T-15 in the U.S.S.R. was scheduled to be operational in 1986.
TECHNOLOGY
General Description
A magnetic fusion reactor consists of an evacuated chamber, called the first wall, that contains the plasma (see Fig. 16.1). This is enclosed by a structure contain- ing both the blanket and the radiation shield. The blan- ket is the region where most of the energy from the fusion reaction is deposited. The shield is the region behind the blanket that stops the neutrons that have escaped capture in the blanket. Superconducting mag- netic coils are used to confine and shape the plasma and are located outside of the radiation shield. Supplemen- tary systems include the energy conversion system and the radiation containment systems. If the fusion plant is studied in terms of each system's function, the plant can be divided into a few large systems that meet generic requirements. These major systems are (1) the electro- magnetic system, which contains, heats, and controls the plasma, (2) the fueling and impurity control system, which includes fuel production, preparation, delivery, and recycling, as well as impurity control systems, (3) the power transport and conversion system, (4) the radiation containment system, which includes shielding, containment, and storage, and ( 5 ) other reactor systems. (Some fusion reactor components, such as divertors, which control both the plasma shape and purity, are part of more than one system.) Each of these is treated briefly here. For a fuller description, see Refs. 1-3,8, and 9.
Electromagnetic System
In a magnetic fusion reactor, electromagnetic compo- nents will include (1) one or more magnetic systems to confine the plasma, (2) magnetic systems to prevent end losses (mirrors in linear systems) or provide additional stability and equilibrium (poloidal field coils in toka- maks), (3) magnet coils to correct field errors, (4) coils to change the local field shape to form a divertor, and ( 5 ) coils to control the plasma position. Most of these coils must be superconducting to reduce the recirculat- ing power needed to drive the magnets.
Pulsed magnetic subsystems could include coil systems to drive the plasma current, radio-frequency power systems to supply energy to the plasma, and neu- tral beam injectors to aid in plasma heating. Other sub- systems of the electromagnetic system include pulsed power storage and electrical power conversion systems.
The confinement magnets are usually large; a mag- net with a major radius in the range of 4-6 m may be required for tokamak reactors. The largest magnet, the poloidal magnet in a tokamak, may have a bore wider than 25 m. The field at the coils will range from 5 to 12 teslas, with a maximum limit set by the characteristics of available superconductors. Normal copper magnets may be used in some special applications.
drive some magnetic field coils, plasma heating systems, or inertial confinement drivers. These systems must deliver large amounts of power during plasma startup. They may provide a small amount of power during the plasma bum, or they may be "off' during bum or recycle phases of the reactor operation. (Continuously operating reactors, if they prove feasible, will not require signifi- cant amounts of pulsed power.) These requirements mandate a power storage and delivery system that can be rapidly charged and discharged with low power losses.
Fueling and Impurity Control System
The fueling system of a fusion power plant must supply deuterium, tritium, or another advanced fuel to the plasma reaction zone. This system may include external components, such as (1) a heavy-water production plant to produce deuterium, (2) lithium mining and extraction facilities to produce the lithium required to breed triti- um, and (3) an operation supplying the initial charge of tritium. Within an operating D-T reactor, tritium will be produced continuously in the blanket zone by neutron transmutation of lithium. This tritium must be efficient- ly delivered from the blanket to a collection and process- ing system and then to the plasma chamber.
It has been proposed that fuel could be supplied to magnetically confined plasmas by gas puffing or pellet injection. In gas puffing, small amounts of neutral D-T gas mixture would be introduced near the edge of the plasma and would move into the plasma by diffusion. The injection method would deliver pellets of frozen D-T mixtures accelerated to energies adequate to pene- trate to the center of the plasma. The pellet could be accelerated by electrostatic, magnetic, or mechanical methods.
The vacuum pump subsystem of the fuel manage- ment system will extract fuel and impure gases from the plasma. The fuel (tritium and deuterium) must then be
Pulsed power delivery systems will be required to
310

recovered and fed to the refueling cycle. Similarly, subsystems that salvage tritium from leaks, accidental releases, and contaminated equipment will supply recovered tritium to the refueling cycle.
fusion. Initial cleanliness and impurity extraction be- tween burns are controlled by the vacuum system. The design and location of plasma limiters or divertors at- tempt to restrict contact between the plasma and first- wall materials by distributing the energy deposition, actively cooling the components, and selecting appropri- ate materials. Because materials such as iron, which may be used as the first-wall structure, are particularly deleterious, all structural surfaces facing the plasma wall will probably be specially treated, Le., they will be cov- ered with an adherent coating. The preferred coating material would have a low atomic number (e.g., beryl- lium, elemental carbon, or compounds such as silicon carbide, titanium carbide, and titanium boride). A care- ful choice of the materials and coolant design is neces- sary to minimize the effect of high-energy fluxes of particles on the limiter or divertor material.
Another requirement of fusion reactors fueled by D-T is that the quantity of tritium produced (bred) be sufficient to replace the quantity burned, lost, and s u p plied as the initial charges for new power plants. For radiological safety reasons, mtium is cycled with mini- mum accumulation in any subsystem so that the plant tritium inventory is held to a minimum. Inventory limits of less than 10 kg of tritium have been suggested; this amount of tritium is equivalent to 1 million Ci of radiation.
Maintaining a pure plasma is a major requirement in
Power Transport and Conversion System
The power transport and conversion system starts with the first wall and blanket, where the kinetic energy of fusion-product particles is converted to thermal energy, and continues through the conversion of heat to electri- cal energy. Because at least 20% of the fusion energy is radiated or otherwise deposited on the divertor or front surface of the reactor first wall, these components must be efficiently cooled. This heat can be removed by adding coolant from this source to the blanket coolant system, sending it to a separate power conversion sys- tem, or "dumping" it through a heat rejection system.
Heat is generated throughout the blanket at a rate that decreases exponentially with distance from the first wall. Heat is extracted by using one of several possible coolants; the most commonly suggested coolants are liquid lithium, helium, and water. The coolant is often ducted first to the first wall to cool this most critical component and then back through the blanket. Coolant
passages may become more widely spaced as blanket regions that have lower heating rates are traversed. The coolant system is designed to both prevent reactor over- heating and deliver coolant to the power conversion system at temperatures high enough for efficient elec- tricity production.
The thermal-to-electrical power conversion most commonly specified is a steam cycle driving a turbine- generator. For primary cooling by liquid metal, inert gases, or water, these steam cycles are usually modeled after analogous fission and fossil energy systems. Inter- mediate coolant loops are often included between the primary coolant loop and the steam generator loop, to isolate radioactive materials, separate reactive coolants, and possibly (in some pulsed systems) store thermal energy. For helium-cooled reactors, some design studies have proposed that heat can be converted to electricity through direct-cycle helium turbines. Other, more ad- vanced power conversion systems have also been suggested.
Heat must be extracted from reactor components other than the first-wall and blanket. Low-quality heat, typically representing only a few percent of the reactor's output, will be extracted in separate cooling systems and probably be dumped through the heat rejection system. The radiation shields will be the primary source of waste heat, but several auxiliary cooling systems will also make small contributions.
Radiation Containment System
Radiation containment systems shield critical compo- nents (such as superconducting coils), shield operation and maintenance personnel, and prevent releases of radioactive material from the plant. Neutron shields will be located outside the reactor blanket to prevent radia- tion damage, limit heat loads on magnetic and electrical systems, and, especially, limit heat input to the super- conducting magnets. Additional shielding will be required around reactor penetrations, such as pumping ports. Shields will be ma& of materials that most effi- ciently satisfy the structural requirements and absorb neutrons.
Biological shielding and the reactor containment building will provide additional barriers to limit radia- tion escape from the reactor. Biological shielding will likely be incorporated into the building; reinforced con- crete walls 1- to 2-m thick are expected to be adequate for the purpose. The building may also have a metal liner to prevent leakage of tritium and other gases. The building atmosphere can be processed by the tritium recovery system and must also be filtered for particulate removal.
311

Releases of solid radioactive products to the envi- ronment are unlikely, since they will be contained by the reactor building. However, at the end of a component life or at reactor decommissioning, these materials must be maintained in controlled storage. The plant therefore must include facilities for short-term storage (probably a water-filled pool on the plant site) and long-term storage (long-term storage has not yet been addressed in detail).
Other Reactor Systems
Numerous other necessary systems are needed in the "reactor" portion of a fusion power plant. Although critical to reactor operation, these systems are generally better understood than the systems described previously, and their design often involves fewer unknowns.
singled out because of its critical nature. This structure, which is defined as including the first wall, must provide the primary vacuum and maintain containment integrity. Energy deposition rates are high, so a failure in any part of the system (piping and headers) that delivers coolant to the blanket is unacceptable. First-wall and blanket assemblies, called sectors, will be modular to facilitate easy replacement of worn components (Fig. 16.1).
Other structural systems support and contain vari- ous reactor components. Conditions vary greatly; for example, temperatures range from 4 K (in the cryogenic subsystems and magnets) to more than 1,OOO K (in the blanket). Component integrity is required to prevent coolant from leaking into the plasma chamber and limit releases of tritium. The load-bearing requirements of many structures are demanding; many reactor designs call for high-pressure coolant circuits, and most concepts require the support of large magnet-generated loads.
The vacuum system, which must be a high-capacity system, provides initial pumpdown to achieve high vacuum. The system rapidly exhausts the plasma cham- ber between cycles (if operation is cyclic) and maintains high pumping capacity behind pumped limiters (if that purity control option is selected). The final stage of vacuum pumping will probably involve cryopumps. To allow frequent recycling to extract exhausted tritium for minimum inventory, a redundancy in the number of pumps, by at least a factor of two, will be required.
Cryogenic systems will be required to provide liquid-helium coolant to superconducting magnets and cryopumps and liquid-nitrogen coolant to thermal shields, which are used around the components that carry liquid helium. These will be closed systems that recover and liquefy vaporized fluids. Some makeup helium could possibly come from helium produced in the plasma.
The structural system of the reactor blanket can be
Instrument and control systems for a fusion reactor may be conveniently grouped into two categories: (1) those that monitor more or less conventional process and balance-of-plant operations, such as temperatures, pressures, flows, valve positions, and power settings, and (2) those that measure the fusion plasma and require highly specialized instruments. As many as 50,000 signals may require processing, with an update rate of 1 ms.1 These will represent a mix of simple instrumen- tation in common use today and specialized plasma- diagnostic instrumentation now under development.
ment located within the reactor building. All known or foreseen maintenance operations are planned to be remote. The reactor and the support systems may be maintained by a combination of equipment that is mounted on a monorail system, overhead cranes, and bridge-mounted electromechanical manipulators. All viewing will be done using a remote closed-circuit tele- vision. Whereas simple operations will be performed on reactor Components without removing them, a philoso- phy of "replace and repair" is likely for more extensive work. Replacement of failed components to minimize reactor downtime and repair of the component in a hot- cell area will require the use of fully remote equipment in both zones.
Hot cells, radioisotope storage buildings, and other service buildings will be located outside the reactor building but will have connecting access.
A maintenance system is required to serve all equip-
Resource Requirements
Deuterium can be obtained from the oceans, where it occurs as deuterium oxide (DOH) at a concentration of about 150 ppm. Tritium, on the other hand, does not occur naturally in appreciable quantities but can be bred from lithium. Total lithium resources worldwide are estimated to be 7,600 metric tons (t), of which 10% is found in the United States. Assuming that lithium has an energy content of 25 MW/g when used in the D-T fuel cycle,lo the domestic supply is sufficient for operat- ing the current U.S. electrical generating capacity for over 3,000 yr. Helium, required to operate supercon- ducting niobium alloy magnets, is present in the atmos- phere at about 0.65 ppm and also in underground gas deposits. To recover it from the atmosphere costs sig- nificantly more than to recover it from natural gas and store it for later use. Currently, niobium is the only material that can be used for superconducting magnet coils; it could be imported or obtained at higher cost domestically.
312

Altogether, 28 elements are of special interest for fusion reactors. Resources of four of these -- magne- sium, carbon, sodium, and silicon -- are abundant. On the world market, few problems are envisioned for the metals nickel, cobalt, manganese, and chromium within the time frame considered. The elements most likely to become scarce, based on world reserves, include zinc, lead, copper, tungsten, molybdenum, and tantalum.
ensuring continued imports. Elements of most concern include tantalum, chromium, niobium, tungsten, and tin because resources for these elements are too sparse to support a large enough domestic industry and ensure self-sufficiency.11 Although bauxite resources are small, no problem for aluminum is anticipated because of the availability of large alternative resources. All of our cobalt and most of our nickel needs currently axe met by imports; however, later use of large, presently uneco- nomical resources could make the United States self- sufficient in these two metals.
The problem on the domestic scene is mainly one of
Fusion Compared to Other Energy Alternatives
The potential for fusion as a clean and safe energy source becomes apparent when the intrinsic features of fusion reactors are compared to those of other power systems. Specifically, undesirable combustion products (such as sulfur dioxide and carbon dioxide) and fission products (such as actinides), which are intrinsic to fossil and fission energy sources, respectively, are not pro- duced in fusion reactions. A summary of the issues for various energy systems is shown in Table 16.2.3
ENVIRONMENTAL ISSUES
Inherent Safety Issues
Potentially adverse environmental impacts of construct- ing and operating D-T magnetic-fusion power plants include exposure of workers and the general population to small quantities of tritium and other radionuclides, disposal of radioactive waste, exposure of workers to magnetic fields, depletion of scarce resources, and con- tinued use of centralized energy technologies. These impacts, and thus potential environmental concerns, are generic to all magnetic confinement schemes. Other environmental issues are associated with nonradioactive plant effluents, such as waste heat, biocides, other chemicals from the plant cooling systems, and solid
waste from sanitary and other process systems; with nonradioactive atmospheric emissions from evaporative cooling tower systems (assuming the facility waste heat is dissipated via closed-cycle cooling systems); and with power plant construction. These environmental interac- tions are dependent more on the power conversion sys- tem and attendant balance-of-plant than on the energy source. Also, many impacts are site-specific and gener- ally can be minimized through proper site selection and plant design.
Several of these impacts are associated with the features of magnetic fusion reactors that burn D-T. The features include the intense flux of high-energy (14.1-MeV) neumns into surrounding structures; the requirement that kilogram quantities of tritium be bred and processed; the presence of localized, intense mag- netic fields for plasma confinement; and the reactor’s relatively low power density (energy per unit of volume). The blanket-shield structure and other struc- tures close to the reactor will become radioactive from neutron-induced reactions. Some of the structures will require replacement periodically due to radiation dam- age from the energetic fusion neutrons. The relatively large inventories of tritium, coupled with its chemical and physical properties, lead to containment and con- tamination problems that could affect both the occupa- tional work force and the general public. The effects from intense, localized magnetic fields are limited to the work force because the strength of the fields decreases in direct proportion to distance from the reactor, to near background levels at locations beyond the plant bound- ary. For fusion reactors that have a low power density, material requirements per unit of energy produced may be greater than requirements for fission and fossil energy technologies.
Estimate of Radiological Exposures
Small quantities of radioactive materials will be released routinely during operation of D-T reactors. Activated corrosion products from the reactor coolant systems and a small fraction of the tritium inventory will be the dominant sources of radioactivity released.
from waste processing systems in a controlled manner. For the reference STARFIRE plant, it is estimated that annual losses of radioactive corrosion products would be about 5,000 mCi to the aquatic environment and 280 mCi to the atmosphere.l.2 Annual tritium releases would be about 8,000 Ci, with about 80% released to the atmosphere. These effluents would result in a 50-yr dose commitment of 0.64 mredyr to the maximally
Generally, the radioactive effluents will emanate
313

c w Table 16.2 Summary of Issues and Impacts of Long-Term Alternative Energy Technologies P
Technology Air Quality Human Health and Safety Water Resources Land Use Ecology
Fusion reactors
Fission reactors
Solar t h e m 1
Cooling tower drift
Cooling tower drift
Cooling tower drift
Photovoltaics Negligible
Wind power
Biomass
Ocean thermalb
Geothermalc
Negligible
Gaseous and palti- culate emissions; cooling water drift
Possible reduction of rainfall in southeastern United States
Releases of hydrogen sulfide, methane, and ammonia
100 million mVyr per 1 ,OOO MW for cooling; thermal and biocide effluents
100 million mVyr per 1 ,OOO MW for cooling; thermal and biocide effluents
40 ha/l,OOO MW
40 hall ,OOO MW
100 million mVyr per 1,OOO MW for cooling; possible interference with groundwater supplies and flows; thermal and biocide effluents
Possible interference with rain and groundwater supplies and flows; mining and manufacturing waste streams
Negligible
100 million mVyr per 1,OOO MW for cooling; large-scale agricultural impacts; thermal and biocide effluents; increased sediments
100 billion mWyr circulated per 1,000 Mw; potential leaks; release of corrosion inhibitors and biocides
100 million mWyr per 1 ,OOO MW for cooling; impacts from disposal of spent fluids
5,000 ha/1,000 MW; potential conflicts with existing uses
5,000 ha/1,000 MW; potential conflicts with existing uses
600 ha/1,000 MW for towers at scattered sites
25,000 ha/1,000 Mw for cultivation and waste disposal; soil depletion
About 50 hall00 Mw for onshore plant sites
5-10,oOO ha/1,000 MW; possible land subsidence
Cooling mechanisms and effluents will affect aquatic life
Cooling mechanisms and effluents will affect aquatic life
Large-scale losses of vegetation and wildlife
Large-scale losses of vegetation and wildlife
Increased bird mortality; some losses of vegetation and wildlife
Large-scale losses or mod- ifications of vegetation and wildlife; sedimentation will affect aquatic life
Effluents and temperature changes will affect marine life
Waste disposal, effluents, and land use will affect wildlife
Potential radiological exposures from accidents and handling and disposal of radioactive wastes; materials safeguards (tritium)
Potential radiological exposures from accidents and handling and disposal of radioactive wastes; materials safeguards (actinides)
Exposure of workers to thermal and chemical hazards
Exposure of workers to chemical hazards during manufacture and maintenance
Noise; possible interference with aviation rout&; hazards to workers
Toxic combustion products; harvest and transport of trees hazardous to workers
Possible reduction of rainfall in southeastern United States <&
Impacts from land subsidence; hazards to workers from hydrogen sulfide
~~ ~
nTransportation impacts are negligible for all technologies except biomass, which would require about 5 million vehicle-Wquad for transporting trees at plantations.
bSites under consideration are limited to the Gulf of Mexico and Hawaii.
cSites under consideration are limited to the western United States and the Gulf coasts of Louisiana and Texas.
Source: Ref. 3.

exposed individual (near the site boundary); 8.5 person- rem to a population of one million, uniformly distributed within an 80-km radius of the plant; and 23 person-rem to the global population.2 These doses would constitute, respectively, about 1%, 0.01%, and O.OWOOl% of the 100 mrem/yr now received annually from natural back- ground radiation. To the population within 80 km, tritium would contribute 24% of the dose and cobalt-60 would contribute 70% of the dose; to the global popula- tion, 99% of the radiation would be from tritium. Although the global dose would roughly increase in proportion to the number of fusion plants operated, this cumulative effect still would be of minor significance.
Tritium and activation products could also be re- leased to the environment during abnormal operating conditions. Because intrinsic safety features of magnetic fusion reactors are expected to limit releases of radioac- tivity under accident conditions, any such releases would be from the coolant systems or a vulnerable tritium- processing system. For the reference reactor, such re- leases would result in a maximum radiation dose to exposed individuals (off site) of less than 1 rem. This level is equivalent to that accrued over a 10-yr period from natural sources.
indicates an upper limit of about 1 redworker-yr and a lower limit of a few millirems per worker-year; the difference depends upon the degree to which remote maintenance is employed and the choice of structural materials. Doses of up to 1 rem from external exposure are not expected to be a significant health hazard, The major sources of these exposures for the maximum-dose case are (1) routine maintenance, which is expected to result in exposures similar to those observed at fmion reactors (about 250 worker-redyr), (2) major repair or replacement of steam generators or other major com- ponents, which could result in a one-time exposure of about LO00 worker-rem during the reactor lifetime, and (3) replacement of blanket sectors, which would cause additional exposures of 100-200 worker-redyr unless all operations are done remotely.
Conservative analysis of potential worker exposures
Nonradioactive Hazards
The work force at a magnetic fusion power plant would also be exposed to fringe magnetic fields. During opera- tion of the reference reactor, superconducting magnet coils would superimpose a fringe magnetic field of 0.oooO2-0.oooO5 tesla upon the earth’s normal field outside the reactor building. Fringe magnetic fields in excess of 0.02 tesla would be found in the reactor build- ing, but no personnel would be present in this location.
Personnel in work areas would not be exposed to magnetic fields above 0.01 tesla, while workers in the reactor control room would be exposed to about O.OOO1 tesla. The potential health effects of magnetic fields are not fully understood. However, personnel at the reference fusion power plant would not be exposed to levels above the interim exposure guidelines estab- lished by DOE. Likewise, radio-frequency fields used to heat the plasma would be contained and shielded so that locations of potential exposure are maintained at or below exposure guideline levels.
Safety precautions would ensure minimal exposure to toxic materials as well as radioactivity. Toxic chemi- cals may be used at fusion reactor sites either as reactor components or process chemicals. Normally, toxic chemicals would also be associated with tritium and activation products and would thus be separated from personnel by the remote operations that protect against radiation exposure. Consequently, potential exposure during most of the routine chemical operations would be minimized.
The operators of a full-scale fusion power plant would also be required to implement other precautionary practices common to major industrial complexes. For example, the handling and processing of large inven- tories of lithium will require carefully designed proce- dures. However, it is not expected that these or other required safety practices will be beyond the scope of best available practices developed for other industries with similar material handling and processing activities.
Radioactive Waste
The radioactive waste inventory will consist primarily of activated metallic structures that are no longer functional (either by design or failure); wet and dry solid wastes generated by waste processing systems; and contami- nated clothing, paper, and other miscellaneous items (e.g., laboratory equipment). Component failures and design constraints will require removal of some struc- tures before plant decommissioning and, in some in- stances, processing for on-site storage. First-wall and blanket sectors are expected to dominate waste handling operations for activated structures, essentially because of their volu-me, weight (typically greater than 50 t), high activity levels, replacement intervals, and processing requirements for storage or shipment. The activity of wet and dry solid wastes will be derived primarily from activated corrosion products in the primary reactor coolant (i.e., for water-cooled reactors), items con- taminated with tritium, and airborne radioactivity and particulates in the atmospheres of various enclosures.
315

The quantity and specific activity of wet and dry solid wastes generated annually would be comparable to low-level wastes currently generated by light-water fission reactors (LWRs). No difficulties are expected from storage and disposal of these materials, since they can be handled under present regulations and with cur- rent practice (CFR Title 10, Part 61).12 The low- and high-activity wastes produced by replacing blanket sectors would be somewhat different from routinely handled radioactive wastes, but in many respects, these wastes may introduce fewer disposal problems. The wastes will be in relatively stable forms (corrosion resis- tant metals) and will not contain the fission products and actinide elements present in wastes from LWRs. Cur- rent practice and regulations are expected to be adequate for handling these materials without affecting the envi- ronment more than current operations.
About 12 rail shipments per year are required to remove the fiist-wall material, primary candidate (PCA) stainless steel in shielded casks, from the STARFIRE reactor. In addition, about 35 truck shipments per year would be required to remove wastes produced by the blanket sector removal. Finally, about 27 shipments per month would be necessary to remove the accumulated low-activity wastes derived from maintaining the coolant quality. However, if low-activation construction materials can be used, the use of shielded casks will not be necessary and all of the sector wastes could be handled by about 12 truck shipments per year.
For the fusion-based energy economy, the metals used in the reactor will represent an increasingly valu- able resource. The timing of recycling any given com- ponent of the stored material will be determined by many factors, including economics and the domestic and international availability of the material. Lithium and magnet conductors seem to have the greatest potential for reclamation. Various steels in the reactor have a much lower value than magnet conductors and may thus be subject to different market-value and storage-cost trade-offs before recycling is practical.
Decommissioning
After the useful life of a fusion reactor has ended, it will be necessary to dismantle the components and prepare them for recycling or disposal. The degree of dismantle- ment will depend on the future use of the site and the modifications required if a new fusion reactor is to be consmcted on the site. The technologies used for decontaminating and decommissioning fusion reactors will be similar to those used or considered for use in decommissioning fission reactors. At present,
Regulatory Guide 1.86 of the U.S. Atomic Energy Com- mission is the principal guide in specifying acceptable options for decommissioning a radioactive site: moth- balling, dismantlement, entombment, and conversion.13
The purpose of decommissioning is to remove essentially all of the radioactivity to permit unrestricted use of the site. In general, there are two possible final results in decommissioning a fusion reactor site. The f i s t is complete dismantlement and removal of equip- ment and buildings to restore the site to its original con- dition; this might include burial of concrete and assorted other debris. The second possible result is entombment of the reactor. A variation of the first alternative is to dismantle and remove the reactor, the steam generators, and turbine and then refurbish the buildings and site to accommodate a new fusion reactor.
Associated with operations in and around a fusion reactor site is a potential radiation dose from the induced radioactivity. Limits on this radiation dose restrict the freedom of movement about the reactor and may limit the amount of time that a worker can spend on a particu- lar job. This radioactivity is most intense when the reactor ceases operation; the radioactivity decreases with time. A simple way to reduce the radioactivity level (and the dose rate) is to permit the radioactivity to decay to a more manageable level. For example, a typical shield, which consists of an alloy of iron, manganese, nickel, and chromium, will have a radioactivity level of 20 Ci/m3. After 10 yr of decay, the radioactivity will have decreased by a factor of 50, and after 30 yr, it will have decreased by a factor of 10,OOO. Thus, a study weighing the cost of waiting for decay against the cost of dismantling and decontaminating at a given radioac- tivity level may result in a decision to delay action. Such a technique is called mothballing; that is, the plant is allowed to stand for a time after shutdown to permit the radioactivity to decay.
Most of the radioactivity will be in the blanket sectors, which are routinely processed during the reactor lifetime. During decommissioning, the sectors will be disassembled and removed by the same dedicated machines used during annual routine maintenance.
After the sectors have been removed, the steel from the reactor island must be removed. In dismantling a fusion reactor, large reactor components will be cut into small pieces, either for on-site or off-site metal recovery or for shipment to a site for permanent disposal. The sizes of the pieces will vary as a result of several factors, one of which is the radiation dose rate. If the materials are shipped off-site for permanent disposal or recovery and the surface dose rates are very high, the pieces will have to be small enough to fit into shipping casks. This situation would probably apply to blanket components,
316

that is, the particular stainless steel which has been des- ignated PCA, which is used in the first wall and struc- tural portions of the blanket. However, hardware con- taining very low levels of radioactivity might be shipped with little or no shielding. This situation would prob- ably apply to magnet coils and some other components.
For an estimated 23,500 t of reactor island struc- tures, about 13,000 kg of kerf weight would be produced during the cutting of all STARFIRE components in preparation for subsequent disposal (kerf weight is the debris generated in cutting).l About 600 kg of fine particles would reach high-efficiency particulate (HEPA) filters if all the generic STARFIRE components were cut in air; only 60 kg would reach the filters if the components were cut underwater. The filters for the former case would add about 2% to the volume of waste. All of the PCA stainless steel and some shielding prob- ably will be disposed of as wastes. The radioactivity of the other materials will be low enough to make recycling feasible, if economic or other factors warrant recycling.
To put waste handling in perspective, comparisons may be made with the wastes anticipated from LWRs. The volume of all wastes from the reactor island of a water-cooled fusion reactor at decommissioning amounts to 6,950 m3. Integrated over the plant capacity and lifetime, the decommissioning waste amounts to about 200 m3/GW-yr. This value can be compared with values for two types of LwRs: 70 mYGW-yr for pres- surized-water fission reactors (PWRs) and 280 m3/GW- yr for boiling-water fission reactors.14.15
On the basis of the current waste classification scheme for land burial, the PCA structure would be the only reactor island material not suitable for near-surface burial. Other items, such as steam generators and tur- bines, could be disposed of in a manner analogous to the disposal of the same equipment in fission reactors. The specialized machines used for remote maintenance and equipment for subsidiary functions, such as tritium recovery and air purification, will also require disposal. These materials should amount to not more than 10% of the material in the reactor island and should qualify for disposal as low-level radioactive waste.
In any case, the materials must be packaged for shipment or storage. The same procedure would ensue at decommissioning; however, the quantity of material handled would be six times greater. The remainder of the materials would be suitable for near-surface burial, if recycling were not contemplated. In that case, the metal can be packaged in 55-gal(O.2-m3) drums. Assuming that a compaction of 50% is achieved, the 4,750 m3 of the remainder of the reactor island could be packaged in 47,500 drums. Because of the large number of drums
required to contain the waste, it might be feasible to permit transport of larger packages for those materials with very low radioactivity levels.
Low-Activation Blanket Materials
The use of low-activation materials in the blanket struc- tures can significantly alter the induced radioactivity and, thus, the final disposal of reactor structures that are designated as wastes. The low-activation modification of the STARFIRE reactor, while not a fully engineered design, does illustrate that large benefits may be accrued by choosing appropriate materials.16 These benefits include reducing occupational radiation exposure and permitting the use of near-surface disposal for essential- ly all major reactor components. Currently, no consen- sus prevails within the fusion research community as to which materials might be most efficient. In any case, it appears that the constraints on near-surface waste dis- posal posed by the STARFIRE reactor design can be overcome by selective improvements in materials.lo~7 However, the use of low-activation materials may result in other environmental problems, such as an increased tritium inventory and less than optimal mechanical properties.
ENVIRONMENTAL CONTROLS
Nonradioactive Effluents
Nonradioactive effluents from a fusion power plant will include waste heat, sanitary wastes, biocides, and other chemicals used to purify and treat the plant water sup- plies. Thermal releases will come mainly from the power-conversion system. There will also be minor contributions from equipment cooling cycles that either remove too little energy to make recovery economical or are too low-grade (low-temperature) for inclusion in the primary conversion cycle. Nonradioactive chemicals will be discharged with blowdown effluents from the cooling systems (i.e., for closed-cycle cooling). Sanitary and uncontaminated solid wastes will include sewage, laundry wastes, and the solid refuse of office and plant support facilities that do not handle radioactive materials and equipment.
The magnitude of nonradioactive effluents can best be estimated by comparison with conventional power plant effluents. In particular, the similarity between the balance-of-plant of a generic fusion reactor (STAR-
317

FIRE) and a LWR allows for the developed systems of PWRs to be used as a basis for estimating the effluents of a fusion power plant.1
The projected thermal efficiencies of recent concep- tual tokamak reactor designs are just over 30%, which is similar to PWR efficiencies. The thermal energy dis- charge is 2,662 Mw for a plant that has a thermal power Of 4,000 Mw and a net elecmcal output of 1,200 IvIW. Adjusted to a net electrical output of 1,ooO MW, this load would result in a heat dissipation of about 8 trillion J/h. Closed-cycle cooling using natural draft cooling towers is probable. With this method of cooling, most of the waste heat would be dissipated to the atmosphere. However, about 2% of the waste heat (0.16 trillion J/h) is discharged with the cooling tower blowdown to the blowdown receiving waters.
A schematic diagram of the cooling water flow for a generic tokamak reactor (STARFIRE) is given in Fig. 16.4. Similar system elements would be included in
any power plant steam turbine that converts thermal energy to electricity.
plant has a standby cooling system (Fig. 16.4) that provides, during abnormal operating conditions, high- quality demineralized and deionized cooling water to the system that removes residual reactor heat, the atmo- spheric tritium-cleanup systems, and other auxiliary systems. The standby cooling system operates when the main reactor has been shut down, off-site power is not available, or the plant is using the on-site standby power source. During shutdown, the standby cooling system maintains the spxified blanket temperature by removing residual or decay heat. The system indirectly cools the blanket using an intermediate heat exchanger.
A dry cooling tower is used for standby cooling to maintain a closed system, which is desirable for main- taining water quality and preventing releases of small quantities of titium or activated corrosion products that
In addition to the main circulating water system, the
Evaporation anddraft I
I
*
Circulating water pumps
Condensate
Tritium facility
Residual
Hot cell ATC
Reactor *building ATC *
Solid waste -W storageand +-
processing
- * heat
* +-
Standby cooling
power pumps
Chemical
cooling water tower
lakeup water
Blowdown
structure
Raw water Uptake reservior structure
Figure 16.4 Cooling Water Flow for the Generic Reactor STARFIRE (Source: Adapted from Ref. 3)
318

may migrate into the system. The standby cooling water system is estimated to have a maximum heat load of about 60 M W . This heat load requires the dissipation of 0.22 trillion J/h to the atmosphere.
Activation Product Releases
As at conventional nuclear power plants, most routine releases of activation products (radioactive materials) from fusion reactors will originate from the liquid waste processing systems and the ventilation systems of those buildings where radioactivity may become airborne. Radioactive materials recovered in liquid and gaseous processing systems will be contained and disposed of in approved waste disposal facilities.
Coolant
The primary coolant is the major source of radioactive materials discharged from the liquid waste processing systems. The activated materials will be radionuclides dissolved or suspended in a liquid coolant or particles in liquid or gas coolants, which are produced by corrosion, erosion, or sputtering. Much of the radioactive material in the primary loop is trapped in the primary side of the steam generator or adheres to the interior surface of primary coolant piping. In addition, a liquid waste pro- cessing system for the primary loop is designed to re- move additional suspended and dissolved solids and thus control the radioactivity level in the primary coolant.
Because the primary coolant can leak through the steam generator components into the secondary loop, a separate liquid waste processing system for the secon- dary loop is provided to limit radioactivity releases from the secondary loop. Coolant that leaks through valve stems, pump-shaft seals, and other equipment in either coolant loop is collected in catch pans or floor drains and processed before release.
tive corrosion products; these radionuclides will be removed in cleanup systems and will contribute to the discharge of activated products through leaks. The auxiliary cooling systems will include continuous cool- ing systems, which are used to cool highly radioactive components (such as limiters, divertors, and plasma heating devices), systems for cooling low-activity com- ponents (such as magnets and power supplies), and systems that are occasionally used to cool reactor com- ponents after they have been removed for repair. Dis- charges from the auxiliary circuits will be collected and processed with discharges from the primary and secon- dary circuits.
Auxiliary cooling systems may also entrain radioac-
Other sources of radioactive materials that must be processed include on-site laundry, decontamination m a drains, decontamination showers and sinks for workers, and demineralizer backwash and rinse. The specific cleanup operation depends on the nature of the waste.
Figure 16.5 shows an example of a system that controls and removes radionuclides and chemicals from the cooling systems of a fusion reactor.3 The liquid waste processing system for a water-cooled fusion reac- tor is based on similar systems in fission reactors.
Gaseous
The principal sources of gaseous radioactive emissions will be activation products contained in the primary coolant, particularly those that leak into the secondary sides of steam generators; activation of cover gas or air inside the reactor containment building; releases of tritium from components and piping of the tritium sys- tems, which are located in several buildings; and par- ticulate and gas releases in auxiliary buildings during radioactive waste-management operations (Fig. 16.6).3 While all of the emissions will be vented to the atmos- phere, the cleanup operation and release point varies with the gas. Gaseous streams are treated to remove radioactive materials and, in general, released through a tall (100-m) stack.
Three systems are provided to minimize discharges of radioactivity other than tritium: filters to retain par- ticulates, equipment to convert organic materials to carbon dioxide and collect it, and a gas holdup system to permit decay of short-lived radionuclides.
Tritium Effluents
A schematic diagram of the major components of a D-T fuel cycle is shown in Fig. 16.7 and pathways of tritium release are shown in Fig. 16.8. Unburned D-T fuel and impurities are removed from the plasma by the pumping system. This fuel must be purified before it is reinserted into the plasme. In addition, consumed tritium must be replaced by tritium extracted from the blanket or reserve storage. The blanket system, because it is coupled to the plasma chamber and the steam generator, may not be totally enclosed in a secondary enclosure. Thus, some tritium from the blanket assemblies may be discharged into the reactor confinement building.
Other release mechanisms in the tritium systems are steady leaks from imperfect fluid-system connectors, valves, and pumps; permeation through pipes and vessel walls; occasional leaks during routine maintenance; and accidents. To control releases, all piping and compo- nents are made of stainless steel and joints are welded.
319

L
r
Leakage
reactor condenser
r---- Feedwater
1 -----
r----l r-----l Purification Cation
demineralizer demineralizer
cvcs rli! Purification c - system 1 Degassing
tank
------
Figure 165 RadionucUde Removal Paths for Fusion Reactors with Steam Generators Similar to Those of LWRs (Source: Adapted from Ref. 3)
Components that have potentially high leak rates or other hazards will be housed within secondary confiie- ment, with continuous processing of the containment atmosphere. These cleanup systems are based on the catalytic recombination of hydrogen and oxygen to form water, which is subsequently absorbed on molecular sieves.
Possible Needs in Future Control Technology
In fusion reactors, large amounts of carbon-14 could be produced in the liquid-nitrogen systems, which are used to precool the superconducting magnets. The radioac- tivity of carbon-14 is of great concern, since its half-life is 5,730 yr and it is incorporated into living material. It may be necessary to develop a special system for han- dling this radioactive waste.
ENVIRONMENTAL CONSTRAINTS
The DOE’S policy is that radiation exposure to individu- als and population groups be “as low as reasonably achievable.” The various types of operating conditions and radiation exposure guidelines for a commercial fusion reactor are listed in Table 16.3.18 These guide- lines are for exposure from all sources, but tritium is likely to be the most significant. In addition, these guidelines are lower than the DOE allowable limits by a factor of five. Fusion power plant activities, including the transportation of tritium and waste materials, would be covered under seven federal codes19-25 as well as various state and local regulations.
the suitability of sites for commercial fusion reactors. It is assumed that criteria will be generated that will
There is not yet an official guideline for evaluating
320

- Turbine building
- - -
qkk-t exchanger
Turbine building
- -
Plant stack
filter Tritium
L_ -
Holdup tank Ventilation for decay of ourification nitrogen-I3
Tritium L_ -
I ' 1 1 and argon-1 41
----) recycle spaces
carbon-I4
----) recycle spaces
L
Makeup air
Reactor - room m
Storage
building pool b
Blanket HEPA segment - filters - processing
- Auxiliary 7 air 1
1 E;F t water
I storage I
water storage
-It- Evaporator
Figure 16.6 Principal Sources of Gaseous Radioactive Emissions from Fusion Power Plants (Source: Adapted from Ref. 3:
include public protection from radiation exposure, as well as seismic and geological considerations.
given energy technology have been investigated3 Fusion plants can be expected to be inherently much safer than fission reactors, especially if the most severe accidents are considered. The public risk from routine operations is centered on the tritium release potential and waste management practices. Designs based on currently achievable technology have acceptable levels of safety, but they are not completely free of potential hazards. Safety may be improved if low-level activation materials and neutron-free fuel cycles are developed. The cost of such a development effort will have to be weighed against the expected benefit.
The occupational and public risks associated with a
REFERENCES
1. Baker, C.C., et al., STARFIRE - A Commercial Fusion Tokamak Power Plant Study, Argonne National Laboratory Report ANUFPP-80-1 (Sept. 1980).
Cannon, J.B., et al., Background Igormation and Basis for Assessment of Environmental Implica- tions of Magnetic Fusion Energy, US. Dept. of Energy Report DOEER-0170 (Aug. 1983).
Preliminary Draft Generic Environmental Impact Statement, Magnetic Fusion Energy Program, U.S. Dept. of Energy (Sept. 1982).
2.
3.
32 1

Reserve tritium J
I +
Blanket Tritium coolant loops extraction tritium loops
T2 supply
Compressor Cleanup Isotope h (remove separation and buffer
volume -- H, He, etc.)
I I I
Impurity Vacuum control pumping system system
makeup
Atmospheric
I -
322
Figure 16.7 Simplified Deuterium-Tritium Fuel Cycle (Source: Adapted from Ref. 3)
4. Magnetic Fusion Program Plan, U.S. Dept. of Energy Report DOE/ER-0214 (Feb. 1985).
Magnetic Fusion Energy Program Summary Document, Office of Fusion Energy, U.S. Dept. of Energy (Jan. 1980).
Blake, E.M., Fusion '85: And the JT-60 Makes Three, Nuclear News, pp. 77-83 (1985).
Rippon, S. , Fusion '85: Europe Keeps the Pace, Nuclear News, pp. 87-89 (1985).
5.
6.
7.
8. Lagan, B.G., A Mirror Advanced Reactor Study - MARS, presented at 5th Topical Meeting on Tech- nology of Fusion Energy, American Nuclear Society, Knoxville, Tenn. (April 26-28, 1983).
Anderson, J.L., Tritium Handling Requirements and Development for Fusion, Roc. IEEE,
Kulcinski, G.L., Fusion Power - An Assessment of Its Potential Impact in the USA., Energy Policy, 2:104-125 (June 1974).
9.
69~1069-1087 (Aug. 1981).
10.

To the environment
‘.
t I I I I
Emergency I Routine
cleanup system I cleanup system I
atmospheric * ’ atmospheric
4 A ” / A /
/ /
/ /
/ 0 .- _-_/’
Coolant systems
Plasma systems Blanket systems (torus, injectors, (including tritium
divertors) recovery equipment)
Fuel handling system (processing
and storage) I
Figure 16.8 Tritium Release Pathways (Source: Adapted from Ref. 3)
Table 163 Summary of U.S. DOE Policy on Radiation Protection Standards
Dose Type of Exposure Exposure Period (rem)
Occupational
Whole body. head and trunk, gonads, eye lens, bone marrow, or active blood-forming tissue Unlimited skin areas (except hands and forearms) or other organs Bone
Forearms
Hands and feet
Public, maximum individual exposure
Whole body, gonads, or bone
Other organs IlMrrOW
Year Calendar quarter
Year Calendar quarter
Year Calendar quarter Year Calendar quarter Year Calendar quarter
Year
Year
5 3
15 5
30 10 30 10 75 25
0.5
1.5
11.
12.
13.
14.
15.
16.
Mineral Commodity Summaries, US. Bureau of Mines, U.S. Dept. of Interior (1978).
Draft Environmental Impact Statement on 10 CFR Part 61 Licensing Requirements for Land Dis- posal ofRadioactive Waste, U.S. Nuclear Regulatory Commission Report NUREG-0782 (Sept. 1981).
Termination of Operating Licenses for Nuclear Reactors, Regulatory Guide 1.86, U.S. Atomic Energy Commission (1974).
Phillips, J., A Waste Inventory Report for Reactor and Fuel-Fabrication Facility Wastes, Office of Nuclear Waste Isolation, Battelle Memorial Insti- tute Report ONWI-20 (March 1979).
Bordtenschlager, R., et al., Decommissioning of Lighr - Water Reactor Nuclear Power Plants, Nu- clear Engineering & Design, 45:l-51 (1978).
Hopkins, G., et al., Low Activation Materials Safety Studies Annual Report for Fiscal Year 1981, Oct. I , 1980 - Sept. 30,1981, General Atomic Co. Report GA-A16425, San Diego (1981).
Source: Ref. 18.

17.
18.
19.
20.
21.
3 24
Alloy Development for Irradiation Performance Semiannual Progress Report for Period Ending March 31,1983, U.S. Dept. of Energy Report DOE/ER-0045/10 (1983).
Environmental Protection, Safety, and Health Protection Program for DOE Operations; Chapter X I , Requirements for Radiation Protec- tion, U.S. Dept. of Energy Order 5480.1, Change 6 (Aug. 13, 1981).
Code of Federal Regulations Title 10, Part 50, U.S. Nuclear Regulatory Commission.
Standards for Protection Against Radiation, Code of Federal Regulations Title 40, Part 20.
Special Nuclear Materials, Code of Federal Regu- lations Title 10, Part 70.
22.
23.
24.
25.
26.
Packaging of Radioactive Material for Transport and Transportation of Radioactive Material Un- der Certain Conditions, Code of Federal Regula- tions Title 10, Part 71.
Physical Protection of Plants and Materials, Code of Federal Regulations Title 10, Part 73.
National Emission Standards for Radionuclide Emissions from DOE Facilities and from Facili- ties Licensed by NRC and Non-DOE Facilities, Code of Federal Regulations Title 40, Subparts H and I.
Hazardous Materials Regulations, Code of Fed- eral Regulations Title 49, Parts 170 through 179.
Kazimi, M.S., Review Paper: Safety Aspects of Fusion, Nuclear Fusion, 24:1461 (1984).

Chapter 17
Wood Biomass Combustion
BACKGROUND
History
Direct wood combustion is the simplest and most com- mon thermochemical process for converting wood biomass into energy. It has had a long history of suc- cessful use in residential, industrial, commercial, and utility applications (see Fig. 17.1). Wood was the prin- cipal source of heat energy until the latter part of the nineteenth century. During the mid-I800s, wood sup- plied more than 90% of the nation’s energy needs.1 From the turn of the century through the mid-1970s, the use of wood energy in the United States decreased as low-priced coal, oil, natural gas, and electricity became available. However, in the 1970s, as the costs of fossil fuels rapidly increased, the use of wood for heating increased dramatically.2 For home heating, while wood was primarily used in the mid-1900s as a secondary heat source in rural areas with low population density, its use has spread to many homes in metropolitan areas, in- creasingly as a primary heat source. The drop and sub- sequent rapid increase in wood fuel use are most evident in the residential and commercial sectors, as shown in Fig. 17.2, which illustrates the trends in wood energy consumption over a 30-yr period2
Data developed by the U.S. Energy Information Administration show that wood provided about 2.6 quads (1 quad = 1 quadrillion Btu), or 3.6%, of the total primary energy consumed in 1983 in the United States. Wood represents a much smaller share of U.S. energy consumption than oil, gas, or coal but is close in share to hydroelectric and nuclear power.3
The use of wood fuel will likely continue to in- crease. The current wood resource base is not likely to limit the expanded use of wood fuels in the near term. Forests occupy about one-third of the nation’s total land
area, and nearly two-thirds of the forest area is classified as commercial timberland. Although the current bal- ances between growth and removal show that the hard- wood forests and eastern softwood forests cannot sup- port additional timber harvests, these balances can vary over a wide range. If commercial timberland owners continue to respond to price and inventory changes and manage their timber stands as they have in the recent past, timber harvests can be increased substantially dur- ing the next few decades.4
Although the wood resource base appears to meet anticipated demands, there are near-term concerns about the existing supply and distribution system. Localized shortages have been experienced, especially in the resi- dential sector, because the existing supply system is unable to respond to increased demand. Potential indus- trial users may find difficulty in identifying reliable and stable supply resources. Not only is there increased demand for wood as an energy feedstock, but other markets, such as lumber, paper, chemicals, and plastics, will be competing for available wood resources. New methods of debarking logs and producing pulp are con- tinually reducing the quantity of waste available for fuel.4
Government Programs
According to U.S. energy policy, biomass energy is considered to be a significant part of the nation’s energy supp1y.S The federal government has initiated numerous programs over the past decade to foster the development of biomass energy and thereby reduce US. dependence on foreign sources of petroleum.6 Both the Energy Research Advisory Board of the U.S. Department of Energy (DOE) and the U.S. Congressional Office of Technology Assessment have projected the possible contributions of biomass energy to the nation’s energy
325

/.

- 1.2 - 1.0 ?\, -
Year
6i 20.6 ,5 17.2
- - .- L
Figure 17.2 Estimated Wood Energy Consumption Trends by Sector, 1949-1981 (Source: Adapted from Ref. 2)
0.8
0.6
0.4
0.2
supply.7 By the year 2000, wood energy could provide 4.77 quads per year, according to the advisory board’s estimates,B and anywhere from 5 to 10 quads per year, according to the Office of Technology Assessment.9
The Biomass Energy Production and Use Plan for the United States, 1983 - 1990, jointly prepared by the U.S. Department of Agriculture and DOE, was submit- ted to Congress in October 1983. This plan forecasts biomass energy use of 4 quads annually by 1990, about 5% of the nation’s energy requirements.5 The bulk of the energy produced will be from direct combustion of wood and wood residue. The biomass energy plan recommends two basic policies: (1) allow market forces to determine the types and quantities of biomass energy produced and consumed and (2) support selected long- term biomass energy research and development activities.
sored by DOE with the objective of developing a tech- nology base that will enable industry to bring efficient, economic, and environmentally acceptable renewable
A broad range of biomass energy programs is spon-
- ‘\ - \*
--/./ 5, ---#
/ - 10.3 --. 1’ - 6.9
Commercial -- - L-. Utility - 3.4
\
e.-.-. I”-.-.-.$ .-.-.-. 3 / *- . c. d. 0 1
energy resources and technologies into the marketplace. The DOE Bio-Energy Coordinating Committee has been functioning since 1980 to ensure optimum use of DOE’s expertise and achieve effective coordination and infor- mation exchange among DOE offices active in bio- energy research and development.10 These offices and their program goals are listed in Table 17.1. The DOE strategy also includes coordination with the U.S. Depart- ment of Agriculture and the U.S. Environmental Protec- tion Agency (EPA), as well as other federal agencies, state and local governments, regional organizations, and the private sector.
Industrial and Utility Applications
The industrial sector accounts for about two-thirds of the wood fuel consumed in the United States. In 1983, industrial wood fuel consumption totaled 1.69 quads, or 7.9% of the total energy consumed by industry.3 The paper and allied products industry accounts for 69-75%
327

Table 17.1 Biomass Program Goals of DOE Offices
DOE Offices Goals
Renewable Energy Technologies, Biofuels and Municipal Waste Technology Division
To provide a generic technology base that will encourage industry to use biomass and municipal wastes for energy. Activities include study of the biomass feedstock production of short-rotation woody crops.
Conservation To develop technologies for producing and using fuels and chemicals from renewable resources that are cost-competitive with nonrenewable fuels and chemicals and that will enhance national energy security. Major activities relate to wood-fired space heating systems and use of industrial wastes
Building Energy Research and
Industrial Programs Vehicle Engine Research and
Energy Systems Research for fuels.
Development
Development
Energy Research To conduct research on principles and mechanisms related to biomass production and conversion and energy-related biotechnology.
Basic Energy Sciences Health and Environmental Research
Fossil Energy To develop technologies for fossil fuel beneficia- tion, conversion to liquid and gasews fuels, and pollution control.
Source: Ref. 10.
of industrial wood fuel use and the lumber and wood products industry for 23-28%. A predominant industrial energy conversion system is the wood-fired boiler (Fig. 17.3),11 with steam production ranging from 10,000 Ib/h to over 500,000 lb/h. As of 1978, over 1,600 such systems were in use, Other conversion sys- tems include kilns, dryers, cogenerators, and gasifiers. Wood fuel types include wood chips, bark, hogged fuel, sawdust, and spent (black) liquor. The latter material is generated by wood pulping processes and is consumed internally by recovery boilers. On an energy input (Btu) basis, spent liquor accounts for a significant proportion of industrial wood fuel consumption.
As of 1984, there were only nine wood-fired electric utility facilities in the United States.12 These range in size from 1 to 50 MW, relatively small in comparison to fossil-fuel-fired electricity-generating plants. The new- est and largest of the nine facilities is the 50-MW Joseph C. McNeil plant in Vermont, which came on-line com- mercially in June 1984. Although the operation of this facility should dramatically increase the quantity of wood consumed by the utility sector, little additional capacity is envisioned since only two additional wood- fired units are planned beyond 1984. There are also about 70 wood-fired facilities qualified by the Federal Energy Regulatory Commission as small power produc-
tion or cogeneration facilities or as municipal facilities producing electricity in the industrial sector.12 However, most of these are small and many are accounted for within the data for the industrial sector.
Residential Applications
At the turn of the century, wood was a major source of energy in the residential sector and remained so until the middle of the twentieth century. However, as shown in Fig. 17.4, residential wood consumption declined steadi- ly from the 1940s until the mid-l970s, when the trend rever~ed.2~3 In 1983, about 21 million households burned an estimated 54 million short tons of wood for fuel (as either a primary or secondary source), cooking, or aesthetic purposes.3.13 However, only about 25% of these households used wood as a primary source of heat. On a regional basis, the South accounts for over 35% of the residential consumption, the Northeast and North Central regions for 25% each, and the West for 13%. In recent years, consumption in the South has increased in both absolute and relative terms. In addition to conven- tional split-wood forms, relatively new, refined wood fuel forms, such as pellets, briquettes, and cubes, have begun to be marketed to the residential sector.
328

Legend:
facility
t 13 Steam - Resources - - - + Air emissions I=> Liquid wastes
Solid wastes
and <
Combustion air
-
Wood fuel storage
disposal
I
Leachate
Wood feed
Blow-
Steam Particulate
(mechanical co I I ec t o rs) --
Steam boiler
I
;: 4 I I I I
Exhaust stack
-?- I
Particulate
classifier Bottom
Classifier ash
Fly ash
Aqueous discharge
Iote: Not all systems incorporate a sand classifier.
Figure 173 Process Flow in an Industrial Wood-Fired Boiler (Source: Adapted from Ref. 11)
TECHNOLOGY
Basic Process
In the combustion process, an oxidant is reacted with a fuel to free stored energy as thermal energy. The two primary combustible chemical elements of significance are carbon and hydrogen. Sulfur is usually of minor significance as a source of heat, but it can be of major significance in corrosion and pollution problems. Car- bon and hydrogen, when burned to completion with oxygen, form carbon dioxide (C02) and water and release heat at a rate of about 14,100 Btdlb of carbon
burned and 61,000 Btu/lb of hydrogen burned. The maximum objective is to release all of this heat while minimizing losses from combustion imperfections and superfluous air. The joining of a fuel’s combustible elements and compounds with oxygen requires a tem- perature high enough to ignite the constituents, promote mixing or turbulence, and provide sufficient time for complete combus tion. 14 Incomplete combustion occurs when a fuel element is not completely oxidized in the combustion process, causing inefficient use of the fuel and production of air pollutants.ls
three successive, but overlapping stages: (1) drying, which proceeds rapidly on the surface but requires time
Combustion releases heat and breaks down wood in
329

60
50
C 0 .- I a 5 40- Y) c z z P r r , O
f g 30- u c 0 0 z i -- .- I
E 20- E a, U
10 : 1950 1960 1970 1980 1990
Year
-
-
-
Figure 17.4 Residential Wood Consumption, 1949-1983 (Sources: Adapted from Refs. 2 and 3)
to reach the interior parts of large pieces, (2) distillation and burning of volatile matter, and (3 ) burning of fixed carbon. Heat or energy must be supplied to start the combus tion.14
Industrial and Utility Combustion Technology
The most common method of burning wood waste in the industrial and utility sectors is by use of the spreader- stoker boiler. Typical boiler components are illustrated in Fig. 17.5. Other methods include overfeed stoker ~firng, combustion in fuel cell boilers, suspension frring, and fluidized-bed combustion (FBC). An additional method, the Dutch oven, was phased out (for new con- struction) in the 1950s because of its high construction cost, low efficiency, and slow response to fluctuations in steam demar1d.16~17
In a spreader-stoker boiler, large pieces of wood fuel enter the stoker through a fuel chute and are spread pneumatically or mechanically in a thin, even bed on a grate across the furnace. Part of the fuel bums in sus- pension while, simultaneously, the flame over the grate radiates heat back to the fuel to aid combustion. Spreader stoker boilers, as well as other boiler types, can
Superheater - Fuel conveyor
Fuel bin
Fuel chute
Fuel spreader
Steam out
Mud drum
Multiple cyclones
,-Air heater
Overfire Y % Jnderfire ai=-
7’
Ash Dit - ~~~ ~
Forced-draft fan
Figure 175 Typical Components of a Spreader-Stoker Boiler (Source: Adapted from Ref. 17)
330

be of either watertube or firetube design. Although some firetube boilers have been built with heat input rates of up to 50 million Btdh, they are usually limited in size to less than 30 million Btdh (8.8 M W ) of ther- mal input. Spreader stokers can bum fuel with moisture contents of up to 62-658, although relatively ineffi- ciently; above this amount, they cannot support stable combustion unless an auxiliary fossil fuel is used.
The overfeed stoker is similar to the spreader stoker except that fuel is spread across the furnace by a moving grate rather than being thrown across by a pneumatic or mechanical fuel spreader. In a fuel cell boiler, the wood is piled on a stationary grate in a refractory-lined cell and forced-draft air is supplied to drive off the volatile substances in the wood and burn the carbon. The vola- tile substances are then mixed with secondary and ter- tiary combustion air above the fuel pile. The Dutch oven was the standard pile-burner design prior to 1950. Essentially, this design incorporates a refractory-lined primary chamber where wood fuel is piled and burned to supply volatile gases to a secondary chamber for further combustion. The disadvantages leading to its loss in the market were noted earlier.
Suspension burning involves rapid burning in a turbulent air stream. Two basic types of suspension burners are available for steam generation: cyclonic burners and solid fuel injection burners. Cyclonic burners mix fuel and air in the proper proportion and bum them in an external cyclonic refractory chamber. In the injection type, air and wood enter the bumer under pressure and mix thoroughly before leaving a nozzle at high velocity. The mixture is subsequently ignited in a refractory section of the burner by a support burner. A major limitation of cyclonic burners is that they require very small fuel particles, such as sander dust.
A recent development in wood burning is FBC, in which the wood is burned on a heated bed of sand kept in constant motion by the influx of combustion air. The fluidized bed is created by introducing air into a plenum chamber through multiple nozzles and is maintained by a forced-draft fan. Increasing the air flow will expand the bed and increase the overall pressure drop in the bed. When the upward pressure drop equals the downward pressure (weight) of the sand bed, the sand mass has fluid characteristics. The fluidized bed improves com- bustion, accommodates odd-sized fuel and fuel with a high moisture content, and allows ash and rock to be removed from the static section of the bed either on- stream or during periodic shutdowns.
Residential Heating Technology
Residential wood heating today bears very little resemblance to the practice followed in early America. Two hundred years ago, in colonial New England, 30 cords of wood per year might be required for home heating18 (A cord is a volume measure corresponding to a pile of stacked wood 4 ft by 4 ft by 8 fL) The heat- ing value of a cord of wood can range from 12 to 40 mil- lion Btu, depending on the wood’s density, moisture content, and other characteristics. With tighter house construction and energy-conserving practices, contem- poraq houses have a heat loss 5-10 times less than that of colonial houses; probably 3-8 cords of wood per year would be needed if contemporary stoves and wood fur- naces are used.18
The basic types of residential heating units include fireplaces, fireplace inserts, wood stoves, and wood furnaces. Fireplaces draw large amounts of warm air up the flue and provide only about 10% of the wood’s potential heat to a house. Indeed, the flue draft may be sufficiently large to draw heated air out of the room itself, resulting in a negative heating efficiency. Installa- tion of a fireplace insert like that shown in Fig. 17.6 would increase the system’s efficiency but only up to about 35%.19
~~
Combustion gases and
Figure 17.6 Fireplace Insert Design with Louvers to Limit the Combustion Air Intake (Source: Adapted from Ref. 19)
33 1

In contrast to fireplaces, wood stoves are fairly efficient when properly designed, installed and oper- ated About 50-70% of the wood's potential thermal energy can be transferred to the house. The two basic wood stove designs are radiating and circulating stoves. Figure 17.7 shows a typical design for a radiating stove.19 Radiating stoves have primary and secondary air inlets and a smoke chamber. The smoke chamber increases the flue gas residence time, and thereby pro- motes heat transfer to the room. Circulating stoves (Fig. 17.8) can deliver about 70% of their effective heat by natural convection.19 Designed with double-wall construction to allow transfer of radiant energy to warm convection air, these systems often have a thermostat that controls the damper opening to allow proper air intake for combustion.
catalyst have been introduced into the market within the last several years. The catalyst promotes improved combustion of the carbon monoxide (CO) and organic compounds released from the firebox. This more com- plete combustion, in turn, resuIts in improved heating efficiency relative to noncatalytic stoves.
basic difference between a wood stove and a furnace is that the heat energy of furnaces is transferred via ducts to other rooms in the house, whereas the wood stove primarily heats only the room it is in. The same com- bustion and control techniques are employed by both. Although wood-fuel furnaces are in limited use because of the large amount of labor needed for hand firing, they can operate at fairly high efficiencies. New residential pellet stoker designs may substantially reduce the amount of labor needed.
New stove designs incorporating a precious metal
Wood furnaces are also used in residences. The
ENVIRONMENTAL ISSUES
The environmental and health issues related to current wood combustion technology are gaseous and particu- late emissions, residue disposal, and safety. Other issues are associated with harvesting, transportation, handling, and storage, and include nutrient depletion and soil erosion in forest areas, stream sedimentation, changes in the water yield from forest watersheds, land use compe- tition, emissions from wood-handling systems, leachate from wood storage, and accidents in wood harvesting. Terrestrial and aquatic ecological impacts will become more pronounced as the demand for wood resources increases. Regions that experience intensive harvesting will be particularly susceptible to erosion, sediment transport, flooding, nutrient depletion, and terrestrial and aquatic disruption.
Smoke chamber
Secondary air inlet
Primary air inlets construction
W liner
Figure 17.7 Typical Radiating Stove (Source: Adapted from Ref. 19)
Louvered top
\ Flue collar
Ash dooi " \ ' / A i r intake'
Draft damper
Ash pan
Figure 17.8 Typical Circulating Stove (Source: Adapted from Ref. 19)
Emissions from Wood Combustion
Industrial and Utility Emissions
Emissions of interest from wood-fired industrial and utility facilities include particulates, nitrogen oxides (NO,), hydrocarbons (HC), CO, and trace substances. Particulate matter is a pollutant of primary concern in wood combustion, and it consists of both inorganic and organic materials. The inorganic fraction is derived to a great degree from the ash content of the wood as well as from sand and dirt mixed with the wood during
332

handling. As shown in Table 17.2, wood ash contents are fairly low when compared to the ash content of coal, which can be as high as 1 O % P The organic component can consist of incompletely burned particles (essentially pure carbon) and compounds of moderately high molec- ular weight that vaporize, but do not bum, and then condense as the flue gases cool. Both the inorganic and organic particulates can serve as condensation nuclei for these organic molecules. Sulfur dioxide (S02) is also produced by wood combustion, but only in small amounts since the sulfur content of wood is negligible, particularly when compared to coal.
trial boilers are presented in Table 17.3.21 Recently, EF'A proposed new source performance standards (NSPS) for particulate emissions from industrial, com- mercial, and institutional steam-generating units (includ- ing wood-fired units) capable of combusting more than 100 million Btdh of heat input22 In order to establish a technological base for such a standard, EPA reviewed particulate emission data from a number of wood-fired boilers equipped with various types of control equip- ment. Table 17.4 summarizes some of the findings, which led EPA to propose NSPS for particulates of 43 ng/J (0.1 lb/million Btu). As Table 17.4 indicates,
Some typical emission factors for wood-fired indus-
Table 173 Typical Analysis of Dry Wood Fuel
Constituent or Parameter Amount
Proximate analysis (%) Volatile mauer 74-82 Fixed &on 17-23 Ash 0.5-2.2
Chemical constituents (%) Carbon 49.6-53.1 Hydrogen 5.8-6.1 Oxygen 39.8-43.8 Sulfur a Nitrogen 0.1
Heating value BWlb 8,560-9,130 kJ/kg 19,900-2 1,250
Moisture contentb (a) 36-58
generally a medium-pressure wet scrubber, an electro- static precipitator, or a fabric filter control system would be required on new wood-fned boilers to meet the pro- posed standard. These control systems can also be aug- mented with high-grade mechanical collectors that can substantially reduce the particulate loading in the flue gas before the gas enters the higher-efficiency control system. The EPA analysis also indicated that a high wood moisture content and fly ash reinjection increase particulate emissions by increasing the concentration of particles in the steam -generating unit and entraining them in the flue gas as air is forced through the combus- tion zone.
The EPA also recently proposed SO2 NSPS for large (greater than 100 million Btu/h heat input capacity) industrial, commercial, and institutional steam-generat- ing units operating on coal, oil, or mixtures of these fuels with any other fuels (including wood), as well as a particulate matter NSPS for units firing oil or mixtures of oil with any other fuels23 However, with the excep- tion of special situations involving certain coaUwood or oiYwood systems, no So;? controls would be required for typical wood-fired units. Development of NSPS is under way to limit SOZ, NO,, and particulate matter emissions from steam-generating units with heat input capacities of 100 million Btdh or less; however, no details have been forthcoming to date.
The proposed NSPS also incorporate a limit on visible emissions from wood-fired steam-generating units. That limit is 20% opacity (6-min average), excluding water vapor. In addition, continuous opacity monitoring is required
Table 1 7 3 Typical Uncontrolled Emissions from Industrial Wood-Fired Boilers
Emission Rate
pncp ng/J lb/miIIion BIU Pollutant
Carbon monoxide 0.01-0.5 161,900 0.033-4.4
Rydrocarbons 0.62.1 15-110 0.035-0.26
Nitrogen oxides 0.1-1.2 6-97 0.01 4-0.23
Particulates 1.5-13 100-1,300 0.23-3.0
Sulfur dioxide 0.01-0.5 0.43-23 0.001 -0.053 aNegligible.
bAs received.
Source: Ref. 20. Source: Ref. 21.
333

Table 17.4 Particulate Emissions from Wood-Fired Boilers with Control Equipment.
Emission Rate
Control Equipment ng/J lb/million Btu
Double mechanical collectors 129 0.30
Wet scrubbers Low pressure dropb 30-90 0.07-0.21 Medium pressure drop 22-30 0.05-0.07
Electrostatic precipitator 2630 0.06-0.07
Baghouse 9 0.02
aThe EPA has proposed palticulate NSPS of 43 ng/J,
S 8 in.
CIS-26 in.
Source: Ref.22.
or 0.1 1Wmillion Btu.
Trace element emissions from wood-fired boilers have also been measured. Some sample results are given in Table 17.5.24
Residential Emissions
A number of significant empirical investigations have been conducted in recent years to characterize emissions from residential wood-burning appliances. In addition, studies of ambient air quality in several communities indicate that residential wood combustion (RWC) may pose a significant potential for adverse health effects. This health concern is based on the observation that particulates from RWC are within the size range deposit- ed within the lungs and that some of the organic material is toxic or carcinogenic. In addition, the areas with the highest RWC emission densities often coincide with areas of high population density.
On a national aggregated basis, it has been esti- mated that RWC contributes the following annual emis- sions: 2.7 million tons of particulates, including 20,000 tons of polycyclic organic matter (POM); 7.4 million tons of CO; and 62,000 tons of HC.B
devices is high, significant air quality problems are caused by RWC. For example, in a study of 12 sites in Washington, Oregon, and Idaho during the winter of 1980-198 1, RWC emissions were found to typically account for 66-75% of the fine particle mass in residen- tial areas, while transportation sources contributed 5%,
In communities where the number of wood-burning
334
Table 175 Trace Element Emissions from Wood-Fired Boilers
Trace Amount Element Wk)
Aluminum Arsenic Barium Beryllium Cadmium Calcium Chromium Cobalt
Iron Lead Lithium Manganese Nickel Phosphorus Potassium Silicon Sodium Vanadium
Copper
11 0.22 1.7 <0.02 0.056
0.11 <0.02 2.0
16.3 0.93 0.056 5.8 0.54
270
22 350
14 1.2 0.093
aBased on tests on five
Source: Ref.24.
boilers
secondary sulfate 5.6%, and all industrial sources less than O S % P Using emission inventory and direct sam- pling methods, 54% of particulate and 39% of CO emis- sions during winter in Missoula, Montana, were attrib- uted to RWC. In addition, the average contribution to the respirable portion of particulates ranged from 68 to 76%. Other areas shown to be experiencing high air quality impacts include Bangor, Maine; Portland and Medford, Oregon; Waterbury, Vermont; Denver, Colo- rado; and Chattanooga, Tennessee. This partial list indicates that the majority of the areas affected by RWC emissions are urban areas.
Several factors can significantly affect the type and rate of emissions from wood burning appliances. Major factors include equipment type (including firebox size); burn rate; stage of the bum cycle; and the wood type, moisture content, size, and shape.
range from 0.5 g/kg of wood burned to as high as 97 glkg.2728 This wide range is not surprising because the objectives and methods of individual investigations have varied widely. For example, different emission test
Particulate emission factors reported in the literature

methods have been used to develop emission factors for a number of wood-burning appliance types using wide ranges of operating conditions and a diversity of fuel types. Consequently, it is not possible to specify a typi- cal particulate emission factor for a typical appliance. However, several studies have reported ranges of 0.5-25 gflrg.
More than 80% of particulate emissions from RWC are smaller than 2.5 pm and almost all are less than 10 pm. Particulate matter of this size is considered respirable, and its deposition in the tracheobronchial and aveolar regions of the lung can increase coughing and chest discomfort and aggravate cardiovascular diseases. In addition, RWC is thought to account for about 50% of all POM emitted nationally.29 Although POM consti- tutes slightly less than 1% of total particulate emissions from RWC, this is of concern since several POM com- pounds, such as benzo(a)pyrene, have been shown to be carcinogenic and others mutagenic.
wood burned to 400 glkg.27 However, a typical emis- sion factor range for stoves and other airtight appliances would be about 100-200 g/kg. Carbon monoxide from fireplaces appears to be significantly lower, probably due to the more complete combustion that occurs in fireplaces.
Emission rates for HC have ranged from 0.1 to 112 g k g of wood burned. However, it is very difficult to analyze data from different studies since different measurement techniques and parameters were used. A representative range of 20-60 g/kg has been suggested based on a review of a number of tests.27
Data for NO, emissions also are not conclusive, but measured values have been relatively low, ranging from 0.03 to 2.0 g k g , with an average value of 0.75 gkg.27 However, these emission rates are not considered sig- nificant relative to those for NOx from other residential heating appliances.
Finally, the impact of RWC appliance operation on indoor air quality has been investigated in recent years. Although wood stoves and fiplaces are vented to the outdoor atmosphere, a number of circumstances can cause combustion products to be emitted indoors: a stove that is not airtight (e.g., one with visible gaps in the stove’s construction), improper installation (e.g., insufficient stack height or poor fitting of the stovepipe), cracks or leaks in the stove pipe, negative indoor air pressure, downdrafts, and accidents (eg., a log rolling out of the fireplace). The impact of these sources on indoor air quality may vary substantially among homes.
tion results in higher levels of CO and particulates in- doors than outdoors. However, no significant, general
Emission rates for CO have ranged from 4 g/kg of
Generally, studies indicate that wood stove combus-
conclusions can be drawn from the results of the few studies conducted to date.
Residues from Industrial Wood Combustion
Water-Leached Contaminants
In general, large stockpiles of outdoor chips are undesir- able. If provisions for dry storage are not made avail- able, the resultant high moisture content of the fuel will result in lower combustion efficiencies. In addition, wood fuel piles may become a significant source of pollution if pile leachate directly enters surface or under- ground waters. Little information is available on the quality of the runoff effluent from a wood storage area, but it is expected to have a moderate to high biological oxygen demand (lOO-l,OOO mg/L) resulting from organ- ic compounds leached from the wood and an acidic leachate3 One analysis of leachate from a wood chip stockpile indicated a relatively high chemical oxygen demand and high concentrations of potassium, total phosphate, and total organic and ammonia nitrogen3 At another site, fdms of HC were observed on water surfaces near large outdoor woodchip storage areas.32 The quantity of runoff from wood storage areas is gener- ally proportional to the surface area of the wood storage pile and the quantity of precipitation at the site.%
Wastewater from wood combustion processes, particularly from wood-fired boiler facilities, is another pollution source. Major wastewater streams include those from the makeup boiler water treatment system, the flue gas scrubber system (if applicable), and the ash disposal system. Table 17.6 shows the characteristics of the various streams.34Js
The discharge stream from water treatment facilities must adhere to state water quality standards. Water quality parameters for which standards may exist in- clude dissolved solids, dissolved oxygen, sulfates, chloride, arsenic, cadmium, chromium, mercury, zinc, and acidity or alkalinity (Le., pH). There are no federal standards governing the liquid discharge33
Solid Residues
Boiler ash, clinker and slag, fly ash, and carbon char are the solid residues from the combustion process. The major components of these wastes are silica, alumina, and calcium oxides. Minor constituents include sodium, magnesium, potassium, and trace amounts of heavy metals.
The major wastes resulting from the direct combus- tion of wood are bottom and fly ash. The ash contents of most wood types vary from 0.1 to 3%, depending on
335

Table 17.6 Major Wastewater Streams from Wood-Fired Boilers
Wastewater Stream Discharge Characteristics
Solids removal from filter backwashing
High in suspended solids; may be recycled after solids are removed or used as makeup water supplement for sluny ash disposal.
Sodium softening or demineralizer unit
Low in suspended solids and high in dissolved solids; can be used to supplement makeup water for ash slurring.
Oveflow from ash disposal lagoon or holding pond
Low in suspended solids; may contain organics and some heavy metals, high pH, and high potassium levels.
Flue gas scrubbing May contain suspended solids, dissolved solids, and dissolved organics.
Sources: Refs. 34 and 35.
the wood type, percentage of bark included, and other factors9 Wood-burning furnaces are not usually trou- bled with severe slagging conditions unless the wood is burned in combination with other fuels or unless the wood contains large quantities of sand or dirt. The ashes from two fuels often combine to form an ash with a lower melting temperature than that of either ash taken separately.
Few data are available on the environmental effects of landfiiling wood ash. The potential leaching of heavy metals in the ash from the ash disposal site may be of environmental concern. The alkaline leachate may have both adverse and beneficial environmental impacts. For example, the leachate can contaminate groundwater; on the other hand, its alkalinity can improve the growing potential of acidic soils. The ash can also be used to improve soil texture.
In one analysis of leachates produced from wood bottom ash and fly ash, column leachate concentration levels were measured21 None of the samples tested had contaminated levels that exceeded the concentration limits set in the EPA extraction procedure guidelines. However, the maximum contaminant concentrations set in the National Interim Primary Drinking Water Regula- tions for lead, barium and selenium were exceeded by both the bottom ash and the fly ash, and that for arsenic was exceeded by the fly ash as well. The fly ash also surpassed the Safe Drinking Water Act standard for sulfates (SO4). However, the combined effects of dilu- tion and the attenuation of leachate pollutants by soils may reduce the contaminants below hazardous levels. Therefore, the study concluded that under proper landfill disposal conditions, the ash residues should not pose any serious environmental hazard.
At present, solid wastes from direct wood combus- tion are not considered hazardous wastes under regula- tions promulgated under the Resource Conservation and Recovery Act. However, their disposal may be subject to state or local limitations.33
Another source of solid wastes is wood bark, which picks up impurities during transportation as rough logs are dragged to central loading points. Therefore, provi- sions must sometimes be made for removal of large amounts of sand and dirt that are dragged in with the logs and that otherwise may become entrained in the combustion gases.
Safety
In addition to potential air and water pollution, a number of safety and health implications are associated with wood combustion. These include hazards of harvesting and transporting wood; industrial plant operation; resi- dential chain saw and axe use; and bums and fires from stoves, chimney connectors, and chimneys.
tional injury and illness rates for the forest industry for the years 1977-1979 ranged from 10.5 to 13 incidences per 100 full-time w0rkers.37~38 For logging contractors, for the same years, the incidence rate ranged from 24.2 to 26.3 per 100 full-time workers (22,000 incidences in 1978 and 21,000 in 1979). Several other studies have estimated injuries and deaths associated with wood removal and transportation.39-41 Estimates for whole tree and tree residue removal are compared to under- ground coal mining in Table 17.7. Deaths and injuries for transporting wood are estimated to be 0.0036 and 0.096 per aillion Btu, respectively.37
The U.S. Department of Labor reported that occupa-
336

Table 17.7 Deaths, 4uries, and Lust Workdays: Wood Removal versus Coal Minlng (incidences per trflUon Btu of heating value)
Tree Removal Under- ground
Whole Tree Coal Incidences Trees Residueb h4iningc
Deaths 0.162 0.47 0.01 Injuries 26.4 76.5 1.1 Lostworkdays 190 658 57.7
.From Ref. 39.
bFmm Ref. 40.
CFmm Refs. 40 and 41.
Although actual statistics are not available for death and injury rates for wood-fired industrial steam boilers, estimates have been reported based on coal-fired plant statistics. For a wood-fired boiler plant, projected deaths range from 0 to 0.0095 per trillion Btu of energy pro- duced and projected injuries range from 0.16 to 0.19 per trillion Btu of energy produced?
Residential use of chain saws and axes presents another safety consideration linked to wood combustion. The U.S. Consumer Product Safety Commission (CPSC) estimates that between 1978 and 1982, chain saw inju- ries treated in hospital emergency rooms fluctuated amund the level of 63,000 injuries per year.42 Rota- tional kickback injuries were estimated as one in five injuries involving chain saws in 1982. About 20 million consumer saws were in use in 1982 and the risk of injury was about 34.3 per 10,OOO in use. In addition, 107 chain-saw-related deaths were reported between 1978 and 1982. Based on these data, the CPSC commenced a proceeding in 1981 to develop a consumer product safety standard for chain saws and their components. Subsequently, the CPSC participated in the chain saw industry’s formulation of an industry-wide voluntary standard. After concluding in 1985 that the voluntary standard would be effective and universally adopted by the chain saw industry, the CPSC terminated its proceeding.43
and split wood are assumed to be included in the CPSC National Electronic Injury Surveillance System, which monitors hospital emergency room treatments of injuries associated with selected consumer products. A total of 28,000 hospital-treated injuries related to usage of
Data on injuries associated with axes used to cut
hatchets and axes wete noted for the 1-yr period ending March 3 1,198 1.44 This total does not include injuries treated outside hospital emergency rooms, and it is also difficult to ascertain the fraction of the total attributed to residential wood combustion.
Accidental fires and burns pose an additional safety risk due to residential wood burning. Accidental fires are due mainly to the ignition of flammable materials by hot surfaces or sparks and to chimney fires caused by creosote ignition. National fire loss estimates indicate that in 1982 almost 140,000 fms attended by fire ser- vices involved solid fuel heating equipment, and that these fires resulted in 250 deaths, 2,700 injuries, and more than $250 million in property damage.45 A total of 59% of the fies resulted from the solid fuel heating unit and another 38% from accidents involving the chimney flue and chimney connector. Table 17.8 lists the fires, deaths, and injuries due to solid fuel heating equipment in 1982. Such deaths reached a peak in 1980 and appear to have declined somewhat since. Nevertheless, begin- ning in 1980, solid fuel fire deaths have become more frequent than deaths from any other kind of heating equipment.45
A National Bureau of Standards study examined solid-fuel-related fire reports by local fire departments to the Massachusetts State Fire Marshal’s Office from late 1977 through June 1978.46 About 75% were related to unsafe installations and 25% to unsafe operation or maintenance. Fewer than 2% of the fires were caused by defects or poor design in the heating appliance itself. Hence, the prevention of accidental f ies in wood- burning appliances should focus on installation, opera- tion, and maintenance.
Residential wood stoves result in burns from acci- dental contact with the hot surface of the stove or from falls against it. An estimated 9,800 persons were treated in hospital emergency rooms for injuries from solid fuel stoves in 1980.47 The majority of these injuries were nonfiie-related burns.
The creosote problem is receiving increasing atten- tion as a safety concern. Creosote is a tar-like substance containing many complex compounds; it is formed from wood smoke that condenses on a cool surface, and it burns fiercely if ignited. The rate of creosote deposition on flue surfaces depends on the density of smoke and fumes from the fire and on the temperature of the sur- face on which it is condensing.22 High smoke densities result when a large amount of wood in relatively small pieces is added to a hot bed of coal and the air inlet damper is closed. The wood is pyrolyzed, but with little combustion and little air to dilute the smoke. Chimneys of leaky stoves or fireplaces have a greater tendency to build up creosote and thus have a higher potential for
337

Table 17.8 Projected Nationwide Losses from Residential Fires in Heating Equipment, 1982.
Residential Property Loss Fires Deaths Injuries ($million) Fire Source
676,500 5,000 43,600 3,253.0
Heating equipment Solid-fuel-fired
Fixed heaters Portable heaters Fireplaces Central furnaces Chimney flues Chimney connectors Other or unknown Total
All types
47,300 1 ,Ooo
31,900 2,700
46,600 7,100 3,300
139,800 217,100
110 1,050 70
50 690 30 90 50 590 10 190
30 250 2,710 860 7,350
80.8 2.2
64.2 8.4
63.5 31.8 6.4
257.4 716.7
a h r i v e d by applying the proportions observed in data from the 32 states reporting to the U.S. Fire Administration in 1982 to national fire losses estimated by the National Fire Protection Association, U.S. Fire Administration, and U.S. Consumer Product Safety Commission. Values may not sum to totals due to independent rounding.
creosote fires. Proper design and installation of chim- neys or flues and regular maintenance and cleaning are the most effective methods of preventing creosote fires.
The CPSC conducted a study on the relative safety rrf metal versus masonry chimneysfs The results indi- cated that the risk of fire was higher in a masonry than in a metal chimney, when computed as a function of the number in use. However, a larger proportion of metal chimney fires extended beyond the point of origin, so that the risk of an uncontained fire appeared to be the same in a metal as in a masonry chimney.
Since a relatively large percentage of accidental house fires results from wood-burning devices, the CPSC requires that these devices have a warning label and be accompanied by complete installation, operation, and maintenance directions.%49 The warning label states in effect that furnishings and other combustible materials should be kept far away from the appliance.
ENVIRONMENTAL CONTROLS
Current Control Technology
In industrial wood-fired systems, particulate matter is the pollutant of primary concern. Many types of control
equipment can be used for removal of particulate matter from flue gases. These include mechanical collectors, wet scrubbers, baghouses (fabric filters), dry scrubbers, and electrostatic precipitators. However, as indicated earlier in the discussion of emissions from large wood- fired systems, generally only medium-pressure wet scrubbers, electrostatic precipitators, and baghouses are capable of meeting the proposed NSPS particulate and opacity standards for steam-generating units capable of combusting more than 100 million Btdh of heat input. Wood-fired units with capacities less than that generally are subject to state air quality standards, depending on which other control technology, such as well-designed mechanical collectors of the multiple small-cyclone type, may be adequate.
Few control technology options for RWC appli- ances have been identified to date. Approaches to emis- sion control have centered on methods to combust unburned fuel components produced in the primary combustion zone. In ordinary airtight stoves, these combustible compounds remain unburned because they cool rapidly once they are driven out of the wood and, as soon as their temperature drops below the ignition point, no further burning occurs. The most promising technol- ogy marketed in recent years to promote secondary combustion is the catalytic combustor, which is a sub- strate with a thin noble metal coating. Under normal
338

operating conditions, a catalyst properly located in the flue gas stream sufficiently lowers the ignition tempera- ture to allow secondary combustion to occur. However, catalysts can be poisoned, and they may lose their effec- tiveness over time, thus requiring periodic replacement. Another design approach incorporates a secondary com- bustion chamber or other stove modification to promote the mixing of unburned compounds from the primary chamber with additional oxygen at a temperature suffi- cient to ignite the mixture or sustain burning. Although this appears to work well at high burn rates, it appears difficult to maintain at low burn rates27
The promotion of secondary combustion to reduce emissions results in an increase in the thermal efficiency of the combustion unit. Units equipped with catalysts, for example, have reported thermal efficiency increases of 20-30%.25 However, although both of the above approaches appear to reduce emissions, the degree of reduction varies considerably.
Numerous regulatory control strategies have evolved in recent years. These range from public educa- tion programs to wood stove emission certification pro- grams. Table 17.9 summarizes the control strategies in use or proposed for use in the western United States.50
339
One of the most comprehensive control strategies was enacted in Oregon in 1983. The program restricts the sale of wood stoves to only latively clean-burning models. Rules have been adopted regarding emissions and efficiency test procedures and labels, laboratory accreditation requirements, acceptable particulate emis- sion levels, and stove certification procedures.51 Other states are also considering establishing emission stan- dards. For example, the Colorado Air Quality Control Commission has developed control standards for RWC units sold after January 1,1987. In addition, Massachu- seas is considering regulating emissions from RWC devices.
The EPA has developed NSPS for RWC appli- ances.BJ2 The rules mandate the use of the best demon- strated technology for reducing particulate emissions from enclosed, woodburning appliances used for space heating (furnaces, boilers, cookstoves, and open fire- places are exempt -- see Ref. 52 for the specific criteria). The NSPS are being implemented in two phases: (1) until 1990, particulate emissions are limited to 5.5 g/h for catalytic units and 8.5 gfh for noncatalytic units and (2) after 1990, particulate emissions are lim- ited to 4.1 g/h for catalytic units and 7.5 g/h for non- catalytic units.
-
Table 17.9 Control Strategies in Use or Proposed in the Western United States
Strategy States
Public education Alaska, Colorado (various communities), Montana (Missoula), Nevada (Reno), Nevada, and Washington
Visible emission limits Alaska (Juneau) and Montana (Misswla)
Mandatory curtailment of use during high- pollution episodes
Alaska (Juneau), Colorado (Beaver Creek), Montana (Missoula), Nevada (Reno), and Oregon (Medford)
Voluntary curtailment of use during high- pollution episodes
Alaska (Juneau), Colorado (Vail), New Mexico (Albuquerque), and Nevada (Reno)
Reduction of wet wood burning Alaska (Juneau) and Oregon (Medford)
Weatherization requirements for stove use Colorado (Crested Butte) and Oregon (Medford)
Restrictions on wood burning Number of appliances Design standards Emission standards (stove certification) Residential permiuing requirements Alternate heating requirements in new
Colorado (Aspen, Crested Butte, Telluride, and Vail) Colorado (Aspen, Beaver Creek, and Vail) Montana (Missoula) and Oregon Colorado (Beaver Creek) and Montana (Mnsoula) Oregon (Medford)
homes
Source: Ref. 50.

Future Needs
A broad legislative framework already exists to cover several environmental concerns of wood combustion. National Emission Standards for Hazardous Air Pollut- ants, NSPS, and the Prevention of Significant Deteriora- tion (PSD), visibility protection, and nonattainment provisions of the Clean Air Act Amendments are all expected to cover wood combustion. Emission charac- teristics for various combustion units, wood species and conditions, and combustion conditions are being devel- oped by EPA, DOE, and others. This information will help in setting standards for wood combustion and in developing combustion and environmental control systems.
As discussed earlier, EPA has recently proposed NSPS for particulate emissions from wood-fired steam- generating units capable of combusting more than 100 million Btu/h of heat input. The proposed NSPS for particulates of 0.1 lb/million Btu can be met with cur- rently available environmental control equipment. Many states, e.g., in their State Implementation Plans, have particulate emission standards for wood-fied boilers. However, these standards, in general, range from 0.1 to 0.8 lb/million Btu, and separate standards have often been promulgated for old and new sou~ces.53 In addition, the proposed NSPS limit visible emissions from wood-fired steam-generating units. The proposed standard of 20% opacity (excluding water vapor) will require continuous opacity monitoring.
Other wood combustion emissions that may be subject to future controls are CO, HC, and NO,. In addition, if airborne POM occurring in occupational and residential settings is found to be responsible for specific adverse biologic effects on humans, emission controls could be implemented for both small and large combus- tion units. Also, as discussed above EPA has recently promulgated NSPS for residential wood stoves. Local regulations to control these stoves also are appearing where high concentrations of them are creating air pollu- tion problems.
Another aspect of the air pollution problem is the effect of wood combustion on the indoor environment. The discovery that pollutant concentrations are often higher indoors than outdoors has resulted in further research to determine the magnitude of this hazard. The efforts to control indoor air pollution could affect energy conservation efforts as well as safety and building codes.
In addition to atmospheric emissions, wastewater from wood combustion processes and leachates pro- duced from solid wastes from burning wood are also of environmental concern. Although neither of these
pollutant sources is currently subject to federal regula- tion, state and local limits may exist.
Controls such as careful forest management and monitoring will be requiredB mitigate the environmen-- tal effects of wood harvesting, handling, transportation, and storage. -
-__
ENVIRONMENTAL CONSTRAINTS
Air quality constraints are the most significant environ- mental barriers to the development of wood combustion technology. These constraints arise from both source emission control and the siting of wood-frred systems in or near areas where ambient air quality standards may be violated.
Depending on the scale and rate of development of wood resource use in a particular area or region, signifi- cant erosion and water sedimentation problems, as well as effects on wildlife, could occur. Sound forest man- agement practices will be needed. Widespread trespass- ing to fell trees on public and private lands to supply residential units could require local regulation.
Increased wood use may necessitate controls not only on particulates and visibility, but also on CO, NO,, and POM. Also, while PSD and nonattainment regula- tions are directed toward major stationary point sources, a large enough number of residential wood-burning stoves in a given region could contribute to a violation of national ambient air quality standards in a nonattain- ment area. Such diffuse sources would be included in the ambient air quality baseline conditions and would reduce the PSD increment availability for economic and industrial growth in the affected regions. If this were the case, industries wanting to locate in such a region might have to offset residential wood-burning emissions by additional pollution control. Another regulatory alterna- tive would be to set permitting requirements for residen- tial wood-burning installations, as has already been done in some states and urban areas.
REFERENCES
1. Biomass Solar Energy for Farms and Forests, Solar Energy Research Institute, Golden, Colo. (1980).
2. Estimates of US. Wood Energy Consumption from 1949 to 1981, U.S. Dept. of Energy Report DOE/ EIA-0341 (Aug. 1982).
340

3.
4.
5.
6.
7.
8.
9.
10.
11.
12.
13.
14.
15.
Estimates of US. Wood Energy Consumption 1980-1983, U.S. Dept. of Energy Report DOE/
An Analysis of the Timber Situation in the United States. 1952-2030, U.S. Dept. of Agriculture, Forest Resource Report 23 (Dec. 1982).
Gavett, E.E., Overview of US. Department of Agriculture Energy Policy Perspectives, Abstracts, National Meeting on Biomass R&D for Energy Applications, Solar Energy Research Institute Report SEWCP-230-2434 Golden, Colo. (at. 1984).
A Guide to Federal Programs in Biomass Energy, prepared by Meridian Corp. and Science Applica- tions International Corp. for U.S. Dept. of Energy, Contract DE-AC01-83CE30784 (Sept. 1984).
Biomass Energy Technology Research Program Summary, 1983, U.S. Dept. of Energy Report
Biomass Energy, Report of the DOE Energy Research Advisory Board Panel on Biomass, U.S. Dept. of Energy (Nov. 198 1).
Energy from Biological Processes, U.S. Congres- sional Office of Technology Assessment (1980).
Gutstein, M., Biomass Programs at the U S . Department of Energy, Abstracts, National Meet- ing on Biomass R&D for Energy Applications, Solar Energy Research Institute Report SERVCP- 230-2430, Golden, Colo. (Oct. 1984).
Industrial Wood-Fired Boiler Environmental Characterization Information Report, prepared by Mueller Associates, Inc., for U.S. Dept. of Energy (Sept. 1982).
Easterly, J.L., and E.C. Saris, Electric Power from Biofuels: Planned and Existing Projects in the U S . , prepared by Meridian Corp. and Science Applications International Corp. for U.S. Dept. of Energy (Aug. 1984).
Residential Energy Consumption Survey: Con- sumption and Expenditures, April 1982 through March 1983, U.S. Dept. of Energy Report DOE/
Steam, Babcock & Wilcox Co., New York (1975).
ASHRAE Handbook, 1985 Fundamentals, Ameri- can Society of Heating, Refrigerating and Air- Conditioning Engineers, Inc. (1985).
EIA-0341(83) (Nov. 1984).
DOE/CE-0032/1(1983).
EIA-0321/1(82) (Nov. 1984).
16.
17.
18.
19.
20.
21.
22.
23.
24.
25.
26.
27.
Nonfossil Fuel Fired Industrial Boilers: Back- ground Information, US. Environmental Protec- tion Agency Report EPA-450/3-82-007 (March 1982).
Flowers, L., et al., Technical and Economic Review of Wood Energy Systems for Military Bases, Solar Energy Research Institute Report SERUTR-256-1477, Golden, Colo. (June 1983).
Shelton, J.W., The Woodburners Encyclopedia, Vermont Crossroads Press, Waitsfield, Vt. (1979).
Cheremisinoff, N.P., Wood for Energy Produc- tion, Ann Arbor Science Publishers, Inc., Ann Arbor, Mich. (1980).
Baumerster, T., ed., Standard Handbook for Mechanical Engineers, 8th Ed., McGraw-Hill Book Co., New York (1978).
Lim, K., and H. Lips, Overview of Emissions from Wood Combustion, Proc. Conf. on Wood Combus- tion, New Orleans, prepared by Industrial Environ- mental Research Laboratory, Research Triangle Park, N.C., for U.S. Environmental Protection Agency (Feb. 21-24, 1981).
Standards of Performance for New Stationary Sources; Industrial-Commercial-Institutional Steam Generating Units, Federal Register, 49(110):25102 (June 19, 1984).
Air Pollution; Standards of Performance for New Stationary Sources, Industrial-CommerciaI- Institutional Steam Generating Units, Federal Register, 51( 118):22384 (June 19,1986).
Shih, C., and A. TaJcata, Emissions Assessment of Conventional Stationary Combustion Systems: Summary Report, prepared by TRW Environmen- tal Engineering Division for U.S. Environmental Protection Agency (July 1981).
Standards of Performance for New Stationary Sources; Residential Wood Combustion, Federal Register, 50(149):31504 (Aug. 2, 1985).
Burton, B., and A. Sensel, Residential Wood Com- bustion Study: Executive Summary, U.S. Environ- mental Protection Agency Report EPA-91019-82- O89K (Aug. 1984).
Hartman, M., and G. Rives, Literature Review and Survey of Emissions from Residential Wood Com- bustion and Their Impact, U S . Environmental Protection Agency Report EPA-600/2-85-047 (April 1985).
34 1

28.
29.
30.
31.
32.
33.
34.
35.
36.
37.
38.
39.
40.
Wood Combustion: State-ofKnowledge Survey of Environmental, Health and Safety Aspects, pre- pared by Mueller Associates, Inc., for U.S. Dept. of Energy (Oct. 1981).
Air Pollution Control: Regulation of Polycyclic Organic Matter under the Clean Air Act, Federal Register, 49(30):5580 (Feb. 13, 1984).
Braunstein, H.M., et al., Biomass Energy Systems and the Environment, Pergamon Press, Inc., New York (1981).
Yurczyk, J.A., Jr., and T.A. Austin, Analysis of Leachates Produced from Biomass and Biomass Ash Residues, Dept. of Civil Engineering, Iowa State University, Ames (Nov. 1980).
Wood Burning for Power Production, LOS A ~ O S Scientific Laboratory Report LA-7924-MS (Aug. 1979).
Energy Technology Characterizations Handbook, U.S. Dept. of Energy Report DOE-EP-0093 (March 1983).
Dunwoody, J.E., et al., Wood Combustion Sys- tems: Status of Environmental Concerns, U.S. Dept. of Energy Report DOBEV-0064 (Jan. 1980).
Hall, E.H., et al., Comparison of Fossil and Wood Fuels, U.S. Environmental Protection Agency Report EPA-600/2-76-056 (March 1976).
Shelton, J., and A. Shapiro, The Woodburners Encyclopedia, Vermont Crossroads Press, Inc., Waitsfield, Vt. (Dec. 1976).
Occupational Injuries and Illnesses in 1979: Summary, U.S. Dept. of Labor Bulletin 2097 (April 1981).
Occupational Injuries and Illnesses in the United States by Industry, 1978, U.S. Dept. of Labor Bulletin 2078 (Aug. 1980).
Petty, P.N., and W.J. Hopp, Technology Assess- ment of Solar Energy Systems: Residential Use of Fuelwood in the Pacific Northwest, Pacific North- west Laboratory Report PNL-3918 (Aug. 1981).
Hopp, WJ., et al., Technology Assessment of Solar Energy Systems: Availability and Impacts of Woody Biomass Utilization in the Pacific North- west, Pacific Northwest Laboratory Report P N L 3933 (Sept. 1981).
41.
42.
43.
44.
45.
46.
47.
48.
49.
50.
51.
52.
53.
Graves, W.L., et al., A Technology Assessment of Solar Energy Systems: Northeastern Regional Biomass Scenario Assessment, Brookhaven Na- tional Laboratory Report BNL-51437 (Jan. 1981).
Newman, R., and L. Schachter, Chainsaw Rota- tional Kickback Injuries, U.S. Consumer Product Safety Commission (Sept. 1984).
Requirements of Chain Saws and Their Compo- nents and Replacement Parts; Termination of Proceeding to Develop a Consumer Product Safety Standard, Federal Register, 50( 169):35241 (Aug. 30, 1985).
NEISS Data Highlights, National Electric Injury Surveillance System, 5( l), U.S. Consumer Product Safety Commission (Jan.-March 1981).
Harwood, B., and R. Miles, Metal Chimney Fires: National Estimates and Causal Factors, U.S. Consumer Product Safety Commission (Aug. 1984).
Shelton, J.W., Analysis of Fire Reports on File on the Massachusetts State Fire Marshal's Office Relating to Wood and Coal Heating Equipment, National Bureau of Standards Report NBS-GCR-
Harwood, B., Coal and Wood Stove Label Rule, U.S. Product Safety Commission (March 1981).
Coal and Wood Burning Appliances: Perform- ance and Technical Data, Federal Register, 48(95):21898 (May 16,1983).
Provision of Performance and Technical Data for Coal and Wood Burning Appliances, Federal Register, 48(120):28229 (June 21, 1983).
Grotheer, W., Overview of Control Strategies for Residential Wood Combustion, presented at 77th Annual Meeting of the Air Pollution Control Assn. (June 24-29,1984).
Kowalczyk, J.F., and B J. Tombleson, Oregon's Woodstove Certification Program, J. of the Air Pollution Control Assn., 35(6) (June 1985).
Standards of Performance for New Stationary Sources; New Resident Wood Heaters, final rule, Federal Register, 53(38):5860-5922 (Feb. 26, 1988).
Leading Trends in Environmental Regulation that Affect Energy Development, Final Report, U.S. Dept. of Energy Report DOEIEV-01622 (June 1980).
78-149 (1979).
342

Chapter 18
Alcohol Fuels
BACKGROUND
Using biomass for energy generally has been viewed as highly attractive, especially in light of concerns about energy shortages and environmental problems. In 1985, the U.S. Department of Energy (DOE) estimated that biomass could supply the nation with about 4.3 quadril- lion Btu of energy by the year 2000.1 Biomass is pro- duced by photosynthesis, in which green plants convert solar energy, carbon dioxide (COz), and water into car- bohydrates.
Biomass is comprised of collectible, plant-derived materials that are abundant and inexpensive; if properly managed, it is renewable. Biomass includes starch in corn, wheat, potatoes, and other agricultural products; monomeric sugars; and soluble oligomers in corn syrup, molasses, and sulfite waste liquors. It also includes lignocellulose in wood chips, crop residue, urban refuse, and animal manures.
Biomass materials are relatively free of the minerals -- especially sulfur -- that cause pollution problems in coal and oil combustion and synthetic fuel conversion. Thus, biomass energy has been characterized as a "safer, smaller-scale, and more environmentally benign alterna- tive to coal and nuclear development"2
fermentation or chemical conversion. Alcohol vapor forms an explosive mixture with air and can be used as a fuel for internal combustion engines. Alone it bums with a pale blue transparent flame, producing relatively few emissions. Alcohol also can be mixed with gasoline to increase its volume and boost its octane number, although alcohol has a lower energy content than gaso- line. Emissions from gasoline-alcohol blends are similar to their gasoline counterparts; the most pronounced difference is a much higher level of aldehydes. Since it can be produced from a renewable resource, alcohol,
Biomass is readily converted to alcohol by natural
from Biomass
either alone (neat) or as a gasoline additive, has become the subject of considerable interest.
Ethanol, or "grain alcohol," is prepared by fermen- tation of sugar or starch, followed by distillation to remove water; a vat fermenter is shown in Fig. 18.1. Methanol, or "wood alcohol," is currently produced synthetically from liquid or gaseous hydrocarbons with the aid of catalysts (methanol can also be produced by the indirect liquefaction of coal). In the past, methanol was made by destructive distillation of hardwoods.
Ethanol and methanol are good fuels for suitably modified internal combustion engines; they have high octane numbers, and their combustion in such engines has the potential of producing fewer emissions than the combustion of gasoline alone. Their properties can be enhanced further by dispersing some water in the blend. When the alcohols are derived from coal or plant bio- mass, they offer a supplement and possible replacement for petroleum-derived fuels.
The current level of alcohol production in the United States, combined with current automobile engine technology, dictates the use of a gasoline-alcohol blend rather than alcohol alone. Gasohol, a blend of 10% ethanol and 90% gasoline, is the currently preferred alternative fuel, although its use is encouraged largely through state and federal subsidies. Anhydrous ethanol is also blended with gasoline in Brazil, where the goal of having 20% ethanol in the blend was reached in 1980.3
In research programs on methanol usage, interest has centered on gasoline-methanol blends containing about 10% methanol and neat methanol containing about 8540% methanol. Blends with less than 10% methanol are of particular interest because they can be used in automobiles without major redesign of the engine and because addition of small amounts of methanol makes only small changes in most of the properties of gasoline, requiring only minor changes in the gasoline composi- tion. Methanol reduces fuel costs per gallon, but the
343

Figure 18.1 Corn Fermentation Vats at the A. Smith Bowman Distillery in Reston, Virginia
344

cost reduction is nearly matched by the reduced energy content of the methanol blend. Potential savings are between 1 and 296, respectively, for the 30 and 50% blends. Neat methanol can be used in efficient engines with high compression ratios.4
Coal gasification is a convenient source of metha- nol, but because coal supplies are finite, a renewable source for alcohol manufacture is more desirable. Plant biomass is one such renewable source. Vegetable matter can be converted to liquid, solid, and gaseous fuels through pyrolysis, hydrolysis, and anaerobic fermenta- tion; for example, anaerobic fermentation of waste mate- rials rich in carbohydrates, lipids, or proteins could yield large quantities of methane, which can be converted into methanol. But this would only partially satisfy the demand for motor fuel. Industrial ethanol produced mainly from ethylene is used as well.
The annual supply of biomass from harvested lands in the United States is about 15 billion tons. In terms of sheer mass, it is comparable to the combined national output of crude oil (550 million tons), natural gas (400 million tons), and coal (800 million tons).s
Research in bioenergy has created a new low-cost resource composed mainly of lignocellulosic materials that, when allied with advances in biotechnology, offers a remarkable potential for integrated food, fiber, chemi- cal, and fuel production. For indusmalized countries with unused land and pressures on petroleum feedstocks, the biomass option can reduce agricultural overproduc- tion while also reducing imports.
History
Alcohol fuel has had a long history of use in the United States. Because it was clean and odorless, alcohol fuel replaced whale oil in lamps in the mid- 1800s. By the turn of the century, it was being considered as a primary automobile fuel. In 1922, Alexander Graham Bell wrote, "The world's consumption of fuel has become so enormous as to show that our present supplies cannot possibly last for many generations more ... Alcohol is a beautifully clean and efficient fuel which can be pro- duced from vegetable matter of almost any kind. The waste products from our farms are available, even the garbage of our cities."6
Henry Ford was also interested in fuel from renew- able resources. Between 1935 and 1937, he sponsored three major conferences on industrial uses of farm prod- ucts, including grain, soybeans, and peanuts. Ford designed the Model A and the Model T with adjustable carburetors, permitting them to run on gasoline, ethanol, or any combination of the two. The first modem inter-
nal combustion engine, the Otto cycle engine built in 1876, could run on either ethanol or gasoline.
ture, recognizing the finite availability of fossil fuels, considered the feasibility of a national alcohol fuels program. They concluded that government subsidies would be necessary to make the replacement of fossil fuels with ethanol effective. About that same time, Hiram Walker began to market "Alcoline," a gasoline- ethanol blend.
Although alcohol fuels were not popular in the United States, several other nations had extensive alcohol programs. During the 1920s and 1930s, New Zealand used ethanol as its primary automotive fuel. Great Britain removed all restrictions and duty on fuel-grade ethanol shortly after World War I. Although the price of ethanol then was $0.44/gal compared to $0.09/gal for imported oil, other factors spurred many nations into developing active alcohol fuel programs. These nations included Argentina, Brazil, Cuba, Japan, the Philippines, South Africa, and Sweden.
The onset of World War I1 prompted an even greater reliance on alcohol fuel sources. The German army fueled many of its vehicles with ethanol made from potatoes. Japanese aviation fuel also contained some ethanol. In the United States, ethanol was pro- duced as an army motor fuel, and several gasoline stations within the Corn Belt sold an ethanol-gasoline blend known as " Agrol." By 1944, production by the U.S. alcohol industry had increased six-fold. Following the war in 1945, cheap petroleum again was available to the world, so alcohol subsidies were removed and most ethanol production plants were closed. The price of oil was so attractively low that almost all industrial alcohol production was converted from fermentation to a syn- thetic process wherein ethylene was hydrated to ethyl alcohol. The alcoholic beverage industry concentrated into a few fiims and a consumer shift to gins and vodkas was accommodated primarily by waste streams from large corn processing plants. These events were comple- mentary in providing little or no incentive to initiate research and development activities in production of ethyl alcohol by fermentation for over 30 yr.
Through the 1950s and 1960s, few uses were made of alcohol for vehicles. Then, in the early 1970s, rising gasoline prices, coupled with a continuing search for new markets for agricultural products, sparked a re- newed interest in ethanol production for fuel. In November 1975, Brazil's government began an ambi- tious alcohol-fuels program aimed at replacing all auto- motive fuels with sugarcane-derived ethanol by the turn of the century. In terms of production objectives, Brazil's ethanol program is still highly successful as
As early as 1936, the U.S. Department of Agricul-
345

1979 1980 1981 1982 1983 1984 1985 1986 Year
Figure 18.2 U.S. Fuel Ethanol Production (Source: Adapted from Ref. 7)
shown by meeting its goal of supplying roughly 60-70% (5.3 billion gal) of Brazil’s annual fuel requirement with alcohol by 1985.
AIcohol fuels can contribute to U.S. energy resources by allowing use of domestic, renewable resources and coal to extend supplies of high-quality liquid fuels. Although alcohol fuels cannot be a com- plete or even a major solution to the national energy needs in the near term, they could represent an important liquid fuel component for the longer term. The U.S. fuel ethanoI producers have boosted their output from a low of 20 million gal in 1979 to an estimated 625 million gal in 1985; a further 20% increase to 750 million gal was predicted for 1986 (Fig. 18.2).7
Today, the major conmbutors to bioenergy are resources produced by the existing agricultural and forestry sectors. The major component in the industrial- ized countries is associated with producing pulp and paper by using mill and logging residues and recovering pulping liquors. Export of energy through cogeneration of electricity and process heat, or production of densi- fied biomass fuels, is increasingly evident.
Government and Industry Programs
Title I1 of the Energy Security Act of 1980 authorizes DOE to provide financial incentives to encourage
346
construction of fuel-grade alcohol plants with ethanol production capacities of at least 15 million gaYyr. As a result, in August 1981, DOE awarded 11 conditional commitments to guarantee loans. By October 1982, one commitment had been withdrawn and one guarantee issued to the New Energy Company of Indiana (50 mil- lion gaVyr). Four commitments were terminated in 1983, primarily because of difficulties in obtaining equity and debt financing. In 1984, Tennol Inc. of Ten- nessee was issued a guarantee on a $72-million loan for construction of a 25-million-gaVyr plant. In April 1985, an amendment to the Energy Security Act extended the four conditional commitments to September 1985; how- ever, only Agrifuels Refining Corp. secured a loan for a 35-million-gaVyr facility. The remaining three commit- ments expired without closure. As part of the Alterna- tive Fuels Program, DOE is participating financially, through cooperative agreements, in construction of three other ethanol plants: (1) Kentucky Agricultural Energy Corp.’s Franklin facility (21 million gal/yr), (2) South Point Ethanol Corp.’~ facility (60 million gay), and (3) Columbia Energy Resources’ refitted brewery (10 million gaVyr).8 In addition, the Energy and Water Development Act of 1985 requires that DOE maintain a regionally balanced biomass program with each region funded at no less than the 1984 levels.
1970s and over seven years since the gasoline shortage of 1979, the Great Lakes region remains heavily depen- dent on coal, natural gas, and petroleum. To increase production and use of biomass energy in the Great Lakes region, DOE provided the Council of Great Lakes Gov- ernors with a grant to operate the Great Lakes Regional Biomass Energy Program.9
The U.S. producers of fuel ethanol are thriving now, but whether they will be able to maintain their growth throughout the rest of the decade depends on the federal tax strategy on fuels. The industry probably could not have grown, and probably will not survive, without generous federal and state subsidies. The Deficit Reduc- tion Act of 1984 increased the exemption from motor fuels excise tax in gasoline and special motor fuels or diesel fuel blends and increased the tariff on ethyl alco- hol imports. The Tax Reform Act of 1986 retains most of the tax relief essential to the the industry’s existence; however, throughout the country, relief given by the states is dwindling.
At the federal level, by far the most important factor is an exemption of $O.O6/gal from the $O.O9/gal gasoline excise tax for fuel containing at least 10% alcohol that is not made from fossil fuels. For a gasohol blend contain- ing 10% ethanol, this exemption is worth $0.6/gal of ethanol. There is also a $0.045/gal exemption for meth-
More than a decade after the first oil embargo of the

mol, ethanol, or other alcohol products from natural gas. A 10% tax credit for energy investment has already expired, and DOE'S loan guarantee program for fuel ethanol plants will end soon.
In July 1985, the U.S. Environmental Protection Agency (EPA) set an interim limit of 0.5 g of lead per gallon of gasoline, so that blending suboctane gasoline with ethanol became a popular way for some refiners to increase their products' octane rating. Because the allowable limit dropped to 0.1 g/gal at the beginning of 1986, blending probably will become even more popu- lar; in 1986, ethanol blends accounted for 80% of the U.S. gasoline market and displaced the octane equiva- lent of 4 billion g of lead. Suboctane ethanol blends have a future that lies more with unleaded blends than with leaded blends, since more than 75% of all gasoline sold in the United States will be unleaded within about five years. Without a tax credit, however, blending is not economical, although marketers of ethanol think that they can establish a niche for their product in midgrade and premium unleaded gasoline.lo.11
The EPA's regulations require that alcohol fuels meet volatility standards equivalent to those met by commercial gasoline. Because the Clean Air Act prohibits the selling of fuel additives in unleaded fuels without EPA's approval, methanol blends require an EPA waiver such as that granted to DuPont, which stipulates a blend stock with a maximum of 5% metha- nol, a minimum of 2.5% cosolvents (ethanol, propanol, or butanol), and a proprietary DuPont corrosion inhibi- tor. Blends for which waivers have been granted contain oxygenated cosolvents to prevent separation of the methanol and gasoline in the presence of water. The EPA rules also prohibit adding ethanol to gasoline that contains any amount of methyl tertiary-butyl ether (MTBE) or oxygenated fuel. As a result of the phaseout of the use of lead, MTBE is being used increasingly as an Octane enhancer, and even refiners who do not use MTBE find that their "exchange product" may contain traces. This often makes it dfficult for ethanol market- ers to obtain MTBE-free gasoline for blending, although it is hoped that refiners will test other octane boosters, including ethanol.
At present, the ethanol industry is facing a fall in prices. Because the production price for ethanol in the United States is about $1.50-1.6O/gal but the market price is running at about $1.35-1.4O/gal, ethanol produc- ers are losing money. They are saved from going com- pletely out of business by the federal and state tax credits that are still available and by excise tax exemp- tions on automotive fuel containing alcohol. With oil prices continuing to fall, direct competition between gasoline and ethanol will be weighted against ethanol.
The DOE is supporting research to reduce production costs of ethanol, increase conversion efficiencies of feedstock to ethanol, and identify cheaper feedstocks, because there lies the major cost in ethanol production.12
TECHNOLOGY
Biofuels represent an extremely broad field of technol- ogy, involving complex tradeoffs among the various feedstocks and alternate methods for converting the various organic components of the feedstocks into valu- able commodities, such as liquid or gaseous fuels. Spe- cific research objectives have been established for each technological combination of feedstock and conversion that provide the basis for evaluating progress and deter- mining tradeoffs among technical priorities.
fuels (such as methanol) and high-value chemical feed- stocks (such as ethylene) is being viewed with increas- ing interest by the private sector and the federal govern- ment. This interest derives in part from economic pre- dictions suggesting that methanol can be manufactured from wood at a price of about $0.6-0.7/gal. Addition- ally, thermal conversion processes produce a broad spectrum of energy products that fit existing U.S. energy use patterns (Fig. 18.3)P
over the biomass resource itself in that they more closely match existing patterns in the end use of energy, particu- larly in the transportation sector. Perhaps most impor- tant, liquid fuels have a higher energy density than the biomass feedstock, so that the product can be trans- ported and stored more easily and economically. Bio- mass is the only renewable energy source that can con- tribute to the supply of conventional transportation fuels. Because of the molecular composition of biomass, liquid fuels derived from biomass are chemically different from petroleum fuels and the challenge is to generate from biomass high-value liquid fuels that can replace existing liquid fuels and be economically competitive.
fuels include fermentation, liquefaction (direct, pyro- lytic, and catalytic), and hydrolysis (acidic and enzymatic).
Thermochemical conversion of biomass to liquid
Liquid fuels from biomass have several advantages
Major technologies for converting biomass to liquid
Feedstocks
Many plant materials can be used as feedstocks for pro- dlrcing liquid and gaseous fuels. Four major types have been identified: herbaceous plants, woody plants, aquatic plants, and manure.14 Herbaceous plants, that is,
341

Thermochemical Process
Intermediate Product
Final Product
Figure 183 Thermochemical Conversion Can Provide a Broad Spectrum of Products (Source: Adapted from Ref. 20)
plants that do not produce persistent woody material, are divided into those with low moisture content (smal l grain-field residues) and those with high moisture con- tent (residues from sugars and corn). Manure and low- moisture herbaceous plants are residues only, while aquatic plants are produced only as energy crops.
dedicated to useful photosynthesis. Of the total 2.3 bil- lion acres in the United States, 380 million acres (17%) are devoted to crops, 720 million acres (32%) to forest and woodland, and 680 million acres (30%) to pasture or grazing land.15 Of all American crops, corn is the pri- mary source of starch because of its ample supply and low cost relative to other sources of starch or sugar. The 1981-1982 crop of 8 billion bushels (190 million dry tons) contained enough starch to produce 285 billion lb of glucose.16
Much of the biomass supply depends on the land
348
Conversion of biomass materials may be divided into two general processes: thermochemical and biochemical. All types of biomass can be converted thermochemically, but the low-moisture herbaceous and woody materials are the most suitable and favored for such processes as pyrolysis, catalytic liquefaction, and gasification. High-moisture herbaceous plants, manure, and aquatic plants best serve biochemical processes, which are essentially anaerobic digestion (yielding high-Btu gas) and fermentation.
tation of sugars using enzymes produced by yeast; the result is a combination of ethanol, water, and marketable C02. Sugarcane, sugar beets, and sorghum are direct sources of the necessary sugars. Using a more compli- cated process, starches from corn and other grains or from cassava, a root crop, can be converted to sugars and then fermented.17
The simplest form of alcohol production is fermen-

Direct combustion of conventionally grown wood and wood wastes is likely to remain the largest source of biomass energy. But among the alternatives, develop- ment of high-yield herbaceous crops for growth on either marginal or prime agricultural land is expected to lead to economical sources of feedstock for biochemical and thermochemical conversion processes (Table 18.1).5
Potential exists for ethanol production from wood to be an economic success. The cost of producing ethanol from wood is estimated to be between the cost of pro- ducing it from corn by dry and wet milling processes. The cost of ethanol from a corn feedstock is much more sensitive to variations in feedstock cost; however, the estimated cost of producing ethanol from corn is based on proven technology and investment costs, versus assumptions for several key factors for ethanol from Wood.18
A program of research on production of herbaceous energy crops was begun in 1984 by DOE; other ongoing biomass programs involve woody and aquatic energy crops. The goal of the energy crop program is to pro- vide a technological base that allows industry to develop commercially viable species and systems to produce herbaceous biomass for fuels and energy feedstocks. It concentrates on those crops that conmbute supplies while minimizing impacts on food production and the environment (Le., crops suitable for marginal croplands
and winter crops that can be grown between plantings of conventional crops).
Table 18.2 lists the major considerations for each of the four main types of herbaceous energy crops. Ligno- cellulosic herbage crops include all crops whose total biomass content will be used for energy (i.e., hay and silage). In both production and conversion, herbaceous lignocellulosic crops may prove complementary to woody crops, the other major source of lignocellulosic biomass. Oilseed crops could provide a direct source of liquid fuel; some of them, such as winter rapeseed, show promise as winter crops for some areas in the United States. Hydrocarbon crops have some interesting prod- ucts, but plant hydrocarbons currently have much higher values as chemicals, primarily lubricants, than as fuels, and most sugar and starch crops have a higher value as food rather than energy.19
Chemically, almost all biomass, regardless of source, contains 50% moisture as collected and about 45% oxygen on a moisture- and ash-free basis; it also contains less than 0.5% sulfur (Table 18.3).20
Fermentation
The technology needed to produce ethanol by fermenta- tion of starch crops is well established and has been
Table 18.1 Biomass Production and Conversion Alternatives
Conversion Process Feedstock Final Product Fuel Replaced Market Sector
Direct combustion Wood
Gasification Wood
Pyrolysis Wood
Fermentation Wood or herbaceous crops
Anaerobic digestion Herbaceous crops
Exmction of lipids Microalgae
Heat, steam
Medium- to
Electricity Methanol
high-Btu gas
Oil
Ethanol
High-Btu gas
Oil
Coal Industrial Oil, natural gas Residential, commercial
Natural gas Industrial
Fuel oil Utility Gasoline Transportation
Fuel oil Transportation
Gasoline Transportation
Natural gas Industrial
Diesel fuel Transportation
Source: Ref. 5.
349

commercialized for many years. The resource inputs, internal flow streams, and residuals for a hypothetical corn-to-ethanol fermentation facility are shown in Fig. 18.4. The quantities are based on a 60-million-Uyr (about 16-milBon-gaVyr) plant operating 90% of the time.21 Major subprocesses associated with the conver- sion of biomass to ethanol via fermentation are feed- stock preparation, fermentation, distillation, dehydra- tion, process heat generation, and by-product recovery.
Feedstock Preparation
Feedstock preparation breaks the incoming biomass down into sugar. Sugar-containing feedstocks, such as
Table 18.2 Characteristics of the Four Classes of Herbaceous Energy Crops
Potential Food Produc- Environmen- Crop Class Application Iion Impact tal Impact
Lignocel- Versatile lulosic feedstocks
Oilseed Winter
Hydrocarbon High value as chemicals
Sugar and High value starch as foods
Uses marginal croplands
Meal usable as feed
Sites not determined
Often direct competition
Prevents soil loss
Prevents soil loss
Not determined
Intensive management needed
Source: Ref. 19.
sugar beets, are the simplest to convert, requiring only mechanical crushing and addition of water to yield a suitable sugar solution. Cellulosic feedstocks, such as wood or crop residuals, are the most difficult to break down; they require extensive mechanical pretreatment and either acid or enzymatic hydrolysis. Starchy feed- stocks, such as corn, fall somewhere in the middle.
Corn kernels are washed and then finely ground (often in a hammer or roller mill) to expose the starch molecules. The ground material is diluted with water to form a mash and cooked under pressure to solubilize and gelatinize the starch. Then, the mash is cooled to about 60°C, and an enzyme (or acid) preparation is added to convert the starch into fermentable sugar, a process known as saccharification. In preparation for fermenta- tion, the mash is diluted to a 10-22% sugar concentra- tion, further cooled to about 27-32OC, and the pH level is adjusted to between 3.0 and 5.0.
corn handling and feedstock preparation are particulates generated during the grinding process; washwaters that contain dissolved and suspended solids, organics, and pesticides; and grain dust. The emissions and effluents associated with pretreatment of sugar-containing and cellulosic feedstocks are similar to those encountered in preparation of the corn. If acid rather than enzymatic hydrolysis is used to treat cellulosic materials, however, the acidity of the wastewater increases.
The primary effluents and emissions associated with
Fermentation
The mash is transferred to fermentation tanks, and yeasts are added that use sugar as a source of energy. The mash, kept at a constant temperature of 12SoC, ferments for about 48 h, when essentially all of the sugar has been oxidized to produce a mixture with a very low concen-
Table 183 Biomass Elemental Analysis (% by weight)
Pine Corn Urban Feedlot Giant Component Wood Bagasse Cobs Refuse Manure Kelp
Ash (dry basis) 0.5 2.0 1 .o 14.0 24.0 39.0 Moisture 50.0 50.0 7.0 18.0 70.0 90.0 Ash-free dry solids 52.0 47.0 44.0 48.0 46.0 45 .O Oxygen 41.0 46.0 48.0 45.0 43.0 46.0 Hydrogen 6.0 6.0 8.0 6.0 7.0 6.0 Sulfur 0 <0.1 <0.1 0.2 0.5 0.6 Nitrogen 0.1 0.5 0.6 0.6 5.3 2.0
Source: Ref. 20.
350

Corn 19,762 kg/h
4 A
d V 4v
4. condenser
No After cyclone After controls or baghouse vent
Water 4*
21.736 kglh
h
4'
After condenser
I Feed storage - and handling
0.013 kg/h HC (as CH,)
f
To Mash cooking
Feed I--) preparation .--C Fermentation I--) distillation
' Condensate from flash cooler * to cooling tower makeup Flue gases To fluegas from boiler desulfurization
grain dust after the cyclone collector unit
Stillage dried grain From distillatior evaporation
56,412 kg/h
Additional hot air
I
DDG 6.307 kglh
60.398 kg/h
4.2 kg/h makeup cyclohexane or benzene
From fermentation
I + Condensate 18,W kglh SS 12 mg/L 5.5 kg ld TS 130 mg/L 54.6 kg id BOD 650 mglL 273 kg ld pH 3.9
0.025 kg/h other HC (as CH4)
1.2 kgih Benzene
To denaturing
6,043 kg/h ethanol Distillation Dehydration - and storage -
I ' I To stillage
Wastewater, 1,432 kglh
TS 240 mg/L 8.4 kg/d SS 40 mg/L 1.3 kg ld BOD 1,250 mg/L 43 kg ld pH 5.0
3.0 kg/h benzene
1 Figure 18.4 Resource Inputs, Internal Flow Streams, and Residuals for a Hypothetical Corn-to-Ethanol Fermentation Facility (Source: Adapted from Ref. 21)
351

tration (often less than 10% by weight) of ethyl alcohol. The fermented mash (called beer) is then heated to 79OC and sent to distillation columns.
Carbon dioxide, the primary emission associated with fermentation, is most often vented directly to the atmosphere, although recovery is possible. Often a trace of ethanol escapes along with the C02.
Distillation
The beer, containing 6-12% alcohol, is distilled in the beer column (stripper) of a continuous still to separate the ethanol, other alcohols, and aldehydes (fuel oils) from the remainder of the material (proteins, fibers, oils, and some sugars). Although some of the solid residue can be recycled for fermentation, it is usually dried and sold as animal feed. The high-alcohol fraction (60-90% ethanol) is distilled further in a rectifying column to produce 95% alcohol; the low-alcohol fraction is redis- tilled in the beer column with the next batch. The water fraction, which is very high in dissolved solids and has large biological and chemical oxygen demands, is a major effluent.
In ethanol production from sugar cane, an ordinary distillery also contains boilers for steam production and often steam turbines to generate motive power for inter- nal consumption. Bagasse (the cane residue left after sugar has been extracted) fuels the boiler. Because a conventional distillery employs relatively inefficient boilers, it generally uses bagasse and steam inefficiently, consuming about 90% of the bagasse; the remainder is discarded. There is growing interest in using bagasse and steam more efficiently within the distillery to gener- ate large amounts of excess bagasse. Use of diffusers, an extraction technique recently commercialized in Brazil, is beginning in new distilleries. Equipment is also available in Brazil for drying, briquetting, or pellet- ting bagasse22
Dehydration and Denaturation
The product from the distillation columns contains about 5% water and 95% ethanol. The water must be ex- tracted, because only anhydrous alcohol can be mixed with gasoline. Several solvents will separate the alco- hol-water mixture by azeotropic and extractive distilla- tion. Benzene is the drying chemical most frequently used in fuel-alcohol plants; only relatively small quan- tities are needed because it can be recirculated continu- ally in dehydration systems. Although only one distilla- tion column is required for dehydration (water and benzene are removed from the top and ethanol from the bottom of the column), two columns are required to recover and recycle benzene and aqueous ethanol.
About 1 gal of benzene is required for every 100 gal of ethanol obtained. Benzene can be trapped on molecular sieves and recovered, as can traces of ether and ethylene glycol.
After it is dried, the alcohol must be denatured to comply with federal tax regulations. Addition of gaso- line (generally to a 5% concentration) at the plant is the conventional means of complying with this requirement.
Process Heat Generation
Most of the emissions and effluents associated with fermentation are combustion products from support furnaces. Current federal guidelines encourage use of coal-fired boilers to produce heat for the process. The Power Plant and Industrial Fuel Use Act of 1978 prohibits use of oil or gas when more than 250 million BWh of fuel is required; however, the Natural Gas Utili- zation Act of 1985 reflects the finding that there is no longer a need to limit use of natural gas. For the fermentation process described, two furnaces are re- quired, The main process boiler uses coal to produce steam and heat for the general steps in the process; for one plant that was studied, the equivalent of about 7.4 kg of steam per hour was required to produce 1 L of ethanol.23 The second furnace bums oil to provide heat for drying stillage. The emissions from the outlet of the dryer-furnace scrubber contain small amounts of sulfur dioxide (S02) and nitrogen oxides (NO,) and traces of particulates.
By-product Recovery
Stillage, the material remaining after distillation, often is used as animal feed. Wet stillage (92-94% liquid) can be fed to cattle, but it cannot be stored for long periods or transported very far. Storage time can be extended by drying the stillage until it contains about 9% moisture. Depending on the drying processes used, stillage can be converted to distiller’s dried grains, distiller’s dried solubles, or a mixture of the two.
secondary wastes; for example, the scrubber system attached to the dryer furnace generates over 3,242 gaVh of wastewater, and the scrubber blowdown contains dissolved and suspended solids and various organic compounds.
The environmental control systems produce other
Liquefaction
Thermochemical liquefaction is a direct process that makes liquid fuels mainly through depolymerization and deoxygenation of biomass. The processes can be classi-
352

fied into three types according to operating conditions: direct, pyrolytic, and catalytic.
Direct Liquefaction
Direct liquefaction is a chemical action in which solid biomass is treated severely in one step for liquefaction and reduction; the product obtained is partially up- graded, if necessary, to yield mainly hydrocarbons. Production of hydrocarbon fuels from biomass materials has remained an elusive goal despite decades of re- search. Processing research included a number of techniques, none of which were totally successful. Biochemical conversion of cellulosic materials to ethanol is probably the most advanced technique.u
Recent developments in direct liquefaction of biomass= focused on two processing environments: (1) high-pressure, catalytic systems requiring extended residence time at 300-40O0C and (2) flash pyrolysis systems that operate at higher temperatures (about 500OC) and atmospheric pressure with short residence times (less than 1 s). Catalytic hydrotreating has been applied to these thermochemical conversion products to produce useful hydrocarbons, since neither can produce significant yields directly.
A two-step liquefaction involves a cheap first step for biomass depolymerization, i.e., solvolysis or pyroly- sis, and a second step to upgrade the crude liquid or its cuts, leading to hydrocarbons, alcohols, and phenols.
Pyrolytic Liquefaction
Pyrolysis is a method of converting biomass to liquid fuels by heating it under oxygen deficiency. Tradition- ally, this method of slow heating of biomass was used to produce charcoal, tars, wood alcohol, and other solvents, but now typically generates products consisting of about one-third each of gases, pyrolysis oil, and solid char. These tarry liquids have been promoted as boiler fuels, but they are not thought to be suitable for internal com- bustion engines. Rapid heat-up rates (about 1-10°C/s) can produce yields of valuable gases and liquids as high as 95%. These products can be mostly oxygenated liquid, or almost entirely gases that contain a significant amount of desirable unsaturated hydrocarbons, such as ethylene and propylene26
Steinberg and his coworkers carried out experi- ments and developed a process chemistry data base for flash pyrolysis of biomass.27 Flash pyrolysis is a ther- mochemical technique for converting carbonaceous materials to gaseous and condensible hydrocarbons. The technique involves rapidly heating up ground biomass with a pyrolyzing gas at rates of 1,000- l,OOO,OOO°C/s, maintaining the reactants at a desired reaction tempera-
ture for several seconds, and rapidly cooling the reaction products at rates of 100-l,OOO°C/s. The total yield of volatile products thus obtained is significantly higher than that from a slower, more conventional pyrolysis. The process giving this improved yield in flash pyrolysis involves preventing the primary volatilized material from decomposing on residual solid surfaces and degrading to tars and chars as it does in conventional pyrolysis, where the biomass remains at higher tempera- tures longer. In flash pyrolysis, the primary volatile nonradical and molecular species are stabilized by short reaction residence times and rapid cooling so that they can form valuable higher hydrocarbon fuel and feed- stock products. A schematic flow sheet of the entrained tubular reactor used to obtain experimental data is shown in Fig. 18.5.28
Relatively high yields of useful hydrocarbons and carbon monoxide (CO), which are formed in flash methanolysis of wood (flash pyrolysis of biomass with methane gas), indicate an attractive application for pro- duction of the coproducts benzene, ethylene, and metha- nol. Experimental work indicates that wood-conversion yields of ethylene and benzene can reach over 50% and CO yields over 40%. These high yields are obtained with a higher ratio of methane to wood mass. A process design and economical evaluation can determine the optimum conditions for operation of flash methanolysis.
Catalytic Liquefaction
Research on direct liquefaction is based primarily on a concept fmt proposed in the early 1970s by the Pitts- burgh Energy Research Center.29 Biomass is mixed with recycled wood oil, a sodium carbonate catalyst, and a hydrogen-CO reducing gas mixture. The mixture is injected into a high-pressure vessel at 3,000 psi and heated to about 350OC. The product stream is cooled and flashed into a pressure let-down vessel. The oil phase is withdrawn and part of it is recycled for use as slurry medium.
Research is being carried out on concentrated, vis- cous biomass slurries.3o The process uses a modified polymer extruder as a slurry feeding and pumping de- vice capable of handling slurries as concentrated as 60% wood by weight, as compared to 10-20% in conven- tional systems. The ability to handle such concentrated slurries, which are in solid form at normal temperatures, is expected to improve the quality of wood oil from direct liquefaction and also the economics of the pro- cess. The extruder-feeder system is incorporated into the system to develop 3,000 psig at its discharge and preheat the slurry before it enters a vertical reactor. As wood-flour slurry enters the reactor, it is mixed with
353

Wood
Preheater Gas %
Pyrolysis gas feed
Pressure
lfeeder
Reactor heaters (4) 1J
-
P c
- c
U U Compressor Gas storage cylinders Char Product cond
150-1 40 atm trap
1 Gas vent
Gas 1 meter
nsers
Figure 18.5 An Entrained Tubular Reactor (Source: Adapted from Ref. 28)
superheated steam and CO, which raises the reaction temperature to 300OC. Gas dispersion as well as heat and mass transfer are achieved by static mixer elements inside the tubular reactor. Steam and CO also react via the water-gas shift reaction to provide hydrogen for liquefaction. The liquefaction products are split into vapor and liquid fractions, condensed, cooled, and brought to atmospheric pressure by means of a let-down system.
Hydrolysis
In the past decade, a concerted effort was made to de- velop a process for converting lignocellulosic feedstocks into ethanol fuels. This can be accomplished by hydro- lysis of cellulose and hemicellulose to their component sugars and subsequent fermentation of the sugars to ethanol. Hydrolysis can be attained either by acidic or enzymatic treatments. Although acidic processes have low yields, require expensive materials, and consume large amounts of energy, they are faster than enzymatic processes.
Acid Hydrolysis
In the 1940s and 1950s, processes using concentrated acids to catalyze hydrolysis of cellulose failed commer- cially because of a need to recover and recycle the acid.3132 Interest in acid hydrolysis revived in the 1970s as a result of the increased cost of oil. Dilute (0.4% by weight) sulfuric acid is being used at moderate tempera- ture ( 170°C) for 5-min periods in a mild prehydrolysis pretreatment for recovering heat-sensitive hemicellulose sugars prior to applying higher temperatures and at higher temperature (270OC) for 5-s periods for hydrolyz- ing a-cellulose. The two-step process has been explored at a small scale in a number of laboratories, notably by the U.S. Department of Agriculture's Forest Products Laboratory.33
Dilute acid processes reduce acid-associated costs to about $0.03/lb of sugar produced at a lignocellulose cost of $0.03/lb of sugar (1985 dollars), but yields are poor and the processes require rigid control of residence time at high temperature. The overall process for converting cellulosic feedstocks to ethanol by high-temperature hydrolysis using dilute sulfuric acid is shown in Fig. 18.624
354

Cellulose ___L
Size reduction
Prehydrolysis Unreacted Hydrolysis Unreacted TO heat solids generation - 140°C solids 235°C '
Water, sugars
Yeast by-product CO2 by-product
Fermentation Yeast
Ethanol-water
Water
Stillage to waste disposal Purification (distillation)
t Ethanol
Figure 18.6 Cellulase-to-Ethanol Acid Hydrolysis Processing System (Source: Adapted from Ref. 34)
Feedstock Preparation and Prehydrolysis. Because the chemical and physical composition of the feedstock has an important effect on the process, hydrolysis of cellu- lose involves a search for conditions that maximize glucose yield.
any other cellulosic material, is shredded to a diameter of about 1.6 mm, mixed with water, and sent to a pre- hydrolysis unit, which operates at 14OoC with 0.5% sulfuric acid solution. These conditions are sufficient to hydrolyze much of the amorphous cellulose and hemi- cellulose yet are mild enough that the sugars produced are not degraded into furfural and hydroxy methyl fural- deh yde.
Ground solids are diluted into a mixing tank and acid is added and allowed to soak into the particles. The solids proceed into a plug-flow reactor, where they are rapidly heated to 14OoC by injection of 1.3-MPa (200-psia) steam. After passing through the reactor, the
The feedstock, whether wood chips, corn stover, or
solids are flashed to atmospheric pressure through an orifice. The flash-drum effluent is sent to a centrifuge, where solubles (water, glucose, and xylose) are removed. The solids from the centrifuge are diluted (repulped) and centrifuged again to remove a greater percentage of the soluble materials. The liquids are fdtered to remove any solids that are carried over and then neutralized. The solids from the filter and the second centrifuge are sent to a hydrolyzer.
Hydrolysis. This process is identical to prehydrolysis except that the conditions of the reaction are more severe: 235OC, with a 1% acid solution and a residence time of about 12 s. Under these conditions, about 75% of the crystalline cellulose is hydrolyzed to glucose. A third of the glucose produced is degraded; therefore, a typical conversion of crystalline cellulose to glucose in a single pass through the hydrolysis reactor is 50% effi- cient. Unconverted solids are used as fuel for a 4-MPa
355

steam boiler to provide heat for the process or recycled through the reactor along with fresh feedstock.
The sugar-water solutions from prehydrolysis and hydrolysis are neutralized by adding calcium hydroxide. The neutralization is exothermic and done at 12OoC. Calcium sulfate sludge is removed by filtration and sent to waste disposal, while the neutralized sugar solution is pumped to the fermenter.
Fermentation and Dehydration. Fermentation is carried out in closed vessels for 24 h at 3OoC in a continuous cascade. Yeast converts 95% of the glucose to ethanol and C02. The C02 evolved is scrubbed, compressed, liquefied, and sold as a by-product. A portion of the yeast also is sold as a by-product.
The ethanol-water stream from fermentation is concentrated to a 94% ethanol azeotrope in a beer still and then dehydrated in a ternary benzene azeotropic distillation. Aqueous stillage from the bottom of the beer still is sent to waste treatment.
Unreacted solids (mainly lignin and crystalline cellulose) are neutralized, dried to 50% solids, and burned to produce 4-MPa steam. The boiler is sized to dispose of all the spent solids. If necessary, a coal boiler with fl ue-gas desulfurization is added. Excess steam can be sold as a by-product. The aqueous stillage and con- densed flash vapors are sent to a waste treatment pond.
Enzymatic Hydrolysis
The history of enzymatic hydroysis of cellulose to pro- duce sugar syrups dates back to the late 1940s. The early work sought to prevent degradation of cellulose, but in 1968 the emphasis of research shifted to develop- ment of a saccharification process.
The DOE has sponsored a number of basic research and development efforts in the area of enzyme hydro- lysis. The process described here is based on use of debarked hardwood chips as a primary hydrolysis feed- stock and deproteinated cheese whey as a source of raw material for enzyme production3 The basic enzymatic hydrolysis process consists of six essential operations: pretreatment of cellulose-rich feedstock, production of cellulase enzymes, saccharification of pretreated cellu- lose, fermentation of sugar syrups, recovery of ethanol, and processing of by-products and wastes.
Pretreatment and Enzyme Production. The enzymatic hydrolysis of lignocellulose is severely constrained by its insolubility, high degree of crystallinity, low bulk density, and admixture with impurities (such as lignin) that restrict the access of the enzymes to the glucosidic bonds. Various methods of pretreatment include chemi-
cal, thermal, physical, biological, and radiation tech- niques. All are intended to reduce particle size to in- crease the available area for cellulase adsorption, total solvation and decrystallization, disruption of the lignin cellulose association, removal of lignin and other impu- rities, reduction in degree of polymerization of cellulose, and sterilization or pasteurization. After pretreatment, a portion of the substrate can be sterilized and used to produce the cellulase enzymes, while the remaining material is subjected to saccharification.
Enzymes are produced by growing a cellulase- producing organism in submerged culture, using cellu- lose or another suitable cellulase-inducing carbohydrate. The fermentation is aerobic and aseptic and requires 2-7 d at 28-32OC. The basal medium also contains mineral salts, a source of complex nitrogen, and trace elements. Depending on the next stage of the process, the spent fermentation broth can be used whole or it can be filtered to remove undigested solids.
Saccharification and Fermentation. Saccharification (hydrolysis) is carried out by suspending pretreated cellulose in whole or filtered cellulase broth. Levels of cellulose and cellulase range between 14 and 130 mg of protein per gram of suspended substrate. This process can be batch, batch-fed (substrate added gradually), or continuous. Little is known about the performance of long-term continuous hydrolysis. In continuous and batch-fed operation, the limit of cellulose concentration is determined by the degree of final saccharification and the concentration of insoluble impurities. In batch-fed operations, this limit is set by the ability to slurry the feed.
The degree of hydrolysis is a function of time and temperature. Below 4OoC, saccharification of any con- centration of cellulose can theoretically be complete if there is sufficient reaction time. At higher temperatures the reaction proceeds more quickly, but the enzyme is subject to thermal inactivation; enzyme activity, reaction time, and degree of cellulose saccharification must be optimized. Generally, process schemes rely on fairly high saccharification rates at the expense of enzyme inactivation, with temperatures of 45-5OoC and holding times of 24-72 h. The resulting sugar syrups can be used directly or filtered to remove undigested material before further processing.
that sugar syrups can be fermented either in conven- tional batch or continuous fermentation processes. The relatively low concentrations of sugar (7- 12%) generally occurring in hydrolyzates result in low-concentration ethanol streams (3-6%). They should theoretically pre- sent little problem to conventional ethanol-producing
Most enzyme hydrolysis process schemes assume
356

yeasts; this is probably the major reason for the lack of development work and testing in this area of the process.
Product Recovery. Once fermented, the ethanol from the beer must be recovered and dehydrated. Conven- tional distillation of the low-concentration beer has been the favored approach for stripping and rectifying the ethanol to the ethanol-water azeotrope. Final drying can be accomplished with cyclohexane, benzene, or other more-recent approaches to dehydration, including the use of molecular sieves and cellulose and starch adsorbents.
By-product and Waste Processing. Undigested materi- als can be removed by filtration of the cellulose hydro- lyzates. These insoluble materials are primarily lignin and unreacted cellulose. They are easily dewatered by mechanical means to about 50% solids, at which point they represent a source of fuel. The potential use of the lignin as a high-value phenolic extender has also been explored.
The five-carbon sugars that are produced in hydro- lysis remain as dissolved solids in the ethanol fermenta- tion beer and, in most cases, leave the process plant with the still remains from the stripping column. At this point, the sugars can be further processed into other products or concentrated into an animal feed by-product.
ENVIRONMENTAL ISSUES
The potential environmental effects of producing large amounts of alcohol from biomass stem from fuel sub- stitution as well as from massive changes in agriculture and forestry, the construction and operation of conver- sion facilities, and the actual use of the fuels, most likely in automobiles and other vehicles. These issues can be categorized into three distinct phases of the fuel cycle: biomass production, conversion to fuel, and end use.
The impacts of biomass production for energy can be considerable, particularly for soil quality. Prudent harvesting techniques can reduce the effects. Impacts of biomass conversion and end use in principle are similar to burning fossil hels (i.e., air pollution and ash disposal problems), but some unique hazards depend on the bio- mass source (e.g., dioxins from solid waste). Allevia- tion of the public health and environmental risks is possible with known technologies.36
Environmental Issues Associated with Production
The process of obtaining the massive amounts of feed- stock materials necessary for large-scale production clearly causes the most important effects. All of the credible biomass fuel cycles involving agricultural crops, grasses, or trees require various degrees of eco- logical alteration, replacement, or disruption on vast land areas. Each of the alcohol feedstocks -- grain and sugar crops, wood, grasses, and crop residues -- has distinct environmental effects, ranging from minor (or even positive) to severe, that are created both by the feedstocks physical nature and the institutions influenc- ing its use.
Obtaining alcohols through the more traditional “gasohol” route -- using surpluses and new supplies of corn, other grains, and sugar crops -- has a high proba- bility of causing substantial environmental damage. Increased erosion appears to be the major danger of the increased production, which depletes soil fertility and affects air quality, water quality, and ecological commu- nities. Agriculture currently is the primary source of soil erosion in the United States, sending at least a billion tons of soil into the nation’s surface waters each year.37
In addition, energy crops compete directly with food and fiber crops for available land, encouraging the use of less-productive, marginal lands for energy crops. Much of this additional land probably is pasture or hayfields, which may have been put into such use be- cause it was erosive and would have been protected by the perennial grasses; some of the land affected has never before been cultivated and is more sensitive to disruption than established farmland. As this land is stripped of its natural covering to accommodate expan- sion, the potential for erosion grows.
erosion includes filling reservoirs and lakes, degrading aquatic habitats, and debilitating long-term land quality and productivity through a slow drain of topsoil (a net loss of five tons per acre per year leads to a loss of an inch of topsoil in 30 yr).37
All agricultural processes produce a range of or- ganic materials with little or no direct commercial value. Usually these are burned or left in the soil to degrade. Use of crops for energy allows a much larger proportion of the total plant to be gainfully harvested. This will lead to a drastic reduction in the amount of crop residues
Environmental damage from the expected additional
357

allowed to remain in the soil after harvesting, which also can lead to soil erosion, a decrease in organic content and level of nutrients, and an alteration in the physical and chemical state of the soil.
Other important damage from added crop produc- tion includes potential loss of forestland, especially since the clearing costs can be offset in many cases by the value of the wood as fuel -- between 10 and 30 mil- lion acres may be at risk -- and substantial increases in the use of agricultural chemicals, especially pesticides (the current U.S. usage is 1 billion lb/yr11), leading to increased pollution of local surface waters through leaching of synthetic fertilizers.37
Increased use of biomass also can lead to acidifica- tion of forest soils, since basic nutrients taken up by the trees will not be returned to the soil from logging residu- als; again, the potential impacts on soil quality, nutrient content, and erosion are large. Forest harvesting also has many occupational hazards.363 Wood cutting and gathering in North America is a high-risk job in terms of injuries, rivaling underground coal mining. However, the wood energy system appears to be free of some chronic health effects associated with mining.
Biomass sources involving urban or industrial wastes, sewage, and sliuried animal wastes are generally benign, especially if the final by-product is used as an organic fertilizer. For example, disposal of urban refuse and sewage sludge by conventional means is becoming increasingly expensive and can be environmentally damaging. Use of such wastes for energy, therefore, also has a positive environmental effect. Treatment in digesters reduces environmental damage caused by the waste products and helps retain nutrients, so that the material can be used as a fertilizer.
Untreated stillage has a very high biological and chemical demand for oxygen and must be kept out of surface waters. Although stillage from grains is a valu- able animal-feed product and can often be recovered without a need for any further incentives, problems can arise if the market becomes saturated or the protein is removed before ethanol production, which leaves the stillage with little food value. Potential environmental impacts (positive and negative) of production of urban and industrial wastes for energy purposes are summa- rized in Table 18.4.
Environmental Issues Associated with Conversion
Every biomass conversion technology has associated environmental concerns, and as in the case of conven- tional conversions, the level of emissions depends on the
358
Table 18.4 Summary of Environmental Impacts from Biomass Production for Energy
Degree of Impact.
Impact Positive Negative
Material use Land use Water use Air pollution Water pollution Solid waste Noise Visual Heat Ecosystem Subsidence Public health risk Soil damageb Occupational safety
X
X xx xx xx X
xx xx X xx
X X
X
aXX represents a greater effect than X.
bFor crop residuals only.
Source: Ref.36.
type and scale of the technology. In general, however, no extremely toxic waste streams are associated with any of the technologies.
Air Quality
Atmospheric emissions are produced during generation of process heat, processing of feedstocks and by-prod- ucts, and steps directly involved with alcohol produc- tion. In theory, biomass use should not increase the amount of free CO in the atmosphere because the C02 released will precisely equal the COZ taken up during the growth of the plants. However, during a period in which large amounts of already-established growth are being converted to energy, free C02 levels will increase. Sul- fur is not present to any large degree in biomass, so production of sulfur oxides (SO,) should be consider- ably lower from biomass combustion than from a coal- fired unit, perhaps by as much as an order of magnitude. Nitrogen oxides are produced in the conversion of bio- mass, although there is some disagreement as to whether biomass will pollute more or less than coal in this respect. Biomass may produce slightly more NO, than coal since it has a higher nitrogen content, but it is often burned at lower temperatures, Le., lower oxidation rates. Releases of CO from biomass burners is likely to be

considerably higher than from coal. The emissions from various conversion routes are given in Table 18.5.39
Water Quality
Operation of alcohol fuel plants has some potential to degrade water quality. The largest volume of liquid effluent generated by alcohol production processes is condensate from stillage drying (distilleries produce about 13 L of liquid effluent, or stillage, per liter of ethanol produced). The condensate contains a high concentration of organic matter that produces a high biochemical oxygen demand (BOD) and an acidic pH. This effluent creates a serious pollution problem, by reducing the amount of available oxygen, when disposed of in rivers and streams.21 The stillage, however, is rich in minerals and is increasingly being used as a fertilizer, thus converting a potential contaminant into a useful product.4
process heaters can contaminate surface and ground water. Runoff from coal piles is acidic, with elevated levels of some trace elements. Heavy metals are often a
Runoff and infiltration from storage piles of fuel for
significant portion of the trace cations in some coal- waste effluents. Silicon, aluminum, and iron are the major elements in coal ash.
Occupational Safety
Workers in biomass conversion facilities face several different occupational hazards and, in general, have a high accident rate. Fermentation plant workers may be affected by prolonged or accidental exposure to the toxic and corrosive chemicals used. Reagents used in the final distillation step to produce anhydrous ethanol could present an occupational hazard under certain conditions; these reagents include benzene, ethyl ether, and cyclohexane.
and occupational safety records of three fuel production processestl
Land Use and Ecology
Land resource issues should not constrain development of the alcohol fuel industry. Land requirements have
Table 18.6 compares the environmental residuals
Table 185 Emissions from Conversion and Combustion of Biomass Resources (metric tons per quadrillion J)
Total Sulfur Nitrogen Suspended Hydrogen Carbon Hydm
Process Oxides Oxides Particulates Chloride Monoxide carbons
99 50 3.3 NAb NA NA Bioconversion processinga 310 62-490 49 49 NA NA Thermochemical conversionc
Incineration of municipal 1 20 200 2,000 65 650 --e
Refuse-derived fuel 2,600-5,400 650 65-650 48 290-320 36-1 1
solid wasted
combustion for electricityf
solid waste NA NA 1 .o NA NA NA Shredding of municipal
Industrial wood combustione 56-95 370-640 190-950 NA 75-3,900 _- Residential wood combustionh 26 60 1 ,000 NA 19,000 _-
aBiogasification and ethanol fermentation.
bData not available.
CPyrolysis -- 37-39 m3 of wastewater are produced per trillion J.
dwatenvall incineration -- 87 m3 of wastewater are produced per trillion J.
eNot applicable.
fCofiring 10% refuse-derived fuel wih coal.
e752 efficiency to electricity and heat.
h50% efficiency to heat.
Source: Ref. 39.
359

Table 18.6 Environmental Residues and Health Effects from Three Typical Alcohol Fuel Plants (per trillion Btu of energy produced)
Characteristic, Residue, or Effect Plant A Plant B PlantC
Plant characteristics Energy (trillion BWyr) Primary feedstock
Primary product
Air pollutants (tons)a Particulates Ethanol vapor Water vapor C% SOX NOx Fugitive dust Hydrocarbons co Evaporative losses
(million gal)
Water pollutants Blowdown (million gal) Effluent (million gal)a
BOD (tons) Suspended solids (tons) Water flow rate (acre-ft)
Solid wastes (tons) Grain rejects Ash Wastewater sludge Noncellulosics
Occupational safety Personnel Deaths Injuries
3.78 Corn
Ethanol
70.6 476 698.7 45,800 250 1 92 13
64
12.2 96
ND
14.4 2,054
42.1 0.00228 1.81
3.62 Wood
Methanol
Trace
Trace 20
307,000 acre-ft
500-2,300
2,300
65.5 ND ND
3.6 Cellulose waste Ethanol
N D b 115-461
42,700 m ND ND ND ND
83.3-118 83.3-118
1,100 2,800 86,100
21+ 0.001 16 0.92
.Except as otherwise noted.
bNot determined.
Swrce: Ref. 41.
been estimated to be small -- an ethanol plant with a production capacity of 60 million Uyr would require a land area of about 12 ha; plants with much larger pro- duction capacities would probably not require a propor- tionally greater land area.42 A possible exception is the necessity to dispose of large volumes of solid waste by landfiling, especially if stillage is not processed and sold as a by-product.
The effects of ethanol production on terrestrial and aquatic ecology will be highly site-specific. The effects on terresmal ecosystems should be minimal if the area of land occupied by conversion facilities is small and they are located where they do not adversely affect ter- restrial ecological resources. Ethanol production facili- ties should not adversely affect aquatic ecosystems if conventional wastewater treatment, with efficiencies equal to or higher than waste stabilization ponds, is applied to reduce BOD and trace element concentrations in effluents and if alkaline substances are added to raise the pH. This conclusion assumes that the facility is operating normally, since releases of large quantities of untreated effluents could cause considerable damage to aquatic ecosystems21
Environmental Issues Associated with End Use
Air Quality
Substitution of alcohol for gasoline generally has favor- able impacts on air quality. First, there are no lead or sulfur emissions from alcohol-fueled vehicles; CO and hydrocarbon emissions are slightly lower, and NOx emissions are markedly lower. Aldehyde emissions are much greater from ethanol, but this pollutant is produced in relatively small quantities and catalytic converters can greatly reduce the emissions.4
Emissions from ethanol blends are similar to those noted for methanol blends. Ethanol produces a natural leaning effect, making the emissions sensitive to the engine air-fuel ratio. Evaporative emissions can be expected to increase slightly, and aldehyde emissions may increase by as much as 25%. Hydrocarbon emis- sions from ethanol and ethanol blends appear to be less photochemically reactive than those from gasoline.
Neat methanol is an exceptionally clean-burning fuel. It produces no particulate matter, no polycyclic aromatic hydrocarbons, and no SOz. It yields less NO, than gasoline and about the same amount of CO, methanol, and aldehyde emissions. Because methanol does not produce compounds that poison catalytic con- verters, an automobile burning methanol and equipped with a catalytic converter would produce low levels of all pollutants. In addition, unburned methanol is less photochemically reactive than unburned gasoline and would produce less photochemical smog. Experimental evidence supports methanol’s low photochemical reac- tivity when substituted for typical urban hydrocarbons.43
Because methanol has a high Octane rating, engines can be set to operate at higher compression ratios and
360

leaner air-fuel ratios. These modifcations further re- duce CO emissions. Emissions of unburned methanol and aldehyde would, however, tend to increase under these operating conditions. Although aldehyde emis- sions may increase by up to 75% when methanol blends are used, three-way oxidation catalysts are effective in reducing aldehyde emissions to low levels.
Health and Safety
If inhaled over a prolonged period under conditions of poor ventilation, ethanol produces minor health effects, including coughing, eye and nose irritation, and head- aches. Ingestion of ethanol must exceed 100 g before stupor and poisoning occur. Contact with liquid ethanol can remove fat from the skin, producing a dermatitis characterized by cracked, dry skin. Individual tolerance to various concentrations of ethanol varies significantly.
In contrast, methanol is a toxic substance that af- fects the nervous system, producing headaches, nausea, giddiness, and loss of consciousness. The gasoline in a methanol blend also removes fat from the skin, enhanc- ing dermal contact with the alcohol fraction and thereby expediting the onset of toxic effects. However, exposure to methanol via dermal absorption is rare. In severe cases, exposure to methanol by ingestion, inhalation, or dermal absorption may cause damage to the optic nerve and blindness. The toxic effects are believed to be caused by formation of metabolic oxidation products, such as formaldehyde or formic acid. The threshold limit for occupational exposure to methanol is 200 ppm (260 mg/m3) in air for an 8-h workday, with a ceiling of 250 ppm (310 mg/m3) for 15 min.
Denaturing agents will most likely be required if either ethanol or methanol is used directly as a fuel. In many instances, adding a denaturing agent increases the toxicity of the alcohol, particularly ethanol.
Ethanol is volatile, flammable, and potentially explosive in certain mixtures in air. Care must be exer- cised to eliminate sparks and open flames when distill- ing and storing ethanol. Safety practices developed for use of methanol as a motor fuel in automobile and boat racing should be the basis for educating the general public about proper handling. Alcohol-gasoline blends require the same safety precautions as gasoline alone.
Ecosystem Concerns
Transportation and distribution of alcohol fuels will inevitably affect terrestrial and aquatic ecosystems. The two general categories of effects are those resulting from major spills and those resulting from chronic leaks.
alcohol undoubtedly will occur and would be toxic to Localized acute exposure from major spills of neat
soil microflora and fauna. Operation of fuel ethanol plants poses some potential for water quality degrada- tion. Several of the liquid process wastes have high BOD and elevated concentrations of trace metals.
ENVIRONMENTAL CONTROLS
Controls Associated with Biomass Production
Amelioration techniques involve prudent agricultural and silvicultural management. Soil erosion is not a point-source pollution, since there is no specific dis- charge point at which control technologies can be ap- plied. Discharges are made over a wide area and control is difficult. Therefore, efforts must be directed toward prevention rather than treatment, and this can best be achieved by the choice of harvesting system. Often, however, techniques that decrease erosion also increase the need for agricultural herbicides and pesticides. Thinning and selective cutting produce much lower erosion rates than clear cutting systems under all soil, slope, and rainfall conditions.
ing without a loss in productivity. None of the other methods has as great a potential for reducing erosion, so they are less extensively used. Contour hedgerows of species such as poplar and willow, combined with hill- side ditches, provide large amounts of vegetatively propagated planting stock for large-scale reforestation, while effectively checking erosion, reducing ground- water runoff, increasing groundwater infiltration, recharging groundwater reservoirs, and producing by- products of fuel wood and forage for 1ivestock.a Nar- row crop rows provide more ground cover in a shorter time, but require more fertilizer. Perennial lignocellu- losic crops can provide protection against erosion on marginal cropland, and species are available for many types of sites.
The intensity of land use can be as important as the extent of land use in determining environmental impacts from biomass production. Silvicultural operations using longer rotational periods would have significantly lower requirements for agricultural chemicals and other re- sources and could support mixed stands of trees. Har- vesting standing biomass is a less-intensive use of land and can be relatively benign, especially if selective cutting techniques are used.
The cost of improved management practices or environmental controls is not well defined; measures associated with harvesting crop and forest residues are
Soil loss can be reduced 30-5096 by contour farm-
361

less well defined than those associated with agriculture. In general, careful evaluation of existing conditions and long-term effects before harvesting appears to be the best environmental control.
Controls Associated with Conversion
Air Quality
Under normal operating conditions with required air pollution abatement equipment, air quality effects should be minimal. The major capital hardware includes systems for flue-gas scrubbing and ash collection, vapor- controlled storage tanks, and vent condensers; particu- late emissions can be controlled with cyclones, wet scrubbers, baghouse filters, or electrostatic precipita- tors.36
Table 18.6 sumrnarizes the controlled environmen- tal and health effects of three types of alcohol fuel plants: alcohol fermentation (plant A), methanol from wood (plant B), and ethanol from nonwood cellulosic waste (plant C). In plant A, the particulate and SO, emissions in the boiler flue gas are removed by a scrub- bing system using ammonia as the sorbent and waste- water is treated in a two-stage activated sludge treatment facility prior to disposal. In plants B and C, appropriate environmental control technologies are applied to limit residuals to within compliance levels. The cost of envi- ronmental controls accounts for 12-13% of the total fixed investment for a fuel ethanol plant. For example, control costs of the alcohol fermentation plant (plant A in Table 18.6) were $2.4 million compared to total plant construction costs of $18.4 million.41
Water Quality
Water quality problems associated with alcohol fuel plants generally can be solved by using conventional technology. Infiltration can be prevented by imperme- able pads, and runoff can be diverted to ponds and treated before release. Primary and secondary treatment using waste stabilization ponds is adequate to lower BOD and suspended solids to acceptable levels. After treatment, dilution water might be required to reduce the levels of any remaining materials to concentrations below state and federal standards.21
Occupational Safety
Worker health and safety can be protected by minimiz- ing exposure to chemicals, keeping work areas well ventilated, and educating workers to follow proper
safety precautions in handling toxic or corrosive chemi- cals and to wear protective gloves and clothing. When- ever any volatile organic compounds are used, precau- tions must be taken to prevent ignition of leaks or fumes. For example, explosion-proof motors should be used routinely, along with other specially protected electrical equipment.
Land Resources and Ecology
Primary site-selection criteria for alcohol fuel plants will involve economic and logistic factors. Sites should provide efficient access to process inputs (e.g., feed- stocks) and disposition of process outputs (e&, ethanol and waste products). Most potential land resource prob- lems can be mitigated by careful siting. If stillage is not processed and sold as a by-product, landfill areas that are environmentally acceptable and have large disposal capacities would be required.
reduced by siting facilities to avoid adverse effects on prime and unique farmland, floodplains, rare and endangered animal and plant species, and designated natural resource areas. Use of waste stabilization ponds or other forms of wastewater treatment with similar efficiencies should reduce BOD and trace elements to levels that will not have significant effects on aquatic communities. Accidental release and spills of large quantities of untreated wastewater should be avoided.
Potential terresmal impacts in rural areas can be
Controls Associated with End Use
Health, safety, and ecosystem concerns resulting from use of alcohol fuels should be controlled through revised standards or procedural changes in their distribution, handling, and use. Air quality concerns, however, are likely to require technological solutions. Existing oxida- tion and new three-way catalysts are effective in reduc- ing alcohol-fuel exhaust emissions. Furthermore, since neat ethanol and methanol yield no sulfur compounds and no particulates, the catalysts should not be poisoned and should give prolonged satisfactory service.
Particulate control technology is not likely to be added to very small combustion units, so the principal danger comes from widespread use of domestic wood- burning appliances, Residential biomass use is more difficult to regulate. House fires can be reduced with proper installation, handling, and chimney maintenance. In addition, regalatory strategies to control wood stove emissions are being implemented at the federal, state, and local levels (see the chapter on Wood Biomass Combustion).
362

ENVIRONMENTAL CONSTRAINTS
Regulatory Uncertainties
Despite the optimistic outlook projected for alcohol fuels, environmental constraints, such as siting limita- tions and regulatory uncertainties, have hindered or slowed development beyond near-term goals and may continue to do so. Land use is regulated by federal an state laws. The National Environmental Policy Act is of particular importance because its provisions may apply to fuel alcohols if a federal agency is involved in fund- ing, permitting, or otherwise regulating the project.45
Although properly controlled alcohol production facilities generate few emissions, some areas of the United States cannot accommodate even small increases in pollution levels. Crop production regions are particu- larly sensitive to increases because of smcter emission guidelines. The current emphasis on locating coal-fired facilities near the feedstock source could produce atmo- spheric emission levels that are higher than the standards in some areas. Siting that emphasizes use of waste heat, solar energy, or agricultural waste combustion could minimize this problem. Water availability also may be a limiting factor in some areas unless there is extensive recycling of water.
Many uncertainties remain related to the fate and dkposition of unregulated evaporative emissions, spe- cifically aldehydes and unburned alcohols. Despite these uncertainties, no insurmountable environmental barriers to the production and use of fuels from biomass have been identified for near-term production goals.
Food versus Fuel
A food-versus-fuel policy dilemma exists concerning the extent of structural changes in U.S. agriculture that might occur in response to fuel-ethanol production from crops. Any discussion of crops produced expressly for energy must confront the fact that energy crops may compete with food crops for land and water resources.~
Since U.S. alcohol production comes largely from surplus grains, its future will depend on technological developments, economics, and considerations concern- ing the provision of food for Third World nations. At present, U.S. food aid stands at around 5 million tons/yr, about 5% of exports. In theory, the United States could convert its export grain (about 123 million tons) to pro- duce 11.5 billion gaVyr of ethanol (about 10% of the annual petroleum consumption), which would replace
164 million bbl of oil and save 7.1% of annual oil im- ports. In 1980 prices, however, the ethanol produced would be worth $6.6 billion, while the value of the exported corn alone was worth $7.7 billion.47
Three questions arise: Is it wise to devote agricul- tural resources to energy production? In a free market, how will certain energy crops compete with food crops? On what kind of land will energy crops be produced? One solution is to grow the energy crops on land not suitable for food production (e.g., the jojoba and buffalo gourd grown in arid areas).]:, For every part of the na- tion, it is possible to assess what crops would be grown on certain classes of land if assumptions are made about crop prices, energy prices, and costs of production for each of the many food and energy crops considered.48
Unproductive agricultural land in the United States could produce between 19.7 and 32.9 billion L/yr of alcohol. If the 30.1 million acres that farmers were paid not to grow crops on in 1984 were used to produce ethanol from corn, between 20.3 and 40.6 billion L of alcohol could have been produced.49
In Brazil, where government support in the early stages of the alcohol program included low-interest agricultural credit and other incentives similar to those provided for sugar cane and ethanol production, the impact of the alcohol program on land use was by no means trivial. To meet the 1985 ethanol production goal of 10.7 billion L, Brazil would have had to plant about 1.6 million ha of sugar cane in addition to the land already being used (3.9 million ha).=
world at present. Many countries with food shortages could, with long-term planning, greater political and financial recognition for agriculture, and more research and development, raise their crop production dramati- cally. The quality of planning and control required to manage or change biomass use is generally lacking where it is most needed. Both food and biomass energy production must be interlinked to problems of rural development and poverty.45
There a e excesses of both food and energy in the
REFERENCES
1. National Energy Policy Plan -- Projections to 2010, U.S. Dept. of Energy Report DOWPE- 0029/3 (Dec. 1985).
Plotkin, S., Biomass Energy and the Environment, Environment (Nov. 1980).
Moreira, J.R., and J. Goldemberg, Alcohols -Its Use, Energy, and Economics -- A Brazillian
2.
3.
363

4.
5 .
6.
7.
8.
9.
10.
11.
12.
13.
14.
15.
16.
Outlook, Resource Management and Optimization,
Properties and Economics of Methanol-Gasoline Blends with High Methanol Content, Alcohol Fuels Program, U.S. Dept. of Energy Report DOE/CE/50038-1 (May 1985).
Asbury, J.G., Biomass Energy: A Technical and Economic Overview, 20th Intersociety Energy Conversion Engineering Conf. (Aug. 1985).
Paul, J.K., Ethyl Alcohol Production and Use as a Motor Fuel, Noyes Data Corp., Park Ridge, N J. (1979).
Anderson, E., Fuel Ethanol Business Threatened by Tax Reform, Chemical and Engineering News (March 17,1986).
Secretary of Energy: Annual Report to Congress, U.S. Dept. of Energy ReportDOE/S-O01(85) @ec. 1985).
Bancroft, D., Great Lakes Regional Biomass En- ergy Program, Proc. 1985 Biomass Thermochemi- cal Conversion Contractors’ Meeting, U.S. Dept. of Energy Report COW-8510167 (Feb. 1986).
Anderson, E., Use of Gasoline-Ethanol Blends May Rise, Chemical and Engineering News (Jan. 6, 1986).
Anderson, E., Fuel Ethanol Producers Upbeat Despite Problems, Chemical and Engineering News (Dec. 22,1986).
U.S. Dept. of Energy, Energy and Water Develop- ment Appropriations for 1987, Part 5, Solar and Renewable Energy, Fusion, and Environment Safety and Health, Hearings before a Subcommit- tee of the Committee on Appropriations, House of Representatives, 99th Congress (March 6,1986).
Schiefelbien, G.F., hoc. 1985 Biomass Thermo- chemical Conversion Contractors’ Meeting, U.S. Dept. of Energy Report CONF-8510167 (Feb. 1986).
Cuff, D.J., and WJ. Young, The US. Energy Atlas, 2nd Ed., Macmillan Press, New York (1986).
Agricultural Statistics - 1980, U. S . Dept. of Agriculture, p. 4 19 (198 1).
1982 Corn Annual, Corn Refiners Assn., Washington, D.C., p. 15 (1982).
1(3):231-279 (1981). 17.
18.
19.
20.
21.
22.
23.
24.
25.
26.
27.
28.
Flavin, C., and C. Pollock, Harnessing Renewable Energy, State of the World, Worldwatch Institute (1985).
Madewell, C.E., J.E. Jordan, and J.C. Roetheli, Economics of Ethanol Production from Wood Using the Acid Hydrolysis Process, in Energy from Biomass: Building on a Generic Technology Base, Proc. 2nd Technical Review Meeting, Argonne National Laboratory Report ANLl CNSV-TM-146 (Sept. 1984).
Berger, B J., and J.H. Cushman, Herbaceous En- ergy Crops -- Planning for a Renewed C o m m i t - ment, U.S. Dept. of Energy Report CONF-
Busche, R.M., The Business of Biomass, Biotech- nology Progress, 2(3):165 (Sept. 1986).
Waits, E.D., and J.L. Elmore, Environmental Con- sequences of Industrial-Scale Fuel-Ethanol Pro- duction, Environment International, 9(5):325-334 (1983).
Geller, H.S., Ethanol Fuelfrom Sugar Cane in Brazil, Annual Energy Review, lU135-164 (1985).
Scarberry, R.M., andM.P. Papai, Source Test and Evaluation Report: Alcohol Facility for Gasohol Production, Radian C o p , McLean, Va. (1980).
Elliott D.C., and E.G. Baker, Upgrading B i o m s Liquid Fuels, Proc. 1985 Biomass Thermochemi- cal Conversion Contractors’ Meeting, U.S. Dept. of Energy Report CONF-8510167 (Feb. 1986).
Beckman, D., and D.C. Elliott, Canadian J. Chemical Engineering, 63:99-104 (1985).
Diebold, J.P., J.W. Scahill, and RJ . Evans, The Thermal and Catalytic Upgrading of Oxygenated Primary Biomass Pyroiysis Oil Vapors, Proc. 1985 Biomass Thermochemical Conversion Con- tractors’ Meeting, U.S. Dept. of Energy Report CONF-8510167 (Feb. 1986).
Steinberg, M., P.T. Fallon, and M.S. Sundaram, Flash Methanolysis -- The Flash Pyrolysis of Biomass with Methane Gas, Proc. 1985 Biomass Thermochemical Conversion Contractors’ Meet- ing, U.S. Dept. of Energy Report CONF-8510167 (Feb. 1986).
Steinberg, M., P.T. Fallon, and M.S. Sundaram, Flash Pyrolysis of Biomass with Reactive and
84065-1 (1984).
364

29.
30.
31.
32.
33.
34.
35.
36.
37.
38,
Non-Reactive Gases, Bmkhaven Nation;rl Labo- ratory Report BNL-34734 (May 1984).
Appell, H.R, et al., U.S. Bureau of Mines Report of Investigation 7560 (197 I).
White, D.H., and D. Wolf, An Advunced Exfruder- Feeder Biomars Liquefaction System, €‘roc. 1985 Biomass Themochemical Conversion Contrac- m’ Meefing, US. De@, of Energy Report
Dunning, J.W., and E.C. Lathrop, The Saccharifi- cation OfAgricultural Residues in a Continuous Process, Industrial Engineering Chemistry, 36:24 (1945).
Takubo, IC, H. Hosaka, and N.K. Misamoto, The Development of a Concentrated Sulfuric Acid Wood Hydrolysis Process in Japan, FA0 Techni- cal Panel on Wood Chemistry, United Nations Food and Agricultural Organization Report FAO/ WC/60/WHS (Sept. 15,1960).
zerbe, JL., FFL Energy Program Update, pae- sented at TAPPI Chemistry and Energy Subcom- mittee Meeting, U.S. Dept. of Agriculture, Forest produers Laboratot), Madison, Wis. (Feb. 2, 1982).
W w t , JD., High-Temperature Acid Hydrolysis of CellrrloJe for Alcohol Fuel Production, in En- ergy from Biomass: Building on a Generic Tech- ndogy Base, Proc. 2nd Technical Review Meet- ing, Argonne National Laboratory Report ANU CNW-TM-146 (Sept. 1984).
Nystrom, J.M., et al, Technical and Economic Feasibility of Enzyme Hydroiyb for Ethanol Production from Wood, prepared by Arthur D, Little, Inc-, New Yo& State Energy Research and Development fwhority Report 85-9,625-R€ER-
Environmental Impacts of Rewwable Energy Sources and Systems -- COMPASS Series, draft, Organisation for Economic Cooperation and Devekpment, Environment Committee, Grmp on Energy and Environment, Ewiranment Direc- torate, Park Way 1986).
plotkin, S., Enviromnentai Eflats of Obrairrylg Liquid Fuelsjbm Bbmass, Proc. Ammican Insti- tate dPBysin Cmf. (1985).
Morris, SC, Residential W a d Fuel Use: Qrran- d i n g Health Eflects ofCwung* Traqvm, and
COW-8510167 fib. 1986).
BEA-84 (JUW 1985).
39.
40.
41.
42.
43.
44.
45.
46.
47.
48.
49.
Combustion, presented at American Public Health Assn. Meeting, Los Angeles (Nov. 1981).
Moms, G., Integrated Assessment Issues Raised by the Environmental Eflects of Biomass Energy Systems: A Case Study, Energy and Resmrces Group Report ERG-WP-80-6, University of California, Berkeley, Calif. (March 1980).
Annual Review of Energy, Vel. 10, J.M. Hollander, ed., Palo Alto, calif. (1985).
Energy Technology Characterizations Handbook: Environmental Pollution and Control Factors, U.S. Dept of Energy Report DOEEP-0093 (Mar. 1983).
Gasohol: Economic Feasibility Study, prepared by Development Planning and Research Associates, Inc., U.S. Dept. of Energy Report SAN-68 1-T (1978).
The Impact of Alcohol Fuels on Urban Air Pollu- tion: Methanol Photochemistry Study, Alcohol Fuels Program, U.S. Dept. of Energy Report DOE/ CEI50036-1 (Nov. 1984).
we., M.D., Contour Hedgerows for Soil Ero- sion Control and Planting Stock, Forage and Fuelwood Production in Highland Regions, in Energy from Biomass: BuildJng on a Generic Technology Base, Roc. 2nd Technical Review Meeting, Argmne National Laboratory Report
Environmental Assessment of the U S . Department of Energy‘s Interim Alcohol Fuels Production Goal of 60,000 Barrels of Ethanol per Day, pre- pared by Energy and Environmental Analysis, Inc., for US. Dept. of Energy (198 1).
Hall D.O., and PJ. De Groot, B b m s for Food or Fuel: A World Problem, Energy Applications of Biomass, Solar Energy Research Institute, Golden,
Hudson, WJ,, Biomass Energy and Food -- Con- flicts?, Food and Energy Resoums, Academic
Shea, S., Regwnrrl Impacts of Herbaceous and Woody Bi~mass Production of U.S. Agriculture, in Energy from Biomass and Wastes, Vol. MI, Insti- tute of Gas Technotogy, Chicago, 111. (1983).
Biomass for Energy, Organisation for Economic Cooperation and Development, Paris (1984).
ANUCNVS-TM-146 ( S a 1984).
cob, (oct. 1984).
res^ hc., London, pp. 237-256 (1984).
365

I
Figure 19.1 A Decentralized Photovoltaic System at Georgetown University with a Peak Capacity of 300 kW I

BACKGROUND
Photovoltaic cells are solid-state devices that convert sunlight directly into electricity. The photovoltaic effect was first observed in the 19th century, but the first prac- tical solar cell was constructed only in 1954. Since 1958, photovoltaic devices have been used to provide electric power for many space systems. Solar devices have also been used to operate irrigation pumps, naviga- tional systems, and other remote installations. Recently, these devices have been used in grid-connected residen- tial, commercial, and large central-station applications. (See Fig. 19.1 for an example of a decentralized use of solar cells.) Although photovoltaic costs are still high, t k y are expected to be substantially reduced during the next ten years by the research and development that is already in progress.
History
The physical phenomenon responsible for converting sunlight to electricity -- the photovoltaic effect -- was first observed in 1839 by a French physicist, Edmund Becquerel. He noted that a voltage appeared when one of two identical electrodes in a weakly conducting solu- tion was illuminated. The photovoltaic effect was first studied in solids, such as selenium, in the late 19th cen- tury. In the 1880s, selenium photovoltaic cells were built that converted light to electricity with efficiencies of I-2%. Selenium photovoltaic cells never became practical energy systems because their cost was too high relative to the amount of power they produced.1
ics of the photovoltaic phenomenon expanded. In the 1920s and 1930s, quantum mechanics provided the theoretical foundation for the present understanding of
Over the years, knowledge of the underlying phys-
Chapter 19
Photovoltaic Energy Systems
the photovoltaic effect. A major step forward in solar cell technology was the development, in the early 1950s, of a method for producing highly pure crystalline sili- con, which was used by Bell Telephone Laboratories in 1954 to produce a silicon photovoltaic cell with an efficiency of 4%. Bell Laboratories smn produced cells with 11% efficiency, heralding an entirely new era of power-producing cells.2
application of silicon photovoltaic cells were tried, mostly in regions geographically isolated from electric utility lines. These schemes were not very successful, but an unexpected boom arose from a different quarter in 1958, when the U.S. space satellite Vanguard was launched. This satellite used a small array (less than 1 W) of photovoltaic cells to power its radio. The cells worked so well that space scientists soon realized that they could provide an effective power source for many space missions. Photovoltaic energy systems have been an integral part of the U.S. space program ever since.12
Photovoltaic cells have also been used in terrestrial applications since the late 1950s, but only since 1975 has the market for earth-based systems outstripped that for space systems. Currently, photovoltaic systems are penetrating, to varying degrees, three domestic and international markets: (1) very small applications in electronic equipment and novelty items, such as calcula- tors; (2) small remote applications that are not connected to an electric-utility grid, such as mountaintop radio repeaters; and (3) electric power systems comprising small (less than 10 kW), intermediate (10-500 kW), and large (1-100 MW) installations serving single resi- dences, businesses and industries, and central-station generators, respectively.3.4 (Photovoltaic devices are rated according to their peak electrical output.) The high costs of these systems have been the main hindrance to more extensive use of solar cells in these applications,
In the 1950s, a few schemes for the commercial
367

but the rising costs of alternative energy supplies, along with the decreasing costs of photovoltaic devices, are now resulting in expansion into these markets.
Government Programs
In the early 1970s the National Science Foundation provided initial support for the development of earth- based photovoltaic energy systems. The work was transferred in 1974 to the newly established Energy Research and Development Administration. Since 1975, the federal government and the US. photovoltaic indus- try have worked together in pursuit of low-cost, high- performance photovoltaic energy systems. Over this period, the government has spent more than $700 mil- lion on programs to develop commercially viable photovoltaic devices.5
Despite significant progress in reducing the costs of photovoltaic electricity, commercially available systems and designs are still cost-competitive only for remote and special-purpose applications. Consequently, the U.S. Department of Energy’s National Photovoltaics Program is currently supporting research, under the Solar Photovoltaic Energy Research, Development and Demonstration Act of 1978 (Public Law 95-590), to improve the energy conversion efficiency, life expec- tancy, and reliability of photovoltaic cells, modules, arrays, power conditioning units, and systems and to reduce overall costs so that the technology can become cost-competitive in large bulk-power markets3
Recently, federally supported research has been directed at three types of photovoltaic cells: advanced silicon-sheet cells, thin-film cells, and high-efficiency multijunction cells. The National Photovoltaic Program also supports research on collectors to improve manu- facturing processes and reduce design and development costs. There are two types of collectors: flat plate and concentrator. Thin-film single-junction and multijunc- tion cells are used in flat-plate collectors; the concentra- tors use single-crystal or polycrystalline silicon. Con- centrator collectors use lenses to focus direct sunlight onto solar cells, reducing the number of cells required and the overall cost.
government has encouraged the technology’s develop- ment through four successive “block buys” under the Photovoltaic Utilization Act of 1978 (Public Law 95-619, Part 4). Through this program, the federal government purchased a large number of photovoltaic devices for distribution to federal agencies for applica- tions such as lighthouses, military housing, and park lighting. The purpose of these block buys was to boost
In addition to supporting basic research, the federal
privatesector production and to lower unit costs, while providing equipment for test applications and demon- strations. The program was quite successful: array prices dropped from $30/W to about $9/W within three years, showing how quickly the cost of supplying photo- voltaic devices can decrease with innovation and volume production.6 In the past, an incentive for purchasing these devices had also been provided by including them within the class of solar equipment for which a tax credit was allowed.7
Industry Programs
The photovoltaics industry has grown rapidly world- wide. Of the approximately 40 solar-module manufac- turers, 6 are located in the United States, 12 in Europe, and 14 in Japan. About 10 companies are producing photovoltaics on a small scale in developing countries2
In 1984, worldwide production of photovoltaic devices, as measured by the peak power of module ship- ments, was about 25 MW; of this, 11.7 MW were pro- duced by U.S. manufacturers (see Table 19.1).3.8-10 Although 1984 shipments were lower than 1983 ship ments (13.1 Mw), they contrast sharply with U.S. module shipments in 1975, which were estimated at 300 kW.
In recent years, international joint ventures and licensing arrangements have become popular, allowing companies to enter foreign markets and boost sales. American and European companies have formed many
Table 19.1 Estimated Photovoltaic Module Shipments
MW Shipped us. Market
Year World US. Share(%)
1975 0.10 0.03 1976 0.31 0.21 1977 e7.62 NAa 1978 0.8 NA 1979 >1.0 NA 1980 3.3 2.5 1981 6.0 3.5 1982 9.0 5.5 1983 21.7 13.1 1984 24.0 11.7
30 67 NA NA NA 76 58 61 60 49
8Nd available.
Sources: Refs. 3, 8, and 10.
368

partnerships and are now forging links with their com- petitors in Japan. Several companies have signed con- tracts to build photovoltaics manufacturing plants abroad This has helped other countries to move for- ward while providing U.S. firms with needed revenue.
TECHNOLOGY
A typical single-crystal, flat-plate solar cell of present design is about 100 cm2 in size (see Fig. 19.2).11 When sunlight strikes the cel!, electrons are freed in the semi- conductor material and an electric current is generated. The electricity is collected and transported by metallic contacts placed in a grid-like fashion on the surface of the cell. Groups of cells are mounted together on a rigid plate and interconnected to form photovoltaic modules. A typical flat-plate module is about 4 ft long by 2 ft wide, can convert about 11% of the incoming sunlight to electricity, and has a peak generating capacity of 50 W. Concentrator modules contain lenses that focus sunlight onto smaller cells (1 cmz or less in m a ) and cm convert 14% of the incoming sunlight to electricity. Usually, groups of modules are permanently attached to a frame and interconnected to form photovoltaic arrays (see Fig. 19.3).7
System Applications
Although there is little doubt about the continued growth of the use of photovoltaic energy systems, there is dis- agreement about the rate and magnitude of this growth. Significant reductions in photovoltaic cell and system costs are required for these systems to capture a large fraction of the energy-generation market. The costs of conventional fuel systems and the future demand for electricity are also important factors. Demand for elec- tricity production during the 1960s was increasing at a rate of 7%/y in most industrialized countries and at 10-15%/yr in many developing countries. In the late 1970s, electricity growth rates slowed to less than half those levels almost everywhere; they have averaged less than 2%/yr in the United States for the past five years. Because of this reduced growth, the absolute size of the market for photovoltaic systems may be smaller than originally assumed.2 In April 1978, for example, the Council on Environmental Quality, in an assessment of the future role of solar energy in the United Statesp projected that photovoltaics could provide 2-8 quadril- lion Btu, or 2-8 quads, per year by the year 2000 and as much as 10-30 quadslyr by 2020. Other studies, how- ever, suggested that the contribution of photovoltaics could be much smaller.13
Front
Cover
Anti-reflection
semiconductor
contact p-type semiconductor
Figure 19.2 Basic Photovoltaic Cell (Source: Ref. 11)
369

Photovoltaic (PV) cells are discs or squares of specially treated silicon (or another material) that generate a direct-current (DC) voltage when exposed to light.
Photovoltaic modules contain PV cells that are sealed between metal and transparent plates. Modules are either flat plates or use special designs to concentrate light on the cells. The electrical output of modules depends on the efficiency and number of cells.
J
Photovoltaic arrays are groups of PV modules connected together to produce a predetermined voltage for either storage or direct use by a
The future role of photovoltaic devices ultimately will be determined by their costs in comparison with those of competing alternatives. The average price of photovoltaic modules has dropped from $ 2 0 N in the late 1970s to less than $6/W in 1984 (see Fig. 19.4). Today, photovoltaic power generation, in systems where no additional storage is required, typically costs $O.SO-l/kWh, depending on the size of the system, the location, and the method of financing.2.5 In 1983, the U.S. Department of Energy established the goal of a current dollar cost of $O.lS/kWh, or $2/W.5 Although this goal has not yet been met, it now appears that corn-
Figure 193 Cell, Module, and Array Configurations (Source: Adapted from Ref. 7)
mercial technologies that can drive costs below that level will be available soon, possibly by the late 1980s. As prices fall, new markets will open.
likely to occur in the developing countries in the late 1980s. In these countries today, the common source of electricity in most villages is diesel generators, but these are unreliable and expensive ($0.2-1/kWh). If photovol- taic prices fall by 50% or more, solar power will become economical in these areas. The long-range target of most photovoltaic programs, however, is to produce electricity that is economical compared to power from
The f i s t real market competition in photovoltaics is
370

15
14
13
12
11
10
9
8
7
6
5
4
3
2
1
0
-~
- _
15
14
13 PV electricity cost
0 Module shipments
Year (estimated)
Figure 19.4 U.S. Photovoltaic Costs and Shipments as Estimated by the US. Department of Energy (Source: Adapted from Ref. 5)
conventional centralized systems. The steadily rising cost of these systems in recent years works in favor of
System Designs
photovoltaics. Average electricity prices in the United States are below $0.06/kWh, but the plants now being completed will have prices ranging from $O.O8/kWh to more than $0.20/kWh; prices in Japan, which relies on oil for power generation, already average $0.12- O.15kWh. The long-range target for photovoltaics is ambitious, but it is thought to be achievable by the 1990s.2
Solar cells can be made from a number of materials and formed in a variety of designs; they are classified by material and type of fabrication process. Single-crystal silicon is the most frequently used and best understood semiconductor material for photovoltaic cells. In cell fabrication, a Czochralski or floating-zone process is used to obtain single-crystal silicon from polycrystalline silicon. These processes, particularly the Czochralski,
371

have been dominant in photovoltaics manufacture since they were fxst used in 1954; as shown in Table 19.2, they were used for more than 60% of all photovoltaic cells produced worldwide in 1982.9JO These processes, however, are both expensive and wasteful, since they involve relatively large amounts of material and substan- tial losses from cutting; therefore, new material and process options have been developed. Some are now being used commercially, and others are still being studied.
One way to reduce costs is to fabricate silicon-sheet single-crystal cells by using less-refined (polycrystal- line) silicon and reducing material losses due to cutting. The objective of the silicon-sheet research is to over- come generic impediments to improving crystalline ribbon quality and growth rates. Edge-defined film-fed growth, ribbon-to-ribbon growth, and dendritic-web growth are among the processes for making cheaper silicon cells. Some of these options are just beginning to be used commercially. In 1982, their share of the mar- ket was about 19% (Table 19.2); in the short term, it will continue to grow.
Although still in the early stages of development, thin films offer the potential for making very inexpen- sive cells because they require less material and allow highly automated production. Amorphous silicon alloys and several polycrystalline compound semiconductors (e.g., gallium arsenide, copper indium diselenide, cad- mium telluride, and zinc phosphide) show promise as materials for single-junction thin-film cells that will be cost-competitive, and some of them may be also used in multijunction cells. These materials can be applied over relatively large areas by deposition techniques, such as chemical vapor transport, glow discharge, and reactive sputtering. The amorphous silicon cells have reached commercial production, while the others have not.
So far, materials for thin-film cells have shown relatively low efficiency and, in some cases, fast degra- dation in the ambient environment. The maximum efficiencies achieved are 11-12% for small thin-film cells (1 cm2) and about 8% for larger cells (100 cmz). These are much higher than those previously achieved, but still not as high as those of cells currently made by more conventional means, e.g., 19 and 13% for cells made in the laboratory and in production, respectively, by the Czochralski process. Long-term research may yield cell efficiencies as high as 18% with use of select- ed materials -- possibly as high as 25% with some films. As shown in Table 19.2, thin-film cells based on amor- phous silicon are now appearing in the marketplace.5 Ultimately, these types of materials and fabrication processes will replace those currently used.
Table 19.2 Photovoltaics Market Share by Technology (%)
~~
Silicon-Based Technology 1981 1982 1983 1984 1985 .
Czochralski 69.0 62.0 50.0 41.0 44.5 Semicry stallinea 11.0 18.0 14.0 16.0 20.0 Rjbbona 0 1.0 0.5 1.0 1.0 Concentrator 17.0 11.0 21.0 13.0 0 Amorphous silicona 3.0 9.0 14.5 29.0 34.5
.These are known as semicrystalline or polycrystalline devices.
Sources: Refs. 9 and 10.
Multijunction cells are capable of conversion efficiencies as high as 20-35% at the expense of higher production costs.5 The primary concept under develop- ment entails layering different semiconductor materials so that each layer converts a different portion of the solar spectrum into electricity, thus increasing the per- centage of photons that can be converted. Initial research has focused on two areas: crystalline multi- junction concentrator cells and amorphous thin-film multijunction cells. These concepts are still under inves- tigation and have not yet been commercially used.
ENVIRONMENTAL ISSUES
Health and environmental issues related to photovoltaic energy systems arise at several stages: (1) extracting, processing, and refining raw materials, (2) fabricating, installing, operating, and maintaining devices, and (3) decommissioning spent devices. Most attention has focused on the second stage because the activities are specific to photovoltaic systems and involve most of the potential chemical and physical hazards. Some hazards, such as the different pollutants emitted during cell fabrication, are highly technology-dependent.14-20 Others, such as electric shock hazards to persons install- ing or maintaining photovoltaic devices, are of a more generic nature.21-22 The most significant environmental problems in installation and operation of photovoltaic devices are probably associated with large central- station applications; no significant effects are expected from smaller, decentralized applications. For large central-station applications, large areas of land (about 3 kmV100 MW) will be required. Water may be used to clean panels, and herbicides may be used to control plant
372

growth. Also, it has been speculated that these faciIities may produce micro- or mesoscale changes in the envi- ronment. The magnitude of these effects remains largely unknown.
systems will generate large quantities of solid waste. Most of these wastes will be nonhazardous and can simply be disposed of in a landfill or, perhaps, recycled Disposal of spent photovoltaic devices containing cad- mium or arsenic may present unique problems. A utility that owns a central-station array, or maintains a large number of decentralized systems, will probably need to collect solid wastes from spent devices and dispose of them in controlled landfiils (i.e., centralized collection). Decentralized disposal by individual homeowners, how- ever, could result in the release of small quantities of cadmium to the atmosphere (from combustion at munic- ipal incinerators) or terrestrial and aquatic ecosystems (from disposal in municipal landfiils).
taic cell applications. Environmental issues associated with batteries are addressed elsewhere.23.24
In this section, emphasis is given to environmental issues associated with the fabrication of thin-film single- junction and multijunction photovoltaic cells, because these are the most promising technologies. Table 19.3 lists general types of chemical and physical hazards that are present in these technologies; Table 19.4 lists the specific hazards that are associated with several thin- film processes.ls.16 Although cell fabrication entails a large number of steps -- such as substrate processing, crystal growth, etching, metallization, antireflective coating, and encapsulation -- the deposition processes have been studied the most.
The actual risks imposed by these hazards will depend on several variables that have not yet been fully evaluated, including the availability and effectiveness of pollution control equipment and safety systems.17 It should be emphasized that this simple identification of hazards does not imply that a process or material will present significant risks to health or the environment; rather, it allows incorporation of risk control strategies into the original designs.
Decommissioning broken or degraded photovoltaic
Battery storage will be required for many photovol-
Hazardous Gases
The fabrication of thin-film photovoltaic cells will require large quantities of gases. Some of these are listed in Table 19.5 by material and process.ls.l6 Many of them are highly toxic (arsine, phosphine, silicon tetra- fluoride, and diborane), pyrophoric (silane), or flarnma- ble (hydrogen and methane). Many of the gases likely
Table 193 Types and Classes of Chemical and Physical Hazards Asgodated with Solar-Cell Fabrication
Type, Class Hazardous Characteristics
Chemical Gas Toxicity (lethality, carcinogenicity),
explosiveness, flammability, comivity, asphyxiation
Solid Toxicity, explosiveness, flammability
Physical Electrical High electric intensity Electromagnetic Ionizing (alpha) and nonionizing
Thermal High temperatures (radio-frequency) radiation
Sources: Refs. 15 and 16.
to be used in thin-fdm cell production are already being used in industry, but the quantities and application modes will differ. The volumes of some gases, such as phosphine, which is used for large-scale photovoltaic cell fabrication, will be larger than those used for all other purposes. Therefore, the options for handling these gases and disposing of unreacted portions (the efficiencies of the deposition processes are 10-3096) will need careful consideration.
tally either from leaking process and storage systems or the venting of process and control equipment during ab- normal conditions, such as fire and power failure. These could present large risks to populations near these facili- ties because of the significant quantities of gases used.25
Hazardous air pollutants may be released acciden-
Liquid Wastes
The thin-film technologies that are the most promising do not produce liquid wastes that are obviously hazard- ous. Single-crystal and ribbon technologies produce liquid wastes, such as acids and acetones, that can be treated using available technology, such as neutraliza- tion and flocculation. These liquids also require safe storage to control leakage and prevent leaching to groundwater.
Solid Wastes
The solid wastes produced by various cell-fabrication processes are listed in Table 19.6.15.16 These wastes are
373

Table 19.4 Summary of Potential Chemical and Physical Hazards Associated with Deposition Processes in Solar-Cell Fabrication
Chemical Physical Hazards Hazards
Elec- Electro- Technology and Process Gas Solid trical magnetic Thermal
Amorphous silicon (a-Si) RF glow discharge DC proximity glow discharge Reactive RF glow discharge
Reactive ion beam sputtering Chemical vapor deposition (CVD)
sputtering
Gallium arsenide (GaAs) Halide CVD Metal organic CVD (MOCVD)
Cadmium telluride (CdTe) Eledrodeposition (ED) Close-spaced vapor tlanspolt (CSVT) CVD Hot-wall vacuum deposition (HWVD)
Copper indium diselenide (CuInSe2) Ion beam sputtering (IBS) Molecular beam epitaxy (MBE) RF sputtering (RFS) Spray pyrolysis (SP) Thermal evaporation (TE)
Zinc phosphide (Zn3P2) Close-spaced vapor deposition MOCVD
X X X
X X
X X
X X X
X
X X
X X
X X X
X X
X X
X X X X
X X X X X
X X
X X X
X X
X
X X
X X X
X X
X X
X X X
Sources: Refs. 15 and 16.
residuals adhering to chamber walls during deposition, and they must be removed frequently by mechanical or chemical means as a part cf maintenance. Operations may also expose workers to hazardous dusts. Some of these wastes may be classified as "hazardous" under the Resource Conservation and Recovery Act and, if large volumes are produced, will require disposal in controlled landfills.
Physical Hazards
Occupational Hazards
In photovoltaic-cell fabrication plants, the most signifi- cant physical hazards will probably arise from the large variety of electrical equipment to be used (see Table 19.7); risks from mechanical or noise-related
hazards appear to be sma11.15.16 Electrical equipment could present spark generation, laser, electric shock, and radio-frequency (RF) hazards to workers if the equip- ment is improperly designed or used.
sources will be used in many of the thin-film deposition processes. Since flammable and explosive gases are also used in these processes, the possibility of electric sparks igniting these gases may be an occupational hazard.
ards: electric shocks from the high-intensity currents and biological effects from electromagnetic radiation. High-voltage generators can produce a fatal current if not properly grounded. Radio-frequency radiation can damage human cells primarily by a thermal mechanism, but it also may present risks to exposed workers even at levels too low to heat living tissue20
Heating elements and high-voltage RF or DC power
The RF plasma systems present two potential haz-
374

Table 195 Health and Safety Standards for Hazardous Gases Used h Solar-Cell Fabrication
Level (ppm)b Tech-
Gas nology Manufacturing Step LRthal IDLHc TLVd Comments
Arsine
Cadmium telluride
Chlorosilanes
Diborane
Hydrochloric acid
Hydrogen
Hydrogen selenide
Hydrogen sulfide
Methane
Nitrogen
Phosphine
Silane
Silicon tetra- fluoride
Trimethyl
Trimethyl zinc
Zinc phosphide
GaAs
CdTe
a-Si
a-Si
GaAs
a-Si CdTe a s p 2
CuInSe2
CdS
GaAs
a-Si
a-Si hSpZ
a-Si
a-Si
GaAs
a 3 m
halide CVD
CSVT, CVD
glow discharge
glow discharge, CVD, sputtering
halide CVD
glow discharge, CVD CSVT, CVD, ED MOCVD
sputtering
sputtering
MOCVD
glow discharge, CVD
CVD MOCVD
glow discharge
glow discharge
all
MOCVD
CSVT
250
NAe
NA
160
1,300
-
-
-
-
-
2,000
-
50-250
NA
NA
NA
6
40 mg/m3
4,000
40
100
_-
2
2
_ _ _ _
m
_ _
NA
NA
NA
NA
0.05
0.05 mgm3
5
0.1
5
-
0.05
0.05
-
-
0.3
NA
NA
NA
-
-
Highly toxic
Highly toxic; reacts with acid fumes or moisture to emit toxic cadmium compounds
h t s toxic fumes when exposed to water, steam, or heat
Highly toxic; can explode when exposed to heat, flame, air, or chlorine
Noxious and strongly corrosive
Nonlethal; can explode when exposed to heat, flame, or oxidizer
Highly toxic
Highly toxic
Nonlethal; fire and explosion hazard
Nonlethal; can read violently with titanium
Highly toxic; fire and explosion hazard; emits toxic phosphorus oxides when heated
Fire and explosion hazard; may ignite spontaneously in air, emitting toxic fumes
Highly toxic; produces toxic fumes when exposed to heat or acid fumes
Can ignite spontaneously in air
No toxicity data available; fire and explosion hazard, emits toxic fumes when heated
Highly toxic; rea& with moisture or acid fumes to produce phosphine
Gee Table 19.4 for an explanation of abbreviations.
bExcept when otherwise indicated.
CImmediateIy dangerous to life or health (IDLH) is the maximum concentration from which escape could be made within 30 min, without
dThreshold limit value (TLV) is the maximum time-weighted average concentration allowed during a working day (8 h) or week (40 h).
eNA means data not available, and a dash means not applicable.
Sources: Refs. 15 and 16.
escape-impairing symptoms or irreversible health effects.
375

Table 19.6 Summary of Solid Waste Hazards from Solar-Cell Fabrication
Element Tech- Manufacturing
Compounds nology Step Hazard
Cadmium CdS CdS04 CdTe
CuInSez all All Cd compounds are hazardous; protective equipment CdTe ED, CSVT is required during all material handling; waste disposal
in controlled landfills is necessary CVD, MOCVD, HWVD
Copper, indium, CuInSez CuInSez all selenium
Gallium, arsenic GaAs GaAs all
Silicon-hydrogen and a-Si all silicon-hydrogen- fluoride compounds
Toxicity of selenium similar to arsenic, although trace quantities seem essential to normal growth in m e animals; selenium is also a suspected carcinogen; scant toxicology data are available for indium; copper compounds have a Elatively low toxicity
Gallium arsenide may be a carcinogen
Exposure to dust of silicon compounds in cleamng or scribing operations should be avoided; long-term e x p sure to oxidized sisicon (S i03 a d d produce silicosis
Tellurium Te TeO
Zinc znZp3
CdTe HWVD, ED No industry 1 serious illness or death in
&P2
workers exposed to tellurium
Zinc phosphide is a highly toxic rodenticide; sa9ble if kept dry,but decomposes in moist air; redds violently with acids to emit ighly toxic and flammable phosphine
MOCVD, CSVT
aSee Table 19.4 for an explanation of abbreviations
Sources: Refs. 15 and 16.
Table 19.7 Electrical and Electromagnetic Hazards Associated wlth Solar-Cell Fabrication
a-Si all
GaAs all
Silane a d hydrogen in process and
Hydrogen, methaoe, and trimethyl gallium in pmcess and exhaust gases
ahaust &apas
Nonionizing CuInSez RFS, MBE RF exposure radiation &si RF glow dischaw,
reactive RF sputtering ~~
6 e e Table 19.4 for an explanation of abbreviations.
Sources: Refs. 15 and 16.
376

In photovoltaic-cell manufacturing, laser beams may be used to scribe thin layers of cell materials depos- ited on large substrates to form narrow strips for individ- ual solar cells. Possible exposure of personnel to the beam, and to the electric field of the source, gives rise to occupational safety concerns. The beam, whether direct or scattered, can be detrimental to the eye. Most lasers have high-voltage (10-30 kV) DC or RF power supplies, and electric shock from the power source or capacitor discharge can be lethal.20
opment require heating the substrate and, in some cases, the feedstock to temperatures high enough for accidental contact to cause serious bums. In all cases, however, the hot surfaces appear to be isolated within the reaction chamber, so the likelihood of occupational bums appears to %e small.
Most of the thin-film deposition methods in devel-
Public Risks
Homeowners or contractors installing, maintaining, or removing rooftop photovoltaic systems may risk electri- cal shock. Although grounding or contact with these circuits is unlikely, exposures to photovoltaic-generated electricity could produce a spectrum of responses rang- ing from clinical injuries, such as bums, to death from cardiac or pulmonary arrest. Studies suggest that the voltage generated by six modules connected in series is sufficient to cause ventricular fibrillation and possible death at room temperature. In colder weather, the same effect may be produced by fewer modules.21
Homeowners having rooftop photovoltaic arrays may also face the hazards of fires caused by short cir- cuits and spontaneous combustion due to heat being trapped in dead-air spaces. The probability of either has not yet been estimated for photovoltaic systems, but the consequences of such fires have been studied. In 1980, electrical fires were the fifth leading type of fire and the fourth leading cause of fire deaths in the United States. Analysis of this issue suggests that the health risk from fire caused by a photovoltaic system is unlikely to pre- sent undue societal risk (risk per individual times the number of events), but may be significant for dwelling occupants exposed to such risks.21
ENVIRONMENTAL CONTROLS
.Hazardous Gases
Improper handling and disposal of hazardous gases may adversely affect both occupational and public health.
There are many gas-safety management options that could reduce risks from gas hazards. Occupational spaces and reaction chambers should be well-designed and ventilated to prevent accumulation of reactive or toxic gases. Compressed-gas cylinders should be stored in well-ventilated cabinets or secured, outside storage areas. Sensitive detection systems shcdd be installed to automatically shut off the source of a hazardous gas when leaks or failures occur. Production equipment should employ cycle purging, rather than continuous purging, for cleaning dangerous lines. The concentra- tion of poisonous gases in supply cylinders should be kept as low as possible in relation to process and han- dling requirements; in addition, the volume of dl stored gases should be minimized. The oii reservoir chamber of vacuum pumps should be purged with nitrogen to avoid accumulation of pyrophoric gases.
Table 19.8 presents a set of control technologies, with cost estimates, that could be used to reduce or eliminate the potential routine discharge of hazardous gases to the external environment; implementation of these or similar control measures should reduce r isks to public health.15.~ To reduce risks from the accidental release of stored gases, only limited quantities of feed- stock should be kept on hand; gases should be stored in independent, well-ventilated sheds with appropriate monitoring and fire-prevention devices; and all employ- ees handling the gases should have adequate safety train- ing. The estimated control costs represent additional capid, operating, and maintenance costs for each s p - cific process option. Requirements for costly controls should not be viewed as increasing the economic barriers for any particular process, but as indicating a need to develop new and more cost-effective controls.
Solid Wastes
Table 19.9 summarizes the costs for disposing of haz- ardous solid wastes in controlled landfi~s.l5,16
Physical Hazards
Occupational Hazard
Many safety options should be i n c o v M , wherever appropriate, into electrical equipment used in the manu- facture ofphotovdtaic cells. These options are rou- tinely used throughout indusoy and should not present design or engineering barriers to photovoltaics manufacture.
Exposed circuits or equipment that may cause elec- a i d shock should be deenergized and locked or tagged
377

Table 19.8 Environmental Control Costs for Atmospheric Pollutants Produced by Solar-Cell Fabrication
cost ($1 Residuals (kg/yr) Tech- Manufacturing COntrol
S tep Technology Capitalb O&Mc Uncontrolled Controlled Compound nology
Cadmium telluride
Diborane
Hydrogen
Hydrogen selenide
Hydrogen sulfide
Metal vapors
Methane
Phosphine
Silane
Silicon tetra- fluoride
Zinc phosphide
CdTe CdTe
a-Si a-Si a-Si
CdTe CdTe CdTe a-Si Z n g 2
CuInSez
CuInSez
CuInSez
a g 2
a-Si a-Si a-Si z n g 2
a-Si a-Si
a-Si
a&
CSVT CVD
glow discharge sputtering CVD
ED CSVT CVD glow discharge MOCVD
sputtering
sputtering
all
MOCVD
glow discharge RFS CVD MOCVD
glow discharge CVD
glow discharge
CSVT
Particulate filter Particulate filter
KMnO4 or NaOCl a n 0 4 or NaOCl KMn04 or N a d c l
Flare stack Flare stack Flare stack Flare stack Flare stack
NaOH scrubbing
NaOH scrubbing
Particulate filter
Flare stack
KMn04 or NaOCl a n 0 4 or NaOCl KMnO4 or NaOCl KMnO4 saubbing
KOH scrubber KOH scrubber
KOH scrubber
Particulate fdter
100 100
e 12,000
e
200 200 200
200 -
-
-
d
200
e g g
43 1 ,000
32,000 15,000
75,000
100
<40 d <200 <10
0.5 0 0.3 0 0.9 0
2,900 d d d
8,990 d d d
8,990 d
952 <10
366 c4
d d
1212 <40
1,435 7 3% 3
4,900 25 2,772 <40
1,423 d 3% d
4,900 d
d d
.See Table 19.4 for an explanation of abbreviations.
bThe total cost of control equipment for a 10-MW facility.
cThe annual operating and maintenance cost for control for a 10-MW facility.
dhsignificant quantity.
el%e cat is included in the silane control cost.
Not applicable.
gThe cost is included in the diiorane control cost
Sources: Refs. 15 and 16.
378

7
Table 19.9 Environmental Control Casts for Solid Wastes Produced by Solar-Cell Fabrication
Tech- Manufacturing Residuals Disposal Compound nology Step WYr) ( W
Copper indium CuInSez TE 3,430 4200 diselenide CuInSez RFS, IBS 2,770 3,400
Cadmium sulfide CdS TE 2,060 2500 1,660 2,000
Cadmium zinc cdzns TE 1,820 2200 sulfide
CdS sputtering
Cadmium CdTe CSVT 410 500 telluride CdTe CVD 1,980 1,400
CdTe HWVD 1,970 2,400
Amorphous a-Si sputtering 205 260 silicon
Gallium arsenide GaAs CVD 9,990 12,000 GaAs MOCVD 8,830 10,600
Zinc phosphide Zn3Pz CSVT 1,140 1,400 &3PZ MOCVD 653 800
Gee Table 19.4 for an explanation of abbreviations.
boperaling and maintenance costs for a l@Mw facility.
Sources: Refs. 15 and 16.
before employees work near them. Exposed circuits that may become energized should be considered energized and dangerous. When employees must work near ener- gized circuits, they should have ample lighting; insula- ted tools and equipment; shields, barriers, or insulated materials to isolate them from energized components: and extensive training. In addition, the use of portable metal equipment, such as ladders and uninsulated metal probes, should be prohibited. Safety signs and bar- ricades should be used to restrict access to areas where hazards exist.
All equipment and safety controls should be well- designed, insulated, and frequently inspected. Power supplies should be fed through a single main power-line switch to allow the power to be shut off quickly. Elec- tric circuits and any equipment near them should be grounded. In addition, all RF sources should be ade- quately shielded.
Public Risks
Photovoltaic components such as diodes, diode hous- ings, wiring system, and mounting frames in rooftop photovoltaic arrays can cause electric shock and f i e hazards. Safeguards for these components have been identified by Underwriters Laboratories and are now being incorporated into the National Electric Code.22
ENVIRONMENTAL CONSTRAINTS
National Implications
Specific emission standards for the photovoltaics indus- try have not yet been set, but some facilities have been
379

Instit (? ' /
identified as generators of "hazardous" wastes.26 Emis- sion control standards developed f0r related industries (e.g., the semiconductor industry) may serve as guide- lines for control-technology requirements in the photo- voltaics industry. Potential requirements are under various stages of development and include National Emission Standards for Hazardous Air Pollutants for arsenic and, possibly, cadmium; Clean Water Act efflu- ent limitations applicable to the electronics industry; and Resource Conservation and Recovery Act standards for the control of a variety of toxic and hazardous wastes that may be produced during cell fabrication.
Currently, the only specific standards that will have to be adhered to are those promulgated by the Occupa- tional Health and Safety Administration. These cover a variety of chemical and physical hazards to workers. Some issues, such as RF exposure limits, are now being critically reviewed to identify permissible exposure levels; others, such as permitted exposure limits to galIium-arsenide particulates, have not yet been addressed.
Regionaf and Local Implications
Regulations by state and local agencies aimed at control- ling routine or accident-related emissions from various industries have not been cataloged, but they generally require prudent control engineering practices. State agencies are especially concerned with gaseous, liquid, and solid waste stream that contain toxic or hazardous materials. Such waste streams from photovoltaics man- ufacture will probably require some degree of control. In New York State,27 for example, sources emitting air contaminants that are suspected of being human carcino- gens, or that are known to be highly toxic, must apply the "best available control technology" to the effluent stream. Furthermore, applicants for emission levels will comply with specific "acceptable ambient levels" ap- proved by the New York State Department of Environ- mental Conservation or recommended by a Regional Air Pollution Control Engineer.
REFERENCES
1. Hersch, P., and K. Zweibel, Basic Photovoltaic Principles and Methods, Solar Energy Research Institute Report SERVSP-290- 1448, Golden, Colo. (1981).
Flavin, C., Electricity from Sunlight: The Emer- gence of Photovoltaics, Solar Energy Research
2.
3.
4.
5.
6.
7.
8.
9.
10.
11.
12.
13.
14.
15.
16.
El. Revic
Moore, 'I. Plant, EPRi
Five Year Reseo. ics: Electricity fro, ergy Report DOBCb
Maycock, P.D., and E.N.. - Sunlight to Electricity in 0, Publishing Co., Andover, Mass.
Watts, R.L., et al., Photovoltaic Prc and Buyers Guide, Pacific Northwest L
Report PNL-5052 (April 1984).
Kelly, H., Photovoltaic Power Systems: A ZL Through the Alternatives, Science, 199(4329):6, 643 (1978).
Krantz, A., Industry Trends, presented at U.S. Dept. of Energy Photovoltaics Program Annual Review, Crystal City, Va. (Feb. 1983).
PV News, 4(2) (Feb. 1985).
Strawn, N., Photovoltaics Technical Information Guide, Solar Energy Research Institute Report SERVSP-271-2452, Golden, Colo. (Feb. 1985).
Solar Energy Progress and Promise, Council on Environmental Quality, Executive Office of the President (1978).
Ehrenreich, H., and J.H. Martin, Solar Photovol- taic Energy, American Physical Society (Jan. 1979).
Moskowitz, P.D., et al., Health and Environmental Effects Document for Photovoltaic Energy Systems - 1983, Brookhaven National Laboratory Report BNL-51676 (Sept. 1983).
Moskowitz, P.D., V.M. Fthenakis, and J.C. Lee, Potential Health and S4fety Hazards Associated with the Production of Cadmium Telluride, Cop- per Indium Diselenide, and Zinc Phosphide Photo- voltaic Cells, Brookhaven National Laboratory Report BNL-51832 (April 1985).
Fthenakis, V.M., J.C. Lee, and P.D. Moskowitz, Amorphous Silicon and Gallium Arsenide Thin- Film Technologies for Photovoltaic Cell Produc- tion: An Identification of Potential Safety
380

17.
18.
19.
20.
21.
Hazards, Brookhaven National Laboratory Report
Wilenitz, I., V.M. Fthenakis, and P.D. Moskowitz, Costs of Controlling Emissions from the Manufac- twing of Silicon Using Dendritic Web Photovol- taic Cells, Solar Cells, 15:247-266 (1985).
Lee, J.C., and P.D. Moskowitz, Hazard Charac- terization and Management of Arsine and Gallium Arsenide in Large-Scale Production of Gallium Arsenide Thin-Film Photovoltaic Cells, prepared by Brookhaven National Laboratory for Renew- able Energy Sources (April 1985).
Fthenakis, V.M., and P.D. Moskowitz, Charac- terization of Gas Hazards in the Manufacture of a-Si Photovoltaic Cells, Brookhaven National Laboratory Report RNL-51854 (April 1985).
Fthenakis, V.M., Hazards from Radio-Frequency and Laser Equipment in the Manufacture of a-Si Photovoltaic Cells, Brookhaven National Labora- tory Report BNL-51853 (April 1985).
Moskowitz, P.D., et al., Rooftop Photovoltaic Arrays: Electric Shock and Fire Health Hazards, Solar Cells, 9:327-336 (1983).
BNL-51768 (Oct. 1983). 22.
23.
24.
25.
26.
27.
Safety-Related Requirements for Photovoltaic Modules and Arrays, U.S. Dept. of Energy Report
Health and Environmental Effects Document for Batteries - 1980, Argonne National Laboratory Report ANUES-105 (Nov. 1980).
Health and Environmental EIfects Document for Batteries - 1981 : The Zinc/Halogen Batteries, Argonne National Laboratory Report ANL/ES- 119 (Nov. 1981).
LaDou, J.L., The Not-So-Clean Business of Mak- ing Chips, Technology Review, 8723-36 (May/ June 1984).
Moskowitz, P.D., P. Perry, and I. Wilenitz, Photovoltaic Energy Systems: Environmental Concerns and Control Technology Needs, U.S. Environmental Protection Agency Report EPA-
Air Guide - 1 : Application of 6 M C R R Part 222 - Toxic Air Contaminants, New York State Dept. of Environmental Conservation, Albany (Nov. 15, 1984).
DOE/JPU955392-2 (March 1984).
600/S7-82-066 (March 1983).

Figure 20.1 The US. Army Adiabatic Diesel Truck Engine, which Is Installed in a 5-ton Truck
382

BACKGROUND
History and Potential Market
The energy crises of 1973-74 and 1978-79 sparked interest in the potential fuel economy of diesel engines. Although diesel engines can produce more power (per unit of displacement) than gasoline engines and are inherently more fuel efficient, uses of diesels are sensi- tive to operating costs, to which fuel is a major contrib- utor. Potential savings in fuel consumption have been identified in recapturing part of the energy wasted as rejected heat during combustion.~.2
(LHR) diesels is not insignificant: fuel economy can increase 10% due to the higher combustion temperature that characterizes LHR engines, with greater increases when the exhaust energy is used for turbocharging, turbocompounding, or other bottoming systems (which recover otherwise wasted energy and transfer it to the crankshaft). Some authors have estimated the overall economy increase to be 20% in theory3 and 13.5% in practice.4 In theoretical terms, diesel engine operation would move closer to adiabatic (no gain or loss of ther- mal energy) operation by eliminating heat transfer into an engine’s cooling or lubrication system. True adia- batic operation cannot be realized; thus, diesel engines that attempt to minimize heat transfer are more properly called LHR, or uncooled, diesel engines. Such an engine is shown in Fig. 20.1.
LHR engines may be accompanied by a greater toler- ance for low-grade fuels.5 These features of LHR engines combine to make them very desirable for many current diesel applications, including trucks, passenger cars, and combat vehicles.6-8 Because of a projected increase in freight transportation activity, diesel fuel
The energy-saving potential of low-heat-rejection
The potential increase in fuel economy promised by
Chapter 20
Low-Heat -Rejection Diesel Engines
consumption is expected to increase 70% by the year 2000, from 2.77 quadrillion Btu (quads) in 1980 to 4.70 quads (Fig. 2O.2).9 Therefore, LHR engines are viewed as an energy technology with the potential of substantially improving diesel engine fuel efficiency, multifuel capability, and overall attractiveness.
Diesel-fueled highway vehicles consumed about 17 billion gal of fuel in the United States in 1984.10 This amount may grow to 27 billion gal by 2000. A 10% savings of diesel fuel would then be about 1.7- 2.7 billion gaYyr (40-64 million bbYyr). The annual market in the 1980s for new diesel-engine highway vehicles has been about 76,000 heavy trucks, 12,000 medium trucks, and 8,000 buses, with a potential for substantial increases for diesel engines in medium trucks. Penetration into the huge U.S. market for per- sonal vehicles has been slight in terms of market share, falling to 1% or less in the mid-l980s, but even that share amounts to over 10,OOO vehicles -- larger than the bus market. Potentially, a large adiabatic diesel market exists, particularly if fuel prices are high and diesel performance characteristics are improved.
Although adiabatic technology can lower diesel fuel consumption, it cannot guarantee lower emissions of all regulated air pollutants.2~ Theoretical considerations of the higher-temperature combustion in an LHR engine as compared to a standard diesel would predict higher nitrogen oxides (NO,) emissions. Experiments have generally confirmed this result. Although there are exceptions, hydrocarbon and particulate matter (PM) emissions are more difficult to predict than NO,, because their generation depends on several different factors in the engine operation. However, some researchers expect lower hydrocarbon and PM emissions from LHR engines than from conventional diesels, due to the more complete combustion.2,ll
dards for diesel engines in trucks and buses, and the In view of the recently established emission stan-
383

22
20
-
__- - -- 7 ----.I-.-- ------ --_ Residual fuel O I - - - - - - - -
-
18 ---- ------- - - - -____________-- - - - - - - -J- -e--
A 16
14
= 12 -0 a CT Y
6 L 10 a> 5 8
6
4
2
Jet ‘fuel ............. ..................... + ........................ .......................................... t
Gasoline I I I I I i I
1980 1985 1990 1995 2000 2005 201 0
Year
Figure 20.2 Projections of U.S. Transportation Energy Use by Fuel Type (Source: Adapted from Ref. 9)
absence of durable and reliable technologies to meet those standards, it is necessary to address the potential of the LHR diesel engine to meet conflicting market de- mands for power and fuel efficiency while meeting strict emission regulations. Significant developments are occurring at a more rapid pace in the 1980s than in the 1970s, as foreign and U.S. engine designers conduct research and development (R&D) for LHR diesels and gain experience in manufacturing key components that are prerequisites of such engines.
Government and Industry Research Programs
In 1981, the U.S. Department of Energy (DOE) initiated a research program to develop a technology base that industry can use to implement an advanced, fuel-effi- cient, heavy-duty diesel engine suitable for long- distance trucking -- the largest user of diesel fuel in the transportation sector.12 The program’s objective is to
384
support R&D that will enable heavy-duty truck engines in the 1990s to have fuel efficiency improved by 30% over that of conventional engines, cost effectiveness comparable to that of conventional engines, equal or better noise levels and durability compared to those of conventional engines, compliance with prevailing emis- sions regulations, and adaptability to minimal quality, low-cetane (higher-viscosity) fuels .I3
The DOE program provides for extensive industry involvement to assist in program direction, as well as the identification of technical problems and potential solu- tions. The DOE, working with industry, has determined that adiabatic diesel technology had the highest potential fuel efficiency of any advanced engine concept for truck applications. 14
The U.S. Army’s Tank and Automotive Command has had a long interest in adiabatic diesel technology, for several reasons. Adiabatic technology could reduce engine size and weight by 40%, eliminate the cooling system (which is a major source of maintenance prob- lems), and improve the cold-start capability. Over the

past ten years, the Army has sponsored R&D in the following four adiabatic engine programs:lS (1) in- vehicle demonstration of an early version of a nonturbo- compounded adiabatic engine, which was lightly insu- lated with ceramic coatings, in a 54011 truck (see Fig. 20. l), (2) second-generation design of a 600- to 750-hp, turbocompounded, heavily insulated adiabatic engine for medium-weight combat vehicles, (3) compet- itive design studies of 1,200- to 1,500-hp adiabatic engine concepts for applications in main battle tanks, and (4) research on minimum-friction adiabatic engine technology.
Currently, the DOE and U.S. Army actively sponsor adiabatic engine R&D. Current private-sector R&D for adiabatic technology is focused on several applications, including automobiles, trucks, marine vessels, and sta- tionary power engines. Although privately funded R&D is usually proprietary, the presence of nongovernment research on adiabatic engines indicates that the market potential of the technology may be significant. It is because of both government and industry interest that environmental issues are being addressed at this early stage.
TECHNOLOGY
The basic design approach of the LHR engine (Fig. 20.3) is to insulate the combustion chamber of a reciprocating, compression-ignition engine with high- temperature insulating materials, eliminate the cooling system, and create near-adiabatic (Le., low heat transfer) operating conditions.5 Energy distribution in a conven- tional diesel engine is compared to an adiabatic engine in Fig. 20.4. Additional power and improved efficiency result from the adiabatic concept because the thermal energy, which is normally lost to the cooling and ex- haust systems, is conserved through the use of high- temperature insulating materials and converted to useful power through turbocharging or turbocompounding systems. However, reduced volumetric efficiency is associated with any approach to the LHR diesel unless higher peak pressures can be tolerated. Therefore, an increase in the engine size and waste heat recovery sys- tem must be considered in the evaluation of the system.
gine technology arises from the fact that the thermal and The challenge in the development of adiabatic en-
r turbine
Gear train I crankshaft to
Figure 203 Basic Design of an Adiabatic Diesel Engine (Source: Adapted from Ref. 5)
385

Basic
Turbocharged
Tu rbocompou nd plus
Adiabatic
Base horsepower n- Base horsepower Base horsepower
Figure 20.4 Typical Energy Balances for Three Diesel Engine Configurations (Source: Adapted from Ref. 5)
structural design of an adiabatic engine is quite different from conventional, water-cooled, all-metal engine tech- nology. The test data and empirical relationships used to determine the boundary conditions in conventional engines for loading, heat transfer, and deformation of each engine component cannot be directly applied to the LHR engine design. The latter design includes the addi- tion of various new technologies, such as the use of insulating materials (ceramics, composites, or coatings), air gaps, or both. Also, because the combustion cham- ber surfaces in the LHR engine approach temperatures close to 1,000'F, engine component performance is not well understood due to a lack of operating experience. Consequently, an integrated modeling approach is used to assess the effects of various component modifications both individually and interactively.
The use of materials with low thermal conductivity (such as silicon carbide and partially stabilized zirconia) reduces heat loss from the combustion area, permits a higher fuel energy conversion in the cylinder, and increases the availability of the thermal energy of the exhaust gases.16 Transfer of some of the exhaust stream energy to the wheels could result in improved fuel effi- ciency. Using existing modeling techniques, an efficien- cy improvement of 10% under rated power conditions was predicted.17
Energy Implications
changes in fuel consumption due to reduced heat rejec- tion, but their results vary widely depending on the assumptions used. The increase in energy efficiency ranges from only 1-2% to about 15%, with many esti- mates in the 4-8% range.lJl.18-22 In general, the im- provement in fuel efficiency can be expected to increase linearly with the degree of insulation in the engine, although there is some disagreement over the slope of the curve. Figure 20.5 illustrates the results of several studies that relate the amount of insulation to the im- provement in fuel efficiency,23 while Fig. 20.6 shows the modeling results of changes in fuel efficiency due to increased thicknesses of a ceramic material (partially stabilized zirconia).ll
Further studies now indicate that larger increases in fuel efficiency may be possible by recovering the waste heat, which would have an increased thermal potential because of the higher exhaust temperature of an LHR engine. Additional energy efficiency improvements (beyond the in-cylinder efficiencies) of 12-15% are possible.14 The following section discusses several promising waste heat recovery concepts. Furthermore, the elimination of the cooling system with its attendant parts would allow considerable redesign of the engine compartment. The potential for associated aerodynamic improvements, especially important for long-distance trucking, could further increase fuel efficiency, perhaps on the order of engine efficiency improvements, although no experimental results have been reported.
Computer modeling has been used by several companies and government-funded research organizations to predict
386

16
0 Adiabatic
0
0 Isothermal
0 0 20 40 60 80 100
Degree of Insulation (Vo)
Figure 20.5 Experimental and Theoretical Gains in Fuel Efficiency Due to Engine Insulation (Source: Adapted from Ref. 23)
7
0 0 10 20 30 40 50 60 70
Adiabacity (Vo)
Figure 20.6 Fuel Efficiency Gain Due to Increased Adiabaticity (Source: Adapted from Ref. 11)
387

The magnitude of the potential fuel savings is a function of both the efficiency improvements (Le., 16-23% including waste heat recovery) and the fuel consumption characteristics of the market into which the technology is introduced. Low-heat-rejection technolo- gy is well suited to the heavy-duty segment of the trans- portation market, including over-the-road diesel trucks (vehicles over 10,000 Ib gross vehicle weight), railroad locomotives, and inland marine tughow boats. The truck segment alone is projected to consume 20 billion gal of diesel fuel (or 2.8 quads) in the year 2000. Truck fuel use is expected to continue to grow to 24.6 billion gal (3.4 quads) by 2010. Together with forecasts of rail and inland marine energy consumption of over 9 billion gal (1.1 quads) in the year 2000 and 12 billion gal (1.5 quads) in 2010, the potential diesel fuel savings from the complete penetration of LHR engines could approach 0.7-0.9 quad by 2010. Even if the market were more narrowly defined to include only the heaviest trucks with the most intense duty cycles, theoretical savings could range from 0.4 to 0.5 quad in 2010.9
Diesel reciprocator
____
Waste Heat Conversion
-
236 kW =d specific fuel consumption: - 0.192 kglkWh
The energy efficiency gained by the use of insulating materials in the LHR diesel engine can be further enhanced by methods to recover waste heat from the engine exhaust. Conventional waste heat recovery options include preheating, turbocharging, turbocom- poimding, and Rankine bottoming systems; innovative methods include combining the compressor and ex- pander. Preheating the air reduces engine power, and preheating the fuel complicates fuel metering while improving combustion efficiency only slightly. Thus, preheating is not viable for heavy-duty applications, while the other four options are. Preheating can be useful for partial load operation, which is characteristic of passenger car engines.
In turbocharging for an internal combustion engine, like an LHR diesel, an air compressor powered by an exhaust gas turbine increases the engine inlet pressure, flow rate, and output power (Fig. 20.7).24 The inlet air density and power can be further increased by aftercool- ing the compressor outlet air, which also reduces NO, emissions. A diesel engine that does not incorporate turbocharging is said to be naturally aspirated.
In a turbocompounded engine, the exhaust gases of the base engine are expanded in a turbine and the power generated is transferred to the engine crankshaft (Fig. 20.8).24 Turbocompounding can be incorporated into naturally aspirated or turbocharged engines. With
388
Figure 20.7 Turbocharged Diesel Engine (Source: Adapted from Ref. 24)
Turbocharger
Air inlet Turbocompound power turbine and
Exhaust 616°C 857 C
1,301 k g i h
Diesel reciprocator 250 k W specific fuel consumption
0 181 k g l k W h
Figure 20.8 Turbocompounded Diesel Engine (Source: Adapted from Ref. 24)
the latter, the turbocompound turbine is placed downstream of the turbocharger turbine.
In Rankine engine compounding, the exhaust energy of the base engine is used as a heat source to vaporize a low-boiling-point fluid and expand the vapor in a turbine. The power generated is transferred to the engine crankshaft (Fig. 20.9).24 In a comparison of several waste heat recovery devices, organic Rankine cycles have been found to offer the greatest energy sav- ings -- about 20% compared to a turbocharged diesel engine -- but are likewise the most costly and complex.24
for converting exhaust heat from adiabatic diesel en- gines uses a paired positive-displacement, double-screw compressor (supercharger) and expander (Fig. 2O.lO)P When combined with an adiabatic diesel for supercharg- ing and mechanical power compounding, they form an efficient, compact power system.% The Atkinson cycle is the basis for the thermodynamic principles of an adiabatic diesel that uses high supercharging and
A relatively new alternative to turbocompounding

Air inlet 29°C
Turbocharged diesel Heat-recovery organic cycle
Heat-recovery Turbocharger vapor generator
671°C 1,309 kg/h
Single-stage axial turbine
..- Flow rate: 2,049 kg/h 6.0 MPa 158°C
Liquid feedpurnp Diesel reciprocator
fuel rate: 45.3 kg/h 57°C
Diesel 236 kW Rankine 43 kW
Total 279 kW
Figure 20.9 DiesellOrganic-Rankine-Cycle System (Source: Adapted from Ref. 24)
converts after-cycle heat energy to mechanical power by increasing exhaust gas expansion, which allows the working fluid to extract more energy.
Implementation of this system would require the production of (1) low-cost, high-precision roton de- signed for unlubricated operation with antifriction bear- ings and (2) materials that would operate unlubricated and without expensive synchronous timing gears. The expander requirements would be similar but stricter due to higher operating temperatures and the need for proven bearing systems and composite material rotor designs. Although some recent developments in ceramic materi- als technology have addressed these concerns, signifi- cant development is required to make this technology viable.
Current Status
The progress toward adiabatic operation of diesel en- gines in the last decade has fueled hopes for production engines in the 1990s. The design and manufacture of ceramic prototype components with sufficient strength at high temperatures have advanced rapidly at many com- panies. Although the short-term pressures of rising fuel
prices and limited fuel availability that helped initiate this engine concept have lessened in the mid-l980s, research programs continue worldwide.27-30 Engine development problems center on performance charac- teristics of essential ceramic materials and on lubricants for the ceramic parts. The nature of those problems and the status of test engines are discussed below.
Development of Ceramic Materials
The greatest drawback to the design and fabrication of ceramic parts and engines has been the tendency of ceramic parts to fracture or shatter under load. In ceramic components, microscopic impurities and voids can produce rapidly propagating cracks, resulting in sudden and catastrophic failure. This brittleness pre- sents a serious technical challenge to both producers of ceramic parts and designers of engines.
A second major problem area is reliability. The low production volume of prototype ceramic engines has not provided engine manufacturers with sufficient experi- ence to understand the required material properties of appropriate ceramics and employ mass production tech- niques. Reliable high-volume production is needed to reduce costs, but the necessary volumes will not be
389

achieved until these components are accepted in the marketplace. Progress will be slow until this cycle is broken.
A related problem is the limited knowledge of the long-term behavior of ceramics under a variety of uses. In recent years, finiteelement analytical techniques have dramatically reduced the time needed to determine the materials properties of ceramics and develop ceramic composites to eliminate brittleness and enhance tough- ness.
Some of the technology developed may be ideally suited to the rotary Wankel engine and may appear on the market in the 1990s.31 Advances in the United States in ceramics, new piston designs, and solid lubri- cants have made new approaches possible, but the high cost is the single most important factor that has kept ceramic engines and components out of the market. Newer processing methods, such as injection molding, slip casting, and hot isostatic pressing, have helped in the fabrication of more uniform ceramic parts with fewer defects. Further improvements in quality control, machining techniques, and nondestructive testing tech- niques will also lower costs.
Figure 20.10 Helical Screw Expander (Source: Adapted from Ref. 26)
Heavy- Versus Light-Duty Applications
Much R&D has focused on materials development and component manufacture. Test engines are often single- cylinder, laboratory devices, not engines that are in- stalled in a vehicle. However, the potential markets for motor vehicles have been assessed in several studies. For heavy-duty applications, the higher fuel economy, multifuel capability, and lower particulate emissions of LHR diesel engines are particularly attractive.32 Base- line forecasts of diesel truck energy use predict a sub- stantial shift from gasoline- to diesel-fueled vehicles, in part due to the greater attractiveness of ceramic technology.14
Extensive use of ceramics in light-duty engines could make the diesel a serious contender for personal- use vehicles, as acceleration performance is improved and fuel economy maintained relative to gasoline-fueled engines. Preliminary studies have reported on adiabatic concepts for light-duty vehicles (ie., personal automo- biles and light trucks) that are presently being research- ed, but have yet to be field tested.3.6 The estimated fuel economy of these vehicles is about 37 &gal, on the basis of the U.S. Environmental Protection Agency’s
390

(EPA’s) combined urban-rural driving cycle for a 1,364-kg vehicle capable of an acceleration of 0-60 mi/h in 15 s.
Military applications of adiabatic diesel technology are motivated by the improved power density relative to a conventional diesel, the elimination of the radiator, and the weaker thermal signature of the vehicles (Le., more difficult to locate with infrared detection devices) com- pared to a gas turbine; an incidental advantage is the multifuel capability of LHR engines.
ENVIRONMENTAL ISSUES
The environmental issues associated with the use of adiabatic engines are the same as those associated with conventional diesel engines: air pollutant emissions, especially PM and NO,. The fuel economy improve- ments that are characteristic of the LHR engine are not accompanied simultaneously with decreases in tailpipe emissions of all criteria pollutants, i.e., pollutants for which EPA has established emission standards.
Current regulatory attention is focused on PM and NO,, and recently promulgated regulations have lowered allowable emission levels substantially for each pollut- ant. In 1991, the PM standard for urban bus engines will be reduced to 0.1 gram per brake horsepower-hour (g/bhp-h). Truck engines will be required to meet this standard in 1994. Allowable NO, emissions will be redirrced by more than a factor of 2 by 1991, from 10.7 to 5 g/bhp-h. The same standards (see Table 20.1) will apply to adiabatic as well as conventional diesels23
The control of PM and NO, is particularly difficult in a diesel engine. Particulate emissions are not a con- cern for gasoline-fueled engines, but are for diesel- fueled engines because of incomplete combustion during low-temperature operation (e.g., idling) and impurities in the less-refined diesel fuel. LHR engines are likely to have lower particulate emissions caused by fuel combus- tion because the hotter combustion chamber is likely to bum off the particulates. However, careful combustion system design is required due to the inherent trade-off between PM and NO,. Combustion of engine oil is another source of PM emissions from diesel engines23 The higher operating temperatures of the LHR engines may result in the elimination of lubricating oils and thus remove the potential hazard of wastes from oil degrada- tion. However, if high-temperature-resistant liquids must be used, their constituents may have significantly different emissions characteristics that will have to be evaluated.
Table 20.1 Future Emission Standards for Heavy-Duty Diesel Engines (ghhp-h)
Effective Date NO, Particulates
1987 10.7 None 1988. 6.0 0.6 1991 5.0 0.25 (truck)
1994 5.0 0.10 0.10 (urban bus)
aA federal court ruling has postponed the effective date to 1990, on the basis that the EPA cannot impose standards that take effect less than four model years from the date of promulgation (1985 in this case).
Source: Ref. 33.
Particulate emissions from diesel fuel combustion are of great concern because of their potential health effects. The two main types of concerns are (1) the potential carcinogenic or mutagenic nature of the poly- cyclic organic matter in PM emissions and (2) the poten- tial increase in respiratory disorders, such as emphysema and asthma, related to an increase in PM emissions3 Although some studies, such as Salmonella mutagenicity tests and short-term animal exposures, have indicated some validity for these concerns, definitive human epi- demiological studies have yet to be conducted. Previous epidemiological studies, including the London transport workers study, have focused on employees who are routinely exposed to heavy-duty diesel exhaust; how- ever, these studies did not consider the smoking habits of the study groups3 (For more details on such studies, see Refs. 37-44.)
A subsequent study by a National Research Council committee reiterated the shortcomings of the epidemio- logical studies, concluding that more data are needed on the incidence of cancer (especially lung cancer) and nonmalignant diseases (e.g., chronic bronchitis and emphysema) to compare populations exposed to diesel emissions with control groups before fiim conclusions can be drawn.45 The in-vitro studies that were reviewed by the committee provided more questions than answers about the potential carcinogenic effects of diesel ex- haust. There is no doubt that PM emitted from diesel exhaust contains sufficiently high levels of both muta- genic and carcinogenic substances to induce cell
39 J

transformations at high levels of exposure. However, inhalation of diesel exhaust by laboratory animals has not produced lung tumors, although skin cancer has been induced when diesel emission extracts have been applied to the backs of mice.
Emissions of NO, would be expected to increase in the adiabatic engine relative to the conventional engine, because of the higher LHR combustion temperatures. In general, when the combustion temperature in an internal combustion engine rises, fuel efficiency increases, which decreases carbon monoxide and hydrocarbon emissions but increases NO, emissions. In gasoline-fueled, spark- ignition engines, this inherent characteristic of combus- tion has resulted in the use of downstream pollution control devices (Le., catalytic converters), coupled with exhaust or combustion gas recycling, to remove NO, from the exhaust gases. Equivalent technology has not been widely used for diesel engines, although M.A.N. (a German diesel engine and vehicle manufacturer) has used catalytic devices on diesel buses fueled with meth anol.46
The debate on the level of NO, emissions from advanced LHR diesel engines continues as various de- signers test different approaches to reduce heat transfer. One approach is to adopt the current level of diesel NO, emissions as a standard and force LHR engines to meet that level. An alternative approach recognizes the docu- mented rise in NO, emissions as adiabaticity increases, but does not use the rising NO, levels as a constraint on the engine design. If NO, emissions are forced to the level of the conventional engine, the fuel economy bene- fits of the LHR diesel engine are unlikely to be realized, according to other engine designers.11
Laboratory and field experience varies substantially among different researchers. Some have found that NO, emissions rise with the fuel-air ratio, while others found a similar, but more complex, pattern when the top-ring reversal temperature was studied over a narrow range of fuel-air ratios2 Still others have noted higher NO, emis- sions and lower carbon monoxide emissions with LHR than with conventional diesel and a dependence of hydrocarbon emissions on the fuel-air ratio3 It appears, therefore, that NO, emissions increase with fuel-air ratio and combustion temperature.
ENVIRONMENTAL CONTROL
Emissions Standards
All diesel engines face the same emissions regulations for PM and NO, recently promulgated by the EPA (see Table 20.1). The first increment of the standard becomes effective in 1990, as NO, emissions are con- trolled at 6.0 g/bhp-h and PM at 0.6 g/bhp-h. In 1991, PM emissions will be reduced to 0.25 g/bhp-h for trucks and 0.1 g/bhp-h for buses. In 1994, trucks will be ex- pected to meet the same PM standard as buses and NO, emissions will be restricted to 5 g/bhp-h. Since no diesel engine configuration, including LHR, ensures lower levels of PM and NO,, all diesel engines may need downstream emission controls. Strategies that are under consideration include the use of particulate traps or a switch to methanol fuel.
Control Techniques
The particulate trap is a device, usually made of a ceramic, that eliminates particulates from the exhaust stream by burning them at high temperatures. During normal operation, the accumulations of particles within the trap are burned off at extremely high temperatures to restore the trap to the original efficiency of operation. If the trap is not regenerated in this fashion, it will become plugged, which increases the back pressure, adversely affects engine operation, and increases the hazard of spontaneous ignition and fire in the trap. Particulate trap technology has been developed to the point that demon- stration models can remove enough PM from the ex- haust to meet the particulate standard. However, these traps do not have the durability needed for the required warranty, and most of the designs need energy for regen- eration (possibly through diesel fuel consumption). Moreover, the use of low-grade, lower-cetane fuels in LHR diesels could pose currently unforeseen clogging problems.
Currently, the most difficult design barrier for particulate traps for heavy-duty diesel engines is the maintenance of long-term durability over the life of the
392

Engine exhaust
line Porous walls
Particulate laden
exhaust
I Particulate
buildup
Y Ceramic plugs
Figure 20.11 Ceramic Monolith Trap (Source: Adapted from Ref. 47)
vehicle (often exceeding 500,000 mi) under a variety of operating conditions. Several types of traps have been examined; the most extensive tests have been conducted on the ceramic monolith trap shown in Fig. 20.1 1-47 This design consists of alternately open and closed cells. As the exhaust flows through the open cells, the particu- lates are collected as they build up on the ceramic plugs. The cleaned exhaust passes through porous walls and exits through the tailpipe. This concept has demon- strated a high trapping efficiency, good durability, and relatively low cost. However, the problems of high back pressure (which increases rapidly with higher particulate loadings) and the possibility of clogging from ash reten- tion have not been solved. Current assessments show that ceramic monolith traps will need replacement at 150,000- to 200,000-mi intervals.47
Other particulate trap configurations have been tested, including ceramic-fiber traps and a catalytic, radial-flow, wire-mesh trap. In the fiber trap design, silica fibers are wound across a porous metal substrate to produce cylinders through which the exhaust gases must pass. Currently, the drawbacks of this design include trap clogging, unacceptably high back pressures, and excessive size.47 The wire-mesh trap consists of stain- less steel mesh formed into cylinders of increasing den- sity toward the center. The exhaust gas passes through the cylinder walls, exiting through the center. This system may have lower back pressure than the mono-
lithic design and be less susceptible to thermal cracking. However, costs are likely to be higher, efficiencies may be lower, and sulfate emissions may be increased.47 In all trap designs, regeneration is necessary to restore the trap to its original efficiency level.
Some engine manufacturers do not believe that standards for PM emissions can be met even with the use of particulate traps. As an alternative, such manu- facturers are exploring the use of methanol fuel in the diesel engine. Experiments are underway for urban buses, most notably in San Francisco at Golden Gate Transit, to learn whether methanol fuel can be success- fully burned in two- or four-stroke diesel engines, with- out excessive engine wear. Although emissions testing has not been extensive, preliminary results indicate that even methanol-fueled engines may require downstream pollution control devices to meet NOx and PM standards due, in the latter case, to lubricant bum-off (which may not be a problem in the LHR engine).48 At Golden Gate Transit, the test bus with the two-stroke engine does not use any downstream devices and has substantially higher PM emissions than the bus with the four-stroke engine.
CONSTRAINTS
An evaluation of the affects of adiabatic technology on emissions is difficult in view of the small data base from
393

test engines. It is also difficult to make reasonable theoretical predictions of the emissions that would be expected from particular engine designs because of the complexity of the diesel cycle and the effects of engine- specific design and operating parameters. The value of the theoretical calculations is also lessened by the wide range in results in the few studies of emissions that have been completed.
The success of adiabatic diesels depends on the development of (1) durable ceramic materials to allow operation of the engine and (2) downstream emission control technologies that will permit the engine to meet U.S. PM and NO, standards in 1991 and 1994. In the first area, progress has been steady in the last few years, particularly with the production by Japanese manufac- turers of several ceramic components (glow plugs, wear parts, and turbocharger rotors). Low-heat-rejection engines require development of advanced ceramic mate- rials that withstand extremely high operating tempera- tures, yet are strong enough to handle the thermal stresses and mechanical vibration during operation of the vehicle. At present, the outlook is cautiously opti- mistic for such development.
can be achieved with a catalytic converter that reduces the NO, in the exhaust, similar to devices used on gasoline-fueled automobiles and light trucks. This approach to NO, control is not favored for two-stroke diesels, as the exhaust is recycled into the engine to increase the power output. At least one four-stroke bus engine uses a catalytic converter, but substantial retool- ing costs are likely to arise from the use of exhaust catalysts. Also, the lower temperature of LHR diesel engine exhaust may have an effect on catalyst efficiency. Effective and durable pollution control devices may need to be designed to maintain the fuel economy advantage of LKR engines.
promise for increased performance and widespread commercialization in heavy-duty (including off-road applications such as agricultural and construction equip ment) and, eventually, light-duty vehicles. However, as with any new engine technology, appropriate emissions control technology must be developed. Achievement of the emissions limitations established by EPA, while taking advantage of the potential energy savings, re- quires that emissions control technology be developed in conjunction with the most suitable exhaust-gas recovery device. Once the emissions control is achieved, the LHR diesel could produce a major savings in national fuel consumption, particularly in the heavy transport sector.
Control of NO, emissions from LHR diesel engines
In conclusion, the LHR engine holds considerable
REFERENCES
1.
2.
3.
4.
5.
6.
7.
8.
9.
10.
11.
12.
Kamo, R., and W. Bryzik, Adiabatic Turbocom- pound Engine Performance Prediction, Society of Automotive Engineers Paper 780068, Warrendale, Penn. (1978).
Thring, R.H., Low Heat Rejection Engines, Soci- ety of Automotive Engineers Paper 860314, The Adiabatic Engine: Global Developments, Publica- tion SP-650, Warrendale, Penn. (Feb. 1986).
Yoshimitsu, T., et al., Capabilities of Heat Insu- lated Diesel Engine, Society of Automotive Engi- neers Paper 82043 1, Warrendale, Penn. (1982).
Toyama, K., et al., Heat Insulated Turbocom- pound Engine, Society of Automotive Engineers Paper 831345, Warrendale, Penn. (1983).
Bryzik, W., TACOMICum’ns Adiabatic Engine Program, Proc. 20th Automotive Technology Contractors’ Coordination Meeting, P-120, Soci- ety of Automotive Engineers, Warrendale, Penn. (April 1983).
Sekar, R.R., et al., Advanced Adiabatic Diesels for Passenger Cars, Society of Automotive Engineers Paper 840434, Adiabatic Engines: Worldwide Review, Publication SP-57 1, Warrendale, Penn. (Feb.-March 1984).
Siegla, D.C., and C.A. Amann, Exploratory Study of the Low Heat Rejection Diesel for Passenger Car Application, Society of Automotive Engineers Paper 840435, Warrendale, Penn. (1983).
Kamo, R., and W. Bryzik, Cum’ns-TACOM Advanced Adiabatic Engine, Society of Automo- tive Engineers Paper 840428, Adiabatic Engines: Worldwide Review, Publication SP-57 1, Warren- dale, Penn. (Feb.-March 1984).
Millar, M., and A. Vyas, Transportation Energy Demand From 1980 to 2010: The ANL-8.5N2 Forecast, Argonne National Laboratory Report
Highway Statistics 1984, U.S. Department of Transportation Report FHW A-HP-HS-84 (1985).
Sudhakar, V., Performance Analysis of Adiabatic Engine, Society of Automotive Engineers Paper 84M3 1, Detroit (1984).
Wood, J.C., Overview of the Heavy Duty Trans- port Technology Project, Proc. 22nd Automotive
ANLKNSV-TM-169 (Aug. 1985).
394

13.
14.
15.
16.
17.
18.
19.
20.
21.
22.
23.
Technology Development Contractors’ Coordina- tion Meeting, Warrendale, Penn. (March 1985).
Heavy Duty Transport Technology Development Plan, U.S. Dept. of Energy Report DOWCE-0130 (June 1985).
Graves, R.L., D.L. Greene, and E.W. Gregory 11, Application of the Adiabatic Diesel to Heavy Trucks -- A Technology Assessment, Oak Ridge National Laboratory Report ORNL/TM-9554 (March 1986).
Bryzik, W., Adiabatic Engine Program, 19th Summary Report, Automotive Technology Devel- opment Contractors’ Coordination Meeting, U.S. Dept. of Energy Report CONF-811090 (Oct. 1981).
Sidney, H.E., A New Chromium Carbide-Based Tribological Coating for Use to 900°C with Par- ticular Reference to the Stirling Engine, U.S. Dept. of Energy Report DOWNASN50112-65 (April 1986).
Glance, P.C., CAE Analysis of Adiabalic Engine Components, Society of Automotive Engineers Paper 850361, Detroit (1985).
Toni, E., et al., New Perspectives for Advanced Adiabatic Diesel Engines, Intersociety Energy Conversion and Efficiency Conf. Paper 839099, Orlando, Fla. (1983).
Wade, W.R., et al., Fuel Economy Opportunities with an Uncooled DI Diesel Engine, Society of Automotive Engineers Paper 84 1286, Warrendale, Penn. (1984).
Hoag, K.L., et al., CumminslTACOM Adiabatic Engine Program, Society of Automotive Engi- neers Paper 850356, Warrendale, Penn. (1985).
Tovell, J.F., The Reduction of Heat Losses to the Diesel Engine Cooling System, Society of Auto- motive Engineers Paper 8303 16, Warrendale, Penn. (1983).
Assanis, D.N., and J.B. Heywood, Development and Use of a Computer Simulation of the Turbo- compound Diesel System for Engine Performance and Component Heat Tranger Studies, Society of Automotive Engineers Paper 860329, The Adia- batic Engine: Global Developments, Publication SP-650, Warrendale, Penn. (Feb. 1986).
French, C.C J., Ceramics in Reciprocaling Inter- nal Combustion Engines, Society of Automotive
24.
25.
26.
27.
28.
29.
30.
31.
32.
33.
34.
Engineers Paper 841 135, Warrendale, Penn. (1984).
Bailey, M.M., Comparative Evaluation of Three Alternative Power Cycles for Waste Heat Recov- ery from the Exhaust of Adiabatic Diesel Engines, U.S. Dept. of Energy Report DOENASA150194- 43 (July 1985).
Sekar, R., and R. Kamo, Positive Displacement Compounding of a Heavy Duty Diesel Engine, prepared by Cummins Engine Co. for U.S. Dept. of Energy and National Aeronautical and Space Administration under Contract DE-ACM- 78CS54936, Columbus, Ind. (Nov. 1983).
Wurm, J., et al., Assessment of Positive Displace- ment Supercharging and Compounding of Adia- batic Diesels, Society of Automotive Engineers Paper 840430, Detroit (1984).
Kamo, R., High Technology Ceramics for Japa- nese Heat Engines, Materials and Society, 8(2):415-440 (1984). Ceramic Engines Losing Support in Japan, Wall Street J . (Aug. 12, 1986).
Secretary of Energy’s Annual Report IO Congress, U.S. Dept . of Energy Report DOE/5-0010(84) (Sept. 1984).
Advances in Ceramics Spur Adiabatic Engine Development, Mechanical Engineering (July 1985).
Kamo, R., R.M. Kakwani, and W. Hady, Adia- batic Wankel Type Rotary Engine, Society of Automotive Engineers Paper 860616, The Adia- batic Engine: Global Developments, Publication SP-650, Warrendale, Penn. (Feb. 1986).
LaBelle, S.J., et al., Technology Assessment of Productive Conservation in Urban Transporta- tion, Argonne National Laboratory Report ANLl
Control of Air Pollution from New Motor Vehicle Engines: Gaseous Emission and Particulate Emission Regulations, final rule, U.S. Environ- mental Protection Agency, Federal Register, 50:10606 (March 15, 1985).
Alkidas, A.C., The Influence of Partiul Suppres- sion of Heat Rejection on the Performance and Emissions of a Divided-Chamber Diesel Engine, Society of Automotive Engineers Paper 860309, The Adiabatic Engine: Global Developments,
ES-130 (Nov. 1982).
395

35.
36.
37.
38.
39.
40.
41.
396
Publication SP-650, Warrendale, Penn. (Feb. 1986).
Energy Technologies and the Environment - Envi- ronmental I@ormation Handbook, US. Dept. of Energy Report DOEEP-0026 (June 198 1).
Luepher, R.B., and M.L. Smith, Mortality in Unionized Truck Drivers, J. Occupational Medi- cine, 20:677-682 (1978). Rudd, C.J., Diesel Particulate Extracts in CUI- tured Mammalian Cells, General Motors Research Laboratories, Warren, Mich. (1979).
Husing, J., et al., Application of a Battery of Short Term Mutogenesis and Carcinogeneses Bioassays to the Evaluation of Soluble Organics from Diesel Particulates, U.S. Environmental Protection Agency, Health Effects Research Laboratory, Research Triangle Park, N.C. (1979).
Srak, S.S., T.L. Chan, and P.S. Lee, Diesel Par- ticulate Extracts in Bacterial Test Systems, Gen- eral Motors Research Laboratories, Warren, Mich. (1979).
Pepelko, W.E., Overview of the Health Esfects Laboratories Diesel Exhaust Health Effects Study, U.S. Environmental Protection Agency, Health Effects Research Laboratory, Cincinnati (1979).
O’Neil, J J., et al., Functional and Morphological Consequences of Diesel Exhaust Inhalation in Mice, U.S. Environmental Protection Agency, Health Effects Research Laboratory, Cincinnati (1979).
42.
43.
44.
45.
46.
47.
48.
Campbell, R.I., et al., Enhanced Susceptibility to Infection in Mice After Exposure to Dilute Exhaust from Light-Duty Diesel Engines, U.S. Environ- mental Protection Agency, Health Effects Re- search Laboratory, Cincinnati (1979).
Reger, R., and 3. Hancock, Coal Miners Exposed to Diesel Exhaust Emissions, Proc. Health Impli- cations of New Energy Technologies, Park City, Utah (April 1979).
Vradana E., et al., Cancer Experience of Men Exposed to Inhalation of Chemicals or to Combus- tion Products, J. Occupational Medicine, 18787- 792 (1976).
Diesel Cars: Benefits, Risks, and Public Policy, Final Report of the Diesel Impacts Study Commit- tee, National Research Council, National Acad- emy Press, Washington, D.C. (1982).
Ullman, T.C., and C.T. Hare, Emissions Charac- terization of Two Methanol Fueled Transit Buses, U.S. Environmental Protection Agency Report EPA-4670/3-85-011 (Feb. 1986).
Rajan, J., and M.K. Singh, Cost Analysis of Par- ticulate Emission Control Technology for Heavy- Duty Diesel Vehicles, Argonne National Labora- tory Report ANL/EES-TM-310 (May 1986).
Lipari, F., and D. Keski-Hynnila, Aldehyde and Unburned Fuel Emissions from Methanol-Fueled Heavy Duty Diesel Engines, Society of Automo- tive Engineers Paper 860307, Warrendale, Penn. (1986)

Chapter 21
Used Oil
BACKGROUND
Waste oils are classified as either "used oil" or "unused waste oil." Both types of waste oil can be either petroleum-derived or synthetic products.
Used oil has been contaminated during or after use as a lubricant, hydraulic fluid, metalworking fluid, insu- lating fluid, or coolant. Used oil is generated at auto- motive garages, service stations, truck and taxi fleet facilities, military installations, industrial and manufac- turing facilities, and residences (when personal vehicle owners change oil at home). Used oil can be converted into useful products (see Fig. 21.1).
Unused waste oil, on the other hand, has been con- taminated before its intended use. Examples include crude oil or virgin fuel'oil that is spilled, oily sludge at the bottom of oil storage tanks, and oily wastes from refinery operations (e&, separator sludge). The sources of unused waste oil are widely dispersed, and few data are available on the quantities generated. Data on the reuse of unused waste oil are also scarce. In general, the spills are landfilled while the oily wastewater is treated. Oils generated by inadequate handling or formulation are either reformulated, sold for another use, or disposed of.
The following discussion focuses on used oil, since it is the principal source of environmental concern. Figure 21.2 illustrates the flow of used oil from its source through end use.
About 66% (or 800 million gal) of the used oil generated each year is managed and reused by col- lectors, reprocessors, rerefiners, and end users. The remaining 400 million gal is often disposed of off-site rather than accumulated. This latter category consists of used oils generated by personal vehicle owners who change oil at home; agricultural and construction machinery operators; and other small generators of used
industrial oils who dump their oils into sanitary sewers, landfills, or other unsafe places.1
Techniques for reusing or recycling used oil can be grouped into two categories: reprocessing and rerefin- ing. Reprocessors use mild pretreatment and cleaning methods, such as settling and centrifugation, to produce a fuel or fuel supplement. Rerefiners use advanced and specialized equipment, such as distillation columns, coupled with clay treatment to produce a base lubricat- ing oil.
As shown in Fig. 21.2, the major end use of used oil is as a fuel. In general, used oil is an excellent source of energy. Its properties compare well with No. 4 and No. 6 fuel oils, with the exception of bottom sediment and water (the sludge produced by filtration), sediment, and ash contents. To comply with the American Society for Testing and Materials specifications for No. 6 fuel oil, used oil requires a reduction of about 85% in the bottom sediment and water content and a 90% reduction in the sediment and ash content.2 Such reductions can be achieved by either blending the used oil with virgin oil or by treating the oil by separation techniques.
The rerefining industry dates back to the early 1900s in Europe, where the primary impetus for recov- ery and reclamation was the low supply of local crude oil and the high cost of imported crude oil. In the United States, rerefining dates back to World War I, when rerefined oil was successfully used in military aircraft. With renewed interest during and after World War 11, the industry prospered and grew rapidly. By 1960, the industry contained about 150 rerefiners pro- ducing about 300 million gaVyr of rerefined oil (almost 18% of the U.S. lubricating needs).V
By 1987, there were fewer than 16 rerefiners pro- ducing less than 63 million gal/yr.lJ Several factors have contributed to this decline, including lower crude oil prices, higher feedstock prices through competition
397

Figure 21.1 Construction of the Evergreen Oil, Inc., Resource Recovery Facility for Converting Waste Oil into Lubricating Oil
398

Generation
27
7
537 b
Collection Processing End Products
m Other
147 56 73
169 4
I I I loo I 42 1 Reprocessors 490 520
I 590 1
r i Lube oil
4 63 I b3 -4 Re-refiners 1
7- I Disposal I .
406
Figure 21.2 U.S. Waste Oil Flow (million gal), Excluding Unrecovered Automotive Oil (Source: Compiled from Ref. 1)
from other uses for used oil, regulations (now repealed) prohibiting the use of recycled waste oil, elimination of government financial incentives, restrictive labeling requirements, and the costs of environmental compli- ance. In addition, many rerefiners were small businesses that lacked sufficient capital.
In contrast to the small number of rerefiners, there were 200-300reprocessors in the United States in 1987. These reprocessors, including some used oil generators, collect and process the oil through treatments such as settling, filtration, centrifugation, and distillation. Almost all of the reprocessed product is used for fuel oil, although some is used for road oiling.
While there are no federally sponsored waste oil research programs, some private organizations are work- ing to improve the performance of existing processes or develop alternative processes for various types of used 0il.s Most of the private research is proprietary.
TECHNOLOGY
The management system for handling used oil encom- passes generation, collection, processing, and end use.
Used oil generated by automotive and industrial sources is either dumped, used on-site, or gathered by collectors (independent or affiliated), who then act as suppliers to reclaiming facilities or fuel oil dealers. Reclaimers include oil reprocessors or rerefiners who upgrade and clean the used oil for use as fuel, dust suppressants, or lubricants.
Generation and Collection of Used Oil
In general, the availability of used oil relates directly to the demand for virgin oil. As shown in Table 21.1, about 1.2 billion gal of used oil was generated in the United States in 1983.1 Of this amount, 700 million gal (58%) consisted of automotive oils while the remainder was industrial oils. About 56% of automotive oils and 48% of industrial oils were available for collection.
An estimated 450,000 U.S. automotive and indus- trial facilities generate used oils.1 Automotive genera- tors include service stations, repair shops, car dealer- ships, state and local government collection centers, and truck stops. With the exception of personal vehicle owners, used automotive oils are usually generated centrally. Industrial oils are generated at dispersed
399

Table 21.1 Used Oil Generation by Oil Type, 1983
New Used Oil Used Oil Oil Sales Generation Generation
Oil Type (million gal) FactoF (million gal)
Automotive oils On-road engine oils
Personal vehicles At-home oil changes Other
Commercial vehicles Cars and light trucks Trucks and buses
All on-road vehicles Off-road engine oils Hydraulic fluids Greases and nongenerated oils
All automotive oils
Industrial oils General industrial oils Industrial engine oils Metalworking oils Process oils Industrial grease
All industrial oils
Total
357 85
159 1 40 740 212 190 109
1,251
421 144 163 298 35
1,061
2,312
0.67 0.67
0.66 0.59 0.65 0.59 0.48 0
0.56
0.70 0.30 0.77 0.14 0
0.48
239 57
1 05 82
483 125 92 0
699
295 44
125 43 0
507
,206
sceneration factor equals the fraction available for collection in the used oil management system; it does not include oil disposed of in wastewater treatment sludges.
Source: Ref. 1.
Table 21.2 Number of Used Oil Generators and Quantities Generated Annually
Number of Estab- Quantity Generated lishments (thousands) (million gal/yr)
Generator Category Industrial Other Total Industrials Othela Total
Less than 100 kg/mo 258 121c 379 23 2 4 c 47
100-1,000 kg/mo 76 150 226 84 300 384
Greater than 1,000 kg/mo 24 24 48 350 164 514
Total 358 295 653 456 488 9446
dncludes metalworking shops, steel mills, and various other industrial facilities.
bIncludes automotive service establishments.
CAdditionally, an estimated 2.4 million farms generate some 44 million gal of oil each year.
dDoes not include the 167 million gal of used oil that are disposed of each year by homeowners.
Source: Ref. 6.
400

sources that range from automobile manufacturers to chemical producers.1
Another estimate of the number of used-oil genera- tors and quantities is given in Table 21.2,6 which shows that most (55%) of the used oil comes from large (greater than 300 gal/mo) generators. However, these large generators represent only 7% of the total number of establishments generating used oil$ most generators are small businesses who do not generate large amounts of used oil.
Not all used oil is accumulated for collection; small generators, such as personal vehicle owners and agricul- tural machinery operators, often dispose of their used oils. This explains the difference between the personal- vehicle-owner estimates of Table 21.1 and Fig. 21.2. It is also the primary reason for the relatively low collec- tion rate (45%) of automotive oils compared to indus- trial oils (69%).
Used Oil Characteristics
The principal source of contamination during oil use is the chemical breakdown of additives and the subsequent interaction among the resultant components to produce corrosive acids and other undesired substances.1 Other sources of contamination include introduction of soot and lead compounds from engine blow-by, dirt, dust, and rust particles. The quantities of contaminants in
used oil depend on the original detergents and dilutants added to the virgin oil. They will also be affected by used oil storage, collection, transportation, and other management practices.
Used oil is mismanaged not only during used oil generation but also during its collection, transportation, and processing. Examples of this type of contamination include the mixing or dumping of materials (such as rags, crash, solvents, and water) into used oil and the use of improperly cleaned trucks to transport used oil.
chemical and physical properties of used oil by standard tests. While some results from these studies are gener- ally similar, others show significant variations in the chemical and physical properties of used oil (Tables 21.3 and 21.4).1,7
Several comprehensive studies have analyzed the
Contaminants in Used Oil
Several factors could explain the wide variations in the c.ontaminant concentrations of used oil. Among them are variations in sampling techniques (random versus selective), sample sizes (small versus large), sample handling and storage techniques, and the time of sam- pling. In general, used oil collected in the last few years tends to be more contaminated due to hazardous waste disposal regulations and the resulting rapid rise in dis- posal costs.1.7
Table 213 Physical Properties of Used Oil.
Number PropeflY of Samples Mean Median Range
Flash point (OF)
viscosity (mmz/s at 100'~)
Specific glavity ('API)b
Energy content (thousand Btdlb)
Bottom sediment and water (C)
Water only (a) Carbon residue (%)
Ash (%)
289 210
70 71 47
48 28 27
231 16.5 17.2
3 20 19 9
36 11 5
60-525
1-513
13-80
4.1-23.0
0-99
0-67
1.8-4.4
0.03-3.8
aIncludes both automotive and industrial used oils.
bMeasurement scale developed by the American Petroleum Institute.
Sources: Refs. 1 and 7.
401

Table 21.4 Concentration of Potentially Hazardous Substances in Used Oil, 19838
Concentration (ppm)
No. of At 90th Contaminant Samples Mean Percentileb Range
Metals Arsenic Barium Cadmium Chromium Lead Zinc
Chlorinated solvents Dichlorodifluoromethane Trichlorotrifluoroethane 1,l ,l-Trichloroethane Trichloroethylene Tetrachloroethylene Total chlorine
Other organics Benzene Toluene Xylenes Benz(a)anthracene B enzo(a) p yrene Naphthalene PCBs
5 37 752 744 756 835 810
87 28
616 608 599 590
236 242 235 27 65 25
753
17.26 131.92
3.11 27.97
664.50 580.28
373.27 62,935.88 2,800.41 1,387.63 1,420.89 4,995.00
961.20 2,200.48 3,385.54
71.30 24.55
475.20 108.51
18 25 1
10 35
1,200 1,130
640 100,000
3,500 800
1,600 9,500
300 4,500 3,200
40 16
800 50
<0.01-100 0-3,906 0-57 0-690 0-21,700
<0.5-8,6 10
<1-2,200 <20-550,000
<1-110,000 c 1-40,000 < I-32,OOO 4046,700
<1-55,000 <1-55,000 <I-139,000 <5-660 <1-405
110-1,400 0-3,800
aResults determined from the analyses of 1,071 used oil (automotive and industrial) samples.
Calculated for detected concentrations only; for the purposes of determining mean and percentile concentrations, undetected levels were assumed to be equal to the detection limit.
Source: Ref. 1.
As shown in Table 21.3, the flash point of used oil has a range of 60-525OF compared to 100-400'F for virgin oil, probably because of the presence of highly ignitable chlorinated materials and organic solvents, such as benzene, toluene, and xylenes from engine blow-by. Although not shown in Table 21.3, nearly 7% of the 650 used oil samples analyzed had a flash point below lOO'F.1 In addition, almost 28% (80 out of 289) of the samples showed a flash point below 140°F, which would classify these materials as hazardous waste according to the definition in the Resource Conservation and Recovery Act (RCRA).l
The high solvent content is also responsible for low viscosity values, whereas the presence of inorganic solids and water affect the oil's energy content, which ranges between 4,142 and 23,045 Btdlb compared to 20,000 Btdlb or more for virgin lube oil.1
Water concentrations ranging from 0 to 67% have also been reported. Laboratory analyses of the water in contaminated oil samples show large amounts of sodium, zinc, barium, calcium, iron, phosphorus, mag- nesium, boron, tin, and lead, implying that these metals may be present in ionic or salt-like forms.8 Conse- quently, simply separating the oil and water may be sufficient to remove some of these metals.
sent in very large concentrations, which are attributed chiefly to piston blow-by in engines using leaded gasoline. Small amounts of lead may also be due to antiwear or extreme-pressure additives. The level of lead in used oil is expected to decline because of the phase-down of permissible lead levels in gasoline. U.S. Environmental Protection Agency (EPA) standards required that lead be reduced from 1.1 to 0.5 g/gal by
Among the metals listed in Table 21.4, lead is pre-
402

July 1985, and to 0.10 g/gal by January 1986.9 Reduc- tions exceeding 80% of current levels have been pro- jected, which would result in lead concentrations of 67-248 ppm in used oil. Testimony provided by used oil collectors to the Massachusetts Department of Environ- mental Quality Engineering indicated that lead levels had dropped to 300-500 ppm by the beginning of 1986.10
Besides lead, chlorinated solvents are also present in significant quantities, mainly as a result of the break- down of additive packages and the addition of chlorine and bromine, as lead scavengers, to leaded gasoline. Chlorinated solvents may also be introduced indirectly through careless management practices of generators or collectors, such as dumping degreasing solvents into used-oil storage tanks. High chlorine concentrations indicate mixing of the used oil with chlorinated solvents or the presence of metalworking oils in significant quan- tities. The metalworking oils contain large amounts of extreme-pressure additives composed of chlorinated paraffinic compounds, which can result in organic chlo- rine levels of several percent in unused virgin oil. How- ever, these oils account for only a small segment of the industrial oil market. Consequently, few used oils are expected to contain total chlorine levels exceeding 1,000 ppm. In addition, as lead is phased out of gasoline, chlorine and bromine additives will also be lower, further reducing halogen levels.9
With respect to polynuclear aromatic hydrocarbon (PAH) compounds, it has been reported that the concen- tration of benz(a)anthracene in used oil is much higher than that of benzo(a)pyrene (both PAHs are of concern due to their carcinogenicity). In general, the levels of benz(a)anthracene and benzo(a)pyrene in used oil and virgin oil are comparable.7.11 Finally, polychlorinated biphenyls (PCBs) have been detected in concentrations ranging from 0 to 3,800 ppm, with most samples show- ing levels below 50 ppm. Only 18% of the samples showed signs of PCBs.1
Comparison of Industrial and Automotive Used Oils
In general, used industrial oils are much more diverse than used automotive oils. The contaminants in used industrial oils vary by the oil’s function as well as by the type of additives. Furthermore, the components of the additive packages are less predictable than those in automotive oils because users of industrial oils fre- quently have additive packages custom blended. Thus, unlike used automotive oils, it is impossible to identify a set of contaminants that can be expected in used indus- trial oils.1
Analysis of 1,07 1 used oil samples revealed some differences in the composition of used automotive and industrial oils. In general, the data show that, with the exception of cadmium and chromium, the concentration of metals is higher in used automotive oils than in used industrial oils. No significant differences were observed with chlorinated and other aromatic solvents, except for PCBs. Industrial oils contain higher levels of PCBs than used automotive oils, primarily because older hydraulic and electrical oils contain 50-500 ppm PCBs.
While the use of oils containing PCBs has been discontinued recently (as a consequence of strict Toxic Substance Control Act and RCRA provisions), many transformers and other electrical equipment systems still use oils containing PCBs. When these systems are cleaned, the PCBs accumulate in the used industrial oils. As more of these existing systems are cleaned out and refilled, PCB levels will decrease, but used industrial oils will always contain some PCBs since they cannot be completely cleaned out. Most samples of used industrial oils do not contain PCBs. For example, a recent study reported that only 4% of the used automotive samples and 6% of the industrial samples analyzed contained PCBs.1 In comparison to used industrial oils, the princi- pal source of PCBs in used automotive oils is transmis- sion fluid, which formerly contained small amounts of PCBs to enhance controlled swelling of rubber seals.
Used Oil Reclamation
As noted earlier, reprocessors use mild processing tech- niques to produce partially cleaned fuel oil. The treat- ment ranges from water and bottom sediment removal by settling to the use of chemicals (e.g., acids and caus- tics). In general, however, reprocessing does not remove all the contaminants from used oil.
In comparison, the principal product of a rerefiner is clean oil that is used primarily as a lube oil base. Sev- eral processes are available to produce this product, including vacuum distillation, solvent extraction, and chemical treatment; however, they generate different by-products and residues.
Reprocessing Technologies
The objective of the reprocessing technologies is to remove from used oil most, if not all, of the contami- nants that can cause environmental or operational problems. Treatment options include settling, centri- fugation, filtration, and combinations of these operations to remove coarse solids, water, and other substances.
403

Some reprocessors heat the oil to decrease its viscosity, which increases settling. Others may use distillation to evaporate the water and light fuel fractions. In general, the type and degree of treatment depends on the quality of used oil desired.
Settling generally involves the pumping of used oil into a large holding tank where, given sufficient time, large solid particles separate out and accumulate at the bottom of the tank. Although small suspended particles usually do not settle out in a settling tank, they can be separated in a filtration system. By drawing heated used oil through a filter cartridge suspended in a vacuum vessel, most of the water, volatile hydrocarbons, and other contaminants can be removed. The disadvantages of the filtration system are the periodic servicing re- quired to replace clogged filters and the need to dispose of the filter cake, which has been classified as hazardous.12J3
Centrifugal force can separate materials with differ- ent specific gravities. This form of contaminant removal is usually much faster and more automated than gravity settling.12 Two examples of reprocessing operations are the settling-centrifugal and the centrifugal systems.~o In the settling-centrifugal system, the used oil is settled, filtered, neutralized, demulsified, and heated (to 300'F). After the filtrate settles in another tank, the upper layer is collected as a final product and the bottom layer is sent to a centrifuge. In the centrifugal system, the used oil is settled, filtered, chemically treated, heated, and centrifuged. About 90% of the clean oil is stored as finished product while the rest is recycled.
Rerefining Technologies
Rerefining used oil to produce a high-quality, lube oil base begins with pretreatment, such as the application of heat and fitration, and continues with one of the follow- ing processes: vacuum distillation with clay or hydro- gen finishing, solvent extraction with clay or hydrogen finishing, and chemical treatment with hydrotreating (see Table 21.5).14 Most processes have an average product yield of 70-80%, will not accept used oils con- taining PCBs, and produce rerefined oils that perform as well as virgin oils.
In the acid-clay process, used oil is initially filtered and dewatered (e.g., heated or stripped) to remove water, debris, and other solids. It is then contacted with 92-93% sulfuric acid to extract metal salts, acids, aromatics, asphaltics, and other impurities from the oil; the resulting acidic sludge settles out of the oil.lS Next, the slightly acidic oil is mixed with active fuller's earth (a clay) to remove mercaptans and other contaminants
404
and to improve color. The final steps in the process are neutralization and distillation. After the rerefined prod- uct is removed, spent clay is removed from the bottoms by filtrationP
In the Phillips rerefined oil process, an aqueous solution of diammonium phosphate is first mixed with heated used oil to reduce its metals content. Through a series of reactions that occur below 300'F and 20 psig, metallic phosphates are formed and removed by filtration.1s During the demetallization reactions, water and light fractions are formed and removed. The re- maining oil is heated, mixed with hydrogen, percolated through a bed of clay, and passed over a nickel molyb- date catalyst. This series of operations removes sulfur, nitrogen, oxygen, chlorine, and other trace inorganic compounds and improves the oil's color. The resulting lube oil base is flashed, cooled, and distilled to strip off any remaining contaminants.
The Kinetics Technology International B.V. Process combines distillation and hydrofinishing to remove most of the contaminants of waste oil. First, a distillation column removes water and light hydrocarbons. Then, a vacuum distillation column removes products in the lube oil range. The latter equipment also generates a heavy residue containing asphaltenes, metals, and polymeriza- tion products.9 The oil that remains is then mixed with hydrogen, heated, and passed through a catalytic reactor to improve the color and odor of the oil and other prod- ucts. The hydrotreated oil is finally stripped with steam or fractionated, depending upon product requirements and specifications. The Bartlesville Energy Technology Center solvent extraction process is similar to the Kinetics Technology process with the addition of sol- vent treatment.
pretreated to remove emulsified water and dirt, heated to 300'F to remove water, and fed into a flash tank. As the heated oil enters the flash tank, the more volatile frac- tions are flashed off as vapor, condensed, collected in a receiver, and pumped to temporary storage. The heavier fractions are sent to a thin-film evaporator. The jacket temperature of the thin-film evaporator and the internal vacuum are controlled to generate a wide range of products. The final step consists of adding clay in the correct proportions and pumping the slurry through a filter press to remove the clay and any other impurities.
Some of the many other approaches for rerefining used oils are characterized in Table 21.5. Some proc- esses use chemical flocculants and others use solvents. Some of the substances used are propane, sodium, ethane, aluminum chloride, triethanolamine, and
In the distillationklay-filtration process, used oil is
I trichloroethylene. I
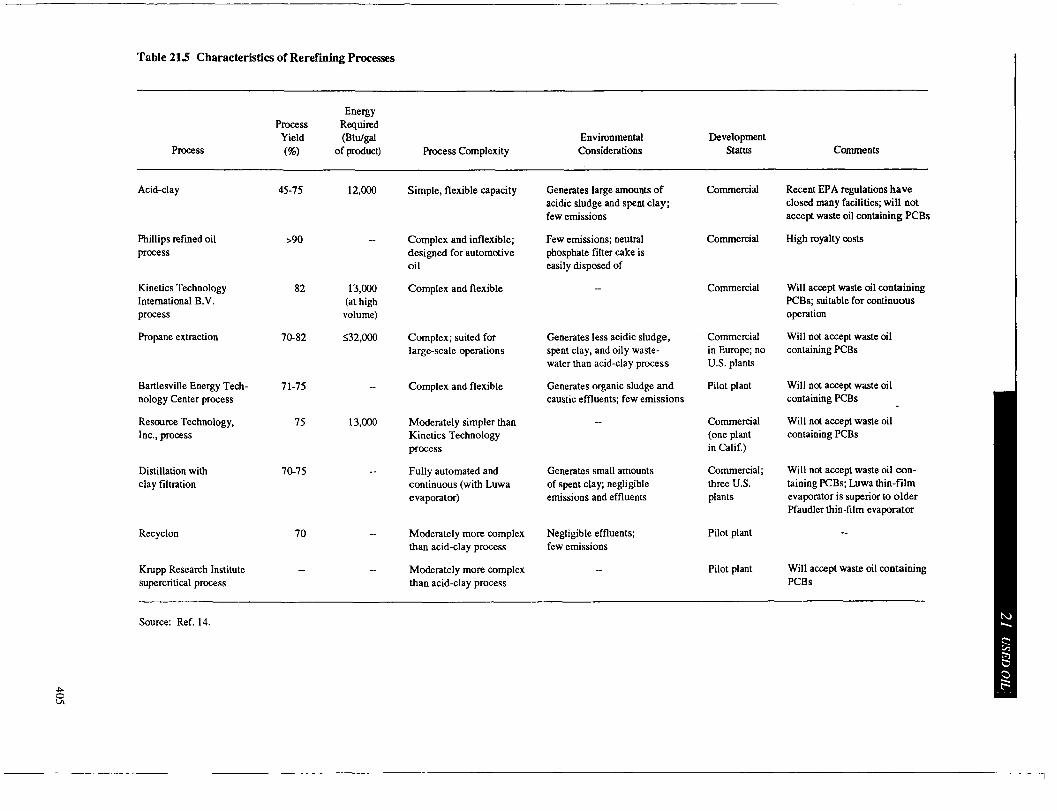
Table 215 Characteristics of Rerefirning Processes
Energy Process Required
Environmental Development Yield Process (%I of product) Process Complexity Considerations Status Comments
Commercial Recent EPA regulations have closed many facilities; will not accept waste oil containing PCBs
High royalty costs
Acid-clay 45-75 12,000 Simple, flexible capacity Generates large amounts of acidic sludge and spent clay; few emissions
Few emissions; neutral phosphate filter cake is easily disposed of
Phillips refined oil process
>90 __ Complex and inflexible; designed for automotive oi I
Complex and flexible
Commercial
Kinetics Technology International B.V. process
Propane extraction
82 13,000 (at high volume)
70-82 S32,000
Commercial Will accept waste oil containing PCBs; suitable for continuous operation
Will not accept waste oil containing PCBs
Complex; suited for large-scale operations
Generates less acidic sludge, spent clay, and oily waste- water than acid-clay process
Generates organic sludge and caustic effluents; few emissions
Commercial in Europe; no U.S. plants
Pilot plant Bartlesville Energy Tech- nology Center process
Resource Technology, Inc., process
Complex and flexible Will not accept waste oil containing PCBs
Will not accept waste oil containing PCBs
71-75 _ _
75 13,000 Commercial (one plant in Calif.)
Commercial; three U.S. plants
Moderately simpler than Kinetics Technology process
Fully automated and continuous (with Luwa evaporator)
70-75 Will not accept waste oil con- taining PCBs; Luwa thin-film evaporator is superior to older Pfaudler thin-film evaporator
Distillation with clay filtration
Generates small amounts of spent clay; negligible emissions and effluents
Recyclon Moderately more complex than acid-clay process
Moderately more complex than acid-clay process
Negligible effluents; few emissions
Pilot plant
K ~ p p Research Institute supercritical process
Pilot plant Will accept waste oil containing PCBs
Source: Ref. 14.

Table 21.6 Contaminant Levels in Used Oil after Selected Reclaiming Treatments (vol %)
Contaminant Level
Treatment Process BS&Wa Water Sediment Ash Lead
No treatment 10 8 5 3 1
Pretreatment Settling 1 0 2.5 2.3 0.9 Centrifugation 1.5 1 1.7 1.5 0.75
Primary treatmentb Solvent extraction 0 . 3 ~ o c 0 . 3 ~ 0.3 0.1 Vacuum distillation 0 0 0 0 0
aBottom sediment and water.
bAssuming the oil is pretreated.
CUsing hexane and 2-propanol solvents.
Source: Ref. 16.
Effects of Reclaiming Operations
The effects of physical treatments on selected con- taminants in used oil are shown in Table 21.6.16 In general, the data indicate that appreciable amounts of water and sediment are removed by settling and filtra- tion or centrifugation. Further processing of this oil by solvent extraction or vacuum distillation removes addi- tional water and sediments as well as ash and lead.16
The results of several studies comparing the proper- ties of raw and clean oil indicate that most of the solubil- ized contaminants in used oil are not removed by repro- cessing unless these constituents are present in particu- late form or solubilized in a separable water fraction.1 In general, reprocessing methods are useful for remov- ing water, solids, and, perhaps, the light hydrocarbons in used oil.
Unlike reprocessing, rerefining removes most solubilized contaminants from used oil. In general, the physical and chemical properties of most rerefined oils are similar to those of virgin lube oils. As shown in Table 21.7, rerefined lube oil base retains some con- taminants, including chlorine, oxygenated compounds, and trace metals.17
Used Oil Reuse
About 56% of the used oil generated is sold by col- lectors, reclaimers, and fuel oil dealers (Table 21.8).1 Of this oil, about 73% is sold as fuel, while very little is
discarded. Of the amount dumped overall, about half is dumped by personal vehicle owners or fleet operators and the other half by users of large off-road vehicles in farming, mining, and construction operations.1
Used oil is burned in a variety of applications: cement kilns, diesel engines, space heaters, and large industrial and commercial boilers. Any boiler designed to burn No. 6 fuel oil, and most boilers firing No. 4 and No. 5 fuel oils, can bum used oil. Some modifications, however, may be necessary to burn used oil in systems designed for lighter fuels. Alternatively, the used oil could be blended with virgin fuel oils.
used oil generated in the United States was used for road oiling. A state-to-state survey determined that 30-50 million g&yr of used oil is used in commercial road oiling; if road oiling by generators such as farmers and mining and construction companies is included, the total used oil fraction for road oiling would be 50-80 million gaVyr.18
risks in oiling roads with used oil and have taken regulatory actions to limit its use. As of February 1984, 21 states formally regulated the use of used oil on roads;l9 of these, 8 states prohibit the use of used oil as a dust suppressant. In addition, suppressing dust with used oil contaminated with hazardous waste is pro- hibited by the RCRA. In general, road oiling is most prevalent in rural areas and on privately owned roads at or near the source of used oil generation.18
In 1983, 69 million gal, or about 5.7%, of the total
Some states have begun to recognize the inherent
406

Table 21.7 Comparison of Virgin and Rereflned Lube Oil Properties
Virgin Base Oilsa Rerefined Base Oilsb
Composite Composite Average Range Average bpe f lY Range
Physical Viscosity index Refractive index Colorc Density (lb/ft3) Pour point (OF)
Flash point (OF)
Molecular weight (average)
Boiling-point distribution (OF) 10% point 50% point 90% point
Chemical Moisture (ppm) Total acid No.
(mg KOHWg) Total base No.
(mg K O W Saponification NO. Chlorine (ppm) Bromine (ppm) Sulfated ash (wt %) Carbon residue (wt %) Total nitrogen (ppm) Basic nitrogen (ppm) Sulfur (wt %) Inorganic metals (ppm)
Zinc Lead Iron Manganese Magnesium Calcium Barium Silicon
95-100 1.4798-1.4829
0.5-1 .o 7.26-7.31
10-21 428-460 440-460
721-795 846869 916984
26-55 0.001-0.02
0.03-0.2
0.18-0.76 0.01-0.2
0.01-0.02 0-0.0005 0.02-0.09
8-49 0.01-0.16
18-55
- __ - - _- - - __
98 1.4816
0.8 7.29
16 44 1 450
763 855 948
37 0.006
0.1
0.4 0.1
0.005 0.0002
0.07 33
26.1 0.08
<1 <1 <1 <1 <1
<10 < I O
<5
90-108
3.0-8.0 1.4825-1.4881
7.29-7.37 5-18
345-466 432-516
619-792 777-882 928-988
40-219 0.076-1.69
<O.cQ1-0.041
0.9-4.1 6.6-1,140
0.0005-0.0144 0.124.27
9-47 0.4-14.7
0.12-0.25
0.15-3.9
<0.2-41 <1-8.0
0.5-13.0 <0.08C cO.78c
<0.2-13.2 - -
102 1.4852
5.5 7.33
14 408 480
705 828 970
92 0.4
0.0091
0.9 23 1 5.82
0.0043 0.2 21 3.3
0.18
6.19 2
2.8 0.03 0.44 3.04 <10 d
.Typical values from three medium-viscosity base oils: one mid-continent, one mid-east. and one 50150 mixture of light and heavy neutrals.
bTypical values from 10 rerefined base oils.
che r i can Society for Testing and Materials color scale.
dPotassium hydroxide.
cThe lower limits are not available.
Source: Ref. 17.
407

Table 21.8 Used Oil Reuse, 1983.
Used Oil Used Oil Flowing through Not Entering Total Used
Management System Management Systemb Oil Generated
End Use Million Gal % Million Gal % Million Gal %
Rerefined lube oil 63 9.4 63 5.2
On-site recycling 4 4 C 8.2 4.4 3.6
Nonfuel industriala 35 5.2 0 0 35 2.9
Burning 490 73.2 loOe 18.7 590 48.9
Road oiling 39 5.9 29 5.4 68 5.7
Disposal or dumping 42 6.3 364 67.7 406 33.7
Total 669 100.0 5 37 100.0 1,206 100.0 ~ ~-
aAll volumes represent oil with consumed additives. Solid and liquid contaminants (including water)
bIncludes used oil that is managed entirely by the generator either through reuse or disposal.
CReuse of lubricants by industry may use sophisticated rerefining technologies or simpler processor
dIncludes flotation oils in phosphate industry and asphalt extenders.
eOf this amount, 8 million gal were burned by personal vehicle owners in various ways, primarily
Source: Ref. 1.
are not included in quantities.
technologies.
blended with home heating oil.
The nonfuel industrial market for used oil is rela- tively small, and is found principally in the phosphate, asphalt, and concrete industries. For example, the phos- phate industry incorporates used oil into their process as a flotation oil (this is a fairly significant market in some southern states, especially Florida). Asphalt plants sometimes blend used oil into their product as an ex- tender, and used oil sometimes serves as a forms lubri- cant in concrete construction. In addition to these markets, noncommercial recycling uses include machin- ery lubricants, pesticide carriers, weed killers, cattle oilers, and even all-purpose cleaners.
ENVIRONMENTAL ISSUES
The most important environmental, health, and safety impacts associated with used oil are encountered when it is reused directly, either as a fuel supplement or dust control agent, or disposed of via incineration, landfill, or
sewage treatment. The following discussion addresses the potential air, water, and land pollution resulting from used oil management techniques (Table 21.9).14
Atmospheric Emissions
Used oil reuse and disposal activities generate emissions primarily by combustion and incineration, although small amounts are generated by road oiling and rerefin- ing operations. The amounts of these emissions are generally related to the volumes of used oil consumed by the operations as well as the type of operation, such as combustion in large or small systems.
Combustion in Large Boilers
In general, the amount of ash in the fuel (including met- als and other inorganics) determines the level of particu- late emissions. Assuming no chemical changes and no soot from incomplete combustion, a 0.3% ash content in
408

Table 21.9 Summary of Environmental Impacts of Used Oil Management Systems
Media Affected
Action Air Water Land
Generation
Collection
Reclamation Reprocessing Rerefining
USe Combustion
Large systems Small systems
Road oiling
Disposal Incineration Sewer Landfill or lagoon
X X
X X
X X X X X
X Xa Xa X x X
X X X X x
aPossibly from emissions control.
Source: Ref. 14.
a blended oil would result in a particulate emission rate of 0.12 gr per dry standard cubic foot at 0% excess air. Extrapolating this estimate to waste oil indicates that 0.5-1.2 lb of particulates per million Btu (heat input) would be emitted from waste oil containing 0.9-2.2% ash. 1620
boilers with rated capacities of 0.5-12.5 million Btu/h: particulate emissions ranged from 0.07 to 1.2 lb/h, with an average value of 0.73 lblh (0.34 lb/million Btu). Although significantly higher than the literature value of 0.09 Ib/million Btu for commercial boilers firing residual oil, the higher value is consistent with the much higher ash content of used oil, which can range from 0.15 to 1.5%. Measurements of particulate size at four of the six test sites indicate that 80-90% of the particu- lates containing lead are less than 1 pm in diameter and would be readily inhalable.
Test bums of used oil in combustion systems indi- cated that inorganic and trace element emissions depend on the size and type of combustion system.llJ6.20 For example, a large steam boiler (greater than 5 million Btu/h) burning used oil, either pure or in blends, can emit 20-100% of the lead that enters it. Most of the remainder is deposited on the tubes or elsewhere in the
Similar results were observed by EPA in tests of six
combustion furnace. In general, an increased lead con- centration in used oil decreases the amount of lead emitted as a percent of the lead input. It is possible that some lead emissions are of a form other than particulates (e.g., aerosol or vapor). Furnace deposits may be removed during sootblowing (for large boilers) or during furnace and boiler cleaning.
Lead emissions from used oil combustion can be controlled. For example, a boiler equipped with an electrostatic precipitator and firing a blend of used oil and coal emitted less than 0.2% of the lead to the atmos- phere. In another test, a suspension preheater cement kiln equipped with electrostatic precipitators emitted about 0.03-0.05% of the lead in the used oil that it burned. Finally, in a lead smelting reverberatory furnace equipped with a baghouse and firing a blend of No. 2 fuel oil and used crankcase oil bottoms, lead emissions did not increase over the levels emitted when firing No. 2 fuel oil alone.
from used oil combustion in large boilers, as measured by a 1983 study.16 Although not shown in the table, these data indxate that about 59% of the incoming lead is emitted compared to 71% for zinc. This estimate of the fraction of lead emitted is consistent with that reported in the literature and is comparable to the value of 52% measured by a similar study in 1980.13 During two of the runs conducted during the 1980 test period, the measured concentrations of lead in the flue gas were 19,000 and 25,000 yg/m3. However, as shown in Table 21.10, the values estimated by the recent study are two to three times higher. These differences in flue gas concentrations can be largely attributed to variations in the lead concentration of the fuel, which was 660 ppm for the 1980 tests and 1,890 ppm for the recent study.16 Repeated experiments and mass flow calculations by EPA indicate that 50-60% of the lead introduced into commercial boilers exits from the system in flue gas streams.21 Significant quantities of the particulates containing lead and zinc were less than 1 pm in diameter20
chromium -- are generally present at very low concentra- tions in the stack gas such that, when diluted in the atmosphere, they should not cause major problems. However, the situation is still of some concern as the concentration of these metals could be substantially higher in different used oil fuels.
elements, such as sulfur, nitrogen, phosphorus, and halides, during used oil combustion. In general, the form of emissions resulting from their combustion will vary with the source and type of waste oil.
Table 21.10 shows the concentration of elements
Other toxic metals -- arsenic, cadmium, and
Few data are available about the fate of inorganic
409

Table 21.10 Trace Element Emissions from Used Oil Combustion in Large Boilers and Small Heaters
Combustion Emissions (pIm3)
Vaporizing Space Atomizing Space Heatera Heatera
Concentration Large Boiler in Fuel GCA EPA GCA EPA
Element Wg) Test 1 Test2 Test 1 Testc Test IC Testc
Aluminum Antimony Arsenic Barium Beryllium Boron Cadmium Calcium Chromium Cobalt
Iron Lead Magnesium Manganese Molybdenum Nickel Selenium Silicon Silver Sodium Strontium Thallium Tin Titanium Vanadium Zinc
Copper
11 1
17 95
11
1,060
0.03
1.6
4.1 <o. 1 23
170 1,890
320 14 4.5 1.2
4 . 7 14
100 0.03
1.4 <2.0 8.6 0.2 0.2
1 ,OOo
150 1
330 300 <1 70 40
10,000 95 2
900 2,800
43,000 3,600
270 90
110 < I
d c0.2
3,100 30 3
120 d
440 35,000
-340
550 1 ,oo
<1 270 45
18,000 95
1 1 ,OOo 3,700
65,000 6,200
330 100 55 < I
d <0.2
6,000 25 c1
220 20
150 41,000
<0.2 200
3 3 4
<1 130 <1
380 6
41 6
20 280 90 3 3 5
<1 500 <1 60 <1 <1 2 8
<I 40
25 I
- 25
670 1
25 4200
54 16
15,200 1,600
8 420 250 21 <1
-
-- - -
<4 7
340 2
<1 190
570 40
700 3,800
3 100 65
93,000 250
5 1,200 5,300
97,000 14,500
800 190 60 <1
1,360 2
4,100 85 <l
230 30 7
56,000
650 __ __
1,300
1,960 110
1 1,900 4,950
70 2,400
22,300 144,000 7,000 1,300 1,300 3,500
<1
-_
-- - -
50 7
490 80 16
~ , O O o
aKroll Model W800L (Model W400L used for EPA test).
bDravo Hastings Thermoflow Model 2@WO.
CWith automotive used oil; raw oil composition not available.
dNot analyzed due to instrumental difficulties.
Source: Ref. 16.
About 0.152-0.465 Ib of sulfur dioxide (S02) per million Btu can be emitted by combusting used oil con- taining 0.16-0.36% sulfur. The majority of the sulfur contained in used oil is emitted as SO,, with some sulfur trioxide (SO3) and sulfuric acid. Small amounts of sul- fur also are emitted with particulates and are deposited as sulfate and sulfite compounds in the boiler.
Nitrogen is emitted in the form of nitric oxide and nitrogen dioxide. Other sources of nitrogen emissions are particulates, boiler deposits (as nitrate and nitrite
410
compounds), and ammonia compounds. Organic bromine, chlorine, and fluorine compounds are emitted as hydrobromic, hydrochloric, and hydrofluoric acids, respectively. Phosphorus, in comparison, is emitted with particulates in the form of phosphates.
With respect to organic emissions from commercial boiler systems, EPA’s data indicate that used oil com- bustion efficiencies will range from 99% to greater than 99.9%, which in turn correspond to organic compound destruction and removal efficiencies of 99.4-99.99%. The EPA observed no strong correlations between

destruction efficiencies and boiler sizes or firing tech- niques. However, one trend was apparent from the data: the destruction efficiencies for semivolatile compounds (e.g., trichlombenzene, 1 chloronaphthalene, and 2,4,5- uichlorophenol) were consistently higher than those for volatile compounds (e.g., chloroform, trichloroethane, trichloroethylene, and perchloroethylene).
In addition, detectable levels of polychlorinated dibenzofuran and polychlorinated dibenzodioxin com- pounds were found in the flue gas of some of the boilers tested. These compounds, when present, were usually at levels less than 5 pg/m3, which is less than 0.5 ppb (by volume) in the stack gas. The extent to which these compounds pose a hazard at these low levels is undeter- mined. However, tests on used oil indicated no detect- able dioxin or dibenzofuran compounds (the detection limit for dioxin is 200 ppb). The dioxins and diben- zofurans found in the stack gas are most probably formed during combustion.21
concentrations measured in the various fuels generally agree with raw used oil data; i.e., No. 2 fuel oil and virgin lubricating oil tend to be low in benzo(a)pyrene content, while heavier fuel oils and used oil tend to have slightly greater amounts of PAHs. However, none of these fuels emitted measurable quantities of ben- zo(a)pyrene during combustion.lW
hydrocarbon emissions from waste oil combustion would be in the range previously measured for No. 2 and No. 6 fuel oils.11 In addition, another study identified only two PAH compounds (naphthalene and phenan- threndanthracene) in very low concentrations (2-3 pg/m3 of flue gas).l3
With respect to emissions of PAHs, benzo(a)pyrene
Results of a 1980 study indicate that PAH and total
Combustion in Small Heaters
Data on used oil combustion in small heaters indicate that burner design has a marked effect on trace element emissions (Table 21.10): a vaporizing pot burner retains most trace elements within the vaporizing pot residue, whereas an air atomizing burner emits most elemental species in the flue gas. Further, the air atomizing burner emits more particulates when firing used oil than when firing No. 2 fuel oil, due to the higher inorganic content of used 0i1.23
Because the vaporizing pot burner retains a signifi- cant amount of the trace elements in the pot residue, disposing of the residue can be a problem. This residue, representing about 3% of the feed, contains over 90% of the oil’s trace elements and a variety of organic com- ponents, including PAHs.
Recent tests of used oil combustion in space heaters illustrated that emissions of organic compounds will range from 1.1 to 1.4 rnglm3, with the concentration being slightly lower for used automotive oil combustion than truck crankcase oil combustion.z3 Chemical analy- ses of these emissions showed two major types of con- stituents: hydrocarbons, such as aliphatic, olefinic, and aromatic compounds, and oxidized species, such as ketones, esters, aldehydes, acids, and (to a lesser extent) ethers, anhydrides, alcohols, and lactones. In addition, significant quantities of PAHs are found in the emis- sions from the vaporizing burner fueled with automotive crankcase oils. Although not measured or identified, similar types of PAH compounds are expected in the vaporizing pot residue when fueled with used truck crankcase oils. Furthermore, the combustion of truck crankcase oils tends to generate more oxidized organic species than automotive crankcase oils due to the rela- tively higher levels of acids and lactones in the emis- sions from the combustion of truck crankcase oil.23
Gas chromatography and mass spectrometry analy- ses of the semivolatile organic emissions show that the flue gases of small waste oil heaters are essentially free of semivolatile organics. Furthermore, none of the com- ponents present as spikes (e&, trichlorophenol and N-nitrosodiphenylamine) in the feed oil were detected in the flue gases at a detection limit corresponding to a flue gas concentration of 0.15 pg/m3. In general, these results appear comparable to those found for combustion of conventional fuel oils.
Comparison of Combustion in Large Boilers and Small Heaters
To assess the significance of these concentrations, Table 2 1.1 1 provides two indicators of potential en- vironmental impact.16 The data show that lead is the trace element emission of most concern from commer- cial boiler and space heater systems. Other elements of possible concern are copper, iron, and zinc. Depending on their concentrations in used oil, other elements could also have an impact, if leaky flues or excessive contact with the flue gas lead to greatly elevated human exposures. Benzo(a)pyrene is also of concern in the vaporizing space heater.
In general, used oils are cleaner fuels than No. 6 fuel oil and coal. Because they contain less sulfur, silicon, sodium, vanadium, and nickel than residual fuel, their combustion emissions will contain smaller amounts of these elements. In addition, substituting used oil for coal will sharply reduce emissions of calcium, iron, magnesium, beryllium, manganese, silver, strontium,
411

Table 21.11 Measured Emissions and Calculated Severlty Factors for Specific Pollutants from Large Boilers and Small Heaters
Vaporizing Atomizing Commercial Boilela Space Heater Space Heater
Concentration Environmental in Used Oil Impact Indexa Emissions Seventy Emissions Seventy Emissions Seventy
(pglm3) Factorc Pollutant (P@€!) (pg/m3) (pglm3) FactoF @glm3) Factorc
75 225,000 0.1 1 7,840 <0.001 473,000 0.006 Particulatesd -
Metals Cadmium Chromium Cobalt
Iron Lead Nickel Zinc
Copper
1.6 4.1
<o. 1 23
170 1,890
1,000 1.2
50 500 50
200 1,000
150 100
5 , m
40 95 2
870 2,850
42,700 110
34,800
0.03 0.008 0.002 0.15 0.12
0.04 0.28
11
1 6 1 6
20 280
5 40
<0.001 <0.001 <0.001 0.005
<0.001 0.015
<0.001 <0.001
65 250
5 1,200 5,300
97,000 60
55,700
0.013 0.005
<0.001 0.6 0.055 7 0.006 0.114
Organic compounds 1 <0.001 Naphthalene 580 50,000 3 <0.001 190 <0.001
210 1,600 2 <0.001 160 <0.001 2 <0.001 Pyrene 40 230,000 NDe - 100 co.001 1 <0.001 Benz(a)anthncene 20 45 ND - 30 0.005 ND __ Benzo(a)pyrene <IO 0. a2 ND I 30 l l d ND --
Phenanthrene
aThe environmental impact index is the threshold limit values (as reported by the American Conference of Governmental Industrial Hygienists) for trace elements and the discharge multimedia environmental goals for organic compounds.
bBased on stack height of 10 m.
cThe source seventy factory is defined as the ratio of the calculated maximum ground level concentration of the pollutant species to the level at which a potential environmental hazard exists. A source severity factor equal to or greater than 0.05 is considered indicative of potential hazard.
Walues are based on primary national ambient air quality standard for paniculates.
not detected.
Source: Ref. 16.
aluminum, titanium, boron, and molybdenum.20 In general, blending 1% (by weight) used oil with coal will not substantially change the trace element content of the blend. However, a 5% blend of used oil and coal has significantly higher lead concentration and somewhat higher phosphorus content than pure coal.
Road Oiling and Dumping
When used oil is dumped or applied to land, the oil and its contaminants can migrate by volatilization and dust transport.7 The quantities of contaminants transported by these mechanisms vary greatly, depending on the type and quality of used oil, terrain, soil porosity, weather, traffic volume, and rate of application. The potential for environmental contamination can be significant.
412
In general, very little information is available regarding the fate or disposition of contaminants in used oil applied to a road surface. One study reported that only about 1% of the oil applied to dirt roads over long periods (about 12 yr) is retained on the road surface? About 17-18% of the oil evaporates while another 10-2096 is lost through rainfall runoff, with most of the runoff occurring during the first rains following applica- tion. Although no data are available, it has been sug- gested that other factors, such as biodegradation and reentrainment of oil-coated particles by road traffic, could account for a large fraction of the long-term oil transport from the road surface^^ The composition of the oil and the surrounding environmental conditions will also influence the fate of contaminants.w6 The oil does not appear to penetrate more than a few millimeters below the road surface.

Table 21.12 Evaporative Emlalorn of Sckcted Used Oil Contamlnaats from Road OUlngs
0.0015
0.001 1 0.0033 0.0092 O.oW7
O.oo08
a m
a m
0.0084 0.0528 0.0060 0.0180 0.0504 0.wa 0.1444 0.0042
4.25 0.38 2.68 1.6 0.4 0.78 0.08 5.72
In general, the evaporation, seepage, and dust transport of used oil occur primarily during initial appli- cation. These impacts occur simultaneously, but at varying rates, as illustrated by Table 21.12.1s The results tend to indicate that the environmental impact of road oiling is not severe, although a few severe cases (not shown) have been reported from highly conumina- ted Oi1.16
Rerefining
various distances downwin# of a rerefinery in New York.2 The computer model employed was general in nature and incorporated such variabies as wind sped and direction, source location and kight, and atmo- spheric stability. It combined 31 different p m s emis- sion points as a “single point source.” The emission rate potential, as determined by material balance calculations on individual sources, was used to accumulate the total mass emission rate for the facility. ‘The results of the model showed that at a distance of slightly more than 3 mi downwind of the site, the hydrocarbon concentra- tion will be in the range of 0.016-0.185 j1g/m3. At a distance of about 0.1 mi downwind the hydrocarbon concentration will be higher: 4.87-10.56 pglm3.27
from a rerefinery are normally sent to a furnace to bum combustible materials. In some plmts, caustic or
impact of these emissions. Thus, M separate emissions control equipment is necessary.
In general, a properly operating rerefinery will emit few air pollutants. ?he principal sources of these emissions are vents from process and wastewater treatment units and storage tanks. Little is known about the actual mm- position of the emissions, although some odors are apparent around most rerefining facilities. The Lilrely
containing oxygen and nitrogen. Very low concentra- tions of organic sulfur compounds may also be present. In addition, small amounts of SOz and % may be pre
With respect to mitigation techniques, the emissions
sources Of these OdWs are and Organic ‘ ammonia may be reduce the p d l u t i o n
d u d by acid-sludge processes.* Thus, the types and quantities of emissions generated will vary with the rerefining technology used to process the waste oil. They will also be influenced by the composition of the waste oil as well as by the environmental control methods and management techniques employed.
A mathematical model was used Wendy to Predict the expected concentration of airborne hydrocarbons at
Liquid Eflluents
Liquid effluents from waxte oil management systems emanate from several sources. At rerefining facilities, they include water separated from raw drain oil, con- taminated cooling water, plant runoff water, and uater from vent gas scrubbers. Effluents are also generated by

. . . . . . . . ... . . . . , . . . . . . . . . . . .
mad oiling operatim; runoff from oiled roads: and disposal in sewers, landfills, lagoons, and injection wells. In addition, small amounts of wastewater are generated from condensed steam that contacts oil.
Rerefining
In general, the characteristics of liquid effluents from rerefrning processes depend on the process and the type of used oil. The effluents are expected to contain trace metals (as dissolved or suspended solids), chlorinated solvents, phenols, and other organics, as well as sus- pended or emulsified oil.8 The differences in waste- water and used oil compositions depend on the solubility of their constituents in water and oil (Table 21.13).1 In general, the metals remain in the oil rather than settle with the wastewater. Thus, the low metals concentration in th2 wastewater is due to the small amount of oil that remains in the separated water fraction. The concentra- tions of chlorinated and aromatic solvents in the waste- water are fairly high, but are not significantly different
from those m used oil. The solubility of other contami- nants is similar in both phases, and 25% of the waste- water samples were found to contain FCBs. No PAHs were detected, but the data were limited.16
The properties of wastewater, in turn, dictate the nature of treatment facilities at a rerefinery. These facil- ities will also depend on local sewage treatment plant availability and regulations. Typically, most rerefineries are equipped with neutralizatior. facilities. They also may be equipped with a more elaborate system capable of treating aqueous effluents. The product of the waste- water treatment facility could be used for cooling water makeup or discharged into a sewer system.
Road Oiling
When used oil is applied to land, the oil and its contami- nants c'an migrate by flotation, percolation, and direct runoff. Like dust-borne evaporation, the quantities of these effluents will vary with the type and quality of used oil as well as with environmental conditions.
Table 21.13 Composition of Wastewater Generated during Waste Oil Storage and Processing
Concentration (ppm)
No. of At% P d l u w Samples Mean. Percentile Range
Metals Arsenic Barium cadmium Chromium Lead Zinc
Chlorinated solvents 1 ,l ,l-Trichloroethane Trichlocoeth ylene Tetrachlomihylene Total chlorine
Other organics Benzene Toluene Benz.(a)anlhracene Benzo(a)pyrene Naphthalene PCBs
16 3.4 19 80 19 0.34b 17 10 19 27 I 19 250
13 666 11 561 13 309 5 1566
10 364 10 1,306 2 2 8 283
21 2.9
22 24 1 37 68
585 1,300
1,800 2,600
700 4,170
890 5,800
700 14
0.03-22 0-300 0-37 0-68
<O. 1-2.300 <0.005-1,650
12-1,900 20-2.600 3.3-1.300 764,170
<0.4-890 14-5,8oO
<0.02-<1 <0.02-< 1
0.04-14 0.7-700
Calculated for detected concentratioas only.
bOne sample with a very high concentration (37 ppm) was omiued to avoid distortion of the mean.
Source: Ref. 1.
4 14

While precise estimates are not available, it has been reported that between 3 and 20% of the oil applied to road surfaces is lost by rainfall runoff. In general, rainfall runoff is intermittent in nature and occurs pri- marily during periods of heavy rainfall. An elemental analysis of rainfall runoff (see Table 21.14) indicated that the concentration of some contaminants in the run- off is small, but possibly significant.16 An assessment of the data shown in the table is difficult because of the lack of temporal data (transfer as a function of time) and the possible influence of external contributions to the concentrations in the runoff. These external factors include rainfall pH, leachates from the soil and its impurities, and windblown contaminants and dust.16
In general, the level of contaminants will depend on the amount of rain that leaves the road surface as runoff. The concentration of contaminants rises with the amount of runoff, primarily because of contaminant solubility under acidic conditions. At low concentrations (e.g., OS%), contaminants are associated primarily with their solubility in water, while at higher concentrations (e.g., 5% and above), both soluble and adsorbed contaminants are normally present in the runoff.
and rainfall runoff, the major constituent of rainfall runoff is phenol (Table 21.14). In addition, most organ- ics present in the runoff are at concentrations below 10 pg/L. Given the ppm-level concentrations of com- pounds such as benzo(a)pyrene and PCBs in the used oil applied to the soil, it is doubtful if they will be present at the ppb level in the runoff.16
Oils are generaIIy stable in water. In addition, because they are lighter than water, oils will coat the water’s surface with a thin film. For example, one pint of oil can produce a slick of about one acre in size. As little as 35 ppm of oil can be seen floating on water as a thin film. These surface oil films coat and destroy plankton, algae, and aquatic insects.28
As determined by organic analyses of the road oil
Dumping
In general, only low-quality used oils are discarded by generators and collectors. In some cases, higher-quality oils are also dumped because the quantities generated are not sufficient to warrant storage and use; however, such dumping is rare with large generators and collec- tors. Oil dumped into sanitary sewers goes to a sewage treatment plant where it can upset plant operation. The presence of trace metals, such as metal salts, can also effect the plant’s operation when such concentrations exceed certain limits.
water-soluble fraction of oil-water mixtures has been In terms of contaminant levels in sewer systems, the
reported to contain a number of organic and inorganic compounds. One estimate indicates that the concentra- tion of hydrocarbons in urban sewer systems ranges between 1 and 24 mg/L, with most of the oil (about 85%) associated with suspended particulates in the runoff. The total organics concentration was less than 20 mg/L and the compounds identified included phenol, naphthalene, and toluene. At detection limits of about 10 ppb, no high-molecular-weight PAH compounds were detected, suggesting that discharge into sewers served by secondary treatment plants would have little or no adverse impact. This is primarily because the concentration levels of organics in sanitary sewers are well below those suggested as being harmful to publicly owned treatment works (POW) operation29 In addi- tion, solubilized inorganic concentration levels do not appear to be of major concern. The contaminant load- ings of concern in POTW-treated sewer systems appear to be those associated with suspended solids. Although primary treatment measures, such as sedimentation, reportedly reduce solids loadings by 50%, the reduction associated with the oil influent is unknown.16
With respect to impacts on humans, recent data indicate that only 25% of the urban population is served by combined sewer systems using effective primary and secondary treatment plants. The remaining 75% of the urban population is served by storm sewer systems or lives in areas without sewers.16 In general, stormwater discharged from storm sewer systems will not receive any treatment. Because the concentrations of some of the Contaminants exceed the goals suggested by EPA for stream discharge (e.g., 5.0 pg/L for phenol), disposal of used oil in storm sewers is potentially harmful to the populations living downstream of stormwater discharge points. 16
The major problem with dumping waste oils into landfills is contamination of groundwater supplies. This contamination usually occurs when refuse leachate from the landfill penetrates groundwater sources in deep sand- stone or shallow aquifers. The potential harm is greater for used oil than unused oil because the former contains hazardous contaminants. Such concerns can be avoided by disposing of the waste oil in RCRA-permitted facilities.
Solid Wastes
The major source of solid wastes from used oil manage- ment activities is the rerefining process. Most rerefining processes generate two types of solid waste streams: spent clay and sludge, such as dehydration sludge, acid sludge, and solvent sludge. The type and quantity of
415

Table 21.14 Contaminant Transfer from Oiled Roadbed to Rainfall Runoff
Concentration Concentration c of in Applied Oil in Runoffa Weight Applied
Contaminant ( W g ) ( W g ) in Runoff
Elements Aluminum Antimony Arsenic Barium Beryllium Boron Cadmium Calcium Chromium Cobalt Copper Iron Lead Magnesium Manganese Molybdenum Nickel Selenium Silicon Silver sodium Strontium Thallium Tin Titanium Vanadium Zinc
Organic compoundsb Phenol Chlorophenol 2,4,6Trichlorophenol Nitrobenzene N-nitroso
Naphthalene Phenanthrene/
anthracene Pyrene Benzo(a)pyrene Dibutylphthalate
PCBs (Aroclor 1260)
diphenylamine
4,4'-DDEc
31 0.6 8.1
61 <o. 1
6.2 1.3
7.7 0.8
990
34 214
1,090 212
14 3.2 3.7
<1 40 <0.1
257 1.9
<I 16 7.8 4.1
740
11 40 40 30
116
440 150
60 10 60 94 34
1.0 <0.01 <0.03 0.005
<0.0012 <0.004 0.001 0.6
~0.003 <0.003 <0.002 0.5 <0.02 0.35 0.02
c0.002 co.005 40.02 0.6
<0.001 3.8 0.005 < O N <0.03 0.002 0.005 0.16
0.6 0.2
<0.01 0.02
<0.01
<0.01 <0.01
<0.01 <0.01 0.02
<0.01 <0.01
asample corrected for runoff from unoiled surface.
bWg = PkW-. CPesticide.
Source: Ref. 16.
416

Table 21.15 Solld Waste Generation Rates for Typical Rerefineries
these waste streams depend on the process technology employed (see Table 21.15)1 and the composition and quality of used oil. In addition to the rerefinery waste streams, small amounts of solid wastes are generated during storage, combustion, incineration, landfilling, and Generation Rate (tons/yr)o
Rerefining Process lagooning. and Residue LOW High
Reprocessing Acid-cla y
In-line filtered residue Acid sludge Spent clay
Vacuum distillation In-line filtered residue Spent clay
aExcept as noted otherwise.
Source: Ref. 1.
Table 21.16 shows the composition of settled sludge generated during used oil storage or processing to remove water and solids.1 These data indicate that the composition of settled sludge is similar to that measured for used oil (Table 21.4), primarily because the sludge
Distillation bottoms are residues, containing semi- volatile and nonvolatile materials, generated by distilla- tion processes. They typically contain significantly larger quantities of ash, sulfur, nitrogen, and oxygen
0.10 1.0 250,000 gal/yr 750,000 gal/yr
300 500
2.5 0.25 500 2,000 contains more than 50% oiI.29
Table 21.16 Composition of Settled Sludges Generated during Waste Oil Storage and Processing
Pollutant
Metals Arsenic Barium Cadmium Chromium Lead Zinc
Chlorinated solventsb Dichlorodifluoromethane l,l,l-Trichlomethane Trichloroethylene Tetrachloroethylene Total chlorine
Other organics Benzo(a)pyrene PCBs
Concentration (ppm)
At 90th Samples Means Percentile Range
41 11 12 0.013-24 47 40 63 48 0.02-2 16 37 215 714 4 3 2 , 1 3 0 50
416 1,200 0.21-3,610
802 1,400 0.02-7,770 47 568 1,550 0.09-3,150
8 131 59 < 1-640 39 1,579 5,400 19-1 10,ooO
41 1,400 1,900 70-8,200 41 469 1,100 2.2-1,300
39 3,1286 13,100 88-1 8 1,ooO
7 4 12 <1-12 42 182 50 <1-500
~~
aCalculated for detected concentrations only.
NO data are available for trichlorotrifluoroethane.
cone sample with a very high concentration (1 10,000 ppm) was omitted to avoid distorting
dTWo samples with very high concentrations (75,400 and 181,000 ppm) were omitted to
the mean.
avoid distorting the mean.
Scnicr. RcC. :

than the feed oil. For example, ash contents may range between 10 and 25% while lead content approaches 1.5%, depending on the composition of the used oil and the extent of pretreatment.29 The concentrations of some toxic metals (e.g., arsenic, barium, cadmium, chromium, and zinc) are also fairly high, but they are generally lower than the concentration of lead. Distillation bottoms are commonly used as asphalt extenders; if discarded, they are usually disposed of in lagoons.29
Rerefining
The primary source of acid sludge is the acid-clay rerefining process. Besides sulfuric acid, the acid sludge contains aromatic and asphaltic compounds, metals, polymers, and organic acids.8 Because of the high acid content, the sludge is handled as carefully as the original acid. As much as 30-50% of the acid sludge is water soluble, complicating land disposal. Lead content, believed to be in the 2-10% range, primarily as sulfate, is another important factor to be considered prior to any dumping24
Since it has no economic value, most acid sludge is disposed of in landfills or lagoons, usually without neutralization. Neutralization and incineration, widely practiced in Europe, lead to high SO2 emissions. Acid recovery is very expensive on a small scale and transpor- tation costs are too high to justify centralized recovery plants. The sludge can be disposed of with wastewater only where high-volume wastewater treatment facilities are available for dilution.24
Compared with acid sludge, solvent sludge contains higher concentrations of metal by-products, ash, and nonvolatile residues and lower concentrations of insolu- bles and sulfur. It is also reported to have only a small fraction of the acidity contained in acid sludge streams and a higher heating value. This type of waste is pro- duced primarily by solvent extraction processes.
ing. Small amounts of spent clay are also generated by processes using clay as a filter media: about 0.4 Ib per gallon of oil treated.8
Like the acid and solvent sludges, the composition of spent clay varies widely. For example, the concentra- tion of metals is lowest in the spent clays used to polish lube oils from distillationklay-filtration processes, while the highest levels are reported for clay used in contact filtration processing and in chemical treatmentklay-bead rerefining. Intermediate levels have been measured in clays from acid-clay rerefining facilities?
Other common contaminants in spent clay include acidic and carbonaceous residues and nitrogen- and oxygen-containing compounds, such as PCBs. Their
Spent clay is generated primarily during clay polish-
concentration in spent clay will depend on their presence in used oil. In addition, negligible quantities of chlori- nated and aromatic solvents are present.15
although some uses, such as a surfacing material, have been identified29
Spent clay is ordinarily disposed of in a landfill,
Other Solid Wastes
In addition to the major residues discussed above, several other types of solid wastes are generated during used oil recycling. Some of these residues are tank bottoms from storage and settling tanks, ash or residue from combustion, and filter sludge from screen filtra- tion. All of these materials are contaminated by heavy metals. Lead concentrations are particularly high, with concentrations above 10,000 ppm common for some sludges and filter cakes. Generally, the simple screen filtration processes are not efficient methods for remov- ing metals from used oil; consequently, their sludges will have the lowest metal concentrations of all the solid waste residues. Lead levels in screen filtration sludges have typically been measured at 100 ppm.1
Little or no data are available on the contamination of these residues by hazardous constituents other than heavy metals. Such contamination is probably directly related to their presence in used oil.
Health and Safety
As discussed above, used oil typically contains a number of toxicants in concentrations well above those neces- sary to cause substantial harm. These constituents in- clude lead, trichloroethylene, tetrachloroethylene, l , l , 1- trichloroethane, naphthalene, benzene, and toluene. Other constituents found in used oil include arsenic, barium, beryllium, cadmium, carbon tetrachloride, chromium, cyanide, nickel, phenol, PCBs, and selenium.
The hazardous nature of used oil is primarily related to the many contaminants that are known to have carcin- ogenic, mutagenic, teratogenic, or other chronic or acutely toxic properties. For example, tetrachloro- ethylene has been identified as chronically toxic and possibly carcinogenic to humans. Trichloroethylene has been identified as a potential human carcinogen, and l,l,l-trichloroethane has been shown toxic in animal studies.30 Toluene, naphthalene, and lead also are known to have adverse health effects in humans.30 Other contaminants of concern are benz(a)anthracene, benzo(a)pyrene, and nitrosamines.
cadmium, and chromium. Both arsenic and cadmium Used oil also contains significant levels of arsenic,
418

have been categorized as potential human carcinogens, and hexavalent chromium also demonstrates evidence of carcinogenic potential. Arsenic, cadmium, and hexa- valent chromium also demonstrate mutagenic effects, and arsenic and cadmium further show teratogenic activity.
tent, and bioaccumulative; they have the potential for increased migration in hazardous concentrations. There- fore, waste oils are capable of causing substantial harm if not handled properly.
Many contaminants in used oil are mobile, persis-
ENVIRONMENTAL CONTROLS
Most current methods of waste oil reuse and disposal can contaminate air, water, or soil with substances that pose substantial hazards to humans, animals, and plants.30 While virtually all used oils are technically recyclable, the feasibility and desirability of recycling are limited by environmental hazards and economic considerations.
of recycling used. For example, the acid-clay process for rerefining used oil generates acid sludge that can be safely disposed of only in landfills suitable for hazard- ous wastes and after neutralization of the acid content. The disposal of spent clay is also a concern, although i t is not expected to be a major problem. Some acid-clay processes generate smaller amounts of acid sludge. In general, atmospheric emissions and water effluents from rerefining operations are relatively minor because of the considerable wastewater treatment (e.g., neutralization and flocculation) and other environmental control facili- ties installed in most rerefineries.
Similar impacts are observed when used oil is com- busted in large or small boiler systems. In particular, the combustion of untreated used oil emits significant quan- tities of trace elements, oxides, and aromatics. However, if the used oil was cleaned prior to combus- tion, the level of emissions would be reduced. For example, nitrogen and sulfur levels can be significantly reduced by vacuum distillation to concentrate these elements in the bottoms, which can then be disposed of or used in asphaltic products. Solvents, such as PAHs, can also be removed by distillation. Lead and ash can be removed by centrifugation and settling.
The use of controls on combustion systems is still another method of reducing emissions. For example, particulate emissions can be removed from combustion flue gases by electrostatic precipitators, bag filters, scrubbers, and other methods. These technologies are expensive, but they can allow the use of a cheaper fuel
The environmental barriers depend upon the method
(Le., used oil). However, emission controls are not normally practiced, giving way to dilution with virgin oils to minimize the net ash content to meet particulate emission standards. In addition, scrubbing can reduce sulfur, bromine, and chlorine emissions, and combustion modifications can reduce hydrocarbon emissions.
On the whole, the environmental impacts from used oil recycling appear to be much less of a problem if the used oil were processed prior to any use. In other words, although expensive, the processing of used oil reduces its environmental impact.
ENVIRONMENTAL CONSTRAINTS
While properly equipped used oil use and disposal facili- ties generate few environmental residuals, several envi- ronmental constraints, such as regulatory and economic uncertainties, may hinder or slow their widespread appli- cability. Table 21.17 summarizes the various federal regulations applicable to different segments of the used oil industry.14 The EPA has proposed several times to classify used oil as a hazardous waste to enhance envi- ronmental protection by forcing, at a price, more energy recovery through fuel reprocessing and lube oil rerefin- ing among the sources and channels under regulatory control. While these regulations appeared promising to the rerefiner through lower used oil prices, they would also have some adverse effects, since the cost of complying with the regulations could also encourage improper disposal.
The EPA eventually concluded that the listing of used oil as a hazardous waste would disrupt existing collection and recycling networks and potentially increase improper disposal of used oil by as much as 61-128 million gal/yr. This disruption is attributable both to direct economic effects (e.g., costs of managing combustion residues as hazardous wastes) as well as psychological effects, such as public relations problems, that may translate into economic effects (e.& the cost of an asphalt company hiring a community relations spe- cialist to allow continued burning of used oil fuel).31 Some disruption could also stem from noneconomic reasons, with persons opting out of the oil recycling system to avoid handling a hazardous waste.
(at least in the short term) to the extent necessary to absorb all of the used oil displaced from burning; cur- rently, the number of rerefiners is declining. Generators would then have difficulty in finding recyclers willing to accept their used oil and, as a result, commercial auto
In addition, rerefining would not be able to expand
419

Table 21.17 Summary of Federal Regulations Applicable to the Used Oil Industry
Activity Applicable Federal Requirements
Generation
Collecting, processing, and marketing
Mixing of hazardous wastes with used oil is prohibited.
Off-specification used oil may be sold only to industrial and utility burners;
Used oil meeting EPA specifications is exempt from regulation; facilities facilities selling off-specification used oil must notify EPA.
must still notify EPA.
Burning Burning of off-specification used oil in nonindustrial boilers is prohibited. Burners of off-specification used oil must notify EPA of their activity as used oil
burners (a one-time requirement), inform suppliers of this notification, bum off- specification used oil in an industrial device only, and keep records of invoices.
Burners of specification used oil are not regulated.
Storage Storage of used oil is not specifically regulated unless it is mixed with hazardous wastes or exhibits one of the characteristics of hazardous waste; in such cases, used oil storage is regulated by the RCRA.
Source: Ref. 14.
centers would likely refuse to accept used oil and significantly increase the price of oil changes. These developments would increase the number of at-home oil changes by personal vehicle owners and, thus, the uncontrolled disposal of used oil.
serves more energy than reprocessing it to make fuel; however, the economics may not be as favorable, as evidenced by industry trends.14 Typically, reprocessing and rerefining are favorable at high crude oil prices because the product can then be sold at relatively high prices. However, at low crude oil prices, the prices of the refined virgin products are also low and, in most instances, insufficient to cover the cost of reclamation. Reclaimers who used to pay for used oil are now charg- ing generators for collecting it. A recent survey in Maryland, Virginia, and the District of Columbia found that reclaimers were charging $0.10-0.30/gal for used oil pickups compared to the $0.02-0.18/gal they paid previously.10
The net result is that many service stations and other collectors of used oil have stopped accepting oil from personal vehicle owners and other small sources who, in turn, may illegally dump their oil. In 1983, about 406 million gal were disposed of, while 605 million gal were sent to reclaimers. Today, it is possible that these quantities are nearly equal. Thus, efforts should concen- trate on recovering currently disposed of oil and iden- tifying alternatives to handling the waste oil.
In general, rerefining used oil to make lube oil con-
In general, any recovery option saves energy com- pared to disposal, with rerefining saving more energy on a per-gallon basis than reprocessing. However, on an aggregate basis, the savings are higher for reprocessing because of the large volume of used oil reprocessed. Further, if all the discarded used oils were converted to lube oil, the additional energy that could be conserved would be equivalent to approximately 12 million bbl/yr of crude 0il.14
REFERENCES
1.
2.
3.
4.
Composition and Management of Used Oil Gener- ated in the United States, US. Environmental Protection Agency Report PB85-180297 (Nov. 1985).
Emmerson, H.R., The Advantage of Used Oil Rerefning, prepared for Bartlesville Energy Tech- nology Center, Bartlesville, Okla. (May 1980).
Brinkman, D.W., Waste Hydrocarbon Recycling, Chemical Engineering Progress, 82(3):67-70 (March 1986).
McBain, J.A., Recent Factors Affecting the Oil Recycling Industry, Proc. Conf. on Measurements and Standards for Recycled Oil - IV, National Bureau of Standards Publication 674, Gaithers- burg, Mcl. (Sept. 14-16, 1982).
420

5 .
6.
7.
8.
9.
10.
11.
12.
13.
14.
15.
16.
17.
18.
19.
Brinkman, D., National Institute for Petroleum and Energy Research, Bartlesville, Okla., personal communication (May 21,1987).
Hazardous Waste Management System; Recycled Used Oil Standards, Federal Register, 50(230): 49212-49257 (Nov. 29,1985).
Listing of Waste Oil as a Hazardous Waste, U.S. Environmental Protection Agency Report to Con- gress (Jan. 198 1).
Chicoine, L.C., et al., Reuse of Waste Oil at Army Installations, U.S. Army Corps of Engineers Tech- nical Report N-135, Champaign, 111. (Sept. 1982).
Federal Register, 50(45):9385-9399 (March 7, 1985).
Used Oil: A Slippery Problem, The Washington Post (Oct. 19, 1986).
Used Oil Burned as a Fuel, prepared by Recon Systems, Inc., and ETA Engineering, Inc., for U.S. Environmental Protection Agency (1980).
Berk, D.S., Recycling Systems Give Waste Oil New Life, Plant Engineering, 35(16):103-106 (Aug. 6, 1981).
Kirk-Othmer Encyclopedia of Chemical Technol- ogy, Vol. 9,3rd Ed., John Wiley & Sons, New York (1978).
Waste Oil: Technology, Economics, and Environ- mental, Health and Safety Considerations, U.S. Dept. of Energy Report DOE/EV/l0450-H2 (Jan. 1987).
Rerefining Waste Oil, Chemical Engineering, 86104-106 (April 23, 1979).
The Fate of Hazardous and Nonhazardous Waste in Used Oil Disposal and Recycling, U S . Dept. of Energy Report DOE/BC/10375-6 (Oct. 1983).
Weinstein, K.D., et al., Enhanced Utilization of Used Lubricating Oil Recycling Process By- Products, U.S. Dept. of Energy Report
Metzler, S., and C. Jarvis, Effects of Waste Oil Contamination, Environmental Progress, 4(1):61-68 (Feb. 1985).
Regulatory Impacts Analysis of Proposed Stand- ards for the Management of Used Oil, prepared by Temple, Barker & Sloane, Inc., for U.S. Environ- mental Protection Agency (Nov. 1985).
DOE/BC/10059-19 (March 1982).
20.
21.
22.
23.
24.
25.
26.
27.
28.
29.
30.
-31.
Waste Automotive Lubricating Oil as a Fuel, U.S. Environmental Protection Agency Report PB- 241357 (Sept. 1974).
Fennelly, P.F., et al., Environmental Characteriza- tion of Disposal of Waste Oils by Combustion in Small Commercial Boilers, U.S. Environmental Protection Agency Report EPA-60062-84-150 (Nov. 1984).
Emmerson, H.R., The Regulation of Used Oil Utilization, prepared for Bartlesville Energy Tech- nology Center, Bartlesville, Okla. (April 1980).
Hall, R.E., et al., Comparison of Air Pollutant Emissions from Vaporizing and Air Atomizing Waste Oil Heaters, J. Air Pollution Control Assn., 33(7):683-687 (July 1983).
Freestone, FJ., Runoff of Oils from Rural Roads Treated to Suppress Dust, prepared for U.S. En- vironmental Protection Agency (Aug. 1974).
Bider, W.L., et al., Evaluation of the Use of Waste Oil as a Dust Suppressant, prepared for U.S. Envi- ronmental Protection Agency (Sept. 1983).
Evaluation of Health and Environmental Prob- lem Associated with the Use of Waste Oil as a Dust Suppressant, draft prepared by Franklin Associates Ltd. and PEDCo Environmental Specialists, Inc., for US. Environmental Protec- tion Agency (Nov. 1983).
Booth 111, G.T., et al., Used Lubricating Oil Re- refining Demonstration Plant Data Acquisition - Topical Report I : Environmental Considerations, U.S. Dept. of Energy Report DOWBC/10562-5 (Jan. 1983).
Yates, JJ., et al., Used Oil Recycling in Illinois: Data Book, Illinois State Institute of Natural Resources Report 78/34, Chicago (Oct. 1978).
Waste Oil Recycling and Disposal, U.S. Environ- mental Protection Agency Report PB-236148 (Aug. 1974).
Hazardous Waste Management Systems; General; Identification and Listing of Hazardous Waste; Used Oil, Federal Register, 50(230):49258-49270 (Nov. 29, 1985).
Identification and Listing of Hazardous Waste; Used Oil, Federal Register, 51 (223):4 1900-4 1904 (Nov. 19, 1986).

Appendix A
Summary of Environmental Laws and Regulations Affecting
Energy Technologies
INTRODUCTION
This Appendix summarizes major federal regulatory provisions governing air and water pollution, solid and hazardous waste, occupational safety and health, surface mining, toxic substances, ionizing radiation, endangered species, coastal zones, marine protection, historic sites, and transportation of hazardous materials. State and local requirements within these areas are mentioned, but their diversity prevents any detailed discussion. The purpose of this Appendix is to acquaint the reader with the overall goals and requirements of federal environ- mental programs and to identify the major legislation and regulations. This Appendix discusses the National Environmental Policy Act, air quality regulations, water quality regulations, solid and hazardous waste regula- tions, occupational safety and health regulations, the Surface Mining Control and Reclamation Act, the Toxic Substances Control Act, radiation standards, the Super- fund, and other environmental laws.
noted where possible, federal environmental programs are dynamic. The reader is cautioned that, although the requirements discussed were current on the preparation date of this Appendix (June 1987), they may change.
Where appropriate, this Appendix refers to the statutes and regulations that establish environmental requirements. These requirements are contained in public laws, the United States Code (USC), the Federal Register (Fed. Reg.), and the Code of Federal Regula- tions (CFR). Public laws, which are acts of Congress, are periodically published as the USC (an index that correlates public laws with sections of the USC can be found in Refs. 1 and 2). In general, section numbers for acts discussed in this Appendix refer to the sections in the original act (Le., the public law). Regulations promulgated by federal agencies in the executive branch, which derive their authority from acts of Congress, are
Although future anticipated regulatory programs are
initially published in the Federal Register before being incorporated into the CFR. (An index that lists the USC sections that provide authority for CFR parts can be found in Ref. 3).
THE NATIONAL ENVIRON- MENTAL POLICY ACT
The National Environmental Policy Act (NEPA) of 1969 (USC Title 12, Section 4321 et seq.) requires that all federal agencies incorporate factors that affect the human environment into all stages of decision making. The NEPA process is intended to help public officials base decisions on an understanding of environmental consequences and take actions that protect, restore, and enhance the environment. NEPA requires federal agen- cies to prepare detailed studies of the environmental impact of proposed major federal actions that could significantly affect the quality of the environment. A "federal action" includes any action undertaken directly by federal agencies, such as operating programs, con- structing facilities, and providing funding to others. It also includes a federal agency's decision on whether to grant permission for activities of others, such as private businesses or state and local governmentsf
NEPA requires agencies to consider the range of alternatives available and prohibits them from commit- ting resources that would prejudice the selection of alter- natives before making a final decision. NEPA also requires agencies to invite public participation in this interdisciplinary approach to decision making.
regulations for all federal agencies on implementing NEPA (see CFR Title 10, Parts 1500-1508). Federal agencies have prepared supplemental guidelines that apply NEPA procedures to agency activities. These
The Council on Environmental Quality has issued
423

guidelines typically classify the types of agency actions that require the preparation of either an environmental assessment (EA), a more detailed environmental impact statement (EIS), or neither. For example, the U.S. Department of Energy (DOE) classifies conceptual design or feasibility studies as "not normally requiring either an EA or an EIS"; detailed design, development, and testing of an energy system prototype as "normally requiring an EA, but not necessarily an EIS"; and actions resulting in construction and operation of a full- scale energy system project as "normally requiring an EIS." Figure A.l shows the steps for implementing NEPA procedures within the DOE.5
AIR QUALITY REGULATIONS
The Clean Air Act of 1970, as amended (USC Title 42, Section 7401 et seq.), is designed to protect and enhance the quality of US. air resources. The Clean Air Act and its implementing regulations, which are issued by the U.S. Environmental Protection Agency (EPA), obligate the owners and operators of air pollution sources to (1) achieve and maintain high levels of ambient air qual- ity and (2) ensure that the best technologies for control- ling air pollution are developed and used.
Significant provisions of the act include National Ambient Air Quality Standards (NAAQS), requirements for State Implementation Plans (SIPS), New Source Performance Standards (NSPS), National Emission Standards for Hazardous Air Pollutants (NESHAPs), standards for prevention of significant deterioration (PSD) of air quality, a mechanism for visibility protec- tion, requirements for new construction in nonattainment areas, and motor vehicle requirements. Important features of these are described below.
National Ambient Air Quality Standards
Section 109 of the Clean Air Act gives the EPA the authority and responsibility for promulgating NAAQS. Accordingly, the EPA has promulgated NAAQS for seven pollutants (CFR Title 40, Part 50): particulates, sulfur dioxide, nitrogen dioxide, hydrocarbons, ozone (photochemical oxidants), carbon monoxide, and lead. These standards are designed to protect public health (primary standards) and welfare (secondary standards), and they apply nationwide (Table A. 1). Although emis- sion limitations for other pollutants (e.g., NESHAPs) and source groups (e.g., NSPS) have also been issued by the EPA, ambient air quality standards for the seven
424
"criteria pollutants" form the basis for regulating most existing sources of air pollution.
The Clean Air Act requires the EPA to review all ambient standards every five years to ensure that they conform with scientific data and adequately protect public health and welfare. Since the original NAAQS were promulgated in 197 1, a new standard for lead was added on October 5,1978, and the ambient standards for two pollutants (particulates and ozone) were changed. The original NAAQS for ozone and total suspended particulates were revised on February 8, 1979, and July 1,1987, respectively. The ozone standard was changed from a "not to be exceeded more than once per year" standard (at 160 pg/m3) to an "expected exceedance" standard (at 235 pg/m3). The initial NAAQS for total suspended particulates were eliminated and replaced by an "expected exceedance" standard for thoracic particu- lates (particulate matter with aerodynamic diameters less than 10 pm, or PMIo).
Under Section 107(d), each air quality control region or portion of a region is designated as attaining, not attaining, or incapable of classification for each standard. (Air quality control regions are jurisdictional regions used by the EPA for air quality planning.) These designations (CFR Title 40, Part 8 1) are central to basing the requirements for constructing new facilities on their geographic location and defining the nature and extent of requirements on states for submitting their SIPs. Currently proposed revisions to the NAAQS are given in Table A.2.6 A fine particulates standard to protect visibility was proposed for continued review on July 1, 1987. A decision on a visibility-based standard for particulates is being deferred to consider compati- bility with potential new sulfur control programs for visibility protection and acid deposition mitigation.
State Implementation Plans
Within nine months of the promulgation (or revision) of an ambient air quality standard, each state must submit a plan to the EPA that provides for meeting, maintaining, and enforcing the standard within the state's air-quality- control regions (see Section 110 of the Clean Air Act and CFR Title 40, Part 51). The plan must contain enforceable emission limits for pollution sources (Tables A.3 and A.4), any necessary compliance sched- ules for installing the control equipment required to meet those limits, and any work practice or equipment standards necessary to achieve and maintain compliance (when no numerical limit can be set). An SIP must also set forth the state's provisions for monitoring ambient

Prepare memorandum to file
- Public review I
Internal revlew and - approval
Complete EIS Prepare dratt EIS - finding of ' no impkrwntatm
significant plan impact' -
- ^ . . . e Not required
for legislative proposals
meetings I optional I
0 Scoping
ecision naking 3
and rationale e Mmgating
measures
w ruDilc near ing 111 appropriate1 45 day m I n i m u m
To @-
Figure A.1 U S . Department of Energy Decision Tree for Implementing NEPA Procedures (Source: Adapted from Ref. 5 )

Table A.l Current National Ambient Air Quality Standards
Primary NAAQS Secondary NAAQS Averaging
Pollutant Time W m 3 PPm pg/m3 ppm
Aerosols
Thoracic particulatesa
Lead
Gases
Sulfur dioxide
Nitrogen oxides
Carbon monoxide
Ozone
Nonmethane hydrocarbons
1 yrb 50 50 24 h 150 150
3mo 1.5 1.5
80 0.03 365 0.14
1,300 0.50
100 0.053 100 0.053
10 9.0 10 9.0 40 35.0 40 35.0
235 0.12 235 0.12
160 0.24 160 0.24
~~~
aPatiicles with aerodynamic diameters less than 10 p n (also called PMlo).
bGeometric mean.
CShort-term standards are not to be exceeded more than once per year; annual standards
dSpecified as “expected no. of days/@‘ with an hourly concentration not to be exceeded.
eUsed only as a reference in conjunction with the ozone standard.
Sources: Fed. Reg., 3622384 (Nov. 25,1971) for sulfur dioxide, nitrogen oxides, carbon
are not to be exceeded at all.
See CFR Title 40, Part 50, App. H, for a definition of “expected no. of days/yr.”
dioxide, ozone, and nonmethane hydrocarbons; Fed. Reg., 44:8220 (Feb. 8, 1979) for ozone revisions; Fed. Reg., 43:46258 (Oct 5,1978) for lead; and Fed. Reg., 52524634 (July 1,1987) for thoracic particulates.
air quality, issuing construction permits for new sources of pollution, and implementing the plan.
The EPA reviews each state’s submittal and sup- porting documentation, including any demonstrations of attainment through the use of applicable air quality dispersion models. If statutory and regulatory require- ments are met, the EPA approves the plan (CFR Title 40, Part 52).
Since the EPA does not codify provisions of approved SIPS (Le,, in the CFR), it is often difficult to determine which state air quality control provisions are also federal law. In fact, federal and state laws differ in cases where the state did not submit a particular provi- sion, the provision has been disapproved by the EPA, or its approval is pending. Environmental managers should consult federal (i.e., the appropriate regional EPA office), state, and local air pollution control agencies on
the exact requirements applicable to the facility. Thus, full compliance with air pollution control regulations may involve complying with the regulations of three (or more) jurisdictions, and compliance with one does not release facility owners and operators from liability for violating the others, even if the provisions are inconsis tent.
New Source Performance Standards
Under the authority of Section 11 1 of the Clean Air Act, the EPA has prcmulgated emission limits that apply to categories of new sources of pollution (see CFR Title 40, Part 60). These requirements include limits on the emissions of criteria pollutants (Le., those having related NAAQS) and noncriteria pollutants, as well as certain
426

Table A.2 Proposed Revisions to the National Ambient Air Quality Standards
Primary NAAQS Secondary NAAQS Averaging
Pollutant Time W m 3 PPm P m 3 PP*
Fine particulatesa b None None b b
Ozoneb 1 hc 157-235 0.08-0.12 None None 8hc 157-235 0.08-0.12 None None 7 hc 157-235 0.08-0.12 None None 1 mod None None 78-118 0.04-0.06 3 m d None None 78-1 18 0.04-0.06
Sulfur dioxidee l h 520-1,300 0.2-0.3 None None
Leadf 1 mo 0.25-0.75 None None
sParticles with aerodynamic diameters less than 2.5 pm.
bThe EPA proposed to continue the review process for establishing a secondary standard on July 1, 1987 (Fed. Reg., 52:24670). The standard level and averaging time will be determined.
cTen short-term air quality indicators -- 5 "peak' and 5 "statistical" - are being evaluated in various forms based on maximum running and block daily averages using I-, 7-, and 8-h averaging times.
in various forms based on 1- and 8-h averages. dTen long-term air quality indicators -- 5 monthly and 5 quarterly - are being evaluated
cA proposal is expected in late November 1987; options are a new I-h standard or retention
fA notice of proposed rule making is expected in November 1989.
Source: Ref. 6.
of existing standards.
monitoring, testing, and reporting requirements. The EPA has delegated the authority to implement and enforce some of these federal standards to various state and local agencies, although it always retains indepen- dent enforcement authority.
A new source is subject to NSPS if (1) it falls within the industrial category defined by the size and nature of the. process or (2) its construction was com- menced on or after the proposal date of the standard. Most questions over the applicability of NSPS arise from the second criterion. To "commence construction" generally means the initial letting of binding contracts for the affected process equipment. An environmental manager who has any questions about the applicability of the standard should contact the EPA (CFR Title 40, Part 60.5).
Although compliance with the standards is required from the time of start-up of the new or moc-llfied facility, Section 1 11 0) of the Clean Air Act provides for an innovative-technology waiver of a standard: the waiver
may be available for the earlier of either (1) up to seven years from the date on which the waiver is granted or (2) up to four years from commencement of operation. Such waivers may be subject to numerous terms and conditions and are primarily designed to permit the adequate demonstration of new technologies that will comply with the standard with less energy use or eco- nomic cost or that transfer fewer effects to other envi- ronmental media.
One NSPS provision applies to emerging technolo- gies. Owners or operators of new or modified electric- utility steam generators who propose to commercially demonstrate the emerging technologies of solvent- refined-coal combustion, coal-derived liquid combus- tion, or fluidized-bed combustion may apply to the EPA for commercial demonstration permits that allow higher emission levels than would otherwise be allowed (CFR Title 40, Part 60.453). The number of these permits that may be granted is limited by an electrical generation capacity ceiling.
427

Table A 3 Sample SIP for Illinois: SO2 Emission Limits by Fuel Type and Source Size
~~
Emission Limit by Source Sizea (Ib/million Btu)
Heat Input Heat Input I250 > 250
Source Type Fuel million Btu/h million Btuh
Existing
Sources in Chicago, Coal 1.8 1.8 St. Louis, and Peoria
All others Coal 6.8 b Distillate oil 0.3 0.3 Residual oil 1 .o 1 .o
Newc Coal 1.8 1.2 Distillate oil 0.3 0.3 Residual oil 1 .o 0.8 Combined fuels d d
aTotal heat input based on unit design.
bEmission limit (E) is computed as follows: E = [(Ha)0.11](He)2/128, where Ha = average stack height in feet and He = effective height of effluent release, which is He = Ha t AH; AH = plume rise, or E = 20,M)O(H$300)2, where H, is the heat input for solid fuel.
CSources larger than 250 million BtWh heat input must comply at least with the
dEmission limit (E) is computed by E = S,H, + 0.3Hd + S,H,, where S, = solid fuel standard (lb/million Btu); Sr = residual fuel standard (Ib/million Btu); and H,, H,, and Ha are the heat inputs (million Btu/h) for solid, residual, and distillate fuels, respectively.
NSPS, or with more stringent state standards.
New source performance standards have been promulgated for over 30 source categories. Table A S lists those categories directly related to energy produc- tion and use, along with the regulated pollutants and dates of the most recent rule making.
National Emission Standards for Hazardous Air Pollutants
The EPA has determined that eight pollutants -- asbes- tos, beryllium, mercury, vinyl chloride, benzene, air- borne radionuclides, coke oven emissions, and arsenic -- are hazardous under Section 112 of the Clean Air Act, because these pollutants can cause or contribute to air pollution that may result in increased mortality or seri- ous irreversible or incapacitating reversible illness (CFR Title 40, Part 61). The listing of a pollutant triggers the
EPA administrator’s responsibility to develop emission standards within six months. The NESHAPs are required to protect the public with an ample margin of safety.
over 27 source categories or facilities for seven of the eight listed pollutants. Table A.6 lists the current NESHAPs pollutants and affected sources. In June and September 1984, EPA proposed NESHAPs for coke oven emissions and benzene emissions from coke by- product recovery plants. As of February 1987, final regulations for coke oven emissions were pending review by the Office of Management and Budget.
Due to the substantial regulatory effort required of the EPA by Section 112, as well as congressional com- plaints that the EPA has not expediently addressed the hazardous air pollutant problem, EPA’s NESHAPs approval process has been revised. In late 1983, the
Emissions standards have been promulgated for
428

Table A.4 Sample SIP for Illinois: Particulate Matter Emission Limits by Fuel Type and Source Size
Emission Limit by Source Size8 (Iblmillion Blu)
Source Type Fuel QSlO lO<Q<250 Q Z S O
Existing
Chicago metropolitan Coal or oil 0.1 0.1 0.1 area Combined fuels b b b
Cook County, excluding Coal C C C
Chicago Combined fuels b b b
All others All fuels 0.1 5.1 8Q-O.715 0.1
Newd
Chicago metropolitan Coal or oil 0.1 0.1 0.1 area Combined fuels b b b
All others All fuels 1.0 5.1 840.71 5 0.1
EHeat input (Q, in million Btu/h) refers to the aggregate of all fuels burned (for each stack).
bEmission limit (E) for combined fuels is E = S, + H, + 0.1€I~, where S, is solid fuel emission standard (Ibhillion Btu) and H, and HL are the heat input (million Btu/h) of solid and liquid fuels, respectively.
CEmissions of particles larger than 44 pm are limited to no more than 10% by weight.
dSources with a heat input greater than 250 million Btdh must comply at least with the NSPS, or with more stringent state standards.
EPA made a commitment to Congress to publish regulatory decisions on 20-35 priority pollutants. Because Section 112 establishes a strict time frame for developing NESHAPs once a pollutant is listed as haz- ardous, the EPA, in December 1985, proposed an "intent-to-list'' program that would provide more time for developing appropriate NESHAPs. Under this program, decisions on 25 pollutants were made by January 1988 (Table A.7). One pollutant, acrylonitrate, was referred to the states for regulation as a part of the EPA's June 1985 revised air toxics strategy.
All new sources subject to a NESHAP (Le., for which construction commenced on or after the proposal date of the standard) are required to comply at the time of start-up and to have a construction permit. Sources existing before a standard's proposal date are eligible to apply for a compliance waiver of up to two years to install necessary control equipment (see CFR Title 40, Parts 61.10-61.11). Presidential exemptions are allowed for national security facilities for which compliance technology is not available.
Prevention of Significant Deterioration of Air Quality
Although the federal PSD program has been established through an elaborate and lengthy regulatory, legislative, and judicial process, its primary purpose has remained the same: to protect the air quality of "clean" areas of the United States through regulation of new major sources of pollution. Clean areas are classified by a system that controls the increments of increased pollu- tion permitted from new sources, as described in CFR Title 40, Part 52.21(c). Construction permits are required for major new or modified sources in accor- dance with applicable new-source review requirements, including PSD. (Modified sources are those for which process or other changes cause a significant increase of emissions of any pollutant.) Also, states are required to include PSD provisions in their SIPS.
The main stages of the construction permit process are determination of applicability, submission of a
429

Table A 5 Selected Source Categories for which New Source Performance Standards Have Been Promulgated
Source Category Pollutants
Fossil fuel steam generators, Particulates, sulfur >250 million Btwh dioxide, nitrogen
oxides, opacity Electric utilities, Particulates, sulfur
>250 million Btu/h dioxide, opacity Incinerators, A 0 tondd Particulates
Petroleum refineries Particulates, sulfur dioxide, opacity
Storage vessels for petroleum Volatile organic liquids compounds
Coal preparation plants Particulates, opacity
Stagnant gas turbines Sulfur dioxide,
Lead-acid battely plants Lead, opacity Surface coating of automobiles
and light-duty trucks compounds
nitrogen oxides
Volatile organic
Date(s) of Rule Making and Latest Revisions
Dec. 23, 1971 Jan. 15,1982
June 11,1979 Feb. 6,1980 Dec. 23,1971 March 3,1978 March 8,1974 Dec. 1,1980 March 8,1974 April 4,1980 Dec. 18,1980 Jan. 15,1976 March 3,1978 Sept 10,1979 Jan. 27,1982 April 16, 1982 Dec. 24,1980
Reference (Subpart of
CFR Title 40, Part 5 1)
D
Da
E
K
K, Ka
Y
GG
KK MM
complete permit application, and the opportunity for public comment. The minimum requirements for a construction permit are that the owner or operator of the new source demonstrate that (1) the best available control technology (BACT) will be applied, (2) the proposed project will not cause relevant PSD increments and NAAQS to be exceeded (see Tables A.l and A.8), and (3) the source will not adversely affect the air- quality-related values (soils, vegetation, and visibility) of a Class I (pristine) area.
The current federal regulations appear in the August 7, 1980, Federal Register. Because of their complexity, readers are advised against using any sum- mary of these regulations, including the one that fol- lows, to determine compliance requirements.
preparation of a PSD permit application, the procedures can be divided into seven parts: (1) determining source applicability, (2) determining pollutant applicability, ( 3 ) determining the B A a , (4) analyzing ambient air quality, ( 5 ) analyzing the effect of the source on air quality, and (6) submitting a complete application for review. The applicant must know the technical and legal
To illustrate and simplify the requirements for the
provisions and definitions in the regulations to complete the application. Some of the key provisions and defini- tions are summarized below.
Source Type and Size
New and modified major stationary sources are subject to PSD requirements if their proposed sites fall within geographic areas of PSD applicability. Major sources include (1) all sources in 28 specific industrial categories that have the potential to emit 100 tons/yr or more of any regulated pollutant and (2) all sources, regardless of industrial type, having the potential to emit 250 tons/yr or more of any regulated pollutant (Table A.9).
The "potential to emit" is the ability, at maximum design capacity, to emit air pollution, taking into ac- count any control equipment in place and any federally enforceable permit conditions that constrain potential emissions (by limiting hours of operation, for example). The estimate of annual emissions must account for fugi- tive emissions -- those emissions that cannot reasonably be passed through a stack -- for 27 categories of sources. (These categories are similar to the source categories specifically named as "major.")
430

Table A.6 National Emission Standards for Hazardous Air Pollutants
Pollutant Sources or Source Facilities
Reference (Subpafi of
CFR Title 40, Part 61)
Asbestos
Beryllium
Mercury
M Asbestos mills Manufacturing (with asbestos) of textile materials; cement
products; fire-proofing and insulating materials; friction products; paper, millboard, and felt; floor tile; paints, coatings, caulks, adhesives, and sealants; plastic and rubber materials; chlorine; shotgun shells; and asphalt concrete
Roadway surfacing Demolition and renovation Spraying of certain asbestos-containing materials Asbestos waste disposal
C, D Beryllium processing by extraction, ceramic, foundry,
Machine shops processing beryllium or beryllium alloys Beryllium-mket-motor test sites
incinerator, and propellant plants
E Mercury ore processing Production of chlorine gas and alkali metal hydroxide with
Incineration and drying of wastewater treatment plant sludge mercury chloralkali cells
F Vinyl chloride Production of ethylene dichloride, vinyl chloride, and polymers containing polymerized vinyl chloride
0 Arsenic Primary lead, zinc, and copper smelters
J, V Benzene and other volatile pollutants
Fugitive emissions sources (e.g., within petroleum refineries and other manufacturing facilities)
Radionuclides Underground uranium mines (radon-222) DOE energy facilities NRC-licensed facilities Elemental phosphorus plants
Geographic Location
If a source or modification qualifies as major, its pro- spective location must be in a PSD area for PSD regula- tions to apply. A PSD area is one formally designated as in attainment or unclassifiable for any criteria pol- lutant. Location of the source in a PSD area for any pollutant triggers the geographic applicability. PSD review then applies to all pollutants except those for which the area is designated as nonattainment, and non- attainment new-source review applies to emissions of the nonattainment pollutants.
pollutant (Table A.10), except those pollutants, from major sources, for which the area is classified as nonat- tainment. The determination of BACT accounts for the energy, environmental, and economic costs and includes process design changes as well as emission capture and cleaning devices. Application of BACT at modified sources is required for each pollutant emitted in signifi- cant net increased amounts, but only on those units whose modifications or addition results in a source-wide net increase.
Air Qualiry Analyses
Best Available Control Technology The owner or operator of a proposed construction pro- ject subject to PSD review must perform three air qual- ity analyses. The first is an assessment of the existing
causes significant ambient impacts. Representative air
The BACT is determined on a case-by-case basis. It is
tial to emit significant amounts of any regulated required for prospective that have the poten- ambient quality for each pol lu~nt that
43 1

Table A.7 Air Toxics Regulatory Review Program under Section 112 of the Clean Air Act
Date of Pollutant Decision EPA Decision
Initiation of Coke oven emissionsb rule makinga
Intent to list Cadmium
Benzene in coke by-product plants
Chromium and hexavalent
Ethylene dichloride Carbon tetrachloride Ethylene oxide 13-Butadiene chloroform Methylene chloride Perchloroethylene Trichloroethylene
Reconsiderationd Radionuclides Benzene
No regulation Benzenee CFC 113 Chlorinated benzenes Choroprene Epichlorohydrin Hexachlomyclopentadiene Manganese Methyl chloroform Nickel Phenol Polycyclic organic material Toluene Vinylidene chloride
chromium
Referral to states Acrylonitrile
April 23.1987 June 6,19M
at. 16,1986 June 10, 1985
Oct. 16, 1985 Aug. 13,1985 OcL 2,1985 Oct. 10, 1985 Sept. 27, 1985 O n 17, 1985 Dec. 26, 1985 Dw. 23,1985
Jan. 2, 1988 Jan. 2, 1988
June 10,1985 Aug. 13, 1985 Sept. 27, 1985 June 27,1985 Oct. 1,1985 Aug. 13, 1985 June 10, 1985 SepL 9,1985 June 23,1986 Aug. 8,1984 May 5,1984 Aug. 13,1985
June 10, 1985
.Notices of proposed rule making are expected in October 1988 for perchloroethylene used in dry cleaning, ethylene oxide from commercial sterilization, and emissions from cleaning with organic solvents.
bFrom coke oven charging, door leaks, and top-side leaks on wet-coal- charged batteries. Final action expected in October 1988.
CFinal action expected in December 1988.
dFina1 action expected in August 1989.
eIncluding maleic anhydride manufacturing plants, ethylbenzene and styrene manufacturing, and benzene storage.
quality monitoring or field measurement data for one year before application submission are generally required for all criteria pollutants. Exemptions are applicable to (1) source emissions that would cause impacts less than the "significant monitoring concentra- tions" or (2) situations where the background concentra- tion of the pollutant is below these concentrations. The significant monitoring concentrations for 16 criteria and
noncritena pollutants are given in Table A.11. Disper- sion modeling can be used to extend or support ambient monitoring assessments and normally may be the sole basis for noncriteria pollutant ambient analysis. The second analysis is an assessment of the amount of incre- ment available for sulfur dioxide and particulate matter where the proposed source would emit these pollutants in significant amounts. A permit will not be issued for a source that would exceed an allowable increment. The third analysis, if required, involves postconstruction ambient monitoring. Adverse effects on the air quality indicators of Class I ateas are not allowed.
Visibility Protection
In 1977, Congress addressed the problem of air pollution threats to the scenic value of park and wilderness areas by requiring the EPA to issue regulations designed to prevent any future, and to remedy existing, impairment of "visibility" in these areas (Sections 169A and 165 of the Clean Air Act Amendments of 1977). Visibility protection is required for the 156 mandatory Class I areas of the counay where the visual quality of the ambient air is important. Final rules were published in the Federal Register on December 2, 1980.
Two areas of visibility impairment, "regional haze" and "plume blight," have been identified by the EPA. The final rules do not address regional haze, which is generally a complex, multisource problem for which no adequate modeling and monitoring methods have been developed. The regulations do, however, address plume blight, whose cause can be identified, modeled, and monitored. The rules outline Phase I of the visibility program, which is designed to prevent and correct plume-related visibility impairment.
three general requirements: controls for certain single sources or groups of sources that are contributors to visibility-degrading pollution, evaluation and control of new sources to prevent future visibility impairment, and development and adoption of other strategies for reme- dying existing (and preventing future) visibility impair- ment.
State agencies, in cooperation with federal land managers in the U.S. Department of the Interior and U.S. Department of Agriculture, will analyze existing industrial sources and, where necessary, require the installation of the best available retrofit technology on sources in operation on or after August 7, 1962, whose emissions affect visibility. Visibility-protection reguIa- tions outlined in Section 169A of the Clean Air Act are also addressed in Section 165, which outlines the PSD
Phase I of the visibility-protection requiremenrs has
432

Table A S Air Quality Increments for Prevention of Significant Deterioration
Air Quality Incrementa (pglrn3) Averaging
Pollutant T i Class1 ClassII ClassIII
Aerosols
Total suspended particulates
Thoracic particulates
Lead
Gases
Sulfur dioxide
Nitrogen oxides
Carbon monoxide
Ozone
Nomethane hydrocarbons
l y r
l y r 24 h
3 mo
24 h
l y r 24 h 3 h
l y r 8 h l h
l h
I h
5 10
None
None
2 5
25
None
None None
None
None
19 37
None
None
20 91
512
None
None None
None
None
37 75
None
None
40 182 700
None
None None
None
None
.The classification system is as follows: Class I - pristine air quality areas, Class I1 - all areas not designated as Class I, and Class 111 - areas reclassi- fied by state governors where economic growth constraints were imposed by a Class I1 designation and the NAAQS would not be violated.
Source: Fed. Reg., 4552677 (Aug. 7, 1980).
regulations. The PSD regulations require that planned industrial facilities, or facilities with planned major modifications, be evaluated for potential visibility im- pacts. If it is determined that a source would adversely affect visibility in Class I mas, then a state must deny the required construction permit. Finally, states contain- ing Class I areas targeted for visibility protection must revise their SIPs to include long-term strategies for making reasonable progress toward the visibility goal. For example, states are to consider measures such as smoke management techniques, source retirement, and source replacement schedules.
The 36 states that contain mandatory Class I federal areas targeted for visibility protection must, within nine months of the final promulgation of these rules, revise and submit SIPs that reflect the measures outlined above. (When this Appendix was written, visibility rules were not yet promulgated.)
impact near Class I areas in western regions, since visi- The EPA’s Phase I program could have a significant
bility in these areas is especially sensitive to &gradation by pollution. In addition, the majority of Class I areas are located in the West, where much of the projected energy-related development is expected. Enforcement of the visibility protection program has the potential to cause denial or delay of permits for new facilities, as well as increase the costs for control equipment. Sub- sequent phases of visibility regulation development will focus on regional haze and urban plume controls.
New Construction in Nonattainment Areas
In an effort to balance the needs of industrial develop- ment and air pollution cleanup requirements in nonat- tainment areas, the EPA developed the emission offset policy (EOP). This policy was sanctioned by Congress in the 1977 Clean Air Act Amendments (Sections 129 and 172) and forms the framework for the construction permit requirements of SIPs for these areas. Although not all EOP requirements have been incorporated (or
433

Table A.9 Sources Subject to PSD Standards
Industrial categories (source is major if it has an emission potential of 100 tondyr or more)
Fossil-fuel-fired, steam-electric plants of more than
Coal cleaning plants (with thermal dryers) Kraft pulp mills Portland cement plants Primary zinc smelters Iron and steel mills Primary aluminum ore reduction plants Primary copper smelters Municipal incinerators capable of charging more than 250 tons/d
Hydrofluoric, sulfuric, and nitric acid plants Petroleum refineries Lime plants Phosphate rock processing plants Coke oven batteries Sulfur recovery plants Carbon black plants (furnace process) Primary lead smelters Fuel conversion plants Sintering plants Secondary metal production plants Chemical process plants Fossil fuel boilers (or combinations thereof) totaling more than
Petroleum storage and transfer units with a total storage capacity
Taconite ore processing plants Glass fiber processing plants Charcoal production plants
250 million Btu/h heat input
of refuse
250 million Btdh heat input
exceeding 300,000 bbl
All sources, regardless of size or industrial category, with the potential to emit 250 tondyr or more of any regulated pollutant
Source: CFR Title 40, Part 52.21(b)(l)(i).
were required to be incorporated) in current approved SIPS, states have generally adopted the approach of the EOP. The state or local air pollution control agency is the primary permit-issuing body and should be consulted for specific guidance regarding new source construction within its jurisdiction.
Title 10, Part 51, App. S . New, modified, and recon- structed sources that are major emitters (i.e., have the potential to emit 100 tons/yr or more) of the nonattain- ment pollutant(s) for the area in which the ownen pro- pose to locate them are subject to the EOP and must have construction permits. The three general EOP requirements are outlined below.
lowest achievable emission rate. This emission limit,
The EPA has published EOP requirements in CFR
The proposed source is required to comply with the
Table A.10 PSD Significance Levels
Amount Pollutant (tondyr)
Carbon monoxide Nitrogen oxides Sulfur dioxide Total suspended particulates Tholacic particulates (PMlo) Ozone (volatile organic
Lead Asbestos Beryllium Mercury Vinyl chloride Fluorides Sulfuric acid mist Hydrogen sulfide Total reduced sulfup Reduced sulfur compoundsa
compounds)
100 40 40 25 15 40
0.6 0.007 0.0004 0.1 1 3 7
10 10 10
UIncluding hydrogen sulfide.
Source: Fed. Reg., 4552676 (Aug. 7, 1980).
applicable only to the nonattainment pollutants emitted in major amounts, is the more stringent of either the lowest rate achieved in practice or the lowest SIP re- quirement in effect. Emission limits for other pollutants emitted in significant amounts are set through the PSD mechanism on the basis of BACT.
The owner or operator of the proposed source must demonstrate that all its major stationary sources within the same state as the proposed source are either in com- pliance with the Clean Air Act or on compliance schedules .
time of operation must either (1) be more than offset by decreases in pollution from existing sources or (2) be within growth allowances that the state has set through its approved SIP. These "offsets" must be federally enforceable and can be accomplished either through internal means (controlling emissions in the area from the owner's facilities more than is otherwise required) or external means (controlling emissions from other facili- ties in the area more than otherwise required).
The total allowable emissions from the source at the
Motor Vehicle Requirements
Under Title I1 of the Clean Air Act, as amended, EPA establishes emission requirements for new motor
434

Table A . l l Significant Concentrations for Use in Determining the Need for Preconstruction Ambient Monitoring
Air Quality Concentration Averaging
Pollutant @p/m3) Time
Carbon monoxide Nitrogen dioxide Sulfur dioxide Total suspended particulates 'horacic particulates (PMlo) Ozone Lead Asbestos Beryllium Mercury Vinyl chloride Fluorides Sulfuric acid mist Total reduced sulfurc Reduced sulfw Hydrogen sulfide
515 14 13 10 10
b 0.1
0.001 0.25
0.25
f f
0.02
C
15
c
8 h
24 h 24 h 24 h
3moa
24 hd 24 h 24 h 24 h
1P
1 hd
aThe averaging times are corrected to be consistent with the averaging time of the standard.
bNo specific air quality concentration for ozone is prescribed. Exemptions are granted when a source's emissions of volatile organic compounds are less than 100 tondyr.
cMonitoring is not required until acceptable techniques are developed.
dThese concentrations are corrected from the previous edition and are about five times the minimum detectable concentra- ions. These concentrations are consistent with other values in this table.
eIncluding hydrogen sulfide.
gAcceptable monitoring techniques are expected to be available soon.
vehicles and aircraft and requirements for motor vehicle fuel additives. Title II also establishes requirements for vehicle testing, certification, recall, importation, and use. The EPA requirements for motor vehicles and fuels can be found in CFR Title 40, Parts 79-80 and 85-87.
Motor Vehicle Emissions
Since 1968, the federal government has regulated air pollutants in the exhaust of new light-duty motor vehi- cles. Emission standards for light-duty vehicles are expressed in terms of maximum allowed levels of emis-
sions per unit distance while the vehicle is operating on a prescribed duty cycle. Sampling procedures and test equipment are also prescribed by the regulations. Although the standards apply to new vehicles, the certi- fication procedure requires that test cars meet emission standards after being driven over a prescribed durability schedule. Table A.12 lists these emission standards for model years 1978-1988 (and after).
Separate emission control regulations for new heavy-duty gasoline- and diesel-fueled truck engines manufactured for long-distance transport have been in effect since 1970. The Clean Air Act Amendments of 1977 require the EPA to prescribe, for heavy-duty en- gines and vehicles, emission standards requiring a 90% reduction in hydrocarbons and carbon monoxide from uncontrolled levels beginning with the 1983 model year.
Both interim (1978 and 1979) and longer-term (1980 and beyond) emission standards for motorcycles designed for street use were promulgated by the EPA in 1977 (CFR Title 40, Part 86, Subparts E and F).
Fuel and Fuel Additives
All motor vehicle fuels and fuel additives must be regis- tered with the EPA before they can be sold commer- cially (CFR Title 40, Part 79). (This requirement does not apply to motor oils.7) In addition, Section 211(f) of the Clean Air Act makes it unlawful to introduce into commerce any fuel or fuel additive that is not substan- tially similar to any fuel (or additive) used to certify a class of vehicles or engines (in model year 1975 or beyond) as complying with emission standards. (See Fed. Reg., 46:38582, July 28, 1981, for the EPA's inter- pretation of the "substantially similar" clause, which determines whether a particular fuel or additive needs a waiver.) The EPA must act on a waiver request within 180 d or the waiver is automatically granted (the waiver for gasohol was granted in this way).
Since the implementation of Section 112(f), fuel manufacturers have requested waivers for a variety of oxygenated materials, due to the oil crises of the 1970s and a phase-down of the use of lead for octane enhance- ment. The EPA has granted 9 of the 20 waiver requests submitted (a waiver for PetrocoalTM by Anafuel Unlim- ited was initially granted but later revoked); Table A.13 lists the fuels and additives for which the EPA has granted waivers.8 Currently, ethanol or methanol blends account for about 10% of the total U.S. gasoline market9
refiners of gasoline are given in CFR Title 40, Part 80. Requirements for lead-based adQtives applicable to
435

Table A.12 Federal Exhaust Emission Standards and Control Levels for Light-Duty Vehicles
Standard (glmi)
Light-Duty Light-Duty Light-Duty , Light-Duty Model Gasoline-Fueled Diesel-Fueled Gasoline-Fueled 6 Diesel-Fueled Year Pollutant. Passenger Carsb Passenger Carsb Trucks Tmcksc
1978
1979
1980
1981
1982
1983
1984
1985- 1987
1988 and after
Hydrocarbons Carbon monoxide Nitrogen oxides Particulates
Hydrocarbons Carbon monoxide Nitrogen oxides Particulates
Hydrocarbons Carbon monoxide Nitrogen oxides Particulates
Hydrocarbons Carbon monoxide Nitrogen oxides Particulates
Hydrocarbons Carbon monoxide Nitrogen oxides Particulates
Hydrocarbons Carbon monoxide Nitrogen oxides Particulates
Hydrocarbons Carbon monoxide Nitrogen oxides Particulates
Hydrocarbons Carbon monoxide Nitngen oxides Particulates
Hydrocarbons Carbon monoxide Nitrogen oxides Particulates
1.5 15 2
1.5 15 2
0.41 7.0 2.0
0.41 3.46 1 .oe
0.41 3.46 1 .o
0.41 3.4 1 .o
0.41 3.4 1.0
0.41 3.4 1 .o
0.41 3.4 1 .o 0.2
1.5 15 2
1.5 15 2
0.41 7.0 2.0
0.41 3.4d 1 .oe
0.41 3.46 1 .o 0.6
0.41 3.4 1 .oe 0.6
0.41 3.4 1 .oe 0.6
0.41 3.4 1 .o 0.2
0.4 1 3.4 1 .o 0.2
2 20 3.1
1.7
2.3 18
1.7
2.3 18
1.7
2.3 18
1.7
2.3 18
1.7
2.3 18
1.7 10.0 2.3
1.7 10.0 2.3
0.8 10.0
1.2f 0.26
2 20 3.1
1.7
2.3 18
1.7
2.3 18
1.7
2.3 18
1.7
2.3 0.6
1.7
2.3 0.6
1.7 9.4 2.3 0.6
1.7 10.0 2.3 0.26
0.8 10.0
1.2f 0.26
18
18
aGasoline-fueled light-duty passenger cars and trucks are also subject to standards for emissions from fuel evaporation and crankcase fumes.
bUnder 6,000 Ib gross vehicle weight.
CUnder 8,500 Ib gross vehicle weight.
d?he 1981 and 1982 carbon monoxide standards can be waived to 7 @mi.
e?he nitrogen oxides standard may be waived for diesels up to a maximum of 1.5 @mi for model years 1981-1984,
fIf the loaded vehicle weight is greaterthan 3,750 Ib, the standard is 1.7 @mi.
if the manufacturer can show that such a waiver is necessaxy to permit use of diesel technology.
436

Table A.13 Fuel or Fuel Additive Waiven Granted under Section llZ(T) d the Clean A h Act-
Cas Plus, loc.
ARC0
ARC0
Sun Pelrdeum
Tcxaw
ARC0
Spu, 76 Fuel carp. E.I. DuPoof de NCWK and -PnY Texas M e t h a d C W .
Gasohol (up IO 10% anhydrous clhlaol)
Up IO 74 mmy butyl alcohol
Up lo 7 2 teniary butyl ether
Up lo 55% blend dmethaml and l e n q h t ) l alcohd
TC-11064"
Blend of up to 4 75% muhaad and up to 4 7% tewry butyl alcohol, tocll m y p conteal
10% ethlad plus a propnetnry d d l l l v e
UMol C X d 35%
5% m e w , 2.546 codolveat alcohols, and a rpecdied mmton IPbtbitw
o(JTAh4LP. 5% mthzwl. 25% ( C f i cardvenr alcohdr, adrspaliedcYmcmon inhiblW
k. 1978
Feb. 1979
F&. 1979
JUDC 1979
Aug. 1980 Nov. 1981
May 1982
Jan 1985
Feb. 1988
. F a further idcmatim. write IO Fuels seclioo. Field OpcAonr rad
bSun Refining and Markding Co. bas rrqwned a waiver for 1% mcchyl tertiary butyl der. Ihe desish is drw by Sep 12,1988.
[See Fed. Reg.,Sl:39800, 0~~31,1986, for a mcdificatkm oftbe o c i g i ~ l condition&
dsCe Fed. Reg., 53:17977. May 19.1968. for a cormdoa dlhe cosolvent specificattons.
SuppA Divkiaa, EPA. Washington. D C. 20460.
Scurcc: Ref. 8.
WATER QUALITY REGULATIONS
Although legislation to contrd water pollution dates back to the 1899 Refuse Act, the current framework for federal regulation pertaining to water quality is the Water Pollution Control Act of 1972 (USC Title 33, Section 466 et seq.). which was amended in 1977 todeal with toxic water pollutants and renamed the Clean Water Act. Congress amended the Clean Water Act (Public Law 100-4) on February 4, 1987. to refine existing programs, as well as establish new programs.
The Clean Water Act establishes a system for limit- ing or otherwise preventing discharges of pollutants i n t o any waters of the United States from any point source. Indirect, or "nonpoint," sources (e.g., runoff) are also addressed to a smaller degree. Major provisions of the act include permit!, under the National Pollutant Dis- charge Elimination System (hTDE-S). discharges to publicly owned treatment works, regulation of nonpoint sources, discharges of oil and hazardous substances, md k d discharges.
Potential contamination of groundwater was addressed with enactment of the Safe Drinking Water Act of 1974 (Public Law 93-523). The major provision affecting industry deals with controlling underground injection to prevent contamination of drinking water supplies. Other statutes, such as the Resource Consena- tion and Recovery Act (RCRA), also regulate activities that affect groundwater quality.
The National Pollutant Discharge Eliminaion System
The NPDES prograrr. (CFR Title 40, Part 122) requires pennits for the discharge of pollutant$ from a point source into any waters of the United States. The permit establishes mandatory effluent limits and monitoring and reporting requirements to determine compliance. Under Section 301 of the Clean ?'ater Act, technology- b d effluent guidelines and standards have been promulgated for 34 indusmal categories (Table A.14). These standards establish direct discharge limits for conventional pollutants (biochemical oxygen demand, total suspended solids, pH, fecal coliform bacteria, and oil and grease) as well as toxic pollutants (65 priority pollutants and classes of compounds, or 129 specific pollutants). A third category, "nonconventional non- toxic pollutants." coven all other pollutants; only about ten substancts are so regulated.
The Clean Water Act establishes a schedule for attaining technology-based effluent limits by certain deadlines: best practicable technology by July 1, 1977; best available technology by July 1.1984, for toxic pollutants and by July 1, 1987, for "nonconventional" pollutants; and best conventional technology by July 1, 1984, for conventional pollutants.
The initial step, requiring the best practicable tech- nology, was designed to bring similar types of industrial plants up to the highest level of effluer I control current- ly achieved within each industry. 'I%: EPA has defined best available technology as the "very best control and treatment meawes that have been or are capable of being achieved" Although the LPA is required to
437

:,: ._.; :...:.:.:.: .._:....-_ . . . ... . . .
Table A.14 Prlmary Industry Categories for the National Pollutant Discharge EUmlnation System
&--
Adhesives and sealanls Aluminum farming Auto and other laundries Battery manufacturing Coal mining Coil coating Copper forming Electrical and eledronic components Electroplating Explosives manufacturing Foundries Gum and wood chemicals Inorganic chemicals manufacturing Iron and steel manufacturing Leather tanning and finishing Mechanical produds manufacturing Nonferrous metals manufacturing Ore mining Organic chemicals manufacturing Pain: and ink formulation Pesticides Petroleum refining Pharmaceutical preparations Photographic equipment and supplies Plastics promsing Plastic and synthetic materials manufacturing Porcelain enameling Printing and plblishing Pulp and paper mills Rubber processing Soap and detergent manufacturing Steam electric power plants Textile mills Timber prcducts processing
Source: CFR Title 40, Part 122, App. A.
consider the cost of achieving the required effluent reduction in determining whether a best-available- technology limit is economical, it is not required to balance cost against the effluent reduction benefit, as it is in the case of the best practicable technology. Efflu- ent limits for the best available technolcgy now focus primarily on the priority pollutants and toxic pollutants identified pursuant to Section 307(a) of the act. The best conventional technology effluent limits are, like the other limits, to be adopted on an industry-by-industry basis but apply only to those pollutants identified as "conventional." Procedures for establishing these limits consider the costs of treatment versus the benefits derived, and the level of treatment is expected to be comparable to that achieved by secondary sewage treatment.
It was initially anticipated that the EPA's guideline regulations would be published well in advance of the statutory attainment deadlines. However, the EPA has experienced delays in promulgating the effluent limita- tions guidelines for various industry categories. As a result, Congress revised the 1984 and 1987 compliance deadlines with the 1987 amendments. Section 301 of the amendments extends the deadlines for the tech- nology-based limits to three years after the EPA promul- gates effluent guidelines, but no lata than March 31, 1989.
Limits for New Sources
Section 306 prescribes effluent limits for "new sources," which are defined as any facility for which consauction is commenced "after the publication of proposed regula- tions" prescribing an applicable performance standard. These standards may be more smngent than those for existing sources, regarding both the level of treatment required and the manner of applying the established limits. For instance, Section 306 criteria may address not only pollution control techniques (Le., end-of-pipe treatment) but also various alternative production pro- cesses, operating methods, and in-plant control proce- dures. By addressing plants that have yet to be con- structed, the new source standards may effect more stringent effluent limits by incorporating them into the total facility design. The issuance of NPDES permits to new sources may constitute a major federal action appli- cable to review under NEPA.
Water Quality Criteria
In addition to technology-based effluent limits, NPDES permits may provide for more smngent requirements where dictated by the need to protect or maintain water quality in specific bodies of water. As specified in CFR Title 40, Part 131, the states set their own water quality standards, which must attain the Clean Water Act's goal of fishable, swimmable waters wherever attainable and must specify and protect appropriate water uses (Le., water supply, fish, and wildlife). These standards must apply to both conventional and toxic pollutants. Sec- tion 303 of the Act requires that, for bodies of water having pollutant levels that exceed the water quality criteria (referred to as "water quality limited segments"), states must establish maximum loadings for each seg- ment and provide a system for allocating those maxi- mum loadings among all dischargers to the affected waters. In addition, the 1987 amkdments require states to submit to the EPA a list of water bodies that will not
438

attain or maintain state water quality standards after implementation of the best available technology, due to point source discharges of toxic pollutants. For each segment of the listed water bodies, the state must iden- tify the specific point sources preventing or impairing acceptable water quality and submit a control strategy. The standards are to be achieved as soon as possible, but no later than three years after strategy implementation.
Discharges to Publicly Owned Treatment Works
Standards for pretreatment of wastewater discharges to publicly owned treatment works are covered in CFR Title 40, Part 403. The regulations control and monitor discharges of nonconventional and toxic pollutants that pass through, disrupt, or in other ways adversely affect the operation, performance, or by-product sludge dis- posal of public treatment works. Specific pretreatment limits for existing and new industrial sources are defined for each respective industry in CFR Title 40, Parts 405- 461. Regulation of the 129 toxic pollutants is empha- sized. State and local pretreatment programs are required for any community with more than 50,000 people or a sewage flow over 5 million gaVd; the pro- grams must have been approved by the EPA by July 1, 1983.
Nonpoint Sources
Accidental and unanticipated discharges, or discharges that by their nature are not subject to confinement and treatment (e.g., area-wide or plant-site runoff), account for a large portion of the pollutants introduced into U.S. waters. Section 208 of the Clean Air Act established nonpoint source pollution controls, but a lack of funding has made this provision ineffective.4 Under CFR Title 40, Part 122, any stormwater collection system that is either located in an urbanized area or discharges from lands or facilities used for industrial or commercial activities must obtain an NPDES permit. The 1987 amendments require the EPA to establish permit appli- cation requirements for industrial stormwater discharges (i.e., discharges related to manufacturing, processing, or raw materials storage at a plant) by February 1989. Applications must be filed by February 1990, and the EPA must issue or deny permits by February 1991. Exemptions are provided for stormwater from mining operations or oil and gas exploration, production, processing, or transmission. Section 304(e) of the act authorizes the EPA to require permit holders to adopt
the best management practices to control toxic pollutants resulting from ancillary industrial activities. These requirements are detailed in CFR Title 40, Part 125, Subpart K.
Discharges of Oil and Hazardous Substances
Discharges of oil and hazardous substances are treated separately in Section 3 11, which requires the develop- ment, implementation, and maintenance of spill preven- tion, control, and countermeasure plans by owners and operators of large oil storage facilities (CFR Title 40, Part 112). Financial responsibility and reporting and cleanup requirements are also specified. Hazardous substance releases in excess of their "reportable quan- tities" (CFR Title 40, Part 117) must also be reported. Potential penalties associated with spills of oil and haz- ardous substances dictate the need for developing well- defined compliance procedures and contingency plans.
Thermal Discharges
Heat is defined as a pollutant by the Clean Water Act and is therefore subject to technology-based effluent limits. Although permit issuers typically propose "no discharge" and requirements for the best available tech- nology for heat, Section 3 16 of the act provides for less-stringent effluent limits if the discharger can pro- vide scientific data that verify protection of shellfish, fish, and wildlife in and on the body of water where the discharge is to occur.
Groundwater Protection
The Safe Drinking Water Act was enacted to ensure safe drinking water supplies, protect especially valuable aquifers, and protect drinking water from contamination by the underground injection of wastes. Implementation of programs addressing these goals is primarily the responsibility of the states. The EPA has promulgated primary and secondary drinking water standards in CFR Title 40, Parts 141 and 143, respectively. In areas where an aquifer provides the sole water supply, no federal assistance may be provided for any project if the EPA determines that it may contaminate the aquifer. The regulation of underground injection most directly affects hazardous waste disposal, the reinjection of brine from oil and gas production, and certain mining processes. The EPA classifies wells into five categories (Table A.15). Permits are required for all injection
439

Table A.15 Injection Well Classifications
Class Description
I Wells used to dispose of hazardous waste, or any other industrial and municipal fluid waste, that inject the waste beneath the lowermost formation containing, within 0.25 mi of the well bore, an underground source of drinking water.
Wells that inject fluids brought to the surface in connection with conventional oil or natural gas production or storage and may be commingled with wastewaters from gas plants that are an integral part of production operations, unless those waters are. classified as a hazardous waste at the time of injection.
Wells that inject fluids for (1) enhanced recovery of oil or natural gas or (2) storage of hydmadJons that are liquid at standard temperature and pressure.
I1
111 Wells that inject fluids to aid in mineral extraction, including mining of sulfur by the French process; in-situ production of uranium or other metals from ore bodies that have not been conventionally mined; and solution mining of salts or potash.
Wells owned, operated, or used by generators, managers, and disposers of hazardous or radioactive waste to dispose of the waste into, or less than 0.25 mi above, a formation that contains an underground source of drinking water.
IV
Hazardous waste disposal wells that inject waste into, or less than 0.25 mi above or below, an aquifer that cannot be classified under Class I or other Class IV criteria (e.g., if an aquifer has been exempted pursuant to Part 145.05).
V Injection wells not included in Classes I, 11,111, or IV.
Source: CFR Title 40, Part 144.6.
wells, and certain wells are prohibited due to location, material injected, or proximity to underground drinking water sources. Final regulations governing underground injection control programs became effective in 1980 (CFR Title 40, Parts 122, 124, and 146). Proposed amendments to these regulations were issued on October 1, 1981, and finalized on February 3, 1982.
SOLID AND HAZARDOUS WASTE REGULATIONS
The chief objectives of the RCRA of 1976 (USC Title 42, Section 6901 et seq.) are to regulate the man- agement of hazardous wastes from generation through disposal, through the EPA or state programs authorized by the EPA; regulate the land disposal of all other solid wastes by states, in accordance with minimum federal criteria; and establish resource recovery and conserva- tion as the preferred solid waste management approach.
The first implementing regulations were promul- gated by the EPA on May 19, 1980 (Fed. Reg., 45: 33066). The regulations established basic definitions; identified hazardous wastes; and established standards for generators, transporters, and owners and operators
of hazardous waste treatment, storage, and disposal facilities. At the same time, the EPA issued permit regulations for such facilities. Since then, the RCRA has been amended several times, most recently by the Hazardous and Solid Waste Amendments of 1984 (Public Law 98-616), which significantly expanded both the scope of coverage and the detailed requirements of the RCRA.
The RCRA includes solids, liquids, semisolids, sludges, and contained gaseous materials in its definition of solid waste. Wastes are included irrespective of whether they are discarded, stored, used, reclaimed, or transported. On January 4, 1985 (Fed. Reg., 50:614), the EPA issued final regulations that redefined the term "solid waste" to include many recycling activities previ- ously exempted. The effect of the RCRA on solid waste management depends largely on whether the wastes are designated hazardous or nonhazardous (Subtitle D of the RCRA addresses the disposal of nonhazardous waste). In addition, all states have an authorized permit program for nonhazardous solid waste disposal facilities, includ- ing incinerators and landfills, as required under CFR Title 40, Part 256. Most states also regulate storage, collection, transportation, and recycling. Table A. 16 lists federal guidelines issued to provide a uniform mini- mum control level.
440

Table A.16 Federal Guidelines for Solid Waste Management
Guideline
Reference (Part of
CFR Title 40)
Thermal processing and land disposal of solid
Solid waste storage and collection Beverage containers Resource recovery facilities Source separation for materials recovery Procurement of products that contain recycled
Procurement of cement- and concrete-containing
Prior notice of citizen suits Identification of regions and agencies for solid
Criteria for classification of solid waste disposal
wastes
material
fly ash
waste management
facilities and practices
240-241
243 244 245 246 247
249
254 255
257
Regulation of Hazardous Waste
Because of the associated environmental and public health risks, hazardous waste management has been the primary focus of the EPA regulations, which are issued under RCRA Subtitle C (Hazardous Waste Manage- ment). The following briefly summarizes the most significant subsections of Subtitle C.
Identification and Listing of Hazardous Waste
Section 3001 provides two mechanisms for identifying a hazardous waste. First, the EPA can list hazardous solid waste. The EPA has developed three lists of hazardous waste products and materials: waste from nonspecific sources in CFR Title 40, Part 261.3; waste from specific sources in CFR Title 40, Part 261.32; and commercial chemical products in CFR Title 40, Part 261.33(c) and (0. Second, the EPA has identified hazardous waste characteristics in CFR Title 40, Part 261, Subpart C. If a solid waste is not a listed hazardous waste or a mixture of a listed waste and a solid waste, it must be tested to ascertain whether it exhibits any of the four hazardous waste characteris tics (ignitability, corrosivity, reactivity, and extraction procedure toxicity).
In both cases, it is the responsibility of the persons handling the solid waste to ascertain whether it is haz- ardous. Specific energy-related exemptions from the hazardous designation include utility waste from coal combustion; waste from the exploration, development,
and production of crude oil, natural gas, and geothermal energy; waste from the extraction, beneficiation, and processing of ores and minerals, including coal; and mining overburden returned to the mine site.
In addition, the 1984 amendments removed the exemption for burning of hazardous waste fuels. The EPA published proposed rules to regulate hazardous waste that is marketed and burned for energy recovery on November 29,1985. The purpose of these rules is to prohibit the burning of hazardous waste and contami- nated used oil (as defined in the regulations) in nonin- dustrial boilers. Technical standards for controlling emissions of toxic organic compounds, toxic metals, and hydrogen chloride from industrial and utility boilers and industrial furnaces that bum hazardous waste were scheduled to be issued in late 1987.
Standards for Generators and Transporters of Hazardous Waste
Section 3002 pertains to generators of hazardous waste, who, through the Uniform Hazardous Waste Manifest System, are responsible for the ultimate safe disposal of the waste. Implementing regulations (CFR Title 40, Part 262) establish requirements for preparing the mani- fest, recordkeeping, reporting to regulatory agencies, labeling and containers, and management strategies of generators to reduce the volume and toxicity of their waste. Generators of smaller quantities (those who generate between 100 and 1,000 kglmo) are subject to modified requirements.
Section 3003 applies to any party engaged in trans- porting hazardous waste by air, rail, highway, or water, except on the site of generation. Implementing regula- tions in CFR Title 40, Part 263, are closely coordinated with U.S. Department of Transportation standards (CFR Title 49, Parts 17 1-179) issued under the Hazardous Materials Transportation Act. The EPA regulations address compliance with the manifest system, record- keeping, labeling, marking, placarding, using proper containers, discharge reporting, and emergency response.
Hazardous Waste Treatment, Storage, and Disposal Facilities
Section 3004 establishes a comprehensive set of regula- tions governing the management of all aspects of operat- ing facilities that treat, store, or dispose of hazardous waste. Standards of general applicability cover record- keeping, reporting, the manifest system, monitoring, inspections, siting, design, emergency preparedness, financial responsibility, and closure requirements. In addition, the EPA has promulgated specific design and
44 1

operating standards for each of the facility types regu- lated under the RCRA: containers; tanks; surface impoundments; waste piles; land treatment units; land- fills; incinerators; thermal treatment units; chemical, physical, and biological treatment units; and under- ground injection wells (CFR Title 40, Part 265, Subparts J-R, and Part 269, Subparts J-0).
Among the provisions added to Section 3004 by the 1984 amendments are a ban on the disposal of liquids in landfills and minimum technological requirements for existing and new surface impoundments and landfills. In addition, the EPA must determine whether to ban, in whole or in part, all RCRA-listed hazardous wastes from land disposal. The EPA's final rule on solvents and dioxins requires the "best demonstrated available treat- ment" before land disposal may occur (Fed. Reg., 51:40572). Treatment by incineration is required for most waste containing concentrated organic solvents listed as hazardous under the RCRA. A two-year ex- emption from the treatment requirements is granted for dilute waste containing organic solvents and dioxins due to inadequate treatment capacity. In addition, the EPA has proposed treatment standards and associated effec- tive dates (Fed. Reg., 51:44714) for a group of hazard- ous compounds known as the California list (Le., liquid hazardous waste containing polychlorinated biphenyls [PCBs] and liquid and solid hazardous waste containing halogenated organics, certain metals, free cyanides, or corrosives). The EPA has established a schedule setting forth the order in which listed hazardous wastes will be prohibited from land disposal unless the EPA can set appropriate treatment standards or grant case-by-case exemptions (Fed. Reg., 51:19300). Table A.17 sum- marizes the major requirements and schedules associated with the Hazardous and Solid Waste Amendments (HSWA) of 1984.10
Section 3005 requires every owner or operator of a hazardous waste treatment, storage, and disposal facility to obtain a permit and comply with the facility standards set forth in Section 3009. Facilities operating under "interim status" were required to terminate operations as of November 8, 1985, unless the owner or operator submitted an application for a final permit and certified that the facility was in compliance with groundwater monitoring and financial responsibility requirements. The EPA must then process all applications according to a specified schedule. Newly issued permits require
corrective actions to be taken for all releases of hazard- ous waste and constituents at the facility.
Other Hazardous Waste Provisions
In RCRA Subtitle C, states are authorized to develop and operate hazardous waste programs pursuant to con- ditions in RCRA Section 3006, which establishes EPA's inspection program. All privately owned hazardous waste facilities are to be inspected at least once every two years. Section 3008 of the RCRA establishes civil and criminal enforcement sanctions, and Section 3010(a) establishes a mechanism whereby persons managing hazardous waste are to identify themselves and their activities to the EPA.
Other RCRA Provisions
Under RCRA Subtitle D, Section 4009, states are pro- vided minimum criteria for evaluating existing solid waste disposal facilities. Guidelines in Section 1008(a) recommend considerations and practices for locating, designing, constructing, operating, and maintaining landfill facilities to meet the Section 4009 criteria. Those solid waste facilities that do not comply are clas- sified as "open dumps" and must be closed or upgraded; however, no enforcement authority is provided. The EPA is required to submit a report to Congress by November 1987 on the adequacy of the Section 4004 and 1008(a) criteria and the need for additional enforce- ment authority. Concern is due to the fact that many Subtitle D facilities have become Superfund sites.
regulatory program for underground tanks containing "regulated substances," which include all hazardous substances as defined under Superfund (except hazard- ous waste regulated under RCRA Subtitle C) and liquid petroleum substances. The 1984 amendments estab- lishing Subtitle I require underground tank owners to notify the EPA of the existence of the tanks. The EPA is directed to promulgate regulations that require monitor- ing to detect leaks, recordkeeping, reporting of releases, corrective action in response to a release, performance standards for new tanks, and tank closure practices to prevent future releases. States are expected to manage the regulatory program upon approval of their "release detection, prevention, and correction programs" by the EPA.
Subtitle I of the RCRA establishes a comprehensive
442

Table A.17 Summary of Regulatory Requirements for Waste Management Facilities
Requirement
Effective Date or Compliance
Deadline Requirement
Effective Date or Compliance
Deadline
Permitting
Permit needed for facility construction Interim status terminates, unless Part B application is submitted Incinerators All other facilities0
Land disposal Incineration Other storage
Application for exemption Interim facilities must use double liners and
EPA must process applications from facilities for:
Retrofitting of surface impoundments
collect leachate Minimum technology standards
New land disposal facilities must use double liners, collect leachate, and monitor groundwater
Expansion and replacement of interim facilities subject to requirements for new facilities
EPA to publish list of vulnerable aquifers EPA to publish regulations or guidance for
liners EPA to publish interim facility standards for leak detection and atmospheric emissions
Waste bans and listings (by the EPA) Wastes banned from land disposal
Solvents and dioxins EPA to publish schedule for listing Listing of "California" wastes Listing of other wastes First Second Third
Liquids banned from land disposal
underground mines, and caves Bulk (uncontained) liquids in salt domes,
Bulk and uncontained liquids Injection of liquids within 0.25 mi of an
Liquids in containers that can biodegrade
EPA to decide on deep-well injection EPA to review wastes disposed of by
aquifer
or leak
undergound injection
Nov. 8,1984
Nov. 8, 1986 Nov. 8,1988
Nov. 8,1988 Nov. 8, 1989 Nov. 8,1992
Nov. 8,1986 Nov. 8,1988
Nov. 8,1984
May 18,1985
May 8, 1986 Nov. 8,1986
May 8, 1986
Nov. 8,1986 Nov. 8,1986 July 8, 1986
Aug. 8, 1988 June 8, 1989 May 8, 1990
Nov. 8,1984
May 8, 1985 May 8, 1985
Feb. 2, 1986
Aug. 8, 1988 Aug. 8, 1988
Waste bans and listings (cont'd)
Burning and blending of wastes Warning labels required for fuels derived
Notification to EPA by those who produce, from hazardous waste
bum, distribute, and sell fuels derived from hazardous waste
EPA to publish recordkeeping requirements for fuels derived from hazardous waste
EPA to publish transportation standards for fuels derived from hazardous waste
Measures to ban or list other wastes Refining wastes Paint production wastes Solvents Other wastes to be listed under HWSA
EPA to identify additional "hazardous
Temporary delistings expire
Sec. 301 (e)
characteristics"
Underground storage tanks
Interim standards Notification of state agencies Suppliers of regulated substauces inform tank
Notification to states by owners of active tanks
Tank suppliers inform buyers of responsibility
owners of responsibility to notify states
removed from service since Jan. 1, 1974
to notify states Petroleum Hazardous substances
Promulgation of final standards Petroleum Hazardous substances
Other requirements
Waste minimization certification needed for permit applications and manifests of generators and treatment, storage, or disposal facilities
quantity generators EPA to publish new regulations for small-
EPA to publish organic toxicity characteristics
Feb. 6,1985
Feb. 2,1986
Feb. 2,1986
Nov. 8,1986
Feb. 8,1986b Feb. 8,1986b Feb. 8,1986b Feb. 8,1986b
Nov. 1 1,1986
Nov. 11,1986
May 7,1985
Dec. 8,1985 to June 8, 1987 May 8, 1986
March 8,1986 Sept. 8, 1988
Feb. 8, 1987 Aug. 8,1987
Sept. 1,1985
March 24, 1986
Nov. 8,1986
aFor land disposal facilities, the EPA terminated interim status if their operators failed to submit a Part B application by Nov. 8, 1985.
bThe EPA is expected to extend the completion date.
Source: Adapted from Ref. 10.
443

OCCUPATIONAL SAFETY AND HEALTH REGULATIONS
Table A.18 OSHA Final Standards for Hazardous Materials
Occupational Safety and Health Act
The purpose of the Occupational Safety and Health Act of 1970, USC Title 29, Section 651 et seq. (the act), is "to assure so far as possible every working man and woman in the nation safe and healthful working condi- tions and to preserve our human resources." Further- more, the act mandates that "each employer shdl furnish his employees employment and place of employment which are free from recognized hazards that are causing or are likely to cause death or serious injury." Enforce- ment of the act is the responsibility of the Occupational Safety and Health Administration (OSHA), under the direction of the U.S. Department of Labor.
responsible for enforcing the act and may promulgate, modify, or revoke occupational health and safety stan- dards accordingly. These standards, published in CFR Title 29, Part 1910, cover a wide variety of areas, such as fiie protection, proper use of power equipment and compressed gas and air equipment, use of protective clothing, handling and storage of hazardous materials, workplace ventilation, and exposure to noise and radia- tion. With regard to toxic or harmful materials, expo- sure levels are set on the basis of the "best available evidence" and "to the extent feasible" such that no employee will suffer impairment of health or functional capacity, even if the employee has regular exposure to the hazard over his or her working life. To date, OSHA has promulgated ten final health standards (Table A.18) and listed threshold limits, or "consensus standards," for about 400 substances adopted from recommended limits set by various government and private industry hygiene organizations (Fed. Reg., 49:23502, June 27, 1974). In addition to consensus and permanent standards, Sec- tion 6(c) authorizes OSHA to issue an emergency temporary standard if necessary to protect workers from "grave danger" due to toxic substances or other hazards in the workplace. Most of the current permanent stan- dards began as emergency temporary standards.
OSHA has other responsibilities in addition to promulgating safety and health standards. OSHA can prescribe the use of labels, material safety data sheets, other forms of warning, or training programs to protect employees from occupational hazards and potential chemical risks (Fed. Reg., 4952380, Nov. 25,1984). Where appropriate, OSHA can prescribe the type and frequency of medical examination that an employer
Under Section 6 of the act, the Secretary of Labor is
444
Keference (Part of
Substance CFR Title 29)
Asbestos "Fourteen carcinogens"
4-Nitrobiphenyl alpha-Naphthylamine Methyl chloromethyl ether 3,3-Dichlorobenzidine bis Chloromethyl ether beta-Naphthylamine Benzidine 4-Aminodiphenyl Ethyleneimine beta-Propiolactone 2-Acetylaminofluorene 4-Dimethylaminoazobenzene N-Nitrosodimethylamine MOCA
Vinyl chloride
Lead Coke oven emissions Cotton dust 1,2-Dibromo-3-chloropropane Acrylonitrile Ethylene oxide
Inorganic arsenic
1910.1001
1910.1003 1910.1004 1910.1006 19 10.1007 1910.1008 1910.1009 1910.1010 1910.1011 1910.1012 1910.1013 1910.1014 1910.1015 1910.101 6
a 1910.1017 1910.1018 1910.1025 1 9 1 0.1 029 1910.1043 1910.1044 1910.1045 191 0.1046
aRegulation stayed by court action.
must make available to an employee. OSHA can man- date employer recordkeeping and reporting requirements on work-related deaths, injuries, illnesses, and employee exposures to toxic substances. Also, employees have the right to request an OSHA inspection if a violation of a standard presents an "imminent danger" to employees; employees have the right to accompany OSHA inspec- tors during all inspections. OSHA inspectors have the right to enter at reasonable times, without advance notice, any workplace for the purpose of inspection and investigations under the act. However, the U.S. Su- preme Court (see Ref. 11) limited OSHA's authority to conduct unannounced inspections of work-places. In general, OSHA is required to obtain a search warrant, if denied entry, before conducting an inspection. Finally, OSHA can assess civil penalties and issue citations for noncompliance with the law.
Any state can assume responsibility for developing and enforcing occupational safety and health standards by submitting a state plan. Upon approval of the plan by OSHA, the state has primary responsibility; however,

OSHA retains the right to evaluate the implementation of the plan and to nullify it if the state substantially fails to comply with any provision of the plan.
safety program for employees consistent with health and safety standards, as well as keep adequate records of accidents and illnesses.
Each federal agency must establish and maintain a
Mine Safety and Health Act
In 1977, the Mine Safety and Health Amendment Act (USC Title 30, Section 80 et seq.) was enacted to pro- vide greater health and safety protection to miners under a single comprehensive law. The responsibilities of the U.S. Department of the Interior for the enforcement of mine safety and health laws were transferred to the Mine Safety and Health Administration (MSHA), under the direction of the U.S. Department of Labor. The Federal Mine Safety and Heath Review Commission was estab- lished under the act as an independent board to hear and interpret the statutes and procedures for appeals by mine operators or representatives of miners.
Under the current statute, the Secretary of Labor is directed to develop and revise standards for protecting the health and safety of miners, while maintaining pre- existing levels of protection. Standards have been de- veloped in areas such as control and monitoring of noise, toxic gases, and respirable dust; electrical hazards; use of explosives; and mine roof support (CFR Title 30, Chapter 1). Emergency temporary standards, effective upon publication in the Federal Register, may be issued by the Secretary of Labor in cases of grave danger.
The act requires the MSHA to inspect underground mines at least four times a year and surface mines at least twice a year. More frequent inspections are re- quired for particularly hazardous mines. No advance notice of these inspections is given to the mine opera- tors. Any miner has the right to request an immediate inspection in the case of suspected "imminent danger" or violation of mandatory standards.
closing down any area of the mine where he or she finds "imminent danger" or sufficient violations caused by "unwarrantable failure" of an operator to comply with the standards. Miners are entitled to full compensation if they are idled by closure of a mine or an area of a mine because of "unwarrantable failure" of the mine operator to comply with any health or safety standard. Coal mine operators and their representatives are subject to criminal or civil penalties for noncompliance with the act. In addition, Section 114 of the act requires each
An MSHA inspector may issue a withdrawal order
operator to have a miner health and safety training pro- gram approved by the Secretary of Labor.
Black Lung Disease
Black lung disease, or coal workers' pneumoconiosis, is caused by inhaling mineral dust that produces pathologi- cal changes in the lung.
Miners with evidence of black lung disease have the option of transferring, without incurring financial loss, to an area of the mine with a lower level of respirable dust. Coal workers receive free routine examinations for black lung disease. Miners with evidence of a progres- sive form of the disease become eligible for disability compensation. Black lung benefits are paid by either the U.S. Department of Labor, the state government, or the mine operator, in accordance with the relevant provi- sions of the Black Lung Benefits Act (USC Title 30, Section 901 et seq.) and the miner's state of health.
THE SURFACE MINING CONTROL AND RECLAMATION ACT
The Surface Mining Control and Reclamation Act (SMCRA) of 1977 (USC Title 30, Section 1201 et seq.) requires surface mine operations to comply with envi- ronmental performance standards during both mining and mine site reclamation. By enacting the law, Congress sought to establish a nationwide program to protect people and the environment from the adverse effects of surface coal mining. Also, Congress sought to "strike a balance between protection of the environment and agricultural productivity and the Nation's need for coal as an essential source of energy."
The SMCRA specifies that, because of the diversity in terrain, climate, and other physical conditions in areas subject to coal mining operations, states have the pri- mary governmental responsibility for regulating surface coal mining and reclamation operations. To achieve primary regulatory authority, often referred to as "primacy," a state must submit a program to the Office of Surface Mining Reclamation and Enforcement (OSMRE). The OSMRE regulations are set forth in CFR Title 30, Parts 700-899.
Under the provisions of the surface mining law, the OSMRE also is charged with collecting a fee of 354 for every ton of coal mined by surface methods, 154 for every ton of coal mined underground, and IO@ for every
445

ton of lignite mined. The fees are deposited into the Abandoned Mine Reclamation Fund to be used for reclaiming land and water resources affected by any past mining, reclaiming rural lands as designated by the Secretary of Agriculture, assisting small mine operators in meeting permit requirements, acquiring unreclaimed lands, preparing for emergency response, and conduct- ing research and demonstration projects.
Of primary importance in carrying out the stated purposes of the act is the requirement for a permit (Section 506). Each permit issued to an operator re- quires operators to comply with all Section 515 perfor- mance standards (or Section 516 for the surface effects of underground mining) for environmental protection. The permit application details current hydrologic and geologic conditions at the proposed mine site. Operators must also include in the permit application a reclamation plan detailing how they will reclaim the land and the use for which the land will be suited after reclamation. Requirements are specified in Section 508. Under Section 509, operators are required to post a perfor- mance bond sufficient to ensure the completion of the reclamation plan by the regulatory authority if the opera- tor should default; the minimum bond is $10,000. The law also specifies inspection and monitoring require- ments, penalties, and enforcement authority. The SMCRA allows citizens sue to compel compliance or collect damages.
Key Provisions
Under Section 510(b)(5) of the SMCRA, a surface coal mine operation west of the 100th meridian cannot (1) interrupt, discontinue, or preclude farming on allu- vial valley floors that are irrigated or naturally subir- rigated or (2) materially damage the surface water or groundwater systems that supply these valley floors. Undeveloped rangelands not significant to farming are excluded from this provision. Surface mining on prime agricultural lands is allowed only if the land can be restored to original crop yield levels or levels higher than those from undisturbed prime farmland in the sur- rounding area. Also, surface mining within 500 ft of underground mines is prohibited without special approval from the OSMRE.
Sedimentation ponds are the key sediment control structures required in the fiial regulations in Sec- tion 515(b)( lO)(B)(ii). Each sedimentation pond must be inspected during construction and certified after con- struction under the supervision of a registered profes- sional engineer.
446
Each permit applicant must prepare a detailed reclamation plan that shows how the surface mine opera- tor will comply with the environmental performance standards in OSMRE’s regulatory program detailed in Section 508(a). The regulations specify that a reclama- tion plan must describe timetables, cost estimates, the current and foreseen condition and use of the land, coal conservation, subsoil and topsoil conservation and resto- ration, erosion control, revegetation, debris removal and disposal, drainage control, and compliance measures for environmental and safety regulations.
Section 517(b)(2) requires the monitoring of groundwater levels, infiltration rates, subsurface flow and storage characteristics, and groundwater quality in the mine plan area. Surface water monitoring require- ments can be satisfied by compliance with NPDES monitoring and reporting requirements.
Section 515(b)(22)(H) requires specific design and performance standards for spoil disposal, including control of leachates and surface runoff, stability of the fill, and certification of the fill by a registered profes- sional engineer. The regulations provide further guid- ance for valley fills, head-of-hollow fills, and durable rock fills. Other performance standards for environmen- tal protection set forth in Section 515 include restoration of the land to its approximate original contour and a condition that can support its prior use; stabilization of mining areas and waste piles to minimize erosion and air and water pollution; redistribution of topsoil on the affected areas; segregation and replacement of prime farmland soil on all prime farmlands, including the de- sign and construction of permanent water impoundments to protect water quality and quantity and the provision of natural barriers to improve safety and stability; and disposal of acid-forming, toxic, and flammable materials in a manner to prevent water pollution and fires. Also, mine operations must conduct reclamation contempora- neously with mining, as practicable, and assume respon- sibility for successful revegetation for five years in areas with greater than 26 in. of annual precipitation and for ten years in areas with less than 26 in. of annual precipitation.
Regulatory Coordination
The OSMRE and EPA have begun to consolidate the implementation of regulatory provisions that overlap. The regulation of coal mining wastes, for example, will be controlled under the SMCRA, rather than the RCRA. Also, the OSMRE has proposed to consolidate EPA’s WDES permit with its surface-mining permit. The EPA encourages states that have authority to issue

NPDES pennits to consolidate them with surface mining permits, after the OS= approves the state's surface mining program.
Both the OS= and EPA also have the authority to regulate fugitive dust emissions. The OSh4RE re- quires the monitoring of these emissions for all western surface coal mines with production levels in excess of 1 million tons/yr. The EPA regulates fugitive dust emis- sions from new facilities under its PSD requirements. Although surface mines are currently excluded from PSD regulation, future applicability under certain cir- cumstances is possible. The EPA has proposed NSPS for coal mines to regulate fugitive dust. Industry predicts that complying with the new requirements will have significant effects, largely through reduced mining acreage.
447
THE TOXIC SUBSTANCES CONTROL ACT
-
An estimated 2 million chemical compounds have been recognized, and the EPA calculates that about 1,000 new chemical substances are developed and sold commer- cially each year. The Toxic Substances Control Act (TSCA) of 1976 (USC Title 15, Section 260 et seq.) provides the EPA with authority to require testing of new and existing chemical substances and to restrict the processing and use of those substances that display an unreasonable risk of injury to health or the environment.
Other laws, such as the Clean Water Act and Clean Air Act, deal with toxic substances only when they enter the environment as wastes (e.g., as atmospheric emis- sions or discharges to water), and the Occupational Safety and Health Act is limited to worker exposure to chemical substances. The TSCA was designed to fill these gaps, both in regulatory powers and in authority to require that developers test new chemicals before people or the environment become exposed to them.
The TSCA provides for the prevention of unreason- able risks of injury to health or the environment associ- ated with the manufacture, processing, sale, use, or dis- posal of all chemical substances, mixtures, or materials. Mechanisms for risk minimization include premarket scrutiny and review of chemical substances proposed for commercial distribution, direct regulation of industrial chemicals for their health or environmental effect, authority to comprehensively examine the hazards asso- ciated with all chemicals, and a mechanism for collect- ing information on the health and environmental effects of chemical substances from their manufacturers and processors.
Specifically, Section 5 of the TSCA provides for premarket notification at least 90 d before (1) the first commercial manufacture of a new chemical substance or (2) the manufacture or processing of any chemical sub- stance for a significant new use. New chemical sub- stances are those not included on the list of existing chemicals compiled by the EPA under Section 8(b). The most recent compilation, listing 58,000 substances, was released in June 1982. The factors constituting a "signi- ficant new use" are defined in Section 5(a)(2); however, comprehensive implementing regulations have not been issued.
After receiving a premarket notification, the EPA must publish basic information on the substance in the Federal Register, including a description of toxicological tests that demonstrate whether the chemical presents an "unreasonable risk of injury to health or the environ- ment." If the EPA determines that the notification is insufficient to make an evaluation, or the chemical may pose a risk to humans or the environment, it may restrict or even prohibit any aspect of the chemical's production or distribution. Final regulations were issued in May 1983 (Fed. Reg., 48:21742).
Testing requirements under TSCA Section 4(a) apply to any chemicals, old or new, suspected of posing an unreasonable risk to health or the environment or produced in quantities such that significant human or environmental exposure could occur. The EPA can specify the biochemical effects to be tested, the types of tests to be conducted, and specific protocols to be fol- lowed. A list of the highest priority testing candidates is prepared by the EPA, under authority of Section 4(e).
Section 6 of the TSCA prescribes restrictions for any chemical substance or mixture that presents an un- reasonable risk of injury to health or the environment (CFR Title 40, Part 750). Remedial actions available range from simple labeling requirements to prohibitions on the chemical substances or mixtures. Restrictions on the manufacturing, use, storage, and disposal of PCBs, for example, are listed in C m Title 40, Part 761. The EPA has issued numerous regulations addressing electric transformers and capacitors (Fed. Reg., 4737342), exemptions (Fed. Reg., 4746980), and incidental by- product generation of PCBs during chemical manufac- ture. In addition, the EPA's policy on cleaning up spills of materials containing PCBs at concentrations of 50 ppm or greater was issued on April 2,1987 (Fed. Reg., 52: 10688).
Section 8 of the TSCA authorizes the collection and reporting of information. Manufacturers or processors of chemical substances may be required to submit perti- nent information on their identity, uses, produced

amounts, by-products, health effects, and exposure lev- els (Fed. Reg., 4726992). In addition, lists of health and safety studies conducted by, initiated by, or known to persons within the chemical industry must be sub- mitted, and a report on any study on the list may also need to be submitted. Section 8(e) requires manufac- turers to notify the EPA of any information that indi- cates possible "substantial r isk of injury to health or the environment due to the chemical substance. In addition, under Section 8(c), manufacturers must maintain records of "significant adverse reactions" alleged to have been caused by the chemical.
RADIATION STANDARDS
Prior to 1970, the authority to regulate public exposure to ionizing radiation was derived from the Atomic En- ergy Act of 1954 and the Public Health Service Act. Accordingly, various federal agencies regulated expo- sure to ionizing radiation from the nuclear fuel cycle, uranium mining, and medical and consumer products. When the EPA was formed in 1970, it received the juris- diction of (1) the Federal Radiation Council, to advise on radiation matters affecting health, including guidance to federal agencies in the formulation of radiation stand- ards; (2) the US. Department of Health, Education, and Welfare, in radiation-protection activities pertaining to consumer products and medical exposure; and (3) the Division of Radiation Protection Standards of the Atomic Energy Commission, "to the extent that such functions ... consist of establishing generally applicable environmental standards for the protection of the general environment from radioactive material."
Since 1970, the EPA has developed and promul- gated five major radiation protection regulations, includ- ing (1) environmental protection standards for nuclear power operations (CFR Title 40, Part 190), (2) interim primary drinking water regulations for radionuclides (CFR Title 90, Part 141), (3) standards for the land dis- posal of transuranic and high-level radioactive wastes (CFR Title 40, Part 190), (4) national emission standards for radionuclides (CFR Title 40, Part 61), and (5 ) stan- dards for disposal of radioactive materials at active uranium and thorium processing sites (CFR Title 40, Part 192). The two standards currently under develop- ment are for Ocean disposal of radioactive waste and land disposal of low-level radioactive wastes. Federal radiation protection guidance currently limits exposure levels to underground uranium mining and other high- risk occupations, in addition to medical diagnostic X rays. Guidance is still under development to limit doses to the general population from environmental
releases of transuranics and to control public exposure to radio-frequency radiation.
A summary of the current provisions of the five major radiation protection regulations is provided below.
Radiation Standards for Nuclear Power
On January 13,1977, EPA promulgated environmental radiation protection standards for the commercial nuclear fuel cycle (Fed. Reg., 42:2858). The standards specify environmental levels below which normal opera- tions of the uranium fuel cycle are determined to be environmentally acceptable. The uranium fuel cycle is defined as milling of uranium ore, chemical conversion of uranium, isotopic enrichment of uranium, fabrication of uranium fuel, electricity generation in a light-water- reactor power plant, and reprocessing of spent uranium fuel, to the extent that any of these directly support electricity production for public use (CFR Title 40, Part 190). Specifically excluded are uranium mining, radon-222 emissions from mill tailings, operations at waste disposal sites, transportation of radioactive mate- rial in support of electricity production, and reuse of any recovered nonuranium radioactive materials.
The standards are designed to limit the annual radia- tion dose received by the public in the vicinity of regu- lated facilities as a result of exposures to planned re- leases of radionuclides. These radiation exposure stan- dards are to be achieved by limits placed on total annual activity-level releases of specific radionuclides. Table A.19 summarizes the annual limits of dose- equivalent exposure to the public and the resmctions on activity release rates for long-lived radionuclides.
The Nuclear Regulatory Commission (NRC), through its licensing and enforcement activities, is responsible for ensuring compliance with these stan- dards (Fed. Reg., 45:260, April 17, 1980). On March 25, 1981, the NRC published amendments to these regulations requiring licensees to submit reports to the NRC of overexposure and excessive concentration or activity levels resulting from planned releases.
Drinking Water Regulations for Radionuclides
In July 1976, the EPA promulgated interim primary regulations to limit the population dose from radioac- tivity in drinking water (CFR Title 40, Part 141). The regulations require monitoring and compliance with limits on radium (Ra-226 and Ra-228) and gross alpha particle concentration levels in public drinking water.
448

Table A.19 Nuclear Uranium Fuel Cycle Operations and Drinking Water Radiation Protection Standards
449
Spent Nuclear Fuel and High-Level and Transuranic Radioactive Wastes
-
Description of Effedive Dose or Release Limita Date
Inhalation doseb
25 mredyr Dec. 1 ,1979~ Whole body Thyroid 75 mredyr Dec. 1 ,1979~ Other organsd 25 mredyr Dec. 1 ,1979~
Radionuclide release
Krypton-85 Iodine-129 Transuranicsc
50 kCi/GW-yr Jan. 1 , 1983 5 mCilGW-yr Jan. 1,1983 0.5 mCilGW-yr Dec. 1, 1979
Maximum contaminant releases to drinking water Radium-226 and -228 5 pCi/Lf July 9,1976 Gross alpha (excluding 15 pCi/L
radon and uranium)
Ingestion dose, whole body 4 mredyr @eta and gamma radiation)
aA millirem is a unit of "dose equivalent," which is the product of absorbed dose and appropriate factors that account for different biological effects due to the quantity of radiation and its spatial distribution in the body. A curie is the quantity of radioactive material producing 37 billion nuclear transformations per second. A gigawatt-year is equivalent to the amount of energy output repre- sented by an average electric power level of one billion watts for one year.
bMaXimum individual dose, exduding radon and its decay products.
cLimit for milling of uranium ore effective on Dec. 1, 1980.
dExcept skin (dermus and epidermus) or cornea.
eAlpha emitters with a half-life greater than one year.
Calculations using rem/Ci ingestion factors yield whole body exposure in the 0.4- to 9-mredyr range.
Sources: For inhalation doses and radionuclide releases, CFR Title 40, Part 190, and Fed. Reg., 42:2858 (Jan. 13, 1977); for drinking water and ingestion doses, CFR Title 40, Part 141, and Fed. Reg., 41:28402 (Aug. 9,1976).
The EPA intends the regulations to provide a mecha- nism whereby water suppliers can be cognizant of changes in the level of radioactivity in their water sources so that appropriate remedial measures can be taken if necessary. Table A.19 summarizes the con- centration and dose limits; revisions to these limits were proposed on September 30, 1986.
Pursuant to the authority of the Nuclear Waste Policy Act of 1982, the EPA developed and promulgated stan- dards on September 19,1985 (CFR Title 40, Part 190), applicable to the management and disposal of spent reactor fuel, including high-level and transuranic wastes. (See the chapter on Nuclear Waste Management.) The commercial uranium fuel cycle and atomic energy defense activities are subject to these standards. The standards require the NRC to license repository sites in compliance with EPA-developed management and dis- posal guidance. The DOE has the responsibility for siting, constructing, and operating repositories in accor- dance with the specific standards. The regulations de- fine limits and requirements in two broad areas. First, radiation exposure to the general population from the management and storage of "high-level" wastes by regu- lated facilities is limited to specific levels expressed in annual dose equivalents (identical to limits promulgated for normal nuclear power operations on January 13, 1977, when the management and disposal of nuclear wastes were still exempted). Second, the regulation imposes disposal requirements for "high-level" wastes, including containment performance assessments, proce- dures for ensuring long-term (l0,OOO yr after disposal) compliance with the containment requirements, individ- ual protection requirements, and resmctions on leakage of radioactivity into groundwater sources. Table A.20 summarizes the "high-level" waste standards.
Most high-level wastes are currently stored at indi- vidual reactor sites. Defense-related high-level waste is stored on three federal reservations in Idaho, South Carolina, and Washington.
NESHAPs for Radionuclides
Atmospheric emissions of radionuclides are regulated under NESHAPs as authorized in Section 112 of the 1977 Clean Air Act Amendments. Since these amend- ments were enacted, three NESHAPs for radionuclide emissions have been promulgated ((3% Title 40, Part 61). These regulations apply to federal and NRC- licensed facilities, uranium mines, and uranium mill tailing piles. The first EPA standards for radionuclides were promulgated on February 6, 1985 (Fed. Reg., 50:5190), to limit releases to air of radionuclides from

Table A.20 High-Level Waste Management and Disposal Standardsr
Coverage
Management and storage of high- level wastes at all MC-regulated and DOE-operated facilities
Waste disposal systems, site design, and operation requirements
Containment
Individual protection
Groundwater protection
Limit or Requirement
Annual dose limit of 25 mrem to the whole body, 75 mrem to the thyroid, and 25 mmn to other critical organs.
Ensure a probability of one chance in ten of exceeding activity limits for specified radionuclides from cumulative releases to the accessible environment for 10,000 yr.
Procedures for assessing long-term compliance with containment requirements.
Annual doses to public in accessible environment from potential pathways are limited to 25 mrenV1,OOO yr to the whole body and 75 mrem/l,M)O yr to any critical organ.
Maximum concentrations in groundwater (per 1,ooO yr) are 5 pCi/L of radium-226 and radium-228 and 15 pCi/L of alpha emitters (excluding radon); maximum exposure is 4 mredyr from beta and gamma emitters for individuals drinking 2 L of water per day.
*Standards effective on Nov. 15,1985.
Source: Fed. Reg., 50:38084.
three source categories: DOE-operated facilities, NRC- licensed and non-DOE federal facilities, and elemental phosphorus plants. Before final regulations can be implemented, sections of the final rule pertaining to weighting factors for alternative emission standards and reporting requirements need to be finalized.
and development; production of nuclear weapons; en- richment of uranium and production of plutonium for nuclear weapons and reactors; and the processing, stor- ing, and disposing of radioactive wastes. The IWC- licensed and non-DOE federal facilities include research and test reactors, shipyards, facilities within the radio- pharmaceutical industry, and other research and industrial facilities. Atmospheric emissions from com- mercial nuclear facilities (e.g., power plants) were ex- empted from NESHAPs due to coverage under previ- ously promulgated EPA regulations (CFR Title 40, Part 190). Table A.21 summarizes the population expo- sure standards.
The third and final source category, commercial elemental phosphorus plants, affects six U.S. plants that process phosphate rock into elemental phosphorus used for the production of phosphoric acid, phosphate-based
The DOE operations include facilities for research
450
detergents, and organic chemicals. Some of the uranium decay products contained in the phosphate rock, espe- cially polonium-210 and lead-210, are volatilized by the high temperatures in the plant calciners. Table A.21 gives the emission limits (polonium-210) for these facilities. Lead-210 emissions are not controlled due to the small amounts found in phosphate rock and cor- respondingly insignificant amount of radioactivity that would be released by this isotope.
for uranium mines and uranium mill tailing piles on April 17,1985 (Fed. Reg., 50:15386), and September 24, 1986 (Fed. Reg., 51:34056), respectively. Opera- tions at underground uranium mines include the han- dling of large quantities of ore containing uranium-238 and its decay products. Radon-222 gas is the most sig- nificant radionuclide emitted to the atmosphere from underground uranium mining activities. This gas is released in relatively high concentrations through mine ventilation systems. The NESHAPs covering uranium mining require bulkhead construction as a work practice for limiting radon emissions (Subpart B). In its rule making, the EPA found that emission rates of radon from underground mines may be highly variable,
The second and third NESHAPs were promulgated

Table A.21 NESHAPs for Radionuclides
Coverage Emission Standards Effective Dates
DOE-operated and NRC- licensed facilities
Radionuclide emissions are not to exceed amounts that cause an exposure of 25 mredyr to the whole body or 75 mremlyr to critical organs.
Pending rule making on alternative standards and reporting requirements
Elemental phosphoms plants Polonium-210 emissions from calciners and June 6,1985 nodulizing kilns are limited to 21 Ci/yr.
Underground uranium mines with a cumulative or annual production greater than 10,ooO tons
Bulkheads must be installed and maintained to isolate all abandoned or temporarily abandoned areas (alternative standards are provided if bulk- heads would cause unique, unusual, or unsafe circumstances).
April 17, 1985, for new mines July 17, 1985, for existing mines
Uranium mill tailing piles Piles must be designed and constructed to meet work practice standards; the continued use of existing tailing piles is restricted.
Sept. 24, 1986
Source: CFR Title 40, Chapter 1, Subparts B, H, I , K, and W.
depending on mine ventilation rates, ore grade, areas exposed, mining practices, and geologic formations.
Uranium milling involves the handling of large quantities of ore containing uranium and its decay products. The milling recovers the uranium in the ore through mechanical and chemical processes. The depleted portion of the ore -- radioactive sand-like mate- rials (mill tailings) separated from the extracted and concentrated uranium -- is pumped to tailings piles as a slurry. The tailings contain virtually all of the uranium decay products present in the ore, including thorium-230 and radium-226, which decay to radon. The standards require the use of improved technology for managing all future uranium tailing piles. Existing piles may be used for an additional 6-15 yr, depending on the status of the pile. Risk analyses have shown that radon-222 gas presents the highest risk of any radionuclide released to the air at uranium mines and that the tailing pile is the most significant source of radon emissions. Table A.21 summarizes the control requirements for underground uranium mines and the work practice requirements for mill tailing piles.
Uranium and Thorium Processing
Two regulations apply to solid and liquid radioactive waste at uranium and thorium processing sites (CFR Title 40, Part 192). The first was established to institute remedial actions at inactive uranium processing sites.
Health and environmental standards to govern stabi- lization, control, and cleanup of residual radioactive materials (primarily mill tailings) at inactive uranium processing sites were promulgated on January 5, 1983 (Fed. Reg., 48590). Cleanup and long-term control of uranium mill tailings are required at 24 inactive mill sites that qualify for remedial action under the Uranium Mill Tailing Radiation Control Act of 1978. Inactive sites are located in Arizona, Colorado, Idaho, New Mexico, North Dakota, Oregon, Pennsylvania, Texas, Utah, and Wyoming. The standards for control require that the tailings be stabilized to reasonably ensure that the health hazards associated with them will be control- led and limited for a long time. They also established a requirement to control releases of radon from tailing piles. The standards for cleanup set limits on the radon decay-product concentration and gamma radiation levels in buildings affected by tailings and on the radium-226 concentration in contaminated land (Table A.22).
The second regulation was issued to cover the dis- posal of radioactive materials and the control of efflu- ents at active uranium and thorium processing sites. Health and environmental standards to govern stabi- lization and control of by-products (primarily mill tail- ings) at licensed commercial uranium and thorium proc- essing sites were promulgated on October 7, 1983 (Fed. Reg., 48:45946). The standards for disposal of tailings require stabilization so that the health hazards associated with tailings will be controlled and limited for at least 1,000 yr. They require that disposal be designed to limit
45 1

Table A.22 Health and Environmental Standards for Remedial Actions at Inactive Uranium Processing Sites
Coverage Standards ~~~ ~~
Control of residual radioactive materials
Cleanup of residual radioactive materials
Radon-222 atmospheric emissions are not to exceed (1) 20 pCilm2.s on average or an annual average concentration in air at any location outside the disposal site or (2) 0.5 pCi/L of air.
Contaminated land Average concentration of radium226 in land (averaged over any 100-rnz area) should not exceed background levels by more than 5 pCi/g over the top 15 cm of soil and 15 pCdg over 15-cm layers of soil deeper than I5 cm below surface.
Indoor radon decay products should not exceed an annual average working level of 0.02 of known decay product concentration (including background), to the extent practicab1e.b
The maximum gamma radiation exposure should not exceed 20 pR above backgr0und.c
Contaminated occupied or habitable buildings
Gtandards effective on March 7,1983.
bThe working level is any combination of short-lived radon decay products in 1 L of air that will result in the ultimate emission of alpha particles with a total energy of 130 GeV. It is a measure of the concentration of radioactivity in air, rather than exposure to humans.
cA roentgen is a unit of exposure equal to that quantity of gamma or X-ray radiation (<3 MeV) such that the associated cor~us- cular emission per 0.001293 g of air (1 cm3 of dry air at standard temperature and pressure) produces air ions carrying one unit of electric charge of either sign.
Sources: Fed. Reg., 48:602, and Fed. Reg., 48:45946.
releases of radon to 20 pCilm2.s, averaged over the sur- face of the disposed tailings, and require measures to avoid releases of radionuclides and other hazardous substances from tailings to water. The standards for tailings at operating mills, prior to final disposal, add two elements and a measure of radioactivity to the groundwater protection requirements now specified under the Solid Waste Disposal Act, as amended. Exist- ing EPA regulations and federal radiation protection guidance currently applicable to tailings remain un- changed. Implementation and enforcement of these standards are the direct responsibility of the M C or states with NRC regulatory agreements. Twenty-seven licensed milling sites are distributed among the states of Colorado, New Mexico, South Dakota, Texas, Utah, Washington, and Wyoming.
SUPERFUND
The Comprehensive Environmental Response, Compen- sation, and Liability Act of 1980 (known as CERCLA or Superfund -- see USC Title 42, Section 9601 et seq.) was passed in response to a growing national concern
about the release of hazardous substances to the environ- ment. CERCLA establishes a system of liability, com- pensation, cleanup, and emergency response for acciden- tal discharges of hazardous substances (from a vessel or any onshore or offshore facility) and for releases of hazardous substances from abandoned hazardous waste disposal sites. In concert with the RCRA, which regu- lates ongoing treatment, storage, and disposal activities, these laws are intended to change the way that U.S. industry generates, manages, and disposes of hazardous waste.
The Superfund Amendments and Reauthorization Act (SARA -- see Public Law 99-499) was signed into law on October 17, 1986. In addition to reauthorizing CERCLA for another five years, SARA increased the size of the Superfund, strengthened or clarified many key provisions, and increased the scope of the program by adding several new provisions to the original law. These changes were needed to address the problems that developed during the first five years under the law and to expand the resources available for a task that turned out to be far greater than anticipated. In 1980, the EPA estimated that about 400 major hazardous waste sites existed, but by 1985, the General Accounting Office estimated the number of sites was closer to 4,000 and
452

that cleanup costs could total $39 billion.12 The Office of Technology Assessment predicts that 10,OOO sites may be discovered over the next 50 yr and associated cleanup costs could reach $100 billion.13
ers and operators of vessels and facilities. Whenever there is a release of a “hazardous substance,” it must be reported and the responsible party must then clean it up. A “hazardous substance” is defined in a “list of lists” compiled by reference to four other major federal en- vironmental statutes under which toxic or hazardous substances are identified. In addition, the EPA is given authority to add hazardous substances to the list.
If the responsible party fails to clean up the release of hazardous substances, the federal government may clean up the site and recover the costs from the responsi- ble party. The response powers of the federal govern- ment are considerable. It may not only clean up the listed “hazardous substances,” but it may also clean up other substances, referred to in CERCLA as pollutants or contaminants, when it determines that these pollutants or contaminants “may present an imminent and substan- tial danger to the public health or welfare.” Under exist- ing law, the government may recover costs of removal of hazardous substances, but not pollutants and con- taminants, from the responsible party.
present or former owner or operator of a site where hazardous substances have been disposed, any trans- porter who selected the site for the disposal of hazardous substances, and any generator of hazardous substances or wastes who sent them to the site for disposal. In cases where many wastes have been disposed of at a site over many years, often extending far back into the past, there may be hundreds of potentially responsible parties. The courts’ application of strict, joint, and several liability to CERCLA remedial cleanup actions implies that (1) ownen and operators of treatment, storage, and disposal facilities and transporters, persons who ar- ranged for transport, and contractors are liable regardless of whether negligence or other wrongdoing was in- volved during their respective management of the mate- rials and (2) each defendant is independently responsible for the entire cost of the cleanup, regardless of their degree of contribution to the release. However, where more than one responsible party is identified, the courts apportion responsibility for cleanup costs.
Under Section 107 of CERCLA, parties responsible for a release of hazardous substances that cause “an injury to, destruction of, or loss of natural resources” must reimburse the U.S. government and the state in which the damage occurred for the costs of restoring,
CERCLA requires reporting and cleanup from own-
Those who are liable for cleanup costs include any
rehabilitating, or replacing damaged natural resources. This may represent significant future costs to indusq. SARA amends CERCLA to limit payments from Super- fund for natural resource claims to those for which the claimant has exhausted all administrative and judicial remedies to recover from potentially liable parties.
Section 122 of SARA prescribes the ground rules for Superfund settlements, emphasizing the central role that privately financed cleanups are intended to play in the Superfund program. Certain procedures and protec- tions are defined to expedite and facilitate settlement agreements among potentially responsible parties. For example, Section 122(c)( 1) authorizes the inclusion of a “covenant not to sue“ in settlement agreements whereby settling parties will not be sued for additional cleanup costs. Section 122(f) provides for releases from future liability under specific conditions.
The Hazardous Substances Response Fund, or Su- perfund, provides federal financing for cleanup and remedial action in emergency situations, where responsi- ble parties cannot be identified, or where they cannot pay for cleanup. Section 105 of CERCLA provides that the government’s cleanup activity is to be conducted in accordance with the National Contingency Plan, which establishes a blueprint for cleanup in response to re- leases into water, onto land, or into air, thus defining a nationwide, multimedia plan dealing with environmental emergencies. Section 105(8) requires the EPA to estab- lish criteria for determining priorities among releases or threatened releases at sites throughout the nation and to establish a National Priorities List of sites for purposes of taking remedial action.
SARA increased the Superfund from $1.6 billion to $8.5 billion over five years and established a $0.5- billion trust fund for leaking underground storage tanks. The Superfund will be financed over a five-year period by a petroleum tax ($2.75 billion), a broad-based cor- porate income tax ($2.5 billion), a chemical feedstock tax ($1.4 billion), general revenues ($1.25 billion), and cost recoveries and interest ($0.6 billion).
OTHER ENVIRONMENTAL LAWS
There are many federal statutes that authorize programs designed to conserve lands and wildlife for their es- thetic, ecological, educational, historical, recreational, and scientific value to the nation. Other statutes protect the health and safety of persons from various hazards of commercial activity. Some of the more significant stat- utes are discussed below.
453

Endangered Species Act
The Endangered Species Act of 1973, as amended (USC Title 16, Section 1541 et seq.), authorizes the U.S. De- partment of the Interior’s Fish and Wildlife Service to list species of animals and plants that are endangered or threatened with extinction because of, among other causes, the present or threatened destruction of their habitat, disease or predation, or man-made factors affect- ing their continued existence (CFR Title 50, Parts 17.11 and 17.12). In addition, a notice-of-review procedure allows emergency listing of any species imminently threatened, for example, by major construction activity. A11 federal actions, including permits and authorizations, must be consistent with the conservation of endangered and threatened species. The service can disapprove a proposed project if it finds, after consulting with the agency initiating the project and conducting biological studies, that the proposed project will have an adverse effect on an endangered species or its habitat. Only if the project can be modified to eliminate the adverse effect or relocated to another site will there be any likelihood of overcoming a finding of probable adverse effect2
Coastal Zone Management Act
The Coastal Zone Management Act of 1972 (USC Title 16, Section 1451 et seq.) provides for a com- prehensive, long-range, coordinated national program for the management, use, protection, and development of the U.S. coastal zone. Under the legislation, coastal states submit coastal zone management plans for U.S. Department of Commerce approval (CFR Title 15, Part 923). Federal agencies, and applicants for federal licenses and permits for activities affecting the coastal zone, must obtain an acknowledgment from the state that the proposed activity is consistent with the state’s approved management plan (CFR Title 15, Part 930). Although state plans cannot influence sales of oil and gas leases on the outer continental shelf, activities car- ried out under such leases must be consistent with the state’s coastal management plan.
Marine Protection, Research, and Sanctuaries Act
The Marine Protection, Research, and Sanctuaries Act of 1972 (USC Title 33, Section 1401 et seq., and USC Title 16, Section 1431 et seq.) authorizes the EPA to regulate the dumping of material into ocean waters. The
EPA permits are required for all Ocean dumping (except dredged material, which is subject to the permitting requirements of the U.S. Army Corps of Engineers -- see CFR Title 40, Part 220 et seq.). The statute forbids the ocean dumping of high-level radioactive waste.
Historic Sites Act
Under the Historic Sites Act (USC Title 16, Section 461 et. seq.), the Secretary of the Interior is empowered to expand and maintain a National Register of districts, sites, buildings, structures, and objects significant in American history and culture (CFR Title 36, Part 1202). Federal agencies are required to take into account the effect of any of their activities, either federal or federally assisted, on sites listed in the National Register.
Hazardous Materials Transportation Act
Under the Hazardous Materials Transportation Act (USC Title 49, Section 1801 et seq.), the Secretary of Transportation designates materials for which transpor- tation may pose an unreasonable risk to health, safety, or property. The U.S. Department of Transportation has issued extensive regulations on the handling, packaging, and labeling of hazardous materials, as well as proce- dures applicable to carriers of these materials, such as reporting requirements in the case of a transport incident involving discharges of hazardous materials (CFR Title 49, Part 17 1 et seq.).
REFERENCES
1. United States Code Service Tables: Statutes at Large from 196.5 through 1978, Lawyers Co- Operative Publishing co., Rochester, N.Y. (1985).
2. United States Code Service Tables: Statutes at Large from 1979, Executive Orders, Proclamations, Reorganization Plans, Popular Names, Lawyers Co-Operative Publishing Co., Rochester, N.Y. (1985).
3. United States Code Service Index and Finding Aids to Code of Federal Regulations, Lawyers Co- operative Publishing co., Rochester, N.Y. (1987).
4. Arbuckle, J.G., et al., Environmental Law Hand- book, 8th Ed., Government Institutes, Inc., Rock- ville, Md. (June 1985).
454

5 . Environmental Compliance Guide, U.S. Dept. of al Protection Agency Report EPA-AA-SDSB-85-5 (Nov. 1985). Energy, Office of Environment (1981, as amended).
6. McCurdy, T., U.S. Environmental Protection 10. ERT Inc., RCRA Handbook, 2nd Ed., Concord, Agency, Office of Air Quality Planning and Stan- dards, Personal communication (Feb. and March 1986 and Jan. 1987).
Mass. (June 1986).
11. Marshall v . Barlow’s Inc., 436 U.S. (1978).
12. Cleaning Up Hazardous Wastes: An Overview of Superfund Reauthorization Issues, US. General Accounting Office Report GAORCED-85-69
7. Lubrizol Corp. v. EPA, 562 F.2d 807, D.C. Circuit Court (1977).
8. Office of Mobile Sources, U.S. Environmental (March 1985). Protection Agency, Ann Arbor, Mich., personal communication (June 1988).
13. Superfund Strategy, Office of Technology Assess- ment Report OTA-ITE-252 (April 1985).
9. Study of Gasoline Volatility and Hydrocarbon Emissions from Motor Vehicles, U.S. Environment-
455

Appendix B
Units of Measure
bmel(s) brake horsepower British thermal unit(s)
cubic centimeter(s) cubic foot (feet) cubic meter(s) cubic mile(s) cubic yard(s) curie(s)
day(s) decibel( s) degree(s) Celsius degree(s) Fahrenheit degree(s) Kelvin
foot (feet)
gallon(s) gigaelectronvolt(s) gigawatt(s) gigawatt(s)-electric gigawatt(s)-hour gigawatt(s)-year grain(s)
hectare(s) hour(s) horsepower
inch( es)
joule( s)
kilocurie( s) kiloelectronvolt(s) kilogram( s) kilojoule(s) kilometer( s) kilopasc al( s) kilovolt(s)
gram(s)
bbl
Btu
cm3 f t3
m3 m i 2
Ci
bhP
Y d3
d dB OC OF K ft
gal GeV GW
GWe GWh
GW-yr gr g
ha h
hP in.
J kCi keV
kJ km kPa kV
kg
kilowatt(s) kilowatt-hour(s)
liter(s)
megaelectronvolt(s) megapascal(s) megawattb) megawatt-day@) megawatt( s) -electric megawatt-hour(s) meg aw att(s)-thermal megawatt-year(s) meter(s) memc ton(s) microgram(s) micrometer(s) microroentgen(s) mile(s) millicurie(s) milligram(s) milliliter(s) millimeter(s) millirad(s) millirem(s) millisecond(s) minute(s) month(?+)
nanocurie(s) nanogram(s1
part(s) per billion part(s) per million picocurie(s)
pound(s) per square inch pound(s) per square inch,
pound(s) per square inch,
pound(s)
absolute
gage
kW kWh
L
MeV MPa MW
MW-d MWe Mwh MWt
W-Yr m
t
CLm ClR mi
mCi mg mL mm mrd
mrem ms
min mo
nCi ng
PPb PPm Pci
lb psi
psia
451

R roentgen(s)
rem roentgen equivalent man
S second( s) short ton(s) ton@) square centimeter(s) cm2 square foot (feet) ftz
km2 square lcilometer(s)
volt(s) square mile(s) mi2
watt(s) W
V
week(s) wk
Yr Yea@)