L-Arginine Induces White Adipose Tissue Browning—A New
16
Citation: Kalezic, A.; Korac, A.; Korac, B.; Jankovic, A. L-Arginine Induces White Adipose Tissue Browning—A New Pharmaceutical Alternative to Cold. Pharmaceutics 2022, 14, 1368. https://doi.org/ 10.3390/pharmaceutics14071368 Academic Editors: Han-Joo Maeng and Kwang-Hoon Chun Received: 20 May 2022 Accepted: 25 June 2022 Published: 28 June 2022 Publisher’s Note: MDPI stays neutral with regard to jurisdictional claims in published maps and institutional affil- iations. Copyright: © 2022 by the authors. Licensee MDPI, Basel, Switzerland. This article is an open access article distributed under the terms and conditions of the Creative Commons Attribution (CC BY) license (https:// creativecommons.org/licenses/by/ 4.0/). pharmaceutics Article L-Arginine Induces White Adipose Tissue Browning—A New Pharmaceutical Alternative to Cold Andjelika Kalezic 1 , Aleksandra Korac 2 , Bato Korac 1 and Aleksandra Jankovic 1, * 1 Institute for Biological Research “Sinisa Stankovic”—National Institute of Republic of Serbia, University of Belgrade, 11060 Belgrade, Serbia; [email protected] (A.K.); [email protected] (B.K.) 2 Faculty of Biology, Center for Electron Microscopy, University of Belgrade, 11060 Belgrade, Serbia; [email protected] * Correspondence: [email protected]; Tel.: +381-11-2078-307 Abstract: The beneficial effects of L-arginine supplementation in obesity and type II diabetes involve white adipose tissue (WAT) reduction and increased substrate oxidation. We aimed to test the potential of L-arginine to induce WAT browning. Therefore, the molecular basis of browning was investigated in retroperitoneal WAT (rpWAT) of rats exposed to cold or treated with 2.25% L-arginine for 1, 3, and 7 days. Compared to untreated control, levels of inducible nitric oxide (NO) synthase protein expression and NO signaling increased in both cold-exposed and L-arginine-treated groups. These increases coincided with the appearance of multilocular adipocytes and increased expression levels of uncoupling protein 1 (UCP1), thermogenic and beige adipocyte-specific genes (Cidea, Cd137, and Tmem26), mitochondriogenesis markers (peroxisome proliferator-activated receptor (PPAR)-γ coactivator-1α, mitochondrial DNA copy number), nuclear respiratory factor 1, PPARα and their respective downstream lipid oxidation enzymes after L-arginine treatment. Such browning phenotype in the L-arginine-treated group was concordant with end-course decreases in leptinaemia, rpWAT mass, and body weight. In conclusion, L-arginine mimics cold-mediated increases in NO signaling in rpWAT and induces molecular and structural fingerprints of rpWAT browning. The results endorse L-arginine as a pharmaceutical alternative to cold exposure, which could be of great interest in obesity and associated metabolic diseases. Keywords: nitric oxide; L-arginine; browning; obesity 1. Introduction An imbalance in energy intake and expenditure leads to an unhealthy surplus of white adipose tissue (WAT), i.e., obesity, which represents a fertile ground for various metabolic diseases. Accumulating evidence demonstrates that a shift from WAT toward brown adipose tissue (BAT)-like phenotype, via so-called browning, may restrain obesity and improve overall metabolic profile (as reviewed recently in [1]). Namely, genuine brown and beige adipocytes that appear during WAT browning upon stimulation attain a unique capacity to burn lipids and dissipate chemical energy as heat via uncoupled respiration. WAT browning is enabled by structural and metabolic reprogramming, including lipid body remodeling from unilocular to multilocular morphology, mitochondriogenesis, and an up- surge in the expression of fatty acid oxidation enzymes and ultimately uncoupling protein 1 (UCP1) [2]. Activation of UCP1 in interscapular BAT increases the uptake and oxidation of metabolic substrates to boost the adaptive non-shivering thermogenesis [3,4]. Increasing such functional, BAT-like features in WAT may help in the weight-gain regulation [5] and in buffering excess nutrients and potentially noxious metabolites [6,7]. Therefore, WAT browning is an attractive therapeutic target for obesity and associated metabolic diseases. Hypermetabolic states (such as cold exposure and exercise) and various nutritional and Pharmaceutics 2022, 14, 1368. https://doi.org/10.3390/pharmaceutics14071368 https://www.mdpi.com/journal/pharmaceutics
-
Upload
khangminh22 -
Category
Documents
-
view
1 -
download
0
Transcript of L-Arginine Induces White Adipose Tissue Browning—A New
Citation: Kalezic, A.; Korac, A.;
Korac, B.; Jankovic, A. L-Arginine
Induces White Adipose Tissue
Browning—A New Pharmaceutical
Alternative to Cold. Pharmaceutics
2022, 14, 1368. https://doi.org/
10.3390/pharmaceutics14071368
Academic Editors: Han-Joo Maeng
and Kwang-Hoon Chun
Received: 20 May 2022
Accepted: 25 June 2022
Published: 28 June 2022
Publisher’s Note: MDPI stays neutral
with regard to jurisdictional claims in
published maps and institutional affil-
iations.
Copyright: © 2022 by the authors.
Licensee MDPI, Basel, Switzerland.
This article is an open access article
distributed under the terms and
conditions of the Creative Commons
Attribution (CC BY) license (https://
creativecommons.org/licenses/by/
4.0/).
pharmaceutics
Article
L-Arginine Induces White Adipose Tissue Browning—A NewPharmaceutical Alternative to ColdAndjelika Kalezic 1 , Aleksandra Korac 2 , Bato Korac 1 and Aleksandra Jankovic 1,*
1 Institute for Biological Research “Sinisa Stankovic”—National Institute of Republic of Serbia,University of Belgrade, 11060 Belgrade, Serbia; [email protected] (A.K.);[email protected] (B.K.)
2 Faculty of Biology, Center for Electron Microscopy, University of Belgrade, 11060 Belgrade, Serbia;[email protected]
* Correspondence: [email protected]; Tel.: +381-11-2078-307
Abstract: The beneficial effects of L-arginine supplementation in obesity and type II diabetes involvewhite adipose tissue (WAT) reduction and increased substrate oxidation. We aimed to test thepotential of L-arginine to induce WAT browning. Therefore, the molecular basis of browning wasinvestigated in retroperitoneal WAT (rpWAT) of rats exposed to cold or treated with 2.25% L-argininefor 1, 3, and 7 days. Compared to untreated control, levels of inducible nitric oxide (NO) synthaseprotein expression and NO signaling increased in both cold-exposed and L-arginine-treated groups.These increases coincided with the appearance of multilocular adipocytes and increased expressionlevels of uncoupling protein 1 (UCP1), thermogenic and beige adipocyte-specific genes (Cidea, Cd137,and Tmem26), mitochondriogenesis markers (peroxisome proliferator-activated receptor (PPAR)-γcoactivator-1α, mitochondrial DNA copy number), nuclear respiratory factor 1, PPARα and theirrespective downstream lipid oxidation enzymes after L-arginine treatment. Such browning phenotypein the L-arginine-treated group was concordant with end-course decreases in leptinaemia, rpWATmass, and body weight. In conclusion, L-arginine mimics cold-mediated increases in NO signaling inrpWAT and induces molecular and structural fingerprints of rpWAT browning. The results endorseL-arginine as a pharmaceutical alternative to cold exposure, which could be of great interest in obesityand associated metabolic diseases.
Keywords: nitric oxide; L-arginine; browning; obesity
1. Introduction
An imbalance in energy intake and expenditure leads to an unhealthy surplus ofwhite adipose tissue (WAT), i.e., obesity, which represents a fertile ground for variousmetabolic diseases. Accumulating evidence demonstrates that a shift from WAT towardbrown adipose tissue (BAT)-like phenotype, via so-called browning, may restrain obesityand improve overall metabolic profile (as reviewed recently in [1]). Namely, genuine brownand beige adipocytes that appear during WAT browning upon stimulation attain a uniquecapacity to burn lipids and dissipate chemical energy as heat via uncoupled respiration.WAT browning is enabled by structural and metabolic reprogramming, including lipid bodyremodeling from unilocular to multilocular morphology, mitochondriogenesis, and an up-surge in the expression of fatty acid oxidation enzymes and ultimately uncoupling protein1 (UCP1) [2]. Activation of UCP1 in interscapular BAT increases the uptake and oxidationof metabolic substrates to boost the adaptive non-shivering thermogenesis [3,4]. Increasingsuch functional, BAT-like features in WAT may help in the weight-gain regulation [5] andin buffering excess nutrients and potentially noxious metabolites [6,7]. Therefore, WATbrowning is an attractive therapeutic target for obesity and associated metabolic diseases.Hypermetabolic states (such as cold exposure and exercise) and various nutritional and
Pharmaceutics 2022, 14, 1368. https://doi.org/10.3390/pharmaceutics14071368 https://www.mdpi.com/journal/pharmaceutics
Pharmaceutics 2022, 14, 1368 2 of 16
pharmacological agents can induce WAT browning (as reviewed in [8]); however, there is alack of safe and efficient browning inducers that could be therapeutically exploited.
Cold-induced β-adrenergic signaling is the primary physiological inducer of thermo-genesis in BAT and browning in WAT [8]. The thermogenic response of BAT is mediatedby increased levels of redox-active molecule nitric oxide (NO) [9]. Two out of three nitricoxide synthase (NOS) isoforms contribute to NO synthesis in adipose tissues, endothelialand inducible NOS (eNOS and iNOS, respectively) [10]. Both isoforms are sensitive tosympathetic signaling in BAT, contributing to NO production upon cold exposure [11,12]and mediating and amplifying adaptive thermogenesis in BAT. Namely, NO signaling actson the transcription program and metabolic reprogramming, supporting the processesinvolved in large-scale tissue remodeling (angiogenesis, vascularisation, proliferation,and differentiation) [9,13]. In WAT, inorganic nitrite supplementation has been shown toactivate browning by increasing NO levels [14,15]. Several studies indicated that this non-canonical, reductive pathway of NO production, which is attributed to distinct enzymespossessing nitrite reductase activity, occurs in physiologic conditions, confined to specificacidic or hypoxic conditions [16]. On the other hand, the involvement of the NOS/NOpathway—the canonical NO synthesis pathway [17] through oxidative degradation ofL-arginine to citrulline catalyzed by NOS isoforms—in WAT browning remains unclear.
When applied in vivo, a substrate for NOS-mediated NO synthesis, L-arginine, in-creases the rate of endogenous NO synthesis and cGMP-dependent signaling [18]. Besides,NO may act via nitrosation- and nitration-mediated posttranslational redox regulatorymechanisms that affect gene and protein expression, enzyme activity, cell morphology, andtissue structure [19]. Previous studies have shown that L-arginine has beneficial effects onmetabolic homeostasis, acting on thermogenesis in BAT and overall oxidative metabolism,resulting in fat mass reduction while sparing lean body mass in both animal and humanstudies [18,20–29]. However, whether such beneficial effects of L-arginine involve WATbrowning is currently unknown.
Therefore, in the present study, we aimed to examine the involvement of the NOS/NOsynthesis pathway in rpWAT browning during cold exposure and whether a priory upregu-lation of this pathway by a physiological dose of L-arginine instigates the browning process.Therefore, we examined the effects of L-arginine on NO levels and key enzymes involvedin the L-arginine/NO synthesis pathway during 1, 3, and 7 days of cold exposure and2.25% L-arginine treatment. Additionally, we assessed structural, metabolic, and molecularindicators of rpWAT browning, including nuclear respiratory factor 1 (NRF1), peroxi-some proliferator-activated receptor α (PPARα), peroxisome proliferator-activated receptor-gamma coactivator-1α (PGC-1α), mitochondrial DNA copy number (MCN), enzymesinvolved in fatty acid turnover and oxidation, thermogenic and beige adipocyte-specificgenes and the pattern of UCP1 expression in parallel with the occurrence of multilocularadipocytes morphology. The results indicate that the NOS/NO pathway is involved incold-mediated rpWAT browning and strongly suggest that L-arginine could be an effectivepharmaceutical tool for the induction of WAT browning.
2. Materials and Methods2.1. Animal Study
All common chemicals such as digestion enzymes, antibiotics, and buffers wereobtained from Sigma-Aldrich (Sigma-Aldrich Chemie GmbH, Munich, Germany), unlessstated otherwise. First, 2.5 months old, age- and weight-matched male Mill Hill hooded rats(Rattus norvegicus, Berkenhout, 1769) raised in the vivarium at the Institute for BiologicalResearch “Sinisa Stankovic” were randomly divided into three groups (n = 6): control(maintained at 24 ± 1 ◦C), cold-exposed (maintained in a cold chamber at 4 ± 1 ◦C for1, 3, or 7 days), and L-arginine-treated (ad libitum 2.25% solution of L-arginine ·HCl for1, 3, or 7 days). Animals were housed in conventional cages under a 12 h light/darkphotoperiod with free access to standard chow food and water ad libitum. Food andwater intake were monitored daily. Following cold exposure and L-arginine treatment,

Pharmaceutics 2022, 14, 1368 3 of 16
body weights were measured, animals were sacrificed by decapitation, and visceral whiteadipose tissues (WAT) depots, including retroperitoneal (rpWAT), mesenteric (mWAT),and epididymal (eWAT), were immediately dissected and weighted. rpWAT was furtherprocessed for molecular, microscopy, and ex vivo analyses. Adiposity index was calculatedas the quotient of the sum of the rpWAT, mWAT, and gWAT mass (g) and total body weight(g) × 100. Blood was collected, allowed to clot, and centrifuged at 3500× g to obtain serum.
2.2. Biochemistry/ELISA Assays
Blood glucose was measured following decapitation by glucose-oxidase reagent strips(GlucoSure test, Prizma, Kragujevac, Serbia). Serum lipid parameters (total cholesterol,LDL-cholesterol, HDL-cholesterol, and triglycerides) were determined using standardbiochemical methods on an ILab300+ analyzer (Instrumentation Laboratory, Milan, Italy).All reagents used for biochemical analyses were purchased from BioSystems (Barcelona,Spain). Leptin and adiponectin levels were determined by Rat Leptin and AdiponectinELISA kits (KRC2281, Invitrogen Thermo Fisher Scientific, Waltham, MA, USA and E-EL-R3012, Elabscience, Huston, TX, USA), according to the manufacturer’s instructions.
2.3. Isolation of Mature Adipocytes
For mature adipocytes isolation and culture, rats were kept for 7 days either untreated(controls), exposed to cold (4 ± 1 ◦C), or treated with L-arginine (ad libitum 2.25% solutionof L-arginine ·HCl). After decapitation, whole rpWAT depots were weighed and placedinto capped, sterile 50 mL conical tubes containing sterile transport medium (Dulbeccophosphate-buffered saline, pH 7.4 with 1% penicillin-streptomycin). Tissues were trans-ported to the laminar flow hood within 5 min, transferred into petri dishes with steriledigestion buffer pre-warmed to 37 ◦C (Medium 199, 1% penicillin-streptomycin, 1 mg/mLcollagenase Type II from Clostridium histolyticum and 1 mg/mL dispase II), and mincedfor approximately 2 min to the homogenous mixture. Three mL of digestion buffer wereused per one gram of rpWAT. Finely minced adipose tissue was transferred to 50 mL tubesand left in the water bath at 37 ◦C for 35 min. Every 5 min, the stage of digestion waschecked visually, and tubes were vortexed for 10 s. Following tissue digestion, undigestedpieces of tissue were removed by filtration through a sterile gauze mesh, and adipocyteswere resuspended and washed two times with 50 mL of wash buffer (M199 mediumsupplemented with 10% fetal bovine serum and 1% penicillin-streptomycin). Each time,adipocytes were allowed to float out for 3–5 min, and the infranatant containing the washbuffer was removed with an 18-gauge needle and syringe. Finally, mature adipocyteswere centrifuged for 30 s at 800 rpm, and the infranatant and lipid layer above the floatingadipocytes were carefully removed and discarded. To calculate the number of adipocytes,20 µL of packed adipocytes were mixed with an equal volume of 0.4% trypan blue, andcells were counted using a hemocytometer chamber under a light microscope with 20×magnification. Isolated mature white adipocytes were used for further analyses.
2.4. NO Production
Measurements were done in triplicate per 100 µL of packed adipocytes (~6 × 10⁵ adip-ocytes). Production of NO by isolated mature adipocytes was measured electrochemicallywith a highly selective NO-sensitive electrode (amiNO-700 sensor electrode; InnovativeInstruments Inc., Tampa, FL, USA). The sensor was polarized in an aqueous solution for atleast 24 h before calibration, as suggested by the manufacturer. The sensor was calibratedby the conversion of NO2 to NO in an acidic solution containing potassium iodide. Toincrease the NO output, ~6 × 10⁵ adipocytes were incubated for 30 min at 37 ◦C with400 µL of fresh M199 medium (containing 300 µM L-arginine and supplemented with10 µM superoxide dismutase mimetic manganese (III) tetrakis 4-benzoic acid porphyrinmonochloride (Cayman Chemical, MI, USA)) prior to NO measurement. After incubation,the cells were spun for 5 s, and the infranatant was immediately thereafter used for NO

Pharmaceutics 2022, 14, 1368 4 of 16
measurement. NO was measured by adding 300 µL of medium sample to 50 µL of H2O,which served as the baseline for the sensor.
2.5. H&E Staining
Immediately after dissection and washing, one part of rpWAT tissue was fixed in 4%paraformaldehyde and routinely processed for embedding. Paraffin-embedded 7–10µm-thick sections of rpWAT tissue were routinely stained with hematoxylin and eosin, asdescribed previously [2].
2.6. Immunohistochemistry of UCP1
Semi-fine (1µm thick) sections were used for the detection of UCP1 by routine im-munohistochemistry, as described previously [2], using primary antibodies against UCP1(1 µg/mL; ab10983) and appropriate secondary antibodies (all purchased from Abcam,Cambridge, UK). Briefly, before incubation with primary antibodies, antigen retrieval wasperformed in citrate buffer in the microwave for 5 min. Sections were incubated with pri-mary antibodies overnight at 4 ◦C and incubated with secondary antibodies for 2 h at roomtemperature. For immunodetection and visualization, a Dako LSAB Universal Kit (DakoScientific, Glostrup, Denmark) was used. Finally, sections were mounted with DPX (Sigma-Aldrich, St. Louis, MO, USA). All sections were counterstained with hematoxylin andanalyzed with an optical light microscope (Leica DMLB microscope, Leica Microsystems,Wetzlar, Austria). Negative controls were obtained by omitting the primary antibody.
2.7. RT-PCR/Gene Expression Analysis
Total rpWAT RNA was extracted with Trizol (Invitrogen, Life Technologies, Waltham,MA, USA), and first-strand cDNA synthesis was done with a Revert Aid First StrandcDNA Synthesis Kit (Thermo Fischer Scientific, Waltham, MA, USA) according to themanufacturer’s instructions. The concentration and quality of RNA samples were assessedwith a NanoPhotometer® (Implen GmbH, München, Germany) at 260 nm and 280 nm.Real-time PCR was performed under standard conditions using a FastStart Essential DNAGreen Master kit (Roche, Basel, Switzerland) and QuantStudio™ 3 ReaL-Time PCR System(Thermo Fischer Scientific, Waltham, MA, USA). Primer sequences and cycling conditionsare given in Figure S1. As an internal standard for amplification, 18S was quantified.Prior optimization was conducted for each set of primers that consisted of optimal primer,MgCl2, template concentration determination, verification of amplification efficiency, andnonspecific amplification. PCR amplification was performed in duplicate in a total reactionvolume of 10 µL.
2.8. Mitochondrial DNA Copy Number (MCN)
Total DNA was extracted with Trizol (Invitrogen, Life Technologies, Waltham, MA,USA), and the concentration was assessed with a NanoPhotometer® (Implen GmbH,Munich, Germany) at 260 nm and 280 nm, subsequently, calculated per formula A260of 1.0 = 50 µg/mL of pure double-stranded DNA. Then, 10 ng of total DNA were used forRT-PCR determination of relative mitochondrial copy number. RT-PCR was performed forthe 18S gene as the nuclear target and the Nd4 gene as the mitochondrial target under thefollowing cycling conditions: 95 ◦C for 10 min, 40 cycles at 95 ◦C for 15 s, 60 ◦C for 30 s,72 ◦C for 45 s, and melt curve analysis at 95 ◦C for 15 s, 60 ◦C for 1 min, 95 ◦C for 1 s in aQuantStudio™ 3 ReaL-Time PCR System (Thermo Fischer Scientific, Waltham, MA, USA).Mitochondrial DNA content relative to nuclear DNA content was calculated as 2 × 2∆CT,where ∆CT stands for CT(18S)–CT(Nd4).
2.9. Western Blot/Protein Expression Analysis
Western blot analysis was conducted as described previously [2] using primary an-tibodies against endothelial nitric oxide synthase (eNOS, 1 µg/mL; sc-376751), induciblenitric oxide synthase (iNOS, 1 µg/mL; sc-8310), 3-nitrotyrosine (3-NT, 1 µg/mL; sc-65385),

Pharmaceutics 2022, 14, 1368 5 of 16
arginase I (1 µg/mL; sc-47715), arginase II (1 µg/mL; sc-393496), hormone sensitive lipase(HSL, 1 µg/mL; sc-74489), adipose triglyceride lipase (ATGL, 1 µg/mL; sc-365278), monoa-cylglycerol acyltransferase 1 (MGAT1, 1 µg/mL; sc-376079), carnitine palmitoyltransferase1 (CPT1, 1 µg/mL; sc-393070), proliferating cell nuclear antigen (PCNA, 1 µg/mL; sc-7907),all purchased from Santa Cruz (Dallas, TX, USA), and nuclear factor erythroid 2-relatedfactor 2 (Nrf2, 1 µg/mL; ab31163), uncoupling protein 1 (UCP1, 1 µg/mL; ab10983), β-actin(1 µg/mL; ab8226), nuclear respiratory factor 1 (NRF1, 1 µg/mL; ab86516), peroxisomeproliferator-activated receptor-α (PPARα, 1 µg/mL; ab8934), acyL-CoA dehydrogenasemedium chain (ACADM, 1 µg/mL; ab92461), all purchased from Abcam (Cambridge, UK).Immunoreactive bands were analyzed using the Image J software (Version v1.53c, NationalInstitutes of Health, Bethesda, MD, USA). Band density for each protein of interest wasnormalized as the ratio of pixel intensity for the target protein averaged against the loadingcontrol (β-actin). The figures show the protein content as protein expression in arbitraryunits (AU) from three independent experiments. Images of whole uncut blots are shown inFigure S1.
2.10. Statistical Analyses
All data were statistically analyzed using GraphPad Prism software (Version 8.4.3GraphPad Software, San Diego, CA, USA). The Student’s t-test was used to evaluatedifferences between two groups, while one-way analysis of variance (ANOVA) followedby multiple comparison Dunnett’s post hoc test was used for evaluation of inter-groupdifferences between multiple groups. Error bars represent standard deviation (SD) orstandard error of the mean (SEM), as stated in the figure legends. Statistical significancewas accepted at p < 0.05.
3. Results3.1. Cold Exposure-Induced Browning Is Associated with Endogenous NO Synthesis; L-ArginineIncreases NO Synthesis in rpWAT to a Similar Extent
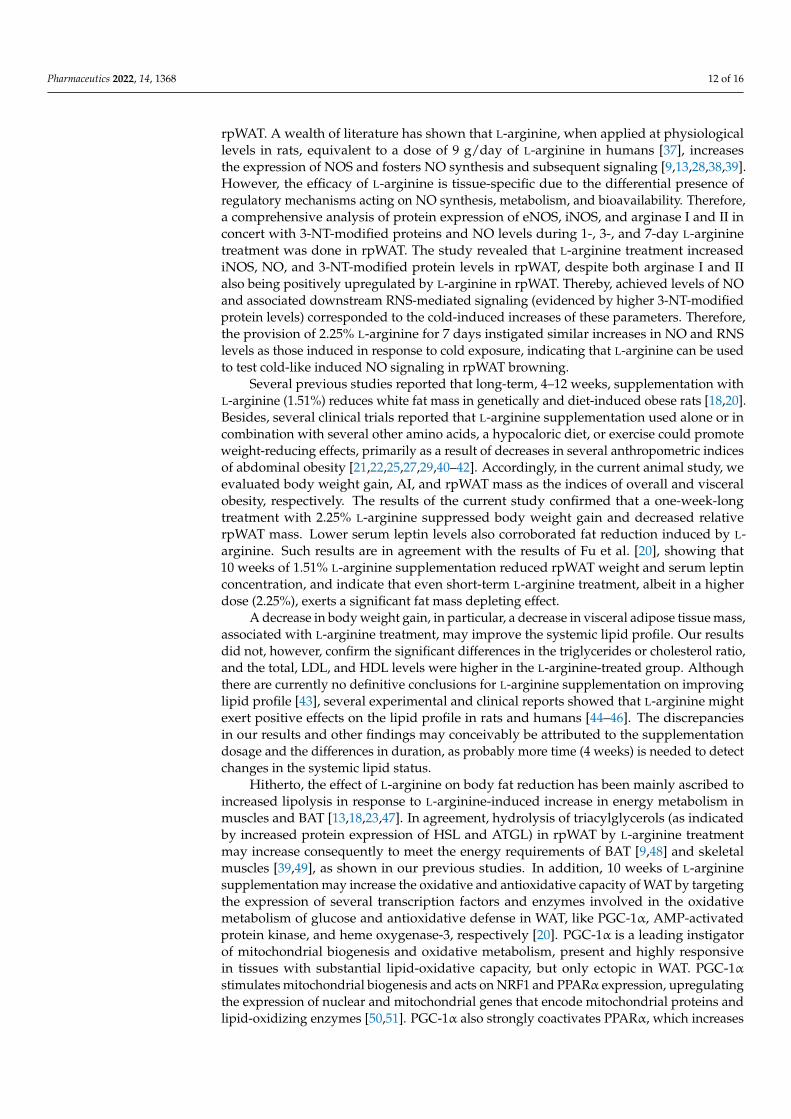
Exposure to cold is one of the most powerful physiological stimuli for the induction ofWAT browning. To examine if NO is involved in the cold-induced browning of rpWAT andwhether the physiological dose of L-arginine increases the endogenous NO synthesis inrpWAT, we determined protein expression levels of enzymes involved in the arginine-NOsynthesis pathway, 3-NT-modified proteins, and NO level during 7-day cold exposureand 2.25% L-arginine treatment. Two enzymes, eNOS and iNOS, that are present in WATand metabolize L-arginine to NO and citrulline were examined. The results showed that,in comparison to room-temperature maintained controls, eNOS protein expression wasincreased following 1, 3, and 7 days of cold acclimation (p < 0.001). A more transientincrease in iNOS protein expression was detected on day 1 of cold exposure (p < 0.05),which subsequently returned to the control level. During L-arginine supplementation,L-arginine predominately acted on iNOS protein expression in rpWAT, whose proteinexpression increased 50–75% compared to the control (Figure 1a). Adipocytes also expressarginases, enzymes that restrain NOS-mediated NO synthesis, diverting L-arginine towardsdegradation to ornithine and urea. Protein expression of arginase I was significantlyincreased both following cold exposure and L-arginine treatment, while protein expressionof arginase II was upregulated only on day 3 of L-arginine treatment (Figure 1a). The netresult of NOSs and arginases induction was shifted toward higher NO synthesis, bothduring cold exposure and L-arginine treatment, since NO levels measured in adipocytesisolated from cold-exposed and L-arginine-treated rats were higher (p < 0.001) compared toadipocytes isolated from controls (Figure 1c). NO can be bound to heme proteins, includingthe soluble guanylate cyclase, increasing the cGMP synthesis and signaling, and/or canalso propel downstream reactive nitrogen species (RNS) that act on various proteins vianitration- and nitrosation-related redox signaling. The expression pattern of 3-NT-modifiedproteins was examined in rpWAT, and the results have identified two bands (correspondingto 35 kD and 55 kD) whose intensity was increased both during cold exposure and, also,

Pharmaceutics 2022, 14, 1368 6 of 16
transiently on day 1 and day 3 of L-arginine treatment (Figure 1a). To assess the shift inthe pro-nitrooxidative redox status, we additionally determined the expression of redox-rheostat—transcription factor nuclear factor-erythroid factor 2-related factor 2 (Nrf2) andfound that its protein expression was increased in response to cold-induced and L-arginine-induced redox changes. Precisely, the protein level of Nrf2 increased following 3 and 7 daysof cold exposure (p < 0.001) and following 1 and 3 days of L-arginine treatment (p < 0.001)(Figure 1c).
Pharmaceutics 2022, 14, x FOR PEER REVIEW 6 of 16
The net result of NOSs and arginases induction was shifted toward higher NO synthesis, both during cold exposure and L-arginine treatment, since NO levels measured in adipo-cytes isolated from cold-exposed and L-arginine-treated rats were higher (p < 0.001) com-pared to adipocytes isolated from controls (Figure 1c). NO can be bound to heme proteins, including the soluble guanylate cyclase, increasing the cGMP synthesis and signaling, and/or can also propel downstream reactive nitrogen species (RNS) that act on various proteins via nitration- and nitrosation-related redox signaling. The expression pattern of 3-NT-modified proteins was examined in rpWAT, and the results have identified two bands (corresponding to 35 kD and 55 kD) whose intensity was increased both during cold exposure and, also, transiently on day 1 and day 3 of L-arginine treatment (Figure 1a). To assess the shift in the pro-nitrooxidative redox status, we additionally determined the expression of redox-rheostat—transcription factor nuclear factor-erythroid factor 2-related factor 2 (Nrf2) and found that its protein expression was increased in response to cold-induced and L-arginine-induced redox changes. Precisely, the protein level of Nrf2 increased following 3 and 7 days of cold exposure (p < 0.001) and following 1 and 3 days of L-arginine treatment (p < 0.001) (Figure 1c).
Figure 1. Induction of L-arginine/NO pathway in rpWAT of cold-exposed rats and the effects of 2.25% L-arginine supplementation. Protein expression analysis of endothelial NO synthase (eNOS), inducible NO synthase (iNOS), arginases I and II, nuclear factor-erythroid factor 2-related factor 2 (Nrf2), and 3-nitrotyrosine (3-NT)-modified proteins (represented by two-immunoreactive bands, at 35 and 55 KDa) during 1, 3, and 7 days of cold exposure and L-arginine treatment (a) and their corresponding blots (b). Each band is representative of six pooled samples per group. Protein con-tent is expressed relative to control acclimated to room temperature (100%). Experiments were re-peated in triplicate. Data were quantified as described in the Methods. (c) Detection of nitric oxide (NO) levels in the mature adipocytes stimulated by L-arginine (300 μM) for 30 min, at 37 °C, previ-ously isolated from rpWAT of untreated (control), cold-exposed, and L-arginine (2.25%)-treated rats
Figure 1. Induction of L-arginine/NO pathway in rpWAT of cold-exposed rats and the effects of2.25% L-arginine supplementation. Protein expression analysis of endothelial NO synthase (eNOS),inducible NO synthase (iNOS), arginases I and II, nuclear factor-erythroid factor 2-related factor 2(Nrf2), and 3-nitrotyrosine (3-NT)-modified proteins (represented by two-immunoreactive bands,at 35 and 55 KDa) during 1, 3, and 7 days of cold exposure and L-arginine treatment (a) and theircorresponding blots (b). Each band is representative of six pooled samples per group. Protein contentis expressed relative to control acclimated to room temperature (100%). Experiments were repeatedin triplicate. Data were quantified as described in the Methods. (c) Detection of nitric oxide (NO)levels in the mature adipocytes stimulated by L-arginine (300 µM) for 30 min, at 37 ◦C, previouslyisolated from rpWAT of untreated (control), cold-exposed, and L-arginine (2.25%)-treated rats for7 days (n = 9, 3 per group, in three technical replicates per group). Data represent the mean ± SEM.* Compared to control, * p < 0.05, ** p < 0.01 and *** p < 0.001.
3.2. Effects of L-Arginine Treatment on Circulatory Parameters and Adipokines Levels
The effects of 7-day L-arginine treatment on several systemic circulating biochemicalparameters and endocrine function of WAT are shown in Table 1. L-arginine treatment

Pharmaceutics 2022, 14, 1368 7 of 16
triggered an increase in the total, HDL-, and LDL-cholesterol levels, but these changes didnot disturb the ratio between the cholesterols indicating atherogenic and heart disease risk.Besides, there was no difference in circulating glucose and triglyceride levels (measured inthe fed state) between L-arginine-treated rats and controls, which is in line with equal foodintake in examined groups. Serum adiponectin was not affected by L-arginine treatment,while serum leptin was decreased (p < 0.001).
Table 1. Effects of L-arginine on blood glucose and serum leptin, adiponectin, total, HDL-, LDL-cholesterol, and triglyceride levels; 2.5-month-old rats were randomly assigned to receive drinkingwater or 2.25% L-arginine-HCl in drinking water for 7 days.
Control L-Arginine
Glucose (mmol L−1) 5.8 ± 0.5 6.0 ± 0.4Total cholesterol (mmol L−1) 1.63 ± 0.2 1.9 ± 0.2 *LDL-cholesterol (mmol L−1) 0.51 ± 0.04 0.61 ± 0.06 *HDL-cholesterol (mmol L−1) 0.7 ± 0.1 0.9 ± 0.1 *
Triglyceride (mmol L−1) 0.7 ± 0.2 0.8 ± 0.1LDL-cholesterol/HDL-cholesterol 0.7 ± 0.07 0.7 ± 0.02Total cholesterol/HDL-cholesterol 2.4 ± 0.2 2.3 ± 0.1
TG/HDL-cholesterol 0.97 ± 0.2 0.98 ± 0.03Leptin (pg mL−1) 985.7 ± 90.0 664.8 ± 56.4 ***
Adiponectin (ng mL−1) 93.9 ± 1.9 88.9 ± 8.3The results represent the means ± SD (n = 6 per group). * Comparison with control; * p < 0.05; *** p < 0.001.
3.3. Slimming Effects of L-Arginine Are Associated with Diminution of rpWAT Depot Mass
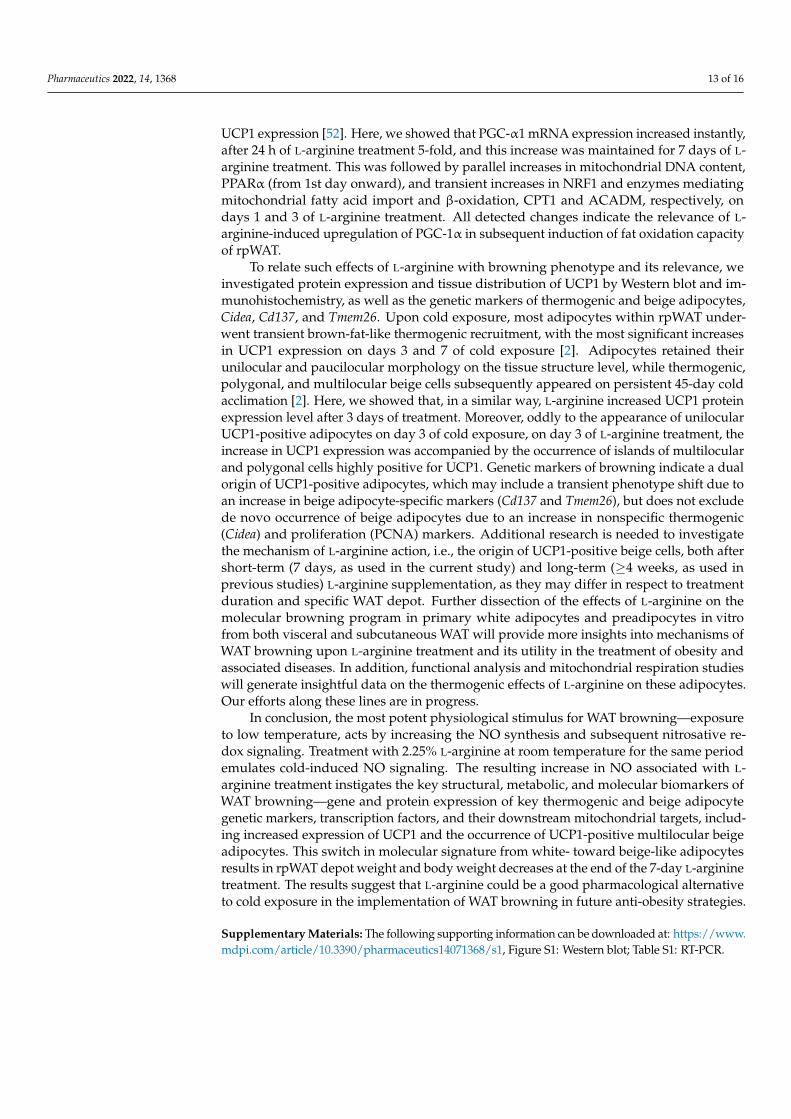
Body weight gain, adiposity index (the approximate index of intra-abdominal fatmass and cardiovascular risk), and relative rpWAT mass of L-arginine-treated animals andcontrols are presented in Figure 2. The treatment triggered a reduction in body weight gain(p < 0.01), which is associated with the lower relative mass of rpWAT (p < 0.05). Adiposityindex was also determined following a 7-day L-arginine treatment and showed a reducingtrend that did not reach statistical significance (p = 0.07).
Pharmaceutics 2022, 14, x FOR PEER REVIEW 7 of 16
for 7 days (n = 9, 3 per group, in three technical replicates per group). Data represent the mean ± SEM. * Compared to control, * p < 0.05, ** p < 0.01 and *** p < 0.001.
3.2. Effects of L-Arginine Treatment on Circulatory Parameters and Adipokines Levels The effects of 7-day L-arginine treatment on several systemic circulating biochemical
parameters and endocrine function of WAT are shown in Table 1. L-arginine treatment triggered an increase in the total, HDL-, and LDL-cholesterol levels, but these changes did not disturb the ratio between the cholesterols indicating atherogenic and heart disease risk. Besides, there was no difference in circulating glucose and triglyceride levels (meas-ured in the fed state) between L-arginine-treated rats and controls, which is in line with equal food intake in examined groups. Serum adiponectin was not affected by L-arginine treatment, while serum leptin was decreased (p < 0.001).
Table 1. Effects of L-arginine on blood glucose and serum leptin, adiponectin, total, HDL-, LDL-cholesterol, and triglyceride levels; 2.5-month-old rats were randomly assigned to receive drinking water or 2.25% L-arginine-HCl in drinking water for 7 days.
Control L-Arginine Glucose (mmol L−1) 5.8 ± 0.5 6.0 ± 0.4
Total cholesterol (mmol L−1) 1.63 ± 0.2 1.9 ± 0.2 * LDL-cholesterol (mmol L−1) 0.51 ± 0.04 0.61 ± 0.06 * HDL-cholesterol (mmol L−1) 0.7 ± 0.1 0.9 ± 0.1 *
Triglyceride (mmol L−1) 0.7 ± 0.2 0.8 ± 0.1 LDL-cholesterol/HDL-cholesterol 0.7 ± 0.07 0.7 ± 0.02 Total cholesterol/HDL-cholesterol 2.4 ± 0.2 2.3 ± 0.1
TG/HDL-cholesterol 0.97 ± 0.2 0.98 ± 0.03 Leptin (pg mL−1) 985.7 ± 90.0 664.8 ± 56.4 ***
Adiponectin (ng mL−1) 93.9 ± 1.9 88.9 ± 8.3 The results represent the means ± SD (n = 6 per group). * Comparison with control; * p < 0.05; *** p < 0.001.
3.3. Slimming Effects of L-Arginine Are Associated with Diminution of rpWAT Depot Mass Body weight gain, adiposity index (the approximate index of intra-abdominal fat
mass and cardiovascular risk), and relative rpWAT mass of L-arginine-treated animals and controls are presented in Figure 2. The treatment triggered a reduction in body weight gain (p < 0.01), which is associated with the lower relative mass of rpWAT (p < 0.05). Adiposity index was also determined following a 7-day L-arginine treatment and showed a reducing trend that did not reach statistical significance (p = 0.07).
Figure 2. L-arginine reduces body weight gain and retroperitoneal white adipose tissue (rpWAT) mass. Body weight gain, adiposity index, and relative rpWAT mass of untreated (control) and L-arginine-treated rats; 2.5-month-old rats were randomly assigned to receive drinking water or 2.25% L-arginine∙HCl in drinking water for 7 days. * Comparison with control; (n = 6–8 per group); * p < 0.05; ** p < 0.01.
Figure 2. L-arginine reduces body weight gain and retroperitoneal white adipose tissue (rpWAT)mass. Body weight gain, adiposity index, and relative rpWAT mass of untreated (control) andL-arginine-treated rats; 2.5-month-old rats were randomly assigned to receive drinking water or2.25% L-arginine·HCl in drinking water for 7 days. * Comparison with control; (n = 6–8 per group);* p < 0.05; ** p < 0.01.
3.4. Net Lipid Mobilization Effect of L-Arginine Is Associated with Increased Lipolysis
The relative mass of WAT is mainly determined by its lipid reserves. Namely, mostof the adipocyte cell volume is occupied by triacylglycerols that are stored and mobilizedvia triacylglycerol synthesis and hydrolysis, respectively. Here, the expression levels ofkey enzymes involved in both processes are presented in Figure 3. Note that 1-day and3-day L-arginine treatments increased the expression levels of hormone-sensitive lipase(HSL) and adipocyte triacylglycerol lipase (ATGL), in parallel with monoacylglycerol O-acyltransferase 1 (MGAT1). Following a 7-day long treatment, however, only HSL remainedincreased compared to the untreated control (p < 0.05).

Pharmaceutics 2022, 14, 1368 8 of 16
Pharmaceutics 2022, 14, x FOR PEER REVIEW 8 of 16
3.4. Net Lipid Mobilization Effect of L-Arginine Is Associated with Increased Lipolysis The relative mass of WAT is mainly determined by its lipid reserves. Namely, most
of the adipocyte cell volume is occupied by triacylglycerols that are stored and mobilized via triacylglycerol synthesis and hydrolysis, respectively. Here, the expression levels of key enzymes involved in both processes are presented in Figure 3. Note that 1-day and 3-day L-arginine treatments increased the expression levels of hormone-sensitive lipase (HSL) and adipocyte triacylglycerol lipase (ATGL), in parallel with monoacylglycerol O-acyltransferase 1 (MGAT1). Following a 7-day long treatment, however, only HSL re-mained increased compared to the untreated control (p < 0.05).
Figure 3. L-arginine increases fatty acid turnover in retroperitoneal white adipose tissue (rpWAT). Protein content of hormone sensitive lipase (HSL), adipose triglyceride lipase (ATGL), and mono-acylglycerol O-acyltransferase 1 (MGAT1) in rpWAT of rats receiving either drinking water or 2.25% L-arginine∙HCl in drinking water for 1, 3, and 7 days, determined by Western blot. The signals from representative Western blots are shown (a). Data obtained after quantification of specific bands and expressed as % of the control group taken as 100% represent the mean ± SEM (b). Each band is representative of six pooled samples per group. Experiments were repeated in triplicate. Data were quantified as described in the Methods. * Comparison between control and L-arginine-treated group; * p < 0.05, ** p < 0.01, *** p < 0.001.
3.5. L-Arginine Elicits an Increase in Expression of PGC-1α, NRF1, PPARα, and Their Downstream Mitochondrial Targets in rpWAT
Changes in response to L-arginine treatment at the level of PGC-1α gene expression and the protein expression of its downstream transcription targets, NRF1 and PPARα, as well as metabolic enzymes in rpWAT, are shown in Figures 4 and 5, respectively. After 1 day of L-arginine treatment, PGC-1α mRNA expression increased significantly compared to the untreated control, and this increase was maintained until day 7 of L-arginine treat-ment. Such upregulation of PGC-1α was associated with a concordant increase in relative MCN (Figure 4) and the protein expression level of NRF1 and PPARα (Figure 5). In addi-tion, a transient increase in the expression levels of enzymes that facilitate long-chain fatty acid transport—carnitine palmitoyl transferase 1 (CPT1) and subsequent β-oxidation—
Figure 3. L-arginine increases fatty acid turnover in retroperitoneal white adipose tissue (rpWAT).Protein content of hormone sensitive lipase (HSL), adipose triglyceride lipase (ATGL), and monoa-cylglycerol O-acyltransferase 1 (MGAT1) in rpWAT of rats receiving either drinking water or 2.25%L-arginine·HCl in drinking water for 1, 3, and 7 days, determined by Western blot. The signals fromrepresentative Western blots are shown (a). Data obtained after quantification of specific bands andexpressed as % of the control group taken as 100% represent the mean ± SEM (b). Each band isrepresentative of six pooled samples per group. Experiments were repeated in triplicate. Data werequantified as described in the Methods. * Comparison between control and L-arginine-treated group;* p < 0.05, ** p < 0.01, *** p < 0.001.
3.5. L-Arginine Elicits an Increase in Expression of PGC-1α, NRF1, PPARα, and TheirDownstream Mitochondrial Targets in rpWAT
Changes in response to L-arginine treatment at the level of PGC-1α gene expressionand the protein expression of its downstream transcription targets, NRF1 and PPARα, aswell as metabolic enzymes in rpWAT, are shown in Figures 4 and 5, respectively. After 1 dayof L-arginine treatment, PGC-1α mRNA expression increased significantly compared tothe untreated control, and this increase was maintained until day 7 of L-arginine treatment.Such upregulation of PGC-1α was associated with a concordant increase in relative MCN(Figure 4) and the protein expression level of NRF1 and PPARα (Figure 5). In addition, atransient increase in the expression levels of enzymes that facilitate long-chain fatty acidtransport—carnitine palmitoyl transferase 1 (CPT1) and subsequent β-oxidation—medium-chain acyl-CoA dehydrogenase (ACADM) in mitochondria were observed in rpWATfollowing L-arginine treatment (Figure 5). Interestingly, although the protein level ofPPARα and the relative MCN remained increased on day 7 of treatment, the expressionof NRF1 and ACADM returned to their control values on days 3 and 7 of the treatment,respectively (Figure 5).

Pharmaceutics 2022, 14, 1368 9 of 16
Pharmaceutics 2022, 14, x FOR PEER REVIEW 9 of 16
medium-chain acyl-CoA dehydrogenase (ACADM) in mitochondria were observed in rpWAT following L-arginine treatment (Figure 5). Interestingly, although the protein level of PPARα and the relative MCN remained increased on day 7 of treatment, the expression of NRF1 and ACADM returned to their control values on days 3 and 7 of the treatment, respectively (Figure 5).
Figure 4. Peroxisome proliferator-activated receptor-gamma coactivator—1α (PGC-1α) gene ex-pression and mitochondrial DNA copy number (MCN) level increase in retroperitoneal white adi-pose tissue (rpWAT) upon 1 and 7 days of 2.25% L-arginine∙HCl treatment. * Comparison with con-trol (n = 6 per group); ** p < 0.01, *** p < 0.001.
Figure 5. Protein content of nuclear respiratory factor 1 (NRF1), peroxisome proliferator-activated receptor-α (PPARα), carnitine palmitoyltransferase 1 (CPT1), and acyl-CoA dehydrogenase me-dium chain (ACADM) in retroperitoneal white adipose tissue (rpWAT) of rats receiving either drinking water or 2.25% L-arginine∙HCl in drinking water for 1, 3, and 7 days. Data obtained after quantification of specific bands and expressed as % of the control group taken as 100% represent the mean ± SEM (a). Each band is representative of six pooled samples per group (b). Experiments were repeated in triplicate. Data were quantified as described in the Methods. * Comparison be-tween control and L-arginine-treated group; * p < 0.05, ** p < 0.01, *** p < 0.001.
3.6. UCP1 Protein Expression Level Increases upon L-Arginine Treatment and Over-Exceeds Cold-Induced Effects
Figure 4. Peroxisome proliferator-activated receptor-gamma coactivator—1α (PGC-1α) gene expres-sion and mitochondrial DNA copy number (MCN) level increase in retroperitoneal white adiposetissue (rpWAT) upon 1 and 7 days of 2.25% L-arginine·HCl treatment. * Comparison with control(n = 6 per group); ** p < 0.01, *** p < 0.001.
Pharmaceutics 2022, 14, x FOR PEER REVIEW 9 of 16
medium-chain acyl-CoA dehydrogenase (ACADM) in mitochondria were observed in rpWAT following L-arginine treatment (Figure 5). Interestingly, although the protein level of PPARα and the relative MCN remained increased on day 7 of treatment, the expression of NRF1 and ACADM returned to their control values on days 3 and 7 of the treatment, respectively (Figure 5).
Figure 4. Peroxisome proliferator-activated receptor-gamma coactivator—1α (PGC-1α) gene ex-pression and mitochondrial DNA copy number (MCN) level increase in retroperitoneal white adi-pose tissue (rpWAT) upon 1 and 7 days of 2.25% L-arginine∙HCl treatment. * Comparison with con-trol (n = 6 per group); ** p < 0.01, *** p < 0.001.
Figure 5. Protein content of nuclear respiratory factor 1 (NRF1), peroxisome proliferator-activated receptor-α (PPARα), carnitine palmitoyltransferase 1 (CPT1), and acyl-CoA dehydrogenase me-dium chain (ACADM) in retroperitoneal white adipose tissue (rpWAT) of rats receiving either drinking water or 2.25% L-arginine∙HCl in drinking water for 1, 3, and 7 days. Data obtained after quantification of specific bands and expressed as % of the control group taken as 100% represent the mean ± SEM (a). Each band is representative of six pooled samples per group (b). Experiments were repeated in triplicate. Data were quantified as described in the Methods. * Comparison be-tween control and L-arginine-treated group; * p < 0.05, ** p < 0.01, *** p < 0.001.
3.6. UCP1 Protein Expression Level Increases upon L-Arginine Treatment and Over-Exceeds Cold-Induced Effects
Figure 5. Protein content of nuclear respiratory factor 1 (NRF1), peroxisome proliferator-activatedreceptor-α (PPARα), carnitine palmitoyltransferase 1 (CPT1), and acyl-CoA dehydrogenase mediumchain (ACADM) in retroperitoneal white adipose tissue (rpWAT) of rats receiving either drinkingwater or 2.25% L-arginine·HCl in drinking water for 1, 3, and 7 days. Data obtained after quantificationof specific bands and expressed as % of the control group taken as 100% represent the mean ± SEM (a).Each band is representative of six pooled samples per group (b). Experiments were repeated intriplicate. Data were quantified as described in the Methods. * Comparison between control andL-arginine-treated group; * p < 0.05, ** p < 0.01, *** p < 0.001.
3.6. UCP1 Protein Expression Level Increases upon L-Arginine Treatment and Over-ExceedsCold-Induced Effects
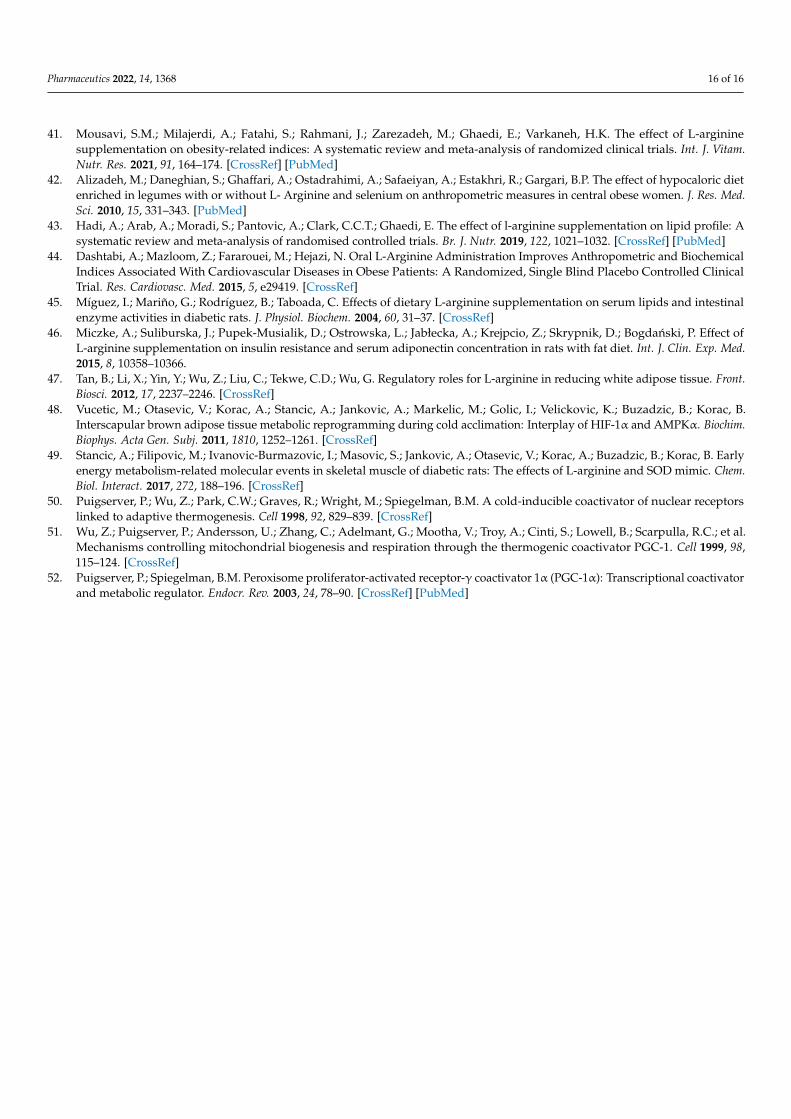
As compared to untreated control, protein expression of UCP1 was increased (2.8-fold,p < 0.001) following 3 days of L-arginine treatment; such an increase over-exceeds (91%)the cold exposure-induced increase in UCP1 protein level (data not shown) (Figure 6a).Additionally, islands of polygonal, multilocular adipocytes, strongly positive for UCP1,were observed only in L-arginine-treated rats (Figure 6b).

Pharmaceutics 2022, 14, 1368 10 of 16
Pharmaceutics 2022, 14, x FOR PEER REVIEW 10 of 16
As compared to untreated control, protein expression of UCP1 was increased (2.8-fold, p < 0.001) following 3 days of L-arginine treatment; such an increase over-exceeds (91%) the cold exposure-induced increase in UCP1 protein level (data not shown) (Figure 6a). Additionally, islands of polygonal, multilocular adipocytes, strongly positive for UCP1, were observed only in L-arginine-treated rats (Figure 6b).
Figure 6. UCP1 protein expression level and tissue expression pattern in control, cold-exposed, and L-arginine-treated rats. Analysis of UCP1 protein expression after 1, 3, and 7 days of L-arginine treat-ment (a). Maximum induction of UCP1 was observed on day 3 of L-arginine treatment. Protein con-tent is expressed relative to control rats (100%). Data represent the mean ± SEM. * Compared to control, * p < 0.05, *** p < 0.001. Experiments were repeated in triplicate. Data were quantified as described in the Methods. Analysis on the morphological level (H&E) indicates the simultaneous appearance of sporadic islets of multilocular cells selectively in retroperitoneal white adipose tissue (rpWAT) of L-arginine-treated rats (b). Inset, enlarged area of multilocular cells. Scale bars, 200 μm. Immunohistochemical staining for UCP1 (b, lower panel) showed that, compared with very weak UCP1-immunopositive adipocytes in the control, stronger UCP1-immunopositivity characterized adipocytes in rpWAT of rats exposed to cold and treated with L-arginine for 3 days. Moreover, highly positive UCP1-positive multilocular adipocytes appear only in the L-arginine-treated group of rats. Scale bars, 50 μm.
3.7. L-Arginine Elicits the Expression of Genetic Markers of Beige Adipocytes To dissect the cellular basis of L-arginine-induced WAT browning, we investigated
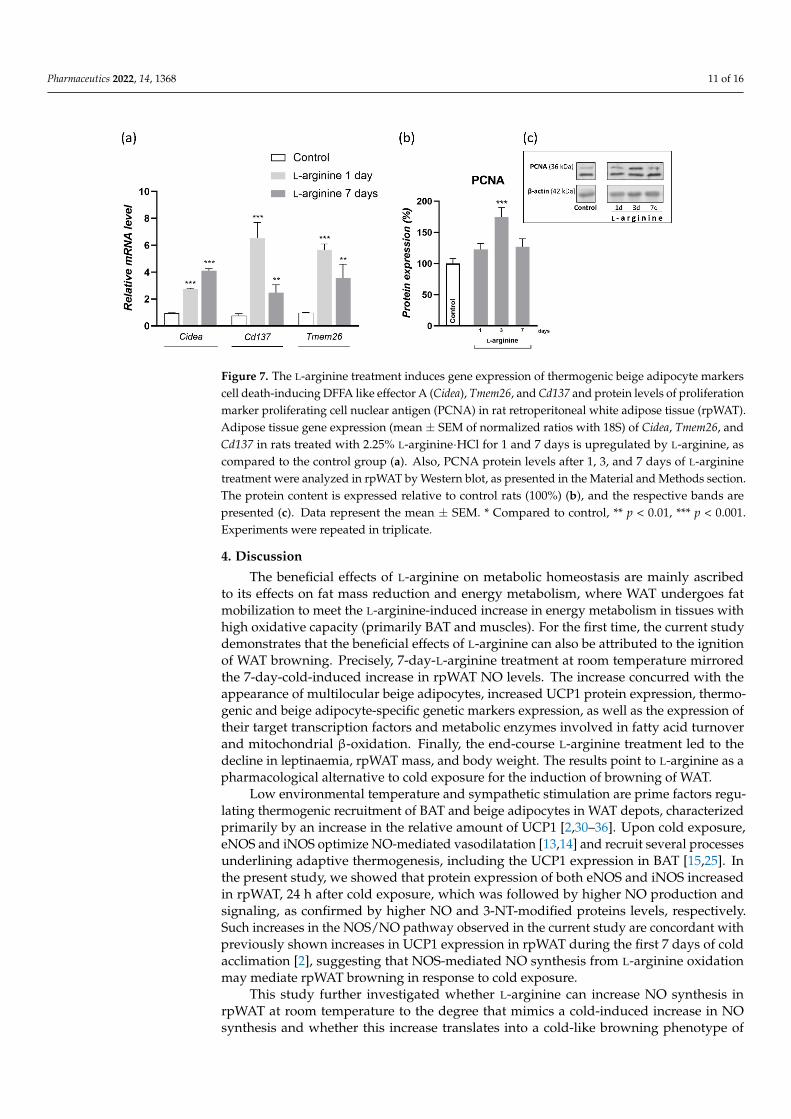
gene expression of thermogenic adipocytes marker (Cidea) and the more specific markers of beige adipocytes (Cd137 and Tmem26) in rpWAT of L-arginine-treated animals and controls (Figure 7). After twenty-four hours of L-arginine treatment, gene expression levels of thermogenic and beige adipocyte markers, Cidea, Cd137, and Tmem26 were all increased, and these levels were maintained until the end of the 7-day L-arginine treatment (Figure 7a). In parallel, protein expression of proliferation marker proliferating cell nuclear antigen (PCNA) increased on day 3 of L-arginine treatment (p < 0.001) (Figure 7b).
Figure 6. UCP1 protein expression level and tissue expression pattern in control, cold-exposed, andL-arginine-treated rats. Analysis of UCP1 protein expression after 1, 3, and 7 days of L-argininetreatment (a). Maximum induction of UCP1 was observed on day 3 of L-arginine treatment. Proteincontent is expressed relative to control rats (100%). Data represent the mean ± SEM. * Comparedto control, * p < 0.05, *** p < 0.001. Experiments were repeated in triplicate. Data were quantified asdescribed in the Methods. Analysis on the morphological level (H&E) indicates the simultaneousappearance of sporadic islets of multilocular cells selectively in retroperitoneal white adipose tissue(rpWAT) of L-arginine-treated rats (b). Inset, enlarged area of multilocular cells. Scale bars, 200 µm.Immunohistochemical staining for UCP1 (b, lower panel) showed that, compared with very weakUCP1-immunopositive adipocytes in the control, stronger UCP1-immunopositivity characterizedadipocytes in rpWAT of rats exposed to cold and treated with L-arginine for 3 days. Moreover, highlypositive UCP1-positive multilocular adipocytes appear only in the L-arginine-treated group of rats.Scale bars, 50 µm.
3.7. L-Arginine Elicits the Expression of Genetic Markers of Beige Adipocytes
To dissect the cellular basis of L-arginine-induced WAT browning, we investigatedgene expression of thermogenic adipocytes marker (Cidea) and the more specific markers ofbeige adipocytes (Cd137 and Tmem26) in rpWAT of L-arginine-treated animals and controls(Figure 7). After twenty-four hours of L-arginine treatment, gene expression levels ofthermogenic and beige adipocyte markers, Cidea, Cd137, and Tmem26 were all increased,and these levels were maintained until the end of the 7-day L-arginine treatment (Figure 7a).In parallel, protein expression of proliferation marker proliferating cell nuclear antigen(PCNA) increased on day 3 of L-arginine treatment (p < 0.001) (Figure 7b).
Pharmaceutics 2022, 14, 1368 11 of 16Pharmaceutics 2022, 14, x FOR PEER REVIEW 11 of 16
Figure 7. The L-arginine treatment induces gene expression of thermogenic beige adipocyte markers cell death-inducing DFFA like effector A (Cidea), Tmem26, and Cd137 and protein levels of prolifer-ation marker proliferating cell nuclear antigen (PCNA) in rat retroperitoneal white adipose tissue (rpWAT). Adipose tissue gene expression (mean ± SEM of normalized ratios with 18S) of Cidea, Tmem26, and Cd137 in rats treated with 2.25% L-arginine∙HCl for 1 and 7 days is upregulated by L-arginine, as compared to the control group (a). Also, PCNA protein levels after 1, 3, and 7 days of L-arginine treatment were analyzed in rpWAT by Western blot, as presented in the Material and Methods section. The protein content is expressed relative to control rats (100%) (b), and the respec-tive bands are presented (c). Data represent the mean ± SEM. * Compared to control, ** p < 0.01, *** p < 0.001. Experiments were repeated in triplicate.
4. Discussion The beneficial effects of L-arginine on metabolic homeostasis are mainly ascribed to
its effects on fat mass reduction and energy metabolism, where WAT undergoes fat mo-bilization to meet the L-arginine-induced increase in energy metabolism in tissues with high oxidative capacity (primarily BAT and muscles). For the first time, the current study demonstrates that the beneficial effects of L-arginine can also be attributed to the ignition of WAT browning. Precisely, 7-day-L-arginine treatment at room temperature mirrored the 7-day-cold-induced increase in rpWAT NO levels. The increase concurred with the appearance of multilocular beige adipocytes, increased UCP1 protein expression, thermo-genic and beige adipocyte-specific genetic markers expression, as well as the expression of their target transcription factors and metabolic enzymes involved in fatty acid turnover and mitochondrial β-oxidation. Finally, the end-course L-arginine treatment led to the de-cline in leptinaemia, rpWAT mass, and body weight. The results point to L-arginine as a pharmacological alternative to cold exposure for the induction of browning of WAT.
Low environmental temperature and sympathetic stimulation are prime factors reg-ulating thermogenic recruitment of BAT and beige adipocytes in WAT depots, character-ized primarily by an increase in the relative amount of UCP1 [2,30–36]. Upon cold expo-sure, eNOS and iNOS optimize NO-mediated vasodilatation [13,14] and recruit several processes underlining adaptive thermogenesis, including the UCP1 expression in BAT [15,25]. In the present study, we showed that protein expression of both eNOS and iNOS increased in rpWAT, 24 h after cold exposure, which was followed by higher NO produc-tion and signaling, as confirmed by higher NO and 3-NT-modified proteins levels, respec-tively. Such increases in the NOS/NO pathway observed in the current study are concord-ant with previously shown increases in UCP1 expression in rpWAT during the first 7 days of cold acclimation [2], suggesting that NOS-mediated NO synthesis from L-arginine oxi-dation may mediate rpWAT browning in response to cold exposure.
This study further investigated whether L-arginine can increase NO synthesis in rpWAT at room temperature to the degree that mimics a cold-induced increase in NO synthesis and whether this increase translates into a cold-like browning phenotype of rpWAT. A wealth of literature has shown that L-arginine, when applied at physiological levels in rats, equivalent to a dose of 9 g/day of L-arginine in humans [37], increases the
Figure 7. The L-arginine treatment induces gene expression of thermogenic beige adipocyte markerscell death-inducing DFFA like effector A (Cidea), Tmem26, and Cd137 and protein levels of proliferationmarker proliferating cell nuclear antigen (PCNA) in rat retroperitoneal white adipose tissue (rpWAT).Adipose tissue gene expression (mean ± SEM of normalized ratios with 18S) of Cidea, Tmem26, andCd137 in rats treated with 2.25% L-arginine·HCl for 1 and 7 days is upregulated by L-arginine, ascompared to the control group (a). Also, PCNA protein levels after 1, 3, and 7 days of L-argininetreatment were analyzed in rpWAT by Western blot, as presented in the Material and Methods section.The protein content is expressed relative to control rats (100%) (b), and the respective bands arepresented (c). Data represent the mean ± SEM. * Compared to control, ** p < 0.01, *** p < 0.001.Experiments were repeated in triplicate.
4. Discussion
The beneficial effects of L-arginine on metabolic homeostasis are mainly ascribedto its effects on fat mass reduction and energy metabolism, where WAT undergoes fatmobilization to meet the L-arginine-induced increase in energy metabolism in tissues withhigh oxidative capacity (primarily BAT and muscles). For the first time, the current studydemonstrates that the beneficial effects of L-arginine can also be attributed to the ignitionof WAT browning. Precisely, 7-day-L-arginine treatment at room temperature mirroredthe 7-day-cold-induced increase in rpWAT NO levels. The increase concurred with theappearance of multilocular beige adipocytes, increased UCP1 protein expression, thermo-genic and beige adipocyte-specific genetic markers expression, as well as the expression oftheir target transcription factors and metabolic enzymes involved in fatty acid turnoverand mitochondrial β-oxidation. Finally, the end-course L-arginine treatment led to thedecline in leptinaemia, rpWAT mass, and body weight. The results point to L-arginine as apharmacological alternative to cold exposure for the induction of browning of WAT.
Low environmental temperature and sympathetic stimulation are prime factors regu-lating thermogenic recruitment of BAT and beige adipocytes in WAT depots, characterizedprimarily by an increase in the relative amount of UCP1 [2,30–36]. Upon cold exposure,eNOS and iNOS optimize NO-mediated vasodilatation [13,14] and recruit several processesunderlining adaptive thermogenesis, including the UCP1 expression in BAT [15,25]. Inthe present study, we showed that protein expression of both eNOS and iNOS increasedin rpWAT, 24 h after cold exposure, which was followed by higher NO production andsignaling, as confirmed by higher NO and 3-NT-modified proteins levels, respectively.Such increases in the NOS/NO pathway observed in the current study are concordant withpreviously shown increases in UCP1 expression in rpWAT during the first 7 days of coldacclimation [2], suggesting that NOS-mediated NO synthesis from L-arginine oxidationmay mediate rpWAT browning in response to cold exposure.
This study further investigated whether L-arginine can increase NO synthesis inrpWAT at room temperature to the degree that mimics a cold-induced increase in NOsynthesis and whether this increase translates into a cold-like browning phenotype of
Pharmaceutics 2022, 14, 1368 12 of 16
rpWAT. A wealth of literature has shown that L-arginine, when applied at physiologicallevels in rats, equivalent to a dose of 9 g/day of L-arginine in humans [37], increasesthe expression of NOS and fosters NO synthesis and subsequent signaling [9,13,28,38,39].However, the efficacy of L-arginine is tissue-specific due to the differential presence ofregulatory mechanisms acting on NO synthesis, metabolism, and bioavailability. Therefore,a comprehensive analysis of protein expression of eNOS, iNOS, and arginase I and II inconcert with 3-NT-modified proteins and NO levels during 1-, 3-, and 7-day L-argininetreatment was done in rpWAT. The study revealed that L-arginine treatment increasediNOS, NO, and 3-NT-modified protein levels in rpWAT, despite both arginase I and IIalso being positively upregulated by L-arginine in rpWAT. Thereby, achieved levels of NOand associated downstream RNS-mediated signaling (evidenced by higher 3-NT-modifiedprotein levels) corresponded to the cold-induced increases of these parameters. Therefore,the provision of 2.25% L-arginine for 7 days instigated similar increases in NO and RNSlevels as those induced in response to cold exposure, indicating that L-arginine can be usedto test cold-like induced NO signaling in rpWAT browning.
Several previous studies reported that long-term, 4–12 weeks, supplementation withL-arginine (1.51%) reduces white fat mass in genetically and diet-induced obese rats [18,20].Besides, several clinical trials reported that L-arginine supplementation used alone or incombination with several other amino acids, a hypocaloric diet, or exercise could promoteweight-reducing effects, primarily as a result of decreases in several anthropometric indicesof abdominal obesity [21,22,25,27,29,40–42]. Accordingly, in the current animal study, weevaluated body weight gain, AI, and rpWAT mass as the indices of overall and visceralobesity, respectively. The results of the current study confirmed that a one-week-longtreatment with 2.25% L-arginine suppressed body weight gain and decreased relativerpWAT mass. Lower serum leptin levels also corroborated fat reduction induced by L-arginine. Such results are in agreement with the results of Fu et al. [20], showing that10 weeks of 1.51% L-arginine supplementation reduced rpWAT weight and serum leptinconcentration, and indicate that even short-term L-arginine treatment, albeit in a higherdose (2.25%), exerts a significant fat mass depleting effect.
A decrease in body weight gain, in particular, a decrease in visceral adipose tissue mass,associated with L-arginine treatment, may improve the systemic lipid profile. Our resultsdid not, however, confirm the significant differences in the triglycerides or cholesterol ratio,and the total, LDL, and HDL levels were higher in the L-arginine-treated group. Althoughthere are currently no definitive conclusions for L-arginine supplementation on improvinglipid profile [43], several experimental and clinical reports showed that L-arginine mightexert positive effects on the lipid profile in rats and humans [44–46]. The discrepanciesin our results and other findings may conceivably be attributed to the supplementationdosage and the differences in duration, as probably more time (4 weeks) is needed to detectchanges in the systemic lipid status.
Hitherto, the effect of L-arginine on body fat reduction has been mainly ascribed toincreased lipolysis in response to L-arginine-induced increase in energy metabolism inmuscles and BAT [13,18,23,47]. In agreement, hydrolysis of triacylglycerols (as indicatedby increased protein expression of HSL and ATGL) in rpWAT by L-arginine treatmentmay increase consequently to meet the energy requirements of BAT [9,48] and skeletalmuscles [39,49], as shown in our previous studies. In addition, 10 weeks of L-argininesupplementation may increase the oxidative and antioxidative capacity of WAT by targetingthe expression of several transcription factors and enzymes involved in the oxidativemetabolism of glucose and antioxidative defense in WAT, like PGC-1α, AMP-activatedprotein kinase, and heme oxygenase-3, respectively [20]. PGC-1α is a leading instigatorof mitochondrial biogenesis and oxidative metabolism, present and highly responsivein tissues with substantial lipid-oxidative capacity, but only ectopic in WAT. PGC-1αstimulates mitochondrial biogenesis and acts on NRF1 and PPARα expression, upregulatingthe expression of nuclear and mitochondrial genes that encode mitochondrial proteins andlipid-oxidizing enzymes [50,51]. PGC-1α also strongly coactivates PPARα, which increases
Pharmaceutics 2022, 14, 1368 13 of 16
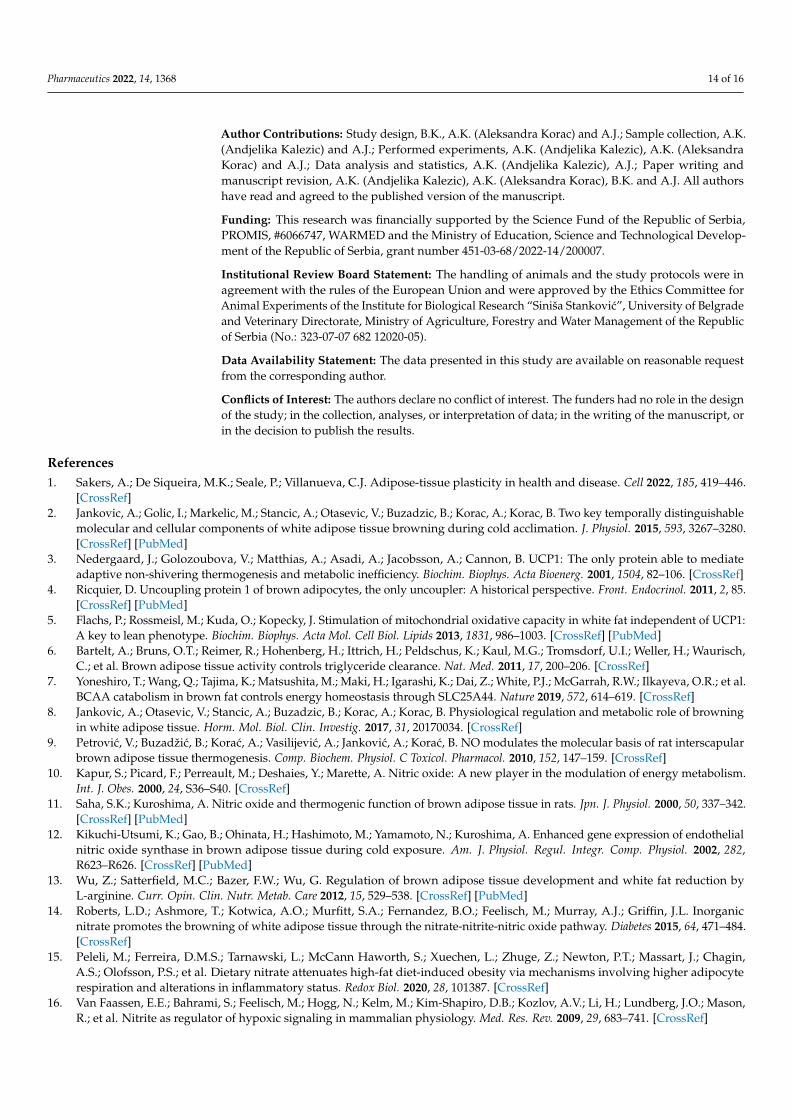
UCP1 expression [52]. Here, we showed that PGC-α1 mRNA expression increased instantly,after 24 h of L-arginine treatment 5-fold, and this increase was maintained for 7 days of L-arginine treatment. This was followed by parallel increases in mitochondrial DNA content,PPARα (from 1st day onward), and transient increases in NRF1 and enzymes mediatingmitochondrial fatty acid import and β-oxidation, CPT1 and ACADM, respectively, ondays 1 and 3 of L-arginine treatment. All detected changes indicate the relevance of L-arginine-induced upregulation of PGC-1α in subsequent induction of fat oxidation capacityof rpWAT.
To relate such effects of L-arginine with browning phenotype and its relevance, weinvestigated protein expression and tissue distribution of UCP1 by Western blot and im-munohistochemistry, as well as the genetic markers of thermogenic and beige adipocytes,Cidea, Cd137, and Tmem26. Upon cold exposure, most adipocytes within rpWAT under-went transient brown-fat-like thermogenic recruitment, with the most significant increasesin UCP1 expression on days 3 and 7 of cold exposure [2]. Adipocytes retained theirunilocular and paucilocular morphology on the tissue structure level, while thermogenic,polygonal, and multilocular beige cells subsequently appeared on persistent 45-day coldacclimation [2]. Here, we showed that, in a similar way, L-arginine increased UCP1 proteinexpression level after 3 days of treatment. Moreover, oddly to the appearance of unilocularUCP1-positive adipocytes on day 3 of cold exposure, on day 3 of L-arginine treatment, theincrease in UCP1 expression was accompanied by the occurrence of islands of multilocularand polygonal cells highly positive for UCP1. Genetic markers of browning indicate a dualorigin of UCP1-positive adipocytes, which may include a transient phenotype shift due toan increase in beige adipocyte-specific markers (Cd137 and Tmem26), but does not excludede novo occurrence of beige adipocytes due to an increase in nonspecific thermogenic(Cidea) and proliferation (PCNA) markers. Additional research is needed to investigatethe mechanism of L-arginine action, i.e., the origin of UCP1-positive beige cells, both aftershort-term (7 days, as used in the current study) and long-term (≥4 weeks, as used inprevious studies) L-arginine supplementation, as they may differ in respect to treatmentduration and specific WAT depot. Further dissection of the effects of L-arginine on themolecular browning program in primary white adipocytes and preadipocytes in vitrofrom both visceral and subcutaneous WAT will provide more insights into mechanisms ofWAT browning upon L-arginine treatment and its utility in the treatment of obesity andassociated diseases. In addition, functional analysis and mitochondrial respiration studieswill generate insightful data on the thermogenic effects of L-arginine on these adipocytes.Our efforts along these lines are in progress.
In conclusion, the most potent physiological stimulus for WAT browning—exposureto low temperature, acts by increasing the NO synthesis and subsequent nitrosative re-dox signaling. Treatment with 2.25% L-arginine at room temperature for the same periodemulates cold-induced NO signaling. The resulting increase in NO associated with L-arginine treatment instigates the key structural, metabolic, and molecular biomarkers ofWAT browning—gene and protein expression of key thermogenic and beige adipocytegenetic markers, transcription factors, and their downstream mitochondrial targets, includ-ing increased expression of UCP1 and the occurrence of UCP1-positive multilocular beigeadipocytes. This switch in molecular signature from white- toward beige-like adipocytesresults in rpWAT depot weight and body weight decreases at the end of the 7-day L-argininetreatment. The results suggest that L-arginine could be a good pharmacological alternativeto cold exposure in the implementation of WAT browning in future anti-obesity strategies.
Supplementary Materials: The following supporting information can be downloaded at: https://www.mdpi.com/article/10.3390/pharmaceutics14071368/s1, Figure S1: Western blot; Table S1: RT-PCR.
Pharmaceutics 2022, 14, 1368 14 of 16
Author Contributions: Study design, B.K., A.K. (Aleksandra Korac) and A.J.; Sample collection, A.K.(Andjelika Kalezic) and A.J.; Performed experiments, A.K. (Andjelika Kalezic), A.K. (AleksandraKorac) and A.J.; Data analysis and statistics, A.K. (Andjelika Kalezic), A.J.; Paper writing andmanuscript revision, A.K. (Andjelika Kalezic), A.K. (Aleksandra Korac), B.K. and A.J. All authorshave read and agreed to the published version of the manuscript.
Funding: This research was financially supported by the Science Fund of the Republic of Serbia,PROMIS, #6066747, WARMED and the Ministry of Education, Science and Technological Develop-ment of the Republic of Serbia, grant number 451-03-68/2022-14/200007.
Institutional Review Board Statement: The handling of animals and the study protocols were inagreement with the rules of the European Union and were approved by the Ethics Committee forAnimal Experiments of the Institute for Biological Research “Siniša Stankovic”, University of Belgradeand Veterinary Directorate, Ministry of Agriculture, Forestry and Water Management of the Republicof Serbia (No.: 323-07-07 682 12020-05).
Data Availability Statement: The data presented in this study are available on reasonable requestfrom the corresponding author.
Conflicts of Interest: The authors declare no conflict of interest. The funders had no role in the designof the study; in the collection, analyses, or interpretation of data; in the writing of the manuscript, orin the decision to publish the results.
References1. Sakers, A.; De Siqueira, M.K.; Seale, P.; Villanueva, C.J. Adipose-tissue plasticity in health and disease. Cell 2022, 185, 419–446.
[CrossRef]2. Jankovic, A.; Golic, I.; Markelic, M.; Stancic, A.; Otasevic, V.; Buzadzic, B.; Korac, A.; Korac, B. Two key temporally distinguishable
molecular and cellular components of white adipose tissue browning during cold acclimation. J. Physiol. 2015, 593, 3267–3280.[CrossRef] [PubMed]
3. Nedergaard, J.; Golozoubova, V.; Matthias, A.; Asadi, A.; Jacobsson, A.; Cannon, B. UCP1: The only protein able to mediateadaptive non-shivering thermogenesis and metabolic inefficiency. Biochim. Biophys. Acta Bioenerg. 2001, 1504, 82–106. [CrossRef]
4. Ricquier, D. Uncoupling protein 1 of brown adipocytes, the only uncoupler: A historical perspective. Front. Endocrinol. 2011, 2, 85.[CrossRef] [PubMed]
5. Flachs, P.; Rossmeisl, M.; Kuda, O.; Kopecky, J. Stimulation of mitochondrial oxidative capacity in white fat independent of UCP1:A key to lean phenotype. Biochim. Biophys. Acta Mol. Cell Biol. Lipids 2013, 1831, 986–1003. [CrossRef] [PubMed]
6. Bartelt, A.; Bruns, O.T.; Reimer, R.; Hohenberg, H.; Ittrich, H.; Peldschus, K.; Kaul, M.G.; Tromsdorf, U.I.; Weller, H.; Waurisch,C.; et al. Brown adipose tissue activity controls triglyceride clearance. Nat. Med. 2011, 17, 200–206. [CrossRef]
7. Yoneshiro, T.; Wang, Q.; Tajima, K.; Matsushita, M.; Maki, H.; Igarashi, K.; Dai, Z.; White, P.J.; McGarrah, R.W.; Ilkayeva, O.R.; et al.BCAA catabolism in brown fat controls energy homeostasis through SLC25A44. Nature 2019, 572, 614–619. [CrossRef]
8. Jankovic, A.; Otasevic, V.; Stancic, A.; Buzadzic, B.; Korac, A.; Korac, B. Physiological regulation and metabolic role of browningin white adipose tissue. Horm. Mol. Biol. Clin. Investig. 2017, 31, 20170034. [CrossRef]
9. Petrovic, V.; Buzadžic, B.; Korac, A.; Vasilijevic, A.; Jankovic, A.; Korac, B. NO modulates the molecular basis of rat interscapularbrown adipose tissue thermogenesis. Comp. Biochem. Physiol. C Toxicol. Pharmacol. 2010, 152, 147–159. [CrossRef]
10. Kapur, S.; Picard, F.; Perreault, M.; Deshaies, Y.; Marette, A. Nitric oxide: A new player in the modulation of energy metabolism.Int. J. Obes. 2000, 24, S36–S40. [CrossRef]
11. Saha, S.K.; Kuroshima, A. Nitric oxide and thermogenic function of brown adipose tissue in rats. Jpn. J. Physiol. 2000, 50, 337–342.[CrossRef] [PubMed]
12. Kikuchi-Utsumi, K.; Gao, B.; Ohinata, H.; Hashimoto, M.; Yamamoto, N.; Kuroshima, A. Enhanced gene expression of endothelialnitric oxide synthase in brown adipose tissue during cold exposure. Am. J. Physiol. Regul. Integr. Comp. Physiol. 2002, 282,R623–R626. [CrossRef] [PubMed]
13. Wu, Z.; Satterfield, M.C.; Bazer, F.W.; Wu, G. Regulation of brown adipose tissue development and white fat reduction byL-arginine. Curr. Opin. Clin. Nutr. Metab. Care 2012, 15, 529–538. [CrossRef] [PubMed]
14. Roberts, L.D.; Ashmore, T.; Kotwica, A.O.; Murfitt, S.A.; Fernandez, B.O.; Feelisch, M.; Murray, A.J.; Griffin, J.L. Inorganicnitrate promotes the browning of white adipose tissue through the nitrate-nitrite-nitric oxide pathway. Diabetes 2015, 64, 471–484.[CrossRef]
15. Peleli, M.; Ferreira, D.M.S.; Tarnawski, L.; McCann Haworth, S.; Xuechen, L.; Zhuge, Z.; Newton, P.T.; Massart, J.; Chagin,A.S.; Olofsson, P.S.; et al. Dietary nitrate attenuates high-fat diet-induced obesity via mechanisms involving higher adipocyterespiration and alterations in inflammatory status. Redox Biol. 2020, 28, 101387. [CrossRef]
16. Van Faassen, E.E.; Bahrami, S.; Feelisch, M.; Hogg, N.; Kelm, M.; Kim-Shapiro, D.B.; Kozlov, A.V.; Li, H.; Lundberg, J.O.; Mason,R.; et al. Nitrite as regulator of hypoxic signaling in mammalian physiology. Med. Res. Rev. 2009, 29, 683–741. [CrossRef]

Pharmaceutics 2022, 14, 1368 15 of 16
17. Hobbs, A.J.; Fukuto, J.M.; Ignarro, L.J. Formation of free nitric oxide from L-arginine by nitric oxide synthase: Direct enhancementof generation by superoxide dismutase. Proc. Natl. Acad. Sci. USA 1994, 91, 10992–10996. [CrossRef]
18. Jobgen, W.; Meininger, C.J.; Jobgen, S.C.; Li, P.; Lee, M.J.; Smith, S.B.; Spencer, T.E.; Fried, S.K.; Wu, G. Dietary L-argininesupplementation reduces white fat gain and enhances skeletal muscle and brown fat masses in diet-induced obese rats. J. Nutr.2009, 139, 230–237. [CrossRef]
19. Jankovic, A.; Korac, A.; Buzadzic, B.; Stancic, A.; Otasevic, V.; Ferdinandy, P.; Daiber, A.; Korac, B. Targeting the NO/superoxideratio in adipose tissue: Relevance to obesity and diabetes management. Br. J. Pharmacol. 2017, 174, 1570–1590. [CrossRef]
20. Fu, W.J.; Haynes, T.E.; Kohli, R.; Hu, J.; Shi, W.; Spencer, T.E.; Carroll, R.J.; Meininger, C.J.; Wu, G. Dietary L-arginine supplemen-tation reduces fat mass in Zucker diabetic fatty rats. J. Nutr. 2005, 135, 714–721. [CrossRef]
21. Monti, L.D.; Setola, E.; Lucotti, P.C.G.; Marrocco-Trischitta, M.M.; Comola, M.; Galluccio, E.; Poggi, A.; Mammì, S.; Catapano,A.L.; Comi, G.; et al. Effect of a long-term oral l-arginine supplementation on glucose metabolism: A randomized, double-blind,placebo-controlled trial. Diabetes Obes. Metab. 2012, 14, 893–900. [CrossRef] [PubMed]
22. Lucotti, P.; Setola, E.; Monti, L.D.; Galluccio, E.; Costa, S.; Sandoli, E.P.; Fermo, I.; Rabaiotti, G.; Gatti, R.; Piatti, P.M. Beneficialeffects of a long-term oral L-arginine treatment added to a hypocaloric diet and exercise training program in obese, insulin-resistant type 2 diabetic patients. Am. J. Physiol. Endocrinol. Metab. 2006, 291, E906–E912. [CrossRef] [PubMed]
23. McKnight, J.R.; Satterfield, M.C.; Jobgen, W.S.; Smith, S.B.; Spencer, T.E.; Meininger, C.J.; McNeal, C.J.; Wu, G. Beneficial effectsof L-arginine on reducing obesity: Potential mechanisms and important implications for human health. Amino Acids 2010, 39,349–357. [CrossRef] [PubMed]
24. Ueda, K.; Nakamura, Y.; Yamaguchi, M.; Mori, T.; Uchida, M.; Fujita, S. Amino acid mixture enriched with arginine, alanine, andphenylalanine stimulates fat metabolism during exercise. Int. J. Sport Nutr. Exerc. Metab. 2016, 26, 46–54. [CrossRef]
25. Sasai, H.; Ueda, K.; Tsujimoto, T.; Kobayashi, H.; Sanbongi, C.; Ikegami, S.; Nakata, Y. Dose-ranging pilot randomized trial ofamino acid mixture combined with physical activity promotion for reducing abdominal fat in overweight adults. Diabetes Metab.Syndr. Obes. Targets Ther. 2017, 10, 297–309. [CrossRef]
26. Ueda, K.; Sanbongi, C.; Takai, S.; Ikegami, S.; Fujita, S. Combination of aerobic exercise and an arginine, alanine, and phenylalaninemixture increases fat mobilization and ketone body synthesis. Biosci. Biotechnol. Biochem. 2017, 81, 1417–1424. [CrossRef]
27. Ueda, K.; Sasai, H.; Tsujimoto, T.; Sanbongi, C.; Ikegami, S.; Kobayashi, H.; Shioya, N.; Suzuki, S.; Nakata, Y. Randomized trial ofamino acid mixture combined with physical activity promotion for abdominal fat reduction in overweight adults. Diabetes Metab.Syndr. Obes. Targets Ther. 2018, 11, 23–33. [CrossRef]
28. Jobgen, W.S.; Fried, S.K.; Fu, W.J.; Meininger, C.J.; Wu, G. Regulatory role for the arginine-nitric oxide pathway in metabolism ofenergy substrates. J. Nutr. Biochem. 2006, 17, 571–588. [CrossRef]
29. Hurt, R.T.; Ebbert, J.O.; Schroeder, D.R.; Croghan, I.T.; Bauer, B.A.; McClave, S.A.; Miles, J.M.; McClain, C.J. L-arginine for thetreatment of centrally obese subjects: A pilot study. J. Diet. Suppl. 2014, 11, 40–52. [CrossRef]
30. Loncar, D. Convertible adipose tissue in mice. Cell Tissue Res. 1991, 266, 149–161. [CrossRef]31. Giordano, A.; Morroni, M.; Carle, F.; Gesuita, R.; Marchesi, G.F.; Cinti, S. Sensory nerves affect the recruitment and differentiation
of rat periovarian brown adipocytes during cold acclimation. J. Cell Sci. 1998, 111, 2587–2594. [CrossRef] [PubMed]32. Himms-Hagen, J.; Melnyk, A.; Zingaretti, M.C.; Ceresi, E.; Barbatelli, G.; Cinti, S. Multilocular fat cells in WAT of CL-316243-
treated rats derive directly from white adipocytes. Am. J. Physiol. Cell Physiol. 2000, 279, 670–681. [CrossRef] [PubMed]33. Frontini, A.; Cinti, S. Distribution and Development of Brown Adipocytes in the Murine and Human Adipose Organ. Cell Metab.
2010, 11, 253–256. [CrossRef] [PubMed]34. Waldén, T.B.; Hansen, I.R.; Timmons, J.A.; Cannon, B.; Nedergaard, J. Recruited vs. nonrecruited molecular signatures of brown,
“brite,” and white adipose tissues. Am. J. Physiol. Endocrinol. Metab. 2012, 302, E19–E31. [CrossRef] [PubMed]35. Van Der Lans, A.A.J.J.; Hoeks, J.; Brans, B.; Vijgen, G.H.E.J.; Visser, M.G.W.; Vosselman, M.J.; Hansen, J.; Jörgensen, J.A.; Wu, J.;
Mottaghy, F.M.; et al. Cold acclimation recruits human brown fat and increases nonshivering thermogenesis. J. Clin. Invest. 2013,123, 3395–3403. [CrossRef]
36. van Marken Lichtenbelt, W.D.; Vanhommerig, J.W.; Smulders, N.M.; Drossaerts, J.M.A.F.L.; Kemerink, G.J.; Bouvy, N.D.;Schrauwen, P.; Teule, G.J.J. Cold-Activated Brown Adipose Tissue in Healthy Men. N. Engl. J. Med. 2009, 360, 1500–1508.[CrossRef]
37. Evans, R.W.; Fernstrom, J.D.; Thompson, J.; Morris, S.M.; Kuller, L.H. Biochemical responses of healthy subjects during dietarysupplementation with L-arginine. J. Nutr. Biochem. 2004, 15, 534–539. [CrossRef]
38. Petrovic, V.; Buzadžic, B.; Korac, A.; Korac, B. Antioxidative defense and mitochondrial thermogenic response in brown adiposetissue. Genes Nutr. 2010, 5, 225–235. [CrossRef]
39. Stancic, A.; Buzadzic, B.; Korac, A.; Otasevic, V.; Jankovic, A.; Vucetic, M.; Markelic, M.; Velickovic, K.; Golic, I.; Korac, B.Regulatory role of PGC-1α/PPAR signaling in skeletal muscle metabolic recruitment during cold acclimation. J. Exp. Biol. 2013,216, 4233–4241. [CrossRef]
40. Zeinali Khosroshahi, M.; Asbaghi, O.; Moradi, S.; Rezaei kelishadi, M.; Kaviani, M.; Mardani, M.; Jalili, C. The effects ofsupplementation with L-arginine on anthropometric indices and body composition in overweight or obese subjects: A systematicreview and meta-analysis. J. Funct. Foods 2020, 71, 104022. [CrossRef]
Pharmaceutics 2022, 14, 1368 16 of 16
41. Mousavi, S.M.; Milajerdi, A.; Fatahi, S.; Rahmani, J.; Zarezadeh, M.; Ghaedi, E.; Varkaneh, H.K. The effect of L-argininesupplementation on obesity-related indices: A systematic review and meta-analysis of randomized clinical trials. Int. J. Vitam.Nutr. Res. 2021, 91, 164–174. [CrossRef] [PubMed]
42. Alizadeh, M.; Daneghian, S.; Ghaffari, A.; Ostadrahimi, A.; Safaeiyan, A.; Estakhri, R.; Gargari, B.P. The effect of hypocaloric dietenriched in legumes with or without L- Arginine and selenium on anthropometric measures in central obese women. J. Res. Med.Sci. 2010, 15, 331–343. [PubMed]
43. Hadi, A.; Arab, A.; Moradi, S.; Pantovic, A.; Clark, C.C.T.; Ghaedi, E. The effect of l-arginine supplementation on lipid profile: Asystematic review and meta-analysis of randomised controlled trials. Br. J. Nutr. 2019, 122, 1021–1032. [CrossRef] [PubMed]
44. Dashtabi, A.; Mazloom, Z.; Fararouei, M.; Hejazi, N. Oral L-Arginine Administration Improves Anthropometric and BiochemicalIndices Associated With Cardiovascular Diseases in Obese Patients: A Randomized, Single Blind Placebo Controlled ClinicalTrial. Res. Cardiovasc. Med. 2015, 5, e29419. [CrossRef]
45. Míguez, I.; Mariño, G.; Rodríguez, B.; Taboada, C. Effects of dietary L-arginine supplementation on serum lipids and intestinalenzyme activities in diabetic rats. J. Physiol. Biochem. 2004, 60, 31–37. [CrossRef]
46. Miczke, A.; Suliburska, J.; Pupek-Musialik, D.; Ostrowska, L.; Jabłecka, A.; Krejpcio, Z.; Skrypnik, D.; Bogdanski, P. Effect ofL-arginine supplementation on insulin resistance and serum adiponectin concentration in rats with fat diet. Int. J. Clin. Exp. Med.2015, 8, 10358–10366.
47. Tan, B.; Li, X.; Yin, Y.; Wu, Z.; Liu, C.; Tekwe, C.D.; Wu, G. Regulatory roles for L-arginine in reducing white adipose tissue. Front.Biosci. 2012, 17, 2237–2246. [CrossRef]
48. Vucetic, M.; Otasevic, V.; Korac, A.; Stancic, A.; Jankovic, A.; Markelic, M.; Golic, I.; Velickovic, K.; Buzadzic, B.; Korac, B.Interscapular brown adipose tissue metabolic reprogramming during cold acclimation: Interplay of HIF-1α and AMPKα. Biochim.Biophys. Acta Gen. Subj. 2011, 1810, 1252–1261. [CrossRef]
49. Stancic, A.; Filipovic, M.; Ivanovic-Burmazovic, I.; Masovic, S.; Jankovic, A.; Otasevic, V.; Korac, A.; Buzadzic, B.; Korac, B. Earlyenergy metabolism-related molecular events in skeletal muscle of diabetic rats: The effects of L-arginine and SOD mimic. Chem.Biol. Interact. 2017, 272, 188–196. [CrossRef]
50. Puigserver, P.; Wu, Z.; Park, C.W.; Graves, R.; Wright, M.; Spiegelman, B.M. A cold-inducible coactivator of nuclear receptorslinked to adaptive thermogenesis. Cell 1998, 92, 829–839. [CrossRef]
51. Wu, Z.; Puigserver, P.; Andersson, U.; Zhang, C.; Adelmant, G.; Mootha, V.; Troy, A.; Cinti, S.; Lowell, B.; Scarpulla, R.C.; et al.Mechanisms controlling mitochondrial biogenesis and respiration through the thermogenic coactivator PGC-1. Cell 1999, 98,115–124. [CrossRef]
52. Puigserver, P.; Spiegelman, B.M. Peroxisome proliferator-activated receptor-γ coactivator 1α (PGC-1α): Transcriptional coactivatorand metabolic regulator. Endocr. Rev. 2003, 24, 78–90. [CrossRef] [PubMed]