Characterization of the new CelerisTM Arginine column
9
Journal of Chromatography A 1651 (2021) 462316 Contents lists available at ScienceDirect Journal of Chromatography A journal homepage: www.elsevier.com/locate/chroma Characterization of the new Celeris TM Arginine column: Retentive behaviour through a combination of chemometric tools and potential in drug analysis Giacomo Russo a , Maura Vallaro b , Luca Cappelli b , Scott Anderson c , Giuseppe Ermondi b , Giulia Caron b,∗ a School of Applied Sciences, Sighthill Campus, Edinburgh Napier University, 9 Sighthill Ct, EH11 4BN Edinburgh, United Kingdom b CASSMedChem Research Group, Molecular Biotechnology and Health Sciences Department, University of Turin, Italy c Regis Technologies Inc., 8210 Austin Ave, Morton Grove IL, 60053, USA a r t i c l e i n f o Article history: Received 26 April 2021 Revised 31 May 2021 Accepted 1 June 2021 Available online 4 June 2021 Keywords: Arginine Block relevance analysis Mixed-mode selectivity Liquid chromatography Drug analysis Chemometrics a b s t r a c t Celeris TM Arginine (ARG) is a mixed-mode stationary phase recently released on the market. To charac- terize its analytical behavior, the retention factors of a pool (n=100, of which 36 neutrals, 26 acids and 38 bases) of pharmaceutically relevant compounds have been measured on this phase over eight percent- ages (from 10 to 90% v/v) of acetonitrile (MeCN) as organic modifier. The ARG phase exhibited enhanced affinity for the molecules that are in their anionic form at the experimental pH, whilst basic compounds, albeit over a wide range of lipophilicity and pK a values, were on average poorly retained. To dissect the separation mechanism of the ARG phase, the overall analytical retention has been deconvoluted into the individual contributions of intermolecular forces by a QSPR/ Partial Least Square (PLS)/Block Relevance (BR) analysis tool recently developed by us. For the neutrals, the most relevant blocks were found to be Size, describing the interaction due to the dimension of the molecule, and O, representing the solute’s hydrogen bond donor properties. The change in sign from positive to negative of the Size block, which occurs between 10% and 20% MeCN, allowed to visually appreciate the switch in the separation mode from reversed phase to normal phase. Some good statistic models for rationalizing the analytical behaviour of neutrals were developed from VS+ descriptors. However, their performance in modelling the analytical retention of acids was substandard, probably due to the intrinsic inefficacy of VS+ descriptors in handling electric charges. This instance was addressed by a complimentary MLR strategy, which led to successfully model the retention of acids on the ARG column and to shed light into their retention mechanism, which seemed to be substantially driven by electrostatics. © 2021 Elsevier B.V. All rights reserved. 1. Introduction Nowadays liquid chromatography (LC) is one of the most essen- tial and pervasive techniques in the toolbox of analytical chemists, allowing identification, quantification, and purification of the indi- vidual components from a mixture [1-3]. For instance, LC is widely applied in almost all stages of the drug discovery/development process [4] to check the identity and the purity of new chemical entities before testing their potency against the desired molecular target(s). Other noteworthy applications relate to therapeutic drug monitoring [5, 6], which is conducted by determining the analytes ∗ Corresponding author. E-mail address: [email protected] (G. Caron). of interest in biological specimens, such as blood, urine or tissues during the preclinical and clinical phase. LC is also massively ex- ploited to quality control, impurity checks, stability investigations, and many other purposes relevant in drug development [7]. Albeit LC is extremely widespread and of rather common use, analytical method development can be an extremely daunting pro- cess, as +1000 stationary phase chemistries are available on the market and their commercial offer keeps widening [8]. Moreover, the complexity of samples to screen is constantly increasing, pos- ing to separation scientists unprecedented challenges. Whichever purpose the separation scientist pursues, a deep understanding of the intermolecular interactions establishing be- tween the analytes and the stationary phase [9] should be re- garded as mandatory not only to select the right analytical column https://doi.org/10.1016/j.chroma.2021.462316 0021-9673/© 2021 Elsevier B.V. All rights reserved.
-
Upload
khangminh22 -
Category
Documents
-
view
2 -
download
0
Transcript of Characterization of the new CelerisTM Arginine column
Journal of Chromatography A 1651 (2021) 462316
Contents lists available at ScienceDirect
Journal of Chromatography A
journal homepage: www.elsevier.com/locate/chroma
Characterization of the new Celeris
TM Arginine column: Retentive
behaviour through a combination of chemometric tools and potential
in drug analysis
Giacomo Russo
a , Maura Vallaro
b , Luca Cappelli b , Scott Anderson
c , Giuseppe Ermondi b , Giulia Caron
b , ∗
a School of Applied Sciences, Sighthill Campus, Edinburgh Napier University, 9 Sighthill Ct, EH11 4BN Edinburgh, United Kingdom
b CASSMedChem Research Group, Molecular Biotechnology and Health Sciences Department, University of Turin, Italy c Regis Technologies Inc., 8210 Austin Ave, Morton Grove IL, 60053, USA
a r t i c l e i n f o
Article history:
Received 26 April 2021
Revised 31 May 2021
Accepted 1 June 2021
Available online 4 June 2021
Keywords:
Arginine
Block relevance analysis
Mixed-mode selectivity
Liquid chromatography
Drug analysis
Chemometrics
a b s t r a c t
Celeris TM Arginine (ARG) is a mixed-mode stationary phase recently released on the market. To charac-
terize its analytical behavior, the retention factors of a pool ( n = 100, of which 36 neutrals, 26 acids and
38 bases) of pharmaceutically relevant compounds have been measured on this phase over eight percent-
ages (from 10 to 90% v/v) of acetonitrile (MeCN) as organic modifier. The ARG phase exhibited enhanced
affinity for the molecules that are in their anionic form at the experimental pH, whilst basic compounds,
albeit over a wide range of lipophilicity and pK a values, were on average poorly retained. To dissect the
separation mechanism of the ARG phase, the overall analytical retention has been deconvoluted into the
individual contributions of intermolecular forces by a QSPR/ Partial Least Square (PLS)/Block Relevance
(BR) analysis tool recently developed by us.
For the neutrals, the most relevant blocks were found to be Size, describing the interaction due to the
dimension of the molecule, and O, representing the solute’s hydrogen bond donor properties. The change
in sign from positive to negative of the Size block, which occurs between 10% and 20% MeCN, allowed
to visually appreciate the switch in the separation mode from reversed phase to normal phase. Some
good statistic models for rationalizing the analytical behaviour of neutrals were developed from VS +
descriptors. However, their performance in modelling the analytical retention of acids was substandard,
probably due to the intrinsic inefficacy of VS + descriptors in handling electric charges. This instance was
addressed by a complimentary MLR strategy, which led to successfully model the retention of acids on
the ARG column and to shed light into their retention mechanism, which seemed to be substantially
driven by electrostatics.
© 2021 Elsevier B.V. All rights reserved.
1
t
a
v
a
p
e
t
m
o
d
p
a
a
c
m
t
i
h
0
. Introduction
Nowadays liquid chromatography (LC) is one of the most essen-
ial and pervasive techniques in the toolbox of analytical chemists,
llowing identification, quantification, and purification of the indi-
idual components from a mixture [1-3] . For instance, LC is widely
pplied in almost all stages of the drug discovery/development
rocess [4] to check the identity and the purity of new chemical
ntities before testing their potency against the desired molecular
arget(s). Other noteworthy applications relate to therapeutic drug
onitoring [ 5 , 6 ], which is conducted by determining the analytes
∗ Corresponding author.
E-mail address: [email protected] (G. Caron).
u
t
g
ttps://doi.org/10.1016/j.chroma.2021.462316
021-9673/© 2021 Elsevier B.V. All rights reserved.
f interest in biological specimens, such as blood, urine or tissues
uring the preclinical and clinical phase. LC is also massively ex-
loited to quality control, impurity checks, stability investigations,
nd many other purposes relevant in drug development [7] .
Albeit LC is extremely widespread and of rather common use,
nalytical method development can be an extremely daunting pro-
ess, as + 10 0 0 stationary phase chemistries are available on the
arket and their commercial offer keeps widening [8] . Moreover,
he complexity of samples to screen is constantly increasing, pos-
ng to separation scientists unprecedented challenges.
Whichever purpose the separation scientist pursues, a deep
nderstanding of the intermolecular interactions establishing be-
ween the analytes and the stationary phase [9] should be re-
arded as mandatory not only to select the right analytical column
G. Russo, M. Vallaro, L. Cappelli et al. Journal of Chromatography A 1651 (2021) 462316
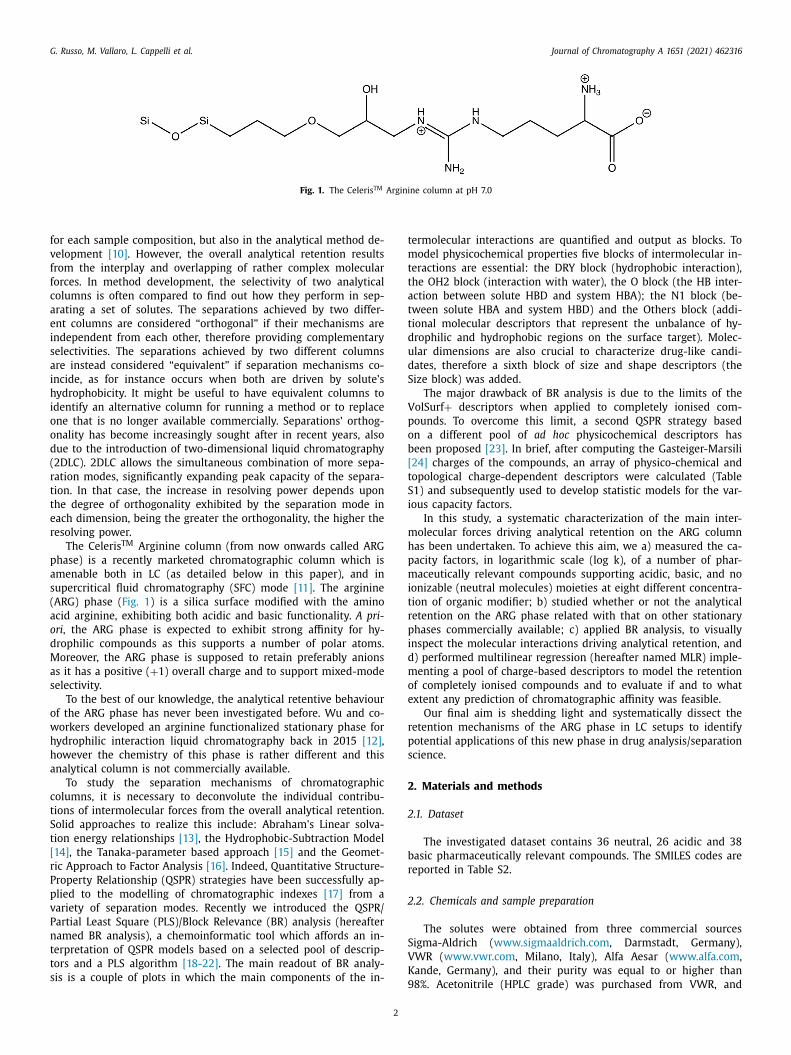
Fig. 1. The Celeris TM Arginine column at pH 7.0
f
v
f
f
c
a
e
i
s
a
i
h
i
o
o
d
(
r
t
t
e
r
p
a
s
(
a
o
d
M
a
s
o
w
h
h
a
c
t
S
t
[
r
P
p
v
P
n
t
t
s
t
m
t
t
a
t
t
d
u
d
S
V
p
o
b
[
t
S
i
m
h
p
m
i
t
r
p
i
d
m
o
e
r
p
s
2
2
b
r
2
S
V
K
or each sample composition, but also in the analytical method de-
elopment [10] . However, the overall analytical retention results
rom the interplay and overlapping of rather complex molecular
orces. In method development, the selectivity of two analytical
olumns is often compared to find out how they perform in sep-
rating a set of solutes. The separations achieved by two differ-
nt columns are considered “orthogonal” if their mechanisms are
ndependent from each other, therefore providing complementary
electivities. The separations achieved by two different columns
re instead considered “equivalent” if separation mechanisms co-
ncide, as for instance occurs when both are driven by solute’s
ydrophobicity. It might be useful to have equivalent columns to
dentify an alternative column for running a method or to replace
ne that is no longer available commercially. Separations’ orthog-
nality has become increasingly sought after in recent years, also
ue to the introduction of two-dimensional liquid chromatography
2DLC). 2DLC allows the simultaneous combination of more sepa-
ation modes, significantly expanding peak capacity of the separa-
ion. In that case, the increase in resolving power depends upon
he degree of orthogonality exhibited by the separation mode in
ach dimension, being the greater the orthogonality, the higher the
esolving power.
The Celeris TM Arginine column (from now onwards called ARG
hase) is a recently marketed chromatographic column which is
menable both in LC (as detailed below in this paper), and in
upercritical fluid chromatography (SFC) mode [11] . The arginine
ARG) phase ( Fig. 1 ) is a silica surface modified with the amino
cid arginine, exhibiting both acidic and basic functionality. A pri-
ri , the ARG phase is expected to exhibit strong affinity for hy-
rophilic compounds as this supports a number of polar atoms.
oreover, the ARG phase is supposed to retain preferably anions
s it has a positive ( + 1) overall charge and to support mixed-mode
electivity.
To the best of our knowledge, the analytical retentive behaviour
f the ARG phase has never been investigated before. Wu and co-
orkers developed an arginine functionalized stationary phase for
ydrophilic interaction liquid chromatography back in 2015 [12] ,
owever the chemistry of this phase is rather different and this
nalytical column is not commercially available.
To study the separation mechanisms of chromatographic
olumns, it is necessary to deconvolute the individual contribu-
ions of intermolecular forces from the overall analytical retention.
olid approaches to realize this include: Abraham’s Linear solva-
ion energy relationships [13] , the Hydrophobic-Subtraction Model
14] , the Tanaka-parameter based approach [15] and the Geomet-
ic Approach to Factor Analysis [16] . Indeed, Quantitative Structure-
roperty Relationship (QSPR) strategies have been successfully ap-
lied to the modelling of chromatographic indexes [17] from a
ariety of separation modes. Recently we introduced the QSPR/
artial Least Square (PLS)/Block Relevance (BR) analysis (hereafter
amed BR analysis), a chemoinformatic tool which affords an in-
erpretation of QSPR models based on a selected pool of descrip-
ors and a PLS algorithm [18-22] . The main readout of BR analy-
is is a couple of plots in which the main components of the in-
92
ermolecular interactions are quantified and output as blocks. To
odel physicochemical properties five blocks of intermolecular in-
eractions are essential: the DRY block (hydrophobic interaction),
he OH2 block (interaction with water), the O block (the HB inter-
ction between solute HBD and system HBA); the N1 block (be-
ween solute HBA and system HBD) and the Others block (addi-
ional molecular descriptors that represent the unbalance of hy-
rophilic and hydrophobic regions on the surface target). Molec-
lar dimensions are also crucial to characterize drug-like candi-
ates, therefore a sixth block of size and shape descriptors (the
ize block) was added.
The major drawback of BR analysis is due to the limits of the
olSurf + descriptors when applied to completely ionised com-
ounds. To overcome this limit, a second QSPR strategy based
n a different pool of ad hoc physicochemical descriptors has
een proposed [23] . In brief, after computing the Gasteiger-Marsili
24] charges of the compounds, an array of physico-chemical and
opological charge-dependent descriptors were calculated (Table
1) and subsequently used to develop statistic models for the var-
ous capacity factors.
In this study, a systematic characterization of the main inter-
olecular forces driving analytical retention on the ARG column
as been undertaken. To achieve this aim, we a) measured the ca-
acity factors, in logarithmic scale (log k), of a number of phar-
aceutically relevant compounds supporting acidic, basic, and no
onizable (neutral molecules) moieties at eight different concentra-
ion of organic modifier; b) studied whether or not the analytical
etention on the ARG phase related with that on other stationary
hases commercially available; c) applied BR analysis, to visually
nspect the molecular interactions driving analytical retention, and
) performed multilinear regression (hereafter named MLR) imple-
enting a pool of charge-based descriptors to model the retention
f completely ionised compounds and to evaluate if and to what
xtent any prediction of chromatographic affinity was feasible.
Our final aim is shedding light and systematically dissect the
etention mechanisms of the ARG phase in LC setups to identify
otential applications of this new phase in drug analysis/separation
cience.
. Materials and methods
.1. Dataset
The investigated dataset contains 36 neutral, 26 acidic and 38
asic pharmaceutically relevant compounds. The SMILES codes are
eported in Table S2.
.2. Chemicals and sample preparation
The solutes were obtained from three commercial sources
igma-Aldrich ( www.sigmaaldrich.com , Darmstadt, Germany),
WR ( www.vwr.com , Milano, Italy), Alfa Aesar ( www.alfa.com ,
ande, Germany), and their purity was equal to or higher than
8%. Acetonitrile (HPLC grade) was purchased from VWR, and
G. Russo, M. Vallaro, L. Cappelli et al. Journal of Chromatography A 1651 (2021) 462316
A
A
c
2
C
p
3
s
1
e
2
n
p
t
a
2
k
a
t
f
2
2
/
2
m
t
p
l
a
2
S
p
e
t
i
t
c
M
w
n
O
±
b
p
I
1
a
t
r
t
t
t
h
c
n
a
p
2
3
3
t
s
i
b
i
o
v
i
d
l
i
t
v
w
a
s
b
r
v
i
t
e
s
b
t
e
f
mmonium Acetate (reagent grade ≥ 98%) was purchased from
lfa Aesar.
All the compounds were solubilised in the mobile phase, at a
oncentration range of 50-100 μg mL −1 .
.3. Chromatographic hardware
An HPLC Varian ProStar chromatograph (Agilent, 5301 Stevens
reek Blv, Santa Clara, CA, USA) equipped with a 410 autosam-
ler with a built-in thermostatable column compartment, a PDA
35 LC Detector and Galaxie Chromatography Data System Ver-
ion 1.9.302.952 was used. The column was a Celeris TM Arginine
00 × 4.6 mm, 5 μm, 100 A from Regis Technologies (Austin Av-
nue, Morton Grove, IL, USA).
.4. Chromatographic conditions
All LC analyses were performed at 30 °C with a 20 mM ammo-
ium acetate buffer pH 7.0 in mixture with acetonitrile at various
ercentages (from 10 to 80%, v/v). Flow rate was 1.0 ml min
−1 and
he injection volume was 10 μL. Capacity factors results from the
verages of at least three independent measurements.
.5. Postprocessing of chromatographic signals
Capacity factors on the ARG phase were accounted for by Eq. 1:
=
t r − t 0 t 0
(1)
In which t r is the retention time (min) of the analyte of interest
nd t 0 the dead time, determined by monitoring the baseline dis-
urbance. Plotting and data analysis was done by Microsoft Excel
or Office 365 v 16.0 at 64 bits.
.6. Computational analysis
.6.1. Principal Components Analysis (PCA)
PCA was performed with a MatLab script (ver. R2019a, https:
/it.mathworks.com/ ).
.6.2. Comparison between ARG selectivity and those of other
arketed analytical columns
A data matrix including log k of 36 neutrals obtained on
he Celeris TM Arginine and those measured on other stationary
hases/experimental conditions was submitted to Matlab to calcu-
ate the correlation matrix. The columns used for the comparison
re the following:
• ABZ [25] (Supelco, Bellefonte, PA, USA 5 μm, 5 cm × 4.6 mm,
120 A) • X-Bridge [25] (Waters, Milford. MA, USA 5 μm, 5 cm × 4.6 mm,
130 A) • PLRP-S [26] (Agilent, Santa Clara, CA, USA 5 μm, 5 cm × 4.6
mm, 100 A) • IAM.PC.DD2 [27] (Regis Technologies Inc., Morton Grove, IL, USA
10 μm, 100 × 4.6 mm 300 A) • IAM.SPH [18] (synthesized in house [28] , 5 μm 10 cm × 2.1
mm, 300 A) • ZIC®-cHILIC [22] (Merck, Darmstadt, Germany, 3 μm, 10
cm × 4.6 mm, 100 A) • ZIC®-HILIC [22] (Merck, Darmstadt, Germany, 5 μm 10
cm × 4.6 mm, 200 A) • ZIC®-pHILIC [22] (Merck, Darmstadt, Germany, 5 μm 10
˚
cm × 4.6 mm, 200 A) c3
.6.3. BR analysis
BR analysis was accomplished as detailed elsewhere [19] . The
MILES codes (Table S2) of the 88 compounds were used as an in-
ut for VolSurf + software ( www.moldiscovery.com , ver 1.1.2). The
lectrical state was assigned by pK a calculations implemented in
he software and an average conformation was build and min-
mised. The 82 descriptors directly obtained from 3D molecular in-
eraction fields (MIFs) were then calculated. The data matrixes, in-
luding descriptors and chromatographic data, were submitted to
atlab to perform PLS and VIP analysis. As already discussed else-
here [19] , since here the PLS model is used for interpretative and
ot predictive purposes, only internal validation was performed.
utliers were identified from the residual plots, when exceeding
0.5.
Finally, an in-house Matlab script grouped the descriptors in
locks and processed the corresponding VIPs to draw the BR
lots. Processing was done on a laptop equipped with a 4 cores
ntel i7-4700MQ and 12 GB of RAM operating with Windows
0.
BR analysis interpretation is obtained by two graphical outputs:
) the absolute BR plot that shows the relevance of any block to
he PLS model independently of the sign (the higher, the more
elevant) and b) the BR plot with signs which splits the contribu-
ion of any block into positive BR ( + ) and negative BR (-) por-
ions. BR ( + ) indicates how much the considered block favours
he considered descriptor ( e.g., log k ARG ) whereas BR (-) shows
ow much the block lowers the descriptor. Blocks with small and
omparable positive and negative contributions indicate the high
oise and inter-correlation of the descriptors of the block itself
nd thus are poorly relevant in the description of the investigated
henomenon.
.6.4. MLR
MLR analysis was accomplished by VEGA ZZ x64 software
.2.0.9 [29] implemented on a one 8 core i7 at 3.1 Ghz CPU and
2 GB of RAM Windows desktop machine. Physico-chemical and
opological properties (Virtual log P [30] , lipole [31] , volume, polar
urface area, surface accessible to the solvent, gyration radius, oval-
ty, mass, number of atoms, angles, dihedrals, etc) were calculated
y VEGA ZZ software (Table S1) and finally, all molecules were
nserted into a Microsoft Access database. An additional number
f descriptors (HLB, polarizability, log P) were calculated by Mar-
inSketch v. 21.3 operated on an 8-core Mac computer. Detailed
nformation is reported in here [32] . In brief, the starting three-
imensional structures of the considered molecules were down-
oaded from PubChem database [ 33 , 34 ], and they were considered
n both zero atomic charge and ionized form (acids and bases). Fur-
hermore, a weighted average according the the experimental pK a
alues was performed. The Gasteiger −Marsili method [24] , along
ith CHARMM force field [35-37] , was applied to calculate the
tomic charges. After that, structures were minimized by AMMP
oftware [38] (conjugate gradients, 30 0 0 iterations, toler 0.01). The
est independent variables were selected by calculating the cor-
espondent equation with a single regressor. Regressions with r 2
alue less than 0.10 automatically determine the exclusion of the
ndependent variable. Collinear independent variables were iden-
ified by calculating the Variance Inflation Factor (VIF) value for
ach regressor pair. Variable pairs with VIF > 5.0 were not con-
idered in the model calculation. Statistic models with a num-
er of regressors from one to three were developed by using ei-
her the zero-charge or the ionized forms of the compounds. For
ach model, a cross-validation procedure (leave-one-out) is per-
ormed. For the sake of conciseness, only LOO models were dis-
ussed.
G. Russo, M. Vallaro, L. Cappelli et al. Journal of Chromatography A 1651 (2021) 462316
3
3
o
t
t
s
m
S
c
l
s
l
m
n
s
s
(
v
X
s
a
u
o
s
t
p
b
d
3
V
o
(
d
9
(
o
b
d
3
m
o
t
u
c
t
i
c
s
w
i
t
w
b
g
o
a
w
t
t
t
c
a
e
t
s
t
v
s
s
c
k
s
s
o
t
i
s
l
c
t
c
t
a
o
w
s
r
3
s
3
i
c
p
t
i
A
s
l
i
s
b
w
m
n
d
t
v
t
. Results and discussion
.1. Relationships between selectivity of ARG phase and other phases
n the market
The relationships between the various log k values measured on
he ARG phase of the dataset of 36 the compounds in Table S3 and
hat of other commercially available stationary phases have been
tudied. It is noteworthy that none of the tested phases supports
ixed-selectivity. An exemplative chromatogram is shown in Fig.
1.
Results are shown in Table S3, which lists the r values of the
orrelation matrix. An r of -1 indicates a perfect negative linear re-
ationship between variables, an r of 0 indicates no linear relation-
hip between variables, and an r of 1 indicates a perfect positive
inear relationship between variables. Consequently, r = 0 implies
ax orthogonality, which takes place when the separation mecha-
isms of each system are fully independent from each other.
Data in Table S3 supports that only ARG affinity values mea-
ured at 90/10 buffer 20 mM ammonium acetate/MeCN exhibit
ome degree of similarity of retention on other octadecylsilyl
ODS)- and IAM.SPH- based chromatographic systems. In fact, r
alues range between 0.65 and 0.70 when we consider ABZ and
-Bridge. This suggests that the analytical selectivities overlap to
ome extent. However, for most chromatographic systems and for
ll the other eluent compositions tested on the ARG phase, val-
es very close to zero are observed. This implies that the features
f the ARG phase are not depicted by any other chromatographic
ystem among those tested, suggesting strong orthogonality and,
herefore, originality in the separation process afforded by this
hase. Consistently, an extensive characterization of the analytical
ehaviour of the ARG phase was deemed relevant and hereby un-
ertaken.
.2. PCA analysis
To verify the dataset distribution, we performed PCA using the
S + descriptors (see 2.6.3).
For the 36 neutral compounds, results show that more than 90%
f the variance is explained by the first two principal components
Fig. S2A). The scores plot (Fig. S2B) shows that the compounds are
istributed in the four quadrants. For acidic compounds, more than
0% of the variance was found to be explained by the first two PCs
Fig. S3A). The scores plot (Fig S3B) shows a good although not
ptimal compounds distribution. Similar results were obtained for
asic compounds, which show an optimal distribution in the VS +
escriptors chemical space (Fig. S4).
.3. Dependency of analytical retention on ARG column upon organic
odifier concentration
Log k ARG values of the 36 neutral compounds were isocratically
btained using mobile phases with MeCN content varying from 10
o 80%. ARG capacity factors (Table S4) evidence that retention val-
es could be determined for most but not all the organic modifier
oncentrations, being a number of compound poorly retained over
he 70/30 and 80/20 buffer/MeCN eluent compositions.
When monitoring the dependency of log k versus organic mod-
fier concentration, most compounds could be classified in four
lasses according to the different trends (descending, minimum,
nake and bell, Fig. S5). However, we could not associate trends
ith the presence of common substructures and compounds show-
ng similar trends were not always clustered in the same region of
he PCA scores plot (Fig. S2B).
Capacity factors of 26 acids at eight concentrations of MeCN
ere also determined (Table S5). Acidic compounds were retained
4
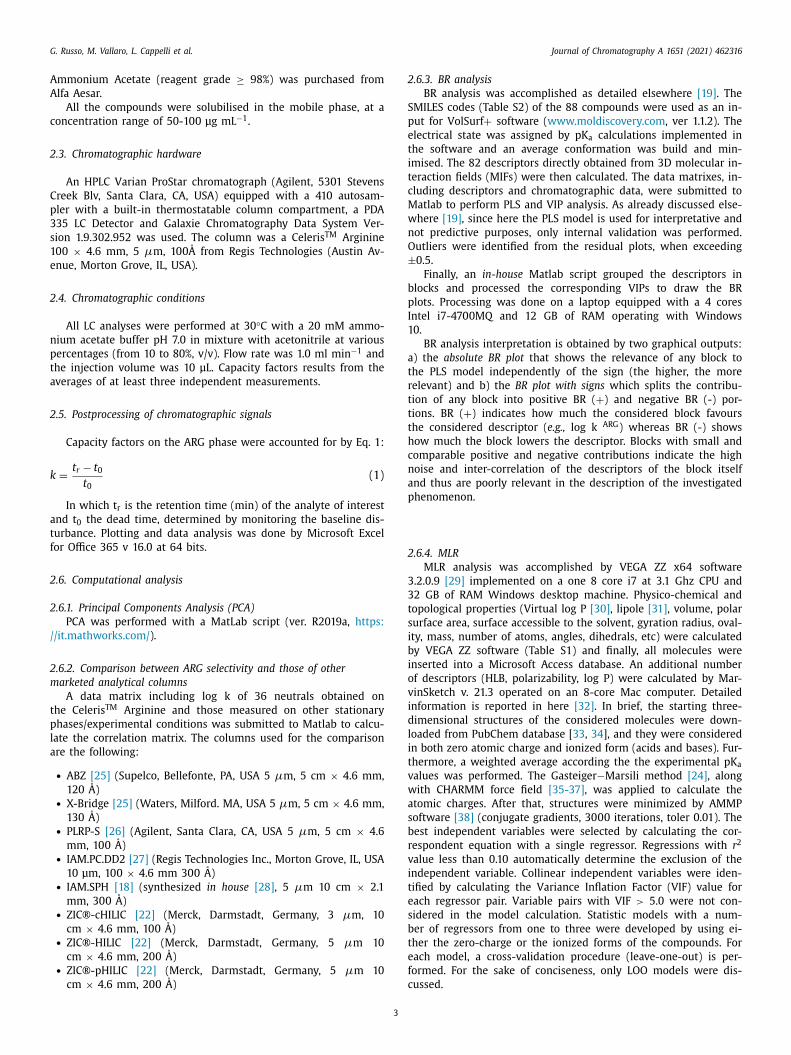
y the ARG column to a greater extent than neutral molecules, sug-
esting effectiveness of this phase in the retention and separation
f anionic molecules. This is plausible, since the ARG phase bears
+ 1 total electric charge at the experimental pH ( Fig. 1 ). Fig. 2 ,
hich reports log k ARG of the 26 acidic compounds as a function of
he mobile phase composition, suggests that most molecules fea-
ure a similar descending trend.
The calculated pK a values, which are listed in Table S6, are in
he 3-5 range for most monoprotic acids. This supports that these
ompounds interact with the ARG phase prevalently in their neg-
tively charged forms. In fact, according to Henderson-Hasselbalch
quation, they are in their undissociated:ionic form ratio to an ex-
ent spanning from 1: 100 and 1: 10.0 0 0. The dataset does include
ome molecules featuring more than one acidic moiety e.g. , cap-
opril, citric acid, furosemide, valsartan. However, the lowest pK a
alue of these polyprotic acids lies again the in the same 3-5 range,
upporting that also these compounds would interact with the ARG
tationary phase preferentially in their anionic form.
Log k ARG of the 38 basic compounds (Table S7) at eight con-
entrations of MeCN were also measured (Fig. S6 shows the log
vs mobile phase composition plot). Evidently, a number of ba-
ic compounds were poorly retained or not retained at all. A rea-
on supporting this analytical behaviour might be the occurrence
f repulsive electrostatic interactions between these molecules and
he ARG phase. Moreover, the negative charge of the carboxy group
s located only onto the outer part of the phase, allowing only a
uperficial interaction and preventing these basic solutes to estab-
ish a deeper engagement with the ARG phase. However, the bases
onsidered span a wider calculated pK a range i.e. , 6-10 (Table S8)
han the studied acidic compounds. This implies that not all the
ompounds would interact with the stationary phase prevalently in
heir cationic forms, but some in their neutral forms. Since the an-
lytical retention of many bases could not be measured at various
rganic modifier concentrations, no solid evidence could be drawn
ith regards to trends. However, data collected indicates that ARG
tationary phase may not be the best choice if one aims at sepa-
ating a mixture of bases.
.4. BR analysis
The three dataset subclasses (neutrals, acids and bases) were
ubmitted to BR analysis.
.4.1. Neutrals
An overview of the statistics of the final PLS models is shown
n Table 1 .
Notably, log k ARG values achieved at 70% and 80% MeCN eluent
ompositions were not considered since many compounds were
oorly retained and the size of their datasets was too limited
o draw any solid conclusion. An analysis of the statistics listed
n Table 1 suggest that more accurate models were achieved for
RG affinity values measured in prevalently aqueous eluents, and
pecifically in 20% MeCN. It is reasonable to assume that in preva-
ently aqueous medium the tendency of the ARG phase to ionise
s greater than that in eluents richer in acetonitrile. Since all these
olutes are neutrals, this does not affect dipole-dipole interactions,
eing that all the molecules are zero charge. However, this may
ell play a role in dipole-dipole induced interactions, which are
agnified at lower organic modifier concentrations. Indeed, most
eutrals support polar atoms, and consequently, polarized bonds.
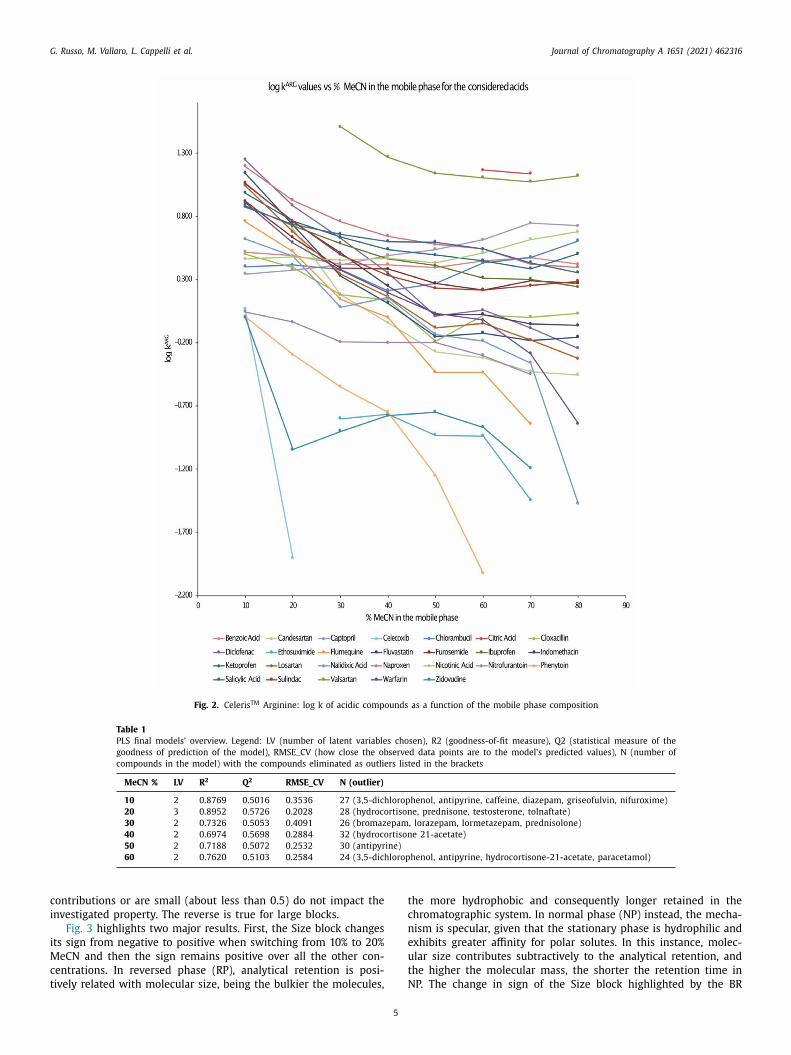
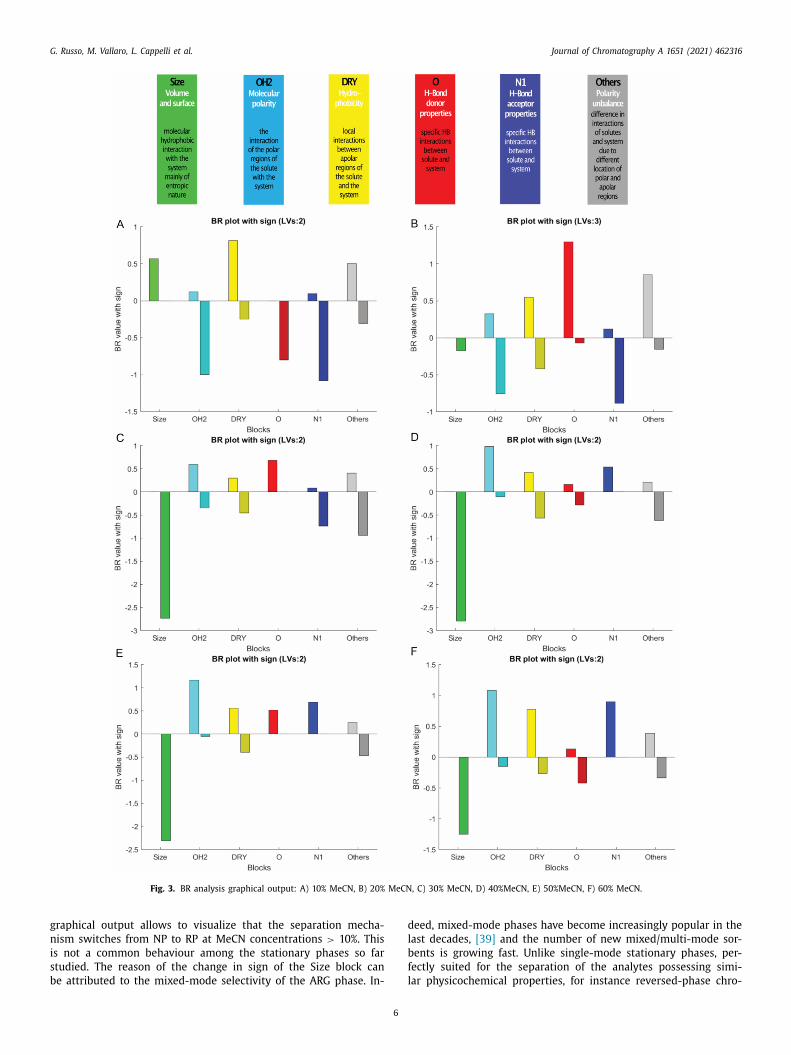
Fig. 3 shows the BR analysis graphical output for the retention
ata of the 36 neutrals over increasing concentration of acetoni-
rile. Overall, as schematized in Fig. 3 G the plots show the rele-
ance of any block to the model: the higher, the more important
he block. Blocks which either show similar positive and negative
G. Russo, M. Vallaro, L. Cappelli et al. Journal of Chromatography A 1651 (2021) 462316
Fig. 2. Celeris TM Arginine: log k of acidic compounds as a function of the mobile phase composition
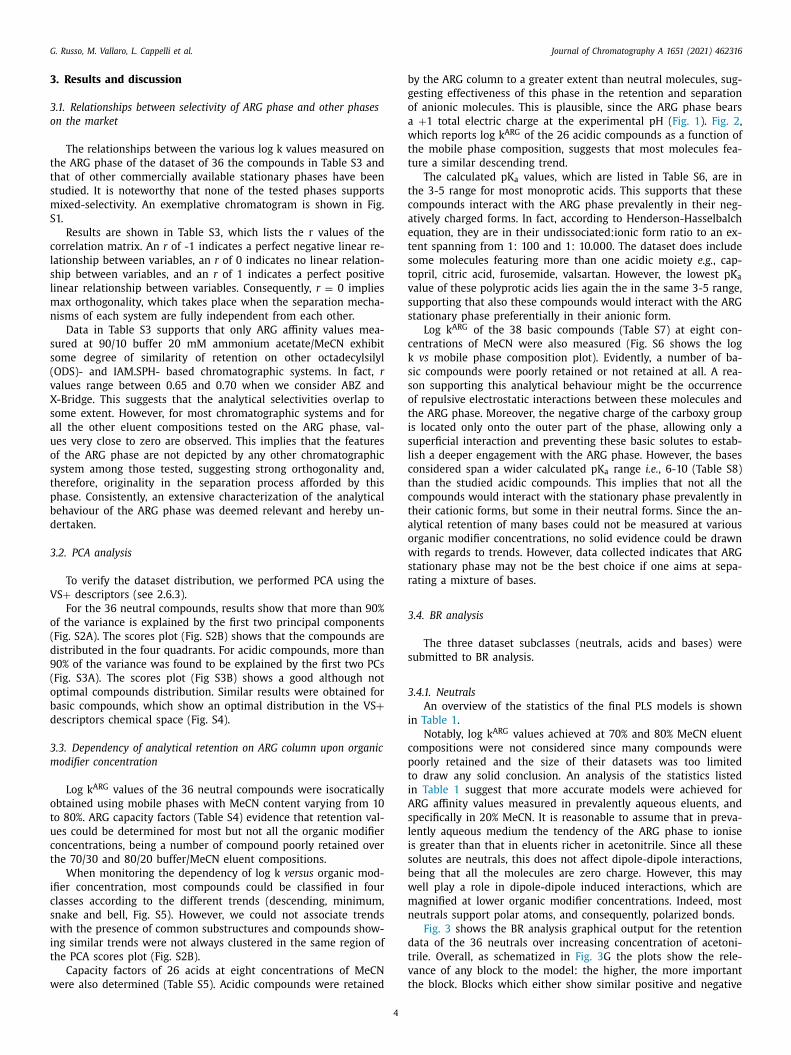
Table 1
PLS final models’ overview. Legend: LV (number of latent variables chosen), R2 (goodness-of-fit measure), Q2 (statistical measure of the
goodness of prediction of the model), RMSE_CV (how close the observed data points are to the model’s predicted values), N (number of
compounds in the model) with the compounds eliminated as outliers listed in the brackets
MeCN % LV R 2 Q
2 RMSE_CV N (outlier)
10 2 0.8769 0.5016 0.3536 27 (3,5-dichlorophenol, antipyrine, caffeine, diazepam, griseofulvin, nifuroxime)
20 3 0.8952 0.5726 0.2028 28 (hydrocortisone, prednisone, testosterone, tolnaftate)
30 2 0.7326 0.5053 0.4091 26 (bromazepam, lorazepam, lormetazepam, prednisolone)
40 2 0.6974 0.5698 0.2884 32 (hydrocortisone 21-acetate)
50 2 0.7188 0.5072 0.2532 30 (antipyrine)
60 2 0.7620 0.5103 0.2584 24 (3,5-dichlorophenol, antipyrine, hydrocortisone-21-acetate, paracetamol)
c
i
i
M
c
t
t
c
n
e
u
t
N
ontributions or are small (about less than 0.5) do not impact the
nvestigated property. The reverse is true for large blocks.
Fig. 3 highlights two major results. First, the Size block changes
ts sign from negative to positive when switching from 10% to 20%
eCN and then the sign remains positive over all the other con-
entrations. In reversed phase (RP), analytical retention is posi-
ively related with molecular size, being the bulkier the molecules,
5
he more hydrophobic and consequently longer retained in the
hromatographic system. In normal phase (NP) instead, the mecha-
ism is specular, given that the stationary phase is hydrophilic and
xhibits greater affinity for polar solutes. In this instance, molec-
lar size contributes subtractively to the analytical retention, and
he higher the molecular mass, the shorter the retention time in
P. The change in sign of the Size block highlighted by the BR
G. Russo, M. Vallaro, L. Cappelli et al. Journal of Chromatography A 1651 (2021) 462316
Fig. 3. BR analysis graphical output: A) 10% MeCN, B) 20% MeCN, C) 30% MeCN, D) 40%MeCN, E) 50%MeCN, F) 60% MeCN.
g
n
i
s
b
d
l
b
f
l
raphical output allows to visualize that the separation mecha-
ism switches from NP to RP at MeCN concentrations > 10%. This
s not a common behaviour among the stationary phases so far
tudied. The reason of the change in sign of the Size block can
e attributed to the mixed-mode selectivity of the ARG phase. In-
6
eed, mixed-mode phases have become increasingly popular in the
ast decades, [39] and the number of new mixed/multi-mode sor-
ents is growing fast. Unlike single-mode stationary phases, per-
ectly suited for the separation of the analytes possessing simi-
ar physicochemical properties, for instance reversed-phase chro-
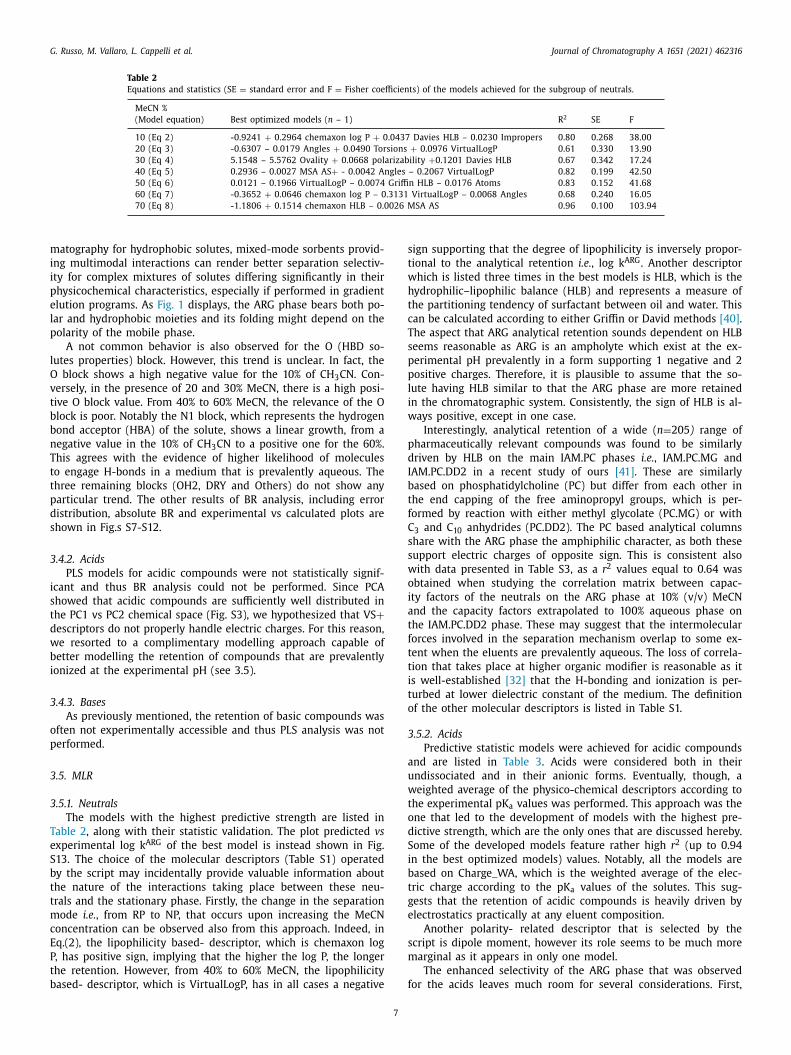
G. Russo, M. Vallaro, L. Cappelli et al. Journal of Chromatography A 1651 (2021) 462316
Table 2
Equations and statistics (SE = standard error and F = Fisher coefficients) of the models achieved for the subgroup of neutrals.
MeCN %
(Model equation) Best optimized models ( n – 1) R 2 SE F
10 (Eq 2) -0.9241 + 0.2964 chemaxon log P + 0.0437 Davies HLB – 0.0230 Impropers 0.80 0.268 38.00
20 (Eq 3) -0.6307 – 0.0179 Angles + 0.0490 Torsions + 0.0976 VirtualLogP 0.61 0.330 13.90
30 (Eq 4) 5.1548 – 5.5762 Ovality + 0.0668 polarizability + 0.1201 Davies HLB 0.67 0.342 17.24
40 (Eq 5) 0.2936 – 0.0027 MSA AS + - 0.0042 Angles – 0.2067 VirtualLogP 0.82 0.199 42.50
50 (Eq 6) 0.0121 – 0.1966 VirtualLogP – 0.0074 Griffin HLB – 0.0176 Atoms 0.83 0.152 41.68
60 (Eq 7) -0.3652 + 0.0646 chemaxon log P – 0.3131 VirtualLogP – 0.0068 Angles 0.68 0.240 16.05
70 (Eq 8) -1.1806 + 0.1514 chemaxon HLB – 0.0026 MSA AS 0.96 0.100 103.94
m
i
i
p
e
l
p
l
O
v
t
b
b
n
T
t
t
p
d
s
3
i
s
t
d
w
b
i
3
o
p
3
3
T
e
S
b
t
t
m
c
E
P
t
b
s
t
w
h
t
c
T
s
p
p
l
i
w
p
d
I
b
t
f
C
s
s
w
o
i
a
t
f
t
t
i
t
o
3
a
u
w
t
o
d
S
i
b
t
g
e
s
m
f
atography for hydrophobic solutes, mixed-mode sorbents provid-
ng multimodal interactions can render better separation selectiv-
ty for complex mixtures of solutes differing significantly in their
hysicochemical characteristics, especially if performed in gradient
lution programs. As Fig. 1 displays, the ARG phase bears both po-
ar and hydrophobic moieties and its folding might depend on the
olarity of the mobile phase.
A not common behavior is also observed for the O (HBD so-
utes properties) block. However, this trend is unclear. In fact, the
block shows a high negative value for the 10% of CH 3 CN. Con-
ersely, in the presence of 20 and 30% MeCN, there is a high posi-
ive O block value. From 40% to 60% MeCN, the relevance of the O
lock is poor. Notably the N1 block, which represents the hydrogen
ond acceptor (HBA) of the solute, shows a linear growth, from a
egative value in the 10% of CH 3 CN to a positive one for the 60%.
his agrees with the evidence of higher likelihood of molecules
o engage H-bonds in a medium that is prevalently aqueous. The
hree remaining blocks (OH2, DRY and Others) do not show any
articular trend. The other results of BR analysis, including error
istribution, absolute BR and experimental vs calculated plots are
hown in Fig.s S7-S12.
.4.2. Acids
PLS models for acidic compounds were not statistically signif-
cant and thus BR analysis could not be performed. Since PCA
howed that acidic compounds are sufficiently well distributed in
he PC1 vs PC2 chemical space (Fig. S3), we hypothesized that VS +
escriptors do not properly handle electric charges. For this reason,
e resorted to a complimentary modelling approach capable of
etter modelling the retention of compounds that are prevalently
onized at the experimental pH (see 3.5).
.4.3. Bases
As previously mentioned, the retention of basic compounds was
ften not experimentally accessible and thus PLS analysis was not
erformed.
.5. MLR
.5.1. Neutrals
The models with the highest predictive strength are listed in
able 2 , along with their statistic validation. The plot predicted vs
xperimental log k ARG of the best model is instead shown in Fig.
13. The choice of the molecular descriptors (Table S1) operated
y the script may incidentally provide valuable information about
he nature of the interactions taking place between these neu-
rals and the stationary phase. Firstly, the change in the separation
ode i.e. , from RP to NP, that occurs upon increasing the MeCN
oncentration can be observed also from this approach. Indeed, in
q.(2), the lipophilicity based- descriptor, which is chemaxon log
, has positive sign, implying that the higher the log P, the longer
he retention. However, from 40% to 60% MeCN, the lipophilicity
ased- descriptor, which is VirtualLogP, has in all cases a negative
7
ign supporting that the degree of lipophilicity is inversely propor-
ional to the analytical retention i.e. , log k ARG . Another descriptor
hich is listed three times in the best models is HLB, which is the
ydrophilic–lipophilic balance (HLB) and represents a measure of
he partitioning tendency of surfactant between oil and water. This
an be calculated according to either Griffin or David methods [40] .
he aspect that ARG analytical retention sounds dependent on HLB
eems reasonable as ARG is an ampholyte which exist at the ex-
erimental pH prevalently in a form supporting 1 negative and 2
ositive charges. Therefore, it is plausible to assume that the so-
ute having HLB similar to that the ARG phase are more retained
n the chromatographic system. Consistently, the sign of HLB is al-
ays positive, except in one case.
Interestingly, analytical retention of a wide ( n = 205 ) range of
harmaceutically relevant compounds was found to be similarly
riven by HLB on the main IAM.PC phases i.e. , IAM.PC.MG and
AM.PC.DD2 in a recent study of ours [41] . These are similarly
ased on phosphatidylcholine (PC) but differ from each other in
he end capping of the free aminopropyl groups, which is per-
ormed by reaction with either methyl glycolate (PC.MG) or with
3 and C 10 anhydrides (PC.DD2). The PC based analytical columns
hare with the ARG phase the amphiphilic character, as both these
upport electric charges of opposite sign. This is consistent also
ith data presented in Table S3, as a r 2 values equal to 0.64 was
btained when studying the correlation matrix between capac-
ty factors of the neutrals on the ARG phase at 10% (v/v) MeCN
nd the capacity factors extrapolated to 100% aqueous phase on
he IAM.PC.DD2 phase. These may suggest that the intermolecular
orces involved in the separation mechanism overlap to some ex-
ent when the eluents are prevalently aqueous. The loss of correla-
ion that takes place at higher organic modifier is reasonable as it
s well-established [32] that the H-bonding and ionization is per-
urbed at lower dielectric constant of the medium. The definition
f the other molecular descriptors is listed in Table S1.
.5.2. Acids
Predictive statistic models were achieved for acidic compounds
nd are listed in Table 3 . Acids were considered both in their
ndissociated and in their anionic forms. Eventually, though, a
eighted average of the physico-chemical descriptors according to
he experimental pK a values was performed. This approach was the
ne that led to the development of models with the highest pre-
ictive strength, which are the only ones that are discussed hereby.
ome of the developed models feature rather high r 2 (up to 0.94
n the best optimized models) values. Notably, all the models are
ased on Charge_WA, which is the weighted average of the elec-
ric charge according to the pK a values of the solutes. This sug-
ests that the retention of acidic compounds is heavily driven by
lectrostatics practically at any eluent composition.
Another polarity- related descriptor that is selected by the
cript is dipole moment, however its role seems to be much more
arginal as it appears in only one model.
The enhanced selectivity of the ARG phase that was observed
or the acids leaves much room for several considerations. First,
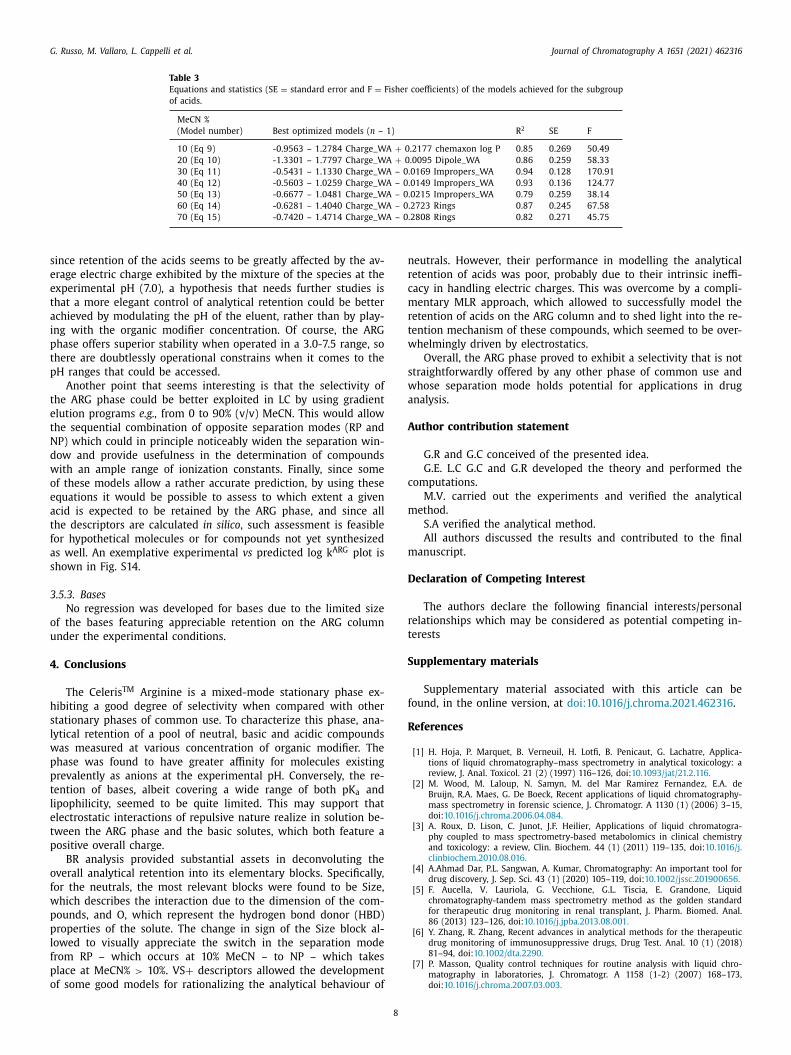
G. Russo, M. Vallaro, L. Cappelli et al. Journal of Chromatography A 1651 (2021) 462316
Table 3
Equations and statistics (SE = standard error and F = Fisher coefficients) of the models achieved for the subgroup
of acids.
MeCN %
(Model number) Best optimized models ( n – 1) R 2 SE F
10 (Eq 9) -0.9563 – 1.2784 Charge_WA + 0.2177 chemaxon log P 0.85 0.269 50.49
20 (Eq 10) -1.3301 – 1.7797 Charge_WA + 0.0095 Dipole_WA 0.86 0.259 58.33
30 (Eq 11) -0.5431 – 1.1330 Charge_WA – 0.0169 Impropers_WA 0.94 0.128 170.91
40 (Eq 12) -0.5603 – 1.0259 Charge_WA – 0.0149 Impropers_WA 0.93 0.136 124.77
50 (Eq 13) -0.6677 – 1.0481 Charge_WA – 0.0215 Impropers_WA 0.79 0.259 38.14
60 (Eq 14) -0.6281 – 1.4040 Charge_WA – 0.2723 Rings 0.87 0.245 67.58
70 (Eq 15) -0.7420 – 1.4714 Charge_WA – 0.2808 Rings 0.82 0.271 45.75
s
e
e
t
a
i
p
t
p
t
e
t
N
d
w
o
e
a
t
f
a
s
3
o
u
4
h
s
l
w
p
p
t
l
e
t
p
o
f
w
p
p
l
f
p
o
n
r
c
m
r
t
w
s
w
a
A
c
m
m
D
r
t
S
f
R
ince retention of the acids seems to be greatly affected by the av-
rage electric charge exhibited by the mixture of the species at the
xperimental pH (7.0), a hypothesis that needs further studies is
hat a more elegant control of analytical retention could be better
chieved by modulating the pH of the eluent, rather than by play-
ng with the organic modifier concentration. Of course, the ARG
hase offers superior stability when operated in a 3.0-7.5 range, so
here are doubtlessly operational constrains when it comes to the
H ranges that could be accessed.
Another point that seems interesting is that the selectivity of
he ARG phase could be better exploited in LC by using gradient
lution programs e.g., from 0 to 90% (v/v) MeCN. This would allow
he sequential combination of opposite separation modes (RP and
P) which could in principle noticeably widen the separation win-
ow and provide usefulness in the determination of compounds
ith an ample range of ionization constants. Finally, since some
f these models allow a rather accurate prediction, by using these
quations it would be possible to assess to which extent a given
cid is expected to be retained by the ARG phase, and since all
he descriptors are calculated in silico , such assessment is feasible
or hypothetical molecules or for compounds not yet synthesized
s well. An exemplative experimental vs predicted log k ARG plot is
hown in Fig. S14.
.5.3. Bases
No regression was developed for bases due to the limited size
f the bases featuring appreciable retention on the ARG column
nder the experimental conditions.
. Conclusions
The Celeris TM Arginine is a mixed-mode stationary phase ex-
ibiting a good degree of selectivity when compared with other
tationary phases of common use. To characterize this phase, ana-
ytical retention of a pool of neutral, basic and acidic compounds
as measured at various concentration of organic modifier. The
hase was found to have greater affinity for molecules existing
revalently as anions at the experimental pH. Conversely, the re-
ention of bases, albeit covering a wide range of both pK a and
ipophilicity, seemed to be quite limited. This may support that
lectrostatic interactions of repulsive nature realize in solution be-
ween the ARG phase and the basic solutes, which both feature a
ositive overall charge.
BR analysis provided substantial assets in deconvoluting the
verall analytical retention into its elementary blocks. Specifically,
or the neutrals, the most relevant blocks were found to be Size,
hich describes the interaction due to the dimension of the com-
ounds, and O, which represent the hydrogen bond donor (HBD)
roperties of the solute. The change in sign of the Size block al-
owed to visually appreciate the switch in the separation mode
rom RP – which occurs at 10% MeCN – to NP – which takes
lace at MeCN% > 10%. VS + descriptors allowed the development
f some good models for rationalizing the analytical behaviour of
8
eutrals. However, their performance in modelling the analytical
etention of acids was poor, probably due to their intrinsic ineffi-
acy in handling electric charges. This was overcome by a compli-
entary MLR approach, which allowed to successfully model the
etention of acids on the ARG column and to shed light into the re-
ention mechanism of these compounds, which seemed to be over-
helmingly driven by electrostatics.
Overall, the ARG phase proved to exhibit a selectivity that is not
traightforwardly offered by any other phase of common use and
hose separation mode holds potential for applications in drug
nalysis.
uthor contribution statement
G.R and G.C conceived of the presented idea.
G.E. L.C G.C and G.R developed the theory and performed the
omputations.
M.V. carried out the experiments and verified the analytical
ethod.
S.A verified the analytical method.
All authors discussed the results and contributed to the final
anuscript.
eclaration of Competing Interest
The authors declare the following financial interests/personal
elationships which may be considered as potential competing in-
erests
upplementary materials
Supplementary material associated with this article can be
ound, in the online version, at doi:10.1016/j.chroma.2021.462316 .
eferences
[1] H. Hoja, P. Marquet, B. Verneuil, H. Lotfi, B. Penicaut, G. Lachatre, Applica-
tions of liquid chromatography–mass spectrometry in analytical toxicology: a
review, J. Anal. Toxicol. 21 (2) (1997) 116–126, doi: 10.1093/jat/21.2.116 . [2] M. Wood, M. Laloup, N. Samyn, M. del Mar Ramirez Fernandez, E.A. de
Bruijn, R.A. Maes, G. De Boeck, Recent applications of liquid chromatography- mass spectrometry in forensic science, J. Chromatogr. A 1130 (1) (2006) 3–15,
doi: 10.1016/j.chroma.2006.04.084 . [3] A. Roux, D. Lison, C. Junot, J.F. Heilier, Applications of liquid chromatogra-
phy coupled to mass spectrometry-based metabolomics in clinical chemistry
and toxicology: a review, Clin. Biochem. 44 (1) (2011) 119–135, doi: 10.1016/j. clinbiochem.2010.08.016 .
[4] A.Ahmad Dar, P.L. Sangwan, A. Kumar, Chromatography: An important tool for drug discovery, J. Sep. Sci. 43 (1) (2020) 105–119, doi: 10.10 02/jssc.20190 0656 .
[5] F. Aucella, V. Lauriola, G. Vecchione, G.L. Tiscia, E. Grandone, Liquid chromatography-tandem mass spectrometry method as the golden standard
for therapeutic drug monitoring in renal transplant, J. Pharm. Biomed. Anal. 86 (2013) 123–126, doi: 10.1016/j.jpba.2013.08.001 .
[6] Y. Zhang, R. Zhang, Recent advances in analytical methods for the therapeutic
drug monitoring of immunosuppressive drugs, Drug Test. Anal. 10 (1) (2018) 81–94, doi: 10.1002/dta.2290 .
[7] P. Masson, Quality control techniques for routine analysis with liquid chro- matography in laboratories, J. Chromatogr. A 1158 (1-2) (2007) 168–173,
doi: 10.1016/j.chroma.20 07.03.0 03 .
G. Russo, M. Vallaro, L. Cappelli et al. Journal of Chromatography A 1651 (2021) 462316
[
[
[
[
[
[
[
[
[
[
[
[
[
[
[
[
[
[
[
[
[
[
[
[8] H. Qiu, X. Liang, M. Sun, S. Jiang, Development of silica-based stationary phases for high-performance liquid chromatography, Anal. Bioanal. Chem. 399 (10)
(2011) 3307–3322, doi: 10.10 07/s0 0216- 010- 4611- x . [9] D. Sykora, J. Vozka, E. Tesarova, Chromatographic methods enabling the char-
acterization of stationary phases and retention prediction in high-performance liquid chromatography and supercritical fluid chromatography, J. Sep. Sci. 39
(1) (2016) 115–131, doi: 10.1002/jssc.201501023 . [10] C. West, S. Khater, Characterization of retention and separation mechanisms
with Pirkle-type enantioselective stationary phases in supercritical fluid chro-
matography, J. Chromatogr. A 1626 (2020) 461352, doi: 10.1016/j.chroma.2020. 461352 .
[11] R. TechnologiesCeleris Arginine stationary phase, 2021 https://www.registech. com/celeris- arginine- 2/ .
12] S. Wu, X. Li, F. Zhang, G. Jiang, X. Liang, B. Yang, An arginine-functionalized sta-tionary phase for hydrophilic interaction liquid chromatography, Analyst 140
(12) (2015) 3921–3924, doi: 10.1039/c5an00570a .
[13] M.J. Kamlet, R.M. Doherty, J.L. Abboud, M.H. Abraham, R.W. Taft, Linear sol- vation energy relationships: 36. molecular properties governing solubilities
of organic nonelectrolytes in water, J. Pharm. Sci. 75 (4) (1986) 338–349, doi: 10.10 02/jps.260 0750405 .
[14] L.R. Snyder , J.W. Dolan , P.W. Carr , The hydrophobic-subtraction model of reversed-phase column selectivity, J. Chromatogr. A 1060 (1-2) (2004)
77–116 .
[15] K. Kimata, K. Iwaguchi, S. Onishi, K. Jinno, R. Eksteen, K. Hosoya, M. Araki, N. Tanaka, Chromatographic characterization of silica C18 packing materials.
correlation between a preparation method and retention behavior of stationary phase, J. Chromatogr. Sci. 27 (12) (1989) 721–728, doi: 10.1093/chromsci/27.12.
721 . [16] Z. Liu, D.G. Patterson, M.L. Lee, Geometric approach to factor analysis for
the estimation of orthogonality and practical peak capacity in comprehen-
sive two-dimensional separations, Analyt. Chem. 67 (21) (1995) 3840–3845, doi: 10.1021/ac0 0117a0 04 .
[17] M.J. den Uijl, P.J. Schoenmakers, B.W.J. Pirok, M.R. van Bommel, Recent applica- tions of retention modelling in liquid chromatography, J. Sep. Sci. 44 (1) (2021)
88–114, doi: 10.10 02/jssc.2020 0 0905 . [18] G. Russo, G. Ermondi, G. Caron, D. Verzele, F. Lynen, Into the first biomimetic
sphingomyelin stationary phase: Suitability in drugs’ biopharmaceutic profil-
ing and block relevance analysis of selectivity, Eur. J. Pharm. Sci. 156 (2021) 105585, doi: 10.1016/j.ejps.2020.105585 .
[19] G. Ermondi, G. Caron, Molecular interaction fields based descriptors to inter- pret and compare chromatographic indexes, J. Chromatogr. A 1252 (2012) 84–
89, doi: 10.1016/j.chroma.2012.06.069 . 20] G. Ermondi, A. Visconti, R. Esposito, G. Caron, The Block Relevance (BR) anal-
ysis supports the dominating effect of solutes hydrogen bond acidity on
DeltalogP(oct-tol), Eur. J. Pharm. Sci. 53 (2014) 50–54, doi: 10.1016/j.ejps.2013. 12.007 .
21] G. Ermondi, G. Caron, Block relevance (BR) analysis and polarity descriptors in property-based drug design, ADMET and DMPK 6 (3) (2018), doi: 10.5599/
admet.532 . 22] M. Vallaro, G. Ermondi, G. Caron, Chromatographic HILIC indexes to charac-
terize the lipophilicity of zwitterions, Eur. J. Pharm. Sci. 145 (2020) 105232, doi: 10.1016/j.ejps.2020.105232 .
23] A . Pedretti, A . Mazzolari, S. Gervasoni, L. Fumagalli, G. Vistoli, The VEGA
suite of programs: an versatile platform for cheminformatics and drug design projects, Bioinformatics (2020), doi: 10.1093/bioinformatics/btaa774 .
24] J. Gasteiger, M. Marsili, Iterative partial equalization of orbital electronegativity—a rapid access to atomic charges, Tetrahedron 36 (22)
(1980) 3219–3228, doi: 10.1016/0040-4020(80)80168-2 . 25] G. Ermondi, M. Vallaro, G. Goetz, M. Shalaeva, G. Caron, Experimental
lipophilicity for beyond Rule of 5 compounds, Future Drug Discov. 1 (1) (2019)
FDD10, doi: 10.4155/fdd- 2019- 0 0 02 .
9
26] G. Ermondi, F. Catalano, M. Vallaro, I. Ermondi, M.P.C. Leal, L. Rinaldi, S. Visentin, G. Caron, Lipophilicity of amyloid beta-peptide 12-28 and 25-35
to unravel their ability to promote hydrophobic and electrostatic interactions, Int. J. Pharm. 495 (1) (2015) 179–185, doi: 10.1016/j.ijpharm.2015.08.075 .
27] G. Ermondi, M. Vallaro, G. Caron, Learning how to use IAM chromatography for predicting permeability, Eur. J. Pharm. Sci. 114 (2018) 385–390, doi: 10.1016/j.
ejps.2018.01.001 . 28] D. Verzele, F. Lynen, M. De Vrieze, A.G. Wright, M. Hanna-Brown, P. Sandra, De-
velopment of the first sphingomyelin biomimetic stationary phase for immobi-
lized artificial membrane (IAM) chromatography, Chem. Commun. (Camb.) 48 (8) (2012) 1162–1164, doi: 10.1039/c2cc16872c .
29] A. Pedretti , L. Villa , G. Vistoli , VEGA–an open platform to develop chemo-bio-informatics applications, using plug-in architecture and script pro-
gramming, J. Comput. Aided Mol. Des. 18 (3) (2004) 167–173 . 30] P. Gaillard , P.A . Carrupt , B. Testa , A . Boudon , Molecular lipophilicity potential,
a tool in 3D QSAR: method and applications, J. Comput. Aided Mol. Des. 8 (2)
(1994) 83–96 . 31] A. Pedretti , L. Villa , G. Vistoli , Modeling of binding modes and inhibition mech-
anism of some natural ligands of farnesyl transferase using molecular docking, J. Med. Chem. 45 (7) (2002) 1460–1465 .
32] G. Russo, L. Grumetto, R. Szucs, F. Barbato, F. Lynen, Determination of in vitro and in silico indexes for the modeling of blood-brain barrier partitioning of
drugs via micellar and immobilized artificial membrane liquid chromatog-
raphy, J. Med. Chem. 60 (9) (2017) 3739–3754, doi: 10.1021/acs.jmedchem. 6b01811 .
33] S. Kim, P.A. Thiessen, E.E. Bolton, J. Chen, G. Fu, A. Gindulyte, L. Han, J. He,S. He, B.A. Shoemaker, J. Wang, B. Yu, J. Zhang, S.H. Bryant, PubChem substance
and compound databases, Nucleic. Acids. Res. 44 (D1) (2016) D1202–D1213, doi: 10.1093/nar/gkv951 .
34] S. Kim, J. Chen, T. Cheng, A. Gindulyte, J. He, S. He, Q. Li, B.A. Shoemaker,
P.A. Thiessen, B. Yu, L. Zaslavsky, J. Zhang, E.E. Bolton, PubChem 2019 update: improved access to chemical data, Nucleic. Acids. Res. 47 (D1) (2019) D1102–
D1109, doi: 10.1093/nar/gky1033 . 35] B.R. Brooks, R.E. Bruccoleri, B.D. Olafson, D.J. States, S. Swaminathan,
M. Karplus, CHARMM: a program for macromolecular energy, minimization, and dynamics calculations, J. Comput. Chem. 4 (2) (1983) 187–217, doi: 10.
10 02/jcc.540 040211 .
36] A.D. MacKerell, B. Brooks, C.L. Brooks, L. Nilsson, B. Roux, Y. Won, M. Karplus, CHARMM: The Energy Function and Its Parameterization, Encyclopedia
of Computational Chemistry, John Wiley & Sons, Ltd, 2002, doi: 10.1002/ 0470845015.cfa007 .
37] B.R. Brooks, C.L. Brooks, A.D. Mackerell, L. Nilsson, R.J. Petrella, B. Roux, Y. Won, G. Archontis, C. Bartels, S. Boresch, A. Caflisch, L. Caves, Q. Cui, A.R. Din-
ner, M. Feig, S. Fischer, J. Gao, M. Hodoscek, W. Im, K. Kuczera, T. Lazaridis,
J. Ma, V. Ovchinnikov, E. Paci, R.W. Pastor, C.B. Post, J.Z. Pu, M. Schaefer, B. Tidor, R.M. Venable, H.L. Woodcock, X. Wu, W. Yang, D.M. York, M. Karplus,
CHARMM: the biomolecular simulation program, J. Comput. Chem. 30 (10) (2009) 1545–1614, doi: 10.1002/jcc.21287 .
38] R.W. Harrison, Stiffness and energy conservation in molecular dynamics: an improved integrator, J. Comput. Chem. 14 (9) (1993) 1112–1122, doi: 10.1002/
jcc.540140912 . 39] D. Sýkora, P. Rezanka, K. Záruba, V. Král, Recent advances in mixed-mode
chromatographic stationary phases, J. Separation Sci. 42 (1) (2019) 89–129,
doi: 10.1002/jssc.201801048 . 40] R.C. Pasquali, M.P. Taurozzi, C. Bregni, Some considerations about the
hydrophilic–lipophilic balance system, Int. J. Pharmaceut. 356 (1) (2008) 44–51, doi: 10.1016/j.ijpharm.2007.12.034 .
41] G. Russo, L. Grumetto, F. Barbato, G. Vistoli, A. Pedretti, Prediction and mecha- nism elucidation of analyte retention on phospholipid stationary phases (IAM-
HPLC) by in silico calculated physico-chemical descriptors, Eur. J. Pharm. Sci.
99 (2017) 173–184, doi: 10.1016/j.ejps.2016.11.026 .