Kynurenine pathway metabolism in human blood–brain–barrier cells: implications for immune...
12
Kynurenine pathway metabolism in human blood–brain–barrier cells: implications for immune tolerance & neurotoxicity Robert Owe-Young,* Nicole L. Webster, Muhammad Mukhtar,à ,1 Roger J. Pomerantz,à ,2 George Smythe,§ David Walker,¶ Patricia J. Armati,** Suzanne M. Crowe , and Bruce J. Brew* , §§ *University of New South Wales Centre for Immunology, St. Vincent’s Hospital, Darlinghurst, New South Wales, Australia AIDS Pathogenesis & Clinical Research Program, Macfarlane Burnet Institute for Medical Research & Public Health, Melbourne, Vic., Australia àCentre for Human Retrovirology, Division of Infectious Diseases, Department of Medicine, Jefferson Medical College, Thomas Jefferson University, Philadelphia, Pennsylvania, USA §Biomedical Mass Spectrometry Facility, Faculty of Medicine, University of New South Wales, Sydney, New South Wales, Australia ¶Department of Physiology, Monash University, Clayton, Vic., Australia **Department of Medicine, Nerve Research Foundation, University of Sydney, New South Wales, Australia Department of Medicine, Monash University, Melbourne, Vic., Australia §§Departments of Neurology & HIV Medicine, St. Vincent’s Hospital, Darlinghurst, New South Wales, & National Centre in HIV Epidemiology & Clinical Research, Darlinghurst, New South Wales, Australia Received August 20, 2007; revised manuscript received January 8, 2008; accepted January 11, 2008. Address correspondence and reprint requests to Dr R. Owe-Young, Garvan Institute of Medical Research, 384 Victoria St. Darlinghurst, NSW 2010, Australia. E-mail: [email protected] 1 Current address: Department of Biochemistry, Pir Mehr Ali Shah Arid Agriculture University Rawalpindi, Rawalpindi 46300, Pakistan 2 Current address: Tibotec, Inc., 1020 Stony Hill Rd., Yardley, PA 19067, USA. Abbreviations used: 3HAA, 3-hydroxyanthranilic acid, 2-amino-3- hydroxybenzoic acid; BBB, blood–brain–barrier; EC, endothelial cell; FITC, fluorescein isothiocyanate; GAPDH, glyceraldehyde phosphate dehydrogenase; GC-MS, gas chromatography-mass spectrometry; HAAO, 3-hydroxyanthranilate 3,4-dioxygenase; HIV, human immuno- deficiency virus; HMW-MAA, high molecular weight-melanoma-asso- ciated antigen; IDO, indoleamine 2,3-dioxygenase; IFN, interferon; KA, kynurenic acid; KMO, kynurenine monooxygenase; KP, kynurenine pathway; KYN, kynurenine; KYNU, L-kynurenine hydrolase; MdM, monocyte-derived macrophages; MIP, macrophage inhibitory protein; NK, natural killer; PBS, phosphate-buffered saline; PIC, picolinic acid; QPRTase, quinolinate phosphoribosyltransferase; QUIN, quinolinic acid; TCA, trichloroacetic acid; TNF-a, tumor necrosis factor-alpha; vWF, von Willebrand Factor. Abstract The catabolic pathway of L-tryptophan (L-trp), known as the kynurenine pathway (KP), has been implicated in the patho- genesis of a wide range of brain diseases through its ability to lead to immune tolerance and neurotoxicity. As endothelial cells (ECs) and pericytes of the blood–brain–barrier (BBB) are among the first brain-associated cells that a blood-borne pathogen would encounter, we sought to determine their expression of the KP. Using RT-PCR and HPLC/GC-MS, we show that BBB ECs and pericytes constitutively express components of the KP. BBB ECs constitutively synthesized kynurenic acid, and after immune activation, kynurenine (KYN), which is secreted basolaterally. BBB pericytes pro- duced small amounts of picolinic acid and after immune acti- vation, KYN. These results have significant implications for the pathogenesis of inflammatory brain diseases in general, particularly human immunodeficiency virus (HIV)-related brain disease. Kynurenine pathway activation at the BBB results in local immune tolerance and neurotoxicity: the basolateral secretion of excess KYN can be further metabolized by peri- vascular macrophages and microglia with synthesis of quin- olinic acid. The results point to a mechanism whereby a systemic inflammatory signal can be transduced across an intact BBB to cause local neurotoxicity. Keywords: Blood–brain barrier, IDO, immune tolerance, neurotoxicity, quinolinic acid, tryptophan metabolism. J. Neurochem. (2008) 105, 1346–1357. d JOURNAL OF NEUROCHEMISTRY | 2008 | 105 | 1346–1357 doi: 10.1111/j.1471-4159.2008.05241.x 1346 ȑ 2008 University of New South Wales, J. Neurochem. (2008) 105, 1346–1357
Transcript of Kynurenine pathway metabolism in human blood–brain–barrier cells: implications for immune...
Kynurenine pathway metabolism in human blood–brain–barriercells: implications for immune tolerance & neurotoxicity
Robert Owe-Young,* Nicole L. Webster,� Muhammad Mukhtar,�,1 Roger J. Pomerantz,�,2
George Smythe,§ David Walker,¶ Patricia J. Armati,** Suzanne M. Crowe�,�� andBruce J. Brew*,§§
*University of New South Wales Centre for Immunology, St. Vincent’s Hospital, Darlinghurst, New South Wales, Australia
�AIDS Pathogenesis & Clinical Research Program, Macfarlane Burnet Institute for Medical Research & Public Health, Melbourne,
Vic., Australia
�Centre for Human Retrovirology, Division of Infectious Diseases, Department of Medicine, Jefferson Medical College, Thomas
Jefferson University, Philadelphia, Pennsylvania, USA
§Biomedical Mass Spectrometry Facility, Faculty of Medicine, University of New South Wales, Sydney, New South Wales, Australia
¶Department of Physiology, Monash University, Clayton, Vic., Australia
**Department of Medicine, Nerve Research Foundation, University of Sydney, New South Wales, Australia
��Department of Medicine, Monash University, Melbourne, Vic., Australia
§§Departments of Neurology & HIV Medicine, St. Vincent’s Hospital, Darlinghurst, New South Wales, & National Centre in HIV
Epidemiology & Clinical Research, Darlinghurst, New South Wales, Australia
Received August 20, 2007; revised manuscript received January 8, 2008;accepted January 11, 2008.Address correspondence and reprint requests to Dr R. Owe-Young,
Garvan Institute of Medical Research, 384 Victoria St. Darlinghurst,NSW 2010, Australia. E-mail: [email protected] address: Department of Biochemistry, Pir Mehr Ali Shah AridAgriculture University Rawalpindi, Rawalpindi 46300, Pakistan2Current address: Tibotec, Inc., 1020 Stony Hill Rd., Yardley, PA 19067,USA.Abbreviations used: 3HAA, 3-hydroxyanthranilic acid, 2-amino-3-
hydroxybenzoic acid; BBB, blood–brain–barrier; EC, endothelial cell;
FITC, fluorescein isothiocyanate; GAPDH, glyceraldehyde phosphatedehydrogenase; GC-MS, gas chromatography-mass spectrometry;HAAO, 3-hydroxyanthranilate 3,4-dioxygenase; HIV, human immuno-deficiency virus; HMW-MAA, high molecular weight-melanoma-asso-ciated antigen; IDO, indoleamine 2,3-dioxygenase; IFN, interferon; KA,kynurenic acid; KMO, kynurenine monooxygenase; KP, kynureninepathway; KYN, kynurenine; KYNU, L-kynurenine hydrolase; MdM,monocyte-derived macrophages; MIP, macrophage inhibitory protein;NK, natural killer; PBS, phosphate-buffered saline; PIC, picolinic acid;QPRTase, quinolinate phosphoribosyltransferase; QUIN, quinolinic acid;TCA, trichloroacetic acid; TNF-a, tumor necrosis factor-alpha; vWF,von Willebrand Factor.
Abstract
The catabolic pathway of L-tryptophan (L-trp), known as the
kynurenine pathway (KP), has been implicated in the patho-
genesis of a wide range of brain diseases through its ability to
lead to immune tolerance and neurotoxicity. As endothelial
cells (ECs) and pericytes of the blood–brain–barrier (BBB) are
among the first brain-associated cells that a blood-borne
pathogen would encounter, we sought to determine their
expression of the KP. Using RT-PCR and HPLC/GC-MS, we
show that BBB ECs and pericytes constitutively express
components of the KP. BBB ECs constitutively synthesized
kynurenic acid, and after immune activation, kynurenine
(KYN), which is secreted basolaterally. BBB pericytes pro-
duced small amounts of picolinic acid and after immune acti-
vation, KYN. These results have significant implications for
the pathogenesis of inflammatory brain diseases in general,
particularly human immunodeficiency virus (HIV)-related brain
disease. Kynurenine pathway activation at the BBB results in
local immune tolerance and neurotoxicity: the basolateral
secretion of excess KYN can be further metabolized by peri-
vascular macrophages and microglia with synthesis of quin-
olinic acid. The results point to a mechanism whereby a
systemic inflammatory signal can be transduced across an
intact BBB to cause local neurotoxicity.
Keywords: Blood–brain barrier, IDO, immune tolerance,
neurotoxicity, quinolinic acid, tryptophan metabolism.
J. Neurochem. (2008) 105, 1346–1357.
d JOURNAL OF NEUROCHEMISTRY | 2008 | 105 | 1346–1357 doi: 10.1111/j.1471-4159.2008.05241.x
1346 � 2008 University of New South Wales, J. Neurochem. (2008) 105, 1346–1357
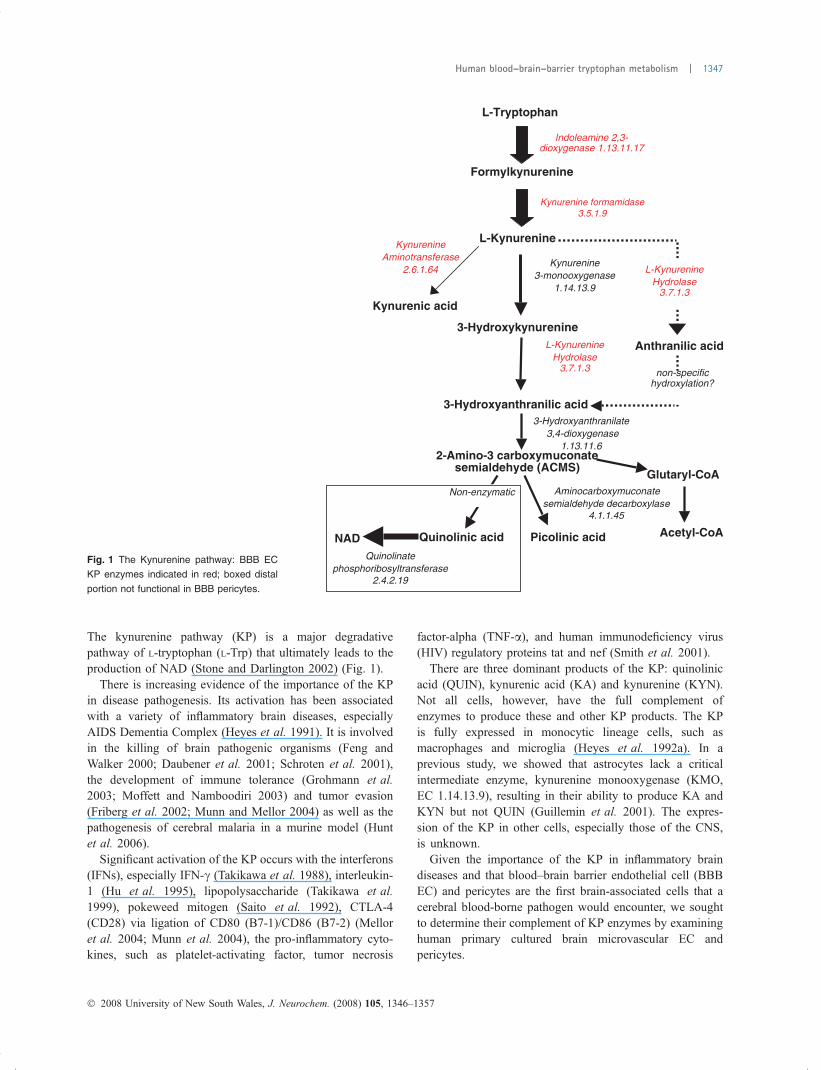
The kynurenine pathway (KP) is a major degradativepathway of L-tryptophan (L-Trp) that ultimately leads to theproduction of NAD (Stone and Darlington 2002) (Fig. 1).
There is increasing evidence of the importance of the KPin disease pathogenesis. Its activation has been associatedwith a variety of inflammatory brain diseases, especiallyAIDS Dementia Complex (Heyes et al. 1991). It is involvedin the killing of brain pathogenic organisms (Feng andWalker 2000; Daubener et al. 2001; Schroten et al. 2001),the development of immune tolerance (Grohmann et al.2003; Moffett and Namboodiri 2003) and tumor evasion(Friberg et al. 2002; Munn and Mellor 2004) as well as thepathogenesis of cerebral malaria in a murine model (Huntet al. 2006).
Significant activation of the KP occurs with the interferons(IFNs), especially IFN-c (Takikawa et al. 1988), interleukin-1 (Hu et al. 1995), lipopolysaccharide (Takikawa et al.1999), pokeweed mitogen (Saito et al. 1992), CTLA-4(CD28) via ligation of CD80 (B7-1)/CD86 (B7-2) (Melloret al. 2004; Munn et al. 2004), the pro-inflammatory cyto-kines, such as platelet-activating factor, tumor necrosis
factor-alpha (TNF-a), and human immunodeficiency virus(HIV) regulatory proteins tat and nef (Smith et al. 2001).
There are three dominant products of the KP: quinolinicacid (QUIN), kynurenic acid (KA) and kynurenine (KYN).Not all cells, however, have the full complement ofenzymes to produce these and other KP products. The KPis fully expressed in monocytic lineage cells, such asmacrophages and microglia (Heyes et al. 1992a). In aprevious study, we showed that astrocytes lack a criticalintermediate enzyme, kynurenine monooxygenase (KMO,EC 1.14.13.9), resulting in their ability to produce KA andKYN but not QUIN (Guillemin et al. 2001). The expres-sion of the KP in other cells, especially those of the CNS,is unknown.
Given the importance of the KP in inflammatory braindiseases and that blood–brain barrier endothelial cell (BBBEC) and pericytes are the first brain-associated cells that acerebral blood-borne pathogen would encounter, we soughtto determine their complement of KP enzymes by examininghuman primary cultured brain microvascular EC andpericytes.
Fig. 1 The Kynurenine pathway: BBB EC
KP enzymes indicated in red; boxed distal
portion not functional in BBB pericytes.
� 2008 University of New South Wales, J. Neurochem. (2008) 105, 1346–1357
Human blood–brain–barrier tryptophan metabolism | 1347
Methods and materials
Cell culturePrimary-cultured human brain microvascular EC (BBB EC) and
pericytes were purchased from Cell Systems, Inc. (Kirkland, WA,
USA) as frozen cultures. The frozen cells were rapidly thawed in a
37�C waterbath and seeded onto culture surfaces (Falcon, Becton
Dickinson, North Ryde, NSW, Australia) that were pre-coated with
Cell Attachment Factor (Cell Systems, Inc.) for 2 h at 37�C.Blood–brain–barrier EC were maintained in Clonetics (Cambrex
BioScience, Sydney, Australia) EBM-2 basal medium supplemented
with low serum EGM-2 Bullet Kit (Clonetics, San Diego, CA,
USA). Cells were fed every 48 h until � 80% confluence was
reached, at which point they were passaged at 1 : 3 split ratio using
EDTA, trypsin and trypsin inhibitor (Passage Reagent Group, Cell
Systems, Inc.).
In some experiments, BBB EC (104/well) were cultured on
collagen-coated polyester membrane transwell inserts (Cat. No.
3472, Corning, Inc., Lowell, MA, USA) and cultured to confluence
(day 3). Transwells were coated with Bovine Collagen Type 1 (Cat
no. 3442-100-01; Cultrex, Trevigen, Inc., Gaithersburg, MD, USA)
at least 1 day prior to EC culture. Collagen (3 mg/mL in 0.1% acetic
acid) was mixed 1 : 1 with absolute ethanol and 30 lL was added to
each polyester membrane and left to air dry.
Pericytes weremaintained in serum-free conditions using the CS-C
serum-free kit (Cell Systems, Inc.), supplemented with 50 lg/mL
gentamycin (Sigma–Aldrich, Castle Hill, NSW,Australia). Cells were
fed every 48 h until� 80% confluence was reached, when they were
passaged at 1 : 5 split ratio using Passage Reagent Group as above.
All culture media were further supplemented with 2 mM (final
concentration) L-glutamine (Invitrogen Australasia, Sydney, NSW,
Australia). All cultures were maintained at 37�C in a humidified
atmosphere of 5% CO2/95% air.
Immunofluorescence phenotyping of BBB cellsCultures of cells were seeded at equivalent split ratio into
appropriate attachment factor-coated, four-well glass chamber slides
(Lab-Tek, Nalge Nunc, In Vitro Technologies, Sydney, Australia)
and maintained as described above. At � 80% confluence, cells
were fixed for 8–10 min with 2% formaldehyde in phosphate-
buffered saline (PBS) containing 1 mM Ca2+/Mg2+ (PBS + Ca/Mg).
The cells were washed three times with PBS + Ca/Mg and
permeabilized for 2 min on ice with 0.1% Nonidet P-40 (Sigma–
Aldrich) in PBS + Ca/Mg (Mukhtar et al. 2002). After three washesin PBS + Ca/Mg, anti-human primary antibodies, diluted in
antibody diluent (Pharmingen 559148, Becton Dickinson) were
applied to the cells and incubated overnight at 4�C, after which the
wells were washed three times with PBS + Ca/Mg. Secondary
labeled antibodies, diluted 1 : 100 in antibody diluent, were
incubated on the cells for 1 h at 20�C in a light-proof box. Negative
control staining was performed on wells which had the primary
antibody omitted. Primary antibodies, their specificities, sources and
the dilution used are listed in Table 1.
Secondary FITC-labeled antibodies were goat anti-mouse IgG
(H + L)-FITC and goat anti-rabbit IgG (H + L)-FITC (Southern
Biotechnology Associates, Birmingham, AL, USA).
The cells were washed three times with PBS + Ca/Mg, then
once in distilled water, and incubated in 2 lg/mL in water of
4¢, 6-diamidino-2-phenylindole (D-9542, Sigma–Aldrich) for 5 min
at 20�C to counter-stain cell nuclei. The cells were mounted in
Fluoromount-G (Southern Biotechnology Associates) and visualized
with an Olympus BX-60 microscope (Olympus Australia, Mt
Wavetley, Vic., Australia) equipped with 60· oil immersion lens and
illumination provided by a mercury vapor lamp providing excita-
tion, through suitable filters, at 488 nm. Precision focusing was
achieved by an electronically controlled microscope stage (Ludl
Electronic Products, Hawthorne, NY, USA). Images were captured
with a SensiCam CCD camera (PCO Imaging, Kelheim, Germany)
interfaced to a Macintosh G4 computer (Apple Computer, Palo Alto,
CA, USA); camera control was provided by IPLab v3.2 software
(Scanalytics, BD Biosciences, Rockville, MD, USA). Post-capture
image manipulation was performed in Adobe Photoshop v7.1
(Adobe Systems Pty. Ltd., Chatswood, NSW, Australia).
Mapping of the constitutive and inducible KPHuman cytokines IFN-c and TNF-a, were obtained from R&D
Systems (Bioscientific, Sydney, NSW, Australia) as sterile lyoph-
ilized powders. Stock solutions were made in sterile PBS containing
0.1% bovine serum albumin (Sigma–Aldrich) and aliquots were
stored at )80�C. Cytokines were thawed and diluted to working
concentrations in the appropriate culture medium immediately
before use.
Table 1 Antibodies used to phenotype hu-
man BBB cellsCell Antigen Species Isotype Dilution Source
EC vWF Rabbit polyclonal 1 : 60 Sigma-Aldrich
BBB EC ZO-1 Mouse IgG1 1 : 100 Zymed
BBB EC GLUT-1 Rabbit polyclonal 1 : 60 Chemicon
EC CD146 Mouse IgG1 1 : 100 Chemicon
Astrocytes GFAP Mouse IgG1 1 : 100 Novocastra
Macrophages CD68 Mouse IgG1 1 : 100 Clone Ki-M1P
Neurons MAP-2 Mouse IgG1 1 : 200 Roche
Pericytes HMW-MAA Mouse IgG1 1 : 10 Clone 225.28
Pericytes PDGFBr Mouse IgG2B 1 : 100 Sigma
Macrophage-specific anti-CD68, clone Ki-M1P (Wacker et al. 1990) was a gift from Dr. G. Gu-
illemin, Centre for Immunology, St. Vincent’s Hospital. Sydney NSW, Australia. Pericyte-specific
anti-HMW-MAA, clone 225.28 was a gift from Prof. S. Ferrano, Department of Immunology Roswell
Park Cancer Institute, Buffalo, New York 14263, USA (Schlingemann et al. 1990).
� 2008 University of New South Wales, J. Neurochem. (2008) 105, 1346–1357
1348 | R. Owe-Young et al.

QUIN (2,3-pyridinedicarboxylic acid, Sigma–Aldrich) was dis-
solved in 4.8 lM NaOH to a stock concentration of 1 mM, sterile-
filtered through 0.22 lm filters (Millipore-Waters, Lane Cove,
NSW, Australia) and stored at 4�C. Working concentrations in
culture medium were made just before use.
3-Hydroxyanthranilic acid (3HAA; 2-amino-3-hydroxybenzoic
acid, Sigma–Aldrich) was dissolved in dimethyl sulphoxide
(Sigma–Aldrich) to a stock concentration of 1 mM and stored at
)80�C. Working concentrations were made in culture medium just
before use and sterile-filtered through 0.22 lm.
To map the constitutive expression of KP enzymes, cells were
seeded in triplicate wells of matrix-coated six-well plates at
equivalent split ratio and fed every 48 h. At 80% confluence, they
were re-fed with fresh medium and incubated for 24 h as described
in Cell Culture.
To map the inducible expression of KP enzymes, parallel
triplicate cultures of each cell type were established in six-well
plates as above. At 80% confluence they were re-fed with fresh
medium which included vehicle alone (unstimulated control), IFN-c(100 IU/mL), TNF-a (100 IU/mL) and in some experiments IFN-
c + TNF-a (100 IU/mL each) and incubated for 24 h as described
in Cell Culture.
At the end of the incubation period, the supernatant medium was
aspirated from all wells and processed for HPLC and GC/M-S
quantitation of KP metabolites as described below.
To assess the distribution of newly synthesized KYN between
apical and basolateral surfaces of BBB EC, cells were cultured in
triplicate on collagen-coated transwells for 3 days. After replacing
culture media in the bottom well (600 lL) on day 3, BBB EC in the
top well were cultured in 100 lL of EBM-2 media ± IFN-c 100 IU/
mL for 24 h. Culture media from the apical side (top well) and
basolateral side (bottom well) was recovered for KYN assay by
HPLC as described below.
After the supernatants were removed, to each well was added
1 mL/10 cm2 culture area RNA reagent Biotecx UltraSpec Total
RNA isolation reagent (Fisher Scientific, Perth, WA, Australia) or
Trizol (Invitrogen Australasia). The wells were incubated for 5 min
on a rocking platform at 20�C to allow for solubilization of the cells.
The cell lysates were dispensed into sterile, RNAse-free/DNAse-free
microfuge tubes, and snap frozen in dry ice for storage at )80�C for
later RNA isolation and cDNA synthesis.
To assess the downstream catabolism of the KP, cells were seeded
in triplicate wells of matrix-coated six-well plates at equivalent split
ratio and fed every 48 h. At 80% confluence they were re-fed with
fresh medium which included an exogenous KP intermediate
metabolite with or without cytokine stimulus:
3HAA (100 lM) or QUIN (1200 nM) without cytokine stimu-
lation (control);
The cytokine treatments were as follows:
1. 3HAA (100 lM) or QUIN (1200 nM) + IFN-c 100 IU/mL
2. 3HAA (100 lM) or QUIN (1200 nM) + TNF-a 100 IU/mL
3. 3HAA (100 lM) or QUIN (1200 nM) + IFN-c+TNF-a100 IU/mL each
and incubated for 24 h, after which the supernatant medium was
aspirated and processed for HPLC/GC-MS quantitation of KP
metabolites. The cells were solubilized with RNA reagent as
detailed above, for later RNA isolation and cDNA synthesis.
RNA isolation and cDNA synthesis for RT-PCRTrizol-extracts of monocyte-derived macrophages (MdM) stimu-
lated with IFN-c were kindly supplied by Dr Gilles Guillemin,
Centre for Immunology (Guillemin et al. 2001), for use as positive
controls in KP enzyme RT-PCR, as the KP is fully expressed in
these cells. The MdM were grown as previously described (Kerr
et al. 1997).The aliquots of frozen solubilized cells and MdM were thawed at
20�C, and RNA was isolated according to the manufacturer’s
instructions.
The RNA pellets were dissolved in 50 lL Water For Injection
(WFI, Baxter Healthcare, Old Toongabbie, NSW, Australia) and the
concentration of a 1 : 50 dilution of the recovered RNA was
quantitated by UV spectrophotometry at 260 nm; 2 lg total RNA
from each sample was used for poly-A cDNA synthesis primed with
200 nM oligo-dT15 (Roche Diagnostics, Sydney, NSW, Australia),
0.5 U Avian Myoblastosis Virus reverse transcriptase and 2 U
RNAsin RNAse inhibitor (both Promega Corp, Annandale, NSW,
Australia) and 10 mM dinucleotide triphosphates (Roche Diagnos-
tics) in a reaction volume of 50 lL. Reverse transcription was
performed in a Techne (Cambridge, UK) Genius thermocycler,
using one cycle of 60 min at 42�C for the reverse transcription
reaction to proceed, followed by one cycle of 10 min at 65�C to
heat-inactivate the reverse transcriptase enzyme, and then a final,
untimed cycle at 4�C to keep the samples chilled until further
storage at )20�C, preceding RT-PCR.
RT-PCR of KP enzymes in BBB cellsPrimers, synthesized to HPLC purity by GeneWorks (Thebarton,
SA, Australia) for each of the major KP enzymes indoleamine 2,3-
dioxygenase (IDO, EC 1.13.11.17), kynurenine monooxygenase
(KMO, EC 1.14.13.9), L-kynurenine hydrolase (KYNU, EC
3.7.1.3), 3-hydroxyanthranilate 3,4-dioxygenase (HAAO, EC
1.13.11.6) and quinolinate phosphoribosyltransferase (QPRTase,
EC 2.4.2.19) were used in RT-PCR to map KP enzyme expression as
previously described (Guillemin et al. 2001). Primers for reporter
gene glyceraldehyde phosphate dehydrogenase (GAPDH, EC
1.2.1.12) were used as positive controls for the RT-PCR (Benveniste
et al. 1996). The primer sequences are listed in Table 2.
Table 2 Primer sequences used to map expression of five key human
KP enzymes
Genes Primers Sequences
IDO Forward
Reverse
5¢-ACCACAAGTCACAGCGCC-3¢5¢-CCCAGCAGGACGTCAAAG-3¢
KMO Forward
Reverse
5¢-GATGAGGAAGATAAGCTGAGGC-3¢5¢-CTTAAGGTTTCTTCCCCCTCTC-3¢
KYNU Forward
Reverse
5¢-GACTATTCCACCTAAGAACGGAGA-3¢5¢-ACAGGAAGACACAAACTAAGGTCG-3¢
HAAO Forward
Reverse
5¢-GAGGGCCTTCTTGGTGTG-3¢5¢-CATTGATTGGTTGTGAGTGG-3¢
QPRTase Forward
Reverse
5¢-GGTCACAGGAGCAGCAGG-3¢5¢-AAGCCAGAGGAGCTGCAC-3¢
GAPDH Forward
Reverse
5¢-ACCACCATGGAGAAGGCTGG-3¢5¢-CTCAGTGTAGCCCAGGATGC-3¢
� 2008 University of New South Wales, J. Neurochem. (2008) 105, 1346–1357
Human blood–brain–barrier tryptophan metabolism | 1349
Cycling conditions for KP enzyme RT-PCR were: 35 cycles at
92�C for 1 min, 60�C for 1 min, 72�C for 90 s. Cycling conditions
for GAPDH were: 32 cycles at 95�c for 45 s, 60�C for 2 min, 72�Cfor 1 min.
RT-PCR was performed in a final volume of 100 lL, using 2 lLcDNA, 10 mM dNTPs (Roche Diagnostics), 20 lM each forward
and reverse primers, 0.5 U Taq DNA polymerase (Roche Diagnos-
tics) in a Techne Genius thermocycler. PCR products were run out
on 1.5% agarose/Tris/borate/EDTA gels (Amresco, Solon, OH,
USA) with HaeIII-digested uX-174 DNA molecular weight
standards (Promega) and visualized on a UV lightbox. The gels
were photographed with an Olympus C-2040z digital camera
(Olympus Optical Co., Tokyo, Japan).
HPLC and GC/MS quantitation of KP metabolitesL-Trp and KYN were measured by RP-HPLC in culture supernatants
obtained from stimulation experiments, after precipitating protein
with an equal volume of 10% TCA. KAwas measured using HPLC
with a fluorescence detector (excitation, 344 nm; emission, 398 nm)
after isocratic elution from a polymeric reversed phase column. The
limit of detection of KA was 0.3 pmol (Nicholls et al. 2001).QUIN and PIC were assayed in TCA-extracted culture superna-
tants by GC–MS in electron-capture negative ionization mode. The
on-column limit of detection for QUIN and PIC was < 1 fmol
(Smythe et al. 2002).
Statistical analysesResults of KP metabolite quantitation were analyzed for significance
using Student’s unpaired T-test, using Prism v.4 software (GraphPad
Software, San Diego, CA, USA).
Results
Cell cultureRecovery of frozen cells upon thawing appeared satisfactory:cultured ECs grew well, necessitating passaging at least onceweekly. The pericytes grew much more slowly, beingmaintained in the absence of serum. All cells were easilypassaged with trypsin and the viability from these procedures
appeared to be > 90%. EC were not used for theseexperiments beyond passage 6, as expression of vWF/FVIII:RAg was rapidly lost beyond this passage.
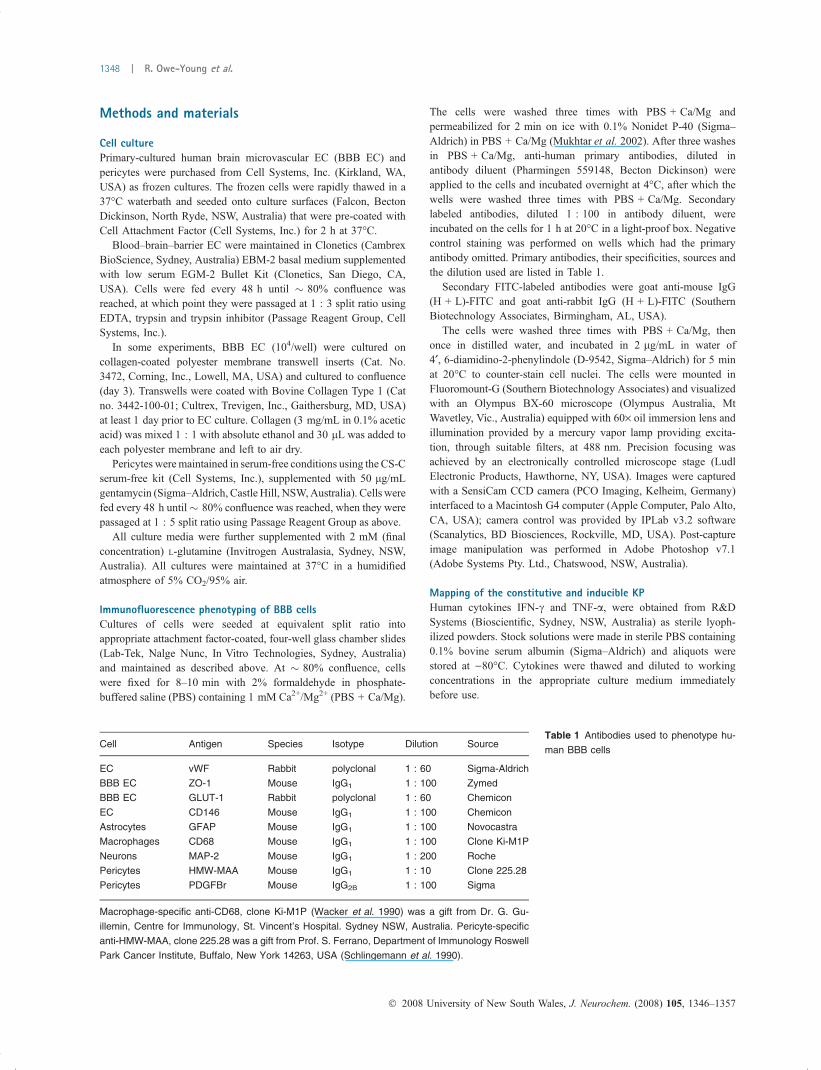
Immunofluorescence phenotyping of BBB cellsBlood–brain barrier EC (Fig. 2) expressed vWF/FVIII:RAg,GLUT-1 and ZO-1. They did not express any of the othermarkers tested, thus showing that they expressed at least twoBBB-specific markers ZO-1 and GLUT-1. This also demon-strated that these cultures were homogeneous, and free fromother contaminating neural cells. Expression of vWF/FVIII:RAg by EC was maintained until the seventh oreighth passage, beyond which expression was rapidly lost;cells were routinely used up to passage 6.
Pericytes were weakly positive for HMW-MAA (notshown) but negative for all other antibodies tested. Expres-sion of the platelet-derived growth factor-B receptor was notdetected.
RT-PCR mapping of the constitutive and inducible KPAll cDNAs from quiescent and cytokine-stimulated EC(Fig. 3a lanes 1–4) amplified for the control gene GAPDH,except for the PCR negative control (lane 5-water alone).Lane 6 is MdM.
In control, unstimulated EC (lane 1, Fig. 3b) there was noexpression of IDO or KMO. KYNU was constitutivelyexpressed, and following IFN-c, TNF-a or IFN-c+TNF-astimulation.
Endothelial cells stimulated with IFN-c (lane 2) showedIDO expression, with weak KMO expression. TNF-astimulation (lane 3) induced IDO and KMO expression,with KMO expression being weak. Stimulation with IFN-c+TNF-a (lane 4) induced IDO and KMO expression. In allPCRs, the MdM (positive control) was expressed (lane 6).Expression of QPRTase and HAAO were equivocal incontrol (unstimulated) cells and cells stimulated with IFN-c,TNF-a or IFN-c+TNF-a (not shown).
(a) (b)
(d) (e)
(c)
Fig. 2 Immunofluorescence phenotyping of
BBB EC. Scale bar: 20 lm. (a) vWF. (b)
ZO-1 (c) negative control. (d) GLUT-1 (e)
negative control.
� 2008 University of New South Wales, J. Neurochem. (2008) 105, 1346–1357
1350 | R. Owe-Young et al.

In pericytes (Fig. 4), all cDNAs amplified for the controlgene GAPDH. IDO expression was induced by both IFN-c,TNF-a and IFN-c+TNF-a (lanes 2–4). There was noexpression of KMO, constitutively or after cytokine treat-ment. KYNU expression was constitutive with apparentinduction after TNF-a (lanes 1–4). HAAO and QPRTasewere constitutively expressed and in all treatment conditions.
Table 3a and b summarizes the RT-PCR results for theconstitutive and cytokine-activated expression of the KP inthese cells, respectively.
HPLC and GC/MS quantitation of KP metabolites
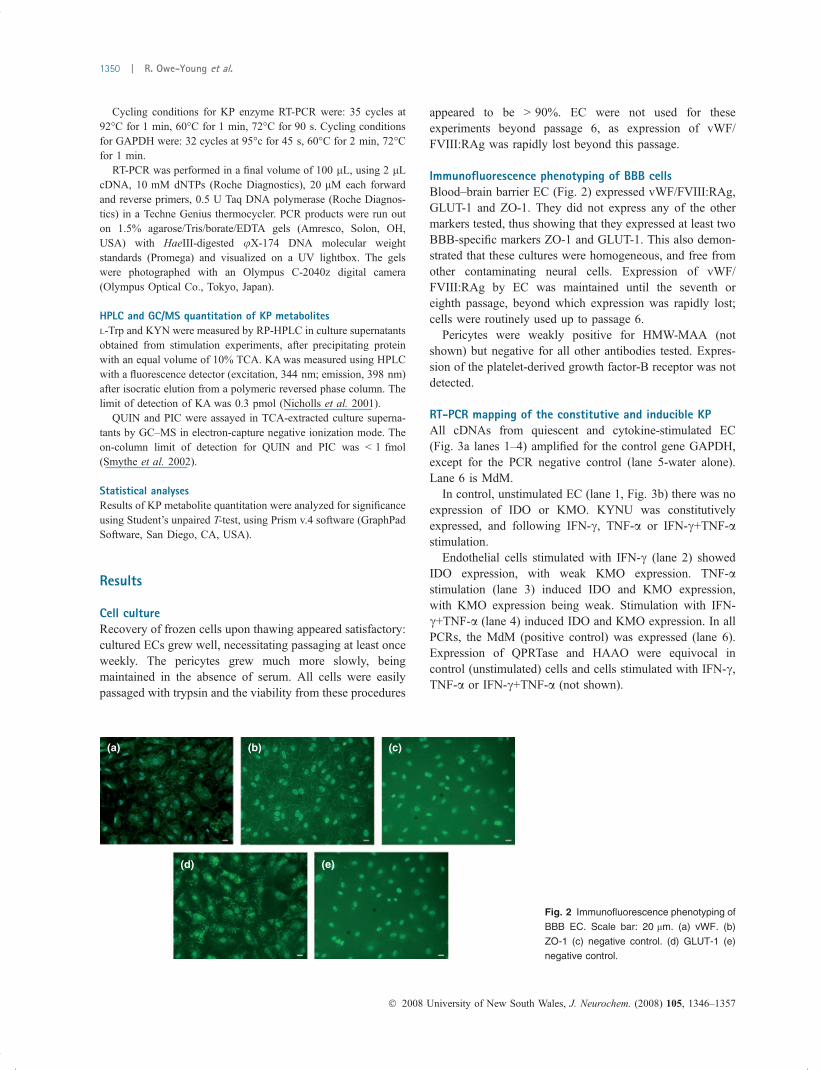
Blood–brain–barrier ECProduction of KP metabolites in control, unstimulated- andcytokine-stimulated EC is shown in Fig. 5(a). In theunstimulated BBB EC control (n = 3), constitutive produc-tion of KP metabolites was: PIC 1.13 ± 0.66 lM, QUIN0.09 ± 0.07 lM, KYN 1.04 ± 1.81 lM and KA 10.91 ±1.28 nM. After IFN-c treatment, there was no up-regulationof PIC (0.44 ± 0.34 lM, p > 0.05), nor QUIN (0.08 ±0.07 lM, p > 0.05). KYN was significantly up-regulated(10.90 ± 1.10 lM, p = 0.0013), indicating expression ofIDO. IFN-c significantly increased KA expression (15.35 ±1.28 nM, p = 0.0132).
After TNF-a treatment, there was no change in PIC(0.44 ± 0.44 lM, p > 0.05), QUIN (0.08 ± 0.05 lM, p >0.05), KYN (1.04 ± 1.81 lM, p > 0.05) or KA (10.91 ±
1.28 nM), indicating that TNF-a did not stimulate the KP inthese cells.
When BBB EC were cultured on transwells, there was nodetectable KYN in the supernatants above (i.e., luminally) ineither control or IFN-c stimulated cells. There was, however,102.1 ± 40.7 nM KYN in the supernatant below (i.e.,basolaterally) in IFN-c stimulated cells. No specific KYNsynthesis was detected in the supernatant below control cells.
BBB EC + 3HAAProduction of KP metabolites in control, unstimulated- andcytokine-stimulated EC in the presence of the intermediatecatabolite 3HAA is shown in Fig. 5(b). In the presence of
Fig. 4 RT-PCR of quiescent and cytokine-
stimuIated pericytes. Lane 1: negative
control; lane 2: IFN-c. 100 IU/mL, lane 3:
TNF-a 100 IU/mL; lane 4: IFN-c + TNF-a
100 IU/mL; lane 5: positive control M/ +
IFN-c 100 IU/mL.
(a) (b)
Fig. 3 RT-PCR of quiescent and cytokine-stimulated HBMVEC: (a) GAPDH (b) KP enzymes IDO, KMO & KYNU. Lane 1: control; lane 2: IFN-c;
lane 3: TNF-a; lane 4: IFN-c + TNF-a; lane 5: negative control-water; lane 6: positive control-M/ + IFN-c.
Table 3 Summary of constitutive KP enzyme expression by RT-PCR
in BBB cells (a) and summary of cytokine-inducible KP expression by
RT-PCR in BBB cells (b)
IDO KYNU KMO HAAO QPRTase
(a)
BB EC X + X ? ?
pericytes X + X + +
(b)
BBB EC + (+) weak ? ?
pericytes + ( + TNF-a) (+) X (+) (+)
+ expressed; X not expressed; (+) constitutive expression; ? equivo-
cal.
� 2008 University of New South Wales, J. Neurochem. (2008) 105, 1346–1357
Human blood–brain–barrier tryptophan metabolism | 1351
100 lM 3-HAA without stimulus (control) (n = 3) PIC was0.27 ± 0.28 lM, QUIN was 0.91 ± 0.13 lM, KYN was13.12 ± 1.92 lM and KA was 7.96 ± 1.28 nM.
After IFN-c treatment, there was no change to PIC(0.27 ± 0.33 lM, p = 0.9756), QUIN (0.88 ± 0.10 lM,p = 0.7924) or KA (10.91 ± 2.26 nM, p = 0.1479). KYNwas significantly up-regulated (23.11 ± 4.00 lM, p =0.0175).
After TNF-a treatment, there was no change to PIC(0.25 ± 0.22 lM, p = 0.8939), QUIN (1.19 ± 0.19 lM,p = 0.1067) or KYN (12.01 lM, p = 0.3733). KAwas significantly up-regulated (10.91 ± 1.28 lM, p =0.0474).
IFN-c + TNF-a treatment was not done in this series.
BBB EC + QUINProduction of KP metabolites in control, unstimulated- andcytokine-stimulated EC (n = 3) in the presence of theintermediate catabolite QUIN is shown in Fig. 5(c). Inuntreated control cells, PIC was 1.24 ± 0.18 lM, QUIN was1.33 ± 0.14 lM, KYN was 1.04 ± 1.81 lM, KA was13.13 ± 1.28 nM.
After IFN-c treatment, there was no change to PIC(1.05 ± 0.39 lM, p = 0.4756), QUIN (1.31 ± 0.23 lM,p = 0.8930) or KA (13.13 ± 1.28 nM, p = 0.9999). KYNwas significantly up-regulated (14.23 ± 2.94 lM, p =0.0027).
After TNF-a treatment, there was no change to PIC(1.36 ± 0.62 lM, p = 0.7761), QUIN (1.28 ± 0.08 lM,p = 0.6291) or KA (10.17 ± 2.56 lM, p = 0.1481). KYNwas not detected.
IFN-c + TNF-a treatment was not done in this series.The functional expression of the KP in BBB EC is
represented by the coloured enzyme names in Fig. 1.In this series we noted the increased constitutive produc-
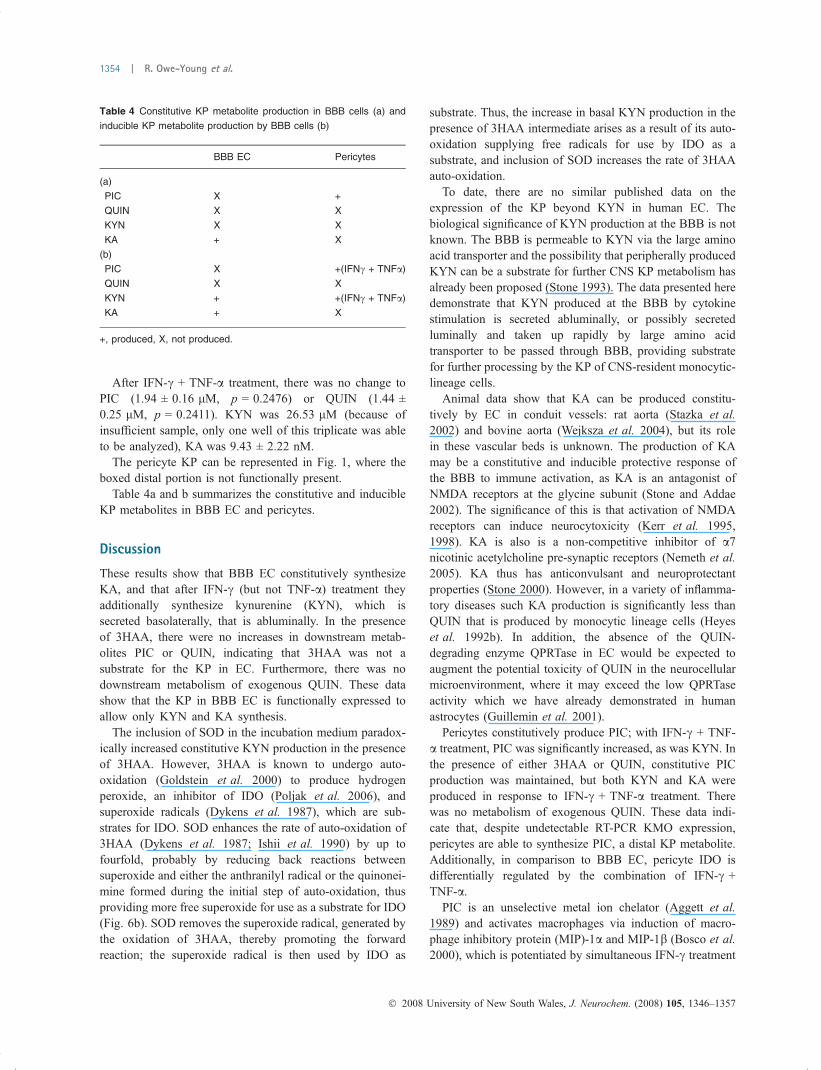
tion of KYN by EC in the presence of the intermediatemetabolite 3HAA (Fig. 5b), which is unprecedented; 3HAAis not a substrate for IDO, and levels of impurities in the purecompound as purchased from the manufacturer would notaccount for such production. We hypothesized that auto-oxidation products of 3HAA might serve as substrate forIDO. In a separate experiment (n = 3), we added superoxidedismutase (SOD) in the incubation medium (1, 10 & 100 U)to block basal induction of IDO by superoxide radicalshowever basal production of KYN was increased, shown inFig. 6(a). In the control + 3HAA, KYN was 3.15 ±0.08 lM; in the presence of 1U SOD, KYN was 5.80 ±0.22 lM (p < 0.0001); in the presence of 10U SOD, KYNwas 5.74 ± 0.52 lM; in the presence of 100U SOD, KYNwas 5.35 ± 0.33 lM.
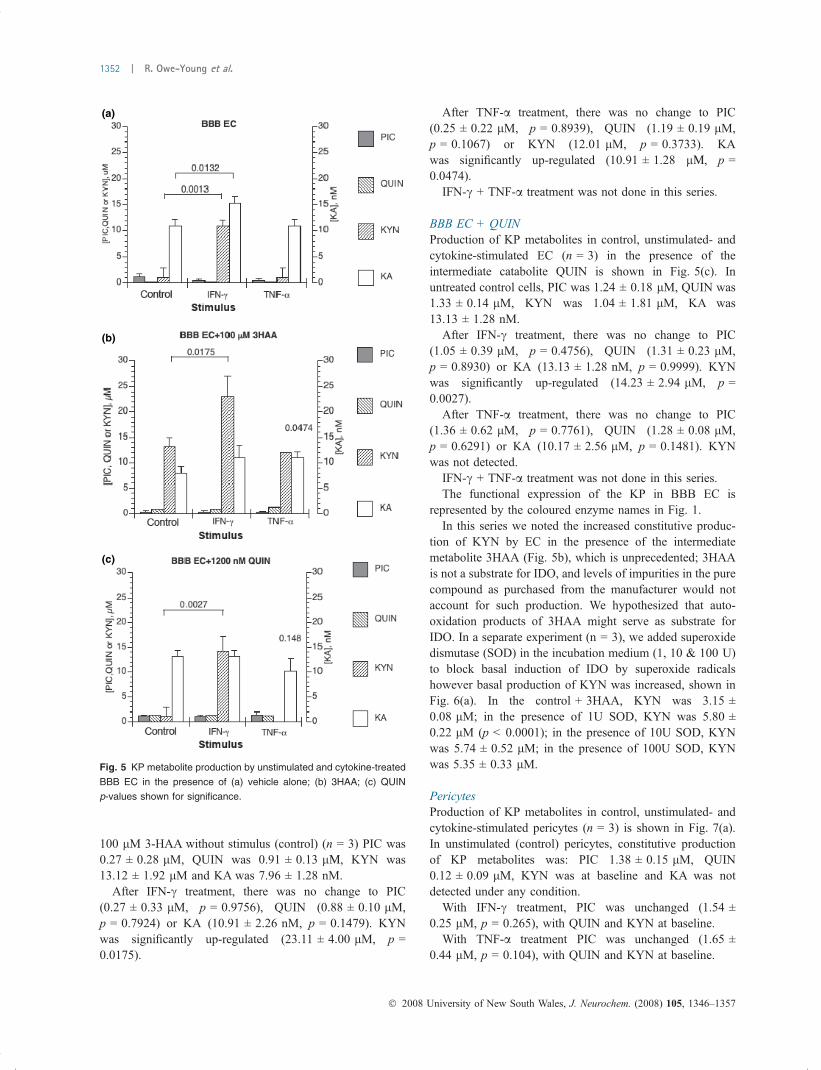
PericytesProduction of KP metabolites in control, unstimulated- andcytokine-stimulated pericytes (n = 3) is shown in Fig. 7(a).In unstimulated (control) pericytes, constitutive productionof KP metabolites was: PIC 1.38 ± 0.15 lM, QUIN0.12 ± 0.09 lM, KYN was at baseline and KA was notdetected under any condition.
With IFN-c treatment, PIC was unchanged (1.54 ±0.25 lM, p = 0.265), with QUIN and KYN at baseline.
With TNF-a treatment PIC was unchanged (1.65 ±0.44 lM, p = 0.104), with QUIN and KYN at baseline.
(a)
(b)
(c)
Fig. 5 KP metabolite production by unstimulated and cytokine-treated
BBB EC in the presence of (a) vehicle alone; (b) 3HAA; (c) QUIN
p-values shown for significance.
� 2008 University of New South Wales, J. Neurochem. (2008) 105, 1346–1357
1352 | R. Owe-Young et al.
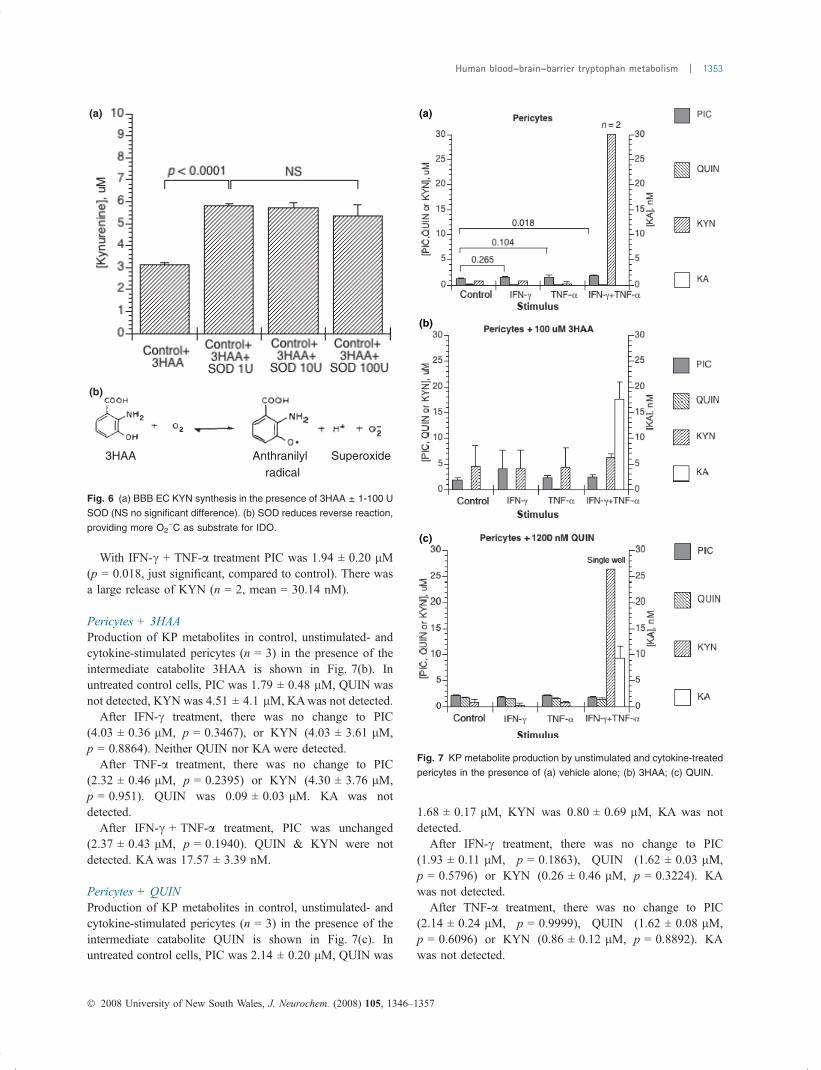
With IFN-c + TNF-a treatment PIC was 1.94 ± 0.20 lM(p = 0.018, just significant, compared to control). There wasa large release of KYN (n = 2, mean = 30.14 nM).
Pericytes + 3HAAProduction of KP metabolites in control, unstimulated- andcytokine-stimulated pericytes (n = 3) in the presence of theintermediate catabolite 3HAA is shown in Fig. 7(b). Inuntreated control cells, PIC was 1.79 ± 0.48 lM, QUIN wasnot detected, KYN was 4.51 ± 4.1 lM, KAwas not detected.
After IFN-c treatment, there was no change to PIC(4.03 ± 0.36 lM, p = 0.3467), or KYN (4.03 ± 3.61 lM,p = 0.8864). Neither QUIN nor KA were detected.
After TNF-a treatment, there was no change to PIC(2.32 ± 0.46 lM, p = 0.2395) or KYN (4.30 ± 3.76 lM,p = 0.951). QUIN was 0.09 ± 0.03 lM. KA was notdetected.
After IFN-c + TNF-a treatment, PIC was unchanged(2.37 ± 0.43 lM, p = 0.1940). QUIN & KYN were notdetected. KA was 17.57 ± 3.39 nM.
Pericytes + QUINProduction of KP metabolites in control, unstimulated- andcytokine-stimulated pericytes (n = 3) in the presence of theintermediate catabolite QUIN is shown in Fig. 7(c). Inuntreated control cells, PIC was 2.14 ± 0.20 lM, QUIN was
1.68 ± 0.17 lM, KYN was 0.80 ± 0.69 lM, KA was notdetected.
After IFN-c treatment, there was no change to PIC(1.93 ± 0.11 lM, p = 0.1863), QUIN (1.62 ± 0.03 lM,p = 0.5796) or KYN (0.26 ± 0.46 lM, p = 0.3224). KAwas not detected.
After TNF-a treatment, there was no change to PIC(2.14 ± 0.24 lM, p = 0.9999), QUIN (1.62 ± 0.08 lM,p = 0.6096) or KYN (0.86 ± 0.12 lM, p = 0.8892). KAwas not detected.
(a)
3HAA Anthranilylradical
Superoxide
(b)
Fig. 6 (a) BBB EC KYN synthesis in the presence of 3HAA ± 1-100 U
SOD (NS no significant difference). (b) SOD reduces reverse reaction,
providing more O2)C as substrate for IDO.
(a)
(b)
(c)
Fig. 7 KP metabolite production by unstimulated and cytokine-treated
pericytes in the presence of (a) vehicle alone; (b) 3HAA; (c) QUIN.
� 2008 University of New South Wales, J. Neurochem. (2008) 105, 1346–1357
Human blood–brain–barrier tryptophan metabolism | 1353
After IFN-c + TNF-a treatment, there was no change toPIC (1.94 ± 0.16 lM, p = 0.2476) or QUIN (1.44 ±0.25 lM, p = 0.2411). KYN was 26.53 lM (because ofinsufficient sample, only one well of this triplicate was ableto be analyzed), KA was 9.43 ± 2.22 nM.
The pericyte KP can be represented in Fig. 1, where theboxed distal portion is not functionally present.
Table 4a and b summarizes the constitutive and inducibleKP metabolites in BBB EC and pericytes.
Discussion
These results show that BBB EC constitutively synthesizeKA, and that after IFN-c (but not TNF-a) treatment theyadditionally synthesize kynurenine (KYN), which issecreted basolaterally, that is abluminally. In the presenceof 3HAA, there were no increases in downstream metab-olites PIC or QUIN, indicating that 3HAA was not asubstrate for the KP in EC. Furthermore, there was nodownstream metabolism of exogenous QUIN. These datashow that the KP in BBB EC is functionally expressed toallow only KYN and KA synthesis.
The inclusion of SOD in the incubation medium paradox-ically increased constitutive KYN production in the presenceof 3HAA. However, 3HAA is known to undergo auto-oxidation (Goldstein et al. 2000) to produce hydrogenperoxide, an inhibitor of IDO (Poljak et al. 2006), andsuperoxide radicals (Dykens et al. 1987), which are sub-strates for IDO. SOD enhances the rate of auto-oxidation of3HAA (Dykens et al. 1987; Ishii et al. 1990) by up tofourfold, probably by reducing back reactions betweensuperoxide and either the anthranilyl radical or the quinonei-mine formed during the initial step of auto-oxidation, thusproviding more free superoxide for use as a substrate for IDO(Fig. 6b). SOD removes the superoxide radical, generated bythe oxidation of 3HAA, thereby promoting the forwardreaction; the superoxide radical is then used by IDO as
substrate. Thus, the increase in basal KYN production in thepresence of 3HAA intermediate arises as a result of its auto-oxidation supplying free radicals for use by IDO as asubstrate, and inclusion of SOD increases the rate of 3HAAauto-oxidation.
To date, there are no similar published data on theexpression of the KP beyond KYN in human EC. Thebiological significance of KYN production at the BBB is notknown. The BBB is permeable to KYN via the large aminoacid transporter and the possibility that peripherally producedKYN can be a substrate for further CNS KP metabolism hasalready been proposed (Stone 1993). The data presented heredemonstrate that KYN produced at the BBB by cytokinestimulation is secreted abluminally, or possibly secretedluminally and taken up rapidly by large amino acidtransporter to be passed through BBB, providing substratefor further processing by the KP of CNS-resident monocytic-lineage cells.
Animal data show that KA can be produced constitu-tively by EC in conduit vessels: rat aorta (Stazka et al.2002) and bovine aorta (Wejksza et al. 2004), but its rolein these vascular beds is unknown. The production of KAmay be a constitutive and inducible protective response ofthe BBB to immune activation, as KA is an antagonist ofNMDA receptors at the glycine subunit (Stone and Addae2002). The significance of this is that activation of NMDAreceptors can induce neurocytoxicity (Kerr et al. 1995,1998). KA is also is a non-competitive inhibitor of a7nicotinic acetylcholine pre-synaptic receptors (Nemeth et al.2005). KA thus has anticonvulsant and neuroprotectantproperties (Stone 2000). However, in a variety of inflamma-tory diseases such KA production is significantly less thanQUIN that is produced by monocytic lineage cells (Heyeset al. 1992b). In addition, the absence of the QUIN-degrading enzyme QPRTase in EC would be expected toaugment the potential toxicity of QUIN in the neurocellularmicroenvironment, where it may exceed the low QPRTaseactivity which we have already demonstrated in humanastrocytes (Guillemin et al. 2001).
Pericytes constitutively produce PIC; with IFN-c + TNF-a treatment, PIC was significantly increased, as was KYN. Inthe presence of either 3HAA or QUIN, constitutive PICproduction was maintained, but both KYN and KA wereproduced in response to IFN-c + TNF-a treatment. Therewas no metabolism of exogenous QUIN. These data indi-cate that, despite undetectable RT-PCR KMO expression,pericytes are able to synthesize PIC, a distal KP metabolite.Additionally, in comparison to BBB EC, pericyte IDO isdifferentially regulated by the combination of IFN-c +TNF-a.
PIC is an unselective metal ion chelator (Aggett et al.1989) and activates macrophages via induction of macro-phage inhibitory protein (MIP)-1a and MIP-1b (Bosco et al.2000), which is potentiated by simultaneous IFN-c treatment
Table 4 Constitutive KP metabolite production in BBB cells (a) and
inducible KP metabolite production by BBB cells (b)
BBB EC Pericytes
(a)
PIC X +
QUIN X X
KYN X X
KA + X
(b)
PIC X +(IFNc + TNFa)
QUIN X X
KYN + +(IFNc + TNFa)
KA + X
+, produced, X, not produced.
� 2008 University of New South Wales, J. Neurochem. (2008) 105, 1346–1357
1354 | R. Owe-Young et al.
(Pais and Appelberg 2000). It possesses both extracellularand intramacrophage anti-microbial activity against Myco-bacterium avium (Cai et al. 2006; Shimizu and Tomioka2006), Candida albicans (Abe et al. 2004) as well asantiviral/apoptotic activity against HIV-1- and Herpes sim-plex virus-2-infected cells (Fernandez-Pol et al. 2001).Further, it blocks the neurotoxic (but not the neuroexcitant)effects of quinolinic acid (Beninger et al. 1994; Kalisch et al.1994), possibly by zinc chelation (Jhamandas et al. 1998). Inthe context of the present experiments, the constitutivepericyte synthesis of PIC may contribute to brain homeosta-sis by countering the neurotoxic effects of QUIN, until theconstitutive synthesis is overwhelmed by de novo QUINproduced by inflammatory insults.
Thus, it is likely that at the BBB, in disease stateswhere there is induction of IDO, there will be depletion ofmicroenvironment L-Trp with resultant restriction of certainviral and bacterial pathogens (Adams et al. 2004; Adamet al. 2005), thereby preventing their ingress into the brain.In conjunction with the constitutive pericyte production ofPIC, this may constitute an effective brain homeostaticmicrobicidal and antiviral mechanism which dampens theimmune response that such pathogens would otherwisestimulate. This may limit immune activation to minimizeneural damage, and may contribute to the brain’s immuno-logically privileged state. Furthermore, L-Trp depletionand production of other KP catabolites can lead toapoptosis of (mainly CD4 + ) T cells, B cells and NKcells (Frumento et al. 2002; Moffett and Namboodiri2003), and induction of a regulatory T-cell phenotype viadown-regulation of T-cell receptor f-chain (Fallarino et al.2006).
Kynurenine, which can cross the intact BBB could beprocessed by adjacent perivascular macrophages to QUIN,further limiting the immune response by mediating apop-tosis of T cells. EC KYN production thus may be a factorin limiting CNS immune cell activity through L-Trpdepletion. KYN could also be processed by adjacentBBB astrocytes to KA, thereby limiting the potentialneuronal toxicity of QUIN. This provides a uniquemechanism whereby an inflammatory signal, chiefly in theform of IFN-c, can be transduced across an otherwise intactBBB into the brain parenchyma.
The data herein show that the human BBB has limitedexpression of the KP, which can be activated by immunestimulation to produce intermediate metabolites whichcould be further processed by brain-resident monocytic-lineage cells to neurotoxic KP metabolites, in particularQUIN, which are relevant to AIDS Dementia Complexpathogenesis. Moreover, the KP-mediated immune paresisparticularly affecting T cells at the BBB is likely tofacilitate selection of macrophage tropic viral strains andcontribute to persistence of viral infection in perivascularmacrophages.
Acknowledgments
This work was supported by a NSW Department of Health
Infrastructure grant, and a Program Grant from the Commonwealth
National Health and Medical Research Council.
References
Abe S., Hu W., Ishibashi H., Hasumi K. and Yamaguchi H. (2004)Augmented inhibition of Candida albicans growth by murineneutrophils in the presence of a tryptophan metabolite, picolinicacid. J Infect Chemother 10, 181–184.
Adam R., Russing D., Adams O., Ailyati A., Sik Kim K., Schroten H.and Daubener W. (2005) Role of human brain microvascularendothelial cells during central nervous system infection. Signifi-cance of indoleamine 2,3-dioxygenase in antimicrobial defence andimmunoregulation. Thromb. Haemost. 94, 341–346.
Adams O., Besken K., Oberdorfer C., MacKenzie C. R., Russing D. andDaubener W. (2004) Inhibition of human herpes simplex virus type2 by interferon gamma and tumor necrosis factor alpha is mediatedby indoleamine 2,3-dioxygenase. Microbes Infect 6, 806–812.
Aggett P. J., Fenwick P. K. and Kirk H. (1989) An in vitro study of theeffect of picolinic acid on metal translocation across lipid bilayers.J. Nutr. 119, 1432–1437.
Beninger R. J., Colton A. M., Ingles J. L., Jhamandas K. and BoegmanR. J. (1994) Picolinic acid blocks the neurotoxic but not theneuroexcitant properties of quinolinic acid in the rat brain: evi-dence from turning behaviour and tyrosine hydroxylase immuno-histochemistry. Neuroscience 61, 603–612.
Benveniste O., Vaslin B., Villinger F., Le Grand R., Ansari A. A. andDormont D. (1996) Cytokine mRNA levels in unmanipulated(ex vivo) and in vitro stimulated monkey PBMCs using a semi-quantitative RT-PCR and high sensitivity fluorescence-baseddetection strategy. Cytokine 8, 32–41.
Bosco M. C., Rapisarda A., Massazza S., Melillo G., Young H. andVaresio L. (2000) The tryptophan catabolite picolinic acid selec-tively induces the chemokines macrophage inflammatory protein-1alpha and -1 beta in macrophages. J. Immunol. 164, 3283–3291.
Cai S., Sato K., Shimizu T., Yamabe S., Hiraki M., Sano C. and TomiokaH. (2006) Antimicrobial activity of picolinic acid against extra-cellular and intracellular Mycobacterium avium complex and itscombined activity with clarithromycin, rifampicin and fluoroqui-nolones. J. Antimicrob. Chemother. 57, 85–93.
Daubener W., Spors B., Hucke C., Adam R., Stins M., Kim K. S. andSchroten H. (2001) Restriction of Toxoplasma gondii growth inhuman brain microvascular endothelial cells by activation ofindoleamine 2,3-dioxygenase. Infect. Immun. 69, 6527–6531.
Dykens J. A., Sullivan S. G. and Stern A. (1987) Oxidative reactivity ofthe tryptophan metabolites 3-hydroxyanthranilate, cinnabarinate,quinolinate and picolinate. Biochem. Pharmacol. 36, 211–217.
Fallarino F., Grohmann U., You S., et al. (2006) The combined effects oftryptophan starvation and tryptophan catabolites down-regulate Tcell receptor zeta-chain and induce a regulatory phenotype in naiveT cells. J. Immunol. 176, 6752–6761.
Feng H. M. and Walker D. H. (2000) Mechanisms of intracellular killingof Rickettsia conorii in infected human endothelial cells, hepato-cytes, and macrophages. Infect. Immun. 68, 6729–6736.
Fernandez-Pol J.A., Klos D. J. and Hamilton P. D. (2001) Antiviral,cytotoxic and apoptotic activities of picolinic acid on humanimmunodeficiency virus-1 and human herpes simplex virus-2infected cells. Anticancer Res. 21, 3773–3776.
Friberg M., Jennings R., Alsarraj M., Dessureault S., Cantor A., Exter-mann M., Mellor A. L., Munn D. H. and Antonia S. J. (2002)
� 2008 University of New South Wales, J. Neurochem. (2008) 105, 1346–1357
Human blood–brain–barrier tryptophan metabolism | 1355
Indoleamine 2,3-dioxygenase contributes to tumor cell evasion ofT cell-mediated rejection. Int. J. Cancer 101, 151–155.
Frumento G., Rotondo R., Tonetti M., Damonte G., Benatti U. andFerrara G. B. (2002) Tryptophan-derived catabolites are responsi-ble for inhibition of T and natural killer cell proliferation inducedby indoleamine 2,3-dioxygenase. J. Exp. Med. 196, 459–468.
Goldstein L. E., Leopold M. C., Huang X., et al. (2000) 3-Hydroxy-kynurenine and 3-hydroxyanthranilic acid generate hydrogenperoxide and promote alpha-crystallin cross-linking by metal ionreduction. Biochemistry 39, 7266–7275.
Grohmann U., Fallarino F. and Puccetti P. (2003) Tolerance, DCsand tryptophan: much ado about IDO. Trends Immunol 24, 242–248.
Guillemin G. J., Kerr S. J., Smythe G. A., Smith D. G., Kapoor V.,Armati P. J., Croitoru J. and Brew B. J. (2001) Kynurenine path-way metabolism in human astrocytes: a paradox for neuronalprotection. J. Neurochem. 78, 842–853.
Heyes M. P., Brew B. J., Martin A., Price R. W., Salazar A. M., SidtisJ. J., Yergey J. A., Mouradian M. M., Sadler A. E. and Keilp J.(1991) Quinolinic acid in cerebrospinal fluid and serum in HIV-1infection: relationship to clinical and neurological status. Ann.Neurol. 29, 202–209.
Heyes M. P., Saito K. and Markey S. P. (1992) Human macrophagesconvert L-tryptophan into the neurotoxin quinolinic acid. Biochem.J. 283, 633–635.
Heyes M. P., Jordan E. K., Lee K., Saito K., Frank J. A., Snoy P. J.,Markey S. P. and Gravell M. (1992) Relationship of neurologicstatus in macaques infected with the simian immunodeficiencyvirus to cerebrospinal fluid quinolinic acid and kynurenic acid.Brain Res. 570, 237–250.
Hu B., Hissong B. D. and Carlin J. M. (1995) Interleukin-1 enhancesindoleamine 2,3-dioxygenase activity by increasing specificmRNA expression in human mononuclear phagocytes. J. Inter-feron Cytokine Res. 15, 617–624.
Hunt N. H., Golenser J., Chan-Ling T., Parekh S., Rae C., Potter S.,Medana I. M., Miu J. and Ball H. J. (2006) Immunopathogenesis ofcerebral malaria. Int. J. Parasitol. 36, 569–582.
Ishii T., Iwahashi H., Sugata R., Kido R. and Fridovich I. (1990)Superoxide dismutases enhance the rate of autoxidation of 3-hy-droxyanthranilic acid. Arch. Biochem. Biophys. 276, 248–250.
Jhamandas K. H., Boegman R. J., Beninger R. J. and Flesher S. (1998)Role of zinc in blockade of excitotoxic action of quinolinic acid bypicolinic acid. Amino Acids 14, 257–261.
Kalisch B. E., Jhamandas K., Boegman R. J. and Beninger R. J. (1994)Picolinic acid protects against quinolinic acid-induced depletion ofNADPH diaphorase containing neurons in the rat striatum. BrainRes. 668, 1–8.
Kerr S. J., Armati P. J. and Brew B. J. (1995) Neurocytotoxity ofquinolinic acid in human brain cultures. J. Neurovirol. 1, 375–380.
Kerr S. J., Armati P. J., Guillemin G. J. and Brew B. J. (1998) Chronicexposure of human neurons to quinolinic acid results in neuronalchanges consistent with AIDS dementia complex. AIDS 12, 355–363.
Kerr S. J., Armati P. J., Pemberton L. A., Smythe G., Tattam B. andBrew B. J. (1997) Kynurenine pathway inhibition reduces neuro-toxicity of HIV-1-infected macrophages. Neurology 49, 1671–1681.
Mellor A. L., Chandler P., Baban B., Hansen A. M., Marshall B., PihkalaJ., Waldmann H., Cobbold S., Adams E. and Munn D. H. (2004)Specific subsets of murine dendritic cells acquire potent T cellregulatory functions following CTLA4-mediated induction ofindoleamine 2,3 dioxygenase. Int. Immunol. 16, 1391–1401.
Moffett J. R. and Namboodiri M. A. (2003) Tryptophan and the immuneresponse. Immunol. Cell Biol. 81, 247–265.
Mukhtar M., Harley S., Chen P., BouHamdan M., Patel C., AcheampongE. and Pomerantz R. J. (2002) Primary isolated human brainmicrovascular endothelial cells express diverse HIV/SIV-associ-ated chemokine coreceptors and DC-SIGN and L-SIGN. Virology297, 78–88.
Munn D. H. and Mellor A. L. (2004) IDO and tolerance to tumors.Trends Mol Med 10, 15–18.
Munn D. H., Sharma M. D. and Mellor A. L. (2004) Ligation ofB7-1/B7-2 by human CD4+ T cells triggers indoleamine 2,3-dioxygenase activity in dendritic cells. J. Immunol. 172, 4100–4110.
Nemeth H., Toldi J. and Vecsei L. (2005) Role of kynurenines in thecentral and peripheral nervous systems. Curr Neurovasc Res 2,249–260.
Nicholls T., Nitsos I., Smythe G. and Walker D. W. (2001) Kynurenineproduction and catabolism in fetal sheep with embolized or non-embolized placentas. Am. J. Obstet. Gynecol. 185, 988–995.
Pais T. F. and Appelberg R. (2000) Macrophage control of mycobacterialgrowth induced by picolinic acid is dependent on host cell apop-tosis. J. Immunol. 164, 389–397.
Poljak A., Grant R., Austin C.J., Jamie J. F., Willows R. D., TakikawaO., Littlejohn T. K., Truscott R. J., Walker M. J., Sachdev P. andSmythe G. A. (2006) Inhibition of indoleamine 2,3 dioxygenaseactivity by H2O2. Arch. Biochem. Biophys. 450, 9–19.
Saito K., Markey S. P. and Heyes M. P. (1992) Effects of immuneactivation on quinolinic acid and neuroactive kynurenines in themouse. Neuroscience 51, 25–39.
Schlingemann R. O., Rietveld F. J., de Waal R. M., Ferrone S. and RuiterD. J. (1990) Expression of the high molecular weight melanoma-associated antigen by pericytes during angiogenesis in tumors andin healing wounds. Am. J. Pathol. 136, 1393–405.
Schroten H., Spors B., Hucke C., Stins M., Kim K. S., Adam R. andDaubener W. (2001) Potential role of human brain microvascularendothelial cells in the pathogenesis of brain abscess: inhibition ofStaphylococcus aureus by activation of indoleamine 2,3-dioxy-genase. Neuropediatrics 32, 206–210.
Shimizu T. and Tomioka H. (2006) Activity of picolinic acid incombination with the antiprotozoal drug quinacrine againstMycobacterium avium complex. Antimicrob. Agents Chemother.50, 3186–3188.
Smith D. G., Guillemin G. J., Pemberton L., Kerr S., Nath A., SmytheG. A. and Brew B. J. (2001) Quinolinic acid is produced bymacrophages stimulated by platelet activating factor, Nef and Tat.J. Neurovirol. 7, 56–60.
Smythe G. A., Braga O., Brew B. J., Grant R. S., Guillemin G. J., KerrS. J. and Walker D. W. (2002) Concurrent quantification ofquinolinic, picolinic, and nicotinic acids using electron-capturenegative-ion gas chromatography-mass spectrometry. Anal. Bio-chem. 301, 21–26.
Stazka J., Luchowski P., Wielosz M., Kleinrok Z. and Urbanska E. M.(2002) Endothelium-dependent production and liberation ofkynurenic acid by rat aortic rings exposed to L-kynurenine. Eur. J.Pharmacol. 448, 133–137.
Stone T. W. (1993) Neuropharmacology of quinolinic and kynurenicacids. Pharmacol Rev 45, 309–379.
Stone T. W. (2000) Development and therapeutic potential of kynurenicacid and kynurenine derivatives for neuroprotection. TrendsPharmacol Sci 21, 149–154.
Stone T. W. and Addae J. I. (2002) The pharmacological manipulation ofglutamate receptors and neuroprotection. Eur. J. Pharmacol. 447,285–296.
Stone T. W. and Darlington L. G. (2002) Endogenous kynurenines astargets for drug discovery and development. Nat Rev Drug Discov1, 609–620.
� 2008 University of New South Wales, J. Neurochem. (2008) 105, 1346–1357
1356 | R. Owe-Young et al.
Takikawa O., Kuroiwa T., Yamazaki F. and Kido R. (1988) Mechanismof interferon-gamma action. Characterization of indoleamine 2,3-dioxygenase in cultured human cells induced by interferon-gammaand evaluation of the enzyme-mediated tryptophan degradation inits anticellular activity. J. Biol. Chem. 263, 2041–2048.
Takikawa O., Tagawa Y., Iwakura Y., Yoshida R. and Truscott R. J.(1999) Interferon-gamma-dependent/independent expression ofindoleamine 2,3-dioxygenase. Studies with interferon-gamma-knockout mice. Adv. Exp. Med. Biol. 467, 553–557.
Wacker H. H., Hansmann M. L., Lumbeck H., Radzun H. J. and Par-waresch M. R. (1990) A new pan-macrophage antibody Ki-M1Pstains plasmacytoid cells in paraffin sections of lymph nodes. VerhDtsch Ges Pathol 74, 159–164.
Wejksza K., Rzeski W., Parada-Turska J., Zdzisinska B., Rejdak R.,Kocki T., Okuno E., Kandefer-Szerszen M., Zrenner E. and TurskiW. A. (2004) Kynurenic acid production in cultured bovine aorticendothelial cells. Homocysteine is a potent inhibitor. NaunynSchmiedebergs Arch Pharmacol 369, 300–304.
� 2008 University of New South Wales, J. Neurochem. (2008) 105, 1346–1357
Human blood–brain–barrier tryptophan metabolism | 1357