
krones Group Annual Report 2019 - AnnualReports.com
206
krones Group Annual Report 2019 Set on success
-
Upload
khangminh22 -
Category
Documents
-
view
4 -
download
0
Transcript of krones Group Annual Report 2019 - AnnualReports.com

krones Group Annual Report 2019
Set on success

Despite difficult overall economic conditions, consolidated revenue increased
in 2019 by 2.7% to €3.96 billion.
Order intake, at €4.08 billion, was up 3.2% year-on-year.
Profitability affected by high personnel costs and one-time expenses for restructuring
and impairments. The EBT margin is 1.1% (prior year 5.3%). Without one-time effects,
the EBT margin would be 2.8%, in line with the guidance of around 3%.
KronEs is making good progress in implementing structural measures for
a sustained improvement in earnings.
KronEs plans to pay a dividend based on earnings excluding one-time effects.
Shareholders will receive a dividend of €0.75 per share for 2019
2019 highlights
2019 2018 Change
Revenue € million 3,958.9 3,854.0 + 2.7 %Order intake € million 4,083.5 3,957.3 + 3.2 %Orders on hand at 31 December € million 1,385.7 1,261.1 + 9.9 %
EBITDA € million 227.3 305.9 – 25.7 %EBITDA margin % 5.7 7.9 – 2.2 PP*EBIT € million 43.9 203.2 – 78.4 %EBT € million 41.7 204.3 – 79.6 %EBT margin % 1.1 5.3 – 4.2 PP*Consolidated net income € million 9.2 150.6 – 93.9 %Earnings per share € 0.30 4.78 – Dividend per share € 0.75** 1.70 – 55.9 %
Capital expenditure for PP&E and intangible assets € million 168.9 179.1 – €10.2 million
Free cash flow € million – 94.4 120.7 – €215.1 millionNet cash at 31 December*** € million 38.1 215.1 – €177.0 millionWorking capital to revenue **** % 26.9 27.3 – 0.4 PP*ROCE % 2.7 12.8 – 10.1 PP*
Employees at 31 December Worldwide 17,353 16,545 + 808 Germany 10,733 10,887 – 154
Outside Germany 6,620 5,658 + 962*Percentage points **As per proposal for the appropriation of earnings available for distribution ***Cash and cash equivalents less debt ****Average of last 4 quarters

To oUr sHArEHoLdErs
2 ConsoLidATEd mAnAgEmEnT rEporT
4
3 CorporATE govErnAnCE
ConsoLidATEd finAnCiAL sTATEmEnTs
5 noTEs To THE ConsoLidATEd finAnCiAL sTATEmEnTs
6 oTHEr informATion
1

1 To oUr sHArEHoLdErs
Set on success . . . . . . . . . . . . . . . . . . . . . . . . . . . . . . . . . . . . . . . . . . . . . . . . . . . . . . . . . . . . . . . . . . . . . . . . . 5
Letter from the Executive Board . . . . . . . . . . . . . . . . . . . . . . . . . . . . . . . . . . . . . . . . . . . . . . . . . 25
The Executive Board . . . . . . . . . . . . . . . . . . . . . . . . . . . . . . . . . . . . . . . . . . . . . . . . . . . . . . . . . . . . . . . . 27
Report of the Supervisory Board. . . . . . . . . . . . . . . . . . . . . . . . . . . . . . . . . . . . . . . . . . . . . . . . . 28
The Supervisory Board . . . . . . . . . . . . . . . . . . . . . . . . . . . . . . . . . . . . . . . . . . . . . . . . . . . . . . . . . . . . . 32
The KronEs share. . . . . . . . . . . . . . . . . . . . . . . . . . . . . . . . . . . . . . . . . . . . . . . . . . . . . . . . . . . . . . . . . . . . 34

Set on success
The 2019 financial year has clearly shown the need for changes at Krones. So that the company stays competitive going forward, the Executive Board has decided structural measures that are now being implemented. Among other things, we are further expanding our global footprint and optimising the entire House of Krones product portfolio. We will eliminate the weaknesses in the company overall.
Despite the many challenges, we look to the future with confidence and self-assurance – because Krones’ strengths clearly predominate. We are outstandingly well positioned in markets with stable growth in the medium and long term. Our workforce is both highly qualified and highly motivated. Moreover, the company has very sound finances and a stable majority shareholder. Building on this strong foundation, we are sure that together with our team, we have Krones set on success.
Set on sucess
1 | 5
2 | Consolidated ManageMent RepoRt
1 | to ouR shaReholdeRs 3 | CoRpoRate goveRnanCe 4 | Consolidated FinanCial stateMents
6 | otheR inFoRMation5 | notes to the Consolidated FinanCial stateMents
1 | 5

Set on sucess
1 | 6
2 | Consolidated ManageMent RepoRt
1 | to ouR shaReholdeRs 3 | CoRpoRate goveRnanCe 4 | Consolidated FinanCial stateMents
6 | otheR inFoRMation5 | notes to the Consolidated FinanCial stateMents
The costs recognised in 2019 for the implemen-ted measures will already be offset by positive EBT impacts in 2020 and these will significantly exceed the costs within two years.
Costs 2019
Structure Portfolio Growth
Global footprint
€20 million €30 million €20 million
Segments Prices
Headcount
€45 million €20 million €15 million
Products After-sales
Procurement
These are the measures to keep Krones on track for success.
Cumulative
Positive impact
Positive EBT impacts
2020
2021 €150 million
€80 million
€70 million
MeasuresOverview

Set on sucess
1 | 7
2 | Consolidated ManageMent RepoRt
1 | to ouR shaReholdeRs 3 | CoRpoRate goveRnanCe 4 | Consolidated FinanCial stateMents
6 | otheR inFoRMation5 | notes to the Consolidated FinanCial stateMents
Expansion of our global footprint in emerging markets
StructureGlobal footprint
GermanyHungary
Czech Republic
India
By the end of 2020, Krones will implement a total of 600,000 production hours at its new locations in Hungary and China. The new Hungarian production facility is expected to save Krones about €5–10 million in 2020. When it is fully established, we expect annual cost savings of €20 million. The production facility in China will deliver savings of at least €2 million in the first stage.
Added to this are 200,000 construction hours in Hungary, China, the Czech Republic and India.
China

Set on sucess
StructureGlobal footprint
The plant in Hungary will increase our future profitability
The plant in Debrecen, Hungary, will be fully operational by the end of 2020. It will then have a capacity of 36,000 working hours per month. At the beginning of 2020, the new plant had 450 employees. Another 50 are to be added by the end of 2020.
1 | 8
2 | Consolidated ManageMent RepoRt
1 | to ouR shaReholdeRs 3 | CoRpoRate goveRnanCe 4 | Consolidated FinanCial stateMents
6 | otheR inFoRMation5 | notes to the Consolidated FinanCial stateMents

Set on sucess
1 | 9
2 | Consolidated ManageMent RepoRt
1 | to ouR shaReholdeRs 3 | CoRpoRate goveRnanCe 4 | Consolidated FinanCial stateMents
6 | otheR inFoRMation5 | notes to the Consolidated FinanCial stateMents
Expanding our global footprint with local cost structures
Krones has already significantly expanded its emerging markets workforce in past years. At the end of 2019, we had 4,187 employees in emerging markets, 33% more than in 2018.
That has a simple reason: To take advantage of market growth opportunities in emerging economies, we need more employees in the regions where customers are located. We already employ about 24% of the workforce in emerging markets. Given corresponding market growth, we will further increase that percentage.
StructureGlobal footprint

Set on sucess
Expansion of our global footprint in process technology
A critical success factor in process technology is the ability to support customers locally with capabilities along the entire value chain. For this purpose, Krones has built up and expanded in-house capacity in recent years. We have addi-tionally strengthened our process technology capabilities with acquisitions. In this way, Krones has gained process technology locations in the USA and China. These will gener-ate positive earnings contributions from 2020.
StructureGlobal footprint
1 | 10
2 | Consolidated ManageMent RepoRt
1 | to ouR shaReholdeRs 3 | CoRpoRate goveRnanCe 4 | Consolidated FinanCial stateMents
6 | otheR inFoRMation5 | notes to the Consolidated FinanCial stateMents

Set on sucess
StructureEmployees
Reduction in workforce in Germany and internationally
To increase profitability for the long term, group processes and resources are to be further optimised and organisational units streamlined. As part of its efficiency measures, Krones has already reduced full-time jobs in Germany in 2019. This will continue in 2020.
In Germany, the structural measures result in the loss of 500 jobs, comprising 200 in the reporting period and 300 in 2020. About 200 jobs will be cut inter-nationally by the end of 2020.
þ ¨
Germany (in-house) – 200 FTeGermany (temp) – 50 FTeRoW (in-house) 0 FTe
2019 – 250 FTE
Germany (in-house) – 300 FTeGermany (temp) – 100 FTeRoW (in-house) – 200 FTe
2020 – 600 FTE
1 | 11
2 | Consolidated ManageMent RepoRt
1 | to ouR shaReholdeRs 3 | CoRpoRate goveRnanCe 4 | Consolidated FinanCial stateMents
6 | otheR inFoRMation5 | notes to the Consolidated FinanCial stateMents

Set on sucess
1 | 12
2 | Consolidated ManageMent RepoRt
1 | to ouR shaReholdeRs 3 | CoRpoRate goveRnanCe 4 | Consolidated FinanCial stateMents
6 | otheR inFoRMation5 | notes to the Consolidated FinanCial stateMents
Reduction in workforce in Germany and internationally
StructureEmployees The measures to reduce personnel costs necessitated
around €30 million in provisions in 2019 and had a corresponding negative impact on earnings. By reducing the workforce, Krones expects savings in personnel costs totalling around €45 million in 2020 and 2021.
2019 2020/2021
€30 million
Provisions
€45 million €15 million
Savings in personnel costs
Difference between provisions and savings

Set on sucess
1 | 13
2 | Consolidated ManageMent RepoRt
1 | to ouR shaReholdeRs 3 | CoRpoRate goveRnanCe 4 | Consolidated FinanCial stateMents
6 | otheR inFoRMation5 | notes to the Consolidated FinanCial stateMents
PortfolioSegments
Portfolio streamlining in the House of Krones
We are streamlining our portfolio across the entire House of Krones. This includes new products and services as well as exiting from unprofitable areas and technologies.
Digitalisation
Bottling and packaging equipment
Labelling technologyInspection technologyFilling technologyCleaning technologyPlastics technologyPacking and palletising technologyConveyor technology
Intralogistics
Warehouse management systemsIn-house solutionsOrder picking systems
Automatic control systemsiT services
Lifecycle Service Line efficiencyOn-site serviceRetrofits
Process technology
BeerMalt beveragesSoft drinksJuiceWaterLiquid food

Set on sucess
PortfolioSegments
Portfolio streamlining in process technology1 | 14
2 | Consolidated ManageMent RepoRt
1 | to ouR shaReholdeRs 3 | CoRpoRate goveRnanCe 4 | Consolidated FinanCial stateMents
6 | otheR inFoRMation5 | notes to the Consolidated FinanCial stateMents

Set on sucess
PortfolioSegments
Portfolio streamlining in process technology
Process technology is one pillar of the House of KronES. It includes products and areas that are developing well. Overall, however, profitability in process technology is insufficient. This is mainly due to beverage production. We are going to make this a legally independent unit. This enables us to better assess how the individual businesses, specifically with regard to the different types of beverages, are developing on a standalone basis.
After several acquisitions in the past, we currently plan no acquisitions in process technology.
1 | 15
2 | Consolidated ManageMent RepoRt
1 | to ouR shaReholdeRs 3 | CoRpoRate goveRnanCe 4 | Consolidated FinanCial stateMents
6 | otheR inFoRMation5 | notes to the Consolidated FinanCial stateMents

Set on sucess
PortfolioSegments
Portfolio streamlining in Bottling and Packaging Equipment1 | 16
2 | Consolidated ManageMent RepoRt
1 | to ouR shaReholdeRs 3 | CoRpoRate goveRnanCe 4 | Consolidated FinanCial stateMents
6 | otheR inFoRMation5 | notes to the Consolidated FinanCial stateMents

Set on sucess
This segment is suffering as a result of the critically skewed debate about plastics. We create sustainable material cycles with our high-quality PET recycling systems, material-saving container design and low-energy container production.
At the same time, we continue to expand our product portfolio in glass and cans as packaging types.
Portfolio streamlining in Bottling and Packaging Equipment
PortfolioSegments
1 | 17
2 | Consolidated ManageMent RepoRt
1 | to ouR shaReholdeRs 3 | CoRpoRate goveRnanCe 4 | Consolidated FinanCial stateMents
6 | otheR inFoRMation5 | notes to the Consolidated FinanCial stateMents

Set on sucess
PortfolioSegments
Portfolio streamlining in Intralogistics1 | 18
2 | Consolidated ManageMent RepoRt
1 | to ouR shaReholdeRs 3 | CoRpoRate goveRnanCe 4 | Consolidated FinanCial stateMents
6 | otheR inFoRMation5 | notes to the Consolidated FinanCial stateMents

Set on sucess
PortfolioSegments
Portfolio streamlining in Intralogistics
Wackersdorf
Fiorano ModeneseCastellon
Malmö
MexicoBangkok
Arden
London
The third pillar of the House of KronES, intralogistics, continues to see very good demand for our products and services. We will manage the rapid rate of growth and push ahead with internationalisation. For this purpose, we have pooled all intralogistics activities in SySTEm LogiSTicS and made this a legally independent unit.
1 | 19
2 | Consolidated ManageMent RepoRt
1 | to ouR shaReholdeRs 3 | CoRpoRate goveRnanCe 4 | Consolidated FinanCial stateMents
6 | otheR inFoRMation5 | notes to the Consolidated FinanCial stateMents

Set on sucess
PortfolioSegments
Portfolio streamlining in digitalisation
Looking ahead, we will concentrate our digitalisation activities more intensively around solutions for our core bottling and packaging equipment segment and notably for lifecycle services. Overall, investment in digitalisation will continue to impact profitability in the next few years. Krones sees good market opportu-nities here in the medium to long term.
1 | 20
2 | Consolidated ManageMent RepoRt
1 | to ouR shaReholdeRs 3 | CoRpoRate goveRnanCe 4 | Consolidated FinanCial stateMents
6 | otheR inFoRMation5 | notes to the Consolidated FinanCial stateMents

Set on sucess
PortfolioProcurement
Internationalisation and optimisation of procurement
At about €2 billion, cost of materials is by far the largest expense item in the statement of profit and loss.
Expansion of our global footprint relates not only to production, but also to the procurement of material inputs. Best-cost country (Bcc) sourcing secures us significant reductions in procurement costs.
We will rigorously continue with the international procurement measures we have implemented so far.
1 | 21
2 | Consolidated ManageMent RepoRt
1 | to ouR shaReholdeRs 3 | CoRpoRate goveRnanCe 4 | Consolidated FinanCial stateMents
6 | otheR inFoRMation5 | notes to the Consolidated FinanCial stateMents

Set on sucess
Internationalisation and optimisation of procurement
Krones has already successfully implemented this in Taicang, China. It has also established a supplier network in India, Taiwan, Thailand and Turkey.
BCC procurement volume totalled around €45 million in 2019. This will continue to rise and will deliver significant cost savings in the years ahead.
PortfolioProcurement
Current status
Cumulative savings in next 3 years
KRONES action
€20–30 million €20–30 million €30–40 million
Use of known cost levers Advanced tools
Medium-term measures
Ongoing optimisation of current expense structure
Maintenance of negotiating practices
Systematic assessment covering 80% of total expenses
Optimised procurement strategy
Planning and use of all options
Combined requirements and consolidated supplier base
Product structure optimised for outsourcing
Main categories assessed
Concrete outcomes attained
To be published
Category management BCC and make-or-buy
Large potential savings in procurement
1 | 22
2 | Consolidated ManageMent RepoRt
1 | to ouR shaReholdeRs 3 | CoRpoRate goveRnanCe 4 | Consolidated FinanCial stateMents
6 | otheR inFoRMation5 | notes to the Consolidated FinanCial stateMents

GrowthPrices
Implementation of price increases
€Price increases are necessary in order to partially offset rising labour and material costs. The basis for this is strong price discipline. Realistically, a €10–20 million earnings contribution is attainable. A 1% price increase on self-produced machinery would provide an additional eBT contribution of €10–15 million in 2020.
Set on sucess
1 | 23
2 | Consolidated ManageMent RepoRt
1 | to ouR shaReholdeRs 3 | CoRpoRate goveRnanCe 4 | Consolidated FinanCial stateMents
6 | otheR inFoRMation5 | notes to the Consolidated FinanCial stateMents

GrowthAfter-Sales
Exploiting after-sales market potential
Due to the strong installed base, the after-sales market has considerable growth potential for Krones in the medium to long term. Krones has around 40,000 machines installed in customers’ factories. Further expanding our service locations around the world will enable us to significantly increase our service business. Our LCs team so far serve about 60% of our installed base. Each percentage point generates €12 million annually in profitable service revenue.
Krones proportion of service ~ 60%
Third-party providers proportion of service ~ 40%
Set on sucess
1 | 24
2 | Consolidated ManageMent RepoRt
1 | to ouR shaReholdeRs 3 | CoRpoRate goveRnanCe 4 | Consolidated FinanCial stateMents
6 | otheR inFoRMation5 | notes to the Consolidated FinanCial stateMents

Dear shareholders and friends of krones,
2019 was very challenging for Krones. Due to various factors, we had to lower our earnings guid-ance mid-year. In response, the Executive Board introduced far-reaching structural measures to strengthen profitability and keep the company set on success.
krones continues stable growth despite weakening economy
Forecasts for the economy gradually worsened over the course of the year. The Us trade disputes with China and Europe and the long-unresolved Brexit weighed down on the economy. International Mon-
etary Fund (IMF) experts had to revise their global growth forecast downwards several times in 2019, from at first 3.5% to 2.9%. The sometimes highly emotion-ally charged plastics debate also did not benefit our business.
Despite these uncertainties, demand in our markets serving the international beverage and packaging industry was satisfactory. Krones was able to use the relatively stable demand and increased revenue during the reporting period by 2.7% to €3.96 billion. This means we met our 3% growth forecast. Order intake grew similarly, improving by 3.2% to €4.08 billion.
“Krones will rigorously implement the measures it has decided in order to put us back on track for success.”
Christoph Klenk Ceo
Profitability in 2019 significantly below target
In contrast to revenue and order intake, profitability did not develop as planned at the beginning of 2019. Krones’ profitability was hit unexpectedly hard during the reporting period by significant rises in labour costs. In addition an unfavourable product mix leading to capacity underutilisation in plastics technology and temporarily weak demand in parts of the after-sales business also had a negative impact, primarily in the second quarter. In total, the eBT margin fell in the reporting period from 5.3% to 1.1%. It should also be noted that we recognised €70 million in expenses for provisions and writedowns in 2019. Adjusted for these expenses for structural measures, the eBT margin was 2.8%. Krones therefore attained the target of around 3%, which had been reduced mid-year (from originally around 6%).
Structural measures launched – initial benefits visible
To stay competitive for the long term and attain the profitability needed for the purpose, we launched a package of short and medium-term measures in the second half of 2019. The aim is to improve cost structures, raise efficiency, review our portfolio and create new growth momentum. Many of the individ-ual measures to be implemented in 2020 and 2021 are described in detail on pages 5 to 24.
Krones is already seeing initial benefits. We are progressing well with the cost savings. Selling prices have stabilised and are moving in the right direction. We are also making good progress with the expansion of our global footprint. The
Letter from the Executive Board1 | 25
2 | Consolidated ManageMent RepoRt
1 | to ouR shaReholdeRs 3 | CoRpoRate goveRnanCe 4 | Consolidated FinanCial stateMents
6 | otheR inFoRMation5 | notes to the Consolidated FinanCial stateMents Letter from the
Executive Board

most important project here is our new plant in Hungary. After delays, the fac-tory will be fully operational in the second half of 2020 and from then onwards will save some €20 million a year. We have also significantly strengthened our presence in China after expanding production and establishing completely regional procurement structures.
There is still much to be done in process technology, however, most of all in business with breweries. We have set ourselves clear targets here, together with a timescale for attaining them. If the beverage production business does not meet the required profitability target by 2021, we will make clear-cut decisions about the future of this business.
Continued high level of investment in innovation
As part of the action package, we are reducing the recently very high level of capital expenditure back to normal levels. This mainly relates to spending on property, plant and equipment and on acquisitions. Regarding acquisitions, we are going to concentrate on integrating the companies acquired in recent years. No major acquisitions are planned for the time being.
Technologically leading products and services are our company’s aspiration and future. Consequently, we are going to maintain our high level of invest-ment in innovation and will not be cutting our research and development budget or expenditure on digital activities.
Krones has innovative products for global challenges such as reducing Co2 emissions and sustainability in plastic packaging. We will secure our tech-nology leadership with further innovations in the years ahead. Some of our innovations from the reporting period are showcased on pages 58 to 63.
International workforce to grow – reduction in Germany
The number of employees in the Group increased in the reporting period by around 800 to 17,353. In Germany, the number employed decreased by 150. The job cuts in Germany are very painful but regrettably unavoidable. As difficult as those job cuts in Germany have been for us, we have to relocate parts of our value creation abroad in order to remain competitive as a strongly export- oriented company in our international markets. Especially in the current challenging and, for our company, unusual situation, I would like on behalf of the entire Executive Board to extend my sincere thanks to the entire Krones team for their hard work and commitment.
Targets for 2020 – delivering sustained turnaround in profitability
After the difficult year in 2019, Krones aims to achieve a rapid and sustained turnaround in profitability so that we meet our medium-term targets as soon as possible. Although we have set ambitious targets for 2020, we do not expect any growth in revenue with a view to the current uncertain situation in the markets. The eBITDA margin (see also page 49 following) is expected to improve to about 6.7–7.2%. For our third performance target, working capital to revenue, we will attain 26% this year and in doing so, in combination with lower capital expenditure, we will also increase free cash flow.
We are the market and technology leaders in a globally growing market. The task now is to continue implementing the structural aspects and the adopted measures together with our motivated global team. I firmly believe that together we can put Krones back on track for success.
Christoph Klenk CEo
1 | 26
2 | Consolidated ManageMent RepoRt
1 | to ouR shaReholdeRs 3 | CoRpoRate goveRnanCe 4 | Consolidated FinanCial stateMents
6 | otheR inFoRMation5 | notes to the Consolidated FinanCial stateMents Letter from the
Executive Board

The Executive Board
Norbert BrogerCfo
Ralf GoldbrunnerBottling and Packaging EquipmentCompact Class
Markus TischerInternational Operations and ServicesDigitalisation
Thomas Ricker Cso
Christoph KlenkCEoIntralogisticsProcess Technology
1 | 27
2 | Consolidated ManageMent RepoRt
1 | to ouR shaReholdeRs 3 | CoRpoRate goveRnanCe 4 | Consolidated FinanCial stateMents
6 | otheR inFoRMation5 | notes to the Consolidated FinanCial stateMents The Executive Board

Report of the Supervisory BoardLadies and Gentlemen,
Krones is in a challenging situation. The past few years have mainly been characterised by profitable growth. However, the 2019 financial year has clearly shown that there is a need for changes. Although revenue increased, earnings fell well short of expectations. So that Krones stays competitive moving forward, the Executive Board, in close con-sultation with the Supervisory Board, has already implemented strategic and operational measures and initiated further structural adjustments. Those measures also include what for Krones is the un-
usual step of a reduction in the workforce. This was not an easy decision for the Executive Board and Supervisory Board, but it is regrettably unavoidable. The Supervisory Board has consulted in great detail on the causes of the weak earnings as explained by the Executive Board together with the measures to improve profitability. It considers the path now taken and the structural measures to be the right way forward. The Supervisory Board will follow and review the implementation of the measures. It will work closely and con-structively for this purpose with the Executive Board.
Advice and oversight
The Supervisory Board of Krones AG continuously oversaw and advised the Executive Board during the 2019 financial year, as prescribed by the German Stock Corporation Act and the company’s articles of association, and dis-charged its responsibilities with due care. Full regard was given at all times to the provisions of the German Corporate Governance Code and those of the German Stock Corporation Act on Executive Board reporting obligations to
Volker Kronseder Chairman of the Supervisory Board
the Supervisory Board. The Executive Board regularly informed the Super-visory Board about the company’s business and financial situation and risk management in written and oral reports both during and outside of Super-visory Board meetings. With regard to decisions of particular significance to Krones AG and the Group, the Supervisory Board was informed and involved by the Exe cutive Board at an early stage. The Chairman of the Supervisory Board and the Chief Executive Officer in particular maintained regular contact between meetings. In that connection, they jointly discussed questions of cor-porate strategy, current business performance, the risk situation, risk manage-ment and com pliance.
Focuses of the work of the Supervisory Board in 2019 included current business performance and in particular earnings performance, strategy and measures for target attainment and sustained strengthening of profitability. Other fo-cuses of the Supervisory Board’s work were market and competition topics. There were no changes in the membership of the Supervisory Board in 2019.
Conflicts of interest
Under section 5.5.2 of the German Corporate Governance Code, each member of the Supervisory Board must inform the Supervisory Board of any conflicts of interest, particularly if they could arise as a result of performing an advisory role or membership of a governing body at customers, suppliers, lenders or other third parties. No such conflicts of interest were disclosed in the reporting period.
Supervisory Board meeting reports
In total, four regular Supervisory Board meetings were held in 2019. All 18 Supervisory Board members were present at three of the four meetings. One member of the Supervisory Board was unable to attend one meeting.
1 | 28
2 | Consolidated ManageMent RepoRt
1 | to ouR shaReholdeRs 3 | CoRpoRate goveRnanCe 4 | Consolidated FinanCial stateMents
6 | otheR inFoRMation5 | notes to the Consolidated FinanCial stateMents Report of the Supervisory
Board

Representatives from Krones’ auditing firm were present for a portion of the first meeting on 20 March. They gave the Supervisory Board a detailed ex-planation of their audit engagement together with the focus of their audit of the 2018 annual financial statements and provided a detailed overview of the audit. Questions from the Supervisory Board were explained and answered by the auditors in detail. The Supervisory Board then ratified the annual financial statements and management report of Krones AG and approved the consoli-dated financial statements and consolidated management report. Under the
“Supervisory Board and Executive Board matters” agenda item, the Chairman of the Supervisory Board presented the findings of the efficiency review on the work of the Supervisory Board. In summary, the Chairman of the Supervisory Board noted that the efficiency of the Supervisory Board in 2018 was rated as very positive. Under the same agenda item, the Supervisory Board unani-mously resolved to extend the contract of Chief Sales Officer Thomas Ricker, which was set to expire on 31 December 2019, by five years to 31 December 2024. In doing so, the Supervisory Board complied with the recommendation of the Standing Committee. On the same occasion, the Supervisory Board adopted the agenda for the 2019 annual general meeting. Finally, the Management Board provided the Supervisory Board as part of reporting on business planning with a detailed explanation of the targets and measures for target attainment for 2019 together with the medium-term planning.
The Supervisory Board held its second meeting in 2019 on 24 July. Reporting on the business situation, the Executive Board informed the Supervisory Board about the most important figures for the first half of 2019 and the outlook for the full year. In the same connection, the Executive Board members each gave a current status report and the outlook for 2019 with regard to the business areas in their respective portfolios. The Supervisory Board consulted in detail on the reasons for the current difficult business situation and the downgraded guidance published by the company on 10 July. Following lengthy discussion, the Supervisory Board also decided to terminate, with immediate effect, the appointment of Michael Andersen as a member of the Executive Board of
Krones AG. His responsibilities were provisionally assumed by Chief Executive Officer Christoph Klenk.
The third meeting of the Supervisory Board in 2019 took place on 25 September. At the recommendation of the Standing Committee, the Supervisory Board unanimously appointed Norbert Broger as member of the Executive Board and Chief Financial Officer of Krones AG with effect from 1 January 2020 to 31 December 2022. Prior to his appointment, the selection procedure was out-lined to the Supervisory Board and Norbert Broger introduced himself in per-son. A further item on the agenda was the business situation at Krones. Chief Executive Officer Christoph Klenk and the members of the Executive Board heading the various units explained their analysis and the measures planned.
The Supervisory Board held its fourth meeting of 2019 on 27 November. During the meeting, an external expert in capital market law gave a presentation and informed the Supervisory Board about important formal stipulations and the adoption of Supervisory Board resolutions. The “Executive Board matters” agenda item included the redistribution of responsibilities within the Execu-tive Board. Another item on the agenda at the fourth meeting of the Super-visory Board was the report of the Audit and Risk Management Committee, addressing the topics of risk management, internal auditing and compliance. The Executive Board then presented the Supervisory Board with figures on the current performance of the business and the outlook for the full year 2019. Finally, the Supervisory Board considered the Executive Board’s budgeting for the 2020 financial year. The Supervisory Board unanimously approved the annual and investment budget for 2020.
The work of the Audit and Risk Management Committee
The Audit and Risk Management Committee consists of Supervisory Board Chairman Volker Kronseder, his deputy Werner Schrödl and Supervisory Board members Norman Kronseder, Hans-Jürgen Thaus, Josef Weitzer and Jürgen Scholz. Its Chairman is Hans-Jürgen Thaus. The Audit and Risk Management
1 | 29
2 | Consolidated ManageMent RepoRt
1 | to ouR shaReholdeRs 3 | CoRpoRate goveRnanCe 4 | Consolidated FinanCial stateMents
6 | otheR inFoRMation5 | notes to the Consolidated FinanCial stateMents Report of the Supervisory
Board

Committee oversees the company’s accounting and financial reporting, the audit of the financial statements and other reporting, and prepares related proposals for Supervisory Board resolutions. In addition, the committee pre-pares the Supervisory Board’s review of the annual financial statements, the management report and the auditor’s report for the separate and consolidated financial statements, and makes recommendations. Furthermore, the Audit and Risk Management Committee monitors the effectiveness of the internal control system, the risk management system and the compliance system.
The Audit and Risk Management Committee met five times in 2019. All six members were present at four of the five meetings. One member of the com-mittee was absent at the meeting on 20 November.
At its 14 March meeting, the committee mainly considered the auditor’s report on the audit of the annual and consolidated financial statements as of 31 December 2018.
On 20 March, the committee met to prepare the Supervisory Board meeting held to ratify the financial statements. Based on the remarks of the auditor and information from the auditor’s report, the members of the Audit and Risk Man-agement Committee agreed to recommend that the Supervisory Board ratify the annual financial statements and management report of KRONES AG for the 2018 financial year and approve the consolidated financial statements and con-solidated management report for 2018.
At its third meeting on 10 April, the Audit and Risk Management Committee addressed the report on the non-financial statement. The auditor presented the audit findings for this purpose. The Audit and Risk Management Committee approved the audit findings and had no objections. The committee members decided to recommend that the Supervisory Board ratify the consolidated non-financial report. In addition, the committee explained the recommenda-tion to the Supervisory Board for the auditor to be proposed by Supervisory Board to the Annual General Meeting for election as auditor of the annual and consolidated financial statements for 2019.
Items on the agenda at the fourth meeting of the Audit and Risk Management Committee on 15 October included KRONES’ current financing situation, the Ex-ecutive Board’s review of the portfolio and of portfolio streamlining measures and the Group’s current situation.
At the fifth meeting of the Audit and Risk Management Committee on 20 No-vember, the heads of Controlling, Internal Audit and Compliance informed the members of the committee about the current risk situation, internal audit and compliance management.
The work of the Standing Committee
The Standing Committee consists of Werner Schrödl, Norman Kronseder, Josef Weitzer, and Volker Kronseder. It is chaired by Volker Kronseder. The committee generally deals with all other topics that are outside the remit of the Audit and Risk Management Committee. These include, for example, human resources strategy and Executive Board and Supervisory Board remuneration. The Stand-ing Committee met three times in 2019. All four members were present at all three meetings.
At the meeting on 14 March, the Standing Committee prepared the extension of Chief Sales Officer Thomas Ricker’s contract for the Supervisory Board. The committee members resolved to recommend that the Supervisory Board adopt the resolution to extend the contract with Thomas Ricker by five years to 31 December 2024.
The Standing Committee’s second meeting took place on 10 July. At that meet-ing, Chief Executive Officer Christoph Klenk and Chief Finance Officer Michael Andersen informed the committee about the current business situation and measures for improving earnings in the short to medium term.
The Standing Committee’s meeting on 12 September was primarily convened to make a recommendation in advance of the Supervisory Board meeting on 25 September for the appointment of Norbert Broger as a member of the Executive Board of KRONES AG.
1 | 30
2 | Consolidated ManageMent RepoRt
1 | to ouR shaReholdeRs 3 | CoRpoRate goveRnanCe 4 | Consolidated FinanCial stateMents
6 | otheR inFoRMation5 | notes to the Consolidated FinanCial stateMents Report of the Supervisory
Board

Supervisory Board concurs with audit findings
The annual financial statements of KRONES Aktiengesellschaft prepared by the Executive Board, the consolidated financial statements, the management re-port for KRONES AG and the group management report for the period ended 31 December 2019 were examined by the auditors elected by the annual general meeting, Ernst & Young GmbH Wirtschaftsprüfungsgesellschaft, and each is-sued with an unqualified audit report. The audited annual financial statements and consolidated financial statements, the management report for KRONES AG and the consolidated management report for the period ended 31 December 2019 were duly submitted to all members of the Supervisory Board for review. The audited financial statements and management reports were the subject of the Supervisory Board meeting held to ratify the financial statements on 18 March 2020. Representatives of the auditing firm also participated in the meet-ing and reported to the Supervisory Board on their audit findings and the focal points of their audit.
The Supervisory Board noted and approved the audit findings. No objections were raised following the final review by the Supervisory Board, which covered in particular the matters described in the auditor’s audit report including the audit procedures. The Supervisory Board has ratified the annual financial state-ments for KRONES AG and approved the consolidated financial statements as well as the Executive Board’s proposal for the appropriation of earnings avail-able for distribution. The 2019 annual financial statements for KRONES AG are thus ratified.
The auditors included in their audit the Executive Board’s report, in accordance with section 312 of the German Stock Corporation Act, on KRONES AG’s relations to affiliated companies and submitted their audit report to the Supervisory Board. The audit by the auditors did not give rise to any objections. The auditor issued the following unqualified audit opinion on the dependency report:
“Based on our due audit and assessment, we confirm that
1. the statements as to fact made in the report are accurate, 2. the consideration given by the company in respect of the legal transactions referred to in the report was not unreasonably high.”
The Supervisory Board’s review of the report in accordance with section 312 of the German Stock Corporation Act on KRONES AG’s relations to affiliated companies did not give rise to any objections. The Supervisory Board therefore concurred with the findings of the audit by the auditors. Following the final outcome of its own review, the Supervisory Board did not raise any objections to the Executive Board’s concluding declaration on relations with affiliated companies.
In addition to the statutory audit, Ernst & Young GmbH Wirtschaftsprüfungs-gesellschaft also performed a limited assurance review of the separate com-bined non-financial report for KRONES AG and the Group for the period from 1 January to 31 December 2019. On the basis of that review, the auditor did not raise any objections to the reporting in and fulfilment of the statutory require-ments for the non-financial statement.
Thanks to the Executive Board and the workforce
The members of the Supervisory Board would like to thank the Executive Board and all of the company’s employees for their dedication and wholly successful work in the 2019 financial year.
Neutraubling, March 2020 The Supervisory Board
Volker Kronseder Chairman of the Supervisory Board
1 | 31
2 | Consolidated ManageMent RepoRt
1 | to ouR shaReholdeRs 3 | CoRpoRate goveRnanCe 4 | Consolidated FinanCial stateMents
6 | otheR inFoRMation5 | notes to the Consolidated FinanCial stateMents Report of the Supervisory
Board

The Supervisory Board1 | 32
2 | Consolidated ManageMent RepoRt
1 | to ouR shaReholdeRs 3 | CoRpoRate goveRnanCe 4 | Consolidated FinanCial stateMents
6 | otheR inFoRMation5 | notes to the Consolidated FinanCial stateMents
Volker Kronseder
Chairman of the Supervisory Board * University Hospital Regensburg* Economic Advisory Board, Bayerische Landesbank
Werner Schrödl**
Deputy Chairman of the Supervisory BoardChairman of the Group Works CouncilChairman of the Central Works Council* Executive Board member of the Bavarian
Company Health Insurance Funds Confederation
Dr. Verena Di Pasquale**
Deputy Chairperson of dgB Bayern (the German Trade Union Confederation in Bavaria)
Robert Friedmann
Spokesman for the central managing board of the Würth Group* Zf Friedrichshafen Ag
Klaus Gerlach**
Head of Central International Operations and Services
Oliver Grober**
Chairman of the Employees’ Council, Rosenheim
Thomas Hiltl**
Chairman of the Employees’ Council,Nittenau
Norman Kronseder
Farmer and forester* Bayerische Futtersaatbau GmbH
* Other Supervisory Board seats held, pursuant to Section 125 (1) sentence 5 of the German Stock Corporation Act ** Elected by the employees
The Supervisory Board

1 | 33
2 | Consolidated ManageMent RepoRt
1 | to ouR shaReholdeRs 3 | CoRpoRate goveRnanCe 4 | Consolidated FinanCial stateMents
6 | otheR inFoRMation5 | notes to the Consolidated FinanCial stateMents
Prof. Dr. jur. Susanne Nonnast
Professor at Ostbayerische Technische Hochschule (oTH) Regensburg
Beate Eva Maria Pöpperl **
Independent Member of the Employees’Council
Petra Schadeberg-Herrmann
Managing Partner, Krombacher BrauereiBernhard Schadeberg GmbH & Co. Kg,Krombacher Finance GmbH, Schawei GmbH, Diversum Holding GmbH & Co. Kg
Norbert Samhammer
Managing Director, Samhammer Holding GmbH* Samhammer Ag
Jürgen Scholz**
First authorised representative, ig Metall administrative office in Regensburg* Infineon Technologies Ag
Hans-Jürgen Thaus
* Maschinenfabrik Reinhausen GmbH* Hawe Hydraulik sE, Aschheim/Munich (until 27 June 2019)
Josef Weitzer**
Deputy Group Employees’ Council ChairmanDeputy Composite Employees’ Council ChairmanEmployees’ Council Chairman, Neutraubling* Sparkasse Regensburg
Matthias Winkler
Managing Partner, WW + Kn Steuerberatungsgesellschaft mbH
The Supervisory Board
* Other Supervisory Board seats held, pursuant to Section 125 (1) sentence 5 of the German Stock Corporation Act ** Elected by the employees

krones share price impacted in 2019 by revised earnings guidance
The Krones share price fluctuated sharply between January and December 2019. After a good start to the 2019 stock market year and significant price gains in the first quarter, our share price continued to rise at the beginning of the second quarter. Krones shares reached their high point for 2019 at
€88.85 on 18 April. This marked a gain of 32% on the opening price of €67.50 at the beginning of the year. Our share price then increasingly moved away from that level as the year progressed. This was partly due to a temporary general market correction. Mainly, however, the decreases in the share price were due to the unsatisfactory operating business. Krones’ profitability performance was weaker than expected in 2019.
Low interest rates stimulate international stock markets
Two main themes dominated the 2019 stock market year. One focus was the sustained low interest rate policy pursued by central banks. The activities of the Us Federal Reserve and the European Central Bank caused long-term bond yields in 2019 to fall on both sides of the Atlantic. Central banks addi-tionally indicated that they plan to continue apply-
ing expansionary monetary policy going forward. Low interest rates encourage investment in equities. On the other hand, the simmering trade conflict be-tween the UsA and China was an ongoing source of concern for investors in 2019. This led to sharp price swings on several occasions. On balance, however, posi-tive factors prevailed and most share indices gained strongly in 2019.
The leading German share index, the DAX, improved by 25.5% between January and December 2019 to close the year at 13,250 points. As a result, the DAX ended 2019 only slightly below its all-time high of nearly 13,600 points in 2018. The eUro sToXX 50, comprising the 50 largest companies in the euro area, gained similarly strongly to the DAX with an increase of 24.8% in the reporting period. 2019 saw the Dow Jones index reach new record levels. The leading Us stock mar-ket index climbed 22.3%. Compared with the UsA and Europe, the upward trend on the Japanese stock market was not quite as dynamic. The Nikkei index rose by 18.2% in 2019.
“Krones’ profitability was below expectations in 2019. That was also reflected in our share price.”
Olaf Scholz Head of Investor Relations
The Krones share
€50.00
€60.00
€70.00
€80.00
€90.00
€100.00
Jan Feb Mar Apr May Jun Jul Aug Sep Oct Nov Dec
KRONES share price performance compared with the SDAX 2019
KronEs share sdAX indexed
The Krones share price fell sharply in the third quarter of 2019 due to the revised guidance. This was the main reason why our shares un-derperformed the sDAX over the full year 2019.
1 | 34
2 | Consolidated ManageMent RepoRt
1 | to ouR shaReholdeRs 3 | CoRpoRate goveRnanCe 4 | Consolidated FinanCial stateMents
6 | otheR inFoRMation5 | notes to the Consolidated FinanCial stateMents The KronEs share
� Stock markets benefit from low interest rates
� krones share price affected by revised
guidance
� Shareholders to receive €0.75 per share
dividend for 2019

On 10 July, Krones published an ad-hoc announcement lowering its guidance for the eBT margin in 2019. This accelerated the downward trend in our share price. Krones shares reached their lowest level during the reporting period at €47.46 on 15 August. Although our share price subsequently recovered, the price of €55.45 at the end of September was 18% down on the beginning of the year. The fourth quarter of 2019 brought a strong rise in our share price. A contributing factor was the publication of details on structural measures to secure sustained gains in Krones’ profitability. Our share price also benefited from a favourable overall market. The Krones share price at the end of December 2019, at €67.50, was exactly the same as a year earlier. Including the €1.70 per share dividend, the annual performance of the Krones share price in 2019 was 2.5%. The sDAX, of which Krones has been a component since 18 June 2018, improved by 31.6% in 2019.
krones shares deliver very solid long-term return
The past ten years from 2010 to 2019 have seen our share price almost double with an increase of 90%. Krones’ average annual share price gain over the ten-year period comes to 6.6%. That is less than the sDAX price index (+11.1%), meaning the sDAX excluding dividends. Including dividends, and assuming reinvestment of the dividends in Krones shares, the average annual return since 2010 comes to 8.2%. The comparable sDAX performance index gained 13.4% annually.
The Krones share price has risen by an average of 6.6% a year over the last ten years.
Key figures for the KronEs share
at 31 December 2019 2018 2017
Earnings per share € 0.30 4.78 5.97
Equity per share € 43.36 45.36 42.10
Free cash flow per share € – 2.99 3.82 – 4.77
Price/earning (p/E) ratio based on closing price for the year 225.0 14.1 19.2
Dividend per share € 0.75* 1.70 1.70
High € 88.85 122.80 121.25
Low € 47.46 66.10 87.28
Year’s closing price € 67.50 67.50 114.50
* As per proposal for the appropriation of earnings available for distribution 0.00%
20.00%
40.00%
60.00%
80.00%
100.00%
120.00%
140.00%
160.00%
180.00%
200.00%
220.00%
240.00%
260.00%
2010 2011 2012 2013 2014 2015 2016 2017 2018 2019
Performance of KRONES shares compared with the SDAX price index, 2010 – 2019
KronEs share sdAX price index
1 | 35
2 | Consolidated ManageMent RepoRt
1 | to ouR shaReholdeRs 3 | CoRpoRate goveRnanCe 4 | Consolidated FinanCial stateMents
6 | otheR inFoRMation5 | notes to the Consolidated FinanCial stateMents The KronEs share
krones retains strong position in sDAX index
Krones shares have been listed and available for trading on all German stock exchanges since 29 October 1984. Our shares are no par value ordi-nary bearer shares. Each share carries one vote in the annual general meeting. The total number of Krones shares is 31,593,072.
Our share has been a component of the sDAX since mid-2018. The sDAX is the German stock exchange index containing the 70 companies that succeed those listed in the MDAX in market capitalisation and revenue. Over the reporting period, Krones slipped to 25th place (previous year: 13th place) among the companies in the sDAX in terms of market capitalisation. In terms of trading volume, on the other hand, the Krones share gained significantly, improving to 11th place at the end of 2019 (previous year: 23rd place). This makes our shares one of the larger and highest-revenue sDAX components.
Total daily trading volume in XeTrA trading and on Frankfurt stock exchange averaged around 71,000 Krones shares in 2019 (previous year: 40,000 shares). 2019 likewise saw more Krones shares change hands on alternative trading platforms, which primarily handle orders from institutional investors. Average daily trading volume there came to around 108,000 shares (previous year: around 63,000).
Due to its below-average performance, the Krones share price slipped down the ranking in terms of market capitalisation in 2019. In contrast, there was a strong rise in trading volume.
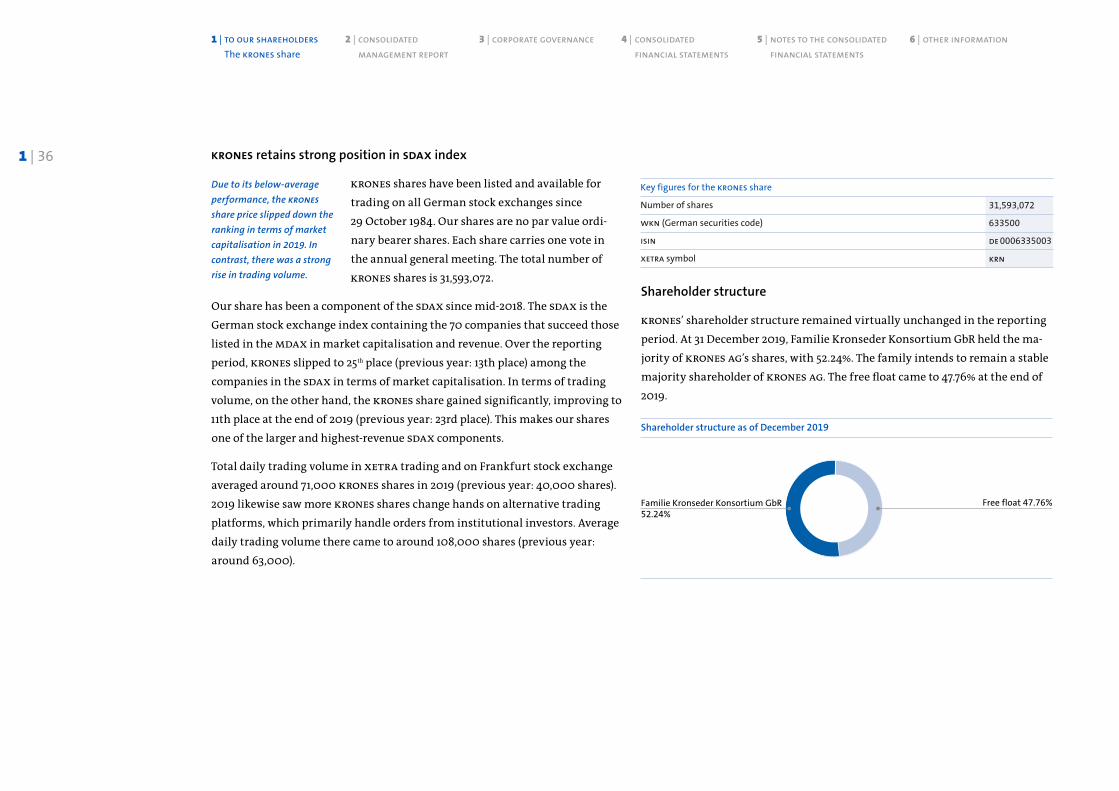
Shareholder structure
Krones’ shareholder structure remained virtually unchanged in the reporting period. At 31 December 2019, Familie Kronseder Konsortium GbR held the ma-jority of Krones AG’s shares, with 52.24%. The family intends to remain a stable majority shareholder of Krones AG. The free float came to 47.76% at the end of 2019.
ISIN
WKN (German securities code)
Number of shares
Key figures for the KRONES share
XETRA symbol
31,593,072
633500
DE 0006335003
KRN
Free float 47.76%Familie Kronseder Konsortium GbR
52.24%
Shareholder structure as of December 2019
1 | 36
2 | Consolidated ManageMent RepoRt
1 | to ouR shaReholdeRs 3 | CoRpoRate goveRnanCe 4 | Consolidated FinanCial stateMents
6 | otheR inFoRMation5 | notes to the Consolidated FinanCial stateMents The KronEs share

krones plans to pay a dividend of €0.75 per share for 2019
The company’s long-term dividend policy is to pay out 25% to 30% of consoli-dated net income to shareholders. At the Annual General Meeting on 18 May 2020, the Executive Board and Supervisory Board will be proposing a dividend of €0.75 per share for the 2019 financial year (previous year: €1.70 per share).
Dividend per share (€)
0
0.40
0.80
1.20
1.60
2.00
2015 2016 2017
1.45
* As per proposal for the appropriation of earnings available for distribution
1.55
1.70
2018
1.70
2019
0.75*
1 | 37
2 | Consolidated ManageMent RepoRt
1 | to ouR shaReholdeRs 3 | CoRpoRate goveRnanCe 4 | Consolidated FinanCial stateMents
6 | otheR inFoRMation5 | notes to the Consolidated FinanCial stateMents The KronEs share

2 ConsoLidATEd mAnAgEmEnT rEporT
Fundamental information about the group
KronEs at a glance. . . . . . . . . . . . . . . . . . . . . . . . . . . . . . . . . . . . . . . . . . . . . . . . . . . . . . . . . . . . . . . . 39
2019 in review . . . . . . . . . . . . . . . . . . . . . . . . . . . . . . . . . . . . . . . . . . . . . . . . . . . . . . . . . . . . . . . . . . . . . 42
Systems and lifecycle service – performance matters . . . . . . . . . . . . . . . . . . . 46
Strategy and management system. . . . . . . . . . . . . . . . . . . . . . . . . . . . . . . . . . . . . . . . . . . 49
Research and development (r&d). . . . . . . . . . . . . . . . . . . . . . . . . . . . . . . . . . . . . . . . . . . . . 58
Report on economic position
Economic environment . . . . . . . . . . . . . . . . . . . . . . . . . . . . . . . . . . . . . . . . . . . . . . . . . . . . . . . . . . 64
KronEs in figures. . . . . . . . . . . . . . . . . . . . . . . . . . . . . . . . . . . . . . . . . . . . . . . . . . . . . . . . . . . . . . . . . . 72
Report from the segments. . . . . . . . . . . . . . . . . . . . . . . . . . . . . . . . . . . . . . . . . . . . . . . . . . . . . . 85
Overall assessment of economic position . . . . . . . . . . . . . . . . . . . . . . . . . . . . . . . . . . 89
Employees . . . . . . . . . . . . . . . . . . . . . . . . . . . . . . . . . . . . . . . . . . . . . . . . . . . . . . . . . . . . . . . . . . . . . . . . . . 90
Sustainability at KronEs . . . . . . . . . . . . . . . . . . . . . . . . . . . . . . . . . . . . . . . . . . . . . . . . . . . . . . . . 91
Risk and opportunity report . . . . . . . . . . . . . . . . . . . . . . . . . . . . . . . . . . . . . . . . . . . . . . . . . . . . . . 92
Events after the reporting period . . . . . . . . . . . . . . . . . . . . . . . . . . . . . . . . . . . . . . . . . . . . . .103
Report on expected developments. . . . . . . . . . . . . . . . . . . . . . . . . . . . . . . . . . . . . . . . . . . . .104Disclosures required under Sections § 315 a (1) and 289 a (1)
of the German Commercial Code (HgB). . . . . . . . . . . . . . . . . . . . . . . . . . . . . . . . . . . . . . .108
Dependency report . . . . . . . . . . . . . . . . . . . . . . . . . . . . . . . . . . . . . . . . . . . . . . . . . . . . . . . . . . . . . . . .110
Remuneration report . . . . . . . . . . . . . . . . . . . . . . . . . . . . . . . . . . . . . . . . . . . . . . . . . . . . . . . . . . . . . .111
Responsibility statement . . . . . . . . . . . . . . . . . . . . . . . . . . . . . . . . . . . . . . . . . . . . . . . . . . . . . . . . .120

Krones at a glance
Emerging markets 50.2%
KRONES group share of consolidated revenue 2019
Advanced economies 49.8%
Fundamental Information about the group KronEs at a glance
Business model, business areas and organisational structure
Krones offers machinery and systems for bottling and packaging and for beverage production. Inno-vative digitalisation and intralogistics solutions round out our portfolio. Krones’ customers include breweries, beverage producers and companies from the food, chemical, pharmaceutical and cosmetic industries. Services are an important part of Krones’ business model. The company maintains service centres and offices around the world.
Krones reports on two segments: Machines and
Lines for Product Filling and Decoration and Machines
and Lines for Beverage Production/Process Tech-
nology. The Machines and Lines for the Compact Class segment, which was reported on separately until 2017, was made part of Krones’ core segment Machines and Lines for Product Filling and Decoration with effect from 1 January 2018.
Major markets and competitive position
Customers in the beverage industry account for most of Krones’ revenue. The remaining revenue comes from business in non-beverage sectors (food, dairy, chemicals, pharmaceuticals and cosmetics).
Krones is heavily export-oriented, generating almost 90% of consolidated revenue outside Ger-many. The regional breakdown of revenue is well balanced overall. In the reporting period, Krones generated 49.8% of its revenue in industrialised countries and 50.2% in the rapidly growing emerg-ing markets.
Apart from a few large companies that are part of a corporate group, Krones competes with a number of companies that offer only individual bottling and packaging products. Most of our main compe-titors are based in the euro area. Chinese manu-facturers have primarily competed against Krones for orders on their home market.
Backed by our global service portfolio, which en-ables us to provide fast service to customers on-site, Krones is well positioned in the competitive arena as a full-service provider.
2 | 39
2 | Consolidated ManageMent RepoRt
3 | CoRpoRate goveRnanCe 4 | Consolidated FinanCial stateMents
6 | otheR inFoRMation5 | notes to the Consolidated FinanCial stateMents
1 | to ouR shaReholdeRs

Machines and Lines for Product Filling and Decoration
This is by far KronEs’ largest segment. It offers machines, lines, and solutions for filling, labelling, packaging, and conveying prod-ucts. Machines for producing pET containers and converting used plastic bottles into food-grade recycled material (pET recycling systems) are also part of this segment.
Revenue (€ million)
Product treatment technology
Systems engineering Labelling technology Inspection technology Filling technology
Cleaning technology Plastics technology Packing and palletising
technology Conveyor technology
See also Segment report, pages 85 and 137.
2015 2016
2,815*2,937*
2017
3,090*
2018
3,178
2019
3,265.4
2019 2018
EBT (€ million) 56.4 223.3
EBT margin (%) 1.7 7.0
Fundamental Information about the group KronEs at a glance
2 | 40
2 | Consolidated ManageMent RepoRt
3 | CoRpoRate goveRnanCe 4 | Consolidated FinanCial stateMents
6 | otheR inFoRMation5 | notes to the Consolidated FinanCial stateMents
1 | to ouR shaReholdeRs

This KronEs segment supplies customers with machines, lines, and digitalisation solutions for producing and processing beer, soft drinks, fruit juices, milk, and dairy drinks. Beverage Produc-tion/Process Technology also includes intralogistics products and services offered by the subsidiaries sysTEm LogisTiCs, sysKron and TriACos as well as EvogUArd brand components.
Machines and Lines for Beverage Production/Process technology
2019 2018
EBT (€ million) – 14.7 – 19.0
EBT margin (%) – 2.1 – 2.8
2015 2016
359
454
2017
601
2018
676
2019
694Revenue (€ million)
Brewhouse and filtration technology Digitalisation Information technology Intralogistics
See also Segment report, pages 87 and 137.
Fundamental Information about the group KronEs at a glance
2 | 41
2 | Consolidated ManageMent RepoRt
3 | CoRpoRate goveRnanCe 4 | Consolidated FinanCial stateMents
6 | otheR inFoRMation5 | notes to the Consolidated FinanCial stateMents
1 | to ouR shaReholdeRs

Order intake Q1 (€ million)
Revenue Q1 (€ million)
EBT Q1 (€ million)
Share price 31 March (€)
Krones made a good start to 2019. Revenue in the period January to March increased by 10.3% year-on-year to €983.5 million. Order intake improved by 5.0% to €1,041.6 million. Due to the tight cost situa-tion, earnings before taxes decreased – despite the higher revenue – by 8.4% to €51.5 million.
Low interest rates and hopes of an end to the trade conflict between China and the UsA buoyed stock markets in the first quarter of 2019. Equity prices fluctuated strongly, however. This also affected the price of Krones shares. The strong start to the year was followed by a sharp correction in late January. From mid-February, however, our share price gained continuously. With a price of €78.55 at the end of March, our shares were 16.4% up on the be-ginning of the year. Our share price thus gained more strongly in the first quarter than the sDAX, which went up by 15.0%.
2018 2019
2018 2019
2018 2019
2018 2019
992.41,041.6
109.40
78.55
891.7
983.5
56.251.5
875.5
105.15
899.4
66.0
822.2
105.85
772.1
55.1
787.0
96.93
738.9
50.2
2017
2017
2017
2017
2016
2016
2016
2016
2015
2015
2015
2015
First quarter 2019
Fundamental Information about the group2019 in review
2 | 42
2 | Consolidated ManageMent RepoRt
3 | CoRpoRate goveRnanCe 4 | Consolidated FinanCial stateMents
6 | otheR inFoRMation5 | notes to the Consolidated FinanCial stateMents
1 | to ouR shaReholdeRs

Order intake Q2 (€ million)
Revenue Q2 (€ million)
EBT Q2 (€ million)
Share price 30 June (€)
The Krones Annual General Meeting was held in Neutraubling on 5 June. Attendance – the propor-tion of the company’s share capital represented at the meeting – was some 81%. Shareholders adopted all agenda items submitted for voting with a large majority. The dividend was held stable relative to 2018 at €1.70 per share.
Krones’ profitability was impacted in the second quarter by high material and labour costs and by an unfavourable product mix. Revenue was lower than expected on products with a large proportion of in-house added value, such as machines and lines in plastics technology. That led to capacity un-derutilisation in this area. Earnings before taxes came to −€3.6 million in the second quarter. Reve-nue increased by 0.7% year-on-year to €905.8 mil-lion, while the €997.0 million order intake was 2.5% down on the previous year.
The Krones share price performed worse in the second quarter than the overall market. One reason for this was the figures for the first quarter, which Krones published at the end of April. Profitability fell short of analysts’ expectations. In total, the Krones share price went down by 9.7% between April and June and stood at €70.95 at the end of the second quarter.
2018 2019
2018 2019
2018 2019
2018 2019
1,022.4 997.0
110.70
70.95
899.1 905.8
56.5
– 3.6
903.8
101.40
875.8
55.0
780.2
94.80
788.2
52.2
737.1
93.76
764.8
53.9
2017
2017
2017
2017
2016
2016
2016
2016
2015
2015
2015
2015
Second quarter 2019
Fundamental Information about the group2019 in review
2 | 43
2 | Consolidated ManageMent RepoRt
3 | CoRpoRate goveRnanCe 4 | Consolidated FinanCial stateMents
6 | otheR inFoRMation5 | notes to the Consolidated FinanCial stateMents
1 | to ouR shaReholdeRs

Order intake Q3 (€ million)
Revenue Q3 (€ million)
EBT Q3 (€ million)
Share price 30 September (€)
The company announced in an ad-hoc announce-ment on 10 July that it would not achieve its earn-ings target for 2019. Krones published a new target for the eBT margin in 2019 of about 3%. The previ-ous target had been about 6%. At the same time, the Executive Board announced structural changes for sustained improvements in profitability.
The Krones share price came under pressure in the third quarter. This was mainly due to the ad-justment to the earnings forecast. The share price marked its lowest point in mid-August at around €47.50. It then recovered substantially. At the end of September, our share price stood at €55.45.
At its meeting of 25 September 2019, the Super-visory Board appointed Norbert Broger as Chief Financial Officer of Krones AG with effect from 1 January 2020. He served Krones from 2006 to 2012 as Head of Controlling, Risk Management and Strategic Corporate Development.
After the weak second quarter, business went better for Krones between July and September 2019. Revenue was up 10.9% year-on-year, to €1,000.4 million. Order intake was 0.6% down. Krones gen-erated eBT of €13.5 million in the third quarter.
2018 2019
2018 2019
2018 2019
2018 2019
925.2 919.3
90.35
55.45
902.0
1,000.4
26.7
13.5
917.5
117.55
733.7
47.0
850.1
86.60
819.8
56.3
787.2
94.10
767.0
52.0
2017
2017
2017
2017
2016
2016
2016
2016
2015
2015
2015
2015
Third quarter 2019
Fundamental Information about the group2019 in review
2 | 44
2 | Consolidated ManageMent RepoRt
3 | CoRpoRate goveRnanCe 4 | Consolidated FinanCial stateMents
6 | otheR inFoRMation5 | notes to the Consolidated FinanCial stateMents
1 | to ouR shaReholdeRs

Order intake Q4 (€ million)
Revenue Q4(€ million)
EBT Q4 (€ million)
Share price 31 December (€)
Krones took part in a number of major interna-tional trade fairs during the autumn. At K, the leading global trade fair for the plastics and rubber industry, Krones exhibited solutions for a closed plastics cycle. The centrepiece was the MetaPure PeT recycling system.
In the fourth quarter, Krones recognised provi-sions for personnel-related measures and impair-ments in connection with portfolio streamlining. This resulted, in total, in one-off expenses of around €70 million. As a result, earnings before taxes were negative, at –€19.7 million. By contrast, the operating business developed in the final quarter according to plan.
The fourth quarter of 2019 brought a strong rise in our share price, with a gain of 22% between October and December. A contributing factor was the publi-cation of details on structural measures to secure sustained gains in Krones’ profitability. The Krones share price at the end of 2019, at €67.50, was exactly the same as a year earlier.
2018 2019
2018 2019
2018 2019
1,017.3
67.50
1,161.21,090.0
114.50
1,182.5
988.8
86.90
1,011.2
877.7
110.30
902.8
2017
2017
20172016
2016
20162015
2015
2015
Fourth quarter 2019
Fundamental Information about the group2019 in review
1,125.9
67.50
1,069.2
2018
64.9
– 19.7
90.8
74.067.2
201720162015 2019
2 | 45
2 | Consolidated ManageMent RepoRt
3 | CoRpoRate goveRnanCe 4 | Consolidated FinanCial stateMents
6 | otheR inFoRMation5 | notes to the Consolidated FinanCial stateMents
1 | to ouR shaReholdeRs

Systems and Lifecycle Service – performance matters
KronEs delivers turnkey plants to the beverage and liquid
food industry. We use our expertise to keep our customers’
investment and operating costs low. Of equal importance,
we enable our customers to produce reliably and at high
quality.
We deliver all of the machines and lines necessary for
producing, filling and packaging beverages. We also
provide complete logistics systems, supply and disposal
systems and custom IT and digitalisation solutions that
manage and document all production processes.
In addition, we support our customers with excellent, 24/7
after-sales service. That is crucial to ensuring that beverage
plants deliver consistently high performance. KronEs’
lifecycle service (LCs) experts are not just service providers –
they are partners to our customers. Together, we find
solutions for efficient, secure, reliable and cost-effective
production. As well as providing optimum maintenance
and retrofitting, our LCs team offer expert consulting as
Partners for Performance.
The following model of a complete beverage plant provides
a brief overview of our offerings.
2 | 46
2 | ConsoLidATEd mAnAgEmEnT rEporT Fundamental Information about the group Systems and Lifecycle Service – performance matters
3 | CorporATE govErnAnCE 4 | ConsoLidATEd finAnCiAL sTATEmEnTs
6 | oTHEr informATion5 | noTEs To THE ConsoLidATEd finAnCiAL sTATEmEnTs
1 | To oUr sHArEHoLdErs

1
6
7
10
9
124
5
8
11
2
3
2 | 47
2 | Consolidated ManageMent RepoRt
3 | CoRpoRate goveRnanCe 4 | Consolidated FinanCial stateMents
6 | otheR inFoRMation5 | notes to the Consolidated FinanCial stateMents
1 | to ouR shaReholdeRs
1 Brewhouse (malt silo, mash tun, lauter tun, wort kettle, whirlpool and wort chiller)
2 Fermentation tanks, conditioning tanks and filters
3 Conditioning and production tanks
4 Administration
10 Order picking and distribution
11 Heat, cooling, compressed air and energy supplies
12 Disposal systems
5 Laboratory
6 Bottling hall
7 Packing and palletising machines
8 Fully automated high-bay warehouse
9 Semi-automated or manual warehouse
Fundamental Information about the group Systems and Lifecycle Service – performance matters

Fundamental Information about the group Systems and Lifecycle Service – performance matters
Control cabinet production at Krones has had a new home at our Neutraubling headquarters since August 2019, in a brand-new building with 6,000 m² of production space and 850 m² of office space. A key advantage is that logistics and production are now in one place. Optimized material flows and close proximity make for faster throughput and higher productivity.
The new building features state-of-the-art techno logy. An automated driverless transport vehicle keeps workstations supplied with parts. The previous manual warehouse has made way for a fully automated warehouse. Krones was able to draw here on the expertise of subsidiaries sysTeM LoGIsTICs AnD TrIACos.
Not to forget the employee-friendly working con-ditions: The new factory building is naturally well-lit and the assembly benches are height and tilt- adjustable. All in all, the new facility provides the ideal conditions for efficient production.
State-of-the-art production: The new Krones control cabinet production facility2 | 48
2 | Consolidated ManageMent RepoRt
3 | CoRpoRate goveRnanCe 4 | Consolidated FinanCial stateMents
6 | otheR inFoRMation5 | notes to the Consolidated FinanCial stateMents
1 | to ouR shaReholdeRs

Krones currently finds itself in an unusually challenging business situation. Except for the crisis year 2009, the company’s performance trend has mainly been one of profitable growth. We contin-ued to deliver respectable revenue growth in 2018 and 2019. However, Krones has recently seen a sig-nificant decline in profitability. Krones’ strategy is therefore focused on resolutely implementing the defined measures in order to set the company for success.
Krones serves an attractive market. Our market is growing stably because demand for packaged bev-erages and foods is rising. The market benefits from megatrends such as world population growth, a growing middle class in emerging economies and increasing urbanisation. In the long term, we ex-pect market growth to be above global GDP growth.
With its full global portfolio of products and ser-vices, Krones is well positioned to profit from the market opportunities. The company provides customers in the liquid food industry with everything they need from a single source, from beverage production to filling to packaging. Intralogistics solutions, information technology and high-quality after-sales service round out the portfolio.
Strategy and management system
“Our market continues to be attractive, but it is also chal-lenging. That has been plain to see in the last two years. If we resolutely implement the measures we have initi-ated, Krones will be set for success.”
Christoph Klenk Ceo
As the recent past has shown, the market not only offers opportunities and is not immune to current developments in the global economy. Trade conflicts, political uncertainties and economic crises in individual countries and regions, together with the sometimes highly irrational and emotionally charged plas-tics debate, make for uncertainty among our customers. Competition for orders will remain intense and the targeted price increases will be hard to push through. Digitalisation will also require high levels of investment.
krones has ambitious medium-term goals
From 2020, Krones will use the eBITDA margin instead of the eBT margin as the target figure for profitability. This is because eBITDA (earnings before inter-est, taxes, depreciation and amortisation) is closer to cash flow and more com-parable because it does not include depreciation and amortisation, financial in-come/expense and taxes. Our medium-term target of 6–8% for the eBT margin corresponds to an eBITDA margin of 9–12%. To consolidate its good market position and have sufficient headroom for capital expenditure, Krones has set itself ambitious medium-term financial targets.
� 2% to 5% average organic revenue growth per year� 9 to 12% eBITDA margin� 22% to 24% working capital to revenue ratio
Medium-term targets
EBITDA margin
9–12%
Revenuegrowth
2–5%
Working capitalto revenue
22 –24%
Fundamental Information about the group Strategy and management system
2 | 49
2 | Consolidated ManageMent RepoRt
3 | CoRpoRate goveRnanCe 4 | Consolidated FinanCial stateMents
6 | otheR inFoRMation5 | notes to the Consolidated FinanCial stateMents
1 | to ouR shaReholdeRs

Various challenges – such as rising material and labour costs, the plastics debate, and also general economic uncertainty – meant that we did not reach our original targets for 2018 and 2019. Despite in-creased market volatility, Krones sets ambitious
medium-term targets. However, Krones will take longer to attain those targets. The company regards a period of three to four years as realistic. During the re-porting period, we launched many measures with which we want to set the Krones team for success. Now it is a matter of resolutely implementing them.
Profitability improvement: measures in progress
To remain competitive for the long term, Krones must generate sustained and sufficient earnings. With an eBT margin of 2.8% in 2019 (excluding expenses for provisions to reduce labour costs and impairments for portfolio streamlining in a total amount of about €70 million), we are still short of our target. In the second half of 2019, the company therefore initiated medium-term alongside short-term measures to improve earnings. The measures are divided into three pillars.
Krones aims to attain the medium-term targets as quickly as possible and regards a period of three to four years as realistic.
Fundamental Information about the group Strategy and management system
Medium-term measures and impacts
The positive EBT impact will exceed the costs within two years.
Costs 2019
Structure Portfolio Growth
Global Footprint
€20 million €30 million €20 million
Segments Prices
Headcount
€ 45 million €20 million €15 million
Products After-sales
Procurement
CumulativePositive EBT impact
2020
2021 €150 million
Positive impact
€80 million
€70 million
2 | 50
2 | Consolidated ManageMent RepoRt
3 | CoRpoRate goveRnanCe 4 | Consolidated FinanCial stateMents
6 | otheR inFoRMation5 | notes to the Consolidated FinanCial stateMents
1 | to ouR shaReholdeRs

Structural measures make up the largest share of the action package. Most of all, they include expansion of Krones’ global footprint. We currently generate only a small share of added value outside of Germany even though almost 90% of revenue comes from abroad. In the short and medium term, therefore, we plan to relocate parts of the value chain to best-cost countries. The most im-portant project here is our new factory in Hungary. This is scheduled to go into full operation with 500 employees in the second half of 2020. Production has also been expanded in China. In total, about 600,000 hours of production time are to be implemented in Hungary and China by the end of 2020. Added to this are 200,000 design and planning hours in future in the Czech Republic, India, Hungary and China.
In addition, group processes and resources are to be further optimised and or-ganisational units streamlined. In Germany, the structural measures result in a reduction of 500 jobs: 200 in the reporting period and 300 in 2020. About 200 jobs will be reduced internationally by the end of 2020. The new process tech-nology locations established in the UsA, China and India as a result of acquisi-tions in recent years will also contribute positively to earnings.
Krones is also expanding its global footprint to counteract the rise in material costs. Best-cost country (BCC) sourcing secures significant reductions in pro-curement costs. Krones has already successfully implemented this in Taicang, China. Furthermore, we have established a supplier network in India, Taiwan, Thailand and Turkey. We will rigorously continue with the international pro-curement measures we have implemented so far.
Optimising the House of krones portfolio
With the “House of Krones”, Krones has tailored its business model to cus-tomer needs and to the state-of-the-art beverage plant. This approach will not change. We will, however, continue to make individual adjustments and opti-mise the portfolio. In the Process Technology pillar, we will begin by making the beverage production business a legally independent unit. We can then better assess how this business is developing on a standalone basis, specifically with regard to the different types of beverages. Currently, we do not plan any acqui-sitions in process technology. We are concentrating on integrating the acquisitions made in recent years in the UsA and China.
Digital solutions
Bottling and packagingequipment
Process technology Intralogistics
LCS LCS LCS
Fundamental Information about the group Strategy and management system
2 | 51
2 | Consolidated ManageMent RepoRt
3 | CoRpoRate goveRnanCe 4 | Consolidated FinanCial stateMents
6 | otheR inFoRMation5 | notes to the Consolidated FinanCial stateMents
1 | to ouR shaReholdeRs

The core bottling and packaging equipment segment is affected by the critical plastics debate. In our opinion, PeT has a wrongly bad reputation. PeT plastic has a major advantage over other types of packaging such as glass: It is signifi-cantly lighter than other materials and PeT bottles have a correspondingly smaller ecological footprint in long-distance transportation. This is a key rea-son why PeT continues to be the fastest growing packaging material worldwide.
It is often overlooked that plastic packaging can in fact be sustainable. This requires packaging materials to be produced in a resource-efficient manner and kept in a closed cycle. Krones’ technologies and products meet both of these criteria. We provide material-saving container design, low-energy production and used plastics recycling. With our high-quality PeT recycling systems that turn used PeT bottles into raw material for new ones, we support a sustainable material cycle.
Extending the company’s good position in glass and cans
In its core segment, Krones will continue to strengthen the glass and cans product portfolio. As the megatrend towards packaged beverages continues, weak demand for PeT packaging would mean greater demand for other types of packaging such as glass and cans. Krones has always been well positioned here with a broad product range for both packaging types. The company added a key innovation to the glass portfolio during the reporting year with the Craftmate G glass bottle filler.
As well as expanding the broad-based bottling and packaging segment with further attractive products, we are also going to strip the portfolio of less profitable activities and technologies in order to focus our capital on the most attractive investments.
The third pillar of the House of Krones, intralogistics, continues to see good demand for our products and services. Intralogistics is a major element of the digital beverage plant. It is an important area for our customers because it allows them to optimise material flow management. The priority in this area is on managing the rapid rate of growth and pushing ahead with international-isation. For this purpose, we have pooled all intralogistics activities in sysTeM LoGIsTICs and made this a legally independent unit. This enables us to react quickly and flexibly to market requirements.
Price increases important for sustained business performance
Price increases are necessary in order to partially offset rising labour and material costs. We will implement our goals here by means of increased price discipline. For 2020, we consider an earnings contribution of €10–20 million to be realistic from higher prices.
Fundamental Information about the group Strategy and management system
2 | 52
2 | Consolidated ManageMent RepoRt
3 | CoRpoRate goveRnanCe 4 | Consolidated FinanCial stateMents
6 | otheR inFoRMation5 | notes to the Consolidated FinanCial stateMents
1 | to ouR shaReholdeRs

Krones will continue to invest in its operations at home and in its global foot-print, although at a lower level than in preceding years.
Digitalisation offers huge opportunities in the medium to long term
In digitalisation, Krones has the major advantage as a full-service supplier of being able to capture all material and data flows around the clock throughout the entire beverage plant production process. Combining the captured data with the knowhow of our workforce, some of whom have decades of experience, we develop new products and services – primarily for the life cycle services (LCs) subsegment – that significantly improve plant efficiency. In this way we create lasting added value for customers. The aim is to develop digital business models and establish them as quickly as possible in the food and beverage in-dustry.
Overall, investment in digitalisation will continue to impact profitability in the next few years. Krones sees good market opportunities here in the medium to long term.
High-growth service business strengthens profitability
Our service business is important to the profita-bility of Krones. The key success factor for the LCs business is and remains availability, meaning how quickly the service team can solve a customer’s problems on the spot. That means both technicians
and spare parts must be as close to the customer as possible. To ensure this, we will further reinforce our global network of service and sales offices. Alongside availability, another major growth driver for the service business takes the form of innovative products and services supported by innovation in digital-isation.
The service market has considerable further growth potential for Krones in the medium to long term. A major asset for Krones is the large installed base of about 40,000 machines in customers’ factories. Our LCs team so far serve about 60% of our installed base. We are going to raise this figure in the years ahead by convincing customers of the benefits of our services, which enable them to significantly increase productivity.
Capital expenditure returning to normal levels
To remain competitive for the long term, Krones must invest – both in its German locations and in its global footprint. In contrast to the strong growth investment of the preceding years, capital expen diture will be scaled back to normal levels in the short to medium term. Most capital expenditure in Ger-many is to be on IT infrastructure. Germany remains Krones’ central location for the development of innovative machines, lines and services.
Elsewhere, Krones will invest in the organisation and in integrating the acqui-sitions made in recent years. We will also further expand our IT internationally.
Innovations: key investment for the future
Innovations secure our company’s future and are the basis for sustained growth. For this reason, even in economically more challenging times, Krones will maintain its comparatively high spending on research and development.
Fundamental Information about the group Strategy and management system
2 | 53
2 | Consolidated ManageMent RepoRt
3 | CoRpoRate goveRnanCe 4 | Consolidated FinanCial stateMents
6 | otheR inFoRMation5 | notes to the Consolidated FinanCial stateMents
1 | to ouR shaReholdeRs

New products and services must provide added value for customers in order to be a market success. Close contact with our customers gives us important input for innovations and improvements. Based on customer needs, we work together to develop ideas for new products and services. We also generate ideas of our own by thinking out of the box. Close contact and good working relationships with universities, research institutions and startups also help us in this regard.
Alongside digital innovations, solutions at Krones focus on environmentally compatible, cost-cutting, flexible and operator-friendly machines and products (see r&D p. 58).
Security from solid financial and capital structure
With insufficient cash flow from operating activities in 2019, free cash flow and net cash and cash equivalents also decreased significantly due to the high level of capital expenditure. The equity ratio was a comparatively satisfactory 41.3%. Krones therefore retains a robust financial and capital structure. The company has sufficient financial headroom to finance growth investment and potential acquisitions and to accord shareholders their due share of the company’s suc-cess in the form of dividends. Krones’ dividend strategy is to pay out 25% to 30% of consolidated net income to shareholders.
Ongoing strong focus on free cash flow
Krones continues to focus on free cash flow. This fell significantly in 2019 because of the decline in the operating business, above-average capital expen-diture and a rise in working capital. We will work hard on all three of those
parameters in the coming years. First of all, as described earlier, we will regain our former profitability. After several years of strong growth investment, we will return capital expenditure to normal levels. A clear focus in future capital expenditure will be on whether business units are generating sufficient cash. This criterion will also be a deciding factor in portfolio streamlining. We are holding back on acquisitions. No major acquisitions are planned for the short or medium term. However, we have the capacity to act on attractive acquisition opportunities at any time.
The greatest potential for improving free cash flow consists of reducing work-ing capital. Krones is not satisfied with working capital as a percentage of reve-nue, which is our third target. This came to 26.9% in 2019, which is well short of our 22–24% medium-term target. The lower our working capital, the more capi-tal we have available for other uses. For each percentage point by which we im-prove this ratio, our free cash flow and therefore our available resources grow by around €40 million.
The main burden on working capital is the high level of customer receivables and contract assets. Krones will shorten the timespan from delivery to invoic-ing. First of all, on-site assembly and acceptance are to be completed sooner. Secondly, contracts with customers need to be drafted in such a way that per-formance rendered can still be invoiced in the event of delays for which we are not responsible. Overall, it is planned for trade receivables to grow below aver-age in the next few years relative to revenue. There is also room for improve-ment in trade payables, but not on the same scale as in receivables.
Fundamental Information about the group Strategy and management system
2 | 54
2 | Consolidated ManageMent RepoRt
3 | CoRpoRate goveRnanCe 4 | Consolidated FinanCial stateMents
6 | otheR inFoRMation5 | notes to the Consolidated FinanCial stateMents
1 | to ouR shaReholdeRs

Workforce the foundation of lasting success
The workforce is pivotal to Krones’ success – especially at times when condi-tions become more challenging and there is a break in the continuous upward trend. Our customers buy from Krones because they trust in the company and its workforce. It is the workforce who are responsible for customers’ satisfaction with our products and services. And customer satisfaction is a highly decisive factor when competing for orders.
We had to take various measures due to negative developments during the re-porting period – including major job cuts affecting several hundred employees in Germany and elsewhere.
The company will continue to invest heavily in employee training and develop-ment in order to maintain workforce knowhow at the same very high level.
Krones will further expand the workforce in the years ahead where this con-tributes to profitability. To take advantage of market growth opportunities in emerging economies, we need more employees in the regions where customers are located. We currently employ about 24% of the workforce in emerging markets. Given corresponding market growth, we will further increase that percentage.
Employees in the emerging markets 2014 – 2019
Year SouthAmerica
Africa Asia-Pacific Cis/EasternEurope
China Total
2014 501 363 453 136 385 1,838
2015 519 376 502 147 451 1,995
2016 549 386 602 155 508 2,200
2017 581 393 734 398 608 2,714
2018 637 452 830 507 716 3,142
2019 782 671 1,009 933 792 4,187
Employees in the emerging markets 2018/2019
South America
Africa
637
400
600
800
1,000
200
0
671
Asia-Pacific
1,009
CIS/EasternEurope
933
China
716792782
452
830
507
Fundamental Information about the group Strategy and management system
2 | 55
2 | Consolidated ManageMent RepoRt
3 | CoRpoRate goveRnanCe 4 | Consolidated FinanCial stateMents
6 | otheR inFoRMation5 | notes to the Consolidated FinanCial stateMents
1 | to ouR shaReholdeRs

krones’ global footprint
Expanding the company’s global footprint is a key strategic priority. Krones will make further progress here in the years ahead.
Lyon
Sollenau
Roverbella
Erie
Singapore
Pilsen
Rochester
Zurich
Waukesha
Tampa
Arden
Fiorano Modenese
Taicang
Moscow
Johannesburg
Franklin
Bangkok
Mexico CityDubai
Jakarta
Louvain-la-Neuve
Bolton
Bangalore
Lagos
Nairobi
São Paulo
Debrecen
Neutraubling
KRONES subsidiaries andrepresentative offices
Productionlocations
Engineeringlocations
Centre
Germany:AltenstadtBarbingCollenbergDassowFlensburgFreisingHochheim/Main
KelkheimLaatzenLangenfeldNittenauRosenheimWackersdorf
Fundamental Information about the group Strategy and management system
2 | 56
2 | Consolidated ManageMent RepoRt
3 | CoRpoRate goveRnanCe 4 | Consolidated FinanCial stateMents
6 | otheR inFoRMation5 | notes to the Consolidated FinanCial stateMents
1 | to ouR shaReholdeRs

krones’ management system
Krones’ management primarily uses the following financial performance indicators to steer the group and its two segments:
� Revenue� eBT margin (earnings before taxes as a percentage of revenue)� Working capital as a percentage of revenue
In order to strengthen our market position and utilise economies of scale, we aim for above market average revenue growth.
Earnings before taxes (EBT) are an important earnings indicator. It is out of eBT that the group pays taxes and dividends and makes investments and capital ex-penditures. Profitability, measured as the EBT margin, is among our key targets and parameters. The eBT margin indicates the company’s profitability in rela-tion to revenue. For the group, we set the target margin as the weighted aver-age of the two segments. From 2020, we are replacing the eBT margin with the EBITDA margin (earnings before interest, taxes, depreciation and amortisation as a percentage of revenue). The eBITDA margin indicates the company’s profit-ability in relation to revenue, irrespective of the tax rate, financial income/ex-pense and depreciation and amortisation.
Our third major performance indicator is working capital to revenue, which is calculated at group level. Working capital is calculated as follows: (inventories + trade receivables + contract assets) – (trade payables + contract liabilities). This figure indicates how much working capital is needed to finance revenue gen-eration. The lower the number, the less capital is tied up in operations and the more financial leeway the company has to use its cash and cash and cash equiv-alents for other purposes.
Other financial key performance figures
In addition to the above, a further important performance indicator for Krones is free cash flow (cash flow from operating activities less cash flow from investing activities). We take further guidance from the development of EBT (earnings before taxes) and ROCE (return on capital employed, the ratio of EBIT to average capital employed).
Fundamental Information about the group Strategy and management system
2 | 57
2 | Consolidated ManageMent RepoRt
3 | CoRpoRate goveRnanCe 4 | Consolidated FinanCial stateMents
6 | otheR inFoRMation5 | notes to the Consolidated FinanCial stateMents
1 | to ouR shaReholdeRs

Some 2,300 highly qualified people at Krones keep the pipeline filled with new and evolving machines, systems and services. Innovations are the basis of our future business success. New products and services must create added value for customers. That is key to Krones in consolidating and extending its market position. The increase in the portfolio of registered patents and utility
models from 5,707 in the previous year to 5,877 at the end of 2019 confirms the Krones team’s innovative capacity. A total of €195 million (previous year: €179 million) was invested in research and development in
the reporting period. That corresponds to 4.9% of consolidated revenue. Of this total, €32.5 million was capitalised as development costs in 2019 (previous year: €38.5 million).
Innovation: leading with boldness and expertise
Products development at Krones is primarily driven by market requirements. Thanks to the frequent contact between our sales and service staff and custom-ers, we know very well what customers’ requirements are and how we can cre-ate added value for them. The House of Krones additionally provides us with a 360-degree view of customer needs.
What our customers require most from our machines and systems are safety, affordability, versatility and environmental performance. Machinery should also offer maximum ease of use and take up minimum space.
These needs combined with the extensive knowledge of our workforce result in ideas for new products. Such ideas lead in turn to development projects that our mechanical, electronics, pneumatics and automation experts implement as quickly as possible. In projects that are successful, the innovation process generates products that do well in the market, as shown by the examples on the pages that follow.
Alongside this, we will also break out of the status quo by applying bold for-ward thinking. Close collaboration with universities and research institutions additionally brings in valuable ideas from outside. By having the courage to think outside the box, we will create innovations that astonish our customers – as with our bottling-on-demand concept study for maximum flexibility in fill-ing. We must do this in order to maintain our technology leadership in the industry.
Another focus of our r&D strategy is transformation – from analogue to digital. This mainly entails further evolving the technologies and methods behind our existing success.
Research and development (r&D)� 4.9% of revenue invested in r&D
� PeT debate: krones has solutions
� Expansion of glass and cans product portfolio
� Continued focus on customer benefit in innovation
Registered patents and utility models – KRONES Group
2015 2016
4,450
3,000
4,500
6,000
1,500
0
5,028
2017
5,484
2018
5,707
2019
5,877
Krones invested approxi-mately 4.9 % of consoli-dated revenue in research and development in 2019.
Fundamental Information about the group Research and development (r&d)
2 | 58
2 | Consolidated ManageMent RepoRt
3 | CoRpoRate goveRnanCe 4 | Consolidated FinanCial stateMents
6 | otheR inFoRMation5 | notes to the Consolidated FinanCial stateMents
1 | to ouR shaReholdeRs

Digitalisation needs the analogue skills of our workforce
Thanks to technical advances, it is now possible to digitally simulate the entire value creation process in a beverage plant. Krones subsidiary sysKron, which pools our digitalisation activities, is tasked with developing new digital busi-ness models for our industry. This is done using data collected from our sys-tems and equipment. Combining the analogue expertise and experience of our workforce with technologies such as cloud computing and big data, Krones develops new products and solutions for customers.
Krones is already among the leaders in digital services. Broadband communi-cation, for example, enables us to significantly improve quality in remote sup-port and reduce downtime. A case in point is Argos, a headset with camera and miniature display. The machine operator wearing the headset can be provided with troubleshooting support by a Krones service technician as if they were to-gether in the same room.
In the Krones.shop, the company has successfully operated a digital platform for more than five years where customers can quickly and conveniently order spare parts, upgrades, components, training courses and other services.
PeT debate: krones has solutions
Public debate around plastic waste and plastic packaging has risen significantly during the reporting period and has spread uncertainty, especially among our European customers. Their hesitance in placing orders has naturally also
affected Krones, as we generate a large proportion of revenue with machines and lines for filling and packaging plastic containers made of PeT. It is often overlooked in the debate that PeT remains the world’s most popular packaging option and that plastic packaging can be far more sustainable than is thought. This requires the packaging materials to be produced in a resource-efficient manner and kept in a closed cycle.
Krones’ technology and products meet both these criteria. We provide material- saving container design, low-energy production and used plastics recycling. Most of all with our high-quality PeT recycling systems that turn used bottles into raw material for new ones, we support a sustainable material cycle. The problem is not the PeT bottles themselves but the fact that they are thrown away and not recycled. With our PeT recycling systems, we contribute significantly to reducing the global waste problem.
Continuous expansion of the glass and cans product portfolio
Krones’ great advantage is that it is not restricted to a single packaging type. As the megatrend towards packaged beverages continues, weak demand for PeT packaging would mean greater demand for other types of packaging such as glass and cans. Krones has always been well positioned here with a broad pro-duct range for both packaging types. The company has added various innova-tions to the glass and cans portfolio during the reporting year, including the Craftmate G glass bottle filler, and will continue to provide for both of these types of packaging.
Fundamental Information about the group Research and development (r&d)
2 | 59
2 | Consolidated ManageMent RepoRt
3 | CoRpoRate goveRnanCe 4 | Consolidated FinanCial stateMents
6 | otheR inFoRMation5 | notes to the Consolidated FinanCial stateMents
1 | to ouR shaReholdeRs

krones expands enviro sustainability programme
A key objective of all Krones innovations is to reduce energy and media con-sumption on our machines and lines. For this purpose, Krones introduced the enviro sustainability programme, a TÜV-certified management system back in 2008. enviro is an integral part of the product development process at Krones. As a result, all new Krones machines and systems are above average in effi-ciency and environmental performance.
From 2019, in addition to machines and systems, packaging innovations are likewise assessed and certified against objective sustainability criteria in enviro Design. Krones again teams up with TÜV here as the provider of objective assessment. The aim of enviro Design is to minimise the environ-mental impact of packaging. Several environment-friendly packaging solutions were in the process of assessment at the end of the reporting period. In 2020, it is planned for the first packaging innovations that meet the strict criteria to be awarded the enviro design seal.
A selection of our innovations Modulfill nWJ: flexible filling system for high-viscosity products
Krones has further developed its existing filling technology for safe, clean and hygienic handling of viscous products. Modulfill nWJ covers a wide range, from low-viscosity products such as olive oil and salad dressings to high- viscosity products such as mayonnaise and mustard. It also handles products with particle sizes up to 10 mm, such as barbecue sauces and grainy mustard. Modulfill nWJ can be used both with glass and with PeT containers.
A key advantage of the newly developed Modulfill nWJ is its high filling accu-racy. Using a novel measuring and valve system, the filler responds to varia-tions in viscosity during the filling process by adjusting flow rates. A newly developed valve geometry ensures a clean fill without smearing or dripping.
Modulfill nWJ can fill up to 48,000 containers per hour and features fully automated cleaning. That saves both time and labour.
Fundamental Information about the group Research and development (r&d)
2 | 60
2 | Consolidated ManageMent RepoRt
3 | CoRpoRate goveRnanCe 4 | Consolidated FinanCial stateMents
6 | otheR inFoRMation5 | notes to the Consolidated FinanCial stateMents
1 | to ouR shaReholdeRs

New size for can filler series: Modulfill VFs-C
Krones has the ideal solution for the lower output range (6,000-20,000 containers per hour) with the Craftmate can filler specially designed for craft breweries, while the Modulfill VFs-C unveiled at drinktec 2017 operates at higher speeds (up to 135,000 containers per hour). Now, Krones has an attractive option for small and medium-sized breweries with a smaller version of Modulfill VFs-C (26,000 containers per hour).
The latest version of Modulfill is similar in appearance to the Craftmate. Tech-nologically speaking it has all the advantages of the more powerful machine series of the same name. An inductive flow meter ensures precise liquid quan-tity control. Pneumatic valve operation also makes for cleaner production as no lubrication is required.
Argos: real-time service with smart glasses
Digitalisation brings many advantages for Krones and our customers, espe-cially with regard to service. One digital service product provided by Krones is Argos. Smart glasses enable quick and easy troubleshooting.
In the event of a fault or error message, the line operator contacts Krones Sup-port as normal. To troubleshoot the problem, the machine operator puts on the Argos headset, which has a camera and a miniature display. Real-time video and audio enables the Krones service technician to see exactly what is happen-ing and give precise instructions as if the operator and the technician were in the same room. For the customer, this significantly reduces downtime and in-creases line productivity.
Fundamental Information about the group Research and development (r&d)
2 | 61
2 | Consolidated ManageMent RepoRt
3 | CoRpoRate goveRnanCe 4 | Consolidated FinanCial stateMents
6 | otheR inFoRMation5 | notes to the Consolidated FinanCial stateMents
1 | to ouR shaReholdeRs

Digital printing for recycled PeT containers
In the view of many experts, direct printing and PeT recycling have so far been incompatible. Krones has proved that wrong. As a result, the benefits of direct printing – such as the ability to do without labels and great versatility – are now also available for recycled PeT containers. The interaction between material, ink type and ink adhesion plays a key role here. With the DecoType direct print-ing machine, Krones can print bottles made of 100% recycled PeT.
An important requirement is for the directly printed PeT bottles to be recyc-lable as well. This means it must be possible to remove the ink from the plastic without any residue. Our solution meets this requirement, as the Us Associa-tion of Plastic Recyclers (APr) confirmed for Krones in 2018.
PeT-Asept D: dry sterilisation for small batches
Krones has developed a compact version of the PeT-Asept D specifically for the low output range. The newly developed system provides microbiologically safe filling of acidic beverages. It covers the 12,000-16,000 containers per hour out-put range.
PeT-Asept D performs completely dry sterilisation. The sterilisation medium, hydrogen peroxide, is applied to the containers in warm gaseous form. This disinfects them quickly and efficiently without unwanted condensation. Due to its high versatility and small footprint, the system is particularly well suited to small batch production. Following complete cleaning and sterilisation, it is fully ready for use again after just 150 minutes.
Fundamental Information about the group Research and development (r&d)
2 | 62
2 | Consolidated ManageMent RepoRt
3 | CoRpoRate goveRnanCe 4 | Consolidated FinanCial stateMents
6 | otheR inFoRMation5 | notes to the Consolidated FinanCial stateMents
1 | to ouR shaReholdeRs

Craftmate G: compact glass bottle filler for beers and CsDs
Craftmate G is the latest addition to the Krones filler family. As the G suggests, it fills glass bottles. Craftmate C, the can filler, has been on the market since 2015. The company first presented the compact glass bottle filler for beers and carbonated soft drinks (CsDs) at BrauBeviale in 2019.
In technological terms, Craftmate G is similarly equipped to its big brothers in the ModulFill range. It has the added advantages of requiring little space and being able to combine with up to two cappers. This gives brewers the versatility to fill CsDs as well as beers. Its output of up to 24,000 bottles per hour and com-pact form factor mean it is particularly well suited to small and medium-sized breweries.
VarioFlash B: flash pasteurisation for beer
The VarioFlash B flash pasteuriser ensures microbiologically safe beer filling. Spanning an output range of 18 to 600 hectolitres per hour, the system can be combined with bottle or can fillers. VarioFlash B is technologically optimised to minimise water and energy consumption without compromise on microbio-logical safety.
The small version of the VarioFlash B was primarily developed for craft brewers and small batch breweries. It is ideally suited to the 18 to 45 hectolitres per hour output range. Customers benefit from rapid installation and commissioning, low product losses and media consumption and also low maintenance costs.
Fundamental Information about the group Research and development (r&d)
2 | 63
2 | Consolidated ManageMent RepoRt
3 | CoRpoRate goveRnanCe 4 | Consolidated FinanCial stateMents
6 | otheR inFoRMation5 | notes to the Consolidated FinanCial stateMents
1 | to ouR shaReholdeRs

� Global economic growth slowed in 2019
� Difficult conditions for German mechanical engineering
� Rising global demand for packaged beverages
Global economy affected by trade conflicts
The global economy was weaker than expected in 2019. This is due to various sources of uncertainty, including the Us trade disputes with China and Europe. The long-unresolved Brexit also weighed down on the economy. International Monetary Fund (IMF) experts had to revise their growth forecast downwards several times in 2019. According to the January 2020 data, global gross domes-tic product (GDP) grew by 2.9% in 2019 (2018: plus 3.6%). The IMF growth forecast at the beginning of 2019 had been 3.5%.
Growth in emerging and developing economies slowed down unexpectedly sharply during the reporting period. GDP there increased by only 3.7% in 2019 (2018: plus 4.5%). According to the IMF experts, that was partly due to develop-ments in India, where political unrest severely curtailed economic growth. After GDP growth of 6.8% in the previous year, India’s economy grew by just 4.8% in 2019. Growth likewise slowed in China. Chinese GDP climbed by 6.1% in 2019 (previous year: plus 6.6%). The Latin America region recorded minimal GDP growth of 0.1% in 2019 (previous year: plus 1.1%). This was mainly due to Mexico’s stagnating economy. Growth in the Middle East/Central Asia region was 0.8% in the reporting year (previous year: plus 1.9%). There was a slight im-provement in economic growth in the Sub-Saharan Africa region. GDP growth there was 3.3% in the reporting period (previous year: plus 3.2%).
Economic growth in mature industrialised economies slowed significantly overall to 1.7% in 2019 (previous year: plus 2.2%). Growth in the euro area declined even more sharply. GDP there went up by 1.2% in 2019, compared to a 1.9% increase in the previous year. The world’s biggest economy, the UsA, grew by 2.3% in the reporting period (previous year: plus 2.9%). GDP growth in Japan accelerated to 1.0% in 2019 (previous year: plus 0.3%).
Economic environment
Report on economic position Economic environment
GDP growth worldwide (%)
2015 2016
3.43.2
1
0
2
3
4
2017
3.8
2018
3.6
2019
2.9
Source: IWF
GDP growth rate by region (%)
USA EuroArea
Japan China India LatinAmerica
MiddleEast
Sub-Saharan
Africa
1
0
2
3
4
2.3
1.21.0
6.14.8
0.1
0.8
3.3
Quelle: IWF
2 | 64
2 | Consolidated ManageMent RepoRt
3 | CoRpoRate goveRnanCe 4 | Consolidated FinanCial stateMents
6 | otheR inFoRMation5 | notes to the Consolidated FinanCial stateMents
1 | to ouR shaReholdeRs

German GDP growth of 0.6% in 2019
As a strongly export-oriented economy, Germany was hit particularly hard by the trade disputes. According to preliminary figures from Germany’s Federal Statistical Office, German GDP grew by 0.6% in 2019 relative to the previous year. Growth was supported by private and public consumption. The German economy grew much less dynamically overall in 2019 than in 2018. GDP growth in the previous year was 1.5%.
Slowdown for German mechanical engineering in 2019
The German mechanical engineering industry faced difficult business condi-tions in 2019. According to the Mechanical Engineering Industry Association (VDMA), the industry was held back by the gloomy macroeconomic environ-ment, threats and sanctions in the global trade disputes and radical structural
change in the automotive industry. Output in the reporting period conse-quently developed worse than expected. On preliminary figures, the VDMA expects machinery and industrial equipment output to have decreased in value by 2% in 2019 relative to the previous year. The VDMA’s original forecast for 2019 had been plus 2%.
Megatrends ensure stable market growth
Krones operates in a market exhibiting stable long-term growth. The average annual growth rate is higher than that of the world economy as a whole. Several megatrends are driving this stronger de-mand for food and beverage packaging machinery.
The overarching megatrend is global population growth. At the end of 2019, some 7.75 billion people inhabited the earth. According to United Nations forecasts, that number is growing at a rate of more than 70 million each year. Population growth is especially strong in Africa and Asia. The world’s popula-tion is expected to reach about 8.5 billion by 2030. All those people will need to eat and drink. And, increasingly, they are opting for packaged beverages and foods.
The rising global population, growth of the middle class and urbanisation are mega-trends that support the growth of Krones’ markets.
Report on economic position Economic environment
GDP growth Germany (%)
2015 2016
1.7
0
1
2
2.2
2017
2.5
2018
1.5
2019
0.6
Source: Germany's Federal Statistical Office
2 | 65
2 | Consolidated ManageMent RepoRt
3 | CoRpoRate goveRnanCe 4 | Consolidated FinanCial stateMents
6 | otheR inFoRMation5 | notes to the Consolidated FinanCial stateMents
1 | to ouR shaReholdeRs

Source: United Nations, (World Urbanization Prospects, The 2018 Revision)
Urban population in 2015 and 2050 (% of total)
Asia 48%
Asia 66%
North America 89%
North America 82%
Europe 84%
Oceania 72%
Latin America/Caribbean 88%
Africa 59%
Latin America/Caribbean 80%
Europe 74%
Oceania 68%
Africa 41%
Growing middle class increases consumer spending
More and more people in emerging and developing economies are escaping poverty and rising into the middle class. According to forecasts by the oeCD, the middle class worldwide will grow from 3.2 billion people to 4.9 billion in the period from 2020 to 2030. As incomes rise, so too does consumer spending
– and that includes spending for packaged beverages and foods. Asia accounts for a large share of the growth of the middle class and the corresponding in-crease in buying power worldwide. The oeCD predicts that Asia’s share of total middle class consumer spending worldwide will be 42% by 2020. By 2030, that figure is expected to rise to 59%. The total of consumer spending by the global middle class is likely to increase from Us$35 trillion to Us$55.7 trillion in that time.
Urbanisation is driving growth
Increasing urbanisation, the migration of people from rural areas to cities, also promotes demand for packaged food and beverages. That is because city-dwell-ers generally consume more packaged products than people who live in the countryside.
The United Nations forecasts that two out of three of the earth’s inhabitants will live in cities by 2050. At present, only about half of the world’s population lives in cities. The strongest influx of people into cities is in the developing and emerging market countries of Africa and Asia.
The trend towards urbanisation is strongest in Africa and Asia.
Source: OECD
Asia’s share of global middle class consumption is growing rapidly
2020 (expected) US$35.0 trillion 2030 (expected) US$55.7 trillion
Asia 42 %
Asia 59 %
North America
Europe
Central and South America
Middle East/Nothern Africa
North America
Europe
Central and South AmericaMiddle East/Nothern Africa
Rapidly increasing numbers of people are moving up into the middle classes, especially in Asia. The region conse-quently accounts for a growing share of the world’s rising middle-class con-sumer expenditure.
Report on economic position Economic environment
2 | 66
2 | Consolidated ManageMent RepoRt
3 | CoRpoRate goveRnanCe 4 | Consolidated FinanCial stateMents
6 | otheR inFoRMation5 | notes to the Consolidated FinanCial stateMents
1 | to ouR shaReholdeRs

From 2019, Krones obtains data on the global beverage and packaging market from Global Data. This data came in previous years from Euro-monitor. The two providers differ in matters such as the countries covered and meth-odological approach. There is therefore only limited com-parability between the Euro-monitor and Global Data figures.
Global consumption of packaged beverages growing continuously
Driven by megatrends, global consumption of packaged beverages is steadily increasing. According to preliminary figures from market research institute Global Data, the world population consumed 1,380 billion litres of packaged beverages in 2019. That was 2.2% more than in the previous year. Global Data projects stable growth in global packaged beverage consumption for the years ahead. For the period 2019 to 2022, the experts expect average annual growth of 2.1%. The growth rates vary between the different types of beverage.
Consumption of bottled water is expected to increase significantly more rapidly than the overall market. With global consumption of some 465 bil-lion litres in 2019, bottled water is by far the largest segment of the global beverage market. It accounts for about one third of all packaged beverage con-sumption. The Global Data experts expect con-sumption of bottled water to grow by an average of 3.4% a year from 2019 to 2022. Key growth drivers are rising demand for clean bottled drink-ing water in emerging and developing countries and the trend to healthy nutrition in industrialised countries.
Demand for alcoholic beverages, the second largest segment accounting for 19.6% of the market, is expected to grow less rapidly than the overall market. This is because beer consumption is rising only slowly overall. While beer con-sumption is growing strongly in some emerging markets, in many industri-alised countries demand is saturated. Demand for wine and spirits is growing more strongly. However, these have only minor significance in the alcoholic beverages segment. Overall, Global Data expects that the consumption of pack-aged alcoholic beverages will grow at an average annual rate of 1.3% between 2019 and 2022.
Within the milk and dairy drinks segment (share of global beverage consump-tion in 2019: 18.8%), rapid increases are expected in the consumption of niche products such as yoghurt smoothies (average growth rate 2019–2022: 9.5%) and flavoured milk (+3.1%). Demand for plain milk, which accounts for around three-quarters of the market segment, is expected to grow on average by just 1.2%. Overall, the milk and dairy drinks segment is expected to grow in step with the overall market from 2018 to 2021 (average annual growth rate: 2.1%).
Milk and dairy drinks 260.4 (18.8%)
Carbonated soft drinks (CSDs) 224.4 (16.2%)
Global consumption of packaged beverages in 2019 (billion litres)
Water 465.4 (33.7%)
Alcoholic beverages* 271.5 (19.6%)
New drinks** 75.4 (5.5%)
2019: 1,383.0 billion litres (e) *Beer, wine, and spirits ** Energy drinks, sports drinks, and ready-to-drink tea and coffee
Average annual growth of beverage types 2019 to 2022
0.9%
1.3%
2.1%
3.4%
0.1%
2.9%
Sources: Global Data
Fruit and vegetablejuices 85.9 (6.2%)
Report on economic position Economic environment
2 | 67
2 | Consolidated ManageMent RepoRt
3 | CoRpoRate goveRnanCe 4 | Consolidated FinanCial stateMents
6 | otheR inFoRMation5 | notes to the Consolidated FinanCial stateMents
1 | to ouR shaReholdeRs

Another large market is carbonated soft drinks (CSDs). People around the world consumed some 224 billion litres of packaged CsDs in 2019 (share of total bever-age consumption: 16.2%). CsDs such as cola and lemonades often contain sugar. Due to increasing consumer health awareness, demand for CsDs is growing at a lesser rate than the overall market. Global Data projects average annual growth rates of 0.9% for the period 2019 to 2022.
Fruit and vegetable juices (share of total beverage consumption in 2019: 6.2%) and new drinks (5.5%) are the two smaller beverage segments. New drinks in-clude ready-to-drink tea and coffee together with sports and energy drinks. From 2019 to 2022, new drinks are expected to show significantly higher aver-age growth rates (+2.9%) than fruit and vegetable juices (+0.1%).
Booming demand for packaged beverages in emerging markets
The megatrends – global population growth, a bur-geoning middle class and urbanisation – mainly play out in emerging and developing countries. These are consequently the strongest source of growth in demand for packaged beverages.
The market researchers expect that the highest growth rate will be in the Africa/Middle East region.
Demand for packaged beverages is anticipated to rise there by an annual aver-age of 4.2% between 2019 and 2022. Consumption in Asia/Pacific is also ex-pected to grow at an above-average rate. For this region, the experts forecast an average annual growth rate of 3.2%. Growth in beverage consumption likewise continues at a rapid pace in China, with an average growth rate of 2.9%.
In emerging and developing economies, Krones is bene-fiting from population growth and a growing mid-dle class. The growing diver-sity of beverages and pack-aging stimulate demand in mature industrial countries.
Worldwide consumption of packaged beverages
2019 (e) 2022 (e) Average annual growth (%)
Billion litres
%* Billion litres
%* 2019 – 2022
Asia-Pacific 321.8 23.5 354.2 24.3 3.2
China 249.2 18.2 271.7 18.6 2.9
North America/Central America 203.6 14.9 211.6 14.5 1.3
South America 184.1 13.4 186.7 12.8 0.5
Western Europe 138.3 10.1 139.9 9.6 0.4
Africa/Middle East 122.5 8.9 138.6 9.5 4.2
Russia/CIS/Eastern Europe 94.7 6.9 99.0 6.8 1.5
Central Europe 56.1 4.1 56.3 3.9 0.1
Worldwide 1,370.3 100.0 1,457.9 100.0 2.1
*Share of global consumption Sources: Global Data
Demand in mature markets such as Europe and North and Central America is expected to grow at a lower rate than the overall market. These are regions with low population growth. Krones’ growth opportunities in such markets therefore relate not to rising beverage consumption, but to the increasing diversity of bever-ages and packaging.
Demand for packaged beverages is growing at high rates in the Africa/Middle East and Asia/ Pacific regions.
Report on economic position Economic environment
2 | 68
2 | Consolidated ManageMent RepoRt
3 | CoRpoRate goveRnanCe 4 | Consolidated FinanCial stateMents
6 | otheR inFoRMation5 | notes to the Consolidated FinanCial stateMents
1 | to ouR shaReholdeRs

+ 0.4% + 2.9%+ 1.5%+ 4.2%
+ 0.1%
+ 1.3%
Russland/ /Osteuropa
China
Nordamerika/Mittelamerika
Global consumption of packaged beverages by region – annual growth (%)*
+ 3.2%
+ 0.5%
Africa/Middle East
Asia-Pacific
Western Europe
Russia/CIS/Eastern Europe
Central Europe
China
Sources: Global Data
North America/Central America
South America
Global consumption of packaged beverages by region: annual growth 2019 –2022
Demand for packaged beverages is growing at high rates in the Africa/Middle East and Asia/ Pacific regions.
Report on economic position Economic environment
2 | 69
2 | Consolidated ManageMent RepoRt
3 | CoRpoRate goveRnanCe 4 | Consolidated FinanCial stateMents
6 | otheR inFoRMation5 | notes to the Consolidated FinanCial stateMents
1 | to ouR shaReholdeRs

Global consumption of packaged beverages by region: billion litres*
203.6 211.6
North America/
Central America
2019 2022
+ 8.0
2019 2022
South America
+ 2.6
184.1 186.7
2019 2022
CentralEurope
+ 0.2
56.1 56.3
2019 2022
WesternEurope
+ 1.6
138.3 139.9
2019 2022
Africa/Middle
East
+ 16.1
122.5138.6
2019 2022
Russia/CIS/Eastern Europe
+ 4.3
94.7 99.0
2019 2022
China
+ 22.5
249.2271.7
2019 2022
Asia-Pacific
+ 32.4
321.8
354.2
Sources: Global Data*Forecast = Growth between 2019 and 2022 (billion litres)
In the Asia/Pacific region, it is expected that 354.2 billion litres of packaged beverages will be con-sumed in 2022. That is 32.4 billion litres more than in 2019. Consump-tion in China is expected to in-crease by 22.5 billion litres over the same period. The combined growth in the two regions roughly equals total consumption in Central Europe today.
Global consumption of packaged beverages by region: billion litres*
Report on economic position Economic environment
2 | 70
2 | Consolidated ManageMent RepoRt
3 | CoRpoRate goveRnanCe 4 | Consolidated FinanCial stateMents
6 | otheR inFoRMation5 | notes to the Consolidated FinanCial stateMents
1 | to ouR shaReholdeRs

PeT plastic the preferred packaging material for beverages
According to preliminary figures from Global Data, some 1,690 billion contain-ers will have been filled with beverages worldwide in 2019. That quantity is growing steadily with rising beverage consumption and is expected to increase by 2.7% per year on average to 1,827 billion by 2022. Most beverages are sold in plastic bottles, glass bottles, metal cans and paper-based cartons.
By far the most frequent packaging material for beverages is polyethylene terephthalate (PET). This is primarily because water – globally the most widely
consumed beverage – is mainly sold in PeT bottles. According to figures from Global Data, some 525 billion or over a third of all beverage containers were made of PeT in 2019. The quantity of PeT beverage containers is expected to in-crease by an average of 3.5% per year through to 2022, which is faster than the overall beverage packaging market.
The second most frequent packaging material for beverages is glass. Glass accounted for 24.0% of all beverage containers in 2019. Glass bottles are pri-marily used for beer and other alcoholic beverages – that is, beverages for which demand is growing disproportionately slowly relative to the overall market. Accordingly, the number of beverage containers made of glass is expected to see annual average growth of just 1.0% from 2019 to 2022.
Significantly faster growth is expected for metal beverage packaging. 19.0% of beverage containers last year were metal cans. These are frequently used for beer and carbonated soft drinks (CsDs). The number of cans used for beverage packaging is likely to gain by an average of 3.1% per year through to 2022.
A further significant packaging material comprises paper-based cartons. Cartons are mainly used to package milk, dairy drinks and fruit and vegetable juices. The number of paper-based cartons (share of beverage packaging in 2019: 10.4%) is expected to grow by an average of 2.4% per year through to 2022.
As one of the leading providers of machines and lines for the production, filling, and packaging of PeT containers, Krones benefits from the continued growth in PeT packaging. The company also has a strong market position in lines for filling and packaging beverages in glass bottles and cans. Krones does not provide solutions for carton packaging.
The strongest growth is in demand for PeT beverage packaging.
Cartons 10.4%
Cans 19.0%
Other 15.5%
Glass 24.0%
PET 31.2%
Average annual growth of packaging types 2019–2022
Sources: Global Data
3.2%3.1%
2.4%
1.0%
3.5%
Global beverage market by packaging material in 2019 (based on units filled)
Ca
ns
Gla
ss
Oth
er
Ca
rto
ns
PET
Report on economic position Economic environment
2 | 71
2 | Consolidated ManageMent RepoRt
3 | CoRpoRate goveRnanCe 4 | Consolidated FinanCial stateMents
6 | otheR inFoRMation5 | notes to the Consolidated FinanCial stateMents
1 | to ouR shaReholdeRs

� krones’ consolidated revenue rose 2.7% in 2019 to €3.96 billion.
� Profitability has been hit by excessive labour costs and expenses
for restructuring and impairments.
� krones plans to pay a dividend based on earnings excluding one-off effects.
Shareholders are to receive a dividend of €0.75 per share for 2019.
krones revenue up 2.7% to €3.96 billion
Despite the difficult general economic conditions, Krones’ markets were relatively stable in 2019. We were able to take advantage of this as a leading
provider with a broad global footprint. Our full service range also benefited us. Revenue grew by 2.7% year-on-year in 2019, from €3,854.0 million to €3,958.9 million.
Krones in figures
Forecast 2019
Actual 2019
Revenue growth 3% 2.7%
EBT margin about 6% 1.1%*
Working capital/revenue 26% 26.9%
*Including expenses for structural measures
Revenue performance in the financial year was partly affected by the PeT debate. In plastics technology, comprising machines and lines for filling and packaging in PeT, revenue was down in 2019. Krones was able to make up for this with growth in other areas. In total, Krones attained its 3% growth target for consolidated revenue in 2019.
Krones’ revenue continued to grow and almost hit the €4 billion mark in 2019.
KRONES Group revenue (€ million)
2015 2016
3,174
2,000
2,500
3,000
3,500
4,000
1,500
1,000
500
0
3,391
2017
3,691
2018
3,854
2019
3,959
Report on economic position KronEs in figures
2 | 72
2 | Consolidated ManageMent RepoRt
3 | CoRpoRate goveRnanCe 4 | Consolidated FinanCial stateMents
6 | otheR inFoRMation5 | notes to the Consolidated FinanCial stateMents
1 | to ouR shaReholdeRs

Revenue by Segment
Revenue in the core segment, Machines and Lines for Product Filling and Decoration, rose by 2.8%, from €3,177.9 million in the previous year to €3,265.4 million in 2019. The segment’s share of consolidated revenue was 82.5%, as in the previous year.
Revenue in the Machines and Lines for Beverage Production/Process Tech-nology segment went up by 2.6%, from €676.1 million in the previous year to €693.5 million in 2019. The segment contributed 17.5% of consolidated revenue (previous year: 17.5%).
Further information can be found under “Report from the segments” beginning on page 85 and under “Segment reporting” in the notes to the consolidated financial statements on page 137.
Revenue by region
Krones’ revenue in Germany increased in 2019 by 29.3% year-on-year, from €362.3 million to €468.4 million. The German share of revenue was 11.8% in the reporting period (previous year: 9.4%). The base effect must also be taken into account here. In 2018, the share of revenue accounted for by Germany decreased from 10.5% to 9.4%.
Krones’ revenue in Europe (excluding Germany) was slightly down, decreasing by 5.8% from €1,213.4 million in the previous year to €1,142.8 million in the reporting period. A major reason for this was lower revenue in the large Western Europe sales region, which was affected by the PeT debate. Revenue there went down by 14.1% to €620.1 million. It should be noted, however, that business in Western Europe has grown strongly in recent years and the compar-ative figure is consequently very high. In Central Europe (Austria, Switzerland and the Netherlands), revenue decreased in 2019 by 10.5% to €200.9 million. Revenue in Eastern Europe climbed 31.0% in the reporting period to €245.4 mil-lion. Business in 2019 was relatively stable for Krones in the Russia/CIs region. There, revenue was down by a slight 4.3% to €76.4 million.
Krones is strongly export- oriented. The company gen-erated just under 90% of rev-enue internationally in 2019.
Krones generated revenue growth in both segments in 2019. The percentage increase was slightly greater in the core segment (+2.8%) than in process technology (+2.6%).
Revenue in 2019: €3,958.9 million
Machines and Lines for Beverage Production/Process Technology17.5% (€693.5 million)
Machines and Lines for Product Filling and Decoration 82.5% (€3,265.4 million)
Share of consolidated revenue
Revenue in 2018: €3,854.0 million
Machines and Lines for Beverage Production/Process Technology17.5% (€676.1 million)
Machines and Lines for Product Filling and Decoration 82.5% (€3,177.9 million)
Report on economic position KronEs in figures
2 | 73
2 | Consolidated ManageMent RepoRt
3 | CoRpoRate goveRnanCe 4 | Consolidated FinanCial stateMents
6 | otheR inFoRMation5 | notes to the Consolidated FinanCial stateMents
1 | to ouR shaReholdeRs

Share of consolidated revenue 2019 2018 Change
€ million % € million % %
Germany 468.4 11.8 362.3 9.4 + 29.3
Central Europe (excluding Germany) 200.9 5.1 224.6 5.8 – 10.5
Western Europe 620.1 15.7 721.6 18.7 – 14.1
Eastern Europe 245.4 6.2 187.4 4.9 + 31.0
Russia, Central Asia (Cis) 76.4 1.9 79.8 2.1 – 4.3
Middle East/Africa 451.5 11.4 500.6 13.0 – 9.8
Asia-Pacific 521.1 13.2 445.7 11.6 + 16.9
China 319.9 8.1 290.8 7.5 + 10.0
North and Central America 683.4 17.3 533.2 13.8 + 28.2
South America/Mexico 371.8 9.4 508.0 13.2 – 26.8
Total 3,958.9 100.0 3,854.0 100.0 + 2.7 Revenue 2019: €3,958.9 million
Russia, Central Asia (CIS)1.9% (€76.4 million)
Middle East/Africa11.4% (€451.5 million)
Asia-Pacific13.2% (€521.1 million)
China8.1% (€319.9 million)
North and Central America17.3% (€683.4 million)
South America/Mexico9.4% (€371.8 million)
Europe38.8% (€1,534.8 million)
Share of consolidated revenue
Revenue 2018: €3,854.0 million
Russia, Central Asia (CIS)2.1% (€79.8 million)
Middle East/Africa13.0% (€500.6 million)
Asia-Pacific11.6% (€445.7 million)
China7.5% (€290.8 million)
North and Central America13.8% (€533.2 million)
South America/Mexico13.2% (508.0 million)
Europe38.3% (€1,495.9 million)
Report on economic position KronEs in figures
In total, the share of consolidated revenue in the reporting period accounted for by Europe (excluding Germany) decreased from 31.5% in the previous year to 28.9% in 2019.
In past years, Krones recorded in part strong growth in the Middle East/Africa region. Business there has most recently consolidated at a high level. In 2019, revenue in the region fell 9.8% year-on-year to €451.5 million. Krones’ business in China, on the other hand, continued its upward trend in 2019. Revenue there improved by 10.0% to €319.9 million. The core bottling and packaging equip-ment segment recorded growth above this rate. In the remainder of the Asia/ Pacific region, revenue grew in 2019 by 16.9% to €521.1 million.
Business in North and Central America showed healthy growth during the reporting period due to the stronger general economic situation. Overall, revenue in the region was up 28.2% year-on-year to €683.4 million. Krones’ revenue was down in the South America/Mexico region. At €371.8 million, revenue there decreased in 2019 by 26.8% year-on-year. One reason for the decline consisted of the general economic situation in parts of South America.
Overall, Krones’ revenue remains well balanced in-ternationally in established and emerging markets. The company generated a total of 50.2% of consolidated rev-enue in emerging markets in 2019 (previous year: 52.2%). Mature industrialised econ-omies accounted for 49.8% (previous year: 47.8%) of Krones’ revenue.
2 | 74
2 | Consolidated ManageMent RepoRt
3 | CoRpoRate goveRnanCe 4 | Consolidated FinanCial stateMents
6 | otheR inFoRMation5 | notes to the Consolidated FinanCial stateMents
1 | to ouR shaReholdeRs

Order intake and order backlog
Growth in demand for krones products and services in 2019
The many economic uncertainties hit investment confidence among our customers in 2019. This mainly affected the second quarter. Overall, we are
satisfied with the demand trend in the reporting period. This is partly due to very strong sales at the end of the year. Orders rose sharply from October to December 2019, and the contract value of orders in the fourth quarter exceeded the previous year’s figure by 10.6%. In the full year 2019, Krones’ order intake rose by 3.2% year-on-year, from €3,957.3 million to €4,083.5 million. Krones was able to offset the lower demand in plastics technology thanks to its broad product and service range.
The contract value of orders increased by 3.2% year-on-year in 2019.
Contrary to what was planned, order intake went up by more than the average in 2019 in North America and Eastern Europe. In the regions of China, Asia- Pacific and South America, demand remained stable overall as planned. The contract value of orders was down in Europe in 2019.
Further increase in order backlog
Krones had orders on hand totalling €1,385.7 million at the end of 2019. This represents growth of 9.9% compared with a year earlier (€1,261.1 million). At customers’ request, however, some of these orders will not go into production until the end of the 2020 financial year.
KRONES Group order intake (€ million)
2015 2016
3,189
500
2,500
3,000
3,500
4,000
0
3,441
2017
3,787
2018
3,957
2019
4.083
KRONES Group orders on hand at 31 December (€ million)
2015 2016
1,095
1,000
1,500
2,000
2,500
500
0
1,145
2017
1,240
2018
1,261
2019
1,386
Report on economic position KronEs in figures
2 | 75
2 | Consolidated ManageMent RepoRt
3 | CoRpoRate goveRnanCe 4 | Consolidated FinanCial stateMents
6 | otheR inFoRMation5 | notes to the Consolidated FinanCial stateMents
1 | to ouR shaReholdeRs

krones Group earnings
krones’ profitability hit by excessively high costs
Krones’ earnings were hit in 2019 by high cost in-creases, especially for labour. The product mix also had a negative impact on profitability. In the first half year, for example, we had poor production capacity utilisation in plastics technology due to
temporarily weak demand. The earnings performance also reflects service rev-enues being slightly below target in parts of the service business. In total, earn-ings before taxes (eBT) fell from €204.3 million in the previous year to €41.7 million in 2019. The eBT margin decreased from 5.3% to 1.1%. It should be noted
in 2019, the eBT margin would have been 2.8%. This would have been in line with the July 2019 downward revision of our margin target to around 3%. The original guidance for 2019 was for an eBT margin of around 6%.
in this connection that Krones recognised provisions and impairments total-ling around €70 million in 2019 for measures to cut personnel expenses and streamline the portfolio. Had there been no expenses for structural measures
Partly due to expenditure for structural measures, the eBT margin went down from 5.3% in the previous year to 1.1% in 2019.
KRONES Group EBT (€ million)
2015 2016
223.3
200
250
150
100
50
0
237.6
2017
258.8
2018
204.3
2019
41.7
KRONES Group EBT margin (%)
2015 2016
7.0
0
2
4
6
87.0
2017
7.0
2018
5.3
2019
1.1
KRONES Group net income (€ million)
2015 2016
156.3
0
50
100
150
200
250
169.1
2017
187.1
2018
150.6
2019
9.2
Report on economic position KronEs in figures
2 | 76
2 | Consolidated ManageMent RepoRt
3 | CoRpoRate goveRnanCe 4 | Consolidated FinanCial stateMents
6 | otheR inFoRMation5 | notes to the Consolidated FinanCial stateMents
1 | to ouR shaReholdeRs

Krones’ tax rate increased substantially from 26.3% in the previous year to 77.9% in 2019. This is because of higher, non-offsettable income taxes incurred alongside tax-neutral effects as a result of the one-off expenses. Consolidated net income consequently decreased more sharply in the reporting period than eBT, from €150.6 million to €9.2 million. Earnings per share went down from €4.78 to €0.30.
krones plans to pay a dividend of €0.75 per share for 2019
The impairments and provisions recognised by Krones in connection with the structural measures in the reporting period have no effect on the dividend for the 2019 financial year. The proposed dividend is based on earnings excluding those one-off expenses. Krones’ policy is to pay out 25% to 30% of consolidated net income in the form of dividends. At the Annual General Meeting on 18 May 2020, the Executive Board and Supervisory Board will be proposing a dividend of €0.75 per share for the 2019 financial year (previous year: €1.70 per share).
KRONES Group earnings per share (€)
2015 2016
4.98
0
1
2
3
4
5
6
7
5.40
2017
5.97
2018
4.78
2019
0.30
KRONES Group Dividend per share (€)
2015 2016
1.45
0
0.25
0.5
0.75
1.0
1.25
1.5
1.75
1.55
2017
1.70
2018
1.70
2019
0.75*
* As per proposal for the appropriation of retained earnings available for distribution
Report on economic position KronEs in figures
2 | 77
2 | Consolidated ManageMent RepoRt
3 | CoRpoRate goveRnanCe 4 | Consolidated FinanCial stateMents
6 | otheR inFoRMation5 | notes to the Consolidated FinanCial stateMents
1 | to ouR shaReholdeRs

€ million 2019 2018 Change
Revenue 3,958.9 3,854.0 +2.7%
Changes in inventories of finished goods and work in progress + 8.7 + 1.1 –
Total operating performance 3,967.6 3,855.1 +2.9%
Other own work capitalised + 63.0 + 49.6 +27.0%
Other operating income + 99.8 + 114.5 – 12.8%
Goods and services purchased – 2,041.8 – 2,032.0 + 0.5%
Personnel expenses – 1,275.5 – 1,137.3 + 12.2%
Other operating expenses – 585.9 – 544.0 + 7.7%
EBiTdA 227.3 305.9 – 25.7%
Depreciation and amortisation on fixed assets – 183.3 – 102.7 + 78.4%
EBiT 43.9 203.2 – 78.4%
Financial income/expense – 2.2 + 1.1 –
EBT 41.7 204.3 – 79.6%
Income tax – 32.5 – 53.7 – 39.4%
Consolidated net income 9.2 150.6 – 93.9%
For further information, please see the full statement of profit and loss on p. 130.
Krones improved total operating performance in the full year 2019 by 2.9% to €3,967.6 million. This was slightly greater than the growth in revenue (which was up 2.7%) because inventories of finished goods and work in progress in-creased in the reporting period by €8.7 million, compared with €1.1 million in the previous year.
Personnel expenses increased more strongly than total operating performance in 2019, gaining 12.2% to €1,275.5 million. The substantial increase was due to pay rises under collective agreements, expansion of the workforce at interna-tional locations – primarily in Hungary – and acquisitions. Personnel expenses
were also affected by around €30 million in provi-sions for cuts in the workforce. The ratio of person-nel expenses to total operating performance went up from 29.5% in the previous year to 32.2% in 2019.
Goods and services purchased were slightly positive relative to the previous year, rising by 0.5% in the reporting period to €2,041.8 million. The ratio of goods and services purchased to total operating performance decreased from 52.7% to 51.5%. The additional measures taken to reduce material costs began to take effect in the second half of the year. Goods and services purchased as a percentage of total operating performance dropped in this period from 55.4% in the previous year to 51.9%. Despite the slight positive signals, the general trend to rising material purchase prices must be countered on a lasting basis with the measures taken.
Other operating expenses went up by more than total operating performance in the reporting period, increasing by 7.7% to €585.9 million. While other oper-ating income fell from €114.5 million to €99.8 million, other own work capital-ised increased in the financial year from €49.6 million to €63.0 million. The net balance of other operating income and expenses and own work capitalised changed by 11.4% from –€379.9 million to –€423.0 million. As a percentage of total operating performance, this represented an increase from 9.9% to 10.7%.
Overall, eBITDA (earnings before interest, taxes, depreciation and amortisation) went down by 25.7% in the reporting period, from €305.9 million to €227.3 mil-lion. The eBITDA margin consequently dropped from 7.9% to 5.7%. Depreciation and amortisation of fixed assets was significantly higher than in the previous year, increasing from €102.7 million in the previous year to €183.3 million. This includes approximately €40 million in impairment losses on intangible assets as a result of the portfolio streamlining in 2019. The increase also reflected the high level of capital expenditure in the preceding years and the application of the new IFrs 16 Leases, which led to €33.6 million higher depreciation in the reporting period.
Around €70 million in pro-visions and impairments for structural measures reduced Krones’ profitability in 2019.
krones Group earnings structure
Report on economic position KronEs in figures
2 | 78
2 | Consolidated ManageMent RepoRt
3 | CoRpoRate goveRnanCe 4 | Consolidated FinanCial stateMents
6 | otheR inFoRMation5 | notes to the Consolidated FinanCial stateMents
1 | to ouR shaReholdeRs

KRONES Group EBIT (€ million)
2015 2016
216.9
200
250
150
100
50
0
228.0
2017
245.5
2018
203.2
2019
43.9
Due to the higher depreciation and amortisation, earnings before interest and taxes (eBIT) decreased more sharply than eBITDA, falling from €203.2 million to €43.9 million. Net financial income/expense went down from €1.1 million to –€2.2 million. This was mainly due to the reduction in investment income relat-ing to non-consolidated companies from €8.7 million to €5.6 million.
Earnings before taxes (eBT) fell from €204.3 million to €41.7 million. This results in an eBT margin of 1.1% (previous year: 5.3%). Adjusted for the provisions and impairments totalling around €70 million as a result of the structural measures in the reporting period, the eBT margin was 2.8%. Krones’ tax rate was ex-tremely high in 2019, at 77.9% (previous year: 26.2%). Consolidated net income went down in 2019 relative to the previous year by €141.4 million to €9.2 million.
KRONES Group EBITDA (in € million)
250
300
100
50
0 2015 2016
305.3320.8
2017
340.2
2018
305.9
2019
227.3
KRONES Group EBITDA margin (%)
6
8
10
4
2
0 2015 2016
9.5
2017
9.2
2018
7.9
2019
9.6
5.7
Report on economic position KronEs in figures
2 | 79
2 | Consolidated ManageMent RepoRt
3 | CoRpoRate goveRnanCe 4 | Consolidated FinanCial stateMents
6 | otheR inFoRMation5 | notes to the Consolidated FinanCial stateMents
1 | to ouR shaReholdeRs

Consolidated cash flow
€ million 2019 2018
Earnings before taxes 41.7 204.3
Other non-cash changes + 309.4 + 19.3
Changes in working capital – 202.3 + 178.9
Changes in other assets and liabilities – 55.3 – 87.4
Cash flow from operating activities 93.5 315.1
Capital expenditure for intangible assets and property, plant and equipment – 168.9 – 179.1
m&A activities – 28.0 – 28.3
Other + 9.0 + 13.0
Free cash flow – 94.4 120.7
Cash flow from financing activities – 19.3 – 77.9
Other + 5.3 – 6.0
Net change in cash and cash equivalents – 108.4 36.8
Cash and cash equivalents at the end of the period 110.4 218.8
After a strong prior year, Krones’ cash flow was significantly lower in 2019. Cash flow from operat-ing activities was thus down €221.6 million to €93.5 million. Alongside the lower earnings before taxes, the decrease was mainly due to a substantial rise in working capital. Krones increased working capital by €202.3 million in the reporting period after
having reduced it by €178.9 million in the previous year to a very low level. The non-cash changes in the amount of €309.4 million (previous year: €19.3 million) include the increase in provisions and primarily depreciation and amortisation in the amount of €183.3 million. Changes in other assets and liabilities amount to –€55.3 million on the cash flow statement (previous year: –€87.4 million)
For further information, please see the statement of cash flows on p. 134.
Krones’ cash flow from op-erating activities decreased to €93.5 million in 2019 (pre-vious year: €315.1 million). This was mainly due to a substantial increase in work-ing capital relative to the low prior-year figure.
KRONES Group cash flow from operating activities (€ million)
174.4
100
50
0
150
200
250
300
194.7
–5.9
2015 2016 2017 2018
315.1
2019
93.5
Report on economic position KronEs in figures
2 | 80
2 | Consolidated ManageMent RepoRt
3 | CoRpoRate goveRnanCe 4 | Consolidated FinanCial stateMents
6 | otheR inFoRMation5 | notes to the Consolidated FinanCial stateMents
1 | to ouR shaReholdeRs

Working capital as a percentage of revenue down to 26.9%
Krones was able to reduce average working capital over the past four quarters as a percentage of revenue from 27.3% to 26.9% in the reporting period. Despite the slight improvement, we did not meet our full-year target of 26% in 2019. While there was a decrease in trade receivables and contract assets, higher in-ventories and in particular lower trade payables and contract liabilities nega-tively impacted working capital as of the reporting date.
Krones invested a total of €168.9 million in prop-erty, plant and equipment and intangible assets in the reporting period. As planned, this was below the very high prior-year figure of €179.1 million. Most of the capital expenditure was incurred at locations in Germany and in Hungary. Due to the exceptionally high depreciation and amortisation in the reporting period, the ratio of capital expenditure to deprecia-tion and amortisation fell from 1.74 in the previous year to 0.92 in 2019.
KRONES Group working capital to revenue (%, average over four quarters)
2015 2016
24.6
10
5
0
20
25
15
26.7
2017
27.3
2018
27.3
2019
26.9
KRONES Group capital expenditure for PP&E and intangible assets (€ million)
2015 2016
102.6
80
120
160
200
40
0
111.3
2017
133.5
2018
179.1
2019
168.9
Krones reduced capital ex-penditure on property, plant and equipment and intangi-ble assets by €10.2 million in 2019, from €179.1 million to €168.9 million.
Report on economic position KronEs in figures
2 | 81
2 | Consolidated ManageMent RepoRt
3 | CoRpoRate goveRnanCe 4 | Consolidated FinanCial stateMents
6 | otheR inFoRMation5 | notes to the Consolidated FinanCial stateMents
1 | to ouR shaReholdeRs

At €19.3 million in 2019, the cash outflow from financing activities was €58.6 mil-lion down on the previous year’s €77.9 million. This was mainly due to short-term bank borrowings of €72.2 million (previous year: €0.6 million). In the oppo-site direction, there was a cash outflow from the repayment of lease liabilities in the amount of €32.1 million as a result of IFrs 16. As in the previous year, Krones distributed €53.7 million to shareholders during the reporting period. Changes in exchange rates and the consolidated group increased liquidity by €5.3 million (previous year: €6.0 million). In total, cash and cash equivalents decreased in 2019 by €108.4 million to €110.4 million.
KRONES Group free cash flow (€ million)
2015 2016
70.7
0
20
40
60
80
100
120
140
49.2
2017 2018
–150.7
120.7
2019
–94.4
KRONES Group dividend payout (€ million)
2015 2016
39.5
0
20
40
60
45.8
2017
49.0
2018
53.7
2019
53.7
Krones’ free cash flow (net cash generated from operat-ing activities) went down in the reporting period to a
–€94.4 million (previous year: positive €120.7 million). Operating free cash flow, which is adjusted for acquisi-
tions, came to a negative €66.4 million, likewise substantially below the previ-ous year’s positive €149.0 million.
KRONES Group cash and cash equivalents at 31 December (€ million)
2015 2016
364.6
100
0
200
300
400 368.9
2017
182.0
2018
218.8
2019
110.4
Report on economic position KronEs in figures
Krones’ free cash flow went down in 2019 by €215.1 million to
–€94.4 million.
2 | 82
2 | Consolidated ManageMent RepoRt
3 | CoRpoRate goveRnanCe 4 | Consolidated FinanCial stateMents
6 | otheR inFoRMation5 | notes to the Consolidated FinanCial stateMents
1 | to ouR shaReholdeRs

Assets and capital structure
€ million at 31 December 2019 2018 2017
Non-current assets 1,154 1,010 882
of which fixed assets 1,070 936 797
Current assets 2,165 2,312 2,158
of which cash and equivalents 110 219 182
Equity 1,370 1,433 1,330
Total debt 1,949 1,888 1,710
Non-current liabilities 452 359 314
Current liabilities 1,497 1,529 1,396
Total 3,319 3,321 3,040
For further information, please see the full balance sheet on p. 132 to 133.
After a substantial (9.3%) increase in the previous year, Krones’ total assets, at €3,319.4 million as of 31 December 2019, were virtually unchanged relative to the end of 2018.
The company’s non-current assets totalled €1,154.0 million at the end of 2019, up 14.3% on the previous year (€1009.8 million). This was primarily due to a €1,069.8 million increase in fixed assets (previous year: €936.4 million). Much of that increase related to property, plant and equipment and right-of-use as-sets due to the first-time application of the new IFrs 16 lease accounting stan-dard. The carrying amount as of the reporting date was €87.6 million. Property, plant and equipment went up in total by €122.4 million to €693.2 million. Intangible assets climbed – despite about €38 million in impairments – to €345.2 million (previous year: €328.2 million). Alongside additions to goodwill due to acquisitions in the reporting period, most of the increase related to the capitalization of development costs.
Krones’ current assets decreased. At the end of the 2019 financial year, the company had current assets totalling €2,165.4 million. That is a reduction of 6.3% or €146.2 million relative to the 2018 year-end. A contributing factor was a fall in cash and cash equiv-alents. Mostly due to the negative free cash flow and dividend payments, these dropped in the reporting period from €218.8 million to €110.4 million. Contract assets also decreased significantly. These went down from €647.1 million to €571.3 million. Trade receivables were also lower, at €932.9 million (previous year: €955.4 million). By contrast, Krones reported significantly higher inventories, at €382.5 million as of the end of 2019 (31 De-cember 2018: €320.7 million).
On the equity and liabilities side, Krones’ non-current liabilities increased significantly in the reporting period to €452.0 million (31 December 2018: €358.8 million). This was partly due to higher financial and lease liabilities, which climbed from €41.3 million to €104.9 million. Most of the increase in this balance sheet item – an amount of €58.8 million – relates to the application of the new IFrs 16 lease accounting standard. A rise in provisions for pensions to €260.2 million (previous year: €220.6 million) – mostly due to a reduction in the discount factor and mostly not recognized through profit or loss – also con-tributed to the increase in non-current liabilities. Krones had non-current bank debt totalling €0.1 million at the end of 2019 (previous year: €3.2 million).
Current liabilities totalled €1,497.4 million at the end of 2019 (previous year: €1,529.4 million). Krones reduced trade payables in the reporting period to €463.7 million (31 December 2018: €491.6 million). There was also a decrease in contract liabilities, which are mostly trade-related. These went down from €547.2 million to €442.9 million. Conversely, Krones increased short-term
Krones’ total assets were virtually constant as of the reporting date. Non-current assets and liabilities in-creased while current assets and liabilities were down.
Report on economic position KronEs in figures
2 | 83
2 | Consolidated ManageMent RepoRt
3 | CoRpoRate goveRnanCe 4 | Consolidated FinanCial stateMents
6 | otheR inFoRMation5 | notes to the Consolidated FinanCial stateMents
1 | to ouR shaReholdeRs

The low consolidated net income of €9.2 million, a €27.2 million decrease in other reserves and the €53.7 million dividend payout meant that equity de-creased by 4.4% in 2019, from €1,433.2 million to €1,370.7 million. The equity ratio consequently went down from 43.2% to 41.3%. Overall, however, Krones continues to possess an exceptionally robust financial and capital structure.
Return on capital employed (roCe) down from 12.8% to 2.7%
Return on capital employed (roCe) – the ratio of eBIT to average net capital employed – decreased from 12.8% in the previous year to 2.7% in the reporting period. This was mainly due to the lower eBIT, which was down significantly due to the one-off expenses.
bank debt. This came to €72.2 million as of the reporting date (31 December 2018: €0.6 million). Other liabilities and provisions likewise increased, mainly due to the increase in the provision for outstanding invoices. These amounted to €325.8 million (previous year: €261.7 million).
Krones had net cash and cash equivalents (cash and cash equivalents less bank debt) of €38.1 mil-lion at the 2019 reporting date (previous year: €215.1 million). In addition, the group has approximately €219 million in unused lines of credit. A backup facility of €500 million is also available. Krones
thus further advanced its primary financial management objective, which is to safeguard the company’s strong financial resources and independence.
KRONES Group equity ratio (%)
2015 2016
10
0
20
30
40
50
41.0 39.9
2017
43.8
2018
43.2
2019
41.3
KRONES Group ROCE (%)
2015 2016
17.7
0
8
12
16
4
20
17.0
2017
16.6
2018
12.8
2019
2.7
Krones continues to have strong finances with an equity ratio of 41.3%, net cash and cash equivalents of €38.1 million and some €719 million in lines of credit.
Due to the lower eBIT, Krones’ roCe went down from 12.8% to 2.7% in 2019.
Report on economic position KronEs in figures
2 | 84
2 | Consolidated ManageMent RepoRt
3 | CoRpoRate goveRnanCe 4 | Consolidated FinanCial stateMents
6 | otheR inFoRMation5 | notes to the Consolidated FinanCial stateMents
1 | to ouR shaReholdeRs

Segment revenue
Revenue in the core segment, Machines and Lines for Product Filling and Decoration, grew overall in line with expectations in 2019. Despite a temporary
weakness in demand in plastics technology, segment revenue increased by 2.8% year-on-year, from €3,177.9 million to €3,265.4 million. The core segment’s share of consolidated revenue remained stable year-on-year at 82.5% in 2019.
Segment earnings
Core segment profitability was mainly impacted in 2019 by high personnel expenses and temporarily low production capacity utilisation in plastics tech-nology. Personnel expenses went up disproportion-ately, partly because of Krones establishing the new plant in Hungary and recognising around €30 million in provisions in the fourth quarter of 2019 for job cuts. Impairments also reduced segment earn-ings by just under €30 million. In total, earnings before taxes (eBT) fell from €223.3 million in the previous year to €56.4 million. The eBT margin decreased from 7.0% to 1.7%.
Krones’ core segment met the growth target of around 3% for 2019
Due to high costs, an unfavourable product mix and additional expenses for structural measures, core segment earnings were sig-nificantly down in 2019.
Report from the segmentsMachines and Lines for Product Filling and Decoration
Segment revenue (€ million)
2015
* incl. Machines and lines for the Compact Class segment
2016
2,814.8*
1,000
0
2,000
3,0002,937.2*
2017
3,090.0*
2018
3,177.9
2019
3,265.4
Segment EBT (€ million) and EBT margin (%)
8.0 8.0
2015 2016
225.4*
100
5
10
0
200
300
236.0*
2017
263.3*
8.5
EBT margin2018
223.3
7.0
2019
56.4
* incl. Machines and lines for the Compact Class segment
1.7
Report on economic position Report from the segments
2 | 85
2 | Consolidated ManageMent RepoRt
3 | CoRpoRate goveRnanCe 4 | Consolidated FinanCial stateMents
6 | otheR inFoRMation5 | notes to the Consolidated FinanCial stateMents
1 | to ouR shaReholdeRs

Machines and Lines for Product Filling and Decoration
Report on economic position Report from the segments
2 | 86
2 | Consolidated ManageMent RepoRt
3 | CoRpoRate goveRnanCe 4 | Consolidated FinanCial stateMents
6 | otheR inFoRMation5 | notes to the Consolidated FinanCial stateMents
1 | to ouR shaReholdeRs

Segment revenue
Revenue in the Machines and Lines for Beverage Production/Process Technology segment went up 2.6%, from €676.1 million in the previous year to €693.5 million in the period January to December
2019. Due to a weak fourth quarter, segment earnings thus did not grow faster than consolidated revenue as had been forecast. The segment’s share of con-solidated revenue was 17.5% in 2019, the same as in the previous year.
Segment earnings
Segment earnings before taxes (eBT) improved from –€19.0 million in the previous year to –€14.7 million in the reporting period. It should be noted that impairment losses and expenses for restruc-turing impacted eBT in 2019 by around €11 million. Even without this effect, however, segment earn-ings were still below expectations. This was mainly because of structural profitability problems in parts of the process technology business and start-up losses for the digitalisation activities, which are not yet profitable. The segment eBT margin was –2.1% in the reporting period (previous year: –2.8%).
Machines and Lines for Beverage Production/Process Technology
At €693.5 million, total segment revenue was slightly below expectations in 2019.
Krones was able to improve segment earnings in 2019 rel-ative to the previous year but remains unsatisfied with prof-itability. Structural measures are intended to deliver sus-tained improvements in seg-ment profitability.
Segment revenue (€ million)
2015 2016 2018
358.7
676.1
2019
693.5
2017
601.4
400
200
0
600
800
1,000
454.1
Segment EBT (€ million) and EBT margin (%)
2015 2016 2017 2018
0
– 5
5
EBT margin2019
– 2.1
– 4.5
1.5
–0.6
0.3
–0.7
–19.0–14.7
–2.1–2.8
Report on economic position Report from the segments
2 | 87
2 | Consolidated ManageMent RepoRt
3 | CoRpoRate goveRnanCe 4 | Consolidated FinanCial stateMents
6 | otheR inFoRMation5 | notes to the Consolidated FinanCial stateMents
1 | to ouR shaReholdeRs

Machines and Lines for Beverage Production/Process Technology
Report on economic position Report from the segments
2 | 88
2 | Consolidated ManageMent RepoRt
3 | CoRpoRate goveRnanCe 4 | Consolidated FinanCial stateMents
6 | otheR inFoRMation5 | notes to the Consolidated FinanCial stateMents
1 | to ouR shaReholdeRs

Gesamtaussage zur wirtschaftlichen LageOverall assessment of economic position
In the opinion of the Executive Board, Krones faces a challenging situation overall at the time of publication of this annual report. This is mainly due to the general economic situation, which is marked by numerous uncertainties. For example, it is hard to predict the impact of the coronavirus on the global economy. Overall, the Executive Board expects that due to the uncertainties, the market for packaging technology machinery and systems will not grow in the short term. Krones has launched extensive structural measures to ensure that its profitability improves despite the flat revenue performance expected for 2020. On the whole, Krones is in stable financial shape.
The company grew as planned in 2019. Krones benefited in this from its broad global footprint and its full range of products and services. Revenue at Krones rose by 2.7% year-on-year to €3,958.9 million in 2019. The company conse-quently attained its 3% growth target. In percentage terms, revenue in each of the two segments increased by about the same rate.
On the other hand, profitability fell short of the original expectations. This was mainly due to high labour costs and expenses for restructuring and im-pairments. Earnings before taxes (eBT) were down from €204.3 million in the previous year to €41.7 million in 2019. The eBT margin was 1.1% (previous year: 5.3%). It should be noted in this connection that Krones recognised provisions and impairments totalling around €70 million in 2019 for measures to cut personnel expenses and streamline the portfolio. Had there been no expenses
for structural measures, the eBT margin would have been 2.8%. With that, Krones would have been in line with the July 2019 downward revision of the margin target to around 3%. The original guidance for 2019, published in the 2018 management report, was for an eBT margin of around 6%.
While eBT in the Machines and Lines for Beverage Production/Process Technol-ogy segment improved from –€19.0 million in the previous year to –€14.7 mil-lion in 2019, profitability deteriorated sharply in the core Machines and Lines for Product Filling and Decoration segment. The bulk of the expenditure for the structural measures – some €60 million – was incurred in the core segment. Partly for this reason, the segmental eBT margin dropped from 7.0% to 1.7%.
Working capital as a percentage of revenue – Krones’ third performance target – improved in 2019 from 27.3% to 26.9%. Krones did not attain the fore-cast figure of 26%, however.
The company’s financial and capital structure remains solid. At the end of 2019, it had cash and cash equivalents of €110.4 million. Net cash and cash equiva-lents (cash and cash equivalents less bank debt) came to €38.1 million. The equity ratio is comfortable at 41.3%. At the end of 2019, Krones had undrawn credit lines totalling around €220 million and a reserve line of €500 million. Krones thus further advanced its primary financial management objective, which is to safeguard the company’s strong financial resources and indepen-dence.
Report on economic position Overall assessment of economic position
2 | 89
2 | Consolidated ManageMent RepoRt
3 | CoRpoRate goveRnanCe 4 | Consolidated FinanCial stateMents
6 | otheR inFoRMation5 | notes to the Consolidated FinanCial stateMents
1 | to ouR shaReholdeRs

Number of employees up 4.9% to 17,353 worldwide; slight decrease in Germany
While Krones further added to its international workforce in 2019, the number of employees in Germany decreased. This reflected the strategic expansion of Krones’ global footprint, which is essential for such a strongly export-oriented company. In total, the company employed 17,353 people worldwide at the end of 2019, 4.9% more than in the previous year. The number employed in Germany fell by 154 to 10,733. The work-force outside Germany expanded by 962 to 6,620 people. The share of employ-ees outside Germany rose from 34.2% to 38.1% at the end of 2019.
Strong growth in emerging markets workforce
Significantly more than half of the workforce outside of Germany is now em-ployed in emerging markets. Krones increased the number of employees in emerging market regions during the reporting period by 33.3% to 4,187. The bulk of the increase is due to acquisitions and to expansion of the Eastern European workforce for the new plant in Hungary.
Employees
Employees by region
8,000
10,000
12,000
14,000
16,000
6,000
4,000
2,000
0 2015
3,579
2016
9,767
13,346
Total Germany Outside Germany
4,382
10,061
14,443
2017
4,933
10,366
15,299
2018
5,658
10,887
16,545
2019
6,620
10,733
17,35318,000
Employees in the emerging markets 2015 – 2019
Year South America
Africa Asia-Pacific Cis/Eastern Europe
China Total
2015 519 376 502 147 451 1,995
2016 549 386 602 155 508 2,200
2017 581 393 734 398 608 2,714
2018 637 452 830 507 716 3,142
2019 782 671 1,009 933 792 4,187
Report on economic position Employees
Krones significantly in-creased its international workforce in 2019 while re-ducing the number of jobs in Germany. The share of employees outside Germany rose from 34.2% to 38.1%.
2 | 90
2 | Consolidated ManageMent RepoRt
3 | CoRpoRate goveRnanCe 4 | Consolidated FinanCial stateMents
6 | otheR inFoRMation5 | notes to the Consolidated FinanCial stateMents
1 | to ouR shaReholdeRs

In the context of its sustainability management activities, the KRONES Group contributes to sustainable development. In order to identify potential risks at an early stage, reduce our environmental footprint and continuously enhance our positive impact on the community, sustainability is incorporated in all major decisions. We are aware of our responsibility in the KRONES Group, not only for our business performance, but also for the effects of our business activities on the environment, employees, society and future generations.
Non-financial report for 2019
Under the CSR Directive Implementation Act, which entered into force in Germany in 2017, we disclose the policies we followed in the last financial year with respect to the non-financial aspects that are material to KRONES. The non-financial report for 2019, which is not part of the group management report, is simultaneously the combined separate consolidated non-financial report for the KRONES Group and KRONES AG for the 2019 financial year, within the meaning of Sections 315b and 315c read in conjunction with Sections 289c to 289e of the German Commercial Code (HGB).
The Non-financial Report is published online at https://www.krones.com/en/ company/responsibility/downloads.php.
Sustainability at KRONES
Report on economic positionSustainability at Krones
The company plans to continue its rapid growth in emerging markets, where KRONES has for years generated more than 50% of consolidated revenue. With our training centres in Africa, China and
South America, we already have a good basis in this regard. The more people we recruit for our international locations from local regions, the closer we are to our customers and markets. In the medium term, given corresponding market growth, we will further increase the proportion of the workforce in emerging markets.
In order to exploit the opportunities offered by our attractive market, KRONESneeds a qualified and motivate workforce. The company consequently contin-ues to invest heavily in training and employee development in Germany and internationally.
More information on our labour practices can be found in our Non-financial Report. This is available online at https://www.krones.com/en/company/respon-sibility/downloads.php.
KRONES increased its work-force in the emerging markets by 33.3% in 2019 to 4,187.
2 | 91
2 | Consolidated ManageMent RepoRt
3 | CoRpoRate goveRnanCe 4 | Consolidated FinanCial stateMents
6 | otheR inFoRMation5 | notes to the Consolidated FinanCial stateMents
1 | to ouR shaReholdeRs

� Risks identified on an ongoing basis
� Efficient control and management tools limit risks
krones’ risk management system
Krones is exposed to a variety of risks that are inextricably linked with doing business globally. We continuously monitor all significant business processes to identify risks early and to actively manage and limit them. Within our corporate strategy, we also identify, analyse and unlock op-
portunities. Unlike risks, business opportunities are not documented within our risk management system.
In essence, risks are defined as potential negative deviations from our earnings forecast for the 2020 financial year. Opportunities are potential positive devia-tions from our earnings forecast for the 2020 financial year. Because they share the same sales and procurement markets, the same risks and opportunities essentially also apply to both of the Krones Group’s operating segments.
Krones’ risk management system consists of an internal control system with which we record, analyse and assess all relevant risks. We monitor all material risks and any countermeasures already taken in a detailed, ongoing process that entails planning, information and control.
We assess risks on the basis of the likelihood of an event and its potential financial impact. Earnings before interest and taxes (eBIT) serve as the measure for potential financial impact. Starting with gross risk, we determine the net risk, which takes into account any mitigating actions taken.
Krones presents risks using a three-column approach, which covers the maxi-mum loss associated with a risk, the likelihood of an event and the financial impact – the latter being the product of the first two factors. Each factor is categorised as low, medium, or high.
The categories are defined as follows:
Risk and opportunity report
Krones actively addresses potential risks. All key business processes are con-stantly subject to an inter-nal control and manage-ment system.
Risk and opportunity report
Maximum loss*(€ million)
Likelihood of an event (%)
Potential financial impact*(€ million)
low 1.0 to 10.0 low 0 to 20 low 1.0 to 10.0
medium 10.1 to 50.0 medium 21 to 49 medium 10.1 to 50.0
high > 50.0 high 50 to 100 high > 50.0
*Based on EBiT
2 | 92
2 | Consolidated ManageMent RepoRt
3 | CoRpoRate goveRnanCe 4 | Consolidated FinanCial stateMents
6 | otheR inFoRMation5 | notes to the Consolidated FinanCial stateMents
1 | to ouR shaReholdeRs

Multi-stage risk management system
We are continually improving our risk management system on the basis of practical experience. The system consists of the following modules: risk analysis, risk monitoring, and risk planning and control.
Risk analysisIn order to identify risks early, we continuously monitor all business activities. Material project-related risks are reduced or avoided before an order is accepted. We conduct a profitability analysis of all quotes prior to order acceptance. For orders that exceed a specified volume, we also conduct a multidimensional risk analysis. Apart from profitability, we also individually record and evaluate financing risks, technological risks and tax risks as well as scheduling and other contractual risks before accepting an order.
To manage risks that arise from changes in the market and competitive situa-tion, we create detailed market and competition analyses for all segments and business areas on a regular basis.
In addition, we conduct a comprehensive risk inventory annually for Krones AG and all significant group companies. The results of the risk inven-tory and mitigating actions are used in our annual planning and forecasting. The basic principles and the process are documented in our risk policy. The risk management system serves not only the purpose mandated by law – early detection of going concern risks – but also covers all risks that may have a significant negative impact on earnings.
Risk monitoringWe use a variety of interlinked controlling processes to monitor risks within the Krones Group. Regular comprehensive reports from the individual busi-ness units keep the Executive Board and other decision-makers apprised in a timely manner of all possible risks and deviations from company planning and of the status of mitigating actions. For projects with a high contract value, po-tential risks are examined and evaluated in regular meetings. Employees who identify risks pass their information on without delay through the company’s internal reporting system.
Risk planning and controlWe primarily use the following tools to plan our business activities and control risk within our internal control system:
� Annual planning � Medium-term planning� Strategic planning� Rolling forecasts� Monthly and quarterly reports� Capital expenditure planning
� Production planning� Capacity planning� Project controlling� Accounts receivable management � Exchange rate hedges� Insurance policies
Risk and opportunity report
2 | 93
2 | Consolidated ManageMent RepoRt
3 | CoRpoRate goveRnanCe 4 | Consolidated FinanCial stateMents
6 | otheR inFoRMation5 | notes to the Consolidated FinanCial stateMents
1 | to ouR shaReholdeRs

Risk management organisation at KRONES
Shareholders
Report to the annualgeneral meeting
Auditor’s reportAuditor
Audit system for early detection of risks
Supervisory Board – Audit and Risk Management Committee
Monitor efficacy of the internal control system and the risk management and compliance systems
Internal audit
Review risk management and internal control system
Information about material risks
Report on risk inventory
Consolidatedfinancial statements
Consolidated management report
Risk management
The Executive Board (Vorstand)Overall responsibility for the risk management system
Central risk management� Central point of contact� Support risk management process� Manage risk reporting system� Risk controlling
Risk management officers for the business units Detect and report risks and introduce countermeasures
Krones’ risk management system is continuously monitored and reviewed. This is governed by clear areas of responsibility and accountability.
Risk management organisation
Risk management at Krones is part of Controlling. The risk management system is reviewed by Inter-nal Audit.
All relevant information is collated in Controlling, where it is processed and made available in a man-
agement tool for the Executive Board. In addition, the various segments and business units also have risk management officers who are responsible for risk management. This includes identifying and reporting risks as well as introduc-ing and implementing measures to actively control them.
Risk and opportunity report
2 | 94
2 | Consolidated ManageMent RepoRt
3 | CoRpoRate goveRnanCe 4 | Consolidated FinanCial stateMents
6 | otheR inFoRMation5 | notes to the Consolidated FinanCial stateMents
1 | to ouR shaReholdeRs

The aim of the internal control and risk manage-ment system is to ensure that all business transac-tions are correctly recorded, processed, recognised and included in financial reporting.
Key features of the internal control system and the risk management system as relates to accounting and financial reporting
Krones has an internal control and risk management system for accounting and financial reporting processes to ensure that all business transactions are always correctly recorded, processed, recognised and included in financial reporting. Krones’ internal control and risk management system comprises all principles, methods and measures to ensure that the company’s accounting and financial reporting are effective, efficient and proper and in compliance with all relevant regulations and standards.
The key features of Krones’ internal control and risk management system relating to (group) accounting and financial reporting can be described as follows:
The Krones Group has a clear management and corporate structure. Cross- cutting key functions are centrally managed.
� The duties of the units that are materially involved in accounting and financial reporting processes are explicitly segregated and responsibilities clearly assigned.
� Regular reviews and audits are conducted within the various units, primarily by Controlling.
� Commercial off-the-shelf software is used for accounting and financial reporting as far as possible.
� Special security precautions protect the software and IT systems used for accounting and financial reporting against unauthorised access.
� Sufficient binding policies (e.g. for payments and travel expenses) are in place and updated on an ongoing basis.
� All of the departments involved in the accounting and financial reporting process work constantly to assure the quality of their work.
� Regular spot checks are used to continuously verify the completeness and accuracy of our accounting data.
� The software used in accounting performs programmed plausibility checks.
� We use dual verification for all accounting-related processes.
Risk and opportunity report
2 | 95
2 | Consolidated ManageMent RepoRt
3 | CoRpoRate goveRnanCe 4 | Consolidated FinanCial stateMents
6 | otheR inFoRMation5 | notes to the Consolidated FinanCial stateMents
1 | to ouR shaReholdeRs

Risk categories Maximum loss Likelihood of event
Potential financial impact
General business environment and industry-specific risks
General economic risks high medium medium
Industry-specific risks high low medium
Financial risks
Default risks high low medium
Liquidity risk low low low
Interest rate risk low low low
Currency risk medium medium low
Operational risks
Price risk high medium medium
Procurement risks low low low
Cost risk high low high
Personnel risk low low low
Legal risks high medium medium
Environmental and safety risks high low low
IT risks medium low low
General business environment and industry-specific risks
General economic risks As a provider of products and services for the food and beverage industries, Krones is less dependent on economic cycles than other machinery manu-facturers. However, the company cannot escape the influence of the general economic situation entirely. Our direct impact from international trade con-flicts is minor. If, however, global economic growth were to be considerably weaker than expected, for example due to sustained trade conflicts, this would have a negative impact on Krones’ revenue and earnings. The coronavirus out-break at the beginning of 2020 significantly impacted the Chinese economy. Krones manufactures a small share of its products in China. We also generate a substantial portion of consolidated revenue there. If economic growth in China were to be severely hit by the effects of the coronavirus, this could have a nega-tive impact on revenue and earnings. However, it is not currently possible to predict the impacts on the global economy.
A global financial crisis could likewise have a negative impact on investment in machines and lines from Krones because financing options would worsen in general. The company’s broad international base puts Krones in a position to at least attenuate any decline in business in individual regions.
Impact of general economic risks: We rate the maximum loss as high, the likelihood of an event as medium and the financial impact as medium.
Industry-specific risksKrones is exposed to industry-specific risks primarily through the develop-ment of the global packaging market and the actions of competitors. The com-petitive environment could intensify if Krones’ competitors resort to price dumping in an effort to win orders and thus more fully utilise their production
Overview and description of material risks
KRONES classifies the maximum loss, the likelihood of an event and the potential financial impact of material risks into the three risk categories low, medium and high. Definitions are provided below on page 92.
Risk and opportunity report
2 | 96
2 | Consolidated ManageMent RepoRt
3 | CoRpoRate goveRnanCe 4 | Consolidated FinanCial stateMents
6 | otheR inFoRMation5 | notes to the Consolidated FinanCial stateMents
1 | to ouR shaReholdeRs

capacities. We are addressing the risk of loss of market share by further ex-panding our technology leadership. Krones’ strong focus on service also sets the company apart from the competition.
A debate on plastic and PeT packaging flared up temporarily in 2019, mainly in Europe. This resulted in our customers delaying investment decisions for machines and lines for filling and packaging beverages in PeT bottles. Krones generates a large proportion of revenue with such products. It cannot be ruled out that the PeT debate will intensify and spread regionally in the long term. This could have a negative impact on our customers’ willingness to invest in plastics technology and hence on consolidated revenue and earnings.
Impact of industry-specific risks: We rate the maximum loss as high, the l ikelihood of an event as low and the financial impact as medium.
Financial risks
The financial risks to which Krones is exposed are default risks, liquidity risks, interest rate risks and currency risks. Our description of these risks and suit-able actions below is in keeping with the disclosure requirements under IFrs 7 on the reporting of risks relating to financial instruments. Because of regional and customer-related diversification, there is no material concentration of risk.
1. Default risks Default risk is the maximum potential risk arising from each individual exposure at the reporting date. Any counter-exposures are not taken into account.
1.1 Trade receivablesCredit risk in trade receivables is the risk of economic loss arising from a customer’s failure to fulfil contractual payment obligations.
Krones manages credit risk on trade receivables on the basis of internal policies. Most trade receivables are backed by various, sometimes coun-try-specific, forms of security. These include retentions of title, guarantees and documentary credits. In order to prevent credit risk, we also run exter-nal credit checks on customers. In addition, there are processes in place for continually monitoring receivables that may be at risk of default. Write-downs on bad debt (non-recoverable trade receivables) are taken on an indi-vidual basis. The very low volume of actual defaults, as measured against the total volume of receivables, attests to the effectiveness of the measures taken.
The theoretical maximum credit risk from trade receivables corresponds to the carrying amount.
Risk and opportunity report
€ thousand
Carrying amount
Of which not overdue
at the reporting
date
Of which overdue by the following
number of days at the reporting date
up to 90 days
between 90 and
180 days
between 180 and
360 daysmore than
360 days
31 Dec 2019Trade receivablesand contract assets 1,533,050 1,368,344 115,204 21,677 19,501 8,324
31 Dec 2018Trade receivablesand contract assets 1,635,059 1,460,726 116,017 21,212 24,337 12,767
2 | 97
2 | Consolidated ManageMent RepoRt
3 | CoRpoRate goveRnanCe 4 | Consolidated FinanCial stateMents
6 | otheR inFoRMation5 | notes to the Consolidated FinanCial stateMents
1 | to ouR shaReholdeRs

€ thousand Carrying
amount at
31 Dec
2018
Cash flow for
2019
Cash flow for
2020 – 2023
Cash flow for
2023 or later
Interest
Repay-
ment Interest
Repay-
ment Interest
Repay-
ment
Derivative financial instruments 1,982 0 1,980 0 2 0 0Liabilities to banks 3,724 0 555 680 3,169 0 0Liabilities from trade receivables 491,586 0 491,585 0 1 0 0Liabilities from leases 295 6 118 15 177 0 0Discounted trade bills 106,670 0 106,670 0 0 0 0Other financial liabilities 111.201 0 69,899 44 41,302 0 0
715,458 6 670,807 739 44,651 0 0
€ thousand Carrying
amount at
31 Dec
2019
Cash flow for
2020
Cash flow for
2021 – 2024
Cash flow for
2024 or later
Interest
Repay-
ment Interest
Repay-
ment Interest
Repay-
ment
Derivative financial instruments 3,392 0 2,828 0 564 0 0Liabilities to banks 72,242 0 72,178 3 64 0 0
Liabilities from trade receivables 463,736 0 463,722 0 14 0 0Liabilities from leases 89,048 2,082 29,802 5,125 56,034 611 3,212Other financial liabilities 146,013 0 100,347 0 47,216 0 0
774,431 2,082 668,877 5,128 103,892 611 3,212
1.2 Derivative financial instrumentsKrones uses derivative financial instruments on the basis of individual contracts solely for risk management purposes. Not using derivative finan-cial instruments would expose the company to greater financial risks. These instruments essentially cover the risks arising from changes in exchange rates between the euro and the Us dollar, the Canadian dollar, the Norwegian krone and the Japanese yen. The material contractual details (amount and term) of the underlying and hedge transactions are largely identical. Default risk relating to derivative financial instruments in the event of counterparty default is limited to the balance of the positive fair values. More on this topic is in the notes to the consolidated financial statements.
1.3 Other financial assetsThe maximum credit risk position arising from other financial assets corre-sponds to the carrying amount of the instruments. Krones is not exposed to any material default risk arising from its other assets, all of which are current assets.
Impact of default risks: We rate the maximum loss as high, the likelihood of an event as low and the financial impact as medium.
2. Liquidity riskLiquidity risk is the risk of a company being unable to sufficiently fulfil its financial obligations.
Krones generates most of its cash and cash equivalents through operating activities. These funds primarily serve to finance working capital and capi-tal expenditures. Krones manages its liquidity by reserving sufficient cash and cash equivalents and credit lines with banks in addition to the regular inflow of payments from operating activities. The company’s liquidity man-agement for operations consists of a cash management system that is based
in part on rolling monthly liquidity planning with a planning horizon of one year. This enables Krones to be proactive about any possible liquidity bottlenecks. Apart from cash on hand, Krones’ cash and cash equivalents consist primarily of demand deposits. The following overview of maturities shows how the undiscounted cash flows relating to liabilities as of 31 De-cember 2019 influence the company’s liquidity situation.
Impact of liquidity risk: We rate the maximum loss as low, the likelihood of an event as low and the financial impact as low.
Risk and opportunity report
2 | 98
2 | Consolidated ManageMent RepoRt
3 | CoRpoRate goveRnanCe 4 | Consolidated FinanCial stateMents
6 | otheR inFoRMation5 | notes to the Consolidated FinanCial stateMents
1 | to ouR shaReholdeRs

Material items denominated in foreign currencies in accordance by IFrs 7 classes:
A 10% change in the closing rate at the reporting date would have the following effects on consolidated net income:
Impact of currency risk: We rate the maximum loss as medium, the likelihood of an event as medium and the financial impact as low.
31 Dec 2019€ thousand
CurrencyUsd
CurrencynoK
CurrencyCAd
CurrencyCny
Currencyjpy
Cash and cash equivalents 310 0 450 0 0
Trade receivables 0 1.920 0 0 0
Other financial receivables 0 0 0 0 0
Derivatives at positive market values 395 0 0 1 474
Total assets 705 1.920 450 1 474
Liabilities
Trade payables 2,044 18 8,117 317 – 3,129
Due to banks 0 0 0 0 0
Other liabilities 0 0 0 0 0
Derivatives at negative market values 1,611 24 1,198 545 – 8
Total liabilities 3,655 42 9,315 862 – 3,137
Balance of assets and liabilities – 2,950 1,878 – 8,865 – 861 –2,663
Net exposure at 31 Dec 2019 – 2,950 1,878 – 8,865 – 861 –2,663
3. Interest rate riskKrones is exposed to risk arising from possible fluctuations in market interest rates. As of the 2019 reporting date, Krones made comparatively minor use of bank borrowings relative to its business volume.
Impact of interest rate risk: We rate the maximum loss as low, the likelihood of an event as low and the financial impact as low.
4. Currency risk Because exports to countries outside the eurozone make up a significant portion of total revenue, we are exposed in principle to currency risk. We use exchange rate hedges to counter such risk as far as possible. In addition, we make most purchasing and sales transactions in euros or the relevant functional currency.
Risk and opportunity report
€ thousand CurrencyUsd
CurrencynoK
CurrencyCAd
CurrencyCny
Currencyjpy
Consolidated statement of profit and loss – 2,958 – 12 536 – 2,512 206
Consolidated equity 5,590 0 1,654 1,953 1,478
2 | 99
2 | Consolidated ManageMent RepoRt
3 | CoRpoRate goveRnanCe 4 | Consolidated FinanCial stateMents
6 | otheR inFoRMation5 | notes to the Consolidated FinanCial stateMents
1 | to ouR shaReholdeRs

Operational risks
1. Price risk Krones operates in a highly competitive market in which some orders are generated by way of prices that do not cover costs. Fixed-price contracts with customers also entail price risks as Krones must bear any additional costs that arise. Krones has introduced a multidimensional order analysis process to minimise this risk. Any enquiry or order equal to or greater than a specific amount is assessed on the basis of financial, technical/techno-logical, tax, legal and regional risks.
Impact of price risk: We rate the maximum loss as high, the likelihood of an event as medium and the financial impact as medium.
2. Procurement risksKrones is exposed to market price risk relating to its procurement of parts and raw materials for operations. Geopolitical and macroeconomic devel-opments are the primary factors influencing raw materials prices. Essen-tially, the risk is that raw material prices will develop to our disadvantage. The company mitigates this risk through targeted procurement manage-ment and long-term supply contracts to reduce material commodity price risks. With respect to suppliers, we also face risks relating to products, deadlines and quality. A specially designed process for supplier selection, monitoring and management helps minimise these risks.
Impact of procurement risks: We rate the maximum loss as low, the likelihood of an event as low and the financial impact as low.
3. Cost riskOur earnings forecast is based on us reducing costs as a result of structural measures. Examples include our new plant in Hungary and increasing material procurement in best-cost countries. We seek to optimise cost structures along the entire value chain. Krones is exposed to the risk that these cost savings will be less than expected. We mitigate this risk by continually monitoring the projects underway across the company.
Impact of cost risk: We rate the maximum loss as high, the likelihood of an event as low and the financial impact as high.
4. Personnel risk Krones intends to step up growth, in particular on the services and digital side. For that purpose we need highly qualified employees in Germany and abroad. There is a risk that the company will not find enough suitable employees. We will ensure early access to qualified employees through ongoing cooperation with colleges and universities. We regularly employ students pursuing their bachelor’s and master’s degrees. We also use pro fessional Hr consultants.
Impact of personnel risk: We rate the maximum loss as low, the likelihood of an event as low and the financial impact as low.
Legal risks
Krones is exposed to risks arising from operating activities in connection with possible legal disputes. Krones addresses legal risks with its rules of conduct, codes and an internal compliance structure. In addition, the company has taken out insurance policies that are customary for our sector.
Impact of legal risks: We rate the maximum loss as high, the likelihood of an event as medium and the financial impact as medium.
Risk and opportunity report
2 | 100
2 | Consolidated ManageMent RepoRt
3 | CoRpoRate goveRnanCe 4 | Consolidated FinanCial stateMents
6 | otheR inFoRMation5 | notes to the Consolidated FinanCial stateMents
1 | to ouR shaReholdeRs

Environmental and safety risks
As a manufacturing company, Krones is exposed to risks relating to the environment and safety that could lead to possible harm to individuals, goods or the company’s reputation. Any harm caused by technical or human error in production can have a direct impact on our financial position. Such an event and any resulting fines, claims for damages or harm to our reputation can also have an indirect financial impact. Krones mitigates environmental and safety risks with high technical standards in production, training, rules of conduct and insurance policies customary in our industry.
Impact of environmental and safety risks: We rate the maximum loss as high, the likelihood of an event as low and the financial impact as low.
IT risks
All of Krones’ material business processes are based on functioning IT systems. The risks here are failure or malfunction of or unauthorised access to critical systems. Such events could result in the loss of important confidential data. Krones uses internationally recognised IT security measures to protect against these risks. We have redundant IT systems in place for critical business pro-cesses.
Impact of IT risks: We rate the maximum loss as medium, the likelihood of an event as low and the financial impact as low.
Material opportunities
Krones does not record business opportunities within the risk management system. For this reason, we do not report in the following on likelihood of event or possible financial impact. We describe opportunities in general below.
General economic opportunitiesGeneral economic opportunities arise for Krones as a result of the company’s good international positioning. We stand to benefit if the economy develops better than predicted in individual world regions. In particular, Krones has considerably strengthened its market position in the emerging markets in the Asia-Pacific region and in Africa and the Middle East in recent years. Additional opportunities would therefore arise for us if the overall economy in emerging markets grows faster than expected. International Monetary Fund experts ex-pect that economic growth in the euro area and the UsA will slow down in 2020. If this forecast does not prove accurate and GDP grows more strongly than ex-pected in these regions, this could result in earnings above our guidance.
Industry-specific opportunitiesBeverage and food producers are increasingly focused on conserving energy and other resources. There is a chance of this trend intensifying and customers being more willing to accept higher prices. That would open additional selling and revenue opportunities for Krones due to the company’s competitive ad-vantages in this area. With enviro, our certified management system, we have established the basis for ensuring that Krones machines and lines feature es-pecially low energy and media consumption. The company has also developed a competitive advantage here.
Overview and description of material opportunities
Risk and opportunity report
2 | 101
2 | Consolidated ManageMent RepoRt
3 | CoRpoRate goveRnanCe 4 | Consolidated FinanCial stateMents
6 | otheR inFoRMation5 | notes to the Consolidated FinanCial stateMents
1 | to ouR shaReholdeRs
Opportunities arising from acquisitionsKrones’ focus in 2020 is on integrating past acquisitions. No major acquisitions are planned for 2020. However, the company’s sound financial position and capital structure enable Krones to seize any favourable opportunities for ex-ternal growth that may arise. Acquisitions are not included in our earnings forecasts. External growth could open up opportunities for Krones.
Operational opportunities
1. Selling prices Krones aims to achieve its target for earnings improvement by way of a better cost base. In addition, we are making sustained efforts to uphold the price increases we announced in May 2018 for all bottling and packaging equipment and process technology. If market prices should develop better than expected, this would yield opportunities for the company.
2. Procurement prices The company increasingly buys standardised parts and complete assem-blies from suppliers. In addition, Krones increasingly procures materials locally at the company’s locations worldwide and in best-cost countries. The opportunity exists that, overall, we might save more in this way than forecast. Additional opportunities arise if commodity prices are generally lower than expected.
3. Costs Krones has launched a range of short-term and structural measures to optimise the company’s cost structure. Opportunities arise for Krones if specific measures have greater or more rapid effect than planned.
Summary of risks and opportunities
Viewed from today’s perspective, Krones is not exposed to any going concern risks. Compared with the previous year, our assessment of the risks and oppor-tunities has not materially changed. The main risks remain in the general busi-ness environment and in industry-specific and financial risks.
Risk and opportunity report
2 | 102
2 | Consolidated ManageMent RepoRt
3 | CoRpoRate goveRnanCe 4 | Consolidated FinanCial stateMents
6 | otheR inFoRMation5 | notes to the Consolidated FinanCial stateMents
1 | to ouR shaReholdeRs

The outbreak and rapid spread of the coronavirus (CoVID-19) since the beginning of 2020 has affected business and economic activity not only in China, but also worldwide. The financial effect of this event on Krones could not be estimated at the time of publication of the annual report because it was not possible to estimate the extent of the spread and the consequences for Krones’ business.
Events after the reporting period
Events after the reporting period
2 | 103
2 | Consolidated ManageMent RepoRt
3 | CoRpoRate goveRnanCe 4 | Consolidated FinanCial stateMents
6 | otheR inFoRMation5 | notes to the Consolidated FinanCial stateMents
1 | to ouR shaReholdeRs

� Global economic outlook stable at a low level but subject
to many uncertainties
� krones focusing in 2020 on increasing profitability
� From 2020, the eBITDA margin is krones’ key performance
indicator for profitability
Global economy expected to grow 3.3% in 2020
In January 2020, the International Monetary Fund (IMF) slightly lowered its forecast for global economic growth in the full year 2020 from 3.4% to 3.3% (previous year: 2.9%). This was mainly due to a slowdown in some emerging markets – especially India – and to social unrest in a number of regions. Accord-ing to the IMF, positive effects on the global economy will come in 2020 as the trade dispute eases between China and the UsA and the main central banks continue to apply very loose monetary policy. The experts see further down-side risks most of all in a worsening of the political conflict between the UsA and Iran and in further tariff disputes between the UsA and its trading partners.
Growth in emerging and developing economies is likely to pick up again compared with the weak prior year, at 4.4% in 2020 (previous year: 3.7%). In October 2019, however, the IMF experts had still expected growth of 4.6%. The slight markdown
mainly related to India. India’s gross domestic product (GDP) is now expected to increase by only 5.8% in 2020 (previous year: 4.8%), compared with the October 2019 forecast of 7.0%. While the IMF expects the Chinese economy to see a slight
decline in GDP growth to 6.0% in 2020 (previous year: 6.1%), its forecast for the Middle East/Central Asia region is for a significant increase to 2.8% (previous year: 0.8%). The growth rate in Latin America is likewise expected to accelerate, with GDP growth of 1.6% relative to 2019 (previous year: +0.1%).
For industrialised economies, the IMF forecasts 1.6% GDP growth in 2020 (previ-ous year: 1.7%). The experts expect growth to accelerate in Germany especially, where they forecast a 1.1% GDP increase in 2020 after only 0.5% in the previous year. For the euro area, the IMF forecasts 1.3% growth (previous year: 1.2%). As the effects of the fiscal incentives in the UsA taper off, the world’s largest econ-omy is expected to increase GDP by only 2.0% in 2020 (previous year: 2.3%). For Japan, the IMF is forecasting 0.7% growth (previous year: 1.0%).
Report on expected developmentsPercentage GDP growth in 2020 (forecast)
ChinaGermanyEuroarea
USA Middle East/Africa
Japan
+ 6.0
+ 1.1+ 1.3+ 2.0
World
+ 3.3
2
1
4
3
6
5
7
Source: IMF, without Corona
+ 2.8
+ 0.7
Expected developments
The IMF’s January forecast of 3.3% for global growth in 2020 does not include any potential impact of the coronavirus.
2 | 104
2 | Consolidated ManageMent RepoRt
3 | CoRpoRate goveRnanCe 4 | Consolidated FinanCial stateMents
6 | otheR inFoRMation5 | notes to the Consolidated FinanCial stateMents
1 | to ouR shaReholdeRs

Strong employment and moderate inflation rates support consumer spending
In the medium and long term, the propensity to consume and therefore de-mand for packaged beverages depends on purchasing power. Low unemploy-ment and inflation rates have a positive effect on consumer’s buying power. This supports demand for packaged food and beverages and indirectly influ-ences demand for Krones’ products and services. If more beverages and liquid foods have to be packaged, beverage and food producers need suitable and efficient technology for the purpose. We do not expect the unemployment rate and inflation to have any negative effect on Krones’ business overall in 2020. However, due to the many overall economic uncertainties, Krones’ customers are postponing investment decisions despite rising end consumer demand.
Further downturn expected in German machinery and industrial equipment output
The German Mechanical Engineering Industry Association (VDMA) once again does not expect a sig-nificant improvement in the situation in 2020, with machinery and equipment output decreasing 2% in value as in the previous year. Factors affecting the industry this year continue to be the relatively weak global economy, simmering trade conflicts and the radical structural change in the automotive industry. Potential impacts of the coronavirus are not yet taken into account here.
Year-on-year change in German mechanical engineering output, in %
2016 2017
– 0.30
2
–2
4
* Forecast Source: Germany's Federal Statistical Office, VDMA
+ 3.9
2018
+ 2
2019
– 2*
2020
– 2*
Expected developments
Global inflation rate 2010 to 2018 and forecast to 2021, in %
1
2
3
4
5
* Forecast Source: Statista 2020
3.73
5.06
4.07
3.66
3.23
2.77 2.77
3.20
3.623.41
3.56 3.48
2020* 2021*2019*201820172016201520142013201220112010
The German Mechani-cal Engineering Industry Association (VDMA) expects another difficult year for the industry in 2020, forecast-ing a further 2% decrease in output.
2 | 105
2 | Consolidated ManageMent RepoRt
3 | CoRpoRate goveRnanCe 4 | Consolidated FinanCial stateMents
6 | otheR inFoRMation5 | notes to the Consolidated FinanCial stateMents
1 | to ouR shaReholdeRs

krones expecting no growth for 2020
After a difficult year in 2019, Krones is making a moderate start to the 2020 financial year with a view to the short-term demand trend. There are sufficient reasons for exercising a degree of caution. While the economic forecasts for this year are still positive overall, 2020 will once again be marked by political and economic uncertainties. In particular, it is not yet possible to predict the nega-tive impacts of the coronavirus on the global economy. These uncertainties are also affecting order placement by Krones customers. Although consumer demand for packaged beverages is expected to continue rising in 2020, com-panies in the international beverage industry are temporarily holding back on investment due to the unstable overall economic situation. We therefore expect no short-term growth in the global market for bottling and packaging equip-ment for the full year 2020. For the same reason, both competition in our markets and cost pressure will remain strong this financial year.
However, Krones only expects the market to stay flat for the short term. The medium and long-term outlooks remain positive. This is because consumer demand for packaged beverages and liquid foods is steadily growing due to a number of megatrends such as the growing world population. Food and bever-age providers need suitable technology to meet the increasing demand. For this reason, the market for packaging machinery is growing at a relatively stable rate in the medium and long term.
Focus in 2020 on improving profitability in both segments
Due to the adopted structural measures, Krones will initiate a sustained turn-around in profitability in 2020. The clear-cut goal is to increase profitability in both segments. A major contribution to this will come from further expansion of the global footprint and from cost reductions. No major acquisitions are planned in either segment for 2020. Efforts are focused on integrating the acquisitions made in the group in previous years.
The focus in the core Machines and Lines for Product Filling and Decoration seg-
ment in 2020 is on the start of production at the new plant in Hungary. The new plant will go into full operation at the end of 2020. The new production facility is expected to save Krones about €5–10 million in 2020. Annual cost savings of €20 million are expected when it is fully established. We will expand the core segment with further attractive products and rid the portfolio of less profitable activities and technologies. A continued focus is also on countering the rising cost of material.
For the core segment in 2020, Krones does not expect any increase in revenue, especially considering the short-term uncertainty among our clients. It is not currently possible to predict the full impacts of the coronavirus on the global economy. This could have a further substantial effect on the targets for 2020. The eBITDA margin is expected to be around 7.5% to 8.0% (equivalent to an eBT margin of around 4.0–4.5%).
Expected developments
2 | 106
2 | Consolidated ManageMent RepoRt
3 | CoRpoRate goveRnanCe 4 | Consolidated FinanCial stateMents
6 | otheR inFoRMation5 | notes to the Consolidated FinanCial stateMents
1 | to ouR shaReholdeRs

Implementing the structural measures is likewise the focus in the Machines and Lines for Beverage
Production/Process Technology segment. The carve-out of the beverage production business has priority here. We are going to make this a legally independent unit. This enables us to better assess how the individual businesses, specifically with regard to the different types of bever-ages, are developing on a standalone basis. Krones will leverage additional revenue and earnings potential from the full integration and positive business development of, the acquisitions made in the preceding years. Intralogistics continues to see good demand for our products and services. We will push ahead with the further internationalisation of our business in 2020. For this purpose, we have pooled all intralogistics activities in sysTeM LoGIsTICs and made this a legally independent unit.
In all, for the Process Technology segment in 2020, we plan stable revenue with an eBITDA margin of around 2.5% to 3.5% (equivalent to an eBT margin of around 0% to 1%). It is not currently possible to predict the full impacts of the coronavirus on the global economy. This could have a further substantial effect on the targets for 2020.
Based on the prevailing macroeconomic outlook and the current expected development of the markets relevant to Krones, which is affected in the short term by reluctance by customers to invest, the company expects that consol-
idated revenue in 2020 will match the previous year’s level. We only expect the market to stay flat temporarily. The medium and long-term growth trend re-
mains intact. Our customers’ short-term reluctance to invest due to the many uncertainties will mainly be noticeable in the first half of 2020. It is not cur-rently possible to predict the full impacts of the coronavirus on the global economy. This could have a further substantial effect on the targets for 2020.
eBITDA replaces eBT as key performance indicator for profitability – eBITDA margin of around 6.7% to 7.2% targeted for 2020
Krones is now positioned in such a way that the expected zero revenue growth will not fully affect profitability. We plan to improve profitability this year as a result of the measures taken. From 2020, Krones manages profitability using the eBITDA margin instead of the eBT margin. This is because eBITDA (earnings before interest, taxes, depreciation and amortisation) is closer to cash flow and more comparable because it does not include depreciation and amortisation, financial income/expense and taxes.
For the group in 2020, Krones expects an eBITDA margin of around 6.7% to 7.2%. That is equivalent to an eBT margin of around 3.2% to 3.7%.
For its third performance target, working capital to revenue, Krones expects a figure of 26%. We intend to improve on this target this year by means of more intensive receivables management.
The Process Technology Segment is expected to be in profit in 2020.
Krones aims to keep revenue stable and increase the eBITDA margin in 2020. Forecast 2020 Actual 2019
Revenue growth 0 % 2.7%
EBiTdA marginaround 6.7%
to 7.2% 5.7%
Working capital to revenue 26% 26.9%
Expected developments
2 | 107
2 | Consolidated ManageMent RepoRt
3 | CoRpoRate goveRnanCe 4 | Consolidated FinanCial stateMents
6 | otheR inFoRMation5 | notes to the Consolidated FinanCial stateMents
1 | to ouR shaReholdeRs

Name of shareholder Total share of voting rights
Of which: indirect voting rights attributable pur-
suant to Section 34 (2) of the Securities Trading Act
Familie Kronseder Konsortium GbR, Neutraubling, Germany 52.24% 52.24%
Pursuant to Section 4 (1) of the articles of association, the share capital of Krones Aktiengesellschaft amounts to €40,000,000.00 and is divided into 31,593,072 ordinary bearer shares.
Under Section 20 (1) of the articles of association, each share entitles its holder to one vote in the annual general meeting. Unless mandatory provisions of law stipulate otherwise, resolutions of the annual general meeting are made with a simple majority of votes cast or, in cases in which the law prescribes a majority of shares in addition to a majority of votes, with a simple majority of the share capital represented in the vote.
Pursuant to Section 18 (1) of the articles of association, only those shareholders who register with the company in writing in German or English and provide proof of their shareholding prior to the annual general meeting are entitled to participate and vote in the annual general meeting. Special verification of the shareholding in text form, issued in German or English by the institution with which the custody account is held, shall constitute sufficient evidence of the shareholding. The evidence of shareholding must relate to the start of the twenty-first day prior to the annual general meeting.
Pursuant to Section 18 (2) of the articles of association, voting rights can be exercised by proxy. Granting, revocation, and evidence of proxy authorisation must be submitted to the company in text form. The notice convening the annual general meeting may specify a relaxation of this requirement without prejudice to Section 135 of the German Stock Corporation Act (AktG).
In the annual general meeting, the chair of the meeting can set appropriate time limits for shareholders’ questions and comments (Section 19 (3) of the articles of association).
The Executive Board of the company is not aware of any other restrictions relating to voting rights or the transfer of shares.
The company is aware of the following direct and indirect shareholdings in the company’s capital that exceed 10% of the voting rights:
Changes to the shareholdings listed above that are not required to be reported to the company may have occurred since the specified date (December 2019). Because the company’s shares are bearer shares, the company is generally only aware of changes in shareholdings if the changes are subject to reporting requirements.
The appointment and dismissal of Executive Board members is governed by Sections 84 and 85 of the German Stock Corporation Act (AktG). Pursuant to Section 6 (1) of the articles of association, the Executive Board consists of at least two members. Pursuant to Section 6 (2) of the articles of association, determination of the number of Executive Board members, the appointment of regular and deputy members of the Executive Board, the execution of their employment contracts and revocation of appointments are the responsibility of the Supervisory Board.
Amendments to the articles of association are subject to the provisions of Sections 179 et seq. of the German Stock Corporation Act. Such amendments are to be adopted by resolution of the annual general meeting (Section 119 (1) No. 5 and Section 179 (1) of the German Stock Corporation Act). The Supervisory Board is authorised to make amendments that affect only the wording of the articles of association (Section 13 of the articles of association).
Disclosures required under Sections 315 a (1) and 289 a (1) of the German Commercial Code (HGB)
Disclosures required under Sections 315 a (1) and 289 a (1)
2 | 108
2 | Consolidated ManageMent RepoRt
3 | CoRpoRate goveRnanCe 4 | Consolidated FinanCial stateMents
6 | otheR inFoRMation5 | notes to the Consolidated FinanCial stateMents
1 | to ouR shaReholdeRs

Pursuant to Section 4 (4) of the articles of association, the Executive Board may, with the approval of the Supervisory Board, increase the share capital by a total of up to €10 million (authorised capital) by issuing ordinary bearer shares against cash contributions on one or more occasions up to and including 15 June 2021. Shareholders must normally be granted subscription rights to such shares. The Executive Board may exclude shareholders’ subscription rights, with the approval of the Supervisory Board, for any fractional amounts that may arise.
By resolution of the annual general meeting of 13 June 2018, the Executive Board is authorised, up to and including 12 June 2023, with the approval of the Supervisory Board, to buy treasury shares totalling up to 10% of the company’s share capital at the time that the resolution was adopted or, if smaller, at the time that the authorisation is exercised.
By resolution of the annual general meeting of 13 June 2018, the Executive Board is authorised to use any treasury shares bought pursuant to the afore-mentioned authorisation in accordance with Section 71 (1) No. 8 of the Stock Corporation Act, besides for sale on the stock exchange or by offer to all share-holders, for any permissible purpose, and in particular as follows:
1) The shares may be cancelled, without the cancellation or its execution requiring a further resolution by the annual general meeting.
2) The shares may be offered and transferred to third parties in return for non-cash contributions, in particular in connection with business combinations or on the acquisition of companies, businesses, parts of companies or equity interests. In addition, the shares may also be used for the termination or set-tlement of shareholder actions at affiliates of the company.
3) The shares may be sold to third parties against cash payment if the price at which the shares in the company are sold is not significantly lower, within the meaning of sections 71 (1) no. 8 sentence 5 and 186 (3) sentence 4 of the Stock Corporation Act, than the stock exchange price of a company share at the time of sale.
4) The shares may be used to service obligations or rights to purchase shares in the company arising from and in connection with convertible bonds or bonds with warrants, or profit-sharing rights with conversion rights or warrants, issued by the company or any of its group companies.
Shareholders’ statutory subscription rights to such shares are excluded to the extent that the shares are used in exercise of the authorisations set out above under 2) to 4) inclusive or, in the case of sales of treasury shares to all share-holders, to the extent necessary to avoid fractional amounts.
Krones AG has not made any material agreements containing special provi-sions relating to a change or acquisition of control following a takeover offer.
The company has not made any agreements with members of the Executive Board or company employees relating to compensation in the event of a take-over offer.
Disclosures required under Sections 315 a (1) and 289 a (1)
2 | 109
2 | Consolidated ManageMent RepoRt
3 | CoRpoRate goveRnanCe 4 | Consolidated FinanCial stateMents
6 | otheR inFoRMation5 | notes to the Consolidated FinanCial stateMents
1 | to ouR shaReholdeRs

The statement on corporate governance is also available online at https://www.krones.com/en/company/investor-relations/corpo-rate-governance-statement.php
Dependecy report
Dependency report
Pursuant to Section 17 of the German Stock Corporation Act (AktG), Familie Kronseder Konsortium GbR, Neutraubling, has a controlling influence over Krones AG. Thus, in keeping with Section 312 AktG, the Executive Board has prepared a report which contains the following final declaration:
Krones AG did not carry out any legal transactions with third parties at the instigation or in the interests of the shareholders of Familien-GbR or their affiliates. Measures requiring reporting within the meaning of Section 312 AktG were neither taken nor omitted.
For every transaction made between Krones AG and the owners of Familie Kronseder Konsortium GbR and affiliated companies in the reporting period, Krones AG made arrangements for appropriate consideration within the meaning of Section 312 AktG and – to the extent that it was to be fulfilled in the reporting period – also received said consideration.
2 | 110
2 | Consolidated ManageMent RepoRt
3 | CoRpoRate goveRnanCe 4 | Consolidated FinanCial stateMents
6 | otheR inFoRMation5 | notes to the Consolidated FinanCial stateMents
1 | to ouR shaReholdeRs

The remuneration report presents the basic features, structure and amounts of Executive Board and Supervisory Board remuneration at Krones AG. In the in-terest of clarity and transparency, the disclosures on individual remuneration and the description of the basic features of the remuneration system have been combined in the following remuneration report, which forms part of the con-solidated management report. As such, it covers the disclosures required under Section 314 (1) No. 6a of the German Commercial Code (HGB).
Executive Board remuneration
Basic principles of Executive Board remunerationDetermining the total remuneration of the individual Executive Board mem-bers is the responsibility of the Supervisory Board’s plenary meetings. The Standing Committee prepares the Supervisory Board resolutions relating to remuneration and makes recommendations.
The criteria for determining the appropriateness of the remuneration include but are not limited to the tasks, responsibilities, personal performance and experience of each member of the Executive Board and the economic position, performance and expected development of the enterprise, taking into account its peer companies.
The Supervisory Board reviews the appropriateness of the system on a regular basis using external benchmarks and comparisons with senior management and the entire workforce.
The current remuneration system for the Executive Board was last revised in 2017.
In this connection, the previous five-year long-term incentive (LTI) was re placed by a new three-year long-term incentive arrangement awarded on a revolving basis.
A transitional phase beginning 1 January 2018 was agreed to ensure neutrality in allocation.
The new arrangement was adopted by resolution of the Supervisory Board on 29 November 2017 and approved by the Annual General Meeting on 13 June 2018.
Remuneration componentsThe remuneration system for the Executive Board consists of the following remuneration components:
� Fixed components (basic salary and fringe benefits)� Variable components which are payable annually and based on business
performance (short-term incentives) and which contain risk elements� Variable components that serve as long-term incentives containing risk
elements, with a measurement period of three years� Post-employment benefits
All in all, the remuneration structure breaks down as follows: 59% fixed remu-neration and 41% variable remuneration. In sum, the remuneration system is designed to provide an incentive for successful long-term management. The long-term components of variable remuneration thus account for 64% of total variable remuneration. Moreover, variable remuneration is subject to caps and to requirements that must be met for payment to occur.
Remuneration report
Remuneration report
Text-Aktualisierung?
2 | 111
2 | Consolidated ManageMent RepoRt
3 | CoRpoRate goveRnanCe 4 | Consolidated FinanCial stateMents
6 | otheR inFoRMation5 | notes to the Consolidated FinanCial stateMents
1 | to ouR shaReholdeRs

Fixed components (basic salary and fringe benefits)The fixed amount is the base salary stipulated in members’ contracts and is paid out in equal monthly amounts. It is reviewed on a regular basis. For the 2019 financial year, the base salaries of the five members of the Executive Board who were active in 2019 totalled €2,668 thousand (previous year: €2,930 thousand).
In addition, the members receive fringe benefits which are essentially the cost or non-cash benefit of customary insurance premiums, housing expenses, school fees and the use of a company car. For the 2019 financial year, the mem-bers of the Executive Board received fringe benefits totalling €182 thousand (previous year: €280 thousand).
Variable componentsThe variable remuneration contains risk elements and is thus not guaranteed. The incentive package for the Executive Board has consisted of the following since 2017:
� Short-term incentive (sTI, measurement period: one year) � Awarded annually� Target bonus: Three months’ salary per annum
(at 100% target attainment) � Reference figures: eBT margin (primary), order intake, consolidated
revenue and net working capital � Capped at 200% (max. six months’ salary)� No payment if eBT is negative
The sTI payment for the financial year 2019 amounts to €27.6 thousand in 2020 (previous year: €220 thousand). In addition, the Supervisory Board can, at its equitable discretion, pay out a special bonus if extraordinary events or excep-tional performance warrant it. No special bonuses were paid out for the 2019 financial year.
� Mid-term incentive (MTI, measurement period: three years) � Replaced by three-year LTI and therefore last awarded in 2017� Target bonus: Three months’ salary per annum (at 100% performance
target attainment)� Reference figures: Net working capital, revenue, eBT margin and
quality costs� Capped at 200% (max. six months’ salary) � No payment if eBT is negative on average
The provision for the medium-term incentive amounted at the end of the financial year to €99.0 thousand (previous year: €807 thousand), of which €17.6 thousand relates to remuneration for 2019 (prior year: €398 thousand).
� Long-term incentive (LTI, measurement period: three years) � Awarded annually (on a revolving basis) (from 2018)� Target bonus: 5.4 months’ salary per annum (at 100% target attainment)� Reference figures: Enterprise value on three-year average (eBT times
nine, eBITDA times seven, revenue times one) for start and end value plus net cash and less pension provisions
� Up to 2018: capped at 200% (max 10.8 months’ salary); from 2019: capped at 250% (max. 13.5 months’ salary)
� No payment if eBT is negative on average (up to 2018); from 2019: paid out if the calculated enterprise value is at least 100% of the starting level
Remuneration report
2 | 112
2 | Consolidated ManageMent RepoRt
3 | CoRpoRate goveRnanCe 4 | Consolidated FinanCial stateMents
6 | otheR inFoRMation5 | notes to the Consolidated FinanCial stateMents
1 | to ouR shaReholdeRs

The provision for the long-term incentive amounted at the end of the financial year to €1,342.7 thousand (previous year: €238 thousand), of which €793.4 thou-sand relates to remuneration for the 2019 financial year.
The transitional LTI pays out at the end of the 2020 financial year provided that the reference figures have been attained or exceeded. If an Executive Board member leaves before the end of the measurement period, payment is pro-rated.
Total Executive Board remuneration amounted to €3,131 thousand (previous year: €6,479 thousand).
The change in remuneration partly relates to the four active members of the Executive Board waiving the payment due for the sTI 2019 and for the MTI 2017–2019 and to Mr Andersen’s paid notice leave and early contract termina-tion (base salary and fringe benefits €322 thousand). The termination agree-ment between Krones AG and Mr Andersen includes a severance payment of €2,350 thousand and a pro-rata payment of €109 thousand in variable remu-neration, consisting of €19.7 thousand STI, €12.5 thousand MTI and €76.6 thou-sand LTI.
There are and have been no stock-option plans or comparable share-based long-term incentive components of remuneration for Executive Board mem-bers at Krones AG.
Post-employment benefitsThe company has made post-employment benefit commitments to the mem-bers of the Executive Board.
For Executive Board members who joined the board in 2012 or later, the post-employment benefits are contribution-based. Annual contributions in the amount of 40% of the respective member’s annual base salary are paid into an external pension liability insurance policy in which the benefits are pledged to the beneficiary. There they accrue annual interest until the benefits fall due, at the rate guaranteed when the policy was established plus any annual invest-
ment returns. Post-employment pension benefits are granted when a member reaches the age of 62 and only after the member leaves the Executive Board. Executive Board members can choose to receive a lump-sum payout of the post-employment benefits instead of annuity-based payments. Executive Board members’ entitlements to post-employment benefits based on contributions from Krones AG become vested immediately. Executive Board members may elect to receive supplemental monthly benefits for permanent disability and/or a monthly widow(er)’s pension.
Members of the Executive Board who entered the board before 2012 received benefit commitments under a defined benefit plan. The benefit commitment equals 30% of the last base salary received (average of the last 12 months of em-ployment). The commitments include post-employment, permanent disability and surviving dependant benefits. Here, too, post-employment benefits are granted after a member reaches the age of 62 and leaves the Executive Board. If a member of the Executive Board leaves the company before reaching the age of 62 for reasons of permanent disability or because the employment contract is terminated or not renewed, the amount of the pension entitlement in rela-tion to the company is reduced by a certain percentage for each calendar year up to age 62; the percentage is determined in the individual’s contract. If an Executive Board member dies, the member’s spouse receives the full amount of the annuity that would have been owed to the Executive Board member for the first six months following the member’s death. Thereafter, the widow(er)’s annuity is reduced to 70% of that benefit amount. Vesting of benefits is deter-mined based on the provisions of the laws applicable at the inception of each contract.
In the case of both contribution-based plans and defined benefit plans, the indi-vidual employment contracts contain provisions that govern discontinuation, reduction or cancellation of benefits (including widow(er)’s benefits in the event of particularly substantial changes in accordance with the provisions of the German Stock Corporation Act.
Remuneration report
2 | 113
2 | Consolidated ManageMent RepoRt
3 | CoRpoRate goveRnanCe 4 | Consolidated FinanCial stateMents
6 | otheR inFoRMation5 | notes to the Consolidated FinanCial stateMents
1 | to ouR shaReholdeRs

IFrs pension provisions of €2,735 thousand (previous year: €2.087 thousand) were recognised for active members of the Executive Board. At the end of 2019, following changes in the actuarial discount rate, the corresponding defined benefit obligation (DBo) amounted to the following: for Mr Klenk €4,715 thou-sand, for Mr Ricker €52 thousand, for Mr Tischer €58 thousand, and for Mr Goldbrunner €40 thousand.
In addition, €1,172 thousand (previous year: €1,172 thousand) was paid into the contribution-based post-employment benefits plan in 2019. Such contributions amounted to the following in 2019: for Mr Klenk €320 thousand, for Mr Ander-son €252 thousand, for Mr Ricker €216 thousand, for Mr Tischer €192 thousand, and for Mr Goldbrunner €192 thousand.
Additional benefits in the event of termination of employmentThe members’ employment contracts contain a non-compete clause that in-cludes suitable compensation to be paid for the non-compete period. Further benefits in the event of termination have not been agreed.
Advances and loans No loans or advances were provided to members of the Executive Board in 2019.
Benefits paid to former members of the Executive BoardBenefits granted to former members of the Executive Board and their surviving dependants amounted to €1,842 thousand (previous year: €1,688 thousand). This mainly consists of pension benefits. IFrs pension provisions were rec-ognised in the amount of €12,069 thousand (previous year: €8,761 thousand). The increase relates to changes in the actuarial discount rate.
Remuneration report
2 | 114
2 | Consolidated ManageMent RepoRt
3 | CoRpoRate goveRnanCe 4 | Consolidated FinanCial stateMents
6 | otheR inFoRMation5 | notes to the Consolidated FinanCial stateMents
1 | to ouR shaReholdeRs

Remuneration 2019 pursuant to GAs 17 (€ thousand)
Name Position Base salary
Fringe benefits
Total Short-term incentive
Medium-term incentive
Long-term incentive
Total remun-eration
Christoph Klenk CEoHuman Resources, Intralogistics, Digitalisation, Communication, Quality, Information Management
since 2003 800 29 829 0 0 0 829
Michael Andersen CfoFinance, Controlling, Process Technology, Strategic Purchasing
since 2016 368 83 450 27 99 155 732
Thomas Ricker Sales and Marketing since 2012 540 22 562 0 0 0 562
Markus Tischer International Operations and Services since 2014 480 17 497 0 0 0 497
Ralf Goldbrunner Bottling and Packaging Equipment since 2014 480 31 511 0 0 0 511
The incentive amounts are amounts that will be paid out in the subsequent year.
Total remuneration paid to members of the Executive Board in 2018/2019
Remuneration report
2 | 115
2 | Consolidated ManageMent RepoRt
3 | CoRpoRate goveRnanCe 4 | Consolidated FinanCial stateMents
6 | otheR inFoRMation5 | notes to the Consolidated FinanCial stateMents
1 | to ouR shaReholdeRs

Remuneration 2018 pursuant to GAs 17 (€ thousand)
Name Position Base salary
Fringe benefits
Total Short-term incentive
Medium-term incentive
Long-term incentive
Total remun-eration
Christoph Klenk CEoHuman Resources, Intralogistics, Digitalisation, Communication, Quality, Information Management
since 2003 800 28 828 60 133 920 1,942
Michael Andersen CfoFinance, Controlling, Process Technology, Strategic Purchasing
since 2016 630 182 812 47 85 0 945
Thomas Ricker Sales and Marketing since 2012 540 21 561 41 67 669 1,337
Markus Tischer International Operations and Services since 2014 480 18 498 36 57 569 1,160
Ralf Goldbrunner Bottling and Packaging Equipment since 2014 480 31 511 36 57 493 1,096
The incentive amounts are amounts that will be paid out in the subsequent year.
Remuneration report
2 | 116
2 | Consolidated ManageMent RepoRt
3 | CoRpoRate goveRnanCe 4 | Consolidated FinanCial stateMents
6 | otheR inFoRMation5 | notes to the Consolidated FinanCial stateMents
1 | to ouR shaReholdeRs

Supervisory Board remuneration
Remuneration of the members of the Supervisory Board is governed by Section 15 of the articles of association and resolved by the annual general meeting. For the 2019 financial year, the articles of association as amended by the annual general meeting on 13 June 2018 apply.
The members of the Supervisory Board receive remuneration that is commen-surate with their responsibilities and the company’s position. In keeping with the recommendations of the German Corporate Governance Code, the Chair-person and Deputy Chairperson of the Supervisory Board as well as the chair-persons and members of committees receive additional compensation.
The Supervisory Board’s remuneration consists of an annual fixed remunera-tion of €35,000. The Chairperson of the Supervisory Board receives two-and-a-half times the amount of the fixed remuneration and the Deputy Chairperson of the Supervisory Board receives one-and-a-half times the fixed remuneration amount. Moreover, the members of the Supervisory Board receive a flat €1,500 fee per meeting as reimbursement for their expenses unless they submit proof of having incurred higher expenses.
Members of the Supervisory Board who belong to special committees within the Supervisory Board receive additional remuneration of €7,000 annually as well as a €1,500 flat-rate reimbursement for expenses per meeting.
Members of the Supervisory Board who belonged to the board for only a por-tion of the financial year receive pro-rated remuneration.
The total remuneration paid to members of the Supervisory Board for the financial year 2019 amounted to €812 thousand (previous year: €712 thousand) and is shown in the table below with individualised disclosure:
Remuneration report
2 | 117
2 | Consolidated ManageMent RepoRt
3 | CoRpoRate goveRnanCe 4 | Consolidated FinanCial stateMents
6 | otheR inFoRMation5 | notes to the Consolidated FinanCial stateMents
1 | to ouR shaReholdeRs

Remuneration 2019 pursuant to GAs 17 (€ thousand)
Name Position Base compensation
Additional compensation for committee work
Meeting attendance fee
Total remuneration in 2018
Volker Kronseder Chairman of the Supervisory Board 87.5 7.0 15.0 109.5
Werner Schrödl*,** Deputy Chairman of the Supervisory Board 52.5 7.0 15.0 74.5
Robert Friedmann Regular member 35.0 4.5 39.5
Klaus Gerlach* Regular member 35.0 6.0 41.0
Oliver Grober*,** Regular member 35.0 6.0 41.0
Thomas Hiltl*,** Regular member 35.0 6.0 41.0
Norman Kronseder Regular member 35.0 7.0 15.0 57.0
Prof. Dr. jur. Susanne Nonnast Regular member 35.0 6.0 41.0
Dr. phil. Verena Di Pasquale*,** Regular member 35.0 6.0 41.0
Beate Eva Maria Pöpperl*,** Regular member 35.0 6.0 41.0
Norbert Samhammer Regular member 35.0 6.0 41.0
Petra Schadeberg-Herrmann Regular member 35.0 6.0 41.0
Jürgen Scholz*,** Regular member 35.0 7.0 9.0 51.0
Hans-Jürgen Thaus Regular member 35.0 7.0 12.0 54.0
Josef Weitzer*,** Regular member 35.0 7.0 15.0 57.0
Matthias Winkler Regular member 35.0 6.0 41.0
* Employee representative ** A share of remuneration is donated in accordance with the current rules of the Hans-Böckler-Stiftung
Total remuneration paid to members of the Supervisory Board in 2018/2019
Remuneration report
2 | 118
2 | Consolidated ManageMent RepoRt
3 | CoRpoRate goveRnanCe 4 | Consolidated FinanCial stateMents
6 | otheR inFoRMation5 | notes to the Consolidated FinanCial stateMents
1 | to ouR shaReholdeRs

Remuneration 2018 pursuant to GAs 17 (€ thousand)
Name Position Base compensation
Additional compensation for committee work
Meeting attendance fee
Total remuneration in 2018
Volker Kronseder Chairman of the Supervisory Board 87.5 7.0 15.0 109.5
Werner Schrödl*,** Deputy Chairman of the Supervisory Board 52.5 7.0 13.5 73.0
Robert Friedmann Regular member 17.5 4.5 22.0
Klaus Gerlach* Regular member 35.0 6.0 41.0
Oliver Grober*,** Regular member 17.5 4.5 22.0
Thomas Hiltl*,** Regular member 17.5 4.5 22.0
Norman Kronseder Regular member 35.0 7.0 15.0 57.0
Prof. Dr. jur. Susanne Nonnast Regular member 35.0 4.5 39.5
Dr. phil. Verena Di Pasquale*,** Regular member 35.0 6.0 41.0
Beate Eva Maria Pöpperl*,** Regular member 35.0 4.5 39.5
Norbert Samhammer Regular member 17.5 4.5 22.0
Petra Schadeberg-Herrmann Regular member 35.0 4.5 39.5
Jürgen Scholz*,** Regular member 35.0 7.0 10.5 52.5
Hans-Jürgen Thaus Regular member 35.0 7.0 10.5 52.5
Josef Weitzer*,** Regular member 35.0 7.0 15.0 57.0
Matthias Winkler Regular member 17.5 4.5 22.0
* Employee representative ** A share of remuneration is donated in accordance with the current rules of the Hans-Böckler-Stiftung
Remuneration report
2 | 119
2 | Consolidated ManageMent RepoRt
3 | CoRpoRate goveRnanCe 4 | Consolidated FinanCial stateMents
6 | otheR inFoRMation5 | notes to the Consolidated FinanCial stateMents
1 | to ouR shaReholdeRs

Christoph KlenkCEo
Thomas Ricker Markus Tischer
Norbert Broger
Ralf Goldbrunner
“To the best of our knowledge, and in accordance with the applicable reporting principles, the consolidated financial statements give a true and fair view of the assets, liabilities, financial position, and profit or loss of the group, and the consolidated management report includes a fair review of the development and performance of the business and the position of the group, together with a description of the principal opportunities and risks associated with the ex-pected development of the group.”
Neutraubling, 12 March 2020 Krones AG The Executive Board
Responsibility statement
Responsibility statement
2 | 120
2 | Consolidated ManageMent RepoRt
3 | CoRpoRate goveRnanCe 4 | Consolidated FinanCial stateMents
6 | otheR inFoRMation5 | notes to the Consolidated FinanCial stateMents
1 | to ouR shaReholdeRs

CorporATE govErnAnCE
Statement on corporate governance . . . . . . . . . . . . . . . . . . . . . . . . . . . . . . . . . . . . . . . . . .122
Declaration of compliance . . . . . . . . . . . . . . . . . . . . . . . . . . . . . . . . . . . . . . . . . . . . . . . . . . . .123
Composition of the Supervisory Board . . . . . . . . . . . . . . . . . . . . . . . . . . . . . . . . . . . . .124
Information on corporate governance practices . . . . . . . . . . . . . . . . . . . . . . . . .125
Diversity policies, succession planning for the Executive Board. . . . . .126
Duties and activities of the Executive Board
and Supervisory Board. . . . . . . . . . . . . . . . . . . . . . . . . . . . . . . . . . . . . . . . . . . . . . . . . . . . . . . . . .127
Composition, duties, and activities of the Audit and
Risk Management Commitee . . . . . . . . . . . . . . . . . . . . . . . . . . . . . . . . . . . . . . . . . . . . . . . .127
Composition, duties, and activities of the Standing Commitee . . . . .128
Determinations pursuant to Sections 76 (4) and 111 (5)
of the German Stock Corporation Act. . . . . . . . . . . . . . . . . . . . . . . . . . . . . . . . . . . . . . .128
3

3 | 122
krones recognises its responsibilities
For Krones, the German Corporate Governance Code is an integral part of corporate governance. The following is the report from the Executive Board and the Supervisory Board on corporate governance at Krones in accordance with Section 3.10 of the German Corporate Governance Code.
The Code comprises essential statutory requirements for the management and supervision (governance) of German listed companies and contains inter-nationally and nationally recognised standards of good and responsible corpo-rate governance. The management of Krones takes the principles and rules of corporate governance into account in all business activities.
Statement on corporate governance
2 | Consolidated ManageMent RepoRt
3 | CoRpoRate goveRnanCe 4 | Consolidated FinanCial stateMents
6 | otheR inFoRMation5 | notes to the Consolidated FinanCial stateMents
1 | to ouR shaReholdeRs Statement on corporate governance

3 | 123 Supervisory Board of KRONES AG, who suggest nominees. We do not therefore consider it necessary to create a separate nominating committee. The tasks concerned are performed by the Standing Committee.
� In its election recommendations to the annual general meeting, the Super-visory Board does not currently disclose the personal and business relation-ships of every candidate with the enterprise, the company’s governing bodies and any shareholders with a material interest in the company (Section 5.4.1 paragraphs 5 and 6 of the Code). The Supervisory Board deems the requirements of paragraphs 5 and 6 to be unclear and vague in the details and to potentially violate the privacy of those affected.
� No special consideration is given to chairmanship of Supervisory Board committees in terms of remuneration (Section 5.4.6 of the Code). The Supervisory Board is of the opinion that, given the size of the committees, the current additional remuneration paid to members of committees is also appropriate for the committee chairs.”
Neutraubling, 22 January 2020
For the Executive Board: For the Supervisory Board:
Christoph Klenk Volker Kronseder CEo Chairman
Declaration of compliance pursuant to Section 161 of the German Stock Corporation Act
“The Executive Board and the Supervisory Board of Krones AG declare that the recommendations of the Government Commission on the German Corporate Governance Code established by the German federal government regarding the management and supervision of German listed companies as amended on 7 February 2017 have been and continue to be complied with in accordance with the German Corporate Governance Code (hereinafter the Code), which is published on the website of Krones AG, with the following exceptions:
� The D&o policy for the Supervisory Board does not include a deductible (Section 3.8 of the Code). No specific deductible has been agreed for the policy because the Supervisory Board duly performs its duties at all times irrespective of any deductible.
� The remuneration report is required to present certain information about Executive Board remuneration in prescribed model tables (Section 4.2.5 Sentences 5 and 6 of the Code). Some points of interpretation are unclear and, moreover, it is doubtful that the additional use of the model tables would serve to make the remuneration report more clear and generally understandable, as the company aims to do in its compliance with financial reporting requirements (see Section 4.2.5 Sen-tence 3 of the Code).
� There is currently no nominating committee at Krones AG (Section 5.3.3 of the Code). Committees are primarily useful for larger bodies if they make the body’s work more efficient. There are eight shareholder representatives on the
Statement on corporate governance
2 | Consolidated ManageMent RepoRt
3 | CoRpoRate goveRnanCe 4 | Consolidated FinanCial stateMents
6 | otheR inFoRMation5 | notes to the Consolidated FinanCial stateMents
1 | to ouR shaReholdeRs

3 | 124 Composition of the Supervisory Board
Pursuant to Item 5.4.1 of the German Corporate Governance Code, the Super-visory Board must specify concrete objectives relating to its composition and develop a profile of skills and expertise for the board as a whole. With consider-ation to the company’s specific situation, the composition of the board should duly take into account the company’s international activities, potential con-flicts of interest, the number of independent Supervisory Board members within the meaning of Section 5.4.2, an age limit to be specified for Supervisory Board members, a regular limit on the length of membership to be specified for the members of the Supervisory Board, and diversity. With respect to the elected employee representatives, the specific requirements of codetermina-tion law must be taken into account.
In keeping with the above, the Supervisory Board of Krones has specified the following objectives:
a) Composition based on suitable knowledge, skills and experience
The Supervisory Board of Krones AG shall be composed in such a way that its members possess the knowledge, skills, and professional experience required to properly complete the tasks of a member of the Supervisory Board of an in-ternational corporation and to preserve Krones AG’s public reputation.
Motivation, integrity, character, professionalism and independence should also be taken into account when considering candidates for election.
b) Potential conflicts of interest (independence of the members)
The independence of the members of the Supervisory Board shall be ensured in order to prevent conflicts of interest. Potential candidates shall not serve as advisors or board members to major competitors of Krones AG and shall not hold management positions at companies that are customers, suppliers or
Krones AG group companies. The Supervisory Board shall contain no more than two former members of the Executive Board.
Moreover, the members of the Supervisory Board shall meet the criteria for in-dependence under Section 5.4.2 of the Corporate Governance Code. Presuming that execution of a Supervisory Board mandate as employee representative casts no doubt on compliance with the criteria for independence under Item 5.4.2 of the Code, the majority of the members of the Supervisory Board shall be independent within the meaning of Item 5.4.2 of the Code. At least two shareholder representatives on the Supervisory Board must be independent. In the reporting period, those were Prof. Dr. Susanne Nonnast, Hans-Jürgen Thaus and Robert Friedmann.
Each member of the Supervisory Board shall agree to submit a declaration to the Chairman of the Supervisory Board if there is any conflict of interest. If a conflict of interest persists over an extended period or is material, the Super-visory Board member in question must resign.
c) Age limit
The age limit for members of the Supervisory Board is 70 years. A member’s term in office ends at the conclusion of the annual general meeting that follows his or her 70th birthday. Reasons must be given for any deviation from this rule.
d) Limit on duration of membership
The Supervisory Board has not set a limit (cap) on the duration of Supervisory Board membership. We believe that such a cap does not make sense because the expertise of experienced Supervisory Board members should remain available to the company. The Supervisory Board of Krones will continue to examine the suitability of Supervisory Board members on an individual basis, regardless of how long members have already been on the board. Because we have not set a term limit, we also have nothing to report on the status of implementation.
Statement on corporate governance
2 | Consolidated ManageMent RepoRt
3 | CoRpoRate goveRnanCe 4 | Consolidated FinanCial stateMents
6 | otheR inFoRMation5 | notes to the Consolidated FinanCial stateMents
1 | to ouR shaReholdeRs

3 | 125 e) International experience
Krones AG operates internationally and has subsidiaries and offices in many countries around the globe. Therefore, international experience must be taken into consideration when selecting members of the Supervisory Board.
International experience relates not only to foreign language skills but also to employment in other international companies.
f) Diversity
The Supervisory Board of Krones AG takes diversity into account in the selec-tion of its members. Under Germany’s Act on Equal Participation of Women and Men in Leadership Positions in the Private and Public Sectors, which en-tered into force on 1 May 2015, at least 30 percent of Supervisory Board seats at Krones must be held by women and men, respectively. Employee and share-holder representatives on the Supervisory Board of Krones AG have both decided to each meet the gender quota separately. In accordance with the law and the articles of association, the Supervisory Board of Krones AG comprises eight shareholder representatives and eight employee representatives. Thus, the Supervisory Board should have at least two female employee representa-tives and two female shareholder representatives. Petra Schadeberg-Herrmann and Prof. Dr. Susanne Nonnast represent shareholders on the Supervisory Board. The Supervisory Board also has two female employee representatives, Dr. Verena Di Pasquale and Beate Eva Maria Pöpperl.
The Supervisory Board of Krones implemented all of the objectives a) through f) in the financial year 2019.
Information on corporate governance practices
Corporate governance at Krones is based on fairness and transparency. This principle applies both to cooperation between the Executive Board and the Supervisory Board and to our interaction with employees, customers, suppliers and the general public.
Compliance at Krones is an overarching concept denoting conduct consistent with the rules, where the rules to be observed within the company far exceed statutory requirements. They also include internal guidelines and regulations, and embody the moral values and standards that correspond to Krones’ ethi-cal principles.
Krones revised its Code of Conduct in 2019. Subjects covered in the Code of Conduct include corporate values, acting in accordance with the law and ethics, social responsibility and handling information and knowledge. Concrete exam-ples on each topic help employees implement and adhere to the rules set out in the Code of Conduct in their daily work.
In order to strengthen compliance, Krones introduced a compliance whistle-blower portal in 2018. This reporting system on the Krones website allows company employees and outsiders to anonymously bring attention to potential infringements of the law or rules and regulations.
We review all strategic decisions for their long-term probability of success. Our aim is to optimise profits and cash flow in a sustainable manner. To secure the company’s long-term survival, we review all of our activities with respect to sustainability, factoring in not only our social and economic responsibilities but also the ecological impact of the manufacture and use of our products. Krones maintains eco-friendly production operations and not only complies with statutory regulations but makes every effort to remain as far as possible below prescribed limits.
Statement on corporate governance
2 | Consolidated ManageMent RepoRt
3 | CoRpoRate goveRnanCe 4 | Consolidated FinanCial stateMents
6 | otheR inFoRMation5 | notes to the Consolidated FinanCial stateMents
1 | to ouR shaReholdeRs

3 | 126 Our governance principles ensure that the welfare of the very people who con-tribute to our success is never subordinated to economic interests. In order to prevent accidents at the workplace and work-related illness, Krones creates a safe environment that is conducive to the good health of our employees. All of our workflows are designed with employee safety and health in mind, and we ensure that the workplace is ergonomic.
When choosing our suppliers, we look at their performance with respect to sustainable, socially responsible business practices. Krones has developed a suppliers’ code for this purpose. The code covers safety and health, the environ-ment, working conditions and compliance. In addition, selected suppliers are regularly audited to verify that Krones suppliers meet the required standards.
Diversity policy and succession planning for the Executive Board
The Executive Board, the Supervisory Board and the Standing Committee are responsible for succession planning and for monitoring diversity. For the appointment of members of the Executive Board, preference is given to candi-dates whose accomplishments and knowledge make them the best qualified to safeguard the interests of the company and its stakeholders for the long term. The company’s diversity policy is also taken into account in such appointment processes. When filling a position on the Executive Board, the Supervisory Board considers diversity with respect to candidates’ professional and educa-tional backgrounds, age, gender and international management qualifications. The policy consists of the following aspects in detail:
� The Supervisory Board has set a standard age limit for members of the Executive Board. The standard age limit is 62 years (62nd birthday). The Supervisory Board also gives due consideration to ensuring a balanced age structure.
� At least two members of the Executive Board are required to have a technical/engineering background. At least two members are required to have international management experience. The Executive Board as a whole is required to represent the best possible composition for the Krones Group, its core business and all stakeholders.
� With the current all-male composition of the Executive Board, the percent-age of women on the Executive Board is 0%. The reason for the current all-male composition of the Executive Board is that the Supervisory Board, despite the existence of suitable female candidates, has been unable to recruit any of those candidates for a position on the Executive Board. Pur suant to Section 111 (5) of the German Stock Corporation Act, the Super-visory Board of Krones AG has accordingly established a target of 0% participation of women on the Executive Board. This quota applies for as long as the Executive Board remains in its current composition on the basis of the agreed lengths of contract, including any extensions. However, under the company’s diversity policy, women will be given priority consideration for filling any openings on the Executive Board.
� The Supervisory Board has set the contract term for first-time appointees to Executive Board positions at three years.
Statement on corporate governance
2 | Consolidated ManageMent RepoRt
3 | CoRpoRate goveRnanCe 4 | Consolidated FinanCial stateMents
6 | otheR inFoRMation5 | notes to the Consolidated FinanCial stateMents
1 | to ouR shaReholdeRs

3 | 127 Duties and activities of the Executive Board and the Supervisory Board
The Executive Board of Krones AG consisted of five members until 24 July 2019. Michael Andersen stepped down from the Executive Board on 24 July. From that date until the end of 2019, the Executive Board consisted of four members. Until the end of 2019, Michael Andersen’s responsibilities were temporarily assumed by Ceo Christoph Klenk. Members of the Executive Board are each responsible for their respective Executive Board portfolio (see pages 27 and 192). The Executive Board manages the company and its affairs. The members of the Executive Board hold daily Executive Board meetings. At these meetings, the Executive Board discusses current and strategic topics and makes decisions. For strategically important decisions, the Executive Board involves the Supervisory Board in the decision-making process in a timely manner. The work of the Exec-utive Board, such as the majority required for resolutions and transactions that require Supervisory Board approval, is governed by rules of procedure for the Executive Board issued by the Supervisory Board.
The Supervisory Board oversees the Executive Board. In accordance with the articles of association, the Supervisory Board has 16 members. The Executive Board and the Supervisory Board communicate on a regular basis. The Execu-tive Board informs the Supervisory Board in a timely manner about business development, the company’s financial situation, risk management, business forecasts and strategy. In addition to regular oral reports, the members of the Supervisory Board receive written reports on the company’s earnings and financial situation from the Executive Board each month.
The Chairman of the Supervisory Board coordinates the work of the Super-visory Board (see pages 32/33 and 192 for a listing of the members). The Chair-man or Deputy Chairman presides over the Supervisory Board’s meetings.
The Supervisory Board adopts resolutions either in its meetings or in exceptional cases by circulation. Members of the Executive Board participate in meetings of the Supervisory Board at the invitation of the Chairman or
Deputy Chairman of the Supervisory Board. The Executive Board members give oral or written reports on the agenda items and respond to questions from Supervisory Board members.
Each year, the Chairman of the Supervisory Board describes the Board’s activi-ties in his report to shareholders in the annual report and at the annual general meeting.
The Supervisory Board has adopted rules of procedure of its own, governing matters such as responsibilities and rules for the passage of resolutions.
In order to perform its work in the most efficient manner possible, the Super-visory Board has formed an Audit and Risk Management Committee and a Standing Committee.
Composition, duties and activities of the Audit and Risk Management Committee
The Audit and Risk Management Committee consists of Supervisory Board Chairman Volker Kronseder, his deputy Werner Schrödl and Supervisory Board members Norman Kronseder, Hans-Jürgen Thaus, Josef Weitzer and Jürgen Scholz. Its Chairman is Hans-Jürgen Thaus.
The Audit and Risk Management Committee meets regularly and oversees the accounting and financial reporting process and the audit of the financial statements and prepares corresponding proposals for resolutions for the Super-visory Board. The Committee also prepares the Supervisory Board’s review of the annual financial statements, the management report and the auditor’s report for the separate and consolidated financial statements and makes recommendations. In addition, the Audit and Risk Management Committee monitors the effectiveness of the internal control system, the risk management system and the compliance system.
Statement on corporate governance
2 | Consolidated ManageMent RepoRt
3 | CoRpoRate goveRnanCe 4 | Consolidated FinanCial stateMents
6 | otheR inFoRMation5 | notes to the Consolidated FinanCial stateMents
1 | to ouR shaReholdeRs

3 | 128 Composition, duties and activities of the Standing Committee
The Standing Committee consists of Volker Kronseder, Werner Schrödl, Norman Kronseder and Josef Weitzer. Volker Kronseder chairs the committee. The Standing Committee meets regularly and deals with all other topics that do not fall within the scope of the Audit and Risk Management Committee. These include corporate strategy, human resources strategy, Supervisory Board remuneration and Executive Board remuneration.
Determinations pursuant to Sections 76 (4) and 111 (5) of the German Stock Corporation Act
Under Section 76 (4) of the German Stock Corporation Act, the Executive Board is required to determine targets for the participation of women in the two levels of management below the Executive Board. It must also set a deadline for compliance with the targets. Despite intensive efforts, the heavily engineer-ing-oriented context at Krones has meant that only a small number of vacant management positions have so far been filled with women possessing compa-rable qualifications. As of 31 December 2017, the percentage of women in each of these two levels of management came to 10.9%. The Executive Board of Krones AG has set itself the goal of at least holding this figure stable through to 30 June 2020. At the end of the 2019 financial year, the figure was 9.3%.
So far, despite intensive efforts, the Supervisory Board has not been able to re-cruit suitable women candidates for the Executive Board. Because the lengths of current contracts mean that no changes can be expected on the Executive Board in the medium term, the Supervisory Board has set a target of 0% for the percentage of women on the Executive Board of Krones AG and thus complies with the requirements under Section 111 (5) of the German Stock Corporation Act. There is therefore no need to set a deadline for compliance.
Statement on corporate governance
2 | Consolidated ManageMent RepoRt
3 | CoRpoRate goveRnanCe 4 | Consolidated FinanCial stateMents
6 | otheR inFoRMation5 | notes to the Consolidated FinanCial stateMents
1 | to ouR shaReholdeRs

4 ConsoLidATEd finAnCiAL sTATEmEnTs
Consolidated statement of profit and loss . . . . . . . . . . . . . . . . . . . . . . . . . . . . . . . . . 130
Consolidated statement of comprehensive income . . . . . . . . . . . . . . . . . . . . . . 131
Consolidated statement of financial position – Assets . . . . . . . . . . . . . . . . . 132
Consolidated statement of financial position – Equity and
liabilities . . . . . . . . . . . . . . . . . . . . . . . . . . . . . . . . . . . . . . . . . . . . . . . . . . . . . . . . . . . . . . . . . . . . . . . . . . . . . 133
Consolidated statement of cash flows . . . . . . . . . . . . . . . . . . . . . . . . . . . . . . . . . . . . . . . 134
Consolidated statement of changes in equity . . . . . . . . . . . . . . . . . . . . . . . . . . . . . 135

4 | 130
2019 2018
€ thousand Notes
Revenue 19 3,958,875 3,853,980Changes in inventories of finished goods and work in progress 5 8,737 1,102Other own work capitalised 20 63,017 49,622Other operating income 21 99,826 4,130,455 114,492 4,019,196
Goods and services purchased 22
Expenses for materials and supplies and for goods purchased – 1,525,551 – 1,523,504 Expenses for services purchased – 516,237 – 2,041,788 – 508,521 – 2,032,025
Personnel expenses 23
Wages and salaries – 1,065,065 – 944,876Social security contributions and expenses for pension plans and for benefits – 210,453 – 1,275,518 – 192,390 – 1,137,266
Depreciation and amortisation of intangible assets and property, plant and equipment 1/2 – 183,315 – 102,736Other operating expenses 24 – 585,885 – 544,018EBIT 43,949 203,151
Investment income 25 5,588 8,747Profit or loss shares attributable to associates that are accounted for using the equity method 4 – 686 821Income from other securities and loans classified as non-current financial assets 25 0 2Interest and similar income 25 7,520 6,121Interest and similar expenses 25 – 14,628 – 14,592Financial income/expense 25 – 2,206 1,099
Earnings before taxes 41,743 204,250
Income tax 8/26 – 32,501 – 53,650
Consolidated net income 9,242 150,600Profit share of non-controlling interests – 249 – 483Profit share of KronEs Group shareholders 9,491 151,083
Earnings per share (diluted/basic) in € 27 0.30 4.78
Consolidated statement of profit and loss
Consolidated statement of profit and loss
2 | Consolidated ManageMent RepoRt
3 | CoRpoRate goveRnanCe 4 | Consolidated FinanCial stateMents
6 | otheR inFoRMation5 | notes to the Consolidated FinanCial stateMents
1 | to ouR shaReholdeRs

4 | 131
2019 2018
€ thousand Notes
Consolidated net income 9,242 150,600
Items that will not be reclassified subsequently to profit or loss Remeasurement of defined benefit plans 12 – 26,568 4,396
– 26,568 4,396
Items that may be reclassified subsequently to profit or loss Exchange differences on translation 7,868 – 2,279 Cash flow hedges 12 – 585 – 2,380
7,283 – 4,659
Other comprehensive expenses and income after income taxes 9 – 19,285 – 263
Total comprehensive income 9 – 10,043 150,337
of which attributable to non-controlling interests – 249 – 483 of which attributable to KronEs Group shareholders – 9,794 150,820
Consolidated statement of comprehensive income
Consolidated statement of comprehensive income
2 | Consolidated ManageMent RepoRt
3 | CoRpoRate goveRnanCe 4 | Consolidated FinanCial stateMents
6 | otheR inFoRMation5 | notes to the Consolidated FinanCial stateMents
1 | to ouR shaReholdeRs

4 | 132
31 Dec 2019 31 Dec 2018
€ thousand Notes
Intangible assets 1 345,152 328,183Property, plant and equipment 2 693,185 570,820Non-current financial assets 3 28,127 8,770Investments accounted for using the equity method 4 3,369 28,661Fixed assets 1,069,833 936,434
Deferred tax assets 8 41,617 32,450Trade receivables 6 28,913 32,578Tax receivables 252 49Other assets 6 13,434 8,248Non-current assets 1,154,049 1,009,759
Inventories 5 382,523 320,734
Trade receivables 6 932,876 955,392Contract assets 6/19 571,261 647,089Tax receivables 16,360 11,733Other assets 6 151,985 157,880
Cash and cash equivalents 7 110,382 218,802Current assets 2,165,387 2,311,630
Total 3,319,436 3,321,389
Consolidated statement of financial position – Assets
Consolidated statement of financial position
2 | Consolidated ManageMent RepoRt
3 | CoRpoRate goveRnanCe 4 | Consolidated FinanCial stateMents
6 | otheR inFoRMation5 | notes to the Consolidated FinanCial stateMents
1 | to ouR shaReholdeRs

4 | 133
31 Dec 2019 31 Dec 2018
€ thousand Notes
Subscribed capital 9 40,000 40,000Capital reserves 10 141,724 141,724Profit reserves 11 340,278 331,521Other reserves 12 – 116,313 – 89,160Consolidated retained earnings 964,966 1,009,193Consolidated equity of the parent company 1,370,655 1,433,278Non-controlling interests 13 – 629 – 72Equity 1,370,026 1,433,206
Provisions for pensions 14 260,194 220,550Deferred tax liabilities 8 3,673 23,344Other provisions 15 75,192 63,658Tax liabilities 5,356 4,434Liabilities to banks 16 64 3,169Trade payables 16 14 1Other financial obligations and lease liabilities 16 104,912 41,302Other liabilities 16 2,600 2,298Non-current liabilities 452,005 358,756
Other provisions 15 141,048 107,230Liabilities to banks 16 72,178 555Contract liabilities 16/19 442,884 547,222Trade payables 16 463,722 491,585Tax liabilities 16,868 14,510Other financial obligations and lease liabilities 16 34,887 106,670Other liabilities and accruals 16 352,818 261,655Current liabilities 1,497,405 1,529,427
Total 3,319,436 3,321,389
Consolidated statement of financial position – Equity and liabilities
Consolidated statement of financial position
2 | Consolidated ManageMent RepoRt
3 | CoRpoRate goveRnanCe 4 | Consolidated FinanCial stateMents
6 | otheR inFoRMation5 | notes to the Consolidated FinanCial stateMents
1 | to ouR shaReholdeRs

Consolidated statement of cash flows
2019 2018
€ thousand Notes
Earnings before taxes 41,743 204,250Depreciation and amortisation and reversals 1/2 183,315 102,736Increase (previous year: decrease) in provisions and accruals 15/16 105,928 – 85,721Interest and similar expenses and income 25 7,108 8,471Gains and losses from the disposal of non-current assets 21/24 – 216 27Other non-cash expenses and income 13,252 – 6,234Decrease in trade receivables, contract assets and other assets not attributable to investing or financing activities 114,345 10,189Increase in inventories 5 – 59,421 – 39,102Decrease (previous year: increase) in trade payables, contract liabilities and other liabilities not attributable to investing or financing activities – 258,388 195,221Cash generated from operating activities 147,666 389,837Interest paid – 4,354 – 923Income tax paid and refunds received – 49,787 – 73,861Cash flow from operating activities 93,525 315,053
Cash payments to acquire intangible assets 1 – 61,265 – 57,581Proceeds from the disposal of intangible assets 1 411 43Cash payments to acquire property, plant and equipment 2 – 107,644 – 121,547Proceeds from the disposal of property, plant and equipment 2 8,994 2,363Cash payments to acquire non-current financial assets – 12,692 – 7,159Proceeds from the disposal of non-current financial assets 92 680Cash payments to acquire affiliated companies – 27,952 – 24,753Interest received 5,325 2,819Dividends received 6,807 10,740Cash flow from investing activities – 187,924 – 194,395
Cash payments to owners – 53,708 – 53,708Proceeds from new borrowing 72,178 524Cash payments to service debt – 3,660 – 24,620Cash payments to acquire non-controlling interests – 1,915 0Cash payments for the repayment of lease liabilities – 32,156 – 98Cash flow from financing activities – 19,261 – 77,902
Net change in cash and cash equivalents – 113,660 42,756Changes in cash and cash equivalents arising from changes in exchange rates 1,475 – 6,417Changes in cash and cash equivalents arising from changes in the consolidated group 3,765 468
Cash and cash equivalents at the beginning of the period 218,802 181,995
Cash and cash equivalents at the end of the period 7 110,382 218,802
4 | 134
Consolidated statement of cash flows
2 | Consolidated ManageMent RepoRt
3 | CoRpoRate goveRnanCe 4 | Consolidated FinanCial stateMents
6 | otheR inFoRMation5 | notes to the Consolidated FinanCial stateMents
1 | to ouR shaReholdeRs

Consolidated statement of changes in equity
Parent companyNon-
controlling interests
Consolidated equity
€ thousand Share capital
Capitalreserves
Profitreserves
Currencydifferences
in equity
Otherreserves
Groupretainedearnings
Equity Equity
Notes 9 10 11 11 12 13
At 1 January 2018 40,000 141,724 377,381 – 35,864 – 91,176 912,794 1,344,859 – 3,085 1,341,774
Dividend payment (€1.70 per share) – 53,708 – 53,708 – 53,708
Consolidated net income 2018 151,083 151,083 – 483 150,600
Allocation to profit reserves 776 – 776 0 0
Changes in the consolidated group – 8,493 – 200 – 8,693 3,496 – 5,197
Other comprehensive expenses and income – 2,279 2,016 – 263 – 263
At 31 December 2018 40,000 141,724 369,664 – 38,143 – 89,160 1,009,193 1,433,278 – 72 1,433,206
Dividend payment (€1.70 per share) – 53,708 – 53,708 – 53,708
Consolidated net income 2019 9,491 9,491 – 249 9,242
Allocation to profit reserves 0 0 0
Changes in the consolidated group 889 – 10 879 – 308 571
Other comprehensive expenses and income 7,868 – 27,153 – 19,285 – 19,285
At 31 December 2019 40,000 141,724 370,553 – 30,275 – 116,313 964,966 1,370,655 – 629 1,370,026
4 | 135
Consolidated statement of changes in equity
2 | Consolidated ManageMent RepoRt
3 | CoRpoRate goveRnanCe 4 | Consolidated FinanCial stateMents
6 | otheR inFoRMation5 | notes to the Consolidated FinanCial stateMents
1 | to ouR shaReholdeRs

5 noTEs To THE ConsoLidATEd finAnCiAL sTATEmEnTs
Consolidated segment reporting . . . . . . . . . . . . . . . . . . . . . . . . . . . . . . . . . . . . . . . . . . . . . 137
General disclosures . . . . . . . . . . . . . . . . . . . . . . . . . . . . . . . . . . . . . . . . . . . . . . . . . . . . . . . . . . . . . . . 138
Notes to the consolidated statement of financial position . . . . . . . . . . . . . 153
Notes to the consolidated statement of profit and loss . . . . . . . . . . . . . . . . . 179
Accounting standards applied for the first time . . . . . . . . . . . . . . . . . . . . . . . . . . . 182
Other disclosures . . . . . . . . . . . . . . . . . . . . . . . . . . . . . . . . . . . . . . . . . . . . . . . . . . . . . . . . . . . . . . . . . . 184
Standards and interpretations . . . . . . . . . . . . . . . . . . . . . . . . . . . . . . . . . . . . . . . . . . . . . . . . . 186
Shareholdings . . . . . . . . . . . . . . . . . . . . . . . . . . . . . . . . . . . . . . . . . . . . . . . . . . . . . . . . . . . . . . . . . . . . . . 187
Members of the Supervisory Board and the Executive Board . . . . . . . . . . 192
Proposal for the appropriation of earnings available for
distribution . . . . . . . . . . . . . . . . . . . . . . . . . . . . . . . . . . . . . . . . . . . . . . . . . . . . . . . . . . . . . . . . . . . . . . . . . 193

Consolidated segment reporting
€ thousand Machines and Linesfor Product Filling andDecoration
Machines and Linesfor Beverage Production/Process Technology
KronEs Group
2019 2018 2019 2018 2019 2018
Revenue 3,265,417 3,177,850 693,458 676,130 3,958,875 3,853,980
Depreciation, amortisation and impairments 155,600 89,949 27,715 12,787 183,315 102,736of which impairments 29,201 1,644 8,931 0 38,132 1,644
Interest income 5,812 4,770 477 788 6,289 5,558Interest expense 4,537 2,456 1,747 1,387 6,284 3,843
EBT 56,405 223,295 – 14,662 – 19,045 41,743 204,250Share of profit or loss of associates accounted for using the equity method – 330 821 – 356 0 – 686 821
EBIT 62,850 223,544 –18,901 –30,393 43,949 203,151
EBT margin (EBT to revenue) 1.7% 7.0% – 2.1% – 2.8% 1.1% 5.3%
5 | 137
2 | Consolidated ManageMent RepoRt
3 | CoRpoRate goveRnanCe 4 | Consolidated FinanCial stateMents
5 | notes to the Consolidated FinanCial stateMents
6 | otheR inFoRMation1 | to ouR shaReholdeRs
Consolidated segment reporting

5 | 138
� Legal basis
Krones provides machinery and systems for bottling and packaging and for beverage production. Innovative digitalisation and intralogistics solu-tions round out the portfolio. Krones AG, which is registered in the Com-mercial Register of Regensburg Local Court (HrB 2344) and is headquartered in Neutraubling, Germany.
The consolidated financial statements of Krones AG, Neutraubling (the “Krones Group”) for the period ended 31 December 2019 have been prepared in accordance with the International Financial Reporting Standards (IFrs) of the International Accounting Standards Board (IAsB), London, applicable at the reporting date, including the interpretations issued by the Interna-tional Financial Reporting Interpretation Committee (IFrIC), as adopted by the European Union.
The group has not undertaken early application of IFrs standards and inter-pretations that have not yet entered into force. A list of such standards and interpretations and of standards applied for the first time is provided on page 186. The commercial law stipulations under Section 315e (1) of the German Commercial Code (HGB) have been complied with in addition. The Executive Board authorised the publication of the consolidated financial statements on 12 March 2020.
General disclosuresNon-controlling interests in consolidated equity are presented on the statement of financial position as a separate item within equity. On the statement of profit and loss, the share of profit or loss attributable to non-controlling interests is presented as a component of consolidated net income. The shares of consolidated net income attributable to the owners of the parent and to non-controlling interests are presented separately.
Non-controlling interests are additionally shown on the statement of changes in equity.
The explanatory notes provided in the following comprise disclosures and commentary that, in accordance with IFrs, must be included as notes to the interim consolidated financial statements in addition to the statement of financial position, statement of profit and loss, statement of comprehensive income, statement of changes in equity and statement of cash flows.
The statement of profit and loss was prepared using the nature of expense method.
The group currency is the euro.
Unless otherwise stated, all financial information presented in euros is rounded to the nearest thousand.
General disclosures
2 | Consolidated ManageMent RepoRt
3 | CoRpoRate goveRnanCe 4 | Consolidated FinanCial stateMents
5 | notes to the Consolidated FinanCial stateMents
6 | otheR inFoRMation1 | to ouR shaReholdeRs

5 | 139 � Consolidated group
Besides Krones AG, the consolidated financial statements of Krones AG for the period ended 31 December 2019 include all domestic and foreign subsid-iaries over which Krones AG has direct or indirect control on account of a majority of voting rights.
In a step acquisition over the course of the 2019 financial year, 100% of the remaining ownership interest was acquired in AUToMATA s.A., Guatemala City, Guatemala. In addition, the remaining 60% ownership interest was ac-quired in InTeGrATeD PACKAGInG sysTeMs (IPs) FZCo, Dubai, United Arab Emirates (UAe). Krones now has a 100% ownership interest in the company. It was previously accounted for using the equity method.
Also during the financial year, Krones MIDDLe eAsT AFrICA FZCo, Dubai, United Arab Emirates, was established and included in the scope of consoli-dation together with Krones InDIA PVT. LTD., Bangalore, India.
On 1 April 2019, Krones acquired the remaining 60% ownership interest in InTeGrATeD PACKAGInG sysTeMs (IPs) FZCo, Dubai, United Arab Emirates (UAe). This acquisition strengthens Krones’ distribution structure in the Middle East/Africa region.
With the acquisition of 100% of the business operations of AUToMATA s.s., Guatemala City, Guatemala on 1 June 2019, Krones strengthened its capa-bilities in process technology.
Initial accounting of the acquired business operations was completed as of the acquisition date. For the effect on profit or loss from measurement of the previously held interests at fair value, please see under financial income/expense.
The table below presents the consideration transferred for the acquisitions and the fair values of the assets identified and liabilities assumed at the acquisition date.
The goodwill recognised for InTeGrATeD PACKAGInG sysTeMs (IPs) FZCo relates to the strengthening of the sales, distribution and service structure in the Middle East/Africa region. This earnings potential, which cannot be allocated to items capable of recognition as assets under IFrs, is reflected in goodwill.
The goodwill recognised for AUToMATA s.s. relates to the strengthening of the service structure by the integration of AUToMATA s.s. and its workforce in the group. This earnings potential, which cannot be allocated to items capable of recognition as assets under IFrs, is reflected in goodwill.
€ thousand ips dUBAi Other Total
Fair value Fair value Fair value
Goodwill 34,408 2,881 37,289
Non-current assets 6,634 1,358 7,992
Current assets 23,837 1,154 24,991
(of which trade receivables) 9,710 1,063 10,773
Cash and cash equivalents 1,794 1,395 3,189
Total assets acquired 66,673 6,788 73,461
Liabilities 18,032 3,526 21,558
Total liabilities acquired 18,032 3,526 21,558
Net assets acquired 48,640 3,262 51,902
Non-controlling interests 0 0 0
Purchase prices 48,640 3,262 51,902
of which paid in cash 29,184 1,957 31,141
of which fair value of previously held interests 19,456 1,304 20,761
General disclosures
2 | Consolidated ManageMent RepoRt
3 | CoRpoRate goveRnanCe 4 | Consolidated FinanCial stateMents
5 | notes to the Consolidated FinanCial stateMents
6 | otheR inFoRMation1 | to ouR shaReholdeRs

5 | 140 The total amount of goodwill that is expected to be deductible for tax purposes is €0 thousand.
The fair value of trade receivables equals the gross amount. None of the trade receivables are impaired and the contractually agreed amounts are expected to be recoverable in their entirety.
InTeGrATeD PACKAGInG sysTeMs (IPs) FZCo contributed a net profit of €370 thousand and revenue of €2,188 thousand to Krones from the acqui-sition date to 31 December 2019. Had initial accounting for InTeGrATeD PACKAGInG sysTeMs (IPs) FZCo been completed as of January 1, 2019, reve-nue of €2,917 thousand and a net profit of €493 thousand would have been recognised in the consolidated statement of profit and loss.
AUToMATA s.s. contributed a net profit of €20 thousand to Krones from the acquisition date to 31 December 2019. As the company only provides ser-vices within the group, no consolidated revenues are included. Had initial accounting for AUToMATA s.s. been completed as of January 1, 2019, the net profit would have been €34 thousand.
The costs directly attributable to the acquisitions amount to €181 thousand and were recognised as expense.
� Consolidation principles
The annual financial statements of Krones AG and of the domestic and foreign subsidiaries included in the consolidated financial statements have been prepared using uniform accounting policies, in accordance with IFrs 10. They are all prepared as of the reporting date of the consolidated financial statements.
Acquisition accounting is performed in accordance with IFrs 3 (Business Combinations), under which all business combinations must be accounted for using the acquisition method. The acquired assets and liabilities are therefore recognised at fair value.
Goodwill that arose before 1 January 2004 continues to be accounted for as a deduction from equity.
Shares in the equity of a subsidiary that are not attributable to the parent are presented as non-controlling interests. If an acquisition includes put options granted to non-controlling interests for their interests in group companies and Krones has identical call options, the options are accounted for as if they had already been exercised and each is recognised as a liability at fair value instead of recognising non-controlling interests (anticipated acquisition method). The liabilities are measured through profit or loss at fair value as of the reporting date.
Inter-company receivables, liabilities, provisions, income and expenses between consolidated companies are eliminated in consolidation. This also applies for inter-company profits or losses from deliveries made or services provided between group companies provided the inventories from these transactions are still held by the group at the reporting date.
General disclosures
2 | Consolidated ManageMent RepoRt
3 | CoRpoRate goveRnanCe 4 | Consolidated FinanCial stateMents
5 | notes to the Consolidated FinanCial stateMents
6 | otheR inFoRMation1 | to ouR shaReholdeRs

5 | 141 Companies for which Krones has the ability to exercise significant influ-ence over their business and financial policies (generally by indirectly or directly holding between 20% and 50% of voting rights), are accounted for in the consolidated financial statements using the equity method and initially recognised at cost. Any excess of the cost of the investment over Krones’ share of the net fair value of an associate’s identifiable assets and liabilities is adjusted on a fair-value basis and the remaining amount is rec-ognised as goodwill. Goodwill relating to the acquisition of an associate is included in the carrying amount of the investment and is not amortised. Instead, it is tested for impairment as part of the entire carrying amount of the investment in the associate. Krones’ share in an associate’s profit or loss subsequent to the acquisition date is recognised in the consolidated statement of profit and loss. The carrying amount of the associate is in-creased or decreased to recognise cumulative changes in fair value sub-sequent to the acquisition date. Krones’ share in associates’ gains or losses resulting from transactions between Krones and its associates is elimi-nated.
� Currency translation
The consolidated financial statements are presented in euros, the func-tional currency of Krones AG.
The financial statements of consolidated companies that are prepared in a foreign currency are translated on the basis of the functional currency
approach. Because the subsidiaries primarily operate independently in the economic environment of their respective countries, the functional cur-rency is normally the local currency for each subsidiary. In the consolidated financial statements, assets and liabilities are therefore translated at the closing rate at the reporting date, while income and expenses from the financial statements of subsidiaries are translated at average annual rates.
Any exchange differences resulting from translation using these different rates in the statement of financial position and the statement of profit and loss are recognised directly in other comprehensive income. Exchange dif-ferences resulting from the translation of equity using historical exchange rates are also recognised in other comprehensive income.
Exchange rate differences compared with the previous year arising from acquisition accounting are normally recognised outside profit or loss, in other profit reserves.
In the separate financial statements of Krones AG and its subsidiaries, receivables and liabilities in foreign currencies are translated using the exchange rate at the time of the transaction and exchange differences are recognised in profit or loss at the closing rate at the reporting date. Non-monetary items in foreign currencies are carried at historical cost.
Exchange rates of subsidiaries’ functional currencies against the euro:
General disclosures
2 | Consolidated ManageMent RepoRt
3 | CoRpoRate goveRnanCe 4 | Consolidated FinanCial stateMents
5 | notes to the Consolidated FinanCial stateMents
6 | otheR inFoRMation1 | to ouR shaReholdeRs

5 | 142 � Estimates and judgements
In preparing the consolidated financial statements, management makes judgements, estimates and assumptions that affect the reported amounts of assets and liabilities as of the reporting date, the disclosure of contingent liabilities and the reported amounts of expenses and income. The uncer-tainty inherent in such assumptions and estimates can, however, lead to events that result in material adjustments to the carrying amounts of affected assets and liabilities in future periods.
Major assumptions made about the future, and other sources of estimation uncertainty at the end of the reporting period that have a significant risk of resulting in material adjustments to the carrying amounts of assets and liabilities within the next financial year, are explained in the following.
Development costs are capitalised if they are associated with a future eco-nomic benefit and the remaining requirements in IAs 38.57 are met.
If there are indications that intangible assets are impaired or if annual im-pairment testing is required (intangible assets with an indefinite useful life, intangible assets in the development phase and goodwill), an impairment test is applied.
This is done by comparing the carrying amount of an asset (or cash-gene-rating unit) with its recoverable amount. The first step of this comparison consists of determining value in use. If value in use is less than the carrying amount, fair value less costs of disposal is determined and compared with the carrying amount. If fair value less costs of disposal is less than the car-rying amount, an impairment loss is recognised by reducing the carrying amount to the higher of value in use and fair value less costs of disposal.
Closing rate Average rate
31 Dec 2019 31 Dec 2018 2019 2018
Us dollar Usd 1.123 1.145 1.120 1.182British pound gBp 0.850 0.897 0.878 0.885Swiss franc CHf 1.086 1.127 1.113 1.155Danish krone dKK 7.471 7.468 7.466 7.453Canadian dollar CAd 1.462 1.560 1.486 1.530Japanese yen jpy 121.930 125.960 122.061 130.454Brazilian real BrL 4.513 4.445 4.413 4.305Chinese renminbi (yuan) Cny 7.833 7.860 7.719 7.806Mexican peso mXn 21.239 22.520 21.566 22.707Ukrainian hryvnia UAH 26.610 31.735 28.934 32.136South African rand ZAr 15.765 16.470 16.172 15.617Kenyan shilling KEs 113.794 116.642 114.219 119.671Nigerian naira ngn 408.970 416.290 405.052 425.572Russian rouble rUB 69.844 80.026 72.477 74.008Thai baht THB 33.445 37.048 34.770 38.182Indonesian rupiah idr 15,587.100 16,468.500 15,833.329 16,801.557Angolan kwanza AoA 537.803 352.423 404.416 296.577Turkish lira Try 6.680 6.056 6.357 5.700Kazakhstan tenge KZT 429.940 440.150 428.853 407.128Australian dollar AUd 1.601 1.623 1.611 1.580New Zealand dollar nZd 1.666 1.706 1.700 1.707Swedish krona sEK 10.445 10.251 10.587 10.257Vietnamese dong vnd 26,018.000 26,564.000 26,006.790 27,201.202Philippine peso pHp 56.869 60.125 58.000 62.253Bangladeshi taka BdT 95.319 95.753 94.522 99.179Singapore dollar sgd 1.511 1.560 1.527 1.593Myanmar kyat mmK 1,657.230 1,769.390 1,704.062 1,701.225United Arab Emirates dirham AEd 4.124 4.207 4.113 4.341Hungarian forint HUf 330.610 321.060 325.278 318.819Malaysian ringgit myr 4.593 4.733 4.638 4.764Pakistani rupee pKr 173.880 160.104 168.356 143.257Polish zloty pLn 4.260 4.298 4.298 4.261Norwegian krone noK 9.866 9.940 9.852 9.600Indian rupee inr 80.150 79.909 78.803 80.711Guatemalan quetzal gTQ 8.651 8.850 8.622 8.887Cambodian riel KHr 4,575.300 4,601.600 4,542.179 4,779.214Bulgarian lev Bgn 1.956 1.956 1.956 1.956
General disclosures
2 | Consolidated ManageMent RepoRt
3 | CoRpoRate goveRnanCe 4 | Consolidated FinanCial stateMents
5 | notes to the Consolidated FinanCial stateMents
6 | otheR inFoRMation1 | to ouR shaReholdeRs

5 | 143 Impairment testing involves making estimates and assumptions that may differ from the actual amounts in particular with regard to future cash and cash equivalents, cash flows and the planning period. The actual amounts may differ from the assumptions and estimates made if the conditions re-ferred to change contrary to expectations.
Krones determines value in use using a present value method (the dis-counted cash flow method). The cash flows used in the calculation are based on long-term corporate planning prepared by management. They are dis-counted at market discount rates.
The cash flows used in testing goodwill are taken as a rule from the detailed planning for the next three financial years. Revenue growth at the end of the forecast period is the long-term growth rate of the respective industrial sectors and countries in which the cash-generating units do business. They are discounted at market discount rates. Cash-generating units are tested for impairment using the pre-tax weighted average cost of capital (WACC). For the main assumptions made in impairment testing of cash-generating units, sensitivity analyses are carried out in order to rule out the possibility that reasonably possible changes in the assumptions used to determine the recoverable amount would lead to an impairment.
Purchase agreements for acquisitions include options for Krones to acquire the remaining minority interests. If the seller holds identical put options, the group assumes that the option will be exercised and therefore does not present the minority interests in the consolidated financial statements (an-ticipated acquisition method). Instead, a liability from the acquisition is rec-ognised at fair value. The fair value is measured using the discounted cash flow method; the main input factors are medium-term planning and the discount rate. With regard to the exercise date, it is assumed as a rule that
the probability of exercise is evenly distributed unless otherwise indicated. Impairment testing involves making estimates and assumptions about the timing. The actual amounts may differ from the assumptions and estimates made if the conditions referred to change contrary to expectations. Further details are provided in Note 18.
Accounting for deferred tax assets, which are mainly recognised for unused tax loss carryforwards, requires management to make estimates and judge-ments regarding the size of the future taxable profits that will be available against which the unused tax losses can be utilised. Tax planning strategies and the expected timing of events under such strategies are taken into ac-count if they are sufficiently probable. Deferred tax assets are recognised as a rule to the extent that deductible deferred tax liabilities are expected in the same amount and with the same timing. Otherwise, deferred tax assets are only recognised if it is highly likely that sufficient future taxable profits will be available against which the deferred tax assets recognised for loss carryforwards and temporary differences can be utilised. For the purpose of this assessment, expected taxable income is taken from corporate plan-ning prepared according to the principles described above. In the case of loss-making entities, deferred tax assets are not recognised until turn-around is imminent or future profits are highly probable. When measuring loss allowances for deferred tax assets recognised for loss carryforwards, due account is taken of rules restricting loss utilisation (minimum taxa-tion). Further details are provided in Note 8.
The post-employment pension expense from defined benefit plans is deter-mined on the basis of actuarial calculations. Those calculations are based on assumptions and judgements regarding discount rates on the net obliga-tion, mortality and future pension increases. Such estimates are subject to
General disclosures
2 | Consolidated ManageMent RepoRt
3 | CoRpoRate goveRnanCe 4 | Consolidated FinanCial stateMents
5 | notes to the Consolidated FinanCial stateMents
6 | otheR inFoRMation1 | to ouR shaReholdeRs
5 | 144 significant uncertainties due to the long-term nature of such plans. Details of those uncertainties, together with sensitivities, are presented in Note 14.
Provisions for warranties are accounted for on the basis of expected costs from customer orders. The estimates for the warranty obligations are based on experience in recent financial years and generally relate to a warranty term of between one and two years from the acceptance date. It is therefore expected that the majority of provisions for warranties will be settled within the next two years. Further details are provided on page 168.
Krones has already cut jobs in 2019 as part of its efficiency programme. This programme continues in 2020. The restructuring provisions rec-ognised for this purpose were determined on the basis of estimates and are therefore subject to uncertainty.
For the purpose of accounting in accordance with IFrs 15, judgements are made regarding whether revenue is realised over time. Krones has come to the conclusion that revenue for highly customer-specific projects is to be recognised over time rather than at a point in time, as the resulting assets have no alternative use as a rule and Krones has a legal right to payment, including a profit margin, for performance already completed. Krones has determined that an input method is the most suitable for determining progress as there is a direct relationship between production cost being in-curred and transfer of the product or service to the customer. The percent-age of completion is the ratio of contract costs incurred up to the reporting date to the total estimated cost of the projects. Changes in estimates and differences between actual costs and estimated costs affect the profit on such projects.
� Intangible assets
Acquired and internally generated intangible assets, excluding goodwill, are recognised in accordance with IAs 38 if it is sufficiently probable that the use of an asset will result in a future economic benefit and the cost of the asset can be reliably determined. The assets are recognised at cost and amortised systematically on a straight-line basis over their estimated use-ful lives. Amortisation of intangible assets is normally applied over a useful life of between three and five years and is presented in “Depreciation and amortisation of intangible assets and property, plant and equipment”. Intangible assets that are not yet available for use are tested annually for impairment.
� Research and development expenditure
Development costs in the Krones Group are capitalised at cost if all recog-nition criteria in IAs 38.57 are met. In accordance with IAs 38, research ex-penditure cannot be capitalised and is therefore immediately recognised as an expense in profit or loss. Borrowing costs are capitalised as cost at a capitalisation rate of 0.15%.
� Goodwill
Goodwill is not amortised. Instead, it is tested annually for impairment. It is also tested for impairment if an event occurs or circumstances arise that suggest that the recoverable amount may be less than the carrying amount. Goodwill is recognised at cost less cumulative impairment losses.
Goodwill is tested for impairment at the level of the cash-generating unit or group of cash-generating units represented by a division (or corresponding unit).
General disclosures
2 | Consolidated ManageMent RepoRt
3 | CoRpoRate goveRnanCe 4 | Consolidated FinanCial stateMents
5 | notes to the Consolidated FinanCial stateMents
6 | otheR inFoRMation1 | to ouR shaReholdeRs

5 | 145 The cash-generating unit or group of cash-generating units represents the lowest level at which the goodwill is monitored for internal management purposes.
For the purposes of impairment testing, goodwill acquired in a business combination is allocated to the cash-generating unit or group of cash-gen-erating units that is expected to benefit from the synergies of the business combination. If the carrying amount of the cash-generating unit or group of cash-generating units to which the goodwill is allocated exceeds the re-coverable amount, an impairment loss is recognised for the goodwill allo-cated to the cash-generating unit or group of cash-generating units. The recoverable amount is the fair value less costs of disposal or value in use, whichever is higher, of the cash-generating unit or group of cash-generating units. If either of these exceeds the carrying amount, it is not always neces-sary to determine both values. The values are normally measured on the basis of discounted cash flows. Even if the recoverable amount of the cash-generating unit or group of cash-generating units to which goodwill is allocated exceeds the carrying amount in subsequent periods, impairment losses on that goodwill are not reversed.
� Property, plant and equipment
The Krones Group’s property, plant and equipment are accounted for at cost less systematic depreciation on a straight-line basis over their esti-mated useful lives. The cost of self-constructed assets comprises all directly attributable costs and an allocation of overheads.
No revaluation of property, plant and equipment has been undertaken in accordance with IAs 16.
Systematic depreciation is based on the following useful lives, which are applied uniformly throughout the group:
The useful lives take into account the different components of assets with significant differences in cost.
Government grants are only recognised if there is reasonable assurance that the conditions attaching to them will be complied with and the grants will be received.
Government grants related to assets are deducted from the cost of the assets and reversed in future periods to profit or loss in depreciation and amortisation of intangible assets and property, plant and equipment.
� Leases
A lease is a contract that conveys the right to use an asset for a period of time in exchange for consideration.
Until 31 December 2018, leases in which the Krones Group, as the lessee, bore substantially all the risks and rewards incidental to ownership of the leased asset were accounted for on inception as finance leases in accordance with IAS 17. The leased asset was recognised as a non-current asset at fair value or, if lower, at the present value of the minimum lease payments. The
General disclosures
Useful life Years
Buildings 14 – 50
Technical equipment and machinery 5 – 18
Furniture and fixtures and office equipment 3 – 15
2 | Consolidated ManageMent RepoRt
3 | CoRpoRate goveRnanCe 4 | Consolidated FinanCial stateMents
5 | notes to the Consolidated FinanCial stateMents
6 | otheR inFoRMation1 | to ouR shaReholdeRs

5 | 146 leased asset was depreciated systematically on a straight-line basis over the shorter of the lease term and the useful life of the asset. Payment obli-gations for future lease instalments were recognised under other liabilities. In the case of operating leases, the leased assets were treated as assets belonging to the lessor as the lessor bore the risks and rewards. The lease expense was recognised in profit or loss.
From 1 January 2019, Krones normally recognises all leases and related contractual rights and obligations in the statement of financial position. Krones recognises a right-of-use asset and a corresponding lease liability at the time the leased item is available for use by the group.
Lease liabilities include the present value of the following lease payments:
� Fixed payments less any lease incentives payable by the lessor;� Variable lease payments that depend on an index or a rate;� Amounts expected to be payable under residual value guarantees;� The exercise price of a purchase option, if the option is reasonably
certain to be exercised;� Payments of penalties for terminating the lease, if the lease term
reflects the exercising of an option to terminate the lease. The lease payments are discounted using the interest rate implicit in the lease, if that rate can be readily determined. If not, they are discounted using the incremental borrowing rate. The finance costs are recognised in profit or loss over the lease term. The carrying amount of lease liabilities is remeasured if there is a change in the lease or in the assessment of an option to purchase the underlying asset.
Right-of-use assets are measured at cost, which comprises:
� The amount of the initial measurement of the lease liability;� Lease payments made at or before the commencement date, less any
lease incentives received;� Initial direct costs incurred;� Dismantling obligations.
Subsequent measurement is at cost less any accumulated depreciation and any accumulated impairment losses. Right-of-use assets are depreciated on a straight-line basis over the shorter of the useful life and the lease term. Right-of-use assets are likewise tested for impairment.
With regard to the practical expedients provided for in the standard, Krones makes use of the practical expedients for low-value assets and for short-term leases (less than 12 months). The payments for short-term leases and leases of low-value assets are recognised as an expense on a straight-line basis.
Furthermore, the new rules are not applied to leases of intangible assets. In the case of contracts that contain non-lease components as well as lease components, use is made of the option not to separate non-lease compo-nents from lease components. Please also see the information on page 180.
General disclosures
2 | Consolidated ManageMent RepoRt
3 | CoRpoRate goveRnanCe 4 | Consolidated FinanCial stateMents
5 | notes to the Consolidated FinanCial stateMents
6 | otheR inFoRMation1 | to ouR shaReholdeRs

5 | 147 � Financial instruments
In accordance with IFrs 9, Krones classifies financial assets into three cate-gories: financial instruments at amortised cost (AC), financial instruments at fair value through profit or loss (FVTPL) and financial instruments at fair value through other comprehensive income (FVoCI).
The classification of financial assets is made on the basis of Krones’ busi-ness model for managing the financial assets and their contractual cash flow characteristics.
In accordance with IFrs 9, Krones classifies financial liabilities into three categories: financial instruments at amortised cost (AC), financial instru-ments at fair value through profit or loss (FVTPL) and financial instruments at fair value through other comprehensive income (FVoCI).
For the various classes of financial assets and liabilities, the carrying amounts are generally a reasonable approximation of fair value.
The fair value of financial assets and liabilities is determined on the basis of financial accounting models using inputs observable in the market at the reporting date (Level 2 within the meaning of IFrs 13.72). Level 2 assets and liabilities are primarily hedging and non-hedging derivatives.
The fair value of Level 1 financial assets and liabilities is based on unad-justed quoted prices in active markets for financial instruments.
For Level 3 inputs within the meaning of IFrs 13.72, the fair values are the same as the carrying amounts. Measurement is based on estimates from forecasts of future developments.
Transactions against cash settlement are accounted for at the settlement date. Derivative financial instruments are accounted for at the trade date.
Net gains and losses include impairments and measurement changes for derivative financial instruments and are set out in the explanatory notes on the various measurement categories.
Loss allowances are therefore measured on the basis of one of the following:
� 12-month expected credit losses: Expected credit losses that result from default events that are possible within twelve months after the report-ing date.
� Lifetime expected credit losses: Expected credit losses that result from all possible default events over the expected life of a financial instru-ment.
Loss allowances are measured on the basis of lifetime expected credit losses if the credit risk on a financial asset at the reporting date has in-creased significantly since initial recognition; otherwise, loss allowances are measured on the basis of 12-month expected credit losses. An entity may assume that the credit risk on a financial asset has not increased significantly if the financial asset is determined to have low credit risk at the reporting date. However, loss allowances must always be measured on the basis of lifetime expected credit losses for trade receivables and con-tract assets without a significant financing component; Krones also mea-sures loss allowances on this basis for trade receivables and contract assets with a significant financing component.
General disclosures
2 | Consolidated ManageMent RepoRt
3 | CoRpoRate goveRnanCe 4 | Consolidated FinanCial stateMents
5 | notes to the Consolidated FinanCial stateMents
6 | otheR inFoRMation1 | to ouR shaReholdeRs

5 | 148 The expected credit losses on trade receivables and on contract assets are estimated on the basis of external ratings and historical credit loss experi-ence over the last 36 months. Within each group of financial instruments, credit risks are segmented on the basis of shared credit risk characteristics.
Trade receivables and contract assets have been grouped on the basis of shared credit risk characteristics for the purpose of measuring expected credit losses. The contract assets generally have the same risk characteris-tics as trade receivables.
Information on risk reporting in accordance with IFrs 7 is provided in the risk report in the group management report.
� Derivative financial instruments and hedge accounting
The derivative financial instruments used in the Krones Group are used to hedge against currency risks from operating activities. The election has been made to apply the hedge accounting requirements of IAs 39 instead of the requirements in IFrs 9.
The main categories of currency risk at Krones comprise transaction risk arising from exchange rates and cash flows in foreign currencies. The main such currencies are the Us dollar, the Canadian dollar, the Norwegian krone, the Japanese yen and the euro.
Within the hedging strategy, 100% of items denominated in foreign curren-cies are generally hedged. The instruments used for this purpose are mostly forward exchange contracts and, in isolated cases, swaps, including cur-rency swaps.
The strategy objective is to minimise currency risk by using hedging instru-ments that are judged to be highly effective, thus hedging the exchange rate and providing planning certainty.
The derivative financial instruments are measured on initial recognition and in subsequent measurement at fair value as of the reporting date. Fair value is determined using Level 2 inputs within the meaning of IFrs 13.72. Gains and losses on measurement are recognised in profit or loss unless the criteria for hedge accounting are met.
The derivative financial instruments for which hedge accounting is applied comprise forward currency contracts and currency swaps whose changes in fair value are presented in profit or loss or as a component of equity. In the case of cash flow hedges of currency risks on hedged items, changes in fair value are initially recognised directly in equity and subsequently reclassi-fied to profit or loss when the hedged item affects profit or loss.
These derivative financial instruments are measured on the basis of the forward rates provided by the commercial bank concerned. They are derecognised/reclassified when the corresponding hedged items are recognised in the statement of financial position.
� Receivables and other assets
Receivables and other assets, with the exception of derivative financial instruments, are accounted for at amortised cost. Non-interest-bearing and low-interest receivables with maturities of more than one year are dis-counted.
The group makes use of the possibility as a rule of selling export receivables that are covered by credit insurance and/or documentary letters of credit. Receivables sold without recourse as of the reporting date were derecog-nised in full. In the case of receivables covered by credit insurance, the risk relating to the exporter’s deductible is generally retained. The group as-
General disclosures
2 | Consolidated ManageMent RepoRt
3 | CoRpoRate goveRnanCe 4 | Consolidated FinanCial stateMents
5 | notes to the Consolidated FinanCial stateMents
6 | otheR inFoRMation1 | to ouR shaReholdeRs

5 | 149 sumes in such cases that substantially all the risks and rewards of the re-ceivables transfer to the purchaser of the receivables if the deductible does not exceed 10% of the value of each individual receivable. The fair value of the expected recourse obligation under the retained deductibles was rec-ognised as an expense.
The sale of receivables from the spare parts business as of the reporting date was carried out under an established master factoring agreement. Sub-ject to the legal validity of the receivables, the factor bears the credit risk on the receivables it has purchased.
� Inventories
Inventories are carried at the lower of cost and net realisable value. Cost includes costs that are directly related to the units of production and an allocation of fixed and variable production overheads.
The allocation of overheads is based on normal capacity.
Selling costs and general and administrative costs are not capitalised. In-ventory risks arising from increased storage periods or reduced usability are accounted for with write-downs.
The FIFo and weighted-average cost methods are applied as simplified measurement methods for raw materials, consumables and supplies.
� Income tax
The tax expense comprises current and deferred taxes. Current taxes and deferred taxes are recognised in profit or loss except to the extent that they relate to a business combination or to an item recognised directly in equity or in other comprehensive income.
Current taxes are the amounts of taxes expected to be paid or recovered in respect of the taxable profit or tax loss for the financial year on the basis of the tax rates that apply at the reporting date or will apply in the near future together with all adjustments recognised for current tax of prior periods.
Deferred tax assets and deferred tax liabilities are accounted for using the liability method and are recognised for all temporary differences between the tax base and the carrying amounts in accordance with IFrs and for con-solidation adjustments recognised in profit or loss. Deferred tax assets are only recognised to the extent that it is probable that the related tax benefits can be realised.
Deferred taxes are measured on the basis of the income tax rates that apply in the various countries at the time of realisation. Changes in the tax rates are taken into account if it is sufficiently certain that they will occur. Where legally permissible, deferred tax assets and liabilities have been offset.
Tax liabilities are recognised in the event that amounts in tax returns will probably not be realised (uncertain tax items). The amount is the best esti-mate of the expected tax payment (the expected amount or most likely amount of the uncertain tax item). Tax receivables from uncertain tax items are recognised if it is probable that they can be realised. Only if there is a tax loss carryforward or unused tax credit is no tax liability or tax re-ceivable recognised for the uncertain tax item; the deferred tax asset for the unused tax loss carryforwards and tax credits is then adjusted instead.
The IFrIC published a clarification on accounting for income taxes in 2019. In accordance with that clarification, the previous provisions for income taxes must be presented in future as income tax liabilities. As a result, the current and non-current provisions for income taxes (€9,000 thousand and
General disclosures
2 | Consolidated ManageMent RepoRt
3 | CoRpoRate goveRnanCe 4 | Consolidated FinanCial stateMents
5 | notes to the Consolidated FinanCial stateMents
6 | otheR inFoRMation1 | to ouR shaReholdeRs

5 | 150 €4,434 thousand respectively) as of 31 December 2018 were reclassified as current and non-current tax liabilities respectively. The reclassification has no effect on financial performance or the financial position.
� Provisions for pensions
Provisions for pensions are measured using the projected unit credit method in accordance with IAs 19. This method takes into account known vested benefits at the reporting date together with expected future in-creases in state pensions and salaries based on a prudent assessment of relevant variables. The provisions are calculated on the basis of actuarial appraisals that take into account biometric factors.
Actuarial gains and losses have a direct impact on the consolidated state-ment of financial position, resulting in an increase or decrease in provi-sions for pensions and similar obligations and a reduction or increase in other reserves in equity. The consolidated statement of profit and loss is not affected by actuarial gains and losses as they are required to be recognised in other comprehensive income. Net interest on the net defined benefit obli-gation is determined by multiplying the net defined benefit obligation by the discount rate used to measure the defined benefit obligation. Because the net defined benefit obligation is reduced by any plan assets, the same discount rate is used to calculate return on plan assets. Current and past service costs and net interest are recognised in profit or loss.
� Partial retirement benefit obligations
According to the definition of post-employment benefits in IAs 19, top-up payments under partial retirement agreements come under other long-term employee benefits. Such top-up payments are therefore not rec-ognised in full as liabilities at their net present value. Instead, they are accrued on a pro-rated basis across the relevant years of active service of the employees taking partial retirement.
� Other provisions
Other provisions are recognised when the group has an obligation to a third party as a result of a past event, an outflow is probable, and the amount of the obligation can be reliably estimated. The provisions are measured at fully attributable costs or on the basis of the most probable settlement amount.
Restructuring provisions are recognised in connection with measures that materially change the scope of the business undertaken by a segment or business unit or the manner in which that business is conducted. Most such measures involve the termination of employment relationships. Restruc-turing provisions are recognised when implementation of a detailed formal plan has started or such a plan has been announced.
Provisions with a residual term of more than one year are recognised at the settlement amount discounted to the reporting date. The discount rate reflects the risks specific to the liability. The increase in the provision due to the passage of time is recognised as an interest expense.
General disclosures
2 | Consolidated ManageMent RepoRt
3 | CoRpoRate goveRnanCe 4 | Consolidated FinanCial stateMents
5 | notes to the Consolidated FinanCial stateMents
6 | otheR inFoRMation1 | to ouR shaReholdeRs

5 | 151 � Revenue
The basic criterion for revenue recognition under IFRS 15 is transfer of con-trol. A distinction is made between transfer of control at a point in time and transfer of control over time:
Krones provides machinery and systems for bottling and packaging and for beverage production. Krones recognises revenue for highly custom-er-specific projects over time rather than at a point in time, as the resulting assets have no alternative use as a rule and Krones has a legal right to pay-ment, including a profit margin, for performance already completed. Prog-ress is measured using an input method. The percentage of completion is the ratio of contract costs incurred up to the reporting date to the total estimated cost of the project.
A further important part of Krones’ business model consists of services. The company maintains service centres and offices around the world. Krones provides a comprehensive range of products and services for cus-tomers under the heading of lifecycle service (LCs). Krones recognises reve-nue from sales of spare parts at a point in time, on delivery of the goods (transfer of control). Revenue for services that come under LCs is mostly rec-ognised over time as the customer simultaneously receives and consumes the benefits provided by the group’s performance as the group performs. Accordingly, revenue is mostly recognised over time using an input method on the basis of the costs incurred. Revenue is only recognised on a straight-line basis in the case of longer-term maintenance services.
A provision is recognised in accordance with IAs 37 for anticipated losses relating to customer orders.
Costs to obtain contracts where the amortisation period of the costs would be one year or less are immediately recognised as expense.
Krones receives payments from customers on the basis of a payment plan that is part of the contracts. The payment terms vary among business units and countries. Contract assets relate to our conditional right to consider-ation for contractual performance obligations satisfied to date. Trade re-ceivables are recognised when the right to receive the consideration be-comes unconditional.
Contract liabilities relate to payments received in advance, meaning before contractual performance obligations have been satisfied. Contract liabilities are recognised as revenue when we satisfy the contractual performance ob-ligations. If performance exceeds advance payments, the resulting positive balance is presented in contract assets.
Financing components are not included in the amount of revenue to be rec-ognised if it is expected at inception of the contract that the period between the transfer of the promised good or promised service and payment for that good or service will be one year or less.
Revenue is presented net of reductions.
� Segment reporting
Krones reports on two operating segments, which are the strategic busi-ness units. The two segments are organised by product divisions and ser-vices and managed separately due to the different technologies they cover. The Executive Board, as the chief operating decision maker, manages the company as a whole on the basis of monthly reports from the segments. Segment 1 comprises machines and lines for product filling and decoration.
2 | Consolidated ManageMent RepoRt
3 | CoRpoRate goveRnanCe 4 | Consolidated FinanCial stateMents
5 | notes to the Consolidated FinanCial stateMents
6 | otheR inFoRMation1 | to ouR shaReholdeRs

5 | 152 Segment 2 comprises machines and lines for beverage production and process technology. The accounting policies used are the same as those described under “General disclosures” above. Segment performance is mea-sured on the basis of internal reporting to the Executive Board, primarily segment revenue and segment eBT.
The table below shows revenue generated through business with third par-ties in each country (based on the location of customer headquarters).
The table below shows non-current assets in each country:
€ thousand 2019 2018
Germany 747,465 687,477
North America 54,618 63,141
Rest of the world 278,852 189,260
1,080,935 939,878
€ thousand 2019 2018
Germany 468,354 362,344
North America 683,459 533,063
Rest of the world 2,807,062 2,958,573
3,958,875 3,853,980
General disclosures
2 | Consolidated ManageMent RepoRt
3 | CoRpoRate goveRnanCe 4 | Consolidated FinanCial stateMents
5 | notes to the Consolidated FinanCial stateMents
6 | otheR inFoRMation1 | to ouR shaReholdeRs

1 Intangible assets
The carrying amount of intangible assets changed as follows:
€ thousand Industrial property rights
and similar rights and assets as
well as licenses
Goodwill Capitalised development expenditure
Advance payments
made
Total
31 December 2017Cost 181,789 62,736 377,595 5 622,125Accumulated depreciation 123,484 0 235,078 0 358,563Net carrying amount 58,305 62,736 142,517 5 263,562
Changes in 2018CostConsolidated additions 5,253 39,782 0 0 45,035Additions 24,214 0 38,506 158 62,878Disposals 5,485 0 0 0 5,485Transfers 53 0 0 – 1 52Exchange differences 282 742 0 0 1,024
AmortisationAdditions 21,408 0 21,083 0 42,491Disposals 5,450 0 0 0 5,450Transfers 88 0 0 0 88Exchange differences 1,755 0 0 0 1,755Net carrying amount at 31 December 2018 64,821 103,260 159,940 162 328,183
31 December 2018Cost 208,411 103,260 416,100 162 727,933Accumulated depreciation 143,590 0 256,160 0 399,750Net carrying amount 64,821 103,260 159,940 162 328,183Table continued on next page
5 | 153 Notes to the consolidated statement of financial position
Financial position
2 | Consolidated ManageMent RepoRt
3 | CoRpoRate goveRnanCe 4 | Consolidated FinanCial stateMents
5 | notes to the Consolidated FinanCial stateMents
6 | otheR inFoRMation1 | to ouR shaReholdeRs

€ thousand Industrial property rights
and similar rights and assets as
well as licenses
Goodwill Capitalised development expenditure
Advance payments
made
Total
Changes in 2019CostConsolidated additions 6,124 37,289 0 0 43,413Additions 25,376 0 32,516 36 57,928Disposals 7,489 0 155 0 7,644Transfers 165 0 0 – 170 – 5Exchange differences 218 514 0 0 732
AmortisationAdditions 25,837 17,545 41,155 0 84,537Disposals 7,208 0 25 0 7,233Transfers – 32 0 0 0 – 32Exchange differences 208 – 25 0 0 183Net carrying amount at 31 December 2019 70,410 123,543 151,171 28 345,152
31 December 2019Cost 232,805 141,063 448,461 28 822,357Accumulated depreciation 162,395 17,520 297,290 0 477,205Net carrying amount 70,410 123,543 151,171 28 345,152
The additions to industrial property rights and licenses mainly relate to licenses for IT software. Customer bases amounting to €8,716 thousand (previous year: €5,652 thousand) are included in the carrying amount as of the reporting date.
All goodwill underwent a regular impairment test in accordance with IAs 36, as in the previous year. Impairment testing is performed on the basis of
value in use at the level of the smallest cash-generating unit (CGU) or group of cash-generating units. The cash flow projections underlying impairment tests are based on the approved financial forecasts within the forecast pe-riod. These forecasts are based in part on external sources of information. They also take into account price agreements based on past experience and expected efficiency gains as well as assumptions about revenue growth based on strategy.
5 | 154
Financial position
2 | Consolidated ManageMent RepoRt
3 | CoRpoRate goveRnanCe 4 | Consolidated FinanCial stateMents
5 | notes to the Consolidated FinanCial stateMents
6 | otheR inFoRMation1 | to ouR shaReholdeRs

The table below provides an overview of the tested goodwill and the as-sumptions used for the respective impairment tests, each of which was performed at the level of the smallest cash-generating unit (CGU):
The pre-tax discount rates are based on risk-free interest rates, which are de-termined on the basis of long-term government bond yields. This discount rate is adjusted for a risk premium that reflects the general risk associated with equity investments and the specific risk of the CGU. Revenue growth at the end of the forecast period is the long-term average growth rate of the respective industrial sectors and countries in which the CGUs do business.
The impairment test resulted in the recognition of goodwill impairments in the amount of €17,545 thousand (previous year: €0 thousand). These mainly relate to reduced earnings prospects and are included in amortisation of in-tangible assets.
For the remaining CGUs that include goodwill, Krones AG is of the opinion that no reasonably foreseeable change to any of the material basic assump-tions used to determine the value in use of cash-generating units to which goodwill has been allocated could result in the carrying amount being higher than its recoverable amount.
The capitalised development expenditure relates to new machinery proj-ects of Krones AG. Development expenditure capitalised in the reporting period amounts to €32,516 thousand (previous year: €38,506 thousand).
As in the previous year, this includes borrowing costs in a non-material amount. Including capitalised development expenditure, a total of €194,502 thousand was spent on research and development in 2019 (previous year: €179,033 thousand). An impairment loss on capitalised development expen-diture was recognised in amortisation in the reporting year in the amount
CgU Carrying amount of goodwill in € thousand
Forecast period in years
Annual reve-nue growth at end of forecast period
Discount rate before taxes
ips 2019 34,408 3 1.0 % 6.2 %
sprinKmAn 2019 3,107 3 2.0 % 10.9 %
2018 7,411 5 2.0 % 10.4 %
mHT 2019 20,180 3 1.0 % 8.2 %
2018 20,180 5 1.0 % 13.4 %
s.p.s 2019 4,307 3 1.0 % 9.0 %
2018 9,298 6 1.0 % 10.5 %
jAvLyn 2019 4,589 3 1.5 % 12.9 %
2018 4,498 5 1.5 % 10.4 %
TrAns-mArKET 2019 7,219 3 2.5 % 10.9 %
2018 11,443 5 2.9 % 9.8 %
sysTEm LogisTiCs 2019 30,906 3 1.0 % 8.3 %
2018 30,906 3 1.0 % 9.4 %
HsT 2019 4,258 3 1.0 % 8.3 %
2018 4,258 3 1.0 % 9.2 %
TriACos 2019 4,631 3 1.0 % 8.3 %
2018 4,631 3 1.0 % 8.8 %
Other 1) 2019 9,938 3 – 4 1.0 % – 2.0 % 7.2 % – 13.4 %
2018 10,635 2 – 5 1.0 % – 3.0 % 7.9 % – 13.0 %1) Goodwill with a carrying amount of less than €4 million in each case
5 | 155
Financial position
2 | Consolidated ManageMent RepoRt
3 | CoRpoRate goveRnanCe 4 | Consolidated FinanCial stateMents
5 | notes to the Consolidated FinanCial stateMents
6 | otheR inFoRMation1 | to ouR shaReholdeRs

of €20,587 thousand (previous year: €1,644 thousand). As in the previous year, the charge was incurred in the Machines and Lines for Product Filling and Decoration segment. The figure in the reporting period relates to direct printing technologies that are not being pursued further.
In the reporting period, business combinations resulted in €43,413 thou-sand in additions to net carrying amounts for intangible assets (previous year: €45,035 thousand), of which €37,289 thousand is goodwill (previous year: €39,782 thousand).
2 Property, plant and equipment
In 2019, as in the previous year, the depreciation figure for property, plant and equipment did not include any impairments in accordance with IAs 36. Additions to land and buildings and to construction in progress primarily related to the establishment of the production location in Hungary, expan-sion at the Neutraubling, Wackersdorf and Nittenau locations in Germany and investment in the UsA. The €66,417 thousand in capital expenditure on technical equipment and machinery and on other equipment, furniture and fixtures and office equipment primarily relates to capacity expansion and modernisation at existing production locations.
In 2019, the carrying amounts for property, plant and equipment included government grants of €10,802 thousand (previous year: €2.658 thousand). Government grants in the amount of €145 thousand (previous year: €10 thousand) were reversed to profit or loss in 2019. As in the previous year, the depreciation figure in 2019 does not include any impairment reversals.
The reported property, plant and equipment is not subject to any restrictions of title or disposal.
In the reporting period, business combinations resulted in €2,242 thousand in additions to net carrying amounts for property, plant and equipment (previous year: €9.498 thousand).
5 | 156
Financial position
2 | Consolidated ManageMent RepoRt
3 | CoRpoRate goveRnanCe 4 | Consolidated FinanCial stateMents
5 | notes to the Consolidated FinanCial stateMents
6 | otheR inFoRMation1 | to ouR shaReholdeRs

Property, plant and equipment, including right-of-use assets, changed as follows:
€ thousand Land and buildings
Technical equipment and
machinery
Other equipment, furniture and
fixtures and office equipment
Construction in progress
Advance payments
made
Total
31 December 2017
Cost 499,957 329,377 239,033 33,036 1,351 1,102,754
Accumulated depreciation 206,835 226,282 168,020 0 0 601,138
Net carrying amount 293,122 103,094 71,012 33,036 1,351 501,616
Changes in 2018
Cost
Consolidated additions 6,674 1,648 1,049 127 0 9,498
Additions 16,765 11,258 33,827 48,129 12,574 122,552
Disposals 2,432 6,441 15,698 0 167 24,738
Transfers 26,450 1,945 2,489 – 29,840 – 1,096 – 52
Exchange differences 1,180 692 – 619 19 – 2 1,271
Depreciation
Additions 13,882 19,975 26,388 0 0 60,245
Disposals 1,191 6,081 15,076 0 0 22,348
Transfers 22 – 120 10 0 0 – 88
Exchange differences 707 745 67 0 0 1,518
Net carrying amount at 31 Dec 2018 328,339 97,677 80,672 51,472 12,660 570,820
31 December 2018
Cost 548,595 339,635 263,139 51,472 12,660 1,215,501
Accumulated depreciation 220,256 241,958 182,467 0 0 644,681
Net carrying amount 328,339 97,677 80,672 51,472 12,660 570,820Table continued on next page
5 | 157
Financial position
2 | Consolidated ManageMent RepoRt
3 | CoRpoRate goveRnanCe 4 | Consolidated FinanCial stateMents
5 | notes to the Consolidated FinanCial stateMents
6 | otheR inFoRMation1 | to ouR shaReholdeRs

€ thousand Land and buildings
Technical equipment and
machinery
Other equipment, furniture and
fixtures and office equipment
Construction in progress
Advance payments
made
Total
Changes in 2019
Cost
Restatement due to ifrs 16* 63,814 573 24,094 0 0 88,481
At 1 January 2019, restated 612,409 340,208 287,233 51,472 12,660 1,303,982
Consolidated additions 1,264 0 978 0 0 2,242
Additions 56,314 28,363 38,054 15,542 223 138,496
Disposals 1,629 9,243 26,270 6,694 0 43,836
Transfers 37,120 4,624 3,012 – 43,713 – 1,030 13
Exchange differences 861 579 888 – 320 – 152 1,856
Depreciation
Additions 35,644 21,150 41,632 0 0 98,426
Disposals 1,306 8,512 25,240 0 0 35,058
Transfers 0 – 305 344 0 0 39
Exchange differences 357 333 790 0 0 1,480
Net carrying amount at 31 Dec 2019 451,387 109,907 103,902 16,287 11,701 693,185
31 December 2019
Cost 706,339 364,531 303,895 16,287 11,701 1,402,753
Accumulated depreciation 254,951 254,624 199,993 0 0 709,568
Net carrying amount 451,387 109,907 103,902 16,287 11,701 693,185* See accounting standards applied for the first time, page 180.
5 | 158
Financial position
2 | Consolidated ManageMent RepoRt
3 | CoRpoRate goveRnanCe 4 | Consolidated FinanCial stateMents
5 | notes to the Consolidated FinanCial stateMents
6 | otheR inFoRMation1 | to ouR shaReholdeRs

The table below shows the recognised right-of-use assets for leased assets accounted for in property, plant and equipment:
Information on the corresponding lease liabilities is provided on page 169.
Interest expenses include €3,297 thousand in interest expense on leases. Other operating expenses include €3,698 thousand in expenses from short-term leases, €689 thousand in expenses from leases of low-value assets and €716 thousand in expenses for variable lease payments. Total cash outflows for leases amount to €37,173 thousand.
In the previous year, property, plant and equipment included leased assets in the amount of to €68 thousand, beneficial ownership of which was at-tributed to the group company concerned in accordance with IAs 17 (finance leases).
3 Non-current financial assets
The non-current financial assets consist primarily of lendings to and investments in non-consolidated companies.
4 Investments accounted for using the equity method
One associated company was accounted for using the equity method as of the reporting date (previous year: two companies).
€ thousand Land and buil-dings
Technical equipment and
machinery
Other equipment, furniture and
fixtures and office equipment
Total
31 Dec 2019
Net carrying amount 61,409 2,900 23,324 87,633
Additions 17,520 3,097 12,106 32,723
Depreciation 19,919 772 12,923 33,614
The table below lists the associates accounted for using the equity method:
The table below summarises the aggregated earnings data an aggregated carrying amounts of associates accounted for using the equity method (excluding the investment in InTeGrATeD PACKAGInG sysTeMs (IPs) FZCo, Dubai):
On 1 April 2019, Krones acquired the remaining 60% ownership interest in InTeGrATeD PACKAGInG sysTeMs (IPs) FZCo, Dubai. From that date onwards, the company has been fully consolidated. Until 31 March 2019, the invest-ment was included in the consolidated financial statements as an associate accounted for using the equity method.
In financial year 2019, the share in profit or loss of InTeGrATeD PACKAGInG sysTeMs (IPs) FZCo, Dubai, was –€330 thousand (previous year: €894 thou-sand). The carrying amount as of the reporting date was €0 thousand (pre-vious year: €25,132 thousand).
Name Place of business Ownership interest
%
Associates
TECHnoLogisCHEs insTiTUT für AngEWAndTE KünsTLiCHE inTELLigEnZ gmBH Weiden, Germany 44
€ thousand 2019 2018
Profit or loss for the period – 809 – 165
Other comprehensive income 0 0
Total comprehensive income – 809 – 165
Share of profit or loss – 356 – 73
Carrying amount at 31 Dec 3,369 3,529
5 | 159
Financial position
2 | Consolidated ManageMent RepoRt
3 | CoRpoRate goveRnanCe 4 | Consolidated FinanCial stateMents
5 | notes to the Consolidated FinanCial stateMents
6 | otheR inFoRMation1 | to ouR shaReholdeRs

5 Inventories
The inventories of the Krones Group are composed as follows:
Inventories are recognised at the lower of cost and fair value less selling expenses.
Write-downs of €1,585 thousand on inventories were recognised as expense in 2019 (previous year: €7,267 thousand) and are substantially based on customary net realisable values and obsolescence allowances. The amount of reversals of write-downs recognised in profit or loss due to improved market conditions was not material.
6 Receivables and other assets
€ thousand 31 Dec 2019 31 Dec 2018
Trade receivables 961,789 987,970
Contract assets 571,261 647,089
Other assets 165,419 166,128
The group measures expected credit losses using the simplified approach under IFrs 9; accordingly, all trade receivables and contract assets are accounted for with lifetime expected credit losses.
The loss allowance for expected credit losses on trade receivables and con-tract assets changed as follows:
The loss allowances include €5,964 thousand (previous year: €5,195 thou-sand) in allowances of contract assets. Other assets mainly comprise ad-vance payments made (€19,006 thousand; previous year: €19,959 thousand), current tax assets (€78,334 thousand; previous year: €69,076 thousand), prepaid expenses (€13,887 thousand; previous year: €9,519 thousand) and other financial assets (€41,706 thousand; previous year: €29,940 thousand).
The derivative financial instruments measured at fair value that were en-tered into for future payment receipts and meet the conditions for hedge accounting or that were entered into as stand-alone hedge transactions to-talled €903 thousand at the reporting date (previous year: €860 thousand).
€ thousand 31 Dec 2019 31 Dec 2018
Raw materials, consumables and supplies 242,033 208,019
Work in progress 64,452 46,559
Finished goods 44,164 35,946
Goods purchased for sale 26,572 25,606
Other 5,302 4,604
Total 382,523 320,734
Trade receivables and contract assets
€ thousand 2019 2018
At 1 Jan 35,572 27,444
Change due to first-time application as of 1 Jan 2018 0 13,652
Change due to currency effects 131 –198
Additions 5,671 104
Reversals – 805 –5,430
At 31 Dec 40,569 35,572
5 | 160
Financial position
2 | Consolidated ManageMent RepoRt
3 | CoRpoRate goveRnanCe 4 | Consolidated FinanCial stateMents
5 | notes to the Consolidated FinanCial stateMents
6 | otheR inFoRMation1 | to ouR shaReholdeRs

7 Cash and cash equivalents
Apart from cash on hand totalling €2,030 thousand (previous year: €150 thousand), the cash and cash equivalents of €110,382 thousand (previous year: €218,802 thousand) consist primarily of demand deposits.
Changes in cash and cash equivalents in accordance with IAS 7 Statement of Cash Flows are presented in the statement of cash flows on page 134.
8 Income tax
Income tax receivables and liabilities relate exclusively to income tax in accordance with IAs 12.
The income tax breaks down as follows:
Deferred taxes are measured on the basis of the tax rates that, based on the current legal situation, apply or are expected to apply in the various coun-tries at the time of realisation. In Germany, the tax rates that apply are a corporate income tax rate of 15.0% plus a solidarity surcharge of 5.5% and a local trade tax multiplier (Gewerbesteuerhebesatz) for Krones AG averaging 336%. The total income tax rate for the companies in Germany is conse-quently 27.6%. Tax rates abroad range between 9% and 35%.
€ thousand 31 Dec 2019 31 Dec 2018
Deferred tax expense/income (–) – 17,614 693
Current tax 50,115 52,957
Total 32,501 53,650
The deferred tax assets and liabilities at 31 December 2019 break down by items on the statement of financial position as follows:
The deferred tax assets and liabilities recognised in other comprehensive income amounted to €44,003 thousand at the reporting date (previous year: €28,887 thousand). This figure includes €43,400 thousand (previous year: €32,821 thousand) for actuarial gains and losses recognised in other comprehensive income in accordance with IAs 19. An amount of €603 thou-sand (previous year: €380 thousand) related to hedging activities.
€ thousand Deferred tax assets Deferred tax liabilities
31 Dec 2019 31 Dec 2018 31 Dec 2019 31 Dec 2018
Intangible assets 1,102 54 45,718 45,476
Property, plant and equipment 0 144 12,564 10,005
Non-current financial assets 187 14,486 175 39
Other non-current assets 1,616 1,319 118 67
Inventories 14,450 13,071 1,033 1,657
Other current assets 3,228 2,798 32,967 27,303
Tax loss carryforwards 29,155 11,116 0 0
Provisions, non-current 12,479 9,964 264 10,292
Other non-current liabilities 2,134 2,057 62 366
Provisions, current 13,483 19,134 6,121 92
Other current liabilities 15,502 1,540 374 167
Deferred tax items recognised in other comprehensive income 44,003 31,191 0 2,304
Subtotal 137,339 106,874 99,396 97,768
Offsetting (–) – 95,722 – 74,424 – 95,722 – 74,424
Total 41,617 32,450 3,674 23,344
5 | 161
Financial position
2 | Consolidated ManageMent RepoRt
3 | CoRpoRate goveRnanCe 4 | Consolidated FinanCial stateMents
5 | notes to the Consolidated FinanCial stateMents
6 | otheR inFoRMation1 | to ouR shaReholdeRs

Deferred taxes on tax loss carryforwards in the amount of €46,992 thou-sand (previous year: €14,056 thousand) and deferred taxes on deductible temporary differences in the amount of €14 thousand (previous year: €46 thousand) were not recognised because it is not sufficiently certain that the tax assets will be realised in the foreseeable future. These loss carryfor-wards can essentially be carried forward indefinitely.
Entities that made losses in the year under review and whose deferred tax assets are not covered by deferred tax liabilities have recognised deferred tax assets in the amount of €7,217 thousand. There is convincing evidence that these tax assets will be realised on the basis of management assump-tions and judgements about the development of the business deriving from past experience and taking into account one-off effects in the financial year under review.
The temporary differences relating to equity interests in subsidiaries (out-side basis differences) came to €300,876 thousand at the reporting date (previous year: €293,875 thousand) and are excepted from recognition of deferred tax liabilities.
The tax expense of €32,501 thousand reported in 2019 is €20,980 thousand higher than the expected tax expense that would theoretically result from application of the domestic tax rate of 27.6% at the group level. The differ-ence can be attributed to the following:
9 Equity
Krones AG’s share capital amounted to €40,000,000.00 at 31 December 2019, as in the previous year. It is divided into 31,593,072 ordinary bearer shares, each with a theoretical par value of €1.27 per share. 31,593,072 shares were in circulation at the reporting date (previous year: 31,593,072). At 31 De-cember 2019, as in the previous year, the company held no treasury shares.
The company is authorised in accordance with Section 71 (1) No. 8 of the Ger-man Stock Corporation Act (AktG) to buy treasury shares totalling up to 10% of the current share capital in compliance with the provisions of the law and of the authorising resolution.
€ thousand 2019 2018
Earnings before taxes 41,743 204,250
Tax rate for the parent company KronEs Ag 27.60% 27.30%
Expected (theoretical) tax expense 11,521 55,760
Adjustment due to difference between local tax rate and tax rate of KronEs Ag – 656 – 1,428
Reductions in tax due to tax-exempt income – 15,573 – 14,724
Current tax losses for which no deferred taxes recognised 7,581 28
Increases in tax expense due to non-deductible expenses 29,691 23,134
Tax effect of as-yet unrealised deferred taxes on loss carryforwards – 247 – 1,070
Tax income (–) / tax expense (+) for previous years – 2,814 – 1,491
Tax effect of as-yet unrealised deductible temporary differences 662 – 4,672
Other 2,336 – 1,887
Taxes on income 32,501 53,650
5 | 162
Financial position
2 | Consolidated ManageMent RepoRt
3 | CoRpoRate goveRnanCe 4 | Consolidated FinanCial stateMents
5 | notes to the Consolidated FinanCial stateMents
6 | otheR inFoRMation1 | to ouR shaReholdeRs

The authorisation can be exercised by the company, by its consolidated companies or by a third party acting on its or their behalf, either in whole or in part, once or multiple times, in pursuit of one or multiple purposes.
The authorisation became effective upon resolution by the annual general meeting on 13 June 2018 and applies until midnight on 12 June 2023.
By resolution of the annual general meeting on 15 June 2016, the Executive Board is authorised to increase the company’s share capital, with the ap-proval of the Supervisory Board, by up to €10 million (authorised capital) through the issuance on one or more occasions of new ordinary bearer shares against cash contributions up to and including 15 June 2021. Share-holders must be granted subscription rights to these shares. The Executive Board is authorised to exclude the subscription rights of shareholders, with the approval of the Supervisory Board, for any fractional amounts that may arise. Moreover, the Executive Board is authorised to determine the further details of the capital increase and its implementation, in both cases with the approval of the Supervisory Board. The Supervisory Board is authorised to amend the articles of association in accordance with any utilisation of the authorised capital and upon expiration of the term of the authorisation.
The changes in equity that are recognised in other comprehensive income (excluding dividends) totalled –€19.285 thousand in the reporting period (previous year: –€263 thousand) and consist of changes in currency differ-ences and cash flow hedges as well as the recognition of actuarial gains and losses on pensions under other reserves. In addition, the allocation of profit or loss to non-controlling interests resulted in a change in equity of –€249 thousand (previous year: –€483 thousand). The sum of changes in equity that are recognised in other comprehensive income and those that are rec-ognised in profit or loss was –€10,043 thousand (previous year: €150,337 thousand).
A dividend of €1.70 per share was approved for the 2018 financial year and paid out by Krones AG in 2019 (previous year: €1.70 per share). The total dividend payout came to €53,708 thousand (previous year: €53,708 thousand).
Disclosures about capital management
A strong equity position is an important prerequisite for ensuring Krones’ long-term survival. To achieve this, Krones regularly monitors and man-ages its capital on the basis of the equity ratio. In order to share the com-pany’s success with shareholders, Krones’ policy is to pay out 25% to 30% of consolidated profit in the form of dividends.
10 Capital reserves
The capital reserves total €141,724 thousand (previous year: €141,724 thou-sand). The capital reserves include amounts transferred under Section 272 (2) No. 4 of the German Commercial Code (HGB) and amounts transferred under Section 272 (2) No. 1 HGB totalling €37,848 thousand.
11 Profit reserves
The legal reserve remains unchanged from the previous year at €51 thou-sand.
The other profit reserves include deductions for negative goodwill from acquisition accounting for subsidiaries consolidated before 1 January 2004 and adjustments made directly in equity at 1 January 2004 on the first-time application of IFrs. They also include the adjustments made directly in eq-uity on the first-time application of IFrs 9 and IFrs 15 as of 1 January 2018.
5 | 163
Financial position
2 | Consolidated ManageMent RepoRt
3 | CoRpoRate goveRnanCe 4 | Consolidated FinanCial stateMents
5 | notes to the Consolidated FinanCial stateMents
6 | otheR inFoRMation1 | to ouR shaReholdeRs

Currency differences recognised under profit reserves contain the currency translations of financial statements of foreign subsidiaries that are rec-ognised in other comprehensive income. Changes in profit reserves are shown in the consolidated statement of changes in equity.
12 Other reserves
Other reserves changed as follows in financial year 2019:
The measurement changes for cash flow hedges include additions of €1,832 thousand and amounts reclassified to profit or loss totalling
–€1,247 thousand after taxes.
13 Non-controlling interests
In the 2019 financial year, non-controlling interests totalled –€629 thou-sand (previous year: –€72 thousand).
A detailed overview of the composition of and changes to the individual equity components for the KRONES Group in 2019 and the previous year is presented in the statement of changes in equity on page 135.
14 Provisions for pensions
Provisions for pensions are recognised for obligations relating to vested benefits and current benefit payments for eligible active and former em-ployees of Krones Group companies and their surviving dependants. Vari-ous forms of retirement provision exist depending on the legal, economic and tax circumstances of the relevant country and are generally based on employees’ remuneration and years of service.
Company pension plans are generally either defined contribution plans or defined benefit plans.
In defined contribution plans, the company does not assume any obliga-tions beyond establishing contribution payments to special-purpose funds. Contributions are recognised as personnel expense in the year in which they are paid.
In defined benefit plans, the company undertakes an obligation to render the benefits promised to active and former employees, where a distinction is made between systems financed by provisions and systems financed through pension funds. The amount of the pension obligations (the defined benefit obligation) was computed in accordance with actuarial methods. Apart from the assumptions regarding life expectancy based on the 2018G Heubeck actuarial tables, the following average values for the group were also taken into account in the actuarial calculations:
The basis for calculating provisions for pensions in Germany is the company’s pension scheme from 31 December 1982, which is closed to new entrants. The scheme entitles all covered employees to post-employment, permanent disability and widow(er)’s pensions. The age limits are 63 for men and 60 for women. The post-employment pension amounts to 1% (0.5% beginning 1 January 1983) of the eligible earned income for each eligible
€ thousand Reserve for post- employment benefits
Reserve for cash flow hedges
Other Total
At 31 Dec 2017 – 91,505 1,133 – 804 – 91,176
Measurement change 5,948 – 3,070 0 2,878
Tax on items taken directly to or transferred from equity – 1,552 690 0 – 862
At 31 Dec 2018 – 87,109 – 1,247 – 804 – 89,160
Measurement change – 37,149 – 805 0 – 37,954
Tax on items taken directly to or transferred from equity 10,581 220 0 10,801
At 31 Dec 2019 – 113,677 – 1,832 – 804 – 116,313
5 | 164
Financial position
2 | Consolidated ManageMent RepoRt
3 | CoRpoRate goveRnanCe 4 | Consolidated FinanCial stateMents
5 | notes to the Consolidated FinanCial stateMents
6 | otheR inFoRMation1 | to ouR shaReholdeRs

year of employment, not to exceed 25%. It should also be noted that a safe-guard for workers’ benefits was put into place at the time the new scheme was established on 31 December 2014.
The basis for measurement of the permanent disability and widow(er)’s pensions (50% of post-employment pension) is the post-employment pension that can be earned by the time the employee reaches the age limit, although for the permanent disability benefit only that portion is granted which corresponds to the years of service actually reached. The measure-ment date for eligible years of service is 31 December 1982. A fixed table ap-plies to new entries after this date. The individual provisions are based on individual contractual agreements.
There are further non-material pension plans in Germany and other coun-tries. These therefore do not need to be described in detail.
Both the defined benefit obligations and plan assets are subject to fluctua-tions over time. This can have a positive or negative effect on funding sta-tus. Fluctuations in the defined benefit obligation within the Krones Group result primarily from changes in financial assumptions such as discount rates and increases in the cost of living as well as changes in demographic assumptions such as changed life expectancy.
The rates recommended for measuring pension liabilities at the end of the business year as published by Heubeck AG, Mercer Deutschland GmbH, Tow-ersWatson and Aon Hewitt are used to determine the relevant discount rates. These values, which in turn are determined on the basis of market yields on senior fixed-coupon corporate bonds, are used to obtain an inter-est rate that reflects the anticipated benefit payments.
The following amounts are expected to be contributed to the defined bene-fit obligation in the coming years.
The average weighted residual term of post-employment benefit obligations is 20 years (previous year: 18 years).
The projected increases in wages and salaries comprise expected future pay increases, which are estimated each year on the basis of inflation and em-ployees’ years of service with the company. Since the pension commitments at our companies in Germany are independent of future pay increases, the projected increase in wages and salaries was not taken into account when determining the corresponding pension provisions.
Increases or decreases in either the net present value of defined benefit obli-gations or the fair value of fund assets can result in actuarial gains or losses due to factors such as changes in parameters, changes in estimates relating to the risks associated with the pension commitments and differences be-tween the actual and expected return on plan assets. The net value of the pension provisions breaks down as follows:
% Average for the group
2019 2018
Discount rate 1.2 2.0
Projected increases in wages and salaries 0.0 0.0
Projected increases in state pensions 2.0 2.0
€ thousand 2019
Within the next 12 months 6,454
Between 2 and 5 years 27,907
Between 5 and 10 years 41,254
5 | 165
Financial position
2 | Consolidated ManageMent RepoRt
3 | CoRpoRate goveRnanCe 4 | Consolidated FinanCial stateMents
5 | notes to the Consolidated FinanCial stateMents
6 | otheR inFoRMation1 | to ouR shaReholdeRs

The pension provisions, which amounted to €248,672 thousand at the reporting date (previous year: €212,086 thousand), are primarily attribut-able to Krones AG. The actuarial gains or losses resulting from changes in financial assumptions totalled €37,802 thousand (previous year: €9.140 thousand). Experience adjustments total –€653 thousand (previous year:
–€17 thousand); adjustments due to changes in demographic assumptions total €0 thousand (previous year: –€3,311 thousand).
The costs arising from pension obligations amounted to €5,889 thousand (previous year: €5,272 thousand) and break down as follows:
The present value of defined benefit obligations, which amounted to €287,778 thousand (previous year: €248,633 thousand), the fair value of the plan assets, which amounted to €27,584 thousand (previous year: €28,083 thousand), and the net amount of the two items reconcile as follows:
€ thousand 31 Dec 2019 31 Dec 2018 31 Dec 2017
Current service cost 1,213 727 618
Interest expense 5,010 4,562 4,492
Expected return on plan assets – 553 – 508 – 545
Past service cost and plan curtailments 218 491 156
Costs arising from pension obligations 5,889 5,272 4,721
€ thousand
Present value of benefit
commit-ments
Fair value of plan assets
Total
At 1 January 2018 249,851 – 29,622 220,229
Consolidated additions 3,742 0 3,742
Current service cost 727 0 727
Interest expense (+)/interest income (–) 4,562 – 508 4,054
Actuarial gains/losses – 6,448 500 – 5,948
Employer contributions 0 – 1,222 – 1,222
Benefits paid – 4,765 2,752 – 2,013
Recognised past service cost 491 0 491
Exchange differences 473 17 490
At 31 December 2018 248,633 – 28,083 220,550
€ thousand
Present value of benefit
commit-ments
Fair value of plan assets
Total
At 1 January 2019 248,633 – 28,083 220,550
Consolidated additions 0 0 0
Current service cost 1,213 0 1,213
Interest expense (+)/interest income (–) 5,010 – 553 4,457
Actuarial gains/losses 38,819 – 1,670 37,149
Employer contributions 0 – 477 – 477
Benefits paid – 6,518 3,205 – 3,313
Recognised past service cost 929 0 0
Exchange differences – 308 – 7 – 315
At 31 December 2019 287,778 – 27,584 260,194
€ thousand 31 Dec 2019 31 Dec 2018 31 Dec 2017
Present value of benefit commitments financed by provisions 234,644 199,099 199,129
Present value of benefit commitments financed through pension funds 53,134 49,534 50,722
Present value of benefit commitments (gross) 287,778 248,633 249,851
Fair value of plan assets – 27,584 – 28,083 – 29,622
Carrying amount at 31 December (net defined benefit obligation) 260,194 220,550 220,229
5 | 166
Financial position
2 | Consolidated ManageMent RepoRt
3 | CoRpoRate goveRnanCe 4 | Consolidated FinanCial stateMents
5 | notes to the Consolidated FinanCial stateMents
6 | otheR inFoRMation1 | to ouR shaReholdeRs

The actuarial gains or losses mainly relate to changes in financial assump-tions. Krones Unterstützungs-Fonds e.V., an occupational pension scheme, is responsible for administrating and managing a portion of the plan assets. Krones AG is the scheme’s sponsoring company. Allianz Global Investor is responsible for administrating and managing another portion of the plan assets as pension liability insurer.
The fair value of plan assets was €27.6 million as of 31 December 2019 (previ-ous year: €28.1 million). Of that, €23.5 million consist of pension liability insurance policies (previous year: €23.6 million). The rest of the plan assets are attributable to Krones Unterstützungs-Fonds e.V., headquartered in Neutraubling. The fund assets are invested in a special-purpose fund that is administered and actively managed by Allianz GI (AGI). The eligible instru-ments are specified in the investment guidelines.
A defensive investment strategy is used. At 31 December 2019, the AGI fund consisted of 39.6% government bonds, 6.7% Pfandbriefe (covered bonds gov-erned by the German Pfandbrief Act), and 17.0% investment-grade corpo-rate bonds. The amount held as cash in hand came to 0.6%. The remainder was primarily equity funds. Interest rate risk is actively managed using in-terest rate futures. The duration of the investment volume is 2.31 years. Management of currency risk: No direct currency investments are made. The overall rating of the fund assets is A+. Krones AG’s plan assets are se-cured as follows: 84% through the pension liability insurance policies from Allianz and 16% through Krones Unterstützungs-Fonds e.V.
The expected contributions to plan assets in 2020 are €456 thousand. The expected pension benefit payments to be paid out of plan assets in 2020 amount to €2,849 thousand.
In 2019, a total of €56,742 thousand (previous year: €55,404 thousand) was spent on the employer contribution to defined contribution plans (contributions to pension insurance).
The sensitivity of the total pension commitments to changes in the weighted assumptions is as follows:
The above sensitivity analysis is based on a change in one assumption, with all other factors held constant. It is unlikely that this would be the case in reality and changes in several assumptions may be correlated. The same method was used to calculate the sensitivity of the defined benefit obliga-tion to actuarial assumptions as was used to calculate the provisions for pensions in the statement of financial position.
Effect on the obligation
Change in assumption
Assumption increases
Assumption decreases
Discount rate 0.50% 9.1% decrease 10.5% increase
Change in state pensions
0.50% 7.5% decrease 6.7% increase
Life expectancy 1 year 4.0% increase 3.5% decrease
5 | 167
Financial position
2 | Consolidated ManageMent RepoRt
3 | CoRpoRate goveRnanCe 4 | Consolidated FinanCial stateMents
5 | notes to the Consolidated FinanCial stateMents
6 | otheR inFoRMation1 | to ouR shaReholdeRs

15 Other provisions
The provisions for personnel obligations primarily comprise, alongside provisions for severance payments, provisions for non-current obligations relating to partial retirement. The provisions for severance payments were recognised in the amount of €26,528 thousand in connection with restruc-turing and relate to a planned reduction in the workforce by 300 employees in Germany. The personnel obligations include €964 thousand for the ef-fects of the time value of money (previous year: €309 thousand).
Provisions for anticipated losses relate to anticipate losses arising from cus-tomer contracts. As soon as an anticipated loss is identified, a provision is immediately recognised for it at the expected amount.
The provisions for warranties relate to project business and represent the expected costs from customer orders. The estimates for liabilities relating to project business are based on experience in recent years and mostly have a contractual term of between one and two years from acceptance. Krones therefore expects that the majority of provisions for warranties will be set-tled within the next two years.
The other remaining provisions primarily include provisions for damages and legal fees. The non-current provisions have been discounted using rates between 0.6% and 1.0%.
16 Liabilities
€ thousand 1 Jan 2019 Consolidated additions
Utilisation Reversal Unwinding of discount/
change in discount rate
Additions Exchange differences
31 Dec 2019 Due within 1 year
Personnel obligations 48,453 5,020 9,991 993 964 39,023 – 21 82,455 30,371
Provisions for anticipated losses 31,648 0 17,559 8,252 0 13,011 47 18,895 18,663
Provisions for warranties 55,648 0 5,798 3,510 60 12,124 56 58,580 44,913
Other remaining provisions 35,139 310 10,297 8,508 46 39,678 – 58 56,310 47,101
Total 170,888 5,330 43,645 21,263 1,070 103,836 24 216,240 141,048
€ thousand Residual term of up
to 1 year
Residual term of 1 to
5 years
Residual term of
over 5 years
Total at 31 Dec
2019
Liabilities to banks 72,178 64 0 72,242
Contract liabilities 442,884 0 0 442,884
Trade payables 463,722 14 0 463,736
Other financial obligations 5,085 45,666 0 50,751
Liabilities from leases 29,802 56,034 3,212 89,048
Other liabilities* 325,818 2,600 0 328,418
Total 1,339,489 104,378 3,212 1,447,079
* The other liabilities include €98,654 thousand in financial liabilities.
5 | 168
Financial position
2 | Consolidated ManageMent RepoRt
3 | CoRpoRate goveRnanCe 4 | Consolidated FinanCial stateMents
5 | notes to the Consolidated FinanCial stateMents
6 | otheR inFoRMation1 | to ouR shaReholdeRs

Liabilities to banks carried interest at an average rate of 0.15% in the financial year.
Reconciliation of movements in liabilities to cash flow from financing activities
The table below shows changes in liabilities to banks and lease liabilities as a result of cash and non-cash changes.
The other changes mainly comprise additions from new leases.
The other financial obligations are obligations on bills, put/call options and earn-out obligations. Under IFrs 9, the obligations on bills represent possi-ble liabilities from bills sold and are also recognised as trade receivables amounting to €0 thousand (previous year: €106,670 thousand).
The other liabilities break down as follows:
€ thousand Residual term of up
to 1 year
Residual term of 1 to
5 years
Residual term of
over 5 years
Total at 31 Dec
2018
Liabilities to banks 555 3,169 0 3,724
Contract liabilities 547,222 0 0 547,222
Trade payables 491,585 1 0 491,586
Other financial obligations 106,552 41,125 0 147,677
Liabilities from leases 118 177 0 295
Other liabilities* 261,655 2,298 0 263,953
Total 1,407,687 46,770 0 1,454,457
* The other liabilities include €72,176 thousand in financial liabilities.
€ thousand 31 Dec 2018
Non-cash change due to first-time
application of ifrs 16
Other changes
Cash changes
Non-cash change due
to acquisi-tions
31 Dec 2019
Liabilities to banks 3,724 68,518 0 72,242
Liabilities from leases 295 88,186 31,537 – 32,156 1,186 89,048
Total 4,019 88,186 31,537 36,362 1,186 161,290
€ thousand 31 Dec 2017
Non-cash change due to first-time
application of ifrs 16
Other changes
Cash changes
Non-cash change due
to acquisi-tions
31 Dec 2018
Liabilities to banks 24,620 0 – 24,065 3,169 3,724
Liabilities from leases 102 291 – 98 0 295
Total 24,722 291 – 24,163 3,169 4,019
€ thousand Residual term of up
to 1 year
Residual term of 1 to
5 years
Residual term of
over 5 years
Total at 31 Dec
2019
Tax liabilities 36,382 74 0 36,456
Social security liabilities 8,959 0 0 8,959
Payroll liabilities 23,802 928 0 24,730
Accruals 221,998 0 0 221,998
Other 34,677 1,598 0 36,275
Total 325,818 2,600 0 328,418
5 | 169
Financial position
2 | Consolidated ManageMent RepoRt
3 | CoRpoRate goveRnanCe 4 | Consolidated FinanCial stateMents
5 | notes to the Consolidated FinanCial stateMents
6 | otheR inFoRMation1 | to ouR shaReholdeRs

Accruals, which amounted to €221,998 thousand (previous year: €158,605 thousand), have greater certainty with respect to their amount and timing than is the case with provisions. The primary items they include are out-standing supplier invoices, obligations relating to flexible working hours, accrued vacation, and performance bonuses.
17 Contingent liabilities
There were no contingent liabilities in the reporting period or in the previous year.
18 Other disclosures relating to financial instruments
The derivative financial instruments of the Krones Group substantially cover the currency risks relating to the Us dollar, the Canadian dollar, the Norwegian krone, the Japanese yen and the euro.
The nominal and fair values of the derivative financial instruments are as follows at the reporting date:
The fair value includes the difference between the forward rate received from the relevant commercial bank and the rate at the reporting date to-gether with appropriate premiums or discounts under accepted appraisal methodologies. These financial instruments are generally accounted for at the trade date.
€ thousand Residual term of up
to 1 year
Residual term of 1 to
5 years
Residual term of
over 5 years
Total at 31 Dec
2019
Tax liabilities 32,999 0 0 32,999
Social security liabilities 9,887 0 0 9,887
Payroll liabilities 27,653 1,354 0 29,007
Accruals 158,605 0 0 158,605
Other 32,511 944 0 33,455
Total 261,655 2,298 0 263,953
€ thousand 31 Dec 2019 31 Dec 2018 31 Dec 2019 31 Dec 2018
Nominal value
Nominal value
Fair value Fair value
Financial assets
Currency hedging
Forward exchange contracts 85,689 55,041 903 860
of which hedge accounting 76,953 28,875 872 450
Financial liabilities
Currency hedging
Forward exchange contracts 197,511 73,431 3,392 1,981
of which hedge accounting 97,853 61,338 2,479 1,781
5 | 170
Financial position
2 | Consolidated ManageMent RepoRt
3 | CoRpoRate goveRnanCe 4 | Consolidated FinanCial stateMents
5 | notes to the Consolidated FinanCial stateMents
6 | otheR inFoRMation1 | to ouR shaReholdeRs

Default risk relating to derivative financial instruments in the event of counterparty default is limited to the balance of the positive fair values. The cash flow hedges presented are judged to be effective. The net loss from derivatives was –€5.037 thousand in the reporting period (previous year: net loss of €386 thousand).
The German master agreements and IsDA agreements do not meet the crite-ria to require offsetting in the consolidated statement of financial position. That is because the company currently does not have a legally enforceable right to offset the recognised amounts. The right to offset these amounts is only enforceable if future events occur such as insolvency of a party to the contract. Hedging transactions entered into directly by subsidiaries of the Krones Group also cannot be offset.
The table below presents the carrying amounts of the financial assets and liabilities underlying these agreements:
The following table presents the financial instruments by their measure-ment categories and classes and also shows how the financial instruments that are measured at fair value fit within the fair value hierarchy.
€ thousand 31 Dec 2019 31 Dec 2018
Financial assets
Gross amounts of recognised financial assets 1,688,445 1,887,606
Amounts that are netted in accordance with IAS 32.42 0 0
Net amounts of recognised financial assets 1,688,445 1,887,606
Amounts subject to master netting agreement
Derivates – 3,392 – 1,981
Net amount of financial assets 1,685,053 1,885,625
Financial liabilities
Gross amounts of recognised financial liabilities 774,431 715,458
Amounts that are netted in accordance with IAS 32.42 0 0
Net amounts of recognised financial liabilities 774,431 715,458
Amounts subject to master netting agreement 0 0
Derivates – 903 – 860
Net amount of financial liabilities 773,528 714,598
5 | 171
Financial position
2 | Consolidated ManageMent RepoRt
3 | CoRpoRate goveRnanCe 4 | Consolidated FinanCial stateMents
5 | notes to the Consolidated FinanCial stateMents
6 | otheR inFoRMation1 | to ouR shaReholdeRs
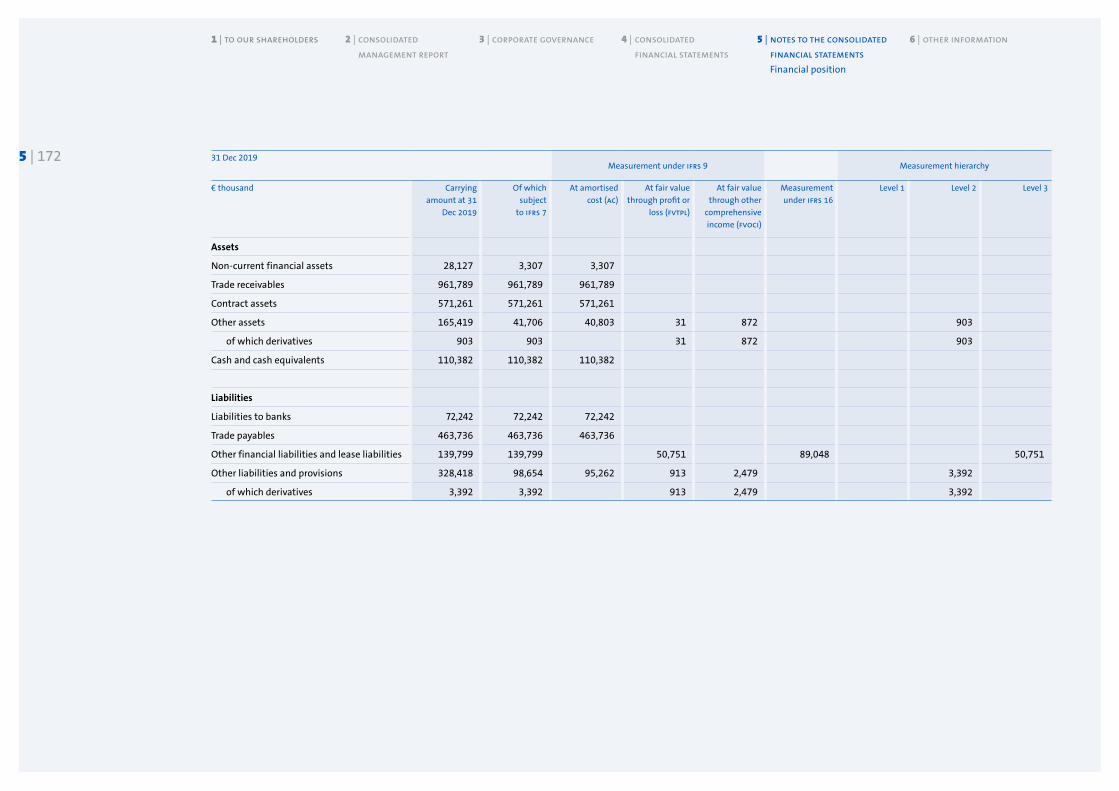
31 Dec 2019Measurement under ifrs 9 Measurement hierarchy
€ thousand Carrying amount at 31
Dec 2019
Of which subject
to ifrs 7
At amortised cost (AC)
At fair value through profit or
loss (fvTpL)
At fair value through other
comprehensive income (fvoCi)
Measurement under ifrs 16
Level 1 Level 2 Level 3
Assets
Non-current financial assets 28,127 3,307 3,307
Trade receivables 961,789 961,789 961,789
Contract assets 571,261 571,261 571,261
Other assets 165,419 41,706 40,803 31 872 903
of which derivatives 903 903 31 872 903
Cash and cash equivalents 110,382 110,382 110,382
Liabilities
Liabilities to banks 72,242 72,242 72,242
Trade payables 463,736 463,736 463,736
Other financial liabilities and lease liabilities 139,799 139,799 50,751 89,048 50,751
Other liabilities and provisions 328,418 98,654 95,262 913 2,479 3,392
of which derivatives 3,392 3,392 913 2,479 3,392
5 | 172
Financial position
2 | Consolidated ManageMent RepoRt
3 | CoRpoRate goveRnanCe 4 | Consolidated FinanCial stateMents
5 | notes to the Consolidated FinanCial stateMents
6 | otheR inFoRMation1 | to ouR shaReholdeRs

5 | 173 31 Dec 2018Measurement under ifrs 9 Measurement hierarchy
€ thousand Carrying amount at 31
Dec 2018
Of which subject
to ifrs 7
At amortised cost (AC)
At fair value through profit or
loss (fvTpL)
At fair value through other
comprehensive income (fvoCi)
Measurement under iAs 17
Level 1 Level 2 Level 3
Assets
Non-current financial assets 8,770 3,805 3,805
Trade receivables 987,970 987,970 987,970
Contract assets 647,089 647,089 647,089
Other assets 166,128 29,940 29,080 410 450 860
of which derivatives 860 860 410 450 860
Cash and cash equivalents 218,802 218,802 218,802
Liabilities
Liabilities to banks 3,724 3,724 3,724
Trade payables 491,586 491,586 491,586
Other financial liabilities 147,972 147,972 106,889 41,083 41,083
Other liabilities and provisions 263,953 72,176 69,899 199 1,781 295 1,982
of which derivatives 1,982 1,982 199 1,781 1,982
Financial position
2 | Consolidated ManageMent RepoRt
3 | CoRpoRate goveRnanCe 4 | Consolidated FinanCial stateMents
5 | notes to the Consolidated FinanCial stateMents
6 | otheR inFoRMation1 | to ouR shaReholdeRs

been measured on the basis of recognised accounting models, taking into ac-count contractual agreements as well as market and company data available at the reporting date.
The fair value of the put/call option for sysTeM LoGIsTICs was measured using the discounted cash flow method. The main input factors are medi-um-term planning and the discount rate. The estimated range of the undis-counted exercise prices is between €18,070 thousand and €55,104 thousand at the reporting date. On this basis, the fair value at the reporting date was €36,133 thousand. The fair value of the put option for IPs PLAsTICs was mea-sured using the discounted cash flow method. The main input factors are medium-term planning and the discount rate. On this basis, the fair value at the reporting date was €1,277 thousand.
There were no transfers between levels of the hierarchy.
€ thousand 2019 2018
Net carrying amount at 1 January 41,083 26,974
Additions resulting from acquisitions 0 2,582
Changes 9,668 11,527
(of which currency effects) 172 234
Net carrying amount at 31 December 50,751 41,083
€ thousand
Carrying amount
Of which not overdue at the reporting date
Of which overdue by the following number of days at the reporting date
Up to 90 daysBetween 90
and 180 daysBetween 180 and 360 days
More than 360 days
31 Dec 2019 Trade receivables and contract assets 1,533,050 1,368,344 115,204 21,677 19,501 8,324
31 Dec 2018 Trade receivables and contract assets 1,635,059 1,460,726 116,017 21,212 24,337 12,767
The age structure of trade receivables and other receivables is as follows at 31 December 2019:
5 | 174 Financial instruments categorised as Level 3 inputs and measured at fair value developed as follows:
There were no other changes. The financial liabilities, which are based on in-dividual measurement parameters and recognised at fair value, comprise contingent consideration and combined put/call options relating to acquisi-tions. These items are recognised under other financial liabilities and have
Financial position
2 | Consolidated ManageMent RepoRt
3 | CoRpoRate goveRnanCe 4 | Consolidated FinanCial stateMents
5 | notes to the Consolidated FinanCial stateMents
6 | otheR inFoRMation1 | to ouR shaReholdeRs

Indicators that trade receivables and contract assets may be impaired include significant financial difficulties on the part of the customer.
In addition, specific valuation allowances were recognised in the amount of €24,874 thousand (previous year: €21,901 thousand) for uncollectible receivables.
The default risk to which the Group is exposed in trade receivables and contract assets primarily depends on customer creditworthiness.
Krones’ management has implemented a process in which each customer is assessed in terms of creditworthiness on the basis of external data such as ratings or internal data such as payment history and past-due status of receivables.
The final assessment is made on the basis of customer groups and a classi-fication of customers into one of five risk categories, A to E, according to past-due status.
An expected credit loss rate is computed for each risk category on the basis of meaningful data.
The table below shows the gross carrying amounts and expected credit losses on trade receivables and contract assets:
Category
31 Dec 2019 A B C d E Total
Average loss rate (%) 0.56 % 0.50 % 1.45 % 4.20 % 11.21 %
Gross carrying amount in € thousand 252,763 42,674 15,182 7,001 12,291 329,911
Loss allowance in € thousand 1,417 212 220 294 1,378 3,521
Category
31 Dec 2018 A B C d E Total
Average loss rate (%) 0.23 % 0.18 % 1.70 % 5.33 % 39.62 %
Gross carrying amount in € thousand 279,308 49,426 9,342 9,998 8,225 356,299
Loss allowance in € thousand 608 81 147 495 3,026 4,357Rating-based at 31 Dec 2019 Gross
carrying amount in
€ thousand
Average loss rate
Loss allowance
in € thousand
Key accounts 536,860 0.11% 501
Major customers 706,849 1.81% 7,224
Total 1,243,709 12,179
Rating-based at 31 Dec 2018 Gross carrying
amount in € thousand
Average loss rate
Loss allowance
in € thousand
Key accounts 471,345 0.45% 1,984
Major customers 821,086 0.99% 7,330
Total 1,292,431 9,314
5 | 175
Financial position
2 | Consolidated ManageMent RepoRt
3 | CoRpoRate goveRnanCe 4 | Consolidated FinanCial stateMents
5 | notes to the Consolidated FinanCial stateMents
6 | otheR inFoRMation1 | to ouR shaReholdeRs

The following overview of maturities shows how the undiscounted cash flows relating to liabilities as of 31 December 2019 influence the company’s liquidity situation.
€ thousand Carrying amount at
31 Dec 2019
Cash flow2020
Cash flow 2021 – 2024
Cash flowbeyond 2024
Interest Repayment Interest Repayment Interest Repayment
Derivative financial instruments 3,392 0 2,828 0 564 0 0
Liabilities to banks 72,242 0 72,178 3 64 0 0
Trade payables 463,736 0 463,722 0 14 0 0
Liabilities from leases 89,048 2,082 29,802 5,125 56,034 611 3,212
Other financial liabilities 146,013 0 100,347 0 47,216 0 0
774,431 2,082 668,877 5,128 103,892 611 3,212
€ thousand Carrying amount at
31 Dec 2018
Cash flow
2019
Cash flow
2020 – 2023
Cash flow
beyond 2023
Interest Repayment Interest Repayment Interest Repayment
Derivative financial instruments 1,982 0 1,980 0 2 0 0
Liabilities to banks 3,724 0 555 680 3,169 0 0
Trade payables 491,586 0 491,585 0 1 0 0
Liabilities from leases 295 6 118 15 177 0 0
Discounted trade bills 106,670 0 106,670 0 0 0 0
Other financial liabilities 111,201 0 69,899 44 41,302 0 0
715,458 6 670,807 739 44,651 0 0
5 | 176
Financial position
2 | Consolidated ManageMent RepoRt
3 | CoRpoRate goveRnanCe 4 | Consolidated FinanCial stateMents
5 | notes to the Consolidated FinanCial stateMents
6 | otheR inFoRMation1 | to ouR shaReholdeRs

Material items denominated in foreign currencies in accordance with IFrs 7 classes:
A change in the reporting date exchange rate by +10% in relation to the for-eign currency against the euro (indirect quotation) would have the follow-ing effect on consolidated net income and other equity components:
31 Dec 2019 € thousand
CurrencyUsd
CurrencynoK
CurrencyCAd
CurrencyCny
Currencyjpy
Cash and cash equivalents 310 0 450 0 0
Trade receivables 0 1.920 0 0 0
Other financial receivables 0 0 0 0 0
Derivatives at positive market values 395 0 0 1 474
Total assets 705 1.920 450 1 474
Liabilities
Trade payables 2,044 18 8,117 317 – 3,129
Liabilities to banks 0 0 0 0 0
Other liabilities 0 0 0 0 0
Derivatives at negative market values 1,611 24 1,198 545 – 8
Total liabilities 3,655 42 9,315 862 – 3,137
Balance of assets and liabilities – 2,950 1,878 – 8,865 – 861 –2,663
Net exposure at 31 Dec 2019 – 2,950 1,878 – 8,865 – 861 –2,663
€ thousand CurrencyUsd
CurrencynoK
CurrencyCAd
CurrencyCny
Currencyjpy
Consolidated statement of profit and loss – 2,958 – 12 536 – 2,512 206
Consolidated equity 5,590 0 1,654 1,953 1,478
5 | 177
Financial position
2 | Consolidated ManageMent RepoRt
3 | CoRpoRate goveRnanCe 4 | Consolidated FinanCial stateMents
5 | notes to the Consolidated FinanCial stateMents
6 | otheR inFoRMation1 | to ouR shaReholdeRs

A change in reporting date closing rate by +10% in relation to the foreign currency against the euro (indirect quotation) would have the following effect on consolidated net income and other equity components:
5 | 178 31 Dec 2018 € thousand
CurrencyUsd
CurrencynoK
CurrencyCAd
CurrencyCny
CurrencygBp
Cash and cash equivalents 395 0 132 56 0
Trade receivables 907 0 5.238 0 0
Other financial receivables 0 635 34 0 0
Derivatives at positive market values 194 284 269 0 45
Total assets 1,496 919 5,673 56 45
Liabilities
Trade payables – 2,114 0 0 – 1,082 – 39
Liabilities to banks 0 0 0 0 0
Other liabilities – 856 – 14,217 – 2,543 0 – 4,007
Derivatives at negative market values –1,100 – 11 – 7 – 589 0
Total liabilities – 4,070 – 14,228 – 2,550 – 1,671 – 4,046
Balance of assets and liabilities – 2,574 – 13,309 3,123 – 1,615 – 4,001
Net exposure at 31 Dec 2018 – 2,574 – 13,309 3,123 – 1,615 – 4,001
€ thousand CurrencyUsd
CurrencynoK
CurrencyCAd
CurrencyCny
CurrencygBp
Consolidated statement of profit and loss –116 1,254 –87 68 567
Consolidated equity 3,022 1,254 553 214 671
Financial position
2 | Consolidated ManageMent RepoRt
3 | CoRpoRate goveRnanCe 4 | Consolidated FinanCial stateMents
5 | notes to the Consolidated FinanCial stateMents
6 | otheR inFoRMation1 | to ouR shaReholdeRs

19 Revenue
The Krones Group’s revenue of €3,958,875 thousand (previous year: €3,853,980 thousand) is recognised revenue from contracts with customers. Revenue from contracts with customers breaks down by segment and in-voice recipients in geographical regions as follows.
The group’s contract assets and contract liabilities changed as follows in the financial year:
The amount of revenue recognised in 2019 that was included in the contract liability balance at the beginning of the reporting period was €547,222 thou-sand (previous year: €392,986 thousand).
The reduction in contract assets is mainly due to a lower volume of work in progress. The reduction in contract liabilities is mainly due to lower prepay-ments from customers.
The amount of the transaction price allocated to performance obligations unsatisfied (or partially unsatisfied) at the end of the reporting period was €32,057 thousand (previous year: €25,072 thousand). Krones will recognise most of this as revenue in the next 36 months. No disclosures under IFrs 15.120 are made for performance obligations with an original expected duration of one year or less.
Most revenue in the Machines and Lines for Product Filling and Decoration segment and almost all revenue in the Machines and Lines for Beverage Production/Process Technology segment is recognised over time.
20 Other own work capitalised
Other own work capitalised consists primarily of capitalised development expenditure and capitalised cost of self-constructed property, plant and equipment at the Hungary and Neutraubling production locations.
With respect to development expenditure capitalised in accordance with IAs 38, please refer to the notes on intangible assets.
€ thousand 2019 2018Machines and Lines
for Product Filling and
Decoration
Machines and Lines
for Beverage Production/
Process Technology
Machines and Lines
for Product Filling and
Decoration
Machines and Lines
for Beverage Production/
Process Technology
Germany 394,327 74,027 273,431 88,913
Central Europe (excluding Germany) 187,141 13,832 205,006 19,587
Western Europe 448,784 171,362 543,892 177,751
Middle East/Africa 385,806 65,640 424,271 76,371
Eastern Europe 201,245 44,152 164,971 22,458
Russia, Central Asia (Cis) 69,992 6,365 62,014 17,842
Asia-Pacific 449,856 71,182 402,170 43,556
China 361,781 10,039 277,993 12,778
North and Central America 536,520 146,939 420,611 112,452
South America/Mexico 229,965 89,920 403,491 104,422
Total 3,265,417 693,458 3,177,850 676,130
€ thousand 31 Dec 2019 31 Dec 2018
Contract assets 571,261 647,089
Contract liabilities 442,884 547,222
5 | 179 Notes to the consolidated statement of profit and loss
Consolidated statement of profit and loss
2 | Consolidated ManageMent RepoRt
3 | CoRpoRate goveRnanCe 4 | Consolidated FinanCial stateMents
5 | notes to the Consolidated FinanCial stateMents
6 | otheR inFoRMation1 | to ouR shaReholdeRs

21 Other operating income
Apart from prior-period income from reversal of provisions and accruals (€16,062 thousand; previous year: €13,727 thousand), gains from disposals of non-current assets (€846 thousand; previous year: €479 thousand) and the reversal of loss allowances (€2,032 thousand; previous year: €7,910 thou-sand), the other operating income, which amounts to €99,826 thousand (previous year: €114,492 thousand), consists substantially of currency trans-lation gains of €35,505 thousand (previous year: €36,548 thousand). This compares with additions to loss allowances of €14,598 thousand (previous year: €3,148 thousand) and currency translation losses of €45,888 thousand (previous year: €45,201 thousand) under other operating expenses.
22 Goods and services purchased
The expenses for goods and services purchased comprises expenses for materials and supplies and for goods purchased amounting to €1,525,551 thousand (previous year: €1,523,504 thousand) and expenses for services purchased amounting to €516,237 thousand (previous year: €508,521 thou-sand).
23 Personnel expenses
Within the Krones Group, 16,589 people (previous year: 15,330) including trainees (591; previous year: 546) were employed on average over the year. The workforce of the Krones Group is composed as follows (average for the year):
24 Other operating expenses
Apart from the €630 thousand in prior-period losses from disposals of non-current assets (previous year: €453 thousand), the other operating expenses include additions to loss allowances (€14,598 thousand; previous year: €3,148 thousand), other taxes (€6,152 thousand; previous year: €5,664 thousand), freight costs (€121,034 thousand; previous year: €124,272 thou-sand), travel costs (€115,479 thousand; previous year: €110,677), currency translation losses (€45,888; previous year: €45,201 thousand), rent and cleaning costs (€6,719 thousand; previous year: €40,873 thousand) and maintenance costs (€38,985 thousand; previous year: €36,191 thousand).
25 Financial income/expense
The financial income/expense of –€2,206 thousand (previous year: €1,099 thousand) breaks down as follows:
Besides interest and similar income of €7,520 thousand (previous year: €6,121 thousand) and interest and similar expenses of €14,628 thousand (previous year: €14,592 thousand), financial income/expense also included investment income of €5,588 thousand (previous year: €8,747 thousand)
€ thousand 2019 2018
Income from other securities and long-term loans 0 2
Interest and similar income 7,520 6,121
Interest and similar expenses – 14,628 – 14,592
Interest income/expense – 7,108 – 8,471
Investment income 5,588 8,747
Profit or loss shares attributable to associates that are accounted for using the equity method – 686 821
Net financial income/expense – 2,206 1,099
2019 2018
White-collar employees exempt from collective agreements 2,907 2,766
Employees covered by collective agreements 13,682 12,564
Total 16,589 15,330
5 | 180
Consolidated statement of profit and loss
2 | Consolidated ManageMent RepoRt
3 | CoRpoRate goveRnanCe 4 | Consolidated FinanCial stateMents
5 | notes to the Consolidated FinanCial stateMents
6 | otheR inFoRMation1 | to ouR shaReholdeRs
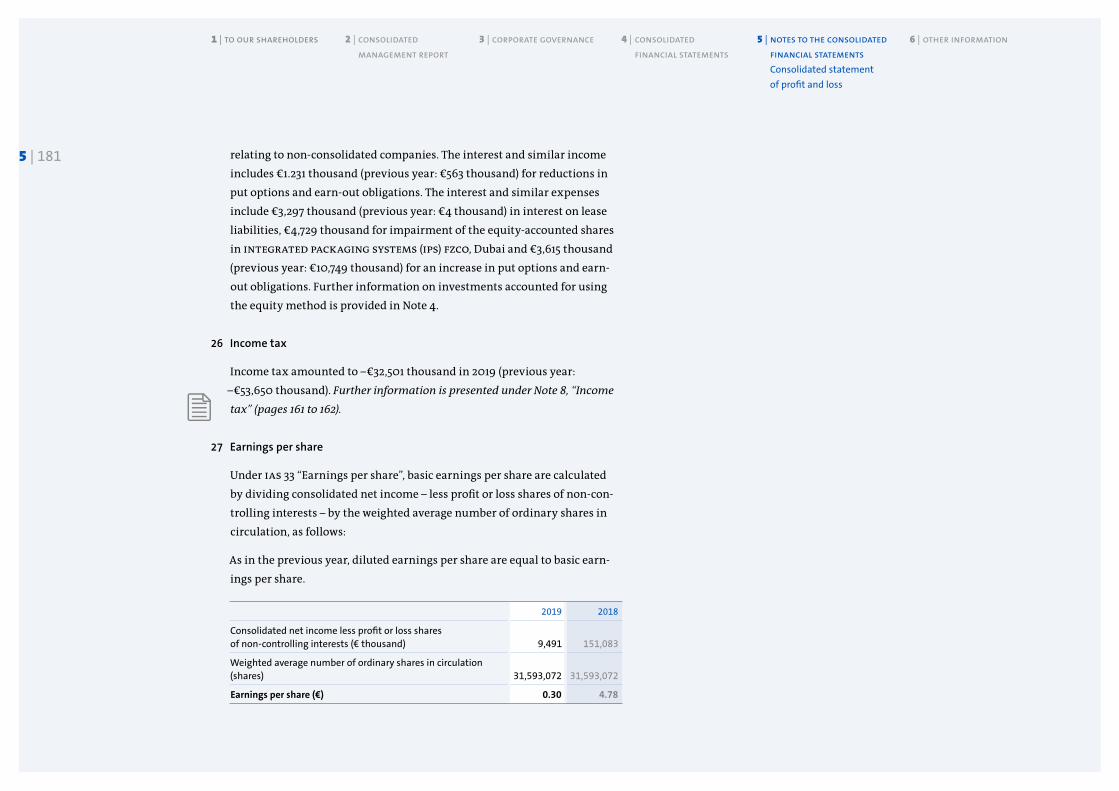
relating to non-consolidated companies. The interest and similar income includes €1.231 thousand (previous year: €563 thousand) for reductions in put options and earn-out obligations. The interest and similar expenses include €3,297 thousand (previous year: €4 thousand) in interest on lease liabilities, €4,729 thousand for impairment of the equity-accounted shares in InTeGrATeD PACKAGInG sysTeMs (IPs) FZCo, Dubai and €3,615 thousand (previous year: €10,749 thousand) for an increase in put options and earn-out obligations. Further information on investments accounted for using the equity method is provided in Note 4.
26 Income tax
Income tax amounted to –€32,501 thousand in 2019 (previous year: –€53,650 thousand). Further information is presented under Note 8, “Income tax” (pages 161 to 162).
27 Earnings per share
Under IAs 33 “Earnings per share”, basic earnings per share are calculated by dividing consolidated net income – less profit or loss shares of non-con-trolling interests – by the weighted average number of ordinary shares in circulation, as follows:
As in the previous year, diluted earnings per share are equal to basic earn-ings per share.
2019 2018
Consolidated net income less profit or loss shares of non-controlling interests (€ thousand) 9,491 151,083
Weighted average number of ordinary shares in circulation (shares) 31,593,072 31,593,072
Earnings per share (€) 0.30 4.78
5 | 181
Consolidated statement of profit and loss
2 | Consolidated ManageMent RepoRt
3 | CoRpoRate goveRnanCe 4 | Consolidated FinanCial stateMents
5 | notes to the Consolidated FinanCial stateMents
6 | otheR inFoRMation1 | to ouR shaReholdeRs
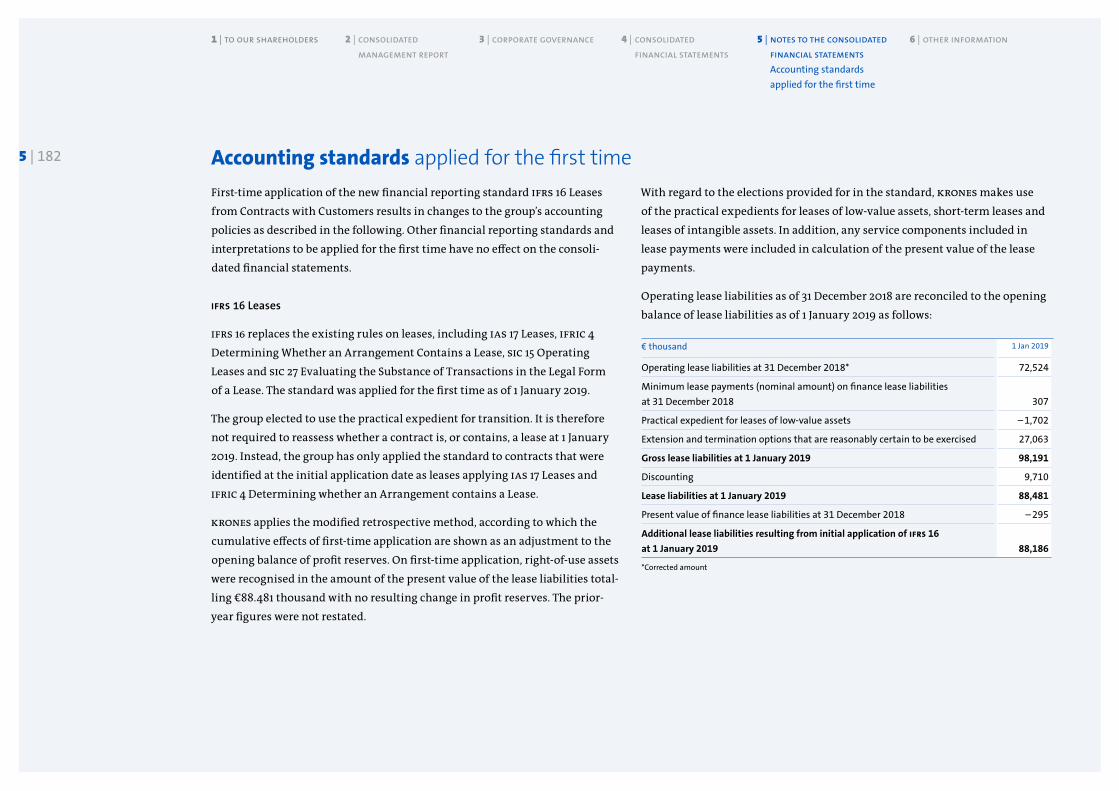
5 | 182
First-time application of the new financial reporting standard IFrs 16 Leases from Contracts with Customers results in changes to the group’s accounting policies as described in the following. Other financial reporting standards and interpretations to be applied for the first time have no effect on the consoli-dated financial statements.
IFrs 16 Leases
IFrs 16 replaces the existing rules on leases, including IAs 17 Leases, IFrIC 4 Determining Whether an Arrangement Contains a Lease, sIC 15 Operating Leases and sIC 27 Evaluating the Substance of Transactions in the Legal Form of a Lease. The standard was applied for the first time as of 1 January 2019.
The group elected to use the practical expedient for transition. It is therefore not required to reassess whether a contract is, or contains, a lease at 1 January 2019. Instead, the group has only applied the standard to contracts that were identified at the initial application date as leases applying IAs 17 Leases and IFrIC 4 Determining whether an Arrangement contains a Lease.
Krones applies the modified retrospective method, according to which the cumulative effects of first-time application are shown as an adjustment to the opening balance of profit reserves. On first-time application, right-of-use assets were recognised in the amount of the present value of the lease liabilities total-ling €88.481 thousand with no resulting change in profit reserves. The prior- year figures were not restated.
With regard to the elections provided for in the standard, Krones makes use of the practical expedients for leases of low-value assets, short-term leases and leases of intangible assets. In addition, any service components included in lease payments were included in calculation of the present value of the lease payments.
Operating lease liabilities as of 31 December 2018 are reconciled to the opening balance of lease liabilities as of 1 January 2019 as follows:
Accounting standards applied for the first time
€ thousand 1 Jan 2019
Operating lease liabilities at 31 December 2018* 72,524
Minimum lease payments (nominal amount) on finance lease liabilities at 31 December 2018 307
Practical expedient for leases of low-value assets – 1,702
Extension and termination options that are reasonably certain to be exercised 27,063
Gross lease liabilities at 1 January 2019 98,191
Discounting 9,710
Lease liabilities at 1 January 2019 88,481
Present value of finance lease liabilities at 31 December 2018 – 295
Additional lease liabilities resulting from initial application of IFRS 16 at 1 January 2019 88,186
*Corrected amount
Accounting standards applied for the first time
2 | Consolidated ManageMent RepoRt
3 | CoRpoRate goveRnanCe 4 | Consolidated FinanCial stateMents
5 | notes to the Consolidated FinanCial stateMents
6 | otheR inFoRMation1 | to ouR shaReholdeRs

5 | 183 The lease liabilities were discounted as of January 1, 2019 using the incremental borrowing rate. The weighted average incremental borrowing rates was 3.6%. For the purpose of determining the incremental borrowing rate, benchmark in-terest rates for the lease terms of committed leases were derived from yields on similar corporate bonds in a similar economic environment and with similar security. The benchmark interest rates were supplemented by a lease risk pre-mium.
Information on right-of-use assets and lease liabilities, together with further explanations, are provided under the respective items of the statement of financial position.
Accounting standards applied for the first time
2 | Consolidated ManageMent RepoRt
3 | CoRpoRate goveRnanCe 4 | Consolidated FinanCial stateMents
5 | notes to the Consolidated FinanCial stateMents
6 | otheR inFoRMation1 | to ouR shaReholdeRs

� Audit and consulting fees
The total fee invoiced by the auditor of the financial statements was as follows:
Disclosures in accordance with the eU Audit Regulation
Other assurance services include statutory audits of corporate governance and supervision systems and functions (non-audit services required by na-tional law) and non-statutory assurance services relating to non-financial information (non-audit services).
The other services are a benchmark analysis (non-audit service).
� Events after the reporting period
The outbreak and rapid spread of the coronavirus (CoVID-19) since the be-ginning of 2020 has affected business and economic activity not only in China, but also worldwide. The financial effect of this event on Krones could not be estimated at the time of publication of the annual report because it was not possible to estimate the extent of the spread and the consequences for Krones’ business.
� Related party disclosures
Within the meaning of IAs 24 Related Party Disclosures, the members of the Supervisory Board and of the Executive Board of Krones AG and the com-panies of the Krones Group, including unconsolidated subsidiaries, are deemed related parties.
The ultimate controlling party of Krones AG is Familie Kronseder Kon-sortium GbR. Purchases and sales between the related companies are trans-acted at prices customary on the market (“at arm’s length”). Sales to subsid-iaries that are not consolidated amounted to €31,534 thousand in 2019 (previous year: €27,738 thousand). Commissions received from such subsid-iaries amounted to €5,262 thousand in 2019 (previous year: €8,885 thou-sand). Trade and other payment transactions resulted in assets of €11,972 thousand (previous year: assets of €10,008 thousand). Repayment is nor-mally within twelve months. Loss allowances were recognised on receiv-ables in the amount of €2,959 thousand in the financial year (previous year: €0 thousand). Also included is income from long-term equity investments in non-consolidated entities in the amount of €5,588 thousand (previous year: €8,747 thousand).
There are no contingent liabilities relating to guarantees (previous year: €2,697 thousand). Trade and other payment transactions with associates to-talled €6,946 thousand in 2019 (previous year: €22,532 thousand). This did not result in any liabilities (previous year: liabilities of €1,616 thousand).
Other disclosures
€ thousand 2019
Audit services 471
Other assurance services 59
Other services 30
5 | 184
Other disclosures
2 | Consolidated ManageMent RepoRt
3 | CoRpoRate goveRnanCe 4 | Consolidated FinanCial stateMents
5 | notes to the Consolidated FinanCial stateMents
6 | otheR inFoRMation1 | to ouR shaReholdeRs

� Executive Board remuneration and benefits paid to former members
of the Executive Board
Total Executive Board remuneration, plus expenses for the long-term incen-tive provision and benefit expense for the termination agreement with Mr. Michael Andersen, amounted to €6,897 thousand for the 2019 financial year (previous year: €5,745 thousand).
This includes short-term benefits in the amount of €2,258 thousand (previ-ous year: €4,084 thousand), other long-term benefits in the amount of €686 thousand (previous year: €489 thousand) and early termination benefits in the amount of €2,781 thousand (previous year: €0 thousand). The short-term benefit expense is reduced by the Executive Board waiving payment of remuneration components or by contractual arrangements on leaving. In addition, €1,172 thousand (previous year: €1,172 thousand) was paid into the contribution-based post-employment benefits plan in 2019. Information on the individual remuneration of members of the Executive Board is pro-vided in the remuneration report.
� Benefits granted to former members of the Executive Board and their sur-viving dependants amounted to €1,842 thousand (previous year: €1,688 thousand). This mainly consists of pension benefits. Pension provisions were recognised in the amount of €12,069 thousand (previous year: €8,761 thousand). The increase relates to changes in the actuarial discount rate.
� Supervisory Board remuneration
The total remuneration paid to members of the Supervisory Board for the 2019 financial year amounted to €812 thousand (previous year: €712 thou-sand). Information on the individual remuneration of members of the Supervisory Board is provided in the remuneration report.
� Corporate Governance
Shareholders can view the declaration of the Executive Board and the Supervisory Board of 22 January 2020 pursuant to Section 161 of the Ger-man Stock Corporation Act [AktG] concerning the Corporate Governance Code as amended on 7 February 2017 at Krones AG’s website. The exceptions are also listed there.
� Risk report
The risk report is part of the management report and is on pages 92 to 102.
5 | 185
Other disclosures
2 | Consolidated ManageMent RepoRt
3 | CoRpoRate goveRnanCe 4 | Consolidated FinanCial stateMents
5 | notes to the Consolidated FinanCial stateMents
6 | otheR inFoRMation1 | to ouR shaReholdeRs

The accounting policies used in these consolidated financial statements are the standards and interpretations whose application is mandatory as of 31 Decem-ber 2019. The following new or amended standards and interpretations applied for the 2019 financial year.
Various new or amended standards entered into force in the reporting period. First-time application of the new standard IFrs 16 Leases resulted in changes to the group’s accounting policies. The effects of first-time application of this stan-dard are described on page 176. The remaining new or amended standards and interpretations listed above have no material relevance for Krones AG.
The following standards and interpretations have been issued by the IAsB but their application is not mandatory until after 31 December 2019.
These standards and interpretations are not expected to have a material impact on the consolidated financial statements of Krones AG in the reporting period to which they are applied for the first time.
Standards/interpretations
Standard or interpretation
Endorse-ment
Application mandatory for annual periods beginning
iAs 19 Amendments to: Plan Amendment, Curtailment or Settlement
completed 1 Jan 2019
iAs 28 Amendments to: Long-term Interests in Associates and Joint Ventures completed 1 Jan 2019
ifrs 9 Amendments to: Prepayment Features with Negative Compensation completed 1 Jan 2019
ifrs 16 Leases completed 1 Jan 2019
ifriC 23 Uncertainty over Income Tax Treatments completed 1 Jan 2019
Annual Improvements to ifrs – 2015–2017 Cycle completed 1 Jan 2019
Standard or interpretation
Endorse-ment
Application mandatory for annual periods be-ginning
Concep-tual Fra-mework
Amendments to: Conceptual Framework for Financial Reporting and Amendments to References to the Con-ceptual Framework in ifrs Standards completed 1 Jan 2020
iAs 1 Amendments to: Classification of Liabilities as Current or Non-Current
open 1 Jan 2022
ifrs 3 Amendments to: Definition of a Business open 1 Jan 2020
ifrs 17 Insurance Contracts open 1 Jan 2021
iAs 1 und 8
Amendments to: Definition of Material completed 1 Jan 2020
ifrs 9, iAs 29 and ifrs 7
Amendments to: Interest Rate Benchmark Reform
completed 1 Jan 2020
Standards and interpretations
5 | 186
2 | Consolidated ManageMent RepoRt
3 | CoRpoRate goveRnanCe 4 | Consolidated FinanCial stateMents
5 | notes to the Consolidated FinanCial stateMents
6 | otheR inFoRMation1 | to ouR shaReholdeRs

Name and location of the company Share in capital held by KronEs Ag (%*)
dEKron gmBH, Kelkheim 100.00
EComAC gEBrAUCHTmAsCHinEn gmBH, Neutraubling 100.00
EvogUArd gmBH, Nittenau 100.00
gErnEp gmBH ETiKETTiErTECHniK 100.00
HsT mAsCHinEnBAU gmBH, Dassow 100.00
KiC KronEs inTErnATionALE CoopErATions-gEsELLsCHAfT mBH, Neutraubling 100.00
KronEs BETEiLigUngsgEsELLsCHAfT mBH, Neutraubling 100.00
KronEs sErviCE EUropE gmBH (former mAinTEC sErviCE gmBH), Collenberg/Main 100.00
mHT HoLding Ag, Hochheim am Main 100.00
mHT moLd & HoTrUnnEr TECHnoLogy Ag, Hochheim am Main 100.00
miLKron gmBH, Laatzen 100.00
pmr gmBH, Wackersdorf 100.00
sysKron gmBH, Wackersdorf 100.00
sysKron HoLding gmBH, Wackersdorf 100.00
sysKron X gmBH, Wackersdorf 100.00
sysTEm LogisTiCs gmBH, Wackersdorf (former nEUspEd nEUTrAUBLingEr spEdiTions-gmBH, Neutraubling) 100.00
TECHnoLogisCHEs insTiTUT für AngEWAndTE KünsTLiCHE inTELLigEnZ gmBH, Weiden i. d. Opf. 44.00
TriACos ConsULTing & EnginEEring gmBH, Altenstadt an der Waldnaab 100.00
KosmE fBA sA (former s.p.s. – soLUTions for pACKAging sErviCEs s.A.), Charleroi, Belgium 100.00
s.A. KronEs n.v., Louvain-la-Neuve, Belgium 100.00
KronEs sErviCE EUropE Eood (former mAinTEC sErviCE Eood), Sofia, Bulgaria 100.00
KronEs nordiC Aps, Holte, Denmark 100.00
KronEs s.A.r.L., Viviers-du-Lac, France 100.00
*Direct and indirect shareholdings
Shareholdings
Shareholdings
5 | 187
2 | Consolidated ManageMent RepoRt
3 | CoRpoRate goveRnanCe 4 | Consolidated FinanCial stateMents
5 | notes to the Consolidated FinanCial stateMents
6 | otheR inFoRMation1 | to ouR shaReholdeRs

Name and location of the company Share in capital held by KronEs Ag (%*)
KosmE fBA sAs (former sps s.A.s. – soLUTions for pACKAging sErviCEs s.A.s.), Lyon, France 100.00
KronEs UK LTd., Bolton, U.K. 100.00
sysTEm LTd., London, U.K. 60.00
KosmE s.r.L., Roverbella (mn), Italy 100.00
KronEs s.r.L., Garda (vr), Italy 100.00
sysTEm LogisTiCs s.p.A., Fiorano Modenese (md), Italy 60.00
KronEs KAZAKHsTAn Too, Almaty, Kazakhstan 100.00
ips inTEgrATEd pACKAging sysTEms mALTA LTd., Naxxar, Malta 100.00
KronEs nEdErLAnd B.v., Bodegraven, Netherlands 100.00
KosmE gEsELLsCHAfT mBH, Sollenau, Austria 100.00
KronEs spóLKA Z.o.o., Warschau, Poland 100.00
KronEs porTUgAL EQUipAmEnTos indUsTriAis LdA., Barcarena, Portugal 100.00
KronEs romAniA prod. s.r.L., Bukarest, Romania 100.00
KronEs sErviCE EUropE srL (former mAinTEC sErviCE srL), Bukarest, Romania 100.00
KronEs o.o.o., Moscow, Russia 100.00
sysTEm norTHErn EUropE AB, Malmö, Sweden 60.00
inTEgrATEd pLAsTiCs sysTEms Ag, Baar, Switzerland 70.00
KronEs Ag, Buttwil, Switzerland 100.00
KronEs iBEriCA, s.A.U., Barcelona, Spain 100.00
sysTEm LogisTiCs spAin sL, Castellon, Spain 60.00
KronEs s.r.o., Prague, Czech Republic 100.00
KonpLAn s.r.o., Pilsen, Czech Republic 100.00
KronEs mAKinA sAnAyi vE TiKArET LTd. sirKETi, Istanbul, Turkey 100.00
KronEs UKrAinE LLC, Kiev, Ukraine 100.00
KronEs HUngAry KfT., Debrecen, Hungary 100.00
KronEs sErviCE EUropE KfT. (former mAinTEC sErviCE KfT.), Budapest, Hungary 100.00
inTEgrATEd pACKAging sysTEms – ips, Cairo, Egypt 100.00
KronEs AngoLA – rEprEsEnTACoEs, ComErCio E indUsTriA, LdA., Luanda, Angola 100.00
*Direct and indirect shareholdings
Shareholdings
5 | 188
2 | Consolidated ManageMent RepoRt
3 | CoRpoRate goveRnanCe 4 | Consolidated FinanCial stateMents
5 | notes to the Consolidated FinanCial stateMents
6 | otheR inFoRMation1 | to ouR shaReholdeRs

Name and location of the company Share in capital held by KronEs Ag (%*)
KronEs sUrLATinA s.A., Buenos Aires, Argentina 100.00
KronEs pACifiC pTy LimiTEd, Sydney, Australia 100.00
KronEs BAngLAdEsH LimiTEd, Dhaka, Bangladesh 100.00
KronEs do BrAZiL LTdA., São Paulo, Brazil 100.00
KronEs s.A., São Paulo, Brazil 100.00
KronEs CHiLE spA., Santiago de Chile, Chile 100.00
KronEs AsiA LTd., Hong Kong, China 100.00
KronEs mACHinEry (TAiCAng) Co. LTd., Taicang, China 100.00
KronEs TrAding (TAiCAng) Co. LTd., Taicang, China 100.00
KronEs proCEssing (sHAngHAi) Co. LTd., Shanghai, China 100.00
KronEs sALEs (BEijing) Co. LTd., Beijing, China 100.00
AUTomATA s.A., Guatemala-City, Guatemala 100.00
KronEs indiA pvT. LTd., Bangalore, India 100.00
UniCorn indUsTriEs LTd., Secunderabad, India 60.00
pT. KronEs mACHinEry indonEsiA, Jakarta, Indonesia 100.00
ips jApAn Co. LTd., Tokyo, Japan 100.00
KronEs jApAn Co. LTd., Tokyo, Japan 100.00
KronEs (CAmBodiA) Co. LTd., Phnom Penh, Cambodia 100.00
inTEgrATEd pACKAging sysTEms inC., Montréal, Québec, Canada 100.00
KronEs mACHinEry Co. LTd., Mississauga, Ontario, Canada 100.00
KronEs LCs CEnTEr EAsT AfriCA LimiTEd, Nairobi, Kenya 100.00
KronEs AndinA LTdA., Bogotá, Colombia 100.00
KronEs KorEA LTd., Seoul, Korea 100.00
KronEs mACHinEry mALAysiA sdn. BHd., Kuala Lumpur, Malaysia 100.00
KronEs mEX s.A. dE C.v., Mexico-City, Mexico 100.00
sysTEmLog dE mEXiCo s.A. dE C.v., Santa Caterina, Nuevo Leon, Mexico 60.00
KronEs myAnmAr LTd., Sanchaung Township, Republik der Union Myanmar 100.00
KronEs nEW ZEALAnd LimiTEd, Auckland, New Zealand 100.00
KronEs LCs CEnTEr WEsT AfriCA LimiTEd, Lagos, Nigeria 100.00
*Direct and indirect shareholdings
Shareholdings
5 | 189
2 | Consolidated ManageMent RepoRt
3 | CoRpoRate goveRnanCe 4 | Consolidated FinanCial stateMents
5 | notes to the Consolidated FinanCial stateMents
6 | otheR inFoRMation1 | to ouR shaReholdeRs

Name and location of the company Share in capital held by KronEs Ag (%*)
KronEs pAKisTAn (privATE) LimiTEd, Lahore, Pakistan 100.00
KronEs fiLipinAs inC., Taguig City, Philippines 100.00
KronEs-iZUmi proCEssing pTE LTd., Singapore, Singapore 73.00
KronEs singAporE LTd., Singapore, Singapore 100.00
inTEgrATEd pACKAging sysTEms soUTH AfriCA (pTy) LimiTEd, Cape Town, South Africa 100.00
KronEs soUTHErn AfriCA (prop.) LTd., Johannesburg, South Africa 100.00
KronEs (THAiLAnd) Co. LTd., Bangkok, Thailand 100.00
sysTEm LogisTiCs AsiA Co. LTd., Bangkok, Thailand 60.00
inTEgrATEd pACKAging sysTEms – ips TUnisiA, Tunis, Tunesia 100.00
KronEs inC., Franklin, Wisconsin, UsA 100.00
sysTEm LogisTiCs CorporATion, Arden, North Carolina, UsA 60.00
TrAns-mArKET LLC, Tampa, Florida, UsA 100.00
jAvLyn proCEss sysTEms LLC, Rochester, New York, UsA 100.00
mHT UsA LLC., Peachtree City, Georgia, UsA 100.00
proCEss And dATA AUTomATion LLC, Erie, Pennsylvania, UsA 100.00
W.m. sprinKmAn LLC, Waukesha, Wisconsin, UsA 100.00
mAQUinAriAs KronEs dE vEnEZUELA s.A., Caracas, Venezuela 100.00
inTEgrATEd pACKAging sysTEms (ips) fZCo, Dubai, United Arab Emirates 100.00
KronEs middLE EAsT AfriCA fZCo, Dubai, United Arab Emirates 100.00
KronEs viETnAm Co. LTd., Ho-Chi-Minh-City, Vietnam 100.00
*Direct and indirect shareholdings
Shareholdings
5 | 190
2 | Consolidated ManageMent RepoRt
3 | CoRpoRate goveRnanCe 4 | Consolidated FinanCial stateMents
5 | notes to the Consolidated FinanCial stateMents
6 | otheR inFoRMation1 | to ouR shaReholdeRs

Name and location of the company
KronEs BETEiLigUngsgEsELLsCHAfT mBH, Neutraubling
dEKron gmBH, Kelkheim
EComAC gEBrAUCHTmAsCHinEn gmBH, Neutraubling
EvogUArd gmBH, Nittenau
gErnEp gmBH ETiKETTiErTECHniK, Barbing
HsT mAsCHinEnBAU gmBH, Dassow
KiC KronEs inTErnATionALE CoopErATions-gEsELLsCHAfT mBH, Neutraubling
miLKron gmBH, Laatzen
sysTEms LogisTiCs gmBH, Wackersdorf
The companies are directly and/or indirectly affiliated with KronEs Ag by a profit transfer agreement.
Use of exemptions
The following fully consolidated German group companies made use of the exemption in Section 264 (3) HGB in the 2019 financial year.
Shareholdings
5 | 191
2 | Consolidated ManageMent RepoRt
3 | CoRpoRate goveRnanCe 4 | Consolidated FinanCial stateMents
5 | notes to the Consolidated FinanCial stateMents
6 | otheR inFoRMation1 | to ouR shaReholdeRs

Members of the Supervisory Board and the Executive BoardPursuant to Section 8 (1) of the articles of association, eight members of the Supervisory Board are elected by the shareholders in
accordance with the German Stock Corporation Act (Sections 96 (1) and 101). Eight members are elected by the employees pursuant
to Section 1 (1) and Section 7 (1) Sentence 1 Number 1 of the Codetermination Act.
* Other Supervisory Board seats held, pursuant to Section 125 (1) Sentence 5 of the German Stock Corporation Act ** Elected by the employeesIn addition, each of the group companies is the responsibility of two members of the Executive Board.
Volker KronsederChairman of the Supervisory Board * UnivErsiTäTsKLiniKUm rEgEnsBUrg* WirTsCHAfTsBEirAT BAyErisCHE LAndEsBAnK
Werner Schrödl**Deputy Chairman of the Supervisory Board Chairman of the Group Empoyees’ Council Chairman of the Composite Empoyees’ Council* Verwaltungsrat der BAyErisCHEn BETriEBsKrAnKEnKAssEn
Dr. Verena Di Pasquale**Deputy Chairperson of dgB BAyErn (the German Trade Union Confederation in Bavaria)
Robert FriedmannSpokesman for the central managing board of the WürTH groUp* Zf friEdriCHsHAfEn Ag
Klaus Gerlach**Head of Central International Operations and Services
Oliver Grober**Chairman of the Employees’ Council, Rosenheim
Thomas Hiltl**Chairman of the Employees’ Council, Nittenau
Norman KronsederFarmer and forester* BAyErisCHE fUTTErsAATBAU gmBH
Professor Dr. jur. Susanne NonnastProfessor at Ostbayerische Technische Hochschule (oTH) Regensburg
Beate Eva Maria Pöpperl**Independent Member of the Employees’ Council
Norbert SamhammerChief executive of sAmHAmmEr HoLding gmBH*sAmHAmmEr Ag
Petra Schadeberg-Herrmann Managing partner KromBACHEr BrAUErEiBErnHArd sCHAdEBErg gmBH & Co. Kg,KromBACHEr finAnCE gmBH, sCHAWEi gmBH, divErsUm HoLding gmBH & Co. Kg
Jürgen Scholz**First authorised representative ig mETALL administrative office, Regensburg* infinEon TECHnoLogiEs Ag
Hans-Jürgen Thaus* mAsCHinEnfABriK rEinHAUsEn gmBH* HAWE HydrAULiK sE, AsCHHEim/ münCHEn (bis 27.06.2019)
Josef Weitzer**Deputy Group Employees’ Council ChairmanDeputy Composite Employees’ Council ChairmanChairman of the Employees’, Neutraubling* spArKAssE rEgEnsBUrg
Matthias WinklerManaging partner at WW+ Kn sTEUErBErATUngs- gEsELLsCHAfT mBH
Christoph KlenkCEoIntralogisticsProcess Technology
Michael Andersenuntil 24 July 2019CfoProcess Technology
Norbert Brogersince 1 January 2020Cfo
Thomas Ricker Cso
Markus TischerInternational Operations and ServicesDigitalisation
Ralf GoldbrunnerBottling and Packaging EquipmentCompact Class
Supervisory Board Executive Board
Supervisory Board and Executive Board
5 | 192
2 | Consolidated ManageMent RepoRt
3 | CoRpoRate goveRnanCe 4 | Consolidated FinanCial stateMents
5 | notes to the Consolidated FinanCial stateMents
6 | otheR inFoRMation1 | to ouR shaReholdeRs

Krones AG had earnings available for distribution as of 31 December 2019 of € 258,681,143.94.
We propose to the annual general meeting on 18 May 2020 that this amount be used as follows:
Neutraubling, 12. March 2020
KronEs Ag
The Executive Board
Christoph KlenkCEo
Norbert Broger
Thomas Ricker Ralf GoldbrunnerMarkus Tischer
Proposal for the appropriation of earnings available for distribution €
Dividend of €0.75 per share (for 31,593,072 shares) 23,694,804
Amount brought forward to new account 234,986,339.94
Proposal for the appropriation of earnings available for distribution
Proposal for the appropriation of KronES Ag’s earnings available for distribution
5 | 193
2 | Consolidated ManageMent RepoRt
3 | CoRpoRate goveRnanCe 4 | Consolidated FinanCial stateMents
5 | notes to the Consolidated FinanCial stateMents
6 | otheR inFoRMation1 | to ouR shaReholdeRs

6 oTHEr informATion
Auditor’s report . . . . . . . . . . . . . . . . . . . . . . . . . . . . . . . . . . . . . . . . . . . . . . . . . . . . . . . . . . . . . . . . . . . .195
Commercial glossary . . . . . . . . . . . . . . . . . . . . . . . . . . . . . . . . . . . . . . . . . . . . . . . . . . . . . . . . . . . . . .202
Technical glossary . . . . . . . . . . . . . . . . . . . . . . . . . . . . . . . . . . . . . . . . . . . . . . . . . . . . . . . . . . . . . . . . . .203
Key figures for the KronEs Group . . . . . . . . . . . . . . . . . . . . . . . . . . . . . . . . . . . . . . . . . . . . . .204
Publishing information . . . . . . . . . . . . . . . . . . . . . . . . . . . . . . . . . . . . . . . . . . . . . . . . . . . . . . . . . . .205
Financial calendar . . . . . . . . . . . . . . . . . . . . . . . . . . . . . . . . . . . . . . . . . . . . . . . . . . . . . . . . . . . . . . . . . .205
Contact. . . . . . . . . . . . . . . . . . . . . . . . . . . . . . . . . . . . . . . . . . . . . . . . . . . . . . . . . . . . . . . . . . . . . . . . . . . . . . . .206

6 | 195
To Krones Aktiengesellschaft
Report on the audit of the consolidated financial statements and of the group management report
Opinions
We have audited the consolidated financial statements of Krones Aktienge-sellschaft, Neutraubling and its subsidiaries (the Group), which comprise the consolidated statement of profit and loss and the consolidated statement of comprehensive income for the fiscal year from 1 January 2019 to 31 December 2019, the consolidated statement of financial position as of 31 December 2019, the consolidated statement of changes in equity and the consolidated state-ment of cash flows for the fiscal year from 1 January 2019 to 31 December 2019, and notes to the consolidated financial statements, including a summary of significant accounting policies. In addition, we have audited the group manage-ment report of Krones Aktiengesellschaft for the fiscal year from 1 January 2019 to 31 December 2019. In accordance with the German legal requirements, we have not audited the content of the responsibility statement included in sec-tion “Responsibility statement” of the group management report. In accor-dance with the German legal requirements, we have not audited the content of the group statement on corporate governance, which was published on the Company’s website and referred to in the “Dependency report” section of the group management report. We have not audited the following information not typical of management reports, which is part of other information:
� Section “Fundamental information about the group”, sub-section “State- of-the-art production: The new Krones control cabinet production facility”
� Section “Fundamental information about the group”, sub-section “A selection of our innovations”
In our opinion, on the basis of the knowledge obtained in the audit,
� the accompanying consolidated financial statements comply, in all material respects, with the IFrss as adopted by the eU, and the additional require-ments of German commercial law pursuant to Sec. 315e (1) HGB [“Handels-gesetzbuch”: German Commercial Code] and, in compliance with these re-quirements, give a true and fair view of the assets, liabilities and financial position of the Group as at 31 December 2019 and of its financial perfor-mance for the fiscal year from 1 January 2019 to 31 December 2019, and
� the accompanying group management report as a whole provides an ap-propriate view of the Group’s position. In all material respects, this group management report is consistent with the consolidated financial state-ments, complies with German legal requirements and appropriately pres-ents the opportunities and risks of future development. Our opinion on the group management report does not cover the content of the aforemen-tioned responsibility statement and the group statement on corporate governance as well as the information not typical of management reports referred to above.
Pursuant to Sec. 322 (3) Sentence 1 HGB, we declare that our audit has not led to any reservations relating to the legal compliance of the consolidated financial statements and of the group management report.
Independent auditor’s report
Independent auditor’s report
2 | Consolidated ManageMent RepoRt
3 | CoRpoRate goveRnanCe 4 | Consolidated FinanCial stateMents
5 | notes to the Consolidated FinanCial stateMents
6 | otheR inFoRMation1 | to ouR shaReholdeRs

6 | 196 Basis for the opinions
We conducted our audit of the consolidated financial statements and of the group management report in accordance with Sec. 317 HGB and the eU Audit Regulation (No 537/2014, referred to subsequently as “eU Audit Regulation”) and in compliance with German Generally Accepted Standards for Financial State-ment Audits promulgated by the Institut der Wirtschaftsprüfer [Institute of Public Auditors in Germany] (IDW). Our responsibilities under those require-ments and principles are further described in the “Auditor’s responsibilities for the audit of the consolidated financial statements and of the group manage-ment report” section of our auditor’s report. We are independent of the group entities in accordance with the requirements of European law and German commercial and professional law, and we have fulfilled our other German pro-fessional responsibilities in accordance with these requirements. In addition, in accordance with Art. 10 (2) f) of the eU Audit Regulation, we declare that we have not provided non-audit services prohibited under Art. 5 (1) of the eU Audit Regulation. We believe that the audit evidence we have obtained is sufficient and appropriate to provide a basis for our opinions on the consolidated finan-cial statements and on the group management report.
Key audit matters in the audit of the consolidated financial statements
Key audit matters are those matters that, in our professional judgment, were of most significance in our audit of the consolidated financial statements for the fiscal year from 1 January to 31 December 2019. These matters were addressed in the context of our audit of the consolidated financial statements as a whole, and in forming our opinion thereon; we do not provide a separate opinion on these matters.
Below, we describe what we consider to be the key audit matters:
1. Revenue recognition for customer-specific construction contracts Reasons why the matter was determined to be a key audit matter
The major part of group revenue is generated from customer projects involving machinery and lines for product filling and beverage production. The perfor-mance comprising the design and manufacture of machinery and its installa-tion and commissioning on site is considered as a single performance obliga-tion. As contracts for this machinery and lines are customer-specific, the Group’s performance creates an asset that does not have an alternative use to the Group. The Group has a legal right to payment for the performance com-pleted to date, including an appropriate margin. In accordance with IFrs 15, rev-enue is therefore recognized over time on the basis of the percentage of com-pletion method. The percentage of completion is calculated on the basis of the costs incurred as of the reporting date in relation to the expected total costs of the respective project. There is a particular risk of error when estimating total costs. The significance of revenue for the consolidated financial statements, the judgment involved in estimating total costs and the fact that revenue is one of the financial performance indicators for the group in terms of corporate man-agement and forecasts meant that the recognition of revenue as of the report-ing date was a key audit matter.
Auditor’s response
During the reporting period, we performed tests to assess the design and operating effectiveness of the significant controls implemented by the execu-tive directors in the area of reporting of costs accrued and the estimate of total contract costs. In this context, we tested both transaction-level controls and entity-level controls, such as regular review meetings.
Independent auditor’s report
2 | Consolidated ManageMent RepoRt
3 | CoRpoRate goveRnanCe 4 | Consolidated FinanCial stateMents
5 | notes to the Consolidated FinanCial stateMents
6 | otheR inFoRMation1 | to ouR shaReholdeRs

6 | 197 For a sample of projects, we obtained an overview of the content of the con-tracts and the status of the respective fulfillment of contracts and analyzed the actual costs incurred and the total costs over the period of the project’s prog-ress. We also reviewed the analysis of planning variance of total costs of proj-ects over time performed by the Executive Board in terms of mathematical accuracy and obtained explanations for deviations on a sample basis. Further-more, we compared the transaction prices used with their applicable contrac-tual bases.
Our audit procedures did not lead to any reservations relating to the recogni-tion of revenue allocated to the period.
Reference to related disclosures
The disclosures on the principles of revenue recognition are contained in sec-tion “General disclosures/Revenue” of the notes to the consolidated financial statements.
2. Impairment testing of goodwill
Reasons why the matter was determined to be a key audit matter
The Group performs an impairment test to test impairment of goodwill at least once each year. A complex calculation model is used for the test, which particu-larly involves a number of assumptions subject to judgment and values derived therefrom. This also includes the expected development of business and earn-ings, the assumed long-term growth rates and the discount rates applied.
Against the background of the underlying complexity of impairment tests as well as the judgment exercised during valuation and the associated high risk for accounting misstatement, impairment testing of goodwill, which is a signif-icant item of the statement of financial position in the consolidated financial statements, was a key audit matter.
Auditor’s response
During the audit of the impairment testing of goodwill, we used a substantive audit approach.
We involved internal valuation specialists to verify the DCF models applied in terms of clerical accuracy and methods used and investigated whether these were calculated using the relevant financial reporting standards in accordance with IAs 36. We assessed the derivation of the weighted average cost of capital (WACC) by evaluating the beta factor used for the benchmark companies in-volved and comparing the interest rates for equity and liabilities with available market data.
We also analyzed the corporate planning applied for impairment testing of goodwill by comparing the actual earnings recorded in the past with current developments in the business figures. For the appraisal of the underlying cor-porate planning, we also obtained explanations related to the estimates and as-sumptions on growth and business development.
Our audit procedures did not lead to any reservations regarding the measure-ment of goodwill.
Reference to related disclosures
For more information on the impairment tests performed and underlying as-sumptions, please refer to the disclosures in section “Notes to the consolidated statement of financial position/1 Intangible assets” of the notes to the consoli-dated financial statements.
Independent auditor’s report
2 | Consolidated ManageMent RepoRt
3 | CoRpoRate goveRnanCe 4 | Consolidated FinanCial stateMents
5 | notes to the Consolidated FinanCial stateMents
6 | otheR inFoRMation1 | to ouR shaReholdeRs

6 | 198 Other information
The Supervisory Board is responsible for the Report of the Supervisory Board. The executive directors and the Supervisory Board are responsible for the Cor-porate Governance Report and the Group Corporate Governance Declaration. In all other respects, the executive directors are responsible for the other informa-tion.
Other information comprises the abovementioned responsibility statement as well as the group statement on corporate governance, the information not typi-cal of management reports in the group management report, the combined, separate group non-financial report published in the internet and also other components designated for the annual report, of which we received a version prior to issuing this auditor’s report, particularly
� Section “Highlights 2019”
� Chapter 1 “To our shareholders”
� Chapter 3 “Corporate governance”
� Chapter 6 “Other information”
but not the consolidated financial statements, not the disclosures in the group management report included in the audit of content and not our auditor’s report.
Our opinions on the consolidated financial statements and on the group man-agement report do not cover the other information, and consequently we do not express an opinion or any other form of assurance conclusion thereon.
In connection with our audit, our responsibility is to read the other informa-tion and, in so doing, to consider whether the other information
� is materially inconsistent with the consolidated financial statements, with the group management report or our knowledge obtained in the audit, or
� otherwise appears to be materially misstated.
If, based on the work we have performed, we conclude that there is a material misstatement of this other information, we are required to report that fact. We have nothing to report in this regard.
Responsibilities of the executive directors and the Supervisory Board for the consolidated financial statements and the group management report
The executive directors are responsible for the preparation of the consolidated financial statements that comply, in all material respects, with IFrss as adopted by the eU and the additional requirements of German commercial law pursu-ant to Sec. 315e (1) HGB, and that the consolidated financial statements, in com-pliance with these requirements, give a true and fair view of the assets, liabili-ties, financial position and financial performance of the Group. In addition, the executive directors are responsible for such internal control as they have deter-mined necessary to enable the preparation of consolidated financial statements that are free from material misstatement, whether due to fraud or error.
In preparing the consolidated financial statements, the executive directors are responsible for assessing the Group’s ability to continue as a going concern. They also have the responsibility for disclosing, as applicable, matters related to going concern. In addition, they are responsible for financial reporting based on the going concern basis of accounting unless there is an intention to liqui-date the Group or to cease operations, or there is no realistic alternative but to do so.
Independent auditor’s report
2 | Consolidated ManageMent RepoRt
3 | CoRpoRate goveRnanCe 4 | Consolidated FinanCial stateMents
5 | notes to the Consolidated FinanCial stateMents
6 | otheR inFoRMation1 | to ouR shaReholdeRs

6 | 199 Furthermore, the executive directors are responsible for the preparation of the group management report that, as a whole, provides an appropriate view of the Group’s position and is, in all material respects, consistent with the con-solidated financial statements, complies with German legal requirements, and appropriately presents the opportunities and risks of future development. In addition, the executive directors are responsible for such arrangements and measures (systems) as they have considered necessary to enable the prepara-tion of a group management report that is in accordance with the applicable German legal requirements, and to be able to provide sufficient appropriate evidence for the assertions in the group management report.
The Supervisory Board is responsible for overseeing the Group’s financial reporting process for the preparation of the consolidated financial statements and of the group management report.
Auditor’s responsibilities for the audit of the consolidated financial statements and of the group management report
Our objectives are to obtain reasonable assurance about whether the consoli-dated financial statements as a whole are free from material misstatement, whether due to fraud or error, and whether the group management report as a whole provides an appropriate view of the Group’s position and, in all material respects, is consistent with the consolidated financial statements and the knowledge obtained in the audit, complies with the German legal requirements and appropriately presents the opportunities and risks of future development, as well as to issue an auditor’s report that includes our opinions on the consoli-dated financial statements and on the group management report.
Reasonable assurance is a high level of assurance, but is not a guarantee that an audit conducted in accordance with Sec. 317 HGB and the eU Audit Regulation and in compliance with German Generally Accepted Standards for Financial Statement Audits promulgated by the Institut der Wirtschaftsprüfer (IDW) will always detect a material misstatement. Misstatements can arise from fraud or error and are considered material if, individually or in the aggregate, they could reasonably be expected to influence the economic decisions of users taken on the basis of these consolidated financial statements and this group manage-ment report.
We exercise professional judgment and maintain professional skepticism throughout the audit. We also:
� Identify and assess the risks of material misstatement of the consolidated financial statements and of the group management report, whether due to fraud or error, design and perform audit procedures responsive to those risks, and obtain audit evidence that is sufficient and appropriate to provide a basis for our opinions. The risk of not detecting a material misstatement resulting from fraud is higher than for one resulting from error, as fraud may involve collusion, forgery, intentional omissions, misrepresentations, or the override of internal control;
� Obtain an understanding of internal control relevant to the audit of the consolidated financial statements and of arrangements and measures (sys-tems) relevant to the audit of the group management report in order to de-sign audit procedures that are appropriate in the circumstances, but not for the purpose of expressing an opinion on the effectiveness of these systems;
� Evaluate the appropriateness of accounting policies used by the executive directors and the reasonableness of estimates made by the executive direc-tors and related disclosures;
Independent auditor’s report
2 | Consolidated ManageMent RepoRt
3 | CoRpoRate goveRnanCe 4 | Consolidated FinanCial stateMents
5 | notes to the Consolidated FinanCial stateMents
6 | otheR inFoRMation1 | to ouR shaReholdeRs
6 | 200 � Conclude on the appropriateness of the executive directors’ use of the going concern basis of accounting and, based on the audit evidence obtained, whether a material uncertainty exists related to events or conditions that may cast significant doubt on the Group’s ability to continue as a going con-cern. If we conclude that a material uncertainty exists, we are required to draw attention in the auditor’s report to the related disclosures in the con-solidated financial statements and in the group management report or, if such disclosures are inadequate, to modify our respective opinions. Our conclusions are based on the audit evidence obtained up to the date of our auditor’s report. However, future events or conditions may cause the Group to cease to be able to continue as a going concern;
� Evaluate the overall presentation, structure and content of the consolidated financial statements, including the disclosures, and whether the consoli-dated financial statements present the underlying transactions and events in a manner that the consolidated financial statements give a true and fair view of the assets, liabilities, financial position and financial performance of the Group in compliance with IFrss as adopted by the eU and the addi-tional requirements of German commercial law pursuant to Sec. 315e (1) HGB;
� Obtain sufficient appropriate audit evidence regarding the financial infor-mation of the entities or business activities within the Group to express opinions on the consolidated financial statements and on the group man-agement report. We are responsible for the direction, supervision and per-formance of the group audit. We remain solely responsible for our audit opinions;
� Evaluate the consistency of the group management report with the con-solidated financial statements, its conformity with [German] law, and the view of the Group’s position it provides;
� Perform audit procedures on the prospective information presented by the executive directors in the group management report. On the basis of suffi-cient appropriate audit evidence we evaluate, in particular, the significant assumptions used by the executive directors as a basis for the prospective information, and evaluate the proper derivation of the prospective infor-mation from these assumptions. We do not express a separate opinion on the prospective information and on the assumptions used as a basis. There is a substantial unavoidable risk that future events will differ materially from the prospective information.
We communicate with those charged with governance regarding, among other matters, the planned scope and timing of the audit and significant audit find-ings, including any significant deficiencies in internal control that we identify during our audit.
We also provide those charged with governance with a statement that we have complied with the relevant independence requirements, and communicate with them all relationships and other matters that may reasonably be thought to bear on our independence and where applicable, the related safeguards.
From the matters communicated with those charged with governance, we determine those matters that were of most significance in the audit of the con-solidated financial statements of the current period and are therefore the key audit matters. We describe these matters in our auditor’s report unless law or regulation precludes public disclosure about the matter.
Independent auditor’s report
2 | Consolidated ManageMent RepoRt
3 | CoRpoRate goveRnanCe 4 | Consolidated FinanCial stateMents
5 | notes to the Consolidated FinanCial stateMents
6 | otheR inFoRMation1 | to ouR shaReholdeRs

6 | 201 Other legal and regulatory requirements Further information pursuant to Art. 10 of the eU Audit Regulation
We were elected as group auditor by the annual general meeting on 5 June 2019. We were engaged by the Supervisory Board on 5 June 2019. We have been the group auditor of Krones Aktiengesellschaft since fiscal year 2019.
We declare that the opinions expressed in this auditor’s report are consistent with the additional report to the audit committee pursuant to Art. 11 of the eU Audit Regulation (long-form audit report).
German Public Auditor responsible for the engagement
The German Public Auditor responsible for the engagement is Udo Schuberth.
Nuremberg, 12 March 2020
Ernst & Young GmbH Wirtschaftsprüfungsgesellschaft
Schuberth Timphaus-Möller Wirtschaftsprüfer Wirtschaftsprüferin [German Public Auditor] [German Public Auditor]
Independent auditor’s report
2 | Consolidated ManageMent RepoRt
3 | CoRpoRate goveRnanCe 4 | Consolidated FinanCial stateMents
5 | notes to the Consolidated FinanCial stateMents
6 | otheR inFoRMation1 | to ouR shaReholdeRs

6 | 202
Cash flow All inflows and outflows of cash and cash equivalents during a period.
Corporate governance Framework for responsible corporate management and supervision that is oriented toward sustain ability.
Depreciation and Non-cash expenses that represent the cost of currentamortisation and non-current assets being used over time.
EBIT Earnings before interest and taxes.
EBITDA Earnings before interest, taxes, depreciation and amortisa-tion.
EBITDA margin Ratio of earnings before interest, taxes, depreciation and amortisation to revenue
EBT Earnings before taxes.
EBT margin Ratio of earnings before taxes to revenue.
Equity Funds made available to the company by the owners by way of contribution and/or investment, plus retained earnings.
Free cash flow Measure of financial performance calculated as the cash flow from operating activities minus cash flow from investing activities. It is the cash available to pay dividends, reduce debt, or to be retained.
IFRS International Financial Reporting Standards. Accounting standards issued by the International Accounting Standards Board (IASB) that are harmonised and applied internationally.
Net cash and equivalents Cash and highly liquid securities under current assets less liabilities to banks.
Return on equity Ratio of earnings before taxes to average equity.before taxes
ROCE Ratio of EBIT to average capital employed (total assets less interest-free liabilities and interest-free other provisions).
Total debt Combined term for the provisions, liabilities, and deferred income stated on the liabilities side of the balance sheet.
Working capital Working capital is calculated as follows: (inventories + trade receivables + contract assets) – (trade
payables + contract liabilities).
Working capital to The ratio of working capital to revenue indicates how revenue much capital is needed to finance revenue generation.
Commercial glossary
Commercial glossary
2 | Consolidated ManageMent RepoRt
3 | CoRpoRate goveRnanCe 4 | Consolidated FinanCial stateMents
5 | notes to the Consolidated FinanCial stateMents
6 | otheR inFoRMation1 | to ouR shaReholdeRs

6 | 203
Technical glossary
Aseptic beverage filling Germ-free filling of beverages at ambient tempera ture.
Craft brewer/craft beer Small brewery, independent of any large corporation,
producing artisan (craft) beer.
Brewhouse In the brewhouse, the raw materials malt, hops, and water are processed in several stages to produce beer.
Digital printing Printing process in which data are transferred directly from a computer onto an object, without a print template first being generated. Digital printing is far more flexible and significantly more cost-effective on smaller print runs (batches) than conventional printing and labelling processes.
Energy drink A beverage that acts as a stimulant. The main ingredients are sugar and caffeine.
enviro Krones’ sustainability programme. enviro was certified by TÜV sÜD in 2009. This independent certification enables Krones to award the enviro seal for efficient use of energy and media and environmental friendliness for its machines and lines. All new developments at Krones are aligned with the criteria of our enviro sustainability programme.
Intralogistics The internal flow of materials and goods within a company, including warehouse, order-picking, and conveyance systems.
PeT Polyethylene terephthalate, a thermoplastic material from the polyester family used for producing beverage bottles.
Recyclate Product obtained in a recycling process.
Soft drinks Non-alcoholic beverages, usually carbonated.
Stretch blow-moulding Process for the manufacture of hollow plastic products such as PeT bottles.
Technical glossary
2 | Consolidated ManageMent RepoRt
3 | CoRpoRate goveRnanCe 4 | Consolidated FinanCial stateMents
5 | notes to the Consolidated FinanCial stateMents
6 | otheR inFoRMation1 | to ouR shaReholdeRs

6 | 204 Key figures for the KronEs Group 2015 – 2019
Key figures for the KronEs Group 2015 – 2019
2019 2018 2017 2016 2015Revenue Revenue € million 3,959 3,854 3,691 3,391 3,174 Germany € million 468 362 388 354 382 Outside Germany € million 3,491 3,492 3,303 3,037 2,792 Export share % 88 91 89 90 88
Earnings Earnings before taxes (EBT) € million 42 204 259 238 223 Consolidated net income € million 9 151 187 169 156 Earnings per share € 0.30 4.78 5.97 5.40 4.98
Assets and capital structure Non-current assets € million 1,154 1,010 882 799 697 of which fixed assets € million 1,070 936 797 725 646 Current assets € million 2,165 2,312 2,158 2,272 2,010 of which cash and equivalents € million 110 219 182 369 365 Equity € million 1,370 1,433 1,330 1,226 1,111 Total debt € million 1,949 1,888 1,710 1,845 1,596 Non-current liabilities € million 452 359 314 308 278 Current liabilities € million 1,497 1,529 1,396 1,537 1,318 Total assets € million 3,319 3,321 3,040 3,071 2,707
Cash flow/capital expenditure Free cash flow € million – 94 121 – 151 49 71 Capital expenditure for pp&E and intangible assets € million 169 179 134 111 103 Depreciation, amortisation and impairments € million 183 103 95 93 88 Net cash position (cash and cash equivalents less debt) € million 38 215 157 369 365
Profitability ratios EBT margin % 1.1 5.3 7.0 7.0 7.0 EBiTdA margin % 5.7 7.9 9.2 9.5 9.6 Working capital to revenue* % 26.9 27.3 27.3 26.7 24.6 roCE % 2.7 12.8 16.6 17.0 17.7
Employees (at 31 December) 17,353 16,545 15,299 14,443 13,346 Germany 10,733 10,887 10,366 10,061 9,767 Outside Germany 6,620 5,658 4,933 4,382 3,579
Dividend Dividend per share € 0.75** 1.70 1.70 1.55 1.45* Average over 4 quarters ** As per proposal for appropriation of earnings available for distribution
2 | Consolidated ManageMent RepoRt
3 | CoRpoRate goveRnanCe 4 | Consolidated FinanCial stateMents
5 | notes to the Consolidated FinanCial stateMents
6 | otheR inFoRMation1 | to ouR shaReholdeRs

6 | 205 Publishing information
This English language report is a trans lation of the original German KronEs Konzern Geschäftsbericht 2019. In case of discrepancies the German text shall prevail.
We would be happy to mail you a copy of the original German version of this Annual Report on request. You can also find it in the Investor Relations section at krones.com.
Published by KronEs Ag Böhmerwaldstrasse 5 93073 Neutraubling GermanyProject lead Roland Pokorny, Head of Corporate CommunicationsDesign Büro BenselerText KronEs Ag InvestorPress GmbHPhotography KronEs Ag
Publishing information and financial calendar
Financial calendar
29 April 2020 Quarterly statement for the period ended 31 March 2020
18 May 2020 Annual general meeting
30 July 2020 Interim report for the period ended 30 June 2020
29 October 2020 Quarterly statement for the period ended 30 September 2020
2 | Consolidated ManageMent RepoRt
3 | CoRpoRate goveRnanCe 4 | Consolidated FinanCial stateMents
5 | notes to the Consolidated FinanCial stateMents
6 | otheR inFoRMation1 | to ouR shaReholdeRs

Contact
KronEs AgInvestor RelationsOlaf ScholzPhone +49 9401 70-1169E-mail [email protected]öhmerwaldstrasse 593073 NeutraublingGermany