SMBC Group Annual Report - 2019
378
SMBC Group Annual Report 2019 YEAR ENDED MARCH 31, 2019
-
Upload
khangminh22 -
Category
Documents
-
view
0 -
download
0
Transcript of SMBC Group Annual Report - 2019

SMBC Group Annual Report2019YEAR ENDED MARCH 31, 2019

At Sumitomo Mitsui Financial Group, we position “Our Mission”
as the universal philosophy underpinning the management of
SMBC Group and as the foundation for all of our corporate activities.
To be a global financial group that leads growth in Japan and Asia by earning
the highest trust of our customers
Customer FirstProactive and Innovative
SpeedQuality
Team SMFG
Mission
Vision
Values
We grow and prosper together with our customers, by providing services of greater value to them.
We aim to maximize our shareholders’ value through the continuous growth of our business.
We create a work environment that encourages and rewards diligent and highly-motivated employees.

Rising MarkThe Rising Mark is the upward curving strip seen beside the letters “SMBC.” This mark indicates our desire for the Group to grow together with our customers, shareholders, and society by providing high- value-added, cutting-edge, and revolutionary services.
Corporate ColorsThe fresh green color (color of young grass) of the Rising Mark symbolizes youthfulness, intellect, and gentleness while the trad green (deep, dark green) background presents tradition, reliability, and stability.
“SMBC” has been designated as the corporate group’s master brand. All Group companies use the SMBC logo and promote the SMBC brand in order to enhance the brand power of the entire SMBC Group.
Values See page 61 for information on our Code of Conduct.
Vision
Mission
1SMBC Group Annual Report 2019

SMBC Group Report 2019 is designed to convey financial and
non-financial information about the overall picture, business strategy,
and corporate infrastructure of SMBC Group. It has been compiled
with reference to the International Integrated Reporting Framework
issued by the International Integrated Reporting Council (IIRC)
in December 2013.
The appendix in the back of this report contains more detailed
information on the Group. Additional information on Sustainability
activities can be found on the Company’s corporate website.
Scope of Report
Period covered:FY2018 (April 2018 to March 2019)Some subsequent information is also included.
Organizations covered:Sumitomo Mitsui Financial Group and its subsidiaries and affiliates
PublishedAugust 2019
CAUTIONARY STATEMENT REGARDING FORWARD-LOOKING STATEMENTSThis document contains “forward-looking statements” (as defined in the U.S. Private Securities Litigation Reform Act of 1995), regarding the intent, belief or current expectations of us and our management with respect to our future financial condition and results of operations. In many cases but not all, these state-ments contain words such as “anticipate,” “believe,” “estimate,” “expect,” “intend,” “may,” “plan,” “probability,” “risk,” “project,” “should,” “seek,” “target,” “will” and similar expressions. Such forward-looking statements are not guarantees of future performance and involve risks and uncertainties, and actual results may differ from those expressed in or implied by such forward-looking statements contained or deemed to be contained herein. The risks and uncertainties which may affect future performance in-clude: deterioration of Japanese and global economic conditions and financial markets; declines in the value of our securities portfolio; incurrence of significant credit-related costs; our ability to successfully implement our business strategy through our subsidiaries, affiliates and alliance partners; and exposure to new risks as we expand the scope of our business. Given these and other risks and uncertainties, you should not place undue reliance on forward-looking statements, which speak only as of the date of this document. We undertake no obligation to update or revise any forward looking statements. Please refer to our most recent disclosure documents such as our annual report on Form 20-F and other documents submitted to the U.S. Securities and Exchange Commission, as well as our earnings press releases, for a more detailed description of the risks and uncertainties that may affect our financial condition and our operating results, and investors’ decisions.
Editorial Policy
2 SMBC Group Annual Report 2019

About SMBC Group 4 History of SMBC Group
6 Financial Highlights
7 ESG Highlights
10 SMBC Group’s Value Creation Process
12 Promotion of Sustainability Management
To Our Stakeholders 14 Message from the Group CEO
26 Message from the Group CFO
32 Core Policies of Medium-Term Management Plan (FY2017–2019)
34 Using Digital Technology to Create the Future of Finance
38 Have a good Cashless.
Business Strategies for Creating Value 42 Group Structure
44 Retail Business Unit
46 Wholesale Business Unit
48 International Business Unit
50 Global Markets Business Unit
52 Special Feature: Transformation of Business and Asset Portfolio through Group Reorganization
54 Special Feature: Realizing Asia-centric: The New BTPN Opens Its Doors for Business
56 Special Feature: Issuance of Japan’s First Contractual Law Covered Bonds
Corporate Infrastructure Supporting Value Creation 60 Corporate Governance
68 SMBC Group Global Advisors
70 Outside Director Interview
72 Sumitomo Mitsui Financial Group Directors
76 Towards Sustainable Development of Society
80 Customer-Oriented Initiatives
83 Internal Audit
84 Compliance
86 Risk Management
90 Human Resources Strategy
94 IT Strategies
96 Communication with Stakeholders
98 Financial Review
Contents
3SMBC Group Annual Report 2019

1895Sumitomo Bank established
1590Riemon Soga (Brother-in-law of Masatomo Sumitomo) starts copper refining business
1876Mitsui Bank established
1673Takatoshi Mitsui opens Mitsui Echigoya Kimono Dealer
Sumitomo Mitsui Banking Corporation formed
SMBC Nikko Securities(Former Nikko Cordial Securities)
Sumitomo Mitsui Financial Group established
Sumitomo Mitsui Card Company
Sumitomo Mitsui Finance and Leasing
SMBC Friend SecuritiesMerged with SMBC Nikko Securities in January 2018
Japan Research Institute
Sumitomo Mitsui Asset Management
The Bank of East Asia(Hong Kong)
Vietnam Eximbank(Vietnam)
Operating Environment• “Program for
Financial Revival” commenced
Disposal of non-performing Loans conducted
• Lift the ban of securities intermediary
• Zero interest rate policy rescinded by the Bank of Japan
• Implementation of Basel II• Collapse of the IT bubble
• Subprime mortgage crisis
• Financial crisis
• Firewall regulations between banking and securities alleviated
• Financial Instruments and Exchange Act enacted• Full lift of the insurance products sale by banks• Japan Post privatized
• Blanket guarantee of deposits fully lifted
Japan
Global
SMBC Consumer Finance (Former Promise)
2007
20012002
20032004
2005 20062008
2009
History of SMBC GroupSMBC Group has overcome numerous challenges and enhanced the quality of our corporate infrastructure
via the flexible and timely shifting of target businesses by expanding the scope of our operations and the
markets in which we operate based on the changing needs of the times.
CedynaOMC Card, Central Finance, and QUOQ merged
About SMBC Group
4 SMBC Group Annual Report 2019

Expansion of Business Domain
Expansion of Regional Coverage
Became a consolidated subsidiary
Became a wholly owned subsidiary
Became a wholly owned subsidiary(Became a wholly owned subsidiary of Sumitomo Mitsui Card Company in April 2019)
Became equity method affiliate
Became a wholly owned subsidiary
SMBC Trust Bank(Former Societe Generale Private Banking (Japan))Acquired Citibank Japan’s retail banking operations in November 2015
Sumitomo Mitsui DS Asset Management (Former Sumitomo Mitsui Asset Management) Merged with Daiwa SB Investments in April 2019
SMBC Aviation Capital(Ireland / former RBS Aerospace)
SMBC Rail Services(United States)
Bank BTPN(Indonesia)
ACLEDA Bank(Cambodia)
• European sovereign debt crisis• Dodd-Frank Act enacted in the U.S.
• Implementation of Basel III
• U.S. federal funds rate raised for the first time in nine and a half years
• Finalization of the Basel III reform
• U.K. announces withdrawal from the European Union
• Great East Japan Earthquake
• Start of “Abenomics”
• Introduction of quantitative and qualitative monetary easing
• NISA introduced
• Consumption tax rate raised to 8%
• “Principles for Customer-Oriented Business Conduct” released
• Introduction of negative interest rate policy
• Japan’s Corporate Governance Code instituted
• Workstyle reform-related laws established
20102011
2012 20132014
20152016 2017
20182019
• Trade friction between the United States and China erupts
Became a wholly owned subsidiary
Merged with Bank Sumitomo Mitsui Indonesia in February 2019
Became equity method affiliate
About S
MB
C G
roupTo O
ur Stakeholders
Business S
trategies for C
reating ValueC
orporate Infrastructure S
upporting Value Creation
5SMBC Group Annual Report 2019

Financial Highlights
Credit ratings (As of June 30, 2019)
Holding company SMBC
Long-term Short-term Long-term Short-term
Moody’s A1 P-1 A1 P-1
S&P A- — A A-1
Fitch A F1 A F1
R&I A+ — AA- a-1+
JCR AA- — AA J-1+
500
1,000
’14 ’15 ’16 ’17 ’18 (FY)0
(Billions of yen)
Profit attributable to owners of parent
Profit attributable to owners of parent exceeded the target of ¥700 billion in FY2018. This was mainly due to the robust growth in the International Business Unit, a driver of group-wide growth, while the wealth management business was sluggish due to the deterioration of market conditions seen in the second half of the fiscal year.
¥726.7 billion
60
80
’14 ’15 ’16 ’17 ’18 (FY)0
(%)
Overhead ratio (OHR)
OHR was lower than the target of the Medium-Term Management Plan: 1% reduction compared with FY2016 (62.1%). This was the result of ongoing group-wide cost control measures as well as the benefits of the deconsolidation of Kansai Urban Banking Corporation and THE MINATO BANK, both of which have relatively high OHR.
60.3%
100
200
’14 ’15 ’16 ’17 ’18 (FY)0
(Yen)
Dividend per share of common stock
Dividend per share was ¥180 in FY2018, ¥10 higher than the previous fiscal year and our initial forecast, since profit attributable to owners of parent was higher than our target because of the steady progress in the Medium-Term Management Plan.
¥180
10
15
’14 ’15 ’16 ’17 ’18 (FY)0
(%)
Return on equity (ROE)*
ROE exceeded our Medium-Term Management Plan target of 7–8% due to the steady progress of the plan that led to higher than expected profit attributable to owners of parent.
8.2%
* Calculated using stockholders’ equity as the denominator
15
20
’15/3 ’16/3 ’17/3 ’18/3 ’19/30
(%)
Common Equity Tier 1 capital ratio (CET1 ratio)*
CET1 ratio increased by 1.87% due to the rise in CET1 capital following the accumulation of retained earnings as well as the decrease in risk-weighted assets primarily attributable to the deconsolidation of Sumitomo Mitsui Finance and Leasing Company.
16.37%
* Basel III fully-loaded basis
About SMBC Group
6 SMBC Group Annual Report 2019

ESG Highlights
Support for initiatives in Japan and overseas
As a global corporate citizen of the global society, SMBC Group is fully aware of the social impact of financial institutions,
and it supports the following initiatives in Japan and overseas (the action guidelines for the corporate activities and principles).
Accreditation
Selected for the fourth time in the Nadeshiko Brand selection of listed companies excelling at empowering female employees
compiled jointly by METI and the Tokyo Stock Exchange
Selected for inclusion in the 2019 Competitive IT Strategy Company Stock Selection of listed companies engaged in
competitive and strategic IT investment aimed at increasing corporate value and competitiveness from a medium- to long-term management perspective compiled jointly by
METI and the Tokyo Stock Exchange
Received a 4-star rating in the 2nd NIKKEI Smart Work Management Survey through which Nikkei recognizes compa-
nies that stand on the forefront of sustainable growth by heightening productivity through workstyle reforms
Selected for the third time as a Certified Health and Productivity Management Organization (large enterprise category) by the
Ministry of Economy, Trade and Industry in a program designed to recognize companies exercising superior health and
productivity management
About S
MB
C G
roupTo O
ur Stakeholders
Business S
trategies for C
reating ValueC
orporate Infrastructure S
upporting Value Creation
7SMBC Group Annual Report 2019

ESG Highlights
40
30
’17/6 ’18/4 ’19/40
Social See page 78, 92 for more information.
Environment See page 76 for more information.
Project finance for overseas renewable energy projects
Annual CO2 reduction
20,122 thousand t-CO2
Ratio of GM positions with locally hired employees(%)
’14 ’18 (FY)0
1,500
3,000
4,500
(People)
34.0%
Number of employees taking parental leave (male and female)
3,438
Ratio of employees with disabilities
50
100
150
’15 ’16 ’17 ’18 (FY)0
(t-CO2)
Total CO2 Emissions (per m2)
104thousand t-CO2 per thousand m2
Wind power
Geothermal power Hydropower
Biomass
Solar power
49projects
’15 ’16 ’17 ’18 (FY)0
2.2
2.4
2.6
(%) 2.47%
Note: Figures are for SMBC and overseas bases of major affiliates.
15
25
’16/3 ’17/3 ’18/3 ’19/30
Target 25% by March 31, 2020
(%)
Note: Figures are for SMBC and overseas bases of major affiliates.
Ratio of female managers
24.0%
Note: Figures are for SMBC.
Note: The figure for FY2018 is a preliminary figure.
About SMBC Group
8 SMBC Group Annual Report 2019

Governance See page 60 for more information.
ESG Indices on which Sumitomo Mitsui Financial Group is listedSMBC Group has been included in the following major global ESG indices (as of June 30, 2019).
’14/6 ’15/6 ’16/6 ’17/6 ’19/6’18/60
10
20
30
40
50(%)
Ratio of Outside DirectorsComposition of the Board of Directors
47%
Outside directors 7
Internal directors (non-executive)
3
Internal directors (executive)
5
Change in Number of Directors (Year on Year)
17 15Non-executive
directors
10 67%
Reporting line (including personnel right of consent)
Departments
Company with Auditors
Company with Three Committees
Management Committee Business execution decisions
Board of Directors Focus on supervision of executive officers’ and directors’ execution of duties
Nomination Committee
Compensation Committee
Audit Committee
Risk Committee (Optional)
Internal Committees
Internal Audit Dept.
Outside directors
Inside directors
Internal, non-executive directors
Chairman
Outside expert
Areas of Expertise
Management 3
Finance / accounting 1
Law 2
Diplomacy 1
About S
MB
C G
roupTo O
ur Stakeholders
Business S
trategies for C
reating ValueC
orporate Infrastructure S
upporting Value Creation
9SMBC Group Annual Report 2019

Top tier global financial group that delivers the highest quality in all aspects of our business
Wholesale Business Unit P46
Global Markets Business Unit P50
Retail Business Unit P44
International Business Unit P48
On-the ground
capabilities(human
resources)Spirit of
innovation
Speed
History and brand
Domestic and international
network
Solid customer
base
Sources of Value Creation for SMBC Group
Digitalization
Risk management, compliance, and financial soundness
Corporate governance
SMBC Group’s Value Creation Process
SMBC Group works to improve corporate value by providing high-quality services to its customers.
At the same time, we address social issues through a concerted Group effort.
Social Issues
E EnvironmentClimate change
Low-carbon society
S SocialSupport for growing industries
and regional revitalization
Financial inclusion
Digitalization
100-Year life society
G GovernanceCompliance
Anti-money laundering
Fiduciary duties
Cybersecurity
Diversity, Workstyle reform
Financial Environment
Cashless payment
Global liquidity glut
Prolonged negative interest rate environment in Japan
Trade friction between the United States and China
About SMBC Group
10 SMBC Group Annual Report 2019

Provision of Value to Stakeholders
Shareholders
Maximization of our shareholders’ value
Customers
Greater value of services
Employees
Work environment that allows employees to fully
exert their ability
Society
Positive contribution to society as a good
corporate citizen
To be a global financial group that leads growth in Japan and Asia by
earning the highest trust of our customers
Medium- to long-term vision
About S
MB
C G
roupTo O
ur Stakeholders
Business S
trategies for C
reating ValueC
orporate Infrastructure S
upporting Value Creation
11SMBC Group Annual Report 2019

Environment Promote Environmental Business
Manage Environmental Risks
Reduce Environmental Impacts
Renewable energy initiatives
Funding through green bonds
Measures for combating climate change
Next Generation
Support for growth industries
Contribute to emerging countries
Promote financial literacy education
Promotion of cashless payments among SMEs
Business succession support that addresses cognitive impairment issues
Financial and economic education
CommunityAchieve safe/secure community
Promote social inclusion
Reconstruct natural disasters
Regional revitalization using traditional Japanese dwellings
SDGs social loan initiatives
Support for developing countries via donations through employee volunteer fund
Governance
Corporate Governance
Risk Management
Compliance
Internal Audits
Customer-Oriented Initiatives
Human Resources Strategy
Strengthening and enhancement of corporate governance
Customer-oriented business conduct and customer satisfaction and quality improvement
Promotion of diversity and workstyle reforms
Promotion of Sustainability Management
SMBC Group has designated three priority issues, “Environment,” “Next Generation,” and “Community,”
to guide its efforts to fulfill its mission as a global financial group. In addition, 10 goals from among the
United Nations Sustainable Development Goals (SDGs) have been selected as areas of focus. Initiatives
for addressing issues in these areas are incorporated into the measures of business units so that we can
respond to these issues through our business activities.
Furthermore, the Corporate Sustainability Committee, which is chaired by the Group CEO, was established
in October 2018 to promote the realization of a sustainable society. Under the strong commitment of top
management, SMBC Group will accelerate sustainability management initiatives and seek to contribute to
the resolution of social issues and the accomplishment of the SDGs through its business activities.
Issues We Should Address Focused SDGs
E
S
G
About SMBC Group
Various Social Issues
SMBC Group’s Initiatives
12 SMBC Group Annual Report 2019

Environment Promote Environmental Business
Manage Environmental Risks
Reduce Environmental Impacts
Renewable energy initiatives
Funding through green bonds
Measures for combating climate change
Next Generation
Support for growth industries
Contribute to emerging countries
Promote financial literacy education
Promotion of cashless payments among SMEs
Business succession support that addresses cognitive impairment issues
Financial and economic education
CommunityAchieve safe/secure community
Promote social inclusion
Reconstruct natural disasters
Regional revitalization using traditional Japanese dwellings
SDGs social loan initiatives
Support for developing countries via donations through employee volunteer fund
Governance
Corporate Governance
Risk Management
Compliance
Internal Audits
Customer-Oriented Initiatives
Human Resources Strategy
Strengthening and enhancement of corporate governance
Customer-oriented business conduct and customer satisfaction and quality improvement
Promotion of diversity and workstyle reforms
Realization of a Sustainable
Society
Initiative Examples
P76
P78
P79
P60
P80
P90
About S
MB
C G
roupTo O
ur Stakeholders
Business S
trategies for C
reating ValueC
orporate Infrastructure S
upporting Value Creation
SMBC Group’s Initiatives
13SMBC Group Annual Report 2019

Jun OhtaDirector President and Group CEO
Sumitomo Mitsui Financial Group, Inc.
Building the Future of FinanceWe will Pursue Further Excellence by Tirelessly Reinventing Ourselves
Message from the Group CEO
To Our Stakeholders
14 SMBC Group Annual Report 2019

The Future we are Facing
We are currently facing the need to evolve.
Distortions and deviations have become visible in the framework of capitalism, which has been the
prerequisite for the continued growth of the global economy in the post-war era. Cracks are becoming
ever more apparent in the traditional global order led by the United States. Nationalism is on the rise
in the United States, and we are seeing the rapid spread of anti- globalism that is symbolized by
protectionism. In Europe, which has long walked beside the United States, democracy and multi-
culturalism, concepts that are the basic principles of European integration, are being challenged with
populism and anti-government movements gaining momentum. There is an increasing possibility that
the clash between the United States and China for economic, technological, and military hegemony
will continue as China, which has expanded its presence in the global economy, pursues its unique
brand of state capitalism. The new era of Reiwa has ushered in a world of uncertainty and doubt
where there is no clear or agreed upon global leader.
Domestically speaking, we are also moving into a new period. While we have been aware of this
for quite some time, Japan is expected to face serious population decline that would accelerate the
contraction of the domestic market. In 2040, about twenty years from now, while the global population
is expected to increase by 20%, Japan’s working age population is expected to decrease by more
than 20%. However, this can also be viewed as an excellent opportunity to break free of traditional
business models. For example, it will become possible to draw out the full potential of each employee
by implementing work style reform and streamlining operations. Furthermore, if the private and public
sectors work together to promote innovation and improve productivity, it should reverse Japan’s decline
in international competitiveness. I believe that Japan still possesses much growth potential although
it is facing headwinds, such as population decline and a fall in its relative status on the global stage.
The unprecedented levels of monetary easing pursued by various countries have led to massive
liquidity. The Bank of Japan’s total assets now easily exceed ¥500 trillion and for the first time in the
post-war era surpassed Japan’s GDP. This number jumps to ¥1,600 trillion if we include the total
assets of the US Federal Reserve and the European Central Bank. This means that the total assets
held by the central banks of Japan, the US, and the EU have quadrupled during the decade following
the global financial crisis. This type of liquidity may destabilize financial markets due to the increased
risk of an asset bubble forming. The underlying question going forward will be whether central
banks can carry-out monetary policy normalization without causing disruption given that it is an
unprecedented challenge.
Digitalization has brought on a paradigm shift in various industries, including the financial sector.
Changing industrial structures and advances in technology have blurred traditional boundaries that
I was appointed as President and Group CEO of Sumitomo Mitsui Financial Group in April
2019. My key responsibility as Group CEO is to leverage the business foundations and
strengths which our predecessors built over our long history to realize the further growth
and development of SMBC Group. There is no change in our basic principles or vision that
we are pursuing together as SMBC Group. I will spearhead efforts to realize our medium-
to long-term vision: “To be a global financial group that leads growth in Japan and Asia
by earning the highest trust of our customers.”
About S
MB
C G
roupTo O
ur Stakeholders
Business S
trategies for C
reating ValueC
orporate Infrastructure S
upporting Value Creation
15SMBC Group Annual Report 2019

have separated businesses. Our business has not been immune to this trend with players from
sectors such as logistics, telecommunications, and IT entering the financial sector. In the not too
distant future, business-based categories within the financial sector, such as banking, securities,
and insurance may have lost all relevance, leaving only function-based categorizations, such as
loans, deposits, payments, and investments.
What is common among these structural changes is that they are irreversible and that they will
have a major impact on us. In other words, issues such as Japan being our contracting “mother
market” or intensifying competition due to entrants from other sectors are not cyclical issues which
will eventually resolve themselves; these are unpleasant realities which we must confront head-on.
If we are to realize sustainable growth we must, now more than ever before, look forward into the
future and evolve relentlessly.
SMBC Group: Our Journey and Our Strengths
However, these structural changes are by no means a recent development. SMBC, SMBC Group’s
core commercial banking entity, set sail in stormy waters when it was formed in 2001. Japan’s financial
sector had just embarked on an age of large-scale restructuring and reorganization due to domestic
non-performing loans becoming a serious problem under Japan’s prolonged deflationary environment.
Shortly after we had completed paying back our public funds and turned our attention to pursuing
growth, the US subprime loan crisis triggered the global financial crisis in 2008. The lessons that
were learned during this period led to the tightening of international financial regulations, which was
a game changer.
While these events shook our business at its very foundations, each time we succeeded in realizing
quality growth by refashioning ourselves into a stronger, more tenacious financial group. As a result of
such changes, we have developed three universal strengths.
First, a robust client base built upon many years of mutual trust.
SMBC Group is made up of leading corporates operating in various industries, such as banking,
leasing, securities, and consumer finance. The unique combination of SMBC (a Japanese megabank)
and SMBC Nikko (one of the three major Japanese securities companies) is one of our key strengths.
In terms of our domestic retail business, we hold the number one position in key fields, such as credit
card memberships and consumer loan balance, with 43 million customers supported by 50 thousand
employees.
In regards to our global business, our traditional approach was to build a strong presence by
cultivating relationships focusing on corporate clients, for example western multi-national corporations
and leading companies of key ASEAN countries. However, in February 2019 we completed the
merger of BTPN, a local Indonesian bank, with PT Bank Mitsui Sumitomo Indonesia, establishing a
platform from which we can offer a full-line of wholesale and retail banking services in Indonesia.
The post-merger bank is staffed by approximately 20 thousand employees and serves seven million
customers through its digital banking business where our collaborations with BTPN commenced well
before the merger.
Second, a solid business foundation which has been developed with proactive and speedy
initiatives through the changing times.
In Japan, our mother market, the business environment for commercial banks has been challeng-
ing for some time now due to low growth and low interest rates. However, by diversifying our revenue
sources through the expansion of our business and regional coverage, the contribution of SMBC
P54Merger of BTPN and PT Bank Sumitomo Mitsui Indonesia
P4Expand business and regional coverage
To Our Stakeholders Message from the Group CEO
16 SMBC Group Annual Report 2019

Group companies other than SMBC to consolidated net business profit increased significantly
from 8% in FY2003 to 51% in FY2018, surpassing 50% for the first time. During this time, profit
attributable to owners of parent increased from ¥330.4 billion to ¥726.7 billion, proving that we
have been successful in our efforts to realize quality growth.
As a growth driver, our international business has been increasing its net business profit at an
annual rate of 13% since the establishment of our Group. As a result, our international businesses’
contribution to consolidated net business profit rose from 5% in FY2003 to 33% in FY2018. We
have also increased businesses that we are globally competitive in. For example, our project finance
business, which a team of four employees including myself launched thirty-three years ago with the
dream of one day becoming the best in the world, is now ranked number two in the world.
Furthermore, in the past few years our focus has shifted from growing our topline profit to
maximizing efficiencies given the slowdown in the growth of emerging markets, the introduction
of the negative interest rate policy by the Bank of Japan and tightening international financial
regulations. We have been able to raise the quality of our business foundation by reorganizing our
Group companies (regional banking subsidiaries, leasing business, etc.), and realizing strict cost
controls through Robotic Process Automation (“RPA”) and branch reorganization.
Expand business and regional coverage
Third, top-tier employees who provide advanced and client-focused business solutions.
Employees are the most important management resource for a financial institution. The reason that
we have been able to consistently maintain the highest loan spread among the Japanese megabanks
and net business profit per employee at a very high level over the years is thanks to our motivated
employees who possess excellent marketing capabilities and expertise providing speedy and on-target
business solutions to our clients. None of our success would have been possible without the trust and
knowhow accumulated by our employees.
We are also carrying out work style reform related initiatives so that our employees can perform at
an even higher level. We have introduced RPA on a Group basis and have already produced world-
class results. RPA is often described in the context of headcount reduction, but this is incorrect. The
purpose of RPA is to leverage digital technology to free our employees from low productivity tasks and
allow them to focus on high-value added tasks and corporate planning activities so that we can further
enhance the quality of our products and services. Such initiatives should contribute to our growth as
they lead to heightened employee motivation.
Group companies excl. SMBC International business Bottom-line profit
(Contribution to consolidated net business profit)
JPY330.4bn
JPY726.7bn
FY2003 FY2018FY2003 FY2003FY2018 FY2018
Policy interest rate 0.15%
51% 33%8% 5%
NIRP
About S
MB
C G
roupTo O
ur Stakeholders
Business S
trategies for C
reating ValueC
orporate Infrastructure S
upporting Value Creation
17SMBC Group Annual Report 2019

Stakeholder Themes that I will Work on Looking Ten, Twenty Years in the Future
I will work on the following stakeholder themes looking ten, twenty years in the future, while also tak-
ing into account our unchanging universal strengths and the irreversible major changes in the exter-
nal environment which I shared with you earlier.
Customers: Ensure Customer-Oriented Business Conduct and Provide New Added Value“We grow and prosper together with our customers, by providing services of greater value to them.”
This is the very first section of Our Mission. In addition, “Customer First” (always acting based on a
customer-oriented mindset) has been placed at the head of our Five Values; a set of common values
and behavioral guidelines which are shared among SMBC Group employees to realize Our Mission.
We are working to ensure the comprehensive implementation of customer-oriented business opera-
tions based on the belief that continuously providing high quality products and services that address
our clients’ needs increases business, which in turn leads to the growth of SMBC Group.
We will continue our never-ending efforts to provide clients with higher quality services and new
added value. Recently, some have made the argument that banks are no longer needed. I believe
that if banks are not really needed, we do not have to continue being a bank. There is no need for
us to remain as a bank if the nature of finance changes due to the spread of digitalization, leading
to the creation of more convenient, lower priced products and services which benefit the economy
and society, and these products and services are being provided by entities other than banks. I am
determined that SMBC Group will become a provider of such products and services by tirelessly
reinventing ourselves.
Shareholders: Maximize Shareholder Value by Further Enhancing Shareholder Returns and Realizing Sustainable GrowthI will continue to devote our utmost efforts to maximize shareholder value by further enhancing share-
holder returns and realizing sustainable growth.
The goal of our basic capital policy is to achieve a healthy balance between securing financial
soundness, enhancing shareholder returns, and investing for growth. In regards to securing financial
“I believe that if banks are not really needed, we do not have to continue being a bank.”
P80Customer-Oriented Initiatives
P28Capital Policy
To Our Stakeholders Message from the Group CEO
18 SMBC Group Annual Report 2019

soundness, our CET1 ratio at the end of FY2018 reached the 10% target set under the Medium-Term
Management Plan, one year ahead of schedule. As such, we will shift from a phase where capital
accumulation was the priority to a new stage where we can focus on strengthening share holders
returns and investing for growth.
Going forward, we will strive to maximize shareholder value by further enhancing shareholder
returns and realizing sustainable growth as a result of striking the right balance of allocating capital
between shareholder returns and investing for growth. In terms of investing for growth, we will engage
in organic investments to accelerate the growth of our domestic and global businesses, in addition to
pursuing inorganic opportunities in a disciplined manner. Potential inorganic opportunities which
we may pursue would be investments in global businesses and portfolios which possess high capital
or asset efficiencies, and investments related to the construction of business platforms aimed at
realizing future growth.
Dividends are our principal approach to shareholder returns, and we are aiming to achieve a
dividend payout ratio of 40% during the next Medium-Term Management Plan. In respect to flexible
share buybacks, we implemented a ¥70 billion share buyback program in May 2018 and a ¥100
billion share buyback program in May 2019. The total payout ratio for FY2019 is expected to be 50%,
which means that we will return exactly half of our earnings to shareholders. We have been steadily
enhancing shareholder returns with our total payout ratio increasing by 20% over the three year
period covered by the current Medium-Term Management Plan.
Employees: Create a Work Environment Where Employees can Pursue Their Dreams with Confidence and Ambition.I will create a work environment where each one of our employees can pursue their dreams with
confidence and ambition.
Ever since I was appointed as Group CEO, I have been calling on employees to “Break the Mold.”
We will surely be left behind in this era of rapid change if we shut ourselves behind our molds,
in other words, if our thoughts and actions are constrained by precedent and preconceptions, prohib-
iting us from engaging in self-improvement. Financial institutions have traditionally been considered
as being conservative and as devoted followers of the so called “demerit principle.” Now we must
actively pursue new challenges and determine how we can best leverage the experiences we have
gained through past failures. I will create an energetic workplace in which our employees bravely
pursue new challenges with their colleagues being inspired by such challenges, leading to a steady
stream of new business opportunities being developed.
In addition, we will also revise our human resources framework so that our employees can carry out
their responsibilities with a sense of enthusiasm and maximize their potential. For example, with the
aim of encouraging employees to engage in new challenges, SMBC is in the process of revising its
human resources framework based on the three concepts of Fair: A framework that fairly evaluates
and rewards our employees, Challenge: A framework that encourages and rewards an employee’s
desire to engage in more challenging responsibilities, and Chance: A framework under which all
employees are given opportunities to demonstrate their abilities to the fullest extent. In addition, as
Group CEO, I will redouble our efforts to develop next generation leaders and assign employees based
on the “right person for the right position” approach. I believe that developing a culture and establish-
ing a framework that allows employees to pursue their dreams with confidence and ambition is one of
the key tasks of a business leader.
P90Human Resources Strategy
About S
MB
C G
roupTo O
ur Stakeholders
Business S
trategies for C
reating ValueC
orporate Infrastructure S
upporting Value Creation
19SMBC Group Annual Report 2019

Environment and Society: Resolving Social Issues Through Our Business Operations and Our Initiatives Related to the Sustainable Development Goals (“SDGs”).We are currently facing various environmental and social issues which need to be addressed on a
global basis, for example climate change resulting from global warming and human rights violations
in supply chains operating in emerging markets. Financial institutions are expected to play a substan-
tial role in addressing such developments as our business allows us to act as a hub connecting
various industries. SMBC Group will further strengthen efforts to resolve social issues through our
business operations and in relation to our SDG related initiatives so that we may realize the sustain-
able development of society.
We at SMBC Group have positioned the sustainable development of society as a key issue and in
October 2018 reorganized the CSR Committee into the Corporate Sustainability Committee to enable
us to better carry out CSR-related initiatives. The committee has the strong support of top manage-
ment, I serve as the Chairperson of the committee, and it will lead our efforts to promote sustainability
management based on a non-financial perspective. Furthermore, we have designated Environment,
Next Generation, and Community as social issues we will address over the medium- to long-term.
We designated ten goals within the SDGs to focus on in order to resolve the three social issues and
have incorporated them into our business units’ strategies and initiatives. Our initiatives have been
highly evaluated by outside parties as illustrated by the fact that Sumitomo Mitsui Financial Group
is included in many of the world’s major ESG indices. We will continue to engage in group-based
efforts from the perspectives of Environment, Next Generation, and Community to resolve social
issues via our business operations and to achieve the SDGs.
The EnvironmentWe continue to engage in proactive initiatives that are ahead of our competitors. In December 2017,
SMBC Group expressed its support for the Task Force on Climate-related Financial Disclosures
(TCFD), a task force established by the Financial Stability Board. As a part of our efforts, in April
2019 SMBC Group became the first global financial institution to calculate the financial impact of
climate-related risks and disclose the detailed results of such calculations. Furthermore, in February
2019 SMBC promptly announced its endorsement of the Principles for Responsible Banking put
forward by the United Nations Environment Programme Finance Initiative.
With environmentally friendly finance drawing increasing attention, SMBC has limited the financing
of new coal-fired power plants to those using ultra-supercritical or more highly efficient methods,
in addition to the issuance of green bonds to fund eco-friendly projects. Furthermore, SMBC Nikko
established the SDGs Finance Department in September 2018 to support clients in issuing SDG
bonds, namely green bonds, and raise funds that help resolve social and environmental issues.
SocietyFrom the standpoint of initiatives aimed at addressing social issues, SMBC Group companies,
such as SMBC, SMBC Nikko, and SMBC Consumer Finance have been focusing on financial literacy
education based on their respective business models. In addition, in light of Japan’s changing
“Ever since I was appointed as Group CEO, I have been calling on employees to ‘Break the Mold.’”
P12, P76Sustainable Development of Society
To Our Stakeholders Message from the Group CEO
20 SMBC Group Annual Report 2019

demographics, SMBC Group is introducing facilities and services in order to become a financial insti-
tution which all our customers, including elderly customers, customers with cognitive impairments,
and customers with disabilities feel comfortable dealing with.
We will also accelerate our diversity-related initiatives to further enhance the engagement of our
employees, one of SMBC Group’s strengths. The ratio of female managers is on an upward trend with
SMBC announcing a new target of 25% to be achieved by the end of FY2019 as they had achieved
their original target of 20% by FY2020 ahead of schedule. The ratio of locally hired General Managers
is also rising, reaching 34% as of April 2019. Having said this however, our diversity-related initiatives
are far from complete as long as we continue to apply categorizations such as “sex” and “locally
hired.” SMBC Group will continue its efforts to construct a truly diverse workplace in which innovation
is realized as a result of employees of different backgrounds and attributes, such as gender, national-
ity, and values engaging in open and free-spirited debate.
GovernanceWe realize that there is no perfect form for corporate governance structures. Accordingly, we
will continue working, on both a group and global basis, toward the enhancement of corporate
governance in order to realize higher levels of effectiveness. In April 2017, we instituted a new Group
governance system through the introduction of group-wide business units and the CxO system. In
June of the same year, we transitioned to a Company with Three Committees. Due to these changes,
I feel that at our Board of Director meetings “big-picture” discussions have increased as it is now
possible to engage in more intensive deliberations while leveraging the expertise of our outside
directors. In June 2019, the number of directors was reduced from 17 to 15. As a result, the ratio
of outside directors sitting on the Board of Directors rose to 47%. Also, in June 2019, SMBC and
SMBC Nikko transformed to a company with an Audit and Supervisory Committee in order to
accelerate the execution of operations and enhance the Board of Directors’ supervisory capabilities.
In August 2018, SMBC Group established the SMBC Group Global Advisory Meeting, a meeting
which SMBC Group Global Advisors, a select group of experts in global political, economic, and
business matters, would act in an advisory capacity to the SMBC Group Management Committee.
The management committee is receiving valuable advice concerning changes in global trends and
the state of various countries’ political and economic environments. We are also working to ensure
the effectiveness of corporate governance-related efforts by conducting compliance surveys so that
management is aware of our employees’ thoughts and concerns.
Progress of the Medium-Term Management Plan and the Focus of Our Strategies Going Forward
I will now address the progress we have made regarding the strategic initiatives introduced under the
current Medium-Term Management Plan and discuss the focus of our strategies going forward.
In April 2017, the Medium-Term Management Plan “SMBC Group Next Stage” was introduced
under the new Group management system, and we have been engaging in various initiatives focusing
on three core policies: Discipline, Focus, and Integration.
Generally speaking, we have produced solid results during the first two years in terms of imple-
mented initiatives and financial results.
First, I will discuss the core policy of Discipline. Under the current Medium-Term Management
Plan we have consistently looked to better control our costs. During the first two years we realized
P60Corporate Governance
P68SMBC Group Global Advisors
P32Medium-Term Management Plan “SMBC Group Next Stage”
About S
MB
C G
roupTo O
ur Stakeholders
Business S
trategies for C
reating ValueC
orporate Infrastructure S
upporting Value Creation
21SMBC Group Annual Report 2019

cost savings of ¥36 billion versus the three year target of ¥50 billion due to the success of key
initiatives, such as business process reform through the application of RPA and the transformation
of all of the 430 SMBC branches into smart branches (259 branches have been converted into
smart branches in the first two years). We also improved asset and capital efficiencies as a result
of implementing a number of measures aimed at reorganizing our Group companies, for example
Sumitomo Mitsui Finance and Leasing Co., Ltd., the two Kansai regional banks, Sumitomo Mitsui
Card Company, and BTPN.
For Focus, initiatives targeting each of the Seven Core Business Areas are producing steady results.
Our Retail Business Unit is transforming its wealth management business into a management fee
based revenue model from its original sales commission based revenue model. Our International
Business Unit accelerated its Multi-Franchise Strategy by merging BTPN and PT Bank Mitsui
Sumitomo Indonesia. In our asset management business, Sumitomo Mitsui Asset Management
Company merged with Daiwa SB Investments in April 2019 to form Sumitomo Mitsui DS Asset
Management. The new company has ¥21 trillion of assets under management, number eight in
the domestic market.
For Integration, as I have discussed earlier, initiatives related to enhancing the Group management
system, digitalization, and ESGs are being steadily carried out.
Key initiatives
Digitalization InitiativesGoing forward, I believe digitalization will be a key decisive factor in determining a company’s com-
petitive advantage, regardless of the industry it is operating in. In order to realize our goals of becoming
“A Group which leads the evolution of the financial sector” and “A Group that drives innovation with-
out being bound by existing frameworks or boundaries,” we are accelerating our digitalization initia-
tives with cashless payment, data utilization, and generating new businesses as the key themes.
For example, cashless payment in Japan is not as popular as in other countries given that it
possesses a highly developed banking system which offers a variety of services, such as account
transfers, and the high level of trust placed in cash. However, we view Japan’s cashless payment
market as having great growth potential over the medium- to long-term. If we take a closer look at the
market, the value of credit card settlements is about ¥50 trillion while the value of cash settlement
remains quite high at about ¥130 trillion. I believe that promoting cashless payments in Japan and
taking over some of the market share from cash settlements will lead to substantial business opportu-
nities. With Sumitomo Mitsui Card Company and Cedyna, SMBC Group has top-tier capabilities in
both the issuing and acquiring operations in Japan. As part of efforts to further expand our competitive
advantage, we entered into a strategic partnership with GMO Payment Gateway, a leading company
in the electronic commerce and online payment market, and Visa, a company that possesses the
world’s largest payment network, to develop a next-generation payment platform. We are also working
Discipline Executed Group reorganization measures in a speedy manner to improve capital and asset efficiency
Already reduced cost by ¥36 billion out of the ¥50 billion target
Focus Each business unit made good progress in key strategic initiatives of the Medium-Term Management Plan
Completed M&A in strategic business areas (credit cards, Indonesia, asset management)
Integration Sophisticated Group management by transforming to a Company with Three-Committees and implemented the business unit system and the CxO system
Capital policy entering into a new stage as the CET1 ratio reached the target one year ahead of schedule
P42Four Business Units
P34Digitalization
P52Reorganization of Group companies
To Our Stakeholders Message from the Group CEO
22 SMBC Group Annual Report 2019

to expand the availability of cashless payments to medium and small size merchants through
collaboration with Square, a US company with which we have a capital and business partnership,
by providing free of charge small terminals that process credit card payments. SMBC Group will
continue to act as a front-runner in the spread of cashless payments in Japan.
In recent years, advances in digital technology have enabled the collection and analysis of large
volumes of diverse data. The utilization of data, which has been called “the oil of the 21st century,” is
drawing the attention of not only the financial sector but of various industries from around the world.
SMBC Group companies operating in the banking, securities, and consumer finance businesses pos-
sess a tremendous volume of payment and credit information. Of course, ensuring the protection of
our customers’ information and data security are key issues which must be addressed prior to the use
of such data, and SMBC Group’s expertise in information management and the trust which we have
accumulated over many years are significant advantages when addressing our customers’ concerns.
SMBC Group already has a head start in the application of data for business purposes with SMBC
developing a system which uses artificial intelligence (“AI”) to detect changes in a company’s financial
conditions, while SMBC Nikko has launched an investment information service which uses AI to pre-
dict individual stock prices. With these initiatives being highly evaluated, SMBC became the only bank
to be selected as a “Competitive IT Strategy Company 2019” by METI and the Tokyo Stock Exchange.
Generating new business through collaborations with other industries is also an important theme.
In September 2019, SMBC Group established an innovation hub, hoops link tokyo, in Shibuya, Tokyo.
As part of hoops link tokyo’s activities, we established SMBC BREWERY, a workshop program con-
ducted by SMBC Group together with outside companies. The AI investment information service
which I introduced earlier was a new business developed as a result of SMBC BREWERY bringing
together HEROZ, inc., a company renowned for its Shogi (Japanese chess) AI, with SMBC Nikko.
Risk Management InitiativesWhile there are an extremely diverse set of risk factors which global financial institutions must pay
close attention to, AML/CFT and cybersecurity are issues which are of particular concern, along with
growing geopolitical risks and prolonged monetary easing.
With the threat of terrorism rising throughout the world, international AML/CFT standards have
rapidly increased in severity, and we have seen many cases in which companies have been subject to
substantial fines levied by overseas regulatory authorities. Overlooking the movement of funds con-
nected to criminal or terrorist activities can disrupt the lives of law abiding citizens as it allows criminal
proceeds to reach criminal and terrorist organizations. In addition, there is the risk that international
trust in Japan’s financial system will be damaged if it is deemed that related controls and frameworks
put in place by Japanese financial institutions are inadequate. The onsite inspection related to the
fourth round of the FATF mutual evaluation for Japan is scheduled to commence in fall 2019.
Management has been driving efforts to ensure SMBC Group’s success in the mutual evaluation by
launching a cross-group project team to review AML risk and client management procedures while
incorporating the recommendations of third party experts, in addition to strengthening related
systems and heightening employees’ awareness.
“SMBC Group will continue to act as a front-runner in the spread of cashless payments in Japan.”
P86Risk Management
About S
MB
C G
roupTo O
ur Stakeholders
Business S
trategies for C
reating ValueC
orporate Infrastructure S
upporting Value Creation
23SMBC Group Annual Report 2019

Although convenience is increasing with business and operational processes becoming digitalized,
cybersecurity risk is growing at a rapid pace because every system is now connected to the internet.
Finance is a key part of the economic and social infrastructure of today’s world, and it goes without
saying that system failures, data breaches, and data tampering resulting from cyberattacks would not
only seriously impact SMBC Group’s operations but also Japan’s economic activities and the lives of
Japanese people. In fact, as a result of global networks there is the risk that such attacks would also
substantially affect the systems of countries around the world. SMBC Group recognizes cyber-risk as a
key management risk, and management is leading efforts to implement various measures to strengthen
our cybersecurity measures based on the Declaration of Cyber Security Management issued in March
2018 to address cyber-threats which are becoming increasingly sophisticated on a daily basis. Some
examples of such measures are training personnel to ensure that they have the necessary expertise and
experience and establishing contingency plans aimed at realizing prompt recovery from cyber-incidents.
The Focus of Our Strategies Going Forward
FY2019 is the final year of the current Medium-Term Management Plan. Thanks to the above
mentioned initiatives delivering the desired results, we have made good progress concerning the
three financial targets of financial soundness, capital efficiency, and cost efficiency set under the
Medium-Term Management Plan. However, we cannot deny the fact that uncertainty in the global
economy’s future is increasing. Given such a backdrop, SMBC Group aims to reach its goals by
focusing its resources with a keen sense of urgency to ensure that its various initiatives produce
results, and we will consistently strive to be one step ahead of the times and clearly understand
what our customers’ true needs are.
The new Medium-Term Management Plan will not be a mere extension of the current plan, rather,
we are planning to actively debate a range of topics, including new business opportunities, without
being bound by a traditional mindset. I have identified the following three points as the focus of our
strategies going forward so that we can meet the true needs of our customers by taking full advantage
of our competitive strength; our ability to keep-up with the changing times by transforming ourselves.
Bold TransformationIn response to the challenging earnings environment, we will focus on evolving our business model
and optimizing the allocation of resources. For example, in our Retail Business Unit, we will realize
sustainable growth by making further progress in our efforts to shift the business model of our wealth
management business from one that relies on sales commissions generated by investment products
to one that relies on management fees generated by customers’ assets under management (“AUM”)
while reducing costs through branch reorganization and the promotion of digitalization. In the Inter-
national Business Unit, we will shift to a growth model that does not rely on expanding our balance
sheet. Furthermore, in addition to expanding our business and regional coverage by investing for
growth, including through inorganic measures looking at businesses’ growth potential, profitability,
and efficiency, we will continue to pursue our “select and concentrate” strategy and further
strengthen our cost control initiatives.
Continuous InnovationThe spread of digitalization is changing how the financial sector operates, with SMBC Group’s role
and the expectation of our customers also changing. In the face of such change, SMBC Group will
P94IT Strategies
To Our Stakeholders Message from the Group CEO
24 SMBC Group Annual Report 2019

engage in continuous innovation so that we not only survive but thrive in this environment. We will
consistently provide new value to our customers by identifying what the next age will bring, focusing on
generating new business by collaborating with other industries, utilizing data, and process automation.
Maximize Our Group ValuesI feel that the Group management system centered on the holding company has steadily taken root
over the past two years through group-wide business units and the CxO system. On the other hand,
potential still remains in various sectors to expand Group synergies. In addition to determining how to
best increase the corporate value of SMBC Group companies, for example via increased investment
and allocating human resources to growth areas, we will enhance our ability to address customers’
needs by maximizing synergies as a result of further expanding collaborations among Group
companies and optimizing resource allocation on an SMBC Group basis.
Building the Future of the Financial Sector
Looking back over our history, you can see that we have overcome various challenges, for example
issues regarding non-performing loans and the global financial crisis, by continuously evolving.
The impact of the structural changes we are currently facing equals or even exceeds that of past
challenges, but I firmly believe that they present a rare opportunity for us, if we can face these
changes head-on and adjust accordingly, to drive forward our competitive advantages.
I am certain that we can unlock a new era and build the future of finance, if we boldly pursue cutting-
edge initiatives which are one step ahead of the times while steadily carrying-out strategies formulated
under a long-term vision leveraging the various strengths of SMBC Group which I have shared with you
during the course of this message. We will pursue further excellence through tireless self-reinvention.
In closing, I would like to ask for the continued support and understanding of all our stakeholders.
July 2019
Jun Ohta
Director President and Group CEO
Sumitomo Mitsui Financial Group, Inc.
About S
MB
C G
roupTo O
ur Stakeholders
Business S
trategies for C
reating ValueC
orporate Infrastructure S
upporting Value Creation
25SMBC Group Annual Report 2019

Message from the Group CFO
SMBC Group aims to become a resilient, first class global
financial group by focusing on enhancing capital, asset,
and cost efficiencies. In order to realize this vision, we have
established three financial targets in the current Medium-
Term Management Plan: ROE, OHR, and CET1 ratio.
We produced strong financial results for 1H FY2018 with
all four of our business units realizing a Year-on-Year increase
in profit. We have exceeded our targets for consolidated net
business profit and profit attributable to owners of parent due
I was appointed as Group CFO and CSO in April 2019. The positions of CFO and CSO are
concurrently held by the same individual based on the belief that in the context of management,
financial and business strategies are two sides of the same coin. In other words, we believe
that both strategies are fundamental to the continued success of our business. By having one
individual fill these two roles, it makes it possible to accelerate the decision making process
and consistently take into account both perspectives when developing strategies.
Business Management Focusing on Enhancing Operational Efficiencies
to the performance of the International Business Unit and
a group-wide cost control approach, although the Retail
Business Unit’s wealth management business experienced
difficulties in 2H FY2018 due to deteriorating market
conditions. Controlling risk-weighted assets through the
reorganization of Group companies, which I will describe in
more detail later, was also an important factor behind the
strong results in regards to our three financial targets.
To Our Stakeholders
Toru NakashimaGroup CFODirector Senior Managing Corporate Executive Officer
Implement a capital policy focused on enhancing shareholder returns and investing for growth while proactively disclosing information via interactive and constructive communication
26 SMBC Group Annual Report 2019

* Post-Basel III reforms basis* Excluding special factors, such as the effects of implementing the consolidated corporate-tax system
Transforming Our Business and Asset PortfolioIn order to enhance capital and asset efficiencies, we need to
maximize returns by carefully selecting target businesses and
focusing our resources on those businesses. SMBC Group has
been swiftly reorganizing its Group companies by reviewing its
business and asset portfolio based upon the goals and strate-
gies established under the Medium-Term Management Plan.
We carried out in rapid-succession the reorganization of
businesses for which there was room to improve capital and
asset efficiencies and merged overlapping business that ex-
isted within SMBC Group. In addition to the merger of SMBC
Nikko and SMBC Friend Securities and the deconsolidation
of the Kansai regional banks, in FY2018 we reorganized our
leasing business to deconsolidate Sumitomo Mitsui Finance
and Leasing and consolidated BTPN by merging the bank
with PT Bank Mitsui Sumitomo Indonesia and by increasing
our capital investment. In April 2019, we also merged
Sumitomo Mitsui Asset Management Company with Daiwa
SB Investments and turned Sumitomo Mitsui Card Company,
a joint venture with NTT DOCOMO, into a wholly owned
subsidiary. Both of these initiatives contributed to improving
capital and asset efficiencies by increasing bottom-line profit
and/or reducing risk weighted assets.
These reorganizations possess multiple merits, not only
from the standpoint of improving efficiencies but also business
strategy. For example, due to the reorganization of our leasing
business, Sumitomo Mitsui Finance and Leasing is able to
expand its leasing operations by entering into new businesses
while SMBC Group is now able to initiate strategic initiatives
through Sumitomo Mitsui Card Company in a flexible and
speedy manner, making the company the central piece of
our group’s cashless payment strategy.
Please refer to page 52 for the reorganization of Group companies
Cost ControlThe current Medium-Term Management Plan has a
target to reduce cost by ¥50 billion during its three years by
implementing three key initiatives: business reform to improve
efficiency, retail branch reorganization, and reorganization of
Group companies. We have already realized cost savings of
¥36 billion as of the end of FY2018 and expect to exceed
our target of ¥50 billion in FY2019.
For business reform to improve efficiency, we are proactively
introducing RPA to various parts of our business and SMBC
Group has already produced world-class results. The Medium-
Term Management Plan set a target to automate three million
working hours (annual workload of 1,500 employees) of op-
erations for which we have already accomplished automating
two million working hours (annual workload of 1,025 employ-
ees) as of the end of FY2018. For retail branch reorganization,
our goal is to transform all of the 430 branches into smart
branches which leverage digital technologies during the three
year term. As of the end of FY2018, 259 branches have been
transformed into smart branches and we have consolidated
the back-office clerical operations of 278 branches. In regard
to reorganization of our Group companies, we are expecting
to realize cost reductions which exceed our target via the
integrated management of Sumitomo Mitsui Card Company
and Cedyna Financial Corporation which was not planned at
the time of preparing the current Medium-Term Management
Plan. We will continue to reduce cost with our medium-term
goal being ¥100 billion.
Furthermore, while we initially planned to reduce the
workload equivalent to four thousand employees through the
key initiatives, we now expect to exceed this target and reduce
the workload equivalent to five thousand employees as we
have introduced RPA to Group companies other than SMBC.
We expect to reduce our domestic headcount by about four
thousand through attrition taking into account the above
mentioned workload reduction.
ROE
Financial targets
OHR CET1 ratio
FY2016 FY2016 Mar.17
7.8%*8.3%
62.1%
FY2017 FY2017 Mar.18
8.8% 9.5%60.9%
FY2018 FY2018 Mar.19
8.2%
10.3%
60.3%
FY2019 target
FY2019 target
Mar.20 target
7–8%
10%vs.FY2016 (1)%
About S
MB
C G
roupTo O
ur Stakeholders
Business S
trategies for C
reating ValueC
orporate Infrastructure S
upporting Value Creation
27SMBC Group Annual Report 2019

Our Basic Capital PolicyAs stated in the “Message from the Group CEO,” the goal of
our basic capital policy is to achieve a healthy balance among
securing financial soundness, enhancing shareholder returns,
and investing for growth. We will shift from a phase where
capital accumulation was the priority to a new stage where
we will focus on shareholder returns and investing for growth,
as we reached our CET1 ratio target of 10% as of the end of
FY2018, one year ahead of schedule. We have traditionally
used a triangle to illustrate our basic capital policy with
securing financial soundness placed at the top. To show that
our capital policy has entered a new stage, we have started
using an inverted triangle with enhancing shareholder returns
and investing for growth at the top. Going forward, we will
focus on striking the right balance of allocating capital to
these two items.
Enhancing Shareholder ReturnsDividends are our principal approach to shareholder returns.
We will pursue a progressive dividends policy, a policy which
means that we will not reduce dividends; we will maintain or
increase dividends. Our goal is to achieve a payout ratio of 40%
during the next Medium-Term Management Plan. In addition,
we will proceed with share buybacks on a flexible basis.
Based on this policy, we increased our dividend for FY2018
to ¥180 per share, ¥10 higher than our initial forecast, and
announced a ¥100 billion share buyback program in May
2019. This was an increase of ¥30 billion from the previous
year. We decided to increase the amount due to various fac-
tors, such as the fact that we had achieved our CET1 ratio
target, we expect to continue to accumulate profits in FY2019,
current growth investment opportunities, our stock price, and
the positive impact on ROE. Among them, our low stock price
was the key factor.
Our Capital Policy: A New Stage
Progressive dividend policy• Progressive dividend policy
means not to reduce dividends, and will maintain or increase dividends
Dividend Payout ratio• Aim to achieve 40% during
the period of next Medium-Term Management Plan (FY2020-FY2022)
Flexible share buybacks
Turned the triangle upside down
Investment criteria• Fits with our strategy
• ROE of over 8% after synergies and excluding amortization of goodwill
• Risk is manageable
CET1 ratio target: 10%
Securing financial soundness
Investing for growth
Enhancing shareholder returns
Basic Capital Policy
Enhancing shareholder returns
Securing financial soundness
Investing for growth
[Before]
Sustainable growth of corporate
valueROE target
7-8%
While we will continue our efforts to reduce cost so that we
may achieve our OHR target, we understand the importance
of making the necessary investments in IT given the rapid
spread of digitalization. As such, we have been reviewing our
budget during the fiscal year in a flexible manner so that we
can address changes in the environment. Of course, we are
applying ample levels of discipline when engaging in such
investments, carefully studying the benefits that they will bring.
Please refer to page 94 for our IT investment strategy
To Our Stakeholders Message from the Group CFO
28 SMBC Group Annual Report 2019

For FY2019, we will maintain dividends at ¥180 per share
despite an expected decline in profit attributable to owners of
parent as part of our efforts to meet the expectations of our
shareholders and investors.
Investing for GrowthSMBC Group will pursue sustainable growth by using its
capital to invest in growth opportunities. While we focused on
capital accumulation and not increasing risk weighted assets
prior to achieving our CET1 ratio goal, going forward we will
pursue organic growth by increasing assets, especially in
overseas markets. We will determine whether to pursue
M&A opportunities based on whether the deal contributes to
sustained ROE improvement following the three investment
criteria shown in the basic capital policy chart. Potential M&A
opportunities which we will pursue will be investments that
focus on global businesses and portfolios which possess
high capital or asset efficiencies and investments related to
the construction of business platforms aimed at realizing
future growth.
The former refers to areas in which SMBC Group possess
global strengths. Past investments include aircraft leasing, rail
car leasing, and middle-market LBO finance. Investments of
this type will not only further strengthen our global business
but will also promptly raise ROE. Some examples of invest-
ments of the latter type are commercial banking in Asia, asset
management, securities, and trust banking businesses. In
February 2019, the merger of BTPN and PT Bank Sumitomo
Mitsui Indonesia was completed with the post-merger bank
becoming the eighth largest commercial bank in Indonesia in
terms of loan balance. We will pursue investment opportunities
’19 (estimate)
’16 ’17 ’18’15’14’13’12’110
50
100
150
200
170180 180
150150140
120110
100
10
Dividend payout ratio
26.8% 21.3% 20.3% 26.2% 32.7% 29.9% 32.7% 34.6% 35.9%
(Ref) Total payout ratio 44.2% 50.2%
Ordinary dividend Commemorative dividend(FY)
(JPY bn)
Dividends per share(JPY)
Use of capital
9.5%
10.3% 10%
726.7
700
250
250
100
70
Impact on CET1 ratio
+0.9%(0.3)%
(0.1)%(0.1)%
+0.4%
CET1 ratio (Mar.18)
FY2018 FY2019
CET1 ratio (Mar.19)
CET1 ratio (Mar.20)
Net income
Net income
Dividends DividendsShare buybacks
Share buybacks
Growth investment
etc.
BTPN consoli-dation
SMFL deconsoli-
dation
About S
MB
C G
roupTo O
ur Stakeholders
Business S
trategies for C
reating ValueC
orporate Infrastructure S
upporting Value Creation
29SMBC Group Annual Report 2019

in other countries so that we can create a second, or potentially
a third, SMBC Group.
How we use our capital is drawing increasing attention from
our shareholders and investors as a result of our capital policy
shifting to a new stage. We began using the chart shown below
as of the beginning of this fiscal year at investor presentations
so that we could better convey how we are using our capital.
Profit attributable to owners of parent is expected to be
¥700 billion in FY2019, and we are allocating ¥250 billion to
dividends and ¥100 billion to share buybacks. This means
that we will return about half of our profit to shareholders. In
terms of investing for growth, we allocated ¥80 billion to the
conversion of Sumitomo Mitsui Card Company to a wholly
owned subsidiary and the merger of Sumitomo Mitsui Asset
Management Company and Daiwa SB Investments, both of
which took place in April 2019. We are planning to allocate
about ¥150 billion to organic growth opportunities with the focus
being on increasing assets overseas. The remaining capital
will be allocated to other growth investment opportunities.
Securing Financial SoundnessAlthough our capital policy has entered a new stage,
there is no change to the fact that capital will be allocated to
enhancing shareholder returns or investing for growth only
when we are sure that financial soundness has been secured.
Our CET1 ratio target of 10% has been calculated taking
into account the impact of the Basel III reforms which were
finalized in December 2017, and as I stated earlier we
achieved this target as of the end of FY2018. We set our target
at a level which allows us to maintain the minimum CET1 ratio
of 8% even in the case of a once-in-a-decade stress scenario.
Furthermore, the TLAC framework came into effect in Japan
from the end of March 2019. The minimum TLAC require-
ments which SMBC Group must satisfy are 16% in terms of
risk-weighted assets and 6% of the leverage exposure mea-
sure. SMBC Group has cleared both requirements as of the
end of FY2018. We are currently working to secure the capital
required to satisfy the new TLAC requirements, which will
increase starting from 2022 to 18% and 6.75%, respectively.
The minimum acceptable leverage ratio has been set at 3.0%
for 2019-2021 and 3.5% for 2022 onwards. SMBC Group
has already secured a leverage ratio of 4.88% as of the end
of FY2018.
Reducing Strategic Shareholdings Our goal is to reduce strategic shareholdings in five years by
¥500 billion (book value basis) based on the policy: “We will
halve the ratio of stocks to CET1 to 14% over the five years
starting 2015 September-end.” SMBC Group has reduced
its strategic shareholdings by ¥360 billion since 2015
(JPY tn)
Reduction Plan
Sep.15 Mar.16 Mar.18Mar.17 Mar.19Mar.02Apr.010
2
4
6
8
10
5.36
1.80 1.79 1.69 1.57 1.44
6.09
28%27%
21%24%
18%
149%
Reduction plan (announced Nov.2015)
Toward a level appropriate for G-SIFIs
Book value of domestic listed stocks within other securities Ratio of Stocks-to-CET1 capital
To 14% by around 2020
* Apr.01 and Mar.02 are ratio against SMBC consolidated Tier1 capital
Reduce the ratio by half within
5 years
To Our Stakeholders Message from the Group CFO
30 SMBC Group Annual Report 2019

Although I was appointed as Group CFO in April 2019,
I communicated with institutional and individual investors
during FY2018 in my role as Deputy Group CFO. I engaged in
numerous discussions with investors during my four overseas
investor relations trips and the various conferences which I
took part in. I also met with representatives from domestic and
overseas credit rating agencies. While I became confident that
we were able to gain the understanding of our shareholders/
investors regarding the aims and goals of our strategies
through these discussions, I also came to appreciate the very
high expectations our shareholders/investors had regarding
the enhancement of shareholder returns. In response to such
matters, we decided to increase dividend payments and share
buybacks in our FY2019 shareholder return policy following
repeated discussions at meetings of our Board of Directors.
In addition, my discussion with shareholders/investors
regarding ESG and SDGs led to SMBC calculating and
disclosing the financial impact of climate change as part
of our TCFD- related measures.
I strongly believe that one of my most important missions
as Group CFO is to engage in constructive discussions
with investors and analysts. SMBC Group will continue to
proactively disclose information that is useful to shareholders/
investors while leveraging interactive communications to
increase our corporate value and realize sustainable growth.
Toru NakashimaGroup CFO
Director Senior Managing Corporate Executive Officer
Communicating with Our Shareholders and Investors
September- end, including a reduction of ¥130 billion during
FY2018. In addition, we have obtained our clients’ consent
to sell a further ¥88 billion of strategic shareholdings that has
yet to be executed. Thus, as of the end of FY2018 we have
practically realized a total reduction of ¥448 billion.
We will continue efforts to reduce our strategic share-
holdings so that we have reached a level at the end of FY2019
where we have practically achieved our final target figure
with the aim of conforming to Japan’s amended Corporate
Governance Code and mitigating the impact of share price
fluctuations on our financial base.
About S
MB
C G
roupTo O
ur Stakeholders
Business S
trategies for C
reating ValueC
orporate Infrastructure S
upporting Value Creation
31SMBC Group Annual Report 2019

To achieve sustainable growth by combining the Group’s strengths with more focused business management
*Post-Basel III reforms basis
Capital Efficiency ROE 7~8% Maintain at least 7% notwithstanding accumulation of capital
Cost Efficiency OHR1% reduction compared with FY2016
Reduce to around 60% at the earliest opportunity in or after FY2020 (FY2016: 62.1%)
Financial Soundness CET1 ratio* 10%Maintain capital in line with the tightening of regulations (FY2016: 8.3%)
Core Policies of Medium-Term Management Plan (FY2017–2019)
FY2019 Financial Targets
To Our Stakeholders
Business Portfolio Transformation
Enhance
Transform
Grow
Build
SMBC Group’s competitive advantage
Business growth for SMBC Group
Global products
Domestic retail business
Sales & Trading
Trust banking/Asset management
Credit card
Global large corporations
Wealth management
Asia-centric
Japan mid-sized enterprises
Businesses competing with domestic
regional banks
Mortgage loans
32 SMBC Group Annual Report 2019

1
DisciplineDisciplined business management
Transformation of business/asset portfolio
Improving productivity and efficiency
FocusFocus on our strengths to generate growth
Focus on Seven Core Business Areas
2
IntegrationIntegration across the Group and globally to achieve sustainable growth
Introduced CxO system and group-wide business units
Digitalization
ESG
3
Concept Strategic Focus
EnhanceEnhance business base in domestic market
1 Hold the number one retail banking franchise in Japan
2 Build on our lead position in the Japanese medium-sized enterprise market
3 Increase market share in Corporate & Investment Banking in key global marketsGrowSustainable growth of US/EU businessesMake Asia our second mother market
4 Establish a top-tier position in product lines where we are competitive globally
5 Accelerate our “Asia-centric” strategy
BuildBuild our new strengths for future growth
6 Strengthen sales & trading capability
7 Develop asset-light businesses: trust banking and asset management
Digitalization
Seven Core Business Areas
Corporate Governance Framework
A Company with Three Committees
Execution
Supervisory
About S
MB
C G
roupTo O
ur Stakeholders
Business S
trategies for C
reating ValueC
orporate Infrastructure S
upporting Value Creation
CxO System and Group-Wide Business Units
Group Management Committee
SMBC
PresidentSumitomo Mitsui Financial Group
PresidentSMBC NIKKO
PresidentMajor subsidiaries
President
Head of Business Unit Business units (Retail, Wholesale, International, Global Markets)
CxO Head office functions
Nomination Committee
Compensation Committee
Audit Committee
Sta
tuto
ry
Com
mit
tees
Board of Directors
Risk Committee
33SMBC Group Annual Report 2019

As CDIO, I will become SMBC Group’s internal disrupter and lead efforts to pursue new opportunities.
To Our Stakeholders
Katsunori TanizakiSenior Managing Corporate Executive OfficerGroup CDIO
Using Digital Technology to Create the Future of Finance
34 SMBC Group Annual Report 2019nnual Report 2019

In order to implement our digitalization initiatives in a speedy
and efficient manner, we must engage in open innovation that
brings together the data, technology, and expertise of not
only SMBC Group companies, but also of partner companies,
which include start-ups, and our customers. We will no
longer rely on our traditional principle of self-sufficiency;
rather, we will focus on developing business opportunities by
collaborating with partners, including the use of application
programming interface (“API”s.)
In regards to the digitalization of SMBC Group, I believe
it is important that innovation is not undertaken by a small
group of personnel or divisions with specialized skill sets.
Digitalization must involve all parties within SMBC Group. In
order to make this vision a reality, we need to create an envi-
ronment in which all SMBC Group employees, especially our
younger employees, can pursue new challenges without fear
of failure. At the same time as CDIO, I will become SMBC
Reinventing SMBC Group and Pursuing New Opportunities
Our digitalization initiatives have been recognized by outside parties
Group’s disruptor and spearhead efforts to drive forward
initiatives that are not bound by traditional frameworks.
We will create high-quality, appealing services by focusing
equally on accelerating the reinvention of SMBC Group’s
business culture, for example marketing style and the work-
style of head office employees, and pursuing new opportuni-
ties. All of our customers will be offered these services,
regardless of whether they are wholesale or retail customers.
Received an award in the Cyber Security Category (conducted by a subsidiary of the Financial Times)
Selected as a “Competitive IT Strategy Company 2019” by METI and the Tokyo Stock Exchange
The economy and society are in the process of undergoing
major change due to the spread of digitalization. Technology
is progressing at an astonishing speed, and SMBC Group
is faced with a situation in which its business model may
undergo change of such a scale that it could be seen as a
paradigm shift. There is no doubt that this is a substantial
challenge for us. However, I believe that there is much
potential for us to evolve by absorbing and adopting these
technological advances. In addition, we will collaborate with
external partners to create new business opportunities, which
would not have been possible based solely on the resources
and expertise of SMBC Group.
In our current Medium-Term Management Plan “SMBC
Group Next Stage,” we have positioned digitalization as a pillar
which penetrates all Seven Core Business Areas. More specifi-
cally, we will spread digitalization by leveraging new technol-
ogy, such as blockchain and AI, in all business areas with the
goal of increasing customer convenience, creating new busi-
nesses, increasing productivity and efficiency, and enhancing
our business infrastructure.
For example, in the cashless payment sector we are in the
midst of creating a next-generation payment platform with the
aim of providing hybrid payment solutions that fuse together
finance, IT, and marketing. Furthermore, by using data which
is accumulated through activities such as payments, we are
working to develop and provide advanced financial products
using high-quality risk analysis and realize a more personal-
ized approach to marketing. New business models which
leverage data, such as the information bank business model,
are being developed, and I believe there is the possibility that
in the future SMBC Group will gradually move from the
financial sector to the information sector.
Mr. Tanizaki attended the 2019 Spring Membership Meeting of the Institute of International Finance.
About S
MB
C G
roupTo O
ur Stakeholders
Business S
trategies for C
reating ValueC
orporate Infrastructure S
upporting Value Creation
35SMBC Group Annual Report 2019

Promoting Open Innovation
SMBC BREWERYSMBC BREWERY, a workshop in which SMBC Group
companies collaborate with non-financial sector
partners to develop new ideas, kicked-off in April
2018. SMBC Group companies spend half a day
working with companies, including start-ups, from
outside the financial sector to discuss ideas
on which they could collaborate.
Through the workshop, SMBC Nikko and HEROZ,
inc., a firm with considerable expertise in AI, part-
nered together to develop an investment information
service “AI Portfolio Diagnosis*,” a service which has
been successfully commercialized and is available
to customers.* The AI program compiles a suggested portfolio with a high expected
rate of return by forecasting companies’ profitability one month in the future based on an analysis of factors such as stock price and earnings.
Discovering and Developing Cutting Edge Technology
The SMFG Silicon Valley Digital Innovation LaboratoryThe SMFG Silicon Valley Digital Innovation
Laboratory was established in Silicon Valley and is in
charge of discovering high-potential local start-ups.
For example, SMBC Group adopted Trifacta Wrangler
Enterprise, software which dramatically accelerates
data analysis, starting March 2019. Traifcacta,
the company which developed the software, was
discovered by the SMFG Silicon Valley Digital
Innovation Laboratory.
Establishing the Advanced Technology LaboratorySMBC Group has established the Advanced
Technology Laboratory at The Japan Research
Institute, and through the laboratory we conduct
research/studies into basic and advanced
technology in collaboration with IT companies
and research institutes.
To Our Stakeholders
A company’s IT strategy is a key business strategy given the rapid digitalization of our world.
SMBC Group has positioned digitalization as an initiative that will encompass all Seven Core
Business Areas and will promote digitalization from both defensive and offensive perspectives.
I would now like to share with you a few examples of SMBC Group’s digitalization
related initiatives.
Using Digital Technology to Create the Future of Finance
36 SMBC Group Annual Report 2019

Application of AIAML InitiativesThe efficiency of the screening process targeting
suspicious transactions has greatly increased
following the application of AI.
SMBC ChatbotWe are proactively marketing commercialized sys-
tems such as the SMBC Chatbot, an AI-based auto-
matic response system developed to deal with
internal inquiries, to customers.
A System that Detects Changes in a Company’s Financial ConditionsA system that detects changes in a company’s finan-
cial conditions which was developed in
partnership with JSOL*, a company that engages in
IT consulting and systems development, uses AI to
analyze movements in the target company’s bank
account to recognize changes in the company’s
financial conditions in a timely manner. The system
is already in use at SMBC and SMBC Group is
planning to market the system to customers with
the initial focus being Japanese regional banks. * JSOL is a subsidiary of NTT Data and an equity-method affiliate of
SMBC Group.
Enhancing Our Data Analysis Capabilities
Promoting Digital Marketing InitiativesBrainCell, Inc., which was established in partnership
with Yahoo! JAPAN, is classified as a business that
will contribute to the sophistication of the banking
industry under Japan’s Amended Banking Act. We
will initially focus on pushing forward SMBC Group’s
digital marketing initiatives leveraging the search
knowledge of Yahoo! JAPAN.
Verification Exercises Regarding the Data Bank Business Model SMBC and The Japan Research Institute have been
commissioned by the Ministry of Internal Affairs and
Communications to conduct verification exercises
regarding the data bank business model. We are
working to enhance the convenience of patients
by facilitating the sharing of information regarding
medical examinations/check-ups and prescriptions
between hospitals and pharmacies.
Individual user
Medical treatment
Medical data Contract Instruct
data use
SMBC Group
(Information bank)
Hospital / clinic (data utilization operator)
Hospital (data
provider)
Contract Contract
Data Data
Request data (data portability)
About S
MB
C G
roupTo O
ur Stakeholders
Business S
trategies for C
reating ValueC
orporate Infrastructure S
upporting Value Creation
37SMBC Group Annual Report 2019

While cashless payments are increasing in popularity all over
the world, cashless payments account for only about 20% of
payments made in Japan. Having said this, interest in cash-
less payments in Japan has been rapidly increasing in recent
years. The Japanese government has set a target to increase
the ratio of cashless payments to 40% by 2025.
A variety of measures to promote cashless payments, for
example a points reward program for consumers and subsi-
dies for fees associated with cashless payment terminals, are
scheduled to be introduced to coincide with the scheduled
2019 consumption tax rise.
Japan’s cashless payments market has grown while also
becoming more diverse and complicated with new payment
methods, such as mobile payments and QR codes, joining
the more traditional methods of credit cards, debit cards,
and e-money. In order to accelerate the spread of cashless
Good Cashless Solutions make a Good Day, Everyday
payments in Japan, it is not enough to merely offer new
payment methods. Rather, we believe that the best strategy
is to create an open payment platform which can address
the needs of both merchants and end-users in a flexible
and speedy manner.
SMBC Group has Sumitomo Mitsui Card Company and
Cedyna, two credit card companies that have long led Japan’s
cashless payment market, amongst its Group companies.
From April 2019 we started to manage, in practice, the two
firms as a single business entity, an entity which forms the
cornerstone of SMBC Group’s cashless payment strategy.
SMBC Group will drive the spread of cashless payments in
Japan by implementing a highly efficient and up-tempo strategy
that brings together the wide-ranging strengths of our business
partners, the expertise accumulated by Sumitomo Mitsui Card
Company and Cedyna, and the client base of SMBC.
The reason for the slow spread of cashless payments in
Japan is the convenience offered by Japan’s extensive
ATM network and the ease which cash can be obtained,
for example consumers feeling safe carrying cash due to
Japan’s low crime rate. Having said this, there are a
number of positive factors that will arise from the spread
of cashless payments, such as increased liquidity, less
manpower required to processes payments, and stimulat-
ing consumption via the use of payment data.
We believe that the key aspects to spreading cashless
payments in Japan are not merely convenience and
rationality. Carrying “safety” which also results in carrying
“peace of mind and freedom” are also key aspects of
spreading cashless payments in Japan.
A society in which anybody can spend their days in
a carefree manner. A society in which each day is free
and welcoming.
Sumitomo Mitsui Card Company has adopted the motto
“Have a good Cashless” to reflect these values.
To Our Stakeholders
38 SMBC Group Annual Report 2019

Enhancing Solutions for Merchants
By promoting the adoption of Square, a credit card
payment system for medium/small size merchants and
sole proprietors, and keeping in mind the Japanese
government’s Point Reward Project for Consumers
using Cashless Payment that will come into effect in
October 2019, we will accelerate growth in the number
of stores which
have installed
Square. Square
can be acquired
at all domestic
SMBC branches.
Enhancing Services to End-users
SMBC Group will realize a new cashless payment
experience with convenience, safety/peace of mind,
and good value as the three key pillars. We renewed
the mobile application of SMBC/Sumitomo Mitsui
Card Company in FY2018 and added a number of
new features, such as a payment limit for debit
cards and an asset
management function
which reflects funds
held in banks other
than SMBC.
Constructing a Next-Generation Payment Platform
Visa, the company that possesses the world’s largest payment
network, joined Sumitomo Mitsui Card Company and GMO
Payment Gateway in establishing a next-generation payment
platform. In February 2019, the three companies came to an
agreement to develop an even stronger payment platform by
bringing together each company’s respective skills and
expertise.
Our goal is to build a payment platform which satisfies the
following criteria: 1) The terminal must be compatible with the
large number of cashless payment options which exist in the
domestic market, a situation which can be said to be unique
to Japan, 2) The platform must seamlessly merge the online
and real worlds, and 3) The platform must provide new high-
value added services while offering world-class security. We
are aiming to launch the new platform during FY2019.
Lately, we are seeing an increasing number of non-financial
companies introduce their own, unique payment service with
the aim of obtaining and using customers’ payment data. We
at SMBC Group have also identified the successful use of data
obtained from payments as a key part of our cashless payment
strategy. SMBC Group possesses one of Japan’s largest
cashless payment foundations, processing payments worth
¥30 trillion. SMBC Group will develop/enhance our ability to
support businesses’ marketing needs and produce competi-
tive services while increasing the added value we derive from
our payment data by fully leveraging this foundation so that
our next-generation payment platform is used by as many
merchants and end-users as possible.
Joint press conference with SquareOur Renewed Mobile Application
All-in-one terminal
Multi-payment system
Next-generation platformEnd-users Merchants
1 Payments through a single terminal
3 World class security and stability
online
real
2 Omni Channel
GMO +
SMCC
Payment center
Visa +
SMCC
Network
SMCC
Acquirer
About S
MB
C G
roupTo O
ur Stakeholders
Business S
trategies for C
reating ValueC
orporate Infrastructure S
upporting Value Creation
39SMBC Group Annual Report 2019

Business Strategies for Creating Value
SMBC Group Annual Report 201940

42 Group Structure
44 Retail Business Unit
46 Wholesale Business Unit
48 International Business Unit
50 Global Markets Business Unit
52 Special Feature: Transformation of Business and Asset Portfolio through Group Reorganization
54 Special Feature: Realizing Asia-centric: The New BTPN Opens Its Doors for Business
56 Special Feature: Issuance of Japan’s First Contractual Law Covered Bonds
Business Strategies for Creating Value
41SMBC Group Annual Report 2019

SMBC Group is a global financial group that
develops operations in a wide range of fields,
including banking, leasing, securities, credit
cards, and consumer finance.
Under the holding company, Sumitomo
Mitsui Financial Group, we have established
four business units that draft and implement
Group strategies based on customer segments.
For head office functions, we have clarified
the managers responsible for specific areas of
group-wide management and planning under
the CxO system. In addition, we are taking
steps to share management resources and
optimize the allocation of resources.
Group-Wide Business Units and CxO System
Banking Securities
Business Units
Retail
Wholesale
International
Global Markets
Head Office (CxO System)
SMBC Nikko SecuritiesSMBC Trust BankSumitomo Mitsui
Banking Corporation
Leasing
Sumitomo Mitsui Finance and Leasing
CCOCROCFO CSO
Group Structure
Chief Financial Officer
Chief Strategy Officer
Chief Risk Officer
Chief Compliance Officer
Business Strategies for Creating Value
42 SMBC Group Annual Report 2019
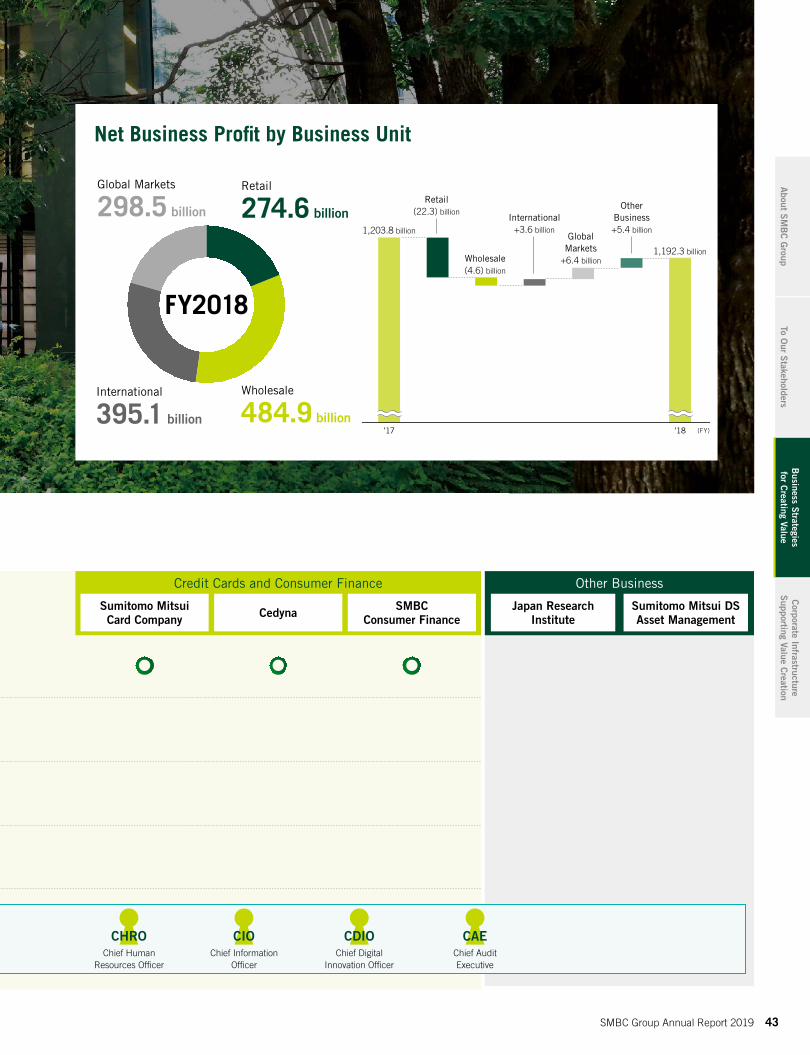
Net Business Profit by Business Unit
Other BusinessCredit Cards and Consumer Finance
SMBC Consumer FinanceCedynaSumitomo Mitsui
Card Company Japan Research
InstituteSumitomo Mitsui DS Asset Management
Retail
274.6 billion
Wholesale
484.9 billion
International
395.1 billion
Global Markets
298.5 billion
’17 ’18 (FY)
1,203.8 billion
1,192.3 billion
Retail(22.3) billion
Wholesale(4.6) billion
International+3.6 billion
Global Markets
+6.4 billion
Other Business+5.4 billion
FY2018
CIOCHRO CDIO CAEChief Human
Resources OfficerChief Information
OfficerChief Digital
Innovation OfficerChief Audit Executive
About S
MB
C G
roupTo O
ur Stakeholders
Business S
trategies for C
reating ValueC
orporate Infrastructure S
upporting Value Creation
43SMBC Group Annual Report 2019

Senior Managing Executive OfficerHead of Retail Business Unit
Naoki Tamura
Contribution to Consolidated Net Business Profit
The top-class companies in banking, securities,
credit card, and consumer finance industries that
comprise the Retail Business Unit are enhancing
intra-Group coordination to address the financial
needs of all individual customers, striving to
develop the most trusted and No. 1 Japanese
retail finance business.
19%
Retail Business Unit
FY2018 Increase (Decrease)*1
Gross profit (JPY bn) 1,281.6 (25.7)
Expenses (JPY bn) 1,021.4 (4.5)
(Overhead ratio) 79.7% +1.2%
Net business profit (JPY bn) 274.6 (22.3)
ROE*2 7.3% +0.1%
RwA*3 (JPY tn) 12.8 (0.1)
Review of FY2018
Our credit card and consumer finance businesses performed favorably with
growth in sales handled exceeding the industry average coupled with success
in capitalizing on the healthy capital needs of individual customers. Conversely,
the wealth management business suffered a year-on-year decline in profit
due to low appetites for investment amid a sluggish market. As a result,
net business profit in the Retail Business Unit decreased ¥22.3 billion, to
¥274.6 billion, while return on equity (ROE) declined to 7.3%. Nevertheless,
our customer-oriented wealth management business initiatives, cashless
payment strategies, and branch reorganizations drove steady increases in
the underlying strength that supports ongoing profit growth.
With a wide range of businesses encompassing wealth management, cashless payments, and consumer
finance, the Retail Business Unit boasts the No. 1 operating foundation in Japan. After the introduction of
the group-wide business units, we were quick to conduct business model reforms, including those related
to customer-oriented business operations and digitalization. The benefits of these efforts are steadily
emerging in the forms of improved customer convenience and reformed cost structures.
Currently, changes in society are giving rise to business opportunities, such as the new financial
needs appearing as the era of the centenarian approaches and the Japanese government’s push to promote
cashless payments.
Faced with these changes in the operating environment, the Retail Business Unit continues to advance
cutting-edge business model reforms based on the key themes of “customer oriented” and “digitalization.”
*1 Figures are after adjustments for interest rate and exchange rate impacts. *2 Figure is on a managerial accounting basis with RwA calculated assuming
Basel III reforms are finalized and exclude the impact from the provision for losses on interest repayments and the cost from branch reorganizations.
*3. Figures are on a Basel III transitional basis.
Business Strategies for Creating Value Review of Operations by Business Unit
44 SMBC Group Annual Report 2019

Balance of Stock-Based Assets(SMBC and SMBC NIKKO)
15
12
13
14
11
0’17/3 ’18/3 ’19/3 ’20/3 (Target)
(JPY tn)
Number of “SMBC Direct” Users*
’17 ’18 (FY)’160
2
4
6
8
(Millions of people)
* Number of customers who have logged in SMBC Direct at least once every six months
Note: Investment products that generate stock-based gains, such as investment trusts, fund wraps, and foreign currency deposits (market value basis)
Payment Service Using Square’s Card Reader
+1.1 trillion
From FY16 +1.8 trillion
+3.1 trillion
Priority Strategies
Wealth Management BusinessIn the wealth management business, we continued to promote the transition
to a customer-oriented wealth management business throughout FY2018. Our
goal in this area is to develop a sustainable, customer-oriented business and
stabilize profits by providing medium- to long-term diversified investment
proposals that respond to customers’ need to protect and increase their assets.
The senior citizen market is anticipated to grow in the upcoming era in which
people consistently live to be 100. We therefore intend to augment our ability to
respond to the long-term wealth management, inheritance, and succession
needs seen in this market.
Cashless Payment StrategiesThe Retail Business Unit looks to grow its market share through the full-fledged
implementation of cashless payment strategies. For example, U.S. partner Square,
Inc., has developed a cashless payment service with a simple and intuitive
interface. We will focus on increasing the number of small and medium-sized
enterprises that handle this service by utilizing SMBC’s customer base.
In addition, we renovated our smartphone application in FY2018. We are
now focused on the enhancement of user services, with regard to which we
have begun offering on-the-spot issuance of debit cards, use limit settings,
and household budget management functions.
Branch ReorganizationsOver the past two years, SMBC has transformed 259 of its 430 branches into
next-generation branches. The goal of our reorganizations is not to reduce the
number of branches, but rather to maintain our network, which furnishes our
points of contact with customers, while cutting costs at branches. We are also
reforming our ATM network to better accommodate customer needs. In September
2019, we plan to make it possible for customers of both MUFG Bank, Ltd., and
SMBC to use the same off-site ATMs (ATMs in unstaffed locations other than
branches and convenience stores).
Another area of focus is enhancing the functionality and user interface of our
smartphone application. To this end, we are utilizing the input and requests garnered
from customers through our various contact points to develop optimal services.
Initiatives for Accomplishing Sustainable Development Goals
Opportunities for Investment in Environmentally and Socially Minded Companies
SMBC Nikko Securities handles investment trusts emphasizing environmental, social, and governance (ESG) factors to provide customers with opportunities for investment in environmentally and socially minded companies. In addition, SMBC began offering the World Impact Investment Fund that invests in companies boasting innovative technologies or business models. Through these and other initiatives, SMBC Group is supporting companies intent on accomplishing the United Nations Sustainable Development Goals.
For more information on SMBC Group’s initiatives for contributing to the accomplishment of the United Nations Sustainable Development Goals, please refer to page 76.
About S
MB
C G
roupTo O
ur Stakeholders
Business S
trategies for C
reating ValueC
orporate Infrastructure S
upporting Value Creation
45SMBC Group Annual Report 2019

Wholesale Business Unit
Senior Managing Executive OfficerCo-Head of Wholesale Business Unit
Kimio Matsuura
Contribution to Consolidated Net Business Profit
Review of FY2018
In FY2018, high levels of net business profit and ROE were achieved with
figures of ¥484.9 billion and 12.1%, respectively. This achievement can be
attributed to higher non-interest income at SMBC following profit structure
reforms as well as growth in the investment bank operations of SMBC Nikko
Securities. These factors counteracted the decline in domestic loans and
investment management income at SMBC that was a result of Japan’s negative
interest rate policy and intense competition.
In addition, we were No. 1 in terms of the number of M&A advisory deals
for the second consecutive year and also became No. 1 in the number of
initial public offerings in which we were the lead underwriter. These accom-
plishments indicated the steady growth of the Wholesale Business Unit’s
underlying strength.
The Wholesale Business Unit contributes
to the development of the Japanese economy
by providing financial solutions that respond
to the diverse needs of domestic companies in
relation to financing, investment management,
M&A advisory, and leases through a united
Group effort.
The operating environment for financial institutions is transforming rapidly as indicated by changes in eco-
nomic and financial circumstances and reforms to customer business models stimulated by progress in the
digitalization trend.
Even in the midst of such constant changes to customer business models, the Wholesale Business Unit
has remained focused on developing frameworks for providing customers with high levels of value through a
united Group effort.
Going forward, we will further improve our strengths, including our keen ability to make proposals, speed,
and pioneering spirit, while sharing management resources among Group companies to provide high-value-
added, customer-oriented solutions.
As a business unit that develops operations in our mother market of Japan, we will give each of our corpo-
rate clients our full attention, grow with them, and contribute to the development of the Japanese economy.
FY2018 Increase (Decrease)*1
Gross profit (JPY bn) 784.9 +0.6
Expenses (JPY bn) 345.1 +0.9
(Overhead ratio) 44.0% +0.1%
Net business profit (JPY bn) 484.9 (4.6)
ROE*2 12.1% (0.1)%
RwA*3 (JPY tn) 19.5 (0.4)
*1 Figures are after adjustments for interest rate and exchange rate impacts.*2 Figure is on a managerial accounting basis with RwA calculated assuming Basel III reforms are finalized.*3 Figures are on a Basel III transitional basis.
33%
Deputy President and Executive OfficerCo-Head of Wholesale Business Unit
Gotaro Michihiro
Business Strategies for Creating Value Review of Operations by Business Unit
46 SMBC Group Annual Report 2019

Priority Strategies
Increase Market Share in Corporate & Investment Banking in Key Global Markets
We will fully utilize the available capabilities of Group companies to propose
solutions to large corporations active on the global stage.
Specifically, we will develop frameworks that allow for greater coordination
among domestic and overseas bases and Group companies to swiftly make
high-quality proposals pertaining to global initiatives.
We will provide solutions for improving the corporate value of our clients and
increase customers’ satisfaction and market share of SMBC Group.
Build on Our Lead Position in the Japanese Mid-Sized Corporation and SME Market
In the Japanese mid-sized corporation and SME market where we have
strengths, the Wholesale Business Unit will expand SMBC Group’s customer
base by providing various solutions based on the customers’ growth stages.
For companies in the early stages of their development, SMBC Group
provides comprehensive management support through SMBC Startup Hub,
which was opened in Tokyo’s Shibuya Ward with the goal of offering assistance
to start-up companies. For growing companies, we propose measures for
resolving management issues pertaining to initial public offering to support
their ongoing growth. SMBC Group thereby aims to grow with our customers
and expand our customer base.
Adaptation to New Business ModelsSMBC Group’s business model is being updated to adapt to the changes in
customer business models spurred by the progress of the digitalization trend.
At the same time, we are working to create new markets through co-creation
activities with customers in various business fields.
Other initiatives include development of infrastructure, active use of data ac-
quired both inside and outside of the Group, and improvement of employee digital
literacy to build frameworks for making higher-quality proposals to customers.
Ongoing Support Based on Customers’ Growth Stages
Cross-Border M&A Project
Draw Up Hypothesis
Permanent Financing
Incubation
Further growth
Building Network with Third Parties
Venture Capital
Investment
Venture Loan
IPO Support
M&A
Business Succession, Carve-Outs,
etc.
Seamless Support by SMBC Group Companies Based on Costumers’ Growth Stages
Growth stageEarly stage
Collaboration
Adaption to New Business Models
SMBC Group Customers
Co-creation
Sharing
IoT and other data
use
Subscription
Platforms
Cashless
Initiatives for Accomplishing Sustainable Development Goals
Assessment Loans
The Wholesale Business Unit provides a wide variety of assessment loans to support customers seeking to work toward environmental issues or to address social issues such as the empowerment of female employees and workstyle reforms. In FY2019, we began offering SDG promotion assessment loans through a scheme in which we first identify the relationship between customers’ businesses and the SDGs when commencing new financing and then offer advice for advancing future initiatives pertaining to the SDGs. These loans are just a part of our proactive efforts to contribute to the accomplishment of the SDGs.
For more information on SMBC Group’s initiatives for contributing to the accomplishment of the United Nations Sustainable Development Goals, please refer to page 76.
About S
MB
C G
roupTo O
ur Stakeholders
Business S
trategies for C
reating ValueC
orporate Infrastructure S
upporting Value Creation
Bridge Financing
Post-Merger Integration
Transaction Banking
Financial and Growth Strategies/ Various Solution
Proposals
47SMBC Group Annual Report 2019

International Business Unit
Deputy President and Executive Officer Head of International Business Unit
Masahiko Oshima
Contribution to Consolidated Net Business Profit
The International Business Unit
supports the global business operations
of domestic and overseas customers
by leveraging SMBC Group’s extensive
office network and the various products
and services in which the Group
possesses global strengths.
27%
Review of FY2018
The highly volatile market of FY2018 led to our securities businesses under-
performing, and we also booked one-time expenses associated with Brexit and the
merger of BTPN and SMBCI. Nonetheless, growth was achieved in deposits, foreign
exchange, derivatives, and other non-asset-based profits. In addition, we were able
to progressively move forward with priority strategies pertaining to initiatives such
as the implementation of asset-turnover based business models. As a result, net
business profit in FY2018 rose ¥3.6 billion, to ¥395.1 billion, and ROE was 9.3%.
Furthermore, we were able to maintain the balance of foreign currency depos-
its, a key prerequisite for sustainable growth, at a high level of approximately
US$200 billion, while also improving the quality of those deposits.
Over the years, the International Business Unit (“INBU”) bolstered its foreign currency procurement capa-
bilities while overcoming numerous financial crises, expanded transactions with leading overseas companies,
and enhanced its ability to offer products which met customers’ demands. Through such efforts, INBU was
able to realize steady growth while expanding its balance sheet. SMBC Group’s overseas network has grown
to 137 branches and offices in 40 countries and regions. Revenue generated by INBU has increased tenfold
over the past 20 years, coming to represent roughly 30% of SMBC Group’s total revenue. Going forward, we
will maintain our focus on capital and asset efficiencies. In order to realize this vision, we will pursue syner-
gies by carrying out various initiatives, such as leveraging the products in which SMBC Group possesses
top-tier capabilities to enhance our cross-selling capabilities and asset turnover initiatives. In this manner,
we will fully capitalize on the competitive edge we have over rivals to transition to a growth model that is not
overly dependent on the expansion of our balance sheet. Through such efforts, we will enhance SMBC
Group’s collective strengths in high growth potential overseas markets so that we may achieve sustainable
growth. INBU will also seek to reinforce corporate governance, compliance, and risk management to achieve
a healthy balance between “offense” and “defense” as it fulfills its role as a growth driver for SMBC Group.
FY2018 Increase (Decrease)*1
Gross profit (JPY bn) 689.6 +31.2
Expenses (JPY bn) 333.4 +22.2
(Overhead ratio) 48.3% +1.1%
Net business profit (JPY bn) 395.1 +3.6
ROE*2 9.3% (1.1)%
RwA*3 (JPY tn) 22.3 +1.1
*1 Figures are after adjustments for interest rate and exchange rate impacts.*2 Figure is on a managerial accounting basis with RwA calculated assuming Basel III reforms are finalized
and excludes medium- to long-term foreign currency funding costs.*3 Figures are on a Basel III transitional basis.
Business Strategies for Creating Value Review of Operations by Business Unit
48 SMBC Group Annual Report 2019

Promote Cross-Selling by Leveraging Our Strengths
Breakdown of Net Business Profit (FY2018)
Sumitomo Mitsui Banking Corporation 80%
Sumitomo Mitsui Finance and Leasing 11% (Of which, SMBC AC* 10%)
The Bank of East Asia 4%
BTPN 1%
SMBC Nikko Securities 1%
Other 3%
Enhancement of Sticky Foreign Currency Deposits Based on CMS*
’14 ’15 ’16 ’17 ’18 (FY)0
5,000
10,000
15,000
20,000
0
35
30
25
20
10
15
5
Number of customers (left axis) Balance of liquid deposits (right axis)
* Cash management system
(USD bn)(Customers)
Product capabilities
Banking business
Cross-Selling by Leveraging Our
Strengths
Global network
Securities business
Japanese customer base
* SMBC Aviation Capital
Priority Strategies
Improve Efficiencies (Asset and Capital)We will leverage strengths in product areas in which SMBC Group boasts top-tier
capabilities, such as aircraft-related businesses and project finance, to enhance
relationships with customers so that we are able to service their funding and invest-
ment management needs, such as loans, deposits, foreign exchange, and
capital market transactions. We will also continue with our efforts to grow
asset-turnover based businesses and make further progress in shifting the make-up
of our portfolio from low-profit assets to high-profit assets. At the same time, we
will coordinate these various initiatives to heighten synergies and improve profitability
to achieve sustainable growth without significantly expanding INBU’s balance sheet.
Maximize Group StrengthsSMBC Group’s growth has traditionally been driven by SMBC, which accounts for
approximately 80% of the group’s revenue. Going forward, however, we will seek
to enhance synergies among Group companies, investees, and partners in order
to further bolster our earnings capacity. The securities business, in particular, will
continue to be a strategic focal area with significant growth potential. In regards
to the merger of PT Bank Tabungan Pensiunan Nasional Tbk (“BTPN”) and PT
Bank Sumitomo Mitsui Indonesia (“SMBCI”), which was concluded in February
2019, we will look to accelerate intra-group collaborations with the post-merger
full-line commercial bank in order to enhance our foundation for medium- to
long-term growth under the Multi- Franchise Strategy.
Enhancing “Defense” through Better Controlled Business OperationsFor foreign currency deposits, INBU will conduct funding activities with an
emphasis on costs and stickiness, in addition to diversifying procurement meth-
ods in order to further stabilize its foreign currency procurement capabilities.
At the same time, cost reductions will be pursued by eliminating redundant
functions throughout SMBC Group and consolidating back-office operations.
INBU will also pursue ongoing improvements in corporate governance, control
functions, and compliance in conjunction with the growth of its business. At the
same time, we will practice flexible and agile business management, paying due
consideration to rising geopolitical risks and market volatility while vigilantly
monitoring changes in the operating environment.
Initiatives for Accomplishing Sustainable Development Goals
Financial Inclusion* through Our Multi-Franchise Strategy
In Indonesia, Bank BTPN offers “BTPN Wow!”, a service that uses mobile phone technology to allow customers without bank accounts to perform bank transactions. By leveraging its strengths and collective capabilities, SMBC Group is promoting financial inclusion* by providing everyone with safe and easy-to-use financial services.
* The act of facilitating access to financial services to help add new levels of stability to people’s lives.
For more information on SMBC Group’s initiatives for contributing to the accomplishment of the United Nations Sustainable Development Goals, please refer to page 76.
About S
MB
C G
roupTo O
ur Stakeholders
Business S
trategies for C
reating ValueC
orporate Infrastructure S
upporting Value Creation
49SMBC Group Annual Report 2019

Global Markets Business Unit
Senior Managing Executive OfficerHead of Global Markets Business Unit
Hiroshi Munemasa
Contribution to Consolidated Net Business Profit
The Global Markets Business Unit
offers solutions through foreign exchange,
derivatives, bonds, stocks, and other
marketable financial products and also
undertakes asset liability management (“ALM”)
operations which comprehensively control balance
sheet liquidity risks and interest rate risks.
21%
Review of FY2018
In FY2018, we achieved earnings amid a volatile operating environment by
rebalancing risks associated with the increasing severity of the trade disputes
between China and the United States and by implementing other flexible
portfolio management measurements. As a result, net business profit grew
by ¥6.4 billion, to ¥298.5 billion, and ROE was 31.8%.
In sales and trading, foreign exchange-related transactions were brisk. These
brisk transactions were a reflection of our ability to solicit transactions from
various customers by responding to diverse customer needs with high-quality
solutions proposals.
The Global Markets Business Unit is a team of market professionals that transforms economic cycles
into profits by collecting and analyzing information on various global developments to formulate scenarios
and accurately identify short-, medium-, and long-term market trends.
This unit is responsible for efforts to “strengthen sales & trading capability,” one of the Group’s
strategic focuses. Aiming to satisfy as many customers as possible, we will provide customers with optimal
solutions by fully utilizing the market-related insight and experience we have accumulated in order to fulfill
this responsibility.
Another responsibility of the Global Markets Business Unit is to support SMBC Group’s overseas
businesses by efficiently managing assets and liabilities based on consideration for stability and costs.
We continue to expand our investor base and diversify procurement methods for this purpose.
*1 Figures are after adjustments for interest rate and exchange rate impacts.
*2 Figure is on a managerial accounting basis with RwA calculated assuming Basel III reforms are
finalized and excludes IRRBB (Interest-Rate Risk in the Banking Book).
*3. Figures are on a Basel III transitional basis.
FY2018 Increase (Decrease)*1
Gross profit (JPY bn) 333.6 +4.8
Expenses (JPY bn) 54.2 (0.4)
(Overhead ratio) 16.2% (0.4)%
Net business profit (JPY bn) 298.5 +6.4
ROE*2 31.8% +1.4%
RwA*3 (JPY tn) 4.9 (1.2)
Business Strategies for Creating Value Review of Operations by Business Unit
50 SMBC Group Annual Report 2019

1Q 2Q 3Q 4Q 1Q 2Q 3Q 4Q 1Q 2Q 3Q 4Q 1Q 2Q 3Q 4Q’17 ’18 (FY)’16’15
0
20
40
60
80
100
120
140
Turning point of trend
Dynamic portfolio rebalancing
Turning point of trend
Carefully-crafted risk control
Equities
Bonds
Foreign Exchange Transaction Volume
’17 ’18 (FY)’160
200
400
600
800
(USD bn)
(bp)
Funding through Medium- to Long-Term Currency Swaps
Funding amount Five-year dollar-yen basis swap spread
Priority Strategies
Market-Sensitive, Dynamic Portfolio ManagementBy conducting various scenario analyses by dealers around the globe, we will
strive to find opportunities to optimize our risk/reward ratio. We will identify signs
of market change to take advantage of profit opportunities through proactive
monitoring and dynamic but well-calculated market operations.
Solutions Provided through Marketable Financial Products—S&T OperationsThe Global Markets Business Unit is strengthening its sales and trading opera-
tions to create an earnings pillar that is not dependent on market conditions.
Specifically, we intend to respond to customers’ hedging and investment
management needs by enhancing cooperation between domestic and overseas
product sales teams and bolstering our lineup of foreign exchange, derivatives,
bonds, stocks, and other marketable financial products.
Strengthening of Foreign Currency Funding CapabilitiesIn FY2018, we sought to expand our investor base and diversify procurement
methods by issuing Japan’s first contractual law covered bonds along with regu-
lar foreign currency bonds. At the same time, we have been pursuing the ideal
foreign currency funding portfolio by increasing medium- to long-term currency
swaps while being mindful of procurement costs.
To support the overseas businesses of SMBC Group, we will continue to
promote high-quality foreign currency funding emphasizing stability and costs.
At the same time, we will appropriately control our balance sheet in response
to international financial regulations.
Initiatives for Accomplishing Sustainable Development Goals
Issuance of Green Bonds
Green bonds are bonds for which the use of procured funds is restricted to renewable energy and other eco-friendly projects. By issuing green bonds, SMBC Group is contributing to the promotion of environmental businesses and the reduction of environmental impacts. Furthermore, we became the first private Japanese company to issue green bonds to individual customers in December 2018. Going forward, we seek to help drive the development of the market and the preservation of the global environment as a leading Japanese issuer of green bonds.
For more information on SMBC Group’s initiatives for contributing to the accomplishment of the United Nations Sustainable Development Goals, please refer to page 76.
About S
MB
C G
roupTo O
ur Stakeholders
Business S
trategies for C
reating ValueC
orporate Infrastructure S
upporting Value Creation
51SMBC Group Annual Report 2019

Transformation of Business PortfolioIn accordance with the Medium-Term Management Plan,
“SMBC Group Next Stage”, SMBC Group has categorized its
current business portfolio into the four quadrants detailed to
the right (see page 32 for details).
Based on these quadrants, we are undertaking swift
reorganizations of the Group’s businesses in order to optimize
our Group structure while pursuing improvements in capital
and asset efficiency.
Merger of SMBC Nikko Securities and SMBC Friend Securities
Goals of Reorganization
Improve customer satisfaction through increased product offering, product-related research and enhancement of sales channels
Enhance productivity through the optimization of sales personnel staffing
Streamline overlapping functions and management infrastructure to achieve cost saving synergies
Reorganization of the Sumitomo Mitsui Financial Group and Sumitomo Corporation Joint Leasing Partnership
Goals of Reorganization
Engage in the full-scale undertaking of new business initiatives
• Develop of operations in the eco-business, infrastructure, healthcare, and other growth fields
• Grow asset-based finance operations
• Create value chains with the aim of enhancing businesses targeting clients’ commercial channels
Improve capital and asset efficiency
EnhanceGrow
Sumitomo Mitsui Financial Group
Sumitomo Mitsui Financial Group
SMBC Nikko Securities
SMBC Friend Securities
Sumitomo Mitsui Banking Corporation
Sumitomo Mitsui Finance and Leasing
Sumitomo Mitsui Finance and Leasing
SMBC Nikko Securities(Merged with
SMBC Friend Securities)
100%
100%
100%
100% 100%
60%
Sumitomo Mitsui Financial Group
Sumitomo Mitsui Financial Group
Sumitomo Corporation
Sumitomo Corporation
Before Reorganization
Transformation of Business and Asset Portfolio through Group Reorganization
Grow Businesses with strong growth potential to which resources will be allocated as growth drivers
Businesses of which we aim to increase profitability through maximizing synergies and enhancing efficiency on a group-wide basis while allocating resources in a suitable manner
Businesses to which resources will be allocated with the aim of realizing future growth by establishing highly distinctive business models
Businesses that compete with banks that are only subject to domestic capital adequacy standards and whose business models will be revised
Enhance
Build
Transform
After Reorganization
Before Reorganization
After Reorganization
Sumitomo Mitsui Banking Corporation
40%
50% 50%
Business Strategies for Creating Value Special Feature
52 SMBC Group Annual Report 2019

Reorganization Quadrant Timing
Merger of SMBC Nikko Securities and SMBC Friend Securities Grow January 2018
Conversion of The Japan Net Bank, into a consolidated subsidiary of Yahoo! JAPAN Transform February 2018
Change of ownership ratio of (reduction of investment in) POCKET CARD Transform March 2018
Deconsolidation of Kansai Urban Banking Corporation and THE MINATO BANK Transform March 2018
Reorganization of the Sumitomo Mitsui Financial Group and Sumitomo Corporation
Joint Leasing PartnershipEnhance November 2018
Merger of BTPN and Bank Sumitomo Mitsui Indonesia Grow, Build February 2019
Conversion of Sumitomo Mitsui Card Company into a Wholly Owned Subsidiary Grow April 2019
Merger of Sumitomo Mitsui Asset Management and Daiwa SB Investments Build April 2019
Merger of Sumitomo Mitsui Asset Management and Daiwa SB Investments
Goals of Reorganization
Maximize use of personnel, customer base and product lineup to expand through the merger
Lead the industry in areas such as product development and digitalization
Management that effectively controls costs, such as streamlining overlapping management bases and operations
Conversion of Sumitomo Mitsui Card Company into a Wholly Owned Subsidiary
Goals of Reorganization
Develop business structure to form the core of cashless payment strategies
Facilitate flexible strategy formulation and swift strategy execution
Use management resources mutually
BuildGrow
Sumitomo Mitsui Financial Group
CedynaSumitomo Mitsui Card Company
NTT DOCOMO
Sumitomo Mitsui Financial Group
Sumitomo Mitsui Card Company
Cedyna
Note: The two companies were owned through an intermediate holding company
Sumitomo Mitsui Financial Group
Daiwa Securities
MS&AD Insurance Group
Holdings
SUMITOMO LIFE INSURANCE COMPANY
Sumitomo Mitsui DS Asset Management
Company formed through merger of Sumitomo Mitsui Asset Management and Daiwa SB Investments
10.4%15.0%23.5% 50.1%
Before Reorganization
After Reorganization
100% 34%66%
100%
100%
After Reorganization
About S
MB
C G
roupTo O
ur Stakeholders
Business S
trategies for C
reating ValueC
orporate Infrastructure S
upporting Value Creation
53SMBC Group Annual Report 2019

BTPN: A Bank with a Robust Presence in the Retail SectorBTPN was established in 1958 to handle the pensions of
retired military personnel. BTPN focused on providing finan-
cial education and services to retirees, micro-, small, and
medium-enterprises, and people residing in rural areas who
did not possess a bank account. Through such efforts, BTPN
deepened its footprint in Indonesia as a commercial bank with
a robust presence in the mass market segment.
BTPN also developed a reputation as one of Indonesia’s
most innovative banks. While Indonesia’s population exceeds
260 million, an estimated 50% of its adult population does not
possess a bank account. Given such an environment, BTPN
was quick to focus on expanding its digital services in line with
the rapid spread of mobile phones and smartphones, launch-
ing its mobile banking service “BTPN Wow!” in 2015. The aim
of BTPN Wow! is to provide affordable, safe, and convenient
financial services to the many people who do not possess a
bank account. The number of BTPN Wow! users have now
exceeded 6 million. “Jenius,” a mobile banking service for
smartphones that targets the middle-class, was launched in
2016. The number of Jenius users exceeded 1 million by the
end of the service’s second year.
In February 2019, PT Bank Tabungan Pensiunan Nasional Tbk (“BTPN”), an equity-method affiliate of Sumitomo Mitsui
Banking Corporation, merged with PT Bank Sumitomo Mitsui Indonesia (“SMBCI”), a local subsidiary of Sumitomo Mitsui
Banking Corporation, to create PT Bank BTPN Tbk (“Bank BTPN”), a commercial bank with net assets exceeding ¥1
trillion. Bank BTPN will play an important role in realizing SMBC Group’s Asia-centric strategy as a full-line
commercial bank that offers a comprehensive range of banking services in both the wholesale and retail sectors.
Realizing Asia-centric: The New BTPN Opens Its Doors for Business
Transformation into a Full-Line Commercial BankSMBCI was established in 1989 and offered various financial
services targeting the wholesale sector. SMBCI developed a
strong presence in the market for large corporates, namely
Japanese and leading local companies. In recent years,
SMBCI actively engaged in project finance, syndicated loans,
and structured finance transactions in relation to infra-
structure development, a theme which continues to draw
the strong interest of the Indonesian government.
Through its merger with SMBCI, BTPN transformed into a
full-line commercial bank by adding a comprehensive portfolio
of wholesale banking services to its existing portfolio of retail
banking services. The new
bank’s net assets exceed
¥1 trillion, making it the
8th largest Indonesian bank.
New company logo of the merged bank
Business Strategies for Creating Value Special Feature
54 SMBC Group Annual Report 2019

We will be the most preferred bank in Indonesia that changes our customers’ lifestyles
The merger of BTPN and SMBCI to form Bank BTPN represents a unique and
an ideal combination of two complementary banks. With its new vision, to be
Indonesia’s most preferred bank which makes a meaningful difference in the
lives of millions powered by technology, Bank BTPN will become a larger and
stronger bank that contributes more to the country’s economy. We believe
Bank BTPN will be able to unlock the opportunities that generate more valuable
customer solutions across businesses.
Ongki Wanadjati Dana President Director
BTPN Milestones
1958 Established to serve retired military personnel
2008 Listed on the Indonesia Stock Exchange.
2013 SMBC acquired a 24.3% ownership in BTPN via the purchase of shares owned by TPG Nusantara S.à r.l. and other shareholders.
2014 SMBC increased its ownership in BTPN to become the controlling shareholder with a 40.0% ownership stake.
2019 Merged with PT Bank Sumitomo Mitsui Indonesia to form PT Bank BTPN Tbk.
A Strategic Component of Asia-centricSMBC Group’s medium- to long-term vision is: “To be a global
financial group that leads growth in Japan and Asia
by earning the highest trust of our customers.” Furthermore,
“Accelerate our ‘Asia-centric’ strategy” has been stipulated as
one of the Group’s Seven Core Business Areas in the current
Medium-Term Management Plan (FY2017-FY2019).
As part of such efforts, SMBC Group has been pursuing its
Multi-Franchise Strategy, through which it will create a second
and a third SMBC Group in Asia that offers full-line commercial
banking services. Indonesia was selected as the first country
to implement the strategy given its high growth potential, and
the creation of Bank BTPN can be said to be an embodiment
of the strategy’s goal. As a result of the merger, SMBC Group
was able to make significant strides towards realizing its
Asia-centric strategy.
Bank BTPN will leverage the strengths its predecessor
banks have developed over the years to expand the coverage
of its services. In the retail sector, Bank BTPN will work to
expand its presence from the mass market segment to include
middle-class customers, while in the wholesale sector it will
expand its traditional focus on large corporates to include
medium-sized corporate/SME customers. Bank BTPN’s
operations will transcend Indonesia so that it may function as
a strategic component of SMBC Group’s Asia-centric strategy.
Overview of Merged Bank (as of March 2019)
Total assets
192.15trillion IDR
SMBC’s ownership
97.3%
Number of branches
795Number of employees
19,454Number of digital banking customers
7 million
About S
MB
C G
roupTo O
ur Stakeholders
Business S
trategies for C
reating ValueC
orporate Infrastructure S
upporting Value Creation
55SMBC Group Annual Report 2019

Realization of a New Method of Foreign Currency Funding
The prolongation of low interest rates in Japan is placing
downward pressure on the profitability of domestic busi-
nesses. This situation has prompted SMBC to bolster its over-
seas operations, causing the balance of outstanding loans
overseas to quadruple over the past decade and climb above
¥20 trillion. In response to this increase in foreign currency-
denominated assets, SMBC ramped up its foreign currency
funding by working to increase customer deposits and issuing
senior unsecured bonds. We also looked to diversify our
foreign currency funding methods through the issuance of
Australian dollar-denominated bonds and green bonds as part
of our efforts to realize stability in foreign currency funding.
The issuance of covered bonds was one new initiative that
drew our attention in this undertaking. Covered bonds are a
type of secured corporate bond originating in Europe that are
generally issued with collateral provided in the form of a pool
of housing loans and other low-risk assets (cover pool).
Should the issuer default, investors are able to seek recourse
to the issuer and are given priority access to recourse to the
cover pool above other creditors. This dual recourse frame-
work is a major characteristic of covered bonds. These bonds
also feature other investor protection provisions, such as
requirements that the issuer maintain an amount of collateral
in excess of the outstanding principal amount of the bonds.
These bonds are commonly issued overseas, with legal
frameworks pertaining to covered bonds in place in various
European and other countries. However, such frameworks do
not exist in Japan, and there are no prior cases of covered
bonds being issued in this country. It was against this back-
drop that SMBC sought to arrange and issue covered bonds
as a new method of foreign currency funding.
Goals of Covered Bond IssuanceSMBC turned its attention to covered bonds with two main
goals. The first goal was to realize a foreign currency funding
method that is highly viable under extraordinary
circumstances, such as those of high market volatility. In
Europe, the financial crises seen in the 2000s and forward
underscored the importance of covered bonds as a viable
foreign currency funding method for use when conditions are
extreme, spurring an increase in the utilization of such bonds.
The worldwide balance of outstanding covered bonds stood at
€2.5 trillion, and the total amount of covered bonds issued in
2017 climbed as high as €445.0 billion.
The second goal was to diversify our investor base. Until
now, attracting central banks, government institutions, and
other such investors into our conventional senior unsecured
bonds has proven difficult. This difficulty arises from the
tendency of such investors to only invest in highly rated
bonds, such as government bonds and the bonds of govern-
ment agencies. The ratings assigned by rating agencies
display the reliability of bonds. Our senior unsecured bonds
will never be able to exceed the ratings of Japanese govern-
ment bonds. Covered bonds, however, can achieve ratings
that are higher than those of Japanese government bonds,
thereby enabling us to expand our investor base.
Creation of Revolutionary Scheme for Issuance
The greatest obstacle to arranging covered bonds in
Japan was the establishment of a dual recourse framework.
In Europe, there are legal frameworks in place ensuring that
the cover pool is not affected by bankruptcy proceedings
(separation of cover pool from bankruptcy). The legal frame-
works in Japan, however, were thought to obstruct the
development of dual recourse frameworks.
Breaking away from such preconceptions, we made it
possible to realize the separation of the cover pool from
bankruptcy through the use of a revolutionary scheme that
uses the close-out netting principle by applying the Japanese
Netting Act of Specified Financial Transactions Conducted by
Financial Institutions should the issuer default. However, the
ability to fulfill the necessary requirement to issue covered
bonds did not guarantee that there would be demand for this
SMBC has succeeded in issuing Japan’s first contractual law covered bonds. In this section,
we will explain the background and the significance behind the arrangement and issuance of
these covered bonds, which entailed overcoming the challenges presented by a lack of legal
frameworks in Japan in comparison with Europe.
Issuance of Japan’s First Contractual Law Covered Bonds
Business Strategies for Creating Value Special Feature
56 SMBC Group Annual Report 2019

product from investors. SMBC’s covered bonds differ from
conventional covered bonds in their application of the afore-
mentioned Netting Act and in their use of residential
mortgage- backed securities (“RMBS”s) for the cover pool. In
light of these differences, it was unclear whether investors
would welcome these bonds. For this reason, we took steps to
gather input from a wide range of investors, including central
banks, government institutions, asset managers, and banks,
and ongoing discussions were held on how to reflect this input
into the structure. This process led us to judge that investors
would be receptive toward the following structure, which was
then used to issue Japan’s first contractual law covered bond.
Low-Cost Foreign Currency Funding from a Wide Range of Investors
SMBC’s euro-denominated contractual law covered bonds
received a rating of Aaa from Moody’s Investors Service, Inc.,
which exceeded the rating therefrom of A1 assigned to Japa-
nese government bonds. SMBC Group thus gained a method
of foreign currency funding at interest rates that are lower by
0.35% compared to the rate of the euro-denominated senior
unsecured bonds issued in July 2018.
Our contractual law covered bonds were issued in late
October 2018, at the same time as the slump in the senior
unsecured bonds market that followed market volatility stem-
ming from the downgrading of Italian government bonds and
the trade friction between China and the United States. These
covered bonds exhibited their viability as a foreign currency
funding method under extraordinary circumstances as we
were able to raise a sufficient amount of foreign currency
funding, despite the adverse market conditions.
Of the investors that purchased SMBC’s covered bonds, 42%
were fixed income asset managers. The next largest group was
comprised of central banks and official institutions, which ac-
counted for 22% of all investors, a substantially higher level than
would have been seen for our conventional senior unsecured
bonds. This figure is evidence that these bonds have enabled
us to incorporate a group of new investors into our investor base
that was previously out of reach. In this manner, the contractual
law covered bonds achieved their initial goal by making large
contributions to the expansion of our investor base.
Amalgamation of SMBC Group’s High-Level Expertise
Forged through more than six months of coordination, the
contractual law covered bonds were an amalgamation of the
high-level expertise of SMBC Group in the areas of banking,
securities, and trusts. Covered bonds have a history of more
than 250 years in Europe, and there have been attempts to
introduce these bonds into Japan for over a decade. However,
the issuance of such bonds in Japan was deemed to be im-
possible due to the legal restrictions. It was the passion of the
team to overcome these restrictions and realize the issuance of
covered bonds in Japan that drove this undertaking to success.
This accomplishment made waves throughout the market and
legal community in Japan and overseas, with some going as far
as to compare this innovative idea with the egg of Columbus.
We hope that this Aaa-rated scheme of foreign currency
funding will find a wider range of use throughout the market
as a low-cost, stress-resistant foreign currency funding method
and come to contribute to the stabilization of the foreign cur-
rency funding of Japanese financial institutions going forward.
SMBC Group covered bond team
* Total return swap, a derivative transaction in which the principal is swapped together with the economic gains (losses) of an asset
SMBC
Covered bond investors Overseas trustee
Issuer (SMBC’s trust account)
SMBC(TRS
counterparty)
Ability to seek recourse to SMBC or the cover pool (dual recourse)
Covered bond proceeds
Covered bond issuance
Provision of RMBSs as collateral
Covered bond proceeds
TRS* transaction
RMBSs
Cover pool
About S
MB
C G
roupTo O
ur Stakeholders
Business S
trategies for C
reating ValueC
orporate Infrastructure S
upporting Value Creation
57SMBC Group Annual Report 2019

Corporate Infrastructure Supporting Value Creation
SMBC Group Annual Report 201958

60 Corporate Governance
68 SMBC Group Global Advisors
70 Outside Director Interview
72 Sumitomo Mitsui Financial Group Directors
76 Towards Sustainable Development of Society
80 Customer-Oriented Initiatives
83 Internal Audit
84 Compliance
86 Risk Management
90 Human Resources Strategy
94 IT Strategies
96 Communication with Stakeholders
98 Financial Review
Corporate Infrastructure Supporting Value Creation
59SMBC Group Annual Report 2019

Initiatives for Improving Corporate Governance
2002
Establishment of Sumitomo Mitsui Financial Group
Voluntary establishment of Nominating Committee, Compensation Committee, and Risk Committee as internal committees of the Board of Directors
2005Voluntary establishment of Audit Committee as internal committee of the Board of Directors
2006
Formulation of “Basic Policy on Internal Control Systems” through internal control resolution made based on “Our Mission” and “Code of Conduct” in order to establish frameworks for ensuing appropriate operations
2010
Listing of shares on the New York Stock Exchange in order to improve transparency of financial reporting, increase convenience for investors, and diversify fund procurement methods
2014Appointment of independent directors and independent auditors based on stipulations of the Tokyo Stock Exchange
2015
Establishment of the “SMFG Corporate Governance Guideline”
Increase in the number of outside directors to five and the number of outside corporate auditors to three
2016
Strengthening of Group governance by appointing the Chairman of SMBC Nikko Securities as a director of Sumitomo Mitsui Financial Group along with the President of SMBC
Commencement of evaluations of the effectiveness of the Board of Directors
2017
2019
Transition to a Company with Three Committees; increase in the number of outside directors to seven; establishment of voluntary Risk Committee together with legally mandated Nomination Committee, Compensation Committee, and Audit Committee; and appointment of outside directors as chairmen of three legally mandated committees
Institution of new Group governance system through introduction of group-wide business units and CxO system
Transition to the Company with Audit and Supervisory Committee structure by core subsidiaries SMBC and SMBC Nikko Securities
We position “Our Mission” as the universal
philosophy underpinning the management of
SMBC Group and as the foundation for all of
our corporate activities. We are working toward
effective corporate governance as we consider
the strengthening and enhancement of corporate
governance to be one of our top priorities in
realizing “Our Mission.”
Corporate Governance
Our Approach
Corporate Infrastructure Supporting Value Creation
60 SMBC Group Annual Report 2019

Sumitomo Mitsui Financial Group’s Corporate Governance SystemWe have set forth a “Code of Conduct” to serve as action
guidelines across all business activities with the aim of sharing
the principles of “Our Mission” throughout the Group. In
addition, the “SMFG Corporate Governance Guideline,” a
guideline for corporate governance, has been formulated and
disclosed. We are promoting awareness and understanding
regarding these guidelines among all SMBC Group officers
and employees.
SMBC Group employs the Company with Nominating
Committee, etc., structure described in the Companies Act.
This structure was adopted in order to establish a corporate
governance system that is globally recognized and is aligned
with international banking regulations and supervision
requirements and achieve enhanced oversight of the exercise
of duties by the Board of Directors and expedite this exercise
of duties. In addition, core subsidiaries SMBC and SMBC
Nikko Securities transitioned to the Company with Audit and
Supervisory Committee described in the Companies Act in
June 2019.
We realize that there is no perfect form for corporate
governance structures. Accordingly, we will continue working
toward the strengthening and enhancement of corporate
governance in order to realize higher levels of effectiveness.
Reporting line (including personnel right of consent)
Departments
Management CommitteeBusiness execution decisions
Internal Audit Dept.
Board of DirectorsFocus on supervision of executive officers’ and directors’ execution of duties
Internal Committees
Nomination Committee
Compensation Committee
Audit Committee
Risk Committee (Optional)
Outside directors
Inside directors
Outside expert
Internal, non-executive directors
Chairman
Corporate Governance System
Code of Conduct To strive to increase shareholder value whilst also maintaining
healthy relationships with customers, employees, and other stakeholders. To give utmost consideration to the trust which people have in the firm, to abide by all laws and regulations, to maintain a high ethical standard, and to act fairly and sincerely;
To continue improving our knowledge and capability and, at the same time, to raise our productivity in order to provide superior financial services at competitive prices;
To establish a top brand global financial group by understanding the needs of each customer and by providing valuable services which meet those needs;
To be selective and focused in the implementation of our busi-ness strategy, to define and develop the competitive advantages which we have over our competitors and, by allocating manage-rial resources strategically to those businesses, to become a top player in our selected markets;
To be creative, proactive, and courageous in order to be in a leading position in all business areas and always a step ahead of our competitors;
To build a strong organization based on market practice and sound principles whilst reflecting our diverse values. To delegate internal authority under an efficient and effective management system which facilitates speedy decision-making and execution;
To support our business growth and the development of our employees by setting challenging targets within an evaluation and compensation framework which emphasizes their capabilities and achievements.
About S
MB
C G
roupTo O
ur Stakeholders
Business S
trategies for C
reating ValueC
orporate Infrastructure S
upporting Value Creation
61SMBC Group Annual Report 2019

Board of DirectorsRole of the Board of Directors
The Board of Directors of the Company is primarily respon-
sible for making decisions on the matters that are within its
legally mandated scope of authority, such as basic manage-
ment policies, as well as for overseeing the exercise of duties
of executive officers and directors. Authority for execution
decisions other than those legally required to be made by the
Board of Directors will, in principle, be delegated to executive
officers. The purpose for this delegation is to enhance the
oversight function of the Board of Directors and to expedite
the exercise of duties.
The Board of Directors works toward the realization of “Our
Mission” and the long-term growth of corporate value and the
common interests of the shareholders. Any action that may
impede those objectives will be addressed with impartial
decisions and response measures.
Furthermore, the Board of Directors is responsible for estab-
lishing an environment that supports appropriate risk taking
by executive officers. It will develop a system for ensuring the
appropriateness of SMBC Group’s business operations pursu-
ant to the Companies Act and other relevant legislation in
order to maintain sound management. Another responsibility
of the Board of Directors is to exercise highly effective over-
sight of executive officers from an independent and objective
standpoint. Accordingly, the Board of Directors endeavors to
appropriately evaluate company performance and reflect
these evaluations in its assessment of executive officers.
Composition of the Board of DirectorsThe Board of Directors is comprised of directors with various
backgrounds and diverse expertise and experience. The
Company strives to maintain the appropriate number of direc-
tors in order to enable the Board of Directors to function with
the greatest degree of effectiveness and efficiency. In addition,
the Board of Directors is to be comprised of at least two direc-
tors, and more than one-third of all directors should be out-
side directors designated as independent directors based on
the stipulations of the Tokyo Stock Exchange.
As of June 27, 2019, the Board of Directors was comprised
of 15 directors. Ten of the 15 directors did not have business
execution responsibilities at the Company or its subsidiaries,
with seven of these 10 directors being outside directors. The
chairman of Sumitomo Mitsui Financial Group, who does not
have business execution responsibilities, served as the chair-
man of the Board of Directors. This membership ensures an
objective stance toward supervising the exercise of duties by
executive officers and directors.
Outside directors serve as chairmen and members of the
Company’s legally mandated and voluntarily established com-
mittees when necessary, outside directors will request reports
on compliance, risk management, or other matters from the
relevant divisions in order to promote appropriate coordination
and supervision.
Outside directors 7
Internal directors (non-executive)
3
Internal directors (executive)
5
Change in Number of Directors (Year on Year)
17 15Non-executive
directors
10 67%
Composition of the Board of Directors
Areas of Expertise
Management 3
Finance / accounting 1
Law 2
Diplomacy 1
Corporate Infrastructure Supporting Value Creation Corporate Governance
62 SMBC Group Annual Report 2019

Chairman Member
Nomination Committee(1 inside director,
5 outside directors)
Compensation Committee(2 inside directors, 4 outside directors)
Audit Committee(2 inside directors, 3 outside directors)
Risk Committee(1 inside director, 4 outside
directors, and outside experts)
Masayuki Matsumoto Outside directorArthur M. Mitchell Outside directorShozo Yamazaki Outside directorMasaharu Kohno Outside directorYoshinobu Tsutsui Outside directorKatsuyoshi Shinbo Outside directorEriko Sakurai Outside directorTakeshi Kunibe Chairman of the Board
Jun OhtaDirectorPresident
Toru NakashimaDirectorSenior Managing Corporate Executive Officer
Atsuhiko Inoue DirectorToru Mikami DirectorHirohide Yamaguchi*1 Outside expertTatsuo Yamasaki*2 Outside expert
*1 Chairman of the Advisory Board of Nikko Research Center, Inc., former Deputy Governor of the Bank of Japan*2 Specially appointed professor of International University of Health and Welfare
Internal CommitteesNomination Committee
The Nomination Committee is responsible for preparing pro-
posals regarding the appointment and dismissal of directors to
be submitted to the general meeting of shareholders. This
committee also deliberates on matters regarding personnel
decisions pertaining to officers of the Company and major
subsidiaries and the selection of successors to the presidents
of the Company and of core subsidiaries. The Nomination
Committee comprises one internal director and five outside
directors. In order to ensure transparency in deliberations on
officer personnel decisions, an outside director has been
appointed to serve as the chairman of this committee.
Compensation CommitteeThe Compensation Committee is responsible for deciding
policies for determining the compensation of executive officers
and directors of the Company as well as compensation amounts
of individual executive officers and directors of the Company
based on those policies. In addition, this committee deliber-
ates on the policies for determining the compensation of the
executive officers of major subsidiaries and the compensation
amounts of individual executive officers of the Company. The
Compensation Committee is comprised of two internal directors
and four outside directors. In order to ensure transparency in
deliberations on officer compensation, an outside director has
been appointed to serve as the chairman of this committee.
Audit CommitteeThe Audit Committee is responsible for the auditing of the
execution of duties by the executive officers and directors of
the Company, preparation of audit reports, and determination
of the content of proposals for election, dismissal, or non-
reelection of the accounting auditor to be submitted to the
general meeting of shareholders. Committee members are
appointed by this committee to perform audits of the opera-
tions and assets of the Company and its subsidiaries. The
Audit Committee is comprised of two internal directors and
three outside directors. An outside director has been ap-
pointed to serve as the chairman of this committee in order to
guarantee the objectivity of audits and independence from
business execution. In principle, at least one member of this
committee is to possess specialized expertise in finance.
Risk CommitteeThe Risk Committee is responsible for deliberation on
matters relating to environmental and risk awareness, the
operation of the Risk Appetite Framework, and the implemen-
tation of risk management systems as well as other important
matters pertaining to risk management and reporting to the
Board of Directors on these matters. The Risk Committee is
comprised of one internal director, two outside directors, and
two outside experts.
Internal Committee Composition
About S
MB
C G
roupTo O
ur Stakeholders
Business S
trategies for C
reating ValueC
orporate Infrastructure S
upporting Value Creation
63SMBC Group Annual Report 2019

In order for an outside director or outside corporate auditor (“Outside Director or Corporate Auditor”) of the Company to be
classified as independent, they must not fall under, or have recently fallen under, any of the following categories:
1Major Business Partner
• An entity that has the Company or SMBC as a major business partner or an executive director, officer, or other person engaged in the execution of business of such an entity.
• An entity that is a major business partner of the Company or SMBC or an executive director, officer, or other person engaged in the execution of business of such an entity.
2 Specialist
• A legal expert, accounting expert, or consultant who has received money or other property from the Company or SMBC averaging more than JPY 10 million per year over the last three years, in addition to any compensation received as a director or corporate auditor.
• A member of a Juridical Person, etc., or other organization that provides specialist services, such as a law firm, accounting firm, or consulting firm, which has received large amounts of money or other property from the Company or SMBC.
3 DonationsA person who has received – or an executive director, officer, or other person engaged in the execution of business of an entity which has received – on average over the last three years, donations or other payments from the Company or SMBC in excess of the greater of JPY 10 million per year and 2% of the recipient’s annual revenue.
4Major Shareholder
A major shareholder of the Company or an executive director, officer, or other person engaged in the execution of business of a major shareholder (including anyone who has been a major shareholder, or an executive director, officer, or other person engaged in the execution of business of a major shareholder, within the last three years).
5Close Relative
A close relative of any person (excluding non-material personnel) who falls under any of the following:(1) A person who falls under any of 1 through 4 above; or(2) A director, corporate auditor, executive officer, or other person engaged in the execution of business of the Company or a
subsidiary thereof.
• Participation in meetings of general managers of core Group companies and other executive team meetings, tours of bases of Group companies, and discussions with presidents of Group companies for facilitating a greater understanding of business operations and business activities
• Explanatory forums on Board of Directors’ meeting agenda items prior to Board meetings to assist in understanding of items
• Study sessions for outside directors led by external lecturers on topics such as corporate governance and financial regulations
• Small meetings with institutional investors to provide opportunities for understanding the perspectives of stakeholders
• Training through SMBC Academy training website for employees
Please see Reference 7 of the “SMFG Corporate Governance Guideline” for more information.https://www.smfg.co.jp/english/aboutus/pdf/cg_guideline_e.pdf
Outside Director and Corporate Auditor Independence Standards
Meetings Only Attended by Outside DirectorsAs described in the “SMFG Corporate Governance Guideline,”
outside directors may hold meetings that only outside direc-
tors may attend to serve as forums for building consensus and
exchanging information with regard to matters pertaining to
corporate governance and businesses from an independent
and objective standpoint. In FY2018, three such meetings
were held. During these meetings, outside directors engaged
in vigorous discussion regarding topics such as the ideal
procedures for selecting agenda items based on the role of
the Board of Directors and management issues for SMBC
Group. The results of these discussions were communicated
to management.
Support Systems for Outside DirectorsThe Company recognizes that outside directors require an
in-depth understanding of the Group’s business operations
and business activities. Accordingly, we endeavor to continu-
ally supply outside directors with the information and insight
on business activities that is necessary to supervise manage-
ment while also providing the opportunities needed to fulfill
their roles.
Initiatives to support directors in FY2018 included the
following.
Corporate Infrastructure Supporting Value Creation Corporate Governance
64 SMBC Group Annual Report 2019

Evaluation of the Board of Directors’ EffectivenessThe “SMFG Corporate Governance Guideline” contains provi-
sions on evaluating the effectiveness of the Board of Directors.
In accordance with these provisions, annual analyses and
evaluations are conducted by the Board of Directors to deter-
mine whether or not it is executing its duties in line with the
guideline, and the results of these analyses and evaluations
are disclosed.
In FY2018, the evaluation focused on the four areas de-
scribed below, which are areas for which provisions exist in
Japan’s Corporate Governance Code and the “SMFG Corporate
Governance Guideline.” All seven outside directors were asked
for their opinions regarding these areas at meetings of the
Board of Directors held in April and May 2019, and interviews
of internal directors were conducted thereafter. The primary
subject of interviews with internal directors was their expecta-
tions of outside directors. Discussions based on the findings
took place at Board of Directors’ meetings in June, after which
analyses and evaluations were carried out to determine wheth-
er or not the Board of Directors was executing its duties in line
with the “SMFG Corporate Governance Guideline.” Moreover,
reviews by external specialists with expertise from developed
nations are received at each stage of the evaluation process.
Composition of the Board of Directors
As of March 31, 2019, the Board of Directors consisted of 17 direc-tors, seven of which were outside directors. Accordingly, outside directors represented over 40% of all directors.
It was once again acknowledged that the outside directors represented a diverse range of expertise, genders, and nationalities and that the Board of Directors features an atmosphere conducive to outside directors voicing opinions regarding management.
There is a need to continue evaluating and revising the number of members and the composition of the Board of Directors to ensure that the Board of Directors is suitable based on its role.
Proceedings of the Board of Directors
The number and content of agenda items as well as the amount of time dedicated to discussion of agenda items were more or less around the appropriate level.
Discussions were livelier than in the previous fiscal year due to the allocation of time to discuss topics not included in agenda and seating arrangement-related measures.
The following measures were taken to encourage frank discussion at meetings of the Board of Directors.
• Preparation of clearer explanations and materials on the points to be discussed
• Measures related to the direction of proceedings
Role of the Board of Directors
Steps are taken to invigorate discussions while taking advantage of the highly specialized expertise of the outside directors. These discussions were geared toward medium- to long-term improvements in corporate value based on the interests of various stakeholders while incorporating important matters related to business strategies to contribute to the fulfillment of “Our Mission.”
Based on the executive-side discussions of the Management Commit-tee, matters related to business plans and other basic management policies as well as the status of the business execution were presented and reported on several occasions. As a result, effective deliberations on these matters were able to take place and oversight functions were exercised properly.
Further evaluations and revisions are necessary for enabling outside directors to better exercise their functions based on the issues and future direction for SMBC Group, ongoing, in-depth discussions on the overarching management issues (big picture) pertaining to medium- to long-term targets, and the expectations of outside directors.
Support Systems for Outside Directors
Information necessary for making flexible management decisions in a changing operating environment and for exercising effective oversight functions continued to be supplied to Board of Directors’ members in an appropriate and timely manner.
The Company continued to provide systems for effectively supporting the Board of Directors in making management decisions through venues such as study sessions for outside directors and forums for discussions between outside directors and internal directors, executive officers, and the accounting auditor.
It is desirable for the Company to continue promoting initiatives for utilizing the insight of outside directors (such as by arranging forums for exchanges of valuable information between outside directors or between the executive and oversight functions and increasing the amount of information provided to outside directors).
Overview of Evaluation Results
Effectiveness evaluation
Implementation (1 year)
TargetsImprovement
proposals
PDCA Cycle
About S
MB
C G
roupTo O
ur Stakeholders
Business S
trategies for C
reating ValueC
orporate Infrastructure S
upporting Value Creation
65SMBC Group Annual Report 2019

Providing more appropriate incentives for executives
Further aligning the interests of executives with those of shareholders
Compensation Components Payment Standards (Range of Variation) Payment Method
Base salary Fixed compensation • Cash
Bonus (cash) Compensation determined based on SMFG’s annual performance (0%–150%)Standard levels × annual performance of SMFG and SMBC as well as on the performance of the executive
• Cash: 70%• Restricted stock: 30%Bonus (Stock
Compensation Plan II)
Stock Compensation Plan I
Compensation determined based on SMFG’s medium-term performance, etc. (0%–150%)Standard levels × SMFG’s medium-term performance, etc.
[Performance Indices]
• Restricted stock
Stock Compensation Plan III (Promotion reward plan) • Restricted stock
Applicable to malus and claw-back provisions
Portion of stock-based com
pensation: 25
%
Portion of variable com
pensation: 40
%Category Performance Indices
Financial Targets
Capital Efficiency ROE/RORA
Cost Efficiency Overhead ratio
Financial Soundness Common equity tier 1 capital ratio
Growth Growth (rate/amount) of net profit
Shareholder ValueTotal shareholder return
Dividend per share
Customer Value Customer satisfaction surveys, etc.
1. Providing more appropriate incentives for executives,
strengthening linkage with our short-, medium-, and
long-term performance, and
2. Further aligning the interests of executives with those
of shareholders, by increasing the weight of stock
compensation and enhancing the shareholding of
our executives.
Foster a prudent risk culture expected of a financial institution
Executive Compensation System
Compensation ProgramWe revised the executive compensation program and
introduced new Stock Compensation Plans as a part of the
executive compensation program, for the purpose of:
We also introduced the malus (forfeiture) of restricted stock
and the claw-back of vested stock allocated to the executives
under the Plans to restrain excessive risk-taking and foster a
prudent risk culture expected of a financial institution.
Corporate Infrastructure Supporting Value Creation Corporate Governance
66 SMBC Group Annual Report 2019

Executive Management Systems
Management CommitteeThe Management Committee is set up under the Board
to serve as the top decision-making body. The Management
Committee is chaired by the President of Sumitomo Mitsui
Financial Group with other members including executive
officers and other officers designated by the President.
The President of Sumitomo Mitsui Financial Group
considers important matters relating to the execution of
business in accordance with the basic policies set by the
Board of Directors and based on discussions held by the
committee members.
Group-Wide Business Units and CxO SystemIn April 2017, the Company introduced group-wide
business units and the CxO system with the aim of enhancing
Group management. The group-wide business unit structure
entailed the creation of the Retail Business Unit, the Whole-
sale Business Unit, the International Business Unit, and the
Global Markets Business Unit. The goal of this structure is to
heighten our ability to address the various needs of customers
on a group-wide basis by enabling the business units to
formulate and implement business strategies based on their
respective customer segments. The CxO system entails the
appointment of nine Group chief officers in charge of specific
areas in addition to the Group CEO (President of Sumitomo
Mitsui Financial Group). This system is meant to improve
Group management capabilities centered on the holding
company. The heads of business units as well as the chief
officer positions will, in principle, be filled with executive
officers of the Company, with the one exception being the
Group Chief Audit Executive (CAE). Individuals appointed to
these positions are expected to exercise their duties as the
person responsible for overseeing their business unit or head
office division and report on the execution of their duties to
the Board of Directors.
About S
MB
C G
roupTo O
ur Stakeholders
Business S
trategies for C
reating ValueC
orporate Infrastructure S
upporting Value Creation
67SMBC Group Annual Report 2019

SMBC Group Global Advisors
SMBC Group Global Advisors (“Global Advisors”) act in an advisory capacity to the SMBC
Group Management Committee by attending SMBC Group Global Advisory Meetings, which we
hold on a regular basis.SMBC Group appointed Global Advisors to provide advice to it on global business and on political and
economic issues in Americas, EMEA and Asia.
At SMBC Group Global Advisory Meetings, advisors inform the Management Committee of trends and
developments in the financial sector and the political and economic environments of the respective regions.
The Global Advisors also provide regular insight in respect of political and economic issues relating to the
formulation of strategy by SMBC Group and key risks faced by SMBC Group.
The Third SMBC Group Global Advisory Meeting was held in
Tokyo in May 2019. Five SMBC Group Global Advisors and
members of the Management Committee took part in the
meeting, and actively discussed the business environment,
the business trends, and the global affairs which we need to
take into consideration when formulating the next Medium-
Term Management Plan.
Especially in regards to the business trends in the financial
services sector, various opinions were raised concerning how
SMBC Group plays roles in the market and what kind of
strategy it should focus on, as the digitalization has been
rapidly progressing and the threats of new entrants has
been increasing.
The Third SMBC Group Global Advisory Meeting
In addition to that, the business environment was also
well discussed from the viewpoints of risks which SMBC
Group needs to take into consideration in its global business
operations, such as the prolonged US-China tensions.
SMBC Group states in its Vision: “We will become a global
financial group that, by earning the highest trust of our
customers, leads the growth of Japan and the Asian region”
and will actively leverage the expertise of the Global Advisors
in achieving the realization of that Vision.
Corporate Infrastructure Supporting Value Creation Corporate Governance
68 SMBC Group Annual Report 2019

SMBC Group Global Advisors
Dr. Andreas Dombret
Mr. Andrew N. Liveris
Sir David Wright
Mr. Cesar V. Purisima
Mr. Joseph Yam
Career summary
2010–2018
A member of the Executive Board, Deutsche Bundesbank
2005–2009
Vice Chairman Europe, Bank of America
Career summary
2017–2018
Executive Chairman, DowDuPont Inc.
2006–2017
Chairman and CEO, The Dow Chemical Company
Career summary
2003–2017
Vice Chairman, Barclays
1996–1999
British Ambassador to Japan
Career summary
2010–2016
Secretary of Finance of the Republic of the Philippines
2004–2005
Secretary of Trade and Industry of the Republic of the Philippines
Career summary
2017–Present
A member of the Executive Council, Hong Kong SAR
1993–2009
Chief Executive of the Hong Kong Monetary Authority
Dr. Robert D. Hormats
Career summary
2013–Present
Vice Chairman, Kissinger Associates
2009–2013
United States Under Secretary of State
About S
MB
C G
roupTo O
ur Stakeholders
Business S
trategies for C
reating ValueC
orporate Infrastructure S
upporting Value Creation
69SMBC Group Annual Report 2019

Outside Director Interview: Selection Process for the New Group CEO
FY2019 marked the first time our Group CEO changed since Sumitomo Mitsui Financial Group transferred to a Company with Three Committees. Could you please describe the selection process that was taken?
I was appointed as an outside director of Sumitomo Mitsui Financial Group in 2017, the same year in which the company transferred to a Company with Three Committees. In terms of internal committees, I am a member of the Compensation Committee and I am the Chairman of the Nomination Commit-tee. The Nomination Committee has been constructed in a manner which stresses objectivity and transparency, with five of its six members being outside directors. Of course, the quality of discussions takes precedence over the committee’s format. Repeated discussions took place at the Nomination Committee meetings for more than one year regarding the selection of the new Group CEO, and I am confident that the deliberations were conducted in an objective and transparent manner.
The Nomination Committee established a number of specific points which needed to be considered when selecting the new Group CEO after carefully studying the business environment and business operations of SMBC Group and the qualities we believed the Group’s leader needed to possess. For example, in order to realize SMBC Group’s medium- to long- term vision of becoming a global financial group, we believe that the success-ful candidate would need to possess a broad global-based perspective, deep insights, and a creative imagination. As such, these qualities were included in the selection criteria. The selection criteria were by no means limited to abilities and skills, they also included character and behavioral traits, for example the tenacity and persistence to assemble timely decisions and to implement those decisions, the ability to form and deploy outstanding teams, leadership and optimism which demonstrate courage, and grit/tolerance. Based on such qualities, the Nomination Committee came to its final decision in December 2018 following a deliberate selection process, which included candidate interviews.
Q
Corporate Infrastructure Supporting Value Creation Corporate Governance
Sumitomo Mitsui Financial GroupDirectorChairman of the Nomination Committee
Yoshinobu Tsutsui
70 SMBC Group Annual Report 2019

Could you please share with us some points to which you paid particular attention during the Nomination Committee’s selection process?
I did not focus on any single point during the selection process. The reason being that the criteria required of the individual selected to lead SMBC Group are multi-faceted and diverse. My focus was on whether the candidates satisfied all of the required criteria to a very high standard, and I believe that the other members of the Nomination Committee shared this mindset, which allowed us to engage in deliberations based on a common understanding. The purpose of involving outside directors in this type of process is to ensure the presence of opinions that are based on impartiality, fairness, and neutrality. I believe this is precisely what shareholders and other stakeholders expect. As such, I paid very careful attention to ensure that such values were reflected in the discussions I guided as the Chairman of the Nomination Committee. Mr. Ohta was selected as the new Group CEO, and I have no doubt whatsoever that SMBC Group’s stakeholders understand why Mr. Ohta was selected once they refer to the required abilities and skills, experience, and character and behavioral traits that I mentioned earlier. If we take the aforementioned “possess a broad global-based perspective, deep insights, and a creative imagination” as an example, Mr. Ohta has been a leader in SMBC’s project finance business since its infancy more than 20 years ago. Project finance has grown into a business in which SMBC Group is a top-tier global player. Mr. Ohta also has abundant experience conducting business on the global stage, including from his experience residing in Singapore. In addition, Mr. Ohta accumu-lated considerable experience and knowledge concerning digital technology, which is rapidly growing in importance in the finan-cial sector, during his tenure as CDIO where he was responsible for a number of SMBC Group’s new business strategies, for example cashless payments. Having said this, if I was asked what quality I consider to be most important to a business leader, and I was to disregard my role as Chairman of the Nomination Committee, I would reply: “leadership.” While similar words exist, for example captaincy, they give the image of individuals forcibly imposing their will on others. The leadership I refer to is the ability to attract people and instill a strong sense of loyalty in them. An individual making the most of his character and insights, in other words his personal capabilities, to guide SMBC Group. This is the leadership which I am referring to.
With the goal of ensuring impartiality, fairness, and neutrality the Nomination Committee engaged in deliberations focusing on the qualities I discussed earlier, but I want to stress the fact that Mr. Ohta certainly possesses, in ample amounts, the type of leadership which I just shared with you.
SMBC Group has stated that becoming a global financial group is its medium- to long-term vision. What do you think is the most important factor to realizing this vision?
I believe the most important factor is to strengthen SMBC Group’s corporate governance on a global basis. While it is also necessary to devote resources to create the framework itself, as SMBC Group has been making steady progress in this regard I believe that the focus should now be on further enhancing the framework’s effectiveness. In order for this to happen, SMBC Group employees must address and resolve existing differences in perception by communicating with each other, and this needs to be done on a global basis. People will always have different perceptions. For example, employees will feel different levels of urgency regarding a particular risk. If we look at SMBC Group, differ-ences in perception exist between Group companies, business units, administrative departments and front office departments, domestic and overseas offices, even between customers and markets. Creating a system which can promptly detect and resolve such differences will increase the effectiveness of SMBC Group’s corporate governance framework. The key to achieving this is to develop personnel who are highly sensitive to such differences. I believe that developing as many such personnel as possible is a critical part of enhancing SMBC Group’s global corporate governance capabilities. I was President of the Nippon Life Insurance Company for seven years starting in 2011. During this time I failed to sense a critical difference in the perception of the company’s employees which led to the deterioration of a particular issue. As such, I have consistently focused on the effectiveness of SMBC Group’s corporate governance in my role as an outside director. I will continue to devote my utmost efforts to support the realization of SMBC Group’s Medium-Term Management Plan and the sustained improvement of SMBC Group’s corporate value by proactively voicing my views, which reflect my experiences as a business leader, at Board of Director, Nomination Committee, and Compensation Committee meetings.
Q
Q
About S
MB
C G
roupTo O
ur Stakeholders
Business S
trategies for C
reating ValueC
orporate Infrastructure S
upporting Value Creation
71SMBC Group Annual Report 2019

Sumitomo Mitsui Financial Group Directors (As of June 27, 2019)
Makoto TakashimaDirectorPresident of SMBC
Jun OhtaDirectorPresident (Representative Corporate Executive Officer)Group CEO
Takeshi KunibeChairman of the Board
Haruyuki NagataDirector Senior Managing Corporate Executive OfficerGroup CRODirector and Senior Managing Executive Officer of SMBC
Career summary
1982 Joined Sumitomo Bank
2009 Executive Officer of SMBC
2012 Managing Executive Officer of SMBC
2014 Senior Managing Executive Officer of SMBC
2016 Director and Senior Managing Executive Officer of SMBC
2017 President of SMBC (to present)
Director of the Company (to present)
Career summary
1982 Joined Sumitomo Bank
2009 Executive Officer of SMBC
2012 Managing Executive Officer of SMBC
2013 Managing Executive Officer of the Company
2014 Senior Managing Executive Officer of the Company
Senior Managing Executive Officer of SMBC
Director of the Company
2015 Director and Senior Managing Executive Officer of SMBC
2017 Director and Deputy President of the Company
Resigned as Director of SMBC
Director Deputy President and Corporate Executive Officer of the Company
2018 Director and Deputy President of SMBC
2019 Director President of the Company (to present)
Resigned as Director of SMBC
Career summary
1976 Joined Sumitomo Bank
2003 Executive Officer of Sumitomo Mitsui Banking Corporation (“SMBC”)
2006 Managing Executive Officer of SMBC
2007 Managing Executive Officer of the Company
Director of the Company
2009 Director and Senior Managing Executive Officer of SMBC
2011 President and Chief Executive Officer of SMBC
2017 President of the Company
Resigned as Director of SMBC
Director President of the Company
2019 Chairman of the Board of the Company (to present)
Career summary
1985 Joined Mitsui Bank
2011 General Manager of Financial Accounting Department of the Company
2013 Executive Officer of SMBC
2015 Managing Executive Officer of SMBC
2016 Managing Executive Officer of the Company
2018 Director and Managing Executive Officer of SMBC
Director and Senior Managing Executive Officer of SMBC (to present)
2019 Senior Managing Corporate Executive Officer of the Company
Director Senior Managing Corporate Executive Officer of the Company (to present)
Corporate Infrastructure Supporting Value Creation Corporate Governance
72 SMBC Group Annual Report 2019

Toru NakashimaDirector Senior Managing Corporate Executive OfficerGroup CFO, Group CSODirector and Senior Managing Executive Officer of SMBC
Tetsuya KuboDirectorRepresentative Director, Chairman of SMBC Nikko
Atsuhiko InoueDirectorDirector of SMBC
Toru MikamiDirector
Career summary
1986 Joined Sumitomo Bank
2013 General Manager of Consumer Business Planning Department of the Company
2014 Executive Officer of SMBC
2015 General Manager of Corporate Planning Department of the Company
2016 Managing Executive Officer of SMBC
2017 Managing Executive Officer of the Company
2019 Director and Managing Executive Officer of SMBC
Senior Managing Corporate Executive Officer of the Company
Director and Senior Managing Executive Officer of SMBC (to present)
Director Senior Managing Corporate Executive Officer of the Company (to present)
Career summary
1976 Joined Sumitomo Bank
2003 Executive Officer of SMBC
2006 Managing Executive Officer of SMBC
2008 Managing Executive Officer of the Company
2009 Senior Managing Executive Officer of the Company
Director and Senior Managing Executive Officer of SMBC
2011 Deputy President and Executive Officer of the Company
Director and Deputy President of SMBC
Director of SMBC Nikko Securities Inc. (“SMBC Nikko”)
Director of the Company
2013 Resigned as Director of the Company
Resigned as Director of SMBC
Representative Director, President & CEO of SMBC Nikko
2016 Representative Director, Chairman of SMBC Nikko (to present)
Director of the Company (to present)
Career summary
1981 Joined Sumitomo Bank
2008 Executive Officer of SMBC
2011 Managing Executive Officer of SMBC
2014 Senior Managing Executive Officer of the Company
Director and Senior Managing Executive Officer of SMBC
Director of the Company
2015 Resigned as Director of the Company
Senior Managing Executive Officer of SMBC
2019 Director of the Company (to present)
Director of SMBC (to present)
Career summary
1984 Joined Sumitomo Bank
2006 General Manager of Legal Department of SMBC
2013 Co-General Manager of General Affairs Department of the Company
2015 Senior Manager of Head Office of SMBC
Standing Corporate Auditor of the Company
2017 Director of the Company (to present)
About S
MB
C G
roupTo O
ur Stakeholders
Business S
trategies for C
reating ValueC
orporate Infrastructure S
upporting Value Creation
73SMBC Group Annual Report 2019

Masayuki MatsumotoDirectorSpecial Advisor of Central Japan Railway Company
Shozo YamazakiDirectorCertified public accountant
Arthur M. MitchellDirectorAttorney at law, admitted in New York, the U.S.A. and Foreign Attorney in Japan
Masaharu KohnoDirectorFormer diplomat
Career summary
1970 Joined Tohmatsu Awoki & Co. (currently Deloitte Touche Tohmatsu LLC)
1974 Registered as a certified public accountant (to present)
1991 Representative Partner of Tohmatsu & Co.(currently Deloitte Touche Tohmatsu LLC)
2010 Retired from Deloitte Touche Tohmatsu LLC
Chairman and President of The Japanese Institute of Certified Public Accountants
2013 Advisor of The Japanese Institute of Certified Public Accountants (to present)
2014 Professor of Tohoku University Accounting School
2017 Director of the Company (to present)
Career summary
1976 Registered as an attorney at law, admitted in New York, the U.S.A. (to present)
2003 General Counsel of the Asian Development Bank
2007 Joined White & Case LLP
2008 Registered as Foreign Attorney in Japan (to present)
Registered Foreign Attorney in Japan at White & Case LLP (to present)
2015 Director of the Company (to present)
Career summary
1973 Joined Ministry of Foreign Affairs of Japan
2005 Director-General of Foreign Policy Bureau in Ministry of Foreign Affairs of Japan
2007 Deputy Minister for Foreign Affairs (in charge of economy) of Ministry of Foreign Affairs of Japan
2009 Ambassador of Japan to Russia
Ambassador of Japan to Russia, Armenia, Turkmenistan and Belarus
2011 Ambassador of Japan to Italy
Ambassador of Japan to Italy, Albania, San Marino and Malta
2014 Retired from office
2015 Director of the Company (to present)
Sumitomo Mitsui Financial Group Directors (As of June 27, 2019)
Career summary
1967 Joined the Japanese National Railways
1987 Joined Central Japan Railway Company
2004 President and Representative Director of Central Japan Railway Company
2010 Vice Chairman and Representative Director of Central Japan Railway Company
2011 Resigned as Director of Central Japan Railway Company
President of Japan Broadcasting Corporation
2014 Retired from Japan Broadcasting Corporation
Special Advisor of Central Japan Railway Company (to present)
2015 Director of SMBC
2017 Director of the Company (to present)
Retired as Director of SMBC
Corporate Infrastructure Supporting Value Creation Corporate Governance
74 SMBC Group Annual Report 2019

Please see page 135 for SMBC directors, Audit and Supervisory Committee.
Note: Messrs. and Ms. Matsumoto, Mitchell, Yamazaki, Kohno, Tsutsui, Shinbo and Sakurai satisfy the requirements for an “outside director” under the Companies Act.
Yoshinobu TsutsuiDirectorChairman of Nippon Life Insurance Company
Eriko SakuraiDirectorChairman and CEO of Dow Toray Co., Ltd
Katsuyoshi ShinboDirectorAttorney at law
Career summary
1977 Joined Nippon Life Insurance Company
2004 Director of Nippon Life Insurance Company
2007 Director and Executive Officer of Nippon Life Insurance Company
Director and Managing Executive Officer of Nippon Life Insurance Company
2009 Director and Senior Managing Executive Officer of Nippon Life Insurance Company
2010 Representative Director and Senior Managing Executive Officer of Nippon Life Insurance Company
2011 President of Nippon Life Insurance Company
2017 Director of the Company (to present)
2018 Chairman of Nippon Life Insurance Company (to present)
Career summary
1987 Joined Dow Corning Corporation
2008 Director of Dow Corning Toray Co., Ltd.
2009 Chairman and CEO of Dow Corning Toray Co., Ltd.
2011 Regional President -Japan/Korea of Dow Corning Corporation
2015 President and Representative Director of Dow Corning Holding Japan Co., Ltd.
Director of the Company (to present)
2018 Executor, Dow Switzerland Holding GmbH, which is a Representative Partner of Dow Silicones Holding Japan G.K. (to present)
Chairman and CEO of Dow Toray Co., Ltd. (to present)
Career summary
1984 Registered as an attorney at law (to present)
1999 Attorney at law at Shinbo Law Office (currently Shinbo & Partners) (to present)
2015 Corporate Auditor of SMBC
2017 Director of the Company (to present)
Resigned as Corporate Auditor of SMBC
About S
MB
C G
roupTo O
ur Stakeholders
Business S
trategies for C
reating ValueC
orporate Infrastructure S
upporting Value Creation
75SMBC Group Annual Report 2019

Promotion of Renewable Energy through Financial Functions
SMBC Group is proactive in its efforts to reduce environmental
impacts through its business. For example, we are helping
promote the spread of renewable energy projects that use
natural forces, such as solar and wind, to generate power. As a
comprehensive financial group, we are uniting all Group com-
panies and capitalizing on their unique characteristics in this
undertaking. Accordingly, support for such projects is provided
by SMBC through financing, SMBC Nikko Securities through
investment, SMBC Trust Bank through contracting related to
generation equipment and sites, and Sumitomo Mitsui Finance
and Leasing through leasing of generation equipment.
In addition, SMBC Group has issued four green bonds, a
type of bond that is used to collect funds to be exclusively
allocated to eco-friendly projects. Furthermore, the SDGs
Finance Department established within SMBC Nikko Securi-
ties’ Capital Markets Division is playing a central role in the
provision of support to customers seeking to issue green or
social bonds.
Initiatives for Supporting the Environment
¥30.0–¥40.0billion
7.8%
Physical Risks Identified through Scenario Analyses (Projected increase in credit costs)
Carbon-Related Asset Exposure Ratio
EnvironmentRenewable Energy Project Funding Amount (FY2018)
¥520.0billion
Green Bond Issues
Date of Issue Issuer Amount
October 20, 2015Sumitomo Mitsui Banking Corporation
US$500 million
October 11, 2017Sumitomo Mitsui Financial Group
€500 million
December 20, 2018Sumitomo Mitsui Banking Corporation
US$227.8 million
AUD83.2 million
May 30, 2019Sumitomo Mitsui Financial Group
€500 million
Towards Sustainable Development of Society
Our Approach
On a global scale, we are currently facing various environmental issues,
such as climate change resulting from global warming, as well as social
issues, such as human rights violations. In Japan, we must address various
challenges arising in conjunction with changes to the social structure, such
as rapid population aging and the contraction of the workforce.
SMBC Group believes that it is the social responsibility of a company to
contribute to the sustainable development of society as a whole by providing
stakeholders with even higher value through the course of its business.
Corporate Infrastructure Supporting Value Creation
76 SMBC Group Annual Report 2019

Credit PolicyIn the Credit Policy of SMBC, which contains our overall fi-
nancing policy, guidelines, and rules, we declare that we will
cease to provide financial support to borrowers engaged in
businesses contrary to public responsibility, or which may
have a significant negative impact on the global environment.
Caution for environmental, social, and other impacts is
practiced with regard to the areas detailed to the right.
For more information, please refer to Sumitomo Mitsui Financial Group’s corporate website.
https://www.smfg.co.jp/english/responsibility/smfgcsr/esg_initiative/risk/
• Defense manufacturing, cluster munitions, and other armament• Palm oil plantation developments• Deforestation• Coal-fired power plants• Soil contamination and asbestos
Response to Climate Change (Announcement of Support for TCFD)
We announced our support of the Task Force on Climate-related Financial Disclosures (TCFD)*
in December 2017, and we are performing climate change scenario analysis and working together
with customers to address the root causes of climate change and help realize a low-carbon society.
The following initiatives are being carried out with regard to the four areas advocated in the
recommendations of the TCFD.
Governance
We have established Group environmental policies to continuously implement measures to make our corporate activities conducive to preserving the global environment and curbing pollution. The Basic Policy on Climate Change is reflected in SBMC Group's business strategy based on the discussions of the Corporate Sustainability Committee and decisions of the Executive Committee, and the details of our initiatives are reported regularly to the Board of Directors.
Strategy
Physical RisksIn light of the recent emergence of natural disasters linked to climate change, SMBC has performed climate change scenario analyses of the physical risks related to water disasters in Japan, thereby calculating, on a preliminary basis, that the impact could equate to an aggregate increase in credit costs of between ¥30.0 billion and ¥40.0 billion by FY2050. When viewed as a per-year average value, it is an additional credit cost of approximately ¥1 billion and thus the impact of water damage caused by climate change on current SMBC’s single-year finances is considered to be limited.
Transition RisksIn the process of transitioning to a low-carbon society, there is a risk that the value of the affected assets will decline (Stranded asset Risk). Carbon-related assets (electricity, energy, etc.) currently account for 7.8% of all loans by SMBC. Based on this situation, we will keep evaluating the potential impact of stranded assets.
OpportunitiesThe market for climate-change-related businesses is expected to grow going forward. Against this backdrop, we are promoting environmental businesses and reducing environmental impacts in Japan and overseas. Measures to this end include conducting a total of ¥520.0 billion in financing of renewable energy projects in FY2018 and issuing green bonds based on the guidelines of the International Capital Market Association and the Ministry of the Environment, Government of Japan.
Risk Management
SMBC has adopted the Equator Principles, which are guidelines developed by private financial institutions for managing environmental and social risks related to financing large-scale development projects to identify and assess risks to both the environment and society. In addition, SMBC Group companies estab-lished lending policies for specific sectors, including coal-fired power plants.
Metrics and Targets
SMBC Group is working to reduce greenhouse gas emissions, and it realized reductions in per-area CO2 emissions of 15.16 tons per m2 in FY2017 and 104.21 tons per m2 in FY2018.
* The Task Force on Climate-related Financial Disclosures was established to urge individual companies to disclose their impact on climate change in their financial reports.
For more information on initiatives regarding the recommenda-tions of the TCFD, please refer to Sumitomo Mitsui Financial Group’s corporate website.
https://www.smfg.co.jp/english/responsibility/smfgcsr/esg_initiative/climate/
About S
MB
C G
roupTo O
ur Stakeholders
Business S
trategies for C
reating ValueC
orporate Infrastructure S
upporting Value Creation
77SMBC Group Annual Report 2019

Support for SMEs in Introducing Cashless Payment Systems
We are supporting SMEs across Japan in introducing cashless
payment systems by promoting the payment services of
Square, Inc., a company with which SMBC Group has formed
a business alliance.
The card readers offered by Square are very simple
payment terminals that allows credit card payments to be
made merely by connecting the reader to a smartphone or
tablet. As such, these readers can be introduced with ease
even at retailers, outdoor events, and other locations with
limited space. Moreover, examinations are also brief, allowing
for use as early as the day after application, and payments are
deducted as soon as the following day, enabling customers
to use this payment service in a similar manner to cash
payments. Furthermore, introducing Square’s point-of-sale
register system helps support business growth with increased
efficiency in payment processes realized through smooth
coordination of inventory management, sales analysis, and
accounting software.
Using this system, SMBC Group aims to support SMEs in
introducing cashless payment systems and thereby contribute
to the promotion of cashless payments throughout Japanese
society as a whole.
Business Succession Support Framework that Uses Trust Functions to Address Cognitive Impairment Issues
SMBC Trust Bank provides financial solutions that address
potential social issues as the “100-Year life” era approaches.
Specifically, SMBC Trust Bank has developed a business
succession framework that addresses the needs of customers
seeking to decide the process through which shares of their
company’s stock will be transferred to successors and those
looking to mitigate management risks arising from an inability
to exercise voting rights due to future cognitive impairment or
other forms of cognitive decline.
Characteristics of this product include special provisions for
the following:• Acquisition of trust beneficiary rights to stock by successor
after inheritance• Instructions for successor to exercise voting rights on behalf
of customer should they suffer cognitive decline.
Going forward, through the provision of financial products,
we hope to contribute to the realization of a society in which
business operators are able to feel peace of mind as they
continue to develop their business.
Initiatives for Supporting the Next Generation
Social
Business Succession Support Framework
Customer
Successor
SMBC Trust Bank
1 Trust of stock in customer’s company
4 Acquisition of trust beneficiary rights to stock in customer’s company by successor after inheritance
3 Instructions for successor to exercise voting rights on behalf of customer based on defined conditions should they suffer cognitive decline
10,000 ¥20 million
Students We Supported in Emerging Countries
Donations to Social Welfare Organizations through Employee Volunteer Fund
Participants at Financial and Economic Education Programs
140,000
2 Acquisition of trust beneficiary rights to stock in customer’s company
Corporate Infrastructure Supporting Value Creation Towards Sustainable Development of Society
78 SMBC Group Annual Report 2019

Traditional Japanese dwelling converted into lodging facility
Dazaifu Tenmangu Shrine
Traditional Japanese Dwelling Lodging Business
In January 2019, Sumitomo Mitsui Finance and Leasing
established Dazaifu Co-Creation through joint investment with
Nishi-Nippon Railroad Co., Ltd., and The Bank of Fukuoka,
Ltd. Dazaifu Co-Creation operates a dispersed traditional
Japanese dwelling lodging business via coordination with
Dazaifu City, Fukuoka Prefecture, and Dazaifu Tenmangu
Shrine. This business entails renovating traditional Japanese
dwellings located throughout the region to function as lodging
facilities and restaurants and welcoming tourists through a
community-wide effort.
In this business, traditional Japanese dwellings are rented
and renovated to become facilities and restaurants. Sumitomo
Mitsui Finance and Leasing supports this business by leasing
interior fixtures, lodging facilities, kitchen equipment, and
equipment and machinery used in restaurants and by provid-
ing other financial services.
SMBC Group is supporting tourism and subsequently the
development of regional economies by participating in such
tourism projects as a partner and by providing leasing and
various other financial services.
SDGs Social Loans
SMBC has launched Japan’s first SDG social loan.
These loans are meant to provide funding to projects that
help resolve social issues. Through a scheme entailing impact
reports that measure impacts on society and third-party
evaluations, we are working together with customers to
resolve social issues.
For example, utilizing funds loaned to Healthcare & Medical
Investment Corporation, a Japanese real estate investment
trust specializing in healthcare facilities, we are helping supply
such facilities. These efforts are largely contributing to resolv-
ing the various issues that face the rapidly aging Japanese
society, by lowering the burden placed on the families of
individuals requiring nursing care, reducing the number of
people who are unable to receive such care, and promoting
women’s participation in the workforce.
Initiatives for Supporting Communities
2 Submission of loan framework
1 Support to establish framework
5 Facility purchase
6 Impact reports
4 Loan preparation
3 Evaluation of social loans
SMBC (Arranger) Participation Loan Provider
Third-party evaluation firm(Japan Credit Rating Agency, Ltd.,
in this case)Healthcare Facilities
Disclosure
SMBC (Arranger) Participation Loan Provider
Investee
About S
MB
C G
roupTo O
ur Stakeholders
Business S
trategies for C
reating ValueC
orporate Infrastructure S
upporting Value Creation
79SMBC Group Annual Report 2019

Customer-Oriented Initiatives
CS and Quality Improvement SystemWe have established the CS Improvement Subcommittee as
well as the CS Improvement Committee, through which we are
advancing initiatives, reinforcing management systems, and
promoting Group coordination related to customer-oriented
business conduct.
Declaration of Compliance with ISO 10002 SMBC and SMBC Consumer Finance have declared their intent to comply with the ISO 10002 (JIS Q 10002) international standard with regard to their processes for incorporating customer feedback into management.
Our Approach
SMBC Group companies are united in their efforts for
customer satisfaction (CS) and quality improvement in
line with “Our Mission,” which states “We grow
and prosper together with our customers, by providing
services of greater value to them.”
Outside experts are invited to serve as advisors at meetings
of the CS Improvement Subcommittee, where information is
exchanged on how to fully entrench a customer-oriented
mindset. Meanwhile, the CS Improvement Committee, which
shares members with the Group Management Committee,
deliberates on concrete measures based on reports from the
CS Improvement Subcommittee.
Incorporation of Customer Feedback into Management
Customer
Group Companies
Report / Share
Verify
CS Improvement Subcommittee
CS Improvement Committee
ReportInstruct Information gathering
Feedback
Analysis
Improvement activities
Holding Company (Sumitomo Mitsui Financial Group)
Corporate Infrastructure Supporting Value Creation
80 SMBC Group Annual Report 2019

Basic Policy for Customer-Oriented Business Conduct in the Retail Business Unit
Based on the Sumitomo Mitsui Financial Group’s Basic Policy
for Customer-Oriented Business Conduct, the Retail Business
Unit shall adhere to the following conduct policies
in offering service as a retail company that is responsible for
providing wealth management and asset building services
for individual customers.
In accordance with these policies, the Retail Business Unit
shall implement a plan-do–check-act (PDCA) cycle that en-
tails disclosing specific indicators, confirming and analyzing
its status in relation to these indicators, and utilizing this
information in the future to improve business practices.
Conduct Policies1. Customer-Oriented Wealth Management Proposals
Based on Medium- to Long-Term Diversified Investment With a focus on accurately addressing customers’ wealth
management needs related to protecting or building assets,
we will provide customer-oriented wealth management
proposals based on medium- to long-term diversified
investment. Through this approach, we strive to deliver
customer-oriented financial products.
2. Lineup of Customer-Oriented ProductsWe shall constantly revise our product lineup, utilizing
third-party evaluations of the products of Group companies
and other products as necessary, in order to enhance our
lineup so that we can accurately address customers’ needs
related to protecting or building assets. At the same time,
we will increase the amount of information provided to
customers and take steps to ensure that this information
is easy to understand.
3. Customer-Oriented After-Sales ServicesWe will provide fine-tuned after-sales services to help
customers continue to hold our wealth management
products with peace of mind over the long term.
4. Customer-Oriented Performance Evaluation SystemsWe shall develop performance evaluation systems that
encourage employees to engage in effective customer-
oriented sales activities.
5. Improvement of Consulting CapabilitiesWe shall continuously improve our consulting capabilities
to ensure we are always capable of proposing the best
possible solution for customers’ wide-ranging needs.
Customer-Oriented Business InitiativeBased on the Principles for Customer-Oriented Business
Conduct (a guideline on fiduciary duties) released by the
Financial Services Agency, SMBC Group* formulated its
Basic Policy for Customer-Oriented Business Conduct and
the Basic Policy for Customer-Oriented Business Conduct
in the Retail Business Unit.
* Group companies applicable under this policy: Sumitomo Mitsui Banking Corporation; SMBC Trust Bank Ltd.; SMBC Nikko
Securities Inc.; Sumitomo Mitsui DS Asset Management Company, Limited
For information on the Basic Policy for Customer-Oriented Business Conduct, please see page 124–125.
Basic Policy for Customer-Oriented Business Conduct (Excerpt) SMBC Group’s Customer-Oriented Business Conduct
In “Our Mission,” it is stated that “We grow and prosper together with our customers, by providing services of greater value to them.” To give form to this principle, we have defined our Five Values, a list of five key words that repre-sent the values and action guidelines shared by executives and employees in Japan and overseas. “Customer First” (always think and act based on a customer-oriented perspective) is at the top of this list.
Initiatives for Promoting Customer-Oriented Business Conduct
SMBC Group will implement the following initiatives to entrench the principles of customer-oriented business conduct into its activities.
SMBC Group aims to facilitate the shift from savings to asset holding seen in Japan through such initiatives. Furthermore, we will periodically disclose information on initiatives by SMBC Group based on this policy with the aim of facilitating understanding regarding these initiatives among customers. In addition, the status of initiatives and their results will be verified so that initiatives can be revised as necessary to improve upon operating practices. Information regarding these verifications and revisions will be disclosed.
1. Provision of Products and Services Suited to the Customer
2. Easy-to-Understand Explanation of Important Information
3. Clarification of Fees4. Management of Conflicts of Interest5. Frameworks for Properly Motivating Employees
About S
MB
C G
roupTo O
ur Stakeholders
Business S
trategies for C
reating ValueC
orporate Infrastructure S
upporting Value Creation
81SMBC Group Annual Report 2019

Disclosed Indicators
Breakdown of Losses and Gains by Customers Using Investment Trusts and Fund Wraps (Indicator 13 )Figures are calculated based on the definitions contained in
the common key performance indicators (KPIs) comparable
across investment trust distributors released by the Financial
Services Agency in June 2018.
Customers posting net gains represent more than 50% of all
customers in both categories.
–100
0
+100
+200
+300
+400
–1,600
0
+1,600
+3,200
+4,800
+6,400
(FY)
4Q3Q2Q1Q
’154Q3Q2Q1Q
’18’164Q3Q2Q1Q Apr May Jun Jul Aug Sep Oct Nov Dec Jan Feb Mar
’17
Increase in balance of investment assets (left axis) Increase in balance of investment assets (aggregated, right axis)
(JPY bn) (JPY bn)
Note: Figures for 2015 to 2017 represent quarterly averages.
Increase in Balance of Investment Assets
Performance with Regard to Disclosed Indicators Increase in Balance of Investment Assets (Indicator 1 )
In FY2018, the total balance of investment assets for
the entire Retail Business Unit continued to grow due in part
to the continuation of customer-oriented initiatives focused
on medium- to long-term diversified investment.
(%)
Notes: Figures exclude canceled transactions with no outstanding balance.Rate of return = Total return ÷ Market value
0
40
30
20
10
+50% and above
+30%–+50%
+10%–+30%
±0%–+10%
-10%–±0%
-30%–-10%
-50%–-30%
-50% and below
SMBC (As of March 31, 2019)
811
2120
32
611
0
40
30
20
10
+50% and above
+30%–+50%
+10%–+30%
±0%–+10%
-10%–±0%
-30%–-10%
-50%–-30%
-50% and below
(%)
SMBC Nikko Securities (As of March 31, 2019)
1411
182121
11
12
0
40
30
20
10
+50% and above
+30%–+50%
+10%–+30%
±0%–+10%
-10%–±0%
-30%–-10%
-50%–-30%
-50% and below
(%)
SMBC Trust Bank (As of March 31, 2019)
129
20
34
18
510
1 Increase in balance of investment assets2 Number of customers using wealth management products3 Ratio sales by wealth management product4 Average investment trust holding period5 Fund wrap sales and cancellation amounts6 Amount of fixed-term foreign currency deposits7 Number of investment trust and automatic foreign
currency deposit accounts8 Amount of investment trusts and automatic foreign
currency deposits9 Tsumitate Nisa account numbers, balances, and ratio
of new users
10 By product sales amounts of lump-sum insurance products11 Ratio of sales of investment trust products of Group
companies12 Sales amounts of investment trusts (including fund wraps)
(Breakdown of monthly allocation type and others)13 Breakdown of losses and gains by customers using
investment trusts and fund wraps14 Costs and returns of investment trusts with top-ranking
balance amounts15 Risks and returns of investment trusts with top-ranking
balance amounts16 Acquisition status of FP qualifications
Corporate Infrastructure Supporting Value Creation Customer-Oriented Initiatives
82 SMBC Group Annual Report 2019

As a part of SMBC Group’s internal control framework, the audit department (the Department)
verifies the effectiveness of the internal control of business units, risk management units, and
other units from an independent standpoint and pursues the quality of internal audits in order
to contribute to development and the highest trust across the entire SMBC Group.
Our Approach
Internal Audit
Overview of the Group’s Internal Audit Framework
The Department has been established under the
Audit Committee and is independent from business units,
compliance units, and risk management units. Internal audits
within our Group companies are structured broadly in line
with SMFG. The Group Chief Audit Executive oversees
group-wide internal audit activities.
The Department verifies the appropriateness and the
effectiveness of internal control which aims to assure the
appropriateness of Group operations and the soundness of
assets by conducting internal audits on each department and
Group entity as well as conducting on continuous monitoring
of Group companies’ internal auditing and other activities. The
activities are based on the “Group Internal Audit Charter” and
the “Basic Audit Policy and Plan” formulated by the Audit
Committee and the Board of Directors.
Major audit findings and relevant information are regularly
reported to the Audit Committee, the Board of Directors, and
the Group Management Committee. Whilst the Department
strives to strengthen cooperation to conduct proper audit
practices through frequent information exchange with
external auditors.
Enhancement and Effectiveness of Internal Audit
The Department has adopted auditing methods in accordance
with the Institute of Internal Auditors (IIA) standards,* con-
ducts risk-based audits, and expands the same approach to
Group companies. To implement effective and efficient inter-
nal audits, the Department conducts monitoring by
attending important meetings and by obtaining internal
management documents of SMFG and Group companies.
In addition, the Department seeks to enhance group-wide
internal auditors’ expertise by gathering up-to-date internal
audit practices, providing the practices to Group companies,
holding training programs, and encouraging auditors to obtain
internal auditors’ international certification.
Furthermore, the Department enhances its quality assur-
ance on a group-wide basis by both fully satisfying the IIA
standards and referring to G-SIFIs practices.* The Institute of Internal Auditors, Inc. (IIA), was founded in 1941 in the United
States as an organization dedicated to raise the level of specialization and the status of professionalism of internal auditing staff. Its main activity is to study the theory and practice of internal audit and to provide an internationally recognized qualification (Certified Internal Auditor (CIA)).
Holding Company (Sumitomo Mitsui Financial Group)
Management Committee
Group Companies
Board of Directors
Chief Audit Executive
Audit Committee
Internal Audit Dept.
Internal Audit Framework
Reporting line (including right to consent personnel affairs)
About S
MB
C G
roupTo O
ur Stakeholders
Business S
trategies for C
reating ValueC
orporate Infrastructure S
upporting Value Creation
Corporate Infrastructure Supporting Value Creation
83SMBC Group Annual Report 2019

Compliance ManagementSMBC Group seeks to maintain a compliance system that
provides appropriate instructions, guidance, and monitoring
for compliance to ensure sound and proper business opera-
tions across the Group. Measures have been put in place to
prevent misconduct and quickly detect inappropriate activities
that have occurred to implement corrective measures.
SMBC Group has established the Compliance Committee,
which is chaired by the Group CCO responsible for overseeing
matters related to compliance. This committee comprehen-
sively examines and discusses SMBC Group’s various work
processes from the perspective of compliance.
In addition, SMBC Group formulated the Group Compliance
Program to provide a concrete action plan for practicing
compliance on a group-wide level. SMBC and other Group
companies develop their own compliance programs based
on the Group program and take necessary steps to effectively
install compliance frameworks.
The Company receives consultations and reports on
compliance- related matters from Group companies, providing
suggestions and guidance as necessary to ensure compliance
throughout the Group.
Initiatives for Supporting Healthy Risk Taking and Appropriate Risk Management
Management positions the strengthening of compliance and
risk management as a key issue in enabling SMBC Group to
fulfill its public mission and social responsibilities. SMBC
Group is therefore devoted to improving its systems in these
areas in order to become a truly outstanding global group. To
this end, SMBC Group has defined the Principles of Action on
Compliance and Risk to serve as guidelines for executives and
employees in practicing compliance and other aspects of risk
management.
Business units function as the risk owners responsible for
compliance and risk management as it pertains to their
Holding Company (Sumitomo Mitsui Financial Group)
Board of Directors
Group CCO
Group Management Committee
Department Overseeing Compliance (General Affairs Dept.)
Compliance Committee
Audit Committee
Group Companies
Audit Dept.
Compliance
Compliance Systems at SMBC Group
Our Approach
Management positions the strengthening of
compliance and risk management as a key issue
in enabling SMBC Group to fulfill its public
mission and social responsibilities as a global
financial group. We are therefore working to en-
trench such practices into our operations as we
aim to become a truly outstanding global group.
Corporate Infrastructure Supporting Value Creation
84 SMBC Group Annual Report 2019

Agreement with Federal Reserve Bank of New YorkIn April 2019, SMBC entered into a written agreement with the Federal Reserve Bank of New York (the “Reserve Bank”) to improve its New York Branch’s program for compliance with the Bank Secrecy Act (“BSA”) and related U.S. anti-money laundering (“AML”) laws and regulations, which was found to be inadequate by the Reserve Bank. Under the terms of the written agreement, SMBC is required to undertake a number of actions to enhance the Branch’s overall BSA/AML compliance program, corporate governance and management oversight, the Branch’s customer due diligence and suspicious activity monitoring and reporting programs, internal audit, and the Branch’s program for compli-ance with the laws and regulations administered by the U.S. Department of the Treasury’s Office of Foreign Assets Control. SMBC has already taken actions to improve compliance with U.S. AML requirements and is fully committed to complying with all of the terms set forth in the written agreement.
Response to Anti-Social ForcesSMBC Group has established a basic policy stipulating that all
Group companies must unite in establishing and maintaining
a system that ensures that the Group does not have any con-
nection with anti-social forces or related individuals.
Specifically, the Group strives to ensure that no business
transactions are made with anti-social forces or individuals.
Contractual documents or terms and conditions state the
exclusion of anti-social forces from any business relationship.
In the event that it is discovered subsequent to the com-
mencement of a deal or trading relationship that the opposite
party belongs to or is affiliated with an anti-social force, we
undertake appropriate remedial action by contacting outside
professionals specializing in such matters.
Customer Information ManagementSMBC Group has established Group policies that set forth
guidelines for the entire Group regarding proper protection
and use of customer information. All Group companies adhere
to these policies in developing frameworks for managing
customer information.
SMBC and its Group companies establish and disclose
privacy policies for their measures regarding the proper
protection and use of customer information and customer
numbers. Appropriate frameworks are established based
on these policies.
business. Acting in accordance with the Principles of Action
on Compliance and Risk, business units practice healthy risk
taking (business activities) coupled with disciplined compli-
ance and risk management. The Compliance Unit performs
monitoring, oversight, and training regarding the status of
compliance and risk management at business units. Further-
more, the Internal Audit Unit verifies and evaluates the ad-
equacy and effectiveness of compliance and risk management
systems to help fortify these systems.
Anti-Money Laundering and Prevention of Funding Terrorist Organizations
SMBC Group strictly complies with AML/CFT regulations by
establishing the Group policy and implementing effective
internal control systems in each of the Group companies to
ensure that our operations are sound and appropriate. The
Group policy/systems are in accordance with the require-
ments of the relevant international organizations (e.g. the
Financial Action Task Force Recommendations) and the law/
regulation of relevant countries including Japan (e.g. U.S.
“Office of Foreign Assets Control Regulations”).
Specifically, SMBC Group is developing systems to prevent
its products and services from being used for money launder-
ing (ML) and financing of terrorism (FT), which may have a
massive negative impact on the economy.
Basic Policy for Anti-Social Forces1. Completely sever any connections or relations from anti-
social forces.2. Repudiate any unjustifiable claims, and do not engage in
any “backroom” deals. Further, promptly take legal action as necessary.
3. Appropriately respond as an organization to any anti-social forces by cooperating with outside professionals.
About S
MB
C G
roupTo O
ur Stakeholders
Business S
trategies for C
reating ValueC
orporate Infrastructure S
upporting Value Creation
85SMBC Group Annual Report 2019

Risk CultureIn order for SMBC Group to realize and maintain a sustainable
growth in corporate value as a “Top Tier Global Financial
Group,” each one of our colleagues should think and judge on
their own if their actions meet the expectations and require-
ments of customers, markets, and other stakeholders, not just
if they are compliant with laws and regulations. SMBC Group
has established “Principles of Action on Compliance and Risk”
in order for every colleague to hold onto as a “keystone” of
their daily business. The principle includes “Business based
on the Risk Appetite Framework” and “Business operations
which give a high priority to the management of risks such as
credit risk, market risk, liquidity risk and operational risk.”
Concrete measures include internal surveys for monitoring the
compliance awareness and risk sensitivity of our colleagues as
well as internal training for fostering a sound risk culture.
Risk Appetite FrameworkSMBC Group has introduced a Risk Appetite Framework for
controlling group-wide risks that clarifies the types and levels
of risk that we are willing to take on or are prepared to tolerate
in order to grow profits (risk appetite).
The Risk Appetite Framework is one of two pivots of our
business management alongside business strategies. It func-
tions as a management framework for sharing information on
the operating environment and risks facing SMBC Group
among management and for facilitating appropriate risk taking
based thereon.
Risk Appetite Composition
Risk Appetite Framework Positioning
Our Approach
Strengthening of compliance and risk
management is positioned as a key issue
in SMBC Group’s Principles of Action on
Compliance and Risk. SMBC Group is
therefore devoted to improving its systems
in these areas in order to become a truly
outstanding global group.
Business strategy
Risk Appetite Framework
Stress testing
Risk registerKey Risk Events
Environment/Risk ViewTop Risks
*Conduct Risk: Conduct risk is the risk that our conduct negatively affects customers, market integrity, or effective competition.
Risk Appetite Statement Risk Appetite Measures
• A qualitative explanation of our approach to risk taking and risk management for various risk categories
• Quantitative Risk Appetite Measures that function as benchmarks for risks that we are considering taking and for risk/return
Established for each category
Soundness CreditProfitability
Market Conduct*
Liquidity
Operational
Categories
Risk Management
Two pivots of our business management
Corporate Infrastructure Supporting Value Creation
86 SMBC Group Annual Report 2019

Individual risk appetites have been established for specific
business units or strategies as necessary based on the overall
risk appetite of SMBC Group.
Risk appetites are decided during the process of formulat-
ing business strategies and management policies. These risk
appetites are set based on Top Risks that threaten to signifi-
cantly impact management and on risk analyses (stress test-
ing) that illustrate the impact if a risk should materialize. In
addition, risk register and Key Risk Events (KRE) are utilized
in verifying the adequacy of Top Risks, risk appetites, and
business strategies.
The outlooks for the operating environment and risks and
the risk appetite situation are monitored throughout the
course of the fiscal year. Risk Appetite Measures and business
strategies are revised as necessary. Three risk management
levels are set for Risk Appetite Measures, which are monitored
accordingly.
In addition, we apply a uniform standard, risk capital*1
based on value at risk (VaR),*2 which is used to set upper
limits for risk exposure based on group-wide management
constitution. Each business unit operates their business
within that limit.*1 Risk capital: The amount of capital required to cover the theoretical maximum
potential loss arising from risks of business operations.*2 VaR: The maximum loss that can be expected to occur with a certain degree of
probability when holding a financial asset portfolio for a given amount of time.
Top RisksSMBC Group identifies risks that threaten to significantly
impact management as Top Risks.
The selection of Top Risks involves comprehensive screening
of risk factors, evaluation of each risk scenario’s possibility of
occurrence and potential impact on management, and discus-
sion by the Risk Management Committee and the Management
Committee. Top Risks are utilized to enhance risk management
by being incorporated into discussions of the Risk Appetite
Framework and the formulation of business strategies and into
the creation of risk scenarios for stress testing.
Top Risks
Note: The above is only a portion of the risks recognized by SMBC Group. It is possible that the materialization of risks other than those listed above could have a significant impact on our management.
Stress TestingAt SMBC Group, we use stress testing to analyze and compre-
hend the impact on SMBC Group’s businesses of changes in
economic or market conditions, in order to plan and execute
forward-looking business strategies.
In our stress testing, we prepare multiple risk scenarios
including macroeconomic variables such as GDP, stock
prices, interest rates, and foreign exchange rates based on
the aforementioned Top Risks, discussions with experts and
related departments.
When developing business strategies, we set out scenarios
assuming stressed business environments such as serious
economic recessions and market disruption for the sake of
assessing risk-taking capabilities at SMBC Group and verifying
whether adequate soundness can be maintained under stress.
In addition, we conduct detailed stress testing for individual
risks such as credit risk, market risk, and liquidity risk, so as
to decide and review risk-taking strategies.
Intensification of international political confrontation
Volatile financial and economic environment
Decline in Japan’s social vitality
Ideological and religious conflicts
Ceased operation of information systems due to cyber attacks
Changes in competitive climate due to emergence of FinTech or
other new technologies
Increase of large-scale natural disasters
Legal or compliance- related incidents
Materialization of strategic risks
Please see page 109 for Top Risks.
About S
MB
C G
roupTo O
ur Stakeholders
Business S
trategies for C
reating ValueC
orporate Infrastructure S
upporting Value Creation
87SMBC Group Annual Report 2019

External Audit
Holding Company (Sumitomo Mitsui Financial Group)
Group Companies
Board of Directors
Group CRO Risk Management Committee
ALM Committee
Credit Risk Committee
Group CRO Committee
Global CRO Committee
Management Committee
Risk Committee Audit Committee
Risk RegisterA risk register is formulated by each business unit for
the purpose of realizing more sophisticated risk governance
and enhancing business units’ risk ownership. In formulating
these registers, business units communicate with risk
management departments to identify the risks present in
their business, and these risks are reflected in business
strategies after they have been evaluated and the adequacy
of measures for controlling them has been verified.
Key Risk EventsKey Risk Events (KRE), external events that indicate the in-
creased threat of risks, have been identified to ascertain the
symptoms of the potential risks. KRE are utilized to analyze
and assess how likely similar cases will occur in SMBC Group
and what effects such similar cases will have on SMBC Group,
and to enhance our risk management system.
Risk Management SystemBased on the recognition of the importance of risk manage-
ment, the group-wide basic policies for risk management
are determined by the Management Committee before being
authorized by the Board of Directors in order to have top man-
agement play an active role in the risk management process.
In accordance with these basic policies for risk manage-
ment, three lines of defense have been defined, and we have
clarified related roles and responsibilities. Risk management
systems have been established based on the characteristics of
particular businesses, and measures are being put in place to
strengthen and improve the effectiveness of these systems.
Furthermore, SMBC Group is strengthening group-wide risk
management systems through the Group CRO Committee and
the Global CRO Committee.
Internal Audit Dept.
SMBC Group’s Risk Management System
Departments Responsible for Risk Management
Corporate Infrastructure Supporting Value Creation Risk Management
88 SMBC Group Annual Report 2019

Definition of SMBC Group’s Three Lines of Defense
The Basel Committee on Banking Supervision’s “Corporate governance principles for banks” recommends “three lines of
defense” as a framework for risk management and governance. Based on this framework, we have defined our three lines of
defense with the aim of achieving more effective and stronger risk management and compliance systems through the
clarification of roles and responsibilities.
Principal Organizations Roles and Responsibilities
First Line Business Units
The Business Units shall be risk owners concerning their operations and shall be responsible for the following in accordance with the basic principles provided by Second Line. Identification and evaluation of risks encountered in the business activities Implementation of measures for minimizing and controlling risks Monitoring of risks and reporting within First Line and to Second Line Creation and fostering of a sound risk culture
Second Line
Risk Management and Compliance Departments
The Risk Management and Compliance Departments shall assume the following functions and responsibilities in order to manage the risk management and compliance systems. Drafting and development of basic principles and frameworks concerning risk management and compliance
Oversight, monitoring, and development of training programs for First Line
Third Line Audit Department
Independent from First Line and Second Line, the Audit Department shall assess and verify the effectiveness and appropriateness of risk management and compliance systems managed and operated by First Line and Second Line, and report these results to the Audit Committee and the Management Committee. The Department shall provide recommendations regarding identified issues/problems.
About S
MB
C G
roupTo O
ur Stakeholders
Business S
trategies for C
reating ValueC
orporate Infrastructure S
upporting Value Creation
89SMBC Group Annual Report 2019

Developing, Retaining, and Recruiting Talent to Support the Group
Group-Wide Talent Development InitiativesSMBC Group established the Learning and Development
Institute to grow its group-wide talent development activities.
Through joint training programs and seminars that are avail-
able to employees from Group companies, we are promoting
cross-entity understanding among employees and fostering
a sense of solidarity. Furthermore, we are promoting the
development of future leaders of the Group via training and
personnel rotations, as well as the establishment of open
application platform to support self-driven career development
on a group-wide basis.
In addition, we have established the “Digital University”
as a talent development program designed in light of the
trend toward digitalization. The courses available through this
program are not limited to those for bolstering conventional
system planning and development capabilities and increasing
the IT literacy of all employees; but, moreover, we are expand-
ing our courses which enhance planning and development
capabilities by utilizing digital technologies. Furthermore, in
view of developing talent required in highly specialized fields,
we continue to send our employees to domestic or overseas
graduate schools.
Level
Specialization
Advanced
Basic
Specialists
Departments
All officers and employees
Target Program Overview
SecondmentDispatch to graduate schools
• Data science
• Cyber security, etc.
Digital University
Group training, study sessions
e-learning
Digitalization-Related Talent Development Programs
• Data utilization
• Agile software development
• Advanced technologies
• IT literacy, etc.
Human Resources Strategy
Our Approach
We have established the Five Values as a set
of shared beliefs and behavioral guidelines for all
100,000 employees around the world in order to
achieve “Our Mission.” We are moving ahead with
the strategic development of talent and the creation
of a workplace that maximizes the contributions
of a diverse workforce, to enable all employees to
perform to the extent of their capabilities.
Corporate Infrastructure Supporting Value Creation
90 SMBC Group Annual Report 2019

Talent Development to Cope with the Changing Business Environment
SMBC is planning to establish a model to encourage
“business-oriented, self-controlled development, in response
to the changes in the current operating environment. In the
highly volatile environment, there is a growing importance for
all employees to be motivated to pursue their own growth and
to continue learning through autonomous target setting. To
accommodate this, we will develop an environment to support
those employees who proactively pursue their own targets,
regardless of their seniorities.
In addition, we will enhance self-driven career development
by reflecting employees’ proactive skill development efforts
and results to personnel transfers, such as promotion of junior
employees to management.
Development of Talent on a Global BasisSMBC Group conducts operations in 40 countries around the
world and we are working together to realize identification,
development, and promotion of our talent on a global basis.
We aim to promote our Group business by realizing optimal
talent management, regardless of location of hire.
For talent development, we provide global training programs
involving participants from offices around the globe. To date,
around 1,300 employees have participated at these global
programs, including a leadership program delivered in partner-
ship with a world-leading business school and joint training
programs targeted for junior to middle-class employees from
Japan and overseas offices.
In addition, we promote cross-border secondment of
employees for both business promotion and training purposes.
We aim to provide services of greater value to our customers
by creating an environment where employees with different
backgrounds work together and inspire each other.
Optimal Allocation of Human Resources to Support Business Strategies
Strategic Allocation of Human ResourcesSMBC Group is strengthening capabilities in prioritized areas
by reallocating existing human resources as well as
by increasing its new hires.
Furthermore, we are actively promoting cross-entity
transfers with a view to securing and developing the talent
to manage the Group or to aggressively advance business
strategies in the medium to long term.
Optimization of Human Resources AllocationSMBC Group is developing frameworks for gathering human
resources-related data, such as employee numbers, person-
nel expenses, and other information for Group companies. In
addition, the Group is developing frameworks to realize
optimal allocation of human resources by refining its training
programs and establishing cross-entity transfer processes.
Participants in a global training program (Global Management Program)
Support to front offices in running PDCA for talent development programs
Foster the environment which encourages self-driven
growth and development
Provision of learning opportunities for management
Enhanced contents
Increase in feedback from supervisors or coworkers
Provision of infrastructure offering access to desired learning resources regardless of location or time
Proactive support for nighttime study at graduate schools and acquisition of qualifications
Reinforcement of management skills to lead self-driven growth
and development
About S
MB
C G
roupTo O
ur Stakeholders
Business S
trategies for C
reating ValueC
orporate Infrastructure S
upporting Value Creation
91SMBC Group Annual Report 2019

Support for Balancing Careers with Childcare or Nursing Care
SMBC Group strives to ensure that no employee finds them-
selves wrought with concern over their ability to balance their
career with their private life and that all ambitious employees
are able to continue working without sacrificing their desired
career. To this end, we are expanding our support systems for
balancing careers with childcare or nursing care and cultivat-
ing a forward-looking corporate culture that is understanding
and supportive toward employees seeking to balance their
work life with their private life.
SMBC is targeting a 100% acquisition rate for short-term
paid childcare leave, which can be acquired flexibly in one-day
increments. This company also holds seminars for supporting
employees working to balance their career with childcare. Both
parents are encouraged to participate in these seminars as
part of SMBC’s efforts to foster a workplace environment in
which it is natural for men to play a role in childcare.
Empowerment of Female EmployeesTargets have been set for the promotion of female employees
to management positions and initiatives are being advanced
with the goal of accomplishing these targets, in order to
support the career development of female employees and
accelerate the diversification of management.
We also have in place a leadership program for cultivating
future management candidates aimed at mid-level female
employees in core positions. This program comprises busi-
ness skills training as well as discussions with management
for cultivating the big picture perspective expected of a leader.
This stance toward proactively supporting female employees
and the results achieved thereby have led to SMBC Group
being included in the Nadeshiko Brand selection for an
industry- topping four times. Among other high evaluations
by external organizations was our inclusion in the 2019
Bloomberg Gender-Equality Index sponsored by Bloomberg
L.P. of the United States.
Creating an Environment to Encourage Diverse Workforce
Diversity Promotion Framework and Basic PoliciesSMBC Group is promoting “Diversity and Inclusion” as it
constitutes a growth strategy itself.
To accelerate diversity and inclusion initiatives on a group-
wide basis, SMBC Group established the SMFG Diversity
and Inclusion Department as a dedicated diversity promotion
organization in 2017. We also hold the SMFG Diversity and
Inclusion Committees, chaired by the Group CEO and
comprises of the leaders of Group companies.
Promotion of Diversity in ManagementSMBC Group is increasing the diversity of our management,
including directors and executive officers, in order to create
an organization capable of transforming diversity into com-
petitiveness. We are also promoting correct understanding
regarding diversity and inclusion and workstyle reforms while
encouraging changes in awareness and behavior.
For example, training programs designed to help individuals
realize and address their own unconscious biases are being
introduced at Group companies.
“Platinum Kurumin” Certification Received from the Ministry of Health, Labour and Welfare
Sumitomo Mitsui Banking Corporation
Japan Research InstituteSumitomo Mitsui Card Company
SMFG Diversity and Inclusion Committee
Chairman CEO of Sumitomo Mitsui Financial Group
Vice chairman CHRO of Sumitomo Mitsui Financial Group
Members Presidents of 9 major SMBC Group companies
Board of Directors / Management Committee
Reports, exchanges of opinion
Diversity Promotion Framework
Corporate Infrastructure Supporting Value Creation
Female executive officers
11Non-Japanese
executive officers
14
Human Resources Strategy
92 SMBC Group Annual Report 2019

Initiatives in Support of Sexual Minorities Such as LGBT, etc.
SMBC Group has established a range of human resource and
employee welfare systems related to same-sex partners and is
supporting TOKYO RAINBOW PRIDE, one of Japan’s largest
LGBT pride events, and sending employee volunteers from
Group companies to participate in this event in order to foster
awareness regarding the LGBT community.
Health and Productivity ManagementSMBC Group promotes health and productivity initiatives by
implementing stress checks for all employees, establishing
consultation venues regarding mental health, and holding
health improvement events. In addition, SMBC Nikko Securi-
ties has formulated its Declaration of Health and Productivity
Management and, under the guidance of its Chief Health
Officer, established a dedicated Health and Productivity Man-
agement Office to spearhead efforts to strengthen systems for
helping employees and their families maintain and improve
their health.
Workstyle ReformsWe are implementing workstyle reforms to create a work
environment in which every employee is able to feel motivated
in their work, fully exercising their skills while realizing high
levels of productivity. Group companies are endeavoring to
prevent excessive working hours by defining key performance
indicators for working hours and paid leave acquisition rates
and employing robotic process automation to improve work
efficiency. In addition, frameworks are being put in place
to allow employees more freedom in choosing the times
when and locations at which they work. Examples of these
frameworks include flextime, staggered working hours, and
teleworking systems.
At SMBC, employees are provided access to satellite offices
to be used to reduce commuting times or to enable sales
representatives to utilize the time between appointments more
efficiently. In addition to six locations at its branches (as of
June 30, 2019, to be increased going forward), employees
can choose from any of roughly 50 satellite offices operated
by third parties.
Furthermore, SMBC Group is promoting increased flexibility
and diversity in workstyle through educational programs for
management as well as study sessions and a smart work card
system for employees.
Acquired Top Gold Rating in PRIDE index evaluation for LGBT-related initiatives from work with Pride for second consecutive year (Sumitomo Mitsui Banking Corporation)
Employment of Differently Abled IndividualsBoth SMBC subsidiary SMBC Green Service Co., Ltd.,
and SMBC Nikko Securities subsidiary Nikko MiRun are
specially certified subsidiaries as defined under the Act on
Employment Promotion of Persons with Disabilities. Together
with these companies, we promote employment of and
provide employment support for differently abled individuals.
Furthermore, we aid all employees in exercising their unique
skills and aptitudes.
In addition, we employ numerous leading differently abled
athletes who take part in competitions in Japan and overseas to
foster understanding with regard to differently abled individuals.
SMBC Green Service
Smart work cards used at SMBC
Paid Leave Acquisition Rate at SMBC Group(%)
0
75
70
65
’18 (FY)’17’16
65.567.3
70.6
About S
MB
C G
roupTo O
ur Stakeholders
Business S
trategies for C
reating ValueC
orporate Infrastructure S
upporting Value Creation
93SMBC Group Annual Report 2019

Proactive and Defensive Digitalization Initiatives
SMBC Group is moving forward with digitalization initiatives
targeting four areas. Through proactive digitalization initiatives,
the Group aims to (1) generate new businesses and (2) create
customer benefits and business value through the trans-
formation of existing business models. Under defensive
digitalization initiatives, the Group seeks to (3) automate
operations and processes in conventional businesses and
(4) establish IT infrastructure to support medium- to long-term
business reform.
Proactive digitalization initiatives include utilizing artificial
intelligence, promoting cashless and other strategies. Mean-
while, defensive digitalization initiatives go beyond maintaining
existing systems and ensuring stable operation to include IT
transformation initiatives for adopting cutting-edge architec-
tures. In these initiatives, we pursue efficient operations
through the development of shared group-wide platforms and
the utilization of cloud technologies while embracing state-of-
the-art IT infrastructure and development technologies.
IT Investment StrategiesUnder the previous Medium-Term Management Plan, SMBC
Group completed the overhaul of large-scale systems through
measures including the renewal of its core banking system
platform and the implementation of a mutual backup function
between data centers. Initiatives as part of the current Medium-
Term Management Plan involves the increased allocation of
IT budget to strategic investments for business innovation and
the creation of new businesses through digitalization.
SMBC Group applies rigorous standards to the selection
of system development projects while also assessing and
verifying the benefits of these projects before and after in
order to maximize those benefits. Specific targets for return
on investment and key performance indicators must be set
for all projects, and the degree to which these targets are
accomplished will be reviewed over a five-year period after
the completion of each project. Corrective measures will be
implemented with regard to those systems that have not
reached the appropriate performance levels. Even after the
desired performance has been realized, the effectiveness
of each system will be measured in terms of sufficiency,
efficiency, stability, and utilization so that improvements can
be implemented to systems that have suffered declines in
effectiveness. This process constitutes a PDCA (plan-do-
check-act) cycle that will be employed to maximize the
benefits of IT investments.
Digital Governance and Sophisticated Human Resources Development
Under the guidance of the Group Chief Information Officer
(CIO), we clarify lines of reporting for overseas offices and
other Group companies in order to develop a corporate gover-
nance system that is integrated across the Group and globally.
At the same time, we practice IT governance that emphasizes
quality while evolving digital governance frameworks to
IT StrategiesOur Approach
SMBC Group is advancing both
proactive and defensive digitalization
initiatives to support efforts in its
Seven Core Business Areas.
Corporate Infrastructure Supporting Value Creation
94 SMBC Group Annual Report 2019

IT Planning Dept.
SMBC Group’s Cyber Security Governance System
incorporate risk-based and speed-oriented perspectives for
accelerating digitalization initiatives.
SMBC Group executes systematic personnel exchanges
between the IT divisions of Group companies. In addition, the
Digital University has been established within core IT Group
company The Japan Research Institute, Limited, as an inter-
nal training institution for promoting IT adoption and digitaliza-
tion. At the Digital University, we offer a unique menu of
training programs including training based on the operations
of specific Group companies, curricula employing the exper-
tise gained from project case studies, and cutting-edge tech-
nology workshops.
Cyber SecurityCyber attacks are becoming ever-more serious and sophisti-
cated. In order to respond to the risks of such attacks, SMBC
Group has strengthened cyber security measures by defining
cyber risks as one of its Top Risks and, establishing a Declara-
tion of Cyber Security Management.
Seeking to facilitate management-led measures for fortifying
response frameworks, the general manager of the System Risk
Planning Department has been appointed as the Chief Infor-
mation Security Officer (CISO). Positioned under the Group
CIO and the Group Chief Risk Officer (CRO), the CISO has
professional expertise regarding measures in this area, and
steps have been taken to clarify the roles and responsibilities
Security vendors, experts etc.
Board of Directors / Management Committee
System Risk Planning Dept.
Group CISO
SMBC Group SOC (security operation center)
Group companies and offices in Japan / overseas
Corporate staff
Corporate Planning Dept.
Public Relations Dept.
General Affairs Dept.
Risk Planning Dept.
Government, law enforcement agencies
ISAC, industry bodies
National Center of Incident Readiness and
Strategy for Cybersecurity
ISAC, industry bodies
Metropolitan Police Department
Financials ISAC
CEPTOAR-Council
SMBC Group CSIRT(Computer Security Incident Response Team)
Group CIO Group CRO
etc.
etc.
of CISO. Furthermore, we have established a computer secu-
rity incident response team (CSIRT) and a security operation
center (SOC), and analyses are performed on information
regarding threats and observed phenomena collected from
inside and outside of the Group. The results of these analyses,
along with information on the status of security measures
currently being implemented, are discussed regularly at meet-
ings of the Board of Directors and the Management Committee
to drive ongoing improvements to our cyber security measures.
The CSIRT is centered on the System Risk Planning Depart-
ment, which possesses dedicated cyber security functions. To
ensure preparedness for cyber incidents, the CSIRT coordi-
nates with national government agencies as well as with the
U.S. Financial Services Information Sharing and Analysis
Center (FS-ISAC),*1 Financials ISAC Japan (Financials ISAC),*2
and other external institutions to share information on perti-
nent topics such as cyber attack methods and vulnerabilities.
The SOC, which is centered around The Japan Research
Institute, is dedicated to continuously fortifying cyber security
monitoring systems to mitigate the ever-rising threat of cyber
attacks. Measures taken by SOC include the integration of the
monitoring systems of Group companies and the development
of global systems for conducting monitoring on a 24-hours-a-
day, 365-days-a-year basis.*1 An organization responsible for coordinating financial industry cyber security
measures in the United States*2 The Japanese equivalent of the FS-ISAC
About S
MB
C G
roupTo O
ur Stakeholders
Business S
trategies for C
reating ValueC
orporate Infrastructure S
upporting Value Creation
95SMBC Group Annual Report 2019

Stakeholders of SMBC Group
Shareholders and the market
Employees
Customers
The environment and society
Our Approach
Engagement with Society and the EnvironmentIn addition to the contribution to society through our business
operations, SMBC Group will contribute to realize a flourishing
society in the future by pursuing diverse social contribution
activities in order to fulfill responsibilities as a “good corporate
citizen.”
For example, our employees and their families have taken
part in numerous volunteer activities, including retrieving
valuables and other belongings from collapsed houses and
sorting garbage, in regions still recovering from large-scale
natural disasters, such as the Great East Japan Earthquake,
2016 Kumamoto earthquakes, the heavy rains that hit north-
ern Kyushu in 2017, and others.
Stakeholder Type Example Communication Activities
CustomersIn-branch questionnaires, Customer satisfaction surveys, Call centers
Shareholders and the market
General meeting of shareholders, Investors meetings, One-on-one meetings
EmployeesOpinion exchange meetings with top management, Employee surveys
The environment and society
Support for initiatives in Japan and overseas, Volunteer activities of employees
P80
Communication with Stakeholders
SMBC Group strives to contribute to the
sustainable development of society. To this
end, we work diligently to provide greater value
to our various stakeholders: “Customers,”
“Shareholders and the market,” “Employees”
and “The environment and society.”
Volunteering activity in northern Kyushu area
Corporate Infrastructure Supporting Value Creation
96 SMBC Group Annual Report 2019

Engagement with Shareholders and the MarketSMBC Group recognizes that appropriate disclosure of
corporate and management information must form the foun-
dation of our efforts to realize one of the statements posted in
“Our Mission”: “We aim to maximize our shareholders’ value
through the continuous growth of our business.”
For this reason, we are enhancing disclosure through
investor meetings after announcement of financial results,
conferences, one-on-one meetings, large meetings for
individual investors, and other activities.
Engagement with EmployeesEach company at SMBC Group holds town hall meetings and
discussion forums to enhance mutual understanding between
top management and all employees.
In addition, SMBC holds the “SMBC Pitch Contest,” which
provides opportunities for all domestic and overseas employees
to present their business ideas directly to top management.
“SMBC Pitch Contest” award ceremony (SMBC)
The 17th Ordinary General Meeting of Shareholders
Large meeting for individual investors
SMBC Group IR Day
Town hall meeting (SMBC NIKKO)
Activities in FY2018
General meeting of shareholders 585 attendees*1
IR meetings for institutional investors and analysts*2
11 meetings
One-on-one meetings with institutional investors and analysts
343 meetings
Conferences held by securities companies 6 conferences
Large meetings for individual investors 3 meetings
*1 143 attendees at site of broadcast in Osaka*2 Investors’ meetings, SMBC Group IR Day, etc.
About S
MB
C G
roupTo O
ur Stakeholders
Business S
trategies for C
reating ValueC
orporate Infrastructure S
upporting Value Creation
97SMBC Group Annual Report 2019

Financial Review
Consolidated Performance Summary (Billions of yen)
Year ended March 31 2015 2016 2017 2018 2019
Consolidated gross profit 2,980.4 2,904.0 2,920.7 2,981.1 2,846.2
Net interest income 1,505.2 1,422.9 1,358.6 1,390.2 1,331.4
Net fees and commissions + Trust fees 999.6 1,007.5 1,017.1 1,070.5 1,064.6
Net trading income + Net other operating income 475.7 473.5 545.0 520.3 450.2
General and administrative expenses 1,659.3 1,724.8 1,812.4 1,816.2 1,715.1
Overhead ratio 55.7% 59.4% 62.1% 60.9% 60.3%
Equity in gains (losses) of affiliates (10.6) (36.2) 24.6 39.0 61.1
Consolidated net business profit 1,310.5 1,142.9 1,132.9 1,203.8 1,192.3
Total credit cost (gains) 7.8 102.8 164.4 94.2 110.3
SMBC non-consolidated (80.1) (3.2) 61.1 (26.7) (2.2)
Gains (losses) on stocks 66.7 69.0 55.0 118.9 116.3
Other income (expenses) (48.2) (123.9) (17.6) (64.5) (63.1)
Ordinary profit 1,321.2 985.3 1,005.9 1,164.1 1,135.3
Extraordinary gains (losses) (11.8) (5.1) (26.6) (55.3) (11.7)
Income taxes 441.4 225.0 171.0 270.5 331.4
Profit attributable to non-controlling interests 114.4 108.4 101.8 104.0 65.5
Profit attributable to owners of parent 753.6 646.7 706.5 734.4 726.7
Consolidated Balance Sheet SummaryMarch 31
Total assets 183,442.6 186,585.8 197,791.6 199,049.1 203,659.1
Loans and bills discounted 73,068.2 75,066.1 80,237.3 72,945.9 77,979.2
Securities 29,633.7 25,264.4 24,631.8 25,712.7 24,338.0
Total liabilities 172,746.3 176,138.2 186,557.3 187,436.2 192,207.5
Deposits 101,047.9 110,668.8 117,830.2 116,477.5 122,325.0
Negotiable certificates of deposit 13,825.9 14,250.4 11,880.9 11,220.3 11,165.5
Total net assets 10,696.3 10,447.7 11,234.3 11,612.9 11,451.6
Stockholders’ equity 7,018.4 7,454.3 8,119.1 8,637.0 9,054.4
Retained earnings 4,098.4 4,534.5 5,036.8 5,552.6 5,992.2
Accumulated other comprehensive income 2,003.9 1,459.5 1,612.5 1,753.4 1,713.9
Non-controlling interests 1,671.7 1,531.0 1,499.3 1,219.6 678.5
Financial IndicatorsMarch 31
Total capital ratio (BIS guidelines) 16.58% 17.02% 16.93% 19.36% 20.76%
Tier 1 capital ratio (BIS guidelines) 12.89% 13.68% 14.07% 16.69% 18.19%
Common equity Tier 1 capital ratio (BIS guidelines) 11.30% 11.81% 12.17% 14.50% 16.37%
Dividend per share (Yen) 140 150 150 170 180
Dividend payout ratio 26.2% 32.7% 29.9% 32.7% 34.6%
ROE (on a stockholders’ equity basis) 11.2% 8.9% 9.1% 8.8% 8.2%
Market Data (As of the end of each fiscal year)
Nikkei Stock Average (Yen) 19,207 16,759 18,909 21,454 21,206
Foreign exchange rate (USD/JPY) 120.15 112.62 112.19 106.25 111.00
Principal Financial Data
Corporate Infrastructure Supporting Value Creation
98 SMBC Group Annual Report 2019

Consolidated Net Business ProfitConsolidated gross profit decreased by ¥134.9 billion year-on-
year to ¥2,846.2 billion. Performance was sluggish in the
wealth management business of the Retail Business Unit,
which showed strong performance in the previous fiscal year,
due to the deterioration of market conditions in the second
half of FY2018. Meanwhile, strong performance continued in
the International Business Unit, leading group-wide growth,
which contributed to a slight increase in consolidated gross
profit when excluding the financial impacts of Group reorgani-
zation detailed to the right.
General and administrative expenses decreased by ¥101.1
billion year-on-year to ¥1,715.1 billion. They decreased even
after excluding the impact of Group reorganization because of
ongoing group-wide cost control initiatives.
As a result, consolidated net business profit decreased
by ¥11.6 billion year-on-year to ¥1,192.3 billion. Excluding
the impacts of reorganizations, it reached the same level as
the strong performance in FY2017, despite the challenging
business environment.
Profit Attributable to Owners of ParentTotal credit cost increased by ¥16.1 billion year-on-year to
¥110.3 billion primarily due to reduced gains on reversal of
provisions at SMBC.
Consequently, ordinary profit decreased by ¥28.8 billion
year-on-year to ¥1,135.3 billion. Profit attributable to
owners of parent decreased by ¥7.7 billion year-on-year to
¥726.7 billion, however, it surpassed the disclosed target
of ¥700.0 billion.
Performance of Major Group Companies (Left: FY2018 performance; Right: Year-on-year comparison)
(Billions of yen)
SMBC SMBC Trust
Gross profit 1,395.6 (32.3) 49.8 +5.6
Expenses 811.5 +0.8 51.7 +1.0
Net business profit 584.1 (33.1) (1.9) +4.7
Net income 477.4 (99.7) (3.8) +2.0
SMBC Nikko*1 SMCC
Gross profit 323.1 (61.4) 254.2 +28.1
Expenses 276.0 (15.4) 190.9 +20.6
Net business profit 47.1 (46.0) 63.3 +7.5
Net income 31.0 (27.2) (58.5)*2 (86.9)
Cedyna SMBCCF
Gross profit 154.1 (3.2) 268.5 +7.4
Expenses 114.4 (1.2) 110.9 +1.8
Net business profit 40.0 (1.8) 157.6 +5.6
Net income 11.9 +9.5 45.1 +20.5
SMAM SMFL
Gross profit 25.7 (0.7) 179.8 (4.7)
Expenses 17.9 +0.2 88.3 +3.3
Net business profit 7.9 (0.9) 93.5 (7.9)
Net income 5.3 (0.7) 80.0 +25.5
*1 Excludes profit from overseas equity method affiliates of SMBC Nikko, (consolidated subsidiaries of Sumitomo Mitsui Financial Group), year-on-year comparisons include figures of SMBC Friend Securities
*2 Includes tax impact of approximately ¥(90.0) billion by becoming a wholly owned subsidiary of SMFG
*3 Changed the ownership ratio of SMFL in November 2018. Consolidated subsidiary with 60% ownership until the end of December 2018 and equity method affiliate with 50% ownership after that
Consolidated Performance Summary
Financial Impacts of Group Reorganization*
(Approximations, billions of yen)
Consolidated gross profit (139.0)Consolidated net business profit
(12.0)
General and administrative expenses
(92.0)Profit attributable to owners of parent
0
Equity in gains (losses) of affiliates
+35.0
* Deconsolidation of Kansai Urban Banking Corporation, THE MINATO BANK, LTD., and Sumitomo Mitsui Finance and Leasing Company, Limited; the consolidation of PT Bank Tabungan Pensiunan Nasional Tbk; the conversion of Sumitomo Mitsui Card Company, Limited into a wholly owned subsidiary
50%*360%
66%
Ratio of Ownership by SMFG
About S
MB
C G
roupTo O
ur Stakeholders
Business S
trategies for C
reating ValueC
orporate Infrastructure S
upporting Value Creation
99SMBC Group Annual Report 2019

limited to 0.02 percentage point, and this downward trend
appears to be bottoming out.
Domestic Loan-to-Deposit Spread (%)
FY2018 FY2017
1Q 2Q 3Q 4QYearly
averageYearly
average
Interest earned on loans and bills discounted 0.95 0.95 0.93 0.93 0.94 0.98
Interest paid on deposits 0.00 0.00 0.00 0.00 0.00 0.00
Loan-to-deposit spread 0.95 0.95 0.93 0.93 0.94 0.98
SecuritiesOther securities decreased by ¥1,639.6 billion year-on-year
to ¥23,800.5 billion due to a decrease in the amount of
Japanese government bonds held by SMBC. Net unrealized
gains on other securities decreased by ¥86.8 billion year-on-
year to ¥2,321.3 billion mainly because of lower stock prices.
Unrealized Gains (Losses) on Other Securities(Billions of yen)
Balance Net unrealized gains (losses)
March 31, 2019 YoY March 31, 2019 YoY
Stocks 3,486.6 (402.7) 1,902.9 (270.7)
Bonds 8,983.7 (2,850.5) 60.4 +16.0
Others 11,330.2 +1,613.5 358.0 +167.9
Total 23,800.5 (1,639.6) 2,321.3 (86.8)
NPLs Based on the Financial Reconstruction ActThe balance of NPLs based on the Financial Reconstruction
Act increased by ¥22.8 billion year-on-year to ¥695.2 billion.
However, the NPL ratio declined by 0.02 percentage point to
0.76% as a result of an increase in outstanding credit.
Consolidated Balance Sheet SummaryLoans and Bills Discounted (SMBC non-consolidated)
Loans and bills discounted increased by ¥2,505.6 billion
year-on-year to ¥76,401.8 billion due to an increase in
overseas loans.
Deposits (SMBC non-consolidated)Deposits increased by ¥5,847.9 billion year-on-year to
¥116,091.1 billion. This increase was mainly due to increases
in both individual and corporate deposits in Japan.
Domestic offices (excluding Japan offshore banking accounts) Overseas offices and Japan offshore banking accounts
Individuals (domestic) Corporates (domestic) Others
120
60
0’15/3 ’16/3 ’17/3 ’19/3’18/3
(Trillions of yen)
100
50
0’15/3 ’16/3 ’17/3 ’19/3’18/3
(Trillions of yen)
Balance of Loan
Balance of Deposit
116.1110.2
76.473.9
47.145.3
54.053.2
50.247.6
22.420.7
105.6
75.6
43.6
54.5
44.1
21.1
98.8
69.3
42.3
50.1
39.8
19.2
91.3
68.3
41.8
49.3
36.0
18.9
Balance of NPLs Based on the Financial Reconstruc-tion Act and NPL Ratio(Billions of yen) (%)
600
1,800 6
4
2
’15/3 ’16/3 ’17/3 ’18/3 ’19/3
1,200
0 0
Balance: Consolidated SMBC non-consolidatedRatio: Consolidated SMBC non-consolidated
1,174.8992.7 927.7
695.2
0.97
1.39
0.78
1.15
0.65
1.00
0.51 0.54
769.0622.6 567.7
436.3 476.5
0.78 0.76
Domestic Loan-to-Deposit Spread (SMBC non-consolidated) In FY2018, domestic loan-to-deposit spread decreased by
0.04 percentage point year-on-year to 0.94% primarily as a
result of a decline of loan spreads. After the second quarter,
the decrease in domestic loan-to-deposit spread has been
Corporate Infrastructure Supporting Value Creation Financial Review
100 SMBC Group Annual Report 2019

CapitalCapital
Common equity Tier 1 capital increased by ¥437.1 billion
year-on-year due to an increase in retained earnings.
Risk-Weighted AssetsRisk-weighted assets decreased by ¥4,597.5 billion year-on-
year, due to the deconsolidation of Sumitomo Mitsui Finance
and Leasing as well as improvement of the credit portfolio for
domestic large borrowers in the Wholesale Business Unit.
Capital RatioThe common equity Tier 1 ratio was 16.37% and the total
capital ratio was 20.76%. In addition, the external TLAC ratio
reached its required level on both the risk-weighted asset
basis and the leverage exposure basis.
Total Capital Ratio (BIS Guidelines) (Billions of yen)
2019 (A) 2018 (B)Increase
(decrease) (A–B)
Common equity Tier 1 capital 9,654.5 9,217.4 +437.1
Additional Tier 1 capital 1,072.7 1,392.9 (320.1)
Tier 1 capital 10,727.2 10,610.2 +117.0
Tier 2 capital 1,513.3 1,693.9 (180.6)
Total capital 12,240.5 12,304.1 (63.6)
Risk-weighted assets 58,942.8 63,540.3 (4,597.5)
Common equity Tier 1 capital ratio 16.37% 14.50% +1.87%
Total capital ratio 20.76% 19.36% +1.40%
Leverage RatioLeverage ratio 4.88% 5.01% (0.13)%
External TLAC RatioRisk-weighted asset basis 26.90%
Leverage exposure basis 8.19%
Ordinary Dividend per Share of Common Stock
200
150
100
50
0’14 ’15 ’16 ’18 (FY)’17
(Yen)
140
180170150150
Dividend Payout Ratio
26.2% 32.7% 29.9% 32.7% 34.6%
(Reference) Total payout ratio 44.2%
Overview of Repurchase of Own Shares
Type of shares to be repurchased Common stock
Aggregated amount repurchased ¥100.0 billion (upper limit)
Aggregate number of shares to be repurchased 32,000,000 shares (upper limit)
Repurchase period May 16 – August 30, 2019
Shareholder ReturnsFor FY2018, the Company distributed ordinary dividend
per share of common stock of ¥180, ¥10 higher than in the
previous fiscal year and the disclosed forecast, in reflection of
the fact that profit attributable to owners of parent was higher
than the target because of steady progress in the measures of
the Medium-Term Management Plan.
In addition, the Company announced plans to repurchase
¥100.0 billion of own shares with the aim of further enhancing
shareholder returns.
About S
MB
C G
roupTo O
ur Stakeholders
Business S
trategies for C
reating ValueC
orporate Infrastructure S
upporting Value Creation
101SMBC Group Annual Report 2019

Initiatives for Generating Interest in the Olympic and Paralympic Games Tokyo 2020
SMBC Group is holding events across Japan with the aim
of generating interest in the Olympic and Paralympic Games
Tokyo 2020. For example, we organized SMBC FRIENDS
RUN 2019 in YOKOHAMA at International Stadium Yokohama
500 days prior to the opening day of the games as part of
500 Days to Go! Festival—500 Days Until the Olympic and
Paralympic Games Tokyo 2020.
With only one year remaining until the Olympic and
Paralympic Games Tokyo 2020, SMBC is engaged in a con-
certed effort to generate interest in the Games across Japan.
SMBC Group employs 12 para-athletes (as of June 30, 2019).
These athletes take part in events for fostering understanding
with regard to para sports and for encouraging social ac-
ceptance by holding para sports workshops for children and
acting as presenters at new employee rallies.
Together with these employees, SMBC Group is contributing
to the spread of para sports leading up to the Paralympic
Games Tokyo 2020.Note: Photograph is of javelin competitor Yukiko Saito.
Contributions to Para Sports in Preparation for the Paralympic Games Tokyo 2020
Sumitomo Mitsui Financial Group is the Gold Partner (Banking Category) of the Olympic and Paralympic Games Tokyo 2020.
SMBC Group Supports the Olympic and Paralympic Games Tokyo 2020.
102 SMBC Group Annual Report 2019

CONTENTS
Group Companies .......................................... 104
Risk Management ........................................... 109
Internal Reporting Systems and Hotline for Inappropriate Accounting and Auditing Activities .................................... 123
Basic Policy for Customer-Oriented Business Conduct ........................................... 124
Support for Mid-Sized Corporations and SMEs, Vitalization of Local Regions in Japan ............ 126
Employees ....................................................... 128
Main Work-Life Balance Support System ........ 131
Corporate Data ............................................... 133
Sumitomo Mitsui Financial Group, Inc.
Directors and Executive Officers ................ 133
Sumitomo Mitsui Financial Group Organization ............................................... 134
Sumitomo Mitsui Banking Corporation
Board of Directors, Directors, Members of the Audit and Supervisory Committee and Executive Officers ........................................ 135
SMBC Organization .................................... 138
Principal Subsidiaries and Affiliates ................ 140
Principal Domestic Subsidiaries ................. 140
Principal Overseas Subsidiaries ................. 141
Principal Affiliates ........................................ 142
International Directory .................................... 143
Appendix I
103SMBC Group Annual Report 2019

www.smbc.co.jp/global/index.html
Group Companies (as of March 31, 2019)
The companies of Sumitomo Mitsui Financial Group primarily conduct commercial banking through the following financial services: leas-ing, securities, consumer finance, system development data processing, and asset management.
Company Name: Sumitomo Mitsui Financial Group, Inc.
Business Description: 1. Management of banking subsidiaries and other
companies that can be treated as subsidiaries under the stipulations of Japan’s Banking Act as well as the performance of ancillary functions
2. Functions that can be performed by bank holding companies under the stipulations of Japan’s Banking Act
Establishment: December 2, 2002Head Office: 1-2, Marunouchi 1-chome, Chiyoda-ku,
Tokyo, JapanChairman of the Board: Takeshi Kunibe
(Appointed on April 1, 2019)President: Jun Ohta
(Appointed on April 1, 2019)Capital: ¥2,339.4 billionStock Exchange Listings:Tokyo Stock Exchange (First Section)Nagoya Stock Exchange (First Section)Note: American Depositary Receipts (ADRs) are
listed on the New York Stock Exchange.
• We grow and prosper together with our customers, by providing services of greater value to them.
• We aim to maximize our shareholders’ value through the continuous growth of our business.
• We create a work environment that encourages and rewards diligent and highly motivated employees.
Business Mission
Credit Ratings (as of June 30, 2019)
Long-term Short-termMoody’s A1 P–1Standard & Poor’s A– —Fitch Ratings A F1R&I A+ —JCR AA– —
Financial Information (Consolidated basis, years ended March 31)
Billions of yen2019 2018 2017 2016
For the Year:Ordinary income �������� ¥ 5,735�3 ¥ 5,764�1 ¥ 5,133�2 ¥ 4,772�1Ordinary profit��������� 1,135�3 1,164�1 1,005�8 985�2Profit attributable to owners of parent ����� 726�6 734�3 706�5 646�6
At Year-End:Net assets �������������� 11,451�6 11,612�8 11,234�2 10,447�6Total assets ������������ ¥203,659�1 ¥199,049�1 ¥197,791�6 ¥186,585�8
www.smfg.co.jp/english/
Sumitomo Mitsui Banking Corporation (“SMBC”) was established in April 2001 through the merger of the two leading banks of The Sakura Bank, Limited and The Sumitomo Bank, Limited. Sumitomo Mitsui Financial Group, Inc. was established in December 2002 as a bank holding company through a share transfer, and SMBC became a wholly owned subsidiary of Sumitomo Mitsui Financial Group. In March 2003, SMBC merged with The Wakashio Bank, Ltd. SMBC’s competitive advantages include its solid and extensive client base, the expe-ditious implementation of strategies, and also the service providing capability of its predominant Group companies. Under the management of Sumitomo Mitsui Financial Group, SMBC will unite with other SMBC Group companies in an effort to provide highly sophisticated and comprehensive financial services to clients.
Company Name: Sumitomo Mitsui Banking CorporationBusiness Profile: Commercial bankingEstablishment: June 6, 1996Head Office: 1-2, Marunouchi 1-chome, Chiyoda-ku,
Tokyo, JapanPresident and CEO: Makoto Takashima
(Concurrent Director at Sumitomo Mitsui Financial Group)
Number of Employees: 28,482Number of branches and other business locations: In Japan: 2,086* Branches: 511 (Including 47 specialized deposit account branches) Sub-branches: 382 Banking agencies: 1 Automated service centers: 1,192 Overseas: 45 Branches: 19 Sub-branches: 23 Representative offices: 4* The number of domestic branches excludes ATMs
located at retail convenience stores. The number of overseas branches excludes branches that are closing and locally incorporated companies overseas.
Credit Ratings (as of June 30, 2019)
Long-term Short-termMoody’s A1 P–1Standard & Poor’s A A–1Fitch Ratings A F1R&I AA– a–1+JCR AA J–1+
Financial Information (Consolidated basis, years ended March 31)
Billions of yen2019 2018 2017 2016
For the Year:Ordinary income ������� ¥ 3,369�8 ¥ 3,117�0 ¥ 3,014�4 ¥ 3,059�0Ordinary profit �������� 894�5 932�7 829�4 930�3Net income ������������� 617�4 627�5 543�1 680�1
At Year-End:Net assets �������������� 8,986�7 9,090�4 8,908�1 9,446�1Total assets ������������ ¥190,690�2 ¥182,727�4 ¥180,946�6 ¥180,408�6
104 SMBC Group Annual Report 2019

www.smfl.co.jp/english/
www.smbctb.co.jp/en
Formerly Societe Generale Private Banking, SMBC Trust Bank Ltd. joined SMBC Group in October 2013. We then made a fresh start fol-lowing the integration of the retail banking operations of Citibank Japan Ltd. under the new PRESTIA brand in November 2015. As a trust bank with strengths in the fields of trusts, foreign currency, and real estate, SMBC Trust Bank provides finely tuned sup-port and custom-tailored products and solutions to address wealth management and inheritance needs as Japan’s population ages and achieves a longer life span.
Company Name: SMBC Trust Bank Ltd.Business Profile: Commercial banking and
Trust BankingEstablishment: February 25, 1986Head Office: 1-3-1, Nishi-Shimbashi,
Minato-ku, TokyoPresident and CEO: Fumiaki KuraharaNumber of Employees: 2,091Number of branches: In Japan: 54 (Including Internet Branch, and Sub-Branches, and Foreign Exchange Counters)
Financial Information (Years ended March 31)
Billions of yen2019 2018 2017 2016
For the Year:Ordinary income ������� ¥ 61�9 ¥ 50�6 ¥ 39�9 ¥ 20�5Ordinary profit (loss) �� (2�4) (7�1) (15�8) (9�5)Net income (loss) ������ (3�7) (5�7) (4�1) (10�8)
At Year-End:Total assets �������������� ¥3,273�6 ¥3,064�4 ¥2,710�8 ¥2,517�2
Sumitomo Mitsui Finance and Leasing (“SMFL”) is a leading Japanese leasing com-pany with an extensive history going back to its origination of the leasing business in 1968. SMFL provides financial solutions and services appropriate to the diverse needs of customers by taking advantage of its abun-dant experience and past performance results accumulated over the years while appropriately responding to the globalization of capital expenditures and sales activities overseas. SMFL also develops an unparal-leled aircraft leasing business. In November 2018, a reorganization of Sumitomo Mitsui Financial Group’s and Sumitomo Corporation’s joint leasing part-nership was executed with the goal of drastically heightening competitiveness and achieving sustainable growth. Acting in its capacity as SMBC Group’s leasing business platform, SMFL is contributing to the devel-opment of society through engagement in the business sectors which are expected to experience future growth such as green energy, social infrastructure, and healthcare.
Company Name: Sumitomo Mitsui Finance and Leasing Company, Limited
Business Profile: LeasingEstablishment: February 4, 1963Head Office: Tokyo Head Office: 3-2, Marunouchi 1-chome,
Chiyoda-ku, Tokyo, Japan Osaka Head Office: 3-10-19, Minami-Semba,
Chuo-ku, OsakaPresident and CEO: Masaki TachibanaNumber of Employees: 3,285
Credit Ratings (as of June 30, 2019)
Long-term Short-termStandard & Poor’s A– —R&I A+ a–1JCR AA– J–1+
Financial Information (Consolidated basis, years ended March 31)
Billions of yen2019 2018 2017 2016
For the Year:Leasing transaction volume ��������������������� ¥2,412�2 ¥2,185�0 ¥2,192�6 ¥1,994�8Operating revenue ����� 1,502�3 1,622�8 1,420�4 1,147�8Operating profit ��������� 90�9 96�4 89�0 79�6Ordinary profit����������� 87�5 97�6 90�4 81�0Profit attributable to owners of parent ������� 80�0 54�5 50�4 45�5
At Year-End:Total assets �������������� ¥5,812�6 ¥5,660�6 ¥5,601�6 ¥4,736�8
105SMBC Group Annual Report 2019

www.smbc-card.com
www.smbcnikko.co.jp/en
SMBC Nikko Securities Inc. has continued to build strong relationships with individual and corporate clients for more than a century. In January 2018, SMBC Nikko Securities was merged with SMBC Friend Securities Co., Ltd., enabling it to amalgamate the strengths of both companies and to provide financial services that capitalize on the collective strength of SMBC Group as its comprehen-sive securities company. Guided by its brand slogan of “Share the Future,” SMBC Nikko Securities aspires to become the foremost Japanese comprehen-sive securities company as a provider of high-quality services to customers in Japan and overseas.
Company Name: SMBC Nikko Securities Inc.Business Profile: SecuritiesEstablishment: June 15, 2009Head Office: 3-1, Marunouchi 3-chome,
Chiyoda-ku, TokyoPresident and CEO: Yoshihiko Shimizu Number of Employees: 10,122
Credit Ratings (as of June 30, 2019)
Long-term Short-termMoody’s A1 P–1Standard & Poor’s A A–1R&I AA– a–1+JCR AA —
Financial Information (Years ended March 31)
Billions of yen2019 2018 2017 2016
For the Year:Operating revenue ����� ¥ 344�6 ¥ 376�0 ¥ 334�4 ¥ 297�9Operating income������ 38�6 84�8 69�0 46�9Ordinary profit����������� 42�1 87�4 70�5 48�3Net income ��������������� 28�0 57�7 39�4 33�1
At Year-End:Total assets �������������� ¥10,753�1 ¥10,541�4 ¥11,536�9 ¥10,346�2
(Japanese only)
Since its founding in 1967, Sumitomo Mitsui Card Company, Limited, has continued to drive the development of Japan’s credit card industry as a pioneer in the issuance of the Visa Card in Japan and as a comprehensive payment service provider at the forefront of the cashless payment trend. In April 2019, Cedyna Financial Corpora-tion was converted into a wholly owned subsidiary of Sumitomo Mitsui Card Com-pany to solidify the core of SMBC Group’s cashless payment strategies, and these two companies have been effectively functioning as a single business entity since. Capitalizing on the transaction base, expertise, credibility, and other strengths it has accumulated as an industry leader, Sumitomo Mitsui Card Company aims to become Japan’s No. 1 comprehensive pay-ment service provider in the burgeoning cashless society through the integration of its credit card, consumer credit, and financing solution businesses.
Company Name: Sumitomo Mitsui Card Company, Limited
Business Profile: Credit cardEstablishment: December 26, 1967Head Office: Tokyo Head Office: 1-2-20, Kaigan,
Minato-ku, Tokyo Osaka Head Office: 4-5-15, Imabashi,
Chuo-ku, OsakaPresident and CEO: Yukihiko OnishiNumber of Employees: 2,546
Credit Rating (as of June 30, 2019)
Long-term Short-termR&I AA– a–1+
Financial Information (Years ended March 31)
Billions of yen2019 2018 2017 2016
For the Year:Revenue from credit card operations ��������� ¥15,466�2 ¥13,756�0 ¥12,262�7 ¥11,360�6Operating revenue ����� 279�3 247�7 223�4 210�1Operating profit ��������� 48�0 41�5 34�7 40�5Ordinary profit����������� 47�7 41�0 34�5 40�5Net income (loss)������� (58�5) 28�3 24�4 26�6
At Year-End:Total assets �������������� ¥ 1,933�3 ¥ 1,698�2 ¥ 1,500�7 ¥ 1,356�3Number of cardholders (in thousands) ����������� 29,207 27,471 25,731 24,239
106 SMBC Group Annual Report 2019

www.cedyna.co.jp/english/
www.smbc-cf.com/english/
Formed in April 2009 as a result of the merger of OMC Card, Inc., Central Finance Co., Ltd., and QUOQ Inc., Cedyna Financial Corpora-tion celebrated the 10th anniversary of its founding in April 2019. Moreover, Cedyna was converted into a wholly owned subsidiary of Sumitomo Mitsui Card Company in April 2019 to solidify the core of SMBC Group’s cashless payment strategies, and these two companies have been effectively functioning as a single busi-ness entity since. Together with Sumitomo Mitsui Card Com-pany, Cedyna aims to become Japan’s No. 1 comprehensive payment service provider in the burgeoning cashless society by capitaliz-ing on the transaction base, expertise, credibility, and other strengths it has accu-mulated to date and integrating its credit card, consumer credit, and financing solution businesses.
Company Name: Cedyna Financial CorporationBusiness Profile: Credit card and installmentEstablishment: September 11, 1950Head Office: Head Office: 3-23-20, Marunouchi,
Naka-ku, Nagoya Tokyo Head Office: 2-16-4, Konan,
Minato-ku, TokyoPresident and CEO: Naoki Ono
(Appointed on April 1, 2019)Number of Employees: 3,248
Financial Information (Years ended March 31)
Billions of yen2019 2018 2017 2016
For the Year:Operating revenue ����� ¥ 146�3 ¥ 149�6 ¥ 152�1 ¥ 149�9Operating profit ��������� 2�9 2�0 7�0 0�4Ordinary profit����������� 3�0 2�2 7�1 0�4Net income (loss)������� 3�5 (5�9) 14�2 0�2
At Year-End:Total assets �������������� ¥2,128�7 ¥2,115�0 ¥2,112�5 ¥2,037�8Number of cardholders (in thousands) ����������� 16,159 16,410 16,650 17,020
Cooperation:SHOCHIKU Co., Ltd.,
Kabuki-za Co., Ltd.
Since its establishment in 1962, with the original goal of striving to become the leading provider of innovative financial services for consumers, Promise Co., Ltd., currently known as SMBC Consumer Finance Co., Ltd., has developed convenient loan prod-ucts for individuals to accommodate the changing times and has created an appropri-ate system for offering loan consultation services and executing loan agreements. SMBC Consumer Finance strives to become the kind of global consumer finance company which “would be able to earn the utmost trust of clients” by consistently and sincerely working with clients as an expert in the consumer finance business.
Company Name: SMBC Consumer Finance Co., Ltd.Business Profile: Consumer lendingEstablishment: March 20, 1962Head Office: 4-12-15, Ginza, Chuo-ku, TokyoPresident and CEO: Ryohei Kaneko
(Appointed on April 1, 2019)Number of Employees: 2,252
Credit Rating (as of June 30, 2019)
Long-term Short-termR&I A —
Financial Information (Years ended March 31)
Billions of yen2019 2018 2017 2016
For the Year:Operating revenue ����� ¥196�4 ¥192�2 ¥186�2 ¥178�3Operating profit (loss) �� 23�6 15�4 51�6 (72�3)Ordinary profit (loss) �� 32�0 15�7 51�8 (72�3)Net income (loss)������� 35�9 8�9 100�8 (72�1)
At Year-End:Total assets �������������� ¥959�9 ¥939�3 ¥925�8 ¥858�5
107SMBC Group Annual Report 2019

www.jri.co.jp/english/
www.smd-am.co.jp/english/
The Japan Research Institute, Limited (“JRI”) is a comprehensive information services company with information systems, consult-ing, and think-tank functions. In addition to providing IT-based strategic data systems planning and development and outsourcing services, JRI offers consultation in areas such as management strategy and admin reforms. It also engages in activities ranging from economic research and analysis on Japan and other countries and policy recom-mendation to business incubation.
Company Name: The Japan Research Institute, Limited
Business Profile: System development, data processing, management consulting and economic research
Establishment: November 1, 2002Head Office: Tokyo Head Office: 2-18-1, Higashi-Gotanda,
Shinagawa-ku, Tokyo Osaka Head Office: 2-2-4, Tosabori,
Nishi-ku, OsakaPresident and CEO: Masahiro FuchizakiNumber of Employees: 2,621
Financial Information (Years ended March 31)
Billions of yen2019 2018 2017 2016
For the Year:Operating revenue ����� ¥138�4 ¥136�5 ¥132�9 ¥125�0Operating profit ��������� 3�6 2�8 2�2 2�2Ordinary profit����������� 3�4 2�5 2�0 1�8Net income ��������������� 2�6 1�7 1�5 1�3
At Year-End:Total assets �������������� ¥104�9 ¥103�4 ¥103�2 ¥101�8
Formed from the merger of Sumitomo Mitsui Asset Management Company, Limited, and Daiwa SB Investments Ltd. in April 2019, Sumitomo Mitsui DS Asset Management Company, Limited is one of Japan’s top-tier asset managers. Leveraging its industry-leading research platform and global network, Sumitomo Mitsui DS Asset Management Company provides high-quality asset management services that meet specific needs of its diverse client base composed of Japanese and non-Japanese institutional (pension funds, financial institu-tions, etc.) and individual investors. The company’s vision is to become the best asset management firm for better Quality of Life of our clients and all the other stakeholders.
Company Name: Sumitomo Mitsui DS Asset Management Company, Limited
Business Profile: Investment management (discretionary/advisory) and investment trust fund management
Establishment: July 15, 1985Head Office: 2-5-1 Atago, Minato-ku, TokyoPresident and CEO: Takashi MatsushitaNumber of Employees: 1,099
Financial Information (Years ended March 31)
Sumitomo Mitsui Asset ManagementBillions of yen
2019 2018 2017 2016For the Year:Operating revenue ����� ¥46�9 ¥46�5 ¥39�1 ¥41�7Operating profit ��������� 6�0 7�3 4�5 5�5Ordinary profit����������� 6�0 7�4 4�6 5�5Net income ��������������� 4�1 4�9 3�5 4�0
At Year-End:Total assets �������������� ¥48�9 ¥53�8 ¥46�5 ¥45�1
Daiwa SB InvestmentsBillions of yen
2019 2018 2017 2016For the Year:Operating revenue ����� ¥28�7 ¥31�5 ¥32�5 ¥37�8Operating profit ��������� 4�4 6�8 6�9 8�6Ordinary profit����������� 4�5 6�8 6�9 8�7Net income ��������������� 2�9 4�7 4�8 5�5
At Year-End:Total assets �������������� ¥38�6 ¥39�3 ¥35�8 ¥36�0
108 SMBC Group Annual Report 2019

Risk Management
Risk Management CategoriesSMBC Group defines the following risk management categories and conducts management of these risks accordingly.
Group companies manage risk in accordance with the characteristics of their particular businesses. These risk categories are continuously
reviewed and new ones may be added in response to changes in the operating environment.
Risk Category Department in Charge
Credit risk Credit risk is the possibility of a loss arising from a credit event, such as deterioration in the financial condition of a borrower, that causes an asset (including off-balance sheet transactions) to lose value or become worthless.
Credit & Investment Planning Department
Market risk Market risk is the possibility that fluctuations in interest rates, foreign exchange rates, stock prices, or other market prices will change the market value of financial products, leading to a loss.
Corporate Risk Management Department
Liquidity risk Liquidity risk is defined as uncertainty around the ability of the firm to meet debt obligations without incurring unacceptably large losses. Examples of such risk include the possible inability to meet current and future cash flow / collateral needs, both expected and unexpected. In such cases, the firm may be required to raise funds at less-than-favorable rates or be unable to raise sufficient funds for settlement.
Corporate Risk Management Department
Operational risk Operational risk is the possibility of losses arising from inadequate or failed internal processes, people, and systems or from external events (see page 119 for information on risk categories and the departments in charge).
Corporate Risk Management Department
Conduct risk Conduct risk is the risk that our conduct negatively affects customers, market integrity, or effective competition.
Corporate Risk Management DepartmentGeneral Affairs Department
Top RisksThe Top Risks, risks that threaten to significantly impact management, recognized by SMBC Group and examples of the scenarios that could
potentially result from these risks are listed in the table below (see page 87 for information on methods of utilizing Top Risks).
Top Risks Example Risk Scenarios
Intensification of the international political confrontation
Slowdown in the global economy resulting from increased opaqueness in the US or European political climates
Volatile financial and economic environment
US, China, or other countries’ economic slowdown spillovers to the global economy or sharp resource price movementsLack of reliability or efficiency with regard to foreign currency procurement due to rising foreign currency procurement costs
Decline in Japan’s social vitality Economic slowdown or increased financial instability in Japan resulting from sluggish overseas demand, yen appreciation, poor market conditions, etc., in the midst of a low potential economic growth rate; deterioration of financial institutions’ earnings resulting from prolonged monetary easing measures by the Bank of Japan
Ideological and religious conflicts Slowdown in the economies of specific countries resulting from the increased geopolitical risks associated with tensions in the Korean peninsula and the Middle East, domestic or overseas acts of terrorism, etc.
Ceased operation of information systems due to cyber attacks
Difficulty in maintaining business continuity due to ceased operation or destruction of information systems following cyber attacks, etc.
Changes in competitive climate due to emergence of FinTech or other new technologies
Decreased profitability due to significant erosion of our market share or necessity of incurring costs that place downward pressure on performance as a result of intensified competition following entry into the financial industry by companies from other industries
Increase of large-scale natural disasters
Halting of operations of business partners as a result of supply chain disruptions, system failures, etc.Adverse impacts on our profits from store closures, system failures, etc.
Legal or compliance-related incidents
Damage to reputation due to incurring government penalties or other sanctions as a result of incidents stemming from misconduct; government penalties due to insufficient measures for Anti-Money Laundering/Combating the Financing of Terrorism, etc.
Materialization of strategic risks Difficulty in securing human resources in strategic or specialized fields and in maintaining a sufficient base of diverse employees
Note: The above is only a portion of the risks recognized by SMBC Group. It is possible that the materialization of risks other than those listed above could have a significant impact on our management.
109SMBC Group Annual Report 2019

Stress TestingSMBC Group conducts stress testing for each category of risks
as well as stress testing used to verify the overall soundness of
comprehensive risk management practices. The level of soundness
used for verifications is determined based on risk appetite com-
bined with consideration for the severity of the scenario anticipated.
When evaluating group-wide soundness, evaluations are
made using the consolidated balance sheets and consolidated
statements of income, which include data from affiliates, with the
goal of identifying major risks to our business and asset portfolio.
Specifically, scenarios are selected based on the aforementioned
severity level as well as background conditions that cover all areas
in which we may face risks (e.g. an outlook encompassing the entire
world). We also employ methodology for ensuring scenarios can
be accurately reflected and for incorporating business and portfolio
characteristics.
Commonly used statistical methods are utilized in developing
such methodologies. However, as it is necessary to estimate out-
liers, we may choose the methodology that best recreates outliers
rather than the methodology that offers the highest statistical
accuracy. When projecting scenarios for which there are no prior
examples, human judgment may be given greater weight than the
results of estimates.
In this manner, stress testing processes often require a variety
of expertise. When selecting the background conditions for scenar-
ios, expertise regarding macroeconomic conditions and geopolitical
risks is required. When selecting methodologies, insight into the
statistical and other mathematical analysis techniques is crucial.
When calculating impacts on SMBC Group as a whole, insight into
SMBC Group and the businesses of its customers must be used.
Stress testing processes will thus be based on discussions among
and opinions of directors, members of upper management, special-
ists, and representatives from relevant organizations and records
will be created of these discussions and opinions in order to ensure
objectivity, transparency, and reproducibility. In this way, measures
for practicing proper governance of stress testing will be applied.
(1) Scenario DesignScenarios are designed by the Corporate Risk Management Department after compil-ing information on SMBC Group’s Top Risks and the views of related departments on such factors as future global trends.
(2) Scenario FinalizationScenarios are revised as necessary based on the outcome of discussions between specialists and related departments.
(3) Calculation of ImpactThe scenario’s impact on each financial item is estimated for analysis of the impact on such indicators as the CET1.
(4) Confirmation by the Management Committee
At the Management Committee, business strategies are examined based on analyses of risk impact amounts and then verified from the perspective of capital adequacy.
■ Stress Testing Process
110 SMBC Group Annual Report 2019

Risk-Weighted AssetsRisk-weighted assets subject to the Basel Capital Accord totaled
¥58,942.8 billion as of March 31, 2019, down ¥4,597.5 billion from
March 31, 2018. The main factors behind the decrease in risk-
weighted assets were the conversion of Sumitomo Mitsui Finance
and Leasing Company, Limited to an equity-method investee and
the improvement of our portfolio of corporate exposure.
■ Risk-Weighted Assets as of March 31, 2019 (Trillions of yen)
March 31, 2018
March 31, 2019
Increase (decrease)
Credit risk 57.3 53.0 (4.3)Market risk 2.7 2.3 (0.4)Operational risk 3.5 3.6 +0.1Total 63.5 58.9 (4.6)
■ Risk Assets of Individual Business Units (Trillions of yen)
SMBC Group
Credit risk 53.0
Market risk 2.3
Operational risk 3.6
Retail Business Unit 12.8
Wholesale Business Unit 19.5
International Business Unit 22.3
Global Markets Business Unit 4.9
Credit Risk
1. Basic Approach to Credit Risk Management(1) Characteristics of Credit RiskCredit risk is characterized by the possibility of a loss arising from
a credit event, such as deterioration in the financial condition of a
borrower, that causes an asset (including off-balance sheet transac-
tions) to lose value or become worthless.
(2) Fundamental Principles for Credit Risk ManagementAll Group companies follow the fundamental principles established
by SMBC Group to assess and manage credit risk on a group-wide
basis and further raise the level of accuracy and comprehensive-
ness of group-wide credit risk management. Each Group company
must comprehensively manage credit risk according to the nature of
its business, and assess and manage credit risk of individual loans
and credit portfolios quantitatively and using consistent standards.
Credit risk is the most significant risk to which SMBC Group is
exposed. Without effective credit risk management, the impact of
the corresponding losses on operations can be overwhelming.
The purposes of credit risk management is to keep credit risk
exposure to a permissible level relative to capital, to maintain the
soundness of group-wide assets, and to ensure returns commen-
surate with risk. Doing so leads to a loan portfolio that achieves high
returns on capital and assets.
(3) Credit PolicySMBC Group’s credit policy comprises clearly stated universal
and basic operating concepts, policies, and standards for credit
operations, in accordance with our business mission and rules of
conduct. SMBC Group is promoting the understanding of and strict
adherence to its Group credit policy among all its managers and
employees. By fostering a culture of appropriate levels of risk-taking
and providing high-value-added financial services, SMBC Group
aims to enhance shareholder value and play a key contributory role
in the community.
2. Credit Risk Management SystemAt SMBC Group, the Group CRO formulates credit risk manage-
ment policies each year based on the group-wide basic policies
for risk management. Meanwhile, the Credit & Investment Planning
Department is responsible for the comprehensive management of
credit risk. This department drafts and administers credit risk regu-
lations, including the Group credit policies, manages non-performing
loans (NPLs), and performs other aspects of credit portfolio manage-
ment. We have also established the Credit Risk Committee to serve
as a body for deliberating on matters related to group-wide credit
portfolios.
At SMBC, the core bank of SMBC Group, the Credit &
Investment Planning Department within the Risk Management Unit
furnishes the credit risk management system and is thus responsible
for the comprehensive management of credit risk. This department
drafts and administers credit policies, the internal rating system,
credit authority guidelines, and credit application guidelines, and
also manages NPLs and performs other aspects of credit portfolio
management.
The department also cooperates with the Corporate Risk
Management Department in quantifying credit risk (risk capital and
risk-weighted assets) and controls the bank’s entire credit risk.
Further, the Credit Portfolio Management Department within the
Credit & Investment Planning Department has been strengthening
its active portfolio management function for stable credit portfolios
mainly through credit derivatives and the sales of loans.
111SMBC Group Annual Report 2019

The credit departments within each business unit conduct credit
risk management, along with the branches, for loans handled by
their units and manage their units’ portfolios. The credit approval
authority is determined based on the credit amount and internal
grades, while credit departments focus on the analysis and manage-
ment of customers and transactions with relatively high credit risk.
The Credit Administration Department is responsible for handling
NPLs of borrowers classified as potentially bankrupt or lower, and
draws up plans for their workouts, including write-offs. It works to
efficiently reduce the amount of NPLs through Group company
SMBC Servicer Co., Ltd., which engages in related services, and
by such means as the sell-off of claims. Through industrial and
sector-specific surveys and studies of individual companies, the
Corporate Research Department works to form an accurate idea of
the circumstances of borrower companies and quickly identify those
with potentially troubled credit positions as well as promising growth
companies.
The Compliance Unit has in place a system of coordinating
to establish systems for providing explanations to customers and
develop information management practices for the purpose of cus-
tomer protection and to prevent transactions with antisocial forces,
among other tasks.
The Internal Audit Unit, operating independently of the business
units, audits asset quality, the accuracy of gradings and self-
assessment, and the state of credit risk management, and reports
the results directly to the Board of Directors and the Management
Committee.
SMBC has established the Credit Risk Committee as a con-
sultative body to round out its oversight system for undertaking
flexible and efficient control of credit risks, and ensuring the overall
soundness of the bank’s loan operations.
3. Credit Risk Management Methods(1) Credit Risk Assessment and QuantificationAt SMBC Group, to effectively manage the risk involved in individual
loans as well as the credit portfolio as a whole, we first acknowl-
edge that every loan entails credit risks, assess the credit risk posed
by each borrower and loan using an internal rating system, and
quantify that risk for control purposes.
(a) Internal Rating System
There is an internal rating system for each asset control category
established according to portfolio characteristics. For example,
credits to corporates are assigned an “obligor grade,” which indi-
cates the borrower’s creditworthiness, and/or “facility grade,” which
indicates the collectibility of assets taking into account transaction
conditions, such as guarantee/collateral, credit period, and tenor. An
obligor grade is determined by first assigning a financial grade using
a financial strength grading model and data obtained from the obli-
gor’s financial statements. The financial grade is then adjusted taking
into account the actual state of the obligor’s balance sheet and
qualitative factors to derive the obligor grade. In the event that the
J1
J2
J3
J4
J5
J6
J7
J8
J9
J10
G1
G2
G3
G4
G5
G6
G7
G8
G9
G10
Domestic (C&I), etc.
Overseas (C&I), etc.
Obligor Grade
NormalAssets
Substandard Loans
DoubtfulAssets
Bankrupt andQuasi-Bankrupt
Assets
Financial Reconstruction Act Based Disclosure Category
Very high certainty of debt repayment
High certainty of debt repayment
Satisfactory certainty of debt repayment
Debt repayment is likely but this could change in cases of significant changes in economic trends or business environment
No problem with debt repayment over the short term, but not satisfactory over the mid to long term and the situation could change in cases of significant changes in economic trends or business environment
Currently no problem with debt repayment, but there are unstable business and financial factors that could lead to debt repayment problems
Close monitoring is required due to problems in meeting loan terms and conditions, sluggish/unstable business, or financial problems
(Borrowers Requiring Caution identified as Substandard Borrowers)
Currently not bankrupt, but experiencing business difficulties, making insufficient progress in restructuring, and highly likely to go bankrupt
Though not yet legally or formally bankrupt, has serious business difficulties and rehabilitation is unlikely; thus, effectively bankrupt
Legally or formally bankrupt
NormalBorrowers
Substandard Borrowers
Potentially Bankrupt Borrowers
BorrowersRequiring Caution
VirtuallyBankrupt Borrowers
BankruptBorrowers
DefinitionBorrowerCategory
J7R G7R
■SMBC’s Obligor Grading System
112 SMBC Group Annual Report 2019

borrower is domiciled overseas, internal ratings for credit are made
after taking into consideration country rank, which represents an
assessment of the credit quality of each country, based on its polit-
ical and economic situation as well as its current account balance
and external debt. The borrower categories used in self-assessment
are consistent with the obligor grade categories.
Obligor grades and facility grades are reviewed once a year, and
whenever necessary, such as when there are changes in the credit
situation. There are also grading systems for loans to individuals and
project finance and other structured finance tailored according to
the risk characteristics of these types of assets.
The Credit & Investment Planning Department centrally man-
ages the internal rating systems and properly designs, operates,
supervises, and validates the grading models. It validates the grad-
ing models and systems of main assets following the procedures
manual (including those for statistical validation) once a year to
ensure their effectiveness and suitability and submits reports with
this regard. SMBC, the core bank of SMBC Group, employs a total
of 22 grading models for corporate, specialized lending, and retail
applications. For details on internal rating methods, please refer to
Appendix II.
(b) Quantification of Credit Risk
Credit risk quantification refers to the process of estimating the
degree of credit risk of a portfolio or individual loan taking into
account not just the obligor’s Probability of Default (PD) but also the
concentration of risk in a specific customer or industry and the loss
impact of fluctuations in the value of collateral, such as real estate
and securities.
Specifically, first, the PD by grade, Loss Given Default (LGD),
credit quality correlation among obligors, and other parameter
values are estimated using historical data of obligors and facilities
stored in a database to calculate the credit risk. Then, based on
these parameters, we run a simulation of simultaneous default using
the Monte Carlo method to calculate our maximum loss exposure to
the estimated amount of the maximum losses that may be incurred.
Based on these quantitative results, we allocate risk capital.
Risk quantification is also executed for purposes such as to
determine the portfolio’s risk concentration, or to simulate economic
movements (stress tests), and the results are used for making
optimal decisions across the whole range of business operations,
including formulating business plans and providing a standard
against which individual credit applications are assessed. For details
on internal rating methods, please refer to Appendix II.
(2) Framework for Managing Individual LoansSMBC Group strives to maintain a sound portfolio through appro-
priate credit assessments and monitoring conducted over credit
periods. The following framework is used for managing individual
loans at SMBC, the core bank of SMBC Group.
(a) Credit Assessment
At SMBC, credit assessment of corporate loans involves a variety
of financial analyses, including cash flow, to predict an enterprise’s
capability of loan repayment and its growth prospects. These quan-
titative measures, when combined with qualitative analyses of indus-
trial trends, the enterprise’s R&D capabilities, the competitiveness
of its products or services, and its management caliber, result in a
comprehensive credit assessment. The loan application is analyzed
in terms of the intended utilization of the funds and the repayment
schedule. Thus, SMBC is able to arrive at an accurate and fair credit
decision based on an objective examination of all relevant factors.
Increasing the understandability to customers of loan conditions
and approval standards for specific borrowing purposes and loan
categories is a part of SMBC’s ongoing review of lending practices,
which includes the revision of loan contract forms with the chief aim
of clarifying lending conditions utilizing financial covenants.
To respond proactively and promptly to customers’ funding
needs—particularly those of SMEs—we employ a standardized
credit risk assessment process for SMEs that uses a credit-scoring
model. With this process, we are building a regime for efficiently
marketing our Business Select Loan and other SME loans.
In the field of housing loans for individuals, we employ a credit
assessment model based on credit data amassed and analyzed
by SMBC over many years. This model enables our loan officers
to efficiently make rational decisions on housing loan applications
and to reply to the customers without delay. It also facilitates the
effective management of credit risk as well as the flexible setting of
interest rates.
We also provide loans to individuals who rent out properties
such as apartments. The loan applications are subjected to a
precise credit risk assessment process utilizing a risk assessment
model that factors in the projected revenue from the rental business.
We also provide advice to such customers on how to revise their
business plans.
113SMBC Group Annual Report 2019

(b) Credit Monitoring System
At SMBC, in addition to analyzing loans at the application stage, the
Credit Monitoring System is utilized to maintain an understanding
of the circumstances surrounding the obligor in order to reassess
obligor grades and review self-assessment and credit policies so
that problems can be detected at an early stage and quick and
effective action can be taken. The system includes periodic moni-
toring carried out each time an obligor enterprise discloses financial
results as well as continuous monitoring performed each time credit
conditions change, as indicated in the diagram below.
(3) Framework for Credit Portfolio ManagementIn addition to managing individual loans, SMBC Group applies the
following basic policies to the management of the entire credit port-
folio to maintain and improve its soundness and profitability over the
medium to long term. Information on the status of credit portfolio
management is reported to the Management Committee and the
Board of Directors and regular monitoring is performed through the
Risk Appetite Framework (RAF).
(a) Appropriate Risk Control within Capital
To take risks within acceptable level of capital, we set an upper limit
for internal credit risk capital based on risk appetite and portfolio
plan of each business unit.
(b) Controlling Concentration Risk
As the equity capital of SMBC Group may be materially impaired in
the event that the credit concentration risk becomes apparent, we
implement measures to manage credit toward industrial sectors with
excessive risk concentration and introduce large exposure limit lines
and conduct intensive loan review for obligors with large exposure.
To manage country risk, we also have credit limit guidelines
based on each country’s creditworthiness.
(c) Researching Borrowers More Rigorously and Balancing Risk
and Returns
Against a backdrop of drastic change in the business environment,
we rigorously research borrower companies’ actual conditions.
It runs credit operations on the basic principle of earning returns
that are commensurate with the credit risk involved, and makes
every effort to reduce credit and capital costs as well as general and
administrative expenses.
(d) Preventing and Reducing Non-Performing Loans
On NPLs and potential NPLs, we carry out regular loan reviews
to clarify handling policies and action plans, enabling it to swiftly
implement measures to prevent deterioration of borrowers’ busi-
ness situations, support business recoveries, collect on loans, and
enhance loan security.
(e) Actively Managing Portfolios
We make active use of credit derivatives, loan asset sales, and
other instruments to proactively and flexibly manage its portfolios to
stabilize credit risk.
(4) Self-Assessment, Write-Offs and Provisions, Non-Performing Loans Disclosure
(a) Self-Assessment
Self-assessment is a preparatory task for ensuring SMBC Group’s
asset quality and calculating the appropriate level of write-offs and
provisions. Each asset is assessed individually for its security and
collectibility. Depending on the borrower’s current situation, the
borrower is assigned to one of five categories: Normal Borrowers,
Borrowers Requiring Caution, Potentially Bankrupt Borrowers,
Virtually Bankrupt Borrowers, and Bankrupt Borrowers. Based
on the borrower’s category, claims on the borrower are classified
into Classification I, II, III, and IV assets according to their default
■SMBC’s Credit Monitoring System
Obligor Information Processing Flow of Obligor Grading/Grading Outlook/Credit Policies/Action Plans/Facility Grading Assignment
Not Flagged
Self-Assessment Logic
NormalBorrowers
BorrowersRequiringCaution
PotentiallyBankruptBorrowers
VirtuallyBankrupt
Borrowers
BankruptBorrowers
Grading Outlook Assessment
PerformanceTrends
QualitativeRisk
Factors
•Positive•Flat•Negative
Action Plan Formulation
Facility Grading Assignment
Determination ofCredit Policies
Policy for HandlingEach Individual
Company
Credit Policy Segment
Flagged
Registrationof FinancialStatements/Creation andRevision ofCorporate
Card
Non-Consolidated
Financial Grade
ConsolidatedFinancial
Grade
EffectiveFinancial
Grade
FlaggingAccording to
Self-Assessment
CriteriaQuantitativeAssessment
FinancialAssessment
Credit Status
QualitativeAssessment
RestructuringFeasibility
FinalObligorGrade
BasicApproach
SpecificAction Plan
+
114 SMBC Group Annual Report 2019

and impairment risk levels, taking into account such factors as
collateral and guarantees.
SMBC, the core bank of SMBC Group, conducts rigorous
self-assessments of asset quality using criteria based on the
Financial Inspection Manual of the Financial Services Agency and
the Practical Guideline published by the Japanese Institute of
Certified Public Accountants. Self-assessment is the latter stage of
the obligor grading process for determining the borrower’s ability to
fulfill debt obligations, and the obligor grade criteria are consistent
with the categories used in self-assessment. As part of our efforts
to bolster risk management throughout SMBC Group, consoli-
dated subsidiaries carry out self-assessment in substantially the
same manner.
Borrower Categories, Defined
Normal Borrowers Borrowers with good earnings performances and no significant financial problems
Borrowers Requiring Caution Borrowers identified for close monitoring
Potentially Bankrupt Borrowers Borrowers perceived to have a high risk of falling into bankruptcy
Virtually Bankrupt Borrowers Borrowers that may not have legally or formally declared bankruptcy but are essentially bankrupt
Bankrupt Borrowers Borrowers that have been legally or formally declared bankrupt
Asset Classifications, Defined
Classification I Assets not classified under Classifications II, III, or IV
Classification II Assets perceived to have an above-average risk of uncollectibility
Classification III Assets for which final collection or asset value is very doubtful and which pose a high risk of incurring a loss
Classification IV Assets assessed as uncollectible or worthless
(b) Write-Offs and Provisions
In cases in which claims have been determined to be uncollectible
or deemed to be uncollectible, write-offs signify the recognition of
losses on the account books with respect to such claims. Write-
offs can be made either in the form of loss recognition by offsetting
uncollectible amounts against corresponding balance sheet items,
referred to as a direct write-off, or else by recognition of a loan
loss provision on a contra-asset account in the amount deemed
uncollectible, referred to as an indirect write-off. Recognition of
indirect write-offs is generally known as provision for the reserve for
possible loan losses.
The write-off and provision standards and procedures for each
self-assessment borrower category at SMBC, the core bank of
SMBC Group, are shown below. As part of our overall measures
to strengthen credit risk management throughout SMBC Group, all
consolidated subsidiaries use substantially the same standards as
SMBC for write-offs and provisions.
SMBC’s Standards for Write-Offs and Provisions
Self-Assessment Borrower Categories
Standards for Write-Offs and Provisions
Normal Borrowers The expected loss amount for the next 12 months is calculated for each grade based on the grade’s historical bankruptcy rate, and the total amount is recorded as “provision for the general reserve for possible loan losses�”
Borrowers Requiring Caution These assets are divided into groups according to the level of default risk� Amounts are recorded as provisions for the general reserve in proportion to the expected losses based on the historical bankruptcy rate of each group� The groups are “claims on Substandard Borrowers” and “claims on other Borrowers Requiring Caution�” The latter group is further subdivided according to the borrower’s financial position, credit situation, and other factors� Further, when cash flows can be estimated reasonably accurately, the discounted cash flow (DCF) method is applied mainly to large claims for calculating the provision amount�
Potentially Bankrupt Borrowers A provision for the specific reserve for possible loan losses is made for the portion of Classification III assets (calculated for each borrower) not secured by collateral, guarantee, or other means� Further, when cash flows can be estimated reasonably accurately, the DCF method is applied mainly to large claims for calculating the provision amount�
Virtually Bankrupt / Bankrupt Borrowers
Classification III asset and Classification IV asset amounts for each borrower are calculated, and the full amount of Classification IV assets (deemed to be uncollectible or of no value) is written off in principle and provision for the specific reserve is made for the full amount of Classification III assets�
Notes
General Reserve Provisions made in accordance with general inherent default risk of loans, unrelated to specific individual loans or other claims
Specific Reserve Provisions made for claims that have been found uncollectible in part or in total (individually evaluated claims)
Discounted Cash Flow Method
SMBC uses the discounted cash flow (DCF) method to calculate the provision amounts for large claims on Substandard Borrowers and Potentially Bankrupt Borrowers when the cash flow from repayment of principal and interest received can be estimated rea-sonably accurately. SMBC then makes provisions equivalent to the excess of the book value of the claims over the said cash inflow discounted by the initial contractual interest rate or the effective interest rate at the time of origination. One of the major advantages of the DCF method over conventional methods of calculating the provision amount is that it enables effective evaluation of each indi-vidual borrower. However, as the provision amount depends on the future cash flow estimated on the basis of the borrower’s business reconstruction plan and the DCF formula input values, such as the discount rate and the probability of the borrower going into bank-ruptcy, SMBC makes every effort to utilize up-to-date and correct data to realize the most accurate estimates possible.
115SMBC Group Annual Report 2019

(c) Non-Performing Loans Disclosure
Non-Performing Loans are loans and other claims of which recovery
of either principal or interest appears doubtful and are disclosed in
accordance with the Banking Act (in which they are referred to as
“risk-monitored loans”) and the Financial Reconstruction Act (in which
they are referred to as “Non-Performing Loans”). Non-Performing
Loans are classified based on the borrower categories assigned
during self-assessment. For detailed information on results of self-
assessments, asset write-offs and provisions, and disclosure of Non-
Performing Loans at March 31, 2019, please refer to page 335.
4. Risk Management of Marketable Credit Transactions
Financial products, such as investments in funds, securitized
products, and credit derivatives, that bear indirect risk arising from
underlying assets such as bonds and loan obligations are considered
to be exposed to both credit risk from the underlying assets as well
as “market risk” and “liquidity risk” that arise from their trading as
financial products. This is referred to as marketable credit risk.
For these types of products, we manage credit risk by analyzing
and assessing the characteristics of the underlying assets, but, for the
sake of complete risk management, we also apply the methods for
management of market and liquidity risks.
In addition, we have established guidelines based on the charac-
teristics of these types of risks and appropriately manage the risk of
losses.
Market and Liquidity Risks
1. Basic Approach to Market and Liquidity Risk Management
(1) Definitions of Market and Liquidity RisksMarket risk is the possibility that fluctuations in interest rates, foreign
exchange rates, stock prices, or other market prices will change the
market value of financial products, leading to a loss.
Liquidity risk is defined as the uncertainty around the ability of the
firm to meet debt obligations without incurring unacceptably large
losses. Examples of such risk include the possible inability to meet
current and future cash flow/collateral needs, both expected and
unexpected. In such cases, the firm may be required to raise funds
at less than favorable rates or be unable to raise sufficient funds for
settlement.
(2) Fundamental Principles for Market and Liquidity Risk Management
SMBC Group is working to further enhance the effectiveness of
its quantitative management of market and liquidity risks across
the entire Group by setting allowable risk limits; ensuring the
transparency of the risk management process; and clearly sep-
arating front-office, middle-office, and back-office operations to
establish a highly efficient system of mutual checks and balances.
2. Market and Liquidity Risk Management SystemIn accordance with the group-wide basic policies for risk man-
agement decided upon by the Management Committee, SMBC
Group determines important matters relating to the management
of market and liquidity risks, such as basic policies and risk lim-
its, in order to manage these risks. The ALM Committee meets
four times a year, in principle, to report on the state of market and
liquidity risk management and to discuss ALM operation policies.
The Corporate Risk Management Department, which is indepen-
dent of the business units that directly handle market transactions,
manages market and liquidity risks in an integrated manner. This
department not only monitors the current risk situations but also
reports regularly to the Management Committee and the Board of
Directors. Furthermore, the ALM Committee at SMBC, the core
bank of SMBC Group, meets on a monthly basis to examine reports
on the state of observance of limits on market and liquidity risks and
to discuss ALM operation policies.
Verification of the effectiveness of this risk management system
is conducted through regular internal audits implemented by the
independent Audit Department.
3. Market and Liquidity Risk Management Methods(1) Market Risk ManagementSMBC Group manages market risk by setting maximum limits for
value at risk (VaR) and maximum loss based on business policies
pertaining to market transactions. These limits are set within the risk
capital limit, which is determined taking into account the Group’s
shareholders’ equity and other principal indicators of the Group’s
financial position and management resources.
Market risk can be divided into various factors: foreign
exchange rates, interest rates, equity prices, and option risks.
SMBC Group manages each of these risk categories by employing
the VaR method as well as supplemental indicators suitable for
managing the risk of each risk factor, such as the BPV.
Trading activities are market operations that gain profits by
taking advantage of fluctuations of market prices in the short term
or price differences among markets. We assess and manage the
market risk of trading activities on a daily basis by utilizing VaR and
other tools. Banking activities are market operations which gain
profits by controlling interest rates and term period for assets (loans,
bonds, etc.) and liabilities (deposits, etc.). In the same way as in the
case of trading activities, we assess and manage the market risk of
banking activities on a daily basis, utilizing VaR and other tools.
116 SMBC Group Annual Report 2019

Please note that, the risk of interest rate fluctuation differs
substantially by how to recognize the dates for the maturity of
demand deposits (current accounts and ordinary deposit accounts
that can be withdrawn at any time) and how to estimate the time of
cancellation prior to maturity of time deposits and consumer loans.
At SMBC, the maturity of demand deposits that are expected to
be left with the bank for a prolonged period is regarded to be up
to five years (2.5 years on average). The cancellation prior to the
maturity of time deposits and consumer loans is estimated based
on historical data.
(a) Market Risks
a. Trading activities
Trading activities are market operations that gain profits by taking
advantage of fluctuations of market prices in the short term or price
differences among markets. At SMBC Group, we assess and man-
age the market risk of trading activities on a daily basis by utilizing
VaR and other tools.
The following table shows the VaR results of the Group’s trading
activities during fiscal 2018. VaR fluctuated greatly during this fiscal
year due to changes in the nature and investment positions of our
trading operations.
b. Banking activities
Banking activities are market operations which gain profits by con-
trolling interest rates and term period for assets (loans, bonds, etc.)
and liabilities (deposits, etc.). At SMBC Group, in the same way as in
the case of trading activities, we assess and manage the market risk
of banking activities on a daily basis, utilizing VaR and other tools.
The following table shows the VaR results of the Group’s bank-
ing activities during fiscal 2018.
■ VaR for Trading Activities(Billions of yen)
Fiscal 2018March 31, 2018
March 31, 2019 September 30, 2018 Maximum Minimum Average
Sumitomo Mitsui Financial Group (consolidated)
16.4 15.7 33.0 14.7 19.7 21.5
Interest rates 10.5 10.0 19.0 8.5 12.8 11.3Foreign exchange 5.1 3.9 6.9 3.2 4.4 4.3Equities, commodities, etc. 7.7 8.1 21.7 4.7 7.7 7.5
SMBC (consolidated) 6.6 7.2 13.5 5.7 7.6 8.1
SMBC (non-consolidated) 2.5 2.8 9.3 2.0 3.7 4.9
Note: VaR for a one-day holding period with a one-sided confidence interval of 99.0% [computed daily using the historical simulation method (based on four years of historical observations)].
■ VaR for Banking Activities(Billions of yen)
Fiscal 2018March 31, 2018
March 31, 2019 September 30, 2018 Maximum Minimum Average
Sumitomo Mitsui Financial Group (consolidated)
44.8 42.9 50.6 37.0 42.3 48.2
Interest rates 38.2 35.6 38.4 28.4 33.0 33.7Equities, etc. 19.8 20.5 33.7 17.8 24.3 28.1
SMBC (consolidated) 43.9 40.4 48.4 36.0 40.4 45.7
SMBC (non-consolidated) 35.8 35.6 44.1 31.6 35.4 41.3
Notes: 1. VaR for a one-day holding period with a one-sided confidence interval of 99.0% [computed daily using the historical simulation method (based on four years of historical observations)]. 2. The above category of “Equities” does not include stocks held for strategic purposes.
117SMBC Group Annual Report 2019

(b) Market Risk Volume Calculation Model
SMBC Group uses internal models to measure VaR and stressed
VaR. For information on the consolidated subsidiaries that employ
these internal models, please refer to the section on market risk.
a. Presuppositions and limits of model
In the Group’s internal VaR and stressed VaR models, various
market fluctuation scenarios are drawn up on the basis of past
data, and the historical simulation method is used to run profit-
and-loss movement simulations that enable us to forecast probable
maximum losses. The appropriateness of the internal model is later
verified through back-testing.
However, as back-testing cannot take into account major
market fluctuations that have not actually occurred historically, we
supplement this method with the use of stress testing.
This internal model employed by SMBC Group undergoes
regular auditing by an independent auditing firm to ensure that it
operates appropriately.
b. Validity verification process
i Outline of validity verification
SMBC Group uses back-testing as a method for verification of
the validity of the internal model. VaR figures calculated by the
internal model are compared with actual portfolio profit-and-loss
figures on a given day to compute an appropriate VaR level and
confirm the adequacy of risk capital management.
ii Back-testing results
Information on back-testing of trading in fiscal 2018 can be found
on page 299.
c. Indicators substitute for the back-testing method
SMBC Group employs, as a method substitute for the back-testing
method, the VaR wherein presumptions for the model, such as
observation periods, change.
d. Changes in model from fiscal 2017
There have been no changes in the model from fiscal 2017.
(c) Stress Testing
The market occasionally undergoes extreme fluctuations that
exceed projections. To manage market risk, therefore, it is important
to run simulations of unforeseen situations that may occur in finan-
cial markets (stress testing). SMBC Group conducts stress tests
regularly, assuming various scenarios, and has measures in place
for irregular events.
(d) Management of Stocks Held for Strategic Purposes
SMBC Group establishes risk allowance limits on stocks held for
strategic purposes and monitors the observance of these limits
in order to control stock price fluctuation risk appropriately. More
specifically, VaR (1 year holding period) computed from profit-and-
loss simulations based on historical market fluctuation data and
aggregated fluctuation in market price from the beginning of the
fiscal year are subject to the risk capital limit management and mon-
itored on a daily basis.
To diminish the impact of stock price declines on capital, we
have drawn up plans for reducing equity holdings from the perspec-
tive of securing the financial base necessary to sufficiently exercise
intermediary functions, even under high-stress environments that
create substantial decline in stock prices. In accordance with these
plans, we are seeking to reduce the Group’s holdings*1 to a common
equity Tier1 (CET1)*2 ratio of 14% over approximately five years from
September 2015, when the level was 28%.*1: Refers to Group holdings of stocks listed in Japan*2: Based on full implementation under the Basel III framework
■ Composition, by Industry, of Listed Equity Portfolio
25(%)
0
5
10
15
20
(March 31, 2019)
Fisheries/Farming/Forestry
Mining
ConstructionFood ProductsTextilesPulp/Paper
Pharmaceuticals
Petroleum/Coal
Rubber ProductsGlass/M
ineralsSteelNonferrous M
etalsM
etal ProductsM
achineryElectric M
achineryTransport M
achineryPrecision M
achineryOther ProductsElectricity/Gas UtilitiesOverland TransportM
arine TransportAir TransportW
arehousing/DistributionTelecom
munications
Wholesale
RetailBankingSecurities/Com
modity/Futures Trading
InsuranceOther FinancialReal EstateServices
Chemicals
SMBC Group’s PortfolioTOPIXNikkei Average
(2) Liquidity Risk ManagementAt SMBC Group, liquidity risk is regarded as one of the major risks.
The Group’s liquidity risk management is based on a framework
consisting of setting Risk Appetite Measures and establishing con-
tingency plans.
The Risk Appetite Measures are measures for selecting the
types and levels of risk that we are willing to take on or tolerate. As
the level of liquidity risk is evaluated based on cash flow and balance
sheet conditions, Risk Appetite Measures have been set for both of
these areas. These measures include Liquidity Coverage Ratio, a
liquidity regulation; periods set for which it will be possible to main-
tain funding levels even under stress due to deposit outflow or other
factors; and the ratio that stable funding covers loans.
118 SMBC Group Annual Report 2019

The tolerated levels of risk are set based on account funding
status, cash management planning, economic environments, and
other factors, and measures are monitored on a daily or monthly
basis in order to limit reliance on short-term funding and appropri-
ately manage liquidity.
As a framework to complement the Risk Appetite Measures,
upper limits are set in place on both a Group company basis and
an individual branch basis with regard to funding gaps, which is
defined as a maturity mismatch between the source of funds and
use of funds.
Furthermore, contingency plans are established in preparation
for emergency situations. These plans contain information on chains
of command and lines of reporting as well as detailed action plans
depending on the existing situation (i.e., normal, concerned, or criti-
cal). Meanwhile, SMBC carries out quantitative management of alert
indications based on early warning indicators established to assist
the bank in promptly and systematically detecting liquidity risks.
Operational Risk
1. Basic Approach to Operational Risk Management(1) Definition of Operational RiskOperational risk is the risk of loss arising from inadequate or failed
internal processes, people, and systems or from external events.
Specifically, the risk—which, in addition to processing risk and sys-
tem risk, covers legal risk, human resources risk, reputational risk,
and tangible asset risk—consists of the following seven event types
that may lead to the risk of loss defined in the Basel Capital Accord:
(1) internal fraud, (2) external fraud, (3) employment practices and
workplace safety, (4) clients, products, and business practices, (5)
damage to physical assets, (6) business disruption and system
failures, and (7) execution, delivery, and process management.
(2) Fundamental Principles for Operational Risk ManagementWe have set forth the policies on Operational Risk Management to
define the basic rules to be observed in the conduct of operational
risk management across the entire Group. Under these policies, we
have been working to enhance the operational risk management
framework across the whole Group by establishing an effective sys-
tem for identifying, assessing, controlling, and monitoring material
operational risks as well as a system for addressing risks that have
materialized and implementing emergency response measures.
Based on the framework of the Basel Capital Accord, we have been
continuously pursuing sophisticated quantification of operational
risks and advanced group-wide management.
2. Operational Risk Management SystemBased on the group-wide basic policies for risk management
established by Sumitomo Mitsui Financial Group, Group companies
have developed an operational risk management system.
At Sumitomo Mitsui Financial Group, the Management
Committee makes decisions on basic policies for operational risk
management, and these decisions are authorized by the Board of
Directors. In addition, the Corporate Risk Management Department
oversees the overall management of operational risks and works
together with departments responsible for the subcategories such
as processing risks and system risks to establish a system for
comprehensively managing operational risks.
As a brief overview, this system operates by collecting and
analyzing internal loss data and Key Risk Indicators (KRI) from
Group companies. In addition, the system entails comprehen-
sively specifying scenarios involving operational risks based on
the operational procedures of companies that have adopted the
Advanced Measurement Approach (AMA) on a regular basis and
estimating the loss amount and frequency of the occurrence of
such losses based on each scenario. Risk severities are quantified
for each scenario. For those scenarios having high severities, risk
mitigation plans will be developed and the implementation status
Risk Category Definition Department in charge
Operational risk The risk of loss arising from inadequate or failed internal processes, people, and systems or from external events. Corporate Risk Management Department
Processing risk The risk of losses arising from negligent processing by directors and employees, and from accidents or misconducts. Operations Planning Department
System risk The risk arising from nonconformity to the business strategies, inappropriate technologies applied, changes to the development plan and delay in development when building an information system, and the risk of loss incurred due to the breakdown including those caused by cyber attack, malfunction, deficiency, or unauthorized use (unauthorized alteration, destruction, duplication, and leakage of the information).
IT Planning Department
Legal risk The risk of compensation of damages arising from insufficient legal consideration or breach of contract, or a surcharge, a forfeit or an administrative fine for infringing the laws and regulations.
General Affairs Department
Human resources risk The risk of loss arising from inappropriate labor practices, poor working environments, discriminatory conduct, an outflow or loss of human resources, or deterioration in employee morale.
Human Resources Department
Reputational risk The risk of loss arising from deterioration in reputation as a consequence of the spread of rumors or media reports of the actual risk events.
General Affairs Department,Public Relations Department
Tangible asset risk The risk of loss arising from damage to tangible assets or deterioration in the operational environment caused by disasters or inadequate asset maintenance.
Administrative Services Department
119SMBC Group Annual Report 2019

of such risk mitigation plans will be monitored by the Corporate
Risk Management Department. Furthermore, operational risks are
quantified and quantitatively managed by utilizing the collected
internal loss data and scenarios.
Regular reports are issued to the Group CRO on internal loss
data, KRI, scenario risk severity information, and the status of
risk mitigation. In addition, the Risk Management Committee, a
cross-organizational committee established within Sumitomo Mitsui
Financial Group, discusses measures for mitigating risks. Through
these and other efforts, we are striving to ensure effective risk man-
agement. Moreover, our independent Internal Audit Department
conducts periodic internal audits to verify that the Group’s opera-
tional risk management system is functioning properly.
3. Operational Risk Management MethodologyAs previously defined, operational risks cover a wide range of
cases, including the risks of losses due to errors in operation,
system failures, and natural disasters. Also, operational risk events
can occur virtually anywhere and everywhere. Thus, it is essential
to check whether material operational risks have been overlooked,
monitor the overall status of risks, and manage and control them.
To this end, it is necessary to be able to quantify risks using a
measurement methodology that can be applied to all types of oper-
ational risks and to comprehensively and comparatively capture the
status of and changes in potential operational risks in business pro-
cesses. Also, from the viewpoint of internal control, the measure-
ment methodology used to create risk mitigation measures must be
such that the implementation of the measures quantitatively reduces
operational risks.
At the end of March 2008, SMBC Group adopted the AMA set
forth by the Basel Capital Accord for calculating the operational risk
equivalent amount. The approach has been utilized for the manage-
ment of operational risks since then.
Specifically, a model to which internal loss data and scenario
analysis results are input has been introduced to calculate the oper-
ational risk equivalent amount and risk asset amounts. In addition,
steps are taken to ensure the objectivity, accuracy, and comprehen-
siveness of scenario evaluations by utilizing external loss data and
Business Environment and Internal Control Factors in verification
processes.
The quantification model produces the distribution of loss
frequency and loss severity based on the internal loss data and
scenario analysis results, and it also produces the loss distribution
based on the said distribution of loss frequency (distribution of
losses in a year) and the distribution of loss severity (distribution of
loss amount per case) by making various combinations of frequen-
cies and amounts of losses according to the Monte Carlo simulation
method. In addition, the model calculates the maximum amount of
loss expected, due to operational risks, based on the assumption
of one-sided confidence interval of 99.9% and the holding period of
one year. Regarding losses on repayment of excess interest of cer-
tain subsidiaries engaged in consumer finance operations, expected
losses are deducted from the maximum amount of operational risk
loss when calculating the operational risk equivalent amount.
Operational risk equivalent amount in respect of the tangible
asset damages arising from earthquakes is measured using the
probability data of earthquake occurrence in each part of Japan and
the distribution of loss amount from those earthquake occurrences.
The measurement units are Sumitomo Mitsui Financial Group
consolidated basis, SMBC consolidated basis, and SMBC non-
consolidated basis. The operational risk equivalent amount based
on the AMA is calculated as the simple aggregate of the amount
■ Basic Framework of Operational Risk Measurement
0.4
0.3
0.2
0.1
0
0.30
0.25
0.20
0.15
0.10
0.05
00 2 4 6 8 10
0.20
0.15
0.10
0.05
00 5 1510 20 25 30
Business Environment and Internal Control Factors
External Loss Data
Internal Loss Data
Verifi-cation
ScenarioAnalysisResults
Datainput
Calculation of Operational Risk Equivalent Amount Using Quantification Model
Distribution of Loss Frequency
Distribution of Loss Severity
Probability of occurrence (frequency)
Probability of occurrence (frequency)
Number of incidents/year
Loss per incident
99.9%
Aggregated Loss Distribution
Frequency x Severity
Probability of occurrence (frequency)
Aggregated annual loss amount
120 SMBC Group Annual Report 2019

of the seven event types set forth by the Basel Capital Accord and
of tangible asset damages arising from earthquakes. However, in
the case of Sumitomo Mitsui Financial Group consolidated basis,
the risk of losses on repayment of excess interest is added on. The
measurement accuracy is ensured through a framework of regu-
larly conducted verifications of the quantification models pre- and
post-measurement.
Meanwhile, the operational risk equivalent amounts of other
Group companies that do not apply the AMA are calculated
according to the Basic Indicator Approach (BIA), and the opera-
tional risk equivalent amounts for Sumitomo Mitsui Financial Group
consolidated basis and SMBC consolidated basis are calculated by
consolidating such amounts calculated based on the BIA with the
operational risk equivalent amount calculated based on the AMA.
4. Processing Risk ManagementProcessing risk is the risk of losses arising from negligent processing
by directors and employees, and from accidents or misconducts.
SMBC Group has clarified the divisions responsible for the over-
sight functions for processing risk management, and we are working
to raise the level of sophistication of our management of processing
risk across the whole Group on a risk basis by establishing systems
for managing the processing risks faced by Group companies,
ensuring in-office inspection, minimizing losses in the event of
processing risk materialization by drafting exhaustive contingency
plans, and carrying out thorough quantification of the risk under
management as basic principles.
Basic policies for processing risk management are decided by
the Management Committee and then approved by the Board of
Directors. The status of processing risk management is reported to
the Management Committee and the Board of Directors regularly
and when necessary. These and other steps are taken to ensure
that we can provide customers with high-quality services.
Based on the group-wide basic policies for risk management,
Group companies promote appropriate operating practices by
establishing operating rules and regulations, systematizing trans-
action processing, receiving guidance from business divisions, and
inspecting conditions related to transaction processing.
5. System Risk ManagementSystem risk is the risk arising from nonconformity to the business
strategies, inappropriate technologies applied, changes to the
development plan and delay in development when building an
information system, and the risk of loss incurred due to system
breakdown including those caused by cyber attack, malfunction,
deficiency or unauthorized use (unauthorized alteration, destruction,
duplication and leakage of information).
SMBC Group has set the following as basic principles: rec-
ognizing information systems as an essential part of management
strategy taking into account advances in IT, minimizing system risk
by updating policies and procedures, including a security policy and
establishing contingency plans to minimize losses if a system risk
materializes. A risk management system has thus been put in place
to ensure adequate risk management.
The methods whereby cyber attacks are carried out are grow-
ing more sophisticated and diverse, and the threat of cyber risks
to financial institutions is becoming more serious. In response to
the growing threat of cyber risks, SMBC Group is enhancing its
response measures while utilizing third-party assessments to objec-
tively evaluate its response systems. To ensure preparedness for a
wide range of cyber attacks, we plan to augment our prior program
of cyber attack response drills and training with more sophisticated
practical-application drills, which incorporate the fundamental ele-
ments* for cyber risk management by the financial sector released
by the G7 Cyber Expert Group in October 2018. Meanwhile, the
focus on constant monitoring and human resources development by
dedicated organizations will continue to be maintained to reinforce
response measures to cyber risks.
In addition, we actively and openly incorporate various tech-
nological progress to improve convenience for customers, create
new businesses, boost productivity and efficiency, and otherwise
promote digitalization in a wide range of fields. The systems for
managing the risks projected to arise from such activities are being
strengthened on an ongoing basis in response to operating environ-
ment changes. As SMBC Group adopts artificial intelligence, cloud,
robotic process automation, and application programing interface
technologies, shared group-wide manuals are being prepared with
regard to items requiring compliance at the time of introduction,
technology-specific risks, and items for periodic monitoring. These
manuals are being utilized as part of efforts to reinforce group-wide
IT governance.
SMBC operates its risk management system by conducting
risk assessments based on the Security Guidelines published by
the Center for Financial Industry Information Systems (FISC) and by
enhancing safety measures based on the results of these assess-
ments. System troubles at banks have the potential to heavily impact
society. In addition, system risks are diversifying due to advances
in IT and the expansion of business fields. Recognizing these facts,
we have numerous measures in place for system trouble prevention,
including maintenance to ensure stable and uninterrupted operation,
duplication of various systems and infrastructure, and a disaster-
prevention system consisting of data centers in eastern and western
Japan. To maintain the confidentiality of customer data and prevent
leaks of information, sensitive information is encrypted, unauthorized
external access is blocked, and all other possible measures are
taken to secure data. We also have contingency plans for unforeseen
circumstances and hold training sessions as necessary to ensure full
preparedness in the event of an emergency.* As defined in G-7 Fundamental Elements for Threat-led Penetration Testing
121SMBC Group Annual Report 2019

ALMAbbreviation for Asset Liability ManagementMethod for comprehensive management of assets and liabilities, with appropriate controls on market risk (interest rates, exchange rates, etc.) and liquidity risk.
Advanced Measurement Approach (AMA)Based on the operational risk measurement methods used in the inter-nal management of financial institutions, this is a method for obtaining the operational risk equivalent amount by calculating the maximum amount of operational risk loss expected over a period of one year, with a one-sided confidence interval of 99.9%.
Back-testingA formal statistical framework that consists of verifying that actual losses are in line with projected losses. This involves systematically comparing the history of VaR forecasts with their associated portfolio returns.
Basic Indicator Approach (BIA)A calculation approach in which an average value for the most recent three years derived by multiplying gross profit for the financial institution as a whole by certain level (15%) is deemed to be the operational risk equivalent amount.
BPVAbbreviation for Basis Point ValuePotential change in present value of financial product corresponding to 0.01-percentage-point increase in interest rates.
Credit costAverage losses expected to occur during the coming year.
Historical simulation methodMethod of simulating future fluctuations without the use of random num-bers, by using historical data for risk factors.
LGDAbbreviation for Loss Given DefaultPercentage of loss assumed in the event of default by obligor; ratio of uncollectible amount of the exposure owned in the event of default.
Monte Carlo simulation methodGeneral term used for a simulation method which uses random numbers.
Operational risk equivalent amountOperational risk capital requirements under the Basel Capital Accord.
PDAbbreviation for Probability of DefaultProbability of becoming default by obligor during one year.
Present valueA future amount of money that has been discounted to reflect its current value taking into account the interest rate and the extent of credit risk.
Risk appetiteThe types and levels of risk that we are willing to take on or tolerate to drive earnings growth.
Risk capitalThe amount of capital required to cover the theoretical maximum potential loss arising from risks of business operations. It differs from the minimum regulatory capital requirements, and it is being used in the risk management framework voluntarily developed by financial institutions for the purpose of internal management.
Risk factorAnything which may become a factor for risk. In the case of market risk, it would be the share price or interest rate; in the case of credit risk, it would be the default rate or economic environment.
Risk-weighted assetsThe denominator used in the calculation of the capital ratio designed to maintain prudential standards for banks.
VaRAbbreviation for Value at RiskThe maximum loss that can be expected to occur with a certain degree of probability when holding a financial asset portfolio for a given amount of time.
Glossary
122 SMBC Group Annual Report 2019

Internal Reporting Systems and Hotline for Inappropriate Accounting and Auditing Activities
SMBC Group Alarm Line is intended to promote self-correction
through early detection and rectification of actions that may violate
laws and regulations. All Group employees can use this internal
means of reporting from inside and outside their company. In addi-
tion, SMBC and other Group companies have established internal
reporting systems for their employees.
Sumitomo Mitsui Financial Group Accounting and Auditing
Hotline is aimed at strengthening the Group’s self-correction function
by encouraging early detection and rectification of improper actions
relating to accounting, accounting internal controls, and auditing
at the Company and its consolidated subsidiaries. The hotline can
be used from inside or outside the Group to report accounting and
auditing irregularities.
SMFG Accounting and Auditing Hotline/Designated Dispute Resolution Agencies
SMFG Accounting and Auditing Hotline
Reports may be submitted by regular mail or e-mail to the following addresses.
Mailing address: SMFG Accounting and Auditing Hotline Iwata Godo Attorneys and Counselors at Law 10th floor, Marunouchi Building 2-4-1, Marunouchi, Chiyoda-ku, Tokyo 100-6310
E-mail address: [email protected]
• The hotline accepts any alerts of inappropriate activities concerning accounting and auditing at the Company or its consolidated subsidiaries.
• Anonymous reports are also accepted; however, if possible, providing personal information such as your name and contact information would be appreciated and helpful.
• Please provide as much detail as possible for such inappropriate activities. An investigation may not be feasible if adequate information is not provided.
• Personal information will not be disclosed to any third parties without your consent, unless such disclosure is required by law.
Designated Dispute Resolution Agencies
For the handling of any complaints received from and conflicts with our clients, SMBC has executed agreements, respectively, with the Japanese Bankers Association, a designated dispute res-olution agency under the Banking Act, and the Trust Companies Association of Japan, a Designated Dispute Resolution Organization under the Trust Business Act and Act on Provision, etc. of Trust Business by Financial Institutions and the specified non-profit organization of “Financial Instruments Mediation Assistance Center,” one of the “Designated Dispute Resolution Agencies” under the Financial Instruments and Exchange Act.
Japanese Bankers AssociationContact information: Consultation office,
Japanese Bankers AssociationTelephone numbers: (Japan) 0570-017109 or 03-5252-3772Business hours: Mondays through Fridays
(except public and bank holidays) 9:00 am to 5:00 pm
Trust Companies Association of JapanContact information: Consultation office,
Trust Companies Association of JapanTelephone numbers: (Japan) 0120-817335 or 03-6206-3988Business hours: Mondays through Fridays
(except public and bank holidays) 9:00 am to 5:15 pm
Financial Instruments Mediation Assistance CenterContact information: Financial Instruments Mediation
Assistance CenterTelephone number: (Japan) 0120-64-5005Fax: (Japan) 03-3669-9833Business hours: Mondays through Fridays
(except public and bank holidays) 9:00 am to 5:00 pm
123SMBC Group Annual Report 2019

Basic Policy for Customer-Oriented Business Conduct
SMBC Group*1 has formulated the Basic Policy for Customer-
Oriented Business Conduct for its domestic asset management and
asset formulation businesses, based on which they are promoting
customer-oriented business conduct.
This policy informs our basic stance of emphasizing the dispers-
ing of investments over the medium to long term through which
we seek to support customers in stable asset formulation. Also
based on this policy, Sumitomo Mitsui Financial Group and its Group
companies aim to contribute to the development of capital markets
that provide companies with the funds they need to grow and to
economic growth through their asset management and asset formu-
lation businesses.
1. SMBC Group’s Customer-Oriented Business Conduct
In “Our Mission,” it is stated that “We grow and prosper together
with our customers, by providing services of greater value to them.”
To give form to this principle, we have defined our Five Values, a
list of five key words that represent the values and action guide-
lines shared by executives and employees in Japan and overseas.
“Customer First” (always think and act based on a customer-
oriented perspective) is at the top of this list. SMBC Group continues
to push forward with various initiatives in accordance with these
values and action guidelines.
Sumitomo Mitsui Financial Group is fully aware of the severity
of the government penalties imposed on SMBC in April 2006 in
relation to its sales practices for interest rate swaps. We are thus
committed to preventing the reoccurrence of such malpractice.
Accordingly, we have adopted a customer- oriented perspective in
pursuing sustainability throughout our management, internal control,
and compliance systems. Through these and other efforts, we have
endeavored to regain trust from customers and from society as a
whole.
Furthermore, the Customer Satisfaction (CS) Improvement
Subcommittee has been set up to incorporate customer input into
management. The opinions of external experts*2 are utilized in meet-
ings of this committee as discussions on and verification of initiatives
at Group companies are carried out to promote the exercise of a
customer-oriented perspective on a group-wide basis. In addition,
the CS Improvement Committee, which comprises officers sitting on
the Group Management Committee, holds regular discussions on
customer-oriented business conduct.
We are convinced that the ongoing quest to provide quality
products and services based on customer needs and desires will
contribute to economic growth and subsequently growth for SMBC
Group. Everyone at SMBC Group will carry out their duties in an
earnest and just manner while exercising a high degree of special-
ized knowledge and good business ethics. SMBC Group will never
let up in its efforts to ensure that it always thinks and acts based on
a customer-oriented perspective in the truest sense as it strives to
generate the greatest profits for its customers.
Five Values
Create new value from a forward-looking perspective
Proactive and Innovative
Exercise speed in making decisions and carrying out duties
Speed
Act as a team to create the best possible results
Team SMFG
Seek quality from all angles
Quality
Always think and act based on a customer-oriented perspective
Customer First
124 SMBC Group Annual Report 2019

2. Initiatives for Promoting Customer-Oriented Business ConductSumitomo Mitsui Financial Group will implement the following ini-
tiatives to entrench the principles of customer-oriented business
conduct into its activities.
(1) Provision of Products and Services Suited to the Customer
When drawing up and underwriting financial products, we will act
with an accurate understanding of customer needs, determining the
ideal target customer group based on the risks and complexity of
the products, in order to properly develop and select products.
We will also help customers to find the ideal products and ser-
vices. Our first step in this process will be to learn about our custom-
ers, inquiring into their needs and goals. We will next look at their level
of knowledge, investment experience, and asset portfolios so that we
can propose the best possible products and services for them.
If we think that a product may not be ideally suited to a custom-
er’s needs based on its characteristics or risks, we will discuss this
matter with the customer as necessary and refrain from proposing
such products when doing so is inappropriate.
(2) Easy-to-Understand Explanation of Important Information
The amount of information provided to customers on the charac-
teristics, risks, and fees of the products we handle as well as on
the economic climate and market trends will be enhanced to help
customers make informed decisions. Furthermore, we will strive to
explain this information in an easy-to-understand manner.
(3) Clarification of FeesSumitomo Mitsui Financial Group receives fees from customers for
the products and services it provides out of consideration for the
need to develop and improve the quality of products and services
and to supply various types of information as well as for process-
ing- and infrastructure-related expenses. We will seek to provide
thorough explanations of these fees that are as easy to understand
as possible.
(4) Management of Conflicts of InterestPerforming duties in an earnest and just manner based on a cus-
tomer-oriented perspective entails managing any potential conflicts
of interest to ensure that our operations are truly customer oriented.
Based on the Management Policy Concerning Conflicts of
Interest in Sumitomo Mitsui Financial Group, we have defined the
types of conflicts of interest requiring management as well as the
types of transactions that tend to present conflicts of interest and
procedures for identifying these transactions, methods and systems
for managing conflicts of interest, and the scope of Group compa-
nies at which conflicts of interest should be managed. In this manner,
we take steps to ensure that conflicts of interest are properly man-
aged and therefore do not impede the interests of customers.
(5) Frameworks for Properly Motivating EmployeesAlways thinking and acting based on a customer-oriented perspec-
tive in the truest sense requires our employees to be properly moti-
vated so that they can remain dedicated and effective in their work.
Sumitomo Mitsui Financial Group thus develops its performance
evaluation systems from a long-term perspective with the aim of
encouraging customer-oriented sales activities. At the same time, we
are expanding our range of training programs for promoting earnest
and just work practices and higher levels of business ethics.
SMBC Group aims to facilitate the shift from savings to asset
holding seen in Japan through such initiatives.
Furthermore, we will periodically disclose information on initiatives
by SMBC Group based on this policy with the aim of facilitating
understanding regarding these initiatives among customers. In addi-
tion, the status of initiatives and their results will be verified so that
initiatives can be revised as necessary to improve upon operating
practices. Information regarding these verifications and revisions will
be disclosed.
*1 Sumitomo Mitsui Financial Group and its subsidiaries and affiliates are referred to collectively as “SMBC Group.” The following SMBC Group companies are subject to this policy:
SMBC; SMBC Trust Bank Ltd.; SMBC Nikko Securities Inc.; Sumitomo Mitsui DS Asset Management Company, Limited*2 External experts* are invited to meetings of the CS Improvement
Subcommittee to provide advice and suggestions with the aim of incor-porating a wide range of perspectives into management that includes and goes beyond input and requests from customers.
* External experts (in alphabetical order)
Name Position
Professor Hideki KandaEmeritus Professor, University of Tokyo, and Professor, Gakushuin University Law School
Kumiko Bando President, Japan Legal Support Center
Taku Umezawa Partner, Nagashima Ohno & Tsunematsu
125SMBC Group Annual Report 2019

Services for CorporationsIn April 2014, SMBC established its Area Main Offices to more fully
address the wholesale-retail integral needs of mid-sized corporations
and SME clients, including the aspect of business succession. Area
Main Offices enable us to offer integrated corporate and personal
consulting and draw on SMBC Group networks to provide specialist
services. In addition to providing business loans, SMBC Group
companies offer tailored support, including consultation on overseas
business development, business matching, business succession,
and internal company reforms, alongside consultation on personal
asset management, loans, inheritance, and asset succession.
Collaboration with Local Credit Guarantee CorporationsSMBC offers Business Select Loans, a loan service that offers
unsecured and unguaranteed financing, and also provides jointly
guaranteed loans through collaboration with local credit guarantee
corporations, enabling it to meet a diverse range of funding needs.
We will continue offering services to fund and support the man-
agement of the mid-sized corporations and SMEs that form the
backbone of the Japanese economy.
Credit Guarantee Corporation Name
Credit Guarantee Corporation of Tokyo SMBC Strengthen Management Base Guarantee (SDGs, electronic contracts)
Credit Guarantee Corporation of Kanagawa Kanagawa Asset 200
Credit Guarantee Corporation of Osaka CS Next Guarantee
Credit Guarantee Corporation of Hyogo-Ken HIYAKU
Support System for Mid-Sized Corporations and SMEs
SMBC Group
• Loans
• Management consultation
• Management support
SMBC
• Departments of the head office
• Corporate Business Offices
• Area Main Offices
• Branches, etc.
AffiliationAffiliation
SMBC Group Companies
Mid-sized
corporations,
SMEs, and retail
customers
• External organizations
• External experts / professionals
Support for Mid-Sized Corporations and SMEs, Vitalization of Local Regions in Japan
Affiliation
126 SMBC Group Annual Report 2019

Support for Improved Management, Business Turnaround, and Business TransformationAlong with its efforts to fulfill its financial intermediary function
smoothly, SMBC seeks to provide solutions to management issues,
putting itself in the position of the client to devise optimum propos-
als based on the nature of the issues and the client’s stage in life.
Examples include offering a full range of loan products designed
to meet funding needs and address management issues. We also
provide solutions in such areas as business matching, overseas
business development, and business succession.
Our assistance in business operating improvements and regen-
eration involves links with external experts / professionals*1 and
external organizations*2 to provide support in drawing up plans for
improvement and advice in such areas as cost cutting and asset
sales.
For clients that have suffered damage in natural disasters, we
propose optimal solutions and support the implementation of
rebuilding lives and business.
*1 SMBC Consulting, certified tax accountants, certified public accountants, etc.
*2 Council supporting revitalization of SMEs, Regional Economy Vitalization Corporation of Japan, etc.
Involvement in Regional RevitalizationRegional revitalization continues to be a key theme for the Japanese
government. Related “regional comprehensive strategy” plans drawn
up by local government entities are in their wrap-up stage.
It is becoming more important for regions to exercise their overall
capabilities. There are thus high expectations for contributions that
financial institutions can make by leveraging their wide-reaching
information networks.
SMBC Group has entered into cooperation agreements with local
government entities as part of its efforts to assist in local industrial
development. Based on these agreements, we are making con-
tributions to regional revitalization from various angles based on
specific issues and needs of individual local government entities and
regions across Japan. By coordinating with local government entities,
regional financial institutions, and private-sector companies, we
provide a wide variety of support services. For example, we leverage
the functions of SMBC Group companies to help enhance regional
infrastructure, attract tourists from overseas, develop comfortable
cities that are conducive to interactions between various generations,
accomplish the United Nations Sustainable Development Goals,
promote the expansion of regional employment by assisting migra-
tion to less urban areas, and
increase popularity of regional
specialties in Tokyo.
We will continue to work
with local government entities
and regional financial institu-
tions across Japan, drawing
on SMBC Group’s network to
contribute to local economies
through regional revitalization.
Ceremony commemorating the conclusion of a cooperation agreement for transforming Yokohama into a futuristic city compatible with the Sustainable Development Goals
Measures for Finance Facilitation
SMBC’s “Basic Policy for Finance Facilitation” underlies efforts to be diligent and thorough in the provision of funding and consultation.
“Basic Policy for Finance Facilitation”
1. Conduct appropriate review of applications submitted for a new loan or requests to modify loan conditions
2. Provide appropriate management consultation and guidance for clients and appropriate support for management improvements
3. Strive to improve the ability to assess the value of a client’s business appropriately
4. Provide appropriate and thorough explanations to clients in consultations and applications for new loans or modification of loan conditions
5. Respond appropriately and adequately to client inquiries regarding new loan and modification consultations and applications and to consulting requests or complaints
6. Liaise closely with other financial institutions involved in applications for modifying loan conditions, applications for support through public and third-party institutions, or other applications
7. Respond appropriately in respect of personal guarantees in accordance with the “Guidelines for Personal Guarantee Provided by Business Owners”
127SMBC Group Annual Report 2019

Employees
SMBCMarch 31 2017 2018 2019Number of employees*1 27,904 27,935 27,154
Male 13,261 12,989 12,471Percentage of total 47.52% 46.50% 45.93%
Female 14,643 14,946 14,683Percentage of total 52.48% 53.50% 54.07%
Average age 37 yrs 1 mos� 37 yrs 1 mos� 37 yrs 5 mos�Male 40 yrs 7 mos� 40 yrs 5 mos� 40 yrs 4 mos�Female 33 yrs 11 mos� 34 yrs 2 mos� 34 yrs 10 mos�
Average years of service 13 yrs 0 mos� 13 yrs 1 mos� 13 yrs 6 mos�Male 15 yrs 9 mos� 15 yrs 10 mos� 15 yrs 11 mos�Female 10 yrs 5 mos� 10 yrs 9 mos� 11 yrs 4 mos�
Number of women in managerial positions 911 1,022 1,164
Ratio of employees with disabilities (% of total)*2 2.28% 2.38% 2.47%
*1 The number of full-time employees, including employees seconded to other companies and organizations� The following list of employees is deducted from the total number of employees: executive officers, employees on short-term contracts, part-time employees, employees of temporary employment agencies, and locally hired employees at overseas branches�
*2 As of March 1 of respective years
April 1 2017 2018 2019Number of new hires 1,347 803 667Number of newly employed female graduates 842 372 269Ratio of newly employed females to total new employees 62.5% 46.3% 40.3%
Fiscal 2016 2017 2018Number of employees taking parental leave*3 2,183 2,217 2,370 <Men taking such leave> <332> <223> <316>Number of career hires*3 115 32 16
*3 Retroactive revisions have been made to previous fiscal years due to change in definition�
SMBC Trust BankMarch 31 2017 2018 2019Number of employees*1 1,930 1,937 1,985
Male 875 907 948Percentage of total 45.34% 46.82% 47.76%
Female 1,055 1,030 1,037Percentage of total 54.66% 53.18% 52.24%
Average age 41 yrs 1 mos� 42 yrs 5 mos� 44 yrs 7 mos�Male 44 yrs 5 mos� 44 yrs 4 mos� 46 yrs 11 mos�Female 40 yrs 2 mos� 40 yrs 9 mos� 41 yrs 4 mos�
Average years of service 8 yrs 7 mos� 9 yrs 1 mos� 7 yrs 3 mos�Male 8 yrs 7 mos� 8 yrs 6 mos� 6 yrs 3 mos�Female 8 yrs 11 mos� 9 yrs 7 mos� 8 yrs 2 mos�
Number of women in managerial positions 97 90 95
Ratio of employees with disabilities (% of total)*2 1.87% 1.96% 2.51%
*1 The number of full-time employees, including employees seconded to other companies and organizations� The number excludes employees seconded from other companies and organizations, directors, employees on short-term contracts, part-time employees, and employees of temporary employment agencies�
*2 The legally mandated number of employees with disabilities had been hired as of March 31, 2019�
April 1 2017 2018 2019Number of new hires 56 54 44Number of newly employed female graduates 26 28 18Ratio of newly employed females to total new employees 46.4% 51.9% 40.9%
Fiscal 2016 2017 2018Number of employees taking parental leave 95 94 95 <Men taking such leave> <1> <1> <33>Number of career hires*3 208 35 28
*3 Retroactive revisions have been made to previous fiscal years due to change in definition�
Sumitomo Mitsui Finance and LeasingMarch 31 2017 2018 2019Number of employees*1, 2 1,678 1,683 2,434
Male 1,067 1,072 1,581Percentage of total 63.59% 63.70% 64.95%
Female 611 611 853Percentage of total 36.41% 36.30% 35.05%
Average age*2 40 yrs 2 mos� 40 yrs 6 mos� 40 yrs 7 mos�Male 42 yrs 2 mos� 42 yrs 5 mos� 42 yrs 8 mos�Female 36 yrs 7 mos� 37 yrs 1 mos� 37 yrs 2 mos�
Average years of service*2 14 yrs 10 mos� 15 yrs 0 mos� 15 yrs 0 mos�Male 16 yrs 8 mos� 16 yrs 10 mos� 16 yrs 11 mos�Female 11 yrs 5 mos� 11 yrs 11 mos� 11 yrs 10 mos�
Number of women in managerial positions 19 20 26
Ratio of employees with disabilities (% of total)*2, 3 2.23% 2.18% 2.05%
*1 The number of full-time employees, including employees seconded to other companies and organizations� The following list of employees is deducted from the total number of employees: employees seconded from other companies and organizations, executive officers, employees on short-term contracts, part-time employees, employees of temporary employment agencies, and full-time employees of affiliates (including overseas subsidiaries)�
*2 Retroactive revisions have been made to previous fiscal years due to change in definition�*3 As of March 1 of respective years
April 1 2017 2018 2019Number of new hires*4 49 56 76Number of newly employed female graduates*4 25 28 43Ratio of newly employed females to total new employees*4 51.0% 50.0% 56.6%
*4 Retroactive revisions have been made to previous fiscal years due to change in definition�
Fiscal 2016 2017 2018Number of employees taking parental leave*5 81 69 44 <Men taking such leave> <48> <35> <17>Number of career hires 10 7 16
*5 Retroactive revisions have been made to previous fiscal years due to change in definition�
SMBC Nikko SecuritiesMarch 31 2017 2018 2019Number of employees*1, 2 8,705 10,678 10,394
Male 5,283 6,579 6,411Percentage of total 60.69% 61.61% 61.68%
Female 3,422 4,099 3,983Percentage of total 39.31% 38.39% 38.32%
Average age*2 40 yrs 1 mos� 40 yrs 0 mos� 40 yrs 7 mos�Male 41 yrs 3 mos� 41 yrs 4 mos� 41 yrs 9 mos�Female 38 yrs 4 mos� 37 yrs 11 mos� 38 yrs 8 mos�
Average years of service*2, 3 13 yrs 11 mos� 11 yrs 10 mos� 12 yrs 6 mos�Male 14 yrs 7 mos� 12 yrs 1 mos� 12 yrs 8 mos�Female 13 yrs 0 mos� 11 yrs 5 mos� 12 yrs 3 mos�
Number of women in managerial positions 154 166 171
Ratio of employees with disabilities (% of total)*4 2.25% 2.16% 2.38%
*1 Excluding executive officers, part-time employees, dispatched employees, locally hired employees (LH) at overseas branches
*2 Retroactive revisions have been made to previous fiscal years due to change in definition�*3 The average years of service of applicable employees� Years of service for employees joined
through the merger with SMBC Friend Securities are counted from the date of the merger�*4 As of March 1 of respective years
April 1 2017 2018 2019Number of new hires 516 354 325Number of newly employed female graduates 285 133 114Ratio of newly employed females to total new employees 55.2% 37.6% 35.1%
Fiscal 2016 2017 2018Number of employees taking parental leave*5 303 399 409 <Men taking such leave> <18> <62> <64>
*5 Retroactive revisions have been made to previous fiscal years due to change in definition�Note: The merger with SMBC Friend Securities was conducted in January 2018�
128 SMBC Group Annual Report 2019

Sumitomo Mitsui CardMarch 31 2017 2018 2019Number of employees*1 2,439 2,482 2,495
Male 1,140 1,151 1,141Percentage of total 46.74% 46.37% 45.73%
Female 1,299 1,331 1,354Percentage of total 53.26% 53.63% 54.27%
Average age*1 38 yrs 9 mos� 39 yrs 0 mos� 39 yrs 6 mos�Male 40 yrs 9 mos� 41 yrs 0 mos� 41 yrs 5 mos�Female 36 yrs 11 mos� 37 yrs 4 mos� 37 yrs 10 mos�
Average years of service*1 14 yrs 5 mos� 14 yrs 8 mos� 15 yrs 0 mos�Male 15 yrs 8 mos� 15 yrs 11 mos� 16 yrs 2 mos�Female 13 yrs 4 mos� 13 yrs 8 mos� 14 yrs 0 mos�
Number of women in managerial positions*2 40 48 89
Ratio of employees with disabilities (% of total)*3 2.32% 2.32% 2.45%
*1 The number of full-time employees� This excludes directors, consultants, advisors, part-time employees, specialist contract employees, affiliated company employees (including employees sec-onded from other companies and organizations), and locally hired employees at overseas branches� Retroactive revisions have been made to previous fiscal years due to change in definition�
*2 Total of group managers, vice presidents, and assistant vice presidents*3 Computed based on single month of March
April 1 2017 2018 2019Number of new hires 86 69 54Number of newly employed female graduates 46 42 28Ratio of newly employed females to total new employees 53.5% 60.9% 51.9%
Fiscal 2016 2017 2018Number of employees taking parental leave 172 187 202 <Men taking such leave> <19> <29> <33>Number of career hires*4 21 22 16*4 Retroactive revisions have been made to previous fiscal years due to change in calculation
methodology�
CedynaMarch 31 2017 2018 2019Number of employees*1 3,389 3,425 3,349
Male 1,998 1,971 1,897Percentage of total 58.96% 57.55% 56.64%
Female 1,391 1,454 1,452Percentage of total 41.04% 42.45% 43.36%
Average age 42 yrs 1 mos� 42 yrs 8 mos� 43 yrs 0 mos�Male 44 yrs 6 mos� 44 yrs 10 mos� 45 yrs 2 mos�Female 38 yrs 8 mos� 39 yrs 7 mos� 40 yrs 2 mos�
Average years of service 18 yrs 0 mos� 18 yrs 2 mos� 18 yrs 6 mos�Male 20 yrs 2 mos� 20 yrs 6 mos� 20 yrs 9 mos�Female 14 yrs 11 mos� 15 yrs 1 mos� 15 yrs 7 mos�
Number of women in managerial positions 62 75 88
Ratio of employees with disabilities (% of total)*2 2.14% 2.39% 2.32%
*1 Excluding employees seconded from other companies, employees on short-term contracts and part-time employees
*2 As of March 1 of respective years
April 1 2017 2018 2019Number of new hires 58 60 51Number of newly employed female graduates 23 38 25Ratio of newly employed females to total new employees 39.7% 63.3% 49.0%
Fiscal 2016 2017 2018Number of employees taking parental leave*3 137 136 180 <Men taking such leave> <2> <3> <32>Number of career hires 0 0 0*3 Including employees on short-term childcare leave� Retroactive revisions have been made to
previous fiscal years due to change in calculation methodology�
SMBC Consumer FinanceMarch 31 2017 2018 2019Number of employees*1, 2 2,078 2,134 2,263
Male 1,366 1,386 1,425Percentage of total 65.74% 64.95% 62.97%
Female 712 748 838Percentage of total 34.26% 35.05% 37.03%
Average age*2 40 yrs 5 mos� 41 yrs 0 mos� 41 yrs 2 mos�Male 42 yrs 1 mos� 42 yrs 7 mos� 42 yrs 8 mos�Female 37 yrs 5 mos� 38 yrs 1 mos� 38 yrs 8 mos�
Average years of service*2 16 yrs 4 mos� 16 yrs 8 mos� 16 yrs 4 mos�Male 18 yrs 2 mos� 18 yrs 7 mos� 18 yrs 1 mos�Female 12 yrs 10 mos� 13 yrs 3 mos� 13 yrs 6 mos�
Number of women in managerial positions 96 112 118
Ratio of employees with disabilities (% of total)*3 2.23% 2.32% 2.43%
*1 The number of full-time employees on a non-consolidated basis, including employees seconded to other companies and organizations� The following list of employees is deducted from the total number of employees: employees seconded from other companies, locally hired employees at overseas branches, executive officers, contract employees, part-time employees, and employees of temporary employment agencies�
*2 Retroactive revisions have been made to previous fiscal years due to change in definition�*3 As of March 31 of respective years
April 1 2017 2018 2019Number of new hires 49 55 48Number of newly employed female graduates 27 24 24Ratio of newly employed females to total new employees 55.1% 43.6% 50.0%
Fiscal 2016 2017 2018Number of employees taking parental leave*4 75 63 53 <Men taking such leave> <0> <3> <3>Number of career hires 1 1 1
*4 Including employees who retired during the fiscal year� Retroactive revisions have been made to previous fiscal years due to change in definition�
Japan Research InstituteMarch 31 2017 2018 2019Number of employees*1, 2 2,296 2,357 2,427
Male 1,677 1,710 1,773Percentage of total 73.04% 72.55% 73.05%
Female 619 647 654Percentage of total 26.96% 27.45% 26.95%
Average age*2 40 yrs 6 mos� 40 yrs 6 mos� 40 yrs 9 mos�Male 41 yrs 3 mos� 41 yrs 4 mos� 41 yrs 6 mos�Female 38 yrs 5 mos� 38 yrs 6 mos� 38 yrs 10 mos�
Average years of service*2 12 yrs 3 mos� 12 yrs 6 mos� 12 yrs 8 mos�Male 12 yrs 7 mos� 12 yrs 10 mos� 13 yrs 1 mos�Female 11 yrs 5 mos� 11 yrs 7 mos� 11 yrs 10 mos�
Ratio of employees with disabilities (% of total)*3 2.68% 2.40% 2.27%
*1 The number of full-time employees, including employees seconded to other companies and organizations� The following list of employees is deducted from the total number of employees: executive officers, consultants, advisors, employees on short-term contracts, part-time employees, employees of temporary employment agencies, locally hired employees at overseas branches, and full-time employees of affiliates�
*2 Retroactive revisions have been made to previous fiscal years due to change in definition�*3 As of March 31 of respective years
April 1 2017 2018 2019Number of new hires 103 105 110Number of newly employed female graduates*4 32 32 30Ratio of newly employed females to total new employees 31.1% 30.5% 27.3%
*4 Including only Sogoshoku employees� Ippanshoku employees are excluded�
Fiscal 2016 2017 2018Number of employees taking parental leave 69 64 75 <Men taking such leave> <24> <21> <30>Number of career hires*5 32 33 46
*5 Excluding employees of temporary employment agencies converted to direct employees and former bank employees transferred to the company
129SMBC Group Annual Report 2019

Sumitomo Mitsui Asset ManagementMarch 31 2017 2018 2019Number of employees*1, 2 538 551 552
Male 382 388 386Percentage of total 71.00% 70.42% 69.93%
Female 156 163 166Percentage of total 29.00% 29.58% 30.07%
Average age*2 43 yrs 10 mos� 44 yrs 1 mos� 44 yrs 7 mos�Male 45 yrs 6 mos� 45 yrs 10 mos� 46 yrs 3 mos�Female 39 yrs 7 mos� 39 yrs 10 mos� 40 yrs 6 mos�
Average years of service*2, 3 7 yrs 11 mos� 8 yrs 5 mos� 9 yrs 3 mos�Male 8 yrs 4 mos� 8 yrs 10 mos� 9 yrs 9 mos�Female 6 yrs 11 mos� 7 yrs 5 mos� 8 yrs 2 mos�
Number of women in managerial positions 8 10 9
*1 The number of full-time employees� The following list of employees is deducted from the total number of employees: executive officers, employees of temporary employment agencies, and locally hired employees at overseas branches�
*2 Retroactive revisions have been made to previous fiscal years due to change in definition�*3 New employees joining due to mergers are calculated based on the merger date�
April 1 2017 2018 2019Number of new hires 10 11 15Number of newly employed female graduates 5 5 6Ratio of newly employed females to total new employees 50.0% 45.5% 40.0%
Fiscal 2016 2017 2018Number of employees taking parental leave*4 19 11 10 <Men taking such leave> <0> <1> <0>Number of career hires*4 24 32 15
*4 Retroactive revisions have been made to previous fiscal years due to change in definition�
Daiwa SB InvestmentsMarch 31 2017 2018 2019Number of employees*1 307 316 322
Male 239 245 245Percentage of total 77.85% 77.53% 76.09%
Female 68 71 77Percentage of total 22.15% 22.47% 23.91%
Average age 44 yrs 4 mos� 44 yrs 9 mos� 45 yrs 1 mos�Male 45 yrs 5 mos� 45 yrs 8 mos� 45 yrs 10 mos�Female 40 yrs 9 mos� 41 yrs 6 mos� 42 yrs 9 mos�
Average years of service 14 yrs 10 mos� 15 yrs 9 mos� 15 yrs 10 mos�Male 15 yrs 10 mos� 16 yrs 3 mos� 17 yrs 1 mos�Female 11 yrs 3 mos� 11 yrs 11 mos� 11 yrs 11 mos�
Number of women in managerial positions 0 0 0
Ratio of employees with disabilities (% of total) 0.98% 0.95% 1.56%
*1 The number of full-time employees� The following list of employees is deducted from the total number of employees: executive officers, employees of temporary employment agencies, and locally hired employees at overseas branches�
April 1 2017 2018 2019Number of new hires 4 6 —Number of newly employed female graduates 1 1 —Ratio of newly employed females to total new employees 25.0% 16.7% —
Fiscal 2016 2017 2018Number of employees taking parental leave 8 5 10 <Men taking such leave> <6> <1> <7>Number of career hires 7 13 6
130 SMBC Group Annual Report 2019

Main Work-Life Balance Support System
Parental leave Leave for taking care of sick children
Shorter working hours
Restrictions on overtime
Exemption from late-night work Other principal systems
SMBC
18 months or maximum of 2 years in case of inability to place in daycare center
Until March 31 of the 6th grade (10 days per annum per child; 20 days for two or more children)
Employees can choose shorter working hours for each day or fewer days worked per week, both applicable until March 31 of the 6th grade
Until March 31 of the 6th grade
Until March 31 of the 6th grade
• Short-term childcare leave • Work relocations• Childcare subsidies• Leave for nursing care• Shorter working hours allowed for nursing care• System for rehiring former employees• Half day leave• Telework• Staggered working hours
SMBC Trust Bank
1 year or maximum of 18 months in case of inability to place in daycare centerUp to 26 months if other conditions are met
Until the entry into junior high school (5 days per annum per child; 10 days for two or more children)
Employees can work shortened hours equivalent to working a minimum of 6 hours per day until child’s entry into elementary school
Until the entry into elementary school
Until the entry into elementary school
• Flextime system• Flexibility in working hours• Flexibility in the work place• Paternity leave (3 days)• Leave for nursing care• Shorter working hours allowed for nursing care• Family care time off• Family support leave• Short-term childcare leave• Annual leave in hour increments
Sumitomo Mitsui Finance and Leasing
1 year or maximum of 2 years in case of inability to place in daycare center
Until the entry into elementary school (5 days per annum per child; 10 days for two or more children)
Employees can reduce daily working hours to a minimum of 5 hours 30 minutes until March 31 of the 6th grade
Until the entry into elementary school
Until the entry into elementary school
• Short-term childcare leave• Leave for nursing care• Shorter working hours allowed for nursing care• Nursing care leave system• Staggered working hours• Half day leave• System for rehiring former employees• Work relocations• Flextime system• Flexibility in the work place
SMBC Nikko Securities
Until 3 years of age Until the entry into junior high school (5 days per annum per child; 10 days for two or more children)
Employees may reduce daily working hours in increments of 30 minutes up to 2�5 hours until March 31 of the 6th grade
Until March 31 of the 6th grade
Until March 31 of the 6th grade
• Short-term childcare leave• Discounted rates for daycare center• Nursing care leave• Special days off for nursing care• Shorter working hours allowed for nursing care• Short-term leave for nursing care• Staggered working hours (working in shifts)• Rehiring former employees• Childcare subsidies• Flexibility in the work place
Sumitomo Mitsui Card
18 months or maximum of 2 years in case of inability to place in daycare center
Until March 31 of the 6th grade (5 days per annum per child; 10 days for two or more children)
Employees can choose to reduce daily working hours by 30, 60, or 90 minutes or reduce the number of days worked a week until March 31 of child’s 3rd-grade year
Until March 31 of the 3rd grade
Until March 31 of the 3rd grade
• Work relocations• Staggered working hours• Half-day paid leave• Special leave (for spouse’s childbirth)• Childcare subsidies• Nursing care leave, days off for nursing care• Shorter working hours for nursing care• Rehiring former employees
Cedyna
Until 3 years of age Until completion of the 6th grade (40 hours per annum per child; 80 hours for two or more children)
Until completion of the 3rd grade (Employees can choose to work 5, 6, or 7 hours a day)�
Until the entry into elementary school
Until the entry into elementary school
• Maternity leave and work• Short-term childcare leave• Leave for nursing care• Shorter working hours allowed for nursing care• System for rehiring former employees• Paternity leave• Leave for providing nursing care or taking care of sick children
(by the hour)
SMBC Consumer Finance
18 months or maximum of 2 years in case of inability to place in daycare center
Until the entry into elementary school (5 days per annum per child; 10 days for two or more children)
Until March 31 of the 6th grade (Employees can choose to work 6, 6�5, 7, or 7�5 hours a day)�
Until the entry into junior high school
Until the entry into junior high school
• Personnel system being employed under the regional system of no possibility of transfers with movings
• Rehiring retirees• A grace period for job rotation• Leave for nursing care• Shorter working hours allowed for nursing care• Paid leave by the hour• Half-day paid leave• Leave before and after maternity• Childcare leave (2 days)• School-visiting day (2 days a year)• Rehiring of former employees who quit for childcare or
care-giving reasons• Husband’s maternity leave (3 days)• Rollover of unused paid vacation days to subsequent years• Nursing care leave• Adjustment of work start and end times
Japan Research Institute
18 months or maximum of 2 years in case of inability to place in daycare center
Until March 31 of the 6th grade (5 days per annum per child; no upper limit)
Employees can choose to work 4, 5, 6 or 7 hours per day until March 31 of the 3rd grade (this system can be combined with flextime)�
Until the entry into elementary school
For employees who are pregnant or have given birth within previous 12 months
• Childcare subsidies• Telecommuting• Flextime system• Nursing care leave• Shorter working hours (for nursing care, etc�)• Time off and shorter working hours• Days off for nursing care• Special leave (for spouse’s childbirth)• Paid leave for initial 15 days of childcare• Half day leave
Sumitomo Mitsui DS Asset Management
1 year or maximum of 36 months in case of inability to place in daycare center
Until the entry of child into elementary school (5 days per annum per child; 10 days for two or more children)
Until March 31 of the 6th grade (Employees can choose to work 5, 6, 6�5, or 7 hours a day)�
Until child completes 6th grade of elementary school
Until child completes 3rd grade of elementary school
• Leave for childbirth by spouse• Leave for taking care of sick children• Leave for nursing care• Staggered working hours for childcare or nursing care purposes• Annual leave in half-day increments• Telecommuting• Lifestyle enriching leave• Paid leave for initial 15 days of childcare• Annual leave in hour increments• Flextime system• Daycare subsidies• Celebratory gifts for birth of 3rd child• Leave for accompanying spouse undergoing job relocation
131SMBC Group Annual Report 2019

132 SMBC Group Annual Report 2019

■ Directors and Executive Officers (as of June 30, 2019)
DIRECTORS AND CORPORATEEXECUTIVE OFFICERS
Chairman of the Board
Takeshi Kunibe
Director President (Representative Executive Officer)
Jun OhtaGroup CEO
Director
Makoto Takashima
Director Senior Managing Executive Officers
Haruyuki NagataGroup CROCorporate Risk Management Dept., Credit & Investment Planning Dept.
Toru NakashimaGroup CFO and Group CSOPublic Relations Dept., Corporate Planning Dept., Financial Accounting Dept., Subsidiaries & Affiliates Dept.
Directors
Atsuhiko InoueToru MikamiTetsuya KuboMasayuki Matsumoto (1)
Arthur M. Mitchell (1)
Shozo Yamazaki (1)
Masaharu Kohno (1)
Yoshinobu Tsutsui (1)
Katsuyoshi Shinbo (1)
Eriko Sakurai (1)
Deputy President and Executive Officers(Representative Executive Officers)
Gotaro MichihiroCo-Head of Wholesale Business Unit
Masahiko OshimaHead of International Business Unit
Toshikazu YakuGroup CCO and Group CHROHuman Resources Dept., Quality Management Dept.,General Affairs Dept., Administrative Services Dept.
Senior Managing Executive Officers
Katsunori TanizakiGroup CDIOIT Innovation Dept.
Naoki TamuraHead of Retail Business Unit
Hiroshi MunemasaHead of Global Markets Business Unit
Kimio MatsuuraCo-Head of Wholesale Business Unit(Planning Dept., Wholesale Business Unit)
Managing Executive Officer
Shoji MasudaGroup CIOIT Planning Dept., Data Management Dept., Operations Planning Dept.
(1) Messrs. and Ms. Matsumoto, Mitchell, Yamazaki, Kohno, Tsutsui, Shinbo and Sakurai satisfy the requirements for an “outside director” under the Companies Act.
DEPUTY CHAIRMENManabu NaritaYasuyuki Kawasaki
EXECUTIVE OFFICERS
Senior Managing Executive Officers
Toshihiro IsshikiPrivate Banking Planning Dept., Transaction Business Planning Dept.
Ryuji NishisakiDeputy Head of International Business Unit(Asia Business Strategic Planning Dept., Asia Growing Markets Dept.)
Kenichi HosomiDeputy Head of International Business Unit
Iwao KawaharadaDeputy Head of Wholesale Business Unit
Managing Executive Officers
Youichi MoriGroup Deputy CIO
Hiroshi MishimaDeputy Head of Global Markets Business Unit
Akira InoueGroup Deputy CRO
Takehisa IkedaWholesale Business Unit
CHOW Ying HoongCo-Head of Asia Pacific Division
Naoya IshidaWholesale Business Unit
Hiroaki ToyodaDeputy Head of Retail Business Unit
Takashi AikiGroup Deputy CIO and Group Deputy CDIO
Tetsuro ImaedaHead of Europe, Middle East and Africa Division
Nobuyuki KawabataInternational Business Unit
Eiichi SekiguchiWholesale Business Unit,Retail Business Unit
Naoki TakahashiDeputy Head of Wholesale Business Unit
Hitoshi IshiiDeputy Head of Wholesale Business Unit
Kazuhiro NotsuGroup Deputy CSO
Hitoshi MinamiDeputy Head of International Business Unit
Masaaki SasaiCo-Head of Asia Pacific Division
Kengo NakagawaWholesale Business Unit
Masayoshi FurushoGroup Deputy CHRO
Narumitsu YoshiokaHead of East Asia Division
Masamichi KoikeDeputy Head of Global Markets Business Unit
Takaki OnoWholesale Business Unit
Kotaro HagiwaraPublic Relations Dept., Corporate Planning Dept., Subsidiaries & Affiliates Dept.
Yoshihiro HyakutomeHead of Americas Division
Takashi YamashitaDeputy Head of Retail Business UnitGeneral Manager, Planning Dept., Retail Business Unit
Atsushi OkuRetail Business Unit
Yuichiro KondoGroup Deputy CFO
Toshihiro SatoDeputy Head of Global Markets Business Unit
Takeshi MikamiPublic Relations Dept., Corporate Planning Dept., Financial Accounting Dept.Olympic and Paralympic Dept., Corporate Planning Dept.
Executive Officers
Yukio NodaGroup Deputy CCO
Ryo SuzukiWholesale Business Unit,International Business Unit
Rie AsayamaRetail Business UnitQuality Management Dept.
Yukiko YoritakaGeneral Manager, Learning and Development Institute, Human Resources Dept.
Keiichiro NakamuraGeneral Manager, Planning Dept., International Business Unit
Nobuaki NakamuraGlobal Markets Business Unit
Shuji YabeDeputy Head of Americas Division
Jun UchikawaGeneral Manager, IT Planning Dept.
Yoshiyuki GonoGeneral Manager, Corporate Risk Management Dept.
Hiroyuki FukumaruGeneral Manager, Credit & Investment Planning Dept.
Takanori KatoWholesale Business Unit(Planning Dept., Wholesale Business Unit)
Fumihiko ItoGeneral Manager, Corporate Planning Dept.
Hirofumi OtsukaGeneral Manager, Asia Business Strategic Planning Dept.
Takashi KobayashiGeneral Manager, Human Resources Dept.
Isaac DeutschDeputy Head of Americas Division
Akio IsowaGeneral Manager, Transaction Business Planning Dept.
Tomoaki NakayamaGeneral Manager, IT Innovation Dept.
Natsuhiro SamejimaGeneral Manager, Planning Dept., Americas Division
Kazuhiro FukudaGeneral Manager, Planning Dept., East Asia Division
Yukihiro MabuchiGeneral Manager, Planning Dept., Wholesale Business Unit
[REFERENCE]
Group CxO/Head of Business Units(as of June 30, 2019)
Group CxO Group CEO
Jun OhtaGroup CFO and Group CSO
Toru NakashimaGroup CRO
Haruyuki NagataGroup CCO and Group CHRO
Toshikazu YakuGroup CIO
Shoji MasudaGroup CDIO
Katsunori TanizakiGroup CAE
Tetsuro Yoshino
Head of Business UnitsHead of Retail Business Unit
Naoki TamuraCo-Head of Wholesale Business Unit
Gotaro MichihiroCo-Head of Wholesale Business Unit
Kimio MatsuuraHead of International Business Unit
Masahiko OshimaHead of Global Markets Business Unit
Hiroshi Munemasa
Sumitomo Mitsui Financial Group, Inc.
Corporate Data
133SMBC Group Annual Report 2019

Public Relations Dept.
Corporate Planning Dept.
Planning Dept., Global Markets Business Unit
Global Markets Engineering Dept.
Global Markets Business Unit
*1
*2
Planning Dept., Wholesale Business Unit
Private Banking Planning Dept.
Transaction Business Planning Dept.
Wholesale Business UnitBoard ofDirectors
CompensationCommittee
NominationCommittee
AuditCommittee
RiskCommittee
AuditCommittee
Office
*1 Belongs to both Retail Business Unit and Wholesale Business Unit.*2 Belongs to Retail Business Unit, Wholesale Business Unit and International Business Unit.
GroupManagementCommittee
Shareholders’Meeting
Investor Relations Dept.
Financial Accounting Dept.
Subsidiaries & Affiliates Dept.
Equity Portfolio Management Dept.
IT Planning Dept.
System Risk Planning Dept.
IT Innovation Dept.
Data Management Dept.
Credit & Investment Planning Dept.
Silicon Valley Digital Innovation Lab.
Corporate Risk Management Dept.
Risk Management Information Dept.
General Affairs Dept.
Operations Planning Dept.
Audit Dept.
Anti Money Laundering & Financial Crime Prevention Dept.
Legal Dept.
Administrative Services Dept.
Secretariat
Cost Control Dept.
Human Resources Dept.
Quality Management Dept.
Learning and Development Institute
Corporate Treasury Dept.
Financial Research Dept.
Corporate Sustainability Dept.
Olympic and Paralympic Dept.
Productivity Management Dept.
Diversity and Inclusion Dept.
Global Human Resources Dept.
*2
Asia Business Strategic Planning Dept.
Transaction Business Planning Dept.
Americas Division
Europe, Middle East and Africa Division
East Asia Division
Risk Management Dept., Americas Division
Asia PacificDivision
Planning Dept., Asia Pacific Division
Asia GrowingMarkets Dept.
Planning Dept., Europe, Middle East and Africa Division
Planning Dept.,East Asia Division
Planning Dept., InternationalBusiness Unit
International Business Unit
Global Portfolio Strategy Dept.,International Business Unit
Planning Dept., Americas Division
Corporate Real Estate Management Dept.
Tax Planning Dept.
Planning Dept., Retail Business Unit
Retail Marketing Dept.
Retail IT Strategy Dept.
Private Banking Planning Dept. *1
Transaction Business Planning Dept. *2
Retail Business Unit
Sumitomo Mitsui Financial Group Organization (as of June 30, 2019)
134 SMBC Group Annual Report 2019

■ Board of Directors, Directors, Members of the Audit and Supervisory Committee and Executive Officers (as of June 30, 2019)
BOARD OF DIRECTORS
Chairman of the Board
Koichi Miyata
President and Chief Executive Officer (Representative Director)
Makoto Takashima*
Director and Deputy Presidents (Representative Directors)
Gotaro Michihiro*Co-Head of Wholesale Banking UnitHead of Global Corporate Banking Division
Masahiko Oshima*Head of International Banking Unit
Toshikazu Yaku*Human Resources Dept., Human Resources Development Dept., Quality Management Dept., General Affairs Dept., Administrative Services Dept.
Director and Senior Managing Executive Officers
Haruyuki Nagata*Risk Management Unit (Corporate Risk Management Dept., Credit & Investment Planning Dept.)Human Resources Dept., Human Resources Development Dept.
Keiji Kakumoto*Deputy Head of Wholesale Banking Unit (in charge of West Japan)Located at Osaka
Fumiharu Kozuka*Internal Audit Dept., Credit Review Dept.
Toru Nakashima*Public Relations Dept., Corporate Planning Dept., Financial Accounting Dept., Subsidiaries & Affiliates Dept.
Director and Managing Executive Officer
Shoji Masuda*IT Planning Dept., Data Management Dept.,Operations Planning Dept., Operations Support Dept.,Inter-Market Settlement Dept.
Director
Paul Yonamine (1)
* These Directors are appointed as Executive Officers also.
(1) Mr. Yonamine satisfies the requirements for an “outside director” under the Companies Act.
DIRECTORS, MEMBERS OF THE AUDIT ANDSUPERVISORY COMMITTEE
Yozo TakigawaToshiaki NakaiHiroshi Takahashi (2)
Sonosuke Kadonaga (2)
Masaaki Oka (2)
Michiko Kuboyama (2)
Atsuhiko Inoue(2) Messrs. and Ms. Takahashi, Kadonaga, Oka, and Kuboyama satisfy the requirements for
an “outside director” under the Companies Act.
Sumitomo Mitsui Banking Corporation
135SMBC Group Annual Report 2019

DEPUTY CHAIRMEN
Manabu NaritaYasuyuki Kawasaki
EXECUTIVE OFFICERS
Senior Managing Executive Officers
Katsunori TanizakiIT Innovation Dept.
Kimio MatsuuraCo-Head of Wholesale Banking Unit(Planning Dept., Wholesale Banking Unit, Strategic Corporate Business Dept., Public & Financial Institutions Banking Dept., Wholesale Banking Unit, Growth Business Development Dept., M&A Advisory Services Dept., Real Estate Finance Dept.)
Naoki TamuraHead of Retail Banking Unit
Ryuji NishisakiHead of Corporate Advisory DivisionDeputy Head of Wholesale Banking Unit(Strategic Corporate Business Dept.),Deputy Head of International Banking Unit(Asia Business Strategic Planning Dept., Asia Growing Markets Division)Global Advisory Dept.
Hiroshi MunemasaHead of Treasury Unit
Toshihiro IsshikiPrivate Advisory Division,Transaction Business Division
Kenichi HosomiDeputy Head of International Banking Unit
Iwao KawaharadaDeputy Head of Wholesale Banking UnitHead of Corporate Banking Division
Toru SawadaDeputy Head of Wholesale Banking Unit(Credit Administration Dept., Corporate Credit Dept.)Corporate Research Dept.Deputy Head of Financial Solutions Unit (Trust Services Dept.)
Managing Executive Officers
Nobuyuki KawabataDeputy Head of International Banking Unit
CHOW Ying HoongCo-Head of The Asia Pacific Division and Head of Asia Growing Markets Division
Tetsuro ImaedaHead of Europe, Middle East and Africa Division and CEO of Sumitomo Mitsui Banking Corporation Europe Limited
Atsushi TakadaHead of Kobe Middle Market Banking Division
Eiichi SekiguchiDeputy Head of Wholesale Banking Unit,Deputy Head of Retail Banking Unit
Kengo NakagawaDeputy Head of Wholesale Banking Unit (in charge of East Japan)Tokyo Corporate Banking Division(Tokyo Corporate Banking Dept. XII)
Muneo KanamaruTokyo Corporate Banking Division(Tokyo Corporate Banking Depts. IV, VI, IX and XI)
Teiko KudoHead of Financial Solutions UnitDeputy Head of International Banking Unit
Yusuke HirakoNagoya Corporate Banking Division (Nagoya Corporate Banking Dept.)Head of Nagoya Middle Market Banking Division
Takashi ArimaOsaka Corporate Banking Division(Osaka Corporate Banking Depts. I, II and III)
Hiroyoshi KorosueTokyo Corporate Banking Division(Tokyo Corporate Banking Depts. II, III and X)
Masaaki SasaiCo-Head of The Asia Pacific Division
Narumitsu YoshiokaHead of East Asia DivisionGlobal Advisory Dept.Chairman of Sumitomo Mitsui Banking Corporation (China) Limited
Masamichi KoikeDeputy Head of Treasury Unit
Takaki OnoDeputy Head of Wholesale Banking Unit (in charge of West Japan)
Kotaro HagiwaraPublic Relations Dept., Corporate Planning Dept., Subsidiaries & Affiliates Dept.
Yoshihiro HyakutomeHead of The Americas Division and President of SMBC Americas Holdings, Inc.
Takashi YamashitaDeputy Head of Retail Banking Unit
Tomofumi SaekiHead of Kyoto Hokuriku Middle Market Banking Division
Akira UedaHead of Higashinihon Daini Middle Market Banking Division
Hiroshi IrieDeputy Head of Financial Solutions Unit,Deputy Head of Wholesale Banking Unit(Growth Industry Cluster Dept.)
Hideo OharaDeputy Head of Retail Banking Unit (in charge of East Japan)
Hiroyuki KamimotoDeputy Head of Corporate Advisory Division
Kenji HiraoTokyo Corporate Banking Division(Tokyo Corporate Banking Depts. I, V, VII and VIII)
Takeshi MikamiPublic Relations Dept., Corporate Planning Dept., Financial Accounting Dept.Olympic and Paralympic Dept., Corporate Planning Dept.
136 SMBC Group Annual Report 2019

Executive Officers
William Karl(Executive Officer without portfolio)
Stanislas RogerDeputy Head of Europe, Middle East and Africa Division
Ryo SuzukiDeputy Head of Wholesale Banking Unit,Deputy Head of International Banking Unit
Rie AsayamaDeputy Head of Retail Banking UnitQuality Management Dept.
Rajeev KannanGeneral Manager, Investment Banking Dept., Asia
Isaac DeutschDeputy Head of The Americas Division
John FerreiraCo-General Manager, Sydney Branch
Yukiko YoritakaGeneral Manager, Learning and Development Institute, Human Resources Dept.
Antony YatesChairman of SMBC Capital Markets, Inc.and President of SMBC Nikko Capital Markets Limited
Shuji YabeDeputy Head of The Americas Division and Chairman of SMBC Nikko Securities America, Inc.
Masatsugu KojimaHead of Higashinihon Daisan Middle Market Banking Division
Yoshiaki KageyamaDeputy Head of The Asia Pacific Division and General Manager, Japanese and Korean Corporate Banking Dept., Asia Pacific Division
Masanao NakaoGeneral Manager, Osaka Corporate Banking Dept. I
Koji MatsumotoGeneral Manager, Planning Dept., Financial Solutions Unit
Keiichiro NakamuraGeneral Manager, Planning Dept., International Banking Unit
Nobuaki NakamuraGeneral Manager, Planning Dept., Treasury Unit
Fumito YoshiokaHead of Higashinihon Daiyon Middle Market Banking Division
Alan KroukGeneral Manager, Global FIG Dept.
Airo ShibuyaHead of Transaction Business Division
Ryoichi TanakaDeputy Head of Corporate Advisory Division
Jun UchikawaGeneral Manager, IT Planning Dept.
Shinji OnoPresident of Sumitomo Mitsui Banking Corporation (China) Limited
Tomohiro OhisaGeneral Manager, Corporate Credit Dept.
Hiroyuki KanekoDeputy Head of Retail Banking Unit (in charge of West Japan)
Yoshiyuki GonoGeneral Manager, Corporate Risk Management Dept.
Hiroyuki FukumaruGeneral Manager, Credit & Investment Planning Dept.
Takanori KatoGeneral Manager, Planning Dept., Wholesale Banking Unit
Fumihiko ItoGeneral Manager, Corporate Planning Dept.
Katsufumi UchidaGeneral Manager, International & Structured Finance Dept., Europe, Middle East and Africa Division
Hirofumi OtsukaGeneral Manager, Asia Business Strategic Planning Dept.
Takashi KobayashiGeneral Manager, Human Resources Dept.
Takafumi TsujiGeneral Manager, Distribution Dept.
Akihiro YasudaGeneral Manager, Marunouchi Corporate Business Office
James FennerGeneral Manager, Specialised Products Dept., Europe, Middle East and Africa Division
Takayuki InoueDeputy Head of International Banking Unit (Credit Depts., Americas Division, Europe, Middle East and Africa Division, Asia Pacific Division, East Asia Division and International Banking Unit)
Makoto UedaHead of Nishinihon Daisan Middle Market Banking Division
Yuichi NishimuraCountry Head of Thailand and General Manager, Bangkok Branch
Noriyuki WatanabeDeputy Head of Wholesale Banking Unit(Credit Depts. I and II, Wholesale Banking Unit),Deputy Head of Retail Banking Unit (Credit Dept., Retail Banking Unit)
Akio IsowaGeneral Manager, Transaction Business Planning Dept.
Akihiro UedaGeneral Manager, Gaien Area Main Office
Yoshiyuki OgataGeneral Manager, Hong Kong Branch
Nobuo OzawaGeneral Manager, Akasaka Corporate Business Office
Tomoaki NakayamaGeneral Manager, IT Innovation Dept.
Hiroyuki FukudaGeneral Manager, Osaka Corporate Banking Dept. II
Katsuya FujitaGeneral Manager, Treasury Dept., East Asia Division
Hitoshi MiyakeGeneral Manager, Structured Finance Dept.
Natsuhiro SamejimaGeneral Manager, Planning Dept., Americas Division
Hideki NiiyamaGeneral Manager, Nagoya Corporate Banking Dept.
Kazuhiro FukudaGeneral Manager, Planning Dept., East Asia Division
Yukihiro MabuchiGeneral Manager, Planning Dept., Wholesale Banking Unit and Global Corporate Banking Dept., Planning Dept., Wholesale Banking Unit
Richard MilesGeneral Manager, Corporate Banking Dept.-II, Europe, Middle East and Africa Division
137SMBC Group Annual Report 2019

Channel Strategy Dept.
Shareholders’Meeting
Board ofDirectors
Management Committee
Audit and SupervisoryCommittee Of�ce
Retail Banking Unit
Wholesale Banking Unit
International Banking Unit
Treasury Unit
Financial Solutions Unit
Corporate Staff Unit
Compliance Unit
Risk Management Unit
Corporate Services Unit
Internal Audit Unit
Public Relations Dept.Corporate Planning Dept.
Financial Accounting Dept.
Financial Research Dept.Corporate Sustainability Dept.Olympic and Paralympic Dept.Productivity Management Dept.
IT Planning Dept.
IT Innovation Dept.Data Management Dept.
Quality Management Dept.Customer Relations Dept.
Human Resources Dept.
Human Resources Development Dept.
Learning and Development InstituteCounseling Dept.
System Risk Planning Dept.
Diversity and Inclusion Dept.Global Human Resources Dept.
Internal Audit Dept.Credit Review Dept.
Subsidiaries & Af�liates Dept.
Tax Planning Dept.Equity Portfolio Management Dept.
General Affairs Dept.
Legal Dept.
Anti Money Laundering & Financial Crime Prevention Department
Corporate Risk Management Dept.Risk Management Information Dept.
Credit & Investment Planning Dept.Credit Portfolio Management Dept.
Administrative Services Dept.SecretariatCorporate Real Estate Management Dept.
Operations Planning Dept.Operations Support Dept.Inter-Market Settlement Dept.
Planning Dept., Retail Banking Unit
Strategic Corporate Business Dept. Business Promotion Of�ce
Next W-ing Project Dept.Retail Facilitating Financing Dept.
Retail Business Control Dept.Retail Financial Products Compliance Dept.Retail Anti Money Laundering Dept.
Retail Human Resources Dept.
Area Support Dept.
Global Supply Chain Finance Dept.
Financial Consulting Dept., Retail Banking Unit
Area Support Dept.Retail Marketing Dept., Retail Banking Unit
Retail IT Strategy Dept.Credit Dept., Retail Banking Unit
Business Promotion Dept., Retail Banking UnitSmall and Medium Enterprises Planning Dept.
Middle Market Facilitating Financing Dept.Global Corporate Banking Dept.Wholesale Business Control Dept.
Structured Finance Credit Dept.
Area Main Of�ce
Global Client Business Dept.Global Trade Finance Dept.
Global FIG Dept.Institutional Client Dept., Asia
Transportation Dept.
Corporate Business Of�ceStrategic Finance Promotion Of�ceCredit Business Of�ceReal Estate Corporate Business Of�cePublic Institutions Business Of�ceGlobal Transaction Of�ce*6
E-Transaction Business Center*6
Departments of Americas Division
Global Transaction Of�ce*6
E-Transaction Business Center*6
BranchPrivate Banking Dept.*7
Consumer Loan Promotion Of�ceRemote Marketing Dept.Call CenterConsumer Finance Promotion Of�ce
Global Transaction Of�ce*6Retail Credit Business Of�ce
E-Transaction Business Center*6
Departments of Europe, Middle East and Africa Division
Tokyo Corporate Banking Division Osaka Corporate Banking DivisionNagoya Corporate Banking Division
East Asia Division Branches/Representative Of�ces in East Asia
Americas DivisionEurope, Middle East and Africa Division
Branches/Representative Of�ces in Asia Paci�c Division
Asia Paci�c Division
Real Estate Finance Dept.*1
Credit Dept. I, Wholesale Banking UnitCredit Dept. II, Wholesale Banking UnitCredit Administration Dept.Growth Business Development Dept.M&A Advisory Services Dept.
Public & Financial Institutions Banking Dept., Wholesale Banking UnitCorporate Credit Dept.
Planning Dept., East Asia Division
Planning Dept., International Banking UnitIT & Business Administration Planning Dept.Aviation & Maritime Strategy Dept.Global Portfolio Strategy Dept.
Asia Business Strategic Planning Dept.
Planning Dept., Asia Paci�c Division
Credit Dept., Asia Paci�c Division Risk Management Dept., Asia
Credit Dept., East Asia Division Asia Growing Markets Division
Asia Retail Innovation Dept.
Corporate Solutions Dept., Asia
Information Control Dept., Americas Division
Financial Products Credit Dept., Americas Division
Planning Dept., Americas Division
Credit Dept., Americas Division
Risk Management Dept., Americas Division
Planning Dept., Europe, Middle East and Africa Division
Credit Dept., Europe, Middle East and Africa Division
Risk Management Dept., Middle East and Africa Division
Compliance Dept., Americas Division
Planning Dept., Treasury Unit
Treasury Dept.International Treasury Dept.Trading Dept.Treasury Marketing Dept.Financial Products Dept.
Securities Direct Sales Dept.Treasury Dept., Asia Paci�c DivisionTreasury Dept., East Asia Division
Global Markets Engineering Dept.Global Credit Investment Dept.
Planning Dept., Financial Solutions Unit
Acquisition and Leveraged Finance Dept.Structured Finance Dept.
Investment Banking Services Dept.Debt Finance Dept.
Trust Business Operations Dept.Trust Services Dept.
Real Estate Finance Dept.*1
Merchant Banking Dept.Distribution Dept.Growth Industry Cluster Dept.*2
Branch Service Of�ceHead/Main Service Of�cePublic Institutions Operations Of�ceSouzoku-of�ce Sub-BranchOperations Service Of�ce
*1 Belongs to both Financial Solutions Unit and Wholesale Banking Unit.*2 Belongs to both Financial Solutions Unit and Wholesale Banking Unit (Corporate Advisory Division).*3 • Corporate Advisory Division
• Advisory Dept. I• Advisory Dept. II• Advisory Dept. III• Corporate Research Dept.• Growth Industry Cluster Dept.*2
*4 • Private Advisory Division• Private Advisory Business Dept.
• Private Banking Planning Dept.• Inheritance Advisory Business Dept.• Corporate Employees Solution Dept.
• De�ned Contribution Dept.*5 • Transaction Business Division
• Transaction Business Planning Dept.• Transaction Products Development Dept.• Asset Finance Dept.• Transaction Banking Dept.• Global Transaction Banking Dept.• Global Advisory Dept.• Global Business Promotion Dept.• Global Transaction Support Dept.
*6 • Belongs to Retail Banking Unit, Wholesale Banking Unit and International Banking Unit.*7 • Belongs to both Retail Banking Unit and Wholesale Banking Unit.
Planning Dept., Wholesale Banking Unit
Corporate Banking Dept.
Private Banking Dept.*7
Middle Market Banking DivisionCorporate Banking Division
Global Corporate Banking Division
Loan Business Dept.
Asset Finance Credit Dept.LBO Credit Dept., Europe, Middle East and Africa Division
Legal and Compliance Dept., Asia Pacific Division
Credit Dept., International Banking UnitEnvironment Analysis Dept., International Banking Unit
Learning and Development Dept., Asia
*3
*4
*5
Compliance Dept., Europe, Middle East and Africa Division
Audit and Supervisory Committee
IT & Security Planning Dept., Europe, Middle East and Africa Division
SMBC Organization(as of June 30, 2019)
138 SMBC Group Annual Report 2019

Channel Strategy Dept.
Shareholders’Meeting
Board ofDirectors
Management Committee
Audit and SupervisoryCommittee Of�ce
Retail Banking Unit
Wholesale Banking Unit
International Banking Unit
Treasury Unit
Financial Solutions Unit
Corporate Staff Unit
Compliance Unit
Risk Management Unit
Corporate Services Unit
Internal Audit Unit
Public Relations Dept.Corporate Planning Dept.
Financial Accounting Dept.
Financial Research Dept.Corporate Sustainability Dept.Olympic and Paralympic Dept.Productivity Management Dept.
IT Planning Dept.
IT Innovation Dept.Data Management Dept.
Quality Management Dept.Customer Relations Dept.
Human Resources Dept.
Human Resources Development Dept.
Learning and Development InstituteCounseling Dept.
System Risk Planning Dept.
Diversity and Inclusion Dept.Global Human Resources Dept.
Internal Audit Dept.Credit Review Dept.
Subsidiaries & Af�liates Dept.
Tax Planning Dept.Equity Portfolio Management Dept.
General Affairs Dept.
Legal Dept.
Anti Money Laundering & Financial Crime Prevention Department
Corporate Risk Management Dept.Risk Management Information Dept.
Credit & Investment Planning Dept.Credit Portfolio Management Dept.
Administrative Services Dept.SecretariatCorporate Real Estate Management Dept.
Operations Planning Dept.Operations Support Dept.Inter-Market Settlement Dept.
Planning Dept., Retail Banking Unit
Strategic Corporate Business Dept. Business Promotion Of�ce
Next W-ing Project Dept.Retail Facilitating Financing Dept.
Retail Business Control Dept.Retail Financial Products Compliance Dept.Retail Anti Money Laundering Dept.
Retail Human Resources Dept.
Area Support Dept.
Global Supply Chain Finance Dept.
Financial Consulting Dept., Retail Banking Unit
Area Support Dept.Retail Marketing Dept., Retail Banking Unit
Retail IT Strategy Dept.Credit Dept., Retail Banking Unit
Business Promotion Dept., Retail Banking UnitSmall and Medium Enterprises Planning Dept.
Middle Market Facilitating Financing Dept.Global Corporate Banking Dept.Wholesale Business Control Dept.
Structured Finance Credit Dept.
Area Main Of�ce
Global Client Business Dept.Global Trade Finance Dept.
Global FIG Dept.Institutional Client Dept., Asia
Transportation Dept.
Corporate Business Of�ceStrategic Finance Promotion Of�ceCredit Business Of�ceReal Estate Corporate Business Of�cePublic Institutions Business Of�ceGlobal Transaction Of�ce*6
E-Transaction Business Center*6
Departments of Americas Division
Global Transaction Of�ce*6
E-Transaction Business Center*6
BranchPrivate Banking Dept.*7
Consumer Loan Promotion Of�ceRemote Marketing Dept.Call CenterConsumer Finance Promotion Of�ce
Global Transaction Of�ce*6Retail Credit Business Of�ce
E-Transaction Business Center*6
Departments of Europe, Middle East and Africa Division
Tokyo Corporate Banking Division Osaka Corporate Banking DivisionNagoya Corporate Banking Division
East Asia Division Branches/Representative Of�ces in East Asia
Americas DivisionEurope, Middle East and Africa Division
Branches/Representative Of�ces in Asia Paci�c Division
Asia Paci�c Division
Real Estate Finance Dept.*1
Credit Dept. I, Wholesale Banking UnitCredit Dept. II, Wholesale Banking UnitCredit Administration Dept.Growth Business Development Dept.M&A Advisory Services Dept.
Public & Financial Institutions Banking Dept., Wholesale Banking UnitCorporate Credit Dept.
Planning Dept., East Asia Division
Planning Dept., International Banking UnitIT & Business Administration Planning Dept.Aviation & Maritime Strategy Dept.Global Portfolio Strategy Dept.
Asia Business Strategic Planning Dept.
Planning Dept., Asia Paci�c Division
Credit Dept., Asia Paci�c Division Risk Management Dept., Asia
Credit Dept., East Asia Division Asia Growing Markets Division
Asia Retail Innovation Dept.
Corporate Solutions Dept., Asia
Information Control Dept., Americas Division
Financial Products Credit Dept., Americas Division
Planning Dept., Americas Division
Credit Dept., Americas Division
Risk Management Dept., Americas Division
Planning Dept., Europe, Middle East and Africa Division
Credit Dept., Europe, Middle East and Africa Division
Risk Management Dept., Middle East and Africa Division
Compliance Dept., Americas Division
Planning Dept., Treasury Unit
Treasury Dept.International Treasury Dept.Trading Dept.Treasury Marketing Dept.Financial Products Dept.
Securities Direct Sales Dept.Treasury Dept., Asia Paci�c DivisionTreasury Dept., East Asia Division
Global Markets Engineering Dept.Global Credit Investment Dept.
Planning Dept., Financial Solutions Unit
Acquisition and Leveraged Finance Dept.Structured Finance Dept.
Investment Banking Services Dept.Debt Finance Dept.
Trust Business Operations Dept.Trust Services Dept.
Real Estate Finance Dept.*1
Merchant Banking Dept.Distribution Dept.Growth Industry Cluster Dept.*2
Branch Service Of�ceHead/Main Service Of�cePublic Institutions Operations Of�ceSouzoku-of�ce Sub-BranchOperations Service Of�ce
*1 Belongs to both Financial Solutions Unit and Wholesale Banking Unit.*2 Belongs to both Financial Solutions Unit and Wholesale Banking Unit (Corporate Advisory Division).*3 • Corporate Advisory Division
• Advisory Dept. I• Advisory Dept. II• Advisory Dept. III• Corporate Research Dept.• Growth Industry Cluster Dept.*2
*4 • Private Advisory Division• Private Advisory Business Dept.
• Private Banking Planning Dept.• Inheritance Advisory Business Dept.• Corporate Employees Solution Dept.
• De�ned Contribution Dept.*5 • Transaction Business Division
• Transaction Business Planning Dept.• Transaction Products Development Dept.• Asset Finance Dept.• Transaction Banking Dept.• Global Transaction Banking Dept.• Global Advisory Dept.• Global Business Promotion Dept.• Global Transaction Support Dept.
*6 • Belongs to Retail Banking Unit, Wholesale Banking Unit and International Banking Unit.*7 • Belongs to both Retail Banking Unit and Wholesale Banking Unit.
Planning Dept., Wholesale Banking Unit
Corporate Banking Dept.
Private Banking Dept.*7
Middle Market Banking DivisionCorporate Banking Division
Global Corporate Banking Division
Loan Business Dept.
Asset Finance Credit Dept.LBO Credit Dept., Europe, Middle East and Africa Division
Legal and Compliance Dept., Asia Pacific Division
Credit Dept., International Banking UnitEnvironment Analysis Dept., International Banking Unit
Learning and Development Dept., Asia
*3
*4
*5
Compliance Dept., Europe, Middle East and Africa Division
Audit and Supervisory Committee
IT & Security Planning Dept., Europe, Middle East and Africa Division
139SMBC Group Annual Report 2019

■ Principal Domestic Subsidiaries Note: Figures in parentheses ( ) in the voting rights columns indicate voting rights held indirectly via subsidiaries and affiliates.
Company NameIssued Capital(Millions of Yen)
Percentage ofSMFG’s Voting
Rights (%)
Percentage ofSMBC’s Voting
Rights (%)
Date of Establishment or
InvestmentMain Business
Sumitomo Mitsui Banking Corporation 1,770,996 100 — Jun. 6, 1996 Commercial banking
SMBC Trust Bank Ltd. 87,550 0 (100) 100 Feb. 25, 1986 Trust service and commercial banking
SMBC Nikko Securities Inc. 10,000 100 — Jun. 15, 2009 Securities
Sumitomo Mitsui Card Company, Limited 34,000 0 (65.99) — Dec. 26, 1967 Credit card services
Cedyna Financial Corporation 82,843 0 (100) — Sep. 11, 1950 Credit card services, Installment
SMBC Consumer Finance Co., Ltd. 140,737 100 — Mar. 20, 1962 Consumer loans
The Japan Research Institute, Limited 10,000 100 — Nov. 1, 2002System engineering, data processing, management consulting, and economic research
Sumitomo Mitsui Asset Management Company, Limited
2,000 51.19 — Dec. 1, 2002 Investment management
SMBC Guarantee Co., Ltd. 187,720 0 (100) 0 (99.99) Jul. 14, 1976 Credit guarantee
SMFG Card & Credit, Inc. 49,859 100 — Oct. 1, 2008 Business management
SMM Auto Finance, Inc. 7,700 0 (51) 41 Sep. 17, 1993 Automotive financing
SMBC Finance Service Co., Ltd. 71,705 0 (100) — Dec. 5, 1972 Collecting agent and factoring
SMBC Mobit Co., Ltd. 20,000 0 (100) — May 17, 2000 Consumer lending
JAIS, Limited 450 0 (100) — Oct. 16, 1990 System engineering and data processing
NCore Co., Ltd. 10 0 (50.99) 50.99 Apr. 1, 2004 Data processing service and e-trading consulting
SMBC VALUE CREATION CO., LTD. 495 0 100 Feb. 20, 2019 Data processing service and e-trading consulting
SMBC GMO PAYMENT, Inc. 490 0 (51) 51 Nov, 2, 2015 Settlement agent
SMBC Venture Capital Co., Ltd. 500 0 (40) 0 (40) Sep. 22, 2005 Venture capital
SMBC Consulting Co., Ltd. 1,100 0 (100) 50 (1.63) May 1, 1981Management consulting and seminar organizer
Japan Pension Navigator Co., Ltd. 1,600 0 (69.71) 69.71 Sep. 21, 2000 Defined contribution plan administrator
SMBC Loan Business Planning Co., Ltd. 100,010 0 (100) 100 Apr. 1, 2004 Management support services
SMBC Servicer Co., Ltd. 1,000 0 (100) 100 Mar. 11, 1999 Servicer
SMBC Electronic Monetary Claims Recording Co., Ltd.
500 0 (100) 100 Apr. 16, 2009 Electronic monetary claims recording
SMBC Staff Service Co., Ltd. 90 0 (100) 100 Jul. 15, 1982 Fee-based headhunting services and contracting of human resources-related procedures
SMBC Learning Support Co., Ltd. 10 0 (100) 100 May 27, 1998 Seminar organizer
SMBC PERSONNEL SUPPORT CO., LTD. 10 0 (100) 100 Apr. 15, 2002 Banking clerical work
SMBC OPERATION SERVICE CO., LTD. 30 0 (100) 100 Jan. 31, 1996 Banking clerical work
SMBC Green Service Co., Ltd. 30 0 (100) 100 Mar. 15, 1990 Banking clerical work
SMBC Real Estate Appraisal Service Co., Ltd. 30 0 (100) 100 Feb. 1, 1984 Collateral real estate survey and appraisal
Polarify, Inc. 420 76.90 — May 1, 2017Biometric authentication services (Polarify biometric authentication services) and e-KYC service (Polarify e-KYC)
Principal Subsidiaries and Affiliates (as of March 31, 2019)All companies shown hereunder are consolidated subsidiaries or affiliates of Sumitomo Mitsui Financial Group, Inc.Those printed in green ink are consolidated subsidiaries or affiliates of Sumitomo Mitsui Banking Corporation.
140 SMBC Group Annual Report 2019

■ Principal Overseas Subsidiaries
Company Name Country Issued CapitalPercentage ofSMFG’s Voting
Rights (%)
Percentage ofSMBC’s Voting
Rights (%)
Date of Establishment or
InvestmentMain Business
Sumitomo Mitsui Banking Corporation Europe Limited
U.K. US$3,200 million 0 (100) 100 Mar. 5, 2003 Commercial banking
Sumitomo Mitsui Banking Corporation (China) Limited
China CNY10.0 billion 0 (100) 100 Apr. 27, 2009 Commercial banking
PT Bank BTPN Tbk Indonesia Rp163.0 billion 0 (98.49) 98.49 Feb. 5, 1958 Commercial banking
SMBC Americas Holdings, Inc. U.S.A US$1,500 0 (100) 100 Aug. 8, 1990Management of the US BHC and US BHC subsidiaries
Manufacturers Bank U.S.A. US$80.786 million 0 (100) 100 Jun. 26, 1962 Commercial banking
Banco Sumitomo Mitsui Brasileiro S.A.
Brazil R$793.819 million 0 (100) 100 Oct. 6, 1958 Commercial banking
JSC Sumitomo Mitsui Rus Bank Russia RUB6.4 billion 0 (100) 99 (1) May 8, 2009 Commercial banking
SMBC Bank EU AG Germany €450 million 0 (100) 100 Nov. 23, 2017 Commercial banking
Sumitomo Mitsui Banking Corporation Malaysia Berhad
Malaysia MYR2,452 million 0 (100) 100 Dec. 22, 2010 Commercial banking
SMBC Leasing and Finance, Inc. U.S.A. US$4,350 0 (100) 0 (100) Nov. 9, 1990 Leasing, investments
SMBC Rail Services LLC U.S.A. 0 0 (100) 0 (100) May 11, 2011 Leasing
SMBC Nikko Securities America, Inc. U.S.A. US$388 0 (100) 0 (80) Aug. 8, 1990 Securities, investments
SMBC Nikko Capital Markets Limited U.K. US$1,138 million 0 (100) 84.84 Mar. 13, 1990Derivatives and investments, securities services
SMBC Capital Markets, Inc. U.S.A. US$100 0 (100) 0 (100) Dec. 4, 1986 Derivatives and investments
SMBC Cayman LC Limited* Cayman Islands US$500 0 (100) 100 Feb. 7, 2003Credit guarantee, bond investment
SMBC MVI SPC Cayman Islands US$195 million 0 (100) 100 Sep. 9, 2004 Loans, buying/ selling of monetary claims
SMBC DIP Limited Cayman Islands US$8 million 0 (100) 100 Mar. 16, 2005 Loans, buying/ selling of monetary claims
SFVI Limited British Virgin Islands US$6,600 0 (100) 100 Jul. 30, 1997 Investments
SMBC, S.A.P.I. DE C.V., SOFOM, E.N.R.
Mexico MXN1,460 million 0 (100) 100 Sep. 18, 2014Money lending business, services related to leasing and used lease properties
SMBC International Finance N.V. Curaçao US$200,000 0 (100) 100 Jun. 25, 1990 Finance
SMFG Preferred Capital GBP 2 Limited Cayman Islands £0.01 100 — Oct. 25, 2007 Finance
SMFG Preferred Capital JPY 2 Limited Cayman Islands ¥173,000 million 100 — Nov. 3, 2008 Finance
SMFG Preferred Capital JPY 3 Limited Cayman Islands ¥268,400 million 100 — Aug. 12, 2009 Finance
SMBC Preferred Capital GBP 2 Limited Cayman Islands £1.5 million 0 (100) 100 Oct. 25, 2007 Finance
SMBC Preferred Capital JPY 2 Limited Cayman Islands ¥180,600 million 0 (100) 100 Nov. 19, 2008 Finance
Sumitomo Mitsui Finance Dublin Limited Ireland US$18 million 0 (100) 100 Sep. 19, 1989 Finance
Sakura Finance Asia Limited Hong Kong US$65.5 million 0 (100) 100 Oct. 17, 1977 Investments
SMBC Capital Partners LLC U.S.A. US$10,000 0 (100) 100 Dec. 18, 2003 Holding and trading securities
SMBC Derivative Products Limited U.K. US$200 million 0 (100) 0 (100) Apr. 18, 1995 Derivatives and investments
SMBC Advisory Services Saudi Arabia LLC Saudi Arabia SAR3,500,000 0 (100) 100 Dec. 29, 2017 Consulting
* SMBC Cayman LC Limited, like other subsidiaries of SMBC, is a separate corporate entity with its own separate creditors and the claims of such creditors are prior to the claims of SMBC, as the direct or indirect holder of the equity in such subsidiary.
141SMBC Group Annual Report 2019

■ Principal Affiliates
Company NameIssued Capital(Millions of Yen)
Percentage ofSMFG’s Voting
Rights (%)
Percentage ofSMBC’s Voting
Rights (%)
Date of Establishment or
InvestmentMain Business
The Japan Net Bank, Limited 37,250 0 (46.58) 46.58 Sep. 19, 2000 Commercial banking
Kansai Mirai Financial Group, Inc. 29,589 0 (24.09) 21.31 (0.14) Nov. 14, 2017 Business management
Kansai Urban Banking Corporation 47,039 0 (100) 0 (100) Jul. 1, 1922 Commercial banking
The Kinki Osaka Bank, Ltd. 38,971 0 (100) 0 (100) Nov. 24, 1950 Commercial banking
THE MINATO BANK, LTD. 27,484 0 (100) 0 (100) Sep. 6, 1949 Commercial banking
PT Oto Multiartha Rp928,707 million 0 (35.10) 35.10 Mar. 28, 1994 Automotive financing
PT Summit Oto Finance Rp2,442,060 million 0 (35.10) 35.10 Sep. 20, 1990 Motorcycle financing
Vietnam Export Import Commercial Joint Stock Bank VND12,526,947 million 0 (15.07) 15.07 May 24, 1989 Commercial banking
ACLEDA Bank Plc. US$395 million 0 (18.25) 18.25 Dec. 1, 2003 Commercial banking
The Bank of East Asia, Limited HKD39,925 million 0 (19.52) 19.52 Nov. 14, 1918 Commercial banking
Sumitomo Mitsui Finance and Leasing Company, Limited
15,000 50 — Feb. 4, 1963 Leasing
Sumitomo Mitsui Auto Service Company, Limited 13,636 21.99 (48) — Feb. 21, 1981 Leasing
SMBC Aviation Capital Limited US$887 million 0 (100) 32 Aug. 14, 1997 Leasing
POCKET CARD CO., LTD. 14,374 0 (20) 20 May 25, 1982 Credit card services
JSOL CORPORATION 5,000 0 (50) — Jul. 3, 2006System engineering and data processing
Sakura Information Systems Co., Ltd. 600 0 (49) 49 Nov. 29, 1972System engineering and data processing
SAKURA KCS Corporation 2,054 0 (49.86) 28.52 (3.66) Mar. 29, 1969System engineering and data processing
brees corporation 100 0 (49) 49 Dec. 5, 2014 Information processing services
Daiwa SB Investments Ltd. 2,000 48.96 — Apr. 1, 1999 Investment management
China Post & Capital Fund Management Co., Ltd. CNY304 million 0 (23.67) 23.67 Apr. 24, 2012 Investment management
Daiwa Securities SMBC Principal Investments Co., Ltd.
100 0 (40) 40 Feb. 1, 2010 Investments, fund management
MSD Investment, Ltd. 49 0 (33.33) 33.33 Sep. 1, 2015 Investments
Spring Infrastructure Capital Co., Ltd. 250 0 (24.50) 24.50 Jul. 31, 2018 Investments
BrainCell, Inc. 300 49 — Jun. 1, 2018 Marketing
142 SMBC Group Annual Report 2019

Asia and Oceania
SMBC Branches and Representative Offices
Hong Kong Branch7th, 8th Floor, One InternationalFinance Centre, 1 Harbour View Street, Central, Hong KongSpecial Administrative Region,The People’s Republic of ChinaTel: 852-2206-2000
Taipei Branch3F, Walsin Lihwa Xinyi Building,No. 1 Songzhi Road, Xinyi District,Taipei 11047, TaiwanTel: 886 (2) 2720-8100
Seoul Branch12F, Mirae Asset CENTER1 Bldg. West Tower, 26, Eulji-ro 5-gil, Jung-gu Seoul, 04539, The Republic of KoreaTel: 82 (2) 6364-7000
Singapore Branch3 Temasek Avenue #06-01,Centennial Tower, Singapore039190, Republic of SingaporeTel: 65-6882-0001
Sydney BranchLevel 35, The Chifley Tower,2 Chifley Square, Sydney, NSW 2000, AustraliaTel: 61 (2) 9376-1800
Perth BranchLevel 19, Exchange Tower, 2 The Esplanade, Perth, Western Australia 6000, AustraliaTel: 61 (8) 9492-4900
New Delhi Branch13th Floor, Hindustan Times House, 18-20, Kasturba Gandhi Marg, New Delhi 110001, IndiaTel: 91 (11) 4768-9111
Mumbai BranchUnit No. 601, 6th Floor, Platina Building, Plot No. C-59, G Block, Bandra Kurla Complex, Bandra (East), Mumbai 400051, Maharashtra, IndiaTel: 91 (22) 6229-5000
Bangkok Branch8th-10th Floor, Q.House LumpiniBuilding, 1 South Sathorn Road,Tungmahamek, Sathorn, Bangkok 10120, ThailandTel: 66 (2) 353-8000
Chonburi BranchHarbor Office 14th Floor, 4/222 Moo. 10 Sukhumvit Road, Tungsukla, Sriracha, Chonburi 20230, ThailandTel: 66 (38) 400-700
Ho Chi Minh City Branch15th Floor, Times Square Building, 22-36 Nguyen Hue Street, District 1, Ho Chi Minh City, VietnamTel: 84 (28) 3520-2525
Hanoi BranchUnit 1201, 12th Floor, Lotte Center Hanoi, 54 Lieu Giai Street, Cong Vi Ward, Ba Dinh District, Hanoi, VietnamTel: 84 (24) 3946-1100
Manila Branch21st Floor, Tower One & Exchange Plaza, Ayala Triangle, Ayala Avenue, Makati City, The Philippines 1226Tel: 63 (2) 8807100
Yangon BranchLevel #5 Strand Square, No.53 Strand Road, Pabedan Township, Yangon, MyanmarTel: 95 (1) 2307380
Yangon Branch Thilawa Front OfficeRoom No. 103, Administration Building, Corner of Thilawa Development Road and Dagon - Thilawa Road, Thilawa SEZ, Thanlyin Township, Yangon, MyanmarTel: 95 (1) 2309100
Labuan BranchLevel 12 (B&C), Main Office Tower, Financial Park Labuan,Jalan Merdeka, 87000 Labuan,Federal Territory, MalaysiaTel: 60 (87) 410955
Labuan Branch Kuala Lumpur OfficeSuite 22-03, Level 22, Integra Tower,The Intermark, 348, Jalan Tun Razak,50400 Kuala Lumpur, MalaysiaTel: 60 (3) 2176-1700
Ulaanbaatar Representative OfficeUnit 1011, 10F, Central Tower, 2 Chinggis Square, 8th Khoroo, Sukhbaatar District, Ulaanbaatar, 14200, MongoliaTel: 976-7011-8950
Phnom Penh Representative OfficeExchange Square (7th Floor) Unit 701,No.19 and 20, Street 106, Sangkat WatPhnom, Village 2, Khan Daun Penh,Phnom Penh, Kingdom of CambodiaTel: 855 (23) 964-080
SMBC Principal Subsidiaries/ Affiliates SMFG Network
Sumitomo Mitsui Banking Corporation (China) Limited Head Office (Shanghai)11F, Shanghai World Financial Center, 100 Century Avenue, Pudong New Area, Shanghai 200120, The People’s Republic of ChinaTel: 86 (21) 3860-9000
Sumitomo Mitsui Banking Corporation (China) Limited Guangzhou Branch12F, International Finance Place,No.8 Huaxia Road, Tianhe District,Guangzhou 510623, The People’s Republic of ChinaTel: 86 (20) 3819-1888
Sumitomo Mitsui Banking Corporation (China) Limited Hangzhou Branch5F, Offices At Kerry Centre, 385 Yan An Road, Xia Cheng District,Hangzhou, Zhejiang Province, The People’s Republic of ChinaTel: 86 (571) 2889-1111
Sumitomo Mitsui Banking Corporation (China) Limited Chongqing BranchUnit 2, 34F, Tower1, River International, 22 Nanbin Road, Nan’an District, Chongqing 400060, The People’s Republic of ChinaTel: 86 (23) 8812-5300
Sumitomo Mitsui Banking Corporation (China) Limited Shenzhen Branch23/F, Tower Two, Kerry Plaza, 1 Zhongxinsi Road, Futian District, Shenzhen 518048, The People’s Republic of ChinaTel: 86 (755) 2383-0980
Sumitomo Mitsui Banking Corporation (China) Limited Shenyang Branch1606, 1 Building, Forum 66, No.1 Qingnian Street, Shenhe District, Shenyang, Liaoning Province, The People’s Republic of ChinaTel: 86 (24) 3128-7000
Sumitomo Mitsui Banking Corporation (China) Limited Suzhou Branch12F, SND International Commerce Tower, No.28 Shishan Road, Suzhou New District, Suzhou, Jiangsu 215011, The People’s Republic of ChinaTel: 86 (512) 6606-6500
International Directory (as of June 30, 2019)
143SMBC Group Annual Report 2019

Sumitomo Mitsui Banking Corporation (China) Limited Dalian BranchSenmao Building 4F-A, 147 Zhongshan Road, Xigang District, Dalian, The People’s Republic of ChinaTel: 86 (411) 3905-8500
Sumitomo Mitsui Banking Corporation (China) Limited Tianjin Branch12F, The Exchange Tower 2, 189 Nanjing Road, Heping District,Tianjin 300051, The People’s Republic of ChinaTel: 86 (22) 2330-6677
Sumitomo Mitsui Banking Corporation (China) Limited Beijing BranchUnit1601,16F, North Tower,Beijing Kerry Centre, No.1, GuangHua Road, Chao Yang District,Beijing 100020, The People’s Republic of ChinaTel: 86 (10) 5920-4500
Sumitomo Mitsui Banking Corporation (China) Limited Kunshan Sub-BranchRoom 2001-2005, Taiwan Business Association International Plaza, No. 399 Qianjin East Road, Kunshan, Jiangsu 215300, The People’s Republic of ChinaTel: 86 (512) 3687-0588
Sumitomo Mitsui Banking Corporation (China) Limited Shanghai Pilot Free Trade Zone Sub-BranchRoom 15T21, 15F, Shanghai WorldFinancial Center, 100 Century Avenue,Pudong New Area, Shanghai 200120,The People’s Republic of ChinaTel: 86 (21) 2067-0200
Sumitomo Mitsui Banking Corporation (China) Limited Shanghai Puxi Sub-Branch1, 12, 13, 12F, Maxdo Center, 8 Xingyi Road, Changning District, Shanghai, The People’s Republic of ChinaTel: 86 (21) 2219-8000
Sumitomo Mitsui Banking Corporation (China) Limited Changshu Sub-Branch8F, Science Innovation Building (Kechuang Building), No.333 Dongnan Road, Changshu Southeast Economic Development Zone of Jiangsu, Changshu, Jiangsu, The People’s Republic of ChinaTel: 86 (512) 5235-5553
Sumitomo Mitsui Banking Corporation (China) Limited Suzhou Industrial Park Sub-Branch16F, International Building, No.2,Suzhou Avenue West, Suzhou Industrial Park, Jiangsu 215021,The People’s Republic of ChinaTel: 86 (512) 6288-5018
Sumitomo Mitsui Banking Corporation (China) Limited Tianjin Binhai Sub-Branch8F, E2B, Binhai Financial Street,No.20, Guangchang East Road,TEDA, Tianjin 300457, The People’s Republic of ChinaTel: 86 (22) 6622-6677
PT Bank BTPN TbkMenara BTPN, 29th Floor, CBD Mega Kuningan, Jl. Dr. Ide Anak Agung Gde Agung Kav. 5.5-5.6, Jakarta 12950, IndonesiaTel: 62 (21) 300-26200
PT Bank Tabungan Pensiunan Nasional Syariah TbkMenara BTPN, 12th Floor, CBD Mega Kuningan Jl. Dr. Ide Anak Agung Gde Agung Kav. 5.5-5.6, Jakarta 12950, IndonesiaTel: 62 (21) 300-26400
Sumitomo Mitsui Banking Corporation Malaysia BerhadSuite 22-03, Level 22, Integra Tower,The Intermark, 348, Jalan Tun Razak,50400 Kuala Lumpur, MalaysiaTel: 60 (3) 2176-1500
SMBC Capital Markets (Asia) Limited7th Floor, One International Finance Centre, 1 Harbour View Street, Central, Hong KongSpecial Administrative Region,The People’s Republic of ChinaTel: 852-2532-8500
SMBC Nikko Capital Markets Limited (Sydney Office)Level 35, The Chifley Tower, 2 Chifley Square, Sydney, NSW 2000, AustraliaTel: 61 (2) 9376-1895
BSL Leasing Co., Ltd.19th Floor, Sathorn City Tower,175 South Sathorn Road, Thungmahamek, Sathorn,Bangkok, 10120, ThailandTel: 66 (2) 670-4700
The Bank of East Asia, Limited10 Des Voeux Road, Central, Hong KongTel: 852-3608-3608
Vietnam Export Import Commercial Joint Stock Bank8th Floor, Vincom Center Building, 72 Le Thanh Ton Street, Ben Nghe Ward, District 1, Ho Chi Minh City, VietnamTel: 84 (28) 3821-0056
PT Oto MultiarthaSummitmas II, 18th floor, Jl. Jend. Sudirman Kav. 61-62, Jakarta 12190, IndonesiaTel: 62 (21) 522-6410
PT Summit Oto FinanceSummitmas II, 8th floor, Jl. Jend. Sudirman Kav. 61-62, Jakarta 12190, IndonesiaTel: 62 (21) 252-2788
ACLEDA Bank Plc.#61, Preah Monivong Blvd., Sangkat Srah Chork, Khan Daun Penh, Phnom Penh, Kingdom of CambodiaTel: 855 (23) 998-777
The Japan Research Institute (Shanghai) Solution Co., Ltd.Unit 141, 18F, Hang Seng Bank Tower, 1000 Lujiazui Ring Road,Pudong New Area, Shanghai, 200120, The People’s Republic of ChinaTel: 86 (21) 6841-2788
Sumitomo Mitsui Finance and Leasing (Singapore) Pte. Ltd.152 Beach Road, 21-05 Gateway East, Singapore 189721Tel: 65-6224-2955
Sumitomo Mitsui Finance and Leasing (Hong Kong) Ltd.Unit 4206-8,42/F, Sunlight Tower, 248 Queen’s Road East, Wanchai, Hong KongTel: 852-2523-4155
SMFL Leasing (Thailand) Co., Ltd.30th Floor, Q. House Lumpini Building, 1 South Sathorn Road, Tungmahamek, Sathorn, Bangkok 10120, ThailandTel: 66-2-677-7400
Sumitomo Mitsui Finance and Leasing (China) Co., Ltd.Unit 2302, TaiKoo Hui Tower 1, 385 Tianhe Road, Tianhe District, Guangzhou, ChinaTel: 86-20-8755-0021
144 SMBC Group Annual Report 2019

Shanghai Sumitomo Mitsui General Finance and Leasing Co., Ltd.10 F, Gopher Center, 757 Mengzi Road, Huangpu District, Shanghai, ChinaTel: 86-21-5396-5522
Shanghai Sumitomo Mitsui Finance and Leasing Co., Ltd.Room 723, 7/F, No. 6 Ji Long Rd, China (Shanghai) Pilot Free Trade Zone, Shanghai 200131, ChinaTel: 86-21-5065-6052
Sumitomo Mitsui Finance and Leasing (China) Co., Ltd. Beijing BranchUnit 3001-3007, 30F, North Tower, Beijing Kerry Centre, 1 Guanghua Road, Chaoyang District, Beijing, ChinaTel: 86-10-8529-7887
Shanghai Sumitomo Mitsui General Finance and Leasing Co., Ltd. Chengdu BranchRoom 2002, YanLord Landmark, No.1, Section 2, Renmin South Road, Chengdu, ChinaTel: 86-28-8691-7181
SMFL Leasing (Malaysia) Sdn. Bhd.Suite 16D, Level 16, Vista Tower, The Intermark No. 348, Jalan Tun Razak, 50400 Kuala Lumpur, MalaysiaTel: 60-3-2710-0170
PT. SMFL Leasing IndonesiaMenara BTPN, 31st Floor, Jl. Dr. Ide Anak Agung Gde Agung, Kav. 5.5 - 5.6, Mega Kuningan, Jakarta Selatan 12950, IndonesiaTel: 62-21-8062-8710
Sumitomo Mitsui Auto Leasing & Service (Thailand) Co., Ltd.161 Nantawan Building, 17th Floor,Rajdamri Road, Lumpinee, Pathumwan, Bangkok 10330, ThailandTel: 66-2252-9511
Summit Auto Lease Australia Pty Ltd.Unit 7, 38-46 South Street Rydalmere, NSW 2116 AustraliaTel: 61 (2) 9638-7833
SMAS Auto Leasing India Private LimitedOffice No. 406, 4th Floor, Worldmark-2, Asset area No.8,Aerocity Hospitality District, New Delhi-110037, IndiaTel: 91 (11) 4828-8300
PROMISE (HONG KONG) CO., LTD.14th Floor, Luk Kwok Centre, 72 Gloucester Road, Wanchai, Hong Kong Special Administrative Region, The People’s Republic of ChinaTel: 852 (3199) 1000
Liang Jing Co., Ltd.8FI, No.6, Sec 3, Min Chuan E. Rd., Taipei, Taiwan 10477, R.O.C.Tel: 886 (2) 2515-1598
PROMISE (THAILAND) CO., LTD.12th, 15th, 22nd Floor, Capital Tower, All Seasons Place, 87/1 Wireless Road, Lumpini, Phatumwan, Bangkok 10330, ThailandTel: 66 (2) 655-8574
PROMISE (SHENZHEN) CO., LTD.1001, 10/F, Tower A, Kingkey 100 Building, No. 5016 Shennan East Road, Luohu District, Shenzhen 518000, The People’s Republic of ChinaTel: 86 (755) 2396-6200
PROMISE (SHENYANG) CO., LTD.5F, No.1 Yuebin Street, Shenhe District, Shenyang, Liaoning Province 110013, The People’s Republic of ChinaTel: 86 (24) 2250-6200
Promise Consulting Service (Shenzhen) Co., Ltd.1003, 10/F, Tower A, Kingkey 100 Building, No. 5016 Shennan East Road, Luohu District, Shenzhen 518000, The People’s Republic of ChinaTel: 86 (755) 3698-5100
PROMISE (TIANJIN) CO., LTD.Room H-I-K 17th Floor, TEDA Building No. 256, Jie-Fang Nan Road, Hexi District, Tianjin 300042, The People’s Republic of ChinaTel: 86 (22) 5877-8700
PROMISE (CHONGQING) CO., LTD.38F, Xinhua International Mansion, No.27, Minquan Road, Yuzhong District, Chongqing, 400010, The People’s Republic of ChinaTel: 86 (23) 6037-5200
PROMISE (CHENGDU) CO., LTD.Level 18, Minyoun Financial Plaza, No.35 Zidong Section Dongda Street, Jinjiang District, Chengdu, 610061, The People’s Republic of ChinaTel: 86 (28) 6528-5000
PROMISE (WUHAN) CO., LTD.14F, Block A, Pingan International Financial Building, 216 Gongzheng Road, Wuchang, Wuhan, Hubei, 430000, The People’s Republic of ChinaTel: 86 (27) 8711-6300
PROMISE (SHANGHAI) CO., LTD.Room 03-10, Floor 14, China Insurance Building No.166, East Lujiazui Road, Pudong New Area, Shanghai 200120, The People’s Republic of ChinaTel: 86 (21) 2066-6262
PROMISE ASSET MANAGEMENT (TAIWAN) CO., LTD.8F No.6, Sec 3, Min Chuan E. Rd., Taipei, Taiwan 10477, R.O.C.Tel: 886 (2) 2515-6369
SMCC Consulting (Shanghai) Co., Ltd.Room 5135, 51F Raffles City Centre, 268 Xi Zang Middle Road, Huang Pu District, Shanghai 200001, The People’s Republic of ChinaTel: 86 (21) 2312-7632
Sumitomo Mitsui Asset Management Company, Limited Shanghai Representative OfficeSuite1002, 10F, CITIC Square, 1168 Nanjing Road West, Shanghai 200041, The People’s Republic of ChinaTel: 86 (21) 5292-5960
Sumitomo Mitsui Asset Management (Hong Kong) Limited24th Floor, Shanghai Commercial Bank Tower, 12 Queen’s Road Central, Hong KongTel: 852-2521-8883
UOB-SM Asset Management Pte. Ltd.80 Raffles Place #15-22, UOB Plaza2, Singapore 048624Tel: 65-6589-3850
145SMBC Group Annual Report 2019

The Americas
SMBC Branches and Representative Offices
New York Branch277 Park Avenue, New York,NY 10172, U.S.A.Tel: 1 (212) 224-4000
Canada BranchToronto Dominion Centre, 222 Bay Street, Suite 1400, P.O. Box 172, Toronto, Ontario M5K 1H6, CanadaTel: 1 (416) 368-4766
Cayman Branch25 Main Street, George Town, P.O. BOX 694, Grand Cayman, Cayman Islands
Los Angeles Branch601 South Figueroa Street,Suite 1800, Los Angeles,CA 90017, U.S.A.Tel: 1 (213) 452-7800
San Francisco Branch555 California Street, Suite 3350,San Francisco, CA 94104, U.S.A.Tel: 1 (415) 616-3000
Chicago Representative Office300 S. Riverside Plaza, Suite 1970,Chicago, IL 60606, U.S.A.Tel: 1 (312) 796-3668
Dallas Representative Office14241 Dallas Parkway, Suite 660, Dallas,TX 75254, U.S.A.Tel: 1 (972) 942-7000
Houston Representative OfficeTwo Allen Center, 1200 Smith Street, Suite 1140, Houston, TX 77002, U.S.A.Tel: 1 (713) 277-3500
Silicon Valley Representative Office101 Jefferson Drive, Menlo Park, CA 94025, U.S.A.Tel: 1 (650) 460-1669
Mexico City Representative OfficeTorre Virreyes-Pedregal 24, Piso 5, Int502-A, Col. Molino del Rey, Ciudad de Mexico, Mexico, 11040Tel: 52 (55) 2623-0200
Leon Representative OfficePlaza de la Paz #102. int.901 Puerto Interior, Silao, Guanajuato, CP36275, MexicoTel: 52 (472) 500-0177
Bogota Representative Office80 Once Building, Carrera 11 No. 79-52, Suite 1002, Bogota, ColombiaTel: 57 (1) 619-7200
Lima Representative OfficeAvenida Canaval y Moreyra 380, Oficina 702, San Isidro, Lima 27, PeruTel: 51 (1) 200-3600
Santiago Representative OfficeIsidora Goyenechea 3000, Suite 2102, Las Condes, Santiago, ChileTel: 56 (2) 2896-8440
SMBC Principal Subsidiaries/ Affiliates SMFG Network
Manufacturers Bank515 South Figueroa Street,Los Angeles, CA 90071, U.S.A.Tel: 1 (213) 489-6200
Banco Sumitomo Mitsui Brasileiro S.A.Avenida Paulista, 37-11 e 12 andar Sao Paulo-SP-CEP 01311-902, BrazilTel: 55 (11) 3178-8000
Banco Sumitomo Mitsui Brasileiro S.A. Cayman Branch25 Main Street, George Town, P.O. BOX 694, Grand Cayman, Cayman Islands
SMBC Capital Markets, Inc.277 Park Avenue, New York,NY 10172, U.S.A.Tel: 1 (212) 224-5100
SMBC Leasing and Finance, Inc.277 Park Avenue, New York,NY 10172, U.S.A.Tel: 1 (212) 224-5200
SMBC, S.A.P.I. DE C.V., SOFOM, E.N.R. Torre Virreyes-Pedregal 24, Piso 5, Int502-A, Col. Molino del Rey, Ciudad de Mexico, Mexico, 11040Tel: 52 (55) 2623-1373
SMBC Nikko Securities America, Inc.277 Park Avenue, New York,NY 10172, U.S.A.Tel: 1 (212) 224-5300
JRI America, Inc.277 Park Avenue, New York,NY 10172, U.S.A.Tel: 1 (212) 224-4200
Sumitomo Mitsui Finance and Leasing Company, Limited New York Branch666 Third Avenue, New York, NY 10017, U.S.A.Tel: 1 (212) 224-5201
Sumitomo Mitsui Asset Management (New York) Inc.300 Park Avenue, 16th Floor, New York, NY 10022, U.S.A.Tel: 1 (212) 418-3030
SMBC Americas Holdings, Inc.251 Little Falls Drive, Wilmington, New Castle, DE 19808, U.S.A.Tel: 1 (212) 224-4000
Europe, Middle Eastand Africa
SMBC Branches and Representative Offices
London Branch99 Queen Victoria Street, London EC4V 4EH, U.K.Tel: 44 (20) 7786-1000
Düsseldorf BranchPrinzenallee 7, 40549 Düsseldorf,GermanyTel: 49 (211) 36190
Frankfurt BranchMain Tower, 17th Floor, Neue Mainzer Str. 52-58, 60311 Frankfurt am Main, GermanyTel: 49 (69) 222298201
Brussels BranchNeo Building, Rue Montoyer 51, Box 6, 1000 Brussels, BelgiumTel: 32 (2) 551-5000
DIFC Branch-DubaiBuilding One, 5th Floor, GatePrecinct, Dubai InternationalFinancial Centre, PO Box 506559Dubai, United Arab EmiratesTel: 971 (4) 428-8000
Abu Dhabi Representative OfficeOffice No.801, Makeen Tower, Al Zahiyah, Abu Dhabi, United Arab EmiratesTel: 971 (2) 495-4000
146 SMBC Group Annual Report 2019

Istanbul Representative OfficeMetrocity Is Merkezi, Kirgulu Sokak No:4 Kat:7/A D Blok, Esentepe Mahallesi, Sisli 34394, Istanbul, Republic of TurkeyTel: 90 (212) 371-5900
Doha QFC OfficeOffice 1901, 19th Floor, Qatar Financial Centre Tower,Diplomatic Area-West bay, Doha,Qatar, P.O.Box 23769Tel: 974-4496-7572
Bahrain Representative OfficeNo.406 & 407 (Entrance 3, 4th Floor) Manama Centre,Government Road, Manama,State of BahrainTel: 973-17223211
Johannesburg Representative OfficeBuilding Four, First Floor,Commerce Square,39 Rivonia Road, Sandhurst,Sandton 2196, South AfricaTel: 27 (11) 219-5300
Cairo Representative Office23rd Floor, Nile City Towers, North Tower, 2005C, Cornish El Nile, Ramlet Boulak, Cairo, EgyptTel: 20 (2) 2461-9566
Tehran Representative OfficeFirst Floor, No. 17, Haghani Expressway (north side), Between Modarres & Africa,Tehran 1518858117, IranTel: 98 (21) 8888-4301/4302
SMBC Principal Subsidiaries/ Affiliates SMFG Network
Sumitomo Mitsui Banking Corporation Europe Limited Head Office99 Queen Victoria Street, LondonEC4V 4EH, U.K.Tel: 44 (20) 7786-1000
Sumitomo Mitsui Banking Corporation Europe Limited Paris Branch1/3/5 rue Paul Cézanne, 75008, Paris, FranceTel: 33 (1) 44 (90) 48-00
SMBC Bank EU AGMain Tower, Neue Mainzer Str. 52-58, 60311 Frankfurt am Main, GermanyTel: 49 (69) 222298200
SMBC Bank EU AG Amsterdam BranchWorld Trade Center Amsterdam,Tower H, Level 15 Zuidplein 130,1077XV, Amsterdam, The NetherlandsTel: 31 (20) 718-3888
SMBC Bank EU AG Dublin BranchIFSC House, IFSC, Dublin 1, IrelandTel: 353 (1) 859-9300
SMBC Bank EU AG Prague BranchInternational Business Centre, Pobrezni 3 186 00 Prague 8, Czech RepublicTel: 420 (295) 565-800
SMBC Bank EU AG Madrid BranchCalle Pedro Teixeira 8, Edificio Iberia Mart I, planta 4a., 28020 Madrid, SpainTel: 34 (91) 312-7300
SMBC Bank EU AG Milan BranchVia della Spiga 30/ Via Senato 25,20121 Milan, ItalyTel: 39 (02) 7636-1700
JSC Sumitomo Mitsui Rus BankPresnenskaya naberezhnaya, house 10, block C, Moscow, 123112 Russian FederationTel: 7 (495) 287-8200
SMBC Nikko Capital Markets LimitedOne New Change, London EC4M 9AF, U.K.Tel: 44 (20) 3527-7000
SMBC Derivative Products LimitedOne New Change, London EC4M 9AF, U.K.Tel: 44 (20) 3527-7000
Sumitomo Mitsui Finance Dublin LimitedLa Touche House, I.F.S.C.,Custom House Docks, Dublin 1,IrelandTel: 353 (1) 670-0066
JRI Europe, Limited99 Queen Victoria Street, LondonEC4V 4EH, U.K.Tel: 44 (20) 7406-2700
Sumitomo Mitsui Asset Management (London) Limited3rd Floor, 90 Basinghall Street, London EC2V 5AY, U.K.Tel: 44 (20) 7397-3970
SMBC Aviation Capital LimitedIFSC House, IFSC, Dublin 1, IrelandTel: 353 (1) 859-9000
SMBC Advisory Services Saudi Arabia LLC7th Floor Al Faisaliah Tower, P.O. Box 54995, Riyadh 11524, Kingdom of Saudi ArabiaTel: 966 (11) 484-7105
SMBC Nikko Capital Markets Europe GmbHNeue Mainzer Str. 52-58, 60311 Frankfurt am Main, GermanyTel: 49 (69) 2222-9-8500
147SMBC Group Annual Report 2019

JSC Sumitomo Mitsui Rus Bank
Tianjin Binhai Sub-Branch Houston Representative Of�ceDallas Representative Of�ce
SMBC Leasing and Finance, Inc.SMBC Nikko Securities America, Inc.
GLOBAL NETWORKEurope, Middle East and AfricaThe Americas
Overseas service network (as of June 30, 2019) Total: 85(including banking subsidiaries and their branches/sub-branches/rep. offices)Consolidated subsidiary PT Bank BTPN Tbk has 698 offices. (as of June 30, 2019)
Also showing principal overseas subsidiaries
Sumitomo MitsuiBanking Corporation
Europe Limited
Sumitomo MitsuiBanking CorporationEurope LimitedParis Branch
SMBC Bank EU AG Milan Branch
Istanbul Representative Office
Brussels Branch
SMBC Bank EU AGSMBC Nikko Capital Markets Europe GmbHFrankfurt Branch
SMBC Bank EU AG Amsterdam Branch
Düsseldorf Branch
SMBC Bank EU AGMadrid Branch
SMBC Bank EU AG Prague Branch
Tehran Representative Office
Ulaanbaatar Representative Office
New Delhi Branch
DIFC Branch-DubaiBahrain Representative Office
Doha QFC Office
SMBC Advisory Services Saudi Arabia LLC
Mumbai Branch
Abu Dhabi Representative Office
Cairo Representative Office
Johannesburg Representative Office
Sumitomo Mitsui FinanceDublin Limited
SMBC Bank EU AGDublin Branch
SMBC AviationCapital Limited
Sydney BranchPerth Branch
SMBC Nikko Capital Markets Limited (Sydney Office)
Seoul Branch
Hong Kong Branch
GuangzhouBranch Taipei Branch
Head Office (Shanghai)Shanghai Puxi Sub-BranchShanghai Pilot Free Trade Zone Sub-Branch
HangzhouBranch
Suzhou BranchKunshan Sub-Branch
SMBC Capital Markets (Asia) Limited
Tianjin Branch
Beijing Branch
Shenyang Branch
Singapore Branch
Sumitomo Mitsui Banking Corporation Malaysia Berhad
Labuan Branch
Bangkok Branch
Ho Chi Minh City Branch
Phnom Penh Representative OfficeACLEDA Bank Plc.
Vietnam Export ImportCommercial Joint Stock Bank
Thilawa Front OfficeYangon Branch
Mexico City Representative OfficeSMBC, S.A.P.I. DE C.V., SOFOM, E.N.R.
Leon Representative Office
Chonburi Branch
Chongqing Branch
DalianBranch
Hanoi Branch Shenzhen Branch
Manila Branch
Suzhou Industrial Park Sub-BranchChangshu Sub-Branch
New York Branch
Los Angeles Branch
San Francisco BranchSilicon Valley Representative Of�ce
Manufacturers Bank
Canada Branch
Bogota Representative Of�ce
Lima Representative Of�ce
Banco Sumitomo Mitsui Brasileiro S.A.
Santiago Representative Office
Chicago RepresentativeOffice
SMBC Capital Markets, Inc.
SMBC Americas Holdings, Inc.
SMBC Nikko CapitalMarkets Limited
London Branch
Kuala Lumpur Office
Asia and Oceania
PT Bank BTPN TbkPT Oto MultiarthaPT Summit Oto Finance
Cayman BranchBanco Sumitomo Mitsui Brasileiro S.A. Cayman Branch
Indicates branch or sub-branch of Sumitomo Mitsui Banking Corporation (China) Limited
■ Sumitomo Mitsui Banking Corporation (China) Limited Head Office (Shanghai)
■ Sumitomo Mitsui Banking Corporation (China) Limited Guangzhou Branch
■ Sumitomo Mitsui Banking Corporation (China) Limited Hangzhou Branch
■ Sumitomo Mitsui Banking Corporation (China) Limited Chongqing Branch
■ Sumitomo Mitsui Banking Corporation (China) Limited Shenzhen Branch
■ Sumitomo Mitsui Banking Corporation (China) Limited Shenyang Branch
■ Sumitomo Mitsui Banking Corporation (China) Limited Suzhou Branch
■ Sumitomo Mitsui Banking Corporation (China) Limited Dalian Branch
■ Sumitomo Mitsui Banking Corporation (China) Limited Tianjin Branch
■ Sumitomo Mitsui Banking Corporation (China) Limited Beijing Branch
■ Sumitomo Mitsui Banking Corporation (China) Limited Kunshan Sub-Branch
■ Sumitomo Mitsui Banking Corporation (China) Limited Shanghai Pilot Free Trade Zone Sub-Branch
■ Sumitomo Mitsui Banking Corporation (China) Limited Shanghai Puxi Sub-Branch
■ Sumitomo Mitsui Banking Corporation (China) Limited Changshu Sub-Branch
■ Sumitomo Mitsui Banking Corporation (China) Limited Suzhou Industrial Park Sub-Branch
■ Sumitomo Mitsui Banking Corporation (China) Limited Tianjin Binhai Sub-Branch
■ PT Bank BTPN Tbk■ Sumitomo Mitsui Banking Corporation Malaysia Berhad■ Hong Kong Branch■ Taipei Branch■ Seoul Branch■ Singapore Branch■ Sydney Branch■ Perth Branch■ New Delhi Branch■ Mumbai Branch■ Bangkok Branch
■ Chonburi Branch■ Ho Chi Minh City Branch■ Hanoi Branch■ Manila Branch■ Yangon Branch■ Yangon Branch Thilawa Front Office■ Labuan Branch■ Labuan Branch Kuala Lumpur Office■ Ulaanbaatar Representative Office■ Phnom Penh Representative Office■ SMBC Capital Markets (Asia) Limited■ SMBC Nikko Capital Markets Limited (Sydney Office)■ The Bank of East Asia, Limited■ Vietnam Export Import Commercial Joint Stock Bank■ PT Oto Multiartha■ PT Summit Oto Finance■ ACLEDA Bank Plc.
■ New York Branch ■ San Francisco Branch■ Los Angeles Branch■ Canada Branch■ Cayman Branch■ Chicago Representative Office■ Dallas Representative Office■ Houston Representative Office■ Silicon Valley Representative Office■ Mexico City Representative Office■ Leon Representative Office■ Santiago Representative Office■ Bogota Representative Office■ Lima Representative Office■ Manufacturers Bank■ Banco Sumitomo Mitsui Brasileiro S.A.■ Banco Sumitomo Mitsui Brasileiro S.A.
Cayman Branch■ SMBC Capital Markets, Inc. ■ SMBC Nikko Securities America, Inc.■ SMBC Leasing and Finance, Inc. ■ SMBC, S.A.P.I. DE C.V., SOFOM, E.N.R.■ SMBC Americas Holdings, Inc.
■ Sumitomo Mitsui Banking Corporation Europe Limited Head Office
■ Sumitomo Mitsui Banking Corporation Europe Limited Paris Branch
■ SMBC Bank EU AG■ SMBC Bank EU AG Amsterdam Branch■ SMBC Bank EU AG Dublin Branch■ SMBC Bank EU AG Prague Branch■ SMBC Bank EU AG Madrid Branch■ SMBC Bank EU AG Milan Branch■ London Branch■ Düsseldorf Branch■ Frankfurt Branch■ Brussels Branch
■ DIFC Branch-Dubai■ Abu Dhabi Representative Office■ Istanbul Representative Office■ Doha QFC Office■ Bahrain Representative Office■ Johannesburg Representative Office■ Cairo Representative Office■ Tehran Representative Office■ JSC Sumitomo Mitsui Rus Bank■ SMBC Nikko Capital Markets Limited■ SMBC Nikko Capital Markets Europe GmbH■ Sumitomo Mitsui Finance Dublin Limited■ SMBC Aviation Capital Limited■ SMBC Advisory Services Saudi Arabia LLC
The Bank of East Asia, Limited
148 SMBC Group Annual Report 2019

JSC Sumitomo Mitsui Rus Bank
Tianjin Binhai Sub-Branch Houston Representative Of�ceDallas Representative Of�ce
SMBC Leasing and Finance, Inc.SMBC Nikko Securities America, Inc.
GLOBAL NETWORKEurope, Middle East and AfricaThe Americas
Overseas service network (as of June 30, 2019) Total: 85(including banking subsidiaries and their branches/sub-branches/rep. offices)Consolidated subsidiary PT Bank BTPN Tbk has 698 offices. (as of June 30, 2019)
Also showing principal overseas subsidiaries
Sumitomo MitsuiBanking Corporation
Europe Limited
Sumitomo MitsuiBanking CorporationEurope LimitedParis Branch
SMBC Bank EU AG Milan Branch
Istanbul Representative Office
Brussels Branch
SMBC Bank EU AGSMBC Nikko Capital Markets Europe GmbHFrankfurt Branch
SMBC Bank EU AG Amsterdam Branch
Düsseldorf Branch
SMBC Bank EU AGMadrid Branch
SMBC Bank EU AG Prague Branch
Tehran Representative Office
Ulaanbaatar Representative Office
New Delhi Branch
DIFC Branch-DubaiBahrain Representative Office
Doha QFC Office
SMBC Advisory Services Saudi Arabia LLC
Mumbai Branch
Abu Dhabi Representative Office
Cairo Representative Office
Johannesburg Representative Office
Sumitomo Mitsui FinanceDublin Limited
SMBC Bank EU AGDublin Branch
SMBC AviationCapital Limited
Sydney BranchPerth Branch
SMBC Nikko Capital Markets Limited (Sydney Office)
Seoul Branch
Hong Kong Branch
GuangzhouBranch Taipei Branch
Head Office (Shanghai)Shanghai Puxi Sub-BranchShanghai Pilot Free Trade Zone Sub-Branch
HangzhouBranch
Suzhou BranchKunshan Sub-Branch
SMBC Capital Markets (Asia) Limited
Tianjin Branch
Beijing Branch
Shenyang Branch
Singapore Branch
Sumitomo Mitsui Banking Corporation Malaysia Berhad
Labuan Branch
Bangkok Branch
Ho Chi Minh City Branch
Phnom Penh Representative OfficeACLEDA Bank Plc.
Vietnam Export ImportCommercial Joint Stock Bank
Thilawa Front OfficeYangon Branch
Mexico City Representative OfficeSMBC, S.A.P.I. DE C.V., SOFOM, E.N.R.
Leon Representative Office
Chonburi Branch
Chongqing Branch
DalianBranch
Hanoi Branch Shenzhen Branch
Manila Branch
Suzhou Industrial Park Sub-BranchChangshu Sub-Branch
New York Branch
Los Angeles Branch
San Francisco BranchSilicon Valley Representative Of�ce
Manufacturers Bank
Canada Branch
Bogota Representative Of�ce
Lima Representative Of�ce
Banco Sumitomo Mitsui Brasileiro S.A.
Santiago Representative Office
Chicago RepresentativeOffice
SMBC Capital Markets, Inc.
SMBC Americas Holdings, Inc.
SMBC Nikko CapitalMarkets Limited
London Branch
Kuala Lumpur Office
Asia and Oceania
PT Bank BTPN TbkPT Oto MultiarthaPT Summit Oto Finance
Cayman BranchBanco Sumitomo Mitsui Brasileiro S.A. Cayman Branch
Indicates branch or sub-branch of Sumitomo Mitsui Banking Corporation (China) Limited
■ Sumitomo Mitsui Banking Corporation (China) Limited Head Office (Shanghai)
■ Sumitomo Mitsui Banking Corporation (China) Limited Guangzhou Branch
■ Sumitomo Mitsui Banking Corporation (China) Limited Hangzhou Branch
■ Sumitomo Mitsui Banking Corporation (China) Limited Chongqing Branch
■ Sumitomo Mitsui Banking Corporation (China) Limited Shenzhen Branch
■ Sumitomo Mitsui Banking Corporation (China) Limited Shenyang Branch
■ Sumitomo Mitsui Banking Corporation (China) Limited Suzhou Branch
■ Sumitomo Mitsui Banking Corporation (China) Limited Dalian Branch
■ Sumitomo Mitsui Banking Corporation (China) Limited Tianjin Branch
■ Sumitomo Mitsui Banking Corporation (China) Limited Beijing Branch
■ Sumitomo Mitsui Banking Corporation (China) Limited Kunshan Sub-Branch
■ Sumitomo Mitsui Banking Corporation (China) Limited Shanghai Pilot Free Trade Zone Sub-Branch
■ Sumitomo Mitsui Banking Corporation (China) Limited Shanghai Puxi Sub-Branch
■ Sumitomo Mitsui Banking Corporation (China) Limited Changshu Sub-Branch
■ Sumitomo Mitsui Banking Corporation (China) Limited Suzhou Industrial Park Sub-Branch
■ Sumitomo Mitsui Banking Corporation (China) Limited Tianjin Binhai Sub-Branch
■ PT Bank BTPN Tbk■ Sumitomo Mitsui Banking Corporation Malaysia Berhad■ Hong Kong Branch■ Taipei Branch■ Seoul Branch■ Singapore Branch■ Sydney Branch■ Perth Branch■ New Delhi Branch■ Mumbai Branch■ Bangkok Branch
■ Chonburi Branch■ Ho Chi Minh City Branch■ Hanoi Branch■ Manila Branch■ Yangon Branch■ Yangon Branch Thilawa Front Office■ Labuan Branch■ Labuan Branch Kuala Lumpur Office■ Ulaanbaatar Representative Office■ Phnom Penh Representative Office■ SMBC Capital Markets (Asia) Limited■ SMBC Nikko Capital Markets Limited (Sydney Office)■ The Bank of East Asia, Limited■ Vietnam Export Import Commercial Joint Stock Bank■ PT Oto Multiartha■ PT Summit Oto Finance■ ACLEDA Bank Plc.
■ New York Branch ■ San Francisco Branch■ Los Angeles Branch■ Canada Branch■ Cayman Branch■ Chicago Representative Office■ Dallas Representative Office■ Houston Representative Office■ Silicon Valley Representative Office■ Mexico City Representative Office■ Leon Representative Office■ Santiago Representative Office■ Bogota Representative Office■ Lima Representative Office■ Manufacturers Bank■ Banco Sumitomo Mitsui Brasileiro S.A.■ Banco Sumitomo Mitsui Brasileiro S.A.
Cayman Branch■ SMBC Capital Markets, Inc. ■ SMBC Nikko Securities America, Inc.■ SMBC Leasing and Finance, Inc. ■ SMBC, S.A.P.I. DE C.V., SOFOM, E.N.R.■ SMBC Americas Holdings, Inc.
■ Sumitomo Mitsui Banking Corporation Europe Limited Head Office
■ Sumitomo Mitsui Banking Corporation Europe Limited Paris Branch
■ SMBC Bank EU AG■ SMBC Bank EU AG Amsterdam Branch■ SMBC Bank EU AG Dublin Branch■ SMBC Bank EU AG Prague Branch■ SMBC Bank EU AG Madrid Branch■ SMBC Bank EU AG Milan Branch■ London Branch■ Düsseldorf Branch■ Frankfurt Branch■ Brussels Branch
■ DIFC Branch-Dubai■ Abu Dhabi Representative Office■ Istanbul Representative Office■ Doha QFC Office■ Bahrain Representative Office■ Johannesburg Representative Office■ Cairo Representative Office■ Tehran Representative Office■ JSC Sumitomo Mitsui Rus Bank■ SMBC Nikko Capital Markets Limited■ SMBC Nikko Capital Markets Europe GmbH■ Sumitomo Mitsui Finance Dublin Limited■ SMBC Aviation Capital Limited■ SMBC Advisory Services Saudi Arabia LLC
The Bank of East Asia, Limited
149SMBC Group Annual Report 2019

150 SMBC Group Annual Report 2019

151SMBC Group Annual Report 2019
Appendix II
Financial Data
Sumitomo Mitsui Financial GroupFinancial Highlights 152
Consolidated Balance Sheets 153
Consolidated Statements of Income 155
Consolidated Statements of Comprehensive Income 157
Consolidated Statements ofChanges in Net Assets 158
Consolidated Statements of Cash Flows 161
Notes to Consolidated Financial Statements 163
Independent Auditor’s Report 227
SMBCSupplemental Information 228
Sumitomo Mitsui Financial GroupIncome Analysis (Consolidated) 234
Assets and Liabilities (Consolidated) 237
Capital (Non-consolidated) 240
Basel III Information
Sumitomo Mitsui Financial GroupCapital Ratio Information (Consolidated) 243
Countercyclical buffer requirement by country or region 310
Indicators for assessing Global Systemically Important Banks (G-SIBs) 311
Leverage Ratio Information (Consolidated) 313
TLAC information 314
Liquidity Coverage Ratio Information (Consolidated) 317
SMBCFinancial Highlights 319
Income Analysis (Consolidated) 320
Assets and Liabilities (Consolidated) 323
Income Analysis (Non-consolidated) 325
Deposits (Non-consolidated) 329
Loans (Non-consolidated) 331
Securities (Non-consolidated) 336
Ratios (Non-consolidated) 338
Capital (Non-consolidated) 340
Others (Non-consolidated) 341
Trust Assets and Liabilities (Non-consolidated) 343
Compensation
Sumitomo Mitsui Financial GroupCompensation (Consolidated) 366
SMBCCompensation 370
CONTENTS
Basel III Information
SMBCCapital Ratio Information (Consolidated) 344
Leverage Ratio Information (Consolidated) 351
Liquidity Coverage Ratio Information (Consolidated) 352
Capital Ratio Information (Non-consolidated) 354
Leverage Ratio Information (Non-consolidated) 361
Liquidity Coverage Ratio Information (Non-consolidated) 362
006_0800801371908.indd 151 2019/08/16 18:48:47

152
Sumitomo Mitsui Financial Group
SMBC Group Annual Report 2019
Sumitomo Mitsui Financial Group (Consolidated)
Millions of yen Year ended March 31 2019 2018 2017 2016 2015For the Year:
Ordinary income ����������������������������������������������������������� ¥ 5,735,312 ¥ 5,764,172 ¥ 5,133,245 ¥ 4,772,100 ¥ 4,851,202Ordinary profit �������������������������������������������������������������� 1,135,300 1,164,113 1,005,855 985,284 1,321,156Profit attributable to owners of parent ������������������������� 726,681 734,368 706,519 646,687 753,610Comprehensive income ����������������������������������������������� 795,191 984,133 966,057 178,328 2,063,510
At Year-End:Total net assets ������������������������������������������������������������ ¥ 11,451,611 ¥ 11,612,892 ¥ 11,234,286 ¥ 10,447,669 ¥ 10,696,271Total assets ������������������������������������������������������������������ 203,659,146 199,049,128 197,791,611 186,585,842 183,442,585Total capital ratio (International Standard) ������������������� 20.76% 19�36% 16�93% 17�02% 16�58%Tier 1 capital ratio (International Standard) ������������������ 18.19% 16�69% 14�07% 13�68% 12�89%Common equity Tier 1 capital ratio
(International Standard) ��������������������������������������������� 16.37% 14�50% 12�17% 11�81% 11�30%Number of employees �������������������������������������������������� 86,659 72,978 77,205 73,652 68,739
Note: “Number of employees” has been reported on the basis of full-time workers. “Number of employees” includes locally hired overseas staff members but excludes contract employees and temporary staff.
Financial Highlights
010_0800801371908.indd 152 2019/08/16 18:54:01

153
Sumitomo Mitsui Financial Group
SMBC Group Annual Report 2019
Consolidated Balance SheetsSumitomo Mitsui Financial Group, Inc� and Subsidiaries
Millions of yenMillions of
U�S� dollars
March 31 2018 2019 2019
Assets:Cash and due from banks �������������������������������������� *8 ¥ 53,732,582 *8 ¥ 57,411,276 $ 517,219Call loans and bills bought ������������������������������������� 1,881,879 2,465,744 22,214Receivables under resale agreements ������������������� 827,892 6,429,365 57,922Receivables under securities borrowing transactions ���������������������������������������������������������� 8,337,700 4,097,473 36,914
Monetary claims bought ����������������������������������������� *8 4,730,770 *8 4,594,578 41,393Trading assets �������������������������������������������������������� *8 5,585,591 *8 5,328,778 48,007Money held in trust ������������������������������������������������� 1,482 390 4Securities ���������������������������������������������������������������� *1, *2, *8, *16 25,712,709 *1, *2, *8, *16 24,338,005 219,261
Loans and bills discounted ������������������������������������*3, *4, *5, *6, *7,
*8, *9 72,945,934*3, *4, *5, *6, *7,
*8, *9 77,979,190 702,515Foreign exchanges ������������������������������������������������� *7 2,166,190 *7 1,719,402 15,490Lease receivables and investment assets �������������� *8 2,329,431 247,835 2,233Other assets ����������������������������������������������������������� *8 8,005,807 *8 7,307,305 65,832Tangible fixed assets ���������������������������������������������� *8, *10, *11, *12 3,475,131 *10, *11, *12 1,504,703 13,556
Assets for rent ��������������������������������������������������� 2,553,213 573,292 5,165Buildings ������������������������������������������������������������ 341,949 345,420 3,112Land ������������������������������������������������������������������ 424,277 427,484 3,851Lease assets ����������������������������������������������������� 6,332 25,548 230Construction in progress ����������������������������������� 33,971 37,663 339Other tangible fixed assets ������������������������������� 115,387 95,293 859
Intangible fixed assets �������������������������������������������� 865,584 769,231 6,930Software ������������������������������������������������������������ 428,756 431,135 3,884Goodwill ������������������������������������������������������������ 272,203 193,127 1,740Lease assets ����������������������������������������������������� 163 990 9Other intangible fixed assets ����������������������������� 164,460 143,977 1,297
Net defined benefit asset ��������������������������������������� 383,418 329,434 2,968Deferred tax assets ������������������������������������������������ 27,609 40,245 363Customers’ liabilities for acceptances and guarantees ������������������������������������������������������������ 8,575,499 9,564,993 86,171
Reserve for possible loan losses ���������������������������� (536,088) (468,808) (4,223)Total assets ������������������������������������������������������������� ¥199,049,128 ¥203,659,146 $1,834,767
010_0800801371908.indd 153 2019/08/16 18:54:01

154
Sumitomo Mitsui Financial Group
SMBC Group Annual Report 2019
(Continued)
Millions of yenMillions of
U�S� dollars
March 31 2018 2019 2019
Liabilities and net assets:Liabilities:Deposits ����������������������������������������������������������������� *8 ¥116,477,534 *8 ¥122,325,038 $1,102,027Negotiable certificates of deposit �������������������������� 11,220,284 11,165,486 100,590Call money and bills sold ��������������������������������������� 1,190,928 1,307,778 11,782Payables under repurchase agreements ���������������� *8 5,509,721 *8 11,462,559 103,266Payables under securities lending transactions ���������������������������������������������������������� *8 7,186,861 *8 1,812,820 16,332
Commercial paper �������������������������������������������������� 2,384,787 2,291,813 20,647Trading liabilities ����������������������������������������������������� 4,402,110 4,219,293 38,012Borrowed money ���������������������������������������������������� *8, *13 10,829,248 *8, *13 10,656,897 96,008Foreign exchanges ������������������������������������������������� 865,640 1,165,141 10,497Short-term bonds ��������������������������������������������������� 1,256,600 84,500 761Bonds ��������������������������������������������������������������������� *8, *14 9,057,683 *14 9,227,367 83,129Due to trust account ����������������������������������������������� 1,328,271 *8, *15 1,352,773 12,187Other liabilities �������������������������������������������������������� *8 6,348,202 4,873,630 43,907Reserve for employee bonuses ������������������������������ 84,046 70,351 634Reserve for executive bonuses ������������������������������ 3,861 3,091 28Net defined benefit liability ������������������������������������� 39,982 31,816 287Reserve for executive retirement benefits �������������� 2,026 1,374 12Reserve for point service program ������������������������� 22,244 23,948 216Reserve for reimbursement of deposits ����������������� 17,765 7,936 72Reserve for losses on interest repayment �������������� 144,763 147,594 1,330Reserves under the special laws ���������������������������� 2,397 2,847 26Deferred tax liabilities ��������������������������������������������� 455,234 378,220 3,407Deferred tax liabilities for land revaluation ������������� *10 30,539 *10 30,259 273Acceptances and guarantees ��������������������������������� *8 8,575,499 *8 9,564,993 86,171Total liabilities ��������������������������������������������������������� 187,436,236 192,207,534 1,731,599 Net assets:Capital stock ���������������������������������������������������������� 2,338,743 2,339,443 21,076Capital surplus ������������������������������������������������������� 758,215 739,047 6,658Retained earnings �������������������������������������������������� 5,552,573 5,992,247 53,984Treasury stock �������������������������������������������������������� (12,493) (16,302) (147)Total stockholders’ equity �������������������������������������� 8,637,039 9,054,436 81,571Net unrealized gains (losses) on other securities �������������������������������������������������������������� 1,688,842 1,688,852 15,215
Net deferred gains (losses) on hedges ������������������� (68,543) (54,650) (492)Land revaluation excess ����������������������������������������� *10 37,097 *10 36,547 329Foreign currency translation adjustments �������������� 36,906 50,379 454Accumulated remeasurements of defined benefit plans ��������������������������������������������������������� 59,121 (7,244) (65)
Total accumulated other comprehensive income ������������������������������������������������������������������ 1,753,424 1,713,884 15,440
Stock acquisition rights ������������������������������������������ 2,823 4,750 43Non-controlling interests ���������������������������������������� 1,219,604 678,540 6,113Total net assets ������������������������������������������������������ 11,612,892 11,451,611 103,168Total liabilities and net assets ��������������������������������� ¥199,049,128 ¥203,659,146 $1,834,767
Consolidated Balance Sheets
010_0800801371908.indd 154 2019/08/16 18:54:01

155
Sumitomo Mitsui Financial Group
SMBC Group Annual Report 2019
Consolidated Statements of Income Sumitomo Mitsui Financial Group, Inc� and Subsidiaries
Millions of yenMillions of
U�S� dollars
Year ended March 31 2018 2019 2019
Ordinary income �������������������������������������������������������������������������������������� ¥5,764,172 ¥5,735,312 $51,669Interest income ����������������������������������������������������������������������������������� 2,165,788 2,488,904 22,423
Interest on loans and discounts ���������������������������������������������������� 1,469,232 1,666,283 15,012Interest and dividends on securities ��������������������������������������������� 342,013 364,685 3,285Interest on call loans and bills bought ������������������������������������������ 19,462 16,551 149Interest on receivables under resale agreements ������������������������� 24,566 20,457 184Interest on receivables under securities borrowing transactions �� 14,619 17,784 160Interest on deposits with banks ���������������������������������������������������� 75,619 103,135 929Interest on lease transactions ������������������������������������������������������� 70,941 47,573 429Other interest income �������������������������������������������������������������������� 149,333 252,433 2,274
Trust fees �������������������������������������������������������������������������������������������� 3,884 4,656 42Fees and commissions ���������������������������������������������������������������������� 1,244,063 1,240,917 11,179Trading income ����������������������������������������������������������������������������������� 246,338 194,676 1,754Other operating income ��������������������������������������������������������������������� 1,863,345 1,578,159 14,218
Lease-related income �������������������������������������������������������������������� 271,703 233,675 2,105Installment-related income ������������������������������������������������������������ 1,041,351 981,090 8,839Other ��������������������������������������������������������������������������������������������� 550,290 363,393 3,274
Other income �������������������������������������������������������������������������������������� 240,751 227,997 2,054Gains on reversal of reserve for possible loan losses ������������������� 11,562 5,729 52Recoveries of written-off claims ���������������������������������������������������� 10,231 11,047 100Other ��������������������������������������������������������������������������������������������� *1 218,957 *1 211,220 1,903
Ordinary expenses ��������������������������������������������������������������������������������� 4,600,059 4,600,012 41,442Interest expenses ������������������������������������������������������������������������������� 775,560 1,157,482 10,428
Interest on deposits ���������������������������������������������������������������������� 283,229 463,989 4,180Interest on negotiable certificates of deposit �������������������������������� 86,810 136,178 1,227Interest on call money and bills sold ��������������������������������������������� 8,471 14,270 129Interest on payables under repurchase agreements ��������������������� 48,597 119,733 1,079Interest on payables under securities lending transactions ���������� 11,316 1,272 11Interest on commercial paper ������������������������������������������������������� 18,393 45,356 409Interest on borrowed money ��������������������������������������������������������� 54,654 75,883 684Interest on short-term bonds �������������������������������������������������������� 54 60 1Interest on bonds �������������������������������������������������������������������������� 186,095 226,536 2,041Other interest expenses ���������������������������������������������������������������� 77,936 74,201 668
Fees and commissions payments ������������������������������������������������������ 177,418 181,019 1,631Trading losses ������������������������������������������������������������������������������������ 36 3,305 30Other operating expenses ������������������������������������������������������������������ 1,589,355 1,319,328 11,886
Lease-related expenses ���������������������������������������������������������������� 142,894 120,097 1,082Installment-related expenses �������������������������������������������������������� 987,154 930,884 8,386Other ��������������������������������������������������������������������������������������������� 459,305 268,347 2,418
General and administrative expenses ������������������������������������������������ *2 1,816,197 *2 1,715,050 15,451Other expenses ���������������������������������������������������������������������������������� *3 241,491 *3 223,825 2,016
Ordinary profit ����������������������������������������������������������������������������������������� 1,164,113 1,135,300 10,228
010_0800801371908.indd 155 2019/08/16 18:54:01

156
Sumitomo Mitsui Financial Group
SMBC Group Annual Report 2019
Millions of yenMillions of
U�S� dollars
Year ended March 31 2018 2019 2019
Extraordinary gains ���������������������������������������������������������������������������������� ¥ 866 ¥ 2,826 $ 25Gains on disposal of fixed assets ������������������������������������������������������ 852 541 5Reversal of reserve for eventual future operating losses from financial instruments transactions ���������������������������������������������������� 13 — —
Other extraordinary gains ������������������������������������������������������������������� — *4 2,285 21Extraordinary losses �������������������������������������������������������������������������������� 56,129 14,547 131
Losses on disposal of fixed assets ���������������������������������������������������� 5,563 4,485 40Losses on impairment of fixed assets ������������������������������������������������ *5 49,900 *5 9,610 87Provision for reserve for eventual future operating losses from financial instruments transactions ���������������������������������������������������� 665 450 4
Income before income taxes ������������������������������������������������������������������� 1,108,850 1,123,579 10,122Income taxes-current ������������������������������������������������������������������������������ 225,617 276,329 2,489Income taxes-deferred ���������������������������������������������������������������������������� 44,907 55,095 496Income taxes ������������������������������������������������������������������������������������������� 270,524 331,424 2,986Profit �������������������������������������������������������������������������������������������������������� 838,326 792,155 7,137Profit attributable to non-controlling interests ����������������������������������������� 103,957 65,474 590Profit attributable to owners of parent ���������������������������������������������������� ¥ 734,368 ¥ 726,681 $ 6,547
(Continued)
Consolidated Statements of Income
010_0800801371908.indd 156 2019/08/16 18:54:01

157
Sumitomo Mitsui Financial Group
SMBC Group Annual Report 2019
Consolidated Statements of Comprehensive IncomeSumitomo Mitsui Financial Group, Inc� and Subsidiaries
Millions of yenMillions of
U�S� dollars
Year ended March 31 2018 2019 2019
Profit �������������������������������������������������������������������������������������������������������� ¥838,326 ¥792,155 $7,137Other comprehensive income (losses) ���������������������������������������������������� *1 145,807 *1 3,035 27
Net unrealized gains (losses) on other securities ������������������������������� 162,673 31,157 281Net deferred gains (losses) on hedges ����������������������������������������������� (28,659) 29,981 270Land revaluation excess ��������������������������������������������������������������������� 1 — —Foreign currency translation adjustments ������������������������������������������ (50,387) 10,396 94Remeasurements of defined benefit plans ����������������������������������������� 49,221 (65,530) (590)Share of other comprehensive income of affiliates ���������������������������� 12,957 (2,970) (27)
Total comprehensive income ������������������������������������������������������������������� 984,133 795,191 7,164Comprehensive income attributable to owners of parent ������������������ 876,353 687,690 6,195Comprehensive income attributable to non-controlling interests ������ 107,780 107,500 968
010_0800801371908.indd 157 2019/08/16 18:54:01

158
Sumitomo Mitsui Financial Group
SMBC Group Annual Report 2019
Millions of yen Stockholders’ equity
Year ended March 31, 2018Capitalstock
Capitalsurplus
Retainedearnings
Treasurystock Total
Balance at the beginning of the fiscal year ��������������������� ¥2,337,895 ¥757,346 ¥5,036,756 ¥(12,913) ¥8,119,085Changes in the fiscal year
Issuance of new stock������������������������������������������������ 847 847 1,695Cash dividends ����������������������������������������������������������� (218,596) (218,596)Profit attributable to owners of parent ����������������������� 734,368 734,368Purchase of treasury stock����������������������������������������� (142) (142)Disposal of treasury stock ������������������������������������������ (41) 562 521Changes in shareholders’ interest due to transaction with non-controlling interests ����������������������������������� 62 62
Increase due to increase in subsidiaries �������������������� 34 34Increase due to decrease in subsidiaries ������������������� 5 5Decrease due to increase in subsidiaries ������������������� (599) (599)Decrease due to decrease in subsidiaries ����������������� (2) (2)Decrease due to decrease in affiliates accounted for by the equity method ����������������������������������������������� (314) (314)
Reversal of land revaluation excess ���������������� 923 923Net changes in items other than stockholders’ equity in the fiscal year ���������������������������������������������
Net changes in the fiscal year ����������������������������������������� 847 868 515,817 420 517,954Balance at the end of the fiscal year ������������������������������� ¥2,338,743 ¥758,215 ¥5,552,573 ¥(12,493) ¥8,637,039
Millions of yen Accumulated other comprehensive income
Year ended March 31, 2018
Net unrealized gains (losses)
on other securities
Net deferred gains (losses)
on hedges
Land revaluation
excess
Foreign currency
translation adjustments
Accumulated remeasurements
of defined benefit plans Total
Balance at the beginning of the fiscal year ��������������������� ¥1,542,308 ¥(42,077) ¥38,109 ¥ 65,078 ¥ 9,034 ¥1,612,453Changes in the fiscal year
Issuance of new stock������������������������������������������������Cash dividends �����������������������������������������������������������Profit attributable to owners of parent �����������������������Purchase of treasury stock�����������������������������������������Disposal of treasury stock ������������������������������������������Changes in shareholders’ interest due to transaction with non-controlling interests �����������������������������������
Increase due to increase in subsidiaries ��������������������Increase due to decrease in subsidiaries �������������������Decrease due to increase in subsidiaries �������������������Decrease due to decrease in subsidiaries �����������������Decrease due to decrease in affiliates accounted for by the equity method �����������������������������������������������
Reversal of land revaluation excess ���������������������������Net changes in items other than stockholders’ equity in the fiscal year ��������������������������������������������� 146,533 (26,466) (1,012) (28,171) 50,087 140,971
Net changes in the fiscal year ����������������������������������������� 146,533 (26,466) (1,012) (28,171) 50,087 140,971Balance at the end of the fiscal year ������������������������������� ¥1,688,842 ¥(68,543) ¥37,097 ¥ 36,906 ¥59,121 ¥1,753,424
Millions of yen
Year ended March 31, 2018
Stock acquisition
rights
Non- controlling interests
Totalnet assets
Balance at the beginning of the fiscal year ��������������������� ¥3,482 ¥1,499,264 ¥11,234,286Changes in the fiscal year
Issuance of new stock������������������������������������������������ 1,695Cash dividends ����������������������������������������������������������� (218,596)Profit attributable to owners of parent ����������������������� 734,368Purchase of treasury stock����������������������������������������� (142)Disposal of treasury stock ������������������������������������������ 521Changes in shareholders’ interest due to transaction with non-controlling interests ����������������������������������� 62
Increase due to increase in subsidiaries �������������������� 34Increase due to decrease in subsidiaries ������������������� 5Decrease due to increase in subsidiaries ������������������� (599)Decrease due to decrease in subsidiaries ����������������� (2)Decrease due to decrease in affiliates accounted for by the equity method ����������������������������������������������� (314)
Reversal of land revaluation excess ��������������������������� 923Net changes in items other than stockholders’ equity in the fiscal year ��������������������������������������������� (659) (279,659) (139,348)
Net changes in the fiscal year ����������������������������������������� (659) (279,659) 378,606Balance at the end of the fiscal year ������������������������������� ¥2,823 ¥1,219,604 ¥11,612,892
Consolidated Statements of Changes in Net AssetsSumitomo Mitsui Financial Group, Inc� and Subsidiaries
010_0800801371908.indd 158 2019/08/16 18:54:02

159
Sumitomo Mitsui Financial Group
SMBC Group Annual Report 2019
Millions of yen Stockholders’ equity
Year ended March 31, 2019Capital stock
Capital surplus
Retained earnings
Treasurystock Total
Balance at the beginning of the fiscal year ��������������������� ¥2,338,743 ¥758,215 ¥5,552,573 ¥(12,493) ¥8,637,039Changes in the fiscal year
Issuance of new stock������������������������������������������������ 699 699 1,398Cash dividends ����������������������������������������������������������� (245,576) (245,576)Profit attributable to owners of parent ����������������������� 726,681 726,681Purchase of treasury stock����������������������������������������� (70,094) (70,094)Disposal of treasury stock ������������������������������������������ (68) 363 294Cancellation of treasury stock ������������������������������������ (65,922) 65,922 —Changes in shareholders’ interest due to transaction with non-controlling interests ����������������������������������� 4,419 4,419
Increase due to increase in subsidiaries �������������������� 0 0Increase due to decrease in subsidiaries ������������������� 4 4Decrease due to increase in subsidiaries ������������������� (11) (11)Decrease due to decrease in subsidiaries ����������������� (23) (23)Reversal of land revaluation excess ��������������������������� 302 302Transfer from retained earnings to capital surplus ����� 41,704 (41,704) —Net changes in items other than stockholders’ equity in the fiscal year ���������������������������������������������
Net changes in the fiscal year ����������������������������������������� 699 (19,167) 439,673 (3,809) 417,396Balance at the end of the fiscal year ������������������������������� ¥2,339,443 ¥739,047 ¥5,992,247 ¥(16,302) ¥9,054,436
Millions of yen Accumulated other comprehensive income
Year ended March 31, 2019
Net unrealized gains (losses)
on other securities
Net deferred gains (losses)
on hedges
Land revaluation
excess
Foreign currency
translation adjustments
Accumulated remeasurements
of defined benefit plans Total
Balance at the beginning of the fiscal year ��������������������� ¥1,688,842 ¥(68,543) ¥37,097 ¥36,906 ¥ 59,121 ¥1,753,424Changes in the fiscal year
Issuance of new stock������������������������������������������������Cash dividends �����������������������������������������������������������Profit attributable to owners of parent �����������������������Purchase of treasury stock�����������������������������������������Disposal of treasury stock ������������������������������������������Cancellation of treasury stock ������������������������������������Changes in shareholders’ interest due to transaction with non-controlling interests �����������������������������������
Increase due to increase in subsidiaries ��������������������Increase due to decrease in subsidiaries �������������������Decrease due to increase in subsidiaries �������������������Decrease due to decrease in subsidiaries �����������������Reversal of land revaluation excess ���������������������������Transfer from retained earnings to capital surplus �����Net changes in items other than stockholders’ equity in the fiscal year ��������������������������������������������� 10 13,893 (549) 13,473 (66,366) (39,540)
Net changes in the fiscal year ����������������������������������������� 10 13,893 (549) 13,473 (66,366) (39,540)Balance at the end of the fiscal year ������������������������������� ¥1,688,852 ¥(54,650) ¥36,547 ¥50,379 ¥ (7,244) ¥1,713,884
Millions of yen
Year ended March 31, 2019
Stock acquisition
rights
Non- controlling interests
Totalnet assets
Balance at the beginning of the fiscal year ��������������������� ¥2,823 ¥1,219,604 ¥11,612,892Changes in the fiscal year
Issuance of new stock������������������������������������������������ 1,398Cash dividends ����������������������������������������������������������� (245,576)Profit attributable to owners of parent ����������������������� 726,681Purchase of treasury stock����������������������������������������� (70,094)Disposal of treasury stock ������������������������������������������ 294Cancellation of treasury stock ������������������������������������ —Changes in shareholders’ interest due to transaction with non-controlling interests ����������������������������������� 4,419
Increase due to increase in subsidiaries �������������������� 0Increase due to decrease in subsidiaries ������������������� 4Decrease due to increase in subsidiaries ������������������� (11)Decrease due to decrease in subsidiaries ����������������� (23)Reversal of land revaluation excess ��������������������������� 302Transfer from retained earnings to capital surplus ����� —Net changes in items other than stockholders’ equity in the fiscal year ��������������������������������������������� 1,926 (541,063) (578,677)
Net changes in the fiscal year ����������������������������������������� 1,926 (541,063) (161,280)Balance at the end of the fiscal year ������������������������������� ¥4,750 ¥ 678,540 ¥11,451,611
Consolidated Statements of Changes in Net Assets
010_0800801371908.indd 159 2019/08/16 18:54:02

160
Sumitomo Mitsui Financial Group
SMBC Group Annual Report 2019
Millions of U�S� dollarsAccumulated other comprehensive income
Year ended March 31, 2019
Net unrealized gains (losses)
on other securities
Net deferred gains (losses)
on hedges
Land revaluation
excess
Foreign currency
translation adjustments
Accumulated remeasurements
of defined benefit plans Total
Balance at the beginning of the fiscal year ��������������������� $15,215 $(618) $334 $332 $ 533 $15,797Changes in the fiscal year
Issuance of new stock������������������������������������������������Cash dividends �����������������������������������������������������������Profit attributable to owners of parent �����������������������Purchase of treasury stock�����������������������������������������Disposal of treasury stock ������������������������������������������Cancellation of treasury stock ������������������������������������Changes in shareholders’ interest due to transaction with non-controlling interests �����������������������������������
Increase due to increase in subsidiaries ��������������������Increase due to decrease in subsidiaries �������������������Decrease due to increase in subsidiaries �������������������Decrease due to decrease in subsidiaries �����������������Reversal of land revaluation excess ���������������������������Transfer from retained earnings to capital surplus �����Net changes in items other than stockholders’ equity in the fiscal year ��������������������������������������������� 0 125 (5) 121 (598) (356)
Net changes in the fiscal year ����������������������������������������� 0 125 (5) 121 (598) (356)Balance at the end of the fiscal year ������������������������������� $15,215 $(492) $329 $454 $ (65) $15,440
Millions of U�S� dollars
Year ended March 31, 2019
Stock acquisition
rights
Non- controlling interests
Totalnet assets
Balance at the beginning of the fiscal year ��������������������� $25 $10,987 $104,621Changes in the fiscal year
Issuance of new stock������������������������������������������������ 13Cash dividends ����������������������������������������������������������� (2,212)Profit attributable to owners of parent ����������������������� 6,547Purchase of treasury stock����������������������������������������� (631)Disposal of treasury stock ������������������������������������������ 3Cancellation of treasury stock ������������������������������������ —Changes in shareholders’ interest due to transaction with non-controlling interests ����������������������������������� 40
Increase due to increase in subsidiaries �������������������� 0Increase due to decrease in subsidiaries ������������������� 0Decrease due to increase in subsidiaries ������������������� (0)Decrease due to decrease in subsidiaries ����������������� (0)Reversal of land revaluation excess ��������������������������� 3Transfer from retained earnings to capital surplus ����� —Net changes in items other than stockholders’ equity in the fiscal year ��������������������������������������������� 17 (4,874) (5,213)
Net changes in the fiscal year ����������������������������������������� 17 (4,874) (1,453)Balance at the end of the fiscal year ������������������������������� $43 $ 6,113 $103,168
Millions of U�S� dollarsStockholders’ equity
Year ended March 31, 2019Capitalstock
Capitalsurplus
Retained earnings
Treasurystock Total
Balance at the beginning of the fiscal year ��������������������� $21,070 $6,831 $50,023 $(113) $77,811Changes in the fiscal year
Issuance of new stock������������������������������������������������ 6 6 13Cash dividends ����������������������������������������������������������� (2,212) (2,212)Profit attributable to owners of parent ����������������������� 6,547 6,547Purchase of treasury stock����������������������������������������� (631) (631)Disposal of treasury stock ������������������������������������������ (1) 3 3Cancellation of treasury stock ������������������������������������ (594) 594 —Changes in shareholders’ interest due to transaction with non-controlling interests ����������������������������������� 40 40
Increase due to increase in subsidiaries �������������������� 0 0Increase due to decrease in subsidiaries ������������������� 0 0Decrease due to increase in subsidiaries ������������������� (0) (0)Decrease due to decrease in subsidiaries ����������������� (0) (0)Reversal of land revaluation excess ��������������������������� 3 3Transfer from retained earnings to capital surplus ����� 376 (376) —Net changes in items other than stockholders’ equity in the fiscal year ���������������������������������������������
Net changes in the fiscal year ����������������������������������������� 6 (173) 3,961 (34) 3,760Balance at the end of the fiscal year ������������������������������� $21,076 $6,658 $53,984 $(147) $81,571
Consolidated Statements of Changes in Net Assets
010_0800801371908.indd 160 2019/08/16 18:54:02

161
Sumitomo Mitsui Financial Group
SMBC Group Annual Report 2019
Consolidated Statements of Cash FlowsSumitomo Mitsui Financial Group, Inc� and Subsidiaries
Millions of yenMillions of
U�S� dollars
Year ended March 31 2018 2019 2019
Cash flows from operating activities: Income before income taxes �������������������������������������������������������������� ¥ 1,108,850 ¥ 1,123,579 $ 10,122Depreciation ��������������������������������������������������������������������������������������� 281,535 269,010 2,424Losses on impairment of fixed assets ������������������������������������������������ 49,900 9,610 87Amortization of goodwill ��������������������������������������������������������������������� 25,225 25,919 234Gains on step acquisitions ����������������������������������������������������������������� — (2,285) (21)Equity in (gains) losses of affiliates ����������������������������������������������������� (38,992) (61,145) (551)Net change in reserve for possible loan losses ���������������������������������� (67,041) (60,213) (542)Net change in reserve for employee bonuses ������������������������������������ 10,570 (16,467) (148)Net change in reserve for executive bonuses ������������������������������������ 821 (757) (7)Net change in net defined benefit asset and liability ������������������������� (36,499) (25,570) (230)Net change in reserve for executive retirement benefits �������������������� (244) (196) (2)Net change in reserve for point service program ������������������������������� 637 1,704 15Net change in reserve for reimbursement of deposits ����������������������� 3,704 (9,828) (89)Net change in reserve for losses on interest repayment �������������������� (11,939) 2,830 26Interest income ����������������������������������������������������������������������������������� (2,165,788) (2,488,904) (22,423)Interest expenses ������������������������������������������������������������������������������� 775,560 1,157,482 10,428Net (gains) losses on securities ���������������������������������������������������������� (142,228) (101,219) (912)Net (gains) losses from money held in trust ��������������������������������������� (0) (0) (0)Net exchange (gains) losses �������������������������������������������������������������� 323,045 (148,278) (1,336)Net (gains) losses from disposal of fixed assets �������������������������������� 4,710 3,944 36Net change in trading assets ������������������������������������������������������������� 1,475,948 477,890 4,305Net change in trading liabilities ���������������������������������������������������������� (796,943) (1,603,188) (14,443)Net change in loans and bills discounted ������������������������������������������ 761,992 (3,152,247) (28,399)Net change in deposits ���������������������������������������������������������������������� 6,079,437 5,039,495 45,401Net change in negotiable certificates of deposit �������������������������������� (472,574) (73,017) (658)Net change in borrowed money (excluding subordinated borrowings) ��������������������������������������������������������������������������������������� 59,482 1,418,493 12,779
Net change in deposits with banks ���������������������������������������������������� (1,359,236) 1,520,423 13,698Net change in call loans and bills bought and others ������������������������ (338,019) (6,235,713) (56,178)Net change in receivables under securities borrowing transactions�� 422,690 4,240,226 38,200Net change in call money and bills sold and others �������������������������� 2,059,841 6,097,354 54,931Net change in commercial paper ������������������������������������������������������� 108,893 (95,014) (856)Net change in payables under securities lending transactions ���������� (168,890) (5,374,040) (48,415)Net change in foreign exchanges (assets) ����������������������������������������� (453,061) 446,136 4,019Net change in foreign exchanges (liabilities) �������������������������������������� 183,504 298,550 2,690Net change in lease receivables and investment assets �������������������� 26,591 (53,975) (486)Net change in short-term bonds (liabilities) ��������������������������������������� 131,000 (51,200) (461)Issuance and redemption of bonds (excluding subordinated bonds) ���� 860,316 467,587 4,213Net change in due to trust account ���������������������������������������������������� 147,294 24,502 221Interest received ��������������������������������������������������������������������������������� 2,121,086 2,435,453 21,941Interest paid ��������������������������������������������������������������������������������������� (756,202) (1,116,584) (10,059)Other, net �������������������������������������������������������������������������������������������� (768,910) 489,142 4,407Subtotal ���������������������������������������������������������������������������������������������� 9,446,071 4,879,488 43,959Income taxes paid ������������������������������������������������������������������������������ (103,276) (283,245) (2,552)
Net cash provided by (used in) operating activities �������������������������������� 9,342,794 4,596,242 41,408
010_0800801371908.indd 161 2019/08/16 18:54:02

162
Sumitomo Mitsui Financial Group
SMBC Group Annual Report 2019
Millions of yenMillions of
U�S� dollars
Year ended March 31 2018 2019 2019
Cash flows from investing activities: Purchases of securities ���������������������������������������������������������������������� ¥(23,726,100) ¥(26,615,239) $(239,777)Proceeds from sale of securities �������������������������������������������������������� 13,528,011 17,969,410 161,887Proceeds from redemption of securities �������������������������������������������� 8,357,784 10,078,569 90,798Purchases of money held in trust ������������������������������������������������������� (1) (2) (0)Proceeds from sale of money held in trust ���������������������������������������� 1,957 1,094 10Purchases of tangible fixed assets ���������������������������������������������������� (712,563) (510,213) (4,597)Proceeds from sale of tangible fixed assets �������������������������������������� 302,362 104,451 941Purchases of intangible fixed assets �������������������������������������������������� (136,079) (139,329) (1,255)Proceeds from sale of intangible fixed assets ����������������������������������� 3 — —Purchases of stocks of subsidiaries resulting in change in scope of consolidation ������������������������������������������������������������������������������������ *2 (161,851) *2 (57,182) (515)
Proceeds from sale of stocks of subsidiaries resulting in change in scope of consolidation ��������������������������������������������������������������������� *3 (848,822) *3 174,702 1,574
Net cash provided by (used in) investing activities ��������������������������������� (3,395,299) 1,006,260 9,065Cash flows from financing activities:
Repayment of subordinated borrowings �������������������������������������������� (10,000) (8,000) (72)Proceeds from issuance of subordinated bonds and bonds with stock acquisition rights �������������������������������������������������������������������� 254,747 — —
Redemption of subordinated bonds and bonds with stock acquisition rights ����������������������������������������������������������������������������� (180,033) (27,539) (248)
Dividends paid������������������������������������������������������������������������������������ (218,569) (245,594) (2,213)Repayments to non-controlling stockholders ������������������������������������ (135,000) (212,537) (1,915)Dividends paid to non-controlling stockholders �������������������������������� (61,986) (77,185) (695)Purchases of treasury stock �������������������������������������������������������������� (142) (70,094) (631)Proceeds from disposal of treasury stock ������������������������������������������ 521 294 3Purchases of stocks of subsidiaries not resulting in change in scope of consolidation ��������������������������������������������������������������������� (6) — —
Proceeds from sale of stocks of subsidiaries not resulting in change in scope of consolidation ����������������������������������������������������������������� 0 7,837 71
Net cash provided by (used in) financing activities ��������������������������������� (350,468) (632,819) (5,701)Effect of exchange rate changes on cash and cash equivalents ������������ (93,874) 166,646 1,501Net change in cash and cash equivalents ����������������������������������������������� 5,503,152 5,136,329 46,273Cash and cash equivalents at the beginning of the fiscal year ��������������� 42,478,393 47,983,114 432,280Increase in cash and cash equivalents resulting from inclusion of subsidiaries in consolidation ����������������������������������������������������������������� 1,568 1,519 14
Cash and cash equivalents at the end of the fiscal year ������������������������� *1 ¥ 47,983,114 *1 ¥ 53,120,963 $ 478,567
(Continued)
Consolidated Statements of Cash Flows
010_0800801371908.indd 162 2019/08/16 18:54:02

163
Sumitomo Mitsui Financial Group
SMBC Group Annual Report 2019
Notes to Consolidated Financial StatementsSumitomo Mitsui Financial Group, Inc� and Subsidiaries
Sumitomo Mitsui Financial Group, Inc. (“the Company”) was established on December 2, 2002 as a holding company for the SMBC Group
(“the Group”) through a statutory share transfer (kabushiki iten) of all of the outstanding equity securities of Sumitomo Mitsui Banking
Corporation (“SMBC”) in exchange for the Company’s newly issued securities. The Company is a joint stock corporation with limited liability
(Kabushiki Kaisha) incorporated under the Companies Act of Japan. Upon formation of the Company and completion of the statutory share
transfer, SMBC became a direct wholly owned subsidiary of the Company.
The Company has prepared the accompanying consolidated financial statements in accordance with the provisions set forth in the Japanese
Financial Instruments and Exchange Act and its related accounting regulations, and in conformity with accounting principles generally
accepted in Japan (“Japanese GAAP”), which are different in certain respects as to application and disclosure requirements from International
Financial Reporting Standards(“IFRS”).
The accounts of overseas subsidiaries and affiliated companies, are, in principle, integrated with those of the Company’s accounting policies
for purposes of consolidation unless they apply different accounting principles and standards as required under U.S. GAAP or IFRS, in which
case a certain limited number of items are adjusted based on their materiality.
These consolidated financial statements are translated from the consolidated financial statements contained in the annual securities report
filed under the Financial Instrument and Exchange Act of Japan (“FIEA based financial statements”) except for the addition of the non-
consolidated financial statements and US dollar figures.
Amounts less than 1 million yen have been rounded down. As a result, the totals in Japanese yen shown in the financial statements do not
necessarily agree with the sum of the individual amounts.
The translation of the Japanese yen amounts into U.S. dollars is included solely for the convenience of readers outside Japan, using the
prevailing exchange rate at March 31, 2019 which was ¥111.00 to US$1. These translations should not be construed as representations that the
Japanese yen amounts have been, could have been, or could in the future be, converted into U.S. dollars at that rate.
(Basis of presentation)
010_0800801371908.indd 163 2019/08/16 18:54:02

164
Sumitomo Mitsui Financial Group
SMBC Group Annual Report 2019
As of and for the years ended March 31, 2018 and 2019
(Significant accounting policies for preparing consolidated financial statements)1. Scope of consolidation
(1) Consolidated subsidiaries The number of consolidated subsidiaries at March 31, 2019 is 173. Principal companies: Sumitomo Mitsui Banking Corporation (“SMBC”) SMBC Trust Bank Ltd. SMBC Nikko Securities Inc. (“SMBC Nikko”) Sumitomo Mitsui Card Company, Limited (“SMCC”) Cedyna Financial Corporation SMBC Consumer Finance Co., Ltd. The Japan Research Institute, Limited Sumitomo Mitsui Asset Management Company, Limited (“SMAM”) Sumitomo Mitsui Banking Corporation Europe Limited Sumitomo Mitsui Banking Corporation (China) Limited PT Bank BTPN Tbk SMBC Americas Holdings, Inc. SMBC Guarantee Co., Ltd.
Changes in the consolidated subsidiaries in the fiscal year ended March 31, 2019 are as follows:PT Bank BTPN Tbk and 34 other companies were newly included in the scope of consolidation as a result of acquisition of shares
and for other reasons. Sumitomo Mitsui Finance and Leasing Company, Limited and 38 other companies were excluded from the scope of consolidation, as
a result of becoming equity method affiliates due to the partial sale of their stock and for other reasons; and 170 other companies were excluded from the scope of consolidation, as they ceased to be subsidiaries due to liquidation and for other reasons.
(2) Unconsolidated subsidiaries Principal company: SBCS Co., Ltd.
Unconsolidated subsidiaries are excluded from the scope of consolidation because their total amounts in terms of total assets, ordinary income, net income and retained earnings are immaterial, as such, they do not hinder a rational judgment of financial position and results of operations of the Company and its consolidated subsidiaries when excluded from the scope of consolidation.
2. Application of the equity method(1) Unconsolidated subsidiaries accounted for by the equity method The number of unconsolidated subsidiaries accounted for by the equity method at March 31, 2019 is 5.
Principal company: SBCS Co., Ltd.(2) Equity method affiliates The number of equity method affiliates at March 31, 2019 is 110. Principal companies: Sumitomo Mitsui Finance and Leasing Company, Limited Sumitomo Mitsui Auto Service Company, Limited Daiwa SB Investments Ltd.
Changes in the equity method affiliates in the fiscal year ended March 31, 2019 are as follows:Sumitomo Mitsui Finance and Leasing Company, Limited and 38 other companies were excluded from the scope of consolidation and
became equity method affiliates due to the partial sale of their stock and for other reasons; Kansai Mirai Financial Group, Inc. became an equity method affiliate as a result of share exchanges conducted with THE MINATO BANK, LTD. and Kansai Urban Banking Corporation, which are the Company’s equity method affiliates; and 10 other companies became equity method affiliates due to new establishment and for other reasons.
PT Bank BTPN Tbk and 9 other companies were excluded from the scope of equity method affiliates, as a result of becoming subsidiaries due to acquisition of shares and for other reasons.
(3) Unconsolidated subsidiaries that are not accounted for by the equity methodThere are no corresponding companies.
(4) Affiliates that are not accounted for by the equity methodPrincipal company: Daiwa SB Investments (USA) Ltd.Affiliates that are not accounted for by the equity method are also excluded from the scope of equity method because their total
amounts in terms of net income and retained earnings are immaterial, and as such, they do not hinder a rational judgment of the Company’s financial position and results of operations when excluded from the scope of equity method.
Notes to Consolidated Financial Statements
010_0800801371908.indd 164 2019/08/16 18:54:02

165
Sumitomo Mitsui Financial Group
SMBC Group Annual Report 2019
3. The balance sheet dates of consolidated subsidiaries(1) The balance sheet dates of the consolidated subsidiaries at March 31, 2019 are as follows:
October 31............................. 2December 31......................... . 84January 31............................. 5March 31............................... 82
(2) The subsidiaries with balance sheets dated October 31 are consolidated using the financial statements as of January 31. The subsidiaries with balance sheets dated January 31 and certain subsidiaries with balance sheets dated December 31 are consolidated using the financial statements as of March 31. Other subsidiaries are consolidated using the financial statements as of their respective balance sheet dates.
Appropriate adjustments were made to material transactions during the periods between their respective balance sheet dates and the consolidated closing date.
4. Accounting policies(1) Standards for recognition and measurement of trading assets/liabilities and trading income/losses
Transactions for trading purposes (seeking gains arising from short-term changes in interest rates, currency exchange rates, or market prices of securities and other market related indices or from variation among markets) are included in “Trading assets” or “Trading liabilities” on the consolidated balance sheets on a trade date basis. Profits and losses on trading-purpose transactions are recognized on a trade date basis, and recorded as “Trading income” and “Trading losses” on the consolidated statements of income.
Securities and monetary claims purchased for trading purposes are stated at the fiscal year-end market value, and financial derivatives such as swaps, futures and options are stated at amounts that would be settled if the transactions were terminated at the consolidated balance sheet date.
“Trading income” and “Trading losses” include interest received or paid during the fiscal year. The year-on-year valuation differences of securities and monetary claims are also recorded in the above-mentioned accounts. As for the derivatives, assuming that the settlement will be made in cash, the year-on-year valuation differences are also recorded in the above-mentioned accounts.
(2) Standards for recognition and measurement of securities1) Debt securities that consolidated subsidiaries have the positive intent and ability to hold to maturity are classified as held-to-
maturity securities and are carried at amortized cost (based on straight-line method) using the moving-average method. Investments in unconsolidated subsidiaries and affiliates that are not accounted for by the equity method are carried at cost using the moving-average method. Securities other than trading purpose securities, held-to-maturity securities and investments in unconsolidated subsidiaries and affiliates are classified as “other securities” (available-for-sale securities). Stocks (including foreign stocks) in other securities are carried at their average market prices during the final month of the fiscal year, and bonds and others are carried at their fiscal year-end market prices (cost of securities sold is calculated using primarily the moving-average method). Other securities which are extremely difficult to determine fair value are carried at cost using the moving-average method.
Net unrealized gains (losses) on other securities, net of income taxes, are included in “Net assets” except for the amount reflected on the gains or losses by applying fair value hedge accounting.
2) Securities included in money held in trust are carried in the same method as in (1) and (2), 1) above.(3) Standards for recognition and measurement of derivative transactions
Derivative transactions, excluding those classified as trading derivatives, are carried at fair value.(4) Depreciation
1) Tangible fixed assets (excluding assets for rent and lease assets)Buildings owned by the Company and SMBC, which is a consolidated subsidiary of the Company, are depreciated using the straight-line method. Others are depreciated using the declining-balance method. The estimated useful lives of major items are as follows:
Buildings: 7 to 50 yearsOthers: 2 to 20 yearsOther consolidated subsidiaries depreciate tangible fixed assets primarily using the straight-line method over the estimated useful
lives of the respective assets.2) Intangible fixed assets
Intangible fixed assets are depreciated using the straight-line method. Capitalized software for internal use owned by the Company and its consolidated domestic subsidiaries is depreciated over its estimated useful life (5 to 10 years).
3) Assets for rentAssets for rent are depreciated using the straight-line method, assuming that lease terms are, in principle, their depreciation period and the salvage is estimated disposal value when the lease period expires.
4) Lease assetsLease assets with respect to non-transfer ownership finance leases, which are recorded in “Tangible fixed assets,” are depreciated using the straight-line method, assuming that lease terms are their expected lifetime and salvage values are zero.
Notes to Consolidated Financial Statements
010_0800801371908.indd 165 2019/08/16 18:54:02

166
Sumitomo Mitsui Financial Group
SMBC Group Annual Report 2019
(5) Reserve for possible loan lossesThe reserve for possible loan losses of major consolidated subsidiaries is provided as detailed below in accordance with the internal standards for write-offs and provisions.
For claims on borrowers that have entered into bankruptcy, special liquidation proceedings or similar legal proceedings (“Bankrupt borrowers”) or borrowers that are not legally or formally insolvent but are regarded as substantially in the same situation (“Effectively bankrupt borrowers”), a reserve is provided based on the amount of claims, after the write-off stated below, net of the expected amount of recoveries from collateral and guarantees. For claims on borrowers that are not currently bankrupt but are perceived to have a high risk of falling into bankruptcy (“Potentially bankrupt borrowers”), a reserve is provided in the amount deemed necessary based on an overall solvency assessment of the borrowers, net of the expected amount of recoveries from collateral and guarantees.
Discounted Cash Flows (“DCF”) method is used for claims on borrowers whose cash flows from collection of principals and interest can be rationally estimated, and SMBC, which is a consolidated subsidiary of the Company, applies it to claims on large potentially bankrupt borrowers and claims on large borrowers requiring close monitoring that have been classified as “Past due loans (3 months or more)” or “Restructured loans,” whose total loans from SMBC exceed a certain amount. SMBC establishes a reserve for possible loan losses using the DCF method for such claims in the amount of the difference between the present value of principal and interest (calculated using the rationally estimated cash flows discounted at the initial contractual interest rate) and the book value.
For other claims, a reserve is provided based on the historical loan-loss ratio. For claims originated in specific overseas countries, an additional reserve is provided in the amount deemed necessary based on the assessment of political and economic conditions.
Branches and credit supervision departments assess all claims in accordance with the internal rules for self-assessment of assets, and the Credit Review Department, independent from these operating sections, audits their assessment.
The reserve for possible loan losses of other consolidated subsidiaries for general claims is provided in the amount deemed necessary based on the historical loan-loss ratios, and for doubtful claims in the amount deemed uncollectible based on assessment of each claim.
For collateralized or guaranteed claims on bankrupt borrowers and effectively bankrupt borrowers, the amount exceeding the estimated value of collateral and guarantees is deemed to be uncollectible and written off against the total outstanding amount of the claims. The amount of write-off for the years ended March 31, 2018 and 2019 were ¥190,945 million and ¥139,981 million, respectively.
(6) Reserve for employee bonusesThe reserve for employee bonuses is provided for payment of bonuses to employees, in the amount of estimated bonuses, which are attributable to the fiscal year.
(7) Reserve for executive bonusesThe reserve for executive bonuses is provided for payment of bonuses to executives, in the amount of estimated bonuses, which are attributable to the fiscal year.
(8) Reserve for executive retirement benefitsThe reserve for executive retirement benefits is provided for payment of retirement benefits to directors, corporate auditors and other corporate executive officers, in the amount deemed accrued at the fiscal year-end based on our internal regulations.
(9) Reserve for point service programThe reserve for point service program is provided for the potential future redemption of points awarded to customers under the “SMBC Point Pack,” credit card points programs, and other customer points award programs. The amount is calculated by converting the outstanding points into a monetary amount, and rationally estimating and recognizing the amount that will be redeemed in the future.
(10) Reserve for reimbursement of depositsThe reserve for reimbursement of deposits which were derecognized as liabilities under certain conditions is provided for the possible losses on the future claims of withdrawal based on the historical reimbursements.
(11) Reserve for losses on interest repaymentThe reserve for losses on interest repayment is provided for the possible losses on future claims of repayment of interest based on historical interest repayment experience.
(12) Reserve under the special lawsThe reserve under the special laws is a reserve for contingent liabilities and provided for compensation for losses from securities related transactions or derivative transactions, pursuant to Article 46-5 of the Financial Instruments and Exchange Act.
(13) Employee retirement benefitsIn calculating the projected benefit obligation, mainly the benefit formula basis is used to attribute the expected benefit attributable to the respective fiscal year.
Unrecognized prior service cost is amortized on a straight-line basis, primarily over 9 years within the employees’ average remaining service period at incurrence.
Unrecognized net actuarial gain (loss) is amortized on a straight-line basis, primarily over 9 years within the employees’ average remaining service period, commencing from the next fiscal year of incurrence.
Notes to Consolidated Financial Statements
010_0800801371908.indd 166 2019/08/16 18:54:02

167
Sumitomo Mitsui Financial Group
SMBC Group Annual Report 2019
(14) Translation of foreign currency assets and liabilitiesAssets and liabilities of the Company and SMBC, which is a consolidated subsidiary of the Company, denominated in foreign currencies and accounts of SMBC overseas branches are translated into Japanese yen mainly at the exchange rate prevailing at the consolidated balance sheet date, with the exception of stocks of subsidiaries and affiliates translated at rates prevailing at the time of acquisition.
Other consolidated subsidiaries’ assets and liabilities denominated in foreign currencies are translated into Japanese yen at the exchange rate prevailing at their respective balance sheet dates.
(15) Lease transactions1) Recognition of income on finance leases
Interest income is allocated to each period.2) Recognition of income on operating leases
Primarily, lease-related income is recognized on a straight-line basis over the full term of the lease, based on the contractual amount of lease fees per month.
3) Recognition of income and expenses on installment salesPrimarily, installment-sales-related income and installment-sales-related expenses are recognized on a due-date basis over the full period of the installment sales.
(16) Hedge accounting1) Hedging against interest rate changes
As for the hedge accounting method applied to hedging transactions for interest rate risk arising from financial assets and liabilities, SMBC, which is a consolidated subsidiary of the Company, applies deferred hedge accounting.
SMBC applies deferred hedge accounting stipulated in “Treatment for Accounting and Auditing of Application of Accounting Standard for Financial Instruments in Banking Industry” (JICPA Industry Audit Committee Report No. 24, February 13, 2002) to portfolio hedges on groups of large-volume, small-value monetary claims and debts.
As for the portfolio hedges to offset market fluctuation, SMBC assesses the effectiveness of such hedges by classifying the hedged items (such as deposits and loans) and the hedging instruments (such as interest rate swaps) by their maturity. As for the portfolio hedges to fix cash flows, SMBC assesses the effectiveness of such hedges by verifying the correlation between the hedged items and the hedging instruments.
As for the individual hedges, SMBC also assesses the effectiveness of such individual hedges.2) Hedging against currency fluctuations
SMBC, which is a consolidated subsidiary of the Company, applies deferred hedge accounting stipulated in “Treatment of Accounting and Auditing Concerning Accounting for Foreign Currency Transactions in Banking Industry” (JICPA Industry Audit Committee Report No. 25, July 29, 2002) to currency swap and foreign exchange swap transactions executed for the purpose of lending or borrowing funds in different currencies.
Pursuant to JICPA Industry Audit Committee Report No. 25, SMBC assesses the effectiveness of currency swap and foreign exchange swap transactions executed for the purpose of offsetting the risk of changes in currency exchange rates by verifying that there are foreign-currency monetary claims and debts corresponding to the foreign-currency positions.
In order to hedge risk arising from volatility of exchange rates for stocks of subsidiaries and affiliates and other securities (excluding bonds) denominated in foreign currencies, SMBC applies deferred hedge accounting or fair value hedge accounting, on the conditions that the hedged securities are designated in advance and that sufficient on-balance (actual) or off-balance (forward) liability exposure exists to cover the cost of the hedged securities denominated in the same foreign currencies.
3) Hedging against share price fluctuationsSMBC, which is a consolidated subsidiary of the Company, applies fair value hedge accounting to individual hedges offsetting the price fluctuation of the shares that are classified under other securities, and accordingly evaluates the effectiveness of such individual hedges.
4) Transactions between consolidated subsidiariesAs for derivative transactions between consolidated subsidiaries or internal transactions between trading accounts and other accounts (or among internal sections), SMBC manages the interest rate swaps and currency swaps that are designated as hedging instruments in accordance with the non-arbitrary and strict criteria for external transactions stipulated in JICPA Industry Audit Committee Report No. 24 and No. 25. Therefore, SMBC accounts for the gains or losses that arise from interest rate swaps and currency swaps in its earnings or defers them, rather than eliminating them.
Certain other consolidated subsidiaries apply the deferred hedge accounting, fair value hedge accounting or the special treatment for interest rate swaps.
(17) Amortization of goodwillGoodwill is amortized using the straight-line method over a period in which its benefit is expected to be realized, not to exceed 20 years. Immaterial goodwill is charged or credited to income directly when incurred.
(18) Scope of “Cash and cash equivalents” on consolidated statements of cash flowsFor the purposes of presenting the consolidated statements of cash flows, “Cash and cash equivalents” are cash on hand, non-interest earning deposits with banks and deposits with the Bank of Japan.
Notes to Consolidated Financial Statements
010_0800801371908.indd 167 2019/08/16 18:54:02

168
Sumitomo Mitsui Financial Group
SMBC Group Annual Report 2019
(19) Consumption taxesNational and local consumption taxes of the Company and its consolidated domestic subsidiaries are accounted for using the tax-excluded method.
(20) Adoption of the consolidated corporate-tax systemThe Company and certain consolidated domestic subsidiaries apply the consolidated corporate-tax system.
(Unapplied Accounting Standards and Others)“Accounting Standard for Revenue Recognition” (ASBJ Statement No.29) etc. (issued March 30, 2018)
(1) OutlineThe accounting standard etc. provide comprehensive principles for revenue recognition by taking into account of international trends. The principle of revenue recognition in the standard etc. is to recognize revenue to depict the transfer of promised goods or services to customers in an amount of the consideration expected to be earned in exchange for those goods or services.
(2) Date of ApplicationThe date of application is undetermined.
(3) Effects of Application of the Accounting Standard etc.The effects of the application of the accounting standard etc. are currently being examined.
(Notes to consolidated balance sheets)*1 Stocks and investments in unconsolidated subsidiaries and affiliates
Stocks and investments in unconsolidated subsidiaries and affiliates at March 31, 2018 and 2019 were as follows:
Millions of yenMarch 31 2018 2019Stocks ............................................................................................................................... ¥677,723 ¥969,481Investments ...................................................................................................................... 5,428 6,368
Stocks of jointly controlled entities were as follows: Millions of yen March 31 2018 2019Stocks of jointly controlled entities ................................................................................... ¥101,782 ¥340,821
*2 Unsecured loaned securities for which borrowers have the right to sell or pledgeThe amount of unsecured loaned securities for which borrowers have the right to sell or pledge at March 31, 2018 and 2019 were as follows:
Millions of yenMarch 31 2018 2019Japanese government bonds in “Securities” ....................................................................... ¥901 ¥902
As for the unsecured borrowed securities, securities under resale agreements and securities borrowed with cash collateral with rights to sell or pledge without restrictions, those securities pledged, those securities lent and those securities held without being disposed at March 31, 2018 and 2019 were as follows:
Millions of yen March 31 2018 2019Securities pledged ............................................................................................................. ¥6,659,456 ¥7,270,140Securities lent ................................................................................................................... 7,772 140,772Securities held without being disposed ............................................................................. 1,307,487 2,232,706
Notes to Consolidated Financial Statements
010_0800801371908.indd 168 2019/08/16 18:54:02

169
Sumitomo Mitsui Financial Group
SMBC Group Annual Report 2019
*3 Bankrupt loans and non-accrual loansBankrupt loans and non-accrual loans at March 31, 2018 and 2019 were as follows:
Millions of yen March 31 2018 2019Bankrupt loans ................................................................................................................. ¥ 27,709 ¥ 12,806Non-accrual loans ............................................................................................................. 406,066 456,802
“Bankrupt loans” are loans, after write-off, to legally bankrupt borrowers as defined in Article 96-1-3 and 96-1-4 of “Order for Enforcement of the Corporation Tax Act” (Cabinet Order No. 97 of 1965) and on which accrued interest income is not recognized as there is substantial doubt about the ultimate collectability of either principal or interest because they are past due for a considerable period of time or for other reasons.
“Non-accrual loans” are loans on which accrued interest income is not recognized, excluding “Bankrupt loans” and loans on which interest payments are deferred in order to support the borrowers’ recovery from financial difficulties.
*4 Past due loans (3 months or more)Past due loans (3 months or more) at March 31, 2018 and 2019 were as follows:
Millions of yen March 31 2018 2019Past due loans (3 months or more) .................................................................................... ¥12,822 ¥13,444
“Past due loans (3 months or more)” are loans on which the principal or interest payment is past due for 3 months or more, excluding “Bankrupt loans” and “Non-accrual loans.”
*5 Restructured loansRestructured loans at March 31, 2018 and 2019 were as follows:
Millions of yen March 31 2018 2019Restructured loans ............................................................................................................ ¥210,616 ¥193,427
“Restructured loans” are loans on which terms and conditions have been amended in favor of the borrowers (e.g. reduction of the original interest rate, deferral of interest payments, extension of principal repayments or debt forgiveness) in order to support the borrowers’ recovery from financial difficulties, excluding “Bankrupt loans,” “Non-accrual loans” and “Past due loans (3 months or more).”
*6 Risk-monitored loansThe total amount of bankrupt loans, non-accrual loans, past due loans (3 months or more) and restructured loans at March 31, 2018 and 2019 were as follows:
Millions of yen March 31 2018 2019Risk-monitored loans ....................................................................................................... ¥657,215 ¥676,481
The amounts of loans presented in Notes *3 to *6 above are the amounts before deduction of reserve for possible loan losses.
*7 Bills discountedBills discounted are accounted for as financial transactions in accordance with the “Treatment for Accounting and Auditing of Application of Accounting Standard for Financial Instruments in Banking Industry” (JICPA Industry Audit Committee Report No. 24, February 13, 2002). SMBC and its banking subsidiaries have rights to sell or pledge bank acceptance bought, commercial bills discounted, documentary bills and foreign exchanges bought without restrictions, etc. The total face value at March 31, 2018 and 2019 were as follows:
Millions of yen March 31 2018 2019Bills discounted ................................................................................................................ ¥780,542 ¥906,636
Notes to Consolidated Financial Statements
010_0800801371908.indd 169 2019/08/16 18:54:02

170
Sumitomo Mitsui Financial Group
SMBC Group Annual Report 2019
*8 Assets pledged as collateralAssets pledged as collateral at March 31, 2018 and 2019 consisted of the following:
March 31, 2018 Millions of yen March 31, 2019 Millions of yen
Assets pledged as collateral: Cash and due from banks ..................................... ¥ 7,353Monetary claims bought ...................................... 11,459Trading assets ...................................................... 514,328Securities ............................................................. 6,286,499Loans and bills discounted ................................... 9,086,500
Liabilities corresponding to assets pledged as collateral:Deposits .............................................................. 26,089Payables under repurchase agreements ................. 5,762,587Payables under securities lending transactions ..... 1,582,791Borrowed money ................................................. 7,922,955Due to trust account ............................................ 124,550Acceptance and guarantees .................................. 167,027
Assets pledged as collateral: Cash and due from banks ..................................... ¥ 19,998Monetary claims bought ...................................... 19,600Trading assets ...................................................... 2,223,355Securities ............................................................. 5,277,492Loans and bills discounted ................................... 8,014,149Lease receivables and investment assets ................ 13,241Tangible fixed assets ............................................ 51,630Other assets ............................................................ 223
Liabilities corresponding to assets pledged as collateral:Deposits .............................................................. 26,555Payables under repurchase agreements ................. 3,374,283Payables under securities lending transactions ..... 6,167,353Borrowed money ................................................. 6,807,957Bonds .................................................................. 27,901Other liabilities ................................................... 12,477Acceptances and guarantees ................................. 170,036
In addition to the assets presented above, the following assets were pledged as collateral for cash settlements, and substitution for margins of futures transactions and certain other purposes at March 31, 2018 and 2019:
March 31, 2018 Millions of yen March 31, 2019 Millions of yen
Cash and due from banks .......................................... ¥ 12,012 Cash and due from banks .......................................... ¥ 41,584Trading assets ........................................................... 196,313 Trading assets ........................................................... 1,591,280Securities .................................................................. 7,893,437 Securities .................................................................. 4,812,271Loans and bills discounted ........................................ 2,812,382 Loans and bills discounted ........................................ 853,603
Other assets include collateral money deposited for financial instruments, surety deposits, margin of futures markets and other margins. The amounts for such assets were as follows:
March 31, 2018 Millions of yen March 31, 2019 Millions of yen
Collateral money deposited for financial instruments ..... ¥1,745,149 Collateral money deposited for financial instruments ..... ¥1,630,600Surety deposits ......................................................... 108,513 Surety deposits ......................................................... 92,281Margins of futures markets ....................................... 65,172 Margins of futures markets ....................................... 64,340Other margins .......................................................... 38,003 Other margins .......................................................... 43,365
*9 Commitment line contracts on overdrafts and loansCommitment line contracts on overdrafts and loans are agreements to lend to customers, up to a prescribed amount, as long as there is no violation of any condition established in the contracts. The amounts of unused commitments at March 31, 2018 and 2019 were as follows:
Millions of yen March 31 2018 2019The amounts of unused commitments .............................................................................. ¥59,795,908 ¥62,409,943The amounts of unused commitments whose original contract terms are within 1 year or unconditionally cancelable at any time............................................................................ 42,963,575 44,048,947
Since many of these commitments are expected to expire without being drawn upon, the total amount of unused commitments does not necessarily represent actual future cash flow requirements. Many of these commitments include clauses under which SMBC and other consolidated subsidiaries can reject an application from customers or reduce the contract amounts in the event that economic conditions change, SMBC and other consolidated subsidiaries need to secure claims, or other events occur. In addition, SMBC and other consolidated subsidiaries may request the customers to pledge collateral such as premises and securities at the time of the contracts, and take necessary measures such as monitoring customers’ financial positions, revising contracts when such need arises and securing claims after the contracts are made.
Notes to Consolidated Financial Statements
010_0800801371908.indd 170 2019/08/16 18:54:02

171
Sumitomo Mitsui Financial Group
SMBC Group Annual Report 2019
*10 Land revaluation excessSMBC, a consolidated subsidiary of the Company, revalued its own land for business activities in accordance with “Act on Revaluation of Land” (the “Act”) (Act No. 34, effective March 31, 1998) and “Act for Partial Revision of Act on Revaluation of Land” (Act No. 19, effective March 31, 2001). The income taxes corresponding to the net unrealized gains are reported in “Liabilities” as “Deferred tax liabilities for land revaluation excess,” and the Company’s share of the net unrealized gains, net of deferred taxes, are reported as “Land revaluation excess” in “Net assets.”
Certain equity method affiliates also revalued its own land for business activities in accordance with the Act. The Company’s share of the net unrealized gains and net of deferred taxes are reported as “Land revaluation excess” in “Net assets.”
Date of the revaluationSMBC: March 31, 1998 and March 31, 2002Certain equity method affiliates: March 31, 1999 and March 31, 2002
Method of revaluation (stipulated in Article 3-3 of the Act)SMBC: Fair values were determined by applying appropriate adjustments for land shape and timing of appraisal to the values stipulated in Article 2-3, 2-4 or 2-5 of “Order for Enforcement of Act on Revaluation of Land” (Cabinet Order No. 119 effective March 31, 1998).Certain equity method affiliates: Fair values were determined based on the values stipulated in Article 2-3 and 2-5 of “Order for Enforcement of Act on Revaluation of Land” (Cabinet Order No. 119 effective March 31, 1998).
*11 Accumulated depreciation on tangible fixed assetsAccumulated depreciation on tangible fixed assets at March 31, 2018 and 2019 were as follows:
Millions of yen March 31 2018 2019Accumulated depreciation ................................................................................................ ¥1,089,903 ¥741,648
*12 Deferred gain on tangible fixed assets deductible for tax purposesDeferred gain on tangible fixed assets deductible for tax purposes at March 31, 2018 and 2019 were as follows:
Millions of yen March 31 2018 2019Deferred gain on tangible fixed assets deductible for tax purposes ..................................... ¥62,550 ¥62,127
[The consolidated fiscal year concerned] ....................................................................... [661] [—]
*13 Subordinated borrowingsThe balance of subordinated borrowings included in “Borrowed money” at March 31, 2018 and 2019 were as follows:
Millions of yen March 31 2018 2019Subordinated borrowings .................................................................................................. ¥265,000 ¥257,000
*14 Subordinated bondsThe balance of subordinated bonds included in “Bonds” at March 31, 2018 and 2019 were as follows:
Millions of yen March 31 2018 2019Subordinated bonds .......................................................................................................... ¥2,211,841 ¥2,195,130
*15 Borrowings from trust account in relation to covered bonds issued by trust accountThe amount of borrowings from trust account in relation to covered bonds issued by trust account included in “Due to trust account” at March 31, 2018 and 2019 were as follows:
Millions of yen March 31 2018 2019The amount of borrowings from trust account in relation to covered bonds issued
by trust account ........................................................................................................... ¥— ¥124,550
Notes to Consolidated Financial Statements
010_0800801371908.indd 171 2019/08/16 18:54:03

172
Sumitomo Mitsui Financial Group
SMBC Group Annual Report 2019
*16 Guaranteed amount to privately-placed bondsThe amount guaranteed by SMBC and its banking subsidiaries to privately-placed bonds (stipulated by Article 2-3 of the Financial Instruments and Exchange Act) in “Securities” at March 31, 2018 and 2019 were as follows:
Millions of yen March 31 2018 2019Guaranteed amount to privately-placed bonds .................................................................. ¥1,796,308 ¥1,662,777
(Notes to consolidated statements of income)*1 Other income
“Other” in “Other income” for the fiscal years ended March 31, 2018 and 2019 included the following:
Year ended March 31, 2018 Millions of yen Year ended March 31, 2019 Millions of yen
Gains on sales of stocks ............................................. ¥140,695 Gains on sales of stocks ............................................. ¥134,748
*2 General and administrative expenses“General and administrative expenses” for the fiscal years ended March 31, 2018 and 2019 included the following:
Year ended March 31, 2018 Millions of yen Year ended March 31, 2019 Millions of yen
Salaries and related expenses ..................................... ¥689,192 Salaries and related expenses ..................................... ¥641,844Research and development costs ............................... 84 Research and development costs ............................... 167
*3 Other expenses“Other expenses” for the fiscal years ended March 31, 2018 and 2019 included the following:
Year ended March 31, 2018 Millions of yen Year ended March 31, 2019 Millions of yen
Write-off of loans...................................................... ¥105,429Write-off of loans...................................................... ¥105,228
*4 Other extraordinary gains“Other extraordinary gains” for the fiscal year ended March 31, 2019 is gains on step acquisitions.
Notes to Consolidated Financial Statements
010_0800801371908.indd 172 2019/08/16 18:54:03

173
Sumitomo Mitsui Financial Group
SMBC Group Annual Report 2019
*5 Losses on impairment of fixed assetsThe differences between the recoverable amounts and the book value of the following asset is recognized as “Losses on impairment of fixed assets,” and included in “Extraordinary losses” for the fiscal year ended March 31, 2018 and 2019.
Year ended March 31, 2018 Millions of yenArea Purpose of use Type Impairment loss
Tokyo metropolitan area ...............................Idle assets (121 items) Land and buildings, etc. ¥15,424Kinki area ....................................................Idle assets (73 items) Land and buildings, etc. 9,538Other ...........................................................Idle assets (32 items) Land and buildings, etc. 3,627— — Goodwill and Intangible fixed
assets 21,310
Year ended March 31, 2019 Millions of yenArea Purpose of use Type Impairment loss
Tokyo metropolitan area ...............................Branches (14 items) Land and buildings, etc. ¥ 205Idle assets (64 items) 2,335
Kinki area ....................................................Branches (7 items) Land and buildings, etc. 77Idle assets (40 items) 2,139
Other ...........................................................Branches (2 items) Land and buildings, etc. 258Idle assets (19 items) 889
— — Intangible fixed assets 3,703
At SMBC, a branch, which continuously manages and determines its income and expenses, is the smallest unit of asset group for recognition and measurement of impairment loss of fixed assets. Assets such as corporate headquarters facilities, training facilities, data and system centers, and health and recreational facilities which do not produce cash flows that can be attributed to individual assets are treated as corporate assets. As for idle assets, impairment loss is measured individually. At other consolidated subsidiaries, a branch or other group is the smallest asset grouping unit as well.
The carrying amounts of idle assets are reduced to their recoverable amounts, and the decreased amounts are included in “Extraordinary losses” as “Losses on impairment of fixed assets,” if there are indicators that the invested amounts may not be recoverable.
The recoverable amount is calculated using net realizable value which is basically determined by subtracting the expected disposal cost from the appraisal value based on the Real Estate Appraisal Standard.
The unit for goodwill and intangible assets is mainly based on each consolidated subsidiary. For the fiscal year ended March 31, 2018, the book value of goodwill and intangible assets of the PB, Real Estate and Trust Services of SMBC Trust Bank Ltd. was not expected to be recovered. Therefore, all unamortized balance of goodwill and intangible assets at the end of the fiscal year ended March 31, 2018 were included in “Extraordinary losses” as “Losses on impairment of fixed assets.” The recoverable amount is measured by value in use, which is calculated by discounting future cash flows by 10%. In addition, the book value of goodwill and intangible assets of the auto lease business of SMFL Capital Company, Limited was not expected to be recovered. Therefore, all unamortized balance of goodwill and a portion of intangible assets at the end of the fiscal year ended March 31, 2018 were included in “Extraordinary losses” as “Losses on impairment of fixed assets.” The recoverable value is net realizable value, which is calculated based on the revalued corporate value.
Notes to Consolidated Financial Statements
010_0800801371908.indd 173 2019/08/16 18:54:03

174
Sumitomo Mitsui Financial Group
SMBC Group Annual Report 2019
(Notes to consolidated statements of comprehensive income)*1 Reclassification adjustment and tax effect of other comprehensive income
Millions of yenYear ended March 31 2018 2019Net unrealized gains (losses) on other securities:
Amount arising during the fiscal year .......................................................................... ¥ 462,091 ¥ 67,769Reclassification adjustments ........................................................................................ (217,083) (142,464)
Before adjustments to tax effect .............................................................................. 245,008 (74,694)Tax effect ................................................................................................................ (82,335) 105,852Net unrealized gains (losses) on other securities ...................................................... 162,673 31,157
Net deferred gains (losses) on hedges:Amount arising during the fiscal year .......................................................................... (93,976) 381Reclassification adjustments ........................................................................................ 53,058 40,513
Before adjustments to tax effect .............................................................................. (40,918) 40,895Tax effect ................................................................................................................ 12,259 (10,914)Net deferred gains (losses) on hedges ...................................................................... (28,659) 29,981
Land revaluation excess:Amount arising during the fiscal year .......................................................................... — —Reclassification adjustments ........................................................................................ — —
Before adjustments to tax effect .............................................................................. — —Tax effect ................................................................................................................ 1 —Land revaluation excess ........................................................................................... 1 —
Foreign currency translation adjustments:Amount arising during the fiscal year .......................................................................... (57,881) 13,212Reclassification adjustments ........................................................................................ 7,494 (2,815)
Before adjustments to tax effect .............................................................................. (50,387) 10,396Tax effect ................................................................................................................ — —Foreign currency translation adjustments ............................................................... (50,387) 10,396
Remeasurements of defined benefit plans:Amount arising during the fiscal year .......................................................................... 50,592 (80,149)Reclassification adjustments ........................................................................................ 19,696 (15,063)
Before adjustments to tax effect .............................................................................. 70,289 (95,212)Tax effect ................................................................................................................ (21,067) 29,682Remeasurements of defined benefit plans ................................................................ 49,221 (65,530)
Share of other comprehensive income of affiliates:Amount arising during the fiscal year .......................................................................... 13,971 (22,857)Reclassification adjustments ........................................................................................ (1,013) 19,886
Before adjustments to tax effect .............................................................................. 12,957 (2,970)Tax effect ................................................................................................................ — —Share of other comprehensive income of affiliates .................................................... 12,957 (2,970)
Total other comprehensive income ..................................................................... ¥ 145,807 ¥ 3,035
Notes to Consolidated Financial Statements
010_0800801371908.indd 174 2019/08/16 18:54:03

175
Sumitomo Mitsui Financial Group
SMBC Group Annual Report 2019
(Notes to consolidated statements of changes in net assets)Fiscal year ended March 31, 20181. Type and number of shares issued and treasury stock
Number of shares
Year ended March 31, 2018At the beginningof the fiscal year Increase Decrease
At the endof the fiscal year Notes
Shares issued Common stock .................................... 1,414,055,625 387,765 — 1,414,443,390 1
Total ............................................... 1,414,055,625 387,765 — 1,414,443,390Treasury stock
Common stock .................................... 4,028,883 31,554 175,469 3,884,968 2,3Total ............................................... 4,028,883 31,554 175,469 3,884,968
Notes: 1. Increase of 387,765 shares in the total number of shares issued was due to issuance of new stocks as stock-based compensation.
2. Increase of 31,554 shares in the number of treasury common stock was due to purchases of fractional shares.
3. Decrease of 175,469 shares in the number of treasury common stock was due to sales of fractional shares and exercise of stock options.
2. Information on stock acquisition rights
Number of shares Millions of yen
Year ended March 31, 2018Details of stock
acquisition rightsType of shares
At the beginning of the fiscal year Increase Decrease
At the end of the fiscal year
At the end of the fiscal year Notes
The Company Stock acquisition rights as stock
options — — — — — ¥2,823Total ................................ ¥2,823
3. Information on dividends(1) Dividends paid in the fiscal year
Date of resolution Type of shares
Millions of yen, except per share amount
Cash dividends
Cash dividendsper share Record date Effective date
Ordinary General Meeting of Shareholders held on June 29, 2017 ................................ Common stock ¥105,752 ¥75 March 31, 2017 June 30, 2017
Meeting of the Board of Directors held on November 14, 2017 ................................... Common stock 112,844 80 September 30, 2017 December 1, 2017
(2) Dividends to be paid in the next fiscal year
Millions of yen, except per share amount
Date of resolution Type of sharesCash
dividendsSource of dividends
Cash dividendsper share Record date Effective date
Ordinary General Meeting of Shareholders held on June 28, 2018 ................................ Common stock ¥126,950
Retained earnings ¥90 March 31, 2018 June 29, 2018
Notes to Consolidated Financial Statements
010_0800801371908.indd 175 2019/08/16 18:54:03

176
Sumitomo Mitsui Financial Group
SMBC Group Annual Report 2019
Fiscal year ended March 31, 20191. Type and number of shares issued and treasury stock
Number of shares
Year ended March 31, 2019At the beginningof the fiscal year Increase Decrease
At the endof the fiscal year Notes
Shares issued Common stock .................................... 1,414,443,390 326,330 15,368,300 1,399,401,420 1,2
Total ............................................... 1,414,443,390 326,330 15,368,300 1,399,401,420Treasury stock
Common stock .................................... 3,884,968 15,390,528 15,474,578 3,800,918 3,4Total ............................................... 3,884,968 15,390,528 15,474,578 3,800,918
Notes: 1. The increase of 326,330 shares in the total number of shares issued was due to issuance of new stocks as stock-based compensation.
2. The decrease of 15,368,300 shares in the total number of shares issued was due to cancellation of treasury stock.
3. The increase of 15,390,528 shares in the number of treasury common stock comprises the increase of 22,228 shares due to purchase of fractional shares, and the increase of 15,368,300 shares due to purchase of treasury stock.
4. The decrease of 15,474,578 shares in the number of treasury common stock comprises the decrease of 106,278 shares due to sales of fractional shares as well as exercise of stock option, and the decrease of 15,368,300 shares due to cancellation of treasury stock.
2. Information on stock acquisition rightsNumber of shares Millions of yen
Year ended March 31, 2019Details of stock
acquisition rightsType ofshares
At the beginning of the fiscal year Increase Decrease
At the end of the fiscal year
At the end of the fiscal year Notes
The Company Stock acquisition rights as stock
options — — — — — ¥2,539Consolidated subsidiaries ... — — — — — — 2,210Total ................................ ¥4,750
3. Information on dividends(1) Dividends paid in the fiscal year
Date of resolution Type of shares
Millions of yen, except per share amount
Cash dividends
Cash dividendsper share Record date Effective date
Ordinary General Meeting of Shareholders held on June 28, 2018 ................................ Common stock ¥126,950 ¥90 March 31, 2018 June 29, 2018
Meeting of the Board of Directors held on November 13, 2018 ................................... Common stock 118,626 85 September 30, 2018 December 4, 2018
(2) Dividends to be paid in the next fiscal year
Millions of yen, except per share amount
Date of resolution Type of sharesCash
dividendsSource of dividends
Cash dividends per share Record date Effective date
Ordinary General Meeting of Shareholders held on June 27, 2019 ................................ Common stock ¥132,582
Retained earnings ¥95 March 31, 2019 June 28, 2019
Notes to Consolidated Financial Statements
010_0800801371908.indd 176 2019/08/16 18:54:03

177
Sumitomo Mitsui Financial Group
SMBC Group Annual Report 2019
(Notes to consolidated statements of cash flows)*1 The relation between the amounts of accounts listed on the consolidated financial statements and “Cash and cash equivalents”
Millions of yen
Year ended March 31 2018 2019Cash and due from banks .................................................................................................. ¥53,732,582 ¥57,411,276Interest earning deposits with banks (excluding the deposit with the Bank of Japan) ........ (5,749,468) (4,290,312)Cash and cash equivalents ................................................................................................. ¥47,983,114 ¥53,120,963
*2 The major components of assets and liabilities for entities newly consolidated by stock acquisition and for other reasonsThe major components of assets and liabilities at the commencement of consolidation due to stock acquisition of American Railcar Leasing LLC and 19 other companies by SMBC Rail Services LLC’s stock acquisition and the relation between the acquisition cost of shares and expenditure to acquire were as follows;
Year ended March 31, 2018 Millions of yen
Assets ............................................................................................................................... ¥ 319,975Tangible fixed assets .................................................................................................... 304,256
Liabilities ......................................................................................................................... (149,469)Borrowed money ......................................................................................................... (147,523)
Acquisition cost of 20 companies ...................................................................................... 170,506Cash and cash equivalents included in acquired assets of 20 companies ............................. (8,654)Expenditure for acquisition of 20 companies ..................................................................... ¥ 161,851
The major components of assets and liabilities at the commencement of consolidation due to consolidating PT Bank Tabungan Pensiunan Nasional Tbk (“BTPN”) and 1 other company by SMBC’s stock acquisition and the relation between the acquisition cost of shares and expenditure to acquire were as follows;
Year ended March 31, 2019 Millions of yen
Assets ............................................................................................................................... ¥ 837,523Loans and bills discounted ........................................................................................... 522,918
Liabilities ......................................................................................................................... (643,346)Deposits ...................................................................................................................... (538,529)
Foreign currency translation adjustments .......................................................................... 5,049Stock acquisition rights .................................................................................................... (2,141)Non-controlling interests ................................................................................................. (12,402)Goodwill .......................................................................................................................... 4,707Acquisition cost of 2 companies ........................................................................................ 189,390Cash and cash equivalents included in acquired assets of 2 companies ............................... (54,182)Fair value of BTPN’s common stocks immediately prior to the business combination ....... (78,025)Expenditure for acquisition of 2 companies ....................................................................... ¥ 57,182
Notes to Consolidated Financial Statements
010_0800801371908.indd 177 2019/08/16 18:54:03

178
Sumitomo Mitsui Financial Group
SMBC Group Annual Report 2019
*3 The major components of assets and liabilities for entities which were excluded from the scope of consolidation by sale of the sharesThe major components of assets and liabilities of THE MINATO BANK, LTD. (“Minato Bank”) and 15 other companies, and Kansai Urban Banking Corporation (“Kansai Urban”) and 6 other companies which became the Company’s equity method affiliates due to the partial sales of the shares of Minato Bank and Kansai Urban by SMBC in accordance with the tender offers for the common shares of each bank by Resona Holdings, Inc. and the relation between the selling price of shares and the expenditure for sales were as follows;
Minato Bank (consolidated)
Year ended March 31, 2018 Millions of yen
Assets ............................................................................................................................... ¥ 3,528,896Loans and bills discounted ........................................................................................... 2,513,381
Liabilities ......................................................................................................................... (3,384,488)Deposits ...................................................................................................................... (3,233,642)
Stock acquisition rights .................................................................................................... (318)Non-controlling interests ................................................................................................. (138,098)Investment account after sales of stocks ............................................................................ (3,969)Gains (losses) on sales of stocks ......................................................................................... (634)Selling price of 16 companies ........................................................................................... 1,389Cash and cash equivalents included in disposed assets of 16 companies ............................. (550,292)Expenditure for sales of 16 companies ............................................................................... ¥ (548,903)
Kansai Urban (consolidated)
Year ended March 31, 2018 Millions of yen
Assets ............................................................................................................................... ¥ 4,709,055Loans and bills discounted ........................................................................................... 3,939,196
Liabilities ......................................................................................................................... (4,498,339)Deposits ...................................................................................................................... (4,063,161)
Non-controlling interests ................................................................................................. (63,804)Investment account after sales of stocks ............................................................................ (58,581)Gains (losses) on sales of stocks ......................................................................................... (1,332)Selling price of 7 companies ............................................................................................. 86,999Cash and cash equivalents included in disposed assets of 7 companies ............................... (386,917)Expenditure for sales of 7 companies ................................................................................. ¥ (299,918)
The major components of assets and liabilities of Sumitomo Mitsui Finance and Leasing Company, Limited (“SMFL”) and 184 other companies which were excluded from the scope of consolidation due to the partial sale of SMFL’s stock by the Company and the relation between the selling price of shares and the income for sales were as follows;
Year ended March 31, 2019 Millions of yen
Assets ............................................................................................................................... ¥ 6,154,253Lease receivables and investment assets ........................................................................ 2,157,141Tangible fixed assets .................................................................................................... 2,267,524
Liabilities ......................................................................................................................... (5,435,353)Borrowed money ......................................................................................................... (3,101,458)
Non-controlling interests ................................................................................................. (258,602)Investment account after sales of stocks ............................................................................ (301,028)Gains (losses) on sales of stocks ......................................................................................... 17,014Selling price of 185 companies ......................................................................................... 176,284Cash and cash equivalents included in disposed assets of 185 companies ........................... (1,582)Income for sales of 185 companies .................................................................................... ¥ 174,702
Notes to Consolidated Financial Statements
010_0800801371908.indd 178 2019/08/16 18:54:03

179
Sumitomo Mitsui Financial Group
SMBC Group Annual Report 2019
(Notes to lease transactions)1. Finance leases
(1) Lessee side1) Lease assets
(a) Tangible fixed assetsTangible fixed assets mainly consisted of branches and equipment.
(b) Intangible fixed assetsIntangible fixed assets are software.
2) Depreciation method of lease assetsDepreciation method of lease assets is reported in 4. Accounting policies (4) Depreciation.
(2) Lessor side1) Breakdown of lease investment assets
Millions of yen
March 31 2018 2019Lease receivables ...................................................................................................... ¥1,537,348 ¥269,214Residual value ......................................................................................................... 136,677 65,094Unearned interest income ........................................................................................ (211,532) (86,474)Total ........................................................................................................................ ¥1,462,494 ¥247,835
2) The scheduled collections of lease payments receivable related to lease receivables and investment assets are as follows:
Millions of yen
2018 2019
March 31Lease payments receivable related to lease receivables
Lease payments receivable related to investment
assetsLease payments receivable related to lease receivables
Lease payments receivable related to investment
assets
Within 1 year .............................. ¥ 298,334 ¥ 432,502 ¥— ¥ 43,411More than 1 year to 2 years .......... 213,802 347,790 — 24,003More than 2 years to 3 years ........ 162,091 265,262 — 21,214More than 3 years to 4 years ........ 92,799 176,630 — 20,682More than 4 years to 5 years ........ 55,429 109,159 — 13,813More than 5 years ........................ 177,736 206,002 — 146,089Total ............................................ ¥1,000,194 ¥1,537,348 ¥— ¥269,214
3) Non-transfer ownership finance leases, which commenced in fiscal years beginning before April 1, 2008, are valued at their appropriate book value, net of accumulated depreciation, as of March 31, 2008, and recorded as the beginning balance of “Lease receivables and investment assets.”
Moreover, interest on such non-transfer ownership finance leases during the remaining term of the leases is allocated over the lease term using the straight-line method.
As a result of this accounting treatment, “Income before income taxes” for the fiscal years ended March 31, 2018 and 2019 were ¥1,927 million and ¥1,332 million, respectively, more than it would have been if such transactions had been treated in a similar way to sales of the underlying assets.
2. Operating leases (1) Lessee side
Future minimum lease payments on operating leases which were not cancelable were as follows:
Millions of yen
March 31 2018 2019Due within 1 year ......................................................................................................... ¥ 45,672 ¥ 44,385Due after 1 year ............................................................................................................ 258,746 271,612Total ............................................................................................................................. ¥304,419 ¥315,997
(2) Lessor sideFuture minimum lease payments on operating leases which were not cancelable were as follows:
Millions of yen
March 31 2018 2019Due within 1 year ......................................................................................................... ¥ 242,466 ¥ 35,936Due after 1 year ............................................................................................................ 1,390,427 85,242Total ............................................................................................................................. ¥1,632,894 ¥121,178
Notes to Consolidated Financial Statements
010_0800801371908.indd 179 2019/08/16 18:54:03

180
Sumitomo Mitsui Financial Group
SMBC Group Annual Report 2019
(Notes to financial instruments) 1. Status of financial instruments
(1) Policies on financial instrumentsThe Group conducts banking and other financial services such as leasing, securities, consumer finance, system development and information processing. Its banking business includes deposit taking, lending, securities trading and investment, remittance and transfer, foreign exchange, bond subscription agent, trust business, and over-the-counter sales of securities investment trusts and insurance products.
These services entail holding of financial assets such as loans and bills discounted, bonds, and stocks. Meanwhile, the Group raises funds through deposit taking, borrowing, bond offering, etc. Furthermore, it undertakes derivative transactions to meet customers’ hedging needs to control market risk associated with deposit taking and lending (“ALM purposes”), and to make profit on short-term fluctuations in interest rates, foreign exchange rates, etc. (“trading purposes”). At SMBC, the Company’s major consolidated subsidiary, derivative transactions for ALM purposes are undertaken by the Treasury Dept. and the International Treasury Dept. of the Treasury Unit, while derivative transactions for trading purposes are undertaken by the Trading Dept. of the Treasury Unit (in Asia and Oceania regions, the Asia and Oceania Treasury Dept. is responsible for derivative transactions for both ALM and trading purposes).
(2) Details of financial instruments and associated risks1) Financial assets
The main financial assets held by the Group include loans to foreign and domestic companies and domestic individuals, and securities such as bonds (government and corporate bonds) and stocks (foreign and domestic stocks), etc. Bonds such as government bonds are held for both trading and ALM purposes, and certain bonds are held as held-to-maturity securities. Stocks are held mainly for strategic purposes. These assets expose the Group to credit risk, market risk and liquidity risk. Credit risk is the risk of loss arising from nonperformance of obligations by the borrower or issuer due to factors such as deterioration in the borrower’s/issuer’s financial conditions. Market risk is the risk stemming from fluctuations in interest rates, exchange rates, or share prices. Liquidity risk is the risk arising from difficulty executing transactions in desired quantities at appropriate prices due to low market liquidity. These risks are properly monitored and managed based on “(3) Risk management framework for financial instruments” below.
2) Financial liabilitiesFinancial liabilities of the Group include borrowed money and bonds, etc. in addition to deposits. Deposits mainly comprise deposits of domestic and foreign companies and domestic individuals. Borrowed money and bonds include subordinated borrowings and subordinated bonds with special clause specifying that the repayment order of borrowing or bond subordinates to other borrowings or bonds. Also, financial liabilities, like financial assets, expose the Group to not only market risk but also funding liquidity risk: the risk of the Group not being able to raise funds due to market turmoil, deterioration in the Group’s creditworthiness or other factors. These risks are properly monitored and managed based on “(3) Risk management framework for financial instruments” below.
3) Derivative transactionsDerivatives handled by the Group include foreign exchange futures; futures, forwards, swaps and options related to interest rates, currencies, equities, bonds and commodities; and credit and weather derivatives.
Major risks associated with derivatives include market risk, liquidity risk, and credit risk arising from nonperformance of contractual obligations due to deterioration in the counterparty’s financial conditions. These risks are properly monitored and managed based on “(3) Risk management framework for financial instruments” below.
Hedge accounting is applied to derivative transactions executed for ALM purposes, as necessary. Hedging instruments, hedged items, hedging policy and hedging method to assess the effectiveness of the hedge are described in “(Notes to significant accounting policies for preparing consolidated financial statements), 4. Accounting policies, (16) Hedge accounting.”
(3) Risk management framework for financial instrumentsThe fundamental matters on risk management for the entire Group are set forth in “Regulations on Comprehensive Risk Management.” The Company’s Management Committee establishes the basic risk management policy for the entire Group, based on the regulations, which is then approved by the Board of Directors. Each Group company has a risk management system based on the characteristics of its particular businesses and in accordance with the basic policy. Furthermore, the Group CRO is established to assess risk management across the Group unitarily and implement appropriate risk management. The Company is sharing information on group-wide risk management and strengthening related systems through the Group CRO Committee, which consists of the Group CRO and risk management representatives from strategically important Group companies.
1) Management of credit riskThe Company has established fundamental principles on credit risk management to thoroughly manage the credit risk of the entire Group. Each group company conducts integrated management of credit risk according to its operational characteristics, and the credit risk inherent in the entire portfolio as well as the risk in individual credits are managed quantitatively and continuously.
(a) Credit risk management systemThe Group CRO formulates credit risk management policies each year based on the group-wide basic policies for risk management. Meanwhile, the Credit & Investment Planning Dept. is responsible for the comprehensive management of credit risk. This department drafts and administers credit risk regulations, including the Group’s credit policies, and performs credit portfolio management including non-performing loans. The Company has also established the Credit Risk Committee to serve as a body for deliberating on matters related to group-wide credit portfolios.
Notes to Consolidated Financial Statements
010_0800801371908.indd 180 2019/08/16 18:54:03

181
Sumitomo Mitsui Financial Group
SMBC Group Annual Report 2019
At SMBC, the Company’s major consolidated subsidiary, the Credit & Investment Planning Dept. of the Risk Management Unit is responsible for the comprehensive management of credit risk. This department establishes, revises or abolishes credit policies, the internal rating system, credit authority regulations, credit application regulations, and manages non-performing loans and other aspects of credit portfolio management. The department also controls SMBC’s total credit risk by quantifying credit risk (i.e. calculating risk capital and risk-weighted assets) in cooperation with the Corporate Risk Management Dept. Moreover, the Credit Portfolio Management Dept. within the Credit & Investment Planning Dept. works to stabilize SMBC’s overall credit portfolio through selling credit derivatives and loan claims.
The credit departments of each business unit conduct credit risk management for loans handled by their units and manage their units’ portfolios. Credit approval authority is generally determined based on the credit amounts and internal grades, and the credit departments focus on analysis and management of customers and transactions with relatively high credit risk. The Credit Administration Dept. is mainly responsible for formulating and implementing measures to reduce the exposure of non-performing loans. Through industrial and sector-specific surveys and studies of individual companies, the Corporate Research Dept. works to form an accurate idea of the circumstances of borrower companies and identify those with potentially troubled credit positions at early stage.
Moreover, the Credit Risk Committee, a cross-departmental consultative body, rounds out SMBC’s oversight systems for undertaking flexible and efficient control of credit risk and ensuring the overall soundness of SMBC’s loan operations.
In addition to these, the Internal Audit Unit, operating independently of the business units, audits asset quality, grading accuracy, self-assessment, and appropriateness of the credit risk management system, and reports the results directly to the Board of Directors and the Management Committee.
(b) Method of credit risk managementThe Company properly manages the credit risk inherent in individual loans and the entire portfolio by assessing and quantifying the credit risk of each borrower/loan using the internal rating system. In addition to management of individual loans through credit screening and monitoring, it manages the credit portfolio as described below in order to secure and improve the credit portfolio’s soundness and medium-term profitability.• Appropriate risk-taking within capital
To keep credit risk exposure to a permissible level relative to capital, the Company sets credit risk capital limit for internal control purposes. Under these limits, separate guidelines are issued for each business unit and marketing unit. The Company regularly monitors compliance with these guidelines.
• Controlling concentration of riskBecause concentration of credit risk in an industry or corporate group has the potential to impair the Company’s capital significantly, the Company implements measures to prevent excessive concentration of loan in a single industry and to control large exposure to individual borrowers by setting maximum loan amounts and conducting loan reviews thoroughly. To manage country risk, the Company also has credit limit guidelines based on each country’s creditworthiness.
• Greater understanding of actual corporate conditions and balancing returns and risksThe Company runs credit operations on the basic principle of thoroughly understanding actual corporate conditions and gaining profit commensurate with the level of credit risk entailed, and makes every effort to improve profit at after-cost (credit cost, capital cost and overhead cost) level.
• Reduction and prevention of non-performing loansFor non-performing loans and potential non-performing loans, the Company carries out loan reviews to clarify credit policies and action plans, enabling it to swiftly implement measures to prevent deterioration of borrowers’ business situations, support business recoveries, collect on loans, and enhance loan security.
In regard to financial instruments such as investments in certain funds, securitized products and credit derivatives that indirectly retain risks related to assets such as corporate bonds and loan claims (underlying assets), such instruments entail market and liquidity risks in addition to credit risk, since such instruments are traded on the market. Credit risk management for these instruments involving detailed analysis and evaluation of characteristics of underlying assets is performed while market risk is comprehensively managed within the framework for managing market and liquidity risks. Moreover, guidelines have been established based on the characteristics of each type of risk to appropriately manage risks of incurring losses.
In regard to credit risk of derivative transactions, the potential exposure based on the market price is regularly calculated and properly managed. When the counterparty is a financial institution with which the Company frequently conducts derivative transactions, measures such as a close-out netting provision, which provide offsetting credit exposures between two parties in a single net payment from one party to the other in case of bankruptcy or other default event, are implemented to reduce credit risk.
2) Management of market and liquidity risksThe Company manages market and liquidity risks across the entire Group by setting allowable risk limits; ensuring the transparency of the risk management process; and clearly separating front-office, middle-office, and back-office operations for a highly efficient system of mutual checks and balances.
Notes to Consolidated Financial Statements
010_0800801371908.indd 181 2019/08/16 18:54:03

182
Sumitomo Mitsui Financial Group
SMBC Group Annual Report 2019
(a) Market and liquidity risk management systemsIn accordance with the group-wide basic policies for risk management decided upon by the Management Committee, the Company determines important matters relating to the management of market and liquidity risks, such as basic policies and risk limits, in order to manage these risks. The ALM Committee meets four times a year, in principle, to report on the state of market and liquidity risk management and to discuss ALM operation policies. The Corporate Risk Management Dept., which is independent from the business units that directly handle market transactions, manages market and liquidity risks in an integrated manner. This department not only monitors the current risk situations but also reports regularly to the Management Committee and the Board of Directors. Furthermore, the ALM Committee at SMBC, the Company’s major consolidated subsidiary, meets on a monthly basis to examine reports on the state of observance of limits on market and liquidity risks and to discuss ALM operation policies.
In addition, the Internal Audit Dept., which is independent of other departments, periodically performs comprehensive internal audits to verify that the risk management framework is properly functioning and reports the audit results to the Management Committee, the Board of Directors and other concerned committees and departments.
(b) Market and liquidity risk management methodology• Market risk management
The Company manages market risk by setting maximum loss and VaR (value at risk: maximum potential loss that may be incurred to a specific financial instrument for a given probability) within the market risk capital limit, which is set taking into account stockholders’ equity and other factors in accordance with the market transaction policies.
The Company uses the historical simulation method (a method for estimating the maximum loss by running simulations of changes in profit and loss on market fluctuations scenarios based on historical data) to measure VaR. Regarding banking activities (activities for generating profit through management of interest rates, terms, and other aspects such as loans and bonds in assets, deposits in liabilities) and trading activities (activities for generating profit by taking advantage of short-term fluctuations in market values and differences in value among markets), the Company calculates the maximum loss that may occur as a result of market fluctuations in 1 day with a probability of 1% based on 4 years of historical observation. With regard to the holding of shares (such as listed shares) for the purpose of strategic investment, the Company calculates the maximum loss that may occur as a result of market fluctuations in 1 year with a probability of 1% based on 10 years of historical observation.
Regarding risks associated with foreign exchange rates, interest rates, equity risk, option prices and other market risk factors, the Company manages such risks by setting a maximum limit on the indicator suited for each market risk factor such as BPV (basis point value: denotes the change in value of a financial instrument resulting from a 0.01 percentage-point change in the yield).
• Quantitative information on market risksAs of March 31, 2019, total VaR of SMBC and its major consolidated subsidiaries was ¥44.8 billion for the banking activities, ¥16.4 billion for the trading activities and ¥1,156.0 billion for the holding of shares (such as listed shares) for the purpose of strategic investment.
However, it should be noted that these figures are statistical figures that change according to changes in assumptions and calculation methods, and may not cover the risk of future market conditions fluctuating drastically compared to market fluctuations of the past.
• Liquidity risk managementThe Company manages liquidity risk based on the framework of “setting management levels of risk appetite indicators” and “developing contingency plans.” Risk appetite indicators are quantitative benchmarks that select the types and indicate the levels of risk that the Company is willing to take on or tolerate. As an example, the Company sets a lower limit on the number of days over which cash flows could be maintained in the event of stressed conditions such as deposit outflow, so as to secure funding sources that do not fall below the benchmark to avoid excessive reliance on short term funding. In addition, the Company develops contingency plans consisting of instructions, reporting lines and action plans in case of emergency.
Moreover, to manage the liquidity risk of marketable instruments, derivative transactions, etc., the Company has trading limits for each business office classified by currency, instrument, transaction period, etc. As for financial futures, etc., risks are managed by restricting positions to within a certain percentage of open interest in the entire market.
(4) Supplementary explanations about matters concerning fair value of financial instrumentsFair values of financial instruments are based on their market prices and, in cases where market prices are not available, on reasonably calculated prices. These prices have been calculated using certain assumptions, and may differ if calculated based on different assumptions.
Notes to Consolidated Financial Statements
010_0800801371908.indd 182 2019/08/16 18:54:03

183
Sumitomo Mitsui Financial Group
SMBC Group Annual Report 2019
2. Fair value of financial instruments (1) “Consolidated balance sheet amount,” “Fair value” and “Net unrealized gains (losses)” of financial instruments as of March 31, 2018 and
2019 are as follows:The amounts shown in the following tables do not include financial instruments (see (3) below) whose fair values are extremely
difficult to determine, such as unlisted stocks classified as other securities, and stocks of subsidiaries and affiliates.
Millions of yen
March 31, 2018Consolidated balance
sheet amount Fair valueNet unrealizedgains (losses)
1) Cash and due from banks *1 ...................................................... ¥ 53,719,075 ¥ 53,727,901 ¥ 8,8252) Call loans and bills bought *1 .................................................... 1,880,248 1,882,226 1,9773) Receivables under resale agreements .......................................... 827,892 828,019 1274) Receivables under securities borrowing transactions *1 .............. 8,337,151 8,337,727 5755) Monetary claims bought *1 ........................................................ 4,727,884 4,740,759 12,8756) Trading assets
Securities classified as trading purposes ................................. 3,166,912 3,166,912 —7) Money held in trust ................................................................... 1,482 1,482 —8) Securities
Bonds classified as held-to-maturity...................................... 372,463 374,596 2,132Other securities .................................................................... 24,231,212 24,231,212 —
9) Loans and bills discounted ......................................................... 72,945,934Reserve for possible loan losses *1 ......................................... (318,294)
72,627,639 74,501,561 1,873,92110) Foreign exchanges *1 ................................................................. 2,163,382 2,166,382 2,99911) Lease receivables and investment assets *1 .................................. 2,321,355 2,410,967 89,611
Total assets ................................................................................ ¥174,376,701 ¥176,369,750 ¥1,993,0481) Deposits .................................................................................... ¥116,477,534 ¥116,473,422 ¥ (4,111)2) Negotiable certificates of deposit ............................................... 11,220,284 11,223,576 3,2913) Call money and bills sold ........................................................... 1,190,928 1,190,936 74) Payables under repurchase agreements ....................................... 5,509,721 5,509,721 —5) Payables under securities lending transactions ........................... 7,186,861 7,186,861 —6) Commercial paper ..................................................................... 2,384,787 2,384,771 (15)7) Trading liabilities
Trading securities sold for short sales .................................... 2,139,980 2,139,980 —8) Borrowed money ....................................................................... 10,829,248 10,889,743 60,4949) Foreign exchanges ..................................................................... 865,640 865,640 —
10) Short-term bonds ....................................................................... 1,256,600 1,256,600 —11) Bonds ........................................................................................ 9,057,683 9,300,891 243,20812) Due to trust account .................................................................. 1,328,271 1,328,271 —
Total liabilities .......................................................................... ¥169,447,542 ¥169,750,416 ¥ 302,874Derivative transactions *2 ....................................................................................................
Hedge accounting not applied .............................................. ¥ 185,561 ¥ 185,561 ¥ —Hedge accounting applied .................................................... 126,340 126,340 —
Total .......................................................................................... ¥ 311,902 ¥ 311,902 ¥ —
*1 The amounts do not include general reserve for possible loan losses and specific reserve for possible loan losses. The reserves for possible losses on “Cash and due from banks,” “Call loans and bills bought,” “Receivables under securities borrowing transactions,” “Monetary claims bought,” “Foreign exchanges” and “Lease receivables and investment assets” are deducted directly from consolidated balance sheet amount since they are immaterial.
*2 The amounts collectively represent the derivative transactions which are recorded on “Trading assets,” “Trading liabilities,” “Other assets” and “Other liabilities.” Debts and credits arising from derivative transactions are presented on a net basis, with a net debt presented in square brackets.
Notes to Consolidated Financial Statements
010_0800801371908.indd 183 2019/08/16 18:54:03

184
Sumitomo Mitsui Financial Group
SMBC Group Annual Report 2019
Millions of yen
March 31, 2019Consolidated balance
sheet amount Fair valueNet unrealizedgains (losses)
1) Cash and due from banks *1 ...................................................... ¥ 57,404,619 ¥ 57,414,384 ¥ 9,7652) Call loans and bills bought *1 .................................................... 2,463,660 2,466,418 2,7573) Receivables under resale agreements .......................................... 6,429,365 6,429,231 (133)4) Receivables under securities borrowing transactions *1 .............. 4,097,238 4,097,502 2635) Monetary claims bought *1 ........................................................ 4,591,920 4,609,409 17,4896) Trading assets ............................................................................
Securities classified as trading purposes ................................. 2,755,519 2,755,519 —7) Money held in trust ................................................................... 390 390 —8) Securities ...................................................................................
Bonds classified as held-to-maturity...................................... 280,247 281,136 888Other securities .................................................................... 22,696,091 22,696,091 —
9) Loans and bills discounted ......................................................... 77,979,190Reserve for possible loan losses *1 ......................................... (301,809)
77,677,380 79,713,860 2,036,47910) Foreign exchanges *1 ................................................................. 1,717,469 1,720,319 2,85011) Lease receivables and investment assets *1 .................................. 247,550 242,941 (4,609)
Total assets ................................................................................ ¥180,361,453 ¥182,427,205 ¥2,065,7521) Deposits .................................................................................... ¥122,325,038 ¥122,320,963 ¥ (4,074)2) Negotiable certificates of deposit ............................................... 11,165,486 11,170,627 5,1403) Call money and bills sold ........................................................... 1,307,778 1,307,710 (68)4) Payables under repurchase agreements ....................................... 11,462,559 11,462,559 —5) Payables under securities lending transactions ........................... 1,812,820 1,812,820 —6) Commercial paper ..................................................................... 2,291,813 2,291,785 (27)7) Trading liabilities
Trading securities sold for short sales .................................... 1,992,314 1,992,314 —8) Borrowed money ....................................................................... 10,656,897 10,706,117 49,2199) Foreign exchanges ..................................................................... 1,165,141 1,165,141 —
10) Short-term bonds ....................................................................... 84,500 84,500 —11) Bonds ........................................................................................ 9,227,367 9,387,562 160,19512) Due to trust account .................................................................. 1,352,773 1,354,823 2,050
Total liabilities .......................................................................... ¥174,844,490 ¥175,056,926 ¥ 212,435Derivative transactions *2 ..........................................................
Hedge accounting not applied .............................................. ¥ 391,707 ¥ 391,707 ¥ —Hedge accounting applied .................................................... [45,676] [45,676] —
Total .......................................................................................... ¥ 346,030 ¥ 346,030 ¥ —
*1 The amounts do not include general reserve for possible loan losses and specific reserve for possible loan losses. The reserves for possible losses on “Cash and due from banks,” “Call loans and bills bought,” “Receivables under securities borrowing transactions,” “Monetary claims bought,” “Foreign exchanges” and “Lease receivables and investment assets” are deducted directly from consolidated balance sheet amount since they are immaterial.
*2 The amounts collectively represent the derivative transactions which are recorded on “Trading assets,” “Trading liabilities,” “Other assets” and “Other liabilities.” Debts and credits arising from derivative transactions are presented on a net basis, with a net debt presented in square brackets.
(2) Fair value calculation methodology for financial instrumentsAssets1) Cash and due from banks, 2) Call loans and bills bought, 3) Receivables under resale agreements, 4) Receivables under securities borrowing transactions, 9) Loans and bills discounted, 10) Foreign exchanges and 11) Lease receivables and investment assets:Of these transactions, for dues from banks without maturity and overdrafts with no specified repayment dates, the book values are used as fair value as they are considered to approximate their fair value.
For short-term transactions with remaining maturity not exceeding 6 months, in principle, the book values are used as fair value as they are considered to approximate their fair value.
The fair value of those with a remaining maturity of more than 6 months is, in principle, the present value of future cash flows (calculated by discounting estimated future cash flows, taking into account factors such as the borrower’s internal rating and pledged collateral, using a rate comprising of a risk-free interest rate and an adjustment). Certain consolidated subsidiaries of the Company calculate the present value by discounting the estimated future cash flows computed based on the contractual interest rate, using a rate comprising a risk-free rate and a credit risk premium.
Notes to Consolidated Financial Statements
010_0800801371908.indd 184 2019/08/16 18:54:03

185
Sumitomo Mitsui Financial Group
SMBC Group Annual Report 2019
Regarding claims on bankrupt borrowers, effectively bankrupt borrowers and potentially bankrupt borrowers, expected losses on such claims are calculated based on either the expected recoverable amount from disposal of collateral or guarantees, or the present value of expected future cash flows. Since the claims’ balance sheet amounts minus the expected amount of loan losses approximate their fair values, such amounts are considered to be their fair values.5) Monetary claims bought:The fair values of monetary claims bought, such as subordinated trust beneficiary interests related to securitized housing loans, are based on the assessed value of underlying housing loans securitized through the trust scheme minus the assessed value of senior beneficial interests, etc. The fair values of other transactions are, in principle, based on prices calculated using methods similar to the methods applied to 9) Loans and bills discounted.6) Trading assets:The fair values of bonds and other securities held for trading purposes are, in principle, based on their market price at the end of the fiscal year.7) Money held in trust:The fair values of money held in trust are, in principle, based on the market prices of securities held in trust calculated using methods similar to the methods applied to 8) Securities.8) Securities:In principle, the fair values of stocks (including foreign stocks) are based on the average market price during 1 month before the end of the fiscal year. The fair values of bonds and securities with market prices other than stocks are prices calculated based on their market prices as of the end of the fiscal year.
In light of the “Practical Solution on Measurement of Fair Value for Financial Assets” (ASBJ Practical Issue Task Force No. 25), the fair values of floating rate government bonds are based on the present value of future cash flows (the government bond yield is used to discount and estimate future cash flows). Bond yield and yield volatility are the main price parameters. The fair values of those without market prices, such as private placement bonds, are based on the present value of future cash flows calculated by discounting estimated future cash flows taking into account the borrower’s internal rating and pledged collateral by a rate comprising a risk-free interest rate and an adjustment.
However, the fair values of bonds, such as private placement bonds issued by bankrupt borrowers, effectively bankrupt borrowers and potentially bankrupt borrowers are based on the bond’s book value after the deduction of the expected amount of a loss on the bond computed by using the same method applied to the estimation of a loan loss. Meanwhile, the fair values of publicly offered investment trusts are calculated based on the published net asset value (NAV) per share, while those of private placement investment trusts are calculated based on the NAV published by securities firms and other financial institutions.
Liabilities1) Deposits, 2) Negotiable certificates of deposit and 12) Due to trust account:The fair values of demand deposits and deposits without maturity are based on their book values. The fair values of short-term transactions with remaining maturity not exceeding 6 months are also based on their book values, as their book values are regarded to approximate their market values.
The fair values of transactions with a remaining maturity of more than 6 months are, in principle, based on the present value of estimated future cash flows calculated using the rate applied to the same type of deposits that are newly accepted until the end of the remaining maturity.
The fair values of borrowings from the trust account related to covered bond issued by the trust account are based on the amount calculated in accordance with the price quoted on securities exchange.3) Call money and bills sold, 4) Payables under repurchase agreements, 5) Payables under securities lending transactions, 6) Commercial paper, 8) Borrowed money, 10) Short-term bonds and 11) Bonds:The fair values of short-term transactions with remaining maturity not exceeding 6 months are based on their book values, as their book values are considered to approximate their fair values. For transactions with a remaining maturity of more than 6 months, fair values are, in principle, based on the present value of estimated future cash flows discounted by using the refinancing rate applicable to the same type of instruments in the market for the remaining maturity. For certain type of instruments, however, fair values are based on either the amount calculated in accordance with the price quoted by industry associations, etc., or the present value of future cash flows calculated by using the rate derived from the published yield data, etc.7) Trading liabilities:The fair values of bonds sold for short sales and other securities for trading purposes are, in principle, based on their market prices as of the end of the fiscal year.9) Foreign exchanges:The fair values of foreign currency-denominated deposits without maturity received from other banks are based on their book values.
The fair values of foreign exchange related short-term borrowings are based on their book values, as their book values are regarded to approximate their fair values.
Notes to Consolidated Financial Statements
010_0800801371908.indd 185 2019/08/16 18:54:03

186
Sumitomo Mitsui Financial Group
SMBC Group Annual Report 2019
Derivatives transactionsThe fair values of exchange-traded derivatives are based on their closing prices. With regard to OTC transactions, the fair values of interest rate, currency, stock, bond and credit derivatives are based on their prices calculated based on the present value of the future cash flows, option valuation models, etc. The fair values of commodity derivatives transactions are based on their prices calculated based on the derivative instrument’s components, including price and contract term.
(3) Consolidated balance sheet amount of financial instruments whose fair values are extremely difficult to determine are as follows:
Millions of yen
March 31 2018 2019Securities:
Unlisted stocks, etc. *1 *3 ............................................. ¥176,491 ¥170,572Investments in partnership, etc. *2 *3 ........................... 249,390 215,245
Total .................................................................................. ¥425,881 ¥385,817
*1 They are not included in the scope of fair value disclosure since there are no market prices and it is extremely difficult to determine their fair values.
*2 They are capital contributions with no market prices. The above-stated amount includes the book value amount of investments in the partnership of which the Company records net changes in their balance sheets and statements of income.
*3 Unlisted stocks and investments in partnership totaling ¥9,142 million and ¥9,669 million were written-off in the fiscal year ended March 31, 2018 and 2019, respectively.
(4) Redemption schedule of monetary claims and securities with maturities
Millions of yen
March 31, 2018 Within 1 yearAfter 1 year
through 5 yearsAfter 5 years
through 10 years After 10 years
Deposits with banks ................................................... ¥52,990,470 ¥ 23,915 ¥ 15,210 ¥ 1,130Call loans and bills bought ......................................... 1,802,316 79,563 — —Receivables under resale agreements ........................... 758,829 69,062 — —Receivables under securities borrowing transactions ... 8,333,400 4,300 — —Monetary claims bought *1 ......................................... 3,748,669 569,546 67,347 301,601Securities *1 ............................................................... 5,982,341 9,064,475 3,276,795 1,661,510
Bonds classified as held-to-maturity....................... 92,000 280,000 — —Japanese government bonds .............................. 92,000 280,000 — —Japanese local government bonds ...................... — — — —Japanese corporate bonds .................................. — — — —Other ............................................................... — — — —
Other securities with maturity............................... 5,890,341 8,784,475 3,276,795 1,661,510Japanese government bonds .............................. 3,280,000 5,226,000 344,500 300,200Japanese local government bonds ...................... 17 21,748 25,148 16Japanese corporate bonds .................................. 313,490 1,253,754 736,678 242,819Other ............................................................... 2,296,833 2,282,972 2,170,468 1,118,474
Loans and bills discounted *1 *2 .................................. 16,794,489 30,930,098 12,002,922 7,270,166Foreign exchanges *1 .................................................. 2,161,454 3,776 — —Lease receivables and investment assets *1 ................... 655,790 1,247,385 166,152 93,880Total ........................................................................... ¥93,227,762 ¥41,992,123 ¥15,528,429 ¥9,328,290
*1 The amounts shown in the table above do not include amounts for claims on bankrupt borrowers, effectively bankrupt borrowers and potentially bankrupt borrowers and other claims for which redemption is unlikely. The amounts for such claims are Monetary claims bought: ¥0 million, Securities: ¥9,451 million, Loans and bills discounted: ¥423,081 million, Foreign exchanges: ¥960 million, Lease receivables and investment assets: ¥29,545 million.
*2 “Loans and bills discounted” without the maturity dates are not included. Such amount is totaled to ¥5,526,153 million at March 31, 2018.
Notes to Consolidated Financial Statements
010_0800801371908.indd 186 2019/08/16 18:54:03

187
Sumitomo Mitsui Financial Group
SMBC Group Annual Report 2019
Millions of yen
March 31, 2019 Within 1 yearAfter 1 year
through 5 yearsAfter 5 years
through 10 years After 10 years
Deposits with banks ................................................... ¥56,196,163 ¥ 142,027 ¥ 8,980 ¥ 1,125Call loans and bills bought ......................................... 2,416,537 49,206 — —Receivables under resale agreements ........................... 6,169,917 72,150 — —Receivables under securities borrowing transactions ... 4,097,473 — — —Monetary claims bought ............................................. 3,587,450 514,675 161,745 286,006Securities *1 ............................................................... 3,857,187 8,960,637 3,667,235 2,116,326
Bonds classified as held-to-maturity....................... 20,000 260,000 — —Japanese government bonds .............................. 20,000 260,000 — —Japanese local government bonds ...................... — — — —Japanese corporate bonds .................................. — — — —Other ............................................................... — — — —
Other securities with maturity............................... 3,837,187 8,700,637 3,667,235 2,116,326Japanese government bonds .............................. 1,217,500 4,080,400 520,900 335,700Japanese local government bonds ...................... — 11,072 87,188 7Japanese corporate bonds .................................. 292,202 1,200,987 840,586 273,372Other ............................................................... 2,327,484 3,408,177 2,218,560 1,507,246
Loans and bills discounted *1 *2 ................................. 19,029,803 32,387,618 13,497,696 6,642,339Foreign exchanges *1 .................................................. 1,703,142 15,882 — —Lease receivables and investment assets ....................... 38,813 55,765 23,295 64,866Total ........................................................................... ¥97,096,488 ¥42,197,963 ¥17,358,954 ¥9,110,664
*1 The amounts shown in the table above do not include amounts for claims on bankrupt borrowers, effectively bankrupt borrowers and potentially bankrupt borrowers and other claims for which redemption is unlikely. The amounts for such claims are Securities: ¥12,958 million, Loans and bills discounted: ¥417,829 million, Foreign exchanges: ¥378 million.
*2 “Loans and bills discounted” without the maturity dates are not included. Such amount is totaled to ¥6,000,359 million at March 31, 2019.
(5) Redemption schedule of bonds, borrowed money and other interest-bearing debts
Millions of yen
March 31, 2018 Within 1 yearAfter 1 year
through 5 yearsAfter 5 years
through 10 years After 10 years
Deposits * .................................................................. ¥112,396,477 ¥3,426,343 ¥ 179,801 ¥ 474,912Negotiable certificates of deposit ................................ 10,760,778 459,505 — —Call money and bills sold ............................................ 1,190,928 — — —Payables under repurchase agreements ........................ 5,509,721 — — —Payables under securities lending transactions ............ 7,186,861 — — —Commercial paper ...................................................... 2,384,787 — — —Borrowed money ........................................................ 7,875,146 1,569,039 981,380 403,682Foreign exchanges ...................................................... 865,640 — — —Short-term bonds ........................................................ 1,256,600 — — —Bonds ......................................................................... 972,227 4,199,206 2,834,687 1,053,459Due to trust account ................................................... 1,328,271 — — —Total ........................................................................... ¥151,727,440 ¥9,654,095 ¥3,995,869 ¥1,932,054
* Demand deposits are included in “Within 1 year.” Deposits include current deposits.
Notes to Consolidated Financial Statements
010_0800801371908.indd 187 2019/08/16 18:54:04

188
Sumitomo Mitsui Financial Group
SMBC Group Annual Report 2019
Millions of yen
March 31, 2019 Within 1 yearAfter 1 year
through 5 yearsAfter 5 years
through 10 years After 10 years
Deposits * .................................................................. ¥118,166,614 ¥3,495,841 ¥ 182,195 ¥ 480,387Negotiable certificates of deposit ................................ 10,605,811 559,675 — —Call money and bills sold ............................................ 1,307,778 — — —Payables under repurchase agreements ........................ 11,443,460 — — —Payables under securities lending transactions ............ 1,812,820 — — —Commercial paper ...................................................... 2,291,813 — — —Borrowed money ........................................................ 8,430,682 1,086,996 765,268 373,949Foreign exchanges ...................................................... 1,165,141 — — —Short-term bonds ........................................................ 84,500 — — —Bonds ......................................................................... 1,087,139 4,240,236 2,833,135 1,067,400Due to trust account ................................................... 1,228,223 124,550 — —Total ........................................................................... ¥157,623,985 ¥9,507,299 ¥3,780,600 ¥1,921,736
* Demand deposits are included in “Within 1 year.” Deposits include current deposits.
Notes to Consolidated Financial Statements
010_0800801371908.indd 188 2019/08/16 18:54:04

189
Sumitomo Mitsui Financial Group
SMBC Group Annual Report 2019
(Notes to securities)The amounts shown in the following tables include trading securities and short-term bonds classified as “Trading assets,” negotiable certificates of deposit classified as “Cash and due from banks,” and beneficiary claims on loan trust classified as “Monetary claims bought,” in addition to “Securities” stated in the consolidated balance sheets.
1. Securities classified as trading purposes
Millions of yen
March 31 2018 2019Valuation gains (losses) included in the earnings for the fiscal year ..................................... ¥(5,538) ¥20,551
2. Bonds classified as held-to-maturity
March 31, 2018
Millions of yen Consolidated balance
sheet amount Fair valueNet unrealizedgains (losses)
Bonds with unrealized gains: Japanese government bonds ....................... ¥370,463 ¥372,596 ¥2,132Japanese local government bonds ............... — — —Japanese corporate bonds ........................... — — —Other ........................................................ — — —Subtotal ..................................................... 370,463 372,596 2,132
Bonds with unrealized losses: Japanese government bonds ....................... 2,000 2,000 —Japanese local government bonds ............... — — —Japanese corporate bonds ........................... — — —Other ........................................................ — — —Subtotal ..................................................... 2,000 2,000 —
Total ............................................................................................................. ¥372,463 ¥374,596 ¥2,132
March 31, 2019
Millions of yen Consolidated balance
sheet amount Fair value Net unrealizedgains (losses)
Bonds with unrealized gains: Japanese government bonds ....................... ¥280,247 ¥281,136 ¥888Japanese local government bonds ............... — — —Japanese corporate bonds ........................... — — —Other ........................................................ — — —Subtotal ..................................................... 280,247 281,136 888
Bonds with unrealized losses: Japanese government bonds ....................... — — —Japanese local government bonds ............... — — —Japanese corporate bonds ........................... — — —Other ........................................................ — — —Subtotal ..................................................... — — —
Total ............................................................................................................. ¥280,247 ¥281,136 ¥888
Notes to Consolidated Financial Statements
010_0800801371908.indd 189 2019/08/16 18:54:04

190
Sumitomo Mitsui Financial Group
SMBC Group Annual Report 2019
3. Other securities
March 31, 2018
Millions of yen Consolidated
balance sheet amount Acquisition costNet unrealizedgains (losses)
Other securities with unrealized gains:
Stocks ........................................................ ¥ 3,633,885 ¥ 1,442,756 ¥2,191,129Bonds ........................................................ 6,998,992 6,946,588 52,404
Japanese government bonds .................. 4,797,431 4,779,687 17,743Japanese local government bonds .......... 14,051 14,004 47Japanese corporate bonds ...................... 2,187,509 2,152,896 34,613
Other ........................................................ 3,498,836 3,107,132 391,704Subtotal ..................................................... 14,131,714 11,496,477 2,635,237
Other securities with unrealized losses:
Stocks ........................................................ 113,878 131,341 (17,463)Bonds ........................................................ 4,835,189 4,843,215 (8,026)
Japanese government bonds .................. 4,405,604 4,410,865 (5,260)Japanese local government bonds .......... 32,980 33,076 (95)Japanese corporate bonds ...................... 396,604 399,274 (2,670)
Other ........................................................ 5,933,514 6,135,100 (201,585)Subtotal ..................................................... 10,882,582 11,109,658 (227,075)
Total .............................................................................................. ¥25,014,297 ¥22,606,135 ¥2,408,161
Notes: 1. Net unrealized gains (losses) on other securities shown above include gains of ¥15 million for the fiscal year ended March 31, 2018 that are recognized in the earnings by applying fair value hedge accounting.
2. Consolidated balance sheet amounts of other securities whose fair values are extremely difficult to determine are as follows:
March 31, 2018 Millions of yen
Stocks ....................................................................................................... ¥141,578
Other ....................................................................................................... 284,303
Total ......................................................................................................... ¥425,881
These amounts are not included in “3. Other securities” since there are no market prices and it is extremely difficult to determine their fair values.
March 31, 2019
Millions of yen Consolidated
balance sheet amount Acquisition costNet unrealizedgains (losses)
Other securities with unrealized gains:
Stocks ........................................................ ¥ 3,175,611 ¥ 1,242,178 ¥1,933,433Bonds ........................................................ 8,094,287 8,031,868 62,419
Japanese government bonds .................. 5,547,344 5,523,497 23,847Japanese local government bonds .......... 89,608 88,868 740Japanese corporate bonds ...................... 2,457,334 2,419,502 37,831
Other ........................................................ 5,885,370 5,398,325 487,045Subtotal ..................................................... 17,155,270 14,672,372 2,482,898
Other securities with unrealized losses:
Stocks ........................................................ 171,965 202,460 (30,495)Bonds ........................................................ 889,443 891,497 (2,053)
Japanese government bonds .................. 686,982 687,573 (591)Japanese local government bonds .......... 9,555 9,560 (4)Japanese corporate bonds ...................... 192,906 194,363 (1,457)
Other ........................................................ 5,198,045 5,327,052 (129,007)Subtotal ..................................................... 6,259,454 6,421,010 (161,555)
Total .............................................................................................. ¥23,414,725 ¥21,093,383 ¥2,321,342
Notes: 1. Net unrealized gains (losses) on other securities shown above include losses of ¥12,277 million for the fiscal year ended March 31, 2019 that are recognized in the earnings by applying fair value hedge accounting.
2. Consolidated balance sheet amounts of other securities whose fair values are extremely difficult to determine are as follows:
March 31, 2019 Millions of yen
Stocks ....................................................................................................... ¥139,051
Other ....................................................................................................... 246,765
Total ......................................................................................................... ¥385,817
These amounts are not included in “3. Other securities” since there are no market prices and it is extremely difficult to determine their fair values.
Notes to Consolidated Financial Statements
010_0800801371908.indd 190 2019/08/16 18:54:04

191
Sumitomo Mitsui Financial Group
SMBC Group Annual Report 2019
4. Held-to-maturity bonds sold during the fiscal yearFiscal year ended March 31, 2018There are no corresponding transactions.
Fiscal year ended March 31, 2019There are no corresponding transactions.
5. Other securities sold during the fiscal year
Millions of yenYear ended March 31, 2018 Sales amount Gains on sales Losses on sales
Stocks ............................................................................................ ¥ 202,808 ¥106,361 ¥ (89)Bonds ............................................................................................ 6,477,102 9,798 (2,024)
Japanese government bonds ...................................................... 6,088,215 9,534 (86)Japanese local government bonds .............................................. 89,854 9 (342)Japanese corporate bonds .......................................................... 299,031 254 (1,595)
Other ............................................................................................ 6,867,924 51,414 (22,359)Total .............................................................................................. ¥13,547,835 ¥167,573 ¥(24,473)
Millions of yenYear ended March 31, 2019 Sales amount Gains on sales Losses on sales
Stocks ............................................................................................ ¥ 206,738 ¥ 96,067 ¥ (1,139)Bonds ............................................................................................ 8,071,326 11,418 (2,154)
Japanese government bonds ...................................................... 7,797,751 10,798 (2,065)Japanese local government bonds .............................................. 80,253 67 (71)Japanese corporate bonds .......................................................... 193,321 551 (17)
Other ............................................................................................ 9,588,573 48,653 (36,968)Total .............................................................................................. ¥17,866,638 ¥156,140 ¥(40,262)
6. Change of classification of securitiesFiscal year ended March 31, 2018There are no significant corresponding transactions to be disclosed.
Fiscal year ended March 31, 2019There are no significant corresponding transactions to be disclosed.
7. Write-down of securitiesBonds classified as held-to-maturity and other securities (excluding securities whose fair values are extremely difficult to determine) are considered as impaired if the fair value decreases materially below the acquisition cost and such decline is not considered as recoverable. The fair value is recognized as the consolidated balance sheet amount and the amount of write-down is accounted for as valuation loss for the fiscal year. Valuation losses for the fiscal years ended March 31, 2018 and 2019 were ¥3,331 million and ¥9,013 million, respectively. The rule for determining “material decline” is as follows and is based on the classification of issuers under the rules of self-assessment of assets.
Bankrupt/Effectively bankrupt/Potentially bankrupt issuers: Fair value is lower than acquisition cost.
Issuers requiring caution: Fair value is 30% or lower than acquisition cost.
Normal issuers: Fair value is 50% or lower than acquisition cost.
Bankrupt issuers: Issuers that are legally bankrupt or formally declared bankrupt.
Effectively bankrupt issuers: Issuers that are not legally bankrupt but regarded as substantially bankrupt.
Potentially bankrupt issuers: Issuers that are not bankrupt now, but are perceived to have a high risk of falling into bankruptcy.
Issuers requiring caution: Issuers that are identified for close monitoring.
Normal issuers: Issuers other than the above 4 categories of issuers.
Notes to Consolidated Financial Statements
010_0800801371908.indd 191 2019/08/16 18:54:04

192
Sumitomo Mitsui Financial Group
SMBC Group Annual Report 2019
(Notes to money held in trust)1. Money held in trust classified as trading purposesFiscal year ended March 31, 2018There are no corresponding transactions.
Fiscal year ended March 31, 2019There are no corresponding transactions.
2. Money held in trust classified as held-to-maturityFiscal year ended March 31, 2018There are no corresponding transactions.
Fiscal year ended March 31, 2019There are no corresponding transactions.
3. Other money held in trust
Millions of yen
March 31, 2018Consolidated balance
sheet amount Acquisition costNet unrealizedgains (losses)
Other money held in trust ............................................................. ¥1,482 ¥1,482 —
Millions of yen
March 31, 2019Consolidated balance
sheet amount Acquisition costNet unrealizedgains (losses)
Other money held in trust ............................................................. ¥390 ¥390 —
Notes to Consolidated Financial Statements
010_0800801371908.indd 192 2019/08/16 18:54:04

193
Sumitomo Mitsui Financial Group
SMBC Group Annual Report 2019
(Notes to net unrealized gains (losses) on other securities)The breakdown of “Net unrealized gains (losses) on other securities” reported on the consolidated balance sheets is as shown below:
March 31, 2018 Millions of yen
Net unrealized gains (losses) .......................................................................................................................................... ¥2,408,313Other securities ........................................................................................................................................................ 2,408,313Other money held in trust ........................................................................................................................................ —
(-) Deferred tax liabilities 659,098Net unrealized gains (losses) on other securities (before following adjustments) ............................................................. 1,749,215(-) Non-controlling interests .......................................................................................................................................... 65,950(+) The Company’s interest in net unrealized gains (losses) on valuation of other securities held by equity method affiliates ..... 5,577Net unrealized gains (losses) on other securities ............................................................................................................. ¥1,688,842
Notes: 1. Net unrealized gains of ¥15 million for the fiscal year ended March 31, 2018 recognized in the fiscal year’s earnings by applying fair value hedge accounting are deducted from net unrealized gains on other securities.
2. Net unrealized gains (losses) on other securities include foreign currency translation adjustments on foreign currency denominated securities whose fair value is extremely difficult to determine.
March 31, 2019 Millions of yen
Net unrealized gains (losses) .......................................................................................................................................... ¥2,333,619Other securities ........................................................................................................................................................ 2,333,619Other money held in trust ........................................................................................................................................ —
(-) Deferred tax liabilities 553,246Net unrealized gains (losses) on other securities (before following adjustments) ............................................................. 1,780,372(-) Non-controlling interests .......................................................................................................................................... 102,611(+) The Company’s interest in net unrealized gains (losses) on valuation of other securities held by equity method affiliates ..... 11,090Net unrealized gains (losses) on other securities ............................................................................................................. ¥1,688,852
Notes: 1. Net unrealized losses of ¥12,277 million for the fiscal year ended March 31, 2019 recognized in the fiscal year’s earnings by applying fair value hedge accounting are deducted from net unrealized gains on other securities.
2. Net unrealized gains (losses) on other securities include foreign currency translation adjustments on foreign currency denominated securities whose fair value is extremely difficult to determine.
Notes to Consolidated Financial Statements
010_0800801371908.indd 193 2019/08/16 18:54:04

194
Sumitomo Mitsui Financial Group
SMBC Group Annual Report 2019
(Notes to derivative transactions)1. Derivative transactions to which the hedge accounting method is not appliedThe following tables set forth the contract amount or the amount equivalent to the notional amount, fair value, valuation gains (losses) and fair value calculation methodologies by type of derivative with respect to derivative transactions to which the hedge accounting method is not applied at the end of the fiscal year. Contract amount does not indicate the market risk relating to derivative transactions.
(1) Interest rate derivatives
Millions of yen Contract amount Valuation
gains (losses)March 31, 2018 Total Over 1 year Fair value
Listed Interest rate futures:
Sold ............................................................................ ¥ 37,301,443 ¥ 6,925,140 ¥ 16,067 ¥ 16,067Bought ....................................................................... 37,215,533 6,842,217 (14,654) (14,654)
Interest rate options:Sold ............................................................................ 1,391,595 45,200 (300) (300)Bought ....................................................................... 65,110,433 29,958,221 4,520 4,520
Over-the-counterForward rate agreements:
Sold ............................................................................ 12,680,558 521,495 (4,656) (4,656)Bought ....................................................................... 12,344,032 435,954 4,594 4,594
Interest rate swaps: 429,909,020 341,129,716 93,567 93,567Receivable fixed rate/payable floating rate ................... 196,148,823 156,251,285 1,762,226 1,762,226Receivable floating rate/payable fixed rate ................... 193,099,356 154,329,705 (1,689,126) (1,689,126)Receivable floating rate/payable floating rate .............. 40,571,800 30,474,185 9,649 9,649
Interest rate swaptions:Sold ............................................................................ 5,790,268 3,542,146 (7,850) (7,850)Bought ....................................................................... 4,911,806 3,086,445 8,068 8,068
Caps:Sold ............................................................................ 39,511,432 25,413,931 (27,760) (27,760)Bought ....................................................................... 8,998,567 7,222,545 1,176 1,176
Floors:Sold ............................................................................ 666,212 608,582 (728) (728)Bought ....................................................................... 1,123,673 957,378 895 895
Other:Sold ............................................................................ 1,449,762 701,009 (2,589) (2,589)Bought ....................................................................... 15,456,836 13,055,363 15,918 15,918
Total ................................................................................ / / ¥ 86,268 ¥ 86,268
Notes: 1. The above transactions are valued at fair value and the valuation gains (losses) are accounted for in the consolidated statements of income.
2. Fair value of transactions listed on an exchange is calculated using the closing price on the Tokyo Financial Exchange or other relevant exchanges. Fair value of OTC transactions is calculated using discounted present value and option pricing models.
Notes to Consolidated Financial Statements
010_0800801371908.indd 194 2019/08/16 18:54:04

195
Sumitomo Mitsui Financial Group
SMBC Group Annual Report 2019
Millions of yen Contract amount Valuation
gains (losses)March 31, 2019 Total Over 1 year Fair value
Listed Interest rate futures:
Sold ............................................................................ ¥ 30,533,013 ¥ 3,061,730 ¥ (16,015) ¥ (16,015)Bought ....................................................................... 28,898,271 5,902,494 16,633 16,633
Interest rate options:Sold ............................................................................ 3,452,722 3,286,192 (1,929) (1,929)Bought ....................................................................... 130,788,808 65,425,283 24,009 24,009
Over-the-counterForward rate agreements:
Sold ............................................................................ 26,319,818 1,420,320 12,029 12,029Bought ....................................................................... 28,150,897 1,305,595 (12,572) (12,572)
Interest rate swaps: 444,871,798 354,014,671 294,408 294,408Receivable fixed rate/payable floating rate ................... 197,044,427 156,309,066 2,831,588 2,831,588Receivable floating rate/payable fixed rate ................... 189,646,811 153,321,990 (2,545,878) (2,545,878)Receivable floating rate/payable floating rate .............. 58,102,014 44,309,569 (156) (156)
Interest rate swaptions:Sold ............................................................................ 6,329,197 3,871,862 (39,722) (39,722)Bought ....................................................................... 5,706,918 3,485,353 39,242 39,242
Caps:Sold ............................................................................ 48,034,687 31,841,749 (57,898) (57,898)Bought ....................................................................... 11,030,207 7,991,304 6,571 6,571
Floors:Sold ............................................................................ 939,796 767,715 (3,380) (3,380)Bought ....................................................................... 1,253,804 776,639 4,160 4,160
Other:Sold ............................................................................ 1,519,045 772,769 (3,053) (3,053)Bought ....................................................................... 7,769,837 6,281,874 31,891 31,891
Total ................................................................................ / / ¥ 294,374 ¥ 294,374
Notes: 1. The above transactions are valued at fair value and the valuation gains (losses) are accounted for in the consolidated statements of income.
2. Fair value of transactions listed on an exchange is calculated using the closing price on the Tokyo Financial Exchange or other relevant exchanges. Fair value of OTC transactions is calculated using discounted present value and option pricing models.
Notes to Consolidated Financial Statements
010_0800801371908.indd 195 2019/08/16 18:54:04

196
Sumitomo Mitsui Financial Group
SMBC Group Annual Report 2019
(2) Currency derivatives
Millions of yen Contract amount
Fair valueValuation
gains (losses)March 31, 2018 Total Over 1 year
Listed Currency futures:
Sold ............................................................................ ¥ 513 ¥ — ¥ (18) ¥ (18)Bought ....................................................................... 175 — 0 0
Over-the-counterCurrency swaps ................................................................ 39,984,899 27,675,508 90,337 113,215Currency swaptions:
Sold ............................................................................ 431,065 375,092 (3,156) (3,156)Bought ....................................................................... 874,253 772,102 5,364 5,364
Forward foreign exchange ................................................ 76,246,360 8,727,532 21,951 21,951Currency options:
Sold ............................................................................ 2,606,941 1,357,801 (75,760) (75,760)Bought ....................................................................... 2,424,055 1,177,161 79,404 79,404
Total ................................................................................ / / ¥118,123 ¥141,000
Notes: 1. The above transactions are valued at fair value and the valuation gains (losses) are accounted for in the consolidated statements of income.
2. Fair value of transactions listed on exchange is calculated using the closing price on the Tokyo Financial Exchange or other relevant exchanges. Fair value of OTC transactions is calculated using discounted present value, option pricing models and other methodologies.
Millions of yen Contract amount
Fair valueValuation
gains (losses)March 31, 2019 Total Over 1 year
Listed Currency futures:
Sold ............................................................................ ¥ 2,833 ¥ — ¥ 21 ¥ 21Bought ....................................................................... 1,109 — 0 0
Over-the-counterCurrency swaps ................................................................ 46,383,650 34,753,013 82,884 76,881Currency swaptions:
Sold ............................................................................ 341,280 256,973 (628) (628)Bought ....................................................................... 817,560 708,288 1,484 1,484
Forward foreign exchange ................................................ 81,510,434 11,113,122 24,012 24,012Currency options:
Sold ............................................................................ 3,031,324 1,496,970 (62,269) (62,269)Bought ....................................................................... 2,676,865 1,186,165 67,564 67,564
Total ................................................................................ / / ¥113,069 ¥107,066
Notes: 1. The above transactions are valued at fair value and the valuation gains (losses) are accounted for in the consolidated statements of income.
2. Fair value of transactions listed on exchange is calculated using the closing price on the Tokyo Financial Exchange or other relevant exchanges. Fair value of OTC transactions is calculated using discounted present value, option pricing models and other methodologies.
Notes to Consolidated Financial Statements
010_0800801371908.indd 196 2019/08/16 18:54:04

197
Sumitomo Mitsui Financial Group
SMBC Group Annual Report 2019
(3) Equity derivatives
Millions of yen Contract amount
Fair valueValuation
gains (losses)March 31, 2018 Total Over 1 year
Listed Equity price index futures:
Sold ............................................................................ ¥481,952 ¥ 9,744 ¥ (5,450) ¥ (5,450)Bought ....................................................................... 345,111 3,140 1,693 1,693
Equity price index options:Sold ............................................................................ 842,858 374,414 (68,340) (68,340)Bought ....................................................................... 936,687 327,012 42,208 42,208
Over-the-counterEquity options:
Sold ............................................................................ 322,508 252,083 (18,727) (18,727)Bought ....................................................................... 334,710 237,738 22,178 22,178
Equity index forward contracts:Sold ............................................................................ — — — —Bought ....................................................................... 7,564 207 537 537
Equity price index swaps:Receivable equity index/payable short-term floating rate ........................................................................... 73,385 58,755 (8,013) (8,013)
Receivable short-term floating rate/payable equity index ........................................................................ 167,867 140,115 14,971 14,971
Total ................................................................................ / / ¥(18,943) ¥(18,943)
Notes: 1. The above transactions are valued at fair value and the valuation gains (losses) are accounted for in the consolidated statements of income.
2. Fair value of transactions listed on exchange is calculated using the closing price on the Osaka Exchange or other relevant exchanges. Fair value of OTC transactions is calculated using discounted present value and option pricing models.
Millions of yen Contract amount
Fair valueValuation
gains (losses)March 31, 2019 Total Over 1 year
Listed Equity price index futures:
Sold ............................................................................ ¥635,249 ¥ 28,221 ¥ 3,170 ¥ 3,170Bought ....................................................................... 295,976 15,021 (1,081) (1,081)
Equity price index options:Sold ............................................................................ 682,846 350,760 (56,853) (56,853)Bought ....................................................................... 576,496 317,636 29,383 29,383
Over-the-counterEquity options:
Sold ............................................................................ 401,236 290,126 (25,905) (25,905)Bought ....................................................................... 320,518 242,408 24,375 24,375
Equity index forward contracts:Sold ............................................................................ — — — —Bought ....................................................................... 8,094 115 554 554
Equity price index swaps:Receivable equity index/payable short-term floating rate ........................................................................... 67,491 43,666 (8,214) (8,214)
Receivable short-term floating rate/payable equity index ........................................................................ 254,937 177,164 21,736 21,736
Total ................................................................................ / / ¥(12,835) ¥(12,835)
Notes: 1. The above transactions are valued at fair value and the valuation gains (losses) are accounted for in the consolidated statements of income.
2. Fair value of transactions listed on exchange is calculated using the closing price on the Osaka Exchange or other relevant exchanges. Fair value of OTC transactions is calculated using discounted present value and option pricing models.
Notes to Consolidated Financial Statements
010_0800801371908.indd 197 2019/08/16 18:54:04

198
Sumitomo Mitsui Financial Group
SMBC Group Annual Report 2019
(4) Bond derivatives
Millions of yen Contract amount
Fair valueValuation
gains (losses)March 31, 2018 Total Over 1 year
Listed Bond futures:
Sold ............................................................................ ¥2,098,517 ¥ — ¥(11,317) ¥(11,317)Bought ....................................................................... 1,677,824 — 9,729 9,729
Bond futures options:Sold ............................................................................ 427,121 — (421) (421)Bought ....................................................................... 60,157 — 17 17
Over-the-counterBond forward contract:
Sold ............................................................................ 900 — 2 2Bought ....................................................................... 5,359 — 40 40
Bond options:Sold ............................................................................ 93,576 — (223) (223)Bought ....................................................................... 193,642 100,066 644 644
Total ................................................................................ / / ¥ (1,529) ¥ (1,529)
Notes: 1. The above transactions are valued at fair value and the valuation gains (losses) are accounted for in the consolidated statements of income.
2. Fair value of transactions listed on exchange is calculated using the closing price on the Osaka Exchange or other relevant exchanges. Fair value of OTC transactions is calculated using option pricing models.
Millions of yen Contract amount
Fair valueValuation
gains (losses)March 31, 2019 Total Over 1 year
Listed Bond futures:
Sold ............................................................................ ¥2,145,140 ¥ — ¥(28,956) ¥(28,956)Bought ....................................................................... 1,755,892 — 26,722 26,722
Bond futures options:Sold ............................................................................ 446,325 — (662) (662)Bought ....................................................................... 45,285 — 120 120
Over-the-counterBond forward contract:
Sold ............................................................................ 1,328 — 2 2Bought ....................................................................... — — — —
Bond options:Sold ............................................................................ 505,303 — (1,887) (1,887)Bought ....................................................................... 595,039 83,476 853 853
Total ................................................................................ / / ¥ (3,805) ¥ (3,805)
Notes: 1. The above transactions are valued at fair value and the valuation gains (losses) are accounted for in the consolidated statements of income.
2. Fair value of transactions listed on exchange is calculated using the closing price on the Osaka Exchange or other relevant exchanges. Fair value of OTC transactions is calculated using option pricing models.
Notes to Consolidated Financial Statements
010_0800801371908.indd 198 2019/08/16 18:54:04

199
Sumitomo Mitsui Financial Group
SMBC Group Annual Report 2019
(5) Commodity derivatives
Millions of yen Contract amount
Fair valueValuation
gains (losses)March 31, 2018 Total Over 1 year
Listed Commodity futures:
Sold ............................................................................ ¥10,401 ¥ — ¥ (191) ¥ (191)Bought ....................................................................... 10,500 — 129 129
Over-the-counterCommodity swaps:
Receivable fixed price/payable floating price ............... 63,231 51,460 2,549 2,549Receivable floating price/payable fixed price ............... 62,061 50,443 (503) (503)Receivable floating price/payable floating price ........... 3,173 1,922 164 164
Commodity options:Sold ............................................................................ 7,190 6,384 (533) (533)Bought ....................................................................... 4,978 4,189 (8) (8)
Total ................................................................................ / / ¥1,606 ¥1,606
Notes: 1. The above transactions are valued at fair value and the valuation gains (losses) are accounted for in the consolidated statements of income.
2. Fair value of transactions listed on exchange is calculated using the closing price on the New York Mercantile Exchange or other relevant exchanges. Fair value of OTC transactions is calculated based on factors such as price of the relevant commodity and contract term.
3. Underlying assets of commodity derivatives are fuels and metals.
Millions of yen Contract amount
Fair valueValuation
gains (losses)March 31, 2019 Total Over 1 year
Listed Commodity futures:
Sold ............................................................................ ¥14,158 ¥ — ¥ 326 ¥ 326Bought ....................................................................... 14,664 — (296) (296)
Over-the-counterCommodity swaps:
Receivable fixed price/payable floating price ............... 91,437 42,874 (1,163) (1,163)Receivable floating price/payable fixed price ............... 89,660 41,086 3,089 3,089Receivable floating price/payable floating price ........... 2,018 1,461 (10) (10)
Commodity options:Sold ............................................................................ 7,918 2,678 (401) (401)Bought ....................................................................... 5,796 778 12 12
Total ................................................................................ / / ¥ 1,556 ¥ 1,556
Notes: 1. The above transactions are valued at fair value and the valuation gains (losses) are accounted for in the consolidated statements of income.
2. Fair value of transactions listed on exchange is calculated using the closing price on the New York Mercantile Exchange or other relevant exchanges. Fair value of OTC transactions is calculated based on factors such as price of the relevant commodity and contract term.
3. Underlying assets of commodity derivatives are fuels and metals.
Notes to Consolidated Financial Statements
010_0800801371908.indd 199 2019/08/16 18:54:04

200
Sumitomo Mitsui Financial Group
SMBC Group Annual Report 2019
(6) Credit derivative transactions
Millions of yenContract amount
Fair valueValuation
gains (losses)March 31, 2018 Total Over 1 year
Over-the-counter Credit default options:
Sold ............................................................................ ¥549,981 ¥465,481 ¥ 7,755 ¥ 7,755Bought ....................................................................... 691,315 567,065 (7,719) (7,719)
Total ................................................................................ / / ¥ 36 ¥ 36
Notes: 1. The above transactions are valued at fair value and the valuation gains (losses) are accounted for in the consolidated statements of income.
2. Fair value is calculated using discounted present value and option pricing models.
3. “Sold” represents transactions in which the credit risk is accepted; “Bought” represents transactions in which the credit risk is transferred.
Millions of yenContract amount
Fair value Valuation
gains (losses)March 31, 2019 Total Over 1 year
Over-the-counter Credit default options:
Sold ............................................................................ ¥692,851 ¥639,636 ¥ 6,303 ¥ 6,303Bought ....................................................................... 811,914 713,858 (6,955) (6,955)
Total ................................................................................ / / ¥ (651) ¥ (651)
Notes: 1. The above transactions are valued at fair value and the valuation gains (losses) are accounted for in the consolidated statements of income.
2. Fair value is calculated using discounted present value and option pricing models.
3. “Sold” represents transactions in which the credit risk is accepted; “Bought” represents transactions in which the credit risk is transferred.
Notes to Consolidated Financial Statements
010_0800801371908.indd 200 2019/08/16 18:54:04

201
Sumitomo Mitsui Financial Group
SMBC Group Annual Report 2019
2. Derivative transactions to which the hedge accounting method is appliedThe following tables set forth the contract amount or the amount equivalent to the notional amount, fair value and fair value calculation methodologies by type of derivative and hedge accounting method with respect to derivative transactions to which the hedge accounting method is applied at the end of the fiscal year. Contract amount does not indicate the market risk relating to derivative transactions.
(1) Interest rate derivatives
March 31, 2018 Millions of yen
Hedge accounting method Type of derivative
Principal itemshedged
Contract amount Fair valueTotal Over 1 year
Deferral hedge method
Interest futures: Interest-earning/bearing financial assets/liabilities such as loans and bills discounted, other securities, deposits and negotiable certificates of deposit
Sold ..................................................... ¥16,675,512 ¥11,044,262 ¥ 4,287
Bought ................................................ 1,593,750 — 79 Interest rate swaps:
Receivable fixed rate/payable floating
rate .................................................... 35,415,915 27,945,628 (59,991) Receivable floating rate/payable fixed
rate .................................................... 16,132,939 14,569,986 39,356 Interest rate swaptions:
Sold ..................................................... 150,343 150,343 (2,569) Bought ................................................ — — —Recognition of gain or loss on the hedged items
Interest rate swaps: Loans and bills discounted, corporate bondsReceivable fixed rate/payable floating
rate .................................................... 62,830 53,125 (2,536)Receivable floating rate/payable fixed
rate .................................................... 201,714 187,519 (1,245)Special treatment for interest rate swaps
Interest rate swaps: Borrowed money, corporate bondsReceivable floating rate/payable fixed
rate .................................................... 12,840 4,921 (Note 3) Total .......................................................... / / ¥(22,620)
Notes: 1. The Company applies deferred hedge accounting stipulated in “Treatment for Accounting and Auditing of Application of Accounting Standard for Financial Instruments in Banking Industry” (JICPA Industry Audit Committee Report No. 24, February 13, 2002).
2. Fair value of transactions listed on exchange is calculated using the closing price on the Tokyo Financial Exchange or other relevant exchanges. Fair value of OTC transactions is calculated using discounted present value and option pricing models.
3. Interest rate swap amounts measured by the special treatment for interest rate swaps are treated with the borrowed money or other transactions that are subject to the hedge. Therefore, such fair value is included in the fair value of the relevant hedged items such as borrowed money disclosed in “(Notes to financial instruments) 2. Fair value of financial instruments”.
Notes to Consolidated Financial Statements
010_0800801371908.indd 201 2019/08/16 18:54:05

202
Sumitomo Mitsui Financial Group
SMBC Group Annual Report 2019
March 31, 2019 Millions of yen
Hedge accounting method Type of derivative
Principal itemshedged
Contract amount Fair valueTotal Over 1 year
Deferral hedge method
Interest futures: Interest-earning/bearing financial assets/liabilities such as loans and bills discounted, other securities, deposits and negotiable certificates of deposit
Sold ..................................................... ¥ 2,220,000 ¥ 2,220,000 ¥ (149)
Bought ................................................ — — — Interest rate swaps:
Receivable fixed rate/payable floating
rate .................................................... 33,822,621 30,249,753 252,739 Receivable floating rate/payable fixed
rate .................................................... 15,191,315 13,130,451 (282,377) Interest rate swaptions:
Sold ..................................................... 157,065 157,065 3,441 Bought ................................................ — — —Recognition of gain or loss on the hedged items
Interest rate swaps: Loans and bills discounted
Receivable fixed rate/payable floating
rate .................................................... — — —Receivable floating rate/payable fixed
rate .................................................... 301,178 291,450 (3,274)Special treatment for interest rate swaps
Interest rate swaps: Borrowed money, corporate bonds
(Note 3)
Receivable floating rate/payable fixed
rate .................................................... 68,690 66,690 Total .......................................................... / / ¥ (29,620)
Notes: 1. The Company applies deferred hedge accounting stipulated in “Treatment for Accounting and Auditing of Application of Accounting Standard for Financial Instruments in Banking Industry” (JICPA Industry Audit Committee Report No. 24, February 13, 2002).
2. Fair value of transactions listed on exchange is calculated using the closing price on the Tokyo Financial Exchange or other relevant exchanges. Fair value of OTC transactions is calculated using discounted present value and option pricing models.
3. Interest rate swap amounts measured by the special treatment for interest rate swaps are treated with the borrowed money or other transactions that are subject to the hedge. Therefore, such fair value is included in the fair value of the relevant hedged items such as borrowed money disclosed in “(Notes to financial instruments) 2. Fair value of financial instruments”.
Notes to Consolidated Financial Statements
010_0800801371908.indd 202 2019/08/16 18:54:05

203
Sumitomo Mitsui Financial Group
SMBC Group Annual Report 2019
(2) Currency derivatives
March 31, 2018 Millions of yen
Hedge accounting method
Type of derivative
Principal items hedged
Contract amount Total Over 1 year Fair value
Deferral hedge method
Currency swaps ................................ Foreign currency denominated loans and bills discounted, other securities, deposits, foreign exchange, etc.
¥5,995,052 ¥3,158,350 ¥165,826
Forward foreign exchange ................ 51,850 — 379
Recognition of gain or loss on the hedged items
Currency swaps ................................ Loans and bills discounted, foreign exchange
146,889 127,037 (17,089)
Allocation method Currency swaps ................................ Borrowed money 53,215 37,921 (Note 3)Forward foreign exchange ................ 1,381 —
Total ................................................ / / ¥149,116
Notes: 1. The Company applies deferred hedge accounting stipulated in “Treatment of Accounting and Auditing Concerning Accounting for Foreign Currency Transactions in Banking Industry” (JICPA Industry Audit Committee Report No. 25, July 29, 2002).
2. Fair value is calculated using discounted present value.
3. Forward foreign exchange amounts treated by the allocation method are treated with the borrowed money that are subject to the hedge. Therefore, such fair value is included in the fair value of the relevant hedged items such as borrowed money disclosed in “(Notes to financial instruments) 2. Fair value of financial instruments.”
March 31, 2019 Millions of yen
Hedge accounting method
Type of derivative
Principal items hedged
Contract amount Total Over 1 year Fair value
Deferral hedge method
Currency swaps ................................ Foreign currency denominated loans and bills discounted, other securities, deposits, foreign exchange, etc.
¥7,828,136 ¥5,000,432 ¥(22,720)
Forward foreign exchange ................ 2,772 — (218)
Recognition of gain or loss on the hedged items
Currency swaps ................................ Loans and bills discounted, other securities
186,032 131,640 5,056
Allocation method Currency swaps ................................—
— — —Forward foreign exchange ................ — —
Total ................................................ / / ¥(17,882)
Notes: 1. The Company applies deferred hedge accounting stipulated in “Treatment of Accounting and Auditing Concerning Accounting for Foreign Currency Transactions in Banking Industry” (JICPA Industry Audit Committee Report No. 25, July 29, 2002).
2. Fair value is calculated using discounted present value.
(3) Equity derivatives
March 31, 2018 Millions of yen
Hedge accounting method Type of derivative
Principal itemshedged
Contract amount Total Over 1 year Fair value
Recognition of gain or loss on the hedged items
Equity price index swaps: Other securities Receivable floating rate/payable equity
index .......................................................
¥2,218 2,218 (155) Total .............................................................. / / ¥(155)
Note: Fair value is calculated using discounted present value.
March 31, 2019 Millions of yen
Hedge accounting method Type of derivative
Principal itemshedged
Contract amount Total Over 1 year Fair value
Recognition of gain or loss on the hedged items
Equity price index swaps: Other securities Receivable floating rate/payable equity
index .......................................................
¥48,510 48,510 1,826 Total .............................................................. / / ¥1,826
Note: Fair value is calculated using discounted present value.
Notes to Consolidated Financial Statements
010_0800801371908.indd 203 2019/08/16 18:54:05

204
Sumitomo Mitsui Financial Group
SMBC Group Annual Report 2019
(Notes to employee retirement benefits)1. Outline of employee retirement benefitsThe Company’s consolidated subsidiaries have funded and unfunded contributory defined benefit pension plans and defined-contribution pension plans for benefit payments to their employees.
Funded contributory defined benefit pension plans mainly consist of contributory funded defined benefit pension plans and lump-sum severance indemnity plans which set up employee retirement benefit trusts.
Unfunded contributory defined benefit pension plans are lump-sum severance indemnity plans which do not use such trust scheme.Some consolidated subsidiaries adopt the simplified method in calculating the projected benefit obligation. Additional benefits may also be
granted when employees retire.
2. Contributory defined benefit pension plan(1) Reconciliation of beginning and ending balances of projected benefit obligation
Millions of yen
Year ended March 31 2018 2019Beginning balance of projected benefit obligation ......................................................... ¥1,179,737 ¥1,125,746
Service cost ................................................................................................................ 39,579 38,597Interest cost on projected benefit obligation ............................................................... 6,905 5,946Unrecognized net actuarial gain or loss incurred ........................................................ 15,451 31,582Payments of retirement benefits ................................................................................. (67,287) (55,656)Unrecognized prior service cost .................................................................................. (43) 96Net change as a result of business combinations ......................................................... (49,333) (22,529)Other ......................................................................................................................... 738 (22)
Ending balance of projected benefit obligation .............................................................. ¥1,125,746 ¥1,123,760
(2) Reconciliation of beginning and ending balances of plan assets
Millions of yen
Year ended March 31 2018 2019Beginning balance of plan assets ................................................................................... ¥1,435,548 ¥1,469,182
Expected return on plan assets ................................................................................. 41,635 43,473Unrecognized net actuarial gain or loss incurred ...................................................... 65,860 (48,332)Contributions by the employer ................................................................................ 18,130 15,746Payments of retirement benefits ............................................................................... (44,429) (42,816)Net change as a result of business combinations....................................................... (49,287) (14,348)Other ...................................................................................................................... 1,724 (1,525)
Ending balance of plan assets ........................................................................................ ¥1,469,182 ¥1,421,378
(3) Reconciliation of the projected benefit obligation and plan assets to net defined benefit asset and net defined benefit liability reported on the consolidated balance sheets
Millions of yen
March 31 2018 2019Funded projected benefit obligation .............................................................................. ¥(1,096,677) ¥(1,099,416)Plan assets .................................................................................................................... 1,469,182 1,421,378
372,505 321,961Unfunded projected benefit obligation ......................................................................... (29,069) (24,343)Net amount of asset and liability reported on the consolidated balance sheet ................ ¥ 343,435 ¥ 297,617
Millions of yen
March 31 2018 2019Net defined benefit asset ............................................................................................... ¥383,418 ¥329,434Net defined benefit liability .......................................................................................... (39,982) (31,816)Net amount of asset and liability reported on the consolidated balance sheet ................ ¥343,435 ¥297,617
Notes to Consolidated Financial Statements
010_0800801371908.indd 204 2019/08/16 18:54:05

205
Sumitomo Mitsui Financial Group
SMBC Group Annual Report 2019
(4) Pension expenses
Millions of yen
Year ended March 31 2018 2019Service cost ................................................................................................................... ¥ 39,579 ¥ 38,597Interest cost on projected benefit obligation .................................................................. 6,905 5,946Expected return on plan assets ...................................................................................... (41,635) (43,473)Amortization of unrecognized net actuarial gain or loss ................................................ 20,870 (15,100)Amortization of unrecognized prior service cost ............................................................ (126) (131)Other (nonrecurring additional retirement allowance paid and other) ........................... 6,730 6,300Pension expenses .......................................................................................................... ¥ 32,323 ¥ (7,861)
Note: Pension expenses of consolidated subsidiaries which adopt the simplified method are included in “Service cost.”
(5) Remeasurements of defined benefit plansThe breakdown of “Remeasurements of defined benefit plans” (before deducting tax effect) is as shown below:
Millions of yen
Year ended March 31 2018 2019Prior service cost ........................................................................................................... ¥ 120 ¥ 227Net actuarial gain or loss .............................................................................................. (74,335) 94,984Total ............................................................................................................................. ¥(74,215) ¥95,212
(6) Accumulated remeasurements of defined benefit plansThe breakdown of “Accumulated remeasurements of defined benefit plans” (before deducting tax effect) is as shown below:
Millions of yen
March 31 2018 2019Unrecognized prior service cost .................................................................................... ¥ (528) ¥ (300)Unrecognized net actuarial gain or loss ......................................................................... (86,388) 8,596Total ............................................................................................................................. ¥(86,916) ¥8,295
(7) Plan assets1) Major asset classes of plan assets
The proportion of major asset classes to the total plan assets is as follows:
March 31 2018 2019Stocks ...................................................................................................................... 62.7% 58.7%Bonds ...................................................................................................................... 16.4% 17.8%General account of life insurance .............................................................................. 3.0% 2.8%Other ...................................................................................................................... 17.9% 20.7%Total ........................................................................................................................ 100.0% 100.0%
Note: The retirement benefit trusts set up for employee pension plans and lump-sum severance indemnity plans account for 35.2% and 36.3% of the total plan assets at March 31, 2018 and 2019, respectively.
2) Method for setting the long-term expected rate of return on plan assetsThe long-term expected rate of return on plan assets is determined based on the current and expected allocation of plan assets and the current and expected long-term rates of return on various asset classes of plan assets.
(8) Actuarial assumptionsThe principal assumptions used in determining benefit obligation and pension expenses are as follows:
1) Discount rate
Year ended March 31, 2018 Percentages Year ended March 31, 2019 PercentagesDomestic consolidated subsidiaries ....................... (0.1)% to 0.8% Domestic consolidated subsidiaries ....................... (0.1)% to 0.8%Overseas consolidated subsidiaries ........................ 2.4% to 10.3% Overseas consolidated subsidiaries ........................ 2.4% to 9.0%
Notes to Consolidated Financial Statements
010_0800801371908.indd 205 2019/08/16 18:54:05

206
Sumitomo Mitsui Financial Group
SMBC Group Annual Report 2019
2) Long-term expected rate of return on plan assets
Year ended March 31, 2018 Percentages Year ended March 31, 2019 PercentagesDomestic consolidated subsidiaries ....................... 0% to 4.0% Domestic consolidated subsidiaries ....................... 0% to 4.0%Overseas consolidated subsidiaries ........................ 2.6% to 10.3% Overseas consolidated subsidiaries ........................ 2.4% to 9.0%
3. Defined contribution planFiscal year ended March 31, 2018The amount required to be contributed by the consolidated subsidiaries is ¥10,702 million.
Fiscal year ended March 31, 2019The amount required to be contributed by the consolidated subsidiaries is ¥11,500 million.
Notes to Consolidated Financial Statements
010_0800801371908.indd 206 2019/08/16 18:54:05

207
Sumitomo Mitsui Financial Group
SMBC Group Annual Report 2019
(Notes to stock options)1. Amount of stock options expenses
Stock options expenses which were accounted for as general and administrative expenses for the fiscal years ended March 31, 2018 and 2019 are as follows:
Millions of yen
Year ended March 31 2018 2019General and administrative expenses ................................................................................... ¥195 ¥29
2. Amount of profit by non-exercise of stock acquisition rightsProfit by non-exercise of stock acquisition rights which were accounted for as other income for the fiscal years ended March 31, 2018 and 2019 are as follows:
Millions of yen
Year ended March 31 2018 2019Other income ..................................................................................................................... ¥29 ¥—
3. Outline of stock options and changesThe Company(1) Outline of stock options
Date of resolution July 28, 2010 July 29, 2011 July 30, 2012 July 29, 2013Title and number of grantees ........................... Directors of the Company 8
Corporate auditors of the Company 3Executive officers of the Company 2
Directors, corporate auditors and executive officers of SMBC 69
Directors of the Company 9Corporate auditors of the Company 3Executive officers of the Company 2
Directors, corporate auditors and executive officers of SMBC 71
Directors of the Company 9Corporate auditors of the Company 3Executive officers of the Company 2
Directors, corporate auditors and executive officers of SMBC 71
Directors of the Company 9Corporate auditors of the Company 3Executive officers of the Company 3
Directors, corporate auditors and executive officers of SMBC 67
Number of stock options* ................. Common shares
102,600Common shares
268,200Common shares
280,500Common shares
115,700Grant date ......................... August 13, 2010 August 16, 2011 August 15, 2012 August 14, 2013Condition for vesting ......... Stock acquisition right holders
may exercise stock acquisition rights from the day when they are relieved of their positions either as a director, corporate auditor or executive officer of
the Company and SMBC.
Stock acquisition right holders may exercise stock acquisition rights from the day when they are relieved of their positions either as a director, corporate auditor or executive officer of
the Company and SMBC.
Stock acquisition right holders may exercise stock acquisition rights from the day when they are relieved of their positions either as a director, corporate auditor or executive officer of
the Company and SMBC.
Stock acquisition right holders may exercise stock acquisition rights from the day when they are relieved of their positions either as a director, corporate auditor or executive officer of
the Company and SMBC.Requisite service period ..... From June 29, 2010 to the
closing of the ordinary general meeting of shareholders of the
Company for the fiscal year ended March 31, 2011
From June 29, 2011 to the closing of the ordinary general meeting of shareholders of the
Company for the fiscal year ended March 31, 2012
From June 28, 2012 to the closing of the ordinary general meeting of shareholders of the
Company for the fiscal year ended March 31, 2013
From June 27, 2013 to the closing of the ordinary general meeting of shareholders of the
Company for the fiscal year ended March 31, 2014
Exercise period .................. August 13, 2010 to August 12, 2040
August 16, 2011 to August 15, 2041
August 15, 2012 to August 14, 2042
August 14, 2013 to August 13, 2043
Notes to Consolidated Financial Statements
010_0800801371908.indd 207 2019/08/16 18:54:05

208
Sumitomo Mitsui Financial Group
SMBC Group Annual Report 2019
Date of resolution July 30, 2014 July 31, 2015 July 26, 2016Title and number of grantees ........................... Directors of the Company 10
Corporate auditors of the Company 3Executive officers of the Company 2
Directors, corporate auditors and executive officers of SMBC 67
Directors of the Company 8Corporate auditors of the Company 3Executive officers of the Company 4
Directors, corporate auditors and executive officers of SMBC 68
Directors of the Company 8 Corporate auditors of the Company 3Executive officers of the Company 5
Directors, corporate auditors and executive officers of SMBC 73
Number of stock options* ................. Common shares
121,900Common shares
132,400Common shares
201,200Grant date ......................... August 15, 2014 August 18, 2015 August 15, 2016Condition for vesting ......... Stock acquisition right holders
may exercise stock acquisition rights from the day when they are relieved of their positions either as a director, corporate auditor or executive officer of
the Company and SMBC.
Stock acquisition right holders may exercise stock acquisition rights from the day when they are relieved of their positions either as a director, corporate auditor or executive officer of
the Company and SMBC.
Stock acquisition right holders may exercise stock acquisition rights from the day when they are relieved of their positions either as a director, corporate auditor or executive officer of
the Company and SMBC.Requisite service period ..... From June 27, 2014 to the
closing of the ordinary general meeting of shareholders of the
Company for the fiscal year ended March 31, 2015
From June 26, 2015 to the closing of the ordinary general meeting of shareholders of the
Company for the fiscal year ended March 31, 2016
From June 29, 2016 to the closing of the ordinary general meeting of shareholders of the
Company for the fiscal year ended March 31, 2017
Exercise period .................. August 15, 2014 to August 14, 2044
August 18, 2015 to August 17, 2045
August 15, 2016 to August 14, 2046
* Number of stock options has been converted and stated as number of shares.
(2) Stock options granted and changes1) Number of stock options*
Number of stock options
Date of resolution July 28, 2010 July 29, 2011 July 30, 2012 July 29, 2013 July 30, 2014 July 31, 2015 July 26, 2016Before vested
Previous fiscal year-end ...... 8,400 58,400 80,400 56,900 64,300 102,700 168,800Granted ............................. — — — — — — —Forfeited ............................ — — — — — — —Vested ............................... 1,200 44,800 15,000 14,200 4,900 11,500 47,500Outstanding ...................... 7,200 13,600 65,400 42,700 59,400 91,200 121,300
After vestedPrevious fiscal year-end ...... 64,200 168,500 151,700 32,300 29,900 11,300 5,200Vested ............................... 1,200 44,800 15,000 14,200 4,900 11,500 47,500Exercised ........................... 5,700 39,700 5,700 13,200 2,800 8,400 28,100Forfeited............................ — — — — — — —Exercisable ........................ 59,700 173,600 161,000 33,300 32,000 14,400 24,600
* Number of stock options has been converted and stated as number of shares.
2) Price information
Yen
Date of resolution July 28, 2010 July 29, 2011 July 30, 2012 July 29, 2013 July 30, 2014 July 31, 2015 July 26, 2016Exercise price .......................... ¥ 1 ¥ 1 ¥ 1 ¥ 1 ¥ 1 ¥ 1 ¥ 1Average exercise price ............. 4,212 4,302 4,380 4,487 4,490 4,430 4,490Fair value at the grant date ..... 2,215 1,872 2,042 4,159 3,661 4,904 2,811
(3) Method of estimating number of stock options vestedOnly the actual number of forfeited stock options is reflected because it is difficult to rationally estimate the actual number of stock options that will be forfeited in the future.
Notes to Consolidated Financial Statements
010_0800801371908.indd 208 2019/08/16 18:54:05

209
Sumitomo Mitsui Financial Group
SMBC Group Annual Report 2019
PT Bank BTPN Tbk, a consolidated subsidiary of the Company(1) Outline of stock options
Date of resolution March 26, 2015 March 26, 2015 April 29, 2016Title and number of grantees ....................... Executives 16
Employees 309Executives 1Employees 4
Employees 332
Number of stock options* ................. Common shares
141,575,000Common shares
10,500,000Common shares
56,645,000Grant date ......................... April 15, 2015 October 10, 2016 September 21, 2016Condition for vesting ......... In service at the time of
exerciseIn service at the time of
exerciseIn service at the time of
exerciseRequisite service period ..... No provisions No provisions No provisionsExercise period .................. 30 days from May 1, 2017
30 days from November 6, 201730 days from May 7, 2018
30 days from November 5, 201830 days from May 6, 2019
30 days from December 2, 2019
30 days from May 1, 201730 days from November 6, 2017
30 days from May 7, 201830 days from November 5, 2018
30 days from May 6, 201930 days from December 2, 2019
30 days from May 28, 201830 days from December 17, 2018
30 days from May 28, 201930 days from December 19, 2019
30 days from June 1, 202030 days from December 17, 2020
* Number of stock options has been converted and stated as number of shares.
(2) Stock options granted and changes1) Number of stock options*
Number of stock options
Date of resolution March 26, 2015 March 26, 2015 April 29, 2016Before vested
Previous fiscal year-end ...... 98,540,000 9,600,000 38,383,500Granted ............................. — — —Forfeited ............................ 15,300,000 — 63,000Vested ............................... — — 424,000Outstanding ...................... 83,240,000 9,600,000 37,896,500
After vestedPrevious fiscal year-end ...... — — —Vested ............................... — — 424,000Exercised ........................... — — 424,000Forfeited ............................ — — —Exercisable ........................ — — —
*1. Number of stock options has been converted and stated as number of shares. 2. Number of shares of the previous fiscal year-end is as of January 1, 2019, the deemed acquisition date.
2) Price information
IDR
Date of resolution March 26, 2015 March 26, 2015 April 29, 2016Exercise price ....................... 4,000.00 4,000.00 2,617.00Average exercise price ......... — — 3,711.67Fair value at the grant date.... 1,408.90 1,408.90 712.81
(3) Method of estimating number of stock options vestedOnly the actual number of forfeited stock options is reflected because it is difficult to rationally estimate the actual number of stock options that will be forfeited in the future.
Notes to Consolidated Financial Statements
010_0800801371908.indd 209 2019/08/16 18:54:05

210
Sumitomo Mitsui Financial Group
SMBC Group Annual Report 2019
(Notes to deferred tax assets and liabilities)1. Significant components of deferred tax assets and liabilities
March 31, 2018 Millions of yen March 31, 2019 Millions of yen
Deferred tax assets: Net operating loss carryforwards *2 ....................... ¥ 210,814Reserve for possible loan losses and write-off of loans .................................................................... 181,930
Securities ............................................................... 147,466Reserve for losses on interest repayment................. 45,195Net defined benefit liability ................................... 20,546Other .................................................................... 167,821Subtotal ................................................................. 773,774Valuation allowance for net operating loss carryforwards *2 ................................................... (166,296)
Valuation allowance for total amount of deductible temporary differences etc. .................................... (200,111)
Valuation allowance subtotal *1 ............................. (366,407)Total deferred tax assets .............................................. 407,367Deferred tax liabilities:
Net unrealized gains on other securities ................. (551,785)Depreciation .......................................................... (44,994)Retained earnings of subsidiaries ........................... (33,227)Other .................................................................... (115,334)
Total deferred tax liabilities ........................................ (745,341)Net deferred tax assets (liabilities) .............................. ¥ (337,974)
Deferred tax assets: Net operating loss carryforwards ............................ ¥ 372,250Reserve for possible loan losses and write-off of loans .................................................................... 212,541
Securities ............................................................... 46,007Reserve for losses on interest repayment................. 44,328Net defined benefit liability ................................... 32,615Other .................................................................... 243,455Subtotal ................................................................. 951,199
Valuation allowance ............................................... (454,329)Total deferred tax assets .............................................. 496,870Deferred tax liabilities:
Net unrealized gains on other securities ................. (658,469)Depreciation .......................................................... (17,183)Retained earnings of subsidiaries ........................... (24,901)Other .................................................................... (223,939)
Total deferred tax liabilities ........................................ (924,494)Net deferred tax assets (liabilities) .............................. ¥ (427,624)
*1 The change of valuation allowance is due to the decrease of deferred tax assets resulting from excluding SMFL and its consolidated subsidiaries from the scope of consolidation of the Company and including them in the scope of equity method affiliates and for other reasons.
*2 Net operating loss carryforwards and the amount of its deferred tax assets by expiry date.
Millions of yen
March 31, 2019 Within 1 yearMore than 1 year
to 5 yearsMore than 5 years
to 10 years More than 10 years Total
Net operating loss carryforwards* ................... ¥ 41,259 ¥ 105,321 ¥ 23,043 ¥41,190 ¥ 210,814
Valuation allowance ............. (40,810) (102,113) (22,063) (1,308) (166,296)Deferred tax assets ............... 448 3,207 979 39,881 44,517
* Net operating loss carryforwards is multiplied by statutory tax rate.
2. Significant components of difference between the statutory tax rate used by the Company and the effective income tax rate
March 31, 2018 Percentages March 31, 2019 Percentages
Statutory tax rate ........................................................ 30.86%Valuation allowance ............................................... (2.51)Difference between the Company and overseas consolidated subsidiaries ...................................... (1.89)
Foreign tax ............................................................ (1.27)Equity in gains of affiliates .................................... (1.09)Dividends exempted for income tax purposes......... (0.85)Amortization of goodwill ...................................... 0.70Other .................................................................... 0.45
Effective income tax rate ............................................. 24.40%
Statutory tax rate ........................................................ 30.62%Dividends exempted for income tax purposes......... (3.57)Equity in gains of affiliates .................................... (1.67)Difference between the Company and overseas consolidated subsidiaries ...................................... (1.62)
Expired loss carryforwards ..................................... 4.27Valuation allowance ............................................... 2.39Other .................................................................... (0.92)
Effective income tax rate ............................................. 29.50%
Changes due to application of “Partial Amendments to Accounting Standard for Tax Effect Accounting”
“Partial Amendments to Accounting Standard for Tax Effect Accounting” (ASBJ Statement No.28, February 16, 2018 (“Partial Amended Tax Effect Accounting Standard”)) has been adopted from the current fiscal year, whereby we have changed notes to deferred tax assets and liabilities.
In notes to deferred tax assets and liabilities, we have added the contents that are described in the notes (No.8, except for valuation allowance and No.9) that are stipulated from Paragraph 3 to Paragraph 5 of Partial Amended Tax Effect Accounting Standard. We do not describe the contents of the previous fiscal year in accordance with the transitional treatment stipulated in Paragraph 7 of Partial Amended Tax Effect Accounting Standard.
Notes to Consolidated Financial Statements
010_0800801371908.indd 210 2019/08/16 18:54:05

211
Sumitomo Mitsui Financial Group
SMBC Group Annual Report 2019
(Notes to asset retirement obligations)Fiscal year ended March 31, 2018There is no significant information to be disclosed.
Fiscal year ended March 31, 2019There is no significant information to be disclosed.
(Notes to real estate for rent)Fiscal year ended March 31, 2018There is no significant information to be disclosed.
Fiscal year ended March 31, 2019There is no significant information to be disclosed.
(Notes to segment and other related information)[Segment information]1. Summary of reportable segmentThe Group’s reportable segment is defined as an operating segment for which discrete financial information is available and reviewed by the Board of Directors and the Company’s Management Committee regularly in order to make decisions about resources to be allocated to the segment and assess its performance.
The businesses operated by each business unit are as follows;Wholesale Business Unit: Business to deal with domestic medium-to-large-sized enterpriseRetail Business Unit: Business to deal with domestic individual and small-to-medium-sized enterpriseInternational Business Unit: Business to deal with international (including Japanese) corporate customersGlobal Markets Business Unit: Business to deal with financial marketHead office account: Business other than businesses above
2. Method of calculating profit and loss amount by reportable segmentAccounting methods applied to the reported business segment are the same as those described in “(Notes to significant accounting policies for preparing consolidated financial statements).” In case several business units cooperate for transactions, profit and loss, and expenses related to the transactions are recognized in the business units cooperating for the transactions and those amounts are calculated in accordance with internal managerial accounting policy.
The Company does not assess assets by business segments.
Notes to Consolidated Financial Statements
010_0800801371908.indd 211 2019/08/16 18:54:05

212
Sumitomo Mitsui Financial Group
SMBC Group Annual Report 2019
3. Information on profit and loss amount by reportable segment
Millions of yen
Year ended March 31, 2018
WholesaleBusiness
Unit
RetailBusiness
Unit
InternationalBusiness
Unit
Global MarketsBusiness
Unit
Head officeaccount and
others Total
Consolidated gross profit ..... ¥ 772,949 ¥ 1,311,727 ¥ 631,950 ¥356,150 ¥ (91,725) ¥ 2,981,050Expenses .............................. (347,864) (1,027,674) (280,658) (53,936) (106,065) (1,816,197)Others. ................................ 53,576 15,516 46,933 17,575 (94,607) 38,992Consolidated net business profit .................... ¥ 478,661 ¥ 299,569 ¥ 398,225 ¥319,789 ¥(292,398) ¥ 1,203,845
Notes: 1. Figures shown in the parenthesis represent the loss.
2. “Others” includes equity in profit and loss of affiliates and cooperated profit and loss based on internal managerial accounting.
3. “Head office account and others” includes profit or loss to be eliminated as inter-segment transactions.
Millions of yen
Year ended March 31, 2019
WholesaleBusiness
Unit
RetailBusiness
Unit
InternationalBusiness
Unit
Global MarketsBusiness
Unit
Head officeaccount and
others Total
Consolidated gross profit ..... ¥ 784,886 ¥ 1,281,574 ¥ 689,603 ¥333,572 ¥(243,457) ¥ 2,846,178Expenses .............................. (345,133) (1,021,383) (333,382) (54,239) 39,087 (1,715,050)Others. ................................ 45,109 14,445 38,911 19,127 (56,447) 61,145Consolidated net business profit .................... ¥ 484,862 ¥ 274,637 ¥ 395,131 ¥298,460 ¥(260,818) ¥ 1,192,273
Notes: 1. Figures shown in the parenthesis represent the loss.
2. “Others” includes equity in profit and loss of affiliates and cooperated profit and loss based on internal managerial accounting.
3. “Head office account and others” includes profit or loss to be eliminated as inter-segment transactions.
4. Income (loss) of Sumitomo Mitsui Finance and Leasing Company, Limited (“SMFL”) for the period from January 1, 2019 to March 31, 2019 was recorded mainly as “Consolidated gross profit” and “Expenses” under “Wholesale Business Unit” and “International Business Unit,” and those figures were deducted from “Head office account and others” and recorded as “Others” under “Head office account and others.” Income (loss) of SMFL was recorded as “Equity in gains (losses) of affiliates” in the consolidated statement of income.
4. Difference between total amount of consolidated net business profit by reportable segment and ordinary profit on consolidated statements of income (adjustment of difference)
Year ended March 31, 2018 Millions of yen
Consolidated net business profit ................................................................................................................................ ¥1,203,845Other ordinary income (excluding equity in gains of affiliates) .................................................................................. 201,759Other ordinary expenses ........................................................................................................................................... (241,491)Ordinary profit on consolidated statements of income ............................................................................................... ¥1,164,113
Note: Figures shown in the parenthesis represent the loss.
Year ended March 31, 2019 Millions of yen
Consolidated net business profit ................................................................................................................................ ¥1,192,273Other ordinary income (excluding equity in gains of affiliates) .................................................................................. 166,851Other ordinary expenses ........................................................................................................................................... (223,825)Ordinary profit on consolidated statements of income ............................................................................................... ¥1,135,300
Note: Figures shown in the parenthesis represent the loss.
Notes to Consolidated Financial Statements
010_0800801371908.indd 212 2019/08/16 18:54:05

213
Sumitomo Mitsui Financial Group
SMBC Group Annual Report 2019
[Related information]Fiscal year ended March 31, 20181. Information on each serviceThere is no information to be disclosed since information on each service is similar to the segment information.
2. Geographic information(1) Ordinary income
Millions of yenJapan The Americas Europe and Middle East Asia and Oceania Total
¥4,168,743 ¥553,871 ¥564,813 ¥476,744 ¥5,764,172
Notes: 1. Consolidated ordinary income is presented as a counterpart of sales of companies in other industries.
2. Ordinary income from transactions of the Company and its domestic consolidated banking subsidiaries (excluding overseas branches) and other domestic consolidated subsidiaries is classified as “Japan.” Ordinary income from transactions of overseas branches of domestic consolidated banking subsidiaries and overseas consolidated subsidiaries is classified as “The Americas,” “Europe and Middle East” and “Asia and Oceania,” based on their locations and in consideration of their geographic proximity and other factors.
3. The Americas includes the United States, Brazil, Canada and others; Europe and Middle East includes the United Kingdom, Germany, France and others; Asia and Oceania includes China, Singapore, Australia and others except Japan.
(2) Tangible fixed assets
Millions of yenJapan The Americas Europe and Middle East Asia and Oceania Total
¥1,645,637 ¥626,147 ¥1,192,015 ¥11,330 ¥3,475,131
3. Information on major customersThere are no major customers individually accounting for 10% or more of ordinary income reported on the consolidated statements of income.
Fiscal year ended March 31, 20191. Information on each serviceThere is no information to be disclosed since information on each service is similar to the segment information.
2. Geographic information(1) Ordinary income
Millions of yenJapan The Americas Europe and Middle East Asia and Oceania Total
¥3,847,287 ¥734,495 ¥524,807 ¥628,721 ¥5,735,312
Notes: 1. Consolidated ordinary income is presented as a counterpart of sales of companies in other industries.
2. Ordinary income from transactions of the Company and its domestic consolidated banking subsidiaries (excluding overseas branches) and other domestic consolidated subsidiaries is classified as “Japan.” Ordinary income from transactions of overseas branches of domestic consolidated banking subsidiaries and overseas consolidated subsidiaries is classified as “The Americas,” “Europe and Middle East” and “Asia and Oceania,” based on their locations and in consideration of their geographic proximity and other factors.
3. The Americas includes the United States, Brazil, Canada and others; Europe and Middle East includes the United Kingdom, Germany, France and others; Asia and Oceania includes China, Singapore, Australia and others except Japan.
(2) Tangible fixed assets
Millions of yenJapan The Americas Europe and Middle East Asia and Oceania Total
¥880,935 ¥574,502 ¥23,413 ¥25,851 ¥1,504,703
3. Information on major customersThere are no major customers individually accounting for 10% or more of ordinary income reported on the consolidated statements of income.
[Information on impairment loss for fixed assets by reportable segment]The Company does not allocate impairment loss for fixed assets to the reportable segment.Impairment loss for the fiscal year ended March 31, 2018 is ¥49,900 million.Impairment loss for the fiscal year ended March 31, 2019 is ¥9,610 million.
Notes to Consolidated Financial Statements
010_0800801371908.indd 213 2019/08/16 18:54:05

214
Sumitomo Mitsui Financial Group
SMBC Group Annual Report 2019
[Information on amortization of goodwill and unamortized balance by reportable segment]
Millions of yen
Year ended March 31, 2018
WholesaleBusiness
Unit
RetailBusiness
Unit
InternationalBusiness
Unit
Global MarketsBusiness
Unit
Head officeaccount and
others Total
Amortization of goodwill .............. ¥ 681 ¥ 4,019 ¥1,006 ¥— ¥ 19,517 ¥ 25,225Unamortized balance ..................... 7,416 54,120 4,197 — 206,469 272,203
Millions of yen
Year ended March 31, 2019
WholesaleBusiness
Unit
RetailBusiness
Unit
InternationalBusiness
Unit
Global MarketsBusiness
Unit
Head officeaccount and
others Total
Amortization of goodwill .............. ¥309 ¥ 4,019 ¥5,494 ¥— ¥ 16,095 ¥ 25,919Unamortized balance ..................... — 50,100 — — 143,027 193,127
[Information on gains on negative goodwill by reportable segment]Fiscal year ended March 31, 2018There are no corresponding transactions.
Fiscal year ended March 31, 2019There are no corresponding transactions.
[Information on related parties]Fiscal year ended March 31, 2018There is no significant corresponding information to be disclosed.
Fiscal year ended March 31, 2019There is no significant corresponding information to be disclosed.
(Business Combination)<Partial sale of the shares of subsidiaries>Partial sale of the shares of Sumitomo Mitsui Finance and Leasing Company, Limited
The Company sold a portion of shares of Sumitomo Mitsui Finance and Leasing Company, Limited (“SMFL”) to SMFL on November 28, 2018 (the “Sale of the Shares”) based on an agreement concluded on March 30, 2018 between Sumitomo Corporation (“Sumitomo Corp.”), Sumitomo Mitsui Banking Corporation, SMFL, Sumitomo Mitsui Auto Service Company, Limited and SMFL Capital Co., Ltd. (“FLC”), concerning the reorganization of the joint leasing partnership of the Company and Sumitomo Corp. (the “Reorganization”). As a result, the percentage of voting rights in SMFL held by the Company was declined to 50%, and accordingly, the Company excluded SMFL and its subsidiaries, SMBC Aviation Capital Limited and FLC, etc., from the scope of consolidation and included them in the scope of equity method affiliates.
1. Objectives of the Sale of the SharesThe Company conducted the Sale of the Shares to establish an operating framework that will allow the flexible and efficient management of the joint leasing partnership’s overall operations and implementation of its business strategy by adjusting respective ownership percentage of the Company and Sumitomo Corp. in SMFL to 50%.
The Sale of the Shares is as part of the Reorganization aiming to increase the competitiveness and the sustainable growth by taking further advantage of the Company’s global client base, and the financial group’s ability to deliver diverse and cutting-edge financial solutions, and Sumitomo Corp.’s ability to construct value chains and create new business opportunities on a global basis.
2. Outline of the accounting treatment implemented1) Gains (losses) on sale of shares of subsidiaries
17,014 million yen2) Accounting treatment
The Company applied the accounting treatment stipulated in “Accounting Standard for Consolidated Financial Statements” (ASBJ Statement No.22) and “Practical Guidelines on Accounting Standards for Capital Consolidation Procedures in Preparing Consolidated Financial Statements” (JICPA Accounting Practice Committee Statement No.7).
Notes to Consolidated Financial Statements
010_0800801371908.indd 214 2019/08/16 18:54:05

215
Sumitomo Mitsui Financial Group
SMBC Group Annual Report 2019
3) Period of financial results of SMFL included in the consolidated financial statements of the CompanyFrom April 1, 2018 to December 31, 2018
Income (loss) of SMFL for the period from January 1, 2019 to March 31, 2019 was recorded as equity in gains (losses) of affiliates in the consolidated statement of income.
4) Outline of the subsidiaries excluded from the scope of consolidation (as of December 31, 2018) SMFL (Consolidated) (Reportable Segments: Wholesale Business Unit and International Business Unit)
Total assets 6,154,253 million yenLease receivables and investment assets 2,157,141 million yenTangible fixed assets 2,267,524 million yen
Total liabilities 5,435,353 million yenBorrowed money 3,101,458 million yen
Ordinary income 621,331 million yenProfit attributable to owners of parent 46,724 million yen
(Note) Ordinary income is presented as a counterpart of sales of companies in other industries.
<Business combination through acquisition>PT Bank Tabungan Pensiunan Nasional Tbk became a consolidated subsidiary of Sumitomo Mitsui Banking Corporation
On January 30, 2019, Sumitomo Mitsui Banking Corporation (“SMBC”), a consolidated subsidiary of the Company, acquired the common stock of PT Bank Tabungan Pensiunan Nasional Tbk (“BTPN”). As a result, BTPN and its one subsidiary became consolidated subsidiaries of SMBC.
On February 1, 2019, BTPN merged with PT Bank Sumitomo Mitsui Indonesia, and changed its trade name to PT Bank BTPN Tbk.
The outline of the business combination through acquisition is as follows.
1. Outline of the business combination(1) Name of the acquired company and its business
Name: PT Bank Tabungan Pensiunan Nasional TbkBusiness: Banking business
(2) Main reasons for the business combinationSMBC acquired BTPN with the aim to operate a full-fledged commercial banking business that serves both the wholesale and retail segments and develop our franchises to offer broader financial services to our customers in order to promote the Multi-Franchise strategy in Indonesia.
(3) Date of the business combinationJanuary 30, 2019
(4) Legal form of the business combinationStock acquisition
(5) Name of the entity after the business combinationSumitomo Mitsui Financial Group, Inc.
(6) The ratio of acquired voting rightsRatio of voting rights owned by SMBC immediately prior to the business combination: 40.58%Ratio of voting rights acquired additionally by SMBC on the date of business combination: 57.92%Ratio of voting rights after the acquisition: 98.50%
(7) Grounds for deciding on the acquirerSMBC acquired a majority of the voting rights of BTPN, resulting in BTPN becoming a consolidated subsidiary of SMBC.
2. Period of the acquired company’s financial result included in the consolidated financial statements of the CompanyFrom January 1, 2019 to March 31, 2019Income (loss) of the acquired company for the period from April 1, 2018 to December 31, 2018 was recorded as equity in gains (losses) of affiliates in the consolidated statement of income.
Notes to Consolidated Financial Statements
010_0800801371908.indd 215 2019/08/16 18:54:05

216
Sumitomo Mitsui Financial Group
SMBC Group Annual Report 2019
3. Acquisition cost and consideration of the acquired company
Fair value at the business combination of the common shares of BTPN held by SMBC immediately prior to the business combination 78,025 million yenConsideration (cash) for the common share of BTPN additionally acquired by SMBC on the date of business combination 111,365 million yenAcquisition cost of the acquired company 189,390 million yen
4. Difference between acquisition cost and total amount of acquisition cost of each transaction
Acquisition cost 189,390 million yenSum of acquisition costs of each transaction resulting in the acquisition 187,105 million yenDifference (gains on step acquisitions) 2,285 million yen
5. Major acquisition-related costsAdvisory fees, etc. 776 million yen
6. Amount of goodwill, reason for recognizing goodwill, amortization method and the period1) Amount of goodwill
4,707 million yen2) Reason for recognizing goodwill
The Company accounted for the difference between the acquisition cost and fair value of the acquired net assets on the date of the business combination as goodwill.
3) Amortization method and the periodThe amount of goodwill is fully amortized in the fiscal year in which it arises as the amount has no material impact.
7. Amounts of assets acquired and liabilities assumed on the date of the business combination1) Assets
Total assets: 837,523 million yenLoans and bills disounted 522,918 million yen
2) Liabilities
Total liabilities: 643,346 million yenDeposits 538,529 million yen
8. Amounts allocated to intangible fixed assets other than goodwill, breakdown by component and the weighted average amortization period by component
Intangible fixed assets other than goodwill: 50,653 million yen (13 years)Assets related to market: 9,706 million yen (20 years)Assets related to customers: 12,845 million yen (18years)Core deposits: 28,102 million yen (9 years)
9. Approximate amounts and their calculation method of impact on the consolidated statements of income for the fiscal year ended March 31, 2019, assuming that the business combination had been completed at the beginning of the fiscal year
The approximate amounts have not been disclosed since they are immaterial.
Notes to Consolidated Financial Statements
010_0800801371908.indd 216 2019/08/16 18:54:05

217
Sumitomo Mitsui Financial Group
SMBC Group Annual Report 2019
(Per Share Data)
Yen
As of and year ended March 31 2018 2019Net assets per share ................................................................................................................. ¥7,366.21 ¥7,715.91Earnings per share ................................................................................................................... 520.67 519.95Earnings per share (diluted) ..................................................................................................... 520.27 519.59
Notes: 1. Earnings per share and earnings per share (diluted) are calculated based on the following.
Millions of yen except number of shares
Year ended March 31 2018 2019Earnings per share:
Profit attributable to owners of parent ................................................................. ¥ 734,368 ¥ 726,681Amount not attributable to common stockholders ............................................... — —Profit attributable to owners of parent attributable to common stock................... ¥ 734,368 ¥ 726,681Average number of common stock during the fiscal year (in thousand) ................. 1,410,442 1,397,599
Earnings per share (diluted): Adjustment for profit attributable to owners of parent ......................................... ¥ (10) ¥ (21)
Adjustment of dilutive shares issued by consolidated subsidiaries and equity method affiliates ........................................................................................ (10) (21)
Increase in number of common stock (in thousand) .............................................. 1,052 923Stock acquisition rights .................................................................................. 1,052 923
Outline of dilutive shares which were not included in the calculation of “Earnings per share (diluted)” because they do not have dilutive effect: — —
2. Net assets per share are calculated based on the following:
Millions of yen except number of shares
March 31 2018 2019Net assets ................................................................................................................. ¥11,612,892 ¥11,451,611Amounts excluded from Net assets ........................................................................... 1,222,427 683,290
Stock acquisition rights ....................................................................................... 2,823 4,750Non-controlling interests .................................................................................... 1,219,604 678,540
Net assets attributable to common stock at the fiscal year-end .................................. ¥10,390,464 ¥10,768,320Number of common stock at the fiscal year-end used for the calculation of Net assets per share (in thousands) .......................................................................................... 1,410,558 1,395,600
Notes to Consolidated Financial Statements
010_0800801371908.indd 217 2019/08/16 18:54:06

218
Sumitomo Mitsui Financial Group
SMBC Group Annual Report 2019
(Significant Subsequent Events)Fiscal year ended March 31, 2019Repurchase and cancellation of own sharesThe board of directors of the Company resolved on May 15, 2019 to repurchase its own shares under Article 8 of its Articles of Incorporation and pursuant to Paragraph 1 of Article 459 of the Companies Act and cancel the repurchased shares pursuant to Article 178 of the Companies Act.
(1) Reason for the repurchase of own sharesThe Company will proceed with a flexible repurchase of its own shares in order to enhance shareholder returns and improve capital efficiency.
(2) Outline of the repurchase 1) Type of shares to be repurchased: Common stock2) Aggregate number of shares to be repurchased:
Up to 32,000,000 shares (Equivalent to 2.3% of the number of shares issued (excluding treasury stock))3) Aggregate amount to be repurchased: Up to JPY 100,000,000,0004) Repurchase period: From May 16, 2019 to August 30, 20195) Repurchase method:
Market purchases based on a discretionary dealing contract regarding repurchase of its own shares
(3) Outline of the cancellation1) Type of shares to be cancelled: Common stock2) Number of shares to be cancelled: All of the shares repurchased as stated in (2) above3) Scheduled cancellation date: September 20, 2019
Notes to Consolidated Financial Statements
010_0800801371908.indd 218 2019/08/16 18:54:06

219
Sumitomo Mitsui Financial Group
SMBC Group Annual Report 2019
[Consolidated Supplementary Financial Schedules][Schedule of bonds]
Millions of yen Percentages
Company Type of bondsDate of issuance
At the beginning of the fiscal year
At the end of the fiscal year
Interestrate (Note 1) Collateral
Date ofmaturity
The Company
Straight bonds, payable in U.S. dollars (Note 3) ...........................................
Mar.2016 ~ Dec.2018
2,601,531($24,485,000 thousand)
3,219,528 ($29,004,761 thousand)
2.058 ~4.306 None
Mar. 2021 ~ Feb. 2048
Straight bonds, payable in Euro (Note 3) ...........................................
Jun. 2016 ~Aug. 2018
511,154(€3,910,000 thousand)
555,064 (€4,456,556 thousand)
0.141 ~1.716 None
Jan. 2022 ~ Feb. 2033
Straight bonds, payable in Australian dollars (Note 3) ................................
Sep. 2016 ~Jul. 2018
179,956(A$2,204,000 thousand)
183,344(A$2,331,738 thousand)
3.0405 ~4.13 None
Mar. 2022 ~ Jul. 2028
Straight bonds, payable in Hong Kong dollars (Note 3) ................................ Apr. 26, 2018 —
4,242 (HK$300,000 thousand) 3.54 None Apr. 26, 2028
Subordinated bonds, payable in Yen ...Sep. 2014 ~Sep. 2016 370,809 370,669
0.469 ~1.328 None
Sep. 2024 ~ May. 2030
Subordinated bonds, payable in Yen ...Sep. 2014 ~Mar. 2018 387,654 386,312
0.3~0.61 None
Sep. 2024~Mar. 2028
Perpetual subordinated bonds, payable in Yen ..............................................
Jul. 2015 ~Dec. 2017 599,794 598,974
1.29~2.88 None Perpetual
Subordinated bonds, payable in U.S. dollars (Note 3) ................................ Apr.2, 2014
185,903($1,749,682 thousand)
191,741 ($1,727,400 thousand) 4.436 None Apr. 2, 2024
SMBC Straight bonds, payable in Yen (Note 4) ...........................................
Apr. 2013 ~Apr. 2014
100,000[50,000]
50,000[50,000] 0.254 None Apr. 19, 2019
Straight bonds, payable in U.S. dollars (Notes 3 and 4) ................................
Jan. 2012 ~Dec. 2018
2,016,383($18,977,726 thousand)
[708,687]
1,591,494($14,337,789 thousand)
[814,740]1.88 ~ 4.13 None
Jun. 2019~Mar. 2030
Subordinated bonds, payable in U.S. dollars (Note 3) ................................ May. 28, 2015
69,593($655,000 thousand)
72,705($655,000 thousand) 4.3 None May. 30,2045
Straight bonds, payable in Euro (Notes 3 ) .........................................
Jul. 2013 ~Jul. 2018
260,709(€1,994,259 thousand)
429,901(€3,451,637 thousand)
0.192 ~ 2.75 None
Apr. 2020 ~Jul. 2023
Straight bonds, payable in Pound (Notes 3) .......................................... Sep. 2018 —
36,257(£250,017 thousand) 1.193 None Sep. 7, 2020
Straight bonds, payable in Australian dollars (Notes 3 and 4) .....................
Mar. 2014 ~Dec. 2018
63,673(A$779,834 thousand)
[27,761]
41,134(A$523,137 thousand)
[17,298]2.9 ~ 3.88 None
Sep. 2019 ~Mar. 2025
Straight bonds, payable in Hong Kong dollars (Note 3) ................................
Mar. 2015 ~Apr. 2015
32,008(HK$2,364,000 thousand)
33,426(HK$2,364,000 thousand)
2.09 ~ 2.92 None
Apr. 2020 ~Apr. 2025
Straight bonds, payable in Thai Baht (Notes 3 and 4) ................................
Nov. 2016 ~Nov. 2018
25,642(THB7,500,000 thousand)
[—]
33,155(THB9,500,000 thousand)
[12,215]2 ~ 2.66 None
Nov. 2019 ~Nov. 2021
Subordinated bonds, payable in Yen (Note 4) ...........................................
Feb. 2009 ~Dec. 2011
383,567[21,500]
362,786[73,000]
1.43 ~ 2.21 None
Jul. 2019 ~Dec.2026
Subordinated bonds, payable in Euroyen ........................................... Jun. 16, 2008 2,000 — — — —
Perpetual subordinated bonds, payable in U.S. dollars (Note 3) .................... Mar.1, 2012
159,296($1,499,272 thousand)
166,395($1,499,060 thousand) 4.85 None Mar. 1, 2022
Subordinated bonds, payable in Euro (Note 3) ........................................... Nov. 9, 2010
97,815(€748,230thousand)
93,250(€748,695thousand) 4 None Nov. 9, 2020
(*1) Consolidated subsidiaries, straight bonds, payable in Yen (Notes 2 and 4) ................................
Feb. 2011 ~Mar. 2019
804,339[141,273]
706,988[108,921]
0.0052 ~ 20 None
Apr. 2019 ~Mar. 2049
(*2) Consolidated subsidiaries, specified bonds, payable in Yen (Note 2) ........................................... Mar. 24, 2017 27,901 — — — —
(*3) Consolidated subsidiaries, straight bonds, payable in U.S. dollars (Notes 2,3 and 4) .............................
Oct. 2014 ~Mar. 2019
24,742($230,387 thousand)
[3,757]
48,142 ($433,516 thousand)
[3,506]0.01 ~ 4.45 None
Apr. 2019 ~Nov. 2037
(*4) Consolidated subsidiaries, straight bonds, payable in Euro (Notes 2 and 3) ................................ Dec. 18, 2018 —
124(€1,000 thousand) 0.1 None Dec. 18, 2023
(*5) Consolidated subsidiaries, straight bonds, payable in Australian dollars (Notes 2, 3 and 4) ............................
Mar. 2016 ~Dec. 2018
1,895(A$23,220 thousand)
[166]
2,074(A$26,388 thousand)
[—]0.01~3 None
Jun. 2020~Aug. 2031
(*6) Consolidated subsidiaries, straight bonds, payable in Turkish lira (Notes 2 and 3 and 4) .......................
Jul. 2017 ~Dec. 2018
3,567(TRY132,290 thousand)
[—]
5,164(TRY259,660 thousand)
[117]0.01 ~ 15 None
Jul. 2019~Oct. 2023
(*7) Consolidated subsidiaries, straight bonds, payable in U.S. dollars (Notes 2 and 3) ................................
Jul. 2016 ~Jul. 2017
103,660($975,629 thousand) — — — —
Notes to Consolidated Financial Statements
010_0800801371908.indd 219 2019/08/16 18:54:06

220
Sumitomo Mitsui Financial Group
SMBC Group Annual Report 2019
Millions of yen Percentages
Company Type of bondsDate of issuance
At the beginning of the fiscal year
At the end of the fiscal year
Interestrate (Note 1) Collateral
Date ofmaturity
(*8) Consolidated subsidiaries, straight bonds, payable in Indonesia rupiah (Notes 2,3 and 4) .............................
Jul. 2016 ~Oct. 2017
19,080(IDR2,298,898,588 thousand)
[19,080]
19,487(IDR2,498,374,855 thousand)
[2,340]7.50 ~ 8.25 None
Jul. 2019~Oct. 2020
(*9) Consolidated subsidiaries, subordinated bonds, payable in Yen (Notes 2 and 4) ................................
Dec. 1997 ~Aug. 1999
25,000[—]
25,000[5,000]
4 ~4.15 None
Aug. 2019 ~Jan. 2028
(*10) Consolidated subsidiaries, short-term bonds, payable in Yen (Notes 2 and 4) ................................
Jun. 2017 ~Mar. 2019
1,256,600[1,256,600]
84,500[84,500]
0 ~ 0.02 None
Apr. 2019 ~Jun. 2019
Total ............................................................................. — ¥10,314,283 ¥ 9,311,867 — — —
Notes: 1. “Interest rate” indicates a nominal interest rate which is applied at respective consolidated balance sheet dates. Therefore, this rate may differ from an actual interest rate.
2. (*1) This represents straight bonds issued in yen by SMBC Nikko, a domestic consolidated subsidiary. Straight bonds issued in yen by SMFL which became an equity method affiliate in the fiscal 2018 are included in the balance at the beginning of the fiscal year.
(*2) This represents specified bond issued in yen by Otemachi 142 specified purpose enterprise. Otemachi 142 specified purpose enterprise was excluded from the scope of consolidation of the Company in the fiscal 2018.
(*3) This represents straight bonds issued in U.S. dollar by SMBC Nikko, a domestic consolidated subsidiary.
(*4) This represents straight bonds issued in Euro by SMBC Nikko, a domestic consolidated subsidiary.
(*5) This represents straight bonds issued in Australian dollar by SMBC Nikko, a domestic consolidated subsidiary.
(*6) This represents straight bonds issued in Turkish lira by SMBC Nikko, a domestic consolidated subsidiary.
(*7) This represents straight bonds issued in U.S. dollar by SMBC Aviation Capital Limited. SMBC Aviation Capital Limited became an equity method affiliate of the Company in the fiscal 2018.
(*8) This represents straight bonds issued in Indonesia rupiah by PT Bank Tabungan Pensiunan Nasional Tbk which became an overseas consolidated subsidiary of the Company in the fiscal 2018. PT Bank Tabungan Pensiunan Nasional Tbk merged with PT Bank Sumitomo Mitsui Indonesia, and changed its trade name to PT Bank BTPN Tbk in the fiscal 2018. The balance at the beginning of the fiscal year represents straight bonds issued in Indonesia rupiah by PT Bank Sumitomo Mitsui Indonesia.
(*9) This represents subordinated term bonds issued in yen by SMBC International Finance N.V., an overseas consolidated subsidiary.
(*10) This represents short-term bonds issued in yen by SMBC Nikko, a domestic consolidated subsidiary. Short-term bonds issued in yen by SMFL which became an equity method affiliate in the fiscal 2018 are included in the balance at the beginning of the fiscal year.
3. Figures showed in ( ) in “At the beginning of the fiscal year” and “At the end of the fiscal year” are in foreign currency.
4. Figures showed in [ ] in “At the beginning of the fiscal year” and “At the end of the fiscal year” are the amounts to be redeemed within one year.
5. The redemption schedule over the next 5 years after respective balance sheet dates of the consolidated subsidiaries was as follows:
Millions of yen
Within 1 yearMore than 1 year
to 2 yearsMore than 2 years
to 3 yearsMore than 3 years
to 4 yearsMore than 4 years
to 5 years
¥1,171,639 ¥1,273,387 ¥1,200,977 ¥1,057,911 ¥707,959
[Schedule of borrowings]
Millions of yen Percentages
ClassificationAt the beginning of
the fiscal yearAt the end of the fiscal year
Average interest rate Repayment Term
Borrowed money .......................................... ¥10,829,248 ¥10,656,897 0.59 —Other borrowings .................................... 10,829,248 10,656,897 0.59 Jan. 2019 ~ Perpetual
Lease obligations .......................................... 89,940 30,379 3.18 Apr. 2019 ~ Jul. 2032
Notes: 1. “Average interest rate” represents the weighted average interest rate based on the interest rates and “At the end of the fiscal year” at respective balance sheet dates of consolidated subsidiaries.
2. The redemption schedule over the next 5 years on Borrowings and Lease obligations after respective balance sheet dates of the consolidated subsidiaries was as follows:
Millions of yen
Within 1 yearMore than 1
year to 2 yearsMore than 2
years to 3 yearsMore than 3
years to 4 yearsMore than 4
years to 5 years
Other borrowings ........................... ¥8,430,682 ¥337,803 ¥201,000 ¥322,613 ¥225,578Lease obligations ............................ 7,570 6,139 4,811 3,779 3,103
Since the commercial banking business accepts deposits and raises and manages funds through the call loan and commercial paper markets as a normal course of business, the schedule of borrowings shows a breakdown of Borrowed money included in the “Liabilities” and Lease obligations included in “Other liabilities” in the consolidated balance sheet.
Notes to Consolidated Financial Statements
010_0800801371908.indd 220 2019/08/16 18:54:06

221
Sumitomo Mitsui Financial Group
SMBC Group Annual Report 2019
Reference: Commercial paper issued for funding purpose as a normal course of business is as follows:
Millions of yen PercentagesAt the beginning of
the fiscal yearAt the end of the fiscal year
Average interest rate Repayment Term
Commercial paper ........................................ ¥2,384,787 ¥2,291,813 1.85 Apr. 2019 ~ Mar. 2020
[Schedule of asset retirement obligations]Since the amount of asset retirement obligations accounts for 1% or less than the total of liabilities and net assets, the schedule of asset liability obligation is not disclosed.
[Others]Quarterly consolidated financial information in the fiscal year ended March 31, 2019 is as follows:
Millions of yen (except Earnings per share)First quarter consolidatedtotal period
Second quarter consolidatedtotal period
Third quarter consolidatedtotal period
Fiscal year ended March 31, 2019
Ordinary income .......................................... ¥1,426,372 ¥2,952,805 ¥4,391,116 ¥5,735,312Income before income taxes .......................... 330,624 675,155 923,814 1,123,579Profit attributable to owners of parent .......... 227,084 472,648 637,882 726,681Earnings per share ........................................ 161.78 337.70 456.20 519.95
YenFirst quarter consolidated
accounting period
Second quarter consolidated
accounting period
Third quarter consolidated
accounting period
Fourth quarter consolidated
accounting period
Earnings per share ........................................ ¥161.78 ¥175.97 ¥118.40 ¥63.63
Notes to Consolidated Financial Statements
010_0800801371908.indd 221 2019/08/16 18:54:06

222
Sumitomo Mitsui Financial Group
SMBC Group Annual Report 2019
(Non-consolidated financial statements)1. Non-consolidated balance sheets
Millions of yen Millions of U�S� dollars
March 31 2018 2019 2019Assets:
Current assetsCash and due from banks ������������������������������������������������������������������������� ¥ 251,680 ¥ 434,005 $ 3,910Prepaid expenses�������������������������������������������������������������������������������������� 340 365 3Accrued income ���������������������������������������������������������������������������������������� 31,638 42,124 380Accrued income tax refunds ��������������������������������������������������������������������� 67,414 118,877 1,071Other current assets ���������������������������������������������������������������������������������� 45,169 37,124 334Total current assets ����������������������������������������������������������������������������������� 396,243 632,497 5,698
Fixed assetsTangible fixed assets
Buildings ���������������������������������������������������������������������������������������������� 89 85 1Equipment�������������������������������������������������������������������������������������������� 7 5 0Construction in progress ��������������������������������������������������������������������� 13,718 13,718 124Total tangible fixed assets ������������������������������������������������������������������� 13,815 13,809 124
Intangible fixed assetsSoftware ����������������������������������������������������������������������������������������������� 296 276 2Total intangible fixed assets����������������������������������������������������������������� 296 276 2
Investments and other assetsInvestments in subsidiaries and affiliates �������������������������������������������� 6,156,181 6,085,818 54,827Long-term loans receivable from subsidiaries and affiliates ��������������� 5,537,800 6,258,343 56,381Long-term prepaid expenses �������������������������������������������������������������� 315 226 2Deferred tax assets ������������������������������������������������������������������������������ 278 414 4Other investments and other assets ���������������������������������������������������� 0 0 0Total investments and other assets ����������������������������������������������������� 11,694,576 12,344,803 111,214
Total fixed assets��������������������������������������������������������������������������������������� 11,708,687 12,358,889 111,341Total assets ���������������������������������������������������������������������������������������������������� ¥12,104,930 ¥12,991,386 $117,040
Liabilities:Current liabilities
Short-term borrowings ������������������������������������������������������������������������������ ¥ 1,228,030 ¥ 1,228,030 $ 11,063Accounts payable ������������������������������������������������������������������������������������� 11,440 8,924 80Accrued expenses ������������������������������������������������������������������������������������ 34,081 42,571 384Income taxes payable ������������������������������������������������������������������������������� 6 9 0Business office taxes payable ������������������������������������������������������������������� 75 35 0Reserve for employee bonuses����������������������������������������������������������������� 693 722 7Reserve for executive bonuses ����������������������������������������������������������������� 400 389 4Other current liabilities ������������������������������������������������������������������������������ 626 649 6Total current liabilities �������������������������������������������������������������������������������� 1,275,354 1,281,332 11,544
Fixed liabilitiesBonds �������������������������������������������������������������������������������������������������������� 5,105,279 5,790,820 52,170Long-term borrowings ������������������������������������������������������������������������������ 199,221 234,223 2,110Total fixed liabilities ����������������������������������������������������������������������������������� 5,304,500 6,025,043 54,280
Total liabilities ������������������������������������������������������������������������������������������������ 6,579,855 7,306,375 65,823Net assets:
Stockholders’ equityCapital stock ��������������������������������������������������������������������������������������������� 2,338,743 2,339,443 21,076Capital surplus
Capital reserve ������������������������������������������������������������������������������������� 1,560,221 1,560,921 14,062Other capital surplus���������������������������������������������������������������������������� 24,286 — —Total capital surplus ����������������������������������������������������������������������������� 1,584,508 1,560,921 14,062
Retained earningsOther retained earnings
Voluntary reserve ��������������������������������������������������������������������������� 30,420 30,420 274Retained earnings brought forward ����������������������������������������������� 1,581,073 1,767,989 15,928
Total retained earnings������������������������������������������������������������������������� 1,611,493 1,798,409 16,202Treasury stock ������������������������������������������������������������������������������������������� (12,493) (16,302) (147)Total stockholders’ equity ������������������������������������������������������������������������� 5,522,252 5,682,471 51,193
Stock acquisition rights ��������������������������������������������������������������������������������� 2,823 2,539 23Total net assets ���������������������������������������������������������������������������������������������� 5,525,075 5,685,011 51,216
Total liabilities and net assets ���������������������������������������������������������������������������� ¥12,104,930 ¥12,991,386 $117,040
Notes to Consolidated Financial Statements
010_0800801371908.indd 222 2019/08/16 18:54:06

223
Sumitomo Mitsui Financial Group
SMBC Group Annual Report 2019
2. Non-consolidated statements of income
Millions of yen Millions of U�S� dollars
Year ended March 31 2018 2019 2019Operating income:
Dividends on investments in subsidiaries and affiliates ���������������������������������� ¥257,001 ¥371,805 $3,350Fees and commissions received from subsidiaries ���������������������������������������� 10,226 5,665 51Interests on loans receivable from subsidiaries and affiliates ������������������������� 99,093 145,072 1,307Total operating income ������������������������������������������������������������������������������������ 366,321 522,543 4,708
Operating expenses:General and administrative expenses ������������������������������������������������������������� 23,195 24,332 219Interest on bonds �������������������������������������������������������������������������������������������� 106,052 143,809 1,296Interest on long-term borrowings �������������������������������������������������������������������� 4,285 6,449 58Total operating expenses �������������������������������������������������������������������������������� 133,533 174,591 1,573
Operating profit ��������������������������������������������������������������������������������������������������� 232,787 347,952 3,135Non-operating income:
Interest income on deposits ���������������������������������������������������������������������������� 35 32 0Fees and commissions income ����������������������������������������������������������������������� 1 1 0Other non-operating income ��������������������������������������������������������������������������� 186 178 2Total non-operating income ���������������������������������������������������������������������������� 223 212 2
Non-operating expenses:Interest on borrowings ������������������������������������������������������������������������������������ 4,298 4,298 39Fees and commissions payments ������������������������������������������������������������������� 313 254 2Amortization of bond issuance cost ���������������������������������������������������������������� 7,193 2,407 22Other non-operating expenses ����������������������������������������������������������������������� 197 — —Total non-operating expenses ������������������������������������������������������������������������� 12,002 6,960 63
Ordinary profit ������������������������������������������������������������������������������������������������������ 221,008 341,203 3,074Extraordinary gains:
Gains on sales of stocks of subsidiaries and affiliates ������������������������������������ — 106,273 957Total extraordinary gains ��������������������������������������������������������������������������������� — 106,273 957
Extraordinary losses:Losses on sales of stocks of subsidiaries and affiliates���������������������������������� 10 1,414 13Total extraordinary losses �������������������������������������������������������������������������������� 10 1,414 13
Income before income taxes ������������������������������������������������������������������������������ 220,998 446,062 4,019Income taxes-current �������������������������������������������������������������������������������������� (44,393) (27,998) (252)Income taxes-deferred ������������������������������������������������������������������������������������ 36,090 (136) (1)
Income taxes �������������������������������������������������������������������������������������������������������� (8,302) (28,134) (253)Net income ����������������������������������������������������������������������������������������������������������� ¥229,300 ¥474,196 $4,272
Yen U�S� dollars
2018 2019 2019Per share data: Earnings per share ����������������������������������������������������������������������������������������������� ¥162�57 ¥339.29 $3.06Earnings per share (diluted) ���������������������������������������������������������������������������������� 162�45 339.07 3.05
Notes to Consolidated Financial Statements
010_0800801371908.indd 223 2019/08/16 18:54:06

224
Sumitomo Mitsui Financial Group
SMBC Group Annual Report 2019
3. Non-consolidated statements of changes in net assets
Millions of yenStockholders’ equity
Capital surplus Retained earnings
Year ended March 31, 2018Capitalstock
Capitalreserve
Other capitalsurplus
Total capitalsurplus
Other retained earningsTotal retained
earningsVoluntaryreserve
Retained earningsbrought forward
Balance at the beginning of the fiscal year ��� ¥2,337,895 ¥1,559,374 ¥24,327 ¥1,583,701 ¥30,420 ¥1,570,369 ¥1,600,789Changes in the fiscal year:
Issuance of new stock ������������������� 847 847 847Cash dividends ������������������������������ (218,596) (218,596)Net income ������������������������������������� 229,300 229,300Purchase of treasury stock ������������ Disposal of treasury stock �������������� (41) (41) Net changes in items other than
stockholders’ equity in the fiscal year ����� Net changes in the fiscal year �������������� 847 847 (41) 806 — 10,704 10,704Balance at the end of the fiscal year ���� ¥2,338,743 ¥1,560,221 ¥24,286 ¥1,584,508 ¥30,420 ¥1,581,073 ¥1,611,493
Millions of yenStockholders’ equity Stock
acquisitionrights
Totalnet assetsYear ended March 31, 2018
Treasurystock Total
Balance at the beginning of the fiscal year ��� ¥(12,913) ¥5,509,473 ¥3,206 ¥5,512,680Changes in the fiscal year:
Issuance of new stock ������������������� 1,695 1,695Cash dividends ������������������������������ (218,596) (218,596)Net income ������������������������������������� 229,300 229,300Purchase of treasury stock ������������ (142) (142) (142)Disposal of treasury stock �������������� 562 521 521Net changes in items other than
stockholders’ equity in the fiscal year ����� (382) (382)Net changes in the fiscal year �������������� 420 12,778 (382) 12,395Balance at the end of the fiscal year ���� ¥(12,493) ¥5,522,252 ¥2,823 ¥5,525,075
Notes to Consolidated Financial Statements
010_0800801371908.indd 224 2019/08/16 18:54:06

225
Sumitomo Mitsui Financial Group
SMBC Group Annual Report 2019
Millions of yenStockholders’ equity
Capital surplus Retained earnings
Year ended March 31, 2019Capitalstock
Capitalreserve
Other capitalsurplus
Total capitalsurplus
Other retained earningsTotal retained
earningsVoluntaryreserve
Retained earningsbrought forward
Balance at the beginning of the fiscal year ��� ¥2,338,743 ¥1,560,221 ¥ 24,286 ¥1,584,508 ¥30,420 ¥1,581,073 ¥1,611,493Changes in the fiscal year:
Issuance of new stock ������������������� 699 699 699 Cash dividends ������������������������������ (245,576) (245,576)Net income ������������������������������������� 474,196 474,196Purchase of treasury stock ������������ Disposal of treasury stock �������������� (68) (68) Cancellation of treasury stock ������� (65,922) (65,922)Transfer from retained earnings to
capital surplus ����������������������������� 41,704 41,704 (41,704) (41,704)Net changes in items other than
stockholders’ equity in the fiscal year �������Net changes in the fiscal year �������������� 699 699 (24,286) (23,587) — 186,916 186,916Balance at the end of the fiscal year ���� ¥2,339,443 ¥1,560,921 ¥ — ¥1,560,921 ¥30,420 ¥1,767,989 ¥1,798,409
Millions of yenStockholders’ equity Stock
acquisitionrights
Totalnet assetsYear ended March 31, 2019
Treasurystock Total
Balance at the beginning of the fiscal year ��� ¥(12,493) ¥5,522,252 ¥2,823 ¥5,525,075Changes in the fiscal year:
Issuance of new stock ������������������� 1,398 1,398Cash dividends ������������������������������ (245,576) (245,576)Net income ������������������������������������� 474,196 474,196Purchase of treasury stock ������������ (70,094) (70,094) (70,094)Disposal of treasury stock �������������� 363 294 294Cancellation of treasury stock ������� 65,922 — —Transfer from retained earnings to
capital surplus ����������������������������� — —Net changes in items other than
stockholders’ equity in the fiscal year ������� (283) (283)Net changes in the fiscal year �������������� (3,809) 160,219 (283) 159,935Balance at the end of the fiscal year ���� ¥(16,302) ¥5,682,471 ¥2,539 ¥5,685,011
Notes to Consolidated Financial Statements
010_0800801371908.indd 225 2019/08/16 18:54:06

226
Sumitomo Mitsui Financial Group
SMBC Group Annual Report 2019
Millions of U� S� dollarsStockholders’ equity
Capital surplus Retained earnings
Year ended March 31, 2019Capitalstock
Capitalreserve
Other capitalsurplus
Total capitalsurplus
Other retained earningsTotal retained
earningsVoluntaryreserve
Retained earningsbrought forward
Balance at the beginning of the fiscal year ��� $21,070 $14,056 $ 219 $14,275 $274 $14,244 $14,518Changes in the fiscal year:
Issuance of new stock ������������������� 6 6 6Cash dividends ������������������������������ (2,212) (2,212)Net income ������������������������������������� 4,272 4,272Purchase of treasury stock ������������Disposal of treasury stock �������������� (1) (1)Cancellation of treasury stock ������� (594) (594)Transfer from retained earnings to
capital surplus ����������������������������� 376 376 (376) (376)Net changes in items other than
stockholders’ equity in the fiscal year �����Net changes in the fiscal year �������������� 6 6 (219) (212) — 1,684 1,684Balance at the end of the fiscal year ���� $21,076 $14,062 $ — $14,062 $274 $15,928 $16,202
Millions of U� S� dollarsStockholders’ equity Stock
acquisitionrights
Totalnet assetsYear ended March 31, 2019
Treasurystock Total
Balance at the beginning of the fiscal year ��� $(113) $49,750 $25 $49,775Changes in the fiscal year:
Issuance of new stock ������������������� 13 13Cash dividends ������������������������������ (2,212) (2,212)Net income ������������������������������������� 4,272 4,272Purchase of treasury stock ������������ (631) (631) (631)Disposal of treasury stock �������������� 3 3 3Cancellation of treasury stock ������� 594 — —Transfer from retained earnings to
capital surplus ����������������������������� — —Net changes in items other than
stockholders’ equity in the fiscal year ����� (3) (3)Net changes in the fiscal year �������������� (34) 1,443 (3) 1,441Balance at the end of the fiscal year ���� $(147) $51,193 $23 $51,216
Notes to Consolidated Financial Statements
010_0800801371908.indd 226 2019/08/16 18:54:06

227
Sumitomo Mitsui Financial Group
SMBC Group Annual Report 2019
Independent Auditor’s Report
To the Board of Directors ofSumitomo Mitsui Financial Group, Inc.:
We have audited the accompanying consolidated financial statements of Sumitomo Mitsui Financial Group, Inc. (“the Company”) and subsidiaries, which comprise the consolidated balance sheets as at March 31, 2019 and 2018, and the consolidated statements of income, comprehensive income, changes in net assets and cash flows for the years then ended, and basis of presentation, significant accounting policies and other explanatory information.
Management’s Responsibility for the Consolidated Financial Statements
Management is responsible for the preparation and fair presentation of these consolidated financial statements in accordance with accounting principles generally accepted in Japan, and for such internal control as management determines is necessary to enable the preparation of consolidated financial statements that are free from material misstatements, whether due to fraud or error.
Auditor’s Responsibility
Our responsibility is to express an opinion on these consolidated financial statements based on our audits. We conducted our audits in accordance with auditing standards generally accepted in Japan. Those standards require that we comply with ethical requirements and plan and perform the audit to obtain reasonable assurance about whether the consolidated financial statements are free from material misstatement.
An audit involves performing procedures to obtain audit evidence about the amounts and disclosures in the consolidated financial statements. The procedures selected depend on our judgement, including the assessment of the risks of material misstatement of the consolidated financial statements, whether due to fraud or error. In making those risk assessments, we consider internal control relevant to the entity’s preparation and fair presentation of the consolidated financial statements in order to design audit procedures that are appropriate in the circumstances, while the objective of the financial statement audit is not for the purpose of expressing an opinion on the effectiveness of the entity’s internal control. An audit also includes evaluating the appropriateness of accounting policies used and the reasonableness of accounting estimates made by management, as well as evaluating the overall presentation of the consolidated financial statements.
We believe that the audit evidence we have obtained is sufficient and appropriate to provide a basis for our audit opinion.
Opinion
In our opinion, the consolidated financial statements present fairly, in all material respects, the financial position of the Company and subsidiaries as at March 31, 2019 and 2018, and their financial performance and cash flows for the years then ended in accordance with accounting principles generally accepted in Japan.
Convenience Translation
The U.S. dollar amounts in the accompanying consolidated financial statements with respect to the year ended March 31, 2019 are presented solely for convenience. Our audit also included the translation of yen amounts into U.S. dollar amounts and, in our opinion, such translation has been made on the basis described in basis of presentation.
June 26, 2019Tokyo, Japan
010_0800801371908.indd 227 2019/08/16 18:54:06

228
Sumitomo Mitsui Financial Group
SMBC Group Annual Report 2019
SMBC
Supplemental Information
Consolidated Balance Sheets (Unaudited)Sumitomo Mitsui Banking Corporation and Subsidiaries
Millions of yenMillions of
U�S� dollars
March 31 2018 2019 2019Assets:Cash and due from banks �������������������������������������� *8 ¥ 52,122,407 *8 ¥ 55,747,048 $ 502,226Call loans and bills bought ������������������������������������� 1,881,879 2,665,744 24,016Receivables under resale agreements ������������������� 1,675,693 5,082,709 45,790Receivables under securities borrowing transactions ���������������������������������������������������������� 3,562,107 1,440,159 12,974
Monetary claims bought ����������������������������������������� *8 4,550,592 *8 4,582,886 41,287Trading assets �������������������������������������������������������� *8 2,408,549 *8 2,452,825 22,098Money held in trust ������������������������������������������������� 0 0 0Securities ���������������������������������������������������������������� *1, *2, *8, *16 25,217,287 *1, *2, *8, *16 23,469,621 211,438
Loans and bills discounted ������������������������������������*3, *4, *5, *6, *7,
*8, *9 75,853,934*3, *4, *5, *6, *7,
*8, *9 79,792,401 718,850Foreign exchanges ������������������������������������������������� *7 2,164,196 *7 1,715,759 15,457Lease receivables and investment assets �������������� 252,507 247,835 2,233Other assets ����������������������������������������������������������� *8 3,923,004 *8 3,571,248 32,173Tangible fixed assets ���������������������������������������������� *10, *11, *12 1,410,800 *10, *11, *12 1,409,802 12,701
Assets for rent ��������������������������������������������������� 594,576 573,292 5,165Buildings ������������������������������������������������������������ 302,996 308,990 2,784Land ������������������������������������������������������������������ 416,592 421,156 3,794Lease assets ����������������������������������������������������� 2,984 2,597 23Construction in progress ����������������������������������� 19,404 22,561 203Other tangible fixed assets ������������������������������� 74,247 81,203 732
Intangible fixed assets �������������������������������������������� 311,810 375,389 3,382Software ������������������������������������������������������������ 259,587 274,116 2,470Goodwill ������������������������������������������������������������ 12,727 12,003 108Lease assets ����������������������������������������������������� 21 11 0Other intangible fixed assets ����������������������������� 39,474 89,259 804
Net defined benefit asset ��������������������������������������� 377,768 324,672 2,925Deferred tax assets ������������������������������������������������ 28,789 23,399 211Customers’ liabilities for acceptances and guarantees ������������������������������������������������������������ 7,373,185 8,121,131 73,163
Reserve for possible loan losses ���������������������������� (387,022) (332,343) (2,994)Total assets ������������������������������������������������������������ ¥182,727,495 ¥190,690,293 $1,717,931
Supplemental Information
010_0800801371908.indd 228 2019/08/16 18:54:07

229SMBC Group Annual Report 2019
SMBC
(Continued)
Millions of yenMillions of
U�S� dollars
March 31 2018 2019 2019Liabilities and net assets:Liabilities:Deposits ����������������������������������������������������������������� *8 ¥117,227,296 *8 ¥123,190,830 $1,109,827Negotiable certificates of deposit �������������������������� 11,455,284 11,335,486 102,122Call money and bills sold ��������������������������������������� 740,928 572,778 5,160Payables under repurchase agreements ���������������� *8 5,256,519 *8 8,743,386 78,769Payables under securities lending transactions ����� *8 3,324,893 *8 680,051 6,127Commercial paper �������������������������������������������������� 2,385,705 2,291,813 20,647Trading liabilities ����������������������������������������������������� 1,907,416 1,818,610 16,384Borrowed money ���������������������������������������������������� *8, *13 13,973,112 *8, *13 15,988,948 144,045Foreign exchanges ������������������������������������������������� 906,429 1,196,960 10,783Bonds ��������������������������������������������������������������������� *14 3,255,697 *14 2,955,282 26,624Due to trust account ����������������������������������������������� 1,328,271 *8, *15 1,352,773 12,187Other liabilities �������������������������������������������������������� 3,983,839 2,929,172 26,389Reserve for employee bonuses ������������������������������ 32,826 34,283 309Reserve for executive bonuses ������������������������������ 1,333 1,249 11Net defined benefit liability ������������������������������������� 6,552 4,457 40Reserve for executive retirement benefits �������������� 671 669 6Reserve for point service program ������������������������� 966 468 4Reserve for reimbursement of deposits ����������������� 17,765 7,936 72Deferred tax liabilities ��������������������������������������������� 427,853 446,993 4,027Deferred tax liabilities for land revaluation ������������� *10 30,539 *10 30,259 273Acceptances and guarantees ��������������������������������� *8 7,373,185 *8 8,121,131 73,163Total liabilities �������������������������������������������������������� 173,637,092 181,703,543 1,636,969 Net assets:Capital stock ���������������������������������������������������������� 1,770,996 1,770,996 15,955Capital surplus ������������������������������������������������������� 1,970,412 1,966,353 17,715Retained earnings �������������������������������������������������� 3,451,151 3,743,614 33,726Treasury stock �������������������������������������������������������� (210,003) (210,003) (1,892)Total stockholders’ equity ������������������������������������� 6,982,557 7,270,960 65,504Net unrealized gains (losses) on other securities ��� 1,509,249 1,426,493 12,851Net deferred gains (losses) on hedges ������������������� (66,918) (47,281) (426)Land revaluation excess ����������������������������������������� *10 37,042 *10 36,531 329Foreign currency translation adjustments �������������� 12,710 24,371 220Accumulated remeasurements of defined benefit plans ���������������������������������������� 60,463 (5,446) (49)
Total accumulated other comprehensive income ��������������������������������������� 1,552,547 1,434,667 12,925
Stock acquisition rights ������������������������������������������ — 2,210 20Non-controlling interests ���������������������������������������� 555,298 278,910 2,513Total net assets ������������������������������������������������������ 9,090,403 8,986,749 80,962Total liabilities and net assets ������������������������������� ¥182,727,495 ¥190,690,293 $1,717,931
Supplemental Information
010_0800801371908.indd 229 2019/08/16 18:54:07

230
Sumitomo Mitsui Financial Group
SMBC Group Annual Report 2019
SMBC
Millions of yenMillions of
U�S� dollarsYear ended March 31 2018 2019 2019Ordinary income ����������������������������������������������������� ¥3,117,087 ¥3,369,898 $30,359
Interest income �������������������������������������������������� 1,901,507 2,240,944 20,189Interest on loans and discounts ������������������� 1,290,981 1,481,622 13,348Interest and dividends on securities ������������ 331,893 354,451 3,193Interest on call loans and bills bought ��������� 19,464 16,561 149Interest on receivables under resale agreements������������������������������������������������� 34,278 36,101 325
Interest on receivables under securities borrowing transactions������������������������������� 2,588 2,512 23
Interest on deposits with banks ������������������� 74,009 101,030 910Interest on lease transactions ���������������������� 7,699 6,378 57Other interest income ����������������������������������� 140,592 242,285 2,183
Trust fees ����������������������������������������������������������� 3,769 4,541 41Fees and commissions ������������������������������������� 632,125 613,741 5,529Trading income �������������������������������������������������� 85,312 80,112 722Other operating income ������������������������������������ 238,304 225,361 2,030
Lease-related income ����������������������������������� 37,239 44,732 403Installment-related income ��������������������������� 23,078 8,600 77Other ������������������������������������������������������������ 177,985 172,028 1,550
Other income ����������������������������������������������������� 256,067 205,196 1,849Gains on reversal of reserve for possible loan losses ������������������������������������������������� 43,984 35,622 321
Recoveries of written-off claims ������������������� 164 647 6Other ������������������������������������������������������������ *1 211,918 *1 168,926 1,522
Ordinary expenses ������������������������������������������������� 2,184,353 2,475,397 22,301Interest expenses ���������������������������������������������� 748,234 1,138,789 10,259
Interest on deposits ������������������������������������� 282,966 463,791 4,178Interest on negotiable certificates of deposit ��������������������������������������������������� 86,817 136,178 1,227
Interest on call money and bills sold ������������ 8,686 14,586 131Interest on payables under repurchase agreements������������������������������������������������� 48,851 122,755 1,106
Interest on payables under securities lending transactions ����������������������������������� 10,394 959 9
Interest on commercial paper ���������������������� 18,393 45,356 409Interest on borrowed money ������������������������ 133,290 197,488 1,779Interest on bonds ����������������������������������������� 88,810 87,594 789Other interest expenses ������������������������������� 70,022 70,078 631
Fees and commissions payments ��������������������� 167,832 162,563 1,465Trading losses ��������������������������������������������������� 4,127 4,430 40Other operating expenses ��������������������������������� 93,120 79,991 721
Lease-related expenses ������������������������������� 18,988 26,296 237Installment-related expenses ����������������������� 14,515 — —Other ������������������������������������������������������������ 59,617 53,694 484
General and administrative expenses ��������������� *2 1,098,224 *2 1,009,410 9,094Other expenses ������������������������������������������������� *3 72,813 *3 80,212 723
Ordinary profit �������������������������������������������������������� 932,733 894,501 8,059
Consolidated Statements of Income andConsolidated Statements of Comprehensive Income (Unaudited)Sumitomo Mitsui Banking Corporation and Subsidiaries(Consolidated Statements of Income)
Supplemental Information
010_0800801371908.indd 230 2019/08/16 18:54:07

231SMBC Group Annual Report 2019
SMBC
(Consolidated Statements of Income)
(Continued)
Millions of yenMillions of
U�S� dollarsYear ended March 31 2018 2019 2019Extraordinary gains ������������������������������������������������� ¥ 798 ¥ 2,788 $ 25
Gains on disposal of fixed assets ��������������������� 798 502 5Other extraordinary gains ���������������������������������� — *4 2,285 21
Extraordinary losses ����������������������������������������������� 46,568 8,833 80Losses on disposal of fixed assets ������������������� 2,165 4,260 38Losses on impairment of fixed assets ��������������� *5 44,402 *5 4,573 41
Income before income taxes ���������������������������������� 886,964 888,456 8,004Income taxes-current ��������������������������������������������� 212,275 165,371 1,490Income taxes-deferred ������������������������������������������� (8,370) 54,107 487Income taxes ���������������������������������������������������������� 203,904 219,479 1,977Profit ����������������������������������������������������������������������� 683,059 668,976 6,027Profit attributable to non-controlling interests �������� 55,477 51,483 464Profit attributable to owners of parent ������������������� ¥627,582 ¥617,493 $5,563
(Consolidated Statements of Comprehensive Income)
Millions of yen Millions of
U�S� dollarsYear ended March 31 2018 2019 2019Profit ����������������������������������������������������������������������� ¥683,059 ¥668,976 $6,027Other comprehensive income (losses) ������������������� *1 99,442 *1 (120,740) (1,088)
Net unrealized gains (losses) on other securities ��������������������������������������������������������� 113,345 (78,282) (705)
Net deferred gains (losses) on hedges �������������� (31,163) 27,672 249Land revaluation excess ������������������������������������ 1 — —Foreign currency translation adjustments ��������� (43,565) 12,682 114Remeasurements of defined benefit plans �������� 49,110 (67,113) (605)Share of other comprehensive income of affiliates ����������������������������������������������������������� 11,714 (15,698) (141)
Total comprehensive income ���������������������������������� 782,502 548,236 4,939Comprehensive income attributable to owners of parent ���������������������������������������������������������� 738,503 500,124 4,506
Comprehensive income attributable to non-controlling interests ����������������������������������������� 43,999 48,111 433
Supplemental Information
010_0800801371908.indd 231 2019/08/16 18:54:07

232
Sumitomo Mitsui Financial Group
SMBC Group Annual Report 2019
SMBC
Non-consolidated Balance Sheets (Unaudited)Sumitomo Mitsui Banking Corporation
Millions of yen Millions of
U�S� dollars
March 31 2018 2019 2019Assets:Cash and due from banks ������������������������������������������������������������������������������������ ¥ 49,030,209 ¥ 54,205,583 $ 488,339Call loans �������������������������������������������������������������������������������������������������������������� 1,417,562 2,134,392 19,229Receivables under resale agreements ����������������������������������������������������������������� 499,738 3,364,070 30,307Receivables under securities borrowing transactions ������������������������������������������ 3,140,151 1,222,284 11,012Monetary claims bought ��������������������������������������������������������������������������������������� 1,239,394 1,470,872 13,251Trading assets ������������������������������������������������������������������������������������������������������ 1,723,878 1,534,100 13,821Securities �������������������������������������������������������������������������������������������������������������� 25,916,718 24,336,638 219,249Loans and bills discounted ���������������������������������������������������������������������������������� 73,896,163 76,401,807 688,305Foreign exchanges ����������������������������������������������������������������������������������������������� 2,143,021 1,627,105 14,659Other assets ��������������������������������������������������������������������������������������������������������� 3,020,300 2,895,757 26,088Tangible fixed assets �������������������������������������������������������������������������������������������� 798,476 802,501 7,230Intangible fixed assets ������������������������������������������������������������������������������������������ 231,429 236,352 2,129Prepaid pension cost ������������������������������������������������������������������������������������������� 279,360 321,031 2,892Customers’ liabilities for acceptances and guarantees ��������������������������������������� 7,921,169 9,078,706 81,790Reserve for possible loan losses �������������������������������������������������������������������������� (319,868) (275,185) (2,479)Reserve for possible losses on investments �������������������������������������������������������� (14,559) (7,363) (66)Total assets ���������������������������������������������������������������������������������������������������������� ¥170,923,146 ¥179,348,654 $1,615,754 Liabilities and net assets:Liabilities:Deposits ��������������������������������������������������������������������������������������������������������������� ¥110,243,226 ¥116,091,103 $1,045,866Negotiable certificates of deposit ������������������������������������������������������������������������ 11,264,807 11,581,605 104,339Call money ������������������������������������������������������������������������������������������������������������ 928,117 796,761 7,178Payables under repurchase agreements �������������������������������������������������������������� 4,383,418 7,364,577 66,348Payables under securities lending transactions ��������������������������������������������������� 3,073,423 418,912 3,774Commercial paper ������������������������������������������������������������������������������������������������ 1,522,354 1,634,811 14,728Trading liabilities ��������������������������������������������������������������������������������������������������� 1,422,824 1,348,931 12,153Borrowed money �������������������������������������������������������������������������������������������������� 14,023,257 15,567,626 140,249Foreign exchanges ����������������������������������������������������������������������������������������������� 915,154 1,213,861 10,936Bonds ������������������������������������������������������������������������������������������������������������������� 3,211,548 2,910,794 26,223Due to trust account ��������������������������������������������������������������������������������������������� 1,276,907 1,292,699 11,646Other liabilities ������������������������������������������������������������������������������������������������������ 2,391,909 1,659,172 14,948Reserve for employee bonuses ���������������������������������������������������������������������������� 14,163 13,285 120Reserve for executive bonuses ���������������������������������������������������������������������������� 978 937 8Reserve for point service program ����������������������������������������������������������������������� 966 468 4Reserve for reimbursement of deposits ��������������������������������������������������������������� 17,307 7,425 67Deferred tax liabilities ������������������������������������������������������������������������������������������� 359,803 374,529 3,374Deferred tax liabilities for land revaluation ����������������������������������������������������������� 30,539 30,259 273Acceptances and guarantees ������������������������������������������������������������������������������� 7,921,169 9,078,706 81,790Total liabilities ������������������������������������������������������������������������������������������������������ 163,001,878 171,386,468 1,544,022 Net assets:Capital stock �������������������������������������������������������������������������������������������������������� 1,770,996 1,770,996 15,955Capital surplus ����������������������������������������������������������������������������������������������������� 1,776,830 1,774,554 15,987Retained earnings ������������������������������������������������������������������������������������������������ 3,044,175 3,196,504 28,797Treasury stock ������������������������������������������������������������������������������������������������������ (210,003) (210,003) (1,892)Total stockholders’ equity ����������������������������������������������������������������������������������� 6,381,999 6,532,053 58,847Net unrealized gains (losses) on other securities ������������������������������������������������� 1,519,691 1,427,008 12,856Net deferred gains (losses) on hedges ����������������������������������������������������������������� (6,286) (22,444) (202)Land revaluation excess ��������������������������������������������������������������������������������������� 25,863 25,568 230Total valuation and translation adjustments ������������������������������������������������������ 1,539,268 1,430,131 12,884Total net assets ���������������������������������������������������������������������������������������������������� 7,921,268 7,962,185 71,731Total liabilities and net assets ����������������������������������������������������������������������������� ¥170,923,146 ¥179,348,654 $1,615,754
Supplemental Information
010_0800801371908.indd 232 2019/08/16 18:54:07

233SMBC Group Annual Report 2019
SMBC
Non-consolidated Statements of Income (Unaudited)Sumitomo Mitsui Banking Corporation
Millions of yen Millions of
U�S� dollars
Year ended March 31 2018 2019 2019
Ordinary income ��������������������������������������������������������������������������������������������������� ¥2,540,450 ¥2,805,840 $25,278
Interest income ������������������������������������������������������������������������������������������������ 1,647,643 1,970,831 17,755
Interest on loans and discounts ����������������������������������������������������������������� 1,101,467 1,298,725 11,700
Interest and dividends on securities ���������������������������������������������������������� 349,947 345,566 3,113
Trust fees ��������������������������������������������������������������������������������������������������������� 2,038 2,250 20
Fees and commissions ����������������������������������������������������������������������������������� 512,149 524,566 4,726
Trading income ������������������������������������������������������������������������������������������������ 59,398 46,507 419
Other operating income ���������������������������������������������������������������������������������� 101,955 109,674 988
Other Income��������������������������������������������������������������������������������������������������� 217,265 152,009 1,369
Ordinary expenses ����������������������������������������������������������������������������������������������� 1,785,184 2,156,192 19,425
Interest expenses �������������������������������������������������������������������������������������������� 690,606 1,026,727 9,250
Interest on deposits ����������������������������������������������������������������������������������� 229,362 381,304 3,435
Fees and commissions payments ������������������������������������������������������������������� 182,319 182,365 1,643
Trading losses ������������������������������������������������������������������������������������������������� — 3,305 30
Other operating expenses ������������������������������������������������������������������������������� 22,334 45,846 413
General and administrative expenses ������������������������������������������������������������� 835,500 802,961 7,234
Other expenses ����������������������������������������������������������������������������������������������� 54,422 94,986 856
Ordinary profit ������������������������������������������������������������������������������������������������������ 755,266 649,647 5,853
Extraordinary gains ����������������������������������������������������������������������������������������������� 797 380 3
Extraordinary losses ��������������������������������������������������������������������������������������������� 28,641 6,355 57
Income before income taxes �������������������������������������������������������������������������������� 727,422 643,672 5,799
Income taxes - current ����������������������������������������������������������������������������������������� 168,605 136,885 1,233
Income taxes - deferred ��������������������������������������������������������������������������������������� (18,210) 29,420 265
Net income ����������������������������������������������������������������������������������������������������������� ¥ 577,028 ¥ 477,367 $ 4,301
Yen U�S� dollars
2018 2019 2019
Per share data:
Earnings per share �������������������������������������������������������������������������������������� ¥5,430�93 ¥4,492.93 $40.48
Earnings per share (diluted) ������������������������������������������������������������������������ — — —
Supplemental Information
010_0800801371908.indd 233 2019/08/16 18:54:07

234
Sumitomo Mitsui Financial Group
SMBC Group Annual Report 2019
Operating Income, Classified by Domestic and Overseas Operations
Millions of yen 2019 2018
Year ended March 31Domesticoperations
Overseasoperations Elimination Total
Domesticoperations
Overseasoperations Elimination Total
Interest income ����������������������������������������������������� ¥1,178,337 ¥1,409,909 ¥ (99,342) ¥2,488,904 ¥1,251,484 ¥986,827 ¥ (72,523) ¥2,165,788Interest expenses �������������������������������������������������� 355,524 749,988 51,970 1,157,482 296,895 450,827 27,837 775,560
Net interest income ��������������������������������������������������� 822,812 659,921 (151,312) 1,331,421 954,589 535,999 (100,360) 1,390,228Trust fees ������������������������������������������������������������������� 4,656 — — 4,656 3,884 — — 3,884
Fees and commissions ����������������������������������������� 1,033,005 230,997 (23,084) 1,240,917 1,050,071 211,755 (17,763) 1,244,063Fees and commissions payments ������������������������ 160,129 28,199 (7,308) 181,019 140,231 39,791 (2,604) 177,418
Net fees and commissions ���������������������������������������� 872,876 202,798 (15,776) 1,059,898 909,840 171,964 (15,159) 1,066,645Trading income������������������������������������������������������ 163,227 37,423 (5,974) 194,676 220,127 37,511 (11,299) 246,338Trading losses ������������������������������������������������������� 4,058 5,220 (5,974) 3,305 4,183 7,153 (11,299) 36
Net trading income ���������������������������������������������������� 159,169 32,202 — 191,371 215,944 30,357 — 246,301Other operating income ���������������������������������������� 1,291,973 286,957 (771) 1,578,159 1,460,912 403,890 (1,457) 1,863,345Other operating expenses������������������������������������� 1,172,406 149,435 (2,512) 1,319,328 1,327,062 263,573 (1,280) 1,589,355
Net other operating income��������������������������������������� 119,566 137,522 1,740 258,830 133,849 140,317 (176) 273,990
Notes: 1. Domestic operations comprise the operations of the Company, its domestic consolidated banking subsidiaries (excluding overseas branches) and other domestic consolidated subsidiaries.
2. Overseas operations comprise the operations of the overseas branches of domestic consolidated banking subsidiaries and overseas consolidated subsidiaries.
3. Inter-segment transactions are reported in the “Elimination” column.
Average Balance, Interest and Average Rate of Interest-Earning Assets and Interest-Bearing Liabilities
Domestic OperationsMillions of yen
2019 2018Year ended March 31 Average balance Interest Average rate Average balance Interest Average rateInterest-earning assets ���������������������������������������������� ¥ 84,031,845 ¥1,178,337 1.40% ¥ 92,274,420 ¥1,251,484 1�36%
Loans and bills discounted ����������������������������������� 49,778,260 765,630 1.54 56,680,119 822,397 1�45Securities �������������������������������������������������������������� 17,019,375 261,921 1.54 18,983,741 280,161 1�48Call loans and bills bought ������������������������������������ 108,697 358 0.33 81,299 412 0�51Receivables under resale agreements ������������������ 3,940,030 (3,090) (0.08) 93,971 31 0�03Receivables under securities
borrowing transactions ��������������������������������������� 5,324,298 17,746 0.33 8,896,919 14,619 0�16Deposits with banks ���������������������������������������������� 1,961,674 20,898 1.07 1,484,755 14,150 0�95Lease receivables and investment assets ������������ 1,374,202 29,773 2.17 1,870,300 51,754 2�77
Interest-bearing liabilities ������������������������������������������ ¥128,086,199 ¥ 355,524 0.28% ¥135,808,445 ¥ 296,895 0�22%Deposits ��������������������������������������������������������������� 97,629,923 58,851 0.06 99,591,183 44,051 0�04Negotiable certificates of deposit ������������������������� 5,526,249 429 0.01 5,919,870 497 0�01Call money and bills sold �������������������������������������� 580,180 189 0.03 845,376 301 0�04Payables under repurchase agreements �������������� 5,795,961 53,877 0.93 1,742,218 16,292 0�94Payables under securities lending transactions ��� 2,658,313 1,272 0.05 10,299,770 11,316 0�11Commercial paper������������������������������������������������� 101,122 11 0.01 137,316 16 0�01Borrowed money ��������������������������������������������������� 9,637,102 65,994 0.68 10,437,455 70,790 0�68Short-term bonds �������������������������������������������������� 966,046 60 0.01 1,169,237 54 0�00Bonds �������������������������������������������������������������������� 4,151,350 87,123 2.10 4,714,648 98,252 2�08
Notes: 1. Domestic operations comprise the operations of the Company, its domestic consolidated banking subsidiaries (excluding overseas branches) and other domestic consolidated subsidiaries.
2. In principle, average balances are calculated by using daily balances. However, some consolidated subsidiaries use weekly, monthly or quarterly balancesinstead.
3. “Interest-earning assets” are shown after deduction of the average balance of noninterest-earning deposits (2019, ¥44,359,932 million; 2018, ¥41,874,204 million).
Income Analysis (Consolidated)Sumitomo Mitsui Financial Group, Inc� and Subsidiaries
011_0800804261908.indd 234 2019/08/16 19:09:26

235
Sumitomo Mitsui Financial Group
SMBC Group Annual Report 2019
Overseas OperationsMillions of yen
2019 2018Year ended March 31 Average balance Interest Average rate Average balance Interest Average rateInterest-earning assets ���������������������������������������������� ¥44,546,369 ¥1,409,909 3.17% ¥42,485,121 ¥986,827 2�32%
Loans and bills discounted ����������������������������������� 26,222,907 929,632 3.55 24,442,168 683,341 2�80Securities �������������������������������������������������������������� 5,236,149 115,493 2.21 4,275,389 77,124 1�80Call loans and bills bought ������������������������������������ 2,026,876 16,192 0.80 1,740,864 19,050 1�09Receivables under resale agreements ������������������ 1,857,211 39,967 2.15 2,377,014 35,477 1�49Receivables under securities
borrowing transactions ��������������������������������������� 12,108 37 0.31 — — —Deposits with banks ���������������������������������������������� 4,830,531 99,636 2.06 5,070,548 71,232 1�40Lease receivables and investment assets ������������ 420,967 17,800 4.23 466,191 19,187 4�12
Interest-bearing liabilities ������������������������������������������ ¥38,000,522 ¥ 749,988 1.97% ¥34,920,175 ¥450,827 1�29%Deposits ��������������������������������������������������������������� 23,044,643 422,464 1.83 20,416,044 248,973 1�22Negotiable certificates of deposit ������������������������� 6,017,305 135,749 2.26 6,152,649 86,312 1�40Call money and bills sold �������������������������������������� 807,510 14,080 1.74 786,372 8,169 1�04Payables under repurchase agreements �������������� 4,186,351 82,275 1.97 4,112,837 43,247 1�05Payables under securities lending transactions ��� — — — — — —Commercial paper������������������������������������������������� 2,433,961 45,344 1.86 2,005,997 18,376 0�92Borrowed money ��������������������������������������������������� 1,033,629 32,478 3.14 970,117 19,530 2�01Short-term bonds �������������������������������������������������� — — — — — —Bonds �������������������������������������������������������������������� 193,460 7,258 3.75 167,887 5,313 3�16
Notes: 1. Overseas operations comprise the operations of the overseas branches of domestic consolidated banking subsidiaries and overseas consolidated subsidiaries.
2. In principle, average balances are calculated by using daily balances. However, some consolidated subsidiaries use weekly, monthly or quarterly balances instead.
3. “Interest-earning assets” are shown after deduction of the average balance of noninterest-earning deposits (2019, ¥3,210,358 million; 2018, ¥3,089,333 million).
Total of Domestic and Overseas OperationsMillions of yen
2019 2018Year ended March 31 Average balance Interest Average rate Average balance Interest Average rateInterest-earning assets ���������������������������������������������� ¥125,654,947 ¥2,488,904 1.98% ¥131,788,216 ¥2,165,788 1�64%
Loans and bills discounted ����������������������������������� 75,410,118 1,666,283 2.21 80,478,319 1,469,232 1�83Securities �������������������������������������������������������������� 22,035,388 364,685 1.65 23,016,994 342,013 1�49Call loans and bills bought ������������������������������������ 2,135,574 16,551 0.78 1,822,164 19,462 1�07Receivables under resale agreements ������������������ 4,891,163 20,457 0.42 1,297,130 24,566 1�89Receivables under securities
borrowing transactions ��������������������������������������� 5,336,406 17,784 0.33 8,896,919 14,619 0�16Deposits with banks ���������������������������������������������� 5,619,591 103,135 1.84 5,694,884 75,619 1�33Lease receivables and investment assets ������������ 1,795,167 47,573 2.65 2,336,490 70,941 3�04
Interest-bearing liabilities ������������������������������������������ ¥168,829,462 ¥1,157,482 0.69% ¥171,823,617 ¥ 775,560 0�45%Deposits ��������������������������������������������������������������� 119,491,850 463,989 0.39 119,140,090 283,229 0�24Negotiable certificates of deposit ������������������������� 11,543,554 136,178 1.18 12,072,519 86,810 0�72Call money and bills sold �������������������������������������� 1,387,690 14,270 1.03 1,631,748 8,471 0�52Payables under repurchase agreements �������������� 9,076,234 119,733 1.32 4,681,200 48,597 1�04Payables under securities lending transactions ��� 2,658,313 1,272 0.05 10,299,770 11,316 0�11Commercial paper������������������������������������������������� 2,535,084 45,356 1.79 2,143,314 18,393 0�86Borrowed money ��������������������������������������������������� 10,296,695 75,883 0.74 10,859,024 54,654 0�50Short-term bonds �������������������������������������������������� 966,046 60 0.01 1,169,237 54 0�00Bonds �������������������������������������������������������������������� 9,584,336 226,536 2.36 8,618,579 186,095 2�16
Notes: 1. The figures above comprise totals for domestic and overseas operations after inter-segment eliminations.2. In principle, average balances are calculated by using daily balances. However, some consolidated subsidiaries use weekly, monthly or quarterly balances
instead.3. “Interest-earning assets” are shown after deduction of the average balance of noninterest-earning deposits (2019, ¥47,559,830 million; 2018, ¥44,957,810
million).
Income Analysis (Consolidated)
011_0800804261908.indd 235 2019/08/16 19:09:26

236
Sumitomo Mitsui Financial Group
SMBC Group Annual Report 2019
Fees and CommissionsMillions of yen
2019 2018
Year ended March 31Domesticoperations
Overseasoperations Elimination Total
Domesticoperations
Overseasoperations Elimination Total
Fees and commissions ���������������������������������������������� ¥1,033,005 ¥230,997 ¥(23,084) ¥1,240,917 ¥1,050,071 ¥211,755 ¥(17,763) ¥1,244,063Deposits and loans ����������������������������������������������� 15,736 131,375 (6,541) 140,570 22,291 115,568 (4,783) 133,075Remittances and transfers ������������������������������������ 116,871 22,740 (36) 139,574 119,472 20,469 (38) 139,903Securities-related business ����������������������������������� 122,233 36,278 (6,980) 151,532 122,104 36,172 (2,029) 156,248Agency ������������������������������������������������������������������ 11,423 — — 11,423 16,559 — — 16,559Safe deposits �������������������������������������������������������� 4,544 2 — 4,547 5,223 2 — 5,225Guarantees ������������������������������������������������������������ 79,110 11,461 (4,971) 85,599 81,074 12,235 (4,475) 88,834Credit card business ��������������������������������������������� 316,877 0 — 316,878 290,782 1 — 290,783Investment trusts �������������������������������������������������� 122,475 5,286 — 127,761 147,724 6,694 — 154,418
Fees and commissions payments ����������������������������� ¥ 160,129 ¥ 28,199 ¥ (7,308) ¥ 181,019 ¥ 140,231 ¥ 39,791 ¥ (2,604) ¥ 177,418Remittances and transfers ������������������������������������ 31,501 10,630 (4) 42,127 30,206 9,616 (2) 39,820
Notes: 1. Domestic operations comprise the operations of the Company, its domestic consolidated banking subsidiaries (excluding overseas branches) and other domestic consolidated subsidiaries.
2. Overseas operations comprise the operations of the overseas branches of domestic consolidated banking subsidiaries and overseas consolidated subsidiaries.
3. Inter-segment transactions are reported in the “Elimination” column.
Trading IncomeMillions of yen
2019 2018
Year ended March 31Domesticoperations
Overseasoperations Elimination Total
Domesticoperations
Overseasoperations Elimination Total
Trading income ���������������������������������������������������������� ¥163,227 ¥37,423 ¥(5,974) ¥194,676 ¥220,127 ¥37,511 ¥(11,299) ¥246,338Gains on trading securities ����������������������������������� 83,367 — (718) 82,648 191,693 — (4,638) 187,054Gains on securities related to
trading transactions �������������������������������������������� — — — — 6,004 — (281) 5,722Gains on trading-related financial derivatives ������� 79,515 37,423 (5,245) 111,693 22,347 37,511 (6,297) 53,561Others ������������������������������������������������������������������� 345 — (10) 334 82 — (82) —
Trading losses������������������������������������������������������������ 4,058 5,220 (5,974) 3,305 4,183 7,153 (11,299) 36Losses on trading securities ��������������������������������� — 718 (718) — — 4,638 (4,638) —Losses on securities related to
trading transactions �������������������������������������������� 2,956 348 — 3,305 — 281 (281) —Losses on trading-related financial derivatives ����� 1,102 4,143 (5,245) — 4,183 2,114 (6,297) —Others ������������������������������������������������������������������� — 10 (10) — — 119 (82) 36
Notes: 1. Domestic operations comprise the operations of the Company, its domestic consolidated banking subsidiaries (excluding overseas branches) and other domestic consolidated subsidiaries.
2. Overseas operations comprise the operations of the overseas branches of domestic consolidated banking subsidiaries and overseas consolidated subsidiaries.
3. Inter-segment transactions are reported in the “Elimination” column.
Income Analysis (Consolidated)
011_0800804261908.indd 236 2019/08/16 19:09:26

237
Sumitomo Mitsui Financial Group
SMBC Group Annual Report 2019
Assets and Liabilities (Consolidated)Sumitomo Mitsui Financial Group, Inc� and Subsidiaries
Deposits and Negotiable Certificates of Deposit
Year-End BalanceMillions of yen
March 31 2019 2018Domestic operations:
Liquid deposits �������������������������������������������������������������������������������������������� ¥ 74,819,074 ¥ 70,073,538Fixed-term deposits ������������������������������������������������������������������������������������ 17,885,194 18,171,661Others ���������������������������������������������������������������������������������������������������������� 7,317,911 7,338,619Subtotal ������������������������������������������������������������������������������������������������������� 100,022,180 95,583,818Negotiable certificates of deposit ���������������������������������������������������������������� 4,962,651 5,408,020Total ������������������������������������������������������������������������������������������������������������� ¥104,984,831 ¥100,991,839
Overseas operations:Liquid deposits �������������������������������������������������������������������������������������������� ¥ 14,237,044 ¥ 13,298,126Fixed-term deposits ������������������������������������������������������������������������������������ 7,875,029 7,469,541Others ���������������������������������������������������������������������������������������������������������� 190,785 126,047Subtotal ������������������������������������������������������������������������������������������������������� 22,302,858 20,893,715Negotiable certificates of deposit ���������������������������������������������������������������� 6,202,835 5,812,264Total ������������������������������������������������������������������������������������������������������������� ¥ 28,505,693 ¥ 26,705,979
Grand total ������������������������������������������������������������������������������������������������������ ¥133,490,525 ¥127,697,819
Notes: 1. Domestic operations comprise the operations of the Company, its domestic consolidated banking subsidiaries (excluding overseas branches) and other domestic consolidated subsidiaries.
2. Overseas operations comprise the operations of the overseas branches of domestic consolidated banking subsidiaries and overseas consolidated subsidiaries.
3. Liquid deposits = Current deposits + Ordinary deposits + Savings deposits + Deposits at notice4. Fixed-term deposits represents Time deposits
Balance of Loan Portfolio, Classified by Industry
Year-End BalanceMillions of yen
March 31 2019 2018Domestic operations:
Manufacturing���������������������������������������������������������������������������������������������� ¥ 6,715,306 13.05% ¥ 6,178,840 12�46%Agriculture, forestry, fisheries and mining ��������������������������������������������������� 272,306 0.53 133,866 0�27Construction ������������������������������������������������������������������������������������������������ 730,187 1.42 755,081 1�52Transportation, communications and public enterprises ���������������������������� 5,341,650 10.38 4,963,271 10�01Wholesale and retail ������������������������������������������������������������������������������������ 4,299,232 8.35 4,197,459 8�47Finance and insurance �������������������������������������������������������������������������������� 2,282,725 4.43 2,138,843 4�31Real estate, goods rental and leasing ��������������������������������������������������������� 8,727,788 16.96 7,700,984 15�53Services ������������������������������������������������������������������������������������������������������� 4,247,592 8.25 4,180,396 8�43Municipalities ����������������������������������������������������������������������������������������������� 754,500 1.47 914,763 1�85Others ���������������������������������������������������������������������������������������������������������� 18,099,796 35.16 18,416,729 37�15Subtotal ������������������������������������������������������������������������������������������������������� ¥51,471,087 100.00% ¥49,580,236 100�00%
Overseas operations:Public sector ������������������������������������������������������������������������������������������������ ¥ 286,310 1.08% ¥ 296,236 1�27%Financial institutions ������������������������������������������������������������������������������������ 1,821,717 6.87 1,591,536 6�81Commerce and industry ������������������������������������������������������������������������������ 21,381,483 80.66 19,036,593 81�47Others ���������������������������������������������������������������������������������������������������������� 3,018,591 11.39 2,441,330 10�45Subtotal ������������������������������������������������������������������������������������������������������� ¥26,508,102 100.00% ¥23,365,696 100�00%
Total ����������������������������������������������������������������������������������������������������������������� ¥77,979,190 — ¥72,945,934 —
Notes: 1. Domestic operations comprise the operations of the Company, its domestic consolidated banking subsidiaries (excluding overseas branches) and other domestic consolidated subsidiaries.
2. Overseas operations comprise the operations of the overseas branches of domestic consolidated banking subsidiaries and overseas consolidated subsidiaries.
3. Japan offshore banking accounts are included in overseas operations’ accounts.
011_0800804261908.indd 237 2019/08/16 19:09:26

238
Sumitomo Mitsui Financial Group
SMBC Group Annual Report 2019
Reserve for Possible Loan Losses
Millions of yen March 31 2019 2018General reserve ����������������������������������������������������������������������������������������������� ¥318,233 ¥378,469Specific reserve ����������������������������������������������������������������������������������������������� 150,533 156,914Loan loss reserve for specific overseas countries ������������������������������������������ 41 704Reserve for possible loan losses ��������������������������������������������������������������������� ¥468,808 ¥536,088Amount of direct reduction ������������������������������������������������������������������������������ ¥139,981 ¥190,945
Risk-Monitored Loans
Millions of yen March 31 2019 2018Bankrupt loans ������������������������������������������������������������������������������������������������ ¥ 12,806 ¥ 27,709Non-accrual loans ������������������������������������������������������������������������������������������� 456,802 406,066Past due loans (3 months or more) ����������������������������������������������������������������� 13,444 12,822Restructured loans ������������������������������������������������������������������������������������������ 193,427 210,616Total ����������������������������������������������������������������������������������������������������������������� ¥676,481 ¥657,215Amount of direct reduction ������������������������������������������������������������������������������ ¥118,980 ¥140,488
Notes: Definition of risk-monitored loan categories1. Bankrupt loans: Loans on which accrued interest income is not recognized, and to borrowers that are undergoing bankruptcy, corporate reorganization
and rehabilitation proceedings or borrowers receiving a disposition to suspend transactions with a clearing house.2. Non-accrual loans: Loans on which accrued interest income is not recognized, excluding “Bankrupt loans” and loans on which interest payments are
deferred in order to support the borrowers’ recovery from financial difficulties.3. Past due loans (3 months or more): Loans on which the principal or interest is past due for 3 months or more, excluding loans in categories 1. and 2.4. Restructured loans: Loans to borrowers on which terms and conditions have been amended in favor of the borrowers in order to support the borrowers’
recovery from financial difficulties and facilitate collection of loans, excluding loans in categories 1. through 3.
NPLs Based on the Financial Reconstruction Act
Millions of yen March 31 2019 2018Bankrupt and quasi-bankrupt assets �������������������������������������������������������������� ¥ 89,659 ¥ 97,941Doubtful assets ����������������������������������������������������������������������������������������������� 398,295 350,884Substandard loans ������������������������������������������������������������������������������������������ 207,199 223,480Total of NPLs ��������������������������������������������������������������������������������������������������� 695,153 672,306Normal assets ������������������������������������������������������������������������������������������������� 90,694,649 85,211,809Total ����������������������������������������������������������������������������������������������������������������� ¥91,389,803 ¥85,884,115Amount of direct reduction ������������������������������������������������������������������������������ ¥ 139,981 ¥ 190,945
Notes: Definition of problem asset categories1. Bankrupt and quasi-bankrupt assets: Credits to borrowers undergoing bankruptcy, corporate reorganization, and rehabilitation proceedings, as well as
claims of a similar nature2. Doubtful assets: Credits for which final collection of principal and interest in line with original agreements is highly improbable due to deterioration of
financial position and business performance, but not insolvency of the borrower3. Substandard loans: Past due loans (3 months or more) and restructured loans, excluding 1. and 2.4. Normal assets: Credits to borrowers with good business performance and in financial standing without identified problems and not classified into the 3
categories above
Assets and Liabilities (Consolidated)
011_0800804261908.indd 238 2019/08/16 19:09:26

239
Sumitomo Mitsui Financial Group
SMBC Group Annual Report 2019
Securities
Year-End BalanceMillions of yen
March 31 2019 2018Domestic operations:
Japanese government bonds ���������������������������������������������������������������������� ¥ 6,514,573 ¥ 9,575,499Japanese local government bonds ������������������������������������������������������������� 99,164 47,032Japanese corporate bonds ������������������������������������������������������������������������� 2,582,014 2,508,618Japanese stocks ������������������������������������������������������������������������������������������ 3,618,083 4,111,234Others ���������������������������������������������������������������������������������������������������������� 5,711,745 4,692,531Subtotal ������������������������������������������������������������������������������������������������������� ¥18,525,580 ¥20,934,916
Overseas operations:Japanese government bonds ���������������������������������������������������������������������� ¥ — ¥ —Japanese local government bonds ������������������������������������������������������������� — —Japanese corporate bonds ������������������������������������������������������������������������� 68,226 75,495Japanese stocks ������������������������������������������������������������������������������������������ — —Others ���������������������������������������������������������������������������������������������������������� 5,365,181 4,645,121Subtotal ������������������������������������������������������������������������������������������������������� ¥ 5,433,407 ¥ 4,720,616
Unallocated corporate assets:Japanese government bonds ���������������������������������������������������������������������� ¥ — ¥ —Japanese local government bonds ������������������������������������������������������������� — —Japanese corporate bonds ������������������������������������������������������������������������� — —Japanese stocks ������������������������������������������������������������������������������������������ 376,373 57,175Others ���������������������������������������������������������������������������������������������������������� 2,643 —Subtotal ������������������������������������������������������������������������������������������������������� ¥ 379,016 ¥ 57,175
Total ����������������������������������������������������������������������������������������������������������������� ¥24,338,005 ¥25,712,709
Notes: 1. Domestic operations comprise the operations of the Company, its domestic consolidated banking subsidiaries (excluding overseas branches) and other domestic consolidated subsidiaries.
2. Overseas operations comprise the operations of the overseas branches of domestic consolidated banking subsidiaries and overseas consolidated subsidiaries.
3. “Others” include foreign bonds and foreign stocks.
Trading Assets and LiabilitiesMillions of yen
2019 2018
March 31Domesticoperations
Overseasoperations Elimination Total
Domesticoperations
Overseasoperations Elimination Total
Trading assets ����������������������������������������������������������� ¥4,334,415 ¥1,014,471 ¥(20,108) ¥5,328,778 ¥4,674,817 ¥938,646 ¥(27,872) ¥5,585,591Trading securities �������������������������������������������������� 2,346,123 365,398 — 2,711,521 2,896,497 228,922 — 3,125,419Derivatives of trading securities ���������������������������� 74,204 — — 74,204 74,802 — — 74,802Securities related to trading transactions ������������� — — — — — — — —Derivatives of securities related to
trading transactions �������������������������������������������� 28,120 0 — 28,121 13,834 59 — 13,894Trading-related financial derivatives ��������������������� 1,841,968 649,072 (20,108) 2,470,932 1,648,189 709,664 (27,872) 2,329,981Other trading assets���������������������������������������������� 43,997 — — 43,997 41,493 — — 41,493
Trading liabilities �������������������������������������������������������� ¥3,685,269 ¥ 554,132 ¥(20,108) ¥4,219,293 ¥3,619,541 ¥810,441 ¥(27,872) ¥4,402,110Trading securities sold for short sales ������������������ 1,872,773 119,540 — 1,992,314 2,042,937 97,043 — 2,139,980Derivatives of trading securities ���������������������������� 92,370 — — 92,370 94,962 — — 94,962Securities related to trading transactions
sold for short sales ��������������������������������������������� — — — — — — — —Derivatives of securities related to
trading transactions �������������������������������������������� 29,030 2 — 29,032 14,035 147 — 14,182Trading-related financial derivatives ��������������������� 1,691,095 434,588 (20,108) 2,105,576 1,467,606 713,250 (27,872) 2,152,983Other trading liabilities ������������������������������������������ — — — — — — — —
Notes: 1. Domestic operations comprise the operations of the Company, its domestic consolidated banking subsidiaries (excluding overseas branches) and other domestic consolidated subsidiaries.
2. Overseas operations comprise the operations of the overseas branches of domestic consolidated banking subsidiaries and overseas consolidated subsidiaries.
3. Inter-segment transactions are reported in the “Elimination” column.
Assets and Liabilities (Consolidated)
011_0800804261908.indd 239 2019/08/16 19:09:26

240
Sumitomo Mitsui Financial Group
SMBC Group Annual Report 2019
Capital (Non-consolidated)Sumitomo Mitsui Financial Group, Inc�
Changes in Number of Shares Issued and Capital Stock
Millions of yen Number of shares issued Capital stock Capital reserve
Changes Balances Changes Balances Changes BalancesJuly 26, 2017* ������������������������������������������ 387,765 1,414,443,390 847 2,338,743 847 1,560,221August 3, 2018** �������������������������������������� 326,330 1,414,769,720 699 2,339,443 699 1,560,921August 20, 2018*** ���������������������������������� (15,368,300) 1,399,401,420 — 2,339,443 — 1,560,921
Remarks:* Allotment to third parties (in-kind contribtions of monetary compensation claims):
Common stock: 387,765 sharesIssue price: ¥4,372Capitalization: ¥2,186
** Allotment to third parties (in-kind contribtions of monetary compensation claims):Common stock: 326,330 sharesIssue price: ¥4,287Capitalization: ¥2,144
*** The decrease of 15,368,300 shares is due to cancellation of treasury stock.
Number of Shares Issued
March 31, 2019 Number of shares issuedCommon stock ��������������������������������������������������������������������������������������������������������������������������������������������������������������� 1,399,401,420Total �������������������������������������������������������������������������������������������������������������������������������������������������������������������������������� 1,399,401,420
011_0800804261908.indd 240 2019/08/16 19:09:26

241
Sumitomo Mitsui Financial Group
SMBC Group Annual Report 2019
Stock Exchange ListingsTokyo Stock Exchange (First Section)Nagoya Stock Exchange (First Section)New York Stock Exchange** The Company listed its ADRs on the New York Stock Exchange.
Number of Common Shares, Classified by Type of Shareholders
March 31, 2019Number of
shareholdersNumber of
unitsPercentage of
total
Japanese government and local government ������������������������������������������������������������������ 7 4,774 0�03%Financial institutions ��������������������������������������������������������������������������������������������������������� 340 4,134,151 29�58Securities companies ������������������������������������������������������������������������������������������������������� 57 995,174 7�12Other institutions �������������������������������������������������������������������������������������������������������������� 6,697 1,232,156 8�82Foreign institutions ����������������������������������������������������������������������������������������������������������� 1,178 5,964,312 42�68Foreign individuals ����������������������������������������������������������������������������������������������������������� 374 5,990 0�04Individuals and others ������������������������������������������������������������������������������������������������������ 264,799 1,638,658 11�73Total ���������������������������������������������������������������������������������������������������������������������������������� 273,452 13,975,215 100�00%Fractional shares (shares) ������������������������������������������������������������������������������������������������� — 1,879,920 —
Notes: 1. Of 3,800,918 shares in treasury stock, 38,009 units are included in “Individuals and others” and the remaining 18 shares are included in “Fractional shares.”2. “Other institutions” and “Fractional shares” includes 29 units and 48 shares, held at Japan Securities Depository Center, Incorporated.
Principal Shareholders
March 31, 2019Number of
sharesPercentage of
shares outstanding
The Master Trust Bank of Japan, Ltd� (Trust Account) �������������������������������������������������������������������������������� 82,697,100 5�92%Japan Trustee Services Bank, Ltd� (Trust Account) ������������������������������������������������������������������������������������� 82,028,200 5�87NATSCUMCO* ��������������������������������������������������������������������������������������������������������������������������������������������� 40,320,314 2�88Japan Trustee Services Bank, Ltd� (Trust Account 9) ���������������������������������������������������������������������������������� 38,808,100 2�78Japan Trustee Services Bank, Ltd� (Trust Account 5) ���������������������������������������������������������������������������������� 27,285,700 1�95SSBTC CLIENT OMNIBUS ACCOUNT**����������������������������������������������������������������������������������������������������� 27,109,403 1�94JP MORGAN CHASE BANK 385151*** ������������������������������������������������������������������������������������������������������� 24,345,470 1�74JPMorgan Securities Japan Co�, Ltd� ��������������������������������������������������������������������������������������������������������� 22,885,621 1�63Japan Trustee Services Bank, Ltd� (Trust Account 7) ���������������������������������������������������������������������������������� 22,298,600 1�59STATE STREET BANK WEST CLIENT - TREATY 505234*** ����������������������������������������������������������������������� 20,483,327 1�46Total ������������������������������������������������������������������������������������������������������������������������������������������������������������� 388,261,835 27�82%
* Standing agent: Sumitomo Mitsui Banking Corporation** Standing agent: The Hongkong and Shanghai Banking Corporation Limited, Tokyo Branch, Custody Services Department*** Standing agent: Mizuho Bank, Ltd. Settlement Service DepartmentNotes: 1. BlackRock Japan Co., Ltd. has submitted a Change Report of Possession of Large Volume regarding its shareholding as of March 22, 2017. It stated that
BlackRock Japan Co., Ltd. and nine other shareholders held the following common shares in the Company as of March 15, 2017. But, these ten are not included in the above Principal Shareholders because the Company was unable to confirm the number of shares owned by them at the end of the fiscal year ended March 31, 2019. The Change Report of Possession of Large Volume is detailed as follows: Principal Shareholder: BlackRock Japan Co., Ltd.(and nine other joint holders) Number of shares held: 90,686,690 shares (including joint ownership) Shareholding ratio: 6.41%
2. Mizuho Securities Co., Ltd. has submitted a Report of Possession of Large Volume regarding its shareholding as of September 25, 2018. It stated that Mizuho Securities Co., Ltd. and two other shareholders held the following common shares in the Company as of September 14, 2018. But, these three are not included in the above Principal Shareholders because the Company was unable to confirm the number of shares owned by them at the end of the fiscal year ended March 31, 2019. The Report of Possession of Large Volume is detailed as follows: Principal Shareholder: Mizuho Securities Co., Ltd. (and two other joint holders) Number of shares held: 70,765,251 shares (including joint ownership) Shareholding ratio: 5.06%
3. Sumitomo Mitsui Trust Bank, Limited has submitted a Change Report of Possession of Large Volume regarding its shareholding as of December 20, 2018. It stated that Sumitomo Mitsui Trust Asset Management Co., Ltd. and another shareholder held the following common shares in the Company as of December 14, 2018. But, these two are not included in the above Principal Shareholders because the Company was unable to confirm the number of shares owned by them at the end of the fiscal year ended March 31, 2019. The Change Report of Possession of Large Volume is detailed as follows: Principal Shareholder: Sumitomo Mitsui Trust Asset Management Co., Ltd. (and another joint holder) Number of shares held: 71,835,000 shares (including joint ownership) Shareholding ratio: 5.13%
4. Mitsubishi UFJ Financial Group, Inc. has submitted a Change Report of Possession of Large Volume regarding its shareholding as of February 4, 2019. It stated that Mitsubishi UFJ Trust and Banking Corporation and two other shareholders held the following common shares in the Company as of January 28, 2019. But, these three are not included in the above Principal Shareholders because the Company was unable to confirm the number of shares owned by them at the end of the fiscal year ended March 31, 2019. The Change Report of Possession of Large Volume is detailed as follows: Principal Shareholder: Mitsubishi UFJ Trust and Banking Corporation(and two other joint holders) Number of shares held: 55,938,703 shares (including joint ownership) Shareholding ratio: 4.00%
Capital (Non-consolidated)
011_0800804261908.indd 241 2019/08/16 19:09:26

242
Sumitomo Mitsui Financial Group
SMBC Group Annual Report 2019
Stock OptionsMarch 31 2019Number of shares granted�������������������������������������������������������������������������������������������������������� 66,900 sharesType of stock ���������������������������������������������������������������������������������������������������������������������������� Common stockIssue price �������������������������������������������������������������������������������������������������������������������������������� ¥2,216 per shareAmount capitalized when shares are issued ���������������������������������������������������������������������������� ¥1,108 per shareExercise period of stock options ���������������������������������������������������������������������������������������������� From August 13, 2010 to August 12, 2040Date of resolution: Meeting of the Board of Directors held on July 28, 2010
March 31 2019Number of shares granted�������������������������������������������������������������������������������������������������������� 187,200 sharesType of stock ���������������������������������������������������������������������������������������������������������������������������� Common stockIssue price �������������������������������������������������������������������������������������������������������������������������������� ¥1,873 per shareAmount capitalized when shares are issued ���������������������������������������������������������������������������� ¥937 per shareExercise period of stock options ���������������������������������������������������������������������������������������������� From August 16, 2011 to August 15, 2041Date of resolution: Meeting of the Board of Directors held on July 29, 2011
March 31 2019Number of shares granted�������������������������������������������������������������������������������������������������������� 226,400 sharesType of stock ���������������������������������������������������������������������������������������������������������������������������� Common stockIssue price �������������������������������������������������������������������������������������������������������������������������������� ¥2,043 per shareAmount capitalized when shares are issued ���������������������������������������������������������������������������� ¥1,022 per shareExercise period of stock options ���������������������������������������������������������������������������������������������� From August 15, 2012 to August 14, 2042Date of resolution: Meeting of the Board of Directors held on July 30, 2012
March 31 2019Number of shares granted�������������������������������������������������������������������������������������������������������� 76,000 sharesType of stock ���������������������������������������������������������������������������������������������������������������������������� Common stockIssue price �������������������������������������������������������������������������������������������������������������������������������� ¥4,160 per shareAmount capitalized when shares are issued ���������������������������������������������������������������������������� ¥2,080 per shareExercise period of stock options ���������������������������������������������������������������������������������������������� From August 14, 2013 to August 13, 2043Date of resolution: Meeting of the Board of Directors held on July 29, 2013
March 31 2019Number of shares granted�������������������������������������������������������������������������������������������������������� 91,400 sharesType of stock ���������������������������������������������������������������������������������������������������������������������������� Common stockIssue price �������������������������������������������������������������������������������������������������������������������������������� ¥3,662 per shareAmount capitalized when shares are issued ���������������������������������������������������������������������������� ¥1,831 per shareExercise period of stock options ���������������������������������������������������������������������������������������������� From August 15, 2014 to August 14, 2044Date of resolution: Meeting of the Board of Directors held on July 30, 2014
March 31 2019Number of shares granted�������������������������������������������������������������������������������������������������������� 105,600 sharesType of stock ���������������������������������������������������������������������������������������������������������������������������� Common stockIssue price �������������������������������������������������������������������������������������������������������������������������������� ¥4,905 per shareAmount capitalized when shares are issued ���������������������������������������������������������������������������� ¥2,453 per shareExercise period of stock options ���������������������������������������������������������������������������������������������� From August 18, 2015 to August 17, 2045Date of resolution: Meeting of the Board of Directors held on July 31, 2015
March 31 2019Number of shares granted�������������������������������������������������������������������������������������������������������� 145,900 sharesType of stock ���������������������������������������������������������������������������������������������������������������������������� Common stockIssue price �������������������������������������������������������������������������������������������������������������������������������� ¥2,812 per shareAmount capitalized when shares are issued ���������������������������������������������������������������������������� ¥1,406 per shareExercise period of stock options ���������������������������������������������������������������������������������������������� From August 15, 2016 to August 14, 2046Date of resolution: Meeting of the Board of Directors held on July 26, 2016
Capital (Non-consolidated)
011_0800804261908.indd 242 2019/08/16 19:09:26

243
Sumitomo Mitsui Financial Group
SMBC Group Annual Report 2019
Basel III Information
The consolidated capital ratio is calculated using the method stipulated in “Standards for Bank Holding Company to Examine the Adequacy of Its Capital Based on Assets, Etc. Held by It and Its Subsidiaries Pursuant to Article 52-25 of the Banking Act” (Notification No. 20 issued by the Japanese Financial Services Agency in 2006; hereinafter referred to as “the Notification”).In addition to the method stipulated in the Notification to calculate the consolidated capital ratio (referred to as “International Standard” in the Notification), we have adopted the Advanced Internal Ratings-Based (AIRB) approach for calculating credit risk-weighted asset amounts and the Advanced Measurement Approach (AMA) for calculating the operational risk equivalent amount.“Consolidated Capital Ratio Information” was prepared principally based on the Notification, and the terms and details in the section may differ from those in other sections of this report.
■ Scope of Consolidation1. Consolidated Capital Ratio Calculation
• Number of consolidated subsidiaries: 173 Please refer to “Principal Subsidiaries and Affiliates” on page 140 for their names and business outline.• Scope of consolidated subsidiaries for calculation of the consolidated capital ratio is based on the scope of consolidated subsidiaries for preparing consolidated financial statements.• There are no affiliates to which the proportionate consolidation method is applied.
2. Restrictions on Movement of Funds and Capital within Holding Company Group There are no special restrictions on movement of funds and capital among us and its group companies.
3. Names of companies among subsidiaries of bank-holding companies (other financial institutions), with the Basel Capital Accord required amount, and total shortfall amount
Not applicable.
■ Capital Structure Information (Consolidated Capital Ratio (International Standard))Regarding the calculation of the capital ratio of Sumitomo Mitsui Financial Group, an external audit was performed by KPMG AZSA LLC pursuant to the Technical Practical Guidelines 4465 “Practical Guidelines on Agreed-Upon Procedures for the Capital Ratio Calculation Framework.”The aforementioned external audit was not meant to provide a statement of opinions or conclusions on the capital ratio itself or our internal control framework for calculating the capital ratio, but to present us a report on the results of the procedure performed within the scope agreed upon between the external auditor and us. It constitutes neither part of the audit of consolidated financial statements nor part of the audit of our internal control over financial reporting.
Capital Ratio Information (Consolidated)Sumitomo Mitsui Financial Group, Inc. and Subsidiaries
012_0800885851907.indd 243 2019/08/16 19:25:53

244
Sumitomo Mitsui Financial Group
SMBC Group Annual Report 2019
■ CC1: Composition of regulatory capital (Millions of yen, except percentages)
Basel IIITemplate No. Items
a b c
As of March 31, 2019
As of March 31, 2018
Reference to Template
CC2Common Equity Tier 1 capital: instruments and reserves (1)
1a+2-1c-26 Directly issued qualifying common share capital plus related capital surplus and retainedearnings 8,921,854 8,510,089
1a of which: capital and capital surplus 3,078,490 3,096,9582 of which: retained earnings 5,992,247 5,552,573
1c of which: treasury stock (–) 16,302 12,49326 of which: national specific regulatory adjustments (earnings to be distributed) (–) 132,582 126,950
of which: other than the above — —1b Stock acquisition rights to common shares 2,539 2,823
3 Accumulated other comprehensive income and other disclosed reserves 1,713,884 1,753,424 (a)
5 Common share capital issued by subsidiaries and held by third parties (amount allowed in group CET1) 2,181 332
6 Common Equity Tier 1 capital: instruments and reserves (A) 10,640,460 10,266,670Common Equity Tier 1 capital: regulatory adjustments (2)
8+9 Total intangible assets (net of related tax liability, excluding those relating to mortgage servicing rights) 657,131 711,731
8 of which: goodwill (including those equivalent) 247,659 292,3189 of which: other intangibles other than goodwill and mortgage servicing rights 409,472 419,413
10 Deferred tax assets that rely on future profitability excluding those arising from temporarydifferences (net of related tax liability) 2,208 1,432
11 Net deferred gains or losses on hedges (52,610) (67,433)12 Shortfall of eligible provisions to expected losses 81,582 66,25613 Securitisation gain on sale 60,286 60,21514 Gains and losses due to changes in own credit risk on fair valued liabilities 3,940 2,64615 Net defined benefit asset 228,913 266,46816 Investments in own shares (excluding those reported in the Net assets section) 4,491 7,98117 Reciprocal cross-holdings in common equity — —
18Investments in the capital of banking, financial and insurance entities that are outside thescope of regulatory consolidation, net of eligible short positions, where the bank does not own more than 10% of the issued share capital (amount above the 10% threshold)
— —
19+20+21 Amount exceeding the 10% threshold on specified items — —19 of which: significant investments in the common stock of financials — —20 of which: mortgage servicing rights — —21 of which: deferred tax assets arising from temporary differences (net of related tax liability) — —22 Amount exceeding the 15% threshold on specified items — —23 of which: significant investments in the common stock of financials — —24 of which: mortgage servicing rights — —25 of which: deferred tax assets arising from temporary differences (net of related tax liability) — —
27 Regulatory adjustments applied to Common Equity Tier 1 due to insufficient Additional Tier 1and Tier 2 to cover deductions — —
28 Common Equity Tier 1 capital: regulatory adjustments (B) 985,942 1,049,297Common Equity Tier 1 capital (CET1)
29 Common Equity Tier 1 capital (CET1) ((A)-(B)) (C) 9,654,517 9,217,372
Basel III Information
012_0800885851907.indd 244 2019/08/16 19:25:53

245
Sumitomo Mitsui Financial Group
SMBC Group Annual Report 2019
(Millions of yen, except percentages)
Basel IIITemplate No. Items
a b c
As of March 31, 2019
As of March 31, 2018
Reference to Template
CC2 Additional Tier 1 capital: instruments (3)
30
31a Directly issued qualifying Additional Tier 1 instruments plus related capital surplus of which:classified as equity under applicable accounting standards and the breakdown — —
31b Stock acquisition rights to Additional Tier 1 instruments — —
32 Directly issued qualifying Additional Tier 1 instruments plus related capital surplus of which:classified as liabilities under applicable accounting standards 598,974 599,794
Qualifying Additional Tier 1 instruments plus related capital surplus issued by special purposevehicles and other equivalent entities — —
34-35 Additional Tier 1 instruments issued by subsidiaries and held by third parties (amount allowed in group AT1) 62,752 224,359
33+35 Eligible Tier 1 capital instruments subject to transitional arrangements included in AdditionalTier 1 capital: instruments 436,500 650,343
33 of which: instruments issued by bank holding companies and their special purpose vehicles 436,500 650,343
35 of which: instruments issued by subsidiaries (excluding bank holding companies’ special purpose vehicles) — —
36 Additional Tier 1 capital: instruments (D) 1,098,227 1,474,497Additional Tier 1 capital: regulatory adjustments
37 Investments in own Additional Tier 1 instruments — —38 Reciprocal cross-holdings in Additional Tier 1 instruments — —
39Investments in the capital of banking, financial and insurance entities that are outside the scope of regulatory consolidation, net of eligible short positions, where the bank does not own more than 10% of the issued common share capital of the entity (amount above the 10% threshold)
— —
40 Significant investments in the Additional Tier 1 capital of banking, financial and insurance entities that are outside the scope of regulatory consolidation (net of eligible short positions) 25,516 81,640
42 Regulatory adjustments applied to Additional Tier 1 due to insufficient Tier 2 to coverdeductions — —
43 Additional Tier 1 capital: regulatory adjustments (E) 25,516 81,640Additional Tier 1 capital (AT1)
44 Additional Tier 1 capital ((D)-(E)) (F) 1,072,710 1,392,857Tier 1 capital (T1 = CET1 + AT1)
45 Tier 1 capital (T1 = CET1 + AT1) ((C)+(F)) (G) 10,727,228 10,610,229Tier 2 capital: instruments and provisions (4)
46
Directly issued qualifying Tier 2 instruments plus related capital surplus of which: classified asequity under applicable accounting standards and the breakdown — —
Stock acquisition rights to Tier 2 instruments — —Directly issued qualifying Tier 2 instruments plus related capital surplus of which: classified asliabilities under applicable accounting standards 997,723 993,367
Qualifying Tier 2 instruments plus related capital surplus issued by special purpose vehiclesand other equivalent entities — —
48-49 Tier 2 instruments issued by subsidiaries and held by third parties (amount allowed in group T2) 15,087 49,810
47+49 Eligible Tier 2 capital instruments subject to transitional arrangements included in Tier 2:instruments and provisions 488,092 625,381
47 of which: instruments issued by bank holding companies and their special purpose vehicles — —
49 of which: instruments issued by subsidiaries (excluding bank holding companies’ special purpose vehicles) 488,092 625,381
50 Total of general reserve for possible loan losses and eligible provisions included in Tier 2 62,357 75,32850a of which: general reserve for possible loan losses 62,357 75,32850b of which: eligible provisions — —
51 Tier 2 capital: instruments and provisions (H) 1,563,260 1,743,888
Basel III Information
012_0800885851907.indd 245 2019/08/16 19:25:53

246
Sumitomo Mitsui Financial Group
SMBC Group Annual Report 2019
(Millions of yen, except percentages)
Basel IIITemplate No. Items
a b c
As of March 31, 2019
As of March 31, 2018
Reference to Template
CC2Tier 2 capital: regulatory adjustments (5)
52 Investments in own Tier 2 instruments 0 053 Reciprocal cross-holdings in Tier 2 instruments and other TLAC liabilities — —
54
Investments in the capital and other TLAC liabilities of banking, financial and insurance entities that are outside the scope of regulatory consolidation, net of eligible short positions, where the bank does not own more than 10% of the issued common share capital of the entity (amount above the 10% threshold)
— —
54a
Investments in the other TLAC liabilities of banking, financial and insurance entities that are outside the scope of regulatory consolidation, where the bank does not own more than 10% of the issued common share capital of the entity: amount previously designated for the 5% threshold but that no longer meets the conditions
—
55Significant investments in the capital and other TLAC liabilities of banking, financial and insurance entities that are outside the scope of regulatory consolidation (net of eligible short positions)
50,000 50,000
57 Tier 2 capital: regulatory adjustments (I) 50,000 50,000Tier 2 capital (T2)
58 Tier 2 capital (T2) ((H)-(I)) (J) 1,513,260 1,693,888Total capital (TC = T1 + T2)
59 Total capital (TC = T1 + T2) ((G) + (J)) (K) 12,240,489 12,304,117Risk weighted assets (6)
60 Total risk-weighted assets (RWA) (L) 58,942,791 63,540,277Capital ratios (consolidated) and buffers (7)
61 Common Equity Tier 1 risk-weighted capital ratio (consolidated) ((C)/(L)) 16.37% 14.50%62 Tier 1 risk-weighted capital ratio (consolidated) ((G)/(L)) 18.19% 16.69%63 Total risk-weighted capital ratio (consolidated) ((K)/(L)) 20.76% 19.36%64 CET1 specific buffer requirement 3.60% 2.65%65 of which: capital conservation buffer requirement 2.50% 1.87%66 of which: countercyclical buffer requirement 0.10% 0.03%67 of which: G-SIB/D-SIB additional requirement 1.00% 0.75%68 CET1 available after meeting the minimum capital requirements 11.87% 10.00%
Regulatory adjustments (8)
72 Non-significant investments in the capital and other TLAC liabilities of other financials that are below the thresholds for deduction (before risk weighting) 816,189 699,361
73 Significant investments in the common stock of other financials that are below the thresholds for deduction (before risk weighting) 921,378 617,191
74 Mortgage servicing rights that are below the thresholds for deduction (before risk weighting) — —
75Deferred tax assets arising from temporary differences that are below the thresholds fordeduction (before risk weighting)
2,605 3,997
Provisions included in Tier 2 capital: instruments and provisions (9)76 Provisions (general reserve for possible loan losses) 72,970 75,32877 Cap on inclusion of provisions (general reserve for possible loan losses) 62,357 85,252
78 Provisions eligible for inclusion in Tier 2 in respect of exposures subject to internalratings-based approach (prior to application of cap) (if the amount is negative, report as “nil”) — —
79 Cap for inclusion of provisions in Tier 2 under internal ratings-based approach 265,937 288,292Capital instruments subject to transitional arrangements (10)
82 Current cap on AT1 instruments subject to transitional arrangements 487,757 650,343
83 Amount excluded from AT1 due to cap (excess over cap after redemptions and maturities) (if the amount is negative, report as “nil”) — 79,809
84 Current cap on T2 instruments subject to transitional arrangements 610,284 813,713
85 Amount excluded from T2 due to cap (excess over cap after redemptions and maturities) (if the amount is negative, report as “nil”) — —
(Millions of yen)
Items As of March 31, 2019 As of March 31, 2018Required capital ((L) ✕ 8%) 4,715,423 5,083,222
Basel III Information
012_0800885851907.indd 246 2019/08/16 19:25:53

247
Sumitomo Mitsui Financial Group
SMBC Group Annual Report 2019
■ Overview of RWA (OV1) (Millions of yen)
OV1: Overview of RWA
Basel IIITemplate
No.
a b c d
RWA Minimum capital requirements
As of March
31, 2019
As of March
31, 2018
As of March
31, 2019
As of March
31, 20181 Credit risk (CR) (excluding counterparty credit risk) 39,966,325 44,008,267 3,360,021 3,691,9562 Of which: Standardised Approach (SA) 2,843,844 4,773,898 227,507 381,9113 Of which: internal ratings-based (IRB) approach 33,898,986 35,686,496 2,874,634 3,026,214
Of which: significant investments in commercial entities — — — —Of which: lease residual value 52,206 467,926 4,176 37,434Other assets 3,171,288 3,079,946 253,703 246,395
4 Counterparty credit risk (CCR) 4,111,505 3,918,579 333,623 318,1445 Of which: standardised approach for counterparty credit risk (SA-CCR) — — — —
Of which: current exposure method (CEM) 1,094,827 1,051,112 91,618 88,1246 Of which: Expected Positive Exposure (EPE) — — — —
Of which: Credit Valuation Adjustment (CVA) 2,376,345 2,252,318 190,107 180,185Of which: Central Counterparty (CCP) 177,913 172,536 14,233 13,802Others 462,418 442,610 37,664 36,031
7 Equity positions in banking book under market-based approach 699,163 1,134,141 59,289 96,1758 Equity investments in funds – look-through approach 2,107,834 168,6269 Equity investments in funds – mandate-based approach — —
Equity investments in funds – simple approach (subject to 250% risk weight) 20,577 1,669Equity investments in funds – simple approach (subject to 400% risk weight) 317,353 26,834
10 Equity investments in funds – fall-back approach 41,684 3,334Equity investment in funds (SA) 140,870 11,269Equity investment in funds (IRB) 3,125,588 265,049
11 Settlement risk — — — —12 Securitisation exposures in banking book 1,136,269 817,315 90,901 69,249
13 Of which: securitisation IRB approach (SEC-IRBA) or internal assessment approach (IAA) 970,149 77,611
14 Of which: securitisation external ratings-based approach (SEC-ERBA) 158,514 12,68115 Of which: securitisation standardised approach (SEC-SA) — —
Of which: IRB ratings-based approach (RBA) 47,692 4,044Of which: IRB Supervisory Formula Approach (SFA) 184,229 15,622Of which: Standardised Approach (SA) 12,334 986Of which: Risk weight (RW) 1250% is applied 7,605 573,058 608 48,595
16 Market risk 2,323,156 2,697,316 185,852 215,78517 Of which: standardised approach (SA) 752,059 1,135,003 60,164 90,80018 Of which: internal model approaches (IMA) 1,571,096 1,562,313 125,687 124,98519 Operational risk 3,617,535 3,549,141 289,402 283,93120 Of which: Basic Indicator Approach 776,185 700,718 62,094 56,05721 Of which: Standardised Approach — — — —22 Of which: Advanced Measurement Approach 2,841,349 2,848,423 227,307 227,87323 Amounts below the thresholds for deduction (subject to 250% risk weight) 2,309,872 1,552,824 195,867 131,661
RWA subject to transitional arrangements — — — —24 Floor adjustment — — — —25 Total (after applying scaling factors) 58,942,791 63,540,277 4,715,423 5,083,222
Basel III Information
012_0800885851907.indd 247 2019/08/16 19:25:54

248
Sumitomo Mitsui Financial Group
SMBC Group Annual Report 2019
■ Credit Quality of Assets1. Overview of Criteria for Accounting Provisions and Write-Offs
(1) Policies and Methods of Provisions and Write-OffsFor “Policies and Methods of Provisions and Write-Offs,” please refer to pages 112 to 116 (Risk Management - 3. Credit Risk Management Methods - (1) Credit Risk Assessment and Quantification, (4) Self-Assessment, Write-Offs and Provisions, Non-Performing Loans Disclosure).
(2) Extent of the Number of Delinquency Days of “Past Due Loans of Three Months or More” that are Allowed Not to Classify Their Loan Category as “Doubtful Assets” or Below (or Not to Judge as Loans to Parties Classified as Potentially Bankrupt Borrowers or Below) and Reasons ThereofAt SMBC, as a core bank of SMBC Group, the delinquency period of past due loans of three months or more that are allowed not to classify loans as doubtful assets or below (or not to judge as loans to parties classified as potentially bankrupt borrowers or below) is generally less than six months, and they are loans to parties that are expected to improve business conditions. If there are any past due loans of six months or more, they shall be in principle classified as loans to potentially bankrupt borrowers or below.
(3) Definition of Loans Whose Loan Terms and Conditions were Restructured At SMBC, as a core bank of SMBC Group, loans whose loan terms and conditions were restructured are defined as loans with interest rate reduction, deferred payment of interest, deferred repayment of principal amount, abandonment of loans, or other arrangements that are advantageous for the obligors, for the purpose of business rehabilitation or support for the obligors. Obligors with loans whose loan terms and conditions were restructured may not be classified as doubtful assets or below depending on the outlook for business conditions, financial statements and loan terms and conditions. If the borrower category deteriorates due to restructuring of loan terms and conditions, provisions will increase.
(4) Key Differences in Parameters of Credit Risks Used to Calculate Provisions and Capital Ratio, RespectivelySMBC, as a core bank of SMBC Group, uses Probability of Default and loan-loss ratio as parameters for calculation of provisions.Probability of Default is calculated based on the actual performance in the past of the deterioration rate for one year from each borrower category to potentially bankrupt borrowers or below (regarding the deterioration rate to potentially bankrupt borrowers, the deterioration transition rates equivalent to three accumulated years from potentially bankrupt borrowers to effectively bankrupt borrowers or below are included). For the PD used to calculate the capital ratio, deterioration to substandard borrowers or below is defined as default, and assuming a long-term average value of the default rate, conservative estimation for some portfolios is conducted, which is the major difference from the Probability of Default used to calculate provisions.Loan-loss ratio is calculated using the loan-loss amount including direct write-offs and indirect write-offs incurred during the year for each borrower category to the amount of initial existing exposure by borrower category.For details of parameters used to calculate the capital ratio, please refer to pages 254 to 255 “3. Overview of Internal Rating System (2) Parameter Estimation and Its Validation System.”
2. Credit Quality of Assets (CR1) (Millions of yen)
CR1: Credit quality of assets As of March 31, 2019 As of March 31, 2018
Item No.
a b c d a b c dGross carrying
values of:Allowances Net values
(a+b–c)
Gross carryingvalues of:
Allowances Net values (a+b–c)Defaulted
exposures
Non-defaulted exposures
Defaulted exposures
Non-defaulted exposures
On-balance sheet assets1 Loans 679,145 76,937,799 436,374 77,180,570 712,660 72,812,660 482,264 73,043,0562 Securities (of which: debt securities) 4,343 17,806,238 — 17,810,581 5,522 18,988,606 — 18,994,128
3 Other on-balance sheet assets (of which: debt-based assets) 5,765 63,680,487 21,406 63,664,846 5,799 59,162,065 62,432 59,105,432
4 Subtotal (1+2+3) 689,254 158,424,525 457,781 158,655,999 723,981 150,963,333 544,697 151,142,617Off-balance sheet assets
5 Acceptances and guarantees, etc. 12,667 9,847,197 73,339 9,786,525 7,939 8,701,550 87,594 8,621,8956 Commitments, etc. 7,026 20,746,667 60,659 20,693,034 13,508 18,854,794 67,096 18,801,2067 Subtotal (5+6) 19,693 30,593,864 133,998 30,479,559 21,447 27,556,345 154,691 27,423,101
Total8 Total (4+7) 708,948 189,018,390 591,779 189,135,558 745,428 178,519,678 699,388 178,565,718
Basel III Information
012_0800885851907.indd 248 2019/08/16 19:25:54

249
Sumitomo Mitsui Financial Group
SMBC Group Annual Report 2019
3. Changes in stock of defaulted loans and securities (of which: debt securities) (CR2) (Millions of yen)
CR2: Changes in stock of defaulted loans and securities (of which: debt securities)Item No. Amount
1 Stock of loans and securities (of which: debt securities) that were placed in defaulted status as of March 31, 2018 723,981
2
Changes in loans and securities (of which: debt securities) by factors during the current interim period
Amounts defaulted 161,433
3 Amounts returned to non-defaulted status 49,433
4 Amounts written off 111,2695 Other changes (35,457)
6 Stock of loans and securities (of which: debt securities) that were placed in defaulted status as of March 31, 2019 (1+2-3-4+5) 689,254
Note: The major factor for other changes is due to decreases in stock by collection and sale of receivables that were placed in defaulted status at the end of the previous fiscal year.
4. Term-End Balance of Exposures by Category and Their Breakdown by Major Type of Assets(1) Exposure Balance by Type of Assets, Geographic Region and Industry (Millions of yen)
Category
As of March 31, 2019 As of March 31, 2018Loans,
commitments and other off-balance sheet exposures
except derivatives
Bonds Others Total
Loans, commitments and other off-balance sheet exposures
except derivatives
Bonds Others Total
Domestic operations (excluding offshore banking accounts) 113,695,547 13,028,014 7,819,862 134,543,424 105,435,792 14,838,466 10,784,910 131,059,169
Manufacturing 9,095,207 295,529 1,959,265 11,350,002 8,622,976 311,691 2,817,598 11,752,266Agriculture, forestry, fishery and mining 516,118 13,035 10,848 540,001 383,489 4,251 33,127 420,868
Construction 1,162,654 43,884 156,515 1,363,053 1,154,497 49,254 321,144 1,524,896Transport, information, communications and utilities 6,310,609 174,252 615,181 7,100,043 5,936,126 181,049 992,859 7,110,035
Wholesale and retail 5,764,959 249,713 317,123 6,331,796 5,789,870 259,965 832,307 6,882,143Financial and insurance 54,249,795 1,012,399 188,531 55,450,726 47,550,467 933,232 378,959 48,862,659Real estate, goods rental and leasing 9,365,923 1,251,563 136,385 10,753,873 8,066,088 1,208,487 343,144 9,617,719
Services 4,517,647 397,536 124,502 5,039,686 4,506,592 404,287 1,074,615 5,985,494Local municipal corporations 2,435,177 21,102 1,065 2,457,346 2,678,992 65,751 20,961 2,765,705Other industries 20,277,453 9,568,998 4,310,441 34,156,894 20,746,690 11,420,496 3,970,193 36,137,379
Overseas operations and offshore banking accounts 48,427,182 4,784,721 1,564,532 54,776,436 46,481,209 4,155,824 2,879,224 53,516,258
Sovereigns 9,093,815 3,338,992 6,442 12,439,250 11,236,616 1,830,040 — 13,066,656Financial institutions 5,449,564 1,095,238 380,646 6,925,449 5,331,988 728,389 428,845 6,489,222C&I companies 27,931,363 276,791 — 28,208,154 24,798,102 180,533 — 24,978,636Others 5,952,438 73,700 1,177,443 7,203,581 5,114,503 1,416,859 2,450,379 8,981,742
Total 162,122,729 17,812,736 9,384,395 189,319,860 151,917,001 18,994,290 13,664,135 184,575,428
Notes: 1. The above amounts are exposures after Credit Risk Mitigation (CRM).2. The above amounts do not include “securitisation exposures” and “credit RWA under Article 145 of the Notification.”3. “Domestic operations” comprises the operations of us, its domestic consolidated banking subsidiaries (excluding overseas branches) and other domestic consolidated
subsidiaries. “Overseas operations” comprises the operations of the overseas branches of domestic consolidated banking subsidiaries and overseas consolidated subsidiaries.
Basel III Information
012_0800885851907.indd 249 2019/08/16 19:25:54

250
Sumitomo Mitsui Financial Group
SMBC Group Annual Report 2019
(2) Exposure Balance by Type of Assets and Residual Term (Millions of yen)
Category
As of March 31, 2019 As of March 31, 2018Loans,
commitments and other off-balance sheet exposures
except derivatives
Bonds Others Total
Loans, commitments and other off-balance sheet exposures
except derivatives
Bonds Others Total
To 1 year 32,620,590 3,313,354 23,855 35,957,800 41,938,248 6,650,406 475,934 49,064,590More than 1 year to 3 years 18,175,523 5,908,243 — 24,083,766 17,161,498 5,587,944 443,433 23,192,875More than 3 years to 5 years 17,740,873 1,514,641 — 19,255,515 13,094,941 1,086,147 434,360 14,615,449More than 5 years to 7 years 6,460,343 1,687,774 — 8,148,118 5,084,112 451,333 205,309 5,740,755More than 7 years 22,894,533 5,388,722 — 28,283,255 21,489,662 5,218,459 308,768 27,016,890No fixed maturity 64,230,864 — 9,360,540 73,591,404 53,148,538 — 11,796,328 64,944,867Total 162,122,729 17,812,736 9,384,395 189,319,860 151,917,001 18,994,290 13,664,135 184,575,428
Notes: 1. The above amounts are exposures after CRM.2. The above amounts do not include “securitisation exposures” and “credit RWA under Article 145 of the Notification.”3. “No fixed maturity” includes exposures not classified by residual term.
5. Amounts of Reserves and Write-offs Corresponding to the Term-End Balance of Obligors’ Exposures Related to Loans Prescribed in the Provisions of Article 4, Paragraph 2 (Bankrupt and Quasi-Bankrupt Assets), Paragraph 3 (Doubtful Assets) or Paragraph 4 (Substandard Loans) of the Ordinance for Enforcement of the Act on Emergency Measures for the Revitalization of Financial Functions, as well as Breakdown by Each of the Following Categories
(1) By Geographic Region (Billions of yen)
Fiscal 2018 Fiscal 2017Term-end balance
Term-end Reserves
Write-offs for the year
Term-end balance
Term-end Reserves
Write-offs for the year
Domestic operations (excluding offshore banking accounts) 800.4 235.2 90.1 859.8 285.9 41.0
Overseas operations and offshore banking accounts 176.7 86.1 12.2 191.1 85.4 14.5
Asia 24.3 16.0 9.8 15.8 11.3 4.3North America 53.1 20.3 3.0 38.1 6.8 2.1Other regions 99.3 49.8 (0.6) 137.2 67.3 8.1
Total 977.1 321.3 102.3 1,050.9 371.3 55.5
(2) By Industry (Billions of yen)
Fiscal 2018 Fiscal 2017Term-end balance
Term-end Reserves
Write-offs for the year
Term-end balance
Term-end Reserves
Write-offs for the year
Domestic operations (excluding offshore banking accounts) 800.4 235.2 90.1 859.8 285.9 41.0
Manufacturing 109.5 25.7 (0.3) 88.0 37.5 (0.3)Agriculture, forestry, fishery and mining 6.3 6.2 (1.5) 9.5 7.7 1.5Construction 17.5 5.2 0.3 16.8 6.2 (0.1)Transport, information, communications and utilities 40.8 18.0 0.5 57.7 27.5 (8.3)
Wholesale and retail 93.4 39.6 1.9 110.7 49.7 3.0Financial and insurance 8.4 2.9 (0.1) 3.6 3.0 (0.3)Real estate, goods rental and leasing 52.1 5.6 5.8 68.7 12.1 (0.5)Services 78.7 28.3 1.1 92.1 39.7 2.1Other industries 393.7 103.7 82.4 412.7 102.5 43.9
Overseas operations and offshore banking accounts 176.7 86.1 12.2 191.1 85.4 14.5
Financial institutions 2.2 0.3 0.0 2.5 0.4 0.0C&I companies 92.2 54.4 0.5 91.5 52.6 8.9Others 82.3 31.4 11.7 97.1 32.4 5.6
Total 977.1 321.3 102.3 1,050.9 371.3 55.5
Notes: 1. Term-end Reserves include partial direct write-offs (direct reduction).2. “Domestic operations” comprises the operations of SMBC Group (excluding overseas branches) and domestic consolidated subsidiaries. “Overseas operations” comprises the
operations of SMBC Group’s overseas branches and overseas consolidated subsidiaries, and the term-end balances are calculated based on the obligor’s domicile country.
Basel III Information
012_0800885851907.indd 250 2019/08/16 19:25:54

251
Sumitomo Mitsui Financial Group
SMBC Group Annual Report 2019
6. Term-End Balance of Exposures by Past Due Periods (Billions of yen)
Fiscal 2018
Less than 1 month 1 month or more to less than 2 months
2 months or more to less than 3 months 3 months or more Total
180.3 62.7 26.4 59.1 328.5
Notes: 1. Bankrupt and Quasi-Bankrupt Assets prescribed in Article 4, Paragraph 2 of the Ordinance for Enforcement of the Act on Emergency Measures for the Revitalization of Financial Functions and doubtful assets prescribed in Paragraph 3 of the said Article are excluded.
2. Items that are not accompanied by deterioration of business conditions/cash flows are excluded.
(Billions of yen)
Fiscal 2017
Less than 1 month 1 month or more to less than 2 months
2 months or more to less than 3 months 3 months or more Total
169.0 55.8 19.9 53.6 298.3
Notes: 1. Bankrupt and Quasi-Bankrupt Assets prescribed in Article 4, Paragraph 2 of the Ordinance for Enforcement of the Act on Emergency Measures for the Revitalization of Financial Functions and doubtful assets prescribed in Paragraph 3 of the said Article are excluded.
2. Items that are not accompanied by deterioration of business conditions/cash flows are excluded.3. Divergence from the 2018 Annual Report is due to the inclusion of doubtful assets or below by certain group companies.
7. Term-End Balance of Exposures of Obligors Whose Loan Conditions were Restructured for Business Rehabilitation or Support; of Which Amounts of Increased Reserves for Such Exposures and Other Amounts due to the Restructuring of the Loan Conditions
(Billions of yen)
Fiscal 2018 Fiscal 2017
Term-end balance Term-end balanceOf which: amounts of increased
Reserves for such exposures due to the restructuring of the
loan conditions
Of which: other amounts
Of which: amounts of increased Reserves for such exposures due to the restructuring of the
loan conditions
Of which: other amounts
223.2 223.2 0.0 247.9 247.9 0.0
Note: Bankrupt and Quasi-Bankrupt Assets prescribed in Article 4, Paragraph 2 of the Ordinance for Enforcement of the Act on Emergency Measures for the Revitalization of Financial Functions, doubtful assets prescribed in Paragraph 3 of the said Article, and loans past due three months or more prescribed in Paragraph 4 of the said Article are excluded.
Basel III Information
012_0800885851907.indd 251 2019/08/16 19:25:54

252
Sumitomo Mitsui Financial Group
SMBC Group Annual Report 2019
■ Internal Ratings-Based (IRB) Approach1. Background on Determining the Scope of Application of Internal Ratings-Based (IRB) Approach
When the criteria of materiality defined by us according to business characteristics and business conditions, etc. are met, in principle, the IRB approach is adopted by the unit of our asset class or by the unit of the affiliated group companies. In addition, for the asset class or group companies that meet the quantitative criteria specified by the authorities, the IRB approach is in principle adopted regardless of whether the criteria of materiality are met.
For adopting the IRB approach, the Advanced Internal Ratings-Based (AIRB) approach is in principle adopted. However, for group companies which were judged unnecessary or inappropriate to adopt the AIRB approach in light of the scale, business contents, etc., the Foundation Internal Ratings-Based (FIRB) approach is adopted.
2. ScopeWe and the following consolidated subsidiaries have adopted the Advanced Internal Ratings-Based (AIRB) approach for exposures as of March 31, 2009.
(1) Domestic OperationsSumitomo Mitsui Banking Corporation, Sumitomo Mitsui Card Company, Limited and SMBC Guarantee Co., Ltd., Cedyna Financial Corporation, SMBC Trust Bank Ltd.
(2) Overseas OperationsSumitomo Mitsui Banking Corporation Europe Limited, Sumitomo Mitsui Banking Corporation (China) Limited, Banco Sumitomo Mitsui Brasileiro S.A., JSC Sumitomo Mitsui Rus Bank, PT Bank Sumitomo Mitsui Indonesia, Sumitomo Mitsui Banking Corporation Malaysia Berhad, SMBC Leasing and Finance, Inc., SMBC Capital Markets, Inc., SMBC Nikko Capital Markets Limited, SMBC Derivative Products Limited and SMBC Capital Markets (Asia) Limited, SMBC Bank EU AG and PT Bank BTPN Tbk.
SMBC Finance Service Co., Ltd. has adopted the Foundation Internal Ratings-Based (FIRB) approach.
Note: Directly controlled SPCs and limited partnerships for investment of consolidated subsidiaries using the AIRB approach have also adopted the AIRB approach. Further, theAIRB approach is applied to equity exposures on a group basis, including equity exposures of consolidated subsidiaries applying the standardised approach.
3. Overview of Internal Rating System(1) Rating Procedures
(A) Corporate Exposures• “Corporate, sovereign and bank exposures” includes credits to domestic and overseas commercial/industrial (C&I) companies,
individuals for business purposes (domestic only), sovereigns, public sector entities, and financial institutions. Business loans such as apartment construction loans are, in principle, included in “retail exposures.” However, credits of more than ¥100 million are treated as corporate exposures in accordance with the Notification.
• An obligor is assigned an obligor grade by first assigning a financial grade using a financial strength grading model and data obtained from the obligor’s financial statements. The financial grade is then adjusted taking into account the actual state of the obligor’s balance sheet and qualitative factors to derive the obligor grade (for details, please refer to “Credit Risk Assessment and Quantification” on pages 112 to 113). Different rating series are used for domestic and overseas obligors — J1 ~ J10 for domestic obligors and G1 ~ G10 for overseas obligors — as shown in the table following page due to differences in actual default rate levels and portfolios’ grade distribution. Different Probability of Default (PD) values are applied also.
• In addition to the above basic rating procedure which builds on the financial grade assigned at the beginning, in some cases, the obligor grade is assigned based on the parent company’s credit quality or credit ratings published by external rating agencies. The Japanese government, local authorities and other public sector entities with special basis for existence and unconventional financial statements are assigned obligor grades based on their attributes (for example, “local municipal corporations”), as the data on these obligors are not suitable for conventional grading models. Further, credits to individuals for business purposes and business loans are assigned obligor grades using grading models developed specifically for these exposures.
• PDs used for calculating credit risk-weighted assets are estimated based on the default experience for each grade and taking into account the possibility of estimation errors. In addition to internal data, external data are used to estimate and validate PDs. The definition of default is the definition stipulated in the Notification (an event that would lead to an exposure being classified as “substandard loans,” “doubtful assets” or “bankrupt and quasi-bankrupt assets” occurring to the obligor).
• Loss Given Defaults (LGDs) and exposure at default (EAD) used in the calculation of credit risk-weighted assets are estimated based on historical loss experience of credits in default, taking into account the possibility of estimation errors.
Basel III Information
012_0800885851907.indd 252 2019/08/16 19:25:54

253
Sumitomo Mitsui Financial Group
SMBC Group Annual Report 2019
Obligor GradeDomesticCorporate
OverseasCorporate Definition Borrower Category
J1 G1 Very high certainty of debt repayment Normal BorrowersJ2 G2 High certainty of debt repaymentJ3 G3 Satisfactory certainty of debt repaymentJ4 G4 Debt repayment is likely but this could change in cases of
significant changes in economic trends or business environmentJ5 G5 No problem with debt repayment over the short term, but not
satisfactory over the mid to long term and the situation couldchange in cases of significant changes in economic trends orbusiness environment
J6 G6 Currently no problem with debt repayment, but there are unstablebusiness and financial factors that could lead to debt repaymentproblems
J7 G7 Close monitoring is required due to problems in meeting loanterms and conditions, sluggish/unstable business, or financialproblems
Borrowers Requiring Caution
J7R G7R Borrowers Requiring Caution identified as Substandard Borrowers Substandard BorrowersJ8 G8 Currently not bankrupt, but experiencing business difficulties,
making insufficient progress in restructuring, and highly likely togo bankrupt
Potentially Bankrupt Borrowers
J9 G9 Though not yet legally or formally bankrupt, has serious businessdifficulties and rehabilitation is unlikely; thus, effectively bankrupt
Virtually Bankrupt Borrowers
J10 G10 Legally or formally bankrupt Bankrupt Borrowers
• “Specialized lending” is sub-classified into “project finance,” “object finance,” “commodity finance,” “income-producing real estate” (IPRE) and “high-volatility commercial real estate” (HVCRE) in accordance with the Notification. Project finance is financing of a single project, such as a power plant or transportation infrastructure, and cash flows generated by the project are the primary source of repayment. Object finance includes aircraft finance and ship finance, and IPRE and HVCRE include real estate finance (a primary example is non-recourse real estate finance). There were no commodity finance exposures as of March 31, 2019.
• Each SL product is classified as either a facility assigned a PD grade and LGD grade or a facility assigned a grade based primarily on the expected loss ratio, both using grading models and qualitative assessment. The former has the same grading structure as that of corporate, and the latter has ten grade levels as with obligor grades but the definition of each grade differs from that of the obligor grade which is focused on PD.
For the credit risk-weighted asset amount for the SL category, the former facility is calculated in a manner similar to corporate exposures, while the latter facility is calculated by mapping the expected loss-based facility grades to the five categories (hereinafter the “slotting criteria”) of the Notification because it does not satisfy the requirements for PD application specified in the Notification.
(B) Retail Exposures• “Residential mortgage exposures” includes mortgage loans to individuals and some real estate loans in which the property consists
of both residential and commercial facilities such as a store or rental apartment units, but excludes apartment construction loans.• Mortgage loans are rated as follows. Mortgage loans are allocated to a portfolio segment with similar risk characteristics in terms of default risk determined using loan
contract information, results of an exclusive grading model and a borrower category under self-assessment executed in accordance with the financial inspection manual of the Japanese FSA, and recovery risk at the time of default determined using Loan To Value (LTV) calculated based on the assessment value of collateral real estate. PDs and LGDs are estimated based on the default experience for each segment and taking into account the possibility of estimation errors.
Further, the portfolio is subdivided based on the lapse of years from the contract date, and the effectiveness of segmentation in terms of default risk and recovery risk is validated periodically.
Internal data are used to estimate and validate PDs and LGDs. The definition of default is the definition stipulated in the Notification.
• “Qualifying revolving retail exposures” includes card loans and credit card balances.• Card loans and credit card balances are rated as follows. Card loans and credit card balances are allocated to a portfolio segment with similar risk characteristics determined based, for card
loans, on the credit quality of the loan guarantee company, credit limit, settlement account balance and payment history, and, for credit card balances, on repayment history and frequency of use.
PDs and LGDs used to calculate credit risk-weighted asset amounts are estimated based on the default experience for each segment and taking into account the possibility of estimation errors.
Basel III Information
012_0800885851907.indd 253 2019/08/16 19:25:54

254
Sumitomo Mitsui Financial Group
SMBC Group Annual Report 2019
Further, the effectiveness of segmentation in terms of default risk and recovery risk is validated periodically. Internal data are used to estimate and validate PDs and LGDs. The definition of default is the definition stipulated in the
Notification.• “Other retail exposures” includes business loans such as apartment construction loans and consumer loans such as My Car Loan.• Business loans and consumer loans are rated as follows. a. Business loans are allocated to a portfolio segment with similar risk characteristics in terms of default risk determined using
loan contract information, results of exclusive grading model and borrower category under self-assessment executed in accordance with the financial inspection manual of the Japanese FSA, and recovery risk determined based on LTV for business loans.
PDs and LGDs are estimated based on the default experience for each segment and taking into account the possibility of estimation errors.
b. Rating procedures for consumer loans depends on whether the loan is collateralized. Collateralized consumer loans are allocated to a portfolio segment using the same standards as for mortgage loans of “Residential Mortgage Exposures.” Uncollateralized consumer loans are allocated to a portfolio segment based on account history. PDs and LGDs are estimated based on the default experience for each segment and taking into account the possibility of estimation errors.
Further, the effectiveness of segmentation in terms of default risk and recovery risk is validated periodically. Internal data are used to estimate and validate PDs and LGDs. The definition of default is the definition stipulated in the
Notification.
(C) Equity ExposuresWhen acquiring equities subject to the PD/LGD approach, issuers are assigned obligor grades using the same rules as those of general credits to C&I companies, sovereigns and financial institutions. The obligors are monitored (for details, please refer to page 114) and their grades are revised if necessary (credit risk-weighted asset amount is set to 1.5 times when they are not monitored individually). In the case there is no credit transaction with the issuer or it is difficult to obtain financial information, internal grades are assigned using ratings of external rating agencies if it is a qualifying investment.
In the case it is difficult to obtain financial information and it is not a qualifying investment, the simple risk weight method under the market-based approach is applied.
(2) Parameter Estimation and Its Validation SystemA. PD
This is defined as the probability that obligors could default over one year. PD is estimated as the expected value in the long term regardless of the business cycle using the default rate for each fiscal year based on the historical data for five consecutive fiscal years or more. In principle, the default rate for each fiscal year is measured by the initial number of target obligors as the numerator and the number of defaults occurred during the fiscal year as the denominator. For assets, ratings, and portfolios applicable to LDP (LDP: Low Default Portfolio), conservative PD is estimated by creating virtual rating transition data based on Monte Carlo simulation and by using the floor value proposed under Basel regulation.
The actual default rates in the past three periods are lower than PD estimate values applied for the respective periods, because the long-term average value including the recession period is estimated, and also because the possibility of estimation errors is taken into account.
Validation consists of two systems: “backtesting” to retrospectively compare and validate the parameter estimated value and the actual value for the respective applicable period, and “pretesting” to validate before applying the parameter for the purpose of complementing the “backtesting.” The overview for each is as follows.
(a) BacktestingThis is to compare the parameter estimated value with the actual value at least once a year, and to validate that the degree of divergence is within the statistically assumed range.
In case of hitting the predetermined excess criteria as a result of validation, reviews shall be taken including revising the estimation method or rating system.
(b) PretestingThis is to compare and validate the estimated value to be applied and the historical value. In the case of hitting the predetermined excess criteria, the estimated value shall be conservatively corrected.
The purpose is to prevent underestimation by making adjustments, if necessary.
Basel III Information
012_0800885851907.indd 254 2019/08/16 19:25:54

255
Sumitomo Mitsui Financial Group
SMBC Group Annual Report 2019
B. LGDThis is defined as the ratio of loss amounts after default to the amount of receivable at the time of default. LGD is estimated as a long-term average value calculated based on historical data over seven consecutive fiscal years (for retail, five fiscal years) or more. However, in the case where a high positive correlation with the default rate is observed, LGD shall be in principle the value taking into account the possibility that the loss rate of the recession period will exceed the long-term average value, and it is estimated mainly by one of the following methods.• By taking into account the influence of the recession period on the interest rate to customers constituting the discount rate for
calculating the economic loss to be used for estimation• By taking into account the influence of the recession period by modeling the relationship between the loss ratio and economic and
financial indicators, etc. For the purpose of estimating LGD using economic loss based on Basel requirement, discount rate is estimated with using recovery cost. The averaged period from the time of default and the termination of recovery is used as discount period.As for validation, backtesting and pretesting are conducted as in the A. PD.
C. EADThis is defined as the amount of exposure at the time of default. EAD is estimated as a long-term average value calculated based on the historical data over seven consecutive fiscal years (for retail, five fiscal years) or more. For estimation, the possibility that the default balance may exceed the latest balance is assumed and taken into account, and is estimated by one of the following methods.• By estimating the conversion factor that is the ratio of actually drawn amount to the amount associated with undrawn commitments
one year before the time of default• By estimating the conversion factor that is the ratio of the average outstandings of the default borrowers to the average outstandings
of the non-default borrowers of the whole limit-type credit subject to the estimation• By estimating an increased amount by comparing the initial outstandings with ones at the time of default and taking the average
for each segmentAs for validation, backtesting and pretesting are conducted as in the A. PD.
4. Percentage of EAD by Asset Class by Type of Approach for Calculating Credit RWA to Total EAD
As of March 31, 2019 As of March 31, 2018IRB approach 94.82 % 94.17 %
Corporate exposures (Advanced Internal Ratings-Based (AIRB) approach) 81.24 % 78.73 %Corporate exposures (Foundation Internal Ratings-Based (FIRB) approach) 0.27 % 1.27 %Retail exposures 8.15 % 8.78 %Equity exposures 2.19 % 2.43 %Purchased receivables (AIRB approach) 1.00 % 1.00 %Purchased receivables (FIRB approach) 0.00 % 0.04 %Other assets, etc. 1.94 % 1.89 %
SA 5.17 % 5.82 %Total 100.00 % 100.00 %
Basel III Information
012_0800885851907.indd 255 2019/08/16 19:25:54

256
Sumitomo Mitsui Financial Group
SMBC Group Annual Report 2019
5. CR Exposures by Portfolio and PD (CR6) (Millions of yen, %, the number of data in thousands, years)
CR6: IRB - CR exposures by portfolio and PD range
As of March 31, 2019
a b c d e f g h i j k l
ItemNo. PD scale
On-balance sheet gross exposures
Off-balance sheet
exposures pre CCF (Credit Conversion Factor) and
pre CRM
Average CCF(%)
EAD post
CCF and post CRM
Average PD(%)
Number of
obligors
Average LGD(%)
Average maturity
Credit RWA
amounts
RWA density
(%)EL Eligible
provisions
Sovereign exposures (AIRB approach)1 0.00 to <0.15 69,453,467 78,330 89.51 72,190,343 0.00 0.4 34.38 4.0 164,668 0.22 1842 0.15 to <0.25 431,406 38,263 46.67 457,064 0.16 0.1 32.49 2.2 126,865 27.75 2523 0.25 to <0.50 20,692 3,601 47.36 14,852 0.30 0.0 33.57 2.2 5,626 37.88 144 0.50 to <0.75 0 — — 0 0.53 0.0 35.00 1.0 0 42.85 05 0.75 to <2.50 157,002 52,286 68.32 120,951 1.45 0.0 33.68 2.7 93,573 77.36 5906 2.50 to <10.00 56,447 18,344 46.62 21,362 3.98 0.0 34.66 1.9 25,003 117.04 2947 10.00 to <100.00 4,668 1,048 82.16 1,126 12.08 0.0 21.74 2.0 1,088 96.65 308 100.00 (Default) 14 — — 14 100.00 0.0 34.07 2.2 7 53.13 59 Subtotal 70,123,699 191,874 70.26 72,805,716 0.00 0.6 34.37 4.0 416,833 0.57 1,372 1,624
Sovereign exposures (FIRB approach)1 0.00 to <0.15 — — — — — — — — — — —2 0.15 to <0.25 — — — — — — — — — — —3 0.25 to <0.50 — — — — — — — — — — —4 0.50 to <0.75 — — — — — — — — — — —5 0.75 to <2.50 — — — — — — — — — — —6 2.50 to <10.00 — — — — — — — — — — —7 10.00 to <100.00 — — — — — — — — — — —8 100.00 (Default) — — — — — — — — — — —9 Subtotal — — — — — — — — — — — —
Bank exposures (AIRB approach)1 0.00 to <0.15 3,216,252 624,391 71.62 3,837,811 0.03 0.7 33.72 2.2 600,581 15.64 4932 0.15 to <0.25 733,785 319,461 85.48 965,080 0.16 0.2 29.35 1.1 212,981 22.06 4763 0.25 to <0.50 85,671 27,324 83.33 100,131 0.28 0.0 30.12 1.2 31,985 31.94 864 0.50 to <0.75 3,290 — — 3,290 0.53 0.0 34.45 1.3 1,917 58.28 65 0.75 to <2.50 552,906 80,578 64.89 533,872 1.08 0.1 34.64 0.6 318,811 59.71 1,9916 2.50 to <10.00 84,714 64,543 44.96 100,751 2.92 0.6 34.41 1.0 99,100 98.36 1,0067 10.00 to <100.00 — — — — — — — — — — —8 100.00 (Default) 2,706 — — 2,706 100.00 0.0 97.40 1.2 1,356 50.13 2,6369 Subtotal 4,679,326 1,116,298 73.84 5,543,644 0.26 1.7 33.02 1.8 1,266,735 22.85 6,696 7,173
Bank exposures (FIRB approach)1 0.00 to <0.15 15,684 — — 15,684 0.03 0.0 45.00 5.0 5,524 35.22 22 0.15 to <0.25 — — — — — — — — — — —3 0.25 to <0.50 — — — — — — — — — — —4 0.50 to <0.75 — — — — — — — — — — —5 0.75 to <2.50 — — — — — — — — — — —6 2.50 to <10.00 246 — — 246 2.56 0.0 45.00 5.0 454 184.32 27 10.00 to <100.00 — — — — — — — — — — —8 100.00 (Default) — — — — — — — — — — —9 Subtotal 15,930 — — 15,930 0.06 0.1 45.00 5.0 5,978 37.53 4 8
Corporate exposures (AIRB approach)1 0.00 to <0.15 25,503,136 12,003,437 54.96 36,348,114 0.05 7.0 34.46 2.5 6,458,543 17.76 7,2872 0.15 to <0.25 12,341,508 7,974,982 53.90 15,185,261 0.17 6.3 29.18 2.5 4,190,022 27.59 7,5483 0.25 to <0.50 4,543,025 1,692,490 52.14 5,015,580 0.32 3.1 29.70 2.7 1,943,358 38.74 4,6984 0.50 to <0.75 977,494 128,805 50.68 1,029,655 0.53 1.3 28.81 2.4 478,683 46.48 1,5735 0.75 to <2.50 4,393,656 2,751,808 51.35 3,590,654 1.21 3.7 27.06 2.9 2,197,645 61.20 11,6746 2.50 to <10.00 1,177,025 202,744 53.34 1,005,471 3.15 1.3 30.07 3.7 1,083,456 107.75 9,2627 10.00 to <100.00 320,598 223,729 60.72 390,917 13.42 0.4 29.24 2.2 519,952 133.00 14,9648 100.00 (Default) 225,062 8,299 100.00 185,511 100.00 0.3 50.33 2.1 52,915 28.52 93,3819 Subtotal 49,481,506 24,986,298 54.07 62,751,168 0.60 23.7 32.23 2.5 16,924,578 26.97 150,390 154,809
Basel III Information
012_0800885851907.indd 256 2019/08/16 19:25:54

257
Sumitomo Mitsui Financial Group
SMBC Group Annual Report 2019
(Millions of yen, %, the number of data in thousands, years)
CR6: IRB - CR exposures by portfolio and PD range
As of March 31, 2019
a b c d e f g h i j k l
ItemNo. PD scale
On-balance sheet gross exposures
Off-balance sheet
exposures pre CCF and pre
CRM
Average CCF(%)
EAD post
CCF and post CRM
Average PD(%)
Number of
obligors
Average LGD(%)
Average maturity
Credit RWA
amounts
RWA density
(%)EL Eligible
provisions
Corporate exposures (FIRB approach)1 0.00 to <0.15 — — — — — — — — — — —2 0.15 to <0.25 — — — — — — — — — — —3 0.25 to <0.50 — — — — — — — — — — —4 0.50 to <0.75 — — — — — — — — — — —5 0.75 to <2.50 — — — — — — — — — — —6 2.50 to <10.00 40 — — 40 2.56 0.0 45.00 5.0 75 189.84 07 10.00 to <100.00 — — — — — — — — — — —8 100.00 (Default) 23 — — 23 100.00 0.0 45.00 5.0 — 0.00 109 Subtotal 63 — — 63 38.23 0.0 45.00 5.0 75 120.34 10 129
Mid-sized corporations and small-medium enterprises (SMEs) exposures (AIRB approach)1 0.00 to <0.15 576,250 17,679 49.86 623,457 0.08 1.2 26.10 2.8 95,427 15.30 1332 0.15 to <0.25 1,268,741 81,430 61.51 1,260,956 0.17 5.1 30.46 3.4 354,913 28.14 6783 0.25 to <0.50 1,268,465 39,812 63.81 1,243,431 0.31 7.0 32.39 3.9 518,308 41.68 1,2934 0.50 to <0.75 704,287 8,429 54.88 652,713 0.55 5.0 31.01 3.3 302,696 46.37 1,1255 0.75 to <2.50 2,248,740 130,381 62.49 1,809,801 1.44 23.9 36.05 3.1 1,267,982 70.06 9,8106 2.50 to <10.00 917,344 102,701 51.63 630,107 2.65 14.3 29.74 3.9 451,548 71.66 4,9727 10.00 to <100.00 285,084 5,205 49.26 187,175 16.88 4.7 32.54 2.1 249,004 133.03 12,3478 100.00 (Default) 253,076 432 100.00 175,730 100.00 4.0 46.22 1.6 27,097 15.41 81,2389 Subtotal 7,521,991 386,072 58.65 6,583,375 3.95 65.6 32.41 3.3 3,266,979 49.62 111,599 108,991
Mid-sized corporations and SMEs exposures (FIRB approach)1 0.00 to <0.15 — — — — — — — — — — —2 0.15 to <0.25 — — — — — — — — — — —3 0.25 to <0.50 — — — — — — — — — — —4 0.50 to <0.75 — — — — — — — — — — —5 0.75 to <2.50 2 — — 2 1.57 0.0 45.00 1.0 2 110.24 06 2.50 to <10.00 5 — — 5 3.05 0.0 45.00 1.0 7 134.96 07 10.00 to <100.00 — — — — — — — — — — —8 100.00 (Default) — — — — — — — — — — —9 Subtotal 7 — — 7 2.63 0.0 45.00 1.0 10 128.11 0 0
Specialized lending (SL)1 0.00 to <0.15 1,760,726 96,795 46.62 1,764,239 0.04 0.2 24.56 3.5 214,308 12.14 1802 0.15 to <0.25 1,756,561 570,251 52.00 1,884,080 0.16 0.4 25.19 4.1 559,205 29.68 7993 0.25 to <0.50 1,570,972 520,039 58.28 1,274,658 0.36 0.2 24.65 3.9 509,668 39.98 1,1584 0.50 to <0.75 90,408 — — 90,408 0.53 0.0 29.56 4.5 56,914 62.95 1415 0.75 to <2.50 985,045 172,972 57.43 876,489 1.09 0.2 30.64 3.7 620,869 70.83 2,9736 2.50 to <10.00 192,398 29,676 94.19 118,276 3.38 0.0 30.42 3.1 112,731 95.31 1,1727 10.00 to <100.00 63,221 25,192 65.36 76,788 13.54 0.0 32.54 4.1 130,656 170.15 3,4278 100.00 (Default) 52,882 7,851 100.00 50,193 100.00 0.0 55.48 3.2 26,667 53.13 27,8519 Subtotal 6,472,217 1,422,778 55.97 6,135,134 1.35 1.2 26.18 3.8 2,231,023 36.36 37,706 42,089
Equity exposures1 0.00 to <0.15 3,575,798 — — 3,575,798 0.04 1.3 90.00 5.0 3,643,225 101.88 —2 0.15 to <0.25 196,091 — — 196,091 0.17 0.4 90.00 5.0 262,251 133.73 —3 0.25 to <0.50 12,741 — — 12,741 0.27 0.1 90.00 5.0 20,772 163.02 —4 0.50 to <0.75 2,953 — — 2,953 0.53 0.0 90.00 5.0 5,730 194.02 —5 0.75 to <2.50 5,516 — — 5,516 1.36 0.0 90.00 5.0 15,471 280.47 —6 2.50 to <10.00 7,994 — — 7,994 2.56 0.0 90.00 5.0 30,530 381.88 —7 10.00 to <100.00 1,604 — — 1,604 10.30 0.0 90.00 5.0 8,953 557.87 —8 100.00 (Default) 393 — — 393 100.00 0.0 90.00 5.0 4,428 1,125.00 —9 Subtotal 3,803,094 — — 3,803,094 0.07 2.2 90.00 5.0 3,991,363 104.95 — —
Basel III Information
012_0800885851907.indd 257 2019/08/16 19:25:54

258
Sumitomo Mitsui Financial Group
SMBC Group Annual Report 2019
(Millions of yen, %, the number of data in thousands, years)
CR6: IRB - CR exposures by portfolio and PD range
As of March 31, 2019
a b c d e f g h i j k l
ItemNo. PD scale
On-balance sheet gross exposures
Off-balance sheet
exposures pre CCF and pre
CRM
Average CCF(%)
EAD post
CCF and post CRM
Average PD(%)
Number of
obligors
Average LGD(%)
Average maturity
Credit RWA
amounts
RWA density
(%)EL Eligible
provisions
Purchased receivables (corporates) (the amount equivalent to default risks) (AIRB approach)1 0.00 to <0.15 990,373 50,697 99.99 1,030,611 0.05 4.0 35.41 1.1 118,019 11.45 2342 0.15 to <0.25 410,217 115,696 77.19 496,474 0.17 7.7 33.53 1.1 108,517 21.85 3003 0.25 to <0.50 83,101 39,940 100.00 121,873 0.34 5.1 42.27 1.0 48,413 39.72 1784 0.50 to <0.75 14,517 50,469 100.00 64,907 0.61 7.5 59.59 1.0 50,205 77.34 2405 0.75 to <2.50 60,153 75,444 95.20 131,083 1.45 13.8 48.30 1.2 116,078 88.55 8896 2.50 to <10.00 3,812 19,821 100.00 23,503 2.62 3.7 60.36 1.1 28,692 122.07 3737 10.00 to <100.00 589 1,709 100.00 2,296 32.23 0.3 57.66 1.0 4,410 192.02 4248 100.00 (Default) 4,866 270 100.00 5,080 100.00 0.1 80.78 1.0 661 13.01 4,1049 Subtotal 1,567,631 354,049 91.52 1,875,834 0.56 42.5 37.56 1.1 474,998 25.32 6,746 3,137
Purchased receivables (corporates) (the amount equivalent to dilution risks) (AIRB approach)1 0.00 to <0.15 600,177 14,455 46.62 606,917 0.06 0.0 33.83 1.0 68,151 11.22 1352 0.15 to <0.25 232,666 34,959 46.62 248,910 0.17 0.0 30.38 1.0 51,105 20.53 1363 0.25 to <0.50 127,296 18 46.62 127,305 0.32 0.0 31.05 1.0 37,973 29.82 1274 0.50 to <0.75 15,517 — — 15,517 0.53 0.0 35.00 1.1 6,758 43.55 285 0.75 to <2.50 36,218 — — 36,218 1.21 0.0 32.48 1.0 21,609 59.66 1396 2.50 to <10.00 3,576 — — 3,576 3.97 0.0 21.32 1.0 3,507 98.07 517 10.00 to <100.00 — — — — — — — — — — —8 100.00 (Default) 1,928 — — 1,928 100.00 0.0 47.03 1.0 265 13.75 9069 Subtotal 1,017,381 49,434 46.62 1,040,374 0.36 0.1 32.62 1.0 189,371 18.20 1,526 735
Purchased receivables (corporates) (the amount equivalent to default risks) (FIRB approach)1 0.00 to <0.15 — 54 100.00 54 0.05 0.0 45.00 1.0 6 11.21 02 0.15 to <0.25 — 676 100.00 676 0.22 0.0 45.00 1.0 209 31.01 03 0.25 to <0.50 — 1,377 100.00 1,377 0.39 0.0 45.00 1.0 540 39.19 24 0.50 to <0.75 — 4,512 100.00 4,512 0.65 0.0 45.00 1.0 2,326 51.56 135 0.75 to <2.50 — 3,374 100.00 3,374 1.23 0.0 45.00 1.0 2,171 64.35 186 2.50 to <10.00 — 146 100.00 146 3.05 0.0 45.00 1.0 127 86.82 27 10.00 to <100.00 — — — — — — — — — — —8 100.00 (Default) 46 — — 44 100.00 0.0 45.00 1.0 — 0.00 199 Subtotal 46 10,142 100.00 10,186 1.24 0.0 45.00 1.0 5,381 52.83 57 44
Purchased receivables (corporates) (the amount equivalent to dilution risks) (FIRB approach)1 0.00 to <0.15 — — — — — — — — — — —2 0.15 to <0.25 20 — — 20 0.18 0.0 45.00 1.0 5 28.16 03 0.25 to <0.50 2 — — 2 0.39 0.0 45.00 1.0 1 45.37 04 0.50 to <0.75 7 — — 7 0.67 0.0 45.00 1.0 4 61.05 05 0.75 to <2.50 14 — — 14 0.95 0.0 45.00 1.0 13 91.71 06 2.50 to <10.00 — — — — — — — — — — —7 10.00 to <100.00 — — — — — — — — — — —8 100.00 (Default) — — — — — — — — — — —9 Subtotal 46 — — 46 0.52 0.0 45.00 1.0 25 55.07 0 0
Purchased receivables (retail) (the amount equivalent to default risks)1 0.00 to <0.15 3,058 — — 3,058 0.08 0.0 65.00 — 412 13.49 12 0.15 to <0.25 5,605 — — 5,604 0.21 0.0 65.00 — 1,521 27.13 73 0.25 to <0.50 3,688 — — 3,687 0.33 0.4 42.79 — 940 25.50 54 0.50 to <0.75 1,248 — — 1,247 0.64 0.0 64.42 — 665 53.36 55 0.75 to <2.50 130 18 100.00 148 1.11 0.0 62.96 — 99 66.56 16 2.50 to <10.00 — 2 100.00 2 3.05 0.0 65.00 — 1 90.91 07 10.00 to <100.00 — — — — — — — — — — —8 100.00 (Default) 0 — — 0 100.00 0.0 81.53 — 0 13.75 09 Subtotal 13,730 21 100.00 13,750 0.27 0.4 58.97 — 3,641 26.48 21 25
Basel III Information
012_0800885851907.indd 258 2019/08/16 19:25:55

259
Sumitomo Mitsui Financial Group
SMBC Group Annual Report 2019
(Millions of yen, %, the number of data in thousands, years)
CR6: IRB - CR exposures by portfolio and PD range
As of March 31, 2019
a b c d e f g h i j k l
ItemNo. PD scale
On-balance sheet gross exposures
Off-balance sheet
exposures pre CCF and pre
CRM
Average CCF(%)
EAD post
CCF and post CRM
Average PD(%)
Number of
obligors
Average LGD(%)
Average maturity
Credit RWA
amounts
RWA density
(%)EL Eligible
provisions
Purchased receivables (retail) (the amount equivalent to dilution risks) (AIRB approach)1 0.00 to <0.15 49 — — 49 0.03 0.0 45.00 5.0 12 25.88 02 0.15 to <0.25 — — — — — — — — — — —3 0.25 to <0.50 — — — — — — — — — — —4 0.50 to <0.75 — — — — — — — — — — —5 0.75 to <2.50 — — — — — — — — — — —6 2.50 to <10.00 — — — — — — — — — — —7 10.00 to <100.00 — — — — — — — — — — —8 100.00 (Default) — — — — — — — — — — —9 Subtotal 49 — — 49 0.03 0.0 45.00 5.0 12 25.88 0 0
Qualifying revolving retail exposures (QRRE)1 0.00 to <0.15 63,222 183,004 6.55 246,227 0.08 3,519.3 69.57 8,556 3.47 1372 0.15 to <0.25 270,442 110,524 6.35 380,966 0.19 1,842.0 70.17 27,348 7.17 5073 0.25 to <0.50 306,429 287,713 10.90 594,142 0.40 3,858.6 64.60 72,601 12.21 1,5594 0.50 to <0.75 234,914 373,026 57.54 607,941 0.51 3,267.9 74.25 102,965 16.93 2,3215 0.75 to <2.50 542,536 53,874 16.42 596,411 1.67 610.3 77.81 261,390 43.82 7,7896 2.50 to <10.00 827,903 165,197 6.84 993,100 4.73 1,630.0 75.52 864,699 87.07 35,4507 10.00 to <100.00 34,314 4,214 9.59 38,529 49.54 76.2 72.88 65,835 170.87 13,8918 100.00 (Default) 75,609 5,547 100.00 81,157 100.00 139.3 77.62 75,999 93.64 62,9969 Subtotal 2,355,373 1,183,102 33.43 3,538,476 4.62 14,944.0 72.88 1,479,397 41.80 124,653 89,065
Residential mortgage exposures1 0.00 to <0.15 — — — 66,289 0.05 6.9 41.36 16,196 24.43 142 0.15 to <0.25 — — — 2,101 0.17 0.2 66.14 902 42.92 23 0.25 to <0.50 7,487,736 10,596 100.00 7,499,041 0.29 462.7 27.66 1,100,798 14.67 6,0644 0.50 to <0.75 978,326 1,780 100.00 980,108 0.59 54.7 29.57 256,704 26.19 1,7395 0.75 to <2.50 1,074,533 3,202 100.00 1,012,811 1.00 77.8 35.89 466,838 46.09 3,8096 2.50 to <10.00 — — — — — — — — — —7 10.00 to <100.00 32,676 1,418 100.00 29,918 22.72 2.7 30.54 50,806 169.81 2,0548 100.00 (Default) 98,771 70 100.00 98,841 100.00 7.7 30.76 24,618 24.90 30,4089 Subtotal 9,672,044 17,068 100.00 9,689,113 1.48 612.8 28.86 1,916,865 19.78 44,093 28,735
Other retail exposures1 0.00 to <0.15 2 — — 2 0.08 0.0 69.57 0 14.63 02 0.15 to <0.25 102,833 — — 102,833 0.17 2.5 35.25 13,133 12.77 613 0.25 to <0.50 349,497 342 83.62 349,839 0.40 10.8 36.46 80,426 22.98 5144 0.50 to <0.75 50,000 1,284 89.80 51,285 0.69 2.1 35.91 15,825 30.85 1285 0.75 to <2.50 945,786 502,021 95.74 1,447,808 1.41 2,472.7 50.84 830,910 57.39 10,6036 2.50 to <10.00 31,508 147,294 100.00 178,802 3.50 142.0 46.14 117,377 65.64 2,8737 10.00 to <100.00 16,960 5,212 100.00 22,172 22.83 39.5 51.29 24,427 110.16 2,5938 100.00 (Default) 55,898 967 100.00 56,865 100.00 90.4 56.30 90,458 159.07 32,0179 Subtotal 1,552,487 657,123 100.00 2,209,611 4.10 2,760.4 47.25 1,172,559 53.06 48,792 28,150
Total (all portfolios) 158,276,630 30,374,265 58.40 176,015,577 0.65 18,455.9 35.07 — 33,345,832 18.94 533,673 464,718
Basel III Information
012_0800885851907.indd 259 2019/08/16 19:25:55

260
Sumitomo Mitsui Financial Group
SMBC Group Annual Report 2019
(Millions of yen, %, the number of data in thousands, years)
CR6: IRB - CR exposures by portfolio and PD range
As of March 31, 2018
a b c d e f g h i j k l
ItemNo. PD scale
On-balance sheet gross exposures
Off-balance sheet
exposures pre CCF (Credit Conversion Factor) and
pre CRM
Average CCF(%)
EAD post
CCF and post CRM
Average PD(%)
Number of
obligors
Average LGD(%)
Average maturity
Credit RWA
amounts
RWA density
(%)EL Eligible
provisions
Sovereign exposures (AIRB approach)1 0.00 to <0.15 68,167,222 125,318 76.91 70,969,920 0.00 0.4 34.07 3.7 213,320 0.30 2192 0.15 to <0.25 317,319 35,948 47.75 319,948 0.17 0.0 33.89 2.6 103,974 32.49 1883 0.25 to <0.50 55,549 17,544 47.94 59,366 0.33 0.0 32.71 1.7 20,409 34.37 624 0.50 to <0.75 54 — — 54 0.55 0.0 35.00 1.0 23 42.70 05 0.75 to <2.50 109,383 60,078 66.65 58,440 2.01 0.0 32.36 2.9 49,689 85.02 3916 2.50 to <10.00 58,134 28,997 47.31 22,313 4.05 0.0 31.38 2.7 24,865 111.43 2837 10.00 to <100.00 5,023 13,152 52.84 2,298 15.43 0.0 23.46 1.7 2,590 112.67 858 100.00 (Default) 5,691 — — 5,691 100.00 0.0 52.99 1.0 2,974 52.25 3,0169 Subtotal 68,718,379 281,038 65.00 71,438,035 0.01 0.5 34.07 3.7 417,847 0.58 4,246 5,658
Sovereign exposures (FIRB approach)1 0.00 to <0.15 10,630 — — 10,630 0.00 0.0 45.00 4.0 — 0.00 —2 0.15 to <0.25 — — — — — — — — — — —3 0.25 to <0.50 — — — — — — — — — — —4 0.50 to <0.75 — — — — — — — — — — —5 0.75 to <2.50 — — — — — — — — — — —6 2.50 to <10.00 168 — — 168 2.58 0.0 45.00 4.2 243 144.51 17 10.00 to <100.00 — — — — — — — — — — —8 100.00 (Default) — — — — — — — — — — —9 Subtotal 10,798 — — 10,798 0.04 0.0 45.00 4.0 243 2.25 1 2
Bank exposures (AIRB approach)1 0.00 to <0.15 2,624,230 581,505 77.15 3,146,406 0.03 0.6 33.42 1.8 411,117 13.06 4062 0.15 to <0.25 702,915 167,241 83.68 834,879 0.17 0.2 30.31 1.1 196,553 23.54 4313 0.25 to <0.50 124,531 12,565 69.61 117,658 0.34 0.0 32.08 1.4 45,858 38.97 1324 0.50 to <0.75 3,204 — — 3,204 0.55 0.0 35.16 1.6 2,058 64.22 65 0.75 to <2.50 542,118 34,427 74.90 493,919 1.08 0.1 34.91 1.0 334,179 67.65 1,8626 2.50 to <10.00 68,625 80,669 33.45 91,369 3.24 0.6 33.59 1.2 89,728 98.20 9797 10.00 to <100.00 — 83 20.00 — — 0.0 — — 0 — 08 100.00 (Default) 2,661 — — 2,661 100.00 0.0 98.44 1.0 1,299 48.83 2,6209 Subtotal 4,068,287 876,492 74.17 4,690,099 0.29 1.7 33.03 1.5 1,080,795 23.04 6,439 7,994
Bank exposures (FIRB approach)1 0.00 to <0.15 2,637 243 100.00 2,881 0.03 0.0 45.00 4.9 1,088 37.77 02 0.15 to <0.25 — 10 100.00 10 0.18 0.0 45.00 5.0 8 85.48 03 0.25 to <0.50 — — — — — — — — — — —4 0.50 to <0.75 — — — — — — — — — — —5 0.75 to <2.50 — — — — — — — — — — —6 2.50 to <10.00 1,773 315 100.00 2,089 2.58 0.0 45.00 4.0 3,666 175.49 247 10.00 to <100.00 — — — — — — — — — — —8 100.00 (Default) — — — — — — — — — — —9 Subtotal 4,411 568 100.00 4,980 1.10 0.1 45.00 4.5 4,763 95.64 24 42
Corporate exposures (AIRB approach)1 0.00 to <0.15 22,196,795 10,658,246 54.59 32,012,176 0.05 6.8 35.48 2.5 5,766,807 18.01 6,4882 0.15 to <0.25 10,819,575 6,450,034 53.60 13,061,831 0.17 6.0 29.39 2.4 3,638,855 27.85 6,6553 0.25 to <0.50 4,553,570 2,055,308 54.63 5,150,552 0.34 3.1 28.78 2.5 1,933,386 37.53 5,0064 0.50 to <0.75 938,711 68,336 54.33 965,362 0.55 1.4 29.96 2.5 477,409 49.45 1,5915 0.75 to <2.50 4,150,918 2,115,541 52.85 3,385,408 1.46 3.8 27.21 3.0 2,232,607 65.94 13,2276 2.50 to <10.00 1,310,290 271,399 63.23 1,122,868 3.09 1.5 32.62 3.6 1,277,847 113.80 10,6997 10.00 to <100.00 494,124 395,537 55.88 596,149 13.95 0.5 32.63 2.3 916,897 153.80 25,7538 100.00 (Default) 197,593 16,194 100.00 192,826 100.00 0.3 48.77 2.1 54,227 28.12 94,0479 Subtotal 44,661,581 22,030,599 54.30 56,487,175 0.75 23.7 32.83 2.5 16,298,039 28.85 163,471 196,675
Basel III Information
012_0800885851907.indd 260 2019/08/16 19:25:55

261
Sumitomo Mitsui Financial Group
SMBC Group Annual Report 2019
(Millions of yen, %, the number of data in thousands, years)
CR6: IRB - CR exposures by portfolio and PD range
As of March 31, 2018
a b c d e f g h i j k l
ItemNo. PD scale
On-balance sheet gross exposures
Off-balance sheet
exposures pre CCF and pre
CRM
Average CCF(%)
EAD post
CCF and post CRM
Average PD(%)
Number of
obligors
Average LGD(%)
Average maturity
Credit RWA
amounts
RWA density
(%)EL Eligible
provisions
Corporate exposures (FIRB approach)1 0.00 to <0.15 777,916 28,934 96.05 805,710 0.06 1.6 45.44 2.7 205,774 25.53 2502 0.15 to <0.25 347,029 6,838 99.36 353,824 0.17 1.3 45.19 3.4 194,414 54.94 2873 0.25 to <0.50 98,751 1,770 99.77 100,517 0.28 0.8 45.79 2.4 55,231 54.94 1284 0.50 to <0.75 66,698 2,129 100.00 68,827 0.55 0.5 45.00 2.7 52,840 76.77 1705 0.75 to <2.50 83,269 817 100.00 84,087 1.38 0.9 45.00 2.9 92,376 109.85 5226 2.50 to <10.00 262,382 3,066 91.77 265,196 2.58 1.4 45.09 3.3 404,402 152.49 3,0867 10.00 to <100.00 74,717 59 100.00 74,777 13.94 0.1 60.25 2.5 205,493 274.80 5,8678 100.00 (Default) 24,759 — — 24,759 100.00 0.0 45.00 2.0 — 0.00 11,1419 Subtotal 1,735,525 43,614 96.69 1,777,700 2.53 7.0 45.94 2.9 1,210,531 68.09 21,455 12,461
Mid-sized corporations and small-medium enterprises (SMEs) exposures (AIRB approach)1 0.00 to <0.15 486,380 14,611 53.22 498,998 0.08 1.1 26.07 2.7 71,166 14.26 1072 0.15 to <0.25 1,326,614 96,538 60.69 1,330,684 0.17 4.8 30.73 3.4 385,239 28.95 7213 0.25 to <0.50 1,236,338 21,826 55.93 1,205,066 0.30 6.5 32.74 3.7 497,080 41.24 1,2214 0.50 to <0.75 887,394 13,866 49.25 838,231 0.55 5.6 31.35 3.5 405,845 48.41 1,4695 0.75 to <2.50 2,122,881 124,359 68.45 1,767,292 1.49 24.9 37.29 3.1 1,294,555 73.25 10,2446 2.50 to <10.00 1,015,395 131,837 55.37 676,208 2.66 16.1 29.41 4.0 480,886 71.11 5,3067 10.00 to <100.00 339,793 2,744 49.96 207,014 17.26 6.0 35.31 2.1 304,012 146.85 15,1198 100.00 (Default) 262,978 1,227 100.00 205,651 100.00 4.0 47.01 1.6 29,434 14.31 96,6959 Subtotal 7,677,777 407,011 60.47 6,729,149 4.41 69.3 33.05 3.3 3,468,220 51.54 130,885 124,114
Mid-sized corporations and SMEs exposures (FIRB approach)1 0.00 to <0.15 4,575 68 100.00 4,643 0.08 0.1 45.00 2.9 1,361 29.31 12 0.15 to <0.25 12,696 54 100.00 12,750 0.17 0.4 45.00 2.9 5,557 43.58 103 0.25 to <0.50 9,265 72 100.00 9,337 0.27 0.4 45.00 2.6 4,547 48.70 114 0.50 to <0.75 9,706 125 100.00 9,832 0.55 0.4 45.00 2.6 6,646 67.59 245 0.75 to <2.50 28,852 965 99.92 29,817 1.61 1.6 45.00 2.9 28,738 96.38 2166 2.50 to <10.00 6,091 116 100.00 6,208 2.58 0.3 45.00 2.5 6,697 107.87 727 10.00 to <100.00 2,345 52 100.00 2,397 21.46 0.2 45.00 2.5 4,836 201.72 2318 100.00 (Default) 544 6 100.00 551 100.00 0.0 45.00 1.7 — 0.00 2489 Subtotal 74,078 1,460 99.95 75,538 2.40 3.7 45.00 2.8 58,385 77.29 816 684
Specialized lending (SL)1 0.00 to <0.15 1,744,348 159,449 47.79 1,777,731 0.04 0.2 23.81 3.4 212,294 11.94 1802 0.15 to <0.25 1,551,583 496,168 53.75 1,624,615 0.17 0.3 23.23 4.1 455,224 28.02 6423 0.25 to <0.50 1,715,293 574,376 57.85 1,444,767 0.35 0.3 26.58 3.8 622,533 43.08 1,3444 0.50 to <0.75 160,319 — — 160,319 0.55 0.0 28.68 3.7 89,793 56.00 2525 0.75 to <2.50 796,408 203,735 55.78 751,006 1.36 0.1 29.48 3.8 562,793 74.93 2,8336 2.50 to <10.00 192,784 42,326 79.70 118,808 3.49 0.0 30.36 3.6 118,367 99.62 1,2037 10.00 to <100.00 74,703 244 47.79 60,921 16.19 0.0 33.49 3.1 109,117 179.11 3,4448 100.00 (Default) 52,575 1,148 100.00 42,740 100.00 0.0 56.86 4.0 22,331 52.25 24,3069 Subtotal 6,288,017 1,477,449 55.76 5,980,911 1.28 1.2 25.63 3.8 2,192,457 36.65 34,208 34,435
Equity exposures1 0.00 to <0.15 3,872,128 — — 3,872,128 0.04 1.4 90.00 5.0 3,911,909 101.02 —2 0.15 to <0.25 210,449 — — 210,449 0.17 0.5 90.00 5.0 288,416 137.04 —3 0.25 to <0.50 22,503 — — 22,503 0.28 0.2 90.00 5.0 36,736 163.24 —4 0.50 to <0.75 4,671 — — 4,671 0.55 0.1 90.00 5.0 9,575 204.96 —5 0.75 to <2.50 8,256 — — 8,256 1.22 0.1 90.00 5.0 22,777 275.86 —6 2.50 to <10.00 10,538 — — 10,538 2.58 0.0 90.00 5.0 40,108 380.60 —7 10.00 to <100.00 19,848 — — 19,848 10.44 0.0 90.00 5.0 112,310 565.83 —8 100.00 (Default) 188 — — 188 100.00 0.0 90.00 5.0 2,125 1,125.00 —9 Subtotal 4,148,585 — — 4,148,585 0.11 2.5 90.00 5.0 4,423,959 106.63 — —
Basel III Information
012_0800885851907.indd 261 2019/08/16 19:25:55

262
Sumitomo Mitsui Financial Group
SMBC Group Annual Report 2019
(Millions of yen, %, the number of data in thousands, years)
CR6: IRB - CR exposures by portfolio and PD range
As of March 31, 2018
a b c d e f g h i j k l
ItemNo. PD scale
On-balance sheet gross exposures
Off-balance sheet
exposures pre CCF and pre
CRM
Average CCF(%)
EAD post
CCF and post CRM
Average PD(%)
Number of
obligors
Average LGD(%)
Average maturity
Credit RWA
amounts
RWA density
(%)EL Eligible
provisions
Purchased receivables (corporates) (the amount equivalent to default risks) (AIRB approach)1 0.00 to <0.15 983,853 44,762 99.99 1,017,578 0.05 3.6 35.16 1.3 104,854 10.30 2132 0.15 to <0.25 332,316 44,072 87.58 363,873 0.17 3.6 32.90 1.3 85,306 23.44 2193 0.25 to <0.50 99,760 68,714 98.42 163,014 0.36 8.3 44.23 1.5 72,557 44.50 2464 0.50 to <0.75 14,747 29,991 100.00 43,153 0.59 3.9 56.24 1.0 30,631 70.98 1455 0.75 to <2.50 76,713 102,062 91.26 164,126 1.51 16.5 48.61 1.2 150,419 91.64 1,1526 2.50 to <10.00 5,636 19,652 100.00 23,899 3.03 3.8 58.36 1.0 29,578 123.76 3937 10.00 to <100.00 23,528 2,825 100.00 25,367 13.36 0.4 37.66 1.0 36,947 145.64 1,4118 100.00 (Default) 4,016 260 100.00 4,201 100.00 0.1 80.11 1.0 525 12.50 3,3669 Subtotal 1,540,572 312,341 95.04 1,805,215 0.71 40.6 37.70 1.3 510,821 28.29 7,147 4,550
Purchased receivables (corporates) (the amount equivalent to dilution risks) (AIRB approach)1 0.00 to <0.15 593,602 116,625 99.99 710,216 0.06 0.4 39.42 1.0 95,949 13.50 1962 0.15 to <0.25 238,937 64,726 97.43 302,005 0.17 0.3 37.45 1.4 79,808 26.42 2023 0.25 to <0.50 84,015 24,921 100.00 108,937 0.29 0.1 38.61 1.0 37,823 34.72 1224 0.50 to <0.75 11,266 10,463 100.00 21,729 0.55 0.1 49.44 1.1 13,128 60.41 595 0.75 to <2.50 73,619 34,149 89.66 104,238 1.45 0.4 42.29 1.0 85,067 81.60 6476 2.50 to <10.00 1,736 31,479 100.00 33,215 2.65 0.2 62.92 1.0 47,786 143.86 5457 10.00 to <100.00 7,098 2,437 100.00 9,536 11.14 0.0 42.66 1.0 16,239 170.29 4718 100.00 (Default) 151 112 100.00 264 100.00 0.0 47.75 1.0 33 12.50 1269 Subtotal 1,010,428 284,914 98.17 1,290,143 0.40 1.8 39.92 1.1 375,839 29.13 2,371 2,702
Purchased receivables (corporates) (the amount equivalent to default risks) (FIRB approach)1 0.00 to <0.15 51,118 234 100.00 50,507 0.05 0.3 45.00 1.8 19,755 39.11 512 0.15 to <0.25 4,898 790 70.27 5,376 0.18 0.0 45.00 1.8 5,247 97.59 93 0.25 to <0.50 2,393 1,671 100.00 4,020 0.31 0.0 45.00 1.8 1,890 47.02 54 0.50 to <0.75 3,621 2,330 100.00 5,895 0.58 0.1 45.00 2.9 5,495 93.21 155 0.75 to <2.50 3,511 5,015 100.00 8,265 1.05 0.4 45.00 2.3 9,463 114.49 526 2.50 to <10.00 11,815 215 100.00 11,887 2.58 0.2 45.00 2.4 23,956 201.51 1847 10.00 to <100.00 2,987 — — 2,987 26.33 0.0 45.00 4.8 8,956 299.75 3548 100.00 (Default) 200 — — 194 100.00 0.0 45.00 1.1 0 0.00 879 Subtotal 80,548 10,258 97.70 89,135 1.64 1.3 45.00 2.1 74,764 83.87 760 810
Purchased receivables (corporates) (the amount equivalent to dilution risks) (FIRB approach)1 0.00 to <0.15 41,923 3,763 93.75 45,451 0.04 0.0 84.74 1.4 9,896 21.77 162 0.15 to <0.25 2,825 3,291 100.00 6,116 0.18 0.0 58.64 1.4 2,773 45.35 63 0.25 to <0.50 136 2,201 100.00 2,338 0.32 0.0 45.00 1.0 884 37.83 34 0.50 to <0.75 402 272 100.00 674 0.58 0.0 76.35 1.7 863 128.00 25 0.75 to <2.50 4,576 488 100.00 5,065 0.96 0.0 88.82 1.1 6,995 138.10 416 2.50 to <10.00 3,989 240 100.00 4,229 2.61 0.0 79.06 1.6 9,145 216.23 867 10.00 to <100.00 1,039 — — 1,039 26.33 0.0 45.00 1.0 2,432 234.08 1238 100.00 (Default) — — — — — — — — — — —9 Subtotal 54,891 10,258 97.70 64,915 0.73 0.2 80.08 1.4 32,992 50.82 280 337
Purchased receivables (retail) (the amount equivalent to default risks)1 0.00 to <0.15 4,726 — — 4,718 0.06 1.3 60.89 — 1,539 32.62 32 0.15 to <0.25 3,221 — — 3,220 0.19 0.3 65.00 — 1,047 32.51 43 0.25 to <0.50 9,606 — — 9,562 0.30 1.7 49.87 — 3,190 33.36 154 0.50 to <0.75 604 — — 604 0.63 0.1 63.69 — 316 52.44 25 0.75 to <2.50 2,009 18 100.00 1,994 1.21 0.7 54.81 — 1,735 87.04 146 2.50 to <10.00 12 2 100.00 14 3.14 0.0 65.00 — 27 197.60 07 10.00 to <100.00 1 — — 1 26.56 0.0 52.04 — 2 150.79 08 100.00 (Default) 21 — — 19 100.00 0.0 27.86 — 53 272.39 59 Subtotal 20,201 21 100.00 20,134 0.42 4.3 55.76 — 7,912 39.29 45 48
Basel III Information
012_0800885851907.indd 262 2019/08/16 19:25:55

263
Sumitomo Mitsui Financial Group
SMBC Group Annual Report 2019
(Millions of yen, %, the number of data in thousands, years)
CR6: IRB - CR exposures by portfolio and PD range
As of March 31, 2018
a b c d e f g h i j k l
ItemNo. PD scale
On-balance sheet gross exposures
Off-balance sheet
exposures pre CCF and pre
CRM
Average CCF(%)
EAD post
CCF and post CRM
Average PD(%)
Number of
obligors
Average LGD(%)
Average maturity
Credit RWA
amounts
RWA density
(%)EL Eligible
provisions
Purchased receivables (retail) (the amount equivalent to dilution risks) (AIRB approach)1 0.00 to <0.15 405 0 100.00 405 0.07 0.0 86.89 3.7 251 61.97 02 0.15 to <0.25 1,991 — — 1,991 0.18 0.0 99.89 3.2 2,154 108.16 33 0.25 to <0.50 53 0 100.00 53 0.27 0.0 47.55 4.5 42 78.02 04 0.50 to <0.75 96 — — 96 0.55 0.0 100.00 4.3 263 272.82 05 0.75 to <2.50 15 1 100.00 17 0.87 0.0 94.21 2.3 30 175.83 06 2.50 to <10.00 113 18 100.00 132 2.66 0.0 69.82 3.5 324 245.12 27 10.00 to <100.00 — — — — — — — — — — —8 100.00 (Default) — — — — — — — — — — —9 Subtotal 2,676 21 100.00 2,697 0.30 0.0 95.38 3.4 3,066 113.66 7 8
Qualifying revolving retail exposures (QRRE)1 0.00 to <0.15 60,794 172,036 7.02 232,831 0.08 6,746.5 69.25 8,053 3.45 1282 0.15 to <0.25 258,257 109,606 7.24 367,864 0.19 3,479.5 70.37 26,482 7.19 4913 0.25 to <0.50 297,081 297,923 7.81 595,005 0.43 7,740.5 61.18 71,847 12.07 1,5594 0.50 to <0.75 232,333 369,070 60.47 601,404 0.51 6,058.6 74.06 102,236 16.99 2,3085 0.75 to <2.50 560,936 59,252 20.80 620,189 1.55 1,259.5 78.17 256,303 41.32 7,4876 2.50 to <10.00 836,700 184,263 13.74 1,020,964 4.72 3,274.2 75.22 876,927 85.89 35,8187 10.00 to <100.00 33,790 4,017 16.85 37,807 47.55 141.5 73.21 66,147 174.95 13,1008 100.00 (Default) 71,709 4,905 100.00 76,614 100.00 192.6 78.16 72,691 94.87 59,8849 Subtotal 2,351,604 1,201,076 33.80 3,552,680 4.47 28,893.2 72.33 1,480,691 41.67 120,779 89,131
Residential mortgage exposures1 0.00 to <0.15 — — — 75,902 0.04 7.7 40.70 16,848 22.19 142 0.15 to <0.25 — — — 2,108 0.17 0.2 63.26 921 43.67 23 0.25 to <0.50 7,682,449 12,935 100.00 7,696,120 0.29 471.8 28.43 1,164,045 15.12 6,4194 0.50 to <0.75 1,004,639 2,074 100.00 1,006,714 0.60 55.5 30.44 274,505 27.26 1,8695 0.75 to <2.50 1,167,124 3,603 100.00 1,096,658 1.03 82.9 36.86 530,081 48.33 4,3736 2.50 to <10.00 — — — — — — — — — —7 10.00 to <100.00 48,445 1,615 100.00 45,383 22.95 3.9 31.87 81,296 179.13 3,2968 100.00 (Default) 108,824 168 100.00 108,992 100.00 8.4 30.95 26,811 24.59 33,7369 Subtotal 10,011,483 20,397 100.00 10,031,880 1.59 630.7 29.70 2,094,510 20.87 49,711 33,682
Other retail exposures1 0.00 to <0.15 21,127 2,422 98.96 23,525 0.07 — 61.85 2,745 11.67 102 0.15 to <0.25 97,719 — — 97,719 0.17 — 35.69 12,639 12.93 593 0.25 to <0.50 372,939 4,325 99.27 377,233 0.38 — 39.45 89,699 23.77 5604 0.50 to <0.75 138,075 1,895 100.00 139,970 0.61 — 45.02 51,448 36.75 4005 0.75 to <2.50 1,176,450 508,853 99.97 1,685,196 1.51 — 50.78 988,941 58.68 13,1396 2.50 to <10.00 54,834 154,610 100.00 209,444 3.55 — 47.71 142,107 67.84 3,4967 10.00 to <100.00 19,876 4,623 100.00 24,500 22.80 — 50.46 26,596 108.55 2,8328 100.00 (Default) 65,578 1,115 100.00 66,693 100.00 — 52.98 93,642 140.40 35,3379 Subtotal 1,946,602 677,847 99.97 2,624,284 4.10 — 48.19 1,407,820 53.64 55,837 33,076
Total (all portfolios) 154,406,453 27,635,372 59.40 170,824,061 0.77 29,682.4 35.65 — 35,143,661 20.57 598,491 546,416
Basel III Information
012_0800885851907.indd 263 2019/08/16 19:25:55

264
Sumitomo Mitsui Financial Group
SMBC Group Annual Report 2019
6. Effect on Credit RWA of Credit Derivatives Used as CRM Techniques (CR7) (Millions of yen)
CR7: IRB – Effect on credit RWA of credit derivatives used as CRM techniques As of March 31, 2019 As of March 31, 2018
ItemNo. Portfolio
a b a bPre-credit derivatives credit RWA
Actual credit RWA
Pre-credit derivatives credit RWA
Actual credit RWA
1 Sovereign exposures - FIRB — — 243 2432 Sovereign exposures - AIRB 324,283 324,283 315,559 315,5593 Bank exposures - FIRB 5,978 5,978 4,763 4,7634 Bank exposures - AIRB 1,232,599 1,232,599 1,046,365 1,046,3655 Corporate exposures (excluding SL) - FIRB 85 85 1,268,916 1,268,9166 Corporate exposures (excluding SL) - AIRB 20,216,917 20,216,202 19,797,293 19,796,9177 SL - FIRB 561,130 561,130 552,198 552,1988 SL- AIRB 2,325,087 2,325,087 2,289,154 2,289,1549 Retail - QRRE 1,479,397 1,479,397 1,480,691 1,480,691
10 Retail - Residential mortgage exposures 1,916,865 1,916,865 2,094,510 2,094,51011 Retail - Other retail exposures 1,172,559 1,172,559 1,407,820 1,407,82012 Equity - FIRB — — 171,058 171,05813 Equity - AIRB 4,690,527 4,690,527 5,387,041 5,387,04114 Purchased receivables - FIRB 5,407 5,407 107,757 107,75715 Purchased receivables - AIRB 668,024 668,024 897,638 897,63816 Total 34,598,865 34,598,150 36,821,014 36,820,637
7. RWA flow statements of credit risk exposures under IRB approach (CR8) (One hundred billions of yen)
CR8: RWA flow statements of credit risk exposures under IRB approachItem No. RWA amounts
1 RWA as of March 31, 2018 3682
Breakdown of variations in the credit risk-weighted assets
Asset size 73 Asset quality (17)4 Model updates —5 Methodology and policy (1)6 Acquisitions and disposals (13)7 Foreign exchange movements 28 Other —9 RWA as of March 31, 2019 345
Basel III Information
012_0800885851907.indd 264 2019/08/16 19:25:55

265
Sumitomo Mitsui Financial Group
SMBC Group Annual Report 2019
8. Backtesting of Probability of Default (PD) per Portfolio (CR9) (%, the number of data)
CR9: IRB - Backtesting of PD per portfolioa b c d e f g h i
Portfolio PD Range
External rating equivalent
Weighted average PD
(EAD weighted)
Arithmetic average PD
(by obligors)
Number of obligors Number of
defaulted obligors
in the year
Of which: number of new
defaulted obligors
in the year
Average historical annual default rate (5 years)
S&P Moody’s Fitch R&I JCRAs of March
31, 2018
As of March
31, 2017
Corporates
0.00 to < 0.05 AAA~A+ Aaa~A1 AAA~A+ AAA~A- AAA~A- 0.00% 0.03% 1,729 1,729 2 0 0.02%0.05 to < 0.10 A~A- A2~A3 A~A- BBB+~BBB- BBB+~BBB- 0.08% 0.08% 4,506 4,506 1 0 0.03%0.10 to < 0.50 BBB+~BB Baa1~Ba2 BBB+~BB to BB+ to BB+ 0.20% 0.25% 13,415 13,415 10 0 0.06%0.50 to < 2.50 BB-~B Ba3~B2 BB-~B to BB+ to BB+ 1.05% 1.39% 26,519 26,516 72 3 0.21%2.50 to < 100.00 to B- to B3 to B- to BB+ to BB+ 5.68% 7.38% 15,315 15,312 937 3 4.71%
Qualifying revo l v i ng retail
0.00 to < 0.05 — — — — — — —0.05 to < 0.10 0.08% 0.08% 4,812,835 4,624,194 3,932 1,464 0.07%0.10 to < 0.50 0.27% 0.23% 2,108,335 2,015,548 3,501 481 0.14%0.50 to < 2.50 1.02% 0.62% 7,361,578 7,226,945 25,139 3,914 0.32%2.50 to < 100.00 7.04% 7.67% 1,610,273 1,582,522 80,656 3,333 4.59%
Residential mortgage
0.00 to < 0.05 — — — — — — —0.05 to < 0.10 — — — — — — —0.10 to < 0.50 0.29% 0.29% 672,122 677,408 696 10 0.12%0.50 to < 2.50 0.85% 0.89% 171,058 176,003 643 5 0.45%2.50 to < 100.00 23.75% 25.14% 3,860 3,589 292 0 10.81%
Other retail
0.00 to < 0.05 0.03% 0.03% 838 838 0 0 0.00%0.05 to < 0.10 0.08% 0.08% 1,909 1,909 0 0 0.00%0.10 to < 0.50 0.34% 0.33% 23,464 25,278 37 1 0.13%0.50 to < 2.50 1.36% 1.59% 1,910,495 1,912,099 9,819 2,011 0.52%2.50 to < 100.00 3.87% 4.46% 2,554,313 2,552,239 23,103 3,186 1.89%
Notes: 1. IRB model presented in this table covers all models used within the scope of regulatory consolidation.2. Applicable portfolios of each IRB model take into account the portfolio classification under Basel Capital Accord. “Corporates” include “Sovereign,” “Financial entities,”
“Specialized lending,” “Equity (PD/LGD method)” and “Purchased receivables (corporates),” and “Residential mortgage” and “Other retail” include “Purchased receivables (retail).” Therefore, the same classifications are used in this table.
3. A maximum of ten categories of obligor rating in the internal rating system are consolidated into five categories as PD categories.4. For the external ratings associated with, external ratings equivalent to the PD of non-Japanese companies mainly are listed in the columns of S&P, Moody’s, and Fitch, and
external ratings equivalent to the PD of Japanese companies mainly are listed in the columns of R&I and JCR.5. The number of obligors of “Qualifying revolving retail,” “Residential mortgage” and “Other retail” states the number of receivables.6. The proportion of credit risk-weighted assets subject to the IRB approach is that “Corporates” accounts for 84.53 percent, “Qualifying revolving retail” accounts for 4.15
percent, “Residential mortgage” accounts for 5.81 percent, and “Other retail” accounts for 3.97 percent.
Basel III Information
012_0800885851907.indd 265 2019/08/16 19:25:55

266
Sumitomo Mitsui Financial Group
SMBC Group Annual Report 2019
9. SL (Slotting Criteria Approach) and Equity Exposures (Market-Based Approach, etc.) (CR10) (Millions of yen, except percentages)
CR10: IRB - SL (slotting criteria approach) and equity exposures (market-based approach, etc.)
As of March 31, 2019
a b c d e f g h i j k lSL (slotting criteria approach)
Other than high-volatility commercial real estate (HVCRE)
Regulatory categories
Remaining maturity
On-balance sheet amount
Off-balance sheet amount RW
Exposure amount (EAD) Credit RWA amount
Expected lossesPF OF CF IPRE Total
Strong
Less than 2.5 years 7,686 28,595 50% 36,282 — — — 36,282 18,141 —
Equal to or more than 2.5 years
17,399 18,062 70% 22,398 3,437 — — 25,835 18,084 103
Good
Less than 2.5 years 4,899 710 70% 5,257 — — — 5,257 3,679 21
Equal to or more than 2.5 years
45,993 — 90% 45,993 — — — 45,993 41,394 367
Satisfactory 2,179 — 115% 2,179 — — — 2,179 2,506 61Weak 24 — 250% — 24 — — 24 61 1Default 3,317 — — 3,317 — — — 3,317 — 1,658Total 81,500 47,368 — 115,428 3,461 — — 118,890 83,868 2,214
HVCRE
Regulatory categories
Remaining maturity
On-balance sheet amount
Off-balance sheet amount RW
Exposure amount (EAD)
Credit RWA
amount
Expected losses
Strong
Less than 2.5 years 5,483 3,097 70% 6,927 4,849 27
Equal to or more than 2.5 years
2,820 2,900 95% 4,172 3,964 16
Good
Less than 2.5 years 58,520 36,546 95% 75,837 72,045 303
Equal to or more than 2.5 years
122,748 42,273 120% 144,101 172,922 576
Satisfactory 153,511 901 140% 153,931 215,504 4,310Weak — — 250% — — —Default — — — — — —Total 343,084 85,719 — 384,971 469,285 5,234
Equity exposures (market-based approach, etc.)Equity exposures subject to market-based approach
Categories On-balance sheet amount
Off-balance sheet amount RW
Exposure amount (EAD)
Credit RWA
amountSimple risk weight method –listed shares 31,926 — 300% 31,926 95,779
Simple risk weight method –unlisted shares 57,835 8,520 400% 61,808 247,232
Internal models approach 191,666 59,500 141% 251,166 356,151Total 281,428 68,021 — 344,901 699,163Equity exposures subject to 100% risk weightEquity exposures subject to 100% risk weight pursuant to the provisions of Article 166, Paragraph 1 of the Notification No. 19 issued by the Japan Financial Service Agency in 2006
— — 100% — —
Basel III Information
012_0800885851907.indd 266 2019/08/16 19:25:56

267
Sumitomo Mitsui Financial Group
SMBC Group Annual Report 2019
(Millions of yen, except percentages)
CR10: IRB - SL (slotting criteria approach) and equity exposures (market-based approach, etc.)
As of March 31, 2018
a b c d e f g h i j k lSL (slotting criteria approach)
Other than high-volatility commercial real estate (HVCRE)
Regulatory categories
Remaining maturity
On-balance sheet amount
Off-balance sheet amount RW
Exposure amount (EAD) Credit RWA amount
Expected lossesPF OF CF IPRE Total
Strong
Less than 2.5 years 19,945 401 50% 13,732 — — 6,404 20,137 10,068 —
Equal to or more than 2.5 years
14,996 13,228 70% 12,418 3,627 — 5,287 21,333 14,933 85
Good
Less than 2.5 years 10,834 27,550 70% 36,175 — — 2,209 38,384 26,869 153
Equal to or more than 2.5 years
35,767 585 90% 34,536 — — 1,511 36,047 32,442 288
Satisfactory 35,415 1,360 115% 13,270 — — 22,795 36,065 41,475 1,009Weak 47 350 250% 262 47 — — 309 774 24Default 4,874 — — 3,282 — — 1,592 4,874 — 2,437Total 121,882 43,475 — 113,677 3,674 — 39,800 157,153 126,563 3,999
HVCRE
Regulatory categories
Remaining maturity
On-balance sheet amount
Off-balance sheet amount RW
Exposure amount (EAD)
Credit RWA
amount
Expected losses
Strong
Less than 2.5 years 6,752 4,028 70% 8,677 6,074 34
Equal to or more than 2.5 years
5,507 17,688 95% 13,960 13,262 55
Good
Less than 2.5 years 31,122 16,770 95% 39,136 37,179 156
Equal to or more than 2.5 years
80,441 14,202 120% 87,512 105,014 350
Satisfactory 168,459 10,768 140% 173,606 243,048 4,860Weak 1,787 3,851 250% 4,676 11,690 374Default — — — — — —Total 294,070 67,310 — 327,569 416,270 5,832
Equity exposures (market-based approach, etc.)Equity exposures subject to market-based approach
Categories On-balance sheet amount
Off-balance sheet amount RW
Exposure amount (EAD)
Credit RWA
amountSimple risk weight method –listed shares 25,093 — 300% 25,093 75,280
Simple risk weight method –unlisted shares 117,759 8,715 400% 121,924 487,697
Internal models approach 184,951 20,949 277% 205,900 571,163Total 327,804 29,664 — 352,918 1,134,141Equity exposures subject to 100% risk weightEquity exposures subject to 100% risk weight pursuant to the provisions of Article 166, Paragraph 1 of the Notification No. 19 issued by the Japan Financial Service Agency in 2006
— — 100% — —
Basel III Information
012_0800885851907.indd 267 2019/08/16 19:25:56

268
Sumitomo Mitsui Financial Group
SMBC Group Annual Report 2019
10. Credit Risk-Weighted Assets under Article 145 of the NotificationExposures under Article 145 of the Notification include investments to funds. In the case of such exposures, in principle, each underlying asset of the fund is assigned an obligor grade to calculate the asset’s credit risk-weighted asset amount and the amounts are totaled to derive the credit risk-weighted asset amount of the fund. When it is difficult to calculate the credit risk-weighted asset amount of individual underlying assets, the credit risk-weighted average of individual underlying assets is calculated, where risk weight of 250%/ 400% is applied if the result of such calculation proved to be 250%/400% or less, while 1,250% is applied otherwise.
(Millions of yen)
Calculation method As of March 31, 2018Exposure under Article 145 of the Notification 1,317,837
(Millions of yen)
Calculation method As of March 31, 2019Look-through approach 1,337,269Mandate-based approach —Simple approach (subject to 250% risk weight) 8,231Simple approach (subject to 400% risk weight) 79,338Fall-back approach 3,334
Basel III Information
012_0800885851907.indd 268 2019/08/16 19:25:56

269
Sumitomo Mitsui Financial Group
SMBC Group Annual Report 2019
■ Standardised Approach1. Scope
The following consolidated subsidiaries have adopted the standardised approach for exposures as of March 31, 2019 (i.e. consolidatedsubsidiaries not listed in the “Internal Ratings-Based (IRB) Approach: 1. Scope” on page 252).
(1) Consolidated Subsidiaries Planning to Adopt Phased Rollout of the AIRB ApproachSMBC Consumer Finance Co., Ltd.
(2) Consolidated Subsidiaries Planning to Adopt Phased Rollout of the FIRB ApproachCurrently, there are no subsidiaries applicable.
(3) Other Consolidated SubsidiariesThese are consolidated subsidiaries judged not to be significant in terms of credit risk management based on the type of business, scale, and other factors. These subsidiaries will adopt the standardised approach on a permanent basis.
2. Credit Risk-Weighted Asset Calculation MethodologyA 100% risk weight is applied to claims on corporates in accordance with Article 45 of the Notification, and risk weights corresponding tocountry risk scores published by the Organization for Economic Co-operation and Development (OECD) are applied to claims on sovereignsand financial institutions.
3. CR Exposure and Credit Risk Mitigation (CRM) Effects (CR4) (Millions of yen, except percentages)
CR4: SA – CR exposure and CRM effects As of March 31, 2019
ItemNo.
a b c d e fExposures pre-CCF and pre-CRM Exposures post-CCF and post-CRM
Credit RWA amount RWA density
Asset classesOn-balance
sheet amountOff-balance
sheet amountOn-balance
sheet amountOff-balance
sheet amount1 Cash 29,321 — 29,321 — 0 0.00%
2 Government of Japan and Bank of Japan (BOJ) 2,732,090 — 2,732,090 — 0 0.00%
3 Foreign central governments and foreign central banks 1,295,182 — 1,295,182 — 11,203 0.86%
4 Bank for International Settlements, etc. — — — — — —
5 Local governments of Japan 1,065 — 1,065 — 0 0.00%
6 Foreign non-central government public sector entities (PSEs) 5,966 — 5,966 — 1,193 20.00%
7 Multilateral development banks (MDBs) 3,862 — 3,862 — 0 0.00%
8 Japan Finance Organization for Municipalities (JFM) — — — — — —
9 Government- affiliated agencies of Japan 24,632 — 24,632 — 2,463 10.00%
10 The three local public corporations — — — — — —
11
Banks entities and financial instruments business operators engaged in Type I Financial Instruments Business
1,014,364 — 1,014,364 — 208,559 20.56%
12 Corporates 693,915 244,629 693,306 100,975 805,109 101.36%13 SMEs and retail 1,432,756 999,406 1,432,756 749,729 1,636,864 75.00%14 Residential mortgage loans 114,618 — 114,618 — 40,116 35.00%15 Real estate acquisition activities — — — — — —
16Past due loans (three months or more),etc. (excluding residential mortgage loans)
100,681 676 100,482 676 138,293 136.70%
17 Past due loans (three months or more) (residential mortgage loans) 40 — 40 — 40 100.00%
18 Bills in the course of collection — — — — — —
19 Guaranteed by credit guarantee associations, etc. — — — — — —
20Guaranteed by Regional Economy Vitalization Corporation of Japan (REVIC), etc.
— — — — — —
21 Investments, etc. (excluding significant investments) — — — — — —
22 Total 7,448,496 1,244,712 7,447,687 851,382 2,843,844 34.26%
Basel III Information
012_0800885851907.indd 269 2019/08/16 19:25:56

270
Sumitomo Mitsui Financial Group
SMBC Group Annual Report 2019
(Millions of yen, except percentages)
CR4: SA – CR exposure and CRM effects As of March 31, 2018
ItemNo.
a b c d e fExposures pre-CCF and pre-CRM Exposures post-CCF and post-CRM
Credit RWA amount RWA density
Asset classesOn-balance
sheet amountOff-balance
sheet amountOn-balance
sheet amountOff-balance
sheet amount1 Cash 16,048 — 16,048 — 0 0.00%
2 Government of Japan and Bank of Japan (BOJ) 2,470,922 — 2,470,922 — 0 0.00%
3 Foreign central governments and foreign central banks 1,150,561 — 1,150,561 — 9 0.00%
4 Bank for International Settlements, etc. — — — — — —
5 Local governments of Japan 1,570 — 1,570 — 0 0.00%
6 Foreign non-central government public sector entities (PSEs) 31,310 — 31,310 — 1,337 4.27%
7 Multilateral development banks (MDBs) 5,454 — 5,454 — 0 0.00%
8 Japan Finance Organization for Municipalities (JFM) — — — — — —
9 Government- affiliated agencies of Japan 17,675 — 17,675 — 1,767 10.00%
10 The three local public corporations 6,977 — 6,977 — 0 0.01%
11
Banks entities and financial instruments business operators engaged in Type I Financial Instruments Business
510,984 4,797 510,984 2,398 134,872 26.27%
12 Corporates 3,043,686 225,151 3,043,686 102,874 3,138,389 99.74%13 SMEs and retail 1,048,482 1,006,652 1,048,482 769,972 1,363,841 75.00%14 Residential mortgage loans 88,014 — 88,014 — 30,805 35.00%15 Real estate acquisition activities — — — — — —
16Past due loans (three months or more),etc. (excluding residential mortgage loans)
76,914 869 76,914 869 102,814 132.18%
17 Past due loans (three months or more) (residential mortgage loans) 59 — 59 — 59 100.00%
18 Bills in the course of collection — — — — — —
19 Guaranteed by credit guarantee associations, etc. — — — — — —
20Guaranteed by Regional Economy Vitalization Corporation of Japan (REVIC), etc.
— — — — — —
21 Investments, etc. (excluding significant investments) — — — — — —
22 Total 8,468,662 1,237,470 8,468,662 876,114 4,773,898 51.08%
Basel III Information
012_0800885851907.indd 270 2019/08/16 19:25:56

271
Sumitomo Mitsui Financial Group
SMBC Group Annual Report 2019
4. CR Exposures by Asset Classes and Risk Weights (CR5) (Millions of yen)
CR5: SA – CR exposures by asset classes and risk weights As of March 31, 2019
ItemNo.
a b c d e f g h i j kCR exposure amounts (post-CCF and CRM)
Risk weightAsset classes 0% 10% 20% 35% 50% 75% 100% 150% 250% 1250% Total
1 Cash 29,321 — — — — — — — — — 29,3212 Government of Japan and BOJ 2,732,090 — — — — — — — — — 2,732,090
3 Foreign central governments and foreign central banks 1,272,774 — — — 22,407 — — — — — 1,295,182
4 Bank for International Settlements, etc. — — — — — — — — — — —
5 Local governments of Japan 1,065 — — — — — — — — — 1,065
6 Foreign non-central government PSEs — — 5,966 — — — — — — — 5,966
7 MDBs 3,862 — — — — — — — — — 3,8628 JFM — — — — — — — — — — —
9 Government- affiliated agencies of Japan — 24,632 — — — — — — — — 24,632
10 The three local public corporations — — — — — — — — — — —
11
Banks and financial instruments business operators engaged in Type I Financial Instruments Business
— — 999,989 — 11,626 — 2,749 — — — 1,014,364
12 Corporates 8,318 — 5,587 — — — 780,375 — — — 794,28213 SMEs and retail — — — — — 2,182,486 — — — — 2,182,48614 Residential mortgage loans — — — 114,618 — — — — — — 114,61815 Real estate acquisition activities — — — — — — — — — — —
16Past due loans (three months or more), etc. (excluding residential mortgage loans)
— — — — 6,347 — 14,194 80,616 — — 101,159
17Past due loans (three months or more) (residential mortgage loans)
— — — — — — 40 — — — 40
18 Bills in the course of collection — — — — — — — — — — —
19 Guaranteed by credit guarantee associations, etc. — — — — — — — — — — —
20 Guaranteed by REVIC of Japan, etc. — — — — — — — — — — —
21 Investments, etc. (excluding significant investments) — — — — — — — — — — —
22 Total 4,047,432 24,632 1,011,542 114,618 40,382 2,182,486 797,359 80,616 — — 8,299,070
Basel III Information
012_0800885851907.indd 271 2019/08/16 19:25:56

272
Sumitomo Mitsui Financial Group
SMBC Group Annual Report 2019
(Millions of yen)
CR5: SA – CR exposures by asset classes and risk weights As of March 31, 2018
ItemNo.
a b c d e f g h i j kCR exposure amounts (post-CCF and CRM)
Risk weightAsset classes 0% 10% 20% 35% 50% 75% 100% 150% 250% 1250% Total
1 Cash 16,048 — — — — — — — — — 16,0482 Government of Japan and BOJ 2,470,922 — — — — — — — — — 2,470,922
3 Foreign central governments and foreign central banks 1,150,511 — 49 — — — — — — — 1,150,561
4 Bank for International Settlements, etc. — — — — — — — — — — —
5 Local governments of Japan 1,570 — — — — — — — — — 1,570
6 Foreign non-central government PSEs 24,621 — 6,688 — — — — — — — 31,310
7 MDBs 5,454 — — — — — — — — — 5,4548 JFM — — — — — — — — — — —
9 Government- affiliated agencies of Japan — 17,675 — — — — — — — — 17,675
10 The three local public corporations 6,973 — 3 — — — — — — — 6,977
11
Banks and financial instruments business operators engaged in Type I Financial Instruments Business
— — 488,165 — 22,122 — 3,095 — — — 513,382
12 Corporates 3,886 — 5,356 — — — 3,137,317 — — — 3,146,56013 SMEs and retail — — — — — 1,818,455 — — — — 1,818,45514 Residential mortgage loans — — — 88,014 — — — — — — 88,01415 Real estate acquisition activities — — — — — — — — — — —
16Past due loans (three months or more), etc. (excluding residential mortgage loans)
57 — 91 — 13,654 — — 63,979 — — 77,783
17Past due loans (three months or more) (residential mortgage loans)
— — — — — — 59 — — — 59
18 Bills in the course of collection — — — — — — — — — — —
19 Guaranteed by credit guarantee associations, etc. — — — — — — — — — — —
20 Guaranteed by REVIC of Japan, etc. — — — — — — — — — — —
21 Investments, etc. (excluding significant investments) — — — — — — — — — — —
22 Total 3,680,047 17,675 500,355 88,014 35,777 1,818,455 3,140,472 63,979 — — 9,344,777
Note: As the sum of the respective risk weight of the original obligor and the original obligee are applied for the risk weight for loan participation transactions by a bank adopting the SA, the credit RWA amount calculated by summing up the exposure amount multiplied by the corresponding risk weights in the above table does not match with the credit RWA amount shown in column e of CR4 (SA-CR exposure and CRM effects).
Basel III Information
012_0800885851907.indd 272 2019/08/16 19:25:56

273
Sumitomo Mitsui Financial Group
SMBC Group Annual Report 2019
■ Credit Risk Mitigation (CRM) Techniques1. Overview of Risk Characteristics, Risk Management Policy, Risk Management Procedures and Risk Management System
In calculating credit risk-weighted asset amounts, We take into account credit risk mitigation (CRM) techniques. Specifically, amounts are adjusted for eligible financial or real estate collateral, guarantees, and credit derivatives. The methods and scope of these adjustments and methods of management are as follows.
(1) Scope and ManagementA. Collateral (Eligible Financial or Real Estate Collateral)
SMBC designates deposits and securities as eligible financial collateral, and land and buildings as eligible real estate collateral.Real estate collateral is evaluated by taking into account its fair value, appraisal value, and current condition, as well as our lien
position. Real estate collateral must maintain sufficient collateral value in the event security rights must be exercised due to delinquency. However, during the period from acquiring the rights to exercising the rights, the property may deteriorate or suffer damage from earthquakes or other natural disasters, or there may be changes in the lien position due to, for example, attachment or establishment of liens by a third party. Therefore, the regular monitoring of collateral is implemented according to the type of property and the type of security interest.
B. Guarantees and Credit DerivativesGuarantors are sovereigns, municipal corporations, credit guarantee corporations and other public entities, financial institutions, and C&I companies. Counterparties to credit derivative transactions are mostly domestic and overseas banks and securities companies.
Credit risk-weighted asset amounts are calculated taking into account credit risk mitigation of guarantees and credit derivatives acquired from entities with sufficient ability to provide protection such as sovereigns, municipal corporations and other public sector entities of comparable credit quality, and financial institutions and C&I companies with sufficient credit ratings.
(2) Concentration of Credit Risk and Market Risk under Credit Risk Mitigation TechniquesThere is a framework in place for controlling concentration of risk in obligors with large exposures which includes large exposure limit lines, risk concentration monitoring, and reporting to the Credit Risk Committee (please refer to pages 93 to 98). Further, exposures to these obligors are monitored on a group basis, taking into account risk concentration in their parent companies in cases that expo-sures to the obligors are guaranteed by the parent companies for risk mitigation.
In addition, when marketable financial products (for example, credit derivatives) are used as credit risk mitigants, market risk generated by these products is controlled by setting upper limits.
As credit risk mitigation techniques, eligible real estate collateral and guarantees have shown a certain effect.
2. Credit Risk Mitigation Techniques (CR3) (Millions of yen)
CR3: CRM techniques As of March 31, 2019
ItemNo.
a b c d e
Exposures unsecured
Exposures secured
Exposures secured by collateral
Exposures secured by
financial guarantees
Exposures secured by credit
derivatives
1 Loans 49,092,490 28,088,080 13,092,100 9,260,609 —
2 Securities (of which: Debt securities) 16,890,132 920,449 258,021 51,641 600
3 Other on-balance sheet assets (of which: debt-based assets) 63,331,991 332,855 6,071 275,620 —
4 Total (1+2+3) 129,314,614 29,341,384 13,356,193 9,587,871 6005 Of which: defaulted 536,741 152,513 81,179 6,482 —
Basel III Information
012_0800885851907.indd 273 2019/08/16 19:25:56

274
Sumitomo Mitsui Financial Group
SMBC Group Annual Report 2019
(Millions of yen)
CR3: CRM techniques As of March 31, 2018
ItemNo.
a b c d e
Exposures unsecured
Exposures secured
Exposures secured by collateral
Exposures secured by
financial guarantees
Exposures secured by credit
derivatives
1 Loans 45,660,454 27,382,601 13,034,567 8,743,128 5,312
2 Securities (of which: Debt securities) 18,024,738 969,389 258,935 63,312 —
3 Other on-balance sheet assets (of which: debt-based assets) 58,895,107 210,324 5,620 154,070 —
4 Total (1+2+3) 122,580,301 28,562,315 13,299,124 8,960,511 5,3125 Of which: defaulted 512,629 251,536 91,471 5,594 —
Basel III Information
012_0800885851907.indd 274 2019/08/16 19:25:56

275
Sumitomo Mitsui Financial Group
SMBC Group Annual Report 2019
■ Counterparty Credit Risk1. Overview of Risk Characteristics
Counterparty credit risk is actualized when counterparties become default in a condition where derivative transactions, etc. have a positive value, and risks fluctuate according to the credit quality of counterparties and related market indicators.
2. Risk Management Policy and Procedures(1) Risk Management Policy
For counterparty credit risks, credit limits are set according to the frameworks of credit management in each SMBC Group company. For transactions with CCP, credit risks are managed after validating the financial base and the default management process, etc.
(2) Policy on Collateral Security and Impact of Deterioration of Our Credit QualityCollateralized derivative is a CRM technique in which collateral is delivered or received regularly in accordance with replacement cost.The Group conducts collateralized derivative transactions as necessary, thereby reducing credit risk. In the event our credit qualitydeteriorates, however, the counterparty may demand additional collateral, but its impact is deemed to be insignificant.
(3) NettingNetting is another CRM technique, and “close-out netting” is the main type of netting. In close-out netting, when a default event, suchas bankruptcy, occurs to the counterparty, all claims against, and obligations to, the counterparty, regardless of maturity and currency,are netted out to create a single claim or obligation. Close-out netting is applied to foreign exchange and swap transactions coveredunder a master agreement with a net-out clause or other means of securing legal effectiveness, and the effect of CRM is taken intoaccount only for such claims and obligations.
3. Amount of Counter Party Credit Risk (CCR) Exposure by Approach (CCR1) (Millions of yen)
CCR1: Amount of CCR exposure by approach As of March 31, 2019
ItemNo.
a b c d e f
Replacement cost PFE Effective EPE
(EEPE)
Alpha used for computing
regulatory EAD
EAD post-CRM RWA
1 SA-CCR — — 1.4 — —CEM 1,328,818 2,558,596 3,887,415 1,094,827
2 Expected exposure method (IMM) — — — —3 Simple approach for CRM — —4 Comprehensive approach for CRM 4,676,937 462,418
5 Exposure fluctuation estimation model — —
6 Total 1,557,246
(Millions of yen)
CCR1: Amount of CCR exposure by approach As of March 31, 2018
ItemNo.
a b c d e f
Replacement cost PFE Effective EPE
(EEPE)
Alpha used for computing
regulatory EAD
EAD post-CRM RWA
1 SA-CCR — — 1.4 — —CEM 1,490,810 2,249,561 3,740,371 1,051,112
2 Expected exposure method (IMM) — — — —3 Simple approach for CRM 5,658,971 312,8404 Comprehensive approach for CRM 3,178,754 129,770
5 Exposure fluctuation estimation model — —
6 Total 1,493,723
Basel III Information
012_0800885851907.indd 275 2019/08/16 19:25:56

276
Sumitomo Mitsui Financial Group
SMBC Group Annual Report 2019
4. CVA Capital Charge (CCR2) (Millions of yen)
CCR2: CVA risk capital charge As of March 31, 2019 As of March 31, 2018
ItemNo.
a b a b
EAD post-CRM
RWA(Amount
calculated by dividing CVA
capital charge by 8%)
EAD post-CRM
RWA(Amount
calculated by dividing CVA
capital charge by 8%)
1 Total portfolios subject to the advanced CVA capital charge — — — —2 (i) VaR component (including the 3×multiplier) — —3 (ii) Stressed VaR component (including the 3×multiplier) — —4 Total portfolios subject to the standardised CVA capital charge 3,455,139 2,376,345 3,353,374 2,252,3185 Total subject to the CVA capital charge 3,455,139 2,376,345 3,353,374 2,252,318
5. CCR Exposures by Regulatory Portfolio and Risk Weights (CCR3) (Millions of yen)
CCR3: CCR exposures by regulatory portfolio and risk weights As of March 31, 2019
ItemNo.
a b c d e f g h iCredit equivalent amounts (post-CRM)
Risk weightRegulatory porfolio 0% 10% 20% 50% 75% 100% 150% Others Total
1 Government of Japan and BOJ 81,773 — — — — — — — 81,773
2 Foreign central governments and foreign central banks — — — — — — 10 — 10
3 Bank for International Settlements, etc. — — — — — — — — —
4 Local governments of Japan 62 — — — — — — — 62
5 Foreign non-central government PSEs — — — — — — — — —
6 MDBs — — — — — — — — —7 JFM — — — — — — — — —
8 Government- affiliated agencies of Japan — — — — — — — — —
9 The three local public corporations — — — — — — — — —
10Banks and financial instruments business operators engaged in Type I Financial Instruments Business
— — 604,407 1,093 — — — — 605,501
11 Corporates — — — — — 366,869 — — 366,86912 SMEs and retail — — — — 66,984 — — — 66,98413 Other than the above — — — — — 38,851 — — 38,85114 Total 81,836 — 604,407 1,093 66,984 405,721 10 — 1,160,053
Basel III Information
012_0800885851907.indd 276 2019/08/16 19:25:56

277
Sumitomo Mitsui Financial Group
SMBC Group Annual Report 2019
(Millions of yen)
CCR3: CCR exposures by regulatory portfolio and risk weights As of March 31, 2018
ItemNo.
a b c d e f g h iCredit equivalent amounts (post-CRM)
Risk weightRegulatory porfolio 0% 10% 20% 50% 75% 100% 150% Others Total
1 Government of Japan and BOJ 163,953 — — — — — — — 163,953
2 Foreign central governments and foreign central banks — — — — — — — — —
3 Bank for International Settlements, etc. — — — — — — — — —
4 Local governments of Japan 6,979 — — — — — — — 6,979
5 Foreign non-central government PSEs — — — — — — — — —
6 MDBs — — — — — — — — —7 JFM — — — — — — — — —
8 Government- affiliated agencies of Japan — — — — — — — — —
9 The three local public corporations — — — — — — — — —
10Banks and financial instruments business operators engaged in Type I Financial Instruments Business
974,127 — 403,048 1,953 — 383 — — 1,379,513
11 Corporates 4,083,144 — 7,868 — — 245,565 — — 4,336,57712 SMEs and retail — — — — 171,452 — — — 171,45213 Other than the above — — — — — 21,264 — — 21,26414 Total 5,228,204 — 410,916 1,953 171,452 267,214 — — 6,079,742
Basel III Information
012_0800885851907.indd 277 2019/08/16 19:25:56

278
Sumitomo Mitsui Financial Group
SMBC Group Annual Report 2019
6. IRB Approach – CCR Exposures by Portfolio and PD Scale (CCR4) (Millions of yen, %, the number of data in thousands, years)
CCR4: IRB - CCR exposures by portfolio and PD scale As of March 31, 2019
a b c d e f g
ItemNo. PD scale EAD post-
CRMAverage PD
(%)Number of
obligors
Average LGD(%)
Average maturity Credit RWA RWA density
(%)
Sovereign exposures (AIRB approach)1 0.00 to <0.15 87,145 0.01 0.8 27.06 2.9 6,370 7.312 0.15 to <0.25 19,471 0.16 0.0 23.14 0.0 1,911 9.813 0.25 to <0.50 — — — — — — —4 0.50 to <0.75 — — — — — — —5 0.75 to <2.50 364 0.86 0.0 35.00 3.5 285 78.356 2.50 to <10.00 2,159 2.56 0.0 1.01 1.0 62 2.877 10.00 to <100.00 — — — — — — —8 100.00 (Default) — — — — — — —9 Subtotal 109,141 0.09 0.8 25.87 2.4 8,629 7.90
Sovereign exposures (FIRB approach)1 0.00 to <0.15 — — — — — — —2 0.15 to <0.25 — — — — — — —3 0.25 to <0.50 — — — — — — —4 0.50 to <0.75 — — — — — — —5 0.75 to <2.50 — — — — — — —6 2.50 to <10.00 — — — — — — —7 10.00 to <100.00 — — — — — — —8 100.00 (Default) — — — — — — —9 Subtotal — — — — — — —
Bank exposures (AIRB approach)1 0.00 to <0.15 4,105,450 0.03 15.2 16.34 1.0 237,771 5.792 0.15 to <0.25 914,345 0.16 4.6 17.65 0.9 150,782 16.493 0.25 to <0.50 498 0.29 0.0 31.92 1.6 184 36.914 0.50 to <0.75 — — — — — — —5 0.75 to <2.50 51,747 0.85 0.0 3.97 0.0 3,402 6.576 2.50 to <10.00 169,601 3.96 0.1 0.56 0.0 3,009 1.777 10.00 to <100.00 — — — — — — —8 100.00 (Default) — — — — — — —9 Subtotal 5,241,643 0.19 20.2 15.94 0.9 395,151 7.53
Bank exposures (FIRB approach)1 0.00 to <0.15 — — — — — — —2 0.15 to <0.25 — — — — — — —3 0.25 to <0.50 — — — — — — —4 0.50 to <0.75 — — — — — — —5 0.75 to <2.50 — — — — — — —6 2.50 to <10.00 — — — — — — —7 10.00 to <100.00 — — — — — — —8 100.00 (Default) — — — — — — —9 Subtotal — — — — — — —
Basel III Information
012_0800885851907.indd 278 2019/08/16 19:25:56

279
Sumitomo Mitsui Financial Group
SMBC Group Annual Report 2019
(Millions of yen, %, the number of data in thousands, years)
CCR4: IRB - CCR exposures by portfolio and PD scale As of March 31, 2019
a b c d e f g
ItemNo. PD scale EAD post-
CRMAverage PD
(%)Number of
obligors
Average LGD(%)
Average maturity Credit RWA RWA density
(%)
Corporate exposures (AIRB approach)1 0.00 to <0.15 957,186 0.05 46.6 29.65 2.3 142,052 14.842 0.15 to <0.25 427,536 0.16 22.8 30.47 3.4 150,001 35.083 0.25 to <0.50 96,278 0.30 7.9 34.45 2.4 43,218 44.884 0.50 to <0.75 12,922 0.53 3.5 34.99 3.0 7,949 61.515 0.75 to <2.50 34,043 1.53 4.2 32.19 3.2 28,198 82.836 2.50 to <10.00 13,397 2.72 0.6 34.21 2.6 14,987 111.867 10.00 to <100.00 4,401 14.56 0.4 32.31 2.1 6,321 143.618 100.00 (Default) 173 100.00 0.0 41.51 4.0 23 13.759 Subtotal 1,545,940 0.21 86.4 30.32 2.7 392,753 25.40
Corporate exposures (FIRB approach)1 0.00 to <0.15 — — — — — — —2 0.15 to <0.25 — — — — — — —3 0.25 to <0.50 — — — — — — —4 0.50 to <0.75 — — — — — — —5 0.75 to <2.50 — — — — — — —6 2.50 to <10.00 — — — — — — —7 10.00 to <100.00 — — — — — — —8 100.00 (Default) — — — — — — —9 Subtotal — — — — — — —
Mid-sized corporations and SMEs exposures (AIRB approach)1 0.00 to <0.15 8,073 0.08 3.2 33.45 2.8 1,672 20.712 0.15 to <0.25 13,019 0.17 6.0 35.00 3.1 4,261 32.733 0.25 to <0.50 7,548 0.27 2.9 34.00 3.3 3,015 39.944 0.50 to <0.75 7,631 0.53 2.4 34.42 3.4 4,313 56.525 0.75 to <2.50 9,493 1.37 4.9 34.84 3.5 7,143 75.246 2.50 to <10.00 1,859 2.56 0.5 35.00 4.3 1,692 91.017 10.00 to <100.00 354 13.77 0.1 35.00 4.3 507 143.158 100.00 (Default) 366 100.00 0.0 46.91 4.5 50 13.759 Subtotal 48,347 1.41 20.5 34.55 3.3 22,656 46.86
Mid-sized corporations and SMEs exposures (FIRB approach)1 0.00 to <0.15 — — — — — — —2 0.15 to <0.25 — — — — — — —3 0.25 to <0.50 — — — — — — —4 0.50 to <0.75 — — — — — — —5 0.75 to <2.50 — — — — — — —6 2.50 to <10.00 — — — — — — —7 10.00 to <100.00 — — — — — — —8 100.00 (Default) — — — — — — —9 Subtotal — — — — — — —
Basel III Information
012_0800885851907.indd 279 2019/08/16 19:25:56

280
Sumitomo Mitsui Financial Group
SMBC Group Annual Report 2019
(Millions of yen, %, the number of data in thousands, years)
CCR4: IRB - CCR exposures by portfolio and PD scale As of March 31, 2019
a b c d e f g
ItemNo. PD scale EAD post-
CRMAverage PD
(%)Number of
counterparties
Average LGD(%)
Average maturity Credit RWA RWA density
(%)
SL1 0.00 to <0.15 96,708 0.04 0.2 18.68 4.8 13,306 13.752 0.15 to <0.25 215,673 0.16 0.4 22.33 4.8 64,682 29.993 0.25 to <0.50 89,110 0.36 0.6 22.00 4.8 37,065 41.594 0.50 to <0.75 339 0.53 0.0 30.00 4.4 212 62.685 0.75 to <2.50 49,437 1.18 0.1 25.26 4.6 34,188 69.156 2.50 to <10.00 3,713 3.98 0.0 46.18 4.9 6,440 173.437 10.00 to <100.00 1,392 14.27 0.0 42.94 4.9 3,240 232.798 100.00 (Default) 2,852 100.00 0.0 65.94 4.8 1,515 53.139 Subtotal 459,226 0.98 1.5 22.35 4.8 160,652 34.98
Equity exposures1 0.00 to <0.15 — — — — — — —2 0.15 to <0.25 — — — — — — —3 0.25 to <0.50 — — — — — — —4 0.50 to <0.75 — — — — — — —5 0.75 to <2.50 — — — — — — —6 2.50 to <10.00 — — — — — — —7 10.00 to <100.00 — — — — — — —8 100.00 (Default) — — — — — — —9 Subtotal — — — — — — —
Other retail exposures1 0.00 to <0.15 — — — — — —2 0.15 to <0.25 — — — — — —3 0.25 to <0.50 — — — — — —4 0.50 to <0.75 — — — — — —5 0.75 to <2.50 — — — — — —6 2.50 to <10.00 — — — — — —7 10.00 to <100.00 — — — — — —8 100.00 (Default) — — — — — —9 Subtotal — — — — — —
Total (sum of portfolios) 7,404,300 0.25 129.6 19.61 1.6 979,843 13.23
Basel III Information
012_0800885851907.indd 280 2019/08/16 19:25:56

281
Sumitomo Mitsui Financial Group
SMBC Group Annual Report 2019
(Millions of yen, %, the number of data in thousands, years)
CCR4: IRB - CCR exposures by portfolio and PD scale As of March 31, 2018
a b c d e f g
ItemNo. PD scale EAD post-
CRMAverage PD
(%)Number of
obligors
Average LGD(%)
Average maturity Credit RWA RWA density
(%)
Sovereign exposures (AIRB approach)1 0.00 to <0.15 156,313 0.00 0.5 22.69 1.2 150 0.092 0.15 to <0.25 31,027 0.16 0.0 23.76 0.6 4,405 14.203 0.25 to <0.50 — — — — — — —4 0.50 to <0.75 0 0.55 0.0 35.00 1.0 0 42.705 0.75 to <2.50 118 1.69 0.0 35.00 3.1 107 91.456 2.50 to <10.00 51 2.60 0.0 34.93 1.0 42 81.227 10.00 to <100.00 — — — — — — —8 100.00 (Default) — — — — — — —9 Subtotal 187,511 0.02 0.5 22.88 1.1 4,706 2.50
Sovereign exposures (FIRB approach)1 0.00 to <0.15 — — — — — — —2 0.15 to <0.25 — — — — — — —3 0.25 to <0.50 — — — — — — —4 0.50 to <0.75 — — — — — — —5 0.75 to <2.50 — — — — — — —6 2.50 to <10.00 — — — — — — —7 10.00 to <100.00 — — — — — — —8 100.00 (Default) — — — — — — —9 Subtotal — — — — — — —
Bank exposures (AIRB approach)1 0.00 to <0.15 3,160,226 0.03 13.9 18.87 1.0 210,607 6.662 0.15 to <0.25 741,034 0.16 4.3 16.49 0.9 121,970 16.453 0.25 to <0.50 972 0.34 0.0 34.97 1.5 432 44.454 0.50 to <0.75 — — — — — — —5 0.75 to <2.50 61,064 0.96 0.0 5.01 0.0 6,088 9.976 2.50 to <10.00 121,139 4.11 0.1 0.38 0.0 1,372 1.137 10.00 to <100.00 — — — — — — —8 100.00 (Default) — — — — — — —9 Subtotal 4,084,436 0.19 18.4 17.69 1.0 340,471 8.33
Bank exposures (FIRB approach)1 0.00 to <0.15 737 0.09 0.0 45.00 1.2 193 26.182 0.15 to <0.25 — — — — — — —3 0.25 to <0.50 — — — — — — —4 0.50 to <0.75 — — — — — — —5 0.75 to <2.50 — — — — — — —6 2.50 to <10.00 — — — — — — —7 10.00 to <100.00 — — — — — — —8 100.00 (Default) — — — — — — —9 Subtotal 737 0.09 0.0 45.00 1.2 193 26.18
Basel III Information
012_0800885851907.indd 281 2019/08/16 19:25:56

282
Sumitomo Mitsui Financial Group
SMBC Group Annual Report 2019
(Millions of yen, %, the number of data in thousands, years)
CCR4: IRB - CCR exposures by portfolio and PD scale As of March 31, 2018
a b c d e f g
ItemNo. PD scale EAD post-
CRMAverage PD
(%)Number of
obligors
Average LGD(%)
Average maturity Credit RWA RWA density
(%)
Corporate exposures (AIRB approach)1 0.00 to <0.15 1,125,009 0.04 47.0 38.35 2.2 171,663 15.252 0.15 to <0.25 378,409 0.16 23.8 29.78 3.4 130,581 34.503 0.25 to <0.50 91,512 0.29 9.3 31.24 3.3 40,672 44.444 0.50 to <0.75 16,474 0.55 3.0 34.24 2.4 9,392 57.015 0.75 to <2.50 86,968 2.04 3.9 16.18 1.3 35,695 41.046 2.50 to <10.00 32,765 2.99 1.5 32.10 4.0 37,083 113.177 10.00 to <100.00 10,342 11.68 1.8 33.42 1.5 14,559 140.778 100.00 (Default) 419 100.00 0.0 48.38 3.2 52 12.509 Subtotal 1,741,901 0.34 90.7 34.83 2.5 439,701 25.24
Corporate exposures (FIRB approach)1 0.00 to <0.15 — — — — — — —2 0.15 to <0.25 — — — — — — —3 0.25 to <0.50 — — — — — — —4 0.50 to <0.75 — — — — — — —5 0.75 to <2.50 — — — — — — —6 2.50 to <10.00 941 2.58 0.0 45.00 3.7 1,603 170.307 10.00 to <100.00 — — — — — — —8 100.00 (Default) — — — — — — —9 Subtotal 941 2.58 0.0 45.00 3.7 1,603 170.30
Mid-sized corporations and SMEs exposures (AIRB approach)1 0.00 to <0.15 8,050 0.08 2.9 35.00 2.5 1,559 19.372 0.15 to <0.25 14,954 0.17 5.2 34.16 2.9 4,533 30.313 0.25 to <0.50 10,642 0.29 3.5 34.28 3.0 4,293 40.344 0.50 to <0.75 8,806 0.55 3.5 35.00 3.1 4,821 54.745 0.75 to <2.50 8,880 1.33 6.3 34.39 2.9 6,231 70.166 2.50 to <10.00 5,630 2.58 0.9 34.99 4.2 5,203 92.417 10.00 to <100.00 694 12.28 0.3 35.00 3.0 951 137.088 100.00 (Default) 228 100.00 0.2 50.40 4.1 28 12.509 Subtotal 57,887 1.19 23.1 34.61 3.0 27,623 47.71
Mid-sized corporations and SMEs exposures (FIRB approach)1 0.00 to <0.15 — — — — — — —2 0.15 to <0.25 — — — — — — —3 0.25 to <0.50 — — — — — — —4 0.50 to <0.75 — — — — — — —5 0.75 to <2.50 — — — — — — —6 2.50 to <10.00 — — — — — — —7 10.00 to <100.00 — — — — — — —8 100.00 (Default) — — — — — — —9 Subtotal — — — — — — —
Basel III Information
012_0800885851907.indd 282 2019/08/16 19:25:57

283
Sumitomo Mitsui Financial Group
SMBC Group Annual Report 2019
(Millions of yen, %, the number of data in thousands, years)
CCR4: IRB - CCR exposures by portfolio and PD scale As of March 31, 2018
a b c d e f g
ItemNo. PD scale EAD post-
CRMAverage PD
(%)Number of
counterparties
Average LGD(%)
Average maturity Credit RWA RWA density
(%)
SL1 0.00 to <0.15 99,975 0.04 0.2 20.90 4.8 15,582 15.582 0.15 to <0.25 202,540 0.16 0.4 23.82 4.9 65,072 32.123 0.25 to <0.50 72,588 0.36 0.3 25.28 4.8 34,680 47.774 0.50 to <0.75 168 0.55 0.0 34.24 2.7 97 58.015 0.75 to <2.50 43,064 1.46 0.1 27.14 4.4 32,318 75.046 2.50 to <10.00 4,203 4.13 0.0 39.91 4.9 6,372 151.607 10.00 to <100.00 469 17.00 0.0 35.17 4.3 924 197.038 100.00 (Default) 1,928 100.00 0.0 68.76 4.8 1,007 52.259 Subtotal 424,938 0.81 1.1 24.10 4.8 156,055 36.72
Equity exposures1 0.00 to <0.15 — — — — — — —2 0.15 to <0.25 — — — — — — —3 0.25 to <0.50 — — — — — — —4 0.50 to <0.75 — — — — — — —5 0.75 to <2.50 — — — — — — —6 2.50 to <10.00 — — — — — — —7 10.00 to <100.00 — — — — — — —8 100.00 (Default) — — — — — — —9 Subtotal — — — — — — —
Other retail exposures1 0.00 to <0.15 — — — — — —2 0.15 to <0.25 — — — — — —3 0.25 to <0.50 — — — — — —4 0.50 to <0.75 — — — — — —5 0.75 to <2.50 — — — — — —6 2.50 to <10.00 — — — — — —7 10.00 to <100.00 — — — — — —8 100.00 (Default) — — — — — —9 Subtotal — — — — — —
Total (sum of portfolios) 6,498,356 0.27 134.0 23.01 1.6 970,354 14.93
Basel III Information
012_0800885851907.indd 283 2019/08/16 19:25:57

284
Sumitomo Mitsui Financial Group
SMBC Group Annual Report 2019
7. Composition of Collateral for CCR Exposure (CCR5) (Millions of yen)
CCR5: Composition of collateral for CCR exposure As of March 31, 2019
ItemNo.
a b c d e f
Collateral used in derivative transactions Collateral used in securities financing transactions (SFTs)
Fair value of collateral received Fair value of posted collateral Fair value of collateral received
Fair value of posted
collateralSegregated Unsegregated Segregated Unsegregated
1 Cash (domestic currency) 16,008 53,826 — 216,069 6,219,697 8,270,5062 Cash (other currencies) 110 174,936 — 252,900 3,641,626 2,056,3473 Domestic sovereign debt 154 239 — 39,088 5,901,864 7,019,7744 Other sovereign debt 3,399 — — — 2,037,550 3,681,1765 Government agency debt 5 — — — 1,183,595 —6 Corporate bonds 2,496 — — — 63,059 25,9827 Equity securities 3,376 — — — 1,386,785 356,9318 Other collateral 5,349 — — — 55,026 —9 Total 30,900 229,001 — 508,057 20,489,205 21,410,718
(Millions of yen)
CCR5: Composition of collateral for CCR exposure As of March 31, 2018
ItemNo.
a b c d e f
Collateral used in derivative transactions Collateral used in securities financing transactions (SFTs)
Fair value of collateral received Fair value of posted collateral Fair value of collateral received
Fair value of posted
collateralSegregated Unsegregated Segregated Unsegregated
1 Cash (domestic currency) 20,250 191,880 — 116,006 7,050,517 7,905,0302 Cash (other currencies) 521 162,951 — 368,536 2,747,648 1,436,1263 Domestic sovereign debt 277 796 — 27,963 6,492,040 7,481,0054 Other sovereign debt 4,217 3,498 — 4,544 1,185,978 2,669,2015 Government agency debt 50 — — — 264,077 —6 Corporate bonds 11,574 — — — 48,602 70,8987 Equity securities 5,674 — — — 605,426 40,8778 Other collateral — — — — 35,732 —9 Total 42,567 359,126 — 517,052 18,430,024 19,603,140
8. Credit Derivative Transaction Exposures (CCR6) (Millions of yen)
CCR6: Credit derivative transaction exposures As of March 31, 2019 As of March 31, 2018
ItemNo.
a b a bProtection
bought Protection sold Protection bought Protection sold
Notionals1 Single-name credit default swaps 375,808 472,253 444,503 719,1002 Index credit default swaps 147,640 119,000 66,000 120,8343 Total return swaps — — — —4 Credit options — — — —5 Other credit derivatives — — — —6 Total notionals 523,448 591,253 510,503 839,934
Fair values7 Positive fair value (asset) 1,137 9,593 387 12,9968 Negative fair value (liability) 8,013 4,008 8,034 2,660
Basel III Information
012_0800885851907.indd 284 2019/08/16 19:25:57

285
Sumitomo Mitsui Financial Group
SMBC Group Annual Report 2019
9. RWA flow statements of CCR exposures under the Expected exposure method (IMM) (CCR7)Not applicable.
10. Exposures to Central Counterparties (CCR8) (Millions of yen)
CCR8: Exposures to central counterparties (CCP) As of March 31, 2019 As of March 31, 2018
ItemNo.
a b a bEAD to CCP(post-CRM) RWA EAD to CCP
(post-CRM) RWA
1 Exposures to qualifying central counterparties (QCCPs) (total) 167,548 125,935
2 Exposures for trades at QCCPs (excluding initial margin and default fund contributions); of which 3,320,224 66,407 2,574,667 51,493
3 (i) OTC derivatives 2,826,512 56,532 1,335,139 26,7024 (ii) Exchange-traded derivatives 469,547 9,391 1,215,202 24,3045 (iii) SFTs 24,163 483 24,324 486
6 (iv) Netting sets where cross-product netting has been approved — — — —
7 Segregated initial margin — —8 Non-segregated initial margin 172,119 3,444 134,883 2,6979 Pre-funded default fund contributions 164,959 97,696 136,695 71,74410 Unfunded default fund contributions — — — —11 Exposures to non-QCCPs (total) 10,365 46,601
12 Exposures for trades at non-QCCPs (excluding initial margin and default fund contributions); of which 14,781 9,810 183,077 44,374
13 (i) OTC derivatives 3,617 3,617 4,428 4,42814 (ii) Exchange-traded derivatives 11,163 6,192 178,616 39,91315 (iii) SFTs — — 32 32
16 (iv) Netting sets where cross-product netting has been approved — — — —
17 Segregated initial margin — —18 Non-segregated initial margin 2,771 554 10,843 2,22719 Pre-funded default fund contributions — — — —20 Unfunded default fund contributions — — — —
Basel III Information
012_0800885851907.indd 285 2019/08/16 19:25:57

286
Sumitomo Mitsui Financial Group
SMBC Group Annual Report 2019
■ Securitisation Transactions1. Overview of Risk Characteristics
Securitisation exposures have, in addition to credit risk and market risk, the following intrinsic risks, which are properly managed based on the nature of each risk.(1) Dilution Risk
Means the risk of a decrease in purchased receivables due to cancellation or termination of the original contract for the purchased receiv-ables, or netting of debts between the original obligor and the original obligee.
(2) Servicer RiskA. Commingling Risk
Means the risk of uncollectible funds, which should be collected from the underlying assets, due to the bankruptcy of the servicer before the delivery of the funds collected from the obligor of the receivables.
B. Performance RiskMeans the risk of difficulty in maintenance and collection due to the servicer’s failure to properly and accurately perform its clerical duties and procedures.
(3) Liquidity RiskMeans the risk that cash flows related to the underlying assets may be insufficient for paying the principal and interest of the securitisa-tion exposure due to a timing mismatch between the securitisation conduit’s receipt of the cash flows related to the underlying assets and payment of the securitisation exposure of the principal and interest, etc.
(4) Fraud RiskMeans the risk of a decrease in or complete loss of the receivables subject to collection due to a fraud, prejudicial or other malicious act by a customer or a third-party obligor.
2. Overview of Risk Management Policy and ProceduresDefinition of securitisation exposure has been clarified in order to properly identify, measure, evaluate and report risks, and a risk management department, independent of business units, has been established to centrally manage risks from recognizing securitisation exposures to measuring, evaluating and reporting risks.
Securitisation transactions are subject to the following policies.• Undertake those which allow separate assessment of underlying short-term assets by making credit decisions on individual underlying
assets.• Undertake those which cover short-term receivables, etc., by creating a framework mainly to estimate the default rate of the underlying
assets based on the historical loan-loss ratio and ensure that they have sufficient subordination.• Undertake others such as those requiring special management by implementing additional management, such as an analysis of the market
environment. Particularly, with respect to securitisation transactions backed by retail loans whose creditworthiness is relatively inferior, such as subprime loans in the U.S., the Group deals only with transactions that are sufficiently structured by taking into account not only the above policies, but others such as the underlying asset selection criteria of the originator and the average life. The Group shall basically not conduct resecuritisation transactions. Its policy is to conduct securitisation transactions by verifying effectiveness in mitigating credit risk through the use of the asset transfer
type or synthetic type securitisation transactions covering domestic and foreign exposures and using them as underlying exposures if securitisation transactions are used as an approach for credit risk mitigation.
The Group takes one of the following positions for securitisation transactions.• Originator (a direct or indirect originator of underlying assets or a sponsor of an ABCP conduit or a similar program that acquires
exposures from third-party entities)• Investor• Others (for example, provider of swap for preventing a mismatch between the dividend on trust beneficiary rights and cash flows
generated by underlying assets on which the rights are issued)
Basel III Information
012_0800885851907.indd 286 2019/08/16 19:25:57

287
Sumitomo Mitsui Financial Group
SMBC Group Annual Report 2019
3. Name of Securitisation Conduit and Whether or Not It Possesses Securitisation Exposure Related to Securitisation Transactions, as well as Names of Subsidiaries and Affiliated Companies of us Which Hold Securitisation Exposures Related to Securitisation Transactions Conducted by us and we Engage in the Management of the Company or Provides AdviceIn order to undertake securitisation transactions related to third-party assets, the Group mainly uses a special purpose company (SPC) as a securitisation conduit.• Manhattan Asset Funding Company LLC• Chelsea Capital Corporation• Forest Corporation• Spur Funding Corporation• Deccan Funding GK• Taeguk Funding Designated Activity Company
Excluding consolidated subsidiaries, subsidiaries or affiliated companies holding securitisation exposures related to the security transactions conducted by the Holding Company Group are as follows:• THE MINATO BANK, LTD.
4. Name of Securitisation Conduit that Provides Non-Contractual Credit Enhancement, etc. and Impacts on Capital by Such Non-Contractual Credit Enhancement, etc. for Each Securitisation ConduitNot applicable.
5. Accounting Policy on Securitisation TransactionsThe recognition of the generation and extinguishment of financial assets and financial liabilities associated with securitisation transactions and the valuation and accounting treatment thereof are mainly governed by the “Accounting Standard for Financial Instruments” (ASBJ Statement No. 10).
6. Names of Qualifying External Ratings AgenciesIn order to apply the rating-based approach under the IRB approach or standardised approach or to calculate an amount of market risk asso-ciated with specific risk, the risk weights are determined by mapping the ratings of qualifying rating agencies to the risk weights stipulated in the Notification. The qualifying rating agencies are Rating and Investment Information, Inc. (R&I), Japan Credit Rating Agency, Ltd. (JCR), Moody’s Investors Service, Inc. (Moody’s), S&P Global Ratings (S&P), and Fitch Ratings Ltd. (Fitch).
When more than one rating is available for an exposure, the second smallest risk weight is used, in accordance with the Notification.
7. Securitisation Exposures in the Banking Book (SEC1) (Millions of yen)
SEC1: Securitisation exposures in the banking book As of March 31, 2019
ItemNo. Type of underlying asset
a b c d e f g h iBank acts as originator Bank acts as sponsor Bank acts as investor
Traditional Synthetic Subtotal Traditional Synthetic Subtotal Traditional Synthetic Subtotal
1 Retail (total)- of which 427,251 — 427,251 511,257 — 511,257 750,681 — 750,681
2 Residential mortgage 427,251 — 427,251 — — — 129,918 — 129,9183 Credit card — — — 11,997 — 11,997 302,137 — 302,1374 Other retail exposures — — — 499,260 — 499,260 318,625 — 318,6255 Re-securitisation — — — — — — — — —
6 Wholesale (total)- of which 50,367 94,728 145,095 685,450 — 685,450 1,051,904 170,304 1,222,208
7 Loans to corporates 50,367 94,728 145,095 22,776 — 22,776 884,242 — 884,2428 Commercial mortgage — — — — — — 608 — 6089 Lease and receivables — — — 657,173 — 657,173 73,985 21,401 95,38710 Other wholesale — — — 5,500 — 5,500 93,067 148,903 241,97011 Re-securitisation — — — — — — — — —
Basel III Information
012_0800885851907.indd 287 2019/08/16 19:25:57

288
Sumitomo Mitsui Financial Group
SMBC Group Annual Report 2019
(Millions of yen)
SEC1: Securitisation exposures in the banking book As of March 31, 2018
ItemNo. Type of underlying asset
a b c d e f g h iBank acts as originator Bank acts as sponsor Bank acts as investor
Traditional Synthetic Subtotal Traditional Synthetic Subtotal Traditional Synthetic Subtotal
1 Retail (total)- of which 412,410 — 412,410 533,449 — 533,449 655,834 — 655,834
2 Residential mortgage 412,410 — 412,410 — — — 31,574 — 31,5743 Credit card — — — 39,497 — 39,497 296,940 — 296,9404 Other retail exposures — — — 493,951 — 493,951 327,319 — 327,3195 Re-securitisation — — — — — — — — —
6 Wholesale (total)- of which 17,722 101,189 118,911 771,531 — 771,531 886,361 230,748 1,117,110
7 Loans to corporates 17,722 101,189 118,911 20,296 — 20,296 685,765 220,973 906,7388 Commercial mortgage — — — — — — 1,100 — 1,1009 Lease and receivables — — — 745,635 — 745,635 132,870 9,775 142,64510 Other wholesale — — — 5,600 — 5,600 66,626 — 66,62611 Re-securitisation — — — — — — — — —
8. Securitisation Exposures in the Trading Book (SEC2) (Millions of yen)
SEC2: Securitisation exposures in the trading book As of March 31, 2019
ItemNo. Type of underlying asset
a b c d e f g h iBank acts as originator Bank acts as sponsor Bank acts as investor
Traditional Synthetic Subtotal Traditional Synthetic Subtotal Traditional Synthetic Subtotal
1 Retail (total)- of which — — — — — — 8,717 — 8,717
2 Residential mortgage — — — — — — — — —3 Credit card — — — — — — 740 — 7404 Other retail exposures — — — — — — 7,977 — 7,9775 Re-securitisation — — — — — — — — —
6 Wholesale (total)- of which — — — — — — 250 — 250
7 Loans to corporates — — — — — — — — —8 Commercial mortgage — — — — — — — — —9 Lease and receivables — — — — — — 250 — 250
10 Other wholesale — — — — — — — — —11 Re-securitisation — — — — — — — — —
(Millions of yen)
SEC2: Securitisation exposures in the trading book As of March 31, 2018
ItemNo. Type of underlying asset
a b c d e f g h iBank acts as originator Bank acts as sponsor Bank acts as investor
Traditional Synthetic Subtotal Traditional Synthetic Subtotal Traditional Synthetic Subtotal
1 Retail (total)- of which — — — — — — 10,624 — 10,624
2 Residential mortgage — — — — — — — — —3 Credit card — — — — — — 6,611 — 6,6114 Other retail exposures — — — — — — 4,013 — 4,0135 Re-securitisation — — — — — — — — —
6 Wholesale (total)- of which — — — — — — 3,855 — 3,855
7 Loans to corporates — — — — — — 17 — 178 Commercial mortgage — — — — — — — — —9 Lease and receivables — — — — — — 3,838 — 3,838
10 Other wholesale — — — — — — — — —11 Re-securitisation — — — — — — — — —
Basel III Information
012_0800885851907.indd 288 2019/08/16 19:25:57

289
Sumitomo Mitsui Financial Group
SMBC Group Annual Report 2019
9. Securitisation Exposures in the Banking Book and Associated Regulatory Capital Requirements (Bank Acting as Originator or as Sponsor) (SEC3)
(Millions of yen)
SEC3: Securitisation exposures in the banking book and associated capital regulatory requirements (bank acting as originator or sponsor) (1/2)
As of March 31, 2019
ItemNo.
a b c d e f g h
TotalTraditional
securitisation (subtotal)
Securitisation Re-securitisation
Retail underlying Wholesale Senior Non-senior
Exposure values (by RW bands)1 ≤20% RW 967,718 873,000 873,000 369,183 503,816 — — —2 >20% to 50% RW 427,887 427,887 427,887 286,265 141,622 — — —3 >50% to 100% RW 238,108 238,108 238,108 150,440 87,668 — — —4 >100% to <1250% RW 134,950 134,950 134,950 132,619 2,331 — — —5 1250% RW 389 379 379 — 379 — — —
Exposure values (by regulatory approach)6 SEC-IRBA or IAA 1,642,136 1,547,407 1,547,407 844,890 702,517 — — —7 SEC-ERBA 126,919 126,919 126,919 93,619 33,300 — — —8 SEC-SA — — — — — — — —9 1250% RW — — — — — — — —
Credit RWA amounts (by regulatory approach)10 SEC-IRBA or IAA 609,637 591,525 591,525 401,816 189,708 — — —11 SEC-ERBA 28,497 28,497 28,497 18,723 9,773 — — —12 SEC-SA — — — — — — — —13 1250% RW — — — — — — — —
Capital charge after cap (by regulatory approach)14 SEC-IRBA or IAA 48,771 47,322 47,322 32,145 15,176 — — —15 SEC-ERBA 2,279 2,279 2,279 1,497 781 — — —16 SEC-SA — — — — — — — —17 1250% RW — — — — — — — —
Basel III Information
012_0800885851907.indd 289 2019/08/16 19:25:57

290
Sumitomo Mitsui Financial Group
SMBC Group Annual Report 2019
(Millions of yen)
SEC3: Securitisation exposures in the banking book and associated regulatory capital requirements (bank acting as originator or sponsor) (2/2)
As of March 31, 2019
ItemNo.
i j k l m n o
Synthetic securitisation
(subtotal)Securitisation Re-
securitisationRetail
underlying Wholesale Senior Non-senior
Exposure values (by RW bands)1 ≤20% RW 94,718 94,718 — 94,718 — — —2 >20% to 50% RW — — — — — — —3 >50% to 100% RW — — — — — — —4 >100% to <1250% RW — — — — — — —5 1250% RW 10 10 — 10 — — —
Exposure values (by regulatory approach)6 SEC-IRBA or IAA 94,728 94,728 — 94,728 — — —7 SEC-ERBA — — — — — — —8 SEC-SA — — — — — — —9 1250% RW — — — — — — —
Credit RWA amounts (by regulatory approach)10 SEC-IRBA or IAA 18,112 18,112 — 18,112 — — —11 SEC-ERBA — — — — — — —12 SEC-SA — — — — — — —13 1250% RW — — — — — — —
Capital requirement values (by regulatory approach)14 SEC-IRBA or IAA 1,448 1,448 — 1,448 — — —15 SEC-ERBA — — — — — — —16 SEC-SA — — — — — — —17 1250% RW — — — — — — —
Basel III Information
012_0800885851907.indd 290 2019/08/16 19:25:57

291
Sumitomo Mitsui Financial Group
SMBC Group Annual Report 2019
(Millions of yen)
SEC3: Securitisation exposures in the banking book and associated capital regulatory requirements (bank acting as originator or sponsor) (1/2)
As of March 31, 2018
ItemNo.
a b c d e f g h
TotalTraditional
securitisation (subtotal)
Securitisation Re-securitisation
Retail underlying Wholesale Senior Non-senior
Exposure values (by RW bands)1 ≤20% RW 1,805,620 1,707,334 1,707,334 922,711 784,622 — — —2 >20% to 50% RW 3,333 2,387 2,387 — 2,387 — — —3 >50% to 100% RW 2,426 2,144 2,144 — 2,144 — — —4 >100% to <1250% RW 184 — — — — — — —5 1250% RW 24,737 23,246 23,246 23,147 99 — — —
Exposure values (by regulatory approach)6 IRB RBA (including IAA) 73,071 73,071 73,071 73,071 — — — —7 IRB SFA 1,738,493 1,638,794 1,638,794 849,640 789,154 — — —8 Securitisation exposures subject to SA — — — — — — — —
9
1250% RW pursuant to Article 247, Paragraph 1 of the Notification or Article 225, Paragraph 1 of the Bank Holding Company Equity Capital Adequacy Notification
24,737 23,246 23,246 23,147 99 — — —
Credit RWA amounts (by regulatory approach)10 IRB RBA (including IAA) 5,115 5,115 5,115 5,115 — — — —11 IRB SFA 100,661 92,354 92,354 32,226 60,128 — — —12 SA — — — — — — — —
13
1250% RW pursuant to Article 247, Paragraph 1 of the Notification or Article 225, Paragraph 1 of the Bank Holding Company Equity Capital Adequacy Notification
309,222 290,585 290,585 289,345 1,239 — — —
Capital charge after cap (by regulatory approach)14 IRB RBA (including IAA) 433 433 433 433 — — — —15 IRB SFA 8,536 7,831 7,831 2,732 5,098 — — —16 SA — — — — — — — —
17
1250% RW pursuant to Article 247, Paragraph 1 of the Notification or Article 225, Paragraph 1 of the Bank Holding Company Equity Capital Adequacy Notification
26,222 24,641 24,641 24,536 105 — — —
Basel III Information
012_0800885851907.indd 291 2019/08/16 19:25:57

292
Sumitomo Mitsui Financial Group
SMBC Group Annual Report 2019
(Millions of yen)
SEC3: Securitisation exposures in the banking book and associated regulatory capital requirements (bank acting as originator or sponsor) (2/2)
As of March 31, 2018
ItemNo.
i j k l m n o
Synthetic securitisation
(subtotal)Securitisation Re-
securitisationRetail
underlying Wholesale Senior Non-senior
Exposure values (by RW bands)1 ≤20% RW 98,285 98,285 — 98,285 — — —2 >20% to 50% RW 946 946 — 946 — — —3 >50% to 100% RW 281 281 — 281 — — —4 >100% to <1250% RW 184 184 — 184 — — —5 1250% RW 1,490 1,490 — 1,490 — — —
Exposure values (by regulatory approach)6 IRB RBA (including IAA) — — — — — — —7 IRB SFA 99,698 99,698 — 99,698 — — —8 SA — — — — — — —
9
1250% RW pursuant to Article 247, Paragraph 1 of the Notification or Article 225, Paragraph 1 of the Bank Holding Company Equity Capital Adequacy Notification
1,490 1,490 — 1,490 — — —
Credit RWA amounts (by regulatory approach)10 IRB RBA (including IAA) — — — — — — —11 IRB SFA 8,306 8,306 — 8,306 — — —12 SA — — — — — — —
13
1250% RW pursuant to Article 247, Paragraph 1 of the Notification or Article 225, Paragraph 1 of the Bank Holding Company Equity Capital Adequacy Notification
18,637 18,637 — 18,637 — — —
Capital requirement values (by regulatory approach)14 IRB RBA (including IAA) — — — — — — —15 IRB SFA 704 704 — 704 — — —16 SA — — — — — — —
17
1250% RW pursuant to Article 247, Paragraph 1 of the Notification or Article 225, Paragraph 1 of the Bank Holding Company Equity Capital Adequacy Notification
1,580 1,580 — 1,580 — — —
Basel III Information
012_0800885851907.indd 292 2019/08/16 19:25:57

293
Sumitomo Mitsui Financial Group
SMBC Group Annual Report 2019
10. Securitisation Exposures in the Banking Book Associated Capital Requirements (Bank Acting as Investor) (SEC4)
(Millions of yen)
SEC4: Securitisation exposures in the banking book and associated capital requirements (bank acting as investor) (1/2)
As of March 31, 2019
ItemNo.
a b c d e f g h
TotalTraditional
securitisation (subtotal)
Securitisation Re-securitisation
Retail underlying Wholesale Senior Non-senior
Exposure values (by RW bands)1 ≤20% RW 1,534,395 1,470,068 1,470,068 468,565 1,001,503 — — —2 >20% to 50% RW 261,957 261,957 261,957 261,957 — — — —3 >50% to 100% RW 32,713 32,713 32,713 4,507 28,205 — — —4 >100% to <1250% RW 143,215 37,237 37,237 15,651 21,586 — — —5 1250% RW 608 608 608 — 608 — — —
Exposure values (by regulatory approach)6 SEC-IRBA or IAA 1,576,141 1,405,836 1,405,836 436,086 969,750 — — —7 SEC-ERBA 396,140 396,140 396,140 314,595 81,544 — — —8 SEC-SA — — — — — — — —9 1250% RW 608 608 608 — 608 — — —
Credit RWA amounts (by regulatory approach)10 SEC-IRBA or IAA 360,511 236,940 236,940 74,334 162,606 — — —11 SEC-ERBA 130,017 130,017 130,017 94,532 35,485 — — —12 SEC-SA — — — — — — — —13 1250% RW 7,605 7,605 7,605 — 7,605 — — —
Capital charge after cap (by regulatory approach)14 SEC-IRBA or IAA 28,840 18,955 18,955 5,946 13,008 — — —15 SEC-ERBA 10,401 10,401 10,401 7,562 2,838 — — —16 SEC-SA — — — — — — — —17 1250% RW 608 608 608 — 608 — — —
Basel III Information
012_0800885851907.indd 293 2019/08/16 19:25:57

294
Sumitomo Mitsui Financial Group
SMBC Group Annual Report 2019
(Millions of yen)
SEC4: Securitisation exposures in the banking book and associated capital requirements (bank acting as investor) (2/2)
As of March 31, 2019
ItemNo.
i j k l m n o
Synthetic securitisation
(subtotal)Securitisation Re-
securitisationRetail
underlying Wholesale Senior Non-senior
Exposure values (by RW bands)1 ≤20% RW 64,327 64,327 — 64,327 — — —2 >20% to 50% RW — — — — — — —3 >50% to 100% RW — — — — — — —4 >100% to <1250% RW 105,977 105,977 — 105,977 — — —5 1250% RW — — — — — — —
Exposure values (by regulatory approach)6 SEC-IRBA or IAA 170,304 170,304 — 170,304 — — —7 SEC-ERBA — — — — — — —8 SEC-SA — — — — — — —9 1250% RW — — — — — — —
Credit RWA amounts (by regulatory approach)10 SEC-IRBA or IAA 123,570 123,570 — 123,570 — — —11 SEC-ERBA — — — — — — —12 SEC-SA — — — — — — —13 1250% RW — — — — — — —
Capital charge after cap (by regulatory approach)14 SEC-IRBA or IAA 9,885 9,885 — 9,885 — — —15 SEC-ERBA — — — — — — —16 SEC-SA — — — — — — —17 1250% RW — — — — — — —
Basel III Information
012_0800885851907.indd 294 2019/08/16 19:25:57

295
Sumitomo Mitsui Financial Group
SMBC Group Annual Report 2019
(Millions of yen)
SEC4: Securitisation exposures in the banking book and associated capital requirements (bank acting as investor) (1/2)
As of March 31, 2018
ItemNo.
a b c d e f g h
TotalTraditional
securitisation (subtotal)
Securitisation Re-securitisation
Retail underlying Wholesale Senior Non-senior
Exposure values (by RW bands)1 ≤20% RW 1,721,862 1,510,845 1,510,845 635,543 875,301 — — —2 >20% to 50% RW 301 301 301 — 301 — — —3 >50% to 100% RW 28,573 28,573 28,573 20,291 8,282 — — —4 >100% to <1250% RW 600 600 600 — 600 — — —5 1250% RW 21,606 1,875 1,875 — 1,875 — — —
Exposure values (by regulatory approach)6 IRB RBA (including IAA) 345,204 345,204 345,204 264,534 80,670 — — —7 IRB SFA 1,400,220 1,189,203 1,189,203 385,988 803,215 — — —8 SA 5,912 5,912 5,912 5,312 600 — — —
9
1250% RW pursuant to Article 247, Paragraph 1 of the Notification or Article 225, Paragraph 1 of the Bank Holding Company Equity Capital Adequacy Notification
21,606 1,875 1,875 — 1,875 — — —
Credit RWA amounts (by regulatory approach)10 IRB RBA (including IAA) 42,577 42,577 42,577 28,948 13,628 — — —11 IRB SFA 83,567 82,324 82,324 27,683 54,641 — — —12 SA 6,084 6,084 6,084 3,984 2,100 — — —
13
1250% RW pursuant to Article 247, Paragraph 1 of the Notification or Article 225, Paragraph 1 of the Bank Holding Company Equity Capital Adequacy Notification
270,086 23,449 23,449 — 23,449 — — —
Capital charge after cap (by regulatory approach)14 IRB RBA (including IAA) 3,610 3,610 3,610 2,454 1,155 — — —15 IRB SFA 7,086 6,981 6,981 2,347 4,633 — — —16 SA 486 486 486 318 168 — — —
17
1250% RW pursuant to Article 247, Paragraph 1 of the Notification or Article 225, Paragraph 1 of the Bank Holding Company Equity Capital Adequacy Notification
22,873 1,958 1,958 — 1,958 — — —
Basel III Information
012_0800885851907.indd 295 2019/08/16 19:25:57

296
Sumitomo Mitsui Financial Group
SMBC Group Annual Report 2019
(Millions of yen)
SEC4: Securitisation exposures in the banking book and associated capital requirements (bank acting as investor) (2/2)
As of March 31, 2018
ItemNo.
i j k l m n o
Synthetic securitisation
(subtotal)Securitisation Re-
securitisationRetail
underlying Wholesale Senior Non-senior
Exposure values (by RW bands)1 ≤20% RW 211,017 211,017 — 211,017 — — —2 >20% to 50% RW — — — — — — —3 >50% to 100% RW — — — — — — —4 >100% to <1250% RW — — — — — — —5 1250% RW 19,730 19,730 — 19,730 — — —
Exposure values (by regulatory approach)6 IRB RBA (including IAA) — — — — — — —7 IRB SFA 211,017 211,017 — 211,017 — — —8 SA — — — — — — —
9
1250% RW pursuant to Article 247, Paragraph 1 of the Notification or Article 225, Paragraph 1 of the Bank Holding Company Equity Capital Adequacy Notification
19,730 19,730 — 19,730 — — —
Credit RWA amounts (by regulatory approach)10 IRB RBA (including IAA) — — — — — — —11 IRB SFA 1,242 1,242 — 1,242 — — —12 SA — — — — — — —
13
1250% RW pursuant to Article 247, Paragraph 1 of the Notification or Article 225, Paragraph 1 of the Bank Holding Company Equity Capital Adequacy Notification
246,636 246,636 — 246,636 — — —
Capital charge after cap (by regulatory approach)14 IRB RBA (including IAA) — — — — — — —15 IRB SFA 105 105 — 105 — — —16 SA — — — — — — —
17
1250% RW pursuant to Article 247, Paragraph 1 of the Notification or Article 225, Paragraph 1 of the Bank Holding Company Equity Capital Adequacy Notification
20,914 20,914 — 20,914 — — —
Basel III Information
012_0800885851907.indd 296 2019/08/16 19:25:57

297
Sumitomo Mitsui Financial Group
SMBC Group Annual Report 2019
■ Equity Exposures1. Overview of Risk Management Policy and Procedures
Securities in the banking book are properly managed, for example, by setting upper limits on the allowable amount of risk under the market or credit risk management framework selected according to their holding purpose and risk characteristics.
For securities held as “available-for-sale securities,” the upper limits are also set in terms of price fluctuation risk and default risk.Regarding stocks of subsidiaries, assets and liabilities of subsidiaries are risk-managed on a consolidated basis. As for stocks of affiliates,
risks related to gains and losses from investments are recognized separately. As in each case maximum allowable amount of risk is managed individually, risks as stocks are not measured.
The limits are established within the “risk capital limit” of SMBC group, taking into account the financial and business situations of the subsidiaries and affiliates.
2. Valuation of Securities and Other Significant Accounting PoliciesStocks of non-consolidated subsidiaries and affiliates not accounted for by the equity method are carried at amortized cost using the moving-average method. Available-for-sale securities with market prices (including foreign stocks) are carried at their average market prices during the final month of the fiscal year. Securities other than these securities are carried at their market prices at the end of the fiscal year under review (cost of securities sold is calculated using primarily the moving-average method), and those with no available market prices are carried at cost using the moving-average method.
Net unrealized gains (losses) on available-for-sale securities and net of income taxes are reported as a component of “net assets.”
Basel III Information
012_0800885851907.indd 297 2019/08/16 19:25:57

298
Sumitomo Mitsui Financial Group
SMBC Group Annual Report 2019
■ Market Risk1. Scope
The following approaches are used to calculate market risk equivalent amounts.(1) Internal Models Method
General market risk of SMBC, Sumitomo Mitsui Banking Corporation Europe Limited, SMBC Bank EU AG, Sumitomo Mitsui Banking Corporation (China) Limited, SMBC Capital Markets, Inc., SMBC Nikko Capital Markets Limited, SMBC Derivative Products Limited, and SMBC Capital Markets (Asia) Limited
(2) Standardized Measurement Method• Specific risk• General market risk of consolidated subsidiaries other than SMBC, Sumitomo Mitsui Banking Corporation Europe Limited, SMBC
Bank EU AG, Sumitomo Mitsui Banking Corporation (China) Limited, SMBC Capital Markets, Inc., SMBC Nikko Capital Markets Limited, SMBC Derivative Products Limited, and SMBC Capital Markets (Asia) Limited
• A portion of general market risk of SMBC
2. Market Risk under standardised approach (MR1) (Millions of yen)
MR1: Market risk under standardised approachAs of March 31, 2019 As of March 31, 2018
ItemNo.
RWA(Amounts calculated by dividing risk equivalent amounts by 8%)
RWA(Amounts calculated by dividing risk equivalent amounts by 8%)
1 Interest rate risk (general and specific) 371,760 467,8882 Equity risk (general and specific) 177,934 166,7583 Foreign exchange risk 17,049 20,6404 Commodity risk 627 0
Options5 Simplified approach — —6 Delta-plus method 178,326 298,7037 Scenario approach — —8 Specific risk related to securitisation exposures 3,180 181,0129 Total 748,878 1,135,003
3. RWA flow statements of market risk exposures under an IMA (MR2) (Billions of yen)
MR2: RWA flow statements of market risk exposures under an IMA As of March 31, 2019
Item No.
a b c d e fVaR Stressed VaR IRC CRM Other Total RWA
1a RWA as of March 31, 2018 634 927 — — 1,5621b Ratio of 1a / 1c 2.8 3.6 — — 3.31c RWA at end of March 31, 2018 220 253 — — 473
2
Breakdown of variations in the market risk-weighted assets
Movement in risk levels (60) 101 — — 40
3 Model updates/changes 0 0 — — 0
4 Methodology and policy — — — — —
5 Acquisitions and disposals — — — — —
6 Foreign exchange movements 5 6 — — 12
7 Other (3) — — — (3)8a RWA at end of March 31, 2019 161 361 — — 5228b Ratio of 8c / 8a 2.8 3.0 — — 3.08c RWA as of March 31, 2019 465 1,105 — — 1,571
Basel III Information
012_0800885851907.indd 298 2019/08/16 19:25:57

299
Sumitomo Mitsui Financial Group
SMBC Group Annual Report 2019
4. IMA values for trading portfolios (MR3) (Millions of yen)
MR3: IMA values for trading portfoliosFiscal 2018 Fiscal 2017
ItemNo.
VaR (holding period of 10 business days, one-sided confidence level of 99%)1 Maximum value 30,565 24,0512 Average value 14,441 17,0663 Minimum value 9,587 9,3564 Period end 12,930 17,606
Stressed VaR (holding period of 10 business days, one-sided confidence level of 99%)5 Maximum value 44,514 45,7736 Average value 27,643 25,2837 Minimum value 17,644 13,6728 Period end 28,908 20,254
Incremental risk value (one-sided confidence level of 99.9%)9 Maximum value — —
10 Average value — —11 Minimum value — —12 Period end — —
Comprehensive risk value (one-sided confidence level of 99.9%)13 Maximum value — —14 Average value — —15 Minimum value — —16 Period end — —17 Floor (modified standardized measurement method) — —
Note: The VaR and the stressed VaR are calculated using the historical simulation method. Specifically, they are calculated on a daily basis, assuming a one-sided confidence level of 99.0% and a one-day holding period, based on profit and loss simulation on a scenario-specific basis generated from historical data (the full valuation method, in principle), and they are adjusted to a 10-day holding period using the square root of time method. Under this method, the VaR and the stressed VaR use observation periods of four years immediately preceding, and 12 months including the stress period, respectively.
5. Backtesting results by the internal models approach (MR4)The status of backtesting of trading for Fiscal 2018 and 2017 is as follows. “Daily gain/loss” represents the actual gain/loss incurred, and “Daily VaR” represents the daily VaR calculated using the risk measurement model with a one-day holding period. In the past 250 business days, the number of times loss exceeded VaR was 0, and the VaR model (one-sided confidence level of 99.0%) is considered to have sufficient accuracy.
-14,000
4,0002,000
0-2,000-4,000-6,000-8,000-10,000-12,000
March 2019
Daily gain/loss
March 2018
(Millions of Y
en)
Daily VaR
-14,000
4,0002,000
0-2,000-4,000-6,000-8,000-10,000-12,000
March 2018
Daily gain/loss
March 2017
(Millions of Y
en)
Daily VaR
Basel III Information
012_0800885851907.indd 299 2019/08/16 19:25:58

300
Sumitomo Mitsui Financial Group
SMBC Group Annual Report 2019
■ Interest Rate Risk in the Banking Book1. Overview of Risk Management Policy and Procedures
Interest rate risk in the banking book is the risk to the present value of a bank’s assets and liabilities and/or the future earnings (interest income) from the rate-sensitive instruments when interest rates change. SMBC Group recognizes interest rate risk as a significant risk and manages it in an integrated manner, together with other market risks (equity position risk, etc.) (For details, please refer to pages 116 to 117).Interest rate risk management is conducted using basis point value (BPV) as a measure of the risk, which denotes the change of present value given a basis point rise in the interest rate. Appropriate limits on BPVs are set for each significant subsidiary including SMBC according to its capital and business plan, and BPVs are monitored daily for risk management. BPVs are managed not only by changing the balance and term structures of assets and liabilities, but also by using hedging instruments such as interest rate swaps and futures.
2. Calculation Method of Interest Rate RiskInterest rate risk in the banking book is measured based on the future cash flows of the bank’s assets and liabilities. Especially, the method of recognizing the dates for maturity of demand deposits (current accounts and ordinary deposit accounts that can be withdrawn at any time) and the method of estimating the time of cancellation prior to maturity of time deposits and mortgage loans affect the risk significantly. Key assumptions for measuring interest rate risk of such instruments are as follows.
Method of recognizing the maturity of demand depositsThe amount of the bank’s core deposits is identified as the amount of demand deposits expected to be left with the bank after 5 years (with 50% of the lowest balance during the past 5 years as the upper limit). The maturity of the core deposits is regarded to be 5 years (2.5 years on average). The maturity of the bank’s demand deposits are recognized with 5 years as the maximum term (the average is 0.7 year).
Method of estimating the time of cancellation prior to maturity of time deposits and mortgage loansCash flows of mortgage loans tend to be different from the initial scheduled ones, as customers may exercise their prepayment options to redeem early in a bonus month or as time passes. Similarly, fixed-term deposits may be canceled prior to maturity. For such instruments, interest rate risk is managed by using statistical models to estimate cash flows for each instrument, considering the seasonality, elapsed years, interest rate levels at the effective time, etc. These models are validated and reviewed regularly.
Basel III Information
012_0800885851907.indd 300 2019/08/16 19:25:58

301
Sumitomo Mitsui Financial Group
SMBC Group Annual Report 2019
3. Interest Rate RiskTable IRRBB1 shows changes in economic value of equity (ΔEVE) and net interest income (ΔNII) in the banking book, simulated based on a set of prescribed interest rate shock scenarios. As stipulated under the Pillar 2 of Basel Framework (Supervisory Review Process), in order to identify banks that may have taken too large interest rate risk, the Japan FSA applies “materiality test” as comparing the bank’s ΔEVE with 15% of its Tier 1 capital, under a set of prescribed interest rate shock scenarios. The measurement result of SMBC Group’s ΔEVE shows that the economic value of equity declines when interest rates rise and the maximum change amount is under the prescribed parallel shock up scenario. SMBC Groups’ ΔEVE is not larger than 15% of our Tier 1 capital.As for ΔNII, net interest income declines under the prescribed parallel shock down scenario and increased under the parallel shock up scenario. Due to the assumption of zero floor on the interest rate of customer’s deposits in JPY, which limits reduction of the funding cost when interest rate down, the change amount is larger under the parallel shock down scenario.The measurement scope, the definition of each figure and the calculation assumption are as follows.
ScopeThe consolidated subsidiaries of SMBC• ΔEVE is calculated by simple aggregation of the decrease in economic value for all currencies. • ΔNII is calculated by simple aggregation of the change amount of interest income for each currency in which the total amount of interest
rate-sensitive assets and liabilities is 5% or more of the total.
Definition of Each Figure and Calculation Assumption • ΔEVE
Decrease in economic value (EVE, Economic Value on Equity) against interest rate shock (excluding the credit spread). • ΔNII
Decrease in 1 year interest income (NII, Net Interest Income) under each the interest rate shock. It is calculated under the constant balance sheet, which means that the balance sheet does not change through a year. In each simulation, we do not allow negative interest rate for domestic yen deposits and loans in any scenario.
(Millions of yen)
IRRBB1: Interest rate risk
ItemNo.
a b c d
⊿EVE ⊿NIIAs of March
31, 2019As of March 31,
2018As of March
31, 2019As of March 31,
20181 Parallel up 724,747 450,833 (252,302) (283,158)2 Parallel down 1,172 0 405,058 433,6213 Steepener 343,900 234,6024 Flattener 18,257 14,5095 Short rate up 151,087 69,8806 Short rate down 1,143 2367 Maximum 724,747 450,833 405,058 433,621
e fAs of March 31, 2019 As of March 31, 2018
8 Tier 1 capital 10,727,228 10,610,229
Note: Interest rate shocks of deposits with central banks is considered to be the same with the standardized interest rate shocks when calculating ⊿NII.
Basel III Information
012_0800885851907.indd 301 2019/08/16 19:25:58

302
Sumitomo Mitsui Financial Group
SMBC Group Annual Report 2019
■ Operational Risk1. Operational Risk Equivalent Amount Calculation Methodology
Sumitomo Mitsui Financial Group adopted the Advanced Measurement Approach (AMA) for exposures as of March 31, 2008. The following consolidated subsidiaries have also adopted the AMA, and the remaining consolidated subsidiaries have adopted the Basic Indicator Approach (BIA).
Sumitomo Mitsui Banking Corporation, Sumitomo Mitsui Card Company, Limited, The Japan Research Institute, Limited, SMBC Finance Service Co., Ltd., SMBC Guarantee Co., Ltd., SMBC Operation Service Co., Ltd., SMBC Green Service Co., Ltd., Sumitomo Mitsui Banking Corporation Europe Limited, Sumitomo Mitsui Banking Corporation (China) Limited, SMBC Nikko Securities Inc., Cedyna Financial Corporation and SMBC Consumer Finance Co., Ltd.
2. Outline of the AMAFor the “Outline of the AMA,” please refer to pages 119 to 121.
3. Usage of Insurance to Mitigate RiskSumitomo Mitsui Financial Group had not taken measures to mitigate operational risk through insurance coverage for exposures.
Basel III Information
012_0800885851907.indd 302 2019/08/16 19:25:58

303
Sumitomo Mitsui Financial Group
SMBC Group Annual Report 2019
■ CC2: Reconciliation of regulatory capital to balance sheetSumitomo Mitsui Financial Group, Inc. and Subsidiaries
(Millions of yen)
Items
a b c
Consolidated balance sheet as in published financial
statementsReference to Template CC1 Reference to appended table
As of March 31, 2019
As of March 31, 2018
(Assets)Cash and due from banks 57,411,276 53,732,582Call loans and bills bought 2,465,744 1,881,879Receivables under resale agreements 6,429,365 827,892Receivables under securities borrowing transactions 4,097,473 8,337,700Monetary claims bought 4,594,578 4,730,770Trading assets 5,328,778 5,585,591 7-aMoney held in trust 390 1,482Securities 24,338,005 25,712,709 3-b,7-bLoans and bills discounted 77,979,190 72,945,934 7-cForeign exchanges 1,719,402 2,166,190Lease receivables and investment assets 247,835 2,329,431Other assets 7,307,305 8,005,807 7-dTangible fixed assets 1,504,703 3,475,131Intangible fixed assets 769,231 865,584 3-aNet defined benefit asset 329,434 383,418 4Deferred tax assets 40,245 27,609 5-aCustomers’ liabilities for acceptances and guarantees 9,564,993 8,575,499Reserve for possible loan losses (468,808) (536,088)Total assets 203,659,146 199,049,128
(Liabilities)Deposits 122,325,038 116,477,534Negotiable certificates of deposit 11,165,486 11,220,284Call money and bills sold 1,307,778 1,190,928Payables under repurchase agreements 11,462,559 5,509,721Payables under securities lending transactions 1,812,820 7,186,861Commercial paper 2,291,813 2,384,787Trading liabilities 4,219,293 4,402,110 7-eBorrowed money 10,656,897 10,829,248 9-aForeign exchanges 1,165,141 865,640Short-term bonds 84,500 1,256,600Bonds 9,227,367 9,057,683 9-bDue to trust account 1,352,773 1,328,271Other liabilities 4,873,630 6,348,202 7-fReserve for employee bonuses 70,351 84,046Reserve for executive bonuses 3,091 3,861Net defined benefit liability 31,816 39,982Reserve for executive retirement benefits 1,374 2,026Reserve for point service program 23,948 22,244Reserve for reimbursement of deposits 7,936 17,765Reserve for losses on interest repayment 147,594 144,763Reserves under the special laws 2,847 2,397Deferred tax liabilities 378,220 455,234 5-bDeferred tax liabilities for land revaluation 30,259 30,539 5-cAcceptances and guarantees 9,564,993 8,575,499Total liabilities 192,207,534 187,436,236(Net assets)Capital stock 2,339,443 2,338,743 1-aCapital surplus 739,047 758,215 1-bRetained earnings 5,992,247 5,552,573 1-cTreasury stock (16,302) (12,493) 1-dTotal stockholders’ equity 9,054,436 8,637,039Net unrealized gains or losses on other securities 1,688,852 1,688,842Net deferred gains or losses on hedges (54,650) (68,543) 6Land revaluation excess 36,547 37,097Foreign currency translation adjustments 50,379 36,906Accumulated remeasurements of defined benefit plans (7,244) 59,121Total accumulated other comprehensive income 1,713,884 1,753,424 (a)Stock acquisition rights 4,750 2,823 2,8-aNon-controlling interests 678,540 1,219,604 8-bTotal net assets 11,451,611 11,612,892Total liabilities and net assets 203,659,146 199,049,128
Note: The regulatory scope of consolidation is the same as the accounting scope of consolidation.
Basel III Information
012_0800885851907.indd 303 2019/08/16 19:25:58

304
Sumitomo Mitsui Financial Group
SMBC Group Annual Report 2019
(Appended Table)1. Stockholders’ equity(1) Consolidated balance sheet (Millions of yen)
Consolidated balance sheet items As of March31, 2019
As of March31, 2018 Remarks Ref. No.
Capital stock 2,339,443 2,338,743 1-a
Capital surplus 739,047 758,215 1-b
Retained earnings 5,992,247 5,552,573 1-c
Treasury stock (16,302) (12,493) 1-d
Total stockholders’ equity 9,054,436 8,637,039
(2) Composition of capital (Millions of yen)
Composition of capital disclosure As of March31, 2019
As of March31, 2018 Remarks
Basel III TemplateNo.
Directly issued qualifying common share capital plus related capital surplus and retained earnings
9,054,436 8,637,039Stockholders’ equity attributable to common shares (before adjusting national specific regulatory adjustments (earnings to be distributed))
of which: capital and capital surplus 3,078,490 3,096,958 1a
of which: retained earnings 5,992,247 5,552,573 2
of which: treasury stock (–) 16,302 12,493 1c
of which: other than the above — —
Directly issued qualifying Additional Tier 1 instruments plus related capital surplus of which: classified as equity under applicable accounting standards and the breakdown
— —Stockholders’ equity attributable to preferred shares with a loss absorbency clause upon entering into effectively bankruptcy
31a
2. Stock acquisition rights(1) Consolidated balance sheet (Millions of yen)
Consolidated balance sheet items As of March31, 2019
As of March31, 2018 Remarks Ref. No.
Stock acquisition rights 4,750 2,823 2
of which: Stock acquisition rights issued by bank holding company
2,539 2,823
(2) Composition of capital (Millions of yen)
Composition of capital disclosure As of March31, 2019
As of March31, 2018 Remarks
Basel III TemplateNo.
Stock acquisition rights to common shares 2,539 2,823 1b
Stock acquisition rights to Additional Tier 1 instruments — — 31b
Stock acquisition rights to Tier 2 instruments — — 46
3. Intangible fixed assets(1) Consolidated balance sheet (Millions of yen)
Consolidated balance sheet items As of March31, 2019
As of March31, 2018 Remarks Ref. No.
Intangible fixed assets 769,231 865,584 3-a
Securities 24,338,005 25,712,709 3-b
of which: goodwill attributable to equity-method investees 61,282 27,520
Income taxes related to above 173,381 181,373
(2) Composition of capital (Millions of yen)
Composition of capital disclosure As of March31, 2019
As of March31, 2018 Remarks
Basel III TemplateNo.
Goodwill (including those equivalent) 247,659 292,318 8
Other intangibles other than goodwill and mortgage servicing rights 409,472 419,413 Software and other 9
Mortgage servicing rights — —
Amount exceeding the 10% threshold on specified items — — 20
Amount exceeding the 15% threshold on specified items — — 24
Mortgage servicing rights that are below the thresholds for deduction (before risk weighting)
— — 74
4. Net defined benefit asset(1) Consolidated balance sheet (Millions of yen)
Consolidated balance sheet items As of March31, 2019
As of March31, 2018 Remarks Ref. No.
Net defined benefit asset 329,434 383,418 4
Income taxes related to above 100,520 116,950
Basel III Information
012_0800885851907.indd 304 2019/08/16 19:25:58

305
Sumitomo Mitsui Financial Group
SMBC Group Annual Report 2019
(2) Composition of capital (Millions of yen)
Composition of capital disclosure As of March31, 2019
As of March31, 2018 Remarks
Basel III TemplateNo.
Net defined benefit asset 228,913 266,468 15
5. Deferred tax assets(1) Consolidated balance sheet (Millions of yen)
Consolidated balance sheet items As of March31, 2019
As of March31, 2018 Remarks Ref. No.
Deferred tax assets 40,245 27,609 5-a
Deferred tax liabilities 378,220 455,234 5-b
Deferred tax liabilities for land revaluation 30,259 30,539 5-c
Tax effects on intangible fixed assets 173,381 181,373
Tax effects on net defined benefit asset 100,520 116,950
(2) Composition of capital (Millions of yen)
Composition of capital disclosure As of March31, 2019
As of March31, 2018 Remarks
Basel III TemplateNo.
Deferred tax assets that rely on future profitability excluding those arising from temporary differences (net of related tax liability)
2,208 1,432This item does not agree with the amount reported on the consolidated balance sheet due to offsetting of assets and liabilities.
10
Deferred tax assets arising from temporary differences (net of related tax liability)
2,605 3,997This item does not agree with the amount reported on the consolidated balance sheet due to offsetting of assets and liabilities.
Amount exceeding the 10% threshold on specified items — — 21
Amount exceeding the 15% threshold on specified items — — 25
Deferred tax assets arising from temporary differences that are below the thresholds for deduction (before risk weighting)
2,605 3,997 75
6. Deferred gains or losses on derivatives under hedge accounting(1) Consolidated balance sheet (Millions of yen)
Consolidated balance sheet items As of March31, 2019
As of March31, 2018 Remarks Ref. No.
Net deferred gains or losses on hedges (54,650) (68,543) 6
(2) Composition of capital (Millions of yen)
Composition of capital disclosure As of March31, 2019
As of March31, 2018 Remarks
Basel III TemplateNo.
Net deferred gains or losses on hedges (52,610) (67,433)Excluding those items whose valuation differences arising from hedged items are recognized as “Accumulated other comprehensive income”
11
7. Items associated with investments in the capital of financial institutions(1) Consolidated balance sheet (Millions of yen)
Consolidated balance sheet items As of March31, 2019
As of March31, 2018 Remarks Ref. No.
Trading assets 5,328,778 5,585,591Including trading account securities and derivatives for trading assets
7-a
Securities 24,338,005 25,712,709 7-b
Loans and bills discounted 77,979,190 72,945,934 Including subordinated loans 7-c
Other assets 7,307,305 8,005,807 Including derivatives 7-d
Trading liabilities 4,219,293 4,402,110Including trading account securities sold and derivatives for trading liabilities
7-e
Other liabilities 4,873,630 6,348,202 Including derivatives 7-f
Basel III Information
012_0800885851907.indd 305 2019/08/16 19:25:58

306
Sumitomo Mitsui Financial Group
SMBC Group Annual Report 2019
(2) Composition of capital (Millions of yen)
Composition of capital disclosure As of March31, 2019
As of March31, 2018 Remarks
Basel III TemplateNo.
Investments in own capital instruments 4,491 7,981
Common Equity Tier 1 capital 4,491 7,981 16
Additional Tier 1 capital — — 37
Tier 2 capital 0 0 52
Reciprocal cross-holdings in the capital of banking, financial and insurance entities
— —
Common Equity Tier 1 capital — — 17
Additional Tier 1 capital — — 38
Tier 2 capital and other TLAC liabilities — — 53
Investments in the capital of banking, financial and insurance entities that are outside the scope of regulatory consolidation, net of eligible short positions, where the bank does not own more than 10% of the issued share capital (amount above the 10% threshold)
816,189 699,361
Common Equity Tier 1 capital — — 18
Additional Tier 1 capital — — 39
Tier 2 capital and other TLAC liabilities — — 54
Non-significant investments in the capital and other TLAC liabilities of other financials that are below the thresholds for deductions (before risk weighting)
816,189 699,361 72
Significant investments in the capital of banking, financial and insurance entities that are outside the scope of regulatory consolidation (net of eligible short positions)
996,894 748,831
Amount exceeding the 10% threshold on specified items — — 19
Amount exceeding the 15% threshold on specified items — — 23
Additional Tier 1 capital 25,516 81,640 40
Tier 2 capital and other TLAC liabilities 50,000 50,000 55
Significant investments in the common stock of other financials that are below the thresholds for deductions (before risk weighting)
921,378 617,191 73
8. Non-controlling interests(1) Consolidated balance sheet (Millions of yen)
Consolidated balance sheet items As of March31, 2019
As of March31, 2018 Remarks Ref. No.
Stock acquisition rights 4,750 2,823 8-a
Non-controlling interests 678,540 1,219,604 8-b
(2) Composition of capital (Millions of yen)
Composition of capital disclosure As of March31, 2019
As of March31, 2018 Remarks
Basel III TemplateNo.
Amount allowed in group CET1 2,181 332After reflecting amounts eligible for inclusion (Non-Controlling Interest after adjustments)
5
Qualifying Additional Tier 1 instruments plus related capital surplus issued by special purpose vehicles and other equivalent entities
— —After reflecting amounts eligible for inclusion (Non-Controlling Interest after adjustments)
30-31ab-32
Amount allowed in group AT1 62,752 224,359After reflecting amounts eligible for inclusion (Non-Controlling Interest after adjustments)
34-35
Qualifying Tier 2 instruments plus related capital surplus issued by special purpose vehicles and other equivalent entities
— —After reflecting amounts eligible for inclusion (Non-Controlling Interest after adjustments)
46
Amount allowed in group T2 15,087 49,810After reflecting amounts eligible for inclusion (Non-Controlling Interest after adjustments)
48-49
9. Other capital instruments(1) Consolidated balance sheet (Millions of yen)
Consolidated balance sheet items As of March31, 2019
As of March31, 2018 Remarks Ref. No.
Borrowed money 10,656,897 10,829,248 9-a
Bonds 9,227,367 9,057,683 9-b
(2) Composition of capital (Millions of yen)
Composition of capital disclosure As of March31, 2019
As of March31, 2018 Remarks
Basel III TemplateNo.
Directly issued qualifying Additional Tier 1 instruments plus related capital surplus of which: classified as liabilities under applicable accounting standards
598,974 599,794 32
Directly issued qualifying Tier 2 instruments plus related capital surplus of which: classified as liabilities under applicable accounting standards
997,723 993,367 46
Basel III Information
012_0800885851907.indd 306 2019/08/16 19:25:58

307
Sumitomo Mitsui Financial Group
SMBC Group Annual Report 2019
■ Linkages between Regulatory Exposure Amounts and Carrying Values in Consolidated Financial Statements Differences between Regulatory Exposure Amounts and Carrying Values in Consolidated Financial Statements and Explanations of the Factors
1. Differences between Accounting and Regulatory Scopes of Consolidation and Mapping of Consolidated Financial Statement Categories with Regulatory Risk Categories (LI1)
(Millions of yen)
LI1: Differences between accounting and regulatory scopes of consolidation and mapping of consolidated financial statement categories with regulatory risk categories
As of March 31, 2019
a b c d e f g
Carrying values as
reported in published
Consolidated financial
statement
Carrying values
under scope of regulatory consolidation
Carrying values of items:
CR (excluding amounts
relevant to d and e)
CCR
Securitisation (excluding amounts
relevant to f)
Market risk
Items not subject to
capital requirements or subject to
deduction from capital
AssetsCash and due from banks 57,411,276 57,411,276 57,411,276 — — — —Call loans and bills bought 2,465,744 2,465,744 2,465,744 — — — —Receivables under resale agreements 6,429,365 6,429,365 — 6,429,365 — — —Receivables under securities borrowing transactions 4,097,473 4,097,473 — 4,097,473 — — —Monetary claims bought 4,594,578 4,594,578 2,831,930 — 1,762,647 — —Trading assets 5,328,778 5,328,778 — 2,573,258 — 5,328,778 4,883Money held in trust 390 390 390 — — — —Securities 24,338,005 24,338,005 23,726,859 — 524,347 — 86,798Loans and bills discounted 77,979,190 77,979,190 77,114,769 — 814,420 — 50,000Foreign exchanges 1,719,402 1,719,402 1,719,402 — — — —Lease receivables and investment assets 247,835 247,835 247,835 — — — —Other assets 7,307,305 7,307,305 3,824,944 2,279,073 1,880 — 1,201,406Tangible fixed assets 1,504,703 1,504,703 1,504,703 — — — —Intangible fixed assets 769,231 769,231 173,381 — — — 595,849Net defined benefit asset 329,434 329,434 100,520 — — — 228,913Deferred tax assets 40,245 40,245 15,503 — — — 24,742Customers’ liabilities for acceptances and guarantees 9,564,993 9,564,993 9,415,628 — 149,365 — —Reserve for possible loan losses (468,808) (468,808) (468,808) — — — —Total assets 203,659,146 203,659,146 180,084,082 15,379,171 3,252,662 5,328,778 2,192,594LiabilitiesDeposits 122,325,038 122,325,038 3,245 — — — 122,321,793Negotiable certificates of deposit 11,165,486 11,165,486 — — — — 11,165,486Call money and bills sold 1,307,778 1,307,778 — — — — 1,307,778Payables under repurchase agreements 11,462,559 11,462,559 — 8,390,797 — — 3,071,762Payables under securities lending transactions 1,812,820 1,812,820 — 719,063 — — 1,093,756Commercial paper 2,291,813 2,291,813 — — — — 2,291,813Trading liabilities 4,219,293 4,219,293 — 2,226,979 — 4,219,293 28,131Borrowed money 10,656,897 10,656,897 — — — — 10,656,897Foreign exchanges 1,165,141 1,165,141 — — — — 1,165,141Short-term bonds 84,500 84,500 — — — — 84,500Bonds 9,227,367 9,227,367 — — — — 9,227,367Due to trust account 1,352,773 1,352,773 — — — — 1,352,773Other liabilities 4,873,630 4,873,630 — 1,572,866 1,172 — 3,299,590Reserve for employee bonuses 70,351 70,351 — — — — 70,351Reserve for executive bonuses 3,091 3,091 — — — — 3,091Net defined benefit liability 31,816 31,816 — — — — 31,816Reserve for executive retirement benefits 1,374 1,374 — — — — 1,374Reserve for point service program 23,948 23,948 — — — — 23,948Reserve for reimbursement of deposits 7,936 7,936 — — — — 7,936Reserve for losses on interest repayment 147,594 147,594 — — — — 147,594Reserve under the special laws 2,847 2,847 — — — — 2,847Deferred tax liabilities 378,220 378,220 — — — — 378,220Deferred tax liabilities for land revaluation 30,259 30,259 — — — — 30,259Acceptances and guarantees 9,564,993 9,564,993 — — — — 9,564,993Total liabilities 192,207,534 192,207,534 3,245 12,909,706 1,172 4,219,293 177,329,228
Basel III Information
012_0800885851907.indd 307 2019/08/16 19:25:58

308
Sumitomo Mitsui Financial Group
SMBC Group Annual Report 2019
(Millions of yen)
LI1: Differences between accounting and regulatory scopes of consolidation and mapping of consolidated financial statement categories with regulatory risk categories
As of March 31, 2018
a b c d e f g
Carrying values as
reported in published
Consolidated financial
statement
Carrying values
under scope of regulatory consolidation
Carrying values of items:
CR (excluding amounts
relevant to d and e)
CCR
Securitisation (excluding amounts
relevant to f)
Market risk
Items not subject to
capital requirements or subject to
deduction from capital
AssetsCash and due from banks 53,732,582 53,732,582 53,732,582 — — — —Call loans and bills bought 1,881,879 1,881,879 1,881,879 — — — —Receivables under resale agreements 827,892 827,892 — 827,892 — — —Receivables under securities borrowing transactions 8,337,700 8,337,700 — 8,337,700 — — —Monetary claims bought 4,730,770 4,730,770 2,935,869 — 1,794,900 — —Trading assets 5,585,591 5,585,591 — 2,418,678 — 5,585,591 7,838Money held in trust 1,482 1,482 1,482 — — — —Securities 25,712,709 25,712,709 25,111,327 — 492,221 — 109,160Loans and bills discounted 72,945,934 72,945,934 72,358,267 — 537,666 — 50,000Foreign exchanges 2,166,190 2,166,190 2,166,190 — — — —Lease receivables and investment assets 2,329,431 2,329,431 2,329,431 — — — —Other assets 8,005,807 8,005,807 4,729,195 2,394,436 19,687 — 862,487Tangible fixed assets 3,475,131 3,475,131 3,475,131 — — — —Intangible fixed assets 865,584 865,584 181,373 — — — 684,211Net defined benefit asset 383,418 383,418 116,950 — — — 266,468Deferred tax assets 27,609 27,609 8,048 — — — 19,561Customers’ liabilities for acceptances and guarantees 8,575,499 8,575,499 8,354,354 — 221,144 — —Reserve for possible loan losses (536,088) (536,088) (536,088) — — — —Total assets 199,049,128 199,049,128 176,845,998 13,978,706 3,065,621 5,585,591 1,999,727LiabilitiesDeposits 116,477,534 116,477,534 3,540 — — — 116,473,993Negotiable certificates of deposit 11,220,284 11,220,284 — — — — 11,220,284Call money and bills sold 1,190,928 1,190,928 — — — — 1,190,928Payables under repurchase agreements 5,509,721 5,509,721 — 2,238,633 — — 3,271,087Payables under securities lending transactions 7,186,861 7,186,861 — 5,547,010 — — 1,639,851Commercial paper 2,384,787 2,384,787 — — — — 2,384,787Trading liabilities 4,402,110 4,402,110 — 2,262,129 — 4,402,110 17,362Borrowed money 10,829,248 10,829,248 — — — — 10,829,248Foreign exchanges 865,640 865,640 — — — — 865,640Short-term bonds 1,256,600 1,256,600 — — — — 1,256,600Bonds 9,057,683 9,057,683 — — — — 9,057,683Due to trust account 1,328,271 1,328,271 — — — — 1,328,271Other liabilities 6,348,202 6,348,202 — 1,912,702 2,252 — 4,433,248Reserve for employee bonuses 84,046 84,046 — — — — 84,046Reserve for executive bonuses 3,861 3,861 — — — — 3,861Net defined benefit liability 39,982 39,982 — — — — 39,982Reserve for executive retirement benefits 2,026 2,026 — — — — 2,026Reserve for point service program 22,244 22,244 — — — — 22,244Reserve for reimbursement of deposits 17,765 17,765 — — — — 17,765Reserve for losses on interest repayment 144,763 144,763 — — — — 144,763Reserve under the special laws 2,397 2,397 — — — — 2,397Deferred tax liabilities 455,234 455,234 — — — — 455,234Deferred tax liabilities for land revaluation 30,539 30,539 — — — — 30,539Acceptances and guarantees 8,575,499 8,575,499 — — — — 8,575,499Total liabilities 187,436,236 187,436,236 3,540 11,960,475 2,252 4,402,110 173,347,349
Notes: 1. Transactions in the trading book including derivative transactions extend over multiple risk categories, since they are subject to both market risks and counterparty credit risks.
2. Account titles including monetary claims boughts are subject to securitisation products if they have a characteristic of securitisation products, otherwise they are subject to CR, therefore, they extend over multiple risk categories.
3. Foreign exchange risk and commodities risk in the banking book are not included in column f “Market risk,” since it is difficult to link them with account titles.
Basel III Information
012_0800885851907.indd 308 2019/08/16 19:25:58

309
Sumitomo Mitsui Financial Group
SMBC Group Annual Report 2019
2. Main Sources of Differences between Regulatory Exposure Amounts and Carrying Values in Consolidated Financial Statements (LI2)
(Millions of yen)
LI2: Main sources of differences between regulatory exposure amounts and carrying values in consolidated financial statements amounts
As of March 31, 2019
ItemNo.
a b c d e
Total
Items subject to:
CR (excluding amounts relevant
to c and d)CCR
Securitisation (excluding
amounts relevant to e)
Market risk
1 Asset carrying value amount under scope of regulatory consolidation 201,466,551 180,084,082 15,379,171 3,252,662 5,328,778
2Liabilities carrying value amount under scope of regulatory consolidation
14,878,306 3,245 12,909,706 1,172 4,219,293
3 Total net amount under regulatory scope of consolidation 186,588,245 180,080,837 2,469,464 3,251,489 1,109,485
4 Off-balance sheet amounts 13,606,383 9,252,378 (Note 1) 3,875,495 478,509 —
5 Differences due to consideration of provisions and write-offs 555,230 555,230 (Note 2) — — —
6 Differences due to derivative transactions 6,862,613 — 6,529,139 (Note 3) 10,443 —
7 Differences due to SFTs (638,447) — (638,447) — —8 Other differences 864,648 859,587 3,558 1,503 —9 Regulatory exposure amounts 207,838,675 190,748,034 12,239,210 3,741,945 1,109,485
(Millions of yen)
LI2: Main sources of differences between regulatory exposure amounts and carrying values in consolidated financial statements amounts
As of March 31, 2018
ItemNo.
a b c d e
Total
Items subject to:
CR (excluding amounts relevant
to c and d)CCR
Securitisation (excluding
amounts relevant to e)
Market risk
1 Asset carrying value amount under scope of regulatory consolidation 197,049,401 176,845,998 13,978,706 3,065,621 5,585,591
2Liabilities carrying value amount under scope of regulatory consolidation
14,088,886 3,540 11,960,475 2,252 4,402,110
3 Total net amount under regulatory scope of consolidation 182,960,514 176,842,457 2,018,231 3,063,369 1,183,480
4 Off-balance sheet amounts 14,498,018 8,819,294 (Note 1) 5,144,715 534,008 —
5 Differences due to consideration of provisions and write-offs 650,474 650,474 (Note 2) — — —
6 Differences due to derivative transactions 6,408,367 — 6,249,473 (Note 3) 11,869 —
7 Differences due to SFTs 2,021,735 — 2,021,735 — —8 Other differences 378,881 194,769 184,111 — —9 Regulatory exposure amounts 206,917,991 186,506,996 15,618,266 3,609,247 1,183,480
Notes: 1. This mainly comprises exposures due to commitment lines.2. This mainly comprises assets subject to the IRB approach added with specific reserve and partial direct write-offs.3. This mainly comprises the aggregation of the addition of derivative liabilities and regulatory add-on amounts, and the deduction of regulatory netting effect.
Basel III Information
012_0800885851907.indd 309 2019/08/16 19:25:58

310
Sumitomo Mitsui Financial Group
SMBC Group Annual Report 2019
■ Countercyclical buffer requirement by country or region (Millions of yen, except percentages)
CCyB1: Countercyclical buffer (CCyB) requirement by country or regionAs of March 31, 2019
a b c dGeographical breakdown
Applicable CCyB ratio in effect
RWAs used in the computation of CCyB ratio Bank-specific CCyB ratio CCyB amount
Hong Kong 2.50% 1,186,840Sweden 2.00% 16,840UK 1.00% 1,862,990Subtotal 3,066,670Total 46,957,843 0.10% 48,637
Note: While credit risk-weighted asset shall be calculated on an ultimate risk basis where feasible, some assets including funds and other assets or portion of assets subject to standardized approach, are calculated on an obligor basis or on a country of undertaking basis.
Countercyclical buffer requirement by country or region
Basel III Information
012_0800885851907.indd 310 2019/08/16 19:25:58

311
Sumitomo Mitsui Financial Group
SMBC Group Annual Report 2019
■ Indicators for assessing Global Systemically Important Banks (G-SIBs) (Millions of yen)
GSIB1: G-SIB indicatorsBasel III Template
No.
As of March 31, 2019
As of March 31, 2018
1 Cross-jurisdictional activity
Cross-jurisdictional claims 52,187,827 48,875,3062 Cross-jurisdictional liabilities 35,256,002 33,413,1373 Size Total exposures 220,856,829 213,232,1204
Mutual relevanceIntra-financial system assets 32,216,204 30,134,718
5 Intra-financial system liabilities 18,722,769 19,890,1056 Securities outstanding 28,193,246 30,224,9447
Substitutability/financial institution infrastructure
Assets under custody 11,466,654 13,064,236
8 Annual total amount of payments settled through settlement systems 3,431,377,752 3,311,542,881
9 Annual total amount of underwritten transactions in debt and equity markets 9,149,209 9,439,668
10
Complexity
Total amount of notional amount of OTC derivatives and long settlement transactions with other financial institutions 778,148,994 716,218,388
11 Level 3 assets 1,003,465 879,267
12Held-for-trading (HFT) securities and available-for-sale (AFS) securities, excluding HFT and AFS securities that meet the definition of Level 1 assets and Level 2 assets with haircuts
10,131,349 10,321,538
Note: Terms in this form shall, unless otherwise prescribed separately, be used in accordance with the terminology used in the Notification as well as the Bank Holding Company Equity Capital Adequacy Notification.
a. Basel III Template No. (hereinafter referred to as “Item No.” in this form) 3 “Total exposures” shall state the total amount of the following.(1) The amount of on-balance sheet assets (total assets reported in the non-consolidated balance sheet or the consolidated balance
sheet, less the amount of customers’ liabilities for acceptance and guarantees, less the amounts reported with respect to (2) and (3) reported in the non-consolidated balance sheet or the consolidated balance sheet)
(2) The amount of derivative transactions, etc. (referring to forward contract, swap, option, and other derivatives and long settlement transactions; hereinafter the same in (2) and (4)) (the amount of exposure calculated in respect of derivative transactions, etc. (the amount of replacement cost calculated by using current exposure method (which shall be zero if such amount turned out to be a negative value), added by the add-on amount, as well as the notional amount of the credit derivative that provides protection), added by the consideration of the margin deposited in cash in connection with derivative transactions, etc.)
(3) The amount of SFTs (amount of cash receivables in SFTs added by the amount of exposure at the counterparty of transaction calculated for each unit of SFTs (which shall be zero if such amount turned out to be a negative value))
(4) The amount of off-balance sheet transactions (excluding derivative transactions, etc., and SFTs) (the amount of credit risk exposure at the counterparty of transaction, added by the amount of exposure arising from the underlying asset, as well as the amount of securitisation exposure)
b. Item No.4 “Mutual relevance - Intra-financial system assets” shall state the total amount of the following balances concerning the credit granted to financial institutions, etc. (including financial instruments business operators prescribed under Article 2, Paragraph 9 of the Financial Instruments and Exchange Act, insurance companies, central counterparty, pension funds and other business operators of the similar kind; hereinafter the same in b. and c.).(1) Funds deposited with or lent to other financial institutions and undrawn committed lines extended to other financial
institutions(2) Holdings of securities issued by other financial institutions (referring to secured bonds, general unsecured bonds,
subordinated bonds, short-term bonds, negotiable certificates of deposit and stock; hereinafter the same in Item No. 6) (3) Net positive current exposure of SFTs with other financial institutions (which can take into account the effect of legally
binding netting contracts, but cannot have a negative value)(4) The add-on amount calculated based on the amount measured at fair value and by using the current exposure method as
adopted for the derivative instruments transactions and long settlement transactions with other financial institutions, without involving financial instruments markets as defined under Article 2, Paragraph 14 of the Financial Instruments and Exchange Act, and foreign financial instruments markets as defined under Article 2, Paragraph 8, Item 3(b) of the same Act (which can
Indicators for assessing Global Systemically Important Banks (G-SIBs)Sumitomo Mitsui Financial Group, Inc. and Subsidiaries
Basel III Information
012_0800885851907.indd 311 2019/08/16 19:25:58

312
Sumitomo Mitsui Financial Group
SMBC Group Annual Report 2019
take into account the effect of legally valid bilateral netting contracts, but cannot have a negative value; hereinafter collectively referred to as “financial instruments markets, etc.” in Item No. 10 and c.)
c. Item No. 5 “Mutual relevance - Intra-financial system liabilities” shall state the total amount of the following balances.(1) Deposits due to, and loans obtained from other financial institutions (including undrawn committed lines)(2) Net negative current exposure of SFTs with other financial institutions (which can take into account the effect of legally valid
bilateral netting contracts, but cannot exceed zero)(3) The add-on amount calculated based on the amount measured at fair value and by using the current exposure method as
adopted for the derivative instruments transactions and long settlement transactions with other financial institutions, without involving financial instruments markets, etc. (which can take into account the effect of legally valid bilateral netting contracts, but cannot exceed zero)
d. Item No. 8 “Substitutability/financial infrastructure – the annual total amount of payments through settlement systems” shall state the annual total amount of payments settled through the BOJ-NET, the Japanese Banks’ Payment Clearing Network and other similar settlement systems but excluding intra-group payments in the most recently ended fiscal year.
e. Item No.9 “Substitutability/financial infrastructure – the annual total amount of underwritten transactions in debt and equity markets” shall state the annual total amount of transactions underwritten in debt and equity markets in the most recently ended fiscal year (referring to securities underwriting as prescribed in Article 2, Paragraph 8, Item 6 of the Financial Instruments and Exchange Act).
f. Financial institutions mentioned in Item No.10 “Complexity – total amount of notional amount of OTC derivatives and long settlement transactions with other financial institutions” refer to financial institutions, etc. as defined in b. above.
g. Item No.12 “Complexity – Held-for-trading (HFT) securities and available-for-sale (AFS) securities” shall state the total amount of balances of Held-for-trading (HFT) securities and available-for-sale (AFS) securities (excluding HFT and AFS securities that are considered to have high liquidity).
h. In each item in this form, if there is no specific applicable amount in the submitting financial institution, the item in question shall not be deleted but just be marked with [ - ].
i. In this form, all amounts shall be stated in the designated unit herein, and any fraction less than such unit shall be rounded down.
j. This form shall be prepared only by a bank subject to the uniform international standards (excluding the bank that is a consolidated subsidiary of a bank as well as the bank that is a consolidated subsidiary not of a bank but of a banking holding company, and consolidated subsidiary of a regulated foreign entity), or a holding company subject to the uniform international standards that states in Item No. 3 an equivalent to an amount in excess of 200 billion euros at the exchange rate as at the end of its most recently ended fiscal year, or that is designated by the Commissioner of the Financial Services Agency of Japan as an equivalent to a bank or a holding company subject to the uniform international standards.
Basel III Information
012_0800885851907.indd 312 2019/08/16 19:25:58

313
Sumitomo Mitsui Financial Group
SMBC Group Annual Report 2019
■ Composition of Leverage Ratio(In million yen, %)
Corresponding line # on Basel III disclosure
template (Table2)
Corresponding line # on Basel III disclosure
template (Table1)Items
As of March 31,2019
As of March 31,2018
On-balance sheet exposures (1)1 On-balance sheet exposures before deducting adjustment items 179,349,049 177,220,554
1a 1 Total assets reported in the consolidated balance sheet 203,659,146 199,049,128
1b 2The amount of assets of subsidiaries that are not included in the scope of the leverage ratio on a consolidated basis (-)
— —
1c 7The amount of assets of subsidiaries that are included in the scope of the leverage ratio on a consolidated basis (except those included in the total assets reported in the consolidated balance sheet)
— —
1d 3The amount of assets that are deducted from the total assets reported in the consolidated balance sheet (except adjustment items) (-)
24,310,096 21,828,574
2 7 The amount of adjustment items pertaining to Tier 1 capital (-) 999,843 1,135,5093 Total on-balance sheet exposures (a) 178,349,206 176,085,044
Exposures related to derivative transactions (2)
4Replacement cost associated with derivatives transactions, etc. (with the 1.4 alpha factor applied)Replacement cost associated with derivatives transactions, etc. 2,702,937 2,170,604
5Add-on amount for potential future exposure associated with derivatives transactions, etc. (with the 1.4 alpha factor applied)Add-on amount associated with derivatives transactions, etc. 4,302,269 3,809,594The amount of receivables arising from providing cash margin in relation to derivatives transactions, etc.
622,875 244,794
6The amount of receivables arising from providing collateral, provided where deducted from the consolidated balance sheet pursuant to the operative accounting frameworkThe amount of receivables arising from providing cash margin, provided where deducted from the consolidated balance sheet pursuant to the operative accounting framework
— —
7The amount of deductions of receivables (out of those arising from providing cash variation margin) (-)
97,391 244,794
8The amount of client-cleared trade exposures for which a bank or bank holding company acting as clearing member is not obliged to make any indemnification (-)
9 Adjusted effective notional amount of written credit derivatives 591,253 549,981
10The amount of deductions from effective notional amount of written credit derivatives (-)
541,447 509,474
11 4 Total exposures related to derivative transactions (b) 7,580,496 6,020,706Exposures related to repo transactions (3)
12 The amount of assets related to repo transactions, etc. 10,526,838 9,165,59213 The amount of deductions from the assets above (line 12) (-) — —14 The exposures for counterparty credit risk for repo transactions, etc. 731,057 144,76215 The exposures for agent repo transaction16 5 Total exposures related to repo transactions, etc. (c) 11,257,895 9,310,354
Exposures related to off-balance sheet transactions (4)17 Notional amount of off-balance sheet transactions 61,366,247 60,490,251
18The amount of adjustments for conversion in relation to off-balance sheet transactions (-)
39,015,093 40,188,216
19 6 Total exposures related to off-balance sheet transactions (d) 22,351,153 20,302,034Leverage ratio on a consolidated basis (5)
20 The amount of capital (Tier 1 capital) (e) 10,727,228 10,610,22921 8 Total exposures ((a)+(b)+(c)+(d)) (f) 219,538,751 211,718,14022 Leverage ratio on a consolidated basis ((e)/(f)) 4.88% 5.01%
Leverage Ratio Information (Consolidated)Sumitomo Mitsui Financial Group, Inc. and Subsidiaries
Basel III Information
012_0800885851907.indd 313 2019/08/16 19:25:58

314
Sumitomo Mitsui Financial Group
SMBC Group Annual Report 2019
■ TLAC: TLAC composition for G-SIBs (at resolution group level)Sumitomo Mitsui Financial Group, Inc. and Subsidiaries
(Millions of yen, except percentages)
Basel III Template
No.Items
As of March 31, 2019
Preferred resolution strategy (1)The SPE (Single Point of Entry) resolution strategy is considered to be the preferred resolution strategy for Sumitomo Mitsui Financial Group, Inc. (SMFG) and its subsidiaries.More concretely, at the time of a stress, following the relevant authority’s determination that one or more of the material sub-groups, i.e. Sumitomo Mitsui Banking Corporation and SMBC Nikko Securities Inc., have reached the point of non-viability, losses incurred to them would be passed to SMFG, the ultimate holding company. While this could lead to a resolution of SMFG, the material sub-groups are expected to continue their business as usual under the Specified Bridge Financial Institution, etc. incorporated by the Deposit Insurance Corporation of Japan (DICJ) to which SMFG transfers its business.Regulatory capital elements of TLAC and adjustments (2)
1 Common Equity Tier 1 capital (CET1) (A) 9,654,5172 Additional Tier 1capital (AT1) before TLAC adjustments (B) 1,072,7103 AT1 ineligible as TLAC as issued out of subsidiaries to third parties (C) —4 Other adjustments (D) —5 AT1 instruments eligible under the TLAC framework ((B) - (C) - (D)) (E) 1,072,7106 Tier 2 capital (T2) before TLAC adjustments (F) 1,513,2607 Amortised portion of T2 instruments where remaining maturity > 1 year (G) (298,938)8 T2 capital ineligible as TLAC as issued out of subsidiaries to third parties (H) —9 Other adjustments (I) 176,746
10 T2 instruments eligible under the TLAC framework ((F) - (G) - (H) - (I)) (J) 1,635,45311 TLAC arising from regulatory capital ((A) + (E) + (J)) (K) 12,362,681
Non-regulatory capital elements of TLAC (3)12 External TLAC instruments issued directly by the bank and subordinated to excluded liabilities (L) 4,147,402
13 External TLAC instruments issued directly by the bank which are not subordinated to excluded liabilities but meet all other TLAC term sheet requirements
14 of which: amount eligible as TLAC after application of the caps15 External TLAC instruments issued by funding vehicles prior to 1 January 202216 Eligible ex ante commitments to recapitalise a G-SIB in resolution (M) 1,473,56917 TLAC arising from non-regulatory capital instruments before adjustments ((L) + (M)) (N) 5,620,972
Non-regulatory capital elements of TLAC: adjustments (4)18 TLAC before deductions ((K) + (N)) (O) 17,983,653
19 Deductions of exposures between MPE resolution groups that correspond to items eligible for TLAC (not applicable to SPE G-SIBs) (P) —
20 Deduction of investments in own other TLAC liabilities (Q) 23221 Other adjustment to TLAC (R) —22 TLAC after deductions ((O) - (P) - (Q) - (R)) (S) 17,983,421
Risk-weighted assets and leverage exposure measure for TLAC purposes (5)23 Total risk-weighted assets (RWA) (T) 58,942,79124 Total exposures (U) 219,538,751
TLAC ratios and buffers (6)25 TLAC before deduction of CET1 specific buffer requirement (as a percentage of RWA) ((S) / (T)) 30.50%25a TLAC (as a percentage of RWA) 26.90%26 TLAC (as a percentage of total exposures) ((S) / (U)) 8.19%27 CET1 available after meeting the minimum capital requirements 11.87%28 CET1 specific buffer requirement 3.60%29 of which: capital conservation buffer requirement 2.50%30 of which: countercyclical buffer requirement 0.10%31 of which: G-SIB/D-SIB additional requirement 1.00%
TLAC information
Basel III Information
012_0800885851907.indd 314 2019/08/16 19:25:58

315
Sumitomo Mitsui Financial Group
SMBC Group Annual Report 2019
■ TLAC2: - Material subgroup entity - creditor ranking at legal entity levelSumitomo Mitsui Banking Corporation
(Millions of yen)
Creditor rankingSum of1 to 4
Basel III Template
No.Items
12 3
4
(most junior) (most senior)
1 Is the resolution entity the creditor/investor? Yes No Yes No Yes No Yes No
2 Description of creditor ranking Commonshare capital
Additional Tier 1 instruments *1 Tier 2 instruments *2 Other internal
TLAC liabilities
3 Total capital and liabilities net of credit risk mitigation (A) 3,545,551 — 1,100,000 173,000 1,003,250 855,912 4,155,093 — 10,832,806
4 Subset of row 3 that are excluded liabilities (B) — — — — — — — — —
5 Total capital and liabilities less excluded liabilities (A) - (B) 3,545,551 — 1,100,000 173,000 1,003,250 855,912 4,155,093 — 10,832,806
6 Subset of row 5 that are eligible as TLAC 3,545,551 — 1,100,000 173,000 1,003,250 782,912 4,155,093 — 10,759,8067 1 year ≤ residual maturity < 2 years — — — — — 243,412 277,500 — 520,9128 2 years ≤ residual maturity < 5 years — — — — — 339,500 2,006,690 — 2,346,1909 5 years ≤ residual maturity < 10 years — — — — 950,250 175,000 1,747,190 — 2,872,440
10 10 years ≤ residual maturity (excluding perpetual securities) — — — — 53,000 — 123,713 — 176,713
11 Perpetual securities 3,545,551 — 1,100,000 173,000 — 25,000 — — 4,843,551
*1 Including eligible Tier 1 capital instruments subject to transitional arrangements*2 Including eligible Tier 2 capital instruments subject to transitional arrangements
SMBC Nikko Securities Inc.
(Millions of yen)
Creditor rankingSum of1 to 4
Basel III Template
No.Items
12
3
(most junior) (most senior)
1 Is the resolution entity the creditor/investor? Yes No Yes No Yes No
2 Description of creditor ranking Commonshare capital Subordinated debts Other internal
TLAC liabilities3 Total capital and liabilities net of credit risk mitigation (A) 467,714 — — — — — 467,7144 Subset of row 3 that are excluded liabilities (B) — — — — — — —5 Total capital and liabilities less excluded liabilities (A) - (B) 467,714 — — — — — 467,7146 Subset of row 5 that are eligible as TLAC 467,714 — — — — — 467,7147 1 year ≤ residual maturity < 2 years — — — — — — —8 2 years ≤ residual maturity < 5 years — — — — — — —9 5 years ≤ residual maturity < 10 years — — — — — — —10 10 years ≤ residual maturity (excluding perpetual securities) — — — — — — —11 Perpetual securities 467,714 — — — — — 467,714
Basel III Information
012_0800885851907.indd 315 2019/08/16 19:25:58

316
Sumitomo Mitsui Financial Group
SMBC Group Annual Report 2019
■ TLAC3: Creditor ranking of external TLAC, etc.Sumitomo Mitsui Financial Group, Inc.
(Millions of yen)
Creditor rankingSum of1 to 4
Basel III Template
No.Items
12 3
4
(most junior) (most senior)
1 Description of creditor rankingCommon
share capital
Additional Tier 1
instruments *1
Tier 2 instruments
Unsecuredsenior bonds
2 Total capital and liabilities net of credit risk mitigation (A) 3,900,364 866,700 1,003,250 5,436,425 11,206,7393 Subset of row 2 that are excluded liabilities *2 (B) — — — 3,524 3,5244 Total capital and liabilities less excluded liabilities (A) - (B) 3,900,364 866,700 1,003,250 5,432,901 11,203,2155 Subset of row 4 that are eligible as TLAC 3,900,364 866,700 1,003,250 4,155,093 9,925,4076 1 year ≤ residual maturity < 2 years — — — 277,500 277,5007 2 years ≤ residual maturity < 5 years — — — 2,006,690 2,006,6908 5 years ≤ residual maturity < 10 years — — 950,250 1,736,090 2,686,3409 10 years ≤ residual maturity (excluding perpetual securities) — — 53,000 134,813 187,81310 Perpetual securities 3,900,364 866,700 — — 4,767,064
*1 Including eligible Tier 1 capital instruments subject to transitional arrangements*2 Excluding those owed to group companies and conservatively estimated in light of quantitative materiality
Basel III Information
012_0800885851907.indd 316 2019/08/16 19:25:58

317
Sumitomo Mitsui Financial Group
SMBC Group Annual Report 2019
Liquidity Coverage Ratio Information (Consolidated)
Since March 31, 2015, the “Liquidity Coverage Ratio” (hereinafter referred to as “LCR”), the liquidity ratio regulation under the Basel III, has been introduced in Japan. In addition to the application of uniform international standards, Sumitomo Mitsui Financial Group calculates its consolidated LCR using the calculation formula stipulated in the “Criteria for Evaluating the Soundness of Liquidity Status Set Forth by a Bank Holding Company as a Benchmark for Judging the Soundness of Management of Itself and its Subsidiaries, etc., Based on the Provision of Article 52-25 of the Banking Act, and Which Are Also the Criteria to be Referred to for Judging the Soundness of Management in Banks” (Notification No. 62 issued by the Japanese Financial Services Agency in 2014; hereinafter referred to as the “LCR Notification”).
■ Disclosure of Qualitative Information about Liquidity Coverage Ratio1. Intra-period Changes in Consolidated LCR As described on the following page, the LCR has remained stable with no significant fluctuation since the introduction of the liquidity ratio
regulation on March 31, 2015.
2. Assessment of Consolidated LCR The LCR Notification stipulates the minimum requirement of the LCR for 2018 at 90%, and 100% from 2019 onwards. The LCR of
Sumitomo Mitsui Financial Group (consolidated) exceeds the minimum requirements of the LCR for 2018 and for 2019 onwards, having no cause for concern. In terms of the future LCR forecasts, Sumitomo Mitsui Financial Group does not expect significant deviations from the disclosed ratios. In addition, the actual LCR does not differ significantly from the initial forecast.
3. Composition of High-Quality Liquid Assets Regarding the high-quality liquid assets allowed to be included in the calculation, there are no significant changes in locations and
properties of currency denominations, categories and so on. In addition, in respect of major currencies (those of which the aggregate amount of liabilities denominated in a certain currency accounts for 5% or more of Sumitomo Mitsui Financial Group’s total liabilities on the consolidated basis), there is no significant mismatch in currency denomination between the total amount of the high-quality liquid assets allowed to be included in the calculation and the amount of net cash outflows.
4. Other Information Concerning Consolidated LCR Sumitomo Mitsui Financial Group has not applied “special provisions concerning qualifying operational deposits” prescribed in Article 28 of
the LCR Notification and “increased liquidity needs related to market valuation changes on derivative or other transactions simulated through Scenario Approach” prescribed in Article 37 of the LCR Notification. Meanwhile, Sumitomo Mitsui Financial Group records “cash outflows related to small-sized consolidated subsidiaries,” etc. under “cash outflows based on other contracts” prescribed in Article 59 of the LCR Notification.
Sumitomo Mitsui Financial Group, Inc. and Subsidiaries
Basel III Information
012_0800885851907.indd 317 2019/08/16 19:25:59

318
Sumitomo Mitsui Financial Group
SMBC Group Annual Report 2019
■ Disclosure of Quantitative Information about Liquidity Coverage Ratio (Consolidated) (In million yen, %, the number of data)
ItemCurrent Quarter(From 2019/1/1 To 2019/3/31)
Prior Quarter(From 2018/10/1 To 2018/12/31)
High-Quality Liquid Assets (1)1 Total high-quality liquid assets (HQLA) 64,652,351 64,751,939
Cash Outflows (2)TOTAL
UNWEIGHTEDVALUE
TOTALWEIGHTED
VALUE
TOTALUNWEIGHTED
VALUE
TOTALWEIGHTED
VALUE
2 Cash outflows related to unsecured retail funding 49,498,576 3,879,143 48,794,815 3,830,0253 of which, Stable deposits 15,325,748 461,274 15,003,032 450,3014 of which, Less stable deposits 34,172,828 3,417,869 33,791,783 3,379,7235 Cash outflows related to unsecured wholesale funding 66,295,145 33,455,976 65,629,634 32,732,9876 of which, Qualifying operational deposits — — — —
7 of which, Cash outflows related to unsecured wholesale funding other than qualifying operational deposits and debt securities 60,854,642 28,015,473 60,876,108 27,979,462
8 of which, Debt securities 5,440,503 5,440,503 4,753,526 4,753,5269 Cash outflows related to secured funding, etc. 182,782 126,439
10 Cash outflows related to derivative transactions, etc. funding programs, credit and liquidity facilities 22,305,930 7,427,282 22,843,783 7,746,448
11 of which, Cash outflows related to derivative transactions, etc. 1,375,135 1,375,135 1,550,224 1,550,22412 of which, Cash outflows related to funding programs 396,429 396,429 363,907 363,90713 of which, Cash outflows related to credit and liquidity facilities 20,534,367 5,655,719 20,929,652 5,832,31714 Cash outflows related to contractual funding obligations, etc. 9,288,555 7,125,156 9,424,062 6,929,26215 Cash outflows related to contingencies 70,546,945 1,399,443 71,990,380 1,392,42016 Total cash outflows 53,469,782 52,757,580
Cash Inflows (3)TOTAL
UNWEIGHTEDVALUE
TOTALWEIGHTED
VALUE
TOTALUNWEIGHTED
VALUE
TOTALWEIGHTED
VALUE
17 Cash inflows related to secured lending, etc. 6,597,847 371,129 6,363,219 518,04318 Cash inflows related to collection of loans, etc. 3,512,576 2,352,718 2,964,241 1,993,69619 Other cash inflows 3,473,255 1,580,470 3,758,014 1,609,86620 Total cash inflows 13,583,678 4,304,317 13,085,474 4,121,604
Consolidated Liquidity Coverage Ratio (4)21 Total HQLA allowed to be included in the calculation 64,652,351 64,751,93922 Net cash outflows 49,165,466 48,635,97623 Consolidated liquidity coverage ratio (LCR) 131.4% 133.1%24 The number of data used to calculate the average value 58 62
Notes: 1. The data after the introduction of the liquidity ratio regulation on March 31, 2015 is available on Sumitomo Mitsui Financial Group’s website.(https://www.smfg.co.jp/english/investor/financial/basel_3.html)
2. The average values are calculated based on daily data in accordance with Notification No. 7 issued by the Japanese Financial Services Agency in 2015. Some data, such as attribute information of customers and data on consolidated subsidiaries, is updated on the monthly or quarterly basis.
■ Breakdown of High-Quality Liquid Assets (In million yen)
ItemCurrent Quarter(From 2019/1/1 To 2019/3/31)
Prior Quarter(From 2018/10/1 To 2018/12/31)
1 Cash and due from banks 52,343,400 53,500,4092 Securities 12,308,950 11,251,530
3 of which, government bonds, etc. 9,477,525 8,547,966
4 of which, municipal bonds, etc. 201,949 135,926
5 of which, other bonds 905,001 890,848
6 of which, stocks 1,724,476 1,676,791
7 Total high-quality liquid assets (HQLA) 64,652,351 64,751,939
Note: The above amounts are those of high-quality liquid assets in accordance with the liquidity ratio regulation under the Basel III and do not correspond to the financial amounts.The amounts stated are those after multiplying factors in the liquidity ratio regulation under the Basel III.
Basel III Information
012_0800885851907.indd 318 2019/08/16 19:25:59

319
SMBC
SMBC Group Annual Report 2019
Financial Highlights
Sumitomo Mitsui Banking Corporation
Consolidated
Millions of yen Year ended March 31 2019 2018 2017 2016 2015For the Year:
Ordinary income ����������������������������������������������������������� ¥ 3,369,898 ¥ 3,117,087 ¥ 3,014,455 ¥ 3,059,022 ¥ 3,199,409Ordinary profit �������������������������������������������������������������� 894,501 932,733 829,419 930,332 1,198,955Profit attributable to owners of parent ������������������������� 617,493 627,582 543,199 680,162 736,904Comprehensive income ����������������������������������������������� 548,236 782,502 687,157 143,086 1,937,374
At Year-End: Total net assets ������������������������������������������������������������ ¥ 8,986,749 ¥ 9,090,403 ¥ 8,908,192 ¥ 9,446,193 ¥ 10,036,003Total assets ������������������������������������������������������������������ 190,690,293 182,727,495 180,946,664 180,408,672 177,559,197Total capital ratio (BIS guidelines) �������������������������������� 20.32% 21�14% 17�77% 18�19% 17�93%Tier 1 capital ratio (BIS guidelines) ������������������������������� 17.57% 18�22% 14�61% 14�58% 13�91%Common equity Tier 1 capital ratio
(BIS guidelines) ���������������������������������������������������������� 15.17% 15�29% 12�89% 13�04% 12�61%Number of employees �������������������������������������������������� 58,527 40,058 45,963 54,192 50,249
Note: “Number of employees” has been reported on the basis of full-time workers. “Number of employees” includes locally hired overseas staff members but excludes contract employees and temporary staff.
Non-consolidated
Millions of yen Year ended March 31 2019 2018 2017 2016 2015For the Year:
Ordinary income ����������������������������������������������������������� ¥ 2,805,840 ¥ 2,540,450 ¥ 2,551,931 ¥ 2,277,812 ¥ 2,370,998Trust fees ����������������������������������������������������������������� 2,250 2,038 2,111 2,589 1,872
Gross banking profit (A) ����������������������������������������������� 1,395,586 1,427,924 1,663,654 1,534,271 1,634,284Expenses (excluding nonrecurring losses) (B) ������������� 811,533 810,752 816,942 805,483 791,211Overhead ratio (B) / (A) ������������������������������������������������� 58.2% 56�8% 49�1% 52�5% 48�4%Banking profit ��������������������������������������������������������������� 584,053 617,171 809,052 728,787 843,073Banking profit (before provision for general
reserve for possible loan losses) ����������������������������� 584,053 617,171 846,711 728,787 843,073Ordinary profit �������������������������������������������������������������� 649,647 755,266 864,022 747,892 955,992Net income ������������������������������������������������������������������� 477,367 577,028 681,767 609,171 643,015
At Year-End:Total net assets ������������������������������������������������������������ ¥ 7,962,185 ¥ 7,921,268 ¥ 7,417,182 ¥ 7,756,810 ¥ 7,998,715Total assets ������������������������������������������������������������������ 179,348,654 170,923,146 162,281,729 153,641,430 154,724,079Deposits ����������������������������������������������������������������������� 116,091,103 110,243,226 105,590,771 98,839,722 91,337,714Loans and bills discounted ������������������������������������������ 76,401,807 73,896,163 75,585,256 69,276,735 68,274,308Securities ��������������������������������������������������������������������� 24,336,638 25,916,718 24,342,369 25,602,156 29,985,267Trust assets and liabilities �������������������������������������������� 3,842,641 4,756,748 6,881,408 3,394,170 3,542,957
Loans and bills discounted �������������������������������������� 477,094 398,772 635,206 537,839 373,230Securities ����������������������������������������������������������������� 1,330,384 2,358,665 4,156,409 1,305,284 1,451,206
Capital stock ���������������������������������������������������������������� 1,770,996 1,770,996 1,770,996 1,770,996 1,770,996Number of shares issued (in thousands)
Common stock ���������������������������������������������������� 106,248 106,248 106,248 106,248 106,248Preferred stock ���������������������������������������������������� 70 70 70 70 70
Dividend payout ratio ��������������������������������������������������� 73.09% 55�22% 32�61% 67�02% 77�18%Total capital ratio (BIS guidelines) �������������������������������� 20.28% 21�11% 18�61% 19�47% 18�89%Tier 1 capital ratio (BIS guidelines) ������������������������������� 17.37% 18�11% 15�05% 15�29% 14�26%Common equity Tier 1 capital ratio
(BIS guidelines) �������������������������������������������������������� 14.85% 15�07% 13�15% 13�44% 12�80%Number of employees �������������������������������������������������� 28,482 29,192 29,283 28,002 26,416
Note: “Number of employees” has been reported on the basis of full-time workers. “Number of employees” includes locally hired overseas staff members but excludes contract employees, temporary staff, and executive officers who are not also Board members.
013_0800804261908.indd 319 2019/08/16 19:12:17

320
SMBC
SMBC Group Annual Report 2019
Income Analysis (Consolidated) Sumitomo Mitsui Banking Corporation and Subsidiaries
Operating Income, Classified by Domestic and Overseas OperationsMillions of yen
2019 2018
Year ended March 31Domesticoperations
Overseasoperations Elimination Total
Domesticoperations
Overseasoperations Elimination Total
Interest income ����������������������������������������������������� ¥939,515 ¥1,367,558 ¥(66,129) ¥2,240,944 ¥1,001,201 ¥951,447 ¥(51,141) ¥1,901,507Interest expenses �������������������������������������������������� 475,074 728,751 (65,036) 1,138,789 358,652 437,038 (47,456) 748,234
Net interest income ��������������������������������������������������� 464,441 638,806 (1,093) 1,102,155 642,548 514,409 (3,685) 1,153,273Trust fees ������������������������������������������������������������������� 4,541 — — 4,541 3,769 — — 3,769
Fees and commissions ����������������������������������������� 404,067 222,658 (12,985) 613,741 440,754 202,675 (11,303) 632,125Fees and commissions payments ������������������������ 137,556 29,424 (4,417) 162,563 129,219 40,966 (2,353) 167,832
Net fees and commissions ���������������������������������������� 266,510 193,234 (8,568) 451,177 311,534 161,709 (8,950) 464,293Trading income������������������������������������������������������ 48,476 37,423 (5,786) 80,112 55,015 37,511 (7,213) 85,312Trading losses ������������������������������������������������������� 4,058 6,158 (5,786) 4,430 4,183 7,158 (7,213) 4,127
Net trading income ���������������������������������������������������� 44,417 31,264 — 75,682 50,831 30,353 — 81,184Other operating income ���������������������������������������� 108,325 117,384 (348) 225,361 152,073 87,209 (979) 238,304Other operating expenses������������������������������������� 30,699 49,851 (559) 79,991 61,614 31,882 (376) 93,120
Net other operating income��������������������������������������� 77,626 67,532 210 145,370 90,458 55,327 (603) 145,183
Notes: 1. Domestic operations comprise the operations of SMBC (excluding overseas branches) and its domestic consolidated subsidiaries. 2. Overseas operations comprise the operations of SMBC’s overseas branches and its overseas consolidated subsidiaries.3. Inter-segment transactions are reported in the “Elimination” column.
Average Balance, Interest and Average Rate of Interest-Earning Assets and Interest-Bearing Liabilities
Domestic OperationsMillions of yen
2019 2018Year ended March 31 Average balance Interest Average rate Average balance Interest Average rateInterest-earning assets ���������������������������������������������� ¥ 78,953,194 ¥939,515 1.19% ¥ 86,218,582 ¥1,001,201 1�16%
Loans and bills discounted ����������������������������������� 52,262,908 587,504 1.12 58,949,435 649,872 1�10Securities �������������������������������������������������������������� 16,699,025 251,600 1.51 18,836,786 270,731 1�44Call loans and bills bought ������������������������������������ 108,697 368 0.34 79,414 414 0�52Receivables under resale agreements ������������������ 2,570,984 (1,450) (0.06) 0 (0) (0�54)Receivables under securities
borrowing transactions ��������������������������������������� 1,996,660 2,474 0.12 3,416,319 2,588 0�08Deposits with banks ���������������������������������������������� 1,051,668 19,850 1.89 990,820 13,465 1�36
Interest-bearing liabilities ������������������������������������������ ¥126,163,093 ¥475,074 0.38% ¥130,787,112 ¥ 358,652 0�27%Deposits ���������������������������������������������������������������� 97,987,896 58,866 0.06 99,987,013 44,072 0�04Negotiable certificates of deposit ������������������������� 5,778,619 429 0.01 6,594,336 504 0�01Call money and bills sold �������������������������������������� 95,135 505 0.53 241,184 517 0�21Payables under repurchase agreements �������������� 2,849,200 42,895 1.51 524,433 6,802 1�30Payables under securities
lending transactions�������������������������������������������� 714,190 959 0.13 5,787,108 10,394 0�18Commercial paper������������������������������������������������� 101,122 11 0.01 137,316 16 0�01Borrowed money ��������������������������������������������������� 14,370,683 202,805 1.41 12,961,893 161,957 1�25Short-term bonds �������������������������������������������������� — — — — — —Bonds �������������������������������������������������������������������� 3,247,123 84,543 2.60 3,617,420 85,993 2�38
Notes: 1. Domestic operations comprise the operations of SMBC (excluding overseas branches) and its domestic consolidated subsidiaries.2. In principle, average balances are calculated by using daily balances. However, some consolidated subsidiaries use weekly, monthly or quarterly balances
instead.3. “Interest-earning assets” are shown after deduction of the average balance of noninterest-earning deposits (2019, ¥43,355,834 million; 2018, ¥40,923,785
million).
013_0800804261908.indd 320 2019/08/16 19:12:17

321
SMBC
SMBC Group Annual Report 2019
Overseas OperationsMillions of yen
2019 2018Year ended March 31 Average balance Interest Average rate Average balance Interest Average rateInterest-earning assets ���������������������������������������������� ¥44,163,082 ¥1,367,558 3.10% ¥42,296,617 ¥951,447 2�25%
Loans and bills discounted ����������������������������������� 26,444,159 915,868 3.46 24,924,401 677,546 2�72Securities �������������������������������������������������������������� 4,954,867 103,943 2.10 3,977,921 64,907 1�63Call loans and bills bought ������������������������������������ 2,026,876 16,192 0.80 1,740,864 19,050 1�09Receivables under resale agreements ������������������ 1,857,211 39,967 2.15 2,377,014 35,477 1�49Receivables under securities
borrowing transactions ��������������������������������������� 12,108 37 0.31 — — —Deposits with banks ���������������������������������������������� 4,739,001 98,262 2.07 4,986,887 70,303 1�41
Interest-bearing liabilities ������������������������������������������ ¥37,414,455 ¥728,751 1.95% ¥34,314,197 ¥437,038 1�27%Deposits ��������������������������������������������������������������� 23,024,688 422,005 1.83 20,405,863 248,653 1�22Negotiable certificates of deposit ������������������������� 6,017,305 135,749 2.26 6,152,649 86,312 1�40Call money and bills sold �������������������������������������� 807,510 14,080 1.74 786,372 8,169 1�04Payables under repurchase agreements �������������� 4,186,351 82,275 1.97 4,112,837 43,247 1�05Payables under securities
lending transactions�������������������������������������������� — — — — — —Commercial paper������������������������������������������������� 2,433,961 45,344 1.86 2,005,997 18,376 0�92Borrowed money ��������������������������������������������������� 581,343 16,433 2.83 466,803 7,831 1�68Short-term bonds �������������������������������������������������� — — — — — —Bonds �������������������������������������������������������������������� 72,064 3,051 4.23 59,619 2,817 4�73
Notes: 1. Overseas operations comprise the operations of SMBC’s overseas branches and its overseas consolidated subsidiaries.2. In principle, average balances are calculated by using daily balances. However, some consolidated subsidiaries use weekly, monthly or quarterly balances
instead.3. “Interest-earning assets” are shown after deduction of the average balance of noninterest-earning deposits (2019, ¥3,207,665 million; 2018, ¥3,087,837
million).
Total of Domestic and Overseas OperationsMillions of yen
2019 2018Year ended March 31 Average balance Interest Average rate Average balance Interest Average rateInterest-earning assets ���������������������������������������������� ¥121,424,996 ¥2,240,944 1.85% ¥126,901,633 ¥1,901,507 1�50%
Loans and bills discounted ����������������������������������� 78,277,107 1,481,622 1.89 83,223,826 1,290,981 1�55Securities �������������������������������������������������������������� 21,653,892 354,451 1.64 22,814,707 331,893 1�45Call loans and bills bought ������������������������������������ 2,135,574 16,561 0.78 1,820,279 19,464 1�07Receivables under resale agreements ������������������ 4,319,462 36,101 0.84 2,280,570 34,278 1�50Receivables under securities
borrowing transactions ��������������������������������������� 2,008,768 2,512 0.13 3,416,319 2,588 0�08Deposits with banks ���������������������������������������������� 4,639,992 101,030 2.18 5,121,331 74,009 1�45
Interest-bearing liabilities ������������������������������������������ ¥161,886,733 ¥1,138,789 0.70% ¥163,483,617 ¥ 748,234 0�46%Deposits ���������������������������������������������������������������� 119,861,906 463,791 0.39 119,532,087 282,966 0�24Negotiable certificates of deposit ������������������������� 11,795,924 136,178 1.15 12,746,985 86,817 0�68Call money and bills sold �������������������������������������� 902,646 14,586 1.62 1,027,556 8,686 0�85Payables under repurchase agreements �������������� 6,926,818 122,755 1.77 4,540,826 48,851 1�08Payables under securities
lending transactions�������������������������������������������� 714,190 959 0.13 5,787,108 10,394 0�18Commercial paper������������������������������������������������� 2,535,084 45,356 1.79 2,143,314 18,393 0�86Borrowed money ��������������������������������������������������� 14,522,350 197,488 1.36 12,778,946 133,290 1�04Short-term bonds �������������������������������������������������� — — — — — —Bonds �������������������������������������������������������������������� 3,319,188 87,594 2.64 3,677,039 88,810 2�42
Notes: 1. The figures above comprise totals for domestic and overseas operations after inter-segment eliminations.2. In principle, average balances are calculated by using daily balances. However, some consolidated subsidiaries use weekly, monthly or quarterly balances
instead.3. “Interest-earning assets” are shown after deduction of the average balance of noninterest-earning deposits (2019, ¥46,553,893 million; 2018, ¥44,006,805
million).
Income Analysis (Consolidated)
013_0800804261908.indd 321 2019/08/16 19:12:17

322
SMBC
SMBC Group Annual Report 2019
Fees and CommissionsMillions of yen
2019 2018
Year ended March 31Domesticoperations
Overseasoperations Elimination Total
Domesticoperations
Overseasoperations Elimination Total
Fees and commissions ���������������������������������������������� ¥404,067 ¥222,658 ¥(12,985) ¥613,741 ¥440,754 ¥202,675 ¥(11,303) ¥632,125Deposits and loans ����������������������������������������������� 15,736 131,375 (6,138) 140,973 22,299 115,568 (4,458) 133,409Remittances and transfers ������������������������������������ 116,871 22,740 (29) 139,582 119,472 20,469 (29) 139,913Securities-related business ����������������������������������� 12,362 33,086 (784) 44,664 12,932 33,757 (2) 46,688Agency ������������������������������������������������������������������ 9,986 107 — 10,094 15,444 — — 15,444Safe deposits �������������������������������������������������������� 4,544 2 — 4,547 5,223 2 — 5,225Guarantees ������������������������������������������������������������ 32,447 11,461 (2,096) 41,812 35,331 12,235 (1,161) 46,405Credit card business ��������������������������������������������� — — — — 2,006 — — 2,006Investment trusts �������������������������������������������������� 22,337 34 — 22,371 35,334 30 — 35,365
Fees and commissions payments ����������������������������� ¥137,556 ¥ 29,424 ¥ (4,417) ¥162,563 ¥129,219 ¥ 40,966 ¥ (2,353) ¥167,832Remittances and transfers ������������������������������������ 31,501 10,630 (4) 42,127 30,206 9,616 (2) 39,820
Notes: 1. Domestic operations comprise the operations of SMBC (excluding overseas branches) and its domestic consolidated subsidiaries. 2. Overseas operations comprise the operations of SMBC’s overseas branches and its overseas consolidated subsidiaries.3. Inter-segment transactions are reported in the “Elimination” column.
Trading IncomeMillions of yen
2019 2018
Year ended March 31Domesticoperations
Overseasoperations Elimination Total
Domesticoperations
Overseasoperations Elimination Total
Trading income ���������������������������������������������������������� ¥48,476 ¥37,423 ¥(5,786) ¥80,112 ¥55,015 ¥37,511 ¥(7,213) ¥85,312Gains on trading securities ����������������������������������� 530 — (530) — 611 — (611) —Gains on securities related to
trading transactions �������������������������������������������� — — — — 6,004 — (281) 5,722Gains on trading-related financial derivatives ������� 47,919 37,423 (5,245) 80,097 48,376 37,511 (6,297) 79,589Others ������������������������������������������������������������������� 25 — (10) 14 22 — (22) —
Trading losses������������������������������������������������������������ ¥ 4,058 ¥ 6,158 ¥(5,786) ¥ 4,430 ¥ 4,183 ¥ 7,158 ¥(7,213) ¥ 4,127Losses on trading securities ��������������������������������� — 1,655 (530) 1,125 — 4,643 (611) 4,031Losses on securities related to
trading transactions �������������������������������������������� 2,956 348 — 3,305 — 281 (281) —Losses on trading-related financial derivatives ����� 1,102 4,143 (5,245) — 4,183 2,114 (6,297) —Others ������������������������������������������������������������������� — 10 (10) — — 119 (22) 96
Notes: 1. Domestic operations comprise the operations of SMBC (excluding overseas branches) and its domestic consolidated subsidiaries. 2. Overseas operations comprise the operations of SMBC’s overseas branches and its overseas consolidated subsidiaries.3. Inter-segment transactions are reported in the “Elimination” column.
Income Analysis (Consolidated)
013_0800804261908.indd 322 2019/08/16 19:12:17

323
SMBC
SMBC Group Annual Report 2019
Assets and Liabilities (Consolidated)Sumitomo Mitsui Banking Corporation and Subsidiaries
Deposits and Negotiable Certificates of Deposit
Year-End BalanceMillions of yen
March 31 2019 2018
Domestic operations:Liquid deposits �������������������������������������������������������������������������������������������� ¥ 75,716,972 ¥ 70,786,037Fixed-term deposits ������������������������������������������������������������������������������������ 17,908,442 18,198,759Others ���������������������������������������������������������������������������������������������������������� 7,324,007 7,357,074Subtotal ������������������������������������������������������������������������������������������������������� 100,949,421 96,341,871Negotiable certificates of deposit ���������������������������������������������������������������� 5,132,651 5,643,020Total ������������������������������������������������������������������������������������������������������������� ¥106,082,073 ¥101,984,892
Overseas operations:Liquid deposits �������������������������������������������������������������������������������������������� ¥ 14,256,217 ¥ 13,349,167Fixed-term deposits ������������������������������������������������������������������������������������ 7,898,851 7,496,203Others ���������������������������������������������������������������������������������������������������������� 86,339 40,053Subtotal ������������������������������������������������������������������������������������������������������� 22,241,408 20,885,424Negotiable certificates of deposit ���������������������������������������������������������������� 6,202,835 5,812,264Total ������������������������������������������������������������������������������������������������������������� ¥ 28,444,244 ¥ 26,697,689
Grand total ������������������������������������������������������������������������������������������������������ ¥134,526,317 ¥128,682,581
Notes: 1. Domestic operations comprise the operations of SMBC (excluding overseas branches) and its domestic consolidated subsidiaries. 2. Overseas operations comprise the operations of SMBC’s overseas branches and its overseas consolidated subsidiaries.3. Liquid deposits = Current deposits + Ordinary deposits + Savings deposits + Deposits at notice4. Fixed-term deposits represents Time deposits
Balance of Loan Portfolio, Classified by Industry
Year-End BalanceMillions of yen
March 31 2019 2018
Domestic operations:Manufacturing���������������������������������������������������������������������������������������������� ¥ 6,715,306 12.58% ¥ 6,172,929 11�84%Agriculture, forestry, fisheries and mining ��������������������������������������������������� 272,306 0.51 132,783 0�25Construction ������������������������������������������������������������������������������������������������ 730,187 1.37 753,873 1�45Transportation, communications and public enterprises ���������������������������� 5,341,650 10.01 4,952,098 9�50Wholesale and retail ������������������������������������������������������������������������������������ 4,299,125 8.05 4,192,897 8�04Finance and insurance �������������������������������������������������������������������������������� 5,488,335 10.28 5,448,476 10�45Real estate, goods rental and leasing ��������������������������������������������������������� 8,727,653 16.35 8,250,016 15�83Services ������������������������������������������������������������������������������������������������������� 4,247,592 7.96 4,165,416 7�99Municipalities ����������������������������������������������������������������������������������������������� 754,500 1.41 914,763 1�76Others ���������������������������������������������������������������������������������������������������������� 16,808,918 31.48 17,143,345 32�89Subtotal ������������������������������������������������������������������������������������������������������� ¥53,385,577 100.00% ¥52,126,599 100�00%
Overseas operations:Public sector ������������������������������������������������������������������������������������������������ ¥ 286,310 1.08% ¥ 296,236 1�25%Financial institutions ������������������������������������������������������������������������������������ 1,825,955 6.92 1,596,924 6�73Commerce and industry ������������������������������������������������������������������������������ 21,381,483 80.97 19,490,365 82�14Others ���������������������������������������������������������������������������������������������������������� 2,913,075 11.03 2,343,808 9�88Subtotal ������������������������������������������������������������������������������������������������������� ¥26,406,824 100.00% ¥23,727,335 100�00%
Total ����������������������������������������������������������������������������������������������������������������� ¥79,792,401 — ¥75,853,934 —
Notes: 1. Domestic operations comprise the operations of SMBC (excluding overseas branches) and its domestic consolidated subsidiaries. 2. Overseas operations comprise the operations of SMBC’s overseas branches and its overseas consolidated subsidiaries.3. Japan offshore banking accounts are included in overseas operations’ accounts.
013_0800804261908.indd 323 2019/08/16 19:12:17

324
SMBC
SMBC Group Annual Report 2019
Risk-Monitored Loans
Millions of yen March 31 2019 2018Bankrupt loans ������������������������������������������������������������������������������������������������ ¥ 12,801 ¥ 25,728Non-accrual loans ������������������������������������������������������������������������������������������� 409,516 356,353Past due loans (3 months or more) ����������������������������������������������������������������� 6,447 5,297Restructured loans ������������������������������������������������������������������������������������������ 115,668 138,261Total ����������������������������������������������������������������������������������������������������������������� ¥544,433 ¥525,640Amount of direct reduction ������������������������������������������������������������������������������ ¥ 99,554 ¥110,497
Notes: Definition of risk-monitored loan categories1. Bankrupt loans: Loans on which accrued interest income is not recognized, and to borrowers that are undergoing bankruptcy, corporate reorganization
and rehabilitation proceedings or borrowers receiving a disposition to suspend transactions with a clearing house.2. Non-accrual loans: Loans on which accrued interest income is not recognized, excluding “Bankrupt loans” and loans on which interest payments are
deferred in order to support the borrowers’ recovery from financial difficulties.3. Past due loans (3 months or more): Loans on which the principal or interest is past due for 3 months or more, excluding loans in categories 1. and 2.4. Restructured loans: Loans to borrowers on which terms and conditions have been amended in favor of the borrowers in order to support the borrowers’
recovery from financial difficulties and facilitate collection of loans, excluding loans in categories 1. through 3.
Securities
Year-End BalanceMillions of yen
March 31 2019 2018Domestic operations:
Japanese government bonds ���������������������������������������������������������������������� ¥ 6,514,573 ¥ 9,575,499Japanese local government bonds ������������������������������������������������������������� 99,164 47,032Japanese corporate bonds ������������������������������������������������������������������������� 2,582,014 2,541,760Japanese stocks ������������������������������������������������������������������������������������������ 3,434,663 3,840,989Others ���������������������������������������������������������������������������������������������������������� 5,417,732 4,516,750Subtotal ������������������������������������������������������������������������������������������������������� ¥18,048,148 ¥20,522,031
Overseas operations:Japanese government bonds ���������������������������������������������������������������������� ¥ — ¥ —Japanese local government bonds ������������������������������������������������������������� — —Japanese corporate bonds ������������������������������������������������������������������������� 68,226 75,495Japanese stocks ������������������������������������������������������������������������������������������ — —Others ���������������������������������������������������������������������������������������������������������� 5,353,247 4,619,760Subtotal ������������������������������������������������������������������������������������������������������� ¥ 5,421,473 ¥ 4,695,255
Total ����������������������������������������������������������������������������������������������������������������� ¥23,469,621 ¥25,217,287
Notes: 1. Domestic operations comprise the operations of SMBC (excluding overseas branches) and its domestic consolidated subsidiaries. 2. Overseas operations comprise the operations of SMBC’s overseas branches and its overseas consolidated subsidiaries.3. “Others” include foreign bonds and foreign stocks.
Trading Assets and LiabilitiesMillions of yen
2019 2018
March 31Domesticoperations
Overseasoperations Elimination Total
Domesticoperations
Overseasoperations Elimination Total
Trading assets ����������������������������������������������������������� ¥1,428,638 ¥1,044,294 ¥(20,108) ¥2,452,825 ¥1,497,775 ¥938,646 ¥(27,872) ¥2,408,549Trading securities �������������������������������������������������� 11,708 369,842 — 381,551 220,584 228,922 — 449,506Derivatives of trading securities ���������������������������� 363 — — 363 182 — — 182Securities related to trading transactions ������������� — — — — — — — —Derivatives of securities related to
trading transactions �������������������������������������������� 28,120 0 — 28,121 13,834 59 — 13,894Trading-related financial derivatives ��������������������� 1,344,447 674,451 (20,108) 1,998,791 1,224,180 709,664 (27,872) 1,905,971Other trading assets���������������������������������������������� 43,997 — — 43,997 38,994 — — 38,994
Trading liabilities �������������������������������������������������������� ¥1,258,988 ¥ 579,730 ¥(20,108) ¥1,818,610 ¥1,124,847 ¥810,441 ¥(27,872) ¥1,907,416Trading securities sold for short sales ������������������ 5,546 119,540 — 125,086 49,422 97,043 — 146,466Derivatives of trading securities ���������������������������� 547 — — 547 335 — — 335Securities related to trading transactions
sold for short sales ��������������������������������������������� — — — — — — — —Derivatives of securities related to
trading transactions �������������������������������������������� 29,030 2 — 29,032 14,035 147 — 14,182Trading-related financial derivatives ��������������������� 1,223,864 460,187 (20,108) 1,663,943 1,061,053 713,250 (27,872) 1,746,431Other trading liabilities ������������������������������������������ — — — — — — — —
Notes: 1. Domestic operations comprise the operations of SMBC (excluding overseas branches) and its domestic consolidated subsidiaries. 2. Overseas operations comprise the operations of SMBC’s overseas branches and its overseas consolidated subsidiaries.3. Inter-segment transactions are reported in the “Elimination” column.
Assets and Liabilities (Consolidated)
013_0800804261908.indd 324 2019/08/16 19:12:17

325
SMBC
SMBC Group Annual Report 2019
Income Analysis (Non-consolidated)Sumitomo Mitsui Banking Corporation
Gross Banking Profit, Classified by Domestic and International OperationsMillions of yen
2019 2018
Year ended March 31Domesticoperations
Internationaloperations Total
Domesticoperations
Internationaloperations Total
Interest income ������������������������������������������� ¥680,105 ¥1,306,346 ¥1,970,831 ¥746,837 ¥917,340 ¥1,647,643[15,620] [16,535]
Interest expenses ��������������������������������������� 42,009 1,000,338 1,026,727 39,548 667,593 690,606[15,620] [16,535]
Net interest income ���������������������������������������� 638,096 306,008 944,104 707,288 249,747 957,036Trust fees �������������������������������������������������������� 2,191 58 2,250 2,001 37 2,038
Fees and commissions ������������������������������� 325,593 198,973 524,566 336,037 176,111 512,149Fees and commissions payments �������������� 132,234 50,131 182,365 135,292 47,027 182,319
Net fees and commissions ����������������������������� 193,359 148,841 342,201 200,745 129,084 329,829Trading income ������������������������������������������� 556 45,951 46,507 632 58,765 59,398Trading losses ��������������������������������������������� — 3,305 3,305 — — —
Net trading income ����������������������������������������� 556 42,646 43,202 632 58,765 59,398Other operating income ������������������������������ 23,802 85,871 109,674 24,956 77,925 101,955Other operating expenses �������������������������� 8,490 37,356 45,846 5,691 17,569 22,334
Net other operating income���������������������������� 15,312 48,515 63,828 19,265 60,355 79,620Gross banking profit ��������������������������������������� ¥849,516 ¥ 546,070 ¥1,395,586 ¥929,933 ¥497,990 ¥1,427,924Gross banking profit rate (%) ������������������������� 1.22% 1.10% 1.20% 1�29% 1�08% 1�25%
Notes: 1. Domestic operations include yen-denominated transactions by domestic branches, while international operations include foreign-currency-denominated transactions by domestic branches and operations by overseas branches. Yen-denominated nonresident transactions and Japan offshore banking accounts are included in international operations.
2. Figures in brackets [ ] indicate interest payments between domestic and international operations. Difference between sums of domestic and international operations and some figures in the total column due to indication on a net basis of interest from interest rate swaps and similar instruments, is included in figures in brackets [ ].
3. As net figures are shown for financial derivatives, figures in the total column of other operating income and other operating expenses are less than sums of domestic operations and international operations, respectively (¥925 million for the year ended March 31, 2018).
4. Gross banking profit rate = Gross banking profit / Average balance of interest-earning assets ✕ 100
Average Balance, Interest and Average Rate of Interest-Earning Assets and Interest-Bearing Liabilities
Domestic OperationsMillions of yen
2019 2018Year ended March 31 Average balance Interest Average rate Average balance Interest Average rateInterest-earning assets ����������������������������������� ¥ 69,584,790 ¥680,105 0.97% ¥ 71,547,412 ¥746,837 1�04%
[2,777,146] [15,620] [3,581,209] [16,535]Loans and bills discounted ������������������������� 48,779,204 453,649 0.93 49,225,499 476,702 0�96Securities ���������������������������������������������������� 12,664,232 174,918 1.38 14,915,999 217,089 1�45Call loans ���������������������������������������������������� 62,829 3 0.00 13,157 8 0�06Receivables under resale agreements �������� 2,570,984 (1,450) (0.05) 0 (0) (0�55)Receivables under securities borrowing transactions ����������������������������� 1,515,257 400 0.02 2,875,506 546 0�01
Bills bought ������������������������������������������������� — — — — — —Deposits with banks ����������������������������������� 10,725 15 0.14 11,993 16 0�13
Interest-bearing liabilities ������������������������������� ¥107,848,148 ¥ 42,009 0.03% ¥106,977,341 ¥ 39,548 0�03%Deposits������������������������������������������������������ 90,417,718 7,115 0.00 85,721,254 7,931 0�00Negotiable certificates of deposit ��������������� 6,041,635 429 0.00 6,733,487 487 0�00Call money �������������������������������������������������� 36,302 (27) (0.07) 112,490 (84) (0�07)Payables under repurchase agreements ���� 897,869 (1,364) (0.15) 26,866 0 0�00Payables under securities lending transactions ��������������������������������� 175,193 22 0.01 4,641,577 480 0�01
Borrowed money ���������������������������������������� 8,555,317 27,706 0.32 7,790,072 19,933 0�25Short-term bonds ��������������������������������������� — — — — — —Bonds ��������������������������������������������������������� 434,144 7,105 1.63 665,912 9,486 1�42
Notes: 1. “Interest-earning assets” are shown after deduction of the average balance of noninterest-earning deposits (2019, ¥42,195,891 million; 2018, ¥39,179,583 million).
2. Figures in brackets [ ] indicate the average balances of interdepartmental lending and borrowing activities between domestic and international operations and related interest expenses. Difference between sums of domestic and international operations and some figures in the “Total of Domestic and International Operations” due to indication on a net basis of interest from interest rate swaps and similar instruments, is included in figures in brackets [ ].
013_0800804261908.indd 325 2019/08/16 19:12:17

326
SMBC
SMBC Group Annual Report 2019
International OperationsMillions of yen
2019 2018Year ended March 31 Average balance Interest Average rate Average balance Interest Average rateInterest-earning assets ����������������������������������� ¥49,223,041 ¥1,306,346 2.65% ¥46,049,661 ¥917,340 1�99%
Loans and bills discounted ������������������������� 26,790,832 845,075 3.15 25,972,547 624,764 2�40Securities ���������������������������������������������������� 9,794,923 170,648 1.74 8,163,052 132,857 1�62Call loans ���������������������������������������������������� 1,593,638 (3,491) (0.21) 1,401,904 (2,076) (0�14)Receivables under resale agreements �������� 582,477 16,891 2.90 731,619 15,216 2�07Receivables under securities borrowing transactions ����������������������������� 122,858 358 0.29 110,750 322 0�29
Deposits with banks ����������������������������������� 6,386,681 108,377 1.69 5,910,956 70,381 1�19
Interest-bearing liabilities ������������������������������� ¥48,831,825 ¥1,000,338 2.04% ¥45,749,102 ¥667,593 1�45%[2,777,146] [15,620] [3,581,209] [16,535]
Deposits������������������������������������������������������ 22,245,705 374,188 1.68 21,008,293 221,430 1�05Negotiable certificates of deposit ��������������� 5,781,018 133,339 2.30 5,642,513 83,747 1�48Call money �������������������������������������������������� 1,044,194 15,445 1.47 1,039,930 8,200 0�78Payables under repurchase agreements ���� 5,174,319 111,561 2.15 3,326,086 40,441 1�21Payables under securities lending transactions ��������������������������������� 284,133 911 0.32 887,029 9,139 1�03
Borrowed money ���������������������������������������� 5,747,523 176,571 3.07 5,012,948 142,519 2�84Bonds ��������������������������������������������������������� 2,841,907 78,045 2.74 2,964,361 76,751 2�58
Notes: 1. “Interest-earning assets” are shown after deduction of the average balance of noninterest-earning deposits (2019, ¥134,841 million; 2018, ¥139,390 million).
2. Figures in brackets [ ] indicate the average balances of interdepartmental lending and borrowing activities between domestic and international operations and related interest expenses. Difference between sums of domestic and international operations and some figures in the “Total of Domestic and International Operations” due to indication on a net basis of interest from interest rate swaps and similar instruments, is included in figures in brackets [ ].
3. The average balance of foreign-currency-denominated transactions by domestic branches in international operations is calculated by the monthly current method, under which the TT middle rate at the end of the previous month is applied to nonexchange transactions of the month concerned.
Total of Domestic and International OperationsMillions of yen
2019 2018Year ended March 31 Average balance Interest Average rate Average balance Interest Average rateInterest-earning assets ����������������������������������� ¥116,030,685 ¥1,970,831 1.69% ¥114,015,864 ¥1,647,643 1�44%
Loans and bills discounted ������������������������� 75,570,036 1,298,725 1.71 75,198,046 1,101,467 1�46Securities ���������������������������������������������������� 22,459,156 345,566 1.53 23,079,051 349,947 1�51Call loans ���������������������������������������������������� 1,656,467 (3,487) (0.21) 1,415,062 (2,067) (0�14)Receivables under resale agreements �������� 3,153,462 15,441 0.48 731,620 15,216 2�07Receivables under securities borrowing transactions ����������������������������� 1,638,115 759 0.04 2,986,256 868 0�02
Bills bought ������������������������������������������������� — — — — — —Deposits with banks ����������������������������������� 6,397,407 108,392 1.69 5,922,949 70,398 1�18
Interest-bearing liabilities ������������������������������� ¥153,902,827 ¥1,026,727 0.66% ¥149,145,234 ¥ 690,606 0�46%Deposits������������������������������������������������������ 112,663,423 381,304 0.33 106,729,547 229,362 0�21Negotiable certificates of deposit ��������������� 11,822,654 133,768 1.13 12,376,001 84,235 0�68Call money �������������������������������������������������� 1,080,496 15,418 1.42 1,152,420 8,115 0�70Payables under repurchase agreements ���� 6,072,188 110,197 1.81 3,352,952 40,441 1�20Payables under securities lending transactions ��������������������������������� 459,327 933 0.20 5,528,607 9,619 0�17
Borrowed money ���������������������������������������� 14,302,840 204,277 1.42 12,803,020 162,453 1�26Short-term bonds ��������������������������������������� — — — — — —Bonds ��������������������������������������������������������� 3,276,052 85,150 2.59 3,630,273 86,238 2�37
Notes: 1. “Interest-earning assets” are shown after deduction of the average balance of noninterest-earning deposits (2019, ¥42,330,733 million; 2018, ¥39,318,973 million).
2. Figures in the table above indicate the net average balances of amounts adjusted for interdepartmental lending and borrowing activities between domestic and international operations and related interest expenses.
Income Analysis (Non-consolidated)
013_0800804261908.indd 326 2019/08/16 19:12:18

327
SMBC
SMBC Group Annual Report 2019
Breakdown of Interest Income and Interest Expenses
Domestic OperationsMillions of yen
2019 2018
Year ended March 31
Volume-relatedincrease
(decrease)
Rate-relatedincrease
(decrease)
Netincrease
(decrease)
Volume-relatedincrease
(decrease)
Rate-relatedincrease
(decrease)
Netincrease
(decrease)Interest income ����������������������������������������������� ¥(20,093) ¥(46,638) ¥(66,731) ¥21,352 ¥(222,635) ¥(201,283)
Loans and bills discounted ������������������������� (4,289) (18,762) (23,052) 5,993 (34,922) (28,929)Securities ���������������������������������������������������� (31,523) (10,648) (42,171) 7,239 (177,549) (170,309)Call loans ���������������������������������������������������� 2 (8) (5) 4 (4) (0)Receivables under resale agreements �������� (1,450) 0 (1,450) (0) (0) (0)Receivables under securities borrowing transactions ����������������������������� (258) 112 (145) 91 (357) (266)
Bills bought ������������������������������������������������� — — — — — —Deposits with banks ����������������������������������� (1) 0 (1) 2 7 9
Interest expenses ������������������������������������������� ¥ 324 ¥ 2,136 ¥ 2,460 ¥ 3,765 ¥ (8,157) ¥ (4,391)Deposits������������������������������������������������������ 369 (1,185) (816) 541 (1,535) (994)Negotiable certificates of deposit ��������������� (49) (9) (58) (20) (635) (655)Call money �������������������������������������������������� 58 (1) 56 (60) (17) (78)Payables under repurchase agreements ���� (1,323) (40) (1,364) (0) (0) (0)Payables under securities lending transactions ��������������������������������� (462) 4 (457) 164 (0) 163
Borrowed money ���������������������������������������� 2,098 5,673 7,772 7,666 (6,293) 1,372Short-term bonds ��������������������������������������� — — — — — —Bonds ��������������������������������������������������������� (3,301) 920 (2,380) (5,344) 887 (4,457)
International OperationsMillions of yen
2019 2018
Year ended March 31
Volume-relatedincrease
(decrease)
Rate-relatedincrease
(decrease)
Netincrease
(decrease)
Volume-relatedincrease
(decrease)
Rate-relatedincrease
(decrease)
Netincrease
(decrease)Interest income ����������������������������������������������� ¥66,823 ¥322,182 ¥389,006 ¥73,001 ¥138,439 ¥211,441
Loans and bills discounted ������������������������� 20,246 200,064 220,311 40,457 68,916 109,374Securities ���������������������������������������������������� 27,943 9,848 37,791 13,267 18,693 31,961Call loans ���������������������������������������������������� (420) (994) (1,414) (673) (1,214) (1,887)Receivables under resale agreements �������� (3,101) 4,777 1,675 2,659 3,001 5,661Receivables under securities borrowing transactions ����������������������������� 35 0 36 (6) (20) (27)
Deposits with banks ����������������������������������� 6,047 31,947 37,995 2,565 28,664 31,230
Interest expenses ������������������������������������������� ¥47,582 ¥285,163 ¥332,745 ¥54,280 ¥142,171 ¥196,452Deposits������������������������������������������������������ 13,741 139,016 152,758 14,527 72,944 87,471Negotiable certificates of deposit ��������������� 2,104 47,487 49,591 (4,038) 24,381 20,343Call money �������������������������������������������������� 33 7,212 7,245 317 1,044 1,361Payables under repurchase agreements ���� 29,738 41,381 71,120 10,488 19,962 30,451Payables under securities lending transactions ��������������������������������� (4,086) (4,141) (8,228) 1,297 4,737 6,035
Commercial paper������������������������������������������ 4,789 17,423 22,213 (1,575) 1,019 (556)Borrowed money ���������������������������������������� 21,969 12,081 34,051 51,521 (4,709) 46,811Bonds ��������������������������������������������������������� (3,170) 4,463 1,293 (5,842) 6,258 416
Total of Domestic and International OperationsMillions of yen
2019 2018
Year ended March 31
Volume-relatedincrease
(decrease)
Rate-relatedincrease
(decrease)
Netincrease
(decrease)
Volume-relatedincrease
(decrease)
Rate-relatedincrease
(decrease)
Netincrease
(decrease)Interest income ����������������������������������������������� ¥ 29,583 ¥293,604 ¥323,188 ¥ 88,844 ¥ (76,975) ¥ 11,869
Loans and bills discounted ������������������������� 5,474 191,783 197,258 34,743 45,701 80,444Securities ���������������������������������������������������� (9,399) 5,019 (4,380) 21,069 (159,417) (138,347)Call loans ���������������������������������������������������� (508) (911) (1,420) (672) (1,214) (1,887)Receivables under resale agreements �������� 11,859 (11,633) 225 2,659 3,001 5,661Receivables under securities borrowing transactions ����������������������������� (392) 282 (109) 139 (432) (293)
Bills bought ������������������������������������������������� — — — — — —Deposits with banks ����������������������������������� 6,019 31,974 37,993 2,581 28,658 31,239
Interest expenses ������������������������������������������� ¥ 22,684 ¥313,435 ¥336,120 ¥ 58,134 ¥ 135,637 ¥ 193,771Deposits������������������������������������������������������ 13,398 138,543 151,942 11,958 74,518 86,477Negotiable certificates of deposit ��������������� (3,766) 53,299 49,532 (2,539) 22,226 19,687Call money �������������������������������������������������� (506) 7,809 7,302 1,025 258 1,283Payables under repurchase agreements ���� 43,000 26,755 69,755 10,276 20,175 30,451Payables under securities lending transactions ��������������������������������� (8,820) 134 (8,685) 2,189 4,008 6,198
Commercial paper������������������������������������������ 4,789 17,423 22,213 (1,575) 1,019 (556)Borrowed money ���������������������������������������� 20,184 21,639 41,824 61,009 (12,824) 48,184Short-term bonds ��������������������������������������� — — — — — —Bonds ��������������������������������������������������������� (8,414) 7,327 (1,087) (13,880) 9,839 (4,041)
Note: Increase (decrease) attributed to both volume-related and rate-related is prorated according to proportion of change in each factor.
Income Analysis (Non-consolidated)
013_0800804261908.indd 327 2019/08/16 19:12:18

328
SMBC
SMBC Group Annual Report 2019
Fees and CommissionsMillions of yen
2019 2018
Year ended March 31Domesticoperations
Internationaloperations Total
Domesticoperations
Internationaloperations Total
Fees and commissions ����������������������������������� ¥325,593 ¥198,973 ¥524,566 ¥336,037 ¥176,111 ¥512,149Deposits and loans ������������������������������������� 12,730 111,661 124,391 12,444 96,517 108,961Remittances and transfers ������������������������� 95,877 41,454 137,332 93,992 39,593 133,585Securities-related business ������������������������ 10,038 1,790 11,829 10,848 1,322 12,171Agency �������������������������������������������������������� 7,577 — 7,577 9,218 — 9,218Safe deposits ���������������������������������������������� 4,544 — 4,544 4,817 — 4,817Guarantees ������������������������������������������������� 14,232 19,064 33,296 15,025 19,266 34,292
Fees and commissions payments ������������������ ¥132,234 ¥ 50,131 ¥182,365 ¥135,292 ¥ 47,027 ¥182,319Remittances and transfers ������������������������� 26,039 12,122 38,161 24,819 12,472 37,292
Trading IncomeMillions of yen
2019 2018
Year ended March 31Domesticoperations
Internationaloperations Total
Domesticoperations
Internationaloperations Total
Trading income ����������������������������������������������� ¥556 ¥45,951 ¥46,507 ¥632 ¥58,765 ¥59,398Gains on trading securities ������������������������� 530 — 530 610 — 610Gains on securities related to trading transactions ���������������������������������� — — — — 5,722 5,722
Gains on trading-related financial derivatives ������������������������������������������������� — 45,951 45,951 — 53,042 53,042
Others ��������������������������������������������������������� 25 — 25 22 — 22
Trading losses ������������������������������������������������ ¥ — ¥ 3,305 ¥ 3,305 ¥ — ¥ — ¥ —Losses on trading securities ����������������������� — — — — — —Losses on securities related to trading transactions ���������������������������������� — 3,305 3,305 — — —
Losses on trading-related financial derivatives ���������������������������������� — — — — — —
Others ��������������������������������������������������������� — — — — — —
Note: Figures represent net income and loss after offsetting income against expenses.
Net Other Operating Income (Expenses)Millions of yen
2019 2018
Year ended March 31Domesticoperations
Internationaloperations Total
Domesticoperations
Internationaloperations Total
Net other operating income (expenses) ��������� ¥15,312 ¥48,515 ¥63,828 ¥19,265 ¥60,355 ¥79,620Gains (losses) on bonds ����������������������������� 6,388 (3,511) 2,877 7,503 4,185 11,688Gains (losses) on derivatives ���������������������� (2,783) (2,488) (5,272) (1,154) 925 (228)Gains on foreign exchange transactions ���� — 57,576 57,576 — 57,057 57,057
General and Administrative ExpensesMillions of yen
Year ended March 31 2019 2018Salaries and related expenses ������������������������������������������������������������������������ ¥290,697 ¥291,592Retirement benefit cost ����������������������������������������������������������������������������������� (5,231) (1,526)Welfare expenses �������������������������������������������������������������������������������������������� 45,131 45,896Depreciation ���������������������������������������������������������������������������������������������������� 103,972 101,753Rent and lease expenses �������������������������������������������������������������������������������� 59,018 60,697Building and maintenance expenses �������������������������������������������������������������� 7,414 7,124Supplies expenses ������������������������������������������������������������������������������������������ 4,540 5,083Water, lighting, and heating expenses������������������������������������������������������������� 5,252 5,252Traveling expenses ������������������������������������������������������������������������������������������ 6,061 5,509Communication expenses ������������������������������������������������������������������������������� 6,923 7,229Publicity and advertising expenses ����������������������������������������������������������������� 14,376 14,689Taxes, other than income taxes����������������������������������������������������������������������� 48,117 48,843Deposit insurance �������������������������������������������������������������������������������������������� 30,723 30,804Others �������������������������������������������������������������������������������������������������������������� 194,536 187,801Total ����������������������������������������������������������������������������������������������������������������� ¥811,533 ¥810,752
Income Analysis (Non-consolidated)
013_0800804261908.indd 328 2019/08/16 19:12:18

329
SMBC
SMBC Group Annual Report 2019
Deposits (Non-consolidated)Sumitomo Mitsui Banking Corporation
Deposits and Negotiable Certificates of Deposit
Year-End BalanceMillions of yen
March 31 2019 2018Domestic operations:
Liquid deposits �������������������������������������������������������������������������������������������� ¥ 74,533,808 75.3% ¥ 69,675,968 73�5%Fixed-term deposits ������������������������������������������������������������������������������������ 17,778,577 18.0 18,079,255 19�1Others ���������������������������������������������������������������������������������������������������������� 1,277,119 1.3 1,138,105 1�2Subtotal ������������������������������������������������������������������������������������������������������� 93,589,505 94.6 88,893,330 93�8Negotiable certificates of deposit ���������������������������������������������������������������� 5,389,733 5.4 5,895,907 6�2Total ������������������������������������������������������������������������������������������������������������� ¥ 98,979,238 100.0% ¥ 94,789,237 100�0%
International operations:Liquid deposits �������������������������������������������������������������������������������������������� ¥ 10,527,786 36.7% ¥ 9,157,135 34�3%Fixed-term deposits ������������������������������������������������������������������������������������ 6,586,866 22.9 6,576,308 24�6Others ���������������������������������������������������������������������������������������������������������� 5,386,945 18.8 5,616,451 21�0Subtotal ������������������������������������������������������������������������������������������������������� 22,501,598 78.4 21,349,896 79�9Negotiable certificates of deposit ���������������������������������������������������������������� 6,191,872 21.6 5,368,900 20�1Total ������������������������������������������������������������������������������������������������������������� ¥ 28,693,470 100.0% ¥ 26,718,796 100�0%
Grand total ������������������������������������������������������������������������������������������������������ ¥127,672,708 — ¥121,508,034 —
Notes: 1. Liquid deposits = Current deposits + Ordinary deposits + Savings deposits + Deposits at notice2. Fixed-term deposits = Time deposits + Installment savings
Average BalanceMillions of yen
Year ended March 31 2019 2018
Domestic operations:Liquid deposits �������������������������������������������������������������������������������������������� ¥ 71,466,888 ¥ 66,542,423Fixed-term deposits ������������������������������������������������������������������������������������ 18,019,348 18,334,773Others ���������������������������������������������������������������������������������������������������������� 931,481 844,057Subtotal ������������������������������������������������������������������������������������������������������� 90,417,718 85,721,254Negotiable certificates of deposit ���������������������������������������������������������������� 6,041,635 6,733,487Total ������������������������������������������������������������������������������������������������������������� ¥ 96,459,354 ¥ 92,454,742
International operations:Liquid deposits �������������������������������������������������������������������������������������������� ¥ 10,181,064 ¥ 9,642,739Fixed-term deposits ������������������������������������������������������������������������������������ 6,659,091 6,283,475Others ���������������������������������������������������������������������������������������������������������� 5,405,548 5,082,077Subtotal ������������������������������������������������������������������������������������������������������� 22,245,705 21,008,293Negotiable certificates of deposit ���������������������������������������������������������������� 5,781,018 5,642,513Total ������������������������������������������������������������������������������������������������������������� ¥ 28,026,724 ¥ 26,650,806
Grand total ������������������������������������������������������������������������������������������������������ ¥124,486,078 ¥119,105,548
Notes: 1. Liquid deposits = Current deposits + Ordinary deposits + Savings deposits + Deposits at notice2. Fixed-term deposits = Time deposits + Installment savings3. The average balance of foreign-currency-denominated transactions by domestic branches in international operations is calculated by the monthly current
method.
Balance of Deposits, Classified by Type of DepositorMillions of yen
March 31 2019 2018
Individual ��������������������������������������������������������������������������������������������������������� ¥47,106,526 48.4% ¥45,321,720 48�8%Corporate �������������������������������������������������������������������������������������������������������� 50,152,636 51.6 47,557,379 51�2Total ����������������������������������������������������������������������������������������������������������������� ¥97,259,162 100.0% ¥92,879,099 100�0%
Note: The figures above exclude negotiable certificates of deposit and Japan offshore banking accounts.
013_0800804261908.indd 329 2019/08/16 19:12:18

330
SMBC
SMBC Group Annual Report 2019
Balance of Investment Trusts, Classified by Type of CustomerMillions of yen
March 31 2019 2018
Individual ��������������������������������������������������������������������������������������������������������� ¥1,752,186 ¥1,831,496Corporate �������������������������������������������������������������������������������������������������������� 389,246 385,883Total ����������������������������������������������������������������������������������������������������������������� ¥2,141,432 ¥2,217,379
Note: Balance of investment trusts is recognized on a contract basis and measured according to each fund’s net asset balance at the fiscal year-end.
Balance of Time Deposits, Classified by MaturityMillions of yen
March 31 2019 2018
Less than three months ����������������������������������������������������������������������������������� ¥11,297,105 ¥11,376,644Fixed interest rates �������������������������������������������������������������������������������������� 6,425,547 6,420,030Floating interest rates ���������������������������������������������������������������������������������� 7,800 5,155Others ���������������������������������������������������������������������������������������������������������� 4,863,757 4,951,457
Three — six months ���������������������������������������������������������������������������������������� 4,063,914 4,329,652Fixed interest rates �������������������������������������������������������������������������������������� 3,283,324 3,497,572Floating interest rates ���������������������������������������������������������������������������������� 4,620 6,480Others ���������������������������������������������������������������������������������������������������������� 775,970 825,599
Six months — one year ����������������������������������������������������������������������������������� 5,130,177 5,040,694Fixed interest rates �������������������������������������������������������������������������������������� 4,625,278 4,768,276Floating interest rates ���������������������������������������������������������������������������������� 4,194 1,460Others ���������������������������������������������������������������������������������������������������������� 500,704 270,957
One — two years ��������������������������������������������������������������������������������������������� 1,561,296 1,499,400Fixed interest rates �������������������������������������������������������������������������������������� 1,384,263 1,289,327Floating interest rates ���������������������������������������������������������������������������������� 2,810 10,454Others ���������������������������������������������������������������������������������������������������������� 174,223 199,618
Two — three years ������������������������������������������������������������������������������������������� 1,133,375 1,110,494Fixed interest rates �������������������������������������������������������������������������������������� 979,728 1,010,198Floating interest rates ���������������������������������������������������������������������������������� 33,945 2,610Others ���������������������������������������������������������������������������������������������������������� 119,702 97,686
Three years or more ���������������������������������������������������������������������������������������� 1,179,573 1,298,642Fixed interest rates �������������������������������������������������������������������������������������� 477,844 496,746Floating interest rates ���������������������������������������������������������������������������������� 564,626 572,332Others ���������������������������������������������������������������������������������������������������������� 137,102 229,562
Total ����������������������������������������������������������������������������������������������������������������� ¥24,365,443 ¥24,655,527Fixed interest rates �������������������������������������������������������������������������������������� 17,175,987 17,482,152Floating interest rates ���������������������������������������������������������������������������������� 617,995 598,492Others ���������������������������������������������������������������������������������������������������������� 6,571,460 6,574,883
Deposits (Non-consolidated)
013_0800804261908.indd 330 2019/08/16 19:12:18

331
SMBC
SMBC Group Annual Report 2019
Loans (Non-consolidated)Sumitomo Mitsui Banking Corporation
Balance of Loans and Bills Discounted
Year-End BalanceMillions of yen
March 31 2019 2018Domestic operations:
Loans on notes �������������������������������������������������������������������������������������������� ¥ 778,382 ¥ 394,395Loans on deeds ������������������������������������������������������������������������������������������� 38,876,438 38,852,395Overdrafts ���������������������������������������������������������������������������������������������������� 10,045,587 9,898,871Bills discounted ������������������������������������������������������������������������������������������� 51,559 68,805Subtotal ������������������������������������������������������������������������������������������������������� ¥49,751,966 ¥49,214,467
International operations:Loans on notes �������������������������������������������������������������������������������������������� ¥ 1,219,916 ¥ 1,177,844Loans on deeds ������������������������������������������������������������������������������������������� 25,218,669 23,335,028Overdrafts ���������������������������������������������������������������������������������������������������� 211,254 168,822Bills discounted ������������������������������������������������������������������������������������������� — —Subtotal ������������������������������������������������������������������������������������������������������� ¥26,649,840 ¥24,681,695
Total ����������������������������������������������������������������������������������������������������������������� ¥76,401,807 ¥73,896,163
Average BalanceMillions of yen
Year ended March 31 2019 2018
Domestic operations:Loans on notes �������������������������������������������������������������������������������������������� ¥ 365,950 ¥ 437,013Loans on deeds ������������������������������������������������������������������������������������������� 38,850,821 38,735,608Overdrafts ���������������������������������������������������������������������������������������������������� 9,517,142 9,990,889Bills discounted ������������������������������������������������������������������������������������������� 45,290 61,988Subtotal ������������������������������������������������������������������������������������������������������� ¥48,779,204 ¥49,225,499
International operations:Loans on notes �������������������������������������������������������������������������������������������� ¥ 1,377,375 ¥ 1,264,012Loans on deeds ������������������������������������������������������������������������������������������� 25,198,453 24,491,784Overdrafts ���������������������������������������������������������������������������������������������������� 215,003 216,740Bills discounted ������������������������������������������������������������������������������������������� — 10Subtotal ������������������������������������������������������������������������������������������������������� ¥26,790,832 ¥25,972,547
Total ����������������������������������������������������������������������������������������������������������������� ¥75,570,036 ¥75,198,046
Note: The average balance of foreign-currency-denominated transactions by domestic branches in international operations is calculated by the monthly current method.
Balance of Loans and Bills Discounted, Classified by PurposeMillions of yen
March 31 2019 2018
Funds for capital investment ��������������������������������������������������������������������������� ¥20,985,244 27.5% ¥20,920,584 28�3%Funds for working capital �������������������������������������������������������������������������������� 55,416,563 72.5 52,975,578 71�7Total ����������������������������������������������������������������������������������������������������������������� ¥76,401,807 100.0% ¥73,896,163 100�0%
Balance of Loans and Bills Discounted, Classified by CollateralMillions of yen
March 31 2019 2018
Securities ��������������������������������������������������������������������������������������������������������� ¥ 1,710,219 ¥ 1,665,388Commercial claims ������������������������������������������������������������������������������������������ 1,130,011 1,177,980Commercial goods ������������������������������������������������������������������������������������������ — —Real estate ������������������������������������������������������������������������������������������������������� 6,984,177 7,033,067Others �������������������������������������������������������������������������������������������������������������� 1,548,178 1,197,769Subtotal ����������������������������������������������������������������������������������������������������������� 11,372,585 11,074,206Guaranteed ������������������������������������������������������������������������������������������������������ 19,848,704 19,588,275Unsecured ������������������������������������������������������������������������������������������������������� 45,180,516 43,233,680Total ����������������������������������������������������������������������������������������������������������������� ¥76,401,807 ¥73,896,163
013_0800804261908.indd 331 2019/08/16 19:12:18

332
SMBC
SMBC Group Annual Report 2019
Balance of Loans and Bills Discounted, Classified by MaturityMillions of yen
March 31 2019 2018One year or less ���������������������������������������������������������������������������������������������� ¥13,664,684 ¥12,059,922One — three years ������������������������������������������������������������������������������������������ 13,468,749 12,836,241
Floating interest rates ���������������������������������������������������������������������������������� 10,555,003 10,377,892Fixed interest rates �������������������������������������������������������������������������������������� 2,913,746 2,458,348
Three — five years ������������������������������������������������������������������������������������������� 11,884,345 12,120,427Floating interest rates ���������������������������������������������������������������������������������� 9,119,424 9,010,749Fixed interest rates �������������������������������������������������������������������������������������� 2,764,921 3,109,678
Five — seven years ����������������������������������������������������������������������������������������� 6,036,444 5,531,818Floating interest rates ���������������������������������������������������������������������������������� 4,883,153 4,331,834Fixed interest rates �������������������������������������������������������������������������������������� 1,153,291 1,199,983
More than seven years ������������������������������������������������������������������������������������ 21,090,740 21,280,057Floating interest rates ���������������������������������������������������������������������������������� 19,289,929 19,561,190Fixed interest rates �������������������������������������������������������������������������������������� 1,800,810 1,718,867
No designated term ����������������������������������������������������������������������������������������� 10,256,841 10,067,694Floating interest rates ���������������������������������������������������������������������������������� 10,256,841 10,067,694Fixed interest rates �������������������������������������������������������������������������������������� — —
Total ����������������������������������������������������������������������������������������������������������������� ¥76,401,807 ¥73,896,163
Note: Loans with a maturity of one year or less are not classified by floating or fixed interest rates.
Balance of Loan Portfolio, Classified by IndustryMillions of yen
March 31 2019 2018
Domestic operations:Manufacturing���������������������������������������������������������������������������������������������� ¥ 6,621,443 12.3% ¥ 6,072,608 11�4%Agriculture, forestry, fisheries and mining ��������������������������������������������������� 267,135 0.5 132,783 0�3Construction ������������������������������������������������������������������������������������������������ 729,545 1.3 741,835 1�4Transportation, communications and public enterprises ���������������������������� 5,226,335 9.7 4,861,154 9�1Wholesale and retail ������������������������������������������������������������������������������������ 4,283,282 7.9 4,178,942 7�9Finance and insurance �������������������������������������������������������������������������������� 7,131,892 13.2 7,352,639 13�8Real estate ��������������������������������������������������������������������������������������������������� 7,053,528 13.1 6,684,889 12�6Goods rental and leasing ����������������������������������������������������������������������������� 1,598,278 3.0 1,499,241 2�8Services ������������������������������������������������������������������������������������������������������� 4,168,190 7.7 4,090,964 7�7Municipalities ����������������������������������������������������������������������������������������������� 754,500 1.4 914,763 1�7Others ���������������������������������������������������������������������������������������������������������� 16,133,209 29.9 16,678,320 31�3Subtotal ������������������������������������������������������������������������������������������������������� ¥53,967,341 100.0% ¥53,208,143 100�0%
Overseas operations:Public sector ������������������������������������������������������������������������������������������������ ¥ 176,684 0.8% ¥ 195,113 1�0%Financial institutions ������������������������������������������������������������������������������������ 1,668,433 7.4 1,621,969 7�8Commerce and industry ������������������������������������������������������������������������������ 18,979,331 84.6 17,418,127 84�2Others ���������������������������������������������������������������������������������������������������������� 1,610,015 7.2 1,452,810 7�0Subtotal ������������������������������������������������������������������������������������������������������� ¥22,434,465 100.0% ¥20,688,019 100�0%
Total ����������������������������������������������������������������������������������������������������������������� ¥76,401,807 — ¥73,896,163 —
Notes: 1. Domestic operations comprise the operations of SMBC (excluding overseas branches). Overseas operations comprise the operations of SMBC’s overseas branches.
2. Japan offshore banking accounts are included in overseas operations’ accounts.
Loans to Individuals/Small and Medium-Sized EnterprisesMillions of yen
March 31 2019 2018
Total domestic loans (A) ���������������������������������������������������������������������������������� ¥53,967,341 ¥53,208,143Loans to individuals, and small and medium-sized enterprises (B) ���������������� 32,994,754 33,700,117(B) / (A) ������������������������������������������������������������������������������������������������������������� 61.1% 63�3%
Notes: 1. The figures above exclude the outstanding balance of loans at overseas branches and of Japan offshore banking accounts.2. Small and medium-sized enterprises are individuals or companies with capital stock of ¥300 million or less, or an operating staff of 300 or fewer employ-
ees. (Exceptions to these capital stock and staff restrictions include wholesalers: ¥100 million or less, 100 employees or fewer; retailers: ¥50 million or less, 50 employees or fewer; and service industry companies: ¥50 million or less, 100 employees or fewer.)
Loans (Non-consolidated)
013_0800804261908.indd 332 2019/08/16 19:12:18

333
SMBC
SMBC Group Annual Report 2019
Consumer Loans OutstandingMillions of yen
March 31 2019 2018Consumer loans ���������������������������������������������������������������������������������������������� ¥13,000,685 ¥13,498,645
Housing loans ���������������������������������������������������������������������������������������������� 12,118,257 12,566,778Residential purpose ��������������������������������������������������������������������������������� 9,660,356 9,998,693
Others ���������������������������������������������������������������������������������������������������������� 882,427 931,866
Note: Housing loans include general-purpose loans used for housing purposes as well as housing loans and apartment house acquisition loans.
Breakdown of Reserve for Possible Loan LossesMillions of yen
Year ended March 31, 2019Balance at beginning
of the fiscal yearIncrease duringthe fiscal year
Decrease during the fiscal year Balance at endof the fiscal yearObjectives Others
General reserve for possible loan losses������������������ ¥226,555 ¥171,358 ¥ — ¥226,555* ¥171,358[(2,987)]
Specific reserve for possible loan losses ����������������� 96,858 103,826 21,053 75,804* 103,826[(1,138)]
For nonresident loans ������������������������������������������� 34,833 40,756 7,192 27,641* 40,756[(1,138)]
Loan loss reserve for specific overseas countries ��� 581 0 — 581* 0Total �������������������������������������������������������������������������� ¥323,995 ¥275,185 ¥21,053 ¥302,941 ¥275,185
[(4,126)]
* Reversal by reversal methodNote: Figures in brackets [ ] indicate foreign exchange translation adjustments.
Millions of yen
Year ended March 31, 2018Balance at beginning
of the fiscal yearIncrease duringthe fiscal year
Decrease during the fiscal year Balance at endof the fiscal yearObjectives Others
General reserve for possible loan losses������������������ ¥255,838 ¥223,567 ¥ — ¥255,838* ¥223,567[3,118]
Specific reserve for possible loan losses ����������������� 128,460 95,720 23,216 105,244* 95,720[1,303]
For nonresident loans ������������������������������������������� 35,882 33,694 12,232 23,650* 33,694[1,249]
Loan loss reserve for specific overseas countries ��� 1,005 581 — 1,005* 581Total �������������������������������������������������������������������������� ¥385,304 ¥319,868 ¥23,216 ¥362,087 ¥319,868
[4,421]
* Reversal by reversal methodNote: Figures in brackets [ ] indicate foreign exchange translation adjustments.
Write-Off of LoansMillions of yen
Year ended March 31 2019 2018
Write-off of loans ��������������������������������������������������������������������������������������������� ¥9,245 ¥7,364
Note: Write-off of loans include amount of direct reduction.
Specific Overseas LoansMillions of yen
March 31 2019 2018
Argentina ��������������������������������������������������������������������������������������������������������� ¥15 ¥ 22Egypt ��������������������������������������������������������������������������������������������������������������� — 4,711Azerbaijan �������������������������������������������������������������������������������������������������������� — 4,652Total ����������������������������������������������������������������������������������������������������������������� ¥15 ¥9,386Ratio of the total amounts to total assets ������������������������������������������������������� 0.00% 0�01%Number of countries ���������������������������������������������������������������������������������������� 1 3
Loans (Non-consolidated)
013_0800804261908.indd 333 2019/08/16 19:12:18

334
SMBC
SMBC Group Annual Report 2019
Risk-Monitored Loans
Millions of yen March 31 2019 2018Bankrupt loans ������������������������������������������������������������������������������������������������ ¥ 11,612 ¥ 24,444Non-accrual loans ������������������������������������������������������������������������������������������� 386,396 328,954Past due loans (3 months or more) ����������������������������������������������������������������� 5,525 4,460Restructured loans ������������������������������������������������������������������������������������������ 58,230 67,521Total ����������������������������������������������������������������������������������������������������������������� ¥461,765 ¥425,380Amount of direct reduction ������������������������������������������������������������������������������ ¥ 82,342 ¥ 92,343
Notes: Definition of risk-monitored loan categories1. Bankrupt loans: Loans on which accrued interest income is not recognized, and to borrowers that are undergoing bankruptcy, corporate reorganization
and rehabilitation proceedings or borrowers receiving a disposition to suspend transactions with a clearing house.2. Non-accrual loans: Loans on which accrued interest income is not recognized, excluding “Bankrupt loans” and loans on which interest payments are
deferred in order to support the borrowers’ recovery from financial difficulties.3. Past due loans (3 months or more): Loans on which the principal or interest is past due for 3 months or more, excluding loans in categories 1. and 2.4. Restructured loans: Loans to borrowers on which terms and conditions have been amended in favor of the borrowers in order to support the borrowers’
recovery from financial difficulties and facilitate collection of loans, excluding loans in categories 1. through 3.
Non-performing loans (NPLs) based on the Financial Reconstruction Act
Millions of yen March 31 2019 2018Bankrupt and quasi-bankrupt assets �������������������������������������������������������������� ¥ 75,341 ¥ 80,942Doubtful assets ����������������������������������������������������������������������������������������������� 337,375 283,393Substandard loans ������������������������������������������������������������������������������������������ 63,756 71,981Total ����������������������������������������������������������������������������������������������������������������� 476,472 436,317Normal assets ������������������������������������������������������������������������������������������������� 88,460,445 85,468,271Grand Total ������������������������������������������������������������������������������������������������������ ¥88,936,918 ¥85,904,588Amount of direct reduction ������������������������������������������������������������������������������ ¥ 89,256 ¥ 99,662
Notes: Definition of NPLs categoriesThese assets are disclosed based on the provisions of Article 7 of the Financial Reconstruction Act (Act No. 132 of 1998) and classified into the 4 categories based on financial position and business performance of obligors in accordance with Article 6 of the Act. Assets in question include private place-ment bonds, loans and bills discounted, foreign exchanges, accrued interest, and suspense payment in “other assets,” customers’ liabilities for acceptances and guarantees, and securities lent under the loan for consumption or leasing agreements.1. Bankrupt and quasi-bankrupt assets: Credits to borrowers undergoing bankruptcy, corporate reorganization, and rehabilitation proceedings, as well as
claims of a similar nature2. Doubtful assets: Credits for which final collection of principal and interest in line with original agreements is highly improbable due to deterioration of
financial position and business performance, but not insolvency of the borrower3. Substandard loans: Past due loans (3 months or more) and restructured loans, excluding 1. and 2.4. Normal assets: Credits to borrowers with good business performance and in financial standing without identified problems and not classified into the 3
categories above
Category of borrowers underself-assessment Risk-monitored loans
Other assets
Bankrupt loans
Non-accrual loans
Past due loans (3 months or more)
Restructured loans
Bankrupt Borrowers
Total loans Total loansOther assets
Bankrupt andquasi-bankrupt assets
Substandard loans
(Normal assets)
Doubtful assets
Normal Borrowers
Effectively Bankrupt Borrowers
Potentially Bankrupt Borrowers
Borrowers Requiring Caution
A B C
C
NPLs based on the Financial Reconstruction Act
Non-performing loans (NPLs) based on the Financial Reconstruction Act, and Risk-Monitored Loans
Loans (Non-consolidated)
013_0800804261908.indd 334 2019/08/16 19:12:18

335
SMBC
SMBC Group Annual Report 2019
Category ofborrowers underself-assessment
Reserve for possibleloan losses
Bankrupt Borrowers
Effectively BankruptBorrowers
PotentiallyBankruptBorrowers
BorrowersRequiringCaution
Normal Borrowers
I II III
NPL ratio (5) / (4)
General reserve for substandard loans ¥12.0
Reserve ratio(D) / (C)
(Note 5)
(4)
(A) = (1) + (2) + (3)
(B) = ( a ) + (b) + (c)
Coverage ratio { (B) + (D) } / (A)
(C) = ( A ) – (B)
IV
Bankrupt andquasi-bankrupt assets (1)
Claims to normalborrowers
Portion of claims secured bycollateral or guarantees, etc. (a) Fully reserved
Necessaryamountreserved
Directwrite-offs(Note 1)
Portion of claims secured bycollateral or guarantees, etc. (b)
Portion of substandard loanssecured by collateral or
guarantees, etc. (c)
Claims to borrowers requiringcaution, excluding claims to
substandard borrowers
Doubtful assets (2)
Substandard loans (3)
(Claims to substandard borrowers)
Normal assets
Total
Classification under self-assessment
Classification Classification Classification Classification
Specificreserve
Generalreserve
Loan loss reserve for specific overseas countries
Total reserve for possible loan losses
(D) Specific reserve + General reservefor substandard loans
[ ]
(Billions of yen)
Portion secured by collateral orguarantees, etc.
Unsecured portion
(Note 2) (Note 3)
(Note 2) (Note 3)
(Note 3)(Note 3)
(Note 4)
(Note 4)
(Note 6)
Reserve ratioNPLs based on the Financial
Reconstruction Act
¥75.3
¥337.4
¥63.8
¥88,460.4
¥88,936.9
( 5)¥476.5
0.54%
¥303.1 ¥173.3
87.86%
66.62%
¥0.0
¥115.5
¥275.2
4.64%10.86%
0.11%¥171.7
¥15.6
42.39%
100%
66.47%
13.77%
¥87.9
¥33.2
¥64.7
¥205.2
¥10.6
¥132.2
March 31, 2019
Notes: 1. Includes amount of direct reduction totaling ¥89.3 billion.2. Includes reserves for assets that are not subject to disclosure under the Financial Reconstruction Act. (Bankrupt/Effectively Bankrupt Borrowers: ¥5.0
billion; Potentially Bankrupt Borrowers: ¥2.6 billion)3. Reserve ratios for claims on Bankrupt/Effectively Bankrupt Borrowers, Potentially Bankrupt Borrowers, Substandard Borrowers, and Borrowers Requiring
Caution (including Substandard Borrowers): The proportion of each category’s total unsecured claims covered by reserve for possible loan losses.4. Reserve ratios for claims on Normal Borrowers and Borrowers Requiring Caution (excluding claims to Substandard Borrowers): The proportion of each
category’s total claims covered by reserve for possible loan losses. The reserve ratio for unsecured claims on Borrowers Requiring Caution (excluding claims to Substandard Borrowers) is shown in brackets.
5. Includes Specific reserve for Borrowers Requiring Caution totaling ¥0.3 billion.6. The proportion of the reserve to the claims, excluding the portion secured by collateral or guarantees, etc.
Results of off-balancing of NPLs
Billions of yen
March 31, 2017➀
Fiscal 2017 March 31, 2018➁
Fiscal 2018 March 31, 2019➂New occurrences Off-balanced New occurrences Off-balanced
Bankrupt and quasi-bankrupt assets ��� ¥118�4 ¥ 31�9 ¥ (69�4) ¥ 80�9 ¥ 31�1 ¥ (36�7) ¥ 75�3Doubtful assets ������������������������������������ 347�4 78�0 (142�0) 283�4 191�7 (137�7) 337�4Total ������������������������������������������������������ ¥465�8 ¥109�9 ¥(211�4) ¥364�3 ¥222�8 ¥(174�4) ¥412�7
Increase/Decrease
➁ – ➀
Increase/Decrease
➂ – ➁Bankrupt and quasi-bankrupt assets ��� ¥ (37�5) ¥ (5�6)Doubtful assets ������������������������������������ (64�0) 54�0Total ������������������������������������������������������ ¥(101�5) ¥48�4
Notes: 1. The off-balancing (also known as “final disposal”) of NPLs refers to the removal of such assets from the bank’s balance sheet by way of sale,direct write-off or other means.
2. The figures shown in the above table under “new occurrences” and “off-balanced” are simple additions of the figures for the first and second halves of fiscal 2018. Amount of ¥30.6 billion in fiscal 2018, recognized as “new occurrences” in the first half of the term, was included in the amounts off-balanced in the second half.
Classification based on Self-Assessment, and the Financial Reconstruction Act, and Write-Offs/Reserves
Loans (Non-consolidated)
013_0800804261908.indd 335 2019/08/16 19:12:19

336
SMBC
SMBC Group Annual Report 2019
Securities (Non-consolidated)Sumitomo Mitsui Banking Corporation
Balance of Securities
Year-End BalanceMillions of yen
March 31 2019 2018Domestic operations:
Japanese government bonds ���������������������������������������������������������������������� ¥ 6,252,329 ¥ 9,313,092Japanese local government bonds ������������������������������������������������������������� 99,164 47,032Japanese corporate bonds ������������������������������������������������������������������������� 2,602,228 2,563,569Japanese stocks ������������������������������������������������������������������������������������������ 3,814,443 4,238,818Others ���������������������������������������������������������������������������������������������������������� 765,571 1,018,723
Foreign bonds ������������������������������������������������������������������������������������������ / /Foreign stocks ����������������������������������������������������������������������������������������� / /
Subtotal ������������������������������������������������������������������������������������������������������� ¥13,533,737 ¥17,181,235International operations:
Japanese government bonds ���������������������������������������������������������������������� ¥ — ¥ —Japanese local government bonds ������������������������������������������������������������� — —Japanese corporate bonds ������������������������������������������������������������������������� — —Japanese stocks ������������������������������������������������������������������������������������������ — —Others ���������������������������������������������������������������������������������������������������������� 10,802,901 8,735,482
Foreign bonds ������������������������������������������������������������������������������������������ 7,134,782 5,342,481Foreign stocks ����������������������������������������������������������������������������������������� 3,668,118 3,393,001
Subtotal ������������������������������������������������������������������������������������������������������� ¥10,802,901 ¥ 8,735,482Total ����������������������������������������������������������������������������������������������������������������� ¥24,336,638 ¥25,916,718
Average BalanceMillions of yen
Year ended March 31 2019 2018Domestic operations:
Japanese government bonds ���������������������������������������������������������������������� ¥ 6,971,707 ¥ 8,904,513Japanese local government bonds ������������������������������������������������������������� 53,283 80,701Japanese corporate bonds ������������������������������������������������������������������������� 2,517,314 2,523,831Japanese stocks ������������������������������������������������������������������������������������������ 2,195,195 2,414,764Others ���������������������������������������������������������������������������������������������������������� 926,730 992,188
Foreign bonds ������������������������������������������������������������������������������������������ / /Foreign stocks ����������������������������������������������������������������������������������������� / /
Subtotal ������������������������������������������������������������������������������������������������������� ¥12,664,232 ¥14,915,999International operations:
Japanese government bonds ���������������������������������������������������������������������� ¥ — ¥ —Japanese local government bonds ������������������������������������������������������������� — —Japanese corporate bonds ������������������������������������������������������������������������� — —Japanese stocks ������������������������������������������������������������������������������������������ — —Others ���������������������������������������������������������������������������������������������������������� 9,794,923 8,163,052
Foreign bonds ������������������������������������������������������������������������������������������ 6,355,459 5,164,854Foreign stocks ����������������������������������������������������������������������������������������� 3,439,463 2,998,198
Subtotal ������������������������������������������������������������������������������������������������������� ¥ 9,794,923 ¥ 8,163,052Total ����������������������������������������������������������������������������������������������������������������� ¥22,459,156 ¥23,079,051
Note: The average balance of foreign-currency-denominated transactions by domestic branches in international operations is calculated by the monthly currentmethod.
013_0800804261908.indd 336 2019/08/16 19:12:19

337
SMBC
SMBC Group Annual Report 2019
Balance of Securities Held, Classified by MaturityMillions of yen
March 31 2019 2018
One year or lessJapanese government bonds ���������������������������������������������������������������������� ¥1,236,610 ¥3,373,256Japanese local government bonds ������������������������������������������������������������� — 17Japanese corporate bonds ������������������������������������������������������������������������� 206,765 187,331Others ���������������������������������������������������������������������������������������������������������� 1,715,067 1,560,459
Foreign bonds ������������������������������������������������������������������������������������������ 1,713,538 1,543,149Foreign stocks ����������������������������������������������������������������������������������������� 818 —
One — three yearsJapanese government bonds ���������������������������������������������������������������������� 3,983,873 4,451,753Japanese local government bonds ������������������������������������������������������������� 10,097 4,677Japanese corporate bonds ������������������������������������������������������������������������� 550,063 593,116Others ���������������������������������������������������������������������������������������������������������� 1,306,488 751,964
Foreign bonds ������������������������������������������������������������������������������������������ 1,259,089 714,367Foreign stocks ����������������������������������������������������������������������������������������� 451 2,251
Three — five yearsJapanese government bonds ���������������������������������������������������������������������� 116,667 818,615Japanese local government bonds ������������������������������������������������������������� 990 17,063Japanese corporate bonds ������������������������������������������������������������������������� 602,804 681,269Others ���������������������������������������������������������������������������������������������������������� 921,128 428,767
Foreign bonds ������������������������������������������������������������������������������������������ 869,053 397,387Foreign stocks ����������������������������������������������������������������������������������������� 2,348 —
Five — seven yearsJapanese government bonds ���������������������������������������������������������������������� — 51,985Japanese local government bonds ������������������������������������������������������������� 5,110 4,081Japanese corporate bonds ������������������������������������������������������������������������� 571,678 346,164Others ���������������������������������������������������������������������������������������������������������� 1,312,373 325,851
Foreign bonds ������������������������������������������������������������������������������������������ 1,241,178 250,470Foreign stocks ����������������������������������������������������������������������������������������� 11,126 8,882
Seven — ten yearsJapanese government bonds ���������������������������������������������������������������������� 530,926 296,787Japanese local government bonds ������������������������������������������������������������� 82,956 21,173Japanese corporate bonds ������������������������������������������������������������������������� 312,742 432,659Others ���������������������������������������������������������������������������������������������������������� 939,119 1,759,954
Foreign bonds ������������������������������������������������������������������������������������������ 869,989 1,676,773Foreign stocks ����������������������������������������������������������������������������������������� 4,070 6,918
More than ten yearsJapanese government bonds ���������������������������������������������������������������������� 384,252 320,694Japanese local government bonds ������������������������������������������������������������� 8 18Japanese corporate bonds ������������������������������������������������������������������������� 358,173 323,028Others ���������������������������������������������������������������������������������������������������������� 1,416,986 1,033,261
Foreign bonds ������������������������������������������������������������������������������������������ 1,181,933 760,333Foreign stocks ����������������������������������������������������������������������������������������� 105,365 119,447
No designated termJapanese government bonds ���������������������������������������������������������������������� — —Japanese local government bonds ������������������������������������������������������������� — —Japanese corporate bonds ������������������������������������������������������������������������� — —Japanese stocks ������������������������������������������������������������������������������������������ 3,814,443 4,238,818Others ���������������������������������������������������������������������������������������������������������� 3,957,307 3,893,946
Foreign bonds ������������������������������������������������������������������������������������������ — —Foreign stocks ����������������������������������������������������������������������������������������� 3,543,937 3,255,502
TotalJapanese government bonds ���������������������������������������������������������������������� ¥6,252,329 ¥9,313,092Japanese local government bonds ������������������������������������������������������������� 99,164 47,032Japanese corporate bonds ������������������������������������������������������������������������� 2,602,228 2,563,569Japanese stocks ������������������������������������������������������������������������������������������ 3,814,443 4,238,818Others ���������������������������������������������������������������������������������������������������������� 11,568,472 9,754,206
Foreign bonds ������������������������������������������������������������������������������������������ 7,134,782 5,342,481Foreign stocks ����������������������������������������������������������������������������������������� 3,668,118 3,393,001
Securities (Non-consolidated)
013_0800804261908.indd 337 2019/08/16 19:12:19

338
SMBC
SMBC Group Annual Report 2019
Ratios (Non-consolidated)Sumitomo Mitsui Banking Corporation
Income Ratio
PercentageYear ended March 31 2019 2018Ordinary profit to total assets �������������������������������������������������������������������������� 0.35% 0�43%Ordinary profit to stockholders’ equity ������������������������������������������������������������ 8.18 9�84Net income to total assets ������������������������������������������������������������������������������ 0.26 0�32Net income to stockholders’ equity ���������������������������������������������������������������� 6.01 7�52
Notes: 1. Ordinary profit (net income) to total assets = Ordinary profit (net income) / Average balance of total assets excluding customers’ liabilities for acceptancesand guarantees ✕ 100
2. Ordinary profit (net income) to stockholders’ equity = (Ordinary profit (net income) – Preferred dividends) / {(Net assets at the beginning of the fiscal year– Number of shares of preferred stock outstanding at the beginning of the fiscal year ✕ Issue price) + (Net assets at the end of the fiscal year – Number ofshares of preferred stock outstanding at the end of the fiscal year ✕ Issue price)} divided by 2 ✕ 100
Yield/Interest Rate
PercentageYear ended March 31 2019 2018Domestic operations:
Interest-earning assets (A) ��������������������������������������������������������������������������� 0.97% 1�04%Interest-bearing liabilities (B) ����������������������������������������������������������������������� 0.60 0�62(A) – (B) �������������������������������������������������������������������������������������������������������� 0.37 0�42
International operations:Interest-earning assets (A) ��������������������������������������������������������������������������� 2.65% 1�99%Interest-bearing liabilities (B) ����������������������������������������������������������������������� 2.45 1�86(A) – (B) �������������������������������������������������������������������������������������������������������� 0.20 0�13
Total:Interest-earning assets (A) ��������������������������������������������������������������������������� 1.69% 1�44%Interest-bearing liabilities (B) ����������������������������������������������������������������������� 1.19 1�00(A) – (B) �������������������������������������������������������������������������������������������������������� 0.50 0�44
Loan-Deposit Ratio
Millions of yen March 31 2019 2018Domestic operations:
Loans and bills discounted (A) �������������������������������������������������������������������� ¥ 49,751,966 ¥ 49,214,467Deposits (B) ������������������������������������������������������������������������������������������������� 98,979,238 94,789,237Loan-deposit ratio (%)
(A) / (B) ����������������������������������������������������������������������������������������������������� 50.26% 51�91%Ratio by average balance for the fiscal year �������������������������������������������� 50.56 53�24
International operations:Loans and bills discounted (A) �������������������������������������������������������������������� ¥ 26,649,840 ¥ 24,681,695Deposits (B) ������������������������������������������������������������������������������������������������� 28,693,470 26,718,796Loan-deposit ratio (%)
(A) / (B) ����������������������������������������������������������������������������������������������������� 92.87% 92�37%Ratio by average balance for the fiscal year �������������������������������������������� 95.59 97�45
Total:Loans and bills discounted (A) �������������������������������������������������������������������� ¥ 76,401,807 ¥ 73,896,163Deposits (B) ������������������������������������������������������������������������������������������������� 127,672,708 121,508,034Loan-deposit ratio (%)
(A) / (B) ����������������������������������������������������������������������������������������������������� 59.84% 60�81%Ratio by average balance for the fiscal year �������������������������������������������� 60.70 63�13
Note: Deposits include negotiable certificates of deposit.
013_0800804261908.indd 338 2019/08/16 19:12:19

339
SMBC
SMBC Group Annual Report 2019
Securities-Deposit Ratio
Millions of yen March 31 2019 2018Domestic operations:
Securities (A) ������������������������������������������������������������������������������������������������ ¥ 13,533,737 ¥ 17,181,235Deposits (B) ������������������������������������������������������������������������������������������������� 98,979,238 94,789,237Securities-deposit ratio (%)
(A) / (B) ����������������������������������������������������������������������������������������������������� 13.67% 18�12%Ratio by average balance for the fiscal year �������������������������������������������� 13.12 16�13
International operations:Securities (A) ������������������������������������������������������������������������������������������������ ¥ 10,802,901 ¥ 8,735,482Deposits (B) ������������������������������������������������������������������������������������������������� 28,693,470 26,718,796Securities-deposit ratio (%)
(A) / (B) ����������������������������������������������������������������������������������������������������� 37.64% 32�69%Ratio by average balance for the fiscal year �������������������������������������������� 34.94 30�62
Total:Securities (A) ������������������������������������������������������������������������������������������������ ¥ 24,336,638 ¥ 25,916,718Deposits (B) ������������������������������������������������������������������������������������������������� 127,672,708 121,508,034Securities-deposit ratio (%)
(A) / (B) ����������������������������������������������������������������������������������������������������� 19.06% 21�32%Ratio by average balance for the fiscal year �������������������������������������������� 18.04 19�37
Note: Deposits include negotiable certificates of deposit.
Ratios (Non-consolidated)
013_0800804261908.indd 339 2019/08/16 19:12:19

340
SMBC
SMBC Group Annual Report 2019
Capital (Non-consolidated)Sumitomo Mitsui Banking Corporation
Changes in Number of Shares Issued and Capital StockMillions of yen
Number of shares issued Capital stock Capital reserveChanges Balances Changes Balances Changes Balances
February 16, 2010* ����������������������������������� 20,016,015 106,318,401 484,037 1,770,996 484,037 1,771,043
Remarks:* Allotment to third parties:
Common stock: 20,016,015 sharesIssue price: ¥48,365Capitalization: ¥24,182.5
Number of Shares Issued
March 31, 2019 Number of shares issuedCommon stock ��������������������������������������������������������������������������������������������������������������������������������������������������������������� 106,248,400Preferred stock (1st series Type 6) ��������������������������������������������������������������������������������������������������������������������������������� 70,001Total �������������������������������������������������������������������������������������������������������������������������������������������������������������������������������� 106,318,401
Note: The shares above are not listed on any stock exchange.
Principal Shareholdersa. Common Stock
March 31, 2019 Number of sharesPercentage of
shares outstandingSumitomo Mitsui Financial Group, Inc� ���������������������������������������������������������� 106,248,400 100�00%
b. Preferred Stock (1st series Type 6)
March 31, 2019 Number of sharesPercentage of
shares outstandingSumitomo Mitsui Banking Corporation ����������������������������������������������������������� 70,001 100�00%
013_0800804261908.indd 340 2019/08/16 19:12:19

341
SMBC
SMBC Group Annual Report 2019
Others (Non-consolidated)Sumitomo Mitsui Banking Corporation
Employees
March 31 2019 2018Number of employees ������������������������������������������������������������������������������������� 28,482 29,192Average age (years–months) ��������������������������������������������������������������������������� 36-9 36-4Average length of employment (years–months) ���������������������������������������������� 13-6 13-1Average annual salary (thousands of yen) ������������������������������������������������������� ¥8,203 ¥8,105
Notes: 1. Temporary and part-time staff are excluded from the above calculations but includes overseas local staff. Executive officers who do not concurrently serveas Directors are excluded from “Number of employees.”
2. “Average annual salary” includes bonus, overtime pay and other fringe benefits.3. Overseas local staff are excluded from the above calculations other than “Number of employees.”
Number of Offices
March 31 2019 2018Domestic network:
Main offices and branches �������������������������������������������������������������������������� 511 507Subbranches ����������������������������������������������������������������������������������������������� 382 455Agency ��������������������������������������������������������������������������������������������������������� 1 1
Overseas network:Branches ����������������������������������������������������������������������������������������������������� 19 18Subbranches ����������������������������������������������������������������������������������������������� 23 22Representative offices ��������������������������������������������������������������������������������� 4 4
Total ����������������������������������������������������������������������������������������������������������������� 940 1,007
Notes: 1. “Main offices and branches” includes the International Business Operations Dept. (2019, 2 branches; 2018, 2 branches), specialized deposit account branches (2019, 47 branches; 2018, 46 branches) and ATM administration branches (2019, 18 branches; 2018, 17 branches).
2. “Subbranches” includes Corporate Business Office, etc.
Number of Automated Service Centers
March 31 2019 2018Automated service centers������������������������������������������������������������������������������ 50,378 49,518
Domestic Exchange Transactions
Millions of yen Year ended March 31 2019 2018Exchange for remittance:
Destined for various parts of the country:Number of accounts (thousands) ������������������������������������������������������������ 437,415 416,752Amount ���������������������������������������������������������������������������������������������������� ¥ 535,257,829 ¥ 528,632,417
Received from various parts of the country:Number of accounts (thousands) ������������������������������������������������������������ 318,485 312,105Amount ���������������������������������������������������������������������������������������������������� ¥ 932,517,945 ¥ 916,130,917
Collection:Destined for various parts of the country:
Number of accounts (thousands) ������������������������������������������������������������ 1,771 1,897Amount ���������������������������������������������������������������������������������������������������� ¥ 4,451,331 ¥ 4,638,705
Received from various parts of the country:Number of accounts (thousands) ������������������������������������������������������������ 649 690Amount ���������������������������������������������������������������������������������������������������� ¥ 2,333,608 ¥ 1,827,751
Total ����������������������������������������������������������������������������������������������������������������� ¥1,474,560,716 ¥1,451,229,791
013_0800804261908.indd 341 2019/08/16 19:12:19

342
SMBC
SMBC Group Annual Report 2019
Foreign Exchange Transactions
Millions of U�S� dollarsYear ended March 31 2019 2018Outward exchanges:
Foreign bills sold������������������������������������������������������������������������������������������ $2,171,749 $ 2,243,809Foreign bills bought ������������������������������������������������������������������������������������� 1,352,488 1,536,739
Incoming exchanges:Foreign bills payable ������������������������������������������������������������������������������������ $1,094,203 $ 1,056,842Foreign bills receivable �������������������������������������������������������������������������������� 42,055 38,355
Total ����������������������������������������������������������������������������������������������������������������� $4,660,496 $ 4,875,747
Note: The figures above include foreign exchange transactions by overseas branches.
Breakdown of Collateral for Customers’ Liabilities for Acceptances and Guarantees
Millions of yenMarch 31 2019 2018Securities ��������������������������������������������������������������������������������������������������������� ¥ 111,466 ¥ 145,511Commercial claims ������������������������������������������������������������������������������������������ 57,386 86,690Commercial goods ������������������������������������������������������������������������������������������ — —Real estate ������������������������������������������������������������������������������������������������������� 50,416 40,986Others �������������������������������������������������������������������������������������������������������������� 67,462 32,529Subtotal ����������������������������������������������������������������������������������������������������������� ¥ 286,732 ¥ 305,717Guaranteed ������������������������������������������������������������������������������������������������������ 940,913 752,407Unsecured ������������������������������������������������������������������������������������������������������� 7,851,060 6,863,044Total ����������������������������������������������������������������������������������������������������������������� ¥9,078,706 ¥7,921,169
Others (Non-consolidated)
013_0800804261908.indd 342 2019/08/16 19:12:19

343
SMBC
SMBC Group Annual Report 2019
Trust Assets and Liabilities (Non-consolidated)Sumitomo Mitsui Banking Corporation
Statements of Trust Assets and Liabilities
Millions of yen March 31 2019 2018Assets:
Loans and bills discounted �������������������������������������������������������������������������� ¥ 477,094 ¥ 398,772Loans on deeds ��������������������������������������������������������������������������������������� 477,094 398,772
Securities ����������������������������������������������������������������������������������������������������� 1,330,384 2,358,665Japanese government bonds ������������������������������������������������������������������ 38,517 65,099Corporate bonds�������������������������������������������������������������������������������������� 1,265,810 2,255,684Japanese stocks �������������������������������������������������������������������������������������� — —Foreign securities������������������������������������������������������������������������������������� 26,056 37,881
Trust beneficiary right ���������������������������������������������������������������������������������� 28,278 33,040Entrusted securities ������������������������������������������������������������������������������������� 50,000 15,000Monetary claims ������������������������������������������������������������������������������������������ 538,047 593,135
Monetary claims for housing loans ���������������������������������������������������������� 14,893 13,481Other monetary claims ���������������������������������������������������������������������������� 523,154 579,653
Other claims ������������������������������������������������������������������������������������������������ 999 1,107Call loans ����������������������������������������������������������������������������������������������������� — —Due from banking account �������������������������������������������������������������������������� 1,291,710 1,275,695Cash and due from banks ��������������������������������������������������������������������������� 126,080 81,222
Deposits with banks �������������������������������������������������������������������������������� 126,080 81,222Others ���������������������������������������������������������������������������������������������������������� 46 108
Others ������������������������������������������������������������������������������������������������������ 46 108Total assets �������������������������������������������������������������������������������������������������� ¥3,842,641 ¥4,756,748
Liabilities:Designated money trusts����������������������������������������������������������������������������� ¥1,270,266 ¥1,376,554Specified money trusts �������������������������������������������������������������������������������� 952,323 1,038,705Money in trusts other than money trusts ����������������������������������������������������� 35,015 —Securities in trusts ��������������������������������������������������������������������������������������� 50,000 15,000Monetary claims trusts �������������������������������������������������������������������������������� 291,991 346,176Composite trusts ����������������������������������������������������������������������������������������� 1,243,045 1,980,311Total liabilities ���������������������������������������������������������������������������������������������� ¥3,842,641 ¥4,756,748
Notes: 1. Amounts less than 1 million yen have been rounded down.2. SMBC has no co-operative trusts under any other trust bank’s administration as of the year-end.3. Excludes trusts whose monetary values are difficult to calculate.
013_0800804261908.indd 343 2019/08/16 19:12:19

344
SMBC
SMBC Group Annual Report 2019
■ CC1: Composition of regulatory capital
(Millions of yen, except percentages)
Basel IIITemplate No. Items
a b c
As of March 31,2019
As of March 31,2018
Reference to Template
CC2Common Equity Tier 1 capital: instruments and reserves (1)
1a+2-1c-26 Directly issued qualifying common share capital plus related capital surplus and retainedearnings 7,120,831 6,856,015
1a of which: capital and capital surplus 3,527,346 3,531,4062 of which: retained earnings 3,743,614 3,451,151
1c of which: treasury stock (–) — —26 of which: national specific regulatory adjustments (earnings to be distributed) (–) 150,128 126,541
of which: other than the above — —1b Stock acquisition rights to common shares — —
3 Accumulated other comprehensive income and other disclosed reserves 1,434,667 1,552,547 (a)
5 Common share capital issued by subsidiaries and held by third parties (amount allowed in group CET1) 2,181 333
6 Common Equity Tier 1 capital: instruments and reserves (A) 8,557,681 8,408,896Common Equity Tier 1 capital: regulatory adjustments (2)
8+9 Total intangible assets (net of related tax liability, excluding those relating to mortgage servicing rights) 281,339 239,397
8 of which: goodwill (including those equivalent) 26,214 31,5889 of which: other intangibles other than goodwill and mortgage servicing rights 255,125 207,809
10 Deferred tax assets that rely on future profitability excluding those arising from temporarydifferences (net of related tax liability) 2,208 1,213
11 Net deferred gains or losses on hedges (45,242) (65,809)12 Shortfall of eligible provisions to expected losses — —13 Securitisation gain on sale 60,286 60,21514 Gains and losses due to changes in own credit risk on fair valued liabilities 3,940 2,64615 Net defined benefit asset 225,610 262,54716 Investments in own shares (excluding those reported in the Net assets section) 3 —17 Reciprocal cross-holdings in common equity — —
18Investments in the capital of banking, financial and insurance entities that are outside the scope of regulatory consolidation, net of eligible short positions, where the bank does not own more than 10% of the issued share capital (amount above the 10% threshold)
— —
19+20+21 Amount exceeding the 10% threshold on specified items — —19 of which: significant investments in the common stock of financials — —20 of which: mortgage servicing rights — —21 of which: deferred tax assets arising from temporary differences (net of related tax liability) — —22 Amount exceeding the 15% threshold on specified items — —23 of which: significant investments in the common stock of financials — —24 of which: mortgage servicing rights — —25 of which: deferred tax assets arising from temporary differences (net of related tax liability) — —
27 Regulatory adjustments applied to Common Equity Tier 1 due to insufficient Additional Tier 1and Tier 2 to cover deductions — —
28 Common Equity Tier 1 capital: regulatory adjustments (B) 528,146 500,211Common Equity Tier 1 capital (CET1)
29 Common Equity Tier 1 capital (CET1) ((A)-(B)) (C) 8,029,535 7,908,684
Capital Ratio Information (Consolidated)Sumitomo Mitsui Banking Corporation and Subsidiaries
Basel III Information
014_0800885851907.indd 344 2019/08/16 19:33:47

345
SMBC
SMBC Group Annual Report 2019
(Millions of yen, except percentages)
Basel IIITemplate No. Items
a b c
As of March 31,2019
As of March 31,2018
Reference to Template
CC2Additional Tier 1 capital: instruments (3)
30
31a Directly issued qualifying Additional Tier 1 instruments plus related capital surplus of which:classified as equity under applicable accounting standards and the breakdown — —
31b Stock acquisition rights to Additional Tier 1 instruments — —
32 Directly issued qualifying Additional Tier 1 instruments plus related capital surplus of which:classified as liabilities under applicable accounting standards 1,100,000 1,100,000
Qualifying Additional Tier 1 instruments plus related capital surplus issued by special purposevehicles and other equivalent entities — —
34-35 Additional Tier 1 instruments issued by subsidiaries and held by third parties (amount allowed in group AT1) 23,795 30,026
33+35 Eligible Tier 1 capital instruments subject to transitional arrangements included in AdditionalTier 1 capital: instruments 173,000 466,652
33 of which: instruments issued by banks and their special purpose vehicles 173,000 466,65235 of which: instruments issued by subsidiaries (excluding banks’ special purpose vehicles) — —36 Additional Tier 1 capital: instruments (D) 1,296,795 1,596,678
Additional Tier 1 capital: regulatory adjustments37 Investments in own Additional Tier 1 instruments — —38 Reciprocal cross-holdings in Additional Tier 1 instruments — —
39Investments in the capital of banking, financial and insurance entities that are outside the scope of regulatory consolidation, net of eligible short positions, where the bank does not own more than 10% of the issued common share capital of the entity (amount above the 10% threshold)
— —
40 Significant investments in the Additional Tier 1 capital of banking, financial and insurance entities that are outside the scope of regulatory consolidation (net of eligible short positions) 25,516 81,640
42 Regulatory adjustments applied to Additional Tier 1 due to insufficient Tier 2 to coverdeductions — —
43 Additional Tier 1 capital: regulatory adjustments (E) 25,516 81,640Additional Tier 1 capital (AT1)
44 Additional Tier 1 capital ((D)-(E)) (F) 1,271,279 1,515,038Tier 1 capital (T1 = CET1 + AT1)
45 Tier 1 capital (T1 = CET1 + AT1) ((C)+(F)) (G) 9,300,814 9,423,723Tier 2 capital: instruments and provisions (4)
46
Directly issued qualifying Tier 2 instruments plus related capital surplus of which: classified asequity under applicable accounting standards and the breakdown — —
Stock acquisition rights to Tier 2 instruments — —Directly issued qualifying Tier 2 instruments plus related capital surplus of which: classified asliabilities under applicable accounting standards 1,003,250 994,937
Qualifying Tier 2 instruments plus related capital surplus issued by special purpose vehiclesand other equivalent entities — —
48-49 Tier 2 instruments issued by subsidiaries and held by third parties (amount allowed in group T2) 5,921 3,488
47+49 Eligible Tier 2 capital instruments subject to transitional arrangements included in Tier 2:instruments and provisions 488,222 625,890
47 of which: instruments issued by banks and their special purpose vehicles 488,222 625,89049 of which: instruments issued by subsidiaries (excluding banks’ special purpose vehicles) — —50 Total of general reserve for possible loan losses and eligible provisions included in Tier 2 7,664 33,097
50a of which: general reserve for possible loan losses 7,477 6,21050b of which: eligible provisions 187 26,886
51 Tier 2 capital: instruments and provisions (H) 1,505,059 1,657,414
Basel III Information
014_0800885851907.indd 345 2019/08/16 19:33:48

346
SMBC
SMBC Group Annual Report 2019
(Millions of yen, except percentages)
Basel IIITemplate No. Items
a b c
As of March 31,2019
As of March 31,2018
Reference to Template
CC2Tier 2 capital: regulatory adjustments (5)
52 Investments in own Tier 2 instruments — —53 Reciprocal cross-holdings in Tier 2 instruments and other TLAC liabilities — —
54
Investments in the capital and other TLAC liabilities of banking, financial and insurance entities that are outside the scope of regulatory consolidation, net of eligible short positions, where the bank does not own more than 10% of the issued common share capital of the entity (amount above the 10% threshold)
— —
55Significant investments in the capital and other TLAC liabilities of banking, financial and insurance entities that are outside the scope of regulatory consolidation (net of eligible short positions)
50,000 150,000
57 Tier 2 capital: regulatory adjustments (I) 50,000 150,000Tier 2 capital (T2)
58 Tier 2 capital (T2) ((H)-(I)) (J) 1,455,059 1,507,414Total capital (TC = T1 + T2)
59 Total capital (TC = T1 + T2) ((G) + (J)) (K) 10,755,873 10,931,137Risk weighted assets (6)
60 Total risk-weighted assets (RWA) (L) 52,910,688 51,707,483Capital ratio (consolidated) (7)
61 Common Equity Tier 1 risk-weighted capital ratio (consolidated) ((C)/(L)) 15.17% 15.29%62 Tier 1 risk-weighted capital ratio (consolidated) ((G)/(L)) 17.57% 18.22%63 Total risk-weighted capital ratio (consolidated) ((K)/(L)) 20.32% 21.14%
Regulatory adjustments (8)
72 Non-significant investments in the capital and other TLAC liabilities of other financials that are below the thresholds for deduction (before risk weighting) 289,593 331,209
73 Significant investments in the common stock of other financials that are below the thresholds for deduction (before risk weighting) 567,146 596,582
74 Mortgage servicing rights that are below the thresholds for deduction (before risk weighting) — —
75Deferred tax assets arising from temporary differences that are below the thresholds fordeduction (before risk weighting)
220 1,617
Provisions included in Tier 2 capital: instruments and provisions (9)76 Provisions (general reserve for possible loan losses) 7,477 6,21077 Cap on inclusion of provisions (general reserve for possible loan losses) 29,069 22,963
78 Provisions eligible for inclusion in Tier 2 in respect of exposures subject to internalratings-based approach (prior to application of cap) (if the amount is negative, report as “nil”) 187 26,886
79 Cap for inclusion of provisions in Tier 2 under internal ratings-based approach 243,795 259,290Capital instruments subject to transitional arrangements (10)
82 Current cap on AT1 instruments subject to transitional arrangements 371,357 495,143
83 Amount excluded from AT1 due to cap (excess over cap after redemptions and maturities) (if the amount is negative, report as “nil”) — —
84 Current cap on T2 instruments subject to transitional arrangements 610,358 813,811
85 Amount excluded from T2 due to cap (excess over cap after redemptions and maturities) (if the amount is negative, report as “nil”) — —
(Millions of yen)
Items As of March 31,2019 As of March 31,2018Required capital ((L) ✕ 8%) 4,232,855 4,136,598
Basel III Information
014_0800885851907.indd 346 2019/08/16 19:33:48

347
SMBC
SMBC Group Annual Report 2019
■ CC2: Reconciliation of regulatory capital to balance sheetSumitomo Mitsui Banking Corporation and Subsidiaries
(Millions of yen)
a b c
Items
Consolidated balance sheet as in published financial
statementsReference to Template CC1 Reference to appended table
As of March 31, 2019
As of March 31, 2018
(Assets)Cash and due from banks 55,747,048 52,122,407Call loans and bills bought 2,665,744 1,881,879Receivables under resale agreements 5,082,709 1,675,693Receivables under securities borrowing transactions 1,440,159 3,562,107Monetary claims bought 4,582,886 4,550,592Trading assets 2,452,825 2,408,549 6-aMoney held in trust 0 0Securities 23,469,621 25,217,287 2-b,6-bLoans and bills discounted 79,792,401 75,853,934 6-cForeign exchanges 1,715,759 2,164,196Lease receivables and investment assets 247,835 252,507Other assets 3,571,248 3,923,004 6-dTangible fixed assets 1,409,802 1,410,800Intangible fixed assets 375,389 311,810 2-aNet defined benefit asset 324,672 377,768 3Deferred tax assets 23,399 28,789 4-aCustomers’ liabilities for acceptances and guarantees 8,121,131 7,373,185Reserve for possible loan losses (332,343) (387,022)Total assets 190,690,293 182,727,495
(Liabilities)Deposits 123,190,830 117,227,296Negotiable certificates of deposit 11,335,486 11,455,284Call money and bills sold 572,778 740,928Payables under repurchase agreements 8,743,386 5,256,519Payables under securities lending transactions 680,051 3,324,893Commercial paper 2,291,813 2,385,705Trading liabilities 1,818,610 1,907,416 6-eBorrowed money 15,988,948 13,973,112 8Foreign exchanges 1,196,960 906,429Bonds 2,955,282 3,255,697Due to trust account 1,352,773 1,328,271Other liabilities 2,929,172 3,983,839 6-fReserve for employee bonuses 34,283 32,826Reserve for executive bonuses 1,249 1,333Net defined benefit liability 4,457 6,552Reserve for executive retirement benefits 669 671Reserve for point service program 468 966Reserve for reimbursement of deposits 7,936 17,765Deferred tax liabilities 446,993 427,853 4-bDeferred tax liabilities for land revaluation 30,259 30,539 4-cAcceptances and guarantees 8,121,131 7,373,185Total liabilities 181,703,543 173,637,092(Net assets)Capital stock 1,770,996 1,770,996 1-aCapital surplus 1,966,353 1,970,412 1-bRetained earnings 3,743,614 3,451,151 1-cTreasury stock (210,003) (210,003) 1-dTotal stockholders’ equity 7,270,960 6,982,557Net unrealized gains or losses on other securities 1,426,493 1,509,249Net deferred gains or losses on hedges (47,281) (66,918) 5Land revaluation excess 36,531 37,042Foreign currency translation adjustments 24,371 12,710Accumulated remeasurements of defined benefit plans (5,446) 60,463Total accumulated other comprehensive income 1,434,667 1,552,547 (a)Stock acquisition rights 2,210 — 7-aNon-controlling interests 278,910 555,298 7-bTotal net assets 8,986,749 9,090,403Total liabilities and net assets 190,690,293 182,727,495
Note: The regulatory scope of consolidation is the same as the accounting scope of consolidation.
Basel III Information
014_0800885851907.indd 347 2019/08/16 19:33:48

348
SMBC
SMBC Group Annual Report 2019
(Appended Table)1. Stockholders’ equity(1) Consolidated balance sheet (Millions of yen)
Consolidated balance sheet items As of March31, 2019
As of March31, 2018 Remarks Ref. No.
Capital stock 1,770,996 1,770,996Including eligible Tier 1 capital instruments subject to transitional arrangement
1-a
Capital surplus 1,966,353 1,970,412Including eligible Tier 1 capital instruments subject to transitional arrangement
1-b
Retained earnings 3,743,614 3,451,151 1-c
Treasury stock (210,003) (210,003)Eligible Tier 1 capital instruments subject to transitional arrangement
1-d
Total stockholders’ equity 7,270,960 6,982,557
(2) Composition of capital (Millions of yen)
Composition of capital disclosure As of March31, 2019
As of March31, 2018 Remarks
Basel III TemplateNo.
Directly issued qualifying common share capital plus related capital surplus and retained earnings
7,270,960 6,982,557Stockholders’ equity attributable to common shares (before adjusting national specific regulatory adjustments (earnings to be distributed))
of which: capital and capital surplus 3,527,346 3,531,406 1a
of which: retained earnings 3,743,614 3,451,151 2
of which: treasury stock (–) — — 1c
of which: other than the above — —
Directly issued qualifying Additional Tier 1 instruments plus related capital surplus of which: classified as equity under applicable accounting standards and the breakdown
— —Stockholders’ equity attributable to preferred shares with a loss absorbency clause upon entering into effectively bankruptcy
31a
2. Intangible fixed assets(1) Consolidated balance sheet (Millions of yen)
Consolidated balance sheet items As of March31, 2019
As of March31, 2018 Remarks Ref. No.
Intangible fixed assets 375,389 311,810 2-a
Securities 23,469,621 25,217,287 2-b
of which: goodwill attributable to equity-method investees 14,211 18,861
Income taxes related to above 108,261 91,273
(2) Composition of capital (Millions of yen)
Composition of capital disclosure As of March31, 2019
As of March31, 2018 Remarks
Basel III TemplateNo.
Goodwill (including those equivalent) 26,214 31,588 8
Other intangibles other than goodwill and mortgage servicing rights 255,125 207,809 Software and other 9
Mortgage servicing rights — —
Amount exceeding the 10% threshold on specified items — — 20
Amount exceeding the 15% threshold on specified items — — 24
Mortgage servicing rights that are below the thresholds for deduction (before risk weighting)
— — 74
3. Net defined benefit asset(1) Consolidated balance sheet (Millions of yen)
Consolidated balance sheet items As of March31, 2019
As of March31, 2018 Remarks Ref. No.
Net defined benefit asset 324,672 377,768 3
Income taxes related to above 99,062 115,220
(2) Composition of capital (Millions of yen)
Composition of capital disclosure As of March31, 2019
As of March31, 2018 Remarks
Basel III TemplateNo.
Net defined benefit asset 225,610 262,547 15
Basel III Information
014_0800885851907.indd 348 2019/08/16 19:33:48

349
SMBC
SMBC Group Annual Report 2019
4. Deferred tax assets(1) Consolidated balance sheet (Millions of yen)
Consolidated balance sheet items As of March31, 2019
As of March31, 2018 Remarks Ref. No.
Deferred tax assets 23,399 28,789 4-a
Deferred tax liabilities 446,993 427,853 4-b
Deferred tax liabilities for land revaluation 30,259 30,539 4-c
Tax effects on intangible fixed assets 108,261 91,273
Tax effects on net defined benefit asset 99,062 115,220
(2) Composition of capital (Millions of yen)
Composition of capital disclosure As of March31, 2019
As of March31, 2018 Remarks
Basel III TemplateNo.
Deferred tax assets that rely on future profitability excluding those arising from temporary differences (net of related tax liability)
2,208 1,213This item does not agree with the amount reported on the consolidated balance sheet due to offsetting of assets and liabilities.
10
Deferred tax assets arising from temporary differences (net of related tax liability)
220 1,617This item does not agree with the amount reported on the consolidated balance sheet due to offsetting of assets and liabilities.
Amount exceeding the 10% threshold on specified items — — 21
Amount exceeding the 15% threshold on specified items — — 25
Deferred tax assets arising from temporary differences that are below the thresholds for deduction (before risk weighting)
220 1,617 75
5. Deferred gains or losses on derivatives under hedge accounting(1) Consolidated balance sheet (Millions of yen)
Consolidated balance sheet items As of March31, 2019
As of March31, 2018 Remarks Ref. No.
Net deferred gains or losses on hedges (47,281) (66,918) 5
(2) Composition of capital (Millions of yen)
Composition of capital disclosure As of March31, 2019
As of March31, 2018 Remarks
Basel III TemplateNo.
Net deferred gains or losses on hedges (45,242) (65,809)Excluding those items whose valuation differences arising from hedged items are recognized as “Accumulated other comprehensive income”
11
6. Items associated with investments in the capital of financial institutions(1) Consolidated balance sheet (Millions of yen)
Consolidated balance sheet items As of March31, 2019
As of March31, 2018 Remarks Ref. No.
Trading assets 2,452,825 2,408,549Including trading account securities and derivatives for trading assets
6-a
Securities 23,469,621 25,217,287 6-b
Loans and bills discounted 79,792,401 75,853,934 Including subordinated loans 6-c
Other assets 3,571,248 3,923,004 Including derivatives 6-d
Trading liabilities 1,818,610 1,907,416Including trading account securities sold and derivatives for trading liabilities
6-e
Other liabilities 2,929,172 3,983,839 Including derivatives 6-f
Basel III Information
014_0800885851907.indd 349 2019/08/16 19:33:48

350
SMBC
SMBC Group Annual Report 2019
(2) Composition of capital (Millions of yen)
Composition of capital disclosure As of March31, 2019
As of March31, 2018 Remarks
Basel III TemplateNo.
Investments in own capital instruments 3 —
Common Equity Tier 1 capital 3 — 16
Additional Tier 1 capital — — 37
Tier 2 capital — — 52
Reciprocal cross-holdings in the capital of banking, financial and insurance entities
— —
Common Equity Tier 1 capital — — 17
Additional Tier 1 capital — — 38
Tier 2 capital and other TLAC liabilities — — 53
Investments in the capital of banking, financial and insurance entities that are outside the scope of regulatory consolidation, net of eligible short positions, where the bank does not own more than 10% of the issued share capital (amount above the 10% threshold)
289,593 331,209
Common Equity Tier 1 capital — — 18
Additional Tier 1 capital — — 39
Tier 2 capital and other TLAC liabilities — — 54
Non-significant investments in the capital and other TLAC liabilities of other financials that are below the thresholds for deductions (before risk weighting)
289,593 331,209 72
Significant investments in the capital of banking, financial and insurance entities that are outside the scope of regulatory consolidation (net of eligible short positions)
642,662 828,222
Amount exceeding the 10% threshold on specified items — — 19
Amount exceeding the 15% threshold on specified items — — 23
Additional Tier 1 capital 25,516 81,640 40
Tier 2 capital and other TLAC liabilities 50,000 150,000 55
Significant investments in the common stock of other financials that are below the thresholds for deductions (before risk weighting)
567,146 596,582 73
7. Non-controlling interests(1) Consolidated balance sheet (Millions of yen)
Consolidated balance sheet items As of March31, 2019
As of March31, 2018 Remarks Ref. No.
Stock acquisition rights 2,210 — 7-a
Non-controlling interests 278,910 555,298 7-b
(2) Composition of capital (Millions of yen)
Composition of capital disclosure As of March31, 2019
As of March31, 2018 Remarks
Basel III TemplateNo.
Amount allowed in group CET1 2,181 333After reflecting amounts eligible for inclusion (Non-Controlling Interest after adjustments)
5
Qualifying Additional Tier 1 instruments plus related capital surplus issued by special purpose vehicles and other equivalent entities
— —After reflecting amounts eligible for inclusion (Non-Controlling Interest after adjustments)
30-31ab-32
Amount allowed in group AT1 23,795 30,026After reflecting amounts eligible for inclusion (Non-Controlling Interest after adjustments)
34-35
Qualifying Tier 2 instruments plus related capital surplus issued by special purpose vehicles and other equivalent entities
— —After reflecting amounts eligible for inclusion (Non-Controlling Interest after adjustments)
46
Amount allowed in group T2 5,921 3,488After reflecting amounts eligible for inclusion (Non-Controlling Interest after adjustments)
48-49
8. Other capital instruments(1) Consolidated balance sheet (Millions of yen)
Consolidated balance sheet items As of March31, 2019
As of March31, 2018 Remarks Ref. No.
Borrowed money 15,988,948 13,973,112 8
(2) Composition of capital (Millions of yen)
Composition of capital disclosure As of March31, 2019
As of March31, 2018 Remarks
Basel III TemplateNo.
Directly issued qualifying Additional Tier 1 instruments plus related capital surplus of which: classified as liabilities under applicable accounting standards
1,100,000 1,100,000 32
Directly issued qualifying Tier 2 instruments plus related capital surplus of which: classified as liabilities under applicable accounting standards
1,003,250 994,937 46
Basel III Information
014_0800885851907.indd 350 2019/08/16 19:33:48

351
SMBC
SMBC Group Annual Report 2019
■ Composition of Leverage Ratio(In million yen, %)
Corresponding line # on Basel III disclosure
template (Table2)
Corresponding line # on Basel III disclosure
template (Table1)Items
As of March 31,2019
As of March 31,2018
On-balance sheet exposures (1)1 On-balance sheet exposures before deducting adjustment items 172,497,155 166,530,561
1a 1 Total assets reported in the consolidated balance sheet 190,690,293 182,727,495
1b 2The amount of assets of subsidiaries that are not included in the scope of the leverage ratio on a consolidated basis (-)
— —
1c 7The amount of assets of subsidiaries that are included in the scope of the leverage ratio on a consolidated basis (except those included in the total assets reported in the consolidated balance sheet)
— —
1d 3The amount of assets that are deducted from the total assets reported in the consolidated balance sheet (except adjustment items) (-)
18,193,137 16,196,934
2 7 The amount of adjustment items pertaining to Tier 1 capital (-) 534,678 584,7983 Total on-balance sheet exposures (a) 171,962,477 165,945,762
Exposures related to derivative transactions (2)
4Replacement cost associated with derivatives transactions, etc. (with the 1.4 alpha factor applied)Replacement cost associated with derivatives transactions, etc. 2,329,551 1,878,627
5Add-on amount for potential future exposure associated with derivatives transactions, etc. (with the 1.4 alpha factor applied)Add-on amount associated with derivatives transactions, etc. 3,413,858 2,921,033The amount of receivables arising from providing cash margin in relation to derivatives transactions, etc.
499,696 244,794
6The amount of receivables arising from providing collateral, provided where deducted from the consolidated balance sheet pursuant to the operative accounting frameworkThe amount of receivables arising from providing cash margin, provided where deducted from the consolidated balance sheet pursuant to the operative accounting framework
— —
7The amount of deductions of receivables (out of those arising from providing cash variation margin) (-)
97,391 244,794
8The amount of client-cleared trade exposures for which a bank acting as clearing member is not obliged to make any indemnification (-)
9 Adjusted effective notional amount of written credit derivatives — 86,781
10The amount of deductions from effective notional amount of written credit derivatives (-)
— 86,781
11 4 Total exposures related to derivative transactions (b) 6,145,714 4,799,660Exposures related to repo transactions (3)
12 The amount of assets related to repo transactions, etc. 6,522,869 5,237,80113 The amount of deductions from the assets above (line 12) (-) — —14 The exposures for counterparty credit risk for repo transactions, etc. 562,301 125,21115 The exposures for agent repo transaction16 5 Total exposures related to repo transactions, etc. (c) 7,085,171 5,363,012
Exposures related to off-balance sheet transactions (4)17 Notional amount of off-balance sheet transactions 55,580,884 54,953,486
18The amount of adjustments for conversion in relation to off-balance sheet transactions (-)
35,362,496 36,521,778
19 6 Total exposures related to off-balance sheet transactions (d) 20,218,388 18,431,707Leverage ratio on a consolidated basis (5)
20 The amount of capital (Tier 1 capital) (e) 9,300,814 9,423,72321 8 Total exposures ((a)+(b)+(c)+(d)) (f) 205,411,750 194,540,14322 Leverage ratio on a consolidated basis ((e)/(f)) 4.52% 4.84%
Leverage Ratio Information (Consolidated)Sumitomo Mitsui Banking Corporation and Subsidiaries
Basel III Information
014_0800885851907.indd 351 2019/08/16 19:33:48

352
SMBC
SMBC Group Annual Report 2019
Liquidity Coverage Ratio Information (Consolidated)
Since March 31, 2015, the “Liquidity Coverage Ratio” (hereinafter referred to as “LCR”), the liquidity ratio regulation under the Basel III, has been introduced in Japan. In addition to the application of uniform international standards, SMBC calculates its consolidated LCR using the calculation formula stipulated in the “Criteria for Evaluating the Soundness of Liquidity Status Set Forth by a Bank as a Benchmark for Judging its Soundness of Management, Based on the Provision of Article 14-2 of the Banking Act” (Notification No. 60 issued by the Japanese Financial Services Agency in 2014; hereinafter referred to as the “LCR Notification”).
■ Disclosure of Qualitative Information about Liquidity Coverage Ratio1. Intra-period Changes in Consolidated LCR As described on the following page, the LCR has remained stable with no significant fluctuation since the introduction of the liquidity ratio
regulation on March 31, 2015.
2. Assessment of Consolidated LCR The LCR Notification stipulates the minimum requirement of the LCR for 2018 at 90%, and 100% from 2019 onwards. The LCR of SMBC
(consolidated) exceeds the minimum requirements of the LCR for 2018 and for 2019 onwards, having no cause for concern. In terms of the future LCR forecasts, SMBC does not expect significant deviations from the disclosed ratios. In addition, the actual LCR does not differ significantly from the initial forecast.
3. Composition of High-Quality Liquid Assets Regarding the high-quality liquid assets allowed to be included in the calculation, there are no significant changes in locations and
properties of currency denominations, categories and so on. In addition, in respect of major currencies (those of which the aggregate amount of liabilities denominated in a certain currency accounts for 5% or more of SMBC’s total liabilities on the consolidated basis), there is no significant mismatch in currency denomination between the total amount of the high-quality liquid assets allowed to be included in the calculation and the amount of net cash outflows.
4. Other Information Concerning Consolidated LCR SMBC has not applied “special provisions concerning qualifying operational deposits” prescribed in Article 29 of the LCR Notification and
“increased liquidity needs related to market valuation changes on derivative or other transactions simulated through Scenario Approach” prescribed in Article 38 of the LCR Notification. Meanwhile, SMBC records “cash outflows related to small-sized consolidated subsidiaries,” etc. under “cash outflows based on other contracts” prescribed in Article 60 of the LCR Notification.
Sumitomo Mitsui Banking Corporation and Subsidiaries
Basel III Information
014_0800885851907.indd 352 2019/08/16 19:33:48

353
SMBC
SMBC Group Annual Report 2019
■ Disclosure of Quantitative Information about Liquidity Coverage Ratio (Consolidated) (In million yen, %, the number of data)
ItemCurrent Quarter(From 2019/1/1 To 2019/3/31)
Prior Quarter(From 2018/10/1To 2018/12/31)
High-Quality Liquid Assets (1)1 Total high-quality liquid assets (HQLA) 63,295,852 63,573,365
Cash Outflows (2)TOTAL
UNWEIGHTEDVALUE
TOTALWEIGHTED
VALUE
TOTALUNWEIGHTED
VALUE
TOTALWEIGHTED
VALUE
2 Cash outflows related to unsecured retail funding 49,498,644 3,879,145 48,794,925 3,830,0313 of which, Stable deposits 15,325,816 461,276 15,003,093 450,3034 of which, Less stable deposits 34,172,828 3,417,869 33,791,832 3,379,7285 Cash outflows related to unsecured wholesale funding 65,960,285 33,120,999 65,164,271 32,262,2496 of which, Qualifying operational deposits — — — —
7 of which, Cash outflows related to unsecured wholesale funding other than qualifying operational deposits and debt securities 60,421,380 27,582,094 60,566,560 27,664,538
8 of which, Debt securities 5,538,905 5,538,905 4,597,711 4,597,7119 Cash outflows related to secured funding, etc. 143,251 115,021
10 Cash outflows related to derivative transactions, etc. funding programs, credit and liquidity facilities 22,270,514 7,206,152 22,910,054 7,594,563
11 of which, Cash outflows related to derivative transactions, etc. 1,101,703 1,101,703 1,317,653 1,317,65312 of which, Cash outflows related to funding programs 396,429 396,429 363,907 363,90713 of which, Cash outflows related to credit and liquidity facilities 20,772,382 5,708,020 21,228,494 5,913,00314 Cash outflows related to contractual funding obligations, etc. 6,607,593 5,124,925 6,356,380 4,746,42515 Cash outflows related to contingencies 65,772,699 1,310,014 66,268,915 1,238,24116 Total cash outflows 50,784,486 49,786,531
Cash Inflows (3)TOTAL
UNWEIGHTEDVALUE
TOTALWEIGHTED
VALUE
TOTALUNWEIGHTED
VALUE
TOTALWEIGHTED
VALUE
17 Cash inflows related to secured lending, etc. 3,334,466 367,764 2,886,957 511,10318 Cash inflows related to collection of loans, etc. 3,284,080 2,294,153 2,604,514 1,813,90919 Other cash inflows 2,507,259 1,113,161 2,618,680 1,085,40820 Total cash inflows 9,125,806 3,775,079 8,110,151 3,410,420
Consolidated Liquidity Coverage Ratio (4)21 Total HQLA allowed to be included in the calculation 63,295,852 63,573,36522 Net cash outflows 47,009,407 46,376,11023 Consolidated liquidity coverage ratio (LCR) 134.6% 137.0%24 The number of data used to calculate the average value 58 62
Notes: 1. The data after the introduction of the liquidity ratio regulation on March 31, 2015 is available on Sumitomo Mitsui Financial Group’s website.(https://www.smfg.co.jp/english/investor/financial/basel_3.html)
2. The average values are calculated based on daily data in accordance with Notification No. 7 issued by the Japanese Financial Services Agency in 2015. Some data, such as attribute information of customers and data on consolidated subsidiaries, is updated on the monthly or quarterly basis.
■ Breakdown of High-Quality Liquid Assets (In million yen)
ItemCurrent Quarter(From 2019/1/1 To 2019/3/31)
Prior Quarter(From 2018/10/1To 2018/12/31)
1 Cash and due from banks 51,493,412 52,667,8722 Securities 11,802,440 10,905,493
3 of which, government bonds, etc. 9,453,776 8,529,560
4 of which, municipal bonds, etc. 79,243 61,560
5 of which, other bonds 869,375 862,568
6 of which, stocks 1,400,047 1,451,805
7 Total high-quality liquid assets (HQLA) 63,295,852 63,573,365
Note: The above amounts are those of high-quality liquid assets in accordance with the liquidity ratio regulation under the Basel III and do not correspond to the financial amounts.The amounts stated are those after multiplying factors in the liquidity ratio regulation under the Basel III.
Basel III Information
014_0800885851907.indd 353 2019/08/16 19:33:48

354
SMBC
SMBC Group Annual Report 2019
■ CC1: Composition of regulatory capital
(Millions of yen, except percentages)
Basel IIITemplate No. Items
a b c
As of March 31,2019
As of March 31,2018
Reference to Template
CC2Common Equity Tier 1 capital: instruments and reserves (1)
1a+2-1c-26 Directly issued qualifying common share capital plus related capital surplus and retainedearnings 6,382,096 6,255,453
1a of which: capital and capital surplus 3,335,548 3,337,8242 of which: retained earnings 3,196,677 3,044,170
1c of which: treasury stock (–) — —26 of which: national specific regulatory adjustments (earnings to be distributed) (–) 150,128 126,541
of which: other than the above — —1b Stock acquisition rights to common shares — —
3 Valuation and translation adjustment and other disclosed reserves 1,430,047 1,539,402 (a)6 Common Equity Tier 1 capital: instruments and reserves (A) 7,812,144 7,794,855
Common Equity Tier 1 capital: regulatory adjustments (2)
8+9 Total intangible assets (net of related tax liability, excluding those relating to mortgage servicing rights) 164,075 160,658
8 of which: goodwill — —9 of which: other intangibles other than goodwill and mortgage servicing rights 164,075 160,658
10 Deferred tax assets that rely on future profitability excluding those arising from temporarydifferences (net of related tax liability) — —
11 Net deferred gains or losses on hedges (20,578) (5,293)12 Shortfall of eligible provisions to expected losses 19,757 45413 Securitisation gain on sale 60,286 60,21514 Gains and losses due to changes in own credit risk on fair valued liabilities — —15 Prepaid pension cost 222,859 193,93116 Investments in own shares (excluding those reported in the Net assets section) — —17 Reciprocal cross-holdings in common equity — —
18Investments in the capital of banking, financial and insurance entities that are outside the scope of regulatory consolidation, net of eligible short positions, where the bank does not own more than 10% of the issued share capital (amount above the 10% threshold)
— —
19+20+21 Amount exceeding the 10% threshold on specified items — —19 of which: significant investments in the common stock of financials — —20 of which: mortgage servicing rights — —21 of which: deferred tax assets arising from temporary differences (net of related tax liability) — —22 Amount exceeding the 15% threshold on specified items — —23 of which: significant investments in the common stock of financials — —24 of which: mortgage servicing rights — —25 of which: deferred tax assets arising from temporary differences (net of related tax liability) — —
27 Regulatory adjustments applied to Common Equity Tier 1 due to insufficient Additional Tier 1and Tier 2 to cover deductions — —
28 Common Equity Tier 1 capital: regulatory adjustments (B) 446,401 409,966Common Equity Tier 1 capital (CET1)
29 Common Equity Tier 1 capital (CET1) ((A)-(B)) (C) 7,365,742 7,384,889
Capital Ratio Information (Non-consolidated)Sumitomo Mitsui Banking Corporation
Basel III Information
014_0800885851907.indd 354 2019/08/16 19:33:48

355
SMBC
SMBC Group Annual Report 2019
(Millions of yen, except percentages)
Basel IIITemplate No. Items
a b c
As of March 31,2019
As of March 31,2018
Reference to Template
CC2Additional Tier 1 capital: instruments (3)
30
31a Directly issued qualifying Additional Tier 1 instruments plus related capital surplus of which:classified as equity under applicable accounting standards and the breakdown — —
31b Stock acquisition rights to Additional Tier 1 instruments — —
32 Directly issued qualifying Additional Tier 1 instruments plus related capital surplus of which:classified as liabilities under applicable accounting standards 1,100,000 1,100,000
Qualifying Additional Tier 1 instruments plus related capital surplus issued by special purposevehicles and other equivalent entities — —
33+35 Eligible Tier 1 capital instruments subject to transitional arrangements included in AdditionalTier 1 capital: instruments 173,000 466,652
36 Additional Tier 1 capital: instruments (D) 1,273,000 1,566,652Additional Tier 1 capital: regulatory adjustments
37 Investments in own Additional Tier 1 instruments — —38 Reciprocal cross-holdings in Additional Tier 1 instruments — —
39Investments in the capital of banking, financial and insurance entities that are outside the scope of regulatory consolidation, net of eligible short positions, where the bank does not own more than 10% of the issued common share capital of the entity (amount above the 10% threshold)
— —
40 Significant investments in the Additional Tier 1 capital of banking, financial and insurance entities that are outside the scope of regulatory consolidation (net of eligible short positions) 25,516 76,261
42 Regulatory adjustments applied to Additional Tier 1 due to insufficient Tier 2 to coverdeductions — —
43 Additional Tier 1 capital: regulatory adjustments (E) 25,516 76,261Additional Tier 1 capital (AT1)
44 Additional Tier 1 capital ((D)-(E)) (F) 1,247,483 1,490,391Tier 1 capital (T1 = CET1 + AT1)
45 Tier 1 capital (T1 = CET1 + AT1) ((C)+(F)) (G) 8,613,226 8,875,280Tier 2 capital: instruments and provisions (4)
46
Directly issued qualifying Tier 2 instruments plus related capital surplus of which: classified asequity under applicable accounting standards and the breakdown — —
Stock acquisition rights to Tier 2 instruments — —Directly issued qualifying Tier 2 instruments plus related capital surplus of which: classified asliabilities under applicable accounting standards 1,003,250 994,937
Qualifying Tier 2 instruments plus related capital surplus issued by special purpose vehiclesand other equivalent entities — —
47+49 Eligible Tier 2 capital instruments subject to transitional arrangements included in Tier 2:instruments and provisions 488,222 625,890
50 Total of general reserve for possible loan losses and eligible provisions included in Tier 2 — —50a of which: general reserve for possible loan losses — —50b of which: eligible provisions — —
51 Tier 2 capital: instruments and provisions (H) 1,491,472 1,620,828
Basel III Information
014_0800885851907.indd 355 2019/08/16 19:33:48

356
SMBC
SMBC Group Annual Report 2019
(Millions of yen, except percentages)
Basel IIITemplate No. Items
a b c
As of March 31,2019
As of March 31,2018
Reference to Template
CC2Tier 2 capital: regulatory adjustments (5)
52 Investments in own Tier 2 instruments — —53 Reciprocal cross-holdings in Tier 2 instruments and other TLAC liabilities — —
54
Investments in the capital and other TLAC liabilities of banking, financial and insurance entities that are outside the scope of regulatory consolidation, net of eligible short positions, where the bank does not own more than 10% of the issued common share capital of the entity (amount above the 10% threshold)
— —
55Significant investments in the capital and other TLAC liabilities of banking, financial and insurance entities that are outside the scope of regulatory consolidation (net of eligible short positions)
50,000 150,000
57 Tier 2 capital: regulatory adjustments (I) 50,000 150,000Tier 2 capital (T2)
58 Tier 2 capital (T2) ((H)-(I)) (J) 1,441,472 1,470,828Total capital (TC = T1 + T2)
59 Total capital (TC = T1 + T2) ((G) + (J)) (K) 10,054,699 10,346,108Risk weighted assets (6)
60 Total risk-weighted assets (RWA) (L) 49,574,518 49,001,855Capital ratio (7)
61 Common Equity Tier 1 risk-weighted capital ratio ((C)/(L)) 14.85% 15.07%62 Tier 1 risk-weighted capital ratio ((G)/(L)) 17.37% 18.11%63 Total risk-weighted capital ratio ((K)/(L)) 20.28% 21.11%
Regulatory adjustments (8)
72 Non-significant investments in the capital and other TLAC liabilities of other financials that are below the thresholds for deduction (before risk weighting) 281,885 324,525
73 Significant investments in the common stock of other financials that are below the thresholds for deduction (before risk weighting) 516,070 572,602
74 Mortgage servicing rights that are below the thresholds for deduction (before risk weighting) — —
75Deferred tax assets arising from temporary differences that are below the thresholds fordeduction (before risk weighting)
— —
Provisions included in Tier 2 capital: instruments and provisions (9)76 Provisions (general reserve for possible loan losses) — —77 Cap on inclusion of provisions (general reserve for possible loan losses) 3,671 2,694
78 Provisions eligible for inclusion in Tier 2 in respect of exposures subject to internalratings-based approach (prior to application of cap) (if the amount is negative, report as “nil”) — —
79 Cap for inclusion of provisions in Tier 2 under internal ratings-based approach 248,544 262,631Capital instruments subject to transitional arrangements (10)
82 Current cap on AT1 instruments subject to transitional arrangements 371,207 494,943
83 Amount excluded from AT1 due to cap (excess over cap after redemptions and maturities) (if the amount is negative, report as “nil”) — —
84 Current cap on T2 instruments subject to transitional arrangements 605,172 806,896
85 Amount excluded from T2 due to cap (excess over cap after redemptions and maturities) (if the amount is negative, report as “nil”) — —
(Millions of yen)
Items As of March 31,2019 As of March 31,2018Required capital ((L) ✕ 8%) 3,965,961 3,920,148
Basel III Information
014_0800885851907.indd 356 2019/08/16 19:33:48

357
SMBC
SMBC Group Annual Report 2019
■ CC2: Reconciliation of regulatory capital to balance sheetSumitomo Mitsui Banking Corporation
(Millions of yen)
a b c d
Items
Balance sheet as in published financial
statementsUnder regulatory scope of consolidation
Reference to Template CC1
Reference to appended tableAs of
March 31, 2019
As of March 31,
2018
As of March 31,
2019
As of March 31,
2018
(Assets)
Cash and due from banks 54,205,583 49,030,209 54,205,583 49,030,209
Call loans 2,134,392 1,417,562 2,134,392 1,417,562
Receivables under resale agreements 3,364,070 499,738 3,364,070 499,738
Receivables under securities borrowing transactions 1,222,284 3,140,151 1,222,284 3,140,151
Monetary claims bought 1,470,872 1,239,394 1,470,872 1,239,394
Trading assets 1,534,100 1,723,878 1,534,100 1,723,878 6-a
Securities 24,336,638 25,916,718 24,328,778 25,905,947 6-b
Loans and bills discounted 76,401,807 73,896,163 76,401,807 73,896,163 6-c
Foreign exchanges 1,627,105 2,143,021 1,627,105 2,143,021
Other assets 2,895,757 3,020,300 2,895,757 3,020,300 6-d
Tangible fixed assets 802,501 798,476 802,501 798,476
Intangible fixed assets 236,352 231,429 236,352 231,429 2
Prepaid pension cost 321,031 279,360 321,031 279,360 3
Customers’ liabilities for acceptances and guarantees 9,078,706 7,921,169 9,078,706 7,921,169
Reserve for possible loan losses (275,185) (319,868) (275,185) (319,868)
Reserve for possible losses on investments (7,363) (14,559) (7,363) (14,559)Total assets 179,348,654 170,923,146 179,340,794 170,912,376
(Liabilities)Deposits 116,091,103 110,243,226 116,084,925 110,236,473
Negotiable certificates of deposit 11,581,605 11,264,807 11,581,605 11,264,807
Call money 796,761 928,117 796,761 928,117
Payables under repurchase agreements 7,364,577 4,383,418 7,364,577 4,383,418
Payables under securities lending transactions 418,912 3,073,423 418,912 3,073,423
Commercial paper 1,634,811 1,522,354 1,634,811 1,522,354
Trading liabilities 1,348,931 1,422,824 1,348,931 1,422,824 6-e
Borrowed money 15,567,626 14,023,257 15,392,856 13,552,461 7
Foreign exchanges 1,213,861 915,154 1,213,861 915,154
Bonds 2,910,794 3,211,548 2,910,794 3,211,548
Due to trust account 1,292,699 1,276,907 1,292,699 1,276,907
Other liabilities 1,659,172 2,391,909 1,657,565 2,386,166 6-f
Reserve for employee bonuses 13,285 14,163 13,285 14,163
Reserve for executive bonuses 937 978 937 978
Reserve for point service program 468 966 468 966
Reserve for reimbursement of deposits 7,425 17,307 7,425 17,307
Deferred tax liabilities 374,529 359,803 374,529 359,803 4-a
Deferred tax liabilities for land revaluation 30,259 30,539 30,259 30,539 4-b
Acceptances and guarantees 9,078,706 7,921,169 9,078,706 7,921,169
Total liabilities 171,386,468 163,001,878 171,203,913 162,518,585
(Net assets)
Capital stock 1,770,996 1,770,996 1,770,996 1,770,996 1-a
Capital surplus 1,774,554 1,776,830 1,774,554 1,776,830 1-b
Retained earnings 3,196,504 3,044,175 3,196,677 3,044,170 1-c
Treasury stock (210,003) (210,003) (210,003) (210,003) 1-d
Total stockholders’ equity 6,532,053 6,381,999 6,532,225 6,381,995
Net unrealized gains or losses on other securities 1,427,008 1,519,691 1,427,008 1,519,691
Net deferred gains or losses on hedges (22,444) (6,286) (22,542) (6,383) 5
Land revaluation excess 25,568 25,863 25,568 25,863
Foreign currency translation adjustments — — 13 230
Total valuation and translation adjustments 1,430,131 1,539,268 1,430,047 1,539,402 (a)
Non-controlling interests — — 174,606 472,393
Total net assets 7,962,185 7,921,268 8,136,880 8,393,790
Total liabilities and net assets 179,348,654 170,923,146 179,340,794 170,912,376
Basel III Information
014_0800885851907.indd 357 2019/08/16 19:33:49

358
SMBC
SMBC Group Annual Report 2019
(Appended Table)1. Stockholders’ equity(1) Balance sheet (Millions of yen)
Balance sheet items As of March31, 2019
As of March31, 2018 Remarks Ref. No.
Capital stock 1,770,996 1,770,996Including eligible Tier 1 capital instruments subject to transitional arrangement
1-a
Capital surplus 1,774,554 1,776,830Including eligible Tier 1 capital instruments subject to transitional arrangement
1-b
Retained earnings 3,196,677 3,044,170 1-c
Treasury stock (210,003) (210,003)Eligible Tier 1 capital instruments subject to transitional arrangement
1-d
Total stockholders’ equity 6,532,225 6,381,995
(2) Composition of capital (Millions of yen)
Composition of capital disclosure As of March31, 2019
As of March31, 2018 Remarks
Basel III TemplateNo.
Directly issued qualifying common share capital plus related capital surplus and retained earnings
6,532,225 6,381,995Stockholders’ equity attributable to common shares (before adjusting national specific regulatory adjustments (earnings to be distributed))
of which: capital and capital surplus 3,335,548 3,337,824 1a
of which: retained earnings 3,196,677 3,044,170 2
of which: treasury stock (–) — — 1c
of which: other than the above — —
Directly issued qualifying Additional Tier 1 instruments plus related capital surplus of which: classified as equity under applicable accounting standards and the breakdown
— —Stockholders’ equity attributable to preferred shares with a loss absorbency clause upon entering into effectively bankruptcy
31a
2. Intangible fixed assets(1) Balance sheet (Millions of yen)
Balance sheet items As of March31, 2019
As of March31, 2018 Remarks Ref. No.
Intangible fixed assets 236,352 231,429 2
Income taxes related to above 72,276 70,771
(2) Composition of capital (Millions of yen)
Composition of capital disclosure As of March31, 2019
As of March31, 2018 Remarks
Basel III TemplateNo.
Goodwill — — 8
Other intangibles other than goodwill and mortgage servicing rights 164,075 160,658 Software and other 9
Mortgage servicing rights — —
Amount exceeding the 10% threshold on specified items — — 20
Amount exceeding the 15% threshold on specified items — — 24
Mortgage servicing rights that are below the thresholds for deduction (before risk weighting)
— — 74
3. Prepaid pension cost(1) Balance sheet (Millions of yen)
Balance sheet items As of March31, 2019
As of March31, 2018 Remarks Ref. No.
Prepaid pension cost 321,031 279,360 3
Income taxes related to above 98,171 85,428
(2) Composition of capital (Millions of yen)
Composition of capital disclosure As of March31, 2019
As of March31, 2018 Remarks
Basel III TemplateNo.
Prepaid pension cost 222,859 193,931 15
Basel III Information
014_0800885851907.indd 358 2019/08/16 19:33:49

359
SMBC
SMBC Group Annual Report 2019
4. Deferred tax assets(1) Balance sheet (Millions of yen)
Balance sheet items As of March31, 2019
As of March31, 2018 Remarks Ref. No.
Deferred tax liabilities 374,529 359,803 4-a
Deferred tax liabilities for land revaluation 30,259 30,539 4-b
Tax effects on intangible fixed assets 72,276 70,771
Tax effects on prepaid pension cost 98,171 85,428
(2) Composition of capital (Millions of yen)
Composition of capital disclosure As of March31, 2019
As of March31, 2018 Remarks
Basel III TemplateNo.
Deferred tax assets that rely on future profitability excluding those arising from temporary differences (net of related tax liability)
— —This item does not agree with the amount reported on the balance sheet due to offsetting of assets and liabilities.
10
Deferred tax assets arising from temporary differences (net of related tax liability)
— —This item does not agree with the amount reported on the balance sheet due to offsetting of assets and liabilities.
Amount exceeding the 10% threshold on specified items — — 21
Amount exceeding the 15% threshold on specified items — — 25
Deferred tax assets arising from temporary differences that are below the thresholds for deduction (before risk weighting)
— — 75
5. Deferred gains or losses on derivatives under hedge accounting(1) Balance sheet (Millions of yen)
Balance sheet items As of March31, 2019
As of March31, 2018 Remarks Ref. No.
Net deferred gains or losses on hedges (22,542) (6,383) 5
(2) Composition of capital (Millions of yen)
Composition of capital disclosure As of March31, 2019
As of March31, 2018 Remarks
Basel III TemplateNo.
Net deferred gains or losses on hedges (20,578) (5,293)Excluding those items whose valuation differences arising from hedged items are recognized as “Total valuation and translation adjustments”
11
6. Items associated with investments in the capital of financial institutions(1) Balance sheet (Millions of yen)
Balance sheet items As of March31, 2019
As of March31, 2018 Remarks Ref. No.
Trading assets 1,534,100 1,723,878Including trading account securities and derivatives for trading assets
6-a
Securities 24,328,778 25,905,947 6-b
Loans and bills discounted 76,401,807 73,896,163 Including subordinated loans 6-c
Other assets 2,895,757 3,020,300 Including derivatives 6-d
Trading liabilities 1,348,931 1,422,824Including trading account securities sold and derivatives for trading liabilities
6-e
Other liabilities 1,657,565 2,386,166 Including derivatives 6-f
Basel III Information
014_0800885851907.indd 359 2019/08/16 19:33:49

360
SMBC
SMBC Group Annual Report 2019
(2) Composition of capital (Millions of yen)
Composition of capital disclosure As of March31, 2019
As of March31, 2018 Remarks
Basel III TemplateNo.
Investments in own capital instruments — —
Common Equity Tier 1 capital — — 16
Additional Tier 1 capital — — 37
Tier 2 capital — — 52
Reciprocal cross-holdings in the capital of banking, financial and insurance entities
— —
Common Equity Tier 1 capital — — 17
Additional Tier 1 capital — — 38
Tier 2 capital and other TLAC liabilities — — 53
Investments in the capital of banking, financial and insurance entities that are outside the scope of regulatory consolidation, net of eligible short positions, where the bank does not own more than 10% of the issued share capital (amount above the 10% threshold)
281,885 324,525
Common Equity Tier 1 capital — — 18
Additional Tier 1 capital — — 39
Tier 2 capital and other TLAC liabilities — — 54
Non-significant investments in the capital and other TLAC liabilities of other financials that are below the thresholds for deductions (before risk weighting)
281,885 324,525 72
Significant investments in the capital of banking, financial and insurance entities that are outside the scope of regulatory consolidation (net of eligible short positions)
591,586 798,863
Amount exceeding the 10% threshold on specified items — — 19
Amount exceeding the 15% threshold on specified items — — 23
Additional Tier 1 capital 25,516 76,261 40
Tier 2 capital and other TLAC liabilities 50,000 150,000 55
Significant investments in the common stock of other financials that are below the thresholds for deductions (before risk weighting)
516,070 572,602 73
7. Other capital instruments(1) Balance sheet (Millions of yen)
Balance sheet items As of March31, 2019
As of March31, 2018 Remarks Ref. No.
Borrowed money 15,392,856 13,552,461 7
(2) Composition of capital (Millions of yen)
Composition of capital disclosure As of March31, 2019
As of March31, 2018 Remarks
Basel III TemplateNo.
Directly issued qualifying Additional Tier 1 instruments plus related capital surplus of which: classified as liabilities under applicable accounting standards
1,100,000 1,100,000 32
Directly issued qualifying Tier 2 instruments plus related capital surplus of which: classified as liabilities under applicable accounting standards
1,003,250 994,937 46
Basel III Information
014_0800885851907.indd 360 2019/08/16 19:33:49

361
SMBC
SMBC Group Annual Report 2019
■ Composition of Leverage Ratio(In million yen, %)
Corresponding line # on Basel III disclosure
template (Table2)
Corresponding line # on Basel III disclosure
template (Table1)Items
As of March 31,2019
On-balance sheet exposures (1)1 On-balance sheet exposures before deducting adjustment items 162,689,001
1a 1 Total assets reported in the balance sheet 179,340,794
1b 3The amount of assets that are deducted from the total assets reported in the balance sheet (except adjustment items) (-)
16,651,792
2 7 The amount of adjustment items pertaining to Tier 1 capital (-) 432,2093 Total on-balance sheet exposures (a) 162,256,791
Exposures related to derivative transactions (2)
4Replacement cost associated with derivatives transactions, etc. (with the 1.4 alpha factor applied)Replacement cost associated with derivatives transactions, etc. 1,314,321
5Add-on amount for potential future exposure associated with derivatives transactions, etc. (with the 1.4 alpha factor applied)Add-on amount associated with derivatives transactions, etc. 2,017,546The amount of receivables arising from providing cash margin in relation to derivatives transactions, etc.
506,786
6The amount of receivables arising from providing collateral, provided where deducted from the balance sheet pursuant to the operative accounting frameworkThe amount of receivables arising from providing cash margin, provided where deducted from the balance sheet pursuant to the operative accounting framework
—
7The amount of deductions of receivables (out of those arising from providing cash variation margin) (-)
283,480
8The amount of client-cleared trade exposures for which a bank acting as clearing member is not obliged to make any indemnification (-)
9 Adjusted effective notional amount of written credit derivatives —10 The amount of deductions from effective notional amount of written credit derivatives (-) —11 4 Total exposures related to derivative transactions (b) 3,555,174
Exposures related to repo transactions (3)12 The amount of assets related to repo transactions, etc. 4,586,35413 The amount of deductions from the assets above (line 12) (-) —14 The exposures for counterparty credit risk for repo transactions, etc. 542,83115 The exposures for agent repo transaction16 5 Total exposures related to repo transactions, etc. (c) 5,129,185
Exposures related to off-balance sheet transactions (4)17 Notional amount of off-balance sheet transactions 58,704,79818 The amount of adjustments for conversion in relation to off-balance sheet transactions (-) 37,308,72419 6 Total exposures related to off-balance sheet transactions (d) 21,396,073
Leverage ratio (5)20 The amount of capital (Tier 1 capital) (e) 8,613,22621 8 Total exposures ((a)+(b)+(c)+(d)) (f) 192,337,22622 Leverage ratio ((e)/(f)) 4.47%
Leverage Ratio Information (Non-consolidated)Sumitomo Mitsui Banking Corporation
Basel III Information
014_0800885851907.indd 361 2019/08/16 19:33:49

362
SMBC
SMBC Group Annual Report 2019
Liquidity Coverage Ratio Information (Non-consolidated)
Since March 31, 2015, the “Liquidity Coverage Ratio” (hereinafter referred to as “LCR”), the liquidity ratio regulation under the Basel III, has been introduced in Japan. In addition to the application of uniform international standards, SMBC calculates its non-consolidated LCR using the calculation formula stipulated in the “Criteria for Evaluating the Soundness of Liquidity Status Set Forth by a Bank as a Benchmark for Judging its Soundness of Management, Based on the Provision of Article 14-2 of the Banking Act” (Notification No. 60 issued by the Japanese Financial Services Agency in 2014; hereinafter referred to as the “LCR Notification”).
■ Disclosure of Qualitative Information about Liquidity Coverage Ratio1. Intra-period Changes in Non-consolidated LCR As described on the following page, the LCR has remained stable with no significant fluctuation since the introduction of the liquidity ratio
regulation on March 31, 2015.
2. Assessment of Non-consolidated LCR The LCR Notification stipulates the minimum requirement of the LCR for 2018 at 90%, and 100% from 2019 onwards. The LCR of SMBC
(non-consolidated) exceeds the minimum requirements of the LCR for 2018 and for 2019 onwards, having no cause for concern. In terms of the future LCR forecasts, SMBC does not expect significant deviations from the disclosed ratios. In addition, the actual LCR does not differ significantly from the initial forecast.
3. Composition of High-Quality Liquid Assets Regarding the high-quality liquid assets allowed to be included in the calculation, there are no significant changes in locations and
properties of currency denominations, categories and so on. In addition, in respect of major currencies (those of which the aggregate amount of liabilities denominated in a certain currency accounts for 5% or more of SMBC’s total liabilities on the non-consolidated basis), there is no significant mismatch in currency denomination between the total amount of the high-quality liquid assets allowed to be included in the calculation and the amount of net cash outflows.
4. Other Information Concerning Non-consolidated LCR SMBC has not applied “special provisions concerning qualifying operational deposits” prescribed in Article 29 of the LCR Notification and
“increased liquidity needs related to market valuation changes on derivative or other transactions simulated through Scenario Approach” prescribed in Article 38 of the LCR Notification. Meanwhile, SMBC records “due to trust account,” etc. under “cash outflows based on other contracts” prescribed in Article 60 of the LCR Notification.
Sumitomo Mitsui Banking Corporation
Basel III Information
014_0800885851907.indd 362 2019/08/16 19:33:49

363
SMBC
SMBC Group Annual Report 2019
■ Disclosure of Quantitative Information about Liquidity Coverage Ratio (Non-Consolidated) (In million yen, %, the number of data)
ItemCurrent Quarter(From 2019/1/1 To 2019/3/31)
Prior Quarter(From 2018/10/1 To 2018/12/31)
High-Quality Liquid Assets (1)1 Total high-quality liquid assets (HQLA) 58,459,328 58,447,129
Cash Outflows (2)TOTAL
UNWEIGHTEDVALUE
TOTALWEIGHTED
VALUE
TOTALUNWEIGHTED
VALUE
TOTALWEIGHTED
VALUE
2 Cash outflows related to unsecured retail funding 46,872,458 3,646,436 46,298,086 3,606,9333 of which, Stable deposits 14,877,087 446,313 14,620,293 438,6094 of which, Less stable deposits 31,995,371 3,200,123 31,677,793 3,168,3245 Cash outflows related to unsecured wholesale funding 63,131,293 31,983,823 62,284,521 30,988,2016 of which, Qualifying operational deposits — — — —
7 of which, Cash outflows related to unsecured wholesale funding other than qualifying operational deposits and debt securities 57,549,368 26,401,898 57,731,485 26,435,165
8 of which, Debt securities 5,581,925 5,581,925 4,553,036 4,553,0369 Cash outflows related to secured funding, etc. 130,868 102,228
10 Cash outflows related to derivative transactions, etc. funding programs, credit and liquidity facilities 19,935,467 6,305,396 20,598,934 6,656,688
11 of which, Cash outflows related to derivative transactions, etc. 364,472 364,472 552,987 552,98712 of which, Cash outflows related to funding programs 396,429 396,429 363,907 363,90713 of which, Cash outflows related to credit and liquidity facilities 19,174,565 5,544,495 19,682,040 5,739,79414 Cash outflows related to contractual funding obligations, etc. 5,412,004 3,238,611 5,418,642 3,082,42615 Cash outflows related to contingencies 65,548,744 1,229,351 65,941,841 1,153,03516 Total cash outflows 46,534,486 45,589,512
Cash Inflows (3)TOTAL
UNWEIGHTEDVALUE
TOTALWEIGHTED
VALUE
TOTALUNWEIGHTED
VALUE
TOTALWEIGHTED
VALUE
17 Cash inflows related to secured lending, etc. 2,304,730 360,841 2,087,811 502,87918 Cash inflows related to collection of loans, etc. 4,081,325 3,190,202 3,179,147 2,468,17419 Other cash inflows 1,795,885 870,716 1,787,920 843,84820 Total cash inflows 8,181,941 4,421,759 7,054,878 3,814,901
Non-Consolidated Liquidity Coverage Ratio (4)21 Total HQLA allowed to be included in the calculation 58,459,328 58,447,12922 Net cash outflows 42,112,727 41,774,61023 Non-consolidated liquidity coverage ratio (LCR) 138.8% 139.9%24 The number of data used to calculate the average value 58 62
Notes: 1. The data after the introduction of the liquidity ratio regulation on March 31, 2015 is available on Sumitomo Mitsui Financial Group’s website.(https://www.smfg.co.jp/english/investor/financial/basel_3.html)
2. The average values are calculated based on daily data in accordance with Notification No. 7 issued by the Japanese Financial Services Agency in 2015. Some data such as attribute information of customers, is updated on the monthly or quarterly basis.
■ Breakdown of High-Quality Liquid Assets (In million yen)
ItemCurrent Quarter(From 2019/1/1 To 2019/3/31)
Prior Quarter(From 2018/10/1 To 2018/12/31)
1 Cash and due from banks 47,473,613 48,282,0512 Securities 10,985,715 10,165,078
3 of which, government bonds, etc. 8,787,725 7,918,967
4 of which, municipal bonds, etc. 79,218 61,533
5 of which, other bonds 718,726 732,773
6 of which, stocks 1,400,047 1,451,805
7 Total high-quality liquid assets (HQLA) 58,459,328 58,447,129
Note: The above amounts are those of high-quality liquid assets in accordance with the liquidity ratio regulation under the Basel III and do not correspond to the financial amounts.The amounts stated are those after multiplying factors in the liquidity ratio regulation under the Basel III.
Basel III Information
014_0800885851907.indd 363 2019/08/16 19:33:49

364
Sumitomo Mitsui Financial Group
SMBC Group Annual Report 2019
ABLAbbreviation for Asset Based Lending of having movable assets as col-lateral such as accounts receivable and/or inventory.
Advanced Measurement Approach (AMA)Based on the operational risk measurement methods used in the internal management of financial institutions, this is a method for obtaining the operational risk equivalent amount by calculating the maximum amount of operational risk loss expected over a period of one year, with a one-sided confidence interval of 99.9%.
Basic Indicator Approach (BIA)A calculation approach in which an average value for the most recent three years derived by multiplying gross profit for the financial institution as a whole by certain level (15%) is deemed to be the operational risk equivalent amount.
Calculation of credit risk-weighted assets under Article 145 of the NotificationMethod used for calculating the credit risk-weighted assets for the fund exposure, etc. There is a method of making the total credit risk-weighted asset of individual underlying asset of funds, etc. as the relevant expo-sure of the credit risk-weighted asset; or a method of applying the risk weight determined based on the formation of underlying assets to the relevant exposure.
Capital adequacy ratio notification (“the Notification”)Administrative action or written ordinance by which the Financial Services Agency officially informs Japanese banks of regulations regard-ing capital adequacy ratio.
CCFAbbreviation for Credit Conversion FactorRatio required for converting off-balance sheet items such as guaranteesor derivatives into on-balance sheet credit exposure equivalents.
CCP-related exposureExposure to a central counterparty (CCP) that interposes itself between counterparties to contracts traded in one or more financial markets, becoming the buyer to every seller and the seller to every buyer and thereby ensuring the future performance of open contracts.
CDSAbbreviation for Credit Default SwapDerivative transactions which transfer the credit risk.
Credit Risk Mitigation (CRM) TechniquesMethod of reducing credit risk by guarantees, collateral and purchase of credit derivatives, etc.
Credit risk-weighted assetsTotal assets (lending exposures, including credit equivalent amount of off-balance sheet transactions, etc.) which is reevaluated according to the level of credit risk.
Current exposure methodOne of the methods for calculating the credit exposure equivalents of derivative transactions, etc. Method of calculating the equivalents by adding the amount (multiplying the notional amount by certain rate, and equivalent to the future exposure fluctuation amount) to the mark-to-market replacement cost calculated by evaluating the market price of the transaction.
CVA (credit value adjustment) amountCapital charges for market-price fluctuation of derivatives transaction due to deteriorated creditworthiness of a counterparty.
ELAbbreviation for Expected LossAverage loss expected to occur over the coming one year.
Full revaluation approachAn approach for PL simulation by repricing the financial instruments un-der each scenario.
High-quality liquid assets (HQLA)Liquid assets that can be converted easily and immediately into cash to meet liquidity needs in a specified stress scenario for the subsequent 30 calendar days.
Historical simulation methodA method of simulating future fluctuations without the use of random numbers, by using historical data for risk factors.
Internal models approachMethods of measuring market risk equivalent amount as the value at risk(VaR) calculated with models determined by each bank.
Internal models methodOne of the methods of market-based approach using the VaR model to calculate the loss for shares held by the bank applying the Internal Ratings-Based Approach, and dividing such loss amount by 8% to obtain the credit risk-weighted asset of the equity exposure.
The Internal Ratings-Based (IRB) ApproachA method of calculating the risk asset by applying PD (Probability of Default) estimated internally by financial institution which conducts sophisticated risk management. There are two methods to calculate exposures to corporate client, etc.: the Advanced Internal Ratings- Based (AIRB) Approach and the Foundation Internal Ratings-Based (FIRB) Approach. The former uses self-estimated LGD and EAD values, while the latter uses LGD and EAD values designated by the authorities.
LCR NotificationAdministrative action and written ordinance for official notification to the general public of regulations concerning the LCR of financial institutions in Japan which are decided by the Japanese Financial Services Agency based on the Basel Agreement.
LGDAbbreviation for Loss Given Default Percentage of loss assumed in the event of default by obligor; ratio of uncollectible amount of the exposure owned in the event of default.
Market-based approachMethod of calculating the risk assets of equity exposures, etc., by using the simple risk weight method or internal model method.
Market risk equivalent amountPursuant to the Basel Capital Accord, the required capital amount im-posed on the market-related risk calculated for the four risk categories of mainly the trading book: interest rates, stocks, foreign exchange and commodities.
Net cash outflowsNet cash flows calculated as total expected cash outflows minus total expected cash inflows in a specified stress scenario for the subsequent 30 calendar days.
Object financeFor providing credit for purchasing ships or aircrafts, the only source of repayments for the financing should be profits generated from the said tangible assets; and the said tangible assets serve as collaterals, and having an appreciable extent of control over the said tangible assets and profits generated from the said tangible assets.
Operational risk equivalent amountOperational risk capital requirements under the Basel Capital Accord.
Glossary
Basel III Information
014_0800885851907.indd 364 2019/08/16 19:33:49

365
Sumitomo Mitsui Financial Group
SMBC Group Annual Report 2019
OriginatorThe term “originator” is used in the case that we are directly or indirectly involved in the formation of underlying assets for securitisation transac-tions when we have the securitisation exposure; or the cases of provid-ing the back-up line for ABCP issued by the securitisation conduit for the purpose of obtaining exposure from the third party, or providing ABL to the securitisation conduit (as sponsor).
PDAbbreviation for Probability of DefaultProbability of becoming default by obligor during one year.
Phased rolloutUnder the Basel Capital Accord, it is a transition made by certain group companies planning to apply the Internal Ratings-Based Approach after the implementation of such methods on consolidated-basis.
Project financeOut of credit provided for specified businesses such as electric power plants and transportation infrastructure, the only source of repayments is profits generated from the said businesses, and the collateral is tangi-ble assets of the said businesses, and having an appreciable extent of control over the said tangible assets and profits generated from the said tangible assets.
Qualifying Revolving Retail Exposures (QRRE)Exposure which may fluctuate up to the upper limit set forth by an agreement according to the individual’s voluntary decision, such as card loan and credit card, etc., and the upper limit of the exposure without any collateral is 10 million yen or less.
Resecuritisation transactionOut of securitisation transactions, it is a transaction with securitisa-tion exposure for part of or entire underlying assets. However, in the case that all of underlying assets is the single securitisation exposure and the transaction’s risk characteristics are substantively unchanged prior to or after the securitisation, the transaction is excluded from the resecuritisation transactions.
Risk capitalThe amount of capital required to cover the theoretical maximum potential loss arising from risks of business operations. It differs from the minimum regulatory capital requirements, and it is being used in the risk management framework voluntarily developed by financial institutions for the purpose of internal management.
Risk weightIndicator which indicates the extent of credit risk determined by the types of assets (claims) owned. Risk weight becomes higher for assets with high risk of default.
Root-T ruleA method of converting the term of estimating the maximum loss as VaR into short term or long term using statistical assumption.
Securitisation transactionIt is a transaction which stratifies the credit risk for the underlying assets into more than two exposures of senior/subordinated structure and has the quality of transferring part of or entire exposure to the third party.
Servicer riskThe risk of becoming unable to claim for the collectives, in cases of which bankruptcy of the supplier/servicer occurs prior to collecting receivables, in securitisation and purchased claims transactions.
Simple risk weight methodOne of market-based approaches for calculating the risk-weighted asset amount for the equity exposure, etc. by multiplying the listed shares and unlisted shares with the risk weights of 300% and 400%, respectively.
Slotting criteriaFor risk-weighted asset calculation under the Internal Ratings-Based (IRB) Approach, it is a method of mapping the credit rating to the risk-weight in 5 levels set forth by the Financial Services Agency for Specialised Lending.
Small-sized consolidated subsidiariesConsolidated subsidiaries that have extremely small impact on the level of the consolidated LCR.
Specialized Lending (SL)General term used for project finance, object finance, commodity finance and lending for commercial real estate.
The Standardised Approach (SA)Method of calculating risk-weighted assets by multiplying each obligor classification (corporation, financial institution, country, retail, etc.) by the risk-weight designated by the authorities.
Standardised methodMethod of calculating market risk using formula determined by the Financial Services Agency.
Underlying assetsGeneral term used for assets which serve as the source of payments for principal and interest for securitisation exposures, etc.
VaRAbbreviation for Value at RiskThe maximum loss that can be expected to occur with a certain degree of probability when holding a financial asset portfolio for a given amount of time.
Basel III Information
014_0800885851907.indd 365 2019/08/16 19:33:49

366
Sumitomo Mitsui Financial Group
SMBC Group Annual Report 2019
■ Compensation Framework of Sumitomo Mitsui Financial Group and Its Group Companies1. Scope of Officers, Employees and Others
The scope of officers, employees and others whose compensation is subject to disclosure under the revised Cabinet Office on Disclosure ofCorporate Affairs, etc. and other ordinances are as described below.(1) Scope of Officers
Officers subject to compensation disclosure are directors and executive officers of Sumitomo Mitsui Financial Group during the fiscal year under review (excluding outside directors).
(2) Scope of Employees and OthersEmployees and others subject to compensation disclosure are employees of Sumitomo Mitsui Financial Group and officers and employees of its major consolidated subsidiaries who are highly compensated and have a material influence on the business management or the assets of Sumitomo Mitsui Financial Group and its major consolidated subsidiaries.a) Scope of major consolidated subsidiaries
A major consolidated subsidiary is a consolidated subsidiary of Sumitomo Mitsui Financial Group with total assets accounting for more than 2% of the total consolidated assets of Sumitomo Mitsui Financial Group and has a material influence on the management of Sumitomo Mitsui Financial Group and its group companies. Specifically, they are Sumitomo Mitsui Banking Corporation, SMBC Nikko Securities Inc., SMBC Guarantee Co., Ltd., Limited and overseas subsidiaries such as Sumitomo Mitsui Banking Corporation Europe Limited and Sumitomo Mitsui Banking Corporation (China) Limited.
b) Scope of highly compensated personsA highly compensated person is an individual whose compensation paid by Sumitomo Mitsui Financial Group or its major subsidiaries is equal to or more than the base amount. The base amount of Sumitomo Mitsui Financial Group is set at ¥60 million which is based on the average amount of compensation paid to the officers of Sumitomo Mitsui Financial Group and SMBC (excluding officers appointed or retired during the fiscal year in question) over the last three fiscal years (hereinafter “executive compensation amount”) and is applied to all group companies. This is because many of the officers of Sumitomo Mitsui Financial Group also serve as officers of SMBC, and their executive compensation amount is determined according to their contribution to the group as a whole. With respect to lump-sum retirement payment for officers serving in Japan, the executive compensation amount for the fiscal year in question is “(his/her executive compensation amount – lump-sum retirement payment) + (lump-sum retirement payment/years of service)” and the executive compensation amount calculated using this formula is compared to the base amount.
c) Material influence on the business management or assets of Sumitomo Mitsui Financial Group and its major consolidated subsidiariesA person has a material influence on the business management or assets of Sumitomo Mitsui Financial Group and its major consolidated subsidiaries if his/her regular transactions or regular matters managed by him/her have a substantial impact on the business management of Sumitomo Mitsui Financial Group and its group companies, or losses incurred through such actions have a significant impact on the financial situation of Sumitomo Mitsui Financial Group and its group companies. Specifically, persons having such influence are directors, corporate auditors and corporate officers of Sumitomo Mitsui Financial Group and its major consolidated subsidiaries, both domestic and overseas.
2. Names, Compositions, and Duties of the Main Bodies, Such as the Committee Responsible for Supervising Business Execution Concerning the Determination of Compensation, Its Payment and Other Related Matters(1) Establishment and Maintenance of the Compensation Committee
Sumitomo Mitsui Financial Group, as a Company with a Nomination Committee, has established a Compensation Committee to resolve the “policy to determine individual remuneration for directors and executive officers,” “executive compensation programme and relevant regulations,” and “individual remuneration for Sumitomo Mitsui Financial Group’s directors and corporate executive officers.” The Compensation Committee is a body independent from the influence of business units, chaired by an outside director, with the majority of its members being also outside directors, and tasked to determine and deliberate matters related to executive compensation of Sumitomo Mitsui Financial Group and its group companies. In addition, Sumitomo Mitsui Financial Group Compensation Committee reviews and discusses executive compensation programmes/practices of group companies of Sumitomo Mitsui Financial Group and the individual remuneration for Sumitomo Mitsui Financial Group’s other executive officers. Furthermore, group companies of Sumitomo Mitsui Financial Group respect the details of the deliberations at the Compensation Committee of Sumitomo Mitsui Financial Group and determine the compensation for directors and corporate auditors within the maximum total amount of compensation approved at an ordinary general meeting of shareholders.
(2) For Employees and OthersThe amount and type of compensation paid to the employees of Sumitomo Mitsui Financial Group and SMBC and the officers and employees of major consolidated subsidiaries are determined and paid according to the compensation policies established by the boards of directors of Sumitomo Mitsui Financial Group and its major consolidated subsidiaries. Compensation systems based on the compensation policies are designed and documented by the HR departments of respective companies, independent from the influence of business units. The compensation policies of major consolidated subsidiaries are regularly reported to the HR department of Sumitomo Mitsui Financial Group for review. The amount and type of compensation for overseas officers and employees is determined and paid under the compensation system established by the relevant office or subsidiary in accordance with local laws, regulations and employment practices.
(3) Total Amount of Compensation Paid to Compensation Committee Members and Number of Compensation CommitteeMeetings Held
Number of Meetings Held(April 1, 2018 to March 31, 2019)
Compensation Committee (Sumitomo Mitsui Financial Group) ����������������������������������������������������������������������� 6Compensation Committee (SMBC Nikko Securities Inc�) �������������������������������������������������������������������������������� 2
Note: The total amount of compensation is not provided because the portion of the compensation paid to a committee member for services rendered as a committee membercannot be calculated as the amount of compensation paid is based on the committee member’s position in the company.
CompensationSumitomo Mitsui Financial Group
015_0800885851907.indd 366 2019/08/20 15:19:47

367
Sumitomo Mitsui Financial Group
SMBC Group Annual Report 2019
■ Assessment of Design and Operation of Compensation StructureCompensation Policies for Officers, Employees and Others
(1) For OfficersSumitomo Mitsui Financial Group hereby establishes the Executive Compensation Policy (the “Policy”) in order to provide guiding prin-ciples for its Compensation Committee to determine individual remuneration for its directors and executive officers (the “Executives”).The Policy’s aim is that executive compensation pursuant to it shall provide the appropriate incentives for the Executives to pursue our Mission and our medium-/long-term vision of becoming “a global financial group that, by earning the highest trust of our customers, leads the growth of Japan and the Asian region”.Group companies of Sumitomo Mitsui Financial Group shall determine their executive compensations in accordance with this Policy.
<Core Principles>I. Sumitomo Mitsui Financial Group’s executive compensation aims at providing appropriate incentives toward the realization of our
mission and our vision.II. Sumitomo Mitsui Financial Group’s executive compensation shall reflect the changing business environment and the short-, medi-
um- and long-term performance of the group, and shall account for the contribution to shareholder value and customer satisfaction.III. Individual remuneration shall reflect the assigned roles and responsibilities as well as the performance of the respective Executive.IV. Sumitomo Mitsui Financial Group shall research and review market practices, including the use of third-party surveys, in order to
provide its Executives with a competitive remuneration package.V. Sumitomo Mitsui Financial Group’s executive compensation shall discourage excessive risk-taking and foster a prudent risk culture
expected of a financial institution.VI. Both external and internal regulations/guidelines on executive compensation shall be observed and respected.VII. Sumitomo Mitsui Financial Group shall establish appropriate governance and controls of the compensation process, and shall regu-
larly review to update its executive compensation practices according to changing market practices and/or business environment.
<Compensation Programme>I. Sumitomo Mitsui Financial Group’s executive compensation programme (the “Programme”) shall have three components: base sal-
ary, cash bonus, and stock compensation.II. In order to hold the Executives accountable and provide them with appropriate incentives for the performance of the group, the
Programme targets the variable compensation component of total remuneration at 40%, if paid at standard levels. Corresponding with performance and the business environment, the variable component could range from 0% to 150% of the standard levels, which shall be determined by corporate titles of the Executives.
III. In order to enhance shareholding of the Executives and align their interests with shareholders, the Programme targets its stock-based compensation components at 25% of total remuneration, if paid at standard levels.
IV. The above target levels shall be appropriately set in accordance with the roles, responsibilities, etc. of each Executive.V. Base salary shall be paid in cash and shall be, in principle, determined by the corporate titles of each Executive, reflecting the roles,
responsibilities, etc.VI. Annual incentives shall be determined based on the annual performance of the group, the group company and the business unit
each Executive is accountable for, as well as on the performance of the respective Executive reviewed both from short-term and me-dium-/long-term perspectives. 70% of the determined amount shall be paid as a cash bonus and the remaining 30% shall be paid under Stock Compensation Plan I (annual performance share plan).
VII. Stock compensation plans consist of Stock Compensation Plan I (the “Plan I”), under which the remuneration of the Executives shall be determined based on Sumitomo Mitsui Financial Group’s medium-term performance, etc., Stock Compensation Plan II (the “Plan II”), determined based on Sumitomo Mitsui Financial Group’s annual performance, etc. and Stock Compensation Plan III (the “Plan III”), determined based on corporate titles, etc.
a. Under the stock compensation plans, the Executives shall receive remuneration via shares of Sumitomo Mitsui Financial Group common stock. The transfer of such stock shall be restricted for appropriately defined periods.
b. Remuneration under Plan I shall be determined based on Sumitomo Mitsui Financial Group’s performance against the Medium-term Management Plan, performance of Sumitomo Mitsui Financial Group shares, and the results of customer satisfaction surveys, etc.
c. Remunerations under Plan II shall be determined based on the annual performance of Sumitomo Mitsui Financial Group, the group company, and the business unit each Executive is accountable for, as well as on the performance of each Executive reviewed both from a short-term and medium-/long-term perspectives. Remuneration paid by restricted shares, they shall effectively act as deferred compensation.
d. Remuneration under Plan III shall be determined based on corporate titles, roles, and responsibilities, etc.VIII. In the event of material amendments to the financial statements or material reputational damages caused by the Executives, remu-
nerations under the Plans could be reduced or fully forfeit.IX. Notwithstanding the above, executive compensation for the Executives domiciled outside Japan shall be individually designed and
determined not only in accordance with this Policy, but also with consideration to local regulations, guidelines, and other local market practices, whilst ensuring the compensation should not incentivize for excessive risk-taking.
<Governance and Control of the Compensation Processes>Sumitomo Mitsui Financial Group, as a Company with a Nomination Committee, has established a Compensation Committee to resolve the following: • The Policy, executive compensation programme and relevant regulations. • Individual remunerations for Sumitomo Mitsui Financial Group’s directors and corporate executive officers.In addition to the above, Sumitomo Mitsui Financial Group Compensation Committee shall review and discuss the below: • Executive compensation programmes/practices of group companies of Sumitomo Mitsui Financial Group. • The individual remuneration for Sumitomo Mitsui Financial Group’s other executive officers.
(2) For Employees and OthersIn order to link the business philosophy and strategy of the company to the roles and responsibilities of employees and others, Sumitomo Mitsui Financial Group and its major consolidated subsidiaries determine the domestic compensation taking into account their job responsibilities, business performance and other factors.
■ Consistency between Compensation Structure and Risk Management and Link between Compensation and Performance1. Sumitomo Mitsui Financial Group and SMBC
In determining the compensation for the officers of Sumitomo Mitsui Financial Group, the details of individual compensation for directors and executive officers are determined by the mandatory Compensation Committee, where the majority of the committee
Compensation
015_0800885851907.indd 367 2019/08/20 15:19:47

368
Sumitomo Mitsui Financial Group
SMBC Group Annual Report 2019
members are the outside directors. The compensation for the officers of SMBC are determined within the scope approved at a shareholders' meeting.In order to hold the Executives accountable and provide them with appropriate incentives for theperformance of the group, the Programme targets the variable compensation component of totalremuneration at 40%, if paid at standard levels. The Programme shall have three components: base salary, cash bonus, and stock compensation. Cash bonus shall be determined based on the annual performance of the group, as well as on the performance of the respective Executive reviewed both from short-term and medium-/long-term perspectives. Stock compensation is determined based on the progress of the Medium-term Management plan, performance of Sumitomo Mitsui Financial Group shares, and the results of customer satisfaction surveys, etc. Sumitomo Mitsui Financial Group and SMBC allot restricted stocks via the Plans to Executives to effectively defer part of executive compensation.Stock Compensation Plan I involves removal of the restriction on transfer, after the expiry of Sumitomo Mitsui Financial Group’s Medium-term Management Plan. In the event that the finalized amount of compensation falls short of the initially allocated amount, Sumitomo Mitsui Financial Group will retrieve all or part of the allotted shares at nil cost in the case the final amount falls below the initial amount. Stock Compensation Plan II involves step-by-step removal of the restriction on transfer, one third in each year over the three years following the payment.Stock Compensation Plan III involves removal of the restriction on transfer, either 30 years after payment or at the time of retirement from the position of officer.In addition, Sumitomo Mitsui Financial Group and SMBC introduced the malus (forfeiture) of restricted stock and the claw-back of vested stock allocated to the Executives under the Plans in order to restrain excessive risk-taking and foster a prudent risk culture expected of a financial institution. Provisions on malus and clawbacks are included in the Allotment Agreement and they shall be exercised in the event of material amendments to the financial statements or material reputational damage caused by the Executives after thorough review at the Compensation Committee.In addition, in determining the compensation for employees, their job responsibilities and business performance are taken into account. For variablecompensation, in order to avoid an excessive result-oriented approach, it is determined after comprehensive evaluation based on not only short-term performance results but also qualitative evaluation. Compensation is individually designed with consideration to local regulations, guidelines, and other market practices, whilst ensuring the compensation should not incentivize for excessive risk-taking.
2. Other Major Consolidated SubsidiariesThe compensation for officers and employees of other major subsidiaries of Sumitomo Mitsui Financial Group are determined by comprehensively taking into account the assessment of the subsidiaries’ medium- and long-term earnings, and in the case of an overseas subsidiary, local laws, regulations and employment practices, and a compensation structure that could affect the risk management of the group has not been adopted. While terms of employment presented at the time of recruitment may in-clude the minimum amount of compensation within a reasonable scope under local practice, the compensation structure is designed to avoid an excessive result-oriented approach. In addition, expenses for employee retention are recorded for em-ployees of certain major consolidated subsidiaries.
■ Type, Total Amount Paid, and Payment Method of Compensation for Officers, Employees and Others of Sumitomo Mitsui Financial Group and Its Group Companies
Compensation, etc. allocated to the applicable fiscal year (Headcount, millions of yen)
Item No�
(a) (b)
Officers Employees and others
1
Fixed compensation
Number of applicable officers, employees and others 14 1442 Total fixed compensation (3+5+7) 864 6,3023 of which: cash compensation 803 5,7004 of which in 3: deferred amount — —
5 of which: amount of stock compensation or stock-linked compensation 42 406
6 of which in 5: deferred amount 42 4067 of which: other compensation 18 1958 of which in 7: deferred amount — —9
Variable compensation
Number of applicable officers, employees and others 12 14110 Total variable compensation (11+13+15) 499 5,50511 of which: cash compensation 239 4,76712 of which in 11: deferred amount — 669
13 of which: amount of stock compensation or stock-linked compensation 260 737
14 of which in 13: deferred amount 260 67115 of which: amount of other compensation — —16 of which in 15: deferred amount — —17
Retirement allowance
Number of applicable officers, employees and others — 7018 Amount of retirement allowance — 39519 of which: deferred amount — —20
Other compensationNumber of applicable officers, employees and others — 15
21 Amount of other compensation — 17522 of which: deferred amount — —23 Total compensation, etc� (2+10+18+21) 1,364 12,380
Notes: 1. Compensation amount includes those amounts of major consolidated subsidiaries. 2. Stock Compensation Plan III is classified as fixed compensation because the amount allotted depends on the individual’s position. Other stock compensation involves an
amount of issuance prone to performance-linked fluctuations, and is thus classified as variable compensation.
Compensation
015_0800885851907.indd 368 2019/08/20 15:19:47

369
Sumitomo Mitsui Financial Group
SMBC Group Annual Report 2019
Special compensation, etc. (Headcount, millions of yen)
(a) (b) (c) (d) (e) (f)Bonus guarantee One-off recruitment payment Additional retirement allowance
Headcount Total amount Headcount Total amount Headcount Total amountOfficers — — — — — —Employees and others 2 49 1 31 1 95
■ Other Information Regarding Compensation Structures of Sumitomo Mitsui Financial Group and its Group Companies
Deferred compensation, etc. (Millions of yen)
(a) (b) (c) (d) (e)
Balance of deferred
compensation, etc�
Of the amount in (a), balance of
deferred compensation,
etc� subjected to adjustment or
prone to fluctuations
With respect to post allocation compensation,
amount of fluctuation after adjustment not
linked to fluctuations of criteria in the
applicable fiscal year
With respect to post allocation compensation,
amount of fluctuation after
adjustment linked to fluctuations of
criteria in the applicable fiscal
year
Amount of deferred
compensation, etc� paid in the applicable fiscal
year
Officers
Amount of cash compensation — — — — —Amount of stock compensation or stock-linked compensation 978 559 — — —
Amount of other compensation — — — — —
Employees and others
Amount of cash compensation 803 265 — — 624Amount of stock compensation or stock-linked compensation 2,482 1,642 — — 27
Amount of other compensation — — — — —Total amount 4,263 2,466 — — 651
Compensation
015_0800885851907.indd 369 2019/08/20 15:19:47

370
SMBC
SMBC Group Annual Report 2019
■ Compensation Framework of SMBC Group1. Scope of Officers and Employees
The scope of officers, employees and others whose compensation is subject to disclosure under the revised Cabinet Office on Disclosure ofCorporate Affairs, etc. and other ordinances are as described below.(1) Scope of Officers
Officers subject to compensation disclosure are directors and corporate auditors of SMBC during the fiscal year under review (excluding outside directors and corporate auditors).
(2) Scope of Employees and OthersEmployees and others subject to compensation disclosure are employees of SMBC and officers and employees of its major consolidatedsubsidiaries who are highly compensated and have a material influence on the business management or the assets of SMBC and its majorconsolidated subsidiaries.a) Scope of major consolidated subsidiaries
A major consolidated subsidiary is a consolidated subsidiary of SMBC with total assets accounting for more than 2% of the total consolidated assets of SMBC and has a material influence on the management of SMBC and its group companies. Specifically, they are SMBC Guarantee Co., Ltd. and overseas subsidiaries such as Sumitomo Mitsui Banking Corporation Europe Limited and Sumitomo Mitsui Banking Corporation (China) Limited.
b) Scope of highly compensated personsA highly compensated person is an individual whose compensation paid by SMBC or its major subsidiaries is equal to or more thanthe base amount. The base amount of SMBC is set at ¥60 million which is based on the average amount of compensation paid to theofficers of Sumitomo Mitsui Financial Group and SMBC (excluding officers appointed or retired during the fiscal year in question) over the last three fiscal years (hereinafter “executive compensation amount”) and is applied to all group companies. This is because many of the officers of Sumitomo Mitsui Financial Group also serve as officers of SMBC, and their executive compensation amount is determined according to their contribution to the group as a whole. With respect to lump-sum retirement payment for officers serving in Japan, the executive compensation amount for the fiscal year in question is “(his/her executive compensation amount – lump-sum retirement payment) + (lump-sum retirement payment/years of service)” and the executive compensation amount calculated using this formula is compared to the base amount.
c) Material influence on the business management or assets of SMBC and its major consolidated subsidiariesA person has a material influence on the business management or assets of SMBC and its major consolidated subsidiaries if his/herregular transactions or regular matters managed by him/her have a substantial impact on the business management of SMBC and itsgroup companies, or losses incurred through such actions have a significant impact on the financial situation of SMBC and its groupcompanies. Specifically, persons having such influence are directors, corporate auditors and corporate officers of SMBC and its majorconsolidated subsidiaries, both domestic and overseas.
2. Names, Compositions, and Duties of the Main Bodies, Such as the Committee Responsible for Supervising Business Execution Concerning the Determination of Compensation, Its Payment and Other Related MattersDetermination of compensation is stated in “Compensation” of Sumitomo Mitsui Financial Group (please refer to “2. Names, Compositions, and Duties of the Main Bodies, Such as the Committee Responsible for Supervising Business Execution Concerning the Determination of Compensation, Its Payment and Other Related Matters” on page 366).
■ Assessment of Design and Operation of Compensation StructureCompensation Policy
Compensation policy is stated in “Compensation” of Sumitomo Mitsui Financial Group (please refer to “Compensation Policy” on page 367).
■ Consistency between Compensation Structure and Risk Management and Link between Compensation and PerformanceConsistency between compensation structure and risk management and link between compensation and performance is stated in “Compensation” of Sumitomo Mitsui Financial Group (please refer to “Consistency between Compensation Structure and Risk Management and Link between Compensation and Performance” on pages 367 to 368.
CompensationSumitomo Mitsui Banking Corporation (SMBC) and Its Group Companies
015_0800885851907.indd 370 2019/08/20 15:19:47

371
SMBC
SMBC Group Annual Report 2019
■ Type, Total Amount Paid, and Payment Method of Compensation for Officers, Employees and Others of SMBC and Its Group Companies
1. Compensation Allocated in the Applicable Fiscal Year (SMBC consolidated) (Headcount, millions of yen)
Item No�
(a) (b)
Officers Employees and others
1
Fixed compensation
Number of applicable officers, employees and others 19 1332 Total fixed compensation (3+5+7) 963 5,7713 of which: cash compensation 882 5,1994 of which in 3: deferred amount — —
5 of which: amount of stock compensation or stock-linked compensation 58 382
6 of which in 5: deferred amount 58 3827 of which: other compensation 22 1898 of which in 7: deferred amount — —9
Variable compensation
Number of applicable officers, employees and others 16 13010 Total variable compensation (11+13+15) 506 5,05611 of which: cash compensation 223 4,41612 of which in 11: deferred amount — 594
13 of which: amount of stock compensation or stock-linked compensation 282 639
14 of which in 13: deferred amount 282 57315 of which: amount of other compensation — —16 of which in 15: deferred amount — —17
Retirement allowance
Number of applicable officers, employees and others 1 7018 Amount of retirement allowance 0 39519 of which: deferred amount — —20
Other compensationNumber of applicable officers, employees and others — 15
21 Amount of other compensation — 17522 of which: deferred amount — —23 Total compensation, etc� (2+10+18+21) 1,470 11,399
Notes: 1. Compensation amount includes those amounts of major consolidated subsidiaries. 2. Stock Compensation Plan III is classified as fixed compensation because the amount allotted depends on the individual’s position. Other stock compensation involves an
amount of issuance prone to performance-linked fluctuations, and is thus classified as variable compensation.
2. Special Compensation, Etc. (Headcount, millions of yen)
(a) (b) (c) (d) (e) (f)Bonus guarantee One-off recruitment payment Additional retirement allowance
Headcount Total amount Headcount Total amount Headcount Total amountOfficers — — — — — —Employees and others 2 49 1 31 1 95
Compensation
015_0800885851907.indd 371 2019/08/20 15:19:47

372
SMBC
SMBC Group Annual Report 2019
1. Compensation Allocated in the Applicable Fiscal Year (SMBC non-consolidated) (Headcount, millions of yen)
Item No�
(a) (b)
Officers Employees and others
1
Fixed compensation
Number of applicable officers, employees and others 19 1332 Total fixed compensation (3+5+7) 963 5,7713 of which: cash compensation 882 5,1994 of which in 3: deferred amount — —
5 of which: amount of stock compensation or stock-linked compensation 58 382
6 of which in 5: deferred amount 58 3827 of which: other compensation 22 1898 of which in 7: deferred amount — —9
Variable compensation
Number of applicable officers, employees and others 16 13010 Total variable compensation (11+13+15) 506 5,05611 of which: cash compensation 223 4,41612 of which in 11: deferred amount — 594
13 of which: amount of stock compensation or stock-linked compensation 282 639
14 of which in 13: deferred amount 282 57315 of which: amount of other compensation — —16 of which in 15: deferred amount — —17
Retirement allowance
Number of applicable officers, employees and others 1 7018 Amount of retirement allowance 0 39519 of which: deferred amount — —20
Other compensationNumber of applicable officers, employees and others — 15
21 Amount of other compensation — 17522 of which: deferred amount — —23 Total compensation, etc� (2+10+18+21) 1,470 11,399
Notes: 1. Compensation amount includes those amounts of major consolidated subsidiaries. 2. Stock Compensation Plan III is classified as fixed compensation because the amount allotted depends on the individual’s position. Other stock compensation involves an
amount of issuance prone to performance-linked fluctuations, and is thus classified as variable compensation.
2. Special Compensation, Etc. (Headcount, millions of yen)
(a) (b) (c) (d) (e) (f)Bonus guarantee One-off recruitment payment Additional retirement allowance
Headcount Total amount Headcount Total amount Headcount Total amountOfficers — — — — — —Employees and others 2 49 1 31 1 95
Compensation
015_0800885851907.indd 372 2019/08/20 15:19:47

373
SMBC
SMBC Group Annual Report 2019
■ Other Information Regarding Compensation Structures of Sumitomo Mitsui Financial Group and its Group Companies
Amount of Deferred Compensation, Etc. (SMBC consolidated) Deferred compensation, etc. (Millions of yen)
(a) (b) (c) (d) (e)
Balance of deferred
compensation, etc�
Of the amount in (a), balance of
deferred compensation,
etc� subjected to adjustment or
prone to fluctuations
With respect to post allocation compensation,
amount of fluctuation after adjustment not
linked to fluctuations of criteria in the
applicable fiscal year
With respect to post allocation compensation,
amount of fluctuation after
adjustment linked to fluctuations of
criteria in the applicable fiscal
year
Amount of deferred
compensation, etc� paid in the applicable fiscal
year
Officers
Amount of cash compensation — — — — —Amount of stock compensation or stock-linked compensation 1,209 650 — — 31
Amount of other compensation — — — — —
Employees and others
Amount of cash compensation 618 265 — — 532Amount of stock compensation or stock-linked compensation 2,093 1,433 — — 25
Amount of other compensation — — — — —Total amount 3,922 2,348 — — 590
Amount of Deferred Compensation, Etc. (SMBC non-consolidated) Deferred compensation, etc. (Millions of yen)
(a) (b) (c) (d) (e)
Balance of deferred
compensation, etc�
Of the amount in (a), balance of
deferred compensation,
etc� subjected to adjustment or
prone to fluctuations
With respect to post allocation compensation,
amount of fluctuation after adjustment not
linked to fluctuations of criteria in the
applicable fiscal year
With respect to post allocation compensation,
amount of fluctuation after
adjustment linked to fluctuations of
criteria in the applicable fiscal
year
Amount of deferred
compensation, etc� paid in the applicable fiscal
year
Officers
Amount of cash compensation — — — — —Amount of stock compensation or stock-linked compensation 1,209 650 — — 31
Amount of other compensation — — — — —
Employees and others
Amount of cash compensation 618 265 — — 532Amount of stock compensation or stock-linked compensation 2,093 1,433 — — 25
Amount of other compensation — — — — —Total amount 3,922 2,348 — — 590
Compensation
015_0800885851907.indd 373 2019/08/20 15:19:47

015_0800885851907.indd 374 2019/08/20 15:19:47

SMBC Group Home Page
https://www.smfg.co.jp/ (Japanese)
https://www.smfg.co.jp/english/ (English)
IR Information
https://www.smfg.co.jp/investor/ (Japanese)
https://www.smfg.co.jp/english/investor/ (English)
Websites
Corporate Social Responsibility
https://www.smfg.co.jp/responsibility/ (Japanese)
https://www.smfg.co.jp/english/responsibility/ (English)

Printed in Japan