The China Compass - Q2 2019 - Axis Group
210
www.axisgroupinternational.com www.axisgroupinternational.com The China Compass Economic Trends & Analysis Q2 2019
-
Upload
khangminh22 -
Category
Documents
-
view
0 -
download
0
Transcript of The China Compass - Q2 2019 - Axis Group

www.axisgroupinternational.comwww.axisgroupinternational.com
The China Compass
Economic Trends & Analysis
Q2 2019

Axis Group 11
DMCC Business Centre, Level No. 1, Unit No. 939,
Jeweller 3
Dubai, United Arab Emirates
T +61 (0) 483 386 118 / +86 138 0111 2112
Beijing | Shanghai | Singapore | Perth | Bangkok | Mumbai | Dubai | Johannesburg
Axis Group provides market access solutions. For clients that compete in
complex international markets, our deep capabilities, expertise and
commitment translate into business performance and profitability
• Procurement & Supply
• Market Expansion
• Corporate Advisory
www.axisgroupinternational.com
Global markets. Connected

Other Recent Research & Publications
by Axis Group - Please contact us for
access to i.e.:
1. Asian Export Guide – What to export
to Asian economies and how to
succeed?
2. China Export Guide – What to export
to China and how to succeed?
3. 20 Years of SA-China Diplomatic ties
– Looking ahead at the next phase of
economic and business relations
2
Agenda
1. Foreword
2. Feature: Chinese Engagements and Activities in Africa
3. China Profile, Facts and Figures
4. China in the World
5. Conclusions, Implications and Recommendations
6. About Axis Group
Image Source: Trippest (cover page), Visual China Group (视觉中国) (agenda)

3
In the same manner that a compass highlights the cardinal points of north, south, east and west, The China Compass is intended to serve as a navigational instrumentfor understanding China's position and its direction in the global economic landscape. By closely examining China's importance to, and progressive integration with, theworld economy, Axis Group presents The China Compass as a knowledge tool for executives with a China agenda.
Following a modest revival in global activity during 2017 and 2018, there are again many headwinds that are framing the international economic context. However, thereare also many prevailing geo-political uncertainties, with the US-China trade war, Brexit and several other political flashpoints having become defining obstacles in aworld of turmoil. Growth in US economic activity seems to have plateaued and the post-election process remains as painful as ever, as Americans continue to grapplewith issues across a deepening divide - the latest US government shutdown a case in point. Meanwhile, European revival remains tentative with Brexit-pains andongoing shifting political sentiments across Europe. These obstacles continue to cast a shadow of uncertainty. Hence, China’s slowdown over 2019 only adds to alreadyrising concerns; both over China’s domestic economic prospects but also for the world economy.
China’s transformation continues to accelerate – and the rate of change is now very rapid. As stated before, this leaves a wake of changes that has been destructive forsome, but that also heralds a new dawn for others. The impact is being felt domestically and internationally. China’s policy makers clearly recognise the risks andevolving nature of the country's social, economic, and financial terrain; and despite mounting challenges, our view remains that Beijing still has enough policy leeway tooffer critical support to offset the pressures in the economy; so, no hard landing on the horizon. But, deep-rooted and often painful reforms must continue as a matter ofurgency so as to safeguard not just the current cycle, but also the structural integrity of China’s economy and its ability to deliver on its long-term development goals. Thiswill ensure sustained high GDP growth of above 5.5% - and the ability to overcome many challenges along the way - and the ongoing transition to a consumer-driven,service-oriented and higher-value-add economy.
Meanwhile, China’s global participation and influence are only rising – and is being played out across many dimensions, i.e. geopolitics, international economics, trade,capital flows, and culture. In our feature segment, we investigate China’s activities and engagement in Africa by looking into its role in African trade, capital flows, andinfrastructure. We also delve deeper into the China – South Africa economic relationship following 20 years of diplomatic ties.
In Section 1, we set the scene. Section 2 features 'China’s engagements and activities in Africa’. Sections 3 and 4 provide a more detailed, quantitative look into China'sdomestic economic, social, financial, and geopolitical make-up, and presents a comparison with selected economies in the wider global community. Finally, Section 5offers insights into key trends and outlines the high-level conclusions, implications, and recommendations for players that are engaging in/with China.
We trust that this edition will be useful for those who are in the midst of planning a China agenda, and that it will shed light on past developments and future prospects ofa uniquely Chinese story of human development.
As always, we welcome all feedback.
Kobus van der WathChief Executive OfficerAxis Group [email protected]
Foreword
Other Recent Research & Publications by Axis Group
Please contact us for access to i.e.:
1. Asian Export Guide – What to export to Asian economies and how to succeed?
2. China Export Guide – What to export to China and how to succeed?
3. 20 Years of SA-China Diplomatic ties – Looking ahead at the next phase of economic and business relations

4
0
4
8
12
16
78 80 82 84 86 88 90 92 94 96 98 00 02 04 06 08 10 12 14 16 18 20F
China’s GDP growth is expected to continue moderating, making it more sustainable - GDP growth rates in recent years already reflect this ‘new normal’
China’s Real Y-o-Y GDP Growth Rate (%, 1978-2020F)
Source: The World Bank; IMF; Axis Group Analysis
8-10% GDP
growth band Soft landing amid
global uncertainty
Overheating
concerns
7-8% GDP
growth band
More moderate
and stable
growth rate
6-7% GDP
growth band
Past periods of
overheating

5
With a GDP of USD 12tn in 2017, China accounted for 15% of the world’s economy and 40% of all developing economies; whilst China, India and Indonesia accounted for 53% of all developing economies
0%
10%
20%
30%
40%
50%
60%
70%
80%
90%
100%
World GDP World GDP GDP of DevelopingEconomies
China GDP(Expenditure)
China GDP(Sectoral)
China GDP(Geographic)
China GDP(Geographic)
Hebei
Others
Africa
Germany
Japan
U.K.
US
China
CanadaBrazilItaly
FranceIndia
Other
Developed
Economies
Developed
Asia1
Other
Developing
Economies
& EITs2
Africa
China
Other
Developing
Economies
Africa
Other
Developing
Asia3
Indonesia
India
China
Net Exports
Gross
Capital
Formation
Final
Consumption
Expenditure
Tertiary
Industry
Secondary
Industry
Primary
Industry
Northwest
Northeast
Southwest
North
Central
South
East
Others
Fujian
Hunan
HubeiSichuan
Henan
Zhejiang
Guangdong
Shandong
Jiangsu
All Data in 2017USD 79.9tn USD 79.9tn USD 29.6tn USD 12tn USD 12tn USD 12tn USD 12tn
1. Developed Asia includes Japan; South Korea; Singapore; Macao SAR, China; and Hong Kong SAR, China
2. EITs denote economies referred to by the UN as “Economies in Transition”, and include Russia among other former Soviet states
3. Other Developing Asia includes Turkey, Saudi Arabia, Taiwan (Taiwan, China), Thailand, Iran, UAE, Israel, Malaysia, Philippines, Pakistan, Bangladesh, Vietnam, Iraq, Qatar, Kuwait, Sri Lanka, Oman,
Myanmar, Lebanon, Bahrain, Nepal, Cambodia, Afghanistan, Lao PDR, Yemen, Brunei, Mongolia, Fiji, Maldives and Bhutan
Source: IMF; National Bureau of Statistics of China; Axis Group Analysis

6
-4
0
4
8
12
16
1991 1995 1999 2003 2007 2011 2015 2019
World China
Developed World Developing Asia
Latin America & Caribbean Africa
GDP Growth Rate (Annual Y-o-Y%, 1991-2019F)
% 1995 2000 2005 2010 2015 2016 2017 2018E 2019F
World GDP (USD tn) 31.00 33.84 47.54 66.01 74.60 75.65 80.05 84.84 88.08
World GDP 100 100 100 100 100 100 100 100 100
Advanced
Economies81 79 76 66 61 61 60 60 60
US 25 30 27 23 24 25 24 24 24
Euro Area 25 19 22 19 16 16 16 16 16
Japan 18 14 10 9 6 7 6 6 6
Other Advanced 13 16 17 15 15 13 14 14 14
Emerging Market
and Developing
Economies19 21 24 34 39 39 40 40 40
China 2 4 5 9 15 15 15 16 16
Latin America &
Caribbean6 7 6 8 7 7 7 6 6
Africa 2 2 2 3 3 3 3 3 3
Other EM&D 9 8 11 14 14 14 15 15 15Note: 2018 and 2019 numbers are based on the IMF’s estimated (E) and forecasted (F) data
Source: IMF; Various; Axis Group Analysis
Global GDP Breakdown (%, 1995-2019F)
China’s rapid economic growth has increased the country’s share of global GDP from 2% in 1995, to 15% in 2015 and 16% in 2018
China
Developing Asia
Africa
Developed WorldLatin America & Caribbean World

7
15, 735 43,050
8,461
2,404
24,044
2,444
6,201
3,662 1,954
12,608 36,745
7,040
2,028
17,491
1,946
5,493
3,190
0
1
2
3
4
5
6
7
0 2 4 6 8 10 12 14 16 18 20 22 24 26 28 30 32 34 36 38 40 42 44 46 48 50
Emerging and Developing Asia accounted for around 22% of global GDP in 2017 –set to have its share increase to 24% by 2020
Regional GDP Comparison (%, 2014-2020F)
Note: 1. GDP values are in national currencies converted to U.S. dollars using market exchange rates (yearly average) as given in IMF WEO April 2018
2. France, Germany and Italy have been included both in the Euro Area and Major Advanced Economies (G7) for the purpose of this representation
Source: IMF; Axis Group Analysis
Average GDP Growth Rate (2014-2017, 2017-2020F)
Share of Global GDP (2017- 2020F)
A bubble of this size represents USD 5,000 bn
BRICS2014-17 Avg. GDP
Growth Rate (%)
2017 GDP per
Capita (USD)
2020F GDP per
Capita (USD)
China 6.9 8,643 12,029
Brazil -1.4 9,895 11,141
Russia -0.1 10,608 12,426
India 7.3 1,983 2,539
S. Africa 1.2 6,180 6,815
Other Advanced
Economies
Emerging and
Developing Asia
Forecasted average
global GDP growth
(2017-2020): 3.7%
Note: Refers to 2017 data
Refers to forecasted 2020 data
Sub-Saharan Africa
Euro Area
Major Advanced
Economies (G7)
Commonwealth of
Independent States
Emerging and
Developing Europe
1,531
Emerging and Developing Asia
comprises 30 economies across
Eastern Asia, South Asia and the
Pacific. China accounts for 69% of the
GDP within this group in 2017, and is
projected to account for 70.5% in 2020
MENA
Latin America and
the Caribbean

8
GDP 2018E
(USD bn)
GDP Per-
Capita
2018E
(USD)
Population
2018E (mn)
China 14,170 10,100 1,400
India 2,960 2,190 1,350
Indonesia 1,070 3,970 268
Malaysia 372 11,340 32
Philippines 354 3,250 109
Thailand 524 7,570 69
Vietnam 266 2,790 95
Total 19,716 5,887 3,323
The Asia Pacific region is large and diverse, and home to countries at different stages of development
Note: *Taiwan, China; Hong Kong SAR, China; and Macau SAR, China; will be referred to as Taiwan, Hong Kong, and Macau
2018 estimate is from the IMF World Economic Outlook October 2018 Report
Source: IMF; Various; Axis Group Analysis
GDP 2018E
(USD bn)
GDP Per-
Capita 2018E
(USD)
Population
2018E (mn)
Pakistan 309 1,641 204
Bangladesh 313 1,880 166
Sri Lanka 98 4,470 22
Myanmar 74 1,390 53
Nepal 30 1.010 30
Cambodia 26 1,600 16
Papua New
Guinea21 2,500 8
Lao PDR 20 2,910 7
Brunei 15 34,560 0.44
Mongolia 14 4,470 3
Timor-Leste 3 2,630 1.3
Bhutan 2 3,420 0.8
Total 926 5,206 511
GDP
2018E
(USD bn)
GDP Per-
Capita
2018E (USD)
Population
2018E (mn)
Japan 5,220 41,420 126
South Korea 1,700 32,770 51
Australia 1,460 57,200 25
Taiwan,
China*626 26,520 24
Hong Kong
SAR, China*380 50,570 7
Singapore 359 62,980 6
New Zealand 212 42,010 5
Total 9,957 44,781 244
Tier 1: Emerging Markets Tier 3: Developed MarketsTier 2: Developing Markets
Total Asia Pacific GDP in 2018E – USD 30,599bnAsia Pacific’s Share of World GDP in 2018E – ~34.74%Asia Pacific’s Share of World Population in 2018E – ~54%
India
China
Mongolia
Pakistan
Bangladesh
Bhutan
Myanmar
ThailandLao PDR
Vietnam
Cambodia
Hong Kong, SAR, China
South Korea
Taiwan, China
Japan
Philippines
MalaysiaSingapore
Indonesia
Brunei
Papua New Guinea
Sri Lanka
Timor-Leste
Australia New
Zealand

9
0
10,000
20,000
30,000
40,000
50,000
60,000
-1 0 1 2 3 4 5 6 7 8 9 10
As the largest economy in Asia, China plays a critical role in the region’s ongoing transformation, both as a major market and as a supply base
Note: Timor-Leste and Bhutan’s GDP are too small to appear
Source: World Bank; Axis Group Analysis
Comparison of GDP Size, GDP per Capita and GDP Growth across Selected Asia Pacific Economies (2017)
GDP per Capita (USD, 2017)
Average Annual GDP Growth (%, 2007-2017)
Bubble Size: GDP = USD 2,500bn
China
New Zealand
Australia
Japan
Singapore
Hong Kong SAR, China
South Korea
Taiwan, China
India
Thailand
Pakistan
Nepal
Malaysia
Myanmar Cambodia
Brunei
Sri Lanka
Vietnam
Indonesia
Philippines
Lao PDR
Papua New
Guinea

10Note: Calculation through weighted GDP at purchasing-power parity
Source: World Bank; Axis Group Analysis
-2.00
-1.00
0.00
1.00
2.00
3.00
4.00
5.00
6.00
1991 1993 1995 1997 1999 2001 2003 2005 2007 2009 2011 2013 2015 2017
China US EU Other BRICS All other countries
Over the last decade, China has been an increasingly important contributor to the world economy, typically accounting for more than 30% of total global GDP growth
Contribution to World GDP Growth (Percentage Points, 1991-2017)
World Total, % increase from 2011-2012
3.77%
In 2017, China contributed 1.22% to
world GDP growth percentage points,
which accounts for 32% of total 3.77%
GDP growth
Contribution to world GDP growth as
percentage points from the different
regions adds up to the world growth rate
in any given year
Financial crisis in the US and some EU
countries led to overall global GDP
decrease in 2009

11
Setting the scene
Source: Axis Group Analysis
• Although China is in a long-term structural adjustment phase towards lower GDP growth, it maintains world-leading growth levelsand currently is still the single largest contributor to global economic growth
• With GDP growth of 6.6% in 2018 and with 2019 forecast at above 6%, the role of China as the growth engine in the globaleconomy will largely remain unchanged but will nevertheless dampen certain sectors’ and countries’ growth prospects – theseexposures and risks must be managed
• Drastic policy measures and reforms are being undertaken to ensure that China’s long-term growth is sustainable; however, evendeeper reforms are needed to sustain the efficiencies and to de-risk the future
• China is the world’s largest exporter, and ranks only behind the US as the largest importer. China’s position as a trade behemoth,and its favourable trade surplus, also gives it the necessary economic clout to make valuable overseas investments
• The US-China trade war has wide-reaching ramifications for China, the US and other countries – and their respective companies.The impact on global supply chains has already been significant and is likely to intensify. This is a major risk over the next severalquarters
• Increased outward investment – despite the recent curbs on OFDI – and growing domestic demand are hallmarks of China’s neweconomic growth model. We interrogate aspects of these developments with regard to Africa in our special feature
• Indeed, for the last 30 years, China has traditionally been a net importer of FDI, with the country being a highly attractiveinvestment destination since the mid-1990s. However, recent years have seen China evolve into a major net global investor
• Executives and managers need to think very differently about China now – numerous risks (and opportunities) must be measuredand managed proactively, and this is particularly true for those that are directly or indirectly exposed to Chinese activity in theirinbound supply chain, outbound supply chain and capital choices

Other Recent Research & Publications
by Axis Group - Please contact us for
access to i.e.:
1. Asian Export Guide – What to export
to Asian economies and how to
succeed?
2. China Export Guide – What to export
to China and how to succeed?
3. 20 Years of SA-China Diplomatic ties
– Looking ahead at the next phase of
economic and business relations
12
Agenda
1. Foreword
2. Feature: Chinese Engagements and Activities in Africa
– China-Africa Overview
– China’s Trade with Africa
– China’s Financial Engagement with Africa
– China’s Role in Africa’s Infrastructure Development
– South Africa-China Focus
3. China Profile, Facts and Figures
4. China in the World
5. Conclusions, Implications and Recommendations
6. About Axis Group

13Source: China Pictorial

14
The China-Africa relationship is one which has expanded greatly in the past two decades, and this is likely to continue well into the 2020s and 2030s
1: Swaziland is the only African country that maintains diplomatic relations with Taipei
Source: EY; American Enterprise Institute; Axis Group Analysis
Sino-African Relations Timeline
1975 China completes construction of the TAZARA railway linking the port of Dar es
Salaam with Zambia’s Kapiri Mposhi
1996 Jiang Zemin tours Africa, visiting Kenya, Ethiopia, Namibia, Zimbabwe
2000 Forum on China-Africa Cooperation (FOCAC) founded
2006 FOCAC summit held in Beijing, joined by 35 African countries
2007 China-Africa Development Fund established in Beijing
2009 Hu Jintao tours Africa, visiting 8 countries and giving a speech in South Africa
2013 Xi Jinping visits Tanzania, South Africa, and Republic of Congo
2014 Li Keqiang makes a speech at the Africa summit of WEF, pledging financial
support for Africa’s infrastructure development
2015 African Union and China sign an MOU for continental transport development
2015 6th FOCAC summit, held in Johannesburg
2018 Li Zhanshu visits African Union headquarters and pledges China’s support
2018 7th FOCAC summit, 3rd held in Beijing
Sino-African Relationship Overview
• USD 94.4bn in loans to Africa between 2000 and 2015
• USD 94.1bn FDI value in Africa (2016)
• USD 676bn FDI projects in Africa (2016)
• USD 149bn in trade (2016)
• 53/54¹ African countries have formal diplomatic ties with China
• Nearly 50,000 African students are studying in China
• 15% of imports into Africa are sourced from China

15Source: Various; Axis Group Analysis
China-Africa relations have steadily progressed through three distinct phases. The current phase is mainly driven by China's increasing need for resources and Africa's search for a long-term development model
Political Phase
(1950s – mid-1970s)
Dormant Phase
(mid-1970s – late 1990s)
Commercial Phase
(2000s – present)
• Non-aligned movement
• African post-colonialism
• PRC vs. Taiwan recognition
• Recognition by China of newly
independent African states
• Foreign aid by China in return for PRC
(vs. Taiwan) recognition
• Mutually-beneficial UN voting support
Phase
Drivers
Examples
• China focus with post-1978 “Open-Door
Policy” and economic reforms
• Heavy competition for African influence
from US and USSR
• Slowly rising Chinese exports of light
industry production (garments, textiles,
toys, etc.)
• Small, trade-driven deals mainly with
private Chinese firms
• China’s demand for raw materials and
other resources
• China’s quest for new markets for its goods
and services
• China’s quest for international influence
through OFDI, aid, mediation, and UN
votes
• FOCAC, CAD Fund
• Government-to-government resource deals
• Resources for infrastructure
• Long term financing with no strings
attached
• Chinese EPCs in Africa’s infrastructure
build-up

16
China’s Historical GDP at Current Prices (USD bn, 2000-2018E)
Note: 2018 estimate is from the IMF World Economic Outlook October 2018 Report
Source: National Bureau of Statistics of China; IMF; Axis Group Analysis
Africa’s Historical GDP at Current Prices (USD bn, 2000-2018E)
0
500
1,000
1,500
2,000
2,500
2000
2001
2002
2003
2004
2005
2006
2007
2008
2009
2010
2011
2012
2013
2014
2015
2016
2017
2018
E
Rest of AfricaMoroccoAngolaAlgeriaEgyptSouth AfricaNigeria
Top 6
countries:
62%
0
2,500
5,000
7,500
10,000
12,500
2000
2001
2002
2003
2004
2005
2006
2007
2008
2009
2010
2011
2012
2013
2014
2015
2016
2017
2018
E
14%
7%
Between 2000 and 2017, Africa’s GDP at current prices increased at an average rate of 7%, while China’s increased at 14% per year. Africa’s growth was, in large part, fueled by China’s rapid growth and resource consumption (correlation and causality)
17-year CAGRCAGR

17
China’s Historical GDP at Constant Prices (USD bn, 2000-2017)
Note: Rest of Africa does not include Swaziland, South Sudan, Sudan and Tanzania as GDP figures for them are unavailable
Source: UNCTAD; Axis Group Analysis
Africa’s Historical GDP at Constant Prices (USD bn, 2000-2017)
0
500
1,000
1,500
2,000
2,500
2000
2001
2002
2003
2004
2005
2006
2007
2008
2009
2010
2011
2012
2013
2014
2015
2016
2017
Rest of AfricaMoroccoAngolaAlgeriaEgyptSouth AfricaNigeria
Top 6
countries:
70%
0
2,500
5,000
7,500
10,000
12,500
2000
2001
2002
2003
2004
2005
2006
2007
2008
2009
2010
2011
2012
2013
2014
2015
2016
2017
9%
4%
Between 2000 and 2017, Africa’s GDP at constant prices increased at an average rate of 4% per year; China’s increased at 9% per year. Africa’s growth was, in large part, fueled by China’s rapid growth and resource consumption (correlation and causality)
17-year CAGRCAGR

18
China’s Provincial GDP Spread (2018)
Source: National Bureau of Statistics of China; IMF; Axis Group Analysis
African Countries’ GDP Spread (2018)
Much of China’s economic activity remains concentrated along its coastline. While economic prosperity in Africa is distributed across its different regions, all of its most prosperous areas have access to maritime trade, similar to China
USD 100bn or more
USD 25bn-USD100bn
USD 10bn-USD 25bn
Less than USD 10bn
Nigeria
397bn
Morocco
118bn
Algeria
188bn Egypt
249bn
Angola
114bn
SA
377bn
USD 1,000bn or more
USD 500bn-USD1,000bn
USD 250bn-USD 500bn
Less than USD 250bn
Guangdong
1,439bn
Jiangsu
1,370bn
Shandong
1,131bn
Zhejiang
820bn
Henan
711bn

19Source: Various; Axis Group Analysis
Multi-lateral and Bi-lateral Membership of both China and African countries
B&R FOCACBRICSAIIB
• The Belt & Road (B&R) initiative opens
considerable potential in economic,
political and cultural areas
• China to expand market reach, foothold
• The large infrastructure requirement in
Asia, coupled with many Asian countries’
inability to meet these requirements, has
driven the emergence of the AIIB
• The importance of the BRICS economies
has grown tremendously – this trend is
being supported by new institutions, such
as the New Development Bank
• FOCAC is a strategic mechanism for
cooperation between China and Africa - it
must be seen strategically in this horizon
and beyond
G20 WTOUNSouth-South
Cooperation
• International forum for some of the world’s
largest and most powerful economies
• South Africa is the only African G20
member
• It is a framework of collaboration among
countries of the global South in the
political, economic, social, cultural,
environmental and technical domains
• The UN is an intergovernmental
organization that seeks to promote
international cooperation and enables
governmental dialogue
• The WTO deals with the global rules of
trade between nations. It is a forum for
governments to negotiate trade
agreements and settle trade disputes
Initiated/led by PRC

20
AIIB BRICS/NDB FOCAC New Silk Road Fund
Year
FoundedMarch 2015 July 2014 October 2000 September 2013
Type of
Organisation
New Asian multilateral
organisation in the ‘Asian century’,
initiated by China, but attracting
most major powers worldwide,
including European nations
The five BRICS governments
(Brazil, Russia, India, China, and
South Africa) have developed an
important platform for cooperation
among emerging markets and
developing countries
Conference established for
strengthening cooperation
between China and African states,
and to seek common economic
development
A suite of joint investment projects
and regional trade blocs with the
potential to bring economic growth
and stability to all countries
involved
Members64 countries worldwide, including
numerous Western nations
Brazil, Russia, India, China, and
South Africa
China, 50 African states and the
Commission of the African UnionState-owned entity
Key
Objectives
- Asian countries seeking funds
for infrastructure development
- China wishes to bridge that
gap by investing its funds
- Constructive agenda for co-
operation (donors & recipients)
- Mobilisation of resources for
infrastructure and other
sustainable development
projects
- Currency pool to combat
currency crises
- Establish a development bank
- Equal consultation
- Enhancing understanding
- Expanding consensus
- Strengthening friendship
- Promoting cooperation
- Policy coordination
- Infrastructure connectivity
- Unimpeded trade
- Financing for B&R-related
energy and transportation
projects across Eurasia
Key Details for AIIB, BRICS/NDB, FOCAC and the New Silk Road Fund
Source: Various; Axis Group Analysis
China is pursuing an ambitious global strategy with various international initiatives. There are various platforms / organisations launched around the world to serve its goals and objectives

21
40%
65%
30%
25%
Duisburg
Beijing
Xi’anLanzhou
Urumqi
KhorgasAlmaty
BishkekSamarkand
DushanbeTehran
Moscow
Istanbul
Rotterdam
Venice
Athens
Nairobi
Colombo
Kolkata
Jakarta
Kuala Lumpur
HanoiBeihai
Haikou
Fuzhou
QuanzhouGuangzhou
Zhanjiang
Source: Reuters; Various; Axis Group Analysis
The Belt and Road Initiative has an impact on social, political and economic relations between Africa and China – with the potential to open up new opportunities in various areas of business
Footprint and Characteristics of Belt and Road Countries
Maritime Silk Road
Silk Road Economic Belt
• Trade between China and NSR to
surpass USD 2.5tn in a decade
• >900 planned cooperation projects
with more than USD 890bn in
investments
• 65% of the world population, 40%
of the world GDP
New Silk Road
China has also announced that the China-
Pakistan Economic Corridor (CPEC) and the
Bangladesh–China–India–Myanmar Forum
for Regional Cooperation (BCIM) will be
closely associated with the New Silk Road
Share of Global GDP
Share of China’s OFDI
Share of Global Population
Share of China’s Trade

22
In recent years, the focus of BRICS has gradually expanded from working towards mutual benefit via financial and ICT cooperation to addressing issues related to global security and international political economy
Source: New Development Bank; Various; Axis Group Analysis
2011
3
2012
4
2018
10
2009
1
2010
2
2013
5
2014 2015 2016 2017
6 7 8 9
• First BRIC summit takes place in
the aftermath of the global
financial crisis, with focus on
improving global economic
situation
• Need for a global reserve
currency is discussed
• SA then-president Jacob Zuma
attends the second BRIC summit
as a guest. SA was in the
process of applying for formal
admission to BRIC at this time
First BRICS summit with SA
• SA joins as a new member. The
group adds ‘S’ at the end for
South Africa, changing the
group’s name to BRICS
The Delhi Declaration
• BRICS members agree on key
focus initiative to establish a
development bank
• BRICS contingent reserve
agreement
• Discussions towards creating the
new multilateral development
bank dominate much of the
discussion in the 5th annual
BRICS summit
NDB Established
• Member countries sign the
agreement outlining the creation
of the New Development Bank,
endowed with USD100bn in
authorized capital
• NDB formally enters into force at
the 7th annual BRICS summit.
• Members discuss opening up
each other’s ICT markets to one
another, in an effort to challenge
the US monopoly in the sector
• Specific priorities of infrastructure
projects for the NDB to provide
funding are discussed.
• Member nations also agreed on
cooperation within IP rights and
the digital economy
Xiamen Declaration
• Member countries agree to
cooperate on issues relating to
terrorism and global security.
This was especially significant for
China-India relations, as it eased
border tensions a bit
• Theme: Collaboration for Inclusive Growth and Shared Prosperity in the 4th Industrial
Revolution
• Key topics: Global Governance and Security, intra-BRICS trade, and shared prosperity
among members with regards to 4th industrial revolution
• The Johannesburg Declaration: Member nations agree to create “broad counter-terrorism
coalition.” In addition, a “Roadmap” on cooperation within ICT sector was signed, citing
security concerns
BRICS refers to the partnership of five nations — Brazil, Russia, India, China, and South
Africa — which have agreed to cooperate on number of issues, ranging from geopolitics,
infrastructure and development finance to national security. The original group (calling
itself ‘BRIC’) did not include South Africa, but recognized South Africa’s membership in
2011. BRICS is known for its New Development Bank (NDB) which provides financing for
a range of infrastructure and energy projects
Background of BRICS (2009 – Present) 2018 BRICS Summit, Johannesburg
Fortaleza XiamenBenaulim JohannesburgDurbanYekaterinburg Brasilia New Delhi UfaSanya

23
The Forum on China-Africa Cooperation (FOCAC) is a strategic mechanism for collaboration between China and Africa – must be seen strategically in this horizon and beyond Key Developments at Past FOCAC Meetings
Source: FOCAC; Axis Group Analysis
2000 (1st Ministerial
Conference)
2003 (2nd Ministerial
Conference)
2006 (3rd Ministerial
Conference)
2009 (4th Ministerial
Conference)
2012 (5th Ministerial
Conference)
Location Key Developments/Planned Agenda
- USD 20bn to assist with infrastructure & agricultural development
- A series of new measures to support Africa's development in investment and financing,
assistance, integration, non-government exchanges and security
- USD 10bn committed towards measures covering agriculture, environmental protection,,
investment, market access expansion, etc.
- Measures to strengthen cooperation to support development in Africa, including increased
assistance, provision of preferential loans, establishment of the China-Africa Development
Fund (CADFund), etc.
- Adoption of Beijing Declaration of the FOCAC
- Exemption of RMB 10bn of debts by China of heavily indebted countries
- Establishment of the Human Resources Development Fund for Africa
- China pledged to train 10,000 African professionals in various fields
- Zero-tariff treatment of selected exports to China by some African countries
Beijing
Addis Ababa
Beijing
Sharm el-Sheikh
Beijing
2015 (6th Ministerial
Conference)
- Infrastructure development from AIIB and New Development Bank
- Improving Africa’s healthcare system – post Ebola
- Increased focus on security, stabilisation and conflict resolution in Africa
Johannesburg
2018 (7th Ministerial
Conference)
- Aid in development of agriculture, water conservation for Africa
- USD 10bn towards industrial capacity cooperation
- China direct investment in Africa to increase to USD 100bn by 2020
Beijing

24
At the 2018 Beijing Summit and the 7th Ministerial Conference of FOCAC, China announced significant efforts in re-branding its relationship with Africa
Source: FOCAC; Axis Group Analysis
President Xi Detailed the 8 Major Initiatives Announced at FOCAC 2018
In trade and investment, and agriculture; building and upgrading selected economic and trade cooperation
zones in AfricaIndustrial Promotion
1
Trade Facilitation3
Green Development4
Capacity Building5
Infrastructure Connectivity2
Health Care6
People-to-people
Exchange
7
Peace and Security8
China will support African countries in making better use of financing resources such as the AIIB, NDB and the
SRF, etc.
Increasing non-resource product imports from Africa; marketing activities for Chinese and African products
etc.
50 exchange and cooperation projects linked to climate change, environment and wildlife protection etc.
Setting up 10 vocational training workshops; providing Africans government scholarships, training
opportunities etc.
Upgrading 50 medical and health aid programs and China-Africa Friendship Hospitals; training medical
specialists
China will establish an Institute of African Studies; the China-Africa Joint Research and Exchange Plan will
be upgraded etc.
Setting up of a China-Africa peace and security fund; China to continue providing military aid to the African
Union etc.

25
35
5
5
5
10
Preferential andconcessional loans
Grants and interest-freeloans
China-AfricaDevelopment Fund
Special loan fordevelopment of AfricanSME's
China-Africa productioncapacity co-operationfund
First USD 60bn Pledged to Africa at FOCAC 2015
15
2010
5
10
Grants, interest-free loansand concessional loans
Credit lines
Special fund fordevelopment financing
Special fund for financingimports from Africa
Investment over next threeyears
Source: Mail & Guardian; Axis Group Analysis
Second USD 60bn Pledged to Africa at FOCAC 2018
At FOCAC 2015, China pledged USD 60bn in financing to Africa. At FOCAC 2018, the Chinese government will be providing an additional USD 50bn, with Chinese companies investing USD 10bn

Other Recent Research & Publications
by Axis Group - Please contact us for
access to i.e.:
1. Asian Export Guide – What to export
to Asian economies and how to
succeed?
2. China Export Guide – What to export
to China and how to succeed?
3. 20 Years of SA-China Diplomatic ties
– Looking ahead at the next phase of
economic and business relations
26
Agenda
1. Foreword
2. Feature: Chinese Engagements and Activities in Africa
– China-Africa Overview
– China’s Trade with Africa
– China’s Financial Engagement with Africa
– China’s Role in Africa’s Infrastructure Development
– South Africa-China Focus
3. China Profile, Facts and Figures
4. China in the World
5. Conclusions, Implications and Recommendations
6. About Axis Group

27
5 8 16
21 29
36
56
43
67
93
113 117 116
70
57
76
7 10 1419
27
37
51 48
60
73
8593
106 108
92 95
120
80
40
0
40
80
120
2002 2003 2004 2005 2006 2007 2008 2009 2010 2011 2012 2013 2014 2015 2016 2017
China's Imports from Africa China's Exports to Africa
Total Africa-China Trade in Goods (USD bn, 2002-2017)
19%
19%
Decline in imports primarily due to
drop in crude oil and gold prices,
which are the top two biggest
imports from Africa
Note: 1. Trade data is using China reported data
2. Africa includes 54 African countries based on UN
Source: UN Comtrade; Axis Group Analysis
China’s trade with Africa has grown at an accelerated rate since the turn of the century, reaching its peak in 2014 at USD 221bn. This growth has been in conjunction with burgeoning industrialisation, an export-led growth policy in China, and a rapidly growing African market
CAGR

28
Africa’s Total Exports to China by Sector (USD bn, 2017)
0
500
1,000
1,500
2,000
2,500
3,000
3,500
4,000
Sou
th A
fric
a
Ang
ola
Rep
ublic
of C
ongo
DR
Con
go
Zam
bia
Gab
on
Gha
na
Nig
eria
Equ
ator
ial G
uine
a
Gui
nea
Liby
a
Egy
pt
Sou
th S
udan
Zim
babw
e
Mau
ritan
ia
Mor
occo
Sud
an
Moz
ambi
que
Cam
eroo
n
Alg
eria
Eth
iopi
a
Sie
rra
Leon
e
Tan
zani
a
Nam
ibia
Cha
d
Mad
agas
car
Tun
isia
Erit
rea
Ken
ya
Côt
e d’
Ivoi
re
Sen
egal
Nig
er
The
Gam
bia
Ben
in
Tog
o
Mal
i
Bot
swan
a
Uga
nda
Libe
ria
Rw
anda
Cen
tral
Afr
ican
Rep
ublic
Mal
awi
Leso
tho
Mau
ritiu
s
Bur
kina
Fas
o
Som
alia
Bur
undi
Sw
azila
nd
Gui
nea-
Bis
sau
Sey
chel
les
Com
oros
Djib
outi
Cab
o V
erde
São
Tom
é an
d P
rínc
ipe
34.8
34.1
5.0
0.9 0.7 0.3
Fuels
Metals & Minerals
Agriculture & Forestry
Textiles, Hides and Skins
Chemicals & Plastics
Machinery & Electronics
Others
Africa’s Total Exports to China by Country (USD mn, 2017)
24,389Top 15 countries’ exports to China
account for approximately 84% of total
African exports to China
20,699
China’s Import Boom:
- China imported USD 1.8tn in total
- China’s imports to increase to USD
8tn in the next 5 years
- African exporters must position
themselves to claim a share of this
growth
Note: Trade data is using China reported data
Source: UN Comtrade; Axis Group Analysis
Africa’s overall exports to China are made up of raw materials (metals & minerals, and fuels), and is led by South Africa and Angola

29
0
1,000
2,000
3,000
4,000
5,000
6,000
7,000
8,000
9,000
10,000
Sou
th A
fric
a
Nig
eria
Egy
pt
Alg
eria
Ken
ya
Gha
na
Mor
occo
Tan
zani
a
Eth
iopi
a
Ang
ola
Sud
an
Djib
outi
Libe
ria
Sen
egal
Ben
in
Tog
o
Côt
e d’
Ivoi
re
Cam
eroo
n
Tun
isia
Moz
ambi
que
Gui
nea
Liby
a
Mad
agas
car
DR
Con
go
Rep
ublic
of C
ongo
Mau
ritan
ia
Uga
nda
Mau
ritiu
s
Zam
bia
Som
alia
Gab
on
Zim
babw
e
The
Gam
bia
Mal
i
Nam
ibia
Mal
awi
Sie
rra
Leon
e
Bot
swan
a
Bur
kina
Fas
o
Equ
ator
ial G
uine
a
Rw
anda
Cha
d
Nig
er
Cab
o V
erde
Com
oros
Leso
tho
Sou
th S
udan
Sey
chel
les
Bur
undi
Erit
rea
Sw
azila
nd
Gui
nea-
Bis
sau
Cen
tral
Afr
ican
Rep
ublic
São
Tom
é an
d P
rínc
ipe
26.6
20.0
0.9
11.6
7.8
15.6
4.8
12.7Machinery & Electronics
Textiles, Hides and Skins
Metals & Minerals
Chemicals & Plastics
Transportation
Agriculture & Forestry
Fuels
Others
Africa’s Total Imports from China by Country (USD mn, 2017)
Africa’s Total Imports from China by Sector (USD bn, 2017)14,809
Top 5 countries’ imports from China
account for 51% of total African
imports from China
Top 23 countries’ imports from China
(greater than USD 1bn) account for
90% of total African imports from
China
Note: Trade data is using China reported data
Source: UN Comtrade; Axis Group Analysis
Africa’s overall imports from China are diverse, but are dominated by two major sectors: machinery and textiles. The three top importers are South Africa, Nigeria, and Egypt respectively
12,153

30
20,000
15,000
10,000
5,000
0
5,000
10,000
15,000
20,000
Sou
th A
fric
aA
ngol
aE
gypt
Nig
eria
Alg
eria
Balance of Trade Between African Countries and China (USD mn, 2017)1
1. Figures to the UN reported by each respective country
Source: UN Comtrade; Axis Group Analysis
Africa’s total trade with China was USD 171bn in 2017, 7.8% of its GDP. As a whole, the continent ran a trade deficit of USD 19bn with China
31% of African countries ran a
trade surplus with China in 2017.
Angola was the highest at USD
18.4.bn
Exports to
China
Imports
from China
5,500
4,500
3,500
2,500
1,500
500
500
1,500
2,500
3,500
4,500
Gha
naK
enya
Tan
zani
aE
thio
pia
Mor
occo
DR
Con
goR
epub
lic o
f Con
goZ
ambi
aS
udan
Sen
egal
Djib
outi
Ben
inT
ogo
Cam
eroo
nG
abon
Moz
ambi
que
Gui
nea
Côt
e d’
Ivoi
reLi
beria
Mau
ritan
iaLi
bya
Sou
th S
udan
Tun
isia
Zim
babw
eM
adag
asca
r 1,000
500
0
500
1,000
1,500
2,000
Uga
nda
Equ
ator
ial G
uine
a
Mau
ritiu
s
Sie
rra
Leon
e
Mal
i
Nam
ibia
The
Gam
bia
Som
alia
Bot
swan
a
Mal
awi
Erit
rea
Nig
er
Cha
d
Bur
kina
Fas
o
Rw
anda
80
60
40
20
0
20
40
Leso
tho
Sey
chel
les
Cab
o V
erde
Com
oros
Bur
undi
CA
P
Sw
azila
nd
Gui
nea-
Bis
sau
ST
and
P
24,388
Djibouti’s trade deficit with
China of USD 2.1bn exceeds
its GDP
Some smaller African
nations have little or no
exports to ChinaEquatorial Guinea only traded
USD 1.6 bn worth of goods with
China in 2017, of which it had a
trade surplus of USD 1.3 bn
Trade Balance20,698

31
Value of China-Africa trade has grown significantly over the past two decades, but composition of China’s imports from Africa has remained largely concentrated in primary products, while exports to the continent tend to be value-added products
80
60
40
20
0
20
40
60
80
100
120
2017201620152014201320122011201020092008200720062005200420032002
Agriculture & Forestry
Metals & Minerals
Chemicals & Plastics
Textiles, Hides and Skins
Transportation
Machinery & Electronics
Fuels
Others
Balance
China’s
Imports from
Africa
China’s
Exports to
Africa
Sectorial Breakdown of Imports and Exports between China and Sub-Saharan Africa1 (USD mn, 2002-2017)
19.7%
19.2%
2015’s decrease in imports was caused mostly
by 99% drop in goods classified by the World
Bank as ‘miscellaneous’
Narrowing of trade in 2009 mirrors
global trend in trade for that year due to
the global financial crisis
1. World Bank trade statistics only has Sub-Saharan Africa as a region, with sectorial trade data breakdown
Source: WITS; Axis Group Analysis
CAGR

32
The results of free trade zones in African countries have been highly varied, with commitment by government and policy consistency cited as core determinants of success
Special Economic Zones (SEZ) in Africa
Country Name of ZoneArea
(ha)Incentives
No. of
Firms1 Success2
Egypt
TEDA Suez
Economic and
Trade Cooperation
Zone
600
Prime location, tax relief, bonded
warehousing and
comprehensive logistics
infrastructure
58 High
EthiopiaEastern Industrial
Zone200
Extensive tax and duty
exemptions, streamlined
government services27 High
Zambia
China-Zambia
Economic and
Trade Cooperation
Zone
1,158Tax exemption on dividends for
five years from the year of first
declaration of dividends; 0%
corporate tax for five years from
the first year profits are made
38Medium/
Low
520 10Medium/
Low
Mauritius
Jinfei Economic and
Trade Cooperation
Zone
352Tax exemptions and raw
material import tariff waiver- Low
NigeriaLekki Free Trade
Zone3,000
Halved corporate and local
income tax rate, inexpensive
land and facility use21 Low
NigeriaOgun-Guangdong
Free Trade Zone250
VAT waiver, customs
streamlining, reduced corporate
and income tax16 Low
DjiboutiDjibouti International
Free Trade Zone4,800
The initial USD 370mn, 240-hectare pilot phase consists of
four industrial clusters which will focus on trade and logistics,
export processing, business and financial support services, as
well as manufacturing and duty-free merchandise retail1. No. of Firms refers to the number of companies that have signed lease agreements in the zone
2. Efficiency is based on whether the zone has been able to generate an abundance of business activity
Source: Various; Axis Group Analysis
Tanzania
Kenya
Angola
South
Africa
Democratic
Republic
of Congo
Zambia
Mauritania
Algeria
Ethiopia
Sudan
Nigeria
Chad
Mali
Namibia
Niger
Libya
South
Sudan
Egypt
Botswana
Zimbabwe
Description of African SEZ in Cooperation with China
Senegal
Guinea
Sierra LeoneLiberia
Cote
D’Ivoire
Tunisia
Eritrea
DjiboutiBurkina
Faso
Gha
na
Gabon
Malawi
RwandaBurundi
C.A.R.
Gambia
Guinea-
Bissau
Togo Benin
Lesotho
Swaziland
Equatorial Guinea
Sao Tome
& Principe
Cabo
Verde
Seychelles
Comoros
MauritiusNumber of SEZ in operation
and under development
0
1-5
6-10
More than 10
African SEZ in Cooperation
with China

33
Trade Frameworks / Agreements between China and Africa
Multilateral Frameworks
Bilateral Frameworks
1
2
• Since 2011, the Chinese government has signed Framework Agreements on Economic and Trade Cooperation with
both the East African Community (EAC) and the Economic Community of West African States (ECOWAS)
• The frameworks look to expand cooperation in promoting trade facilitation, direct investment, cross-border
infrastructure construction and development aid
• China had been negotiating the establishment of a free trade agreement with EAC since 2016
• Recently, China and the Southern African Customs Union (SACU) have been negotiating a Free Trade Agreement
• Kenya declined to sign the China-EAC free trade agreement in 2018 on the grounds that this would threaten its fragile
manufacturing sector
• Thus far, there’s no free trade agreements between any African countries or communities / blocs with China. However,
there are some African countries in advanced discussions with China about Free Trade Agreements
• There are several bilateral trade agreements or frameworks existing between China and several African countries, such
as Malawi, Nigeria, and Kenya
• Mauritius looks set to become the first African country to sign an FTA with China after months of negotiations
• At FOCAC 2018, minister-level officials from both sides signed a memorandum of understanding around the conclusion
of FTA negotiations
DevelopmentsSubject
Source: Various; Axis Group Analysis

Other Recent Research & Publications
by Axis Group - Please contact us for
access to i.e.:
1. Asian Export Guide – What to export
to Asian economies and how to
succeed?
2. China Export Guide – What to export
to China and how to succeed?
3. 20 Years of SA-China Diplomatic ties
– Looking ahead at the next phase of
economic and business relations
34
Agenda
1. Foreword
2. Feature: Chinese Engagements and Activities in Africa
– China-Africa Overview
– China’s Trade with Africa
– China’s Financial Engagement with Africa
– China’s Role in Africa’s Infrastructure Development
– South Africa-China Focus
3. China Profile, Facts and Figures
4. China in the World
5. Conclusions, Implications and Recommendations
6. About Axis Group

35Source: UNCTAD; MOFCOM; Axis Group Analysis
China’s OFDI Stock in Africa by Industry (USD bn, 2017)
China’s OFDI into Africa has been increasing rapidly over time and is primarily
channeled towards the construction, transport, manufacturing, mining and finance
sectors
2.64.5
7.89.3
13.0
16.2
21.7
26.2
32.434.7
39.9
43.3
0.5 1.65.5 1.4 2.1
3.2 2.5 3.4 3.2 3.0 2.44.1
0
5
10
15
20
25
30
35
40
45
2006 2007 2008 2009 2010 2011 2012 2013 2014 2015 2016 2017
Stock Flow
China’s OFDI Stock and Flow in Africa (USD bn, 2006-2017)
12.88
9.766.08
5.71
2.31
6.59
Construction Mining
Finance Manufacturing
Leasing and Business Services Others

36
Global and China’s OFDI Flow to Africa (USD bn, 2011-2016)
Source: National Bureau of Statistics; MOFCOM; Axis Group Analysis
In 2016, China’s OFDI flow into Africa accounted for less than 3% of global OFDI flow into Africa. However, its OFDI stock in Africa ranked 4th among all investor economies in Africa
0 20 40 60
United States
United kingdom
France
China
South Africa
Italy
Singapore
India
Hong Kong, China
Switzerland
2016 2011
Top 10 Investor Economies in Africa by OFDI Stock (USD bn, 2011 & 2016)
0
20
40
60
80
100
2011 2012 2013 2014 2015 2016
Global OFDI Flow to Africa China's OFDI Flow to Africa
In 2017, China’s OFDI flow
into Africa increased by
71% from 2016

37
0
100
200
300
400
500
600
700
Ang
ola
Ken
ya
DR
C
Sou
th A
fric
a
Zam
bia
Gui
nea-
Bis
sau
Con
go
Sud
an
Eth
iopi
a
Nig
eria
Source: MOFCOM; Axis Group Analysis
In 2017, China’s total OFDI flow into Africa was USD 4.1bn. As of 2017, South Africa holds the largest amount of China’s OFDI stock in Africa
China’s OFDI Flow to Africa by Country (USD mn, 2017)
China’s OFDI Stock in Africa by Country (USD bn, 2017)
0
1
2
3
4
5
6
7
8
Sou
th A
fric
a
DR
C
Zam
bia
Nig
eria
Ang
ola
Eth
iopi
a
Alg
eria
Zim
babw
e
Gha
na
Ken
ya
China’s OFDI in Africa is concentrated in
a number of resources-rich countries

38
0
5
10
15
20
25
30
35
40
45
50
Ang
ola
Eth
iopi
a
Ken
ya
Rep
. of C
ongo
Sud
an
Zam
bia
Cam
eroo
n
Nig
eria
Sou
th A
fric
a
Gha
na
DR
C
Egy
pt
Uga
nda
Cot
e d'
Ivoi
re
Tan
zani
a
0
5
10
15
20
25
30
35
2002
2003
2004
2005
2006
2007
2008
2009
2010
2011
2012
2013
2014
2015
2016
2017
Chinese Loans to Africa (USD bn, 2002-2017) Top 15 Destinations of Chinese Loans to Africa (USD bn, 2010-2017)
China’s role in Africa is more of a contractor and builder than a financier. Providing an alternative to loans with rigid conditions, China has promoted development in a diverse range of African countries through the provision of credit
Source: SAIS-CARI; Axis Group Analysis
39
Annual Sum of Chinese Loans to African States (USD bn, 2003-2017)
Source: UN Comtrade; China-Africa Research Initiative (CARI); Axis Group Analysis
Sectorial Composition of Chinese Loans to Africa (USD bn, 2017)
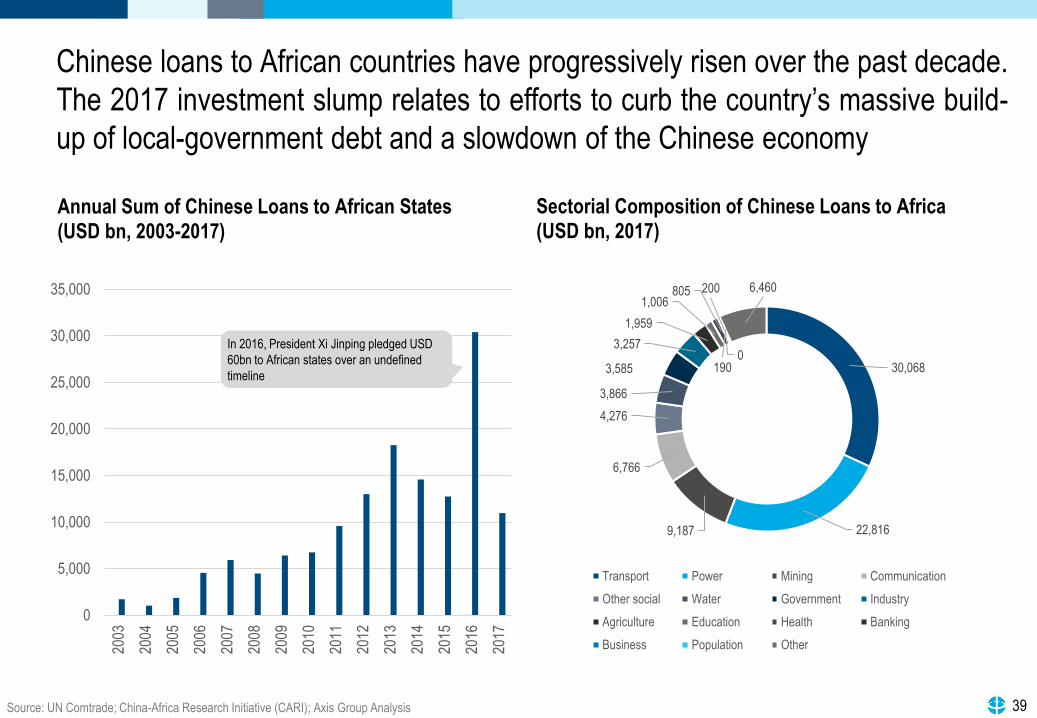
Chinese loans to African countries have progressively risen over the past decade.
The 2017 investment slump relates to efforts to curb the country’s massive build-
up of local-government debt and a slowdown of the Chinese economy
30,068
22,8169,187
6,766
4,276
3,866
3,585
3,257
1,959
1,006805 200
1900
6,460
Transport Power Mining Communication
Other social Water Government Industry
Agriculture Education Health Banking
Business Population Other
0
5,000
10,000
15,000
20,000
25,000
30,000
35,000
2003
2004
2005
2006
2007
2008
2009
2010
2011
2012
2013
2014
2015
2016
2017
In 2016, President Xi Jinping pledged USD
60bn to African states over an undefined
timeline

40
Institution Africa Role / Description
EXIM Bank of China
The vast majority of infrastructure financing arrangements done by
China in the African continent are financed by the China EXIM Bank,
which (like any trade bank) is devoted primarily to providing export
sellers’ and buyers’ credits to support the trade of Chinese goods
Industrial and
Commercial Bank of
China
ICBC bought a 20 percent share of South Africa’s Standard Bank for
USD 5.1bn in 2007. Standard Bank’s impressive access to the African
market, backed by Chinese capital is set to transform the continent as
Chinese acquisitions expand and accelerate
Bank of China
Committing itself to providing high-quality bespoke financial services
and actively developing Renminbi Internationalization throughout the
African continent
China Construction
Bank
The business targets clients in the integrated energy, communication,
mining, financial services, trading, logistics, manufacturing and media
industries in 47 countries across the sub-Saharan region
CADFund
Its mission is to support African countries’ agriculture, manufacturing,
and energy sectors development; to expand transportation and
telecommunications networks; and to promote the pace of urban
infrastructure, resource extraction and the establishment of trade
zones, or Chinese business centers, in Africa
China UnionPay
By 2013, UnionPay credit cards were enabled for use with ATMs in
more than 40 African countries, though the cards were all issued in
China
Chinese Financial Institutions with Large African Presences
.
Source: Various; Axis Group Analysis
Chinese Financial Institutions with Large African Presences
Chinese financial institutions have established their branches within coastal countries in Africa and provide regional services, with South Africa being a prime choice
EXIM Bank of China
Industrial and Commercial
Bank of China
Bank of China
China Construction Bank
CADFund
China UnionPay

41
The energy sector in Africa is one of the largest recipients of credit from China.
The credit is primarily dispensed through Chinese policy banks. Loans to the
continent are highly concentrated among the top 6 recipients
China’s Main Lenders – Energy Sector
Source: Boston University Global Policy Development Centre; Axis Group Analysis
Regional Distribution of Chinese Energy Sector Lending (USD bn, 2000-2017)
Export-Import Bank of China:
• EXIM Bank is one of China’s primary
policy banks
• Has lent USD 70.3bn in overseas
development finance in the energy
sector since 2000
• Co-financed projects worth USD
28.1bn with the Chinese
Development Bank
Loans since 2000:
USD 70.3bn
Loans since 2000:
USD 127.4bn
• CDB is the main institution responsible
for funding the Chinese national
government’s developmental
objectives
• Has lent USD 127.4bn in overseas
development finance in the energy
sector since 2000
Chinese Development Bank:
8.9
6.6
2.6 2.1 2 1.6
11
0
2
4
6
8
10
12
Angola Nigeria Zambia Uganda SouthAfrica
Sudan Rest ofAfrica
Total: USD 34.8bn
Top 6 loan recipients
receive USD 23.8bn,
almost 70% of the total
Loans to Africa’s Energy Sector (USD bn, 2000-2017)
68.7
61.9
60.3
34.8
Europe/CentralAsiaLatin America
Asia
Africa
Country Loan Value
Russia 42.7
Brazil 39.3
Pakistan 24.8
Angola 8.9
India 7.7
Top 5 Energy Sector Loan
Recipients (USD bn)

Other Recent Research & Publications
by Axis Group - Please contact us for
access to i.e.:
1. Asian Export Guide – What to export
to Asian economies and how to
succeed?
2. China Export Guide – What to export
to China and how to succeed?
3. 20 Years of SA-China Diplomatic ties
– Looking ahead at the next phase of
economic and business relations
42
Agenda
1. Foreword
2. Feature: Chinese Engagements and Activities in Africa
– China-Africa Overview
– China’s Trade with Africa
– China’s Financial Engagement with Africa
– China’s Role in Africa’s Infrastructure Development
– South Africa-China Focus
3. China Profile, Facts and Figures
4. China in the World
5. Conclusions, Implications and Recommendations
6. About Axis Group

43
23.7
13.9
7.66.96.3
5.3
4.8
3.9
27.6
China
Spain
France
US
Germany
South Korea
Turkey
Italy
Others
48
11
11
13
14
43
46
64
0 10 20 30 40 50 60 70 80
All Others
Spain
South Korea
Japan
Italy
US
Turkey
China
International Revenue Percentage Share (%, 2017)
Note: *ENR’s list of top 250 international contractors is based on contractor’s total overseas revenue collected in the previous year (2016)
Source: ENR; Axis Group Analysis
Although revenues generated by the top 250 international contractors outside their home countries decreased between 2015 and 2017, Chinese companies continue to dominate this market, when compared with other major global players
Number of Contractors
Nationality of Top 250 International Contractors* (2018)

44
China has become the top international contractor in Africa with Chinese contractors claiming a 52% share of the USD 74.5bn in revenues from these activities. China’s ‘Going out Policy’ has underpinned a rapidly increased Chinese presence in Africa over the last decadeInternational Contracted Revenue in Africa1 (USD mn, 2007-2018)
1. The revenue figures are for the previous calendar year
Source: ENR; Axis Group Analysis
Africa Total
56,812
50,885
28,595
17,911
60,592
0 10 20 30 40 50 60 70 80
2007
2008
2009
2010
2011
2012
2013
2014
2015
2016
2017
2018
China
Italy
France
US
Other
38.7%
45.2%
38.7%
39.0%
29.1%
48.7%
40.1%
49.4%
29.3%
60,590
58,149
62,236
70,950
54.8%64,515
12.9% CAGR
52.2%
52.2%74,450
70,410

45
Chinese contractor activity in Africa is highly concentrated in a few resource-rich economies as well as geo-strategic partners of China
Revenue of Chinese Contractors in Africa, Top 30 Countries (USD mn, 2014)
Source: China Statistical Yearbook 2015; Axis Group Analysis
0
1,000
2,000
3,000
4,000
5,000
6,000
7,000
8,000
Eth
iopi
a
Ang
ola
Alg
eria
Nig
eria
Rep
. of C
ongo
Eq.
Gui
nea
Tan
zani
a
Zam
bia
Sud
an
Ken
ya
Gha
na
DR
C
Cam
eroo
n
Uga
nda
Cha
d
Egy
pt
Nig
er
Moz
ambi
que
Gab
on
Mor
occo
Sou
th A
fric
a
Djib
outi
Nam
ibia
Sen
egal
Cot
e d'
lvoi
re
Mal
i
Zim
babw
e
Mau
ritan
ia
Bot
swan
a
Top 6: Mostly oil and gas-related
economies; USD 28.7bn or 40% of total
Rank 7 to 17: Oil and minerals-related
economies; USD 15.9bn or 22% of total
Rank 18 to 30: Diverse minor players;
USD 5.3bn or 7.5% of total

46Source: Various; Axis Group Analysis
Chinese companies have invested in infrastructure projects across the African continent and in diverse areas – cities, ports, railways, power, etc. (1/2)
No. Project Company Years StatusValue
(USD)Location Financiers Notes
1
Algeria East-
West
Highway
China Railway
Construction
Corporation,
CITIC
2009- Ongoing 6.0bn AlgeriaGovt. of
Algeria
Chinese
companies are
building the
central &
western sections
2
Central
Business
District of
Egypt’s new
capital
China State
Construction
Engineering
Corporation
2018- Ongoing 3.0bn Egypt
Chinese
banks
(85%)
The new capital
is a mega
project worth
USD 45bn
3
Mambila
Hydroelectric
Power Project
JV of China
Civil
Engineering
Construction
Corporation
2017- Approved 5.8bn Nigeria
EXIM Bank
of China
(85%)
Will help Nigeria
fulfil its
commitment
under the Paris
Agreement
4
Lagos-
Calabar
Coastal
Railway
China Civil
Engineering
Construction
Corporation
2018- Proposed 11.0bn Nigeria
EXIM Bank
of China
(85%)
Financing is yet
to be approved
in the National
Assembly
5
Addis Ababa-
Djibouti
Railway
China Railway
Group, CRCC
2011-
2017Opened 4.5bn
Ethiopia,
Djibouti
EXIM Bank
of China,
CDB, ICBC
90% of
Ethiopia’s trade
passes through
Djibouti
10 Significant Chinese Infrastructure Projects in Africa and their Locations
Highlights of these 10 Significant Chinese Infrastructure Projects in Africa (1/2)
12
53
4
Algeria
Egypt
Ethiopia
Djibouti
Nigeria

47Source: Various; Axis Group Analysis
No. Project Company Years StatusValue
(USD)Location Financiers Notes
6Garissa Solar
Power StationChina Jiangxi 2016- Ongoing 135mn Kenya
EXIM Bank
of China
Will power
about 625,000
homes on
completion
7
Mombasa-
Nairobi
Standard
Gauge Railway
China Road
and Bridge
Corporation
2014-
2017Opened 3.6bn Kenya
EXIM Bank
of China
(90%)
Largest
infrastructure
project in Kenya
since its
independence
8 Bagamoyo Port
China
Merchants
Group
2018- Approved 11.0bn Tanzania
CMPHC,
Sovereign
Wealth fund
of Oman
Will become the
largest port in
East Africa on
completion
9 Lobito-Luau
Railway
China Railway
Construction
Corporation
2006-
2014Opened 1.8bn Angola
China
International
Fund
Part of an
ambitious plan
to connect the
Atlantic & Indian
oceans by rail
10Modderfontein
New CityZendai Group 2015- Ongoing 8.0bn
South
Africa
Zendai
Group
A new urban
district located
20 km from
Johannesburg
10 Significant Chinese Infrastructure Projects in Africa and their Locations
Chinese companies have invested in infrastructure projects across the African continent and in diverse areas – cities, ports, railways, power, etc. (2/2)
6
8
9
10
7
Highlights of these 10 Significant Chinese Infrastructure Projects in Africa (2/2)
South Africa
Angola
Kenya
Tanzania

48
Uganda
Mozambique
Liberia
Mali
Cote
D’Ivoire
Sudan
Ethiopia
Kenya
Tanzania
Angola
Republic of
Congo
GhanaNigeria
Zambia
Zimbabwe Madagascar
Democratic
Republic
of Congo
Cameroon
Power Generation Capacity
Hydro Solar Wind
Biomass Gas-fired Waste
Oil-firedGeo-
thermal
Coal-
fired
Transmission and Distribution
Cross-border
lines
National and
local networks
Greenfield Power Projects Contracted to Chinese Companies in Sub-Saharan Africa (2010 - 2020)
Source: OECD/IEA; Axis Group Analysis
Niger
ChadEritrea
Djibouti
South
Africa
NamibiaBotswana
Malawi
Rwanda
Central
African
Republic
Senegal
Sierra Leone
Togo
Equatorial Guinea
At present, a large spectrum of power generation projects are contracted to Chinese companies across Sub-Saharan Africa

Other Recent Research & Publications
by Axis Group - Please contact us for
access to i.e.:
1. Asian Export Guide – What to export
to Asian economies and how to
succeed?
2. China Export Guide – What to export
to China and how to succeed?
3. 20 Years of SA-China Diplomatic ties
– Looking ahead at the next phase of
economic and business relations
49
Agenda
1. Foreword
2. Feature: Chinese Engagements and Activities in Africa
– China-Africa Overview
– China’s Trade with Africa
– China’s Financial Engagement with Africa
– China’s Role in Africa’s Infrastructure Development
– South Africa-China Focus
3. China Profile, Facts and Figures
4. China in the World
5. Conclusions, Implications and Recommendations
6. About Axis Group
Other Recent Research & Publications
by Axis Group International / Axis
Group
Please contact us for access to i.e.:
1. Asian Export Guide – What to export
to Asian economies and how to
succeed?
2. China Export Guide – What to export
to China and how to succeed?
3. 20 Years of SA-China Diplomatic ties
– Looking ahead at the next phase of
economic and business relations

50
The political relationship between South Africa and China has progressed through four distinct phases
From Taipei to Beijing: Establishment of Diplomatic
Relations (1998 – 2004)- South African government of national unity looked to allow new
leadership to forge a strategic relationship without being
encumbered by the past
- Establishment of bi-national commission under the Pretoria
Declaration of 2000
- Pretoria Declaration entrenched commitment to building economic
prosperity in the relationship
- Bilateral relations seen as a vehicle for cooperation on continental
issues in Africa like security and development
Strategic Partnership (2004 – 2010)- Growing convergence between South Africa and China on global
outlook and developmental concerns
- Second bi-national commission elevated bilateral relations to
‘Strategic Partnership’ status
- South Africa grants China ‘market status’
- Zuma administration promotes a more Asian-style development
approach
Comprehensive Strategic Partnership (2010 – present)- Concrete pivot to China by South Africa and indication that SA features
more centrally in China’s African and international endeavours
- Beijing Declaration elevates relations to ‘Comprehensive Strategic
Partnership’ status
- Mutual commitment to restructuring trade relations to grow value-added
exports from South Africa to China
2018 Outcomes:
- Agreements were signed to strengthen high-level exchanges, deepen
mutual trust, align development strategies, promote practical
cooperation and increase people-to-people exchanges
- Both countries pledged to carry forward their traditional friendly relations
and advance their comprehensive strategic partnership in the new era
Pre-1998: Limited Contact and Hostility- During the 19th century, the first Chinese community, comprising
labourers taken to work in the gold mines, settled in South Africa
- Largely non-existent/hostile relationship - South Africa’s Air Force
fought with the United Nations against PRC’s People’s Liberation Army
during the Korean War
- South Africa’s growing isolation during the Apartheid era led PW Botha
to establish official relations with ROC in 1980
- Following hostilities, resulting from the Sino-Soviet split, a 1982
meeting between OR Tambo and PRC Premier Zhao Ziyang
normalised ties between PRC and ANC/SACP
- Mandela administration resolves to shift diplomatic relations from ROC
to PRC
Source: Various; Axis Group Analysis

51
20
10
0
10
20
30
40
50
1998 1999 2000 2001 2002 2003 2004 2005 2006 2007 2008 2009 2010 2011 2012 2013 2014 2015 2016 2017
China's Imports from South Africa China's Exports to South Africa Trade Balance
Jacob Zuma assumes
presidency and begins to foster
a closer relationship with China
According to official Chinese sources, the size of South African exports to China is fundamentally determined by gold prices. Whilst Chinese imports have risen significantly in the last decade, its exports have remained relatively constant
Precious metals being SA’s main exports
to China, trade between the two countries
grew significantly from 2009 to 2012 owing
to gold prices rising by 93% in that period
Global gold prices decreased by
37% from 2013 to 2016. The overall
decrease in South African exports to
China during this period is
attributable to this change
Trade balance line contradicts SA’s perspective.
For further information, please see page 51 & 52 18%
15%
Total SA-China Trade in Goods (USD bn, 1998-2017)
Trade declined in 2009 due to the effects
of the global financial crisis
Official Chinese perspective
CAGR
Bilateral trade volumes
begin to grow in 2017 as
commodity prices
recover. Trade growth
expected to continue as
China seeks to grow
imports, as indicated with
the CIIE held in 2018
where SA was a ‘Guest
of Honour’ country
Note: Whilst UN Comtrade was the primary source used, National Bureau of Statistics of China data was also referenced
Source: National Bureau of Statistics; UN Comtrade; Axis Group Analysis

52
16
12
8
4
0
4
8
12
2000 2001 2002 2003 2004 2005 2006 2007 2008 2009 2010 2011 2012 2013 2014 2015 2016 2017
South Africa's Exports to China South Africa's Imports from China Trade Balance CAGR
According to the official South African reports¹, SA-China trade has grown substantially since the establishment of relations. Reaching its peak in 2013, the total value of trade gradually declined over the next three years
Following a peak in 2013, lower
commodity prices contributed to
lower trade values
Total SA-China Trade in Goods (USD bn, 2000-2017)
Official South African perspective
Trade declined in 2009
due to the effects of the
global financial crisisSA did not report gold numbers. For further
information, please see page 51 & 52
21%
17%Beijing Declaration signed
in 2010 with the goal of
increasing bilateral trade
President Zuma remarks on
the unsustainability of an
unequal trade relationship
with China
Jacob Zuma assumed the
presidency and began to foster
a closer relationship with China
Note: Whilst UN Comtrade was the primary source used, South African Revenue Services data was also referenced
Source: South African Revenue Services; UN Comtrade; Axis Group Analysis

53Source: UN Comtrade; World Bank; UNCTAD; Axis Group Analysis
0
10
20
30
40
50
1998
1999
2000
2001
2002
2003
2004
2005
2006
2007
2008
2009
2010
2011
2012
2013
2014
2015
2016
2017
Reported bySouth Africa
Reported byChina
Major Discrepancy
Since 2008, the difference in bilateral trade data as reported by official Chinese and South African sources grew substantially. There tend to be various reasons for discrepancies, including misinvoicing and indirect trade
Comparison of Total Flow of Goods from China to South Africa as Reported by South Africa and China (USD bn, 1998-2017)
Growth in discrepancy
mirrors changes in gold
prices
0
5
10
15
20
1998
1999
2000
2001
2002
2003
2004
2005
2006
2007
2008
2009
2010
2011
2012
2013
2014
2015
2016
2017
Reported bySouth Africa
Reported byChina
Minimal Discrepancy
Comparison of Total Flow of Goods from South Africa to China as Reported by South Africa and China (USD bn, 1998-2017)
Size of Discrepancy:
2013 (Peak): USD 36bn
2017: USD 15.7bn
-10
10
30
50
2000
2001
2002
2003
2004
2005
2006
2007
2008
2009
2010
2011
2012
2013
2014
2015
2016
2017
Reported by China Reported by SA
SA Total Flow of Goods to China - Significant Discrepancy (USD bn, 2000-2017)
Peak of discrepancy – USD 36bn
Main Causes of Discrepancies in Trade Data- Misinvoicing: Falsification of the value or volume of an international commercial
transaction of goods or services by at least one party to the transaction. Often traders do
this to avoid taxes and tariffs, this is particularly the case with products that have an export
levy
- Indirect Trade: Goods are not shipped directly to their final destination, but through
another country first
- Categorisation: Differing classifications of goods between two parties to bilateral trade
flows
- Lack of Data Specificity: Trade partners are sometimes not disclosed for specific product
groups
- Freight and Insurance: Often exporters report trade value exclusive of insurance and
transport, whereas importers report values that include these
- Reporting Lag: Imports may be recorded with lags, creating mismatches in mirror values
of bilateral imports and exports
USD15.7bn

54Source: UN Comtrade; World Bank; UNCTAD; Axis Group Analysis
15.5
0.2
0
4
8
12
16
20
2017
Others Metals and Minerals
One of the primary causes of the discrepancies in trade statistics between South Africa and China is that South Africa did not attribute its gold exports to specific partners; but this misreporting only partially explains the discrepancy
Comparison of Major Importers of South African Gold by Size of Imports as Reported by Importer (USD bn, 2017)
0 2 4 6
China
United Kingdom
India
Hong Kong
Switzerland
Turkey
Italy
Canada
USA
Size of goldImportsFrom SA
Total Trade Data Discrepancy Composition (USD bn, 2017)
725297 351 300
17 40 11
506 334 162451
50 14 8
224 (37) 188 (151) (33) 26 2
Agricultureand Forestry
Textiles,Hides and
Skins
Chemicalsand Plastics
Fuels Machineryand Electrical
Equipment
TransportManufactures
Others
China's importsfrom SA
South Africa'sexport's to China
Discrepancy
Sectorial Composition of Discrepancy, Excluding Metals and Minerals (USD mn, 2017)
7.07
3.952.28
1.30
0.90
2017
Others
Platinum
Minerals
Diamonds
Gold
Composition of Discrepancy by Product Category in Metals and Minerals (USD bn, 2017)
USD15.7 bn
The South
African
Revenue
Service does
not specify
gold export
destinations
Gold imports from South Africa as reported by
other countries is just over USD 16bn, while
the total global exports of gold reported by
South Africa is only USD 4.96bn

55
10 12
42
16
93
5 4
14
95 5
12
62 2
12
1443
33
8
34
9
12
8
1213
17
2213 16
27
0
20
40
60
80
100
China's GlobalExports
China's Exports toSA
SA's Global Exports China's GlobalImports
China's Imports fromSA
Others
Textiles, Hides and Skins
Chemicals and Plastics
Machinery and Electrical Equipment
Fuels
Transport Manufactures
Agriculture and Forestry
Metals and Minerals
Note: 1. Trade data reported by South Africa
2. Trade data reported by China
3. This representation is based on Chinese-reported trade data as South African sources omit certain major goods categories from their reports
Source: World Bank; Axis Group Analysis
While South Africa’s overall exports and China’s total imports are fairly diversified, Chinese imports from South Africa are highly concentrated around metals and minerals. The bulk of the flow of goods from South Africa to China is composed of primary commodities
Sectorial Composition and Comparison of China’s Global Exports and Exports to SA, SA’s Global Exports, China’s Global Imports and China’s Imports from SA (%, 2017)
7
USD 88bn USD 24.4bnUSD 1.8tn
3
1
2 2 2
USD 2.3tn USD 14.8bn

56
0 3,000 6,000 9,000
Metal mountings
Flat-rolled steel
Mattresses
Containers
Plastic Closures
Knit t-shirts
Plastic houseware
House linens
Electrical control boards
Articles of iron or steel
Woven fabrics of cotton
Machinery parts
Heterocyclic compounds
Cars
Pumps
Transmissions
Motorcycles
Centrifuges
Iron houseware
Other steel bars
Raw plastic sheeting
Medical instruments
Non-Knit male overcoats
Knit men's suits
Other cloth articles
Knit socks and hosiery
Electro-mechanical domestic appliances
Entertainment articles
Parts of vehicles
Porcelain or china
Machinery having individual functions
Engine parts
Unspecified
Polyacetals
Stainless steel
Aluminium plates, sheets and strip
Knit women's undergarments
Plasic coated textile fabric
Plywood
Ball bearings
Iron fasteners
Insecticides (retail)
Building stone
Other heating machinery
Electric Filament
Ceramic paving and tiles
Radio receivers
Iron pipes
Fish Fillets
Vacuum cleaners
China's Global Exports
SA's Imports from China
0 25,000 50,000
Telephone
Data processing machines
Integrated circuits
Machinery parts
Monitors and projectors
Vehicle parts
Light fixtures
LCD's
Trunks and cases
Semiconductor Devices
Furniture
Refined petroleum
Electrical Transformers
Non-Knit women's suits
Models and stuffed animals
Seats
Insulated Wire
Rubber footwear
Electric heaters
Industrial printers
Passenger and cargo ships
Other plastic products
Knit sweaters
Microphones and headphones
Knit women's suits
Elec. Protection Equip.
Air conditioners
Valves
Pneumatic tyres
Printed Circuit Boards
Video and card games
Air pumps
Textile footwear
Broadcasting accessories
Flat-rolled Iron
Synthetic filament yarn
Non-Knit men's suits
Electric batteries
Jewellery
Other electrical machinery
Electric motors
Structures of iron or steel
Motor-working tools
Sports equipment
Electric filament
Computers
Leather footwear
Other knitted fabrics
Non-Knit women's coats
Refrigerators
China's Global Exports
SA's Imports from China
China’s Top 100 Global Exports and Respective Exports to South Africa (USD mn, 2017)
141,971219,1611
2
3
4
5
6
7
8
9
10
11
12
13
14
15
16
17
18
19
20
21
22
23
24
25
26
27
28
29
30
31
32
33
34
35
36
37
38
39
40
41
42
43
44
45
46
47
48
49
50
51
52
53
54
55
56
57
58
59
60
61
62
63
64
65
66
67
68
69
70
71
72
73
74
75
76
77
78
79
80
81
82
83
84
85
86
87
88
89
90
91
92
93
94
95
96
97
98
99
100
South Africa is a market for most of China’s top exports, but exports to South Africa account for a marginal proportion of China’s total exports. These exports consist primarily of electronics, machinery and household items
China’s total exports:
USD 2.26tn
Top 100
Shown:
USD 1.54tn
68%
67,201
China’s total exports:
USD 2.26tn
Top 50 Shown:
USD 1.24tn
54.8%
Size of top 50
exports to SA:
USD 7.5bn
Size of top 100
exports to SA:
USD 9.4bn
Source: UN Comtrade; Axis Group Analysis

57
Positive Aspects Possible Drawbacks
Increase the volume of trade
between the two parties
No significant increase in production
or employment
Greater Chinese market access for
SACU exports
Cost of Chinese imports will cripple
respective SACU industries
Negate prospects of new
industrialisation in specific sectors
Positive Aspects Possible Drawbacks
Help South Africa to correct the
trade imbalance
Scepticism from trade unions
(aligned with the ANC)
Improve employment opportunities
in South Africa
Disadvantage to other SACU
countries, some of whom already
have duty-free exports to China
Draw new sources of investment to
South Africa
More competition between/within
sectors
Give mutual assignment of Most
Favoured Nation (MFN) status
Both countries have sizeable
domestic markets
Positions SA and China as regional
access points for one another
A South Africa-China Free Trade Agreement
Source: SAIIA; Various; Axis Group Analysis
A SACU-China Free Trade Agreement
• Southern African Customs Union (SACU) is a customs union between
the Southern African countries of Botswana, Lesotho, Namibia, South
Africa and Swaziland
• Recently, FTA between SACU and China has resurfaced on the
trade agenda
China-Mauritius FTAAfter the third round of talks, negotiations on a China-
Mauritius FTA were concluded. This will be the first
FTA between China and an African country
African Continental Free Trade Agreement (CFTA)
• Adopted in March 2018, it is the largest trade agreement since the creation of the WTO
• Is expected to facilitate increased intra-continental trade in goods and services
• Will enhance market access for Chinese goods with lower barriers between different
African markets
There are currently no ongoing Free Trade Agreement negotiations between South Africa and China. Official discussions on an FTA were initiated in 2005, but subsequently abandoned primarily due to concerns among South African and other regional stakeholders. There are active efforts to enhance bilateral trade relations

58
China’s FDI stock in SA has more than doubled in the last 8 years, a result of China’s ‘going out’ strategy among other factors; this is indicative of growing confidence in South Africa as a destination for capital
Source: MOFCOM; Fdi Markets; SAIIA; Axis Group Analysis
-1
0
1
2
3
4
5
6
7
8
06 07 08 09 10 11 12 13 14 15 16 17
FDI Flow FDI Stock
China’s FDI Flow and FDI stock in South Africa (USD bn, 2006-2017)
Sector Distribution of China’s OFDI Stock in South Africa (%, 2005-2016)
27.5
27.413.3
9.9
4.2
17.7 Mining
Construction
Manufacturing
Finance
Science andTechnology Service37%
96 96
67 64 62 5643 35
24 2314
138
0
40
80
120
160
Sou
th A
fric
a
Mor
occo
Ken
ya
Nig
eria
Eth
iopi
a
Egy
pt
Gha
na
Tan
zani
a
Alg
eria
Cot
e d'
Ivoi
re
Uga
nda
Oth
er
Number of Inbound FDI Projects in Africa (2017)
The 2008 jump in FDI is mainly
attributed to ICBC’s purchase of
a 20% stake in Standard Bank
The bulk of investment has
been within the mining
sector, which is consistent
with the Pretoria Declaration
(2000)’s focus on expanding
trade and investment.
Specific areas of interest
were natural resources,
mining, and manufacturing
The ICBC investment in Standard Bank, coupled with
the CAD Fund office opening in Johannesburg, has
played a significant role in increasing Chinese
awareness of investment opportunities in SA
CAGR

59
As South Africa seeks to diversify its exports to China, expanding agricultural exports will be crucial. Access to China for South Africa’s exports has increased over time, but many strong exports remain without access as negotiations are slow
Citrus (orange, lemon,
grapefruit and mandarin)
2006 2007 2008 2009
Grapes
2010 2011
Apples
2012
Beef
Market AccessGeneral:
- Market access in fresh agricultural
produce (fruit and meat) requires a
phytosanitary/veterinary protocol to be in
place between the two countries,
signalling compliance with International
Standards for Phytosanitary Measures
(ISPMs)
- Without this there is no access for these
goods to either market
- Bilateral protocol on export of frozen
beef from South Africa to China is
signed – access gained
- Entry-exit animal inspection and
quarantine MoU signed
- Phytosanitary protocol on
grapes signed – access gained
- Phytosanitary protocol on
apples signed
- Phytosanitary protocol on
apples signed – access gained
Major Access Challenges:1. Shortage of information on China’s market and regulatory conditions among SA exporters
2. China only negotiates access for one fruit/vegetable category at a time. Generally, lower
pest carrying risk leads to faster negotiations
3. Language barrier
4. Shipment of fresh produce to China lengthy; maintaining freshness and quality complex
2013 2014 2015 2016 2017
Poultry - Protocol on sanitary requirements of
inspection and quarantine for heat treated
poultry meat
Pears
- Phytosanitary protocol
on pears signed
5. Natural disaster - the drought
6. Slow import administration process and other inefficiencies
7. Competition from other markets, especially Australia and Chile
8. Challenging labeling requirements for China jurisdiction
9. China's agriculture self-sufficiency policy
10. WTO rules and regulations
Apples
- Phytosanitary protocol on
apples signed
Tobacco
- Phytosanitary protocol
on tobacco signedSouth
Africa
to China
China to
South
Africa
Dates
- Phytosanitary protocol on
dates signed
South African Access to China:
- Agricultural goods are a core component
and growth driver for SA exports to China
- Gaining access to China for agricultural
goods is a priority but a slow process
Chinese Access to South Africa:
- China’s exports to South Africa have
been mainly machinery and electronics
as well as textiles
- Other than tariff barriers, no special
barriers apply to these goods
2018
- Relaxed health restrictions on
South African beef imports
- Bilateral protocol on export of
frozen beef from SA to China is
signed – access gained
Source: Various; Axis Group Analysis

60
Key Facts about the New Development Bank (NDB)
41%
18%
18%
18%
5%
China
Brazil
Russia
India
South Africa
NDB Currency Reserve Pool Contribution (%, 2015)
The New Development Bank is an important tool for economic stabilisation and to make infrastructure funding available to BRICS countries
Total = USD 100bn
The NDB currency reserve
pool, known as the
Contingent Reserve
Arrangement (CRA), will
provide liquidity to members
in the event of crises
• USD 50bn in initial capital – equally funded by all members
• Long-term goal of fostering the growth potential of member countries via infrastructure projects
• Further reflection of the need for an alternative to the IMF and World Bank
Putian Pinghai Bay Wind Project
USD 298mn
Loans to SA
Loans to China
Total: USD 1,179mn
5 projects
financed by NDB
Eskom renewable energy project
USD 180mn
Transnet Durban Port Upgrade
USD 200mn
Total: USD 680mn
3 projects
financed by NDB
Greenhouse Gas Emissions Reduction
USD 300mn
Luoyang Metro Project
USD 300mn
Lingang Solar Power Project 200mn
Source: Various; Axis Group Analysis

61
Upshot
• Since 2002, both the Chinese and the African continental GDP have markedly outgrown average global growth. During this periodof unprecedented growth, trade between China and Africa has grown at a CAGR of over 19%. Chinese investment, construction,and financing in Africa have increased dramatically
• Formal diplomatic ties between China and African countries have formed and been expanded over the past decade. In severalmultilateral institutions such as BRICS and FOCAC, China cooperates closely with African member states to build towards sharedgoals of infrastructure development
• China’s rapid industrialization and export-led expansion have resulted in significant trading relationships with major Africaneconomies like South Africa, Angola, and Nigeria. Many African nations run large trade deficits with China, and their composition ofexports to China remains concentrated in primary products. China and Africa continue to actively pursue policies that expand trade
• China has grown its ties to Africa through large growth in financing engagement. China’s FDI stock in Africa grew at a CAGR of28% since 2006, with over half of FDI in mining or construction. Similarly, China’s loans to Africa grew at a CAGR of 32% between2000 and 2015, concentrating heavily in transportation and agriculture. Chinese banks, which facilitate financing, have sprung up allover Africa
• China has taken its expertise in large-scale urbanization and infrastructure development to Africa. Since late 2015, China hascaptured over half the market for contracting in Africa, building some of the largest infrastructure projects that Africa has ever seen,which include ambitious energy, transportation, and urbanization projects
• In addition to being a large recipient of Chinese FDI, South Africa has emerged as China’s largest trading partner in Africa. SouthAfrica and China have worked together to bring about more open trade. Like many African nations however, there remains animbalance of composition in goods traded between China and South Africa, as most of South Africa’s exports to China are metalsand minerals
Source: Axis Group Analysis

Other Recent Research & Publications
by Axis Group - Please contact us for
access to i.e.:
1. Asian Export Guide – What to export
to Asian economies and how to
succeed?
2. China Export Guide – What to export
to China and how to succeed?
3. 20 Years of SA-China Diplomatic ties
– Looking ahead at the next phase of
economic and business relations
62
Agenda
1. Foreword
2. Feature: Chinese Engagements and Activities in Africa
3. China Profile, Facts and Figures
– Selected Macroeconomic Indicators
– Domestic Consumption and Foreign Trade
– Domestic and Foreign Investment
– Financial Indicators
– Social Indicators
4. China in the World
5. Conclusions, Implications and Recommendations
6. About Axis Group

63Source: Finance Monthly

64
0
4
8
12
16
78 80 82 84 86 88 90 92 94 96 98 00 02 04 06 08 10 12 14 16 18 20F
China’s GDP growth is expected to continue moderating, making it more sustainable - GDP growth rates in recent years already reflect this ‘new normal’
China’s Real Y-o-Y GDP Growth Rate (%, 1978-2020F)
Source: The World Bank; IMF; Axis Group Analysis
8-10% GDP
growth band Soft landing amid
global uncertainty
Overheating
concerns
7-8% GDP
growth band
More moderate
and stable
growth rate
6-7% GDP
growth band
Past periods of
overheating

65
Growth rates in China’s east and northeast provinces have trended lower in recent years to below the national average. Growth rates in China’s western provinces remain some of the highest in the state
-3
2
7
12
17
22
1997
1998
1999
2000
2001
2002
2003
2004
2005
2006
2007
2008
2009
2010
2011
2012
2013
2014
2015
2016
2017
E
Beijing
Tianjin
Hebei
Shanxi
InnerMongoliaLiaoning
Jilin
Heilongjiang
NationalAverage
6
8
10
12
14
16
1997
1998
1999
2000
2001
2002
2003
2004
2005
2006
2007
2008
2009
2010
2011
2012
2013
2014
2015
2016
2017
E
Shanghai
Jiangsu
Zhejiang
Anhui
Fujian
Jiangxi
Shandong
NationalAverage
6
8
10
12
14
16
18
1997
1998
1999
2000
2001
2002
2003
2004
2005
2006
2007
2008
2009
2010
2011
2012
2013
2014
2015
2016
2017
E
Chongqing
Sichuan
Guizhou
Yunnan
Tibet
Shaanxi
Gansu
Qinghai
Ningxia
Xinjiang
National Average6
8
10
12
14
16
1997
1998
1999
2000
2001
2002
2003
2004
2005
2006
2007
2008
2009
2010
2011
2012
2013
2014
2015
2016
2017
E
Henan
Hubei
Hunan
Guangdong
Guangxi
Hainan
National Average
North/Northeast Provinces GRP (Y-o-Y % change, 1997 – 2017E)
East Provinces GRP (Y-o-Y % change, 1997 –2017E)
Central South Provinces GRP (Y-o-Y % change, 1997 – 2017E)
West Provinces GRP (Y-o-Y % change, 1997 –2017E)
Source: National Bureau of Statistics of China; Axis Group Analysis

66
China’s Provincial GRP (Q3 2018, Y-o-Y % change)
North & Northeast East Central South West
Province GRP % Province GRP % Province GRP % Province GRP %
Beijing 6.7 Shanghai 6.6 Henan 7.4 Chongqing 6.3
Tianjin 3.5* Jiangsu 6.7 Hubei 7.9 Sichuan 8.1
Hebei 6.6 Zhejiang 7.5 Hunan 7.8 Guizhou 9.0
` 6.1 Anhui 8.2 Guangdong 6.9 Yunnan 9.1
Inner Mongolia 5.1 Fujian 8.3 Guangxi 7.0 Tibet 9.0
Liaoning 5.4 Jiangxi 8.8 Hainan 5.4 Shaanxi 8.4
Jilin 4.0 Shandong 6.5 Gansu 6.3
Heilongjiang 5.1 Qinghai 6.8
Ningxia 7.0
Xinjiang 5.3
Most of the provinces have kept a growth rate higher than 5%, with the exception of Tianjin and Jilin. Overall, western and central south provinces have relatively greater growth potential
Note: GRP=Gross Regional Product, defined as a monetary measure of the market value of all final goods and services produced in a region or subdivision of a country in a period of time
Source: National Bureau of Statistics of China; Axis Group Analysis
*Tianjin’s GRP is the lowest with only 3.5% in
2018 Q3, which could be the lag effect of the
massive explosion at Tianjin port in 2015

67
4.85.8 6.4
0
2
4
6
8
2013 2015 2017
3.64.5
5.8
0
2
4
6
8
2013 2015 2017
Consumption (USD tn)
China continues to see slower growth – a ‘new’ growth trajectory is unfolding, but does this represent ‘better’ growth?
Major Economic Indicators for China
Note: 2018 estimate is from the IMF World Economic Outlook October 2018 Report
Source: World Bank; IMF; National Bureau of Statistics China; Axis Group Analysis
7.8 6.9 6.9
0
2
4
6
8
2014 2016 2018E
GDP Growth Rate (%)
7,683 8,11710,100
0
4,000
8,000
12,000
2014 2016 2018E
GDP per Capita (USD)
260
591422
0
200
400
600
800
2013 2015 2017
4.6 5.0 5.3
0
2
4
6
8
2013 2015 2017
Net Exports (USD bn)
Gross Investment (USD tn) Govt. Debt (USD tn)
10.5 11.2 14.1
X Represents GDP in USD tn X Represents Population in bn X% Net Exports as a % of GDP
2.7% 5.3% 3.4%
50% 53% 53% 47% 45% 44%
X% Consumption as a % of GDP X% Investment as a % of GDP X% Govt. Debt as a % of GDP
41% 47%37%
1.36 1.38 1.4

68
Following years of rapid growth, China’s economy is beginning to moderate as the country undergoes a structural transformation
Y-o-Y Change in China’s Major Economic Indicators (%, 2002-2018E)
Source: National Bureau of Statistics of China; Axis Group Analysis
-20
-10
0
10
20
30
40
2002 2003 2004 2005 2006 2007 2008 2009 2010 2011 2012 2013 2014 2015 2016 2017 2018
GDP Y-o-Y % Export Y-o-Y %Import Y-o-Y % Fixed Asset Investment Y-o-Y %Household Consumption Expenditure Y-o-Y % Industrial Production Y-o-Y %
Decline in global trade
during financial crisis
China’s major economic
indicators are beginning
to moderate

69
9.4
Contribution to GDP Growth (%, 1998-2017)
China is slowing and the growth levers are changing - household consumption growth is accelerating, while government consumption and capital formation growth are slowing down
-6
-4
-2
0
2
4
6
8
98 99 00 01 02 03 04 05 06 07 08 09 10 11 12 13 14 15 16 17
Net Exports of Goods and Services
Gross Capital Formation
Household Consumption Expenditure
Government Consumption Expenditure
Note: The four components of GDP by expenditure approach are final consumption expenditure (composed of household and government consumption), gross capital formation and net exports of goods
and services
Source: China Statistical Yearbook; Axis Group Analysis
Government stimulating
household consumption as a
means of driving GDP growth
8.3 9.18.5 10.0 10.1 11.4 12.7 14.2 9.7 10.6 9.5 7.9 7.8 7.37.77.8 6.9 6.7
Annual GDP growth rate (%)X
6.9
China revised its
2017 GDP to 6.8

70
0
5
10
15
20
25
30
35
Q1 Q2 Q3 Q4 Q1 Q2 Q3 Q4 Q1 Q2 Q3 Q4 Q1 Q2 Q3 Q4
Wholesale & Retail TransportationHotels Financial IntermediationReal Estate Software & ITLeasing & Business Services Others
5
6
7
8
9
10
0
20
40
60
80
100
Q1 Q2 Q3 Q4 Q1 Q2 Q3 Q4 Q1 Q2 Q3 Q4 Q1 Q2 Q3 Q4 Q1 Q2 Q3 Q4 Q1 Q2 Q3 Q4
Agriculture Industry Services Y-o-Y GDP Growth (RHS)
China’s Share of GDP Growth by Sector (%, 2013-2018)
Source: National Bureau of Statistics of China; Axis Group Analysis
China’s Service Sector GDP Growth Rates (Y-o-Y %, 2015-2018)
High-value services such as IT & software and leasing & business services are replacing industry and manufacturing as the primary drivers of China’s economy
Policies to control the growth of credit and local government
debt have reduced the contribution of industry – services are
increasingly driving GDP growth
2015 2016 20182013 2014 2015 2016 2017
7.8% 7.3% 6.9% 6.7%
2018
6.9%
Annual GDP growth rateX%
2017
6.6%

71
China’s Fastest Growing Provinces (GDP CAGR, 2007-2012)
Source: National Bureau of Statistics of China; Axis Group Analysis
China’s Fastest Growing Provinces (GDP CAGR, 2012-2017)
China’s focus is shifting inward, away from the coast – western provinces are increasingly becoming major drivers of GDP growth
5
1069
7
8
4
Inner Mongolia
15.4%
Shaanxi
15.7%
Guizhou
14.4%
Ningxia
15.6%
Jiangxi
13.0%
Tianjin
14.9%
Chongqing
16.8%
3
Hubei
13.6%
Qinghai
13.6%1
2
Hunan
13.6%
1
2
3 4
5
6
7
8
9
10
Tibet
11.5%
Yunnan
8.1%
Guangdong
7.7%
Fujian
8.6%
Jiangxi
8.2%
Guizhou
12.7%
Chongqing
9.5%
Hubei
8.6%
Jiangsu
7.9%
Anhui
8.0%Westward Shift

72
Megacities are on the rise in China – as new global business and consumption hubs emerge, companies will have new markets to serve and will need to alter their strategies accordingly
Population and Density of Chinese Megacities (2016)
Note: A ‘megacity’ is defined as a city with a population greater than 10 mn
Source: OECD; Axis Group Analysis
Tianjin
Shanghai
Beijing
Chengdu
Shenzhen
Guangzhou
Population mn
10
15
20
25
10.9
mn
10.4
mn
12.1
mn
Region No. of Megacities
China 15
Rest of Asia 16
Africa 1
Latin America 4
North America 2
Europe 2
Middle East 1
Total 41
10.5
mn
Harbin
11 mn
Jinan
19 mn Wuhan
Chongqing
13.4
mn
Hangzhou
Xi’an
12.4
mn24.3 mn
Changzhou
12
mn
Shantou
11.7
mn
Nanjing
12.9
mn
21.7 mnIn terms of global megacities, China dominates – with
increasing urbanisation, this trend of the development of
megacities is set to continue
Major metropolises and large Tier 1 cities
are still concentrated along coastal areas
in Eastern China – expect this to shift
westward
29.7 mn
17 mn

73
0
1
2
3
4
5
6
7
8
9
Q1 Q2 Q3 Q4 Q1 Q2 Q3 Q4 Q1 Q2 Q3 Q4 Q1 Q2 Q3 Q4 Q1 Q2 Q3 Q4 Q1 Q2 Q3 Q4 Q1 Q2 Q3 Q4
59
32
9
-40
-20
0
20
40
60
80
100
120
140
1999 2001 2003 2005 2007 2009 2011 2013 2015 2017
Net Exports of Goods and ServicesGross Capital Formation (GCF)Final Consumption Expenditure (FCE)
China’s Quarterly Y-o-Y GDP Growth Rate (%, 2012-2018)
Source: National Bureau of Statistics of China; Axis Group Analysis
Contribution to China’s GDP (% of Total, 1999-2017)
China’s ongoing economic transition will entail more moderate growth – capital formation will remain a key contributor, but consumption is likely to play an increasingly bigger role
Falling net exports
contribution
Effect from stimulus
package in 2009
Policy easing to
provide room for
growth moderation
2012 Y-o-Y
GDP: 7.9%
2018 Q4 Y-o-Y
GDP growth
rate was 6.4%
2012 2013 2014 2015 2016 2017 2018
2013 Y-o-Y
GDP: 7.8%
2014 Y-o-Y
GDP: 7.3%
2015 Y-o-Y
GDP: 6.9%
2016 Y-o-Y
GDP: 6.7%2017 Y-o-Y
GDP: 6.9%
2018 Y-o-Y
GDP: 6.6%

74
0 200 400 600 800 1,000 1,200 1,400
GuangdongJiangsu
ShandongZhejiang
HenanSichuan
HubeiHebei
HunanFujian
ShanghaiBeijingAnhui
LiaoningShaanxiJiangxi
GuangxiChongqing
TianjinYunnan
HeilongjiangInner Mongolia
JilinShanxi
GuizhouXinjiang
GansuHainanNingxiaQinghai
Tibet
China’s GDP by Province (USD bn, 2017)
Note: Also includes the centrally-administered municipalities of Beijing, Tianjin, Chongqing and Shanghai
Source: National Bureau of Statistics of China; Axis Group Analysis
Geographical Distribution of China’s GDP (USD bn, 2017)
3
4
2
5
1
Henan
666
Zhejiang
766
Shandong
1,075
Guangdong
1,330
Jiangsu
1,271
3029
28
27Gansu
114
Hainan
66
Ningxia
51
Top 5 provinces share of
GDP amounts to 40.4% of
total GDP
Top 5 Provinces by GDP
Bottom 5 Provinces by GDPHighlighted on the map on right
123456789
10111213141516171819202122232425262728293031
Five coastal provinces account for about 40% of China’s total GDP, although this share has started to decline as the output of other provinces increases
Qinghai
39Tibet
19 31

75
Yunnan
5.1
0 5 10 15 20
BeijingShanghai
TianjinJiangsu
ZhejiangFujian
GuangdongShandong
Inner MongoliaChongqing
HubeiShaanxi
JilinLiaoningNingxiaHunanHainan
HebeiHenanJiangxi
XinjiangSichuanQinghai
AnhuiHeilongjiang
GuangxiShanxi
TibetGuizhouYunnanGansu
Thousands
China’s GDP Per Capita by Province (USD ‘000, 2017)
Note: Also includes the centrally-administered municipalities of Beijing, Tianjin, Chongqing and Shanghai
Source: National Bureau of Statistics of China; Axis Group Analysis
Tianjin, Beijing and Shanghai, three of the centrally-administered municipalities, each have per capita incomes greater than USD 16,000
4
5
1
27
29
Geographical Distribution of China’s GDP Per Capita (USD ‘000, 2017)
Top 5 Provinces by GDP per capita
Bottom 5 Provinces by GDP per capitaHighlighted on the map on right
China’s GDP per capita reached
USD 8,836 in 2017
3
123456789
1011
1213141516171819202122232425262728293031
2
Beijing
19.1
Zhejiang
13.6
Shanghai
18.5
Jiangsu
15.9
Tianjin
17.7Gansu
4.3Shanxi
6.0
Tibet
5.8
Guizhou
5.6
28
30
31

76Note: Also includes the centrally-administered municipalities of Beijing, Tianjin, Chongqing and Shanghai
Source: National Bureau of Statistics of China; Axis Group Analysis
Tianjin aside, the coastal regions are no longer China’s fastest growing regions –reflective of the government’s growing emphasis on developing inland provinces
0% 2% 4% 6% 8% 10%
GuizhouTibet
YunnanChongqing
JiangxiAnhui
SichuanFujianHunan
ShaanxiZhejiang
HenanHubei
NingxiaXinjiang
GuangdongShandong
GuangxiQinghaiJiangsuShanxiHainan
ShanghaiHebei
BeijingHeilongjiang
JilinLiaoning
Inner MongoliaTianjinGansu
China’s GDP Growth Rate by Province (%, 2017) Geographical Distribution of China’s GDP Growth Rate (%, 2017)
123456789
10111213141516171819202122232425262728293031
5
30
28
27
Top 5 Provinces by GDP growth
Bottom 5 Provinces by GDP growthHighlighted on the map on right
1
4
Yunnan
9.5% 3
Tibet
10.0%
2
Guizhou
10.2%
Chongqing
9.3%
Jiangxi
8.9%
Inner Mongolia
4.0%
Tianjin
3.6%
Liaoning
4.2%
Jilin
5.3%
Gansu
3.6% 31
29

77
0
3
6
9
12
15
1997 1998 1999 2000 2001 2002 2003 2004 2005 2006 2007 2008 2009 2010 2011 2012 2013 2014 2015 2016 2017 2018
13.5%
The tertiary sector has been the fastest growing sector in recent years and constituted 52% of China’s GDP in 2018
Composition of GDP by Sector (USD tn, 1997-2018)
Note: The primary sector includes industries involved in the extraction and collection of natural resources. The secondary sector of an economy is dominated by the manufacturing of finished products.
The tertiary industry is made up of companies that primarily earn revenue by providing intangible products and services
Source: National Bureau of Statistics of China; Axis Group Analysis
Primary Sector Secondary Sector Tertiary Sector
52%
41%
7% 8.6%
12.7%
15.8%
CAGR (1997-2018)X%

78Note: Others include sectors such as Tourism, Education, Science and Technology, Telecom, Media, Public Health etc.
Source: National Bureau of Statistics of China; Axis Group Analysis
While China’s secondary sector has traditionally played the largest role in the economy, the tertiary sector is now the largest contributor to the country’s GDP
Value-added Breakdown of Secondary Sector (USD bn, 1998-2017)
Value-added Breakdown of Tertiary Sector (USD bn, 1998-2017)
0
500
1,000
1,500
2,000
2,500
3,000
3,500
4,000
4,500
5,000
5,500
6,000
6,500
98 99 00 01 02 03 04 05 06 07 08 09 10 11 12 13 14 15 16 17
Transport, Storage and Post
Wholesale and Retail Trades
Hotels and Catering Services
Financial Intermediation
Real Estate
Others
0
500
1,000
1,500
2,000
2,500
3,000
3,500
4,000
4,500
5,000
98 99 00 01 02 03 04 05 06 07 08 09 10 11 12 13 14 15 16 17
Construction Sector
Industrial Sector
13.2%
CAGRX%
16.1%

79
25
45
65
85
105
125
145
0 50 100 150 200 250 300 350 400 450 500 550 600
Capital formation, which is primarily concentrated in China’s larger coastal provinces, remains a large contributor to the economy - far surpassing the world average
Total Capital Formation (USD bn)
% of Provincial GDPA bubble this size represents 1% of national
total GCF
Source: China Statistical Yearbook; Axis Group Analysis
China’s Gross Capital Formation (2017)
Northern
Northeastern
Eastern
Southwestern
Northwestern
Southern Central
Ningxia
Shandong Jiangsu
Guangdong
Henan
Zhejiang
Liaoning
HebeiFujian
GuangxiTianjin
Yunnan
Shaanxi
Shanxi
Anhui
Heilongjiang
Jiangxi
Chongqing
Guizhou
Gansu
Hainan
Qinghai
Hubei
Inner Mongolia
Shanghai
Tibet
Jilin
Xinjiang
Hunan
Sichuan
Beijing
Provinces in central and western China are very
dependent on capital formation
National average = 54.74%

80
30
40
50
60
70
80
0 50 100 150 200 250 300 350 400 450 500 550 600 650
35% of final consumption in China is focused in just four coastal provinces, with Guangdong as the outright leader
China’s Final Consumption (2018E)
Note: Final consumption includes both household consumption expenditure and government consumption expenditure
Source: China Statistical Yearbook; Axis Group Analysis
Provincial Final Consumption (USD bn)
A bubble this size represents 1% of total
final consumption% of Provincial GDP
Guangdong
Jiangsu
Shandong
Zhejiang
Henan
Sichuan
Shanghai
Beijing
Hunan
Hubei
Liaoning
Hebei
Anhui
Fujian
YunnanHeilongjiang
Jilin
Guangxi
Jiangxi
Shaanxi
Shanxi
Chongqing
Tianjin
Inner Mongolia
Guizhou
Xinjiang
Gansu
Hainan
Tibet
Qinghai
Ningxia
Northern
Northeastern
Eastern
Southwestern
Northwestern
Southern Central

81
During the last decade, China’s industrial value-added output growth has averaged 20% per year. However, this growth has been affected by weak overseas demand in recent years
Industrial Value Added Output (2000-2018)
Source: National Bureau of Statistics of China; Axis Group Analysis
-10%
0%
10%
20%
30%
0
1,000
2,000
3,000
4,000
00 01 02 03 04 05 06 07 08 09 10 11 12 13 14 15 16 17 18
Industrial Value Added Output Y-o-Y Growth Rate (RHS)
WTO accession on
11 December 2001
USD bn
13.4%
CAGRX%

82
104
105
100
103
104
99
98
99
101
106
105
104
105
108
103
104
99
97 97 98
100
103
99
102
101
103
108
105
102
105
104 104
105
103
106 106
106
110
107 108
110
106 104
104
106
104
104
104
104 104
100
101
100
103
107
106 105
107
109
108 109
113
111
113
112113
115
115
119
124
121
123
122
124
122
123
123
118
120
119 119
119122
123
90
95
100
105
110
115
120
125
Jan
Mar
May Ju
l
Sep
Nov Jan
Mar
May Ju
l
Sep
Nov Jan
Mar
May Ju
l
Sep
Nov Jan
Mar
May Ju
l
Sep
Nov Jan
Mar
May Ju
l
Sep
Nov Jan
Mar
May Ju
l
Sep
Nov Jan
Mar
May Ju
l
Sep
Nov
China’s consumer confidence has also remained high and stable, reflecting the overall optimistic economic outlook generally shared by consumers
China’s Consumer Confidence Index (2012-2018)
Note: The consumer confidence index measures the level of optimism that consumers have about the performance of the economy
Source: National Bureau of Statistics of China; Axis Group Analysis
CCI over 100 indicates that
consumers are optimistic
2013 20152012 2014 2016 2017
The calculation of the CCI combines the level of
optimism that consumers have about their
consumption intentions with their expectations of
living standards
2018

83
China’s annual inflation rate stood at 2.1% in 2018. It is expected to continue at a mild rate in 2019, allowing room for policy maneuvers for high-quality development
China’s Consumer Price Inflation (%, 2013-2018)
0
1
2
3
4
5
Jan
Mar
May Ju
l
Sep
Nov Jan
Mar
May Ju
l
Sep
Nov Jan
Mar
May Ju
l
Sep
Nov Jan
Mar
May Ju
l
Sep
Nov Jan
Mar
May Ju
l
Sep
Nov Jan
Mar
May Ju
l
Sep
Nov
General Rural Urban
2014 20162013 2015 2017
2.6% 2.0% 1.4% 2.0% 1.6%
X%Represents average annual consumer price inflation for the year
2018
Designated inflation target of 3% was set by
the Chinese government for 2018
2.1%
Source: National Bureau of Statistics of China; Axis Group Analysis

84
-4
-2
0
2
4
6
8
10
J F M A M J J A S O N D J F M A M J J A S O N D J F M A M J J A S O N D J F M A M J J A S O N D J F M A M J J A S O N D
General Food* Tobacco*, Liquor and Articles
Clothing Household Facilities and Articles Healthcare & Personal Articles
Transportation & Communication Recreation, Education, Culture Articles Residence
2014
China’s CPI hit a two-year low in February 2017 but subsequently increased throughout the latter part of 2017. Actual inflation rates for 2017 were lower than the year’s target of 3%
China’s Consumer Price Inflation Breakdown (%, 2014-2018)
Note: The consumer price index (CPI) shows the change in prices of a standard package of goods and services which Chinese households purchase for consumption
Source: National Bureau of Statistics of China; Axis Group Analysis
Seasonal peaks due to Chinese New Year holiday
Food is an important driver, with a
weight of over 30% of the total CPI
*As of 2016, the NBS has
merged Food and Tobacco
2015 2016 2017 2018

85
-2
0
2
4
6
97 98 99 00 01 02 03 04 05 06 07 08 09 10 11 12 13 14 15 16 17 18
China’s Annual Consumer Price Inflation (%, 1997-2018)
Source: National Bureau of Statistics of China; Axis Group Analysis
Geographical Distribution of China’s Consumer Inflation (% Y-o-Y, Dec 2018)
Controlling inflation is no longer a key concern for policymakers as it was in the aftermath of the global financial crisis. Inflation has fallen steadily since 2011 and appears to be leveling out
Commodity and
food price pressure
Overheating and
overinvestment
Deflation and
overcapacity
Doubling of M2
money supply
28
1
Provinces with Lowest Inflation
Provinces with Highest Inflation
4
31
27
29
2
30
Xinjiang
0.9% Liaoning
1.3%
Heilongjiang
1.2%
Qinghai
2.6%
Fujian
1.2%
Guangxi
2.3%
Jiangsu
2.2%
3
5
Chongqing
2.2%
Guangdong
2.1%
Shanghai
1.2%

86
-8
-6
-4
-2
0
2
4
6
8
10
Jan
Mar
May Ju
l
Sep
Nov Jan
Mar
May Ju
l
Sep
Nov Jan
Mar
May Ju
l
Sep
Nov Jan
Mar
May Ju
l
Sep
Nov Jan
Mar
May Ju
l
Sep
Nov Jan
Mar
May Ju
l
Sep
Nov Jan
Mar
May Ju
l
Sep
Nov
Producer prices in China experienced slower growth last year compared to 2017, with the PPI for December 2018 being 0.9%
China’s Producer Price Inflation (%, 2012-2018)
Source: National Bureau of Statistics of China; Axis Group Analysis
2012 20152013 2014
Avg. Producer
Price Inflation
2016
-1.7%
Represents average annual producer price inflation for the year
2017 2018
-1.9% -1.9% -4.6% -1.3% 6.3%
X%
Deflation due to depressed
overseas market demand
and sluggish domestic
manufacturing activity
3.5%

87
Since 2017, China’s PPI for mining and quarrying has moderated on the back of lower commodity prices and industrial overcapacity. This has negatively affected corporate profits in the mining sector whilst reducing inflationary pressure
China’s Producer Price Inflation Breakdown by Industry (%, 2012-2018)
Source: National Bureau of Statistics of China; Axis Group Analysis
-25
-15
-5
5
15
25
35
45
Jan
Mar
May Ju
l
Sep
Nov Jan
Mar
May Ju
l
Sep
Nov Jan
Mar
May Ju
l
Sep
Nov Jan
Mar
May Ju
l
Sep
Nov Jan
Mar
May Ju
l
Sep
Nov Jan
Mar
May Ju
l
Sep
Nov Jan
Mar
May Ju
l
Sep
Nov
Mining & Quarrying Raw Materials Manufacturing Food Clothing Articles for Daily Use Durable Consumer Goods
2017 20182012 20142013 2015 2016
0

88
-8
-6
-4
-2
0
2
4
6
8
97 98 99 00 01 02 03 04 05 06 07 08 09 10 11 12 13 14 15 16 17
China’s Annual Producer Price Inflation (%, 1997-2017)
Source: National Bureau of Statistics of China; Axis Group Analysis
Geographical Distribution of China’s Producer Price Inflation (% Y-o-Y, Dec 2018)
China’s PPI has been making a recovery since September 2016, after 5 years of continuous decline
Provinces with Lowest Producer Inflation
Provinces with Highest Producer Inflation
29
27
5
1
4
30
31
2
3
28
Xinjiang
2.7%
Shanxi
4.5%
Heilongjiang
2.4%
Beijing
-0.5%
Tibet
-1.4%
Qinghai
-1.9%
Tianjin
-0.3%
Guangxi
-0.5%
Fujian
2.4%
Shanxi
2.9%

89
China’s manufacturing sector has begun to expand over the last few years. In the face of low inflation, there have been renewed calls for a more liberal credit policy as a means of boosting production
China’s Purchasing Managers’ Index of the Manufacturing Industry (2014-2018)
45
50
55
Jan
Mar
May Ju
l
Sep
Nov Jan
Mar
May Ju
l
Sep
Nov Jan
Mar
May Ju
l
Sep
Nov Jan
Mar
May Ju
l
Sep
Nov Jan
Mar
May Ju
l
Sep
Nov
PMI
3-month moving average
Source: National Bureau of Statistics of China; Axis Group Analysis
A reading above 50 reflects expansion; below
50 reflects contraction
2014 2015 2016 2017 2018

90
J M M J S N J M M J S N J M M J S N J M M J S N J M M J S N J M M J S N80
90
100
110
120
130
140
150
160
170
Beijing Tianjin Shanghai
Chongqing Guangzhou Shenzhen
Sales Price Index of Residential1 Buildings in Selected Cities (Y-o-Y, 2013-2018)
98
99
100
101
102
103
104
105
106
107
108
J M M J S N J M M J S N J M M J S N J M M J S N J M M J S N J M M J S N
Beijing Tianjin Shanghai
Chongqing Guangzhou Shenzhen
1. Starting from Jan 2018, data is for Commercialized Buildings as the data for Residential Buildings was no longer released by government authority
Source: National Bureau of Statistics of China; Axis Group Analysis
Sales Price Index of Residential1 Buildings in Selected Cities (M-o-M, 2013-2018)
House prices in China’s major cities have adjusted through 2017. Policymakers have set restrictions on purchases in tier 1 cities to keep the prices stable
2013 2014 2015 2016 2017
Shenzhen has the least
restriction among the six
Tier-1 cities
2013 2014 2015 2016 2017
Shenzhen has the least
restriction among the six
Tier-1 cities
2018 2018

91
Internet Penetration in China (%, 2016)
Note: *Internet penetration rate as of 31 December 2016
Source: China Internet Watch; China Internet Network Information Center; Various; Axis Group Analysis
Internet penetration in China is rapidly rising, but is still very unevenly distributed
1 Beijing 77.8%
2 Shanghai 74.1%
Guangdong 74.0%
Fujian 69.7%
Tianjin 64.6%
Zhejiang 65.6%
Liaoning 62.6%
Jiangsu 56.6%
Xinjiang 54.9%
Shanxi 55.5%Qinghai 54.5% Hebei 53.3%
Hainan 51.6%
Shaanxi
52.4%
Shandong 52.9%
Chongqing
51.6%
Ningxia 50.7%
Hubei 51.4%
Jilin 50.9%
Heilongjiang 48.1%
Guangxi
46.1%
Tibet 46.1%
Hunan
44.4%
Anhui
44.3%Sichuan 43.6%
Henan
43.4%
Guizhou 43.2%
Yunnan 39.9%
Jiangxi
44.6%
6
13
8
5
4
3
2325
24
26
17
31 29
15
7
19
21
10
11
30
22
27
14
20 9
18
28
16
Provinces with internet penetration above 50%
Provinces with internet penetration between 40-50%
Provinces with internet penetration below 40%
China’s overall internet
penetration was at 53.1% as
of Dec 2016
With the increasing popularity of smartphones and the
further implementation of broadband networks, regional
differences in internet development in China will be
further reduced
12
Selected Countries’ Internet
Penetration (%, 2016*)
89 8553
3520
Despite significantly lower
internet penetration levels,
both China and India have more
internet users than the US does

Other Recent Research & Publications
by Axis Group - Please contact us for
access to i.e.:
1. Asian Export Guide – What to export
to Asian economies and how to
succeed?
2. China Export Guide – What to export
to China and how to succeed?
3. 20 Years of SA-China Diplomatic ties
– Looking ahead at the next phase of
economic and business relations
92
Agenda
1. Foreword
2. Feature: Chinese Engagements and Activities in Africa
3. China Profile, Facts and Figures
– Selected Macroeconomic Indicators
– Domestic Consumption and Foreign Trade
– Domestic and Foreign Investment
– Financial Indicators
– Social Indicators
4. China in the World
5. Conclusions, Implications and Recommendations
6. About Axis Group

93
China’s growing retail sector is indicative of consumer confidence in the economy. Urban areas still make up an overwhelmingly large part of retail sales. However, rural retail sales are now growing at a faster rate
China’s Annual Retail Sales and Growth Rate by Administrative Level (1978-2017)
-10%
-5%
0%
5%
10%
15%
20%
25%
30%
35%
40%
45%
0
500
1,000
1,500
2,000
2,500
3,000
3,500
4,000
4,500
5,000
5,500
78 79 80 81 82 83 84 85 86 87 88 89 90 91 92 93 94 95 96 97 98 99 00 01 02 03 04 05 06 07 08 09 10 11 12 13 14 15 16 17
Retail Sales (Urban) Retail Sales (Suburban) Retail Sales (Rural)
Urban Growth (RHS) Suburban Growth (RHS) Rural Growth (RHS)USD bn¹
Note: 1. Chinese Statistics Bureau has changed the structure of these figures since 2010. In the new category breakdown, urban includes suburban
2. Figures converted from RMB to USD using the average exchange rate for the respective years. The growth rate, however, does not factor in exchange rate fluctuations
Source: National Bureau of Statistics of China; Axis Group Analysis

94
0
100
200
300
400
500
600
Jan-
06
Jan-
07
Jan-
08
Jan-
09
Jan-
10
Jan-
11
Jan-
12
Jan-
13
Jan-
14
Jan-
15
Jan-
16
Jan-
17
Jan-
18
China’s Annual Retail Sales (USD bn, 1979-2017)
Source: National Bureau of Statistics of China; Axis Group Analysis
China’s Monthly Retail Sales (USD bn, 2006-2018)
Domestic consumption has increased in line with targets set within the 13th Five-Year Plan. The dramatic increase in retail sales over the past decade has made domestic consumption a key pillar of the Chinese economy
0
500
1,000
1,500
2,000
2,500
3,000
3,500
4,000
4,500
5,000
5,500
79 82 85 88 91 94 97 00 03 06 09 12 15
Annual retail sales reached
USD 5,419bn in 2017

95
0 100 200 300 400 500 600
GuangdongShandong
JiangsuZhejiang
HenanSichuan
HubeiHebei
HunanLiaoning
FujianShanghai
BeijingAnhui
HeilongjiangShaanxi
ChongqingJilin
GuangxiJiangxi
Inner MongoliaShanxi
YunnanTianjin
GuizhouGansu
XinjiangHainanNingxiaQinghai
Tibet
China’s Retail Sales by Province (USD bn, 2017)
Source: National Bureau of Statistics of China; Axis Group Analysis
China’s eastern, coastal provinces have the highest retail sales due to a large population, high employment, and high disposable income
123456789
10111213141516171819202122232425262728293031
Highlighted on the map on right
China’s total retail
sales in 2017 was
USD 5.4tn
Total retail sales of
United States in 2017
was USD 5.7tn
Hainan
24
27
29
5
28
1
31
Tibet
8
Qinghai
12
Ningxia
14
Geographical Distribution of China’s Retail Sales (USD bn, 2017)
Bottom 5 Provinces by Retail Sales
Top 5 Provinces by Retail Sales
30 2
3
4
Xinjiang
45Shandong
498
Jiangsu
470
Zhejiang
360Henan
291
Guangdong
565

96
-25
-15
-5
5
15
25
35
45
55
65
J MM J S N J MM J S N J MM J S N J MM J S N J MM J S N J MM J S N200
100
0
100
200
300
J MM J S N J MM J S N J MM J S N J MM J S N J MM J S N J MM J S N
Series2 Series1
China’s Monthly Exports and Imports (USD bn, 2013-2018)
Source: China Customs; Axis Group Analysis
China’s Monthly Trade Balance (USD bn, 2013-2018)
Overall, China has a trade surplus each month; however, its trade value diminishes during the Spring Festival season
2013 2014 2015
2,209 2,342 2,273 2,098
1,950 1,959 1,680
2,263
1,843
2016
Yearly Total:
Yearly Total:
2017 2018
Trade reaches its nadirs during
Chinese New Year holiday
2013 2014 2015 2016 2017 2018
1,588

97
-60%
-40%
-20%
0%
20%
40%
60%
0
50
100
150
200
250
JMMJ SN JMMJ SNJMMJ SN JMMJ SNJMMJ SN JMMJ SN
ExportsExports' Monthly Growth Rate (M-o-M, RHS)
2,277
-20%
-10%
0%
10%
20%
30%
40%
50%
0
500
1,000
1,500
2,000
2,500
3,000
97 99 01 03 05 07 09 11 13 15 17
Exports Exports' Growth Rate (RHS)
China’s Annual Exports (USD bn, 1997-2018)
Source: China Customs; China Monthly Economic Indicators; Axis Group Analysis
China’s Monthly Exports (USD bn, 2013-2018)
The growth rate of Chinese exports had been slowing since 2010; however, exports rebounded in 2017
China’s entry into
the WTO in 2002,
increased its export
growth rate
Seasonal drop due to Chinese New Year holiday
X Total Annual Exports (USD bn)
2,217 2,343 2,098 2,263
2013 2014 2015 2016 2017 2018
2,485

98
430279
137103
72716867
574544434241393635323129
USHK
JapanKorea
VietnamGermany
IndiaNetherlands
UKSingapore
Taiwan, PRCRussia
MalaysiaAustraliaThailand
MexicoIndonesia
PhilippinesCanada
Italy
Source: China Customs; Axis Group Analysis
Top exported commodities:
• Electrical machinery, equipment and parts
• Telecommunication, sound recording equipment
and reproducing apparatus
• Automatic data processing machines and parts
Vietnam
3.2%
Hong Kong
12.34%
Japan
6.1%
Germany
3.1%
US
19.0%
South Korea
4.5%
Netherlands
3.0%
UK
2.5%
Singapore
2.0%
India
3.0%
1
2
3
45
89
6
10
7
Over 68% of
China’s total
exports went to
the top 15 export
partners
Hong Kong is a
trading hub for
China and the
rest of Asia
In 2017, 45% of China’s total exports went to its top 5 export partners, the US, Hong Kong, Japan, South Korea and Vietnam. Export growth to the EU, US and especially Japan has been sluggish amidst weaker demand
Total Exports = USD 2, 263 tn
China’s Top Export Destinations (USD bn, 2017)

99
CAGR 2001-2017 2017 Growth Category
9% -2.1%
9% 31.7%
11% 2.4%
16% 15.9%
14% 4.8%
12% 3.4%
16% 10%
14% 7.7%
0
600
1,200
1,800
2,400
2001 2002 2003 2004 2005 2006 2007 2008 2009 2010 2011 2012 2013 2014 2015 2016 2017
Others
Mineral Items
Foodstuffs
Chemicals and Related Products
Products Classified by Material
Miscellaneous Manufactured Articles
Machinery and Equipment
As China shifts towards high value-added exports, machinery and equipment are accounting for an ever larger portion of its exports – close to 50% of exports in 2017
Composition of China’s Exports (USD bn, 2001-2017)
Note: Composition is according to the SITC Classification System
Source: MOFCOM; China Customs; Axis Group Analysis
Total
2017 records a growth rate
of 7.7% from 2016

100
-20%
-10%
0%
10%
20%
30%
40%
50%
0
500
1,000
1,500
2,000
2,500
97 99 01 03 05 07 09 11 13 15 17
Imports Imports' Growth Rate (RHS)
China’s Annual Imports (USD bn, 1997-2018)
Source: China Customs; Axis Group Analysis
China’s Monthly Imports (USD bn, 2013-2018)
After experiencing consecutive negative growth rates for 2 years since 2015, the Chinese economy’s import growth rate increased by 15.8% in 2018
China’s entry
into the WTO
USD bn
-40%
-20%
0%
20%
40%
60%
0
50
100
150
200
250
JMMJ SNJMMJ SN JMMJ SNJMMJ SNJMMJ SN JMMJ SN
Imports
Imports' Monthly Growth Rate (M-o-M, RHS)
2013 2014
USD bn
2015
Total Annual Imports (USD bn)
1,950 1,959 1,680 1,8431,588
2016 2017 2018
X

101
In 2017, South Korea, Japan, Taiwan, the US, and Germany were China’s top sources of imports, accounting for about 41% of China’s total imports
Top Countries of Origin for China’s Imports (%, 2017)
Source: China Customs; Axis Group Analysis
Machinery, vehicles,
electronics
Top imported commodities:
• Electrical machinery, equipment and parts
• Mineral fuels, mineral oils and products of their distillation
• Metalliferrous ores and metal scrap
Total Imports = USD 1,841bn
178
166
155
154
97
95
59
54
50
42
South Korea
Japan
Taiwan
US
Germany
Australia
Brazil
Malaysia
Vietnam
Thailand
Taiwan 8.4%
South Korea 9.6%
Germany
5.3%US
8.4%
Japan
9.0%
Australia
5.2%
Malaysia 2.9%
Vietnam
2.7%
Thailand
2.3%
Brazil
3.2%
12
3
4
5
6
7
8
910
Machinery, technology,
consumer goods
Vehicles,
Machinery
Iron ore, soybean,
petroleum
Petroleum, soft
commodities Iron ore,
coal
Machinery,
electronics

102
CAGR 2001-2017 2017 Growth Category
23% -44.3%
28% 404.4%
8% -56.9%
10% 59%
9% -17.6%
12% -23.9%
18% 28.9%
13% 11.7%
13% 12.1%
As a manufacturing powerhouse, China relies heavily on imported products such as machinery, chemicals and minerals; imports of foodstuffs grew a remarkable 404.4% from 2016-17
Composition of China’s Imports (USD bn, 2001-2017)
Note: SITC Classification System; Crude material: inedible, except fuels
Source: MOFCOM; China Customs; Axis Group Analysis
Total
0
600
1,200
1,800
2,400
2001 2002 2003 2004 2005 2006 2007 2008 2009 2010 2011 2012 2013 2014 2015 2016 2017
Others
Foodstuffs
Miscellaneous Manufactured Articles
Products Classified by Material
Chemicals and Related Products
Mineral Items
Crude Materials
Machinery and Equipment
2017 records a growth rate
of 12.1% from 2016

103
Almost 42% of China’s total trade is with the US, Hong Kong, Japan, and South Korea. The US, China’s largest trading partner, accounted for USD 700bn, or 19% of China’s total trade, in 2017
China’s Largest Trading Partners (%, 2017)
Source: UN Comtrade; China Customs; Axis Group Analysis
Hong Kong 12.3%
Japan 6.1%US
19.0%South Korea 4.5%
430
279
137
103
71
71
68
67
57
45
US
Hong Kong
Japan
South Korea
Germany
Vietnam
India
Netherlands
UK
Singapore
India
3.0%
Vietnam 3.1%
Netherlands
3.0%
1 3
2
4
6
5
7
89
Trade Surplus
Trade Deficit
Germany 3.1%
China’s total trade: USD 4,105bn
Total imports: USD 1,841bn
Total exports: USD 2,264bn
10
Total Exports = USD 2,097bn
Singapore 2.0%
UK
2.5%

104
Taiwan
276
272
56
52
34
-28
-30
-53
-75
-111
While China has a large trade surplus with both Hong Kong and the US, its trade deficit is largely centered in the Asia Pacific economies of Taiwan, South Korea and Australia
China’s Trade Balance with its Five Largest Surplus and Deficit Regions (USD bn, 2017)
Source: China Customs; Axis Group Analysis
USA
Hong Kong
South Korea
Australia
Netherlands
China’s world trade surplus = USD 423bnIndia
UK
Brazil
US
Hong Kong
Netherlands
India
UK
Japan
Brazil
Australia
South Korea
Taiwan
Trade Surplus
Trade Deficit
Japan

105
-50%
-25%
0%
25%
50%
75%
100%
-40
-20
0
20
40
60
80
J MM J S N J MM J S N J MM J S N J MM J S N J MM J S N J MM J S N J MM J S N J MM J S N J MM J S N J MM J S N J MM J S N J MM J S N
Trade Balance Exports, % change Y-o-Y (RHS) Imports, % change Y-o-Y (RHS)
China’s trade balance has been decreasing since a high in 2015, as its exports decrease and its import demand stagnates
China’s Monthly Trade Balance (USD bn, 2007-2018)
Source: China Customs; Axis Group Analysis
2012 2013 20142009 2010 20112007 2008 2015
21.9 24.6 16.4 15.4
X Average Monthly Trade Balance
13.2 19.4 22.1 31.7 45.2
2016
45.9
2017 2018
35.2
USD bn29.5

106
0
2
4
6
8
10
00 01 02 03 04 05 06 07 08 09 10 11 12 13 14 15 16 17
1. Net Exports here do not include service trade
Source: National Bureau of Statistics of China; China Customs; Axis Group Analysis
Share of Net Exports1 in China’s Quarterly GDP (%, Q1 2008-Q3 2018)
Contribution of net exports to GDP has been declining, while fixed asset investment and total consumption are becoming the primary drivers of GDP growth – in line with the government’s policy of boosting domestic consumption
Share of Net Exports1 in China’s Annual GDP (%, 2000-2017)
0
2
4
6
8
10
Q1-08
Q1-09
Q1-10
Q1-11
Q1-12
Q1-13
Q1-14
Q1-15
Q1-16
Q1-17
Q1-18

107
Jiangsu 16%
About 75% of China’s total international trade value is concentrated in 6 coastal provinces. This is chiefly due to their access to world-class port facilities, large manufacturing bases and large share of domestic consumption
Trade by Province as a Percentage of China’s Total Trade Value (%, 2017)
Source: China Customs; Axis Group Analysis
Percentage of China’s total trade value:
Top 60%
Next 30%
Next 10%
Total Trade: USD 4,105bn
Imports: USD 1,841bn
Exports: USD 2,264bn
Shaanxi Henan2%
Hunan
Fujian 4% Taiwan
Guangdong27%
Guangxi1%
Guizhou
Yunnan
Heilongjiang
Jilin
Liaoning3%
Hebei2%
Shanghai 11%
Zhejiang9%
Jiangxi
Tibet
Hubei
Inner Mongolia
Ningxia
Sichuan2%
Qinghai
Xinjiang
Gansu
Shanxi
Chongqing1%
Beijing3%
Hainan
Tianjin3%
Shandong 8%
Anhui2%
China’s total trade in 2017
reported from China Customs
was different from UN Comtrade
system

108
0.24
6.40
0
2
4
6
8
10
1997 2002 2007 2012 2017
China’s Annual Meat, Fish, Fruit, and Vegetable Imports (USD bn, 1997-2017)
USD bn
Note: HS code 02 has been used for meat imports; HS code 03 (fish, crustaceans, mollusks, aquatic, invertebrates) has been used for fish imports; HS code 08 (edible fruit) has been used for fruit imports;
HS code 07 (edible vegetables and certain roots and tubers) has been used for vegetable imports
Source: UN Comtrade; Axis Group Analysis
0.07
2.02
0
2
4
6
8
10
1997 2002 2007 2012 2017
USD bn
Greater demand and better access for foreign producers have underpinned further growth in China’s meat, fish, fruit and vegetable imports in recent years
0.54
8.07
0
2
4
6
8
10
1997 2002 2007 2012 2017
0.15
9.49
0
2
4
6
8
10
1997 2002 2007 2012 2017
Meat Fish
VegetablesFruits
24%15%
19%
19%
CAGRX%

Other Recent Research & Publications
by Axis Group - Please contact us for
access to i.e.:
1. Asian Export Guide – What to export
to Asian economies and how to
succeed?
2. China Export Guide – What to export
to China and how to succeed?
3. 20 Years of SA-China Diplomatic ties
– Looking ahead at the next phase of
economic and business relations
109
Agenda
1. Foreword
2. Feature: Chinese Engagements and Activities in Africa
3. China Profile, Facts and Figures
– Selected Macroeconomic Indicators
– Domestic Consumption and Foreign Trade
– Domestic and Foreign Investment
– Financial Indicators
– Social Indicators
4. China in the World
5. Conclusions, Implications and Recommendations
6. About Axis Group

110
9,346
141
0%
8%
16%
24%
32%
40%
0
1,500
3,000
4,500
6,000
7,500
9,000
1997 1998 1999 2000 2001 2002 2003 2004 2005 2006 2007 2008 2009 2010 2011 2012 2013 2014 2015 2016 2017
Urban Areas Rural Areas Growth of Total FAI (RHS)
Slower growth in FAI1, which has traditionally been one of China’s core economic drivers, is a key factor in China’s slowing GDP growth rate
Total Fixed Asset Investment2 in Urban and Rural Areas in China (1997-2017)
USD bn
Stimulus-induced rise during the
global financial crisis
FAI was USD
9.49tn in 2017
1. FAI: Fixed Asset Investment
2. Fixed asset investment figures are often overstated by local governments, with figures even exceeding GDP in some provinces. In June 2013, NBS announced a pilot reform of data collection relating
to fixed asset investment in order to make local economic statistics more reliable
Source: National Bureau of Statistics of China; Axis Group Analysis

111
The government is focusing on reasonable investment growth in urban infrastructure projects to keep local debt levels in check. Urban fixed asset investment reached an all-time high of USD 1,258bn in June 2018
Monthly Urban Fixed Asset Investment (USD bn, 2012-2018)
Note: In 2011, the National Bureau of Statistics of China extended the statistical scale of monthly fixed assets investment to cover both urban areas and rural enterprises, and defined it as ‘Investment
in Fixed Assets (Excluding Rural Households)’
Source: National Bureau of Statistics of China; Axis Group Analysis
1,258
0
300
600
900
1,200
1,500
J M M J S N J M M J S N J M M J S N J M M J S N J M M J S N J M M J S N J M M J S N
Urban Fixed Asset Investment 3-month Moving Average
2012 2013 2014 2015 2016 2017 2018
Investments gaining strength
from favourable policies
The RMB’s depreciation against the USD
distorts the RMB value of the urban fixed
asset investment

112
0 200 400 600 800
ShandongJiangsuHenan
GuangdongHebeiHubei
HunanSichuanZhejiang
AnhuiFujian
ShaanxiJiangxi
GuangxiYunnan
ChongqingGuizhou
Inner MongoliaJilin
XinjiangTianjin
HeilongjiangBeijing
ShanghaiLiaoning
ShanxiGansuHainanQinghaiNingxia
Tibet
China’s Fixed Asset Investment by Province (USD bn, 2017)
Source: China Statistical Yearbook; Axis Group Analysis
China’s fixed asset investment continues to be primarily concentrated in the more developed coastal provinces. The top five provinces account for over 35% of total FAI
12345678910111213141516171819202122232425262728293031
Top five provinces
account for 35.25% of
total FAI
1
3
4
2
5
Jiangsu
784Henan
649
Shandong
802
Hebei
472
Geographical Distribution of China’s Fixed Asset Investment (USD bn, 2017)
31
Tibet
29
Top 5 Provinces by FAI
Bottom 5 Provinces by FAI
Qinghai
5729
Ningxia
54
30
28
Hainan
61
27
Highlighted on the map on right
Guangdong
553
Provinces in the west that are less developed
received less investments while Hainan, as
the new free trade zone set stricter
investment policies
Gansu
84

113
CAGRAnnual Growth
RateCategory
20% -26%
13% -12%
15% -2%
26% 18%
19% 12%
20% 34%
21% 1%
20% 2%
2,865
2,067
905
1,215
441
1,717
0
1,000
2,000
3,000
4,000
5,000
6,000
7,000
8,000
9,000
2004 2005 2006 2007 2008 2009 2010 2011 2012 2013 2014 2015 2016 2017
Others
Mining
Utilities
Environmental Protection and Public Facilities
Transport, Storage and Post
Real Estate
Manufacturing
Manufacturing and real estate attracts the majority of fixed asset investment in China, accounting for almost 53% of China’s total FAI, reflective of ongoing industrialisation and urbanisation trends
Source: National Bureau of Statistics of China; Axis Group Analysis
Total
China’s Fixed Asset Investment by Sector (USD bn, 2004-2017)
Real estate and
manufacturing account
for 53% of the total FAI
136

114
China's low-cost production base has been a key driver of past FDI1 growth. Going forward, the country's large domestic consumption potential and the liberalisation of various sectors will be key drivers
China’s FDI Inflow (USD bn, 1997-2017)
1. FDI: Foreign Direct Investment
Source: MOFCOM; Axis Group Analysis
-20%
-10%
0%
10%
20%
30%
0
20
40
60
80
100
120
140
1997 1998 1999 2000 2001 2002 2003 2004 2005 2006 2007 2008 2009 2010 2011 2012 2013 2014 2015 2016 2017
FDI Inflow FDI Growth (RHS)USD bn
FDI growth has been
moderating over the last
5 years

115
In 2017, 95% of China’s FDI came from just five regions, led by Hong Kong. Hong Kong remains a crucial gateway for FDI from other countries into China, as well as FDI from Chinese firms headquartered in the SAR1
China’s FDI Inflow by Source Region (% of Total FDI Inflow, 2017)
1. SAR: Special Administrative Region of Hong Kong
Source: MOFCOM; Axis Group Analysis
Hong Kong
Singapore
BVI
South Korea
Japan
US
Cayman Islands
Netherlands
Taiwan
Germany
1
4
2
5
10
93
7
8
6US 1.9%
Hong Kong 69.3%
Japan 2.4%
BVI 2.9%Taiwan 1.3%
Netherlands 1.6%
Cayman Island 1.6%
South Korea 2.7%
Germany 1.1%
Singapore 3.5%
USD bn
94.5
4.8
4.0
3.7
3.3
2.6
2.2
2.2
1.8
1.5 China’s total FDI inflow for 2017 amounted to USD 136bn

116
0 40 80 120 160 200
Beijing Shanghai
Guangdong Jiangsu
Anhui Tianjin
Zhejiang Fujian
Shandong Hubei Hebei
Chongqing Henan
Inner Mongolia Liaoning Yunnan Shanxi Hunan
Sichuan Jiangxi
Qinghai Guangxi Ningxia Hainan
Guizhou Shaanxi
Jilin Xinjiang
Gansu Tibet
Heilongjiang
China’s FDI Inflow by Province (USD bn, 2017)
Source: China Statistical Yearbook; Axis Group Analysis
China’s coastal regions still attract the majority of FDI inflows, but new FDI guidelines are utilising schemes to encourage and incentivise foreign investment in the less-developed central and western regions
12345678910111213141516171819202122232425262728293031
1
2
3
45 Shanghai 18%
Anhui 6%
Jiangsu 7%
Guangdong 11%
Beijing 26%
Top 5 provinces
account for 70% of
total FDI inflows
Top 5 Provinces by FDI Inflow
Bottom 5 Provinces by FDI Inflow
27 Jilin 0.26%
Tibet 0.08%30
Gansu 0.1%29
28 Xinjiang 0.1%
Highlighted on the map on right
Geographical Distribution of China’s FDI Inflow (%, 2017)
Heilongjiang -0.19%31

117
CAGRAnnual
Growth RateCategory
29% 38%
12% 10%
5% -27%
15% 4%
8% -14%
-2% -6%
6% 4%
China’s manufacturing sector receives the bulk of China’s FDI inflow. New FDI guidelines provide incentives for foreign companies to invest in China’s high-end manufacturing, technology and service sectors
China’s FDI Inflow by Sector (USD bn, 2004-2017E)
Source: National Bureau of Statistics; Axis Group Analysis
34
17
17
12
6
47
0
20
40
60
80
100
120
140
2004 2005 2006 2007 2008 2009 2010 2011 2012 2013 2014 2015 2016 2017E
Others
Transport, Storage and Post
Wholesale and Retail Trades
Leasing and Business Services
Real Estate
Manufacturing
Total

118
China’s OFDI flow grew continuously until 2016, largely driven by Chinese companies’ growing need to access new markets, technology and resources. However, it dramatically decreased in 2017 due to stricter overseas investment regulationsChina’s OFDI Flow (2002-2017)
1. SAFE: State Administration of Foreign Exchange
Source: UNCTAD World Investment Report; Axis Group Analysis
-60%
-40%
-20%
0%
20%
40%
60%
80%
100%
120%
140%
0
20
40
60
80
100
120
140
160
180
200
2002 2003 2004 2005 2006 2007 2008 2009 2010 2011 2012 2013 2014 2015 2016 2017
OFDI Flow OFDI Growth Rate (RHS)
In 2005, SAFE1 eased restrictions on
overseas investments made by Chinese
companies
USD bn
Chinese companies increased
acquisition of overseas depressed
assets

119
While China’s OFDI extends to all continents, international financial centres such as Hong Kong and British Virgin Islands receive the bulk of OFDI flow
China’s OFDI Flow by Destination (%, 2017)
Source: MOFCOM; Axis Group Analysis
Hong Kong 57.6%1
3
BVI 12.2%
Australia 2.7%
7
2
Singapore 4.0%
6
10
4
Malaysia 1.1%
MOFCOM China’s total OFDI flow for 2017 amounted to USD 158.29bn; UNCTAD World Investment Report value is USD 124.6bn 1.7
2.1
2.1
2.7
4.2
6.3
6.4
7.5
19.3
91.2
Malaysia
UK
Kazakhstan
Germany
Australia
Singapore
USA
Switzerland
BVI
Hong Kong
Germany 1.7%
US 4.0%
5
USD bn
UK 1.3%
Switzerland 4.7%8
Kazakhstan 1.3%9

120
0 1 2 3 4 5 6 7 8 9 10 11 12 13
ShanghaiGuangdong
ZhejiangShandong
BeijingChongqing
JiangsuHainanFujian
TianjianAnhui
HenanSichuan
HebeiHunan
YunnanHubei
ShaanxiLiaoningXinjiangGuangxi
JiangxiInner Mongolia
HeilongjiangGansuShanxi
JilinTibet
NingxiaGuizhouQinghai
China’s OFDI Flow by Province (USD bn, 2017)
Note: OFDI figures include non-financial OFDI and exclude investments made by central enterprises
Source: MOFCOM; Axis Group Analysis
In 2017, more than half of China’s non-financial OFDI came from just five provinces, all located along the east coast, except for Beijing
12345678910111213141516171819202122232425262728293031
4
1
Guangdong 14%
Shandong 9%
3
2
Beijing 8%
Zhejiang 12%
5
Shanghai 15%
Top 5 provinces’ OFDI
accounts for 58% of
the total
China’s OFDI Flow by Province (%, 2017)
Top 5 Provinces by OFDI
Bottom 5 Provinces by OFDI
27
Tibet 0.27%
Highlighted on the map on right
28
31
30
29Qinghai 0.01%
Guizhou 0.05%
Shanghai, one of the
major drivers of
China’s ‘going out’
policy, registered the
highest OFDI
Jilin 0.27%
Ningxia 0.12%

121
Outward investments in manufacturing, as well as finance, grew substantially in 2016 - reflective of China’s new OFDI profile but in 2017 dropped for the first time on record following increased scrutiny on cross-border deals, notably by the US
CAGRAnnual
Growth RateCategory
28% -55%
30% 2%
3% 226%
-8% -83%
15% 26%
27% 26%
25% -17%
20% -19%
54
19
26
5
30
28
0
20
40
60
80
100
120
140
160
180
200
2007 2008 2009 2010 2011 2012 2013 2014 2015 2016 2017
Others
Manufacturing
Transport, Storage and Post
Mining
Wholesale and Retail Trades
Finance
Leasing and Business Services
China’s OFDI Flow by Sector (USD bn, 2007-2017)
Note: 1. In 2017 the outward investment flow in mining decreased to -3.7bn , and is thus not expressed in the CAGR calculation
2. Business services includes investment in holding companies, regional headquarters and SPVs often established in offshore financial centers from where investments are made in other countries and
sectors; Finance includes investments in the banking industry such as bank branch offices, bank affiliated institutions, bank rep. offices and insurance institutions; Wholesale and retailing, as well as
transportation, warehousing and postal services are closely linked with China’s export and import activities
Source: MOFCOM; Axis Group Analysis
Total-4

Other Recent Research & Publications
by Axis Group - Please contact us for
access to i.e.:
1. Asian Export Guide – What to export
to Asian economies and how to
succeed?
2. China Export Guide – What to export
to China and how to succeed?
3. 20 Years of SA-China Diplomatic ties
– Looking ahead at the next phase of
economic and business relations
122
Agenda
1. Foreword
2. Feature: Chinese Engagements and Activities in Africa
3. China Profile, Facts and Figures
– Selected Macroeconomic Indicators
– Domestic Consumption and Foreign Trade
– Domestic and Foreign Investment
– Financial Indicators
– Social Indicators
4. China in the World
5. Conclusions, Implications and Recommendations
6. About Axis Group

123
China resumed the semi-floating (controlled) exchange rate mechanism in 2010. The doubling of the USD/RMB trading bandwidth in 2014 has been seen as an important step towards establishing a market-based exchange rate system
RMB to USD Nominal Exchange Rate (1 USD, 1990-1H2018)
1. PBoC: People’s Bank of China
Source: The People’s Bank of China; Federal Reserve Bank of St. Louis; Axis Group Analysis
6.36
4.00
5.00
6.00
7.00
8.00
9.00
90 91 92 93 94 95 96 97 98 99 00 01 02 03 04 05 06 07 08 09 10 11 12 13 14 15 16 17 1H 18
In April 2012, China announced that it
would widen the RMB’s daily trade
limit band against the USD from 0.5%
to 1%
In March 2014, China announced
that it will widen RMB’s daily trade
limit band against the USD from 1%
to 2%
On 11 Aug 2015, China devalued
the RMB by 1.9%, triggering the
RMB’s biggest one-day drop since
1994
From 1997 to 2005, China
pegged the RMB to the USD at a
rate of 8.3 to 1, despite
significant criticism
In July 2005, the PBoC1 announced that it would lift the dollar
peg and phase in a flexible exchange rate mechanism.
Following the announcement, the RMB to dollar rate was
revaluated to 8.1Depreciation
Appreciation
In the first half of 2018,
escalation of trade
tensions between the
US and China have put
downward pressure on
the USD/RMB rate

124
60
65
70
75
80
85
90
95
100
ICB
C
CC
B
BoC
Hua
xia
Ban
k
CIT
IC
Mer
chan
ts B
ank
Min
shen
g B
ank
Indu
stria
l Ban
k
Chi
na E
verb
right
AB
C
Ban
k of
Sha
ngha
i
Pin
g A
n B
ank
Loans-to-Deposits Ratio (LDR) for Major Chinese Banks (%, 2017)
• The LDR limit was used as a risk management tool
• A slowdown in China’s current account surplus and capital inflows has slowed the growth of deposits
• Consequently, the LDR for many banks was near the 75% limit in 2014
• This constrained banks’ ability to lend, despite a push to boost credit supply to support growth
• As a result, the LDR limit was removed. This is aimed at stimulating the economy in general, with particular emphasis on rural economies and micro-sized businesses, whilst traditional state-owned powerhouses will lose ground
• The risk is that a freer banking system would lead to an unbridled flow of funds to high-risk marketplaces and investment vehicles
Recent Removal of the LDR Limit
Deregulation of the LDR through a revision of the calculation methodology boosts banks’ ability to lend, further supporting China’s transitioning economy
With effect from 1 October 2015, the
75% LDR upper limit has been removed
Source: Bank Websites; BBVA; Bloomberg; Axis Group Analysis

125
The RMB appreciated against the USD over the last year due to a weaker US
dollar, but the trade war has triggered its depreciation against the USD in 2018
Note: The nominal exchange rate is defined as the actual quote for a currency in relation to another currency
Source: OANDA; Axis Group Analysis
1.18
1.22
1.26
1.30
1.34
1.38
1.42
1.46
1.50
1.54
6.10
6.20
6.30
6.40
6.50
6.60
6.70
6.80
6.90
7.00
Nov
- 1
5Ja
n -
16M
ar -
16
May
- 1
6
Jul -
16
Sep
- 1
6N
ov -
16
Jan
- 17
Mar
- 1
7M
ay -
17
Jul -
17
Sep
- 1
7N
ov -
17
Jan
- 18
Mar
- 1
8M
ay -
18
Jul -
18
Sep
- 1
8N
ov -
18
USD to CNY (LHS) USD to AUD (RHS)
10.00
11.00
12.00
13.00
14.00
15.00
16.00
17.00
6.10
6.20
6.30
6.40
6.50
6.60
6.70
6.80
6.90
7.00
Nov
- 1
5Ja
n -
16M
ar -
16
May
- 1
6Ju
l - 1
6S
ep -
16
Nov
- 1
6Ja
n -
17M
ar -
17
May
- 1
7Ju
l - 1
7S
ep -
17
Nov
- 1
7Ja
n -
18M
ar -
18
May
- 1
8Ju
l - 1
8S
ep -
18
Nov
- 1
8
USD to CNY (LHS) USD to ZAR (RHS)
Nominal Exchange Rates Comparison (Nov 2015-Dec 2018)

126
China’s Benchmark Lending Rates (%, 1998-2018)
Source: Hexun; Axis Group Analysis
4
6
8
10
12
Jan-
98
Jul-9
8
Jan-
99
Jul-9
9
Jan-
00
Jul-0
0
Jan-
01
Jul-0
1
Jan-
02
Jul-0
2
Jan-
03
Jul-0
3
Jan-
04
Jul-0
4
Jan-
05
Jul-0
5
Jan-
06
Jul-0
6
Jan-
07
Jul-0
7
Jan-
08
Jul-0
8
Nov
-08
May
-09
Nov
-09
May
-10
Nov
-10
May
-11
Nov
-11
May
-12
Nov
-12
May
-13
Nov
-13
May
-14
Nov
-14
May
-15
Nov
-15
May
-16
Nov
-16
May
-17
Nov
-17
May
-18
Nov
-18
6 months to 1 year (including 1 year) 1 year to 3 years (including 3 years) 3 years to 5 years (including 5 years) Longer than 5 years
First loan interest rate
decrease in six years
First loan interest rate
decrease since the global
financial crisis
From November 2014 to the end of October 2015, the PBoC cut interest rates six times to spur economic growth. On 24 October 2015, the benchmark interest rate was cut to a record low of 4.35% and it has remained there since then
Four adjustments
in the loan interest
rate since Nov.
2014
In Oct 2008, the lending
rate was adjusted 3 times in
a month

127
3
4
5
6
7
J MM J SN J MM J SN J MM J SN J MM J SN J MM J SN J MM J SN J MM J SN J MM J SN J
China’s Benchmark 1-Year Lending Rate (%, 2011-2018)
• Market-oriented interest rate reforms are also part of a push towards economic reforms
• Banks can now set rates for loans and deposits more autonomously
• After becoming more stable in 2016, capital outflows fell by two thirds in 2017
• China has continued to raise open market rates in recent months in efforts to gradually deleverage
Source: Bloomberg; Pictet; Axis Group Analysis
Key Business Implications of China’s Interest Rate Liberalization
After decreasing the benchmark lending rate to its all-time lowest level, it has been kept at 4.35% for over three years
2011 2012 2014 2015 2016
China’s benchmark lending rate was cut to
4.35% in October 2015 to keep the economy
growing at a reasonable pace
2013 2017 2018
Buoyed by stable fundamentals, China’s benchmark
lending rate stayed at 6% for almost two years
between 2012 and 2014

128
1,000
1,500
2,000
2,500
3,000
3,500
4,000
01-2
016
02-2
016
03-2
016
04-2
016
05-2
016
06-2
016
07-2
016
08-2
016
09-2
016
10-2
016
11-2
016
12-2
016
01-2
017
02-2
017
03-2
017
04-2
017
05-2
017
06-2
017
07-2
017
08-2
017
09-2
017
10-2
017
11-2
017
12-2
017
01-2
018
02-2
018
03-2
018
04-2
018
05-2
018
06-2
018
07-2
018
08-2
018
09-2
018
10-2
018
11-2
018
12-2
018
SSE SZSE
China Stock Market Indices (Index Value, 2016-18)
Source: Yahoo Finance; Bloomberg; Axis Group Analysis
China’s stock markets have become cautiously optimistic in the past year, but have cooled recently over concerns of souring trade relations with the United States
Sudden market fears about
growth slowdown, debt and
capital flight triggered a
massive drop in the
beginning of 2016
SSE falls to its lowest level since
November 2014
SSE reaches two year high due to
bond market crackdowns, jump in
2017 corporate profits, and the
CNY’s 2 year-high against the USD
SSE plunges 4% following
similar selloff in the prior
US market day
Concerns over US-
China trade war sends
stock market downward

129
QFII RQFII
NameQualified Foreign Institution
Investor
RMB Qualified Foreign
Institution Investor
Date
Created2002 2011
Regulator CSRC, SAFE CSRC, SAFE, PBoC
Eligible
Applicants
Commercial banks,
securities companies, asset
mgmt. companies,
insurance companies, etc.
Financial institutions
registered and mainly
operated in Hong Kong
Currency USD RMB
Investment
Scope
Stocks, bonds, funds, warrants, Initial Public Offerings
(IPOs), bond issuance, and other products approved by
CSRC
Investment
Limitations
<30% for QFII shareholding in total, <10% for single QFII
shareholding
Comparison of QFII and RQFII Investors
0
50
100
150
200
250
300
350
0
20
40
60
80
100
120
2004
2005
2006
2007
2008
2009
2010
2011
2012
2013
2014
2015
2016
2017
2018
QFII quota RQFII quota
QFII institutions (RHS) RQFII institutions (RHS)
Source: Shenzhen Stock Exchange; SAFE; CSRC; Axis Group Analysis
Approved Quotas and Number of Licensed Institutions (USD bn, 2014-2018)
QFII and RQFII are two major quotas for foreign institutional investors looking to access China’s stock market. Beijing has used these quotas to allow increased access to local markets
No. of
InstitutionsUSD bn
In June 2018, a 20% ceiling on profit
repatriation was removed for both QFIIs
and RQFIIs. Other restrictions were also
removed, such as lockup periods for
principal and access to domestic currency
hedging schemes. SAFE and PBoC
continue to increase quotas for foreign
financial firms

130
The PBoC’s M2 growth for 2017 fell far below its 12% target. The PBoC tends not to set fixed targets, instead implementing regular revisions of the target based on the needs of the economy
China’s Money Supply (USD tn, 2012-2018)
Source: The People’s Bank of China; Axis Group Analysis
0
5
10
15
20
25
30
J M M J S N J M M J S N J M M J S N J M M J S N J M M J S N J M M J S N J M M J S N
M2 M1 M0
2012 2013 2014 2015 2016 2017 2018

131
The PBoC has continued to maintain a prudent monetary policy in 2016, as it looks to keep credit growth stable and quicken the pace of market-oriented interest rate reform
China’s Benchmark Deposit Interest Rates (% p.a., Mar 1998-Dec 2018)
Source: The People’s Bank of China; Axis Group Analysis
0
2
4
6
8
25-M
ar-9
8
1-Ju
l-98
7-D
ec-9
8
10-J
un-9
9
21-F
eb-0
2
29-O
ct-0
4
19-A
ug-0
6
19-A
ug-0
6
18-M
ar-0
7
19-M
ay-0
7
21-J
ul-0
7
22-A
ug-0
7
15-S
ep-0
7
21-D
ec-0
7
9-O
ct-0
8
30-O
ct-0
8
27-N
ov-0
8
23-D
ec-0
8
20-O
ct-1
0
26-D
ec-1
0
9-F
eb-1
1
6-A
pr-1
1
7-Ju
l-11
8-Ju
n-12
6-Ju
l-12
22-N
ov-1
4
1-M
ar-1
5
11-M
ay-1
5
28-J
un-1
5
25-A
ug-1
5
23-O
ct-1
5
21-D
ec-1
6
28-D
ec-1
7
27-D
ec-1
8
5 years 1 year 6 months 3 months
First cut since global
financial crisis
Adjustments in 2012 to widen the range within which banks can set deposit rates mark an
important step towards interest rate liberalisation
The interest rates have
remained unchanged
since October 2015

132
0
5,000
10,000
15,000
20,000
25,000
30,000
35,000
2000 2001 2002 2003 2004 2005 2006 2007 2008 2009 2010 2011 2012 2013 2014 2015 2016 2017 2018
Loans
Deposits
Chinese banks have funded themselves mainly from deposits at a loan-to-deposit ratio (LDR) of about 75%. Total deposits reached USD 31tn by the end of 2018, while loans amounted to USD 23tn
China’s Total Loans and Deposits1 (USD bn, 2000-2018)
1. Total Loans and Deposits in RMB and Foreign Currency
2. CBRC: China Banking Regulatory Commission
Source: The People’s Bank of China; Axis Group Analysis
Loans-to-Deposit Ratio (%)
7180 78 77 76 74 68 67 67 65 70 69 70 72 74
X
In 2007, the CBRC² implemented a
75% LDR ratio limit for all banks in
China
In 2015, the LDR ratio reached 75%. In June 2015
the China’s State Council issued a draft proposal to
relax the ratio limit
71
17.8%
71
18.3%
74
CAGR
75

133
15 16 17
Overseas
Non-banking FinancialInstitutionsGovernment
Non-financialEnterprisesHouseholds
25,206 9,647
8,442
4,521
2,271
3250
5,000
10,000
15,000
20,000
25,000
TotalDeposits
Households Non-financialEnterprises
Government Non-bankingFinancial
Institutions
Overseas
China’s Sources of Deposits (USD bn, 2007-2017)
Note: Classification in Sources & Uses of Financial Institution Credit Funds was changed in 2011 and 2015
Source: The People’s Bank of China; Axis Group Analysis
China’s Sources of Deposits (USD bn, 2017)
China’s high savings rate remained as the main source of funds for Chinese banks. In 2017, household banking deposits accounted for 38% of total deposits, while non-financial companies deposits accounted for 33%
33%
38%
0
5,000
10,000
15,000
20,000
25,000
07 08 09 10
Other Deposits
Trust Deposits
Agricultural Deposits
Fiscal Deposits
Deposits of Gov. Dept. &Org.Company Deposits
Household SavingsDeposits
11 12 13 14
Other Deposits
Designated Deposits
Temporary Deposits
Fiscal Deposits
Personal Deposits
Corporate Deposits
18%
9%

134
Since bottoming out in July 2014, China’s monthly new loans have been steeply increased and decreased in the diverse phases, as a result of several reductions in interest rates and bank deposit-reserve ratios
China’s Monthly New Loans (USD bn, 2011-Nov 2018)
Source: The People’s Bank of China; Axis Group Analysis
-13%15%
8% 11%14% 4%
9%
-80
-60
-40
-20
0
20
40
60
80
100
120
0
50
100
150
200
250
300
350
400
450
J F M A M J J A S O N D J F M A M J J A S O N D J F M A M J J A S O N D J F M A M J J A S O N D J F M A M J J A S O N D J F M A M J J A S O N D J F M A M J J A S O N D J F M A M J J A S O N
Monthly Loan Size Y-o-Y Growth Rate (rhs) Yearly Cummulative % Change
2011 2012 2013 2014 20162015 2017 2018
Chinese banks front-load their
balance sheets in anticipation of
support from the Chinese government
due to economic slowdown

135
15 16 17
Overseas
Non-bankingFinancial Institutions
Non-financialEnterprises andGov. Dep. & Org.Households
Note: Classification in Sources & Uses of Credit Funds of Financial Institutions was changed in 2011 and 2015
Source: The People’s Bank of China; Axis Group Analysis
0
5,000
10,000
15,000
20,000
07 08 09 10
Other Loans
Trust Loans
Short-term Loans
Medium & Long-termLoans
11 12 13 14
Overseas Loans
Advances
Bill Financing
Financial Lease
Medium & Long-termLoansShort-term Loans
18,485 5,914
11,680
388 503
0
2,000
4,000
6,000
8,000
10,000
12,000
14,000
16,000
18,000
Total Loans Households Non-financialEnterprises and
Gov. Dep. &Org.
Non-bankingInstitions
Overseas
63%
32%
Composition of China’s New Loans (USD bn, 2007-2017)
Composition of China’s New Loans (USD bn, 2017)
In 2017, new RMB loans reached USD 18,485bn, with ‘non-financial enterprises and government department and organisations’ accounting for 63% of total loans

136
396 1,122 4,302 1,747 3,655 3,926 3,330 3,655 3,732 6,064 4,808 7,310 8,143 5,346
834 842 860 864 864 894 931 954 953 995 1,071 1,284 1,395 1,450
547 592 690 740 830 1,169
1,411 1,540 1,536 1,618 1,729
1,959 2,114 2,134
0
1,000
2,000
3,000
4,000
5,000
6,000
7,000
8,000
9,000
0
500
1,000
1,500
2,000
2,500
3,000
3,500
4,000
2005 2006 2007 2008 2009 2010 2011 2012 2013 2014 2015 2016 2017 2018
Number of companies listed on the Shenzhen Stock Exchange (LHS)
Number of companies listed on the Shanghai Stock Exchange (LHS)
Combined Total Market Capitalisation (USD bn, RHS)
Number of Listed Companies and Total Market Value of China’s Stock Exchanges (2005-2018)
By the end of 2017, the Shanghai and Shenzhen Stock Exchanges were the world’s 5th and 7th largest stock markets respectively, by market capitalisation
Source: Shanghai Stock Exchange; Shenzhen Stock Exchange; Axis Group Analysis
Total Market
Value (USD bn)

137
0
1,000
2,000
3,000
4,000
5,000
J A J O J A J O J A J O J A J O J A J O J A J O J A J O J A J O0
1,000
2,000
3,000
4,000
5,000
Market Value of Tradable Shares
Composite Index (RHS)
Shanghai Stock Exchange Composite Index (2011-2018)
0
3,000
6,000
9,000
12,000
15,000
18,000
21,000
0
500
1,000
1,500
2,000
2,500
3,000
3,500
J A J O J A J O J A J O J A J O J A J O J A J O J A J O J A J O
Market Value of Tradable Shares
Component Index (RHS)
Source: Shanghai Stock Exchange; Shenzhen Stock Exchange; Axis Group Analysis
Shenzhen Stock Exchange Component Index (2011-2018)
From 2014, the market value of tradable shares increased significantly, until the drop in mid-2015. Market value then slowly regained value before hitting more significant losses in the first half of 2018
USD bn
2012 2013 20142011 2015 2016 2017 2018
USD bn
2012 2013 20142011 2015 2016 2017 2018

138
0
2,000
4,000
6,000
0
2,000
4,000
6,000
8,000
10,000
12,000
05 06 07 08 09 10 11 12 13 14 15 16 17 18
Trading Volume (LHS)
SH Composite Index (RHS)
AverageP/E Ratio
16.3 33.3 59.2 14.9 28.73 21.61 13.4 10.99 10.99 15.99 17.63 15.91 n.a. 16.37
Total
Turnover
USD bn
235 725 4,017 2,597 6,469 5,893 3,682 8,423 13,309 19,715 40,979 7,375 7,612 7,785
Shanghai Stock Exchange Trading Volume and Composite Index (2005-2018)
Source: EastMoney; Shanghai Stock Exchange; Shenzhen Stock Exchange; Axis Group Analysis
Shenzhen Stock Exchange Trading Volume and Component Index (2005-2018)
After recovering from the global financial crisis in 2009, China’s stock markets have since declined as both domestic and overseas investors have become weary of lax corporate governance and dampened profit outlook
0
5,000
10,000
15,000
20,000
0
1,000
2,000
3,000
4,000
5,000
6,000
7,000
8,000
05 06 07 08 09 10 11 12 13 14 15 16 17 18
bn shares
Average
P/E Ratio16.4 32.7 69.7 16.7 46.01 44.69 23.11 22.02 27.76 34.05 52.75 36.21 33.11
Total
Turnover
USD bn
152 410 2,040 1,248 2,909 3,360 2,095 2,309 3,669 5,642 18,845 11,494 10,593
bn sharesTrading Volume (LHS)
SZSE Composite Index (RHS)

139Note: 1. FX – Foreign Exchange
Source: Bloomberg; The People’s Bank of China; Axis Group Analysis
-20%
-10%
0%
10%
20%
30%
40%
50%
60%
0
600
1,200
1,800
2,400
3,000
3,600
4,200
4,800
1997 1998 1999 2000 2001 2002 2003 2004 2005 2006 2007 2008 2009 2010 2011 2012 2013 2014 2015 2016 2017 2018
Foreign Exchange Reserves Y-o-Y Growth Rate (RHS)
China’s Foreign Exchange Reserves (USD bn, 1997-2018)
China holds the world’s largest FX1 reserves. The foreign reserve growth rate had been negative since 2014, but rebounded in 2017
USD bn

140
-20%
-10%
0%
10%
20%
30%
40%
2,500
3,000
3,500
4,000
4,500
J F MAM J J A S ON D J F MAM J J A S ON D J F MAM J J A S ON D J F MAM J J A S ON D J F MAM J J A S ON D J F MAM J J A S ON D J F MAM J J A S ON D J F MAM J J A S ON D J
Foreign Exchange Reserves Y-o-Y Growth Rate (RHS)
China’s FX reserves fell below USD 3tn in January 2017, and slowly increased during the year. As the floating band of Chinese Yuan widens and cross-border capital flow stabilises, the FX reserves in China remains steady
China’s Foreign Exchange Reserves (USD bn, 2011-Jan 2019)
Source: The People’s Bank of China; Various; Axis Group Analysis
20182012 20142013 2015 2016 20172011
China’s foreign exchange reserves
experienced its first quarterly drop in more
than a decade in Q4-2011
January 2017 China’s FX reserves
fell just under the USD 3tn mark for
the first time in almost 6 years
USD bn

141
Many economists have long considered China’s currency to be undervalued. The IMF officially declared the Renminbi (RMB) to no longer be undervalued in May 2015, with the RMB officially being included in the SDR¹ from October 2016
Annual RMB to Certain Currency Exchange Rate (2001-2018)
40
90
140
190
240
290
340
1 2 3 4 5 6 7 8 9 10 11 12 13 14 15 16 17 18
EUR AUD ZAR USD RUB JPY KRW
AUD
EUR
USD ZAR
KRW
JPY
RUB
The higher the rates are, the more the RMB has
depreciated in relation to these currencies. Conversely,
RMB gains weaken Chinese exports to these countries
The USD is the only currency that
appreciated against the RMB
between 2014 and 2015
Note: 1. SDR = Special Drawing Rights; Artificial currency unit based upon several national currencies. The SDR serves as the official monetary unit of several international organizations and acts as a
supplementary reserve for national banking system
2. Index 2001 = 100
Source: OANDA; fxtop.com; Axis Group Analysis

142
The RMB has gradually strengthened in comparison to other emerging market currencies over the last 6 years, which has detracted from China’s relative manufacturing competitiveness over this long-term period…
Real Effective Exchange Rate (2011-2018)
Note: Real effective exchange rates are the geometric weighted averages of bilateral exchange rates, adjusted by relative consumer prices. The assigned weights represent the partner country’s trade
share within the total trade. The real effective exchange rate on Jan 2011 is assigned a value of 100 to compute the index
Source: BIS; Axis Group Analysis
40
60
80
100
120
140
160
Jan-
11
Apr
-11
Jul-1
1
Oct
-11
Jan-
12
Apr
-12
Jul-1
2
Oct
-12
Jan-
13
Apr
-13
Jul-1
3
Oct
-13
Jan-
14
Apr
-14
Jul-1
4
Oct
-14
Jan-
15
Apr
-15
Jul-1
5
Oct
-15
Jan-
16
Apr
-16
Jul-1
6
Oct
-16
Jan-
17
Apr
-17
Jul-1
7
Oct
-17
Jan-
18
Apr
-18
Jul-1
8
Oct
-18
China Brazil Germany
Over a 6 year period, the relative
competitiveness of the RMB declined
and made exports more expensive
Currency Pair 2011 2016 2018 Competitive Trend
USD-RMB 6.46 6.64 6.87
AUD-RMB 6.67 4.95 4.85
EUR-RMB 8.99 7.35 7.87
Further expanded in
the next slide
Appreciation
Depreciation

143
…however, the recent relative stabilisation and decline in the RMB’s real
effective exchange rate implies that the impact of currency on China’s export
competitiveness has become less significant
Real Effective Exchange Rate (2015-2018)
Note: The real effective exchange rate on Jan 2015 is assigned a value of 100 to compute the index
Source: BIS; Axis Group Analysis
50
60
70
80
90
100
110
120
Jan-
15
Mar
-15
May
-15
Jul-1
5
Sep
-15
Nov
-15
Jan-
16
Mar
-16
May
-16
Jul-1
6
Sep
-16
Nov
-16
Jan-
17
Mar
-17
May
-17
Jul-1
7
Sep
-17
Nov
-17
Jan-
18
Mar
-18
May
-18
Jul-1
8
Sep
-18
Nov
-18
China Brazil Germany India Indonesia Japan
Australia Mexico South Africa Thailand United States Turkey
Appreciation
Depreciation
The RMB stabilised after a long period of
appreciation, and even weakened, which implies
that the RMB’s negative impact on export
competitiveness is declining

Other Recent Research & Publications
by Axis Group - Please contact us for
access to i.e.:
1. Asian Export Guide – What to export
to Asian economies and how to
succeed?
2. China Export Guide – What to export
to China and how to succeed?
3. 20 Years of SA-China Diplomatic ties
– Looking ahead at the next phase of
economic and business relations
144
Agenda
1. Foreword
2. Feature: Chinese Engagements and Activities in Africa
3. China Profile, Facts and Figures
– Selected Macroeconomic Indicators
– Domestic Consumption and Foreign Trade
– Domestic and Foreign Investment
– Financial Indicators
– Social Indicators
4. China in the World
5. Conclusions, Implications and Recommendations
6. About Axis Group
Source: Trippest (cover page), Visual China Group (视觉中国) (agenda)

145
In 2017, China had the world’s largest population with 1.39bn people. However, its population growth has consistently decreased over the past few decades, with current growth stabilising at less than 0.6% per year
China’s Population (mn, 1978-2018E)
Source: IMF; National Bureau of Statistics of China; Axis Group Analysis
0.0%
0.6%
1.2%
1.8%
0
500
1,000
1,500
78 79 80 81 82 83 84 85 86 87 88 89 90 91 92 93 94 95 96 97 98 99 00 01 02 03 04 05 06 07 08 09 10 11 12 13 14 15 16 1718E
Population
Natural Growth Rate (RHS)
mn
Population increase in 2016
attributed to the relaxation of
the one-child policy at the
end of 2015

146
China’s Annual Births (%, 1980-2018)
Source: National Bureau of Statistics of China; Axis Group Analysis
0.0
0.2
0.4
0.6
0.8
1.0
1.2
1.4
1.6
1.8
-0.5
0.0
0.5
1.0
1.5
2.0
2.5
3.0
80 81 82 83 84 85 86 87 88 89 90 91 92 93 94 95 96 97 98 99 00 01 02 03 04 05 06 07 08 09 10 11 12 13 14 15 16 17 18
Birth Rate Natural Population Growth Rate (RHS)
Since 1987, China’s birth rate has been declining significantly – as of November 2015, the amended One Child Policy now allows all families to have a second child
Rising costs of living are
discouraging young urban families
from having more than one child
In 2016, among all newly born
children, 45% of them are the
second or more child in the family

147
55%
60%
65%
70%
75%
80%
550
650
750
850
950
1050
1980 1990 2000 2010 2020F 2030F2040F2050F 2060FWorking Age Pop'n (15-64)
Working Age Pop'n as % of Total Population (RHS)
China Population Maturity Forecast (mn, 1980-2060F)
China’s population is ageing rapidly – unlike other developing economies, it will not be able to leverage a young population base to drive growth
-206 mn
(-21%)
2015,
996 mn
2015,
73%
2050F,
61%
2050F,
790 mn
Significant decline in working
population implies China will
lose its demographic dividend
Fertility Rates1 by Country (1971-2017E)
0
1
2
3
4
5
6
1971
1974
1977
1980
1983
1986
1989
1992
1995
1998
2001
2004
2007
2010
2013
2016
China India Indonesia Japan South Korea
One Child Policy
enacted in 1980
Fueled by growing urbanisation and incomes, the
fastest decline in China’s fertility rate occurred
before 1980
Note: According to OECD, the fertility rate is defined as the total number of children that would be born to each woman if she were to live to the end of her child-bearing years and give birth to children in
alignment with the prevailing age-specific fertility rates
Source: United Nations; World Bank; CIA Factbook; Axis Group Analysis
• Recent relaxation of One Child Policy – all families are now
entitled to have a second child
• While it is projected that China’s fertility rates will not fall to
the levels of Japan and South Korea, China has lost its
demographic dividend

148
0
100
200
300
400
2010 2013 2020FOthers Chinese Herb MedicinesChinese Patent Drugs OTC DrugsGeneric Precription Drugs Patented Prescription Drugs
26.2%
211
370
105
China’s ageing population is driving the growth of the healthcare and pharma industries, which are also starting to play a key role in exports
China Pharmaceutical Sales (USD bn, 2010–2020F)
8.4%
Western
Medicine
Growth rate is expected to be lower in the next
few years, in line with China’s general
economic development and the gradual
maturing of the market
Traditional
Chinese
Medicine
19.5%
50.7%
7.8%13.8%3.3%
4.9%
14.3%
50%
9.5%
15.2%
3.6%7.4%
Note: Others include disposals (e.g. needles and syringes), chemical agents, glass ware, etc.
Source: MOFCOM; NBS; Axis Group Analysis
130209
330154
288
325
149
201
314
0
200
400
600
800
1,000
2012 2016 2020F
Govt. Health Exp. Social Health Exp. Out of Pocket Health Exp.
China’s Healthcare Spending (USD bn, 2012-2020F)
5.3% 6.2% 6.2%
X%Represents healthcare expenditure as a % of GDP
The major drivers of increased healthcare spending in China are the ageing
population, increased govt. focus on healthcare, and increased spending
power in rural and less accessible areas
Became the 2nd largest pharma
market globally in 2016
CAGRX%

149
0 20 40 60 80 100 120
GuangdongShandong
HenanSichuanJiangsu
HebeiHunanAnhuiHubei
ZhejiangGuangxiYunnanJiangxi
LiaoningFujian
ShaanxiHeilongjiang
ShanxiGuizhou
ChongqingJilin
GansuInner Mongolia
ShanghaiXinjiangBeijingTianjinHainanNingxiaQinghai
Tibet
Urban Rural
China Provincial Population Breakdown by Urban andRural Residences (mn, 2017)
Source: China Statistical Yearbook; Axis Group Analysis
As more migrants move to coastal areas in search of better economic opportunities, the already populous regions are facing new socioeconomic challenges in accommodating the incoming population
1
2
3
4
5
6
7
8
9
10
11
12
13
14
15
16
17
18
19
20
21
22
23
24
25
26
27
28
29
30
31
2
4
3 5
1
Henan48
Hainan5
Shandong61
Guangdong78
Jiangsu55
Sichuan42
31
Tibet1
30
Qinghai3 29 Ningxia
4
28
27
Tianjin13
Top 5 Provinces by Urban Population
Bottom 5 Provinces by Urban Population
Highlighted on the map on right
Geographical Distribution of China’s Population (mn, 2017)
Higher wages in more developed areas attract migrant
workers from surrounding provinces

150
Agricultural Sector, 9%
Industry Sector, 40%
Services Sector, 52%
In 2011, employment in China’s services sector overtook the agricultural sector for the first time. As China’s economy continues to develop, the services sector will play an increasingly important role
Total Employed Persons by Sector (% of Total, 2005-2017)
Source: STATISTA; Axis Group Analysis
0
10
20
30
40
50
60
70
80
90
100
05 07 09 11 13 15 17
Agricultural Sector
Industry Sector
Services Sector
Contribution of Each Sector to GDP (%, 2017)

151
Despite a gradual narrowing of the urban-rural income disparity, income levels in urban households are still almost three times more than those of rural households
Annual Income of Urban and Rural Households in China (1997-2018)
Note: 1. Annual disposable income of urban households and net income of rural households per capita
2. Growth rates are calculated at current prices
Source: National Bureau of Statistics of China; Axis Group Analysis
5,947
252
2,215
0%
6%
12%
18%
24%
30%
0
1,000
2,000
3,000
4,000
5,000
6,000
7,000
97 98 99 00 01 02 03 04 05 06 07 08 09 10 11 12 13 14 15 16 17 18
Urban Rural Urban Growth (RHS) Rural Growth (RHS)
USD
662

152
30 10 10 30 50 70
Shanghai Beijing
Zhejiang Jiangsu
Guangdong Tianjin Fujian
Shandong Inner Mongolia
Liaoning Hunan
Chongqing Hubei Anhui
Jiangxi Yunnan Hainan
Shaanxi Xinjiang Sichuan
Tibet Hebei
Guangxi Henan
Ningxia Qinghai Shanxi
Guizhou Jilin
Gansu Heilongjiang
Thousands
Urban Rural
Beijing and Shanghai, China’s political and financial capitals, continue to lead the country in terms of wealth accumulation. Overall, income levels are substantially skewed towards the more developed, eastern coastal provinces
Urban and Rural Households Income Per Annum by Province in China (USD ‘000, 2017)
Note: Represents disposable income of urban households and net income of rural households
Source: China Statistical Yearbook; Axis Group Analysis
Zhejiang
51,261
Guangdong
40,975
Jiangsu
43,622
Beijing
62,406
5
1
3
4
2
29
28
2730
31
Gansu
27,763
Guizhou
29,080
Jilin
28,319
Top 5 Provinces by Urban Household Income
Bottom 5 Provinces by Urban Household Income
Highlighted on
the map on right
Geographical Distribution of China’s Household Income (USD, 2017)
Shanghai
62,596
Shanxi
29,132
Heilongjiang
27,446
1
2
3
4
5
6
7
8
9
10
11
12
13
14
15
16
17
18
19
20
21
22
23
24
25
26
27
28
29
30
31

153
While the downward trend of the Engel Coefficient reflects a progressively higher standard of living, temporary increases in 2004, 2008 and 2011 underscore concerns over food price spikes
China’s Urban and Rural Engel Coefficients (%, 1978-2017)
Note: Engel's Law states that household expenditure on food, on aggregate, declines as income rises; in other words, the income elasticity of demand for food on aggregate is less than one and declines towards
zero with income growth. A common application of this statistic is to regard it as a reflection of the living standards of a country. Engel Coefficient has an inverse correlation with the standard of living of a
country
Source: National Bureau of Statistics of China; Hexun; Axis Group Analysis
28.6
31.2
25
35
45
55
65
75
78 79 80 81 82 83 84 85 86 87 88 89 90 91 92 93 94 95 96 97 98 99 00 01 02 03 04 05 06 07 08 09 10 11 12 13 14 15 16 17
Urban Areas Rural Areas
57.5
67.7
Temporary increases from high
levels of food inflation
Failed price reforms fueled
inflation, especially in urban
areas

154
Income inequality in China is growing, as measured by the Gini Coefficient. There are concerns in China that growing income inequality, if left unchecked, could undermine social stability and future economic growth
China’s Gini Coefficient (1978-2018)
Note: The Gini Coefficient is a measure of statistical dispersion. It is most prominently used as a measure of inequality of income distribution or inequality of wealth distribution. It is defined as a ratio with
values between 0 and 1. A low Gini Coefficient indicates more equal income or wealth distribution, while a high Gini Coefficient indicates more unequal distribution
Source: National Bureau of Statistics of China; Axis Group Analysis
0.474
0.0
0.1
0.2
0.3
0.4
0.5
0.6
78 79 80 81 82 83 84 85 86 87 88 89 90 91 92 93 94 95 96 97 98 99 00 01 02 03 04 05 06 07 08 09 10 11 12 13 14 15 16 17 18E
China exceeded 0.4 – the
recognised warning level for
dangerous levels of inequality – in
2000
Official data shows China’s Gini Coefficient peaked in
2008 at 0.491, while non-official data shows it has
already been greater than 0.5 for some time, signaling
severe inequality
0

155
China’s urban population outnumbered its rural population for the first time in 2011, marking an important milestone in China’s ongoing socio-economic transformation
China’s Urbanisation Rate (%, 1978-2018)
Source: National Bureau of Statistics of China; Annual Report on Urban Development of China;Axis Group Analysis
0
10
20
30
40
50
60
78 79 80 81 82 83 84 85 86 87 88 89 90 91 92 93 94 95 96 97 98 99 00 01 02 03 04 05 06 07 08 09 10 11 12 13 14 15 16 17 18
China’s urbanisation rate
exceeded 50% for the first
time in 2011

Other Recent Research & Publications
by Axis Group - Please contact us for
access to i.e.:
1. Asian Export Guide – What to export
to Asian economies and how to
succeed?
2. China Export Guide – What to export
to China and how to succeed?
3. 20 Years of SA-China Diplomatic ties
– Looking ahead at the next phase of
economic and business relations
156
Agenda
1. Foreword
2. Feature: Chinese Engagements and Activities in Africa
3. China Profile, Facts and Figures
4. China in the World
– Selected Macroeconomic Indicators
– Domestic Consumption and Foreign Trade
– Domestic and Foreign Investment
– Financial Indicators
– Social Indicators
5. Conclusions, Implications and Recommendations
6. About Axis Group

157Source: Face 2 Face Africa

158
China’s rapid economic growth has positioned itself as the world’s 2nd largest economy. Furthermore, it is projected to overtake the US in 2026 and become the world’s largest economy
GDP of Top Economies, excl. US (USD bn, 1995-2018F)
Note: Forecast GDP growth based on IMF Economic Outlook as of April 2018. 2026 forecast based on Bloomberg data
Source: IMF; Bloomberg; Axis Group Analysis
China Rank
(excl. US)7 6 6 6 6 5 5 5 5 5 4 3 2 2 1 1 1 1 1 1 1 1 1 1
0
2,000
4,000
6,000
8,000
10,000
12,000
14,000
16,000
95 96 97 98 99 00 01 02 03 04 05 06 07 08 09 10 11 12 13 14 15 16 17 18F
ChinaJapanGermanyUKIndiaFranceBrazilItalyCanadaRussiaIndonesiaSouth Africa
2005: China
surpassed France
2007: China
surpassed
Germany
2006: China
surpassed UK
2009: China
surpassed Japan
2000: China
surpassed Italy
1996: China
surpassed
Brazil
1995: China
surpassed
Canada
At current growth rates,
China is projected to
overtake the US in around
2026
Between 2013 and 2014,
China’s GDP growth was
more than Indonesia’s
total nominal GDP
2017 Global Rank
2
3
4
5
6
7
9
10
12
16
8
33
Country

159
1,3301,271
1,075766
666547540533
512478
446414407
354324
308302289
275245240238226222
200162
11466
5139
19
1,3801,314
1,015826
679539539525525
495455
417396
351324309304
277277252250235220218201
161110
67524021
1,600 1,400 1,200 1,000 800 600 400 200 0 200 400 600 800 1,000 1,200 1,400 1,600
GuangdongJiangsuShandongZhejiangHenanSichuanHubeiHebeiHunanFujianShanghaiBeijingAnhuiLiaoningShaanxiInner MongoliaJiangxiGuangxiTianjinChongqingHeilongjiangJilinYunnanShanxiGuizhouXinjiangGansuHainanNingxiaQinghaiTibet
The sheer size of China’s economy can be highlighted by the fact that its provinces have GDP figures comparable to those of major global economies
China’s GDP by Province Compared with Similarly Sized World Economies (USD bn, 2017)
AustraliaSpainIndonesiaNetherlandsSwitzerlandSwedenSwedenPolandPolandBelgiumThailandAustriaNorwayIsraelSingaporeColombiaPakistanChileChileFinlandBangladeshEgyptVietnamPortugalGreeceKazakhstanMoroccoMyanmarTanzaniaTunisiaAfghanistan
Note: There is a slight discrepancy between IMF and NBS data for overall GDP levels
Source: National Bureau of Statistics of China; IMF; Axis Group Analysis

160
China’s individual provinces are gaining economic prominence in the global context, with GDP per capita figures comparable to those of developing economies
China’s GDP Per Capita by Province Compared with Selected Developing Economies (USD , 2017)
19,09518,450
17,66015,876
13,63412,289
12,01010,790
9,4489,433
9,1798,4828,309
8,1087,5417,489
7,1737,1076,980
6,6936,6806,6136,5686,547
6,3246,214
6,0075,814
5,6225,117
4,343
19,84018,637
17,66415,769
13,82312,72712,527
10,6089,6079,3049,304
8,8418,5758,575
7,6477,3757,2717,271
6,7636,7636,6846,6436,5936,5936,2736,1806,180
5,7605,678
5,0884,408
20,000 15,000 10,000 5,000 0 5,000 10,000 15,000 20,000 25,000
BeijingShanghaiTianjinJiangsuZhejiangFujianGuangdongShandongInner MongoliaChongqingHubeiShaanxiJilinLiaoningNingxiaHunanHainanHebeiHenanJiangxiXinjiangSichuanQinghaiAnhuiHeilongjiangGuangxiShanxiTibetGuizhouYunnanGansu
Estonia
Greece
Slovak Republic
Trinidad and Tobago
Poland
Equatorial Guinea
Maldives
Russia
St. Lucia
Mexico
Mexico
Kazakhstan
Nauru
Nauru
Montenegro
Dominican Republic
St. Vincent and the Grenadines
St. Vincent and the Grenadines
Peru
Peru
Venezuela
Turkmenistan
Thailand
Thailand
Colombia
South Africa
South Africa
Belarus
Jordan
Iraq
Angola
Source: National Bureau of Statistics of China; IMF; Axis Group Analysis

161
-10
-5
0
5
10
15
20
00 01 02 03 04 05 06 07 08 09 10 11 12 13 14 15 16 17 18F 19F
China Australia Brazil India Japan Russia South Africa United States EU
China’s economy has shown greater resilience than most other major economies, even during the global financial crisis
GDP Growth Comparison (%, 2000-2019F)
Global financial crisis
China’s economy is
stabilising at sub-7%
growth
Eurozone crisis
Dotcom bubble
Note: Annual GDP growth based on YoY percent change in national GDP measured in local currency units using constant prices
Source: IMF; Axis Group Analysis

162Note: Annual GDP growth is based on Y-o-Y percent change in national GDP measured in local currency units using constant prices
Source: IMF; Axis Group Analysis
Since 1980, China’s annual GDP growth rate has consistently exceeded the global average. China is set to remain a global economic engine, even at a lower growth rate of under 7%
China vs. US vs. World Average Annual GDP Growth (% Y-o-Y, 1980-2018F)
-4
0
4
8
12
16
80 81 82 83 84 85 86 87 88 89 90 91 92 93 94 95 96 97 98 99 00 01 02 03 04 05 06 07 08 09 10 11 12 13 14 15 16 17E18F
China US World Average

163
Although China's economic growth slowed to 6.6% in 2018, it still outpaced average global growth by a significant margin
Annual GDP Growth for Asia and Major Economies (% Y-o-Y, 2018)
Note: Annual GDP growth based on Y-o-Y percent change in national GDP measured in local currency units using constant prices
Source: IMF; Axis Group Analysis
6.60
7.30
6.50
4.70
6.60
5.10
2.70 2.80 2.90
1.40
2.90
3.80
2.20
4.60
1.10
0.0
1.0
2.0
3.0
4.0
5.0
6.0
7.0
8.0
Chi
na
Indi
a
Phi
lippi
nes
Mal
aysi
a
Vie
tnam
Indo
nesi
a
Tai
wan
Sou
th K
orea
Sin
gapo
re UK
US
Hon
g K
ong
EU
Tha
iland
Japa
n
Developed Markets Developing Markets
Global GDP growth =
3.46%

164
Nominal GDP Per Capita (USD, 2017)
Note: Most of the nominal GDP per capita figures from the latest IMF database are from 2014
Source: IMF; Axis Group Analysis
USD 25,000 or more
USD 10,000-USD 25,000
USD 2,500-USD 10,000
Less than USD 2,500 or no data
Despite the size of its economy, China’s GDP per capita remains low compared to other developed and developing countries. In 2017, China’s GDP per capita was USD 8,643

165
0
10,000
20,000
30,000
40,000
50,000
60,000
70,000
80,000
01 02 03 04 05 06 07 08 09 10 11 12 13 14 15 16 17 18E
Australia Brazil China
India Japan Russia
South Africa US EU
GDP Per Capita Comparison of Selected Economies (USD, 2001-2018E)
0
2,000
4,000
6,000
8,000
10,000
12,000
14,000
16,000
18,000
01 02 03 04 05 06 07 08 09 10 11 12 13 14 15 16 17 18E
Brazil China India Russia South Africa
Note: 2018 estimate is from the IMF World Economic Outlook October 2018 Report
Source: World Bank; IMF; Axis Group Analysis
Within the BRICS economies, China’s GDP per capita has yet to overtake Russia and Brazil, although it is higher than both India and South Africa
In 2015, China’s GDP per
capita surpassed USD 8,000

166
0
20
40
60
80
100
US
Chi
na
Japa
n
Ger
man
y
UK
Indi
a
Fra
nce
Bra
zil
Italy
Can
ada
Sou
th K
orea
Rus
sia
Aus
tral
ia
Spa
in
Mex
ico
Indo
nesi
a
Tur
key
Net
herla
nds
Sau
di A
rabi
a
Sw
itzer
land
Arg
entin
a
Sw
eden
Pol
and
Bel
gium
Tha
iland
Iran
Aus
tria
Nor
way
UA
E
Nig
eria
32 -
Sou
th A
fric
a
Agriculture Industry Services
Relative to other large economies, China’s economy still has a large industrial sector, highlighting the potential opportunity for the services sector to expand as the economy transitions
Share of GDP by Industry of Top 30 Global Economies (%, 2017)
Source: CIA World Factbook; Axis Group Analysis
Industrial sector contributed 72.8% in
2005; in 2017, the contribution reduced
to 39.50%, showing increasing focus
on value added industries

167
-20
0
20
40
60
80
100
120
US
Chi
na
Japa
n
Ger
man
y
UK
Indi
a
Fra
nce
Bra
zil
Italy
Can
ada
Sou
th K
orea
Rus
sia
Aus
tral
ia
Spa
in
Mex
ico
Indo
nesi
a
Tur
key
Net
herla
nds
Sau
di A
rabi
a
Sw
itzer
land
Arg
entin
a
Sw
eden
Pol
and
Bel
gium
Tha
iland
Iran
Aus
tria
Nor
way
UA
E
Nig
eria
32 -
Sou
th A
fric
a
Net Exports Final Consumption Expenditure Gross Capital Formation (GCF)
The contribution of consumption to China’s GDP is much lower than that of other major economies, highlighting the potential of consumption as an additional lever of future economic growth
Composition of GDP of Top 30 Global Economies – Expenditure Approach (%, 2017)
Source: CIA World Factbook; IMF World Economic Outlook; Axis Group Analysis
China’s GCF and exports
made up 75.7% of GDP in
2005, reducing to 64.1% in
2017

Other Recent Research & Publications
by Axis Group - Please contact us for
access to i.e.:
1. Asian Export Guide – What to export
to Asian economies and how to
succeed?
2. China Export Guide – What to export
to China and how to succeed?
3. 20 Years of SA-China Diplomatic ties
– Looking ahead at the next phase of
economic and business relations
168
Agenda
1. Foreword
2. Feature: Chinese Engagements and Activities in Africa
3. China Profile, Facts and Figures
4. China in the World
– Selected Macroeconomic Indicators
– Domestic Consumption and Foreign Trade
– Domestic and Foreign Investment
– Financial Indicators
– Social Indicators
5. Conclusions, Implications and Recommendations
6. About Axis Group

169
-50
450
950
1,450
1,950
2,450
2,950
-5 15 35 55 75 95 115
China’s Exports (USD bn)
2003 438
2008 1,430
2018 2,399
CAGR (2003-2018) 12%
Asia Pacific’s Major Exporters (2018E)
Exports (USD bn)
South Korea
Bubble Size: GDP = USD 2,000bn
Singapore
Japan
India
Vietnam*Taiwan*
Export/GDP (%)
Australia
In 2018, China was estimated to have been the largest exporter in the region, with total exports of USD 2.39tn, making up 18% of its GDP
Indonesia
Thailand*Philippines
New Zealand
MalaysiaPakistan
Myanmar
Laos*
Macau*Afghanistan*
Sri Lanka
Not shown here is Hong Kong,
with GDP of USD 360bn. Exports
are 159% of its GDP size
Singapore is a major shipping hub
in SEA region. Its imports and
exports are both very large relative
to its GDP
Note: 1. 2016 data was used for countries marked with an asterisk and 2017 data was used for countries marked in double asterisks.
2. For Bangladesh, Papua New Guinea and Bhutan trade data is not available
Source: IMF; UN Comtrade; China Customs; Axis Group Analysis
Mongolia**
Brunei
Cambodia*
China
Other Oceania Island Economies*Developed MarketsDeveloping MarketsEmerging MarketsChina

170
China’s Top 10 Export Commodities 2017 (HS Code) Top 20 Exporters of Electrical Machinery (USD bn, 2017)
China is the world’s largest exporter of electrical machinery. In 2017, China exported nearly USD 600bn of electrical machinery, accounting for 25% of the world’s total
0 100 200 300 400 500 600 700
ChinaHong Kong
USSouth Korea
GermanyOther Asia, nes
SingaporeJapan
MexicoMalaysia
NetherlandsFrance
PhilippinesCzech Republic
ItalyUK
PolandHungarySlovakia
Spain
Total: USD 2,263bn
Electrical machinery and equipment
Nuclear reactors, machinery and mechanical appliances
Furniture, lighting, signs, prefabricated buildings
Articles of apparel and clothing accessories (not knitted)
Articles of apparel and clothing accessories (knitted)
Optical, photographic, technical, medical, etc. apparatus
Plastics and articles
Vehicles other than railway, tramway
Iron and steel
Toys, games and sports requisites32%
2%3%3%3%3%3%3%4%
17%
26%
85
84
94
62
61
90
39
87
73
95
Other
Source: UN Comtrade; China Customs; Axis Group Analysis
China 2002 2017
Export of Electrical
Machinery (USD bn)65.1 598.3
% of World Total 7.6 25.1
China’s share has
risen from only 8% to
25%
598

171
0 100 200 300
ChinaGermany
USJapan
ItalyNetherlandsSouth KoreaHong Kong
MexicoUK
FranceSingapore
Czech Rep.CanadaBelgiumPolandAustriaSpain
MalaysiaSwitzerland
Billions
Source: UN Comtrade; China Customs; Axis Group Analysis
Top 20 Exporters of Power Generation Equipment (USD bn, 2017)
China is the world’s largest exporter of power generating equipment. In 2017, China exported approx. USD 380bn, or 19% of the world’s power generating equipment exports
China 2002 2017
Export of Power Generation
Equipment (USD bn)50.8 383.2
% of World Total 5.8 19.2
China has surpassed major
manufacturing powerhouses to
account for approx. 20% of
global exports
Electrical machinery and equipment
Nuclear reactors, machinery and mechanical appliances
Furniture, lighting, signs, prefabricated buildings
Articles of apparel and clothing accessories (not knitted)
Articles of apparel and clothing accessories (knitted)
Optical, photographic, technical, medical, etc. apparatus
Plastics and articles
Vehicles other than railway, tramway
Iron and steel
Toys, games and sports requisites
China’s Top 10 Export Commodities 2017 (HS Code)
Total: USD 2,263bn 383.2
32%
2%3%3%3%3%3%3%4%
17%
26%
85
84
94
62
61
90
39
87
73
95
Other

172
0 10 20
ChinaGermany
ItalyPoland
USMexico
CanadaCzech Rep.Netherlands
UKFrance
SpainDenmark
TurkeyRomaniaSweden
MalaysiaBelgiumAustria
Portugal
BillionsNote: There’s no data for Vietnam in 2017
Source: UN Comtrade; China Customs; Axis Group Analysis
Top 20 Exporters of Furniture and Lightings (USD bn, 2017)
China is the world’s largest exporter of furniture and lighting, exceeding the combined share of the next 10 largest exporting countries. In 2017, China exported a total of USD 89bn, or 39% of the world’s furniture and lighting goods
88.9
China 2002 2017
Export of Furniture &
Lightings (USD bn)9.8 88.9
% of World Total 11.9 38.6
China accounts for
39% of global exports
Electrical machinery and equipment
Nuclear reactors, machinery and mechanical appliances
Furniture, lighting, signs, prefabricated buildings
Articles of apparel and clothing accessories (not knitted)
Articles of apparel and clothing accessories (knitted)
Optical, photographic, technical, medical, etc. apparatus
Plastics and articles
Vehicles other than railway, tramway
Iron and steel
Toys, games and sports requisites
China’s Top 10 Export Commodities 2017 (HS Code)
Total: USD 2,263bn
32%
2%3%3%3%3%3%3%4%
17%
26%
85
84
94
62
61
90
39
87
73
95
Other

173
0 5 10 15
ChinaItaly
GermanyIndia
SpainHong Kong
FranceTurkey
UKIndonesia
NetherlandsBelgiumPoland
DenmarkUS
MexicoRomaniaSri LankaMyanmar
Tunisia
Billions
Source: UN Comtrade; China Customs; Axis Group Analysis
Top 20 Exporters of Non-Knitted Articles of Apparel (USD bn, 2017)
China is the largest exporter of non-knitted articles of apparel. In 2017, China exported over USD 73 bn, or 39.1% of the world’s products in this category
China 2002 2017
Export of Non-knitted articles of
Apparel (USD bn)20.6 73.4
% of World Total 19.3 39.6
73.4
China accounts for
over a third of global
exports
Electrical machinery and equipment
Nuclear reactors, machinery and mechanical appliances
Furniture, lighting, signs, prefabricated buildings
Articles of apparel and clothing accessories (not knitted)
Articles of apparel and clothing accessories (knitted)
Optical, photographic, technical, medical, etc. apparatus
Plastics and articles
Vehicles other than railway, tramway
Iron and steel
Toys, games and sports requisites
China’s Top 10 Export Commodities 2017 (HS Code)
Total: USD 2,263bn
32%
2%3%3%3%3%3%3%4%
17%
26%
85
84
94
62
61
90
39
87
73
95
Other

174Source: UN Comtrade; China Customs; Axis Group Analysis
Top 20 Exporters of Knitted Articles of Apparel (USD bn, 2017)
China is by far the world’s largest exporter of knitted articles of apparel and clothing accessories. In 2017, China exported a total of USD 71.8 bn, or around 40% of the world’s knitted apparel and clothing accessories
0 5 10 15
ChinaGermany
TurkeyItaly
IndiaHong Kong
SpainBelgiumFrance
NetherlandsIndonesia
UKSri Lanka
USPortugal
PolandEl Salvador
DenmarkMexicoJordan
Billions
China 2002 2017
Export of Knitted Articles of
Apparel (USD bn)16.0 71.8
% of World Total 18.7 40.2
71.8
China accounts for
over a third of global
exports
China’s Top 10 Export Commodities 2017 (HS Code)
Total: USD 2,263bn
Electrical machinery and equipment
Nuclear reactors, machinery and mechanical appliances
Furniture, lighting, signs, prefabricated buildings
Articles of apparel and clothing accessories (not knitted)
Articles of apparel and clothing accessories (knitted)
Optical, photographic, technical, medical, etc. apparatus
Plastics and articles
Vehicles other than railway, tramway
Iron and steel
Toys, games and sports requisites32%
2%3%3%3%3%3%3%4%
17%
26%
85
84
94
62
61
90
39
87
73
95
Other

175
-23
-18
-13
-8
-3
2
7
12
4 9 14 19 24 29 34
Over the last decade, China’s exports of major mining products have grown rapidly, as the country transitions towards manufacturing high-value goods
Note: 1. Chemicals are not included since there are too many types of chemicals
2. Bubble is too small to be shown
Source: UN Comtrade; International Trade Center; Axis Group Analysis
Analysis of China’s Exports of Selected Mining Products (2016)
Export CAGR for 2012-2016 (%)
Fixed Plant & Equipment Material Handling Mining Operations
MRO Consumables
Global Market Share (%)
Processing Electrical Equipment
Electrical equipment
Steel and
structural
products
Cranes and derricks
Material handling
equipment
Ground equipment
tools (GET)
Mining
operations
equipment
Mining
operations
consumables2
Processing
consumables1
Graphite electrode
Grinding Media
Lubricants
A bubble of this size represents
total export value of USD 10bn

176
0
500
1,000
1,500
2,000
10 20 30 40 50 60 70 80 90 100
Note: 1. 2016 data used for countries marked with an asterisk.
2. For Bangladesh, Papua New Guinea and Bhutan trade data is not available
Source: IMF; UN Comtrade; China Customs; Axis Group Analysis
China
South Korea
Bubble Size: GDP = USD 2,500bn
Singapore
Japan
India
Vietnam*Taiwan*
Import/GDP (%)
In China, increasing domestic
consumption has led to growth in
imports
Major shipping hubs in the SEA
region, Singapore and Vietnam’s
imports and exports are both very
large in comparison with GDP
Australia
In 2018, China was the largest importer in the region, with total imports of USD 1.9tn, making up 15% of its GDP
Indonesia Thailand*Philippines
New Zealand
Malaysia
Pakistan
Myanmar
Lao PDR*Macau*
Mongolia*
Other Oceania Island Economies*Sri Lanka
Developed Markets
Afghanistan*
NepalCambodia*
Developing MarketsEmerging MarketsChina
Brunei
Asia Pacific’s Major Importers (2018E)
Imports (USD bn)
2003 413
2008 1,133
2018 1,996
CAGR (2002-2018) 14%
China’s Imports (USD bn)In 2002, the USA’s
imports were six
times greater than
China’s imports

177
China’s Top 10 Import Commodities 2017 (HS Code)
Source: UN Comtrade; China Customs; Axis Group Analysis
Top 20 Importers of Electrical Machinery (USD bn, 2017)
China is the world’s largest importer of electrical machinery and equipment.In 2017, China imported a total of USD 458bn, or 19% of the world’s electrical machinery and equipment imports
Total: USD 1,844bn
0 100 200 300 400
ChinaUS
Hong KongGermany
JapanSingapore
MexicoSouth Korea
UKMalaysia
FranceNetherlands
IndiaCanada
ItalyCzech Republic
RussiaPoland
SpainPhilippines
Billions
China 2002 2017
Import of Electrical
Machinery (USD bn)73.2 457.6
% of World Total 8.3 18.8
Driven by demand from
China’s industrial
sector
457.6
23%
2%3%4%4%
4%
5%
7%
9%
14%
25%
85
27
84
26
90
87
39
71
29
12
Other
Electrical machinery and equipment
Mineral fuels, mineral oil and products of their distillation
Nuclear reactors, machinery and mechanical appliances
Ores, slag, ash
Optical, photographic and cinematographic, equipment
Vehicles other than railway, tramway
Plastics
Pearls and other precious stones
Organic chemicals
Oil seed

178Source: UN Comtrade; China Customs; Axis Group Analysis
Top 20 Importers of Mineral Fuels (USD bn, 2017)
China became the world’s largest importer of mineral fuels. In 2017, China imported a total of USD 250bn, or 13% of the world’s mineral fuels imports
0 50 100 150 200 250 300
ChinaUS
JapanIndia
South KoreaGermany
SingaporeNetherlands
FranceItalyUK
BelgiumSpain
TaiwanTurkeyMexico
CanadaIndonesiaMalaysiaAustralia
China 2002 2017
Import of Mineral
Fuels (USD bn)19.3 250
% of World Total 3.2 13.1
Driven by both industry and
growing personal
consumption
China’s Top 10 Import Commodities 2017 (HS Code)
Total: USD 1,844bn
Electrical machinery and equipment
Mineral fuels, mineral oil and products of their distillation
Nuclear reactors, machinery and mechanical appliances
Ores, slag, ash
Optical, photographic and cinematographic, equipment
Vehicles other than railway, tramway
Plastics
Pearls and other precious stones
Organic chemicals
Oil seed
250
23%
2%3%4%4%
4%
5%
7%
9%
14%
25%
85
27
84
26
90
87
39
71
29
12
Other

179Source: UN Comtrade; China Customs; Axis Group Analysis
Top 20 Importers of Power Generation Equipment (USD bn, 2017)
China is the world’s 2nd largest importer of power generating equipment. In 2017, China imported a total of USD 170bn, or nearly 9% of the world’s power generating equipment imports
21%
0 50 100 150 200
USChina
GermanyFrance
UKMexicoJapan
CanadaHong Kong
South KoreaNetherlands
RussiaSingapore
ItalyIndia
TaiwanSpain
BelgiumAustralia
Czech Republic
Billions
Driven by growing
industrial demand
from China
China’s Top 10 Import Commodities 2017 (HS Code)
Total: USD 1,844bn 349.0
China 2002 2017
Import of Power
Generation Equipment
(USD bn)
52.1 169.5
% of World Total 5.8 8.6
Electrical machinery and equipment
Mineral fuels, mineral oil and products of their distillation
Nuclear reactors, machinery and mechanical appliances
Ores, slag, ash
Optical, photographic and cinematographic, equipment
Vehicles other than railway, tramway
Plastics
Pearls and other precious stones
Organic chemicals
Oil seed23%
2%3%4%4%
4%
5%
7%
9%
14%
25%
85
27
84
26
90
87
39
71
29
12
Other

180Source: UN Comtrade; China Customs; Axis Group Analysis
Top 20 Importers of Ores, Slag and Ash (USD bn, 2017)
China is the world’s largest importer of ores, slag and ash. In 2017, China imported a total of USD 126.4 bn, or over 55% of the world’s total imports of ores, slag and ash
21%
0 5 10 15 20 25
ChinaJapan
South KoreaGermany
IndiaSpain
BelgiumCanada
USTaiwan
PhilippinesNetherlands
FranceBulgariaFinland
MalaysiaUK
RussiaItaly
Poland
Billions
China 2002 2017
Import of Ores, Slag, Ash (USD
bn)4.3 126.4
% of World Total 14.3 55.7
Used as inputs and
raw materials for
industry
126.4
China’s Top 10 Import Commodities 2017 (HS Code)
Total: USD 1,844bn
Electrical machinery and equipment
Mineral fuels, mineral oil and products of their distillation
Nuclear reactors, machinery and mechanical appliances
Ores, slag, ash
Optical, photographic and cinematographic, equipment
Vehicles other than railway, tramway
Plastics
Pearls and other precious stones
Organic chemicals
Oil seed23%
2%3%4%4%
4%
5%
7%
9%
14%
25%
85
27
84
26
90
87
39
71
29
12
Other

181Note: There is no data for Thailand in 2017
Source: UN Comtrade; China Customs; Axis Group Analysis
Top 20 Importers of Optical and Photographic Equipment (USD bn, 2017)
China is the world’s largest importer of optical and photographic equipment.In 2017, China imported a total of USD 98bn, or nearly 18% of the world’s total imports of optical and photographic equipment
21%
0 25 50 75 100
ChinaUS
GermanyJapan
NetherlandsSouth Korea
FranceUK
Hong KongMexico
BelgiumItaly
CanadaSingapore
TaiwanIndia
SpainAustralia
SwitzerlandRussia
Billions
China 2002 2017
Import of Optical &
Photographic
Equipment (USD bn)
13.5 97.5
% of World Total 6.8 18.0
Driven by the growth of the
middle class and evolving
consumer tastes
China’s Top 10 Import Commodities 2017 (HS Code)
Total: USD 1,844bn
Electrical machinery and equipment
Mineral fuels, mineral oil and products of their distillation
Nuclear reactors, machinery and mechanical appliances
Ores, slag, ash
Optical, photographic and cinematographic, equipment
Vehicles other than railway, tramway
Plastics
Pearls and other precious stones
Organic chemicals
Oil seed
97.4
23%
2%3%4%4%
4%
5%
7%
9%
14%
25%
85
27
84
26
90
87
39
71
29
12
Other

Other Recent Research & Publications
by Axis Group - Please contact us for
access to i.e.:
1. Asian Export Guide – What to export
to Asian economies and how to
succeed?
2. China Export Guide – What to export
to China and how to succeed?
3. 20 Years of SA-China Diplomatic ties
– Looking ahead at the next phase of
economic and business relations
182
Agenda
1. Foreword
2. Feature: Chinese Engagements and Activities in Africa
3. China Profile, Facts and Figures
4. China in the World
– Selected Macroeconomic Indicators
– Domestic Consumption and Foreign Trade
– Domestic and Foreign Investment
– Financial Indicators
– Social Indicators
5. Conclusions, Implications and Recommendations
6. About Axis Group

183
342
125
0 50 100 150 200
US
Japan
China
UK
Hong Kong
Germany
Canada
France
Luxembourg
Spain
Russia
South Korea
Singapore
Sweden
Netherlands
Belgium
Thailand
Ireland
UAE
Taiwan
China has been amongst the top 3 largest providers of global FDI during 2015 -2017
Top 20 World FDI Outflows (USD bn, 2015-2017)
Note: 1. British Virgin Islands and Cayman Islands are not included in the ranking because of their nature as offshore financial centres (most FDI is in transit)
2. To make international comparisons, this section utilizes China’s FDI and OFDI figures from the WIR 2016/17/18 instead of figures from MOFCOM
Source: WIR 2018; Axis Group Analysis
300
128
0 50 100 150 200
US
Japan
China
Netherlands
Ireland
Germany
Switzerland
Canada
Hong Kong
Luxembourg
Belgium
Singapore
France
Spain
South Korea
Italy
Russia
Sweden
Norway
Chile
In 2015, China
ranked 3rd
300183
0 50 100 150 200
US
China
Netherlands
Japan
Canada
Hong Kong
France
Ireland
Spain
Germany
Luxembourg
Switzerland
South Korea
Russia
Singapore
Sweden
Italy
Belgium
Norway
Chile
In 2016, China
ranked 2nd
20172015 2016
In 2017, China
ranked 3rd

184
Top 20 World FDI Inflows (USD bn, 2017)
Source: WIR 2018; Axis Group Analysis
Top 20 World FDI Outflows (USD bn, 2017)
In 2017, China remained a key player in FDI inflows and outflows, ranking 2nd and 3rd respectively in the world on both fronts
275136
0 50 100 150 200
US
China
Hong Kong
Brazil
Singapore
Netherlands
France
Australia
Switzerland
India
Germany
Mexico
Ireland
Russia
Canada
Indonesia
Spain
Israel
Italy
South Korea
In 2017, China
ranked 2nd
342
125
0 50 100 150 200
USJapanChina
UKHong Kong
GermanyCanadaFrance
LuxembourgSpain
RussiaSouth Korea
SingaporeSweden
NetherlandsBelgiumThailand
IrelandUAE
Taiwan
In 2017, China
ranked 3rd

185
7,807
1,491
0 1000 2000 3000 4000
US
Hong Kong
UK
China
Singapore
Canada
Switzerland
Netherlands
Germany
Ireland
France
Brazil
Australia
Spain
Belgium
Mexico
Russia
Italy
India
Sweden
Top 20 World FDI Outward Stock (USD bn, 2017)
Source: WIR 2018; Axis Group Analysis
Top 20 World FDI Inward Stock (USD bn, 2017)
In 2017, China ranked 4rd overall and 2nd in Asia for OFDI stock with USD 1,491bn. For FDI inward stock, it ranked 8th with USD 1,482bn
7,799
1,482
0 1000 2000 3000 4000
US
Hong Kong
Germany
Netherlands
UK
Japan
Canada
China
France
Switzerland
Ireland
Singapore
Belgium
Spain
Italy
Australia
Sweden
Russia
Brazil
South Korea
China ranked 4th
China ranked 8th

186
UAE
230
Qatar
320
Source: Sovereign Wealth Fund Institute; Axis Group Analysis
Locations of World’s Top 20 Sovereign Wealth Funds (USD bn, Aug 2018)
China
295
China
1. China Investment Corporation
2. Hong Kong Monetary Authority
Investment Portfolio
3. SAFE Investment Company
4. National Social Security Fund
Oil
Non-Commodity
Oil & Gas
China
441
Australia
108
UAE
226Russia
77
South Korea
134
China
941
Hong Kong
523
Singapore
375
Kuwait
592
Singapore
390
Iran
91
Saudi Arabia
360
Libya
66
UAE
230
Saudi Arabia
516
UAE
683
Norway
1,058
China is home to some of the world’s largest sovereign wealth funds, which are playing key roles in overseas investment
US (Alaska)
66

187
Rank Economy Fund TypeAssets under management
(USD bn)
1 Norway Government Pension Fund – Global Oil 1058.05
2 China China Investment Corporation Non-Commodity 941.40
3 UAE – Abu Dhabi Abu Dhabi Investment Authority Oil 683.00
4 Kuwait Kuwait Investment Authority Oil 592.00
5 China – Hong Kong Hong Kong Monetary Authority Investment Portfolio Non-Commodity 522.60
6 Saudi Arabia SAMA Foreign Holdings Oil 515.60
7 China SAFE Investment Company Non-Commodity 441.00
8 Singapore Government of Singapore Investment Corporation Non-Commodity 390.00
9 Singapore Temasek Holdings Non-Commodity 375.00
10 Saudi Arabia Public Investment Fund Oil 360.00
11 Qatar Qatar investment Authority Oil & Gas 320.00
12 China National Social Security Fund Non-Commodity 295.00
13 UAE – Dubai Investment Corporation of Dubai Non-Commodity 233.80
14 UAE – Abu Dhabi Mabadala Investment Company Oil 226.00
15 South Korea Korea Investment Corporation Non Commodity 134.10
16 Australia Australia Future Fund Non-Commodity 107.70
17 Iran National Development Fund of Iran Oil & Gas 91.00
18 Russia National Welfare Fund Oil 77.20
19 Libya Libyan Investment Authority Oil 66.00
20 US- Alaska Alaska Permanent Fund Oil 65.70
While China’s sovereign wealth funds are some of the largest in the world, the ranking continues to be dominated by Middle East and East Asian countries
Ranking of World’s Top 20 Sovereign Wealth Funds (USD bn, Nov 2018)
Source: Sovereign Wealth Fund Institute; Axis Group Analysis

Other Recent Research & Publications
by Axis Group - Please contact us for
access to i.e.:
1. Asian Export Guide – What to export
to Asian economies and how to
succeed?
2. China Export Guide – What to export
to China and how to succeed?
3. 20 Years of SA-China Diplomatic ties
– Looking ahead at the next phase of
economic and business relations
188
Agenda
1. Foreword
2. Feature: Chinese Engagements and Activities in Africa
3. China Profile, Facts and Figures
4. China in the World
– Selected Macroeconomic Indicators
– Domestic Consumption and Foreign Trade
– Domestic and Foreign Investment
– Financial Indicators
– Social Indicators
5. Conclusions, Implications and Recommendations
6. About Axis Group

189
In 2017, China had the world’s third largest current account surplus at over USD 163bn, behind Japan at USD 175bn and Germany at USD 296bn
Current Account Balance for Select Countries (USD bn, 2017E1)
1. CIA World Factbook estimates for 2017
Source: World Bank; CIA World Factbook; Axis Group Analysis
Top 5 current account surpluses
Top 5 current account deficits
US -462bn
South Korea
85bn
China
163bn
Germany 296bn
UK -91bn
Japan
175bn 2
4
1
3
3
1
2
Canada -56bn
5
India
-34bn
Turkey
-39bn
4
5
Netherlands 82bn

190
China, the world’s largest foreign exchange reserves holder, has more than twice the FX reserves of the 2nd largest holder, Japan. Asian countries largely dominate the top 30
Top 30 Largest Holders of Foreign Exchange and Gold Reserves (USD bn, Q4 2017E)
Note: Estimates are as of 31 December 2017
Source: CIA World Factbook; Axis Group Analysis
0
400
800
1,200
1,600
2,000
Chi
na
Japa
n
Sw
itzer
land
Sau
di A
rabi
a
Tai
wan
, PR
C
Rus
sia
Indi
a
Hon
g K
ong
Bra
zil
Sou
th K
orea
Sin
gapo
re
Tha
iland
Mex
ico
Ger
man
y
Cze
ch R
epub
lic
Fra
nce
Italy
UK
Iran
Indo
nesi
a
US
Pol
and
Isra
el
Tur
key
Alg
eria
Mal
aysi
a
UA
E
Can
ada
Phi
lippi
nes
3,194
East Asia

191
In 2017, China’s external debt was around USD 1,649bn and accounted for just over 1% of the world’s total external debt
Top 30 Economies with Largest External Debt (USD bn, 2017E1)
1. These are CIA World Factbook figures; 2014 estimate has been used for EU because data for 2017 was not available
Source: CIA World Factbook; Axis Group Analysis
1,64
9
0
4,000
8,000
12,000
16,000
At the end of Q4 2017, China’s external
debt amounted to USD 1,649bn
17,910

192
China’s discount rate is relatively low at 2.25%, which is lower than that of other large developing economies
1. The interest rate is charged by a central bank on loans to its member banks. A change in the discount rate is usually followed by similar changes in the interest rates charged by banks and in money markets
2. The central bank discount rate is updated to the latest available month in 2017
Note: Data is from CIA World Factbook latest estimates
Source: CIA World Factbook; Axis Group Analysis
Central Bank Discount Rate1 of Select Economies (%, 20172)
2.25%
0
2
4
6
8
10
12
Bra
zil
Ken
ya
Rus
sia
Vie
tnam
Col
ombi
a
Indo
nesi
a
Indi
a
Mex
ico
Sou
th A
fric
a
Tur
key
Chi
le
Aus
tral
ia
Chi
na
Sou
th K
orea
Can
ada
US
UK
Japa
n
EU
High-rate countries
Medium-rate countries
Low-rate countries
13.75% China Discount
Rate (%)
2010 3.25
2011 2.25
2012 2.25
2013 2.25
2014 2.25
2015 2.25
2016 2.25
2017 2.25

193
64
4.40
0
13
26
39
52
65
Mad
agas
car
Bra
zil
Mal
awi
Gam
bia
Gha
na
Taj
ikis
tan
Yem
en
DR
C
Ven
ezue
la
Gui
nea
Uga
nda
Bur
undi
Eq.
Gui
nea
Tim
or-L
este
Gua
tem
ala
Guy
ana
Geo
rgia
Bar
bado
s
Icel
and
Rom
ania
Gre
ece
Sin
gapo
re
Aus
tral
ia
New
Zea
land
Chi
na US
Sou
th K
orea
Italy
Isra
el
As of December 2018, China’s prime lending rate was 4.4%, which is comparable to that of its Asia Pacific neighbours Australia, Singapore and New Zealand
1. Prime lending rate is a short-term interest rate quoted by a commercial bank to its best commercial customers. Even though banks frequently charge more and sometimes less than the quoted prime
rate, it is a benchmark against which other rates are measured. For various reasons, a rising prime rate is generally considered detrimental to security prices
2. CIA World Factbook, 31 December 2017 estimates
Source: CIA World Factbook; Axis Group Analysis
High-rate countries
Medium-rate countries
Low-rate countries
Commercial Bank Prime Lending Rate1 of Selected Economies (%, 20172)
China’s Prime Lending Rate (%, July 2017 - Dec 2018)
China cut its prime lending rate 4 times
in 5 months from November 2014
0.03
0.04
0.05
0.06
0.07
4291
7
4294
8
4297
9
4300
9
4304
0
4307
0
4310
1
4313
2
4316
0
4319
1
4322
1
4325
2
4328
2
4331
3
4334
4
4337
4
4340
5
4343
5

Other Recent Research & Publications
by Axis Group - Please contact us for
access to i.e.:
1. Asian Export Guide – What to export
to Asian economies and how to
succeed?
2. China Export Guide – What to export
to China and how to succeed?
3. 20 Years of SA-China Diplomatic ties
– Looking ahead at the next phase of
economic and business relations
194
Agenda
1. Foreword
2. Feature: Chinese Engagements and Activities in Africa
3. China Profile, Facts and Figures
4. China in the World
– Selected Macroeconomic Indicators
– Domestic Consumption and Foreign Trade
– Domestic and Foreign Investment
– Financial Indicators
– Social Indicators
5. Conclusions, Implications and Recommendations
6. About Axis Group

195
China is the most populous country in the world with ~ 1.38 billion people. A cultural preference for male heirs has left China with one of the highest male-to-female ratios in the world, alongside India, Saudi Arabia and the UAE
Population of Top 30 Economies by GDP (mn, 2017E1)
1. CIA World Factbook estimates are from July 2017
Source: CIA World Factbook; World Bank; Axis Group Analysis
USChinaJapan
GermanyUK
FranceIndiaItaly
BrazilCanada
South KoreaRussiaSpain
AustraliaMexico
IndonesiaTurkey
NetherlandsSwitzerland
Saudi ArabiaArgentina
SwedenPoland
BelgiumIran
ThailandNigeriaAustriaNorway
UAE
GDP Rank 2016 Total
97 106
94 97 99 96
108 93 97 98
100 86 98
10196
100 101
9897
119 97
1009487
103 96
104 96
101 201
664 703
602 650
Ratio
Male/100 Female321
1,367127
816466
1,25262
2043549
1424823
122256
7917
828431039118266
182959
Female Male

196
0
9
18
27
36
45
0 5 10 15 20 25 30
While China currently has a favourable demographic makeup, its working-age population (15-64) is expected to enter a shrinking phase from 2015 onwards, due to a rapidly ageing population
Child and Elderly Population for Selected Countries (2017E1)
1. CIA World Factbook estimates are from 2017
Source: CIA World Factbook; World Bank; Axis Group Analysis
Population under 15 (%)
Population aged 65+ (%)
India
Saudi Arabia
Poland
South Korea
Nigeria
Australia
Argentina
Japan
China
2017
China
Sweden
Iran
Indonesia
A bubble this size represents a population
of 100mn
Germany
UK
Turkey
Brazil
Mexico
Russia
US Norway
Switzerland
Spain
Netherlands
Belgium
Austria
France
Italy
China
2002
Canada
Taiwan
Thailand

197
China’s social structure is rapidly evolving – the population is becoming richer, more urban, more literate and tech-savvy, and its tastes and consumption patterns are also shifting
China’s Social Demographic Shift (2009, 2017)
Note: People earning less than USD 1.25 per day are categorised as below poverty line; *Mobile penetration is the overall mobile phones in use and does not take into account individual users
Source: Various; Axis Group Analysis
106 126 147
972 1,024 991
240 253 236
2009 2014 2017
64+
15-63
0-14
754 8,8962,514 26,955
2009 2014
Urban
Rural
157
82 46
2009 2014 2016
47% 55% 58%
2009 2014 2017
384668 751
2009 2015Q2 2017Q2
Year Urban Rural
2009 43% 15%
2015 72% 28%
2017Q2 73.3% 26.7%
% Distribution of Internet
Penetration
747 1,206
2009 2014
1,0581,092
2010 2015
Internet Penetration (mn)
29%48%
86%
Mobile Subscriptions (mn*)
56%5.8%
11.8%
Literacy Rate (mn)
Popn. below Poverty Line (mn)
90% of the poor population
comes from rural areas, 99%
of migrant population is
included as rural
In 2014, 519mn (38% of the
population) had access to
smartphones – nearly 43% of
mobile phones were
smartphones
China’s population is aging
rapidly, 10.81% of its
population is above 64 years
old while the birth rate
remains low10 19 17 23
2009 2014 2015 2017
The decline in Luxury
Spending in 2015 was
impacted by the economic
slow down and stock market
crash in Q2/Q3
Chinese consumption
bounced back in 2017, fueled
by consumer confidence and
the rapid emergence of a new
middle class
Luxury Spending (USD bn)Population Distribution (mn)
95%96%
Per Capita Disposable Income (USD)
% Urbanised Population
X% Represents % of population
China’s urbanised population
is expected to reach 60% in
2020 and 70% by 2030
In 2011, China set a
new poverty line at
RMB 2,300
(approximately USD
400)
3.3%
53%

198
98
58
34
2
42
66
Bel
gium
Arg
entin
a
Japa
n
Aus
tral
ia
Den
mar
k
Fra
nce
Bra
zil
Sw
eden
Net
herla
nds
US
Sou
th K
orea
Sau
di A
rabi
a
Can
ada
UK
Nor
way
Spa
in
Mex
ico
Ger
man
y
Rus
sia
Pol
and
Sw
itzer
land
Tur
key
Italy
Iran
Aus
tria
Gre
ece
Sou
th A
fric
a
Chi
na
Indo
nesi
a
Indi
a
Urban Rural
China’s level of urbanisation is still much lower than that of other large economies; however, it has one of the fastest growing urbanisation rates at 2.3%
Urban and Rural Population of Selected Economies (%, 2017)
Source: CIA World Factbook; World Bank; Axis Group Analysis
Annual Rate of Urbanisation Change (%, 2015-2020E)
0
100
Urban0.36 0.93 0.15 1.37 0.58 0.76 0.99 0.86 0.72 0.99 0.55 1.81 1.16 0.82 1.31 0.52 1.37 0.12 -0.15 0.02 1.10 1.54 0.32 1.78 0.51 0.31 1.33 2.30 2.30 2.28

199
90705030101030507090
USChinaJapan
GermanyUK
FranceIndiaItaly
BrazilCanada
South KoreaRussiaSpain
AustraliaMexico
IndonesiaTurkey
NetherlandsSwitzerland
Saudi ArabiaArgentina
SwedenPoland
BelgiumIran
ThailandNigeriaAustriaNorway
UAE
Male Female
While the average life expectancy for both men and women in China is higher than that of other large developing economies, it still lags behind more developed economies
Life Expectancy of Top 30 Economies by GDP (Age, 2017E1)
1. CIA World Factbook estimates are from 2017
Source: CIA World Factbook; World Bank; Axis Group Analysis
GDP Rank 2016
7874

200
10080604020020406080100
USChinaJapan
GermanyUK
FranceIndiaItaly
BrazilCanada
South KoreaRussiaSpain
AustraliaMexico
IndonesiaTurkey
NetherlandsSwitzerland
Saudi ArabiaArgentina
SwedenPoland
BelgiumIran
ThailandNigeriaAustriaNorway
UAE
Male Female
China’s economic activity rate is comparatively larger than those of major developed economies. China has one of the highest female economic activity rate among the world’s top economiesAdult (15 and Older) Labour Participation Rate (%, 20171)
1. Modeled according to ILO estimates of population ages 15+ for 2017
Source: International Labour Organization; Axis Group Analysis
Total Labour Participation Rate
62
70.8
59.1
60.3
62.7
54.9
53.8
48.3
67
65.4
60.8
63.3
58.2
64.6
62.2
67.3
50.3
63.6
68.5
54.5
61
64.5
56.8
53.5
44.7
71.2
56.4
60.2
64.8
79.5
GDP Rank 2016

Other Recent Research & Publications
by Axis Group - Please contact us for
access to i.e.:
1. Asian Export Guide – What to export
to Asian economies and how to
succeed?
2. China Export Guide – What to export
to China and how to succeed?
3. 20 Years of SA-China Diplomatic ties
– Looking ahead at the next phase of
economic and business relations
201
Agenda
1. Foreword
2. Feature: Chinese Engagements and Activities in Africa
3. China Profile, Facts and Figures
4. China in the World
5. Conclusions, Implications and Recommendations
6. About Axis Group

202Source: Visual China Group (视觉中国)

203
Executive Summary – at the Highest Level
1. China set to maintain GDP growth of above 6% over the
short-to-medium term (2019); over the next 2-3 years GDP
growth of around 5.5-6.5%, well above world average
2. Transformation of China’s economy already more broad-
based, yielding different winners and losers; many challenges
and reform needs are even more pressing
3. Innovation, increased investment in R&D, and technology
leadership in many areas are becoming pervasive
4. Financial, structural, and socio-economic risks are numerous
and serious, but we do not see growth faltering; debt situation
is acute but will still be managed
5. There is significant change in China’s manufacturing base,
export profile, and trade composition, i.e. less growth in
certain low-cost segments but new strength in high-end (but
the higher cost of doing business is very real)
6. There is also a rapid change in the composition and growth
rates of imports, as the transformation to middle and higher
income continues; consumerism is rampant and large
opportunities are developing for exporters to China
7. New dynamism and complexity, as the country embraces
digitalisation, online trends and the adoption/diffusion of new
business models – at an accelerating rate of change
8. Shifting geopolitical and geostrategic landscape in a more
competitive world; China is now fully emerging as an equal
power to the US despite some views to the contrary
9. A new comprehensive and assertive global engagement and
increased influence worldwide characterises China’s external
game – but this is not universally welcomed causing tensions
10. China’s integration in the world plays out in many areas and
has wide impact, i.e. in regional and global politics, trade,
investment flows and various fora
1. China remains top driver for global growth and a key inbound /
outbound supply chain partner for companies worldwide (but
slowdown exposes certain sectors/markets)
2. Opportunities emerge in new sectors due to broad-based
transformation; many challenges for traditional sectors -
previous winners must re-invent and adapt, or die
3. China is emerging as a leader in high–value added
manufacturing and exporting more high-end products,
increasingly competing with Japan, US, Germany, etc.
4. China’s competitive model changes dramatically – takes most
of the world by surprise as it shifts from low-cost to high-end
technology; but cost increases opens the door for lower-cost
countries and players in India, Southeast Asia, etc.
5. Becoming more difficult to project in which sectors and how
China will compete in 2-5 years, let alone over the long term;
and where/how other nations will be able to defend/win market
share – need for solid strategic intelligence
6. China’s growing demand for agri-processing, high-end
products, tech, and services, makes it the fastest-growing,
large market; but selling to China has many challenges
7. Increased e-commerce, fintech, digitalisation, and emergence
of the shared economy yield new and vast opportunities; but
must be understood (and go-to-market implementation costs!)
8. Deeper reforms are set to continue resulting in losers that exit
the market; and new winners & champions are emerging
9. China’s influence is rising; more assertive and confident
China assumes new international and diplomatic stance that
may challenge incumbents and existing arrangements via
fora, initiatives, and institutions such as BRI, FOCAC, and
AIIB
10. Change requires effective and comprehensive (and multi-
dimensional) view of China and engagement as a partner,
financier, competitor, producer, influencer, leader, etc.
1. Recalibrate China procurement and inbound supply chains
as China shifts to higher cost and higher value-add
manufacturing and supply; adapt supply focus i.e. potentially
shift to tier-2 suppliers in China and tier-1 suppliers in lower-
cost Asia – anticipate a dynamic supply environment
2. Businesses with complex supply chains must develop a
supply market portfolio approach where China is still
prominent (even dominant) but new supply clusters in other
lower-cost areas must be cultivated. There is an unfolding shift
from China (2005), to China+1 or +2 (2015), to true
international sourcing (2020) or even full-scale global sourcing
(2025) – China will remain key but with new characteristics
3. Look to China for higher-end solutions and technology in
industries where it has gained an advantage; be open to
sourcing of services, turnkey project solutions, and high-end
‘designed and engineered’ solutions from China
4. Use strong risk radar to target relevant industry clusters &
supply; anticipate change; supplier health checks now crucial
5. Tap demand in the Chinese industrial and household
consumer market - develop modern China sales strategies
and create online & offline channels; success requires good
implementation and astute management & teams
6. Confirm the relevant ‘hot sectors’ for your business i.e.
agri, agri-processing, food products, advanced machinery, and
healthcare are some of the key areas for international brands;
develop RTM with right partners that add value - identify the
right partners in all dealings via solid DD
7. Leverage China’s new outbound capital and pursue China
as a capital partner; recognize the changing dynamics in
sector/regional focus, deal structures, and regulation
8. Three keys to China capital: adopt appropriate process to
articulate investment opportunity to correct targets
9. Tap into high-quality strategic intelligence for strategy
processes; deploy stellar implementation teams
Analysis and Key Findings Conclusions and Implications Recommendations

204
Disclaimer
This document is issued by Axis Group. While all reasonable care has been taken in the preparation of this document, no responsibilityor liability is accepted for errors or omissions of fact or for any opinions expressed herein. Wherever applicable, international sourcesof data have been used, which may have discrepancies from Chinese sources. We acknowledge this and welcome any feedbackhighlighting this. Opinions, projections and estimates are subject to change without notice. This document is for information purposesonly, and solely for private circulation. The information contained here has been compiled from sources believed to be reliable. Whileevery effort has been made to ensure that the information is correct and that the views are accurate, Axis Group cannot be heldresponsible for any loss, irrespective of how it may arise. In addition, this document does not constitute any offer, recommendation orsolicitation to any person to enter into any transaction or to adopt any investment strategy, nor does it constitute any prediction of likelyfuture movements or events in any form. Some investments discussed here may not be suitable for all investors. Past performance isnot necessarily indicative of future performance; the value, price or income from investments may fall as well as rise. Axis Group,and/or a connected company, may have a position in any of the investments mentioned in this document. All concerned are advised toform their own independent judgement with respect to any matter contained in this document.

Other Recent Research & Publications
by Axis Group - Please contact us for
access to i.e.:
1. Asian Export Guide – What to export
to Asian economies and how to
succeed?
2. China Export Guide – What to export
to China and how to succeed?
3. 20 Years of SA-China Diplomatic ties
– Looking ahead at the next phase of
economic and business relations
205
Agenda
1. Foreword
2. Feature: Chinese Engagements and Activities in Africa
3. China Profile, Facts and Figures
4. China in the World
5. Conclusions, Implications and Recommendations
6. About Axis Group

Axis Group 206206
DMCC Business Centre, Level No. 1, Unit No. 939,
Jeweller 3
Dubai, United Arab Emirates
T +61 (0) 483 386 118 / +86 138 0111 2112
Beijing | Shanghai | Singapore | Perth | Bangkok | Mumbai | Dubai | Johannesburg
Axis Group provides market access solutions. For clients that compete in
complex international markets, our deep capabilities, expertise and
commitment translate into business performance and profitability
• Procurement & Supply
• Market Expansion
• Corporate Advisory
www.axisgroupinternational.com
Global markets. Connected

207
Axis Group solves complex globally connected supply chains through specialisedcapabilities in Procurement & Supply, Market Expansion and Corporate Advisory
Comprehensive global procurement & supply solutionsthat drive down cost, assure quality, expedite schedulesand mitigate risk
Integrated Sourcing & Supply• Global sourcing• International logistics• Supply to site / delivery / distribution
Global Procurement Services• Procurement advisory• Strategic sourcing• Transactional procurement• Outsourced & managed procurement solutions
Capital Project Procurement Solutions• CAPEX procurement project management• Sourcing & transaction management• Quality management (QA/QC), inspection, testing
& expediting• Project logistics
Professional Resourcing• Skills & resource gap analysis• Talent & skills identification• Placement & on-boarding management• Ongoing management and interaction
Procurement & SupplyWe deliver solutions for selected key markets such as
China: we take products, brands, technologies, services
and raw materials to market, build brand reputation and
accelerate sales & market share
Market Insight, Planning & Decision Support• Market scoping and competitive landscape• Channels to market and key stakeholder
identification• Commercial and regulatory environment • Partner due diligence
Marketing & Brand Management• Marketing strategy & planning, Marketing
communications• Brand activation & management, Events
management• Digital & social marketing services• In-country product / service representation
Business Development & Sales• Client / partner engagement strategy• Route-to-market & channel partner management• Lead development to opportunity management• Sales management including pursuit management• Negotiation, contracting & order management• Proposal management, Client relationship
management (CRM)
On-the-ground Support & Execution• Distribution & logistics • E-commerce solutions and support• Asia team recruitment and training• 3PSP management (legal, registration agency, etc.)
Market ExpansionTrusted niche cross-border transaction and strategicadvice, with implementation support to underpin growthand performance
Strategic AdvisoryStrategy formulation & implementation support to drive decision making, growth and profitability
• Research & analytics• Strategy formulation• Strategy implementation
Transaction AdvisoryIndependent corporate finance advisory & transaction origination services
• Origination services• Financial advisory• Due diligence• Transaction project management
Corporate Advisory
International Inbound
Supply Chain Solved
International Outbound
Supply Chain Solved
International Market
Complexities Solved
Global markets. Connected

208
We leverage deep capabilities across our clients’ value chains – we have developed a unique experience curve
Extensive Supplier Database
More than 7,300 identified suppliers, with over 1,800 pre-qualified
Comprehensive Quality Management
Comprehensive quality planning, Quality Assurance and Quality Control
Enable Cost-down Solutions
Enable cost-down and average savings of approximately 25% for customers (within a savings-range of 5-45%)
CAPEX Projects and OPEX/MRO Supply
Experienced in transacting in over 80 product categories across CAPEX projects and OPEX/MRO
Leader in Global Sourcing & Procurement
Industries include mining and resources, industrial and engineering sectors, chemicals, packaging, healthcare, FMCG and general merchandise
Approaches
Sophisticated methodologies, systems, processes and practices in place with an 18-year experience curve
Global Reach
Integrated, on-the-ground supply-hubs and infrastructure across China, the rest of Asia and Africa
Sourcing & Procurement• Global supply chain strategic
intelligence
• Supplier identification, selection and
management
• Contract terms management
• Quality management and expediting
• Project and risk management
Logistics• Control towers
• Logistics, supply chain and 3rd party
management
• Transportation, warehousing
• Inventory management
• Supply chain finance
Distribution & Supply• Distributor identification, selection and
management
• Order management and processing
• Kitting – product assembly,
repackaging, etc.
• Demand management and
warehousing
• Global market intelligence
• Decision support
• Digital solutions for international supply chain
• Capital advisory
• Team skills and resource augmentation
Suppliers Buyers
International Trading Capabilities
Client Value Chain and Our Capabilities
International Advisory Capabilities
Axis Group International
• Thrives in dynamic and challenging environment, with
focus on emerging and frontier markets
• Emphasizes ‘actions and transactions’ through strategy
implementation
• Collaborates with clients and provides integrated
solutions across their value chain
• Has successfully driven cost down solutions and
mitigated supply chain complexities within several
Chinese and international MNCs across various sectors
and industries i.e. mining and energy, agri and agri-
processing, power & infrastructure, transport, construction,
manufacturing, engineering, packaging and healthcare

www.axisgroupinternational.comwww.axisgroupinternational.com
DMCC Business Centre, Level No. 1, Unit No. 939
Jewellery & Gemplex 3
Dubai, United Arab Emirates
T +61 (0) 483 386 118 / +86 138 0111 2112
Beijing | Shanghai | Singapore | Perth | Bangkok | Mumbai | Dubai | Johannesburg
Global markets. Connected
www.axisgroupinternational.com