Kristallstrukturbestimmung organischer Pigmente aus ...
205
Kristallstrukturbestimmung organischer Pigmente aus Röntgen-Pulverdaten und Kristallstrukturmodellierung niedrig-dimensionaler Festkörper mit Kraftfeld-Methoden Dissertation zur Erlangung des Doktorgrades der Naturwissenschaften vorgelegt beim Fachbereich Biochemie, Chemie und Pharmazie der Johann Wolfgang Goethe-Universität in Frankfurt am Main von Christian Buchsbaum aus Frankfurt am Main Frankfurt 2011 (D30)
-
Upload
khangminh22 -
Category
Documents
-
view
3 -
download
0
Transcript of Kristallstrukturbestimmung organischer Pigmente aus ...

Kristallstrukturbestimmung organischer Pigmenteaus Röntgen-Pulverdaten und
Kristallstrukturmodellierung niedrig-dimensionalerFestkörper mit Kraftfeld-Methoden
Dissertation
zur Erlangung des Doktorgrades
der Naturwissenschaften
vorgelegt beim Fachbereich Biochemie, Chemie und Pharmazie
der Johann Wolfgang Goethe-Universität
in Frankfurt am Main
von
Christian Buchsbaum
aus Frankfurt am Main
Frankfurt 2011
(D30)

vom Fachbereich Biochemie, Chemie und Pharmazie der
Johann Wolfgang Goethe-Universität als Dissertation angenommen.
Dekan: Prof. Dr. Dieter Steinhilber
1. Gutachter: Prof. Dr. Martin U. Schmidt2. Gutachter: Prof. Dr. Erich F. Paulus
Datum der Disputation: 15. Februar 2012

Inhaltsverzeichnis
Danksagung ix
Hinweise xi
Abkürzungs- und Symbolverzeichnis xiii
1 Einleitung 11.1 Themenstellung . . . . . . . . . . . . . . . . . . . . . . . . . . . . . . . . . . . . . 2
2 Theoretische Grundlagen 52.1 Probenvorbereitung . . . . . . . . . . . . . . . . . . . . . . . . . . . . . . . . . . . 5
2.1.1 Synthese . . . . . . . . . . . . . . . . . . . . . . . . . . . . . . . . . . . . . 52.1.2 Kristallitgröße . . . . . . . . . . . . . . . . . . . . . . . . . . . . . . . . . . 52.1.3 Qualität der Messungen . . . . . . . . . . . . . . . . . . . . . . . . . . . . 6
2.2 Indizierung . . . . . . . . . . . . . . . . . . . . . . . . . . . . . . . . . . . . . . . 62.2.1 Vorüberlegungen . . . . . . . . . . . . . . . . . . . . . . . . . . . . . . . . 72.2.2 ito . . . . . . . . . . . . . . . . . . . . . . . . . . . . . . . . . . . . . . . . 82.2.3 dicvol . . . . . . . . . . . . . . . . . . . . . . . . . . . . . . . . . . . . . . 82.2.4 treor . . . . . . . . . . . . . . . . . . . . . . . . . . . . . . . . . . . . . . . 9
2.3 Strukturlösung . . . . . . . . . . . . . . . . . . . . . . . . . . . . . . . . . . . . . 92.4 Strukturverfeinerung . . . . . . . . . . . . . . . . . . . . . . . . . . . . . . . . . . 11
2.4.1 Intensitätsextraktion . . . . . . . . . . . . . . . . . . . . . . . . . . . . . . 112.4.2 Rietveld-Methode . . . . . . . . . . . . . . . . . . . . . . . . . . . . . . . 132.4.3 Beurteilung der Verfeinerung . . . . . . . . . . . . . . . . . . . . . . . . . 14
2.5 Modellierung . . . . . . . . . . . . . . . . . . . . . . . . . . . . . . . . . . . . . . 162.5.1 Dreiding-Kraftfeld . . . . . . . . . . . . . . . . . . . . . . . . . . . . . . . 172.5.2 Ladungen nach Gasteiger und Marsili . . . . . . . . . . . . . . . . . . . 20
3 Bestimmung von Kristallstrukturen organischer Pigmente aus Röntgen-Pulverdaten 233.1 Pigment Red 170 . . . . . . . . . . . . . . . . . . . . . . . . . . . . . . . . . . . . 24
3.1.1 Strukturlösung . . . . . . . . . . . . . . . . . . . . . . . . . . . . . . . . . 243.1.2 Strukturverfeinerung . . . . . . . . . . . . . . . . . . . . . . . . . . . . . . 253.1.3 Zusammenfassung . . . . . . . . . . . . . . . . . . . . . . . . . . . . . . . 26
i

Inhaltsverzeichnis
3.2 Pigment Orange 5 . . . . . . . . . . . . . . . . . . . . . . . . . . . . . . . . . . . . 323.2.1 Strukturlösung . . . . . . . . . . . . . . . . . . . . . . . . . . . . . . . . . 323.2.2 Strukturverfeinerung . . . . . . . . . . . . . . . . . . . . . . . . . . . . . . 333.2.3 Zusammenfassung . . . . . . . . . . . . . . . . . . . . . . . . . . . . . . . 33
3.3 Pigment Yellow 213 . . . . . . . . . . . . . . . . . . . . . . . . . . . . . . . . . . . 373.3.1 Strukturlösung . . . . . . . . . . . . . . . . . . . . . . . . . . . . . . . . . 373.3.2 Rietveld-Verfeinerung . . . . . . . . . . . . . . . . . . . . . . . . . . . . . 383.3.3 Zusammenfassung . . . . . . . . . . . . . . . . . . . . . . . . . . . . . . . 39
3.4 Pigment-Yellow-101-Derivat . . . . . . . . . . . . . . . . . . . . . . . . . . . . . . 403.4.1 Strukturlösung . . . . . . . . . . . . . . . . . . . . . . . . . . . . . . . . . 403.4.2 Rietveld-Verfeinerung . . . . . . . . . . . . . . . . . . . . . . . . . . . . . 413.4.3 Zusammenfassung . . . . . . . . . . . . . . . . . . . . . . . . . . . . . . . 42
3.5 Rietveld-Verfeinerung eines falschen Kristallstrukturmodells . . . . . . . . . . 443.5.1 „Richtige“ und „falsche“ Kristallstrukturen . . . . . . . . . . . . . . . . . 443.5.2 Chinacridon (Pigment Violet 19) . . . . . . . . . . . . . . . . . . . . . . . 443.5.3 Verfeinerung der „falschen“ Kristallstruktur . . . . . . . . . . . . . . . . 453.5.4 Diskussion . . . . . . . . . . . . . . . . . . . . . . . . . . . . . . . . . . . . 453.5.5 Zusammenfassung . . . . . . . . . . . . . . . . . . . . . . . . . . . . . . . 47
3.6 (CF3)2-Thiazinindigo . . . . . . . . . . . . . . . . . . . . . . . . . . . . . . . . . . 493.6.1 Strukturlösung . . . . . . . . . . . . . . . . . . . . . . . . . . . . . . . . . 493.6.2 Rietveld-Verfeinerung . . . . . . . . . . . . . . . . . . . . . . . . . . . . . 503.6.3 Modellierung . . . . . . . . . . . . . . . . . . . . . . . . . . . . . . . . . . 503.6.4 Zusammenfassung . . . . . . . . . . . . . . . . . . . . . . . . . . . . . . . 52
3.7 Thiazinindigo-Derivate . . . . . . . . . . . . . . . . . . . . . . . . . . . . . . . . . 533.7.1 Rietveld-Verfeinerung . . . . . . . . . . . . . . . . . . . . . . . . . . . . . 533.7.2 Zusammenfassung . . . . . . . . . . . . . . . . . . . . . . . . . . . . . . . 56
3.8 Pigment Red 181 . . . . . . . . . . . . . . . . . . . . . . . . . . . . . . . . . . . . 603.8.1 Thioindigo-Pigmente . . . . . . . . . . . . . . . . . . . . . . . . . . . . . . 603.8.2 Strukturlösung I . . . . . . . . . . . . . . . . . . . . . . . . . . . . . . . . 603.8.3 Rietveld-Verfeinerung I . . . . . . . . . . . . . . . . . . . . . . . . . . . . 603.8.4 Strukturlösung II . . . . . . . . . . . . . . . . . . . . . . . . . . . . . . . . 613.8.5 Rietveld-Verfeinerung II . . . . . . . . . . . . . . . . . . . . . . . . . . . 623.8.6 Strukturlösung III . . . . . . . . . . . . . . . . . . . . . . . . . . . . . . . . 643.8.7 Rietveld-Verfeinerung III . . . . . . . . . . . . . . . . . . . . . . . . . . . 653.8.8 Kristallstruktur . . . . . . . . . . . . . . . . . . . . . . . . . . . . . . . . . 653.8.9 Zusammenfassung . . . . . . . . . . . . . . . . . . . . . . . . . . . . . . . 67
4 Modellierung von Kristallstrukturen mit Kraftfeld-Methoden 714.1 Hintergrund der Untersuchungen . . . . . . . . . . . . . . . . . . . . . . . . . . 714.2 Kraftfeld-Entwicklung . . . . . . . . . . . . . . . . . . . . . . . . . . . . . . . . . 724.3 Modelle . . . . . . . . . . . . . . . . . . . . . . . . . . . . . . . . . . . . . . . . . . 72
4.3.1 Fe(II)-Triazol . . . . . . . . . . . . . . . . . . . . . . . . . . . . . . . . . . 724.3.2 Cu(II)-Koordinationspolymer . . . . . . . . . . . . . . . . . . . . . . . . . 73
4.4 Zusammenfassung . . . . . . . . . . . . . . . . . . . . . . . . . . . . . . . . . . . 74
ii

Inhaltsverzeichnis
5 Zusammenfassung 77
A Bibliographie 81A.1 Eigene Veröffentlichungen . . . . . . . . . . . . . . . . . . . . . . . . . . . . . . . 81A.2 Literatur . . . . . . . . . . . . . . . . . . . . . . . . . . . . . . . . . . . . . . . . . 82A.3 Eigener Beitrag zu den Veröffentlichungen . . . . . . . . . . . . . . . . . . . . . 86
B Eigene Veröffentlichungen 89B.1 Pigment Red 170 (deutsch) . . . . . . . . . . . . . . . . . . . . . . . . . . . . . . . 89B.2 Pigment Red 170 (englisch) . . . . . . . . . . . . . . . . . . . . . . . . . . . . . . 90B.3 Pigment Orange 5 . . . . . . . . . . . . . . . . . . . . . . . . . . . . . . . . . . . . 91B.4 Pigment Yellow 213 . . . . . . . . . . . . . . . . . . . . . . . . . . . . . . . . . . . 96B.5 Pigment Yellow 101 . . . . . . . . . . . . . . . . . . . . . . . . . . . . . . . . . . . 108B.6 Rietveld-Verfeinerung einer falschen Kristallstruktur . . . . . . . . . . . . . . . 116B.7 (CF3)2-Thiazinindigo . . . . . . . . . . . . . . . . . . . . . . . . . . . . . . . . . . 124B.8 Thiazinindigo-Derivate . . . . . . . . . . . . . . . . . . . . . . . . . . . . . . . . . 131B.9 Modellierung eines Spin-Crossover-Vorgangs . . . . . . . . . . . . . . . . . . . . 142B.10 Ab-initio-Modellierungen . . . . . . . . . . . . . . . . . . . . . . . . . . . . . . . 156B.11 Cu-basierte Polymerverbindungen . . . . . . . . . . . . . . . . . . . . . . . . . . 164
C Lebenslauf 183C.1 Vollständige Auflistung der eigenen Veröffentlichungen . . . . . . . . . . . . . . 184
C.1.1 Eigene Veröffentlichungen . . . . . . . . . . . . . . . . . . . . . . . . . . . 184C.1.2 Veröffentlichungen außerhalb dieser Dissertation . . . . . . . . . . . . . 185C.1.3 Posterbeiträge . . . . . . . . . . . . . . . . . . . . . . . . . . . . . . . . . . 185
D Akademische Lehrer 187
E Eidesstattliche Erklärung 189
iii

Abbildungsverzeichnis
2.1 Zur Definition des Inversionswinkels ΨI. . . . . . . . . . . . . . . . . . . . . . . 19
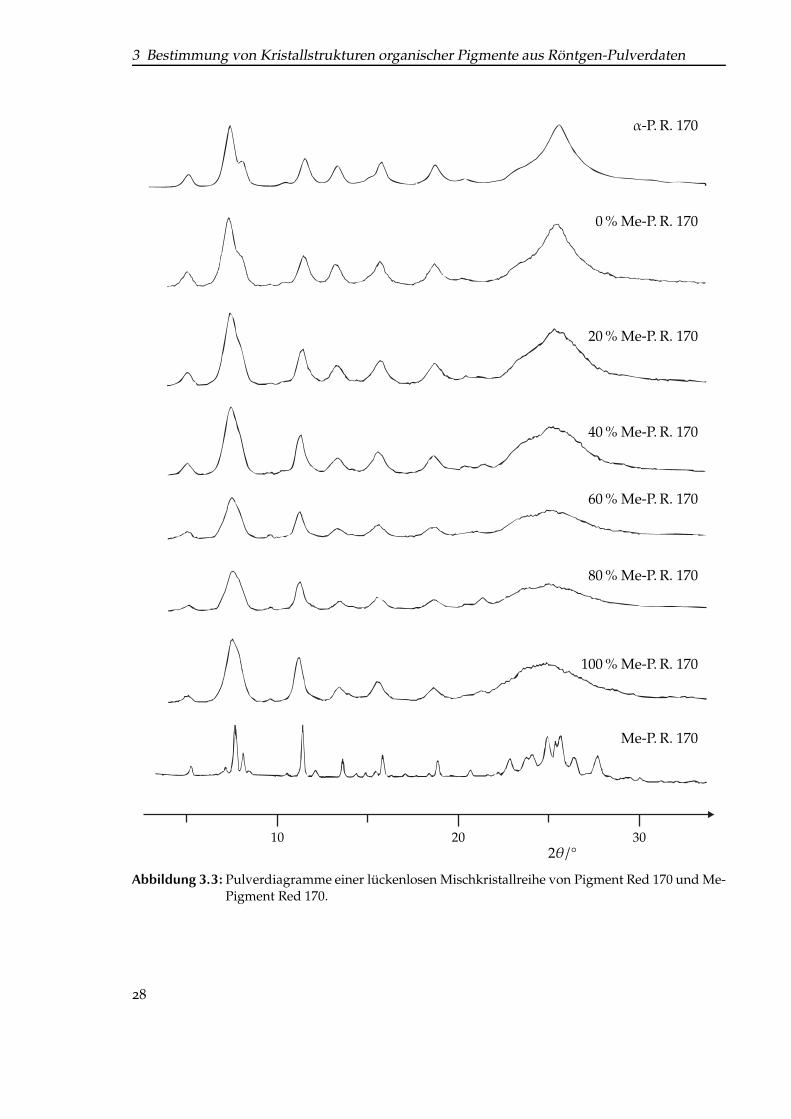
3.1 Molekülstruktur von Pigment Red 170 und Derivaten. . . . . . . . . . . . . . . . 243.2 Pulverdiagramme von α-Pigment Red 170 und Derivaten. . . . . . . . . . . . . 273.3 Pulverdiagramme einer lückenlosen Mischkristallreihe von Pigment Red 170
und Me-Pigment Red 170. . . . . . . . . . . . . . . . . . . . . . . . . . . . . . . . 283.4 Vergleich der Rietveld-Verfeinerungen von Pigment Red 170, F-Pigment
Red 170, Cl-Pigment Red 170, Br-Pigment Red 170 und NO2-Pigment Red 170. 293.5 Kristallstruktur des Methyl-Derivates von Pigment Red 170, Blick senkrecht
zur 21-Achse. . . . . . . . . . . . . . . . . . . . . . . . . . . . . . . . . . . . . . . . 303.6 Kristallstruktur des Methyl-Derivates von Pigment Red 170, Blickrichtung [001]. 313.7 Molekülstruktur von Pigment Orange 5. . . . . . . . . . . . . . . . . . . . . . . . 323.8 Rietveld-Plot von Pigment Orange 5. . . . . . . . . . . . . . . . . . . . . . . . . 343.9 Kristallstruktur von Pigment Orange 5, Blick entlang [001]. . . . . . . . . . . . . 353.10 Kristallstruktur von Pigment Orange 5, Blick entlang [041]. . . . . . . . . . . . . 363.11 Struktur von Pigment Yellow 213. . . . . . . . . . . . . . . . . . . . . . . . . . . . 373.12 Struktur von Pigment Yellow 101 und dem in dieser Arbeit untersuchten Derivat. 403.13 Rietveld-Plot des Derivates von Pigment Yellow 101. . . . . . . . . . . . . . . . 423.14 Struktur von Pigment Violet 19 (Chinacridon). . . . . . . . . . . . . . . . . . . . 443.15 Pulverdiagramme von Pigment Violet 19 mit „richtiger“ und „falscher“ Indi-
zierung. . . . . . . . . . . . . . . . . . . . . . . . . . . . . . . . . . . . . . . . . . . 473.16 Simulierte Neutronenbeugungs-Pulverdiagramme von Pigment Violet 19. . . . 483.17 Struktur von (CF3)2-Thiazinindigo. . . . . . . . . . . . . . . . . . . . . . . . . . . 493.18 Struktur von Thiazinindigo und den in dieser Arbeit untersuchten Derivaten. . 533.19 Vergleich der Pulverdiagramme der untersuchten Thiazinindigo-Derivate. . . . 573.20 Darstellung der konstruierten Fehlordnungsmodelle für Cl-THI. . . . . . . . . . 583.21 Simulierte Pulverdiagramme der Modelle 1, 2 und 3/4 des Mono-chlor-Deriva-
tes von Thiazinindigo. . . . . . . . . . . . . . . . . . . . . . . . . . . . . . . . . . 593.22 Struktur dreier Thioindigo-Pigmente. . . . . . . . . . . . . . . . . . . . . . . . . 603.23 Röntgen-Pulverdiagramm von Pigment Red 181. . . . . . . . . . . . . . . . . . . 613.24 Rietveld-Plot von Pigment Red 181; Verfeinerung I mit gsas. . . . . . . . . . . . 613.25 Vergleich der LeBail-Fits von Pigment Red 181. . . . . . . . . . . . . . . . . . . 633.26 Rietveld-Plot von Pigment Red 181; Verfeinerung II mit topas. . . . . . . . . . . 64
v

Abbildungsverzeichnis
3.27 Rietveld-Plot von Pigment Red 181; Verfeinerung III mit topas. . . . . . . . . . 673.28 Rietveld-Plot von Pigment Red 181; Verfeinerung III mit gsas. . . . . . . . . . . 673.29 Kristallstruktur von Pigment Red 181, Blickrichtung [010]. . . . . . . . . . . . . 683.30 Kristallstruktur von Pigment Red 181, Blickrichtung [100]. . . . . . . . . . . . . 693.31 Vergleich der Kristallstruktur von Pigment Red 181 aus der Verfeinerung mit
gsas und der Verfeinerung mit topas. . . . . . . . . . . . . . . . . . . . . . . . . . 70
4.1 Struktur von Fe-triazol-Verbindungen. . . . . . . . . . . . . . . . . . . . . . . . . 734.2 Kristallstrukturmodell von Fe-triazol mit F– als Gegenion. . . . . . . . . . . . . 754.3 Struktur von CuCCP. . . . . . . . . . . . . . . . . . . . . . . . . . . . . . . . . . . 764.4 Kristallstrukturmodell von CuCCP. . . . . . . . . . . . . . . . . . . . . . . . . . . 76
vi

Tabellenverzeichnis
2.1 Typische Restraints bei Rietveld-Verfeinerungen. . . . . . . . . . . . . . . . . . 15
3.1 Ergebnisse der Rietveld-Verfeinerungen von Pigment Red 170 und Derivaten. 253.2 Ergebnisse der Rietveld-Verfeinerung von Pigment Orange 5. . . . . . . . . . . 333.3 Vergleich der Gitterkonstanten von Pigment Yellow 213 aus Elektronenbeugung
mit den Ergebnissen der Rietveld-Verfeinerung. . . . . . . . . . . . . . . . . . . 383.4 Ergebnisse der Rietveld-Verfeinerung von Pigment Yellow 213. . . . . . . . . . 393.5 Ergebnisse der Indizierung von Pigment Yellow 101. . . . . . . . . . . . . . . . . 413.6 Ergebnisse der Rietveld-Verfeinerung des Derivates von Pigment Yellow 101 . 423.7 Ergebnisse der Rietveld-Verfeinerung. . . . . . . . . . . . . . . . . . . . . . . . . 453.8 Gitterkonstanten der verschiedenen untersuchten Chinacridon-Phasen. . . . . 463.9 Ergebnisse der Indizierung von (CF3)2-THI mit treor. Es wurde eine monokline
Elementarzelle ermittelt. . . . . . . . . . . . . . . . . . . . . . . . . . . . . . . . . 493.10 Ergebnisse der Rietveld-Verfeinerung von (CF3)2-THI. . . . . . . . . . . . . . . 513.11 Ergebnisse der Gitterenergie-Minimierungen von Fehlordnungsmodellen des
(CF3)2-THI. . . . . . . . . . . . . . . . . . . . . . . . . . . . . . . . . . . . . . . . . 513.12 Vergleich der Ergebnisse der Rietveld-Verfeinerung der Strukturmodelle von
ClH-THI. . . . . . . . . . . . . . . . . . . . . . . . . . . . . . . . . . . . . . . . . . 563.13 Ergebnisse der Rietveld-Verfeinerungen der Thiazinindigo-Derivate. . . . . . . 563.14 Ergebnisse der LeBail-Fits von Pigment Red 181 mit unterschiedlichen Zellvo-
lumina. . . . . . . . . . . . . . . . . . . . . . . . . . . . . . . . . . . . . . . . . . . 623.15 Vergleich von Molekülvolumina nach unterschiedlichen Methoden. . . . . . . . 653.16 Vergleich der berechneten Molekülvolumina mit den tatsächlichen Volumina. . 663.17 Ergebnisse der Rietveld-Verfeinerungen I, II, III von Pigment Red 181. . . . . . 66
4.1 Gitterkonstanten der experimentellen Kristallstruktur von CuCCP sowie dermit Kraftfeld-Methoden optimierten Strukturen von CuH2O und CuNH3. . . . 74
vii


Danksagung
Meinen ausdrücklichen Dank möchte ich
• Professor Dr. Martin U. Schmidt für die fordernde Themenstellung und (manchmal auchfordernde) Betreuung,
• Professor Dr. Erich F. Paulus für das Annehmen der Rolle des Zweitgutachters,
• Edith Alig für die besten Pulverdiagramme,
• meinen Korrekturlesern (die nächsten fünf Personen, bei denen ich nicht sicher bin, woich mit dem Danksagen anfangen soll),
• Dr. Lothar Fink,
• Dr. Jürgen Glinnemann,
• Nadine Rademacher,
• Sonja Hammer für Hilfe mit dash und topas,
• Silke Thoms für das „Kopf-geraderücken“
• und überhaupt dem ganzen Arbeitskreis Schmidt
aussprechen. Besonderer Dank gilt meinen Studenten (mit all ihren Talenten) sowie meinenPraktikanten (vor allem den zuletzt genannten) und nicht zuletzt der Herde (der besten dieserErde).
ix


Hinweise
Aus Gründen der einfacheren und übersichtlicheren Darstellung wird in dieser Arbeit aufvereinfachte Struktur-/Lewis-Formeln zurückgegriffen, also beispielsweise
N
O
H
N
N
O
O
N
OO
stattN
O
H
N
N
O
O
N
OO ⊕
⊕
⊖
⊖
.
Eigene Veröffentlichungen werden durch Voranstellen des Zusatzes „CB“ vor die Nummerdes Zitates gekennzeichnet, z. B. [CB1].
Die Zitate am Beginn jedes Kapitels stammen von einem wissenschaftlich auf höchstemNiveau, akribischst und sorgfältigst arbeitenden Beobachter (zwischen)menschlichen Verhal-tens, Dr. h. c. Bernhard Victor Christoph Carl von Bülow.
Gesetzt mit LATEX 2ε, Version 3.1415926-2.3-1.40.12.
xi


Abkürzungs- und Symbolverzeichnis
Rwp gewichteter Profil-R-Wert
s. Abschnitt 2.4.3
Rwpb gewichteter Profil-R-Wert, untergrundkorrigiertRexp erwarteter R-WertRexp,b erwarteter R-Wert, untergrundkorrigiertRF2 R-Wert, Verfeinerung gegen F2
hk l
χ2, χ2red Gütekriterium
GoF Goodness of Fit (Gütekriterium)Fhk l Strukturfaktor|Fhk l| StrukturamplitudeP. R. Pigment RedP. O. Pigment OrangeP. V. Pigment VioletP. Y. Pigment YellowTHI Thiazinindigoa, b, c Basisvektoren des direkten Gittersa, b, c Länge der Basisvektoren (a = |a| etc.)α, β, γ Winkel zwischen den Basisvektorena∗, b∗, c∗ Basisvektoren des reziproken Gittersa∗, b∗, c∗ Länge der Basisvektoren des reziproken Gitters (a∗ = |a∗| etc.)α∗, β∗, γ∗ Winkel zwischen den Basisvektoren des reziproken Gittersap, bp, cp Projektionen der BasisvektorenV Volumen der Elementarzelle des direkten GittersV∗ Volumen der Elementarzelle des reziproken Gittersλ Wellenlänge der verwendeten (Röntgen-)Strahlunghkl Indices eines Bragg-Reflexes(hkl) Miller-Indices einer Netzebene/Netzebenenschardhk l Netzebenen-Abstände[uvw] Indices einer RichtungEZ Elementarzelle
Fortsetzung auf der nächsten Seite
xiii

Abkürzungs- und Symbolverzeichnis
RG Raumgruppeyi Zählrate am Punkt i
obs beobachtet (z. B. in yi,obs)calc berechnet (z. B. in yi,calc)bkgnd Untergrund (z. B. in yi,bkgnd)Ph PhenylMe MethylCCP Copper coordination polymer; in diesem Sinne ist die Bezeichnung „CuCCP“
(Abschnitt 4) ein Pleonasmus, wird jedoch aus Gründen der Konsistenz beibe-halten
xiv
Zu Beginn werde ich 22 Gedichte aus dem ZyklusAbschied lesen, [. . . ] dann acht Balladen aus meinerfrühen Schaffensperiode, gefolgt von derSonettensammlung Die zwölf Monate, hierauf dreiKapitel aus dem Roman Pedokles und zum Schluss einTrauerspiel in drei Akten mit dem Titel Goethe inHalberstadt. Dann haben wir Gelegenheit, miteinanderzu sprechen.
(Loriot)1 Einleitung
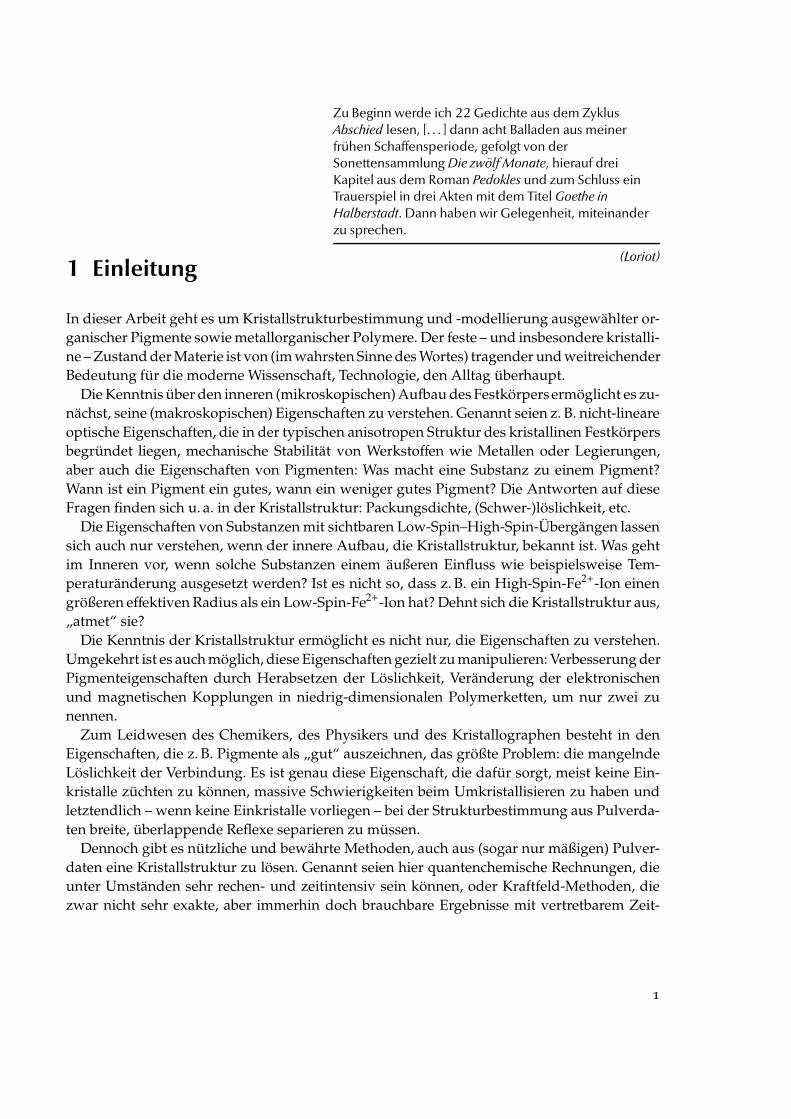
In dieser Arbeit geht es um Kristallstrukturbestimmung und -modellierung ausgewählter or-ganischer Pigmente sowie metallorganischer Polymere. Der feste – und insbesondere kristalli-ne – Zustand der Materie ist von (im wahrsten Sinne des Wortes) tragender und weitreichenderBedeutung für die moderne Wissenschaft, Technologie, den Alltag überhaupt.
Die Kenntnis über den inneren (mikroskopischen) Aufbau des Festkörpers ermöglicht es zu-nächst, seine (makroskopischen) Eigenschaften zu verstehen. Genannt seien z. B. nicht-lineareoptische Eigenschaften, die in der typischen anisotropen Struktur des kristallinen Festkörpersbegründet liegen, mechanische Stabilität von Werkstoffen wie Metallen oder Legierungen,aber auch die Eigenschaften von Pigmenten: Was macht eine Substanz zu einem Pigment?Wann ist ein Pigment ein gutes, wann ein weniger gutes Pigment? Die Antworten auf dieseFragen finden sich u. a. in der Kristallstruktur: Packungsdichte, (Schwer-)löslichkeit, etc.
Die Eigenschaften von Substanzen mit sichtbaren Low-Spin–High-Spin-Übergängen lassensich auch nur verstehen, wenn der innere Aufbau, die Kristallstruktur, bekannt ist. Was gehtim Inneren vor, wenn solche Substanzen einem äußeren Einfluss wie beispielsweise Tem-peraturänderung ausgesetzt werden? Ist es nicht so, dass z. B. ein High-Spin-Fe2+-Ion einengrößeren effektiven Radius als ein Low-Spin-Fe2+-Ion hat? Dehnt sich die Kristallstruktur aus,„atmet“ sie?
Die Kenntnis der Kristallstruktur ermöglicht es nicht nur, die Eigenschaften zu verstehen.Umgekehrt ist es auch möglich, diese Eigenschaften gezielt zu manipulieren: Verbesserung derPigmenteigenschaften durch Herabsetzen der Löslichkeit, Veränderung der elektronischenund magnetischen Kopplungen in niedrig-dimensionalen Polymerketten, um nur zwei zunennen.
Zum Leidwesen des Chemikers, des Physikers und des Kristallographen besteht in denEigenschaften, die z. B. Pigmente als „gut“ auszeichnen, das größte Problem: die mangelndeLöslichkeit der Verbindung. Es ist genau diese Eigenschaft, die dafür sorgt, meist keine Ein-kristalle züchten zu können, massive Schwierigkeiten beim Umkristallisieren zu haben undletztendlich – wenn keine Einkristalle vorliegen – bei der Strukturbestimmung aus Pulverda-ten breite, überlappende Reflexe separieren zu müssen.
Dennoch gibt es nützliche und bewährte Methoden, auch aus (sogar nur mäßigen) Pulver-daten eine Kristallstruktur zu lösen. Genannt seien hier quantenchemische Rechnungen, dieunter Umständen sehr rechen- und zeitintensiv sein können, oder Kraftfeld-Methoden, diezwar nicht sehr exakte, aber immerhin doch brauchbare Ergebnisse mit vertretbarem Zeit-
1
1 Einleitung
und Rechenaufwand liefern. Diese Methoden sind insbesondere dann zur Vorhersage vonKristallstrukturen geeignet, wenn das Pulverdiagramm nicht indizierbar ist.
Wenn die Struktur erst gelöst ist, ist die bewährte Methode der Strukturverfeinerung dieRietveld-Methode.[1–3] Obwohl oder gerade weil die Methode mittlerweile zu einer „Black-Box“-Methode geworden ist, ist die genaue Analyse und Interpretation der Ergebnisse un-abdingbar. Es gibt genügend Beispiele, in denen vermeintlich gute Ergebnisse (struktur-)chemisch sinnlos sind.
1.1 Themenstellung
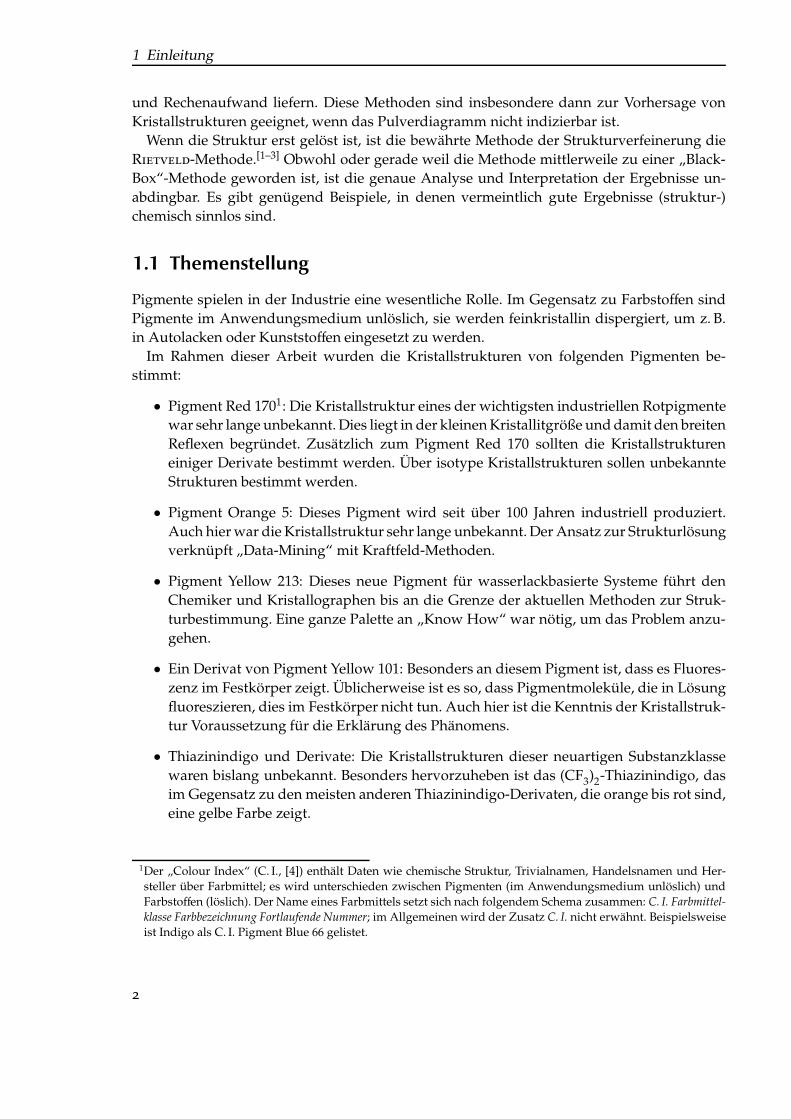
Pigmente spielen in der Industrie eine wesentliche Rolle. Im Gegensatz zu Farbstoffen sindPigmente im Anwendungsmedium unlöslich, sie werden feinkristallin dispergiert, um z. B.in Autolacken oder Kunststoffen eingesetzt zu werden.
Im Rahmen dieser Arbeit wurden die Kristallstrukturen von folgenden Pigmenten be-stimmt:
• Pigment Red 1701: Die Kristallstruktur eines der wichtigsten industriellen Rotpigmentewar sehr lange unbekannt. Dies liegt in der kleinen Kristallitgröße und damit den breitenReflexen begründet. Zusätzlich zum Pigment Red 170 sollten die Kristallstruktureneiniger Derivate bestimmt werden. Über isotype Kristallstrukturen sollen unbekannteStrukturen bestimmt werden.
• Pigment Orange 5: Dieses Pigment wird seit über 100 Jahren industriell produziert.Auch hier war die Kristallstruktur sehr lange unbekannt. Der Ansatz zur Strukturlösungverknüpft „Data-Mining“ mit Kraftfeld-Methoden.
• Pigment Yellow 213: Dieses neue Pigment für wasserlackbasierte Systeme führt denChemiker und Kristallographen bis an die Grenze der aktuellen Methoden zur Struk-turbestimmung. Eine ganze Palette an „Know How“ war nötig, um das Problem anzu-gehen.
• Ein Derivat von Pigment Yellow 101: Besonders an diesem Pigment ist, dass es Fluores-zenz im Festkörper zeigt. Üblicherweise ist es so, dass Pigmentmoleküle, die in Lösungfluoreszieren, dies im Festkörper nicht tun. Auch hier ist die Kenntnis der Kristallstruk-tur Voraussetzung für die Erklärung des Phänomens.
• Thiazinindigo und Derivate: Die Kristallstrukturen dieser neuartigen Substanzklassewaren bislang unbekannt. Besonders hervorzuheben ist das (CF3)2-Thiazinindigo, dasim Gegensatz zu den meisten anderen Thiazinindigo-Derivaten, die orange bis rot sind,eine gelbe Farbe zeigt.
1Der „Colour Index“ (C. I., [4]) enthält Daten wie chemische Struktur, Trivialnamen, Handelsnamen und Her-steller über Farbmittel; es wird unterschieden zwischen Pigmenten (im Anwendungsmedium unlöslich) undFarbstoffen (löslich). Der Name eines Farbmittels setzt sich nach folgendem Schema zusammen: C. I. Farbmittel-
klasse Farbbezeichnung Fortlaufende Nummer; im Allgemeinen wird der Zusatz C. I. nicht erwähnt. Beispielsweiseist Indigo als C. I. Pigment Blue 66 gelistet.
2

1.1 Themenstellung
Zu den genannten Kristallstrukturbestimmungen kommt ein Kapitel mit einer grundsätz-lichen Fragestellung: Wo sind die Grenzen der Strukturbestimmung aus Pulverdaten? Wannist eine Kristallstruktur „richtig“ oder „falsch“?
• Chinacridon: Am Beispiel dieser Verbindung soll gezeigt werden, wie gefährlich essein kann, sich ausschließlich auf mathematisch definierte Gütekriterien (R-Wert, χ2)zu verlassen. Noch gefährlicher: Fast jeder (offensichtliche) Fehler in der Struktur kannwegdiskutiert werden.
Das letzte Pigment verknüpft die beiden vorangehenden Punkte.
• Pigment Red 181: Die Kristallstruktur dieses Pigmentes wurde zwar widerspruchsfreigelöst. Bei der Strukturverfeinerung ergaben sich aber immense Probleme, die auf mas-sive Fehler in der gelösten Struktur deuteten.
Das letzte Kapitel behandelt die Erstellung von Modellstrukturen für niedrig-dimensionalemetall-organische Festkörper.
• Eisen-triazol: Diese Substanz zeigt einen deutlich sichtbaren Übergang vom Low-Spin-in den High-Spin-Zustand (Farbveränderung). Die Synthese der Verbindung liefert aus-nahmslos feinkristalline Pulver; Umkristallisationsversuche blieben erfolglos. Aus die-sem Grund soll eine Modellstruktur mithilfe von Kraftfeld-Methoden erzeugt werden,die als Ausgangspunkt für quantenmechanische Rechnungen (Gruppe Valentí/Jeschke,Institut für Theoretische Physik, Universität Frankfurt) dient.
• Kupfer-CCP: An dieser Substanz soll die Kopplung von verbrückten Cu2+-Ionen mitquntenmechanischen Methoden untersucht werden. Die Kristallstruktur der Stamm-verbindung ist bekannt; für die Kristallstrukturen der (hypothetischen) Derivate sollensinnvolle Modellstrukturen generiert werden.
Beide Substanzen wurden im Rahmen der Forschergruppe 412 („Spin- und Ladungsträger-korrelationen in niedrigdimensionalen metallorganischen Festkörpern“) der DFG hinsichtlichelektronischer und magnetischer Eigenschaften untersucht.
3


Die HS II arbeitet elektronisch mit sechs verschiedenenProgrammen, die vorher wahlweise eingespeist werden.[. . . ] Wasserdruck, Temperatur, Enthärter,Spareinstellung, Zielautomatik und Strahlkrümmung.
(Loriot)
2 Theoretische Grundlagen
Dieses Kapitel gibt eine allgemeine Übersicht der theoretischen Grundlagen zu den in dieserArbeit behandelten Problemen.
Ein Überblick über die nötigen Vorarbeiten bis zum ersten Pulverdiagramm findet sichin Abschnitt 2.1, einen kurzen Einblick in Indizierungsverfahren gibt Abschnitt 2.2, möglicheVorgehensweisen bei der Strukturlösung werden in Abschnitt 2.3 behandelt, in Abschnitt 2.4.1wird die Extraktion von Intensitäten beschrieben, Abschnitt 2.4.2 beschäftigt sich mit denGrundlagen der Rietveld-Methode, abschließend wird in Abschnitt 2.5 auf Modellierung mitKraftfeld-Methoden eingegangen.
2.1 Probenvorbereitung
Die in diesem Abschnitt beschriebenen Arbeiten wurden nicht vom Autor dieser Arbeit durch-geführt; dennoch ist es wichtig, einen kurzen Überblick über diese Tätigkeiten zu geben.
2.1.1 Synthese
Am Beginn einer Kristallstrukturbestimmung steht die Synthese der zu untersuchenden Sub-stanz oder – beispielsweise im Fall von Naturstoffen – deren Extraktion. Im Idealfall wirddabei ein Einkristall der Substanz erhalten. Sollte dies nicht der Fall sein, kommen verschie-dene Verfahren der Umkristallisation in Frage; dabei besteht allerdings immer die Gefahr, z. B.verschiedene (unerwünschte) Polymorphe zu erhalten.
Liegt die Probe als Pulver vor, sollten erste Experimente dahingehend durchgeführt werdensicherzustellen, dass es sich tatsächlich um die gewünschte Substanz handelt (beispielsweisemit Hilfe von Elementaranalyse, IR-, NMR-Spektroskopie, Bestimmung des Schmelz-/Zerset-zungspunktes, TG-DTA, DSC etc.).
Ein anschließend aufgenommenes Pulverdiagramm gibt u. a. Aufschluss über Kristallinitätund Reinheit der Probe.
2.1.2 Kristallitgröße
Um die Reflexlagen für die Indizierung, Strukturlösung und Strukturverfeinerung präzisebestimmen zu können, sollten die Reflexe eine geringe Halbwertsbreite haben.
5

2 Theoretische Grundlagen
Je kleiner allerdings die Kristallite sind, an denen Beugung stattfindet, desto breiter sinddie Reflexe im Pulverdiagramm. Eine Abschätzung über die Domänengrößen der kohärentstreuenden Bereiche lässt sich mit der Scherrer-Formel[5] treffen:
Lhk l = p · dhk l =K · λβ · cosθ
(2.1)
mit der Kristallitdicke Lhk l, der Anzahl der Netzebenen p, dem Netzebenenabstand dhk l,der Wellenlänge der monochromatischen Strahlung λ, der Reflex-Halbwertsbreite β (im Bo-genmaß) und dem halben Beugungswinkel θ. Bei K handelt es sich um einen empirischen„Formfaktor“, der für kugelförmige Kristallite ca. 0,89 und für würfelförmige ca. 0,94 beträgt.Bei unbekannter Kristallitform kann K ≈ 0,9 angesetzt werden.
Zeigt das Pulverdiagramm, dass die Probe eine schlechte Kristallinität aufweist, solltenVersuche unternommen werden, die Probe umzukristallisieren. Mögliche Probleme dabeisind in Abschnitt 2.1.1 beschrieben.
Ein neu aufgenommenes Pulverdiagramm, das im Idealfall schärfere Reflexe aufweist, zeigtgelungene Kristallisationsversuche.
2.1.3 Qualität der Messungen
Um die Qualität der Messung zu verbessern, empfiehlt sich eine lange Zählzeit pro Winkel-schritt. Außerdem ist es sinnvoll, über einen großen Winkelbereich zu messen (möglicherweisefinden sich wertvolle Informationen jenseits von 2θ = 34°).
Sollten im weiteren Verlauf der Strukturverfeinerung schwierig zu erklärende Probleme auf-treten, z. B. nicht anzupassende Reflexe, ist es unter Umständen ratsam, das Pulverdiagrammauf Fremdphasenreflexe zu untersuchen und gegebenenfalls eine neue Messung durchzufüh-ren (s. dazu Abschnitt 3.8).
2.2 Indizierung[6]
Für das weitere Vorgehen im Rahmen der Kristallstrukturbestimmung ist die Kenntnis derElementarzelle unabdingbar. Diese Information steckt indirekt in einem Pulverdiagramm: DieBeugung von Röntgenstrahlen in einem Kristall kann als Reflexion an mit Atomen besetztenNetzebenenscharen aufgefasst werden. Die Abstände der Netzebenen zueinander lassen sichaus der Braggschen Gleichung
λ = 2dhk l sinθ (2.2)
(h, k, l nicht teilerfremd) bestimmen. Aus den erhaltenen Netzebenenabständen lassen sichverschiedene mögliche Elementarzellen rekonstruieren. Da es prinzipiell keine „richtige“ Ele-mentarzelle gibt, wurden Konventionen für die Aufstellung einer einheitlichen, „reduzierten“Zelle eingeführt.
Das Zuordnen bestimmter Indices h, k, l zu Netzebenenscharen zu gemessenen Reflexenwird als Indizierung bezeichnet. Im Falle einer Strukturanalyse aus Einkristalldaten gestaltetsich dieser Vorgang einfach: Die Reflexe sind räumlich getrennt und ihre Intensitäten lassensich verhältnismäßig einfach bestimmen. Da im Gegensatz dazu die dreidimensionale Infor-mation des Einkristallexperiments auf eine Dimension im Pulverexperiment abgebildet wird,
6

2.2 Indizierung
kommt es zu starken Reflexüberlappungen. Je höher der Beugungswinkel 2θ ist, desto stärkerist die Überlappung.
2.2.1 Vorüberlegungen
Das Skalarprodukt eines Vektors r∗ im reziproken Raum mit sich selbst liefert
(r∗)2 =1
d2hk l
= h2a∗2 + k2b∗2 + l2c∗2 + 2hka∗b∗ + 2klb∗c∗ + 2hla∗c∗
= h2a∗2 + k2b∗2 + l2c∗2 + 2hka∗b∗ cosγ∗ + 2klb∗c∗ cosα∗ + 2hla∗c∗ cos β∗ , (2.3)
mit dem Abstand der Netzebenen dhk l aus der Bragg-Gleichung (2.2).Konventionsgemäß werden folgende Vereinfachungen angewendet:
Qhk l =104
d2hk l
und
a11 = 104 · a∗2 ;
a22 = 104 · b∗2 ;
a33 = 104 · c∗2 ;
sowie
a12 = 104 · 2a∗b∗ cosγ∗ ;
a13 = 104 · 2a∗c∗ cos β∗ ;
a23 = 104 · 2b∗c∗ cosα∗ .
Damit ergibt sich für den triklinen Fall
Qhkl = h2a11 + k2a22 + l2a33 + hka12 + kla23 + hla13 . (2.4)
Für höhere Symmetrien nimmt (2.4) einfachere Formen an.Zur Bewertung der Indizierung werden folgende Gütekriterien („Figure of Merit“, FOM) –
M20[7] und FN
[8] – definiert:
M20 =Q20
2 · 〈Q〉 ·N20, (2.5)
wobei Q20 den Wert Q für den 20. beobachteten Reflex bezeichnet, 〈Q〉 die durchschnittlicheAbweichung der beobachteten von den berechneten Q-Werten für die 20 indizierten Reflexeund N20 die Anzahl berechneter Reflexe bis zum d-Wert, der Q20 entspricht.
Je kleiner 〈Q〉, desto größer ist M20 und umso wahrscheinlicher ist es, die „richtige“ Indizie-rung gefunden zu haben. Indizierungen werden als annehmbar angesehen, wenn nicht mehrals zwei Reflexe unindiziert sind und M20 > 10 ist.
7
2 Theoretische Grundlagen
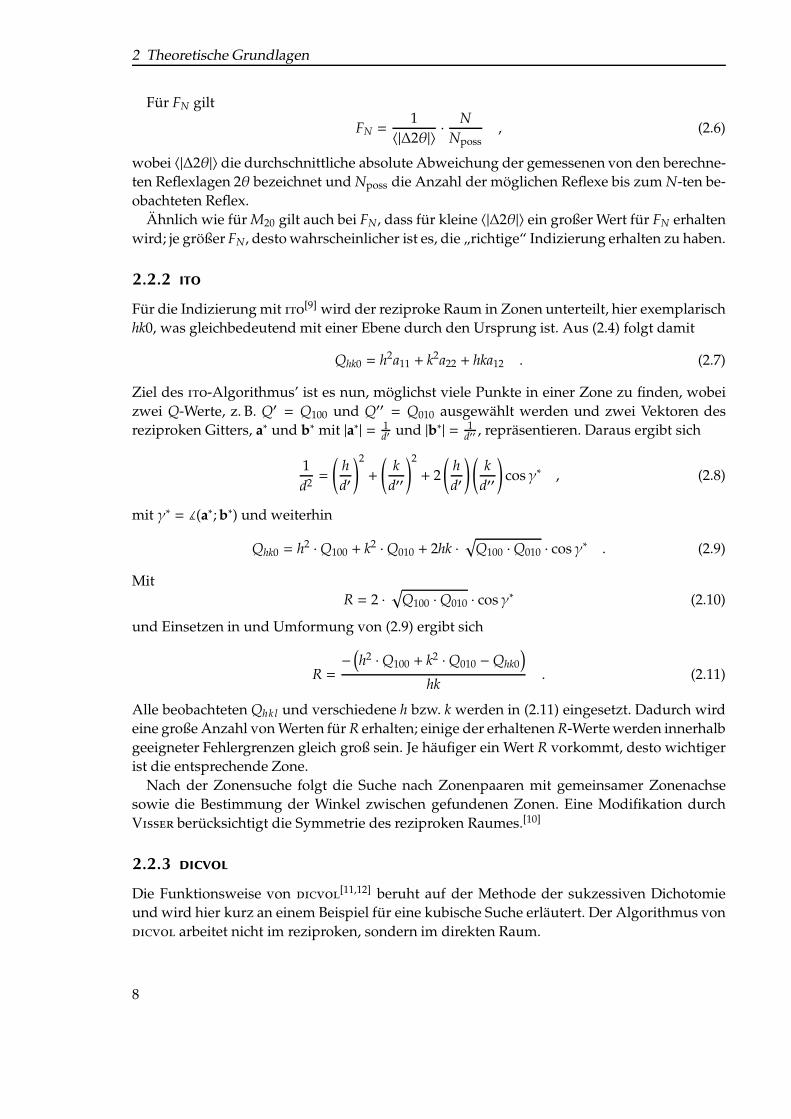
Für FN gilt
FN =1
〈|∆2θ|〉 ·N
Nposs, (2.6)
wobei 〈|∆2θ|〉 die durchschnittliche absolute Abweichung der gemessenen von den berechne-ten Reflexlagen 2θ bezeichnet und Nposs die Anzahl der möglichen Reflexe bis zum N-ten be-obachteten Reflex.
Ähnlich wie für M20 gilt auch bei FN, dass für kleine 〈|∆2θ|〉 ein großer Wert für FN erhaltenwird; je größer FN, desto wahrscheinlicher ist es, die „richtige“ Indizierung erhalten zu haben.
2.2.2 ito
Für die Indizierung mit ito[9] wird der reziproke Raum in Zonen unterteilt, hier exemplarischhk0, was gleichbedeutend mit einer Ebene durch den Ursprung ist. Aus (2.4) folgt damit
Qhk0 = h2a11 + k2a22 + hka12 . (2.7)
Ziel des ito-Algorithmus’ ist es nun, möglichst viele Punkte in einer Zone zu finden, wobeizwei Q-Werte, z. B. Q′ = Q100 und Q′′ = Q010 ausgewählt werden und zwei Vektoren desreziproken Gitters, a∗ und b∗ mit |a∗| = 1
d′ und |b∗| = 1d′′ , repräsentieren. Daraus ergibt sich
1d2 =
(
h
d′
)2
+
(
k
d′′
)2
+ 2(
h
d′
) (
k
d′′
)
cosγ∗ , (2.8)
mit γ∗ = ∡(a∗; b∗) und weiterhin
Qhk0 = h2 ·Q100 + k2 ·Q010 + 2hk ·√
Q100 ·Q010 · cosγ∗ . (2.9)
MitR = 2 ·
√
Q100 ·Q010 · cosγ∗ (2.10)
und Einsetzen in und Umformung von (2.9) ergibt sich
R =−
(
h2 ·Q100 + k2 ·Q010 −Qhk0
)
hk. (2.11)
Alle beobachteten Qhk l und verschiedene h bzw. k werden in (2.11) eingesetzt. Dadurch wirdeine große Anzahl von Werten für R erhalten; einige der erhaltenen R-Werte werden innerhalbgeeigneter Fehlergrenzen gleich groß sein. Je häufiger ein Wert R vorkommt, desto wichtigerist die entsprechende Zone.
Nach der Zonensuche folgt die Suche nach Zonenpaaren mit gemeinsamer Zonenachsesowie die Bestimmung der Winkel zwischen gefundenen Zonen. Eine Modifikation durchVisser berücksichtigt die Symmetrie des reziproken Raumes.[10]
2.2.3 dicvol
Die Funktionsweise von dicvol[11,12] beruht auf der Methode der sukzessiven Dichotomieund wird hier kurz an einem Beispiel für eine kubische Suche erläutert. Der Algorithmus vondicvol arbeitet nicht im reziproken, sondern im direkten Raum.
8

2.3 Strukturlösung
Die Gitterkonstante a kann einen beliebigen Wert zwischen einem Minimalwert amin undeinem Maximalwert amax annehmen. Die Schrittweite sei p = 0,5 Å. Das Intervall für die a-Achse lässt sich als
[(
amin + np)
,(
amin + (n + 1) · p)]
formulieren. Für jedes Intervall ergebensich folgende Grenzen für Q (Untergrenze Qmin,hk l, Obergrenze Qmax,hk l):
Qmin,hk l =h2 + k2 + l2
[
amin + (n + 1) · p]2 (2.12)
und
Qmax,hk l =h2 + k2 + l2[
amin + np]2 . (2.13)
Werden innerhalb der Fehlergrenzen ∆Qobs für alle beobachteten Werte Qobs MillerscheIndices hkl gefunden, für die
Qmin,hk l − ∆Qobs ≤ Qobs ≤ Qmax,hk l + ∆Qobs (2.14)
gilt, wird das Intervall[(
amin + np)
,(
amin + (n + 1) · p)]
in zwei gleiche Teile geteilt und dieProzedur bis zu sechs mal wiederholt.
Die Suche geht von Kristallsystemen mit hoher bis zu solchen mit niedriger Symmetrie.
2.2.4 treor
Die Indizierung mit treor[13] beruht auf der Variation der Millerschen Indices der Reflexebei kleinen Beugungswinkeln 2θ. Diesen Reflexen werden vorläufige Indices zugewiesen, umdie Elementarzelle zu ermitteln.
Grundlage für die Berechnungen ist Gl. (2.4). Die Millerschen Indices hkl, die gesuchtenai j und die bekannten Qhk l (für Reflexe bei kleinen 2θ) lassen sich als Matrizen M, A und Q
schreiben. Um die ai j zu bestimmen, muss folgendes lineare Gleichungssystem gelöst werden:
MA = Q . (2.15)
Der Algorithmus von treor wird ergänzt durch empirisch ermittelte Parametersätze, dieErfahrungen und Ergebnisse aus früheren Indizierungen widerspiegeln.
2.3 Strukturlösung
Ist die Elementarzelle bekannt, ist zu ermitteln, wie die Atome in ihr liegen; dabei ist eine Ab-weichung von den „tatsächlichen“ Atomlagen erlaubt. Diese Abweichung wird im Verlauf derVerfeinerung minimiert. Es sollte auch zunächst ermittelt werden, wie viele FormeleinheitenZ in der Elementarzelle enthalten sind. Dazu bietet es sich an, das Volumen der Elementarzellemit den (abgeschätzten) Atomvolumina[14] in Beziehung zu setzen (s. auch Abschnitt 3.2, 3.6und besonders 3.8).
Ein Strukturmodell kann beispielsweise durch Gitterenergie-Minimierung erhalten werden:
9

2 Theoretische Grundlagen
Das Programm crysca[15] verwendet den Ausdruck
EGitter =12
∑
i
∑
j
(
−Ai j r−6i j + Bi j e−Ci jri j +
14πεε0
·qiq j
ri j
)
+ Eintramol (2.16)
zur Berechnung der Gitterenergie. Dabei bedeuten
i: alle Atome eines Referenzmoleküls,j: alle Atome aller anderen Moleküle,ri j: Atom–Atom-Abstände,A, B, C: Van-der-Waals-Parameter,q: Atomladungen,ε0 ≈ 8,854 · 10−12 A s/(V m) elektrische Feldkonstante,ε = 1,Eintramol: intramolekulare Energie.
Das Programm PowderCryst[16] verknüpft Gitterenergie-Minimierung und Vergleich des si-mulierten mit dem experimentellen Pulverdiagramm. Dabei werden die integralen Intensitä-ten miteinander verglichen. Auf diese Weise lassen sich z. B. vertauschte Reflexe zuverlässigerkennen. Als Eingabe werden lediglich ein Strukturmodell sowie ein Standard-Laborpul-verdiagramm benötigt. Eine vorherige Indizierung ist nicht nötig. Die Gitterenergie wird mitdem Programm FlexCryst[17,18] berechnet. FlexCryst greift dabei auf trainierte Potentiale[19]
zurück: Aus Datenbanken wie der Cambridge Structural Database (CSD)[20,21] oder der Inor-ganic Crystal Structure Database (ICSD)[22,23] wird mittels Data-Mining ein Satz an Kraftfeld-Parametern abgeleitet. Die zu verwendenden Strukturfragmente werden aus den jeweils vor-gegebenen Molekülen ermittelt. Um Rechenzeit zu sparen, werden die Optimierungen in denstatistisch häufigsten Raumgruppen durchgeführt.
Eine weitere häufig genutzte Herangehensweise besteht darin, nach potentiell isotypenVerbindungen mit bekannter Kristallstruktur zu suchen: Sind Reflexlagen und -intensitätenim Pulverdiagramm einer ähnlichen Verbindung vergleichbar mit dem der bekannten Verbin-dung unbekannter Struktur, liegt die Vermutung nahe, dass beide Kristallstrukturen isotypsind, d. h. ähnliche Gitterkonstanten und ähnliche Packungen der Moleküle aufweisen (s. Ab-schnitte 3.1 und 3.7).
Ein weiterer Beleg für die Isotypie zweier Verbindungen ist die Existenz einer lückenlosenMischkristallreihe. Dabei werden die Verbindungen bekannter und unbekannter Struktur inveränderlichen Verhältnissen zur Kristallisation gebracht. Jeweils gemessene Pulverdiagram-me zeigen dann untereinander vergleichbare Reflexlagen und -intensitäten (Abschnitt 3.1).
Am Ende der Strukturlösung steht im Idealfall eine Kristallstruktur mit niedriger Energieund einem simulierten Pulverdiagramm, das in etwa dem gemessenen entspricht. „In etwa“bedeutet hierbei sehr oft keine mathematisch exakt beschreibbare Übereinstimmung, sondernin der Regel eine Beurteilung des Experimentators anhand von subjektiven Kriterien.
Bemerkenswert ist, dass in dieser Arbeit auf die „klassischen“ Methoden der Strukturlösung(Patterson-Methode,[24] direkte Methoden[25,26]) sowie auf die aktuellen „Charge Flipping“-[27,28] und „Realraum“-(Simulated-Annealing-)Methoden[29] verzichtet werden konnte, außerbeim dritten Versuch zu Pigment Red 181 (Abschnitt 3.8). Alle anderen Kristallstrukturlösun-gen wurden mittels Kraftfeld-Methoden durchgeführt.
10

2.4 Strukturverfeinerung
2.4 Strukturverfeinerung
Zeigt sich durch Vergleich des experimentellen mit dem simulierten Pulverdiagramm, dassdie ermittelte Kristallstruktur im Wesentlichen stimmt, folgt der Schritt der Kristallstruktur-verfeinerung.
Während aus den Reflexlagen die Gitterkonstanten ermittelt werden, lassen sich aus denReflexintensitäten die Atompositionen innerhalb der Elementarzelle bestimmen.
Durch Anpassung von Parametern wie Gitterkonstanten, Atompositionen, atomaren Aus-lenkungsparametern, Reflexprofilen etc. soll dabei eine optimale Anpassung des simuliertenPulverdiagramms an die experimentellen Daten erreicht werden.
Am Ende einer erfolgreichen Verfeinerung gilt die Kristallstruktur als bestimmt.Es sei ausdrücklich darauf hingewiesen, dass Begriffe wie „richtige“ oder „falsche“ Kris-
tallstruktur unangebracht sind, da lediglich eine Struktur ermittelt wird, die das Experimenterklärt (s. auch Abschnitte 2.4.3 und 3.5).
Die Rietveld-Verfeinerungen in dieser Arbeit wurden teilweise mit gsas,[30,31] teilweise mittopas
[32] durchgeführt.
2.4.1 Intensitätsextraktion
Die Extraktion von Intensitäten ist im Fall einer Einkristall-Messung eine leichte Aufgabe. BeiMessungen an Kristallpulvern allerdings kommt es zu erheblichen Reflexüberlappungen inden Pulverdiagrammen.
Da die Informationen über Atompositionen und Auslenkungsparameter in den integralenIntensitäten stecken, ist es essentiell, die Flächen – insbesondere von überlappenden Reflexen– exakt zu ermitteln.
Es gibt zwei etablierte Verfahren, um Intensitäten ohne Strukturmodell aus Pulverdiffrak-togrammen zu extrahieren.
Le Bail-Methode
Die Fläche eines Bragg-Reflexes, d. h. seine Intensität Ihk l, ist proportional zum Quadrat derStrukturamplitude |Fhk l|:
Ihk l ∼ |Fhk l|2 . (2.17)
Der Ansatz von LeBail geht davon aus, dass sämtliche integralen Intensitäten zu Beginngleich sind, genauer gesagt: Die Erwartungswerte der Flächen benachbarter Bragg-Reflexesind gleich.[33]
Die Fläche A eines beliebigen Reflexes m in einem Satz von N überlappenden Reflexen lässtsich mit dem Ausdruck
A(r+1)m,obs =
∑
i
A(r)m,obs · qm,i
∑Nn=1 A
(r)n,obs · qn,i
·(
yi,obs − yi,bkgnd
)
(2.18)
rekursiv berechnen; dabei ist im ersten Rekursionsschritt (r = 1) Ar=1n,obs = 1. Weiter gilt A =
j·|Fhk l|2, wobei in j die Reflexmultiplizität eingeht und |Fhk l| die Strukturamplitude bezeichnet.
11

2 Theoretische Grundlagen
qm,i enthält Lorentz-Polarisations-, Absorptions- und Extinktionsterme für den m-ten Reflexam i-ten Messpunkt.
Als Zusatzbedingung muss noch gelten, dass in einem Bereich überlappender Reflexe dieSumme der Intensitäten aller Reflexe der Summe der gemessenen Intensitäten entsprechenmuss:
∑
h
Ah,obs =∑
i
(yi,obs − yi,bkgnd) . (2.19)
Isolierte Reflexe zeigen bereits nach einer Iteration konvergierende Flächeninhalte. Bei über-lappenden Reflexen sind mehrere Iterationen nötig. In der Regel wird nach wenigen ZyklenKonvergenz erreicht, dabei sind die Startwerte teilweise beliebig wählbar.
Schwierigkeiten, d. h. Instabilitäten, können auftreten, wenn beispielsweise der Untergrundzu hoch angesetzt wird und die überlappenden Reflexe ohnehin eine bereits vergleichsweisegeringe Intensität aufweisen. In einem solchen Fall zeigt die LeBail-Methode chaotischesVerhalten ohne Konvergenz.
Ein Grund, warum die LeBail-Methode erfolgreich und weit verbreitet ist, liegt darin,dass die Integration des Verfahrens in Rietveld-Programme leicht vonstatten geht, und dassauf diese Art und Weise mit hoher Zuverlässigkeit Strukturamplituden aus einem Diffrakto-gramm extrahiert werden können.
Pawley-Methode
Die Pawley-Methode benötigt ebenso wie die LeBail-Methode kein Strukturmodell. Sämt-liche Parameter, die die Reflexfläche beeinflussen (Atompositionen, Auslenkungsparameteretc.), fallen demzufolge weg. Stattdessen wird die Reflexfläche selbst als verfeinerbarer Pa-rameter behandelt; Reflexlagen sowie Reflexprofilform (also Parameter unabhängig von derReflexfläche) dagegen werden wie bei der Rietveld-Methode verfeinert.[34]
Die Modellfunktion, die der Pawley-Verfeinerung zu Grunde liegt, lässt sich als
Mi = yi,bkgnd +∑
ki
Akqk,i (2.20)
formulieren. Dabei bedeutet Ak die Fläche des k-ten Reflexes, die zum i-ten Messpunkt beiträgt,qk,i wird im vorigen Abschnitt (LeBail-Methode) erläutert.
Die Strukturamplituden lassen sich durch Minimieren der Summe der gewichteten Diffe-renzen zwischen experimentellen Daten und Modellfunktion
χ2 =∑
i
wi
(
yi,obs −Mi
)2(2.21)
gewinnen.Der Nachteil der Pawley-Methode ist, dass größere Modifikationen in bestehende Rietveld-
Programme nötig sind. Außerdem kann die Pawley-Verfeinerung misslingen, wenn zwei odermehr Reflexe fast vollständig überlappen.
12
2.4 Strukturverfeinerung
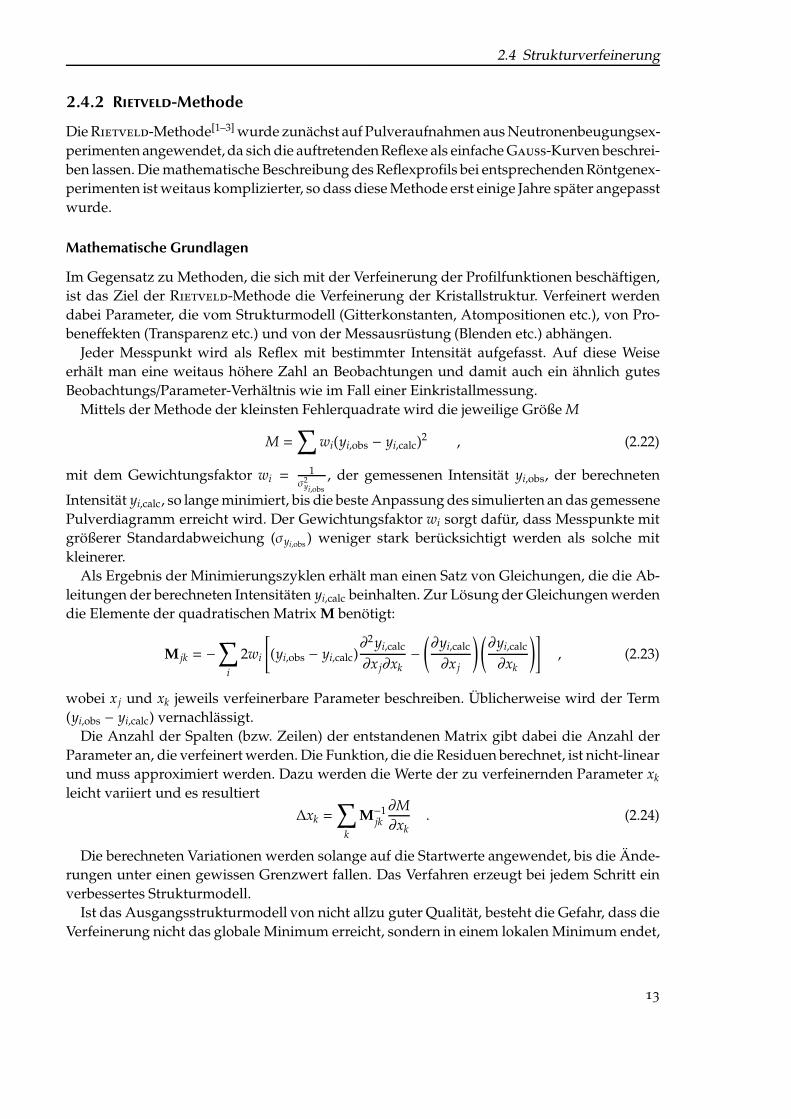
2.4.2 Rietveld-Methode
Die Rietveld-Methode[1–3] wurde zunächst auf Pulveraufnahmen aus Neutronenbeugungsex-perimenten angewendet, da sich die auftretenden Reflexe als einfache Gauss-Kurven beschrei-ben lassen. Die mathematische Beschreibung des Reflexprofils bei entsprechenden Röntgenex-perimenten ist weitaus komplizierter, so dass diese Methode erst einige Jahre später angepasstwurde.
Mathematische Grundlagen
Im Gegensatz zu Methoden, die sich mit der Verfeinerung der Profilfunktionen beschäftigen,ist das Ziel der Rietveld-Methode die Verfeinerung der Kristallstruktur. Verfeinert werdendabei Parameter, die vom Strukturmodell (Gitterkonstanten, Atompositionen etc.), von Pro-beneffekten (Transparenz etc.) und von der Messausrüstung (Blenden etc.) abhängen.
Jeder Messpunkt wird als Reflex mit bestimmter Intensität aufgefasst. Auf diese Weiseerhält man eine weitaus höhere Zahl an Beobachtungen und damit auch ein ähnlich gutesBeobachtungs/Parameter-Verhältnis wie im Fall einer Einkristallmessung.
Mittels der Methode der kleinsten Fehlerquadrate wird die jeweilige Größe M
M =∑
wi(yi,obs − yi,calc)2 , (2.22)
mit dem Gewichtungsfaktor wi =1
σ2yi,obs
, der gemessenen Intensität yi,obs, der berechneten
Intensität yi,calc, so lange minimiert, bis die beste Anpassung des simulierten an das gemessenePulverdiagramm erreicht wird. Der Gewichtungsfaktor wi sorgt dafür, dass Messpunkte mitgrößerer Standardabweichung (σyi,obs ) weniger stark berücksichtigt werden als solche mitkleinerer.
Als Ergebnis der Minimierungszyklen erhält man einen Satz von Gleichungen, die die Ab-leitungen der berechneten Intensitäten yi,calc beinhalten. Zur Lösung der Gleichungen werdendie Elemente der quadratischen Matrix M benötigt:
M jk = −∑
i
2wi
[
(yi,obs − yi,calc)∂2yi,calc
∂x j∂xk−
(
∂yi,calc
∂x j
) (
∂yi,calc
∂xk
)]
, (2.23)
wobei x j und xk jeweils verfeinerbare Parameter beschreiben. Üblicherweise wird der Term(yi,obs − yi,calc) vernachlässigt.
Die Anzahl der Spalten (bzw. Zeilen) der entstandenen Matrix gibt dabei die Anzahl derParameter an, die verfeinert werden. Die Funktion, die die Residuen berechnet, ist nicht-linearund muss approximiert werden. Dazu werden die Werte der zu verfeinernden Parameter xk
leicht variiert und es resultiert
∆xk =∑
k
M−1jk
∂M
∂xk. (2.24)
Die berechneten Variationen werden solange auf die Startwerte angewendet, bis die Ände-rungen unter einen gewissen Grenzwert fallen. Das Verfahren erzeugt bei jedem Schritt einverbessertes Strukturmodell.
Ist das Ausgangsstrukturmodell von nicht allzu guter Qualität, besteht die Gefahr, dass dieVerfeinerung nicht das globale Minimum erreicht, sondern in einem lokalen Minimum endet,
13

2 Theoretische Grundlagen
oder dass die Änderungen der Parameter divergieren. Eine hohe Stabilität der Verfeinerunglässt sich mit Restraints oder Constraints erreichen, wie im Folgenden erläutert wird.
Verfeinerung mit Restraints
Ein grundlegendes Problem bei der Strukturbestimmung aus Pulverdaten liegt in der Unter-bestimmtheit des Verhältnisses von Beobachtungen zu zu verfeinernden Parametern. Um zueiner erfolgreichen Verfeinerung zu gelangen, muss dieses Verhältnis deutlich überbestimmtsein. Man kann diesen Zustand dadurch erreichen, dass man „Beobachtungen“ vorgibt, indemman bekannte Größen wie Bindungslängen und -winkel in der Verfeinerung einsetzt.
Restraints haben die Eigenschaft, dass mit ihnen eine Bedingung vorgegeben wird, dieeinem idealen Wert angenähert ist und eine definierte Abweichung haben darf (Constraintsmüssen die vorgegebenen Bedingungen exakt erfüllen).
Durch einen vorgegebenen Gewichtungsfaktor wird bei der Verfeinerung der Idealwerterzwungen. Zu Beginn wird dieser Gewichtungsfaktor sehr hoch angesetzt, kann aber übli-cherweise im weiteren Verlauf verringert werden.
Mathematisch beschrieben wird das Verfahren analog der Minimierung der ModellfunktionM bei der oben aufgeführten Rietveld-Methode:
MRestr =∑
Restr
wi(yi,obs − yi,calc)2 . (2.25)
yi,obs beschreibt den idealen Wert und yi,calc den berechneten für den jeweiligen Restraint.Tabelle 2.1 gibt eine Übersicht über mögliche Restraints einschließlich der jeweils zu verfei-
nernden Modellfunktion.
Die Addition der Einzelbeiträge ergibt die gesamte Minimierungsgröße
MGes =M + fBL ·MBL + fBA ·MBA + fSOF ·MSOF + fPG ·MPG . (2.26)
Die Koeffizienten f stellen jeweils zusätzliche Gewichtungsfaktoren dar. Zu Beginn einerStrukturverfeinerung werden diese in der Regel auf große Werte gesetzt, was zur Folge hat,dass das Modell im Wesentlichen von den Restraints dominiert wird.
Der Vorteil dabei ist, dass die Struktur starr bleibt und die Verfeinerung stabil läuft. DerNachteil besteht darin, dass die Gütekriterien (Abschnitt 2.4.3) hohe Werte annehmen. Imweiteren Verlauf der Verfeinerung lassen sich die Gewichtungsfaktoren f so weit senken (imIdealfall auf 0), dass sie ohne nennenswerten Einfluss der Restraints stabil läuft.
2.4.3 Beurteilung der Verfeinerung
Zur Beurteilung der Qualität einer Verfeinerung lassen sich Gütekriterien (R-Werte, „Good-ness of Fit“, χ2) formulieren.1 Es existieren zahlreiche verschiedene dieser Kriterien, die mehroder weniger sinnvoll anzuwenden sind (s. [35] sowie Abschnitt 3.5)
1Gelegentlich findet sich auch der Ausdruck χ2red statt χ2. Üblicherweise bezeichnen beide Größen denselben
Sachverhalt.
14

2.4 Strukturverfeinerung
Tabelle 2.1: Typische Restraints bei Rietveld-Verfeinerungen. A, B, C bezeichnen beliebige Atome, v
steht für den Bindungsvektor zwischen zwei Atomen; bei den Besetzungszahlen gibt mi
die Multiplizität der Lage an, fi die Besetzung und si einen vom Nutzer vorgegebenenSkalierungsfaktor.
Restraint Modellfunktion Größe
Bindungslänge (BL) di MBL =
NBL∑
i=1
wi(di,obs − di,calc)2 di = |vAB|
Bindungswinkel (BA) αi MBA =
NBA∑
i=1
wi(αi,obs − αi,calc)2 αi = arccos(
vBA · vBC
|vBA| · |vBC|
)
Planargruppen (PG) pi MPG =
NPG∑
i=1
wi(pi,obs − pi,calc)2 Minimiert werden dieAbstände der Atome vonder besten Ebene, defi-niert durch die Atome derPlanargruppe
Besetzungsfaktoren (SOF) oi MSOF =
NSOF∑
i=1
wi(oi,obs − oi,calc)2 oi =
N∑
i=1
mi fisi
Ein sinnvoller R-Wert folgt beispielsweise unmittelbar aus der zu minimierenden Modell-funktion M (2.22); durch Normierung auf die Summe der gewichteten Messwerte
∑
i wiy2i,obs
ergibt sich der „gewichtete Profil-R-Wert“ Rwp :
Rwp =
√
√
√
√∑
i wi
(
yi,obs − yi,calc
)2
∑
i wiy2i,obs
. (2.27)
Dieser Ausdruck liefert niedrigere R-Werte, je höher der Untergrund des Pulverdiagrammsist. Eine Variante, die dies berücksichtigt, stellt folgende Formulierung dar:
Rwpb =
√
√
√
√
√
√
∑
i wi
(
yi,obs − yi,calc
)2
∑
i wi
(
yi,obs − yi,bkgnd
)2 . (2.28)
gsas verwendet folgenden Ausdruck für Rwpb :
Rwpb =
√
√
√
√
√
√
√
√
∑
i wi
(
(yi,obs−yi,calc)(yi,obs−yi,bkgnd)yi,obs
)2
∑
i wi
(
yi,obs − yi,bkgnd
)2 . (2.29)
Eine Abschätzung über den bestmöglich zu erreichenden R-Wert lässt sich mithilfe von Rexp
treffen:
Rexp =
√
Nobs −Nverf∑
i wiy2i,obs
, (2.30)
15

2 Theoretische Grundlagen
entsprechend mit Untergrundkorrektur:
Rexp,b =
√
√
Nobs −Nverf∑
i wi
(
yi,obs − yi,bkgnd
)2 , (2.31)
wobei Nobs die Anzahl der beobachteten Messpunkte und Nverf die Anzahl der verfeinertenParameter angibt. Der „Goodness of Fit“ (χ) ergibt sich als Verhältnis zwischen folgendenGrößen:
χ =Rwp
Rexp=
Rwpb
Rexp,b=
√
√
∑
i wi
(
yi,obs − yi,calc
)2
Nobs −Nverf(2.32)
und entsprechend
χ2 =R2
wp
R2exp
. (2.33)
In gsaswerden Gleichungen (2.27), (2.29) und (2.33) verwendet, in topasGleichungen (2.27),(2.28) und (2.32). Beide Programme verwenden Gleichungen (2.30) und (2.31) zur Berechnungdes erwarteten R-Wertes.2
Wichtig ist an dieser Stelle zu erwähnen, dass untergrundkorrigierte R-Werte in der Regelgrößer sind als solche ohne Untergrundkorrektur. Außerdem lässt Gl. (2.28) (topas) erkennen,dass der Zähler im Vergleich zu Gl. (2.29) (gsas) größer ist; bei Verfeinerungen derselben Struk-tur mit gsas und topas ist zu erwarten, dass trotz eventuell gleichem Ergebnis verschiedengroße R-Werte erhalten werden.
Zur Bewertung der Verfeinerung gilt ähnliches wie in Abschnitt 2.3: Ein niedriger R-Wertbedeutet nicht zwangsläufig, dass die Struktur „gut“ ist, ebenso ist eine Struktur nicht un-bedingt „schlecht“, wenn der R-Wert hoch ist. Abgesehen von den reinen Zahlenwerten derGütekriterien muss zwingend überprüft werden, ob außerdem die Anpassung des simulier-ten an das experimentelle Pulverdiagramm gelungen ist (die Differenzkurve gibt darüberAufschluss) und ob die Struktur chemisch sinnvoll ist.
2.5 Modellierung
Zur Modellierung von Molekül- oder Kristallstrukturen haben sich zwei prinzipiell unter-schiedliche Ansätze etabliert:
1. quantenmechanische (Ab-initio-)Methoden, die auf einer breiten theoretischen Grundla-ge basieren,
2. empirische (Kraftfeld-)Methoden, die auf bereits bekannten Strukturen basieren.
Im Allgemeinen bieten Kraftfeld-Methoden einen Geschwindigkeitsvorteil, da quantenme-chanische Rechnungen sehr aufwendig und zeitintensiv sind.
In dieser Arbeit wurden ausschließlich Kraftfeld-Methoden verwendet.2Laut gsas-Handbuch wird Rexp folgendermaßen berechnet: Rexp =
Rwp√χ2
. [30, S. 168]
16

2.5 Modellierung
2.5.1 Dreiding-Kraftfeld
Das Kraftfeld Dreiding[36] hat sich für organische Verbindungen sowie organische Kristall-strukturen bewährt. Es ist im Programmpaket Cerius2[37] implementiert.
Die berechneten Energien sind jedoch bestenfalls geeignet, Strukturen miteinander zu ver-gleichen; eine Aussage über absolute Energien ist nicht möglich (s. Abschnitt 4.2).
Allgemein wird die potentielle Energie E für ein beliebiges Molekül mit beliebiger Konfor-mation folgendermaßen berechnet:
E = EBL + EBA + ETA + EIA + EvdW + EQ + EHB (2.34)
mit Energie-Termen EBL abhängig von der Bindungslänge, EBA vom Bindungswinkel, ETA
vom Torsionswinkel, EIA vom Inversionswinkel, einem Term EvdW für Dispersions- oder Van-der-Waals-Kräfte, EQ für elektrostatische Kräfte und EHB für Wasserstoffbrückenbindungen.
Für die Bindungslänge stehen zwei Möglichkeiten zur Verfügung:
EBL =12
keq
(
r − req
)2(2.35)
und
EBL = Deq
[
e−(αnr−req) − 1]2
(2.36)
mit
keq =
(
∂2E
∂r2
)
r=req
(2.37)
und
α =
√
keq
2Deq. (2.38)
Die Gleichgewichts-Bindungslänge req,AB zwischen zwei Atomen A und B berechnet sichaus den Kovalenzradien mit folgender Formel:
req,AB = req,A + req,B − δ (2.39)
mit δ = 0,01 Å.Die Kraftkonstanten werden unabhänging von Atomen A oder B folgendermaßen festge-
setzt3:
kAB,1 = 2928,8kJ
mol Å2 (2.40)
und
DAB,1 = 292,88kJ
mol. (2.41)
3In der Literatur liegen die Angaben in kcal vor, die Werte wurden für diese Arbeit in SI-Einheiten umgerechnet.
17

2 Theoretische Grundlagen
Zur Berechnung von Mehrfachbindungen werden die Kraftkonstanten mit der Anzahl n derBindungen multipliziert:
kAB,n = n · kAB,1 (2.42)
und
DAB,n = n ·DAB,1 . (2.43)
Bindungswinkel werden für zwei Bindungen AB und BC berechnet. Verwendet wird dafürentweder eine harmonische Funktion
EABC =12
CABC
(
θABC − θeq,B
)2(2.44)
oder eine harmonische Cosinus-Funktion
EABC =12
CABC
(
cosθABC − cosθeq,B
)2. (2.45)
Der Wert θeq,B wird als unabhängig von A und B betrachtet. Der Wert für CABC ergibt sich zu
CABC =KABC
sin2 θeq,B. (2.46)
Für Moleküle mit linearer Struktur wird statt Gl. (2.44) der Ausdruck
EABC = KABC (1 + cosθABC) (2.47)
verwendet.In allen Fällen wird als Kraftkonstante KABC der Wert
KABC = 418,4kJ
mol rad2 (2.48)
angenommen.Der Torsionsterm nimmt folgende Form an:
EABCD =12
VBC
[
1 − cos(
nBC
(
φ − φeq,BC
))]
(2.49)
mit dem Diederwinkel φ (Winkel zwischen den Ebenen ABC und BCD), der Periodizität nBC,der Rotationsbarriere VBC und dem Gleichgewichtswinkel φeq,BC.
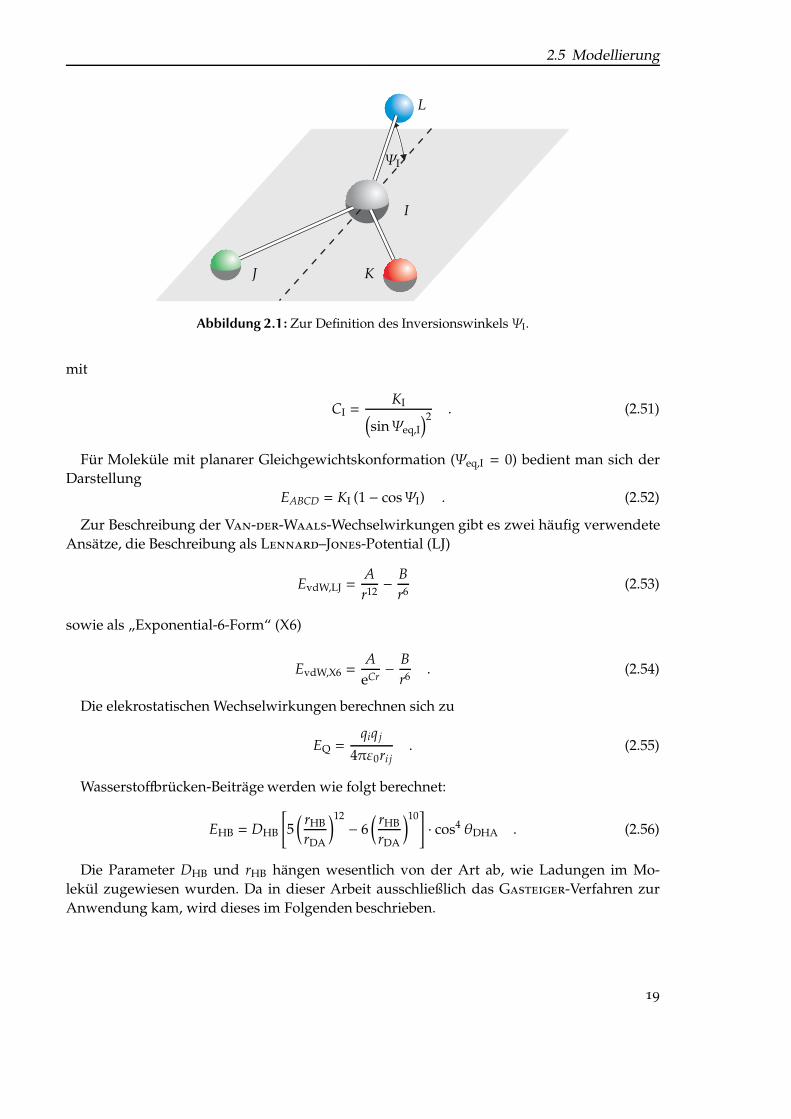
Moleküle wie NH3, PH3 usw. besitzen ein freies Elektronenpaar; es kann zur Inversion kom-men, indem die jeweiligen X–H-Bindungen „umklappen“ und mit dem freien Elektronenpaardie Plätze tauschen. Für die Inversion (Abb. 2.1) wird ein Ausdruck aus der Spektroskopieentlehnt:
EI =12
CI
(
cosΨ − cosΨeq,I
)2(2.50)
18
2.5 Modellierung
ΨI
L
I
KJ
Abbildung 2.1: Zur Definition des Inversionswinkels ΨI.
mit
CI =KI
(
sinΨeq,I
)2 . (2.51)
Für Moleküle mit planarer Gleichgewichtskonformation (Ψeq,I = 0) bedient man sich derDarstellung
EABCD = KI (1 − cosΨI) . (2.52)
Zur Beschreibung der Van-der-Waals-Wechselwirkungen gibt es zwei häufig verwendeteAnsätze, die Beschreibung als Lennard–Jones-Potential (LJ)
EvdW,LJ =A
r12− B
r6 (2.53)
sowie als „Exponential-6-Form“ (X6)
EvdW,X6 =A
eCr− B
r6 . (2.54)
Die elekrostatischen Wechselwirkungen berechnen sich zu
EQ =qiq j
4πε0ri j. (2.55)
Wasserstoffbrücken-Beiträge werden wie folgt berechnet:
EHB = DHB
[
5(
rHB
rDA
)12− 6
(
rHB
rDA
)10]
· cos4 θDHA . (2.56)
Die Parameter DHB und rHB hängen wesentlich von der Art ab, wie Ladungen im Mo-lekül zugewiesen wurden. Da in dieser Arbeit ausschließlich das Gasteiger-Verfahren zurAnwendung kam, wird dieses im Folgenden beschrieben.
19

2 Theoretische Grundlagen
2.5.2 Ladungen nachGasteiger undMarsili[38]
Essentiell für das Gelingen einer Kraftfeld-Rechnung zur Modellierung einer Kristallstrukturist die genaue Kenntnis der Ladungsverteilung im untersuchten Molekül. Ein Verfahren,das in Kombination mit dem Dreiding-Kraftfeld gute Ergebnisse liefert, ist die Methode derLadungsberechnung nach Gasteiger und Marsili.
Das Konzept der Elektronegativität hilft dabei, Partialladungen zu ermitteln. Der Ansatzvon Mulliken[39] stellt einen Zusammenhang zwischen Elektronegativität χA eines Atoms A
und seiner Ionisierungsenergie IA sowie seiner Elektronenaffinität EA her:
χA =12
(IA + EA) . (2.57)
Damit wird die Elektronegativität direkt auf einen bestimmten Valenzzustand bezogen.Zusätzlich muss die Anzahl der Elektronen in einem Orbital berücksichtigt werden. Die
Fähigkeit, Elektronen an sich zu ziehen, ist für ein leeres Orbital (ne− = 0) größer als für eineinfach (ne− = 1) oder doppelt (ne− = 2) besetztes.
Durch Berücksichtigen der Elektronegativität und des daraus folgenden Einführens einerPartialladung δwird letztendlich die Zahl der Elektronen in einem Orbital nicht ganzzahlig.
Die Abhängigkeit der Elektronegativität von der Ladung QA wird mit Hilfe eines Polynomszweiter Ordnung beschrieben:
χA = aA + bAQA + cAQ2A . (2.58)
Es sind nun aA, bA und cA zu bestimmen. aA entspricht der Elektronegativität des ungela-denen Atoms
χA(q = 0) = aA =12
(
I0A + E0
A
)
. (2.59)
Entsprechend gilt für Kationen
χ+A(q = +1) =12
(
I+A + E+A
)
(2.60)
und Anionen
χ−A(q = −1) =12
(
I−A + E−A
)
=12
(
E0A + 0
)
=12
E0A , (2.61)
wenn die Ionisierungsenergie des Anions gleich der Elektronenaffinität des neutralen Atomsgesetzt wird und weiterhin die Annahme gelten soll, dass die Elektronenaffinität des Anions0 ist.
Für bA gilt nun
bA =14
(
I+A + E+A − E0A
)
(2.62)
20

2.5 Modellierung
und für cA
cA =14
(
I+A − 2I0A + E+A − E0
A
)
. (2.63)
Die Orbitalelektronegativität eines einfach positiv geladenen Atoms A wird berechnet,indem QA = +1 gesetzt wird:
χ+A = aA + bA + cA . (2.64)
In einem Molekül muss nun berücksichtigt werden, dass mit jeder durch Elektronegativi-täts-Differenzen verursachten Ladungsumverteilung ein elektrostatisches Feld erzeugt wird,das weitere Ladungsumverteilungen erschwert. Diesem Umstand wird durch Einführen einesDämpfungsfaktors Rechnung getragen:
q(r) =χ(r)
B− χ(r)
A
χ+A
·(12
)r
, (2.65)
mit (r) dem Iterationsschritt und seinem Zahlenwert r.Die Formulierung
q(r)i=
∑
j
1χ+
iν
(
χ(r)jµ− χ(r)
iν
)
+∑
k
1χ+
kλ
(
χ(r)kλ− χ(r)
iν
)
·(12
)r
(2.66)
berücksichtigt Elektronegativitäts-Differenzen in folgender Art und Weise: Für elektronegati-vere Bindungspartner A j eines Atoms Ai wird der Wert χ+
igenommen, für weniger elektro-
negative Bindungspartner AK der Wert χ+k
.
Als Randbedingung muss für jede Iteration die Gesamtladung Q(r)i
gleich der Summe derEinzelladungen q
(r)i
sein:
Q(r)i=
∑
r
q(r)i. (2.67)
Konvergenz der Ladungsverteilung wird nach wenigen Zyklen erreicht.
21

Mach mal ’n Fünfer noch ’n bisschen weiter. Noch . . .noch . . . noch . . . STOP!
(Loriot)
3 Bestimmung von Kristallstrukturen organischer
Pigmente aus Röntgen-Pulverdaten
In diesem Kapitel werden die einzelnen Forschungsprojekte, in denen die Rietveld-Methodeangewendet wurde, vorgestellt. Die Reihenfolge der Projekte gliedert sich dabei grob nachden behandelten Pigment-Klassen:[40]
• Naphthol-AS- und β-Naphthol-Pigmente (Pigment Red 170, Abschnitt 3.1; PigmentOrange 5, Abschnitt 3.2),
• Monoazo-Pigment (Pigment Yellow 213, Abschnitt 3.3),
• Aldazin-Pigment (Pigment Yellow 101, Abschnitt 3.4),
• Chinacridon (Pigment Violet 19, Abschnitt 3.5),
• Indigo-basierte Pigmente ((CF3)2-Thiazinindigo und Thiazinindigo-Derivate, Abschnit-te 3.6 und 3.7; Pigment Red 181, Abschnitt 3.8).
23

3 Bestimmung von Kristallstrukturen organischer Pigmente aus Röntgen-Pulverdaten
3.1 Pigment Red 170[CB1,CB2]
Pigment Red 170 (1, Abb. 3.1) ist eines der wichtigsten industriellen Rotpigmente.[40] Eskristallisiert in drei kristallographischen Phasen: α, β und γ. Die bei der Synthese anfallendebraune α-Phase ist metastabil und geht leicht in die blaustichige, etwas transparente β- unddie gelbstichige, deckendere γ-Phase über.
Trotz langjährigem Einsatz waren die Kristallstrukturen der α- und β-Phase bisher unbe-kannt. Im Rahmen dieser Arbeit konnte die Kristallstruktur zumindest der α-Phase bestimmtwerden.
O
H
N
N
N
H
ON
H
H
R
O
O
CH2
H3C
1
2
3
4
5
6
: R = H (Pigment Red 170): R = CH3 (Me-P. R. 170): R = F (F-P. R. 170): R = Cl (Cl-P. R. 170): R = Br (Br-P. R. 170): R = NO2 (NO2-P. R. 170)
Abbildung 3.1: Molekülstruktur von Pigment Red 170 und Derivaten.
3.1.1 Strukturlösung
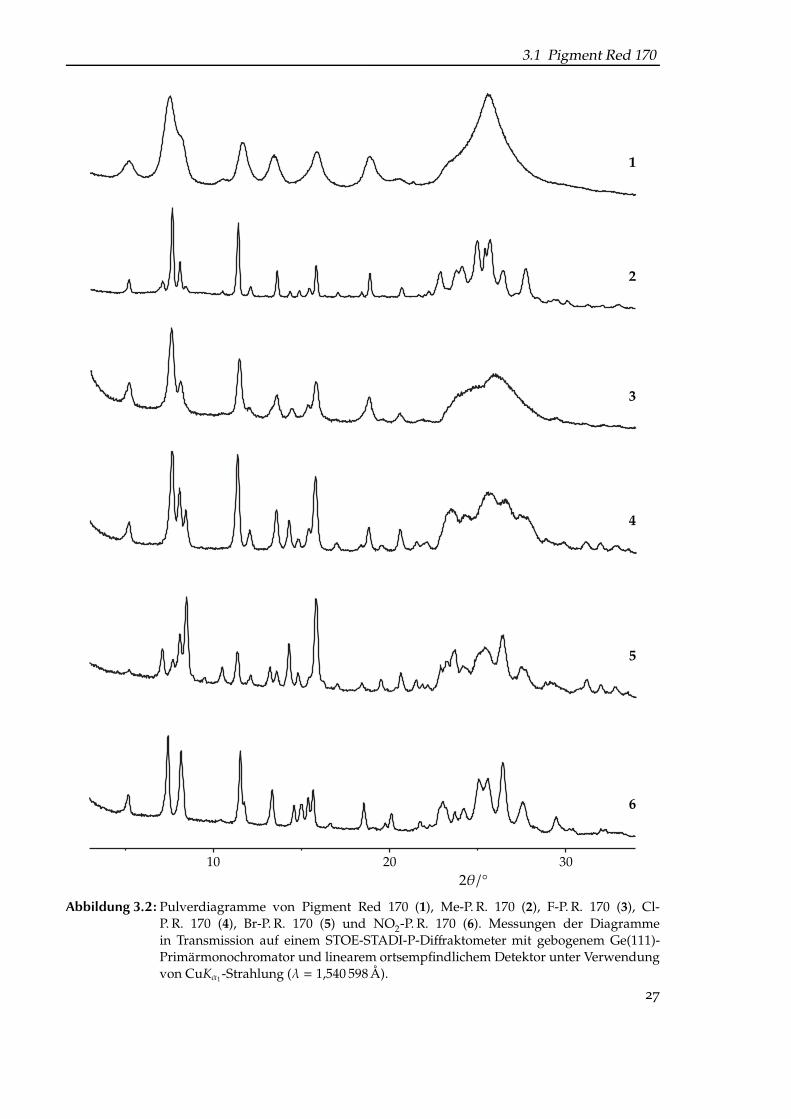
Die Synthese von α-P. R. 170 liefert stets einen nanokristallinen Niederschlag mit schlechterKristallqualität und Domänengrößen von etwa 10 nm, was in stark verbreiterten Reflexenresultiert (Abb. 3.2, S. 27, Pulverdiagramm 1).
Die Kristallitgröße lässt sich nicht durch Umkristallisation erhöhen, stattdessen bildet sich jenach Temperatur und Lösungsmittel entweder die β- oder γ-Modifikation. Aus diesen Grün-den wurde die Kristallstruktur aus Röntgen-Pulverdaten des bei der Synthese anfallendenProduktes bestimmt.
Beim Vergleich der Pulverdiagramme von α-P. R. 170 und des zu dem Zeitpunkt geradeneu entwickelten Methyl-Derivates fiel auf, dass die Reflexlagen und -intensitäten eine guteÜbereinstimmung zeigten (Abb. 3.2, S. 27, Diagramme 1 und 2); beide Kristallstrukturenschienen isotyp zu sein. Bestätigt wurde diese Vermutung durch den Erhalt einer lückenlosenMischkristallreihe (Abb. 3.3, S. 28).
Die Isotypie aller Derivate untereinander lässt sich aus Abb. 3.2 (S. 27) erschließen.Trotz der deutlich besseren Qualität des Pulverdiagramms von 2 ließ es sich nicht eindeutig
indizieren: 30 der 33 sichtbaren Reflexe wurden als hk0-Reflexe indiziert. Damit lassen sich a∗,
24

3.1 Pigment Red 170
b∗ und γ∗ bestimmen, Informationen über c∗, α∗ und β∗ sowie Kristallsystem und Raumgruppesind jedoch nicht zugänglich.
Mögliche Kristallstrukturen von 2 wurden mit dem Programm FlexCryst[17,18,41] berechnet.Dazu wurde das Molekül aus Fragmenten anderer Azopigmente konstruiert. Die Gitterkon-stanten a, b und γwurden vorgegeben, die Rechnungen erfolgten in den 11 statistisch häufigs-ten Raumgruppen (P1, P21, C2, Cc, P21/c, C2/c, P212121, Pca21, Pna21, Pbcn und Pbca).[42] AlsErgebnis wurde ein Satz von Kristallstrukturen erhalten, deren simulierte Pulverdiagrammemit dem experimentellen verglichen wurden.
Die Struktur mit dem ähnlichsten Diagramm (Raumgruppe P212121) wurde anschließendmit crysca[15] unter Freigabe der Molekülkonformation optimiert.
Um die Datenqualität zu erhöhen, wurde ein Pulverdiagramm mit Synchrotronstrahlung(NSLS Brookhaven, Beamline X3B1, λ = 1,149 914 Å) aufgenommen.
3.1.2 Strukturverfeinerung
Zunächst wurde mit gsas die Kristallstruktur von 2 gegen Synchrotrondaten verfeinert. Dieverfeinerte Struktur diente als Ausgangspunkt sowohl für die Konstruktion als auch dieVerfeinerung von 1 sowie seiner Derivate 3, 4, 5 und 6.
Eine Zusammenstellung der Ergebnisse der Verfeinerung findet sich in Tabelle 3.1. Dieentsprechenden Rietveld-Plots sind in Abb. 3.4 (S. 29) und im Fall des Derivates 2 in [CB1,Abb. 1b] dargestellt.
In der Kristallstruktur von α-1 nehmen die (fast planaren) Moleküle eine Fischgrätan-ordnung ein ([CB1, Abb. 2]). Ein Molekül ist über C−−O· · ·N−H-Wasserstoffbrücken mit be-nachbarten Molekülen verbunden (Abb. 3.5, S. 30); die CONH2-Gruppen ordnen sich dabeispiralförmig um eine kristallographische 21-Schraubenachse an (Abb. 3.6, S. 31).
Tabelle 3.1: Ergebnisse der Rietveld-Verfeinerungen von Pigment Red 170 und Derivaten. Zur Be-nennung der Phasen vgl. Abb. 3.1 (S. 24). Zur Berechnung der Gütekriterien vgl. Ab-schnitt 2.4.3.
P. R. 170 CH3-P. R. 170 F-P. R. 170 Cl-P. R. 170 Br-P. R. 170 NO2-P. R. 1701 2 3 4 5 6
RG P212121 P212121 P212121 P212121 P212121 P212121
a/Å 23,960(9) 24,6208(9) 24,429(9) 25,370(6) 24,58(7) 24,270(3)b/Å 23,234(9) 22,8877(9) 23,014(9) 23,573(5) 22,74(7) 23,713(2)c/Å 3,887(1) 3,9388(2) 3,816(3) 3,958(3) 3,914(12) 3,9164(4)V/Å
32164(1) 2219,6(2) 2145(2) 2367(2) 2188(20) 2253,9(3)
Rp 0,0370 0,0519 0,0660 0,0417 0,0645 0,0450Rwp 0,0495 0,0665 0,0828 0,0551 0,0997 0,0563χ2
red 23,16 4,459 13,39 3,581 6,080 6,258χ 4,812 2,112 3,659 1,892 2,466 2,502
25

3 Bestimmung von Kristallstrukturen organischer Pigmente aus Röntgen-Pulverdaten
3.1.3 Zusammenfassung
Die Kristallstrukturen von α-Pigment Red 170 sowie fünf seiner Derivate konnten erfolgreichbestimmt werden. Trotz beschränkter Datenqualität und fehlender oder unvollständiger In-dizierung war es möglich, ihre Kristallstrukturen zu lösen und anschließend zu verfeinern.Dabei wurden sinnvolle Annahmen wie Molekülstruktur und -konformation berücksichtigt.Entscheidend für den Erfolg war jedoch der Umstand, dass die Strukturen isotyp sind.
Weitere Details finden sich in [CB1] bzw. [CB2].
26
3.1 Pigment Red 170
1
2
3
4
5
6
10 20 302θ/°
Abbildung 3.2: Pulverdiagramme von Pigment Red 170 (1), Me-P. R. 170 (2), F-P. R. 170 (3), Cl-P. R. 170 (4), Br-P. R. 170 (5) und NO2-P. R. 170 (6). Messungen der Diagrammein Transmission auf einem STOE-STADI-P-Diffraktometer mit gebogenem Ge(111)-Primärmonochromator und linearem ortsempfindlichem Detektor unter Verwendungvon CuKα1 -Strahlung (λ = 1,540 598 Å).
27
3 Bestimmung von Kristallstrukturen organischer Pigmente aus Röntgen-Pulverdaten
α-P. R. 170
0 % Me-P. R. 170
20 % Me-P. R. 170
40 % Me-P. R. 170
60 % Me-P. R. 170
80 % Me-P. R. 170
100 % Me-P. R. 170
Me-P. R. 170
10 20 302θ/°
Abbildung 3.3: Pulverdiagramme einer lückenlosen Mischkristallreihe von Pigment Red 170 und Me-Pigment Red 170.
28

3.1 Pigment Red 170
bC bC bC bC bC bC bC bC bC bC bC bC bC bC bC bC bC bC bC bC bC bC bC bC bC bC bC bC bC bC bC bC bC bC bC bC bC bC bC bC bC bC bC bC bC bC bC bC bC bC bC bC bC bC bC bC bC bC bC bC bC bC bC bC bC bC bC bC bC bC bC bC bC bC bC bC bC bC bC bC bC bC bCbC bC bC bC bC bC bC bC bCbC bC bC bC bC bC bC bC bC bCbC bC bC bC bC bC bC bC bC bC bC bC bC bC bC bC bC bC bC bC bC bC bC bC bC bC bC bC bC bC bC bC bC bC bC bC bC bC bC bC bC bC bC bC bC bC bC bC bC bC bC bC bC bC bC bC bC bC bC bC bC bC bC bC bC bC bC bC bC bC bC bC bC bC bC bC bC bC
bC bC bC bC bC bC bC bCbC bC bC bC bCbC bC bCbC bC bCbC bC bCbC bC bCbC bCbC bCbC bCbCbC bCbC bCbC bCbC bC bCbC bC bCbC bC bC bC bC bC bC bC bC bC bC bC bC bC bC bC bC bC bC bC bC bC bC bC bC bC bC bC bC bC bC bC bC bC bC bC bC bC bC bC bC bC bC bC bC bC
bC bC bC bC bC bC bC bC bC bC bC bC bC bC bC bC bC bC bC bC bC bC bC bC bC bC bC bC bC bC bC bC bC bC bC bC bC bC bC bC bC bC bC bC bC bC bC bC bC bC bC bC bC bC bC bC bC bC bC bC bC bC bC bC bC bC bC bC bC bC bC bC bC bC bC bC bC bC bC bC bC bC bC bC bC bC bC bC bC bC bC bC bC bC bC bC bC bC bCbC bC bC bC bC bC bC bC bC bC bC bC bC bC bC bC bC bC bC bC bC bC bC bC bC bC bC bC bC bC bC bC bC bC bC bC bC
bC bC bC bC bCbC bC bC bCbC bC bCbC bC bCbC bC bCbC bCbC bCbC bC bC bC bC bC bC bC bC bC bC bC bC bC bC bC bC bC bC bC bC bC bC bC bC bC bC bC bC bC bC bC bC bC bC bC bC bC bC bC bC bC bC bC bC bC bC bC bC bC bC bC bC bC bC bC bC bC bC bC bC bC bC bC bC bC bC bC bC
bC bC bC bC bC bCbC bC bC bC bCbC bC bC bC bCbC bC bC bC bCbC bC bC bC bC bC bC bC bC bC bC bC bC bC bC bC bC bC bC bC bC bC bC bC bC bC bC bC bC bC bC bC bC bC bC bC bC bC bC bC bC bC bC bC bC bC bC bC bC bC bC bC bC bC bC bC bC bC bC bC bC bC bC bC bC bC bC bC bC bC bC bC bC bC bC bC bC bC bC bC bC
bC bC bC bC bC bC bC bC bC bC bC bC bCbC bC bC bC bC bC bC bC bCbC bC bC bC bC bC bCbC bC bC bCbC bC bC bCbC bC bC bC bCbC bC bC bC bC bC bC bC bC bC bC bC bC bC bC bC bC bC bC bC bC bC bC bC bC bC bC bC bC bC bC bC bC bC bC bC bC bC bC bC bC bC bC bC bC bC bC bC bC bC bC bC bC bC bC bC bC bC bC bC bC bC bC bC bC bC bC bC bC bC bC bC bC bC bC bC bC bC bC bC bC bC bC bC bC bC bC bC bC bC bC bC bC bC bC bC bC bC bC bC bC bC bC bC bC bC bC bC bC bC bC bC bC bC bC bC bC
bC bC bC bC bC bC bC bC bC bCbC bC bC bC bC bC bCbC bC bCbC bC bC bCbC bC bC bC bCbC bC bC bC bC bC bC bC bC bC bC bC bC bC bC bC bC bC bC bC bC bC bC bC bC bC bC bC bC bC bC bC bC bC bC bC bC bC bC bC bC bC bC bC bC bC bC bC bC bC bC bC bC bC bC bC bC bC bC bC bC bC bC bC bC bC bC bC bC bC bC bC bC bC bC bC bC bC bC bC bC bC bC bC bC bC bC bC bC bC bC bC bC bC bC bC bC bC bC bC bC bC bC bC bC bC bC bC bC bC bC bC bC bC bC bC bC bC bC bC bC bC bC bC bC bC bC bC bC bC bC bC bC bC bC bC bC bC bC bC bC bC bC bC bC bC bC bC bC bC bC bC bC bC bC bC bC bC bC bC bC bC bC bC bC bC bC bC bC bC bC bC bC bC bC bC bC bC bC bC bC bC bC bC bC bC bC bC bC bC bC
bC bC bC bC bC bC bC bC bC bC bCbC bC bC bC bC bC bC bCbC bC bC bC bC bC bCbC bC bC bC bC bC bC bCbC bC bC bC bC bC bC bC bC bC bC bC bC bCbC bC bC bC bC bC bC bC bC bC bCbC bC bC bC bC bC bC bC bC bC bC bC bC bCbC bC bC bC bC bC bC bC bC bCbC bC bC bC bC bCbC bC bC bC bCbC bC bC bC bC bC bC bCbC bC bC bC bC bCbC bC bC bC bC bCbC bC bC bC bC bCbC bC bC bCbC bC bC bC bC bCbC bC bC bC bCbC bC bC bCbC bC bCbC bC bC bC bCbC bC bC bC bC bC bC bC bC bC bC bC bC bC bC bC bC bC bC bC bC bC bC bC bC bC bC bC bC bC bC bC bC bC bC bC bC bC bC bC bC bC bC bC bC bC bC bC bC bC bC bC bC bC bC bC bC bC bC bC bC bC bC bC bC bC bC bC bC bC bC bC bC bC bC bC bC bC bC bC bC bC bC bC bC bC bC bC bC bC bC bC bC bC bC bC bC bC bC bC bC bC bC bC bC bC bC bC bC bC bC bC bC bC bC bC bC bC bC bC bC bC bC bC bC bC bC bC bC bC bC bC bC bC bC bC bC bC bC bC bC bC bC bC bC bC bC bC bC bC bC bC bC bC bC bC bC bC bC bC bC bC bC bC bC bC bC bC bC bC bC bC bC bC bC bC bC bC bC bC bC bC bC bC bC bC bC bC bC bC bC bC bC bC bC bC bC bC bC bC bC bC bC bC bC bC bC bC bC bC bC bC bC bC bC bC bC bC bC bC bC bC bC bC bC bC bC bC bC bC bC bC bC bC bC bC bC bC bC bC bC bC bC bC bC bC bC bC bC bC bC bC bC bC bC bC bC bC bC bC bC bC bC bC bC bC bC bC bC bC bC bC bC bC bC bC bC bC bC bC bC bC bC bC bC bC bC bC bC bC bC bC bC bC bC bC bC bC bC bC bC bC bC bC bC bC bC bC bC bC bC bC bC bC bC bC bC bC bC bC bC bC bC bC bC bC bC bC bC bC bC bC bC bC bC bC bC bC bC bC bC bC bC bC bC bC bC bC bC bC bC bC bC bC bC bC bC bC bC bC bC bC bC bC bC bC bC bC bC bC bC bC bC bC bC bC bC bC bC bC bC bC bC bC bC bC bC bC bC bC bC bC bC bC bC bC bC bC bC bC bC bC bC bC bC bC bC bC bC bC bC bC bC bC bC bC bC bC bC bC bC bC bC bC
Int/
103
coun
ts
0,0
5,0
10,0
15,0
20,0
25,0
1
bC bC bC bC bC bC bC bC bC bC bC bC bC bC bC bC bC bC bC bC bC bC bC bC bC bC bC bC bC bC bC bC bC bC bC bC bC bC bC bC bC bC bC bC bC bC bC bC bC bC bC bC bC bC bC bC bC bC bC bC bC bC bC bC bC bC bC bC bC bC bC bC bC bC bC bC bC bC bC bC bC bC bC bC bC bC bC bC bC bC bC bC bC bC bC bCbC bC bC bC bCbC bC bC bC bCbC bC bC bC bC bC bCbC bC bC bC bC bC bC bC bC bC bC bC bC bC bC bC bC bC bC bC bC bC bC bC bC bC bC bC bC bC bC bC bC bC bC bC bC bC bC bC bC bC bC bC bC bC bC bC bC bC bC bC bC bC bC bC bC bC bC bC bC bC bC bC bC bC bC bC bC bC bC bC bC bC bC bC bC bC bC bC bC bC bC bC bC bC bC bC bC bC bC
bC bC bC bC bC bC bCbC bC bCbC bC bC bCbC bCbCbCbCbCbCbCbCbCbC bCbC bC bC bC bC bCbCbC bCbCbC bCbC bC bC bC bC bC bC bC bC bC bCbC bC bC bCbC bC bC bC bC bC bC bC bC bC bC bC bC bC bC bC bC bC bC bC bC bC bC bC bC bC bC bC bC bC bC bC bC bC bC bC bC bC bC bC bC bC bC bC bC bC bC bC bC bC bC bC bC bC bC bC bC bC bC bC bC bC bC bC bC bC bC bC bC bC bC bC bC bC bC bC bC bC bC bC bC bC bC bC bC bC bC bC bC bC bC bC bC bC bC bC bC bC bC bC bC bC bC bC bC bC bC bC bC bC bC bC bC bC bC bC bC bC bC bC bC bC bC bC bC bC bC bC bC bC bC bC bC bC bC bC bC bC bC bC bC bC bC bC bC bC
bC bC bC bC bC bC bCbC bC bCbC bCbC bCbCbCbCbCbC bCbC bC bC bCbC bCbCbCbCbCbC bC bC bC bC bC bC bC bC bC bC bC bC bC bC bC bC bC bC bC bC bC bC bC bC bC bC bC bC bC bC bC bC bC bC bC bC bC bC bC bC bC bC bC bC bC bC bC bC bC bC bC bC bC bC bC bC bC bC bC bC bC bC bC bC bC bC bC bC bC bC bC bC bC bC
bC bC bC bC bC bC bCbC bC bC bC bC bC bC bCbC bC bC bCbC bC bC bC bC bC bC bC bC bC bC bC bC bC bC bC bC bC bC bC bC bC bC bC bC bC bC bC bC bC bC bC bC bC bC bC bC bC
bC bC bC bC bCbC bC bC bC bC bC bC bC bC bC bC bC bC bC bC bC bC bC bC bC bC bC bC bC bC bC bC bC bC bC bC bC bC bC bC bC bC bC bC
bC bC bC bC bC bC bCbC bC bC bC bC bC bC bC bC bC bC bC bC bC bC bCbC bC bCbC bCbC bC bC bCbC bC bC bC bC bCbC bCbC bC bC bC bC bC bC bC bC bC bC bC bC bC bC bC bC bC bC bC bC bC bC bC bC bC bC bC bC bC bC bC bC bC bC bC bC bC bC bC bC bC bC bC bC bC bC bC bC bC bC bC bC bC bC bC bC bC bC bC bC bC bC bC bC bC bC bC bC bC bC bC bC bC bC bC bC bC bC bC bC bC bC bC bC bC bC bC bC bC bC bC bC bC bC bC bC bC bC bC bC bC bC bC bC bC bC bC bC bC bC bC bC bC bC bC bC
bC bC bC bC bC bC bC bC bC bC bCbC bC bC bC bC bCbC bC bCbC bC bC bCbC bC bC bC bC bC bC bC bC bCbC bC bC bC bC bC bC bC bC bC bC bC bC bC bC bC bC bC bC bC bC bC bC bC bC bC bC bC bC bC bC bC bC bC bC bC bC bC bC bC bC bC bC bC bC bC bC bC bC bC bC bC bC bC bC bC bC bC bC bC bC bC bC bC bC bC bC bC bC
bC bC bC bC bC bC bC bCbC bC bC bC bC bC bC bC bC bC bC bC bC bC bC bC bC bC bC bC bC bC bC bC bC bC bC bC bC bC bC bC bC bC bC bC bC bC bC bC bC bC bC bC bC bC bC bC bC bC bC bC bC bC bC bC bC bC bC bC bC bC bC bC bC bC bC bC
bC bC bC bC bC bC bC bC bC bC bC bC bC bC bC bC bC bC bC bC bC bC bC bC bC bC bC bC bC bC bC bC bC bC bC bC bC bC bC bC bC bC bC bC bC bC bC bC bC bC bC bC bC bC bCbC bC bC bC bCbC bC bC bC bC bC bC bCbC bC bC bC bC bC bC bC bC bCbC bC bC bC bC bC bCbC bC bC bC bC bCbC bC bC bC bC bC bC bC bCbC bC bC bC bC bC bC bCbC bC bC bC bC bC bC bC bC bC bC bCbC bC bC bC bC bC bC bC bC bC bC bC bC bC bC bC bC bC bC bC bCbC bC bC bC bC bC bC bC bC bC bC bC bC bC bC bC bC bC bC bC bC bC bC bC bC bC bC bC bC bC bC bC bC bC
bC bC bC bC bC bC bC bC bC bC bCbC bC bC bC bC bC bC bC bC bC bC bC bCbC bC bC bC bC bC bC bC bC bC bC bC bC bC bC bC bC bC bC bC bC bC bC bC bC bC bC bC bC bC bC bC bC bC bC bC bC bC bC bC bC bC bC bC bC bC bC bC bC bC bC bC bC bC bC bC bC bC bC bC bC bC bC bC bC bC bC bC bC bC bC bC bC bC bC bC bC bC bC bC bC bC bC bC bC bC bC bC bC bC bC bC bC bC bC bC bC bC bC bC bC bC bC bC bC bC bC bC bC bC bC bC bC bC bC bC bC bC bC bC bC bC bC bC bC bC bC bC bC bC bC bC bC bC bC bC bC bC bC bC bC bC bC bC bC bC bC bC bC bC bC bC bC bC bC bC bC bC bC bC bC bC bC bC bC bC bC bC bC bC bC bC bC bC bC bC bC bC bC bC bC bC bC bC bC bC bC bC bC bC bC bC bC bC bC bC bC bC bC bC bC bC bC bC bC bC bC bC bC bC bC bC bC bC bC bC bC bC bC bC bC bC bC bC bC bC bC bC bC bC bC bC bC bC bC bC bC bC bC bC bC bC bC bC bC bC bC bC bC bC bC bC bC bC bC bC bC bC bC bC bC bC bC bC bC bC bC bC bC bC bC bC bC bC bC bC bC bC bC bC bC bC bC bC bC bC bC bC bC bC bC bC bC bC bC bC bC bC bC bC bC bC bC bC bC bC bC bC bC bC bC bC bC bC bC bC bC bC bC bC bC bC bC bC bC bC bC bC bC bC bC bC bC bC bC bC bC bC bC bC bC bC bC bC bC bC bC bC bC bC bC bC bC bC bC bC bC bC bC bC bC bC bC bC bC bC bC bC bC bC bC bC bC bC bC bC bC bC bC bC bC bC bC bC bC bC bC bC bC bC bC bC bC bC bC bC bC bC bC bC bC bC bC bC bC
Int/
103
coun
ts
0,0
5,0
3
bC bC bC bC bC bC bC bC bC bC bC bC bC bC bC bC bC bC bC bC bC bC bC bC bC bC bC bC bC bC bC bC bC bC bC bC bC bC bC bC bC bC bC bC bC bC bC bC bC bC bC bC bC bC bC bC bC bC bC bC bC bC bC bC bC bC bC bC bC bC bC bC bC bC bC bC bC bC bC bC bC bC bC bC bC bC bC bC bC bC bC bC bC bC bC bC bC bC bCbC bC bC bC bC bCbC bC bCbC bC bC bC bC bC bC bC bC bC bC bC bC bC bC bC bC bC bC bC bC bC bC bC bC bC bC bC bC bC bC bC bC bC bC bC bC bC bC bC bC bC bC bC bC bC bC bC bC bC bC bC bC bC bC bC bC bC bC bC bC bC bC bC bC bC bC bC bC bC bC bC bC bC bC bC bC bC bC bC bC bC bC bC bC bC bC bC bC bC bC bC bC bC bC bC bC bC bC bC
bC bC bC bC bC bCbC bC bC bC bCbC bCbC bCbC bCbCbCbCbCbCbCbC bCbC bC bCbCbCbCbCbC bC bC bC bC bC bCbC bCbC bCbC bC bCbC bC bC bCbC bCbC bCbC bC bC bC bC bCbC bCbC bC bC bC bC bC bC bCbC bC bC bC bC bC bC bC bC bC bC bC bC bC bC bC bC bC bC bC bC bC bC bC bC bC bC bC bC bC bC bC bC bC bC bC bC bC bC bC bC bC bC bC bC bC bC bC bC bC bC bC bC bC bC bC bC bC bC bC bC bC bC bC bC bC bC bC bC bC bC bC bC bC bC bC bC bC bC bC bC bC bC bC bC bC bC bC bC bC bC bC bC bC bC bC bC bC bC bC bC bC bC bC bC bC bC bC bC bC bC bC bC bC bC bC bC bC bC bC bC bC bC
bC bC bC bCbC bC bCbCbCbCbCbCbC
bCbC
bCbC bC bC bCbCbCbCbC
bCbCbCbC bC bC bC bC bC bC bC bC bC bC bC bC bC bC bC bC bCbC bC bC bCbC bC bCbC bC bC bC bC bC bC bC bC bC bC bC bC bC bC bC bC bC bC bC bC bC bC bC bC bC bC bC bC bC bC bC bC bC bC bC bC bC bC bC bC bC bC bC bC bC bC bC bC bC bC bC bC bC bC bC bC bC bC bC
bC bC bC bC bC bCbC bCbC bCbC bCbC bCbC bC bC bC bC bC bC bC bC bC bC bC bC bC bC bC bC bC bC bC bC bC bC bC bC bC bC bC
bC bC bC bCbC bCbC bCbC bC bC bC bC bC bC bC bC bC bC bC bC bC bC bC bC bC bC bC bC bC bC bCbC bC bC bC bC bC bC bC bC bC bC bC bC bC bC bC bC bC bC bC bC bC bC bC bC bC
bC bC bCbC bC bCbC bC bC bC bC bC bC bC bC bC bCbC bCbCbCbCbCbCbCbC bC bC bC bCbCbCbCbC bCbCbC bC bC bC bC bC bC bC bC bC bC bC bC bC bC bC bC bC bC bC bC bC bC bC bC bC bC bC bC bC bC bC bC bC bC bC bC bC bC bC bC bC bC bC bC bC
bC bC bC bC bC bC bC bC bC bC bC bC bC bC bC bC bC bC bC bC bC bC bC bC bC bC bC bC bC bC bC bC bC bC bC bC bC bC bC bC bC bC bC bC bC bC bC bC bC bC bC bC bC bC bC bC bC bC bC bC bC bC bC bC bC bC bC bC bC bC bCbC bC bC bC bC bC bC bC bC bC bC bC bC bC bC bC bC bCbC bC bCbC bC bC bC bC bC bC bC bC bC bC bC bC bC bC bC bC bC bC bC bC bC bC bC bC bC bC bC bC bC bC bC bC bC bC bC bC
bC bC bC bC bC bC bC bC bC bC bC bC bC bC bC bC bC bC bC bC bC bC bC bC bC bC bC bC bC bC bC bC bC bC bC bC bC bC bC bC bC bC bC bC bC bC bCbC bC bCbC bC bCbC bC bC bC bC bC bC bC bC bC bC bC bC bC bC bC bC bC bC bC bC bC bC bC bC bC bC bC bC bC bC bC bC bC bC bC bC bC bC bC bC bC bC bC
bC bC bC bC bC bC bC bC bC bC bC bC bC bC bC bC bC bC bC bC bC bC bC bC bC bC bC bC bC bC bC bC bC bC bCbC bC bC bC bC bC bC bC bC bC bC bC bC bC bC bC bC bC bC bC bC bC bC bC bC bC bC bC bC bC bC bC
bC bC bC bCbC bC bC bC bC bC bCbC bC bCbC bC bC bC bCbC bC bCbC bC bC bC bC bC bC bC bC bC bC bCbC bC bC bC bC bC bC bC bC bC bC bC bC bC bC bC bC bC bC bC bC bC bC bC bC bC bC bC bC bC bC bC bC bC
bC bC bC bC bC bC bC bC bC bC bC bC bC bC bC bC bC bC bC bC bC bC bC bC bC bC bC bC bC bC bC bC bC bC bC bC bC bC bC bC bC bCbC bC bC bC bC bCbC bC bC bC bC bC bC bCbC bC bC bC bC bC bCbC bC bC bC bC bC bC bC bC bC bCbC bC bC bC bC bC bC bC bC bC bC bC bC bC bC bC bC bC bC bC bC bC bC bC bC bC bC bC bC bC bC bC bC bC bC bC bC bC bC bC bC
bC bC bC bC bC bC bC bC bC bC bC bC bC bC bC bC bC bC bC bC bC bC bC bC bC bC bC bC bC bC bC bC bC bC bC bC bC bC bC bC bC bC bC bC bC bCbC bC bC bC bC bC bC bC bC bC bC bC bC bC bC bC bC bC bC bC bC bC bC bC bC bC bC bC bC bC bC bC bC bC bC bC bC bC bC bC bC bC bC bC bC bC bC bC bC bC bC bC bC bC bC bC bC bC bC bC bC bC bC bC bC bC bC bC bC bC bC bC bC bC bC
bC bC bC bC bC bC bC bC bC bC bC bC bC bC bC bC bC bC bC bC bC bC bC bC bC bC bC bC bC bC bC bC bC bC bC bC bC bC bC bC bC bC bC bC bC bC bC bC bC bC bC bC bC bC bC bC bC bC bC bC bC bC bC bC bC bC bC bC bC bC bC bC bC bC bC bC bC bC bC bC bC bC bC bC bC bC bC bC bC bC bC bC bC bC bC bC bC bC bC bC bC bC bC bC bC bC bC bC bCbC bC bC bC bC bC bC bC bC bC bC bC bC bC bC bC bC bC bC bC bC bC bC bC bC bC bC bC bC bC bC bC bC bC bC bC bC bC bC bC bC bC
bC bC bC bC bC bC bC bC bC bC bC bC bC bC bC bC bC bC bC bC bC bC bC bC bC bC bC bC bC bC bC bC bC bC bC bC bC bC bC bC bC bC bC bC bC bC bCbC bC bC bC bC bC bC bC bC bC bC bC bC bC bC bC bC bC bC bC bC bC bC bC bC bC bC bC bC bC bC bC bC bC bC bC bC bC bC bC bC bC bC bC bC bC bC bC bC bC bC bC bC bC bC bC bC bC bC
Int/
103
coun
ts
0,0
5,0
4
bC bC bC bC bC bC bC bC bC bC bC bC bC bC bC bC bC bC bC bC bC bC bC bC bC bC bC bC bC bC bC bC bC bC bC bC bC bC bC bC bC bC bC bC bC bC bC bC bC bC bC bC bC bC bC bC bC bC bC bC bC bC bCbC bC bC bC bC bC bC bC bC bC bC bC bC bC bC bC bC bC bC bC bC bC bC bC bC bC bC bC bC bC bC bC bC bC bC bC bC bC bC bC bC bC bC bC bC bC bC bC bC bC bC bC bC bC bC bC bC bC bC bC bC bC bC bC bC bC bC bC bC bC bC bC bC bC bC bC bC bC bC bC bC bC bC bC
bC bC bC bC bCbC bC bCbC bCbC bCbC bC bC bC bC bC bCbC bC bC bC bC bC bC bC bC bC bC bC bC bC bCbC bC bC bC bCbC bC bCbC bC bC bC bC bC bC bC bC bC bC bC bCbC bCbC bCbCbCbC bCbC bC bC bC bCbC bC bC bC bC bCbCbCbCbCbCbCbCbC bC bC bCbC
bC
bCbCbCbCbC bC bC bC bC bC bC bC bC bC bC bC bC bC bC bC bC bC bC bC bC bC bC bC bC bC bC bC bC bC bC bC bC bC bC bC bC bC bC bC bC bC
bC bC bC bC bC bC bC bC bC bC bC bC bC bC bC bC bC bC bC bC bC bC bC bC bC bC bC bC bC bC bC bC bC bC bC bC bC bC bC bC bC bCbC bC bC bCbC bC bCbC bC bC bC bC bC bC bC bC bC bC bC bC bC bC bC bC bC bC bC bC bC bC bC bC bC bC bC bC bC bC bC bC bC
bC bC bCbC bCbC bCbCbC bC bCbC bC bC bCbCbC bC bC bC bC bC bC bC bC bC bC bC bC bC bC bC bC bC bC bC bC bC bC bC bC bC bC
bC bC bC bCbC bC bC bC bC bC bC bC bC bC bC bC bC bC bC bC bC bC bC bC bC bC bC bC bC bC bC bC bC bC bC bC bC bC bC bC bC bC bC bC bC bC bC bC bC bC bC
bC bC bCbC bCbC bC bCbC bC bC bC bC bC bC bC bC bC bC bC bC bC bCbC bC bCbC bC bC bC bC bC bC bC bC bC bC bC bC bC bC bC bC bC bC bC bC bC bC bC bC bC
bC bC bCbC bCbCbCbCbCbC bC bC bC bCbCbCbCbC bC bC bC bC bC bC bC bC bC bC bC bC bC bCbC bC bCbC bC bC bC bC bC bC bC bC bC bC bC bC bC bC bC bC bC bC bC bC bC bC bC bC bC bC bC
bC bC bC bCbC bC bC bC bC bC bC bC bCbC bCbCbCbCbCbCbCbCbCbC bCbC bCbCbCbCbCbCbCbCbC bC bC bC bC bC bC bC bC bC bC bC bC bC bC bC bC bC bC bC bC bC bC bC bC bC bC bC bC bC bC bC bC bC bC bC bC bC bC bC bC bC bC bC bC bC bC bC
bC bC bC bC bC bC bC bC bC bC bC bC bC bC bC bC bC bC bC bC bC bC bC bC bC bC bC bC bC bC bC bC bC bC bC bC bC bC bC bC bC bC bC bC bC bC bC bC bC bC bC bC bC bC bC bC bC bC bC bC bC bC bC bC bC bC bC bCbC bC bC bC bC bC bC bC bC bC bC bC bC bC bC bC bC bC bC bC bC bC bC bC bC bC bC bC bC bC bC bC bC bC bC bC bC bC bC bC bC bC bC bC bC bC bC bC bC bC bC bC bC
bC bC bCbC bC bC bC bC bC bC bC bC bC bC bC bC bC bC bC bC bC bC bC bC bC bC bC bC bC bC bC bC bC bC bC bC bC bC bC bC bC bC bC bC bC bC bC
bC bC bC bC bC bC bC bC bCbC bCbC bC bCbC bC bC bC bC bC bC bC bC bC bC bC bC bC bC bC bC bC bC bC bC bC bC bC bC bC bC bC bC bC bC bC bC bC bC bC
bC bC bC bC bCbC bC bC bC bC bC bC bC bC bC bC bC bC bC bC bC bC bC bC bC bC bC bC bC bC bC bC bC bC bC bC bC bC bC bC bC bC bC bC bC bC bC bC bC bC bC bC bC bC bC bC bC bC bC bC bC bC bC bC
bC bC bC bC bCbC bC bCbC bC bCbC bC bC bC bC bC bC bC bC bC bC bC bC bC bCbC bC bC bCbC bC bC bC bC bC bC bC bC bC bC bC bCbC bCbC bC bC bC bC bCbC bC bC bC bC bC bC bC bC bC bC bC bC bC bC bC bC bC bC bC bC bCbC bC bC bC bC bC bC bC bC bC bC bC bC bC bC bC bC bC bC bC bC bC bC bC bC bC bC bC bC bC bC bC
bC bC bC bCbC bC bC bCbC bC bC bC bCbC bC bC bC bC bC bC bC bC bC bC bC bC bC bCbC bC bC bC bC bC bC bC bC bC bC bC bC bC bC bC bC bC bC bC bC bC bC bC bC bC bC bC bC bC bC bC bC bC bC bC bC bC bC bC bC bC bC
bC bC bCbC bC bCbC bCbC bCbC bC bC bC bC bC bC bC bC bC bC bC bC bC bC bC bC bC bC bC bC bC bC bC bC bC bC bC bC bC bC bC bC bC bC bC bC bC bC bC bC bC bC bC bC bC bC bC
bC bC bCbC bC bC bC bC bC bC bC bC bC bC bC bC bC bC bC bC bC bC bC bC bC bC bC bC bC bC bC bC bC bC bC bC bC bC bC bC bC bC bC bC bC bC bC bC bC bC bC bC bC bC bC bC bC bC bC bC bC bC bC bC bC bC bC bC bC bC bC bC bC bC
bC bC bC bC bC bC bC bC bC bC bC bC bC bC bC bC bC bC bC bC bC bC bC bC bC bC bC bC bC bC bC bC bC bC bC bC bC bC bC bC bC bC bC bC bC bC bC bC bC bC bC bC bC bC bC bC bC bC bC bC bC bC bC bC bC bC bC bC bC bC bC bC bC bC bC bC bC bC bC bC bC bC bC bC bC bC bC bC bC bC bC bC bC bC bC bC bC bC bCbC bC bC bC bC bC bC bC bC bC bC bC bC bC bCbC bC bC bCbC bC bC bC bC bC bC bC bC bC bC bC bC bC bC bC bC bC bC bC bC bC bC bC bC bC bC bC bC bC bC bC bC bC bC bC bC
bC bC bC bC bC bC bC bC bC bC bC bC bC bC bC bC bC bC bC bC bC bC bC bC bC bC bC bC bC bC bC bC bC bC bC bC bC bC bC bC bC bCbC bC bC bC bC bC bC bC bC bC bC bC bC bC bC bC bC bC bC bC bC bC bC bC bC bC bC bC bC bC bC bC bC bC bC bC bC bC bC bC bC bC bC bC bC bC bC bC bC bC bC bC bC bC bC bC bC bC
Int/
103
coun
ts
0,0
5,0
5
bC bC bC bC bC bC bC bC bC bC bC bC bC bC bC bC bC bC bC bC bC bC bC bC bC bC bC bC bC bC bC bC bC bC bC bC bC bC bC bC bC bC bC bC bC bC bC bC bC bC bC bC bC bC bC bC bC bC bC bC bC bC bC bC bC bC bC bC bC bC bC bC bC bC bC bC bC bC bC bC bC bC bC bC bC bC bC bC bC bC bC bC bC bC bC bC bCbC bC bC bC bCbC bC bC bCbC bC bCbC bC bCbCbC bC bC bC bC bC bC bC bC bC bC bC bC bC bC bC bC bC bC bC bC bC bC bC bC bC bC bC bC bC bC bC bC bC bC bC bC bC bC bC bC bC bC bC bC bC bC bC bC bC bC bC bC bC bC bC bC bC bC bC bC bC bC bC bC bC bC bC bC bC bC bC bC bC bC bC bC bC bC bC bC bC bC bC bC bC bC bC
bC bC bC bC bCbC bC bCbC bCbC bCbCbCbCbCbCbC
bCbCbC bC bC
bC
bC
bC
bCbCbC bC bC bC bC bC bC bC bC bC bC bC bC bC bCbC bC bC bCbC bCbCbC bCbCbCbCbCbCbC bC bCbCbCbC bCbCbCbCbCbCbC bC bC bC bC bC bC bC bC bC bC bC bC bC bC bC bC bC bC bC bC bC bC bC bC bC bC bC bC bC bC bC bC bC bC bC bC bC bC bC bC bC bC bC bC bC bC bC bC bC bC bC bC bC bC bC bC bC bC bC bC bC bC bC bC bC bC bC bC bC bC bC bC bC bC bC bC bC bC bC bC bC bC bC bC bC bC bC bC bC bC bC bC bC bC bC bC bC bC bC bC bC bC bC bC bC bC bC bC bC bC bC bC bC bC bC bC bC bC bC bC bC bC bC bC bC bC bC bC bC bC bC bC bC bC bC bC bC bC bC bC bC bC
bC bC bC bCbC bCbCbCbCbCbC
bCbC
bC bC bC
bC
bC
bCbCbC bC bC bC bC bC bC bC bC bC bC bC bC bC bC bC bC bC bC bC bC bC bC bC bC bC bC bC bC bC bC bC bC bC bC bC bC bC bC bC bC bC bC bC bC bC bC bC bC bC bC bC bC bC bC bC bC bC bC bC bC bC bC bC bC bC bC bC bC bC bC
bC bC bC bCbC bCbC bCbC bCbC bCbC bC bC bCbCbCbCbC bC bC bC bC bC bC bC bC bC bC bC bC bC bC bC bC bC bC bC bC bC bC bC bC bC bC bC bC bC bC bC bC bC bC bC bC bC bC bC bC bC bC bC bC bC bC
bC bC bC bCbC bCbC bCbC bC bC bC bCbC bC bC bC bC bC bC bC bCbC bCbC bC bCbC bC bC bC bC bC bC bC bC bC bC bC bC bC bC bCbC bCbC bCbC bCbC bC bCbC bC bC bC bC bCbCbC bCbC bC bC bC bCbCbCbCbC bC bC bC bC bC bC bC bC bC bC bC bC bC bC bC bC bC bC bC bC bC bC bC bC bC bC bC bC bC bC bC bC bC bC bC bC bC bC bC
bC bC bC bC bC bC bC bC bC bC bC bC bC bC bC bC bC bC bC bC bC bC bC bC bC bC bC bC bC bC bC bC bC bC bC bC bC bC bC bC bC bC bC bC bC bC bC bC bC bC bC bC bC bC bC bC bC bC bC bC bC bC bC bC bC bC bC bC bC bC bC bC bC bC bC bC bC bC bC bC bC bC bC bC bC bC bCbC bC bC bCbC bCbC bCbC bCbC bC bC bCbC bCbC bCbC bC bC bC bC bC bC bC bC bC bC bC bC bC bC bC bC bC bC bC bC bC bC bC bC bC bC bC bC bC bC bC bC bC bC bC bC bC bC bC bC bC bC bC bC bC bC bC
bC bC bC bC bC bC bC bC bC bC bC bC bC bC bC bC bCbC bCbC bCbC bC bC bC bC bC bC bC bC bC bC bC bC bC bC bC bC bC bC bC bC bC bC bC bC bC bC bC bC bC bC bC bC bC bC bC bC bC bC bC bC bC bC bC bC bC bC bC bC bC bC bC bC bC bC bC bC bC bC bC bC bC bC bC bC bC bC bC bC bC bC bC bC bC bC
bC bC bC bC bCbC bC bC bC bC bC bC bC bC bC bC bC bC bC bC bC bC bC bC bC bC bC bC bC bC bC bC bC bC bC bC
bC bC bC bC bC bC bC bC bC bC bC bC bC bC bC bC bC bC bCbC bC bCbC bC bCbC bC bC bC bCbC bC bC bC bCbC bC bC bC bC bC bC bC bC bC bC bC bC bC bC bC bC bC bC bC bC bC bC bC bC bC bC bC bC bC bC
bC bCbC bC bC bC bC bC bC bC bC bC bC bC bC bC bC bC bC bC bCbC bC bC bC bCbC bC bC bC bC bC bC bC bC bC bC bC bC bC bC bC bC bC bC bC bC bC bC bC bC bC bC bC bC
bC bC bC bCbC bC bCbCbC bCbC bC bCbC bCbC bCbC bC bC bC bC bC bC bC bC bC bC bC bC bC bC bC bC bC bCbC bC bC bCbC bC bC bC bC bC bCbC bC bC bC bC bC bC bC bCbC bC bC bC bC bC bC bC bC bC bC bC bC bC bCbC bC bCbC bCbC bCbCbC bCbC bCbC bCbC bC bC bC bCbC bCbCbCbCbCbC bC bCbC bC bC bC bC bC bC bC bC bC bC bC bC bC bC bC bC bC bC bC bC bC bC bC bC bC bC
bC bC bCbC bC bC bCbC bC bC bC bCbC bC bC bC bCbC bC bC bC bC bC bC bC bC bC bC bC bC bC bC bC bC bC bC bC bC bC bC bC bC bC bC bC bC bC bC bC bC bC bC bC bC bC bC bC bC bC bC bC bC bC bC bC bC bC bC bC bC bC bC bC bC bC bC bC bC bC bC bC bC bC bC bC bC bC bC bC bC bC bC bC bC bC bC bC bC bC
bC bC bC bC bCbC bC bCbC bC bC bC bC bC bC bC bC bC bC bC bC bC bC bC bC bC bC bC bC bC bC bC bC bC bC bC bC bC bC bC bC bC bC bC bC bC bC bC bC bC bC bC bC bC bC bC bC bC bC bC bC bC bC bC bC bC bC bC bC bC bC bC bC bC bC bC bC bC bC bC bC bC bC bC bC bC bC bC bC bC bC bC bC bC bC bC bC bC bC bC bC bC bC bC bC bC bC bC bC bC bC bC bC bC bC bC bC bC bC bC bC bC bC bC bC bC bC bC bC bC bC bC bC bC bC
bC bC bC bC bC bC bC bC bC bC bC bC bC bC bC bC bC bC bC bC bC bC bC bC bC bC bC bC bC bC bC bC bC bC bC bC bC bC bC bC bC bC bC bC bC bC bC bC bC bC bC bC bC bC bC bC bC bC bC bC bC bC bC bC bC bC bC bC bC bC bC bC bC bC bC bC bC bC bC bC bC bC bC bC bC bC bC bC bC bC bC bC bC bC bC bC bC bC bC bC bC bC bC bC
Int/
103
coun
ts
0,0
5,0
10,0 20,0 30,02θ/°
6
Abbildung 3.4: Vergleich der Rietveld-Verfeinerungen von 1, 3, 4, 5 und 6. Schwarze Kreise: gemes-senes Pulverdiagramm; rote Linie: simuliertes Pulverdiagramm; blaue Linie: Unter-grund; grüne Linie: Differenzkurve. Das Pulverdiagramm von 5 wurde vor der Riet-veld-Verfeinerung untergrundkorrigiert; die Differenzkurve im Plot von 5 wurde ausGründen der Übersichtlichkeit etwas nach unten verlagert. Der Rietveld-Plot von 2
findet sich in [CB1, Abb. 1b]. 29

3 Bestimmung von Kristallstrukturen organischer Pigmente aus Röntgen-Pulverdaten
Abbildung 3.5: Kristallstruktur des Methyl-Derivates von Pigment Red 170. Eingezeichnet ist eine 21-Schraubenachse (∆) parallel zur Papierebene (parallel zu [001]). Die Wasserstoffatomedes Molekül-Hauptgerüstes wurden aus Gründen der Übersichtlichkeit ausgeblendet.
30
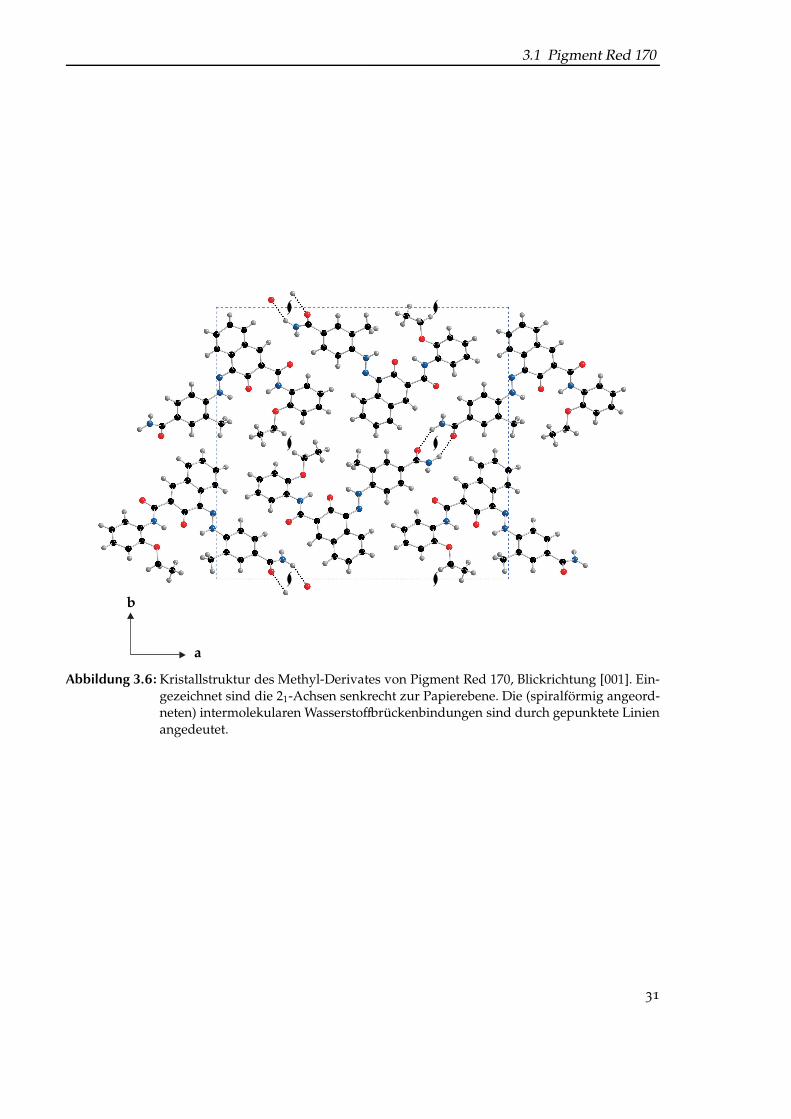
3.1 Pigment Red 170
a
b
ffl ffl
fflffl
ffl ffl
Abbildung 3.6: Kristallstruktur des Methyl-Derivates von Pigment Red 170, Blickrichtung [001]. Ein-gezeichnet sind die 21-Achsen senkrecht zur Papierebene. Die (spiralförmig angeord-neten) intermolekularen Wasserstoffbrückenbindungen sind durch gepunktete Linienangedeutet.
31

3 Bestimmung von Kristallstrukturen organischer Pigmente aus Röntgen-Pulverdaten
3.2 Pigment Orange 5[CB3]
Pigment Orange 5 („Dinitroanilin-Orange“, „Hansa-Rot GG“, 7, Abb. 3.7) gehört zu der Klasseder β-Naphthol–Azopigmente.
P. O. 5 findet vor allem in Druckfarben und in lufttrocknenden Lacken Verwendung. Esweist eine hohe Farbstärke und gute Lichtechtheit auf. Aufgrund dieser Eigenschaften zähltes zu den wichtigsten Orange-Pigmenten und wird seit 1907 produziert,[40] dennoch ist seineKristallstruktur erst kürzlich bestimmt worden.[CB3]
Bei der Synthese (Diazotierung von 2,4-Dinitroanilin und anschließende Kupplung mit β-Naphthol in wässriger Lösung) fällt das Pigment als feinkristallines, nahezu unlösliches Pulveran. Umkristallisation und Strukturbestimmung aus Einkristalldaten kommen demnach nichtin Frage.
N
O
H
N
N
O
O
N
OO
7
Abbildung 3.7: Molekülstruktur von Pigment Orange 5.
3.2.1 Strukturlösung
Für das Pulverdiagramm wurde eine Probe des kommerziellen Produkts „Hansa-Rot GG“verwendet. Die Substanz wurde zwischen zwei Polymer-Folien gegeben und in Transmissionauf einem STOE-STADI-P-Diffraktometer mit CuKα1-Strahlung (λ = 1,540 56 Å) gemessen. Eswurde ein Bereich von 2 bis 34° in 2θ aufgenommen. Diese Routine-Labordaten waren völligausreichend, um die Kristallstruktur zu lösen.
Die Struktur von 7 wurde mit PowderCryst gelöst;[16] dieses Programm verknüpft globaleGitterenergie-Minimierung mit dem Vergleich von simuliertem und experimentellem Pulver-diagramm (s. Abschnitt 2.3). Die Molekülgeometrie wurde mit Hilfe des Dreiding-Kraftfeldesund Gasteiger-Ladungen berechnet; das Molekül wurde dabei als planar angenommen.
Die Gitterenergie-Minimierung wurde in den 11 häufigsten Raumgruppen für Kristalle or-ganischer Molekülverbindungen (P1, P21, C2, Cc, P21/c, C2/c, P212121, Pca21, Pna21, Pbcn undPbca)[42] durchgeführt. Für die verwendete Methode zur Strukturlösung wird lediglich einPulverdiagramm sowie eine sinnvolle Molekülgeometrie benötigt, die Kenntnis der Gitter-
32

3.2 Pigment Orange 5
konstanten ist nicht erforderlich; aus diesem Grund wurde auf eine vorherige Indizierungverzichtet1.
3.2.2 Strukturverfeinerung
Für die Rietveld-Verfeinerung wurde ein neues Pulverdiagramm aufgenommen, das einelängere Messzeit und einen größeren Messbereich (4 bis 85° in 2θ) abdeckt. Die Substanzwurde dazu in eine 0,7 mm-Kapillare gefüllt.
Ein zunächst durchgeführter LeBail-Fit in der Raumgruppe P21/a zeigte, dass die aus derMinimierung erhaltenen Gitterkonstanten sich nur geringfügig änderten. Die Raumgruppeergab sich nach der Gitterenergie-Minimierung. Auf eine Zelltransformation in die Standard-aufstellung P 1 21/c 1[43] wurde verzichtet.
Zu Beginn der Rietveld-Verfeinerung mit gsas wurde lediglich der Skalierungsfaktor ver-feinert. Die weitere Verfeinerung wurde mit Restraints für Bindungslängen, Bindungswinkelund Planargruppen durchgeführt; die Gewichtungsfaktoren wurden sukzessive verkleinert.
Die Ergebnisse der Verfeinerung sind in Tab. 3.2 aufgeführt, der Rietveld-Plot ist in Abb. 3.8(S. 34) dargestellt.
Tabelle 3.2: Ergebnisse der Rietveld-Verfeinerung von Pigment Orange 5.
P. O. 5
RG P21/aa/Å 16,365(5)b/Å 12,874(4)c/Å 6,924(2)β/° 100,143(2)V/Å
31436,0(13)
Rwp 0,0311Rp 0,0219RF2 0,1739χ2
red 3,838
3.2.3 Zusammenfassung
Das Molekül liegt im Kristall als planare Einheit vor, was typisch für β-Naphthol–Azopigmenteist.[CB1,CB2,44,45] Die Moleküle bilden Stapel in c-Richtung (Abb. 3.9), wobei der Normalenvek-tor der Stapel etwas gegen die c-Achse gekippt ist. Daraus resultiert eine „wellige“ Anordnungder Moleküle (Abb. 3.10 und [CB3, Fig. 6]).
Die Strukturlösung und -verfeinerung gestalteten sich in diesem Fall problemlos. Auf einevorhergehende Indizierung konnte verzichtet werden.
Weitere Details finden sich in [CB3].
1Eine Indizierung mit dicvol hätte die korrekte Zelle ergeben.
33

3 Bestimmung von Kristallstrukturen organischer Pigmente aus Röntgen-Pulverdaten
bC bC bC bC bC bC bC bC bC bC bC bC bC bC bC bC bC bC bC bC bC bC bC bC bC bC bC bC bC bC bC bC bC bC bC bC bC bC bC bC bC bC bC bC bC bC bC bC bC bC bC bC bC bC bC bC bC bC bC bC bC bC bC bC bC bC bC bC bC bC bC bC bC bC bC bC bC bC bC bC bC bC bC bC bC bC bC bC bC bC bC bC bC bC bC bC bC bC bC bC bC bC bC bC bC bC bC bC bC bC bC bC bC bC bC bC bC bC bC bC bC bC bC bC bC bC bC bC bC bC bC bC bC bC bC bC bC bC bC bC bC bC bC bC bC bC bC bC bC bC bC bC bC bC bC bC bC bC bC bC bC bC bC bC bC bC bC bC bC bC bC bC bC bC bC bC bC bC bC bC bC bC bC bC bC bC bC bC bC bC bC bC bC bC bC bC bC bC bC bC bC bC bC bC bC bC bC bC bC bC bC bC bC bC bC bC bC bC bC bC bC bC bC bC bC bC bC bCbC bC bC bCbC bCbC bCbC bCbC bC bC bCbCbCbC bC bC bC bC bC bC bC bC bC bC bC bC bC bC bC bC bC bC bC bC bC bC bC bC bC bC bC bC bC bC bC bC bC bC bC bC bC bC bC bC bC bC bC bC bC bC bC bC bC bC bC bC bC bC bC bC bC bC bC bC bC bC bC bC bC bC bC bC bC bC bC bC bC bC bC bC bC bC bC bC bC bC bC bC bC bC bC bC bC
bC bC bC bCbC bC bCbC bCbCbCbCbCbCbC bC bCbCbC
bCbCbCbC bC bC bC bC bC bC bC bC bC bC bC bC bC bC bC bC bC bC bC bC bC bC bC bC bC bC bC bC bC bC bC bC bC bC bC bC bC bC bC bC bC bC bC bC bC bC bC bC bC bC bC bC bC bC bC bC bC bC bC bC bC bC bC bC bC bC bC bC bC bC bC bC bC bC bC bC bC bC bC
bC bC bC bCbC bCbCbCbCbCbCbC bC bCbCbCbCbCbCbC bC bC bC bC bC bC bC bC bC bC bC bC bC bC bC bC bC bC bC bC bC bCbC bC bCbC bCbCbCbCbC bC bC bCbCbCbCbC bC bC bC bC bC bC bC bC bC bC bC bC bC bC bC bC bC bC bC bC bC bC bC bC bC bC bC bC bC bC bC bC bC bCbC bC bC bCbC bC bC bC bC bC bC bC bC bC bC bC bC bC bC bC bC bC bC bC bC bC bC bC bC bC bC bC bC bC bC bC bC bC bC bCbC bC bCbC bC bC bC bC bC bC bC bC bC bC bC bC bC bC bC bC bC bC bC bC bC bC bC bC bC bC bC bC bC bC bC bC bC bC bC bC bC bC bC bC bC bCbC bC bCbC bCbC bCbC bCbC bC bC bC bCbCbCbC bC bC bC bC bC bC bC bC bC bC bC bC bC bC bC bC bC bC bC bC bC bC bC bC bC bC bC bC bC bC bC bC bC bC bC bC bC bC bC bC bC bC bCbC bC bCbC bCbC bCbC bC bC bCbC bC bC bC bC bC bC bC bC bC bC bC bC bC bC bC bC bC bC bC bC bC bC bC bC bC bCbC bC bCbC bCbCbCbCbC bCbC bC bC bCbCbCbCbC bC bC bC bC bC bC bC bC bC bC bC bC bC bC bC bCbC bC bCbC bCbC bCbC bC bC bC bC bCbC bC bC bC bC bC bC bC bC bC bC bC bC bC bC bC bC bC bC bC bC bC bC bC bC bC bC bC bC bC bC bC bC bC bC bC bC bC bC bC bC bC bC bC bC bC bC bC bC bCbC bC bCbC bCbC bCbC bC bC bC bC bC bC bC bC bC bC bC bC bC bC bC bC bC bC bC bC bC bC bC bC bC bC bC bC bC bC bC bC bC bC bC bC bC bC bC bC bC bC bC bC bC bC bC bCbC bC bCbC bCbC bC bCbC bC bC bC bC bC bC bC bC bC bC bC bC bC bC bC bC bC bC bC bC bC bC bC bC bC bC bC bC bC bC bC bC bC bC bC bC bC bC bC bC bC bC bC bC bC bC bC bC bC bC bC bC bC bC bC bC bC bC bC bC bC bC bC bC bC bC bC bC bC bC bC bC bC bC bC bC
bC bC bC bCbC bC bC bC bC bC bC bC bC bC bC bC bC bC bC bC bC bC bC bCbC bCbC bCbC bCbC bC bC bC bC bC bC bC bC bC bC bC bC bC bC bC bC bC bC bC bC bC bC bC bC bC bC bC bC bC bC bC bC bC bC bC bC bC bC bC bC bC bC bCbC bC bC bC bC bC bC bC bC bC bC bC bC bC bC bC bC bC bC bC bC bC bC bC bC bC bC bC bC bC bC bC bC bC bC bC bC bC bC bC bC bC bC bC bC bC bC bC bC bC bCbC bC bC bC bCbC bC bC bC bC bC bC bC bC bC bC bC bC bC bC bC bC bC bCbC bC bC bCbC bC bC bC bC bC bC bC bC bC bC bCbC bCbCbC
bC
bC
bC
bC
bC
bC
bC
bC bC
bC
bC
bC
bC
bC
bC
bC
bCbCbCbCbC bC bC bC bCbCbCbCbCbCbCbCbC bC bC bCbC
bC
bC
bCbCbC bC bC bCbCbCbCbC
bC
bCbCbC bCbCbC
bC
bC
bCbCbCbC bC bC bC bC bC bC bC bC bC bC bC bC bC bC bC bC bC bC bC bC bC bC bC bC bC bC bC bC bCbC bC bC bC bC bC bC bC bC bC bC bC bC bCbC bC bC bC bC bC bC bC bC bC bC bC bC bC bC bC bC bC bC bC bC bC bC bC bC bC bC bC bC bC bC bC bCbC bC bC bCbC bC bC bC bC bC bC bC bC bC bC bC bC bC bC bC bC bC bC bC bC bC bC bC bC bC bC bC bC bC bC bC bC bC bC bC bC bC bC bC bC bC bC bC bC bC bC bC bC bC bC bC bC bC bC bC bC bC bC bC bC bC bC bC bC bC bC bC bC bC bC bC bC bC bC bC bC bC bC bC bC bC bC bC bC bC bC bC bC bC bC bC bC bC bC bC bC bC bC bC bC bC bC bC bC bC bC bC bC bC bC bC bC bC bC bC bC bC bC bC bC bC bC bC bC bC bC bC bC bC bC bC bC bC bC bC bC bC bC bC bC bC bC bC bC bC bC bC bC bC bC bC bC bC bC bC bC bC bC bC bC bC bC bC bC bC bC bC bC bC bC bC bC bC bC bC bC bC bC bC bC bC bC bC bC bC bC bC bC bC bC bC bC bC bC bC bC bC bC bC bC bC bC bC bC bC bC bC bC bC bC bC bC bC bC bC bC bC bC bC bC bC bC bC bC bC bC bC bC bC bC bC bC bC bC bC bC bC bC bC bC bC bC bC bC bC bC bC bC bC bC bC bC bC bC bC bC bC bC bC bC bC bC bC bC bC bC bC bC bC bC bC bC bC bC bC
bC bC bC bC bC bC bC bC bC bC bC bC bC bC bC bC bC bC bC bC bC bC bC bC bC bC bC bC bC bC bC bC bC bC bC bC bC bC bC bC bC bCbC bC bC bC bC bC bC bC bC bC bC bC bC bC bC bC bC bC bC bC bC bC bC bC bC bC bC bC bC bC bC bC bC bC bC bC bC bC bC bC bC bC bC bC bC bC bC bC bC bC bC bC bC bC bC bC bC bC bC bC bC bC bC bC bC bC bC bC bC bC bC bC bC bC bC bC bC bC bC bC bC bC bC bC bC bC bC bC bC bC bC bC bC bC bC bC bC bC bC bC bC bC bC bC bC bC bC bC bC bC bC bC bC bC bC bC bC bC bC bC bC bC bC bC bC bC bC bC bC bC bC bC bC bC bC bC bC bC bC bC bC bC bC bC bC bC bC bC bC bC bC bC bC bC bC bC bC bC bC bC bC bC bC bC bC bC bC bC bC bC bC bC bC bC bC bC bC bC bC bC bC bC bC bC bC bC bC bC bC bC bC bC bC
bC bC bC bCbC bC bC bC bCbC bC bC bC bC bC bC bC bC bC bC bC bC bC bC bC bC bC bC bC bC bC bC bC bC bC bC bC bC bC bC bC bC bC bC bC bC bC bC bC bC bC bC bC bC bC bC bCbC bC bC bC bCbC bC bC bC bC bC bC bC bC bC bC bC bC bC bC bC bC bC bC bC bC bC bC bC bC bC bC bC bC bC bC bC bC bC bC bC bC bC bC bC bC bC bC bC bC bC bC bC bC bC bC bC bC bC bC bC bC bC bC bC bC bC bC bC bC bC bC bC bC bC bC bC bC bC bC bC bC bC bC bC bC bC bC bC bC bC bC bC bC bC bC bC bC bC bC bC bC bC bC bC bC bC bC bC bC bC bC bC bC bC bC bC bC bC bC bC bC bC bC bC bC bC bC bC bC bC bC bC bC bC bC bC bC bC bC bC bC bC bC bC bC bC bC bC bC bC bC bC bC bC bC bC bC bC bC bC bC
bC bC bC bC bC bC bC bC bC bC bC bC bC bC bC bC bC bC bC bC bC bC bC bC bC bC bC bC bC bC bCbC bC bC bC bC bC bCbC bC bC bC bC bC bC bC bC bC bC bC bC bC bC bC bC bC bC bC bC bC bC bC bC bC bC bC bC bC bC bC bC bC bC bC bC bC bC bC bC bC bC bC bC bC bC bC bC bC bC bC bC bC bC bC bC bC bC bC bC bC bC bC bC bC bC bC bC bC bC bC bC bC bC bC bC bC bC bC bC bC bC bC bC bC bC bC bC bC bC bC bC bC bC bC bC bC bC bC bC bC bC bC bC bC bC bC bC bC bC bC bC bC bC bC bC bC bC bC bC bC bC bC bC bC bC bC bC bC bC bC bC bC bC bC bC bC bC bC bC bC bC bC bC bC bC bC bC bC bC bC bC bC bC bC bC bC bC bC bC bC bC bC bC bC bC bC bC bC bC bC bC bC bC bC bC bC bC bC bC bC bC bC bC bC bC bC bC bC bC bC bC bC bC bC bC bC bC bC bC bC bC bC bC bC bC bC bC bC bC bC bC bC bC bC bC bC bC bC bC bC bC bC bC bC bC bC bC bC bC bC bC bC bC bC bC bC bC bC bC bC bC bC bC bC bC bC bC bC bC bC bC bC bC bC bC bC bC bC bC bC bC bC bC bC bC bC bC bC bC bC bC bC bC bC bC bC bC bC bC bC bC bC bC bC bC bC bC bC bC bC bC bC bC bC bC bC bC bC bC bC bC bC bC bC bC bC bC bC bC bC bC bC bC bC bC bC bC bC bC bC bC bC bC bC bC bC bC bC bC bC bC bC bC bC bC bC bC bC bC bC bC bC bC bC bC bC bC bC bC bC bC bC bC bC bC bC bC bC bC bC bC bC bC bC bC bC bC bC bC bC bC bC bC bC bC bC bC bC bC bC bC bC bC bC bC bC bC bC bC bC bC bC bC bC bC bC bC bC bC bC bC bC bC bC bC bC bC bC bC bC bC bC bC bC bC bC bC bC bC bC bC bC bC bC bC bC bC bC bC bC bC bC bC
bC bC bC bC bC bC bC bC bC bC bC bC bC bC bC bC bC bC bC bC bC bC bC bC bC bC bC bC bC bC bC bC bC bC bC bC bC bC bC bC bC bC bC bC bC bC bC bC bC bC bC bC bC bC bC bC bC bC bC bC bC bC bC bC bC bC bC bC bC bC bC bC bC bC bC bC bC bC bC bC bC bC bC bC bC bC bC bC bC bC bC bC bC bC bC bC bC bC bC bC bC bC bC bC bC bC bC bC bC bC bC bC bC bC bC bC bC bC bC bC bC bC bC bC bC bC bC bC bC bC bC bC bC bC bC bC bC bC bC bC bC bC bC bC bC bC bC bC bC bC bC bC bC bC bC bC bC bC bC bC bC bC bC bC bC bC bC bC bC bC bC bC bC bC bC bC bC bC bC bC bC bC bC bC bC bC bC bC bC bC bC bC bC bC bC bC bC bC bC bC bC bC bC bC bC bC bC bC bC bC bC bC bC bC bC bC bC bC bC bC bC bC bC bC bC bC bC bC bC bC bC bC bC bC bC bC bC bC bC bC bC bC bC bC bC bC bC bC bC bC bC bC bC bC bC bC bC bC bC bC bC bC bC bC bC bC bC bC bC bC bC bC bC bC bC bC bC bC bC bC bC bC bC bC bC bC bC bC bC bC bC bC bC bC bC bC bC bC bC bC bC bC bC bC bC bC bC bC bC bC bC bC bC bC bC bC bC bC bC bC bC bC bC bC bC bC bC bC bC bC bC bC bC bC bC bC bC bC bC bC bC bC bC bC bC bC bC bC bC bC bC bC bC bC bC bC bC bC bC bC bC bC bC bC bC bC bC bC bC bC bC bC bC bC bC bC bC bC bC bC bC bC bC bC bC bC bC bC bC bC bC bC bC bC bC bC bC bC bC bC bC bC bC bC bC bC bC bC bC bC bC bC bC bC bC bC bC bC bC bC bC bC bC bC bC bC bC bC bC bC bC bC bC bC bC bC bC bC bC bC bC bC bC bC bC bC bC bC bC bC bC bC bC bC bC bC bC bC bC bC bC bC bC bC bC bC bC bC bC bC bC bC bC bC bC bC bC bC bC bC bC bC bC bC bC bC bC bC bC bC bC bC bC bC bC bC bC bC bC bC bC bC bC bC bC bC bC bC bC bC bC bC bC bC bC bC bC bC bC bC bC bC bC bC bC bC bC bC bC bC bC bC bC bC bC bC bC bC bC bC bC bC bC bC bC bC bC bC bC bC bC bC bC bC bC bC bC bC bC bC bC bC bC bC bC bC bC bC bC bC bC bC bC bC bC bC bC bC bC bC bC bC bC bC bC bC bC bC bC bC bC bC bC bC bC bC bC bC bC bC bC bC bC bC bC bC bC bC bC bC bC bC bC bC bC bC bC bC bC bC bC bC bC bC bC bC bC bC bC bC bC bC bC bC bC bC bC bC bC bC bC bC bC bC bC bC bC bC bC bC bC bC bC bC bC bC bC bC bC bC bC bC bC bC bC bC bC bC bC bC bC bC bC bC bC bC bC bC bC bC bC bC bC bC bC bC bC bC bC bC bC bC bC bC bC bC bC bC bC bC bC bC bC bC bC bC bC bC bC bC bC bC bC bC bC bC bC bC bC bC bC bC bC bC bC bC bC bC bC bC bC bC bC bC bC bC bC bC bC bC bC bC bC bC bC bC bC bC bC bC bC bC bC bC bC bC bC bC bC bC bC bC bC bC bC bC bC bC bC bC bC bC bC bC bC bC bC bC bC bC bC bC bC bC bC bC bC bC bC bC bC bC bC bC bC bC bC bC bC bC bC bC bC bC bC bC bC bC bC bC bC bC bC bC bC bC bC bC bC bC bC bC bC bC bC bC bC bC bC bC bC bC bC bC bC bC bC bC bC bC bC bC bC bC bC bC bC bC bC bC bC bC bC bC bC bC bC bC bC bC bC bC bC bC bC bC bC bC bC bC bC bC bC bC bC bC bC bC bC bC bC bC bC bC bC bC bC bC bC bC bC bC bC bC bC bC bC bC bC bC bC bC bC bC bC bC bC bC bC bC bC bC bC bC bC bC bC bC bC bC bC bC bC bC bC bC bC bC bC bC bC bC bC bC bC bC bC bC bC bC bC bC bC bC bC bC bC bC bC bC bC bC bC bC bC bC bC bC bC bC bC bC bC bC bC bC bC bC bC bC bC bC bC bC bC bC bC bC bC bC bC bC bC bC bC bC bC bC bC bC bC bC bC bC bC bC bC bC bC bC bC bC bC bC bC bC bC bC bC bC bC bC bC bC bC bC bC bC bC bC bC bC bC bC bC bC bC bC bC bC bC bC bC bC bC bC bC bC bC bC bC bC bC bC bC bC bC bC bC bC bC bC bC bC bC bC bC bC bC bC bC bC bC bC bC bC bC bC bC bC bC bC bC bC bC bC bC bC bC bC bC bC bC bC bC bC bC bC bC bC bC bC bC bC bC bC bC bC bC bC bC bC bC bC bC bC bC bC bC bC bC bC bC bC bC bC bC bC bC bC bC bC bC bC bC bC bC bC bC bC bC bC bC bC bC bC bC bC bC bC bC bC bC bC bC bC bC bC bC bC bC bC bC bC bC bC bC bC bC bC bC bC bC bC bC bC bC bC bC bC bC bC bC bC bC bC bC bC bC bC bC bC bC bC bC bC bC bC bC bC bC bC bC bC bC bC bC bC bC bC bC bC bC bC bC bC bC bC bC bC bC bC bC bC bC bC bC bC bC bC bC bC bC bC bC bC bC bC bC bC bC bC bC bC bC bC bC bC bC bC bC bC bC bC bC bC bC bC bC bC bC bC bC bC bC bC bC bC bC bC bC bC bC bC bC bC bC bC bC bC bC bC bC bC bC bC bC bC bC bC bC bC bC bC bC bC bC bC bC bC bC bC bC bC bC bC bC bC bC bC bC bC bC bC bC bC bC bC bC bC bC bC bC bC bC bC bC bC bC bC bC bC bC bC bC bC bC bC bC bC bC bC bC bC bC bC bC bC bC bC bC bC bC bC bC bC bC bC bC bC bC bC bC bC bC bC bC bC bC bC bC bC bC bC bC bC bC bC bC bC bC bC bC bC bC bC bC bC bC bC bC bC bC bC bC bC bC bC bC bC bC bC bC bC bC bC bC bC bC bC bC bC bC bC bC bC bC bC bC bC bC bC bC bC bC bC bC bC bC bC bC bC bC bC bC bC bC bC bC bC bC bC bC bC bC bC bC bC bC bC bC bC bC bC bC bC bC bC bC bC bC bC bC bC bC bC bC bC bC bC bC bC bC bC bC bC bC bC bC bC bC bC bC bC bC bC bC bC bC bC bC bC bC bC bC bC bC bC bC bC bC bC bC bC bC bC bC bC bC bC bC bC bC bC bC bC bC bC bC bC bC bC bC bC bC bC bC bC bC bC bC bC bC bC bC bC bC bC bC bC bC bC bC bC bC bC bC bC bC bC bC bC bC bC bC bC bC bC bC bC bC bC bC bC bC bC bC bC bC bC bC bC bC bC bC bC bC bC bC bC bC bC bC bC bC bC bC bC bC bC bC bC bC bC bC
2θ/°10 20 30 40 50 60 70 80
Int/
104
coun
ts
0
0,5
1,0
1,5
2,0
2,5
3,0
Abbildung 3.8: Rietveld-Plot von Pigment Orange 5. Schwarze Kreise: gemessenes Pulverdiagramm;rote Linie: simuliertes Pulverdiagramm; blaue Linie: Untergrund; grüne Linie: Diffe-renzkurve.
34

3.2 Pigment Orange 5
ap
b
Abbildung 3.9: Kristallstruktur von Pigment Orange 5, Blick entlang [001]. Nur eine Schicht vonMolekülen ist dargestellt.
35

3 Bestimmung von Kristallstrukturen organischer Pigmente aus Röntgen-Pulverdaten
a
c
Abbildung 3.10: Kristallstruktur von Pigment Orange 5, Blick entlang [041].
36
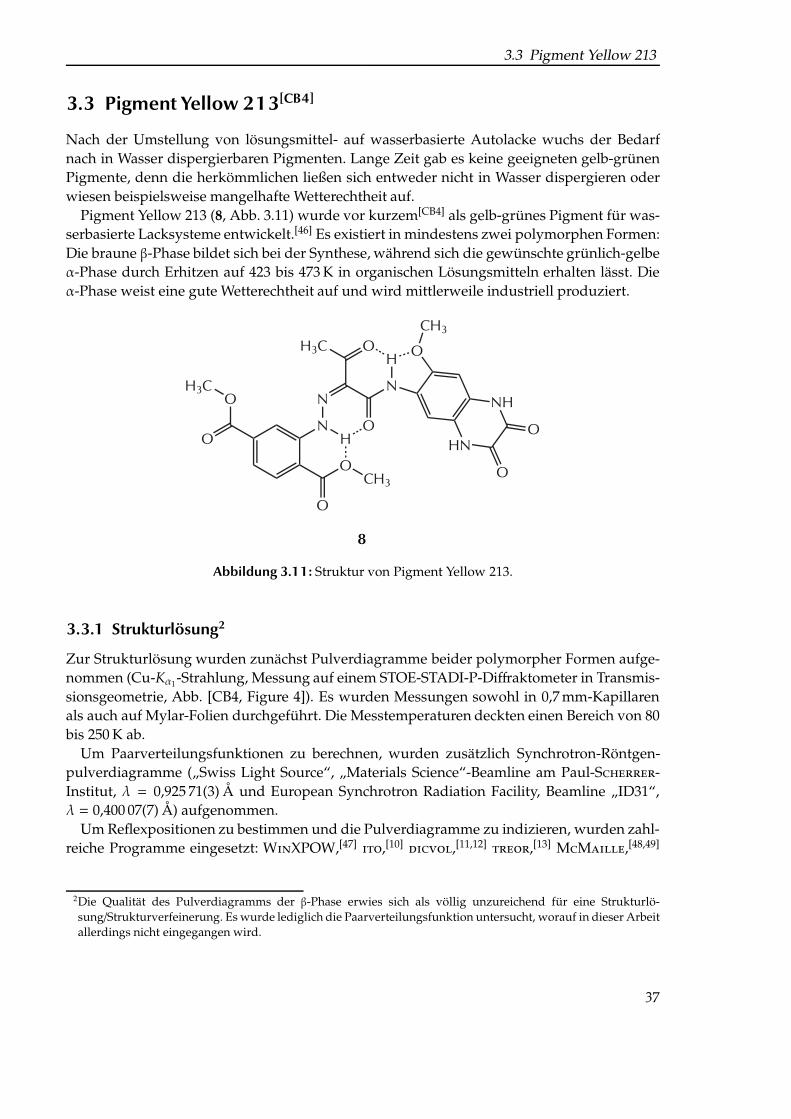
3.3 Pigment Yellow 213
3.3 Pigment Yellow 213[CB4]
Nach der Umstellung von lösungsmittel- auf wasserbasierte Autolacke wuchs der Bedarfnach in Wasser dispergierbaren Pigmenten. Lange Zeit gab es keine geeigneten gelb-grünenPigmente, denn die herkömmlichen ließen sich entweder nicht in Wasser dispergieren oderwiesen beispielsweise mangelhafte Wetterechtheit auf.
Pigment Yellow 213 (8, Abb. 3.11) wurde vor kurzem[CB4] als gelb-grünes Pigment für was-serbasierte Lacksysteme entwickelt.[46] Es existiert in mindestens zwei polymorphen Formen:Die braune β-Phase bildet sich bei der Synthese, während sich die gewünschte grünlich-gelbeα-Phase durch Erhitzen auf 423 bis 473 K in organischen Lösungsmitteln erhalten lässt. Dieα-Phase weist eine gute Wetterechtheit auf und wird mittlerweile industriell produziert.
O
H
N O
N
N
H
O O
HN
NHO
O
H3C
H3C
CH3
O
CH3O
O
8
Abbildung 3.11: Struktur von Pigment Yellow 213.
3.3.1 Strukturlösung2
Zur Strukturlösung wurden zunächst Pulverdiagramme beider polymorpher Formen aufge-nommen (Cu-Kα1-Strahlung, Messung auf einem STOE-STADI-P-Diffraktometer in Transmis-sionsgeometrie, Abb. [CB4, Figure 4]). Es wurden Messungen sowohl in 0,7 mm-Kapillarenals auch auf Mylar-Folien durchgeführt. Die Messtemperaturen deckten einen Bereich von 80bis 250 K ab.
Um Paarverteilungsfunktionen zu berechnen, wurden zusätzlich Synchrotron-Röntgen-pulverdiagramme („Swiss Light Source“, „Materials Science“-Beamline am Paul-Scherrer-Institut, λ = 0,925 71(3) Å und European Synchrotron Radiation Facility, Beamline „ID31“,λ = 0,400 07(7) Å) aufgenommen.
Um Reflexpositionen zu bestimmen und die Pulverdiagramme zu indizieren, wurden zahl-reiche Programme eingesetzt: WinXPOW,[47]
ito,[10]dicvol,[11,12]
treor,[13] McMaille,[48,49]
2Die Qualität des Pulverdiagramms der β-Phase erwies sich als völlig unzureichend für eine Strukturlö-sung/Strukturverfeinerung. Es wurde lediglich die Paarverteilungsfunktion untersucht, worauf in dieser Arbeitallerdings nicht eingegangen wird.
37

3 Bestimmung von Kristallstrukturen organischer Pigmente aus Röntgen-Pulverdaten
Crysfire/CheckCell,[50]dash,[51]
gsas[30,31] und topas.[32] Unter den Indizierungsvorschlägen
gab es sehr viele sinnvolle monokline und trikline Elementarzellen.Die gefundenen Elementarzellen wurden LeBail-Fits[33] unterzogen; die Qualität der An-
passungen sollte dazu herangezogen werden, die „richtige“ Zelle zu ermitteln. Die Gütekri-terien bewegten sich allerdings – trotz deutlich unterschiedlicher Elementarzellen – in einemsehr engen Rahmen; außerdem waren selbst die besten Anpassungen nicht sonderlich über-zeugend.
Da sich die Bestimmung der Gitterkonstanten äußerst schwierig gestaltete, wurden zusätz-lich Elektronenbeugungs-Experimente durchgeführt. Aus der Elektronenbeugung ergabensich zwei Reihen von Gitterkonstanten, die mittels zweier unterschiedlicher Verfahren ermit-telt wurden (Tab. 3.3, Abb. [CB4, Figure 6]).
Zur Strukturlösung wurden Indizierungsvorschläge ausgewählt, deren Zellen ähnlich zuden aus der Elektronenbeugung erhaltenen waren. Zunächst wurde ein Pawley-Fit[34] mittopas durchgeführt; die so erhaltenen („präzisen“) Gitterkonstanten wurden für die Struktur-lösung mit topas verwendet.
3.3.2 Rietveld-Verfeinerung
Das Strukturmodell der α-Phase wurde mit topas verfeinert. Dafür wurde das Synchrotron-Diagramm (λ = 0,40 Å) bis zu einem Beugungswinkel 2θ = 18,75° (entspricht einer Realraum-Auflösung von 1,23 Å) verwendet.
Die Rietveld-Verfeinerung konvergierte mit GoF = 1,34, Rwpb = 17,46 % und Rpb = 26,10 %(Tab. 3.4, Abb. [CB4, Figure 7]). Ein Vergleich der Gitterkonstanten aus Elektronenbeugungmit denen der Rietveld-Verfeinerung findet sich in Tab. 3.3.
Tabelle 3.3: Vergleich der Gitterkonstanten von Pigment Yellow 213 aus Elektronenbeugung mit denErgebnissen der Rietveld-Verfeinerung.
ElektronenbeugungManual Tilting ADTa Rietveld-Verfeinerung
a/Å 6,83 7,0(3) 6,9006(3)b/Å 11,86 11,6(6) 11,8347(6)c/Å 14,31 13,8(2) 14,0592(7)α/° ≈77 81,5 81,811(4)β/° 79,7 78,7 81,032(9)γ/° 86,1 86,3 87,542(1)V/Å
31114 1045 1122,32(1)
Raumgruppe P1 oder P1 P1 oder P1 P1Z 2 2 2a Automatic Diffraction Tomography
38

3.3 Pigment Yellow 213
Tabelle 3.4: Ergebnisse der Rietveld-Verfeinerung von Pigment Yellow 213.
P. Y. 213
RG P1a/Å 6,9006(3)b/Å 11,8347(6)c/Å 14,0592(7)α/° 81,811(4)β/° 81,032(9)γ/° 87,541(10)V/Å
31122,31(10)
Rwpb 0,175Rpb 0,261χ2 1,80
3.3.3 Zusammenfassung
Die Kristallqualität derα-Phase von Pigment Yellow 213 war gerade noch ausreichend für eine„klassische“ (mit voriger Indizierung) Strukturlösung und -verfeinerung. Der weitaus schwe-rer wiegende Grund für die anfänglich misslungene Strukturlösung war das Ausschließeneiner ungewöhnlichen Molekülkonformation der untersuchten Verbindung.
Im Kristall liegen planare Moleküle vor, die Wasserstoffbrücken zu je zwei Nachbarmole-külen ausbilden (Abb. [CB4, Figure 8]). Dadurch ordnen sich die Moleküle in einer Schichtan; mehrere dieser Schichten bilden wiederum Stapel (Abb. [CB4, Figure 9]).
Die anschließend durchgeführte Untersuchung der Paarverteilungsfunktion[52] bestätigtedie ermittelte Kristallstruktur (Abb. [CB4, Figure 11]).
Weitere Details finden sich in [CB4].
39

3 Bestimmung von Kristallstrukturen organischer Pigmente aus Röntgen-Pulverdaten
3.4 Pigment-Yellow-101-Derivat[CB5]
Die meisten organischen Pigmente, die in Lösung Fluoreszenz zeigen, verlieren diese Eigen-schaft im Festkörper. Pigment Yellow 101 (Abb. 3.12, 9) ist das einzige kommerzielle organischePigment, das Fluoreszenz im Festkörper zeigt.
Die Kristallstruktur von P. Y. 101 und drei Derivaten konnte aus Einkristalldaten bestimmtwerden.[53–55]
Pigmente sollen im Anwendungsmedium nahezu unlöslich sein; Pigment Yellow 101 undeinige Derivate zeigen jedoch eine deutliche Löslichkeit. Um die Löslichkeit weiter zu senken,wurden zusätzlich zwei sperrige organische Reste (CO−NH−Ph-Gruppen) eingeführt. Die soerhaltene Verbindung 10 ist Gegenstand dieses Kapitels.
N H
O H
N
O
N
OH
NH
O
H
H
O
N
H
N
H
O
H
H
9 10(P. Y. 101)
Abbildung 3.12: Struktur von Pigment Yellow 101 (9) und dem in dieser Arbeit untersuchten Derivat(10).
3.4.1 Strukturlösung
Die Löslichkeit von 10 ist wesentlich geringer als die von 9; dadurch konnten allerdingskeinerlei Einkristalle erhalten werden. Die Struktur wurde aus Pulverdaten bestimmt.
Nach einer Vielzahl von Umkristallisationsexperimenten konnte eine Probe erhalten wer-den, deren Pulverdiagramm ausreichend für eine Strukturlösung war. Diese Probe wurdeerzeugt, indem eine Suspension des Pigments in Dimethylformamid 30 Minuten gerührt,anschließend filtriert und mit Dimethylformamid und Methanol gewaschen wurde.
Die Indizierung gelang mit dicvol, alle Reflexe konnten indiziert werden. Die erhaltenenGitterkonstanten (Tab. 3.5) zeigen eine orthorhombische Elementarzelle, die Raumgruppekonnte jedoch nicht eindeutig bestimmt werden.
Eine Faustregel besagt, dass Nicht-Wasserstoffatome ein Volumen von ca. 18 Å3
einneh-men.[56] Zieht man in Betracht, dass Pigment-Moleküle im Festkörper dichter gepackt sindund Nicht-Wasserstoffatome ein Volumen von ca. 16 Å
3einnehmen, ergibt sich für 10 ein
40

3.4 Pigment-Yellow-101-Derivat
Tabelle 3.5: Ergebnisse der Indizierung von Pigment Yellow 101.
P. Y. 101
a/Å 9,505b/Å 9,730c/Å 30,124(α = β = γ)/° 90V/Å
32786
Molekülvolumen von VMolekül ≈ 704 Å3; gemäß Volumeninkrementsystem[14] ergibt sich ein
Molekülvolumen von VMolekül = 724,16 Å3. Mit dem ermittelten Volumen der Elementarzelle
(VEZ = 2786 Å3) ergibt sich die Anzahl der Formeleinheiten zu Z = 3,96 bzw. Z = 3,85. Die
Elementarzelle sollte demnach vier Formeleinheiten (in diesem Fall Moleküle) enthalten.Eine genaue Analyse der Reflexionsbedingungen gestaltete sich schwierig, da Symmetrie-
elemente in [001]-Richtung nicht ermittelt werden konnten (symbolisiert durch das Frage-zeichen im vorläufigen Auslöschungssymbol Pna?). Das Symbol Pna? lässt folgende Auslö-schungssymbole zu: Pna-, Pnaa, Pnab, Pnan; mögliche orthorhombische Raumgruppentypenwären demnach Pna21, Pnma, Pccn, Pbcn, Pnna, Pnn2.[43]
Die Punktgruppe des Moleküls ist mindestens 1 bzw. 2/m, wenn es planar ist. Eine sta-tistische Analyse zeigt, dass der überwiegende Teil der Moleküle mit 2/m-Symmetrie aufInversionszentren liegt.[42] Sollte das Molekül in Pnma auf einem Inversionszentrum liegen,wäre aufgrund der zwischen den Molekülen liegenden Spiegelebenen die Packung nicht sehrdicht; die Packung ist dichter, wenn das Molekül auf einer Spiegelebene liegt. Auf Basis dieserÜberlegungen wurde die Besetzung eines Inversionszentrums in Pnma nicht weiter verfolgt,die Besetzung einer Spiegelebene hingegen schon.
Die Strukturlösung wurde in o. g. Raumgruppen mit crysca durchgeführt. Dabei zeigtesich, dass in Pnma keine sinnvolle Molekülanordnung gefunden werden konnte. Stattdessenerwies sich eine Struktur mit der niedrigsten Gitterenergie (E = −217,86 kJ/mol) in Pbcn alssinnvollste.
3.4.2 Rietveld-Verfeinerung
Zu Beginn wurde ein LeBail-Fit mit gsas durchgeführt. Dabei änderten sich die aus derIndizierung gewonnenen Gitterkonstanten nur geringfügig.
Für die Rietveld-Verfeinerung wurde als Startstruktur ein halbes Molekül, das mit einemDummy-Atom verbunden ist, verwendet. Das Dummy-Atom wurde auf einem Inversions-zentrum fixiert. Außerdem wurden Bindungslängen-, Bindungswinkel- und Planargruppen-Restraints mit den entsprechenden Werten aus der Gitterenergie-Minimierung eingeführt.
Im Zuge der Verfeinerung drehten sich die endständigen Phenyl-Gruppen um 35,7° auf 77,5°aus der Molekülebene. Dieser Umstand ist deshalb erstaunlich, da der „Einfangradius“ einer
41

3 Bestimmung von Kristallstrukturen organischer Pigmente aus Röntgen-Pulverdaten
Rietveld-Verfeinerung mit gsas sehr klein ist. Die Verfeinerung konvergierte mit plausiblenWerten für die Gütekriterien (Tab. 3.6) und einem annehmbaren Plot3 (Abb. 3.13).
Tabelle 3.6: Ergebnisse der Rietveld-Verfeinerung von 10.
Verbindung 10
a/Å 30,1335(8)b/Å 9,7307(3)c/Å 9,5125(3)V/Å
32789,3(2)
Rwp 0,0434Rp 0,0339χ2
red 8,845
bC bC bC bC bC bC bC bC bC bC bC bC bC bC bC bC bC bC bC bC bC bC bC bC bC bC bC bC bC bC bC bC bC bC bC bC bC bC bC bC bC bC bC bC bC bC bC bC bC bC bC bC bC bC bC bC bC bC bC bC bC bC bC bC bC bC bC bC bC bC bC bC bC bC bC bC bC bC bC bC bC bC bC bC bC bC bC bC bC bC bC bC bC bC bC bC bC bC bC bC bC bC bC bC bC bC bC bC bC bC bC bC bC bC bC bC bC bC bC bC bC bC bC bC bC bC bC bC bC bC bC bC bC bC bC bC bC bC bC bC bC bC bC bC bC bC bC bC bC bC bC bC bC bC bC bC bC bC bC bC bC bC bC bC bC bC bC bC bC bC bC bC bC bC bC bC bC bC bC bC bC bC bC bC bC bC bC bC bC bC bC bC bC bCbC bC bC bC bC bC bC bC bC bC bC bC bCbC bC bC bC bC bCbC bC bC bCbC bC bCbC bC bCbC bCbC bCbC bCbC bCbC bCbCbC bC bC bC bC bC bC bC bC bCbC bCbCbC bC
bC bC bC bC bC bC bC bC bC bC bC bC bC bC bC bC bC bC bC bC bC bC bC bC bC bC bC bC bC bC bC bC bC bC bC bC bC bC bC bC bC bC bC bC bC bC bC bC bC bC bC bC bC bC bC bC bC bC bC bC bC bC bC bC bC bC bC bC bC bC bC bC bC bC bC bC bC bC bC bC bC bC bC bC bC bC bC bC bC bC bC bC bC bC bC bC bC bC bC bC bC bC bC bC bC bC bC bC bC bC bC bC bC bC bC bC bC bC bC bC bC bC bC bC bC bC bC bC bC bC bC bC bC bC bC bC bC bC bC bC bC bC bC bC bC bC bC bC bC bC bC bC bC bC bC bC bC bC bC bC bC bC bC bC bC bC bC bC bC bC bC bC bC bC bC bC bC bC bC bC bC bC bC bC bC bC bC bC bC bC bC bC bC bC bC bC bC bC bC bC bC bC bC bC bC bC bC bC bC bC bC bC bC bC bC bC bC bC bC bC bC bC bC bC bC bC bC bC bC bC bC bC bC bC bC bC bC bC bC bC bC bC bC bC bC bC bC bC bC bC bC bC bC bC bC bC bC bC bC bC bC bC bC bC bC bC bC bC bC bC bC bC bC bC bC bC bC bC bC bC bC bC bC bC bC bC bC bC bC bC bC bC bC bC bC bC bC bC bC bC bC bC bC bC bC bC bC bC bC bC bC bC bC bC bC bC bC bC bC bC bC bC bCbC bC bC bC bC bC bCbC bC bC bC bCbC bCbC bCbC bCbCbC bCbCbCbCbCbC
bC
bCbCbCbCbC bC bC bC bCbCbCbC
bCbC
bC
bCbCbCbCbCbCbCbC bCbC bC bC bC bC bC bC bC bC bC bC bC bC bC bC bC bC bC bC bC bC bC bC bC bC bC bC bC bC bC bC bC bC bC bC bC bC bC bC bC bC bC bC bC bC bC bC bC bC bC bC bC bC bC bC bC bC bC bC bC bC bC bC bC bC bC bC bC bC bC bC bC bC bC bC bC bC bC bC bC bC bC bC bC bC bC bC bC bC bC bC bC bC bC bC bC bC bC bC bC bC bC bC bC bC bC bC bC bC bC bC bC bC bC bC bC bC bC bC bC bC bC bC bC bC bC bC bC bC bC bC bC bC bC bC bC bC bC bC bC bC bC bC bC bC bC bC bC bC bC bC bC bC bC bC bC bC bC bC bC bC bC bC bC bC bC bC bC bC bC bC bC bC bC bC bC bC
bC bC bC bC bC bC bCbC bC bC bCbC bCbC bCbC bCbC bCbC bCbC bC bC bC bC bCbC bC bCbC bC bC bC bC bC bC bC bCbC bC bC bC bC bC bC bC bC bC bC bC bC bC bC bC bC bC bC bC bC bC bC bC bC bC bC bC bC bC bC bC bC bC bC bC bC bC bC bC bC bC bC bC bC bC bC bC bC bC bC bC bC bC bC bC bC bC bC bC bC bC bCbC bC bC bC bC bCbC bC bC bC bCbC bC bC bC bC bC bC bC bC bC bC bC bC bC bC bC bC bC bC bC bC bC bC bC bC bC bC bC bC bC bC bC bC bC bC bC bC bC bC bCbC bC bC bC bCbC bC bCbC bC bCbC bCbC bCbC bCbCbCbCbCbCbCbCbCbCbC bCbC bCbC bC bC bC bC bCbCbCbCbCbCbCbCbCbCbC
bCbC bC bC bC bC bC bC bC bC bC bC bC bC bC bC bC bC bC bC bC bC bC bC bC bC bC bC bC bC bC bC bC bC bC bC bC bC bC bC bC bC bC bC bC bC bC bC bC bC bC bC bC bC bC bC bC bC bCbC bC bC bC bCbC bC bC bCbC bC bCbC bC bCbC bCbC bC bC bC bC bC bC bC bC bC bC bC bCbC bC bC bC bC bC bC bC bC bC bC bC bC bC bC bC bC bC bC bC bC bC bC bC bC bC bC bC bC bC bC bC bC bC bC bC bC bC bC bC bC bC bC bC bC bC bC bC bC bC bC bC bC bC bC bC bC bC bC bC bC bC bC bC bC bC bC bC bC bC bC bC bC bC bC bC bC bC bC bC bC bC bC bC bC bC bC bC bC bC bC bC bC bC bC bC bC bC bC bC bC bC bC bC bC bC bCbC bC bC bC bC bC bC bC bCbC bC bC bCbC bC bC bCbC bC bCbC bC bCbC bC bC bC bC bC bC bC bC bC bC bC bC bC bC bC bC bC bC bC bC bC bC bC bC bC bC bC bC bC bC bC bC bC bC bC bC bC bC bC bC bC bC bC bC bC bC bC bC bC bC bC bC bC bC bC bC bC bC bC bC bC bC bC bC bC bC bC bC bC bC bC bC bC bC bC bC bC bC bC bC bC bC bC bC bC bC bC bC bC bC bC bC bC bC bC bC bC bC bC bC bC bC bC bC bC bC bC bC bC bC bC bC bC bC bC bC bC bC bC bC bC bC bC bC bC bC bC bC bC bC bC bC bC bC bC bC bC bC bC bC bC bC bC bC bC bC bC bC bC bC bC bC
bC bC bC bC bC bC bC bC bC bCbC bC bC bC bC bCbC bC bC bCbC bCbC bCbC bCbC bCbCbC bCbC bCbC bCbC bC bC bC bC bC bC bC bC bC bC bC bC bC bC bC bC bCbC bC bC bC bC bC bC bC bC bC bC bC bC bC bC bC bC bC bC bC bC bC bC bC bC bC bC bC bC bC bC bC bCbC bC bC bCbC bC bCbC bCbC bCbC bC bCbC bC bC bC bC bC bC bC bC bC bC bC bC bC bC bC bC bC bC bC bC bC bC bC bC bC bC bC bC bC bC bC bCbC bC bC bCbC bC bC bCbC bC bC bCbC bC bC bC bC bCbC bC bCbC bCbC bCbC bCbC bCbCbC bCbCbC bC bC bC bC bC bC bC bCbCbC bC
bC bC bC bC bC bC bC bC bC bCbCbC bC bCbC bCbC bC bC bC bC bC bCbC bC bC bC bC bCbC bCbC bC bC bC bC bC bC bC bC bC bCbC bCbC bCbC bCbCbCbCbCbC bCbC bCbC bCbC bC bCbC bC bC bC bC bC bC bC bC bC bCbCbCbC bC bCbCbC bC bCbCbC bC bC bC bC bC bC bC bC bC bC bC bC bC bC bC bC bC bC bC bC bC bC bC bC bC bC bC bC bC bC bC bC bC bC bC bC bC bC bC bC bC bC bC bC bC bC bC bC bC bC bC bC bC bC bC bC bC bC bC bC bC bC bCbC bC bC bC bC bC bCbC bC bC bCbC bC bCbC bCbC bC bCbC bC bCbC bC bC bC bC bC bC bC bC bC bC bC bC bC bC bC bC bC bC bC bC bC bC bC bC bC bC bC bCbC bC bC bC bC bC bC bC bC bC bC bC bC bC bC bC bC bC bC bC bC bC bC bC bC bC bC bC bC bC bC bC bC bC bC bC bC bC bC bC bC bC bC bC bC bC bC bC bC bC bC bCbC bC bC bC bC bC bC bC bCbC bC bC bC bC bC bC bCbC bC bC bC bC bCbC bC bC bC bCbC bC bCbC bC bCbCbCbCbCbCbCbCbCbCbCbCbCbCbC bCbCbC bC bC bC bC bC bC bCbC bCbCbCbCbCbCbCbCbCbCbCbCbC bC bC bC bC bC bC bC bC bC bC bC bC bC bC bC bC bCbC bC bC bC bCbC bC bCbC bCbCbCbCbC bCbCbC bCbC bC bCbC bC bC bC bCbC bC bCbCbCbCbCbCbCbCbC bC bC bC bC bC bC bC bC bC bC bC bC bC bC bC bC bC bC bC bC bC bC bC bC bC bC bC bC bC bC bC bC bC bC bC bC bC bC bC bC bC bC bC bC bC bC bC bC bC bC bC bC bC bC bC bC bC bC bC bC bC bC bC bC bC bC bC bC bC bC bC bCbC bC bC bC bC bC bC bCbC bC bC bCbC bC bC bCbC bCbC bCbC bCbC bCbC bCbC bCbCbC bCbC bCbC bC bCbC bC bC bC bC bCbC bC bC bCbCbCbC bCbCbC bC
bC bC bC bC bC bC bC bC bC bC bC bC bC bC bC bC bC bC bC bC bC bC bC bC bC bC bC bC bC bC bC bC bC bC bC bC bC bC bC bC bC bC bC bC bC bC bC bC bC bC bC bC bC bC bC bC bC bC bC bC bC bC bC bC bC bC bC bC bC bC bC bC bC bC bC bC bC bC bC bC bC bC bC bC bC bC bC bC bC bC bC bC bC bC bC bC bC bC bC bC bC bC bC bC bC bC bC bC bC bC bC bC bC bC bC bC bC bC bC bC bC bC bC bC bCbC bC bC bC bC bC bC bC bC bC bC bC bCbC bC bC bC bC bC bC bC bCbC bC bC bC bCbC bC bC bCbC bC bCbC bCbC bCbCbCbC bCbCbCbC bCbCbC bCbC bCbC bCbC bCbC bC bC bC bC bCbCbC bCbCbCbCbCbCbCbCbCbCbC bC
bC bC bC bC bC bC bC bC bC bC bC bC bC bC bC bC bC bC bC bC bC bC bC bC bC bC bC bC bC bC bC bC bC bC bC bC bC bC bC bC bC bC bC bC bC bC bC bC bC bC bC bC bC bC bC bC bC bC bC bC bC bC bC bC bC bC bC bC bC bC bC bC bC bC bC bC bC bC bC bC bC bC bC bC bC bC bCbC bC bC bC bC bC bC bC bC bC bC bC bC bC bC bCbC bC bC bC bC bC bCbC bC bC bC bC bC bC bCbC bC bC bC bC bC bC bC bC bC bC bC bC bC bC bC bC bC bC bC bC bC bC bC bC bC bC bC bC bC bC bC bC bC bC bC bC bC bC bC bC bC bC bC bC bCbC bC bC bC bC bC bC bC bC bCbC bC bC bCbC bCbC bCbC bCbCbC bCbCbCbC bCbC bCbC bCbC bC bC bC bCbC bC bC bC bCbC bC bCbC bC bC bC bC bC bC bC bC bC bC bC bC bC bC bC bC bC bC bC bC bC bC bC bC bC bC bC bC bC bC bC bC bC bC bC bC bC bC bC bC bC bC bC bC bC bC bC bC bC bC bC bC bC bC bC bC bC bC bC bC bC bCbC bC bC bC bC bC bC bC bC bC bC bC bC bC bC bC bC bC bC bC bC bC bC bC bC bC bC bC bC bC bC bC bC bC bC bC bC bC bC bCbC bC bC bC bC bCbC bC bC bC bCbC bC bC bC bCbC bC bC bC bC bC bC bCbC bC bC bC bC bC bC bC bC bC bC bC bC bC bC bC bC bC bC bC bC bC bC bC bC bC bC bC bC bC bC bC bC bC bC bC bC bC bC bC bC bC bC bC bC bC bC bC bC bC bC bC bC bC bC bC bC bC bC bC bC bC bC bC bC bC bC bC bC bC bC bC bC bC bC bC bC bC bC bC bC bC bC bC bC bCbC bC bC bC bC bC bC bC bC bC bC bC bC bC bC bC bC bC bC bC bC bC bC bC bC bC bC bC bC bC bC bC bC bC bC bC bC bC bC bC bC bC bC bC bC bC bC bC bC bC bC bC bC bC bC bC bC bC bC bC bC bC bC bC bC bC bC bC bC bC bC bC bC bC bC bC bC bC bC bC bC bC bC bC bC bC bC bC bC bC bC bC bC bC bC bC bC bC bC bC bC bC bC bC bC bC bC bC bC bC bC bC bC bC bC bCbC bC bC bC bC bC bC bC bC bC bC bC bC bC bC bC bC bC bC bC bC bC bC bC bC bC bC bC bC bC bC bC bC bC bC bC bC bC bC bC bC bC bC bC bC bC bC bC bC bC bC bC bC bC bC bC bC bC bC bC bC bC bC bC bC bC bC bC bC bC bC bC bC bC bC bC bC bC bC bC bC bC bC bC bC bC bC bC bC bC bC bC bC bC bC bC bC bC bC bC bC bC bC bC bC bC bC bC bC bC bC bC bC bC bC bC bC bC bC bC bC bC bC bC bC bC bC bC
bC bC bC bC bC bC bC bC bC bC bC bC bC bC bC bC bC bC bC bC bC bC bC bC bC bC bC bC bC bC bC bC bC bC bC bC bC bC bC bC bC bC bC bC bC bC bC bC bC bC bC bC bC bC bC bC bC bC bC bC bC bC bC bC bC bC bC bC bC bC bC bC bC bC bC bC bC bC bC bC bC bC bC bC bC bC bC bC bC bC bC bC bC bC bC bC bC bC bC bC bC bC bC bC bC bC bC bC bC bC bC bC bC bC bC bC bC bC bC bC bC bC bC bC bC bC bC bC bC bCbC bC bC bC bC bC bC bC bC bC bC bC bC bC bC bC bC bC bC bC bC bC bC bC bC bC bC bC bC bC bC bC bC bC bC bC bC bC bC bC bC bC bC bC bC bC bC bC bC bC bC bC bC bC bC bC bC bC bC bC bC bC bC bC bC bC bC bC bC bC bCbC bC bC bC bC bC bC bC bC bC bC bC bC bC bC bC bC bC bC bC bC bC bC bC bC bC bC bC bC bC bC bC bC bC bC bC bC bC bC bC bC bC bC bC bC bC bC bC bC bC bC bC bC bC bC bC bC bC bC bC bC bC bC bC bC bC bC bC bC bC bC bC bC bC bC bC bC bC bC bCbC bC bC bC bC bC bC bC bC bC bC bC bC bC bC bC bC bC bC bC bC bC bC bC bC bC bC bC bC bC bC bC bC bC bC bC bC bC bC bC bC bC bC bC bC bC bC bC bC bC bC bC bC bC bC bC bC bC bC bC bC bC bC bC bC bC bC bC bC bC bC bC bC bC bC bC bC bC bC bC bC bC bC bC bC bC bC bC bC bC bC bC bC bC bC bC bC bC bC bC bC bC bC bC bC bC bC bC bC bC bC bC bC bC bC bC bC bC bC bC bC bC bC bC bC bC bC bC bC bC bC bC bC bC bC bC bC bC bC bC bC bC bC bC bC bC bC bC bC bC bC bC bC bC bC bC bC bC bC bC bC bC bC bC bC bC bC bC bC bC bC bC bC bC bC bC bC bC bC bC bC bC bC bC bC bC bC bC bC bC bC bC bC bC bC bC bC bC bC bC bC bC bC bC bC bC bC bC bC bC bC bC bC bC bC bC bC bC bC bC bC bC bC bC bC bC bC bC bC bC bC bC bC bC bC bC
bC bC bC bC bC bC bC bC bC bC bC bCbC bC bC bC bC bC bC bC bC bC bC bC bC bC bC bC bC bC bC bC bC bC bC bC bC bC bC bC bC bC bC bC bC bC bC bC bC bC bC bC bC bC bC bC bC bC bC bC bC bC bC bC bC bC bC bC bC bC bC bC bC bC bC bC bC bC bC bC bC bC bC bC bC bC bC bC bC bC bC bC bC bC bC bC bC bC bC bC bC bC bC bC bC bC bC bC bC bC bC bC bC bC bC bC bC bC bC bC bC bC bC bC bC bC bC bC bC bC bC bC bC bC bC bC bC bC bC bC bC bC bC bC bC bC bC bC bC bC bC bC bC bC bC bC bC bC bC bC bC
bC bC bC bC bC bC bC bC bC bC bC bC bC bC bCbC bC bC bC bC bC bC bC bC bC bC bC bC bCbC bC bC bC bC bC bC bC bC bC bC bC bC bC bC bC bC bC bCbC bC bC bC bC bC bC bC bC bC bC bC bC bC bC bC bC bC bC bC bC bC bC bC bC bC bC bC bC bC bC bC bC bC bC bC bC bC bC bC bC bC bC bC bC bC bC bC bC bC bC bC bC bC bC bC bC bC bC bC bC bC bC bC bC bC bC bC bC bC bC bC bC bC bC bC bC bC bC bC bC bC bC bC bC bC bC bC bC bC bC bC bC bC bC bC bC bC bC bC bC bC bC bC bC bC bC bC bC bC bC bC bC bC bC bC bC bC bC bC bC bCbC bC bC bC bC bC bC bC bC bC bC bC bC bC bC bC bC bC bC bC bC bC bC bC bC bC bC bC bC bC bC bC bC bC bC bC bC bC bC bC bC bC bC bC bC bC bC bC bC bC bC bC bCbC bC bC bC bC bC bC bC bC bC bC bC bC bC bC bC bC bC bC bC bC bC bC bC bC bC bC bC bC bC bC bC bC bC bC bC bC bC bC bC bC bC bC bC bC bC bC bC bC bC bC bC bC bC bC bC bC bC bC bC bC bC bC bC bC bC bC bC bC bC bC bC bC bC bC bC bC bC bC bC bC bC bC bC bC bC bC bC bC bC bC bC bC bC bC bC bC bC bC bC bC bC bC bC bC bC bC bC bC bC bC bC bC bC bC bC bC bC bC bC bC bC bC bC bC bC bC bC bC bC bC bC bC bC bC bC bC bC bC bC bC bC bC bC bC bC bC bC bC bC bC bC bC bC bC bC bC bC bC bC bC bC bC bC
bC bC bC bC bC bC bC bC bC bC bC bC bC bC bC bC bC bC bC bC bC bC bC bC bC bC bC bC bC bC bC bC bC bC bC bC bC bC bC bC bC bC bC bC bC bC bC bC bC bC bC bC bC bC bC bC bC bC bC bC bC bC bC bC bC bC bC bC bC bC bC bC bC bC bC bC bC bC bC bC bC bC bC bC bC bC bC bC bC bC bC bC bC bC bC bC bC bC bC bC bC bC bC bC bC bC bC bC bC bC bC bC bC bC bC bC bC bC bCbC bC bC bC bC bC bC bC bC bC bC bC bC bC bC bC bC bC bC bC bC bC bC bC bC bC bC bC bC bC bC bC bC bC bC bC bC bC bC bC bC bC bC bC bC bC bC bC bC bC bC bC bC bC bC bC bC bC bC bC bC bC bC bC bC bC bC bC bC bC bC bC bC bC bC bC bC bC bC bC bC bC bC bC bC bC bC bC bC bC bC bC bC bC bC bC bC bC bC bC bC bC bC bC bC bC bC bC bC bC bC bC bC bC bC bC bC bC bC bC bC bC bC bC bC bC bC bC bC bC bC bC bC bC bC bC bC bC bC bC bC bC bC bC bC
bC bC bC bC bC bC bC bC bC bC bC bC bC bC bC bC bC bC bC bC bC bC bC bC bC bC bC bC bC bC bC bC bC bC bC bC bC bC bC bC bC bC bC bC bC bC bC bC bC bC bC bC bC bC bC bC bC bC bC bC bC bC bC bC bC bC bC bC bC bC bC bC bC bC bC bC bC bC bC bC bC bC bC bC bC bC bC bC bC bC bC bC bC bC bC bC bC bC bC bC bC bC bC bC bCbC bC bC bC bC bC bC bC bC bC bC bC bC bC bC bC bC bC bC bC bC bC bC bC bC bC bC bC bC bC bC bC bC bC bC bC bC bC bC bC bC bC bC bC bC bC bC bC bC bC bC bC bC bC bC bC bC bC bC bC bC bC bC bC bC bC bC bC bC bC bC bC bC bC bC bC bC bC bC bC bC bC bC bC bC bC bC bC bC bC bC bC bC bC bC bC bC bC bC bC bC bC bC bC bC bC bC bC bC bC bC bC bC bC bC bC bC bC bC bC bC bC bC bC bC bC bC bC bC bC bC bC bC bC bC bC bC bC bC bC bC bC bC bC bC bC bC bC bC bC bC bC bC bC bC bC bC bC bC bC bC bC bC bC bC bC bC bC bC bC bC bC bC bC bC bC bC bC bC bC bC bC bC bC bC bC bC bC bC bC bC bC bC bC bC bC bC bC bC bC bC bC bC bC bC bC bC bC bC
bC bC bC bC bC bC bC bC bC bC bC bC bC bC bC bC bC bC bC bC bC bC bC bC bC bC bC bC bC bC bC bC bC bC bC bC bC bC bC bC bC bC bC bC bC bC bC bC bC bC bC bC bC bC bC bC bC bC bC bC bC bC bC bC bC bC bC bC bC bC bC bC bC bC bC bC bC bC bC bC bC bC bC bC bC bC bC bC bC bC bC bC bC bC bC bC bC bC bC bC bC bC bC bC bC bC bC bC bC bC bC bC bC bC bC bC bC bC bC bC bC bC bC bC bC bC bC bC bC bC bC bC bC bC bC bC bC bC bC bC bC bC bC bC bC bC bC bC bC bC bC bC bC bC bC bC bC bC bC bC bC bC bC bC bC bC bC bC bC bC bC bC bC bC bC bC bC bC bC bC bC bC bC bC bC bC bC bC bC bC bC bC bC bC bC bC bC bC bC bC bC bC bC bC bC bC bC bC bC bC bC bC bC bC bC bC bC bC bC bC bC bC bC bC bC bC bC bC bC bC bC bC bC bC bC bC bC bC bC bC bC bC bC bC bC bC bC bC bC bC bC bC bC bC bC bC bC bC bC bC bC bC bC bC bC bC bC bC bC bC bC bC bC bC bC bC bC bC bC bC bC bC bC bC bC bC bC bC bC bC bC bC bC bC bC bC bC bC bC bC bC bC bC bC bC bC bC bC bC bC bC bC bC bC bC bC bC bC bC bC bC bC bC bC bC bC bC bC bC bC bC bC bC bC bC bC bC bC bC bC bC bC bC bC bC bC bC bC bC bC bC bC bC bC bC bC bC bC bC bC bC bC bC bC bC bC bC bC bC bC bC bC bC bC bC bC bC bC bC bC bC bC bC bC bC bC bC bC bC bC bC bC bC bC bC bC bC bC bC bC bC bC bC bC bC bC bC bC bC bC bC bC bC bC bC bC bC bC bC bC bC bC bC bC bC bC bC bC bC bC bC bC bC bC bC bC bC bC bC bC bC bC bC bC bC bC bC bC bC bC bC bC bC bC bC bC bC bC bC bC bC bC bC bC bC bC bC bC bC bC bC bC bC bC bC bC bC bC bC bC bC bC bC bC bC bC bC bC bC bC bC bC bC bC bC bC bC bC bC bC bC bC bC bC bC bC bC bC bC bC bC bC bC bC bC bC bC bC bC bC bC bC bC bC bC bC bC bC bC bC bC bC bC bC bC bC bC bC bC bC bC bC bC bC bC bC bC bC bC bC bC bC bC bC bC bC bC bC bC bC bC bC bC bC bC bC bC bC bC bC bC bC bC bC bC bC bC bC bC bC bC bC bC bC bC bC bC bC bC bC bC bC bC bC bC bC bC bC bC bC bC bC bC bC bC bC bC bC bC bC bC bC bC bC bC bC bC bC bC bC bC bC bC bC bC bC bC bC bC bC bC bC bC bC bC bC bC bC bC bC bC bC bC bC bC bC bC bC bC bC bC bC bC bC bC bC bC bC bC bC bC bC bC bC bC bC bC bC bC bC bC bC bC bC bC bC bC bC bC bC bC bC bC bC bC bC bC bC bC bC bC bC bC bC bC bC bC bC bC bC bC bC bC bC bC bC bC bC bC bC bC bC bC bC bC bC bC bC bC bC bC bC bC bC bC bC bC bC bC bC bC bC bC bC bC bC bC bC bC bC bC bC bC bC bC bC bC bC bC bC bC bC bC bC bC bC bC bC bC bC bC bC bC bC bC bC bC bC bC bC bC bC bC bC bC bC bC bC bC bC bC bC bC bC bC bC bC bC bC bC bC bC bC bC bC bC bC bC bC bC bC bC bC bC bC bC bC bC bC bC bC bC bC bC bC bC bC bC bC bC bC bC bC bC bC bC bC bC bC bC bC bC bC bC bC bC bC bC bC bC bC bC bC bC bC bC bC bC bC bC bC bC bC bC bC bC bC bC bC bC bC bC bC bC bC bC bC bC bC bC bC bC bC bC bC bC bC bC bC bC bC bC bC bC bC bC bC bC bC bC bC bC bC bC bC bC bC bC bC bC bC bC bC bC bC bC bC bC bC bC bC bC bC bC bC bC bC bC bC bC bC bC bC bC bC bC bC bC bC bC bC bC bC bC bC bC bC bC bC bC bC bC bC bC bC bC bC bC bC bC bC bC bC bC bC bC bC bC bC bC bC bC bC bC bC bC bC bC bC bC bC bC bC bC bC bC bC bC bC bC bC bC bC bC bC bC bC bC bC bC bC bC bC bC bC bC bC bC bC bC bC bC bC bC bC bC bC bC bC bC bC bC bC bC bC bC bC bC bC bC bC bC bC bC bC bC bC bC bC bC bC bC bC bC bC bC bC bC bC bC bC bC bC bC bC bC bC bC bC bC bC bC bC bC bC bC bC bC bC bC bC bC bC bC bC bC bC bC bC bC bC bC bC bC bC bC bC bC bC bC bC bC bC bC bC bC bC bC bC bC bC bC bC bC bC bC bC bC bC bC bC bC bC bC bC bC bC bC bC bC bC bC bC bC bC bC bC bC bC bC bC bC bC bC bC bC bC bC bC bC bC bC bC bC bC bC bC bC bC bC bC bC bC bC bC bC bC bC bC bC bC bC bC bC bC bC bC bC bC bC bC bC bC bC bC bC bC bC bC bC bC bC bC bC bC bC bC bC bC bC bC bC bC bC bC bC bC bC bC bC bC bC bC bC bC bC bC bC bC bC bC bC bC bC bC bC bC bC bC bC bC bC bC bC bC bC bC bC bC bC bC bC bC bC bC bC bC bC bC bC bC bC bC bC bC bC bC bC bC bC bC bC bC bC bC bC bC bC bC bC bC bC bC bC bC bC bC bC bC bC bC bC bC bC bC bC bC bC bC bC bC bC bC bC bC bC bC bC bC bC bC bC bC bC bC bC bC bC bC bC bC bC bC bC bC bC bC bC bC bC bC bC bC bC bC bC bC bC bC bC bC bC bC bC bC bC bC bC bC bC bC bC bC bC bC bC bC bC bC bC bC bC bC bC bC bC bC bC bC bC bC bC bC bC bC bC bC bC bC bC bC bC bC bC bC bC bC bC bC bC bC bC bC bC bC bC bC bC bC bC bC bC bC bC bC bC bC bC bC bC bC bC bC bC bC bC bC bC bC bC bC bC bC bC bC bC bC bC bC bC bC bC bC bC bC bC bC bC bC bC bC bC bC bC bC bC bC bC bC bC bC bC bC bC bC bC bC bC bC bC bC bC bC bC bC bC bC bC bC bC bC bC bC bC bC bC bC bC bC bC bC bC bC bC bC bC bC bC bC bC bC bC bC bC bC bC bC bC bC bC bC bC bC bC bC bC bC bC bC bC bC bC bC bC bC bC bC bC bC bC bC bC bC bC bC bC bC bC bC bC bC bC bC bC bC bC bC bC bC bC bC bC bC bC bC bC bC bC bC bC bC bC bC bC bC bC bC bC bC bC bC bC bC bC bC bC bC bC bC bC bC bC bC bC bC bC bC bC bC bC bC bC bC bC bC bC bC bC bC bC bC bC bC bC bC bC bC bC bC bC bC bC bC bC bC bC bC bC bC bC bC bC bC bC bC bC bC bC bC bC bC bC bC bC bC bC bC bC bC bC bC bC bC bC bC bC bC bC bC bC bC bC bC bC bC bC bC bC bC bC bC bC bC bC bC bC bC bC bC bC bC bC bC bC bC bC bC bC bC bC bC bC bC bC bC bC bC bC bC bC bC bC bC bC bC bC bC bC bC bC bC bC bC bC bC bC bC bC bC bC bC bC bC bC bC bC bC bC bC bC bC bC bC bC bC bC bC bC bC bC bC bC bC bC bC bC bC bC bC bC bC bC bC bC bC bC bC bC bC bC bC bC bC bC bC bC bC bC bC bC bC bC bC bC bC bC bC bC bC bC bC bC bC bC bC bC bC bC bC bC bC bC bC bC bC bC bC bC bC bC bC bC bC bC bC bC bC bC bC bC bC bC bC bC bC bC bC bC bC bC bC bC bC bC bC bC bC bC bC bC bC bC bC bC bC bC bC bC bC bC bC bC bC bC bC bC bC bC bC bC bC bC bC bC bC bC bC bC bC bC bC bC bC bC bC bC bC bC bC bC bC bC bC bC bC bC bC bC bC bC bC bC bC bC bC bC bC bC bC bC bC bC bC bC bC bC bC bC bC bC bC bC bC bC bC bC bC bC bC bC bC bC bC bC bC bC bC bC bC bC bC bC bC bC bC bC bC bC bC bC bC bC bC bC bC bC bC bC bC bC bC bC bC bC bC bC bC bC bC bC bC bC bC bC bC bC bC bC bC bC bC bC bC bC bC bC bC bC bC bC bC bC bC bC bC bC bC bC bC bC bC bC bC bC bC bC bC bC bC bC bC bC bC bC bC bC bC bC bC bC bC bC bC bC bC bC bC bC bC bC bC bC bC bC bC bC bC bC bC bC bC bC bC bC bC bC bC bC bC bC bC bC bC bC bC bC bC bC bC bC bC bC bC bC bC bC bC bC bC bC bC bC bC bC bC bC bC bC bC bC bC bC bC bC bC bC bC bC bC bC bC bC bC bC bC bC bC bC bC bC bC bC bC bC bC bC bC bC bC bC bC bC bC bC bC bC bC bC bC bC bC bC bC bC bC bC bC bC bC bC bC bC bC bC bC bC bC bC bC bC bC bC bC bC bC bC bC bC bC bC bC bC bC bC bC bC bC bC bC bC bC bC bC bC bC bC bC bC bC bC bC bC bC bC bC bC bC bC bC bC bC bC bC bC bC bC bC bC bC bC bC bC bC bC bC bC bC bC bC bC bC bC bC bC bC bC bC bC bC bC bC bC bC bC bC bC bC bC bC bC bC bC bC bC bC bC bC bC bC bC bC bC bC bC bC bC bC bC bC bC bC bC bC bC bC bC bC bC bC bC bC bC bC bC bC bC bC bC bC bC bC bC bC bC bC bC bC bC bC bC bC bC bC bC bC bC bC bC bC bC bC bC bC bC bC bC bC bC bC bC bC bC bC bC bC bC bC bC bC bC bC bC bC bC bC bC bC bC bC bC bC bC bC bC bC bC bC bC bC bC bC bC bC bC bC bC bC bC bC bC bC bC bC bC bC bC bC bC bC bC bC bC bC bC bC bC bC bC bC bC bC bC bC bC bC bC bC bC bC bC bC bC bC bC bC bC bC bC bC bC bC bC bC bC bC bC bC bC bC bC bC bC bC bC bC bC bC bC bC bC bC bC bC bC bC bC bC bC bC bC bC bC bC bC bC bC bC bC bC bC bC bC bC bC bC bC bC bC bC bC bC bC bC bC bC bC bC bC bC bC bC bC bC bC bC bC bC bC bC bC bC bC bC bC bC bC bC bC bC bC bC bC bC bC bC bC bC bC bC bC bC bC bC bC bC bC bC bC bC bC bC bC bC bC bC bC bC bC bC bC bC bC bC bC bC bC bC bC bC bC bC bC bC bC bC bC bC bC bC bC bC bC bC bC bC bC bC bC bC bC bC bC bC bC bC bC bC bC bC bC bC bC bC bC bC bC bC bC bC bC bC bC bC bC bC bC bC bC bC bC bC bC bC bC bC bC bC bC bC bC bC bC bC bC bC bC bC bC bC bC bC bC bC bC bC bC bC bC bC bC bC bC bC bC bC bC bC bC bC bC bC bC bC bC bC bC bC bC bC bC bC bC bC bC bC bC bC bC bC bC bC bC bC bC bC bC bC bC bC bC bC bC bC bC bC bC bC bC bC bC bC bC bC bC bC bC bC bC bC bC bC bC bC bC bC bC bC bC bC bC bC bC bC bC bC bC bC bC bC bC bC bC bC bC bC bC bC bC bC bC bC bC bC bC bC bC bC bC bC bC bC bC bC bC bC bC bC bC bC bC bC bC bC bC bC bC bC bC bC bC bC bC bC bC bC bC bC bC bC bC bC bC bC bC bC bC bC bC bC bC bC bC bC bC bC bC bC bC bC bC bC bC bC bC bC bC bC bC bC bC bC bC bC bC bC bC bC bC bC bC bC bC bC bC bC bC bC bC bC bC bC bC bC bC bC bC bC bC bC bC bC bC bC bC bC bC bC bC bC bC bC bC bC bC bC bC bC bC bC bC bC bC bC bC bC bC bC bC bC bC bC bC bC bC bC bC bC bC bC bC bC bC bC bC bC bC bC bC bC bC bC bC bC bC bC bC bC bC bC bC bC bC bC bC bC bC bC bC bC bC bC bC bC bC bC bC bC bC bC bC bC bC bC bC bC bC bC bC bC bC bC bC bC bC bC bC bC bC bC bC bC bC bC bC bC bC bC bC bC bC bC bC bC bC bC bC bC bC bC bC bC bC bC bC bC bC bC bC bC bC bC bC bC bC bC bC bC bC bC bC bC bC bC bC bC bC bC bC bC bC bC bC bC bC bC bC bC bC bC bC bC bC bC bC bC bC bC bC bC bC bC bC bC bC bC bC bC bC bC bC bC bC bC bC bC bC bC bC bC bC bC bC bC bC bC bC bC bC bC bC bC bC bC bC bC bC bC bC bC bC bC bC bC bC bC bC bC bC bC bC bC bC bC bC bC bC bC bC bC bC bC bC bC bC bC bC bC bC bC bC bC bC bC bC bC bC bC bC bC bC bC bC bC bC bC bC bC bC bC bC bC bC bC bC bC bC bC bC bC bC bC bC bC bC bC bC bC bC bC bC bC bC bC bC bC bC bC bC bC bC bC bC bC bC bC bC bC bC bC bC bC bC bC bC bC bC bC bC bC bC bC bC bC bC bC bC bC bC bC bC bC bC bC bC bC bC bC bC bC bC bC bC bC bC bC bC bC bC bC bC bC bC bC bC bC bC bC bC bC bC bC bC bC bC bC bC bC bC bC bC bC bC bC bC bC bC bC bC bC bC bC bC bC bC bC bC bC bC bC bC bC bC bC bC bC bC bC bC bC bC bC bC bC bC bC bC bC bC bC bC bC
0,0
0,5
1,0
1,5
2,0
2,5
3,0
Int/
104
2θ/°10 20 30 40 50 60 70 80
Abbildung 3.13: Rietveld-Plot von 10. Schwarze Kreise: gemessenes Pulverdiagramm; rote Linie:simuliertes Pulverdiagramm; blaue Linie: Untergrund; grüne Linie: Differenzkurve.
3.4.3 Zusammenfassung
Trotz Schwierigkeiten in der Bestimmung der Raumgruppe konnte die Kristallstruktur von10 erfolgreich gelöst und abschließend verfeinert werden.
Der mittlere Hauptteil der Moleküle ist planar; die endständigen Phenylgruppen sind um77,5° aus der Molekülebene herausgedreht (Abb. [CB5, Fig. 8]). Zwischen den Molekülen gibtes bis auf Van-der-Waals- und schwache Coulomb-Kräfte (zwischen Atomen mit Partialla-dungen) keine bindenden Wechselwirkungen. Die Moleküle bilden eine Fischgrätanordnung;die Molekülstapel zeigen dabei in Richtung [001] (Abb. [CB5, Fig. 9]).
Die Verbindung weist eine sehr hohe Packungsdichte auf. Außerdem liegen intramolekulareWasserstoffbrückenbindungen solcher Art vor, wie sie nach quantenchemischen RechnungenVoraussetzung sind, um die beobachtete Fluoreszenz zu erklären.
3Die noch vorhandenen Anpassungsmängel sind zurückzuführen auf Schwierigkeiten in der mathematischenBeschreibung der Reflexprofile.
42

3.4 Pigment-Yellow-101-Derivat
Weitere Details finden sich in [CB5].
43

3 Bestimmung von Kristallstrukturen organischer Pigmente aus Röntgen-Pulverdaten
3.5 Rietveld-Verfeinerung eines falschen Kristallstrukturmodells[CB6]
Rietveld-Verfeinerungen werden eingesetzt, um aus Pulverdaten bestimmte Kristallstruktu-ren zu bestätigen. Die Beurteilung der „Richtigkeit“ einer Kristallstruktur richtet sich nachAspekten wie niedrigen R-Werten (s. Abschnitt 2.4.3), einer „glatten“ Differenzkurve undeiner chemisch sinnvollen (Molekül-)Struktur.
Umso erstaunlicher ist es, dass trotz eines völlig falschen Strukturmodells eine Rietveld-Verfeinerung ein annehmbares Ergebnis lieferte.
3.5.1 „Richtige“ und „falsche“ Kristallstrukturen
Es lässt sich zeigen, dass untergrundkorrigierte R-Werte größer sind als entsprechende Werteohne Untergrundkorrektur. Dieser Umstand verleitet Autoren häufig dazu, R-Werte ohneUntergrundkorrektur anzugeben.
Die Differenzkurve zeigt die Unterschiede zwischen experimentellem und simuliertemPulverdiagramm. Bei idealer Anpassung ist die Differenzkurve eine Linie parallel zur x-Achse(2θ-, d−1-, Time-of-flight-Skala o. ä.).
Gelegentlich kommt es zu Schwierigkeiten in der mathematischen Beschreibung bestimm-ter Reflexe, insbesondere wenn sie bei niedrigen Beugungswinkeln auftreten und/oder einehohe Asymmetrie aufweisen. Das resultiert in einer ungenauen Beschreibung des Reflexesund damit in Unterschieden zwischen gemessenem und simuliertem Pulverdiagramm. DieDifferenzkurve zeigt diese Unterschiede deutlich auf.
Um die chemische Sinnhaftigkeit einer Struktur zu beurteilen, werden Kriterien wie Was-serstoffbrückenbindungsmuster, Packung der Moleküle etc. in die Betrachtungen einbezogen.Mit Hilfe von Kristallstrukturdatenbanken lässt sich ebenfalls abschätzen, inwiefern die vor-handene Struktur realistisch sein kann. Nicht zu unterschätzen ist außerdem der menschlicheFaktor, genauer gesagt die Intuition des Chemikers, die es erlaubt, auch trotz gegenteiliger In-dizien eine Struktur als sinnvoll zu erachten und umgekehrt, trotz guter R-Werte eine Strukturals falsch zu erachten.
3.5.2 Chinacridon (Pigment Violet 19)
N
N
O
H
H
O
11
Abbildung 3.14: Struktur von Pigment Violet 19 (Chinacridon).
Chinacridon (11) ist das bedeutendste Pigment für rot-violette Farbtöne. Es kristallisiert in
44
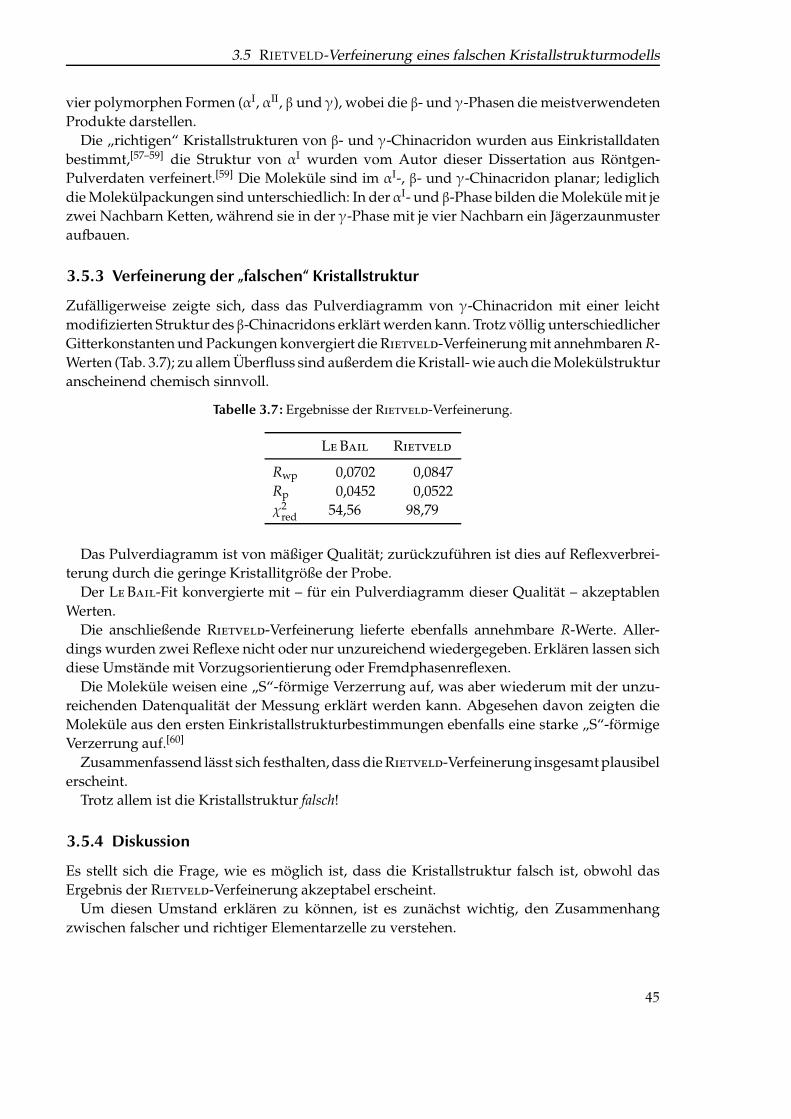
3.5 RIETVELD-Verfeinerung eines falschen Kristallstrukturmodells
vier polymorphen Formen (αI, αII, β und γ), wobei die β- und γ-Phasen die meistverwendetenProdukte darstellen.
Die „richtigen“ Kristallstrukturen von β- und γ-Chinacridon wurden aus Einkristalldatenbestimmt,[57–59] die Struktur von αI wurden vom Autor dieser Dissertation aus Röntgen-Pulverdaten verfeinert.[59] Die Moleküle sind im αI-, β- und γ-Chinacridon planar; lediglichdie Molekülpackungen sind unterschiedlich: In derαI- und β-Phase bilden die Moleküle mit jezwei Nachbarn Ketten, während sie in der γ-Phase mit je vier Nachbarn ein Jägerzaunmusteraufbauen.
3.5.3 Verfeinerung der „falschen“ Kristallstruktur
Zufälligerweise zeigte sich, dass das Pulverdiagramm von γ-Chinacridon mit einer leichtmodifizierten Struktur des β-Chinacridons erklärt werden kann. Trotz völlig unterschiedlicherGitterkonstanten und Packungen konvergiert die Rietveld-Verfeinerung mit annehmbaren R-Werten (Tab. 3.7); zu allem Überfluss sind außerdem die Kristall- wie auch die Molekülstrukturanscheinend chemisch sinnvoll.
Tabelle 3.7: Ergebnisse der Rietveld-Verfeinerung.
LeBail Rietveld
Rwp 0,0702 0,0847Rp 0,0452 0,0522χ2
red 54,56 98,79
Das Pulverdiagramm ist von mäßiger Qualität; zurückzuführen ist dies auf Reflexverbrei-terung durch die geringe Kristallitgröße der Probe.
Der LeBail-Fit konvergierte mit – für ein Pulverdiagramm dieser Qualität – akzeptablenWerten.
Die anschließende Rietveld-Verfeinerung lieferte ebenfalls annehmbare R-Werte. Aller-dings wurden zwei Reflexe nicht oder nur unzureichend wiedergegeben. Erklären lassen sichdiese Umstände mit Vorzugsorientierung oder Fremdphasenreflexen.
Die Moleküle weisen eine „S“-förmige Verzerrung auf, was aber wiederum mit der unzu-reichenden Datenqualität der Messung erklärt werden kann. Abgesehen davon zeigten dieMoleküle aus den ersten Einkristallstrukturbestimmungen ebenfalls eine starke „S“-förmigeVerzerrung auf.[60]
Zusammenfassend lässt sich festhalten, dass die Rietveld-Verfeinerung insgesamt plausibelerscheint.
Trotz allem ist die Kristallstruktur falsch!
3.5.4 Diskussion
Es stellt sich die Frage, wie es möglich ist, dass die Kristallstruktur falsch ist, obwohl dasErgebnis der Rietveld-Verfeinerung akzeptabel erscheint.
Um diesen Umstand erklären zu können, ist es zunächst wichtig, den Zusammenhangzwischen falscher und richtiger Elementarzelle zu verstehen.
45

3 Bestimmung von Kristallstrukturen organischer Pigmente aus Röntgen-Pulverdaten
Tabelle 3.8: Gitterkonstanten der verschiedenen hier untersuchten Chinacridon-Phasen; P21/c, Z = 2.
β γ-falsch γ
a/Å 5,692(1) 6,666(1) 13,697(9)b/Å 3,975(1) 3,8680(5) 3,881(3)c/Å 30,02(4) 27,386(5) 13,402(1)β/° 96,76(6) 100,58(6) 100,44(1)
Es ergeben sich dabei folgende Beziehungen:
aγ-falsch =12
cγ,
bγ-falsch = bγ,
cγ-falsch = 2aγ und
βγ-falsch = βγ.
Damit haben sowohl die falsche als auch die richtige Elementarzelle das gleiche Volumen.Die Transformationsmatrix (sowohl γ→ γ-falsch als auch umgekehrt) lautet
T−1 = T =
0 0 12
0 −1 02 0 0
.
Durch diesen Umstand ändert sich entsprechend auch die Indizierung des Pulverdia-gramms (Abb. 3.15).
Es stellt sich nun die Frage, ob früher hätte bemerkt werden können, dass Strukturmodellund Röntgen-Pulverdaten nicht zueinander passen.
1. Lediglich ein Reflex (bei ≈ 23,8°) wurde nicht durch die Kristallstruktur erklärt. Dieserkann beispielsweise durch Fremdphasen erklärt werden.
2. Die Reflexionsbedingungen für P21/c sind sowohl bei der falschen als auch bei derrichtigen Kristallstruktur erfüllt.
3. Niedrige Messtemperaturen würden zwar für Reflexverschiebungen sorgen, die Quali-tät des Pulverdiagramms verbessert sich allerdings dadurch nicht.
4. Reflexe in höheren 2θ-Bereichen lassen sich häufig mehrdeutig indizieren.
5. Synchrotronmessungen verbessern die Datenqualität nicht wesentlich, denn die Reflex-breiten haben ihre Ursache in der Kristallqualität, nicht im Diffraktometer.
6. Quantenmechanische Rechnungen zeigen, dass das Molekül planar ist. Die Abweichun-gen von der Planarität im Kristall beschränken sich auf (0,23 ± 0,16) Å.
7. Einkristallstrukturanalysen zeigen, dass das Molekül planar ist. Allerdings sind dievermessenen Einkristalle stets von schlechter Qualität.
46

3.5 RIETVELD-Verfeinerung eines falschen Kristallstrukturmodells
002
004
100
102
102
104
104
011
106
012
013
015
108
111
100→
002
200→
004
002→
100
102→
102
102→
102
202→
104
202→
104
110→
?„F
rem
dre
flex“
011→
?„F
rem
dre
flex“
111→
?(≈
013)
400→
008
210→
014
012→
110
5 10 15 20 25 302θ/°
β-11
γ→ γ-falsch
Abbildung 3.15: Pulverdiagramme von Pigment Violet 19 mit „richtiger“ und „falscher“ Indizierung.
8. IR-spektroskopische Untersuchungen hätten keinen Hinweis auf andersartige Wasser-stoffbrückenbindungsmuster ergeben.
9. Elektronenbeugung an einzelnen Kristallen hätte gezeigt, dass die a-Achse verdoppeltund die c-Achse halbiert hätte werden müssen. Da die Kristallstruktur allerdings als be-reits bestimmt betrachtet wurde, bestand kein Anlass, Elektronenbeugungsexperimentedurchzuführen.
10. Neutronenbeugung hätte ebenfalls gezeigt, dass die Kristallstruktur falsch ist(Abb. 3.16). Auch hier gilt analog der Gedankengang bei der Elektronenbeugung:Die Kristallstruktur wurde als bestimmt betrachtet.
11. Die Farbe des Pigments wäre mit viel Erfahrung ein Hinweis darauf, dass die Molekül-anordnung nicht der experimentell bestimmten entspricht, s. dazu [CB6, Abschnitt 4.3.,Punkt (xi)].
3.5.5 Zusammenfassung
Es konnte gezeigt werden, dass trotz einem annehmbaren Ergebnis aus einer Rietveld-Ver-feinerung die so erhaltene Kristallstruktur eingehend geprüft werden muss.
47

3 Bestimmung von Kristallstrukturen organischer Pigmente aus Röntgen-Pulverdaten
γ
γ-falsch
Inte
nsit
ät
10 20 302θ/°
Abbildung 3.16: Simulierte Neutronenbeugungs-Pulverdiagramme von Pigment Violet 19.
Das vorliegende Beispiel zeigt auf schöne Weise, dass mehrere vermeintlich sinnvolle Kris-tallstrukturen ein Pulverdiagramm erklären können – insbesondere, wenn das Pulverdia-gramm von mäßiger Qualität ist.
Weitere Details finden sich in [CB6].
48

3.6 (CF3)2-Thiazinindigo
3.6 (CF3)2-Thiazinindigo[CB7]
Thiazinindigo (THI, 12) und seine Derivate repräsentieren eine neuartige Klasse organischerPigmente. Die meisten THI-Derivate zeigen orange bis rote Farbtöne; im Gegensatz dazu istdie Verbindung 6, 6′-Bis(trifluormethyl)-thiazinindigo (13, kurz: (CF3)2-THI) gelb.
Zum Zeitpunkt der Veröffentlichung war nur eine Kristallstruktur eines chlorierten Thia-zinindigo-Derivates bekannt.[61]
Das Pigment 13 ist äußerst schwerlöslich in Wasser und organischen Lösungsmitteln. Eskonnten daher keine Einkristalle gezüchtet werden, so dass die Kristallstruktur aus Pulver-daten bestimmt wurde.
S
HN
NH
S
O
O R
R
12
13
: R = H: R = CF3
Abbildung 3.17: Struktur von (CF3)2-Thiazinindigo.
3.6.1 Strukturlösung
Das Pulverdiagramm weist einen hohen Untergrund auf, der auf die geringe Kristallinitätder Probe zurückzuführen ist. Eine Abschätzung mit der Scherrer-Formel (2.1) liefert eineKristallitgröße von (21 ± 1) nm.
Dennoch konnten die Reflexpositionen mit hinreichender Genauigkeit bestimmt werden,so dass das Pulverdiagramm indiziert werden konnte. Die Ergebnisse der Indizierung sind inTab. 3.9 aufgeführt.
Tabelle 3.9: Ergebnisse der Indizierung von (CF3)2-THI mit treor. Es wurde eine monokline Ele-mentarzelle ermittelt.
(CF3)2-THI
a/Å 15,43b/Å 7,84c/Å 7,74α/° 90β/° 112,68γ/° 90V/Å
3863,9
49

3 Bestimmung von Kristallstrukturen organischer Pigmente aus Röntgen-Pulverdaten
Das Molekülvolumen von 13 wurde mittels eines mittleren Volumens von 16 Å3
pro Nicht-Wasserstoffatom auf 480 Å
3geschätzt; Volumeninkremente[14] ergeben ein Molekülvolumen
von VMolekül = 454,1 Å3. Die Elementarzelle enthält somit zwei Formeleinheiten.
Aus den Reflexionsbedingungen
hkl : keine,
h0l : l = 2n und
0k0 : k = 2n (soweit sichtbar)
wurde das Auslöschungssymbol P 1 21/c 1 ermittelt, entsprechend Raumgruppe P21/c.Aufgrund statistischer Analysen folgt, dass das Molekül (Symmetrie 2/m) mit seinem In-
versionszentrum auf einem Inversionszentrum in der Elementarzelle liegt.[42]
Die Struktur wurde mit dem Programm crysca gelöst. Dazu wurde das Molekül ausgehendvon den Ergebnissen der Einkristallstrukturanalyse des Cl-Derivats[61] konstruiert.
3.6.2 Rietveld-Verfeinerung
LeBail-Fit und Rietveld-Verfeinerung wurden mit dem Programm gsas durchgeführt. DieErgebnisse finden sich in Tabelle 3.10 sowie in den Abbildungen [CB7, Fig. 3] und [CB7, Fig. 4].
Es wurden Restraints für Bindungslängen, Bindungswinkel und Planargruppen eingeführt;da gsas maximal zwölf Atome pro Planargruppe erlaubt, wurden überlappende Gruppenangelegt. Im Laufe der Verfeinerung wurden die Gewichtungsfaktoren der Restraints gesenkt;dabei trat keine signifikante Abweichung von der Planarität auf. Ein Entfernen der Restraintsführte allerdings zu Divergenz der Rietveld-Verfeinerung.
Zusätzlich wurde die Orientierung der CF3-Gruppe überprüft: Die Gruppe wurde um je-weils 30°, 60° und 90° gedreht. Außerdem wurden die Besetzungsfaktoren sowie die isotropenAuslenkungsparameter verfeinert. Es gab keinen Hinweis auf Rotationsfehlordnung.
Die planaren Moleküle bilden Stapel in [001]-Richtung, mit einem Schichtabstand von3,47 Å. Das Wasserstoffbrückenbindungsmuster (Abb. [CB7, Fig. 5]) entspricht dem des Cl2-THI, jedoch sind die Ketten unterschiedlich angeordnet:
Die Ketten in Cl2-THI (Raumgruppe P1) sind parallel angeordnet, wohingegen Kettenpaarein (CF3)2-THI über eine 21-Achse miteinander verknüpft sind. Daraus resultiert eine antipa-rallele Anordnung der Ketten (Abb. [CB7, Fig. 7]).
3.6.3 Modellierung
Es ist bekannt, dass Strukturen, die aus gestapelten Molekülketten bestehen, dazu neigen, fehl-geordnet zu sein. Deshalb wurde zusätzlich untersucht, ob eine Stapel-Fehlordnung vorliegenkönnte.
Es wurden drei mögliche Fehlordnungsmodelle untersucht:
1. Drehung eines einzelnen Moleküls um 180° um die Moleküllängsachse,
2. Drehung einer einzelnen Molekülkette um 180° um die b-Achse,
3. Drehung eines einzelnen Stapels um 180° um die b-Achse (entspricht einer Translationdes Stapels um (0, 1
2 ,12 )) und
50

3.6 (CF3)2-Thiazinindigo
Tabelle 3.10: Ergebnisse der Rietveld-Verfeinerung von (CF3)2-THI.
(CF3)2-THI
a/Å 15,4136(12)b/Å 7,8384(5)c/Å 7,7102(6)β/° 112,736(6)V/Å
3859,14(8)
Rwp 0,0880Rp 0,0679RF2 0,1155χ2
red 32,14
4. Drehung eines Blocks von vier Stapeln.
Für Modell 1 wurde eine „Überzelle“ mit 2a×3b× c konstruiert, für Modelle 2, 3 und 4 einemit 2a × b × c.
Die Raumgruppensymmetrie der Modelle 1 und 2 ergibt sich damit zu P1, für Modelle 3und 4 zu I 1 2/a 1 (Z = 4).
Die Rechnungen wurden mit Cerius2 durchgeführt. Gitterkonstanten und Atompositionenwurden ohne Beschränkungen optimiert.
Die Ergebnisse der Gitterenergie-Minimierungen sind in Tab. 3.11 zusammengefasst. Ausden berechneten Energien lässt sich mithilfe der Boltzmann-Formel
Ngeordnet
Nfehlgeordnet=
ngeordnet
nfehlgeordnet· e−∆E
RT (3.1)
das Ausmaß der Fehlordnung abschätzen. N gibt dabei die jeweiligen Besetzungszahlen an,n die Entartungsgrade; es wird ngeordnet = nfehlgeordnet angenommen.
Tabelle 3.11: Ergebnisse der Gitterenergie-Minimierungen von Fehlordnungsmodellen des (CF3)2-THI.
Modell 1 Modell 2 Modell 3 Modell 4
∆E/(kJ/mol) 107,4 10,2 6,71 6,68Domänengröße/EZ 1,5 · 1013 17,81 6,65 6,60Domänengröße/Å 2,14 · 1014 274,45 102,48 101,71
Anschließende Rietveld-Verfeinerungen der fehlgeordneten Strukturen erbrachten, dassdie Reflexintensitäten in den simulierten Pulverdiagrammen nicht signifikant anders warenals im gemessenen.
Die Ergebnisse der Boltzmann-Verteilung lassen sich folgendermaßen interpretieren: EineEnergiedifferenz von 6,7 kJ/mol ergibt eine Wahrscheinlichkeit von 16 % für eine Fehlordnung.Das entspricht einer Domänengröße von etwa sechs bis sieben Elementarzellen. Bei einerGitterkonstanten von a = 15,41 Å ergibt sich die Domänengröße damit zu etwa 100 Å. Geht
51

3 Bestimmung von Kristallstrukturen organischer Pigmente aus Röntgen-Pulverdaten
man nun noch davon aus, dass die Kristallitgröße etwa 200 Å beträgt, stellt sich die Frage, obeine sinnvolle Aussage über eine mögliche Fehlordnung angebracht ist.4
3.6.4 Zusammenfassung
Die Kristallstruktur von (CF3)2-THI konnte erfolgreich gelöst und verfeinert werden. Die Qua-lität des Pulverdiagramms war ausreichend, um die genaue Orientierung der CF3-Gruppenzu bestimmen. Mehrere in Frage kommende Fehlordnungsmodelle wurden diskutiert; dieKristallite der Substanz waren allerdings nicht groß genug, um exakte Aussagen über Fehl-ordnungen zu treffen.
Weitere Details finden sich in [CB7].
4Mit der gleichen Betrachtung ergibt sich, dass Modell 1 nicht in Frage kommt (Kristallitgröße ca. 21 km) undModell 2 unwahrscheinlich ist.
52

3.7 Thiazinindigo-Derivate
3.7 Thiazinindigo-Derivate[CB8]
Die Polymorphie sowie die Kristallstrukturen von sechs Thiazinindigo-Derivaten (Abb. 3.18)wurden untersucht.
Hintergründe zu und Eigenschaften von (CF3)2-Thiazinindigo werden in Abschnitt 3.6behandelt.
S
N
N
S
H
O
O
H
R7
R6
R6
R7
R6 R7 R7′
12 H H H13 CF3 H H14 H Cl Cl15 H CH3 CH316 H OCH3 OCH317 H Cl H
′
Abbildung 3.18: Struktur von Thiazinindigo (12) und den in dieser Arbeit untersuchten Derivaten.
Es stellte sich heraus, dass drei der sechs untersuchten Verbindungen Polymorphe bilden.Von zwei Polymorphen (α und β) der unsubstituierten Verbindung sowie von 14[61] wurden
die Kristallstrukturen aus Einkristalldaten bestimmt.Die Pulverdiagramme (Abb. 3.19, S. 57) legen die Vermutung nahe, dass die Kristallstruk-
turen von β-12, 14, 15, β-16 und 17 isotyp sind.Die Ausgangsstrukturen für die Rietveld-Verfeinerung von 15, 16 und 17 wurden mit
dem Programm Cerius2 auf Basis der Struktur von β-14 berechnet; es kamen das Dreiding-Kraftfeld sowie Gasteiger-Ladungen zum Einsatz. Die Kristallstruktur von 17 wird gesondertin Abschnitt 3.7.1 beschrieben.
3.7.1 Rietveld-Verfeinerung
Die Verfeinerung der Kristallstrukturen wurde teils mit gsas (15), teils mit topas (16 und 17)durchgeführt. Die strukturlose Verfeinerung wurde mit gsas unter Anwendung der LeBail-,mit topas unter Anwendung der Pawley-Methode vorgenommen.
Die Verfeinerung von 15 und 16 wurde mit einem halben Molekül durchgeführt, welchesim ersten Fall mit einem Dummy-Atom auf einem Inversionszentrum verknüpft war. Imzweiten Fall wurde ein halbes Molekül verwendet, dessen beide mittlere C-Atome mit halber
53

3 Bestimmung von Kristallstrukturen organischer Pigmente aus Röntgen-Pulverdaten
Besetzung verfeinert wurden; das Inversionszentrum zwischen diesen beiden Atomen erzeugtdas ganze Molekül.
In allen Fällen wurden Restraints für Bindungslängen, Bindungswinkel und Planargruppeneingeführt. Am Ende der Verfeinerungen mit topas wurde die Vorzugsorientierung mittels„Spherical Harmonics“[62,63] beschrieben.
6,6′-Bis(trifluormethyl)-thiazinindigo (13)
Die Verbindung wird ausführlich in Abschnitt 3.6 beschrieben.
7,7′-Dimethyl-thiazinindigo (15)
Aufgrund der Isotypie zu β-12 wurde ausgehend von dieser Verbindung das Dimethyl-Derivatkonstruiert. Dazu wurden CH3-Gruppen an die beiden äußeren Ringe gesetzt. Anschließendwurde die Kristallstruktur mittels Gitterenergie-Minimierung optimiert; die Gitterkonstantenwurden dabei auf die experimentellen Werte von 15 fixiert. Das Ergebnis wurde als Eingabefür die Rietveld-Verfeinerung verwendet.
Vor der Rietveld-Verfeinerung wurden sämtliche Bindungslängen und -winkel gegen Ein-träge in der CSD[20] abgeglichen. Die Verfeinerung konvergierte mit Rp = 4,24 %, Rwp = 5,90 %,χ2
red = 9,545. Der Rietveld-Plot ist in Abb. [CB8, Fig. 8] dargestellt, die Ergebnisse der Verfei-nerung in Tab. 3.13.
7,7′-Dimethoxy-thiazinindigo (16)
Die β-Phase ist die thermodynamisch stabile Phase von 16; sie ist isotyp zu β-12, 14 und15. Das beste Pulverdiagramm von 16 zeigt vier Fremdphasenreflexe, die entsprechendenWinkelbereiche wurden für die Rietveld-Verfeinerung herausgenommen.
Die Indizierung wurde mit dicvol durchgeführt; sie bestätigte die Isotypie von β-16 und15.
Die Pawley-Verfeinerung konvergierte mit Rpb = 6,061 %, Rwpb = 7,139 %, χ2red = 1,324.
Um Aussagen über die Orientierung der Methoxy-Gruppen treffen zu können, wurde dieRietveld-Verfeinerung mit C–O–C–C-Torsionswinkeln von 0° und 180° durchgeführt. Dieermittelte Orientierung wird durch die Qualität der Verfeinerung bestätigt.
Die Ergebnisse der Verfeinerung sind in Tab. 3.13 aufgeführt, der Rietveld-Plot in Abb. [CB8,Fig. 10].
7-Monochlor-thiazinindigo (17)
Das Pulverdiagramm von 17 zeigt, dass diese Verbindung isotyp zu β-12, 14, 15 und β-16 ist.Diese Verbindungen kristallisieren in Raumgruppe P1, Z = 1 mit Molekülen auf Inversions-zentren.
Jedoch besitzt 17 aufgrund der einfachen Substitution kein Symmetriezentrum, demzufolgemuss die Kristallsymmetrie reduziert sein.
Aus diesem Grund wurden folgende Strukturmodelle konstruiert (Abb. 3.20, S. 58):
54

3.7 Thiazinindigo-Derivate
Modell 1: P1, Z = 1. Alle Moleküle sind parallel ausgerichtet. Als Folge davon bildensich Cl · · ·H-Kontakte auf beiden Stapelseiten aus. Weiterhin entstehen günstige Dipol–Dipol-Wechselwirkungen zwischen den Stapeln.
Modell 2: P1, Z = 2, c′ = 2c, mit antiparallel ausgerichteten Molekülen in benachbartenStapeln. Hierbei bilden sich Cl · · ·Cl- und H · · ·H-Kontakte. Sollte diese Struktur dierichtige sein, sollte das Pulverdiagramm Überstrukturreflexe hkl′ mit l′ = l/2 zeigen.
Modell 3: P1, Z = 1, mit statistischer H/Cl-Fehlordnung (halbbesetzte Cl- bzw. H-Positionen).
Modell 4: P1, Z = 1, mit anfangs halbbesetzten Cl-Positionen. Eine Rietveld-Verfeinerungsoll Aufschluss über die tatsächlich vorliegenden Besetzungszahlen geben.
Die Gitterkonstanten (ausgehend von 14) wurden mittels Pawley-Fits ermittelt. Für diekleine Elementarzelle (Z = 1) konvergierte die Verfeinerung mit Rpb = 0,0665, Rwpb = 0,0868und χ2
red = 2,024. Es konnten keine Überstrukturreflexe beobachtet werden.Mit den konstruierten Modellen wurden Gitterenergie-Minimierungen durchgeführt.
Abb. 3.21 zeigt den Vergleich der simulierten Pulverdiagramme der jeweiligen Modelle imVergleich zum experimentellen.
Es zeigt sich, dass Modell 2 deutliche Überstrukturreflexe aufweist (s. Abb. 3.21, S. 59); essollte somit keinesfalls der tatsächlichen Struktur entsprechen.
Alle Modelle wurden einer Rietveld-Verfeinerung unterzogen (Tab. 3.12).Die Rietveld-Verfeinerung von Modell 4 wurde mit freier Verfeinerung der Cl-Besetzungs-
zahlen durchgeführt. Trotz völlig freier Verfeinerung dieser Parameter konvergierte die Verfei-nerung reproduzierbar mit sinnvollen Ergebnissen. Interessanterweise ergab die Summe derCl-Besetzungszahlen einen Wert von ca. 1,07 5. Dieser Umstand deutet auf noch vorhandeneElektronendichte hin, die sich damit erklären lässt, dass ein H-Atom auf der gegenüberliegen-den Molekülseite gebunden ist. Die Elektronendichte an einem H-Atom entspricht etwa 1
17eines Cl-Atoms, was in der Summe 1,06 ergibt. Im Rahmen der Genauigkeit einer Rietveld-Verfeinerung an einem Pulverdiagramm beschränkter Qualität liegt dieser Wert deutlich imToleranzbereich.
Abschließend wurde die Verfeinerung mit einem Strukturmodell durchgeführt, das sowohlH- als auch Cl-Atome an den Positionen 7 und 7′ (und umgekehrt) aufwies. Die Besetzungs-zahlen wurden über Constraints aneinander gekoppelt:
Occ(7′-Cl) = 1 −Occ(7-Cl)
Occ(7-H) = 1 −Occ(7′-H)
mit den Ergebnissen
Occ(7′-Cl) = Occ(7-H) = 0,28(1)
Occ(7-Cl) = Occ(7′-H) = 0,72(1)
5Die Besetzungszahl sollte 1 sein!
55

3 Bestimmung von Kristallstrukturen organischer Pigmente aus Röntgen-Pulverdaten
Aufgrund der niedrigeren R-Werte wird Modell 4 als die korrekte Struktur angesehen.Es sei deutlich darauf hingewiesen, dass mit einem Pulverdiagramm dieser Qualität letzt-lich nie Gewissheit über die Korrektheit der Struktur hergestellt werden kann (s. dazu auchAbschnitt 3.5).
Tabelle 3.12: Vergleich der Ergebnisse der Rietveld-Verfeinerung der Strukturmodelle von ClH-THI.
Modell 1 Modell 2 Modell 3 Modell 4
Rpb 0,0623 0,1169 0,0718 0,0613Rwpb 0,0639 0,1414 0,0736 0,0604GoF 1,483 3,241 1,632 1,377
Tabelle 3.13: Ergebnisse der Rietveld-Verfeinerungen von 13, 15, β-16 und 17.
(CF3)2-THI (CH3)2-THI β-(OCH3)2-THI Cl-THI13 15 β-16 17
Summenformel C18H8N2O2F6S2 C18H14N2O2S2 C18H14N2O4S2 C16H9N2O2S2ClM/(g/mol) 462,39 354,43 386,45 360,82Raumgruppe P21/c P1 P1 P1a/Å 15,4136(12) 4,7483(2) 5,036(2) 4,6017(3)b/Å 7,8384(5) 7,7864(5) 7,740(3) 7,8046(6)c/Å 7,7102(6) 10,5182(5) 10,772(4) 10,3663(10)α/° 90 91,750(5) 90,90(1) 92,835(4)β/° 112,736(6) 98,641(3) 101,24(1) 96,081(6)γ/° 90 94,630(7) 85,70(2) 94,077(5)V/Å
3859,15(2) 382,85(3) 410,66(1) 368,66(5)
Z 2 1 1 1ρ/(g/cm3) 1,787 1,538 1,563 1,626Rwpb 0,0880 0,0590 0,0783 0,0604Rpb 0,0679 0,0424 0,0912 0,0613χ — — 1,651 1,377χ2
red 32,14 9,545 — —
3.7.2 Zusammenfassung
Die Verfeinerungen der untersuchten Thiazinindigo-Derivate bestätigten die aus den Gitte-renergie-Minimierungen erhaltenen Strukturen. Zusätzlich zeigte sich beim monochlor-sub-stituierten Thiazinindigo auf schöne Weise, welche Möglichkeiten eine Strukturbestimmungaus Pulverdaten bietet und welche Aussagen sie zulässt.
Weitere Details finden sich in [CB8].
56

3.7 Thiazinindigo-Derivate
α-12
β-12
13
14
15
β-16
17
⋆⋆ ⋆
⋆
10 20 30
2θ/°
Abbildung 3.19: Vergleich der Pulverdiagramme der untersuchten Thiazinindigo-Derivate. Im Pul-verdiagramm von β-16 sind Fremdphasenreflexe vorhanden (⋆). Die Isotypie vonβ-12, 14, 15, β-16 und 17 lässt sich deutlich erkennen.
57
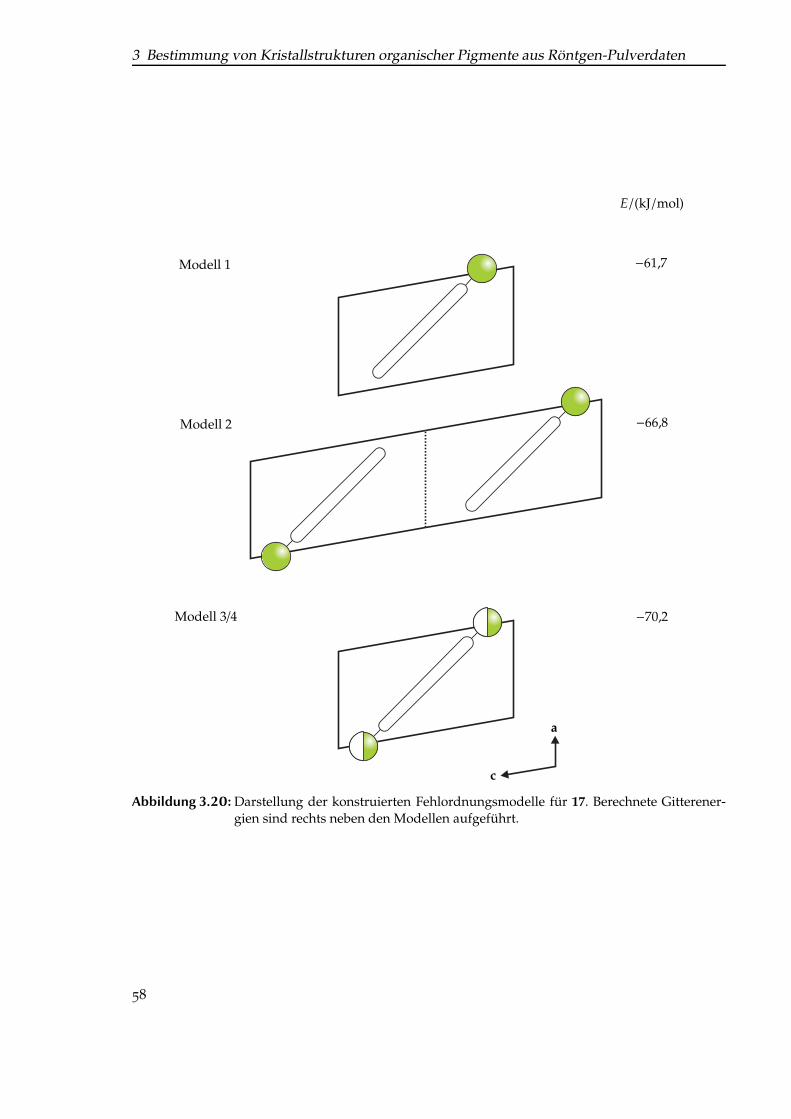
3 Bestimmung von Kristallstrukturen organischer Pigmente aus Röntgen-Pulverdaten
Modell 1
Modell 2
Modell 3/4
E/(kJ/mol)
−61,7
−66,8
−70,2
a
c
Abbildung 3.20: Darstellung der konstruierten Fehlordnungsmodelle für 17. Berechnete Gitterener-gien sind rechts neben den Modellen aufgeführt.
58
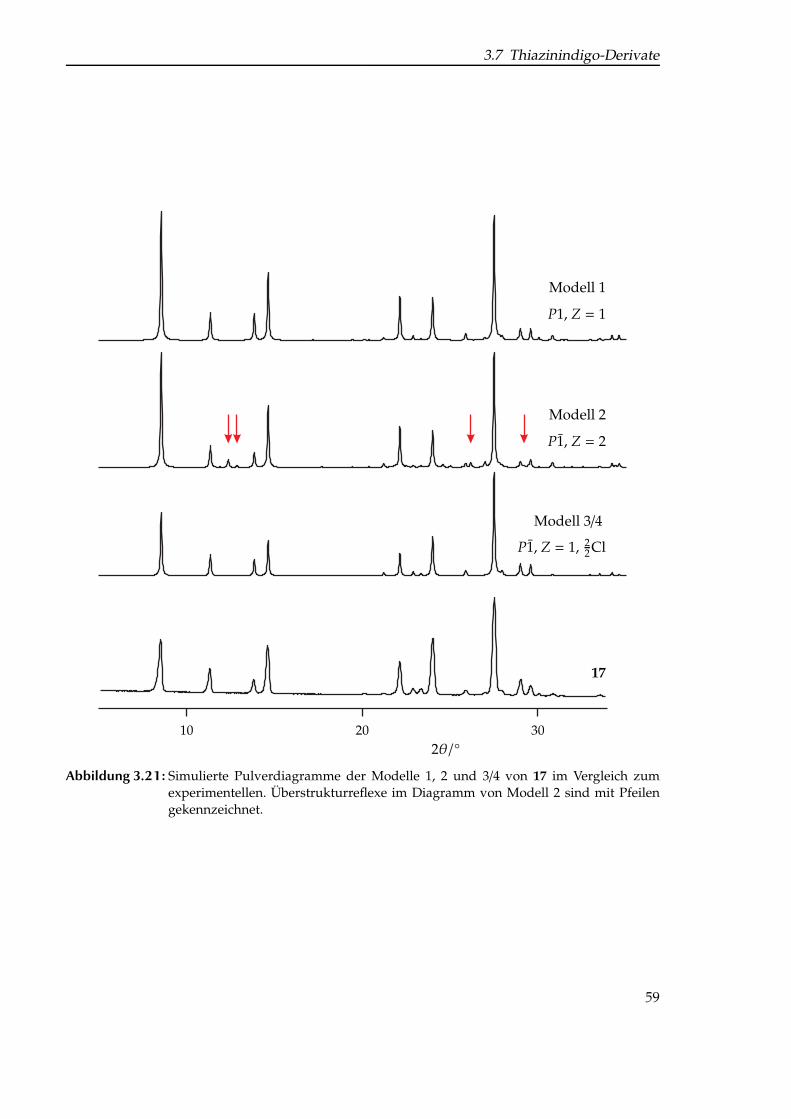
3.7 Thiazinindigo-Derivate
Modell 1
P1, Z = 1
Modell 2
P1, Z = 2
Modell 3/4
P1, Z = 1, 22Cl
17
10 20 302θ/°
Abbildung 3.21: Simulierte Pulverdiagramme der Modelle 1, 2 und 3/4 von 17 im Vergleich zumexperimentellen. Überstrukturreflexe im Diagramm von Modell 2 sind mit Pfeilengekennzeichnet.
59
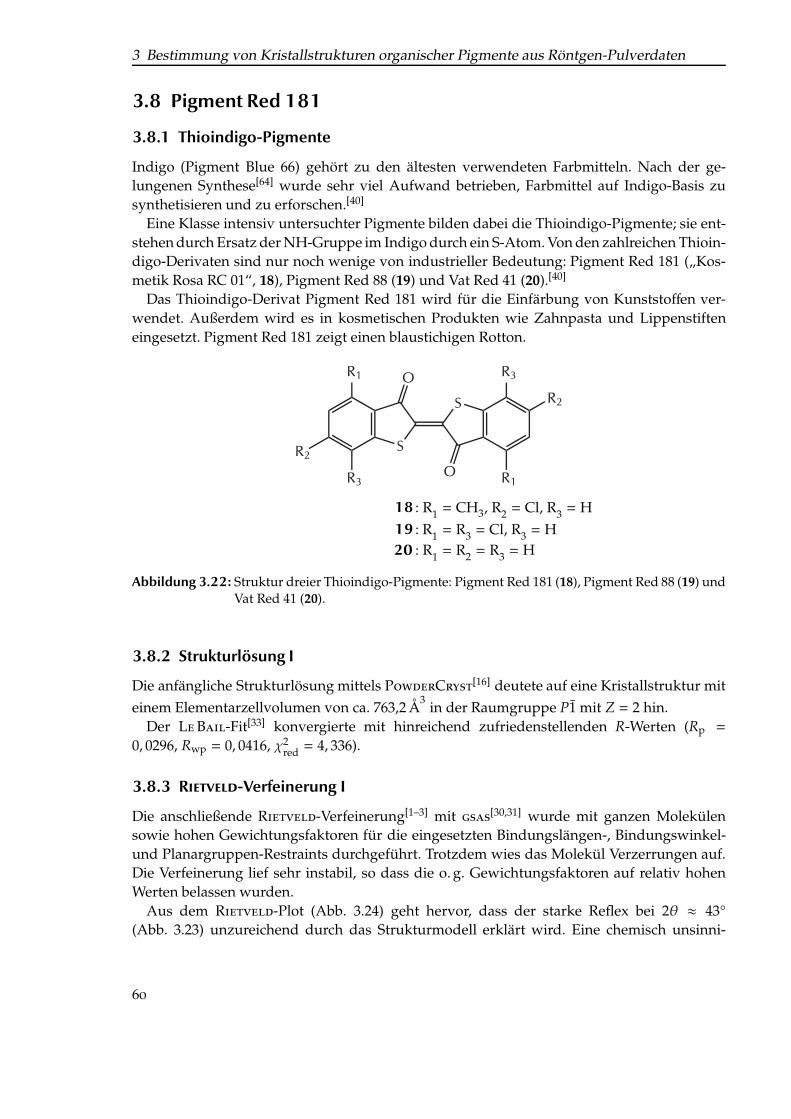
3 Bestimmung von Kristallstrukturen organischer Pigmente aus Röntgen-Pulverdaten
3.8 Pigment Red 181
3.8.1 Thioindigo-Pigmente
Indigo (Pigment Blue 66) gehört zu den ältesten verwendeten Farbmitteln. Nach der ge-lungenen Synthese[64] wurde sehr viel Aufwand betrieben, Farbmittel auf Indigo-Basis zusynthetisieren und zu erforschen.[40]
Eine Klasse intensiv untersuchter Pigmente bilden dabei die Thioindigo-Pigmente; sie ent-stehen durch Ersatz der NH-Gruppe im Indigo durch ein S-Atom. Von den zahlreichen Thioin-digo-Derivaten sind nur noch wenige von industrieller Bedeutung: Pigment Red 181 („Kos-metik Rosa RC 01“, 18), Pigment Red 88 (19) und Vat Red 41 (20).[40]
Das Thioindigo-Derivat Pigment Red 181 wird für die Einfärbung von Kunststoffen ver-wendet. Außerdem wird es in kosmetischen Produkten wie Zahnpasta und Lippenstifteneingesetzt. Pigment Red 181 zeigt einen blaustichigen Rotton.
S
S
O
OR1
R1
R2
R2
R3
R3
18
19
20
: R1 = CH3, R2 = Cl, R3 = H: R1 = R3 = Cl, R3 = H: R1 = R2 = R3 = H
Abbildung 3.22: Struktur dreier Thioindigo-Pigmente: Pigment Red 181 (18), Pigment Red 88 (19) undVat Red 41 (20).
3.8.2 Strukturlösung I
Die anfängliche Strukturlösung mittels PowderCryst[16] deutete auf eine Kristallstruktur miteinem Elementarzellvolumen von ca. 763,2 Å
3in der Raumgruppe P1 mit Z = 2 hin.
Der LeBail-Fit[33] konvergierte mit hinreichend zufriedenstellenden R-Werten (Rp =
0, 0296, Rwp = 0, 0416, χ2red = 4, 336).
3.8.3 Rietveld-Verfeinerung I
Die anschließende Rietveld-Verfeinerung[1–3] mit gsas[30,31] wurde mit ganzen Molekülensowie hohen Gewichtungsfaktoren für die eingesetzten Bindungslängen-, Bindungswinkel-und Planargruppen-Restraints durchgeführt. Trotzdem wies das Molekül Verzerrungen auf.Die Verfeinerung lief sehr instabil, so dass die o. g. Gewichtungsfaktoren auf relativ hohenWerten belassen wurden.
Aus dem Rietveld-Plot (Abb. 3.24) geht hervor, dass der starke Reflex bei 2θ ≈ 43°(Abb. 3.23) unzureichend durch das Strukturmodell erklärt wird. Eine chemisch unsinni-
60

3.8 Pigment Red 181
2θ/°
10 20 30 40 50 60 70 80
Int/
104
0
1,0
2,0
Abbildung 3.23: Röntgen-Pulverdiagramm von Pigment Red 181.
ge Fehlordnung, bei der das S-Atom in der Ringmitte liegt, zeigte eine bessere Beschreibungdes Reflexes. Die Ergebnisse finden sich in Tab. 3.17.
bC bC bC bC bC bC bC bC bC bC bC bC bC bC bC bC bC bC bC bC bC bC bC bC bC bC bC bC bC bC bC bC bC bC bC bC bC bC bC bC bC bC bC bC bC bC bC bC bC bC bC bC bC bC bC bC bC bC bC bC bC bC bC bC bC bC bC bC bC bC bC bC bC bC bC bC bC bC bC bC bC bC bC bC bC bC bC bC bC bC bC bC bC bC bC bC bC bC bC bC bC bC bC bC bC bC bC bC bC bC bC bC bC bC bC bC bC bC bC bC bC bC bC bC bC bC bC bC bC bC bC bC bC bC bC bC bC bC bC bC bC bC bC bC bC bC bC bC bC bC bC bC bC bC bC bC bC bC bC bC bC bC bC bC bC bC bC bC bC bC bC bC bC bC bC bC bC bC bC bC bC bC bC bC bC bC bC bC bC bC bC bC bC bC bC bC bC bC bC bC bC bC bC bC bC bC bC bC bC bC bC bC bC bC bC bC bC bC bC bC bC bC bC bC bC bC bC bC bC bC bC bC bC bCbC bC bC bC bC bC bC bC bC bC bC bC bC bC bC bC bC bC bC bC bC bC bC bC bC bC bC bC bC bC bC bC bC bC bC bC bC bC bC bC bC bC bC bC bC bC bC bC bC bC bC bC bC bC bC bC bC bC bC bC bC bC bC bC bC bC bC bC bC bC bC bC bC bC bC bC bC bC bC bC bC bC bC bC bC bC bC bC bC bC bC bC bC
bC bC bC bC bC bCbC bC bC bCbC bCbC bCbC bCbC bCbC bCbC bC bCbCbCbCbCbCbC bC bC bC bC bC bC bC bC bC bC bC bC bC bC bC bC bC bC bC bC bC bC bC bC bC bC bC bC bC bC bC bC bC bC bC bC bC bC bC bC bC bC bC bC bC bC bC bC bC bC bC bC bC bC bC bC bC bC bC bC bC bC bC bC bC bC bC bC bC bC bC bC bC bC bC bC
bC bC bC bC bC bC bCbC bC bC bC bCbC bC bCbC bCbC bCbC bCbC bCbC bC bC bC bC bC bCbC bC bCbC bC bC bCbC bC bC bC bC bC bC bC bC bC bC bC bC bC bC bC bC bC bC bC bC bC bC bC bC bC bC bC bC bC bC bC bC bC bC bC bC bC bC bC bC bC bC bC bC bC bC bC bC bC bC bC bC bC bC bC bC bC bC bC bC bC bC bC bC bC bC bC bC bC bC bC bC
bC bC bC bC bC bC bC bC bC bC bC bC bC bC bC bC bC bC bC bC bC bC bC bC bC bC bC bC bC bC bC bC bC bC bC bC bC bC bC bC bC bC bC bC bC bC bC bC bC bC bC bC bC bC bC bC bC bC bC bC bC bC bC bC bC bC bC bC bC bC bC bC bC bC bC bC bC bC bC bC bC bC bC bC bC bC bC bC bC bC bC bC bC bC bC bC bC bC bC bC bC bC bC bC bC bC bC bC bC bC bC bC bC bC bC bC bC bC bC bC bC bC bC bC bC bC bC bC bC bC bC bC bC bC bC bC bC bC bC bC bC bC bC bC bC bC bC bC bC bC bC bC bC bC bC bC bC bC bC bC bC bC bC bC bC bC bC bC bC bC bC bC bC bC bC bC bC bC bC bC bC bC bC bC bC bC bC bC bC bC bC bC bC bC bC bC bC bC bC bC bC bC bC bC bC bC bC bC bC bC bC bC bC bC bC bC bC bC bC bC bC bC bC bC bC bC bC bC bC bC bC bC bC bC bC bC bC bC bC bC bC bC bC bC bC bC bC bC bC bC bC bC bC bC bC bC bC bC bC bC bC bC bC bC bC bC bC bC bC bC bC bC bC bC bC bC bC bC bC bC bC bC bC bC bC bC bC bC bC bC bC bC bC bC bC bC bC bCbC bC bC bC bC bC bC bC bC bC bCbC bC bC bC bC bC bC bC bC bC bC bC bC bC bC bC bC bC bC bC bC bC bC bC bC bC bC bC bC bC bC bC bC bC bC bC bC bC bC bCbC bC bC bC bC bC bC bC bC bC bC bC bC bC bC bC bC bC bC bC bC bC bC bC bC bC bC bC bC bC bC bC bC bC bC bC bC bC bC bC bC bC bC bC bC bC bC bC bC bC bCbC bC bC bC bCbC bC bC bC bC bCbC bC bC bC bC bC bC bC bC bC bC bC bC bC bC bC bC bC bC bC bC bC bC bC bC bC bC bC bC bC bC bC bC bC bC bC bC bC bC bC bC bC bC bC bC bC bC bC bC bC bC bC bC bC bC bC bC bC bC bC bCbC bC bC bC bC bCbC bCbC bCbC bC bCbC bC bC bC bC bC bC bC bC bC bC bC bC bC bC bC bC bC bC bC bC bC bC bC bC bC bC bC bC bC bCbC bC bC bC bC bCbC bC bC bC bCbC bC bCbC bC bC bC bC bC bC bC bC bC bC bC bC bC bC bC bC bC bC bC bC bC bC bC bC bCbC bC bC bC bC bC bC bC bC bC bC bC bC bC bC bC bC bC bC bCbC bC bCbC bCbC bCbC bCbCbCbCbC bC bCbC bC bC bC bCbC bCbCbCbC bCbC bC bC bC bC bC bC bC bC bC bC bC bC bC bC bC bC bC bC bC bC bC bC bC bC bC bC bCbC bC bC bC bC bC bCbC bC bC bC bCbC bCbC bCbCbCbCbCbCbCbCbCbCbC bC bCbCbCbCbCbCbCbCbCbC bC bCbC bC bC bC bC bC bC bC bC bC bC bC bC bC bC bC bC bC bC bC bC bC bC bC bC bC bC bC bC bC bC bC bC bC bC bC bC bC bC bC bC bC bC bC bC bC bC bC bC bC bC bC bC bC bC bC bC bCbC bC bC bC bC bC bC bC bC bCbC bC bC bC bC bC bC bC bC bC bC bC bC bC bC bC bC bC bC bC bC bC bC bC bC bC bC bC bC bC bC bC bC bC bC bC bC bC bC bC bC bC bC bC bC bC bC bC bC bC bC bC bC bC bC bC bC bC bC bC bC bC bC bC bCbC bC bC bC bC bC bC bC bC bC bC bC bC bC bC bC bC bC bC bC bC bC bC bC bC bC bC bC bC bC bC bC bC bC bC bC bC bC bC bC bC bCbC bC bC bC bC bC bC bC bC bC bC bC bC bC bC bC bC bC bC bC bC bC bC bC bC bC bC bC bC bC bC bC bC bC bC bC bC bC bC bC bC bC bC bC bC bC bC bC bC bC bC bC bC bC bC bC bC bC bC bC bC bC bC bC bC bC bC bC bC bC bC bC bC bC bC bC bC bC bC bC bC bC bC bC bC bC bC bC bC bC bC bC bC bC bC bC bC bC bC bC bC bC bC bC bC bC bC bC bC bC
bC bC bC bC bC bC bC bC bC bC bC bC bC bC bC bC bC bC bC bC bC bC bC bC bC bC bC bC bC bC bC bC bC bC bC bC bC bC bC bC bC bC bC bC bC bC bC bC bC bC bC bC bC bC bC bC bC bC bC bC bC bC bC bC bC bC bC bC bC bC bC bC bC bC bC bC bC bC bC bC bC bC bC bC bC bC bC bC bC bC bC bC bC bC bC bC bC bC bC bC bC bC bC bC bC bC bC bC bC bC bC bC bC bC bC bC bC bC bC bC bC bC bC bCbC bC bC bC bC bC bC bC bC bC bC bC bC bC bC bC bC bC bC bC bC bC bC bC bC bC bC bC bC bC bC bC bC bC bC bC bC bC bC bC bC bC bC bC bC bC bC bC bC bC bC bC bC bC bC bC bC bC bC bC bC bC bC bC bC bC bC bC bC bC bC bC bC bC bC bC bC bC bC bC bC bC bC bC bC bC bC bC bC bC bC bC bC bC bC bC bC bC bC bC bC bC bC bC bC bC bC bC bC bC bC bC bC bC bC bC bC bC bC bC bC bC bC bC bC bC bC bC bC bC bC bC bC bC bC bC bC bC bC bC bC bC bC bC bC bC bC bC bC bC bC bC bC bC bC bC bC bC bC bC bC bC bC bC bC bC bC bC bC bC bC bC bC bC bC bC bC bC bC bC bC bC bC bC bC bC bC bC bC bC bC bC bC bC bC bC bC bC bC bC bC bC bC bC bC bC bC bC bC bC bC bC bC bC bC bC bC bC bC bC bC bC bC bC bC
bC bC bC bC bC bC bC bC bC bC bC bCbC bC bC bC bC bC bC bC bC bC bC bC bC bC bC bC bC bC bC bC bC bC bC bC bC bC bC bC bC bC bC bC bC bC bC bC bC bC bC bC bC bC bC bC bC bC bC bC bC bC bC bC bC bC bC bC bC bC bC bC bC bC bC bC bC bC bC bC bC bC bC bC bC bC bC bC bC bC bC bC bC bC bC bC bC bC bC bC bC bC bC bC bC bC bC bC bC bC bC bC bC bC bC bC bC bC bC bC bC bC bC bC bC bC bC bC bC bC bC bC bC bC bC bC bC bC bC bC bC bC bC bC bC bC bC bC bC bC bC bC bC bC bC bC bC bC bC bC bC bC bC bC bC bC bC bC bC bC bC bC bC bC bC bC bC bC bC bC bC bC bC bC bC bC bC bC bC bC bC bC bC bC bC bC bC bC bC bC bC bC bC bC bC bC bC bC bC bC bC bC bC bC
bC bC bC bC bC bC bC bC bCbC bC bC bCbC bC bC bC bCbC bC bC bC bC bC bC bC bC bC bC bC bC bC bC bC bC bC bC bC bC bC bC bC bC bC bC bC bC bC bC bC bC bC bC bC bC bC bC bC bC bC bC bC bC bC bC bC bC bC bC bC bC bC bC bC bC bC bC bC bC bC bC bC bC bC bC bC bC bC bC bC bC bC bC bC bC bC bC bC bC bC bC bC bC bC bC bC bC bC bC bC bC bC bC bC bC bC bC bC bC bC bC bC bC bC bC bC bC bC bC bC bC bC bC bC bC bC bC bC bC bC bC bC bC bC bC bC bC bC bC bC bC bC bC bC bC bC bC bC bC bC bC bC bC bC bC bC bC bC bC bC bC bC bC bC bC bC bC bC bC bC bC bC bC bC bC bC bC bC bC bC bC bC bC bC bC bC bC bC bC bC bC bC bC bC bC bC bC bC bC bC bC bC bC bC bC bC bC bC bC bC bC bC bC bC bC bC bC bC bC
bC bC bC bC bC bC bC bC bC bC bC bC bC bC bC bC bC bC bC bC bC bC bC bC bC bC bC bC bC bC bC bC bC bC bC bC bC bC bC bC bC bC bC bC bC bC bC bC bC bC bC bC bC bC bC bC bC bC bC bC bC bC bC bC bC bC bC bC bC bC bC bC bC bC bC bC bC bC bC bC bC bC bC bC bC bC bC bC bC bC bC bC bC bC bC bC bC bC bC bC bC bC bC bC bC bC bC bC bC bC bC bC bC bC bC bC bC bC bC bC bC bC bC bC bC bC bC bCbC bC bC bC bC bC bC bC bC bC bC bC bC bC bC bC bC bC bC bC bC bC bC bC bC bC bC bC bC bC bC bC bC bC bC bC bC bC bC bC bC bC bC bC bC bC bC bC bC bC bC bC bC bC bC bC bC bC bC bC bC bC bC bC bC bC bCbC bC bC bC bC bC bC bC bC bC bC bC bC bC bC bC bC bC bC bC bC bC bC bC bC bC bC bC bC bC bC bC bC bC bC bC bC bC bC bC bC bC bC bC bC bC bC bC bC bC bC bC bC bC bC bC bC bC bC bC bC bC bC bC bC bC bC bC bC bC bC bC bC bC bC bC bC bC bC bC bC bC bC bC bC bC bC bC bC bC bC bC bC bC bC bC bC bC bC bC bC bC bC bC bC bC bC bC bC bC bC bC bC bC bC bC bC bC bC bC bC bC bC bC bC bC bC bC bC bC bC bC bC bC bC bC bC bC bC bC bC bC bC bC bC bC bC bC bC bC bC bC bC bC bC bC bC bC bC bC bC bC bC bC bC bC bC bC bC bC bC bC bC bC bC bC bC bC bC bC bC bC bC bC bC bC bC bC bC bC bC bC bC bC bC bC bC bC bC bC bC bC bC bC bC bC bC bC bC bC bC bC bC bC bC bC bC bC bC bC bC bC bC bC bC bC bC bC bC bC bC bC bC bC bC bC bC bC bC bC bC bC bC bC bC bC bC bC bC bC bC bC bC bC bC bC bC bC bC bC bC bC bC bC bC bC bC bC bC bC bC bC bC bC bC bC bC bC bC bC bC bC bC bC bC bC bC bC bC bC bC bC bC bC bC bC bC bC bC bC bC bC bC bC bC bC bC bC bC bC bC bC bC bC bC bC bC bC bC bC bC bC bC bC bC bC bC bC bC bC bC bC bC bC bC bC bC bC bC bC bC bC bC bC bC bC bC bC bC bC bC bC bC bC bC bC bC bC bC bC bC bC bC bC bC bC bC bC bC bC bC bC bC bC bC bC bC bC bC bC bC bC bC bC bC bC bC bC bC bC bC bC bC bC bC bC bC bC bC bC bC bC bC bC bC bC bC bC bC bC bC bC bC bC bC bC bC bC bC bC bC bC bC bC bC bC bC bC bC bC bC bC bC bC bC bC bC bC bC bC bC bC bC bC bC bC bC bC bC bC bC bC bC bC bC bC bC bC bC bC bC bC bC bC bC bC bC bC bC bC bC bC bC bC bC bC bC bC bC bC bC bC bC bC bC bC bC bC bC bC bC bC bC bC bC bC bC bC bC bC bC bC bC bC bC bC bC bC bC bC bC bC bC bC bC bC bC bC bC bC bC bC bC bC bC bC bC bC bC bC bC bC bC bC bC bC bC bC bC bC bC bC bC bC bC bC bC bC bC bC bC bC bC bC bC bC bC bC bC bC bC bC bC bC bC bC bC bC bC bC bC bC bC bC bC bC bC bC bC bC bC bC bC bC bC bC bC bC bC bC bC bC bC bC bC bC bC bC bC bC bC bC bC bC bC bC bC bC bC bC bC bC bC bC bC bC bC bC bC bC bC bC bC bC bC bC bC bC bC bC bC bC bC bC bC bC bC bC bC bC bC bC bC bC bC bC bC bC bC bC bC bC bC bC bC bC bC bC bC bC bC bC bC bC bC bC bC bC bC bC bC bC bC bC bC bC bC bC bC bC bC bC bC bC bC bC bC bC bC bC bC bC bC bC bC bC bC bC bC bC bC bC bC bC bC bC bC bC bC bC bC bC bC bC bC bC bC bC bC bC bC bC bC bC bC bC bC bC bC bC bC bC bC bC bC bC bC bC bC bC bC bC bC bC bC bC bC bC bC bC bC bC bC bC bC bC bC bC bC bC bC bC bC bC bC bC bC bC bC bC bC bC bC bC bC bC bC bC bC bC bC bC bC bC bC bC bC bC bC bC bC bC bC bC bC bC bC bC bC bC bC bC bC bC bC bC bC bC bC bC bC bC bC bC bC bC bC bC bC bC bC bC bC bC bC bC bC bC bC bC bC bC bC bC bC bC bC bC bC bC bC bC bC bC bC bC bC bC bC bC bC bC bC bC bC bC bC bC bC bC bC bC bC bC bC bC bC bC bC bC bC bC bC bC bC bC bC bC bC bC bC bC bC bC bC bC bC bC bC bC bC bC bC bC bC bC bC bC bC bC bC bC bC bC bC bC bC bC bC bC bC bC bC bC bC bC bC bC bC bC bC bC bC bC bC bC bC bC bC bC bC bC bC bC bC bC bC bC bC bC bC bC bC bC bC bC bC bC bC bC bC bC bC bC bC bC bC bC bC bC bC bC bC bC bC bC bC bC bC bC bC bC bC bC bC bC bC bC bC bC bC bC bC bC bC bC bC bC bC bC bC bC bC bC bC bC bC bC bC bC bC bC bC bC bC bC bC bC bC bC bC bC bC bC bC bC bC bC bC bC bC bC bC bC bC bC bC bC bC bC bC bC bC bC bC bC bC bC bC bC bC bC bC bC bC bC bC bC bC bC bC bC bC bC bC bC bC bC bC bC bC bC bC bC bC bC bC bC bC bC bC bC bC bC bC bC bC bC bC bC bC bC bC bC bC bC bC bC bC bC bC bC bC bC bC bC bC bC bC bC bC bC bC bC bC bC bC bC bC bC bC bC bC bC bC bC bC bC bC bC bC bC bC bC bC bC bC bC bC bC bC bC bC bC bC bC bC bC bC bC bC bC bC bC bC bC bC bC bC bC bC bC bC bC bC bC bC bC bC bC bC bC bC bC bC bC bC bC bC bC bC bC bC bC bC bC bC bC bC bC bC bC bC bC bC bC bC bC bC bC bC bC bC bC bC bC bC bC bC bC bC bC bC bC bC bC bC bC bC bC bC bC bC bC bC bC bC bC bC bC bC bC bC bC bC bC bC bC bC bC bC bC bC bC bC bC bC bC bC bC bC bC bC bC bC bC bC bC bC bC bC bC bC bC bC bC bC bC bC bC bC bC bC bC bC bC bC bC bC bC bC bC bC bC bC bC bC bC bC bC bC bC bC bC bC bC bC bC bC bC bC bC bC bC bC bC bC bC bC bC bC bC bC bC bC bC bC bC bC bC bC bC bC bC bC bC bC bC bC bC bC bC bC bC bC bC bC bC bC bC bC bC bC bC bC bC bC bC bC bC bC bC bC bC bC bC bC bC bC bC bC bC bC bC bC bC bC bC bC bC bC bC bC bC bC bC bC bC bC bC bC bC bC bC bC bC bC bC bC bC bC bC bC bC bC bC bC bC bC bC bC bC bC bC bC bC bC bC bC bC bC bC bC bC bC bC bC bC bC bC bC bC bC bC bC bC bC bC bC bC bC bC bC bC bC bC bC bC bC bC bC bC bC bC bC bC bC bC bC bC bC bC bC bC bC bC bC bC bC bC bC bC bC bC bC bC bC bC bC bC bC bC bC bC bC bC bC bC bC bC bC
bC bC bC bC bC bC bC bC bC bC bC bC bC bC bC bC bC bC bC bC bC bC bC bC bC bC bC bC bC bC bC bC bC bC bC bC bC bC bC bC bC bC bC bC bC bC bC bC bC bC bC bC bC bC bC bC bC bC bC bC bC bC bC bC bC bC bC bC bC bC bC bC bC bC bC bC bC bC bC bC bC bC bC bC bC bC bC bC bC bC bC bC bC bC bC bC bC bC bC bC bC bC bC bC bC bC bC bC bC bC bC bC bC bC bC bC bC bC bC bC bC bC bC bC bC bC bC bC bC bC bC bC bC bC bC bC bC bC bC bC bC bC bC bC bC bC bC bC bC bC bC bC bC bC bC bC bC bC bC bC bC bC bC bC bC bC bC bC bC bC bC bC bC bC bC bC bC bC bC bC bC bC bC bC bC bC bC bC bC bC bC bC bC bC bC bC bC bC bC bC bC bC bC bC bC bC bC bC bC bC bC bC bC bC bC bC bC bC bC bC bC bC bC bC bC bC bC bC bC bC bC bC bC bC bC bC bC bC bC bC bC bC bC bC bC bC bC bC bC bC bC bC bC bC bC bC bC bC bC bC bC bC bC bC bC bC bC bC bC bC bC bC bC bC bC bC bC bC bC bC bC bC bC bC bC bC bC bC bC bC bC bC bC bC bC bC bC bC bC bC bC bC bC bC bC bC bC bC bC bC bC bC bC bC bC bC bC bC bC bC bC bC bC bC bC bC bC bC bC bC bC bC bC bC bC bC bC bC bC bC bC bC bC bC bC bC bC bC bC bC bC bC bC bC bC bC bC bC bC bC bC bC bC bC bC bC bC bC bC bC bC bC bC bC bC bC bC bC bC bC bC bC bC bC bC bC bC bC bC bC bC bC bC bC
2θ/°10 20 30 40 50 60 70 80 90
Int/
103
coun
ts
0
5,0
10,0
Abbildung 3.24: Rietveld-Plot von Pigment Red 181; Verfeinerung I mit gsas. Schwarze Kreise: ge-messenes Pulverdiagramm; rote Linie: simuliertes Pulverdiagramm; blaue Linie: Un-tergrund; grüne Linie: Differenzkurve.
3.8.4 Strukturlösung II
Die bestimmte Struktur von P. R. 181 war alles andere als zufriedenstellend. Es wurde deshalbein neuer Versuch der Strukturlösung unternommen.
Eine genaue Analyse zeigte, dass die Kristallstruktur ebenso mit einer halb so großenElementarzelle wiedergegeben werden kann. Folgender Gedankengang bestätigt diese An-
61
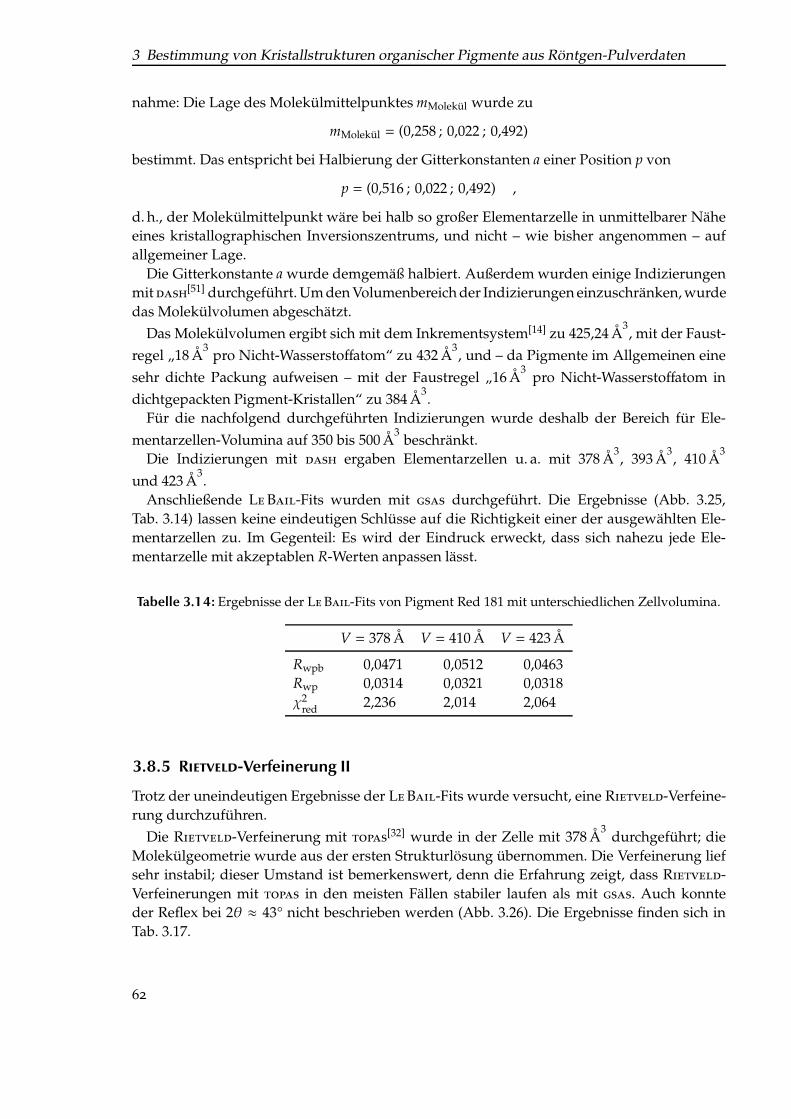
3 Bestimmung von Kristallstrukturen organischer Pigmente aus Röntgen-Pulverdaten
nahme: Die Lage des Molekülmittelpunktes mMolekül wurde zu
mMolekül = (0,258 ; 0,022 ; 0,492)
bestimmt. Das entspricht bei Halbierung der Gitterkonstanten a einer Position p von
p = (0,516 ; 0,022 ; 0,492) ,
d. h., der Molekülmittelpunkt wäre bei halb so großer Elementarzelle in unmittelbarer Näheeines kristallographischen Inversionszentrums, und nicht – wie bisher angenommen – aufallgemeiner Lage.
Die Gitterkonstante a wurde demgemäß halbiert. Außerdem wurden einige Indizierungenmitdash[51] durchgeführt. Um den Volumenbereich der Indizierungen einzuschränken, wurdedas Molekülvolumen abgeschätzt.
Das Molekülvolumen ergibt sich mit dem Inkrementsystem[14] zu 425,24 Å3, mit der Faust-
regel „18 Å3
pro Nicht-Wasserstoffatom“ zu 432 Å3, und – da Pigmente im Allgemeinen eine
sehr dichte Packung aufweisen – mit der Faustregel „16 Å3
pro Nicht-Wasserstoffatom indichtgepackten Pigment-Kristallen“ zu 384 Å
3.
Für die nachfolgend durchgeführten Indizierungen wurde deshalb der Bereich für Ele-mentarzellen-Volumina auf 350 bis 500 Å
3beschränkt.
Die Indizierungen mit dash ergaben Elementarzellen u. a. mit 378 Å3, 393 Å
3, 410 Å
3
und 423 Å3.
Anschließende LeBail-Fits wurden mit gsas durchgeführt. Die Ergebnisse (Abb. 3.25,Tab. 3.14) lassen keine eindeutigen Schlüsse auf die Richtigkeit einer der ausgewählten Ele-mentarzellen zu. Im Gegenteil: Es wird der Eindruck erweckt, dass sich nahezu jede Ele-mentarzelle mit akzeptablen R-Werten anpassen lässt.
Tabelle 3.14: Ergebnisse der LeBail-Fits von Pigment Red 181 mit unterschiedlichen Zellvolumina.
V = 378 Å V = 410 Å V = 423 Å
Rwpb 0,0471 0,0512 0,0463Rwp 0,0314 0,0321 0,0318χ2
red 2,236 2,014 2,064
3.8.5 Rietveld-Verfeinerung II
Trotz der uneindeutigen Ergebnisse der LeBail-Fits wurde versucht, eine Rietveld-Verfeine-rung durchzuführen.
Die Rietveld-Verfeinerung mit topas[32] wurde in der Zelle mit 378 Å3
durchgeführt; dieMolekülgeometrie wurde aus der ersten Strukturlösung übernommen. Die Verfeinerung liefsehr instabil; dieser Umstand ist bemerkenswert, denn die Erfahrung zeigt, dass Rietveld-Verfeinerungen mit topas in den meisten Fällen stabiler laufen als mit gsas. Auch konnteder Reflex bei 2θ ≈ 43° nicht beschrieben werden (Abb. 3.26). Die Ergebnisse finden sich inTab. 3.17.
62

3.8 Pigment Red 181
bC bC bC bC bC bC bC bC bC bC bC bC bC bC bC bC bC bC bC bC bC bC bC bC bC bC bCbC bC bC bC bC bC bC bC bC bC bC bC bC bC bC bC bC bC bC bC bC bC bC bC bC bC bC bC bC bC bC bC bC bC bC bC bC bC bC bC bC bC bC bC bC bC bC bC bC bC bC bC bC bC bC bC bC bC bC bC bC bC bC bC bC bC bC bC bC bC bC bC bC bC bC bC bC bC bC bC bC bC bC bC bC bC bC bC bC bC bC bC bC bC bC bC bC bC bC bC bC bC bC bC bC bC
bC bC bC bC bC bC bC bC bC bC bC bC bC bC bC bC bC bC bC bC bC bC bC bC bC bC bC bC bC bC bC bC bC bC bC bC bC bC bC bC bC bC bC bC bC bC bC bC bC bC bC bC bC bC bC bC bC bC bC bC bC bC bC bC bC bC bC bC bC bC bC bC bC bC bC bC bC bC bC bC bC bC bC bC bC bC bC bC bC bC bCbC bC bC bC bC bCbC bC bC bCbC bC bCbCbC bCbC bCbCbC bCbC bCbC bC bCbCbCbCbCbCbC bC bC bC bC bC bC bC bC bC bC bC bC bC bC bC bC bC bC bC bC bC bC bC bC bC bC bC bC bC bC bC bC bC bC bC bC bC bC bC bC bC bC bC bC bC bC bC bC bC bC bC bC bC bC bC bC bC bC bC bC bC bC bC bC bC bC bC bCbC bC bC bC bC bC bC bC bC bC bC bC bC bCbC bC bC bC bCbC bC bC bCbC bCbC bCbC bCbC bCbC bC bC bC bC bC bCbC bC bCbCbC bC bCbC bC bC bC bC bC bC bC bC bC bC bC bC bC bC bC bC bC bC bC bC bC bC bC bC bC bC bC bC bC bC bC bC bC bC bC bC bC bC bC bC bC bC bC bC bC bC bC bC bC bC bC bC bC bC bC bC bC bC bC bC bC bC bC bC bC bC bC bC bC
bC bC bC bC bC bC bC bC bC bC bC bC bC bC bC bC bC bC bC bC bC bC bC bC bC bC bC bC bC bC bC bC bC bC bC bC bC bC bC bC bC bC bC bC bC bC bC bC bC bC bC bC bC bC bC bC bC bC bC bC bC bC bC bC bC bC bC bC bC bC bC bC bC bC bC bC bC bC bC bC bC bC bC bC bC bC bC bC bC bC bC bC bC bC bC bC bC bC bC bC bC bC bC bC bC bC bC bC bC bC bC bC bC bC bC bC bC bC bC bC bC bC bC bC bC bC bC bC bC bC bC bC bC bC bC bC bC bC bC bC bC bC bC bC bC bC bC bC bC bC bC bC bC bC bC bC bC bC bC bC bC bC bC bC bC bC bC bC bC bC bC bC bC bC bC bC bC bC bC bC bC bC bC bC bC bC bC bC bC bC bC bC bC bC bC bC bC bC bC bC bC bC bC bC bC bC bC bC bC bC bC bC bC bC bC bC bC bC bC bC bC bC bC bC bC bC bC bC bC bC bC bC bC bC bC bC bC bC bC bC bC bC bC bC bC bC bC bC bC bC bC bC bC bC bC bC bC bC bC bC bC bC bC bC bC bC bC bC bC bC bC bC bC bC bC bC bC bC bC bC bC bC bC bC bC bC bC bC bC bC bC bC bC bC bCbC bC bC bC bC bC bC bC bC bCbC bC bC bC bC bC bC bC bC bC bC bC bC bC bC bC bC bC bC bC bC bC bC bC bC bC bC bC bC bC bC bC bC bC bC bC bC bC bC bC bC bC bC bC bCbC bC bC bC bC bC bC bC bC bC bC bC bC bC bC bC bC bC bC bC bC bC bC bC bC bC bC bC bC bC bC bC bC bC bC bC bC bC bC bC bC bC bC bC bC bC bC bC bC bC bCbC bC bC bCbC bC bC bC bC bC bC bC bCbC bC bC bC bC bC bC bC bC bC bC bC bC bC bC bC bC bC bC bC bC bC bC bC bC bC bC bC bC bC bC bC bC bC bC bC bC bC bC bC bC bC bC bC bC bC bC bC bC bC bC bC bC bC bC bC bC bC bC bC bCbC bC bC bC bC bCbC bCbC bCbC bC bCbC bC bCbC bC bC bC bC bC bC bC bC bC bC bC bC bC bC bC bC bC bC bC bC bC bC bC bC bC bC bCbC bC bC bC bC bCbC bC bC bC bCbC bC bCbC bC bC bC bC bC bC bC bC bC bC bC bC bC bC bC bC bC bC bC bC bC bC bC bC bCbC bC bC bC bC bC bC bC bC bC bC bC bC bC bC bC bC bC bC bCbC bC bCbC bCbC bCbC bCbCbCbCbC bC bCbC bCbCbC bCbC bCbCbCbC bCbC bC bC bC bC bCbC bC bC bC bC bC bC bC bC bC bC bC bC bC bC bC bC bC bC bC bC bCbC bC bC bC bC bCbC bC bC bC bCbCbC bCbC bCbCbCbCbCbC
bCbC
bCbCbC bC bCbC
bC
bCbCbC
bCbCbCbC bC bCbC bC bC bC bC bC bC bC bC bC bC bC bC bC bC bC bC bC bC bC bC bC bC bC bC bC bC bC bC bC bC bC bC bC bC bC bC bC bC bC bC bC bC bC bC bC bC bC bC bC bC bC bC bC bCbC bC bC bC bC bC bC bC bCbC bC bC bC bC bC bC bC bC bC bC bC bC bC bC bC bC bC bC bC bC bC bC bC bC bC bC bC bC bC bC bC bC bC bC bC bC bC bC bC bC bC bC bC bC bC bC bC bC bC bC bC bC bC bC bC bC bC bC bC bC bC bC bC bC bC bC bC bCbC bC bC bC bC bC bC bC bC bC bC bC bC bC bC bC bC bC bC bC bC bC bC bC bC bC bC bC bC bC bC bC bC bC bC bC bC bC bC bC bC bCbC bC bC bC bC bC bC bC bC bC bC bC bC bC bC bC bC bC bC bC bC bC bC bC bC bC bC bC bC bC bC bC bC bC bC bC bC bC bC bC bC bC bC bC bC bC bC bC bC bC bC bC bC bC bC bC bC bC bC bC bC bC bC bC bC bC bC bC bC bC bC bC bC bC bC bC bC bC bC bC bC bC bC bC bC bC bC bC bC bC bC bC bC bC bC bC bC bC bC bC bC bC bC bC bC bC bC
bC bC bC bC bC bC bC bC bC bC bC bC bC bC bC bC bC bC bC bC bC bC bC bC bC bC bC bC bC bC bC bC bC bC bC bC bC bC bC bC bC bC bC bC bC bC bC bC bC bC bC bC bC bC bC bC bC bC bCbC bC bC bC bC bC bC bC bC bC bC bC bC bC bC bC bC bC bC bC bC bC bC bC bC bC bC bC bC bC bC bC bC bC bC bC bC bC bC bC bC bC bC bC bC bC bC bC bC bC bC bC bC bC bC bC bC bC bC bC bC bC bCbC bC bC bC bC bC bC bC bC bC bC bC bC bC bC bC bC bC bC bC bC bC bC bC bC bC bC bC bC bC bC bC bC bC bC bC bC bC bC bC bC bC bC bC bC bC bC bC bC bC bC bC bC bC bC bC bC bC bC bC bC bC bC bC bC bC bC bC bC bC bC bC bC bC bC bC bC bC bC bC bC bC bC bC bC bC bC bC bC bC bC bC bC bC bC bC bC bC bC bC bC bC bC bC bC bC bC bC bC bC bC bC bC bC bC bC bC bC bC bC bC bC bC bC bC bC bC bC bC bC bC bC bC bC bC bC bC bC bC bC bC bC bC bC bC bC bC bC bC
bC bC bC bC bC bC bC bC bC bC bC bC bC bC bC bC bC bC bC bC bC bC bC bC bC bC bC bC bC bC bC bC bC bC bC bC bC bC bC bC bC bC bC bC bC bC bC bC bC bC bC bC bC bC bC bC bC bC bC bC bC bC bC bC bC bC bC bC bC bC bC bC bC bC bC bC bC bC bC bC bCbC bC bC bC bC bC bC bC bC bC bCbC bC bC bC bC bC bC bC bC bC bC bC bC bC bC bC bC bC bC bC bC bC bC bC bC bC bC bC bC bC bC bC bC bC bC bC bC bC bC bC bC bC bC bC bC bC bC bC bC bC bC bC bC bC bC bC bC bC bC bC bC bC bC bC bC bC bC bC bC bC bC bC bC bC bC bC bC bC bC bC bC bC bC bC bC bC bC bC bC bC bC bC bC bC bC bC bC bC bC bC bC bC bC bC bC bC bC bC bC bC bC bC bC bC bC bC bC bC bC bC bC bC bC bC bC bC bC bC bC bC bC bC bC bC bC bC bC bC bC bC bC bC bC bC bC bC bC bC bC bC bC bC bC bC bC bC bC bC bC bC bC bC bC bC bC bC bC bC bC bC bC bC bC bC bC bC bC bC bC bC bC bC bC bC bC bC bC bC bC bC bC bC bC bC bC bC bC bC bC bC bC bC
bC bC bC bC bC bC bC bC bCbC bC bC bC bCbC bC bC bC bCbC bC bC bC bC bC bC bC bC bC bC bC bC bC bC bC bC bC bC bC bC bC bC bC bC bC bC bC bC bC bC bC bC bC bC bC bC bC bC bC bC bC bC bC bC bC bC bC bC bC bC bC bC bC bC bC bC bC bC bC bC bC bC bC bC bC bC bC bC bC bC bC bC bC bC bC bC bC bC bC bC bC bC bC bC bC bC bC bC bC bC bC bC bC bC bC bC bC bC bC bC bC bC bC bC bC bC bC bC bC bC bC bC bC bC bC bC bC bC bC bC bC bC bC bC bC bC bC bC bC bC bC bC bC bC bC bC bC bC bC bC bC bC bC bC bC bC
bC bC bC bC bC bC bC bC bC bC bC bC bC bC bC bC bC bC bC bC bC bC bC bC bC bC bC bC bC bC bC bC bC bC bC bC bC bC bC bC bC bC bC bC bC bC bC bC bC bC bC bC bC bC bC bC bC bC bC bC bC bC bC bC bC bC bC bC bC bC bC bC bC bC bC bC bC bC bC bC bC bC bC bC bC bC bC bC bC bC bC bC bC bC bC bC bC bC bC bC bC bC bC bC bC bC bC bC bC bC bC bC bC bC bC bC bC bC bC bC bC bC bC bC bC bC bC bC bC bC bC bC bC bC bC bC bC bC bC bC bC bC bC bC bC bC bC bC bC bC bC bC bC bC bC bC bC bC bC bC bC bC bC bC bC bC bC bC bC bC bC bC bC bC bC bC bC bC bC bC bC bC bC bC bC bC bC bC bC bCbC bC bC bC bC bC bC bC bC bC bC bC bC bC bC bC bC bC bC bC bC bC bC bC bC bC bC bC bC bC bC bC bC bC bC bC bC bC bC bC bC bC bC bC bC bC bC bC bC bC bC bC bC bC bC bC bC bC bC bC bC bC bC bC bC bC bC bC bCbC bC bC bC bC bC bC bC bC bC bC bC bC bC bC bC bC bC bC bC bC bC bC bC bC bC bC bC bC bC bC bC bC bC bC bC bC bC bC bC bC bC bC bC bC bC bC bC bC bC bC bC bC bC bC bC bC bC bC bC bC bC bC bC bC bC bC bC bC bC bC bC bC bC bC bC bC bC bC bC bC bC bC bC bC bC bC bC bC bC bC bC bC bC bC bC bC bC bC bC bC bC bC bC bC bC bC bC bC bC bC bC bC bC bC bC bC bC bC bC bC bC bC bC bC bC bC bC bC bC bC bC bC bC bC bC bC bC bC bC bC bC bC bC bC bC bC bC bC bC bC bC bC bC bC bC bC bC bC bC bC bC bC bC bC bC bC bC bC bC bC bC bC bC bC bC bC bC bC bC bC bC bC bC bC bC bC bC bC bC bC bC bC bC bC bC bC bC bC bC bC bC bC bC bC bC bC bC bC bC bC bC bC bC bC bC bC bC bC bC bC bC bC bC bC bC bC bC bC bC bC bC bC bC bC bC bC bC bC bC bC bC bC bC bC bC bC bC bC bC bC bC bC bC bC bC bC bC bC bC bC bC bC bC bC bC bC bC bC bC bC bC bC bC bC bC bC bC bC bC bC bC bC bC bC bC bC bC bC bC bC bC bC bC bC bC bC bC bC bC bC bC bC bC bC bC bC bC bC bC bC bC bC bC bC bC bC bC bC bC bC bC bC bC bC bC bC bC bC bC bC bC bC bC bC bC bC bC bC bC bC bC bC bC bC bC bC bC bC bC bC bC bC bC bC bC bC bC bC bC bC bC bC bC bC bC bC bC bC bC bC bC bC bC bC bC bC bC bC bC bC bC bC bC bC bC bC bC bC bC bC bC bC bC bC bC bC bC bC bC bC bC bC bC bC bC bC bC bC bC bC bC bC bC bC bC bC bC bC bC bC bC bC bC bC bC bC bC bC bC bC bC bC bC bC bC bC bC bC bC bC bC bC bC bC bC bC bC bC bC bC bC bC bC bC bC bC bC bC bC bC bC bC bC bC bC bC bC bC bC bC bC bC bC bC bC bC bC bC bC bC bC bC bC bC bC bC bC bC bC bC bC bC bC bC bC bC bC bC bC bC bC bC bC bC bC bC bC bC bC bC bC bC bC bC bC bC bC bC bC bC bC bC bC bC bC bC bC bC bC bC bC bC bC bC bC bC bC bC bC bC bC bC bC bC bC bC bC bC bC bC bC bC bC bC bC bC bC bC bC bC bC bC bC bC bC bC bC bC bC bC bC bC bC bC bC bC bC bC bC bC bC bC bC bC bC bC bC bC bC bC bC bC bC bC bC bC bC bC bC bC bC bC bC bC bC bC bC bC bC bC bC bC bC bC bC bC bC bC bC bC bC bC bC bC bC bC bC bC bC bC bC bC bC bC bC bC bC bC bC bC bC bC bC bC bC bC bC bC bC bC bC bC bC bC bC bC bC bC bC bC bC bC bC bC bC bC bC bC bC bC bC bC bC bC bC bC bC bC bC bC bC bC bC bC bC bC bC bC bC bC bC bC bC bC bC bC bC bC bC bC bC bC bC bC bC bC bC bC bC bC bC bC bC bC bC bC bC bC bC bC bC bC bC bC bC bC bC bC bC bC bC bC bC bC bC bC bC bC bC bC bC bC bC bC bC bC bC bC bC bC bC bC bC bC bC bC bC bC bC bC bC bC bC bC bC bC bC bC bC bC bC bC bC bC bC bC bC bC bC bC bC bC bC bC bC bC bC bC bC bC bC bC bC bC bC bC bC bC bC bC bC bC bC bC bC bC bC bC bC bC bC bC bC bC bC bC bC bC bC bC bC bC bC bC bC bC bC bC bC bC bC bC bC bC bC bC bC bC bC bC bC bC bC bC bC bC bC bC bC bC bC bC bC bC bC bC bC bC bC bC bC bC bC bC bC bC bC bC bC bC bC bC bC bC bC bC bC bC bC bC bC bC bC bC bC bC bC bC bC bC bC bC bC bC bC bC bC bC bC bC bC bC bC bC bC bC bC bC bC bC bC bC bC bC bC bC bC bC bC bC bC bC bC bC bC bC bC bC bC bC bC bC bC bC bC bC bC bC bC bC bC bC bC bC bC bC bC bC bC bC bC bC bC bC bC bC bC bC bC bC bC bC bC bC bC bC bC bC bC bC bC bC bC bC bC bC bC bC bC bC bC bC bC bC bC bC bC bC bC bC bC bC bC bC bC bC bC bC bC bC bC bC bC bC bC bC bC bC bC bC bC bC bC bC bC bC bC bC bC bC bC bC bC bC bC bC bC bC bC bC bC bC bC bC bC bC bC bC bC bC bC bC bC bC bC bC bC bC bC bC bC bC bC bC bC bC bC bC bC bC bC bC bC bC bC bC bC bC bC bC bC bC bC bC bC bC bC bC bC bC bC bC bC bC bC bC bC bC bC bC bC bC bC bC bC bC bC bC bC bC bC bC bC bC bC bC bC bC bC bC bC bC bC bC bC bC bC bC bC bC bC bC bC bC bC bC bC bC bC bC bC bC bC bC bC bC bC bC bC bC bC bC bC bC bC bC bC bC bC bC bC bC bC bC bC bC bC bC bC bC bC bC bC bC bC bC bC bC bC bC bC bC bC bC bC bC bC bC bC bC bC bC bC bC bC bC bC bC bC bC bC bC bC bC bC bC bC bC bC bC bC bC bC bC bC bC bC bC bC bC bC bC bC bC bC bC bC bC bC bC bC bC bC bC bC bC bC bC bC bC bC bC bC bC bC bC bC bC bC bC bC bC bC bC bC bC bC bC bC bC bC bC bC bC bC bC bC bC bC bC bC bC bC bC bC bC bC bC bC bC bC bC bC bC bC bC bC bC bC bC bC bC bC bC bC bC bC bC bC bC bC bC bC bC bC bC bC bC bC bC bC bC bC bC bC bC bC bC bC bC bC bC bC bC bC bC bC bC bC bC bC bC bC bC bC bC bC bC bC bC bC bC bC bC bC bC bC bC bC bC bC bC bC bC bC bC bC bC bC bC bC bC bC bC bC bC bC bC bC bC bC bC bC bC bC bC bC bC bC bC bC bC bC bC bC bC bC bC bC bC bC bC bC bC bC bC bC bC bC bC bC bC bC bC bC bC bC bC bC bC bC bC bC bC bC bC bC bC bC bC bC bC bC bC bC bC bC bC bC bC bC bC bC bC bC bC bC bC bC bC bC bC bC bC bC bC bC bC bC bC bC bC bC bC bC bC bC bC bC bC bC bC bC bC bC bC bC bC bC bC bC bC bC bC bC bC bC bC bC
bC bC bC bC bC bC bC bC bC bC bC bC bC bC bC bC bC bC bC bC bC bC bC bC bC bC bC bC bC bC bC bC bC bC bC bC bC bC bC bC bC bC bC bC bC bC bC bC bC bC bC bC bC bC bC bC bC bC bC bC bC bC bC bC bC bC bC bC bC bC bC bC bC bC bC bC bC bC bC bC bC bC bC bC bC bC bC bC bC bC bC bC bC bC bC bC bC bC bC bC bC bC bC bC bC bC bC bC bC bC bC bC bC bC bC bC bC bC bC bC bC bC bC bC bC bC bC bC bC bC bC bC bC bC bC bC bC bC bC bC bC bC bC bC bC bC bC bC bC bC bC bC bC bC bC bC bC bC bC bC bC bC bC bC bC bC bC bC bC bC bC bC bC bC bC bC bC bC bC bC bC bC bC bC bC bC bC bC bC bC bC bC bC bC bC bC bC bC bC bC bC bC bC bC bC bC bC bC bC bC bC bC bC bC bC bC bC bC bC bC bC bC bC bC bC bC bC bC bC bC bC bC bC bC bC bC bC bC bC bC bC bC bC bC bC bC bC bC bC bC bC bC bC bC bC bC bC bC bC bC bC bC bC bC bC bC bC bC bC bC bC bC bC bC bC bC bC bC bC bC bC bC bC bC bC bC bC bC bC bC bC bC bC bC bC bC bC bC bC bC bC bC bC bC bC bC bC bC bC bC bC bC bC bC bC bC bC bC bC bC bC bC bC bC bC bC bC bC bC bC bC bC bC bC bC bC bC bC bC bC bC bC bC bC bC bC bC bC bC bC bC bC bC bC bC bC bC bC bC bC bC bC bC bC bC bC bC bC bC bC bC bC bC bC bC bC bC bC bC bC bC bC bC bC bC bC bC bC bC bC bC bC bC bC bC
V = 378 Å3
Rwpb = 0,0471Rwp = 0,0314χ2
red = 2,236
Int/
104
0,0
1,0
2,0
bC bC bC bC bC bC bC bC bC bC bC bC bC bC bC bC bC bC bC bC bC bC bC bC bC bC bCbC bC bC bC bC bC bC bC bC bC bC bC bC bC bC bC bC bC bC bC bC bC bC bC bC bC bC bC bC bC bC bC bC bC bC bC bC bC bC bC bC bC bC bC bC bC bC bC bC bC bC bC bC bC bC bC bC bC bC bC bC bC bC bC bC bC bC bC bC bC bC bC bC bC bC bC bC bC bC bC bC bC bC bC bC bC bC bC bC bC bC bC bC bC bC bC bC bC bC bC bC bC bC bC bC bC
bC bC bC bC bC bC bC bC bC bC bC bC bC bC bC bC bC bC bC bC bC bC bC bC bC bC bC bC bC bC bC bC bC bC bC bC bC bC bC bC bC bC bC bC bC bC bC bC bC bC bC bC bC bC bC bC bC bC bC bC bC bC bC bC bC bC bC bC bC bC bC bC bC bC bC bC bC bC bC bC bC bC bC bC bC bC bC bC bC bC bCbC bC bC bC bC bCbC bC bC bCbC bC bCbCbC bCbC bCbCbC bCbC bCbC bC bCbCbCbCbCbCbC bC bC bC bC bC bC bC bC bC bC bC bC bC bC bC bC bC bC bC bC bC bC bC bC bC bC bC bC bC bC bC bC bC bC bC bC bC bC bC bC bC bC bC bC bC bC bC bC bC bC bC bC bC bC bC bC bC bC bC bC bC bC bC bC bC bC bC bCbC bC bC bC bC bC bC bC bC bC bC bC bC bCbC bC bC bC bCbC bC bC bCbC bCbC bCbC bCbC bCbC bC bC bC bC bC bCbC bC bCbCbC bC bCbC bC bC bC bC bC bC bC bC bC bC bC bC bC bC bC bC bC bC bC bC bC bC bC bC bC bC bC bC bC bC bC bC bC bC bC bC bC bC bC bC bC bC bC bC bC bC bC bC bC bC bC bC bC bC bC bC bC bC bC bC bC bC bC bC bC bC bC bC bC
bC bC bC bC bC bC bC bC bC bC bC bC bC bC bC bC bC bC bC bC bC bC bC bC bC bC bC bC bC bC bC bC bC bC bC bC bC bC bC bC bC bC bC bC bC bC bC bC bC bC bC bC bC bC bC bC bC bC bC bC bC bC bC bC bC bC bC bC bC bC bC bC bC bC bC bC bC bC bC bC bC bC bC bC bC bC bC bC bC bC bC bC bC bC bC bC bC bC bC bC bC bC bC bC bC bC bC bC bC bC bC bC bC bC bC bC bC bC bC bC bC bC bC bC bC bC bC bC bC bC bC bC bC bC bC bC bC bC bC bC bC bC bC bC bC bC bC bC bC bC bC bC bC bC bC bC bC bC bC bC bC bC bC bC bC bC bC bC bC bC bC bC bC bC bC bC bC bC bC bC bC bC bC bC bC bC bC bC bC bC bC bC bC bC bC bC bC bC bC bC bC bC bC bC bC bC bC bC bC bC bC bC bC bC bC bC bC bC bC bC bC bC bC bC bC bC bC bC bC bC bC bC bC bC bC bC bC bC bC bC bC bC bC bC bC bC bC bC bC bC bC bC bC bC bC bC bC bC bC bC bC bC bC bC bC bC bC bC bC bC bC bC bC bC bC bC bC bC bC bC bC bC bC bC bC bC bC bC bC bC bC bC bC bC bCbC bC bC bC bC bC bC bC bC bCbC bC bC bC bC bC bC bC bC bC bC bC bC bC bC bC bC bC bC bC bC bC bC bC bC bC bC bC bC bC bC bC bC bC bC bC bC bC bC bC bC bC bC bC bCbC bC bC bC bC bC bC bC bC bC bC bC bC bC bC bC bC bC bC bC bC bC bC bC bC bC bC bC bC bC bC bC bC bC bC bC bC bC bC bC bC bC bC bC bC bC bC bC bC bC bCbC bC bC bCbC bC bC bC bC bC bC bC bCbC bC bC bC bC bC bC bC bC bC bC bC bC bC bC bC bC bC bC bC bC bC bC bC bC bC bC bC bC bC bC bC bC bC bC bC bC bC bC bC bC bC bC bC bC bC bC bC bC bC bC bC bC bC bC bC bC bC bC bC bCbC bC bC bC bC bCbC bCbC bCbC bC bCbC bC bCbC bC bC bC bC bC bC bC bC bC bC bC bC bC bC bC bC bC bC bC bC bC bC bC bC bC bC bCbC bC bC bC bC bCbC bC bC bC bCbC bC bCbC bC bC bC bC bC bC bC bC bC bC bC bC bC bC bC bC bC bC bC bC bC bC bC bC bCbC bC bC bC bC bC bC bC bC bC bC bC bC bC bC bC bC bC bC bCbC bC bCbC bCbC bCbC bCbCbCbCbC bC bCbC bCbCbC bCbC bCbCbCbC bCbC bC bC bC bC bCbC bC bC bC bC bC bC bC bC bC bC bC bC bC bC bC bC bC bC bC bC bCbC bC bC bC bC bCbC bC bC bC bCbCbC bCbC bCbCbCbCbCbC
bCbC
bCbCbC bC bCbC
bC
bCbCbC
bCbCbCbC bC bCbC bC bC bC bC bC bC bC bC bC bC bC bC bC bC bC bC bC bC bC bC bC bC bC bC bC bC bC bC bC bC bC bC bC bC bC bC bC bC bC bC bC bC bC bC bC bC bC bC bC bC bC bC bC bCbC bC bC bC bC bC bC bC bCbC bC bC bC bC bC bC bC bC bC bC bC bC bC bC bC bC bC bC bC bC bC bC bC bC bC bC bC bC bC bC bC bC bC bC bC bC bC bC bC bC bC bC bC bC bC bC bC bC bC bC bC bC bC bC bC bC bC bC bC bC bC bC bC bC bC bC bC bCbC bC bC bC bC bC bC bC bC bC bC bC bC bC bC bC bC bC bC bC bC bC bC bC bC bC bC bC bC bC bC bC bC bC bC bC bC bC bC bC bC bCbC bC bC bC bC bC bC bC bC bC bC bC bC bC bC bC bC bC bC bC bC bC bC bC bC bC bC bC bC bC bC bC bC bC bC bC bC bC bC bC bC bC bC bC bC bC bC bC bC bC bC bC bC bC bC bC bC bC bC bC bC bC bC bC bC bC bC bC bC bC bC bC bC bC bC bC bC bC bC bC bC bC bC bC bC bC bC bC bC bC bC bC bC bC bC bC bC bC bC bC bC bC bC bC bC bC bC
bC bC bC bC bC bC bC bC bC bC bC bC bC bC bC bC bC bC bC bC bC bC bC bC bC bC bC bC bC bC bC bC bC bC bC bC bC bC bC bC bC bC bC bC bC bC bC bC bC bC bC bC bC bC bC bC bC bC bCbC bC bC bC bC bC bC bC bC bC bC bC bC bC bC bC bC bC bC bC bC bC bC bC bC bC bC bC bC bC bC bC bC bC bC bC bC bC bC bC bC bC bC bC bC bC bC bC bC bC bC bC bC bC bC bC bC bC bC bC bC bC bCbC bC bC bC bC bC bC bC bC bC bC bC bC bC bC bC bC bC bC bC bC bC bC bC bC bC bC bC bC bC bC bC bC bC bC bC bC bC bC bC bC bC bC bC bC bC bC bC bC bC bC bC bC bC bC bC bC bC bC bC bC bC bC bC bC bC bC bC bC bC bC bC bC bC bC bC bC bC bC bC bC bC bC bC bC bC bC bC bC bC bC bC bC bC bC bC bC bC bC bC bC bC bC bC bC bC bC bC bC bC bC bC bC bC bC bC bC bC bC bC bC bC bC bC bC bC bC bC bC bC bC bC bC bC bC bC bC bC bC bC bC bC bC bC bC bC bC bC bC
bC bC bC bC bC bC bC bC bC bC bC bC bC bC bC bC bC bC bC bC bC bC bC bC bC bC bC bC bC bC bC bC bC bC bC bC bC bC bC bC bC bC bC bC bC bC bC bC bC bC bC bC bC bC bC bC bC bC bC bC bC bC bC bC bC bC bC bC bC bC bC bC bC bC bC bC bC bC bC bC bCbC bC bC bC bC bC bC bC bC bC bCbC bC bC bC bC bC bC bC bC bC bC bC bC bC bC bC bC bC bC bC bC bC bC bC bC bC bC bC bC bC bC bC bC bC bC bC bC bC bC bC bC bC bC bC bC bC bC bC bC bC bC bC bC bC bC bC bC bC bC bC bC bC bC bC bC bC bC bC bC bC bC bC bC bC bC bC bC bC bC bC bC bC bC bC bC bC bC bC bC bC bC bC bC bC bC bC bC bC bC bC bC bC bC bC bC bC bC bC bC bC bC bC bC bC bC bC bC bC bC bC bC bC bC bC bC bC bC bC bC bC bC bC bC bC bC bC bC bC bC bC bC bC bC bC bC bC bC bC bC bC bC bC bC bC bC bC bC bC bC bC bC bC bC bC bC bC bC bC bC bC bC bC bC bC bC bC bC bC bC bC bC bC bC bC bC bC bC bC bC bC bC bC bC bC bC bC bC bC bC bC bC bC
bC bC bC bC bC bC bC bC bCbC bC bC bC bCbC bC bC bC bCbC bC bC bC bC bC bC bC bC bC bC bC bC bC bC bC bC bC bC bC bC bC bC bC bC bC bC bC bC bC bC bC bC bC bC bC bC bC bC bC bC bC bC bC bC bC bC bC bC bC bC bC bC bC bC bC bC bC bC bC bC bC bC bC bC bC bC bC bC bC bC bC bC bC bC bC bC bC bC bC bC bC bC bC bC bC bC bC bC bC bC bC bC bC bC bC bC bC bC bC bC bC bC bC bC bC bC bC bC bC bC bC bC bC bC bC bC bC bC bC bC bC bC bC bC bC bC bC bC bC bC bC bC bC bC bC bC bC bC bC bC bC bC bC bC bC bC
bC bC bC bC bC bC bC bC bC bC bC bC bC bC bC bC bC bC bC bC bC bC bC bC bC bC bC bC bC bC bC bC bC bC bC bC bC bC bC bC bC bC bC bC bC bC bC bC bC bC bC bC bC bC bC bC bC bC bC bC bC bC bC bC bC bC bC bC bC bC bC bC bC bC bC bC bC bC bC bC bC bC bC bC bC bC bC bC bC bC bC bC bC bC bC bC bC bC bC bC bC bC bC bC bC bC bC bC bC bC bC bC bC bC bC bC bC bC bC bC bC bC bC bC bC bC bC bC bC bC bC bC bC bC bC bC bC bC bC bC bC bC bC bC bC bC bC bC bC bC bC bC bC bC bC bC bC bC bC bC bC bC bC bC bC bC bC bC bC bC bC bC bC bC bC bC bC bC bC bC bC bC bC bC bC bC bC bC bC bCbC bC bC bC bC bC bC bC bC bC bC bC bC bC bC bC bC bC bC bC bC bC bC bC bC bC bC bC bC bC bC bC bC bC bC bC bC bC bC bC bC bC bC bC bC bC bC bC bC bC bC bC bC bC bC bC bC bC bC bC bC bC bC bC bC bC bC bC bCbC bC bC bC bC bC bC bC bC bC bC bC bC bC bC bC bC bC bC bC bC bC bC bC bC bC bC bC bC bC bC bC bC bC bC bC bC bC bC bC bC bC bC bC bC bC bC bC bC bC bC bC bC bC bC bC bC bC bC bC bC bC bC bC bC bC bC bC bC bC bC bC bC bC bC bC bC bC bC bC bC bC bC bC bC bC bC bC bC bC bC bC bC bC bC bC bC bC bC bC bC bC bC bC bC bC bC bC bC bC bC bC bC bC bC bC bC bC bC bC bC bC bC bC bC bC bC bC bC bC bC bC bC bC bC bC bC bC bC bC bC bC bC bC bC bC bC bC bC bC bC bC bC bC bC bC bC bC bC bC bC bC bC bC bC bC bC bC bC bC bC bC bC bC bC bC bC bC bC bC bC bC bC bC bC bC bC bC bC bC bC bC bC bC bC bC bC bC bC bC bC bC bC bC bC bC bC bC bC bC bC bC bC bC bC bC bC bC bC bC bC bC bC bC bC bC bC bC bC bC bC bC bC bC bC bC bC bC bC bC bC bC bC bC bC bC bC bC bC bC bC bC bC bC bC bC bC bC bC bC bC bC bC bC bC bC bC bC bC bC bC bC bC bC bC bC bC bC bC bC bC bC bC bC bC bC bC bC bC bC bC bC bC bC bC bC bC bC bC bC bC bC bC bC bC bC bC bC bC bC bC bC bC bC bC bC bC bC bC bC bC bC bC bC bC bC bC bC bC bC bC bC bC bC bC bC bC bC bC bC bC bC bC bC bC bC bC bC bC bC bC bC bC bC bC bC bC bC bC bC bC bC bC bC bC bC bC bC bC bC bC bC bC bC bC bC bC bC bC bC bC bC bC bC bC bC bC bC bC bC bC bC bC bC bC bC bC bC bC bC bC bC bC bC bC bC bC bC bC bC bC bC bC bC bC bC bC bC bC bC bC bC bC bC bC bC bC bC bC bC bC bC bC bC bC bC bC bC bC bC bC bC bC bC bC bC bC bC bC bC bC bC bC bC bC bC bC bC bC bC bC bC bC bC bC bC bC bC bC bC bC bC bC bC bC bC bC bC bC bC bC bC bC bC bC bC bC bC bC bC bC bC bC bC bC bC bC bC bC bC bC bC bC bC bC bC bC bC bC bC bC bC bC bC bC bC bC bC bC bC bC bC bC bC bC bC bC bC bC bC bC bC bC bC bC bC bC bC bC bC bC bC bC bC bC bC bC bC bC bC bC bC bC bC bC bC bC bC bC bC bC bC bC bC bC bC bC bC bC bC bC bC bC bC bC bC bC bC bC bC bC bC bC bC bC bC bC bC bC bC bC bC bC bC bC bC bC bC bC bC bC bC bC bC bC bC bC bC bC bC bC bC bC bC bC bC bC bC bC bC bC bC bC bC bC bC bC bC bC bC bC bC bC bC bC bC bC bC bC bC bC bC bC bC bC bC bC bC bC bC bC bC bC bC bC bC bC bC bC bC bC bC bC bC bC bC bC bC bC bC bC bC bC bC bC bC bC bC bC bC bC bC bC bC bC bC bC bC bC bC bC bC bC bC bC bC bC bC bC bC bC bC bC bC bC bC bC bC bC bC bC bC bC bC bC bC bC bC bC bC bC bC bC bC bC bC bC bC bC bC bC bC bC bC bC bC bC bC bC bC bC bC bC bC bC bC bC bC bC bC bC bC bC bC bC bC bC bC bC bC bC bC bC bC bC bC bC bC bC bC bC bC bC bC bC bC bC bC bC bC bC bC bC bC bC bC bC bC bC bC bC bC bC bC bC bC bC bC bC bC bC bC bC bC bC bC bC bC bC bC bC bC bC bC bC bC bC bC bC bC bC bC bC bC bC bC bC bC bC bC bC bC bC bC bC bC bC bC bC bC bC bC bC bC bC bC bC bC bC bC bC bC bC bC bC bC bC bC bC bC bC bC bC bC bC bC bC bC bC bC bC bC bC bC bC bC bC bC bC bC bC bC bC bC bC bC bC bC bC bC bC bC bC bC bC bC bC bC bC bC bC bC bC bC bC bC bC bC bC bC bC bC bC bC bC bC bC bC bC bC bC bC bC bC bC bC bC bC bC bC bC bC bC bC bC bC bC bC bC bC bC bC bC bC bC bC bC bC bC bC bC bC bC bC bC bC bC bC bC bC bC bC bC bC bC bC bC bC bC bC bC bC bC bC bC bC bC bC bC bC bC bC bC bC bC bC bC bC bC bC bC bC bC bC bC bC bC bC bC bC bC bC bC bC bC bC bC bC bC bC bC bC bC bC bC bC bC bC bC bC bC bC bC bC bC bC bC bC bC bC bC bC bC bC bC bC bC bC bC bC bC bC bC bC bC bC bC bC bC bC bC bC bC bC bC bC bC bC bC bC bC bC bC bC bC bC bC bC bC bC bC bC bC bC bC bC bC bC bC bC bC bC bC bC bC bC bC bC bC bC bC bC bC bC bC bC bC bC bC bC bC bC bC bC bC bC bC bC bC bC bC bC bC bC bC bC bC bC bC bC bC bC bC bC bC bC bC bC bC bC bC bC bC bC bC bC bC bC bC bC bC bC bC bC bC bC bC bC bC bC bC bC bC bC bC bC bC bC bC bC bC bC bC bC bC bC bC bC bC bC bC bC bC bC bC bC bC bC bC bC bC bC bC bC bC bC bC bC bC bC bC bC bC bC bC bC bC bC bC bC bC bC bC bC bC bC bC bC bC bC bC bC bC bC bC bC bC bC bC bC bC bC bC bC bC bC bC bC bC bC bC bC bC bC bC bC bC bC bC bC bC bC bC bC bC bC bC bC bC bC bC bC bC bC bC bC bC bC bC bC bC bC bC bC bC bC bC bC bC bC bC bC bC bC bC bC bC bC bC bC bC bC bC bC bC bC bC bC bC bC bC bC bC bC bC bC bC bC bC bC bC bC bC bC bC bC bC bC bC bC bC bC bC bC bC bC bC bC bC bC bC bC bC bC bC bC bC bC bC bC bC bC bC bC bC bC bC bC bC bC bC bC bC bC bC bC bC bC bC bC bC bC bC bC bC bC bC bC bC bC bC bC bC bC bC bC bC bC bC bC bC bC bC bC bC bC bC bC bC bC bC bC bC bC bC bC bC bC bC bC bC bC bC bC bC bC bC bC bC bC bC bC bC bC bC bC bC bC bC bC bC bC bC bC bC bC bC bC bC bC bC bC bC bC bC bC bC bC bC bC bC bC bC bC bC bC bC bC bC bC bC bC bC bC bC bC bC bC bC bC bC bC bC bC bC bC bC bC bC bC bC bC bC bC bC bC bC bC bC bC
bC bC bC bC bC bC bC bC bC bC bC bC bC bC bC bC bC bC bC bC bC bC bC bC bC bC bC bC bC bC bC bC bC bC bC bC bC bC bC bC bC bC bC bC bC bC bC bC bC bC bC bC bC bC bC bC bC bC bC bC bC bC bC bC bC bC bC bC bC bC bC bC bC bC bC bC bC bC bC bC bC bC bC bC bC bC bC bC bC bC bC bC bC bC bC bC bC bC bC bC bC bC bC bC bC bC bC bC bC bC bC bC bC bC bC bC bC bC bC bC bC bC bC bC bC bC bC bC bC bC bC bC bC bC bC bC bC bC bC bC bC bC bC bC bC bC bC bC bC bC bC bC bC bC bC bC bC bC bC bC bC bC bC bC bC bC bC bC bC bC bC bC bC bC bC bC bC bC bC bC bC bC bC bC bC bC bC bC bC bC bC bC bC bC bC bC bC bC bC bC bC bC bC bC bC bC bC bC bC bC bC bC bC bC bC bC bC bC bC bC bC bC bC bC bC bC bC bC bC bC bC bC bC bC bC bC bC bC bC bC bC bC bC bC bC bC bC bC bC bC bC bC bC bC bC bC bC bC bC bC bC bC bC bC bC bC bC bC bC bC bC bC bC bC bC bC bC bC bC bC bC bC bC bC bC bC bC bC bC bC bC bC bC bC bC bC bC bC bC bC bC bC bC bC bC bC bC bC bC bC bC bC bC bC bC bC bC bC bC bC bC bC bC bC bC bC bC bC bC bC bC bC bC bC bC bC bC bC bC bC bC bC bC bC bC bC bC bC bC bC bC bC bC bC bC bC bC bC bC bC bC bC bC bC bC bC bC bC bC bC bC bC bC bC bC bC bC bC bC bC bC bC bC bC bC bC bC bC bC bC bC bC bC bC bC
V = 410 Å3
Rwpb = 0,0512Rwp = 0,0321χ2
red = 2,014
Int/
104
0,0
1,0
2,0
bC bC bC bC bC bC bC bC bC bC bC bC bC bC bC bC bC bC bC bC bC bC bC bC bC bC bCbC bC bC bC bC bC bC bC bC bC bC bC bC bC bC bC bC bC bC bC bC bC bC bC bC bC bC bC bC bC bC bC bC bC bC bC bC bC bC bC bC bC bC bC bC bC bC bC bC bC bC bC bC bC bC bC bC bC bC bC bC bC bC bC bC bC bC bC bC bC bC bC bC bC bC bC bC bC bC bC bC bC bC bC bC bC bC bC bC bC bC bC bC bC bC bC bC bC bC bC bC bC bC bC bC bC
bC bC bC bC bC bC bC bC bC bC bC bC bC bC bC bC bC bC bC bC bC bC bC bC bC bC bC bC bC bC bC bC bC bC bC bC bC bC bC bC bC bC bC bC bC bC bC bC bC bC bC bC bC bC bC bC bC bC bC bC bC bC bC bC bC bC bC bC bC bC bC bC bC bC bC bC bC bC bC bC bC bC bC bC bC bC bC bC bC bC bCbC bC bC bC bC bCbC bC bC bCbC bC bCbCbC bCbC bCbCbC bCbC bCbC bC bCbCbCbCbCbCbC bC bC bC bC bC bC bC bC bC bC bC bC bC bC bC bC bC bC bC bC bC bC bC bC bC bC bC bC bC bC bC bC bC bC bC bC bC bC bC bC bC bC bC bC bC bC bC bC bC bC bC bC bC bC bC bC bC bC bC bC bC bC bC bC bC bC bC bCbC bC bC bC bC bC bC bC bC bC bC bC bC bCbC bC bC bC bCbC bC bC bCbC bCbC bCbC bCbC bCbC bC bC bC bC bC bCbC bC bCbCbC bC bCbC bC bC bC bC bC bC bC bC bC bC bC bC bC bC bC bC bC bC bC bC bC bC bC bC bC bC bC bC bC bC bC bC bC bC bC bC bC bC bC bC bC bC bC bC bC bC bC bC bC bC bC bC bC bC bC bC bC bC bC bC bC bC bC bC bC bC bC bC bC
bC bC bC bC bC bC bC bC bC bC bC bC bC bC bC bC bC bC bC bC bC bC bC bC bC bC bC bC bC bC bC bC bC bC bC bC bC bC bC bC bC bC bC bC bC bC bC bC bC bC bC bC bC bC bC bC bC bC bC bC bC bC bC bC bC bC bC bC bC bC bC bC bC bC bC bC bC bC bC bC bC bC bC bC bC bC bC bC bC bC bC bC bC bC bC bC bC bC bC bC bC bC bC bC bC bC bC bC bC bC bC bC bC bC bC bC bC bC bC bC bC bC bC bC bC bC bC bC bC bC bC bC bC bC bC bC bC bC bC bC bC bC bC bC bC bC bC bC bC bC bC bC bC bC bC bC bC bC bC bC bC bC bC bC bC bC bC bC bC bC bC bC bC bC bC bC bC bC bC bC bC bC bC bC bC bC bC bC bC bC bC bC bC bC bC bC bC bC bC bC bC bC bC bC bC bC bC bC bC bC bC bC bC bC bC bC bC bC bC bC bC bC bC bC bC bC bC bC bC bC bC bC bC bC bC bC bC bC bC bC bC bC bC bC bC bC bC bC bC bC bC bC bC bC bC bC bC bC bC bC bC bC bC bC bC bC bC bC bC bC bC bC bC bC bC bC bC bC bC bC bC bC bC bC bC bC bC bC bC bC bC bC bC bC bCbC bC bC bC bC bC bC bC bC bCbC bC bC bC bC bC bC bC bC bC bC bC bC bC bC bC bC bC bC bC bC bC bC bC bC bC bC bC bC bC bC bC bC bC bC bC bC bC bC bC bC bC bC bC bCbC bC bC bC bC bC bC bC bC bC bC bC bC bC bC bC bC bC bC bC bC bC bC bC bC bC bC bC bC bC bC bC bC bC bC bC bC bC bC bC bC bC bC bC bC bC bC bC bC bC bCbC bC bC bCbC bC bC bC bC bC bC bC bCbC bC bC bC bC bC bC bC bC bC bC bC bC bC bC bC bC bC bC bC bC bC bC bC bC bC bC bC bC bC bC bC bC bC bC bC bC bC bC bC bC bC bC bC bC bC bC bC bC bC bC bC bC bC bC bC bC bC bC bC bCbC bC bC bC bC bCbC bCbC bCbC bC bCbC bC bCbC bC bC bC bC bC bC bC bC bC bC bC bC bC bC bC bC bC bC bC bC bC bC bC bC bC bC bCbC bC bC bC bC bCbC bC bC bC bCbC bC bCbC bC bC bC bC bC bC bC bC bC bC bC bC bC bC bC bC bC bC bC bC bC bC bC bC bCbC bC bC bC bC bC bC bC bC bC bC bC bC bC bC bC bC bC bC bCbC bC bCbC bCbC bCbC bCbCbCbCbC bC bCbC bCbCbC bCbC bCbCbCbC bCbC bC bC bC bC bCbC bC bC bC bC bC bC bC bC bC bC bC bC bC bC bC bC bC bC bC bC bCbC bC bC bC bC bCbC bC bC bC bCbCbC bCbC bCbCbCbCbCbC
bCbC
bCbCbC bC bCbC
bC
bCbCbC
bCbCbCbC bC bCbC bC bC bC bC bC bC bC bC bC bC bC bC bC bC bC bC bC bC bC bC bC bC bC bC bC bC bC bC bC bC bC bC bC bC bC bC bC bC bC bC bC bC bC bC bC bC bC bC bC bC bC bC bC bCbC bC bC bC bC bC bC bC bCbC bC bC bC bC bC bC bC bC bC bC bC bC bC bC bC bC bC bC bC bC bC bC bC bC bC bC bC bC bC bC bC bC bC bC bC bC bC bC bC bC bC bC bC bC bC bC bC bC bC bC bC bC bC bC bC bC bC bC bC bC bC bC bC bC bC bC bC bCbC bC bC bC bC bC bC bC bC bC bC bC bC bC bC bC bC bC bC bC bC bC bC bC bC bC bC bC bC bC bC bC bC bC bC bC bC bC bC bC bC bCbC bC bC bC bC bC bC bC bC bC bC bC bC bC bC bC bC bC bC bC bC bC bC bC bC bC bC bC bC bC bC bC bC bC bC bC bC bC bC bC bC bC bC bC bC bC bC bC bC bC bC bC bC bC bC bC bC bC bC bC bC bC bC bC bC bC bC bC bC bC bC bC bC bC bC bC bC bC bC bC bC bC bC bC bC bC bC bC bC bC bC bC bC bC bC bC bC bC bC bC bC bC bC bC bC bC bC
bC bC bC bC bC bC bC bC bC bC bC bC bC bC bC bC bC bC bC bC bC bC bC bC bC bC bC bC bC bC bC bC bC bC bC bC bC bC bC bC bC bC bC bC bC bC bC bC bC bC bC bC bC bC bC bC bC bC bCbC bC bC bC bC bC bC bC bC bC bC bC bC bC bC bC bC bC bC bC bC bC bC bC bC bC bC bC bC bC bC bC bC bC bC bC bC bC bC bC bC bC bC bC bC bC bC bC bC bC bC bC bC bC bC bC bC bC bC bC bC bC bCbC bC bC bC bC bC bC bC bC bC bC bC bC bC bC bC bC bC bC bC bC bC bC bC bC bC bC bC bC bC bC bC bC bC bC bC bC bC bC bC bC bC bC bC bC bC bC bC bC bC bC bC bC bC bC bC bC bC bC bC bC bC bC bC bC bC bC bC bC bC bC bC bC bC bC bC bC bC bC bC bC bC bC bC bC bC bC bC bC bC bC bC bC bC bC bC bC bC bC bC bC bC bC bC bC bC bC bC bC bC bC bC bC bC bC bC bC bC bC bC bC bC bC bC bC bC bC bC bC bC bC bC bC bC bC bC bC bC bC bC bC bC bC bC bC bC bC bC bC
bC bC bC bC bC bC bC bC bC bC bC bC bC bC bC bC bC bC bC bC bC bC bC bC bC bC bC bC bC bC bC bC bC bC bC bC bC bC bC bC bC bC bC bC bC bC bC bC bC bC bC bC bC bC bC bC bC bC bC bC bC bC bC bC bC bC bC bC bC bC bC bC bC bC bC bC bC bC bC bC bCbC bC bC bC bC bC bC bC bC bC bCbC bC bC bC bC bC bC bC bC bC bC bC bC bC bC bC bC bC bC bC bC bC bC bC bC bC bC bC bC bC bC bC bC bC bC bC bC bC bC bC bC bC bC bC bC bC bC bC bC bC bC bC bC bC bC bC bC bC bC bC bC bC bC bC bC bC bC bC bC bC bC bC bC bC bC bC bC bC bC bC bC bC bC bC bC bC bC bC bC bC bC bC bC bC bC bC bC bC bC bC bC bC bC bC bC bC bC bC bC bC bC bC bC bC bC bC bC bC bC bC bC bC bC bC bC bC bC bC bC bC bC bC bC bC bC bC bC bC bC bC bC bC bC bC bC bC bC bC bC bC bC bC bC bC bC bC bC bC bC bC bC bC bC bC bC bC bC bC bC bC bC bC bC bC bC bC bC bC bC bC bC bC bC bC bC bC bC bC bC bC bC bC bC bC bC bC bC bC bC bC bC bC
bC bC bC bC bC bC bC bC bCbC bC bC bC bCbC bC bC bC bCbC bC bC bC bC bC bC bC bC bC bC bC bC bC bC bC bC bC bC bC bC bC bC bC bC bC bC bC bC bC bC bC bC bC bC bC bC bC bC bC bC bC bC bC bC bC bC bC bC bC bC bC bC bC bC bC bC bC bC bC bC bC bC bC bC bC bC bC bC bC bC bC bC bC bC bC bC bC bC bC bC bC bC bC bC bC bC bC bC bC bC bC bC bC bC bC bC bC bC bC bC bC bC bC bC bC bC bC bC bC bC bC bC bC bC bC bC bC bC bC bC bC bC bC bC bC bC bC bC bC bC bC bC bC bC bC bC bC bC bC bC bC bC bC bC bC bC
bC bC bC bC bC bC bC bC bC bC bC bC bC bC bC bC bC bC bC bC bC bC bC bC bC bC bC bC bC bC bC bC bC bC bC bC bC bC bC bC bC bC bC bC bC bC bC bC bC bC bC bC bC bC bC bC bC bC bC bC bC bC bC bC bC bC bC bC bC bC bC bC bC bC bC bC bC bC bC bC bC bC bC bC bC bC bC bC bC bC bC bC bC bC bC bC bC bC bC bC bC bC bC bC bC bC bC bC bC bC bC bC bC bC bC bC bC bC bC bC bC bC bC bC bC bC bC bC bC bC bC bC bC bC bC bC bC bC bC bC bC bC bC bC bC bC bC bC bC bC bC bC bC bC bC bC bC bC bC bC bC bC bC bC bC bC bC bC bC bC bC bC bC bC bC bC bC bC bC bC bC bC bC bC bC bC bC bC bC bCbC bC bC bC bC bC bC bC bC bC bC bC bC bC bC bC bC bC bC bC bC bC bC bC bC bC bC bC bC bC bC bC bC bC bC bC bC bC bC bC bC bC bC bC bC bC bC bC bC bC bC bC bC bC bC bC bC bC bC bC bC bC bC bC bC bC bC bC bCbC bC bC bC bC bC bC bC bC bC bC bC bC bC bC bC bC bC bC bC bC bC bC bC bC bC bC bC bC bC bC bC bC bC bC bC bC bC bC bC bC bC bC bC bC bC bC bC bC bC bC bC bC bC bC bC bC bC bC bC bC bC bC bC bC bC bC bC bC bC bC bC bC bC bC bC bC bC bC bC bC bC bC bC bC bC bC bC bC bC bC bC bC bC bC bC bC bC bC bC bC bC bC bC bC bC bC bC bC bC bC bC bC bC bC bC bC bC bC bC bC bC bC bC bC bC bC bC bC bC bC bC bC bC bC bC bC bC bC bC bC bC bC bC bC bC bC bC bC bC bC bC bC bC bC bC bC bC bC bC bC bC bC bC bC bC bC bC bC bC bC bC bC bC bC bC bC bC bC bC bC bC bC bC bC bC bC bC bC bC bC bC bC bC bC bC bC bC bC bC bC bC bC bC bC bC bC bC bC bC bC bC bC bC bC bC bC bC bC bC bC bC bC bC bC bC bC bC bC bC bC bC bC bC bC bC bC bC bC bC bC bC bC bC bC bC bC bC bC bC bC bC bC bC bC bC bC bC bC bC bC bC bC bC bC bC bC bC bC bC bC bC bC bC bC bC bC bC bC bC bC bC bC bC bC bC bC bC bC bC bC bC bC bC bC bC bC bC bC bC bC bC bC bC bC bC bC bC bC bC bC bC bC bC bC bC bC bC bC bC bC bC bC bC bC bC bC bC bC bC bC bC bC bC bC bC bC bC bC bC bC bC bC bC bC bC bC bC bC bC bC bC bC bC bC bC bC bC bC bC bC bC bC bC bC bC bC bC bC bC bC bC bC bC bC bC bC bC bC bC bC bC bC bC bC bC bC bC bC bC bC bC bC bC bC bC bC bC bC bC bC bC bC bC bC bC bC bC bC bC bC bC bC bC bC bC bC bC bC bC bC bC bC bC bC bC bC bC bC bC bC bC bC bC bC bC bC bC bC bC bC bC bC bC bC bC bC bC bC bC bC bC bC bC bC bC bC bC bC bC bC bC bC bC bC bC bC bC bC bC bC bC bC bC bC bC bC bC bC bC bC bC bC bC bC bC bC bC bC bC bC bC bC bC bC bC bC bC bC bC bC bC bC bC bC bC bC bC bC bC bC bC bC bC bC bC bC bC bC bC bC bC bC bC bC bC bC bC bC bC bC bC bC bC bC bC bC bC bC bC bC bC bC bC bC bC bC bC bC bC bC bC bC bC bC bC bC bC bC bC bC bC bC bC bC bC bC bC bC bC bC bC bC bC bC bC bC bC bC bC bC bC bC bC bC bC bC bC bC bC bC bC bC bC bC bC bC bC bC bC bC bC bC bC bC bC bC bC bC bC bC bC bC bC bC bC bC bC bC bC bC bC bC bC bC bC bC bC bC bC bC bC bC bC bC bC bC bC bC bC bC bC bC bC bC bC bC bC bC bC bC bC bC bC bC bC bC bC bC bC bC bC bC bC bC bC bC bC bC bC bC bC bC bC bC bC bC bC bC bC bC bC bC bC bC bC bC bC bC bC bC bC bC bC bC bC bC bC bC bC bC bC bC bC bC bC bC bC bC bC bC bC bC bC bC bC bC bC bC bC bC bC bC bC bC bC bC bC bC bC bC bC bC bC bC bC bC bC bC bC bC bC bC bC bC bC bC bC bC bC bC bC bC bC bC bC bC bC bC bC bC bC bC bC bC bC bC bC bC bC bC bC bC bC bC bC bC bC bC bC bC bC bC bC bC bC bC bC bC bC bC bC bC bC bC bC bC bC bC bC bC bC bC bC bC bC bC bC bC bC bC bC bC bC bC bC bC bC bC bC bC bC bC bC bC bC bC bC bC bC bC bC bC bC bC bC bC bC bC bC bC bC bC bC bC bC bC bC bC bC bC bC bC bC bC bC bC bC bC bC bC bC bC bC bC bC bC bC bC bC bC bC bC bC bC bC bC bC bC bC bC bC bC bC bC bC bC bC bC bC bC bC bC bC bC bC bC bC bC bC bC bC bC bC bC bC bC bC bC bC bC bC bC bC bC bC bC bC bC bC bC bC bC bC bC bC bC bC bC bC bC bC bC bC bC bC bC bC bC bC bC bC bC bC bC bC bC bC bC bC bC bC bC bC bC bC bC bC bC bC bC bC bC bC bC bC bC bC bC bC bC bC bC bC bC bC bC bC bC bC bC bC bC bC bC bC bC bC bC bC bC bC bC bC bC bC bC bC bC bC bC bC bC bC bC bC bC bC bC bC bC bC bC bC bC bC bC bC bC bC bC bC bC bC bC bC bC bC bC bC bC bC bC bC bC bC bC bC bC bC bC bC bC bC bC bC bC bC bC bC bC bC bC bC bC bC bC bC bC bC bC bC bC bC bC bC bC bC bC bC bC bC bC bC bC bC bC bC bC bC bC bC bC bC bC bC bC bC bC bC bC bC bC bC bC bC bC bC bC bC bC bC bC bC bC bC bC bC bC bC bC bC bC bC bC bC bC bC bC bC bC bC bC bC bC bC bC bC bC bC bC bC bC bC bC bC bC bC bC bC bC bC bC bC bC bC bC bC bC bC bC bC bC bC bC bC bC bC bC bC bC bC bC bC bC bC bC bC bC bC bC bC bC bC bC bC bC bC bC bC bC bC bC bC bC bC bC bC bC bC bC bC bC bC bC bC bC bC bC bC bC bC bC bC bC bC bC bC bC bC bC bC bC bC bC bC bC bC bC bC bC bC bC bC bC bC bC bC bC bC bC bC bC bC bC bC bC bC bC bC bC bC bC bC bC bC bC bC bC bC bC bC bC bC bC bC bC bC bC bC bC bC bC bC bC bC bC bC bC bC bC bC bC bC bC bC bC bC bC bC bC bC bC bC bC bC bC bC bC bC bC bC bC bC bC bC bC bC bC bC bC bC bC bC bC bC bC bC bC bC bC bC bC bC bC bC bC bC bC bC bC bC bC bC bC bC bC bC bC bC bC bC bC bC bC bC bC bC bC bC bC bC bC bC bC bC bC bC bC bC bC bC bC bC bC bC bC bC bC bC bC bC bC bC bC bC bC bC bC bC bC bC bC bC bC bC bC bC bC bC bC bC bC bC bC bC bC bC bC bC bC bC bC bC bC bC bC bC bC bC bC bC bC bC bC bC bC bC bC bC bC bC bC bC bC bC bC bC bC bC bC bC bC bC bC bC bC bC bC bC bC bC bC bC bC bC bC bC bC bC bC bC bC bC bC bC bC bC bC bC bC bC bC bC bC bC bC bC bC bC bC bC bC bC bC bC bC bC bC bC
bC bC bC bC bC bC bC bC bC bC bC bC bC bC bC bC bC bC bC bC bC bC bC bC bC bC bC bC bC bC bC bC bC bC bC bC bC bC bC bC bC bC bC bC bC bC bC bC bC bC bC bC bC bC bC bC bC bC bC bC bC bC bC bC bC bC bC bC bC bC bC bC bC bC bC bC bC bC bC bC bC bC bC bC bC bC bC bC bC bC bC bC bC bC bC bC bC bC bC bC bC bC bC bC bC bC bC bC bC bC bC bC bC bC bC bC bC bC bC bC bC bC bC bC bC bC bC bC bC bC bC bC bC bC bC bC bC bC bC bC bC bC bC bC bC bC bC bC bC bC bC bC bC bC bC bC bC bC bC bC bC bC bC bC bC bC bC bC bC bC bC bC bC bC bC bC bC bC bC bC bC bC bC bC bC bC bC bC bC bC bC bC bC bC bC bC bC bC bC bC bC bC bC bC bC bC bC bC bC bC bC bC bC bC bC bC bC bC bC bC bC bC bC bC bC bC bC bC bC bC bC bC bC bC bC bC bC bC bC bC bC bC bC bC bC bC bC bC bC bC bC bC bC bC bC bC bC bC bC bC bC bC bC bC bC bC bC bC bC bC bC bC bC bC bC bC bC bC bC bC bC bC bC bC bC bC bC bC bC bC bC bC bC bC bC bC bC bC bC bC bC bC bC bC bC bC bC bC bC bC bC bC bC bC bC bC bC bC bC bC bC bC bC bC bC bC bC bC bC bC bC bC bC bC bC bC bC bC bC bC bC bC bC bC bC bC bC bC bC bC bC bC bC bC bC bC bC bC bC bC bC bC bC bC bC bC bC bC bC bC bC bC bC bC bC bC bC bC bC bC bC bC bC bC bC bC bC bC bC bC bC bC bC bC bC
V = 423 Å3
Rwpb = 0,0463Rwp = 0,0318χ2
red = 2,064
Int/
104
0,0
1,0
2,0
10,0 20,0 30,0 40,0 50,0 60,0 70,0 80,0
2θ/°
Abbildung 3.25: Vergleich der LeBail-Fits von Pigment Red 181. Schwarze Kreise: gemessenes Pul-verdiagramm; rote Linie: simuliertes Pulverdiagramm; grüne Linie: Differenzkurve.
63

3 Bestimmung von Kristallstrukturen organischer Pigmente aus Röntgen-Pulverdaten
bC bC bC bC bC bC bC bC bC bC bC bC bC bC bC bC bC bC bC bC bC bC bC bC bC bC bC bC bC bC bC bC bC bC bC bC bC bC bC bC bC bC bC bC bC bC bC bC bC bC bC bC bC bC bC bC bC bC bC bC bC bC bC bC bC bC bC bC bC bC bC bC bC bC bC bCbC bC bC bC bC bC bC bC bC bC bC bC bC bC bC bC bC bC bC bC bC bC bC bC bC bC bC bC bC bC bC bC bC bC bC bC bC bC bC bC bC bC bC bC bC bC bC bC bC bC bC bC bC bC bC bC bC bC bC bC bC bC bC bC bC bC bC bC bC bC bC bC bC bC bC bC bC bC bC bC bC bC bC bC bC bC bC bC bC bC bC bC bC
bC bC bC bC bC bCbC bC bC bCbC bCbC bCbC bCbC bCbC bCbC bC bCbCbCbCbCbCbC bC bC bC bC bC bC bC bC bC bC bC bC bC bC bC bC bC bC bC bC bC bC bC bC bC bC bC bC bC bC bC bC bC bC bC bC bC bC bC bC bC bC bC bC bC bC bC bC bC bC bC bC bC bC bC bC bC bC bC bC bC bC bC bC bC bC bC bC bC bC bC bC bC bC bC bC
bC bC bC bC bC bC bCbC bC bC bC bCbC bC bCbC bCbC bCbC bCbC bCbC bC bC bC bC bC bCbC bC bCbC bC bC bCbC bC bC bC bC bC bC bC bC bC bC bC bC bC bC bC bC bC bC bC bC bC bC bC bC bC bC bC bC bC bC bC bC bC bC bC bC bC bC bC bC bC bC bC bC bC bC bC bC bC bC bC bC bC bC bC bC bC bC bC bC bC bC bC bC bC bC bC bC bC bC bC bC
bC bC bC bC bC bC bC bC bC bC bC bC bC bC bC bC bC bC bC bC bC bC bC bC bC bC bC bC bC bC bC bC bC bC bC bC bC bC bC bC bC bC bC bC bC bC bC bC bC bC bC bC bC bC bC bC bC bC bC bC bC bC bC bC bC bC bC bC bC bC bC bC bC bC bC bC bC bC bC bC bC bC bC bC bC bC bC bC bC bC bC bC bC bC bC bC bC bC bC bC bC bC bC bC bC bC bC bC bC bC bC bC bC bC bC bC bC bC bC bC bC bC bC bC bC bC bC bC bC bC bC bC bC bC bC bC bC bC bC bC bC bC bC bC bC bC bC bC bC bC bC bC bC bC bC bC bC bC bC bC bC bC bC bC bC bC bC bC bC bC bC bC bC bC bC bC bC bC bC bC bC bC bC bC bC bC bC bC bC bC bC bC bC bC bC bC bC bC bC bC bC bC bC bC bC bC bC bC bC bC bC bC bC bC bC bC bC bC bC bC bC bC bC bC bC bC bC bC bC bC bC bC bC bC bC bC bC bC bC bC bC bC bC bC bC bC bC bC bC bC bC bC bC bC bC bC bC bC bC bC bC bC bC bC bC bC bC bC bC bC bC bC bC bC bC bC bC bC bC bC bC bC bC bC bC bC bC bC bC bC bC bC bC bC bC bC bC bCbC bC bC bC bC bC bC bC bC bC bCbC bC bC bC bC bC bC bC bC bC bC bC bC bC bC bC bC bC bC bC bC bC bC bC bC bC bC bC bC bC bC bC bC bC bC bC bC bC bC bCbC bC bC bC bC bC bC bC bC bC bC bC bC bC bC bC bC bC bC bC bC bC bC bC bC bC bC bC bC bC bC bC bC bC bC bC bC bC bC bC bC bC bC bC bC bC bC bC bC bC bCbC bC bC bC bCbC bC bC bC bC bCbC bC bC bC bC bC bC bC bC bC bC bC bC bC bC bC bC bC bC bC bC bC bC bC bC bC bC bC bC bC bC bC bC bC bC bC bC bC bC bC bC bC bC bC bC bC bC bC bC bC bC bC bC bC bC bC bC bC bC bC bCbC bC bC bC bC bCbC bCbC bCbC bC bCbC bC bC bC bC bC bC bC bC bC bC bC bC bC bC bC bC bC bC bC bC bC bC bC bC bC bC bC bC bC bCbC bC bC bC bC bCbC bC bC bC bCbC bC bCbC bC bC bC bC bC bC bC bC bC bC bC bC bC bC bC bC bC bC bC bC bC bC bC bC bCbC bC bC bC bC bC bC bC bC bC bC bC bC bC bC bC bC bC bC bCbC bC bCbC bCbC bCbC bCbCbCbCbC bC bCbC bC bC bC bCbC bCbCbCbC bCbC bC bC bC bC bC bC bC bC bC bC bC bC bC bC bC bC bC bC bC bC bC bC bC bC bC bC bCbC bC bC bC bC bC bCbC bC bC bC bCbC bCbC bCbCbCbCbCbCbCbCbCbCbC bC bCbCbCbCbCbCbCbCbCbC bC bCbC bC bC bC bC bC bC bC bC bC bC bC bC bC bC bC bC bC bC bC bC bC bC bC bC bC bC bC bC bC bC bC bC bC bC bC bC bC bC bC bC bC bC bC bC bC bC bC bC bC bC bC bC bC bC bC bC bCbC bC bC bC bC bC bC bC bC bCbC bC bC bC bC bC bC bC bC bC bC bC bC bC bC bC bC bC bC bC bC bC bC bC bC bC bC bC bC bC bC bC bC bC bC bC bC bC bC bC bC bC bC bC bC bC bC bC bC bC bC bC bC bC bC bC bC bC bC bC bC bC bC bC bCbC bC bC bC bC bC bC bC bC bC bC bC bC bC bC bC bC bC bC bC bC bC bC bC bC bC bC bC bC bC bC bC bC bC bC bC bC bC bC bC bC bCbC bC bC bC bC bC bC bC bC bC bC bC bC bC bC bC bC bC bC bC bC bC bC bC bC bC bC bC bC bC bC bC bC bC bC bC bC bC bC bC bC bC bC bC bC bC bC bC bC bC bC bC bC bC bC bC bC bC bC bC bC bC bC bC bC bC bC bC bC bC bC bC bC bC bC bC bC bC bC bC bC bC bC bC bC bC bC bC bC bC bC bC bC bC bC bC bC bC bC bC bC bC bC bC bC bC bC bC bC bC
bC bC bC bC bC bC bC bC bC bC bC bC bC bC bC bC bC bC bC bC bC bC bC bC bC bC bC bC bC bC bC bC bC bC bC bC bC bC bC bC bC bC bC bC bC bC bC bC bC bC bC bC bC bC bC bC bC bC bC bC bC bC bC bC bC bC bC bC bC bC bC bC bC bC bC bC bC bC bC bC bC bC bC bC bC bC bC bC bC bC bC bC bC bC bC bC bC bC bC bC bC bC bC bC bC bC bC bC bC bC bC bC bC bC bC bC bC bC bC bC bC bC bC bCbC bC bC bC bC bC bC bC bC bC bC bC bC bC bC bC bC bC bC bC bC bC bC bC bC bC bC bC bC bC bC bC bC bC bC bC bC bC bC bC bC bC bC bC bC bC bC bC bC bC bC bC bC bC bC bC bC bC bC bC bC bC bC bC bC bC bC bC bC bC bC bC bC bC bC bC bC bC bC bC bC bC bC bC bC bC bC bC bC bC bC bC bC bC bC bC bC bC bC bC bC bC bC bC bC bC bC bC bC bC bC bC bC bC bC bC bC bC bC bC bC bC bC bC bC bC bC bC bC bC bC bC bC bC bC bC bC bC bC bC bC bC bC bC bC bC bC bC bC bC bC bC bC bC bC bC bC bC bC bC bC bC bC bC bC bC bC bC bC bC bC bC bC bC bC bC bC bC bC bC bC bC bC bC bC bC bC bC bC bC bC bC bC bC bC bC bC bC bC bC bC bC bC bC bC bC bC bC bC bC bC bC bC bC bC bC bC bC bC bC bC bC bC bC bC
bC bC bC bC bC bC bC bC bC bC bC bCbC bC bC bC bC bC bC bC bC bC bC bC bC bC bC bC bC bC bC bC bC bC bC bC bC bC bC bC bC bC bC bC bC bC bC bC bC bC bC bC bC bC bC bC bC bC bC bC bC bC bC bC bC bC bC bC bC bC bC bC bC bC bC bC bC bC bC bC bC bC bC bC bC bC bC bC bC bC bC bC bC bC bC bC bC bC bC bC bC bC bC bC bC bC bC bC bC bC bC bC bC bC bC bC bC bC bC bC bC bC bC bC bC bC bC bC bC bC bC bC bC bC bC bC bC bC bC bC bC bC bC bC bC bC bC bC bC bC bC bC bC bC bC bC bC bC bC bC bC bC bC bC bC bC bC bC bC bC bC bC bC bC bC bC bC bC bC bC bC bC bC bC bC bC bC bC bC bC bC bC bC bC bC bC bC bC bC bC bC bC bC bC bC bC bC bC bC bC bC bC bC bC
bC bC bC bC bC bC bC bC bCbC bC bC bCbC bC bC bC bCbC bC bC bC bC bC bC bC bC bC bC bC bC bC bC bC bC bC bC bC bC bC bC bC bC bC bC bC bC bC bC bC bC bC bC bC bC bC bC bC bC bC bC bC bC bC bC bC bC bC bC bC bC bC bC bC bC bC bC bC bC bC bC bC bC bC bC bC bC bC bC bC bC bC bC bC bC bC bC bC bC bC bC bC bC bC bC bC bC bC bC bC bC bC bC bC bC bC bC bC bC bC bC bC bC bC bC bC bC bC bC bC bC bC bC bC bC bC bC bC bC bC bC bC bC bC bC bC bC bC bC bC bC bC bC bC bC bC bC bC bC bC bC bC bC bC bC bC bC bC bC bC bC bC bC bC bC bC bC bC bC bC bC bC bC bC bC bC bC bC bC bC bC bC bC bC bC bC bC bC bC bC bC bC bC bC bC bC bC bC bC bC bC bC bC bC bC bC bC bC bC bC bC bC bC bC bC bC bC bC bC
bC bC bC bC bC bC bC bC bC bC bC bC bC bC bC bC bC bC bC bC bC bC bC bC bC bC bC bC bC bC bC bC bC bC bC bC bC bC bC bC bC bC bC bC bC bC bC bC bC bC bC bC bC bC bC bC bC bC bC bC bC bC bC bC bC bC bC bC bC bC bC bC bC bC bC bC bC bC bC bC bC bC bC bC bC bC bC bC bC bC bC bC bC bC bC bC bC bC bC bC bC bC bC bC bC bC bC bC bC bC bC bC bC bC bC bC bC bC bC bC bC bC bC bC bC bC bC bCbC bC bC bC bC bC bC bC bC bC bC bC bC bC bC bC bC bC bC bC bC bC bC bC bC bC bC bC bC bC bC bC bC bC bC bC bC bC bC bC bC bC bC bC bC bC bC bC bC bC bC bC bC bC bC bC bC bC bC bC bC bC bC bC bC bC bCbC bC bC bC bC bC bC bC bC bC bC bC bC bC bC bC bC bC bC bC bC bC bC bC bC bC bC bC bC bC bC bC bC bC bC bC bC bC bC bC bC bC bC bC bC bC bC bC bC bC bC bC bC bC bC bC bC bC bC bC bC bC bC bC bC bC bC bC bC bC bC bC bC bC bC bC bC bC bC bC bC bC bC bC bC bC bC bC bC bC bC bC bC bC bC bC bC bC bC bC bC bC bC bC bC bC bC bC bC bC bC bC bC bC bC bC bC bC bC bC bC bC bC bC bC bC bC bC bC bC bC bC bC bC bC bC bC bC bC bC bC bC bC bC bC bC bC bC bC bC bC bC bC bC bC bC bC bC bC bC bC bC bC bC bC bC bC bC bC bC bC bC bC bC bC bC bC bC bC bC bC bC bC bC bC bC bC bC bC bC bC bC bC bC bC bC bC bC bC bC bC bC bC bC bC bC bC bC bC bC bC bC bC bC bC bC bC bC bC bC bC bC bC bC bC bC bC bC bC bC bC bC bC bC bC bC bC bC bC bC bC bC bC bC bC bC bC bC bC bC bC bC bC bC bC bC bC bC bC bC bC bC bC bC bC bC bC bC bC bC bC bC bC bC bC bC bC bC bC bC bC bC bC bC bC bC bC bC bC bC bC bC bC bC bC bC bC bC bC bC bC bC bC bC bC bC bC bC bC bC bC bC bC bC bC bC bC bC bC bC bC bC bC bC bC bC bC bC bC bC bC bC bC bC bC bC bC bC bC bC bC bC bC bC bC bC bC bC bC bC bC bC bC bC bC bC bC bC bC bC bC bC bC bC bC bC bC bC bC bC bC bC bC bC bC bC bC bC bC bC bC bC bC bC bC bC bC bC bC bC bC bC bC bC bC bC bC bC bC bC bC bC bC bC bC bC bC bC bC bC bC bC bC bC bC bC bC bC bC bC bC bC bC bC bC bC bC bC bC bC bC bC bC bC bC bC bC bC bC bC bC bC bC bC bC bC bC bC bC bC bC bC bC bC bC bC bC bC bC bC bC bC bC bC bC bC bC bC bC bC bC bC bC bC bC bC bC bC bC bC bC bC bC bC bC bC bC bC bC bC bC bC bC bC bC bC bC bC bC bC bC bC bC bC bC bC bC bC bC bC bC bC bC bC bC bC bC bC bC bC bC bC bC bC bC bC bC bC bC bC bC bC bC bC bC bC bC bC bC bC bC bC bC bC bC bC bC bC bC bC bC bC bC bC bC bC bC bC bC bC bC bC bC bC bC bC bC bC bC bC bC bC bC bC bC bC bC bC bC bC bC bC bC bC bC bC bC bC bC bC bC bC bC bC bC bC bC bC bC bC bC bC bC bC bC bC bC bC bC bC bC bC bC bC bC bC bC bC bC bC bC bC bC bC bC bC bC bC bC bC bC bC bC bC bC bC bC bC bC bC bC bC bC bC bC bC bC bC bC bC bC bC bC bC bC bC bC bC bC bC bC bC bC bC bC bC bC bC bC bC bC bC bC bC bC bC bC bC bC bC bC bC bC bC bC bC bC bC bC bC bC bC bC bC bC bC bC bC bC bC bC bC bC bC bC bC bC bC bC bC bC bC bC bC bC bC bC bC bC bC bC bC bC bC bC bC bC bC bC bC bC bC bC bC bC bC bC bC bC bC bC bC bC bC bC bC bC bC bC bC bC bC bC bC bC bC bC bC bC bC bC bC bC bC bC bC bC bC bC bC bC bC bC bC bC bC bC bC bC bC bC bC bC bC bC bC bC bC bC bC bC bC bC bC bC bC bC bC bC bC bC bC bC bC bC bC bC bC bC bC bC bC bC bC bC bC bC bC bC bC bC bC bC bC bC bC bC bC bC bC bC bC bC bC bC bC bC bC bC bC bC bC bC bC bC bC bC bC bC bC bC bC bC bC bC bC bC bC bC bC bC bC bC bC bC bC bC bC bC bC bC bC bC bC bC bC bC bC bC bC bC bC bC bC bC bC bC bC bC bC bC bC bC bC bC bC bC bC bC bC bC bC bC bC bC bC bC bC bC bC bC bC bC bC bC bC bC bC bC bC bC bC bC bC bC bC bC bC bC bC bC bC bC bC bC bC bC bC bC bC bC bC bC bC bC bC bC bC bC bC bC bC bC bC bC bC bC bC bC bC bC bC bC bC bC bC bC bC bC bC bC bC bC bC bC bC bC bC bC bC bC bC bC bC bC bC bC bC bC bC bC bC bC bC bC bC bC bC bC bC bC bC bC bC bC bC bC bC bC bC bC bC bC bC bC bC bC bC bC bC bC bC bC bC bC bC bC bC bC bC bC bC bC bC bC bC bC bC bC bC bC bC bC bC bC bC bC bC bC bC bC bC bC bC bC bC bC bC bC bC bC bC bC bC bC bC bC bC bC bC bC bC bC bC bC bC bC bC bC bC bC bC bC bC bC bC bC bC bC bC bC bC bC bC bC bC bC bC bC bC bC bC bC bC bC bC bC bC bC bC bC bC bC bC bC bC bC bC bC bC bC bC bC bC bC bC bC bC bC bC bC bC bC bC bC bC bC bC bC bC bC bC bC bC bC bC bC bC bC bC bC bC bC bC bC bC bC bC bC bC bC bC bC bC bC bC bC bC bC bC bC bC bC bC bC bC bC bC bC bC bC bC bC bC bC bC bC bC bC bC bC bC bC bC bC bC bC bC bC bC bC bC bC bC bC bC bC bC bC bC bC bC bC bC bC bC bC bC bC bC bC bC bC bC bC bC bC bC bC bC bC bC bC bC bC bC bC bC bC bC bC bC bC bC bC bC bC bC bC bC bC bC bC bC bC bC bC bC bC bC bC bC bC bC bC bC bC bC bC bC bC bC bC bC bC bC bC bC bC bC bC bC bC bC bC bC bC bC bC bC bC bC bC bC bC bC bC bC bC bC bC bC bC bC bC bC bC bC bC bC bC bC bC bC bC bC bC bC bC bC bC bC bC bC bC bC bC bC bC bC bC bC bC bC bC bC bC bC bC bC bC bC bC bC bC bC bC bC bC bC bC bC bC bC bC bC bC bC bC bC bC bC bC bC bC bC bC bC bC bC bC bC bC bC bC bC bC bC bC bC bC bC bC bC bC bC bC bC bC bC bC bC bC bC bC bC bC bC bC bC bC bC bC bC bC bC bC bC bC bC bC bC bC bC bC bC bC bC bC bC bC bC bC bC bC bC bC bC bC bC bC bC bC bC bC bC bC bC bC bC bC bC bC bC bC bC bC bC bC bC bC bC bC bC bC bC bC bC bC bC bC bC bC bC bC bC bC bC bC bC bC
bC bC bC bC bC bC bC bC bC bC bC bC bC bC bC bC bC bC bC bC bC bC bC bC bC bC bC bC bC bC bC bC bC bC bC bC bC bC bC bC bC bC bC bC bC bC bC bC bC bC bC bC bC bC bC bC bC bC bC bC bC bC bC bC bC bC bC bC bC bC bC bC bC bC bC bC bC bC bC bC bC bC bC bC bC bC bC bC bC bC bC bC bC bC bC bC bC bC bC bC bC bC bC bC bC bC bC bC bC bC bC bC bC bC bC bC bC bC bC bC bC bC bC bC bC bC bC bC bC bC bC bC bC bC bC bC bC bC bC bC bC bC bC bC bC bC bC bC bC bC bC bC bC bC bC bC bC bC bC bC bC bC bC bC bC bC bC bC bC bC bC bC bC bC bC bC bC bC bC bC bC bC bC bC bC bC bC bC bC bC bC bC bC bC bC bC bC bC bC bC bC bC bC bC bC bC bC bC bC bC bC bC bC bC bC bC bC bC bC bC bC bC bC bC bC bC bC bC bC bC bC bC bC bC bC bC bC bC bC bC bC bC bC bC bC bC bC bC bC bC bC bC bC bC bC bC bC bC bC bC bC bC bC bC bC bC bC bC bC bC bC bC bC bC bC bC bC bC bC bC bC bC bC bC bC bC bC bC bC bC bC bC bC bC bC bC bC bC bC bC bC bC bC bC bC bC bC bC bC bC bC bC bC bC bC bC bC bC bC bC bC bC bC bC bC bC bC bC bC bC bC bC bC bC bC bC bC bC bC bC bC bC bC bC bC bC bC bC bC bC bC bC bC bC bC bC bC bC bC bC bC bC bC bC bC bC bC bC bC bC bC bC bC bC bC bC bC bC bC bC bC bC bC bC bC bC bC bC bC bC bC bC bC bC
2θ/°10 20 30 40 50 60 70 80 90
Int/
103
coun
ts
0
5,0
10,0
Abbildung 3.26: Rietveld-Plot von Pigment Red 181; Verfeinerung II mit topas. Schwarze Kreise:gemessenes Pulverdiagramm; rote Linie: simuliertes Pulverdiagramm; blaue Linie:Untergrund; grüne Linie: Differenzkurve.
3.8.6 Strukturlösung III
Von der vorhandenen Substanz des Pigment Red 181 wurde ein neues Pulverdiagramm ineiner Langzeitmessung aufgenommen. Die Messung wurde auf einem STOE-STADI-P-Dif-fraktometer in Transmissionsgeometrie mit Ge(111)-monochromatisierter CuKα1-Strahlung(λ = 1,540 56 Å) durchgeführt. Der Reflex bei 2θ ≈ 43° war nicht mehr vorhanden. Interessan-terweise wurden sowohl die erste als auch die neue Messung mit Substanz aus der gleichenCharge („Kosmetik-Rosa RC 01, DEDA003005“) durchgeführt.
Bevor die Verfeinerung durchgeführt wurde, stellte man sich folgende Fragen:
1. Wie dicht packen Pigment-Moleküle im Kristall?
Es wurden verschiedene Methoden zur Bestimmung des Molekülvolumens miteinanderverglichen und anschließend in Relation zu den tatsächlichen Volumina gestellt. AlsGrundlage dienten dabei Pigment Red 170 und seine Derivate. Tab. 3.15 (S. 65) zeigt denVergleich. Das Volumen nach dem Inkrementsystem zeigt generell die richtige Tendenzund Größenordnung.
Auf dieser Datenbasis ergab sich ein Korrekturfaktor fVol von 0,953 ± 0,030 für dasInkrementsystem. Andere bereits untersuchte Pigmente wurden auf Reproduzierbarkeituntersucht (Tab. 3.16, S. 66).
2. Welches Molekülvolumen hat Pigment Red 181?
Es stellt sich die Frage, welches nun das „richtige“ Molekülvolumen des untersuch-ten Pigment Red 181 ist. Aus der Summenformel C18H10Cl2O2S2 ergibt sich nach
dem Inkrementsystem VMolekül = 425,24 Å3, nach Anwendung des Korrekturfaktors
VMolekül = (405,25 ± 12,76) Å3; mit Z = 1 ergibt sich damit als untere Grenze für das
Volumen der Elementarzelle VEZ = 392,47 Å3, als obere Grenze VEZ = 418,01 Å
3.
64

3.8 Pigment Red 181
Die Strukturlösung mit dash wurde in der Elementarzelle mit VEZ = 393 Å3
in Raum-gruppe P1 mit einem ganzen Molekül durchgeführt. 25 Simulated-Annealing-Läufekonvergierten ausnahmslos mit einem Profil-χ2 von ≈ 4,6.
Tabelle 3.15: Vergleich von Molekülvolumina nach unterschiedlichen Methoden. VInkr bezeichnet dasMolekülvolumen nach [14], V
18 Å3 und V
16 Å3 bezeichnen Volumina nach den Faustre-
geln „18“- bzw. „16 Å3
pro Nicht-Wasserstoffatom“, Vtats das „tatsächliche“ Volumen,berechnet aus VEZ/Z.
Verbindung a Summenformel VInkr/Å3
V18 Å
3/Å3
V16 Å
3/Å3
Vtats/Å3 Vtats
VInkr
P. R. 170 C26H22N4O4 565,14 612 544 541,00 0,957F-P. R. 170 C26H21FN4O4 571,23 630 560 536,25 0,939Cl-P. R. 170 C26H21ClN4O4 585,86 630 560 591,75 1,010Br-P. R. 170 C26H21BrN4O4 592,76 630 560 547,00 0,923NO2-P. R. 170 C26H21N5O6 594,64 666 592 563,25 0,947CH3-P. R. 170 C27H24N4O4 589,17 630 560 554,75 0,942a Daten aus [CB1, CB2].
3.8.7 Rietveld-Verfeinerung III
Für die Rietveld-Verfeinerung mit topas wurde ein halbes Molekül in Raumgruppe P1 ver-wendet; die beiden dem Inversionszentrum nächsten C-Atome wurden mit halber Besetzungverfeinert. Die Verfeinerung konvergierte mit exzellenten R-Werten (Abb. 3.27, Tab. 3.17).
Zusätzlich wurde mit gsas eine Verfeinerung mit einem halben Molekül, geknüpft an einDummy-Atom auf dem Inversionszentrum, durchgeführt. Auch in diesem Fall war die Qua-lität der Verfeinerung außerordentlich gut (Abb. 3.28, Tab. 3.17).
Um die erhaltenen Kristallstrukturen von P. R. 181 mit den bereits veröffentlichten Er-gebnissen[16] vergleichen zu können, wurde keine Transformation der Elementarzelle in dieStandardaufstellung vorgenommen. Zusätzlich ermöglicht die so erhaltene Position und Ori-entierung des Moleküls in der Elementarzelle einen guten Einblick in die Kristallstruktur.
3.8.8 Kristallstruktur
Im Kristall liegt Pigment Red 181 als planares Molekül vor (Abb. 3.29); für die Kristallstruk-turen der bisher untersuchten Indigo- und Thioindigo-Derivate kam man zu dem gleichenErgebnis.
Die Packung der Moleküle jedoch zeigte in den meisten Fällen ein „Jägerzaunmuster “;[65–68]
einzige Ausnahme war bisher ein Dichlor-Derivat des Indigos, bei dem die Moleküle Stapelbilden.[69]
65

3 Bestimmung von Kristallstrukturen organischer Pigmente aus Röntgen-Pulverdaten
Tabelle 3.16: Vergleich der berechneten Molekülvolumina Vber (mittels des empirischen Korrekturfak-tors fVol) mit den tatsächlichen Volumina Vtats.
Verbindung Summenformel Vber/Å3
Vtats/Å3 Vtats
Vber
P. Y. 101 a C26H22N4O4 432,76 ± 13,62 429 0,991P. Y. 213 b C26H22N4O4 359,16 ± 11,31 358,8 0,999P. O. 5 c C26H22N4O4 680,44 ± 21,40 697 1,024α-THI d C16H10N2O2S2 352,13 ± 11,09 345,75 0,982β-THI d C16H10N2O2S2 352,13 ± 11,09 348,1 0,989Cl2-THI d C16H8Cl2N2O2S2 391,63 ± 12,33 367,8f 0,939(CH3)2-THI d C18H14N2O2S2 397,94 ± 12,53 382,85 0,962(OCH3)2-THI d C18H14N2O4S2 419,64 ± 13,21 410,66 0,979(CF3)2-THI d,e C18H8N2O2F6S2 432,76 ± 13,62 429,58 0,993ClH-THI d C16H9ClN2O2S2 371,67 ± 11,71 368,66 0,992a s. [CB5].b s. [CB4].c s. [CB3].d s. [CB8].e s. [CB7].f Messung bei T = 93 K.
Tabelle 3.17: Ergebnisse der Rietveld-Verfeinerungen I (mit gsas), II (mit topas) und III (mit gsas undtopas) von Pigment Red 181. Der drastische Unterschied in den R-Werten von III liegt inder Implementierung verschiedener Formeln für die Berechnung: Gl. (2.29) für gsas undGl. (2.28) für topas.
I II III IIIgsas topas
a/Å 7,5977(11) 3,7991(2) 11,7820(35) 11,7968(28)b/Å 8,9265(27) 8,9258(10) 8,8838(9) 8,8927(21)c/Å 11,334(4) 11,3283(11) 3,9231(5) 3,9279(7)α/° 94,209(26) 94,448(10) 88,705(11) 88,759(9)β/° 96,020(25) 95,985(4) 106,355(12) 106,465(10)γ/° 92,139(23) 93,593(13) 94,794(12) 94,823(8)V/Å
3761,6(4) 379,93(6) 392,63(9) 393,76(3)
Rpb 0,0758 0,0320 0,0321 0,1549Rwpb 0,1057 0,0434 0,0380 0,1710χ2
red 45,85 2,899 1,819 1,105a
χ 6,77 1,703 1,340a 1,051a berechnet gemäß χ =
√
χ2
66

3.8 Pigment Red 181
bC bC bC bC bC bC bC bC bC bC bC bC bC bC bC bC bC bC bC bC bC bC bC bC bC bC bC bC bC bC bC bC bC bC bC bC bC bC bC bC bC bC bC bC bC bC bC bC bC bC bC bC bC bC bC bC bC bC bC bC bC bC bC bC bC bC bC bC bC bC bC bC bC bC bC bC bC bC bC bC bC bC bC bC bC bC bC bC bC bC bC bC bC bC bC bC bC bC bC bC bC bC bC bC bC bC bC bC bC bC bC bC bC bC bC bC bC bC bC bC bC bC bC bC bC bC bCbC bC bC bC bC bC bC bC bC bC bC bC bC bC bC bC bC bC bC bC bC bC bC bC bC bC bC bC bC bC bC bC bC bC bC bC bC bC bC bC bC bC bC bC bC bC bC bC bC bC bC bC bC bC bC bC bC bC bC bC bC bC bC bC bC bC bC bC bC bC bC bC bC bC bC bC bC bC bC bC bC bC bC bC bC bC bC bC bC bC bC bC bC bC bC bC bC bC bC bC bC bC bC bC bC bC bC bC bC bC bC bC bC bC bCbC bC bC bC bC bC bC bC bC bC bC bC bC bC bC bC bC bC bC bC bC bC bC bC bC bC bC bC bC bC bC bC bC bC bC bC bC bC bC bC bC bC bC bC bC bC bC bC bC bC bC bC bC bC bC bC bC bC bC bC bC bC bC bC bC bC bC bC bC bC bC bC bC bC bC bC bC bC bC bC bC bC bC bC bC bC bC bC bC bC bC bC bC bC bC bC bC bC bC bC bC bC bC bC bC bC bC bC bCbC bC bC bC bC bC bC bC bC bC bC bC bC bC bC bC bC bC bC bC bC bC bCbC bC bC bC bC bC bC bC bC bC bC bC bC bC bC bC bC bC bC bC bC bC bC bC bC bC bC bC bC bC bC bC bC bC bC bC bC bC bC bC bC bC bC bC bC bC bC bC bC bC bC bC bC bC bC bC bC bC bC bC bC bC bC bC bC bC bC bC bC bC bC bC bC bC bC bC bC bC bC bC bCbC bC bC bC bC bC bC bC bC bC bC bC bC bC bC bC bC bC bC bC bC bC bC bC bC bC bC bC bC bC bC bC bC bC bC bC bC bC bC bC bC bC bC bC bC bC bC bC bC bC bC bC bC bC bC bC bC bC bC bC bC bC bC bC bC bC bC bC bC bC bC bC bC bC bCbC bC bC bC bC bC bC bC bC bC bC bC bC bC bC bC bC bC bC bC bC bC bCbC bC bC bC bC bC bC bC bC bC bC bC bCbC bC bC bC bC bC bCbC bC bC bCbC bC bC bCbC bC bCbC bC bCbC bC bCbC bCbC bC bC bC bC bC bC bC bC bC bC bC bC bC bC bC bC bC bC bC bC bC bC bC bC bC bC bC bC bC bC bC bC bC bC bC bC bC bC bC bC bC bC bC bC bC bC bC bC bC bC bC bC bC bC bC bC bC bC bC bC bC bC bC bC bC bC bC bC bC bC bC bC bC bC bC bC bC bC bC bC bC bC bC bC bC bC bC bC bC bC bCbC bC bC bC bC bC bC bC bC bC bC bC bC bC bC bC bC bC bC bC bC bC bC bC bC bC bC bC bC bC bC bC bC bC bC bC bC bC bC bC bC bC bC bC bC bC bC bC bC bC bC bC bC bC bC bC bC bC bC bC bC bC bC bC bC bCbC bC bC bC bC bC bC bC bC bC bC bC bC bC bC bC bC bC bC bC bC bC bC bC bCbC bC bC bC bC bCbC bC bC bC bC bC bC bCbC bC bC bC bC bCbC bC bCbC bC bC bC bCbC bC bC bCbC bCbC bC bCbC bC bC bC bC bCbC bC bC bC bC bC bC bC bC bC bC bC bC bC bC bC bC bC bC bC bC bC bC bC bC bC bC bC bC bC bC bC bC bC bC bC bC bC bC bC bC bC bC bC bC bC bC bC bC bC bC bC bC bC bC bC bC bC bC bC bC bC bC bC bC bC bC bC bC bC bC bC bC bC bC bC bC bC bC bC bC bC bC bC bC bC bC bC bC bC bC bC bC bC bC bC bC bC bC bC bC bC bC bC bC bC bC bC bC bC bC bC bC bC bC bC bC bC bC bC bC bC bC bC bC bC bC bC bC bC bC bC bC bC bC bC bC bC bC bC bC bC bC bC bC bC bC bC bC bC bC bC bC bC bC bC bC bC bC bC bC bC bC bC bC bC bC bC bC
bC bC bC bC bC bC bC bC bC bC bC bC bCbC bC bC bC bC bC bC bC bC bC bC bC bC bC bC bC bC bC bC bC bC bC bC bC bC bC bC bC bC bC bC bC bC bC bC bC bC bC bC bC bC bC bC bC bC bC bC bC bC bC bC bC bC bC bC bC bC bC bC bC bC bC bC bC bC bC bC bC bC bC bC bC bC bC bC bC bC bC bC bC bC bC bC bC bC bC bC bC bC bC bC bC bC bC bC bC bC bC bC bC bC bC bC bC bC bC bC bC bC bC bC bC bC bC bC bC bC bC bC bC bC bC bC bC bC bC bC bC bC bC bC bC bC bC bC bC bC bC bC bC bC bC bC bC bC bC bC bC bC bC bC bC bC bC bC bC bC bC bC bC bC bC bC bC bC bC bC bC bC bC bC bC bC bC bC bC bC bC bC bC bC bC bC bC bC bC bC bC bC bC
bC bC bC bC bC bC bC bC bC bC bC bC bC bC bC bC bC bC bC bC bC bC bC bC bC bC bC bC bC bC bC bC bC bC bC bC bC bC bC bC bC bC bC bC bC bC bC bC bC bC bC bC bC bC bC bC bC bC bC bC bC bC bC bC bC bC bC bC bC bC bC bC bC bC bC bC bC bC bC bC bC bC bC bC bC bC bC bC bC bC bC bC bC bC bC bC bC bC bC bC bC bC bC bC bC bC bC bC bC bC bC bC bC bC bC bC bC bC bC bC bC bC bC bC bC bC bC bC bC bC bC bC bC bC bC bC bC bC bC bC bC bC bC bC bC bC bC bC bC bC bC bC bC bC bC bC bC bC bC bC bC bC bC bC bC bC bC bC bC bC bC bC bC bC bC bC bC bC bC bC bC bC bC bC bC bC bC bC bC bC bC bC bC bC bC bC bC bC bC bC bC bCbC bC bC bC bC bC bC bC bC bC bC bC bC bC bC bC bC bC bC bC bC bC bC bC bC bC bC bC bC bC bC bC bC bC bC bC bC bC bC bC bC bC bC bC bC bC bC bC bC bC bC bC bC bC bC bC bC bC bC bC bC bC bC bC bC bC bC bC bC bC bC bC bC bC bC bC bC bC bC bC bC bC bC bC bC bCbC bC bC bC bC bC bC bC bC bC bC bC bC bC bC bC bC bC bC bC bC bC bC bC bC bC bCbC bC bC bC bC bC bC bC bC bC bC bC bC bC bC bC bC bC bC bC bC bC bC bC bC bC bC bC bC bC bC bC bC bC bC bC bC bC bC bC bC bC bC bC bC bC bC bC bC bC bC bC bC bC bC bC bC bC bC bC bC bCbC bC bC bC bC bC bC bC bC bC bC bCbC bC bC bC bC bC bC bC bC bC bC bCbC bC bC bC bC bC bC bC bC bC bC bC bC bC bC bC bC bC bC bC bC bC bC bC bC bC bC bC bC bC bC bC bC bC bC bC bC bC bC bC bC bC bC bC bC bC bC bC bC bC bC bC bC bC bC bC bC bC bC bC bC bC bC bC bC bC bC bC bC bC bC bC bC bC bC bC bCbC bC bC bC bC bC bC bC bC bC bC bC bC bC bC bC bC bC bCbC bC bC bC bC bC bC bC bC bC bC bC bC bC bC bC bC bC bC bC bC bC bC bC bC bC bC bC bC bC bC bC bC bC bC bC bC bC bC bC bC bC bC bC bC bC bC bC bC bC bC bC bC bC bC bC bC bC bC bC bC bC bC bC bC bC bC bC bC bC bC bC bC bC bC bC bC bC bC bC bC bC bC bC bCbC bC bC bC bC bC bC bC bC bC bC bC bCbC bC bC bC bC bC bC bC bC bC bC bC bC bCbC bC bC bC bC bC bC bC bC bC bC bC bC bC bC bC bC bC bC bC bC bC bC bC bC bC bC bC bC bC bC bC bC bC bC bC bC bC bC bC bC bC bC bC bC bC bC bC bC bC bC bC bC bC bC bC bC bC bC bC bC bC bC bC bC bC bC bC bC bC bC bC bC bC bC bC bC bC bC bC bC bC bC bC bC bC bC bC bC bC bC bC bC bC bC bC bC bC bC bC bC bC bC bC bC bC bC bC bC bC bC bC bC bC bC bC bC bC bC bC bC bC bC bC bC bC bC bC bC bC bC bCbC bC bC bC bC bC bC bC bCbC bC bC bC bCbC bC bC bC bC bCbC bC bCbC bC bC bC bC bC bC bC bC bC bC bC bC bC bC bC bC bC bC bC bC bC bC bC bC bC bC bC bC bC bC bC bC bC bC bC bC bC bC bC bC bC bC bC bC bC bC bC bC bC bC bC bC bC bC bC bC bCbC bC bC bC bC bC bC bC bCbC bC bC bC bC bC bC bCbC bC bC bC bC bC bC bC bC bCbC bC bC bC bC bC bC bC bCbC bC bC bC bC bC bC bC bC bC bC bC bC bC bC bC bC bC bC bC bC bC bC bC bC bC bC bC bC bC bC bC bC bC bC bC bC bC bC bC bC bC bC bC bC bC bC bC bC bC bCbC bC bC bC bC bC bC bC bC bC bC bC bC bC bC bC bC bC bC bC bC bC bC bC bC bC bC bC bC bC bC bC bC bCbC bC bC bC bC bC bC bC bCbC bC bC bCbC bC bCbC bC bCbC bC bCbC bC bCbC bC bCbC bC bC bC bCbC bC bC bC bC bC bC bC bC bC bC bC bC bC bC bC bC bC bC bC bC bC bC bC bC bC bC bC bC bC bC bC bC bC bC bC bC bC bC bC bC bC bC bC bC bC bC bC bC bC bC bC bC bC bC bC bC bC bC bC bC bC bC bC bC bC bC bC bC bC bC bC bC bC bC bC bC bC bCbC bC bC bC bC bC bC bC bC bC bC bC bCbC bC bC bC bC bC bC bC bCbC bC bC bC bC bCbC bC bCbC bCbC bCbCbC bCbCbCbC bCbCbCbCbC bCbC bCbC bC bC bC bC bC bC bCbCbC bC bCbC bCbC bC bC bC bC bC bCbC bC bC bC bC bC bC bC bC bC bC bC bC bC bC bC bC bC bC bC bC bC bC bC bC bC bC bC bC bC bC bC bC bC bC bC bC bC bC bC bC bC bC bC bC bC bC bC bC bC bC bC bC bC bC bC bC bC bC bC bC bC bC bC bC bC bC bC bC bC bC bC bC bC bC bC bC bC bC bC bC bC bC bC bC bC bC bC bC bC bC bC bC bC bC bC bC bC bC bC bC bC bC bC bC bC bC bC bC bC bC bC bC bC bC bC bC bC bC bC bC bC bCbC bC bC bC bC bC bC bC bC bC bC bC bC bC bC bCbC bC bC bC bC bC bC bC bC bC bC bC bC bC bC bC bC bC bC bC bC bC bC bC bC bC bC bC bC bC bC bC bC bC bC bC bC bC bC bC bC bC bC bC bC bC bC bC bC bC bC bC bC bC bC bC bC bC bC bC bC bC bC bC bC bC bC bC bC bC bC bC bC bC bC bC bC bC bC bC bC bC bC bC bC bC bC bC bC bC bC bC bC bC bC bC bC bC bC bC bC bC bC bC bC bC bC bC bC bC bC bC bC bC bC bC bC bC bC bC bC bC bC bC bC bC bC bC bC bC bC bC bC bC bCbC bC bC bC bC bC bC bC bC bC bC bC bC bC bC bC bC bC bC bC bC bC bC bC bC bC bC bC bC bC bC bC bC bC bC bC bC bC bC bC bC bC bC bC bC bC bC bC bC bC bC bC bC bC bC bC bC bC bC bC bC bC bC bC bC bC bC bC bC bC bC bC bC bC bC bC bCbC bC bC bC bC bC bC bC bC bC bC bC bC bC bC bC bC bC bC bC bC bC bC bC bC bC bC bC bC bC bC bC bC bC bC bC bC bC bC bC bC bC bC bC bC bC bC bC bC bC bC bC bC bC bC bC bC bC bC bC bC bC bC bC bC bC bC bC bC bC bC bC bC bC bC bC bC bC bC bC bC bC bC bC bC bC bC bC bC bC bC bC bC bC bC bC bC bC bC bC bC bC bC bC bC bC bC bC bC bC bC bC bC bC bC bC bC bC bC bC bC bC bC bC bC bC bC bC bC bC bC bC bC bC bC bC bC bC bC bC bC bC bC bC bC bC bC bC bC bC bC bC bC bC bC bC bC bC bC bC bC bC bC bC bC bC bC bC bC bC bC bC bC bC bC bC bC bC bC bC bC bC bC bC bC bC bC bC bC bC bC bC bC bC bC bC bC bC bC bC bC bC bC bC bC bC bC bC bC bC bC bC bC bC bC bC bC bC bC bC bC bC bC bC bC
bC bC bC bC bC bC bC bC bC bC bC bC bC bC bC bC bC bC bC bC bC bC bC bC bC bC bC bC bC bC bC bC bC bC bC bC bC bC bC bC bC bC bC bC bC bC bC bC bC bC bC bC bC bC bC bC bC bC bC bC bC bC bC bC bC bC bC bC bC bC bC bC bC bC bC bC bC bC bC bC bC bC bC bC bC bC bC bC bC bC bC bC bC bC bC bC bC bC bC bC bC bC bC bC bC bC bC bC bC bCbC bC bC bC bC bC bC bC bC bC bC bC bC bC bC bC bC bC bC bC bC bC bC bC bC bC bC bC bC bC bC bC bC bC bC bC bC bC bC bC bC bC bC bC bC bC bC bC bC bC bC bC bC bC bC bC bC bC bC bC bC bC bC bC bC bC bC bC bC bC bC bC bC bC bC bC bC bC bC bC bC bC bC bC bC bC bC bC bC bC bC bC bC bC bC bC bC bC bC bC bC bC bC bC bC bC bC bC bC bC bC bC bC bC bC bC bC bC bC bC bC bC bC bC bC bC bCbC bC bC bC bC bC bC bC bC bC bC bC bC bC bC bC bC bC bC bC bC bC bC bC bC bC bC bC bC bC bC bC bC bC bC bC bC bC bC bC bC bC bC bC bC bC bC bC bC bC bC bC bC bC bC bC bC bC bC bC bC bC bC bC bC bC bC bC bC bC bC bC bC bC bC bC bC bC bC bC bC bC bC bC bC bC bC bC bC bC bC bC bC bC bC bC bC bC bC bC bC bC bC bC bC bC bC bC bC bC bC bC bC bC bC bC bC bC bC bC bC bC bC bC bC bC bC bC bC bC bC bC bC bC bC bC bC bC bC bC bC bC bC bC bC bC bC bC bC bC bC bC bC bC bC bC bC bC bC bC bC bC bC bC bC bC bC bC bC bC bC bC bC bC bC bC bC bC bC bC bC bC bC bC bC bC bC bC bC bC bC bC bC bC bC bC bC bC bC bC bC bC bC bC bC bC bC bC bC bC bC bC bC bC bC bC bC bC bC bC bC bC bC bC bC bC bC bC bC bC bC bC bC bC bC bC bC bC bC bC bC bC bC bC bC bC bC bC bC bC bC bC bC bC bC bC bC bC bC bC bC bC bC bC bC bC bC bC bC bC bC bC bC bC bC bC bC bC bC bC bC bC bC bC bC bC bC bC bC bC bC bC bC bC bC bC bC bC bC bC bC bC bC bC
bC bC bC bC bC bC bC bC bC bC bC bC bC bC bC bC bC bC bC bC bC bC bC bC bC bC bC bC bC bC bC bC bC bC bC bC bC bC bC bC bC bC bC bC bC bC bC bC bC bC bC bC bC bC bC bC bC bC bC bC bC bC bC bC bC bC bC bC bC bC bC bC bC bC bC bC bC bC bC bC bC bC bC bC bC bC bC bC bC bC bC bC bC bC bC bC bC bC bC bC bC bC bC bC bC bC bC bC bC bC bC bC bC bC bC bC bC bC bC bC bC bC bC bC bC bC bC bC bC bC bC bC bC bC bC bC bC bC bC bC bC bC bC bC bC bC bC bC bC bC bC bC bC bC bC bC bCbC bC bC bC bC bC bC bC bC bC bC bC bC bC bC bC bC bC bC bC bC bC bC bC bCbC bC bC bC bC bC bC bC bC bC bC bC bC bC bC bC bC bC bC bC bC bC bC bC bC bC bC bC bC bC bC bC bC bC bC bC bC bC bC bC bC bC bC bC bC bC bC bC bC bC bC bC bC bC bC bC bC bC bC bC bC bC bC bC bC bC bC bC bC bC bC bC bC bC bC bC bC bC bC bC bC bC bC bC bC bC bC bC bC bC bC bC bC bC bC bC bC bC bC bC bC bC bC bC bC bC bC bC bC bC bC bC bC bC bC bC bC bC bC bC bC bC bC bC bC bC bC bC bC bC bC bC bC bC bC bC bC bC bC bC bC bC bC bC bC bC bC bC bC bC bC bC bC bC bC bC bC bC bC bC bC bC bC bC bC bC bC bC bC bC bC bC bC bC bC bC bC bC bC bC bC bC bC bC bC bC bC bC bC bC bC bC bC bC bC bC bC bC bC bC bC bC bC bC bC bC bC bC bC bC bC bC bC bC bC bC bC bC bC bC bC bC bC bC bC bC bC bC bC bC bC bC bC bC bC bC bC bC bC bC bC bC bC bC bC bC bC bC bC bC bC bC bC bC bC bC bC bC bC bC bC bC bC bC bC bC bC bC bC bC bC bC bC bC bC bC bC bC bC bC bC bC bC bC bC bC bC bC bC bC bC bC bC bC bC bC bC bC bC bC bC bC bC bC bC bC bC bC bC bC bC bC bC bC bC bC bC bC bC bC bC bC bC bC bC bC bC bC bC bC bC bC bC bC bC bC bC bC bC bC bC bC bC bC bC bC bC bC bC bC bC bC bC bC bC bC bC bC bC bC bC bC bC bC bC bC bC bC bC bC bC bC bC bC bC bC bC bC bC bC bC bC bC bC bC bC bC bC bC bC bC bC bC bC bC bC bC bC bC bC bC bC bC bC bC bC bC bC bC bC bC bC bC bC bC bC bC bC bC bC bC bC bC bC bC bC bC bC bC bC bC bC bC bC bC bC bC bC bC bC bC bC bC bC bC bC bC bC bC bC bC bC bC bC bC bC bC bC bC bC bC bC bC bC bC bC bC bC bC bC bC bC bC bC bC bC bC bC bC bC bC bC bC bC bC bC bC bC bC bC bC bC bC bC bC bC bC bC bC bC bC
bC bC bC bC bC bC bC bC bC bC bC bC bC bC bC bC bC bC bC bC bC bC bC bC bC bC bC bC bC bC bC bC bC bC bC bC bC bC bC bC bC bC bC bC bC bC bC bC bC bC bC bC bC bC bC bC bC bC bC bC bC bC bC bC bC bC bC bC bC bC bC bC bC bC bC bC bC bC bC bC bC bC bC bC bC bC bC bC bC bC bC bC bC bC bC bC bC bC bC bC bC bC bC bC bC bC bC bC bC bC bC bC bC bC bC bC bC bC bC bC bC bC bC bC bC bC bC bC bC bC bC bC bC bC bC bC bC bC bC bC bC bC bC bC bC bC bC bC bC bC bC bC bC bC bC bC bC bC bC bC bC bC bC bC bC bC bC bC bC bC bC bC bC bC bC bC bC bC bC bC bC bC bC bC bC bC bC bC bC bC bC bC bC bC bC bC bC bC bC bC bC bC bC bC bC bC bC bC bC bC bC bC bC bC bC bC bC bC bC bC bC bC bC bC bC bC bC bC bC bC bC bC bC bC bC bC bC bC bC bC bC bC bC bC bC bC bC bC bC bC bC bC bC bC bC bC bC bC bC bC bC bC bC bC bC bC bC bC bC bC bC bC bC bC bC bC bC bC bC bC bC bC bC bC bC bC bC bC bC bC bC bC bC bC bC bC bC bC bC bC bC bC bC bC bC bC bC bC bC bC bC bC bC bC bC bC bC bC bC bC bC bC bC bC bC bC bC bC bC bC bC bC bC bC bC bC bC bC bC bC bC bC bC bC bC bC bC bC bC bC bC bC bC bC bC bC bC bC bC bC bC bC bC bC bC bC bC bC bC bC bC bC bC bC bC bC bC bC bC bC bC bC bC bC bC bC bC bC bC bC bC bC bC bC bC bC bC bC bC bC bC bC bC bC bC bC bC bC bC bC bC bC bC bC bC bC bC bC bC bC bC bC bC bC bC bC bC bC bC bC bC bC bC bC bC bC bC bC bC bC bC bC bC bC bC bC bC bC bC bC bC bC bC bC bC bC bC bC bC bC bC bC bC bC bC bC bC bC bC bC bC bC bC bC bC bC bC bC bC bC bC bC bC bC bC bC bC bC bC bC bC bC bC bC bC bC bC bC bC bC bC bC bC bC bC bC bC bC bC bC bC bC bC bC bC bC bC bC bC bC bC bC bC bC bC bC bC bC bC bC bC bC bC bC bC bC bC bC bC bC bC bC bC bC bC bC bC bC bC bC bC bC bC bC bC bC bC bC bC bC bC bC bC bC bC bC bC bC bC bC bC bC bC bC bC bC bC bC bC bC bC bC bC bC bC bC bC bC bC bC bC bC bC bC bC bC bC bC bC bC bC bC bC bC bC bC bC bC bC bC bC bC bC bCbC bC bC bC bC bC bC bC bC bC bC bC bC bC bC bC bC bC bC bC bC bC bC bC bC bC bC bC bC bC bC bC bC bC bC bC bC bC bC bC bC bC bC bC bC bC bC bC bC bC bC bC bC bC bC bC bC bC bC bC bC bC bC bC bC bC bC bC bC bC bC bC bC bC bC bC bC bC bC bC bC bC bC bC bC bC bC bC bC bC bC bC bC bC bC bC bC bC bC bC bC bC bC bC bC bC bC bC bC bC bC bC bC bC bC bC bC bC bC bC bC bC bC bC bC bC bC bC bC bC bC bC bC bC bC bC bC bC bC bC bC bC bC bC bC bC bC bC bC bC bC bC bC bC bC bC bC bC bC bC bC bC bC bC bC bC bC bC bC bC bC bC bC bC bC bC bC bC bC bC bC bC bC bC bC bC bC bC bC bC bC bC bC bC bC bC bC bC bC bC bC bC bC bC bC bC bC bC bC bC bC bC bC bC bC bC bC bC bC bC bC bC bC bC bC bC bC bC bC bC bC bC bC bC bC bC bC bC bC bC bC bC bC bC bC bC bC bC bC bC bC bC bC bC bC bC bC bC bC bC bC bC bC bC bC bC bC bC bC bC bC bC bC bC bC bC bC bC bC bC bC bC bC bC bC bC bC bC bC bC bC bC bC bC bC bC bC bC bC bC bC bC bC bC bC bC bC bC bC bC bC bC bC bC bC bC bC bC bC bC bC bC bC bC bC bC bC bC bC bC bC bC bC bC bC bC bC bC bC bC bC bC bC bC bC bC bC bC bC bC bC bC bC bC bC bC bC bC bC bC bC bC bC bC bC bC bC bC bC bC bC bC bC bC bC bC bC bC bC bC bC bC bC bC bC bC bC bC bC bC bC bC bC bC bC bC bC bC bC bC bC bC bC bC bC bC bC bC bC bC bC bC bC bC bC bC bC bC bC bC bC bC bC bC bC bC bC bC bC bC bC bC bC bC bC bC bC bC bC bC bC bC bC bC bC bC bC bC bC bC bC bC bC bC bC bC bC bC bC bC bC bC bC bC bC bC bC bC bC bC bC bC bC bC bC bC bC bC bC bC bC bC bC bC bC bC bC bC bC bC bC bC bC bC bC bC bC bC bC bC bC bC bC bC bC bC bC bC bC bC bC bC bC bC bC bC bC bC bC bC bC bC bC bC bC bC bC bC bC bC bC bC bC bC bC bC bC bC bC bC bC bC bC bC bC bC bC bC bC bC bC bC bC bC bC bC bC bC bC bC bC bC bC bC bC bC bC bC bC bC bC bC bC bC bC bC bC bC bC bC bC bC bC bC bC bC bC bC bC bC bC bC bC bC bC bC bC bC bC bC bC bC bC bC bC bC bC bC bC bC bC bC bC bC bC bC bC bC bC bC bC bC bC bC bC bC bC bC bC bC bC bC bC bC bC bC bC bC bC bC bC bC bC bC bC bC bC bC bC bC bC bC bC bC bC bC bC bC bC bC bC bC bC bC bC bC bC bC bC bC bC bC bC bC bC bC bC bC bC bC bC bC bC bC bC bC bC bC bC bC bC bC bC bC bC bC bC bC bC bC bC bC bC bC bC bC bC bC bC bC bC bC bC bC bC bC bC bC bC bC bC bC bC bC bC bC bC bC bC bC bC bC bC bC bC bC bC bC bC bC bC bC bC bC bC bC bC bC bC bC bC bC bC bC bC bC bC bC bC bC bC bC bC bC bC bC bC bC bC bC bC bC bC bC bC bC bC bC bC bC bC bC bC bC bC bC bC bC bC bC bC bC bC bC bC bC bC bC bC bC bC bC bC bC bC bC bC bC bC bC bC bC bC bC bC bC bC bC bC bC bC bC bC bC bC bC bC bC bC bC bC bC bC bC bC bC bC bC bC bC bC bC bC bC bC bC bC bC bC bC bC bC bC bC bC bC bC bC bC bC bC bC bC bC bC bC bC bC bC bC bC bC bC bC bC bC bC bC bC bC bC bC bC bC bC bC bC bC bC bC bC bC bC bC bC bC bC bC bC bC bC bC bC bC bC bC bC bC bC bC bC bC bC bC bC bC bC bC bC bC bC bC bC bC bC bC bC bC bC bC bC bC bC bC bC bC bC bC bC bC bC bC bC bC bC bC bC bC bC bC bC bC bC bC bC bC bC bC bC bC bC bC bC bC bC bC bC bC bC bC bC bC bC bC bC bC bC bC bC bC bC bC bC bC bC bC bC bC bC bC bC bC bC bC bC bC bC bC bC bC bC bC bC bC bC bC bC bC bC bC bC bC bC bC bC bC bC bC bC bC bC bC bC bC bC bC bC bC bC bC bC bC bC bC bC bC bC bC bC bC bC bC bC bC bC bC bC bC bC bC bC bC bC bC bC bC bC bC bC bC bC bC bC bC bC bC bC bC bC bC bC bC bC bC bC bC bC bC bC bC bC bC bC bC bC bC bC bC bC bC bC bC bC bC bC bC bC bC bC bC bC bC bC bC bC bC bC bC bC bC bC bC bC bC bC bC bC bC bC bC bC bC bC bC bC bC bC bC bC bC bC bC bC bC bC bC bC bC bC bC bC bC bC bC bC bC bC bC bC bC bC bC bC bC bC bC bC bC bC bC bC bC bC bC bC bC bC bC bC bC bC bC bC bC bC bC bC bC bC bC bC bC bC bC bC bC bC bC bC bC bC bC bC bC bC bC bC bC bC bC bC bC bC bC bC bC bC bC bC bC bC bC bC bC bC bC bC bC bC bC bC bC bC bC bC bC bC bC bC bC bC bC bC bC bC bC bC bC bC bC bC bC bC bC bC bC bC bC bC bC bC bC bC bC bC bC bC bC bC bC bC bC bC bC bC bC bC bC bC bC bC bC bC bC bC bC bC bC bC bC bC bC bC bC bC bC bC bC bC bC bC bC bC bC bC bC bC bC bC bC bC bC bC bC bC bC bC bC bC bC bC bC bC bC bC bC bC bC bC bC bC bC bC bC bC bC bC bC bC bC bC bC bC bC bC bC bC bC bC bC bC bC bC bC bC bC bC bC bC bC bC bC bC bC bC bC bC bC bC bC bC bC bC bC bC bC bC bC bC bC bC bC bC bC bC bC bC bC bC bC bC bC bC bC bC bC bC bC bC bC bC bC bC bC bC bC bC bC bC bC bC bC bC bC bC bC bC bC bC bC bC bC bC bC bC bC bC bC bC bC bC bC bC bC bC bC bC bC bC bC bC bC bC bC bC bC bC bC bC bC bC bC bC bC bC bC bC bC bC bC bC bC bC bC bC bC bC bC bC bC bC bC bC bC bC bC bC bC bC bC bC bC bC bC bC bC bC bC bC bC bC bC bC bC bC bC bC bC bC bC bC bC bC bC bC bC bC bC bC bC bC bC bC bC bC bC bC bC bC bC bC bC bC bC bC bC bC bC bC bC bC bC bC bC bC bC bC bC bC bC bC bC bC bC bC bC bC bC bC bC bC bC bC bC bC bC bC bC bC bC bC bC bC bC bC bC bC bC bC bC bC bC bC bC bC bC bC bC bC bC bC bC bC bC bC bC bC bC bC bC bC bC bC bC bC bC bC bC bC bC bC bC bC bC bC bC bC bC bC bC bC bC bC bC bC bC bC bC bC bC bC bC bC bC bC bC bC bC bC bC bC bC bC bC bC bC bC bC bC bC bC bC bC bC bC bC bC bC bC bC bC bC bC bC bC bC bC bC bC bC bC bC bC bC bC bC bC bC bC bC bC bC bC bC bC bC bC bC bC bC bC bC bC bC bC bC bC bC bC bC bC bC bC bC bC bC bC bC bC bC bC bC bC bC bC bC bC bC bC bC bC bC bC bC bC bC bC bC bC bC bC bC bC bC bC bC bC bC bC bC bC bC bC bC bC bC bC bC bC bC bC bC bC bC bC bC bC bC bC bC bC bC bC bC bC bC bC bC bC bC bC bC bC bC bC bC bC bC bC bC bC bC bC bC bC bC bC bC bC bC bC bC bC bC bC bC bC bC bC bC bC bC bC bC bC bC bC bC bC bC bC bC bC bC bC bC bC bC bC bC bC bC bC bC bC bC bC bC bC bC bC bC bC bC bC bC bC bC bC bC bC bC bC bC bC bC bC bC bC bC bC bC bC bC bC bC bC bC bC bC bC bC bC bC bC bC bC bC bC bC bC bC bC bC bC bC bC bC bC bC bC bC bC bC bC bC bC bC bC bC bC bC bC bC bC bC bC bC bC bC bC bC bC bC bC bC bC bC bC bC bC bC bC bC bC bC bC bC bC bC bC bC bC bC bC bC bC bC bC bC bC bC bC bC bC bC bC bC bC bC bC bC bC bC bC bC bC bC bC bC bC bC bC bC bC bC bC bC bC bC bC bC bC bC bC bC bC bC bC bC bC bC bC bC bC bC bC bC bC bC bC bC bC bC bC bC bC bC bC bC bC bC bC bC bC bC bC bC bC bC bC bC bC bC bC bC bC bC bC bC bC bC bC bC bC bC bC bC bC bC bC bC bC bC bC bC bC bC bC bC bC bC bC bC bC bC bC bC bC bC bC bC bC bC bC bC bC bC bC bC bC bC bC bC bC bC bC bC bC bC bC bC bC bC bC bC bC bC bC bC bC bC bC bC bC bC bC bC bC bC bC bC bC bC bC bC bC bC bC bC bC bC bC bC bC bC bC bC bC bC bC bC bC bC bC bC bC bC bC bC bC bC bC bC bC bC bC bC bC bC bC bC bC bC bC bC bC bC bC bC bC bC bC bC bC bC bC bC bC bC bC bC bC bC bC bC bC bC bC bC bC bC bC bC bC bC bC bC bC bC bC bC bC bC bC bC bC bC bC bC bC bC bC bC bC bC bC bC bC bC bC bC bC bC bC bC bC bC bC bC bC bC bC bC bC bC bC bC bC bC bC bC bC bC bC bC bC bC bC bC bC bC bC bC bC bC bC bC bC bC bC bC bC bC bC bC bC bC bC bC bC bC bC bC bC bC bC bC bC bC bC bC bC bC bC bC bC bC bC bC bC bC bC bC bC bC bC bC bC bC bC bC bC bC bC bC bC bC bC bC bC bC bC bC bC bC bC bC bC bC bC bC bC bC bC bC bC bC bC bC bC bC bC bC bC bC bC bC bC bC bC bC bC bC bC bC bC bC bC bC bC bC bC bC bC bC bC bC bC bC bC bC bC bC bC bC bC bC bC bC bC bC bC bC bC bC bC bC bC bC bC bC bC bC bC bC bC bC bC bC bC bC bC bC bC bC bC bC bC bC bC bC bC bC bC bC bC bC bC bC bC bC bC bC bC bC bC bC bC bC bC bC bC bC bC bC bC bC bC bC bC bC bC bC bC bC bC bC bC bC bC bC bC bC bC bC bC bC bC bC bC bC bC bC bC bC bC bC bC bC bC bC bC bC bC bC bC bC bC bC bC bC bC bC bC bC bC bC bC bC bC bC bC bC bC bC bC bC bC bC bC bC bC bC bC bC bC bC bC bC bC bC bC bC bC bC bC bC bC bC bC bC bC bC bC bC bC bC bC bC bC bC bC bC bC bC bC bC bC bC bC bC bC bC bC bC bC bC bC bC bC bC bC bC bC bC bC bC bC bC bC bC bC bC bC bC bC bC bC bC bC bC bC bC bC bC bC bC bC bC bC bC bC bC bC bC bC bC bC bC bC bC bC bC bC bC bC bC bC bC bC bC bC bC bC bC bC bC bC bC bC bC bC bC bC bC bC bC bC bC bC bC bC bC bC bC bC bC bC bC bC bC bC bC bC bC bC bC bC bC bC bC bC bC bC bC bC bC bC bC bC bC bC bC bC bC bC bC bC bC bC bC bC bC bC bC bC bC bC bC bC bC bC bC bC bC bC bC bC bC bC bC bC bC bC bC bC bC bC bC bC bC bC bC bC bC bC bC bC bC bC bC bC bC bC bC bC bC bC bC bC bC bC bC bC bC bC bC bC bC bC bC bC bC bC bC bC bC bC bC bC bC bC bC bC bC bC bC bC bC bC bC bC bC bC bC bC bC bC bC bC bC bC bC bC bC bC bC bC bC bC bC bC bC bC bC bC bC bC bC bC bC bC bC bC bC bC bC bC bC bC bC bC bC bC bC bC bC bC bC bC bC bC bC bC bC bC bC bC bC bC bC bC bC bC bC bC bC bC bC bC bC bC bC bC bC bC bC bC bC bC bC bC bC bC bC bC bC bC bC bC bC bC bC bC bC bC bC bC bC bC bC bC bC bC bC bC bC bC bC bC bC bC bC bC bC bC bC bC bC bC bC bC bC bC bC bC bC bC bC bC bC bC bC bC bC bC bC bC bC bC bC bC bC bC bC bC bC bC bC bC bC bC bC bC bC bC bC bC bC bC bC bC bC bC bC bC bC bC bC bC bC bC bC bC bC bC bC bC bC bC bC bC bC bC bC bC bC bC bC bC bC bC bC bC bC bC bC bC bC bC bC bC bC bC bC bC bC bC bC bC bC bC bC bC bC bC bC bC bC bC bC bC bC bC bC bC bC bC bC bC bC bC bC bC bC bC bC bC bC bC bC bC bC bC bC bC bC bC bC bC bC bC bC bC bC bC bC bC bC bC bC bC bC bC bC bC bC bC bC bC bC bC bC bC bC bC bC bC bC bC bC bC bC bC bC bC bC bC bC bC bC bC bC bC bC bC bC bC bC bC bC bC bC bC bC bC bC bC bC bC bC bC bC bC bC bC bC bC bC bC bC bC bC bC bC bC bC bC bC bC bC bC bC bC bC bC bC bC bC bC bC bC bC bC bC bC bC bC bC bC bC bC bC bC bC bC bC bC bC bC bC bC bC bC bC bC bC bC bC bC bC bC bC bC bC bC bC bC bC bC bC bC bC bC bC bC bC bC bC bC bC bC bC bC bC bC bC bC bC bC bC bC bC bC bC bC bC bC bC bC bC bC bC bC bC bC bC bC bC bC bC bC bC bC bC bC bC bC bC bC bC bC bC bC bC bC bC bC bC bC bC bC bC bC bC bC bC bC bC bC bC bC bC bC bC bC bC bC bC bC bC bC bC bC bC bC bC bC bC bC bC bC bC bC bC bC bC bC bC bC bC bC bC bC bC bC bC bC bC bC bC bC bC bC bC bC bC bC bC bC bC bC bC bC bC bC bC bC bC bC bC bC bC bC bC bC bC bC bC bC bC bC bC bC bC bC bC bC bC bC bC bC bC bC bC bC bC bC bC bC bC bC bC bC bC bC bC bC bC bC bC bC bC bC bC bC bC bC bC bC bC bC bC bC bC bC bC bC bC bC bC bC bC bC bC bC bC bC bC bC bC bC bC bC bC bC bC bC bC bC bC bC bC bC bC bC bC bC bC bC bC bC bC bC bC bC bC bC bC bC bC bC bC bC bC bC bC bC bC bC bC bC bC bC bC bC bC bC bC bC bC bC bC bC bC bC bC bC bC bC bC bC bC bC bC bC bC bC bC bC bC bC bC bC bC bC bC bC bC bC bC bC bC bC bC bC bC bC bC bC bC bC bC bC bC bC bC bC bC bC bC bC bC bC bC bC bC bC bC bC bC bC bC bC bC bC bC bC bC bC bC bC bC bC bC bC bC bC bC bC bC bC bC bC bC bC bC bC bC bC bC bC bC bC bC bC bC bC bC bC bC bC bC bC bC bC bC bC bC bC bC bC bC bC bC bC bC bC bC bC bC bC bC bC bC bC bC bC bC bC bC bC bC bC bC bC bC bC bC bC bC bC bC bC bC bC bC bC bC bC bC bC bC bC bC bC bC bC bC bC bC bC bC bC bC bC bC bC bC bC bC bC bC bC bC bC bC bC bC bC bC bC bC bC bC bC bC bC bC bC bC bC bC bC bC bC bC bC bC bC bC bC bC bC bC bC bC bC bC bC bC bC bC bC bC bC bC bC bC bC bC bC bC bC bC bC bC bC bC bC bC bC bC bC bC bC bC bC bC bC bC bC bC bC bC bC bC bC bC bC bC bC bC bC bC bC bC bC bC bC bC bC bC bC bC bC bC bC bC bC bC bC bC bC bC bC bC bC bC bC bC bC bC bC bC bC bC bC bC bC bC bC bC bC bC bC bC bC bC bC bC bC bC bC bC bC bC bC bC bC bC bC bC bC bC bC bC bC bC bC bC bC bC bC bC bC bC bC bC bC bC bC bC bC bC bC bC bC bC bC bC bC bC bC bC bC bC bC bC bC bC bC bC bC bC bC bC bC bC bC bC bC bC bC bC bC bC bC bC bC bC bC bC bC bC bC bC bC bC bC bC bC bC bC bC bC bC bC bC bC bC bC bC bC bC bC bC bC bC bC bC bC bC bC bC bC bC bC bC bC bC bC bC bC bC bC bC bC bC bC bC bC bC bC bC bC bC bC bC bC bC bC bC bC bC bC bC bC bC bC bC bC bC bC bC bC bC bC bC bC bC bC bC bC bC bC bC bC bC bC bC bC bC bC bC bC bC bC bC bC bC bC bC bC bC bC bC bC bC bC bC bC bC bC bC bC bC bC bC bC bC bC bC bC bC bC bC bC bC bC bC bC bC bC bC bC bC bC bC bC bC bC bC bC bC bC bC bC bC bC bC bC bC bC bC bC bC bC bC bC bC bC bC bC bC bC bC bC bC bC bC bC bC bC bC bC bC bC bC bC bC bC bC bC bC bC bC bC bC bC bC bC bC bC bC bC bC bC bC bC
2θ/°
10 20 30 40 50 60 70 80
Int/
104
coun
ts
0
1,0
Abbildung 3.27: Rietveld-Plot von Pigment Red 181; Verfeinerung III mit topas. Schwarze Kreise:gemessenes Pulverdiagramm; rote Linie: simuliertes Pulverdiagramm; grüne Linie:Differenzkurve.
bC bC bC bC bC bC bC bC bC bC bC bC bC bC bC bC bC bC bC bC bC bC bC bC bC bC bC bC bC bC bC bC bC bC bC bC bC bC bC bC bC bC bC bC bC bC bC bC bC bC bC bC bC bC bC bC bC bC bC bC bC bC bC bC bC bC bC bC bC bC bC bC bC bC bC bC bC bC bC bC bC bC bC bC bC bC bC bC bC bC bC bC bC bC bC bC bC bC bC bC bC bC bC bC bC bC bC bC bC bC bC bC bC bC bC bC bC bC bC bC bC bC bC bC bC bC bCbC bC bC bC bC bC bC bC bC bC bC bC bC bC bC bC bC bC bC bC bC bC bC bC bC bC bC bC bC bC bC bC bC bC bC bC bC bC bC bC bC bC bC bC bC bC bC bC bC bC bC bC bC bC bC bC bC bC bC bC bC bC bC bC bC bC bC bC bC bC bC bC bC bC bC bC bC bC bC bC bC bC bC bC bC bC bC bC bC bC bC bC bC bC bC bC bC bC bC bC bC bC bC bC bC bC bC bC bC bC bC bC bC bC bCbC bC bC bC bC bC bC bC bC bC bC bC bC bC bC bC bC bC bC bC bC bC bC bC bC bC bC bC bC bC bC bC bC bC bC bC bC bC bC bC bC bC bC bC bC bC bC bC bC bC bC bC bC bC bC bC bC bC bC bC bC bC bC bC bC bC bC bC bC bC bC bC bC bC bC bC bC bC bC bC bC bC bC bC bC bC bC bC bC bC bC bC bC bC bC bC bC bC bC bC bC bC bC bC bC bC bC bC bCbC bC bC bC bC bC bC bC bC bC bC bC bC bC bC bC bC bC bC bC bC bC bCbC bC bC bC bC bC bC bC bC bC bC bC bC bC bC bC bC bC bC bC bC bC bC bC bC bC bC bC bC bC bC bC bC bC bC bC bC bC bC bC bC bC bC bC bC bC bC bC bC bC bC bC bC bC bC bC bC bC bC bC bC bC bC bC bC bC bC bC bC bC bC bC bC bC bC bC bC bC bC bC bCbC bC bC bC bC bC bC bC bC bC bC bC bC bC bC bC bC bC bC bC bC bC bC bC bC bC bC bC bC bC bC bC bC bC bC bC bC bC bC bC bC bC bC bC bC bC bC bC bC bC bC bC bC bC bC bC bC bC bC bC bC bC bC bC bC bC bC bC bC bC bC bC bC bC bCbC bC bC bC bC bC bC bC bC bC bC bC bC bC bC bC bC bC bC bC bC bC bCbC bC bC bC bC bC bC bC bC bC bC bC bCbC bC bC bC bC bC bCbC bC bC bCbC bC bC bCbC bC bCbC bC bCbC bC bCbC bCbC bC bC bC bC bC bC bC bC bC bC bC bC bC bC bC bC bC bC bC bC bC bC bC bC bC bC bC bC bC bC bC bC bC bC bC bC bC bC bC bC bC bC bC bC bC bC bC bC bC bC bC bC bC bC bC bC bC bC bC bC bC bC bC bC bC bC bC bC bC bC bC bC bC bC bC bC bC bC bC bC bC bC bC bC bC bC bC bC bC bC bCbC bC bC bC bC bC bC bC bC bC bC bC bC bC bC bC bC bC bC bC bC bC bC bC bC bC bC bC bC bC bC bC bC bC bC bC bC bC bC bC bC bC bC bC bC bC bC bC bC bC bC bC bC bC bC bC bC bC bC bC bC bC bC bC bC bCbC bC bC bC bC bC bC bC bC bC bC bC bC bC bC bC bC bC bC bC bC bC bC bC bCbC bC bC bC bC bCbC bC bC bC bC bC bC bCbC bC bC bC bC bCbC bC bCbC bC bC bC bCbC bC bC bCbC bCbC bC bCbC bC bC bC bC bCbC bC bC bC bC bC bC bC bC bC bC bC bC bC bC bC bC bC bC bC bC bC bC bC bC bC bC bC bC bC bC bC bC bC bC bC bC bC bC bC bC bC bC bC bC bC bC bC bC bC bC bC bC bC bC bC bC bC bC bC bC bC bC bC bC bC bC bC bC bC bC bC bC bC bC bC bC bC bC bC bC bC bC bC bC bC bC bC bC bC bC bC bC bC bC bC bC bC bC bC bC bC bC bC bC bC bC bC bC bC bC bC bC bC bC bC bC bC bC bC bC bC bC bC bC bC bC bC bC bC bC bC bC bC bC bC bC bC bC bC bC bC bC bC bC bC bC bC bC bC bC bC bC bC bC bC bC bC bC bC bC bC bC bC bC bC bC bC bC
bC bC bC bC bC bC bC bC bC bC bC bC bCbC bC bC bC bC bC bC bC bC bC bC bC bC bC bC bC bC bC bC bC bC bC bC bC bC bC bC bC bC bC bC bC bC bC bC bC bC bC bC bC bC bC bC bC bC bC bC bC bC bC bC bC bC bC bC bC bC bC bC bC bC bC bC bC bC bC bC bC bC bC bC bC bC bC bC bC bC bC bC bC bC bC bC bC bC bC bC bC bC bC bC bC bC bC bC bC bC bC bC bC bC bC bC bC bC bC bC bC bC bC bC bC bC bC bC bC bC bC bC bC bC bC bC bC bC bC bC bC bC bC bC bC bC bC bC bC bC bC bC bC bC bC bC bC bC bC bC bC bC bC bC bC bC bC bC bC bC bC bC bC bC bC bC bC bC bC bC bC bC bC bC bC bC bC bC bC bC bC bC bC bC bC bC bC bC bC bC bC bC bC
bC bC bC bC bC bC bC bC bC bC bC bC bC bC bC bC bC bC bC bC bC bC bC bC bC bC bC bC bC bC bC bC bC bC bC bC bC bC bC bC bC bC bC bC bC bC bC bC bC bC bC bC bC bC bC bC bC bC bC bC bC bC bC bC bC bC bC bC bC bC bC bC bC bC bC bC bC bC bC bC bC bC bC bC bC bC bC bC bC bC bC bC bC bC bC bC bC bC bC bC bC bC bC bC bC bC bC bC bC bC bC bC bC bC bC bC bC bC bC bC bC bC bC bC bC bC bC bC bC bC bC bC bC bC bC bC bC bC bC bC bC bC bC bC bC bC bC bC bC bC bC bC bC bC bC bC bC bC bC bC bC bC bC bC bC bC bC bC bC bC bC bC bC bC bC bC bC bC bC bC bC bC bC bC bC bC bC bC bC bC bC bC bC bC bC bC bC bC bC bC bC bCbC bC bC bC bC bC bC bC bC bC bC bC bC bC bC bC bC bC bC bC bC bC bC bC bC bC bC bC bC bC bC bC bC bC bC bC bC bC bC bC bC bC bC bC bC bC bC bC bC bC bC bC bC bC bC bC bC bC bC bC bC bC bC bC bC bC bC bC bC bC bC bC bC bC bC bC bC bC bC bC bC bC bC bC bC bCbC bC bC bC bC bC bC bC bC bC bC bC bC bC bC bC bC bC bC bC bC bC bC bC bC bC bCbC bC bC bC bC bC bC bC bC bC bC bC bC bC bC bC bC bC bC bC bC bC bC bC bC bC bC bC bC bC bC bC bC bC bC bC bC bC bC bC bC bC bC bC bC bC bC bC bC bC bC bC bC bC bC bC bC bC bC bC bC bCbC bC bC bC bC bC bC bC bC bC bC bCbC bC bC bC bC bC bC bC bC bC bC bCbC bC bC bC bC bC bC bC bC bC bC bC bC bC bC bC bC bC bC bC bC bC bC bC bC bC bC bC bC bC bC bC bC bC bC bC bC bC bC bC bC bC bC bC bC bC bC bC bC bC bC bC bC bC bC bC bC bC bC bC bC bC bC bC bC bC bC bC bC bC bC bC bC bC bC bC bCbC bC bC bC bC bC bC bC bC bC bC bC bC bC bC bC bC bC bCbC bC bC bC bC bC bC bC bC bC bC bC bC bC bC bC bC bC bC bC bC bC bC bC bC bC bC bC bC bC bC bC bC bC bC bC bC bC bC bC bC bC bC bC bC bC bC bC bC bC bC bC bC bC bC bC bC bC bC bC bC bC bC bC bC bC bC bC bC bC bC bC bC bC bC bC bC bC bC bC bC bC bC bC bCbC bC bC bC bC bC bC bC bC bC bC bC bCbC bC bC bC bC bC bC bC bC bC bC bC bC bCbC bC bC bC bC bC bC bC bC bC bC bC bC bC bC bC bC bC bC bC bC bC bC bC bC bC bC bC bC bC bC bC bC bC bC bC bC bC bC bC bC bC bC bC bC bC bC bC bC bC bC bC bC bC bC bC bC bC bC bC bC bC bC bC bC bC bC bC bC bC bC bC bC bC bC bC bC bC bC bC bC bC bC bC bC bC bC bC bC bC bC bC bC bC bC bC bC bC bC bC bC bC bC bC bC bC bC bC bC bC bC bC bC bC bC bC bC bC bC bC bC bC bC bC bC bC bC bC bC bC bC bCbC bC bC bC bC bC bC bC bCbC bC bC bC bCbC bC bC bC bC bCbC bC bCbC bC bC bC bC bC bC bC bC bC bC bC bC bC bC bC bC bC bC bC bC bC bC bC bC bC bC bC bC bC bC bC bC bC bC bC bC bC bC bC bC bC bC bC bC bC bC bC bC bC bC bC bC bC bC bC bC bCbC bC bC bC bC bC bC bC bCbC bC bC bC bC bC bC bCbC bC bC bC bC bC bC bC bC bCbC bC bC bC bC bC bC bC bCbC bC bC bC bC bC bC bC bC bC bC bC bC bC bC bC bC bC bC bC bC bC bC bC bC bC bC bC bC bC bC bC bC bC bC bC bC bC bC bC bC bC bC bC bC bC bC bC bC bC bCbC bC bC bC bC bC bC bC bC bC bC bC bC bC bC bC bC bC bC bC bC bC bC bC bC bC bC bC bC bC bC bC bC bCbC bC bC bC bC bC bC bC bCbC bC bC bCbC bC bCbC bC bCbC bC bCbC bC bCbC bC bCbC bC bC bC bCbC bC bC bC bC bC bC bC bC bC bC bC bC bC bC bC bC bC bC bC bC bC bC bC bC bC bC bC bC bC bC bC bC bC bC bC bC bC bC bC bC bC bC bC bC bC bC bC bC bC bC bC bC bC bC bC bC bC bC bC bC bC bC bC bC bC bC bC bC bC bC bC bC bC bC bC bC bC bCbC bC bC bC bC bC bC bC bC bC bC bC bCbC bC bC bC bC bC bC bC bCbC bC bC bC bC bCbC bC bCbC bCbC bCbCbC bCbCbCbC bCbCbCbCbC bCbC bCbC bC bC bC bC bC bC bCbCbC bC bCbC bCbC bC bC bC bC bC bCbC bC bC bC bC bC bC bC bC bC bC bC bC bC bC bC bC bC bC bC bC bC bC bC bC bC bC bC bC bC bC bC bC bC bC bC bC bC bC bC bC bC bC bC bC bC bC bC bC bC bC bC bC bC bC bC bC bC bC bC bC bC bC bC bC bC bC bC bC bC bC bC bC bC bC bC bC bC bC bC bC bC bC bC bC bC bC bC bC bC bC bC bC bC bC bC bC bC bC bC bC bC bC bC bC bC bC bC bC bC bC bC bC bC bC bC bC bC bC bC bC bC bCbC bC bC bC bC bC bC bC bC bC bC bC bC bC bC bCbC bC bC bC bC bC bC bC bC bC bC bC bC bC bC bC bC bC bC bC bC bC bC bC bC bC bC bC bC bC bC bC bC bC bC bC bC bC bC bC bC bC bC bC bC bC bC bC bC bC bC bC bC bC bC bC bC bC bC bC bC bC bC bC bC bC bC bC bC bC bC bC bC bC bC bC bC bC bC bC bC bC bC bC bC bC bC bC bC bC bC bC bC bC bC bC bC bC bC bC bC bC bC bC bC bC bC bC bC bC bC bC bC bC bC bC bC bC bC bC bC bC bC bC bC bC bC bC bC bC bC bC bC bC bCbC bC bC bC bC bC bC bC bC bC bC bC bC bC bC bC bC bC bC bC bC bC bC bC bC bC bC bC bC bC bC bC bC bC bC bC bC bC bC bC bC bC bC bC bC bC bC bC bC bC bC bC bC bC bC bC bC bC bC bC bC bC bC bC bC bC bC bC bC bC bC bC bC bC bC bC bCbC bC bC bC bC bC bC bC bC bC bC bC bC bC bC bC bC bC bC bC bC bC bC bC bC bC bC bC bC bC bC bC bC bC bC bC bC bC bC bC bC bC bC bC bC bC bC bC bC bC bC bC bC bC bC bC bC bC bC bC bC bC bC bC bC bC bC bC bC bC bC bC bC bC bC bC bC bC bC bC bC bC bC bC bC bC bC bC bC bC bC bC bC bC bC bC bC bC bC bC bC bC bC bC bC bC bC bC bC bC bC bC bC bC bC bC bC bC bC bC bC bC bC bC bC bC bC bC bC bC bC bC bC bC bC bC bC bC bC bC bC bC bC bC bC bC bC bC bC bC bC bC bC bC bC bC bC bC bC bC bC bC bC bC bC bC bC bC bC bC bC bC bC bC bC bC bC bC bC bC bC bC bC bC bC bC bC bC bC bC bC bC bC bC bC bC bC bC bC bC bC bC bC bC bC bC bC bC bC bC bC bC bC bC bC bC bC bC bC bC bC bC bC bC bC
bC bC bC bC bC bC bC bC bC bC bC bC bC bC bC bC bC bC bC bC bC bC bC bC bC bC bC bC bC bC bC bC bC bC bC bC bC bC bC bC bC bC bC bC bC bC bC bC bC bC bC bC bC bC bC bC bC bC bC bC bC bC bC bC bC bC bC bC bC bC bC bC bC bC bC bC bC bC bC bC bC bC bC bC bC bC bC bC bC bC bC bC bC bC bC bC bC bC bC bC bC bC bC bC bC bC bC bC bC bCbC bC bC bC bC bC bC bC bC bC bC bC bC bC bC bC bC bC bC bC bC bC bC bC bC bC bC bC bC bC bC bC bC bC bC bC bC bC bC bC bC bC bC bC bC bC bC bC bC bC bC bC bC bC bC bC bC bC bC bC bC bC bC bC bC bC bC bC bC bC bC bC bC bC bC bC bC bC bC bC bC bC bC bC bC bC bC bC bC bC bC bC bC bC bC bC bC bC bC bC bC bC bC bC bC bC bC bC bC bC bC bC bC bC bC bC bC bC bC bC bC bC bC bC bC bC bCbC bC bC bC bC bC bC bC bC bC bC bC bC bC bC bC bC bC bC bC bC bC bC bC bC bC bC bC bC bC bC bC bC bC bC bC bC bC bC bC bC bC bC bC bC bC bC bC bC bC bC bC bC bC bC bC bC bC bC bC bC bC bC bC bC bC bC bC bC bC bC bC bC bC bC bC bC bC bC bC bC bC bC bC bC bC bC bC bC bC bC bC bC bC bC bC bC bC bC bC bC bC bC bC bC bC bC bC bC bC bC bC bC bC bC bC bC bC bC bC bC bC bC bC bC bC bC bC bC bC bC bC bC bC bC bC bC bC bC bC bC bC bC bC bC bC bC bC bC bC bC bC bC bC bC bC bC bC bC bC bC bC bC bC bC bC bC bC bC bC bC bC bC bC bC bC bC bC bC bC bC bC bC bC bC bC bC bC bC bC bC bC bC bC bC bC bC bC bC bC bC bC bC bC bC bC bC bC bC bC bC bC bC bC bC bC bC bC bC bC bC bC bC bC bC bC bC bC bC bC bC bC bC bC bC bC bC bC bC bC bC bC bC bC bC bC bC bC bC bC bC bC bC bC bC bC bC bC bC bC bC bC bC bC bC bC bC bC bC bC bC bC bC bC bC bC bC bC bC bC bC bC bC bC bC bC bC bC bC bC bC bC bC bC bC bC bC bC bC bC bC bC bC bC
bC bC bC bC bC bC bC bC bC bC bC bC bC bC bC bC bC bC bC bC bC bC bC bC bC bC bC bC bC bC bC bC bC bC bC bC bC bC bC bC bC bC bC bC bC bC bC bC bC bC bC bC bC bC bC bC bC bC bC bC bC bC bC bC bC bC bC bC bC bC bC bC bC bC bC bC bC bC bC bC bC bC bC bC bC bC bC bC bC bC bC bC bC bC bC bC bC bC bC bC bC bC bC bC bC bC bC bC bC bC bC bC bC bC bC bC bC bC bC bC bC bC bC bC bC bC bC bC bC bC bC bC bC bC bC bC bC bC bC bC bC bC bC bC bC bC bC bC bC bC bC bC bC bC bC bC bCbC bC bC bC bC bC bC bC bC bC bC bC bC bC bC bC bC bC bC bC bC bC bC bC bCbC bC bC bC bC bC bC bC bC bC bC bC bC bC bC bC bC bC bC bC bC bC bC bC bC bC bC bC bC bC bC bC bC bC bC bC bC bC bC bC bC bC bC bC bC bC bC bC bC bC bC bC bC bC bC bC bC bC bC bC bC bC bC bC bC bC bC bC bC bC bC bC bC bC bC bC bC bC bC bC bC bC bC bC bC bC bC bC bC bC bC bC bC bC bC bC bC bC bC bC bC bC bC bC bC bC bC bC bC bC bC bC bC bC bC bC bC bC bC bC bC bC bC bC bC bC bC bC bC bC bC bC bC bC bC bC bC bC bC bC bC bC bC bC bC bC bC bC bC bC bC bC bC bC bC bC bC bC bC bC bC bC bC bC bC bC bC bC bC bC bC bC bC bC bC bC bC bC bC bC bC bC bC bC bC bC bC bC bC bC bC bC bC bC bC bC bC bC bC bC bC bC bC bC bC bC bC bC bC bC bC bC bC bC bC bC bC bC bC bC bC bC bC bC bC bC bC bC bC bC bC bC bC bC bC bC bC bC bC bC bC bC bC bC bC bC bC bC bC bC bC bC bC bC bC bC bC bC bC bC bC bC bC bC bC bC bC bC bC bC bC bC bC bC bC bC bC bC bC bC bC bC bC bC bC bC bC bC bC bC bC bC bC bC bC bC bC bC bC bC bC bC bC bC bC bC bC bC bC bC bC bC bC bC bC bC bC bC bC bC bC bC bC bC bC bC bC bC bC bC bC bC bC bC bC bC bC bC bC bC bC bC bC bC bC bC bC bC bC bC bC bC bC bC bC bC bC bC bC bC bC bC bC bC bC bC bC bC bC bC bC bC bC bC bC bC bC bC bC bC bC bC bC bC bC bC bC bC bC bC bC bC bC bC bC bC bC bC bC bC bC bC bC bC bC bC bC bC bC bC bC bC bC bC bC bC bC bC bC bC bC bC bC bC bC bC bC bC bC bC bC bC bC bC bC bC bC bC bC bC bC bC bC bC bC bC bC bC bC bC bC bC bC bC bC bC bC bC bC bC bC bC bC bC bC bC bC bC bC bC bC bC bC bC bC bC bC bC bC bC bC bC bC bC bC bC bC bC bC bC bC bC bC bC bC bC bC bC bC bC bC
bC bC bC bC bC bC bC bC bC bC bC bC bC bC bC bC bC bC bC bC bC bC bC bC bC bC bC bC bC bC bC bC bC bC bC bC bC bC bC bC bC bC bC bC bC bC bC bC bC bC bC bC bC bC bC bC bC bC bC bC bC bC bC bC bC bC bC bC bC bC bC bC bC bC bC bC bC bC bC bC bC bC bC bC bC bC bC bC bC bC bC bC bC bC bC bC bC bC bC bC bC bC bC bC bC bC bC bC bC bC bC bC bC bC bC bC bC bC bC bC bC bC bC bC bC bC bC bC bC bC bC bC bC bC bC bC bC bC bC bC bC bC bC bC bC bC bC bC bC bC bC bC bC bC bC bC bC bC bC bC bC bC bC bC bC bC bC bC bC bC bC bC bC bC bC bC bC bC bC bC bC bC bC bC bC bC bC bC bC bC bC bC bC bC bC bC bC bC bC bC bC bC bC bC bC bC bC bC bC bC bC bC bC bC bC bC bC bC bC bC bC bC bC bC bC bC bC bC bC bC bC bC bC bC bC bC bC bC bC bC bC bC bC bC bC bC bC bC bC bC bC bC bC bC bC bC bC bC bC bC bC bC bC bC bC bC bC bC bC bC bC bC bC bC bC bC bC bC bC bC bC bC bC bC bC bC bC bC bC bC bC bC bC bC bC bC bC bC bC bC bC bC bC bC bC bC bC bC bC bC bC bC bC bC bC bC bC bC bC bC bC bC bC bC bC bC bC bC bC bC bC bC bC bC bC bC bC bC bC bC bC bC bC bC bC bC bC bC bC bC bC bC bC bC bC bC bC bC bC bC bC bC bC bC bC bC bC bC bC bC bC bC bC bC bC bC bC bC bC bC bC bC bC bC bC bC bC bC bC bC bC bC bC bC bC bC bC bC bC bC bC bC bC bC bC bC bC bC bC bC bC bC bC bC bC bC bC bC bC bC bC bC bC bC bC bC bC bC bC bC bC bC bC bC bC bC bC bC bC bC bC bC bC bC bC bC bC bC bC bC bC bC bC bC bC bC bC bC bC bC bC bC bC bC bC bC bC bC bC bC bC bC bC bC bC bC bC bC bC bC bC bC bC bC bC bC bC bC bC bC bC bC bC bC bC bC bC bC bC bC bC bC bC bC bC bC bC bC bC bC bC bC bC bC bC bC bC bC bC bC bC bC bC bC bC bC bC bC bC bC bC bC bC bC bC bC bC bC bC bC bC bC bC bC bC bC bC bC bC bC bC bC bC bC bC bC bC bC bC bC bC bC bC bC bC bC bC bC bC bC bC bC bC bC bC bC bC bC bC bC bC bC bC bC bC bC bC bC bC bC bC bC bC bC bC bC bC bC bC bC bC bC bC bC bC bC bC bC bC bC bC bC bC bCbC bC bC bC bC bC bC bC bC bC bC bC bC bC bC bC bC bC bC bC bC bC bC bC bC bC bC bC bC bC bC bC bC bC bC bC bC bC bC bC bC bC bC bC bC bC bC bC bC bC bC bC bC bC bC bC bC bC bC bC bC bC bC bC bC bC bC bC bC bC bC bC bC bC bC bC bC bC bC bC bC bC bC bC bC bC bC bC bC bC bC bC bC bC bC bC bC bC bC bC bC bC bC bC bC bC bC bC bC bC bC bC bC bC bC bC bC bC bC bC bC bC bC bC bC bC bC bC bC bC bC bC bC bC bC bC bC bC bC bC bC bC bC bC bC bC bC bC bC bC bC bC bC bC bC bC bC bC bC bC bC bC bC bC bC bC bC bC bC bC bC bC bC bC bC bC bC bC bC bC bC bC bC bC bC bC bC bC bC bC bC bC bC bC bC bC bC bC bC bC bC bC bC bC bC bC bC bC bC bC bC bC bC bC bC bC bC bC bC bC bC bC bC bC bC bC bC bC bC bC bC bC bC bC bC bC bC bC bC bC bC bC bC bC bC bC bC bC bC bC bC bC bC bC bC bC bC bC bC bC bC bC bC bC bC bC bC bC bC bC bC bC bC bC bC bC bC bC bC bC bC bC bC bC bC bC bC bC bC bC bC bC bC bC bC bC bC bC bC bC bC bC bC bC bC bC bC bC bC bC bC bC bC bC bC bC bC bC bC bC bC bC bC bC bC bC bC bC bC bC bC bC bC bC bC bC bC bC bC bC bC bC bC bC bC bC bC bC bC bC bC bC bC bC bC bC bC bC bC bC bC bC bC bC bC bC bC bC bC bC bC bC bC bC bC bC bC bC bC bC bC bC bC bC bC bC bC bC bC bC bC bC bC bC bC bC bC bC bC bC bC bC bC bC bC bC bC bC bC bC bC bC bC bC bC bC bC bC bC bC bC bC bC bC bC bC bC bC bC bC bC bC bC bC bC bC bC bC bC bC bC bC bC bC bC bC bC bC bC bC bC bC bC bC bC bC bC bC bC bC bC bC bC bC bC bC bC bC bC bC bC bC bC bC bC bC bC bC bC bC bC bC bC bC bC bC bC bC bC bC bC bC bC bC bC bC bC bC bC bC bC bC bC bC bC bC bC bC bC bC bC bC bC bC bC bC bC bC bC bC bC bC bC bC bC bC bC bC bC bC bC bC bC bC bC bC bC bC bC bC bC bC bC bC bC bC bC bC bC bC bC bC bC bC bC bC bC bC bC bC bC bC bC bC bC bC bC bC bC bC bC bC bC bC bC bC bC bC bC bC bC bC bC bC bC bC bC bC bC bC bC bC bC bC bC bC bC bC bC bC bC bC bC bC bC bC bC bC bC bC bC bC bC bC bC bC bC bC bC bC bC bC bC bC bC bC bC bC bC bC bC bC bC bC bC bC bC bC bC bC bC bC bC bC bC bC bC bC bC bC bC bC bC bC bC bC bC bC bC bC bC bC bC bC bC bC bC bC bC bC bC bC bC bC bC bC bC bC bC bC bC bC bC bC bC bC bC bC bC bC bC bC bC bC bC bC bC bC bC bC bC bC bC bC bC bC bC bC bC bC bC bC bC bC bC bC bC bC bC bC bC bC bC bC bC bC bC bC bC bC bC bC bC bC bC bC bC bC bC bC bC bC bC bC bC bC bC bC bC bC bC bC bC bC bC bC bC bC bC bC bC bC bC bC bC bC bC bC bC bC bC bC bC bC bC bC bC bC bC bC bC bC bC bC bC bC bC bC bC bC bC bC bC bC bC bC bC bC bC bC bC bC bC bC bC bC bC bC bC bC bC bC bC bC bC bC bC bC bC bC bC bC bC bC bC bC bC bC bC bC bC bC bC bC bC bC bC bC bC bC bC bC bC bC bC bC bC bC bC bC bC bC bC bC bC bC bC bC bC bC bC bC bC bC bC bC bC bC bC bC bC bC bC bC bC bC bC bC bC bC bC bC bC bC bC bC bC bC bC bC bC bC bC bC bC bC bC bC bC bC bC bC bC bC bC bC bC bC bC bC bC bC bC bC bC bC bC bC bC bC bC bC bC bC bC bC bC bC bC bC bC bC bC bC bC bC bC bC bC bC bC bC bC bC bC bC bC bC bC bC bC bC bC bC bC bC bC bC bC bC bC bC bC bC bC bC bC bC bC bC bC bC bC bC bC bC bC bC bC bC bC bC bC bC bC bC bC bC bC bC bC bC bC bC bC bC bC bC bC bC bC bC bC bC bC bC bC bC bC bC bC bC bC bC bC bC bC bC bC bC bC bC bC bC bC bC bC bC bC bC bC bC bC bC bC bC bC bC bC bC bC bC bC bC bC bC bC bC bC bC bC bC bC bC bC bC bC bC bC bC bC bC bC bC bC bC bC bC bC bC bC bC bC bC bC bC bC bC bC bC bC bC bC bC bC bC bC bC bC bC bC bC bC bC bC bC bC bC bC bC bC bC bC bC bC bC bC bC bC bC bC bC bC bC bC bC bC bC bC bC bC bC bC bC bC bC bC bC bC bC bC bC bC bC bC bC bC bC bC bC bC bC bC bC bC bC bC bC bC bC bC bC bC bC bC bC bC bC bC bC bC bC bC bC bC bC bC bC bC bC bC bC bC bC bC bC bC bC bC bC bC bC bC bC bC bC bC bC bC bC bC bC bC bC bC bC bC bC bC bC bC bC bC bC bC bC bC bC bC bC bC bC bC bC bC bC bC bC bC bC bC bC bC bC bC bC bC bC bC bC bC bC bC bC bC bC bC bC bC bC bC bC bC bC bC bC bC bC bC bC bC bC bC bC bC bC bC bC bC bC bC bC bC bC bC bC bC bC bC bC bC bC bC bC bC bC bC bC bC bC bC bC bC bC bC bC bC bC bC bC bC bC bC bC bC bC bC bC bC bC bC bC bC bC bC bC bC bC bC bC bC bC bC bC bC bC bC bC bC bC bC bC bC bC bC bC bC bC bC bC bC bC bC bC bC bC bC bC bC bC bC bC bC bC bC bC bC bC bC bC bC bC bC bC bC bC bC bC bC bC bC bC bC bC bC bC bC bC bC bC bC bC bC bC bC bC bC bC bC bC bC bC bC bC bC bC bC bC bC bC bC bC bC bC bC bC bC bC bC bC bC bC bC bC bC bC bC bC bC bC bC bC bC bC bC bC bC bC bC bC bC bC bC bC bC bC bC bC bC bC bC bC bC bC bC bC bC bC bC bC bC bC bC bC bC bC bC bC bC bC bC bC bC bC bC bC bC bC bC bC bC bC bC bC bC bC bC bC bC bC bC bC bC bC bC bC bC bC bC bC bC bC bC bC bC bC bC bC bC bC bC bC bC bC bC bC bC bC bC bC bC bC bC bC bC bC bC bC bC bC bC bC bC bC bC bC bC bC bC bC bC bC bC bC bC bC bC bC bC bC bC bC bC bC bC bC bC bC bC bC bC bC bC bC bC bC bC bC bC bC bC bC bC bC bC bC bC bC bC bC bC bC bC bC bC bC bC bC bC bC bC bC bC bC bC bC bC bC bC bC bC bC bC bC bC bC bC bC bC bC bC bC bC bC bC bC bC bC bC bC bC bC bC bC bC bC bC bC bC bC bC bC bC bC bC bC bC bC bC bC bC bC bC bC bC bC bC bC bC bC bC bC bC bC bC bC bC bC bC bC bC bC bC bC bC bC bC bC bC bC bC bC bC bC bC bC bC bC bC bC bC bC bC bC bC bC bC bC bC bC bC bC bC bC bC bC bC bC bC bC bC bC bC bC bC bC bC bC bC bC bC bC bC bC bC bC bC bC bC bC bC bC bC bC bC bC bC bC bC bC bC bC bC bC bC bC bC bC bC bC bC bC bC bC bC bC bC bC bC bC bC bC bC bC bC bC bC bC bC bC bC bC bC bC bC bC bC bC bC bC bC bC bC bC bC bC bC bC bC bC bC bC bC bC bC bC bC bC bC bC bC bC bC bC bC bC bC bC bC bC bC bC bC bC bC bC bC bC bC bC bC bC bC bC bC bC bC bC bC bC bC bC bC bC bC bC bC bC bC bC bC bC bC bC bC bC bC bC bC bC bC bC bC bC bC bC bC bC bC bC bC bC bC bC bC bC bC bC bC bC bC bC bC bC bC bC bC bC bC bC bC bC bC bC bC bC bC bC bC bC bC bC bC bC bC bC bC bC bC bC bC bC bC bC bC bC bC bC bC bC bC bC bC bC bC bC bC bC bC bC bC bC bC bC bC bC bC bC bC bC bC bC bC bC bC bC bC bC bC bC bC bC bC bC bC bC bC bC bC bC bC bC bC bC bC bC bC bC bC bC bC bC bC bC bC bC bC bC bC bC bC bC bC bC bC bC bC bC bC bC bC bC bC bC bC bC bC bC bC bC bC bC bC bC bC bC bC bC bC bC bC bC bC bC bC bC bC bC bC bC bC bC bC bC bC bC bC bC bC bC bC bC bC bC bC bC bC bC bC bC bC bC bC bC bC bC bC bC bC bC bC bC bC bC bC bC bC bC bC bC bC bC bC bC bC bC bC bC bC bC bC bC bC bC bC bC bC bC bC bC bC bC bC bC bC bC bC bC bC bC bC bC bC bC bC bC bC bC bC bC bC bC bC bC bC bC bC bC bC bC bC bC bC bC bC bC bC bC bC bC bC bC bC bC bC bC bC bC bC bC bC bC bC bC bC bC bC bC bC bC bC bC bC bC bC bC bC bC bC bC bC bC bC bC bC bC bC bC bC bC bC bC bC bC bC bC bC bC bC bC bC bC bC bC bC bC bC bC bC bC bC bC bC bC bC bC bC bC bC bC bC bC bC bC bC bC bC bC bC bC bC bC bC bC bC bC bC bC bC bC bC bC bC bC bC bC bC bC bC bC bC bC bC bC bC bC bC bC bC bC bC bC bC bC bC bC bC bC bC bC bC bC bC bC bC bC bC bC bC bC bC bC bC bC bC bC bC bC bC bC bC bC bC bC bC bC bC bC bC bC bC bC bC bC bC bC bC bC bC bC bC bC bC bC bC bC bC bC bC bC bC bC bC bC bC bC bC bC bC bC bC bC bC bC bC bC bC bC bC bC bC bC bC bC bC bC bC bC bC bC bC bC bC bC bC bC bC bC bC bC bC bC bC bC bC bC bC bC bC bC bC bC bC bC bC bC bC bC bC bC bC bC bC bC bC bC bC bC bC bC bC bC bC bC bC bC bC bC bC bC bC bC bC bC bC bC bC bC bC bC bC bC bC bC bC bC bC bC bC bC bC bC bC bC bC bC bC bC bC bC bC bC bC bC bC bC bC bC bC bC bC bC bC bC bC bC bC bC bC bC bC bC bC bC bC bC bC bC bC bC bC bC bC bC bC bC bC bC bC bC bC bC bC bC bC bC bC bC bC bC bC bC bC bC bC bC bC bC bC bC bC bC bC bC bC bC bC bC bC bC bC bC bC bC bC bC bC bC bC bC bC bC bC bC bC bC bC bC bC bC bC bC bC bC bC bC bC bC bC bC bC bC bC bC bC bC bC bC bC bC bC bC bC bC bC bC bC bC bC bC bC bC bC bC bC bC bC bC bC bC bC bC bC bC bC bC bC bC bC bC bC bC bC bC bC bC bC bC bC bC bC bC bC bC bC bC bC bC bC bC bC bC bC bC bC bC bC bC bC bC bC bC bC bC bC bC bC bC bC bC bC bC bC bC bC bC bC bC bC bC bC bC bC bC bC bC bC bC bC bC bC bC bC bC bC bC bC bC bC bC bC bC bC bC bC bC bC bC bC bC bC bC bC bC bC bC bC bC bC bC bC bC bC bC bC bC bC bC bC bC bC bC bC bC bC bC bC bC bC bC bC bC bC bC bC bC bC bC bC bC bC bC bC bC bC bC bC bC bC bC bC bC bC bC bC bC bC bC bC bC bC bC bC bC bC bC bC bC bC bC bC bC bC bC bC bC bC bC bC bC bC bC bC bC bC bC bC bC bC bC bC bC bC bC bC bC bC bC bC bC bC bC bC bC bC bC bC bC bC bC bC bC bC bC bC bC bC bC bC bC bC bC bC bC bC bC bC bC bC bC bC bC bC bC bC bC bC bC bC bC bC bC bC bC bC bC bC bC bC bC bC bC bC bC bC bC bC bC bC bC bC bC bC bC bC bC bC bC bC bC bC bC bC bC bC bC bC bC bC bC bC bC bC bC bC bC bC bC bC bC bC bC bC bC bC bC bC bC bC bC bC bC bC bC bC bC bC bC bC bC bC bC bC bC bC bC bC bC bC bC bC bC bC bC bC bC bC bC bC bC bC bC bC bC bC bC bC bC bC bC bC bC bC bC bC bC bC bC bC bC bC bC bC bC bC bC bC bC bC bC bC bC bC bC bC bC bC bC bC bC bC bC bC bC bC bC bC bC bC bC bC bC bC bC bC bC bC bC bC bC bC bC bC bC bC bC bC bC bC bC bC bC bC bC bC bC bC bC bC bC bC bC bC bC bC bC bC bC bC bC bC bC bC bC bC bC bC bC bC bC bC bC bC bC bC bC bC bC bC bC bC bC bC bC bC bC bC bC bC bC bC bC bC bC bC bC bC bC bC bC bC bC bC bC bC bC bC bC bC bC bC bC bC bC bC bC bC bC bC bC bC bC bC bC bC bC bC bC bC bC bC bC bC bC bC bC bC bC bC bC bC bC bC bC bC bC bC bC bC bC bC bC bC bC bC bC bC bC bC bC bC bC bC bC bC bC bC bC bC bC bC bC bC bC bC bC bC bC bC bC bC bC bC bC bC bC bC bC bC bC bC bC bC bC bC bC bC bC bC bC bC bC bC bC bC bC bC bC bC bC bC bC bC bC bC bC bC bC bC bC bC bC bC bC bC bC bC bC bC bC bC bC bC bC bC bC bC bC bC bC bC bC bC bC bC bC bC bC bC bC bC bC bC bC bC bC bC bC bC bC bC bC bC bC bC bC bC bC bC bC bC bC bC bC bC bC bC bC bC bC bC bC bC bC bC bC bC bC bC bC bC bC bC bC bC bC bC bC bC bC bC bC bC bC bC bC bC bC bC bC bC bC bC bC bC bC bC bC bC bC bC bC bC bC bC bC bC bC bC bC bC bC bC bC bC bC bC bC bC bC bC bC bC bC bC bC bC bC bC bC bC bC bC bC bC bC bC bC bC bC bC bC bC bC bC bC bC bC bC bC bC bC bC bC bC bC bC bC bC bC bC bC bC bC bC bC bC bC bC bC bC bC bC bC bC bC bC bC bC bC bC bC bC bC bC bC bC bC bC bC bC bC bC bC bC bC bC bC bC bC bC bC bC bC bC bC bC bC bC bC bC bC bC bC bC bC bC bC bC bC bC bC bC bC bC bC bC bC bC bC bC bC bC bC bC bC bC bC bC bC bC bC bC bC bC bC bC bC bC bC bC bC bC bC bC bC bC bC bC bC bC bC bC bC bC bC bC bC bC bC bC bC bC bC bC bC bC bC bC bC bC bC bC bC bC bC bC bC bC bC bC bC bC bC bC bC bC bC bC bC bC bC bC bC bC bC bC bC bC bC bC bC bC bC bC bC bC bC bC bC bC bC bC bC bC bC bC bC bC bC bC bC bC bC bC bC bC bC bC bC bC bC bC bC bC bC bC bC bC bC bC bC bC bC bC bC bC bC bC bC bC bC bC bC bC bC bC bC bC bC bC bC bC bC bC bC bC bC bC bC bC bC bC bC bC bC bC bC bC bC bC bC bC bC bC bC bC bC bC bC bC bC bC bC bC bC bC bC bC bC bC bC bC bC bC bC bC bC bC bC bC bC bC bC bC bC bC bC bC bC bC bC bC bC bC bC bC bC bC bC bC bC bC bC bC bC bC bC bC bC bC bC bC bC bC bC bC bC bC bC bC bC bC bC bC bC bC bC bC bC bC bC bC bC bC bC bC bC bC bC bC bC bC bC bC bC bC bC bC bC bC bC bC bC bC bC bC bC bC bC bC bC bC bC bC bC bC bC bC bC bC bC bC bC bC bC bC bC bC bC bC bC bC bC bC bC bC bC bC bC bC bC bC bC bC bC bC bC bC bC bC bC bC bC bC bC bC bC bC bC bC bC bC bC bC bC bC bC bC bC bC bC bC bC bC bC bC bC bC bC bC bC bC bC bC bC bC bC bC bC bC bC bC bC bC bC bC bC bC bC bC bC bC bC bC bC bC bC bC bC bC bC bC bC bC bC bC bC bC bC bC bC bC bC bC bC bC bC bC bC bC bC bC bC bC bC bC bC bC bC bC bC bC bC bC bC bC bC bC bC bC bC bC bC bC bC bC bC bC bC bC bC bC bC bC bC bC bC bC bC bC bC bC bC bC bC bC bC bC bC bC bC bC bC bC bC bC bC bC bC bC bC bC bC bC bC bC bC bC bC bC bC bC bC bC bC bC bC bC bC bC bC bC bC bC bC bC bC bC bC bC bC bC bC bC bC bC bC bC bC bC bC bC bC bC bC bC bC bC bC bC bC bC bC bC bC bC bC bC bC bC bC bC bC bC bC bC bC bC bC bC bC bC bC bC bC bC bC bC bC bC bC bC bC bC bC bC bC bC bC bC bC bC bC bC bC bC bC bC bC bC bC bC bC bC bC bC bC bC bC bC bC bC bC bC bC bC bC bC bC bC bC bC bC bC bC bC bC bC bC
2θ/°
10 20 30 40 50 60 70 80
Int/
104
coun
ts
0
1,0
Abbildung 3.28: Rietveld-Plot von Pigment Red 181; Verfeinerung III mit gsas. Schwarze Kreise:gemessenes Pulverdiagramm; rote Linie: simuliertes Pulverdiagramm; grüne Linie:Differenzkurve.
Das in dieser Arbeit untersuchte Pigment Red 181 bildet ebenso Stapel; anders als beimDichlor-Indigo bilden sich jedoch keine intermolekularen Wasserstoffbrücken innerhalb einerSchicht, da die dazu notwendige NH-Gruppe durch ein S-Atom ersetzt wurde (Abb. 3.30).
Die Kristallstrukturen, die aus den Rietveld-Verfeinerungen mit gsas bzw. topas erhal-ten wurden, sind im Rahmen der Genauigkeit der Pulverdiffraktometrie deckungsgleich.Abb. 3.31 zeigt das Molekül aus der Verfeinerung mit gsas in rot, aus der Verfeinerung mittopas in gelb.
3.8.9 Zusammenfassung
Die Kristallstruktur von Pigment Red 181 wurde vollständig neu bestimmt. Es zeigte sich,wie empfindlich bereits die Strukturlösung auf „falsche“ Elementarzellen reagiert – von derRietveld-Verfeinerung ganz zu schweigen.
Abschließend ist festzuhalten, dass bei geeigneter Startstruktur die Rietveld-Verfeinerungsowohl mit gsas als auch mit topas gelingt; dabei ist allerdings zu beachten, dass topas in
67

3 Bestimmung von Kristallstrukturen organischer Pigmente aus Röntgen-Pulverdaten
ap
cp
Abbildung 3.29: Kristallstruktur von Pigment Red 181, Blickrichtung [010]. Das Molekül ist völligplanar.
den genannten Fällen weitaus problemloser als gsas Abweichungen von der Idealstrukturtoleriert.
68

3.8 Pigment Red 181
bp
cp
Abbildung 3.30: Kristallstruktur von Pigment Red 181, Blickrichtung [100].
69

3 Bestimmung von Kristallstrukturen organischer Pigmente aus Röntgen-Pulverdaten
0ap
bp
cp
Abbildung 3.31: Vergleich der Kristallstruktur von Pigment Red 181 aus der Verfeinerung mit gsas(rot) und der Verfeinerung mit topas (gelb). Die Moleküle sind fast deckungsgleich.
70

[. . . ] das sind die einzelnen Teile, die zusammengesetztwerden: Brennkammer, Kühlsystem,Neutronenbeschleuniger und die Sicherheitskuppel.[. . . ] wenn man einen Fehler macht, gibt es auch einekleine Explosion.
(Loriot)
4 Modellierung von Kristallstrukturen
niedrig-dimensionaler Festkörper mit Kraftfeld-
Methoden[CB9–CB11]
In diesem Kapitel geht es ausschließlich um die Modellierung von Kristallstrukturen; eswurden keine Rietveld-Verfeinerungen der untersuchten Verbindungen durchgeführt.
Im Rahmen der Forschergruppe 412 („Spin- und Ladungsträgerkorrelationen in niedrig-dimensionalen metallorganischen Festkörpern“) der DFG wurden dabei Modellsysteme er-stellt, die vom Institut für Theoretische Physik (Arbeitsgruppe Prof. Dr. R. Valentí/Dr. H. O.Jeschke) der Universität Frankfurt zunächst mit Car–Parrinello-ab-initio-Moleküldynamik-Methoden[70,71] nachoptimiert werden, und deren elektronische Struktur anschließend mitFull-potential–linear-augmented–plane-wave-Methoden berechnet wurde.
4.1 Hintergrund der Untersuchungen
Einige Verbindungen mit Übergangsmetallen der 4. Periode zeigen kooperative Übergängezwischen Low- und High-Spin-Zuständen. Verstärkt wird diese Kooperativität in (eindimen-sionalen) polymeren Verbindungen, beispielsweise in Fe2+-Koordinationspolymeren. Bei denLiganden handelt es sich um stickstoffhaltige organische Verbindungen (Triazol, abgekürzttrz, sowie einige Derivate), die Fe2+-Ionen verbrücken; die Koordinationszahl am Eisen beträgt6, Fe2+ ist oktaedrisch von Stickstoff-Atomen umgeben. Der Low-Spin–High-Spin-Überganggeht einher mit einer thermisch beeinflussten Hysterese. Das „Umschalten“ von einem in denanderen Spin-Zustand kann dabei ausgelöst werden durch Temperaturänderung, Druck oderLicht. Verbindungen dieser Art sind möglicherweise interessant als Temperatursensoren, fürAnzeigen oder als Informationsspeicher.
Einige Möglichkeiten der Beschreibung dieses Phänomens wurden diskutiert, jedoch fehltebislang die wichtigste Grundlage, diese Verbindungen theoretisch zu untersuchen: die Kennt-nis der Kristallstrukturen.
Bei der Synthese fällt das Produkt als feinkristalliner Niederschlag an; Versuche, die Sub-stanz umzukristallisieren oder zu sublimieren, scheitern, da die Substanz sich dabei zersetzt.Aufgrund der geringen Kristallitgröße zeigen die Pulverdiagramme sehr breite Reflexe, sodass es nicht möglich ist, die Kristallstruktur aus Pulverdaten zu bestimmen.
71

4 Modellierung von Kristallstrukturen mit Kraftfeld-Methoden
Um dennoch chemisch sinnvolle voroptimierte Modellstrukturen zu erhalten, wurden ver-schiedene Modelle mit Hilfe von Kraftfeld-Methoden konstruiert.
4.2 Kraftfeld-Entwicklung
Zum Modellieren der Kristallstrukturen wurde das Programmpaket Cerius2[37] verwendet.Zum Einsatz kam dabei das Kraftfeld Dreiding, das in Abschnitt 2.5 beschrieben wird.
Die Schwierigkeit bei der Anpassung des Kraftfeldes bestand darin, dass das Fe2+-Ionideal-oktaedrisch von N-Atomen umgeben sein soll:
Aus programmtechnischen Gründen lassen sich nur Kraftfeld-Terme für Bindungswin-kel innerhalb eindeutiger Dreiergruppen von Atomen implementieren: gewinkelte/lineareMoleküle (H2O, CO2), trigonal-planare/-pyramidale Moleküle (BF3, NH3) oder tetraedrischeMoleküle (CH4). Bereits bei quadratisch-planarer Koordination (z. B. [Cu(NH3)4]2+) tritt dasProblem auf, dass N–Cu–N-Winkel mit 180° (2×) und 90° (4×) vorkommen. Im Falle einesOktaeders (z. B. [Fe(CN)6]4–) gibt es drei Winkel mit 180° und zwölf mit 90°.
Trotz dieser offensichtlichen Schwierigkeit des Kraftfeldes ist es gelungen, das Dreiding-Kraftfeld so anzupassen, dass reguläre Oktaeder erhalten werden können.
Das in Cerius2 implementierte Dreiding-Kraftfeld verwendet Gl. (2.44) für die Berechnungdes Bindungswinkel-Beitrags zur Gesamtenergie.
Das modifizierte Kraftfeld gibt als Gleichgewichts-Bindungswinkel 180° vor, mit einer Kraft-konstanten KXFeX = 5000 kcal/(mol rad2). Obwohl 90°-Winkel also nicht explizit vorgesehensind, erhält man trotzdem stabile Oktaedersymmetrien. Der Energiebeitrag EXFeX im idealenOktaeder ergibt sich somit zu
EXFeX = 3E180° + 12E90° (4.1)
= 0 + 12 · 12· 5000
kcalmol
·(
π
2
)2
≈ 74 022kcalmol
.
Es sei darauf hingewiesen, dass die mit diesem modifizierten Kraftfeld erhaltenen Gitter-energien nur dazu dienen, eine relative Abfolge der Modellstrukturen zu erhalten; es ist mitdiesem Verfahren nicht möglich, (sinnvolle) absolute Energiewerte zu erhalten.
4.3 Modelle
Im Folgenden werden die konstruierten Modellverbindungen diskutiert (Abb. 4.1 und 4.3).
4.3.1 Fe(II)-Triazol[CB9,CB10]
Die Untersuchung dieser Verbindung setzt eine Kenntnis der (möglichen) Kristallstruktur vor-aus. In diesem Fall soll die Verbindung Fe[(hyetrz)3](4-chlorphenylsulfonat)2 · 3 H2O (hyetrz=Hydroxyethyl-triazol) untersucht werden.
In der Literatur sind bisher nur Einkristallstrukturen von trimeren Eisen-Verbindungenbekannt. Die Ketten werden dabei durch jeweils drei Wasser-Moleküle terminiert.
72

4.3 Modelle
Ausgehend von diesen Informationen wurden Kristallstrukturmodelle erzeugt, die einenpolymeren Aufbau zeigen (Abb. 4.1, Verb. 21). Die Strukturen wurden in RaumgruppeP 1 1 21/m (Nicht-Standardaufstellung von P21/m) konstruiert.
N N
N
R
Fe
N N
N
R
FeN N
N
R
N N
N
R
Fe
N N
N
R
N N
N
R
X X
X Xn
21
22
: R = CH2−CH2−OH, X− = Cl−C6H4−SO−3: R = CH3, X− = F−
Abbildung 4.1: Struktur von Fe-triazol-Verbindungen.
Um die quantenmechanischen Rechnungen weniger aufwendig zu gestalten, mussten eini-ge Vereinfachungen an dem Strukturmodell vorgenommen werden. Der Einfluss der Substitu-enten R und der Gegenionen X– ist von untergeordneter Bedeutung für den HS–LS-Übergang;aus diesem Grund wurde der Ethoxy- durch einen Methyl-Rest sowie das Sulfonat- durch einFluorid-Anion ersetzt (22).
Um verschiedene Ligandenfeld-Aufspaltungen zu simulieren, wurden mehrere Modellemit verschiedenen Fe–N-Abständen konstruiert: 2,00 Å, 2,05 Å, 2,08 Å, 2,09 Å, 2,10 Å, 2,12 Å,2,15 Å und 2,20 Å. Dabei war es essentiell, das Koordinations-Oktaeder ideal zu halten.
Die resultierende Kristallstruktur ist für dFe–N = 2,00 Å in Abb. 4.2 gezeigt.
4.3.2 Cu(II)-Koordinationspolymer (CuCCP)[CB11]
Ziel der Untersuchungen war es, eine Korrelation zwischen chemischen (Umgebung deszentralen Cu2+-Ions) und physikalischen (elektronische und magnetische) Eigenschaften her-zustellen bzw. zu verstehen. Cu2+ als d9-Ion zeigt naturgemäß keinen Low-Spin–High-Spin-Übergang.
Die Cu–Cu-Wechselwirkung hängt sehr stark von der Art des verbrückenden Liganden ab.Durch Änderungen des Restes R (Abb. 4.3) oder der Liganden X– lassen sich diese Wechsel-
73

4 Modellierung von Kristallstrukturen mit Kraftfeld-Methoden
wirkungen beliebig beeinflussen. Diese Kopplung zwischen den Cu-Ionen soll hier untersuchtwerden.
Auch in diesem Fall gelang es nicht, verlässliche Kristallstrukturen zu bestimmen (außer fürdie unsubstituierte Verbindung[72]); außerdem zeigten zahlreiche Experimente, dass die Kris-tallite des Cu-Polymers eine hohe Konzentration von Gitter-Defekten aufwiesen. Aus diesemGrund wurden mehrere Modellsysteme mit Kraftfeld-Methoden erzeugt; diese Strukturendienten als Ausgangspunkt für die späteren quantenmechanischen Berechnungen.
Abbildung 4.4 zeigt exemplarisch die unsubstituierte Verbindung 23.
Tabelle 4.1: Gitterkonstanten der experimentellen Kristallstruktur von 23 sowie der mit Kraftfeld-Methoden optimierten Strukturen von 26 und 27; Raumgruppe P1.
23/24/25/ 26 27
a/Å 5,172 5,234 5,459b/Å 7,959 11,249 11,597c/Å 8,230 8,072 8,349α/° 118,221 117,611 118,423β/° 91,520 68,822 68,840γ/° 100,148 127,155 130,883V/Å
3291,47 330,43 350,49
4.4 Zusammenfassung
Das Hauptproblem, nämlich die oktaedrische Koordination an einem Zentral-Ion zu simulie-ren, ließ sich mit einem Trick erstaunlicherweise leicht lösen. Die Entscheidung, den X–M–X-Gleichgewichtswinkel im Kraftfeld auf 180° vorzugeben, sorgte dafür, dass eine ideale okta-edrische Koordination am Zentralteilchen erzeugt wird. Dass die Energie durch die ebenfallsvorhandenen 90°-Winkel immens hoch wird, spielt dabei keine Rolle. Energien, die mit Kraft-feld-Methoden berechnet werden, gelten allenfalls als Vergleichsmaßstab für verschiedeneModelle. Sie sind nicht geeignet, zuverlässige Aussagen über absolute Energien zu treffen.
Die aus den vorgenommenen Modellierungen erhaltenen Strukturen erwiesen sich als sehrgut geeignet für die nachfolgenden quantenmechanischen Rechnungen der ArbeitsgruppeValentí/Jeschke.
Für weitere Details sei auf die Publikationen [CB9–CB11] hingewiesen.
74

4.4 Zusammenfassung
a
b
c
Abbildung 4.2: Kristallstrukturmodell von Fe-triazol mit F– als Gegenion. Das Modell zeigt einenFe—N-Abstand von 2,00 Å. Blickrichtung ≈ [510]. Die Wasserstoffatome wurden derbesseren Übersicht halber ausgeblendet.
75

4 Modellierung von Kristallstrukturen mit Kraftfeld-Methoden
O
NN
O
N N
Cu
Cu
R
R
X
X
X
X
n
2324252627
———
R X
NH2CN
HH
H
H2ONH3
Abbildung 4.3: Struktur von CuCCP.
a
c
Abbildung 4.4: Kristallstrukturmodell von CuCCP. Blickrichtung [010].
76

[. . . ] und damit möchte ich schließen, hier und heutestellen sich die Fragen, und ich glaube, Sie stimmen mitmir überein, wenn ich sage, letzten Endes, wer wolltedas bestreiten.
Ich danke Ihnen.
(Loriot)
5 Zusammenfassung
Die Bestimmung von Kristallstrukturen mittels Röntgenbeugung ist aus den modernen Natur-und Materialwissenschaften nicht mehr wegzudenken. Sie ist die Methode der Wahl, umzerstörungsfrei Informationen über den inneren Aufbau von Festkörpern zu erhalten.
Da nicht in jedem Fall Einkristalle zur Verfügung stehen – besonders bei Pigmenten –,müssen Kristallstrukturbestimmungen aus Kristallpulvern erfolgen.
In dieser Arbeit wurden folgende Pigmentklassen behandelt: Naphthol-AS- und β-Naphthol-Pigmente, Monoazo-, Aldazin-, Chinacridon- und Indigo-artige Pigmente. Aus derKlasse der Naphthol-AS-Pigmente wurden Pigment Red 170 sowie 5 Derivate untersucht, Pig-ment Orange 5 bildet den Vertreter der β-Naphthol-Pigmente, Pigment Yellow 213 den einesMonoazo-Pigmentes. Zu der Gruppe der Aldazin-Pigmente gehört das untersuchte Derivatvon Pigment Yellow 101. Pigment Violet 19 stammt aus der Klasse der Chinacridon-Pigmente.Aus der großen Gruppe der Indigo-Pigmente wurden die Derivate Pigment Red 181 (Thioin-digo) sowie 5 Thiazinindigo-Pigmente untersucht.
Dabei lassen sich folgende Ergebnisse festhalten:
• Pigment Red 170, α-Phase. Die Kristallstrukturbestimmung dieses Pigments war äu-ßerst schwierig, da die Kristallite von außerordentlich geringer Größe sind und somitdas Pulverdiagramm extrem breite Reflexe zeigt. Dennoch zeigte sich, dass ein struktu-reller Zusammenhang zwischen Pigment Red 170 und seinem Methyl-Derivat besteht:Die Strukturen sind isotyp. Die Kristallstruktur von Me-Pigment Red 170 ließ sich ver-hältnismäßig einfach mittels Gitterenergie-Minimierung lösen. Die anschließende Ver-feinerung lieferte ein Kristallstruktur-Modell, das geeignet war, um die Strukturen vonPigment Red 170 (α-Phase) sowie der F-, Cl-, Br- und NO2-Derivate zu bestimmen.(Veröffentlichungen: [CB1], [CB2].)
• Pigment Orange 5. Die Kristallstruktur wurde mittels Gitterenergie-Minimierung ge-löst; ein neuartiger Ansatz des Vergleichs von gemessenem und simuliertem Pulver-diagramm kam dabei zum Einsatz. Die Strukturverfeinerung lieferte sehr gute undchemisch sinnvolle Daten. (Veröffentlichung: [CB3].)
• Pigment Yellow 213. Die Lösung der Kristallstruktur gestaltete sich extrem schwierig:Bereits die Indizierung mit mehreren verschiedenen Methoden lieferte Elementarzellen,die zwar alle sinnvoll waren, jedoch nicht letzte Sicherheit über deren Richtigkeit gebenkonnten. Hinzu kam, dass die Kristallstruktur erst dann gelöst werden konnte, als eine
77

5 Zusammenfassung
unerwartete (weil chemisch unübliche) Molekülkonformation berücksichtigt wurde.(Veröffentlichung: [CB4].)
• Derivat von Pigment Yellow 101. Die Indizierung des Pulverdiagramms sowie dieInterpretation der Reflexionsbedingungen ließen mehrere sinnvolle Raumgruppen-Vorschläge zu. In diesem Projekt spielten Symmetrie- und Volumenbetrachtungen einewesentliche Rolle: Ist es möglich, die Molekülsymmetrie und das Molekülvolumen inEinklang mit Raumgruppensymmetrie und Volumen der Elementarzelle zu bringen?Dies gelang.
Besonders hervorzuheben an dieser Stelle ist der Umstand, dass sich während der Riet-veld-Verfeinerung die endständigen Phenyl-Gruppen um ca. 36° aus der Molekülebenegedreht haben; dieses Phänomen ist deswegen erwähnenswert, da der Einfangradius beieiner Rietveld-Verfeinerung im Allgemeinen sehr klein ist. (Veröffentlichung: [CB5].)
• Chinacridon. Die Kristallstrukturen von α- und β-Chinacridon waren vor Beginn diesesProjektes bekannt. Was als Verwechslung begann (Verfeinerung des Strukturmodellsder β-Phase gegen das Pulverdiagramm der γ-Phase), entwickelte sich im Laufe dieserArbeit zu einer lehrreichen Erfahrung: Es ist tatsächlich möglich, Strukturmodelle ge-gen falsche Daten zu verfeinern. Die dabei auftretenden Unstimmigkeiten lassen sichallesamt wegdiskutieren. Das Ergebnis dieser Untersuchungen zeigte, dass nicht nurniedrige R-Werte zählen1, sondern auch die chemische Sinnhaftigkeit der erhaltenenStruktur. Eine gute Verfeinerung bedeutet weiterhin nicht unbedingt, dass die Strukturrichtig ist. (Veröffentlichung: [CB6].)
• Thiazinindigo und Derivate. Eine Kombination von Gitterenergie-Minimierungen undUntersuchungen sowie Vergleich isotyper Strukturen ermöglichte es, die Kristallstruk-turen von fünf Verbindungen vollständig zu bestimmen.
Die Untersuchung der Fehlordnung im einfach Cl-substituierten Thiazinindigo war äu-ßerst interessant und lehrreich, denn hier wurden Kraftfeld-Methoden (zum Generierender Modellstrukturen, das Kraftfeld musste stellenweise modifiziert werden) und Riet-veld-Verfeinerung kombiniert. Bei der Strukturverfeinerung ergab sich eine Besetzungs-Fehlordnung der Cl-Atome im Verhältnis 0,28 : 0,72 – ein Ergebnis, das zeigt, welcheInformationen mittels aktueller Methoden aus Routine-Labordaten extrahiert werdenkönnen. (Veröffentlichungen: [CB7], [CB8].)
• Pigment Red 181. Zunächst schien die gefundene Kristallstruktur-Lösung sehr sinn-voll zu sein. Die Rietveld-Verfeinerung zeigte jedoch, dass die Struktur Fehler enthielt(falsche Elementarzelle).
Verschiedene Betrachtungen bezüglich Molekülsymmetrie, Raumgruppensymmetrie,Molekülvolumen (ein modifiziertes Inkrementsystem für Pigmente wurde entwickelt)und Volumen der Elementarzelle wurden angestellt. Als schließlich ein neues Pulverdia-gramm aufgenommen wurde, ließ sich die Kristallstruktur widerspruchsfrei bestimmen.
1Als der Autor das entsprechende Poster präsentierte, kam ein Tagungsteilnehmer und berichtete, dass er endlichein Argument gegen die „R-Wert-Gläubigkeit“ seines Chefs hätte.
78

Außerdem wurden die Ergebnisse der Rietveld-Verfeinerungen von gsas und topasmiteinander verglichen: Sowohl die Gütekriterien als auch die Kristallstrukturen sindin beiden Fällen äußerst gut; die bestimmten Kristallstrukturen sind im Rahmen derFehlergrenzen deckungsgleich.
Ähnlich wie bei Pigmenten sind bei den untersuchten Eisen-Triazol-Komplexen undKupfer-Koordinationspolymeren (CuCCP) kaum Kristallstrukturen bekannt. Für die theo-retischen Rechnungen, die im Rahmen der Forschergruppe 412 angestellt wurden, wurdenModellstrukturen erzeugt und mit Kraftfeld-Methoden optimiert:
• Fe-triazol-Komplexe. Für die Erstellung von Modellen mit oktaedrisch koordiniertenFe2+-Ionen musste zunächst das Dreiding-Krafteld angepasst werden, da dieses keinenTerm für oktaedrische Koordination vorsieht. Es stellte sich heraus, dass – obwohl imOktaeder XMX-Winkel von 180° und 90° vorliegen – es völlig ausreichend ist, einenKraftfeld-Term für die im Oktaeder vorhandenen 180°-Winkel vorzugeben. Die dabeiberechneten Gitterenergien eignen sich, um verwandte Strukturen miteinander zu ver-gleichen, die absoluten Energien verfügen über keinerlei Aussagekraft.
Dieses Beispiel zeigt deutlich, dass in den Naturwissenschaften zwar Fakten zählen, einegewisse Kreativität sowie unkonventionelles Denken durchaus Erfolge zeitigen können.
• CuCCP. Für diese Verbindung konnte auf die Erfahrungen aus dem Fe-triazol zurück-gegriffen werden. Um verschiedene Effekte auf die Cu–Cu-Kopplung zu simulieren,wurden verschiedene Liganden in das Strukturmodell eingeführt.
Die aus den vorgenommenen Modellierungen erhaltenen Strukturen erwiesen sich als sehrgut geeignet für die nachfolgenden quantenmechanischen Rechnungen der ArbeitsgruppeValentí/Jeschke. (Veröffentlichungen: [CB9], [CB10], [CB11].)
79

A Bibliographie
A.1 Eigene Veröffentlichungen
[CB1] M. U. Schmidt, D. W. M. Hofmann, C. Buchsbaum, H. J. Metz, „Kristallstrukturenvon Pigment Red 170 und Derivaten, bestimmt aus Röntgenpulverdiagrammen“,Angewandte Chemie 2006, 118, 1335–1340.
[CB2] M. U. Schmidt, D. W. M. Hofmann, C. Buchsbaum, H. J. Metz, „Crystal Structuresof Pigment Red 170 and Derivatives, as Determined by X-ray Powder Diffraction“,Angewandte Chemie International Edition 2006, 45, 1313–1317.
[CB3] M. U. Schmidt, C. Buchsbaum, J. M. Schnorr, D. W. M. Hofmann, M. Ermrich, „Pig-ment Orange 5: crystal structure determination from a non-indexed X-ray powderdiagram“, Zeitschrift für Kristallographie 2007, 222, 30–33.
[CB4] M. U. Schmidt, S. Brühne, A. K. Wolf, A. Rech, J. Brüning, E. Alig, L. Fink, C.Buchsbaum, J. Glinnemann, J. van de Streek, F. Gozzo, M. Brunelli, F. Stowasser,T. Gorelik, E. Mugnaioli, U. Kolb, „Electron diffraction, X-ray powder diffraction andpair-distribution-function analyses to determine the crystal structures of PigmentYellow 213, C23H21N5O9“, Acta Crystallographica Section B 2009, 65, 189–199.
[CB5] M. U. Schmidt, J. Brüning, C. Buchsbaum, E. Alig, L. Fink, „Crystal-structure deter-mination of the fluorescent bisazomethine pigment C36H26N4O4 from X-ray powderdata“, Zeitschrift für Kristallographie 2007, 222, 539–545.
[CB6] C. Buchsbaum, M. U. Schmidt, „Rietveld refinement of a wrong crystal structure“,Acta Crystallographica Section B 2007, 63, 926–932.
[CB7] M. U. Schmidt, C. Buchsbaum, „Structure determination of 6,6′-bis(trifluoromethyl)-thiazine-indigo from laboratory powder data and lattice-energy minimisation“, Zeit-
schrift für Kristallographie 2008, 223, 418–423.
[CB8] C. Buchsbaum, E. F. Paulus, M. U. Schmidt, „Crystal Structures of Thiazine-IndigoPigments, Determined from Single-Crystal and Powder Diffraction Data“, Zeitschrift
für Kristallographie 2011, 226, 822–831.
[CB9] H. O. Jeschke, L. A. Salguero, B. Rahaman, C. Buchsbaum, V. Pashchenko, M. U.Schmidt, T. Saha-Dasgupta, R. Valentí, „Microscopic modeling of a spin crossovertransition“, New Journal of Physics 2007, 9, 448.
81
A Bibliographie
[CB10] H. O. Jeschke, L. A. Salguero, R. Valentí, C. Buchsbaum, M. U. Schmidt, M. Wagner,„Classical and ab initio preparation of reliable structures for polymeric coordinationcompounds“, Comptes Rendus Chimie 2007, 10, 82–88.
[CB11] L. A. Salguero, H. O. Jeschke, B. Rahaman, T. Saha-Dasgupta, C. Buchsbaum, M. U.Schmidt, R. Valentí, „Cu-based metalorganic systems: an ab initio study of the elec-tronic structure“, New Journal of Physics 2007, 9, 26.
A.2 Literatur
[1] H. M. Rietveld, „Line profiles of neutron powder-diffraction peaks for structurerefinement“, Acta Crystallographica 1967, 22, 151–152.
[2] H. M. Rietveld, „A Profile Refinement Method for Nuclear and Magnetic Structures“,Journal of Applied Crystallography 1969, 2, 65–71.
[3] H. M. Rietveld, „The Rietveld Method: a retrospection“, Zeitschrift für Kristallographie
2010, 225, 545–547.
[4] Colour Index, Bd. 1–4, (Hrsg.: Society of Dyers and Colourists).
[5] R. Allmann, Röntgenpulverdiffraktometrie, Springer, Berlin, Heidelberg, New York,2. Aufl., 2003.
[6] P.-E. Werner in Structure Determination from Powder Diffraction Data, (Hrsg.: W. I. F.David, K. Shankland, L. B. McCusker, C. Baerlocher), IUCr Monographs on Crystal-lography, Oxford University Press, Oxford, New York, 2006.
[7] P. M. de Wolff, „A Simplified Criterion for the Reliability of a Powder Pattern Inde-xing“, Journal of Applied Crystallography 1968, 1, 108–113.
[8] G. S. Smith, R. L. Snyder, „FN: A Criterion for Rating Powder Diffraction Patternsand Evaluating the Reliability of Powder-Pattern Indexing“, Journal of Applied Cry-
stallography 1979, 12, 60–65.
[9] T. Ito, „A General Powder X-Ray Photography“, Nature 1949, 164, 755–756.
[10] J. W. Visser, „A Fully Automatic Program for Finding the Unit Cell from PowderData“, Journal of Applied Crystallography 1969, 2, 89–95.
[11] A. Boultif, D. Louër, „Indexing of Powder Diffraction Patterns for Low-SymmetryLattices by the Successive Dichotomy Method“, Journal of Applied Crystallography
1991, 24, 987–993.
[12] A. Boultif, D. Louër, „Powder pattern indexing with the dichotomy method“, Journal
of Applied Crystallography 2004, 37, 724–731.
[13] P.-E. Werner, L. Eriksson, M. Westdahl, „TREOR, a semi-exhaustive trial-and-errorpowder indexing program for all symmetries“, Journal of Applied Crystallography 1985,18, 367–370.
[14] D. W. M. Hofmann, „Fast estimation of crystal densities“, Acta Crystallographica Sec-
tion B 2002, 58, 489–493.
82
A.2 Literatur
[15] M. U. Schmidt, H. Kalkhof, CRYSCA. Program for crystal structure calculations offlexible molecules, Frankfurt am Main, 1997.
[16] D. W. M. Hofmann, L. Kuleshova, „New similarity index for crystal structure deter-mination from X-ray powder diagrams“, Journal of Applied Crystallography 2005, 38,861–866.
[17] D. W. M. Hofmann, L. Kuleshova, M. Y. Antipin, „Supramolecular Synthons andCrystal Structure Prediction of Organic Compounds“, Crystal Growth & Design 2004,4, 1395–1402.
[18] G. M. Day, W. D. S. Motherwell, H. L. Ammon, S. X. M. Boerrigter, R. G. Della Valle,E. Venuti, A. Dzyabchenko, J. D. Dunitz, B. Schweizer, B. P. van Eijck, P. Erk, J. C.Facelli, V. E. Bazterra, M. B. Ferraro, D. W. M. Hofmann, F. J. J. Leusen, C. Liang,C. C. Pantelides, P. G. Karamertzanis, S. L. Price, T. C. Lewis, A. T. H. Nowell, H. A.Scheraga, Y. A. Arnautova, M. U. Schmidt, P. Verwer, „A third blind test of crystalstructure prediction“, Acta Crystallographica Section B 2005, 61, 511–527.
[19] D. W. M. Hofmann, J. Apostolakis, „Crystal structure prediction by data mining“,Journal of Molecular Structure 2003, 647, 17–39.
[20] F. H. Allen, „The Cambridge Structural Database: a quarter of a million crystalstructures and rising“, Acta Crystallographica Section B 2002, 58, 380–388.
[21] J. van de Streek, „Searching the Cambridge Structural Database for the ‘best’ repre-sentative of each unique polymorph“, Acta Crystallographica Section B 2006, 62, 567–579.
[22] A. Belsky, M. Hellenbrandt, V. L. Karen, P. Luksch, „New developments in theInorganic Crystal Structure Database (ICSD): accessibility in support of materialsresearch and design“, Acta Crystallographica Section B 2002, 58, 364–369.
[23] C. Buchsbaum, S. Höhler-Schlimm, S. Rehme in Data Mining in Crystallography,(Hrsg.: D. W. M. Hofmann, L. N. Kuleshova), Structure and Bonding, Springer, Hei-delberg, Dordrecht, London, New York, 2010, Kap. 2, S. 37–58.
[24] A. L. Patterson, „A direct method for the determination of the components of interato-mic distances in crystals“, Zeitschrift für Kristallographie Kristallgeometrie Kristallphysik
Kristallchemie 1935, 90, 517–542.
[25] D. Harker, J. S. Kasper, „Phases of Fourier Coefficients directly from Crystal Diffrac-tion Data“, Acta Crystallographica 1948, 1, 70–75.
[26] D. Sayre, „The Squaring Method: a New Method for Phase Determination“, Acta
Crystallographica 1952, 5, 60–65.
[27] G. Oszlányi, A. Süto, „Ab initio structure solution by charge flipping“, Acta Crystallo-
graphica Section A 2003, 60, 134–141.
[28] G. Oszlányi, A. Süto, „The charge flipping algorithm“, Acta Crystallographica Section
A 2007, 64, 123–134.
[29] S. Kirkpatrick, C. D. Gelatt Jr., M. P. Vecchi, „Optimization by Simulated Annealing“,Science 1983, 220, 671–680.
83

A Bibliographie
[30] A. C. Larson, R. B. von Dreele, „General Structure Analysis System (GSAS)“, Los
Alamos National Laboratory Report 1994, 86–748.
[31] B. H. Toby, „EXPGUI, a graphical user interface for GSAS“, Journal of Applied Crystal-
lography 2001, 34, 210–221.
[32] A. A. Coelho, TOPAS Academic 4.1, 2007, http://www.topas-academic.net/.
[33] A. Le Bail, H. Duroy, J.-L. Fourquet, „Ab-initio structure determination of LiSbWO6by X-ray powder diffraction“, Materials Research Bulletin 1988, 23, 447–452.
[34] G. S. Pawley, „Unit-Cell Refinement from Powder Diffraction Scans“, Journal of App-
lied Crystallography 1981, 14, 357–361.
[35] B. H. Toby, „R factors in Rietveld analysis: How good is good enough?“, Powder
Diffraction 2006, 1, 67–70.
[36] S. L. Mayo, B. D. Olafson, W. A. Goddard III, „DREIDING: a generic force field formolecular simulations“, Journal of Physical Chemistry 1990, 94, 8897–8909.
[37] Accelrys Ltd., Cerius2, Version 4.9, 334 Cambridge Science Park, Cambridge CB40WN, England, 2003.
[38] J. Gasteiger, M. Marsili, „Iterative partial equalization of orbital electronegativity ––a rapid access to atomic charges“, Tetrahedron 1980, 36, 3219–3222.
[39] R. S. Mulliken, „Electronic Population Analysis on LCAO–MO Molecular Wave Func-tions“, Journal of Chemical Physics 1955, 23, 1833–1840.
[40] W. Herbst, K. Hunger, Industrial Organic Pigments, Wiley-VCH, 2004.
[41] J. Apostolakis, D. W. M. Hofmann, T. Lengauer, „Derivation of a scoring function forcrystal structure prediction“, Acta Crystallographica Section A 2001, 57, 442–450.
[42] E. Pidcock, W. D. S. Motherwell, J. C. Cole, „A database survey of molecular andcrystallographic symmetry“, Acta Crystallographica Section B 2003, 59, 634–640.
[43] International Tables for Crystallography, Bd. A, (Hrsg.: T. Hahn), International Union ofCrystallography, Dordrecht, Boston, 1983.
[44] D. Kobelt, E. F. Paulus, W. Kunstmann, „Röntgeneinkristallstrukturanalyse von 1-(2,5-Dichlorphenylazo)-2-hydroxy-3-naphthoesäure-(4-chlor-2,5-dimethoxy-anilid)(Chlorderivat von Permanentbraun FG®)“, Acta Crystallographica Section B 1972, 28,1319–1324.
[45] P. Gilli, V. Bertolasi, L. Pretto, A. Lycka, G. Gilli, „The Nature of Solid-StateN–H· · ·O/O–H· · ·N Tautomeric Competition in Resonant Systems. IntramolecularProton Transfer in Low-Barrier Hydrogen Bonds Formed by the · · ·O=C–C=N–NH· · · · · ·HO–C=C–N=N· · · Ketohydrazone-Azoenol System. A Variable-Temperature X-ray Crystallographic and DFT Computational Study“, Journal of the
American Chemical Society 2002, 124, 13554–13567.
[46] B. Stengel-Rutkowski, H. J. Metz, „A new yellow azo pigment“, European Coatings
Journal 2001, 3, 126–129.
[47] Stoe & Cie, WinXPOW, Stoe & Cie, Darmstadt, 2004.
84

A.2 Literatur
[48] A. Le Bail, „Monte Carlo indexing with McMaille“, Powder Diffraction 2004, 19, 249–254.
[49] J. Bergmann, A. Le Bail, R. Shirley, V. Zlokazov, „Renewed interest in powder diffrac-tion data indexing“, Zeitschrift für Kristallographie 2004, 219, 783–790.
[50] R. Shirley, The CRYSFIRE System for Automatic Powder Indexing: User’s Manual, TheLattice Press, Surrey, 2000.
[51] W. I. F. David, K. Shankland, J. van de Streek, E. Pidcock, W. D. S. Motherwell,J. C. Cole, „DASH: a program for Crystal Structure Determination from PowderDiffraction Data“, Journal of Applied Crystallography 2006, 39, 910–915.
[52] T. Egami, S. J. L. Billinge, Underneath the Bragg Peaks: structural analysis of complex
materials, (Hrsg.: R. W. Cahn), Pergamon Press, Amsterdam, 2003.
[53] D. Guo, J. Li, J. Xie, C. Duan, Q. Meng, „Synthesis and Crystal Structure of Triple-Helical Di-iron (III) Complex“, Chinese Journal of Inorganic Chemistry 2002, 18, 1215–1220.
[54] A. Dreuw, J. Plötner, L. Lorenz, J. Wachtveitl, J. E. Djanhan, J. Brüning, T. Metz,M. Bolte, M. U. Schmidt, „Molekularer Mechanismus der Festkörperfluoreszenz desorganischen Pigments Yellow 101 und seiner Derivate“, Angewandte Chemie 2005, 117,7961–7964.
[55] A. Dreuw, J. Plötner, L. Lorenz, J. Wachtveitl, J. E. Djanhan, J. Brüning, T. Metz,M. Bolte, M. U. Schmidt, „Molecular Mechanism of the Solid-State FluorescenceBehavior of the Organic Pigment Yellow 101 and Its Derivatives“, Angewandte Chemie
International Edition 2005, 44, 7783–7786.
[56] C. J. E. Kempster, H. Lipson, „A rapid method of assessing the number of moleculesin the unit cell of an organic crystal“, Acta Crystallographica Section B 1972, 28, 3674.
[57] E. F. Paulus, E. Dietz, A. Kroh, F. Prockschy, „Structures of quinacridones“, 12th
European Crystallographic Meeting Moscow Collected Abstracts 1989, 2, 23–24.
[58] T. Senju, T. Sasaki, J. Mizuguchi, „Refinement of the crystal structure of 5,7,12,14-tetrahydro[2,3-b]-quinolinoacridine (γ-form), C20H12N2O2, at 223 K“, Zeitschrift für
Kristallographie – New Crystal Structures 2002, 217, 249–250.
[59] E. F. Paulus, F. J. J. Leusen, M. U. Schmidt, „Crystal structures of quinacridones“,CrystEngComm 2007, 9, 131–143.
[60] Y. Otaka, „Similarity on the crystal structure of γ-form of 5,7,12,14-tetrahydroquino[2,3-b]acridine-7,14-dione and β-form of its 2,9-dimethyl derivative“,Nippon Kagaku Kaishi 1975, 10, 1838–1840.
[61] T. Senju, J. Mizuguchi, „Crystal structure of (2E)-7-chloro-2-(7-chloro-3,4-dihydro-3-oxo-2H-1,4-benzothiazin-2-ylidene)-2H-1,4-benzothiazine-3(4H)-one,C16H8Cl2N2O2S2, at 93 K)“, Zeitschrift für Kristallographie – New Crystal Structu-
res 2003, 218, 129–130.
[62] M. Järvinen, „Application of Symmetrized Harmonics Expansion to Correction ofthe Preferred Orientation Effect“, Journal of Applied Crystallography 1993, 26, 525–531.
85

A Bibliographie
[63] R. B. von Dreele, „Quantitative texture analysis by Rietveld refinement“, Journal of
Applied Crystallography 1997, 30, 517–525.
[64] A. von Baeyer, A. Emmerling, „Reduction des Isatins zu Indigblau“, Berichte der
Deutschen chemischen Gesellschaft zu Berlin 1870, 3, 514–517.
[65] H. von Eller, „Crystal structure of indigo“, Bulletin de la Société Chimique de France
1955, 106, 1433–1438.
[66] H. von Eller, „The structure of indigo and its derivatives“, Acta Crystallographica 1952,5, 142.
[67] H. von Eller, „Crystal structure of thioindigo“, Bulletin de la Société Chimique de France
1955, 106, 1438–1444.
[68] J. Brüning, D. Heintz, A. Meents, M. Bolte, M. U. Schmidt, „Monothioindigo, deter-mined by microcrystal structure analysis“, Acta Crystallographica Section C 2010, 66,o459–o462.
[69] P. Süsse, R. Wäsche, „Parallel Molecular Arrangement in the Crystal Structure of6,6′-Dichloro-Indigo“, Naturwissenschaften 1978, 65, 157.
[70] R. Car, M. Parrinello, „Unified Approach for Molecular Dynamics and Density-Functional Theory“, Physical Review Letters 1985, 55, 2471–2474.
[71] T. D. Kühne, M. Krack, F. R. Mohamed, M. Parrinello, „Efficient and Accurate Car-Parrinello-like Approach to Born-Oppenheimer Molecular Dynamics“, Physical Re-
view Letters 2007, 98, 0664011–0664014.
[72] R. Dinnebier, H.-W. Lerner, L. Ding, K. Shankland, W. I. F. David, P. W. Stephens,M. Wagner, „One-Dimensional Spin Chains from CuII Ions and 2,5-Bis(pyrazol-1-yl)-1,4-dihydroxybenzene“, Zeitschrift für anorganische und allgemeine Chemie 2002, 628,310–314.
A.3 Eigener Beitrag zu den Veröffentlichungen
[CB1,CB2] Rietveld-Verfeinerung.
[CB3] Rietveld-Verfeinerung.
[CB4] Indizierung, Rietveld-Verfeinerung.
[CB5] Indizierung, Kraftfeld-Entwicklung, Gitterenergie-Minimierung, Rietveld-Verfeine-rung.
[CB6] Indizierung, Rietveld-Verfeinerung.
[CB7] Indizierung, Kraftfeld-Entwicklung, Gitterenergie-Minimierung, Rietveld-Verfeine-rung.
[CB8] Indizierung, Strukturvorhersage, Strukturlösung, Kraftfeld-Entwicklung, Gitterener-gie-Minimierung, Rietveld-Verfeinerung.
86

A.3 Eigener Beitrag zu den Veröffentlichungen
[CB9] Kraftfeld-Entwicklung, Gitterenergie-Minimierung, Struktur-Modellierung.
[CB10] Kraftfeld-Entwicklung, Gitterenergie-Minimierung, Struktur-Modellierung.
[CB11] Kraftfeld-Entwicklung, Gitterenergie-Minimierung, Struktur-Modellierung.
87


B Eigene Veröffentlichungen
B.1 Pigment Red 170 (deutsch)
[CB1] M. U. Schmidt, D. W. M. Hofmann, C. Buchsbaum, H. J. Metz, „Kristallstrukturenvon Pigment Red 170 und Derivaten, bestimmt aus Röntgenpulverdiagrammen“,Angewandte Chemie 2006, 118, 1335–1340.
Aus rechtlichen Gründen ist die Veröffentlichung nur in der gedruckten Fassung dieser Dis-sertation zu finden.
doi:10.1002/ange.200502468
89

B.2 Pigment Red 170 (englisch)
[CB2] M. U. Schmidt, D. W. M. Hofmann, C. Buchsbaum, H. J. Metz, „Crystal Structuresof Pigment Red 170 and Derivatives, as Determined by X-ray Powder Diffraction“,Angewandte Chemie International Edition 2006, 45, 1313–1317.
Aus rechtlichen Gründen ist die Veröffentlichung nur in der gedruckten Fassung dieser Dis-sertation zu finden.
doi:10.1002/anie.200502468
90

B.3 Pigment Orange 5
[CB3] M. U. Schmidt, C. Buchsbaum, J. M. Schnorr, D. W. M. Hofmann, M. Ermrich, „Pig-ment Orange 5: crystal structure determination from a non-indexed X-ray powderdiagram“, Zeitschrift für Kristallographie 2007, 222, 30–33.
Mit freundlicher Abdruckgenehmigung des Verlages Oldenbourg.
doi:10.1524/zkri.2007.222.1.30
91

Th
is article is pro
tected b
y Germ
an co
pyrig
ht law
. Yo
u m
ay cop
y and
distrib
ute th
is article for yo
ur p
erson
al use o
nly. O
ther u
se is on
ly allow
ed w
ith w
ritten p
ermissio
n b
y the co
pyrig
ht h
old
er.
Pigment Orange 5: crystal structure determination
from a non-indexed X-ray powder diagram
Martin U. Schmidt*, I, Christian BuchsbaumI, Jan M. SchnorrI, Detlef W. M. HofmannII, 1 and Martin ErmrichIII
I Institute of Inorganic and Analytical Chemistry, University of Frankfurt, Max-von-Laue-Str. 7, 60438 Frankfurt am Main, GermanyII Schleifweg 23, 91080 Uttenreuth, GermanyIII X-ray laboratory Dr. Ermrich, Am Kandelborn 7, 64354 Reinheim/Odenwald, Germany
Received May 25, 2006; accepted August 14, 2006
Pigments / X-ray diffraction / Rietveld refinement /
Powder diffraction structure analysis /
Lattice energy minimization
Abstract. Pigment Orange 5, also known as “Dinitro-
aniline Orange”, is an industrially produced azo pigment.
The structure was solved from routinely measured lab X-
ray powder data without indexing, by means of a newly
developed combination of lattice energy minimization and
simultaneous fit to the X-ray powder diagram. Finally, the
structure was refined by Rietveld methods using restraints.
Pigment Orange 5 crystallizes in space group P21/a with
a ¼ 16:365ð5Þ�A, b ¼ 12:874ð4Þ �A, c ¼ 6:924ð2Þ�A, b ¼100:143ð2Þ�, Z ¼ 2. The molecules are almost planar and
form stacks along the c axis.
Pigment Orange 5 (P.O. 5) is an industrial azo pigment, also
known as “Dinitroaniline Orange” and “Hansa Red GG”.
The compound is produced since almost 100 years and is
still one of the most significant organic orange pigments.
Nevertheless, its crystal structure was hitherto unknown.
The molecular formula of P.O. 5 is shown in Fig. 1.
The compound was invented in 1907 [1]. Already in
1911 it was produced industrially, and sold under the trade
names “Permanent Rot 2G” (Manufacturer: Deutsche Ge-
sellschaft fur Anilin-Fabrikation in Treptow bei Berlin)
and “Litholechtorange R” (BASF). These data are given in
the confidential internal publication “Konstitutions-Tabel-
len neuerer Konkurrenz-Farbstoffe (sic!)” (Structure tables
of new competitors’ dyestuffs) of the “Farbwerke vormals
Meister Lucius & Bruning” (later: Hoechst AG, today:
Clariant GmbH) [2]. In the report of the British intelli-
gence objectives sub-committee (spying investigations in
Germany in 1946), the compound is listed as “Permanent
Red 2G” and “Lithol Fast Orange RN”; both were pro-
duced by I.G. Farben in Hochst [3].
Today, the worldwide production of P.O. 5 totals to ap-
proximately 1500 tons per year with a market share of
about 15 million 1 annually. The high production rate is
caused by the good application properties: P.O. 5 com-
bines a high colour strength, pure shades, and a good light
fastness (photostability), with a relatively low price. The
main applications of P.O. 5 are air drying lacquers, and
emulsion paints. To an appreciable extent it is used in
printing inks, especially for offset, flexo and packaging
gravure printing inks as well as for textile printing. It is
also suitable for a variety of other applications, including
office articles and artists’ colours, e.g. pigmented drawing
inks, coloured pencils, wax and marking crayons and
water colours. Likewise it is used in the mass and surface
colouration of paper [4].
P.O. 5 is industrially synthesized by diazotizing 2,4-
dinitroaniline and subsequent coupling on b-naphthole.The synthesis is done in water, and the pigment immedi-
ately precipitates as a fine, insoluble powder. In the solid
state all naphthol azo pigments exhibit the hydrazo tauto-
meric form, i.e. the hydrogen of the OH group of the b-naphthole fragment moves to the nitrogen atom of the
diazo group forming a hydrazo group as depicted in
Fig. 1.
Pigments are generally insoluble or hardly soluble in
water and all organic solvents, even at elevated tempera-
tures. In most cases the growth of single crystals fails.
Hence many crystal structures of organic pigments have
been determined from powder diffraction data, either
with indexing, [5–7] or even without a previous index-
ing [8–10].
For recording the X-ray powder diagram, a sample of
commercial Hansa Red GG from Clariant was placed be-
30 Z. Kristallogr. 222 (2007) 30–33 / DOI 10.1524/zkri.2007.222.1.30
# by Oldenbourg Wissenschaftsverlag, Munchen
* Correspondence author(e-mail: [email protected])
1 Work done at the Institute of Inorganic and Analytical Chemis-try, University of Frankfurt
O
H
N
N
O
N
N
OO
O
Fig. 1. Molecular formula of Pigment Orange 5.
92

Th
is article is pro
tected b
y Germ
an co
pyrig
ht law
. Yo
u m
ay cop
y and
distrib
ute th
is article for yo
ur p
erson
al use o
nly. O
ther u
se is on
ly allow
ed w
ith w
ritten p
ermissio
n b
y the co
pyrig
ht h
old
er.
tween polymer films (mylar foils) and measured in trans-
mission mode on a STOE STADI-P diffractometer,
equipped with a curved Ge(111) monochromator and a line-
ar position sensitive detector. CuKa1 radiation was used.
The total measuring time was almost two hours for a 2qrange of 2–34� (Fig. 2). The sample was rotated during the
measurement. These lab data generated in a routine manner
were fully sufficient to determine the crystal structure.
The structure was solved by the program internally
called “PowderCryst”, which was recently developed in
our group [11]. Its algorithm combines a global lattice en-
ergy minimization with a comparison of simulated and
experimental powder diagrams. As input, only an approxi-
mated molecular geometry and a laboratory X-ray powder
diagram are required. The knowledge of the lattice para-
meters is not required; i.e. it is not necessary to index the
X-ray powder diagram (This is the main advantage of this
procedure against most other methods to solve crystal
structures from powder diffraction data). The lattice en-
ergy is calculated using trained potentials [12], as imple-
mented in our program FlexCryst [13, 14].
In order to find out, whether a calculated crystal struc-
ture corresponds to the experimental one, the powder
diffractogram is calculated and compared with the experi-
mental powder diffraction data. Since the peak positions in
powder diagrams depend on the lattice parameters, a com-
Pigment Orange 5 31
Fig. 2. Measured powder diagram used for crystal structure solution,background subtracted.
Fig. 3. The 5 planar groups (each differently outlined) used as re-straints in the Rietveld refinement. The current version of GSAS al-lows for only up to 12 atoms per restraint.
Table 1. Crystallographic data for Pigment Orange 5.
Formula C16H10N4O5
Formula weight 338.28Crystal system monoclinicSpace group P21/aa /�A 16.365(5)b /�A 12.874(4)c /�A 6.924(2)b /� 100.143(2)V /�A3 1436.0(13)Z 2Rp 2.19%wRp 3.11%RF2 17.39%
Table 2. Atomic coordinates and displacement parameters (in �A2).
Remark: the small ESDs are due to the use of strong restraints for themolecular geometry. I.e. the ESDs do not show the accuracy of theindividual atomic coordinates but the accuracy of the position andorientation of the whole molecule. Refining only x, y and z whilekeeping Uiso fixed led to the results given below; refining additionallyUiso of the N and O atoms would not change the fractional coordi-nates significantly (about 0.003).
Atom x y z Uiso � 100
C1 0.5100(5) 0.7818(6) 0.3560(13) 2.50
C2 0.5717(7) 0.8474(6) 0.4146(19) 2.50
C3 0.6540(5) 0.8174(7) 0.4361 (23) 2.50
C4 0.6702(7) 0.7112(9) 0.4071(19) 2.50
C5 0.6073(7) 0.6445(7) 0.3471(24) 2.50
C6 0.5241(4) 0.6742(6) 0.3264(15) 2.50
C7 0.4237(5) 0.4408(7) 0.1765(16) 2.50
C8 0.4493(5) 0.3294(6) 0.1609(16) 2.50
C9 0.5317(7) 0.2988(8) 0.2178(24) 2.50
C10 0.5512(6) 0.1994(9) 0.2111(24) 2.50
C11 0.4965(7) 0.1331(7) 0.1538(17) 2.50
C12 0.4128(7) 0.1614(8) 0.1084(19) 2.50
C13 0.3915(6) 0.2580(6) 0.1095(20) 2.50
C14 0.3047(6) 0.2893(8) 0.0466(19) 2.50
C15 0.2796(6) 0.3876(10) 0.0463(22) 2.50
C16 0.3365(6) 0.4694(8) 0.1170(26) 2.50
H17 0.5592(9) 0.9163(17) 0.430(5) 2.50
H18 0.7234(14) 0.6878(13) 0.438(5) 2.50
H19 0.6194(10) 0.5794(19) 0.322(7) 2.50
H20 0.4051(13) 0.6257(12) 0.231(6) 2.50
H21 0.5697(13) 0.3440(14) 0.258(8) 2.50
H22 0.6063(14) 0.1802(12) 0.247(8) 2.50
H23 0.5116(10) 0.0689(18) 0.134(6) 2.50
H24 0.3722(12) 0.1125(14) 0.066(5) 2.50
H25 0.2665(12) 0.2411(14) ––0.003(6) 2.50
H26 0.2240(13) 0.4028(13) 0.009(5) 2.50
N27 0.4298(5) 0.8295(6) 0.3001(13) 2.50
N28 0.4600(5) 0.6038(8) 0.2623(17) 2.50
N29 0.4803(5) 0.5024(10) 0.2244(23) 2.50
N30 0.7218(5) 0.8922(6) 0.4934(11) 2.50
O31 0.3626(8) 0.7792(8) 0.2971(19) 2.50
O32 0.4246(6) 0.9301(10) 0.2719(17) 2.50
O33 0.3134(6) 0.5600(10) 0.1250(21) 2.50
O34 0.7913(8) 0.8635(8) 0.5635(19) 2.50
O35 0.7106(6) 0.9883(10) 0.4455(19) 2.50
93

Th
is article is pro
tected b
y Germ
an co
pyrig
ht law
. Yo
u m
ay cop
y and
distrib
ute th
is article for yo
ur p
erson
al use o
nly. O
ther u
se is on
ly allow
ed w
ith w
ritten p
ermissio
n b
y the co
pyrig
ht h
old
er.
parison of powder diagrams by calculating a difference
curve point-by-point does not work as long as the calcu-
lated lattice parameters do not match with the experimen-
tal ones. Therefore we developed a new similarity index,
which is based on the comparison of the integrated pow-
der diagrams instead of comparing the powder diagrams
themselves [11]. The new index is defined as the mean
difference between the normalized simulated and observed
integrated powder diagrams; it is proportional to the area
between the two integrated curves. The index is zero, if
the peak positions and the peak intensities match comple-
tely; the value increases with deviating lattice parameters
and increasing differences in peak intensities. This algo-
rithm, implemented in our program PowderCryst, is also
used for a preliminary refinement of the crystal structure
against the experimental X-ray powder diagram. The re-
sulting structures are generally by far accurate enough for
a subsequent Rietveld refinement.
For P.O. 5 the molecular geometry was calculated using
the Dreiding force field [15] with Gasteiger charges [16].
The molecule was assumed to be planar. Lattice energy
minimizations were performed in the 11 most common
space groups: P1, P21, C2, Cc, P21 /c, C2/c, P212121,
Pca21, Pna21, Pbcn, and Pbca. These space groups cover
83% of all molecular crystal structures [17]. In all cases
the molecule was placed on a general position. Since
P.O. 5 possesses an intramolecular mirror plane, addition-
ally space groups with molecules on crystallographic mir-
ror planes can be reached during the minimizations. E.g.
during calculations in P1, Z ¼ 2 one can reach the super-
groups P2/m, P21/m (both with Z ¼ 2), or C2/m, Z ¼ 4;
whereas minimizations in P21/c, Z ¼ 4 can result in struc-
tures having symmetries P21/m (Z ¼ 2), C2/m, Pnma,
Pmna, Pbam, Pbcm, Pnnm (all Z ¼ 4), or Cmce (Z ¼ 8)
[18]. Thereby more than 82% of all organic structures
with molecules on crystallographic mirror planes are cov-
ered. The 100 energetically most favourable structures
were refined using the above described similarity index.
The resulting best structure (which was not the number
one in energy) was already quite close to the experimental
structure, as it could be seen by comparing simulated and
measured X-ray powder diagrams.
The lattice energy calculations and the subsequent
refinements with PowderCryst are quite fast; thus the most
time consuming step was not the structure solution, but
the final Rietveld refinement, which had to be carried out
very carefully, because the powder data were of limited
quality. Since indexing is not necessary for our procedure,
we did not make any attempt to index the powder data of
P.O. 5. (After submission of this manuscript we tried in-
dexing of the laboratory data, but did not get a unique
solution. With DICVOL [19] the correct cell would have
been found: a ¼ 16:37ð1Þ, b ¼ 12:848ð8Þ, c ¼ 6:92ð5Þ �A,
b ¼ 101:0ð7Þ�, but with other indexing programs we got
different solutions).
Finally a Rietveld refinement was carried out with GSAS
[20]. In order to get more information about structural details
we measured the powder diagram with higher accuracy: The
powder was filled in a 0.7 mm capillary and placed on a
STOE STADI-P diffractometer with rotating capillary,
CuKa1radiation and a linear position sensitive detector. The
total measuring time was about 8 h for a 2q range of 4–85�.
A Le Bail fit was done to determine the peak profile.
The lattice parameters changed only slightly during this
step. The Rietveld refinement was started by refining the
scaling factor only. In a second step restraints were set up
for bond lengths and angles as well as for planar groups
(Fig. 3).
During the following steps the atomic positions (except
for hydrogen atoms) and thereafter the cell parameters
32 M. U. Schmidt, C. Buchsbaum, J. M. Schnorr et al.
Fig. 4. Rietveld plot of P. O. 5; crosses:observed, continous line: calculated,dashed line: background, difference profileat the bottom.
Fig. 5. View along [001].
94

Th
is article is pro
tected b
y Germ
an co
pyrig
ht law
. Yo
u m
ay cop
y and
distrib
ute th
is article for yo
ur p
erson
al use o
nly. O
ther u
se is on
ly allow
ed w
ith w
ritten p
ermissio
n b
y the co
pyrig
ht h
old
er.
were refined, too. The restraints weight factor was gradu-
ally decreased during the refinement. Subsequently the po-
sitions of the hydrogen atoms were included, and the pro-
file parameters were successively refined. The Rietveld
refinement converged with Rp ¼ 2:19%, wRp ¼ 3:11%,
RF2 ¼ 17:39% and red. c2 ¼ 3:838. Crystallographic de-
tails are given in Tables 1 and 21. The Rietveld plot is
shown in Fig. 4. Both the R-values and the smooth differ-
ence curve show that the refined structure closely matches
the experimental data.
The crystal structure of P.O. 5. consists of almost pla-
nar molecules, as it was found also for other b-naphtholazo pigments [10, 21, 22]. In P.O. 5 the molecules form
stacks along the c axis. The normal vector of the molecule
is slightly tilted against the c direction, leading to the for-
mation of weakly undulating layers (Figs. 5–7).
This work is another example, which shows that it is
possible to determine organic crystal structure from lab
powder data, even without indexing.
References
[1] Lauch, R.: Deutsche Gesellschaft fur Anilin-Fabrikation in Trep-tow bei Berlin. Deutsches Reichspatent No. 217266 (1907).Reprinted in: Fortschritte der Teerfarbenfabrikation. Springer-Verlag, Berlin, Vol. 9 (1911), p. 418.
[2] N. N.: Konstitutions-Tabellen neuerer Konkurrenz-Farbstoffe.
Edited by Farbwerke vormals Meister Lucius & Bruning,Hochst am Main (1911), p. 7.
[3] British intelligence objectives sub-committee. Vol. 1661: “Ger-
man organic pigments and lake dyestuffs”, Technical Information& Documents Unit, London (1946), pp. 94–95 and 135–136.
[4] Herbst, W., Hunger, K.: Industrial Organic Pigments, 3rd ed.Weinheim: Wiley-VCH, (2004).
[5] Schmidt, M. U.; Englert, U.: Prediction of Crystal Structures. J.Chem. Soc. Dalton Trans. (1996) 2077–2082.
[6] Schmidt, M. U.: Crystal Structures of Organic Pigments Deter-
mined from X-ray Powder Data. In Colour Science ’98, Vol. 1:Dye and Pigment Chemistry. (Ed. Griffiths, J.) pp. 72–81. Univ.
of Leeds, England, (1999).[7] Schmidt, M. U.; Dinnebier, R. E.: Combination of Energy Mini-
mizations and Rigid Body Rietveld Refinement: The Structure of
2,5-Dihydroxy-benzo[de]benzo[4,5]-imidazo[2,1-a]isoquinolin-7-one. J. Appl. Cryst. 32 (1999) 178–186.
[8] Schmidt, M. U.; Dinnebier, R. E.: Determination of the structureof the violet pigment C22H12Cl2N6O4 from a non-indexed X-ray
powder diagram. Acta Cryst. B61 (2005) 37–45.[9] Erk, P.: Crystal Design of High Performance Pigments. In: High
Performance Pigments. (Ed. by Smith, H. M.) pp. 103–123.
Weinheim: Wiley-VCH, (2002).[10] Schmidt, M. U.; Hofmann, D. W. M.; Buchsbaum, C.; Metz, H.
J.: Kristallstrukturen von Pigment Red 170 und Derivaten, be-stimmt aus Rontgenpulverdiagrammen. Angew. Chem. 118 (2006)
1335–1340; Angew. Chem. Int. Ed. 45 (2006) 1313–1317.[11] Hofmann, D. W. M.; Kuleshova, L.: New similarity index for
crystal structure determination from X-ray powder diagrams. J.
Appl. Cryst. 38 (2005) 861–866.[12] Hofmann, D. W. M.; Apostolakis, J.: Crystal structure prediction
by data mining. J. Mol. Struct. (Theochem) 647 (2003) 17–39.[13] Hofmann, D. W. M.; Kuleshova, L. N.; Antipin, M. Yu.: Supra-
molecular Synthons and Crystal Structure Prediction of Organ-ic Compounds. Crystal Growth & Design 4 (2004) 1395–
1402.[14] Day, G. M.; Motherwell, W. D. S.; Ammon, H. L.; Boerrigter,
S. X. M.; Della Valle, R. G.; Venuti, E.; Dzyabchenko, A.; Du-
nitz, J. D.; Schweizer, B.; van Eijck, B. P.; Erk, P.; Facelli, J. C.;Bazterra, V. E., Ferraro, M. B., Hofmann, D. W. M.; Leusen,
F. J. J.; Liang, C.; Pantelides, C. C.; Karamertzanis, P. G.; Price,S. L.; Lewis, T. C.; Nowell, H.; Torrisi, A.; Scheraga, H. A.;
Arnautova, Y. A.; Schmidt, M. U.; Verwer, P.: A third blind test
of crystal structure prediction. Acta Cryst. B61 (2005) 511–527.
[15] Mayo, S. L.; Olafson, B. D.; Goddard, W. A. III.: DREIDING: ageneric force field for molecular simulations. J. Phys. Chem.
(1990) 8897–8909.[16] Gasteiger, J.; Marsili, M.: Iterative partial equalization of orbital
electronegativity – a rapid access to atomic charges. Tetrahe-
dron 36 (1980) 3219–3222.[17] Cambridge Structural Database, Cambridge Crystallographic
Data Centre, Cambridge, England, 2006.[18] Schmidt, M. U.: Kristallstrukturberechnungen metallorganischer
Molekulverbindungen. Aachen: Verlag Shaker (1995). (ISBN3-8265-0588-3), p. 43.
[19] Boultif, A.; Louer, D.: Powder pattern indexing with the dichot-
omy method. J. Appl. Cryst. 37 (2004) 724–731.[20] Larson, A. C.; Von Dreele, R. B.: General Structure Analysis
System (GSAS). Los Alamos National Laboratory ReportLAUR (1994) 86–748.
[21] Kobelt, D.; Paulus, E. F.; Kunstmann, W.: Rontgeneinkristall-
strukturanalyse von 1-(2,5-dichlorphenylazo)-2-hydroxy-3-naphthoesaure-(4-chlor-2,5-dimethoxy-anilid) (Chlorderivat von
Permanentbraun FG). Acta Cryst. B28 (1972) 1319–1324.[22] Gilli, P.; Bertolasi, V.; Pretto, L.; Lycka, A.; Gilli, G.: The
Nature of Solid-State N––H � � � O/O––H � � � N Tautomeric Com-petition in Resonant Systems. Intramolecular Proton Trans-
fer in Low-Barrier Hydrogen Bonds Formed by the
� � � O¼C––C¼N––NH � � � Ð � � � HO––C¼C––N¼N � � � Ketohy-drazone-Azoenol System. A Variable-Temperature X-ray Crystal-
lographic and DFT Computational Study. J. Am. Chem. Soc.124 (2002) 13554–13567.
Pigment Orange 5 33
Fig. 6. View along [010].
Fig. 7. View along [041].
1 Supplementary Material: Crystallographic data (excluding struc-ture factors) for the structures reported in this paper have been depos-ited with the Cambridge Crystallographic Data Centre as supplemen-tary publication no. 601924. Copies of available material can beobtained, free of charge via www.ccdc.cam.ac.uk/data_request/cif, bye-mailing [email protected], or by contacting the Cam-bridge Crystallographic Data Centre, 12, Union Road, CambridgeCB2 1EZ, UK; fax: þ44 1223 336033. The list of measured powderdata is available from the author up to one year after the publicationhas appeared.
95

B.4 Pigment Yellow 213
[CB4] M. U. Schmidt, S. Brühne, A. K. Wolf, A. Rech, J. Brüning, E. Alig, L. Fink, C.Buchsbaum, J. Glinnemann, J. van de Streek, F. Gozzo, M. Brunelli, F. Stowasser,T. Gorelik, E. Mugnaioli, U. Kolb, „Electron diffraction, X-ray powder diffraction andpair-distribution-function analyses to determine the crystal structures of PigmentYellow 213, C23H21N5O9“, Acta Crystallographica Section B 2009, 65, 189–199.
Mit freundlicher Abdruckgenehmigung des Verlages Wiley-VCH.
doi:10.1107/S0108768109003759
96
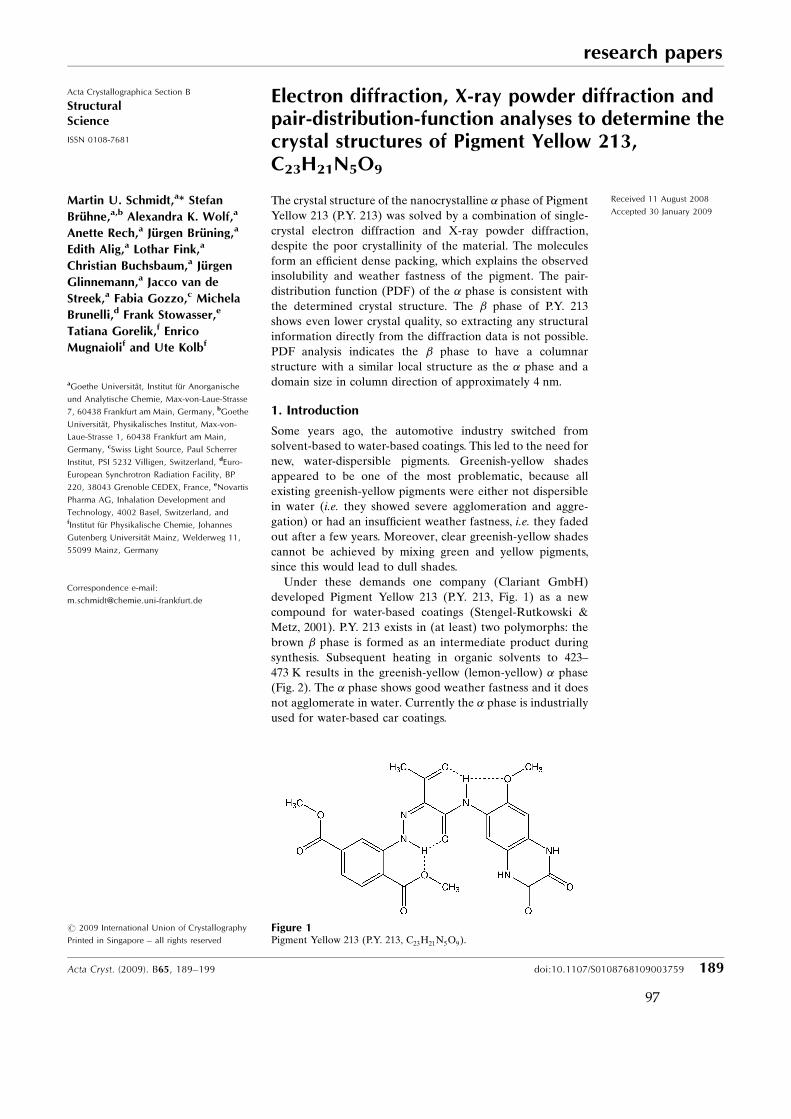
research papers
Acta Cryst. (2009). B65, 189–199 doi:10.1107/S0108768109003759 189
Acta Crystallographica Section B
StructuralScience
ISSN 0108-7681
Electron diffraction, X-ray powder diffraction andpair-distribution-function analyses to determine thecrystal structures of Pigment Yellow 213,C23H21N5O9
Martin U. Schmidt,a* Stefan
Bruhne,a,b Alexandra K. Wolf,a
Anette Rech,a Jurgen Bruning,a
Edith Alig,a Lothar Fink,a
Christian Buchsbaum,a Jurgen
Glinnemann,a Jacco van de
Streek,a Fabia Gozzo,c Michela
Brunelli,d Frank Stowasser,e
Tatiana Gorelik,f Enrico
Mugnaiolif and Ute Kolbf
aGoethe Universitat, Institut fur Anorganische
und Analytische Chemie, Max-von-Laue-Strasse
7, 60438 Frankfurt am Main, Germany, bGoethe
Universitat, Physikalisches Institut, Max-von-
Laue-Strasse 1, 60438 Frankfurt am Main,
Germany, cSwiss Light Source, Paul Scherrer
Institut, PSI 5232 Villigen, Switzerland, dEuro-
European Synchrotron Radiation Facility, BP
220, 38043 Grenoble CEDEX, France, eNovartis
Pharma AG, Inhalation Development and
Technology, 4002 Basel, Switzerland, andfInstitut fur Physikalische Chemie, Johannes
Gutenberg Universitat Mainz, Welderweg 11,
55099 Mainz, Germany
Correspondence e-mail:
# 2009 International Union of Crystallography
Printed in Singapore – all rights reserved
The crystal structure of the nanocrystalline � phase of Pigment
Yellow 213 (P.Y. 213) was solved by a combination of single-
crystal electron diffraction and X-ray powder diffraction,
despite the poor crystallinity of the material. The molecules
form an efficient dense packing, which explains the observed
insolubility and weather fastness of the pigment. The pair-
distribution function (PDF) of the � phase is consistent with
the determined crystal structure. The � phase of P.Y. 213
shows even lower crystal quality, so extracting any structural
information directly from the diffraction data is not possible.
PDF analysis indicates the � phase to have a columnar
structure with a similar local structure as the � phase and a
domain size in column direction of approximately 4 nm.
Received 11 August 2008
Accepted 30 January 2009
1. Introduction
Some years ago, the automotive industry switched from
solvent-based to water-based coatings. This led to the need for
new, water-dispersible pigments. Greenish-yellow shades
appeared to be one of the most problematic, because all
existing greenish-yellow pigments were either not dispersible
in water (i.e. they showed severe agglomeration and aggre-
gation) or had an insufficient weather fastness, i.e. they faded
out after a few years. Moreover, clear greenish-yellow shades
cannot be achieved by mixing green and yellow pigments,
since this would lead to dull shades.
Under these demands one company (Clariant GmbH)
developed Pigment Yellow 213 (P.Y. 213, Fig. 1) as a new
compound for water-based coatings (Stengel-Rutkowski &
Metz, 2001). P.Y. 213 exists in (at least) two polymorphs: the
brown � phase is formed as an intermediate product during
synthesis. Subsequent heating in organic solvents to 423–
473 K results in the greenish-yellow (lemon-yellow) � phase
(Fig. 2). The � phase shows good weather fastness and it does
not agglomerate in water. Currently the � phase is industrially
used for water-based car coatings.
Figure 1Pigment Yellow 213 (P.Y. 213, C23H21N5O9).
97
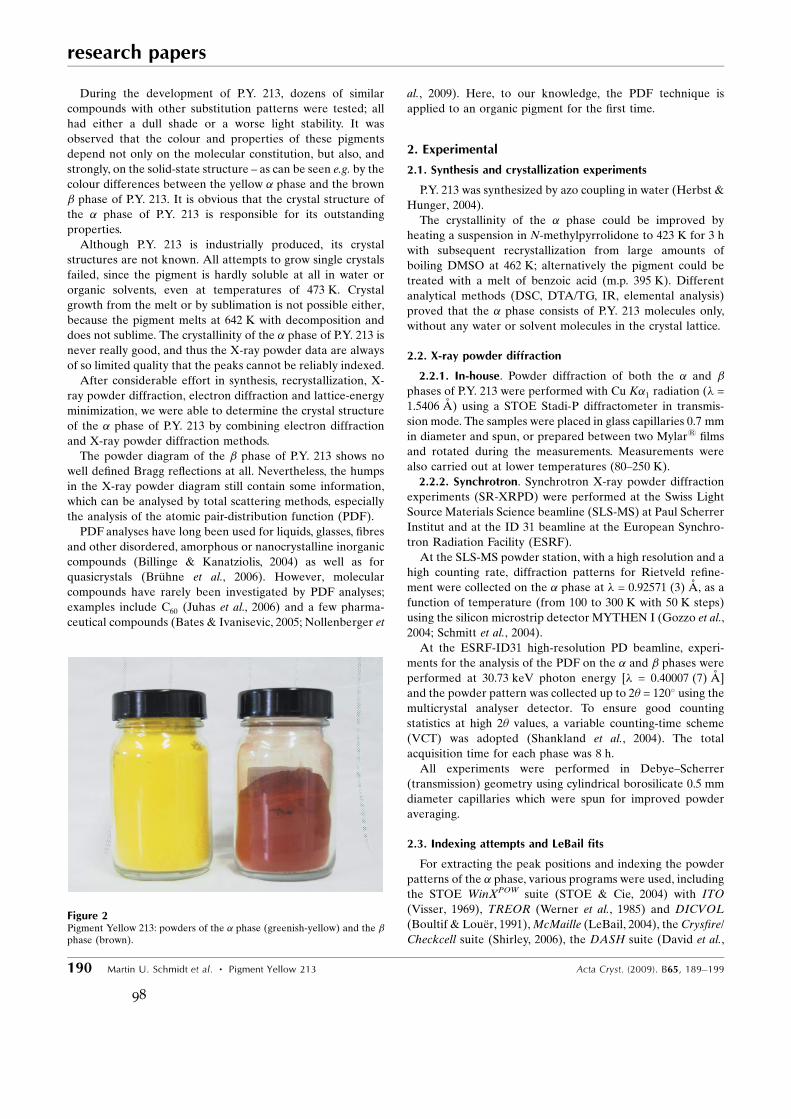
During the development of P.Y. 213, dozens of similar
compounds with other substitution patterns were tested; all
had either a dull shade or a worse light stability. It was
observed that the colour and properties of these pigments
depend not only on the molecular constitution, but also, and
strongly, on the solid-state structure – as can be seen e.g. by the
colour differences between the yellow � phase and the brown
� phase of P.Y. 213. It is obvious that the crystal structure of
the � phase of P.Y. 213 is responsible for its outstanding
properties.
Although P.Y. 213 is industrially produced, its crystal
structures are not known. All attempts to grow single crystals
failed, since the pigment is hardly soluble at all in water or
organic solvents, even at temperatures of 473 K. Crystal
growth from the melt or by sublimation is not possible either,
because the pigment melts at 642 K with decomposition and
does not sublime. The crystallinity of the � phase of P.Y. 213 is
never really good, and thus the X-ray powder data are always
of so limited quality that the peaks cannot be reliably indexed.
After considerable effort in synthesis, recrystallization, X-
ray powder diffraction, electron diffraction and lattice-energy
minimization, we were able to determine the crystal structure
of the � phase of P.Y. 213 by combining electron diffraction
and X-ray powder diffraction methods.
The powder diagram of the � phase of P.Y. 213 shows no
well defined Bragg reflections at all. Nevertheless, the humps
in the X-ray powder diagram still contain some information,
which can be analysed by total scattering methods, especially
the analysis of the atomic pair-distribution function (PDF).
PDF analyses have long been used for liquids, glasses, fibres
and other disordered, amorphous or nanocrystalline inorganic
compounds (Billinge & Kanatziolis, 2004) as well as for
quasicrystals (Bruhne et al., 2006). However, molecular
compounds have rarely been investigated by PDF analyses;
examples include C60 (Juhas et al., 2006) and a few pharma-
ceutical compounds (Bates & Ivanisevic, 2005; Nollenberger et
al., 2009). Here, to our knowledge, the PDF technique is
applied to an organic pigment for the first time.
2. Experimental
2.1. Synthesis and crystallization experiments
P.Y. 213 was synthesized by azo coupling in water (Herbst &
Hunger, 2004).
The crystallinity of the � phase could be improved by
heating a suspension in N-methylpyrrolidone to 423 K for 3 h
with subsequent recrystallization from large amounts of
boiling DMSO at 462 K; alternatively the pigment could be
treated with a melt of benzoic acid (m.p. 395 K). Different
analytical methods (DSC, DTA/TG, IR, elemental analysis)
proved that the � phase consists of P.Y. 213 molecules only,
without any water or solvent molecules in the crystal lattice.
2.2. X-ray powder diffraction
2.2.1. In-house. Powder diffraction of both the � and �
phases of P.Y. 213 were performed with Cu K�1 radiation (� =
1.5406 A) using a STOE Stadi-P diffractometer in transmis-
sion mode. The samples were placed in glass capillaries 0.7 mm
in diameter and spun, or prepared between two Mylar1 films
and rotated during the measurements. Measurements were
also carried out at lower temperatures (80–250 K).
2.2.2. Synchrotron. Synchrotron X-ray powder diffraction
experiments (SR-XRPD) were performed at the Swiss Light
Source Materials Science beamline (SLS-MS) at Paul Scherrer
Institut and at the ID 31 beamline at the European Synchro-
tron Radiation Facility (ESRF).
At the SLS-MS powder station, with a high resolution and a
high counting rate, diffraction patterns for Rietveld refine-
ment were collected on the � phase at � = 0.92571 (3) A, as a
function of temperature (from 100 to 300 K with 50 K steps)
using the silicon microstrip detector MYTHEN I (Gozzo et al.,
2004; Schmitt et al., 2004).
At the ESRF-ID31 high-resolution PD beamline, experi-
ments for the analysis of the PDF on the � and � phases were
performed at 30.73 keV photon energy [� = 0.40007 (7) A]
and the powder pattern was collected up to 2� = 120� using the
multicrystal analyser detector. To ensure good counting
statistics at high 2� values, a variable counting-time scheme
(VCT) was adopted (Shankland et al., 2004). The total
acquisition time for each phase was 8 h.
All experiments were performed in Debye–Scherrer
(transmission) geometry using cylindrical borosilicate 0.5 mm
diameter capillaries which were spun for improved powder
averaging.
2.3. Indexing attempts and LeBail fits
For extracting the peak positions and indexing the powder
patterns of the � phase, various programs were used, including
the STOE WinXPOW suite (STOE & Cie, 2004) with ITO
(Visser, 1969), TREOR (Werner et al., 1985) and DICVOL
(Boultif & Louer, 1991),McMaille (LeBail, 2004), the Crysfire/
Checkcell suite (Shirley, 2006), the DASH suite (David et al.,
research papers
190 Martin U. Schmidt et al. � Pigment Yellow 213 Acta Cryst. (2009). B65, 189–199
Figure 2Pigment Yellow 213: powders of the � phase (greenish-yellow) and the �phase (brown).
98
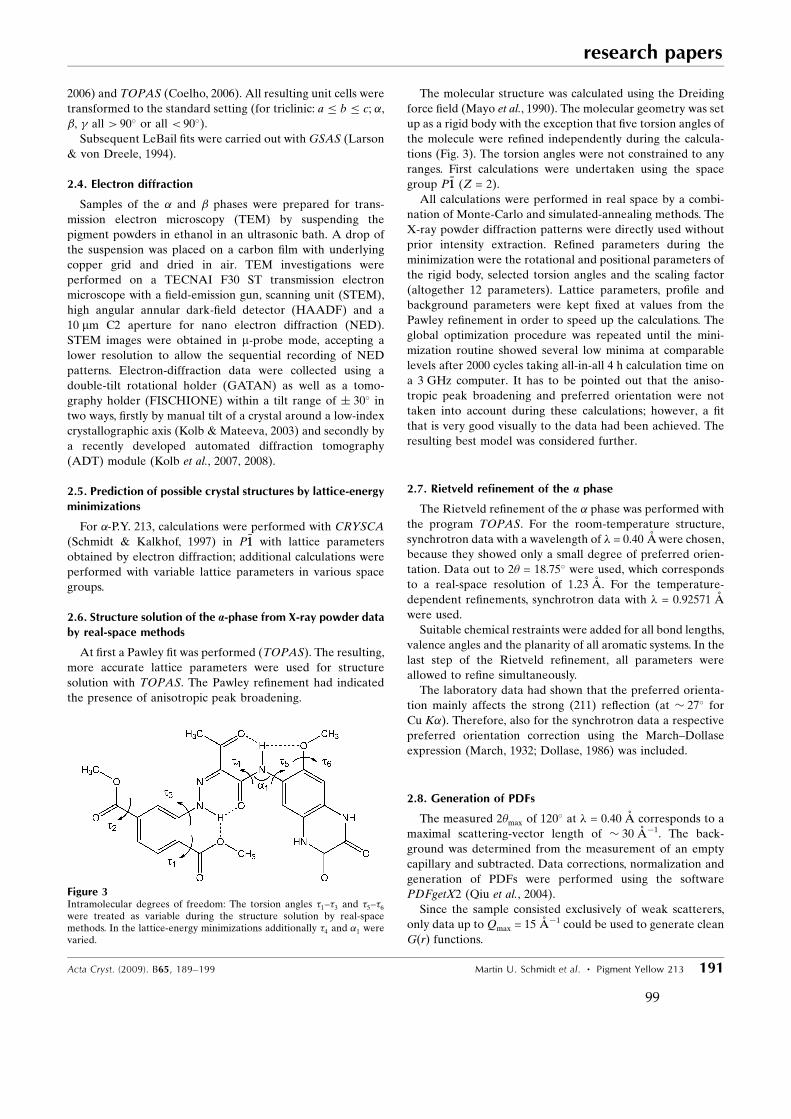
2006) and TOPAS (Coelho, 2006). All resulting unit cells were
transformed to the standard setting (for triclinic: a � b � c; �,
�, all > 90� or all < 90�).
Subsequent LeBail fits were carried out withGSAS (Larson
& von Dreele, 1994).
2.4. Electron diffraction
Samples of the � and � phases were prepared for trans-
mission electron microscopy (TEM) by suspending the
pigment powders in ethanol in an ultrasonic bath. A drop of
the suspension was placed on a carbon film with underlying
copper grid and dried in air. TEM investigations were
performed on a TECNAI F30 ST transmission electron
microscope with a field-emission gun, scanning unit (STEM),
high angular annular dark-field detector (HAADF) and a
10 mm C2 aperture for nano electron diffraction (NED).
STEM images were obtained in m-probe mode, accepting a
lower resolution to allow the sequential recording of NED
patterns. Electron-diffraction data were collected using a
double-tilt rotational holder (GATAN) as well as a tomo-
graphy holder (FISCHIONE) within a tilt range of � 30� in
two ways, firstly by manual tilt of a crystal around a low-index
crystallographic axis (Kolb & Mateeva, 2003) and secondly by
a recently developed automated diffraction tomography
(ADT) module (Kolb et al., 2007, 2008).
2.5. Prediction of possible crystal structures by lattice-energy
minimizations
For �-P.Y. 213, calculations were performed with CRYSCA
(Schmidt & Kalkhof, 1997) in P�11 with lattice parameters
obtained by electron diffraction; additional calculations were
performed with variable lattice parameters in various space
groups.
2.6. Structure solution of the a-phase from X-ray powder data
by real-space methods
At first a Pawley fit was performed (TOPAS). The resulting,
more accurate lattice parameters were used for structure
solution with TOPAS. The Pawley refinement had indicated
the presence of anisotropic peak broadening.
The molecular structure was calculated using the Dreiding
force field (Mayo et al., 1990). The molecular geometry was set
up as a rigid body with the exception that five torsion angles of
the molecule were refined independently during the calcula-
tions (Fig. 3). The torsion angles were not constrained to any
ranges. First calculations were undertaken using the space
group P�11 (Z = 2).
All calculations were performed in real space by a combi-
nation of Monte-Carlo and simulated-annealing methods. The
X-ray powder diffraction patterns were directly used without
prior intensity extraction. Refined parameters during the
minimization were the rotational and positional parameters of
the rigid body, selected torsion angles and the scaling factor
(altogether 12 parameters). Lattice parameters, profile and
background parameters were kept fixed at values from the
Pawley refinement in order to speed up the calculations. The
global optimization procedure was repeated until the mini-
mization routine showed several low minima at comparable
levels after 2000 cycles taking all-in-all 4 h calculation time on
a 3 GHz computer. It has to be pointed out that the aniso-
tropic peak broadening and preferred orientation were not
taken into account during these calculations; however, a fit
that is very good visually to the data had been achieved. The
resulting best model was considered further.
2.7. Rietveld refinement of the a phase
The Rietveld refinement of the � phase was performed with
the program TOPAS. For the room-temperature structure,
synchrotron data with a wavelength of � = 0.40 Awere chosen,
because they showed only a small degree of preferred orien-
tation. Data out to 2� = 18.75� were used, which corresponds
to a real-space resolution of 1.23 A. For the temperature-
dependent refinements, synchrotron data with � = 0.92571 A
were used.
Suitable chemical restraints were added for all bond lengths,
valence angles and the planarity of all aromatic systems. In the
last step of the Rietveld refinement, all parameters were
allowed to refine simultaneously.
The laboratory data had shown that the preferred orienta-
tion mainly affects the strong (211) reflection (at � 27� for
Cu K�). Therefore, also for the synchrotron data a respective
preferred orientation correction using the March–Dollase
expression (March, 1932; Dollase, 1986) was included.
2.8. Generation of PDFs
The measured 2�max of 120� at � = 0.40 A corresponds to a
maximal scattering-vector length of � 30 Aÿ1. The back-
ground was determined from the measurement of an empty
capillary and subtracted. Data corrections, normalization and
generation of PDFs were performed using the software
PDFgetX2 (Qiu et al., 2004).
Since the sample consisted exclusively of weak scatterers,
only data up to Qmax = 15 Aÿ1 could be used to generate clean
GðrÞ functions.
research papers
Acta Cryst. (2009). B65, 189–199 Martin U. Schmidt et al. � Pigment Yellow 213 191
Figure 3Intramolecular degrees of freedom: The torsion angles �1–�3 and �5–�6were treated as variable during the structure solution by real-spacemethods. In the lattice-energy minimizations additionally �4 and �1 werevaried.
99

3. Results and discussion
3.1. a phase
3.1.1. Synthesis and crystallization experiments. The crys-
tallinity of �-P.Y. 213 could be improved by recrystallizing P.Y.
213 from boiling DMSO and suspension treatment in molten
benzoic acid. The resulting powder diagram is shown in Fig. 4.
3.1.2. Indexing attempts and LeBail fits. Indexing was
extensively tried on different laboratory and synchrotron X-
ray powder diagrams from different samples. Various triclinic
and monoclinic unit cells were suggested, but it was not
possible to determine which was the correct one. Even
extensive LeBail fits with GSAS did not help: LeBail fits with
considerably different unit cells gave similar R values, but
none of the fits were really convincing. Therefore, we used
electron diffraction to determine the lattice parameters.
3.1.3. Determination of lattice parameters by electron
diffraction. The crystallites of �-P.Y. 213 are platelets with a
lateral size of 0.5–2 mm (Fig. 5). The material was fairly stable
under electron radiation: the crystals could tolerate an elec-
tron dose rate of 10–15 e Aÿ2 sÿ1.
Electron-diffraction patterns were collected around several
low-index axes by manual tilt. Fig. 6 shows two selected
patterns of the main crystallographic zones [001] and [010],
from which the reciprocal lattice parameters a�, b�, c�, �� and
� could be measured directly. Using least-squares refinement
(CRISP; Hovmoller, 1992) to minimize the statistical error in
the angle determination, the values for �� and � could be
determined with an error of less than 0.5�. Due to the platelet
morphology, the crystallites have a strong preferred orienta-
tion, therefore the [100] crystallographic zone was not acces-
sible, and the angle �� could not be measured directly. Its
value was determined from Vainstein plots (Vainstein, 1964;
Kolb & Gorelik, 2005) built from three-dimensional diffrac-
tion data. The corresponding lattice parameters in direct space
are listed in Table 1.
Alternatively, the lattice parameters were accessed through
a tilt (tilting interval of � 30�, step size of 1�) of the crystal
around an arbitrary axis, whereby diffraction patterns were
collected automatically using an automated diffraction tomo-
graphy (ADT) module. Fig. 6(c) shows an integrated diffrac-
tion volume viewed along the [001] direction: periodic rows of
reflections are clearly seen. After the data were carefully
examined for consistency, unit-cell parameters were deter-
mined using the previously reported procedure (Kolb et al.,
2008). The parameters found from ADT data are included in
Table 1. The determined parameters are comparable with
those obtained by manual tilting. Apparently, the � angle is
still difficult to determine precisely.
3.1.4. Prediction of possible crystal structures by lattice-
energy minimizations. In our attempts to solve the crystal
structure of �-P.Y. 213, we
predicted structures using global
lattice-energy minimization. This
procedure has repeatedly been
used to solve organic crystal
structures from unindexed X-ray
powder data (Hofmann & Kule-
shova, 2005; Schmidt et al., 2005,
2006a,b; Paulus et al., 2007).
For P.Y. 213, one of the
resulting low-energy structures
looked promising in terms of
molecular packing and inter-
molecular hydrogen bonds, and
had a simulated powder diagram
similar to the experimental
diagram of the � phase. The
subsequent Rietveld refinement
with GSAS converged with a
nearly acceptable fit. However, a
research papers
192 Martin U. Schmidt et al. � Pigment Yellow 213 Acta Cryst. (2009). B65, 189–199
Figure 4Pigment Yellow 213: X-ray powder diagrams of the � phase (blue, lowerline) and the � phase (red, upper line); Cu K�1 radiation, � = 1.5406 A.This figure is in colour in the electronic version of this paper.
Figure 5(a) TEM photograph of �-P.Y. 213. The platelet morphology is apparent; (b) m-STEM image (inverted) of�-P.Y. 213 with needle-shaped crystals.
100

Rietveld refinement is not always definite proof for the
correctness of a crystal structure, especially if the powder data
are of limited quality (Buchsbaum & Schmidt, 2007). For �-
P.Y. 213 a comparison of simulated and experimental electron-
diffraction intensities revealed that the calculated structure
was not the correct one.
After the structure had been solved by TOPAS (see x3.1.5),
it turned out that the lattice-energy minimizations failed
because the molecule shows an unusual conformation which
was not included in the minimizations. This results in a
different molecular shape, which considerably changes the
crystal structure and the lattice energies.
3.1.5. Structure solution from X-ray powder data by real-
space methods. The crystal structure of the � phase could
finally be solved by real-space methods using recent devel-
opments of the program TOPAS. The quality of the labora-
tory data turned out to be fully sufficient. From the various
indexing suggestions, one was chosen which had lattice para-
meters similar to the values obtained by electron-diffraction
data (it was the indexing from DASH/DICVOL and TOPAS
on laboratory data). Although the LeBail fit with GSAS was
not convincing, the Pawley fit with TOPAS converged with
good agreement factors (�2 = 0.020, R0wp = 0.072, R0
p = 0.073;
the prime indicates background-subtracted values). The
structure solution trials converged with �2 = 5.4, R0wp = 0.227,
R0p = 0.219 (background-subtracted values). The resulting
molecular conformation was not the expected one: the
COOCH3 group neighbouring the NH group rotated by 180�.
In order to test the obtained structure, individual torsion
angles of the molecule were rotated by 180� off their orien-
tation and the minimization was repeated; for �1 (COOCH3
group) refinements were even carried out in steps of 30�. In no
case was a lower minimum obtained, thus proving the overall
conformation to be the correct one.
3.1.6. Rietveld refinement. For the Rietveld refinement,
synchrotron data were used. The refinement converged with a
smooth difference curve with �2 = 1.34, Rwp = 0.0312 and Rp =
0.0238 (without background subtraction), R0wp = 0.1746 and
R0p = 0.2610 (after background subtraction). The Rietveld plot
is shown in Fig. 7. Crystallographic data are given in Table 2.
Atomic coordinates are given in the supplementary material.1
Ultra-high-resolution powder diffraction patterns measured
at ESRF-ID31 with � = 1.53494 (4) A showed strong aniso-
tropic peak broadening; this points to anisotropic domain
sizes, as it is frequently observed in organic pigments and
other solids with large, almost planar molecules.
The temperature-dependent high-resolution synchrotron
data of the � phase collected at SLS showed no phase tran-
sition between 100 and 300 K, which confirms the results
obtained from the in-house data. Rietveld refinements were
made on all datasets (Table 3). The molecular arrangement
changed very slightly with decreasing temperature; however,
the overall packing arrangement remained the same and the
research papers
Acta Cryst. (2009). B65, 189–199 Martin U. Schmidt et al. � Pigment Yellow 213 193
Figure 6Electron-diffraction patterns of �-P.Y. 213: (a) [010] zone; (b) [001] zone; (c) three-dimensional fully integrated automated diffraction tomography(ADT) data projected along the c� direction.
Table 1Lattice parameters of �-P.Y. 213 at 293 K.
Electron diffraction,manual tilting
Electron diffraction,automated diffractiontomography (ADT)
Final values fromRietveld refinement
a (A) 6.83 7.0 (3) 6.9006 (3)b (A) 11.86 11.6 (6) 11.8347 (6)c (A) 14.31 13.8 (2) 14.0592 (7)� (�) ca 77 81.5 81.811 (4)� (�) 79.7 78.7 81.032 (9) (�) 86.1 86.3 87.542 (1)V (A3) 1114 1045 1122.32 (1)Spacegroup
P1 or P1 P1 or P1 P1
Z 2 2 2
Errors in lattice parameters from ADTwere calculated by the standard deviation of thecluster centre and refined vector position.
1 Supplementary data for this paper are available from the IUCr electronicarchives (Reference: OG5034). Services for accessing these data are describedat the back of the journal.
101

variations observed are just due to the volume contraction of
� 2.5% between 300 and 100 K.
3.1.7. Crystal structure of the a phase. The � polymorph of
P.Y. 213 crystallizes in P1, Z ¼ 2. The molecule is almost
planar. There are two intermolecular hydrogen bonds, both
involving the NH groups of the two cis-amide fragments of the
quinoxalinedione fragment: one of the NH groups forms an
intermolecular hydrogen bond with a C O group of a
neighbouring molecule, resulting in an eight-membered ring
across an inversion centre, as is frequently found for cis-amide
systems, e.g. in benzimidazolones (van de Streek et al., 2009).
The other NH group of the quinoxalinedione moiety forms a
second intermolecular hydrogen bond to a C O of the acetyl
fragment (Fig. 8). The remaining two NH groups form intra-
molecular hydrogen bonds to carbonyl groups, as is always
found for yellow azo pigments with acetoacetyl groups. The
intermolecular hydrogen bonds connect the molecules into
double chains running in the [011] direction. The chains
arrange in layers parallel to the (211) plane, with a layer
distance of 3.34 A (Fig. 9). It is this layer arrangement which
causes the strong intensity for the (211) peak in the X-ray
powder diagram. Molecules of successive layers are stacked on
top of each other, but rotated by 180�, and form columns along
the [100] direction. The layers are connected by van der Waals
and Coulomb interactions.
The most remarkable feature of the crystal structure is the
rare molecular conformation with an NH group forming an
intramolecular hydrogen bond to the OCH3 fragment of the
COOCH3 group (as shown in Fig. 1). In the Cambridge
Structural Database (CSD; Allen, 2002) there are 32 struc-
research papers
194 Martin U. Schmidt et al. � Pigment Yellow 213 Acta Cryst. (2009). B65, 189–199
Table 3Temperature dependence of the lattice parameters of �-P.Y. 213determined by Rietveld refinement.
100 K 200 K 300 K
a (A) 6.7716 (1) 6.8326 (1) 6.9034 (2)b (A) 11.7653 (3) 11.7988 (3) 11.8358 (3)c (A) 14.0269 (4) 14.0483 (3) 14.0628 (3)� (�) 82.209 (2) 81.997 (2) 81.796 (2)� (�) 81.394 (4) 81.155 (4) 81.016 (3) (�) 88.394 (4) 87.968 (5) 87.526 (5)V (A3) 1094.72 (5) 1108.04 (4) 1123.06 (5)
Table 2Experimental data for �-P.Y. 213 (Rietveld refinement at 293 K).
Crystal dataChemical formula C23H21N5O9
Mr 511.45Crystal system, space group Triclinic, P�11Temperature (K) 293a, b, c (A) 6.9006 (3), 11.8347 (6), 14.0592 (7)�, �, (�) 81.811 (4), 81.032 (9), 87.541 (10)V (A3) 1122.31 (10)Z 2Radiation type SynchrotronWavelength of incident radiation (A) 0.40007� (mmÿ1) 0.03Specimen shape, size (mm) Cylinder, 10 � 0.5
Data collectionDiffractometer High resolution (ID31, ESRF)Specimen mounting Borosilicate capillaryScan method ContinuousData-collection mode Transmission2� values (�) 2�min = 1.300, 2�max = 18.750, 2�step =
0.005
RefinementRp, Rwp, Rexp, �
2 0.261, 0.175, 0.130, 1.80Excluded region(s) NoneNo. of data points 5356No. of parameters 1375No. of restraints 159
Figure 7Rietveld plot of �-P.Y. 213 (� = 0.40 A). Calculated (red), observed (blue), and difference (black, below) profiles are shown. Reflection positions areshown as blue tick marks. This figure is in colour in the electronic version of this paper.
102

tures with NH groups neighbouring a COOCH3 group; in all
cases, a hydrogen bond to the C O fragment is formed. Fig. 8
suggests that this unusual conformation of P.Y. 213 is neces-
sary to allow close packing: If the COOCH3 group were
rotated by 180�, there would be an awkward gap in the crystal
structure that would be difficult to fill.
Fig. 8 also gives an explanation for the role of the COOCH3
and OCH3 groups in the crystal structure: These substituents
allow for an efficient packing: Changing e.g. the position of the
COOCH3 or OCH3 groups or substituting e.g. one of the
COOCH3 groups by a COOC2H5 group would result in steric
hindrance and consequently in a less dense packing. It is this
efficient, dense packing which explains the observed good
fastness properties of P.Y. 213.
3.2. b phase
The � phase of P.Y. 213 is a brown, metastable, nanocrys-
talline powder (see Fig. 5b). The powder diagram is included
in Fig. 4. All recrystallization attempts failed: either the
crystallinity did not change or the powder transformed to the
more stable � phase. Due to the low crystallinity of the �
phase, no indexing of the powder-diffraction data was
attempted.
No reliable information has yet been obtained by electron
diffraction.
Crystal-structure predictions were made by lattice-energy
minimizations with variable lattice parameters in various
space groups, but it was not possible to select which of the
calculated structures actually corresponds to the � phase.
To obtain structural information on the � phase, we used
the pair-distribution-function analysis.
3.3. Pair-distribution-function analysis of the a and b phases
3.3.1. PDF analysis of the a phase. The atomic pair-distri-
bution function (PDF) represents the probability to find two
atoms separated by a distance r (Egami & Billinge, 2003).
For the PDF analyses of �-P.Y. 213, high-resolution
synchrotron data were used (Figs. 10a and b). After data
correction and normalization, the reduced structure function
FðQÞ was obtained, see Fig. 10(c). This figure reveals simila-
rities in FðQÞ for the � and � polymorphs of P.Y. 213 which are
not revealed by conventional (not normalized, low Q) powder
diffractograms IðQÞ: the general appearances of the two
curves with Q and the oscillations are clearly related.
The PDF of the � phase of P.Y. 213 is shown in Fig. 11(a).
The first peak includes the C—C, C—O and C—N distances,
the second peak the 1,3- and 1,4-distances. From the third
peak on, intermolecular distances are also included. The
characteristic feature is an oscillation of the PDF with a period
of � 3.3 A. This feature is caused by the molecular stacking:
The distance between neighbouring molecules in a column is
� 3.3 A; this distance occurs for many atoms and conse-
quently dominates the PDF. Perpendicular to the column
direction, the distribution of atom–atom distances is more
homogeneous and does not lead to a pronounced feature in
the PDF.
The oscillation in the PDF still persists at r = 100 A (Fig.
11a). This indicates a long-range translational order in the
column direction, which is also confirmed by the small peak
width of the (211) reflection.
For quantitative analysis, model PDFs can be simulated
using (1)
GðrÞcalc ¼1
r
X
i
X
j
fifj
hf i2� �ðrÿ rijÞ
� �
ÿ 4�r�0; ð1Þ
where fi is the scattering factor of atom i and hf i2 is the
average scattering power of all atoms in the sample.
For a PDF refinement a reliability factor is defined by
RPDF ¼
PN
i¼1½GobsðriÞ ÿGcalcðriÞ�2
PN
i¼1 G2obsðriÞ
( )1=2
: ð2Þ
R values of PDF refinements
should never be mistaken for R
values from Rietveld or single-
crystal structure refinements!
The least-squares refinement
software PDFFIT (Proffen &
Billinge, 1999) was employed to fit
the model PDF of the � phase to
the experimental one using the
crystal structure determined from
X-ray powder data as a structural
model. At present a PDF fit for
organic molecules is hampered by
research papers
Acta Cryst. (2009). B65, 189–199 Martin U. Schmidt et al. � Pigment Yellow 213 195
Figure 9Crystal structure of the � phase of P.Y. 213. View along [011], showing the layer arrangement.
Figure 8Crystal structure of the � phase of P.Y. 213. View along [100].
103

the fact that (to our knowledge) all PDF software is dedicated
to inorganic materials and cannot yet handle rigid bodies,
constraints or restraints, which are required for the refinement
of organic compounds. Therefore, we refined only a scale
factor, and two parameters describing the PDF peak width
(Jeong et al., 1999). All lattice, positional and displacement
parameters were fixed to the values obtained from the Riet-
veld refinement.
The model PDF could be fitted to the measured GðrÞexp for
0.8 A < r< 32 A with an accuracy of RPDF = 0.389. The
resulting fit is shown in Fig. 11(b). The refinements are
summarized in Table 4.
Closer inspection of the fit in Fig. 11(b) reveals that there is
a larger difference for r< 13 A. Consequently, the r range was
split into two ranges, 0.8 < r< 13 and 13 < r< 32 A. Now
RPDF values are 0.465 for the low-r region and 0.234 for the
high r region (Fig. 11c). We conclude here that the average
long-range packing of the molecules is as found by Rietveld
analysis. The long-range averaging is accounted for by a �
value increased about by a factor of three. Assignment of
different displacement parameters to groups of atoms did not
improve the fit. It would be very advantageous to make a
combined Rietveld and PDF fit including restraints for the
molecular structure, but the software has still to be developed.
3.3.2. On the structure of the b phase. The � phase shows
only a few broad peaks in the X-ray powder pattern (Fig. 4),
nevertheless, the PDF contains valuable real-space informa-
tion on the local atomic structure. Fig. 12(a) plots the PDF up
to r = 100 A. Two features are apparent:
(i) The PDF oscillates with a period of � 3.3 A, as for the �
phase.
(ii) In contrast to the � phase, the PDF of the � phase is
damped to zero beyond r ’ 40 A.
Consequently, the molecules in the � phase should form
columnar stacks as in the � phase, but with a reduced coher-
ence length: after 30–40 A – i.e. about 10 molecules – the
translational order in column direction is interrupted either by
a crystal surface or by a severe lattice defect. Correspondingly,
the X-ray powder diagram does not show a sharp peak at d ’
3.3 A (corresponding to 2� = 7� for � = 0.4 A), but a broad
hump whereas the � phase shows a sharp peak. For large,
almost planar molecules like P.Y. 213 the domain sizes are
frequently strongly anisotropic, which is reflected in the
occurrence of both broader and sharper peaks in the powder
research papers
196 Martin U. Schmidt et al. � Pigment Yellow 213 Acta Cryst. (2009). B65, 189–199
Figure 10Synchrotron X-ray powder diffraction data used for the PDF analyses,measured with � = 0.40007 (7) A. (a) � phase; (b) � phase; (c) normalizedstructure function FðQÞ for the � phase (blue) and the � phase (red); notethat the abscissa is Q in Aÿ1. The similar general behaviour of the curvesFðQÞ with Q for � and � phases is apparent.
Table 4PDF refinement parameters for �- and �-P.Y. 213 obtained with PDFFIT,different r ranges, datasets atQmax = 15 Aÿ1; rcut = 1.8 A; � and ’ describethe PDF peak width.
Phase r range (A) R Scale factor � ’
� 0.8–32.0 0.389 0.83 (3) 0.29128 (4) 0.840 (13)0.8–4.0 0.406 0.97 (4) 0.29131 (2) 0.832 (7)0.8–7.0 0.452 0.99 (4) 0.29125 (3) 0.852 (10)0.8–10.0 0.469 0.88 (4) 0.29141 (3) 0.800 (7)0.8–13.0 0.465 0.88 (4) 0.29141 (3) 0.834 (9)13.0–32.0 0.234 0.8 (3) 1 (6) 0.8
� 0.8–4.0 0.391 1.05 (5) 0.29131 (2) 0.832 (7)0.8–7.0 0.463 0.98 (5) 0.29121 (4) 0.863 (13)0.8–10.0 0.485 0.92 (5) 0.29125 (4) 0.850 (13)0.8–13.0 0.561 0.84 (5) 0.29133 (4) 0.823 (13)
104

pattern. At lower 2� angles (1–2� for � ¼ 0:4 A) there are four
peaks which probably correspond to the lateral arrangement
of the columns. From their peak widths the domain size can be
estimated to be � 200–300 A. With a column diameter of 10–
15 A this domain size indicates a translational order of � 20
columns.
The PDFs of the � and the � phase are virtually identical for
r< 10 A, but the similarities cease beyond r> 13 A (Fig. 12b).
Hence the local structures of the � and the � phases should be
similar. This holds for the molecular structure (r = 0.9–18 A)
as well as for the arrangement of neighbouring molecules (r>
3.3 A). On the other hand, a change in the molecular
conformation (e.g. rotation of the COOCH3 group) has only a
minor effect on the PDF, thus it remains obscure if the
molecules in the � and � phases have the same conformations.
A refinement of the PDF of the � phase would require a
structural model. The actual crystal structure of the �-phase is
not known; but since the local structures of the phases are
similar, we tested to refine the PDF of the � phase using the
structural model of the � phase. The character of the PDF of
the � phase does not allow for reasonable refinements of the
range of 0.8 < r< 32 A, nor for 13 < r< 32 A. However, the
refinement for 0.8 < r< 10 A results in R = 0.485 (Table 4 and
Fig. 12c), which compares well to the corresponding region for
the � phase (R = 0.469). This confirms that the local structures
(r< 10 A) are similar. Beyond about r = 10 A, there are major
differences in the packings of the � and � phases.
4. Conclusions
The crystallinity of the � phase of P.Y. 213 is at the borderline
of being suitable for structure determination from X-ray
powder data using the classical approach via initial indexing.
Electron diffraction turned out to be a quite time-consuming,
but very valuable tool for structure solution: we finally
obtained the correct indexing from electron-diffraction tilting
series (although the lattice was triclinic); on the other hand,
the intensity data from electron diffraction were used to test
the correctness of structures proposed by lattice-energy
minimization. If we had not made a wrong assumption on the
molecular conformation, the structure of �-P.Y. 213 would
have been solved by the combination of electron diffraction
and crystal-structure prediction using lattice-energy mini-
mization. The final successful structure solution from labora-
tory X-ray powder data proved the power of today’s real-
space methods. The PDF analysis of the � phase is in agree-
ment with the crystal structure. Although the PDF refinement
was carried out with fixed atomic coordinates and lattice
parameters, the calculated and experimental PDF curves
match well. Software developments have to be carried out to
allow a PDF refinement of atomic coordinates for organic
compounds including rigid bodies and restraints for bond
lengths, bond angles and planar groups, as is available in
Rietveld programs nowadays.
The PDF analysis of the nanocrystalline �-phase revealed
that this phase adopts a columnar structure with a domain size
of below 4 nm in the column direction and a local structure
similar to the � phase. These results show that even a poor
powder diagram still contains information about the solid-
research papers
Acta Cryst. (2009). B65, 189–199 Martin U. Schmidt et al. � Pigment Yellow 213 197
Figure 11(a) PDForGðrÞ of �-P.Y. 213; (b) PDF fit in the range 0.8< r< 32 A; bluedots: experimental GðrÞ, red solid line: calculated GðrÞ (only threeparameters refined), bottom: difference curve; (c) independent PDF fitsfor the ranges 0.8 < r< 13 and 13 < r< 32 A. This figure is in colour inthe electronic version of this paper.
105

state structure of an organic compound, and this information
can be extracted by the PDF method. A PDF analysis for
organic crystals is far from being a routine method, but we are
convinced that an increasing number of solid-state structures
of nanocrystalline organic compounds will be investigated by
PDF analysis in the next decade.
The authors thank Tina Simon and Frank Becker (both:
Clariant GmbH, Frankfurt) for recrystallizations. We would
like to thank Andy Fitch (Grenoble) for his assistance in using
beamline ID31. Alke Meents (SLS, Villigen, now at DESY,
Hamburg) is acknowledged for investigating a microcrystal of
a solvate, Galina Mateeva (Gutenberg Universitat, Mainz) for
electron-diffraction investigations of the � phase, and Valeri
Petkov (Central Michigan University, USA) and Nadine
Rademacher (Goethe Universitat Frankfurt) for additional
PDF investigations. We acknowledge the European Synchro-
tron Radiation Facility (Grenoble) and the Swiss Light Source
(Villigen) for provision of synchrotron radiation facilities. This
work has been supported by Clariant Produkte (Deutschland)
GmbH, and the Deutsche Forschungsgemeinschaft in the
Sonderforschungsbereich 625 Project B8. We know that it is
not a requirement in Acta B, but for this publication I want to
clarify the roles of all individual authors, because it is not self-
explanatory. For example, I want to mention that it was not a
member of my group, but Frank Stowasser for Novartis, who
finally solved the structure from powder data. The authors of
this paper participated in the following way: recrystallizations
were performed by Anette Rech and Jurgen Bruning; X-ray
powder diffraction was performed by Edith Alig, synchrotron
measurements by Fabia Gozzo, Michela Brunelli, Stefan
Bruhne, Jurgen Glinnemann, Jurgen Bruning and Alexandra
K. Wolf. Indexing was attempted by Lothar Fink, Jurgen
Bruning and Christian Buchsbaum, the latter also performed
the LeBail fits with GSAS. Lattice-energy minimizations were
carried out by Alexandra K. Wolf and Martin U. Schmidt.
Electron diffraction was made by Tatiana Gorelik, Enrico
Mugnaioli and Ute Kolb. The structure was solved with
TOPAS by Frank Stowasser. The Rietveld refinement was
carried out by Jacco van de Streek, the refinement of the
temperature-dependent data by Frank Stowasser. The PDF
analysis was carried out by Stefan Bruhne.
References
Allen, F. H. (2002). Acta Cryst. B58, 380–388.Bates, S. & Ivanisevic, I. (2005). International Patent ApplicationPCT WO 2005082012 A2.
Billinge, S. J. L. & Kanatziolis, M. G. (2004). Chem. Commun. pp. 749–760.
Boultif, A. & Louer, D. (1991). J. Appl. Cryst. 24, 987–993.Bruhne, S., Uhrig, E., Kreiner, G. & Assmus, W. (2006). Philos. Mag.
86, 463–468.Buchsbaum, C. & Schmidt, M. U. (2007). Acta Cryst. B63, 926–932.Coelho, A. A. (2006). TOPAS Academic, Version 4.0, http://members.optusnet.com.au/~alancoelho/.
David, W. I. F., Shankland, K., van de Streek, J., Pidcock, E.,Motherwell, W. D. S. & Cole, J. C. (2006). J. Appl. Cryst. 39, 910–915.
research papers
198 Martin U. Schmidt et al. � Pigment Yellow 213 Acta Cryst. (2009). B65, 189–199
Figure 12(a) PDF or GðrÞ of �-P.Y. 213. (b) Comparison of PDFs for the � phase(blue) and � phase (red) in the region r< 40 A; note the localresemblance up to r ¼ 10 A. (c) PDF fit of the � phase (thick blue line)using the structural model of the � phase (thin red line) in the range 0.8< r< 13 A. This figure is in colour in the electronic version of this paper.
106

Dollase, W. A. (1986). J. Appl. Cryst. 19, 267–272.Egami, T. & Billinge, S. J. L. (2003). Underneath the Bragg Peaks.
Oxford: Pergamon Press.Gozzo, F., Schmitt, B., Bortolamedi, T., Giannini, C., Guagliardi, C.,Lange, M., Meister, D., Maden, D., Willmot, P. & Patterson, B. D.(2004). J. Alloys Compd. 362, 206–217.
Herbst, W. & Hunger, K. (2004). Industrial Organic Pigments, 3rd ed.Weinheim: Wiley-VCh.
Hofmann, D. W. M. & Kuleshova, L. (2005). J. Appl. Cryst. 38, 861–866.
Hovmoller, S. (1992). Ultramicroscopy, 41, 121–135.Jeong, I.-K., Proffen, T., Mohiuddin-Jacobs, F. & Billinge, S. J. L.(1999). J. Phys. Chem. A, 103, 921–924.
Juhas, P., Cherba, D. M., Duxburg, P. M., Punch, W. F. & Billinge,S. J. L. (2006). Nature, 440, 655–658.
Kolb, U. & Gorelik, T. (2005). Electron Crystallography, Vol. 211, pp.421–433. Dordrecht, The Netherlands: Kluwer AcademicPublishers.
Kolb, U., Gorelik, T., Kubel, C., Otten, M. T. & Hubert, D. (2007).Ultramicroscopy, 107, 507–513.
Kolb, U., Gorelik, T. & Otten, M. T. (2008). Ultramicroscopy, 108,763–772.
Kolb, U. & Mateeva, G. N. (2003). Z. Kristallogr. 218, 259–268.Larson, A. C. & von Dreele, R. B. (1994). GSAS. Report LAUR. LosAlamos National Laboratory, New Mexico, USA.
LeBail, A. (2004). Powder Diffr. 19, 249–254.March, A. (1932). Z. Kristallogr. 81, 285–297.Mayo, S. L., Olafson, B. D. & Goddard, W. A. III (1990). J. Phys.Chem. 94, 8897–8909.
Nollenberger, K., Gryczke, A., Meier, C., Dressman, J., Schmidt,M. U. & Bruhne, S. (2009). J. Pharm. Sci. 98, 1476–1486.
Paulus, E. F., Leusen, F. J. J. & Schmidt, M. U. (2007).CrystEngComm, 9, 131–143.
Proffen, T. & Billinge, S. J. L. (1999). J. Appl. Cryst. 32, 572–575.Qiu, X., Thompson, J. W. & Billinge, S. J. L. (2004). J. Appl. Cryst. 37,678.
Schmidt, M. U., Ermrich, M. & Dinnebier, R. E. (2005). Acta Cryst.
B61, 37–45.Schmidt, M. U., Hofmann, D. W. M., Buchsbaum, C. & Metz, H. J.(2006a). Angew. Chem. 118, 1335–1340.
Schmidt, M. U., Hofmann, D. W. M., Buchsbaum, C. & Metz, H. J.(2006b). Angew. Chem. Int. Ed. 45, 1313–1317.
Schmidt, M. U. & Kalkhof, H. (1997). CRYSCA. Frankfurt am Main,Germany.
Schmitt, B., Broennimann, C., Eikenberry, E. F., Huelsen, G.,Toyokawa, H., Horisberger, R., Gozzo, F., Patterson, B., Schulze-Briese, C. & Tomikazi, T. (2004). Nucl. Instrum. Methods Phys. Res.
Sect. A, 518, 436–439.Shankland, K., Markvardsen, A. J. & David, W. I. F. (2004). Z.Kristallogr. 219, 857.
Shirley, R. (2006). CRYSFIRE. University of Surrey, England.Stengel-Rutkowski, B. & Metz, H. J. (2001). Eur. Coat. 3, 126–129.
STOE & Cie (2004). WinXPOW. STOE and Cie, Darmstadt,Germany.
Streek, J. van de, Bruning, J., Ivashevskaya, S. N., Ermrich, M., Paulus,E. F., Bolte, M. & Schmidt, M. U. (2009). Acta Cryst. B65 200–211.
Vainstein, B. K. (1964). Structural Analysis by Electron Diffraction.
Oxford: Pergamon Press.Visser, J. W. (1969). J. Appl. Cryst. 2, 89–95.Werner, P.-E., Eriksson, L. & Westdahl, M. (1985). J. Appl. Cryst. 18,367–370.
research papers
Acta Cryst. (2009). B65, 189–199 Martin U. Schmidt et al. � Pigment Yellow 213 199
107

B.5 Pigment Yellow 101
[CB5] M. U. Schmidt, J. Brüning, C. Buchsbaum, E. Alig, L. Fink, „Crystal-structure deter-mination of the fluorescent bisazomethine pigment C36H26N4O4 from X-ray powderdata“, Zeitschrift für Kristallographie 2007, 222, 539–545.
Mit freundlicher Abdruckgenehmigung des Verlages Oldenbourg.
doi:10.1524/zkri.2007.222.10.539
108

Th
is article is pro
tected b
y Germ
an co
pyrig
ht law
. Yo
u m
ay cop
y and
distrib
ute th
is article for yo
ur p
erson
al use o
nly. O
ther u
se is on
ly allow
ed w
ith w
ritten p
ermissio
n b
y the co
pyrig
ht h
old
er.
Crystal-structure determination of the fluorescent bisazomethine
pigment C36H26N4O4 from X-ray powder data
Martin U. Schmidt*, Jurgen Bruning, Christian Buchsbaum, Edith Alig and Lothar Fink
University of Frankfurt, Institute of Inorganic and Analytical Chemistry, Max-von-Laue-Str. 7, 60438 Frankfurt am Main, Germany
Received April 5, 2007; June 8, 2007
Lattice energy minimisation / Fluorescence /
Rietveld refinement / Powder diffraction structure analysis /
X-ray diffraction / Pigment
Abstract. The compound C36H26N4O4, a derivative of
Pigment Yellow 101, is one of the few organic pigments
that show fluorescence in the solid state. Since single crys-
tals could not be grown, the structure was determined
from powder diffraction data. The X-ray powder pattern
could be indexed with an orthorhombic unit cell. The
space group remained ambiguous. The crystal structure
was solved by lattice energy minimisation in different
space groups using the program CRYSCA. Subsequently,
the structure was refined by the Rietveld method using
restraints. The compound crystallises in a herringbone
pattern in Pbcn with a ¼ 30.117(1) �A, b ¼ 9.723(2) �A,
c ¼ 9.511(3) �A, Z ¼ 4 with the molecule on an inversion
centre. The insolubility and the solid-state fluorescence
can be explained from the crystal structure.
1. Introduction
Most organic compounds that fluoresce in solution (e.g.
fluorescein) are not fluorescent in the solid state. Pigment
Yellow 101 (P.Y. 101, 2a) is the only commercial organic
yellow pigment that shows fluorescence as well in the
crystalline state [1]. Recently, the crystal structures of P.Y.
101 and its derivatives 2b–d were determined from single
crystal data [2, 3].
Quantum mechanical calculations (TDDFT/BP86/DZP)
of the excited states reveal that fluorescence can only oc-
cur if a hydrogen bond is formed between the substituent
R2 and the neighbouring nitrogen atom, i.e. if R2 ¼ OH
[3]. This was proven experimentally: the derivatives 2a
and 2c show fluorescence, whereas 2b and 2d do not.
Organic pigments are widely used for the colouration
of plastics, lacquers, and printing inks. For good applica-
tion properties, the pigments must be insoluble in these
media. In contrast, the compounds 2a–d show a non-neg-
ligible solubility in organic solvents. In order to reduce the
solubility we introduced two additional CO––NH––Ph
groups, resulting in compound 1 (3,30-phenylamido-2,20-
dihydroxy-1,10-naphthalazine, Fig. 2).
The synthesis of 1 [4–7] is shown in Fig. 3. Com-
pounds similar to 3 are commonly used for the syntheses
of industrial azo pigments.
As expected, the solubility of 1 in most organic sol-
vents was very low, even at 200 �C. Consequently, no sin-
gle crystals could be grown; therefore the crystal structure
was determined from powder diffraction data.
Z. Kristallogr. 222 (2007) 539–545 / DOI 10.1524/zkri.2007.222.10.539 539
# by Oldenbourg Wissenschaftsverlag, Munchen
* Correspondence author(e-mail: [email protected])
Fig. 1. Structure of Pigment Yellow 101 (2a) and its derivatives (2b–d).
Fig. 2. Structure of the investigated compound (1).
109

Th
is article is pro
tected b
y Germ
an co
pyrig
ht law
. Yo
u m
ay cop
y and
distrib
ute th
is article for yo
ur p
erson
al use o
nly. O
ther u
se is on
ly allow
ed w
ith w
ritten p
ermissio
n b
y the co
pyrig
ht h
old
er.
2. Crystallisation experiments
Despite the limited solubility of 1, we tried to recrystallise
the compound in order to get an X-ray powder diffraction
pattern of improved quality. Different crystallisation me-
thods were used including 1. recrystallisation from various
solvents and solvent mixtures by heating with subsequent
slow cooling, 2. diffusion by overlaying two solvents: one
solvent in which the investigated compound is soluble and
one anti-solvent [8], 3. diffusion of an anti-solvent via the gas
phase into a solution of the investigated compound. Alto-
gether about 180 experiments were carried out. Powder
diffraction patterns were recorded, and examined for poly-
morphs; all samples showed the same crystalline phase.
The sample that showed the best powder diffraction pat-
tern was obtained by recrystallisation: a mixture of 13.20 g
of 1 and 500 mL dimethylformamide was stirred under re-
flux for 30 minutes. After cooling to room temperature the
pigment was isolated by filtration, washed with dimethyl-
formamide and subsequently with methanol; the pigment
was dried at 80 �C in vacuo, yielding 9.07 g yellow fluores-
cent powder with a melting point of 336–337 �C. The che-
mical composition was confirmed by MALDI-MS.
3. X-ray powder diffraction
The samples were measured on a STOE STADI-P diffract-
ometer (Fa. STOE, Darmstadt [9]) with CuKa1 radiation
(curved Ge(111) primary monochromator; l ¼ 1.5406 �A)
in transmission geometry. The samples were prepared be-
tween two polyacetate-films. For the polymorph screening
an image-plate position sensitive detector was used with a
resolution 0.1� in 2q. The measurements were made in the
range between 0.6� and 74.6� in 2q with steps of 0.01�.
For data acquisition the STOE software WinXPOW was
used. For indexing and Rietveld refinement high resolu-
tion measurements were made. The sample showing the
highest degree of crystallinity was measured using a linear
position sensitive detector in the range between 2� and
80� in 2q (24 scans were collected and added).
4. Indexing
The data was unambiguously indexed with DICVOL 91
[10] using the STOE WinXPOW software. The resulting
lattice parameters were a ¼ 9.505 �A, b ¼ 9.730 �A,
c ¼ 30.124 �A, a ¼ b ¼ g ¼ 90�, V ¼ 2786 �A3. There were
no unindexed lines. The number of molecules per unit cell
can generally be estimated applying the rule of thumb
“18 �A3 per non-hydrogen atom” [11]. Organic pigments
generally show quite dense packings; the compounds 2a–
d had volume increments between 15.4 and 16.8 �A3 per
non-hydrogen-atom. Assuming a value of 16 �A3, for com-
pound 1 (C36H26N4O4) and a cell volume of 2786 �A3 a
number of Z ¼ 3.96 is calculated; i.e. the unit cell should
contain 4 molecules.
The possible space groups were determined from the
systematic extinctions, as far as visible in the powder dia-
gram. The following extinction rules could be observed:
hkl: none
0kl: k + l ¼ 2n
h0l: h ¼ 2n
hk0: ambiguous (only reflections 200 and 220 visible)
h00: h ¼ 2n
0k0: k ¼ 2n
00l: l ¼ 2n
These extinctions correspond to the extinction symbol
“Pna?”, where the question mark indicates that the sym-
metry elements in the [001] direction could not be deter-
mined; the extinction symbol may be Pna-, Pnaa, Pnab, or
Pnan. Consequently, the possible space groups are: Pna21,
Pnam (¼ Pnma), Pnaa (¼ Pccn), Pnab (¼ Pbcn), or
Pnan (¼ Pnna) [12]. But some other orthorhombic space
groups (e.g. Pn2n (¼ Pnn2)) could not be ruled out com-
pletely, since the determination of systematic extinctions
from medium-quality X-ray powder data should always be
regarded with caution.
The molecular symmetry could be as high as 2/m, if
the molecule is planar. Correspondingly, in the crystal
structure, the molecule could be situated on sites with
symmetries 2/m, 2, m, 1 or on a general position. A recent
statistical investigation shows that 95% of molecules with
2/m symmetry are located on inversion centres, of which
only 8% occupy a 2/m site [13].
In Pnma with Z ¼ 4 the molecules could be located
either on an inversion centre (Wyckoff positions 4a or 4b)
or on a mirror plane (Wyckoff position 4c). If the mole-
cules are situated on the inversion centres, there will be a
mirror plane between the molecules, which does not allow
for a close packing; consequently the occupancy of an in-
version centre in Pnma is extremely rare [14] and was not
further considered. For molecules with mirror symmetry,
the occupancy of mirror planes in Pnma is generally very
popular, hence this possibility was included in the calcula-
tions.
5. Structure solution by lattice energyminimisation
The structure of 1 was solved by lattice energy minimisa-
tion using the program CRYSCA [15–22]. CRYSCA per-
forms a global optimisation of the lattice energy (i.e. a
crystal structure prediction) with or without reference to
experimental data. Here, the lattice parameters were taken
540 M. U. Schmidt, J. Bruning, C. Buchsbaum et al.
Fig. 3. Synthesis of compound 1.
110

Th
is article is pro
tected b
y Germ
an co
pyrig
ht law
. Yo
u m
ay cop
y and
distrib
ute th
is article for yo
ur p
erson
al use o
nly. O
ther u
se is on
ly allow
ed w
ith w
ritten p
ermissio
n b
y the co
pyrig
ht h
old
er.
from the indexing and kept fixed. Since the space group
was not clear, separate calculations were run in Pbcn,
Pccn, Pnna (each with the molecules fixed on the inver-
sion centres), in Pnma with molecules on mirror planes,
and in Pna21 with molecules on general positions.
The molecular structure of 1 was constructed from sin-
gle crystal data of other molecules and standard fragments
from the CSD [23]. The naphthole–CH¼N––N¼CH–
naphthole moiety was taken from Pigment Yellow 101 [2],
and the geometry of the CO––NH––Ph group was taken
from Pigment Yellow 74 [24]. All hydrogen positions
were idealised with C––H bond lengths of 1.04 �A, and
O––H and N––H distances of 1.01 �A. For the possible
molecular conformations we looked at crystal structures
of similar molecules: the central moiety (naphthole–
CH¼N––N¼CH–naphthole) was assumed to be planar,
since this planarity is also observed for Pigment Yellow
101 and similar molecules, including azo pigments of the
type naphthole¼N––NH––Ph. From crystal structures of
other naphthoic acid anilides it is known that the phenyl
ring may be either coplanar to the naphthalene moiety or
rotated by up to about 30� around the CONH––Ph bond.
Hence this rotation was allowed during the lattice energy
optimisations. In Pbcn, Pccn, and Pnna, where the mole-
cule is situated on a crystallographic inversion centre, the
calculations were carried out using half a molecule, and
the molecule was fixed at the inversion centre using a
dummy atom.
The lattice energy was calculated by the formula:
E ¼1
2
P
i
P
j
�Aijr�6ij þ Bij e
�Cijrij þ1
4p ee0
qiqj
rij
� �
þ Eintramol ð1Þ
with
i: all atoms of a reference molecule
j: all atoms of all other molecules
rij: interatomic distance
A, B, C: Van der Waals parameters [15–18, 25]
q: atomic charges, calculated by the method of
[26]
e ¼ 1
Eintramol: intramolecular energy
For the intramolecular energy we used a torsion potential
of
EintramolðjÞ ¼ kj2 ð2Þ
with k ¼ 0.0025 kJ � mol–1 � degree–2, and j being the di-
hedral angle of the CONH––Ph group defined by the
atoms C12––N13––C14––C15. If the molecule is located
on an inversion centre, the values for j are identical for
both CONH––Ph groups, whereas for calculations in
Pna21 both j values could be different. In Pnma, j must
be zero.
The calculations started from a set of a few thousands
of crystal structures with random molecular orientations
and random values for j; for the Pna21 run also the mole-
cular position, given by (xm, ym, zm) was randomly gener-
ated, except for the zm parameter, which is free in Pna21;
in Pnma the molecule is situated on the mirror plane, hence
only xm, zm and the rotation around [010] were varied. The
crystal structures were optimised by a special steepest des-
cent algorithm down to a maximum shift of 0.0001 �A.
The resulting structures were sorted according to energy
and manually checked for higher symmetries. Higher sym-
metries were only found for calculations in Pna21: Several
packings showed additional inversion symmetry, resulting
in space groups Pbcn, Pccn, or Pnna.
No reasonable crystal structures were found in Pnma,
because with molecules on mirror planes (Wyckoff posi-
tion 4c), the y coordinates of all atoms must be 1=4 or 3=4,and with a b-axis of more than 30 �A and a molecular thick-
ness of less than 4 �A all packings have much empty space
between the molecules in the [010] direction, whereas the
atoms overlap in the [100] and [001] directions.
The lowest energy packings of each space group are
summarised in Table 1.
Structure determination of the fluorescent bisazomethine pigment C36H26N4O4 541
Fig. 4. Comparison of calculated and experimental powder patterns.
Fig. 5. Structure of 1 calculated by energy minimisation, view direc-tion [010]; one molecule is highlighted.
111

Th
is article is pro
tected b
y Germ
an co
pyrig
ht law
. Yo
u m
ay cop
y and
distrib
ute th
is article for yo
ur p
erson
al use o
nly. O
ther u
se is on
ly allow
ed w
ith w
ritten p
ermissio
n b
y the co
pyrig
ht h
old
er.
In order to examine which of the low-energy structures
corresponds to the experimental structure, X-ray powder
diffraction patterns were simulated and compared with the
experimental powder diffraction data (Fig. 4).
The lowest-energy structure (Pbcn_1) seemed to match
best, but other structures, e.g. Pnna_1 could not be ruled
out. Upon Rietveld refinement (see below), the structure
Pbcn_1 turned out to be the correct one. This calculated
structure is shown in Fig. 5.
But what about the two Pna21 structures, whose pow-
der patterns are so similar to the Pbcn structure? The
structure Pna21_1 is indeed similar to the Pbcn structure,
but the molecules are shifted by 1.1 �A in [100] direction,
resulting in a slightly worse lattice energy. The structure
Pna21_2 is also similar to the Pbcn structure, but one of
the phenyl rings is rotated by 57� resulting in a consider-
ably worse lattice energy.
6. Le Bail fit and Rietveld refinement
The background of the powder pattern was described with
a shifted Chebyshev polynomial of the first kind with 14
coefficients. Subsequently the lattice parameters obtained
from the indexing were refined with the Le Bail method
[27] using the program GSAS [28, 29].
The profile was described using a Pseudo-Voigt
profile function with a microstrain broadening as well
as an reflection asymmetry description [30–32]. The
lattice parameters changed only slightly during refine-
ment. The Le Bail fit converged with a ¼ 30.144 �A,
b ¼ 9.734 �A, c ¼ 9.516 �A, Rp ¼ 2.43%, wRp ¼ 3.23%,
red.c2 ¼ 6.460.
The Rietveld refinement [33, 34] was performed with
GSAS using half a molecule attached to a dummy atom
on an inversion centre. Restraints were introduced for
bond lengths, bond angles and planar groups (Fig. 6).
For setting up the restraints, the values for bond
lengths and angles from the minimisation were used, but
the C––H distances were set to 1.08 �A. During the refine-
ment the phenyl groups rotated by 35.7�, which is quite
astonishing, because generally the convergence range of a
Rietveld refinement is quite small and the refinement di-
verges if the structure model is too far from the correct
structure. The refinement converged with Rp ¼ 3.39%,
wRp ¼ 4.34%, red. c2 ¼ 8.845. The final lattice para-
meters were a ¼ 30.1335(8) �A, b ¼ 9.7307(3) �A,
c ¼ 9.5125(3) �A, a ¼ b ¼ g ¼ 90�. Atomic coordinates
are given in Table 2, the Rietveld plot is shown in Fig. 7.
The remaining differences between the observed and
simulated patterns can be mostly attributed to difficulties
in the description of the peak profiles.
542 M. U. Schmidt, J. Bruning, C. Buchsbaum et al.
Table 1. Crystal structures calculated by lattice energy minimisation.The molecular position is given as fractional coordinates of the centre of the molecule; the orientation is given as rotational angles (rotationsaround x-, y- and z-axes, starting from a reference orientation with molecules perpendicular to the shortest unit cell axis).
No. Sitesymm.
Energy(kJ mol�1)
Mol. position Molecular orientation Torsion anglesx y z qx/
� qy/� qz/
� j1/� j2/
�
Pbcn_1 1 �217.862 0 0 0 �146.27 158.73 �69.57 41.7 = –j1
Pbcn_2 1 �187.522 0 0 0 37.57 �0.54 �67.20 23.4 = –j1
Pbcn_3 1 �100.721 0 0 0 141.87 159.46 71.44 52.2 = –j1
Pbcn_4 1 �85.975 0 0 0 �69.85 �19.70 13.70 �5.2 = –j1
Pccn_1 1 �143.011 0 0 0 170.29 15.40 �7.06 �0.6 = –j1
Pccn_2 1 �76.087 0 0 0 �32.80 �157.29 �49.24 29.3 = –j1
Pnna_1 1 �205.812 0 0 0 59.87 5.50 �38.98 51.6 = –j1
Pnna_2 1 �69.613 0 0 0 �84.69 127.26 49.94 39.5 = –j1
Pna21_1 1 �215.582 0.3794 0.2473 0 �64.76 �37.46 7.21 52.0 �42.0
Pna21_2 1 �180.163 0.5365 0.2843 0 116.16 141.38 �7.74 98.3 52.1
Unit cell setting:for Pbcn: a ¼ 30.124, b ¼ 9.730, c ¼ 9.505 �A; for Pccn: a ¼ 9.730, b ¼ 30.124, c ¼ 9.505 �A; for Pnna: a ¼ 9.505, b ¼ 30.124, c ¼ 9.730 �A;for Pna21: a ¼ 9.505, b ¼ 9.730, c ¼ 30.124 �A
Fig. 6. Planar groups (each individually outlined) used as restraints inthe Rietveld refinement. The dummy atom is used to fix the moleculeat an inversion centre.
112

Th
is article is pro
tected b
y Germ
an co
pyrig
ht law
. Yo
u m
ay cop
y and
distrib
ute th
is article for yo
ur p
erson
al use o
nly. O
ther u
se is on
ly allow
ed w
ith w
ritten p
ermissio
n b
y the co
pyrig
ht h
old
er.
7. Crystal structure and properties
Compound 1 crystallises in space group Pbcn, Z ¼ 4, with
molecules on inversion centres. This crystal symmetry is
quite rare and occurs only in about 0.5% of all homomole-
cular structures [14]. The central part of the molecules,
consisting of bisazomethine and naphthalene moieties, is
almost planar as in 2a, b, d. The terminal phenyl groups
are tilted by 77.5� with respect to the naphthalene moi-
eties. The torsion angles for the rotations around the bonds
CO––NH and naphthyl–CO changed as well, but these dis-
tortions should not be overinterpreted, since they might be
an artefact caused by the applied restraints. Each molecule
contains 4 intramolecular hydrogen bonds (Fig. 8).
No intermolecular hydrogen bonds are formed; the mo-
lecules are bound to their neighbours by van der Waals
interactions only.
The molecules are arranged in a herringbone pattern
with stacks along the [001] direction (Fig. 9).
Within the stacks, the interplanar distance between mo-
lecules is 3.741 �A. The least squares planes through trans-
Structure determination of the fluorescent bisazomethine pigment C36H26N4O4 543
Fig. 7. Rietveld plot of compound 1. Exp. data: dots, calc. data: thin line, background: dashed line, diff. curve: bottom of the plot.
Table 2. Final atomic coordinates. Uiso= 0.025 �A2 for all atoms.
Atom x y z
C1 0.0246(3) �0.1440(7) �0.0844(8)
C2 0.0572(2) �0.1808(5) �0.1770(8)
C3 0.0662(3) �0.3247(5) �0.2072(9)
C4 0.0456(2) �0.4336(9) �0.1381(7)
C5 0.0572(2) �0.5612(7) �0.1666(8)
C6 0.0898(3) �0.5895(6) �0.274(1)
C7 0.1129(2) �0.4921(8) �0.3239(8)
C8 0.0996(2) �0.3577(5) �0.3076(8)
C9 0.1240(2) �0.2453(9) �0.3767(9)
C10 0.1115(2) �0.1122(5) �0.3607(8)
C11 0.0787(3) �0.0773(5) �0.261(1)
C12 0.1410(2) �0.0126(6) �0.4302(6)
C13 0.1834(3) 0.2046(8) �0.3979(6)
C14 0.1779(2) 0.2521(9) �0.5201(7)
C15 0.2044(3) 0.3678(9) �0.5661(7)
C16 0.2364(3) 0.4174(9) �0.482(1)
C17 0.2396(3) 0.373(1) �0.3497(8)
C18 0.2133(3) 0.271(1) �0.3040(6)
H19 0.004(1) �0.221(3) �0.043(3)
H20 0.021(1) �0.418(1) �0.087(3)
H21 0.0404(9) �0.638(3) �0.125(3)
H22 0.0946(9) �0.673(4) �0.301(3)
H23 0.134(1) �0.510(1) �0.372(4)
H24 0.150(1) �0.264(1) �0.421(3)
H25 0.036(1) 0.055(1) �0.186(7)
H26 0.145(1) 0.086(3) �0.272(4)
H27 0.159(1) 0.204(3) �0.587(3)
H28 0.2028(7) 0.398(2) �0.664(4)
H29 0.257(1) 0.480(4) �0.516(2)
H30 0.258(1) 0.412(4) �0.293(3)
H31 0.2158(9) 0.242(3) �0.221(4)
N32 0.0144(4) �0.010(1) �0.062(1)
N33 0.1552(3) 0.0863(8) �0.3563(6)
O34 0.0709(3) 0.0540(7) �0.2438(9)
O35 0.1538(2) �0.0310(7) �0.5467(8)Fig. 8. Molecular structure of 1 in the crystalline state.
113

Th
is article is pro
tected b
y Germ
an co
pyrig
ht law
. Yo
u m
ay cop
y and
distrib
ute th
is article for yo
ur p
erson
al use o
nly. O
ther u
se is on
ly allow
ed w
ith w
ritten p
ermissio
n b
y the co
pyrig
ht h
old
er.
lationally equivalent molecules show a distance of 7.481 �A.
The crystal packing is quite dense (r ¼ 1378 kg � m�3), re-
sulting in a high lattice energy, which accounts for the in-
solubility.
8. Conclusion
The present work is another example that crystal struc-
tures of organic compounds can be determined from pow-
der diffraction data fairly easily by lattice energy minimi-
sation and comparison of the experimental and simulated
powder patterns, even if the space group cannot be deter-
mined unambiguously.
The refined structure shows that the fluorescent pig-
ment 1 exhibits a dense and efficient packing (14% more
dense than generally for organic compounds). This ex-
plains the experimentally observed insolubility. Quantum
mechanical calculations of compounds 1 and 2 had shown
that the formation of hydrogen bonds to the N atoms of
the C¼N––N¼C fragment are a prerequisite for the occur-
rence of fluorescence. The corresponding intramolecular
O–H. . .N bonds are formed in the crystal structure of 1,
which explains the observed fluorescence.
Acknowledgments. The authors thank Uwe Jobstmann and ThomasMetz (Clariant GmbH, Frankfurt am Main, Germany) for syntheses,Annette Rech (University of Frankfurt) for crystallisation, and Cla-riant Produkte (Deutschland) GmbH, Research Pigments & Additivesfor financial support.
References
[1] Herbst, W.; Hunger, K.: Industrial Organic Pigments. 3rd ed.,Weinheim: WILEY-VCH. (2004) 576–577.
[2] Guo, D.; Li, J.; Xie, J.; Duan, C.; Meng, Q.: Synthesis andCrystal Structure of Triple-Helical Di-iron (III) Complex. Chin.J. Inorg. Chem. 18 (2002) 1215–1220.
[3] a) Dreuw, A.; Plotner, J.; Lorenz, L.; Wachtveitl, J.; Djanhan,J. E.; Bruning, J.; Metz, T.; Bolte, M.; Schmidt, M. U.: Moleku-larer Mechanismus der Festkorperfluoreszenz des organischenPigments Yellow 101 und seiner Derivate. Angewandte Chemie117 (2005) 7961–7964. b) Dreuw, A.; Plotner, J.; Lorenz, L.;Wachtveitl, J.; Djanhan, J. E.; Bruning, J.; Metz, T.; Bolte, M.;Schmidt, M. U.: Molecular mechanism of the solid state fluores-cence behavior of the organic Pigment Yellow 101 and its deri-vatives. Angew. Chem. Int. Ed. 44 (2005) 7783–7786.
[4] Schapiro, N.: Darstellung von Azinen vermittelst des Hydrazin-Hydrochlorides. Ber. Dtsch. Chem. Ges. 66 (1933) 1103–1106.
[5] Blout, E. R.; Gofstein, R. M.: The Absorption Spectra of Cer-tain Aldazines. J. Am. Chem. Soc. 67 (1945) 13–16.
[6] Mathur, S. S.; Suschitzky, H.: Syntheses of heterocyclic com-pounds. Part XXXII. Intramolecular 1,3-dipolar cycloadditions
of 2-allyloxy- and 2-prop-2-ynyloxy-aromatic aldehyde azines.
J. Chem. Soc. Perkin Trans. 23 (1975) 2479–2483.[7] Sharma, R. K.; Tandon, J. P.: Azine Derivatives of Titanium(IV)
and Zirconium(IV). J. Prakt. Chem. 322 (1980) 161–168.[8] Fock, A.: Einleitung in die chemische Krystallographie. Verlag
Wilhelm Engelmann, Leipzig, 1888, 53–54.[9] STADI/P-Fast Powder Diffraction System. STOE, Darmstadt,
Germany, 1988.[10] Boultif, A.; Louer, D.: Indexing of powder diffraction patterns
for low symmetry lattices by the successive dichotomy method.J. Appl. Cryst. 24 (1991) 987–993.
[11] Kempster, C. J. E.; Lipson, H.: A rapid method of assessing the
number of molecules in the unit cell of an organic crystal. Acta
Cryst. B28 (1972) 3674–3674.[12] International Tables of Crystallography, Vol. A: Space group-
Symmetry. (Ed. Hahn, T.) 5th ed. (2002) 44–51.[13] Pidcock, E.; Motherwell, W. D. S.; Cole, J. C.: A database sur-
vey of molecular and crystallographic symmetry. Acta Cryst.
B59 (2003) 634–640.[14] Belsky, V. K.; Zorkaya, O. N.; Zorky, P. M.: Structural classes
and space groups of organic homomolecular crystals: new statis-tical data. Acta Cryst. A51 (1995) 473–481.
[15] Schmidt, M. U.: Kristallstrukturberechnungen metallorganischer
Molekulverbindungen. Shaker, Aachen (1995).[16] Schmidt, M. U.; Englert, U.: Prediction of Crystal structures, J.
Chem. Soc. Dalton Trans. 1996 (1996) 2077–2082.[17] Schmidt, M. U.; Dinnebier, R. E.: Combination of energy mini-
mizations and rigid body Rietveld refinement: The structure of
2,5-dihydroxy-benzo[de]benzo[4,5] imidazo[2,1-a]isoquinolin-7-
one. J. Appl. Cryst. 32 (1999) 178–186.[18] Schmidt, M. U.; Dinnebier, R. E.: Determination of the crystal
structure of the violet pigment C22H12Cl2N6O4 from a non-in-
dexed X-ray powder diagram. Acta Cryst. B61 (2005) 37–45.[19] Lommerse, J. P. M.; Motherwell, W. D. S.; Ammon, H. L.; Du-
nitz, J. D.; Gavezzotti, A.; Hofmann, D. W. M.; Leusen, F. J. J.;Mooij, W. T. M.; Price, S. L.; Schweizer, B.; Schmidt, M. U.;
van Eijck, B. P.; Verwer, P.; Williams, D. E.: A test of crystal
structure prediction of small organic molecules, Acta Cryst. B56
(2000) 697–714.[20] Motherwell, W. D. S.; Ammon, H. L.; Dunitz, J. D.; Dzyabchen-
ko, A.; Erk, P.; Gavezzotti, A.; Hofmann, D. W. M.; Leusen,
F. J. J.; Lommerse, J. P. M.; Mooij, W. T. M.; Price, S. L.; Schera-ga, H.; Schweizer, B.; Schmidt, M. U.; van Eijck, B. P.; Verwer,
P.; Williams, D. E.: Crystal structure prediction of small organic
molecules: a second blind test, Acta Cryst. B58 (2002) 647–661.[21] Day, G. M.; Motherwell, W. D. S.; Ammon, H. L.; Boerrigter,
S. X. M.; Della Valle, R. G.; Venuti, E.; Dzyabchenko, A.; Du-
nitz, J. D.; Schweizer, B.; van Eijck, B. P.; Erk, P.; Facelli, J. C.;
Bazterra, V. E.; Ferraro, M. B.; Hofmann, D. W. M.; Leusen,
F. J. J.; Liang, C.; Pantelides, C. C.; Karamertzanis, P. G.; Price,S. L.; Lewis, T. C.; Nowell, H.; Torrisi, A.; Scheraga, H. A.;
Arnautova, Y. A.; Schmidt, M. U.; Verwer, P.: A third blind test
of crystal structure prediction. Acta Cryst. B61 (2005) 511–527.[22] a) Schmidt, M. U.; Hofmann, D. W. M.; Buchsbaum, C.; Metz,
H. J.: Kristallstrukturen von Pigment Red 170 und Derivaten, be-
stimmt aus Rontgen-Pulverdiagrammen. Angew. Chem. 118
(2006) 1335–1340. b) Crystal structures of Pigment Red 170 and
Derivatives, determined by X-ray powder diffraction. Angew.Chem. Int. Ed. 45 (2006) 1313–1317.
[23] Cambridge Structural Database. Cambridge Crystallographic
Data Centre, 12 Union Road, Cambridge England (2005).[24] Paulus, E. F.; Schmidt, M. U.: Unpublished results (2000).[25] Schmidt, M. U.: In Crystal Engineering: From Molecules and
Crystals to Materials. (Eds. Braga, D.; Grepioni F.; Orpen, A.
G.) Dordrecht: Kluwer. (1999) 331–348.[26] Gasteiger, J.; Marsili, M.: Iterative partial equalization of orbital
electronegativity: a rapid access to atomic charges. Tetrahedron36 (1980) 3219–3222.
[27] Le Bail, A.; Duroy, H.; Fourquet, J. L.: Ab-initio structure deter-
mination of LiSbWO6 by X-ray powder diffraction. Mat. Res.
Bull. 23 (1988) 447–452.[28] Larson, A. C.; Von Dreele, R. B.: General Structure Analysis
System (GSAS). Los Alamos National Laboratory Report
LAUR (1994) 86–748.
544 M. U. Schmidt, J. Bruning, C. Buchsbaum et al.
Fig. 9. Final crystal structure; view direction [010]; one molecule ishighlighted.
114

Th
is article is pro
tected b
y Germ
an co
pyrig
ht law
. Yo
u m
ay cop
y and
distrib
ute th
is article for yo
ur p
erson
al use o
nly. O
ther u
se is on
ly allow
ed w
ith w
ritten p
ermissio
n b
y the co
pyrig
ht h
old
er.
[29] Toby, B. H.: EXPGUI, a graphical user interface for GSAS. J.Appl. Cryst. 34 (2001) 210–213.
[30] Thompson, P.; Cox, D. E.; Hastings, J. B.: Rietveld refinementof Debye-Scherrer synchrotron X-ray data from Al2O3. J. Appl.Cryst. 20 (1987) 79–83.
[31] Finger, L. W.; Cox, D. E.; Jephcoat, A. P.: A correction forpowder diffraction peak asymmetry due to axial divergence. J.Appl. Cryst. 27 (1994) 892–900.
[32] Stephens, P. W.: Phenomenological model of anisotropic peakbroadening in powder diffraction. J. Appl. Cryst. 32 (1999)281–289.
[33] Rietveld, H. M.: A profile refinement method for nuclear andmagnetic structures. Acta. Cryst. 22 (1967) 151–152.
[34] Rietveld, H. M.: Line profiles of neutron powder-diffractionpeaks for structure refinement. J. Appl. Cryst. 2 (1969) 65–71.
Structure determination of the fluorescent bisazomethine pigment C36H26N4O4 545
115

B.6 Rietveld-Verfeinerung einer falschen Kristallstruktur
[CB6] C. Buchsbaum, M. U. Schmidt, „Rietveld refinement of a wrong crystal structure“,Acta Crystallographica Section B 2007, 63, 926–932.
Diese Veröffentlichung wurde im IUCr-Newsletter Volume 15, Nr. 4 (2007) erwähnt.
Mit freundlicher Abdruckgenehmigung des Verlages Wiley-VCH.
doi:10.1107/S0108768107050823
116

research papers
926 doi:10.1107/S0108768107050823 Acta Cryst. (2007). B63, 926–932
Acta Crystallographica Section B
StructuralScience
ISSN 0108-7681
Rietveld refinement of a wrong crystal structure
Christian Buchsbaum and
Martin U. Schmidt*
Institute of Inorganic and Analytical Chemistry,
Johann Wolfgang Goethe University, Max-von-
Laue-Strasse 7, D-60438 Frankfurt am Main,
Germany
Correspondence e-mail:
# 2007 International Union of Crystallography
Printed in Singapore – all rights reserved
Rietveld refinements are generally used to confirm crystal
structures solved from powder diffraction data. If the Rietveld
refinement converges with low R values and with a smooth
difference curve, and the structure looks chemically sensible,
the resulting structure is generally considered to be close to
the correct crystal structure. Here we present a counter
example: The Rietveld refinement of the X-ray powder
pattern of -quinacridone with the crystal structure of �-
quinacridone gives quite a smooth difference curve; the
resulting crystal structure looks reasonable in terms of
molecular conformation, molecular packing and intermole-
cular hydrogen bonds. However, neither the lattice para-
meters, the molecular packing nor the conformation of the
molecules show any similarity with the actual structure, which
was determined from single-crystal data. This example shows
that a successful Rietveld refinement is not always final proof
of the correctness of a crystal structure; in special cases the
resulting crystal structure may still be wrong.
Received 4 July 2007
Accepted 16 October 2007
1. Introduction
Crystal-structure solution from powder data is a challenging
task, which requires a sophisticated approach. If the powder
pattern is of limited quality, the structural model resulting
from a structure solution step may be ambiguous or even
questionable. Rietveld refinement is then used to determine
the correctness of the crystal structure solved.
It should be stressed that the Rietveld method is not a
method for crystal-structure solution; a reasonable starting
model, which should be close to the real structure, is needed,
because the convergence range of the Rietveld refinement is
quite small.
The result of the Rietveld refinement is believed to be
acceptable, if:
(i) the R values are small,
(ii) the difference plot is smooth, and
(iii) the structure looks chemically sensible.
1.1. When is an R value small?
There are several kinds of R values, each one more or less
systematically smaller than the others, and each more or less
attractive for publication. In, for example, GSAS (Larson &
Von Dreele, 2004) the R values in the refinement are termed
Rwp and Rp, but the R values with and without subtracted
background have the same names. GSAS calculates Rp values
with background correction by
117
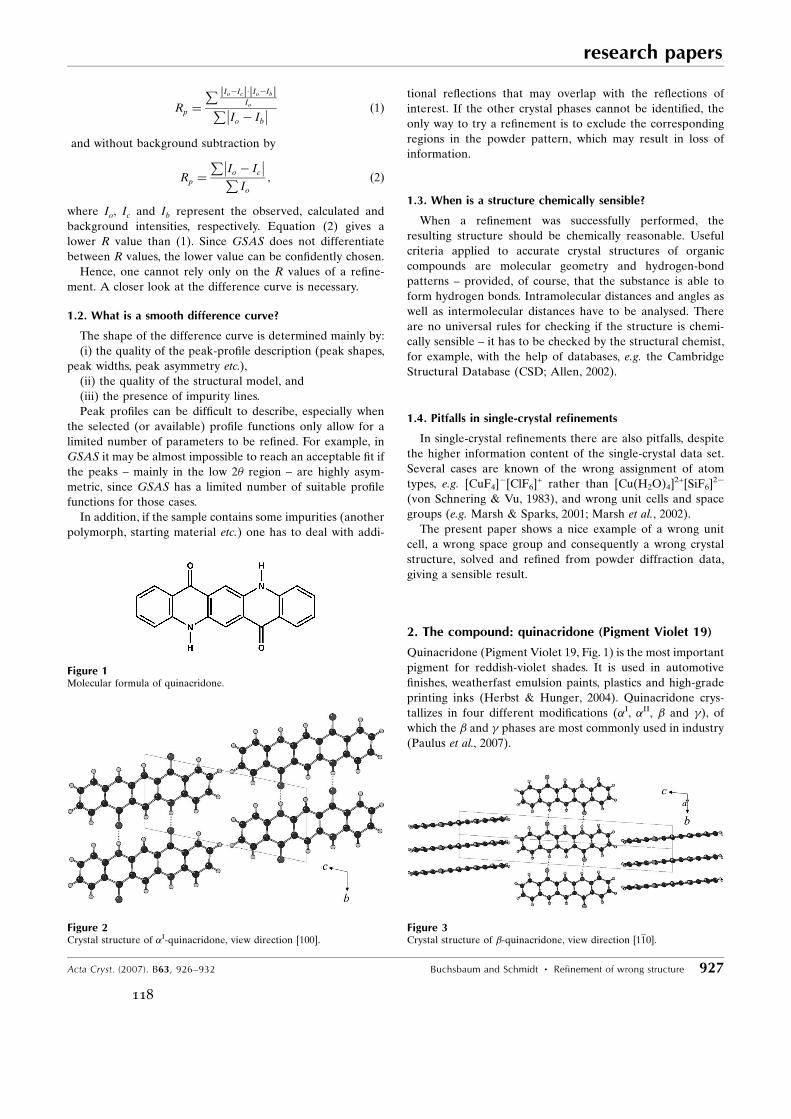
Rp ¼
P IoÿIcj j� IoÿIbj jIo
P
Io ÿ Ib�
�
�
�
ð1Þ
and without background subtraction by
Rp ¼
P
Io ÿ Ic�
�
�
�
P
Io; ð2Þ
where Io, Ic and Ib represent the observed, calculated and
background intensities, respectively. Equation (2) gives a
lower R value than (1). Since GSAS does not differentiate
between R values, the lower value can be confidently chosen.
Hence, one cannot rely only on the R values of a refine-
ment. A closer look at the difference curve is necessary.
1.2. What is a smooth difference curve?
The shape of the difference curve is determined mainly by:
(i) the quality of the peak-profile description (peak shapes,
peak widths, peak asymmetry etc.),
(ii) the quality of the structural model, and
(iii) the presence of impurity lines.
Peak profiles can be difficult to describe, especially when
the selected (or available) profile functions only allow for a
limited number of parameters to be refined. For example, in
GSAS it may be almost impossible to reach an acceptable fit if
the peaks – mainly in the low 2� region – are highly asym-
metric, since GSAS has a limited number of suitable profile
functions for those cases.
In addition, if the sample contains some impurities (another
polymorph, starting material etc.) one has to deal with addi-
tional reflections that may overlap with the reflections of
interest. If the other crystal phases cannot be identified, the
only way to try a refinement is to exclude the corresponding
regions in the powder pattern, which may result in loss of
information.
1.3. When is a structure chemically sensible?
When a refinement was successfully performed, the
resulting structure should be chemically reasonable. Useful
criteria applied to accurate crystal structures of organic
compounds are molecular geometry and hydrogen-bond
patterns – provided, of course, that the substance is able to
form hydrogen bonds. Intramolecular distances and angles as
well as intermolecular distances have to be analysed. There
are no universal rules for checking if the structure is chemi-
cally sensible – it has to be checked by the structural chemist,
for example, with the help of databases, e.g. the Cambridge
Structural Database (CSD; Allen, 2002).
1.4. Pitfalls in single-crystal refinements
In single-crystal refinements there are also pitfalls, despite
the higher information content of the single-crystal data set.
Several cases are known of the wrong assignment of atom
types, e.g. [CuF4]ÿ[ClF6]
+ rather than [Cu(H2O)4]2+[SiF6]
2ÿ
(von Schnering & Vu, 1983), and wrong unit cells and space
groups (e.g. Marsh & Sparks, 2001; Marsh et al., 2002).
The present paper shows a nice example of a wrong unit
cell, a wrong space group and consequently a wrong crystal
structure, solved and refined from powder diffraction data,
giving a sensible result.
2. The compound: quinacridone (Pigment Violet 19)
Quinacridone (Pigment Violet 19, Fig. 1) is the most important
pigment for reddish-violet shades. It is used in automotive
finishes, weatherfast emulsion paints, plastics and high-grade
printing inks (Herbst & Hunger, 2004). Quinacridone crys-
tallizes in four different modifications (�I, �II, � and ), of
which the � and phases are most commonly used in industry
(Paulus et al., 2007).
research papers
Acta Cryst. (2007). B63, 926–932 Buchsbaum and Schmidt � Refinement of wrong structure 927
Figure 1Molecular formula of quinacridone.
Figure 2Crystal structure of �I-quinacridone, view direction [100].
Figure 3Crystal structure of �-quinacridone, view direction ½110�.
118

2.1. Description of the correct crystal structures
The crystal structures of � and quinacridone were deter-
mined from single-crystal data (Potts et al., 1994; Mizuguchi et
al., 2002; Nishimura et al., 2006; Paulus et al., 2007).
In the �I, � and phases the quinacridone molecule is
planar. Each molecule forms four hydrogen bonds to neigh-
bouring molecules; in the �I and � phases two neighbouring
molecules are connected by two hydrogen bonds each,
resulting in molecular chains (Figs. 2 and 3). In the �I phase
the chains are parallel with small steps between the molecules,
while in the � phase the molecular chains show two different
orientations in the crystal structure. In the phase the
molecules form hydrogen bonds to four neighbouring mole-
cules, so that a criss-cross arrangement of molecules is
achieved (Fig. 4).
Crystallographic details for �I, � and quinacridones are
listed in Table 1.
3. Refinement of the wrong crystal structure
By chance we realised that the powder diagram of the phase
can be explained by a slightly modified structure of the �
phase. Even worse: although lattice parameters and molecular
packings are totally different, the Rietveld refinement
converges with acceptable R values. Both the crystal structure
as well as the molecular structure are chemically reasonable
and sensible.
3.1. Data collection
The powder diagrams of the � and quinacridones (Fig. 5)
were recorded in transmission mode in the 2� range 3–35� on a
STOE Stadi-P diffractometer with a curved Ge(111) mono-
chromator; Cu K�1 radiation was used. It has to be stressed
that the limited quality of the powder data is caused by the
quality of the powder (small domain sizes), not by the
diffractometer.
research papers
928 Buchsbaum and Schmidt � Refinement of wrong structure Acta Cryst. (2007). B63, 926–932
Figure 4Crystal structure of -quinacridone, view direction ½250�.
Table 1Crystal data for the correct structures of �I-, �- and -quinacridones.
Crystal phase �I �
Space group P1 P21=c P21=cZ 1 2 2Site symmetry 1 1 1a (A) 3.802 (2) 5.692 (1) 13.697 (9)b (A) 6.612 (3) 3.975 (1) 3.881 (3)c (A) 14.485 (6) 30.02 (4) 13.402 (1)� (�) 100.68 (8) 90.0 90.0� (�) 94.40 (6) 96.76 (6) 100.44 (1) (�) 102.11 (5) 90.0 90.0V (A3) 346.7 (1) 674.5 (9) 700.6 (7)� (g cmÿ3) 1.50 1.54 1.48
Figure 5Powder diagrams of the � and phases of quinacridone.
Figure 6Le Bail fit of -quinacridone with the wrong unit cell; small circles:experimental data; thin line: simulated pattern; dotted line: background;tickmarks indicate possible reflection positions, the difference plot is atthe bottom.
119

3.2. Le Bail fit
Starting from the crystal structure of the � phase, the cell
parameters were manually adjusted in order to explain the
reflection positions in the powder diagram of the phase.
The Le Bail fit was carried out with GSAS (Larson & Von
Dreele, 2004; Toby, 2001) and converged with Rwp = 0.0702, Rp
= 0.0452, red. �2 = 54.56 and a = 6.665 (1), b = 3.881 (3), c =
27.369 (3) A, � = 100.68 (2)�, V = 695.7 (1) A3.
The Le Bail fit is shown in Fig. 6; because of the low quality
of the powder data this result is acceptable.
If if was not known that the unit cell was wrong, the
remaining differences might have been attributed to an
inadequate description of the peak profiles.
3.3. Rietveld refinement
The crystal structure of the � phase was used as the starting
model for the Rietveld refinement of the powder pattern of
the phase, although the packing of the molecules is totally
different. The crystal structure of �-quinacridone is in P21=c,
Z = 2, with a molecule on 1. Half a molecule was set up,
connected to a dummy atom which was placed on a crystal-
lographic inversion centre.
The Rietveld refinement was performed with restraints for
bond lengths, bond angles and planar groups (Fig. 7). The
refinement was carried out carefully in order not to risk
divergence. The weight of the restraints was reduced step by
step (from 100 000 down to 400). Owing to the limited quality
of the powder data it was not possible to remove the restraints
completely. The refinement converged with Rwp = 0.0847, Rp =
0.0522, red. �2 = 98.79 and a = 6.666 (1), b = 3.868 (1), c =
27.386 (5) A, � = 100.58 (2)� and V = 694.1 (1)A3 (Fig. 8).
Atomic coordinates are given in the supplementary material.1
The Rietveld refinement looks quite reasonable with
respect to the limited data quality, except for the peaks at
� 23.5 and � 26.5�. These two peaks in the difference curve
might be explained by e.g. texture effects or preferred orien-
tation, or maybe the sample contained impurities, such as by-
products or other polymorphs. Quinacridone has four known
polymorphs, thus the existence of a fifth polymorph would
hardly be a surprise.
However, taking into account the quality of the powder
data, the problems in peak-profile description and the possible
presence of another phase, as well as the hydrogen-bond
pattern, the structure looks quite reasonable (Figs. 9 and 10).
The ‘S’ shape of the molecule may be true. In fact, the first
single-crystal analysis of quinacridone reported the molecule
to exhibit a strong ‘S’ shape, the outer benzene rings being
bent by 40� against the central ring (Koyama et al., 1966). Also,
the first crystal structure determination of 2,9-dimethylqui-
nacridone resulted in a strongly bent molecule (Fig. 11; Otaka,
1975).
All-in-all, the Rietveld refinement seemed to be reasonable
and the structure looked sensible. However, the crystal
research papers
Acta Cryst. (2007). B63, 926–932 Buchsbaum and Schmidt � Refinement of wrong structure 929
Figure 7Planar group restraints used in the refinement; each group is outlineddifferently.
Figure 8Rietveld refinement of the wrong crystal structure: Refinement of amodified �-quinacridone structure with powder diagram. Small circles:experimental data; thin line: simulated pattern; dashed line: background;tickmarks show possible reflection positions, difference plot at thebottom.
Figure 9Wrong structure of -quinacridone, view direction [010].
1 Supplementary data for this paper are available from the IUCr electronicarchives (Reference: AV5092). Services for accessing these data are describedat the back of the journal.
120

structure is completely wrong! The lattice parameters are
considerably wrong, the molecular conformation is wrong and
the molecular packing is also wrong: the refined structure
shows molecular chains, whereas in the correct structure the
molecules form a criss-cross pattern (Fig. 12). The correct
Rietveld refinement is shown in Fig. 13.
4. Discussion
How can we explain that we obtain a suitable Rietveld fit
although the structure is wrong?
4.1. Comparison of the unit cells
First the relationship between the unit cells of �, and
wrong- quinacridone (Table 2) must be understood. The
relationships are
awrongÿ ¼ c =2;
bwrongÿ ¼ b ;
cwrongÿ ¼ 2a and
�wrongÿ ¼ � :
The unit cells of and wrong- have the same volume and
Z ¼ 2. The transformation matrix for both the transforma-
tions from to wrong- and back is
0 0 12
0 ÿ1 0
2 0 0
0
@
1
A:
Owing to the performed cell transformation the indexing of
the peaks of the powder diagram changes (Fig. 14).
4.2. Indexing
We tested if both unit cells could have been found by
indexing. The program TREOR90 (Werner et al., 1985) was
used.
research papers
930 Buchsbaum and Schmidt � Refinement of wrong structure Acta Cryst. (2007). B63, 926–932
Figure 12Correct structure of -quinacridone, view direction [001] (single-crystaldata).
Figure 13Rietveld plot of -quinacridone (correct structure); Rwp = 0.0447, Rp =0.0319, red. �2 = 24.38. Small circles: experimental data; thin line:simulated pattern; dashed line: background; tickmarks show possiblereflection positions; the difference plot is at the bottom.
Table 2Crystal data for �, and wrong- quinacridones.
Crystal phase � Wrong-
a (A) 5.692 (1) 6.666 (1) 13.697 (9)b (A) 3.975 (1) 3.8680 (5) 3.881 (3)c (A) 30.02 (4) 27.386 (5) 13.402 (1)� (�) 96.76 (6) 100.58 (6) 100.44 (1)Space group P21=c P21=c P21=c
Figure 11Wrong crystal structure of 2,9-dimethylquinacridone (single-crystal data),view direction [001].
Figure 10Wrong structure of -quinacridone, view direction [100].
121

Taking all 15 peaks into account, the correct unit cell was
found among other possible solutions. Assuming that the peak
at � 23.5� may be caused by phase impurities and thus
removing it, both the correct as well as the incorrect unit cell
are found. In both cases no line of the powder pattern remains
unindexed. The M14 values for the correct and the wrong unit
cell are 15 and 8, respectively.
Nevertheless, since there were only 15 clearly distinguish-
able peaks, the result of the indexing should always be
regarded with caution.
4.3. Could we have seen that the structure was wrong?
If we had not had the single-crystal data of -quinacridone,
would we have recognized that the crystal structure obtained
from Rietveld refinement was wrong?
(i) From the Rietveld refinement: Maybe. But surely we had
put some effort into additional crystallizations in order to try
to obtain a sample of better crystallinity resulting in a better
powder pattern. If we had measured the powder data of 10–20
different samples, we would have observed that the peak at
23.5� is always present and always has the same intensity,
hence it cannot be caused by texture effects or phase impu-
rities.
(ii) Concerning the reflection conditions: Since bwrong-� = b ,
the condition 0k0, k= 2n, remains fulfilled. Since cwrong- = 2a ,
there are only even values for l, so the condition h0l, l = 2n, is
also fulfilled.
Hence, the reflection conditions in the space group P21=c
are fulfilled both for wrong- and correct- . This means that the
correct crystal structure cannot be identified either from the
unit cell or from the space group.
(iii) Low-temperature X-ray powder diffraction would not
help: the peaks would shift but the quality of the data would
not improve: the peak at 23.5� would still be the only hint that
the structure might not be correct.
(iv) Higher 2� powder data would not help: at higher 2�
values peaks can be indexed in multiple ways, even with a
wrong unit cell. Rietveld refinement can easily follow the low-
intensity humps at 2� > 35�.
(v) Synchrotron measurements would not improve the data
quality considerably, since the large peak widths are caused by
the crystal quality, not by the diffractometer.
(vi) Quantum mechanical calculations show the individual
molecule to be planar. However, the mean deviation from the
molecular plane in our structure is only 0:23� 0:16 A (the
biggest distance from a C atom to the plane is 0.45 A), which is
within the accuracy of the Rietveld analysis. The same holds
for the in-plane distortion of the six-membered rings: If the
molecular structure is calculated on the 6-31G** level, our
structure is reproduced with an average deviation of
0:31� 0:11 A for the non-H atoms. This is acceptable with
respect to the limited quality of the powder data.
(vii) Single crystal structures of substituted quinacridones
show the quinacridone molecules to be planar, but most
quinacridone single crystals are of poor quality. Even in the
single-crystal structures the C atoms deviate from planarity
and the six-membered rings are distorted.
(viii) In IR spectroscopy the most characteristic band is the
�(C O) vibration at 1600–1700 cmÿ1, which is significantly
shifted if there is a C O� � �H—N hydrogen bond. However,
both our structure and the correct- structure exhibit
C O� � �H—N bonds. In each structure, the two C O groups
are crystallographically equivalent, thus there is no splitting of
the vibration band. Only a very detailed analysis (e.g. of the 0–
400 cmÿ1 region) might have shown that the crystal structure
does not match the IR spectrum. The same holds for Raman
spectroscopy.
(ix) Using electron diffraction on individual crystals (below
100 nm) we would have easily seen that the a axis needed to be
doubled and the c axis halved. But who carries out electron
diffraction, if the structure is solved?
(x) In neutron powder diffraction the simulated powder
diagrams of the wrong and the correct structure show signif-
icant pattern differences (Fig. 15). However, the same ques-
tion as for electron diffraction arises here: Who carries out
neutron diffraction if the structure is solved?
research papers
Acta Cryst. (2007). B63, 926–932 Buchsbaum and Schmidt � Refinement of wrong structure 931
Figure 15Simulated neutron diffraction patterns of (a) ‘wrong- (top) and (b)correct- (bottom) at �neutron = 1.54 A.
Figure 14Comparison of the indexing of the powder diagrams of �, and wrong- quinacridone.
122

(xi) We may have suspected that the structure was wrong
from the colour of the powder: quinacridones with chain
structures such as �I-quinacridone, �-quinacridone and 2,9-
dimethylquinacridone tend to show more violet shades,
whereas quinacridones with criss-cross structures like 4,11-
dichloroquinacridone are red. On the other hand, the colour
of -quinacridone is closer to 2,9-dimethylquinacridone than
to 4,11-dichloroquinacridone, which would be an argument
supporting the wrong structure.
Hence, it is only the misfit of a single peak (at 23.5�) which
would have indicated that the structure might be wrong.
5. Conclusion
The present paper clearly shows that a Rietveld refinement
might not be enough to prove the correctness of a crystal
structure solution. It is always better to have additional data –
which, however, might not necessarily help (see x4.3).
In ambiguous cases it might be helpful to synthesize a series
of mixed crystals and derivatives, hoping that either the mixed
crystals have a better crystallinity (for example, see Schmidt et
al., 2005) or that an isostructural compound of better crys-
tallinity is found (Schmidt et al., 2006a,b).
The authors thank E. F. Paulus (former Hoechst AG,
Frankfurt am Main) and W. Heyse (Sanofi–Aventis, Frankfurt
am Main) for providing powder diagrams of -quinacridone.
References
Allen, F. H. (2002). Acta Cryst. B58, 380–388.Herbst, W. & Hunger, K. (2004). Industrial Organic Pigments. NewYork: Wiley-VCH.
Koyama, H., Scheel, H.-J. & Laves, F. (1966). Naturwissenschaften, 53,700.
Larson, A. C. & Von Dreele, R. B. (2004). GSAS. Report LAUR 86–748. Los Alamos National Laboratory, New Mexico.
Marsh, R. E., Kapon, M., Hu, S. & Herbstein, F. H. (2002). Acta Cryst.B58, 62–77.
Marsh, R. E. & Sparks, R. A. (2001). Acta Cryst. B57,722.
Mizuguchi, J., Sasaki, T. & Tojo, K. (2002). Z. Kristallogr. New Cryst.
Struct. 217, 249–250.Nishimura, N., Senju, T. & Mizuguchi, J. (2006). Acta Cryst. E62,o4683–o4685.
Otaka, Y. (1975). Nippon Kagaku Kaishi, pp. 1838–1840.Paulus, E. F., Leusen, F. J. J. & Schmidt, M. U. (2007).CrystEngComm, 9, 131–143.
Potts, G. D., Jones, W., Bullock, J. F., Andrews, S. J. & Maginn, S. J.(1994). J. Chem. Soc. Chem. Commun. pp. 2565–2566.
Schmidt, M. U., Ermrich, M. & Dinnebier, R. E. (2005). Acta Cryst.
B61, 37–45.Schmidt, M. U., Hofmann, D. W. M., Buchsbaum, C. & Metz, H. J.(2006a). Angew. Chem. Int. Ed. 45, 1313–1317.
Schmidt, M. U., Hofmann, D. W. M., Buchsbaum, C. & Metz, H. J.(2006b). Angew. Chem. 118, 1335–1340.
Schnering, H. G. von & Vu, D. (1983). Angew. Chem. 95, 421.Toby, B. H. (2001). J. Appl. Cryst. 34, 210–213.Werner, P.-E., Eriksson, L. & Westdahl, M. (1985). J. Appl. Cryst. 18,367–370.
research papers
932 Buchsbaum and Schmidt � Refinement of wrong structure Acta Cryst. (2007). B63, 926–932
123

B.7 (CF3)2-Thiazinindigo
[CB7] M. U. Schmidt, C. Buchsbaum, „Structure determination of 6,6′-bis(trifluoromethyl)-thiazine-indigo from laboratory powder data and lattice-energy minimisation“, Zeit-
schrift für Kristallographie 2008, 223, 418–423.
Mit freundlicher Abdruckgenehmigung des Verlages Oldenbourg.
doi:10.1524/zkri.2008.0042
124
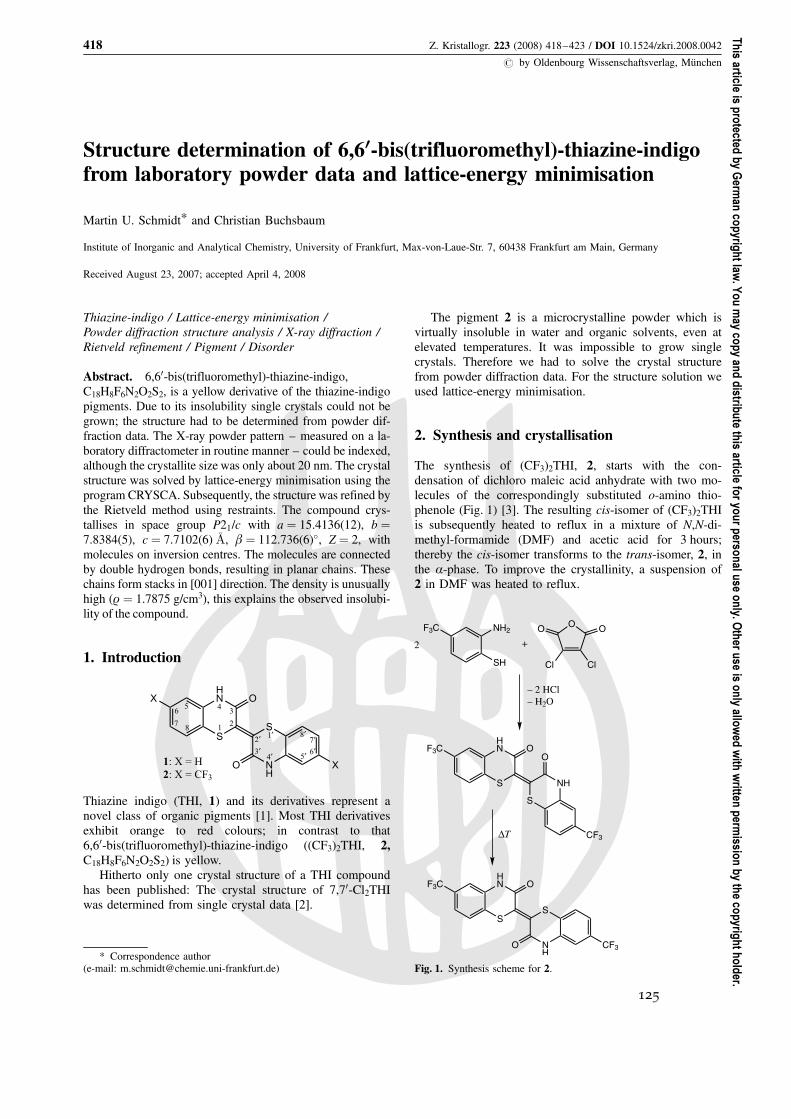
Th
is article is pro
tected b
y Germ
an co
pyrig
ht law
. Yo
u m
ay cop
y and
distrib
ute th
is article for yo
ur p
erson
al use o
nly. O
ther u
se is on
ly allow
ed w
ith w
ritten p
ermissio
n b
y the co
pyrig
ht h
old
er.
Structure determination of 6,60-bis(trifluoromethyl)-thiazine-indigofrom laboratory powder data and lattice-energy minimisation
Martin U. Schmidt* and Christian Buchsbaum
Institute of Inorganic and Analytical Chemistry, University of Frankfurt, Max-von-Laue-Str. 7, 60438 Frankfurt am Main, Germany
Received August 23, 2007; accepted April 4, 2008
Thiazine-indigo / Lattice-energy minimisation /
Powder diffraction structure analysis / X-ray diffraction /
Rietveld refinement / Pigment / Disorder
Abstract. 6,60-bis(trifluoromethyl)-thiazine-indigo,
C18H8F6N2O2S2, is a yellow derivative of the thiazine-indigo
pigments. Due to its insolubility single crystals could not be
grown; the structure had to be determined from powder dif-
fraction data. The X-ray powder pattern – measured on a la-
boratory diffractometer in routine manner – could be indexed,
although the crystallite size was only about 20 nm. The crystal
structure was solved by lattice-energy minimisation using the
program CRYSCA. Subsequently, the structure was refined by
the Rietveld method using restraints. The compound crys-
tallises in space group P21/c with a ¼ 15.4136(12), b ¼7.8384(5), c ¼ 7.7102(6) �A, b ¼ 112.736(6)�, Z ¼ 2, with
molecules on inversion centres. The molecules are connected
by double hydrogen bonds, resulting in planar chains. These
chains form stacks in [001] direction. The density is unusually
high (r ¼ 1.7875 g/cm3), this explains the observed insolubi-
lity of the compound.
1. Introduction
S
HN
NH
S
O
OX
X
1
5 43
2
6
7
1¢8
2¢
3¢4¢ 5¢
6¢
7¢8¢
1: X = H
2: X = CF3
Thiazine indigo (THI, 1) and its derivatives represent a
novel class of organic pigments [1]. Most THI derivatives
exhibit orange to red colours; in contrast to that
6,60-bis(trifluoromethyl)-thiazine-indigo ((CF3)2THI, 2,
C18H8F6N2O2S2) is yellow.
Hitherto only one crystal structure of a THI compound
has been published: The crystal structure of 7,70-Cl2THI
was determined from single crystal data [2].
The pigment 2 is a microcrystalline powder which is
virtually insoluble in water and organic solvents, even at
elevated temperatures. It was impossible to grow single
crystals. Therefore we had to solve the crystal structure
from powder diffraction data. For the structure solution we
used lattice-energy minimisation.
2. Synthesis and crystallisation
The synthesis of (CF3)2THI, 2, starts with the con-
densation of dichloro maleic acid anhydrate with two mo-
lecules of the correspondingly substituted o-amino thio-
phenole (Fig. 1) [3]. The resulting cis-isomer of (CF3)2THI
is subsequently heated to reflux in a mixture of N,N-di-
methyl-formamide (DMF) and acetic acid for 3 hours;
thereby the cis-isomer transforms to the trans-isomer, 2, in
the a-phase. To improve the crystallinity, a suspension of
2 in DMF was heated to reflux.
418 Z. Kristallogr. 223 (2008) 418–423 / DOI 10.1524/zkri.2008.0042
# by Oldenbourg Wissenschaftsverlag, Munchen
* Correspondence author(e-mail: [email protected]) Fig. 1. Synthesis scheme for 2.
125

Th
is article is pro
tected b
y Germ
an co
pyrig
ht law
. Yo
u m
ay cop
y and
distrib
ute th
is article for yo
ur p
erson
al use o
nly. O
ther u
se is on
ly allow
ed w
ith w
ritten p
ermissio
n b
y the co
pyrig
ht h
old
er.
Recrystallisation experiments of 2 in large amounts of
DMF, DMSO (dimethyl-sulfoxide) or NMP (N-methyl-
pyrrolidone) were not successful, since only microcrystal-
line mixtures of a and b phases were obtained.
3. Structure determination
3.1 Powder diffraction
The powder diagram was measured on a STOE STADI-P
diffractometer with CuKa1radiation (curved Ge(111)
monochromator, linear position-sensitive detector) in trans-
mission geometry. The sample was prepared between two
polyacetate films. The powder pattern shows a high back-
ground as well as broad reflections due to a low crystal-
linity of the sample (Fig. 2, top).
The crystallite size L can be calculated according to the
Scherrer formula: [4]
L ¼K � l
b � cos q
with
K ¼ empirical factor, here estimated to be � 0.9,
l ¼ 1.54056 �A,
b (in radians) ¼ full width at half maximum, FWHM,
q ¼ peak position.
Using different peaks in the powder pattern of 2 the
crystallite size could be estimated to be 21(1) nm.
Nevertheless the reflection positions could be determined
with satisfactory accuracy to index the powder pattern.
3.2 Indexing
The indexing was performed with TREOR [5] (there were no
unindexed lines), resulting in a unit cell with a ¼ 15.43,
b ¼ 7.84, c ¼ 7.74 �A, b ¼ 112.68�, a ¼ g ¼ 90�, V ¼863.9 �A
3. The molecular volume of 2 was estimated using a
volume increment of 16 �A3 per non-hydrogen atom, result-
ing in 480 �A3 per molecule. Hence the unit cell should con-
tain 2 molecules.
The following reflection conditions could be observed:
hkl: none
h0l: l ¼ 2n
0k0: k ¼ 2n (as far as visible)
The corresponding extinction symbol is P 1 21/c 1, corre-
sponding to space group P21/c. The space group P21/c
with Z ¼ 2 requires the molecule to be situated on an in-
version centre.
The crystal symmetry P21/c with molecules on inver-
sion centres is quite common, occurring in about 4% of
homomolecular organic compounds, being the 5th most
common structure class and the most frequent one for mo-
lecules with an inversion centre. [6]
Also, from the molecular symmetry, the space group
P21/c with Z ¼ 2 and molecules on �11 is a plausible one.
The molecular symmetry is 2/m and, according to the
work of Kitajgorodskij [7] and Pidcock [8], molecules
with 2/m symmetry prefer to occupy positions with site
symmetry �11.
3.3 Structure solution
The structure solution was performed with the program
CRYSCA [9, 10, 11]. CRYSCA performs a global optimi-
sation of the lattice energy (i.e. crystal structure predic-
tion) with or without reference to experimental data.
The lattice energy is calculated by the formula:
E ¼1
2
P
i
P
j
�Aijr�6ij þ Bij e
�Cijrij þ1
4pee0
qiqj
rij
� �
with
i: all atoms of a reference molecule,
j: all atoms of all other molecules,
rij: interatomic distance,
A, B, C: van der Waals parameters,
q: atomic charges,
e ¼ 1.
The molecular structure was constructed from single
crystal data of other THI compounds. The lattice-energy
minimisations were run in P21/c with Z ¼ 2 with fixed
lattice parameters. The centre of the molecule was fixed
on an inversion centre, the rotational orientation of the
CF3 group was kept fixed.
In order to examine which of the low-energy structures
corresponds to the experimental structure, X-ray powder
patterns were simulated and compared with the experimen-
tal powder diffraction data.
The simulated powder pattern of the lowest-energy
structure shows a high similarity to the experimental pat-
tern (Fig. 2). This indicates that the calculated structure is
already very close to the real one.
This result shows once more that a powder diagram
measured in a routine manner in transmission mode on a
laboratory diffractometer is fully sufficient to solve crystal
structures by lattice-energy minimisation.
Structure determination of 6,60-bis(trifluoromethyl)-thiazine-indigo 419
Fig. 2. Top: Experimental powder pattern, bottom: Simulated powderpattern of the crystal structure with the lowest energy. No fit to theexperimental intensities has been performed in this step.
126

Th
is article is pro
tected b
y Germ
an co
pyrig
ht law
. Yo
u m
ay cop
y and
distrib
ute th
is article for yo
ur p
erson
al use o
nly. O
ther u
se is on
ly allow
ed w
ith w
ritten p
ermissio
n b
y the co
pyrig
ht h
old
er.
Nevertheless, for an accurate Rietveld refinement pow-
der data of higher quality should be used. Therefore the
sample was measured carefully under the same experimen-
tal setup as for the first powder diagram, but with a higher
2q-range (up to 80�) and a longer recording time.
3.4 Structure refinement
The LeBail fit [12] (Fig. 3) was carried out with the program
GSAS [13, 14]. The reflection profiles were described using
a Pseudo-Voigt profile function [15] with a microstrain
broadening [16] as well as an asymmetry description [17].
The lattice parameters changed only slightly during refine-
ment. The Le Bail fit converged with a ¼ 15.4149(8),
b ¼ 7.8383(3), c ¼ 7.7076(5) �A, b ¼ 112.75(1)�, Rp ¼5.41%, Rwp ¼ 7.35% and red. c2 ¼ 22.62.
The Rietveld refinement [18, 19] was performed with
GSAS using half a molecule attached to a dummy atom
on an inversion centre. The H-atoms were included in the
refinement.
Restraints for bond lengths, bond angles and planar
groups were introduced (since GSAS allows for only 12
atoms within a planar-group, we used 2 overlapping pla-
nar groups, including all atoms, except the F-atoms). The
weighting factors for planar-group restraints were de-
creased during refinement. There was no significant devia-
tion from the planarity even with low weighting factors. A
complete removal of the restraints led to divergence.
To prove the orientation of the CF3-groups the
C––C––C––F torsion angle was manually changed by 30�,
60� and 90�, respectively. Additionally, the occupation fac-
tors as well as the anisotropic displacement parameters of
the F-atoms were refined, showing no evidence of any
rotational disorder of the CF3 groups. The refinement led
to the orientation shown in Fig. 5 with C––C––C––F tor-
sion angles of 11.3�, 131.4� and 251.4�.
Subsequently the anisotropic peak broadening para-
meters were refined again.
Finally an overall isotropic displacement parameter (for
all atoms except hydrogens) was refined. A refinement of
420 M. U. Schmidt and C. Buchsbaum
Fig. 3. Le Bail fit of (CF3)2THI: small crosses: experimental powder pattern, black line: simulated diagram, dotted line: background, differenceplot at the bottom.
Fig. 4. Rietveld plot of (CF3)2THI: small crosses: experimental powder pattern, black line: simulated diagram, dotted line: background, differ-ence plot at the bottom.
127

Th
is article is pro
tected b
y Germ
an co
pyrig
ht law
. Yo
u m
ay cop
y and
distrib
ute th
is article for yo
ur p
erson
al use o
nly. O
ther u
se is on
ly allow
ed w
ith w
ritten p
ermissio
n b
y the co
pyrig
ht h
old
er.
individual displacement parameters led to unreasonable
results.
The Rietveld refinement (Fig. 4) converged with a satis-
factory difference curve, and Rp ¼ 6.79%, Rwp ¼ 8.80%
and red. c2 ¼ 32.14. Crystallographic data are listed in
Tables 1 and 2.
The R values are only slightly higher than the ones
obtained from the Le Bail fit. This indicates that the
refined structure is close to the real one.
4. Crystal structure
The molecules are planar (Fig. 6). They form stacks along
[001] and chains in direction [010], the distance between
chains being 3.47 �A. Within the chains double intermole-
cular N––H � � �O hydrogen bonds are formed, resulting in
an 8-membered ring (dO � � �N ¼ 2.864 �A, dO � � �H ¼ 1.950 �A,
dN––H ¼ 0.983 �A, |O––H � � �N ¼ 153.6�). The H-bond pat-
tern in 2 is the same as in Cl2THI, only the arrangement
of the resulting chains is different: in Cl2THI (space group
P�11) the chains are parallel, while in 2 alternating chains
are connected by a 21-axis, resulting in an antiparallel
arrangement (Fig. 7). Neighbouring chains are held to-
gether by van der Waals and Coulomb interactions only.
The shortest intermolecular F � � � F distances are 2.96 �A.
The space filling is quite efficient, leading to a dense
packing of the molecules (r ¼ 1.7875 g/cm3).
4.1 Modelling of disordered crystal structures
Experience shows that a structure with stacks consisting of
chains of planar molecules may exhibit stacking faults. So
we investigated, if the crystal structure might be (partially)
disordered. Such a disorder could lead to a unit cell distor-
tion and/or could result in super-structure reflections. That
would not only influence the Rietveld refinement, but also
the Le Bail fit.
We performed lattice energy minimisations for different
types of disorder.
Basically there are 3 possible types of disorder for
compound 2:
1. rotation of a single molecule around the long mole-
cular axis by 180� without rotation of the surround-
ing molecules,
Structure determination of 6,60-bis(trifluoromethyl)-thiazine-indigo 421
Table 2. Atomic coordinates for 2 from Rietveld refinement.
Atom x/a y/b z/c Uiso/�A2
C �0.0395(8) 0.0670(14) �0.0552(25) 0.076(1)
C �0.0170(10) 0.2469(10) �0.0513(20) 0.076(1)
C �0.2365(8) 0.4474(10) �0.4013(22) 0.076(1)
C �0.3204(6) 0.4148(8) �0.5296(16) 0.076(1)
C �0.3445(7) 0.2456(16) �0.5942(16) 0.076(1)
C �0.2842(7) 0.1018(13) �0.4851(19) 0.076(1)
C �0.2055(9) 0.1355(14) �0.3431(19) 0.076(1)
N �0.0860(8) 0.3490(13) �0.1597(23) 0.076(1)
O 0.0500(7) 0.3024(12) 0.0824(22) 0.076(1)
S �0.1317(4) �0.0277(7) �0.2446(9) 0.076(1)
H �0.068(3) 0.469(4) �0.147(5) 0.025
H �0.216(2) 0.574(4) �0.366(4) 0.025
H �0.409(2) 0.220(2) �0.699(5) 0.025
H �0.306(2) �0.011(4) �0.509(3) 0.025
F �0.4259(7) 0.6215(10) �0.5251(16) 0.076(1)
F �0.4505(6) 0.5115(10) �0.7927(12) 0.076(1)
F �0.3275(6) 0.6937(12) �0.6615(17) 0.076(1)
Fig. 5. Molecular structure of (CF3)2THI in the crystal. The torsion an-gle F––C––C––C is 11.3�. 2 neighbouring molecules are shown, too.
Table 1. Crystallographic data for 2.
Space group P21/cZ 2
a 15.4136(12) �A
b 7.8384(5) �A
c 7.7102(6) �A
b 112.736(6)�
V 859.14(8) �A3
2q-range 2–80�
Rp 0.0679
Rwp 0.0880
red. c2 32.14
RF2 0.1155
Fig. 6. Crystal structure of 2. View along [010]. The interplanar dis-tance is 3.47 �A.
128

Th
is article is pro
tected b
y Germ
an co
pyrig
ht law
. Yo
u m
ay cop
y and
distrib
ute th
is article for yo
ur p
erson
al use o
nly. O
ther u
se is on
ly allow
ed w
ith w
ritten p
ermissio
n b
y the co
pyrig
ht h
old
er.
2. rotation of a single molecular chain around the
b axis by 180� without rotation of neighbouring
chains,
3. rotation of a single stack of molecules around the
b axis by 180� without rotation of the neighbouring
stacks; this operation is equivalent to a translation of
the corresponding stack by 0ð , 12, 12Þ.
Model 1 (rotation of a single molecule) was calculated
with a supercell of the size 2a� 3b� c, models 2 and 3
with 2a� b� c. In cases 1 and 2 the symmetry of the
model is P�11 only, in model 3 the supercell has I12/a1
(Z ¼ 4) symmetry.
The calculations were performed with the program
Cerius2 [20], using a Dreiding 2.21 force field [21] and
atomic charges estimated by the Gasteiger method [22].
The lattice parameters and all atomic coordinates were
optimised without any constraints.
The rotation of a single molecule (model 1) leads to an
increase of lattice energy by 107.4 kJ/mol and a severe
distortion of the structure, because the hydrogen bonds
have to be broken and the molecular packing becomes un-
favourable. Rotation of a single chain (model 2), which
keeps the hydrogen bonds unchanged, results in an energy
increase of 10.2 kJ/mol. By rotation of a whole stack
(model 3) the energy increases by 6.71 kJ/mol only. In
this model every second stack is rotated. Additionally, we
investigated if the simultaneous rotation of a block of 4
stacks would be energetically more favourable. This rota-
tion would create a domain size of 4 unit cells. The result-
ing energy (DE ¼ 6.68 kJ/mol) was similar to the energy
for the rotation of a single stack.
Rietveld refinements of disordered and locally ordered
structures were performed, and the occupations of the in-
dividual molecules were refined. It turned out, that the
intensities in the powder pattern were not significantly af-
fected by a disorder.
On the other hand, according to the Boltzmann for-
mula, an energy difference of 6.7 kJ/mol corresponds to a
statistical probability of about 16% for a dislocation;
hence the domain size should be about 6–7 unit cells (i.e.
rotation of a block of 6–7 stacks). With a lattice para-
meter of a ¼ 15.41 �A this corresponds to a domain size of
about 100 �A. Considering the fact, that the crystallite size
is about 200 �A only, it is questionable, if a possible disor-
der could ever be proven from such a powder diagram.
5. Conclusion
The present work is another example that crystal struc-
tures of organic compounds can be determined from
X-ray powder diffraction data fairly easily by lattice-en-
ergy minimisation and comparison of the experimental
and simulated powder patterns, followed by a Rietveld
refinement.
The refined structure shows that the yellow pigment 2
exhibits a dense and efficient packing (r ¼ 1.7875 g/cm3).
This explains the experimentally observed insolubility.
Acknowledgments. Synthesis was done by Clariant. Measurementswere made by Dr. M. Ermrich (Rontgenlabor Ermrich, Reinheim) andE. Alig (University of Frankfurt). Jan Schnorr (University of Frank-furt) was involved in the Rietveld refinement. Financial support ofClariant is gratefully acknowledged.
References
[1] Herbst, W.; Hunger, K.: Industrial Organic Pigments, 3rd edi-tion. Verlag Chemie, Weinheim, 2004.
[2] Senju, T.; Mizuguchi, J.: Crystal structure of (2E)-7-chloro-2-(7-chloro-3,4-dihydro-3-oxo-2H-1,4-benzothiazin-2-ylidene)-2H-1,4-benzothiazine-3(4H)-one, C16H8Cl2N2O2S2, at 93 K. Z. Kris-tallogr. NCS 218 (2003) 129–130.
[3] Kaul, B. L.: Studies on heterocyclic colouring matters part II:D
2,20-Bi(2H-1,4-benzothiazines). Helv. Chim. Acta 57 (1974)2664–2678.
[4] Allmann, R.: Rontgenpulverdiffraktometrie. Sven von Loga,Koln, 1994.
[5] Werner, P.-E.; Eriksson, L.; Westdahl, M.: TREOR, a semi-ex-haustive trial-and-error powder indexing program for all symme-tries. J. Appl. Cryst. 18 (1985) 367–370.
[6] Belsky, V. K.; Zorkaya, O. N.; Zorky, P. M.: Structural classesand space groups of organic homomolecular crystals: new statis-tical data. Acta Cryst. A51 (1995) 473–481.
[7] Kitajgorodskij, A. I.: General view on molecular packing. In:Advances in Structure Research by Diffraction Methods. Fort-schritte der Strukturforschung mit Beugungsmethoden. Vol. 3,edited by R. Brill & R. Mason. Pergamon Press, Oxford, 1970,173–247.
[8] Pidcock, E.; Motherwell, W. D. S.; Cole, J. C.: A database sur-vey of molecular and crystallographic symmetry. Acta Cryst.B59 (2003) 634–640.
[9] Schmidt, M. U.: Kristallstrukturberechnungen metallorganischerMolekulverbindungen, Shaker, Aachen (1995).
[10] Schmidt, M. U.; Englert, U.: Prediction of crystal structures. J.Chem. Soc. Dalton Trans. 1996 (1996) 2077–2082.
[11] Schmidt, M. U.; Kalkhof, H.: CRYSCA. Program for crystalstructure calculations of flexible molecules. Frankfurt am Main(1997).
[12] Le Bail, A.; Duroy, H.; Fourquet, J. L.: Abinitio structure deter-mination of LiSbWO6 by X-ray powder diffraction. Mat. Res.Bull. 23 (1988) 447–452.
[13] Larson, A. C.; Von Dreele, R. B.: General Structure AnalysisSystem (GSAS). Los Alamos National Laboratory ReportLAUR (1994) 86–748.
[14] Toby, B. H.: EXPGUI, a graphical user interface for GSAS. J.Appl. Cryst. 34 (2001) 210–213.
422 M. U. Schmidt and C. Buchsbaum
Fig. 7. Crystal structure of 2. View along [001]. The upper chains(thick lines) show the opposite orientation of the lower (thin lines).21-axes are shown. To illustrate the dense packing of molecules theupper chains are overlayed with a space filling drawing.
129

Th
is article is pro
tected b
y Germ
an co
pyrig
ht law
. Yo
u m
ay cop
y and
distrib
ute th
is article for yo
ur p
erson
al use o
nly. O
ther u
se is on
ly allow
ed w
ith w
ritten p
ermissio
n b
y the co
pyrig
ht h
old
er.
[15] Thompson, P.; Cox, D. E.; Hastings, J. B.: Rietveld refinementof Debye-Scherrer synchrotron X-ray data from Al2O3. J. Appl.Cryst. 20 (1987) 79–83.
[16] Stephens, P. W.: Phenomenological model of anisotropic peakbroadening in powder diffraction. J. Appl. Cryst. 32 (1999)281–289.
[17] Finger, L. W.; Cox, D. E.; Jephcoat, A. P.: A correction forpowder diffraction peak asymmetry due to axial divergence. J.Appl. Cryst. 27 (1994) 892–900.
[18] Rietveld, H. M.: A profile refinement method for nuclear andmagnetic structures. Acta. Cryst. 22 (1967) 151–152.
[19] Rietveld, H. M.: Line profiles of neutron powder-diffractionpeaks for structure refinement. J. Appl. Cryst. 2 (1969) 65–71.
[20] Cerius2, Version 4.9, Accelrys Ltd., 334 Cambridge SciencePark, Cambridge CB4 0WN, England.
[21] Mayo, S. L.; Olafson, B. D.; Goddard III, W. A.: DREIDING: ageneric force field for molecular simulations. J. Phys. Chem. 94(1990) 8897–8909.
[22] Gasteiger, J.; Marsili, M.: Iterative partial equalization of orbitalelectronegativity –– a rapid access to atomic charges. Tetrahedron36 (1980) 3219–3222.
Structure determination of 6,60-bis(trifluoromethyl)-thiazine-indigo 423
130

B.8 Thiazinindigo-Derivate
[CB8] C. Buchsbaum, E. F. Paulus, M. U. Schmidt, „Crystal Structures of Thiazine-IndigoPigments, Determined from Single-Crystal and Powder Diffraction Data“, Zeitschrift
für Kristallographie 2011, 226, 822–831.
Mit freundlicher Abdruckgenehmigung des Verlages Oldenbourg.
doi:10.1524/zkri.2011.1411
131

Th
is article is pro
tected b
y Germ
an co
pyrig
ht law
. Yo
u m
ay cop
y and
distrib
ute th
is article for yo
ur p
erson
al use o
nly. O
ther u
se is on
ly allow
ed w
ith w
ritten p
ermissio
n b
y the co
pyrig
ht h
old
er.
Crystal structures of thiazine-indigo pigments, determined
from single-crystal and powder diffraction data
Christian BuchsbaumI, Erich F. PaulusII and Martin U. Schmidt*, I
I Goethe-University, Institute of Inorganic and Analytical Chemistry, Max-von-Laue-Str. 7, 60438 Frankfurt am Main, GermanyII Goethe-University, Institute of Mineralogy and Crystallography, Altenhoferallee 1, 60438 Frankfurt am Main, Germany
Received April 5, 2011; accepted August 8, 2011
Single crystal structure analysis /
Powder diffraction structure / X-ray diffraction / Pigment /
Thiazine-indigo
Abstract. The crystal structures of two polymorphs of
thiazine-indigo, C16H10N2O2S2 were determined by single
crystal X-ray diffraction. 7,70-dimethyl-thiazine-indigo, 7,70-
dimethoxy-thiazine-indigo and 7-monochloro-thiazine-indi-
go are isostructural to b-thiazine-indigo and 7,70-dichloro-
thiazine-indigo; their structures are refined by Rietveld
methods. 7-monochloro-thiazine-indigo shows a head-to-
tail-disorder. 6,60-bis(trifluoromethyl)-thiazine-indigo is not
isotypic to any other thiazine-indigo compound. Poly-
morph screenings were performed; three of the six com-
pounds are polymorphic. In all determined structures the
molecules are essentially planar; all molecules are con-
nected by double hydrogen bonds to form parallel chains,
but there are three different arrangement of chains. The
structures are compared with the chain-structures of other
organic pigments like indigo, quinacridone and diketopyr-
rolopyrrole derivatives.
1. Introduction
Thiazine-indigo (THI) compounds (Fig. 1) are a relatively
new class of pigments [1]. The parent compound, 1 (see
Fig. 1), was synthesised about 40 years ago. In a corre-
sponding patent [2], more than 100 derivatives were
claimed, including a description of their colours, but in
fact, only a few of them seem to have been actually synthe-
sised at that time. After the work on THI compounds was
suspended for about 20 years, research was recommenced
in the mid 90s and the 7,70-dichloro derivative was devel-
oped industrially. The synthesis is shown in Fig. 2.
THI pigments show yellow, orange, and red shades.
They have a good, but not perfect, fastness to light and
weathering, which lends to their use in plastics and coat-
ings applications. 7,70-dichloro-THI (2, Fig. 1) is a scarlet-
red pigment with outstanding hiding power (i.e. a high
refractive index); it is internationally registered as “Pig-
ment Red 279”. From 1999 to 2002 it was produced by
Clariant and used for e.g. industrial paints.
All compounds are extremely insoluble in water as
well as in all solvents, even in solvents like dimethylsulf-
oxide (DMSO) or N-methylpyrrolidone (NMP) at 180 to
200 �C. The compounds melt above 400 �C. Consequently,
the growth of single crystals is difficult or even impossi-
ble. Nevertheless, polymorphism occurs frequently.
Crystal structures of THI compounds are not known
except for the 7,70-dichloro-derivative (2) [3] and the
bis(6,60-trifluoromethyl)-derivative (5, Fig. 1) [4]. For 2,
Mizuguchi achieved to grow single crystals by sublima-
tion. For 5, the crystal structure was solved from X-ray
powder data by lattice-energy minimisation.
Here we report the polymorphism of 1–6, and the crys-
tal structures of 1, 3, 4 and 6 (see Fig. 1). For 1, single
crystals of two polymorphs could be grown, which were
named a-1 and b-1, respectively; for 3, 4 and 6, crystal
structures were determined by X-ray powder diffraction.
2. Experimental
In order to search for different crystallographic phases,
solvates or hydrates, a polymorph screening was per-
formed. Different crystallisation methods were employed
822 Z. Kristallogr. 226 (2011) 822–831 / DOI 10.1524/zkri.2011.1411
# by Oldenbourg Wissenschaftsverlag, Munchen
* Correspondence author(e-mail: [email protected])
For Supplementary Material see online-version. Fig. 1. THI compounds.
132
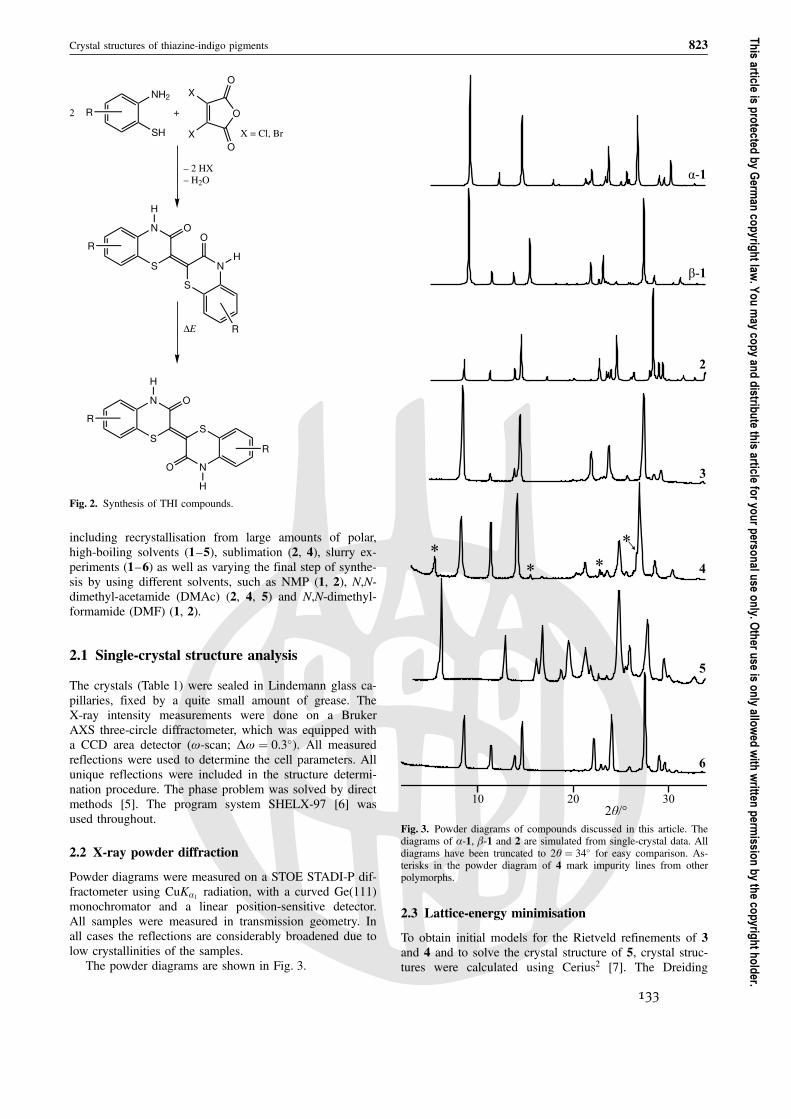
Th
is article is pro
tected b
y Germ
an co
pyrig
ht law
. Yo
u m
ay cop
y and
distrib
ute th
is article for yo
ur p
erson
al use o
nly. O
ther u
se is on
ly allow
ed w
ith w
ritten p
ermissio
n b
y the co
pyrig
ht h
old
er.
including recrystallisation from large amounts of polar,
high-boiling solvents (1–5), sublimation (2, 4), slurry ex-
periments (1–6) as well as varying the final step of synthe-
sis by using different solvents, such as NMP (1, 2), N,N-
dimethyl-acetamide (DMAc) (2, 4, 5) and N,N-dimethyl-
formamide (DMF) (1, 2).
2.1 Single-crystal structure analysis
The crystals (Table 1) were sealed in Lindemann glass ca-
pillaries, fixed by a quite small amount of grease. The
X-ray intensity measurements were done on a Bruker
AXS three-circle diffractometer, which was equipped with
a CCD area detector (w-scan; Dw ¼ 0.3�). All measured
reflections were used to determine the cell parameters. All
unique reflections were included in the structure determi-
nation procedure. The phase problem was solved by direct
methods [5]. The program system SHELX-97 [6] was
used throughout.
2.2 X-ray powder diffraction
Powder diagrams were measured on a STOE STADI-P dif-
fractometer using CuKa1radiation, with a curved Ge(111)
monochromator and a linear position-sensitive detector.
All samples were measured in transmission geometry. In
all cases the reflections are considerably broadened due to
low crystallinities of the samples.
The powder diagrams are shown in Fig. 3.
2.3 Lattice-energy minimisation
To obtain initial models for the Rietveld refinements of 3
and 4 and to solve the crystal structure of 5, crystal struc-
tures were calculated using Cerius2 [7]. The Dreiding
Crystal structures of thiazine-indigo pigments 823
R
NH2
SH
O
O
O
X
X
2 +
X = Cl, Br
– 2 HX
– H2O
S
N
O
O
S
N
H
H
R
RDE
S
N O
H
R
S
NO
H
R
Fig. 2. Synthesis of THI compounds.
*
* *
*
Fig. 3. Powder diagrams of compounds discussed in this article. Thediagrams of a-1, b-1 and 2 are simulated from single-crystal data. Alldiagrams have been truncated to 2q ¼ 34� for easy comparison. As-terisks in the powder diagram of 4 mark impurity lines from otherpolymorphs.
133

Th
is article is pro
tected b
y Germ
an co
pyrig
ht law
. Yo
u m
ay cop
y and
distrib
ute th
is article for yo
ur p
erson
al use o
nly. O
ther u
se is on
ly allow
ed w
ith w
ritten p
ermissio
n b
y the co
pyrig
ht h
old
er.
force field [8] was employed with atomic charges esti-mated by the Gasteiger method [9]. For 6, the 6-exp para-meter set of the Dreiding force field was used. For theenergy calculations, the lattice parameters were fixed tothe values from the indexing (for 3 and 4) or from theLe Bail fit (for 6).
For 6, different structural models were investigated (seeSection 3.6).
To confirm the crystal structures obtained by Rietveldrefinements, dispersion-corrected density-functional theory(DFT) calculations were carried out. The structures wereoptimised with the program GRACE [10], which usesVASP 4.6 [11–14] for single point pure DFT. The calcula-tions were run in the experimentally observed spacegroups. The molecular structures were not restrained; theunit cell parametres were optimised, too.
2.4 Structure determinationfrom powder diffraction data
The structure of 3 was determined with GSAS [15]; for 4and 6, TOPAS [16] was used.
In GSAS the reflection profiles were described using aPseudo-Voigt profile function with microstrain broadening
and a correction for peak asymmetry [17]. After an initialLe Bail fit [18], subsequent Rietveld refinements [19, 20]were performed. The molecules of 3 exhibit 2/m symme-try, they are situated on a crystallographic inversion cen-tre. Hence, refinements were done using half a moleculeattached to a dummy atom on an inversion centre. Allhydrogen atoms were included into the refinements fromthe beginning. Restraints for bond lengths, bond anglesand planar groups were introduced; the weighting factorsfor the restraints were stepwise decreased during the re-finements.
TOPAS performs a Pawley refinement [21] in order todescribe the reflection profile. Subsequent Rietveld refine-ments were performed with half a molecule of 4, fixed toan inversion centre. In case of compound 6 the refine-ment was performed (see Section 3.7) with a single mole-cule (models a, b and d), and half a molecule with occu-pancies of Cl and the corresponding H atoms set to 0.5(model c). Restraints for bond lengths, bond angles andplanarity were introduced into the structural model. Dur-ing the final steps of refinement a spherical harmonicdescription of the peak broadening and an intensity cor-rection for preferred orientation where applied.
824 C. Buchsbaum, E. F. Paulus and M. U. Schmidt
Table 1. Crystal data and structure refinement of a-1 and b-1.
a-1 b-1
Empirical formula C16H10N2O2S2 C16H10N2O2S2
Formula weight 326.38 326.38
Temperature 293(2) K 293(2) K
Wavelength 0.71073 A 0.71073 A
Crystal system monoclinic triclinic
Space group P21/n P�11
Unit cell dimensions a ¼ 4.639(1) A, a ¼ 90�
b ¼ 19.181(3) A, b ¼ 95.06(1)�
c ¼ 7.802(1) A, g ¼ 90�
a ¼ 4.610(1) A, a = 96.48(1)�
b ¼ 7.805(1) A, b ¼ 92.25(1)�
c ¼ 9.807(1) A, g ¼ 96.22(1)�
Volume 691.5(2) A3 348.1(1) A3
Z 2 1
Calculated density 1.568 Mg/m3 1.557 Mg/m3
Absorption coefficient 0.393 mm�1 0.390 mm�1
F(000) 336 168
Crystal size 0.37�0.05�0.02 mm 0.5�0.2�0.05 mm
q-range data collection 2.12 to 25.63� 2.09 to 24.69�
Limiting indices �5 � h � 5, �22 � k � 23, �9 � l � 9 �5 � h � 5, �9 � k � 9, �11 � l � 11
Reflections collected 4144 2023
Reflections unique 1257 1134
Completeness 95.7% 95.2%
Refinement method Full-matrix (F2) Full-matrix (F2)
Data, restraints, param. 1257, 0, 121 1134, 0, 121
Goodness-of-fit on F2 1.062 1.129
Final R indices
I > 2s(I) R1 ¼ 0.0331, wR2 ¼ 0.0706 R1 ¼ 0.0353, wR2 ¼ 0.0871
all data R1 ¼ 0.0463, wR2 ¼ 0.0751 R1 ¼ 0.0408, wR2 ¼ 0.0907
Extinction coefficient 0.002(1) 0.001(4)
Largest diff. peak 0.206 e/A3 0.200 e/A3
Largest hole �0.200 e/A3 �0.263 e/A3
134

Th
is article is pro
tected b
y Germ
an co
pyrig
ht law
. Yo
u m
ay cop
y and
distrib
ute th
is article for yo
ur p
erson
al use o
nly. O
ther u
se is on
ly allow
ed w
ith w
ritten p
ermissio
n b
y the co
pyrig
ht h
old
er.
2.5 Optical investigationsof 7,70-dichloro-thiazine-indigo
The refractive index h was investigated by embeddingcrystals in different organic solvents, including tetraline(h ¼ 1.546), bromobenzene (h ¼ 1.555) and a solution ofsulphur in CH2I2 (h ¼ 1.813). During defocussing, theBecke line was observed, and the refractive index corre-spondingly estimated.
3. Results and discussion
3.1 Parent compound (1)
Polymorphism
Unsubstituted THI (1) exists in three different poly-morphic forms [22]. The a-phase emerges, when the com-pound is synthesised by condensation of 2-aminothiophe-nole with dichloromaleic acid and subsequent treatment ofthe formed cis-thiazine-indigo with dimethylacetamide at140 �C.
The b-phase can be obtained either by synthesis in e.g.
NMF or DMSO, or by recrystallisation from e.g. NMF oracetophenone.
Recrystallisation from benzonitrile yields a mixture ofthe a-phase with a 3rd phase, called g. Since the g-phasecould not be obtained as a pure phase and the powderdata were of limited quality, its crystal structure could notbe determined.
Crystal structures of a-1 and b-1
The molecules are nearly planar (the average deviationfrom the mean plane is 0.02(1) A). The CONH groups oftwo neighbouring molecules combine across an inversioncentre via two N––H � � �O¼C hydrogen bonds to form 8-membered rings. The molecules build one-dimensionalplanar chains.
In the a-phase the chains are arranged in a herringbonepattern (see Figs. 4 and 5). In the b-phase the chains ar-
range in layers (see Figs. 6 and 7). The crystal structure ofthe b-phase is isotypic to 2.
3.2 7,70-dichloro-THI (2)
The crystal structure of 2 was solved in 2003 [3]. Thestructure corresponds to the experimental powder patternof the traded product Pigment Red 279. The crystal struc-ture shows isotypy to b-1, 3 and b-4. In a polymorphscreening, no polymorphs were found.
The optical properties of 2 are strongly anisotropic: Ifthe crystals are viewed under polarised light in a micro-scope, the colour of the crystals changes from yellow to
Crystal structures of thiazine-indigo pigments 825
c
b
Fig. 4. Crystal structure of a-1, view direction [100].
a
b
Fig. 5. Crystal structure of a-1, view direction [001].
b
c
Fig. 6. Crystal structure of b-1, view direction [100].
135

Th
is article is pro
tected b
y Germ
an co
pyrig
ht law
. Yo
u m
ay cop
y and
distrib
ute th
is article for yo
ur p
erson
al use o
nly. O
ther u
se is on
ly allow
ed w
ith w
ritten p
ermissio
n b
y the co
pyrig
ht h
old
er.
red depending on the relative orientation of crystal axesand polarisation direction. Also the refractive index h isquite anisotropic: Embedding the crystals in liquids ofknown refractive index and observing the Becke lineshows, that the lower limit for h is about 1.55, the averagevalue is h ¼ 1.81, the upper limit thus can be estimated tobe �2 to 2.1. This strong optical anisotropy is caused bythe strongly anisotropic crystal structure.
3.3 7,70-dimethyl-THI (3)
For 3 only one polymorphic form is known. The crystal-linity of the material could be improved by heating thecompound suspended in NMP for 5 hours. The powderdiagram showed that the compound 3 is isotypic to b-1and 2. The powder diagram was manually indexed. Start-ing from single crystal data of b-THI the structure of 3
was constructed by adding two methyl groups.The lattice parameters were set to the experimental val-
ues and the crystal structure was optimised by lattice en-ergy minimisations with fixed lattice parameters. The re-sulting structure was used as input for the Rietveldrefinements.
The first step was carrying out a Le Bail fit. The latticeparameters changed only slightly. The refinement convergedwith Rp ¼ 2.98%, Rwp ¼ 4.23% and red. c2 ¼ 4.743.
Before the Rietveld refinement, all bond lengths andangles were checked against data from the CSD [23] inorder to confirm that the corresponding restraints are sen-sible. The Rietveld refinement with GSAS converged withRp ¼ 4.24%, Rwp ¼ 5.90% and red. c2 ¼ 9.545. The Riet-veld plot is shown in Fig. 8, the lattice parameters arelisted in Table 2.
Subsequently, the structure was optimised by disper-sion-corrected DFT calculations. The optimised structurediffers only slightly from the refined one. The average dif-ference in the atomic coordinates of the non-H atoms was0.11 A. For comparison: corresponding calculations on thesingle-crystal structures of a-1 and b-1 resulted in differ-ences of 0.03 and 0.05 A, respectively. For single-crystaldata, differences of more than 0.25 A indicate errors in thestructure. Hence, the DFT calculations confirmed thestructure of 3 to be correct.
3.4 7,70-dimethoxy-THI (4)
The compound shows at least 4 polymorphs. The thermo-dynamical stable phase is the b-phase, which is isostruc-tural to b-1, 2 and 3. The best powder diagram of b-4(Fig. 3) shows 4 impurity lines caused by presence of dif-ferent polymorphs in the sample; those lines were ex-cluded from refinement.
Indexing of the powder pattern was performed withDICVOL [24]. The resulting unit cell confirmed the iso-typy of b-4 and 3.
The Pawley refinement with TOPAS converged withRpb ¼ 6.061%, Rwpb ¼ 7.139% (background subtracted val-ues) and c2 of 1.324.
To check the orientation of the OCH3 groups, the Riet-veld refinement was performed starting from C––O––C––Ctorsion angles of 0� and 180� (Fig. 9) and comparing thequalities of the refinements.
The Rietveld refinement converged with Rpb ¼ 7.833%,Rwpb ¼ 9.121% and a GoF (Goodness of Fit, c) of 1.651.
The Rietveld plot is shown in Fig. 10. In the finalstructure the MeO group is rotated slightly out of the mo-lecular plane; the C––O––C––C torsion angle is �5.30�
(Fig. 9).DFT calculations confirmed the correctness of the crys-
tal structure of 4; the average difference in the atomic co-
826 C. Buchsbaum, E. F. Paulus and M. U. Schmidt
a
c
Fig. 7. Crystal structure of b-1, view direction [010]. Neighbouringchains are connected by inversion centres (or translation along a).
10 30 50
2θ/°
3.0
0.0
1.0
2.0
Int
counts
/104
Fig. 8. Rietveld plot for 3. Circles: ex-perimental powder pattern, throughline: calculated pattern, dotted line:background, difference plot at the bot-tom.
136
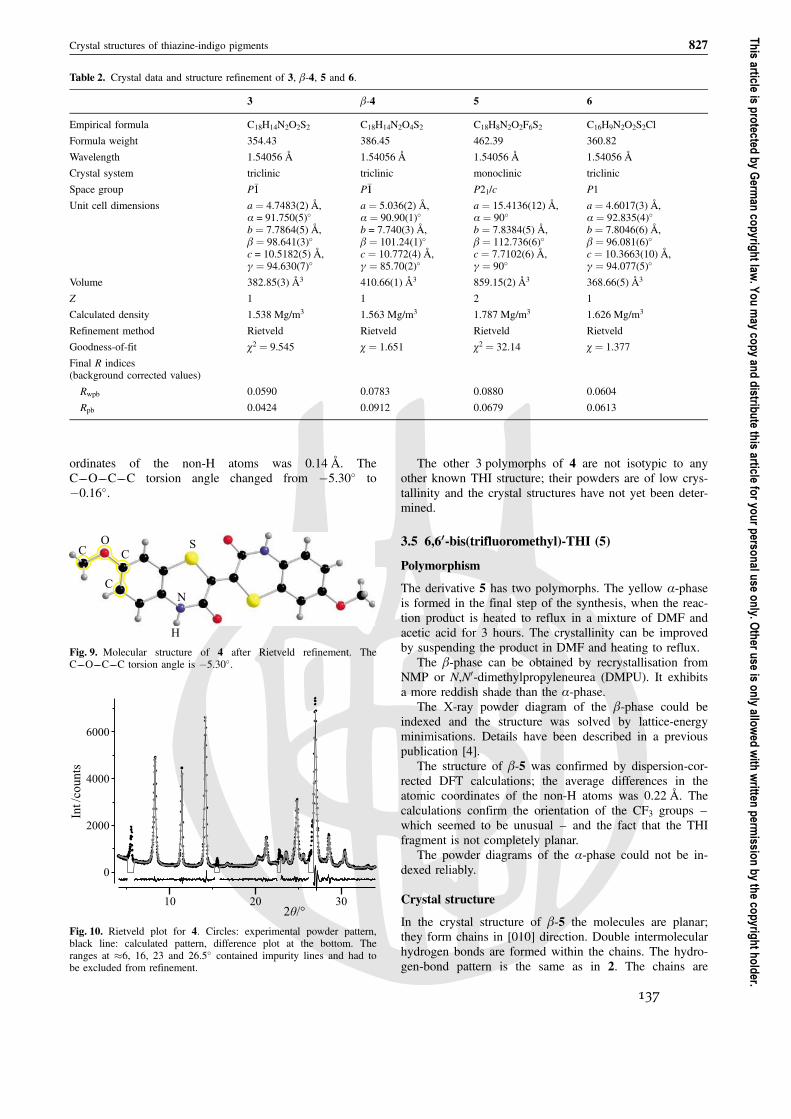
Th
is article is pro
tected b
y Germ
an co
pyrig
ht law
. Yo
u m
ay cop
y and
distrib
ute th
is article for yo
ur p
erson
al use o
nly. O
ther u
se is on
ly allow
ed w
ith w
ritten p
ermissio
n b
y the co
pyrig
ht h
old
er.
ordinates of the non-H atoms was 0.14 A. TheC––O––C––C torsion angle changed from �5.30� to�0.16�.
The other 3 polymorphs of 4 are not isotypic to anyother known THI structure; their powders are of low crys-tallinity and the crystal structures have not yet been deter-mined.
3.5 6,60-bis(trifluoromethyl)-THI (5)
Polymorphism
The derivative 5 has two polymorphs. The yellow a-phaseis formed in the final step of the synthesis, when the reac-tion product is heated to reflux in a mixture of DMF andacetic acid for 3 hours. The crystallinity can be improvedby suspending the product in DMF and heating to reflux.
The b-phase can be obtained by recrystallisation fromNMP or N,N0-dimethylpropyleneurea (DMPU). It exhibitsa more reddish shade than the a-phase.
The X-ray powder diagram of the b-phase could beindexed and the structure was solved by lattice-energyminimisations. Details have been described in a previouspublication [4].
The structure of b-5 was confirmed by dispersion-cor-rected DFT calculations; the average differences in theatomic coordinates of the non-H atoms was 0.22 A. Thecalculations confirm the orientation of the CF3 groups –which seemed to be unusual – and the fact that the THIfragment is not completely planar.
The powder diagrams of the a-phase could not be in-dexed reliably.
Crystal structure
In the crystal structure of b-5 the molecules are planar;they form chains in [010] direction. Double intermolecularhydrogen bonds are formed within the chains. The hydro-gen-bond pattern is the same as in 2. The chains are
Crystal structures of thiazine-indigo pigments 827
Table 2. Crystal data and structure refinement of 3, b-4, 5 and 6.
3 b-4 5 6
Empirical formula C18H14N2O2S2 C18H14N2O4S2 C18H8N2O2F6S2 C16H9N2O2S2Cl
Formula weight 354.43 386.45 462.39 360.82
Wavelength 1.54056 A 1.54056 A 1.54056 A 1.54056 A
Crystal system triclinic triclinic monoclinic triclinic
Space group P�11 P�11 P21/c P1
Unit cell dimensions a ¼ 4.7483(2) A,a = 91.750(5)�
b ¼ 7.7864(5) A,b ¼ 98.641(3)�
c = 10.5182(5) A,g ¼ 94.630(7)�
a ¼ 5.036(2) A,a ¼ 90.90(1)�
b = 7.740(3) A,b ¼ 101.24(1)�
c ¼ 10.772(4) A,g ¼ 85.70(2)�
a ¼ 15.4136(12) A,a ¼ 90�
b ¼ 7.8384(5) A,b ¼ 112.736(6)�
c ¼ 7.7102(6) A,g ¼ 90�
a ¼ 4.6017(3) A,a ¼ 92.835(4)�
b ¼ 7.8046(6) A,b ¼ 96.081(6)�
c ¼ 10.3663(10) A,g ¼ 94.077(5)�
Volume 382.85(3) A3 410.66(1) A3 859.15(2) A3 368.66(5) A3
Z 1 1 2 1
Calculated density 1.538 Mg/m3 1.563 Mg/m3 1.787 Mg/m3 1.626 Mg/m3
Refinement method Rietveld Rietveld Rietveld Rietveld
Goodness-of-fit c2 ¼ 9.545 c ¼ 1.651 c2 ¼ 32.14 c ¼ 1.377
Final R indices(background corrected values)
Rwpb 0.0590 0.0783 0.0880 0.0604
Rpb 0.0424 0.0912 0.0679 0.0613
CO
N
S
H
C
C
Fig. 9. Molecular structure of 4 after Rietveld refinement. TheC––O––C––C torsion angle is �5.30�.
10 20 30
2θ/°
0
2000
4000
6000
Int/counts
Fig. 10. Rietveld plot for 4. Circles: experimental powder pattern,black line: calculated pattern, difference plot at the bottom. Theranges at �6, 16, 23 and 26.5� contained impurity lines and had tobe excluded from refinement.
137

Th
is article is pro
tected b
y Germ
an co
pyrig
ht law
. Yo
u m
ay cop
y and
distrib
ute th
is article for yo
ur p
erson
al use o
nly. O
ther u
se is on
ly allow
ed w
ith w
ritten p
ermissio
n b
y the co
pyrig
ht h
old
er.
stacked in [001] direction. In contrast to all other known
THI structures, molecules of neighbouring chains are not
parallel but rotated by 180� (Fig. 11). The chains are con-
nected by 21 screw axes (Fig. 12).
3.6 7-monochloro-THI (6)
The X-ray powder diagram shows, that 6 is isostructural
to b-1, 2, 3 and b-4 (Fig. 3). Compounds b-1, 2, 3 and b-4crystallise in P�11, Z ¼ 1, with molecules on crystallo-
graphic inversion centres. However, 7-monochloro-THI
does not possess a molecular inversion centre, hence the
crystal symmetry must be reduced. We constructed differ-
ent structural models (Fig. 13), including:
(a) P1, Z ¼ 1. All molecules are parallel, resulting in
Cl � � �H contacts on both sides of each stacks. This
arrangement shows favourable dipole–dipole inter-
actions between the molecular dipoles in different
stacks.
(b) P�11, Z ¼ 2, c0 ¼ 2c, with molecules of neighbouring
stacks in antiparallel orientation. This results in the
formation of alternating Cl � � �Cl and H � � �H con-
tacts on either side of each stack. If this structure
were correct, the X-ray powder diagram must show
superstructure reflections hkl0 with l0 ¼ l/2.
(c) P�11, Z ¼ 1 with a statistical head-to-tail disorder of
all molecules, resulting in an occupancy of 0.5 for
both chlorine positions.
(d) P1, Z ¼ 1 with a head-to-tail disorder as in c, but
with free refinement of the Cl occupancies. Model d
is constructed by reducing the symmetry of mod-
el c.
In a first step the lattice parameters were determined by a
Pawley fit, starting from the lattice parameters of 2. For the
small unit cell with Z ¼ 1 (models a, c and d) the Pawley
refinement resulted in a good fit, with Rpb ¼ 0.0665,
Rwpb ¼ 0.0868 and c2 ¼ 2.024. All peaks were covered,
no superstructure reflections were visible.
Models a–c were optimised by force-field calculations,
keeping the lattice parameters fixed1. The half occupied Cl
828 C. Buchsbaum, E. F. Paulus and M. U. Schmidt
1 Model d was not optimised, as it was derived from model cand used only for Rietveld refinement.
Fig. 11. Crystal structure of 5, view direction [001]. Anti-parallelchains are coloured in red and black, resp.
Fig. 12. Crystal structure of 5, view direction [010]. Neighbouringchains are connected by 21 axes (marked by their crystallographicsymbol).
Model
a�
b�
c�
d�
Fig. 13. Disorder models for 6. The green circles represent the Clatoms.
138

Th
is article is pro
tected b
y Germ
an co
pyrig
ht law
. Yo
u m
ay cop
y and
distrib
ute th
is article for yo
ur p
erson
al use o
nly. O
ther u
se is on
ly allow
ed w
ith w
ritten p
ermissio
n b
y the co
pyrig
ht h
old
er.
atoms of model c were approximated by F atoms. The
resulting energies for models a, b and c were �61.7,
�66.8 and �70.2 kJ/mol, resp. Powder patterns were si-
mulated for the optimised models and compared with the
experimental powder diagram.
Model b, having significant superstructure reflections,
turned out to be not correct.
All four structural models were subjected to Rietveld
refinement (Fig. 14). The refinements of models a, c and
d converged smoothly with reasonable R values (Tab. 3).
Due to the lower R values, model d is considered to be
closer to the real structure than models a, b or c, respec-
tively.
The refinement results of model d show two unequally
occupied Cl positions in the crystal (0.28(1) : 0.72(1)), in-
dicating a partial orientational disorder of molecules. A
statistical 1 : 1 disorder is disproved.
Structural details can be found in Table 2.2
The crystal structure of 6 is shown in Fig. 15. The mo-
lecules are planar as in all THI compounds. Also, the in-
Crystal structures of thiazine-indigo pigments 829
Model a
Int/10counts
4
10 20 30
2θ/°
Model b
Model c
Model d
1.0
2.0
0.0
1.0
2.0
0.0
1.0
2.0
0.0
1.0
2.0
0.0
Int/10counts
4Int/10counts
4Int/10counts
4
Fig. 14. Powder patterns for models a–d after Rietveld refinement.Black circles: experimental data, thin black line: simulated data, dif-ference plot at the bottom. Positions of main superstructure reflec-tions in model b are indicated by arrows.
Table 3. Results of the structure refinement of models a–d.
Model a Model b Model c Model d
Rpb 0.0623 0.1169 0.0718 0.0613
Rwpb 0.0639 0.1414 0.0736 0.0604
GoF 1.483 3.241 1.632 1.377
Fig. 15. Crystal structure of 6, view direction [010]. The chlorineatoms (green) are disordered with hydrogen atoms; both have occu-pancies of 0.28(1) and 0.72(1), resp.
Fig. 16. Crystal structure of 6, view direction [100].
2 Full details of the crystal structure determinations in cif formatare available in the online version, at DOI 10.1524/zkri.2011.1411.
139

Th
is article is pro
tected b
y Germ
an co
pyrig
ht law
. Yo
u m
ay cop
y and
distrib
ute th
is article for yo
ur p
erson
al use o
nly. O
ther u
se is on
ly allow
ed w
ith w
ritten p
ermissio
n b
y the co
pyrig
ht h
old
er.
termolecular hydrogen bonds exhibit the same pattern
(Fig. 16) as in all THI compounds.
4. Comparison of different chain structures
Chain structures built from planar molecules connected by
double hydrogen bonds are formed not only by THI pig-
ments, but also by indigo, quinacridone, and diketopyrro-
lopyrrole (DPP) pigments (structural formulae see Fig. 17).
The simplest possible packing, with parallel chains ar-
ranged in layers (P�11, Z ¼ 1), is observed for b-1, 2, 3,
b-4, and 6, as well as for e.g. the b-phase of indigo (7)
[25], aI-quinacridone (8), 2,9-dimethylquinacridone (9)
[26–28], 2,9-dichloroquinacridone (10) [26, 29], and DPP
(11) [30, 31].
A herringbone arrangement of chains (P21/c, Z ¼ 2)
like in a-1 is also found in e.g. the DPP 12 [30, 31].
In contrast, the structure of 5 with neighbouring chains
rotated by 180� (P21/c, Z ¼ 2) seems to be unique and
does to our knowledge not occur in any other THI, indigo,
quinacridone or DPP pigment. Hence the structure of 5
represents a new structural type for organic pigments.
5. Conclusion
Crystal structures of thiazine-indigo and derivatives were
determined by means of single-crystal and powder struc-
ture analysis. All structures form chains of molecules; the
molecules are held together by hydrogen bonds across a
crystallographic inversion centre. There are three different
arrangements of chains. In b-1, 2, 3, b-4 and 6 all chains
are parallel and form stacks. In a-THI, the molecules form
chains, too, but the molecules are arranged in a herring-
bone-pattern. The structure of 5 forms antiparallel chains;
those chains are connected by a molecular 21 screw axis.
In conclusion, all thiazine-indigo pigments crystallise
in chains like most indigo, quinacridone and diketopyrro-
lopyrrole pigments and exhibit a similarly large variety of
chain arrangements as those pigments.
Acknowledgments. The authors thank Frank Becker (Clariant GmbH,Frankfurt am Main) for crystallisation, Till Borchert and Bruno Pias-tra (both formerly Clariant SA, Huningue) for provision of materials,Ursula Conrad and Barbara Muller (both formerly Hoechst AG,Frankfurt am Main), and Edith Alig (Goethe-University, Frankfurt amMain) for X-ray powder diffraction, Jurgen Bruning and Sonja M.Hammer (both Goethe-University, Frankfurt am Main) for assistancein Rietveld refinements with TOPAS and Jacco van de Streek (Avant-Garde Materials Simulation, Freiburg) for DFT calculations. Financialsupport from the pigments research department of Clariant is grate-fully acknowledged.
References
[1] Zollinger, H.: Color Chemistry. Wiley-VCH Weinheim (2003).[2] Kaul, Bansi L.: Verfahren zur Herstellung schwer loslicher, hete-
rocyclischer Verbindungen. Swiss Patent P 21 51 723.1 (1971).[3] Senju, Takatoshi; Mizuguchi, Jin: Crystal structure of (2E)-7-
chloro-2-(7-chloro-3,4-dihydro-3-oxo-2H-1,4-benzothiazin-2-yli-dene)-2H-1,4-benzothiazine-3(4H)-one, C16H8Cl2N2O2S2, at93 K. Z. Kristallogr. NCS 218 (2003) 129–130.
[4] Schmidt, M. U.; Buchsbaum, C.: Structure determination of6,60-bis(trifluoromethyl)thiazine-indigo from laboratory powderdata and lattice-energy minimization. Z. Kristallogr. 223 (2008)418–423.
[5] Sheldrick, G. M.: Phase Annealing in SHELX-90, Direct Meth-ods for Larger Structures. Acta Crystallographica A46 (1990)467–473.
[6] Sheldrick, G. M.: SHELX-97, Program for the Solution and Re-finement of Crystal Structures. University of Gottingen (Ger-many) 1997.
[7] Accelrys Ltd.: Cerius2, Version 4.9. Cambridge CB4 0WN, Eng-land, 2003.
[8] Mayo, S. L.; Olafson, B. D.; Goddard III, W. A.: DREIDING: ageneric force field for molecular simulations. Journal of PhysicalChemistry 94 (1990) 8897–8909.
[9] Gasteiger, J.; Marsili, M.: Iterative partial equalization of orbitalelectronegativity – a rapid access to atomic charges. Tetra-hedron 36 (1980) 3219–3222.
[10] Neumann, M. A.; Perrin, M.-A.: Energy Ranking of MolecularCrystals Using Density Functional Theory Calculations and anEmpirical van der Waals Correction. J. Phys. Chem. B109
(2005) 15531–15541.[11] Kresse, G.; Furthmuller, J.: Efficiency of ab-initio total energy
calculations for metals and semiconductors using a plane-wavebasis set. Comput. Mater. Sci. 6 (1996) 15–50.
[12] Kresse, G.; Furthmuller, J.: Efficient iterative schemes for abinitio total-energy calculations using a plane-wave basis set.Phys. Rev. B54 (1996) 11169–11186.
[13] Kresse, G.; Hafner, J.: Ab initio molecular dynamics for liquidmetals. Phys. Rev. B47 (1993) 558–561.
[14] Kresse, G.; Joubert, D.: From ultrasoft pseudopotentials to theprojector augmented-wave method. Phys. Rev. B59 (1999)1758–1775.
[15] Larson, A. C.; von Dreele, R. B.: General Structure AnalysisSystem (GSAS). Los Alamos National Laboratory Report(1994) 86–748.
830 C. Buchsbaum, E. F. Paulus and M. U. Schmidt
N
N
H
O
O
H
R
N
N
R
H
O
O
H
N
N
HO
H O
R
R
7
8
9
10
: R = H (Pigment Violet 19)
: R = CH (Pigment Red 122)
: R = Cl (Pigment Red 202)3
11
12
: R = H (Pigment Red 255)
: R = Cl (Pigment Red 254)
Fig. 17. Formulae of indigo (7), quinacridone (8, 9, 10) and diketo-pyrrolopyrrole pigments (11, 12).
140
Th
is article is pro
tected b
y Germ
an co
pyrig
ht law
. Yo
u m
ay cop
y and
distrib
ute th
is article for yo
ur p
erson
al use o
nly. O
ther u
se is on
ly allow
ed w
ith w
ritten p
ermissio
n b
y the co
pyrig
ht h
old
er.
[16] Coelho, A. A.: TOPAS Academic 4.1. http://members.optusnet.com.au/alancoelho/ (2007).
[17] Stephens, P. W.: Phenomenological model of anisotropic peakbroadening in powder diffraction. Journal of Applied Crystallo-graphy 32 (1999) 281–289.
[18] Le Bail, Armel; Duroy, H.; Fourquet, J.-L.: Ab-initio structuredetermination of LiSbWO6 by X-ray powder diffraction. Materi-als Research Bulletin 23 (1988) 447–452.
[19] Rietveld, H. M.: Line profiles of neutron powder-diffractionpeaks for structure refinement. Acta Crystallographica 22 (1967)151–152.
[20] Rietveld, H. M.: A Profile Refinement Method for Nuclear andMagnetic Structures. Journal of Applied Crystallography 2
(1969) 65–71.[21] Pawley, G. S.: Unit-Cell Refinement from Powder Diffraction
Scans. Journal of Applied Crystallography 14 (1981) 357–361.[22] Schmidt, M. U.; Becker, F.; Piastra, B.: Neue Kristallmodifika-
tion von Thiazin-Indigo (New crystal modification of thiazine-indigo). European Patent 919597 B1 (1999).
[23] Allen, F. H.: The Cambridge Structural Database: a quarter of amillion crystal structures and rising. Acta Crystallographica B58
(2002) 380–388.
[24] Boultif, A.; Louer, D.: Powder pattern indexing with the dichotomymethod. Journal of Applied Crystallography 37 (2004) 724–731.
[25] von Eller-Pandraud, H.: Structure Cristalline l’Isoindigo. ActaCrystallographica 13 (1960) 936–938.
[26] Paulus, E. F.; Dietz, E.; Kroh, A.; Prockschy, F.: Crystal Struc-tures of Quinacridones. 12th European Crystallographic Meet-ing, Moscow, Collected Abstracts 2 (1989) 23–24.
[27] Lincke, G.: Studies of the crystal structure of 2,9-dimethylquina-cridone. Chem. Zeit. 109 (1985) 89–96.
[28] Mizuguchi, J.; Senju, T.; Sakai, M.: Crystal structure of 5,12-dihy-dro-2,9-dimethylquino[2,3-b]acridine-7,14-dione, C22H16N2O2, at123 K. Z. Kristallogr. NCS 217 (2002) 525–526.
[29] Senju, Takatoshi; Hoki, Tomonori; Mizuguchi, Jin: 2,9-Di-chloro-5,12-dihydroquino[2,3-b]acridine-7,14-dione. Acta Crys-tallographica E61 (2005) o1061–o1063.
[30] Mizuguchi, J.; Grubenmann, A.; Wooden, G.; Rihs, G.: Struc-tures of 3,6-diphenylpyrrolo[3,4-c]pyrrole-1,4-dione and 2,5-di-methyl-3,6-diphenylpyrrolo[3,4-c]pyrrole-1,4-dione. Acta Crys-tallographica B48 (1992) 696–700.
[31] Mizuguchi, J.; Grubenmann, A.; Rihs, G.: Structures of 3,6-bis(3-chlorophenyl)pyrrolo[3,4-c]pyrrole-1,4-dione and 3,6-bis(4-chlorophenyl)pyrrolo[3,4-c]pyrrole-1,4-dione. Acta Crystallogra-phica B49 (1993) 1056–1060.
Crystal structures of thiazine-indigo pigments 831
141

B.9 Modellierung eines Spin-Crossover-Vorgangs
[CB9] H. O. Jeschke, L. A. Salguero, B. Rahaman, C. Buchsbaum, V. Pashchenko, M. U.Schmidt, T. Saha-Dasgupta, R. Valentí, „Microscopic modeling of a spin crossovertransition“, New Journal of Physics 2007, 9, 448.
Mit freundlicher Abdruckgenehmigung von IOP Publishing.
doi:10.1088/1367-2630/9/12/448
142
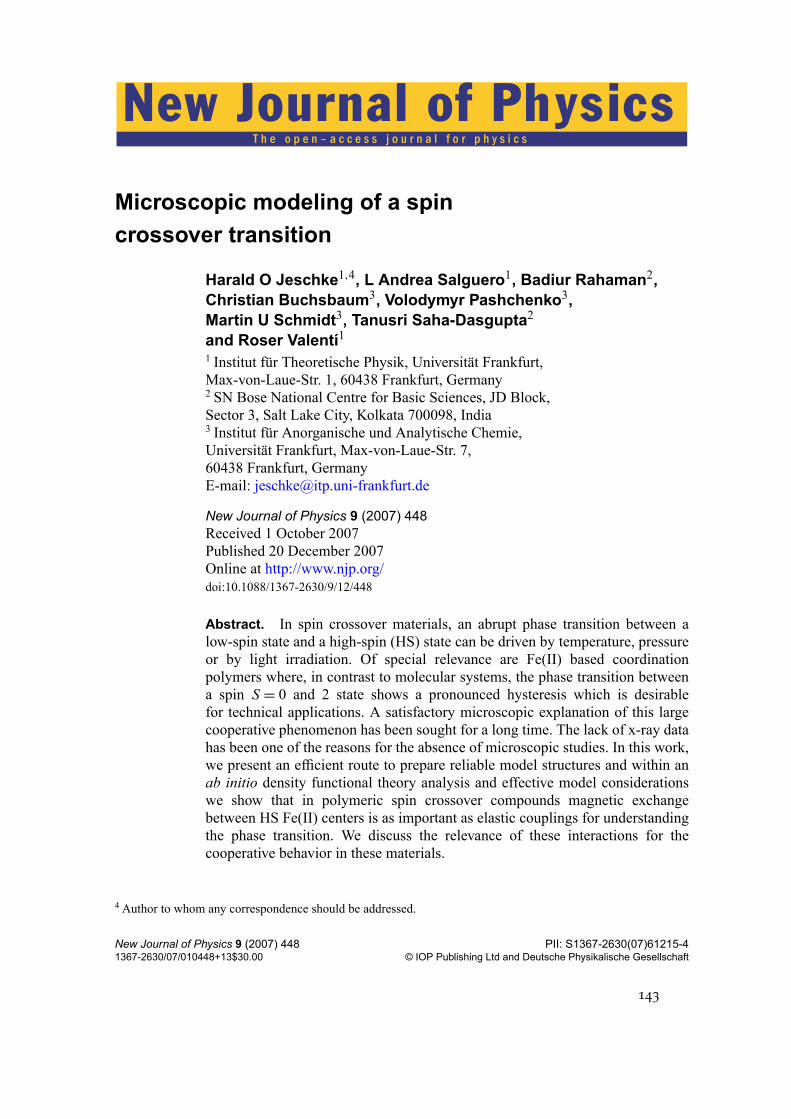
T h e o p e n – a c c e s s j o u r n a l f o r p h y s i c s
New Journal of Physics
Microscopic modeling of a spin
crossover transition
Harald O Jeschke1,4, L Andrea Salguero1, Badiur Rahaman2,
Christian Buchsbaum3, Volodymyr Pashchenko3,
Martin U Schmidt3, Tanusri Saha-Dasgupta2
and Roser Valentí1
1 Institut für Theoretische Physik, Universität Frankfurt,Max-von-Laue-Str. 1, 60438 Frankfurt, Germany2 SN Bose National Centre for Basic Sciences, JD Block,Sector 3, Salt Lake City, Kolkata 700098, India3 Institut für Anorganische und Analytische Chemie,Universität Frankfurt, Max-von-Laue-Str. 7,60438 Frankfurt, GermanyE-mail: [email protected]
New Journal of Physics 9 (2007) 448
Received 1 October 2007Published 20 December 2007Online at http://www.njp.org/doi:10.1088/1367-2630/9/12/448
Abstract. In spin crossover materials, an abrupt phase transition between alow-spin state and a high-spin (HS) state can be driven by temperature, pressureor by light irradiation. Of special relevance are Fe(II) based coordinationpolymers where, in contrast to molecular systems, the phase transition betweena spin S = 0 and 2 state shows a pronounced hysteresis which is desirablefor technical applications. A satisfactory microscopic explanation of this largecooperative phenomenon has been sought for a long time. The lack of x-ray datahas been one of the reasons for the absence of microscopic studies. In this work,we present an efficient route to prepare reliable model structures and within anab initio density functional theory analysis and effective model considerationswe show that in polymeric spin crossover compounds magnetic exchangebetween HS Fe(II) centers is as important as elastic couplings for understandingthe phase transition. We discuss the relevance of these interactions for thecooperative behavior in these materials.
4Author to whom any correspondence should be addressed.
New Journal of Physics 9 (2007) 448 PII: S1367-2630(07)61215-41367-2630/07/010448+13$30.00 © IOP Publishing Ltd and Deutsche Physikalische Gesellschaft
143

2
Contents
1. Introduction 2
2. Crystal structure 3
3. Energy scales 6
4. Electronic structure 7
5. Exchange interaction and magnetic properties 9
6. Discussion 11
Acknowledgments 12
References 12
1. Introduction
An intensively debated class of materials with potential applications as optical switches, sensorsor memory devices [1]–[4] are spin-crossover polymer (SCP) systems involving transitionmetal ions linked with organic ligands [5]. These systems show a sharp transition triggeredby variation of temperature, pressure or by light irradiation between a low-spin (LS) groundstate and a high-spin (HS) excited state with a thermal hysteresis loop [6]. Especially importantin these materials is the large cooperativity shown at the HS–LS transition in contrast tomolecular spin crossover systems, for example. The origin of this transition and its cooperativityhas been mainly discussed in the frame of elastic models [6]–[10], and only recently was apossible role of magnetic exchange suggested [11, 12]. Still, a conclusive ab initio microscopicstudy where all important interactions are considered is missing and the origin of the largecooperativity has not been completely settled. It is our purpose to investigate this issue inwhat follows. Ab initio theoretical studies for SCP systems are faced with major difficultiesdue to the nonexistence of well-determined crystal structures. To our knowledge, electronicstructure calculations have only been performed at the level of semiempirical extended Hückelapproximation for an idealized triazole-bridged Fe(II) chain [13]. In the present work, weovercome the unavailability of structural data by predicting a crystal structure for a Fe(II)spin-crossover polymeric crystal using known experimental constraints and a combination ofclassical force field and quantum mechanical molecular dynamical methods. We analyze withdensity functional theory (DFT) calculations the LS–HS phase transition and show that thereexists an interplay between magnetic exchange and elastic properties that is responsible for thelarge cooperativity in these systems. We also corroborate the quality of our designed structureby comparing with magnetic experiments done on a real sample. Our methodology and resultsprovide a new perspective on the parameters underlying the traditional theoretical approaches.
There have been a number of attempts to theoretically account for the features of theHS–LS transition in spin crossover materials. Most of the theoretical work is based onelastic considerations. Two types of elastic models that focus on the faithful reproductionof macroscopic quantities like the HS fraction, are the following: in the first approach, thecooperativity in the HS–LS transition is defined in terms of local distortions which interact withone another elastically causing a long range effective interaction between spin states. This leadsto an Ising-type Hamiltonian [14]–[16] H =
∑
i, j J i jσiσ j which describes the elastic interactionbetween spin states (LS and HS) in terms of fictitious spin operators (σ =−1 (1) for LS (HS))
New Journal of Physics 9 (2007) 448 (http://www.njp.org/)
144

3
SCl
O
O
O
Fe2+
Fe2+
NN N
R
NCH
N N
CH
R
NCH
N N
CH
R
Fe2+
NN N
R
NCH
N N
CH
R
NCH
N N
CH
R
n
X
X
X
X
1: R = CH2-CH2-OH, X- =
2: R = CH3, X- = F-
Figure 1. Chemical diagram of polymeric Fe(II)-triazole. The modelcompound 2 differs from the synthesized compound 1 in the simplified R andX− groups.
coupled via a nearest neighbor interaction J i j . The coupling constants J i j are parameters of thetheory and have not yet been determined from a microscopic model. In an alternative approach,the free energy of spin crossover systems is calculated based on an anisotropic sphere modelthat describes volume and shape changes of the lattice at the transition [7]–[9]. One of thefew attempts to include magnetic interactions is the recent proposal done in [12] where theauthor considers a one-dimensional (1D) model for HS–LS systems which contains elastic andmagnetic Ising exchange interactions. The ground-state phase diagram is then obtained by thetransfer matrix technique for different relative elastic to magnetic coupling strengths.
In the present work, we concentrate on the electronic and magnetic degrees of freedomin a SCP, and investigate their influence on the microscopic origin of the cooperativity in theHS–LS transition. While it has been assumed in the past that the Fe(II) center nearest neighborinteraction is mostly of phononic origin, our study indicates that a significant part of thisinteraction arises from magnetic exchange.
2. Crystal structure
For this investigation it is indispensable to obtain a reliable crystal structure suitable forDFT analysis. We aim at describing the complex Fe[(hyetrz)3](4-chlorophenylsulfonate)2 ·3H2O [17] (hyetrz stands for 4-(2′-hydroxyethyl)-1,2,4-triazole) (see compound 1 in figure 1),which was synthesized from 2-hydroxyethyltriazole and iron(II)-p-chlorobenzenesulfonate asdescribed in [18].
New Journal of Physics 9 (2007) 448 (http://www.njp.org/)
145

4
This compound precipitates as a fine, polymeric powder and single crystals cannot begrown because the polymer is insoluble in water and organic solvents [19]. Melting orsublimation attempts result in decomposition. Hence, x-ray structure analysis is not possible andeven the x-ray powder diagram consists of a few broad peaks only which prevent the structurebeing determined from x-ray powder data. Other polymeric Fe-triazole compounds have similarproperties and no single crystal structure for these systems is known. In the literature, onlysingle crystal structures for trimeric Fe compounds (e.g. [20]), and polymeric Cu-triazoles[21, 22] were found. In these compounds, the metal ion is coordinated by six nitrogen atoms andneighboring metal ions are connected by three pyrazole bridges. For the polymeric Fe triazolesa similar structure is assumed, see figure 1. This structure is also supported by spectroscopicmethods [22] including solid state NMR [23].
In view of the above and the requirement of having reliable crystal structures formicroscopic studies, we design on the computer a model system of polymeric Fe triazole, asa basis for calculating the electronic and magnetic properties. We consider all experimentalinformation available and construct a crystal structure as close as possible to the actual structure.We employ a method that has been developed and tested on the coordination polymer Cu(II)-2,5-bis(pyrazole-1-yl)-1,4-dihydroxybenzene which has a simpler structure and less atoms perunit cell than polymeric Fe-triazole [24, 25].
Since we aim at understanding the HS–LS transition with accurate all-electron DFTcalculations, which are computer intensive, we keep the essential features of the material andsimplify those elements that are secondary to the transition, like the nature of the substituent Rand the counter ion X− (spin transitions are observed for a wide range of different substituentsR and counter ions X−). We consider compound 2 in figure 1 with R= CH3 and X− = F−.This model structure has the short range environment of the Fe(II) centers exactly as instructure 1 in figure 1, while the longer range environment (&5Å) of the Fe2+ centers issignificantly simplified. The molecular geometry of compound 2 was constructed accordingto data from single crystal analysis of dimeric and trimeric Fe-triazole compounds [26]. Ahypothetical, but sensible crystal structure of compound 2 was built up with the minimumnumber of atoms per unit cell (72 atoms). The iron-triazole chain itself has 63/m 2/m 2/csymmetry. A crystal structure with hexagonal symmetry is in principle possible, e.g. in spacegroup P 63/m, but we chose a structure with P 21/m symmetry with two formula units perunit cell. A similar arrangement of chains is also found in a corresponding Cu polymer,[Cu(hyetrz)3](CF3SO3)2 ·H2O [21]. (This structure is triclinic, with space group P 1 and Z = 2,but the deviations from monoclinic symmetry are probably caused only by the symmetry-breaking hydroxyethyl ligands and CF3SO3
− counterions. Otherwise the symmetry would beP 21/m.) In our structure, the Fe2+ ions are located on crystallographic inversion centers,whereas all triazole units contain a crystallographic mirror plane between the neighboringnitrogen atoms. All Fe2+ ions are crystallographically equivalent and we enforce, for simplicity,a perfectly octahedral environment of the Fe2+ ions.
In the design and analysis of the model structures we employ four distinct classical andab initio methods. For preoptimization of the model structures we consider a classical modifiedDreiding force field [27] with atomic charges calculated by the Gasteiger method [28] asimplemented in the Cerius2 package [29]. We then perform quantum mechanical first principlescalculations within DFT with three different basis sets, each for a distinct purpose: the planewave ab initio molecular dynamics (AIMD) method [30] is used for determination of preciseequilibrium structures. The linearized augmented plane wave (LAPW) method [31] is used to
New Journal of Physics 9 (2007) 448 (http://www.njp.org/)
146

5
determine accurate electronic and magnetic properties and the linearized/N th order muffin tinorbital (LMTO/NMTO) methods [32] are used to calculate effective Fe Wannier functions andto understand the low energy excitations of the system.
For the AIMD calculation [30], we considered a plane wave cut-off of 30Ryd for the planewave part of the wavefunction and we used the following sets of (s,p,d) projector functionsper angular momentum: Fe(2,2,2), F(2,2,1), N(2,2,1), C(2,2,1) and H(2,0,0). We employed a(4× 4× 4) k mesh and the P 21/m symmetry was preserved during the relaxation with thehelp of 131 constraints.
For the LAPW calculations [31], we employed a (6× 6× 9) k mesh and a value ofRMTKmax = 4.2 that is sufficiently large due to the small radii RMT of the hydrogen atoms.
The NMTO-downfolding [32] calculations, which rely on the self-consistent potentialsderived out of LMTO [33] calculations, were carried out with 40 different empty spheres inaddition to atomic spheres to space fill. The convergence of LMTO calculations in each casewas cross-checked with full potential LAPW calculations.
All DFT calculations were performed within the generalized gradient approximation(GGA) [34].
We first proceed with the relaxation of the model structure with the classical forcefield within the P 1 1 21/m space group (non-standard setting of P 21/m), keeping fixedthe Fe–N distances of the FeN6 octahedra to the values dFe−N ∈ {2.00Å, 2.05Å, 2.08Å,
2.09Å, 2.10Å, 2.12Å, 2.15Å, 2.20Å}. This constraint determines the value of crystal fieldsplitting from the onset and constitutes our control parameter as shown below. As the N–N bondof the triazole (see figure 1) has experimentally a well defined bond length of dN−N = 1.38Å, thechoice of a Fe–N distance leads automatically to lattice parameters linear in dFe−N. The relativechange of the lattice parameter c (the chain direction) is larger than that for a and b. This meansthat the volume of the unit cell also increases linearly from V = 6508Å3 at dFe−N = 2.00Å toV = 7317Å3 at dFe−N = 2.20Å. It should be noted that the force field we use is not suitablefor relaxing the F− anion into an equilibrium position due to the lack of appropriate parametersfor F− anions. Therefore, the F − counter-ion is put into a likely position and the optimizationis left to the next step, where we perform a precise relaxation of the structure with the helpof AIMD. This AIMD step is essential as we find that the force field relaxed structures stillshow no or very bad convergence in LAPW, indicating inappropriate positions of at least someatoms. We relax all unconstrained atoms within AIMD until the forces that initially are of theorder of 1000mRyd bohr−1 are far below 1mRyd bohr−1. More significantly, we convergebond lengths to within 10−3Å and bond angles to within 0.1◦. We cross check the final AIMDrelaxed structures by calculating the LAPW forces and making sure that they are of the orderof 10mRyd bohr−1 or less (with the only exception of the difficult to place counter ions F−
for which we allow 30mRyd bohr−1 as they do not play a crucial role for the Fe(II) centerinteractions). The stipulation that forces are very low in two fundamentally different DFT codesis a high standard and gives us confidence that our conclusions about the electronic and magneticstructure are drawn on a solid basis. The precision to which we converge bonds and anglesmeans that we can then proceed to predict interactions between Fe(II) centers with the necessaryprecision of a few kelvin. In figure 2 a representative of the resulting structures is shown.The top panel shows the chain of FeN6 octahedra with alternating orientations, and in thebottom panel we demonstrate the arrangement of the Fe(II) chains in the crystal.
New Journal of Physics 9 (2007) 448 (http://www.njp.org/)
147

6
Fe
ba
ba c
NC H
F
Figure 2. Simplified Fe(II) triazole structure. Top: individual chain of octa-hedrally coordinated Fe2+ ions. Note the strong linkage between Fe(II) centersvia triple N–N bridges. The orientation of the FeN6 octahedra is alternating alongthe chain. Bottom: arrangement of polymeric Fe(II) chains in the crystal.
3. Energy scales
At the atomic level, two sets of energy scales are responsible for the LS and HS state ofthe Fe(II) centers, namely the crystal-field splitting and the Hund’s exchange and Coulombinteractions.
New Journal of Physics 9 (2007) 448 (http://www.njp.org/)
148

7
S = 2
S = 0
1.6
1.8
2.0
2.2
2.4
2.6
2.8
2.0 2.05 2.1 2.15 2.2
∆ (e
V)
d (A)
∆
∆
Figure 3. Crystal field splitting 1 as function of Fe–N distances. The resultsobtained with LAPW (magenta) and LMTO (green) agree very well. The pink(white) background symbolizes the respective colors of the LS (HS) compoundsand indicates the 1 value region that leads to LS (HS). The atomic Fe 3d statediagrams visualize the relationship between crystal field splitting and spin state.
The crystal-field splitting, as mentioned above, is fixed beforehand in the constructionof the structures with given dFe−N distances. In figure 3, we show the dependence of thecrystal field splitting on the size of the FeN6 octahedra calculated with LAPW (magentasymbols) and NMTO (green symbols). Note the good agreement between the two calculations.The crystal field splitting values are obtained by determining the first moment of both t2gand eg densities of states from non-spin polarized LAPW calculations and through constructionof an Fe d only Hamiltonian in the case of NMTO calculations. The atomic state diagrams forFe 3d schematically demonstrate the relationship between crystal field splitting 1 and the spinstate (S = 0 or S = 2). The Hunds exchange is taken into account to some extent within the spinpolarized-GGA approach.
In the extended system, two type of interactions contribute to the phase transition; thephononic excitations and the exchange interaction J , due to nearest neighbor super exchangebetween Fe(II) centers which is typically antiferromagnetic.
The competition between all these energy scales determines the nature of the phasetransition and its cooperativity, as we will discuss in section 6. The role played by the phonons indriving the LS–HS transition in the spin-crossover systems has been discussed at length in termsof elastic models [7, 8, 10, 14, 15]. In our model calculations, the phononic degrees of freedomare frozen and we investigate the role of the electronic and magnetic degrees of freedom.
4. Electronic structure
We performed spin resolved electronic structure calculations for these systems within DFT byconsidering the GGA [34] as exchange-correlation functional and the LAPW basis. In figure 4,we present for four of the designed structures the projection of the total density of states (DOS)on the Fe 3d orbitals, which are responsible for the magnetism of the material. The first and
New Journal of Physics 9 (2007) 448 (http://www.njp.org/)
149
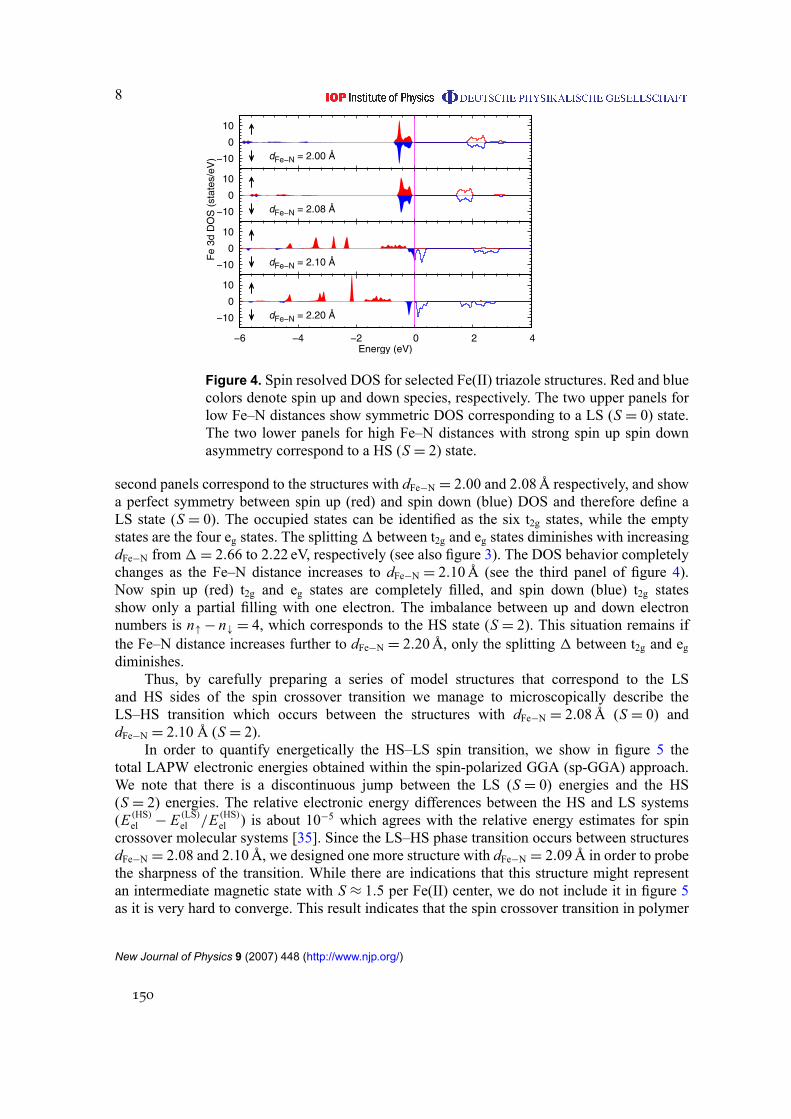
8
01−
0
01
6− 4− 2− 0 2 4 )Ve( ygrenE
Fe
3d D
OS
(st
ates
/eV
)
d N−eF Å 02.2 =
01−
0
01
d N−eF Å 01.2 =
01−
0
01
d N−eF Å 80.2 =
01−
0
01
d N−eF Å 00.2 =
Figure 4. Spin resolved DOS for selected Fe(II) triazole structures. Red and bluecolors denote spin up and down species, respectively. The two upper panels forlow Fe–N distances show symmetric DOS corresponding to a LS (S = 0) state.The two lower panels for high Fe–N distances with strong spin up spin downasymmetry correspond to a HS (S = 2) state.
second panels correspond to the structures with dFe−N = 2.00 and 2.08Å respectively, and showa perfect symmetry between spin up (red) and spin down (blue) DOS and therefore define aLS state (S = 0). The occupied states can be identified as the six t2g states, while the emptystates are the four eg states. The splitting 1 between t2g and eg states diminishes with increasingdFe−N from 1= 2.66 to 2.22 eV, respectively (see also figure 3). The DOS behavior completelychanges as the Fe–N distance increases to dFe−N = 2.10Å (see the third panel of figure 4).Now spin up (red) t2g and eg states are completely filled, and spin down (blue) t2g statesshow only a partial filling with one electron. The imbalance between up and down electronnumbers is n↑− n↓ = 4, which corresponds to the HS state (S = 2). This situation remains ifthe Fe–N distance increases further to dFe−N = 2.20Å, only the splitting 1 between t2g and egdiminishes.
Thus, by carefully preparing a series of model structures that correspond to the LSand HS sides of the spin crossover transition we manage to microscopically describe theLS–HS transition which occurs between the structures with dFe−N = 2.08Å (S = 0) anddFe−N = 2.10 Å (S = 2).
In order to quantify energetically the HS–LS spin transition, we show in figure 5 thetotal LAPW electronic energies obtained within the spin-polarized GGA (sp-GGA) approach.We note that there is a discontinuous jump between the LS (S = 0) energies and the HS(S = 2) energies. The relative electronic energy differences between the HS and LS systems(E (HS)
el − E(LS)
el /E(HS)
el ) is about 10−5 which agrees with the relative energy estimates for spincrossover molecular systems [35]. Since the LS–HS phase transition occurs between structuresdFe−N = 2.08 and 2.10Å, we designed one more structure with dFe−N = 2.09Å in order to probethe sharpness of the transition. While there are indications that this structure might representan intermediate magnetic state with S ≈ 1.5 per Fe(II) center, we do not include it in figure 5as it is very hard to converge. This result indicates that the spin crossover transition in polymer
New Journal of Physics 9 (2007) 448 (http://www.njp.org/)
150

9
−0.95
−0.9
−0.85
−0.8
−0.75
−0.7
2 2.05 2.1 2.15 2.2dFe−N (Å)
E +
926
7 (R
y)
S = 0S = 2
Figure 5. Ground state energies for the set of model structures obtained withinsp-GGA with the LAPW basis.
systems occurs in a very narrow range of crystal field splittings, i.e. is very sharp, as observedexperimentally [5].
5. Exchange interaction and magnetic properties
For the magnetic behavior of this system, we derive first from the DFT electronic calculationsa Hamiltonian which describes the effective interaction between Fe(II) centers. The NMTO-based downfolding method, designed to pick up selectively the low-energy bands from thewhole group of LDA/GGA bands of a compound, has been used to construct the Fe 3donly Hamiltonian of the Fe-triazole compounds. This method has proven to provide reliableinformation on the low energy properties of inorganic [36]–[38] and organic [25] transitionmetal compounds. The tight-binding basis in which these Hamiltonians are constructed form theset of ‘effective’ functions, which span the Hilbert space of theWannier functions correspondingto the low-energy bands. Figure 6 shows the plot of one member of such a set, namely, thedownfoldedWannier function corresponding to Fe 3dxy . In the figure, two such Fe 3dxy Wannierfunctions have been placed at two neighboring Fe sites. While the central part of such aneffective function has the Fe 3dxy symmetry, the tails of the function are shaped accordingto integrated out degrees of freedom in the system, like C sp, N sp, F sp and H s. As isevident from the plot, substantial weight of these tails resides on neighboring triazole rings. Thepresence of these tails hints at an enhanced electronic hybridization between the adjacent Fe2+
ions, contributing to the cooperative nature of the HS–LS transition. Out of these calculationswe can estimate the various hopping matrix elements, t , between the d orbitals of adjacent Fe(II)centers. The values of these hopping parameters range between 1 and 80meV quantifying thestrength of the various interaction paths between neighboring Fe(II) d orbitals.
New Journal of Physics 9 (2007) 448 (http://www.njp.org/)
151
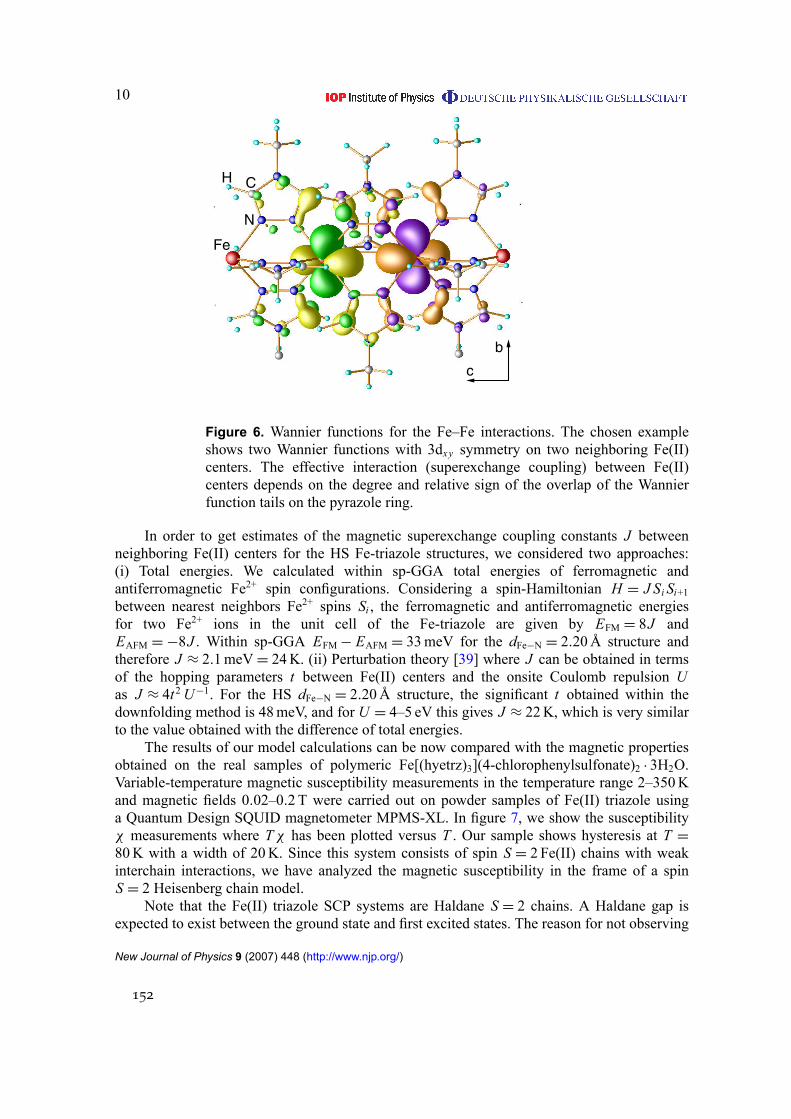
10
c
b
N
Fe
CH
Figure 6. Wannier functions for the Fe–Fe interactions. The chosen exampleshows two Wannier functions with 3dxy symmetry on two neighboring Fe(II)centers. The effective interaction (superexchange coupling) between Fe(II)centers depends on the degree and relative sign of the overlap of the Wannierfunction tails on the pyrazole ring.
In order to get estimates of the magnetic superexchange coupling constants J betweenneighboring Fe(II) centers for the HS Fe-triazole structures, we considered two approaches:(i) Total energies. We calculated within sp-GGA total energies of ferromagnetic andantiferromagnetic Fe2+ spin configurations. Considering a spin-Hamiltonian H = J Si Si+1between nearest neighbors Fe2+ spins Si , the ferromagnetic and antiferromagnetic energiesfor two Fe2+ ions in the unit cell of the Fe-triazole are given by EFM = 8J andEAFM =−8J . Within sp-GGA EFM− EAFM = 33meV for the dFe−N = 2.20Å structure andtherefore J ≈ 2.1meV= 24K. (ii) Perturbation theory [39] where J can be obtained in termsof the hopping parameters t between Fe(II) centers and the onsite Coulomb repulsion U
as J ≈ 4t2U−1. For the HS dFe−N = 2.20Å structure, the significant t obtained within thedownfolding method is 48meV, and for U = 4–5 eV this gives J ≈ 22K, which is very similarto the value obtained with the difference of total energies.
The results of our model calculations can be now compared with the magnetic propertiesobtained on the real samples of polymeric Fe[(hyetrz)3](4-chlorophenylsulfonate)2 · 3H2O.Variable-temperature magnetic susceptibility measurements in the temperature range 2–350Kand magnetic fields 0.02–0.2 T were carried out on powder samples of Fe(II) triazole usinga Quantum Design SQUID magnetometer MPMS-XL. In figure 7, we show the susceptibilityχ measurements where Tχ has been plotted versus T . Our sample shows hysteresis at T =80K with a width of 20K. Since this system consists of spin S = 2 Fe(II) chains with weakinterchain interactions, we have analyzed the magnetic susceptibility in the frame of a spinS = 2 Heisenberg chain model.
Note that the Fe(II) triazole SCP systems are Haldane S = 2 chains. A Haldane gap isexpected to exist between the ground state and first excited states. The reason for not observing
New Journal of Physics 9 (2007) 448 (http://www.njp.org/)
152

11
J eff J eff J eff(c
m K
mol–
1 p
er
Fe
2+)
T
χ3
0
0.5
1
1.5
2
2.5
3
3.5
0 50 100 150 200 250 300 350 400
High fitT
HeatingCooling
(K)T
Figure 7. Measured susceptibility. The solid line corresponds to a high-T fit asexplained in the text. The susceptibility measured while lowering (increasing)the temperature shows a hysteresis of 20K at the transition temperature of 80K.
this gap, is that the transition temperature at which the HS–LS transition happens is higher inenergy than the Haldane gap energy and therefore, the system goes into the non-magnetic S = 0phase before the gap in the S = 2 chain can be observed.
The susceptibility of an L-site chain is given by:
χL =g2µ2
B
kBT
Tr
[
(
∑L
i=1 SZi
)2
e−βH
]
Tr[
e−βH] , (1)
where H is the Heisenberg Hamiltonian H= J Si Si+1, µB is the Bohr magneton, g is thegyromagnetic factor, kB is the Boltzmann constant, T is temperature and Sz
i is the z-componentof the spin on site i . In the thermodynamic limit, the bulk susceptibility at high temperaturescan be obtained as a series expansion in 1/T :
χ J
g2µ2B
=1
3
[
S(S + 1)J
kBT
]
− 8( J
kBT
)2
+ 16( J
kBT
)3
+ O
[
( J
kBT
)4]
. (2)
For kBT/J > S(S + 1) equation (2) compares very well to QMC data for spin S = 2 chains [40].The fit of equation (2) to the measured susceptibility of figure 7 is best for g = 2.2 and
J = 11K.The J values obtained from our ab initio calculations (J ≈ 24K) are slightly larger than the
J extracted from the susceptibility data (J = 11K) on the real sample, but remain in the sameorder of magnitude. Considering that (i) we performed the calculations in a model structure and(ii) the experimental measurements are affected by the quality of the samples, we can concludethat the comparison is quite good and the designed structures are reliable.
6. Discussion
One important topic of this work is the analysis of the various energy scales that contribute to thecooperativity of the HS–LS transition in SCP systems. In our calculations, we froze the elastic
New Journal of Physics 9 (2007) 448 (http://www.njp.org/)
153

12
degrees of freedom and concentrated on the electronic and magnetic properties for which wehave quantified the corresponding parameters. A comparison with the elastic coupling constantsestimated from Ising-like models [15] (in such an approach, a material with a transitiontemperature of T = 80K would be described by elastic interactions of Jelastic ≈ 20–30K) showsthat in 1D Fe(II) triazole, the elastic coupling constants Jelastic are of equal importance as themagnetic exchange for explaining the spin crossover transition, and the cooperativity should beunderstood as an interplay between elastic properties and magnetic exchange. When we cool thesystem from the HS state toward the HS–LS transition temperature, the elastic coupling tendsto drive the system to the LS state, while the magnetic exchange tends to keep up the magneticstate for a larger temperature range (see figure 7). In comparison, in the heating process, themagnetic exchange is initially absent (LS) and therefore the elastic interaction (vibrationalphonons) initially drives the transition which has its onset at a higher temperature than in thecooling process. The width of the transition between cooling and heating (hysteresis) is thereforeenhanced by the magnetic interaction.
A fundamental difference between the polymeric systems we are dealing with in this work,and molecular bi- (tri-, tetra-, . . . ) nuclear Fe systems is the connectivity between the Fe(II)centers. While the molecular systems [41] form isolated clusters of Fe(II) centers and thereforethere is no strong connectivity between clusters, the polymers have important nearest neighborinteractions in the thermodynamic limit. This implies that for the polymers, the magneticsuperexchange is not restricted to the cluster as in the molecular systems, but rather becomesimportant for the nature of the HS–LS phase transition. In [42] various estimates of the magneticJ for molecular systems have been given. The values range between 4 and 6K. The values weestimated for the present polymers are larger, between 11 and 24K and in the energy range ofthe elastic constants, which indicates that the cooperativity in these SCP systems is most likelysignificantly enhanced by the exchange interactions.
In conclusion, this work presents an efficient route to prepare reliable model structures formicroscopic investigations and provides a new interpretation of the origin of the parametersunderlying traditional theoretical approaches for the polymeric spin-crossover materials. Thenext step of this study will be the inclusion of lattice dynamics (phonons) in the ab initio
calculations which is planned in our future work.
Acknowledgments
We thank Chunhua Hu, Jürgen Brüning and Jens Kühne for the syntheses and P Gütlich forstimulating discussions. We would like to acknowledge the German Science Foundation (DFG)for financial support through the FOR 412, TRR/SFB 49 and Emmy Noether programs. T SD thanks the MPG-India partnergroup program for collaboration. We gratefully acknowledgesupport by the Frankfurt Center for Scientific Computing.
References
[1] Cobo S, Molnar G, Real J A and Bousseksou A 2006 Angew. Chem. 45 5786–9[2] Freysz E, Montant S, Létard S and Létard J F 2005 Chem. Phys. Lett. 394 318–23[3] Létard J-F, Guionneau P and Goux-Capes L 2004 Top. Curr. Chem. 235 221–49[4] Garcia Y, Ksenofontov V and Gütlich P 2002 Hyperfine Interact. 139–140 543–51[5] Kahn O and Martinez C J 1998 Science 279 44–8
New Journal of Physics 9 (2007) 448 (http://www.njp.org/)
154
13
[6] Gütlich P, Hauser A and Spiering H 1994 Angew. Chem. Int. Ed. Engl. 33 2024–54[7] Willenbacher N and Spiering H 1988 J. Phys. C: Solid State Phys. 21 1423–39[8] Spiering H and Willenbacher N 1989 J. Phys.: Condens. Matter 1 10089–105[9] Spiering H, Boukheddaden K, Linares J and Varret F 2004 Phys. Rev. B 70 184106[10] Nishino M, Boukheddaden K, Konishi Y and Miyashita S 2007 Phys. Rev. Lett. 98 247203[11] Timm C and Schollwöck U 2005 Phys. Rev. B 71 224414[12] Timm C 2006 Phys. Rev. B 73 014423[13] Yoshizawa K, Miyajima H and Yamabe T 1997 J. Phys. Chem. B 101 4383–9[14] Wajnflasz J and Pick R 1971 J. Physique IV 32 C1–91
[15] Boukheddaden K, Miyashita S and Nishino M 2007 Phys. Rev. B 75 094112
[16] Boukheddaden K, Linares J, Tanasa R and Chong C 2007 J. Phys.: Condens. Matter 19 106201
[17] Garcia Y, Niel V, Muñoz M C and Real J A 2004 Top. Curr. Chem. 233 229–57
[18] Garcia Y, van Koningsbruggen P J, Codjovi E, Lapouyade R, Kahn O and Rabardel L 1997 J. Mater. Chem.
7 857–8
[19] Gütlich P, van Koningsbruggen P J and Renz F 2004 Struct. Bond. 107 27–75
[20] Garcia Y, Guionneau P, Bravic G, Chasseau D, Howard J A K, Kahn O, Ksenofontov V, Reiman S and
Gütlich P 2000 Eur. J. Inorg. Chem. 2000 1531–8
[21] Garcia Y, van Koningsbruggen P J, Bravic G, Chasseau D and Kahn O 2003 Eur. J. Inorg. Chem. 2003 356–62
[22] Garcia Y, van Koningsbruggen P J, Bravic G, Guionneau P, Chasseau D, Cascarano G L, Moscovici J,
Lambert K, Michalowicz A and Kahn O 1997 Inorg. Chem. 36 6357–65
[23] Glaubitz C, Brüning J and Schmidt M U unpublished results
[24] Jeschke H O, Salguero L A, Valentı R, Buchsbaum C, Schmidt M U and Wagner M 2007 C. R. Chim.
10 82–8
[25] Salguero L A, Jeschke H O, Rahaman B, Saha-Dasgupta T, Buchsbaum C, Schmidt M U and Valentı V 2007
New J. Phys. 9 26
[26] 2005 Cambridge Structural Database (Cambridge, UK: Cambridge Crystallographic Data Centre)
[27] Mayo L, Olafson B D and Goddard W A III 1990 J. Phys. Chem. 94 8897–909
[28] Gasteiger J and Marsili M 1980 Tetrahedron 36 3219–28
[29] Cerius2 2003 Version 4.9 (Cambridge, UK: Accelrys Inc.)
[30] Blöchl P E 1994 Phys. Rev. B 50 17953–79
[31] Blaha P, Schwarz K, Madsen G K H, Kvasnicka D and Luitz J 2001 WIEN2k An Augmented Plane Wave
+ Local Orbitals Program for Calculating Crystal Properties (Wein, Austria: Karlheinz Schwarz, Techn.
Universität) ISBN 3-9501031-1-2
[32] Andersen O K and Saha-Dasgupta T 2000 Phys. Rev. B 62 R16219–922
[33] Andersen O K and Jepsen O 1984 Phys. Rev. Lett. 53 2571–4
[34] Perdew J P, Burke S and Ernzerhof M 1996 Phys. Rev. Lett. 77 3865–8
[35] Paulsen H and Trautwein A X 2004 Top. Curr. Chem. 235 197–219
[36] Valentı V, Saha-Dasgupta T, Alvarez J V, Pozgajcic K and Gros C 2001 Phys. Rev. Lett. 86 5381–4
[37] Saha-Dasgupta T, Valentı R, Capraro F and Gros C 2005 Phys. Rev. Lett. 95 107201
[38] Rahaman B, Jeschke H O, Valentı V and Saha-Dasgupta T 2007 Phys. Rev. B 75 024404
[39] Anderson P W 1978 Rev. Mod. Phys. 50 191–201
[40] Yamamoto S 1996 Phys. Rev. B 53 3364–73
[41] Postnikov A V, Kortus J and Pederson M R 2006 Phys. Status Solidi b 243 2533–72
[42] Desroches C, Pilet G, Szilágyi P A, Molnár G, Borshch S A, Bousseksou A, Parola S and Luneau D 2006
Eur. J. Inorg. Chem. 2006 357–65
New Journal of Physics 9 (2007) 448 (http://www.njp.org/)
155

B.10 Ab-initio-Modellierungen
[CB10] H. O. Jeschke, L. A. Salguero, R. Valentí, C. Buchsbaum, M. U. Schmidt, M. Wagner,„Classical and ab initio preparation of reliable structures for polymeric coordinationcompounds“, Comptes Rendus Chimie 2007, 10, 82–88.
Mit freundlicher Abdruckgenehmigung des Verlages Elsevier.
doi:10.1016/j.crci.2006.06.007
156
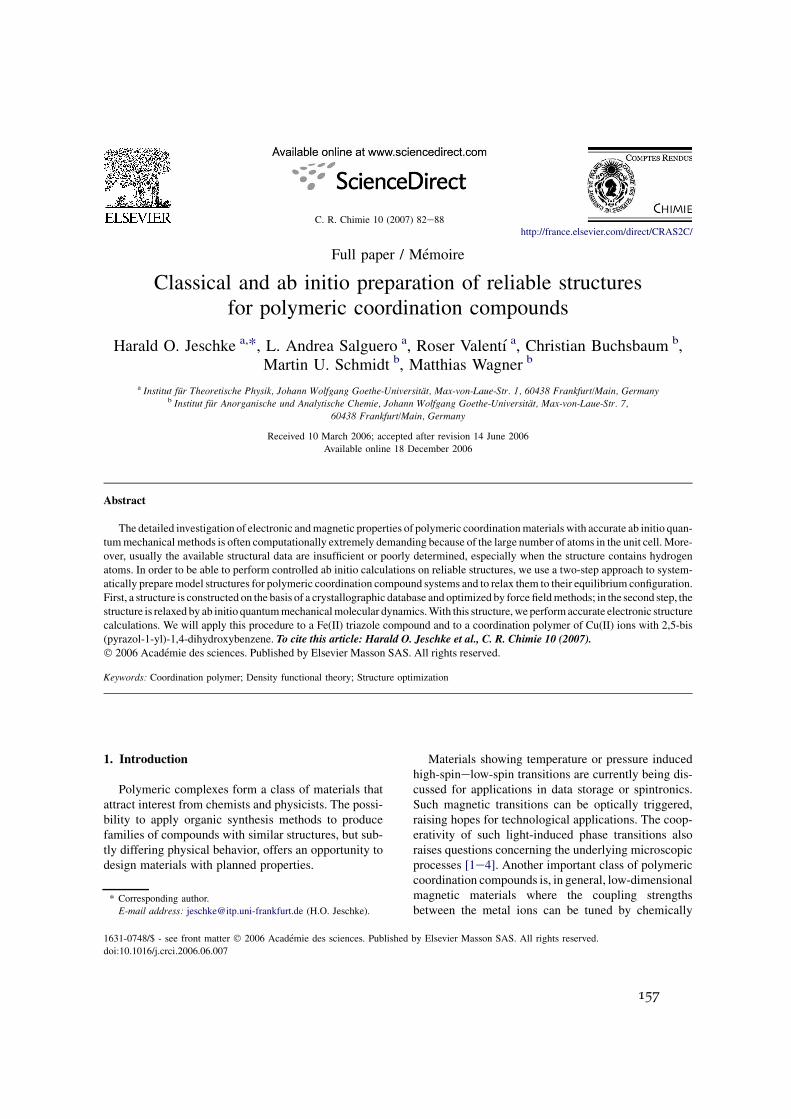
Full paper / Memoire
Classical and ab initio preparation of reliable structuresfor polymeric coordination compounds
Harald O. Jeschke a,*, L. Andrea Salguero a, Roser Valentı a, Christian Buchsbaum b,Martin U. Schmidt b, Matthias Wagner b
a Institut fur Theoretische Physik, Johann Wolfgang Goethe-Universitat, Max-von-Laue-Str. 1, 60438 Frankfurt/Main, Germanyb Institut fur Anorganische und Analytische Chemie, Johann Wolfgang Goethe-Universitat, Max-von-Laue-Str. 7,
60438 Frankfurt/Main, Germany
Received 10 March 2006; accepted after revision 14 June 2006
Available online 18 December 2006
Abstract
The detailed investigation of electronic andmagnetic properties of polymeric coordinationmaterials with accurate ab initio quan-
tummechanical methods is often computationally extremely demanding because of the large number of atoms in the unit cell. More-
over, usually the available structural data are insufficient or poorly determined, especially when the structure contains hydrogen
atoms. In order to be able to perform controlled ab initio calculations on reliable structures, we use a two-step approach to system-
atically preparemodel structures for polymeric coordination compound systems and to relax them to their equilibrium configuration.
First, a structure is constructed on the basis of a crystallographic database and optimized by force fieldmethods; in the second step, the
structure is relaxed by ab initio quantummechanicalmolecular dynamics.With this structure, we performaccurate electronic structure
calculations. We will apply this procedure to a Fe(II) triazole compound and to a coordination polymer of Cu(II) ions with 2,5-bis
(pyrazol-1-yl)-1,4-dihydroxybenzene. To cite this article: Harald O. Jeschke et al., C. R. Chimie 10 (2007).
Ó 2006 Academie des sciences. Published by Elsevier Masson SAS. All rights reserved.
Keywords: Coordination polymer; Density functional theory; Structure optimization
1. Introduction
Polymeric complexes form a class of materials that
attract interest from chemists and physicists. The possi-
bility to apply organic synthesis methods to produce
families of compounds with similar structures, but sub-
tly differing physical behavior, offers an opportunity to
design materials with planned properties.
Materials showing temperature or pressure induced
high-spinelow-spin transitions are currently being dis-
cussed for applications in data storage or spintronics.
Such magnetic transitions can be optically triggered,
raising hopes for technological applications. The coop-
erativity of such light-induced phase transitions also
raises questions concerning the underlying microscopic
processes [1e4]. Another important class of polymeric
coordination compounds is, in general, low-dimensional
magnetic materials where the coupling strengths
between the metal ions can be tuned by chemically* Corresponding author.
E-mail address: [email protected] (H.O. Jeschke).
1631-0748/$ - see front matter Ó 2006 Academie des sciences. Published by Elsevier Masson SAS. All rights reserved.
doi:10.1016/j.crci.2006.06.007
C. R. Chimie 10 (2007) 82e88
http://france.elsevier.com/direct/CRAS2C/
157

modifying the ligands and the transition metal ion coor-
dination. Effects of, for instance, dimensional crossover
can be studied in this way.
Most of these compounds generally contain a large
number of atoms in the unit cell and a very low symme-
try (in 80% of the cases triclinic or monoclinic), making
the first principles study of the electronic and magnetic
properties of these systems under different conditions
(pressure, temperature, light irradiation) computation-
ally very demanding. Moreover, since an accurate
determination of hydrogen positions with X-ray
diffractometry is very difficult, usually the available
structure data are poorly determined, implying unstable
quantum mechanical calculations. For some cases, the
crystal structures are not even known, due to the ab-
sence of single crystals suitable for an X-ray structure
analysis. In order to overcome these shortcomings, we
use in this communication a two-step approach which
allows us to perform accurate ab initio density func-
tional theory (DFT) calculations on reliable model
structures for coordination polymers. It should be noted
that the expression ‘ab initio prediction of crystal struc-
tures’ is also used in the sense of ‘a priori prediction’,
i.e. predictions without reference to diffraction data.
Possible crystal structures of organic compounds with
20e60 atoms can be predicted within some days or
weeks using force field methods [5]. This works also
for organometallic compounds, e.g. pentamethylferro-
cene Fe(C5H5) [(C5CH3)5] [6]. Quantum mechanical
methods are much more time-consuming; hence their
use is limited to local optimizations starting from
a given structural model. Thus, quantum mechanical
and force field methods can be combined by making
first a global optimization using force field methods,
followed by a local optimization with quantum mecha-
nical methods. This was done for many inorganic
systems, e.g. NaCl or MgF2 [7], and a few simple or-
ganic compounds, e.g. glycole C2H4(OH)2 and glycerol
C3H5(OH)3 [8]. In most other cases of crystal structure
predictions, quantum mechanical calculations were
only used for secondary calculations, e.g. to calculate
molecular geometries and electrostatic charges, or to
derive intramolecular or intermolecular potential curves
for subsequent force field optimizations [9].
If experimental data are known, e.g. from crystal
data of analogous structures, this knowledge should of
course be used as far as possible in order to generate
reliable model structures and to calculate solid-state
properties. Here, we apply ab initio DFT methods to
understand the relationships between the structures
and the electronic and magnetic properties of both (i)
spin crossover materials and (ii) low-dimensional spin
systems. We will consider two representatives from
this large class of compounds: (i) a Fe(II) triazole com-
pound [10,11] which is thought to have a polymer struc-
ture and (ii) a coordination polymer of Cu(II) ions with
2,5-bis(pyrazol-1-yl)-1,4-dihydroxybenzene [12] (we
shall denote it as [Cu(bpydhb)]n; alternative names
given in the literature are CuCCP [13]).
For the Fe(II) triazole system [10,11], there is no
direct accurate determination of the crystal structure
of the complex as it cannot be crystallized sufficiently
well. A chain-like structure for such compounds of
formula [Fe(Rtrz)3]A2$S, where A denotes the anion,
was predicted from EXAFS spectroscopy [14]. For
analogous Cu(II) compounds, this chain structure was
confirmed by single crystal X-ray analysis (see e.g.
Refs. [15,16]). Polymeric iron triazole compounds al-
ways show a poor crystallinity, and single crystals
cannot be grown. Hence the X-ray structure analyses
are limited to molecular compounds, e.g. trimers
containing three Fe(II) ions connected by six triazole
ligands and six terminal water molecules [17]. Poly-
meric iron triazole complexes have been studied by
powder diffraction; but apart from a preliminary index-
ing of [Fe(Htrz)3](ClO4)2$1.85 H2O [18], no structural
data have been published so far. On the other hand,
these polymeric compounds show interesting high-
spinelow-spin transitions in the solid state (see e.g.
Ref. [19]), and quantum mechanical calculations could
help to understand the mechanism of this spin cross-
over. Since all calculations of electronic and magnetic
properties require a reliable and reasonable model of
the crystal structure, we constructed the structures of
a hypothetical polymer crystal. All available infor-
mation of molecular iron triazole systems, and of ana-
logous Cu(II) polymers were included. In order to
make the ab initio DFT calculations feasible, we con-
structed at first some models containing small triazoles
(e.g. methyl-triazole) and simple anions (e.g. Fÿ). Our
rationale is that the model compound still has the
same coordination and immediate environment of the
Fe(II) ion as the real material which should thus allow
us to study the mechanisms of the high-spinelow-spin
transition. Structures with more complex anions will be
considered later.
The second system that we study, the coordination
polymer of Cu(II) ions with 2,5-bis(pyrazol-1-yl)-1,4-
dihydroxybenzene, [Cu(bpydhb)]n, has been recently
synthesized by Wagner et al. [12]. The Cu2þ ions in
this compound form spin 1/2 antiferromagnetic Hei-
senberg chains running along the z-axis. We will ana-
lyze the influence on the electronic properties of
slight structural modifications, like substitutions of
83H.O. Jeschke et al. / C. R. Chimie 10 (2007) 82e88
158

small organic groups on the dihydroxybenzene or intro-
duction of water ligands which change the coordination
of Cu from square to octahedral. The structure of Cu(II)
with 2,5-bis(pyrazol-1-yl)-1,4-dihydroxybenzene has
been obtained by X-ray powder diffraction [12] and
we will apply our two-step approach for the modified
structures based on these data.
2. Methods
We derive and investigate model polymeric coordi-
nation compound structures in two steps. First, we cre-
ate a rough structure on the basis of crystallographic
databases [21]. If no crystal structures of similar com-
pounds are known e like in the case of Fe triazoles e,
we construct a hypothetical crystal structure having
the highest possible symmetry, a small number of
atoms per unit cell and a sensible arrangement of the
individual fragments. The crystal structure is opti-
mized by force field methods including the optimiza-
tion of the unit cell parameters, but maintaining the
crystallographic symmetry. We used the Cerius2 pro-
gram package [22] with a modified Dreiding [23]
force field; atomic charges were calculated by the Gas-
teiger and Marsili method [24]. Afterwards we pro-
ceed to improve the structure by relaxing it again,
but now with an ab initio quantum mechanical molec-
ular dynamics method [25]. Note that we employ an
all-electron method already at this step in order to
obtain the best possible equilibrium structure even
for demanding transition metal complexes. Finally,
we analyze the properties of the relaxed model struc-
ture with an all electron ab initio DFT method of the
highest precision [26].
Our Car Parrinello (CP) ab initio molecular dynam-
ics (AIMD) calculations [25] are performed with a pro-
jector augmented wave (PAW) basis set [27]. This is an
all-electron calculation based on the frozen core ap-
proximation. The exchangeecorrelation potential is
evaluated in the generalized gradient approximation
(GGA) as parameterized in Ref. [28]. After a first anal-
ysis of the electronic properties for the classically pre-
pared model in order to determine the structural
stability, we employ an AIMD with friction to refine
the structure. We impose constraints on the atomic co-
ordinates in order to preserve the space group symmetry
of the compound.
For the final analysis step we employ the full poten-
tial linearized augmented plane wave (LAPW,
APWþ lo) method as implemented in the WIEN2k
code [26].
3. Results
3.1. Fe(II) triazole
The Fe(II) spin crossover molecular systems have
been intensively studied in the past [19] and various the-
ories have been developed about the mechanism of the
high-spinelow-spin transition. A few years ago, Kahn
and Jay Martinez [10] proposed that the cooperativity
of this transition may be enhanced by replacing molec-
ular crystals by polymers, since in the latter the metallic
sites are bridged by chemical linkers through which one
may get efficient intersite coupling. A first-principle
DFT study of such systems would bring some light
into the properties of these materials. Unfortunately,
to date it has not been possible to get an accurate
X-ray structure determination of Fe(II) spin crossover
polymer systems, as discussed above, which is an indis-
pensable input for ab initio DFT calculations and there-
fore, to our knowledge, no reliable ab initio studies were
performed. With the two-step method, we have ob-
tained e based on known data for molecular Fe(II)
spin crossover systems e optimized model polymer
structures which can be used as input for ab initio
DFT calculations. In Fig. 1 we present the structure of
the polymer Fe(II) compound with 4-methyl-1,2,4-tria-
zole moieties as bridging ligands between the Fe(II) cat-
ions. As anions we chose simple Fÿ ions in order not to
complicate theDFTcalculations. The structure hasP21/m
symmetry; a higher symmetry was not possible with this
chemical composition. As an initial structure with
Fig. 1. Two unit cells of the triazole model polymer. The usually
complicated anions have been replaced by single atom Fÿ anions.
84 H.O. Jeschke et al. / C. R. Chimie 10 (2007) 82e88
159

low-spin character, the distances between the Fe(II) cen-
ters and the neighboring N atoms of the triazole rings
were chosen to be dFeeN¼ 1.97 A, close to the FeeN
distance of dFeeN¼ 2.0 A, which is known to be typical
for the low-spin variants of Fe triazole complexes [20],
while for the structurewith high-spin character we chose
dFeeN¼ 2.2 A. In Fig. 2 we present the spin-polarized
density of states (DOS) obtained [26] for this system
after structural optimization for the low-spin (Fig. 2(a))
and the high-spin (Fig. 2(b)) states. Shown is the total Fe
d DOS for majority (upper panel) and minority (lower
panel) spin states. Since Fe is in an octahedral environ-
ment of N, the 3 d states split into lower t2g (dxy, dxz,
dyz) and higher eg ðdx2ÿy2 ; dz2Þ states. In Fig. 2(a), the
six electrons of Fe(II) 3d6 occupy fully the t2g states
(see DOS manifold between ÿ2 and ÿ0.2 eV) for
both spins, thus corresponding to a low-spin S¼ 0 state.
The eg states are completely empty and lie above the
Fermi level. In Fig. 2(b), the majority (spin up) t2g and
eg states are occupied (upper panel DOS in the range
between ÿ3.8 and ÿ0.6 eV), while the minority (spin
down, lower panel) t2g states are about one-third occu-
pied and two-thirds empty. The minority eg states are
completely empty (states in the range of energies
between 1 and 3 eV, lower panel). These results indicate
that the system is in a high-spin S¼ 2 state. A detailed
investigation of the magnetic properties of this
polymer system for both spin states will be presented
elsewhere [29].
3.2. Cu(II)epolymer
The Cu(II) coordination polymer [Cu(bpydhb)]nsynthesized by Wagner et al. [12] crystallizes in the tri-
clinic space group P1 (no. 2) and consists of stacks of
chains of deprotonated 2,5-bis(pyrazol-1-yl)-1,4-dihy-
droxybenzene molecules connected by Cu2þ ions.
This system behaves as a homogeneous antiferromag-
netic spin 1/2 Heisenberg chain, with an exchange cou-
pling constant J¼ 21.5 K/kB estimated from magnetic
susceptibility measurements [13]. The modular nature
of this polymer makes it an adequate candidate to study
chemically feasible structural modifications which may
change the electronic and magnetic properties. Of spe-
cial interest is the effect of dimensionality, i.e. tuning
the crossover from one dimension to higher dimensions
with the inclusion of adequately modified ligands. Since
in this communication we want to stress the procedure
we follow to design these structures and how we calcu-
late the electronic properties, we will concentrate here
on one substitution, namely two hydrogen atoms in
the hydroquinone ring by two amino groups and show
the efficiency of the two-step process. A second issue
in this context that requires some attention is the study
of the effect of two additional ligands at the Cu(II) ion,
since such an octahedral coordination of copper is also
frequently observed. We will here present the relaxation
process on [Cu(bpydhb)]n with two additional water
molecules in the environment of copper.
In Fig. 3 we present the relaxed structure of [Cu
(bpydhb)]n where two hydrogen atoms in the hydroqui-
none rings have been substituted by two amino groups.
This structure was obtained first by applying the force
field method, which already has the correct information
of the chemical distances and angles from databases. A
quantum mechanical evaluation of the forces on the
atoms (see Table 1) for this structure performed
with the full potential LAPW method [26] (FPLAPW)
still shows an unstable structure. Our aim is to relax
this structure showing forces in the hundreds of
−6 −4 −2 0 2 4
energy (eV)
−6 −4 −2 0 2 4
energy (eV)
(a)
↑
↓
−10
−5
0
5
10
DO
SD
OS
−10
−5
0
5
10(b)
Fe d
Fe d
Fe d
Fe d
↑
↓
Fig. 2. Spin-polarized Fe d density of states of the Fe triazole struc-
ture in Fig. 1 in units of states/electronvolt/atom/spin. (a) For the
S¼ 0 state of Fe; (b) for the S¼ 2 state of Fe. The upper and lower
panels of the figure show, respectively, the density of states for the
majority and minority spin states. The Fermi energy is indicated
by a dotted line.
85H.O. Jeschke et al. / C. R. Chimie 10 (2007) 82e88
160

mRyd/aB with quantum mechanical molecular dynam-
ics calculations, AIMD, until we find forces smaller
than 25 mRyd/aB which we set as upper bound for the
force values. In order to get structures with forces
smaller than 1 mRyd/aB within the FPLAPW method,
a fine tuning between the various first principles DFT
methods we employ has to be considered. For our pur-
poses here, a benchmark of 25 mRyd/aB is reasonable.
In Table 2 the forces after the AIMD relaxation are
shown and we observe that the structure is relaxed to
our required precision. The fractional coordinates of
this structure are given in Table 3 where the symmetry
and cell parameters were kept unchanged with respect
to the unsubstituted Cu polymer system [Cu(bpydhb)]n[12] a¼ 5.1723 A, b¼ 7.9587 A, c¼ 8.2298 A, and
angles a¼ 118.221�, b¼ 91.520�, g¼ 100.148�.
In a different modification of the Cu(II) polymer
structure, we want to investigate the influence of
a change of the Cu coordination from four to six on
the electronic properties of the Cu(II) polymer. We
added two water molecules bound to the Cu center
and proceeded as outlined for the case of the NH2
Fig. 3. Four unit cells of [Cu(bpydhb)]n (see text for the detailed for-
mula) where two hydrogen atoms in the hydroquinone rings have
been substituted by two amino groups. We find that the relaxed struc-
ture shows some tilting of the amino groups out of the plane defined
by the benzene ring.
Table 1
Forces [26] between the atoms for the Cu(II)eNH2 polymer structure
designed with the force field method
Atom Fx Fy Fz
Cu 0 0 0
O ÿ47.4 ÿ62.7 51.3
N1 89.1 32.8 ÿ42.6
N2 22.4 27.2 ÿ95.8
N3 ÿ94.2 ÿ66.8 33.5
C1 35.0 22.9 1.8
C2 ÿ92.7 ÿ29.2 111.1
C3 ÿ39.2 ÿ41.7 294.8
C4 ÿ239.7 ÿ104.1 16.5
C5 ÿ26.6 ÿ12.8 ÿ304.2
C6 106.7 88.9 46.0
H1 128.6 ÿ28.7 215.0
H2 255.3 106.1 ÿ34.2
H3 23.8 25.6 ÿ279.0
H4 4.8 10.8 ÿ18.3
H5 ÿ16.2 64.5 56.3
Note that the forces were determined under the constraint of inversion
symmetry; thus there are no forces acting on the Cu(II) ion center.
Units are in mRyd/aB. See Table 3 for identification of the atom
location.
Table 2
Forces [26] between the atoms for the relaxed Cu(II)eNH2 polymer
Atom Fx Fy Fz
Cu 0 0 0
O 12.7 16.9 21.7
N1 3.9 0.7 ÿ17.2
N2 12.5 ÿ2.3 8.4
N3 ÿ21.0 ÿ9.4 ÿ5.5
C1 ÿ1.0 ÿ9.3 ÿ19.4
C2 10.3 3.6 ÿ2.1
C3 ÿ7.1 ÿ7.0 14.6
C4 ÿ10.6 ÿ12.7 ÿ3.1
C5 ÿ12.0 ÿ6.0 ÿ19.5
C6 12.0 3.4 ÿ0.7
H1 1.4 ÿ0.7 3.5
H2 3.1 ÿ1.7 ÿ1.4
H3 ÿ0.4 ÿ0.3 ÿ4.1
H4 0.08 ÿ5.5 ÿ0.4
H5 1.1 ÿ0.9 0.5
Units are expressed in mRyd/aB.
Table 3
Fractional atomic positions of nonequivalent atoms in Cu(II)eNH2
obtained after relaxation
Atom x y z
Cu 0.5 0.5 0.5
O 0.45952338 0.34384463 0.62047714
N1 0.87129861 0.67649196 0.85703667
N2 0.81592808 0.67403219 0.69273582
N3 0.89342131 0.81953377 0.25313235
C1 0.48379900 0.42607948 0.80332348
C2 0.68236558 0.58873536 0.92870320
C3 0.03998649 0.76736537 0.66677421
C4 0.23751744 0.83563448 0.81694695
C5 0.12514376 0.77281287 0.93447831
C6 0.70113966 0.66249861 0.12137891
H1 0.20669437 0.78002257 0.06146726
H2 0.43843580 0.91660682 0.83522646
H3 0.04936408 0.77481595 0.53807198
H4 0.82019516 0.86915420 0.37967013
H5 0.94873662 0.93065156 0.22239484
The corresponding unit cell parameters are given in the text.
86 H.O. Jeschke et al. / C. R. Chimie 10 (2007) 82e88
161
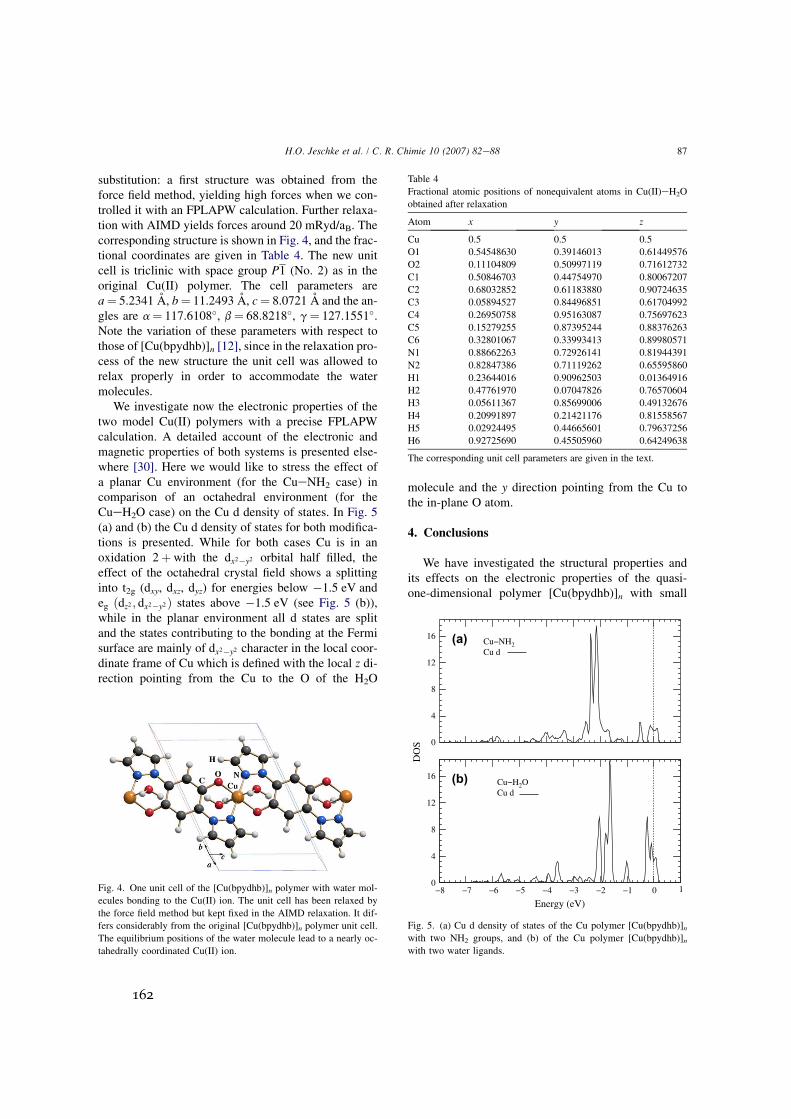
substitution: a first structure was obtained from the
force field method, yielding high forces when we con-
trolled it with an FPLAPW calculation. Further relaxa-
tion with AIMD yields forces around 20 mRyd/aB. The
corresponding structure is shown in Fig. 4, and the frac-
tional coordinates are given in Table 4. The new unit
cell is triclinic with space group P1 (No. 2) as in the
original Cu(II) polymer. The cell parameters are
a¼ 5.2341 A, b¼ 11.2493 A, c¼ 8.0721 A and the an-
gles are a¼ 117.6108�, b¼ 68.8218�, g¼ 127.1551�.
Note the variation of these parameters with respect to
those of [Cu(bpydhb)]n [12], since in the relaxation pro-
cess of the new structure the unit cell was allowed to
relax properly in order to accommodate the water
molecules.
We investigate now the electronic properties of the
two model Cu(II) polymers with a precise FPLAPW
calculation. A detailed account of the electronic and
magnetic properties of both systems is presented else-
where [30]. Here we would like to stress the effect of
a planar Cu environment (for the CueNH2 case) in
comparison of an octahedral environment (for the
CueH2O case) on the Cu d density of states. In Fig. 5
(a) and (b) the Cu d density of states for both modifica-
tions is presented. While for both cases Cu is in an
oxidation 2þwith the dx2ÿy2 orbital half filled, the
effect of the octahedral crystal field shows a splitting
into t2g (dxy, dxz, dyz) for energies below ÿ1.5 eV and
eg ðdz2 ; dx2ÿy2Þ states above ÿ1.5 eV (see Fig. 5 (b)),
while in the planar environment all d states are split
and the states contributing to the bonding at the Fermi
surface are mainly of dx2ÿy2 character in the local coor-
dinate frame of Cu which is defined with the local z di-
rection pointing from the Cu to the O of the H2O
molecule and the y direction pointing from the Cu to
the in-plane O atom.
4. Conclusions
We have investigated the structural properties and
its effects on the electronic properties of the quasi-
one-dimensional polymer [Cu(bpydhb)]n with small
Fig. 4. One unit cell of the [Cu(bpydhb)]n polymer with water mol-
ecules bonding to the Cu(II) ion. The unit cell has been relaxed by
the force field method but kept fixed in the AIMD relaxation. It dif-
fers considerably from the original [Cu(bpydhb)]n polymer unit cell.
The equilibrium positions of the water molecule lead to a nearly oc-
tahedrally coordinated Cu(II) ion.
Table 4
Fractional atomic positions of nonequivalent atoms in Cu(II)eH2O
obtained after relaxation
Atom x y z
Cu 0.5 0.5 0.5
O1 0.54548630 0.39146013 0.61449576
O2 0.11104809 0.50997119 0.71612732
C1 0.50846703 0.44754970 0.80067207
C2 0.68032852 0.61183880 0.90724635
C3 0.05894527 0.84496851 0.61704992
C4 0.26950758 0.95163087 0.75697623
C5 0.15279255 0.87395244 0.88376263
C6 0.32801067 0.33993413 0.89980571
N1 0.88662263 0.72926141 0.81944391
N2 0.82847386 0.71119262 0.65595860
H1 0.23644016 0.90962503 0.01364916
H2 0.47761970 0.07047826 0.76570604
H3 0.05611367 0.85699006 0.49132676
H4 0.20991897 0.21421176 0.81558567
H5 0.02924495 0.44665601 0.79637256
H6 0.92725690 0.45505960 0.64249638
The corresponding unit cell parameters are given in the text.
−8 −7 −6 −5 −4 −3 −2 −1 0 1
Energy (eV)
Cu−H2O
Cu d
0
4
8
12
16
0
4
8
12
16 (a)
(b)
DO
S
Cu−NH2
Cu d
Fig. 5. (a) Cu d density of states of the Cu polymer [Cu(bpydhb)]nwith two NH2 groups, and (b) of the Cu polymer [Cu(bpydhb)]nwith two water ligands.
87H.O. Jeschke et al. / C. R. Chimie 10 (2007) 82e88
162

structural modifications and a model Fe(II) triazole
polymer using classical and ab initio DFT methods.
We demonstrate that the use of a stepwise approach to
the study of complicated coordination polymer mate-
rials is an effective procedure to obtain reliable struc-
tures for accurate quantum mechanical analysis. We
note that an exclusive use of ab initio molecular dynam-
ics is very time-consuming, while the combination of
the classical and quantum approaches speeds up the re-
laxation process considerably. We first employ a classi-
cal force field to create and relax plausible initial
structures. In a second step, we proceed with ab initio
molecular dynamics to relax these structures to a stable
configuration. Finally we extract the electronic proper-
ties of the transition metal compounds with precise
FPLAPW calculations.
Acknowledgments
H.O.J. gratefully acknowledges support from the
DFG through the Emmy Noether Program. This
work was financially supported by the Deutsche For-
schungsgemeinschaft under the auspices of the For-
schergruppe 412 ‘‘Spin and charge correlations in
low-dimensionalmetalorganicsolids’’. We thank A. Kokalj
for providing the visualization code XcrySDen [31].
We gratefully acknowledge support by the Frankfurt
Center for Scientific Computing.
References
[1] T. Tayagaki, K. Tanaka, Phys. Rev. Lett. 86 (2001) 2886.
[2] Y. Ogawa, S. Koshihara, K. Koshino, T. Ogawa, C. Urano,
H. Takagi, Phys. Rev. Lett. 84 (2000) 3181.
[3] S. Koshihara, Y. Tokura, K. Takeda, T. Koda, Phys. Rev. Lett.
68 (1992) 1148.
[4] K. Miyano, T. Tanaka, Y. Tomioka, Y. Tokura, Phys. Rev. Lett.
78 (1997) 4257.
[5] See e.g. P. Verwer, F.J.J. Leusen Rev. Comput. Chem. 12 (1998)
327; W.T.M. Mooij, B.P. van Eijck, S.L. Price, P. Verwer,
J. Kroon, J. Comput. Chem. 19 (1998) 459; J.P.M. Lommerse,
W.D.S. Motherwell, H.L. Ammon, J.D. Dunitz, A. Gavezzotti,
D.W.M. Hofmann, F.J.J. Leusen, W.T.M. Mooij, S.L. Price,
B. Schweizer, M.U. Schmidt, B.P. van Eijck, P. Verwer,
D.E. Williams, Acta Crystallogr., Sect. B 56 (2000) 697;
W.D.S. Motherwell, H.L. Ammon, J.D. Dunitz,
A. Dzyabchenko, P. Erk, A. Gavezzotti, D.W.M. Hofmann,
F.J.J. Leusen, J.P.M. Lommerse, W.T.M. Mooij, S.L. Price,
H. Scheraga, B. Schweizer, M.U. Schmidt, B.P. van Eijck,
P. Verwer, D.E. Williams, Acta Crystallogr., Sect. B 58 (2002)
647; G.M. Day, W.D.S. Motherwell, H.L. Ammon,
S.X.M. Boerrigter, R.G. Della Valle, E. Venuti, A. Dzyabchenko,
J.D. Dunitz, B. Schweizer, B.P. van Eijck, P. Erk, J.C. Facelli,
V.E. Bazterra, M.B. Ferraro, D.W.M. Hofmann, F.J.J. Leusen,
C. Liang, C.C. Pantelides, P.G. Karamertzanis, S.L. Price,
T.C. Lewis, H. Nowell, A. Torrisi, H.A. Scheraga,
Y.A. Arnautova, M.U. Schmidt, P. Verwer, Acta Crystallogr.,
Sect. B 61 (2005) 511.
[6] M.U. Schmidt, U. Englert, J. Chem. Soc., Dalton Trans. 1996
(1996) 2077.
[7] J.C. Schon, M. Jansen, Z. Kristallogr. 216 (2001) 307;
J.C. Schon, M. Jansen, Z. Kristallogr. 216 (2001) 361.
[8] B.P. van Eijck, W.T.M. Mooij, J. Kroon, J. Comput. Chem. 22
(2001) 805.
[9] W.T.M.Mooij, F.B. van Duijnefeldt, J.G.C.M. van Duijnefeldte
van de Rijdt, B.P. van Eijck, J. Phys. Chem. A 103 (1999) 9872;
W.T.M. Mooij, B.P. van Eijck, J. Kroon, J. Phys. Chem. A 103
(1999) 9883.
[10] O. Kahn, C. Jay Martinez, Science 279 (1998) 44.
[11] Y. Garcia, V. Ksenofontov, P. Gutlich, Hyperfine Interact. 139/
140 (2002) 543.
[12] R. Dinnebier, H.W. Lerner, L. Ding, K. Shankland,
W.I.F. David, P.W. Stephens, M. Wagner, Z. Anorg. Allg.
Chem. 628 (2002) 310.
[13] B. Wolf, S. Zherlitsyn, B. Luthi, N. Harrison, U. Low,
V. Pashchenko, M. Lang, G. Margraf, H.-W. Lerner,
E. Dahlmann, F. Ritter, W. Assmus, M. Wagner, Phys. Rev. B
69 (2004) 092403.
[14] See A. Michalowicz, J. Moscovici, O. Kahn, J. Phys. IV 7
(1997) 633 and references therein.
[15] K. Drabent, Z. Ciunik, Chem. Commun. 14 (2001) 1254.
[16] Y. Garcia, P.J. van Koningsbruggen, G. Bravic, P. Guionneau,
D. Chasseau, G.L. Cascarano, J. Moscovici, K. Lambert,
A. Michalowicz, O. Kahn, Inorg. Chem. 36 (1997) 6357.
[17] Y. Garcia, P. Guionneau, G. Bravic, D. Chasseau,
J.A.K. Howard, O. Kahn, V. Ksenofontov, S. Reiman,
P. Gutlich, Eur. J. Inorg. Chem. (2000) 1531.
[18] E. Smit, B. Manoun, S.M.C. Verryn, D. de Waal, Powder Diffr.
16 (2001) 37.
[19] See P. Gutlich, Y. Garcia, H.A. Goodwin, Chem. Phys. Soc.
Rev. 29 (2000) 419 and references therein.
[20] G. Vos, R.A. le Febre, R.A.G. de Graaff, J.G. Haasnoot,
J. Reedijk, J. Am. Chem. Soc. 105 (1983) 1682.
[21] Cambridge Structural Database, Cambridge Crystallographic
Data Centre, Cambridge, England, 2005.
[22] Cerius2, Version 4.9, Accelrys Inc., Cambridge/England, 2003.
[23] L. Mayo, B.D. Olafson, W.A. Goddard III, J. Phys. Chem. 94
(1990) 8897.
[24] J. Gasteiger, M. Marsili, Tetrahedron 36 (1980) 3219.
[25] R. Car, M. Parrinello, Phys. Rev. Lett. 55 (1985) 2471.
[26] P. Blaha, K. Schwartz, G.K.H. Madsen, D. Kvasnicka, J. Luitz,
WIEN2K, an Augmented Plane Waveþ Local Orbitals Pro-
gram for Calculating Crystal Properties, in: K. Schwarz (Ed.),
Techn. University Wien, Austria, 2001, ISBN 3-9501031-1-2.
[27] P.E. Blochl, Phys. Rev. B 50 (1994) 17953.
[28] J.P. Perdew, K. Burke, M. Ernzerhof, Phys. Rev. Lett. 77 (1996)
3865.
[29] L.A. Salguero, H.O. Jeschke, R. Valentı, B. Rahaman, T. Saha-
Dasgupta, C. Buchsbaum, M.U. Schmidt (in preparation).
[30] L.A. Salguero, H.O. Jeschke, R. Valentı, B. Rahaman,
T. Saha-Dasgupta, C. Buchsbaum, M.U. Schmidt, cond-mat/
0602633.
[31] A. Kokalj, Comput. Mater. Sci. 28 (2003) 155 Code available
from, http://www.xcrysden.org/.
88 H.O. Jeschke et al. / C. R. Chimie 10 (2007) 82e88
163

B.11 Cu-basierte Polymerverbindungen
[CB11] L. A. Salguero, H. O. Jeschke, B. Rahaman, T. Saha-Dasgupta, C. Buchsbaum, M. U.Schmidt, R. Valentí, „Cu-based metalorganic systems: an ab initio study of the elec-tronic structure“, New Journal of Physics 2007, 9, 26.
Mit freundlicher Abdruckgenehmigung von IOP Publishing.
doi:10.1088/1367-2630/9/2/026
164

T h e o p e n – a c c e s s j o u r n a l f o r p h y s i c s
New Journal of Physics
Cu-based metalorganic systems: an ab initio study
of the electronic structure
L Andrea Salguero1, Harald O Jeschke1,4, Badiur Rahaman2,
Tanusri Saha-Dasgupta2, Christian Buchsbaum3,
Martin U Schmidt3 and Roser Valentı1
1 Institut für theoretische Physik, Johann Wolfgang Goethe-Universität,
Max-von-Laue-Str. 1, 60438 Frankfurt/Main, Germany2 S N Bose National Centre for Basic Sciences, J D Block, Sector 3,
Salt Lake City, Kolkata 700098, India3 Institut für Anorganische und Analytische Chemie, Johann Wolfgang
Goethe-Universität, Max-von-Laue-Str. 7, 60438 Frankfurt/Main, Germany
E-mail: [email protected]
New Journal of Physics 9 (2007) 26
Received 30 October 2006
Published 13 February 2007
Online at http://www.njp.org/
doi:10.1088/1367-2630/9/2/026
Abstract. Within a first principles framework, we study the electronic
structure of the recently synthesized polymeric coordination compound Cu(II)-
2,5-bis(pyrazol-1-yl)-1,4-dihydroxybenzene (CuCCP),which has been suggested
to be a good realization of a Heisenberg spin-1/2 chain with antiferromagnetic
coupling. By using a combination of classical with ab initio quantum mechanical
methods, we design on the computer reliablemodified structures of CuCCP aimed
at studying effects of Cu–Cu coupling strength variations on this spin-1/2 system.
For this purpose, we performed two types of modifications on CuCCP. In one
case, we replaced H in the linker by (i) an electron donating group (NH2) and
(ii) an electron withdrawing group (CN), while the other modification consisted
of adding H2O and NH3 molecules in the structure which change the local
coordination of the Cu(II) ions. With the Nth order muffin tin orbital (NMTO)
downfoldingmethod,we provide a quantitative analysis of themodified electronic
structure and the nature of the Cu–Cu interaction paths in these new structures
and discuss its implications for the underlying microscopic model.
4 Author to whom any correspondence should be addressed.
New Journal of Physics 9 (2007) 26 PII: S1367-2630(07)36176-41367-2630/07/010026+18$30.00 © IOP Publishing Ltd and Deutsche Physikalische Gesellschaft
165

2 Institute of Physics �DEUTSCHE PHYSIKALISCHE GESELLSCHAFT
Contents
1. Introduction 2
2. Method 4
2.1. Determination of crystal structure. . . . . . . . . . . . . . . . . . . . . . . . . 4
2.2. Electronic structure calculations . . . . . . . . . . . . . . . . . . . . . . . . . 5
3. Results 6
3.1. Crystal structure . . . . . . . . . . . . . . . . . . . . . . . . . . . . . . . . . . 6
3.2. Electronic structure and effective Cu–Cu interactions . . . . . . . . . . . . . . 6
4. Summary 14
Acknowledgments 16
Appendix 16
References 18
1. Introduction
Low-dimensional quantum spin systems have been a subject of intensive research in recent
decades, especially in solid state theory. The discovery in recent years of low-dimensional
materials has allowed a direct comparison of experimental observations with theory predictions.
Out of these studies, the need for available low-dimensional materials with a certain degree of
tunability has emerged since tunability has the advantage of allowing a step by step understanding
of the complexity of the materials. In this paper, we will focus on the search for and study of
tunable low-dimensional materials. We will restrict ourselves to a particular class of systems,
namely metalorganic compounds.
Metalorganic compounds formed by transition metal centres bridged with organic ligands
are being intensively discussed in the context of new molecule-based magnets and electronic
materials [1, 2].They constitute a class of tunablematerials partly due to theirmodular nature.The
modular set-up has the advantage of allowing the modification of relevant subunits chemically
without changing the subsequent crystal engineering. Substitution of organic groups and ligands
in these systems plays the role of doping in the search for materials with the desired magnetic
interaction strengths and charge carrier concentrations.
In the present study, we pursue these ideas from a theoretical point of view. We consider a
computationally feasible combination of classical with quantum mechanical ab initio tools [3]
in order to design and analyse new metalorganic compounds. As an example, we introduce
systematic changes in existing metalorganic materials in order to achieve desirable electronic
or magnetic properties in the modified new structures. Such study (i) allows for a gradual
understanding of the properties of these low-dimensional systems (ii) provides a guide to
systematic synthesis in the laboratory.
We focus our attention on the recently synthesized coordination polymer Cu(II)-2,5-
bis(pyrazol-1-yl)-1,4-dihydroxybenzene (CuCCP) [4] which, from susceptibility measure-
ments [5], has been identified as a model system for a spin-1/2 Heisenberg chain with an
antiferromagnetic exchange coupling constant of J = 21.5K. The polymeric unit is shown in
figure 1. This compound is a good starting point to study effects of coupling strength varia-
tion by appropriately introducing modifications on the linkers as well as changes on the Cu
New Journal of Physics 9 (2007) 26 (http://www.njp.org/)
166

3 Institute of Physics �DEUTSCHE PHYSIKALISCHE GESELLSCHAFT
O O
R
R
NN
N N
Cu
O O
CuX
X
X
X
R
R
NN
N N
n
Cu
X
X
Figure 1. Polymeric unit of Cu(II)-2,5-bis(pyrazol-1-yl)-1,4-dihydroxybenzene
(CuCCP) (X = ∅, R = H). We will consider the substitutions R = CN and
R = NH2 on the central benzene ring and the ligands X = H2O and X = NH3.
coordination. Note that the coupling strength scale for this system is small compared e.g. to
inorganic Cu oxides5 [6], where the couplings are more than one order of magnitude larger.
Accordingly, in this study we will be expecting coupling strength variations in the range of one
to a few tens of meV in energy.
The Cu–Cu interaction in this compound depends on the electronic nature of the linker. Its
properties can be tuned smoothly and predictably by changing the substitution pattern R (see
figure 1) of the central benzene ring (hydroquinone), or by introduction of additional ligands
X at the Cu(II) ions. The substitution or introduction of additional ligands is expected to bring
changes in the electronic properties of the compound. For example, it can change themagnitude of
magnetic interactions between theCu(II) centres in the spin chain via change in the charge density
in the polymeric chain. It may change the effective inter-chain interactions, the one-dimensional
nature of the original compound may thus be modified. It may even change the coordination
and valence of the Cu(II) ions, which may induce changes in the transport properties along the
one-dimensional chain bymoving away from theMott insulator at a half-filled Cu 3dx2−y2 orbital.
With the above ideas in mind, we first considered two possible H replacements in the central
benzene ring: an NH2 group, which acts as electron donating group, and a CN group, which acts
as electronwithdrawing group (see figure 1). Furthermore, extensive crystallization trials showed
that crystallites of the Cu(II) polymer always contain lattice defects in high concentration. In
many compounds, the Cu(II) ions are coordinated by six nitrogen or oxygen atoms instead of four
ligands. The Cu(II) polymer is experimentally crystallized in a mixture of water and ammonia
solvents, and it is likely that H2O or NH3 molecules are built into the crystal lattice. We have,
therefore also considered the introduction of additional ligands like H2O or NH3 at the Cu(II)
ions in our simulation study. In figure 1 and table 1, we give an account of these modified
structures.
The paper is organized as follows: in section 2, we give an account of the computational
methods considered in this study. In section 3, we present our results and discussion of the
relaxed new crystal structures and the analysis of their electronic properties. Finally in section 4,
we summarize our findings.
5 See e.g. the case of La2CuO4 with J values greater than 1000K.
New Journal of Physics 9 (2007) 26 (http://www.njp.org/)
167

4 Institute of Physics �DEUTSCHE PHYSIKALISCHE GESELLSCHAFT
Table 1. Naming convention for the substitutions and ligands on the CuCCP
coordination polymer considered in this study.
Short name R X
CuCCP H –
Cu(II)–NH2 NH2 –
Cu(II)–CN CN –
Cu(II)–H2O H H2O
Cu(II)–NH3 H NH3
2. Method
The methods used in this study can be primarily categorized into two classes. Firstly, a class
of methods has been used for the accurate structural determination of both the parent and the
modified compounds. Once the structural aspects are decided, their electronic structures are
calculated and analysed with another class of methods. Note that the understanding of a complex
system and design of new compounds need a combination of several different methods, each
being focused to deal with one specific aspect. In the following, we give a brief description of
all the methods that we have employed.
2.1. Determination of crystal structure
In the absence of diffraction data, a method much used to a priori predict crystal structures, is the
force field technique [7]–[12]. While such calculations are computationally fast, they rely on a
classical ansatz and therefore miss all possible quantummechanical effects, which are important
for the description of the electronic structure. Quantum mechanical methods, on the other side,
are computationally much more demanding, and they are, in this context, typically employed
for two tasks: one is the local optimization after global optimization with force field methods.
This has been reported for inorganic systems like NaCl or MgF2 [13, 14] and for simple organic
compounds like glycol C2H4(OH)2 and glycerol C3H5(OH)3 [15]. Another is for secondary
computations like the determination of molecular geometries, electrostatic charges or for the
calculation of intramolecular and intermolecular potential curves [16, 17].
In the present study, we used an effective way of designing reliable crystal structures which
shares the advantages of both methods, namely the fast calculations with classical force field
methods and the subsequent accurate quantum mechanical description with ab initio methods.
We first created the modified structures on the basis of crystallographic databases [18] and the
crystal structures were optimized by force field methods. In the second step, the structures were
relaxed by ab initio quantum mechanical molecular dynamics [19] within the density functional
theory (DFT) formalism until the forces on the atoms were less than a given threshold to ensure
structure stability. Our study differs from the previous studies mentioned in the sense that using
this approach, we succeeded in treating materials with large unit cells (of the order of 100 atoms)
and complicated electronic structure (transition metal complexes) with sufficient accuracy.
All force field optimizations were performed using the program package Cerius2 [20].
We modified the Dreiding 2.21 [21] force field by introducing energy terms for the case of
octahedrally coordinatedmetal ions. For the energyminimizationswe used themodifiedDreiding
New Journal of Physics 9 (2007) 26 (http://www.njp.org/)
168

5 Institute of Physics �DEUTSCHE PHYSIKALISCHE GESELLSCHAFT
force field with Gasteiger [22] charges. All structural models were based on the experimentally
determined crystal structure of CuCCP [4]. The crystallographic symmetry of the structure
modelswasmaintained in all relaxations.The position of theCu ionwas kept fixed during all force
field and quantummechanical optimizations. The second step of quantummechanical relaxations
were performed by Car Parrinello (CP) ab initio molecular dynamics (AIMD) calculations [19]
based on the projector augmented wave (PAW) method [23].6
2.2. Electronic structure calculations
We computed the electronic structure of the relaxed structures with the full potential linearized
augmented plane wave basis (FPLAPW) as implemented in theWien2k code [24]. Calculations
were performedwithin the generalizedgradient approximation (GGA) [25].The choice ofmuffin-
tin radii rMT, kmesh and plane-wave cutoffs kmax were carefully tested.We considered a kmesh of
(8 × 6 × 5) in the irreducible Brillouin zone and aRkmax = 3.8, which is reasonable for systems
that contain hydrogen atoms.
It is well-known that local density approximation (LDA) or generalized gradient approxima-
tion (GGA) fails to describe the correct insulating ground state for a strongly correlated electron
system, as is the case here. Introduction of missing correlation effects in a static mean-field like
treatment as is done in the so-called LDA+U approach [26, 27], should give rise to the correct
insulating state, as is supported by our calculations (not shown here). In the present paper, we are
mainly interested in estimating the effective one-electron hopping interactions which are well
described within LDA or GGA. In fact, the use of DFT calculations to understand the chemistry
of correlated materials is a well established method [28].
Finally, in order to analyse the computed electronic structure and to extract an effective
microscopic Hamiltonian, we derived quantitatively the Cu–Cu hopping integrals within
the Nth order muffin tin orbital (NMTO) downfolding technique [29, 30] as implemented in
the Stuttgart code [31].7 The downfolding technique provides a useful way to derive few-orbital
Hamiltonians starting from a complicated full LDA or GGA Hamiltonian by integrating out
degrees of freedom which are not of interest. This procedure naturally takes into account
the renormalization effect due to the integrated-out orbitals by defining energy-selected,
effective orbitals which serve as Wannier-like orbitals for the few-orbital Hamiltonian in the
downfolded representation. The method provides a first-principles way for deriving a few-band,
tight-binding Hamiltonian of the form HTB =∑
ij tij(c†i cj + h.c.) for a complex system, where
the tij define the effective hopping between the downfolded orbitals and c†i (ci) are electron
creation (annihilation) operators on site i. This method has proved to be extremely successful
for systems such as high-Tc cuprates [32], double perovskites [33] or low-dimensional inorganic
quantum spin systems [34]–[38].
Such estimates of the effective hopping integrals are useful in defining the underlying low-
energy magnetic model. More precisely, the one-electron effective Cu–Cu hopping integral,
t can be related to the Cu–Cu magnetic exchange coupling interaction J via a second-order
6 We have performed non-spin polarized DFT calculations—in contrast to spin-polarized ones—for the structure
relaxation since the energy associated with magnetism is much smaller than the cohesion energy and therefore,
possible changes on the atomic positions due to the magnetic energy can be assumed to be negligible.7 The calculations were checked for convergence within the two choices of basis sets (FPLAPW, NMTO).
New Journal of Physics 9 (2007) 26 (http://www.njp.org/)
169

6 Institute of Physics �DEUTSCHE PHYSIKALISCHE GESELLSCHAFT
perturbative treatment within the framework a many-body Hubbard–like model. Assuming that
these couplings are antiferromagnetic and neglecting ferromagnetic contributions, J can be
estimated as JAFM ≈ 4t2/Ueff whereUeff is the effective onsite Coulomb repulsion on theCu site.
3. Results
3.1. Crystal structure
Dinnebier et al [4] reported the synthesis, and crystal structure determination of the CuCCP
systemobtained by layering a solution of 2,5-bis(pyrazol-1-yl)-1,4-dihydroxybenzene inCH2Cl2with a solution ofCuBr2 in concentrated aqueous ammonia.The systemcrystallizes in the triclinic
space groupP 1 with 27 atoms per unit cell. This compound tends to form independent polymeric
chains consisting of deprotonated 2,5-bis(pyrazol-1-yl)-1,4-dihydroxybenzene molecules
bridged by Cu(II) ions with a 3d9 configuration, which corresponds to a local spin-1/2. As
shown in figure 2 the chain axes are oriented along the c-axis of the crystal and the copper ions
are located at (1/2, 1/2, 1/2), which is a centre of symmetry of the space group P 1. The Cu–Cu
distance along the approximate a-axis is about 5.2Å while along the other two axes it is closeto 8Å. These Cu(II) ions are coordinated in an almost square planar fashion by two (pyrazolyl)nitrogen atoms and two oxygen atoms of the deprotonated dihydroxybenzene groups.
The crystal structure was determined from x-ray powder diffraction data; consequently theoverall structure and the arrangement of the chains are reliable, but the individual atomic posi-tions had an accuracy of only about 0.3Å. A DFT analysis of the forces [24] between the atomsshows that the experimentally determined CuCCP structure is still very unstable with forces ofthe order of 100mRyd per aB or more for some atoms. We have therefore relaxed the atomicpositions keeping the Cu position fixed with the AIMD method described in subsection 2.1.
The Cu(II)–NH2 polymer and the Cu(II)–CN polymer were generated from the CuCCPpolymer, by substituting the two hydrogen atoms of the benzene rings by amino (NH2) orcyano (CN) groups, respectively (see figure 1 and table 1). The Cu(II)–H2O (Cu(II)–NH3)polymer was constructed from the CuCCP polymer by adding two water molecules (ammoniamolecules) as additional ligands to the Cu(II) ion (see figure 1 and table 1). In the originalcrystal structure the chains are quite densely stacked. The introduction of the H2O (or NH3)molecules would either lead to unrealistically short contacts to the neighbouring chains, or to aconsiderable increase of the distances between the chains, resulting in an unrealistically looselypacked structure. Therefore the crystal structures of the Cu(II)–H2O and Cu(II)–NH3 polymerswere fully optimized, including an optimization of the lattice parameters. Moreover, in order toachieve a better packing of the Cu(II) polymer chains with a favourable lattice energy, the Cu(II)chains shifted in the optimization process both sideways as well as along the chain directionwith respect to each other. The resulting unit cell parameters are shown in table 2.
All the modified structures were relaxed in the second step with the AIMD method untilthe forces on the atoms were sufficiently small to ensure stability of the quantum mechanicalcalculations. In the appendix, we present the relaxed structural data of all themodified structures.
3.2. Electronic structure and effective Cu–Cu interactions
3.2.1. CuCCP. In figure 3, we present the band structure for the relaxed CuCCP where theCu d band character is shown by bars on the right side. The band characters are given in the
New Journal of Physics 9 (2007) 26 (http://www.njp.org/)
170

7 Institute of Physics �DEUTSCHE PHYSIKALISCHE GESELLSCHAFT
2t
4t
c
0
H
CN
Cu
O
b
3t
c
ba
3t7t
1t
8t
0
Figure 2. Crystal structure of the CuCCP polymer in two different orientations.
The unit cell is shown in the figures (vectors a, b and c). Note the arrangements
of the Cu chains along the c-direction. The various Cu–Cu interaction paths tihave been also drawn where the index i = 1, 2, 3, 7, 8 denotes the ith nearest
neighbour.
New Journal of Physics 9 (2007) 26 (http://www.njp.org/)
171
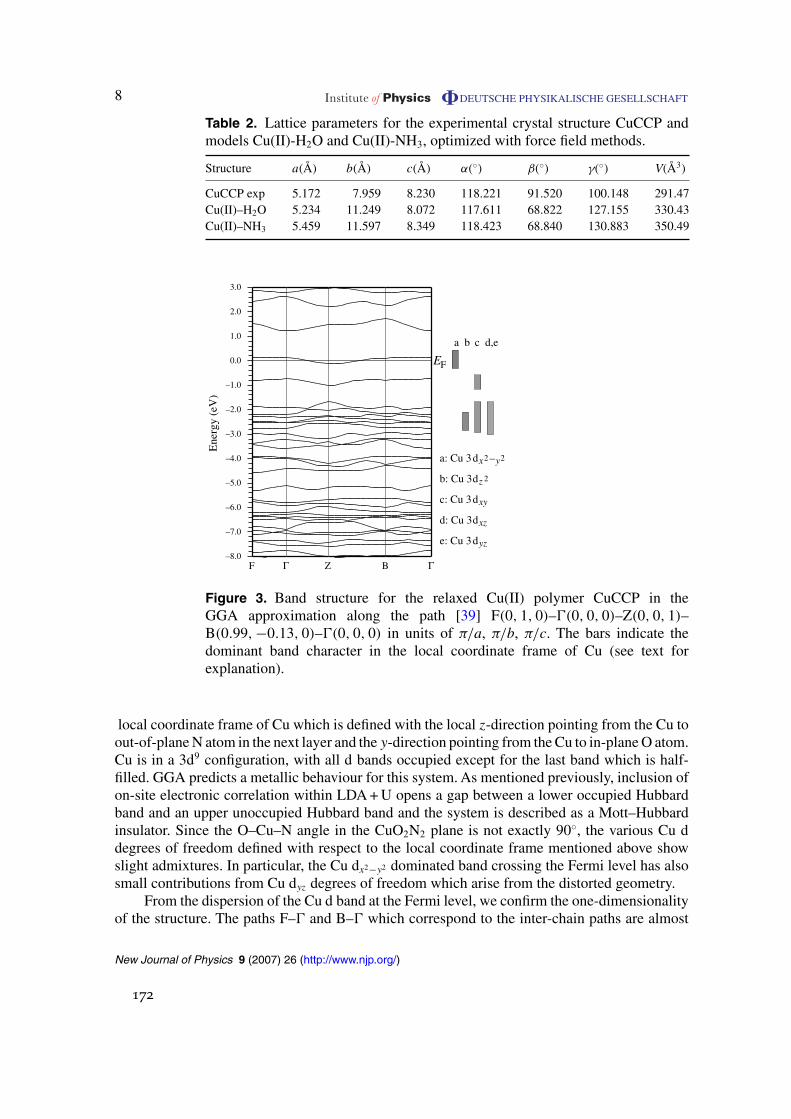
8 Institute of Physics �DEUTSCHE PHYSIKALISCHE GESELLSCHAFT
Table 2. Lattice parameters for the experimental crystal structure CuCCP and
models Cu(II)-H2O and Cu(II)-NH3, optimized with force field methods.
Structure a(Å) b(Å) c(Å) α(◦) β(◦) γ(◦) V(Å3)
CuCCP exp 5.172 7.959 8.230 118.221 91.520 100.148 291.47Cu(II)–H2O 5.234 11.249 8.072 117.611 68.822 127.155 330.43Cu(II)–NH3 5.459 11.597 8.349 118.423 68.840 130.883 350.49
F Γ Z B Γ
E F
Ener
gy (
eV)
0.0
1.0
2.0
3.0
–1.0
–2.0
–3.0
–4.0
–5.0
–6.0
–7.0
–8.0
y
c
xy
xz
yz
x
z
d,ea b
2d –a: Cu 3
b: Cu 3
c: Cu 3
d: Cu 3
e: Cu 3
d
d
d
d
2
2
Figure 3. Band structure for the relaxed Cu(II) polymer CuCCP in theGGA approximation along the path [39] F(0, 1, 0)–Ŵ(0, 0, 0)–Z(0, 0, 1)–B(0.99, −0.13, 0)–Ŵ(0, 0, 0) in units of π/a, π/b, π/c. The bars indicate thedominant band character in the local coordinate frame of Cu (see text forexplanation).
local coordinate frame of Cu which is defined with the local z-direction pointing from the Cu toout-of-planeN atom in the next layer and the y-direction pointing from theCu to in-planeO atom.Cu is in a 3d9 configuration, with all d bands occupied except for the last band which is half-filled. GGA predicts a metallic behaviour for this system.As mentioned previously, inclusion ofon-site electronic correlation within LDA+U opens a gap between a lower occupied Hubbardband and an upper unoccupied Hubbard band and the system is described as a Mott–Hubbardinsulator. Since the O–Cu–N angle in the CuO2N2 plane is not exactly 90◦, the various Cu ddegrees of freedom defined with respect to the local coordinate frame mentioned above showslight admixtures. In particular, the Cu dx2−y2 dominated band crossing the Fermi level has alsosmall contributions from Cu dyz degrees of freedom which arise from the distorted geometry.
From the dispersion of the Cu d band at the Fermi level, we confirm the one-dimensionalityof the structure. The paths F–Ŵ and B–Ŵ which correspond to the inter-chain paths are almost
New Journal of Physics 9 (2007) 26 (http://www.njp.org/)
172

9 Institute of Physics �DEUTSCHE PHYSIKALISCHE GESELLSCHAFT
Table 3. Values for the Cu–Cu hopping integrals calculated with the NMTO
downfolding method for the relaxed CuCCP, Cu(II)–NH2 and Cu(II)–CN
structures. The values are given in meV. The subscripts i = 1, 2, 3, 7, 8, 12
denote the ith nearest neighbours. See figure 2. Only the hopping integrals having
values larger than or equal to one tenth of a meV have been shown.
Path CuCCP Cu(II)–NH2 Cu(II)–CN
t1 4 9 22
t2 8 3 0
t3 79 88 68
t7 5 1 9
t8 3 8 8
t12 0 0 9
dispersionless and the intrachain Ŵ–Z–B path shows a cosine-like behaviour. A quantitative
analysis of the various hopping integrals obtained with the downfolding procedure, by keeping
only the Cu dx2−y2 degrees of freedom active and integrating out all the rest within the NMTO
framework, is given in the first column of table 3. The various interaction paths are as shown in
figure 2. The largest hopping integral t3 is along the chain (see figure 2), while all other hoppings
are almost an order of magnitude smaller.
3.2.2. Cu(II)–NH2 and Cu(II)–CN. In order to have a quantitative account of the structural
changes that the polymer system undergoes under the various substitutions, we define the angle
between the vector perpendicular to theCuO2N2 plane and the vector perpendicular to the benzene
ring as the tilting angle ϑ. The substitution of H by NH2 groups or CN groups in the benzene
rings induces a tilting from ϑ = 34.9◦ in CuCCP to ϑ = 37.3◦ in Cu(II)–NH2 and ϑ = 36.3◦ in
Cu(II)–CN.
In figures 4 (a) and (b), we present the FPLAPW orbital resolved DOS for the Cu(II)–NH2
and the Cu(II)–CNwithin the GGA approximation. Shown is the contribution to the total DOS of
Cu, O, N, C and the groups NH2 and CN.While some changes in the detailed shape of the DOS
for Cu, O, N and C between figures 4 (a) and (b) are observed, the most important effect is the
different electronic nature of the NH2 and CN groups. Figure 4 (c) shows the contribution of these
groups at the Fermi surface. The CN group bands are deep down into the valence band while the
NH2 group has appreciable contribution near the Fermi level, which indicates its involvement in
the effective interaction paths between copper atoms.We will see this more clearly in the plot of
the NMTO-Wannier orbitals to be discussed later in this section.
In figure 5, we show a comparison of the band structure for the relaxed CuCCP, Cu(II)-NH2
and the Cu(II)–CN polymers in the energy range [− 0.25 eV, 0.25 eV] where only the Cu dx2−y2
dominated band is involved. Though the basic nature of the dispersion remains the same upon
substitution, the details however do change. NH2 seems to be the most effective substitution
to increase the intrachain Cu–Cu interaction (the bandwidth widens along the Ŵ–Z–B path for
the Cu(II)–NH2 system). The CN substitution, on the other hand, reduces this interaction (note
the bandwidth narrowing along the Ŵ–Z–B path for the Cu(II)–CN system). The substitution
process also enhances certain interchain couplings. The almost dispersionless behaviour along
F–Ŵ and B–Ŵ becomes more dispersive. Description of such fine and subtle changes needs some
New Journal of Physics 9 (2007) 26 (http://www.njp.org/)
173

10 Institute of Physics �DEUTSCHE PHYSIKALISCHE GESELLSCHAFT
6420
–4 –3 –2 –1 0 1 2
Energy (eV)
DO
S (
stat
es e
V–1)
NH2
6420
C
6420
N
6420
O
6420
Cu(a)
6 4 2 0
–4 –3 –2 –1 0 1 2
Energy (eV)
DO
S (
stat
es e
V–1)
CN
6 4 2 0
C
6 4 2 0
N
6 4 2 0
O
6 4 2 0
Cu(b)
0
0.05
0.1
0.15
0.2
0.25
0.2 0.1 0.0–0.1–0.2Energy (eV)
DO
S (
stat
es e
V–1) NH2
0.2 0.1 0.0–0.1–0.2Energy (eV)
CN
(c)
Figure 4. Orbital resolved DOS for (a) Cu(II)–NH2 and (b) Cu(II)–CN. Panel
(c) shows the comparison of the contribution of the NH2 and CN groups to the
DOS at EF in a blown up scale.
quantitative measures which can be best described by the changes in effective Cu–Cu hoppings.
This is shown in table 3, where the hopping integrals obtained by the NMTO downfolding
method are shown. Note that the t1 hopping for the Cu(II)–CN system along the crystallographic
a-direction is enhanced by a factor of 4.5. Similarly, t7 and t8 hopping terms for the Cu(II)–
CN system between neighbouring Cu chains in the b-direction (see figure 2) are almost 2–3
times larger compared to that of the CuCCP system. The long-ranged t12 hopping parameter
between neighbouring chains along the a-axis also attains appreciable enhancement compared
to a vanishingly small value for the CuCCP system. Similarly, t1 and t8 hoppings are enhanced for
the NH2 substitution by factors of≈2–3.Among all the hoppings, only t2 shows the exception of
New Journal of Physics 9 (2007) 26 (http://www.njp.org/)
174

11 Institute of Physics �DEUTSCHE PHYSIKALISCHE GESELLSCHAFT
E F 0.0
0.2
–0.2
E F
En
erg
y (
eV)
0.0
0.2
–0.2
F Γ Z B Γ
E F 0.0
0.2
–0.2
Cu(II)–NH
CuCCP
Cu(II)–CN
2
Figure 5. Comparison between the band structures for (from top to bottom) the
relaxed CuCCP, Cu(II)–NH2 and Cu(II)–CN respectively.
being systematically decreased upon substitution. The predominant hopping, t3 is enhanced in the
Cu(II)–NH2 system and reduced in the Cu(II)–CN system as already predicted from bandwidth
arguments.
A very helpful tool to understand the origin of these changes is the plot of effective Cu
Wannier orbitals. In figure 6, we show theWannier orbitals for the three Cu(II) systems presented
so far. The plotted Wannier orbitals are obtained with the NMTO downfolding technique as
introduced in subsection 2.2.
The effective Cu Wannier orbital has the expected Cu dx2−y2 symmetry at the central Cu
site while the tails sitting at other sites are shaped according to the symmetries of the various
integrated out orbitals like the rest of the Cu d orbitals, O p, N p or C p. Note that the Cu d,
O p and N p antibonding orbitals in the basic CuN2O2 square plaquette remain similar in all
three cases but the effective orbital distribution in the benzene ring is markedly different. The
changes are most prominent for the NH2 substituted case with the tails attaining appreciable
weight at the sites in the benzene ring. We also notice the occurrence of weight at the NH2
assembly which is in accordance with the orbital resolved DOS study (see figure 4). This leads
to an enhancement in both intra- and some interchain Cu–Cu interactions, caused by the larger
overlap of the effective orbitals. The enhancement happens via two different routes: one is due
to the different tilting of the benzene ring compared to the original compound and the other one
is the opening of additional interaction paths via the NH2 group which enhances the intrachain
as well as interchain interactions t1 and t8 as can be seen in the quantitative estimates of the
hopping interactions in table 3. In the case of the CN substitution, the opening of an additional
New Journal of Physics 9 (2007) 26 (http://www.njp.org/)
175

12 Institute of Physics �DEUTSCHE PHYSIKALISCHE GESELLSCHAFT
Cu
N N
C C
C
C
C
C
NN
C
C
C
O
O
Cu
O
O
NN
Cu(II)–NH
CuCCP
NH
H
2
Cu(II)–CN
CN
2
(a)
(b)
(d)
(c)
Figure 6. Cu Wannier functions for (a) the relaxed CuCCP polymer, (b) the
Cu(II)–NH2 polymer, and (c) the Cu(II)–CN polymer. (d) Indicates the atom
positions common to (a)–(c). The N–C–C–C–H chain of atoms appearing above
the Wannier function belongs to the next layer.
intrachain pathway is absent, which is reflected in the reduced intrachain (t3) hopping interaction.
However the mechanism via the tilting of the benzene ring is still operative which is seen in the
enhancement of several interchain couplings, especially t1.
Relating the magnetic coupling interaction J with the effective hopping interaction t via
a relationship JAFM ≈ 4t2/Ueff , as discussed in subsection 2.2, and choosing Ueff to be 5 eV8 ,
we obtain the nearest-neighbour coupling for the CuCCP system to be JAFM ≈ 58K which is
somewhat larger than the experimental estimate [5] obtained by fitting susceptibility data to
an effective nearest-neighbour Heisenberg model, but remains of the same order of magnitude.
8 Note that this is a very rough Ueff estimate since we have here Cu surrounded by two O and two N atoms and the
Cu–Cu path is via a complicated organic linker. Typical values of Ueff for Cu oxides are 4–6 eV.
New Journal of Physics 9 (2007) 26 (http://www.njp.org/)
176

13 Institute of Physics �DEUTSCHE PHYSIKALISCHE GESELLSCHAFT
Table 4. Values for the Cu–Cu hopping integrals calculated with the NMTO
downfolding method for the relaxed CuCCP, Cu(II)-H2O and Cu(II)-NH3
structures. The values are given inmeV.The subscripts i = 1, 2, 3, 7, 8, 12 denote
the ith nearest neighbours. See figure 2.
Path CuCCP Cu(II)–H2O Cu(II)–NH3
t1 4 8 11
t2 8 7 5
t3 79 57 22
t7 5 1 1
t8 3 0 0
t12 0 0 0
The JAFM values estimated for Cu(II)–NH2 and Cu(II)–CN systems are JAFM ≈ 72K and ≈43K
respectively.
3.2.3. Cu(II)–H2O and Cu(II)–NH3. In our second set of modifications, we introduce two kinds
of ligands, H2O and NH3 in the CuCCP system in the way presented in subsection 3.1. Our
goal is to study the effect of H2O and NH3 satellites on the CuCCP structure as well as to
search for possible routes to change the Cu coordination from planar to octahedral. As explained
in subsection 3.1, in order to obtain realistic structures, the optimization with the force field
method was done without keeping the original cell fixed, since that would force very short
intermolecular distances between theH2O (NH3)moieties and the neighbouring chains.The force
field optimized structures (see table 2) and subsequently relaxed withAIMD are characterized by
Cu–O (O of the H2O molecule) distances of dCuO = 2.17Å while the Cu–O and Cu–N in-planedistances are dCuO = 1.99Å and dCuN = 2.01Å, respectively. This corresponds to a distortedoctahedron elongated along the Cu–H2O direction. For the case of the NH3 ligands the Cu–N(N of the NH3 molecule) distances are dCuN = 2.14Å, while the Cu–O and Cu–N in-planedistances are dCuO = 2.02Å and dCuN = 2.03Å, also giving rise to an elongated octahedronalong the Cu–NH3 direction. The ligands close to the Cu(II) centre also induce a tilting of thebenzene rings with respect to the CuO2N2 plane. From the initial angle of ϑ = 34.9◦ in CuCCPthe tilting due to the H2O ligand is quite significant, leading to ϑ = 42.9◦ in Cu(II)–H2O. TheNH3 molecule, by contrast, leads to a lowering of this angle to ϑ = 31.8◦ in Cu(II)–NH3.
In order to quantify the effect of the H2O and NH3 ligands on the electronic propertiesof CuCCP, we show in table 4 the values of the Cu–Cu hopping integrals calculated with theNMTO downfolding method where the hopping parameters for the original CuCCP have beenincluded for comparison. Note that the intrachain Cu–Cu coupling is reduced by a factor of1.5–3.5 with the inclusion of both ligands. The reduction is especially significant with NH3. Theonly Cu–Cu interchain path that is enhanced is t1 which is between Cu in nearest-neighbourchains and has its origin in the hydrogen bonds between the H of the H2O (NH3) molecule andthe O of the hydroquinone fragments in the chains. Therefore, apart from these hydrogen bonds,the introduction of ligands isolates the Cu ions considerably.
In the Wannier orbital plot in figures 7 and 8, we can see that the distorted octahedralenvironment of the Cu in the Cu(II)–H2O and Cu(II)–NH3 structures induces very little mixingof the Cu dz2 orbital to the predominant dx2−y2 . Also note the little contribution of weight inthe hydroquinone ring, in contrast to the previously discussed systems (see figure 6) which is a
New Journal of Physics 9 (2007) 26 (http://www.njp.org/)
177

14 Institute of Physics �DEUTSCHE PHYSIKALISCHE GESELLSCHAFT
Cu
C
NH
O
a
c
b
Figure 7. CuWannier functions for the Cu(II)–H2O system.
manifestation of the isolated nature of Cu in these structures. The inclusion of the H2O and NH3
satellites, however, changes the Cu coordination onlymarginally from four in the direction of six,
as opposed to our original motivation for the addition of H2O and NH3 ligands. Cu remains in the
oxidation state of almost 2+ as observed in our calculations. While the GGA calculations give
a metallic behaviour with a half-filled predominantly dx2−y2 Cu band, inclusion of correlation
effects with LDA+U drive the system to an insulating state. Therefore the system will remain
an insulator.
4. Summary
In search of low-dimensional quantum spin systems with tunable properties, we have proposed
and analysed within an ab initio framework and using a combination of different computational
methods various chemical modifications to the Cu-based polymeric coordination compound
New Journal of Physics 9 (2007) 26 (http://www.njp.org/)
178

15 Institute of Physics �DEUTSCHE PHYSIKALISCHE GESELLSCHAFT
Cu H
ON
C
c
ba
Figure 8. CuWannier functions for the Cu(II)–NH3 system.
CuCCP. Our goal has been to tune in a controlled way the magnetic interactions between Cu
centres and to test the efficiency and feasibility of the combination of methods proposed here.
We pursued two ways of modifying the original CuCCP structure; by changing the substitution
pattern in the linker (hydroquinone) and by adding ligands to the system. Following the first
scheme, we considered two possible H substitutions in the hydroquinone; an electron donating
group (NH2) and an electron withdrawing group (CN). For the second scheme, we considered
structures with H2O and NH3 ligands. Out of our study, we conclude that the NH2 substitution
in the hydroquinone is the most effective in order to enhance the intrachain Cu–Cu interaction
in CuCCP while the CN substitution induces and enhances the interchain interactions in the
system which were either absent or very weak in the original CuCCP compound. In contrast,
the inclusion of H2O or NH3 ligands has the effect of isolating the Cu ions.
The effects observed in this study are small, mainly due to the fact that the coupling constants
in these metalorganic materials are weak. On the other hand, these systems are, due to the
smallness of the coupling constants, of special interest since application of moderate magnetic
fields or pressure can drive the system to a phase transition. These systems can be described as
Mott–Hubbard insulators and possibly under application of pressure a metal–insulator transition
could be induced. This will form the basis of future studies.
New Journal of Physics 9 (2007) 26 (http://www.njp.org/)
179
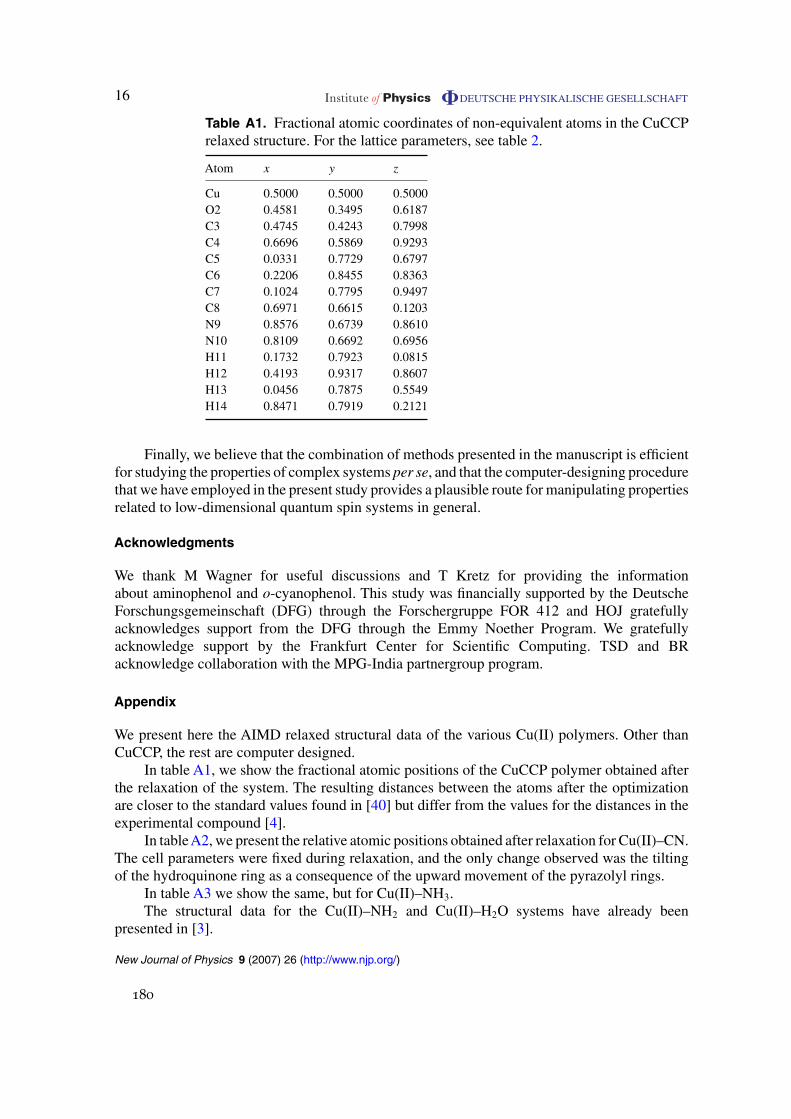
16 Institute of Physics �DEUTSCHE PHYSIKALISCHE GESELLSCHAFT
Table A1. Fractional atomic coordinates of non-equivalent atoms in the CuCCP
relaxed structure. For the lattice parameters, see table 2.
Atom x y z
Cu 0.5000 0.5000 0.5000
O2 0.4581 0.3495 0.6187
C3 0.4745 0.4243 0.7998
C4 0.6696 0.5869 0.9293
C5 0.0331 0.7729 0.6797
C6 0.2206 0.8455 0.8363
C7 0.1024 0.7795 0.9497
C8 0.6971 0.6615 0.1203
N9 0.8576 0.6739 0.8610
N10 0.8109 0.6692 0.6956
H11 0.1732 0.7923 0.0815
H12 0.4193 0.9317 0.8607
H13 0.0456 0.7875 0.5549
H14 0.8471 0.7919 0.2121
Finally, we believe that the combination of methods presented in the manuscript is efficient
for studying the properties of complex systems per se, and that the computer-designing procedure
that we have employed in the present study provides a plausible route for manipulating properties
related to low-dimensional quantum spin systems in general.
Acknowledgments
We thank M Wagner for useful discussions and T Kretz for providing the information
about aminophenol and o-cyanophenol. This study was financially supported by the Deutsche
Forschungsgemeinschaft (DFG) through the Forschergruppe FOR 412 and HOJ gratefully
acknowledges support from the DFG through the Emmy Noether Program. We gratefully
acknowledge support by the Frankfurt Center for Scientific Computing. TSD and BR
acknowledge collaboration with the MPG-India partnergroup program.
Appendix
We present here the AIMD relaxed structural data of the various Cu(II) polymers. Other than
CuCCP, the rest are computer designed.
In table A1, we show the fractional atomic positions of the CuCCP polymer obtained after
the relaxation of the system. The resulting distances between the atoms after the optimization
are closer to the standard values found in [40] but differ from the values for the distances in the
experimental compound [4].
In tableA2, we present the relative atomic positions obtained after relaxation for Cu(II)–CN.
The cell parameters were fixed during relaxation, and the only change observed was the tilting
of the hydroquinone ring as a consequence of the upward movement of the pyrazolyl rings.
In table A3 we show the same, but for Cu(II)–NH3.
The structural data for the Cu(II)–NH2 and Cu(II)–H2O systems have already been
presented in [3].
New Journal of Physics 9 (2007) 26 (http://www.njp.org/)
180

17 Institute of Physics �DEUTSCHE PHYSIKALISCHE GESELLSCHAFT
Table A2. Fractional atomic positions of non-equivalent atoms in Cu(II)–CN
obtained with the PAW method. For the lattice parameters, see table 2 (same as
CuCCP).
Atom x y z
Cu 0.5000 0.5000 0.5000
O2 0.4559 0.3460 0.6195
C3 0.4823 0.4252 0.7998
C4 0.6795 0.5881 0.9253
C5 0.0384 0.7593 0.6620
C6 0.2349 0.8314 0.8139
C7 0.1239 0.7694 0.9310
C8 0.6944 0.6601 0.1182
C9 0.1030 0.1811 0.7598
N10 0.8687 0.6739 0.8553
N11 0.8152 0.6676 0.6880
N12 0.9162 0.0575 0.6788
H13 0.2104 0.7793 0.0570
H14 0.4353 0.9135 0.8323
H15 0.0493 0.7681 0.5346
Table A3. Fractional atomic positions of non-equivalent atoms in Cu(II)–NH3
obtained with the PAW method. For the lattice parameters, see table 2.
Atom x y z
Cu 0.5000 0.5000 0.5000
O2 0.4679 0.3798 0.6285
C3 0.4786 0.4444 0.8064
C4 0.6761 0.6148 0.9103
C5 0.0881 0.8540 0.6283
C6 0.2867 0.9709 0.7753
C7 0.1520 0.8949 0.9023
C8 0.6932 0.6630 0.0956
N9 0.8861 0.7410 0.8310
N10 0.8489 0.7159 0.6631
H11 0.2228 0.9402 0.0374
H12 0.4977 0.0958 0.7892
H13 0.0972 0.8601 0.4997
H14 0.8313 0.7917 0.1793
N15 0.8587 0.4701 0.3123
H16 0.7612 0.3507 0.2812
H17 0.0789 0.5407 0.3673
H18 0.9088 0.4872 0.1907
New Journal of Physics 9 (2007) 26 (http://www.njp.org/)
181

18 Institute of Physics �DEUTSCHE PHYSIKALISCHE GESELLSCHAFT
References
[1] Kahn O and Martinez C J 1998 Science 279 44
[2] Postnikov A V, Kortus J and Pederson M R 2004 Psi-k Newsletter no. 61, p 127
[3] Jeschke H O, Salguero LA, Valentı R, Buchsbaum C, Schmidt M U andWagner M 2007 C. R. Chim. at press
doi: 10.1016/j.crci.2006.06.007
[4] Dinnebier R, Lerner H W, Ding L, Shankland K, David W I F, Stephens P W and Wagner M 2002 Z. Anorg.
Allg. Chem. 628 310
[5] Wolf B et al 2004 Phys. Rev. B 69 092403
[6] Singh R R P, Fleury P A, Lyons K B and Sulewski P E 1989 Phys. Rev. Lett. 62 2736
[7] Schmidt M U and Englert U 1996 J. Chem. Soc. Dalton Trans. 1996 2077
[8] Verwer P and Leusen F J J 1998 Rev. Comput. Chem. 12 327
[9] Mooij W T M, van Eijck B P, Price S L, Verwer P and Kroon J 1998 J. Comput. Chem. 19 459
[10] Lommerse J P M et al 2000 Acta Cryst. B 56 697
[11] Motherwell W D S et al 2002 Acta Cryst. B 58 647
[12] Day G M et al 2005 Acta Cryst. B 61 511
[13] Schön J C and Jansen M 2001 Z. Krist. 216 307
[14] Schön J C and Jansen M 2001 Z. Krist. 216 361
[15] van Eijck B P, Mooij W T M and Kroon J 2001 J. Comput. Chem. 22 805
[16] Mooij W T M, van Duijnefeldt F B, van de Rijdt J G C M and van Eijck B P 1999 J. Phys. Chem.A 103 9872
[17] Mooij W T M, van Eijck B P and Kroon J 1999 J. Phys. Chem. A 103 9883
[18] 2005 Cambridge Structural Database (Cambridge, England: Cambridge Crystallographic Data Centre)
[19] Car R and Parrinello M 1985 Phys. Rev. B 55 2471
[20] 2003 Cerius2, Version 4.9 (Cambridge, UK: Accelrys)
[21] Mayo S L, Olafson B D and Goddard WA III 1990 J. Phys. Chem. 94 8897
[22] Gasteiger J and Marsili M 1980 Tetrahedron 36 3219
[23] Blöchl P E 1994 Phys. Rev. B 50 17953
[24] Blaha P, Schwarz K, Madsen G K H, Kvasnicka D and Luitz J 2001 WIEN2K, An Augmented Plane
Wave + Local Orbitals Program for Calculating Crystal Properties ed K Schwarz (Wien, Austria: Techn.
University) ISBN 3-9501031-1-2
[25] Perdew J P, Burke S and Ernzerhof M 1996 Phys. Rev. Lett. 77 3865
[26] Anisimov V I, Zaanen J and Andersen O K 1991 Phys. Rev. B 44 943
[27] Petukhov A G, Mazin I I, Chioncel L and Lichtenstein A I 2003 Phys. Rev. B 67 153106
[28] Pavarini E,Yamasaki A, Nuss J and Andersen O K 2005 New J. Phys. 7 188
[29] Andersen O K, Saha-Dasgupta T and Ezhov S 2003 Bull. Mater. Sci. 26 19
[30] Andersen O K and Saha-Dasgupta T 2000 Phys. Rev. B 62 R16219
[31] Andersen O K, Saha-Dasgupta T, Ezhov S, Tsetseris L, Jepsen O, Tank R W, Arcangeli C and Krier G 2001
Psi-k Newsletter no. 45, pp 86–119
[32] Pavarini E, Dasgupta I, Saha-Dasgupta T, Jepsen O and Andersen O K 2001 Phys. Rev. Lett. 87 047003
[33] Sarma D D, Mahadevan P, Saha-Dasgupta T, Ray S and Kumar A 2000 Phys. Rev. Lett. 85 2549
[34] Valentı R, Saha-Dasgupta T, Alvarez J V, Pozgajcic K and Gros C 2001 Phys. Rev. Lett. 86 5381
[35] Valentı R and Saha-Dasgupta T 2002 Phys. Rev. B 65 144445
[36] Valentı R, Saha-Dasgupta T and Gros C 2002 Phys. Rev. B 66 054426
[37] Saha-Dasgupta T and Valentı R 2002 Europhys. Lett. 60 309
[38] Valentı R, Saha-Dasgupta T, Gros C and Rosner H 2003 Phys. Rev. B 67 245110
[39] Bradley C J and Cracknell A P 1972 The Mathematical Theory of Symmetry in Solids: Representation Theory
for Point Groups and Space Groups (Oxford: Oxford University Press)
[40] Allen F H, Kennard O, Watson D G, Brammer L, Orpen A G and Taylor R 1987 J. Chem. Soc. Perkin
Trans. II 1987 1
New Journal of Physics 9 (2007) 26 (http://www.njp.org/)
182

Mit 70 muss man damit rechnen, aus biologischenGründen vertragsbrüchig zu werden.
(Loriot)
C Lebenslauf
Persönliche Daten
Christian BuchsbaumKallestraße 3
60488 Frankfurt am MainGeb. am 19. 09. 1974 in Frankfurt am Main
Schulbildung
08/1981–06/1985 Günderrode-Schule (Grundschule) in Frankfurt am Main08/1985–06/1995 Goethe-Gymnasium in Frankfurt am Main (Leistungskurse Mathema-
tik und Englisch)
Zivildienst
08/1995–09/1996 Zivildienst
Studium und berufliche Tätigkeiten
10/1996–03/1997 Studium der Informatik an der Universität Frankfurt am Main04/1997–07/2001 Studium der Chemie an der Universität Frankfurt am Main08/2001–01/2002 Maschinenführer bei Wetropa GmbH & Co. KG, Mörfelden-Walldorf02/2002–08/2003 Fleischverkäufer bei Bioland-Fleischerei, Frankfurt am Main09/2003 Wiederaufnahme des Chemie-Studiums10/2003–03/2004 Diplomarbeit mit dem Titel „Rietveld-Verfeinerung der Kristallstruk-
turen organischer Pigmente“, Gesamtnote 1,704/2004–06/2008 Promotion mit dem Thema „Kristallstrukturbestimmung organischer
Pigmente aus Röntgen-Pulverdaten und Kristallstrukturmodellierungniedrig-dimensionaler Festkörper mit Kraftfeld-Methoden“
10/2006–03/2008 Lehrauftrag Chemie an der Fachhochschule Gießen–Friedberg07/2008–06/2009 Produktmanager icsd bei fiz Karlsruhe07/2009–07/2011 Fortsetzung der Promotion
183

C Lebenslauf
C.1 Vollständige Auflistung der eigenen Veröffentlichungen
C.1.1 Eigene Veröffentlichungen
[CB1] M. U. Schmidt, D. W. M. Hofmann, C. Buchsbaum, H. J. Metz, „Kristallstrukturenvon Pigment Red 170 und Derivaten, bestimmt aus Röntgenpulverdiagrammen“,Angewandte Chemie 2006, 118, 1335–1340.
[CB2] M. U. Schmidt, D. W. M. Hofmann, C. Buchsbaum, H. J. Metz, „Crystal Structuresof Pigment Red 170 and Derivatives, as Determined by X-ray Powder Diffraction“,Angewandte Chemie International Edition 2006, 45, 1313–1317.
[CB3] M. U. Schmidt, C. Buchsbaum, J. M. Schnorr, D. W. M. Hofmann, M. Ermrich, „Pig-ment Orange 5: crystal structure determination from a non-indexed X-ray powderdiagram“, Zeitschrift für Kristallographie 2007, 222, 30–33.
[CB4] M. U. Schmidt, S. Brühne, A. K. Wolf, A. Rech, J. Brüning, E. Alig, L. Fink, C.Buchsbaum, J. Glinnemann, J. van de Streek, F. Gozzo, M. Brunelli, F. Stowasser,T. Gorelik, E. Mugnaioli, U. Kolb, „Electron diffraction, X-ray powder diffraction andpair-distribution-function analyses to determine the crystal structures of PigmentYellow 213, C23H21N5O9“, Acta Crystallographica Section B 2009, 65, 189–199.
[CB5] M. U. Schmidt, J. Brüning, C. Buchsbaum, E. Alig, L. Fink, „Crystal-structure deter-mination of the fluorescent bisazomethine pigment C36H26N4O4 from X-ray powderdata“, Zeitschrift für Kristallographie 2007, 222, 539–545.
[CB6] C. Buchsbaum, M. U. Schmidt, „Rietveld refinement of a wrong crystal structure“,Acta Crystallographica Section B 2007, 63, 926–932.
[CB7] M. U. Schmidt, C. Buchsbaum, „Structure determination of 6,6′-bis(trifluoromethyl)-thiazine-indigo from laboratory powder data and lattice-energy minimisation“, Zeit-
schrift für Kristallographie 2008, 223, 418–423.
[CB8] C. Buchsbaum, E. F. Paulus, M. U. Schmidt, „Crystal Structures of Thiazine-IndigoPigments, Determined from Single-Crystal and Powder Diffraction Data“, Zeitschrift
für Kristallographie 2011, 226, 822–831.
[CB9] H. O. Jeschke, L. A. Salguero, B. Rahaman, C. Buchsbaum, V. Pashchenko, M. U.Schmidt, T. Saha-Dasgupta, R. Valentí, „Microscopic modeling of a spin crossovertransition“, New Journal of Physics 2007, 9, 448.
[CB10] H. O. Jeschke, L. A. Salguero, R. Valentí, C. Buchsbaum, M. U. Schmidt, M. Wagner,„Classical and ab initio preparation of reliable structures for polymeric coordinationcompounds“, Comptes Rendus Chimie 2007, 10, 82–88.
[CB11] L. A. Salguero, H. O. Jeschke, B. Rahaman, T. Saha-Dasgupta, C. Buchsbaum, M. U.Schmidt, R. Valentí, „Cu-based metalorganic systems: an ab initio study of the elec-tronic structure“, New Journal of Physics 2007, 9, 26.
184

C.1 Vollständige Auflistung der eigenen Veröffentlichungen
C.1.2 Veröffentlichungen außerhalb dieser Dissertation
[V1] C. Buchsbaum, S. Höhler-Schlimm, S. Rehme in Data Mining in Crystallography,(Hrsg.: D. W. M. Hofmann, L. N. Kuleshova), Structure and Bonding, Springer, Hei-delberg, Dordrecht, London, New York, 2010, Kap. 2, S. 37–58.
[V2] E. F. Paulus, W. Joswig, V. Bohmer, M. Saadioui, J. Angelkort, N. Buchsbaum,J. Djanhan, N. Gumann, M. Peters, Q. C. Ton, „Crystal structure of 5,11,17,23-tetra-t-butyl-25,27-dihydroxy-26,28-ditosyloxytetrathiacalix[4]arene dichlorometha-ne, C54H60O8S6 · 2 CH2Cl2“, Zeitschrift für Kristallographie – New crystal Structures
2002, 217, 398–400.
C.1.3 Posterbeiträge
[Po1] C. Buchsbaum, M. U. Schmidt, „Bestimmung der Fehlordnung von 6,6′-Bis(trifluormethyl)-Thiazin-Indigo aus Röntgen-Pulverdaten“, 16. Jahrestagung der
Deutschen Gesellschaft für Kristallographie 2008.
[Po2] S. Brühne, L. Fink, J. van de Streek, M. Brunelli, J. Brüning, J. Glinnemann, F. Sto-wasser, C. Buchsbaum, E. Alig, M. Schmidt, „Atompaarverteilungsfunktion, PDF,von Pigment Yellow 213, C23H21O9N5“, 16. Jahrestagung der Deutschen Gesellschaft für
Kristallographie 2008.
[Po3] L. Fink, M. U. Schmidt, S. Brühne, J. Glinnemann, C. Buchsbaum, J. Brüning, J.van de Streek, A. Rech, E. Alig, A. Wolf, F. Stowasser, T. Gorelik, U. Kolb, M.Brunelli, „Strukturlösung von Pigment Yellow 213, C23H21O9N5, mittels Röntgen-Pulverdiffraktometrie und Elektronenbeugung“, 16. Jahrestagung der Deutschen Ge-
sellschaft für Kristallographie 2008.
[Po4] J. Brüning, E. Alig, C. Buchsbaum, J. van de Streek, M. U. Schmidt, „Crystal structuredeterminations of fluorescent organic pigments from X-ray powder data“, EPDIC
2008 2008.
[Po5] C. Buchsbaum, M. U. Schmidt, „Rietveld-Verfeinerungen falscher Kristallstruktu-ren“, 15. Jahrestagung der Deutschen Gesellschaft für Kristallographie 2007.
[Po6] C. Buchsbaum, J. M. Schnorr, M. U. Schmidt, „Bestimmung der Kristallstruktur von6,6′-(CF3)2-Thiazin-Indigo aus Labor-Pulverdaten“, 14. Jahrestagung der Deutschen
Gesellschaft für Kristallographie 2006.
[Po7] J. Brüning, C. Buchsbaum, E. Alig, L. Fink, M. U. Schmidt, „Kristallstrukturbestim-mung aus Röntgenpulverdaten: Das gelbe Fluoreszenzpigment C36H26N4O4“, 14.
Jahrestagung der Deutschen Gesellschaft für Kristallographie 2006.
[Po8] C. Schauerte, C. Buchsbaum, L. Fink, D. W. M. Hofmann, M. U. Schmidt, J. Knipping,R. Boese, „Crystal structures of trans- and cis-octenes“, XX Congress of the International
Union of Crystallography 2005.
[Po9] J. Brüning, J. E. Djanhan, M. Bolte, C. Buchsbaum, M. U. Schmidt, „Crystal structuresof fluorescent bisazomethine pigments“, XX Congress of the International Union of
Crystallography 2005.
185
C Lebenslauf
[Po10] L. A. Salguero, H. O. Jeschke, B. Rahaman, T. Saha-Dasgupta, R. Valentí, C. Buchs-baum, M. U. Schmidt, M. Wagner, „Ab-initio study of a class of metalorganic systems“,Symposium Spin- und Ladungskorrelation 2005.
[Po11] L. A. Salguero, H. O. Jeschke, L. Pisani, R. Valentí, C. Buchsbaum, M. U. Schmidt,„Setting up an investigation of a HS–LS phase transition: classical and ab-initiopreparation of model structures“, Symposium Spin- und Ladungskorrelation 2005.
[Po12] C. Buchsbaum, S. Rühl, D. W. M. Hofmann, M. U. Schmidt, „Bestimmung der Kristall-strukturen der α-Phase von Pigment Red 170 und Derivaten aus nichtindizierbarenPulverdiagrammen“, 12. Jahrestagung der Deutschen Gesellschaft für Kristallographie
2004.
186

D Akademische Lehrer
Physik
Prof. Dr. H. Schmidt-Bocking, Dr. H. Deitinghoff
Mathematik
Prof. Dr. G. Kohlmaier
Anorganische Chemie
Prof. Dr. F. Schuth, Prof. Dr. B. O. Kolbesen, Prof. Dr. M. Tromel, Prof. Dr. M. Wagner, Prof.Dr. M. U. Schmidt, Prof. Dr. N. Auner, Dr. L. Fink
Organische Chemie
Prof. Dr. C. Griesinger, Prof. Dr. M. Gobel, Prof. Dr. J. Engels, Prof. Dr. E. Egert, Prof. Dr. D.Rehm
Physikalische Chemie
Prof. Dr. T. Prisner, Prof. Dr. K. Hensen, Prof. Dr. B. Brutschy, Prof. Dr. J. Wachtveitl, Dr. P.Pickel
Kristallographie
Prof. Dr. E. F. Paulus, Prof. Dr. B. Winkler, Dr. J. Glinnemann
Eingeschränkte Sachkunde nach §5 der ChemVO
Prof. Dr. C. Jochum, Prof. Dr. A. Eckert
187


E Eidesstattliche Erklärung
Hiermit erkläre ich an Eides statt, dass ich die vorliegende Arbeit selbständig und nur unterZuhilfenahme der genannten Literatur und der angegebenen Hilfsmittel angefertigt habe.
Frankfurt am Main, den . . . . . . . . . . . . . . . . . . . . . . . . . .
. . . . . . . . . . . . . . . . . . . . . . . . . . . . . . . . . . . . . . . . . . . . . . . . . .Christian Buchsbaum
189