KeyLIGHTS 6.2 Manual - Product Manuals
259
KeyLIGHTS REVOLUTIONARY HIGHWAY LIGHTING DESIGN SOFTWARE Version 6.2
-
Upload
khangminh22 -
Category
Documents
-
view
2 -
download
0
Transcript of KeyLIGHTS 6.2 Manual - Product Manuals

KeyLIGHTSREVOLUTIONARY HIGHWAY
LIGHTING DESIGNSOFTWARE
Version 6.2

- 2 -
TOC
Copyright Notice 14
Chapter 1 - Introduction 15
1.1 Welcome to KeyLIGHTS 15
1.2 Overview of this manual 16
1.3 Conventions Used in this Manual 18
1.4 Help is at Hand 19
Chapter 2 - Getting Started 21
2.1 Selecting Symbols 22
2.2 AutoCAD Foundation 24
2.3 Drawing Names and Storage 24
2.4 Drawing Units / Scale 25
2.5 Drawing Template, Layer naming and Colour Conventions 26
2.5.1 Template 26
2.5.2 Layer Names 26
2.6 Starting KeyLIGHTS 27
2.7 The Ribbon Menu System 29
2.7.1 Main KeyLIGHTS Ribbon Menu – Main Tab 29
2.7.2 Ribbon Menu – KeyLIGHTS Tools Tab 30
2.7.3 Ribbon Menu – KeyLIGHTS Help Tab 31

- 3 -
2.7.3.1 KeyLIGHTS help 32
2.7.3.2 What’s New 32
2.7.3.3 Check for update 33
2.7.3.1 Change update reminder 34
2.7.3.2 About KeyLIGHTS 35
Chapter 3 - Symbols and Other Features 37
3.1 Introduction 37
3.2 Connecting Objects 41
3.2.1 Drawing Connections (Sockets) – System for Attaching Luminaires, Brack-ets, Columns and Ducts/Cables 41
3.2.2 Electrical Connections 45
3.3 Design Status Colours 47
3.4 Building Symbols – The Lights Manager 49
3.4.1 Selecting Symbols for Street Light Components 51
3.4.2 Selecting Luminaires (Photometric Data) 52
3.4.3 Setting Symbol Properties 54
3.5 Inserting Street Light Symbols 56
3.6 Repeated Insertion of Symbols 58
3.6.1 Fixed Spacing 59
3.6.2 Variable (Any) Spacing 60
3.6.3 Radius Spacing 61
3.6.4 Setout Utilities 62

- 4 -
3.6.4.1 Setout on Line 62
3.6.4.2 Max. Spacing 65
3.6.4.3 Number of Columns (Split and Fill) 66
3.6.4.4 Split Points 67
3.6.4.5 Line Setout Settings 68
3.6.4.6 Calculate Stagger Distance 69
3.7 Civil / Electrical Features 69
3.7.1 Cables 69
3.7.2 Ducts 70
3.7.2.1 Creating Duct Pre-sets 70
3.7.2.2 Editing Pre-set Duct Properties 71
3.7.2.3 Drawing Ducts 72
3.7.2.1 Editing Ducts and Duct Properties 73
3.7.2.2 Different Duct Display Representations 75
3.7.3 Duct Access Chambers 76
3.7.4 Additional KeyLIGHTS Symbols 79
3.7.4.1 Refuge Islands 79
Chapter 4 - Symbol Utilities 81
4.1 Symbol Numbering 81
4.1.1 Adding Numbers 81
4.1.2 Scaling Number Labels 84
4.1.3 Reset Column Number Labels’ Scale to One 85

- 5 -
4.2 Symbol Data 85
4.2.1 Editing Street Light Component Properties (Data) 88
4.2.2 Copying Symbol Data Between Street Light Components 89
4.3 Feature Query Dialog 92
Step 1 – ‘Select Objects’ 93
Step 2 – ‘Apply Filters’ 94
Step 3 – ‘Choose Fields’ 95
Step 4 – ‘View/Modify Results’ 97
Step 5 – Exporting the Data 100
4.4 Symbol Utilities 102
4.4.1 Inquiry ‘Take Off’ 102
4.4.1.1 General Inquiry 103
4.4.1.1 Ducting Inquiry 105
4.4.1.2 Cabling Inquiry 105
4.4.1.1 Inquiry Options 106
4.4.2 Zoom by Property 108
4.4.2.1 Zoom to Column (number search) 109
4.4.2.2 Zoom to Property (text search) 110
4.4.2.3 Zoom to Column number from list 112
4.4.2.4 Zoom Property from List 114
4.4.3 Symbol Editing 115
4.4.3.1 Luminaire Switch 115

- 6 -
4.4.3.2 Flip Symbols 115
4.4.3.3 Change Lighting Symbol 116
4.4.3.4 Change Photometric Data 116
Chapter 5 - Lighting Calculations 118
5.1 Obtaining Light Calculations – Calculation Grids 119
5.1.1 Create Rectangular Grid 120
5.1.2 Create Polygonal Grid 123
5.1.3 Create Linear ‘Grid’ 125
5.1.4 Add Mask to Grid 127
5.1.4.1 Even-Odd / Non-zero Rule Modes 128
5.1.5 Lighting Display Grid Properties 129
5.1.6 Palette 131
5.1.7 Vertical / 3D Rotated Grids 133
5.2 Calculating Illuminance 136
5.2.1 Luminaire Selection 137
5.2.2 Modifying Luminaires 138
5.2.3 Lighting Calculation Options 138
5.2.3.1 Roundtrip and Reality Export 140
5.2.3.2 Grid Default Values 141
5.2.3.3 Default Illuminance Palette 142
5.2.3.4 Miscellaneous 143
5.2.3.5 Database 144

- 7 -
5.2.3.6 Design Status and its Colour 145
5.2.3.1 General Options 145
5.3 Lighting Calculations Using Lighting Reality 146
5.3.1 Export to Lighting Reality 146
5.3.2 Importing from Lighting Reality 147
Chapter 6 - KeyLIGHTS Tools 149
6.1 Keys 149
6.1.1 Autokey 149
6.1.2 Individual and Summed Custom Keys 150
6.1.3 Customising the Individual and Summed Custom Keys 151
6.2 Tabulate Symbols 152
6.3 Distances Table 154
6.4 Labelling 155
6.4.1 Textual Annotation 155
6.4.2 Data Annotation 156
6.4.3 Simple Symbol Label 158
6.4.4 Editing Labels 158
6.4.5 Moving and Erasing Labels 158
6.4.6 Labelling Descriptions and Options 158
6.4.7 XY - Columns 162
6.4.8 XY @ Point 163
6.5 Mayrise Links 163

- 8 -
6.5.1 Plot Units In View 164
6.5.2 Plot Units In The Drawing Extents 164
6.5.3 Plot All Units 165
6.5.4 Zoom to Units Extents 165
6.6 Convert Mayrise Symbols 165
6.7 Driver’s Eye Views 166
6.8 Measuring Tools 166
6.8.1 Measure distances 168
6.8.2 Base & Point distances 168
6.8.3 Moving rule 169
6.8.4 Mark fixed distance 169
6.8.5 Repeat fixed distance 170
6.8.6 Divide between points 170
6.8.7 Multiple splits 170
6.8.8 Measure between points 171
6.8.9 Multiple measures 171
6.8.10 Measure along line 172
6.8.11 Clear marks 172
6.8.12 Polyline Break and Re-join Tools 172
6.8.12.1 Adjust Lines - Measure and Break Polyline 173
6.8.12.2 Adjust Lines - Break Polyline 173
6.8.12.3 Adjust Lines - Re-Join Polyline 173

- 9 -
6.9 Groups 173
6.9.1 Toggle Group selection 174
6.9.2 Create new group 175
6.9.3 Manage groups 176
6.9.4 Select group 177
6.9.5 Group membership 178
6.9.6 Remove deleted groups 178
6.9.7 Explode group 179
6.10 Background 179
6.10.1 Black background 179
6.10.2 White background 180
6.10.3 Grey background (light) 180
6.10.4 Grey background (dark) 180
6.11 Program 181
6.11.1 Options 181
6.11.2 Reload KeyLIGHTS 182
Chapter 7 - Highway Power Calculations 183
7.1 Project Settings 184
7.2 Drawing Electrical Supply 188
7.3 Cables 188
7.3.1 Creating Cable Pre-sets 188
7.3.1.1 Editing Pre-set Cable Properties 190

- 10 -
7.3.2 Drawing Cables 192
7.3.3 Editing Cable Properties 194
7.3.4 Different Cable Display Representations 196
7.3.5 Changing Cable Type (Linetype from Pre-set) 197
7.3.6 Changing Cable Type (Electrical property) 198
7.4 Drawing Ducting 198
7.5 Set Fuse 199
7.6 Circuit Calculations 199
7.7 Saving Results 200
7.8 Cable Schedules 201
7.9 Selective Cable Schedules 203
7.10 Test Schedules 204
7.11 Selective Test Schedules 204
7.12 Schematic Diagrams 205
7.13 HPC Defaults (Options) 207
Chapter 8 - BIM Data and 3D Draping 211
8.1 BIM Data and Object Properties 211
8.1.1 Viewing Data Fields 211
8.1.2 Adding Additional Data – onto individual objects 212
8.1.3 Adding Additional Data – onto multiple objects using templates 213
8.2 3D Draping of Marking and Symbols 215
8.2.1 Using Civil AutoCAD Surfaces 215

- 11 -
8.2.2 Draping Marking and Other Features onto a 3D Surface 215
Chapter 9 - Viewing In 3D: Driver’s Eye Views 218
9.1 DEV - Entering 3D Dev 218
9.2 DEVLAY.ON and KTSDEVFW.DAT Files 219
9.3 DEVOUT – Exiting 3D DEV 220
9.4 Move Driver 220
9.5 Turn View 221
9.6 Adjust Height 222
9.7 ZOOM – Various Zoom Factors 222
9.8 Set View Distance 222
9.9 Features 223
9.10 Seasons 223
9.11 Slideshows 223
9.11.1 Create Slideshow 223
9.11.2 View Step Slideshow 225
9.11.3 View Full Slideshow 226
Chapter 10 - Program Settings and Option 227
10.1 Settings and Options 227
10.2 Program Settings Tab 228
10.2.1 Use Predefined Layers 228
10.2.2 Use Layer Prefix 229
10.2.3 Layer Name Prefix 229

- 12 -
10.2.4 Command Settings 229
10.2.5 Template Settings 229
10.3 Default Values Tab 230
10.3.1 Table Separation Distance 230
10.3.2 Insertion Scales 230
10.3.3 Yellow and Red Line Setting 231
10.3.4 Hatching 231
10.3.5 Loops & Duct 231
10.4 Styles Tab 231
10.4.1 Layer Styles 231
10.4.2 Line Styles 232
10.4.3 Fill Styles 232
10.4.4 Table Styles 232
10.5 Label Descriptions Tab 232
10.6 Label Options Tab 232
10.7 Rates Tab 233
10.8 Tables Tab 233
10.9 Other Program Control Items 234
10.9.1 Reload KeyLIGHTS 234
10.9.2 Reload KeyLIGHTS Menu 234
10.9.3 Restore CUI Menu 235
10.9.4 Reset 235

- 13 -
10.10 Reset User 236
Chapter 11 - Revision History & What’s New 237
11.1 What’s New in v6 238
11.2 Detailed Revision History 239
Chapter 12 - Installation and Configuration 249
Before you start 249
12.1 System Requirements 249
12.2 KeyLIGHTS installation Wizard 251
Appendices 255
Appendix A – Attribute to Data Mapping (v5 → v6) 255
Appendix B – EULUMDAT File Format Specification 257
NOTES 259

- 14 -
Copyright Notice
KeyLIGHTS – Copyright © 2018 by Keysoft Solutions Limited. 1998 – 2018
All rights reserved.
You may use KeyLIGHTS software only under the terms of your Licence Agreement fromKeysoft Solutions Ltd.
KeyLIGHTS software is, and remains, the property of, and copyrighted by, Keysoft Solu-tions Ltd.
KeyLIGHTS documentation is the copyright of Keysoft Solutions Ltd. Any reproduction inwhole or in part without written permission is strictly prohibited.

- 15 -
Chapter 1 - Introduction
Thank you for choosing KeyLIGHTS. We are grateful that you have purchased ourproduct and we feel confident that you will find it of great assistance in the production ofStreet Lighting Scheme design drawings.
You will discover that not only will it save time in the production of drawings but the flex-ible way in which layouts can be altered, easily, will enable more efficient designs to beachieved. And savings in time and materials mean a saving of money. We feel sure thatthis system will soon repay its costs.
KeyLIGHTS does not remove the need for the expertise of the Lighting Engineer. WhatKeyLIGHTS does do is enable designers to make more efficient use of their time and cre-ate a more enjoyable and satisfying atmosphere in which to practise their art.
1.1 Welcome to KeyLIGHTS
KeyLIGHTS is a comprehensive software package comprising of different individual,and interactive functionality:
l The main symbols and drawing componentsl Light calculation enginel The Highway Power Cable modulel Interface to the industry standard Lighting Reality light calculation softwarel Links to the Mayrise Database from Yotta

- 16 -
The features included in the package allow the user to manipulate the symbols com-monly encountered in drawings of this type, with minimum effort, and produce a varietyof scaled drawings for issue to, say, ducting contractors or for Committee Reports.
If you experience any problems with this software, no matter how small, please don’t hes-itate to call us. We will endeavour to resolve your difficulties as quickly as possible. Weare only a phone call away and we are here to help.
1.2 Overview of this manual
This Manual gives an initial overview of the KeyLIGHTS system.
Chapter 1 - Introduction contains installation instructions for KeyLIGHTS and systemrequirements.
Chapter 1 - Getting Started of this manual identifies those features of AutoCAD whichare necessary for proficient use of KeyLIGHTS. It is recommended that the AutoCADmanual or on-line help are also used to get further information.
Chapter 1 - Symbols and Other Features contains the explanation of all the meth-odology relating to the symbols used in KeyLIGHTS. It details how these can be createdto suit you and your organisation’s requirements, including how these are inserted intothe drawing. It also describes various setting out tools that provide for symbols be addedwith specific spacings along the roads.
Chapter 1 - Symbol Utilities contains the explanation of basic KeyLIGHTS functionsand commands.

- 17 -
Chapter 1 - Lighting Calculations contains the explanation of the Lighting calculationfunctions.
Chapter 1 - KeyLIGHTS Tools sets out how various tools and utilities can be used toprovide for those activities that are ancillary to street lighting design, but nonethelessrequired in the production of scheme design drawings.
Chapter 1 - Highway Power Calculations contains the explanation of Highway PowerCalculation (HPC) functions. This is an additional module available for KeyLIGHTS,which is licensed separately. Please contact us for details.
Chapter 1 - Viewing In 3D: Driver’s Eye Views sets out the functions available for nav-igation in 3D from the perspective of the driver. These can greatly assist with schemedesign. The tools available also include symbols and drawing routines available toenhance the driver’s views when it is required to produce realistic views, for example forthe production of consultation drawings.
This Manual assumes that KeyLIGHTS is installed as described in the installationinstructions on a computer running an appropriate version of AutoCAD. KeyLIGHTS ver-sion 6.1 will run only AutoCAD Release 2015 onwards (including AutoCAD Map 3D andCivil 3D variants).
The vast majority of users will solely use a mouse as the input and control device. Allcommands are available from the Ribbon menu. There is also limited support for pull-down menus and toolbars, for legacy only.

- 18 -
To avoid unnecessary repetition of words the following conventions are used:
Enter or <enter> - mean press the ENTER or Return key. Depending on how your pref-erences have been set, you may also find that the right mouse button performs the samefunction as the Enter key (see AutoCAD Tools>Options>User Preferences).
Pick - means press the 'PICK' or left mouse button (also ‘click’ or ‘select’).
'START' - characters within single inverted commas will usually indicate data to betyped in on the keyboard.
<F2> or <return> - means press the F2 function key, or ENTER/ RETURN key respect-ively
"Command" - characters within double inverted commas usually refer to information dis-played on the screen.
Users will soon appreciate the opportunities available to modify the system to meet theirown needs. KeyLIGHTS will continue to be developed and updates will be availablefrom time to time. Suggestions for routines that will improve the program will be wel-come.
1.3 Conventions Used in this Manual
At the start of each section, dealing with a particular menu item, a summary of the func-tions available from the menu will be given.

- 19 -
Paragraphs covering functions available from the KeyLIGHTS and AutoCAD menus willshow the relevant ribbon menu item for the command. This will be indicated for examplefor the KeyLIGHTS Options command, starting with the ribbon tab and panel on whichthe particular item can be found, thus:
RIBBON: ‘KeyLIGHTS Tools → Program→ Options’
Each command is selected from the ribbon menu which contains icons to help quick loc-ation and selection of functions. Large icons are used for the most commonly used com-mands. In the body of this manual the icon will also be shown below the ‘Ribbon’ pathdetailed above.
1.4 Help is at Hand
Those that have a Service Agreement are encouraged to use the telephone helpline.Although you are unlikely to face many problems, when you do you can spend unne-cessary time trying to resolve it yourself. A phone call will usually resolve the problem ina matter of minutes. Feel free to call us, we are here to help. We can be contacted in anyof the following ways:
By Post
Keysoft Solutions Ltd
Ardencroft Court
Ardens Grafton
Alcester

- 20 -
Warwickshire
B49 6DP
By Telephone
Tel - 03451 30 30 40
By Email or Web
Email - [email protected]
Web - http://www.keysoftsolutions.com

- 21 -
Chapter 2 - Getting Started
KeyLIGHTS, along with our Highway Power Cabling (HPC) module, provides for thecivil contract side of lighting scheme implementation (ducts, duct access chambers etc.);calculation of light levels; and cable requirements. Whilst KeyLIGHTS includes a fullyfunctional lighting calculation engine, it can also be used with Lighting Reality whichmust be purchased separately from the Lighting Reality company. Details can be foundat www.lightingreality.com.
KeyLIGHTS is highly data driven. With each component – column, brackets and lumin-aires – many fields are stored, in different categories. Firstly, there are general propertiessuch as column number, location, street, and there is room for text based comments tobe held. There is also a range of data parameters that define what the street light is interms of its primary function, what is the luminaire type and wattage, as well as those thatdefine the physical characteristics, some of which will affect the geometry created.
In addition, a range of symbols for each component can be selected to represent dif-ferent commonly used combinations, and these can be built for re-use across differentdrawings and scheme designs.
The system will allow the designer to create lighting design schemes that reflect the real-ity on the ground. For example, along with HPC, lights can be connected with cables inducts and any edit to these, such as changing the proposed location, will result in thecable and duct geometry to be updated and power values (voltage drops etc.) to be recal-culated automatically. In addition, columns, brackets and luminaire components are also‘connected’ in a similar sense. Some of the data logically ‘cascades’ down from the par-ent column object down to the bracket and luminaire, for example column numbers.

- 22 -
2.1 Selecting Symbols
As no British Standard or similar yet applies to the type of symbol used on plans, it ishoped that the means to build a range of symbols, that can be used to represent the dif-ferent mounting heights and types, will provide fully for all your requirements.
We recommend that each of the mounting heights of 5, 6, 8, 10, 12 and 15 metres isindicated using a structured approach with each symbol selected adding new com-ponents. Also, colour can be used to represent symbols for existing, proposed, markedfor removal, Deemed to Comply and so on. The symbols can then be selected to form aconsistent series, so that it is possible with very little practice to read direct from the draw-ing the type of column used. For example, increasing the height of each type results inthe symbol gradually getting more complex, and different lanterns types consistentlyindicated using filled or unfilled symbols.
Hopefully, the system that you build up in KeyLIGHTS will gradually evolve into thedefault standard for street lighting drawings in your organisation across schemes.
The symbol building and selection dialog is the heart of KeyLIGHTS in terms of placingstreet lighting columns in your designs. For those who have used previous versions itcan be seen that this is a radical departure from the AutoCAD block based methodology.AutoCAD blocks can include attributes – text based information that is stored with the vis-ible geometry, but this has limited functionality, validation and use. KeyLIGHTS now(from version 6) employs a more sophisticated method for storing data, which can be of avariety of types, including numbers, dates, files and simple text. This allows for val-idation, for example a lamp load can be checked so as to disallow invalid entries suchas negative values.

- 23 -
Figure 2.1 Symbol Building and Selection
You should find that, whilst the symbol building and selection dialog, shown in Figure2.1 Symbol Building and Selection, provides for every eventuality, it is easy to use.This provides, by way of a selection of symbols for each component of a street light, forany permutation.
More information on building, selecting and inserting symbols on your drawing can befound in Chapter 3 Symbols and Other Features.

- 24 -
2.2 AutoCAD Foundation
KeyLIGHTS works on top of AutoCAD to provide a tailored solution for street lightingengineers. It does not remove any of the AutoCAD commands or functionality, it adds toand enhances commands and functions designed specifically for street lighting designin the form of automatic routines, libraries of symbols and linetypes and so on. In manyrespects these routines are simply automations of the functions built in to AutoCAD, andas such should provide significant productivity gains and allow greater understandingand quicker learning of the design environment for the less experienced CAD user.
It follows that the more you know about the AutoCAD foundation for KeyLIGHTS, thequicker you will be able to also use KeyLIGHTS, and the more options you will know foreach drawing operation. It will also help if you want to add individual elements to yourdrawings which are not included in KeyLIGHTS.
The standard AutoCAD user manuals or on-line help is comprehensive and well written.Therefore, in this KeyLIGHTS manual, we do not attempt to duplicate standard AutoCADinformation.
Several points are relevant to the use of AutoCAD by KeyLIGHTS, and these are dis-cussed in the following sections. The chapter concludes with a list of standard AutoCADcommands which a user should ideally be familiar with before commencing seriousdrawing work with KeyLIGHTS.
2.3 Drawing Names and Storage
You will have to give some thought as to the storage of the drawings that you will be cre-ating. They should preferably be stored in a folder separate from the one containing theKeyLIGHTS program and drawing files.

- 25 -
Many options exist - either storage only on the local hard disk, in personal sub-dir-ectories, with a folder structure representing site numbers, scheme references or routenumbers etc. or (recommended) a central network location. Choose the methods that suityour needs.
Do not forget the general computer management task of backing-up your drawing files toprotect the significant investment that the time spent creating these represents. This is amundane task, but preferable to repeating all your work should the worst happen.
2.4 Drawing Units / Scale
Within KeyLIGHTS one drawing unit, (the units used by the programme and current co-ordinates displayed in the status line of the screen), should represent one metre through-out. All dimensioning and measurements carried out are thus immediately usable, asthis is a sensible unit for this work.
You should draw all KeyLIGHTS drawings at real life scale (1:1). Roads should there-fore measure, say, 9 units (metres) from side to side (not 9000).
[Most drawings imported into KeyLIGHTS e.g. from O.S. digital maps, will be scaled tometres, but occasionally drawings to be used in KeyLIGHTS may come from an envir-onment (e.g. architectural) where the normal unit is the millimetre. Therefore you wouldneed to insert a scaled copy (x 0.001) of the original drawing to use in KeyLIGHTS.]
The scale of the drawing need only be specified for plotting.

- 26 -
2.5 Drawing Template, Layer naming and Colour Con-ventions
KeyLIGHTS sets up a drawing environment most appropriate for the required designdrawings to be created with the minimum of effort from the user.
2.5.1 Template
By default KeyLIGHTS will start a new drawing from a template ‘Lights6.dwt’. However,the use of this template is not necessary and KeyLIGHTS will be able to create streetlighting designs in any drawing or template file you select.
2.5.2 Layer Names
It is possible for you to define the layers that are automatically used for the variousKeyLIGHTS objects. This includes, optionally a layer name prefix. The settings alsoprovide for you to specify the layer colour, which is particularly useful with the layers foryellow lines and markings.
The Template drawing no longer stores the standard layers, they are created ‘on the fly’by the KeyLIGHTS engine using the settings mentioned above. Some of the standarddefault layer names are listed below, so that they can be identified inside your drawings.
KS_LIGHTS_PROPOSED for proposed lighting columns
KS_LIGHTS_EXISTING for existing lighting columns
KS_LIGHTS_INSPCHAM for inspection chambers
KS_LIGHTS_CABLES for cables

- 27 -
KS_LIGHTS_DUCTS for ducts
etc.
The use of the KS_ prefix is a program setting that can be turned off or changed giving a(default) name for example of KL_LIGHTS_PROPOSED.
You can still create or use any layer for other items you are drawing in your work, usingthe standard AutoCAD functions.
2.6 Starting KeyLIGHTS
KeyLIGHTS is an add-on to AutoCAD, and therefore extends the functionality availablein the base, CAD product. All of AutoCAD’s base functionality is available to you in addi-tion to the extra functionality and automated processes provided by KeyLIGHTS.
During installation shortcut(s) to KeyLIGHTS should be created on your desktop. Theicon used for this shortcut is shown in Figure 2.2 KeyLIGHTS + AutoCAD R2018 short-cut below. For more information about the installation and set-up of KeyLIGHTS seeChapter 11 Installation and Configuration. Shortcuts will be created for any version ofAutoCAD that you have installed,
Note
There may be more than one if you have more than one version of AutoCADinstalled. The shortcut is in fact a shortcut to the AutoCAD program.

- 28 -
Figure 2.2 KeyLIGHTS + AutoCAD R2018 shortcut
When you double-click on the shortcut AutoCAD is launched. KeyLIGHTS is loaded byway of option/settings created for each user at installation time. When loadingKeyLIGHTS a series of messages are received, and the ribbon menu will be loaded.
All of the commands provided in KeyLIGHTS can be found on the three KeyLIGHTS rib-bon menu tabs. As with all Keysoft Solutions’ products the Ribbon menu system isdivided into the main ‘KeyLIGHTS’ tab; a ‘KeyLIGHTS Tools’ tab with editing and addi-tional functions; and the ‘KeyLIGHTS Help’ tab. These are covered in more detail in sec-tion 2.7 The Ribbon Menu System, and throughout this manual. In addition, thefunctionality provided by the Highway Power Calculation (HPC) module has its own rib-bon tab. This is covered in Chapter 7 Highway Power Calculations.
Figure 2.3 KeyLIGHTS screen in AutoCAD

- 29 -
2.7 The Ribbon Menu System
2.7.1 Main KeyLIGHTS Ribbon Menu – Main Tab
Most of the functions you will use are to be found on the main KeyLIGHTS ribbon menutab. This is laid out in a way that is designed to help the workflow. Please let us know ifyour workflow is not well supported by this layout.

- 30 -
Note
The AutoCAD CUI command, for Customising the User Interface (including the rib-bon menu) allows for complete customisation of your menus. It is recommended,however, that should you wish to do this, you create your own menus so that thesecan easily be migrated across machines and versions in the long term.
The ribbon employs a mixture of large and small icons designed to help you find themost commonly used functions. For example, you will insert columns from the left mosticon, number these and then use the Lighting Reality interface (Create grid andRoundtrip) to calculate the light levels.
Figure 2.4 KeyLIGHTS Main Ribbon menu tab
The functions on this main tab are described in various chapters in this manual.
2.7.2 Ribbon Menu – KeyLIGHTS Tools Tab
Figure 2.5 KeyLIGHTS Tools Ribbon menu tab

- 31 -
KeyLIGHTS provides a range of tools that can be used to edit (or inform) your schemedesign, and functions that, whilst not directly assisting with the design process, are nev-ertheless required in the production of drawings to ensure proper installation, such askeys and labelling. These commands are largely described in Chapter 6 KeyLIGHTSTools.
2.7.3 Ribbon Menu – KeyLIGHTS Help Tab
The last KeyLIGHTS menu tab available is the Help Menu as shown in Figure 2.4KeyLIGHTS Main Ribbon menu tab.
Note
There is in fact a further menu for those who have the separately licensed HighwayPower Cable (HPC) module. This menu tab will appear even if you don’t haveaccess to an HPC licence but can easily be removed from view (through the use ofthe right-click menu available when your mouse is over the ribbon menu) if youwish to simplify the menu interface.
Figure 2.6 KeyLIGHTS Help Ribbon menu tab
The functions available from the KeyLIGHTS Help menu are:

- 32 -
l KeyLIGHTS Help – displays the on-screen manuall What’s New – displays the on-screen software revision guidel Check for Update – checks if any updates to KeyLIGHTS has been issued
o Set Check Period – sets the frequency for automatic update checking(monthly is recommended)
l Keysoft Web Site – opens your Internet browser and takes you to the Keysoft Solu-tions’ web site
o Keysoft Events page opens your Internet browser and takes you to theevents page (training, user groups etc.)
l About KeyLIGHTS – displays detailed version information of KeyLIGHTS
These items are covered in the following sections.
2.7.3.1 KeyLIGHTS help
RIBBON: ‘KeyLIGHTS Help → Help Manual’
Choosing KeyLIGHTS Help opens the on-line version of this manual.
A PDF version of the manual is also available from the install folder at c:\ProgramFiles\Keysoft Solutions\KeyLIGHTS\6.0\Help\Manual.
2.7.3.2 What’s New
RIBBON: ‘KeyLIGHTS Help →What’s New’

- 33 -
Selecting this command shows the ‘What’s New’ guide. This revision history details thelatest New Features in KeyLIGHTS, as well as Changes & Enhancements and Fixes.The change history for previous versions is included.
2.7.3.3 Check for update
RIBBON: ‘KeyLIGHTS Help → Check for Update’
Choosing this option checks to see whether there are any updates available toKeyLIGHTS. For this option to be able to perform this check successfully a connection tothe internet is required. If an update has been released a message, similar to that shownin Figure 2.7 KeyLIGHTS update check will be shown
Note
The reported numbers, dates and specification may differ from shown). Upgradesare available as downloads from the logged in area of the Keysoft Solutions’ web-site (www.keysoftsolutions.co.uk).
Additionally, the frequency you want automatic checks for updates to be carried out canbe selected from the ‘Reminder frequency’ list at the bottom left. The choices availableare: Every Time, 1 day, 1 week, 2 weeks, 1 month and Never. Setting this to one monthis recommended although manual checks can be made, or the frequency increasedwhen updates are expected.

- 34 -
Figure 2.7 KeyLIGHTS update check
2.7.3.1 Change update reminder
RIBBON: ‘KeyLIGHTS Help → Check for Update → Change Update Reminder’

- 35 -
To change the frequency for the automatic checking for updates to be carried out can beset by clicking on this icon. On selection the dialog in Figure 2.8 Set update reminderis shown
To change the reminder frequency, select the reminder frequency required. The choicesavailable are: Every Time, 1 day, 1 week, 2 weeks, 1 month and Never. Setting this toone month is recommended although manual checks can be made or the frequencyincreased when updates are expected.
Figure 2.8 Set update reminder
2.7.3.2 About KeyLIGHTS
RIBBON: ‘KeyLIGHTS Help → About KeyLIGHTS’
This option displays the details of the version of KeyLIGHTS database currently in use,see Figure 2.9 About KeyLIGHTS Information.

- 36 -
Figure 2.9 About KeyLIGHTS Information

- 37 -
Chapter 3 - Symbols and Other Features
3.1 Introduction
3.2 Connecting Objects
3.3 Design Status Colours
3.4 Building Symbols – The Lights Manager
3.5 Inserting Street Light Symbols
3.6 Repeated Insertion of Symbols
3.7 Civil / Electrical Features
3.1 Introduction
If you have used a previous version of KeyLIGHTS it is crucial to recognise the fun-damental difference in the street lighting symbols from version 6 onwards. These are nolonger simple AutoCAD blocks. Each component part of a street lighting symbol can beconnected and disconnected. This has the effect that a bracket and luminaire can bedetached from a column and attached perhaps to a building or a column of a differentheight. The height property of a bracket, and therefore of a luminaire, is governed by thecolumn height that it is connected to, or if it is not connected to a column, its own heightproperty.
Figure 3.1 Symbol Building and Selection

- 38 -
The symbol building and selection dialog, shown in Figure 3.1 Symbol Building andSelection above, is the heart of KeyLIGHTS in terms of creating and placing street light-ing columns symbols in your design drawings. For those who have used previous ver-sions it can be seen that this is a radical departure from the AutoCAD block basedmethodology used in version 5 (and earlier versions of) KeyLIGHTS. AutoCAD blockscan include attributes – text based information that is stored with the visible geometry,but this provides only limited functionality, validation and use. KeyLIGHTS (from version6) employs a more sophisticated method for storing data, which can be of a variety oftypes, including numbers, dates, file references as well as text. This allows for validation,for example a lamp load can be checked so as to disallow invalid entries such as a neg-ative value.

- 39 -
The symbol building and selection dialog provides, by way of a selection of symbols foreach component of a lighting column, for a very large number of permutations. Eachrequired symbol can be built using symbols selected for each component.
Note
The dialog provides both for symbols to be defined and also, once defined, inser-ted for use in a scheme design drawing.
Figure 3.2 Design Status Colour Options

- 40 -
It is important to recognise that whilst creating a ‘pre-set’ in the Lights Manager providesfor symbols to be added to the drawing that will be given the visual and other properties,once symbols have been inserted it is possible to edit or otherwise change their prop-erties. Subsequent changes to the pre-sets in the Lights Manager will have no effect onsymbols already inserted. Thus, you may choose to create a ‘proposed’ symbol rep-resenting a specific bracket and luminaire without setting a height for the column itself,this only being a property that you set in each inserted symbol. Once installed, the indi-vidual, inserted symbol could be marked as existing.
It is of course recommended that any symbol used in a specific drawing should con-sistently represent the parameters and properties assigned to it for that scheme,although this may only be for the most basic of properties such as column material andheight.
For each required component, all other properties are specified, such as the luminaire(LDT file), column height, bracket length and so on. Some of these properties will have avisual effect in the drawing, such as column height for the 3D representation, some of theproperties will be to do with data such as manufacturers’ part number or date installed.These defined symbols, and their sub-components, are stored externally to the currentdrawing so can be re-used across schemes.
It is possible, as will be seen, to change the meaning of any defined symbol in the sym-bol dialog, however, it is important to recognise that changing for example the heightparameter of a symbol in this dialog does not change the actual height property of anysymbols already inserted in the drawing. If an additional symbol, representing any dif-ferent property is required, then an additional symbol should be defined or used. This isessentially how we use symbols, but it is the case that the symbols available, and thedefault properties set for these in the dialog, do not necessarily represent exactly theproperties set for any symbol in your drawing.

- 41 -
3.2 Connecting Objects
3.2.1 Drawing Connections (Sockets) – System for Attaching Lumin-aires, Brackets, Columns and Ducts/Cables
New to v6 of KeyLIGHTS is a ‘plug and socket system’ which keeps street lighting com-ponents attached. Unlike AutoCAD blocks in which the geometry of each are linked, it ispossible to detach and re-attach components. Sockets are shown as transient circles ofdifferent colours for each component and connection type.
The system essentially consists of a socket on one object and a plug on the other object. The effect is like a ‘magic magnet’ where if a bracket is dragged and dropped close to acolumn it will automatically ‘jump’, or snap onto the insertion point of the column. Thiscan be referred to as a ‘drawing’ connection.
However, it is normally expected that you will build complete symbols in theLIGHTSMANAGER. You may sometimes require to attach a bracket and luminaire com-bination to an existing column, for example at a different height.
Figure 3.3 Joining Components using the plug and socket system

- 42 -
The bracket and attachedluminaire symbol is selec-ted to that its grips show(bracket - purple)
The bracket's grip is selec-ted and dragged over theround column symbol'ssocket (column - blue)
The bracket and attachedluminaire symbol isdropped and attaches tothe column symbol
To illustrate this in further detail a series of screenshots in a grip editing sequence is cap-tured below. In the top row of three images there is a green junction box (duct accesschamber) attached to the 50mmMDPE duct: 1. the duct object is selected; 2. the vertexon to which the inspection chamber has been attached is selected and moved; and 3.when the duct vertex is dropped to a new location the green inspection chamber symbolis also moved. In the bottom row a similar sequence is captured in which a street lightingcolumn attached to a duct is moved and the attached duct is also redrawn to the new pos-ition of the column.
1 2 3

- 43 -
4 5 6
The benefits of this can be seen when altering a layout of columns and cables, most not-ably when you are using the Highway Power Cabling (HPC) module to ensure the cor-rect cables and fuses are supplied. Calculated values can be updated as cable lengths

- 44 -
between columns are changed, and connected elements are automatically updated. If aconnected column is moved the bracket and luminaires move too as well as any con-nected cables and ducts.
Whilst the last point in the previous paragraph might seem strange, not least to the long-standing user of KeyLIGHTS who will be used to AutoCAD blocks, the new socket sys-tem will clearly reflect the reality of installation, for example if new brackets and lumin-aires are to be placed on existing, deemed to comply columns. The socket system alsoprovides for brackets and luminaires to be detached from the column, just by a drag anddrop moving using the component’s grip. If a column is selected, then moving thecolumn’s grip will move also any attached components. By contrast, if a luminaire isselected, then moving the luminaire’s grip will move only the luminaire, thus detaching itfrom its bracket.
Note
It is important that for inserted symbols, when you need to select a street light youtake care to select the appropriate component.
It is important to ensure, when you intend to move a lighting column and all of its con-nected components, or if you intend to detach and move only a component, that youselect the appropriate grip. For most lighting engineers, it will be sufficient most of thetime to always select the geometry representing the column and then to use thecolumn’s grips to edit these. For example, if a double headed column is to be rotated asone, the column’s red rotation grip can be used. Alternatively, if just a single bracket on acolumn with multiple brackets and luminaires is to be pointed to a different angle, thebracket’s rotation grip should be selected.

- 45 -
Note
A rotation grip for each bracket on a column will only appear if the ‘Even bracketspacing’ property of the column is not enabled.
This socketing system is also used with cables and ducts to ensure duct boxes (inspec-tion chambers) and columns remain attached – duct boxes for example inserted near theend of a duct segment will ‘magnetically’ jump to the exact end (a bit like osnap ‘end’),as they plug into their socket.
3.2.2 Electrical Connections
The method of connecting objects within a drawing described above in section 3.2.1Drawing Connections (Sockets) – System for Attaching Luminaires, Brackets,Columns and Ducts/Cables is distinct from the ‘electrical’ connection, modelling thereal-world objects. The ‘drawing’ connection is a system to connect drawn objects sothat if for example a column is moved, a connected duct will also move in the drawing.To model the electrical connections HPC and the equivalent system in KeyLIGHTS usesa separate mechanism to determine electrical connections. Thus, an object can be ‘draw-ing’ connected so that if one is moved the other will also move, as for duct inspectionchambers and duct vertices. However, in the case of a cable it can be connected in thedrawing, but not electrically connected (e.g. a pass through).
Normally, when you draw cables between a supply and loads, you will be doing this tomake an electrical connection and as such should be picking points that are within theconnector ‘sockets’ that are shown during drawing and grip-editing operations. In Figure3.5 Connector and Connector Text shown during grip-editing this can be seen withthe relevant connector label text shown in purple. It is assumed that you will always want

- 46 -
an electrical connection. If not, you will need to tell KeyLIGHTS, in the (double-click)Feature Properties dialog as shown below.
Figure 3.4 Electrical Connections of a Cable

- 47 -
In Figure 3.4 Electrical Connections of a Cable the connection properties of ‘Cable 1’are shown. Connected to this are a number of 8 metre column symbols, and at vertex 8an additional column and a further branch cable, ‘Cable 2’.
Note
If you wish to detach a connected object you can hold down the ‘Alt’ key whiledrag-and-dropping the object you wish to disconnect.
Figure 3.5 Connector and Connector Text shown during grip-editing
3.3 Design Status Colours
RIBBON: ‘KeyLIGHTS → Lighting Calculations → Options’

- 48 -
An additional concept that must be noted is that a global convention is applied for the col-ours that indicate different design status for each symbol. This applies across all draw-ings. For example, if in one drawing you insert some ‘Proposed’ street lighting symbols,which at the time are coloured red. You then save the drawing and close this. Later, youdecide that the colour you will use to indicate proposed columns for your scheme designdrawings are to be blue, when you re-open the first drawing, the proposed street lightingsymbols will be blue.
Note
The colouration applied to street lights with different status is independent of theLayer colour association used with the BYLAYER colour to change objects’ col-ours.
It is therefore important to be sure to decide on a colour scheme to be used consistentlyfor each design status.
Note
If you are to send your drawing to another lighting engineer who has decided upona different colour scheme for each design status, when they open your drawingwith KeyLIGHTS the colours they see will reflect their ‘local’ choices made inKeyLIGHTS on their own PC and will be familiar to them.

- 49 -
The colours that will be used for each design status can be set in the Miscellaneous tabof the ‘Lights Options’ dialog. This is shown in Figure 1.2 Design Status ColourOptions.
3.4 Building Symbols – The Lights Manager
RIBBON: ‘KeyLIGHTS → Columns → Street Lights’
The dialog in which symbols are built (and from which also inserted) is accessed usingthe icon, shown above. This can be found on the main KeyLIGHTS ribbon menu tab. Intime, you will build a library of symbols, stored externally to your design drawings in adatabase.
There are two ways that a new symbol can be created. If the new symbol is to be basedon an existing one available in the symbol database, this can be cloned by clicking the‘Copy’ button. The copy will be an identical symbol to the one selected.
Alternatively, the button labelled ‘Create New’ can be clicked. It is not normally neces-sary to see the dialog in its expanded view, as shown in Figure 1.1 Symbol Buildingand Selection, unless the symbol used does not make it clear exactly the properties thatit represents. Using a structured approach to the visible symbol selected will help withthis. Many, however, will want to see the properties half of the dialog to as to reassurethemselves that they are selecting the correct symbol for use on the plan.
Figure 3.6 Properties for Creating New Symbols

- 50 -
When creating a new symbol, it is expected that you will be selecting and setting prop-erties so the dialog is expanded to enable this, revealing the list of properties that youcan set for each pre-set symbol.

- 51 -
Note
If the drawing already contains a symbol you wish to add to the database, you canclick ‘Create New – Pick from drawing’. This will also load any photometry that isstored in the drawing.
3.4.1 Selecting Symbols for Street Light Components
The symbol used for each component of a street light can be selected individually. In thisway, a large number of symbols for the combined assembly can be selected so it is notnecessary for a symbol used on one scheme design drawing to represent a differentselection of street light parameters, for example column height or even luminaire.
When creating a new symbol from scratch, KeyLIGHTS will prompt you first to selecteach component symbol. The dialog for this is shown in Figure 3.7 Symbol Com-ponent Selection. It can be seen that there are a number of choices for the shape, inthis case for the luminaire – circular symbols are shown. Depending on whether youselect ‘Is Filled?’ and/or ‘Has Border?’ the range of symbols shown will change.
It is most likely that the luminaire symbol will be selected (not skipped) and once the but-ton ‘Select’ is clicked, KeyLIGHTS will next give a choice for the bracket, and in turn forthe column. Each of these can be skipped, for example if the luminaire is to be directlymounted on the top of the column, or where the luminaire is attached by way of a bracketto a wall or building.
Figure 3.7 Symbol Component Selection

- 52 -
Once the components symbols have been selected, other properties can be set. Theseare many properties available and these are categorised.
3.4.2 Selecting Luminaires (Photometric Data)
KeyLIGHTS is fully integrated with Lighting Reality and can read detailed informationfrom any installed photometric data (LDT or IES) file. Alternatively, a database can bemaintained of any luminaire that you require. This includes some basic information suchas ‘Lamp Type’, ‘Total Wattage’, ‘Lamp Flux’ etc. and also ‘S/P Ratio’, Tilt’ and ‘Cant’,important for light level calculations.
However, it is recommended that a photometric data file be selected from Lighting Real-ity (LR). In this way the light level calculations in the roundtrip (see Chapter 5 LightingCalculations) can be performed accurately.
Figure 3.8 Specifying Photometry

- 53 -
By default, when browsing for a photometry file, the system will show the files installedwith Lighting Reality (LR) if you have the product installed. Luminaires previously selec-ted are shown in a separate group so that they can be found again.
Note
Once the street light symbol is inserted, the photometry is embedded into the draw-ing so if you need to send the drawing to a colleague who may not have the LDT orIES file, you will not need to send the photometry file.
Whichever way the files are viewed, ‘KeyLIGHTS Recently Used’ or those installed byLR, an extract of the data and light distribution ‘butterfly’ is shown, as can be seen in Fig-ure 3.9 Photometric Data Selector).
Figure 3.9 Photometric Data Selector
- 54 -
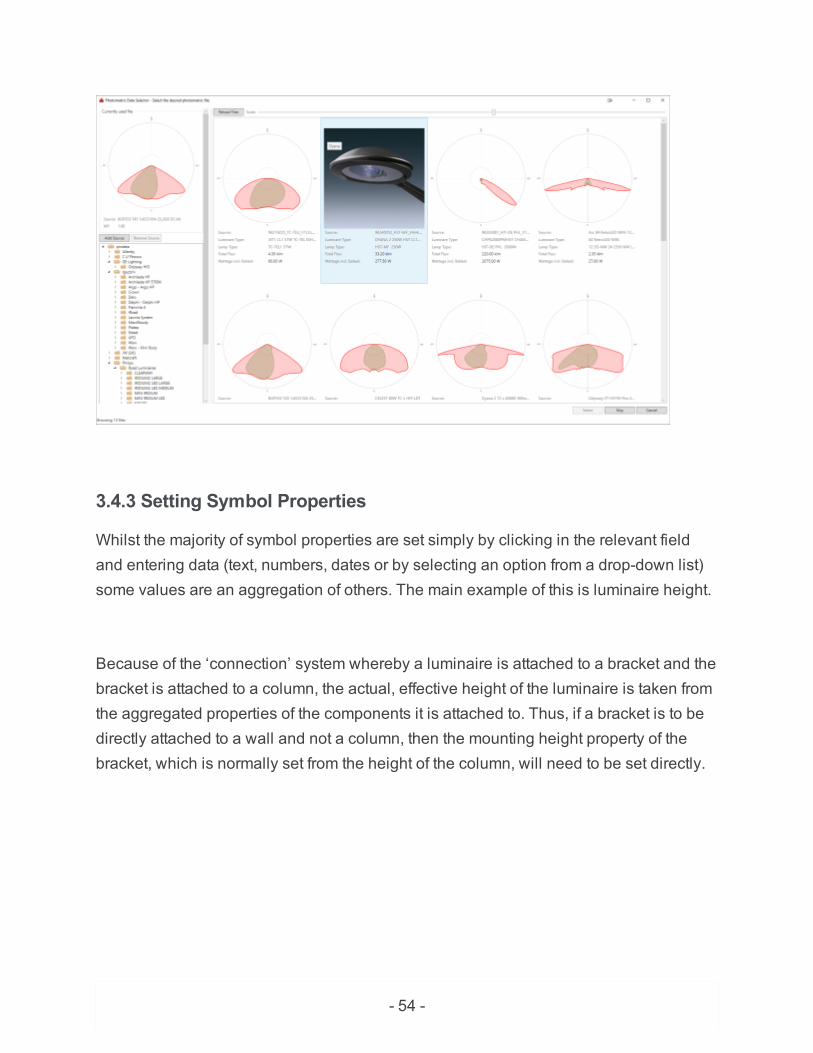
3.4.3 Setting Symbol Properties
Whilst the majority of symbol properties are set simply by clicking in the relevant fieldand entering data (text, numbers, dates or by selecting an option from a drop-down list)some values are an aggregation of others. The main example of this is luminaire height.
Because of the ‘connection’ system whereby a luminaire is attached to a bracket and thebracket is attached to a column, the actual, effective height of the luminaire is taken fromthe aggregated properties of the components it is attached to. Thus, if a bracket is to bedirectly attached to a wall and not a column, then the mounting height property of thebracket, which is normally set from the height of the column, will need to be set directly.

- 55 -
One example of the flexibility of the connection system isthat it is possible to have brackets at different mountingheights. By default, the mounting height property of eachbracket will be set to the overall height of the column it isattached to. This can be changed to allow a lower mountingheight. In addition, properties of each bracket and luminairecan be set individually, with different photometry associatedwith each, as required.
Figure 3.10 Calculated Properties that are Read Only
- 56 -
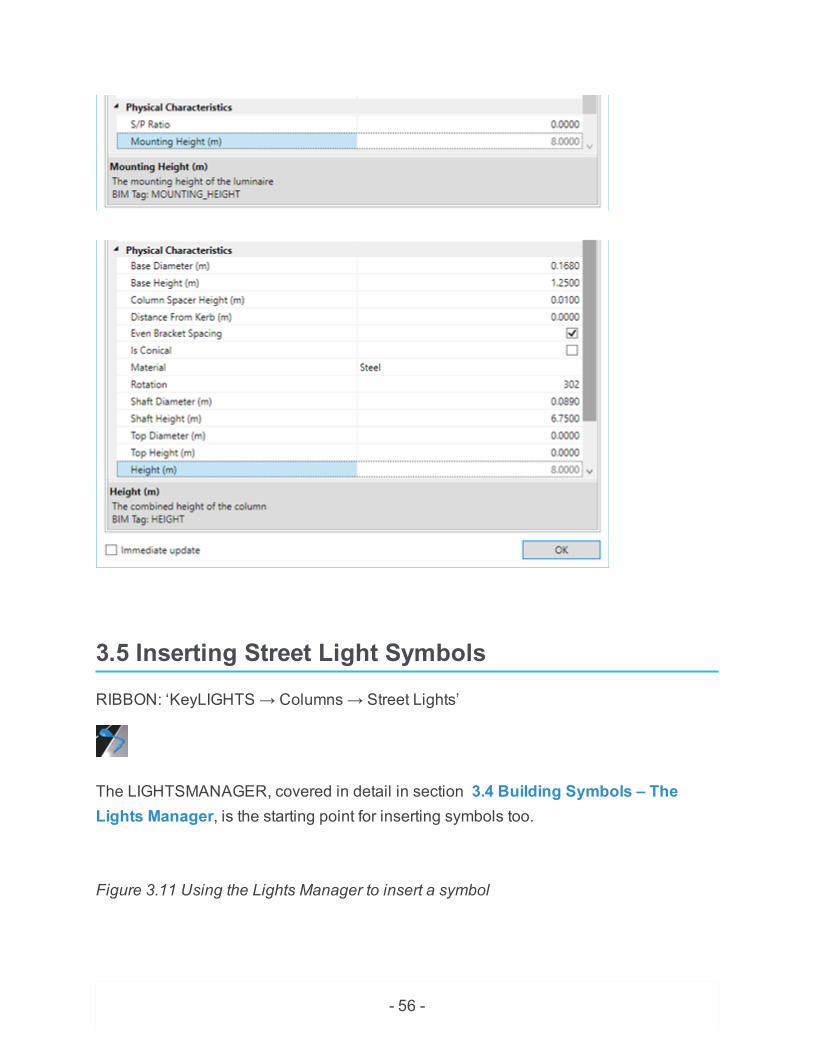
3.5 Inserting Street Light Symbols
RIBBON: ‘KeyLIGHTS → Columns → Street Lights’
The LIGHTSMANAGER, covered in detail in section 3.4 Building Symbols – TheLights Manager, is the starting point for inserting symbols too.
Figure 3.11 Using the Lights Manager to insert a symbol

- 57 -
Note
The screenshot shown in Figure 3.11 Using the Lights Manager to insert a sym-bol shows the dialog in a ‘compacted’ mode in which the detailed properties ofeach pre-set symbol are not shown. To see these, click on the small circular buttonat the bottom right of the dialog.
The required symbol can be selected in the main thumbnail area. The pre-sets definedeffectively give the inserted symbols some pre-set properties. Once inserted the symbolproperties can be edited as required.

- 58 -
Note
Subsequently changing the properties of pre-set symbols does not affect any sym-bols already inserted.
To insert a symbol, select the one required and click ‘Insert’ or double click the requiredsymbol. Then follow the prompts given on-screen at the command line.
3.6 Repeated Insertion of Symbols
After the first street light symbol has been inserted, using the Lights Manager dialog, fur-ther instances of the symbol can more easily be placed using the spacing tools. Thereare several varieties of these, covered below in detail.
RIBBON: ‘KeyLIGHTS → Symbols → Spacing’ (various)

- 59 -
3.6.1 Fixed Spacing
The section of the menu labelled ‘Fixed spacing' provides for you to position additionalstreet lights at a specified, fixed separation from the last symbol inserted, from a pointselected in the drawing, or an existing symbol. The fixed spacing can be for a staggeredarrangement (each successive street light is to be placed alternatively on each side of aroad) or linear arrangement (each column is placed in a line along the same side of aroad).
The menu provides three choices, select:
l '…from Last' to automatically set the last object inserted as the object to be copiedand from which the separation is to be measured;
l ‘…from any Point’ for a reference point (e.g. building corner or junction) to be selec-ted from the drawing and used as the starting measurement point; or
l '…from Symbol' for you to indicate a street light already inserted in the drawing asthe one to be copied and its insertion point to be used as the starting measurementpoint.
As you move your mouse around the drawing a symbol is shown at the fixed distancefrom the last one, chosen object or position depending on which function you have selec-ted from the menu. Once the desired insertion point is indicated, the column may berotated to align correctly as required.

- 60 -
If you are placing columns in a staggered arrangement, you will find the position at thelinear distance specified on the same side of the road to the previous point. You thenindicate the appropriate position on the opposite side of the road.
Note
The column inserted is automatically rotated to face the measured point. If it is notpossible to place the column directly opposite this point, because there is a drive-way for example, the column’s rotation may need to be adjusted later. This can eas-ily be done using its rotation grip.
The command repeats, so you can insert multiple columns until you have added all thatyou require. Finish by pressing Return.
3.6.2 Variable (Any) Spacing
The section of the menu labelled ‘Variable spacing' provides for you to position addi-tional street lights at any, variable separation from the last symbol inserted, from a pointselected in the drawing, or an existing symbol.
The menu provides three choices, select:

- 61 -
l '…from Last' to automatically set the last object inserted as the object to be copied;l ‘…from any Point’ for a reference point (e.g. building corner or junction) to be selec-ted from the drawing; or
l '…from Symbol' for you to indicate a street light already inserted in the drawing asthe one to be copied.
It is worth noting that, for a guide, you can use the distance shown on the AutoCADstatus bar from the last position to the position of the mouse (the length of the ‘rubberband’ line). If this shows the coordinates of the crosshair position on-screen or the num-bers are grey and do not change, click on the coordinates until it shows in the form’35.02<92,0.00’. This indicates the cursor is at a distance of 35.02 metres from the rel-evant point. Once the desired insertion point is indicated, the column may be rotated toalign with the road layout at that point.
The command repeats, so you can insert multiple columns until you have added all thatyou require. Finish by pressing Return.
3.6.3 Radius Spacing
A variant of variable spacing, these functions prompt you to set the minimum and max-imum desirable spacings, and then shows these limits, measured radially from the pre-vious column, chosen column or other fixed point as appropriate. This gives you a visualguide to ensure you position columns in turn within the spacing limits.

- 62 -
3.6.4 Setout Utilities
The following routines use a 'direction of travel rule'. This means that if the two pointsrequested are input as a start and end along a nearside kerb (i.e. in the direction oftravel), the columns will be correctly rotated towards the carriageway. If it is not possibleemploy this rule the columns will end up facing the wrong way. These can easily beflipped round using the ‘Flip Symbols’ command covered in section 1.1.3.2 Flip Sym-bols.
These functions can be used to very quickly add a number of columns. The ‘Divide &Measure’ group can be used along straight sections of road, for example between twojunctions, where column positions are fixed at either end, with the requirement being toset column positions between these points. If the road is not straight it will be more suit-able to use the ‘Setout on Line’ command to have columns run along any polyline, suchas one representing the edge of carriageway or back of footway. This may not work asrequired if junctions or any other map feature means there is no continuous linear objectalong the whole length columns are required. A road centre line may sometimes bemore suitable with offsets from this adjusted accordingly.
3.6.4.1 Setout on Line
RIBBON: ‘KeyLIGHTS → Symbols → Setout → Setout on Line’

- 63 -
If you have a suitable line such as an edge of carriageway line in your base map, thiscan be used to insert a series of columns at specified spacings along it in one operation.The measurement is made along the specified line. Linear and staggered arrangementsare provided. Please note that it will only be possible to place columns at measured inter-vals along the length of the line. If the line doesn’t run the entire length of the road, per-haps because of junctions or other breaks in the geometry, it may be better to select aroad centre line and adjust the offsets entered accordingly.
The point from which the measurement starts is the end nearest the point by which thepolyline is chosen, as prompted during the routine. If you need to start your line ofcolumns at some point other than the start of a polyline, it is possible to break the poly-line at the chosen position using standard AutoCAD commands, or, more easily, usingspecially created KeyLIGHTS commands (see 1.1.12.2 Adjust Lines - Break Polylineand 1.1.12.3 Adjust Lines - Re-Join Polyline for more information). The polyline can bere-joined later if necessary.
Figure 3.12 Setout on Line Options

- 64 -
You can specify the spacing between columns, the offset distances to either or bothsides of it as required. An option for staggered or opposite layouts is also available ifcolumns on both sides of the road are required. If only one side is chosen the programgives you the opportunity to rotate the symbols through 180 degrees (since the specifiedline could be a kerb-edge or back of footway line). If the relevant options next to thecolumn spacing is selected a column will also be added at the start of the polyline.
Figure 3.13 A Staggered ‘setout on line’ arrangement

- 65 -
In the image shown in Figure 3.13 A Staggered ‘setout on line’ arrangement, the set-tings to achieve this layout, on a 10m wide road, with 2, footways, were as entered in thedialog at Figure 3.12 Setout on Line Options.
Together with KeyLIGHTS tools to break a polyline, covered in 1.1.12.2 Adjust Lines -Break Polyline and 1.1.12.3 Adjust Lines - Re-Join Polyline, this spacing option couldbe used as follows:
1. break polyline where transition from staggered to single-sided columns is to occur(could use polyline measuring tool which steps along polyline at specified incre-ments to choose where to break);
2. use dialog box to set settings for single sided section and then run routine;3. use dialog box again to easily change to settings for staggered section, and run
routine again;4. use polyline tool to re-join break in polyline.
3.6.4.2 Max. Spacing
RIBBON: ‘KeyLIGHTS → Symbols → Setout → Max. Spacing’

- 66 -
This routine works like the ‘Split and Fill’ option covered below in 3.6.4.3 Number ofColumns (Split and Fill) except that it requests a maximum spacing in metres, cal-culates how many columns are necessary, then inserts these at a spacing closest to themaximum given. Remember the 'direction of travel rule' when selecting the start and endpoints for the columns to be inserted. The command provides for columns to be flippedby 180 degrees if needed.
The command sequence is as follows:
1. Pick the two points on-screen to define the line along which columns will beplaced. The command will report the distance between these two points.
2. Enter the maximum separation you require between columns. The command willreport, on the command line, the actual separation that can be achieved.
3. You can then select, from the LIGHTSMANAGER dialog, the required symbol.4. The number of columns that can be placed between the two selected points, at the
calculated separation, will be inserted.5. An option is then given to insert a column at the selected points (start and end).6. Finally, if the rotation is incorrect, an option is given to flip all symbols by 180
degrees.
3.6.4.3 Number of Columns (Split and Fill)
RIBBON: ‘KeyLIGHTS → Symbols → Setout → Number of Columns’

- 67 -
This routine works like the ‘Max. Spacing’ command covered above in 3.6.4.2 Max. Spa-cing except that it requests a number of columns, calculates the spacing between thetwo selected points, then inserts the number given. Remember the 'direction of travelrule' when selecting the start and end points for the columns to be inserted. The com-mand provides for columns to be flipped by 180 degrees if needed.
The command sequence is as follows:
1. Pick the two points on-screen to define the line along which columns will beplaced. The command will report the distance between these two points.
2. Enter the number of intermediate columns you want between the selected points.The command will report, in a dialog, the separation calculated at the dividingpoints. You can decide at this point to stop the command by clicking ‘No’.
3. You can then select, from the LIGHTSMANAGER dialog, the required symbol.4. The number of columns you want will be inserted between the two selected points.5. An option is then given to insert a column at the selected points (start and end).6. Finally, if the rotation is incorrect, an option is given to flip all symbols by 180
degrees.
3.6.4.4 Split Points
RIBBON: ‘KeyLIGHTS → Symbols → Setout → Split Points’
This routine works like the ‘Max. Spacing’ command covered above in section 3.6.4.2Max. Spacing. except that it will insert a single column at a specific divisional point. Itmay most often be used to add a column directly at the midpoint between two existingcolumns.

- 68 -
The command sequence is as follows:
1. Pick the two points on-screen to define the line along which columns will beplaced. The command will report the distance between these two points.
2. Enter the number of divisions you require between the two selected points. If youenter two divisions the next step is skipped.
3. If you have entered more than two divisions the routine draws out with light bluemarkers where each divisional point will be. Enter the number of the divisionalpoint for the column to be inserted.
4. You can then select, from the LIGHTSMANAGER dialog, the required symbol.5. The selected column will be inserted at the division indicated.6. An option is then given to insert a column at the selected points (start and end).7. Finally, if the rotation is incorrect, an option is given to flip all symbols by 180
degrees.
3.6.4.5 Line Setout Settings
RIBBON: ‘KeyLIGHTS → Symbols → Setout → Line Setout Settings’
You can change the settings used for the ‘Setout on line’ command easily through thedialog box this command provides, shown in Figure 3.12 Setout on Line Options. Thechoices you make can be used just temporarily, or saved to be the system defaultsacross sessions.
On initiation, the dialog box will show the settings currently in use (these may still be thedefaults). If they have been changed from the defaults, the button labelled ‘Read fromfile’ can be used to load previously saved settings and values, as required.

- 69 -
The options which the user can change are self-explanatory, but note that all meas-urement of offsets and sides is taken from the chosen starting end of the selected poly-line.
3.6.4.6 Calculate Stagger Distance
RIBBON: ‘KeyLIGHTS → Symbols → Other Spacing → Calculate Stagger’
To insert columns at a fixed separation on a staggered layout, this new option allowsusers to specify the linear separation distance and the nominal road width (column tocolumn), and will calculate the actual column to column distance. This value will beretained, so that if the user then uses fixed spacing tools and linear option, each columncan be quickly inserted.
3.7 Civil / Electrical Features
KeyLIGHTS also includes a range of drawing functions for setting out, for example,cable and duct arrangements, duct access chambers, and also other electrical symbolssuch as belisha beacons, signs and bollards.
3.7.1 Cables
RIBBON: ‘KeyLIGHTS → Ducting and Cables → Cables’

- 70 -
Functions for drawing cables are included in Chapter 7 Highway Power Calculationswhich covers the Highway Power Calculation (HPC) module. Whilst these are drawn forthe purpose of cable calculations, you may wish to use these functions to indicate howeach lighting column is supplied. See 7.1 Project Settings for full details about drawingcables.
3.7.2 Ducts
RIBBON: ‘KeyLIGHTS → Ducting and Cables → Ducts’
The dialog in which different linetypes representing each type of duct you require arebuilt (and from which also selected for drawing) is accessed using the icon shownabove. This can be found on the main KeyLIGHTS ribbon menu tab. In time, you willbuild a library of linetypes. These are stored externally to your design drawings in a data-base.
3.7.2.1 Creating Duct Pre-sets
It is important to recognise that, whilst creating a ‘pre-set’ in the Duct Manager providesfor ducts to be added to the drawing that will be given the visual and other properties,once ducts have been drawn it is possible to edit or otherwise change their properties.Subsequent changes to the pre-sets in the Duct Manager will have no effect on ductsalready drawn.
Click the button labelled ‘Create New’ to create new linetypes. It is not normally neces-sary to see the dialog in its expanded view when selecting linetypes to draw, as shownin Figure 3.14 The Duct Manager, unless the symbol preview does not make it clear

- 71 -
exactly the properties that it represents. However, you will want to set the propertieswhen defining new and so this expanded view is shown when creating a new one, afterthe name you wish to use to represent the pre-set has been entered.
After the new duct has been created you can set or change the properties as required inthe same way as you do if you wish to edit an existing pre-set.
3.7.2.2 Editing Pre-set Duct Properties
In the expanded view the properties set for the selected linetype are shown. To changeany of these, simply edit the current entry. Some properties are text, which can be editedas you would expect, numbers again can be entered or the ‘up/down’ arrow control onthe right used to increase or decrease the value by increments.
The exact pattern of the linetype can be entered using the syntax that is used in theAutoCAD .LIN file type. This is somewhat impenetrable, but is well covered in theAutoCAD Help Manual. In KeyLIGHTS a linetype definition file is provided (in the install-ation folder), which includes a range of suitable duct and cable linetypes. To load this,click on the ‘…’ button. With a bit of reading you will find you can edit this file if you wishto add further linetypes that you will share with colleagues (or across machines). Anychanges you make will need to be saved, however, if you click the button to Draw theselected linetype, the changes are saved automatically.
Figure 3.14 The Duct Manager

- 72 -
3.7.2.3 Drawing Ducts
Once you have selected a suitable duct linetype, click the button labelled ‘Draw’ (not‘OK’). You can also double-click the visual representation of the duct. You will then beoffered two methods to draw the duct – by simply picking points in the drawing, includingsockets on objects to which you can connect ducts (e.g. inspection chambers); or by pick-ing cable segments.
When drawing ducts, you will see that the plug/socket connectors will be shown on allrelevant objects. If you click within the circle shown for the socket on duct access cham-bers, for example, the duct will be ‘connected’ to the access chamber.

- 73 -
Note
It is normally expected that you will have only straight segments of duct so it is notpossible to extend a duct by drawing a new segment – ducts cannot connect to theend of other ducts, only access chambers.
When adding ducts to the drawing by ‘picking cable segments’, you simply need to pickthe cable objects.
Note
This will add a duct to the whole length (all segments) of a cable, so if a cable willbranch into a different duct type, the branch should be drawn as a separate object.A single duct object is created along the whole length of the selected cable.
3.7.2.1 Editing Ducts and Duct Properties
Normally, it will be sufficient to simply double-click on a duct object to bring up the‘Feature Properties’ dialog for that object. When a duct has been drawn and ‘contains’ acable, you will need to select which object’s properties you wish to see. After the double-click a small menu is shown (see Figure 3.15 Editing Ducts Containing Cables). Thisalso allows for the cable properties to be accessed.
Figure 3.15 Editing Ducts Containing Cables

- 74 -

- 75 -
3.7.2.2 Different Duct Display Representations
There are a number of ways a duct that contains a cable can be displayed. Firstly, in theFeature Properties for ducts, a ‘Legacy Mode’ toggle is provided.

- 76 -
However, a quick way to change how the ducts are displayed when not in legacy mode,is select the duct object and hover over the rectangular, midlle grip on a particular seg-ment as shown to the right. This causes a small transient box to be temporarily shown. Ifyou select the contained cable, this is shown in the middle of the duct. See Figure 3.16Different Ducts Display Modes for the additional options.
Figure 3.16 Different Ducts Display Modes
3.7.3 Duct Access Chambers
RIBBON: ‘KeyLIGHTS → Ducting and Cables → Duct Access Chambers’

- 77 -
A simple thumbnail menu is shown from with a range of access chamber symbols canbe selected.
Figure 3.17 The Duct Access Chamber Thumbnail Menu
Once you have identified a suitable symbol, select either its thumbnail or description (onthe left) and click the button labelled ‘Insert’.
Note
That there is an additional page which you can access by clicking ‘Next’.

- 78 -
When adding duct access chambers, you will see that the plug/socket connectors will beshown on all relevant objects, for example the vertices of ducts and, in the case of polechangers, light columns. If you click within the circle shown for the socket on a duct ver-tex, the symbol will be ‘connected’ to the duct. Each symbol can be rotated as required.You will note that to assist with the clarity of the drawing, connected ducts are trimmed tothe extents of the duct access chamber symbol.

- 79 -
3.7.4 Additional KeyLIGHTS Symbols
RIBBON: ‘KeyLIGHTS → Symbols → More Symbols’
Note
The icon shown on the ribbon menu (see above) is the icon for the belisha beacon.If you have selected for example a different symbol, this will be promoted to the topand will be shown in place of the belisha beacon icon.
Beacons, bollards and signs are inserted on the drawing using straightforward methods.You should be able to follow the prompts to enable you to place these on your drawing.The same applies to feeder pillars, and these are also accessible on the HPC menu(see Chapter 7 Highway Power Calculations).
3.7.4.1 Refuge Islands
Refuge islands of many sizes and shapes can be introduced very quickly. As well as thepre-defined sizes, KeyLIGHTS provides for you to specify the dimensions of the island,and draw refuges as D, double-D, joined double-D, boat shaped, etc.

- 80 -
In addition, KeyLIGHTS will draw islands suitable for junction arrangements where trafficlanes split. The dimensions required in the construction of these islands refer to thelengths to the intersection of the projected sides of the island, and some experimentationmay be required until the user is used to the method of working. The radii of the corners(ends) of the island can also be specified (default 0.45m), as can the radius of anycurved side of the island (default 10m). The parameters setting the limits for constructinga practicable island have not been determined, so if the values chosen lead to an islandthat would not be suitable, the command can be reversed using the UNDO commandand different values tried.
Figure 3.18 Pedestrian Refuge Thumbnail Menu

- 81 -
Chapter 4 - Symbol Utilities
4.1 Symbol Numbering
The ‘Symbol Numbering’ ribbon panel provides all the tools you should need to numberyour street light symbols. These routines are provided to ensure symbols can quickly benumbered, with the inclusion of a prefix and/or suffix. A label is created and the requirednumber transferred into either the column or scheme identity number for each column.The column number is also transferred by virtue of the socket system to all connectedcomponents (brackets and luminaires). Thus, if a luminaire attached to column number1, which would therefore itself have the number 1, was reattached to a column whosenumber is 2, that luminaire would automatically be renumbered.
4.1.1 Adding Numbers
RIBBON: ‘KeyLIGHTS → Symbol Numbering → Number Columns’
and
Column numbering is a straightforward process, providing an incremental numberingwith a suffix and/or prefix. At the start of the command you can define the number formatas required. The two icons provide a menu macro, each setting the command up in a

- 82 -
different way – placing the column numbers into the ‘Column Identity Number’ data fieldor the ‘Scheme Identity Number field’ respectively. See section 4.1 Symbol Numberingfor more information about the street lighting component properties.
Command: ColumnNumber
Current Settings: Next Value = 2, Prefix = , Suffix = , Incre-
ment = Yes, Add to Scheme Number
Enter initial Column Number or change [Prefix/Suffix/Increment
Yes/Add to Scheme Number/Reset Prefix and Suffix] <2>: a
Add to: [Column Number/Scheme Number/None]<Scheme Number>: c
Add to Column Number set
Enter initial Column Number or change [Prefix/Suffix/Increment
Yes/Add to Column Number/Reset Prefix and Suffix] <2>: P
Enter PREFIX: DCC-
Enter initial Column Number or change [Prefix/Suffix/Increment
Yes/Add to Column Number/Reset Prefix and Suffix] <DCC-2>: S
Enter SUFFIX: -AD
Enter initial Column Number or change [Prefix/Suffix/Increment
Yes/Add to Column Number/Reset Prefix and Suffix] <DCC-2-AD>:
Select insertion point for <DCC-2-AD> or [Enter to finish]:
<point selected on-screen for label>

- 83 -
Select insertion point for <DCC-3-AD> or [Enter to finish]:
<Enter (Return) pressed>
Command:
It can be seen from the command sequence above that selecting options ‘c’ for the num-bers inserted as labels onto the drawing will be added to the ‘Column Number’ data prop-erty (the ‘Scheme’ icon sets the option to add these to the Scheme number property).The sequence also shows that selecting the options ‘P’ and ‘S’ in turn allows a prefixand suffix to be included. After these are defined, the number itself is incremented.
Once you have set your requirements, simply select a location for each number and alabel will be created at the point selected. The routine looks for a column near to theselected point and creates a leader to the nearest column.
Figure 4.1 Column Number Options
Once the labels have been created for all columns you wish to label, simply press returnto finish the command.

- 84 -
After the labels have been created, you can edit the properties of each individual labelusing the command associated with the double-click on KeyLIGHTS street features(KEYPROPOERTIES). An icon is also provided for this on the ‘Number Columns’ drop-down menu. The dialog for this is shown in Figure 4.2 Column Number Properties.Additionally, once a label has been selected two grips are shown, one for the location ofthe label itself, and one for the rotation of the label. The second one is useful for ensur-ing readability when the labels are showing a ‘rotated’ view in a model space viewport inpaper space. When repositioning the label using the first square, blue grip, you will seehow the leader is automatically drawn from the nearest point on the edge of the label.
Figure 4.2 Column Number Properties
4.1.2 Scaling Number Labels
RIBBON: ‘KeyLIGHTS → Symbol Numbering → Scale Numbers’

- 85 -
This function is provided to enable number labels to be scaled ‘en masse’. The com-mand prompts for you to select the labels you wish to scale. Select those you wish toscale and enter a new size for these. The label itself is scaled accordingly.
Note
It can be possible for the label to get to a size where the leader may not makesense, and will need to be moved.
4.1.3 Reset Column Number Labels’ Scale to One
RIBBON: ‘KeyLIGHTS → Symbol Numbering → Reset Column Number Labels’
This function works as the one above, with the difference that it provides a global reset ofall column number labels back to default (scale of 1).
4.2 Symbol Data
RIBBON: ‘KeyLIGHTS → Data → Edit Data

- 86 -
Each symbol component, columns, bracket and luminaire, contains many data fields.These are largely used to inform the lighting design and power requirements. A screen-shot of the luminaire properties is shown in Figure 4.3 Luminaire Properties. Anexample of the properties for a lighting column is shown to the right.
To access the ‘Feature Options’ dialog it should be possible to simply double-click the

- 87 -
relevant object. This action is associated with the KEYPROPERTIES command. TheAutoCAD CUI command can be used to ensure the double-click action is associatedwith this command. Alternatively, the icon provided on the toolbar (shown above) canalso be used.
Note
The dialog presents both options for each symbol (or other KeyLIGHTS objectsuch as lighting grids), that can change the look of an object, as well as para-meters or properties that do not change the geometry of the object.
Figure 4.3 Luminaire Properties

- 88 -
4.2.1 Editing Street Light Component Properties (Data)
RIBBON: ‘KeyLIGHTS → Data → Edit Data’

- 89 -
The ‘Feature Options’ dialog can be accessed using the icon shown, or by a double-click action on the object whose properties you wish to view and/or edit. This initiates theKEYPROPERTIES command which is associated with the double-click action when aKeyLIGHTS street feature object (such as column, luminaire of lighting grid) is selected.
Most of the properties (or parameters) in the ‘Feature Options’ dialog can be set by enter-ing a value, selecting an option from a list or entering text. Each property has a specifictype – comments are ‘free’ text, dimensions are numbers for example. There is a certainamount of validation of the data entered, for example it will not be possible to enter a neg-ative value for column widths. However, whilst for certain values, such as column width,a value of zero may make no sense, these will not always be known at every stage of thedesign so are allowed. For example, while you are deciding on appropriate luminaires toachieve a desired light level, the precise dimensions of columns may not be known, onlythe height will be required.
Care must be taken when changing values, for example the wattage of a luminaire, thatthese match actual values. In the case of luminaires, it is likely that most of these willcome from a LDT photometric data file so will not need to be manually entered. It is theresponsibility of the user to ensure valid values are stored with each symbol.
Electrical properties can be entered if known, normally these will be populated auto-matically when the loads etc. are connected to a circuit, calculated by the HighwayPower Calculation (HPC) module, covered in detail in Chapter 7 Highway Power Cal-culations.
4.2.2 Copying Symbol Data Between Street Light Components
RIBBON: ‘KeyLIGHTS → Data → Copy Data’

- 90 -
In the event that you already have a number of symbols in your drawing and you need tochange one or more properties of those already inserted, this command is provided toallow for the changes to quickly be copied to other selected symbols.
Note
Should you wish to include in your design a symbol with different properties to anythat you have previously built in the LIGHTSMANAGER dialog (see section 1.1Building Symbols – The Lights Manager for more information), it may be simplerto change the required property for one of the pre-set symbols. You can of coursecreate a copy of a pre-set and change the properties of the copy.
Figure 4.4 Copy Data – Field Selection Dialog

- 91 -
Once you have selected a street lighting component from which the data is to be selec-ted, the dialog shown in Figure 4.4 Copy Data – Field Selection Dialog will come up. Itcan be seen that any or all data can be copied. Place a tick in the fields that you wish tobe changed in other symbols. When you click OK you will be prompted to select the sym-bols for the data to be copied to.

- 92 -
Note
It is generally recommended that you always select lighting columns. In the dialogshown in Figure 4.4 Copy Data – Field Selection Dialog hidden out of sight(accessed by scrolling down) is the properties for the connected components. Look-ing at the figure, you will see that a tick has been placed against the ‘lamp type’property and the value of ECO1623-3S-130 can be confirmed at this point, as thiswill be the value that is copied. The image below shows what happens if the lumin-aire component is selected. A prompt will be given, as shown, giving the choice asto whether the data should be copied across to all connected components.
4.3 Feature Query Dialog
RIBBON: ‘KeyLIGHTS → Data → Feature Query’
The Feature Query dialog is provided as a generic tool for creating any output, tabulatingdata fields and some geometry from any street feature created by Keysoft Solutions’

- 93 -
applications such as KeyLIGHTS, KeyLINES or KeySIGNALS. Whilst KeyLIGHTS itselfdoes provide some tools for tabulating various properties of the street lighting symbols(see sections 6.1 Keys, 6.2 Tabulate Symbols and 6.3 Distances Table for moreinformation), you may require a different output. The outputs available are AutoCADtables that can be added to your drawing, and a Comma Separated Values (CSV) filethat can be opened and later manipulated in a spreadsheet.
The tool is provided in wizard form, with a number of pages representing a series oflogical steps. At each step, described in detail below, you can decide and build the exactoutput you require.
Step 1 – ‘Select Objects’
The first step in the command is to select the objects that you wish to query. Unless thereis a specific part of the drawing, or just certain street features that you are concernedwith, it is likely that you will simply enter ‘All’ to select all features in the drawing. At thispoint however, all of the normal AutoCAD selection methods are available such as win-dow or crossing box selection.
When the objects have been selected you may wish to create a template which you canuse again. Templates can be used to repeat any output that you require so that you don’thave to make the same choices more than once. The choice and any changes you makeare automatically saved to the template. If you already have a template, select this first.
On the first page a list of the different features that are in your selection set are displayed.In the screenshot shown in Figure 4.5 Feature Query dialog – Step 1 several featureshave been selected, the Lighting Display Grid objects have been excluded from the sub-sequent steps.

- 94 -
Figure 4.5 Feature Query dialog – Step 1
Select the feature types you wish to query. For this example, we have selected cables,luminaires, brackets and columns.
Step 2 – ‘Apply Filters’
In this step, it is possible to apply a filter. Filters are a way to focus in on a subset of yourselection, for example to find and tabulate only symbols of a certain type. In the screen-shot shown in Figure 4.6 Feature Query dialog – Step 2 a query condition (filter) isbeing set-up for lighting luminaire of a certain wattage. The ‘Value’ list will show only (inthis case) wattages of luminaires found in the current drawing or selection (the valuesshown are dynamically created and so reflect the contents of the selection set).

- 95 -
Note
To add filters you will need to place a tick in the ‘Enable filtering’ box. It is possibleto create a number of filters. To add or remove filter (lines) click on the ‘+’ and ‘-‘ buttons respectively
Figure 4.6 Feature Query dialog – Step 2
Step 3 – ‘Choose Fields’
On this page, you can specify the fields that you wish to tabulate (or export). The avail-able fields are listed on the left, categorised by feature type. In the example shown belowin Figure 4.7 Feature Query dialog – Step 3, fields relating to the luminaire have beenselected from the list and ‘moved’ across to the selected fields list on the right. This isdone by clicking the ‘>’ button. If you wish to include all fields in the output click the ‘>>’

- 96 -
button. The selection can be reversed in the same way by selecting fields in the list onthe right and clicking ‘<’, or to remove all by clicking ‘<<’.
Note
There is an item for each of the street light components called ‘symbol’ when cre-ating a table in a drawing the relevant symbol will be placed. This is not includedin a comma separated values (CSV) output.
Figure 4.7 Feature Query dialog – Step 3

- 97 -
Step 4 – ‘View/Modify Results’
This ‘View/Modify’ page provides for fine tuning of the final output. It is also possible toedit the values in the items shown. You will find its flexibility allows for a very wide rangeof outputs, so you may need to experiment to achieve something that matches yourrequirements.
Firstly, it is possible to review the data in two very different ways, either a flattened tableview (see Figure 4.8 Feature Query dialog – Step 4 ‘Flattened View’) or a hierarchicaltable view (see Figure 4.10 Feature Query dialog – Step 4 ‘Hierarchical View’). In theflattened view, all of the data for each connected component is aggregated into a singlerow. Figure 4.8 Feature Query dialog – Step 4 ‘Flattened View’ shows a symbol forthe column, bracket and luminaire in each row in this example as the drawing containedonly lighting symbols that comprised of all three components connected (this would bedifferent if there were luminaires connected a bracket which was in turn connected to abuilding or wall and not a column).
Note
‘Symbol’ is one of the fields that can be selected in the ‘Choose Fields’ page,which you may wish to omit if you are intending the output be for a spreadsheet.Symbols are not currently added to any output.
Each column has a header, for example, ‘Lighting Luminaire – Column Identity Number’in Figure 4.8 Feature Query dialog – Step 4 ‘Flattened View’. These column headerscan be dragged across so that the data appears in a different part of the output.
Figure 4.8 Feature Query dialog – Step 4 ‘Flattened View’

- 98 -
This flattened view is more akin to the tabulations that would be possible for blocks andblock attributes where symbols are brought together into a single block sharing all attrib-utes in one. Different symbol components’ properties are placed in the same row as therelated (connected) components.
Note
Making the switch of the data between flattened and hierarchical views doesn’tchange the output or tabulation of the data.
Secondly, the ‘View/Modify’ page allows for the properties to be edited. To do this

- 99 -
Figure 4.9 Feature Query dialog – Editing Fields
you must switch to ‘hierarchical’ view mode, and also tick the box labelled ‘Enable editmode’. If you wish to change the value for all of the items in the table, right-click on thecolumn header. This produces the menu item shown in Figure 4.9 Feature Query dia-log – Editing Fields.
Figure 4.10 Feature Query dialog – Step 4 ‘Hierarchical View’
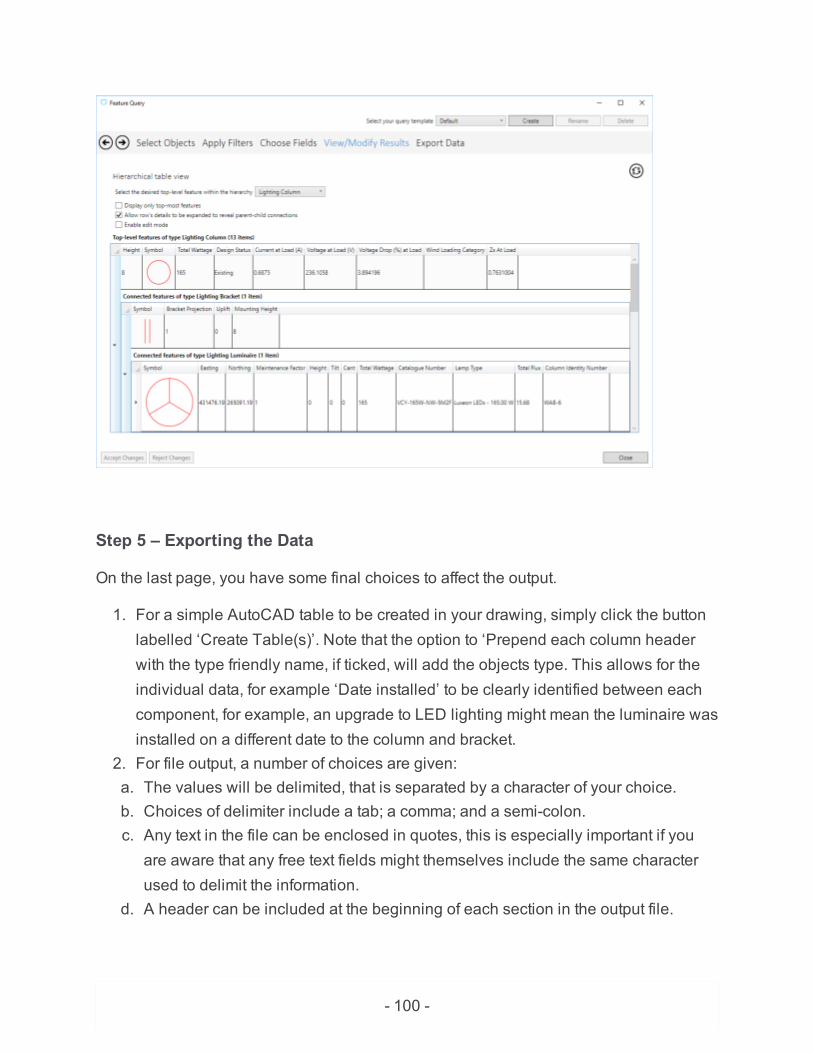
- 100 -
Step 5 – Exporting the Data
On the last page, you have some final choices to affect the output.
1. For a simple AutoCAD table to be created in your drawing, simply click the buttonlabelled ‘Create Table(s)’. Note that the option to ‘Prepend each column headerwith the type friendly name, if ticked, will add the objects type. This allows for theindividual data, for example ‘Date installed’ to be clearly identified between eachcomponent, for example, an upgrade to LED lighting might mean the luminaire wasinstalled on a different date to the column and bracket.
2. For file output, a number of choices are given:a. The values will be delimited, that is separated by a character of your choice.b. Choices of delimiter include a tab; a comma; and a semi-colon.c. Any text in the file can be enclosed in quotes, this is especially important if you
are aware that any free text fields might themselves include the same characterused to delimit the information.
d. A header can be included at the beginning of each section in the output file.

- 101 -
Click ‘Export to CSV’ to save the output to a file through the file selection dialog.
Figure 4.11 Feature Query dialog – Step 5 Exporting the Data
The output tabulated on an AutoCAD drawing is created as an AutoCAD table. This canbe subsequently modified as required.
Note
The table is not linked to the selection of objects used to create the information. Ifthe drawing changes you will need to re-create the output. The use of a query tem-plate will ensure this process involves few steps.

- 102 -
Figure 4.12 Feature Query dialog – Tabular Output
4.4 Symbol Utilities
4.4.1 Inquiry ‘Take Off’
These routines enable you to query the drawing and determine the numbers (quantities)of each type of item on your drawing. Whilst there are icons for each type of object, this isfor convenience only. All commands bring up the same dialog as shown in Figure 4.13Quantity Take-off.
Figure 4.13 Quantity Take-off

- 103 -
4.4.1.1 General Inquiry
This command brings up the dialog shown in Figure 4.13 Quantity Take-off with allobject categories ticked. It is possible to include a rate against each item if this has beenconfigured. The choice of contractor/supplier called ‘Default’ can be used.
Figure 4.14 Quantity Take-off – Additional Output Options
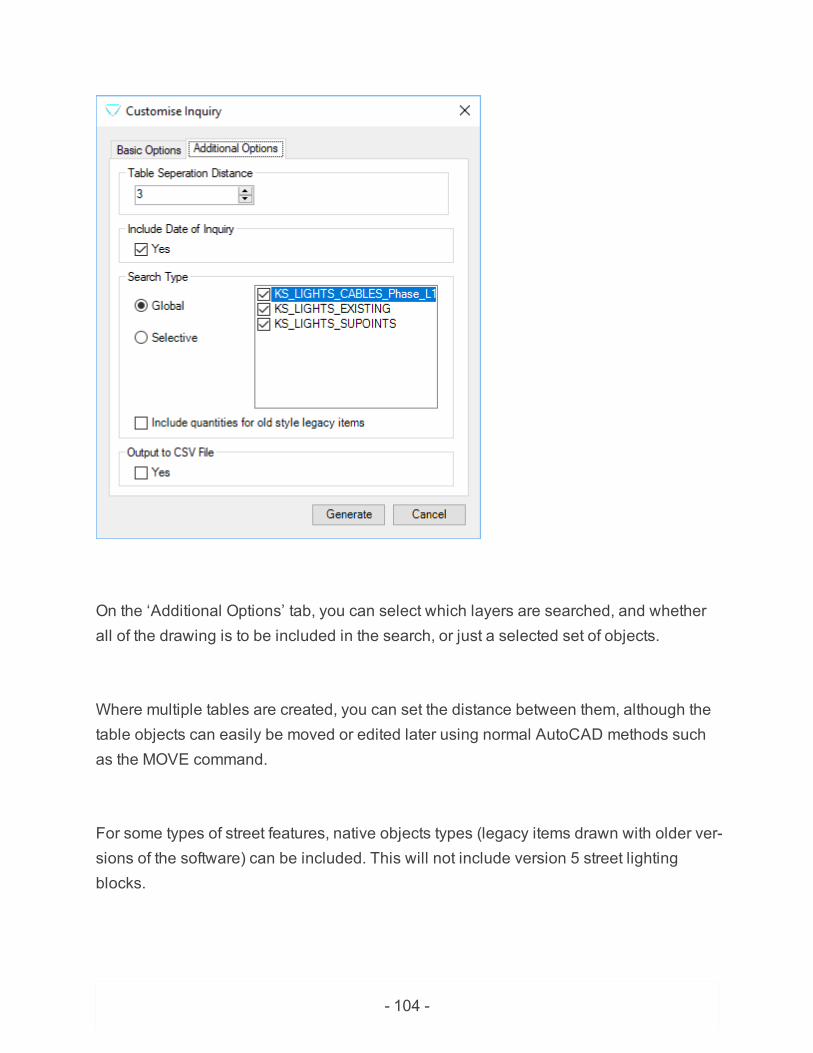
- 104 -
On the ‘Additional Options’ tab, you can select which layers are searched, and whetherall of the drawing is to be included in the search, or just a selected set of objects.
Where multiple tables are created, you can set the distance between them, although thetable objects can easily be moved or edited later using normal AutoCAD methods suchas the MOVE command.
For some types of street features, native objects types (legacy items drawn with older ver-sions of the software) can be included. This will not include version 5 street lightingblocks.

- 105 -
The output is, by default, an AutoCAD table, but you can elect to have this saved to acomma separated values (CSV) file, which can be opened in any spreadsheet softwaresuch as Excel for further manipulation.
Note
A date can be included for the tabulation/output so that you can be sure when theoutput was created, in case further work has happened on the drawings. The tab-ulation is not dynamically linked to the drawing so if you know that quantities havechanged because of changes to your design, simply run the inquiry routines again.
4.4.1.1 Ducting Inquiry
The duct inquiry works as described in the section on General Inquiries. The output is atabulation of the quantity of duct in the current drawing. The columns (fields) that are tab-ulated can be set in the Inquiry Options dialog covered in section 4.4.1.1 InquiryOptions.
4.4.1.2 Cabling Inquiry
The cabling inquiry works as described in the section on General Inquiries. The output isa tabulation of the quantity of cable in the current drawing. The columns (fields) that are

- 106 -
tabulated can be set in the Inquiry Options dialog covered in section 4.4.1.1 InquiryOptions.
Note
This command tabulates the length of cable on the drawing, but does not take intoaccount any allowance required to take the cable up to the termination in anycolumn.
4.4.1.1 Inquiry Options
The general dialog in which many settings and options can be found also includes a tabthat enables you to set which fields are included in the tabulation for each inquirycovered above. This tab is shown in Figure 4.15 Quantity Take-off Format Options.
Figure 4.15 Quantity Take-off Format Options

- 107 -
For each object type, you can decide on the title for each, the width of the column, andwhether the specific quantity is included (displayed) in the table at all.
If you are able to supply accurate rates for each type of feature, these can be added onthe ’Rates’ tab of this dialog, as shown in Figure 4.16 Quantity Take-off Rates. Thesecan be stored in the ‘Default’ contractor, or for a competitive schedule of rates, any num-ber of additional contractors. If you have up-to-date rates, ensure you select the tick boxwhen generating an inquiry. The rates are multiplied by the quantities and tabulated ascell formula. This allows for editing of the table later should this be required, withoutneeding to generate a new table from scratch.

- 108 -
Figure 4.16 Quantity Take-off Rates
4.4.2 Zoom by Property

- 109 -
This function provides a way to identify specific columns on your drawing with matchingproperties such as column identity number. You can also search any other property byselecting the appropriate function from the drop-down shown above.
If any matching columns are found the function will zoom the drawing so that the firstmatching column is viewed in the centre of the screen.
Note
The command doesn’t zoom in or out. Thereafter, you can step through any addi-tional matching columns by pressing ‘F’ to go forward to the next column, and ‘B’ togo back to the previous one. Once the matching columns have been viewed, pressenter (or ‘X’) to exit the command.
If you start the command with a wide view of the drawing, it may not be easily apparentwhich column has the matching property. Press the ‘+’ and ‘-’ keys to zoom in and out,by a factor of two, around the column centred.
4.4.2.1 Zoom to Column (number search)
This function provides a simple means for finding columns with a specific column iden-tity number. You will be asked to enter the column number to search for. If any matchingcolumns are found in the drawing the function will zoom to each in turn. Navigate to eachmatching column using the keyboard as described in 4.4.2 Zoom by Property.

- 110 -
4.4.2.2 Zoom to Property (text search)
This function provides a way to identify specific columns on your drawing with propertiesmatching specific search criteria. Initially you will be asked to select the street light com-ponent whose data you wish to search. You may for example wish to find luminaires of a

- 111 -
specific lamp type or columns with a specific foundation type. Depending on the com-ponent selected the list from which you can select the property to search is presented(see right). Select a property to search and click OK. You will then be prompted to selectthe required search string which can be all or part of what you expect components inyour drawing to include.
If any components match the search text the number of these will be displayed. The func-tion will zoom to each in turn. Navigate to each matching column using the keyboard asdescribed in 4.4.2 Zoom by Property

- 112 -
4.4.2.3 Zoom to Column number from list

- 113 -
This dialog provides a way to identify specific columns on your drawing by the columnidentity number. The function first scans the drawing for all columns and will displaythese in a list (as shown to the right). Unnumbered columns are listed as ‘Not set’. Thiscan be useful in its own right to identify columns that have yet to be numbered.
To zoom to a specific column simply select its number in the list. If you wish to reviewsuccessive columns in the list you can simply click the ‘Next Column >>’ button (this willreturn to the top of the list in a cycle).
You can set the screen height to determine how large the symbols are once the functionhas zoomed. The value is set in drawing units and the smaller this is the closer thezoom.

- 114 -
4.4.2.4 Zoom Property from List
The final function in this set provides a way to identify specific columns on your drawingwith properties matching specific search criteria as that covered in 4.4.2.1 Zoom toColumn (number search). However, any matching symbols are presented in a list aswith the function covered above in 4.4.2.3 Zoom to Column number from list.
The function identifies the information held in a specific property in the symbols in yourdrawing. Initially you will be asked to select the street light component whose data youwish to search. You may for example wish to find luminaires of a specific lamp type orcolumns with a specific foundation type. Depending on the component selected, a list ofrelevant properties is presented. Select a property to search and click OK.
- 115 -
The function scans the drawing for all of the selected component and displays these in alist (as shown to the right). If the property is blank for any specific item the text ‘Not set’ isshown.
To zoom to a specific column simply select its number in the list. If you wish to reviewsuccessive columns in the list you can simply click the ‘Next Column >>’ button (this willreturn to the top of the list in a cycle).
You can set the screen height to determine how large the symbols are once the functionhas zoomed. The value is set in drawing units and the smaller this is the closer thezoom.
4.4.3 Symbol Editing
4.4.3.1 Luminaire Switch
RIBBON: ‘KeyLIGHTS → Symbol Utilities → Edit’
This command is provided to allow for a luminaire to be switched on and off. The ‘Is Lit’property cab be set in the Feature Properties dialog, but it may be inconvenient if thereare a number in your drawing that you wish to switch. This command will flip the propertyof selected symbols which can be selected using normal AutoCAD selection methodssuch as by window or
4.4.3.2 Flip Symbols
RIBBON: ‘KeyLIGHTS → Symbol Utilities → Edit’

- 116 -
This routine is used for rotating any selected street light by 180 degrees, simply selectthe column of any street light that you wish to rotate.
4.4.3.3 Change Lighting Symbol
RIBBON: ‘KeyLIGHTS → Symbol Utilities → Edit’
This function provides for the symbol for any component of a street light symbol to bechanged. For example, you may have a number of DTC column that will have their lumin-aires upgraded, with all else being left unchanged. Thus, you could replace the tra-ditionally used green triangle symbol for the luminaire with one that matches the sametype used elsewhere on your drawing.
4.4.3.4 Change Photometric Data
RIBBON: ‘KeyLIGHTS → Symbols → Change Lights’
This function can be used to change the photometry/luminaire type associated with aspecific symbol. After you have selected the luminaire you wish to change, the Pho-tometric Data Selector dialog, as shown in Figure 1.4 Photometric Data Selector, is

- 117 -
presented. When you have found the luminaire you require, select it and click the buttonlabelled ‘Select’.

- 118 -
Chapter 5 - Lighting Calculations
RIBBON: ‘KeyLIGHTS → Lighting Calculations’
If you have used KeyLIGHTS before version 6 you will most likely have used LightingReality to calculate illuminance values. There is no need for this from version 6 onwardsas KeyLIGHTS now includes its own Light Calculation Engine (LCE).
The roundtrip method is still available should you wish to use Lighting Reality (LR). Thisprocess automates the passing of data to and from LR.
Figure 5.1 Polygonal Grids with Masks

- 119 -
5.1 Obtaining Light Calculations – Calculation Grids
For those who have used versions of KeyLIGHTS prior to the current one (v5 and earlier)it should be noted that lighting grids have been significantly updated. The grid originpoint, the extents and the light level summary have been combined into a single objectand can easily be manipulated until you are satisfied that they will meet your require-ments using grip editing methods and its properties.
Grids can be defined as rectangular or polygonal areas, and calculated values along apolyline can also be obtained.

- 120 -
Once the lighting grid (or linear calculation) extents have been defined, these can beused to obtain light levels. See 5.3 Lighting Calculations Using Lighting Reality.
5.1.1 Create Rectangular Grid
RIBBON: ‘KeyLIGHTS → Lighting Calculations → Lighting Grids’
The CREATEGRID command is used to create rectangular, polygonal and linear cal-culations. In the example command sequence below, the ‘r’ (for rectangular) option wasselected. The position selected for the grid origin point (GOP) is used for the lower leftcorner of the rectangular grid.
Example command sequence:
Command: CreateGrid ↵
Pick suitable construction method [Rectangular array of point-
s/points inside a closed Polyline/points along a polyLine]
<points inside a closed Polyline>: R ↵
Choose GOP position[origin point selected on-screen]
Choose grid rotation <0.0°>:[grid rotation indicated on-
screen]
Choose relevant option [by distance (then Points) along and
across the grid/by Distance (then spacing) along and across
the grid/by Spacing between points] <by distance (then Points)
along and across the grid>: P ↵

- 121 -
Select the width of the grid (x distance) <75.000>[distance
indicated on-screen]
Select the height of the grid (y distance) <75.000>[distance
indicated on-screen]
Enter the number of calculation points in the X direction
<30>: ↵
Enter the number of calculation points in the Y direction
<50>: ↵
Choose the summary position[position for summary selected on-
screen]
Command:
Three methods are offered for the definition of the extents of the grid:
l by distance (then Points) along and across the gridl by Distance (then spacing) along and across the gridl by Spacing between points
For the first, the grid is defined by selecting its size on-screen by reference to the rubberband line from the GOP to the point selected, both for its width and height. Following thatyou enter the number of calculation points you wish to see.
Note
even if you are going to view the light levels as contours, the number of pointsentered will affect the smoothness of these – a higher number of points will givesmoother contours.

- 122 -
For the second option, the grid is also defined by selecting its size on-screen by ref-erence to the rubber band line from the GOP to the point selected, both for its width andheight. The number of points is then defined by reference to the distance these are to bespaced. This leaves KeyLIGHTS to calculate the number of points that will fit in the grid.
For the third option, the grid size is defined by a combination of the spacing you requirebetween points, and the number of points, in each direction.
If you wish to change the number of grid points later on, or to increase or decrease thespacing between them, this can be set in the Feature Properties dialog. Double-clickingthe grid will bring up the Feature Properties dialog, in which this and various other set-tings can be selected. Also, once created, the grid’s size and rotation can be editedusing grip editing methods. To do this, select the grid and this will reveal a red rotationgrip on the x-axis and two pale blue re-sizing grips.
The default grid draw mode – contours, light levels etc. – can be set in theLIGHTSOPTIONS dialog (see Figure 1.1 Lighting Calculation Options for more inform-ation).
Figure 5.2 Rectangular Lighting Grid – grip editing

- 123 -
5.1.2 Create Polygonal Grid
RIBBON: ‘KeyLIGHTS → Lighting Calculations → Lighting Grids’
In combination with masked areas, polygonal grids can be used to ensure the light levelcalculations shown in the summary only reflect the light falling on the area of interestsuch as the roadway. See Figure 1.1 Polygonal Grids with Masks for an exampleshowing the use of a polygonal grid. Polygonal grids are based on selecting an existing,closed polyline in your drawing. So, to start, use the AutoCAD PLINE command to cre-ate the polygonal shape in which a calculation grid will be fitted.
Note
This should be closed. If the polyline includes arc segments, KeyLIGHTS willreplace these in the polygonal grid, with short straight segments.

- 124 -
The CREATEGRID command is used to create rectangular, polygonal and linear cal-culations. In the example command sequence below, the ‘p’ (for polygonal) option wasselected.
Example command sequence:
Command: CreateGrid ↵
Pick suitable construction method [Rectangular array of point-
s/points inside a closed Polyline/points along a polyLine]
<points inside a closed Polyline>: P ↵
Pick a closed polyline[closed polyline selected on-screen]
Select preferred fitting option [X axis aligned/Minimum bound-
ing rectangle (best fit)/Orthogonal to x axis] <Minimum bound-
ing rectangle (best fit)>: X ↵
Choose relevant option [by number of Points along and across
the grid/by Spacing between points] <by number of Points along
and across the grid>: P ↵
Enter the number of calculation points in the X direction
<50>: 30 ↵
Enter the number of calculation points in the Y direction
<50>: 50 ↵
Choose the summary position[position for summary selected on-
screen]
Command:

- 125 -
See Figure 1.1 Polygonal Grids with Masks for an example of a polygonal grid, with asingle masked area.
Note
For polygonal and linear calculations, the contour mode is disabled.
5.1.3 Create Linear ‘Grid’
RIBBON: ‘KeyLIGHTS → Lighting Calculations → Lighting Grids’
The CREATEGRID command is used to create rectangular, polygonal and linear cal-culations. In the example command sequence below, the ‘l’ (for linear) option was selec-ted.
Example command sequence:
Command: CreateGrid
Pick suitable construction method [Rectangular array of point-
s/points inside a closed Polyline/points along a polyLine]
<points inside a closed Polyline>: L ↵
Pick a polyline[polyline selected on-screen]

- 126 -
Select preferred fitting option [X axis aligned/Minimum bound-
ing rectangle (best fit)/Orthogonal to x axis] <X axis
aligned>: X ↵
Choose relevant option [by number of Points along the poly-
line/by Spacing between points] <by number of Points along the
polyline>: S ↵
Enter the spacing between points along the polyline <2>: ↵
Choose the summary position[position for summary selected on-
screen]
Command:
Linear calculations are often required, for example, to ensure that light falling on propertyfrontages do not go above a certain threshold so that first floor rooms to not receiveunwanted light. By default, the calculated values will be the illuminance levels falling onthe road – at a zero elevation to the luminaire heights. If you wish to determine the lightlevels at different elevations, you can set the elevation offset for the linear grid accord-ingly. Figure 5.3 Setting the Elevation of Linear Calculations shows the feature prop-erties for the grid (with a filter ‘elev’ used) to show a setting of 3m for the lightcalculations.
Figure 5.3 Setting the Elevation of Linear Calculations

- 127 -
Note
For polygonal and linear calculations, the contour mode is disabled.
5.1.4 Add Mask to Grid
RIBBON: ‘KeyLIGHTS → Lighting Calculations → Lighting Grids
This command is used to create polygonal masks for any grid, rectangular, polygonal orlinear. Masked areas can be drawn using the command or, if you have an existingclosed polyline representing the area you wish to mask, selected.
Once a grid includes a mask, there are various options as to what KeyLIGHTS does withthese (see Figure 5.4 Grid Mask Options). If you have a mask inside another mask, the‘Masking Mode’ will be important. This works like the AutoCAD hatching property, amask inside a mask switches the calculation back on, and so on for each island insideothers.
Figure 5.4 Grid Mask Options

- 128 -
If you wish to remove a mask you can click the button ‘Delete’ as shown in the figureabove. Since masks are not explicitly named, to may need to deactivate a mask to checkthat you aren’t going to delete the wrong one. The number of vertices shown may helpyou determine which numbered mask is which.
The light summary reflects only the values that are not masked. If a mask is deactivated,the summary will include values within each deactivated masked area.
5.1.4.1 Even-Odd / Non-zero Rule Modes
A specification for the’Even-Odd’ rule, from Scalable Vector Graphics (SVG) states:
This rule determines the "insideness" of a point on the canvas by drawing a ray from thatpoint to infinity in any direction and counting the number of path segments from the givenshape that the ray crosses. If this number is odd, the point is inside; if even, the point isoutside.
Unlike the nonzero-rule algorithm, the even-odd mode will alternatively produce light val-ues or not within successive masks defined by nested closed paths irrespective of theirwinding (containing or overlapping).
In Figure 5.5 Mask Modes below, the image on the left shows the even-odd rule, and onthe right the non-zero rule.
Figure 5.5 Mask Modes

- 129 -
For most applications you should draw the mask polylines as non-overlapping areas. Inthis event the choice of mode will have no effect, it controls what happens when areasoverlap. Normally you can leave the mode set to its default even-odd.
5.1.5 Lighting Display Grid Properties
RIBBON: ‘KeyLIGHTS → Lighting Calculations → Grid Properties’
Once a light level calculation has been performed and light levels obtained, various prop-erties of each grid can be changed, often without the need for the calculations to beredone. For example, the switch from light levels to contours is based on selecting the

- 130 -
required display for the light levels, the colour palette, value cut-offs, number and spa-cing of levels can all be changed to affect the display of levels.
To access the properties of the grid, simply double-click on any part of the grid object,including for example the light level summary or GOP, or use the KEYPROPERTIEScommand.
Most of the properties of a lighting grid will be self-explanatory. The property ‘Is Selec-tion Set Locked’ can be used to ensure that the luminaires included in the grid arelocked and so you won’t need to specify them every time you wish to update the lightlevels. If you need to add further luminaires you can un-tick this property and will there-fore be given to add (or remove) luminaires from the grid calculations. If a luminaire isadded within a grid, this property is automatically un-ticked.
Figure 5.6 Grid Properties - general

- 131 -
5.1.6 Palette
The palette of colours used to display light levels or contours can easily be configured.You may have specific ranges in mind, or even have saved ‘.COL’ files from a previousversion of KeyLIGHTS. These can be imported.

- 132 -
Otherwise, it is quite straightforward to create your own palette, and ones with an evenspread of values can also be generated.
Note
The count of bands will normally be an odd number so that values from 0 to n canbe included. Two gradients are offered, Hot to cold and Yellow to Black.
Note
The lightest yellow is used for the higher light levels, darker colours closer to blackfor low light levels. This is helpful when working in the AutoCAD environment witha black background but will be less satisfactory for plotting (on white paper).
See section 5.3.3.2 for more information about how to configure the palette for a specificgrid.
Figure 5.7 Lighting Calculation Options
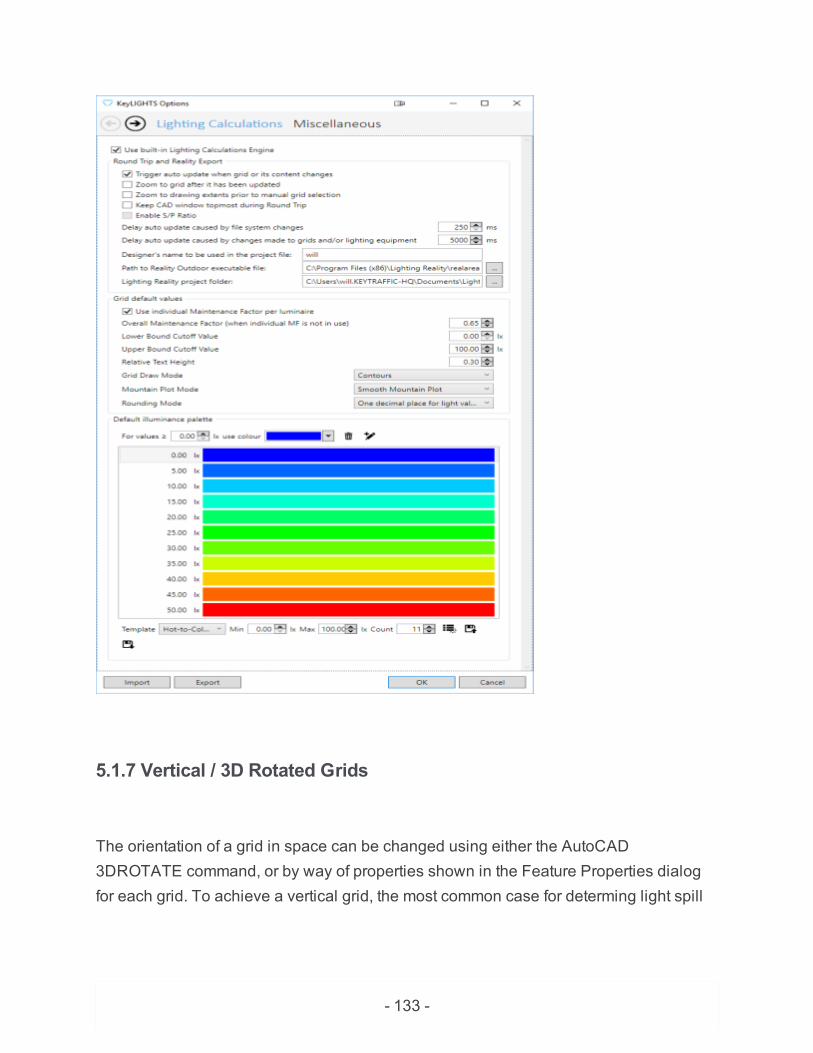
- 133 -
5.1.7 Vertical / 3D Rotated Grids
The orientation of a grid in space can be changed using either the AutoCAD3DROTATE command, or by way of properties shown in the Feature Properties dialogfor each grid. To achieve a vertical grid, the most common case for determing light spill

- 134 -
onto adjacent properties, it is a simple case of rotating your grid by 90 degrees in the 'x'axis of the grid.
Figure 5.8 3D Transformation Control
It can be seen form the figure above that it is possible to set a rotation in any axis, abouteither the base (GOP) point of the grid or the middle. Feedback is given by way of the 3DRotate gizmo, which should help you achieve a desired outcome. In the figure a flat grid,

- 135 -
defined coplanar with the x and y axes, has been 'stood up' to the vertical by setting theX-Axis rotation to 90.0 degrees.
Note
the normal used for the calculated values is perpendicular to the plane of the grid.This gives vertical illuminance if the grid is vertical. The formula stated in BS EN13201-3:2015 in section 7.2.5 is therefore not required as the method employed byKeyLIGHTS is a mathematically equivalent formula.
Figure 5.9 A vertical grid shown over a flat grid

- 136 -
5.2 Calculating Illuminance
RIBBON: ‘KeyLIGHTS → Lighting Calculations → Illuminance’

- 137 -
KeyLIGHTS includes the capability to calculate illuminance levels. If you wish to useLighting Reality for your roundtrips you will first need to switch of the in-built Lighting Cal-culation Engine (LCE). This can be done using the system variable LCEMODE, or byunticking the ‘Use built-in Lighting Calculation Engine’ option in the Lighting Cal-culations Options dialog shown at Figure 5.10 Lighting Calculation Options.
The same icons, shown above, are used to select grid object(s) for calculations, whetheryou are using the LCE or Lighting Reality. The first of these is used to update auto-matically all grids in the current drawing. The selection or modification of luminaires tobe included for each grid cannot be made. The second icon is used to update selectedgrids.
So that the process of calculating light levels can proceed in an automated way, forexample after a luminaire is rotated or relocated, the selection of luminaires for each gridis retained. If you wish to revise the selection, perhaps to include a new street light thatwas not previously selected, you will need to switch off the selection ‘locking’.
If you add additional luminaires within the area of any grid, to ensure that you have theopportunity to modify the luminaire selection when you run the calculation again, you willneed to ensure the box labelled ‘Is Selection Set Locked’ in the properties/options dialogfor your grid is un-ticked. This property is shown in Figure 1.5 Grid Properties -general. If a luminaire is added within a grid, this property is automatically un-ticked.
5.2.1 Luminaire Selection
In most situations, the automated selection of luminaires will be suitable for your lightlevel calculations. It is possible during the calculation process to add or remove lumin-aires from the calculations. In addition, if the ‘Is lit’ property of any luminaire is set to

- 138 -
false, the luminaire will have no influence on light levels in any grid. To ensure you areprompted to change the luminaires selected for any grid, you will need to un-tick the ‘Isselection set locked’ property of a grid. See 5.1.5 Lighting Display Grid Properties formore information.
5.2.2 Modifying Luminaires
If the light level summary shows values that are not suitable, you may wish to modify theincluded luminaires. This could be by simply repositioning column or changing the rota-tion. see and changing photometry in section 4.4.3.4 . When symbols are edited the cal-culated illuminance levels are automatically updated. If you are using Lighting Reality forthis, the process takes a little longer and can be cancelled if required.
5.2.3 Lighting Calculation Options
RIBBON: ‘KeyLIGHTS → Lighting Calculation → Options’
This command brings up the dialog shown in Figure 5.10 Lighting CalculationOptions.
Figure 5.10 Lighting Calculation Options

- 139 -
If you wish to use Lighting Reality for your light level calculations, un-tick the box,labelled ‘Use built-in Lighting Calculation Engine’, at the top of this dialog. When thisoption is not selected the Lighting Reality options can be edited as you require.

- 140 -
The settings and choices you make can be saved to file so that this doesn’t have to becarried out on an individual basis on all PCs. It is also possible for you to save multiple‘set-ups’ in this way that can easily be imported as required.
5.2.3.1 Roundtrip and Reality Export
When the option to use the guilt-in, KeyLIGHTS Lighting Calculations Engine is notselected, the following options affect how KeyLIGHTS interacts with Lighting Reality(LR):
Trigger auto updatewhen grid or its con-tents change
If a change occurs that requires the light levels to be re-cal-culated, this option allows for the update to happen auto-matically, in the background.
Zoom to grid after ithas been updated
KeyLIGHTS will zoom to the extents of a grid after the cal-culations have been completed.
Zoom to drawingextents prior tomanual grid selec-tion
When using the command to manually select which gridsshould be updated, the function will zoom to the extents of thedrawing/grids to aid with grid selection.
Keep CAD windowtopmost duringRound Trip
If selected, this ensures that the LR window doesn’t pop up infront of AutoCAD.
Enable S/P Ratio If selected, the calculations can take into account the Scotop-ic/Photopic Ratios (this function is not implemented in yourinstallation if the option is greyed out).
Delay auto updatecaused by file sys-tem changes
After exporting a file to LR, if this is used in LR and the designaltered and re-saved. KeyLIGHTS will let you know and givethe opportunity, after the delay set in this option, if you want it toread the changes back into the KeyLIGHTS drawing.
Delay auto updatecaused by changesmade to gridsand/or lighting
If an update is triggered you can set a delay before this hap-pens. This allows for further editing for example you may moveand then want immediately to rotate a column before the levelsare re-calculated.
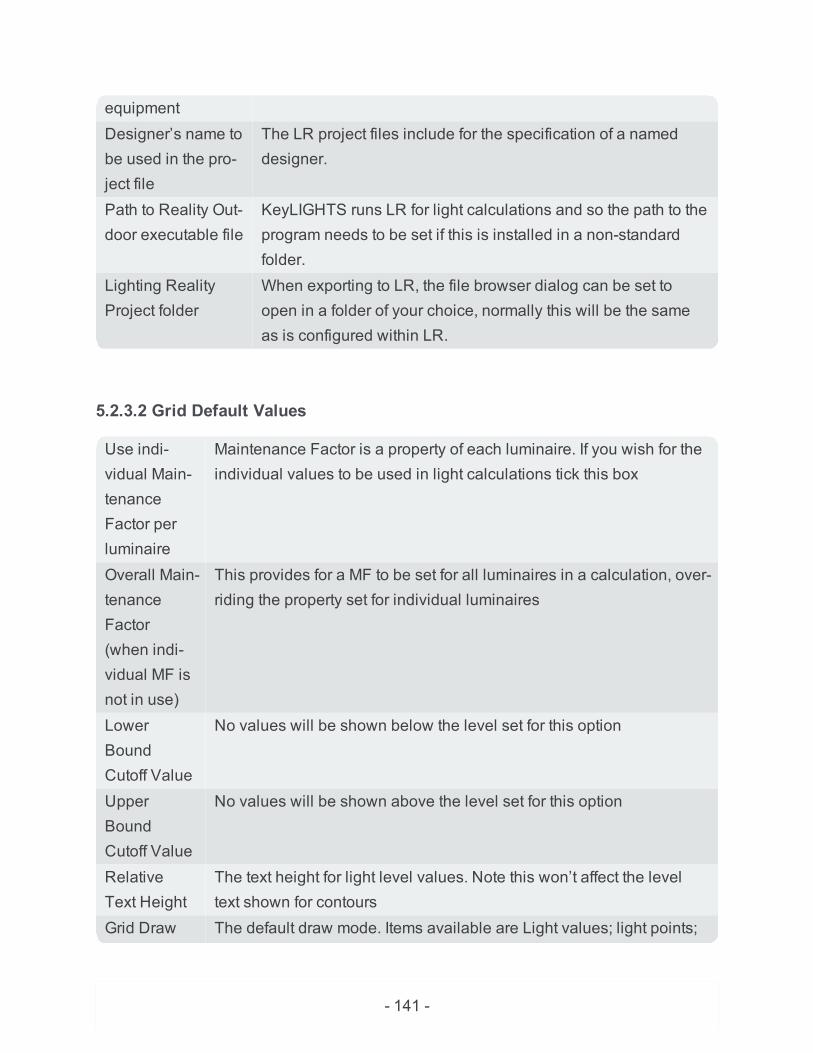
- 141 -
equipmentDesigner’s name tobe used in the pro-ject file
The LR project files include for the specification of a nameddesigner.
Path to Reality Out-door executable file
KeyLIGHTS runs LR for light calculations and so the path to theprogram needs to be set if this is installed in a non-standardfolder.
Lighting RealityProject folder
When exporting to LR, the file browser dialog can be set toopen in a folder of your choice, normally this will be the sameas is configured within LR.
5.2.3.2 Grid Default Values
Use indi-vidual Main-tenanceFactor perluminaire
Maintenance Factor is a property of each luminaire. If you wish for theindividual values to be used in light calculations tick this box
Overall Main-tenanceFactor(when indi-vidual MF isnot in use)
This provides for a MF to be set for all luminaires in a calculation, over-riding the property set for individual luminaires
LowerBoundCutoff Value
No values will be shown below the level set for this option
UpperBoundCutoff Value
No values will be shown above the level set for this option
RelativeText Height
The text height for light level values. Note this won’t affect the leveltext shown for contours
Grid Draw The default draw mode. Items available are Light values; light points;

- 142 -
Mode light values and points and contours. An option to have no display isalso given.
MountainPlot Mode
Light levels can be given a ‘z’ value dependent on their value. Thisgives the impression in a 3D view of peaks and valleys where lightlevels are high and low. Options for the mountain plot are Flat moun-tain plot and smooth mountain plot. Each grid includes a property thatis used for this, labelled ‘Value multiplier for light point ‘z’ height’.
RoundingMode
When light values are shown, these can be displayed to an appro-priate number of decimal places. Options available for this are onedecimal place for light values, two for the summary values; or Complywith EN 13201-3 rounding.
5.2.3.3 Default Illuminance Palette
The lower half of the Lighting Calculation Options dialog provides for you to configurethe palette that will be applied to all new grids. This is covered in detail in section 5.4.1Palette, and shown in Figure 5.11 KeyLIGHTS Lighting Calculation Options –Default Illuminance Palette
Figure 5.11 KeyLIGHTS Lighting Calculation Options – Default Illuminance Palette

- 143 -
5.2.3.4 Miscellaneous
Figure 5.12 Lighting Calculation Options - Miscellaneous

- 144 -
5.2.3.5 Database
KeyLIGHTS stores the pre-set street lights, cables and ducts and other settings in a data-base file. By default, this is stored locally, however its location can be configured to suityour organisation. Use the ‘Path to local database’ option set this as required. You cantype the path and filename or browse to it using the ‘…’ button.
Depending on how often pre-set symbols, cables and ducts are edited, or the databaseadded to, you may find the size of the database increases disproportionately. In any

- 145 -
case, if you wish to send the file to a colleague, you may find it necessary to reduce itssize so that it can be attached to an email. Use the button labelled ‘Compact database’to remove unwanted temporary space in the database.
Since for many, the pre-sets they create will reside solely on their own PC, and in draw-ings created using these, it is possible to receive a drawing that uses pre-sets, for whichspecific photometry has been defined, that are not currently stored in the local database.If you wish to include any symbols found in a drawing, and thereby make available thephotometry defined with them, you can create new symbols from the Lights Manager.See 1.1 Building Symbols – The Lights Manager for more information about this.Alternatively, select the type of file that is stored in the drawing you would likeKeyLIGHTS to add by clicking to ‘Scan the current drawing…’.
5.2.3.6 Design Status and its Colour
Different designers may have their own preferences for the colours used to indicate thestatus of each street light component. The default colours for example used for proposedstreet lights and red for existing. See Figure 5.12 Lighting Calculation Options - Mis-cellaneous for other default colours.
Note
This may not affect existing symbols until the drawing is saved, closed and re-opened.
5.2.3.1 General Options
The General options, as shown in Figure 5.12 Lighting Calculation Options - Mis-cellaneous affect the way that KeyLIGHTS works as follows:

- 146 -
DisplayConnectorText
If selected, labels for each type of plug/socket connector will be shown.This can improve your confidence when dragging and dropping itemssuch as a cable onto a load or supply.
ShowRolloverTooltips
If selected, a tooltip showing key information about luminaires will beshown when you move your mouse over one.
EnablePageTransitionEffect
If selected, animation will be enabled when switching between pages indialogs
5.3 Lighting Calculations Using Lighting Reality
Lighting Calculation using Lighting Reality (LR) are performed by way of a backgroundfile transfer if the option set in the Lighting Calculations Options dialog is not selected touse KeyLIGHTS in-built light calculation engine. This ‘roundtrip’ method creates a LRproject file in the background and the results are passed back to KeyLIGHTS when theprocess is complete.
Alternatively, you may prefer to export the LR project file and open this in LR to performchanges as required such as to apply masking, and then import the saved file back intoKeyLIGHTS.
5.3.1 Export to Lighting Reality
RIBBON: ‘KeyLIGHTS → Lighting Reality → Export / Import’

- 147 -
This function is provided so that you can create a LR project file. For some this is a defacto data transfer format, but of course you can also open the file in LR if further editingis required. The command requires you to select grid(s) and luminaire(s) to include in theLR RAA project file.
Note
If you save the file in LR, in other words so that its ‘date modified’ propertybecomes later than when the file was created by KeyLIGHTS, during the samedrawing session, KeyLIGHTS will detect this and automatically offer the option toimport the edited file and any saved results. YOU MUST ALSO SAVE THE LIGHTLEVEL RESULTS IN LR FOR THIS PROCESS TO COMPLETESUCCESFULLY.
5.3.2 Importing from Lighting Reality
RIBBON: ‘KeyLIGHTS → Lighting Reality → Export / Import’
This function is not normally needed if you are exporting a LR project file, modifying thedesign in LR, saving the results and re-saving the RAA project file. In that case, asdescribed in the previous section, KeyLIGHTS will detect that the file has been updatedand will offer to import the newly saved file and results.
If AutoCAD is closed down this link to the file is lost so you will need to initiate the Importfrom LR routine, select the file, and remake the association. The results and new pos-itions of street lights, if any, will be shown in your drawing.

- 148 -

- 149 -
Chapter 6 - KeyLIGHTS Tools
This section explains, in detail, the different commands available in the KeyLIGHTSTools Ribbon, see Figure 6.1 KeyLIGHTS Tools Ribbon menu.
Figure 6.1 KeyLIGHTS Tools Ribbon menu
All the configuration and settings tools can be accessed from the KeyLIGHTS Tools Rib-bon tab. All the tools are covered in this chapter.
6.1 Keys
KeyLIGHTS provides a number of tabulations for the symbols on your drawing. Underthe banner of ‘keys’ these can also give you quantities (numbers) of columns and dis-tances between columns.
6.1.1 Autokey
RIBBON: ‘KeyLIGHTS Tools → Keys and Labelling → Keys’

- 150 -
This initiates a routine which will examine the contents of a drawing and print into thedrawing one of each symbol used together with a key describing the salient featuresrelated to that type of symbol. Further, the routine will also calculate the number of thosesymbols within the drawing, so this routine is also used to give information for a Bill ofQuantities. An option exists to have the descriptive information on one or two lines oftext.
Figure 6.2 Example AutoKey
6.1.2 Individual and Summed Custom Keys
RIBBON: ‘KeyLIGHTS Tools → Keys and Labelling → Keys’
&
Additional to the AutoKey function described above, is a function that provides for you tospecify which properties are used when KeyLIGHTS generates a report on the columnsin your drawing. Any number of such configuration files can be set up with differentformats, fields and layouts. This function comes in two forms, providing for details ofevery column to be tabulated (individual), or just the number of each similar column(summed).

- 151 -
The ‘individual’ custom key will be useful for example, when numbered columns and loc-ation information is required, whereas the ‘summed’ key is useful for exact numbers ofeach column is needed. Redundant information is not used – for example, the number ofcolumns of each type is not reported when individual output is required, and column num-bers are not reported when a summation is specified (even when these fields are still inthe active area of the dialog box).
You can choose to produce a key for the entire drawing (Global option), for just chosencolumns (Selective option) or columns within an area of a pre-drawn (straight-segment)polygon on the drawing (Polygon option)
6.1.3 Customising the Individual and Summed Custom Keys
RIBBON: ‘KeyLIGHTS Tools → Keys and Labelling → Keys’
The dialog shown in Figure 6.3 Customising the Summed and Individual Keys givesyou control over which fields are tabulated. When a field is selected it can be moved upor down, this being reflected in the order the fields are presented in the tabulation. Amarker line in the dialog denotes the break between active and inactive fields, with thefields above this marker will be included in the tabulation, those below ignored.
You can alter the width the report allows for the selected field, and the heading used forthat field of the table. You will note when using this command that the customisation isstored in a file. This allows for you to share the customisation with colleagues easily.
Figure 6.3 Customising the Summed and Individual Keys

- 152 -
6.2 Tabulate Symbols
RIBBON: ‘KeyLIGHTS Tools → Keys and Labelling → Keys’

- 153 -
This command can be used to create a table of columns which shows the column num-ber, easting and northing, and the rotation of the first bracket. This command is not linkedto the drawing so if any information is changed, for example additional columns areadded or moved, or their rotation changed, you will need to run the command again.
Note
The number of decimal places is controlled by the AutoCAD LUPREC (linear unitprecision) and AUPREC (angular unit precision) system variables.
Figure 6.4 Example Column Tabulation

- 154 -
6.3 Distances Table
RIBBON: ‘KeyLIGHTS Tools → Keys and Labelling → Keys’
This command can be used to create a table of columns which shows the column num-ber and the distance between each column. Whilst the command provides for automaticselection of column symbols, you are most likely going to want to select each column inturn to ensure the order is controlled, unless your numbering sequence exactly matchesthe closest distance between consecutive columns.
Figure 6.5 Example Column Distances Tabulation

- 155 -
6.4 Labelling
KeyLIGHTS offers extensive capabilities to label items in a drawing almost auto-matically, whilst retaining maximum flexibility for the user. The label objects created caneasily be edited using grips, once selected, or by the double-click command associatedwith the label object.
6.4.1 Textual Annotation
RIBBON: ‘KeyLIGHTS Tools → Keys and Labelling → Labels’
This is a general label function that can be used on any Keysoft Solutions’ Framework orAutoCAD object. Due to the differences in the way that KeyLIGHTS provides lightingsymbols, by way of a configuration manager, you will find that the label is very generic,for example a lighting column is simply labelled ‘Lighting Column’. You are likely tomake better use of the Data Annotation label, covered below. Please note, however, thatthis textual annotation still provides a ready way to label any object in your drawing asany text can be entered if the automatically generated text is not sufficient.

- 156 -
Figure 6.6 Label Properties – Adding your own text
The dialog for editing the label, accessed through the double-click, is shown in Figure6.6 Label Properties – Adding your own text. Any custom text can be added for thelabel in the field ‘Feature Text’. The Sub Feature text is automatically generated and can-not be changed, but you can opt for it not to be included by selecting ‘No’ for the ‘IncludeSub Feature Info’ option.
6.4.2 Data Annotation
RIBBON: ‘KeyLIGHTS Tools → Keys and Labelling → Labels’
The Data Annotation is a more powerful and flexible label. It is also used for example, tolabel HPC information calculated for cables. The text for the label comes, by default,

- 157 -
from the default name (for example ‘Lighting Column’), but can also be dynamically gen-erated from any data field.
In the Feature Properties dialog, a list is available to configure the text that will be usedfor the data label. Options are ‘No (just use default name)’; ‘Yes (use default name + cus-tom descriptor’; and ‘Yes (use custom descriptor only)’.
When setting the text to be used, this can be a mixture of free text and the contents of adata field. In the example shown in Figure 6.7 Customising the Data Label Text, thetext ‘Cat. No.’ will be used as a prefix for the label text, and the rest dynamically gen-erated from the ‘Catalogue number’ field. To access the list of internal field names, typea double curly bracket. As you begin to type the letters of the field, the list presented isfiltered. When you see the one you wish to use, click on it with your mouse.
Figure 6.7 Customising the Data Label Text
Note
Any existing labels will need to be re-created for any change to the customdescriptor to be reflected in the labels.

- 158 -
6.4.3 Simple Symbol Label
RIBBON: ‘KeyLIGHTS Tools → Keys and Labelling → Labels’
This command produces a ‘legacy’ style label comprising of AutoCAD text and lineobjects. It first queries the drawing so can take a few moments to start. Options are givenabout the selection of columns to label and whether you wish for the labels to be createdautomatically (or with manual placement). Optionally, you can also decide whether toinclude the label in a box.
6.4.4 Editing Labels
Except for the ‘Simple Symbol Label’, double-clicking a label will open a properties dia-log for the label, as shown in Figure 6.6 Label Properties – Adding your own text.This will not only allow you to change the text that is used with that label, but alsochange many settings used to create the label. Any changes made here are just indi-vidually altered for that one label in the drawing.
6.4.5 Moving and Erasing Labels
No special task is necessary as the normal AutoCAD move and erase will work fine withthese labels. It is also possible to adjust the leader and label position using the bluegrips when the label is highlighted.
6.4.6 Labelling Descriptions and Options
RIBBON: ‘KeyLIGHTS Tools → Program→ KeyLIGHTS Options’

- 159 -
Every street feature in KeyLIGHTS has a label description, which can be accessed viathe main KeyLIGHTS Program Options dialog.
In addition, when adding a label, KeyLIGHTS uses several settings which can be con-figured by the user. Each of these may be adjusted via the ‘Label Options’ tab in theKeyLIGHTS ‘Settings and Options’ dialog, and can be saved either for immediate use byclicking ‘Set Current’, or ‘Save Settings’ whereby the options remain persistent acrosssessions, for the current user.
Figure 6.8 Customising the Label Descriptions

- 160 -
There are many settings available to accommodate most users’ requirement for labels:
1. Text height – the height of the text font used for the labels;2. Maximum Text Line Width – the size of the paragraph used for the text;3. Include the line width when a road marking is labelled;4. Mtext label to be left or right justified inside the paragraph limits;5. The whole text label to be right or left justified to the pick point, or automatically set
by the direction of the leader line;6. Draw a box around the label;7. Set the box line width;

- 161 -
8. Set the distance from text to box (padding);9. Draw an arrowhead on the leader line;10. Set the arrowhead size;11. Colour used when creating the layer for the label.
There are further options for the quick label included here too:
12. Add “Diag’ (or other prefix) to the beginning of the quick label item;13. Colour of layer for quick labels;14. Size of text used.
Figure 6.9 Customising the Label Options

- 162 -
6.4.7 XY - Columns
RIBBON: ‘KeyLIGHTS Tools → Keys and Labelling → Labels’
This command allows you to select a street light column to create a label of the eastingand northing of the column.

- 163 -
Note
The number of decimal places is controlled by the AutoCAD LUPREC (linear unitprecision) system variable.
6.4.8 XY @ Point
RIBBON: ‘KeyLIGHTS Tools → Keys and Labelling → Labels’
This command allows you to select a point on the screen to create a label of the eastingand northing of the column.
Note
The number of decimal places is controlled by the AutoCAD LUPREC (linear unitprecision) system variable.
6.5 Mayrise Links
RIBBON: ‘KeyLIGHTS Tools → Mayrise → Mayrise Link’
& & &
- 164 -
The Mayrise drop-down provides a range of functions that can be used to create sym-bols in your drawing for existing columns as stored in a Mayrise database. The symbolsplotted are AutoCAD blocks. These can be updated with KeyLIGHTS symbol asrequired. Please note this can take some time.
The four commands provide the following function:
1. Plot units (street lights) in view2. Plot units in the drawing extents3. Plot all units4. Zoom to units extents
6.5.1 Plot Units In View
This function is used to plot only the units that are in the current view. This is normallyrecommended due to performance. The function will plot street lights, bollards, signs,and traffic signals form the Mayrise database, each being given its own symbol.
Note
The Mayrise database doesn’t hold rotation information so the symbol is effectivelyjust a blob and only indicative of the column location.
6.5.2 Plot Units In The Drawing Extents
This function is used to plot only the units that are in the extents of the drawing. It isidentical in other respects to the previous command.

- 165 -
6.5.3 Plot All Units
This function is used to plot all the units that are in the Mayrise database. This is not nor-mally recommended due to performance. If you require this it is advisable to run the com-mand when you are able to leave it running.
6.5.4 Zoom to Units Extents
This function queries the Mayrise database to find the shrink-to-fit extents of all units inthe Mayrise database. It will perform a zoom to show those extents and draw a rectangleindicating these.
6.6 Convert Mayrise Symbols
RIBBON: ‘KeyLIGHTS Tools → Mayrise → Mayrise Link’
This function is provided to convert the simple, Mayrise symbols (AutoCAD block) toKeyLIGHTS symbols.
Note
Depending on the number of these to be converted, the command may take sometime.

- 166 -
6.7 Driver’s Eye Views
The Driver’s Eye views are covered in detail in Chapter 8 – Viewing In 3D: Driver’s EyeViews.
6.8 Measuring Tools
Using the KeyLIGHTS Tools Ribbon the Measuring options can be selected from theMeasuring Tools drop-down as show in Figure 6.10 Measure tools drop-down fromUtility panel. The Measuring Tools drop-down contains several functions which can beused to ensure you place your columns at specific, measured points in your drawing.
Figure 6.10 Measure tools drop-down from Utility panel

- 167 -
The options available from the Measuring Tools Menu and Ribbon drop-down are:
6.8.1 Measure distances Simplest tool to measure distances
6.8.2 Base & Point distances Measurement from an anchor to any other point
6.8.3 Moving rule Measure between successive points
6.8.4 Mark fixed distance Measure between a fixed distance

- 168 -
6.8.5 Repeat fixed distance Repeat Fixed Distance measurement
6.8.6 Divide between points Divides distance into equal points
6.8.7 Multiple splits A given division can be marked at several points
6.8.8 Measure between points Measures between two points
6.8.9 Multiple measures Repeat the measure function
6.8.10 Measure along line Measure an existing line
6.8.11 Clear marks Clears any marks that have been plotted
In addition, polyline break and re-join tools:
6.8.12.1 Adjust Lines - Measure and Break Polyline
6.8.12.2 Adjust Lines - Break Polyline
6.8.12.3 Adjust Lines - Re-Join Polyline
6.8.1 Measure distances
RIBBON: ‘Measurement → Measure Distances’
The simplest measure tool which reports the distance between two picked points
6.8.2 Base & Point distances
RIBBON: ‘Measurement → Base point distances’

- 169 -
A base point is anchored, whilst measurements to any number of other points are repor-ted
6.8.3 Moving rule
RIBBON: ‘Measurement → Moving rule 1 & Moving rule 2’
and
This option will report distances between successive points, thereby saving the userrepeated picks. This will report on the cumulative distance from the initial point.
6.8.4 Mark fixed distance
RIBBON: ‘Measurement → Mark Fixed Distance’
This will require users to enter a specific fixed distance, then a measurement base point.Another marker will then be seen which marks the required distance, and which can berotated about the insertion point until it aligns with the direction required. A mark is thenput at the target point.

- 170 -
6.8.5 Repeat fixed distance
RIBBON: ‘Measurement → Repeat Fixed Distance’
This again measures a specific fixed distance, a target point from one measurementbecomes the base point for the next measurement.
6.8.6 Divide between points
RIBBON: ‘Measurement → Divide between Points (split)’
The points and split option will request the user for two extremity points, and will dividethe intervening distance into as many equal sections as required.
6.8.7 Multiple splits
RIBBON: ‘Measurement → Multiple Splits’
This will repeat the split function so that a given division (say into 2 for a road centre-line) can be marked at several positions down the length of a road without repeatedlyconfirming the required split.

- 171 -
6.8.8 Measure between points
RIBBON: ‘Measurement → Measure between Points’
This will request the user for two extremity points, and will mark the intervening distanceat specified intervals. This could be useful, for example, in marking the division of a car-riageway width into desired lane widths.
Note
Measurement starts from the first point selected.
6.8.9 Multiple measures
RIBBON: ‘Measurement → Multiple Measures’
This will repeat the measure function so that a road carriageway may be divided intorequired lane widths at several positions down the length of a road without repeatedlyconfirming the required lane width.
Note
Measurement starts from the first point selected.

- 172 -
6.8.10 Measure along line
RIBBON: ‘Measurement → Measure Along Line’
Select a linear object (line, arc ,polyline or spline) and the its length will be displayed onthe command line.
6.8.11 Clear marks
RIBBON: ‘Measurement → Clear marks’
This will remove all the marks inserted by the above tools in one operation.
6.8.12 Polyline Break and Re-join Tools
The following three tools are supplied as an easy alternative to standard AutoCAD func-tionality. They can be found on the Measuring drop-down menu

- 173 -
6.8.12.1 Adjust Lines - Measure and Break Polyline
This tool provides for you to step along a polyline placing a marker at a specified inter-val. This is useful if, for example, you have broken a centre-line, and wish to change to adifferent mark after a specified distance, or wish to mark where arrows would go, say,every 30 metres. The user has the opportunity to step forward or backwards through theintervals, or break the polyline so that separate offset routines can be run with differentoptions.
6.8.12.2 Adjust Lines - Break Polyline
This tool simply (and more easily than standard AutoCAD) breaks the polyline at thechosen point. It places a little marker at the break for identification. This is useful if, forexample, you wished to use only a certain length of kerb-line for offset double yellow orkerb markings.
6.8.12.3 Adjust Lines - Re-Join Polyline
This reverses the procedure of breaking the polylines described above. It simply re-joinsthe polyline, erasing the break marker.
6.9 Groups
Object grouping is in-built AutoCAD functionality providing an easy route for selectingmultiple objects. Objects can be identified as being part of a group and, once set-up, theselection of the objects in the group can be made by selecting just one of the members.This ‘group selectability’ can be toggled on/off as sometimes you may wish to select justone or part of the members of the group. Selectability can be switched back on after oper-ations on one or part of the members.
Figure 6.11 Groups menu

- 174 -
The options available from the Group drop-down menu, which can be found in the Utilitypanel on the KeyLIGHTS Tools Ribbon Panel tab, are:
6.9.1 Toggle Group selection Select items as a group
6.9.2 Create new group Create a new group of objects
6.9.3 Manage groups Manage existing groups in the drawing
6.9.4 Select group Select a group in a drawing
6.9.5 Group membership Find out which group an object is part of
6.9.6 Remove deleted groups Remove unreferenced groups in a drawing
6.9.7 Explode group Explode a group into individual items
6.9.1 Toggle Group selection
RIBBON: ‘Group → Group Selection’
or

- 175 -
When symbols need to be selected as a group, so that they can be moved easily forexample, make sure that this command has been selected. Its status will be reported onthe command line after selection.
When Group Selection is ‘on’ all items that make up a group, such as a stick diagram,balloon or pie chart will be selected.
If you wish to gain access to an individual item within a group make sure that the statusof Group Selection is ‘off’. This will allow access to individual items within a group forediting, for example stick diagram elements.
This option acts as a toggle click to turn on the group selection and click the item to turnoff group selection.
6.9.2 Create new group
RIBBON: ‘Group → Create New Group’
When selected this command will invoke the command to create a new group and thedialog box shown in Figure 6.12 Create group command will be shown.
This dialog allows a name and description to be entered for a new group. In order toselect individual items that make up a group, click on ‘Select Objects <’. To create thegroup click on ‘Create Group’. A group with the selected items in it will be created.

- 176 -
Figure 6.12 Create group command
6.9.3 Manage groups
RIBBON: ‘Groups → Manage Groups’
In order to manage the attributes associated with a group such as name and descriptionuse the Manage Group tool as shown in Figure 6.13 Manage groups dialog. Items canbe added or removed by using the manage groups command.
Figure 6.13 Manage groups dialog

- 177 -
Much of the functionality available in this dialog is the same as can be found, and is welldocumented in the AutoCAD help system, for the CLASSICGROUP command built in toAutoCAD. This command did not appear on any menu for several years, but hasreappeared in recent releases. For this reason we have not fully documented the func-tionality here.
6.9.4 Select group
RIBBON: ‘Group → Select Group’
This allows a pre-defined group within a drawing to be selected.

- 178 -
6.9.5 Group membership
RIBBON: ‘Group → Group Membership’
When selected you are invited to select an existing group within the drawing, once selec-ted the group name is displayed on the command line.
6.9.6 Remove deleted groups
RIBBON: ‘Group → Remove Deleted Groups’
This command will remove any unreferenced groups from a drawing i.e. groups thathave been deleted. If the option to ‘Confirm removal of deleted groups’ is set to ‘Y’ thena dialog asking to confirm the removal of an unreferenced group is shown as in Figure6.14 Confirm Deleted Group.
Figure 6.14 Confirm Deleted Group

- 179 -
6.9.7 Explode group
RIBBON: ‘Group → Explode Group’
To explode a group, select this command, you will be invited to select the group toexplode, once selected the group will be exploded into its constituent parts.
6.10 Background
This small menu of four items can be used to quickly change the drawing background.Whilst you may prefer to work with AutoCAD showing a dark or black backgroundagainst which lights colours such as yellow appear very clear, these may not be visibleas you wish when printed on white paper. For this reason you may prefer to switch thedefault background colour to white or do this just to check your design will print sat-isfactorily.
The commands duplicate the functions within AutoCAD’s Options dialog (Display tab)however the commands listed here are provided to give quick access to the four specificbackground colours.
6.10.1 Black background
RIBBON: ‘View Utils → Black Background’
Selecting this command will change the AutoCAD background to black.

- 180 -
6.10.2 White background
RIBBON: ‘View Utils → White Background’
Selecting this command will change the AutoCAD background to white.
6.10.3 Grey background (light)
RIBBON: ‘View Utils → Grey Background (Light)’
Selecting this command will change the AutoCAD background to a light grey.
6.10.4 Grey background (dark)
RIBBON: ‘View Utils → Grey Background (Dark)’
Selecting this command will change the AutoCAD background to a dark grey.

- 181 -
6.11 Program
Functions, options and settings relating to the working of KeyLIGHTS can be found onthe Program panel of the KeyLIGHTS Tools Ribbon show below in 6.11 Program .
Figure 6.15 Program Panel
The items available from this ribbon panel are:
l Options – Shows the KeyLIGHTS options dialogl Reload KeyLIGHTS – start the program again, resetting many defaultsl Reload KeyLIGHTS menu – refresh the KeyLIGHTS menul Additional Settings drop-down – access other, specific KeyLIGHTS settings
Figure 6.16 Program Panel – Further Options and Settings
6.11.1 Options
RIBBON: ‘KeyLIGHTS Tools → Program→ KeyLIGHTS Options’

- 182 -
Selecting this command opens the KeyLIGHTS Options dialog. On this dialog are a num-ber of tabs that include items relating to different aspects of the program. Each of these iscovered elsewhere in this manual, in the relevant section. Also, see Chapter 9 Pro-gram Settings and Option for additional information.
6.11.2 Reload KeyLIGHTS
RIBBON: ‘KeyLIGHTS Tools → Program→ Re-load Program’
If the system malfunctions in any way this command can be used to reload theKeyLIGHTS program and reset all variables and settings to their original state withoutleaving AutoCAD.

- 183 -
Chapter 7 - Highway Power Calculations
This section explains, in detail, the different commands available in the Highway PowerCalculation (HPC) module, provided on its own ‘HPC’ ribbon tab.
Note
Much of the functionality provided here is available only when a separately pur-chased module has a licence available. However, certain features such as the abil-ity to draw ducts and cable are independent of the calculations for power providedwithin HPC. Icons for drawing cables and ducts are, for example, also provided onthe main KeyLIGHTS ribbon menu, but are documented here. Where a licence ofHPC is required for certain functionality, this will be indicated in the relevant sec-tion by way of this icon:
Figure 7.1 HPC Ribbon menu

- 184 -
7.1 Project Settings
RIBBON: ‘HPC → Highway Power Calculation → Project Settings’
Each circuit is considered to be a ‘project’.
When a new calculation is performed on a circuit, if any property that is required is notset, HPC will set them to the HPC Defaults. See 7.13 HPC Defaults (Options) for moreinformation about these. For any circuit, it is possible to modify these as required. Youcan also enter important information such as a scheme and a project reference, identifierfor the engineer and version number for example. The dialog includes three pages andis shown in Figure 7.2 HPC Project Circuit Settings Dialog, Figure 7.3 HPC CableDefaults and Figure 7.4 HPC General (Other) Circuit Defaults.
Figure 7.2 HPC Project Circuit Settings Dialog

- 185 -
The first page includes important options that govern how HPC operates. These are:
Auto Calculate Whether the circuit should be automatically updated if anychange occurs to it.
Override Fuse Settings Allows HPC to determine the fuses that are applicable toany circuit
Override Cable Sizes Allows HPC to determine the cable sizes that are applic-able to any circuit
Show HPC Info inAnnotations
Textual Annotations will include (or not) the full electricalinformation calculated by HPC
Save Settings in Draw-ing
Project settings are saved (or not) in the drawing
Colour ConnectedCable by Phase
HPC will automatically change the colour of each cablebased on its phase (or not).
Figure 7.3 HPC Cable Defaults

- 186 -
The second page, shown in Figure 7.3 HPC Cable Defaults, provides for you to set arange of limitations and starting values for various factors that influence the electrical cal-culations relating to cables.
If you wish to change the default cable type, click on the ‘…’ button, this will provide thechoice via the dialog shown below:

- 187 -
The third page, shown in Figure 7.4 HPC General (Other) Circuit Defaults, provides foryou to set the default protective devices so that you don’t have to do this for every circuit.
Figure 7.4 HPC General (Other) Circuit Defaults
If you wish to change the default fuse for lighting columns or branch cables, click on therespective ‘…’ button, this will provide the choice via the dialog shown below:

- 188 -
7.2 Drawing Electrical Supply
RIBBON: ‘HPC → Highway Power Calculation → Supply’
& & & & &
Various symbols for supply points are available. In turn, the icons above represent ahighly symbolic symbol which is large enough to be clear and easily read from yourdrawing at different scales. The additional ones can be used as alternatives and shouldprovide for most requirements. These are illustrated in Figure 7.5 Electrical SupplySymbols.
Figure 7.5 Electrical Supply Symbols
7.3 Cables
7.3.1 Creating Cable Pre-sets
RIBBON: ‘HPC → Highway Power Calculation → Cables’

- 189 -
The dialog in which different linetypes representing each type of cable you require arebuilt (and from which also selected for drawing) is accessed using the icon shownabove. This can be found on both the HPC and the main KeyLIGHTS ribbon menu tab.In time, you will build a library of linetypes. These are stored externally to your designdrawings in a database.
It is important to recognise that, whilst creating a ‘pre-set’ in the Cable Manager providesfor cables to be added to the drawing that will be given the visual and other properties,once cables have been drawn it is possible to edit or otherwise change their properties.Subsequent changes to the pre-sets in the Cable Manager will have no effect on cablesalready drawn.
Figure 7.6 The Cable Manager – defining pre-set properties

- 190 -
Click the button labelled ‘Create New’ to create new linetypes. It is not normally neces-sary to see the dialog in its expanded view when selecting linetypes to draw, as shownin Figure 7.6 The Cable Manager – defining pre-set properties, unless the symbol pre-view does not make it clear exactly the properties that it represents. However, you willwant to set the properties when defining new cables and so this expanded view isshown when creating a new one, after the name you wish to use to represent the pre-sethas been entered.
After the new cable has been created you can set or change the properties as requiredin the same way as you do if you wish to edit an existing pre-set.
7.3.1.1 Editing Pre-set Cable Properties
Figure 7.7 Cable Properties

- 191 -
In the expanded view, the properties set for the selected linetype are shown. To changeany of these, simply edit the current entry. Some properties are text, which can be editedas you would expect, numbers again can be entered or the ‘up/down’ arrow control onthe right used to increase or decrease the value by increments.
The exact pattern of the linetype can be entered using the syntax that is used in theAutoCAD .LIN file type. This is somewhat impenetrable, but is well covered in theAutoCAD Help Manual. In KeyLIGHTS a linetype definition file is provided (in the

- 192 -
installation folder), which includes a range of suitable cable and duct linetypes. To loadthis, click on the ‘…’ button. With a bit of reading you will find you can edit this file if youwish to add further linetypes that you will share with colleagues (or across machines).Any changes you make will need to be saved, however, if you click the button to Drawthe selected linetype, the changes are saved automatically.
7.3.2 Drawing Cables
Once you have selected a suitable cable linetype, click the button labelled ‘Draw’ (not‘OK’). You can also double-click the visual representation of the cable. You will then beoffered three methods to draw the cable – by ‘Drawing’: simply picking points in the draw-ing (recommended), including sockets on objects to which you can connect cable (e.g.inspection chambers); by picking loads and supply points; or by picking duct entrypoints.
When drawing cable, you will see that the plug/socket connectors will be shown on allrelevant objects such as loads, supply points and duct vertices. If you click within the con-nector (socket) circle, it is possible to connect a cables end to any vertex of other cables.This is to accommodate where a 3 phase supply splits into three cables or, for example,if you will subsequently place a load at the vertex and the newly drawn cables will bebranches.
When adding cable to the drawing by ‘picking loads and supply points’ you are able topick points in the drawing in any case so this method doesn’t really differ from the first, ifyou are used to selecting points with the socket circles (connection points).
Note
When a plug/socket connection is made between a cable and a load, an electrical

- 193 -
connection is ALWAYS also made. If you later wish a cable to pass through acolumn base and will not be electrically connected, you must explicitly tellKeyLIGHTS that the relevant cable is not to be electrically connected. See 1.1.2Electrical Connections for more information about electrical connections.
When adding cable to the drawing by ‘picking duct entry points’, you simply need onlypick 3 points in the drawing, regardless of how many vertices a particular duct includes.
Note
This will add the cable to the whole length (all segments) of the duct between theentry and exit points selected. In Figure 7.8 Drawing Cable by Picking Ducts, thetop image shows all but the last point already selected, in the lower image, the com-pleted form. It should be noted that the duct is also changed along the segmentsthat now ‘contain’ a cable. See 7.3.4 Different Cable Display Representationsfor more information about cables and ducts can be displayed in combination.

- 194 -
Figure 7.8 Drawing Cable by Picking Ducts
7.3.3 Editing Cable Properties
Normally, it will be sufficient to simply double-click on a cable object to bring up the‘Feature Properties’ dialog for that object. When a cable has been drawn and is now‘contained’ in a duct, you will need to select which object’s properties you wish to see.After the double-click on a duct that contains the cable you wish to edit, a small menu isshown (see Figure 7.9 Editing Ducts Containing Cables). This also allows for the ductproperties to be accessed.
Figure 7.9 Editing Ducts Containing Cables

- 195 -

- 196 -
7.3.4 Different Cable Display Representations
There a number of ways a cable contained in a duct can be displayed. Firstly, in theFeature Properties for ducts, a ‘Legacy Mode’ toggle is provided.

- 197 -
However, a quick way to change how the cable/duct combination is displayed, when notin legacy mode, is select the duct object and hover over the rectangular, midlle grip on aparticular segment as shown to the right. This causes a small transient box to be tem-porarily shown. If you select the contained cable, this is shown in the middle of the duct.See Figure 7.10 Different Cable/Duct Display Modes for the additional display modes.
Figure 7.10 Different Cable/Duct Display Modes
7.3.5 Changing Cable Type (Linetype from Pre-set)
RIBBON: ‘KeyLIGHTS → Ducting and Cables → Tools
This command can be used to change an entire cable type. For any selected cables onyour drawing you can swap these out, via the Cable Manager dialog, with an alternativetype. The swapped cable will then have all of the default properties set for the pre-setselected from the Cable Manager. See 7.3.1 Creating Cable Pre-sets for more inform-ation about cable pre-sets.

- 198 -
7.3.6 Changing Cable Type (Electrical property)
RIBBON: ‘HPC → Highway Power Calculation → Cables’
This command can be used, unlike the one described above in 7.3.5 Changing CableType (Linetype from Pre-set), for changing the electrical properties only of any selec-ted cable. The command brings up the dialog shown in Figure 7.11 Setting the Elec-trical Properties of a Cable. The dialog allows for you to select an alternativemanufacturer/range. The ‘(unspecified)’ manufacturer refers to generic cable types.
Figure 7.11 Setting the Electrical Properties of a Cable
7.4 Drawing Ducting
RIBBON: ‘KeyLIGHTS → Ducting and Cables → Ducts’
Functions for drawing ducting are available even if you don’t have a licence available toyou for HPC. See 1.1.2 Ducts for full details covering the duct functions, and 1.1.3 DuctAccess Chambers for duct access chambers.

- 199 -
7.5 Set Fuse
RIBBON: ‘HPC → Highway Power Calculation → Set Fuse’
This command can be used to set or change the protective device of any selected cable/-circuit. The command brings up the dialog shown in Figure 7.12 Setting the Protective(fuse) Type. The dialog allows for you to select an alternative manufacturer/range. The‘(unspecified)’ manufacturer refers to generic fuse types.
Figure 7.12 Setting the Protective (fuse) Type
7.6 Circuit Calculations
RIBBON: ‘HPC → Highway Power Calculation → Calculations’
& &
The commands covered in this section are used to control when HPC performs orupdates a calculation for any circuit. By default, when KeyLIGHTS is started, a check forthe availability of a licence is not made. Once a calculation is performed, assuming an

- 200 -
HPC licence is available, a licence is ‘taken’ when this comes from a Network LicenceManager (NLM). If you wish to release this licence back to the NLM then you will need toclose AutoCAD down.
Note
This cable calculation can take a few seconds depending on the complexity ofyour circuit, and also whether there are linked tables or schematic diagrams, whichwill also be updated. If your drawing contains a number of circuits, setting HPC into the mode where all circuits are updated can lead to increased delays. In thiscase, it will be preferable to have the calculations only auto-updating selected cir-cuits. If a number are changed then it is possible to have this option set for specificcircuits only.
The first icon, that includes a question mark, will prompt you to select which circuit(s) tocalculate/update. Any subsequent changes to this circuit will then trigger a refresh of thecalculations, tables and schematics.
The other two icons turn on/off calculations globally for all circuits, although this is byway of a menu macro, which answers the prompt automatically.
7.7 Saving Results
RIBBON: ‘HPC → Highway Power Calculation → Save Results’

- 201 -
When a cable calculation has been completed, it is possible to save the detailed resultsto a text file. Once you have selected a location for the file, you will be offered the chanceto open this. It is most likely that the TXT file type is associated with Notepad on yourPC, if so the file will be opened in Notepad. The text file includes a header with the dateof production and other information as entered into the Project Settings dialog (see 7.1Project Settings), and the contents can be copied into any other document, such as inWord, should you wish to edit or amend any information
7.8 Cable Schedules
RIBBON: ‘HPC → Highway Power Calculation → Cable Schedule’
For any selected circuit, this function creates a table showing some of the details aboutthe circuit and any branches. It details the identity number of each supply (feeds fromand to) and each load. The numbers/references shown are created using the ‘NumberColumns’ command covered in 1.1.1 Adding Numbers. An example of the full cableschedule is shown in Figure 7.13 Example Cable Schedule.
Note
The schedules are linked to the selected circuit so any change that is made, includ-ing to column numbers will trigger an update. You may wish to turn off automaticcalculations if these delays prove to be too long. This is largely dependent on theperformance of your PC.

- 202 -
Note
You can select any part of the circuit network for this command, whether that be abranch or the main part of the circuit. If you wish to have a schedule for a branchonly, you will need to use the ‘Selective Schedule’ command covered next.
Figure 7.13 Example Cable Schedule

- 203 -
7.9 Selective Cable Schedules
RIBBON: ‘HPC → Highway Power Calculation → Cable Schedule’
For any selected branch of a circuit, this function creates a table showing some of thedetails about the branches. It details the identity number of each supply (feeds from andto) and each load. The numbers/references shown are created using the ‘NumberColumns’ command covered in 1.1.1 Adding Numbers. An example of the full cableschedule is shown in Figure 7.14 Example Test Schedule.
Note
The schedules are linked to the selected circuit so any change that is made, includ-ing to column numbers will trigger an update. You may wish to turn off automaticcalculations if these delays prove to be too long. This is largely dependent on theperformance of your PC.
Note
You must select the part of the circuit you wish to tabulate. Branches off the selec-ted part will also be tabulated.
Figure 7.14 Example Test Schedule

- 204 -
7.10 Test Schedules
RIBBON: ‘HPC → Highway Power Calculation → Test Schedule’
Test schedules are created in the same way as Cable Schedules (see 1.1 Cable Sched-ules above). The difference is that the tables created include blank cells so that meas-ured (test) values can be entered by the installing contractor to verify the circuit on-site.An example schedule is shown in Figure 1.1 Example Test Schedule).
7.11 Selective Test Schedules
RIBBON: ‘HPC → Highway Power Calculation → Test Schedule’

- 205 -
Selective Test Schedules are created in the same was Selective Cable Schedules (see1.1 Selective Cable Schedules above).
7.12 Schematic Diagrams
RIBBON: ‘HPC → Highway Power Calculation → Cables’
An example schematic is shown to the right. Schematics can be used to capture the topo-logy (‘London Underground’ map) of the circuit and also to highlight fused branchesclearly.
Fuses are identified, as are column identity numbers for each load in the circuit.
Note
The information shown, as is the topology, is dynamically linked to the selected cir-cuit and its branches, and will update if any changes are made such as to thecolumn numbering or additional loads added. You may wish to turn off automaticcalculations if these delays prove to be too long. This is largely dependent on theperformance of your PC.

- 206 -
The schematic diagram includes various grips when selected that allow for the overallshape to be changed if this suits a particular arrangement better. The overall scale of theobject can easily be changed using the custom grip shown at the bottom right of the dia-gram when this is selected.

- 207 -
7.13 HPC Defaults (Options)
RIBBON: ‘HPC → Highway Power Calculation → HPC Defaults’
Note
The values set in this dialog are used for any new project (circuit). Once a circuithas been created these properties can be modified for the individual circuit. Sub-sequent changes to the HPC defaults do not affect the settings applied to an indi-vidual circuit.
Figure 7.15 HPC Project Default Dialog

- 208 -
Figure 7.16 HPC Project Default Dialog - Cables

- 209 -
Figure 7.17 HPC Project Default Dialog - Miscellaneous

- 210 -

- 211 -
Chapter 8 - BIM Data and 3D Draping
This Keysoft product has function built in to help you in your BIM work flows.
8.1 BIM Data and Object Properties
The markings, symbols and other items created are special objects called KTS_STREETFEATURES. Every street Feature can have data added and this data will besaved in the dwg for other departments to view. This can be especially useful for taskssuch as future maintenance and asset management.
8.1.1 Viewing Data Fields
Double Clicking on a Street Feature will open the usually ‘KeyProperties’ dialog.

- 212 -
In the ‘Road Markings’ section, you can see a number of predefined data fields ready foryou to use. The data types are not limited to just text strings, dates, drop down lists andnumeric values can be specified and entered. Just type or selected the information andafter picking the [OK] button the information will remain as part of the object and savedwithin the dwg.
8.1.2 Adding Additional Data – onto individual objects
The above ‘KeyProperties’ dialog has an icon on the top bar to create additional datafields.

- 213 -
Using this icon will open another dialog where you can specify an additional data field.
After entering the required data field and click OK, then you should see that item in theKeyProperties list in a section called ‘Specific Object’.
8.1.3 Adding Additional Data – onto multiple objects using templates
There will be an additional menu tab on the ribbon called ‘Keysoft BIM 3D’.

- 214 -
The first item on the BIM panel of this tab is called ‘Manage Data Template’ and runs thecommand ‘ManageDataTemplate’. This opens a larger dialog which can also be used toadd data fields. The great benefit of this is that the data fields specified here can bedone on feature in a Category, or just all ‘ahead arrows’ depending on what is required.
In the top corner of this dialog you will see that the sets of data created can be ‘saved’,and previously saved data can be ‘opened’.

- 215 -
This is achieved through a template system. Each time the ‘save’ but is used an XML filetemplate is created which holds the additional data fields and data types. This templateis particularly useful if an organisation wide set of data is required, as an official data tem-plate can be created by a co-ordinator or supervisor and then this xml file can distributedout to all engineers/technicians and other users.
8.2 3D Draping of Marking and Symbols
One of the major features of this software is its ability to drape road markings and otherobjects onto 3D models. This is done automatically with virtually no user interventionand requires very little additional knowledge or training to create a 3D model of a roadlayout and scheme.
8.2.1 Using Civil AutoCAD Surfaces
In order to achieve a 3D model you will need to open or create a drawing in AutoCADCivil 3D software. There will need to be a Civil ‘Surface’ defined in 3D in the dwg for thestreet features to drape onto that surface. The 3D surface and draping abilities are notavailable in plain AutoCAD.
8.2.2 Draping Marking and Other Features onto a 3D Surface
Assuming you are using Civil AutoCAD and already have a ‘surface’ with your opendrawing…
Then just draw a marking in the usual way ‘top down’ exactly like you are drawing in 2D.

- 216 -
Now automatically the marking will find the 3D surface and drape along the surface andits undulations.

- 217 -
This happens virtually instantaneously, and the 3D parts will even dynamically update ifyou edit and adjust the marking using the normal 2D editing functions.

- 218 -
Chapter 9 - Viewing In 3D: Driver’s Eye Views
This chapter shows how to manipulate the drawing in 3D, with minimal effort, to createviews which are equivalent to a Driver’s Eye view of the road design.
These views can be useful for engineering or presentation purposes – for example forsafety assessments or to visualise an obstruction; or to enable presentations or imagesto be prepared for consultation purposes.
A slideshow can be created automatically so these views can be repeated effortlesslyand endlessly.
Several routines are included in the DEV menu section, to manipulate the position of aviewer and chosen direction of view.
9.1 DEV - Entering 3D Dev

- 219 -
DEV - this routine is the first item on the menu. It must be invoked to initiate the DriversEye View before the other menu items can be used.
It requires two points to be selected (1) the driver’s position & (2) the direction (rotation)of the view in which the driver is looking. It then asks for the height to be used.
When invoked, KeyLIGHTS will automatically calculate the resultant view in. The layersset to be turned on/off are also altered on entering DEV, see below.
By default, the command turns off certain layers. If the user enters DEV from within aViewport window then the user is offered a choice to “turn off” or to “freeze in currentviewport”, the layers that are not to be seen. The “current viewport” option will allow otherviewports to remain unaltered whereas the default “turn off” will alter the model and there-fore every viewport.
9.2 DEVLAY.ON and KTSDEVFW.DAT Files
On entering DEV the layers which you see are completely altered. The default settingsfor what you can see are contained in the files “DEVLAY.ON” and “KTSDEVFW.DAT”.

- 220 -
Users can amend these files to alter the layers seen by default, the layers are presentedin a dialog on entering DEV so that the defaults can be changed or adjusted every timethe 3D view is entered. The first file contains straight forward layer names which will beturned ‘on’, the second file is used by the new system engine to change representationsand styles on entering 3Dviewing.
Users can still use standard AutoCAD layer switching tools to alter the display.
9.3 DEVOUT – Exiting 3D DEV
This routine is the last one on the DEV menu. It returns the system to the plan view asseen immediately before the Driver’s Eye View was entered. It also returns the layers totheir previous status. This is very useful if you have manipulated the 3D view and layersas the view is completely reset.
The text styles that are display are changed to back and forth on entering or exiting fromDEV.
9.4 Move Driver
This command has now been superseded by the AutoCAD command 3DWALK whichhas been greatly enhanced over recent releases. We would recommend using 3DWALKas this allows easy 3D movement by mouse and cursor keys.

- 221 -
However, DMOVE is used to alter the original entered viewing position (after going intoDEV), effectively moving the drivers viewing position in the 3D view.
It requires typing in a short code to describe the movement in terms of direction and dis-tance the 3D view being adjusted accordingly. The code is made up of a single letter fordirection - F (forward), B (backwards), L (left) or R (right) and a number for the distancerequired (in metres), e.g. F5 or r6 or L10 etc. = forward 5m, right 6m or left 10m, etc..
You may wish to move the driver through several steps until the required view of theroad layout is achieved. The command therefore repeatedly prompts for movementcodes until a final <Return> to end the command.
Sometimes it is possible that the target point will need to be moved (see TURN VIEWbelow) to prevent leap-frogging over the view target and causing the view to turn aroundor even to look straight down if viewing position and target are coincident.
9.5 Turn View
This command provides for the view target to be manipulated, effectively turning theview.
As with the MOVEDRIVER command above, this command requires the entry of codes -L (left) or R (right) representing the direction of turn, followed by a number for the angle ofturn (in degrees), e.g. R30 or L10 etc. = right 30° or left 10°, etc.). The forward and back-ward options, available in the MOVE DRIVER command are also available in this com-mand, although these will rarely be required unless you’re moving the target to maintaina relationship to a movement performed on the driver’s position.

- 222 -
You may wish to move the driver through several steps until the required view of theroad layout is achieved. The command therefore repeatedly prompts for turn/movementcodes until a final <Return> to end the command.
9.6 Adjust Height
ADJUST HEIGHT - this command provides for adjustments to be made to the height ofboth the position of the view and of the view target. Normally, the target height would beleft at or near ground level to prevent looking at the sky. The default height on entry toDEV is 1.2m as this is an average car driver head height. TIP: it is often useful to alterthe height to get a perspective view to give a more overall view of a scheme or layout. Inthis case a viewing height of 6m and target of 0m can be particularly useful.
9.7 ZOOM – Various Zoom Factors
ZOOMS - this allows the user to zoom in and out when using the driver’s eye view. Thiscan compensate for the limited resolution of the computer monitor screen, and hence theapparent poor performance of Visirail. Although the Visirail barriers are exactly drawn,the screen may appear to indicate that through visibility ceases after only a relativelysmall distance. Using ZOOMx2 etc. can simulate binoculars of various powers, enablingthe user to examine the performance of distant barrier rails and determine the visibilitythat can be obtained with different Visirail types. ZOOMx1 will return the view to that nor-mally seen.
9.8 Set View Distance
SET VIEW DISTANCE - by default, the Driver's Eye View will show all objects in front ofthe camera, even if far ones appear minute and O.S. mapping can merge into a massjust at the horizon. This routine is used to set a limit of the distance (in metres) which can

- 223 -
be seen. By limiting this, it can simplify viewing or plotting for a particular scheme.Distant objects do not affect the view as they are simply not displayed beyond the limit.
9.9 Features
Various 3D features are available to enhance a driver’s eye view. These all have a cor-responding 2D view so can be used to add to the accuracy of your drawing, for exampleto mark the location of trees where sight-lines need to be checked.
9.10 Seasons
In a driver’s eye view, if you have added trees to your drawing, the four season com-mands can be used to add (or remove) leaves, for example where sight-lines need to bechecked.
9.11 Slideshows
These functions provide for a moving view to be captured for example to more easilycheck sight-lines.
9.11.1 Create Slideshow
The 3D view which KeyLIGHTS can generate automatically can be useful both fordesign (including safety audit) and presentation purposes.
Even more useful is the ability to see the view change as a driver/viewer progressesalong a route.

- 224 -
This KeyLIGHTS function now automatically creates a slideshow which follows the pro-gression down any chosen path. Although slideshows are not the ultimate viewing tool,they are the best available within standard AutoCAD functions.
All the user needs to do is to draw a polyline representing the chosen path on the draw-ing, and invoke the routine from plan view. KeyLIGHTS will take care of the transfer toDriver’s Eye mode and all other changes needed.
The user needs to specify a prefix (max. 5 characters) for the slides created. The samename can be used repeatedly to prevent huge numbers of slides building up. Use a dis-tinctive name if you are likely to keep the slideshow for repeated use.
The user needs to specify the Movement Increment (in metres) - in other words, the fre-quency along the route with which the slides are created. This impacts directly on thelength of time the routine takes to run, which can be lengthy if a large number of slidesare created (e.g. from a long polyline or small movement increment).
Use of polylines consisting of smooth arc segments provides a more realistic movementthrough a scene than one consisting of straight sections. In ‘arc’ mode, each subsequentarc extends of the last tangentially, giving that smoothness.
Note
The viewer looks at a target point some distance ahead. If the path followed turnsthrough tight radii, a large view distance could cut across a corner. For tight radii, avalue for the target view distance which approximates to 20 metres appears to be a

- 225 -
reasonable initial start.
Note
The system requires this value to be specified as a multiple of the movement incre-ment, e.g. 4 steps of a 5m increment.
Visibility of the polyline that is followed can be set as required. This simply depends onthe layer on which the polyline has been drawn as with all layers in the DEV. See 8.2DEVLAY.ON and KTSDEVFW.DAT Files for more on this. If visibility is required e.g. toconfirm that the correct path is followed, the polyline should be drawn on a layer which isvisible in the Driver’s Eye View state. If the polyline need not be seen, draw it in a layernot shown in the Driver’s Eye View.
When the routine finishes, it automatically creates files giving information for both of thefollowing viewing methods.
9.11.2 View Step Slideshow
This method of viewing the created slideshow will allow users to step through thesequence of slides created in the above routine, moving forward and backwards, per-haps to check how the view changes between two points, as many times as required.
Simply choose the series name, and the approximate delay time on the slide, and thenstep through the series using the F key on the keyboard for Forwards and the B key forbackwards.

- 226 -
Note
The keyboard buffer on the computer can produce a delayed reaction.
9.11.3 View Full Slideshow
Using this option, the user can run the script file to view the entire slideshow. Simplychoose the name given to the slideshow series, and the show will run.
A low value (e.g. 1 second) will be appropriate if you wish to approximate the feeling ofdriving. A longer value may be needed if you wish to check details as the show pro-gresses. Alternatively, use the step method of viewing, detailed above, which allows theprogress to be halted at any point.

- 227 -
Chapter 10 - Program Settings and Option
This section describes how KeyLIGHTS can be configured to tailor it more closely toeach user’s needs and preferences. KeyLIGHTS offers a great many configuration items.
The program settings and options can be found in the second menu“KeyLIGHTS Tools” and in the section ‘Program + Options > Settings”.
10.1 Settings and Options

- 228 -
The Settings and Options dialog has a number of different tabs along the top and this dia-log may be accessed via other buttons on the menu which initially bring the other tabsforward. You can switch to any tab to alter any setting, no matter which menu item ini-tiated the dialog.
These options have a pre-set ‘program defaults’, ‘all user defaults’ and ‘current userdefaults’, which can be recalled if needed.
When you have altered anything, there are two ‘save’ buttons. If ‘Set Current’ is clickedthen the setting is only altered for the current drawing and only until it closed, but if ‘SaveSettings’ is clicked the settings are saved for the currently logged in user, and remain per-sistent across drawings and sessions.
A command is also available to reset the user options back to the program defaults.
10.2 Program Settings Tab
The following can be set via the General Options dialog:
10.2.1 Use Predefined Layers
KeyLIGHTS will, by default, draw and insert various items on various layers. SelectingNo for this option ensures that the current AutoCAD layer will be used for all objectsdrawn. It is recommended that only advanced users consider changing this, as most con-trol of the layers used is available under the Styles tab.

- 229 -
10.2.2 Use Layer Prefix
Yes or No – Some drawing offices have standards for the layer names used. Quite com-monly this involves starting all layer names with a certain prefix.
10.2.3 Layer Name Prefix
The text entered here is used as a prefix for layer names when the ‘Use Layer Prefix’ set-ting is set to yes.
10.2.4 Command Settings
Default objects – settings here are for the ‘default type of marking or feature’ that is usedby one button in the menu. There are defaults for the Loop types, Duct Linetypes, Reflect-ive studs, Kerb marks & Tactile paving type.
10.2.5 Template Settings
AutoCAD provides various template options in its own “Options” command. This sectionallows for these to be set here too. Basing new drawings on the KeyLIGHTS template isnot imperative but this offered to provide some suitable defaults. However, some draw-ing offices may want to use a customised setting for templates. Setting these herereduces the need for the settings to be adjusted with every new user, as KeyLIGHTS dothis automatically when it is run.

- 230 -
10.3 Default Values Tab
This set of options control various values, distances and toggles used by specific mark-ings and objects.
10.3.1 Table Separation Distance
This sets the gap between each type of quantity table used in the “Inquiry” command.
10.3.2 Insertion Scales
Some of the features and blocks that get inserted by KeyLIGHTS offer control over thesize at which they are drawn. This collection of settings control items like the size of tact-ile paving slabs, the size of the generic sign symbols, the height of the cones. There isalso a set of block customisations, where it is possible to specify custom blocks that areinserted with some symbols.

- 231 -
10.3.3 Yellow and Red Line Setting
Settings to control the size of the offset used in the double yellow / red line commands,as well as the widths of the lines themselves.
10.3.4 Hatching
Yes or No – Sets whether the diagonal hatching commands include by, default, a col-oured surface to the extents of the hatched area.
10.3.5 Loops & Duct
Various Items – a collection of other settings used when drawing loops and/or ducting.They are the same as the items used in the ‘duct_settings’ and ‘loop_settings’ com-mands.
10.4 Styles Tab
This tab controls colours, layers, and patterns used.
10.4.1 Layer Styles
ALL the layers used by KeyLIGHTS when drawing the markings and features are listedhere. Every item will be drawn on a certain layer and the layers should be listed here.The layer name can be changed, as can the colour used when the layer is created. Forexample: white lines are drawn on a KTS_LINES layer style and yellow waiting restric-tions are drawn on a KTS_TRO layer style.

- 232 -
10.4.2 Line Styles
Most line styles in KeyLIGHTS are fixed as prescribed in the TSRGD, but some linessuch as construction lines can be altered here.
10.4.3 Fill Styles
This includes settings for certain hatch patterns are used in KeyLIGHTS. Here the pat-tern, colour and size used can be specified.
10.4.4 Table Styles
The “Inquiry” command creates a number of tables when the quantities of the variousmarkings and other objects are listed. The colour of the table lines and the colour of thetext in the different sections of the tables can be specified here. There are other settingsfor tables available on the ‘Tables’ tab such as various table dimensions.
10.5 Label Descriptions Tab
Every individual marking or feature drawn by KeyLIGHTS has a description used whendoing a full annotation label. With this tab you can edit the text of the label by altering thestored descriptions. This list is a very long list due to the large number of items thatKeyLIGHTS can draw.
10.6 Label Options Tab
As well as the text in labels, the label itself has settings. On this tab the size and appear-ance of the label that is created can be specified.

- 233 -
This tab also includes some options for Quick Labels, to control the colour and size ofthe quick label, towards the bottom of the options on this tab.
10.7 Rates Tab
On this tab the prices/rates that are used by the “Inquiry” command to calculate costs.The rates are applied individually to each type of marking – Area, text, lines, symbolsand paving. There is also an initial setting for specifying the currency used, such as GBPor EURO.
Rates for all items can be saved to support competitive pricing where schedules of ratesare available from more than one contractor. Prices may also vary in different situations.Rates can also be imported and exported as required, so that they can be sharedamongst different PCs in a drawing office to allow these to be managed centrally.
10.8 Tables Tab
This tab controls the contents of the tables that are created by the “Inquiry” routine whencreating tables of quantities. The width of each column, the text title of each column, andwhether that column is displayed in the tables by default can be set.
Note
There are some additional settings concerning the text size and colours in the‘Styles’ tab under ‘Table Styles’.

- 234 -
10.9 Other Program Control Items
There are a number of other buttons under the “Program + Options” menu that are usedto control, change or reset the program behaviour.
10.9.1 Reload KeyLIGHTS
This option is mainly useful if the program has started to function incorrectly, the buttonshould reload and restart the engine behind the KeyLIGHTS system.
Note
This function will not allow for the current Profile to be changed and then to kickstart the program back into operation.
10.9.2 Reload KeyLIGHTS Menu
This option will be mainly used by those users experiencing a problem with the menusystem. This is usually seen when the images on the toolbar and ribbon icons are notavailable and are therefore represented by AutoCAD as smiley faces or a cloud with aquestion mark.
Use of this command with reset the KeyLIGHTS menu system (pull-down, toolbars andthe Ribbon menu. Users should answer Yes to the question “Do you want to over-write…” as this will then replace the existing displayed menu.

- 235 -
10.9.3 Restore CUI Menu
The AutoCAD CUI interface allows for menus to be altered and customised, so it is veryeasy to alter things by mistake and make the menus unusable. This command willrestore the KeyLIGHTS menus back to the standard default menu that was used straightafter installation. This is done by replacing the CUI file with a backup copy of the defaultmenu file ‘KeyLIGHTS.CUI.BAK’.
10.9.4 Reset
This item will cause a return to some of the original variable settings should thesebecome changed. Linetype is set Bylayer, the default width of polylines set to zero, andAutoCAD variables Aperture and Pickbox are reset (see AutoCAD manual for details onthese items).
In addition, the specification of angles within the drawing is returned to its KeyLIGHTSdefault. The standard AutoCAD default for angle specification is to have 0 degrees at theright of the screen (to the East), and angles increasing in value in the anti-clockwise dir-ection. KeyLIGHTS uses the setting more commonly used with mapping - 0 degrees atthe top of the screen with angles increasing in the clockwise direction.
‘Reset’ caters for users accidentally altering the settings, or when working on a drawingimported from another user, who has altered the standard AutoCAD settings.
The file RESET.LSP is provided in order that users can include in it any preferences thatthey feel necessary. Simply add to the latter end of the file using a text editor at the pos-ition shown.

- 236 -
Note
Editing this file requires a basic knowledge of AutoLISP.
10.10 Reset User
The command ‘ResetUser’ will remove (delete) ALL customised user settings that havebeen saved (will be deleted from the registry) for the current user. It will then reload allthe standard program default settings. This will effectively have the effect of resetting alluser settings back to the program defaults, as at installation time, for the current user.

- 237 -
Chapter 11 - Revision History & What’s New
Revision Timeline (from v5)
KeyLIGHTS was first released in July 1991, and has since then gone from strength tostrength to become the street lighting industry’s only fully featured design software.
Version DescriptionReleaseDate
5.0.0 HPC v3 enhancements, compatibility with AutoCAD 2000,2001
May 2000
5.1.0 Export/import to Lighting Reality May 20015.2.0 Dynamic link with Lighting Reality, compatibility with
AutoCAD 2002, 2003July 2002
5.2.5 AutoCAD 2004 compatibility October2003
5.3.0 Enhancements and AutoCAD 2005, 2006 compatibility October2005
5.4.0 Enhancements and AutoCAD 2007 compatibility August2006
5.4.3 AutoCAD 2008 compatibility August2007
5.5.0 Enhancements and AutoCAD 2009 compatibility July 20085.6.0 Enhancements and AutoCAD 2010 compatibility June 20095.6.2 Enhancements and AutoCAD 2011 compatibility August
20105.6.3 AutoCAD 2012, 2013 compatibility and support for 64 bit plat-
formAugust2012
5.7.0 Enhancements and AutoCAD 2014 compatibility December2013

- 238 -
Version DescriptionReleaseDate
5.7.2 Enhancements and AutoCAD 2015 compatibility July 20145.8.0 AutoCAD 2016 compatibility April 20155.9.0 AutoCAD 2017 compatibility February
20165.10.0 AutoCAD 2018 compatibility April 20176.0.0 Completely re-written version (see detailed revision history). January
20186.0.1 AutoCAD 2019 compatibility, fixes and enhancements (see
detailed revision history).April 2018
11.1 What’s New in v6
It is important to recognize that the increment in the ‘major’ (first element of the versionnumber – from 5 to 6 – signals a large step in the inner working of the software.KeyLIGHTS has been almost completely re-written, and is now based on the same com-mon Framework as our other leading software programs KeyLINES and KeySIGNALS.In fact this is a very logical step, particularly when the program is compared toKeySIGNALS – an AutoCAD add-on for signals engineers – used to place lights ontopoles, that must form part of an electrical circuit. Thus any enhancements provided forsignals engineers are likely to produce similar enhancements for the street lightingdesigner and vice versa.
One key new element is the change from AutoCAD block based symbols to a ‘street fea-ture’ that can include properties and attributes that better reflect the real world. Thusnumeric properties can now be added, and this supports full validation. For example afuse rating can be checked to ensure a value greater than zero is used.

- 239 -
11.2 Detailed Revision History
Note
We provide a full description of changes in the on-screen ‘What’s New’ guide thatcan be accessed from the ‘Help’ menu within the product. This document isinstalled on to your PC so can be accessed separately using Windows Explorer ifrequired.
Version 6.1.0 – April 2018
1. Compatibility Release for AutoCAD R2019 products.2. Polygonal grid support added, with masks.3. Linear calculation points added.4. Lighting grid colour property support added.5. HPC enhancement and stability improvements.6. On-line help.
Version 6.0.0 – January 2018
1. Extensive re-write, introducing the Keysoft Solutions’ common framework2. Plug and socket system3. Symbol block attributes replaced by fully validated feature properties4. Improved column numbering and object labelling5. Integrated light calculation engine6. LDT and IES file support7. New symbol, cable and duct managers8. BIM data fields added9. BIM export (to Navisworks10. BIM export to IFC11. 3D draping of al objects12. Dynamic creation of 3D representations

- 240 -
13. 3D sign structure command14. 3D ducts15. HPC integration with KeyLIGHTS objects (cables and ducts)16. HPC – Dynamically linked tables and schematic diagrams
Version 5.11.0 – April 2018
1. Compatibility Release for AutoCAD R2019 products.
Version 5.10.0 – April 2017
1. Compatibility Release for AutoCAD R2018 products.2. Various enhancements and fixes.
Version 5.9.0 – July 2016
1. Compatibility Release for AutoCAD R2017 products.2. Minor bug fixing.
Version 5.8.0 – April 2015
1. Compatibility Release for AutoCAD R2016 products.2. Enhanced browser for setting the luminaire type for Lighting Reality functions.
Version 5.7.1 – May 2014
1. Compatibility Release for AutoCAD R2015 products.2. Minor enhancements and bug fixes.
Version 5.7.0 – December 2013

- 241 -
1. Compatibility Release for AutoCAD R2014 products.2. New software based licensing.
Version 5.6.3 – August 2012
1. Compatibility Release for AutoCAD R2012 and R2013 products.2. 64 Bit support.3. Various bug fixes
Version 5.6.2 – August 2010
1. Compatibility Release for AutoCAD R2011 products.2. User Symbol dialog has new ‘insert’ capabilities.3. Inquiry routine now creates group from tabulations.4. Added icon for ‘Split and Fill’ column insertion onto R2010 (and later) ribbon menu.5. The command to bring up a thumbnail menu of luminaires with no columns (for use with
brackets) is now on the ribbon menu.6. Column numbering commands can now be applied to signs and floodlights.7. Command for editing cable names failed, now resolved.8. Choice of text file output in inquiry routines now takes notice of ‘N’ response and doesn’t
prompt for file.9. Bollards slide library file (for thumbnail image menus) was not included in the installation
for 5.6.0.10. User symbols dialog handles file locations even if the containing folder is not on the Sup-
port File Search.11. HPC didn’t handle the centre beacon symbol (CENBEACON).12. HPC now allows spaces in the names for any supply and for loads.13. Fixed problem with brackets command (no list found in KeyLIGHTS LISP data file).14. TRANSYM command for doing symbol swap failed with certain symbol types (when the
attribute containing the 'column' number is not called COLNO).15. The icon colours for existing and proposed floodlights were the wrong way around (blue
is normally used for proposed, and red for existing).

- 242 -
Version 5.6 – June 2009
1. Compatibility Release for AutoCAD R2010 products.2. New menu structure. Ribbon support (R2010 only), and new icons.3. Enhanced Driver’s Eye View routines and additional 3D furniture available.4. New Pedestrian Refuge routines.5. Enhancements to Lighting Reality roundtrip routines and Grid Origin point definition.6. Lighting levels can now be grouped as well as block created.7. New Light level hiding commands, making it easier than ever to calculate average etc.
levels based on selected light levels8. Common symbol selection routines, including polygon search more widely available.9. Unification of numbering and scaling routines allowing scaling to one, or to user defined
scale.10. New capability within HPC to recalculate network based on stretched cabling.11. New capability within HPC to label cable network with project reference.12. Iso-luminance Slugs commands removed (manufacturers didn’t keep these sufficiently
up-to-date, and live ‘Slugs’ can be generated on-the-fly using Lighting Reality.
Version 5.5 – July 2008
1. Compatibility Release for AutoCAD R2009 products2. New installation structure for compatibility with other KTS products3. New menu structure4. Many enhancements to commands AUTOKEY, INDIKEY, COLNO5. User definable set of symbols with toolbar for symbol 1 to 10. Set can be saved and
loaded.6. Compliance of HPC with 17th Edition of IEE Wiring Regulations (BS 7671:2008).7. Minor bugs and enhancements with HPC (now v4.0.2)
HPC – changes that provide compliance with changes to 17th Edition of IEE WiringRegulations (BS 7671:2008).
1. the default Volt drop is now 5%2. ambient ground temperature is now included

- 243 -
3. All cables now cover all install methods4. When install method selected the programme will decide which temperature factors to
use
Changes to data files:
1. Protective devices2. Maximum circuit impedance has reduced therefore the maximum length of cable pos-
sible has reduced.3. Mcb’s type 1, 2, 3 are still in the system but have not been updated (in case of evaluation
of old drawing).4. All other devices have been set to 17th edition recommendations.5. The selection of cable and install method has been revised to show the new methods
allowed under this current edition.6. Protective device descriptors, install methods have been updated.
Version 5.4 – August 2006 (revision 3 issued August 2007)
1. New functions to find (and zoom, if required, to) any specified column number.2. New functions to find (and zoom, if required, to) any specified column attribute.3. Autokey functions can now be used on pre-drawn polygon shaped areas .4. New function to tabulate distance and cumulative distances between columns.5. Automatic entry of number to column’s attributes when numbering columns.6. Column numbers on plan can be cleared globally/selectively or in polygon area.7. Provision for Lighting Reality lamp types E and F.8. Can store and re-use any number of Lighting Reality option settings.9. Loading of linetypes only when necessary to save time opening drawings.
Version 5.3 – October 2005
1. Support for AutoCAD Release 2006 and AutoCAD Map 20062. More ducting Linetypes3. Autokey layers can now be user-defined

- 244 -
4. Configurable attribute listing5. Data export can use default template6. Drivers’ Eye view offers layers dialog7. Notepad used for files editing e.g. ductinq.lay8. Isolux routines completely revised9. Numbering can be moved to existing/proposed layers for switching off10. Lighting Reality changes – grid is labelled with name; dxf output, multiple polylines
masking; prints summary into drawing; multiple colour files allowed, select existingmasks for new calculations.
Version 5.2.5 – October 2003
1. Support for AutoCAD Release 2004 and AutoCAD Map 2004
Version 5.2 – July 2002
1. Two-way Links with Lighting Reality2. Lighting Reality Options dialog3. Lamp Type and Maintenance Factor options in Lighting Reality output4. Lighting Reality roundtrip – (Lighting Reality runs in background)5. Update column positions in Lighting Reality import6. Option to choose existing Grid Origin Point7. AutoCAD R14 support removed8. Program loads much quicker9. User defined text styles for various items e.g. ‘Autokey’
Version 5.1 – May 2001
1. Lighting Reality export and import added
Version 5 – May 2000

- 245 -
1. HPC Version 3 with more user-friendly cable drawing routine.2. HPC cables now automatically numbered.3. User defined default directory for HPC.4. Inquiry routines now search user-definable layers.5. Duct and cable linetypes can now have user-defined width.6. Dialogs for setting user-defined linetype widths.7. Attribute information stored for Signs and Bollards amended.8. High-mast and floodlight symbols for both existing and proposed.9. Additional symbols for Driver’s Eye View – e.g. telephone box.10. Layers showing calculations can be easily switched on and off.11. Easier installation routines.
Version 4.3 – December 1999
1. Support for AutoCAD Release 2000 and AutoCAD Map 2000
Version 4.2 – April 1999
1. Easily accessed toolbars for many functions to speed selections.2. View limit in Driver's Eye view.3. KeyOSC (Ordnance Survey Companion) with useful mapping and plotting functions.4. Will work on non-KeyLIGHTS drawing without inserting.5. Numbering and measurement marks amended so that they can be changed to another
layer or colour – if layer changed, will not automatically erase.6. Customised AutoKey now possible with user’s choice of information displayed.7. Customised labelling with user’s choice of information displayed.8. Will import results from Urbis TURBOLight (via DXF).9. Can call edit function for results import colours from within KeyLIGHTS.10. Slideshow function can create and show progress in DEV along polyline path.11. KeyLIGHTS program load (useful for users switching profiles).12. Polyline tools useful for ‘setout on line’:13. Tool to break polyline at chosen point:14. Tool to step along polyline at specified intervals, with optional break.15. Tool to easily re-join broken polyline.

- 246 -
16. Tool to calculate column to column distance on staggered layout – can then use easiertool to position.
17. Variable or fixed measurement from last column now repeats for easier insertion.18. Setout on line tool now uses pre-set values – easily changed via dialog box, so with
break tools above can now be much easier to use.19. Split function for individual column insertion.20. Switchable AutoPan function (for Variable/Fixed from Last Spacing and Step/Break tool)
will automatically pan drawing to enable column insertion point etc. to be seen.
Version 4.1 – February 1998
1. All symbols revised for version 2 of HPC module, New symbols for decorative columnsand Symbols revised for spigot-mounted lanterns.
2. Additional cable and ducting linetypes.3. Improved column numbering.4. Additional configuration data in .INI file for simplified installation.5. Improved links with Plesir programme.6. New links to Optilume programme.7. Measuring tools.8. OS mapping and Trimming tools.9. Automatic Purging.10. Sample Isolux contours.11. Isolux handling facilities.12. Simplified Symbol default editing.13. HPC Version 2:
a. Introduction of branch cablesb. selective schedulesc. Automatic schematic diagram
Version 3 – July 1995
1. All symbols redefined to allow for use with H.P.C.2. High Mast and Flood-Light lighting units have attribute information.

- 247 -
3. High mast and floodlight symbols now have attribute data attached, and informationabout these symbols can be taken into the calculation packages. (Flood-Light via arrowsymbol).
4. Improved symbols for bollards.5. Export link to Industria (Plesir) Area package - links restricted by Plesir capabilities.6. Dialog boxes for data selection in data copy routine.7. Grid area displayed and changeable before export to Area programs.8. Import of results can now be colour graded to user requirements.9. 3D levels - new function can now display a symbolic 3D picture showing the relative
lighting levels of results from the Calculux and Urbis packages - translating numericalvalues to pictorial ones.
10. Ability to extract information to ASCII file.11. Ability to import information from ASCII file.12. Additional module (H.P.C.) for calculating required cable sizes to meet regulations (IEE
16th edition), with the results displayed either in tabular form on the drawing or in fileformat.
13. Column numbering can have prefix and suffix to incremental number.14. Column numbering can have pre-set scale for symbol.15. Individual columns can be labelled easily and automatically.16. Groups of columns can be selected by data value to make following operation easier.17. A LIGHTS.INI file exists to allow certain values to be set to user defaults.18. (DOS only) Ability to run calculation programs from routine rather than batch file, allow-
ing return to working directory. Batch files retained for non-standard systems.
Version 2.2 – December 1993
1. Links to Calculux Area and Road programs.
Version 2.1 – December 1992
1. Links to Urbis Area and Road programs.2. All symbols re-defined to prevent co-ordinate conflict, and allow transfer of data to cal-
culation packages.3. 3D features enhanced with hedge, wall, building line and trees.

- 248 -
4. Ability to re-calculate lighting levels over sub-area after importing results from calculationpackages.
5. Ability to pass column number on drawing into data attributes or vice versa.6. Ability to copy data from one column to others in the drawing.7. Functions to turn or rotate symbols, e.g. when moved to opposite side of road.8. Functions to enable user to see both plan view and 3D view simultaneously.9. Cable types expanded to eight.10. Tagging (labelling) for ducts and cable linetypes.11. Spacing function now also works from any point.

- 249 -
Chapter 12 - Installation and Configuration
Before you start
KeyLIGHTS has been designed for use with any system that can run AutoCAD (seemanuals supplied for the system requirements for AutoCAD). Version 6.2 of KeyLIGHTSis designed for use on AutoCAD R2015 – R2019. Also supported in the same range ofreleases are AutoCAD Map 3D and AutoCAD Civil 3D. Other ‘vertical’ versions ofAutoCAD can also be used.
Note
It is necessary to be logged in as a System Administrator to carry out this processcompletely.
As KeyLIGHTS includes an AutoCAD component, it will be necessary to installAutoCAD first. Please ensure that AutoCAD is working correctly before proceeding withthe KeyLIGHTS installation. When the correct operation of AutoCAD has been checked,follow the procedure outlined below.
12.1 System Requirements
Our software has been designed for use with any system that can run the versions ofAutoCAD supported by Autodesk (see AutoCAD manuals for the system requirementsfor AutoCAD). We offer the following recommended specification for the PC, appropriateat the time of writing:

- 250 -
System requirements for AutoCAD 2019OperatingSystem
l Microsoft® Windows® 10 (desktop OS)l Microsoft Windows 8.1 with Update KB2919355l Microsoft Windows 7 SP1
CPU Type 1 gigahertz (GHz) or faster 64-bit (x64) processor
Memory For 64-bit AutoCAD 2018:
l 4 GB (8 GB recommended)
DisplayResolution
1360x768 (1600x1050 or higher recommended) with True Colour.125% Desktop Scaling (120 DPI) or less recommended.
DisplayCard
Windows display adapter capable of 1360x768 with True Colour cap-abilities and DirectX® 9 ¹. DirectX 11 compliant card recommended.
DiskSpace
Installation 6.0 GB
PointingDevice
MS-Mouse compliant
Digitizer WINTAB support
Media(DVD)
Download and installation from DVD
Browser Windows Internet Explorer® 9.0 (or later)
.NETFramework
.NET Framework Version 4.6
ToolClipsMediaPlayer
Adobe Flash Player v10 or up
Network Deployment via Deployment Wizard.
The licence server and all workstations that will run applicationsdependent on network licensing must run TCP/IP protocol.Either Microsoft® or Novell TCP/IP protocol stacks are acceptable.Primary login on workstations may be Netware or Windows.
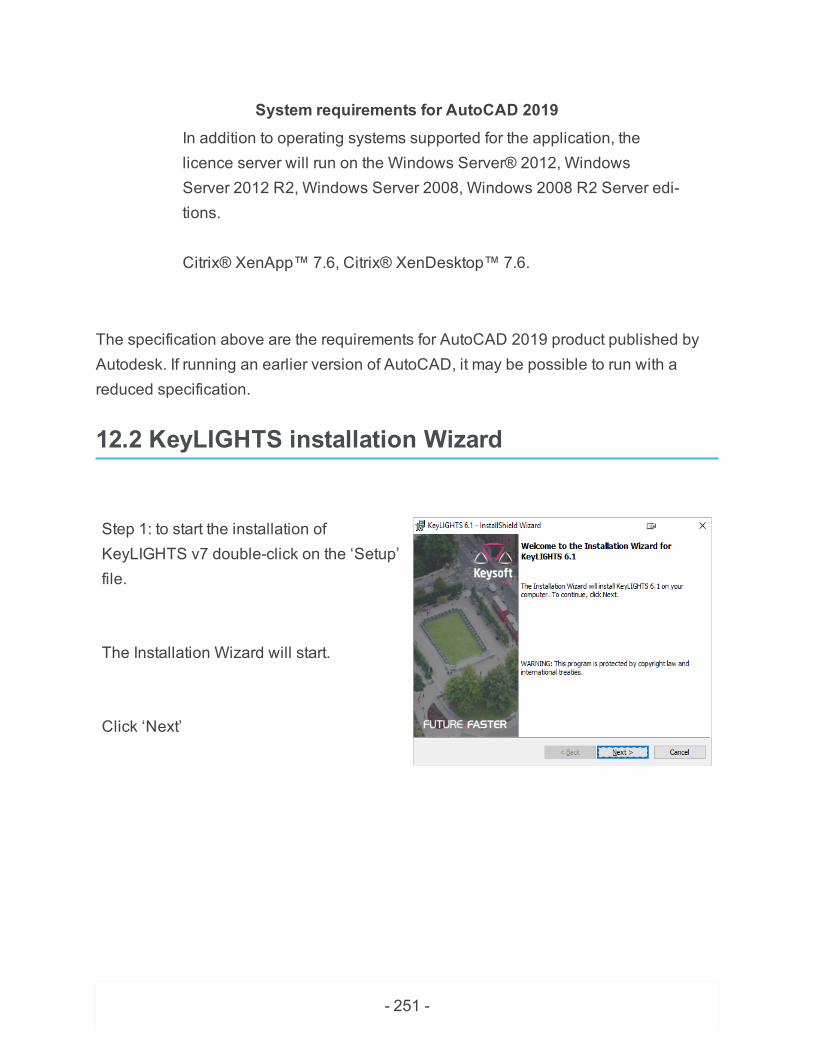
- 251 -
System requirements for AutoCAD 2019In addition to operating systems supported for the application, thelicence server will run on the Windows Server® 2012, WindowsServer 2012 R2, Windows Server 2008, Windows 2008 R2 Server edi-tions.
Citrix® XenApp™ 7.6, Citrix® XenDesktop™ 7.6.
The specification above are the requirements for AutoCAD 2019 product published byAutodesk. If running an earlier version of AutoCAD, it may be possible to run with areduced specification.
12.2 KeyLIGHTS installation Wizard
Step 1: to start the installation ofKeyLIGHTS v7 double-click on the ‘Setup’file.
The Installation Wizard will start.
Click ‘Next’

- 252 -
Step 2: After having read and agreed tothe Licence Agreement select ‘I accept theterms in the license agreement’.
Click ‘Next’
Step 3: Select the folder where the pro-gram will be installed. The default locationis:
C:\Program Files\Keysoft Solu-tions\KeyLIGHTS\6.1
It is strongly recommended that thisdefault is accepted
Once the program location has beendecided click ‘Next’

- 253 -
Step 4: The ready to install screen will beshown. Click ‘Install’ to install the program
Step 5: KeyLIGHTS will now be installed,this process may take several minutes

- 254 -
Step 6: KeyLIGHTS is now installed.

- 255 -
Appendices
Appendix A – Attribute to Data Mapping (v5 → v6) sets out the equivalence (map-ping) between the version 6 data fields and previous versions’ block attribute tags. It willenable an understanding of how a conversion will occur, either using the Mayrise/Yottaplotted symbols, or when converting an older drawing containing the AutoCAD block-based symbols.
Appendix B – EULUMDAT File Format Specification sets out the LDT file format thathas been implemented when reading the photometry data into the data for any luminairesymbol.
Appendix A – Attribute to Data Mapping (v5 → v6)
Version 5 BlockAttribute Tag
Version 6
Data FieldComp. Description
LAMP Lamp Type L Type of lampLANT - L Not currently usedLAMPWATT Total Wattage L Total wattage consumedLAMPFLUX Total Flux L Total luminous flux if the luminaire
in kilolumensLAMPTWIST Cant L Angular deviation from the hori-
zontal planeINCLIN Tilt L The tilt of the luminaire (aiming
angle for floodlighting)LANTNAME Luminaire Type L Luminaire nameBR-SDIST Horizontal
SourceL Internal distance from luminaire
mounting point to light source

- 256 -
Version 5 BlockAttribute Tag
Version 6
Data FieldComp. Description
DistanceBRACK Bracket
OutreachB Distance from column to luminaire
mounting pointMF Maintenance
FactorL Maintenance factor
HT LuminaireHeight
L Actual luminaire height
ROOT Root Type C The type of column foundation rootCOL Material C The material the column is made
fromSTAT Design Status C, B, L Design status (proposed/existing)CONTROL Control C, B, L Control typeSERVICE Service C, B, L Method of serviceCOMM1 Comment 1 C, B, LCOMM2 Comment 2 C, B, LCOMM3 Comment 3 C, B, LLOC Location C, B, L Location or districtSTREET Street C, B, L Street nameAREA Area C, B, L Area or WardCOLNO Column Num-
berC, B, L Column identity number
SCHNO Scheme Num-ber
C, B, L Scheme identity number
* L = Luminaire; B = Bracket; C = Column

- 257 -
Appendix B – EULUMDAT File Format Specification
The following table describes the format (layout) of the LDT photometry file. This spe-cification is followed by the KeyLIGHTS photometry file selector.
Item DesignationNumber ofCharacters
1 Company identification/data bank/version/format identificationmax.
Max. 78
2 Type indicator Ityp (1 - point source with symmetry about the ver-tical axis; 2 - linear luminaire; 3 - point source with any othersymmetry) [See Note 1]
1
3 Symmetry indicator Isym (0 - no symmetry; 1 - symmetry aboutthe vertical axis; 2- symmetry to plane C0-C180; 3- symmetry toplane C90-C270; 4- symmetry to plane C0-C180 and to planeC90-C270)
1
4 Number Mc of C-planes between 0 and 360 degrees (usually 24for interior, 36 for road lighting luminaires)
2
5 Distance Dc between C-planes (Dc = 0 for non-equidistantlyavailable C-planes)
5
6 Number Ng of luminous intensities in each C-plane (usually 19or 37)
2
7 Distance Dg between luminous intensities per C-plane (Dg = 0for non-equidistantly available luminous intensities in C-planes)
5
8 Measurement report number Max. 789 Luminaire name Max. 7810 Luminaire number Max. 7811 File name 812 Date/user Max. 7813 Length/diameter of luminaire (mm) 414 Width of luminaire b (mm) (b = 0 for circular luminaire) 415 Height of luminaire (mm) 4

- 258 -
Item DesignationNumber ofCharacters
16 Length/diameter of luminous area (mm) 417 Width of luminous area b1 (mm) (b1 = 0 for circular luminous
area of luminaire)4
18 Height of luminous area C0-plane (mm) 419 Height of luminous area C90-plane (mm) 420 Height of luminous area C180-plane (mm) 421 Height of luminous area C270-plane (mm) 422 Downward flux fraction DFF (%) 423 Light output ratio luminaire LORL (%) 424 Conversion factor for luminous intensities (depending on meas-
urement)6
25 Tilt of luminaire during measurement (road lighting luminaires) 626 Number n of standard sets of lamps (optional, also extendable
on company-specific basis)4
26a Number of lamps n * 426b Type of lamps n * 2426c Total luminous flux of lamps (lumens) n * 1226d Color appearance / color temperature of lamps n * 1626e Color rendering group / color rendering index n * 626f Wattage including ballast (watts) n * 827 Direct ratios DR for room indices k = 0.6 ... 5 (for determination
of luminaire numbers according to utilization factor method)10 * 7
28 Angles C (beginning with 0 degrees) Mc * 629 Angles G (beginning with 0 degrees) Ng * 630 Luminous intensity distribution (candela / 1000 lumens) [See
Note 2](Mc2-Mc1+1) *Ng * 6

- 259 -
NOTES1. Only linear luminaires (Ityp = 2) are being subdivided in longitudinal and trans-
verse directions.2. The parameters Mc1 and Mc2 for the luminous intensity distribution are determined
by:
Isym Mc1 Mc20 1 Mc1 1 12 1 Mc / 2 + 13 3 * Mc / 4 + 1 Mc1 + Mc / 24 1 Mc / 4 + 1
3. Each field is an ASCII string that is terminated with an MS-DOS <CR><LF> pair.