![Abhishek [Male] Om Sri During Uttarayana period; with Jupiter i](https://static.fdokumen.com/doc/165x107/63122a9b7efb61247603d5e5/abhishek-male-om-sri-during-uttarayana-period-with-jupiter-i.jpg)
Abhishek [Male] Om Sri During Uttarayana period; with Jupiter i
Upload
independentCategory
view
0download
0
arX
iv:1
106.
5510
v1 [
astr
o-ph
.EP]
27
Jun
2011
Draft version June 29, 2011Preprint typeset using LATEX style emulateapj v. 11/10/09
Kepler-14b: A MASSIVE HOT JUPITER TRANSITING AN F STAR IN A CLOSE VISUAL BINARY
Lars A. Buchhave1,2, David W. Latham3, Joshua A. Carter3,4, Jean-Michel Desert3, Guillermo Torres3,Elisabeth R. Adams3, Stephen T. Bryson5, David B. Charbonneau3, David R. Ciardi6, Craig Kulesa7,
Andrea K. Dupree3, Debra A. Fischer8, Francois Fressin3, Thomas N. Gautier III9, Ronald L. Gilliland10,Steve B. Howell5, Howard Isaacson11, Jon M. Jenkins12, Geoffrey W. Marcy11, Donald W. McCarthy13,
Jason F. Rowe12, Natalie M. Batalha14, William J. Borucki5, Timothy M. Brown15, Douglas A. Caldwell12,Jessie L. Christiansen12, William D. Cochran16, Drake Deming17, Edward W. Dunham18, Mark Everett19,
Eric B. Ford20, Jonathan J. Fortney21, John C. Geary3, Forrest R. Girouard22, Michael R. Haas5,Matthew J. Holman3, Elliott Horch23, Todd C. Klaus22, Heather A. Knutson11, David G. Koch5,
Jeffrey Kolodziejczak26, Jack J. Lissauer5, Pavel Machalek12, Fergal Mullally12, Martin D. Still25,Samuel N. Quinn3, Sara Seager24 Susan E. Thompson12, Jeffrey Van Cleve12
Draft version June 29, 2011
ABSTRACT
We present the discovery of a hot Jupiter transiting an F star in a close visual (0.3′′ sky projectedangular separation) binary system. The dilution of the host star’s light by the nearly equal magnitudestellar companion (∼ 0.5 magnitudes fainter) significantly affects the derived planetary parameters,and if left uncorrected, leads to an underestimate of the radius and mass of the planet by 10% and60%, respectively. Other published exoplanets, which have not been observed with high-resolutionimaging, could similarly have unresolved stellar companions and thus have incorrectly derived plane-tary parameters. Kepler-14b (KOI-98) has a period of P = 6.790 days and correcting for the dilution,has a mass of Mp = 8.40+0.19
−0.18MJ and a radius of Rp = 1.136+0.073−0.054RJ, yielding a mean density of
ρp = 7.1± 1.1 g cm−3.
Subject headings: planetary systems — stars: individual (Kepler-14b, KIC 10264660,2MASS J19105011+4719589) techniques: spectroscopic, photometric
1 Niels Bohr Institute, University of Copenhagen, DK-2100Copenhagen, Denmark
2 StarPlan, University of Copenhagen, Denmark3 Harvard-Smithsonian Center for Astrophysics, Cambridge,
MA 02138, USA4 Hubble Fellow5 NASAAmes Research Center, Moffett Field, CA 94035, USA6 NASA Exoplanet Science Institute/California Institute of
Technology, Pasadena, CA 91109, USA7 Lunar and Planetary Laboratory, University of Arizona, Tuc-
son, AZ 85721, USA8 Yale University, New Haven, CT 06520, USA9 Jet Propulsion Laboratory/California Institute of Technol-
ogy, Pasadena, CA 91109, USA10 Space Telescope Science Institute, Baltimore, MD 21218,
USA11 University of California, Berkeley, Berkeley, CA 94720, USA12 SETI Institute/NASA Ames Research Center, Moffett
Field, CA 94035, USA13 Steward Observatory, Uni. of Arizona, Tucson, AZ, USA14 San Jose State University, San Jose, CA 95192, USA15 Las Cumbres Observatory, Goleta, CA 93117, USA16 University of Texas, Austin, TX 78712, USA17 Solar System Exploration Division, NASA Goddard Space
Flight Center, Greenbelt, MD 20771, USA18 Lowell Observatory, Flagstaff, AZ 86001, USA19 National Optical Astronomy Observatory, Tucson, AZ
85719, USA20 University of Florida, Gainesville, FL 3261121 Department of Astronomy and Astrophysics, University of
California, Santa Cruz, CA 95064, USA22 Orbital Sciences Corporation/NASA Ames Research Cen-
ter, Moffett Field, CA 9403523 Department of Physics, Southern Connecticut State Uni-
versity, New Haven, CT 06515, USA24 Massachusetts Institute of Technology, Cambridge, MA
02159, USA25 BAER Institute, Moffett Field, CA 94035, USA26 MSFC, Huntsville, AL 35805 USA
1. INTRODUCTION
Kepler is a space-based telescope using transit pho-tometry to determine the frequency and characteristics ofplanets and planetary systems (Borucki et al. 2010). Theinstrument was launched in March 2009 and is a widefield-of-view (115 square degrees) photometer comprisedof a 0.95-meter effective aperture Schmidt telescope thatmonitors the brightness of about 150,000 stars. Recently,the first four months of photometric data were releasedand over 1200 transiting planet candidates were iden-tified (Borucki et al. 2011). Kepler-14b was identifiedamong the 1235 candidates as KOI-98. Because of itsshort period (P = 6.790 days) and its relatively deeptransit signal, it was identified very early in the missionand quickly passed on to the Kepler Follow-up Program(KFOP) for further investigation.Kepler-14b was scrutinized for evidence of astrophysi-
cal false positives and survived the initial follow-up stage.We therefore gathered high resolution, high signal-to-noise ratio (SNR) spectra in order to extract precise ra-
dial velocities (RVs) using the FIber-fed Echelle Spectro-graph (FIES) on the Nordic Optical Telescope (NOT) atLa Palma in October 2009. The observations yielded aspectroscopic orbit in phase with the photometric ob-servations from Kepler. Meanwhile, other ground basedobservations were gathered and speckle imaging revealedthat the host star of Kepler-14b was in fact not a singlestar, but a nearly equal magnitude binary system with asky projected separation of only 0.29′′. This complicatedthe analysis of the system, and Kepler-14b was thereforenot readied for publication together with the initial batchof five Kepler planets.

2 Buchhave et al.
0.998
0.999
1.000R
elat
ive
Flu
x
−4 −2 0 2 4Time since mid−transit [hr]
−300−150
0150300
O−
C[p
pm]
Figure 1. Light curve for Kepler-14b. The upper panel showsthe photometry folded with the orbital period of 6.790 days. Thefitted transit model is overplotted as a solid line. Residuals fromthe fit are displayed in the bottom panel.
Table 1Speckle measurements of Kepler-14
Band Separationa Position angleb ∆mag
V 0.286± 0.04 143.67 ± 0.07 0.52± 0.05R 0.289± 0.01 143.67 ± 0.07 0.54± 0.12I 0.289± 0.02 143.91 ± 0.05 0.45± 0.04
a In arcseconds.b In degrees.
In this paper, we present the confirmation of Kepler-14b as a planetary companion and analyze the photomet-ric and spectroscopic data taking into account the effectof the dilution by the stellar companion on the derivedplanetary parameters. Without the high spatial resolu-tion imaging, the stellar companion would not have beendetected and Kepler-14 would have been published withincorrect planetary parameters. Other published transit-ing planets that have not been observed with high spatialresolution imaging might suffer the same problem.
2. KEPLER PHOTOMETRY
We use the long cadence photometry (29.4 minute ac-cumulations) of Kepler-14 (KIC 10264660, 19h10m50.s12,+47◦19′58.′′98, J2000, KIC r = 12.128 mag) obtainedbetween 5 May 2009 to 7 September 2010 (Q0 throughQ6) (Jenkins et al. 2010b). The photometry is processedin an analysis pipeline (Jenkins et al. 2010c) to producecorrected pixel data. Simple aperture photometry sumsare formed to produce a photometric time series, whichwas detrended as explained in Koch et al. (2010). Thephotometric data folded with the orbital period of 6.790days are shown in Figure 1. The numerical data are avail-able electronically from the Multi Mission Archive at theSpace Telescope Science Institute (MAST) Web site27.
3. FOLLOW-UP OBSERVATIONS
3.1. High-resolution speckle imaging
Speckle observations of Kepler-14 were obtained on 6different nights between June and Oct 2010. The obser-vations were obtained with the dual channel WIYN tele-scope speckle camera recently described in Horch et al.(2011). The data collection, reduction, and image recon-struction process is described in the aforementioned pa-
27 http://archive.stsci.edu/kepler/
Figure 2. Speckle image of Kepler-14 with its obvious companionstar separated by 0.3′′of nearly equal brightness (∼ 0.5 magnitudefainter).
Figure 3. J and Ks Palomar adaptive optics images of Kepler-14,showing a 2′′ × 2′′ field of view centered on the brighter star.
per as well as in Howell et al. (2011). The latter presentsdetails of the 2010 season of observations for the Keplerfollow-up program.A spatially close (0.3′′), nearly equal brightness (∼ 0.5
magnitude fainter) companion star was easily noted inthe reconstructed speckle images. Table 1 gives theweighted mean values for the separation, position angle,and magnitude difference for our six speckle observations.The observations are weighted by the native seeing dur-ing the time of the speckle data collection as determinedby the data reduction routines when fitting known singlepoint source speckle standard stars obtained near in timeto the Kepler star observations. Figure 2 shows one ofthe reconstructed images of Kepler-14 with its obviouscompanion star.
3.2. High-resolution Palomar AO imaging
Near-infrared adaptive optics imaging of Kepler-14 wasobtained on the night of 03 July 2010 UT with thePalomar Hale 200-inch telescope and the PHARO near-infrared camera (Hayward et al. 2001) behind the Palo-mar adaptive optics system (Troy et al. 2000). PHARO,a 1024×1024 HgCdTe infrared array, was utilized in 25.1mas/pixel mode yielding a field of view of 25′′. Observa-tions were performed in both the J (λ0 = 1.25µm) andKs (λ0 = 2.145µm) filters. The data were collected ina standard 5-point quincunx dither pattern of 5′′ stepsinterlaced with an off-source (60′′ East) sky dither pat-tern. The integration time per source was 24.5 seconds

Kepler-14b 3
Figure 4. MMT/ARIES AO images of Kepler-14 showing a 2.4′′×2.4′′ field of view in J and Ks band. The binary nature of Kepler-14 is clear from the figure, with the fainter star, B, offset by 0.29±0.01′′ to the south-east.
at J and 12.75 seconds at Ks. A total of 20 frameswere acquired at J and Ks for a total on-source inte-gration time of 8.5 minutes and 4 minutes, respectively.The individual frames were reduced with a set of customIDL routines written for the PHARO camera and werecombined into a single final image. The adaptive opticssystem guided on the primary target itself; the widthsof the central cores of the resulting point spread func-tions were FWHM = 0.15′′ at J and FWHM = 0.1′′
at Ks. The final co-added images at J and Ks are shownin Figure 3.Other than the nearby object, two other sources were
detected within 10′′ of the primary target. The secondclosest object is separated from Kepler-14 by 5.5′′ to thenorthwest and has infrared magnitudes of J = 18.08 ±0.04 and Ks = 17.28 ± 0.01. An additional source wasdetected to the southwest at a distance of 6.2′′ havinginfrared magnitudes of J = 19.00±0.05 andKs = 18.14±0.04.The close pair was easily resolved by the adaptive op-
tics at both J and Ks. The pair is separated by ∼ 0.28′′
with a position angle of 142◦ east of north. The pairhas magnitude differences of ∆J = 0.34 ± 0.01 and∆Ks = 0.40± 0.01. The brighter infrared (and optical)source (component A) is the northwestern star.
3.3. High-resolution ARIES AO imaging
High-resolution AO images of Kepler-14 were obtainedusing the ARIES instrument on the 6.5-m MMT. ARIESis a near-infrared diffraction-limited imager and spectro-graph. On 8 November, 2009 it was operated in thef/15 mode, with a 40′′x40′′field of view and a pixel scaleof 0.04′′/pixel. All images of Kepler-14 had exposuretimes of 10 seconds, with 16 images in J (in a 4-point,4′′dither pattern) and 19 images taken in Ks (16 in a4-point, 4′′dither pattern, and 3 images at other offsets).The images for each filter were calibrated using standardIRAF28 procedures, and combined and sky-subtractedusing the IRAF task xdimsum.In both J and Ks, the binary appearance of Kepler-14
is clear, with the fainter star, B, offset by 0.29 ± 0.01′′
to the south-east. The separation is comparable to theimage FWHM (0.5′′in J and 0.3′′in Ks). The rela-tive magnitudes were estimated by PSF fitting, yielding∆J = 0.398± 0.008 and ∆K = 0.490± 0.005.
28 IRAF is distributed by the National Optical Astronomy Ob-servatories, which are operated by the Association of Universitiesfor Research in Astronomy, Inc., under cooperative agreement withthe National Science Foundation.
Table 2Relative Radial-Velocity Measurements of Kepler-14
HJD Phase RV σRV BS σBS
(days) (cycles) (m s−1) (m s−1) (m s−1) (m s−1)
2455048.454298 11.394 −246.1 25.0 21.4 7.42455052.427895 11.979 31.5 17.0 4.2 6.52455107.428247 20.079 −219.1 14.2 −6.8 4.92455108.417046 20.225 −385.2 15.4 −4.0 5.42455109.356436 20.363 −285.7 20.3 15.0 10.82455109.415242 20.372 −269.0 20.7 −1.7 5.32455111.453147 20.672 349.5 14.2 −30.5 6.92455112.462361 20.821 393.2 18.0 −41.2 8.72455113.456678 20.967 89.2 19.6 −5.8 7.02455114.494316 21.120 −260.0 25.6 18.4 6.32455115.492291 21.267 −404.0 30.2 51.2 11.02455122.475354 22.295 −387.8 20.3 −0.3 11.22455123.417485 22.434 −152.6 19.4 9.4 7.32455125.407529 22.727 398.5 19.4 −29.4 7.3
-400
-200
0
200
400
Rad
ial v
eloc
ity (
m s
-1)
-400
-200
0
200
400
Rad
ial v
eloc
ity (
m s
-1)
-500
50
Res
idua
ls
(m s
-1)
0.0 0.2 0.4 0.6 0.8 1.0Phase
-50
050
Bis
ecto
r
var.
(m
s-1)
Figure 5. Upper panel: Radial velocity measurements from the
FIbre–fed Echelle Spectrograph (FIES) at the 2.5m Nordic OpticalTelescope (NOT) at La Palma as a function of orbital phase withthe best orbital fit overplotted. The velocity of the system has beensubtracted and the fit assumes a circular orbit, fixing the ephemeristo that found by the photometry. Middle panel: Phased residualsof the velocities after subtracting the best fit model. The rmsvariation of the residuals is 16.2 m s−1. Bottom panel: Variationsof the bisector spans from the FIES spectra, with the mean valuesubtracted.
The delta magnitudes from the Palomar and ARIESAO imaging are thus similar, but the difference of 0.06magnitude in J and 0.09 magnitude in Ks suggests thatthe accuracy is worse than implied by the formal preci-sion. We combined all the Speckle and AO imaging re-sults for the assessment of the dilution from the nearbycompanion.
3.4. High-resolution high SNR spectroscopy
Spectroscopic observations of Kepler-14 were obtainedusing the FIbre–fed Echelle Spectrograph (FIES) at the2.5m Nordic Optical Telescope (NOT) at La Palma,Spain (Djupvik & Andersen 2010) as well as HIRES(Vogt et al. 1994) mounted on the Keck I telescope onMauna Kea, Hawaii. We acquired 17 FIES spectra be-tween 4 August and 20 October 2009, 3 of which were

4 Buchhave et al.
not used in the analysis because of very low SNR due topoor observing conditions. One HIRES template spec-trum was also observed on 10 September 2009 and usedto derive stellar parameters.For HIRES, we set the spectrometer slit to 0.′′86, re-
sulting in a resolving power of λ/∆λ ≈ 55,000 with awavelength coverage of ∼3800–8000A. We reduced theHIRES spectrum following a procedure based on thatdescribed by Butler et al. (1996).For FIES, we used the medium and the high–resolution
fibers (1.′′3 projected diameter) with resolving powers ofλ/∆λ ≈ 46,000 and 67,000, respectively, giving a wave-length coverage of ∼ 3600− 7400 A. We used the wave-length range from approximately ∼ 3900− 5800A to de-termine the radial velocities. The exposure time was ap-proximately 60 minutes yielding a SNR from 20 to 65 perpixel (SNR of 38 to 120 per resolution element) over thewavelength range used. The rather large range in SNRis due to the variation in instrumental throughput andthe stellar flux as a function of wavelength, and the lowerthroughput of the high resolution fiber.The FIES spectra were rectified and cross correlated
using a custom-built pipeline designed to provide pre-cise radial velocities for Echelle spectrographs. The pro-cedures are described in more detail in Buchhave et al.(2010). The science exposures were bracketed by twothorium argon (ThAr) calibration images taken throughthe same fiber and extracted using the same pipelineas the science exposures. The ThAr images were thencombined to form the basis for the fiducial wavelengthcalibration. Once the spectra had been extracted, across correlation was performed order by order using thestrongest exposure as the template. The orders werecross correlated using a Fast Fourier Transform (FFT)and the cross correlation functions (CCFs) for all the or-ders were co-added and fitted with a Gaussian functionto determine the radial velocity. Uncertainties of the in-dividual velocities were estimated by σ = RMS(v)/
√N ,
where v is the radial velocity of the individual orders andN is the number of orders.The light from the fainter, but nearly equal magnitude
stellar companion (B) dilutes the light of the brighterstar (A). In Section 5.1, use the photometric centroidto determine that it is the brighter star (A) which isundergoing transit and thus is the planet hosting star.The very small angular separation of 0.29′′makes it im-possible to separate the two stars on the fiber for thespectroscopic observations and it is thus necessary to ac-count for the effect of the dilution on the measured radialvelocities (see Section 5.2 and 5.7).In the observed FIES and HIRES spectra, we did not
see a composite spectrum in any of the observations. Wewould easily have been able to identify two cross corre-lation peaks from a composite spectrum, if the two starsdid not have nearly equal radial velocities. The combi-nation of the small angular separation of the two starsand the similar radial velocity makes the probability ofthe two stars being a chance alignment highly unlikely,and we therefore conclude that the two stellar compo-nents are gravitationally bound in a wide orbit yieldingan undetectable radial velocity offset between the twospectra.The radial velocity measurements of the combined light
of the two components in Kepler-14 are reported in Ta-ble 2. The radial velocities are relative, since they aremeasured relative to the strongest of the observed spec-tra adopted as the template. We made a separate esti-mate of the systemic velocity (the γ velocity) by corre-lating the observed spectra against the synthetic libraryspectrum best matching the stellar parameters. We tookthe mean of these velocities and subtracted the gravi-tational redshift of the Sun (0.636 km s−1), which is notincluded in the calculation of the synthetic library spec-tra. We found the mean γ velocity of Kepler-14b to beγ = 6.53± 0.30 km s−1.We fitted a circular orbit to the radial velocities re-
ported in Table 2, adopting the photometric ephemeris,leaving only the orbital semi-amplitude, K, and an arbi-trary RV offset as free parameters. A plot of the orbitalsolution is shown in the top panel in Figure 5 with theresiduals to the fit shown in the middle panel. The orbitalparameters are listed in Table 3. Allowing the eccen-tricity to be a free parameter only reduced the velocityresiduals by a small amount and yielded an eccentricitythat was insignificant (e = 0.035± 0.020). However, weincluded the eccentricity in the light curve analysis inSection 5.4 mainly to allow for more realistic uncertaintyestimates of the planetary parameters.
3.5. Bisector analysis
We carried out a bisector span analysis (Queloz et al.2001; Torres et al. 2007) of the FIES spectra to explorethe possibility that the transit like events are due to aneclipsing binary blended with light from a third star. Thebisector spans are plotted in the bottom panel of Figure5.Since the observed spectrum is a composite of the
planet hosting star and its fainter companion, which weassume is stationary in velocity with respect to the reflexmotion induced by the planet, we expect to see a slightasymmetry in the cross correlation peak as a functionof phase. The bisector span is defined as the velocity ofthe bisector measured near the bottom of the CCF mi-nus the velocity measured near the top, and we wouldthus expect a positive bisector span when the host staris moving toward us and a negative bisector span whenthe host star is moving away. In the bottom planet inFigure 5, we see a slight hint of this effect, with the bi-sector span being predominantly positive around phase0.25 and predominantly negative around phase 0.75. Theamplitude of the bisector spans is significantly less thanthe radial velocity semi-amplitude and the hint of vari-ation is in the expected direction, which supports theinterpretation that the radial velocity variations are dueto a planetary companion.
4. WARM-SPITZER OBSERVATIONS
Kepler-14 was observed during one transit with Warm-Spitzer/IRAC (Werner et al. 2004; Fazio et al. 2004) at4.5 µm (program ID 60028). The observation occurredon UT 2010 August 07 and the visit lasted approximately14 h 20 min. The data were gathered in full-frame mode(256 × 256 pixels) with an exposure time of 30 s perimage, which yielded 1700 images.The method we used to produce photometric time se-
ries from the images is described by Desert et al. (2009).

Kepler-14b 5
It consists of finding the centroid position of the stel-lar point spread function (PSF) and performing aper-ture photometry using a circular aperture on individualexposures. The images used are the Basic CalibratedData (BCD) delivered by the Spitzer archive. Thesefiles are corrected for dark current, flat-fielding, detec-tor non-linearity and converted into flux units. We con-vert the pixel intensities to electrons using the informa-tion on the detector gain and exposure time providedin the FITS headers. This facilitates the evaluation ofthe photometric errors. We extract the UTC-based Ju-lian date for each image from the FITS header (keywordDATE OBS) and correct to mid-exposure. We convertto TDB-based BJD using the UTC2BJD
29 procedure de-veloped by Eastman et al. (2010). This program usesthe JPL Horizons ephemeris to estimate the position ofSpitzer Space Telescope during the observations. Wethen correct for transient pixels in each individual im-age using a 20-point sliding median filter of the pixelintensity versus time. To do so, we compare each pixel’sintensity to the median of the 10 preceding and 10 follow-ing exposures at the same pixel position and we replaceoutliers greater than 4 σ with its median value. Thefraction of pixels we correct is less than 0.06%. The cen-troid position of the stellar PSF is determined using aDAOPHOT-type Photometry Procedure, GCNTRD, fromthe IDL Astronomy Library30. We use the APER routineto perform aperture photometry with a circular aper-ture of variable radius, using radii of 1.5 to 8 pixels, in0.5 steps. The propagated uncertainties are derived as afunction of the aperture radius; we adopt the one whichprovides the smallest errors. We find that the transitdepths and errors vary only weakly with the aperture ra-dius for all the light-curves analyzed in this project. Theoptimal aperture is found to have a radius of 4.0 pix-els. We estimate the background by fitting a Gaussianto the central region of the histogram of counts from thefull array. The contribution of the background to the to-tal flux from the stars is low for both observations, from0.1% to 0.55% depending on the images. Therefore, pho-tometric errors are not dominated by fluctuations in thebackground. We used a sliding median filter to select andtrim outliers in flux and position greater than 5 σ. Wealso discarded the first half-hour of observations, whichare affected by a significant telescope jitter before stabi-lization. The final number of photometric measurementsused is 1570. The raw time series is presented in the toppanel of Figure 6. We find that the point-to-point scatterin the photometry gives a typical signal-to-noise ratio of330 per image, which corresponds to 92% of the theoret-ical signal-to-noise. Therefore, the noise is dominated byPoisson photon noise.
5. ANALYSIS
5.1. Centroid shifts
We use a comparison of the photometric centroid in-and out-of-transit to determine which component con-tains the transit event. These centroids have been mea-sured for quarters 1-6 using two methods: a) a fit ofthe transit model to the whitened row and column cen-troid time series, which provides an average offset in row
29 http://astroutils.astronomy.ohio-state.edu/time/30 http://idlastro.gsfc.nasa.gov/homepage.html
and column for each quarter, and b) centroiding of quar-terly average in- and out-of-transit images, where thein-transit average is constructed from all in-transit ob-servations in a quarter and the out-of-transit average isconstructed from placing the same number of points oneach side of each transit event.Both methods measured essentially identical centroid
offsets. These offsets were used to reconstruct the posi-tion on the sky of the transiting object, using the meth-ods described in appendix A of Jenkins et al. (2010a).The final reconstructed transit source location is thenthe average of the reconstructed transit position over allquarters. The distance of this average reconstructed po-sition from component A is 0.025± 0.024 ′′ (1.04 sigma)and from component B is 0.251 ± 0.030 ′′ (8.33 sigma).We conclude that the transiting object is component A.
5.2. Spectroscopic parameters of the host star
As noted in Section 3.4, we cannot separate the twostellar components on the fiber of the spectrograph andwe thus observed the light from both stars in the spec-tra. As argued in Section 3.4, we assumed that the twostars are physically associated and that they formed to-gether at the same time. Since the stars have nearly thesame temperature due to their position on the H-R dia-gram, we concluded that the small magnitude differencewould result in an insignificant change in the host starparameters (see Section 5.3 for details).We derived stellar atmospheric parameters from both
the HIRES template spectrum and the high SNR FIESspectra used for the orbit determination, which can allbe used because they are not contaminated by absorptionfrom an iodine cell.For the HIRES spectrum, we used an analysis
package known as Spectroscopy Made Easy (SME;Valenti & Piskunov 1996), along with the atomic linedatabase of Valenti & Fischer (2005). From the HIRESspectrum using SME, we found the following parameters:effective temperature Teff⋆ = 6395 ± 60K, metallicity[Fe/H] = +0.12 ± 0.06dex, projected rotational veloc-ity v sin i = 7.9 ± 1.0 km s−1, and stellar surface gravitylog g⋆ = 4.11± 0.10 (cgs).For the FIES spectra, we derived stellar parameters fol-
lowing Torres et al. (2002) and Buchhave et al. (2010),and in addition we employ a new fitting scheme whichis currently still under development and being readiedfor publication, allowing us to extract more precise stel-lar parameters from the high SNR FIES spectra. Wemention these values here as a check on the SME val-ues, but adopt the SME values because our tools are stillunder development. From the FIES spectra, we foundeffective temperature Teff⋆ = 6378 ± 80K, metallicity[Fe/H] = 0.00 ± 0.12 dex, projected rotational velocityv sin i = 10.6 ± 1.0 km s−1, and stellar surface gravitylog g⋆ = 4.02 ± 0.21 (cgs). All values are in good agree-ment with the values derived from the SME analysis,within the uncertainties, except for the value of v sin i.
5.3. Properties of the host star
Global properties of the star including the mass andradius were determined with the help of the stellar evo-lution models from the series by Girardi et al. (2000).Isochrones for a wide range of ages were compared
6 Buchhave et al.
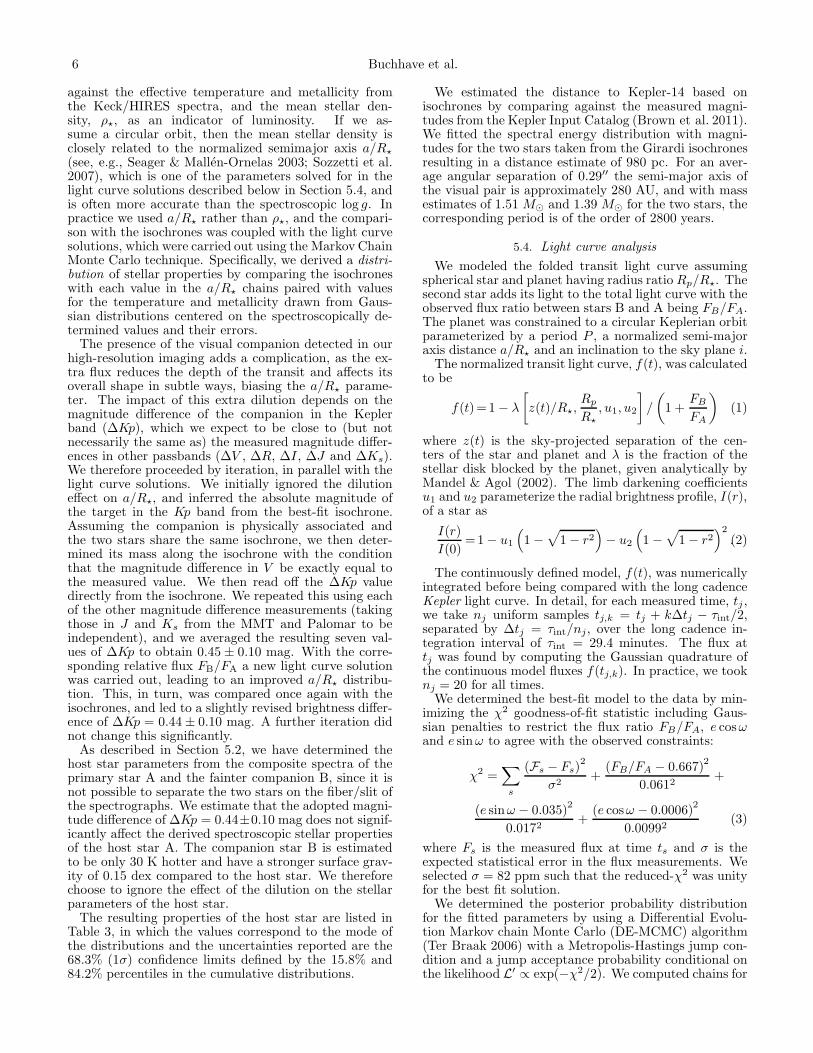
against the effective temperature and metallicity fromthe Keck/HIRES spectra, and the mean stellar den-sity, ρ⋆, as an indicator of luminosity. If we as-sume a circular orbit, then the mean stellar density isclosely related to the normalized semimajor axis a/R⋆
(see, e.g., Seager & Mallen-Ornelas 2003; Sozzetti et al.2007), which is one of the parameters solved for in thelight curve solutions described below in Section 5.4, andis often more accurate than the spectroscopic log g. Inpractice we used a/R⋆ rather than ρ⋆, and the compari-son with the isochrones was coupled with the light curvesolutions, which were carried out using the Markov ChainMonte Carlo technique. Specifically, we derived a distri-bution of stellar properties by comparing the isochroneswith each value in the a/R⋆ chains paired with valuesfor the temperature and metallicity drawn from Gaus-sian distributions centered on the spectroscopically de-termined values and their errors.The presence of the visual companion detected in our
high-resolution imaging adds a complication, as the ex-tra flux reduces the depth of the transit and affects itsoverall shape in subtle ways, biasing the a/R⋆ parame-ter. The impact of this extra dilution depends on themagnitude difference of the companion in the Keplerband (∆Kp), which we expect to be close to (but notnecessarily the same as) the measured magnitude differ-ences in other passbands (∆V , ∆R, ∆I, ∆J and ∆Ks).We therefore proceeded by iteration, in parallel with thelight curve solutions. We initially ignored the dilutioneffect on a/R⋆, and inferred the absolute magnitude ofthe target in the Kp band from the best-fit isochrone.Assuming the companion is physically associated andthe two stars share the same isochrone, we then deter-mined its mass along the isochrone with the conditionthat the magnitude difference in V be exactly equal tothe measured value. We then read off the ∆Kp valuedirectly from the isochrone. We repeated this using eachof the other magnitude difference measurements (takingthose in J and Ks from the MMT and Palomar to beindependent), and we averaged the resulting seven val-ues of ∆Kp to obtain 0.45 ± 0.10 mag. With the corre-sponding relative flux FB/FA a new light curve solutionwas carried out, leading to an improved a/R⋆ distribu-tion. This, in turn, was compared once again with theisochrones, and led to a slightly revised brightness differ-ence of ∆Kp = 0.44± 0.10 mag. A further iteration didnot change this significantly.As described in Section 5.2, we have determined the
host star parameters from the composite spectra of theprimary star A and the fainter companion B, since it isnot possible to separate the two stars on the fiber/slit ofthe spectrographs. We estimate that the adopted magni-tude difference of ∆Kp = 0.44±0.10 mag does not signif-icantly affect the derived spectroscopic stellar propertiesof the host star A. The companion star B is estimatedto be only 30 K hotter and have a stronger surface grav-ity of 0.15 dex compared to the host star. We thereforechoose to ignore the effect of the dilution on the stellarparameters of the host star.The resulting properties of the host star are listed in
Table 3, in which the values correspond to the mode ofthe distributions and the uncertainties reported are the68.3% (1σ) confidence limits defined by the 15.8% and84.2% percentiles in the cumulative distributions.
We estimated the distance to Kepler-14 based onisochrones by comparing against the measured magni-tudes from the Kepler Input Catalog (Brown et al. 2011).We fitted the spectral energy distribution with magni-tudes for the two stars taken from the Girardi isochronesresulting in a distance estimate of 980 pc. For an aver-age angular separation of 0.29′′ the semi-major axis ofthe visual pair is approximately 280 AU, and with massestimates of 1.51 M⊙ and 1.39 M⊙ for the two stars, thecorresponding period is of the order of 2800 years.
5.4. Light curve analysis
We modeled the folded transit light curve assumingspherical star and planet having radius ratio Rp/R⋆. Thesecond star adds its light to the total light curve with theobserved flux ratio between stars B and A being FB/FA.The planet was constrained to a circular Keplerian orbitparameterized by a period P , a normalized semi-majoraxis distance a/R⋆ and an inclination to the sky plane i.The normalized transit light curve, f(t), was calculated
to be
f(t)=1− λ
[
z(t)/R⋆,Rp
R⋆
, u1, u2
]
/
(
1 +FB
FA
)
(1)
where z(t) is the sky-projected separation of the cen-ters of the star and planet and λ is the fraction of thestellar disk blocked by the planet, given analytically byMandel & Agol (2002). The limb darkening coefficientsu1 and u2 parameterize the radial brightness profile, I(r),of a star as
I(r)
I(0)=1− u1
(
1−√
1− r2)
− u2
(
1−√
1− r2)2
.(2)
The continuously defined model, f(t), was numericallyintegrated before being compared with the long cadenceKepler light curve. In detail, for each measured time, tj ,we take nj uniform samples tj,k = tj + k∆tj − τint/2,separated by ∆tj = τint/nj, over the long cadence in-tegration interval of τint = 29.4 minutes. The flux attj was found by computing the Gaussian quadrature ofthe continuous model fluxes f(tj,k). In practice, we tooknj = 20 for all times.We determined the best-fit model to the data by min-
imizing the χ2 goodness-of-fit statistic including Gaus-sian penalties to restrict the flux ratio FB/FA, e cosωand e sinω to agree with the observed constraints:
χ2 =∑
s
(Fs − Fs)2
σ2+
(FB/FA − 0.667)2
0.0612+
(e sinω − 0.035)2
0.0172+
(e cosω − 0.0006)2
0.00992(3)
where Fs is the measured flux at time ts and σ is theexpected statistical error in the flux measurements. Weselected σ = 82 ppm such that the reduced-χ2 was unityfor the best fit solution.We determined the posterior probability distribution
for the fitted parameters by using a Differential Evolu-tion Markov chain Monte Carlo (DE-MCMC) algorithm(Ter Braak 2006) with a Metropolis-Hastings jump con-dition and a jump acceptance probability conditional onthe likelihood L′ ∝ exp(−χ2/2). We computed chains for

Kepler-14b 7
a parallel population of 90 members through ≈2 milliongenerations requiring that approximately 25% of jumpswere accepted on average amongst all population mem-bers. The chains were checked for adequate mixing andconvergence by visual inspection and by observing thatthe number of links was much larger than the autocor-relation length (equal to the number of links at whichthe chain autocorrelation drops below one half) for anyselected parameter. We report the 15.8% and 84.2% val-ues of the cumulative distribution for each parameter,marginalizing over the remaining parameters.
5.5. Analysis of the Warm-Spitzer light curves
We used a transit light curve model multiplied by in-strumental decorrelation functions to measure the tran-sit parameters and their uncertainties from the Warm-Spitzer data as described in Desert et al. (2011a). Wecomputed the transit light curves with the IDL tran-sit routine OCCULTNL from Mandel & Agol (2002). Thisfunction depends on one parameter: the planet-to-starradius ratio Rp/R⋆. The orbital semi-major axis to stel-lar radius ratio (system scale) a/R⋆, the impact param-eter b, and the time of mid transit Tc were fixed to thevalues derived from the Kepler light curve and correctedfor the dilution (See Table 3). We assumed that the limb-darkening is well-approximated by a non-linear law atinfrared wavelengths with four coefficients (Claret 2000)that we set to their values computed by Sing (2010).The Spitzer/IRAC photometry is known to be sys-
tematically affected by the so-called pixel-phase effect(see e.g., Charbonneau et al. 2005; Knutson et al. 2008).This effect is seen as oscillations in the measured fluxeswith a period of approximately 70 min (period of thetelescope pointing jitter) and an amplitude of approxi-mately 2% peak-to-peak. We decorrelated our signal ineach channel using a linear function of time for the base-line (two parameters) and a quadratic function of thePSF position (four parameters) to correct the data foreach channel. We performed a simultaneous Levenberg-Marquardt least-squares fit (Markwardt 2009) to thedata to determine the transit and instrumental modelparameters (7 in total). The errors on each photomet-ric point were assumed to be identical, and were set tothe RMS of the residuals of the initial best fit obtained.To obtain an estimate of the correlated and systematicerrors (Pont et al. 2006) in our measurements, we usedthe residual permutation bootstrap, or “Prayer Bead”,method as described in Desert et al. (2009). In thismethod, the residuals of the initial fit are shifted system-atically and sequentially by one frame, and then added tothe transit light curve model before fitting again. We al-lowed asymmetric error bars spanning 34% of the pointsabove and below the median of the distributions to de-rive the 1 σ uncertainties for each parameter as describedin Desert et al. (2011b).
5.6. Interpretation of the Warm-Spitzer observations
We compute the theoretical dilution factor by extrap-olating the Ks-band measurements to the Spitzer band-pass at 4.5 µm. We estimate that 36% of the photonsrecorded during the observation come from the compan-ion star. We conclude that the presence of the con-taminating star decreases the effective transit depth of
Figure 6. Warm-Spitzer transit light-curve of Kepler-14 observedin the IRAC band-pass at 4.5 µm. Top panel: raw and unbinnedtransit light-curve. The red solid lines correspond to the best fitmodels which include the time and position instrumental decorre-lations as well as the model for the planetary transit (see detailsin Section 4). Middle panel: corrected, binned by 25 minutes andnormalized transit light-curve with the best fit in red. Bottompanel: residuals of the data from the best fit.
0.0 0.2 0.4 0.6 0.8 1.0FB/FA
300
400
500
600
700
800
Vco
r (m
s-1)
Figure 7. The effect of the dilution of Kepler-14 on the measuredradial velocities as a function of flux ratio between the companionstar and the host star. The horizontal dashed line represents theobserved semi-amplitude of the system and the vertical dashed linerepresents the adopted flux ratio of the two stars. If the stars havethe same brightness, the corrected radial velocity is about twicethe observed and at large magnitude differences, the corrected ve-locities approach the observed, as expected.
Kepler-14 by a factor 0.61. We measure the transit depth(limb-darkening removed) of Kepler-14 at 4.5 µm andfind 1722+127
−138 ppm uncorrected for the dilution. This
corresponds to Rp/R⋆ = 0.0415+0.0015−0.0017. Applying the di-
lution correction we find Rp/R⋆ = 0.0531+0.0019−0.0021 which is
consistent with the value derived from the Kepler pho-tometry at better than the 2-σ level. Our Spitzer ob-servations provide an independent confirmation that thetransit signal is achromatic, which supports the plane-tary nature of Kepler-14b.
5.7. Dilution effect on the radial velocities
The measured radial velocities of the host star (A) areaffected by the light contributed by the companion star(B), because the spectrum of B is assumed to be sta-tionary in velocity, while the spectrum of A is Dopplershifted due to the gravitational pull of the planet. Theamplitude of the observed radial velocities will thus besmaller than if the light from A had not been diluted,since the peak of the cross correlation function (CCF)from which we derive the radial velocities will be pulledtoward the stationary CCF of B.In order to assess the dilution effect on the radial veloc-
ities and thus the semi-amplitude of the orbit, we mod-eled the effect using the observed spectrum of Kepler-14.We shifted the observed spectrum in 50 m s−1 incrementsand co-added the shifted spectrum, representing star A,

8 Buchhave et al.
with the same observed spectrum divided by a constantto simulate the stationary companion B at different fluxratios of f = FB/FA. We analyzed this composite spec-trum using the same tools used to extract the radial ve-locities for the orbit.The relation between the artificially induced radial ve-
locity shifts, Vin, and the resulting ”measured” radialvelocity shifts of the composite spectrum, Vout, is linearat given flux ratio, as expected: Vout = afVin, where afis the slope at a given flux ratio. Vin thus represents thetrue (corrected) radial velocities of the host star (Vcor)and Vout represents the observed radial velocities of thehost star (Vobs).We carried out this analysis at different flux ratios,
fitting the linear relation between Vin and Vout, thus ob-taining the slope af at each flux ratio. We then fittedthe slopes, af , themselves as a function of flux ratio witha 3rd order polynomial. This enables us to calculate thedilution effect for the system at any flux ratio:
Vcor =Vobs
af=
Vobs
c0 + c1f + c2f2 + c3f3(4)
where f is the flux ratio of the two stars and ci are thepolynomial coefficients of the 3rd order polynomial. Thedilution effect on the corrected radial velocities as a func-tion of flux ratio can be seen in Figure 7. The horizon-tal dotted line represents the observed semi-amplitudeof the system and the vertical dotted line represents theadopted flux ratio of the two stars. As a sanity check,we see that if the host star and companion have similarbrightness, the corrected radial velocity is about twicethe observed radial velocity and at large magnitude dif-ferences, the corrected radial velocity approaches the ob-served radial velocity, as expected.The observed orbital semi-amplitude of Kepler-14 is
Kobs = 401.7 ± 7.1m s−1. Since the two stars arenearly the same temperature, the dilution changes onlyminutely as a function of wavelength. We thus used themagnitude difference of ∆Kp = 0.44± 0.10 in all orders,and found the corrected semi-amplitude of the orbit tobe Kcor = 682.9± 7.1m s−1.
5.8. Dilution effect on the planetary parameters
The dilution of the nearly equal magnitude stellar com-panion significantly affects the derived planetary param-eters of Kepler-14b. The contamination affects the ob-served transit light curve depth and therefore the inferredradius ratio. In addition, this dilution has a significanteffect on the light curve profile affecting the inferred geo-metric orbital parameters, most notably the normalizedsemi-major axis, a/R⋆. If dilution effects are neglected,the mean stellar density estimate – which is acutely sen-sitive to a/R⋆ – used in conjunction with spectroscopicstellar constraints will yield significantly inaccurate de-rived stellar properties.If we assume that the flux contribution from B is zero
(i.e., FB/FA = 0 and Kobs = 401.7± 7.1m s−1), we findthat Rp,nocorr = 1.036+0.075
−0.084RJ. Using the derived mag-nitude difference ∆Kp = 0.44 ± 0.10, however, we findthe planetary radius to be Rp = 1.136+0.073
−0.054RJ, which isalmost 10% larger.As described in Section 5.7, the orbital semi-amplitude
is also significantly affected by the dilution. Us-
Figure 8. Mass–radius diagram of currently known transitingexoplanets. Kepler planets are shown as red squares and planetsfrom other surveys are shown as blue circles. The Solar systemplanets are shown as green triangles. The dotted lines are iso-density curves (in g cm−3). Kepler-14 is one of the most massivetransiting exoplanets discovered.
ing the observed orbital semi-amplitude of Kobs =401.7 ± 7.1m s−1, the uncorrected mass of Kepler-14bis Mp,nocorr = 5.14+0.15
−0.16MJ. After correction for dilu-tion, the semi-amplitude increases to Kcorr = 682.9 ±7.1m s−1, which in turn leads to a planetary mass thatis significantly larger than before (by ∼60%): Mp =
8.40+0.19−0.18MJ.
The effect of the dilution is much greater on the massthan on the radius of the transiting planet. As describedabove, the dilution of the observed transit light curvechanges not only the depth of the transit, but also thelight curve profile which in turn affects the inferred stellardensity estimate. The radius of the planet is thus notaffected greatly by the dilution, because these two effectswork against each other. The stellar mass, however, isnot strongly affected by the dilution and the effect onthe planetary mass therefore comes almost entirely fromcorrection of the orbital semi-amplitude.
6. DISCUSSION
We present the discovery of a transiting hot-Jupiter ina close visual binary. Had the visual companion not beendetected, the planetary parameters for Kepler-14b wouldhave been significantly biased. The dilution (∆Kp =0.44 ± 0.10 in the Kepler band) results in a planetarymass that, if left uncorrected, is only 60% of the correctvalue, and a planetary radius that is too small by about10%.The close angular separation of this physically associ-
ated visual companion makes it essentially undetectablespectroscopically: the similar radial velocity as the mainstar means the spectrum is effectively single-lined, andthe wide orbit (P ∼ 2800 yr) implies motion that is slowenough that there are no measurable changes in the ve-locity of the primary due to this companion. It is onlywith high-resolution imaging that we were able to detectit. Many of the over 120 published transiting planetsand the over 500 published radial velocity planets havenot been subjected to high-resolution imaging. It is thuspossible that some of the published exoplanets have in-correctly determined planetary parameters, if they have astellar companion like Kepler-14 and the companion hasnot been taken into account. Since many of the published

Kepler-14b 9
Table 3System Parameters for Kepler-14
Parameter Uncorrected Corrected(Adopted)
Transit and orbital parameters
Orbital period P (d)a,h . . . . . . . . . . . . . 6.7901230 ± 0.0000043Midtransit time E (HJD)a . . . . . . . . . . . . . 2454971.08737 ± 0.00018Transit duration (days)a,g 0.2561+0.0025
−0.0025 0.2591+0.0040−0.0039
Scaled semimajor axis a/R⋆a,b 7.472+0.481
−0.371 8.213+0.578−0.093
Scaled planet radius Rp/R⋆a,b 0.0448+0.0008
−0.0002 0.0569 ± 0.0013
Impact parameter b ≡ a cos i/R⋆a,b 0.531+0.088
−0.078 0.00+0.41−0.00
Orbital inclination i (deg)a,b 85.92+0.80−0.92 90.0+0.0
−2.8
Orbital semi-amplitude K (m s−1)b,c 401.7± 7.1 682.9± 7.1e sinωa,c . . . . . . . . . . . . . 0.0350 ± 0.0170e cosωa,c . . . . . . . . . . . . . 0.0006 ± 0.0099Center-of-mass velocity γ (km s−1)c . . . . . . . . . . . . . 6.53± 0.30
Observed stellar parameters
Kepler magnitude Kp f . . . . . . . . . . . . . 12.128Effective temperature Teff (K)d . . . . . . . . . . . . . 6395 ± 60Spectroscopic gravity log g (cgs)d . . . . . . . . . . . . . 4.11± 0.10Metallicity [Fe/H]d . . . . . . . . . . . . . +0.12± 0.06Projected rotation v sin i (km s−1)d . . . . . . . . . . . . . 7.9± 1.0
Derived stellar parameters
Mass M⋆(M⊙)d,e 1.604+0.057−0.060 1.512 ± 0.043
Radius R⋆(R⊙)d,e 2.358+0.147−0.166 2.048+0.112
−0.084
Surface gravity log g⋆ (cgs)d,e 3.899+0.049−0.041 3.994+0.028
−0.036
Luminosity L⋆ (L⊙)d,e 8.30+1.16−1.17 6.29+0.75
−0.58
Age (Gyr)d,e 2.0+0.2−0.2 2.2+0.2
−0.1
Distance (pc)e,f . . . . . . . . . . . . . 980
Planetary parameters
Mass Mp (MJ)a,b,c,d,e 5.14+0.15
−0.16 8.40+0.19−0.18
Radius Rp (RJ, equatorial)a,b,c,d,e 1.036+0.075
−0.084 1.136+0.073−0.054
Density ρp (g cm−3)a,b,c,d,e 5.7+1.5−1.0 7.1± 1.1
a Based on the Kepler photometry.b Based on the dilution by the companion star.c Based on the FIES radial velocities.d Based on an SME analysis on the HIRES spectra.e Based on the Girardi stellar evolution models.f Based on the Kepler Input Catalog.g First to fourth contact point.h The actual orbital period differs fractionally from this value by 2.2± 0.1× 10⁻⁵ as aresult of time dilation for the quoted gamma velocity.
transiting planets have bright host stars, a campaign togather high-resolution imaging of the host stars could becarried out with a modest amount of telescope time.In this paper we confirm and characterize the plan-
etary nature of Kepler-14b, also known as KOI-98 inBorucki et al. (2011). Kepler-14b has a period of P =6.7901230±0.0000043 days, a mass ofMp = 8.40+0.19
−0.18MJ
and a radius of Rp = 1.136+0.073−0.054RJ, yielding a mean
density of ρp = 7.1± 1.1 g cm−3. Not taking the dilutioninto account, the derived mass and radius of the planetwould be Mp,nocorr = 5.14+0.15
−0.16MJ and Rp,nocorr =
1.036+0.075−0.084RJ.
Kepler-14b is plotted on a mass–radius diagram in Fig-ure 8, which shows all the known transiting exoplanets.Kepler-14b is one of the most massive transiting exoplan-ets discovered and is situated in a less dense part of themass–radius diagram together with six other planets ofsimilar mass.
Acknowledgments. The work of L.A.B. was supportedby the Carlsberg Foundation. Funding for this Discov-ery Mission is provided by NASA’s Science Mission Di-rectorate. This paper uses observations obtained withthe Nordic Optical Telescope, operated on the island ofLa Palma jointly by Denmark, Finland, Iceland, Norway,and Sweden, in the Spanish Observatorio del Roque delos Muchachos of the Instituto de Astrofisica de Canarias.This work is also based on observations made with theSpitzer Space Telescope which is operated by the JetPropulsion Laboratory, California Institute of Technol-ogy under a contract with NASA. Support for this workwas also provided by NASA through an award issued byJPL/Caltech.Facilities: The Kepler Mission, NOT (FIES), Keck:I
(HIRES), Spitzer Space Telescope, WIYN (Speckle),Palomar (AO), ARIES (AO)

10 Buchhave et al.
REFERENCES
Borucki, W. J., et al. 2010, Science, 327, 977—. 2011, ArXiv e-printsBrown, T. M., Latham, D. W., Everett, M. E., & Esquerdo, G. A.
2011, ArXiv e-printsBuchhave, L. A., et al. 2010, ApJ, 720, 1118Butler, R. P., Marcy, G. W., Williams, E., McCarthy, C.,
Dosanjh, P., & Vogt, S. S. 1996, PASP, 108, 500Charbonneau, D., et al. 2005, ApJ, 626, 523Claret, A. 2000, A&A, 363, 1081Desert, J.-M., Lecavelier des Etangs, A., Hebrard, G., Sing,
D. K., Ehrenreich, D., Ferlet, R., & Vidal-Madjar, A. 2009,ApJ, 699, 478
Desert, J.-M., et al. 2011a, ArXiv e-prints—. 2011b, A&A, 526, A12+Djupvik, A. A., & Andersen, J. 2010, in Highlights of Spanish
Astrophysics V, ed. J. M. Diego, L. J. Goicoechea,J. I. Gonzalez-Serrano, & J. Gorgas, 211–+
Eastman, J., Siverd, R., & Gaudi, B. S. 2010, PASP, 122, 935Fazio, G. G., et al. 2004, ApJS, 154, 39Girardi, L., Bressan, A., Bertelli, G., & Chiosi, C. 2000, A&AS,
141, 371Hayward, T. L., Brandl, B., Pirger, B., Blacken, C., Gull, G. E.,
Schoenwald, J., & Houck, J. R. 2001, PASP, 113, 105Horch, E. P., Gomez, S. C., Sherry, W. H., Howell, S. B., Ciardi,
D. R., Anderson, L. M., & van Altena, W. F. 2011, AJ, 141, 45Howell, S. B., Everett, M. E., Sherry, W., Horch, E., & Ciardi,
D. R. 2011Jenkins, J. M., et al. 2010a, ApJ, 724, 1108—. 2010b, ApJ, 713, L120—. 2010c, ApJ, 713, L87
Knutson, H. A., Charbonneau, D., Allen, L. E., Burrows, A., &Megeath, S. T. 2008, ApJ, 673, 526
Koch, D. G., et al. 2010, ApJ, 713, L131Mandel, K., & Agol, E. 2002, ApJ, 580, L171Markwardt, C. B. 2009, in Astronomical Society of the Pacific
Conference Series, Vol. 411, Astronomical Data AnalysisSoftware and Systems XVIII, ed. D. A. Bohlender, D. Durand,& P. Dowler, 251–+
Pont, F., Zucker, S., & Queloz, D. 2006, MNRAS, 373, 231Queloz, D., et al. 2001, A&A, 379, 279Seager, S., & Mallen-Ornelas, G. 2003, ApJ, 585, 1038Sing, D. K. 2010, A&A, 510, A21+Sozzetti, A., Torres, G., Charbonneau, D., Latham, D. W.,
Holman, M. J., Winn, J. N., Laird, J. B., & O’Donovan, F. T.2007, ApJ, 664, 1190
Ter Braak, C. 2006, Statistics and Computing, 16, 239,10.1007/s11222-006-8769-1
Torres, G., Neuhauser, R., & Guenther, E. W. 2002, AJ, 123, 1701Torres, G., et al. 2007, ApJ, 666, L121Troy, M., et al. 2000, in Society of Photo-Optical Instrumentation
Engineers (SPIE) Conference Series, Vol. 4007, Society ofPhoto-Optical Instrumentation Engineers (SPIE) ConferenceSeries, ed. P. L. Wizinowich, 31–40
Valenti, J. A., & Fischer, D. A. 2005, ApJS, 159, 141Valenti, J. A., & Piskunov, N. 1996, A&AS, 118, 595Vogt, S. S., et al. 1994, in Society of Photo-Optical
Instrumentation Engineers (SPIE) Conference Series, Vol. 2198,Society of Photo-Optical Instrumentation Engineers (SPIE)Conference Series, ed. D. L. Crawford & E. R. Craine, 362–+
Werner, M. W., et al. 2004, ApJS, 154, 1
Copyright © 2022 FDOKUMEN