Jupiter: a toolkit for interactive large model visualization
7
To appear in the IEEE 2001 Symposium on Parallel and Large Data Visualization and Graphics proceedings Jupiter: A Toolkit for Interactive Large Model Visualization Dirk Bartz, Dirk Staneker, Wolfgang Straßer WSI/GRIS, University of T¨ ubingen, Germany Brian Cripe, Tom Gaskins, Kristann Orton Hewlett-Packard Company, Corvallis, OR, USA Michael Carter, Andreas Johannsen, Jeff Trom Engineering Animation Inc., Ames, IA, USA Abstract The fast increasing size of datasets in scientific computing, me- chanical engineering, or virtual medicine is quickly exceeding the graphics capabilities of modern computers. Toolkits for the large model visualization address this problem by combining efficient ge- ometric techniques, such as occlusion and visibility culling, mesh reduction, and efficient rendering. In this paper, we introduce Jupiter, a toolkit for the interactive visualization of large models which exploits the above mentioned techniques. Jupiter was originally developed by Hewlett-Packard and EAI, and it was recently equipped with new functionality by the University of T¨ ubingen, as being part of the Kelvin project. Earlier this year, an initial version of Jupiter was also released as open source. CR Categories: I.3.3 [Picture/Image Generation]: Viewing Algo- rithms, Occlusion Culling; I.3.4 [Graphics Utilities]: Application Packages, Graphics Packages; I.3.5 [Computational Geometry and Object Modeling]: Object Hierarchies; I.3.7 [Three-Dimensional Graphics and Realism]: Hidden Line/Surface Removal; Keywords: Large Model Visualization, Toolkit, Visibility and oc- clusion culling. 1 INTRODUCTION In recent years, Large Model Visualization (LMV) or Large Scale Data Visualization became one of the most important research fields in scientific computing. The reason of the emergence of LMV lies in the fast increasing size of datasets from various sources. Re- search efforts are mostly driven by simulation of natural phenom- ena (ie., global and regional weather, ocean dynamics, high energy and astro-physics, etc.), the increasing dataset size of medical scan- ners (ie., multi-slice Computer Tomography, rotational biplanar X- ray) and design review tasks in product data management systems (PDM). The developed techniques focus on database management, architectural aspects of large computing systems, parallel comput- ing, and last but not least, rendering techniques for the visualization of large models. Two issues are usually the major subject of large data handling; memory efficiency and rendering performance. However, many bartz,dstaneke,strasser @gris.uni-tuebingen.de standard visualization techniques require substantial auxiliary data like spatial data-structures or distance fields which are usually com- puted in a pre-process. Storing this data can exceed the memory capacities of the visualization host computer, prompting the use of different visualization algorithms. Some visualization applications, ie. design review tasks or intra-operative navigation-based visual- ization in medicine, require a certain rendering performance to pro- vide interactive or even real-time framerates, where an interactive framerate usually specifies more than ten frames-per-second (fps), and a real-time framerate more than 20 fps. Unfortunately, the data volume generated by applications in architecture, medicine, me- chanical engineering, or scientific computing grows faster than the rapidly increasing graphics performance of modern graphics sub- systems. This growing divide requires approaches which reduce the complexity by orders of magnitude. Several methods have been proposed in the recent years to ad- dress this divide. Among the most popular are mesh-reduction [12] and subdivision [34], visibility and occlusion culling [7], parallel processing [4], geometry compression [31], image-based rendering [9], and recently, point-based rendering [6, 21, 23]. Some of these techniques have been integrated in modern 3D rendering toolkits for large models, such as Jupiter. This paper is organized as follows; the next section briefly re- views related toolkits for visualization of large models. In Sec- tion 2, we introduce the Jupiter toolkit for large model visualization and present our extensions in Section 3. Finally, we summarize our results in Section 4. 1.1 Related Work Many research projects focussed on the visualization of large datasets. Some aim at a ray-based visualization [13, 20, 17, 32], others aim at a polygonal representation [30, 22, 14, 15]. Here, we concentrate on polygon-based visualization systems. Among the first systems is the OpenInventor toolkit [30, 33]. OpenInventor emphasized modeling and manipulation aspects which led to a rich functionality and a wide acceptance in the computer graphics com- munity and became an open source project in 2000. Unfortunately, interactive rendering was not a major project goal of OpenInventor, which was complemented by the IRIS Performer toolkit [22] that focussed in particular on interactive rendering in multi-pipe and multi-processor environments. Concepts of IRIS Performer were later incorporated in SGI’s OpenGL Optimizer [15], a toolkit for the efficient rendering of large models. OpenGL Optimizer was built on top of the Cosmo3D scene graph API, which in turn was built on top of the OpenGL graphics API. It provided multi-processor support, view-frustum and occlusion culling (based on SGI’s histogram ex- tension), and many other tools, similar to the toolsets provided by Jupiter, which was developed at the same time by Hewlett-Packard (HP) and Engineering Animation Inc. (EAI). This year, Jupiter be- came open source as part of the Kelvin project (see Section 2). The technology of Jupiter and OpenGL Optimizer was also planned to be part of the Fahrenheit project, which was started in late 1997 by HP, Microsoft, and SGI. With the departure of SGI from the Fahren-
-
Upload
independent -
Category
Documents
-
view
0 -
download
0
Transcript of Jupiter: a toolkit for interactive large model visualization

To appear in the IEEE 2001 Symposium on Parallel and Large Data Visualization and Graphics proceedings
Jupiter: A Toolkit for Interactive Large Model Visualization
Dirk Bartz, Dirk Staneker, Wolfgang StraßerWSI/GRIS�, University of Tubingen, Germany
Brian Cripe, Tom Gaskins, Kristann OrtonHewlett-Packard Company, Corvallis, OR, USA
Michael Carter, Andreas Johannsen, Jeff TromEngineering Animation Inc., Ames, IA, USA
Abstract
The fast increasing size of datasets in scientific computing, me-chanical engineering, or virtual medicine is quickly exceeding thegraphics capabilities of modern computers. Toolkits for the largemodel visualization address this problem by combining efficient ge-ometric techniques, such as occlusion and visibility culling, meshreduction, and efficient rendering.
In this paper, we introduceJupiter, a toolkit for the interactivevisualization of large models which exploits the above mentionedtechniques.Jupiter was originally developed by Hewlett-Packardand EAI, and it was recently equipped with new functionality by theUniversity of Tubingen, as being part of theKelvinproject. Earlierthis year, an initial version ofJupiter was also released as opensource.
CR Categories: I.3.3 [Picture/Image Generation]: Viewing Algo-rithms, Occlusion Culling; I.3.4 [Graphics Utilities]: ApplicationPackages, Graphics Packages; I.3.5 [Computational Geometry andObject Modeling]: Object Hierarchies; I.3.7 [Three-DimensionalGraphics and Realism]: Hidden Line/Surface Removal;
Keywords: Large Model Visualization, Toolkit, Visibility and oc-clusion culling.
1 INTRODUCTION
In recent years, Large Model Visualization (LMV) or Large ScaleData Visualization became one of the most important research fieldsin scientific computing. The reason of the emergence of LMV liesin the fast increasing size of datasets from various sources. Re-search efforts are mostly driven by simulation of natural phenom-ena (ie., global and regional weather, ocean dynamics, high energyand astro-physics, etc.), the increasing dataset size of medical scan-ners (ie., multi-slice Computer Tomography, rotational biplanar X-ray) and design review tasks in product data management systems(PDM). The developed techniques focus on database management,architectural aspects of large computing systems, parallel comput-ing, and last but not least, rendering techniques for the visualizationof large models.
Two issues are usually the major subject of large data handling;memory efficiency and rendering performance. However, many
�fbartz,dstaneke,[email protected]
standard visualization techniques require substantial auxiliary datalike spatial data-structures or distance fields which are usually com-puted in a pre-process. Storing this data can exceed the memorycapacities of the visualization host computer, prompting the use ofdifferent visualization algorithms. Some visualization applications,ie. design review tasks or intra-operative navigation-based visual-ization in medicine, require a certain rendering performance to pro-vide interactiveor evenreal-time framerates, where an interactiveframerate usually specifies more than ten frames-per-second (fps),and a real-time framerate more than 20 fps. Unfortunately, the datavolume generated by applications in architecture, medicine, me-chanical engineering, or scientific computing grows faster than therapidly increasing graphics performance of modern graphics sub-systems. This growing divide requires approaches which reducethe complexity by orders of magnitude.
Several methods have been proposed in the recent years to ad-dress this divide. Among the most popular are mesh-reduction [12]and subdivision [34], visibility and occlusion culling [7], parallelprocessing [4], geometry compression [31], image-based rendering[9], and recently, point-based rendering [6, 21, 23]. Some of thesetechniques have been integrated in modern 3D rendering toolkitsfor large models, such asJupiter.
This paper is organized as follows; the next section briefly re-views related toolkits for visualization of large models. In Sec-tion 2, we introduce theJupitertoolkit for large model visualizationand present our extensions in Section 3. Finally, we summarize ourresults in Section 4.
1.1 Related Work
Many research projects focussed on the visualization of largedatasets. Some aim at a ray-based visualization [13, 20, 17, 32],others aim at a polygonal representation [30, 22, 14, 15]. Here, weconcentrate on polygon-based visualization systems. Among thefirst systems is the OpenInventor toolkit [30, 33]. OpenInventoremphasized modeling and manipulation aspects which led to a richfunctionality and a wide acceptance in the computer graphics com-munity and became an open source project in 2000. Unfortunately,interactive rendering was not a major project goal of OpenInventor,which was complemented by the IRIS Performer toolkit [22] thatfocussed in particular on interactive rendering in multi-pipe andmulti-processor environments. Concepts of IRIS Performer werelater incorporated in SGI’s OpenGL Optimizer [15], a toolkit for theefficient rendering of large models. OpenGL Optimizer was built ontop of the Cosmo3D scene graph API, which in turn was built on topof the OpenGL graphics API. It provided multi-processor support,view-frustum and occlusion culling (based on SGI’s histogram ex-tension), and many other tools, similar to the toolsets provided byJupiter, which was developed at the same time by Hewlett-Packard(HP) and Engineering Animation Inc. (EAI). This year,Jupiter be-came open source as part of theKelvin project (see Section 2). Thetechnology ofJupiterand OpenGL Optimizer was also planned tobe part of the Fahrenheit project, which was started in late 1997 byHP, Microsoft, and SGI. With the departure of SGI from the Fahren-

To appear in the IEEE 2001 Symposium on Parallel and Large Data Visualization and Graphics proceedings
heit project in 1999, this project came to a virtual halt. The lack of ascene graph-based large model visualization Application Program-ming Interface (API) prompted in 2000 the start of theOpenSGproject [10]. OpenSGis planned as an open source project withmulti-processor support and a variety of geometric tools, such assimplification, subdivision, or culling.
Other systems for large model visualization include the also opensource Visualization Toolkit (VTK) [25], the Utah SCIRun project[19], the General Electric Galileo system [28], or the UNC walk-through project [1].
2 THE JUPITER TOOLKIT
In this section, we describeJupiter, a scene graph-based toolkitfor the interactive visualization of large polygonal models [14].Jupiter is based on a software initiative of Hewlett-Packard Com-pany (HP) and Engineering Animation Inc. (EAI) which led earlyin 1997 to the large model toolkitJupiter, formerly also known asDirectModel[8]. (The rights to the name “DirectModel” were lateracquired by Microsoft.) This initiative was canceled later the sameyear, in favor of the Fahrenheit project of HP, Microsoft, and SGI,which included the development of API layers for scene graph-based rendering (Fahrenheit Scene Graph) and for the visualizationof large models (Fahrenheit Large Model). EAI continued work-ing on Jupiter. With the virtual halt of the Fahrenheit project in1999, Jupiter was re-launched by HP as the OpenSource projectKelvin in collaboration with the WSI/GRIS of the University ofTubingen [29]. The two main goals of theKelvin project were theport ofJupiterto PC-based Linux, and the development and imple-mentation of advanced occlusion culling mechanisms, intoJupiter.The source code ofJupiter is now available for download fromhttp://www.gris.uni-tuebingen.de/kelvin.
Originally, Jupiterwas developed as platform and graphics APIindependent toolkit, available with support for OpenGL, Direct3D,and StarBase on Windows and UNIX systems. In the current ver-sion,Jupiter is limited to OpenGL and in the first releases to UNIXsystems (Linux, HP-UX, IRIX1).
2.1 Jupiter Scene Graph
Models are represented inJupiteraslogical graphswhich describea hierarchical organization of the objects of the model. Essentially,this logical graph is nothing else than a scene graph of the model.Therefore, we will only use the term scene graph in the course ofthis paper. These hierarchical representation can be generated froma model database (ie., from an assembly part list of a MCAD prod-uct data management system), from architectural drawings, fromregular subdivision schemes (such as BSP-trees [11], octrees [24],or k-d trees [5]), or they are generated from a “soup” of polygonsby a variety of different methods [18]. The scene graph can alsocontain different levels of detail to allow the rendering at differentfidelity levels to account for the available rendering resources. Incontrast to OpenInventor-like scene graphs [30], nodes inherit at-tributes only top-down (from parent nodes to child nodes), but notfrom the left to the right (through sibling nodes). This enables theparallel evaluation of subtrees of the scene graph, which is plannedfor later versions ofJupiter.
1Note that some of the occlusion culling functionality uses the HP oc-clusion culling flag (HP occlusion flag) [26], which is only available onthe HP Visualize FX series of graphics subsystems. Consequently, the re-lated functionality is neither available on Linux systems with other graphicssubsystems (until similar functionality become available), nor on IRIX sys-tems. However, this is going to change in the future; nVIDIA has alreadyannounced occlusion culling support similar to the HP occlusion culling flagfor the new GeForce3 graphics card.
JtShapeJtPartition JtGroup JtInstance JtLOD
JtPolylineSetJtTriStripSet JtPolygonSet
JtVertexShape
JtNode
JtRangeLOD
Figure 1:Jupiternode class hierarchy
A scene graph inJupiter is an acyclic directed graph. It con-sists of a variety of nodes (see Fig. 1) which describe the partitionof the model into objects and groups of objects (see Fig. 2). Ob-jects or group of objects can be instantiated byJtInstance, whereindividual transformation matrix of every node might specify a dif-ferent 3D location. Furthermore, a group can provide the (groupof) objects at different levels of details (JtLOD). Partitions of the
Figure 2: Jupiter scene graph of a wheel from the Formula Onemodel (see also Fig. 3).
model (JtPartition) specify subtrees of the scene graph which canbe dynamically swapped to disc, if they are evaluated having a lowpriority, or restored from disc otherwise. This swapping mecha-nism is provided by theresidency request managerof Jupiter, toaccommodate for situations, where the model does not fit into theavailable memory (see Fig. 5). Figure 2 shows the scene graph ofa wheel from the Formula One model (see also Fig. 3). It containsthree different levels of details, wrapped in partition nodes.
2.2 Scene Graph Traversal in Jupiter
The scene graph traversal inJupiter is managed by strategies thatdecide which node of the scene graph is rendered, depending ona specified budget2. Each strategy consists of a set of pipelined
2Variations on budget oriented rendering were also presented in 1999 byBartz et al. [3] and later by Klosowski and Silva [16].
2
To appear in the IEEE 2001 Symposium on Parallel and Large Data Visualization and Graphics proceedings
agentswhich evaluate the importance of the scene graph nodes andmanipulate the traversal order accordingly. The importance can bebased on the visibility of the node, on its visual contribution, or onspecific properties of a node. The agents are called in a pipelinedfashion, where the following agent processes the resulting scenegraph from the previous agent. The order of this pipeline also de-termines their performance; agents which have low associated costsshould be executed before agents with high costs, since the numberof nodes evaluated by the expensive agents can be significantly re-duced this way. The result of an applied strategy is arender listofgeometry nodes that are passed to therender contextfor rendering.This list is also handled by an agent.
Jupiter provides agents for several purposes; theresidency re-quest agent(JtResReqAgent) request nodes of the scene graph to beloaded by the residency request manager, or releases nodes whichare no longer needed. If objects need to be omitted from render-ing, the respective nodes can be filtered by theproperty key filteragent (JtPropKeyFilterAgent). The selection of nodes by mouseclicks (“picking”) is calculated by ray intersections from the viewpoint with thepick agent (JtPickAgent).
Figure 3: Three different level of detail nodes of a wheel from theFormula One model. The left full detailed wheel contains 21K tri-angles, the middle medium level of detail contains 10K triangles,and the right lower level of detail contains 6K triangles.
The standard traversal scheme ofJupiter traverses the scenegraph in a depth-first order using a stack-based iterator. How-ever, a different traversal scheme is usually chosen by the prioritydriven heap iterator ofvalue node selector(JtValueNodeSelectA-gent). This agent computes this priority based on the screen cover-age of the bounding sphere, and selects a respective level of detailif provided in the scene graph. The larger the estimate of the screencoverage of the node is, the higher level of detail is selected (seeFig. 3). In contrast, therange level of detail agent(JtRangeLODA-gent) selects the level of detail based on the distance between theview point and the center of the bounding box of the node. A fixedlevel of detail can be chosen by the agentJtFixedARAgent.
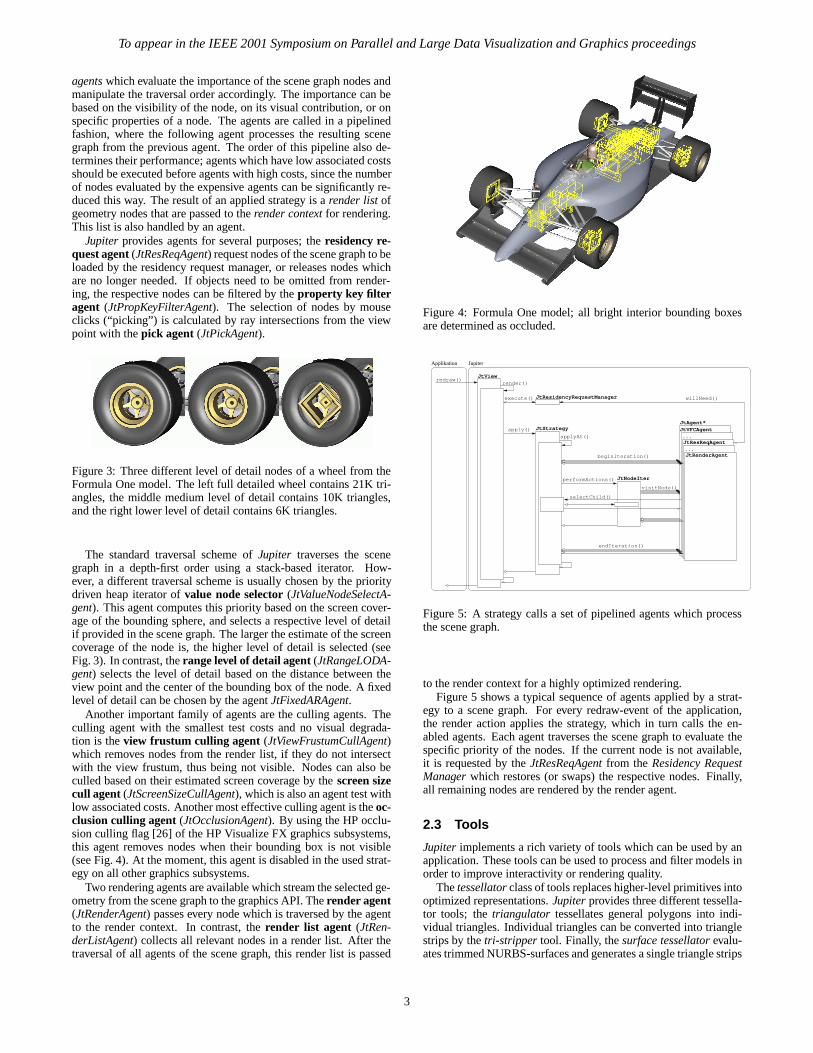
Another important family of agents are the culling agents. Theculling agent with the smallest test costs and no visual degrada-tion is theview frustum culling agent (JtViewFrustumCullAgent)which removes nodes from the render list, if they do not intersectwith the view frustum, thus being not visible. Nodes can also beculled based on their estimated screen coverage by thescreen sizecull agent(JtScreenSizeCullAgent), which is also an agent test withlow associated costs. Another most effective culling agent is theoc-clusion culling agent(JtOcclusionAgent). By using the HP occlu-sion culling flag [26] of the HP Visualize FX graphics subsystems,this agent removes nodes when their bounding box is not visible(see Fig. 4). At the moment, this agent is disabled in the used strat-egy on all other graphics subsystems.
Two rendering agents are available which stream the selected ge-ometry from the scene graph to the graphics API. Therender agent(JtRenderAgent) passes every node which is traversed by the agentto the render context. In contrast, therender list agent (JtRen-derListAgent) collects all relevant nodes in a render list. After thetraversal of all agents of the scene graph, this render list is passed
Figure 4: Formula One model; all bright interior bounding boxesare determined as occluded.
Applikation Jupiter
render()JtView
redraw()
apply() JtStrategy
applyAt()
execute() JtResidencyRequestManager
performActions()
visitNode()
beginIteration()
JtNodeIter
selectChild()
willNeed()
JtAgent*
JtResReqAgent...JtVFCAgent
...JtRenderAgent
endIteration()
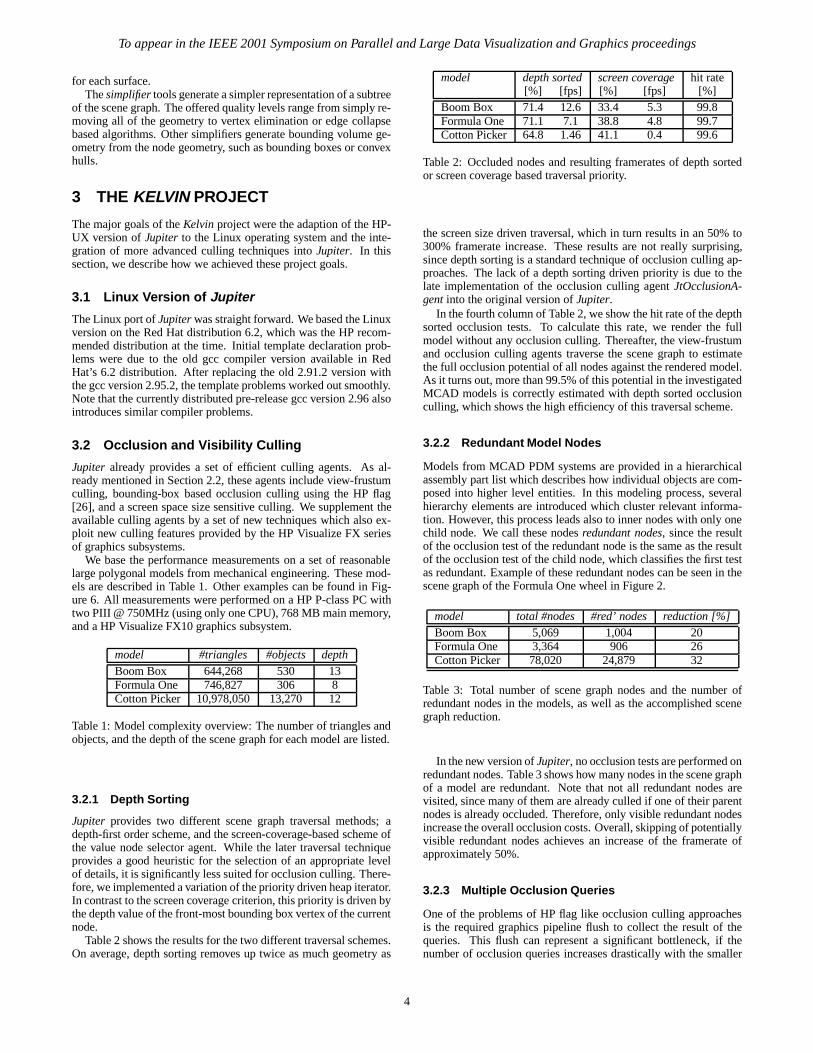
Figure 5: A strategy calls a set of pipelined agents which processthe scene graph.
to the render context for a highly optimized rendering.Figure 5 shows a typical sequence of agents applied by a strat-
egy to a scene graph. For every redraw-event of the application,the render action applies the strategy, which in turn calls the en-abled agents. Each agent traverses the scene graph to evaluate thespecific priority of the nodes. If the current node is not available,it is requested by theJtResReqAgentfrom theResidency RequestManagerwhich restores (or swaps) the respective nodes. Finally,all remaining nodes are rendered by the render agent.
2.3 Tools
Jupiter implements a rich variety of tools which can be used by anapplication. These tools can be used to process and filter models inorder to improve interactivity or rendering quality.
Thetessellatorclass of tools replaces higher-level primitives intooptimized representations.Jupiterprovides three different tessella-tor tools; thetriangulator tessellates general polygons into indi-vidual triangles. Individual triangles can be converted into trianglestrips by thetri-stripper tool. Finally, thesurface tessellatorevalu-ates trimmed NURBS-surfaces and generates a single triangle strips
3
To appear in the IEEE 2001 Symposium on Parallel and Large Data Visualization and Graphics proceedings
for each surface.Thesimplifiertools generate a simpler representation of a subtree
of the scene graph. The offered quality levels range from simply re-moving all of the geometry to vertex elimination or edge collapsebased algorithms. Other simplifiers generate bounding volume ge-ometry from the node geometry, such as bounding boxes or convexhulls.
3 THE KELVIN PROJECT
The major goals of theKelvin project were the adaption of the HP-UX version ofJupiter to the Linux operating system and the inte-gration of more advanced culling techniques intoJupiter. In thissection, we describe how we achieved these project goals.
3.1 Linux Version of Jupiter
The Linux port ofJupiterwas straight forward. We based the Linuxversion on the Red Hat distribution 6.2, which was the HP recom-mended distribution at the time. Initial template declaration prob-lems were due to the old gcc compiler version available in RedHat’s 6.2 distribution. After replacing the old 2.91.2 version withthe gcc version 2.95.2, the template problems worked out smoothly.Note that the currently distributed pre-release gcc version 2.96 alsointroduces similar compiler problems.
3.2 Occlusion and Visibility Culling
Jupiter already provides a set of efficient culling agents. As al-ready mentioned in Section 2.2, these agents include view-frustumculling, bounding-box based occlusion culling using the HP flag[26], and a screen space size sensitive culling. We supplement theavailable culling agents by a set of new techniques which also ex-ploit new culling features provided by the HP Visualize FX seriesof graphics subsystems.
We base the performance measurements on a set of reasonablelarge polygonal models from mechanical engineering. These mod-els are described in Table 1. Other examples can be found in Fig-ure 6. All measurements were performed on a HP P-class PC withtwo PIII @ 750MHz (using only one CPU), 768 MB main memory,and a HP Visualize FX10 graphics subsystem.
model #triangles #objects depthBoom Box 644,268 530 13Formula One 746,827 306 8Cotton Picker 10,978,050 13,270 12
Table 1: Model complexity overview: The number of triangles andobjects, and the depth of the scene graph for each model are listed.
3.2.1 Depth Sorting
Jupiter provides two different scene graph traversal methods; adepth-first order scheme, and the screen-coverage-based scheme ofthe value node selector agent. While the later traversal techniqueprovides a good heuristic for the selection of an appropriate levelof details, it is significantly less suited for occlusion culling. There-fore, we implemented a variation of the priority driven heap iterator.In contrast to the screen coverage criterion, this priority is driven bythe depth value of the front-most bounding box vertex of the currentnode.
Table 2 shows the results for the two different traversal schemes.On average, depth sorting removes up twice as much geometry as
model depth sorted screen coverage hit rate[%] [fps] [%] [fps] [%]
Boom Box 71.4 12.6 33.4 5.3 99.8Formula One 71.1 7.1 38.8 4.8 99.7Cotton Picker 64.8 1.46 41.1 0.4 99.6
Table 2: Occluded nodes and resulting framerates of depth sortedor screen coverage based traversal priority.
the screen size driven traversal, which in turn results in an 50% to300% framerate increase. These results are not really surprising,since depth sorting is a standard technique of occlusion culling ap-proaches. The lack of a depth sorting driven priority is due to thelate implementation of the occlusion culling agentJtOcclusionA-gentinto the original version ofJupiter.
In the fourth column of Table 2, we show the hit rate of the depthsorted occlusion tests. To calculate this rate, we render the fullmodel without any occlusion culling. Thereafter, the view-frustumand occlusion culling agents traverse the scene graph to estimatethe full occlusion potential of all nodes against the rendered model.As it turns out, more than 99.5% of this potential in the investigatedMCAD models is correctly estimated with depth sorted occlusionculling, which shows the high efficiency of this traversal scheme.
3.2.2 Redundant Model Nodes
Models from MCAD PDM systems are provided in a hierarchicalassembly part list which describes how individual objects are com-posed into higher level entities. In this modeling process, severalhierarchy elements are introduced which cluster relevant informa-tion. However, this process leads also to inner nodes with only onechild node. We call these nodesredundant nodes, since the resultof the occlusion test of the redundant node is the same as the resultof the occlusion test of the child node, which classifies the first testas redundant. Example of these redundant nodes can be seen in thescene graph of the Formula One wheel in Figure 2.
model total #nodes #red’ nodes reduction [%]Boom Box 5,069 1,004 20Formula One 3,364 906 26Cotton Picker 78,020 24,879 32
Table 3: Total number of scene graph nodes and the number ofredundant nodes in the models, as well as the accomplished scenegraph reduction.
In the new version ofJupiter, no occlusion tests are performed onredundant nodes. Table 3 shows how many nodes in the scene graphof a model are redundant. Note that not all redundant nodes arevisited, since many of them are already culled if one of their parentnodes is already occluded. Therefore, only visible redundant nodesincrease the overall occlusion costs. Overall, skipping of potentiallyvisible redundant nodes achieves an increase of the framerate ofapproximately 50%.
3.2.3 Multiple Occlusion Queries
One of the problems of HP flag like occlusion culling approachesis the required graphics pipeline flush to collect the result of thequeries. This flush can represent a significant bottleneck, if thenumber of occlusion queries increases drastically with the smaller
4

To appear in the IEEE 2001 Symposium on Parallel and Large Data Visualization and Graphics proceedings
amount of geometry for each object to be tested. Severson ac-counted the costs for one occlusion test with the equivalent of therendering of 190 triangles of the average size of 25 pixels [27].
The HP Visualize FX graphics subsystems allows the pipelinedocclusion query of multiple objects without waiting for the resultof the previous object. This also means that the occlusion potentialof the multiple objects is not taken into account for the succeedingtests. If we assume a depth sorted order of the nodes, most of thefarthest nodes will not contribute much to the occlusion of the othernodes, since they are already occluded by the closer nodes. In thiscase, the multiple occlusion queries of the farthest objects can saveocclusion test overhead.
In Jupiter, we integrated the multiple occlusion queries in an up-dated occlusion culling agent for nodes which are located in thebackward space of the view-frustum. Furthermore, we applied themultiple occlusion queries only to leaf nodes of the scene graph,since inner nodes have a significantly larger influence on the visi-bility information than leaf nodes.
It turned out that an efficient use multiple occlusion queries isquite difficult to achieve. MCAD models frequently have a hi-erarchical representation which enables culling of occluded innernodes, which reduces the number of not yet occluded leaf nodesin the back space of the view-frustum significantly. All achievedperformance gain due to less synchronization costs were used upquickly, if the multiple occlusion queries generated a false positiveocclusion response. Even a wrongly as not occluded classified leafnode of only 1000 triangles outweighs the costs of four to five reg-ular occlusion culling tests.
However, multiple occlusion queries improve their effectivenesswith different traversal techniques; if the occlusion culling agentvisits only the depth sorted leaf nodes of the scene graph, morenodes with a high occlusion likelihood can be passed through themultiple occlusion queries to the graphics subsystem. Traversaltechniques which exploit time-coherence heuristics might also in-crease the efficiency of multiple occlusion queries, and benefit fromthe reduced occlusion culling overhead.
3.2.4 General Bounding Volumes
The original version ofJupiter allows only bounding boxes asbounding volumes for occlusion culling. These bounding boxes dofrequently include a much larger object space and screen area, oncerasterized into screen space, than the actual geometry. That effectcan lead tofalse positiveocclusion tests. These false positive oc-clusion tests can be reduced if tighter bounding volumes are used.Early experiments with the three MCAD models exhibit an addi-tional 10% occlusion potential, if the actual node geometry is usedfor the occlusion test, in contrast to the bounding box [2]. Note thatthis potential can be even larger, if rather irregular shaped objectsneed to be visualized.
In the Kelvin based version ofJupiter, arbitrary bounding vol-umes can be used, if they are provided as a list of triangles. Thesebounding volumes can be generated by theJupitertools, such as theconvex hull simplifier, or other simplified versions of the originalgeometry, as long as they completely contain the original geometryof the node.
4 CONCLUSIONS and FUTURE WORK
In this paper, we introducedJupiter, a toolkit for the interactivevisualization of large models.Jupiter provides a rich set of tech-niques to achieve the requested framerate, including techniques formulti-resolution and geometry culling.
The Linux version ofJupiter is currently available for downloadas open source from http://www.gris.uni-tuebingen.de/kelvin. The
new occlusion culling and traversal techniques are expected to bereleased in the second quarter of this year.
Future work will focus on the adaption of theJupiter occlu-sion culling agents to other graphics subsystems (ie., nVIDIAGeForce3). Other topics include further quantitative occlusionculling techniques using features that are available on the currentgeneration of HP Visualize FX5 and FX10, such as the visibilitystatistics extension, and a more efficient use of multiple occlusionqueries.
Another major topic for future work is support for multiplegraphics pipelines and multiple processors. Some of the projectgoals will probably be managed as open source projects.
ACKNOWLEDGEMENTS
This work is supported byKelvin – the Large Model Visualiza-tion project of the Workstations Systems Lab, Ft. Collins, COof the Hewlett-Packard Company and by DFG project CatTrain.The MCAD datasets are courtesy of Engineering Animation Inc.and Hewlett-Packard Company; the bluntfin dataset is courtesy ofNASA Ames, and the skull dataset is courtesy of Siemens MedicalSystems, Forchheim.
Mike Bialek, Brian Cripe, Tom Gaskins, Dan Olsen, KristannOrton, Andrew Page, Joe Whitty, and Pieter van Zee of HP, andMichael Carter, Brett Harper, Andreas Johannsen, Scott Nations,Sebastian Marino, Helder Pinheiro, Ralph Pinheiro, Adrian San-nier, Jeff Trom, and Samir Uppal of EAI were the members of theoriginal Jupiterdevelopment team.
We would like to thank Andrew Page of HP Labs, Palo Alto, CA,Alan Ward and Bruce Blaho of HP’s Workstations Systems Lab, Ft.Collins, CO, and Michel Benard of HP Europe for their supportand help pursuing theKelvin project, and Michael Meißner of theUniversity of Tubingen for proof reading.
References
[1] D. Aliaga, J. Cohen, A. Wilsonand E. Baker, H. Zhang,C. Erikson, K Hoff, T. Hudson, W. St¨urzlinger, R. Bastos,M. Whitton, F. Brooks, and D. Manocha. MMR: An Inte-grated Massive Model Rendering System Using Geometricand Image-Based Acceleration . InProc. of ACM Symposiumon Interactive 3D Graphics, 1999.
[2] D. Bartz, J. Klosowski, and D. Stanekerßer. k-DOPs asTighter Bounding Volumes for Better Occlusion Performance.In Visual Proc. of ACM SIGGRAPH, 2001.
[3] D. Bartz, M. Meißner, and T. H¨uttner. OpenGL-assisted Oc-clusion Culling of Large Polygonal Models.Computers &Graphics, 23(5):667–679, 1999.
[4] D. Bartz, C. Silva, and B. Schneider. Rendering and Visual-ization in Parallel Environments. InACM SIGGRAPH Course13, 2000.
[5] J. Bentley. Multidimensional Binary Search Trees Used forAssociative Search.Communications of the ACM, 18(9):509–516, 1975.
[6] H. Cline, W. Lorensen, S. Ludke, C. Crawford, and B. Teeter.Two Algorithms for the Three-Dimensional Construction ofTomograms.Medical Physics, 15(3)(3):320–327, 1988.
[7] D. Cohen-Or, Y. Chrysanthou, F. Durand, and C. Silva. Visi-bility: Problems, Techniques, and Application. InACM SIG-GRAPH Course 4, 2000.
5

To appear in the IEEE 2001 Symposium on Parallel and Large Data Visualization and Graphics proceedings
[8] B. Cripe and T. Gaskins. The DirectModel Toolkit: Meet-ing the 3D Graphics Needs of Technical Applications.TheHewlett-Packard Journal, (May):19–27, 1998.
[9] P. Debevec, C. Bregler, M. Cohen, R. Szeliski, L. McMillan,and F. Sillion. Image-Based Modeling, Rendering, and Light-ing. In ACM SIGGRAPH Course 35, 2000.
[10] OpenSG Forum. OpenSG - Open Source Scenegraph.http://www.opensg.org, 2000.
[11] H. Fuchs, Z. Kedem, and B. Naylor. On Visible Surface Gen-eration by a Priori Tree Structures. InProc. of ACM SIG-GRAPH, pages 124–133, 1980.
[12] M. Garland. Multiresolution Modeling: Survey and FutureOpportunities. InEurographics STAR report 2, 1999.
[13] R. Grzeszczuk, C. Henn, and R. Yagel. Advanced GeometricTechniques for Ray Casting Volumes. InACM SIGGRAPHCourse 4, 1998.
[14] Hewlett-Packard. Jupiter 1.0 Specification. Technical report,Hewlett Packard Company, Corvallis, OR, 1998.
[15] Silicon Graphics Inc. OpenGL Optimizer Programmer’sGuide. Technical report, 1998.
[16] J. Klosowski and C. Silva. Rendering on a Budget. InProc.of IEEE Visualization, pages 155–122, 1999.
[17] G. Knittel. The ULTRAVIS System. InProc. of Symposiumon Volume Visualization and Graphics, pages 71–80, 2000.
[18] M. Meißner, D. Bartz, T. H¨uttner, G. Muller, and J. Einigham-mer. Generation of Subdivision Hierarchies for Efficient Oc-clusion Culling of Large Polygonal Models. Technical Re-port WSI-99-13, ISSN 0946-3852, Dept. of Computer Sci-ence (WSI), University of T¨ubingen, 1999.
[19] S. Parker and C. Johnson. SCIRun: A Scientific Program-ming Environment for Computational Steering. InProc. ofSupercomputing, 1995.
[20] S. Parker, P. Shirley, Y. Livnat, C. Hansen, and P. Sloan. In-teractive Ray Tracing for Isosurface Rendering. InProc. ofIEEE Visualization, pages 233–238, 1998.
[21] H. Pfister, M. Zwicker, J. Baar, and M. Gross. Surfels: Sur-face Elements as Rendering Primitives. InProc. of ACM SIG-GRAPH, pages 335–342, 2000.
[22] J. Rohlf and J. Helman. IRIS Performer: A High PerformanceMultiprocessing Toolkit for Real-Time 3D Graphics. InProc.of ACM SIGGRAPH, pages 381–394, 1994.
[23] S. Rusinkiewicz and M. Levoy. Qsplats: A MultiresolutionPoint Rendering System for Large Meshes. InProc. of ACMSIGGRAPH, pages 343–352, 2000.
[24] H. Samet. The Design and Analysis of Spatial Data Struc-tures. Addison-Wesley, Reading, 1994.
[25] W. Schroeder, K. Martin, and B. Lorensen.The VisualizationToolkit. Prentice Hall, Upper Saddle River, NJ, 2nd edition,1998.
[26] N. Scott, D. Olsen, and E. Gannett. An Overview of the VI-SUALIZE fx Graphics Accelerator Hardware.The Hewlett-Packard Journal, (May):28–34, 1998.
[27] K. Severson. VISUALIZE fx Graphics Accelerator Hardware.Technical report, Hewlett Packard Company, available fromhttp://www.hp.com/workstations/support/documentation/whitepapers.html, 1999.
[28] L. Sobierajski-Avila and W. Schroeder. Interactive Visualiza-tion of Aircraft and Power Generation Engines. InProc. ofIEEE Visualization, pages 483–486, 1997.
[29] D. Staneker. Ein hybrider Ansatz zur effizienten Verdeck-ungsrechnung. Master’s thesis, Dept. of Computer Science(WSI), University of Tubingen, 2001.
[30] P. Strauss and Carey R. An Object-oriented 3D GraphicsToolkit. In Proc. of ACM SIGGRAPH, pages 341–349, 1992.
[31] G. Taubin. 3D Geometry Compression and Progressive Trans-mission. InEurographics STAR report 3, 1999.
[32] I. Wald, P. Slusallek, C. Benthin, and M. Wagner. InteractiveRendering with Coherent Ray Tracing. InProc. of Eurograph-ics, 2001.
[33] J. Wernecke.The Inventor Mentor. Addison Wesley, Reading,Mass., 1994.
[34] D. Zorin, P. Schr¨oder, T. DeRose, L. Kobbelt, A. Levin, andW. Sweldens. Subdivision for Modeling and Animation. InACM SIGGRAPH Course 23, 2000.
6
To appear in the IEEE 2001 Symposium on Parallel and Large Data Visualization and Graphics proceedings
(a)
(b) (c)
(d) (e)
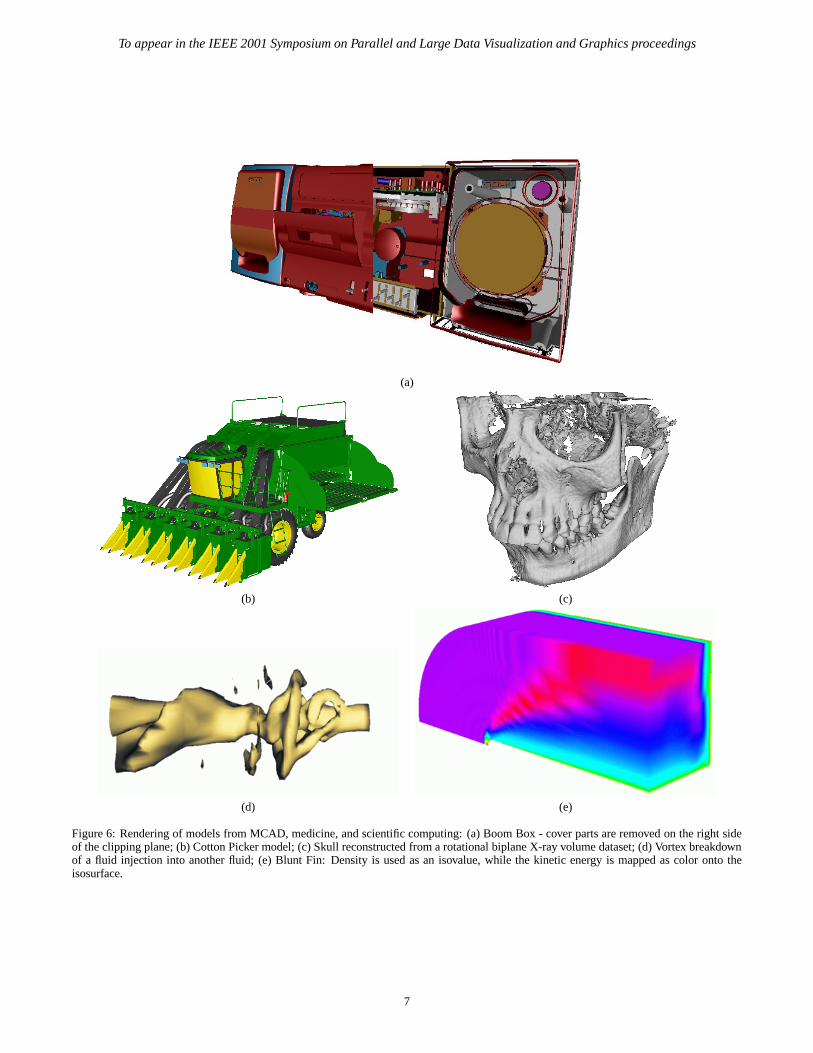
Figure 6: Rendering of models from MCAD, medicine, and scientific computing: (a) Boom Box - cover parts are removed on the right sideof the clipping plane; (b) Cotton Picker model; (c) Skull reconstructed from a rotational biplane X-ray volume dataset; (d) Vortex breakdownof a fluid injection into another fluid; (e) Blunt Fin: Density is used as an isovalue, while the kinetic energy is mapped as color onto theisosurface.
7