JURNAL
10
Technology life cycle analysis method based on patent documents Lidan Gao a,b, ⁎, Alan L. Porter c , Jing Wang d , Shu Fang a , Xian Zhang a , Tingting Ma e , Wenping Wang e , Lu Huang e a Chengdu Library of the Chinese Academy of Sciences, Chengdu 610041, PR China b School of Economics and Management, Southwest Jiaotong University, Chengdu 610031, PR China c School of Public Policy, Georgia Institute of Technology, Atlanta, GA 30332-0345, USA d College of Computer Science & Technology, Huaqiao University, Xiamen, 361021, PR China e School of Management and Economic, Beijing Institute of Technology, Beijing 100081, PR China article info abstract Article history: Received 14 May 2011 Received in revised form 22 June 2012 Accepted 23 August 2012 Available online 28 November 2012 To estimate the future development of one technology and make decisions whether to invest in it or not, one needs to know the current stage of its technology life cycle (TLC). The dominant approach to analysing TLC uses the S-curve to observe patent applications over time. But using the patent application counts alone to represent the development of technology oversimplifies the situation. In this paper, we build a model to calculate the TLC for an object technology based on multiple patent-related indicators. The model includes the following steps: first, we focus on devising and assessing patent-based TLC indicators. Then we choose some technologies (training technologies) with identified life cycle stages, and finally compare the indicator features in training technologies with the indicator values in an object technology (test technology) using a nearest neighbour classifier, which is widely used in pattern recognition to measure the technology life cycle stage of the object technology. Such study can be used in management practice to enable technology observers to determine the current life cycle stage of a particular technology of interest and make their R&D strategy accordingly. © 2012 Elsevier Inc. All rights reserved. Keywords: Technology life cycle Patent Indicator Cathode ray tube Thin film transistor liquid crystal display Nano-biosensor 1. Introduction The rapidly changing economic environment and increasingly fierce competition require companies to be innovative, both in their products and marketing strategies, if they are to flourish. A successful product must balance three components: technology, marketing, and user experience [1]. Technology plays a key role among these three components [2]. Before the product strategy is formulated, a technology strategy must be developed to provide competitive products, materials, processes, or system technologies [3]. The first step for devising a technology strategy is to decide if the technology is worth the investment. How will the technology develop in the future? Will the technology flourish in the future or will it decline? To answer these questions, one should know the current life cycle stage of the technology in order to estimate future development trends to make informed decisions on whether to invest in it or not. Within the Future-oriented Technology Analysis (FTA), technology forecasting traces back to the 1950's [4]. One of its half-dozen or so basic techniques, dating from that time at least, is trend analysis. This includes both historical time series analyses and fitting of growth models to project possible future trends [5]. Most trend projection is “naïve”— i.e., fitting a curve to the historical data under the assumption that whatever forces are collectively driving the trend will continue into the future unabated. It follows that such projection becomes increasingly precarious as the future horizon is extended beyond a few years. Another important technology forecasting technique [6] is the use of analogies. Herein, one anticipates growth in an emerging technology based on the pattern of growth observed in a somewhat related technology. The stronger that relationship, the more likely the pattern will pertain. Technological Forecasting & Social Change 80 (2013) 398–407 ⁎ Corresponding author at: Chengdu Library of the Chinese Academy of Sciences, Chengdu 610041, PR China. Tel.: +86 13811903239. E-mail addresses: [email protected] (L. Gao), [email protected] (A.L. Porter), [email protected] (J. Wang). 0040-1625/$ – see front matter © 2012 Elsevier Inc. All rights reserved. http://dx.doi.org/10.1016/j.techfore.2012.10.003 Contents lists available at SciVerse ScienceDirect Technological Forecasting & Social Change
Transcript of JURNAL

Technology life cycle analysis method based on patent documents
Lidan Gao a,b,⁎, Alan L. Porter c, Jing Wang d, Shu Fang a, Xian Zhang a, Tingting Ma e,Wenping Wang e, Lu Huang e
a Chengdu Library of the Chinese Academy of Sciences, Chengdu 610041, PR Chinab School of Economics and Management, Southwest Jiaotong University, Chengdu 610031, PR Chinac School of Public Policy, Georgia Institute of Technology, Atlanta, GA 30332-0345, USAd College of Computer Science & Technology, Huaqiao University, Xiamen, 361021, PR Chinae School of Management and Economic, Beijing Institute of Technology, Beijing 100081, PR China
a r t i c l e i n f o a b s t r a c t
Article history:Received 14 May 2011Received in revised form 22 June 2012Accepted 23 August 2012Available online 28 November 2012
To estimate the future development of one technology andmake decisionswhether to invest in itor not, one needs to know the current stage of its technology life cycle (TLC). The dominantapproach to analysing TLC uses the S-curve to observe patent applications over time. But using thepatent application counts alone to represent the development of technology oversimplifies thesituation. In this paper, we build a model to calculate the TLC for an object technology based onmultiple patent-related indicators. The model includes the following steps: first, we focus ondevising and assessing patent-based TLC indicators. Then we choose some technologies (trainingtechnologies) with identified life cycle stages, and finally compare the indicator features intraining technologies with the indicator values in an object technology (test technology) using anearest neighbour classifier, which is widely used in pattern recognition to measure thetechnology life cycle stage of the object technology. Such study can be used in managementpractice to enable technology observers to determine the current life cycle stage of a particulartechnology of interest and make their R&D strategy accordingly.
© 2012 Elsevier Inc. All rights reserved.
Keywords:Technology life cyclePatentIndicatorCathode ray tubeThin film transistor liquid crystal displayNano-biosensor
1. Introduction
The rapidly changing economic environment and increasingly fierce competition require companies to be innovative, both in theirproducts andmarketing strategies, if they are to flourish. A successful product must balance three components: technology, marketing,and user experience [1]. Technology plays a key role among these three components [2]. Before the product strategy is formulated, atechnology strategymust be developed to provide competitive products, materials, processes, or system technologies [3]. The first stepfor devising a technology strategy is to decide if the technology isworth the investment. Howwill the technology develop in the future?Will the technology flourish in the future or will it decline? To answer these questions, one should know the current life cycle stage ofthe technology in order to estimate future development trends to make informed decisions on whether to invest in it or not.
Within the Future-oriented Technology Analysis (FTA), technology forecasting traces back to the 1950's [4]. One of itshalf-dozen or so basic techniques, dating from that time at least, is trend analysis. This includes both historical time seriesanalyses and fitting of growth models to project possible future trends [5]. Most trend projection is “naïve” — i.e., fitting a curve tothe historical data under the assumption that whatever forces are collectively driving the trend will continue into the futureunabated. It follows that such projection becomes increasingly precarious as the future horizon is extended beyond a few years.
Another important technology forecasting technique [6] is the use of analogies. Herein, one anticipates growth in an emergingtechnology based on the pattern of growth observed in a somewhat related technology. The stronger that relationship, the morelikely the pattern will pertain.
Technological Forecasting & Social Change 80 (2013) 398–407
⁎ Corresponding author at: Chengdu Library of the Chinese Academy of Sciences, Chengdu 610041, PR China. Tel.: +86 13811903239.E-mail addresses: [email protected] (L. Gao), [email protected] (A.L. Porter), [email protected] (J. Wang).
0040-1625/$ – see front matter © 2012 Elsevier Inc. All rights reserved.http://dx.doi.org/10.1016/j.techfore.2012.10.003
Contents lists available at SciVerse ScienceDirect
Technological Forecasting & Social Change
Another important predecessor approach upon which we draw is the identification of Technology Readiness Levels (TRLs). TheU.S. military, especially the Air Force, has made use of this categorization of technology development to help identify currentstatus and future prospects. Nolte et al. [7] overview the 7-level TRL and how to estimate this. The U.S. National Aeronautics andSpace Administration (NASA) uses a 9-level version [8]. When a complex technical system incorporates a number of emergingtechnologies, use of TRLs has proven helpful in designing a viable new system. The key notion is that progress is likely, but preciseanticipation of when a given advanced technology will be ready for application is precarious. Such a cautionary notion should berecognized for our approach developed here also.
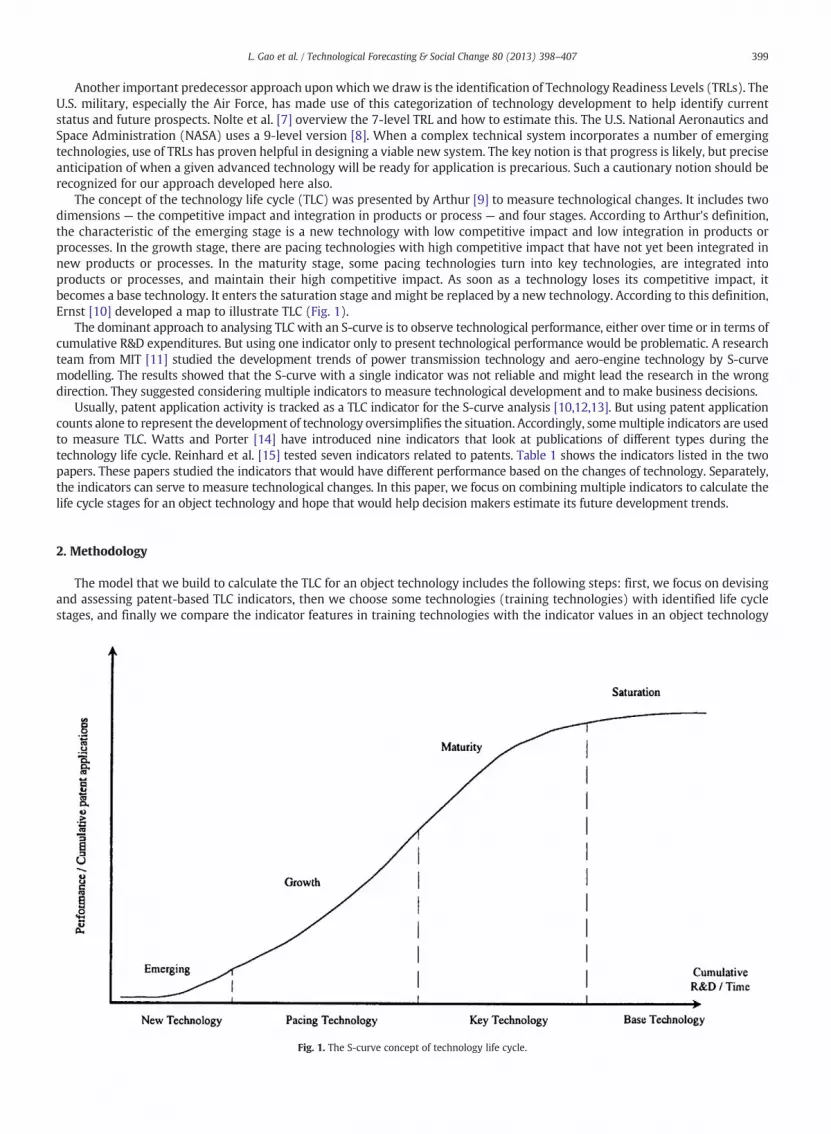
The concept of the technology life cycle (TLC) was presented by Arthur [9] to measure technological changes. It includes twodimensions — the competitive impact and integration in products or process — and four stages. According to Arthur's definition,the characteristic of the emerging stage is a new technology with low competitive impact and low integration in products orprocesses. In the growth stage, there are pacing technologies with high competitive impact that have not yet been integrated innew products or processes. In the maturity stage, some pacing technologies turn into key technologies, are integrated intoproducts or processes, and maintain their high competitive impact. As soon as a technology loses its competitive impact, itbecomes a base technology. It enters the saturation stage and might be replaced by a new technology. According to this definition,Ernst [10] developed a map to illustrate TLC (Fig. 1).
The dominant approach to analysing TLC with an S-curve is to observe technological performance, either over time or in terms ofcumulative R&D expenditures. But using one indicator only to present technological performance would be problematic. A researchteam from MIT [11] studied the development trends of power transmission technology and aero-engine technology by S-curvemodelling. The results showed that the S-curve with a single indicator was not reliable and might lead the research in the wrongdirection. They suggested considering multiple indicators to measure technological development and to make business decisions.
Usually, patent application activity is tracked as a TLC indicator for the S-curve analysis [10,12,13]. But using patent applicationcounts alone to represent the development of technology oversimplifies the situation. Accordingly, somemultiple indicators are usedto measure TLC. Watts and Porter [14] have introduced nine indicators that look at publications of different types during thetechnology life cycle. Reinhard et al. [15] tested seven indicators related to patents. Table 1 shows the indicators listed in the twopapers. These papers studied the indicators that would have different performance based on the changes of technology. Separately,the indicators can serve to measure technological changes. In this paper, we focus on combining multiple indicators to calculate thelife cycle stages for an object technology and hope that would help decision makers estimate its future development trends.
2. Methodology
The model that we build to calculate the TLC for an object technology includes the following steps: first, we focus on devisingand assessing patent-based TLC indicators, then we choose some technologies (training technologies) with identified life cyclestages, and finally we compare the indicator features in training technologies with the indicator values in an object technology
Fig. 1. The S-curve concept of technology life cycle.
399L. Gao et al. / Technological Forecasting & Social Change 80 (2013) 398–407

(test technology) via the nearest neighbour classifier, which is widely used in pattern recognition, in order to measure thetechnology's life cycle stages. The research framework is designed as follows (Fig. 2).
2.1. Indicators and data source
The most fundamental and challenging task is to select suitable indicators and data sources. In a recent work [16], we havecompiled candidate patent indicators from multiple sources. Thirteen indicators are selected for TLC assessment (Table 2). All thedata of the indicators are extracted by priority year (the first filing date year for a patent application), except the first indicator.
In this research, we choose the Derwent Innovation Index (DII) as the data source and VantagePoint (VP) for data cleaning andextraction. Matlab 2010b is used for implementing the algorithms.
2.1.1. Application and priorityUsually, three kinds of dates are included in the DII database: application year, priority year, and basic year. The basic year has
no legal meaning, but only represents the year in which DII obtained the patent documents. Currently, most of TLC relatedliteratures are based on application year [15,17–20]. But the priority year presents the first time an invention has been disclosed.So in this paper, we choose the other two indicators to measure the development of technology: we count the number of patents
Table 1Technology life cycle indicators by former researchers.
Author Indicator
Robert J Watts,Alan L Porter[14]
Number of items in databases such as Science Citation IndexNumber of items in databases such as Engineering IndexNumber of items in databases such as U.S. patentsNumber of items in databases such as Newspaper Abstracts DailyIssues raised in the Business and Popular Press abstractsTrends over time in number of itemsTechnological needs notedTypes of topics receiving attentionSpin-off technologies linked
Reinhard Haupt, Martin Kloyer,Marcus Lange[15]
Backward citationsImmediacy of patent citationsForward citationsDependent claimsPrioritiesDuration of the examination processData base requirements
Fig. 2. Framework of TLC analysis.
400 L. Gao et al. / Technological Forecasting & Social Change 80 (2013) 398–407

in DII by application year for the Application indicator and count the number of patents in DII by priority year for the Priorityindicator.
2.1.2. AssigneeSome business software, such as PatentEX and Webpat, has adopted assignee numbers to develop an S-curve. Three types of
assignees are provided in DII: corporate, non-corporate, and individual. Non-corporate assignees include universities, academies,non-profit labs, and centres. Because of the difference in patent law between the U.S. and other countries, too many individualassignees are observable in U.S. patents, and some of them are inventors. Therefore, we only consider the corporate andnon-corporate assignees. We count the respective numbers for each of these two indicators in DII by priority year.
2.1.3. InventorThis indicator indicates the amount of human resources invested in R&D of one particular technology. Number of Inventors has
been used as indicator to measure the TLC of RFID [21]. We count the number of unique individual inventors of each year bypriority year.
2.1.4. CitationTwo major types of cited references are given in a patent: science literature [22,23] and other patents [24]. Backward citations
to science literature indicate a linkage between science and the patented technology. Backward citations to other patents mayindicate a linkage between other technologies and the patented technology. The number of these two kinds of references can befound on the front page of the patent documents. We count the number of literature citations and the number of patent citationsin DII by priority year.
2.1.5. IPC (four-digit)The International Patent Classification (IPC) system, established by the Strasbourg Agreement 1971, is the most widely used
hierarchical classification system of patents based on the different areas of technologies to which they pertain. It utilizes alanguage-independent symbol for the classification, adopted to varying degrees by every country or organization with an officialpatent office. Lerner [25] introduced four-digit IPC codes to measure the scope of each patent. So in this research, we consider the4-digit IPCs and investigate three types of IPCs. The number of IPC codes represents howmany fields are involved in the developmentof a technology. The IPC top 5 is a group of five IPCswith the highest number of applications. The IPC top 10 is another group of 10 IPCswith the highest number of applications. Generally, the top 5 or top 10 IPCs represent the main technology subjects.
IPC code has been used as an indicator to measure the technology life cycle [26]. We count the number of IPCs (4-digit) in DIIby priority year for the IPC indicator; count the number of patents among the top 5 IPCs in DII by priority year for the IPC top 5indicator; and count the number of patents among the top 10 IPCs in DII by priority year for the IPC top 10 indicator.
2.1.6. MCsThe Derwent manual code (MC) system is a hierarchical classification system developed by Derwent. It is similar to the IPC
classification system. Whereas the IPC is assigned by the examining patent offices, MC is assigned by teams of subject experts atDerwent. The technology structure is also different: MC and IPC are complementary codes, used in this paper to measuretechnology subjects. We count the number of MCs in DII by priority year for the MC indicator; count the number of patents amongthe top 5 MCs in DII by priority year for the MC top 5 indicator; and count the number of patents among the top 10 MCs in DII bypriority year for the MC top 10 indicator.
Table 2Technology life cycle indicators.
No. Indicator Indicator description
1 Application Number of patents in DII by application year2 Priority Number of patents in DII by priority year3 Corporate Number of corporates in DII by priority year4 Non-corporate Number of non-corporates in DII by priority year5 Inventor Number of inventors in DII by priority year6 Literature citation Number of backward citations to literatures in DII by priority year7 Patent citation Number of backward citations to patents in DII by priority year8 IPC Number of IPCs (4-digit) in DII by priority year9 IPC top 5 Number of patents of top 5 IPCs in DII by priority year10 IPC top 10 Number of patents of top 10 IPCs in DII by priority year11 MC Number of Manual Codes (MCs) in DII by priority year12 MC top 5 Number of patents of top 5 MCs in DII by priority year13 MC top 10 Number of patents of top 10 MCs in DII by priority year
401L. Gao et al. / Technological Forecasting & Social Change 80 (2013) 398–407

2.2. TLC stages of CRT and TFT-LCD
It is better to choose a training technology with four TLC stages. From the literature, we find that the Cathode Ray Tube (CRT)has been developed for more than 100 years and is now in the decline stage [27,28]. But the patent information in the early yearsis unavailable (patent data in DII covers 1963 to the present). So we choose another similar technology, the Thin Film TransistorLiquid Crystal Display (TFT-LCD), as the second training technology. Nano-biosensor (NBS) is chosen as the test technology.
We then focus on CRT and TFT-LCD technologies and assess their life cycle stages. We developed the questionnaires based onthe concept of TLC given by Arthur D. Little [9]. Ten experts in CRT, TFT-LCD or display fields were asked to give the time periods offour stages for TFT-LCD and CRT. We obtained four responses. By discussing with two of the experts who gave similar time periodsfor CRT, we finally determined the TLC stages of CRT and the stages of TFT-LCD based on one related paper [29]. Table 3 shows theTLC stages of CRT and TFT-LCD as given by the experts and literature.
2.3. Search query
The search terms for each technology are defined simply but appear to capture the most relevant patents.For TFT-LCD, the search terms are “thin film transistor* liquid crystal display*” in all fields. Using abbreviations “TFT” and “LCD”
brings up many irrelevant records. So we add the IPC code, G02F1/13 (based on liquid crystals to control the intensity, phase,polarisation, or colour), for searching. In this way, we obtain 12,596 records for TFT-LCD.
Correspondingly, for CRT, as no IPC code exists, we use a Derwent Class Code (DC), V05 (Valves, Discharge Tubes and CRTs). Sothe search terms are “cathode ray tube*,” CRT, or V05. In this manner, we obtain 34,469 records for CRT.
We divide NBS technology into two parts: one is a nano-related technology and the other is a biosensor-related technology. Aquery strategy for nanotechnology has been developed by TPAC at the Georgia Institute of Technology [30]. We refine our searchterms for biosensors based on our earlier research [31] and add some keywords related to functions of biosensors, including “test”(or similar keywords, such as measure*, monitor*) and “nucleic acid*” (or some other bio-related keywords, such as lactate orcholesterol), and “sensor*.” After combining the nanotechnology search query with the biosensor terms, we obtain 1493 recordsfor NBS.
All the records are downloaded from DII, and VantagePoint software [www.theVantagePoint.com] is employed to extract,clean, and analyse indicator data.
2.4. Data process
First, we develop a map for 13 indicators of each training technology. Numbers of inventors suggest very interesting changesin different stages. Fig. 3, which presents the emerging and growth stages, shows that the number of inventors is typically higherthan that of all other indicators. This declines in the mid-maturity stage (Fig. 4), but slightly increases in the following years. Thenumber of inventors is less than some other indicators, such as application numbers and priority application numbers in thematurity and decline stages.
Trends of other indicators also show different patterns. In the emerging and growth stages, indicators 1, 2, 4, 5, 9, 10, 11, 12,and 13 show similar trends; indicator 6 and 8 look similar; indicators 3 and 7 are different from the others and also different fromeach other. In the maturity and decline stages, indicators 1, 2, 9 and 10 are similar. To make clear which indicators are similar withthe others in the development trends, we employ a cross-correlation analysis to measure the similarity among the 13 indicators inthe four stages. Table 4 provides the results of the cross-correlation analysis (r≥0.9).
• Emerging stage: In group 1, indicators 1, 2, 3, 7, 9, 10, 11, 12, and 13 have strong correlations. Indicators 5, 6, and 7 are anothergroup with strong correlations. Indicators 4 and 8 are uncorrelated.
• Growth stage: 11 of the 13 indicators are strongly correlated. Indicators 6 and 7 form the other group with strong correlations.• Maturity stage: There are 5 groups in this stage. Indicators 1, 2, 3, 7, 8, 9, 10, 11, and 13 have strong correlations. Indicators 11,12, and 13 form another group. Indicators 4, 5, and 6 are uncorrelated.
• Decline stage: There are 6 groups in this stage. Because CRT is still in its decline stage, the indicator performance should beinterpreted with great caution.
Since the indicators show different trends in different stages, it might be better to combine all 13 indicators to measure thechange of technology rather than using one single indicator.
It is common to process multidimensional data by matrix. The original data are extracted by VantagePoint and imported intoMS Excel— 13 rows of indicators, 30 columns (years) for TFT-LCD (from 1978 to 2007), 36 columns (years) for CRT (from 1972 to2008), and 24 columns (years) for NBS (from 1985 to 2008).
Table 3TLC stages of CRT and TFT-LCD.
Stage Emerging Growth Maturity Decline
Period (year)(CRT) 1897–1929 1930–1972 1973–2000 2001–2020Period (year)(TFT-LCD) 1976–1990 1991–2007 2008– –
402 L. Gao et al. / Technological Forecasting & Social Change 80 (2013) 398–407

We propose a normalisation method with two steps to pre-process the original data. The first step is data smoothing bycalculating three-year moving averages. The original data are defined as
A ¼ A1;A2½ �: ð1Þ
Here A1, A2 represent the original data of TFT-LCD and CRT respectively. Then the smoothed data of TFT-LCD and CRT aredefined as
A ¼ A1 ;A2
h ið2Þ
0
500
1000
1500
2000
2500
3000
3500
1978
1979
1980
1981
1982
1983
1984
1985
1986
1987
1988
1989
1990
1991
1992
1993
1994
1995
1996
1997
1998
1999
2000
2001
2002
2003
2004
2005
2006
2007
2008
2009
Application Priority Corporate Non-corporateInventor Literaturecitation Patentcitation IPC
IP-CTOP10 MC MC-TOP5IP-CTOP5MC-TOP10
Fig. 3. Development trends of 13 indicators (TFT-LCD).
0
500
1000
1500
2000
2500
1972
1973
1974
1975
1976
1977
1978
1979
1980
1981
1982
1983
1984
1985
1986
1987
1988
1989
1990
1991
1992
1993
1994
1995
1996
1997
1998
1999
2000
2001
2002
2003
2004
2005
2006
2007
2008
2009
Application Priority Corporate Non-corporate
Inventor Literaturecitation Patentcitation IPC
IPC-TOP5 IPC-TOP10 MC MC-TOP5
MC-TOP10
Fig. 4. Development trends of 13 indicators (CRT).
403L. Gao et al. / Technological Forecasting & Social Change 80 (2013) 398–407

A1 i; jð Þ ¼ A1 i; jþ 1ð Þ þ A1 i; jð Þ þ A1 i; j−1ð Þ3
; i∈ 1;13½ �; j∈ 2;29½ � ð3Þ
A2 i; jð Þ ¼ A2 i; jþ 1ð Þ þ A2 i; jð Þ þ A2 i; j−1ð Þ3
; i∈ 1;13½ �; j∈ 2;35½ �: ð4Þ
A1 ;A2 represent the smoothed data of TFT-LCD and CRT respectively.The next step is to divide the smoothed data by their maximums. The normalised data are defined as
A ¼ A1; A2
h ið5Þ
A1 i; jð Þ ¼ A1 i; jð Þmaxj A1 i; jð Þ ; i∈ 1;13½ �; j∈ 1;30½ � ð6Þ
A2 i; jð Þ ¼ A2 i; jð Þmaxj0 A2 i; jð Þ ; i∈ 1;13½ �; j∈ 1;36½ � ð7Þ
A1; A2 represent the normalised data of TFT-LCD and CRT respectively.We then apply the same normalisation steps to the NBS data. The smoothed data and the final normalised data of NBS are
defined as B, B respectively,
B i; kð Þ ¼ B i; kþ 1ð Þ þ B i; kð Þ þ B i; k−1ð Þ3
; i;∈ 1;13½ �; k∈ 2;23½ � ð8Þ
B i; kð Þ ¼ B i; kð Þmaxk B i; kð Þ ; i∈ 1;13½ �; k∈ 1;24½ �: ð9Þ
Then the nearest neighbour (NN) classifier is applied to the normalised data to measure the stage status of NBS. NN is widelyused in pattern recognition, machine learning, and computer vision. It has been shown that NN has consistently highperformance. It involves a training set and a test set. The test points in the test set are classified by calculating the distance to thenearest training point in the training set; the sign of each point then determines the classification of the test sample. In the paper,we employ it to process the multi-dimensional (13-D) data.
The normalised data of TFT-LCD and CRT form the training set Ω (Ω⊂R13), and the normalised data of NBS are considered as atest setΨ (Ψ⊂R13). There are 30 training points in the TFT-LCD training set, 36 training points in the CRT training set, and 24 testpoints in the NBS test set. The training points aj and test points bk are defined as
aj ¼A 1; jð Þ
⋮A 13; jð Þ
������
������; ð10Þ
bk ¼B 1; kð Þ
⋮B 13; kð Þ
������
������: ð11Þ
Since we have the TLC stages of TFL-LCD and CRT, we can form the label set of training set
L ¼ la la ¼ 1;2;3;4; a∈Ωj g;f ð12Þli represents TLC stages of TFT-LCD and CRT.
For a training point aj∈Ω and test point bk∈Ψ, the distance between aj and bk is defined as
dist aj; bk� �
¼ ‖aj−bk‖ ¼ffiffiffiffiffiffiffiffiffiffiffiffiffiffiffiffiffiffiffiffiffiffiffiffiffiffiffiffiffiffiffiffiffiffiffiffiffiffiffiffiffiffiffiX13i¼1
a i; jð Þ−b i; kð Þð Þ2:vuut ð13Þ
Table 4Cross-correlation analysis for 13 indicators (r≥0.9).
TLC stage Emerging Growth Maturity Decline
Group 1 1, 2, 3, 7, 9, 10, 11, 12, 13 1, 2, 3, 4, 5, 8, 9, 10, 11, 12, 13 1, 2, 3, 7, 8, 9, 10, 11, 13 1, 2, 7, 9, 10, 12, 13Group 2 5, 6, 7 6, 7 4 2, 3, 8Group 3 4 5 4Group 4 8 6 5Group 5 11, 12, 13 6, 7Group 6 11
404 L. Gao et al. / Technological Forecasting & Social Change 80 (2013) 398–407

For each test point bk∈Ψ, we compute the distance between bk and all the training points and find the nearest training point(Fig. 5), that means
dist aj0−bk� �
¼ min dist aj; bk� �
s:t:aj∈Ω: ð14Þ
Then the label information of bk is considered identical to that of aj0, namely lbk ¼ laj0 . In order to obtain all label informationfor NBS, we have to calculate the minimum distance between each test point and all the training points and then obtain all thelabel information of bk, that is the TLC stage information of NBS.
3. Results and implications for management
Table 5 shows the label results for each test point of NBS. The label information of the first 12 test points (1985–1996) of NBScan be matched with that in the emerging stage of TFT-LCD, and the label information of the second 12 test points (1997–2008) ofNBS can be matched with that in the growth stage of TFT-LCD.
We separately showed our results to two NBS experts who are working for Georgia Institute of Technology. In their opinion,the results fit their understanding for the development of NBS.
Therefore, NBS is still in its growth stage (1997 to the present). And according to the definition of TLC, in a technology's growthstage, there are pacing technologies with high competitive impact that have not yet been integrated into new products orprocesses. That means, some product-related technologies may be commercialised in the future; however, at the moment, thesetechnologies need more work in order to resolve key problems. The most successful commercial biosensor technology—surfaceplasmon resonance—does not have a very good limit of detection (LOD), the nanoparticle based SPR (or local SPR) can provideexcellent LOD. However, the current fabrication technology is expensive [32]. Therefore, the fabrication technology is one of thepacing technologies of NBS. In this stage, a lot of challenging problems must be overcome, such as enhancement of gene array andprotein array, and some new and promising technologies are still under research [33].
Technology observers can make their R&D investment decision by using the proposed approach. The result shows that NBS is in agrowth stage. It means that there aremany technologies still in development, including SPR. Technologymanagersmight inform theirNBS R&D investments by analysing patent application data from 1997 to the present to identify hot research topics or technologicalgaps. For someNBS related companies that have enoughmoney for R&D, it is a good time to invest in NBS to pursue potentialmarkets.
4. Conclusions
How might technology life cycle analysis based on patents contribute to FTA? This approach to gauge a technology's growthtrend provides a more robust projection. However, as mentioned in Section 1, extrapolative technology trend approaches are not
Fig. 5. An example for computing the distance between test point and training points.
405L. Gao et al. / Technological Forecasting & Social Change 80 (2013) 398–407

definitive projections. Indeed, explicit analyses of what factors and forces are apt to alter projected developmental trends areworthwhile— note Ted Gordon's “Trend Impact Analysis” (TIA) especially [34]. A thoughtful anonymous reviewer reminded us ofthe wide range of factors that could change a development trajectory, including new combinations of technologies (existing and/or emerging), and many socio-economic forces (e.g., fluctuations in demand, regulations, ethical or environmental concerns). Inaddition, one would want to address the potential “unintended, indirect, or delayed” impacts on society of introducing newtechnologies – i.e., technology assessment – but that is beyond the scope of this study.
This study is based on patent documents; it adopts 13 indicators that can be quantified to measure the TLC stages of an objecttechnology. We introduce the nearest neighbour classifier, which is commonly used in pattern recognition and some other fields,to process the 13-D data by calculating the nearest distance among the test point and training points to find the most similarfeature in training points. Therefore, the stage of the training point with the nearest distance to the test point predicts the stage ofthe test point. In this study, we take TFT-LCD and CRT as the training technologies and NBS as the test technology. The resultshows that NBS is still in its growth stage. This means that there are pacing technologies with high competitive impact that havenot yet been integrated into new products or processes. Companies with strong capital strength and technical capabilities shouldparticipate in this stage and develop differentiated products to capture the market [35]. This method can be used not only in NBSbut also in other technology fields, since data of the all indicators can be downloaded from most patent databases.
Certainly, our study possesses limitations. First, only two technologies serve as the training technologies to calculate thesimilarity feature with the object technology (test technology). This is due to the lack of ideal training technologies with four TLCstages. So, this study resembles a laboratory test. Though the results seem reasonable, we still need to find more technologies andobtain more data to validate the method. Second, we did not consider the technology type. TFT-LCD and CRT are categorised assingle-technology type, but NBS is a multi-technology: it involves nanotechnology and biotechnology, with diverse applicationpossibilities. Different types of technologies may have different developing patterns, especially for those technologies close tobasic science, such as biotechnology. Future research should also take this into account. Third, the classifier we used in this paperis the nearest neighbour classifier. For future study, we will test some other classifiers, such as nearest feature line (NFL) andBayesian classifier, to assess if we can improve indicator performance.
Many papers have pointed to the desirability of improving the accuracy of trend projection methods [36–39]. If TF is to aid indecision making, robustness is vital. How might this TLC estimation method fit in with other FTA techniques? Porter [40]suggested considering the use of multiple FTA methods tailored to the type of foresight study. He distinguishes 13 methodfamilies. TLC is intriguing in that it combines aspects of several of those: trend analyses (where it best fits), but also monitoringand intelligence, matrices (analogies), modelling, and a hint of roadmapping. More importantly, we suggest that TLC would becomplemented by informal and/or formal expert opinion to check the results and to identify factors apt to alter the course ofdevelopment that TLC suggests. It is oriented mid-term (i.e., 2–10 years in the future) to provide a more robust sense of likelydevelopmental trajectory than does single variable trend projection.
Acknowledgement
This research was undertaken at Georgia Tech, drawing on support from the National Science Foundation (NSF) throughthe Center for Nanotechnology in Society (Arizona State University; Award no. 0531194) and the Science of Science PolicyProgram—“Measuring and Tracking Research Knowledge Integration” (Georgia Tech; Award no. 0830207).
The findings and observations contained in this paper are those of the authors and do not necessarily reflect the views of theNational Science Foundation.
We deeply appreciate the financial support to this research from the West Light Foundation of the Chinese Academy ofSciences, and the Knowledge Innovation Program of the Chinese Academy of Sciences.
We are further sincerely grateful and dedicate our acknowledgement to the experts in TFT-LCD, CRT and NBS: Prof. ShouqianDing, Prof. Linsu Tong, Prof. Zhihua Gu, Prof. Xurong Xu, Dr. Zhengchun Peng, Dr. Jud Ready; and two reviewers, Dr. Li Tang andDr. Jian Wang, for their very useful comments.
References
[1] D.A. Norman, The life cycle of a technology: why it is so difficult for large companies to innovate? Online at, http://www.nngroup.com/reports/life_cycle_of_tech.html 1998.
Table 5TLC stages of NBS.
1985 1986 1987 1988 1989 1990 1991 1992 1993 1994 1995 1996
lb 1 1 1 1 1 1 1 1 1 1 1 11997 1998 1999 2000 2001 2002 2003 2004 2005 2006 2007 2008
lb 2 2 2 2 2 2 2 2 2 2 2 2
So the TLC stages estimated for NBS are:Emerging stage (lb=1): 1985–1996.Growth stage (lb=2): 1997–present.
406 L. Gao et al. / Technological Forecasting & Social Change 80 (2013) 398–407

[2] H.X.G. Ming, W.F. Lu, C.F. Zhu, Technology challenges for product lifecycle management, Technical Report, STR/04/058/SP, Singapore Institute ofManufacturing Technology, 2004.
[3] T.A. Vijay, Challenges in product strategy, product planning and technology development for product life cycle, CIRP Ann. Manuf. Technol. 43 (1) (2008)157–162.
[4] J.P. Martino, Technological Forecasting for Decision Making, 3rd Edition McGraw-Hill, New York, NY, 1993.[5] A.T. Roper, S.W. Cunningham, A.L. Porter, T.W. Mason, F.A. Rossini, J. Banks, Forecasting and Management of Technology, 2nd Edition John Wiley, New York,
NY, 2011.[6] A.L. Porter, M. Rader, Fitting future-oriented technology analysis methods to study types, in: C. Cagnin, M. Keenan, R. Johnston, F. Scapolo, R. Barre' (Eds.),
Future-Oriented Technology Analysis: Strategic Intelligence for an Innovative Economy, Springer, Berllin, 2008, pp. 149–162.[7] W.L. Nolte, B.C. Kennedy, R.J. Dziegiel, Technology readiness level calculator, NDIA Systems Engineering Conference online at, http://lincoln.gsfc.nasa.gov/
trl/Nolte2003.pdf 2003.[8] NASA, HRST Technology Assessments. Online at, http://www.hq.nasa.gov/office/codeq/trl/trlchrt.pdf.[9] A.D. Little, The strategic management of technology. European Management Forum, Davos, 1981.
[10] H. Ernst, The use of patent data for technological forecasting: the diffusion of CNC-technology in the machine tool industry, Small Bus. Econ. 9 (4) (1997)361–381.
[11] T.H. Lee, N. Nakicenovic, Life cycle of technology and commercial policy, Sci. Technol. Rev. 1 (1989) 38–43.[12] W.Y. Zhou, Probe into the research of the electric technological development trend of plasma display with the patent index, Ph.D. dissertation, Chung Yuan
Christian University, Taiwan, 2005.[13] C.M. Chu, Using technology life cycle to analysis the developing trend of thin-film photovoltaic industry, Ph.D. dissertation, National Central University,
Taiwan, 2008.[14] J.W. Robert, A.L. Porter, Innovation forecasting, Technol. Forecast. Soc. Change 56 (1997) 25–47.[15] R. Haupt, M. Kloyer, M. Lange, Patent indicators for the technology life cycle development, Res. Policy 36 (2007) 387–398.[16] X. Zhang, S. Fang, C. Tang, G.H. Xiao, Z.Y. Hu, L.D. Gao, Study on indicator system for core patent documents evaluation, in: Proceedings of ISSI 2009 - The
12th International Conference of the International Society for Scientometrics and Informetrics, Rio de Janeiro, Brazil, 2009, pp. 154–164.[17] C. Zhang, D.H. Zhu, X.F. Wang, Chinese patent analysis of IC package technology, J. Mod. Inf. 9 (2006) 160–166.[18] C.M. Chu, Using technology life cycle to analysis the developing trend of thin-film photovoltaic industry, Ph.D. dissertation, National Central University
Taiwan, 2009.[19] T.T. Tang, P. Liu, P. Zhang, F.B. Ge, M. Li, Application of Gompertz curve model in the patent trend forecast, New Technol. Libr. Inf. Serv. 11 (2009) 59–63.[20] H.L. Yu, Analysis of the particleboard technology based on TRIZ and S-Curve technique evolution law, Forest. Sci. Technol. 34 (4) (2009) 57–60.[21] Y.C. Wu, T.C. Yen, RFID technology innovations: use of patent data, IEEE in Beijing, 2008.[22] M. Meyer, Does science push technology? Patents citing scientific literature, Res. Policy 29 (2000) 409–434.[23] D. Hicks, A. Breitzman, K. Hamilton, F. Narin, Research excellence and patented innovation, Sci. Public Policy 27 (5) (2000) 310–320.[24] F. Narin, E. Noma, R. Perry, Patents as indicators of corporate technological strength, Res. Policy 16 (1987) 143–155.[25] J. Lerner, The importance of patent scope: an empirical analysis, Rand J. Econ. 25 (1994) 319–333.[26] T.H. Chang, A study on the Technique Development of RFID-Base on life-cycle theory, Ph.D. dissertation, National University of Tainan Institutional
Repository, Taiwan, 2007.[27] C.H. Yeh, A comparative analysis of Taiwan's CRT and TFT-LCD industries – based on the viewpoints of industrial ecology and life cycle, Ph.D. dissertation,
Da-Yeh University, Taiwan, 2005.[28] S.Q. Ding, The commemoration for 100th anniversary of the cathode ray tube, Chin. J. Liquid Crystals Displays 12 (3) (1997) 153–160.[29] H.J. Lai, Study on the technique development of TFT-LCD industry-based on patent analysis and life cycle theory, Ph.D. dissertation, Chun Yuan Christian
University, Taiwan, 2003.[30] A.L. Porter, J. Youtie, P. Shapira, D.J. Schoeneck, Refining search terms for nanotechnology, J. Nanopart. Res. 10 (2008) 715–728.[31] L. Huang, Z.C. Peng, Y. Guo, A.L. Porter, Identifying the emerging roles of nanoparticles in biosensors, J. Bus. Chem. 7 (1) (2010) 15–29.[32] D. Erickson, S. Mandal, A.H.J. Yang, B. Cordovez, Nanobiosensors: optofluidic, electrical and mechanical approaches to biomolecular detection at the
nanoscale, Microfluid. Nanofluid. 4 (1–2) (2008) 33–52.[33] G.A. Urban, Micro- and nanobiosensors—state of the art and trends, Meas. Sci. Technol. 20 (2009) 1–18.[34] T.J. Gordon, Trend impact analysis, in: J.C. Glenn, T.J. Gordon (Eds.), Futures Research Methodology Version 3.0., Millennium Project, WFUNA, Washington,
DC, 2009, Chapter 8.[35] E.T. Popper, B.D. Buskirk, Technology life cycles in industrial markets, Ind. Market Manage. 21 (1) (1992) 23–31.[36] E. Hajime, The suitability of technology forecasting/foresight methods for decision systems and strategy: a Japanese view, Technol. Forecast. Soc. Change 70
(3) (2003) 231–249.[37] J. Yoon, K. Kim, Trend perceptor: a property–function based technology intelligence system for identifying technology trends from patents, Expert Syst. Appl.
39 (3) (2012) 2927–2938.[38] E. Hajime, Obstacles for the acceptance of technology foresight to decision makers, lessons from complaint analysis of technology forecasting, Int. J. Foresight
Innov. Policy 1 (3–4) (2004) 1740–2816.[39] C. Lee, Y. Cho, H. Seol, Y. Park, A stochastic patent citation analysis approach to assessing future technological impacts, Technol. Forecast. Soc. Change 79 (1)
(2012) 16–29.[40] A.L. Porter, Technology foresight: types and methods, Int. J. Foresight Innov. Policy 6 (1/2/3) (2010) 36–45.
Lidan Gao is an Associate Professor of Chengdu Library of The Chinese Academy of Sciences. She focuses on patent analysis. She is the author of more than 10articles.
Alan Porter is a Professor Emeritus of Industrial & Systems Engineering, and of Public Policy, at Georgia Tech, where he remains Co-director of the TechnologyPolicy and Assessment Center. He is also a Director of R&D for Search Technology, Inc., Norcross, GA. He is the author of some 220 articles and books, includingTech Mining (Wiley, 2005) and Forecasting and Management of Technology (Wiley, 2011).
Jing Wang is an Associate Professor of Huaqiao University. His major is computer science and technology and he mainly focuses on Pattern Recognition,Neurocomputing et al. He is the author of more than 20 articles.
Shu Fang is a Professor and the Director of Chengdu Library of Chinese Academy of Sciences. He is a Ph. D. doctor supervisor.
Xian Zhang is an Associate Professor of Chengdu Library of The Chinese Academy of Sciences. Her major is informetrics and she focuses on patent analysis. She isthe author of one academic book and over 30 articles.
Tingting Ma is a Ph. D. candidate of School of Management & Economics at Beijing Institute of Technology.
Wenping Wang is a Ph. D. candidate of School of Management & Economics at Beijing Institute of Technology.
Lu Huang is a faculty member in the School of Management and Economics, Beijing Institute of Technology. Her specialty is science and technology management,particularly the study of technology forecasting and assessment. She is focusing on a research on emerging science and technology topics.
407L. Gao et al. / Technological Forecasting & Social Change 80 (2013) 398–407