JURNAL ARKANSAS
33
Crime , Comments , Transportation , Cost of Living , Religion , Voting Economy Arkansas, AR United States Unemployment Rate 8.00% 8.60% Recent Job Growth 0.47% 0.35% Future Job Growth 32.94% 32.10% Sales Taxes 6.00% 5.00% Income Taxes 7.00% 4.70% Income per Cap. $21,468 $26,154 Household Income $40,898 $50,935 ESTIMATED HOUSEHOLDS BY HOUSEHOLD INCOME Income Less Than 15K 16.32% 12.37% Income between 15K and 25K 13.33% 10.53% Income between 25K and 35K 13.19% 10.88% Income between 35K and 50K 17.22% 15.37% Income between 50K and 75K 19.60% 20.14% Income between 75K and 100K 9.73% 12.41% Income between 100K and 150K 7.09% 11.27% Income between 150K and 250K 2.47% 5.01% Income between 250K and 500K 0.95% 1.86% Income greater than 500K 0.09% 0.16% POPULATION BY OCCUPATION 1
Transcript of JURNAL ARKANSAS

Crime, Comments, Transportation, Cost of Living ,
Religion, Voting
EconomyArkansas,
AR
United
States
Unemployment Rate 8.00% 8.60%
Recent Job Growth 0.47% 0.35%
Future Job Growth 32.94% 32.10%
Sales Taxes 6.00% 5.00%
Income Taxes 7.00% 4.70%
Income per Cap. $21,468 $26,154
Household Income $40,898 $50,935
ESTIMATED HOUSEHOLDS BY HOUSEHOLD INCOME
Income Less Than 15K 16.32% 12.37%
Income between 15K and 25K 13.33% 10.53%
Income between 25K and 35K 13.19% 10.88%
Income between 35K and 50K 17.22% 15.37%
Income between 50K and 75K 19.60% 20.14%
Income between 75K and 100K 9.73% 12.41%
Income between 100K and 150K 7.09% 11.27%
Income between 150K and 250K 2.47% 5.01%
Income between 250K and 500K 0.95% 1.86%
Income greater than 500K 0.09% 0.16%
POPULATION BY OCCUPATION
1

2
Management, Business, and Financial
Operations11.78% 14.04%
Professional and Related Occupations 16.88% 20.61%
Service 13.71% 14.45%
Sales and Office 25.42% 26.75%
Farming, Fishing, and Forestry 1.39% 0.70%
Construction, Extraction, and
Maintenance10.62% 9.42%
Production, Transportation, and Material
Moving20.19% 14.05%
The unemployment rate in Arkansas, AR, is 8.00%, with job
growth of 0.47%. Future job growth over the next ten years
is predicted to be 32.94%.
Arkansas, AR Taxes
Arkansas, AR,sales tax rate is 6.00%. Income tax is 7.00%.

3
Arkansas, AR Income and Salaries
The income per capita is $21,468, which includes all adults
and children. The median household income is $40,898.
http://www.bestplaces.net/economy/state/arkansas
http://www.bls.gov/ro6/fax/mls_ar.htm
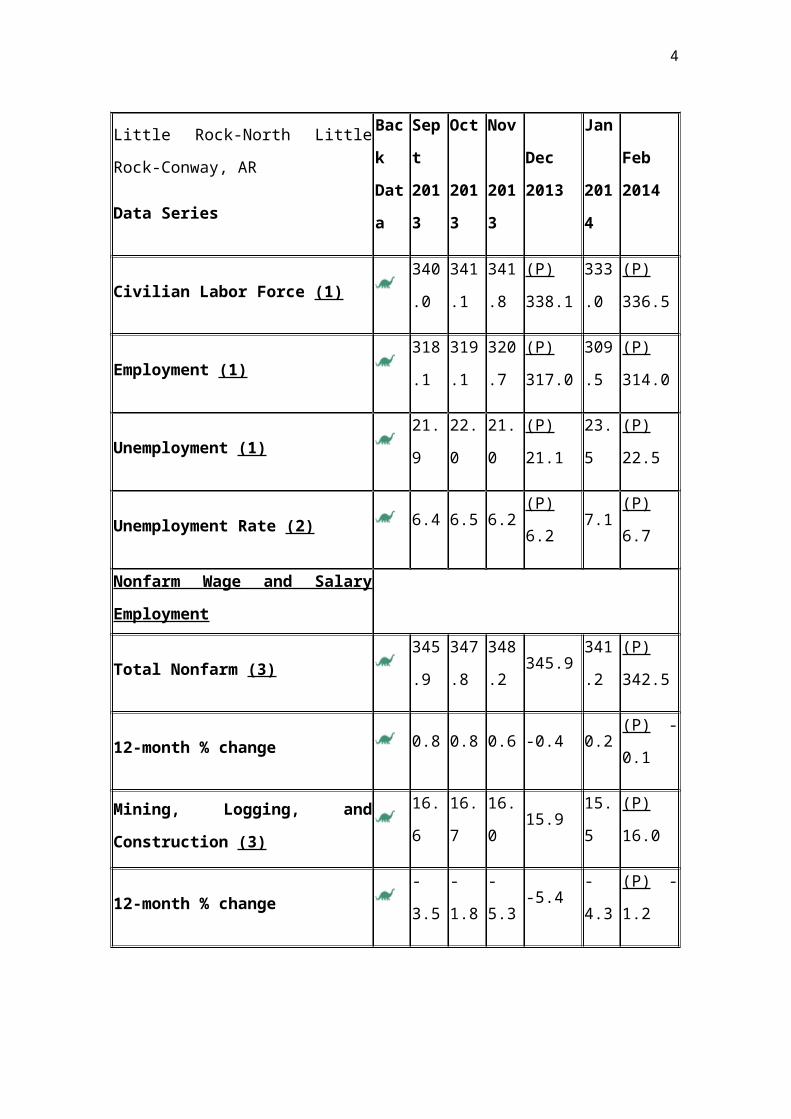
Little Rock-North Little Rock-Conway, AR
Little Rock-North Little
Rock-Conway, AR
Data Series
Bac
k
Dat
a
Sep
t
201
3
Oct
201
3
Nov
201
3
Dec
2013
Jan
201
4
Feb
2014
Labor Force Data
4
Little Rock-North Little
Rock-Conway, AR
Data Series
Bac
k
Dat
a
Sep
t
201
3
Oct
201
3
Nov
201
3
Dec
2013
Jan
201
4
Feb
2014
Civilian Labor Force (1)340
.0
341
.1
341
.8
(P)
338.1
333
.0
(P)
336.5
Employment (1)318
.1
319
.1
320
.7
(P)
317.0
309
.5
(P)
314.0
Unemployment (1)21.
9
22.
0
21.
0
(P)
21.1
23.
5
(P)
22.5
Unemployment Rate (2) 6.4 6.5 6.2(P)
6.27.1
(P)
6.7
Nonfarm Wage and Salary
Employment
Total Nonfarm (3)345
.9
347
.8
348
.2345.9
341
.2
(P)
342.5
12-month % change 0.8 0.8 0.6 -0.4 0.2(P) -
0.1
Mining, Logging, and
Construction (3)
16.
6
16.
7
16.
015.9
15.
5
(P)
16.0
12-month % change-
3.5
-
1.8
-
5.3-5.4
-
4.3
(P) -
1.2

5
Little Rock-North Little
Rock-Conway, AR
Data Series
Bac
k
Dat
a
Sep
t
201
3
Oct
201
3
Nov
201
3
Dec
2013
Jan
201
4
Feb
2014
Manufacturing (3)19.
7
19.
7
19.
619.6
19.
6
(P)
19.6
12-month % change-
1.5
-
1.0
-
0.5-0.5
-
1.0
(P) -
0.5
Trade, Transportation, and
Utilities (3)
66.
6
67.
0
67.
967.8
65.
8
(P)
65.2
12-month % change-
0.30.0
-
0.7-1.6
-
1.2
(P) -
1.8
Information (3) 7.2 7.2 7.2 7.2 7.0(P)
7.0
12-month % change-
1.4
-
1.4
-
1.4-1.4
-
4.1
(P) -
5.4
Financial Activities (3)20.
1
20.
1
20.
120.3
20.
1
(P)
20.1
12-month % change 2.0 2.0 2.0 2.0 2.0(P)
1.5
Professional and Business
Services (3)
45.
4
45.
8
45.
945.4
44.
9
(P)
45.1
12-month % change 4.1 4.8 5.3 3.7 3.0 (P)

6
Little Rock-North Little
Rock-Conway, AR
Data Series
Bac
k
Dat
a
Sep
t
201
3
Oct
201
3
Nov
201
3
Dec
2013
Jan
201
4
Feb
2014
1.1
Education and Health
Services (3)
51.
9
51.
7
51.
751.1
50.
9
(P)
51.4
12-month % change-
0.8
-
2.6
-
2.5-3.2 0.2
(P)
0.4
Leisure and Hospitality (3)31.
6
32.
2
32.
131.0
30.
5
(P)
30.6
12-month % change 4.3 6.3 5.9 1.0 2.0(P)
1.3
Other Services (3)15.
8
15.
6
15.
715.7
15.
7
(P)
15.7
12-month % change 2.6 1.3 1.9 1.9 1.9(P)
1.3
Government (3)71.
0
71.
8
72.
071.9
71.
2
(P)
71.8
12-month % change 0.6 0.4 0.3 0.0 0.0(P)
0.0
Footnotes
(1) Number of persons, in thousands, not seasonally

7
Little Rock-North Little
Rock-Conway, AR
Data Series
Bac
k
Dat
a
Sep
t
201
3
Oct
201
3
Nov
201
3
Dec
2013
Jan
201
4
Feb
2014
adjusted.
(2) In percent, not seasonally adjusted.
(3) Number of jobs, in thousands, not seasonally adjusted.
See About the data.
(P) Preliminary
http://www.bls.gov/eag/eag.ar_littlerock_msa.htm
Chart 1. Private sector gross job gains and losses of employment in Arkansas, June 2008–June 2013 by quarter, seasonally adjusted

8
Article by Luke Jones, Arkansas Business. Read more
here: SBA Lending in Arkansas Rises in 2013

9
http://arcapital.com/sba-lending-in-arkansas-rises-in-
2013/#.U1Bphc4p2_I
Commodity groups cash receipts - 2004
As you can see from the table below, Arkansas ranks 11th
among the states for total agricultural production. Though
the state doesn't quite make it into the top ten for total
agricultural production, Arkansas is a top ten producer in
the livestock and livestock products category.
Commodity groups cash receipts - 2004
Product Group Value
($1,000)
% State total State rank
All
commodities6,604,400 100.0% 11
Livestock
products4,172,669 63.2% 9
Crops 2,431,732 36.8% 18Source: USDA:Economic Research Service
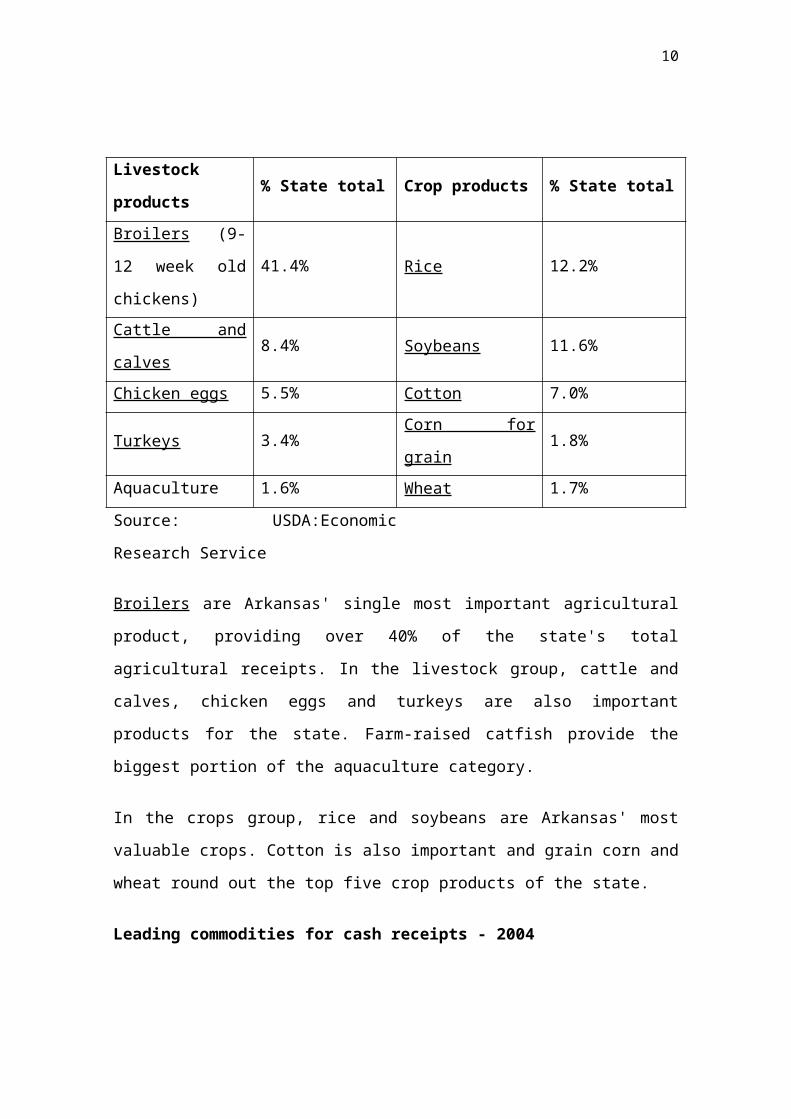
Arkansas's top five commodities by cash receipts - 2004
This table lists Arkansas's top commodities in each of
Arkansas' two agriculutural groups, livestock and crops.
Arkansas's top five commodities by cash
receipts - 2004
10
Livestock
products% State total Crop products % State total
Broilers (9-
12 week old
chickens)
41.4% Rice 12.2%
Cattle and
calves8.4% Soybeans 11.6%
Chicken eggs 5.5% Cotton 7.0%
Turkeys 3.4%Corn for
grain1.8%
Aquaculture 1.6% Wheat 1.7%
Source: USDA:Economic
Research Service
Broilers are Arkansas' single most important agricultural
product, providing over 40% of the state's total
agricultural receipts. In the livestock group, cattle and
calves, chicken eggs and turkeys are also important
products for the state. Farm-raised catfish provide the
biggest portion of the aquaculture category.
In the crops group, rice and soybeans are Arkansas' most
valuable crops. Cotton is also important and grain corn and
wheat round out the top five crop products of the state.
Leading commodities for cash receipts - 2004

11
This table offers a more complete view of the most
important agricultural products of Arkansas.
The dollars produced by the production of broilers in
Arkansas is greater than the dollars generated by all of
the state's other crops put together.
Leading commodities for cash receipts - 2004
Product Value ($1,000) % State Value1. Broilers (9-12
week old chickens)2,731,300 41.4%
2. Rice 808,021 12.2%3. Soybeans 766,264 11.6%4. Cattle and
calves555,145 8.4%
5. Cotton 464,672 7.0%6. Chicken eggs 362,442 5.5%7. Turkeys 226,718 3.4%8. Corn for grain 116,034 1.8%9. Wheat 113,470 1.7%10. Aquaculture 106,618 1.6%11. Hogs 99,741 1.5%12. Hay 66,188 1.0%13. Dairy products 52,080 0.8%14.
Greenhouse/nursery50,539 0.8%
15. Farm chickens 12,196 0.2%16. Sorghum grain 11,808 0.2%
12
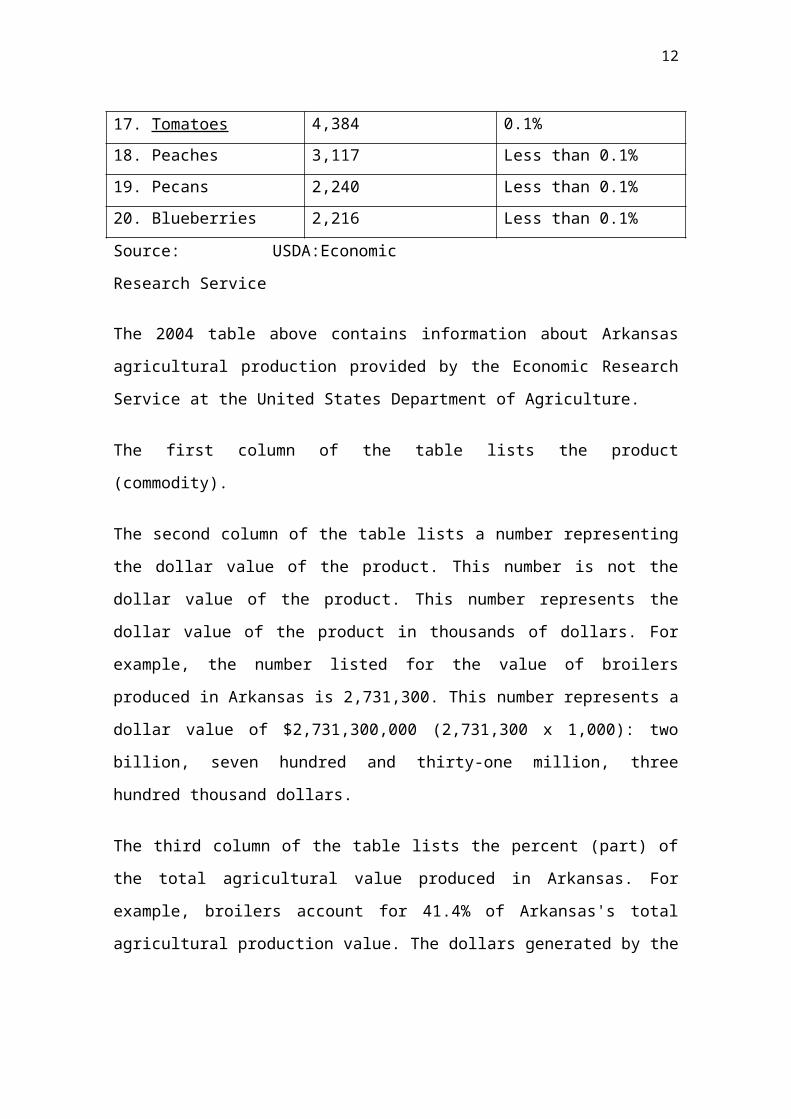
17. Tomatoes 4,384 0.1%18. Peaches 3,117 Less than 0.1%19. Pecans 2,240 Less than 0.1%20. Blueberries 2,216 Less than 0.1%
Source: USDA:Economic
Research Service
The 2004 table above contains information about Arkansas
agricultural production provided by the Economic Research
Service at the United States Department of Agriculture.
The first column of the table lists the product
(commodity).
The second column of the table lists a number representing
the dollar value of the product. This number is not the
dollar value of the product. This number represents the
dollar value of the product in thousands of dollars. For
example, the number listed for the value of broilers
produced in Arkansas is 2,731,300. This number represents a
dollar value of $2,731,300,000 (2,731,300 x 1,000): two
billion, seven hundred and thirty-one million, three
hundred thousand dollars.
The third column of the table lists the percent (part) of
the total agricultural value produced in Arkansas. For
example, broilers account for 41.4% of Arkansas's total
agricultural production value. The dollars generated by the

13
production of broilers account for over 2/5 of Arkansas's
total agricultural production.
National ranking highlights - 2004
Ranks first in production of rice (47% of U.S.
production).
Ranks second in aquaculture (12% of U.S. production);
primarily channel catfish and bait fish.
Arkansas farms and farmland - 2004
Because of different rounding methods (e.g., farm acres
given by the National Argriculture Statistics Service),
percentage of farmland per state should be considered a
rough estimate.
Arkansas farms and farmland – 2004
Number of Total farm Percent of Average farm

14
farms acres state size (acres)47,500 14,392,500 43% 303
Source: USDA:National Agriculture Statistics Service

15

16

17

18
Arkansas's largest companies
Private companies
The following table lists the only privately held companies
headquartered in Arkansas with 2011 revenues over
$1 billion.[17]
State
Rank
by
Revenue
Company
Name
Nationa
l
Rank
Revenue
($billi
ons)
2007
estimat
e
Employe
es
Headquart
ers City
Known
for
1Golden
Living154 2.73 42,000
Fort
Smith
Health
Care
Equipme
nt &
Service
s
Public companies
The following table lists the public companies
headquartered in Arkansas with 2012 revenues placing them
in the 500 largest U.S. companies.[8]
State Company National Revenue Headquart Known for

19
Rank
by
Revenue
Name Rank
($billio
ns)
2012
estimate
ers City
1 Walmart 2 469.2Bentonvil
leRetailing
2Tyson
Foods93 33.3
Springdal
ePoultry
3Murphy
Oil104 28.8 El Dorado Petroleum
4 Dillard's 378 6.8Little
Rock
Clothing/
department
store
5Windstrea
m414 6.2
Little
RockCommunications
6J. B.
Hunt486 5.1 Lowell
Trucking/
transportation
Table 1. Mass layoff events and initial claimants for
unemployment insurance, selected industries, Arkansas,
annual totals
IndustryMass layoff events Initial claims for
unemployment insurance2008 2009 2010 2011 2008 2009 2010 2011
Total, allindustries (1) 116 117 71 154 11,9
1412,353
7,748
16,665
Total private 113 114 68 147 11,6 12,0 7,48 16,1

20
18 43 2 34 Total private
nonfarm 113 114 68 147 11,618
12,043
7,482
16,134
Construction (3) 5 3 3 (3) 458 187 280 Heavy and
civil engineeringconstruction
(3) (3) (3) 3 (3) (3) (3) 280
Manufacturing 78 74 38 94 8,557
8,073
4,566
10,808
Food 15 12 8 26 1,918
1,633 845 2,83
4 Woodproducts 7 8 (3) 7 668 875 (3) 908
Plastics andrubber products
(2)6 5 (3) (3) 524 467 (3) (3)
Primarymetals 8 6 - (3) 673 1,03
9 - (3)
Fabricatedmetal products 8 5 (3) (3) 650 271 (3) (3)
Machinery(2) 10 9 10 10 871 772 950 1,31
0 Electricalequipment andappliances
5 5 5 5 941 459 876 823
Transportation equipment (2) 7 11 (3) 8 795 1,15
2 (3) 653
Furnitureand relatedproducts (2)
(3) 4 (3) 4 (3) 762 (3) 728
Miscellaneous manufacturing
(2)(3) (3) (3) 6 (3) (3) (3) 443
Retail trade (3) 7 6 (3) (3) 943 1,133 (3)
Administrativeand waste services
(2)10 8 (3) 16 742 718 (3) 1,31
9
Administrati 10 8 (3) 16 742 718 (3) 1,31

21
ve and supportservices (2) 9
Health careand socialassistance
8 6 5 10 570 508 428 890
Socialassistance 5 5 4 8 385 427 365 780
Accommodationand food services 3 4 5 8 233 286 397 668
Foodservices and
drinking places3 4 5 8 233 286 397 668
Other servicesexcept publicadministration
- - (3) 3 - - (3) 233
Government 3 3 3 7 296 310 266 531
Federal - - 1 - - - 84 -
State 3 2 1 4 296 246 132 336
Local - 1 1 3 - 64 50 195
Footnotes:(1) Total includes all industries including those not listed in the table.(2) Data beginning in 2008 are not strictly comparable to prior years due to a change in NAICS versions.(3) Data do not meet BLS or state agency disclosure standards.NOTE: Dash represents zero.
Table 1. Covered (1) employment and wages in the United
States and the 3 largest counties in Arkansas, fourth
quarter 2012 (2)
AreaEmployment Average Weekly Wage (3)
December Percent Nation Averag Nation Perce Nation

22
2012(thousan
ds)
change,Decembe
r2011-12(4)
alranking bypercen
tchange(5)
eweeklywage
alranking bylevel(5)
ntchange,
fourth
quarter
2011-12(4)
alranking bypercen
tchange(5)
UnitedStates(6)
133,726.8 1.9 -- $1,00
0 -- 4.7 --
Arkansas 1,160.3 0.2 -- 767 47 4.2 19Benton,Ark. 99.2 1.9 134 900 169 3.9 119
Pulaski,Ark. 246.3 1.0 213 927 150 6.9 24
Washington, Ark. 94.6 3.7 23 837 240 0.8 294
(1) Includes workers covered by Unemployment Insurance (UI) and Unemployment Compensation for Federal Employees (UCFE) programs.(2) Data are preliminary.(3) Average weekly wages were calculated using unrounded data.(4) Percent changes were computed from quarterly employment and pay data adjusted for noneconomic county reclassifications.(5) Ranking does not include the county of San Juan, Puerto Rico.(6) Totals for the United States do not include data for Puerto Rico or the Virgin Islands.
Table 2. Covered (1) employment and wages in the United
States and all counties in Arkansas, fourth quarter 2012
(2)
Area Employment
AverageWeekly
Area Employment
AverageWeekly

23
December2012
Wage(3)
December2012
Wage(3)
UnitedStates(4)
133,726,808 $1,000 Lawrence 4,100 $563
Arkansas 1,160,312 767 Lee 2,058 633Arkansas 9,696 737 Lincoln 3,018 619
Ashley 7,386 774 LittleRiver 3,734 811
Baxter 14,312 661 Logan 5,616 612Benton 99,150 900 Lonoke 13,319 627Boone 13,969 648 Madison 3,251 601Bradley 3,437 592 Marion 3,634 550Calhoun 2,743 915 Miller 13,703 703
Carroll 9,845 532 Mississippi 19,569 765
Chicot 3,431 587 Monroe 2,278 570
Clark 9,372 601 Montgomery 1,476 514
Clay 3,724 568 Nevada 2,435 601Cleburne 7,049 617 Newton 1,118 460Clevelan
d 1,055 550 Ouachita 7,221 595
Columbia 8,560 734 Perry 1,447 592Conway 6,718 698 Phillips 6,237 577Craighea
d 44,955 717 Pike 2,265 554
Crawford 19,233 646 Poinsett 5,197 655Crittend
en 16,250 638 Polk 6,129 545
Cross 5,112 612 Pope 26,311 675Dallas 2,875 556 Prairie 1,454 609Desha 4,715 632 Pulaski 246,276 927Drew 6,424 579 Randolph 4,703 511
Faulkner 41,446 745 Saline 21,809 639
Franklin 4,435 686 Scott 3,108 542Fulton 2,007 511 Searcy 1,573 481Garland 35,531 654 Sebastia 65,629 770

24
nGrant 3,683 642 Sevier 4,980 522Greene 15,223 637 Sharp 3,690 511
Hempstead 8,056 664 St.Francis 7,965 639
HotSpring 8,701 623 Stone 2,511 504
Howard 7,098 556 Union 18,003 833Independe
nce 14,607 670 VanBuren 3,837 626
Izard 3,134 562 Washington 94,625 837
Jackson 5,268 640 White 25,374 682Jefferson 30,762 746 Woodruff 1,847 631Johnson 8,870 555 Yell 6,660 542Lafayette 1,316 601(1) Includes workers covered by Unemployment Insurance and
Unemployment Compensation for Federal Employees programs.
(2)Data are preliminary.
(3) Average weekly wages were calculated using unrounded
data.
(4) Totals for the United States do not include data for
Puerto Rico or the Virgin Islands.

25
Table 3. Covered (1) employment and wages by state, fourth
quarter 2012 (2)
State
Employment Average weekly wage (3)
December2012(thousands)
Percentchange,December2011-12
Averageweeklywage
Nationalrankingbylevel
Percentchange,fourthquarter2011-12
Nationalrankingbypercentchange
UnitedStates (4)
133,726.8 1.9 $1,000 -- 4.7 --
Alabama 1,847.3 1.1 854 33 2.6 41Alaska 314.8 1.1 1,007 15 2.7 38Arizona 2,509.2 2.4 912 22 3.3 33Arkansas 1,160.3 0.2 767 47 4.2 19
California 15,216.3 3.3 1,186 5 7.8 2
Colorado 2,311.4 2.7 1,032 11 5.8 5Connecticu
t 1,657.6 1.0 1,253 3 5.3 8
Delaware 411.0 1.2 1,044 9 6.1 4District
ofColumbia
721.5 1.7 1,703 1 2.2 47
Florida 7,535.5 2.3 880 27 3.9 23Georgia 3,889.9 1.7 927 21 4.7 13Hawaii 620.7 2.1 868 30 2.7 38Idaho 618.4 2.0 732 50 2.1 48
Illinois 5,697.9 1.1 1,058 8 4.4 17Indiana 2,850.5 1.8 816 40 3.4 32Iowa 1,486.6 1.3 821 39 3.7 26
Kansas 1,339.2 1.5 835 37 4.4 17Kentucky 1,796.0 1.4 801 42 1.8 49Louisiana 1,891.9 1.0 884 26 4.1 20Maine 582.2 0.2 773 46 2.4 45
Maryland 2,544.1 1.2 1,086 7 2.5 42

26
Massachusetts 3,279.3 1.3 1,248 4 4.8 11
Michigan 3,988.9 1.9 954 18 2.3 46Minnesota 2,677.2 1.6 985 16 5.1 10Mississipp
i 1,096.5 1.1 720 51 3.2 34
Missouri 2,641.9 0.9 863 31 4.6 14Montana 434.6 1.9 757 48 4.1 20Nebraska 931.3 2.2 797 43 4.6 14Nevada 1,145.8 1.9 877 28 2.9 35New
Hampshire 620.8 0.8 1,023 13 5.5 6
New Jersey 3,846.4 1.1 1,172 6 2.9 35New Mexico 796.8 1.5 802 41 0.4 51New York 8,741.9 1.4 1,280 2 6.9 3North
Carolina 3,963.9 1.9 854 33 3.6 29
NorthDakota 421.0 6.1 944 20 8.4 1
Ohio 5,098.0 1.3 887 25 3.6 29
Oklahoma 1,565.3 1.9 847 35 3.9 23
Oregon 1,654.1 1.4 871 29 2.5 42
Pennsylvania
5,629.8 0.5 972 17 3.8 25
RhodeIsland 456.4 1.0 945 19 2.7 38
Table 3. (1) employment and wages by state, fourth quarter
2012 (2)
State Employment Average weekly wage (3)December2012(thousands)
Percentchange,December2011-12
Averageweeklywage
Nationalrankingbylevel
Percentchange,fourthquarter2011-12
Nationalrankingbypercent

27
changeSouth
Carolina 1,832.2 2.0 784 45 2.8 37
SouthDakota 401.7 1.2 749 49 3.5 31
Tennessee 2,710.4 2.1 903 24 5.2 9
Texas 10,956.4 3.2 1,027 12 5.5 6
Utah 1,246.6 3.7 844 36 4.5 16Vermont 306.1 0.7 829 38 2.5 42Virginia 3,663.7 1.1 1,042 10 3.7 26
Washington 2,902.0 2.1 1,017 14 4.0 22West
Virginia 714.3 0.0 788 44 1.5 50
Wisconsin 2,723.6 1.2 855 32 4.8 11Wyoming 277.6 0.2 908 23 3.7 26PuertoRico 978.6 1.6 550 (5) -0.4 (5)
VirginIslands 39.8 -7.9 738 (5) -3.9 (5)
(1) Includes workers covered by Unemployment Insurance (UI)
and Unemployment Compensation for Federal Employees (UCFE)
programs.
(2) Data are preliminary.
(3) Average weekly wages were calculated using unrounded
data.
(4) Totals for the United States do not include data for
Puerto Rico or the Virgin Islands.
(5) Data not included in the national ranking
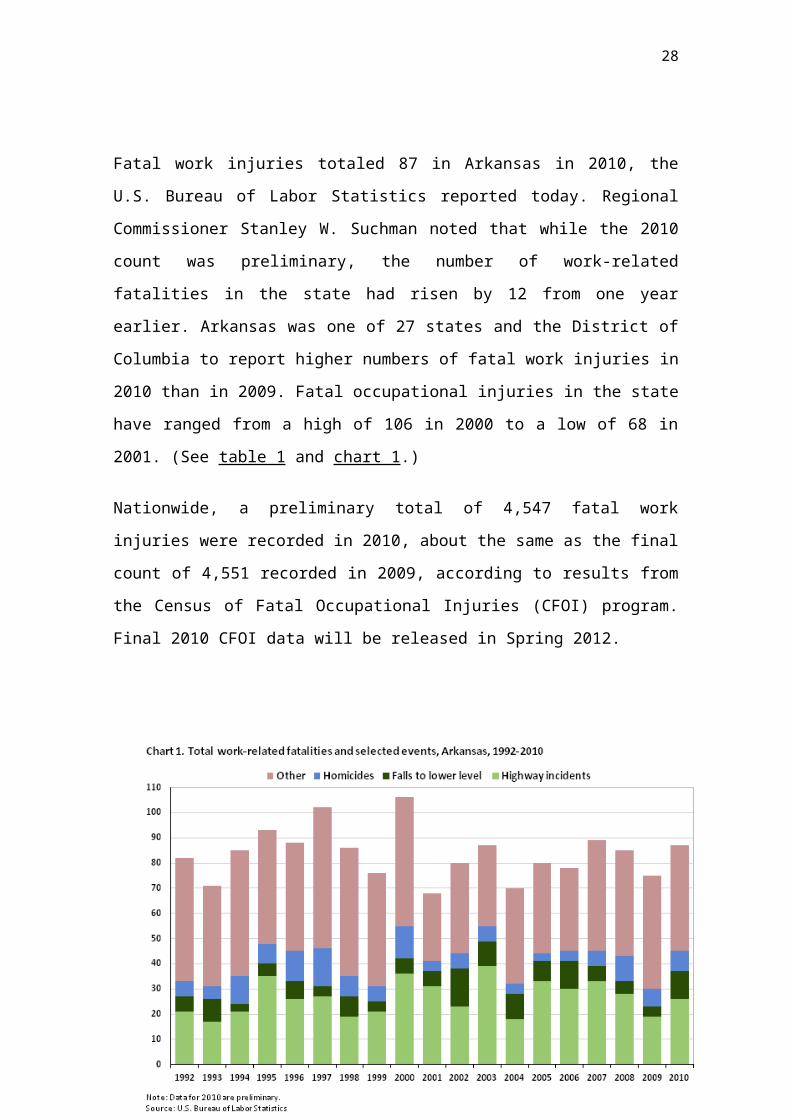
Workplace Fatalities in Arkansas — 2010
28
Fatal work injuries totaled 87 in Arkansas in 2010, the
U.S. Bureau of Labor Statistics reported today. Regional
Commissioner Stanley W. Suchman noted that while the 2010
count was preliminary, the number of work-related
fatalities in the state had risen by 12 from one year
earlier. Arkansas was one of 27 states and the District of
Columbia to report higher numbers of fatal work injuries in
2010 than in 2009. Fatal occupational injuries in the state
have ranged from a high of 106 in 2000 to a low of 68 in
2001. (See table 1 and chart 1.)
Nationwide, a preliminary total of 4,547 fatal work
injuries were recorded in 2010, about the same as the final
count of 4,551 recorded in 2009, according to results from
the Census of Fatal Occupational Injuries (CFOI) program.
Final 2010 CFOI data will be released in Spring 2012.

29
Table 1. Fatal occupational injuries in Arkansas by
selected event groups, 1992-2010
Year
Totalfatalities
Highwayincidents
Falls tolower level Homicides
Struck byobject orequipment
Numbe
r
Perc
ent
Numbe
r
Perc
ent
Numbe
r
Perc
ent
Numbe
r
Perc
ent1992 82 21 26 6 7 6 7 5 61993 71 17 24 9 13 5 7 10 141994 85 21 25 3 4 11 13 16 191995 93 35 38 5 5 8 9 6 61996 88 26 30 7 8 12 14 9 101997 102 27 26 4 4 15 15 15 151998 86 19 22 8 9 8 9 10 121999 76 21 28 4 5 6 8 5 72000 106 36 34 6 6 13 12 15 142001 68 31 46 6 9 4 6 9 132002 80 23 29 15 19 6 8 4 52003 87 39 45 10 11 6 7 7 82004 70 18 26 10 14 4 6 6 92005 80 33 41 8 10 3 4 4 52006 78 30 38 11 14 4 5 6 82007 89 33 37 6 7 6 7 16 182008 85 28 33 5 6 10 12 8 92009 75 19 25 4 5 7 9 9 122010 87 26 30 11 13 8 9 6 7
NOTE: Data for 2010 are preliminary.
Table 2. Fatal occupational injuries by event or exposure,
Arkansas, 2009-2010
Event or exposure(1) 2009Number
2010Number Percent

30
Total 75 87 100Transportation incidents 35 40 46
Highway 19 26 30Collision between vehicles, mobile
equipment 11 17 20
Moving in opposite directions,oncoming 3 7 8
Moving in intersection 3 -- --Vehicle struck object on side of
road 3 4 5
Noncollision 5 5 6Jack-knifed or overturned-no
collision 5 4 5
Overturned 4 4 5Nonhighway (farm, industrial
premises) 6 5 6
Worker struck by a vehicle 9 -- --Aircraft accident -- 5 6
Assaults and violent acts 10 9 10Homicides 7 8 9Shooting 7 7 8
Self-inflicted injuries 3 -- --Contact with objects and equipment 12 13 15
Struck by object or equipment 9 6 7Struck by falling object or
equipment 8 4 5
Caught in or compressed byequipment or objects 3 4 5
Caught in or crushed in collapsingmaterials -- 3 3
Falls 7 12 14Fall to lower level 4 11 13Fall from ladder -- 5 6Fall on same level 3 -- --
Exposure to harmful substances orenvironments 8 12 14
Contact with electric current 5 6 7Contact with temperature extremes -- 4 5

31
Footnotes:(1) Based on the 2007 BLS Occupational Injury and Illness Classification Manual. Includes other events and exposures,such as bodily reaction, in addition to those shown separately.NOTE: Totals for major categories may include subcategoriesnot shown separately. Dashes indicate no data reported or data that do meet publication criteria. Data for 2010 are preliminary.SOURCE: U.S. Department of Labor, Bureau of Labor Statistics, in cooperation with state and federal agencies,Census of Fatal Occupational Injuries.
Table 3. Fatal occupational injuries by worker
characteristics, Arkansas, 2009-2010
Worker
characteristi
cs
2009Number
2010Number Percent
Total 75 87 100Employee Status
Wage andsalary
workers(1)59 75 86
Self-employed(2) 16 12 14
GenderMen 69 79 91Women 6 8 9
Age(3)20 to 24years 3 6 7

32
25 to 34years 8 11 13
35 to 44years 20 18 21
45 to 54years 20 25 29
55 to 64years 18 16 18
65 years andover 5 9 10
Race or Ethnic Origin(4)White, non-Hispanic 64 65 75
Black, non-Hispanic 8 14 16
Hispanic orLatino -- 6 7
Footnotes:(1) May include volunteers and workers receiving other typesof compensation.(2) Includes self-employed workers, owners of unincorporatedbusinesses and farms, paid and unpaid family workers, andmay include some owners of incorporated businesses ormembers of partnerships.(3) Because there may have been no incidents reported forsome ages or because the data do not meet publicationcriteria, information is not available for all age groups.In addition, some fatalities may have had insufficientinformation with which to determine the age of thedecedents.(4) Persons identified as Hispanic or Latino may be of anyrace. The race categories shown exclude Hispanic and Latinoworkers.NOTE: Totals for major categories may include subcategoriesnot shown separately. Dashes indicate no data reported ordata that do meet publication criteria. Data for 2010 arepreliminary.

33
SOURCE: U.S. Department of Labor, Bureau of LaborStatistics, in cooperation with state and federal agencies,Census of Fatal Occupational Injuries.