Arkansas Department of Human Services
391
-
Upload
khangminh22 -
Category
Documents
-
view
2 -
download
0
Transcript of Arkansas Department of Human Services


Arkansas Department of Human Services2019 Statistical Report Summary
Year at a Glance
Division of Aging and Adult Services and Behavior Health Services
Served 1,048,313 congregatge meals to 17,832 clients. (Page-DAABHS-3)
Finalized 941 adoptions during SFY 2019. (Page-DCFS-11)
Investigated 4,592 complaints on endangered adults. Of these Investigations, 360 were substantiated. (Page-DAABHS-7)
Provided services to 76,139 persons through state contracted Mental Health Centers. (Page-DAABHS-16)
46,334 persons served were age 18 - 59. (Page-DAABHS-18)
Division of Child Care and Early Childhood Education
Served 18,651 children in the Child Care Assistance Programs. (Page-DCCECE-3)
Childcare providers served 23,819,058 meals and snacks. (Pages-DCCECE-12)
Conducted 727 licensing violation complaint investigations. Credible evidence of a violation was found in 304of these cases. (Page-DCCECE-26)
Division of Children and Family Services
Conducted 34,226 child maltreatment assessments. Credible evidence of maltreatment was determined to be true in 8,981 cases. (Page-DCFS-1 & 2)
There were 4,331 Foster Care children at the end of SFY 2019. (Page-DCFS-10)
Provided services to 582 Long-Term Protective Custody Clients. (Page-DAABHS-10)
Delivered 1,846,041 meals to 12,583 senior citizens unable to leave their homes. (Page-DAABHS-3)
Page 1

Arkansas Department of Human Services2019 Statistical Report Summary
Year at a Glance
were eligible for the Arkansas Works Medicaid program.
Division of County Operations
Transitional Employment Assistance (TEA)
Total payments for SFY 2019 were $4,380,934. (Page-DCO-4)
In SFY 2019, the total TEA cases were 4,524 (Page-DCO-5)
Total payments for SFY 2019 were $739,041. (Page-DCO-10)
Total cases for SFY 2019 were 605. (Page-DCO-10)
Community Programs
Supplemental Nutrient Assistance Program (SNAP)
Total benefits for SFY 2019 were $462,342,158. (Page-DCO-15)
The unduplicated number of people receiving SNAP was 495,473. (Page-DCO-15)
The number of unduplicated cases was 232,043. (Page-DCO-15)
Medicaid
Work Pays
In SFY 2019, 1,105,430 people were served by the Medicaid program. (Page-DCO-19-20)
The Community Services Block Grant (CSBG) Program had $6,411,561 in funds allocated for assisting anestimated 329,084 people in FFY 2019. (Page-DCO-22)
Division of Developmental Disabilities Services
Entities members, Early Intervention Day Treatment services, and Adult Development Day Treatment services.
DDS serves approximatey 100,000 clients in community services programs providing occupational therapy services, physical therapy services, speech therapy services, Autism services, Provider-led Arkansas Shared
This includes 746,791 children and adults that were eligible for traditional Medicaid and 358,639
Page 2

Arkansas Department of Human Services2019 Statistical Report Summary
Year at a Glance
intermediate care facilities. (DPSQA-4)
nursing home and assisted living industry during SFY19. (DPSQA-2)
providers. (DPSQA 6)
checks for long-term care providers in SFY2019 (DPSQA 8)
(DPSQA 10)
Transitional 702 nursing facility residents to less restrictive settings. (DPSQA 8)
Office of Long Term Care
Conducted 243 standard surveys of nursing homes, psychiatric residential treatment facilities, and
Completed 36,606 medical needs assessments for various facilities. (DPSQA-3)
Community Services Licensure and Certification
Office of Long Term Care
Provided 1,014 hours of continuing education through 163 workshops/seminars to staff members in the
Licensed 303 new mental health and substance abuse facilities during SFY19. (DPSQA-6)
Division of Medical Services
Medicaid
Medicaid expenditures by category of services for SFY 2019 were $7,544,266,920. (Page-DMS-5)
In SFY 2019, 1,086,486 individuals received Medicaid services. (Page-DMS-9)
Prescription Drug Program
A total of 174,346 Arkansas Medicaid beneficiaries used their prescription drug benefit. (Page-DMS-25)
The average cost per prescription drug is $81.17 in SFY 2019. (Page-DMS-25)
Division of Provider and Quality Services
Completed 1,943 surveys and other visits for more than 2,800 home and community based service
Criminal Record Check Program processed 48,030 state record checks and 21,500 federal record
Provided training to 24,483 attendees at 50 events through the Choices in Living Resource Center.
Page 3

Arkansas Department of Human Services2019 Statistical Report Summary
Year at a Glance
Source: Arkansas Department of Human Services 2019 Statistical Report
In SFY 2019, there were 350 commitments made to youth services centers. (Page-DYS-4)
Community-based programs provided services to 5,128 youth. (Page-DYS-18)
Provided Vocational Rehabilitation which includes evaluation, training, medical services, counseling and jobplacement services to 856 people. (Page-DSB-3)
Division of Services for the Blind
Trained 169 older blind persons who were at-risk so that they could remain self-reliant in their homes andcommunities. (Page-DSB-4)
In SFY 2019, the Braille/Tape Production unit received a total of 215 requests for alternative format to print.One hundred ninety seven (197) requests asked for Braille, resulting in the production of 7,063 Braille pages;as well as 4,015 large print pages. (Page-DSB-5)
Division of Youth Services
Page 4

Arkansas Department of Human Services2019 Statistical Report Summary
Year at a Glance
Page 5

Arkansas Department of Human Services2019 Statistical Report Summary
Year at a Glance
Page 6

Arkansas Department of Human Services2019 Statistical Report Summary
Year at a Glance
Page 7

Arkansas Department of Human Services2019 Statistical Report Summary
Year at a Glance
Page 8

○ Introduction Adult Aging○ Services○ Adult Protective Services○ Adult Protective Services Reports Investigated by County○ Adult Protective ServicesInvestigations by County State Map○ Emergency, Temporary or LongTerm Protective Custody Clients○ Adult Protective Services Demographic Tables○ Introduction Behavioral Health○ Unduplicated Mental Health Clients by County and Age Demographic Tables○ Unduplicated Mental Health Clients by Provider and Age Demographic Tables○ Arkansas State Hospital (ASH) Unduplicated Clients by County and Age Demographic Tables○ Unduplicated Children served by County, Gender and Race Demographic Tables○ Unduplicated Clients served Substance Abuse Treatment by County and Age Demographic Tables○ Substance Abuse Treatment total Clients served by Provider and Age Demographic Tables○ Arkansas Health Center Unduplicated Clients served by County and Age Demographic Tables
Division of Child Care and Early Childhood Education (DCCECE)○ Introduction○ Actual Expenditures for Child Care Services○ Child Care Assistance Programs○ Program & Professional Development○ Health and Nutrition Program○ Child Care Licensing and Accreditation○ Preschool Programs
○ Reports of Child Maltreatment○ In-Home Services○ Foster Care○ Adoption○ Resources○ Appendices○ Appendix A: Child Maltreatment Investigations by Area and County○ Appendix B: Children in Foster Care by Race /Ethnicity○ Appendix C: Children in Foster Care by Age○ Appendix D: Children in Foster Care by Gender○ Appendix E: Children in Foster Care by Length of Stay○ Appendix F: Services Provided During the Year○ Appendix G: Summary of Reports Involving Child Fatality ○ Appendix H: Summary of Reports Involving Near Child Fatality○ Appendix I: Fatalities of Children in Foster Care Who Did Not Receive a Maltreatment Investigation○ Appendix J: Average Caseload as of the End of SFY 2018, by County○ Appendix K: Foster Home Closure Reasons○ Appendix L: Summary of Foster Care Maltreatment Reports
○ Introduction○ Expenditures○ Transitional Employment Assistance (TEA)○ Work Pays ○ Supplemental Nutrition Assistance Program (SNAP)○ Medicaid○ Arkansas Works○ Community Distribution Program Summary○ Community Services Block Grant Program○ Home Energy Assistance Program○ Emergency Shelter Grants Program○ Shelter Plus Care Program
DCO-20DCO-21DCO-22DCO-23DCO-24
ARKANSAS DHS STATISTICAL REPORTTABLE OF CONTENTS
SFY 2019
DCCECE-2
DAABHS-8
DAABHS-14
DAABHS-26
DCCECE-3
DAABHS-31
DCCECE-1
DCCECE-5
DCFS-7
Division of Adult Aging and Behavioral Health Services (DAAS) DAABHS-2DAABHS-3DAABHS-7
DAABHS-10DAABHS-11
DAABHS-9
DAABHS-37
DAABHS-18
DAABHS-42DAABHS-48DAABHS-56
Division of Children and Family Services (DCFS)
DCCECE-12
DCFS-10DCFS-16DCFS-19
DCFS-31DCFS-33
DCFS-27DCFS-29
DCFS-35DCFS-40DCFS-38
Division of County Operations (DCO)DCO-1DCO-3DCO-4
DCFS-39DCFS-40DCFS-42
DCCECE-18DCCECE-31
DCFS-1
DCO-25
DCFS-23
DCO-11DCO-16
DCO-25
DCFS-25

○ Introduction○ Goals and Services○ First Connections○ Waiver Services ○ Quality Assurance ○ Community Program Statistics○ Human Developmental Center (HDC) Statiscal Report○ DDS Funding (SFY 2005 - 2018)
○ Introduction○ Expenditures○ Medicaid Caseload by Aid Category Demographic Tables○ Medicaid Payments to Medical Vendors ○ Services covered by Arkansas Medicaid○ Medicaid Administrative Unit Descriptions
○ Introduction○ Office of Long Term Care○ Coumminty Services Licensure and Ceritfication○ Quality Assurance and Provider Engagement○ Expenditures
○ Introduction○ Field Services○ Business and Technology Services○ Director's Office
○ Introduction○ Community Based Programs and Services Providers○ Commitments to Youth Services Centers○ Number of Adjudicated Delinquents Recommitted to Youth Services Centers○ Number of Juveniles Referred to Specialty Provider Facilities○ Community-Based Youth Services Programs○ Interstate Compact on Juveniles
DSB-3DSB-4DSB-5
DMS-8DMS-11
SFY 2019
(CONTINUED)
Division of Medical Services (DMS)DMS-1DMS-2
DDS-1
DDS-14
DDS-4DDS-6DDS-8
DDS-11DDS-12
ARKANSAS DHS STATISTICAL REPORTTABLE OF CONTENTS
DYS-15
Division of Developmental Disabilities Services (DDS)
DMS-13DMS-16
DDS-2
DPSQA-11
Division of Provider Services and Quality Assurance (DPSQA)DPSQA-1
Glossary-1
DYS-1
Glossary
Division of Youth Services (DYS)
DPSQA-2DPSQA-4DPSQA-6
DYS-17DYS-19
DYS-16
DYS-2DYS-3
Division of Services for the Blind (DSB)DSB-1


ARKANSAS DHS STATISTICAL REPORTDIVISION OF AGING, ADULT, AND BEHAVIORAL HEALTH SERVICES
SFY 2019
AREA AGENCIES ON AGING(629 Agencies)
Develop and implement the area plans on aging, serve as advocates for older people, coordinate with otheragencies and organizations in the planning and service areas to develop comprehensive aging servicesystems, and administer the Older Americans Act programs within their jurisdictions.Source: DAAS Website and Division of Aging and Adult Services
STATE UNITS ON AGING(56 Jurisdictions)
Coordinate state level activities on behalf of older people, develop and administer the state plans on aging,serve as advocates, and provide technical assistance to Area Agencies on Aging.
Provide technical assistance to states and monitor state aging programs.
PRESIDENCYDEPARTMENT OF HUMAN SERVICES
ADMINISTRATION ON AGING
Recommends policy, develops regulations to implement the Older Americans Act (OAA) and administers theOAA budget, grants for research, training, model projects, etc.
REGIONAL OFFICES ON AGING(10 Regions)
THE ADMINISTRATIVE AGING NETWORKIn 2012, the Administration for Community Living (ACL) was established to bring together the Administrationon Aging (AoA), the Office on Disability, and the Administration on Developmental Disabilities. ACL is directlyunder the U.S. Department of Health and Human Services (HHS). The administrative network reachesthrough the 10 regional offices of HHS to the 56 State Units on Aging (SUAs) and some 629 Area Agencieson Aging (AAAs).
Since 1965, the Older Americans Act has been amended several times, each time expanding the roles ofstate units on aging. Arkansas legislation has also changed the name of the state unit on aging, theorganizational location, and its authority and funding responsibilities. In 1971, the State Unit was placed withinthe Department of Social and Rehabilitative Services. The responsibility for Adult Services was assumed in
The agency achieved divisional status through Act 228 of 1977, and the responsibility for adult protectiveservices was transferred by the General Assembly in 1979. As a result of Act 348 of 1985, the Division ofAging and Adult Services (DAAS) was created within the reorganized Arkansas Department of HumanServices. In 1997 the Division began providing services to adults with physical disabilities.
MISSION AND OBJECTIVESThe Division’s mission is to promote the independence of older Arkansans through effective prevention,quality treatment, and meaningful recovery. The Division is responsible for planning coordinating, funding,and evaluating programs for older adults and adults with physical disabilities that are authorized by both stateand federal governments.
AGING AND ADULT SERVICES INTRODUCTIONHISTORYA growing nationwide awareness of the problems of the elderly and the needs for services and assistance ontheir behalf led to the passage of the Older Americans Act in 1965. This legislation, which created theAdministration on Aging at the federal level, also mandated the establishment of a state unit on aging in eachstate to administer programs under the Act. Accordingly, the Arkansas Office on Aging was established in1966 by proclamation of Governor Orville Faubus under the auspices of the Governor’s Office.
DAABHS - 2
ARKANSAS DHS STATISTICAL REPORTDIVISION OF AGING, ADULT, AND BEHAVIORAL HEALTH SERVICES
SFY 2019
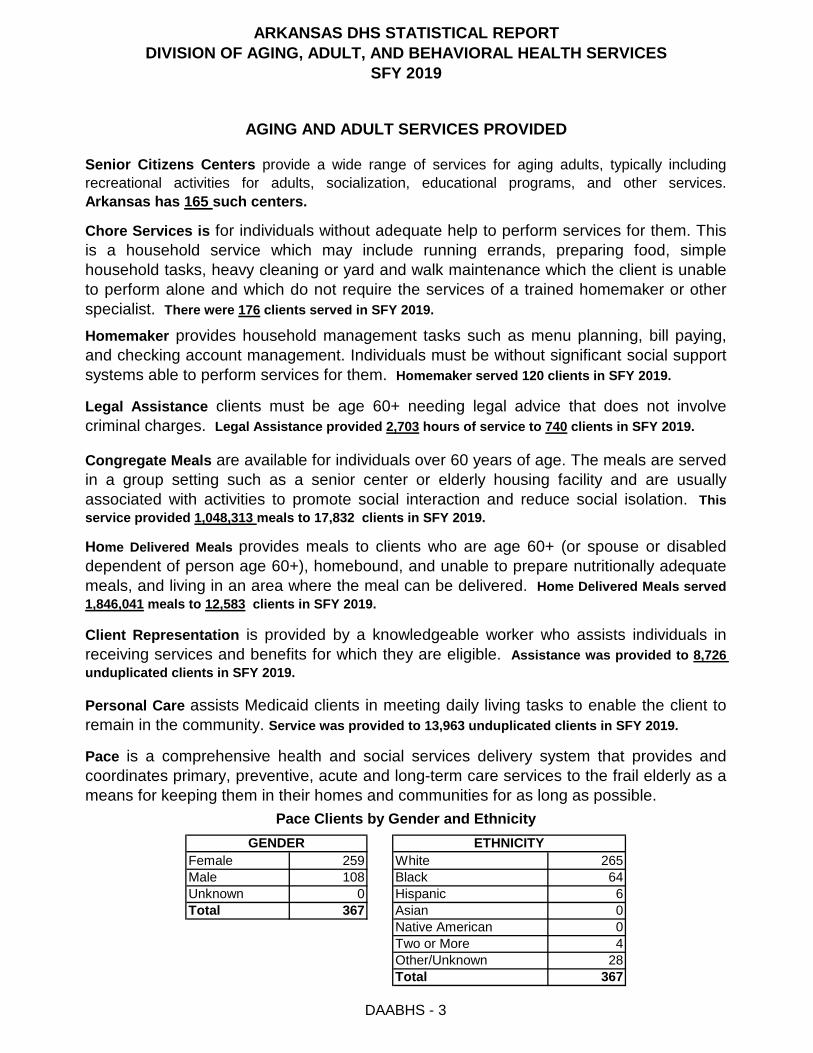
Two or More 4Other/Unknown 28Total 367
Total 367 Asian 0Native American 0
Male 108 Black 64Unknown 0 Hispanic 6
Pace Clients by Gender and EthnicityGENDER ETHNICITY
Female 259 White 265
AGING AND ADULT SERVICES PROVIDED
Senior Citizens Centers provide a wide range of services for aging adults, typically includingrecreational activities for adults, socialization, educational programs, and other services.Arkansas has 165 such centers.
Chore Services is for individuals without adequate help to perform services for them. Thisis a household service which may include running errands, preparing food, simplehousehold tasks, heavy cleaning or yard and walk maintenance which the client is unableto perform alone and which do not require the services of a trained homemaker or otherspecialist. There were 176 clients served in SFY 2019.
Home Delivered Meals provides meals to clients who are age 60+ (or spouse or disableddependent of person age 60+), homebound, and unable to prepare nutritionally adequatemeals, and living in an area where the meal can be delivered. Home Delivered Meals served1,846,041 meals to 12,583 clients in SFY 2019.
Client Representation is provided by a knowledgeable worker who assists individuals inreceiving services and benefits for which they are eligible. Assistance was provided to 8,726 unduplicated clients in SFY 2019.
Personal Care assists Medicaid clients in meeting daily living tasks to enable the client toremain in the community. Service was provided to 13,963 unduplicated clients in SFY 2019.
Pace is a comprehensive health and social services delivery system that provides andcoordinates primary, preventive, acute and long-term care services to the frail elderly as ameans for keeping them in their homes and communities for as long as possible.
Homemaker provides household management tasks such as menu planning, bill paying,and checking account management. Individuals must be without significant social supportsystems able to perform services for them. Homemaker served 120 clients in SFY 2019.
Legal Assistance clients must be age 60+ needing legal advice that does not involvecriminal charges. Legal Assistance provided 2,703 hours of service to 740 clients in SFY 2019.
Congregate Meals are available for individuals over 60 years of age. The meals are servedin a group setting such as a senior center or elderly housing facility and are usuallyassociated with activities to promote social interaction and reduce social isolation. This service provided 1,048,313 meals to 17,832 clients in SFY 2019.
DAABHS - 3

ARKANSAS DHS STATISTICAL REPORTDIVISION OF AGING, ADULT, AND BEHAVIORAL HEALTH SERVICES
SFY 2019
AGING AND ADULT SERVICES PROVIDED
Other/Unknown 374Total 4,264
Hispanic 58Native Hawaiian 1Two or More 32
Total 4,264 Native American 9Asian 36
Female 2,805 White 1,759Male 1,459 Black 1,995
Total 9,788
IndependentChoices began as a consumer-directed Medicaid waiver for Medicaid eligiblepersons age 18 and above who have a functional need for personal care service. On April 1, 2008the IndependentChoices program was approved by CMS as a state plan option within the MedicaidPersonal Care Program. CMS also approved two home and community based waiver services,Adult Companion Services and Homemaker, as eligible services offered through theIndependentChoices Program. This consumer directed service offers a person a monthly budgetin place of traditional personal care. Each participant works with his/her counselor to establish abudget based on his/her individual assessed needs for personal assistance. Eligible persons areable to hire, train, and supervise and pay their own personal care aide and use some of theallowance to purchase goods and services that lessen human dependency needs. TheIndependentChoices participant (or his/her designated Representative) will be assisted by aSupport Coordinator who will coordinate enrollment, provide skills training, and assist withquestions as they arise. The participant receives counseling and financial support services at noadditional cost to the participant's budget.
IndependentChoices Clients by Gender and Ethnicity
GENDER ETHNICITY
Native Hawaiian 11Two or More 117Other/Unknown 608
Native American 44
Male 3,266 Black 2,867Unknown 1 Hispanic 163
AR Choices is a Medicaid program that includes home and community-based services foradults ages 21 through 64 with a physical disability and seniors age 65 or older. Theseservices can offer help doing everyday activities that you may no longer be able to do foryourself like bathing, dressing, getting around your home, preparing meals, or doinghousehold chores.
AR Choices Clients by Gender and Ethnicity
GENDER ETHNICITYFemale 6,521 White 5,925
Total 9,788 Asian 53
DAABHS - 4

ARKANSAS DHS STATISTICAL REPORTDIVISION OF AGING, ADULT, AND BEHAVIORAL HEALTH SERVICES
SFY 2019
AGING AND ADULT SERVICES PROVIDED
Information and Assistance is available to all older persons, their families, and friends. Theservice includes concrete information about services and benefits and where to obtainthem. It may include assistance with referral to an agency providing the service or benefitand follow-up to see if the service was satisfactory. There were 48,506 state referrals given to53,506 clients during SFY 2019.
Adult Day Care services are community-based group programs designed to meet theneeds of functionally and/or cognitively impaired adults through an individual case plan.These structured programs provide a variety of health, social and support services. Adultday centers operate programs during normal business hours with some programs offeringevening and weekend services. These programs served 21 clients in SFY 2019.
Transportation Service transports a client from one location to another so that the clienthas access to needed services, care, or assistance, such as medical services, shopping,bill paying, etc. The service may include escort assistance. This service provided 341,565 oneway trips to 5,263 clients in SFY 2019.
Federal Senior Community Service Employment Programs serves persons with lowincomes who are 55 years old or over and have poor employment prospects. The programhas two purposes: 1) to provide useful community services through part-time, temporaryemployment where program participants are engaged in community services and 2) tofoster individual economic self-sufficiency where participants receive work experience andjob skills that can lead to unsubsidized employment. For Program year July 01, 2018 -June 30, 2019, 159 participants were served in the Federal Senior Community ServiceCommunity Service Employment Program. For this same time period, 125 participants wereserved in the State Older Worker Community Service Program.
Two or More 13Other/Unknown 53
Total 1,035
Native American 3Asian 1Native Hawaiian 2
Male 230 Black 72Total 1,035 Hispanic 5
Assisted Living Clients by Gender and Ethnicity
GENDER ETHNICITYFemale 805 White 886
Assisted Living Facilities provide 24-hour supervision and supportive services includinglimited nursing services in a congregate setting to persons aged 65 and above. AssistedLiving services are also available to persons 21 years of age and above that are blind ordisabled. Assisted Living is a Medicaid and community based waiver program.
DAABHS - 5

ARKANSAS DHS STATISTICAL REPORTDIVISION OF AGING, ADULT, AND BEHAVIORAL HEALTH SERVICES
SFY 2019
AGING AND ADULT SERVICES PROVIDED
●
Source: Division of Aging and Adult Services
Ombudsman Program is a statewide program that advocates for the rights of long-term careresidents. It is a program of community advocates that addresses the complaints of nursing homeand residential care facility residents. Its representatives provide information on facilities, work forsystematic change, and monitor the activities of the regulatory system.
Program Statistics:Facility complaints 1,155
The Governor's Advisory Council on Aging (GACA) is a 18-member Advisory Council, andmeets quarterly.
Telephone inquiries 11,646
Money Follows the Person (MFP) Rebalancing Demonstration Grant helps states rebalancetheir Medicaid long-term care systems. During 2018, the total number of individual served inArkansas was 64.
MFP Goals¨ Increase the use of home and community-based services (HCBS) and reduce the use of institutionally-based services.¨ Eliminate barriers in state law, state Medicaid plans, and state budgets that restrict the use of Medicaid funds to let people get long-term care in the settings of their choice. ¨ Strengthen the ability of Medicaid programs to provide HCBS to people who choose to transition out of institutions.¨ Put procedures in place to provide quality assurance and improvement of HCBS.
Choices in Living Resource Center provides callers with information regarding long-termservices and supports programs and services as well as referral to numerous other assistanceprograms and organizations. The ADRC targets seniors and adults with disabilities who are at riskof nursing home admission to help them access programs and services that will allow them toremain in the community and live as independently as possible. The ADRC provides educationand awareness of DAAS publicly funded programs, including Medicaid Home and CommunityBased waiver programs, through statewide marketing and outreach at Senior Centers, SeniorHealth Fairs and exhibits at various conferences for aging and individuals with disabilities includingintellectual/developmental disabilities.
Special Events
Resident visits 59,007Resident and family council meetings 124Community education sessions 76
DAABHS - 6

ARKANSAS DHS STATISTICAL REPORTDIVISION OF AGING, ADULT, AND BEHAVIORAL HEALTH SERVICES
SFY 2019
▪▪
▪▪▪
*This figure reflects the number of calls that met statutory criteria for an investigation
Founded Investigated Founded18 to 2930 to 3940 to 49 Unknown50 to 5960 to 6970 to 7980 to 8990+UnknownTotal
Investigated Founded FoundedAmerican Indian or Alaska Native Caregiver NeglectAsian ExploitationBlack or African American Mental/Psych AbuseNative American or Other Pacific Physical AbuseUnknown Self-NeglectWhite Sexual AbuseTotal Total *
*One case can have multiple abuse types.
* This figure reflects the number of calls that met statutory criteria for an investigation.Source: Division of Aging and Adult Services
494
This page reflects investigations of adult maltreatment for which Adult Protective Services has jurisdiction under Arkansas Law.
120 9 1,769 2173,512 301 104 54,592 360 5,474
1810 0 474 40
929 46 283
906 56
12712 3 884 87
Investigated9 1 1,960
23 04,592 360
By Race Reports Investigated by Abuse Type
1,153 931,001 91
338 28
487 40 Total 4,592 360
2,615 188209 14 1 0168 18 Female
Reports Investigated and SubstantiatedBy Age, Gender, Race and Abuse Type
By Age By GenderInvestigated
307 20 Male 1,976 172
Reports Pending/Open 374 Visits to Custody Clients 1,913Total reports Founded 360
765Clients in APS Custody
Searches for the least restrictive living alternative for individuals who are capable of providing for themselves.Strives to involve the adult requiring services, as well as the family, in the decision making process.
Reports Investigated for SFY 2019:
4,592Total Reports Investigated
Acts as an advocate for adult Arkansans who are endangered and are impaired or lack capacity.
ADULT PROTECTIVE SERVICES
The Adult Protective Services Unit protects and assists adults, age 18 and older, who are:
Abused, neglected, or exploited, or any combination thereof; andWho are endangered as a result of lack of capacity or impaired from mental or physical disease or defect asthese terms are defined by Arkansas Statute.
Adult Protective Services (APS):
DAABHS - 7

ARKANSAS DHS STATISTICAL REPORTDIVISION OF AGING, ADULT, AND BEHAVIORAL HEALTH SERVICES
SFY 2019
Arkansas 44 Lee 16Ashley 42 Lincoln 19Baxter 52 Little River 29Benton 266 Logan 53Boone 67 Lonoke 134Bradley 21 Madison 20Calhoun 6 Marion 17Carroll 36 Miller 70Chicot 36 Mississippi 63Clark 48 Monroe 27Clay 24 Montgomery 20Cleburne 31 Nevada 18Cleveland 13 Newton 9Columbia 36 Ouachita 48Conway 24 Perry 21Craighead 141 Phillips 56Crawford 92 Pike 31Crittenden 83 Poinsett 46Cross 29 Polk 49Dallas 10 Pope 70Desha 24 Prairie 17Drew 34 Pulaski 739Faulkner 143 Randolph 33Franklin 27 Saint Francis 36Fulton 8 Saline 141Garland 207 Scott 16Grant 21 Searcy 11Greene 44 Sebastian 262Hempstead 58 Sevier 21Hot Spring 48 Sharp 13Howard 37 Stone 11Independence 40 Union 89Izard 14 Van Buren 27Jackson 21 Washington 158Jefferson 124 White 146Johnson 33 Woodruff 11Lafayette 13 Yell 24Lawrence 24 Total 4,592
Source: Division of Aging and Adult Services
ADULT PROTECTIVE SERVICES
Reports Investigated by County
County Referrals County Referrals
DAABHS - 8

ARKANSAS DHS STATISTICAL REPORTDIVISION OF AGING, ADULT, AND BEHAVIORAL HEALTH SERVICES
SFY 2019
46
Source: Division of Aging, Adult, and Behavioral Health Services
36 89
6 21
48
21 10 19
70
13 24
29 58 18 48 34
1342 36
49
124 44
48 21
739
20 207 141 27 56
37 31
17
16 134 16
262 143 11 36
24 21
24 29 83
53 146
27 70 31 21
2733
11 40
24
158 20 9 16 141 63
92
14 13 44
ADULT PROTECTIVE SERVICES
Investigations by County _ Map SFY 201933 24
266 36 67 17 52 8
ARKANSAS
ASHLEY
BAXTERBENTON BOONE
BRADLEYCALHOUN
CARROLL
CHICOT
CLARK
CLAY
CLEBURNE
CLEVELAND
COLUMBIA
CONWAY
CRAIGHEAD
CRAWFORD
CROSS
DALLAS
DESHA
DREW
FAULKNER
FULTON
GARLAND
GRANT
GREENE
HEMPSTEAD
HOT SPRING
HOWARD
IZARD
JACKSON
JEFFERSON
JOHNSON
LAWRENCE
LEE
LINCOLN
LOGAN
LONOKE
MADISON
MARION
MILLER
MISSISSIPP
MONROEMONTGOMERY
NEVADA
NEWTON
OUACHITA
PERRY
PHILLIPS
PIKE
POINSETT
POLK
POPE
PRAIRIE
PULASKI
RANDOLPH
ST. FRANCIS
SALINE
SCOTT
SEARCY
SEVIER
SHARP
STONE
UNION
VAN BUREN
WASHINGTON
WHITE
WOODRUFF
YELL
INDEPENDENCE
SEBASTIAN
FRANKLIN
CRITTENDEN
LITTLE RIVER
LAFAYETTE
DAABHS - 9
ARKANSAS DHS STATISTICAL REPORTDIVISION OF AGING, ADULT, AND BEHAVIORAL HEALTH SERVICES
SFY 2019
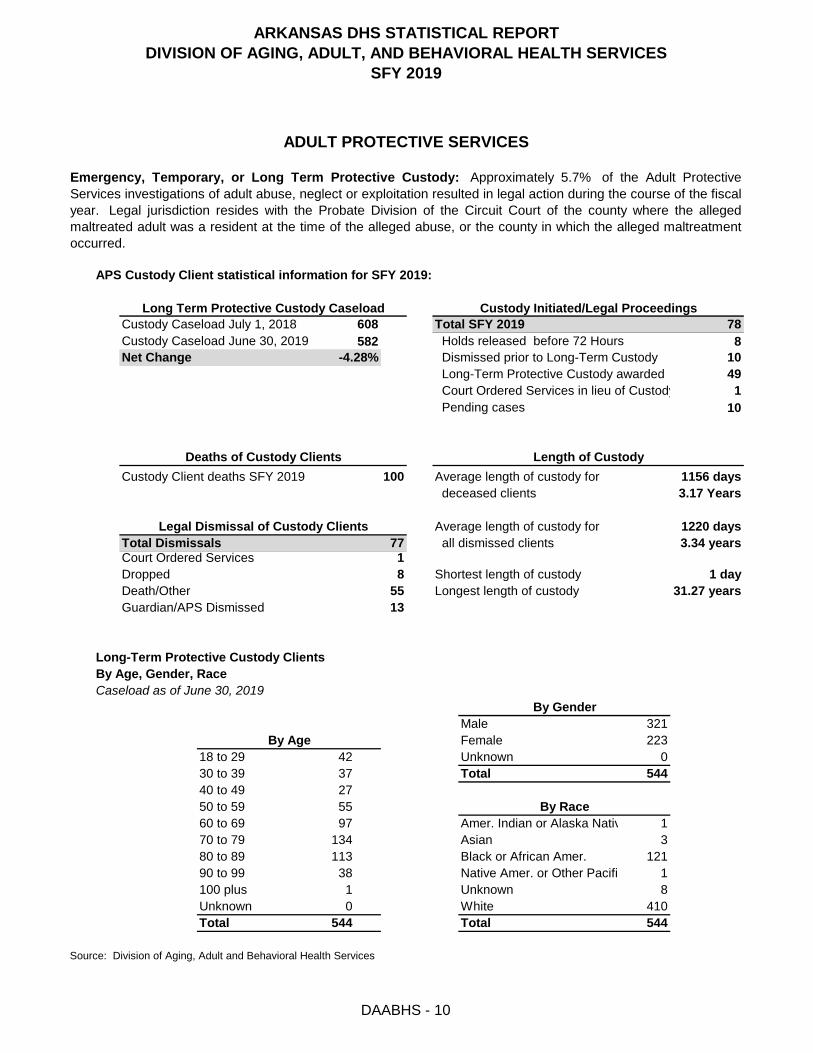
APS Custody Client statistical information for SFY 2019:
Pending cases
Long-Term Protective Custody ClientsBy Age, Gender, Race Caseload as of June 30, 2019
321223
42 Unknown 030 to 39 37 Total 54440 to 49 2750 to 59 5560 to 69 97 Amer. Indian or Alaska Nativ 170 to 79 134 Asian 380 to 89 113 Black or African Amer. 12190 to 99 38 Native Amer. or Other Pacifi 1100 plus 1 Unknown 8Unknown 0 White 410Total 544 Total 544
Source: Division of Aging, Adult and Behavioral Health Services
By Race
MaleBy Age Female
18 to 29
By Gender
Death/Other 55 Longest length of custody 31.27 yearsGuardian/APS Dismissed 13
Court Ordered Services 1Dropped 8 Shortest length of custody 1 day
Total Dismissals 77 all dismissed clients 3.34 yearsLegal Dismissal of Custody Clients Average length of custody for 1220 days
Length of Custody
deceased clients 3.17 YearsCustody Client deaths SFY 2019 100 Average length of custody for 1156 days
Court Ordered Services in lieu of Custody 110
Deaths of Custody Clients
Custody Caseload June 30, 2019 582 Holds released before 72 Hours 8Net Change -4.28% Dismissed prior to Long-Term Custody 10
Long-Term Protective Custody awarded 49
ADULT PROTECTIVE SERVICES
Emergency, Temporary, or Long Term Protective Custody: Approximately 5.7% of the Adult ProtectiveServices investigations of adult abuse, neglect or exploitation resulted in legal action during the course of the fiscalyear. Legal jurisdiction resides with the Probate Division of the Circuit Court of the county where the allegedmaltreated adult was a resident at the time of the alleged abuse, or the county in which the alleged maltreatmentoccurred.
Long Term Protective Custody Caseload Custody Initiated/Legal ProceedingsCustody Caseload July 1, 2018 608 Total SFY 2019 78
DAABHS - 10

ARKANSAS DHS STATISTICAL REPORTDIVISION OF AGING, ADULT, AND BEHAVIORAL HEALTH SERVICES
SFY 2019
RACE BY COUNTY
Amer
. Ind
ian
or A
lask
a N
ativ
e
Asia
n
Blac
k or
Afri
can
Amer
.
Nat
ive
Amer
. Or O
ther
Pac
ific
Unk
now
n
Whi
te
TO
TAL
by C
ount
y RACE BY COUNTY
Amer
. Ind
ian
or A
lask
a N
ativ
e
Asia
n
Blac
k or
Afri
can
Amer
.
Nat
ive
Amer
. Or O
ther
Pac
ific
Unk
now
n
Whi
te
TO
TAL
by C
ount
y
Arkansas 0 0 2 0 0 1 3 Lee 0 0 0 0 0 0 0Ashley 0 0 1 0 0 1 2 Lincoln 0 0 2 0 0 3 5Baxter 0 0 0 0 0 1 1 Little River 0 0 0 0 0 2 2Benton 0 0 0 0 2 28 30 Logan 0 0 2 0 0 17 19Boone 0 0 0 0 0 5 5 Lonoke 0 0 2 0 1 4 7Bradley 0 0 6 0 0 6 12 Madison 0 0 0 0 0 0 0Calhoun 0 0 0 0 0 0 0 Marion 0 0 0 0 0 5 5Carroll 0 0 1 0 0 4 5 Miller 0 0 5 0 0 5 10Chicot 0 0 3 0 0 1 4 Mississippi 0 0 1 0 0 3 4Clark 0 0 5 0 0 4 9 Monroe 0 0 0 0 0 1 1Clay 0 0 0 0 0 2 2 Montgomery 0 0 0 0 0 1 1Cleburne 0 0 0 0 0 3 3 Nevada 0 1 0 0 0 1 2Cleveland 0 0 0 0 0 0 0 Newton 0 0 0 0 0 0 0Columbia 0 0 2 0 0 2 4 Ouachita 0 0 1 0 0 0 1Conway 0 0 1 0 0 4 5 Perry 0 0 0 0 0 0 0Craighead 0 0 12 0 1 13 26 Phillips 0 0 1 0 0 1 2Crawford 0 0 1 0 0 17 18 Pike 0 0 0 0 0 5 5Crittenden 0 0 1 0 0 3 4 Poinsett 0 0 1 0 0 7 8Cross 0 0 1 0 0 1 2 Polk 0 0 0 0 0 5 5Dallas 0 0 0 0 0 1 1 Pope 0 0 1 0 0 6 7Desha 0 0 3 0 0 2 5 Prairie 0 0 0 0 0 2 2Drew 0 0 0 0 0 1 1 Pulaski 0 0 15 0 0 27 42Faulkner 0 0 1 0 0 10 11 Randolph 0 0 0 0 0 2 2Franklin 0 0 0 0 0 1 1 Saline 0 0 3 0 0 9 12Fulton 0 0 0 0 0 1 1 Scott 0 0 0 0 0 2 2Garland 0 0 0 0 1 8 9 Searcy 0 0 0 0 0 0 0Grant 0 0 0 0 0 0 0 Sebastian 0 1 4 0 0 62 67Greene 0 0 1 0 0 2 3 Sevier 0 0 2 0 0 3 5Hempstead 0 0 2 0 0 3 5 Sharp 0 0 0 0 0 4 4Hot Spring 0 0 1 0 0 2 3 St. Francis 0 0 2 0 0 0 2Howard 0 0 0 0 0 8 8 Stone 0 0 0 0 0 1 1Independence 0 0 1 0 0 5 6 Union 0 0 12 0 0 7 19Izard 0 0 0 0 0 4 4 Van Buren 0 0 0 0 0 2 2Jackson 0 0 1 0 0 3 4 Washington 0 1 0 0 1 47 49Jefferson 0 0 14 0 0 5 19 White 1 0 1 0 0 8 10Johnson 0 0 0 0 1 5 6 Woodruff 0 0 5 0 0 2 7Lafayette 0 0 0 0 0 2 2 Yell 0 0 1 0 1 3 5Lawrence 0 0 0 1 0 4 5 Totals 1 3 121 1 8 410 544Source: Division of Aging and Adult Services-Race demographics collected from ANSWER and APS records
ADULT PROTECTIVE SERVICESCUSTODY CLIENT DEMOGRAPHICS BY COUNTY
By Race
DAABHS - 11

ARKANSAS DHS STATISTICAL REPORTDIVISION OF AGING, ADULT, AND BEHAVIORAL HEALTH SERVICES
SFY 2019
Yes No Total Yes No Total3 0 3 0 0 02 0 2 5 0 51 0 1 2 0 2
28 2 30 18 1 195 0 5 7 0 7
11 1 12 0 0 00 0 0 5 0 55 0 5 9 1 104 0 4 3 1 49 0 9 1 0 12 0 2 1 0 13 0 3 1 1 20 0 0 0 0 04 0 4 1 0 15 0 5 0 0 0
25 1 26 2 0 217 1 18 5 0 54 0 4 7 1 82 0 2 4 1 51 0 1 6 1 75 0 5 2 0 21 0 1 38 4 42
10 1 11 1 1 21 0 1 12 0 121 0 1 2 0 29 0 9 0 0 00 0 0 63 4 673 0 3 5 0 54 1 5 3 1 43 0 3 2 0 27 1 8 0 1 16 0 6 19 0 194 0 4 2 0 24 0 4 42 7 49
19 0 19 10 0 106 0 6 7 0 72 0 2 5 0 55 0 5 511 33 544
MillerCarrollMarionCalhoun
Johnson WoodruffLafayette YellLawrence Total
Izard Van BurenJackson WashingtonJefferson White
Hot Spring St. FrancisHoward StoneIndependence Union
Grant SebastianGreene SevierHempstead Sharp
Franklin SalineFulton ScottGarland Searcy
Desha PrairieDrew PulaskiFaulkner Randolph
Crittenden PoinsettCross PolkDallas Pope
Conway PerryCraighead PhillipsCrawford Pike
Cleburne NevadaCleveland NewtonColumbia Ouachita
Chicot MississippiClark MonroeClay Montgomery
Bradley Madison
Baxter Little RiverBenton LoganBoone Lonoke
By County By County Arkansas LeeAshley Lincoln
Recipients Recipients
ADULT PROTECTIVE SERVICESCUSTODY CLIENT DEMOGRAPHICS BY COUNTY
Medicaid Program RecipientsMedicaid Medicaid
DAABHS - 12

ARKANSAS DHS STATISTICAL REPORTDIVISION OF AGING, ADULT, AND BEHAVIORAL HEALTH SERVICES
SFY 2019
PLACEMENT BY COUNTY
AAPD
Wai
ver
Ass
iste
d Li
ving
Fac
ility
DD
S W
aive
r Pla
cem
ent
Ger
iatri
c Ps
ych
Gro
up H
ome
Hum
an D
evel
opm
ent C
Hos
pita
l
IC
F/M
R F
acilit
y
Nur
sing
Hom
e Fa
cilit
y
Oth
er
Priv
ate
Res
iden
ce
Res
iden
tial C
are
Faci
lity
Sup
porte
d Li
ving
Set
tin
Priv
ate
Plac
emen
t T
OTA
L by
Cou
nty
PLACEMENT BY COUNTY
AAPD
Wai
ver
Ass
iste
d Li
ving
Fac
ility
DD
S W
aive
r Pla
cem
ent
Ger
iatri
c Ps
ych
Gro
up H
ome
Hum
an D
evel
opm
ent C
Hos
pita
l
IC
F/M
R F
acilit
y
Nur
sing
Hom
e Fa
cilit
y
Oth
er
Priv
ate
Res
iden
ce
Res
iden
tial C
are
Faci
lity
Sup
porte
d Li
ving
Set
tin
Priv
ate
Plac
emen
t
TO
TAL
by C
ount
y
Arkansas 0 0 0 0 0 0 0 0 1 0 0 2 0 0 3 Lee 0 0 0 0 0 0 0 0 0 0 0 0 0 0 0Ashley 0 0 0 0 0 0 0 0 1 0 0 1 0 0 2 Lincoln 0 0 0 0 0 0 0 0 5 0 0 0 0 0 5Baxter 0 0 0 0 0 0 0 0 1 0 0 0 0 0 1 Little River 0 0 0 0 0 0 0 0 2 0 0 0 0 0 2Benton 0 1 1 0 0 0 1 0 27 0 0 0 0 0 30 Logan 0 1 0 0 0 6 0 2 7 0 0 3 0 0 19Boone 0 0 0 0 2 0 0 0 3 0 0 0 0 0 5 Lonoke 0 0 1 0 0 0 0 0 6 0 0 0 0 0 7Bradley 0 0 0 0 0 7 0 0 3 0 0 0 2 0 12 Madison 0 0 0 0 0 0 0 0 0 0 0 0 0 0 0Calhoun 0 0 0 0 0 0 0 0 0 0 0 0 0 0 0 Marion 0 0 0 0 0 0 0 0 5 0 0 0 0 0 5Carroll 0 2 0 0 0 0 0 0 3 0 0 0 0 0 5 Miller 0 0 0 0 1 0 0 0 9 0 0 0 0 0 10Chicot 0 0 0 0 0 0 0 0 4 0 0 0 0 0 4 Mississippi 0 0 0 0 0 0 0 0 4 0 0 0 0 0 4Clark 0 0 0 0 1 5 0 0 1 0 2 0 0 0 9 Monroe 0 0 0 0 0 0 0 0 1 0 0 0 0 0 1Clay 0 0 0 0 0 0 0 0 2 0 0 0 0 0 2 Montgomery 0 0 0 0 0 0 0 0 1 0 0 0 0 0 1Cleburne 0 0 0 0 0 0 0 0 3 0 0 0 0 0 3 Nevada 0 0 0 0 0 0 0 0 2 0 0 0 0 0 2Cleveland 0 0 0 0 0 0 0 0 0 0 0 0 0 0 0 Newton 0 0 0 0 0 0 0 0 0 0 0 0 0 0 0Columbia 0 0 1 0 0 0 0 0 3 0 0 0 0 0 4 Ouachita 0 0 0 0 0 0 0 0 1 0 0 0 0 0 1Conway 0 0 0 0 0 0 0 1 4 0 0 0 0 0 5 Perry 0 0 0 0 0 0 0 0 0 0 0 0 0 0 0Craighead 1 0 1 0 2 5 0 0 16 0 0 0 0 1 26 Phillips 0 0 0 0 0 0 0 0 1 0 0 1 0 0 2Crawford 0 0 0 0 0 0 0 0 18 0 0 0 0 0 18 Pike 0 0 0 0 0 0 0 0 5 0 0 0 0 0 5Crittenden 0 0 1 0 0 0 0 1 1 0 0 1 0 0 4 Poinsett 0 0 0 0 0 0 0 0 8 0 0 0 0 0 8Cross 0 0 0 0 0 0 0 0 2 0 0 0 0 0 2 Polk 0 1 0 0 0 0 0 0 4 0 0 0 0 0 5Dallas 0 0 0 0 0 0 0 0 1 0 0 0 0 0 1 Pope 0 1 2 0 0 0 0 1 2 0 1 0 0 0 7Desha 0 0 0 0 0 0 0 0 5 0 0 0 0 0 5 Prairie 0 0 0 0 0 0 0 0 2 0 0 0 0 0 2Drew 0 0 1 0 0 0 0 0 0 0 0 0 0 0 1 Pulaski 0 0 4 0 1 0 1 0 35 1 0 0 0 0 42Faulkner 0 0 2 1 0 1 0 0 5 2 0 0 0 0 11 Randolph 0 1 0 0 0 0 0 0 1 0 0 0 0 0 2Franklin 0 0 0 0 0 0 0 0 1 0 0 0 0 0 1 Saline 0 0 1 0 0 0 0 0 1 0 0 0 0 0 2Fulton 0 0 1 0 0 0 0 0 0 0 0 0 0 0 1 Scott 0 0 1 0 0 0 1 0 9 1 0 0 0 0 12Garland 0 0 0 0 0 0 0 0 9 0 0 0 0 0 9 Searcy 0 1 0 0 0 0 0 0 1 0 0 0 0 0 2Grant 0 0 0 0 0 0 0 0 0 0 0 0 0 0 0 Sebastian 0 0 0 0 0 0 0 0 0 0 0 0 0 0 0Greene 0 0 1 0 0 0 0 0 2 0 0 0 0 0 3 Sevier 0 3 5 1 3 0 3 0 50 0 0 0 2 0 67Hempstead 0 0 1 1 0 0 0 0 1 1 0 1 0 0 5 Sharp 0 0 0 0 3 0 0 0 1 0 0 0 1 0 5Hot Spring 0 0 0 0 0 0 0 0 3 0 0 0 0 0 3 St. Francis 0 0 1 0 0 0 0 0 3 0 0 0 0 0 4Howard 0 0 0 0 1 0 0 0 7 0 0 0 0 0 8 Stone 0 0 0 0 0 0 0 0 1 0 0 0 0 0 1Independence 0 0 0 0 0 0 0 0 6 0 0 0 0 0 6 Union 0 0 1 0 0 0 0 5 11 1 1 0 0 0 19Izard 0 0 0 0 0 0 0 0 4 0 0 0 0 0 4 Van Buren 0 0 0 0 0 0 0 0 2 0 0 0 0 0 2Jackson 0 0 0 0 0 0 0 0 4 0 0 0 0 0 4 Washington 1 0 3 2 0 0 1 0 40 0 1 1 0 0 49Jefferson 0 1 1 0 0 0 0 0 17 0 0 0 0 0 19 White 0 0 0 1 0 0 1 0 8 0 0 0 0 0 10Johnson 0 0 1 1 0 0 0 0 4 0 0 0 0 0 6 Woodruff 0 0 0 0 0 0 0 0 7 0 0 0 0 0 7Lafayette 0 0 0 0 0 0 0 0 2 0 0 0 0 0 2 Yell 0 0 0 0 0 0 0 0 5 0 0 0 0 0 5Lawrence 0 0 0 0 0 0 0 0 5 0 0 0 0 0 5 Totals 2 12 31 7 14 24 8 10 409 6 5 10 5 1 544
Source: Division of Aging and Adult Services
ADULT PROTECTIVE SERVICESCUSTODY CLIENT DEMOGRAPHICS BY COUNTY
Custody Client Placement Type
DAABHS - 13

ARKANSAS DHS STATISTICAL REPORTDIVISION OF AGING, ADULT, AND BEHAVIORAL HEALTH SERVICES
SFY 2019
Division Overview
Mental Health Services
Substance Abuse and Prevention ServicesThe Division of the Behavioral Health Services is the single state agency responsible for thefunding of alcohol and drug prevention and treatment services, providing court ordered treatment,licensing of alcohol and drug treatment programs, overseeing the State Methadone Authority,administering the Drug and Alcohol Safety Educational Programs, providing treatment ordered byjuvenile drug court, and assisting with providing training in the field of substance abuse.
BEHAVIORAL HEALTH SERVICES INTRODUCTION
The Behavioral Health Services, within the Division of Aging, Adult, and Behavioral HealthServices (DAABHS) of the Arkansas Department of Human Services, is responsible for ensuringthe provision of public mental health and substance abuse treatment/prevention servicesthroughout the state of Arkansas.
Behavioral Health Services facilitates the provision of public mental health services by operating222 beds in the Arkansas State Hospital (including adult acute care, forensic, and adolescentbeds) and 290 beds in the Arkansas Health Center (a skilled long-term nursing home facility), bycontracting with twelve local, private non-profit Community Mental Health Centers (CMHCs).Priority populations for DAABHS mental health services are individuals involved with the ArkansasState Hospital (ASH) (including persons currently awaiting services, admitted to, or are dischargedfrom ASH). Adults or children without insurance coverage or with coverage that doesn't covermedically necessary Mental Health Services found not guilty by reason of mental disease ordefect, individuals assessed as potentially violent, other forensic clients. Admission to acute carebeds is through a referral from the state’s CMHCs. Admission to forensic beds, for eitherevaluation and/or treatment, is by a circuit court order. The Arkansas Health Center providesskilled nursing home services for individuals with mental health problems that cannot be effectivelymanaged in other nursing homes. The Center also provides some other specialized nursing homecare.Each of the state’s 12 CMHCs provides services in one of 12 designated geographic catchmentareas that encompass the entire state. All CMHCs are nationally accredited by either theCommission on Accreditation of Rehabilitation Facilities (CARF) or The Joint Commission (TJC),or Council on Accredidation (COA). CMHCs operate out of 115 sites located in 65 of the state’s75 counties. Services are provided in all counties of the state. CMHCs provide screenings for allpersons referred for publicly supported inpatient care, including at the Arkansas State Hospitaland in local psychiatric hospital beds paid for through funds provided to the CMHCs.
Additionally CMHCs provide a comprehensive array of clinical and rehabilitative mental healthservices including: crisis intervention and stabilization; mental health, psychiatric, psychologicaland forensic assessment; treatment planning; individual, family, and group therapy; medicationmanagement; case management; day treatment/partial hospitalization programs; psychiatricrehabilitation day programs; specialized services for children with serious emotional disturbance,including interagency service coordination and wrap-around; prevention, consultation, andeducation; and other supportive services such as housing, vocational, and foster care services.
DAABHS - 14

ARKANSAS DHS STATISTICAL REPORTDIVISION OF AGING, ADULT, AND BEHAVIORAL HEALTH SERVICES
SFY 2019
●
●
●
●
●
Drug and Alcohol Safety Educational Program (DASEP)Treatment Services oversee 8 (eight) Drug and Alcohol Safety Educational Programs (DASEP). DASEPPrograms regulates the screening, assessment, and treatment of those who have received a DrivingWhile Intoxicated (DWI) and/or DUI charge within the 75 counties in Arkansas.
Opioid Treatment ProgramsTreatment Services oversee 6 (six) Licensed Opioid Treatment Programs (methadone maintenancetreatment) providing medication and outpatient drug counseling of opiate abusing clients including oneprogram (i.e. UAMS) funded by DAABHS.
Comprehensive Substance Abuse Treatment Statewide ProgramsTreatment Services oversee 3 (three) Funded Statewide Providers/Services: Quapaw House Inc.(Medical Detoxification and CORT Services); University of Arkansas Medical Science (Methadone), andUniversity of Arkansas at Little Rock (Training and Education Services).
Specialized Women’s ServicesTreatment Services oversee 8 (eight) Funded Providers which provides a full array of specializedwomen’s services. Services include: case management, alcohol and other drug treatment, child care,transportation, medical treatment, housing, education/job skill training, parenting skills aftercare, familyeducation and support and house rules.• Sub-contractors Treatment Contracted Providers engage sub-contractors to assist in providinstatewide coverage and a full array of Specialized Women’s Services (SWS).
Substance Abuse and Prevention Services (Continued)DAABHS distributes federal funds from the Substance Abuse Prevention and Treatment Block Grant toprovide alcohol and drug prevention and treatment services in the state.
Prevention Services are funded through five grants (Block Grant, Partnership for Success (PFS), PrescriptionDrug Overdose (PDO), State Targeted Response (STR), and State Opioid Response SOR ) to provide sub-grants and to contract with local programs, communities and other organizations to provide an array ofprevention services and data collection and analysis. Sub-grants include the 13 Regional PreventionProviders (RPR), 13 Partnership for Success Grantee Regional Lead Agencies, 4 subcontractors: Universityof Arkansas at Little Rock at Mid-SOUTH (UALR), Arkansas Foundation for Medical Care (AFMC), CriminalJustice Institute (CJI) and University of Arkansas Medical Science-Reynolds Center (UAMS) in the state thatare designed to respond to the needs of a particular geographical area to support its prevention initiatives.
Treatment ServicesSubstance Abuse Treatment Services is responsible for funding and administering a comprehensiveand coordinated program for the treatment of alcohol and drug abuse within the 75 counties inArkansas.
Comprehensive Substance Abuse Treatment Programs (CSAT)Treatment Services oversee 8 (eight) Funded Providers which provides a full array of substance usedisorder, prevention, treatment, and recovery services within the 75 counties in Arkansas.Comprehensive Substance Abuse Treatment Services includes: detoxification, residential treatment,outpatient treatment, intensive outpatient treatment, adolescent treatment services, juvenile drug courttreatment services, partial day outpatient services, case management, specialized women’s services(SWS), continuing care services, interim services, and education.• Sub-contractors Treatment Contracted Providers engage sub-contractors to assist in providing the fuarray of services
DAABHS - 15

ARKANSAS DHS STATISTICAL REPORTDIVISION OF AGING, ADULT, AND BEHAVIORAL HEALTH SERVICES
SFY 2019
Substance Abuse and Prevention Services (Continued)●
Number of Clients Served
Source: Division Aging, Adult, and Behavioral Health Services
Sub-GrantsSubstance Abuse Treatment Services has 2 (two) grants that provides treatment and recovery fundingto expand the statewide availability of Medication-Assisted Treatment (MAT).• State Targeted Response to Opioid Crisis Grant (STR). Services are provided by: 8 (eight) fundeproviders; University of Arkansas at Little Rock (UALR); University of Arkansas Medical Science(UAMS)• State Response to Opioid Grant (SOR): Services are provided by: Arkansas Foundation for MedicaCare (AFMC); 8 (eight) Funded Providers; 6 (six) Opioid Treatment Programs; University of ArkansasMedical Science (UAMS); Department of Community Correction (DCC); University of Arkansas at LittleRock (UALR); Under Grace Ministries; Lonoke County Jail.
Training services for the field of alcohol and drug services are funded by DAABHS through contract and grantswith Mid-South Addiction Training Network, Mid-South Summer School, and the Prevention Institute. Theseorganizations provide training throughout the state for persons working in the field of substance abuse.
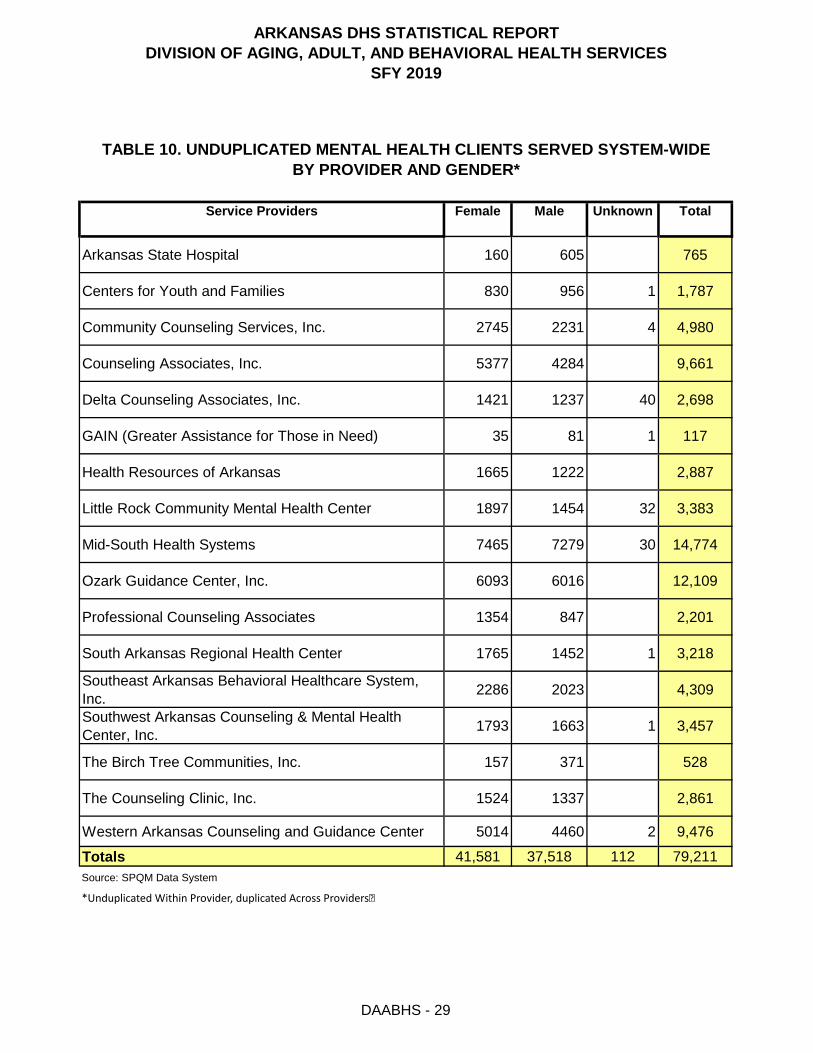
During SFY 2019, 76,139 persons received mental health services through DAABHS mental health programs,11,216 received substance abuse treatment services. DAABHS prevention services are estimated to reachnearly a million people with regional prevention partnerships by informing and educating the public. Tables 11through 14 show the unduplicated number of mental health clients served by each provider without insurance.The total served in these tables (79,211) represents the duplication across providers in the system. Thus,there were 3,072 instances (79,211 - 76,139) during the year where a person who had received mental healthservices from one provider, also received mental health services from another provider. For SFY 2019,Substance Abuse Services reports no duplication across providers.
DAABHS - 16

ARKANSAS DHS STATISTICAL REPORTDIVISION OF AGING, ADULT, AND BEHAVIORAL HEALTH SERVICES
SFY 2019
MENTAL HEALTH CLIENTSArkansas State Hospital & Community Mental Health Centers
DAABHS - 17

ARKANSAS DHS STATISTICAL REPORTDIVISION OF AGING, ADULT, AND BEHAVIORAL HEALTH SERVICES
SFY 2019
County 0-17 18-59 60-64 65+ Total County 0-17 18-59 60-64 65+ TotalArkansas 157 458 44 37 696 Lincoln 189 206 15 23 433Ashley 166 607 31 24 828 Little River 52 154 12 14 232Baxter 114 460 44 44 662 Logan 387 536 29 32 984Benton 2029 1936 89 96 4,150 Lonoke 159 574 31 23 787Boone 134 413 28 12 587 Madison 341 274 6 16 637Bradley 48 251 18 14 331 Marion 110 144 18 10 282Calhoun 9 67 6 6 88 Miller 246 697 40 44 1,027Carroll 103 307 26 26 462 Mississippi 426 986 53 54 1,519Chicot 101 208 20 8 337 Monroe 109 234 16 19 378Clark 187 264 18 24 493 Montgomery 71 69 3 9 152Clay 196 281 16 17 510 Nevada 27 214 25 9 275Cleburne 148 474 27 14 663 Newton 11 64 8 7 90Cleveland 49 99 8 14 170 Ouachita 157 478 33 26 694Columbia 179 519 27 40 765 Out of State 49 268 16 23 356Conway 277 632 30 43 982 Perry 108 206 20 10 344Craighead 1336 1449 99 81 2,965 Phillips 213 466 41 35 755Crawford 1056 991 42 46 2,135 Pike 15 98 5 10 128Crittenden 428 1050 56 81 1,615 Poinsett 95 329 17 19 460Cross 192 326 18 28 564 Polk 225 171 6 5 407Dallas 9 51 8 10 78 Pope 559 1496 77 72 2,204Desha 161 293 27 19 500 Prairie 26 64 2 5 97Drew 120 388 23 17 548 Pulaski 1073 4308 278 242 5,901Faulkner 1257 1763 115 131 3,266 Randolph 219 532 32 35 818Franklin 251 333 14 14 612 Saline 886 1494 120 124 2,624Fulton 53 166 18 11 248 Scott 138 214 14 14 380Garland 778 1986 122 184 3,070 Searcy 56 219 25 25 325Grant 99 285 24 26 434 Sebastian 1507 3035 148 163 4,853Greene 323 998 63 62 1,446 Sevier 80 268 16 10 374Hempstead 152 495 49 47 743 Sharp 53 333 13 20 419Hot Spring 407 691 45 47 1,190 St. Francis 148 443 34 30 655Howard 72 275 13 18 378 Stone 129 325 20 29 503Independence 40 434 22 11 507 Union 374 1035 77 79 1,565Izard 31 157 6 9 203 Unknown 177 695 39 38 949Jackson 34 186 10 2 232 Van Buren 39 311 31 20 401Jefferson 634 1733 137 167 2,671 Washington 3464 1963 118 109 5,654Johnson 157 572 33 16 778 White 100 614 22 9 745Lafayette 35 114 11 4 164 Woodruff 72 80 7 3 162Lawrence 172 434 22 20 648 Yell 123 379 22 20 544Lee 70 212 8 17 307 Totals 23,977 46,334 2,906 2,922 76,139
Source: SPQM Data System
TABLE 1. UNDUPLICATED MENTAL HEALTH CLIENTS SERVED SYSTEM-WIDEBY COUNTY AND AGE
DAABHS - 18
ARKANSAS DHS STATISTICAL REPORTDIVISION OF AGING, ADULT, AND BEHAVIORAL HEALTH SERVICES
SFY 2019
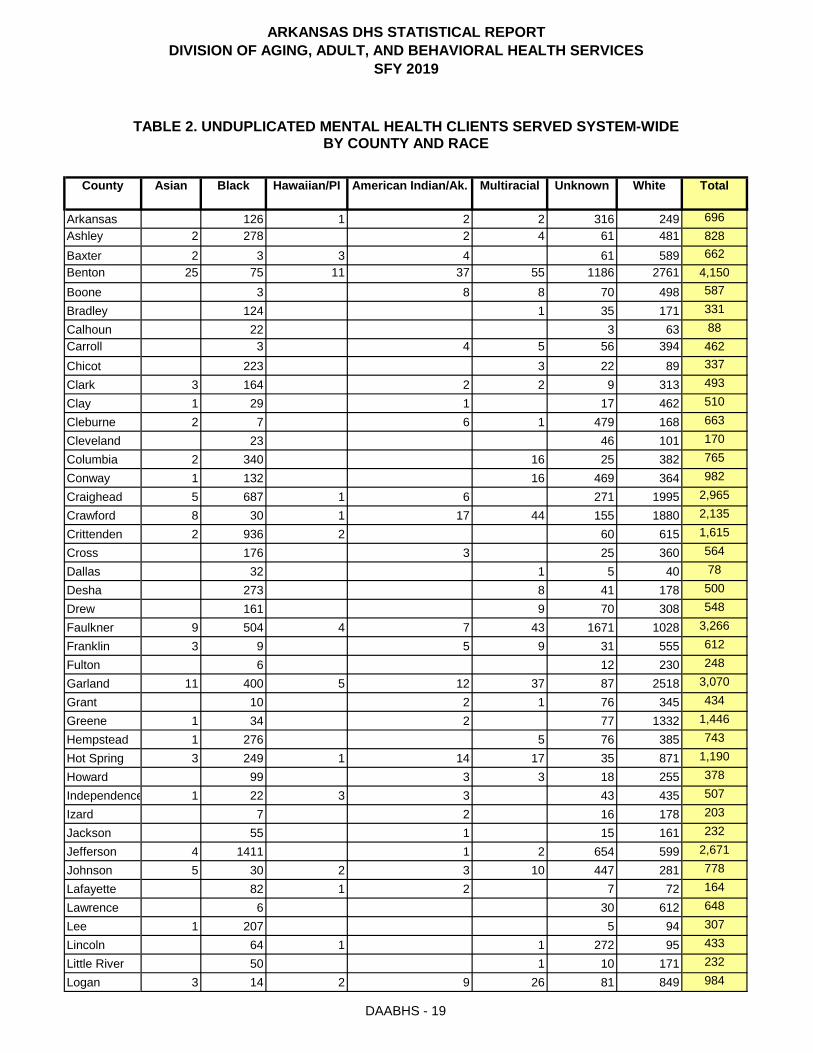
County Asian Black Hawaiian/PI American Indian/Ak. Multiracial Unknown White Total
Arkansas 126 1 2 2 316 249 696Ashley 2 278 2 4 61 481 828Baxter 2 3 3 4 61 589 662Benton 25 75 11 37 55 1186 2761 4,150Boone 3 8 8 70 498 587Bradley 124 1 35 171 331Calhoun 22 3 63 88Carroll 3 4 5 56 394 462Chicot 223 3 22 89 337Clark 3 164 2 2 9 313 493Clay 1 29 1 17 462 510Cleburne 2 7 6 1 479 168 663Cleveland 23 46 101 170Columbia 2 340 16 25 382 765Conway 1 132 16 469 364 982Craighead 5 687 1 6 271 1995 2,965Crawford 8 30 1 17 44 155 1880 2,135Crittenden 2 936 2 60 615 1,615Cross 176 3 25 360 564Dallas 32 1 5 40 78Desha 273 8 41 178 500Drew 161 9 70 308 548Faulkner 9 504 4 7 43 1671 1028 3,266Franklin 3 9 5 9 31 555 612Fulton 6 12 230 248Garland 11 400 5 12 37 87 2518 3,070Grant 10 2 1 76 345 434Greene 1 34 2 77 1332 1,446Hempstead 1 276 5 76 385 743Hot Spring 3 249 1 14 17 35 871 1,190Howard 99 3 3 18 255 378Independence 1 22 3 3 43 435 507Izard 7 2 16 178 203Jackson 55 1 15 161 232Jefferson 4 1411 1 2 654 599 2,671Johnson 5 30 2 3 10 447 281 778Lafayette 82 1 2 7 72 164Lawrence 6 30 612 648Lee 1 207 5 94 307Lincoln 64 1 1 272 95 433Little River 50 1 10 171 232Logan 3 14 2 9 26 81 849 984
TABLE 2. UNDUPLICATED MENTAL HEALTH CLIENTS SERVED SYSTEM-WIDEBY COUNTY AND RACE
DAABHS - 19

ARKANSAS DHS STATISTICAL REPORTDIVISION OF AGING, ADULT, AND BEHAVIORAL HEALTH SERVICES
SFY 2019
County Asian Black Hawaiian/PI American Indian/Ak. Multiracial Unknown White Total
TABLE 2. UNDUPLICATED MENTAL HEALTH CLIENTS SERVED SYSTEM-WIDEBY COUNTY AND RACE
Lonoke 54 1 2 291 439 787Madison 1 6 5 2 152 471 637Marion 1 4 27 250 282Miller 319 1 5 33 669 1,027Mississippi 1 696 2 1 67 752 1,519Monroe 197 1 28 152 378Montgomery 1 1 3 7 140 152Nevada 108 1 9 157 275Newton 1 1 7 81 90Ouachita 1 327 8 5 353 694Perry 35 3 6 45 267 356Phillips 10 2 191 141 344Pike 506 1 26 222 755Poinsett 1 5 1 1 120 128Polk 58 29 373 460Pope 2 2 4 18 381 407Prairie 9 104 1 11 43 1077 959 2,204Pulaski 15 27 55 97Randolph 28 3005 3 21 24 678 2142 5,901Saline 9 47 762 818Scott 4 263 1 11 64 109 2172 2,624Searcy 10 1 1 5 16 347 380Sebastian 2 1 271 51 325Sevier 44 478 4 13 78 466 3770 4,853Sharp 1 18 2 9 45 299 374St. Francis 1 19 3 42 354 419Stone 2 397 1 4 33 218 655Union 1 3 6 2 419 72 503Van Buren 9 697 3 24 22 810 1,565Washington 100 1 5 2 345 496 949White 1 11 1 284 104 401Woodruff 26 242 27 39 82 2502 2736 5,654Yell 1 45 52 647 745Unknown 46 10 106 162Out of State 1 12 2 2 8 264 255 544Totals 228 15,182 87 299 703 14,790 44,850 76,139Source: SPQM Data System
DAABHS - 20

ARKANSAS DHS STATISTICAL REPORTDIVISION OF AGING, ADULT, AND BEHAVIORAL HEALTH SERVICES
SFY 2019
County Hispanic or
Latino Origin
Not Available
Not Hispanic or Latino
Origin
Total County Hispanic or
Latino Origin
Not Available
Not Hispanic or Latino
Origin
Total
Arkansas 19 169 508 696 Lincoln 6 7 420 433Ashley 13 12 803 828 Little River 3 13 216 232Baxter 11 70 581 662 Logan 23 67 894 984Benton 379 961 2810 4150 Lonoke 13 383 391 787Boone 15 85 487 587 Madison 7 343 287 637Bradley 13 2 316 331 Marion 5 28 249 282Calhoun 1 87 88 Miller 15 39 973 1027Carroll 24 89 349 462 Mississippi 25 7 1487 1519Chicot 8 12 317 337 Monroe 4 12 362 378Clark 16 11 466 493 Montgomery 5 11 136 152Clay 9 1 500 510 Nevada 2 21 252 275Cleburne 30 77 556 663 Newton 1 10 79 90Cleveland 2 3 165 170 Ouachita 2 8 684 694Columbia 19 18 728 765 Perry 8 39 309 356Conway 15 124 843 982 Phillips 4 52 288 344Craighead 103 71 2791 2965 Pike 9 4 742 755Crawford 78 145 1912 2135 Poinsett 7 3 118 128Crittenden 26 20 1569 1615 Polk 11 10 439 460Cross 9 9 546 564 Pope 20 9 378 407Dallas 78 78 Prairie 109 249 1846 2204Desha 9 7 484 500 Pulaski 2 28 67 97Drew 10 11 527 548 Randolph 319 746 4836 5901Faulkner 83 829 2354 3266 Saline 6 34 778 818Franklin 12 37 563 612 Scott 58 78 2488 2624Fulton 2 11 235 248 Searcy 17 6 357 380Garland 121 212 2737 3070 Sebastian 35 290 325Grant 3 10 421 434 Sevier 233 692 3928 4853Greene 29 37 1380 1446 Sharp 69 5 300 374Hempstead 64 23 656 743 St. Francis 2 39 378 419Hot Spring 26 45 1119 1190 Stone 14 12 629 655Howard 18 8 352 378 Union 9 54 440 503Independence 9 29 469 507 Van Buren 17 10 1538 1565Izard 3 9 191 203 Washington 14 306 629 949Jackson 11 221 232 White 6 61 334 401Jefferson 13 23 2635 2671 Woodruff 842 1754 3058 5654Johnson 33 50 695 778 Yell 11 35 699 745Lafayette 3 12 149 164 Unknown 5 4 153 162Lawrence 5 16 627 648 Out of State 46 59 439 544Lee 3 304 307 Totals 3181 8536 64422 76139
Source: SPQM Data System
TABLE 3. UNDUPLICATED MENTAL HEALTH CLIENTS SERVED SYSTEM-WIDEBY COUNTY AND ETHNICITY
DAABHS - 21

ARKANSAS DHS STATISTICAL REPORTDIVISION OF AGING, ADULT, AND BEHAVIORAL HEALTH SERVICES
SFY 2019
County Female Male Unknown Total County Female Male Unknown TotalArkansas 384 312 696 Lincoln 235 198 433Ashley 476 352 828 Little River 123 109 232Baxter 399 263 662 Logan 533 451 984Benton 2064 2086 4150 Lonoke 463 324 787Boone 311 275 1 587 Madison 343 294 637Bradley 184 147 331 Marion 144 137 1 282Calhoun 56 32 88 Miller 523 503 1 1027Carroll 257 205 462 Mississippi 735 782 2 1519Chicot 169 165 3 337 Monroe 189 189 378Clark 255 238 493 Montgomery 89 63 152Clay 250 260 510 Nevada 122 153 275Cleburne 373 290 663 Newton 44 46 90Cleveland 85 85 170 Ouachita 379 315 694Columbia 421 343 1 765 Perry 175 181 356Conway 540 442 982 Phillips 187 156 1 344Craighead 1376 1574 15 2965 Pike 389 364 2 755Crawford 1082 1052 1 2135 Poinsett 68 60 128Crittenden 790 823 2 1615 Polk 247 213 460Cross 297 266 1 564 Pope 225 182 407Dallas 44 34 78 Prairie 1210 994 2204Desha 276 222 2 500 Pulaski 58 39 97Drew 288 260 548 Randolph 3218 2664 19 5901Faulkner 1812 1454 3266 Saline 447 369 2 818Franklin 317 295 612 Scott 1400 1224 2624Fulton 142 106 248 Searcy 197 183 380Garland 1699 1369 2 3070 Sebastian 174 151 325Grant 236 198 434 Sevier 2587 2265 1 4853Greene 788 656 2 1446 Sharp 213 161 374Hempstead 409 334 743 St. Francis 230 188 1 419Hot Spring 604 585 1 1190 Stone 320 335 655Howard 202 176 378 Union 273 230 503Independence 278 229 507 Van Buren 844 721 1565Izard 101 102 203 Washington 445 471 33 949Jackson 136 96 232 White 211 190 401Jefferson 1385 1286 2671 Woodruff 2744 2910 5654Johnson 442 336 778 Yell 389 355 1 745Lafayette 78 86 164 Unknown 79 83 162Lawrence 333 312 3 648 Out of State 296 248 544Lee 151 156 307 Totals 40038 36003 98 76139
Source: SPQM Data System
TABLE 4. UNDUPLICATED CLIENTS SERVED SYSTEM-WIDEBY COUNTY AND GENDER
DAABHS - 22

ARKANSAS DHS STATISTICAL REPORTDIVISION OF AGING, ADULT, AND BEHAVIORAL HEALTH SERVICES
SFY 2019
Age Gender Asian Black Hawaiian/ PI
American Indian/Ak. Multiracial Unknown White Total
Female 25 1550 14 38 179 3103 5641 10550Male 22 2514 24 50 220 3563 7004 13397Unknown 4 10 16 30Total 47 4068 38 88 399 6676 12661 23977
Female 88 5133 33 101 169 4020 16152 25696Male 81 4674 12 91 117 3396 12200 20571Unknown 5 45 17 67Total 169 9812 45 192 286 7461 28369 46334
Female 4 434 1 10 8 205 1180 1842Male 4 276 2 3 124 655 1064Unknown 0Total 8 710 1 12 11 329 1835 2906
Female 3 367 2 5 4 200 1369 1950Male 1 225 1 2 3 123 616 971Unknown 1 1Total 4 592 3 7 7 324 1985 2922
Female 120 7484 50 154 360 7528 24342 40038Male 108 7689 37 145 343 7206 20475 36003Unknown 0 9 0 0 0 56 33 98Total 228 15182 87 299 703 14790 44850 76139
Source: SPQM Data System
65+
Totals
TABLE 5. UNDUPLICATED MENTAL HEALTH CLIENTS SERVED SYSTEM-WIDEBY AGE, GENDER AND RACE
0-17
18-59
60-64
DAABHS - 23

ARKANSAS DHS STATISTICAL REPORTDIVISION OF AGING, ADULT, AND BEHAVIORAL HEALTH SERVICES
SFY 2019
Age Gender Hispanic or Latino Origin Not Available Not Hispanic or
Latino Origin Total
Female 865 1691 7994 10550Male 1017 1982 10398 13397Unknown 10 20 30Total 1882 3683 18412 23977
Female 640 2357 22699 25696Male 605 2095 17871 20571Unknown 1 28 38 67Total 1246 4480 40608 46334
Female 17 111 1714 1842Male 11 58 995 1064Unknown 0Total 28 169 2709 2906
Female 14 120 1816 1950Male 11 84 876 971Unknown 1 1Total 25 204 2693 2922
Female 1536 4279 34223 40038Male 1644 4219 30140 36003Unknown 1 38 59 98Total 3181 8536 64422 76139
Source: SPQM Data System
65+
Totals
TABLE 6. UNDUPLICATED CLIENTS SERVED SYSTEM-WIDEBY AGE, GENDER AND ETHNICITY
0-17
18-59
60-64
DAABHS - 24

ARKANSAS DHS STATISTICAL REPORTDIVISION OF AGING, ADULT, AND BEHAVIORAL HEALTH SERVICES
SFY 2019
MENTAL HEALTH CLIENTSArkansas State Hospital & Community Mental Health Centers
DAABHS - 25

ARKANSAS DHS STATISTICAL REPORTDIVISION OF AGING, ADULT, AND BEHAVIORAL HEALTH SERVICES
SFY 2019
Service Providers 0-17 18-59 60-64 65+ Total
Arkansas State Hospital 99 625 19 22 765
Centers for Youth and Families 1417 359 8 3 1,787
Community Counseling Services, Inc. 1444 3096 181 259 4,980
Counseling Associates, Inc. 2853 6094 361 353 9,661
Delta Counseling Associates, Inc. 685 1811 122 80 2,698
GAIN (Greater Assistance for Those in Need) 97 9 11 117
Health Resources of Arkansas 498 2115 169 105 2,887
Little Rock Community Mental Health Center 2990 210 183 3,383
Mid-South Health Systems 4275 9391 555 553 14,774
Ozark Guidance Center, Inc. 6214 5270 319 306 12,109
Professional Counseling Associates 270 1775 94 62 2,201
South Arkansas Regional Health Center 750 2162 145 161 3,218
Southeast Arkansas Behavioral Healthcare System, Inc. 1026 2786 231 266 4,309
Southwest Arkansas Counseling & Mental Health Center, Inc. 706 2423 179 149 3,457
The Birch Tree Communities, Inc. 1 475 39 13 528
The Counseling Clinic, Inc. 1009 1586 120 146 2,861
Western Arkansas Counseling and Guidance Center 3622 5330 251 273 9,476
Totals 24,869 48,385 3,012 2,945 79,211
Source: SPQM Data System
*Unduplicated Within Provider, duplicated Across Providers
TABLE 7. UNDUPLICATED MENTAL HEALTH CLIENTS SERVED SYSTEM-WIDE BY PROVIDER AND AGE*
DAABHS - 26

ARKANSAS DHS STATISTICAL REPORTDIVISION OF AGING, ADULT, AND BEHAVIORAL HEALTH SERVICES
SFY 2019
Service Providers Asian Black Hawaiian/PI
American Indian/Ak. Multiracial Unknown White Total
Arkansas State Hospital 3 367 2 24 369 765
Centers for Youth and Families 3 708 3 6 15 65 987 1,787
Community Counseling Services, Inc. 18 765 5 32 55 149 3956 4,980
Counseling Associates, Inc. 27 735 11 38 123 5814 2913 9,661
Delta Counseling Associates, Inc. 2 1070 2 27 322 1275 2,698
GAIN (Greater Assistance for Those in Need) 73 3 41 117
Health Resources of Arkansas 3 96 2 9 226 2551 2,887
Little Rock Community Mental Health Center 25 1927 1 16 17 208 1189 3,383
Mid-South Health Systems 15 4119 9 27 855 9749 14,774
Ozark Guidance Center, Inc. 54 333 41 100 152 4129 7300 12,109
Professional Counseling Associates 3 436 6 855 901 2,201
South Arkansas Regional Health Center 12 1377 3 44 165 1617 3,218
Southeast Arkansas Behavioral Healthcare System, Inc. 4 1616 2 2 3 1463 1219 4,309
Southwest Arkansas Counseling & Mental Health Center, Inc. 2 1038 1 9 29 199 2179 3,457
The Birch Tree Communities, Inc. 2 216 1 1 3 6 299 528
The Counseling Clinic, Inc. 5 263 1 11 75 113 2393 2,861
Western Arkansas Counseling and Guidance Center 57 543 7 50 177 708 7934 9,476
Totals 235 15,682 89 309 720 15,304 46,872 79,211
Source: SPQM Data System
*Unduplicated Within Provider, duplicated Across Providers
TABLE 8. UNDUPLICATED MENTAL HEALTH CLIENTS SERVED SYSTEM-WIDEBY PROVIDER AND RACE*
DAABHS - 27

ARKANSAS DHS STATISTICAL REPORTDIVISION OF AGING, ADULT, AND BEHAVIORAL HEALTH SERVICES
SFY 2019
Service Providers Hispanic or Latino Origin
Not Available
Not Hispanic or Latino Origin
Unduplicated Total
Arkansas State Hospital 29 2 734 765
Centers for Youth and Families 273 73 1441 1,787
Community Counseling Services, Inc. 198 294 4488 4,980
Counseling Associates, Inc. 333 1672 7656 9,661
Delta Counseling Associates, Inc. 52 131 2515 2,698
GAIN (Greater Assistance for Those in Need) 2 6 109 117
Health Resources of Arkansas 17 209 2661 2,887
Little Rock Community Mental Health Center 59 81 3243 3,383
Mid-South Health Systems 282 326 14166 14,774
Ozark Guidance Center, Inc. 1262 3431 7416 12,109
Professional Counseling Associates 42 1180 979 2,201
South Arkansas Regional Health Center 38 142 3038 3,218
Southeast Arkansas Behavioral Healthcare System, Inc. 28 212 4069 4,309
Southwest Arkansas Counseling & Mental Health Center, Inc. 168 134 3155 3,457
The Birch Tree Communities, Inc. 7 2 519 528
The Counseling Clinic, Inc. 46 97 2718 2,861
Western Arkansas Counseling and Guidance Center 390 963 8123 9,476
Totals 3,226 8,955 67,030 79,211
Source: SPQM Data System
*Unduplicated Within Provider, duplicated Across Providers
TABLE 9. UNDUPLICATED MENTAL HEALTH CLIENTS SERVED SYSTEM-WIDEBY PROVIDER AND ETHNICITY*
DAABHS - 28
ARKANSAS DHS STATISTICAL REPORTDIVISION OF AGING, ADULT, AND BEHAVIORAL HEALTH SERVICES
SFY 2019
Service Providers Female Male Unknown Total
Arkansas State Hospital 160 605 765
Centers for Youth and Families 830 956 1 1,787
Community Counseling Services, Inc. 2745 2231 4 4,980
Counseling Associates, Inc. 5377 4284 9,661
Delta Counseling Associates, Inc. 1421 1237 40 2,698
GAIN (Greater Assistance for Those in Need) 35 81 1 117
Health Resources of Arkansas 1665 1222 2,887
Little Rock Community Mental Health Center 1897 1454 32 3,383
Mid-South Health Systems 7465 7279 30 14,774
Ozark Guidance Center, Inc. 6093 6016 12,109
Professional Counseling Associates 1354 847 2,201
South Arkansas Regional Health Center 1765 1452 1 3,218
Southeast Arkansas Behavioral Healthcare System, Inc. 2286 2023 4,309
Southwest Arkansas Counseling & Mental Health Center, Inc. 1793 1663 1 3,457
The Birch Tree Communities, Inc. 157 371 528
The Counseling Clinic, Inc. 1524 1337 2,861
Western Arkansas Counseling and Guidance Center 5014 4460 2 9,476
Totals 41,581 37,518 112 79,211Source: SPQM Data System
*Unduplicated Within Provider, duplicated Across Providers
TABLE 10. UNDUPLICATED MENTAL HEALTH CLIENTS SERVED SYSTEM-WIDEBY PROVIDER AND GENDER*
DAABHS - 29

ARKANSAS DHS STATISTICAL REPORTDIVISION OF AGING, ADULT, AND BEHAVIORAL HEALTH SERVICES
SFY 2019
DAABHS - 30

ARKANSAS DHS STATISTICAL REPORTDIVISION OF AGING, ADULT, AND BEHAVIORAL HEALTH SERVICES
SFY 2019
County 0-17 18-59 60-64 65+ Total County 0-17 18-59 60-64 65+ TotalArkansas 1 1 2 Lincoln 4 4Ashley 7 7 Little River 1 1Baxter 5 5 Logan 1 7 8Benton 6 17 23 Lonoke 9 19 1 3 32Boone 3 1 4 Madison 2 2Bradley 2 2 Marion 1 1 2Calhoun 2 2 Miller 2 18 20Carroll 3 3 Mississippi 9 9Chicot 6 1 7 Monroe 2 2Clark 13 13 Montgomery 1 1Clay 3 3 6 Nevada 9 1 10Cleburne 1 1 Newton 1 1Cleveland 3 3 Ouachita 1 8 9Columbia 2 2 Perry 3 3Conway 2 21 23 Phillips 5 5Craighead 2 13 15 Pike 1 9 1 11Crawford 2 9 11 Poinsett 2 2Crittenden 2 1 3 Polk 1 2 1 4Cross 1 1 2 Pope 1 4 5Dallas 2 2 Prairie 1 1 1 3Desha 3 3 Pulaski 2 2Drew 10 13 23 Randolph 20 195 7 6 228Faulkner 1 1 Saline 1 4 5Franklin 4 15 1 20 Scott 1 1 2Fulton 1 1 2 Searcy 3 23 3 1 30Garland 1 2 3 Sebastion 1 1Grant 7 1 8 Sevier 3 21 2 26Greene 1 11 12 Sharp 5 5Hempstead 4 4 St. Francis 3 6 1 1 11Hot Spring 6 6 Stone 2 2Howard 1 1 2 Union 15 15Independence 1 6 7 Van Buren 6 19 25Izard 6 19 1 26 Washington 2 5 7Jackson 8 8 White 1 1 2Jefferson 1 1 Woodruff 1 1 2Johnson 3 3 Yell 0Lafayette 1 2 3 Unknown 0Lawrence 0 Out of State 0Lee 0 Total 99 625 19 22 765Source: SPQM Data System
BY COUNTY AND AGETABLE 11. ASH UNDUPLICATED CLIENTS SERVED
DAABHS - 31

ARKANSAS DHS STATISTICAL REPORTDIVISION OF AGING, ADULT, AND BEHAVIORAL HEALTH SERVICES
SFY 2019
County Asian Black Hawaiian/PI American Indian/Ak. Multiracial Unknown White Total
Arkansas 1 1 2 4Ashley 4 3 7 14Baxter 5 5 10Benton 1 2 5 15 23 46Boone 4 4 8Bradley 1 1 2 4Carroll 2 2 4Chicot 3 3 6Clark 3 1 3 7 14Clay 8 5 13 26Cleburne 6 6 12Cleveland 1 1 2Columbia 3 3 6Conway 2 2 4Craighead 11 12 23 46Crawford 1 2 12 15 30Crittenden 9 2 11 22Cross 2 1 3 6Dallas 1 1 2 4Desha 1 1 2 4Drew 2 1 3 6Faulkner 7 16 23 46Franklin 1 1 2Garland 5 15 20 40Grant 2 2 4Greene 3 3 6Hempstead 4 3 1 8 16Hot Spring 3 9 12 24Howard 1 2 1 4 8Independence 1 5 6 12Izard 2 2 4Jackson 3 4 7 14Jefferson 22 4 26 52Johnson 8 8 16Lafayette 1 1 2Lawrence 1 2 3 6Lee 2 1 3 6Lincoln 2 2 4 8Little River 1 1 2Logan 1 7 8 16Lonoke 5 1 26 32 64Madison 2 2 4Marion 2 2 4Miller 10 10 20 40Mississippi 7 2 9 18Monroe 1 1 2 4
BY COUNTY AND RACETABLE 12. ASH UNDUPLICATED CLIENTS SERVED
DAABHS - 32

ARKANSAS DHS STATISTICAL REPORTDIVISION OF AGING, ADULT, AND BEHAVIORAL HEALTH SERVICES
SFY 2019
County Asian Black Hawaiian/PI American Indian/Ak. Multiracial Unknown White Total
BY COUNTY AND RACETABLE 12. ASH UNDUPLICATED CLIENTS SERVED
Montgomery 1 1 2Nevada 4 6 10 20Newton 1 1 2Ouachita 7 2 9 18Out of State 1 2 3 6Perry 2 3 5 10Phillips 10 1 11 22Pike 2 2 4Poinsett 1 3 4 8Polk 5 5 10Pope 2 1 3 6Prairie 2 2 4Pulaski 170 4 54 228 456Randolph 1 4 5 10Saline 2 2 4Scott 14 1 15 30 60Searcy 1 1 2Sevier 1 6 2 17 26 52Sharp 2 3 5 10St. Francis 1 10 11 22Stone 2 2 4Union 8 1 6 15 30Washington 2 1 4 18 25 50White 7 7 14Woodruff 1 1 2 4Yell 2 2 4Total 3 367 2 0 24 369 765 1530Source: SPQM Data System
DAABHS - 33

ARKANSAS DHS STATISTICAL REPORTDIVISION OF AGING, ADULT, AND BEHAVIORAL HEALTH SERVICES
SFY 2019
County Female Male Total County Female Male TotalArkansas 2 2 Lee 3 3Ashley 2 5 7 Lincoln 4 4Baxter 2 3 5 Little River 1 1Benton 10 13 23 Logan 1 7 8Boone 1 3 4 Lonoke 4 28 32Bradley 2 2 Madison 2 2Carroll 2 2 Marion 1 1 2Chicot 1 2 3 Miller 1 19 20Clark 2 5 7 Mississippi 9 9Clay 4 9 13 Monroe 2 2Cleburne 6 6 Montgomery 1 1Cleveland 1 1 Nevada 1 9 10Columbia 2 1 3 Newton 1 1Conway 1 1 2 Ouachita 5 4 9Craighead 2 21 23 Out of State 1 2 3Crawford 5 10 15 Perry 5 5Crittenden 3 8 11 Phillips 1 10 11Cross 3 3 Pike 2 2Dallas 2 2 Poinsett 1 3 4Desha 2 2 Polk 1 4 5Drew 3 3 Pope 1 2 3Faulkner 5 18 23 Prairie 2 2Franklin 1 1 Pulaski 55 173 228Garland 7 13 20 Randolph 1 4 5Grant 2 2 Saline 1 1 2Greene 3 3 Scott 4 26 30Hempstead 8 8 Searcy 1 1Hot Spring 3 9 12 Sevier 9 17 26Howard 1 3 4 Sharp 5 5Independence 3 3 6 St. Francis 11 11Izard 2 2 Stone 2 2Jackson 3 4 7 Union 15 15Jefferson 5 21 26 Washington 6 19 25Johnson 1 7 8 White 2 5 7Lafayette 1 1 Woodruff 2 2Lawrence 3 3 Yell 2 2
Total 160 605 765Source: SPQM Data System
TABLE 13. ASH UNDUPLICATED CLIENTS SERVEDBY COUNTY AND GENDER
DAABHS - 34

ARKANSAS DHS STATISTICAL REPORTDIVISION OF AGING, ADULT, AND BEHAVIORAL HEALTH SERVICES
SFY 2019
Month
2018 JUL2018 AUG
2018 SEP
2018 OCT
2018 NOV2018 DEC
2019 JAN
2019 FEB
2019 MAR
2019 APR
2019 MAY
2019 JUN
Source: Arkansas State Hospital Data System
The average daily census for SFY 2019 was for all patients (acute adult, forensic adult, and adolescent ). 209
208
211
210
211
211
215
207
TABLE 14. ARKANSAS STATE HOSPITAL AVERAGE DAILY CENSUS BY MONTH
All ASH PatientsMonthly Average Daily Census
Census
207208
206
208
210
DAABHS - 35

ARKANSAS DHS STATISTICAL REPORTDIVISION OF AGING, ADULT, AND BEHAVIORAL HEALTH SERVICES
SFY 2019
MENTAL HEALTH CLIENTS(Arkansas State Hospital & Community Mental Health Centers)
DAABHS - 36

ARKANSAS DHS STATISTICAL REPORTDIVISION OF AGING, ADULT, AND BEHAVIORAL HEALTH SERVICES
SFY 2019
As. Bl. Hai/P.I.
Ind./Ak.
MultR
Unk. Wht. As. Bl. Hai/P.I.
Ind./Ak.
MultR
Unk. Wht. Bl. Mult R
Unk. Wht.
Arkansas 63 1 1 2 171 146 63 1 145 103 696
Ashley 2 148 3 30 293 130 2 1 31 188 828
Baxter 1 1 1 2 32 362 1 2 2 2 29 227 662
Benton 14 36 6 22 28 557 1401 11 39 5 15 27 629 1360 4150
Boone 1 2 4 34 270 2 6 4 36 227 1 587
Bradley 66 1 22 95 58 13 76 331
Calhoun 13 43 9 3 20 88
Carroll 4 2 25 226 3 3 31 168 462
Chicot 107 2 8 52 116 1 11 37 3 337
Clark 3 73 2 1 4 172 91 1 5 141 493
Clay 8 8 234 1 21 1 9 228 510
Cleburne 2 3 4 1 272 91 4 2 207 77 663
Cleveland 6 19 60 17 27 41 170
Columbia 1 167 8 15 230 1 173 8 9 152 1 765
Conway 74 6 260 200 1 58 10 209 164 982
Craighead 2 277 1 2 130 964 3 408 4 141 1018 2 13 2965
Crawford 5 13 1 6 19 77 961 3 17 11 25 78 918 1 2135
Crittenden 1 430 32 327 1 505 2 28 287 1 1 1615
Cross 97 11 189 79 3 14 170 1 564
Dallas 18 3 23 14 1 2 17 78
Desha 147 4 22 103 126 4 17 75 2 500
Drew 70 3 32 183 91 6 38 125 548
Faulkner 6 259 3 3 22 901 618 3 245 1 4 21 770 410 3266
Franklin 1 6 3 4 14 289 2 3 2 5 17 266 612
Fulton 2 9 131 4 3 99 248
Garland 6 202 4 4 22 47 1414 5 198 1 8 15 39 1103 1 1 3070
Grant 4 1 45 186 6 2 31 159 434
Greene 1 16 1 35 735 18 1 42 595 2 1446
Hempstead 152 3 40 214 1 124 2 36 171 743
Hot Spring 2 99 1 11 7 15 469 1 150 3 10 20 401 1 1190
Howard 53 2 1 10 136 46 1 2 8 119 378
Independence 1 10 2 1 23 241 12 1 2 20 194 507
Izard 3 12 86 4 2 4 92 203
Jackson 32 8 96 23 1 7 65 232
Jefferson 3 703 342 337 1 708 1 2 312 262 2671
Johnson 3 15 2 7 257 158 2 15 3 3 190 123 778
Lafayette 36 2 40 46 1 2 5 32 164
Lawrence 13 320 5 17 290 1 2 648
Lee 88 2 61 1 119 3 33 307
Lincoln 36 1 1 140 57 28 132 38 433
TABLE 15. UNDUPLICATED CHILDREN SERVEDBY COUNTY AND GENDER AND RACE
County
Female Male UnknownTotal
DAABHS - 37

ARKANSAS DHS STATISTICAL REPORTDIVISION OF AGING, ADULT, AND BEHAVIORAL HEALTH SERVICES
SFY 2019
As. Bl. Hai/P.I.
Ind./Ak.
MultR
Unk. Wht. As. Bl. Hai/P.I.
Ind./Ak.
MultR
Unk. Wht. Bl. Mult R
Unk. Wht.
TABLE 15. UNDUPLICATED CHILDREN SERVEDBY COUNTY AND GENDER AND RACE
County
Female Male UnknownTotal
Little River 31 1 6 85 19 4 86 232
Logan 2 7 1 7 15 41 460 1 7 1 2 11 40 389 984
Lonoke 24 1 179 259 30 1 1 112 180 787
Madison 1 3 2 1 82 254 3 3 1 70 217 637
Marion 1 3 14 126 1 13 123 1 282
Miller 148 1 2 17 355 170 3 16 314 1 1027
Mississippi 1 306 2 25 401 389 1 41 351 1 1 1519
Monroe 99 13 77 98 1 15 75 378
Montgomery 1 1 2 5 80 1 2 60 152
Nevada 40 1 1 80 68 8 77 275
Newton 1 1 3 39 4 42 90
Ouachita 166 4 5 204 1 161 4 149 694
Out of State 17 2 3 20 133 18 1 3 25 134 356
Perry 7 1 97 82 3 1 93 59 1 344
Phillips 250 16 123 256 1 10 97 2 755
Pike 4 64 1 1 1 1 56 128
Poinsett 18 15 214 40 14 159 460
Polk 2 2 9 212 2 2 9 169 407
Pope 5 47 1 7 21 562 567 4 57 4 22 515 392 2204
Prairie 9 18 31 6 9 24 97
Pulaski 13 1664 1 13 15 356 1156 15 1339 2 8 9 309 982 2 13 4 5901
Randolph 5 19 423 4 28 337 2 818
Saline 3 121 9 36 50 1181 1 142 1 2 28 59 991 2624
Scott 2 1 1 4 11 178 8 1 5 169 380
Searcy 142 32 2 1 129 19 325
Sebastian 21 231 1 6 40 247 2041 23 247 3 7 38 218 1729 1 4853
Sevier 7 7 26 173 1 11 2 2 19 126 374
Sharp 9 1 19 201 1 10 2 22 153 1 419
St. Francis 2 183 3 17 115 214 1 1 16 103 655
Stone 1 2 1 239 30 1 5 2 180 42 503
Union 4 345 1 13 11 470 5 352 2 11 11 340 1565
Unknown 54 1 3 1 104 282 45 2 1 209 214 1 32 949
Van Buren 1 1 150 59 1 10 134 45 401
Washington 11 98 14 19 35 1169 1398 15 144 13 20 47 1333 1338 5654
White 1 26 23 339 19 29 307 1 745
Woodruff 19 6 54 27 4 52 162
Yell 6 2 1 4 132 151 1 6 1 4 132 104 544
Total 120 7484 50 154 360 7528 24342 108 7689 37 145 343 7206 20475 9 0 56 33 76139
Source: SPQM Data System
DAABHS - 38
ARKANSAS DHS STATISTICAL REPORTDIVISION OF AGING, ADULT, AND BEHAVIORAL HEALTH SERVICES
SFY 2019
Service Providers Gender Asian BlackHawaiian/
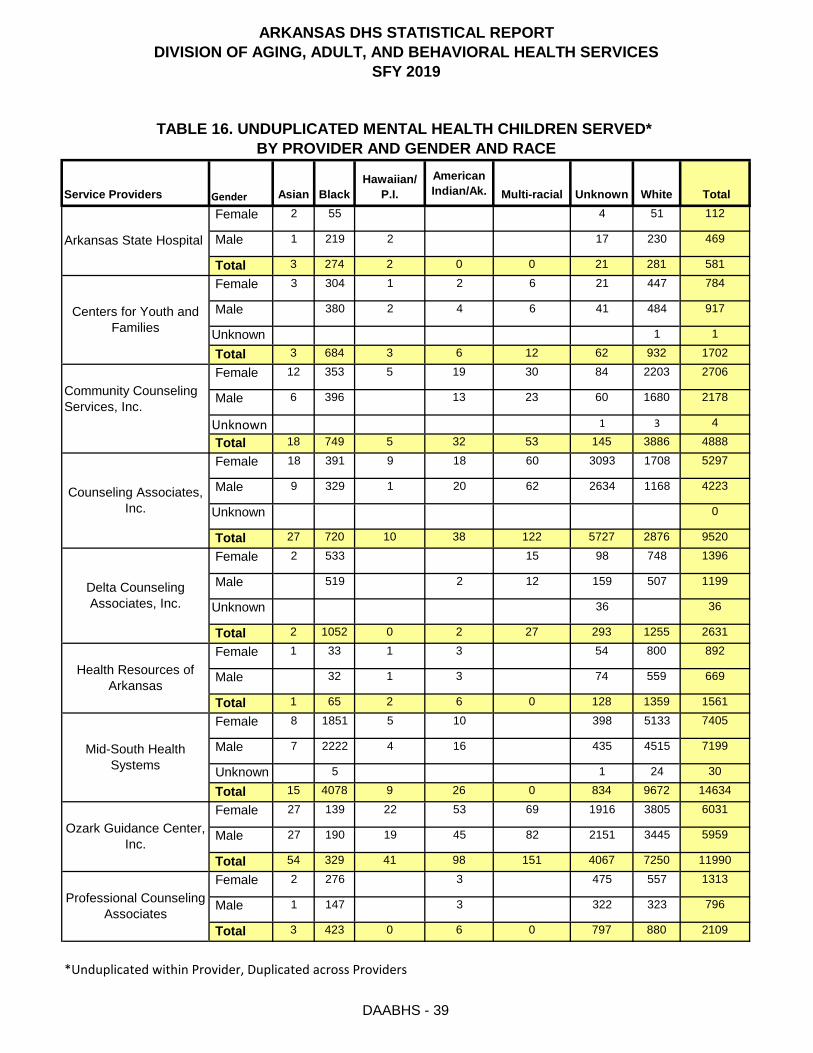
P.I.American Indian/Ak. Multi-racial Unknown White Total
Female 2 55 4 51 112
Male 1 219 2 17 230 469
Total 3 274 2 0 0 21 281 581
Female 3 304 1 2 6 21 447 784
Male 380 2 4 6 41 484 917
Unknown 1 1
Total 3 684 3 6 12 62 932 1702
Female 12 353 5 19 30 84 2203 2706
Male 6 396 13 23 60 1680 2178
Unknown 1 3 4
Total 18 749 5 32 53 145 3886 4888
Female 18 391 9 18 60 3093 1708 5297
Male 9 329 1 20 62 2634 1168 4223
Unknown 0
Total 27 720 10 38 122 5727 2876 9520
Female 2 533 15 98 748 1396
Male 519 2 12 159 507 1199
Unknown 36 36
Total 2 1052 0 2 27 293 1255 2631
Female 1 33 1 3 54 800 892
Male 32 1 3 74 559 669
Total 1 65 2 6 0 128 1359 1561
Female 8 1851 5 10 398 5133 7405
Male 7 2222 4 16 435 4515 7199
Unknown 5 1 24 30
Total 15 4078 9 26 0 834 9672 14634
Female 27 139 22 53 69 1916 3805 6031
Male 27 190 19 45 82 2151 3445 5959
Total 54 329 41 98 151 4067 7250 11990
Female 2 276 3 475 557 1313
Male 1 147 3 322 323 796
Total 3 423 0 6 0 797 880 2109
*Unduplicated within Provider, Duplicated across Providers
TABLE 16. UNDUPLICATED MENTAL HEALTH CHILDREN SERVED* BY PROVIDER AND GENDER AND RACE
Arkansas State Hospital
Centers for Youth and Families
Community Counseling Services, Inc.
Counseling Associates, Inc.
Delta Counseling Associates, Inc.
Health Resources of Arkansas
Mid-South Health Systems
Ozark Guidance Center, Inc.
Professional Counseling Associates
DAABHS - 39

ARKANSAS DHS STATISTICAL REPORTDIVISION OF AGING, ADULT, AND BEHAVIORAL HEALTH SERVICES
SFY 2019
Service Providers Gender Asian BlackHawaiian/P.
I.American Indian/Ak. Multi-racial Unknown White Total
Female 5 692 1 24 61 947 1730Male 7 659 2 20 85 640 1413Unknown 1 1 Total 12 1351 3 0 44 147 1587 3144Female 3 812 2 1 738 681 2237Male 1 783 2 2 663 506 1957Unknown 0 Total 4 1595 2 2 3 1401 1187 4194Female 482 3 17 102 1145 1749Male 1 512 1 6 12 91 979 1602Unknown 1 1 Total 1 995 1 9 29 193 2124 3352 Male 50 2 84 136 Female 2 136 1 1 6 183 329 Total 2 186 0 1 3 6 267 465Female 4 125 9 41 43 1270 1492Male 1 123 1 2 34 63 1071 1295Unknown 0 Total 5 248 1 11 75 106 2341 2787Female 27 249 3 24 86 372 4160 4921Male 29 275 4 23 82 321 3646 4380Unknown 1 1 2 Total 56 524 7 47 168 694 7807 9303Female 6 1120 1 10 9 69 592 1807
Little Rock Community Male 16 721 5 7 81 515 1345Mental Health Center Unknown 3 16 3 22
Total 22 1844 1 15 16 166 1110 3174Female 19 11 30
GAIN Male 46 3 24 73Unknown 1 1 Total 0 65 0 0 0 3 36 104Female 120 7484 50 154 360 7528 24342 40038Male 108 7689 37 145 343 7206 20475 36003Unknown 0 9 0 0 0 56 33 98 Total 228 15182 87 299 703 14790 44850 76,139
*Unduplicated within Provider, Duplicated across ProvidersSource: SPQM Data System
Western Arkansas Counseling and Guidance Center
TOTALS
South Arkansas Regional Health Center
Southeast Arkansas Behavioral Healthcare System, Inc.
Southwest Arkansas Counseling & Mental Health Center, Inc.
The Birch Tree Communities, Inc.
The Counseling Clinic, Inc.
BY PROVIDER AND GENDER AND RACETABLE 16. UNDUPLICATED MENTAL HEALTH CHILDREN SERVED*
DAABHS - 40

ARKANSAS DHS STATISTICAL REPORTDIVISION OF AGING, ADULT, AND BEHAVIORAL HEALTH SERVICES
SFY 2019
SUBSTANCE ABUSE TREATMENT(Division of Aging, Adults, and Behavioral Health Services)
DAABHS - 41

ARKANSAS DHS STATISTICAL REPORTDIVISION OF AGING, ADULT, AND BEHAVIORAL HEALTH SERVICES
SFY 2019
Arkansas 2 136 3 1 142 Lincoln 0 36 0 0 36Ashley 5 118 1 2 126 Little River 2 27 0 0 29Baxter 4 55 1 0 60 Logan 3 86 1 3 93Benton 31 817 17 7 872 Lonoke 0 276 3 4 283Boone 11 50 4 0 65 Madison 0 46 1 1 48Bradley 4 49 0 1 54 Marion 0 14 1 0 15Calhoun 0 6 0 0 6 Miller 4 139 4 5 152Carroll 0 43 0 2 45 Mississippi 0 68 4 1 73Chicot 16 58 2 0 76 Monroe 0 18 1 1 20Clark 1 34 2 0 37 Montgomery 0 12 0 0 12Clay 0 14 0 0 14 Nevada 1 16 0 0 17Cleburne 0 50 2 0 52 Newton 0 7 0 0 7Cleveland 1 27 0 0 28 Ouachita 0 37 2 1 40Columbia 1 41 1 2 45 Perry 0 20 1 0 21Conway 1 78 4 0 83 Phillips 0 22 1 0 23Craighead 10 321 14 6 351 Pike 0 16 0 0 16Crawford 9 253 5 2 269 Poinsett 0 104 4 1 109Crittenden 4 57 2 0 63 Polk 4 46 2 0 52Cross 1 24 1 0 26 Pope 7 233 2 1 243Dallas 0 5 0 0 5 Prairie 0 14 0 0 14Desha 10 64 4 1 79 Pulaski 48 2,122 66 29 2,265Drew 6 96 1 0 103 Randolph 0 39 5 1 45Faulkner 0 218 2 3 223 Saline 5 293 9 5 312Franklin 3 66 3 2 74 Scott 1 55 0 0 56Fulton 0 3 0 0 3 Searcy 0 17 0 0 17Garland 13 652 18 8 691 Sebastian 18 609 16 4 647Grant 0 54 0 2 56 Sevier 1 56 0 0 57Greene 1 194 2 5 202 Sharp 2 47 1 0 50Hempstead 0 61 1 0 62 St. Francis 0 24 0 0 24Hot Spring 0 162 5 0 167 Stone 0 12 0 0 12Howard 0 16 0 0 16 Union 2 100 2 0 104Independence 0 79 3 2 84 Van Buren 0 23 0 0 23Izard 0 18 0 0 18 Washington 35 664 11 4 714Jackson 1 40 1 0 42 White 8 324 5 0 337Jefferson 38 382 21 6 447 Woodruff 1 12 0 0 13Johnson 0 91 0 0 91 Yell 1 47 0 0 48Lafayette 16 18 0 0 34 Out of State 0 154 2 4 160Lawrence 2 52 3 1 58 Unknown 0 139 3 0 142Lee 0 18 0 0 18
Totals 334 10,494 270 118 11,216* County at Admission
Source: Alcohol Drug Management Information System (ADMIS)
County* 0 - 17 18 - 59 60 - 64 65 + Total
SUBSTANCE ABUSE TREATMENTTABLE 17. UNDUPLICATED CLIENTS SERVED SYSTEM-WIDE
BY COUNTY AND AGE County* 0 - 17 18 - 59 60 - 64 65 + Total
DAABHS - 42

ARKANSAS DHS STATISTICAL REPORTDIVISION OF AGING, ADULT, AND BEHAVIORAL HEALTH SERVICES
SFY 2019
County* Asian Black Hawaiian/PI American Indian/Ak. Multiracial Unknown White Total
Arkansas 0 53 0 0 0 89 142
Ashley 0 46 0 1 2 77 126Baxter 0 0 0 0 3 57 60
Benton 5 24 0 15 65 763 872Boone 0 0 0 0 0 65 65
Bradley 0 18 0 0 1 35 54Calhoun 0 0 0 0 0 6 6Carroll 0 0 0 0 1 44 45Chicot 0 43 0 1 2 30 76
Clark 0 5 0 0 0 32 37Clay 0 0 0 0 0 14 14Cleburne 0 0 0 0 0 52 52Cleveland 0 2 0 1 0 25 28Columbia 0 20 0 0 0 25 45Conway 0 10 0 0 0 73 83Craighead 0 24 0 2 11 314 351Crawford 1 4 0 2 6 256 269Crittenden 0 31 0 0 1 31 63Cross 0 2 0 0 0 24 26Dallas 0 1 0 0 0 4 5Desha 0 36 0 0 0 43 79Drew 0 30 0 2 1 70 103Faulkner 3 28 2 0 6 184 223Franklin 0 2 0 2 1 69 74Fulton 0 1 0 0 0 2 3Garland 2 43 5 4 4 633 691Grant 0 0 1 1 0 54 56Greene 0 7 0 1 2 192 202Hempstead 0 20 0 1 5 36 62Hot Spring 0 39 0 0 1 127 167Howard 0 3 0 0 0 13 16Independence 0 5 1 1 3 74 84Izard 0 0 0 0 0 18 18Jackson 1 7 0 0 0 34 42Jefferson 0 235 1 2 1 208 447Johnson 0 1 0 0 2 88 91Lafayette 0 21 0 0 2 11 34Lawrence 0 1 0 0 0 57 58Lee 0 13 0 0 0 5 18Lincoln 0 3 0 0 0 33 36
TABLE 18. UNDUPLICATED CLIENTS SERVED SYSTEM-WIDESUBSTANCE ABUSE TREATMENT
BY COUNTY AND RACE
DAABHS - 43

ARKANSAS DHS STATISTICAL REPORTDIVISION OF AGING, ADULT, AND BEHAVIORAL HEALTH SERVICES
SFY 2019
County* Asian Black Hawaiian/PI American Indian/Ak. Multiracial Unknown White Total
TABLE 18. UNDUPLICATED CLIENTS SERVED SYSTEM-WIDESUBSTANCE ABUSE TREATMENT
BY COUNTY AND RACE
Little River 0 4 0 0 0 25 29Logan 1 2 0 0 2 88 93Lonoke 1 28 0 0 2 252 283Madison 0 0 0 0 2 46 48Marion 0 0 0 0 0 15 15Miller 2 41 0 0 1 108 152Mississippi 0 23 0 0 0 50 73Monroe 0 4 0 0 0 16 20Montgomery 0 0 0 0 0 12 12Nevada 0 2 0 0 0 15 17Newton 0 0 0 0 0 7 7Ouachita 0 12 0 0 0 28 40Perry 0 0 0 1 1 19 21Phillips 0 16 0 0 0 7 23Pike 0 0 0 0 2 14 16Poinsett 0 6 0 0 0 103 109Polk 0 1 0 0 2 49 52Pope 0 20 0 0 1 222 243Prairie 0 2 0 0 0 12 14Pulaski 7 877 3 5 31 1,342 2,265Randolph 0 2 0 0 1 42 45Saline 0 19 0 2 3 288 312Scott 1 0 0 0 5 50 56Searcy 0 0 0 0 0 17 17Sebastian 5 51 0 20 21 550 647Sevier 0 4 0 0 6 47 57Sharp 0 0 0 0 0 50 50St. Francis 0 13 0 0 0 11 24Stone 0 0 0 0 0 12 12Union 0 35 0 1 1 67 104Van Buren 0 0 0 0 1 22 23Washington 5 36 8 8 48 609 714White 0 25 0 0 2 310 337Woodruff 0 2 0 0 0 11 13Yell 0 2 0 0 0 46 48Out of State 0 5 0 74 0 81 160Unknown 0 37 0 3 5 97 142
TOTALS 34 2,047 21 150 0 257 8,707 11,216* County at AdmissionSource: Alcohol Drug Management Information System (ADMIS)
DAABHS - 44

ARKANSAS DHS STATISTICAL REPORTDIVISION OF AGING, ADULT, AND BEHAVIORAL HEALTH SERVICES
SFY 2019
Arkansas 1 0 141 142 Lincoln 0 0 36 36Ashley 5 0 121 126 Little River 1 3 25 29Baxter 2 1 57 60 Logan 3 1 89 93Benton 92 24 756 872 Lonoke 5 1 277 283Boone 3 2 60 65 Madison 2 0 46 48Bradley 1 0 53 54 Marion 0 0 15 15Calhoun 0 0 6 6 Miller 4 22 126 152Carroll 3 0 42 45 Mississippi 1 0 72 73Chicot 2 0 74 76 Monroe 0 1 19 20Clark 0 0 37 37 Montgomery 0 0 12 12Clay 0 1 13 14 Nevada 1 0 16 17Cleburne 2 0 50 52 Newton 0 0 7 7Cleveland 0 1 27 28 Ouachita 0 0 40 40Columbia 1 1 43 45 Perry 1 1 19 21Conway 1 0 82 83 Phillips 0 0 23 23Craighead 20 28 303 351 Pike 2 0 14 16Crawford 11 4 254 269 Poinsett 2 8 99 109Crittenden 3 2 58 63 Polk 2 0 50 52Cross 0 0 26 26 Pope 6 0 237 243Dallas 1 0 4 5 Prairie 0 0 14 14Desha 1 0 78 79 Pulaski 61 61 2,143 2,265Drew 1 1 101 103 Randolph 1 3 41 45Faulkner 13 3 207 223 Saline 6 6 300 312Franklin 3 1 70 74 Scott 6 0 50 56Fulton 0 3 0 3 Searcy 2 0 15 17Garland 17 5 669 691 Sebastian 40 15 592 647Grant 1 3 52 56 Sevier 5 3 49 57Greene 9 1 192 202 Sharp 0 2 48 50Hempstead 4 1 57 62 St. Francis 0 0 24 24Hot Spring 2 2 163 167 Stone 0 0 12 12Howard 0 0 16 16 Union 5 4 95 104Independence 3 0 81 84 Van Buren 1 0 22 23Izard 3 1 14 18 Washington 65 10 639 714Jackson 5 0 37 42 White 6 5 326 337Jefferson 3 17 427 447 Woodruff 0 0 13 13Johnson 2 0 89 91 Yell 1 0 47 48Lafayette 5 0 29 34 Out of State 6 7 147 160Lawrence 1 1 56 58 Unknown 5 2 135 142Lee 0 0 18 18*County of Admission TOTALS 461 258 10,497 11,216Source: Alcohol Drug Management Information System (ADMIS)
SUBSTANCE ABUSE TREATMENT
Not Available
Not Hispanic or Latino
Origin
Total
TABLE 19. UNDUPLICATED CLIENTS SERVED SYSTEM-WIDEBY COUNTY AND ETHNICITY
County* Hispanic or Latino
Origin
Not Available
Not Hispanic or Latino
Origin
Total County* Hispanic or Latino
Origin
DAABHS - 45

ARKANSAS DHS STATISTICAL REPORTDIVISION OF AGING, ADULT, AND BEHAVIORAL HEALTH SERVICES
SFY 2019
County* Female Male Total County* Female Male Unknown Total Arkansas 63 79 142 Lincoln 14 22 0 36Ashley 54 72 126 Little River 12 17 0 29Baxter 22 38 60 Logan 35 58 0 93Benton 317 555 872 Lonoke 122 161 0 283Boone 24 41 65 Madison 23 25 0 48Bradley 24 30 54 Marion 4 11 0 15Calhoun 4 2 6 Miller 58 94 0 152Carroll 15 30 45 Mississippi 33 40 0 73Chicot 27 49 76 Monroe 8 12 0 20Clark 14 23 37 Montgomery 5 7 0 12Clay 7 7 14 Nevada 9 8 0 17Cleburne 14 38 52 Newton 3 4 0 7Cleveland 15 13 28 Ouachita 17 23 0 40Columbia 11 34 45 Perry 14 7 0 21Conway 32 51 83 Phillips 6 17 0 23Craighead 141 210 351 Pike 11 5 0 16Crawford 110 159 269 Poinsett 44 65 0 109Crittenden 26 37 63 Polk 18 34 0 52Cross 9 17 26 Pope 81 162 0 243Dallas 3 2 5 Prairie 9 5 0 14Desha 25 54 79 Pulaski 837 1,425 3 2,265Drew 46 57 103 Randolph 20 25 0 45Faulkner 84 139 223 Saline 125 187 0 312Franklin 33 41 74 Scott 17 39 0 56Fulton 2 1 3 Searcy 9 8 0 17Garland 290 401 691 Sebastian 243 404 0 647Grant 20 36 56 Sevier 28 29 0 57Greene 86 116 202 Sharp 24 26 0 50Hempstead 31 31 62 St. Francis 9 15 0 24Hot Spring 45 122 167 Stone 4 8 0 12Howard 4 12 16 Union 47 57 0 104Independence 23 61 84 Van Buren 9 14 0 23Izard 4 14 18 Washington 251 463 0 714Jackson 14 28 42 White 150 187 0 337Jefferson 162 285 447 Woodruff 5 8 0 13Johnson 35 56 91 Yell 26 22 0 48Lafayette 2 32 34 Out of State 39 121 0 160Lawrence 16 42 58 Unknown 14 128 0 142Lee 5 13 18* County at Admission TOTALS 4,242 6,971 3 11,216Source: Alcohol Drug Management Information System (ADMIS)
SUBSTANCE ABUSE TREATMENTTABLE 20. UNDUPLICATED CLIENTS SERVED SYSTEM-WIDE
BY COUNTY AND GENDER
DAABHS - 46

ARKANSAS DHS STATISTICAL REPORTDIVISION OF AGING, ADULT, AND BEHAVIORAL HEALTH SERVICES
SFY 2019
SUBSTANCE ABUSE TREATMENT(Division of Aging, Adults, and Behavioral Health Services)
DAABHS - 47

ARKANSAS DHS STATISTICAL REPORTDIVISION OF AGING, ADULT, AND BEHAVIORAL HEALTH SERVICES
SFY 2019
Service Providers 0 - 17 18 - 59 60 - 64 65 + Total10TH DISTRICT SUBSTANCE ABUSE PROGRAM 34 566 17 8 625Absolute Recovery Center, LLC 0 16 1 0 17AR COMMUNITY CORRECTION 1 762 18 3 784AR COMMUNITY CORRECTIONS - LITTLE ROCK UNIT 2 162 1 1 166ARKANSAS TREATMENT SERVICES, PA 0 49 0 2 51ARVAC 0 186 6 2 194BETTER COMMUNITY DEVELOPMENT, INC. 2 197 11 4 214BRADFORD HEALTH SERVICES 0 0 0 0 0CAPSTONE TREATMENT CENTER, INC. 4 8 0 0 12CATAR CLINIC 0 0 0 0 0CATAR CLINIC OF HOT SPRINGS 0 0 0 0 0CATAR CLINIC OF NLR 0 119 3 2 124COUNSELING ASSOCIATES, INC. 2 12 2 0 16COUNSELING CLINIC, INC. 4 2 0 0 6Crossroads Treatment Center of West Mempis PC 0 0 0 0 0CROWLEY'S RIDGE DEV. COUNCIL, INC. 1 330 13 4 348DEPT. OF COMMUNITY CORRECTIONS 1 71 2 1 75FAMILY SERVICE AGENCY, INC. 1 42 3 4 50GYST HOUSE 0 18 0 0 18HARBOR HOUSE, INC. 0 936 19 9 964Housley & Associates 0 227 9 2 238JEFFERSON COMPREHENSIVE COUNSELING ASSOCIATES 38 245 14 5 302LIFE STRATEGIES COUNSELING, INC. 9 15 0 0 24New Beginnings Behavioral Health Services, LLC 3 17 0 0 20NORTHEAST ARK CMHC/MID-SOUTH HEALTH SYSTEMS, INC 1 188 9 3 201NORTHEAST ARK CMHC/MID-SOUTH HEALTH SYSTEMS, INC. 1 130 3 2 136Northeast Arkansas Treatment Services, LLC 0 121 15 6 142NORTHWEST ARKANSAS PSYCOLOGICAL GROUP 2 30 0 0 32OZARK GUIDANCE CENTER 1 149 3 2 155OZARK MOUNTAIN ALCOHOL RES. TREATMENT, INC. 0 0 0 0 0PREFERRED FAMILY HEALTHCARE, INC. 5 146 2 2 155QUALITY LIVING CENTER 2 147 5 1 155Quapaw House 28 25 0 0 53QUAPAW HOUSE, INC. 14 2,940 60 23 3,037RECOVERY CENTERS OF AR 4 1,352 27 10 1,393RECOVERY SOLUTIONS, INC. 0 0 0 0 0RESTORED LIFE SERVICES OF ARKANSAS 0 22 0 0 22RIGHT MOVE COUNSELING 0 0 0 0 0SE AR BEHAVIORAL HEALTHCARE 14 16 0 0 30Serenity Ridge Recovery 0 0 0 0 0SOUTHWEST AR COUNSELING & MENTAL HEALTH CENTER 23 314 6 4 347SPRINGDALE TREATMENT CENTER 0 78 0 2 80TEEN CHALLENGE RANCH OF NW ARKANSAS 8 8 0 0 16
TABLE 21. TOTAL CLIENTS SERVED BY PROVIDER AND AGE
SUBSTANCE ABUSE TREATMENT
DAABHS - 48

ARKANSAS DHS STATISTICAL REPORTDIVISION OF AGING, ADULT, AND BEHAVIORAL HEALTH SERVICES
SFY 2019
Service Providers 0 - 17 18 - 59 60 - 64 65 + Total
TABLE 21. TOTAL CLIENTS SERVED BY PROVIDER AND AGE
SUBSTANCE ABUSE TREATMENT
UAMS SUBSTANCE ABUSE 1 112 4 1 118UNITED FAMILY SERVICES, INC. 33 11 0 0 44UNITED METHODIST CHILDREN'S HOME, INC 0 25 0 0 25WESTERN AR COUNSELING 28 243 7 3 281Youth Bridge, Bell House 0 0 0 0 0YOUTH BRIDGE, INC 68 34 0 0 102Youth Bridge, Julie House 0 1 0 0 1
TOTAL 335 10,072 260 106 10,773* The providers listed are licensed by the state of arkansas for substance abuse treatment.
Source: Alcohol Drug Management Information System (ADMIS)
DAABHS - 49

ARKANSAS DHS STATISTICAL REPORTDIVISION OF AGING, ADULT, AND BEHAVIORAL HEALTH SERVICES
SFY 2019
Service Providers Asian Black Hawaiian/PI
American Indian /AK
Multi-racial
Unk. White Total
10TH DISTRICT SUBSTANCE ABUSE PROGRAM 0 242 2 5 7 369 625Absolute Recovery Center, LLC 0 0 0 0 3 14 17
AR COMMUNITY CORRECTION 0 184 0 6 11 583 784AR COMMUNITY CORRECTIONS - LITTLE ROCK UNIT 0 25 0 2 4 135 166ARKANSAS TREATMENT SERVICES, PA 0 2 0 0 0 49 51ARVAC 0 18 1 2 0 173 194BETTER COMMUNITY DEVELOPMENT, INC. 0 102 1 0 1 110 214BRADFORD HEALTH SERVICES 0 0 0 0 0 0 0
CAPSTONE TREATMENT CENTER, INC. 0 0 0 0 1 11 12CATAR CLINIC 0 0 0 0 0 0 0CATAR CLINIC OF HOT SPRINGS 0 0 0 0 0 0 0CATAR CLINIC OF NLR 1 9 1 0 1 112 124COUNSELING ASSOCIATES, INC. 0 1 0 0 1 14 16COUNSELING CLINIC, INC. 0 0 0 0 0 6 6Crossroads Treatment Center of West Mempis PC 0 0 0 0 0 0 0CROWLEY'S RIDGE DEV. COUNCIL, INC. 0 31 0 1 3 313 348DEPT. OF COMMUNITY CORRECTIONS 0 33 0 0 0 42 75FAMILY SERVICE AGENCY, INC. 1 21 0 0 0 28 50GYST HOUSE 0 7 0 0 0 11 18HARBOR HOUSE, INC. 7 73 0 91 26 767 964Housley & Associates 4 9 2 4 15 204 238JEFFERSON COMPREHENSIVE COUNSELING ASSOCIATES 0 154 0 2 2 144 302LIFE STRATEGIES COUNSELING, INC. 0 4 0 0 4 16 24New Beginnings Behavioral Health Services, LLC 0 7 0 0 0 13 20NORTHEAST ARK CMHC/MID-SOUTH HEALTH SYSTEMS, INC 0 42 0 0 4 155 201NORTHEAST ARK CMHC/MID-SOUTH HEALTH SYSTEMS, INC. 0 14 0 0 2 120 136Northeast Arkansas Treatment Services, LLC 0 8 0 0 0 134 142NORTHWEST ARKANSAS PSYCOLOGICAL GROUP 0 0 0 0 3 29 32OZARK GUIDANCE CENTER 3 6 1 2 14 129 155OZARK MOUNTAIN ALCOHOL RES. TREATMENT, INC. 0 0 0 0 0 0 0PREFERRED FAMILY HEALTHCARE, INC. 1 11 1 2 0 140 155QUALITY LIVING CENTER 0 53 0 0 5 97 155Quapaw House 0 2 3 0 0 48 53QUAPAW HOUSE, INC. 6 296 4 21 37 2,673 3,037RECOVERY CENTERS OF AR 8 493 2 1 24 865 1,393RECOVERY SOLUTIONS, INC. 0 0 0 0 0 0 0RESTORED LIFE SERVICES OF ARKANSAS 0 1 0 0 0 21 22RIGHT MOVE COUNSELING 0 0 0 0 0 0 0SE AR BEHAVIORAL HEALTHCARE 0 19 0 0 0 11 30Serenity Ridge Recovery 0 0 0 0 0 0 0SOUTHWEST AR COUNSELING & MENTAL HEALTH CENTER 0 107 0 1 12 227 347SPRINGDALE TREATMENT CENTER 0 1 0 0 4 75 80TEEN CHALLENGE RANCH OF NW ARKANSAS 0 0 0 0 2 14 16UAMS SUBSTANCE ABUSE 0 11 0 1 2 104 118UNITED FAMILY SERVICES, INC. 0 34 0 0 0 10 44UNITED METHODIST CHILDREN'S HOME, INC 0 8 0 0 2 15 25WESTERN AR COUNSELING 2 11 0 1 14 253 281Youth Bridge, Bell House 0 0 0 0 0 0 0YOUTH BRIDGE, INC 1 4 3 3 38 53 102Youth Bridge, Julie House 0 0 0 0 1 0 1
TOTALS 34 2,043 21 145 0 243 8,287 10,773* The providers listed are licensed by the state of arkansas for substance abuse treatment.Source: Alcohol Drug Management Information System (ADMIS)
TABLE 22. TOTAL CLIENTS SERVEDBY PROVIDER AND RACE
SUBSTANCE ABUSE TREATMENT
DAABHS - 50

ARKANSAS DHS STATISTICAL REPORTDIVISION OF AGING, ADULT, AND BEHAVIORAL HEALTH SERVICES
SFY 2019
10TH DISTRICT SUBSTANCE ABUSE PROGRAM 11 1 613 625
Absolute Recovery Center, LLC 2 0 15 17AR COMMUNITY CORRECTION 43 11 730 784
AR COMMUNITY CORRECTIONS - LITTLE ROCK UNIT 6 7 153 166
ARKANSAS TREATMENT SERVICES, PA 3 0 48 51ARVAC 0 2 192 194BETTER COMMUNITY DEVELOPMENT, INC. 3 2 209 214
BRADFORD HEALTH SERVICES 0 0 0 0
CAPSTONE TREATMENT CENTER, INC. 1 5 6 12CATAR CLINIC 0 0 0 0CATAR CLINIC OF HOT SPRINGS 0 0 0 0CATAR CLINIC OF NLR 2 1 121 124COUNSELING ASSOCIATES, INC. 1 1 14 16
COUNSELING CLINIC, INC. 0 0 6 6
Crossroads Treatment Center of West Mempis PC 0 0 0 0
CROWLEY'S RIDGE DEV. COUNCIL, INC. 8 1 339 348
DEPT. OF COMMUNITY CORRECTIONS 0 12 63 75FAMILY SERVICE AGENCY, INC. 0 1 49 50GYST HOUSE 0 0 18 18HARBOR HOUSE, INC. 53 22 889 964Housley & Associates 24 10 204 238
JEFFERSON COMPREHENSIVE COUNSELING ASSOCIATES 4 5 293 302LIFE STRATEGIES COUNSELING, INC. 2 0 22 24New Beginnings Behavioral Health Services, LLC 0 0 20 20
NORTHEAST ARK CMHC/MID-SOUTH HEALTH SYSTEMS, INC 6 0 195 201NORTHEAST ARK CMHC/MID-SOUTH HEALTH SYSTEMS, INC. 4 0 132 136
Northeast Arkansas Treatment Services, LLC 10 53 79 142
NORTHWEST ARKANSAS PSYCOLOGICAL GROUP 3 0 29 32OZARK GUIDANCE CENTER 18 5 132 155
OZARK MOUNTAIN ALCOHOL RES. TREATMENT, INC. 0 0 0 0
PREFERRED FAMILY HEALTHCARE, INC. 1 0 154 155QUALITY LIVING CENTER 8 3 144 155Quapaw House 2 0 51 53QUAPAW HOUSE, INC. 101 15 2,921 3,037RECOVERY CENTERS OF AR 32 39 1,322 1,393RECOVERY SOLUTIONS, INC. 0 0 0 0RESTORED LIFE SERVICES OF ARKANSAS 0 0 22 22RIGHT MOVE COUNSELING 0 0 0 0
SE AR BEHAVIORAL HEALTHCARE 0 11 19 30
SUBSTANCE ABUSE TREATMENTTABLE 23. TOTAL CLIENTS SERVED
BY PROVIDER AND ETHNICITYService Providers Hispanic or
Latino OriginNot Available Not Hispanic or
Latino OriginTotal
DAABHS - 51

ARKANSAS DHS STATISTICAL REPORTDIVISION OF AGING, ADULT, AND BEHAVIORAL HEALTH SERVICES
SFY 2019
SUBSTANCE ABUSE TREATMENTTABLE 23. TOTAL CLIENTS SERVED
BY PROVIDER AND ETHNICITYService Providers Hispanic or
Latino OriginNot Available Not Hispanic or
Latino OriginTotal
Serenity Ridge Recovery 0 0 0 0
SOUTHWEST AR COUNSELING & MENTAL HEALTH CENTER 19 27 301 347SPRINGDALE TREATMENT CENTER 6 0 74 80TEEN CHALLENGE RANCH OF NW ARKANSAS 0 3 13 16
UAMS SUBSTANCE ABUSE 4 0 114 118
UNITED FAMILY SERVICES, INC. 2 2 40 44
UNITED METHODIST CHILDREN'S HOME, INC 2 0 23 25
WESTERN AR COUNSELING 15 0 266 281
Youth Bridge, Bell House 0 0 0 0
YOUTH BRIDGE, INC 40 7 55 102
Youth Bridge, Julie House 1 0 0 1TOTALS 437 246 10,090 10,773
* The providers listed are licensed by the state of arkansas for substance abuse treatment.Source: Alcohol Drug Management Information System (ADMIS)
DAABHS - 52

ARKANSAS DHS STATISTICAL REPORTDIVISION OF AGING, ADULT, AND BEHAVIORAL HEALTH SERVICES
SFY 2019
Service Providers Male Female Total
10TH DISTRICT SUBSTANCE ABUSE PROGRAM 286 339 0 625Absolute Recovery Center, LLC 5 12 0 17AR COMMUNITY CORRECTION 85 699 0 784AR COMMUNITY CORRECTIONS - LITTLE ROCK UNIT 1 165 0 166ARKANSAS TREATMENT SERVICES, PA 23 28 0 51ARVAC 63 131 0 194BETTER COMMUNITY DEVELOPMENT, INC. 104 110 0 214BRADFORD HEALTH SERVICES 0 0 0 0CAPSTONE TREATMENT CENTER, INC. 0 12 0 12CATAR CLINIC 0 0 0 0CATAR CLINIC OF HOT SPRINGS 0 0 0 0CATAR CLINIC OF NLR 53 71 0 124COUNSELING ASSOCIATES, INC. 5 11 0 16COUNSELING CLINIC, INC. 4 2 0 6Crossroads Treatment Center of West Mempis PC 0 0 0 0CROWLEY'S RIDGE DEV. COUNCIL, INC. 219 129 0 348DEPT. OF COMMUNITY CORRECTIONS 24 51 0 75FAMILY SERVICE AGENCY, INC. 12 38 0 50GYST HOUSE 8 10 0 18HARBOR HOUSE, INC. 339 625 0 964Housley & Associates 75 163 0 238JEFFERSON COMPREHENSIVE COUNSELING ASSOCIATES 98 204 0 302LIFE STRATEGIES COUNSELING, INC. 9 15 0 24New Beginnings Behavioral Health Services, LLC 8 12 0 20NORTHEAST ARK CMHC/MID-SOUTH HEALTH SYSTEMS, INC 3 198 0 201NORTHEAST ARK CMHC/MID-SOUTH HEALTH SYSTEMS, INC 58 78 0 136Northeast Arkansas Treatment Services, LLC 63 79 0 142NORTHWEST ARKANSAS PSYCOLOGICAL GROUP 14 18 0 32OZARK GUIDANCE CENTER 63 92 0 155OZARK MOUNTAIN ALCOHOL RES. TREATMENT, INC. 0 0 0 0PREFERRED FAMILY HEALTHCARE, INC. 73 82 0 155QUALITY LIVING CENTER 57 98 0 155Quapaw House 17 36 0 53QUAPAW HOUSE, INC. 1,318 1,718 1 3,037RECOVERY CENTERS OF AR 567 825 1 1,393RECOVERY SOLUTIONS, INC. 0 0 0 0RESTORED LIFE SERVICES OF ARKANSAS 9 13 0 22RIGHT MOVE COUNSELING 0 0 0 0SE AR BEHAVIORAL HEALTHCARE 4 26 0 30Serenity Ridge Recovery 0 0 0 0SOUTHWEST AR COUNSELING & MENTAL HEALTH CENTER 150 197 0 347
TABLE 24. TOTAL CLIENTS SERVED BY PROVIDER AND GENDER
SUBSTANCE ABUSE TREATMENT
DAABHS - 53

ARKANSAS DHS STATISTICAL REPORTDIVISION OF AGING, ADULT, AND BEHAVIORAL HEALTH SERVICES
SFY 2019
Service Providers Male Female Total
TABLE 24. TOTAL CLIENTS SERVED BY PROVIDER AND GENDER
SUBSTANCE ABUSE TREATMENT
SPRINGDALE TREATMENT CENTER 35 45 0 80TEEN CHALLENGE RANCH OF NW ARKANSAS 0 16 0 16UAMS SUBSTANCE ABUSE 54 64 0 118UNITED FAMILY SERVICES, INC. 8 36 0 44UNITED METHODIST CHILDREN'S HOME, INC 25 0 25WESTERN AR COUNSELING 122 159 0 281Youth Bridge, Bell House 0 0 0 0YOUTH BRIDGE, INC 25 77 0 102Youth Bridge, Julie House 0 1 0 1
TOTALS 4,086 6,685 2 10,773
* The providers listed are licensed by the state of arkansas for substance abuse treatment.
Source: Alcohol Drug Management Information System (ADMIS)
DAABHS - 54
ARKANSAS DHS STATISTICAL REPORTDIVISION OF AGING, ADULT, AND BEHAVIORAL HEALTH SERVICES
SFY 2019
DAABHS - 55
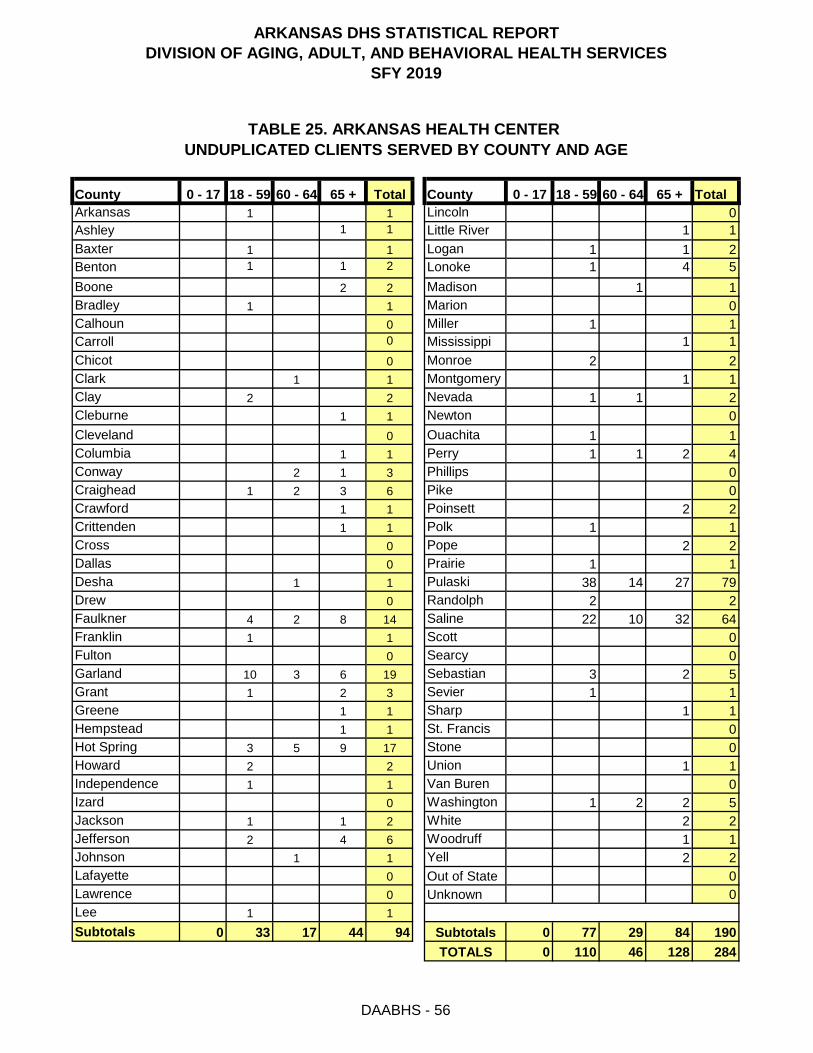
ARKANSAS DHS STATISTICAL REPORTDIVISION OF AGING, ADULT, AND BEHAVIORAL HEALTH SERVICES
SFY 2019
Arkansas 1 1 Lincoln 0Ashley 1 1 Little River 1 1Baxter 1 1 Logan 1 1 2Benton 1 1 2 Lonoke 1 4 5Boone 2 2 Madison 1 1Bradley 1 1 Marion 0Calhoun 0 Miller 1 1Carroll 0 Mississippi 1 1Chicot 0 Monroe 2 2Clark 1 1 Montgomery 1 1Clay 2 2 Nevada 1 1 2Cleburne 1 1 Newton 0Cleveland 0 Ouachita 1 1Columbia 1 1 Perry 1 1 2 4Conway 2 1 3 Phillips 0Craighead 1 2 3 6 Pike 0Crawford 1 1 Poinsett 2 2Crittenden 1 1 Polk 1 1Cross 0 Pope 2 2Dallas 0 Prairie 1 1Desha 1 1 Pulaski 38 14 27 79Drew 0 Randolph 2 2Faulkner 4 2 8 14 Saline 22 10 32 64Franklin 1 1 Scott 0Fulton 0 Searcy 0Garland 10 3 6 19 Sebastian 3 2 5Grant 1 2 3 Sevier 1 1Greene 1 1 Sharp 1 1Hempstead 1 1 St. Francis 0Hot Spring 3 5 9 17 Stone 0Howard 2 2 Union 1 1Independence 1 1 Van Buren 0Izard 0 Washington 1 2 2 5Jackson 1 1 2 White 2 2Jefferson 2 4 6 Woodruff 1 1Johnson 1 1 Yell 2 2Lafayette 0 Out of State 0Lawrence 0 Unknown 0Lee 1 1Subtotals 0 33 17 44 94 Subtotals 0 77 29 84 190
TOTALS 0 110 46 128 284
TABLE 25. ARKANSAS HEALTH CENTER UNDUPLICATED CLIENTS SERVED BY COUNTY AND AGE
County 0 - 17 18 - 59 60 - 64 65 + Total County 0 - 17 18 - 59 60 - 64 65 + Total
DAABHS - 56

ARKANSAS DHS STATISTICAL REPORTDIVISION OF AGING, ADULT, AND BEHAVIORAL HEALTH SERVICES
SFY 2019
HispanicArkansas 1 1Ashley 1 1Baxter 1 1Benton 2 2Boone 2 2Bradley 1 1Calhoun 0Carroll 0Chicot 0Clark 1 1Clay 1 1 2Cleburne 1 1Cleveland 0Columbia 1 1Conway 1 2 3Craighead 2 1 3 6Crawford 1 1Crittenden 1 1Cross 0Dallas 0Desha 1 1Drew 0Faulkner 2 12 14Franklin 1 1Fulton 0Garland 3 16 19Grant 1 2 3Greene 1 1Hempstead 1 1Hot Spring 4 13 17Howard 1 1 2Independence 1 1Izard 0Jackson 1 1 2Jefferson 3 3 6Johnson 1 1Lafayette 0Lawrence 0Lee 1 1
Subtotals 0 22 0 1 2 0 0 69 94
Total
TABLE 26. ARKANSAS HEALTH CENTER UNDUPLICATED CLIENTS SERVED BY COUNTY AND RACE
County Asian Black Hawaiian/PI American Indian/Ak. Multiracial Unknown White
DAABHS - 57

ARKANSAS DHS STATISTICAL REPORTDIVISION OF AGING, ADULT, AND BEHAVIORAL HEALTH SERVICES
SFY 2019
HispanicLincoln 0Little River 1 1Logan 2 2Lonoke 5 5Madison 1 1Marion 0Miller 1 1Mississippi 1 1Monroe 1 1 2Montgomery 1 1Nevada 1 1 2Newton 0Ouachita 1 1Perry 4 4Phillips 0Pike 0Poinsett 2 2Polk 1 1Pope 2 2Prairie 1 1Pulaski 2 28 1 1 47 79Randolph 1 1 2Saline 64 64Scott 0Searcy 0Sebastian 2 3 5Sevier 1 1Sharp 1 1St. Francis 0Stone 0Union 1 1Van Buren 0Washington 1 4 5White 2 2Woodruff 1 1Yell 2 2Out of State 0Unknown 0Subtotals 2 33 0 1 2 0 0 152 190
TOTAL 2 55 0 2 4 0 0 221 284Source: MatrixCare
Multiracial Unknown White Total
TABLE 26. ARKANSAS HEALTH CENTER UNDUPLICATED CLIENTS SERVED BY COUNTY AND RACE
County Asian Black Hawaiian/PI American Indian/Ak.
DAABHS - 58

ARKANSAS DHS STATISTICAL REPORTDIVISION OF AGING, ADULT, AND BEHAVIORAL HEALTH SERVICES
SFY 2019
Arkansas 1 1 Lincoln 0Ashley 1 1 Little River 1 1Baxter 1 1 Logan 2 2Benton 1 1 2 Lonoke 5 5Boone 1 1 2 Madison 1 1Bradley 1 1 Marion 0Calhoun 0 Miller 1 1Carroll 0 Mississippi 1 1Chicot 0 Monroe 2 2Clark 1 1 Montgomery 1 1Clay 2 2 Nevada 2 2Cleburne 1 1 Newton 0Cleveland 0 Ouachita 1 1Columbia 1 1 Perry 1 3 4Conway 1 2 3 Phillips 0Craighead 2 4 6 Pike 0Crawford 1 1 Poinsett 1 1 2Crittenden 1 1 Polk 1 1Cross 0 Pope 2 2Dallas 0 Prairie 1 1Desha 1 1 Pulaski 35 44 79Drew 0 Randolph 1 1 2Faulkner 8 6 14 Saline 34 30 64Franklin 1 1 Scott 0Fulton 0 Searcy 0Garland 5 14 19 Sebastian 3 2 5Grant 2 1 3 Sevier 1 1Greene 1 1 Sharp 1 1Hempstead 1 1 St. Francis 0Hot Spring 8 9 17 Stone 0Howard 1 1 2 Union 1 1e 1 1 Van Buren 0Izard 0 Washington 3 2 5Jackson 1 1 2 White 1 1 2Jefferson 2 4 6 Woodruff 1 1Johnson 1 1 Yell 2 2Lafayette 0 Out of State 0Lawrence 0 Unknown 0Lee 1 1
Subtotals 35 59 0 94 Subtotals 84 106 0 190
TOTALS 119 165 0 284Source: MatrixCare
Unknown Total
TABLE 27. ARKANSAS HEALTH CENTER UNDUPLICATED CLIENTS SERVED BY COUNTY AND GENDER
County Female Male Unknown Total County Female Male
DAABHS - 59

ARKANSAS DHS STATISTICAL REPORTDIVISION OF AGING, ADULT, AND BEHAVIORAL HEALTH SERVICES
SFY 2019
Source: MatrixCare
The average daily census for 2019 for all Residents 242
May-19 235June-19 238
March-19 240April-19 236
January-19 241February-19 240
November-18 243December-18 252
September-18 244October-18 239
July-18 246August-18 244
TABLE 28. ARKANSAS HEALTH CENTERAVERAGE DAILY CENSUS BY MONTH
All AHC ResidentsMonthly Average Daily Census
Month Census
DAABHS - 60


ARKANSAS DHS STATISTICAL REPORTDIVISION OF CHILD CARE AND EARLY CHILDHOOD EDUCATION
SFY 2018
The Arkansas Early Childhood Commission's goals are as follows:
●
●
●
●
●
Source: DCCECE Website
Act 1132 of 1997, established the Division of Child Care and Early Childhood Education within the ArkansasDepartment of Human Services. The purpose of the Division is to enhance the coordination of child care andearly childhood education programs within the state and support the optimal and ongoing development ofyoung children in Arkansas.
To improve the overall quality of in infant and toddler programs
To engage families in the child's education through research-based programs that enhance childoutcomes and success in school
To support restructuring, expanding and growing Better Beginnings/Quality Rating Improvement System
Strengthen and expand local and state partnerships with other agencies and organizations for connectedaction (Established April 2009)
Create awareness of Health and Nutrition Programs and educate parents, children and child careproviders on the benefits of a healthy lifestyle.
DCCECE MISSION STATEMENT
INTRODUCTION
Together we improve the quality of life of all Arkansans by protecting the vulnerable, fostering independenceand promoting better health.
OVERVIEW
DCCECE - 1

Family Support
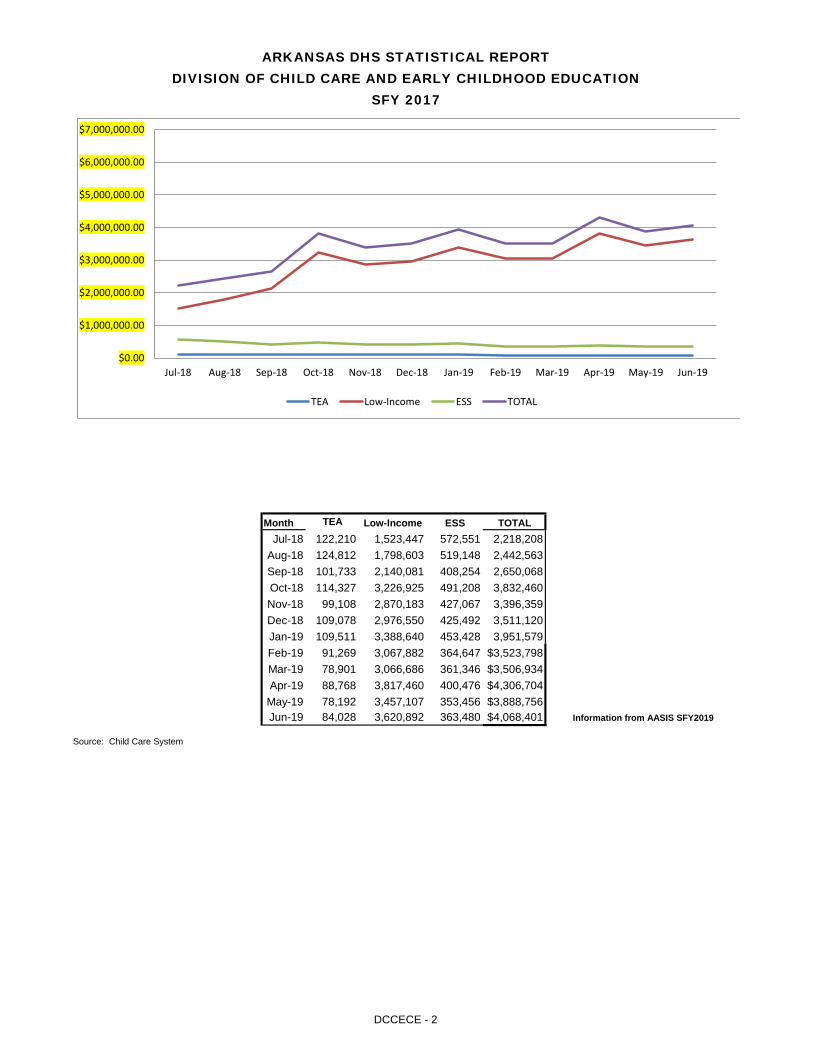
ARKANSAS DHS STATISTICAL REPORTDIVISION OF CHILD CARE AND EARLY CHILDHOOD EDUCATION
SFY 2017
Month TEA Low-Income ESS TOTALJul-18 122,210 1,523,447 572,551 2,218,208
Aug-18 124,812 1,798,603 519,148 2,442,563Sep-18 101,733 2,140,081 408,254 2,650,068Oct-18 114,327 3,226,925 491,208 3,832,460Nov-18 99,108 2,870,183 427,067 3,396,359Dec-18 109,078 2,976,550 425,492 3,511,120Jan-19 109,511 3,388,640 453,428 3,951,579Feb-19 91,269 3,067,882 364,647 $3,523,798Mar-19 78,901 3,066,686 361,346 $3,506,934Apr-19 88,768 3,817,460 400,476 $4,306,704
May-19 78,192 3,457,107 353,456 $3,888,756Jun-19 84,028 3,620,892 363,480 $4,068,401
Source: Child Care System
Information from AASIS SFY2019
ACTUAL EXPENDITURES FOR CHILD CARE SERVICES
$0.00
$1,000,000.00
$2,000,000.00
$3,000,000.00
$4,000,000.00
$5,000,000.00
$6,000,000.00
$7,000,000.00
Jul-18 Aug-18 Sep-18 Oct-18 Nov-18 Dec-18 Jan-19 Feb-19 Mar-19 Apr-19 May-19 Jun-19
TEA Low-Income ESS TOTAL
DCCECE - 2

ARKANSAS DHS STATISTICAL REPORTDIVISION OF CHILD CARE AND EARLY CHILDHOOD EDUCATION
SFY 2019
Source SFY 2019Child Care Development Fund (CCDF) 42,671,304$ Foster Care:
Discretionary FC Non IV-E 3,431,706$ Foster Care 3,296,791$
Foster Care Total 6,728,497$ Protective Services 621,390$ TOTAL 50,021,191$
Foster Care:Discretionary FC Non IV-E 2,203Foster Care 1,495
11,199
JOB SEARCHSCHOOLWORK EXPERIENCE
TOTAL CHILDREN SERVED
The Child Care Assistance Program began in 1989. The initial purpose of this program was to provide subsidized early childhood services to low-income families utilizingchild care voucher services. The families must be working, enrolled in an educational program, or attending training. Child care voucher services are also provided tofamilies and children needing Protective Services and Foster Care. In 1997 with the authorization of welfare reform, the process was expanded to include familiesreceiving Transitional Employment Assistance (TEA) and families transitioning from TEA to Extended Support Services (ESS).
CHILD CARE ASSISTANCE PROGRAMS
Extended Support Services (ESS) WORKING 2,099ESS TOTAL 2,099
Children: (A Child may be counted in each cost center.) All Data
PROTECTIVE SERVICES 449
FOSTER CARE TOTAL 3,698
LOW-INCOMELOW-INCOME TOTAL 11,199
PROTECTIVE SERVICES TOTAL 449
TEA 343132731
TEA TOTAL 1,206
18,651

ARKANSAS DHS STATISTICAL REPORTDIVISION OF CHILD CARE AND EARLY CHILDHOOD EDUCATION
SFY 2019
DCCECE - 3

ARKANSAS DHS STATISTICAL REPORTDIVISION OF CHILD CARE AND EARLY CHILDHOOD EDUCATION
SFY 2019
WORKING
Foster Care:Discretionary FC Non IV-E 1,372Foster Care 998
JOB SEARCHSCHOOLWORK EXPERIENCE
TOTAL FAMILIES SERVED
Number of licensed child care centers or homes and registered homes:
Number of child care centers or homes and registered homes receiving suNumber of Child Care Center or Homes Receiving Subsidy 785
Source: Child Care System
ESS 1,096ESS TOTAL 1,096
Families: (A Family may be counted in each cost center.) All DataCHILD CARE ASSISTANCE PROGRAMS
LOW-INCOME TOTAL 8,017
FOSTER CARE TOTAL 2,370
LOW-INCOME 8,017
OVERALL COUNT TABLE
Number of Cases Served (excluding FC) By DCC/ECE
9,105
Number of Children Served By DCC/ECE
16,327
Number of Cases Served By DCC/ECE
10,828
Number of Children Served (excluding FC)
By DCC/ECE13,475
PROTECTIVE SERVICES 278PROTECTIVE SERVICES TOTAL 278
TEA
12,467
CHILD CARE PROVIDERS:
19988
419TEA TOTAL 706

ARKANSAS DHS STATISTICAL REPORTDIVISION OF CHILD CARE AND EARLY CHILDHOOD EDUCATION
SFY 2019
DCCECE - 4

Program & Professional Dev
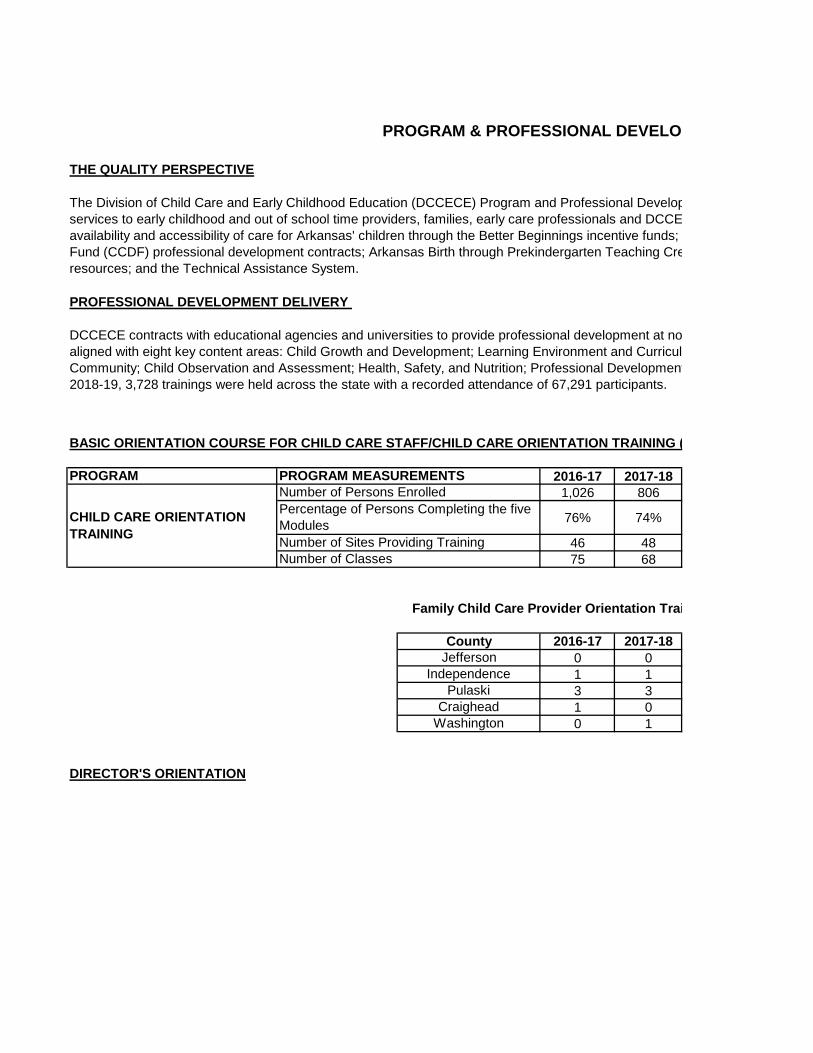
2016-17 2017-181,026 806
76% 74%
46 4875 68
2016-17 2017-180 01 13 31 00 1
DCCECE contracts with educational agencies and universities to provide professional development at no aligned with eight key content areas: Child Growth and Development; Learning Environment and Curricul Community; Child Observation and Assessment; Health, Safety, and Nutrition; Professional Development 2018-19, 3,728 trainings were held across the state with a recorded attendance of 67,291 participants.
PROGRAM & PROFESSIONAL DEVELO
THE QUALITY PERSPECTIVE
The Division of Child Care and Early Childhood Education (DCCECE) Program and Professional Develop services to early childhood and out of school time providers, families, early care professionals and DCCE availability and accessibility of care for Arkansas' children through the Better Beginnings incentive funds; Fund (CCDF) professional development contracts; Arkansas Birth through Prekindergarten Teaching Cre resources; and the Technical Assistance System.
PROFESSIONAL DEVELOPMENT DELIVERY
Independence
BASIC ORIENTATION COURSE FOR CHILD CARE STAFF/CHILD CARE ORIENTATION TRAINING (
PROGRAM PROGRAM MEASUREMENTS
CHILD CARE ORIENTATION TRAINING
Number of Persons EnrolledPercentage of Persons Completing the five ModulesNumber of Sites Providing TrainingNumber of Classes
Family Child Care Provider Orientation Trai
CountyJefferson
DIRECTOR'S ORIENTATION
PulaskiCraighead
Washington

Directors Orientation supports new administrators in successfully fulfilling their responsibilities. The cours new directors of licensed child care centers in Arkansas. Continuing Education Units (CEUs) and Arkansa completion of the 24 clock hours (2.4 CEUs). An outline of the content is listed below.
•Directors Orientation A - Minimum licensing rules and regulations and Better Beginnings•Directors Orientation A-2 - Risk management including playground safety, safe sleep and supervision, te •Directors Orientation B - Communication, professionalism and the NAEYC Code of Ethical Conduct•Directors Orientation C - Brain development research, developmentally appropriate practice, ages and st curriculum
57 courses were held reaching 974 participants in 2018-19.

2018-19840
72%
3961
2018-1900100
cost to early education professionals. Each training must be um; Positive Interactions and Guidance; Family and
t and Leadership; and Program Planning and Management. In
PMENT
pment Unit (PPD) is in a unique position of providing support CE staff. The staff guide and direct improving the quality,
Arkansas Better Chance (ABC) and Child Care Development edential; Child Care Aware of Arkansas Network; educational
(CCOT)
ining

se is provided in four six-hour modules and is required for all as Department of Education (ADE) credit are available upon
echnology, shaken baby syndrome, and child maltreatment tages, early childhood environments, positive guidance and

2016-17 2017-181,026 806
76% 74%
46 4875 68
2016-17 2017-180 01 13 31 00 1
DCCECE contracts with educational agencies and universities to provide professional development at no aligned with eight key content areas: Child Growth and Development; Learning Environment and Curricul Community; Child Observation and Assessment; Health, Safety, and Nutrition; Professional Development 2018-19, 3,728 trainings were held across the state with a recorded attendance of 67,291 participants.
PROGRAM & PROFESSIONAL DEVELO
THE QUALITY PERSPECTIVE
Although the Arkansas Better Beginning program has been a voluntary Quality Rating and Improvement S licensed facilities that accept Child Care Development Block Grant child subsidy/voucher funding. Particip school time providers to increase progress in several key component areas: administration, administrator environment, facility assessment and child health/development. Early childhood and out of school time fa Beginnings websites as a resource to inform parents as they make decisions about care for their children
PROFESSIONAL DEVELOPMENT DELIVERY
In FY17, the Better Beginnings Incentive Grant changed from an annual grant award to a grant given onc is determined by the start level and the licensed capacity of the facility. The award is to be used to suppor enhance the learning environment, curriculum and professional resource books and materials, furniture a materials, family engagement and communication, and professional development.
Independence
BASIC ORIENTATION COURSE FOR CHILD CARE STAFF/CHILD CARE ORIENTATION TRAINING (
PROGRAM PROGRAM MEASUREMENTS
CHILD CARE ORIENTATION TRAINING
Number of Persons EnrolledPercentage of Persons Completing the 5 ModulesNumber of Sites Providing TrainingNumber of Classes
Family Child Care Provider Orientation Trai
CountyJefferson
DIRECTOR'S ORIENTATION
PulaskiCraighead
Washington
Directors Orientation supports new administrators in successfully fulfilling their responsibilities. The cours new directors of licensed child care centers in Arkansas. Continuing Education Units (CEUs) and Arkansa completion of the 24 clock hours (2.4 CEUs). An outline of the content is listed below.
•Directors Orientation A - Minimum licensing rules and regulations and Better Beginnings•Directors Orientation A-2 - Risk management including playground safety, safe sleep and supervision, te •Directors Orientation B - Communication, professionalism and the NAEYC Code of Ethical Conduct•Directors Orientation C - Brain development research, developmentally appropriate practice, ages and st curriculum
57 courses were held reaching 974 participants in 2018-19.

2018-19840
72%
3961
2018-1900100
cost to early education professionals. Each training must be um; Positive Interactions and Guidance; Family and
t and Leadership; and Program Planning and Management. In
PMENT
System in the past, participation became mandatory in 2016 for pation in Better Beginnings requires early childhood and out of
r and staff qualifications, professional development, learning cilities' quality ratings are posted on the DCCECE and Better
n.
e for each certified star level achievement. The grant amount rt quality. Approved uses for the grant include: materials to
and equipment, child health and developmental screening
(CCOT)
ining

se is provided in four six-hour modules and is required for all as Department of Education (ADE) credit are available upon
echnology, shaken baby syndrome, and child maltreatment tages, early childhood environments, positive guidance and

PROFESSIONAL DEVELOPMENT SYSTEM
ENTRY Entry
PROGRAM & PROFESSIONAL DEVELOPMENT
Training / Educational Categories Training / Educational Levels June 2017 June 2018 June 201
ADVANCEDAdvanced 1 415
N/A
Advanced 2 221TOTAL ADVANCED 636
INTERMEDIATE
Intermediate 1 1236Intermediate 2 89Intermediate 3 143
TOTAL INTERMEDIATE 1,468FOUNDATION Foundation 1 5,908
Foundation 2 3,419Foundation 3 12,008 N/A*
21,871 25,433* 31,115TOTAL PRACTITIONERS 52,918 25,433 31,115
TOTAL TRAINERS 1,727 601 863
*In 2017, Arkansas transitioned from the Traveling Arkansas' Professional Pathways Registry to the Arkansas Professional Development Registry. Member levels are unavailable at this time. Data is for the date the report was pulled.
The Arkansas Professional Development Registry (PDR) is the tracking component of the Arkansas Early Childhoo Education and Care Professional Development System. Individuals can register for professional development opportunities and obtain resources to enhance their knowledge and skills. All early childhood professionals working licensed centers, homes and out-of-school time facilities are required to become a member of the PDR. Members have access to their own online training transcript, which lists the trainings attended. A minimum number of training hours is required annually to maintain membership. Members can set professional career goals and use the Individual Professional Development Plan to determine which training is best suited to fit their needs.


19
od
g in
g

Pre-K ELLA
CDELS
Pre-K SEL
PROGRAM & PROFESSIONAL DEVELOPMENT
PRE-K EARLY LEARNING LITERACY IN ARKANSAS (ELLA)
Pre-K ELLA is designed to provide training to early childhood educators in delivering effective literacy stprovide a strong foundation for school readiness and reading success to young children in Arkansas.
2015-16 2016-17 2017-18 2018-19Enrolled 721 627 538 696Graduates 567 421 336 417% Completion 79% 67% 62% 60%Classes 60 37 36 35
ARKANSAS CHILD DEVELOPMENT AND EARLY LEARNING STANDARDS (CDELS)
Arkansas Child Development and Early Learning Standards classes provide early care professionals aknowledge of the standards, strategies for implementing them into the classroom, preparing the environmenplanning using the Early Learning Standards and Kindergarten Readiness. The training also addresses theand assessment of young children.
Program Measurements 2015-16 2016-17 2017-18 2018-19
Graduates 637 274 1,541 1,229
Enrolled 962 379 2,025 1,522
Classes 57 23 71 81
% Completion 66%* 72% 76% 81%
PRE-K SOCIAL EMOTIONAL LEARNING (PRE-K SEL)
Pre-K Social Emotional Learning provides teachers of three to five year old's knowledge and skills to brelationships with children, parents and coworkers, to create productive classroom climates, prevent challengiand to manage disruptive behavior and teach children new skills so they can enter kindergarten ready to learn
Program Measurements 2015-16 2016-17 2017-18 2018-19
Number of Persons Completing 282 332 173 131
Number of Person Enrolled 563 457 261 241
Number of Classes 26 26 17 15
Completion Rate 50% 73% 66% 54%
rategies that
foundationalnt, curriculume observation
build positiveing behavior,
n.

Capital Reduction (Accrued Interest Applied Before Capital is 0 $0.00Total Guarantee Applications Denied/Rescinded $0 1
Total Defaults none None
Current Total Guarantees in Place (Fund Exposure)Current Total of Loans GuaranteedParticipating Financial Institutions 0 1
$0 $40,000$0 $2
July 1, 2018Guarantee Fund Investment $369,776 $372,069
3,62Northeast
PROGRAM & PROFESSIONAL DEVELOPMENT
CHILD CARE RESOURCE AND REFERRAL CENTER
Child Care Aware Resource and Referral Agencies (CCA) are contracted to provide technical assistance tomaintain an early childhood education referral database of licensed and registered programs within theirprofessional development training. For early childhood education programs, CCA Agencies provide: informatioArkansas's quality rating program, Better Beginnings; Resource and Lending Libraries; free marketing; and asearly childhood education program. For families, CCA Agencies provide: information on choosing high-qualityearly childhood education and consumer education on a variety of early childhood topics. For community paAgencies consult with employers on early childhood education options for employees. Parents canlicensed/registered early childhood education homes and centers by accessing the DCCECE website.
PROGRAM PROGRAM MEASUREMENTS 2016-17 2017-
ARKANSAS CHILD CARE FACILITIES LOAN GUARANTEE FUND
Loan guarantees are made to assist with the development of new facilities or expansion of existing facilities, par
PROGRAM July 1, 2017
1,994 7,92Central & Southwest 3,693 4,61West Central 7,474 17,59Distribution of Better Beginnings materials 4,382 7,95
**West Central: Increased community outreach and participation at events and the implementation of a mobile a
Distribution/library usage 18,948 12,04Internet Usage for R & R 181,971 58,968
CHILD CARE RESOURCE AND REFERRAL
North Central 8,445 4,484Northwest 3,986
New Provider Kits Inquiries 2,079 337
*North Central: Agency stopped recording text messages.
***Data is not collected in same manner as past.
SCHOOL READINESS INDICATORS
The University of Arkansas at Little Rock (UALR) Children's Data Center/Institute for Economic Advancementindicators that support learning and provides data for policy planning.
Initiatives to support the implementation of the Better Beginnings/Quality Rating and Improvement System follow
Quality Rating and Improvement System:*Quality Care Education and Outreach Campaign

*Targeted coaching project implemented to help child care providers increase their quality
*Quality Care development of tool kits and training*QRIS Evaluation of standards and processes

$0$0
1None
$40,0002
July 1, 2019$380,675
26 4,596
early childhood professionals,defined region, and provide
on and assistance concerningssistance in starting your ownearly childhood programs andartners and businesses, CCA
n access information on all
-18 2018-19
rticularly in low-income, rural
26 644***8 4,4886** 20,295
56 1,943
app increased reach.
40 8,4638*** 129,090
4* 4,868
7 298
continues to gather and track
w:


-Coordinates network of Infant/Toddler Specialists located in five Child Care Aware Resource andReferral agencies who work to increase quality in programs receiving federal Child CareAssistance/vouchers.
PROGRAM & PROFESSIONAL DEVELOPMENT
Child Health and Well-Being:
-Partners with DCFS to fund the Arkansas Safe Babies Court Team designed to help infant and toddlers in foster care reach loving, safe, permanent homes through training, technical assistance and support. Reduces the recurrence of child maltreatment among the families served.
-Supports Healthy Child Care of Arkansas program, a multi-disciplinary team of health professionals focused on improving the quality of children's health in early child care settings. Offers free consultations to child care professionals on children's health topics through telephone "hotline".
-Provides training and technical assistance on Ages and Stages Parent Questionnaire Developmental Screening, implementation, and evaluation in programs utilizing federal Child Care Assistance/vouchers.
Child Guidance and Behavior/Social Emotional Development:
-Offers through Project Play and REACH the promotion of social emotional development of all children through changes in the early learning environment; 2) decrease of problematic social and emotional behaviors by building the skills of child care providers and family members; and 3) reduction to the number of suspensions and expulsions of young children in early care environments.
-Teaching Important Parenting Skills (TIPS) for Great Kids offers brief parenting intervention sheets forteachers and caregivers in high voucher usage programs to assist parents with child behavior issues
Infant/Toddler Care:
School Age/Youth Development Programming:
-Introduction to the 40 Developmental Assets:This training introduces youth workers to the 40 common sense, positive experiences and qualities thatinfluence the choices young people make as well as how to create an intentionally rich asset-basedafterschool program. This training is required for school-age programs participating in BetterBeginnings.
-Arkansas Youth Development Institute (YDI):YDI consists of 20 online professional development courses for front line youth workers whose OSTprograms serve children and youth in grades K-12. By taking a series of these trainings, youth workerscan receive the Youth Worker Orientation Certificate.


HEALTH AND NUTRITION

Number of Contracts 432 431Program Funds (Approximate) $49,633,362 $40,918,354
HEALTH & NUTRITION PROGRAMThe Health & Nutrition Program provides reimbursement for well-balanced, nutritious meals served toin participating programs. Total grants for these programs were $45,806,045.00. Funds for all progtogether to capture the grand total.
Child and Adult Care Food ProgramThis program provides reimbursement to organizations providing licensed nonresidential day-care servcenters may participate. Organizations may be reimbursed for two meals and one supplement osupplements per day.
SFY 2018 SFY 2019
Total Number of Paid Meals 2,461,232 2,014,886Total Meals 29,049,369 23,819,058
Total Number of Free Meals 19,738,684 15,900,538Total Number of Reduced Meals 6,849,453 5,903,634
Number of Facilities/Sites 60 53Program Funds (Approximate) $2,575,089 $1,863,350
National School Lunch and Breakfast ProgramThis program provides reimbursement to an educational unit of high school grade or under, operatingprofit private ownership in a single building or complex of buildings and organizations that are licensedchild care.
SFY 2018 SFY 2019Number of Contracts 43 36
Total Number of Paid Lunches 129,838 87,421Total Lunches 604,888 426,671
Total Number of Free Lunches 449,932 319,845Total Number of Reduced Lunches 25,118 19,405
Total Number of Paid Breakfasts 8,192 16,315Total Breakfasts 418,316 303,717
Total Number of Free Breakfasts 405,880 283,594Total Number of Reduced Breakfasts 4,244 3,808
Total Number of Paid Snacks 2,324 10,273Total Snacks 164,134 127,810
Total Number of Free Snacks 161,727 116,657Total Number of Reduced Snacks 83 880
Total Number of Paid Meals 140,354 114,009
Total Number of Free Meals 1,078,767 720,096Total Number of Reduced Meals 29,445 24,093

Total Meals 1,248,566 858,198
Number of Contracts 112 107Number of Facilities/Sites 402 373
DCCECE -12
HEALTH & NUTRITION PROGRAM
Summer Food Service Program
The Summer Food Service Program (SFSP) ensures that low-income children continue to receive nschool is not in session.
SFY 2018 SFY 2019
Total Number of Lunches 652,300 541,990Total Number of Suppers 53,143 44,901
Program Funds (Approximate) $3,506,589 $3,025,045
Total Number of Breakfasts 397,232 339,549
Total Number of Supplements 74,080 35,559Total Meals 1,176,755 961,999

Source: Health & Nutrition Program Unit
DCCECE - 13


o individuals enrolledrams must be added
vices. Adult day-care
or one meal and two
under public or non-to provide residential

nutritious meals when


#VALUE!

Total Number of Paid Meals 140,354 0Total Meals 1,248,566 0
Total Number of Free Meals 1,078,767Total Number of Reduced Meals 29,445 0
Total Number of Paid Snacks 2,324Total Snacks 164,134 0
Total Number of Free Snacks 161,727Total Number of Reduced Snacks 83
Total Number of Paid Breakfasts 8,192Total Breakfasts 418,316 0
Total Number of Free Breakfasts 405,880Total Number of Reduced Breakfasts 4,244
Total Number of Paid Lunches 129,838Total Lunches 604,888 0
Total Number of Free Lunches 449,932Total Number of Reduced Lunches 25,118
Number of Facilities/Sites 60Program Funds (Approximate) $2,575,089
National School Lunch and Breakfast ProgramThis program provides reimbursement to an educational unit of high school grade or under, operating under public or non-profit private ownership in a single building or complex of buildings and organizations that are licensed to provideresidential child care.
SFY 2018 SFY 2019Number of Contracts 43
Total Number of Paid Meals 2,461,232Total Meals 29,049,369 0
Total Number of Free Meals 19,738,684Total Number of Reduced Meals 6,849,453
Number of Contracts 432Program Funds (Approximate) $49,633,362
HEALTH & NUTRITION PROGRAMThe Health & Nutrition Program provides reimbursement for well-balanced, nutritious meals served to individuals enrolledin participating programs. Total grants for these programs were $55,927,188.00. Funds for all programs must be addedtogether to capture the grand total.
Child and Adult Care Food ProgramThis program provides reimbursement to organizations providing licensed nonresidential day-care services. Adult day-care centers may participate. Organizations may be reimbursed for two meals and one supplement or one meal and twosupplements per day.
SFY 2018 SFY 2019
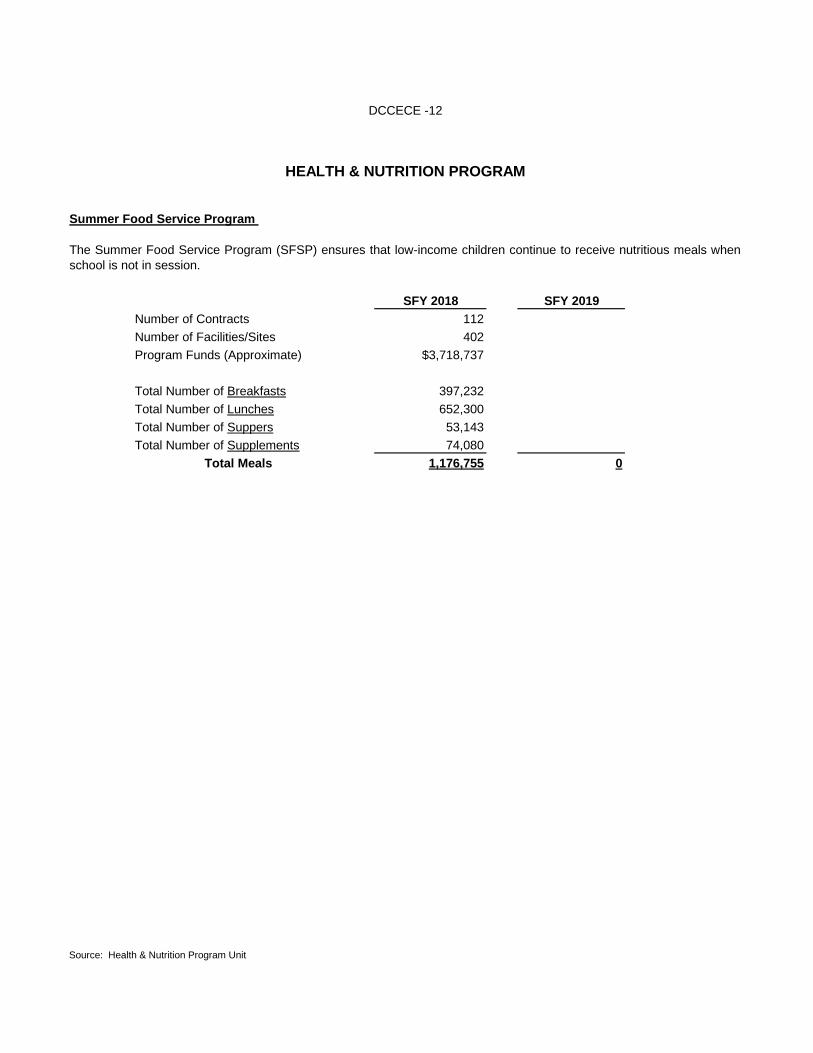
Source: Health & Nutrition Program Unit
Total Number of Supplements 74,080Total Meals 1,176,755 0
Total Number of Lunches 652,300Total Number of Suppers 53,143
Program Funds (Approximate) $3,718,737
Total Number of Breakfasts 397,232
Number of Contracts 112Number of Facilities/Sites 402
DCCECE -12
HEALTH & NUTRITION PROGRAM
Summer Food Service Program
The Summer Food Service Program (SFSP) ensures that low-income children continue to receive nutritious meals whenschool is not in session.
SFY 2018 SFY 2019

DCCECE - 13


#VALUE!

HEALTH & NUTRIT
1.3 1.2
0 9
$2.7$2.6
$1.9
1
2
3
Mill
ions
National School Lunch and Breakfast Program
$40.9
$1.9$3.0
0
5
10
15
20
25
30
35
40
45
SFY 2019
Mill
ions
Health & Nutrition Program 2019 - Program Funds
Child and Ad Food Program
National SchLunch and BrPrograms
Summer FooService Prog
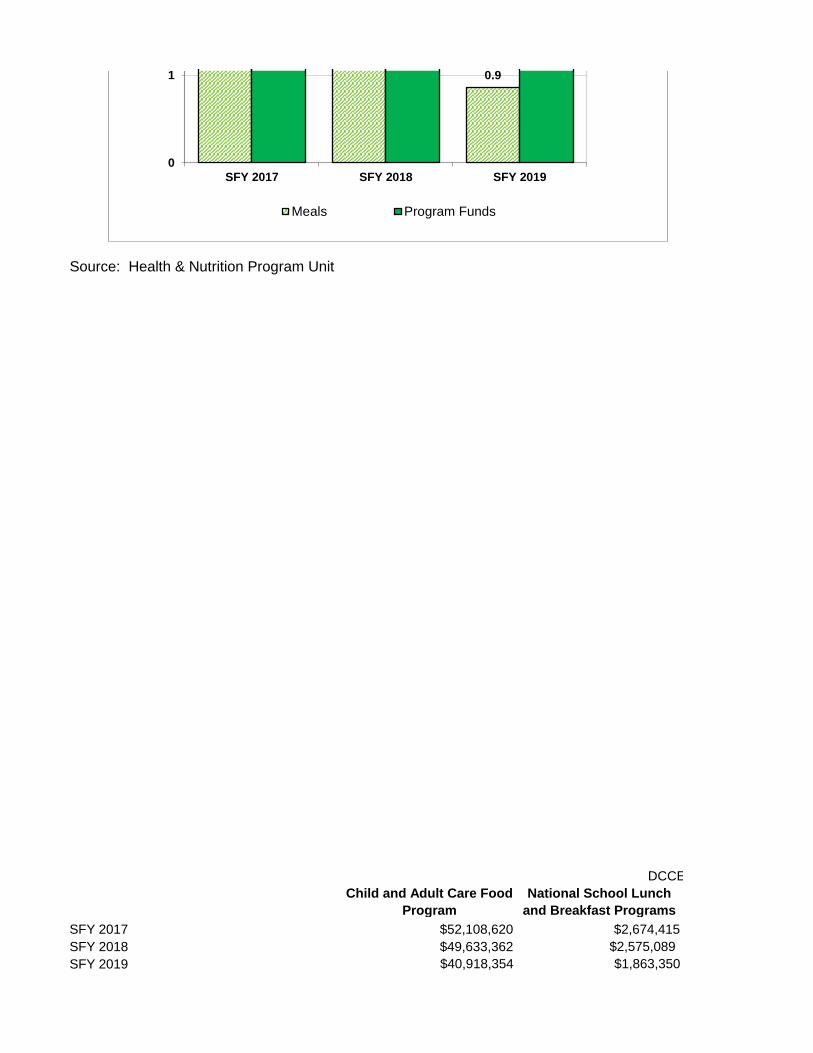
Source: Health & Nutrition Program Unit
Child and Adult Care Food Program
National School Lunch and Breakfast Programs
SFY 2017 $52,108,620 $2,674,415SFY 2018 $49,633,362 $2,575,089SFY 2019 $40,918,354 $1,863,350
DCCE
0.9
0
1
SFY 2017 SFY 2018 SFY 2019
Meals Program Funds

Total MealsChild and Adult Care Food
ProgramNational School Lunch
and Breakfast ProgramsSFY 2017 31,863,094 1,258,228SFY 2018 29,049,369 1,248,566SFY 2019 23,819,058 858,198
Child and Adult Care Food Program
National School Lunch and Breakfast Programs
SFY2018 49,633,362.00 2,575,089.00 SFY 2019 $40,918,354 $1,863,350
Fiscal Year Meals Program FundsSFY 2017 31,863,094 52108620SFY 2018 29,049,369 49633362SFY 2019 23,819,058 40918354
Fiscal Year Meals Program FundsSFY 2017 1,258,228 $2,674,415SFY 2018 1,248,566 $2,575,089SFY 2019 858,198 $1,863,350
Fiscal Year Meals Program FundsSFY 2017 1,464,849 $5,414,135SFY 2018 1,176,755 $3,506,589SFY 2019 961,999 $3,025,045
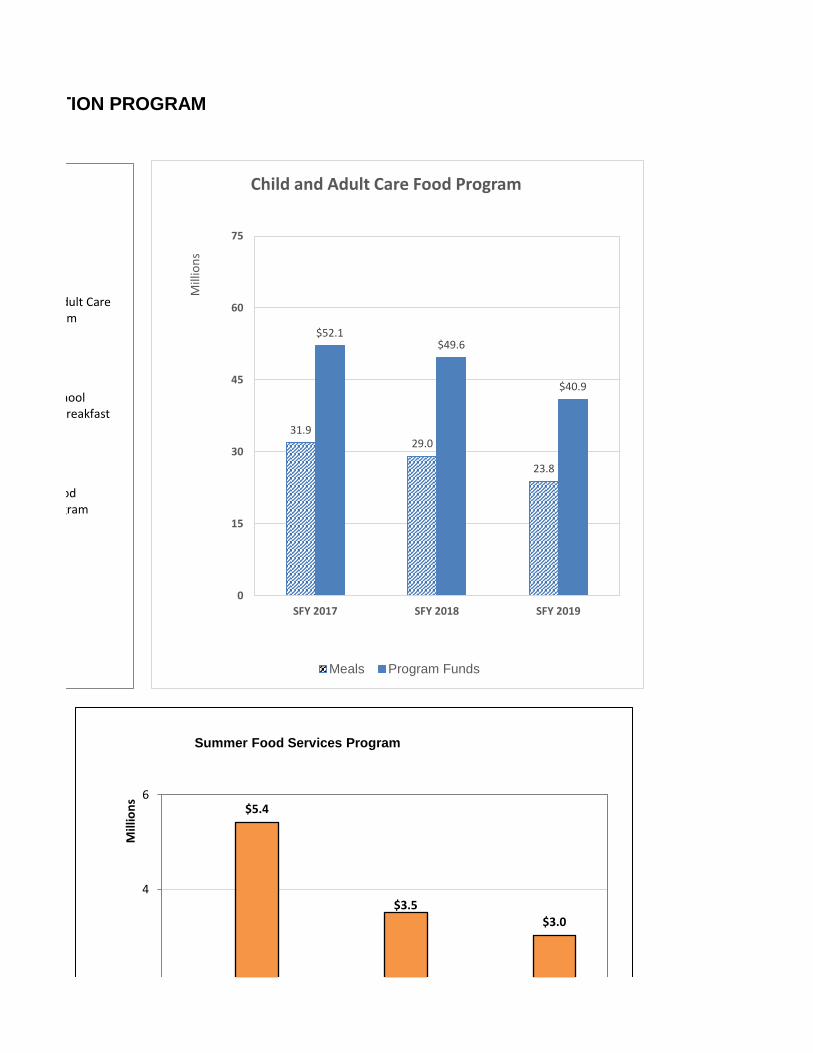
TION PROGRAM
31.929.0
23.8
$52.1$49.6
$40.9
0
15
30
45
60
75
SFY 2017 SFY 2018 SFY 2019
Mill
ions
Child and Adult Care Food Program
Meals Program Funds
$5.4
$3.5$3.0
4
6
Mill
ions
Summer Food Services Program
dult Care m
hool reakfast
od gram

Summer Food Service Program
$5,414,135$3,506,589$3,025,045
ECE - 14
1.51.2
1.0
0
2
SFY 2017 SFY 2018 SFY 2019
Meals Program Funds

Summer Food Service Program
1,464,8491,176,755
961,999
Summer Food Service Program
3,718,737.00 $3,025,045
CACFP
NSLP
SFSP

122,684$
210,826$
448,250$
1,559,324$
339,382$
225,789$
16,420$
321,697$
423,682$
230,718$
129,665$
227,529$
50,332$
323,413$
201,747$
2,136,816$
801,784$
2,330,547$
473,598$
147,194$
550,038$
563,929$
1,319,061$
72,363$
105,497$
1,434,940$
10,973$
444,732$
236,269$
Arkansas Lee Ashley Lincoln
HEALTH & NUTRITION PROGRAMCACFP PAYMENTS BY COUNTY*
County Payments County
Boone LonokeBradley Madison
Baxter Little RivBenton Logan
Chicot MississiClark Monroe
Calhoun MarionCarroll Miller
Cleveland NewtonColumbia Ouachit
Clay MontgoCleburne Nevada
Crawford PikeCrittenden Poinsett
Conway PerryCraighead Phillips
Desha PrairieDrew Pulaski
Cross PolkDallas Pope
Fulton SalineGarland Scott
Faulkner RandolpFranklin Saint Fr
Hempstead Sevier
Grant SearcyGreene Sebastia
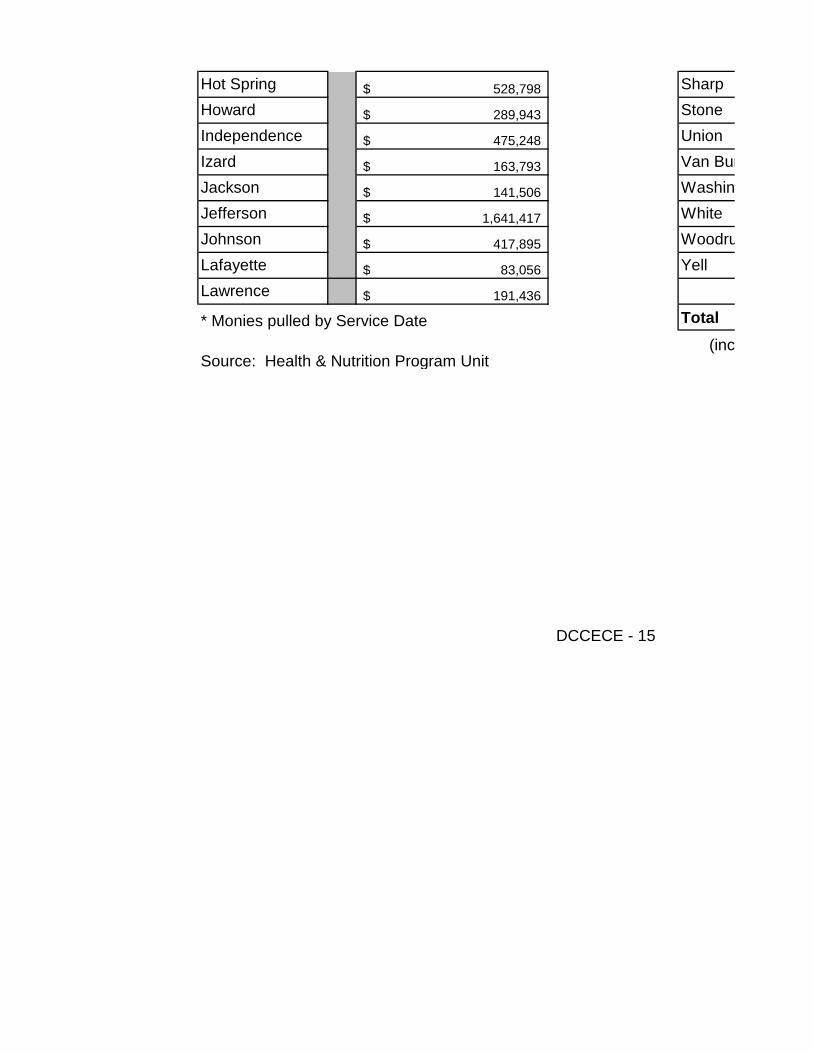
528,798$
289,943$
475,248$
163,793$
141,506$
1,641,417$
417,895$
83,056$
191,436$
* Monies pulled by Service Date Total(inc
Source: Health & Nutrition Program Unit
Hot Spring Sharp
Izard Van BurJackson Washin
Howard StoneIndependence Union
Lafayette YellLawrence
Jefferson WhiteJohnson Woodru
DCCECE - 15


153,507$
141,625$
117,942$
96,863$
644,645$
142,843$
71,375$
429,529$
1,055,253$
178,372$
37,487$
127,200$
61,954$
241,277$
84,975$
775,681$
142,650$
323,114$
238,226$
734,331$
29,514$
7,894,508$
297,411$
360,727$
1,159,941$
56,705$
76,847$
1,510,753$
239,024$
y Payments
n
ver
ippi
ta
merya
t
ph rancis
an

271,382$
126,110$
754,244$
128,225$
1,601,178$
703,923$
127,947$
354,814$
ludes: Homes, Centers and At-Risk)
rengton
uff
$40,884,394


Arkansas 7 487 1 120 5Ashley 12 831 2 94 0Baxter 23 987 5 206 1Benton 65 11183 8 384 18Boone 20 1023 3 184 5Bradley 8 1058 2 76 0Calhoun 2 61 2 61 1Carroll 9 756 1 49 7Chicot 16 822 2 76 7Clark 12 951 3 111 2Clay 5 265 4 220 4Cleburne 7 831 2 45 1Cleveland 3 204 3 204 2Columbia 14 1110 4 158 1Conway 10 713 2 254 5Craighead 53 4007 5 432 10Crawford 19 2437 6 156 3Crittenden 45 2347 2 224 8Cross 15 885 1 56 1Dallas 4 504 1 116 1Desha 25 2339 4 270 2Drew 18 2520 1 52 6Faulkner 33 3748 3 151 13Franklin 4 312 2 139 4Fulton 3 254 2 59 0Garland 43 4391 5 334 5Grant 3 86 0 0 1Greene 17 1469 1 100 3Hempstead 8 574 2 80 1Hot Spring 17 1226 3 230 1Howard 8 582 3 103 4Independence 17 1956 3 139 1Izard 6 379 2 54 1Jackson 10 722 1 60 0Jefferson 65 7431 9 940 7Johnson 17 1324 4 439 2Lafayette 3 161 2 61 0Lawrence 9 517 2 125 1Lee 4 267 0 0 2Lincoln 6 314 1 52 0
HEALTH & NUTRITION PROGRAMCHILD AND ADULT CARE FOOD PROGRAM
CountyDay Care Centers
Licensed Capacity Centers
Head Start Sites
Licensed Capacity Head
Starts Day Care Homes

Little River 6 403 3 78 2Logan 8 383 4 243 10Lonoke 34 2602 4 233 8Madison 8 190 1 40 7Marion 6 155 2 68 2Miller 16 710 3 224 2Mississippi 39 2670 15 1068 9Monroe 8 388 2 60 3Montgomery 3 80 1 20 2Nevada 5 186 2 60 0Newton 9 191 5 100 0Ouachita 12 649 3 186 14Perry 6 292 2 50 0Phillips 22 3328 2 98 5Pike 8 436 3 77 1Poinsett 14 637 3 115 0Polk 11 916 2 214 0Pope 32 2027 8 483 3Prairie 2 47 2 47 0Pulaski 235 20138 15 1318 20Randolph 12 635 3 176 0Saline 12 1476 1 40 5Scott 29 4094 2 193 4Searcy 4 223 2 59 3Sebastian 6 190 1 21 0Sevier 58 3770 3 102 7Sharp 8 527 2 82 4St. Francis 11 599 4 188 6Stone 8 396 1 44 3Union 28 1890 7 545 0Van Buren 7 369 2 69 1Washington 77 6320 7 408 22White 25 2412 5 342 7Woodruff 5 434 1 24 1Yell 18 2016 5 158 3
Total 1,457 123,813 237 13,847 290Source: Health & Nutrition Program Unit


730
10205680
108381265214201668
12230
10410162673
191640
57104210166410100
81320
10320
Licensed Capacity Homes

3212489863226
105293200
1670
721000
420
1620
6758300
734690360
10234821048
3,528

CHILD CARE LICENSING

LICENSING AND ACCREDITATION
The Child Care Licensing Unit was placed with the Division of Child Care and Early Childhood1132 in 1997. The Accreditation program became part of the Unit in 2005 when the Divisionquality rating and improvement system for licensed center and home child care providers.Residential Licensing Unit was placed with the Division. With this growth, the unit was renamewhich consists of three parts: Child Care Licensing, Better Beginnings, and Placement and Res
The Licensing and Accreditation Unit is responsible for licensing early childhood education seare cared for, maintaining the Voluntary Registry for persons providing care to five (5) or feweadministering Better Beginnings, and the licensing of child placement, residential, and adoptiolicensed centers and licensed and registered homes a minimum of three (3) times per year. SoBetter Beginnings Level 2 or higher and have high levels of compliance may be placed on a rassistance and consultative services are provided to licensed and registered programs, applicparticipating in, or who have applied for, Better Beginnings.
The Child Care Licensing Unit investigates complaints of non-compliance on licensed and regisassists the Crimes Against Children Division of the Arkansas State Police, and the Divisioninvestigation of child maltreatment complaints in these facilities. The Child Care Licensingtracking background checks on all child care owners/operators and employees through the FBMaltreatment Central Registry. Child Care Licensing Unit ensures that appropriate correctivehave a record of child maltreatment and that persons who have a conviction of a prohibited offe
The Better Beginnings Unit is responsible for maintaining a tiered quality rating and improvquality tiers above minimum licensing requirements. Providers qualifying for levels above minim other incentives, based on their level. Implementation of Better Beginnings began in July 20Unit is to improve the quality of care for children in licensed child care and early educationprograms participating in Better Beginnings. The Better Beginnings program started with 684SFY2019, 1,341 programs were participating.

DCCECE - 18
The Placement and Residential Licensing Unit is responsible for licensing child placement astate and private agencies that have one or more programs such as placement, foster cafacilities, psychiatric facilities, sex offender facilities, emergency shelters and adoption agenLicensing Unit investigates complaints of non-compliance on licensed agencies. The Unit alsDivision of the Arkansas State Police, and the Division of Children and Family Services incomplaints in these facilities. The Licensing staff members ensure that appropriate correctivehave a record of child maltreatment, and that persons with a prior conviction of a prohibitechildren.


Education following the passage of Actn began work on “Better Beginnings”, a. In July of 2009, the Placement anded the Licensing and Accreditation Unit,
sidential Licensing.
ttings where more than five (5) childrener children and choose to be registered,n agencies. The Unit routinely inspectsome licensed centers or homes that arereduced monitoring schedule. Technicalcants, parents, and to programs that are
stered child care facilities. The Unit alsoof Children and Family Services in theUnit is responsible for processing and
BI, State Police, and the Arkansas Childaction is taken on any persons found to
ense are removed from child care.
vement system which consists of three mum licensing are entitled to grants and
010. The goal of the Better Beginningsn settings by increasing the number of4 programs participating. At the end of

and residential agencies. This includesare, therapeutic foster care, residentialncies. The Placement and Residentialso assists the Crimes Against Childrenthe investigation of child maltreatmentaction is taken on any persons found tod offense are removed from caring for


County# of CCC
**CCC
Capacity# of OST
* OST Cap.
# of LCCFH
***LCCFH
Capacity
# of RCCFH
****Arkansas 12 691 0 0 5 73 0Ashley 14 1,037 1 130 - Baxter 17 1,746 1 275 2 20 - Benton 108 20,057 34 9,070 21 250 1 Boone 17 1,460 1 157 5 68 - Bradley 8 550 2 102 - - - Calhoun 3 81 - - 1 10 - Carroll 10 888 1 176 6 78 - Chicot 13 775 - 7 76 - Clark 15 1,035 1 30 1 16 - Clay 10 513 1 40 4 52 - Cleburne 10 990 - - 1 14 - Cleveland 3 185 - - 1 10 - Columbia 16 1,244 - - - - - Conway 13 930 5 68 - Craighead 56 7,648 13 1,265 10 116 - Crawford 21 2,032 2 87 4 46 - Crittenden 29 3,109 2 304 8 104 - Cross 14 903 1 17 1 10 - Dallas 4 478 - - 1 16 - Desha 15 1,528 - - 3 36 - Drew 17 1,353 1 51 5 68 1 Faulkner 49 6,208 5 834 14 195 - Franklin 11 738 - - 5 80 - Fulton 5 426 - - 2 26 - Garland 46 5,811 7 1,335 4 46 1 Grant 4 317 - - 1 10 - Greene 17 2,144 6 625 3 42 - Hempstead 11 749 - - 1 10 - Hot Spring 13 1,123 1 103 1 10 - Howard 8 585 - - 4 64 - Independence 18 2,306 2 535 1 10 - Izard 6 321 - - 1 10 - Jackson 7 660 1 69 - - - Jefferson 45 4,930 7 981 9 96 - Johnson 11 897 2 32 - Lafayette 5 261 - - 1 16 - Lawrence 10 1,070 5 470 1 10 - Lee 5 337 1 23 1 16 - Lincoln 6 369 - - - - - Little River 6 394 - - 2 32 - Logan 8 805 1 69 10 124 - Lonoke 40 3,546 3 41 5 68 1 Madison 7 264 - - 6 76 - Marion 5 273 - - 2 32 - Miller 17 1,493 2 195 1 16 - Mississippi 35 2,609 2 85 8 95 - Monroe 7 259 - - 4 38 -
Child Care Facilities

Montgomery 4 139 - - 2 32 - Nevada 4 156 - - - - - Newton 8 168 - - - - - Ouachita 15 778 11 128 - Perry 5 277 - - - - - Phillips 16 1,011 1 37 5 72 - Pike 8 455 - - 1 10 - Poinsett 12 720 1 46 - - - Polk 10 746 - - - - - Pope 32 2,733 2 26 - Prairie 5 179 - - - - - Pulaski 280 35,335 23 4,043 13 121 7 Randolph 12 664 - - - - - Saint Francis 11 1,014 1 35 4 51 - Saline 42 5,019 1 60 8 110 1 Scott 2 348 - - 2 20 - Searcy 3 212 - - - - Sebastian 73 6,394 2 225 7 72 1 Sevier 8 649 - - 4 46 - Sharp 9 496 4 64 - Stone 6 275 - - 3 30 - Union 27 2,307 1 40 1 10 - Van Buren 8 445 - - 1 10 - Washington 115 12,912 20 2,241 20 215 - White 34 3,573 2 138 7 82 - Woodruff 4 424 2 143 1 10 - Yell 11 890 - - 3 48 -
1,591 166,447 158 24,077 279 3,442 13 *OST - Out of School Time** CCC - Child Care Centers***LCCFH - Licensed Child Care Family Home****RCCFH - Registered Child Care Family Home
Totals on this page include approximately 270 centers that were transferred to the Provider Support Quality Assurance Unit. That are still monitored under the authority of DCCEC

DCCECE - 20

RCCFH Capacity
Total # of Facilities Total Capacity
0 17 764 - 15 1167 - 20 2041
5 164 29432 - 23 1685 - 10 652 - 4 91 - 17 1142 - 20 851 - 17 1081 - 15 605 - 11 1004 - 4 195 - 16 1244 - 18 998 - 79 9029 - 27 2165 - 39 3517 - 16 930 - 5 494 - 18 1564
5 24 1477 - 68 7237 - 16 818 - 7 452
5 58 7197 - 5 327 - 26 2811 - 12 759 - 15 1236 - 12 649 - 21 2851 - 7 331 - 8 729 - 61 6007 - 13 929 - 6 277 - 16 1550 - 7 376 - 6 369 - 8 426 - 19 998
5 49 3660 - 13 340 - 7 305 - 20 1704 - 45 2789 - 11 297

- 6 171 - 4 156 - 8 168 - 26 906 - 5 277 - 22 1120 - 9 465 - 13 766 - 10 746 - 34 2759 - 5 179
35 323 39534 - 12 664 - 16 1100
5 52 5194 - 4 388 - 3 212
5 83 6696 - 12 695 - 13 560 - 9 305 - 29 2357 - 9 455 - 155 15368 - 43 3793 - 7 577 - 14 938
65 2,041 194,101
CE>


-

CountyTotal
Capacity SFY 2018
Total Capacity SFY 2019
Difference County
Arkansas 804 764 40 LeeAshley 1,125 1,167 -42 LincolnBaxter 2,287 2,041 246 Little RiverBenton 20,695 29,432 -8,737 LoganBoone 1,526 1,685 -159 LonokeBradley 579 652 -73 MadisonCalhoun 91 91 0 MarionCarroll 1,072 1,142 -70 MillerChicot 1,125 851 274 MississippiClark 1,128 1,081 47 MonroeClay 528 605 -77 MontgomeryCleburne 1,047 1,004 43 NevadaCleveland 213 195 18 NewtonColumbia 1,179 1,244 -65 OuachitaConway 1,063 998 65 PerryCraighead 8,272 9,029 -757 PhillipsCrawford 2,117 2,165 -48 PikeCrittenden 3,972 3,517 455 PoinsettCross 928 930 -2 PolkDallas 524 494 30 PopeDesha 1,654 1,564 90 PrairieDrew 1,422 1,477 -55 PulaskiFaulkner 6,290 7,237 -947 RandolphFranklin 799 818 -19 Saint FrancisFulton 429 452 -23 SalineGarland 5,961 7,197 -1,236 ScottGrant 369 327 42 SearcyGreene 2,137 2,811 -674 SebastianHempstead 764 759 5 SevierHot Spring 1,340 1,236 104 SharpHoward 649 649 0 StoneIndependence 2,420 2,851 -431 UnionIzard 360 331 29 Van BurenJackson 660 729 -69 WashingtonJefferson 6,677 6,007 670 WhiteJohnson 1,242 929 313 WoodruffLafayette 277 277 0 Yell
CAPACITY OF CHILD CARE BY COUNTYSFY 2018 vs. SFY 2019
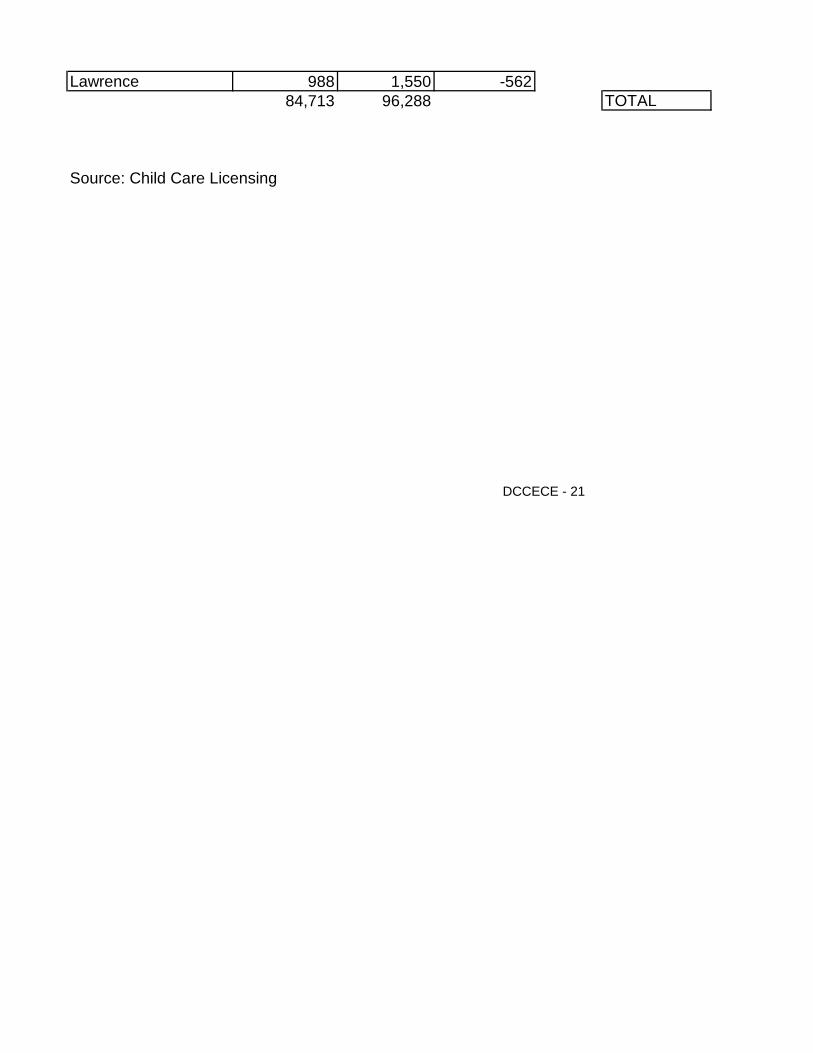
Lawrence 988 1,550 -56284,713 96,288 TOTAL
Source: Child Care Licensing
DCCECE - 21

Total Capacity SFY 2018
Total Capacity SFY 2019
Difference
333 376 -43369 369 0446 426 20861 998 -137
3,728 3,660 68346 340 6305 305 0
1,641 1,704 -632,799 2,789 10
297 297 0171 171 0176 156 20168 168 0954 906 48287 277 10
1,096 1,120 -24465 465 0930 766 164732 746 -14
2,842 2,759 83179 179 0
37,474 39,534 -2,060656 644 12
1,076 1,100 -245,229 5,194 35
497 388 109242 212 30
6,593 6,696 -103695 695 0583 560 23314 305 9
2,410 2,357 53455 455 0
13,260 15,368 -2,1083,934 3,793 141
365 577 -212929 938 -9

93,837 97,793178,550 194,081 -15,531

"All 3" equals refers to facilities that hold all three age groups "IT Only" equals Infan
"IT/PS Only" equals Infant/Toddler/Preschool Only "PS Only" equals Pre
"PS/SA Only" equals Preschool/ School Age Only "SA Only" equals Sch
CHILD CARE LICENSE TYPESFY 2018- 2019
CHILD CARE LICENSE TYPE
0
100
200
300
400
500
600
700

State Fiscal Year All 3 IT/PS only PS/SA only
2017 462 570 102018 463 576 972019 381 527 79
Source: Child Care Licensing
CHILD CARE LICENSESSFY 2017-2019
DCCECE - 22
*Please note that this chart is different than previous years. This year's chart has the license please note that one licensee may hold more than one license type.
1,000
1,500
2,000
2,500

State Fiscal YearChild Care
Center & OST License
Child Care Family Home
License
Total Child Care License Pattern*
2017 1,907 342 2,2492018 1,847 305 2,1662019 1,749 292 2,041
,
Source: Child Care Licensing
CHILD CARE LICENSES GROWTH PATTERN
y p p have been changed to reflect the correct data.
DCCECE - 23
0
500
Child Care Center & OST License Child Care Family Ho

nt/Toddler Only
school Only
hool Age Only
ES*
ES*
2017
2018
2019
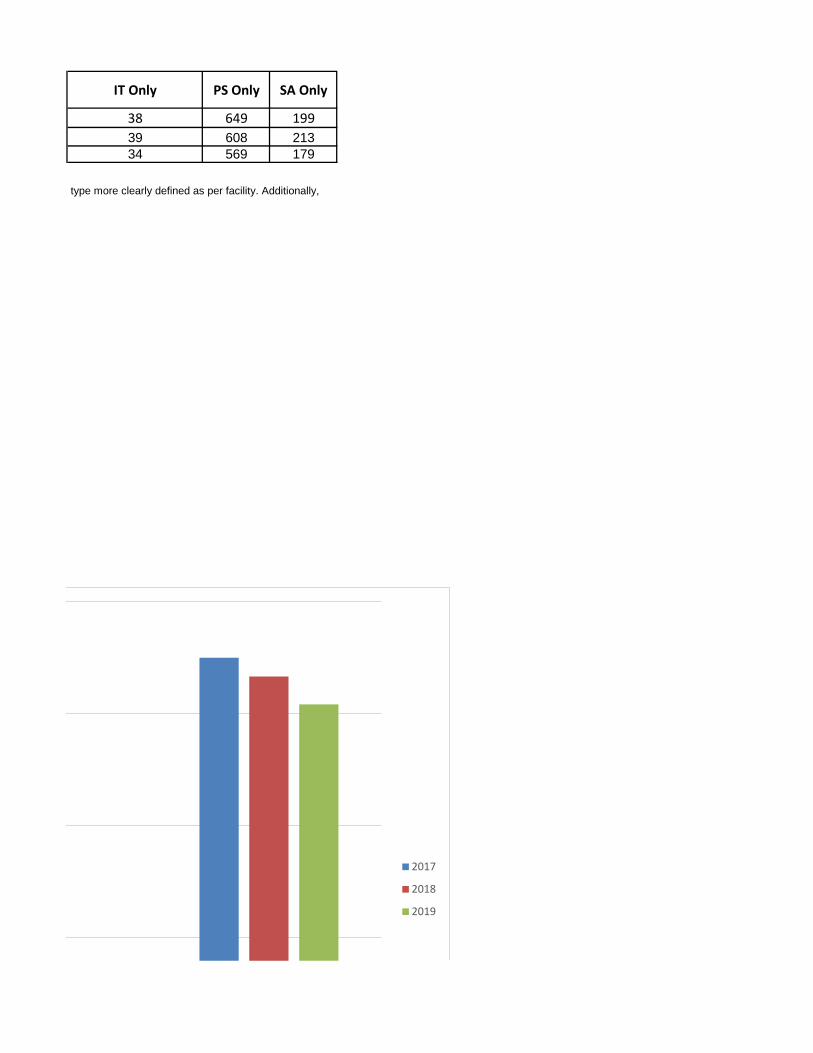
IT Only PS Only SA Only
38 649 19939 608 21334 569 179
type more clearly defined as per facility. Additionally,
2017
2018
2019

ome License Total Child Care License Pattern*


Year Level 12017 6952018 6532019 476
Arkansas Better Beginnings is a building block system, with each level building on the previous level
Level 1 is achieved when all requirements for that level are documented.Level 2 is achieved when all requirements for Levels 1 and 2 are documented.Level 3 is achieved when all requirements for Levels 1, 2 and 3 are documented.
Better Beginnings DataSFY 2017- 2019
The center's quality level affects the availability of grants, as well as tax credits that may become ava
0
100
200
300
400
500
600
700
800
Level 1 Level 2

DCCECE - 24
Better Beginnings Data
476
400
500
600
700
800

Facility Type Level 1
Child Care Center 476
License Child Care Family Home 121
Registered Child Care Family Home 4
Out of School Time Facility 27
Total 628
DCCECE - 25
131
5
54
4 018
00
100
200
300
Child Care Center License Child Care FamilyHome
Registered Child Care FamilyHome

Level 2 Level 3 Total7 672 1374
105 684 144254 615 1145
.
a
ailable to those who choose to send their child to higher level facilities.
Level 3
2017
2018
2019
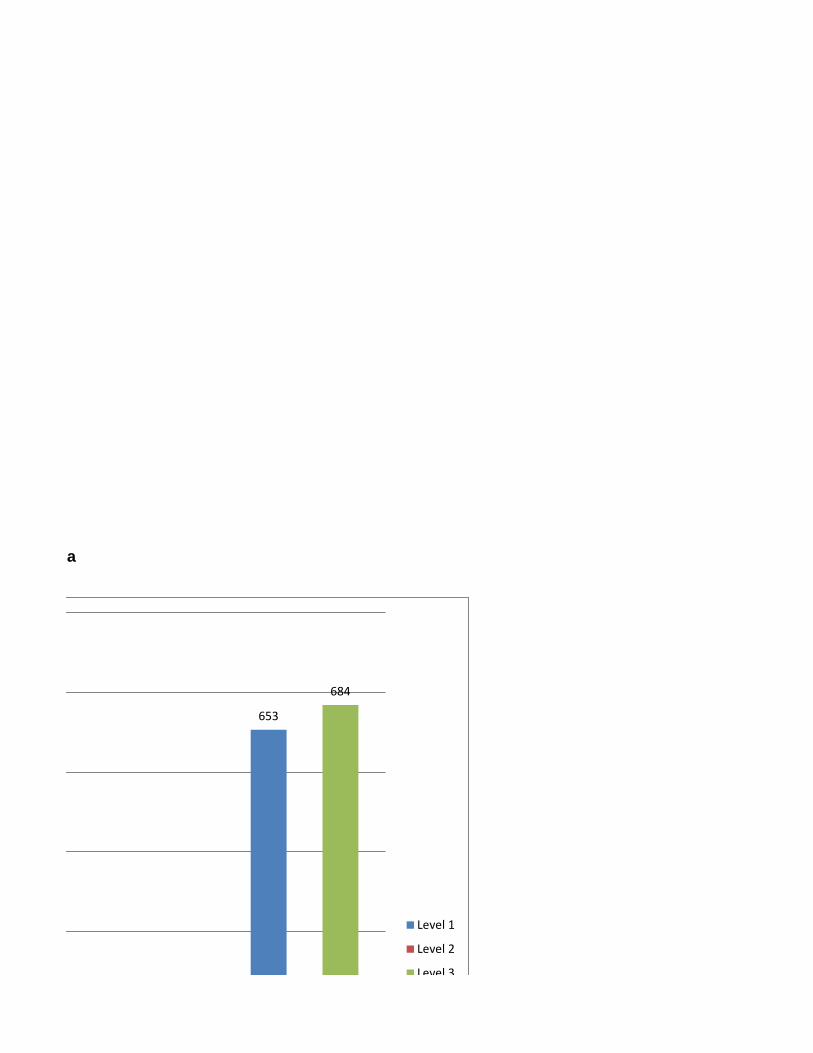
a
653
684
Level 1
Level 2
Level 3

Level 2 Level 3 Total
54 615 1145
2 17 140
0 0 4
0 25 52
56 657 1341
27
0
58
22
Out of School Time Facility Total
Level 3

Voluntary Registered/ Relative In HomeUnlicensedChild Care Family HomeChild Care Facilities Preschool, I/T, SAOut-of-School Time Facilities
595 2486 1
98 4128 14
LICENSING COMPLAI
Investigations Substantiated
0 0
0
100
200
300
400
500
600
Investigations Substantiated

TOTAL
Source: Child Care Licensing
727 304
*Some complaints are also dual complaints with child maltreatment investigations. Two separate findings are recorded for these. Only licensin
DCCECE - 26
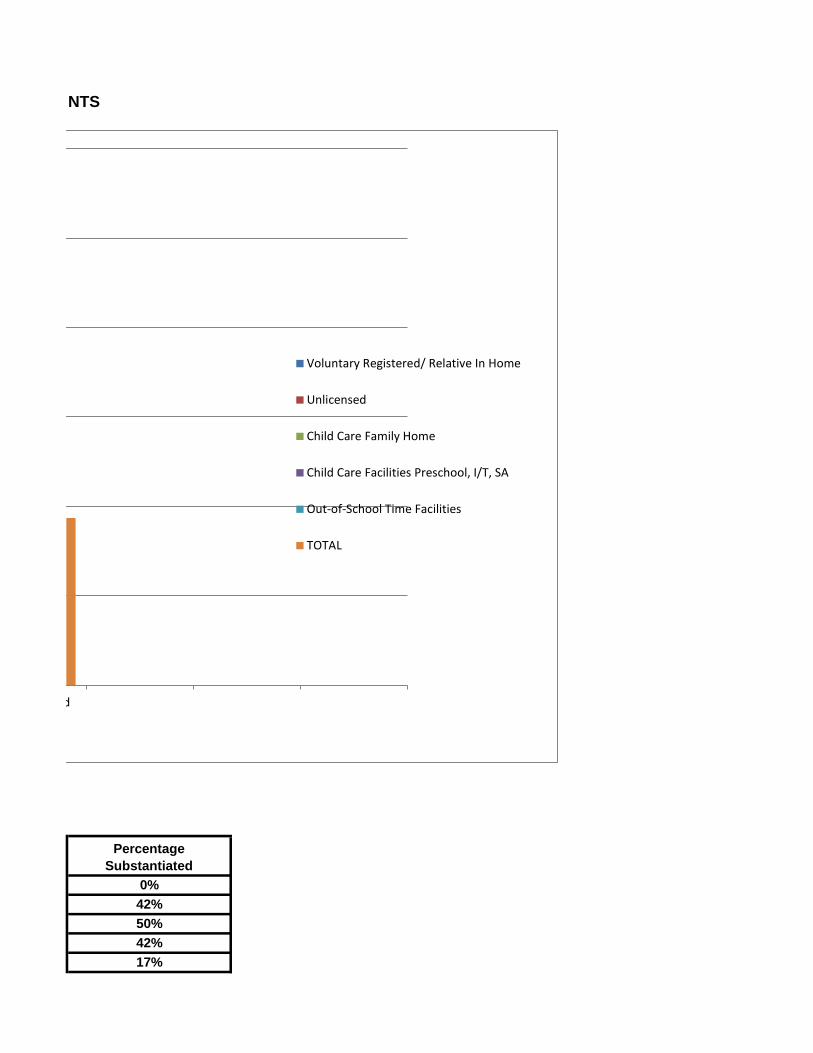
42%17%
42%50%
NTS
Percentage Substantiated
0%
d
Voluntary Registered/ Relative In Home
Unlicensed
Child Care Family Home
Child Care Facilities Preschool, I/T, SA
Out-of-School Time Facilities
TOTAL

*42%
ng complaints are reflected here.

Facilities SFY 2017 SFY 2018 SFY 2019Registered Family Homes 95 70 65Child Care Family Homes 4,200 3,731 3,442Infant/Toddler License Type 34,377 34,479 33,792Preschool License Type 89,386 87,743 86,006School Age License Type 58,469 54,969 48,833
Maximum Capacity 186,527 180,992 172,138
MAXIMUM CAPACITYOF FACILITIES
1
10

Source: Child Care Licensing
DCCECE - 27

1
Series1
Series2
Series3


Licensed 2016 2017 2018Residential 82 89 86Placement 45 56 55
Total 127 145 141Source: Placement and Residential Unit
PLACEMENT AND RESIDENTIAL UNITPLACEMENT AND RESIDENTIAL LICENSES
1 1
0
0.2
0.4
0.6
0.8
1
1.2
1
DCCECE -28
PLACEMENT AND RESIDENTIAL UNITRESIDENTIAL PROVIDER TYPES
0.2
0.4
0.6
0.8
1
1.2

Provider Types 2016 2017 2018
Regular Residential 82 89 86
Placement 45 56 55Totals 127 145 141
Source: Placement and Residential Unit
DCCECE - 29
PLACEMENT AND RESIDENTIAL UNITPLACEMENT PROVIDER TYPES
01
11
1.2

Provider Types 2017 2018 2019Regular Residential 63 78 74Emergency 35 31 30Psychiatric 12 13 13Sex Offender 5 5 5Independent Living 4 6 3Emergency Family Style 4 5 5
Residential Family Style 3 11 20Ind. Living Family Style 1 1 2Transitional Living 4 4 4Totals 132 154 156
0
0.2
0.4
0.6
0.8
1

DCCECE - 30

S
Series1
Series2
Series1
Series2
Series3


Series1
Series2
Series3


ARKANSAS DHS STATISTICAL REPORTDIVISION OF CHILD CARE AND EARLY CHILDHOOD EDUCATION
SFY 2018
Licensed 2016 2017 2018Residential 82 89 86Placement 45 56 55
Total 127 145 141Source: Placement and Residential Unit
PLACEMENT AND RESIDENTIAL UNITPLACEMENT AND RESIDENTIAL LICENSES
82
8986
45
56 55
0
10
20
30
40
50
60
70
80
90
100
2016 2017 2018
Residential
Placement

ARKANSAS DHS STATISTICAL REPORTDIVISION OF CHILD CARE AND EARLY CHILDHOOD EDUCATION
SFY 2018DCCECE -28

ARKANSAS DHS STATISTICAL REPORTDIVISION OF CHILD CARE AND EARLY CHILDHOOD EDUCATION
SFY 2018
Provider Types 2016 2017 2018
Regular Residential 82 89 86
Placement 45 56 55Totals 127 145 141
Source: Placement and Residential Unit
RESIDENTIAL PROVIDER TYPESPLACEMENT AND RESIDENTIAL UNIT
0
20
40
60
80
100
120
140
160
2016 2017 2018
Regular Residential
Placement
Totals

ARKANSAS DHS STATISTICAL REPORTDIVISION OF CHILD CARE AND EARLY CHILDHOOD EDUCATION
SFY 2018DCCECE - 29

ARKANSAS DHS STATISTICAL REPORTDIVISION OF CHILD CARE AND EARLY CHILDHOOD EDUCATION
SFY 2018
Provider Types 2016 2017 2018Regular Residential 52 63 78Emergency 29 35 31Psychiatric 12 12 13Sex Offender 5 5 5Independent Living 7 4 6Emergency Family Style 4 5
Residential Family Style 3 11Ind. Living Family Style 1 1Transitional Living 4 4Totals 105 132 154
PLACEMENT AND RESIDENTIAL UNITPLACEMENT PROVIDER TYPES
0
20
40
60
80
100
120 2016
2016

ARKANSAS DHS STATISTICAL REPORTDIVISION OF CHILD CARE AND EARLY CHILDHOOD EDUCATION
SFY 2018
DCCECE - 30

PRESCHOOL PROGRAMS

ARKANSAS DHS STATISTICAL REPORTDIVISION OF CHILD CARE AND EARLY CHILDHOOD EDUCATION
SFY 2017
We paid additional funds for COLA and special projects. Thus the increase in progrm funds despite reduced number of children
The Early Head Start Child Care Partnership (EHS-CCP) grant provides funding to serve 168 children, ages zeroto three years. The grant is managed by the Early Head Start Unit, a part of the Arkansas Department of HumanSerivces Division of Child Care and Early Childhood Education.
SFY 2019Number of Children 168Program Funds $2,803,332
10,891,530.00$ Total Amount Paid 14,384,430.00$ 14,562,292.80$
Amount Paid for Improvement Slots 3,712,140.00$ Amount Paid for Expansion Slots 10,672,290.00$
3,670,762.80$
Expansion Slots 1364 1391Total No. of Slots 2873 2884
Arkansas is the recipient of the Preschool Development Grand (PDG) program, a federal grant administered bythe U.S. Departments of Education and Health and Human Services supporting states to develop, enhance, orexpand high-quality preschool programs. PDG funds expand the current state funded preschool program.Arkansas Better Chance (ABC), allowing additional children to be served and to improve the services of currentABC children.
SFY 2018 SFY 2019Improvement Slots 1509 1493
Number of Children 23,926 23,975Program Funds $105,392,382 $102,768,027
PRESCHOOL PROGRAMS
Arkansas Better Chance (ABC) program is funded through an appropriation in the Arkansas Department ofEducation (ADE) Public School Fund budget. ADE contracts with the DHS Division of Child Care and EarlyChildhood Education to administer the early childhood program. The Division is responsible for all operationalduties associated with ABC. The State Board of Education is the final authority for approval of rules and grants.ABC provides early childhood education services in center-based and/or home visiting settings.
SFY 2018 SFY 2019

ARKANSAS DHS STATISTICAL REPORTDIVISION OF CHILD CARE AND EARLY CHILDHOOD EDUCATION
SFY 2017
DCCECE - 31

ANNUAL REPORT CARD
Produced for
Arkansas Department of Human Services
Division of Children and Family Services by
NCCD Children’s Research Center
Investigations SUPPORTIVE SERVICES
In-home Protective Services
ADOPTIONS D
iffe
ren
tia
l Re
sp
on
se
Fos
ter
Ca
re

Arkansas Division of Children and Family Services
Table of Contents
Reports of Child Maltreatment ....................................................................................... 1
Volume and Description of Child Maltreatment Reports .............................................. 1 Meeting Agency Policies ............................................................................................. 4 Benefits to Children and Families ................................................................................ 6
In-Home Services ............................................................................................................ 7 Volume and Description of Cases ................................................................................ 7 Meeting Agency Policies .............................................................................................. 8 Benefits to Children and Families ................................................................................ 9 Foster Care .................................................................................................................... 10 Volume and Description of Cases .............................................................................. 10 Meeting Agency Policies ............................................................................................ 13 Benefits to Children and Families .............................................................................. 15
Adoption ........................................................................................................................ 16 Volume and Description of Cases .............................................................................. 16 Meeting Agency Policies ............................................................................................ 17 Benefits to Children and Families .............................................................................. 18
Resources...................................................................................................................... 19 Caseworkers and Caseloads ..................................................................................... 19 Foster Homes ............................................................................................................ 20 Appendices.................................................................................................................... 23 Appendix A: Child Maltreatment Investigations by Area and County ........................ 23 Appendix B: Children in Foster Care by Race/Ethnicity ............................................ 25 Appendix C: Children in Foster Care by Age ............................................................ 27 Appendix D: Children in Foster Care by Gender ....................................................... 29 Appendix E: Children in Foster Care by Length of Stay ............................................ 31 Appendix F: Services Provided During the Year ....................................................... 33 Appendix G: Summary of Reports Involving Child Fatality ........................................ 35 Appendix H: Summary of Reports Involving Near Child Fatality ............................... 38 Appendix I: Fatalities of Children in Foster Care Who Did Not Receive a
Maltreatment Investigation ................................................................... 39 Appendix J: Average Caseload as of the End of SFY 2019, by County ................... 40 Appendix K: Foster Home Closure Reasons ............................................................ 41 Appendix L: Summary of Foster Care Maltreatment Reports ................................... 43

Arkansas Division of Children and Family Services

Arkansas Division of Children and Family Services 1
Reports of Child Maltreatment
Volume of Incoming Reports
Maltreatment Reports Received During SFY 2019
Quick Facts Of the 34,226 reports of child maltreatment accepted by the Arkansas Child Abuse Hotline during State Fiscal Year (SFY) 2019, 84 percent were assigned to DCFS and 16 percent were assigned to the Crimes Against Children Division (CACD) of the Arkansas State Police, which is responsible for investigating the most serious allegations of maltreatment. Of the reports assigned to DCFS, 79 percent were assigned for an investigation and 21 percent were handled through Differential Response (DR). DR allows the Division to respond to specific, low-risk maltreatment reports through a family assessment and provision of services rather than a traditional investigation. The following types of allegations can qualify for DR:
• Inadequate Supervision if children are at least five
• Environmental Neglect if children are at least three
• Medical Neglect if children are at least thirteen
• Lock Out if children are at least ten
• Inadequate Food, Inadequate Shelter, Inadequate Clothing, and Educational Neglect with no age restrictions
• Certain allegations of abuse where the incident occurred at least one year prior to the report date
22,713 (79%)
6,005 (21%)
28,718 (84%)
5,508 (16%)
Investigations
TOTAL REPORTS OF MALTREATMENT
RECEIVED DURING SFY 2019
34,226
ASSIGNED TO CACD
ASSIGNED TO DCFS
ASSIGNED TO DIFFERENTIAL RESPONSE
ASSIGNED TO INVESTIGATION
Volume and Description of Child Maltreatment Reports

Arkansas Division of Children and Family Services 2
A child may have more than one allegation.
Percentage of Children in True Allegations of Maltreatment
Number of Children Cited in True Allegation
Percentage of Children Cited in True Allegation
Neglect 5,631 63%
Physical Abuse 2,475 28%
Sexual Abuse 1,718 19%
Sexual Exploitation 76 1%
Abandonment 63 1%
Quick Facts Twenty-one percent of the investigations assigned to DCFS during SFY 2019 were found true, compared to 34 percent for CACD. The overall substantiation rate stood at 24 percent. There were 8,981 victim children involved in the maltreatment investigations that were found true. Of those children, 67 percent were white and 18 percent were black. Children ages five and younger accounted for almost half of the victim children. Over half of the victim children during SFY 2019 (54 percent) were female. The majority of the 8,981 victim children in true investigations were involved in allegations of neglect, followed by allegations of physical abuse and sexual abuse.
Findings of Child Maltreatment Investigations
Types of Allegations in True Investigations
0%
10%
20%
30%
40%
50%
SFY 2016 SFY 2017 SFY 2018 SFY 2019
22% 21% 20% 21%
35% 35% 34% 34%
24% 24% 23% 24%
Percentage of Investigations Found True
DCFS CACD All Investigations
67%18%
6%8%
1%
Race/Ethnicity of Children in True Reports
WhiteBlackHispanicMore Than 1 RaceOther/Unknown
27%
22%
18%
17%
15%
1%
Ages of Children in True Reports
0 to 1 2 to 5 6 to 910 to 13 14 to 17 Unknown
Characteristics of Children Involved in True Investigations

Arkansas Division of Children and Family Services 3
Number of Reports Assigned to Differential Response
Findings of Maltreatment Reports Involving Fatalities or Near Fatalities
Finding Child Fatality Near Child Fatality
True 33 1
Unsubstantiated 8 0
Pending 12 1
Unable to Locate 0 0
Quick Facts During SFY 2019, there were 53 maltreatment investigations involving a child fatality. While some investigations were still pending, the majority of those in which a disposition had been rendered were found true. There were two investigations of near child fatalities during the year; one was found true and the other was pending. Appendix G includes more details regarding the fatality and near fatality cases that are disclosable at the time of this report’s release. The number of reports assigned to DR during SFY 2019 (6,005) decreased by four percent from SFY 2018.
Educational Neglect and Environmental Neglect were the most commonly cited allegations in reports assigned to DR during the year, followed by Inadequate Supervision.
Reports Involving Fatalities or Near Fatalities
Allegations Cited in DR Reports
Reports Assigned for Differential Response (DR)
01,0002,0003,0004,0005,0006,0007,000
SFY 2016 SFY 2017 SFY 2018 SFY 2019
4,4475,072
6,265 6,005
Number of Reports Assigned to Differential Response
0%
10%
20%
30%
40% 31% 30%26%
13%6% 5% 6%
Types of Allegations Cited in Reports Assigned for DR

Arkansas Division of Children and Family Services 4
Quick Facts The law requires reports of maltreatment to be initiated within 24 hours of a Priority I report or within 72 hours of a Priority II report. Priority I reports cite more severe allegations while Priority II reports cite comparatively less serious allegations. Initiation occurs when all victim children are interviewed or observed (if too young for an interview) within the designated timeframes. DCFS initiated 84 percent of its investigations on time during SFY 2019, performing better on its Priority I investigations than Priority II. DCFS completed 81 percent of its investigations on time (within 45 days of receipt of the report) during SFY 2019, a decrease from the previous year (88 percent).
Meeting Agency Policies
Timeliness of Initiating Investigations
Timeliness of Completing Investigations
0%
25%
50%
75%
100%
SFY 2016 SFY 2017 SFY 2018 SFY 2019
86% 86% 86% 86%81% 82% 83% 83%82% 83% 84% 84%
Timely Initiation of Child Maltreatment Assessments (DCFS Only)
Priority I Priority II Combined
0%
25%
50%
75%
100%
SFY 2016 SFY 2017 SFY 2018 SFY 2019
64%70%
89%82%
63%69%
88%81%
63%69%
88%81%
Timely Completion of Child Maltreatment Assessments(DCFS Only)
Priority I Priority II Combined

Arkansas Division of Children and Family Services 5
Quick Facts DR referrals must be initiated within 72 hours of receipt of the report. DCFS initiated 70 percent of its DR reports on time during SFY 2019, an improvement over the previous year (65 percent). Reports assigned to DR are to close within 30 days of receipt of the report. In certain instances when the families’ needs necessitate longer involvement, two 15-day extensions can be granted, for a total of 60 days. The agency closed 84 percent of its DR reports on time during SFY 2019, taking into account reports in which extensions were granted.
Timeliness of Initiating Reports Assigned to DR
Timeliness of Completing Reports Assigned to DR
68% 68%65%
70%
20%
40%
60%
80%
100%
SFY 2016 SFY 2017 SFY 2018 SFY 2019
Timely Initiation of DR Reports
68% 68%
88%84%
20%
40%
60%
80%
100%
SFY 2016 SFY 2017 SFY 2018 SFY 2019
Timely Closure of DR Reports
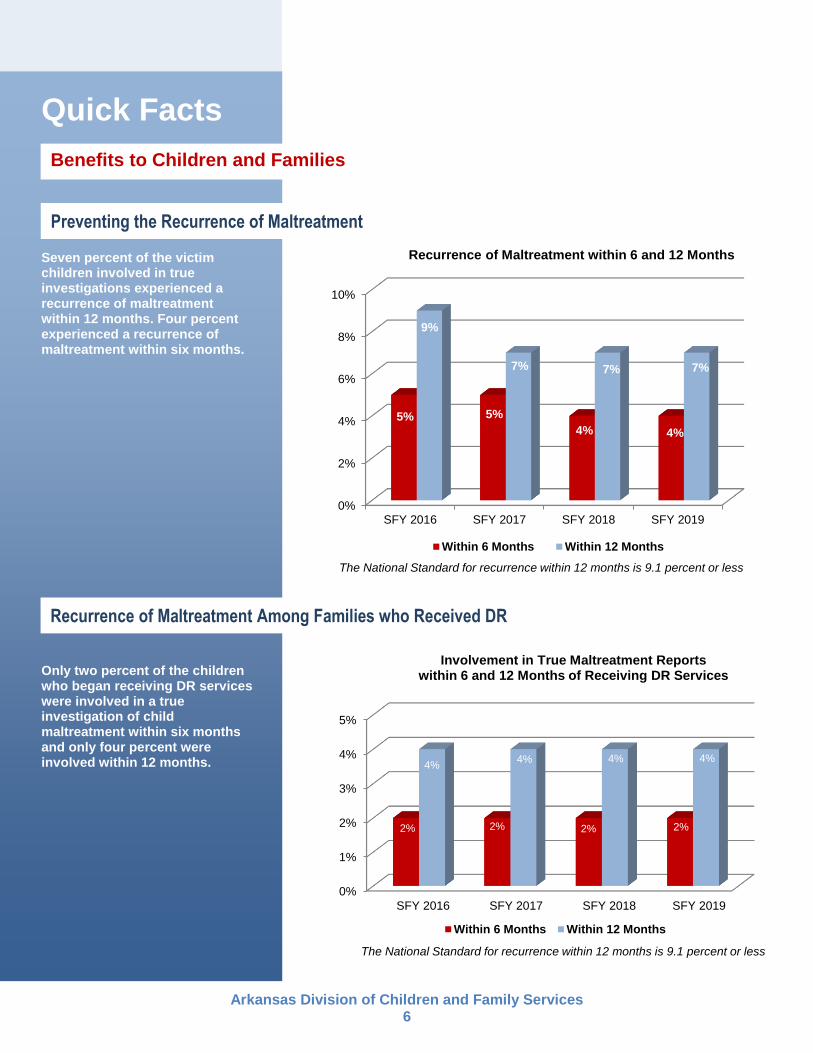
Arkansas Division of Children and Family Services 6
Quick Facts Seven percent of the victim children involved in true investigations experienced a recurrence of maltreatment within 12 months. Four percent experienced a recurrence of maltreatment within six months. Only two percent of the children who began receiving DR services were involved in a true investigation of child maltreatment within six months and only four percent were involved within 12 months.
Benefits to Children and Families
Preventing the Recurrence of Maltreatment
Recurrence of Maltreatment Among Families who Received DR
0%
2%
4%
6%
8%
10%
SFY 2016 SFY 2017 SFY 2018 SFY 2019
5% 5%4% 4%
9%
7% 7% 7%
Recurrence of Maltreatment within 6 and 12 Months
Within 6 Months Within 12 MonthsThe National Standard for recurrence within 12 months is 9.1 percent or less
0%
1%
2%
3%
4%
5%
2% 2% 2% 2%
4% 4% 4% 4%
SFY 2016 SFY 2017 SFY 2018 SFY 2019
Involvement in True Maltreatment Reportswithin 6 and 12 Months of Receiving DR Services
Within 6 Months Within 12 Months
The National Standard for recurrence within 12 months is 9.1 percent or less

Arkansas Division of Children and Family Services 7
In-Home Services
0
500
1,000
1,500
2,000
2,500
3,000
3,500
SFY 2016 SFY 2017 SFY 2018 SFY 2019
2,680 2,753 2,344 2,323
104 109 144 204
Number of In-Home Cases
In-Home Protective Services Cases Supportive Services Cases
0
100
200
300
SFY 2016 SFY 2017 SFY 2018 SFY 2019
169147 133 130
153125 138 126
Average Number of Days Cases Have Been Open
In-Home Protective Services Cases Supportive Services Cases
Quick Facts In most instances DCFS offers in-home services through a protective services case, which is opened when a true maltreatment report or court order necessitates DCFS’ involvement with a family but there is not an immediate threat to any child’s safety in the home. The number of in-home protective services cases open at the end of SFY 2019 decreased slightly from one year ago. At the end of the year, there were 2,323 in-home protective services cases open across the state, involving 5,396 children. The Division also offers in-home supportive services to families on a voluntary basis. DCFS was responsible for 204 supportive services cases at the end of the year. The average length of time in-home protective services cases were open as of the end of the year was just over four months (130 days). Supportive services cases were open, on average, for a similar length of time (125 days). In general, the length of time in-home cases have been open has decreased in recent years.
Volume and Description of Cases
Volume of Cases
Length of Time Cases Have Been Open
Involving 5,396 Children

Arkansas Division of Children and Family Services 8
Quick Facts
Children ages zero to five made up nearly half (48 percent) of children involved in in-home protective services cases at the end of SFY 2019.
On average, 76 percent of the in-home cases received a face-to-face monthly visit from a caseworker during SFY 2019, a considerable increase over the visitation rate observed during the previous year (67 percent).
Meeting Agency Policies
Monthly Visits to In-Home Protective Services Cases
Ages of Children in In-Home Protective Services Cases
22%
26%
21%
18%
13%
Ages of Children in In-Home Cases
0 to 1
2 to 5
6 to 9
10 to 13
14 to 17
20%
40%
60%
80%
SFY 2016 SFY 2017 SFY 2018 SFY 2019
55%57%
67%
76%
Required Monthly Visits to In-Home Cases

Arkansas Division of Children and Family Services 9
Quick Facts Of the children who began receiving in-home protective services one year prior to SFY 2019, six percent experienced a true report of maltreatment within one year. Of the children who began receiving supportive services one year prior to SFY 2019, three percent were involved in a true report within one year.
Of the children who began receiving protective services one year prior to SFY 2019, seven percent entered foster care within one year of the initiation of those services. Meanwhile, three percent of the children who began receiving supportive services during the same timeframe entered care within one year. In-home services prevented the vast majority of the children from being re-victimized or entering foster care within one year of initiation.
Benefits to Children and Families
Victimization Rate Among Children Who Received Protective and Supportive Services
Rate of Entry Into Foster Care Among Children Who Received Protective and Supportive Services
0%
10%
20%
30%
40%
SFY 2016 SFY 2017 SFY 2018 SFY 20191%
3% 3% 3%8%
6%8%
6%
Percentage of Children Receiving Supportive and Protective Services who were Abused or Neglected within
One Year of the Initiation of Service
Supportive Services Protective Services
0%
10%
20%
30%
40%
SFY 2016 SFY 2017 SFY 2018 SFY 2019
1% 1% 3% 3%8% 8% 7% 7%
Percentage of Children Receiving Supportive or Protective Services who Entered Foster Care within
One Year of the Initiation of Service
Supportive Services Protective Services

Arkansas Division of Children and Family Services 10
Foster Care Quick Facts
There were 4,331 children in foster care at the end of SFY 2019. This signified a three percent decrease from SFY 2018 (4,482).
At the end of SFY 2019, children two to five years of age (24 percent) represented the largest group of children in foster care. Sixty-three percent of those in care were white and 19 percent were black. Of the children in foster care at the end of SFY 2019, 51 percent were male and 49 percent were female. During SFY 2019, more children discharged from foster care than entered. This marked the second consecutive year in which discharges had outpaced entries.
Volume and Description of Cases
Number of Children in Foster Care
Characteristics of Children in Foster Care
Admissions Into and Discharges From Foster Care
4,957 5,113
4,482 4,331
4,000
4,500
5,000
5,500
SFY 2016 SFY 2017 SFY 2018 SFY 2019
Number of Children in Foster Care
63%19%
11%6%
1%
Race/Ethnicity of Children in Foster Care
WhiteBlackMore Than 1 RaceHispanicOther/Unknown
17%
24%
17%
18%
19%
5%
Ages of Children in Foster Care
0 to 1 2 to 5 6 to 910 to 13 14 to 17 18+
0
1,000
2,000
3,000
4,000
5,000
SFY 2016 SFY 2017 SFY 2018 SFY 2019
4,200 4,130
3,289 3,236 3,593 3,919 3,876
3,342
Number of Admissions Into and Discharges From Foster Care
Children Entered Into Foster Care Children Discharged From Foster Care

Arkansas Division of Children and Family Services 11
Quick Facts
Substance abuse and neglect were the most prevalent reasons for children entering foster care during the year.
Sixty-three percent of the children who left foster care during SFY 2019 either returned home or were discharged to relatives. Arkansas (91 percent) exceeds the national average of 80 percent of children who either return home or are discharged to relatives or an adoptive home.
1 These 1,704 cases of substance abuse include 1,502 instances of parental drug abuse, 143 instances of parental alcohol abuse, 51 instances of drug abuse by children, and 8 instances of alcohol abuse by children. 2 National data from the Children’s Bureau (November 2018).
Reasons for Children’s Entry Into Foster Care SFY 2019
Placement Reason Number of Entries Total
Substance Abuse 1,7041 53% Neglect 1,603 50% Parent Incarceration 724 22% Physical Abuse 443 14% Inadequate Housing 415 13% Sexual Abuse 214 7% Caretaker Illness 148 5% Child’s Behavior 113 3% Abandonment 85 3% Truancy 50 2% Sexual Offender 31 1% Other 77 2%
A child may have more than one reason for entry.
Reasons for Children’s Discharge From Foster Care SFY 2019
Discharge Reason Number of Discharges Total
Reunification 1,365 41% Adoption 941 28% Relative Custody 652 20% Child Aged Out 197 6% Non-Custodial Parent Custody 76 2% Non-Relative Custody 61 2% Guardianship 37 1% Other 13 <1%
National data2 indicate that the three most prevalent reasons children leave care are reunification (49%), adoption (24%), and guardianship (10%).
Reasons for Children’s Entry Into Foster Care
Reasons for Children’s Discharge From Foster Care

Arkansas Division of Children and Family Services 12
Length of Stay in Foster Care for Children in Care
SFY 2019
Length of Stay Number Percentage National
Less than 30 days 234 6% 5% 30-90 Days 475 11%
22% 3-6 Months 557 13% 6-12 Months 1,017 23% 21% 12-24 Months 956 22% 25% 24-36 Months 470 11% 12% 36+ Months 622 14% 15% Total 4,331 100% 100%
0%
20%
40% 33%28%
9% 7% 6% 5% 4% 3% 5%
Placement of Children in Foster CareProvisional (Rel/Fic): 13%
Foster Home (Rel/Fic): 12%ICPC (Out of State): 2%
Pre-Adoptive (Relative): 1%Other Relative: 0.5%
Quick Facts
Of the children in foster care at the end of SFY 2019, 53 percent had been in care for less than 12 months.
Overall, 79 percent of the children in foster care at the end of SFY 2019 resided in a family-like setting (foster family home, relative placement, trial home visit, therapeutic foster home, pre-adoptive home). Nine percent resided in congregate care, which represents placement in an emergency shelter, residential treatment, or residential care only program. Fifty-three percent of the children in care at the end of SFY 2019 had a permanency goal of reunification (return home) and 27 percent had a goal of adoption. These figures are similar to national data from the Children’s Bureau as of November 2018, with averages of 56 percent for reunification and 27 percent for adoption.
Placement of Children in Foster Care
Length of Stay in Foster Care
Permanency Goal of Children in Foster Care
0%
20%
40%
60%53%
27%7% 8% 4% 1%
Permanency Goals of Children in Foster Care at the End of SFY 2019
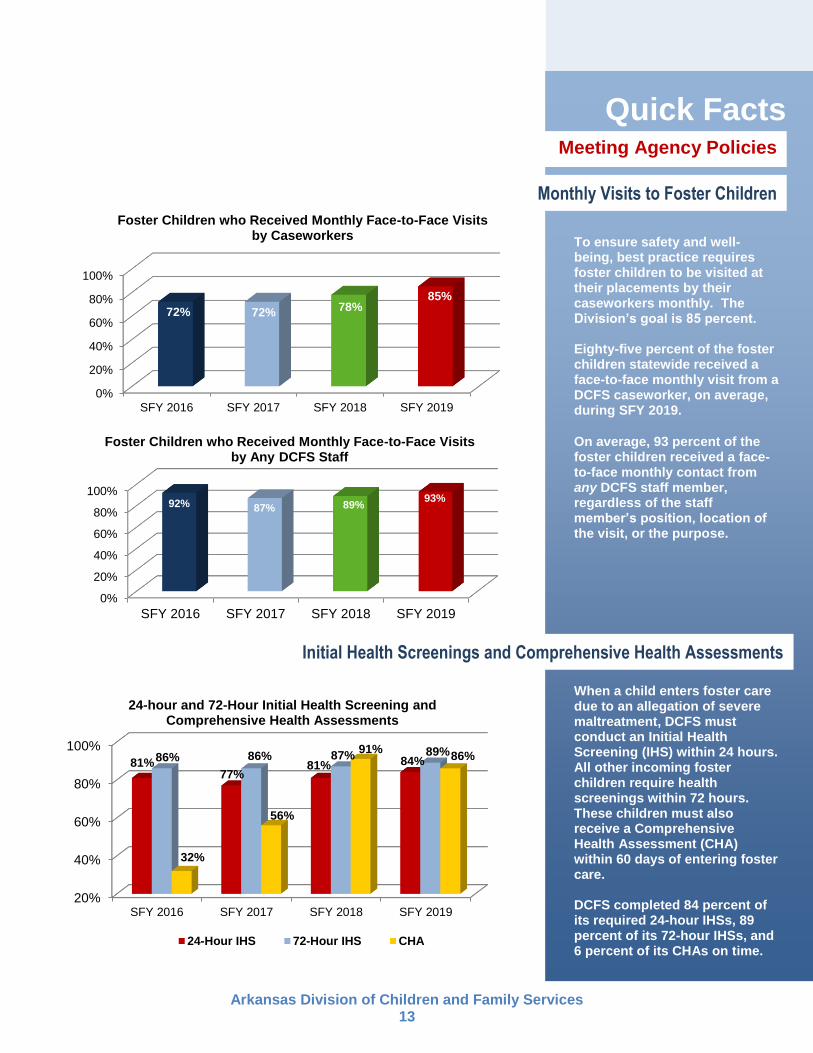
Arkansas Division of Children and Family Services 13
Quick Facts
To ensure safety and well-being, best practice requires foster children to be visited at their placements by their caseworkers monthly. The Division’s goal is 85 percent. Eighty-five percent of the foster children statewide received a face-to-face monthly visit from a DCFS caseworker, on average, during SFY 2019. On average, 93 percent of the foster children received a face-to-face monthly contact from any DCFS staff member, regardless of the staff member’s position, location of the visit, or the purpose.
When a child enters foster care due to an allegation of severe maltreatment, DCFS must conduct an Initial Health Screening (IHS) within 24 hours. All other incoming foster children require health screenings within 72 hours. These children must also receive a Comprehensive Health Assessment (CHA) within 60 days of entering foster care. DCFS completed 84 percent of its required 24-hour IHSs, 89 percent of its 72-hour IHSs, and 6 percent of its CHAs on time.
Meeting Agency Policies
Monthly Visits to Foster Children
Initial Health Screenings and Comprehensive Health Assessments
20%
40%
60%
80%
100%
SFY 2016 SFY 2017 SFY 2018 SFY 2019
81%77%
81% 84%86% 86% 87% 89%
32%
56%
91% 86%
24-hour and 72-Hour Initial Health Screening and Comprehensive Health Assessments
24-Hour IHS 72-Hour IHS CHA
0%
20%
40%
60%
80%
100%
SFY 2016 SFY 2017 SFY 2018 SFY 2019
72% 72% 78%85%
Foster Children who Received Monthly Face-to-Face Visits by Caseworkers
0%
20%
40%
60%
80%
100%
SFY 2016 SFY 2017 SFY 2018 SFY 2019
92% 87% 89% 93%
Foster Children who Received Monthly Face-to-Face Visits by Any DCFS Staff

Arkansas Division of Children and Family Services 14
Quick Facts At the end of SFY 2019, 83 percent of the children with siblings in foster care were placed with at least one of their siblings, while 61 percent were placed with all of their siblings. These figures do not exclude children who were placed separately for valid reasons such as safety issues or court orders. Placement stability is measured by the rate of placement moves per 1,000 days in foster care for children who enter care over a 12-month period. For SFY 2019, the placement stability rate was 6.14, a slight improvement from the previous year. The national standard is a rate of 4.12.
Siblings in Placement Who Are Placed Together
Placement Stability of Children in Foster Care
0%
25%
50%
75%
100%
SFY 2016 SFY 2017 SFY 2018 SFY 2019
76% 78%82% 83%
Siblings in Care who are Placed Together
7.647.08
6.23 6.14
2.00
4.00
6.00
8.00
10.00
12.00
SFY 2016 SFY 2017 SFY 2018 SFY 2019
Rate of Placement Moves Per 1,000 Days in Foster Care
National Standard 4.12 or less

Arkansas Division of Children and Family Services 15
Quick Facts
Arkansas continues to exceed the national standard of 40.5 percent or more for achieving permanency (i.e., exiting foster care to a permanent living situation) for children within 12 months of removal. Discharges from foster care due to reunification, relative custody, non-custodial parent custody, guardianship, adoption, and non-relative custody are considered to be permanent living situations. For SFY 2019 just over eight percent of the children who were discharged to their families re-entered foster care within 12 months. The Division meets the national standard of 8.3 percent or less.
Benefits to Children and Families
Achieving Permanency Within Twelve Months
Preventing Children’s Re-Entry Into Foster Care
9.9%8.7%
7.3%8.3%
0%
2%
4%
6%
8%
10%
12%
14%
SFY 2016 SFY 2017 SFY 2018 SFY 2019
Re-Entries Into Foster Care
54%50% 52% 54%
20%
40%
60%
80%
SFY 2016 SFY 2017 SFY 2018 SFY 2019
Permanency within 12 Months of Entering Foster Care
National Standard
40.5% or more
National Standard
8.3% or less

Arkansas Division of Children and Family Services 16
Adoption
3
3 Children available for adoption are defined as those who (1) have a termination of parental rights on both parents, (2) have a permanency goal of adoption, and (3) are not placed with relatives, fictive kin, or a pre-adoptive family.
Quick Facts At the end of SFY 2019, 458 children were available for adoption. DCFS estimates that it has identified a possible pre-adoptive placement for approximately 20 percent of the children available for adoption. DCFS modified its definition of children available for adoption during SFY 2018 to more accurately identify the number of children who are truly in need of an adoptive family.
Of the available children, 64 percent were white and 14 percent were black. Children ages 10 and older made up the majority (66 percent) of the child available for adoption.
Volume and Description of Cases
Children Available for Adoption
Characteristics of Children Available for Adoption
0
200
400
600
800
SFY 2016 SFY 2017 SFY 2018 SFY 2019
681 701
492 458
Number of Children Available for Adoption
64%14%
9%
13%
Race/Ethnicity of Children Available for Adoption
WhiteBlackHispanicMore than 1 Race
5%12%
17%
35%
31%
Ages of Children Available for Adoption
0 to 1 2 to 5 6 to 910 to 13 14 to 17

Arkansas Division of Children and Family Services 17
Quick Facts
The majority (63 percent) of the children available for adoption at the end of SFY 2019 resided in either a foster family home or a therapeutic foster home. The average length of time from termination of parental rights (TPR) until adoption finalization was almost 13 months during SFY 2019, one month longer than the national average (11.6 months).
Meeting Agency Policies
Placement of Children Available for Adoption
Length of Time to Adoption
0%
20%
40%34%
29%
21%
11%5%
Placement of Children Available for Adoption
11.3 11.8
10.1
12.8
6.0
10.0
14.0
18.0
SFY 2016 SFY 2017 SFY 2018 SFY 2019
Length of Time From TPRto Finalization of Adoption (Months)
National average of 11.6 months

Arkansas Division of Children and Family Services 18
During SFY 2019, 884 children began receiving adoption subsidies. Of those, 878 were federally-funded and 6 were
state funded subsidies.
During SFY 2019, a total of 7,339 children received adoption subsidies.
Subsidized Adoptions
Finalized Adoptions
Quick Facts Nine-hundred and fifty adoptions were finalized during SFY 2019. Thirty-five percent of the adoptions finalized during the year were by relatives.
Children ages two to five were the largest group (36 percent) of children who were adopted during SFY 2019, followed by those ages six to nine (20 percent). Subsidies are given to children with special needs, defined as:
• Caucasian and over nine
• African-American and at least two
• At least two members of a sibling group
• Children who have severe medical or psychological needs that require ongoing treatment
• Children at high risk for the development of serious physical, mental, or emotional conditions documented by a medical professional.
Benefits to Children and Families
Finalized Adoptions
Subsidized Adoptions
0
200
400
600
800
1000
SFY 2016 SFY 2017 SFY 2018 SFY 2019
720
955 1,008 950
Number of Adoptions Finalized
68%
17%
6%9%
1%
Race/Ethnicity of Childrenwith Finalized Adoption
WhiteBlackHispanicMore Than 1 RaceOther/Unknown
19%
36%20%
15%
10%
Ages of Children with Finalized Adoption
0 to 1 2 to 5 6 to 910 to 13 14 to 17

Arkansas Division of Children and Family Services 19
Resources
Quick Facts
As of the end of SFY 2019, the Division was responsible for:
• 1,972 investigations of child maltreatment and 181 DR cases;
• 4,331 foster care cases
(4,000 excluding adoption cases);
• 2,323 in-home cases,
involving 5,396 children; • 204 supportive services
cases and 61 interstate compact for the placement of children (ICPC) cases.
This is while the Division was staffed with 464 family service workers, who were responsible for handling these cases. This graph shows the number of cases that cycled through the system during SFY 2019, i.e., the number of families or children served during the year (as opposed to those active at the end of the year, described above). The Division oversaw 24,672 investigations; 7,673 children in foster care; 6,168 DR cases; 5,054 in-home protective services cases; 652 supportive services cases; and 132 interstate compact for the placement of children (ICPC) cases.
61
204
2,323
4,331
181
1,972
0 1,000 2,000 3,000 4,000 5,000
ICPC
Supportive Services
In-Home
Foster Care
Differential Response
Investigations
Types of Cases at the End of SFY 2019
Involving 5,396 Children
132
652
5,054
7,673
6,168
24,672
0 4,000 8,000 12,000 16,000 20,000 24,000 28,000
ICPC
Supportive Services
In-Home
Foster Care
Differential Response
Investigations
Types of Cases Served During SFY 2019
Involving 12,320 Children
Caseworkers and Caseloads
Caseloads at the End of SFY 2019
Caseloads Handled During the Year
One foster care case is equal to one child in care; one in-home or supportive services case constitutes an entire family, many of which have multiple children.

Arkansas Division of Children and Family Services 20
Quick Facts
The average caseload statewide stood at just under 19 cases per worker at the end of SFY 2019. The Division’s goal is 20 or fewer cases per worker. The average caseload for each county as of June 30, 2019 is presented in Appendix J. There were 1,560 licensed foster family homes open statewide at the end of SFY 2019, lower than the previous year.
During SFY 2019, 851 new foster homes were opened and 938 were closed for a net loss of 87 homes. Appendix K displays the closure reasons for the 938 foster homes that closed during the year.
20.2 20.622.3
23.422.5 21.4 21.0 20.9 20.6 20.9 20.4
18.7
15.0
20.0
25.0
30.0
Average Caseload During SFY 2019
1,000 1,500 2,000 2,500 3,000 3,500 4,000
SFY 2016 SFY 2017 SFY 2018 SFY 2019
1,564 1,809 1,670 1,560
3,398
3,926 3,724
3,527
Number of Foster Homes and Beds
Number of Open Foster Family HomesNumber of Beds Within Foster Family Homes
Average Caseload
Foster Homes
Foster Homes and Beds
0
400
800
1,200
SFY 2016 SFY 2017 SFY 2018 SFY 2019
8561,034
915 851
586
767
1,025938
270267
-110 -87
Number of Foster Family Homes Opened and Closed
Opened Closed Net Gain/Loss

Arkansas Division of Children and Family Services 21
Quick Facts
The ratio of licensed foster home beds to children in foster care was less than one (0.81) at the end of the year, similar to the previous year. The Division’s goal is to have at least one foster home bed available for each child in foster care. Seven reports in which foster parents were identified as alleged offenders were determined to be true during the year. Based on the 2,500 foster homes active during that period, the percentage of foster families with a true report of maltreatment was 0.28 percent. Appendix L provides more detail on maltreatment reports concerning foster homes.
0.0%
0.2%
0.4%
0.6%
0.8%
1.0%
SFY 2016 SFY 2017 SFY 2018 SFY 2019
0.71%
0.59%
0.37%0.28%
Percentage of Foster Families with True Reports of Maltreatment
0.69 0.77
0.83 0.81
0.0
0.2
0.4
0.6
0.8
1.0
SFY 2016 SFY 2017 SFY 2018 SFY 2019
Foster Bed to Foster Child Ratio
Ratio of Foster Home Beds to Foster Children
Foster Families with True Reports of Maltreatment

Arkansas Division of Children and Family Services 22

Arkansas Division of Children and Family Services 23
Appendix A: Child Maltreatment Investigations by Area and County
Area County Total True Sub Rate (%) Unsub Exempt
PrenatalExempt
ReligiousExempt
UJOExempt No Risk UTL Unknown
1 Benton (Bentonville) 2394 342 17.63 1826 66 0 13 0 141 6
1 Carroll (Berryville) 291 62 25.43 192 10 0 2 0 25 0
1 Madison (Huntsville) 210 55 30.29 128 7 0 1 0 17 2
1 Washington (Fayetteville) 2396 353 18.63 1817 73 0 19 0 127 7
5,291 812 19.01 3,963 156 0 35 0 310 15
2 Craw ford (Van Buren) 728 136 23.37 549 27 0 6 0 5 5
2 Franklin (Ozark) 175 45 29.71 121 6 0 1 0 2 0
2 Johnson (Clarksville) 220 35 19.27 163 5 0 2 0 13 2
2 Logan (Booneville) 133 28 22.73 97 1 0 1 0 5 1
2 Logan (Paris) 121 21 20.66 94 3 0 1 0 2 0
2 Scott (Waldron) 114 22 23.42 79 3 0 1 0 6 3
2 Sebastian (Fort Smith) 1312 271 28.25 918 83 0 15 0 19 6
2 Yell (Danville) 205 54 30.69 133 6 0 2 0 7 3
3,008 612 25.94 2,154 134 0 29 0 59 20
3 Clark (Arkadelphia) 193 28 23.28 142 15 0 1 0 3 4
3 Garland (Hot Springs) 1086 174 28.18 720 112 0 9 0 32 39
3 Hot Spring (Malvern) 330 41 20.75 251 23 0 2 0 1 12
3 How ard (Nashville) 90 12 19.54 67 3 0 2 0 3 3
3 Montgomery (Mount Ida) 90 14 20.93 67 4 0 0 0 1 4
3 Perry (Perryville) 86 17 30.49 51 7 0 1 0 6 4
3 Pike (Murfreesboro) 82 12 27.85 57 7 0 3 0 0 3
3 Polk (Mena) 196 46 27.89 134 4 0 3 0 3 6
3 Saline (Benton) 904 129 17.85 693 24 0 6 0 39 13
3,057 473 23.54 2,182 199 0 27 0 88 88
4 Columbia (Magnolia) 160 28 21.43 118 4 0 1 0 3 6
4 Hempstead (Hope) 171 29 25.60 111 9 0 5 0 14 3
4 Lafayette (Lew isville) 70 8 18.84 52 3 0 2 0 4 1
4 Little River (Ashdow n) 84 23 33.33 51 3 0 1 0 3 3
4 Miller (Texarkana) 427 77 24.70 288 22 0 4 0 26 10
4 Nevada (Prescott) 85 16 24.71 60 5 0 0 0 4 0
4 Ouachita (Camden) 211 45 29.76 139 11 0 4 1 5 6
4 Sevier (DeQueen) 117 29 31.53 74 6 0 0 0 2 6
4 Union (El Dorado) 304 58 24.17 216 12 0 3 0 13 2
1,629 313 25.69 1,109 75 0 20 1 74 37
5 Baxter (Mountain Home) 355 85 29.30 235 16 0 3 0 16 0
5 Boone (Harrison) 469 145 33.55 296 7 0 5 0 15 1
5 Conw ay (Morrilton) 191 43 29.63 128 11 0 2 0 5 2
5 Faulkner (Conw ay) 1059 163 20.59 713 41 0 11 0 116 15
5 Marion (Yellville) 141 37 32.14 90 8 0 0 0 5 1
5 New ton (Jasper) 58 15 25.86 42 0 0 0 0 1 0
5 Pope (Russellville) 505 122 30.02 344 22 0 7 0 8 2
5 Searcy (Marshall) 62 14 27.42 42 3 0 0 0 3 0
5 Van Buren (Clinton) 186 27 17.88 139 4 0 1 0 8 7
3,026 651 26.42 2,029 112 0 29 0 177 28
Area Total
Area Total
Area Total
Area Total
Area Total

Arkansas Division of Children and Family Services 24
Area County Total True Sub Rate (%) Unsub Exempt
PrenatalExempt
ReligiousExempt
UJOExempt No Risk UTL Unknown
6 Pulaski (East) 667 79 18.15 520 38 0 3 0 21 6
6 Pulaski (Jacksonville) 638 76 16.35 514 23 0 5 0 18 2
6 Pulaski (North) 836 143 24.00 582 49 0 6 0 45 11
6 Pulaski (South) 505 83 21.31 369 20 0 4 0 26 3
6 Pulaski (Southw est) 527 76 21.03 391 29 1 4 0 22 4
3,173 457 20.31 2,376 159 1 22 0 132 26
7 Bradley (Warren) 74 15 21.92 57 1 0 0 0 0 1
7 Calhoun (Hampton) 31 6 25.81 22 2 0 0 0 1 0
7 Cleveland (Rison) 35 16 54.29 15 3 0 0 0 1 0
7 Dallas (Fordyce) 108 20 22.22 84 1 0 3 0 0 0
7 Grant (Sheridan) 152 20 15.13 128 1 0 2 0 1 0
7 Jefferson (Pine Bluff) 490 88 27.69 339 38 0 8 0 11 6
7 Lincoln (Star City) 69 18 32.81 42 2 0 1 0 1 5
7 Lonoke (Lonoke) 699 93 17.05 563 14 0 12 0 16 1
7 Prairie (DeValls Bluff) 80 11 18.75 65 4 0 0 0 0 0
1,738 287 21.97 1,315 66 0 26 0 31 13
8 Clay (Piggott & Corning) 174 21 18.02 140 8 0 2 0 1 2
8 Craighead (Jonesboro) 1170 320 32.22 737 46 0 11 0 56 0
8 Fulton (Salem) 117 21 20.51 88 3 0 0 0 5 0
8 Greene (Paragould) 747 113 18.51 591 24 0 0 0 12 7
8 Izard (Melbourne) 126 25 26.19 93 5 0 2 1 0 0
8 Law rence (Walnut Ridge) 185 33 21.08 146 5 0 1 0 0 0
8 Mississippi (Blytheville) 342 62 22.99 248 15 0 0 0 10 7
8 Mississippi (Osceola) 138 23 23.19 105 8 0 1 0 1 0
8 Randolph (Pocahontas) 208 43 24.52 156 7 0 1 0 1 0
8 Sharp (Ash Flat) 194 37 22.28 148 5 0 1 0 2 1
3,401 698 24.94 2,452 126 0 19 1 88 17
9 Cleburne (Heber Springs) 204 51 27.09 147 4 0 0 0 1 1
9 Crittenden (West Memphis) 444 87 27.93 314 30 0 7 0 6 0
9 Cross (Wynne) 160 40 33.13 106 13 0 0 0 1 0
9 Independence (Batesville) 369 83 26.02 273 8 0 5 0 0 09 Jackson (New port) 209 56 30.62 145 4 0 4 0 0 09 Poinsett (Harrisburg) 357 93 30.70 239 13 0 3 0 7 29 Stone (Mountain View ) 114 25 26.32 84 4 0 1 0 0 09 White (Searcy) 876 198 25.61 637 16 1 7 0 8 99 Woodruff (Augusta) 66 20 39.06 38 4 0 1 0 1 2
2,799 653 27.94 1,983 96 1 28 0 24 14
10 Arkansas (Dew itt) 61 11 22.95 47 2 0 1 0 0 010 Arkansas (Stuttgart) 88 18 27.27 64 6 0 0 0 0 010 Ashley (Hamburg) 137 27 25.93 100 6 0 2 0 0 210 Chicot (Lake Village) 81 16 29.11 55 7 0 0 0 1 210 Desha (McGehee) 105 17 23.53 78 6 0 1 0 0 310 Drew (Monticello) 140 26 22.63 103 3 0 2 0 3 310 Lee (Marianna) 55 11 27.27 38 4 0 0 0 2 010 Monroe (Brinkley) 29 7 44.83 16 6 0 0 0 0 010 Monroe (Clarendon) 26 5 34.62 17 3 0 1 0 0 010 Phillips (Helena) 163 25 22.70 118 10 0 2 0 8 010 St. Francis (Forrest City) 212 41 28.91 148 18 0 2 0 2 1
1,097 204 26.34 784 71 0 11 0 16 11
99 Unknow n County 2 1 50.00 1 0 0 0 0 0 0
28,221 5,161 23.63 20,348 1,194 2 246 2 999 269Statewide Total
Area Total
Area Total
Area Total
Area Total
Area Total

Arkansas Division of Children and Family Services 25
Appendix B: Children in Foster Care by Race/Ethnicity
Area County Total White Black Asian AIAN NAPI Hispanic More than 1 Unknown
1 Benton (Bentonville) 275 205 9 0 2 0 41 17 1
1 Carroll (Berryville) 95 62 0 0 0 0 12 21 0
1 Madison (Huntsville) 93 86 0 0 0 0 0 4 3
1 Washington (Fayetteville) 532 299 34 0 1 16 98 83 1
995 652 43 0 3 16 151 125 5
2 Craw ford (Van Buren) 191 163 1 0 0 0 7 20 0
2 Franklin (Ozark) 51 44 1 0 0 0 3 3 0
2 Johnson (Clarksville) 77 63 1 0 0 0 4 7 2
2 Logan (Booneville) 69 60 0 0 0 0 4 5 0
2 Logan (Paris) 52 46 4 1 0 0 0 1 0
2 Scott (Waldron) 58 47 0 0 0 0 9 2 0
2 Sebastian (Fort Smith) 834 522 67 4 2 0 93 146 0
2 Yell (Danville) 86 77 1 0 0 0 6 2 0
1,418 1,022 75 5 2 0 126 186 2
3 Clark (Arkadelphia) 33 17 8 0 0 0 1 6 1
3 Garland (Hot Springs) 269 202 20 0 0 0 5 41 1
3 Hot Spring (Malvern) 87 60 6 0 0 0 3 17 1
3 How ard (Nashville) 15 6 2 0 0 0 5 2 0
3 Montgomery (Mount Ida) 6 6 0 0 0 0 0 0 0
3 Perry (Perryville) 14 13 0 0 0 0 0 1 0
3 Pike (Murfreesboro) 29 27 0 0 0 0 1 1 0
3 Polk (Mena) 65 61 0 0 0 0 2 2 0
3 Saline (Benton) 109 85 4 0 0 0 10 9 1
627 477 40 0 0 0 27 79 4
4 Columbia (Magnolia) 50 6 36 0 0 0 1 7 0
4 Hempstead (Hope) 37 18 8 0 0 0 8 3 0
4 Lafayette (Lew isville) 11 3 6 0 0 0 0 2 0
4 Little River (Ashdow n) 39 33 4 0 0 0 0 2 0
4 Miller (Texarkana) 140 61 45 0 0 0 7 27 0
4 Nevada (Prescott) 13 9 3 0 0 0 0 1 0
4 Ouachita (Camden) 69 30 33 0 0 0 0 6 0
4 Sevier (DeQueen) 53 30 1 0 0 1 15 6 0
4 Union (El Dorado) 83 41 27 0 0 0 6 9 0
495 231 163 0 0 1 37 63 0
5 Baxter (Mountain Home) 81 72 0 0 0 0 1 8 0
5 Boone (Harrison) 89 79 2 0 0 0 4 4 0
5 Conw ay (Morrilton) 93 72 7 0 0 0 0 12 2
5 Faulkner (Conw ay) 229 159 26 1 0 0 13 26 4
5 Marion (Yellville) 28 26 0 0 0 0 0 2 0
5 New ton (Jasper) 6 5 0 0 0 0 1 0 0
5 Pope (Russellville) 84 64 5 0 0 0 7 8 0
5 Searcy (Marshall) 18 17 0 0 0 0 1 0 0
5 Van Buren (Clinton) 32 31 0 0 0 0 0 1 0
660 525 40 1 0 0 27 61 6
Area Total
Area Total
Area Total
Area Total
Area Total

Arkansas Division of Children and Family Services 26
Area County Total White Black Asian AIAN NAPI Hispanic More than 1 Unknown
6 Pulaski (East) 64 14 34 0 0 0 5 11 0
6 Pulaski (Jacksonville) 98 48 43 0 0 0 2 5 0
6 Pulaski (North) 179 31 118 1 0 0 11 18 0
6 Pulaski (South) 187 41 120 0 0 0 10 16 0
6 Pulaski (Southw est) 107 22 67 0 0 0 11 7 0
635 156 382 1 0 0 39 57 0
7 Bradley (Warren) 14 7 2 1 0 0 0 4 0
7 Calhoun (Hampton) 5 4 1 0 0 0 0 0 0
7 Cleveland (Rison) 30 24 2 0 0 0 1 1 2
7 Dallas (Fordyce) 21 13 3 0 0 0 5 0 0
7 Grant (Sheridan) 34 27 0 0 0 0 6 1 0
7 Jefferson (Pine Bluff) 185 42 125 0 0 0 3 11 4
7 Lincoln (Star City) 15 9 5 0 0 0 1 0 0
7 Lonoke (Lonoke) 203 158 13 0 0 0 5 25 2
7 Prairie (DeValls Bluff) 11 8 3 0 0 0 0 0 0
518 292 154 1 0 0 21 42 8
8 Clay (Piggott & Corning) 34 34 0 0 0 0 0 0 0
8 Craighead (Jonesboro) 219 116 52 0 0 0 15 36 0
8 Fulton (Salem) 58 53 0 0 0 0 0 3 2
8 Greene (Paragould) 213 175 9 0 0 1 11 14 3
8 Izard (Melbourne) 52 45 1 0 0 0 1 5 0
8 Law rence (Walnut Ridge) 46 37 1 0 0 0 1 6 1
8 Mississippi (Blytheville) 107 47 37 0 0 0 7 16 0
8 Mississippi (Osceola) 49 21 24 0 0 0 1 3 0
8 Randolph (Pocahontas) 66 57 2 0 0 0 3 4 0
8 Sharp (Ash Flat) 72 67 1 0 0 0 1 3 0
916 652 127 0 0 1 40 90 6
9 Cleburne (Heber Springs) 83 76 0 0 0 0 3 4 0
9 Crittenden (West Memphis) 156 33 100 0 0 0 2 20 19 Cross (Wynne) 103 55 43 0 0 0 2 3 09 Independence (Batesville) 126 111 3 0 0 0 3 8 19 Jackson (New port) 108 78 14 0 0 0 2 14 09 Poinsett (Harrisburg) 199 168 2 0 0 0 4 25 09 Stone (Mountain View ) 33 30 0 0 0 0 0 3 09 White (Searcy) 192 144 9 0 0 0 2 37 09 Woodruff (Augusta) 50 36 8 0 0 0 0 6 0
1,050 731 179 0 0 0 18 120 2
10 Arkansas (Dew itt) 19 14 3 0 0 0 2 0 010 Arkansas (Stuttgart) 26 9 16 0 0 0 0 1 010 Ashley (Hamburg) 44 24 10 0 0 0 7 3 010 Chicot (Lake Village) 38 15 20 0 0 0 1 2 010 Desha (McGehee) 10 5 2 0 0 0 0 3 010 Drew (Monticello) 56 24 21 0 0 0 2 9 010 Lee (Marianna) 14 1 12 0 0 0 0 1 010 Monroe (Brinkley) 16 3 6 0 0 0 0 7 010 Monroe (Clarendon) 12 8 2 0 0 0 1 1 010 Phillips (Helena) 54 13 33 0 0 0 0 8 010 St. Francis (Forrest City) 70 13 43 0 0 0 7 7 0
359 129 168 0 0 0 20 42 0
7,673 4,867 1,371 8 5 18 506 865 33Statewide Total
Area Total
Area Total
Area Total
Area Total
Area Total
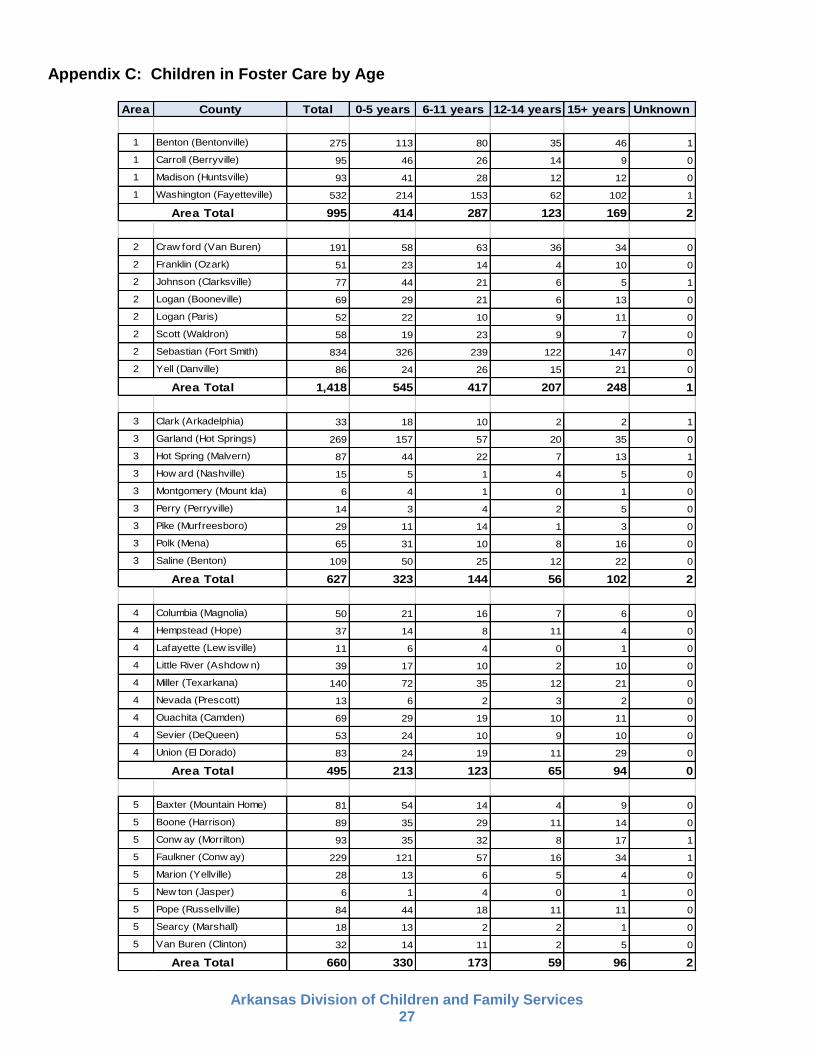
Arkansas Division of Children and Family Services 27
Appendix C: Children in Foster Care by Age
Area County Total 0-5 years 6-11 years 12-14 years 15+ years Unknown
1 Benton (Bentonville) 275 113 80 35 46 1
1 Carroll (Berryville) 95 46 26 14 9 0
1 Madison (Huntsville) 93 41 28 12 12 0
1 Washington (Fayetteville) 532 214 153 62 102 1
995 414 287 123 169 2
2 Craw ford (Van Buren) 191 58 63 36 34 0
2 Franklin (Ozark) 51 23 14 4 10 0
2 Johnson (Clarksville) 77 44 21 6 5 1
2 Logan (Booneville) 69 29 21 6 13 0
2 Logan (Paris) 52 22 10 9 11 0
2 Scott (Waldron) 58 19 23 9 7 0
2 Sebastian (Fort Smith) 834 326 239 122 147 0
2 Yell (Danville) 86 24 26 15 21 0
1,418 545 417 207 248 1
3 Clark (Arkadelphia) 33 18 10 2 2 1
3 Garland (Hot Springs) 269 157 57 20 35 0
3 Hot Spring (Malvern) 87 44 22 7 13 1
3 How ard (Nashville) 15 5 1 4 5 0
3 Montgomery (Mount Ida) 6 4 1 0 1 0
3 Perry (Perryville) 14 3 4 2 5 0
3 Pike (Murfreesboro) 29 11 14 1 3 0
3 Polk (Mena) 65 31 10 8 16 0
3 Saline (Benton) 109 50 25 12 22 0
627 323 144 56 102 2
4 Columbia (Magnolia) 50 21 16 7 6 0
4 Hempstead (Hope) 37 14 8 11 4 0
4 Lafayette (Lew isville) 11 6 4 0 1 0
4 Little River (Ashdow n) 39 17 10 2 10 0
4 Miller (Texarkana) 140 72 35 12 21 0
4 Nevada (Prescott) 13 6 2 3 2 0
4 Ouachita (Camden) 69 29 19 10 11 0
4 Sevier (DeQueen) 53 24 10 9 10 0
4 Union (El Dorado) 83 24 19 11 29 0
495 213 123 65 94 0
5 Baxter (Mountain Home) 81 54 14 4 9 0
5 Boone (Harrison) 89 35 29 11 14 0
5 Conw ay (Morrilton) 93 35 32 8 17 1
5 Faulkner (Conw ay) 229 121 57 16 34 1
5 Marion (Yellville) 28 13 6 5 4 0
5 New ton (Jasper) 6 1 4 0 1 0
5 Pope (Russellville) 84 44 18 11 11 0
5 Searcy (Marshall) 18 13 2 2 1 0
5 Van Buren (Clinton) 32 14 11 2 5 0
660 330 173 59 96 2
Area Total
Area Total
Area Total
Area Total
Area Total

Arkansas Division of Children and Family Services 28
Area County Total 0-5 years 6-11 years 12-14 years 15+ years Unknown
6 Pulaski (East) 64 33 15 4 12 0
6 Pulaski (Jacksonville) 98 49 26 4 19 0
6 Pulaski (North) 179 82 46 15 36 0
6 Pulaski (South) 187 85 40 24 38 0
6 Pulaski (Southw est) 107 38 26 19 24 0
635 287 153 66 129 0
7 Bradley (Warren) 14 5 2 0 7 0
7 Calhoun (Hampton) 5 2 1 0 2 0
7 Cleveland (Rison) 30 14 9 2 5 0
7 Dallas (Fordyce) 21 6 7 4 4 0
7 Grant (Sheridan) 34 15 6 6 7 0
7 Jefferson (Pine Bluff) 185 58 48 26 50 3
7 Lincoln (Star City) 15 5 2 5 3 0
7 Lonoke (Lonoke) 203 76 63 32 31 1
7 Prairie (DeValls Bluff) 11 6 5 0 0 0
518 187 143 75 109 4
8 Clay (Piggott & Corning) 34 8 13 3 10 0
8 Craighead (Jonesboro) 219 94 56 20 49 0
8 Fulton (Salem) 58 17 15 15 11 0
8 Greene (Paragould) 213 85 49 30 47 2
8 Izard (Melbourne) 52 22 14 7 9 0
8 Law rence (Walnut Ridge) 46 18 14 3 11 0
8 Mississippi (Blytheville) 107 49 31 18 9 0
8 Mississippi (Osceola) 49 20 14 8 7 0
8 Randolph (Pocahontas) 66 35 13 7 11 0
8 Sharp (Ash Flat) 72 26 14 16 16 0
916 374 233 127 180 2
9 Cleburne (Heber Springs) 83 37 24 13 9 0
9 Crittenden (West Memphis) 156 77 33 11 35 09 Cross (Wynne) 103 56 18 11 18 09 Independence (Batesville) 126 58 38 15 15 09 Jackson (New port) 108 59 19 5 25 09 Poinsett (Harrisburg) 199 74 59 30 36 09 Stone (Mountain View ) 33 16 4 6 7 09 White (Searcy) 192 95 48 18 31 09 Woodruff (Augusta) 50 13 12 8 17 0
1,050 485 255 117 193 0
10 Arkansas (Dew itt) 19 4 6 3 6 010 Arkansas (Stuttgart) 26 11 8 4 3 010 Ashley (Hamburg) 44 17 10 5 12 010 Chicot (Lake Village) 38 20 6 3 9 010 Desha (McGehee) 10 6 1 0 3 010 Drew (Monticello) 56 22 9 6 19 010 Lee (Marianna) 14 7 2 2 3 010 Monroe (Brinkley) 16 3 8 1 4 010 Monroe (Clarendon) 12 1 5 4 2 010 Phillips (Helena) 54 20 15 8 11 010 St. Francis (Forrest City) 70 36 22 3 9 0
359 147 92 39 81 0
7,673 3,305 2,020 934 1,401 13Statewide Total
Area Total
Area Total
Area Total
Area Total
Area Total

Arkansas Division of Children and Family Services 29
Appendix D: Children in Foster Care by Gender
Area County Total Male Female Unknown
1 Benton (Bentonville) 275 137 137 11 Carroll (Berryville) 95 44 51 01 Madison (Huntsville) 93 51 42 01 Washington (Fayetteville) 532 273 258 1
995 505 488 2
2 Craw ford (Van Buren) 191 82 109 02 Franklin (Ozark) 51 29 22 02 Johnson (Clarksville) 77 35 41 12 Logan (Booneville) 69 35 34 02 Logan (Paris) 52 18 34 02 Scott (Waldron) 58 31 27 02 Sebastian (Fort Smith) 834 438 396 02 Yell (Danville) 86 32 54 0
1,418 700 717 1
3 Clark (Arkadelphia) 33 20 12 13 Garland (Hot Springs) 269 135 134 03 Hot Spring (Malvern) 87 47 39 13 How ard (Nashville) 15 5 10 03 Montgomery (Mount Ida) 6 1 5 03 Perry (Perryville) 14 7 7 03 Pike (Murfreesboro) 29 17 12 03 Polk (Mena) 65 31 34 03 Saline (Benton) 109 57 52 0
627 320 305 2
4 Columbia (Magnolia) 50 25 25 04 Hempstead (Hope) 37 19 18 04 Lafayette (Lew isville) 11 4 7 04 Little River (Ashdow n) 39 21 18 04 Miller (Texarkana) 140 69 71 04 Nevada (Prescott) 13 9 4 04 Ouachita (Camden) 69 34 35 04 Sevier (DeQueen) 53 24 29 04 Union (El Dorado) 83 36 47 0
495 241 254 0
5 Baxter (Mountain Home) 81 33 48 05 Boone (Harrison) 89 47 42 05 Conw ay (Morrilton) 93 45 47 15 Faulkner (Conw ay) 229 121 107 15 Marion (Yellville) 28 15 13 05 New ton (Jasper) 6 1 5 05 Pope (Russellville) 84 47 37 05 Searcy (Marshall) 18 9 9 05 Van Buren (Clinton) 32 19 13 0
660 337 321 2
Area Total
Area Total
Area Total
Area Total
Area Total

Arkansas Division of Children and Family Services 30
Area County Total Male Female Unknown
6 Pulaski (East) 64 41 23 06 Pulaski (Jacksonville) 98 47 51 06 Pulaski (North) 179 81 98 06 Pulaski (South) 187 93 94 06 Pulaski (Southw est) 107 69 38 0
635 331 304 0
7 Bradley (Warren) 14 5 9 07 Calhoun (Hampton) 5 2 3 07 Cleveland (Rison) 30 15 15 07 Dallas (Fordyce) 21 11 10 07 Grant (Sheridan) 34 21 13 07 Jefferson (Pine Bluff) 185 95 87 37 Lincoln (Star City) 15 6 9 07 Lonoke (Lonoke) 203 102 100 17 Prairie (DeValls Bluff) 11 3 8 0
518 260 254 4
8 Clay (Piggott & Corning) 34 16 18 08 Craighead (Jonesboro) 219 110 109 08 Fulton (Salem) 58 24 34 08 Greene (Paragould) 213 103 108 28 Izard (Melbourne) 52 23 29 08 Law rence (Walnut Ridge) 46 23 23 08 Mississippi (Blytheville) 107 53 54 08 Mississippi (Osceola) 49 26 23 08 Randolph (Pocahontas) 66 34 32 08 Sharp (Ash Flat) 72 42 30 0
916 454 460 2
9 Cleburne (Heber Springs) 83 38 45 09 Crittenden (West Memphis) 156 79 77 09 Cross (Wynne) 103 52 51 09 Independence (Batesville) 126 65 61 09 Jackson (New port) 108 56 52 09 Poinsett (Harrisburg) 199 106 93 09 Stone (Mountain View ) 33 13 20 09 White (Searcy) 192 105 87 09 Woodruff (Augusta) 50 26 24 0
1,050 540 510 0
10 Arkansas (Dew itt) 19 8 11 010 Arkansas (Stuttgart) 26 12 14 010 Ashley (Hamburg) 44 19 25 010 Chicot (Lake Village) 38 15 23 010 Desha (McGehee) 10 5 5 010 Drew (Monticello) 56 30 26 010 Lee (Marianna) 14 7 7 010 Monroe (Brinkley) 16 11 5 010 Monroe (Clarendon) 12 6 6 010 Phillips (Helena) 54 27 27 010 St. Francis (Forrest City) 70 36 34 0
359 176 183 0
7,673 3,864 3,796 13Statewide Total
Area Total
Area Total
Area Total
Area Total
Area Total

Arkansas Division of Children and Family Services 31
Appendix E: Children in Foster Care by Length of Stay
Area County TotalLess
than 30 Days
30 to 90 Days
3 to 6 Months
7 to 12 Months
12 to 24 Months
24 to 36 Months
Over 36 Months
1 Benton (Bentonville) 275 27 24 47 73 62 15 27
1 Carroll (Berryville) 95 9 3 9 40 21 4 9
1 Madison (Huntsville) 93 11 18 6 18 22 16 2
1 Washington (Fayetteville) 532 48 47 64 103 162 50 58
995 95 92 126 234 267 85 96
2 Craw ford (Van Buren) 191 17 19 15 24 57 38 21
2 Franklin (Ozark) 51 3 0 7 20 13 4 4
2 Johnson (Clarksville) 77 3 6 5 23 19 15 6
2 Logan (Booneville) 69 0 6 12 12 19 14 6
2 Logan (Paris) 52 1 3 0 7 28 11 2
2 Scott (Waldron) 58 1 4 2 17 19 9 6
2 Sebastian (Fort Smith) 834 20 43 68 141 256 162 144
2 Yell (Danville) 86 1 7 17 11 23 14 13
1,418 46 88 126 255 434 267 202
3 Clark (Arkadelphia) 33 3 3 2 9 9 3 4
3 Garland (Hot Springs) 269 37 36 48 66 43 16 23
3 Hot Spring (Malvern) 87 3 2 9 13 22 25 13
3 How ard (Nashville) 15 1 2 3 3 3 0 3
3 Montgomery (Mount Ida) 6 0 0 0 5 1 0 0
3 Perry (Perryville) 14 0 0 2 8 1 0 3
3 Pike (Murfreesboro) 29 0 1 5 4 6 12 1
3 Polk (Mena) 65 6 6 8 18 13 6 8
3 Saline (Benton) 109 4 18 7 32 29 13 6
627 54 68 84 158 127 75 61
4 Columbia (Magnolia) 50 1 3 6 7 21 6 6
4 Hempstead (Hope) 37 2 17 0 5 7 2 4
4 Lafayette (Lew isville) 11 3 0 0 1 2 0 5
4 Little River (Ashdow n) 39 4 3 9 11 11 1 0
4 Miller (Texarkana) 140 15 14 4 38 29 15 25
4 Nevada (Prescott) 13 0 1 4 4 4 0 0
4 Ouachita (Camden) 69 10 6 11 19 19 0 4
4 Sevier (DeQueen) 53 5 4 10 18 9 2 5
4 Union (El Dorado) 83 5 17 5 16 13 15 12
495 45 65 49 119 115 41 61
5 Baxter (Mountain Home) 81 5 16 20 14 15 4 7
5 Boone (Harrison) 89 5 27 9 19 16 4 9
5 Conw ay (Morrilton) 93 7 12 11 16 21 13 13
5 Faulkner (Conw ay) 229 20 27 19 74 48 29 12
5 Marion (Yellville) 28 5 3 1 6 6 5 2
5 New ton (Jasper) 6 0 0 0 1 2 2 1
5 Pope (Russellville) 84 8 6 5 14 25 9 17
5 Searcy (Marshall) 18 2 1 0 9 3 1 2
5 Van Buren (Clinton) 32 4 1 6 2 11 7 1
660 56 93 71 155 147 74 64
Area Total
Area Total
Area Total
Area Total
Area Total

Arkansas Division of Children and Family Services 32
Area County TotalLess
than 30 Days
30 to 90 Days
3 to 6 Months
7 to 12 Months
12 to 24 Months
24 to 36 Months
Over 36 Months
6 Pulaski (East) 64 2 2 11 14 9 12 14
6 Pulaski (Jacksonville) 98 17 7 9 14 17 18 16
6 Pulaski (North) 179 28 18 10 25 39 22 37
6 Pulaski (South) 187 25 6 9 30 57 25 35
6 Pulaski (Southw est) 107 7 10 5 19 17 17 32
635 79 43 44 102 139 94 134
7 Bradley (Warren) 14 2 0 1 3 3 3 2
7 Calhoun (Hampton) 5 0 1 1 0 0 1 2
7 Cleveland (Rison) 30 1 7 5 11 4 1 1
7 Dallas (Fordyce) 21 3 0 1 4 7 4 2
7 Grant (Sheridan) 34 0 5 1 11 7 3 7
7 Jefferson (Pine Bluff) 185 33 23 29 32 37 6 25
7 Lincoln (Star City) 15 7 4 1 0 2 0 1
7 Lonoke (Lonoke) 203 19 14 29 39 72 24 6
7 Prairie (DeValls Bluff) 11 3 4 0 3 0 0 1
518 68 58 68 103 132 42 47
8 Clay (Piggott & Corning) 34 5 1 4 10 5 7 2
8 Craighead (Jonesboro) 219 17 15 33 45 55 24 30
8 Fulton (Salem) 58 5 3 8 18 11 12 1
8 Greene (Paragould) 213 16 28 21 56 40 13 39
8 Izard (Melbourne) 52 1 1 2 17 21 9 1
8 Law rence (Walnut Ridge) 46 8 7 6 8 7 4 6
8 Mississippi (Blytheville) 107 8 18 9 23 35 12 2
8 Mississippi (Osceola) 49 2 7 16 13 5 2 4
8 Randolph (Pocahontas) 66 1 6 9 23 17 5 5
8 Sharp (Ash Flat) 72 7 3 9 14 31 6 2
916 70 89 117 227 227 94 92
9 Cleburne (Heber Springs) 83 11 13 10 17 25 4 39 Crittenden (West Memphis) 156 22 17 11 46 27 20 139 Cross (Wynne) 103 12 14 13 33 11 9 119 Independence (Batesville) 126 15 11 12 34 38 8 89 Jackson (New port) 108 4 16 20 25 32 3 89 Poinsett (Harrisburg) 199 11 24 26 59 31 23 259 Stone (Mountain View ) 33 2 3 1 18 5 0 49 White (Searcy) 192 33 24 16 52 37 20 109 Woodruff (Augusta) 50 3 11 0 6 20 4 6
1,050 113 133 109 290 226 91 88
10 Arkansas (Dew itt) 19 4 0 2 4 4 0 510 Arkansas (Stuttgart) 26 2 3 6 8 5 2 010 Ashley (Hamburg) 44 4 3 7 6 14 5 510 Chicot (Lake Village) 38 5 2 9 8 3 5 610 Desha (McGehee) 10 3 0 0 4 2 0 110 Drew (Monticello) 56 4 7 2 22 6 5 1010 Lee (Marianna) 14 0 1 2 5 1 3 210 Monroe (Brinkley) 16 1 0 0 7 7 1 010 Monroe (Clarendon) 12 3 0 0 6 0 3 010 Phillips (Helena) 54 0 7 0 7 12 9 1910 St. Francis (Forrest City) 70 6 8 0 16 16 11 13
359 32 31 28 93 70 44 61
7,673 658 760 822 1,736 1,884 907 906Statewide Total
Area Total
Area Total
Area Total
Area Total
Area Total
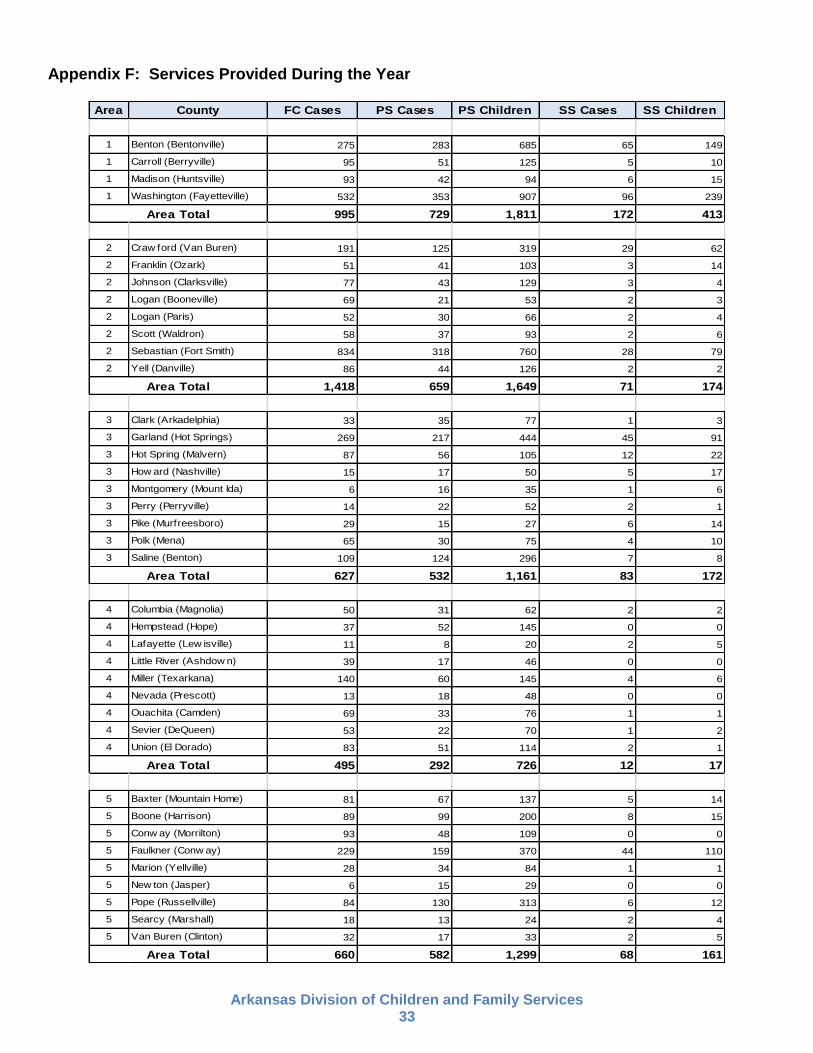
Arkansas Division of Children and Family Services 33
Appendix F: Services Provided During the Year
Area County FC Cases PS Cases PS Children SS Cases SS Children
1 Benton (Bentonville) 275 283 685 65 149
1 Carroll (Berryville) 95 51 125 5 10
1 Madison (Huntsville) 93 42 94 6 15
1 Washington (Fayetteville) 532 353 907 96 239
995 729 1,811 172 413
2 Craw ford (Van Buren) 191 125 319 29 62
2 Franklin (Ozark) 51 41 103 3 14
2 Johnson (Clarksville) 77 43 129 3 4
2 Logan (Booneville) 69 21 53 2 3
2 Logan (Paris) 52 30 66 2 4
2 Scott (Waldron) 58 37 93 2 6
2 Sebastian (Fort Smith) 834 318 760 28 79
2 Yell (Danville) 86 44 126 2 2
1,418 659 1,649 71 174
3 Clark (Arkadelphia) 33 35 77 1 3
3 Garland (Hot Springs) 269 217 444 45 91
3 Hot Spring (Malvern) 87 56 105 12 22
3 How ard (Nashville) 15 17 50 5 17
3 Montgomery (Mount Ida) 6 16 35 1 6
3 Perry (Perryville) 14 22 52 2 1
3 Pike (Murfreesboro) 29 15 27 6 14
3 Polk (Mena) 65 30 75 4 10
3 Saline (Benton) 109 124 296 7 8
627 532 1,161 83 172
4 Columbia (Magnolia) 50 31 62 2 2
4 Hempstead (Hope) 37 52 145 0 0
4 Lafayette (Lew isville) 11 8 20 2 5
4 Little River (Ashdow n) 39 17 46 0 0
4 Miller (Texarkana) 140 60 145 4 6
4 Nevada (Prescott) 13 18 48 0 0
4 Ouachita (Camden) 69 33 76 1 1
4 Sevier (DeQueen) 53 22 70 1 2
4 Union (El Dorado) 83 51 114 2 1
495 292 726 12 17
5 Baxter (Mountain Home) 81 67 137 5 14
5 Boone (Harrison) 89 99 200 8 15
5 Conw ay (Morrilton) 93 48 109 0 0
5 Faulkner (Conw ay) 229 159 370 44 110
5 Marion (Yellville) 28 34 84 1 1
5 New ton (Jasper) 6 15 29 0 0
5 Pope (Russellville) 84 130 313 6 12
5 Searcy (Marshall) 18 13 24 2 4
5 Van Buren (Clinton) 32 17 33 2 5
660 582 1,299 68 161
Area Total
Area Total
Area Total
Area Total
Area Total
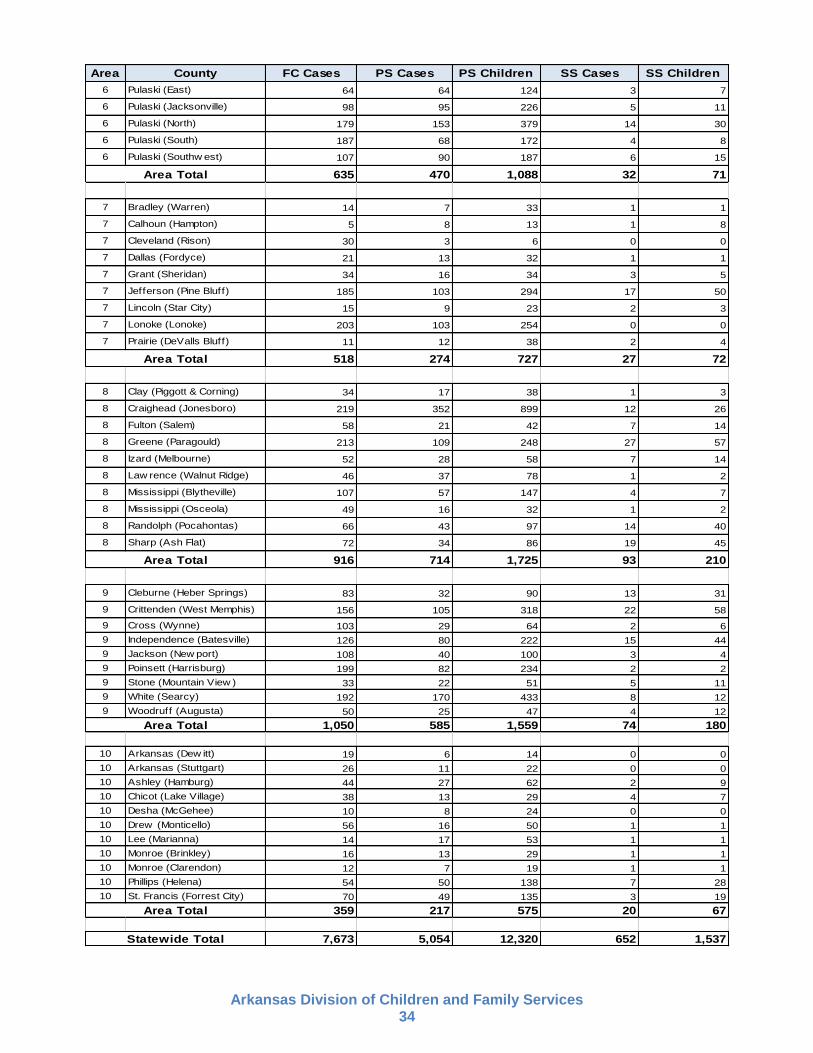
Arkansas Division of Children and Family Services 34
Area County FC Cases PS Cases PS Children SS Cases SS Children6 Pulaski (East) 64 64 124 3 7
6 Pulaski (Jacksonville) 98 95 226 5 11
6 Pulaski (North) 179 153 379 14 30
6 Pulaski (South) 187 68 172 4 8
6 Pulaski (Southw est) 107 90 187 6 15
635 470 1,088 32 71
7 Bradley (Warren) 14 7 33 1 1
7 Calhoun (Hampton) 5 8 13 1 8
7 Cleveland (Rison) 30 3 6 0 0
7 Dallas (Fordyce) 21 13 32 1 1
7 Grant (Sheridan) 34 16 34 3 5
7 Jefferson (Pine Bluff) 185 103 294 17 50
7 Lincoln (Star City) 15 9 23 2 3
7 Lonoke (Lonoke) 203 103 254 0 0
7 Prairie (DeValls Bluff) 11 12 38 2 4
518 274 727 27 72
8 Clay (Piggott & Corning) 34 17 38 1 3
8 Craighead (Jonesboro) 219 352 899 12 26
8 Fulton (Salem) 58 21 42 7 14
8 Greene (Paragould) 213 109 248 27 57
8 Izard (Melbourne) 52 28 58 7 14
8 Law rence (Walnut Ridge) 46 37 78 1 2
8 Mississippi (Blytheville) 107 57 147 4 7
8 Mississippi (Osceola) 49 16 32 1 2
8 Randolph (Pocahontas) 66 43 97 14 40
8 Sharp (Ash Flat) 72 34 86 19 45
916 714 1,725 93 210
9 Cleburne (Heber Springs) 83 32 90 13 31
9 Crittenden (West Memphis) 156 105 318 22 589 Cross (Wynne) 103 29 64 2 69 Independence (Batesville) 126 80 222 15 449 Jackson (New port) 108 40 100 3 49 Poinsett (Harrisburg) 199 82 234 2 29 Stone (Mountain View ) 33 22 51 5 119 White (Searcy) 192 170 433 8 129 Woodruff (Augusta) 50 25 47 4 12
1,050 585 1,559 74 180
10 Arkansas (Dew itt) 19 6 14 0 010 Arkansas (Stuttgart) 26 11 22 0 010 Ashley (Hamburg) 44 27 62 2 910 Chicot (Lake Village) 38 13 29 4 710 Desha (McGehee) 10 8 24 0 010 Drew (Monticello) 56 16 50 1 110 Lee (Marianna) 14 17 53 1 110 Monroe (Brinkley) 16 13 29 1 110 Monroe (Clarendon) 12 7 19 1 110 Phillips (Helena) 54 50 138 7 2810 St. Francis (Forrest City) 70 49 135 3 19
359 217 575 20 67
7,673 5,054 12,320 652 1,537Statewide Total
Area Total
Area Total
Area Total
Area Total
Area Total

Arkansas Division of Children and Family Services 35
Appendix G: Summary of Reports Involving Child Fatality
Per Ark. Code Ann. § 12-18-1104(c), any information regarding a child fatality cannot be released by the Department of Human Services if release of such information would jeopardize a criminal investigation. Of the 53 child fatalities that were reported for SFY 2019, case-specific information could be disclosed for 25 of those incidents at the time of this report’s release (see below). The website https://ardhs.sharepointsite.net/CFN/default.aspx displays up-to-date documentation concerning all child fatalities and near fatalities reported in Arkansas once that information can be disclosed.
True Fatality Reports
Child County Age Race Gender Date of Death
Allegations
or Preliminary
Cause of Death
Placement at the Time of Incident
Relationship of Alleged
Offender to the Child
Agency Conducting
the Investigation
Action(s) Taken by Agency
Prior DCFS Involvement
Jordan Shisler Independence 8 White Male 7/23/2018 Inadequate
Supervision In-Home Relative CACD None None
Mason Randolph Pulaski 3 Black Male 8/14/2018 Inadequate
Supervision In-Home Relative CACD Open PS Case None
Lincoln Warren Cleburne <1 White Male 8/23/2018
Physical Abuse,
Neglect, & Inadequate Supervision
In-Home Relative CACD 72-Hour Hold Prior History
Chanston Williams Craighead 1 Black Male 9/4/2018 Inadequate
Supervision In-Home Relative CACD Open PS Case Prior History
Malakai Shelton Sebastian <1 White Male 10/2/2018 Inadequate
Supervision In-Home Relative CACD None Prior History
Rasique Harmon Hempstead 5 Black Male 10/4/2018 Failure to
Protect In-Home Relative CACD None None
Makiah Munn Hempstead 3 Black Female 10/4/2018 Failure to
Protect In-Home Relative CACD None None
Juliana Miller White 1 Multiple Female 10/14/2018
Neglect & Physical Abuse
In-Home Relative CACD None None
Rion Faulkner Ouachita 3 White Male 11/8/2018
Neglect & Inadequate Supervision
In-Home Relative CACD None None

Arkansas Division of Children and Family Services 36
Child County Age Race Gender Date of Death
Allegations
or Preliminary
Cause of Death
Placement at the Time of Incident
Relationship of Alleged
Offender to the Child
Agency Conducting
the Investigation
Action(s) Taken by Agency
Prior DCFS Involvement
Calvin Mcintosh Craighead 16 Black Male 11/22/2018
Physical Abuse,
Neglect, & Inadequate Supervision
In-Home Relative, Non-
Relative, & Unknown
CACD Open PS Case Prior History
Christian Dunbar Pulaski <1 Black Male 11/28/2018
Physical Abuse &
Substance Misuse
In-Home Relative CACD None None
Blaze Miesner Sebastian <1 White Male 12/12/2018 Inadequate
Supervision In-Home Relative CACD None None
Charlene Golkhajeh Polk 4 White Female 12/12/2018 Physical
Abuse In-Home Relative CACD None None
Lessie Wilson Mississippi <1 Black Female 1/4/2019 Inadequate
Supervision In-Home Relative CACD 72-Hour Hold None
Lucy Beasley Craighead 15 White Female 1/8/2019 Medical
Neglect In-Home Relative CACD None Prior History
Keiderrion Love Mississippi 2 Black Male 5/2/2019 Physical
Abuse In-Home Non-Relative CACD 72-Hour Hold None
Mia Hannah Mississippi <1 Black Female 5/25/2019 Inadequate
Supervision In-Home Relative CACD Open PS Case None

Arkansas Division of Children and Family Services 37
Unsubstantiated Fatality Reports
Child County Age Race Gender Date of Death
Allegations
or Preliminary
Cause of Death
Placement at the Time of Incident
Relationship of Alleged
Offender to the Child
Agency Conducting
the Investigation
Action(s) Taken by Agency
Prior DCFS Involvement
Gideon Harms Madison <1 White Male 9/17/2018 Medical
Neglect In-Home Relative CACD None None
Brennen Esau Pulaski 5 Black Male 9/22/2018 Inadequate Supervision In-Home Relative CACD None Prior History
Elizabeth Fay Lonoke 13 White Female 10/28/2018 Suicide In-Home N/A CACD None Prior History
Nayeli Pina Sebastian <1 White Female 12/11/2018 Failure to Protect In-Home Relative CACD None None
Arron Allred Hot Spring <1 White Male 12/26/2018 Sexual Abuse In-Home Unknown CACD None None
Zayian Tarar Cleburne 4 Unable to Determine Male 1/5/2019 Failure to
Protect In-Home Relative CACD None None
Logan Deen Washington 7 White Male 4/5/2019 Inadequate Supervision In-Home Relative CACD None None
Michael Whitaker Faulkner 4 Black Male 5/17/2019 Inadequate
Supervision In-Home Relative CACD None Prior History
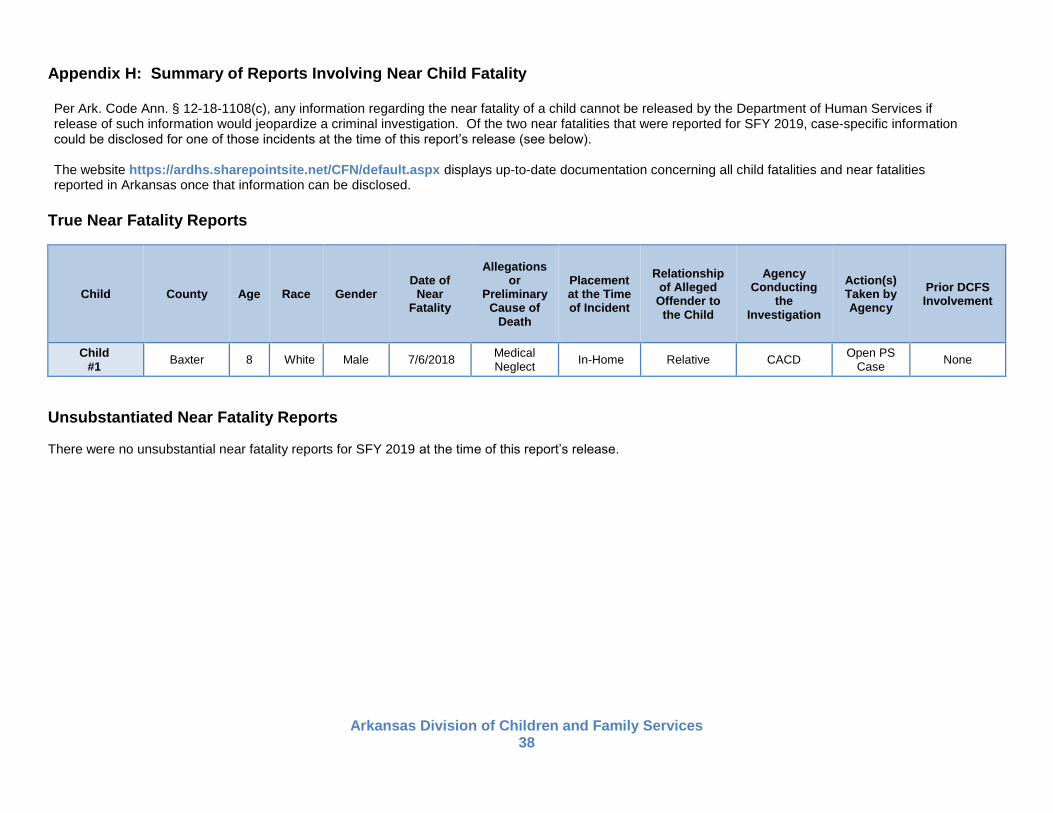
Arkansas Division of Children and Family Services 38
Appendix H: Summary of Reports Involving Near Child Fatality
Per Ark. Code Ann. § 12-18-1108(c), any information regarding the near fatality of a child cannot be released by the Department of Human Services if release of such information would jeopardize a criminal investigation. Of the two near fatalities that were reported for SFY 2019, case-specific information could be disclosed for one of those incidents at the time of this report’s release (see below). The website https://ardhs.sharepointsite.net/CFN/default.aspx displays up-to-date documentation concerning all child fatalities and near fatalities reported in Arkansas once that information can be disclosed.
True Near Fatality Reports
Child County Age Race Gender Date of
Near Fatality
Allegations
or Preliminary
Cause of Death
Placement at the Time of Incident
Relationship of Alleged
Offender to the Child
Agency Conducting
the Investigation
Action(s) Taken by Agency
Prior DCFS Involvement
Child #1 Baxter 8 White Male 7/6/2018 Medical
Neglect In-Home Relative CACD Open PS Case None
Unsubstantiated Near Fatality Reports There were no unsubstantial near fatality reports for SFY 2019 at the time of this report’s release.

Arkansas Division of Children and Family Services 39
Appendix I: Fatalities of Children in Foster Care Who Did Not Receive a Maltreatment Investigation
Child County Age Race Gender Date of Death
Preliminary Cause of
Death
Placement at the Time of Incident
Action(s) Taken by Agency
Services Provided
Prior to the Incident
Child #1 Faulkner 20 Black Female 6/7/2019 Medically
Fragile Foster Care None Foster Care
Child #2 Benton 18 White Male 6/17/2019 Unknown Foster Care None Foster Care
Child #3 Pulaski <1 Black Female 6/24/2019 Medically
Fragile Foster Care None Foster Care

Arkansas Division of Children and Family Services 40
Appendix J: Average Caseload as of the End of SFY 2019, by County
Prairie County did not have any family service workers at the end of the year; its cases were assigned to workers from other counties.

Arkansas Division of Children and Family Services 41
Appendix K: Foster Home Closure Reasons
Area CountyChange in
Family Circumstances
Foster Family’s
Decision
No Longer Meets
Requirements
Adopted/Custody/Guardianship/ Relative Only
OtherFounded Abuse/ Neglect
Provider/ Services No
Longer NeededTotal
1 Benton (Bentonville) 3 31 3 7 0 1 10 551 Carroll (Berryville) 2 1 0 1 0 0 2 61 Madison (Huntsville) 0 1 0 1 0 0 1 31 Washington (Fayetteville) 3 36 6 11 1 0 7 64
8 69 9 20 1 1 20 1282 Crawford (Van Buren) 0 19 5 4 0 0 13 412 Franklin (Ozark) 0 6 1 2 0 0 1 102 Johnson (Clarksville) 0 4 1 2 0 0 2 92 Logan (Booneville) 0 1 2 1 0 0 2 62 Logan (Paris) 0 1 2 0 0 0 3 62 Scott (Waldron) 0 0 0 0 0 0 1 12 Sebastian (Fort Smith) 4 42 2 13 0 0 9 702 Yell (Danville) 0 5 1 0 0 0 4 10
4 78 14 22 0 0 35 1533 Clark (Arkadelphia) 0 1 0 0 0 0 0 13 Garland (Hot Springs) 1 9 3 3 0 0 6 223 Hot Spring (Malvern) 0 9 0 0 0 0 1 103 Howard (Nashville) 0 2 1 2 0 0 0 53 Montgomery (Mount Ida) 0 1 1 0 0 1 0 33 Perry (Perryville) 0 1 0 1 0 0 0 23 Pike (Murfreesboro) 0 1 0 1 0 0 0 23 Polk (Mena) 1 3 0 2 1 0 0 73 Saline (Benton) 1 21 1 4 0 0 2 29
3 48 6 13 1 1 9 814 Columbia (Magnolia) 0 3 1 2 0 0 0 64 Hempstead (Hope) 0 2 0 1 0 0 0 34 Lafayette (Lewisville) 0 0 0 0 0 0 0 04 Little River (Ashdown) 0 0 0 1 0 0 0 14 Miller (Texarkana) 0 5 4 4 0 0 0 134 Nevada (Prescott) 0 0 0 1 0 0 0 14 Ouachita (Camden) 0 0 0 0 0 0 0 04 Sevier (DeQueen) 0 2 0 1 0 0 0 34 Union (El Dorado) 2 4 0 3 0 0 1 10
2 16 5 13 0 0 1 375 Baxter (Mountain Home) 1 6 1 2 0 0 2 125 Boone (Harrison) 0 13 3 1 1 0 2 205 Conway (Morrilton) 0 7 1 1 0 0 0 95 Faulkner (Conway) 2 22 9 5 0 0 1 395 Marion (Yellville) 0 3 0 1 0 0 0 45 Newton (Jasper) 0 1 0 0 0 0 0 15 Pope (Russellville) 0 9 2 4 0 0 0 155 Searcy (Marshall) 0 0 0 1 0 0 0 15 Van Buren (Clinton) 0 3 0 0 0 0 0 3
3 64 16 15 1 0 5 1046 Pulaski (East) 0 7 4 0 0 0 2 136 Pulaski (Jacksonville) 0 13 0 1 0 0 0 146 Pulaski (North) 3 30 4 3 0 0 0 406 Pulaski (South) 5 31 10 0 4 0 1 516 Pulaski (Southwest) 2 8 4 0 0 0 0 14
10 89 22 4 4 0 3 1327 Bradley (Warren) 0 0 0 1 0 0 0 17 Calhoun (Hampton) 0 0 0 0 0 0 0 07 Cleveland (Rison) 1 0 0 0 0 0 0 17 Dallas (Fordyce) 0 0 0 0 0 0 0 07 Grant (Sheridan) 0 2 0 3 0 0 1 67 Jefferson (Pine Bluff) 1 4 2 4 1 0 0 127 Lincoln (Star City) 0 0 0 0 0 0 0 07 Lonoke (Lonoke) 0 15 3 5 2 0 2 277 Prairie (DeValls Bluff) 0 1 0 0 0 0 0 1
2 22 5 13 3 0 3 48
Area Total
Area Total
Area Total
Area Total
Area Total
Area Total
Area Total

Arkansas Division of Children and Family Services 42
Details of the Major Closure Reason Categories Above (Statewide) Reason Specific Reason Number of Homes Closed
Adopted/Custody/Guardianship/Relative Only Child(ren) Left Care 103 Custody/Guardianship 61
Change in Family Circumstances
Personal Issues 17 Moved 11 Pregnant 7 Provider Moved Out of State 6 Health of Parent 4
Foster Family’s Decision
Provider Request 401 Changed to Adopt Only 104 Provider Became Private Therapeutic Foster Home 2 Taking a Break 2
Founded Abuse/Neglect True Maltreatment 7
No Longer Meets Requirements
DHS Request 78 Failed Re-evaluation/Non-Compliance 12 Arrested 2 Not taking Children when Contacted 2
Other Selected in Error 6 Contract Ended 4 Duplicate 2
Provider/Services No Longer Needed Provider/Services No Longer Needed 107
Area CountyChange in
Family Circumstances
Foster Family’s
Decision
No Longer Meets
Requirements
Adopted/Custody/Guardianship/ Relative Only
OtherFounded Abuse/ Neglect
Provider/ Services No
Longer NeededTotal
8 Clay (Piggott & Corning) 0 2 0 2 0 0 0 48 Craighead (Jonesboro) 4 20 1 10 0 1 4 408 Fulton (Salem) 1 1 0 4 0 0 1 78 Greene (Paragould) 0 12 4 6 0 0 4 268 Izard (Melbourne) 0 0 2 3 0 1 0 68 Lawrence (Walnut Ridge) 1 4 0 1 1 0 0 78 Mississippi (Blytheville) 3 10 0 7 0 0 0 208 Mississippi (Osceola) 0 1 0 0 0 1 1 38 Randolph (Pocahontas) 1 3 1 1 0 1 0 78 Sharp (Ash Flat) 1 2 0 2 0 1 0 6
11 55 8 36 1 5 10 1269 Cleburne (Heber Springs) 0 1 0 4 0 0 0 59 Crittenden (West Memphis) 1 1 1 4 0 0 0 79 Cross (Wynne) 0 4 2 1 0 0 2 99 Independence (Batesville) 0 8 1 4 0 0 0 139 Jackson (Newport) 0 3 0 0 0 0 1 49 Poinsett (Harrisburg) 0 4 0 1 0 0 6 119 Stone (Mountain View) 0 3 0 1 0 0 0 49 White (Searcy) 0 21 3 0 0 0 3 279 Woodruff (Augusta) 0 1 0 0 0 0 3 4
1 46 7 15 0 0 15 8410 Arkansas (Dewitt) 1 4 0 0 0 0 0 510 Arkansas (Stuttgart) 0 2 0 0 0 0 2 410 Ashley (Hamburg) 0 3 1 1 0 0 1 610 Chicot (Lake Village) 0 0 0 0 0 0 0 010 Desha (McGehee) 0 1 0 1 0 0 0 210 Drew (Monticello) 0 4 0 1 0 0 1 610 Lee (Marianna) 0 2 0 1 0 0 0 310 Monroe (Brinkley) 0 1 0 0 0 0 1 210 Monroe (Clarendon) 0 0 0 0 0 0 0 010 Phillips (Helena) 0 1 0 4 1 0 0 610 St. Francis (Forrest City) 0 2 0 2 0 0 1 5
1 20 1 10 1 0 6 390 2 1 3 0 0 0 6
45 509 94 164 12 7 107 938Total
Area Total
Area Total
Area TotalOut of State

Arkansas Division of Children and Family Services 43
Appendix L: Summary of Foster Care Maltreatment Reports Characteristics of Children in Foster Care Involved in Allegations of Maltreatment, SFY 2019 Five-hundred and fifty-two reports of alleged maltreatment, involving 592 children in foster care, were received by the hotline during SFY 2019. In 121 reports involving 138 children, foster parents4 were identified as the alleged offenders. As shown by the following chart, seven of those reports were found to be true5 and the seven homes involved in those reports have been closed.
Foster Home Maltreatment Reports SFY 2019
True
Unsubstantiated
Pending
7 114 0
All allegations of maltreatment concerning foster homes are investigated by the Crimes Against Children Division (CACD) of the Arkansas State Police. DCFS staff do not actively participate in the investigation of these reports. Allegations of maltreatment regarding foster homes require the agency to assess the safety of all children residing in the home. The following charts display the characteristics of the 138 foster children involved in allegations of maltreatment, with foster parents as the alleged offenders.
4 This includes foster family homes and therapeutic foster homes 5 The number of true investigations involving foster families reported in this report may differ from what was reported in individual quarterly reports for the same time period. This is due to the fact that some true findings were later overturned to unsubstantiated and some pending findings now have a final disposition.
8%
21%
29%
27%
15%
Ages
0 to 1
2 to 5
6 to 9
10 to 13
14 to 17

Arkansas Division of Children and Family Services 44
67%13%
19%
1%
Race/Ethnicity
White
Black
More Than 1 Race
Other
50%50%
Gender
Female
Male
58%38%
4%
Allegation
Abuse
Neglect
Sexual Abuse

Arkansas Division of Children and Family Services 45
County of Foster Homes in Which Alleged Maltreatment Occurred
County Number of Children Involved in Maltreatment Report(s) County Number of Children Involved
in Maltreatment Report(s) Pulaski 21 Fulton 2 Greene 16 Izard 2 Benton 13 Randolph 2 Washington 13 St. Francis 2 Crawford 7 Carroll 1 Lawrence 6 Chicot 1 Independence 5 Clark 1 Phillips 5 Cleburne 1 Sebastian 5 Crittenden 1 Faulkner 4 Drew 1 Jefferson 4 Howard 1 Lonoke 4 Johnson 1 Mississippi 4 Lee 1 Pope 4 Madison 1 Boone 3 Poinsett 1 Garland 3 Sevier 1 Baxter 2 Sharp 1 Clay 2 White 1 Craighead 2


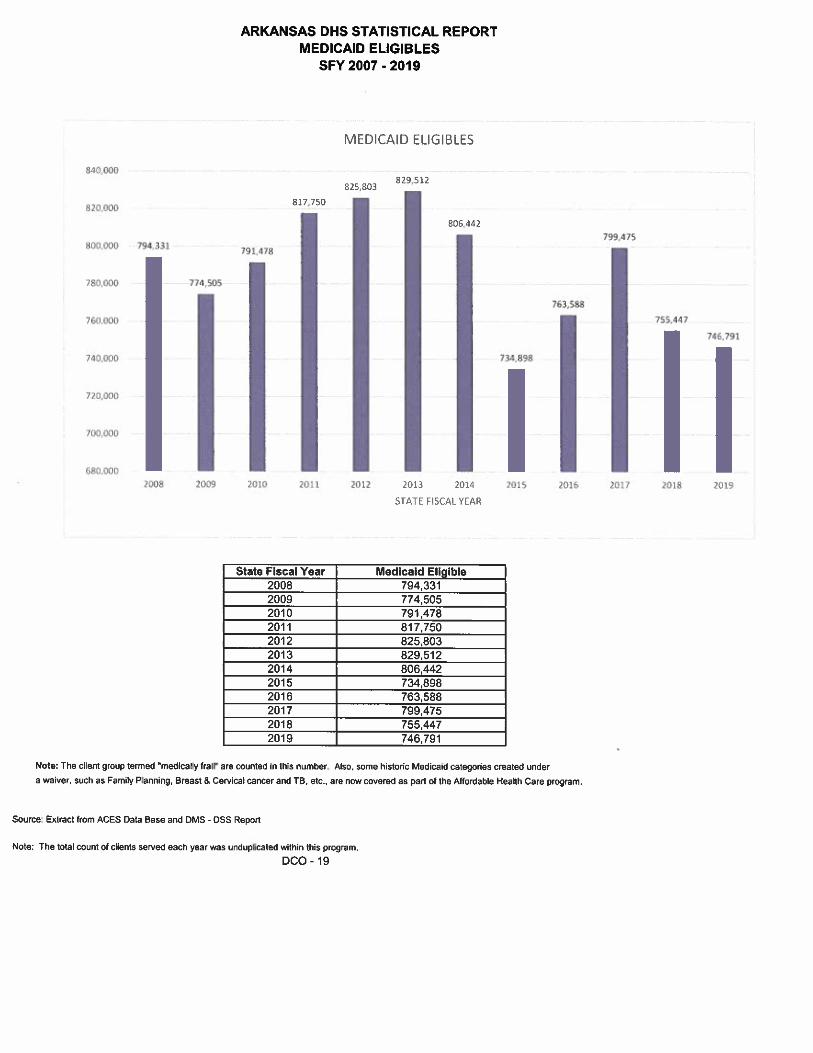


ARKANSAS DHS STATISTICAL REPORTDIVISION OF DEVELOPMENTAL DISABILITIES SERVICES
SFY 2019
*The term "Intellectual Disabilities" has replaced the term "Mental Retardation"
Source: DDS Website
Act 348 of 1985 authorized the reorganization of the Department of Human Services (DHS), and under this changeDDS became one of 13 divisions or offices that made up an integrated services system. This Act designated controland administration of the HDCs under the management and direction of the DDS Board with daily operation authorityextended to the DDS Director, in coordination with the Director of DHS.
The Division of Developmental Disabilities (DDS) provides an extensive range of services to individuals in communitysettings. These services are provided through private not-for-profit programs and other providers whose service areasinclude all 75 counties of the state. DDS oversees Licensed Center-Based Providers, Certified Home and CommunityBased Services (HCBS) Waiver Providers, and Certified First Connections (Part C IDEA Early Intervention)Providers. Additionally, DDS assists individuals and families in accessing generic community services, servicesoffered by other Divisions and agencies, individual and family supports and special needs funding. There are fivestate-operated Human Development Centers (HDC), licensed as Intermediate Care Facilities for Individuals withIntellectual Disabilities (ICF/IID) across the state. The HDCs are located in Conway, Arkadelphia, Jonesboro,Booneville, and Warren. These programs provided services to individuals with developmental disabilities who are inneed of 24-hour residential, medical, and habilitative services.
To accomplish its mission, DDS, the DDS Board, and DDS providers are committed to the principles and practices ofnormalization; least restrictive alternatives; affirmation of individuals' constitutional rights; provision of quality services;the interdisciplinary service delivery model; and the positive management of challenging behaviors.
In 1955, the Arkansas General Assembly created the Arkansas Children's Colony with the passage of Act 6. This acthas been revised and extended by numerous statutes, the latest being Act 1165 of 1975. Act 265 of 1969 created theArkansas Department of Mental Retardation*. It also expanded the authority of the Children's Colony Board to includecertain responsibilities for individuals who, because of other disabilities, show characteristics of intellectualdisabilities.
INTRODUCTION
Services, Mission and History
In 1971, the Governor designated Intellectual and Developmental Disabilities Services to administer the provisions ofthe Developmental Disabilities Services (DDS) and the Facilities Construction Act, or Public Law 91-517, (asamended). This and subsequent legislation expanded the responsibility of the agency to serve not only individualsintellectual disabilities but those with cerebral palsy, epilepsy, autism, spina bifida, and Down syndrome.
In 1981, Act 513 was passed and changed the name and official title of the agency and Board to the Division and theBoard of Developmental Disabilities Services. Under this Act, the Arkansas Children's Colonies became the HumanDevelopment Centers (HDCs). There are five HDCs across the state; the first opened in 1959 in Conway, and the lastopened in 1978 in Warren. In 1987, DDS submitted its initial application for Home and Community Based (HCBS)Waiver Services. The HCBS program currently serves nearly 4,200 people in their own homes and communities.Day services are accessible in every county through Developmental Day Treatment Clinics. The youngest Arkansansare eligible for early intervention services.
Act 38 of 1971 transferred the Arkansas Department of Intellectual Disabilities and its functions, powers, and dutiesto the Department of Social and Rehabilitative Services, which is now the Department of Human Services (DHS).
DDS - 1

ARKANSAS DHS STATISTICAL REPORTDIVISION OF DEVELOPMENTAL DISABILITIES SERVICES
SFY 2019
Below are brief descriptions of our service areas:
Encouraging individual, guardian, parent, family, public, and community involvement in program development, delivery, andevaluation.
Engaging in statewide planning that ensures optimal and innovative growth of the Arkansas service system to meet the needsof persons with developmental disabilities and to assist such persons to achieve independence, productivity, and integrationinto the community.
Any person or organization may refer a child to CHC for diagnosis and recommendations for treatment. CHC staff assist withthe application process, which may occur at a DHS county office, designated hospitals or other DDS locations. CHC staff opensa case record, develops a treatment plan, and coordinates services.
Protecting the constitutional rights of individuals with disabilities and their rights to personal dignity, respect and freedom fromharm.
Assuring that individuals with developmental disabilities who receive services from DDS are provided uninterrupted essentialservices until such time as a person no longer needs to depend on these services.
GOALS AND SERVICES
DDS, the DDS Board, and its providers are dedicated to the pursuit of the following goals:
Advocating for adequate funding, staffing, and services to address the needs of persons with developmental disabilities.
Encouraging an interdisciplinary service system to be utilized in the delivery of appropriate individualized and quality services.
The Children with Chronic Healthcare Needs program(CHC) provides specialized medical care and rehabilitation for childrenwho are chronically ill or have physical disabilities, whose families are at least partially unable to provide for such services, andwho meet the program’s criteria. CHC staff determine financial and medical eligibility. An eligible child is one who is under 18years of age (under age 21 if funding allows,) who has a disabling physical impairment (either congenital or acquired) or whohas other conditions known to produce such physical impairments. Services are provided in a community setting by nurses,social workers, care coordinators, and support staff.
CHC provides medical and surgical treatment, therapies, appliances, medications, and care coordination. All medical specialtyservices for children must be prior approved by CHC service teams.
First Connections (Part C IDEA Early Intervention) and Early Childhood (Part B IDEA) Services:
The Children’s Services Section provides and oversees developmental disability services to children from birth to three yearsold in the child's natural environment and oversees special education services for children of ages three to five. By networkingwith local community providers, DDS ensures that services comply with Parts B and C of the Individuals with DisabilitiesEducation Act (IDEA).
Children with Chronic Healthcare Needs:

ARKANSAS DHS STATISTICAL REPORTDIVISION OF DEVELOPMENTAL DISABILITIES SERVICES
SFY 2019
Source: Division of Developmental Disabilities Services
Residential Services
Five state-operated residential facilities, known as Human Development Centers, are located across the state.
Home and Community Based Services (HCBS) Waiver
This section administers the Community Employment Supports (CES) program under a 1915(c) HCBS Medicaid Waiver,collects and analyzes data, develops policy, remediates problems, and participates in the Waiver Quality Management Systemas required by the Centers for Medicare and Medicaid Services. Administration of this program includes approval of a Person-Centered Service Plan, oversight of plan budget, case review, and prior service authorization. People of any age may apply forservices under this program. Service specialists who assist individuals, families, and providers are located in various countyoffices across the state.
GOALS AND SERVICES
DDS - 2

ARKANSAS DHS STATISTICAL REPORTDIVISION OF DEVELOPMENTAL DISABILITIES SERVICES
SFY 2019DDS - 3

First Connections

ARKANSAS DHS STATISTICAL REPORTDIVISION OF DEVELOPMENTAL DISABILITIES SERVICES
SFY 2019
●
DDS - 4
FIRST CONNECTIONS SECTION
Services to Infants and Toddlers (Ages: Birth to Three) a.k.a The First Connection Program
The Part C First Connections Program provided Early Intervention Services to 2138 children. This programunder the direction of the United States Office of Special Education Programs (OSEP) serves infants andtoddlers ages 0 to 3 in their natural environment. A natural environment as defined by Part C of the Individualswith Disabilities Education Act (IDEA) is a setting that is natural or typical for a same-aged infant or toddlerwithout a disability and may include: their home, community, or other settings that are typical for an infant ortoddler without a disability.

ARKANSAS DHS STATISTICAL REPORTDIVISION OF DEVELOPMENTAL DISABILITIES SERVICES
SFY 2019
Vision 2
●
American Indian or Alaska Native Birth to One YearAsian or Pacific Islander One to Two YearsBlack or African American Two to Three YearsHispanic or LatinoWhiteTwo or More Races 96
Source: Division of Developmental Disabilities Services
2,138Total 2,138 Total
Nutrition Services
Physical Therapy 260Occupational Therapy
1,489
25 1,156359 868167
2 114
First Connections
First Connections Early Intervention-Part C Services provided during the year:
Service
Audiology 1Assistive Technology (Adaptive Equipment) 2
Number of Children
2170
Service Coordination 78
Nursing Services 1Medical Services (Diagnostic/Evaluation) 0Health Services 0
Infants and Toddlers Receiving Early Intervention Services:
By AgeBy Race
Developmental Therapy/Special Instruction 1,339Speech/Language Therapy 652
HR (DayHab) 2Transportation 0
1Social Work
Psychological 0Respite Care 0

ARKANSAS DHS STATISTICAL REPORTDIVISION OF DEVELOPMENTAL DISABILITIES SERVICES
SFY 2019DDS - 5
Waiver Services

ARKANSAS DHS STATISTICAL REPORTDIVISION OF DEVELOPMENTAL DISABILITIES SERVICES
SFY 2019
● Northwest:
● North Central:
● Northeast:
● Central:
● Southwest:
● Southeast:
●
4,2304,5574,737 1
●
2
●
176485231 3
●
144112127 4
●
182187
1, 3, 4
2
Regions Counties Covered
Reported SFY-2019
Reported SFY-2017
Benton, Boone, Carroll, Johnson, Madison, Sebastian and Washington
Cleburne, Conway, Crawford, Faulkner, Franklin, Pope, Prairie, Van Buren, White, and Woodruff
Arkansas, Ashley, Bradley, Calhoun, Chicot, Cleveland, Dallas, Desha, Drew, Grant, Jefferson, Lincoln, Lonoke, Ouachita, Phillips and Union
CES Waiver Services Statistics:
CES Waiver services were approved for the following number of individuals in SFY-2019.
The total CES Waiver Expenditures for individuals in SFY-2019 (waiver services cost only) are.
Baxter, Clay, Craighead, Crittenden, Cross, Fulton, Greene, Independence, Izard, Jackson, Lawrence, Lee, Marion, Mississippi, Monroe, Newton, Poinsett, Randolph, Searcy, Sharp, Stone and St. Francis
Perry, Pulaski and Saline
Clark, Columbia, Garland, Hempstead, Hot Spring, Howard, Lafayette, Little River, Logan, Miller, Montgomery, Nevada, Pike, Polk, Scott, Sevier and Yell
Reported SFY-2018
COMMUNITY AND EMPLOYMENT SUPPORT (CES) WAIVER SERVICES
Data comparison of SFY (State Fiscal Year) 2019 data on; CES Waiver Database, InterChange (MMIS), and CES Waiver Expenditures Report. CES Waiver Expenditures Report for SFY-2019.
Source: Division of Developmental Disabilities Services Reports listed below;
Reported SFY-2017
Reported SFY-2017
Reported SFY-2019
Reported SFY-2019
Reported SFY-2019
The following number of individuals were released from the Waiver Applications List for processing in SFY-2019.
Services for the following number of individuals were closed in SFY-2019.
Reported SFY-2017
Reported SFY-2017
$225,029,744.94
Reported SFY-2019 $180,988,989.45
Reported SFY-2018
Reported SFY-2018
Reported SFY-2018
Reported SFY-2018 $237,512,575.07
Services for the following number of individuals were opened in SFY-2019.
DDS - 6

ARKANSAS DHS STATISTICAL REPORTDIVISION OF DEVELOPMENTAL DISABILITIES SERVICES
SFY 2019
Reported SFY-2017
Reported SFY-2018
Reported SFY-2019
793 865 8930 0 011 13 130 0 00 0 031 37 390 0 420 3 913 13 13
3,052 3,355 3,490330 271 238
4,230 4,557 4,737
GENDER Reported SFY-2017
Reported SFY-2018
Reported SFY-2019
Female 1,728 1,869 1,920Male 2,502 2,688 2,817Total 4,230 4,557 4,737
Reported SFY-2017
Reported SFY-2018
Reported SFY-2019
2,179 2,132 2,103154 191 231665 645 63737 36 38425 679 428321 4 53 223 285
203 3 33 89 9686 0 00 62 32629 30 33125 121 1200 342 432
4,230 4,557 4,737
Reported SFY-2017
Reported SFY-2018
Reported SFY-2019
303 422 4253,927 4,135 4,3124,230 4,557 4,737
DISABILITY Intellectual Disability
Cerebral Palsy Epilepsy Autism Down
Syndrome Spinabifida Other
SFY-2017 3,351 858 715 537 253 38 972SFY-2018 3,232 838 692 529 246 38 931SFY-2019 3,202 825 678 524 242 37 918
RACE
Group Home AdmissionSupportive Living Services
911 Act
Adult Protective Services
Nursing Home
Division of Children and Family Services
WhiteOther or Blank (No race selected)
Regular Request
Intermediate Care Facility for Individuals with Intellectual Disabilities
Total
PRIORITY
HispanicMore than one raceNative Hawaiian or Other Pacific Islander
Age: 18 and UpTotal
AGE
Age: Birth to 17
Tobacco Settlement (Starting in 2018)
CES Waiver Services Statistics (Continued):
COMMUNITY AND EMPLOYMENT SUPPORT (CES) WAIVER SERVICES
The disability numbers include some persons with multiple disabilities, thus the number would exceed the SFY Unduplicated Totals.
Source: Data comparison of SFY-2019 Division of Developmental Disabilities Services data on; DDS Waiver Database, MMIS, and DDS CES Waiver Expenditures Report.
Arkansas State Hospital
Total
Human Development CenterDDS DirectorProvider Tax
Child and Adolescent Service System Program
African AmericanAfrican American and WhiteAmerican Indian or Alaska NativeAmerican Indian or Alaska Native and African AmericanAmerican Indian or Alaska Native and WhiteAsian
DDS - 7

Quality Assurance
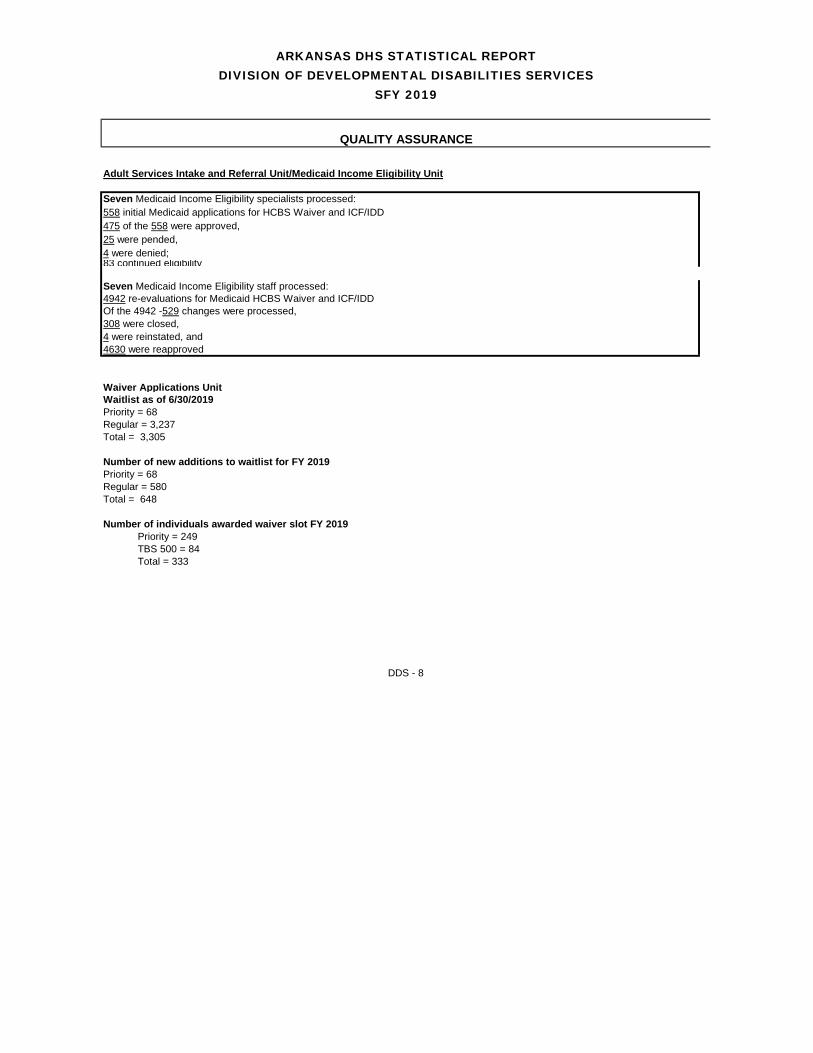
ARKANSAS DHS STATISTICAL REPORTDIVISION OF DEVELOPMENTAL DISABILITIES SERVICES
SFY 2019
Adult Services Intake and Referral Unit/Medicaid Income Eligibility Unit
Waiver Applications UnitWaitlist as of 6/30/2019Priority = 68Regular = 3,237Total = 3,305
Number of new additions to waitlist for FY 2019Priority = 68Regular = 580Total = 648
Number of individuals awarded waiver slot FY 2019 Priority = 249 TBS 500 = 84 Total = 333
DDS - 8
Seven Medicaid Income Eligibility specialists processed:558 initial Medicaid applications for HCBS Waiver and ICF/IDD475 of the 558 were approved,
Of the 4942 -529 changes were processed, 308 were closed, 4 were reinstated, and 4630 were reapproved
25 were pended,
83 continued eligibility
4942 re-evaluations for Medicaid HCBS Waiver and ICF/IDD
4 were denied;
Seven Medicaid Income Eligibility staff processed:
QUALITY ASSURANCE

ARKANSAS DHS STATISTICAL REPORTDIVISION OF DEVELOPMENTAL DISABILITIES SERVICES
SFY 2019
Adult Services Intake and Referral Unit/Medicaid Income Eligibility Unit43 DDS eligibility determinations were made17 were determined to be ineligible;15 Integrated Support Contracts were processed:12 Integrated Support Contracts were re-evaluated1 closed
97 Special needs requests approved;98 Closed0 sent to waiver
89 HDC Referrals processed:89 HDC referrals completed;1 were pended;6 Emergency Respite Requests were processed.
National Core Indicators Survey Project National Core Indicators Surveys NCI Adult Consumer Survey-ACS Waiver 400 NCI Adult Consumer Survey-facility based
Employment Initiatives
(APSE)
- DOL Community of Practice - Working across agencies to increase employment opportunities by identifying and addressing barriers, and sharing resources.
to expand work with transformation from center-based employment to Supported Employment Vendors.
Implementation of State as Model Employer (SAME) Project
‘SAME’ seeks to establish a more diverse and inclusive workforce within state government. DHS/DDS is leading by example in making employment for Arkansans with disabilities a reality by becoming a State Agency Model Employer. Arkansas’ –government is the largest employer in our state… and by establishing Arkansas as- a State Agency Model Employer-we can implement employment strategies that will increase and support public-and private sector employment efforts for individuals with disabilities in our state. Through this initiative DDS has hired nine (9) indidnviudals with Intellectual disabilities in various DDS temporary extra help positions. These great workers work in various areas of state government. Six of them are housed in DHS/DDS; two are housed with ARS; and one is housed with the Governor's Council on Developmental Disabilities.
- Business membership in Arkansas Chapter of National Association of Persons Supporting Employment First
As part of the DDS commitment to excellence, DDS recognizes and supports the national and state efforts to increase employment opportunities for individuals with disabilities. DDS initiatives include:
98 referrals for Special Needs funding were processed:
QUALITY ASSURANCE
DDS - 9

ARKANSAS DHS STATISTICAL REPORTDIVISION OF DEVELOPMENTAL DISABILITIES SERVICES
SFY 2019
Psychology Unit
The Psychology Unit determines eligibility for the ACS Home and Community Based (Waiver) Services.
ACS WaiverINITIAL Application 821Initial approved 683Initial denied 42Pended 96REDETERMINATIONS 963Redeterminations approved 963Redeterminations denied 0Pended n/a
TOTAL 1,784
Review of Priority - Group Homes 34Review of Priority - ICF/IID* 23Review of Priority - DCFS 82Review of Priority - ASH applications 6Review of Priority - Nursing Homes 0Review of HDC and New releases applications 47Review of priority-wait list releases 37
Appeals 1Initial applications 1
*Intermediate Care Facilities for Individuals with Intellectual Disabilities
Source: Division of Developmental Disabilities Services
ELIGIBILITY DETERMINATIONS
DDS HCBS Services

ARKANSAS DHS STATISTICAL REPORTDIVISION OF DEVELOPMENTAL DISABILITIES SERVICES
SFY 2019
DDS - 10

ARKANSAS DHS STATISTICAL REPORTDIVISION OF DEVELOPMENTAL DISABILITIES SERVICES
SFY 2019
Program Number of Individuals
Number of Units Paid Amount Unit Description
Adaptive Equipment 283 322 $134,592.46 Piece of EquipmentAdult Development 248 36,145 $381,761.98 HourAdult Developmental Day Treatment (ADDT) 186 45,858 $458,802.50 HourCommunity Integration 1 1,072 $8,768.96 HourCommunity-Based Wrap-Around Service Per DiemComprehensive Community Support Services 15 minutesComprehensive Community Support Services Per DiemConsultation Services 76 179 $8,418.00 HourCrisis Center/Intervention Services DayDevelopmental Evaluation 693 1,159 $54,500.57 30 minutesDevelopmental Therapy 517 26,551 $476,688.84 15 minutesEarly Intervention 11 92 $6,182.40 DayEarly Intervention Day Treatment (EIDT) 38 7,521 $122,858.06 HourEvaluation Services 33 30 $3,240.00 EvaluationFamily Supports 288 1,227 $322,501.00 YearFamily/Individual Support 17 1 $186.66 YearFirst Connections 5 190 $3,374.50 DayIntegrated Support Group Rate 14 1,255 $84,172.06 DayIntegrated Support Individual 27 2,954 $285,326.11 DayOccupational Therapy-Evaluation 188 283 $11,795.23 30 minutesOccupational Therapy-Group 15 minutesOccupational Therapy-Individual 65 1,661 $34,182.67 15 minutesPatient Office Consultation 80 minutesPersonal Care 1 0 $0.00 15 minutesPhysical Therapy Assistant-Individual 26 1,173 $20,363.81 15 minutesPhysical Therapy-Evaluation 154 215 $9,258.77 15 minutesPhysical Therapy-Individual 134 4,418 $85,448.51 15 minutesPreschool 43 1,845 $29,382.36 HourSpeech Therapy Assistant-Individual 1 4 $69.60 15 minutesSpeech Therapy-Group 15 minutesSpeech Therapy-Individual 485 22,980 $467,620.09 15 minutesSpeech-Evaluation 366 592 $25,536.01 30 minutesTargeted Case Management 15 minutesTherapeutic Activity 15 minutesTherapeutic Exercise 15 minutesTransportation Non Profit-DDTCS 9 2,459 $4,426.20 MileTransportation-Individual MileVocational Maintenance-Supported Employment 884 186,510 $967,228.13 15 minutesWork Activity 25 0 $0.00 Hour
Total * 2,982 346,696 $4,006,685.48 N/A
* This 2019 report gives the unduplicated number of individuals served for the fiscal year. Unduplicated means; the total number of individuals served by all services, determined by DDS ID.
Expenditures for DDS Community Services Programs
COMMUNITY PROGRAM SERVICES STATISTICS
Note: Figures are just for DDS Services purchased with Contract Dollars.
Community Program Services
The following is a list of services provided by DDS licensed/certified providers through contract during SFY-2019
Source: Division of Developmental Disabilities Services Reports listed below;
DDS - 11

ARKANSAS DHS STATISTICAL REPORTDIVISION OF DEVELOPMENTAL DISABILITIES SERVICES
SFY 2019
* A person may have more than one disability.
DDS - 12
The Division of Developmental Disabilites Services currently operates five human development centers at Arkadelphia, Booneville, Conway, Jonesboro, and Warren. The centers provide an array of services based on the needs of the individuals residing at the facillities. The goal of each center is to allow the people served at the facility to advance to his or her maximum potential. The centers are licensed by the Office of Long Term Care and all five centers are currently certified by the Commission on Accreditation of Rehabilitation Facilities, an international accredititing organization which focus on the quality of service offered by residential and non-residential service systems.
Characteristics:
HUMAN DEVELOPMENT CENTER (HDC) STATISTICAL REPORT
917
ProfoundSevereModerateMild
701
315602
917
381
SeizuresDual Diagnosis (IDD and Mental Health)
Challenging Behaviors
917
486
Total PopulationOtherHispanicBlackWhite
Intellectual or Developmental Disabilities (IDD)Total Population
Total Population
693201914917
FemaleMaleTotal Population
481163150123
Secondary Conditions* Total
Vision Impairment/BlindCerebral Palsy
801
251
86
Non-AmbulatoryFragile HealthHearing Impairment/DeafAutism
320
205
243
Race Total Gender Total
Adaptive Level of Function Total Percent
Primary Disability Total
917
52%18%16%13%100%

ARKANSAS DHS STATISTICAL REPORTDIVISION OF DEVELOPMENTAL DISABILITIES SERVICES
SFY 2019
HUMAN DEVELOPMENT CENTER (HDC) STATISTICAL REPORT
Characteristics (Continued):
Work Status Total
DDS - 13
6662121911
1546
917
Total
In the CommunityTotal
12479
Non-Ambulatory Wheelchair (with assistance)Wheelchair (self propels)Walks
Total
Transitioned to CES Waiver Transitioned to other settings (nursing homes, small ICF/IID)Total
65
61
From Home and OtherFrom Home and Community Based Waiver Provider 15
50
1%52%
Percent of Total
PopulationOn HDC Grounds 467 51%
Mobility Status Total
Transitions Total
Admissions Total

ARKANSAS DHS STATISTICAL REPORTDIVISION OF DEVELOPMENTAL DISABILITIES SERVICES
SFY 2019
a.
b. & c.
d.
e.
f.
g.
h.
i.
j.
k.
l
m
n
o
o
a. $18,658,518 transferred to Medical Services for DDS' Medicaid match.
b. $24,075,024 transferred to Medical Services for DDS' Medicaid match.
c. $5 million is due to a provider rate increase. The other increase is due to XIX expenditures and rate increase $2,890,343.
d. $ 24,248,027 transferred to Medical Services for DDS' Medicaid match.
e. $ 25,215,907 transferred to Medical Services for DDS' Medicaid match.
f. $ 25,985,944 transferred to Medical Services for DDS' Medicaid match.
g. $ 25,985,944 transferred to Medical Services for DDS' Medicaid match.
h. $ 25,985,944 transferred to Medical Services for DDS' Medicaid match.
i. $ 25,985,944 transferred to Medical Services for DDS' Medicaid match.
j. $ 25,985,944 transferred to Medical Services for DDS' Medicaid match.
k. $ 27,204,503 transferred to Medical Services for DDS' Medicaid match.
l. $ 27,204,470 transferred to Medical Services for DDS' Medicaid match.
m. $ 27,204,470 transferred to Medical Services for DDS' Medicaid match.
2015 $28,502,111 2015 $120,455,044
2013 $27,346,608 2013 $115,702,4162014 $28,570,682 2014 $118,512,035
2010 $27,276,451 2010 $113,665,3982011 $27,276,451 2011 $118,137,6032012 $27,373,239 2012 $117,340,264
2007 $98,846,0152008 $26,508,188 2008 $101,601,6882009 $27,527,488 2009 $102,217,746
2007 $26,083,292
(State Funding Only) (State and Federal Funding)
2005 2005 $95,898,0972006 $25,790,110 2006 $99,648,430
State Fiscal Year General Revenue State Fiscal Year Total Revenue$20,253,290
HUMAN DEVELOPMENT CENTERSFOR COMMUNITY PROGRAMS
2016 $162,935,854 2016 $53,900,764 2017 $158,691,655 2017 $53,701,845 2018 $156,415,850 2018 $52,503,178 2019 $154,061,230 2019 $52,328,553
CONTRACTS TOTAL EXPENDITURES FOR DDS
2015 $162,218,637
2013 $157,916,725 2013 $50,999,298 2014 $161,063,808 2014 $51,676,206
2015 $55,757,428
2010 $160,619,858 2010 $48,682,326 2011 $164,993,688 2011 $51,664,322
2012 $52,394,960 2012 $164,773,884
2007 $137,892,137 2007 $47,605,461 2008 $140,352,332 2008 $48,032,101
2009 $48,528,726 2009 $141,179,106
DDS FUNDING
2006 $136,652,486 2006 $46,634,942
(State and Federal Funding) REVENUE EXPENDITURES
2005 $138,695,203 2005 $38,578,012
EXPENDITURES FOR OPERATIONS TOTAL STATE GENERAL
State Fiscal Year Total State Fiscal Year General Revenue
2018 $28,277,633 2018 $116,992,6422019 $28,212,923 2019 $116,553,433
2016 $28,578,921 2016 $120,284,7472017 $28,422,644 2017 $116,635,868
DDS - 14

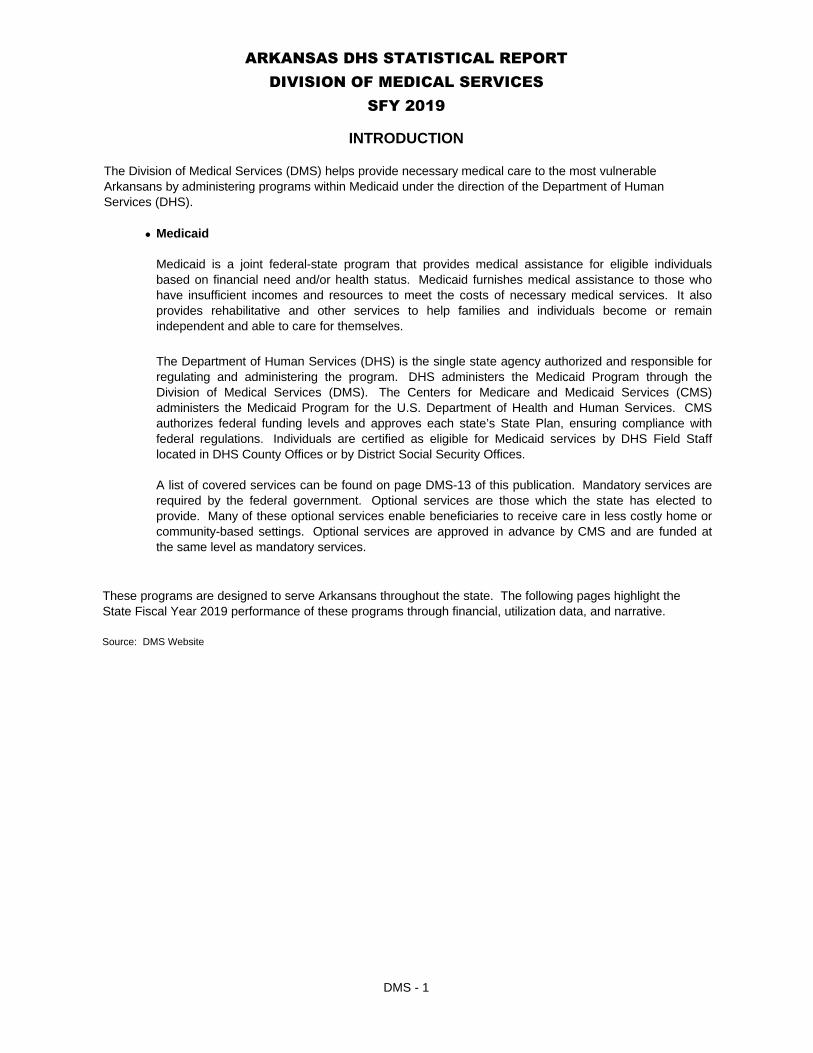
ARKANSAS DHS STATISTICAL REPORTDIVISION OF MEDICAL SERVICES
SFY 2019
The Division of Medical Services (DMS) helps provide necessary medical care to the most vulnerable Arkansans by administering programs within Medicaid under the direction of the Department of Human Services (DHS).
•
DMS - 1
INTRODUCTION
These programs are designed to serve Arkansans throughout the state. The following pages highlight the State Fiscal Year 2019 performance of these programs through financial, utilization data, and narrative.
Source: DMS Website
Medicaid
Medicaid is a joint federal-state program that provides medical assistance for eligible individuals based on financial need and/or health status. Medicaid furnishes medical assistance to those who have insufficient incomes and resources to meet the costs of necessary medical services. It also provides rehabilitative and other services to help families and individuals become or remain independent and able to care for themselves.
The Department of Human Services (DHS) is the single state agency authorized and responsible for regulating and administering the program. DHS administers the Medicaid Program through the Division of Medical Services (DMS). The Centers for Medicare and Medicaid Services (CMS) administers the Medicaid Program for the U.S. Department of Health and Human Services. CMS authorizes federal funding levels and approves each state’s State Plan, ensuring compliance with federal regulations. Individuals are certified as eligible for Medicaid services by DHS Field Staff located in DHS County Offices or by District Social Security Offices.
A list of covered services can be found on page DMS-13 of this publication. Mandatory services are required by the federal government. Optional services are those which the state has elected to provide. Many of these optional services enable beneficiaries to receive care in less costly home or community-based settings. Optional services are approved in advance by CMS and are funded at the same level as mandatory services.
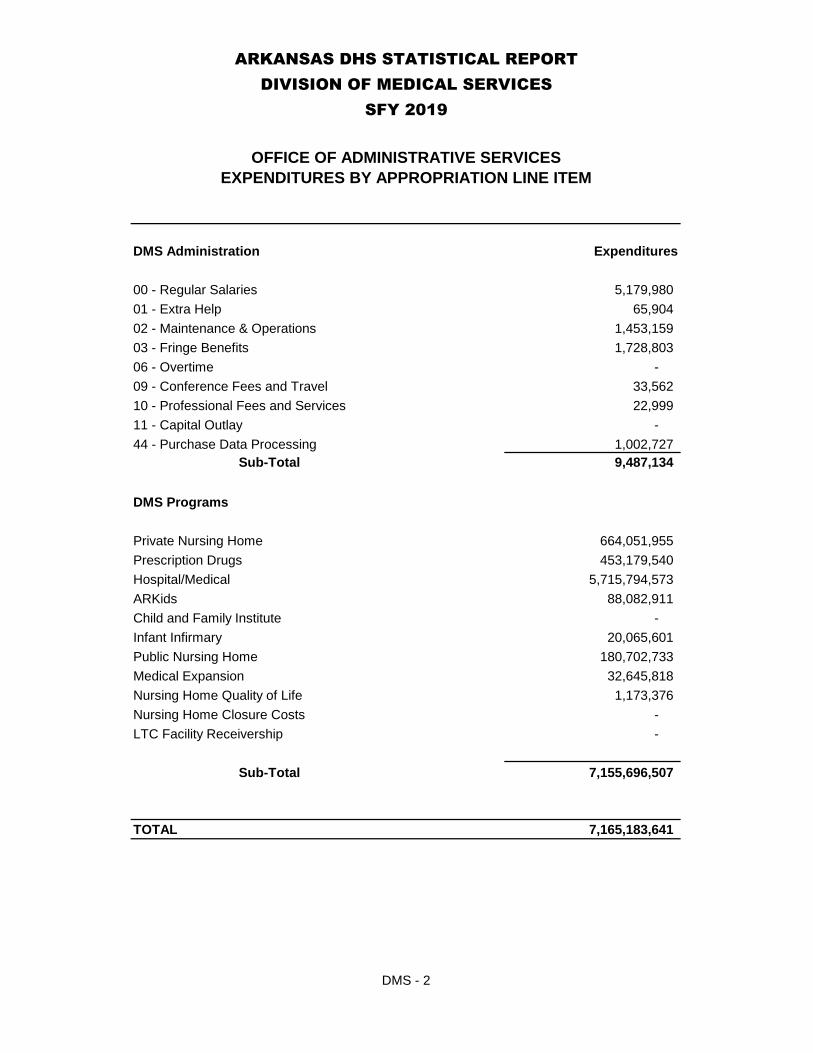
ARKANSAS DHS STATISTICAL REPORTDIVISION OF MEDICAL SERVICES
SFY 2019
DMS Administration Expenditures
00 - Regular Salaries 5,179,980 01 - Extra Help 65,904 02 - Maintenance & Operations 1,453,159 03 - Fringe Benefits 1,728,803 06 - Overtime - 09 - Conference Fees and Travel 33,562 10 - Professional Fees and Services 22,999 11 - Capital Outlay - 44 - Purchase Data Processing 1,002,727
Sub-Total 9,487,134
DMS Programs
Private Nursing Home 664,051,955 Prescription Drugs 453,179,540 Hospital/Medical 5,715,794,573 ARKids 88,082,911 Child and Family Institute - Infant Infirmary 20,065,601 Public Nursing Home 180,702,733 Medical Expansion 32,645,818 Nursing Home Quality of Life 1,173,376 Nursing Home Closure Costs - LTC Facility Receivership -
Sub-Total 7,155,696,507
TOTAL 7,165,183,641
OFFICE OF ADMINISTRATIVE SERVICESEXPENDITURES BY APPROPRIATION LINE ITEM
DMS - 2

ARKANSAS DHS STATISTICAL REPORTDIVISION OF MEDICAL SERVICES
SFY 2019
Hospital, Inpatient/Outpatient: Expenditure
Inpatient Hospital 908,336,715 Outpatient Hospital 412,776,765
1,321,113,480
Medical, Other:Adults with Physical Disabilities Waiver (3,172) Ambulatory Surgical Center 11,580,371 ARKids Immunizations 1,610,455 AR Choices Waiver 127,495,175 AR Seniors 7,791,387 Assisted Living 20,005,834 Audiologist 2,240,298 Autism Intensive Intv Provider Waiver 3,860,362Child Health Management Services (CHMS) 234,042,422 Chiropractor 1,071,821 Community Health Centers (Federally Qualified Health Ctr) 47,921,643 DDS - Non-institutionalization Waiver 179,222,607 Developmental Day Clinic Treatment Services 158,507,174 Durable Medical Equipment/Oxygen 54,142,361 Early Periodic Screening, Diagnosis and Treatment (EPSDT) 40,163,862 Elderchoices Waiver (22,031) Eyeglasses 3,345,108 Family Planning 6,994,426 Family Planning Waiver (705) Health Department, Communicable Diseases 1,724,932 Hemodialysis 6,128,296 Hyperalimentation 2,422,004 Independent Choices Waiver 42,204,570 Lab and X-ray Services 49,607,639 Maternity Clinics 570,379 Medicare Crossovers 1,598,657 Money Follows the Person 2,847,106 Nurse Anesthetist (CRNA) 1,112,371 Nurse Midwife 95,560 Nurse Practitioner 3,113,966 Optometrist/Ocularist 20,218,051 Other Care Crossovers 26,295,340 Other Practitioner Crossovers 2,093,483 PACE 13,525,398 Pharmacy Administered Vaccine 68,043 Rural Health Clinics 18,740,014 Therapy (Speech, Occupational, Physical) 101,339,910 Tuberculosis 48,829 Ventilator 3,699,062
1,197,423,008
MEDICAID EXPENDITURES BY CATEGORY OF SERVICES
DMS - 3

ARKANSAS DHS STATISTICAL REPORTDIVISION OF MEDICAL SERVICES
SFY 2019
Medicare Buy-In: Expenditure
Medicare Buy-In 228,833,581 228,833,581
Mental Health:Community Mental Health Centers (Rehabilitative Services for Persons With Mental Illness) 160,302,091 Inpatient Psychiatric 93,988,382 Psychologist 3,001,681 School-Based Mental Health 62,783 Substance Abuse Program 1,269
257,356,206
Other:Targeted Case Management (Children - Under 21-EPSDT) 86,281 Ages 21 to 59 319 Ages 60 and Older 2,436,619 Case Management/CMS 911,753 Case Management/DCFS - Case Management/DYS (93) Miscellaneous - Adjustments (2,890,515) Health Insurance Premium Payments (HIPP) 5,665,801 Contracts Hospital/Medical 286,174,140 Private Option Premium Payment 1,147,329,239 Private Option Cost Sharing 362,994,266
1,802,707,810
Incentive Payments:Incentive Payments 2,448,861
2,448,861
Physician:Physician Services 398,366,142 Managed Care Fee 14,264,192 CPC Managed Care Fee (14) PCP Supplemental Payment - Provider-Led AR Shared Savings entity 587,552,282
1,000,182,602
Dental Services:Dental Services 141,372,933
141,372,933
MEDICAID EXPENDITURES BY CATEGORY OF SERVICES
DMS - 4

ARKANSAS DHS STATISTICAL REPORTDIVISION OF MEDICAL SERVICES
SFY 2019
Special Care: Expenditure
Home Health Services 13,171,125 Hospice 8,782,789 Nursing Home Hospice 43,041,672 Personal Care Services 93,001,055 Private Duty Nursing 14,221,204
172,217,845
Transportation:Ambulance 30,945,009 Non-profit Transportation 434,898 Public Transportation - Non-Emergency Transportation (NET) Waiver 34,789,348 Non-Public Transportation 9,547,037
75,716,292
Total Hospital/Medical 6,199,372,618
Prescription Drugs:Prescription Drugs 404,810,997 Prescription Drugs - State Contribution to Part D Drug Ben. 70,186,579 Assisted Living Drugs 156,602 Contracts 3,429,468
Total Prescription Drugs 478,583,646
Private Nursing Home:Private Nursing Facilities 663,943,570 Contracts 1,622,097
665,565,667
Private Pediatric ICF/IDIntermediate Care Facility (ICF) Infant Infirmaries 20,065,601
20,065,601
Public Nursing HomePublic Nursing Homes 180,679,388
180,679,388
Total Long Term Care 866,310,656
* Above are Medicaid Program costs which do not include Nursing Home Quality of Lifeor Nursing Home Closure costs.
Source: DMS Financial Activities
MEDICAID EXPENDITURES BY CATEGORY OF SERVICES
DMS - 5
TOTAL MEDICAID PROGRAM * 7,544,266,920

ARKANSAS DHS STATISTICAL REPORTDIVISION OF MEDICAL SERVICES
SFY 2019
Special Care includes Home Health, Private Duty Nursing, Personal Care, and Hospice Services.Transportation includes emergency and non-emergency transportation.Other includes administrative expenditures, Medicare co-pay and deductibles.ICF/ID is an abbreviation for Intermediate Care Facility for Individuals with Intellectual Disabilities.
Source: DMS Financial Activities
Medicaid Expenditures SFY 2018
Medicaid Expenditures SFY 2019
MEDICAID EXPENDITURES BY CATEGORY OF SERVICESFY 2018 and 2019
DMS - 6
Mental Health5.9%
Buy-In2.9%Medical, Other
17.8%
Other27.5%
Transportation 1.3%
Hosp In/Out 17.3%
Priv Nursing Home 9.4%
Priv Ped ICF/ID0.4%
Pub Nursing Home 2.9%
Total Prescription 6.7%
Physician 5.7%
Special Care2.3%
Mental Health3.41% Buy-In
3..03%Medical, Other
17.75%
Other23.93%
Transportation 1%
Hosp In/Out 17.51%
Priv Nursing Home 8.82%
Priv Ped ICF/ID0.27%
Pub Nursing Home 2.39%
Total Prescription
6.34%
Physician 13.26%
Special Care2.28%

ARKANSAS DHS STATISTICAL REPORTDIVISION OF MEDICAL SERVICES
SFY 2019
Source: Financial Activities Section
SFY10: Changed Source from "Medicaid Eligibles-Extract from ACES Database, Beneficiaries-HCFA-2082" to just "HCFA-2082" for Eligible/Beneficiaries data.
Source: HCFA-2082
* Eligibles and Beneficiaries for SFY 2014 through SFY 2019 were enrolled in the Health Care Independence Program(also known as Arkansas Works / Private Option).
MEDICAID EXPENDITURESSFY 2012-2019
UNDUPLICATED MEDICAID ELIGIBLES AND BENEFICIARIESSFY 2013-2019
DMS - 7
$4,590.3
$5,122.2$6,191.8
$4,657.9 $7,126.7 $7,104.8 $7,165.2
$0.0
$1,000.0
$2,000.0
$3,000.0
$4,000.0
$5,000.0
$6,000.0
$7,000.0
$8,000.0
2012 2014 2015 2016 2017 2018 2019EXPE
ND
ITU
RES
IN M
ILLI
ON
S
STATE FISCAL YEAR
798
970 1010
1133 1167 1144 1126
778
902999
11061175 1178
1086
0
200
400
600
800
1,000
1,200
1,400
2013 2014 2015 2016 2017 2018 2019
Axis
Titl
e
Axis Title
ELIGIBLES BENEFICARIES
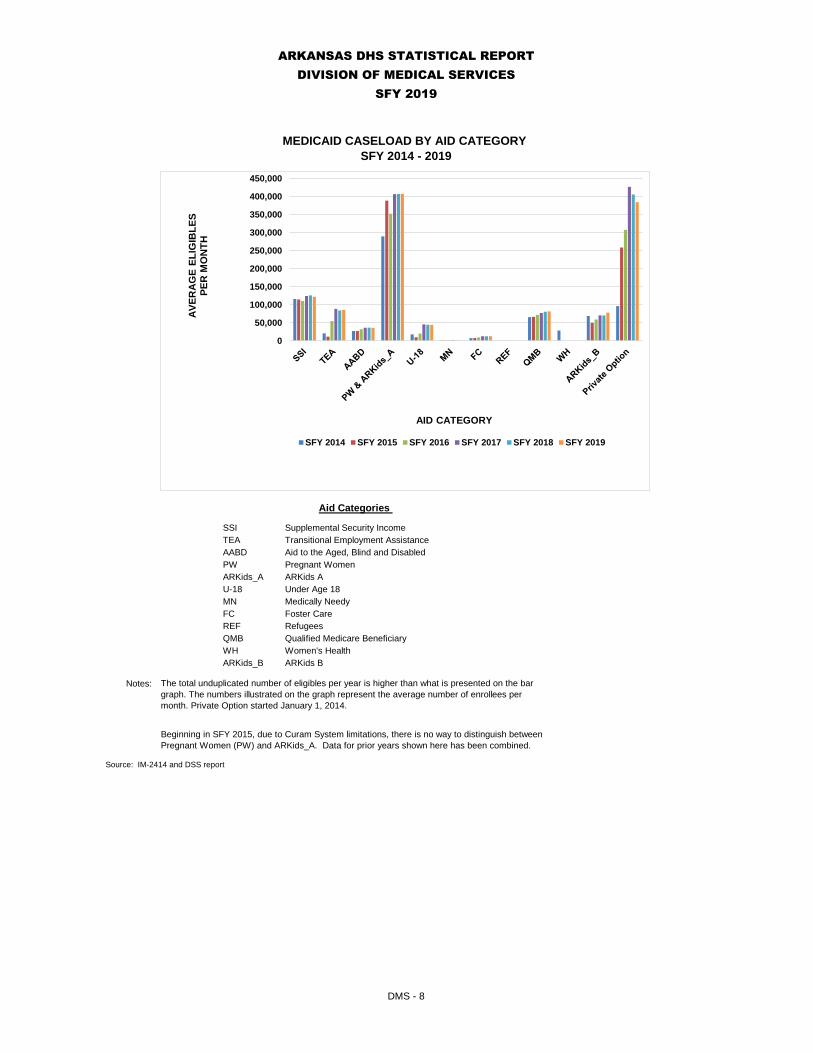
ARKANSAS DHS STATISTICAL REPORTDIVISION OF MEDICAL SERVICES
SFY 2019
SSI Supplemental Security IncomeTEA Transitional Employment AssistanceAABD Aid to the Aged, Blind and DisabledPW Pregnant WomenARKids_A ARKids AU-18 Under Age 18MN Medically NeedyFC Foster CareREF RefugeesQMB Qualified Medicare BeneficiaryWH Women's HealthARKids_B ARKids B
Notes:
Source: IM-2414 and DSS report
MEDICAID CASELOAD BY AID CATEGORY
DMS - 8
Beginning in SFY 2015, due to Curam System limitations, there is no way to distinguish between Pregnant Women (PW) and ARKids_A. Data for prior years shown here has been combined.
Aid Categories
The total unduplicated number of eligibles per year is higher than what is presented on the bar graph. The numbers illustrated on the graph represent the average number of enrollees per month. Private Option started January 1, 2014.
SFY 2014 - 2019
0
50,000
100,000
150,000
200,000
250,000
300,000
350,000
400,000
450,000AV
ERAG
E EL
IGIB
LES
PER
MO
NTH
AID CATEGORY
SFY 2014 SFY 2015 SFY 2016 SFY 2017 SFY 2018 SFY 2019

ARKANSAS DHS STATISTICAL REPORTDIVISION OF MEDICAL SERVICES
SFY 2019
Service Type*Unduplicated
Beneficiaries**Total
Count*** Under 1 1-5 6-14 15-20 21-44 45-64 65-74 75-84 85+
Unduplicated Total Beneficiaries1,086,486 1,086,486 23,029 137,405 232,951 126,473 323,603 177,753 32,665 18,458 14,149
Inpatient hospital services73,882 73,882 20,627 6,776 2,231 4,780 24,411 12,111 1,494 850 602
Inpatient psychiatric facility services for U217,256 7,256 27 3,086 3,178 456 339 87 65 18
ICF services for Individuals with Intellectual Disabilities
1,611 1,611 12 101 190 578 591 122 16 1
SNF services (NF services)20,991 20,991 4 405 3,374 4,123 5,763 7,322
Physician services596,431 596,431 21,500 106,484 149,085 72,857 121,520 81,535 21,498 12,865 9,087
Dental services20,838 20,838 24 4,424 9,404 2,803 1,053 862 593 780 895
Other practitioner services185,091 185,091 179 11,986 67,173 34,225 26,916 26,628 8,603 5,525 3,856
Outpatient hospital services398,706 398,706 12,395 69,887 81,625 47,770 91,709 63,971 16,296 9,268 5,785
Clinical services437,843 437,843 20,053 99,660 154,989 62,287 54,209 34,582 6,450 3,291 2,322
Home health services5,410 5,410 247 274 60 117 1,134 2,938 301 187 152
Lab and x-ray services285,714 285,714 4,836 28,650 41,681 36,822 84,597 59,750 13,807 8,661 6,910
Prescribed drugs480,219 480,219 12,513 93,711 145,634 69,927 98,076 54,028 3,514 1,514 1,302
Other care233,095 233,095 1,018 18,113 89,580 28,477 26,941 34,466 17,075 10,590 6,835
NET Managed Care fees984,570 984,570 21,287 125,360 205,330 111,946 313,549 158,792 24,437 13,255 10,614
Managed care fees529,041 529,041 13,641 119,498 198,997 90,478 67,149 37,795 1,367 84 32
Transportation44,001 44,001 1,467 6,471 4,347 5,427 14,737 10,505 681 223 143
Personal care services13,960 13,960 8 500 223 2,284 5,431 2,727 1,702 1,085
Targeted Case Management11,387 11,387 14 384 966 442 703 2,448 2,479 2,308 1,643
Rehabilitation services33 33 2 15 16
Therapy services48,723 48,723 430 24,503 19,635 2,000 452 1,004 397 208 94
Hospice services6,135 6,135 4 27 19 9 169 1,294 940 1,454 2,219
Prescribed drugs1,241 1,241 7 238 990 6
Nurse practitioner services27,760 27,760 296 2,633 3,561 2,369 8,737 5,451 1,853 1,467 1,393
Private duty nursing103 103 1 33 23 14 29 3
PCMH Care Coordination Payments411,074 411,074 12,724 103,129 160,867 68,500 41,700 23,219 868 45 22
Others1,000,086 1,000,086 20,837 135,720 231,160 124,831 299,720 145,550 23,512 11,346 7,410
***This is the from the Claims data of the beneficiaries who got services.
*** Unduplicated count represents distinct count of individuals present in all age groups*** Total Count represents sum of individual counts of all age groups
DMS - 9
BENEFICIARIES OF MEDICAID SERVICES BY AGE

ARKANSAS DHS STATISTICAL REPORTDIVISION OF MEDICAL SERVICES
SFY 2019
Service Type*
Unduplicated Beneficiaries*
*Total
Counts*** White
Black or African
American
American Indian or Alaska Native Asian
Hispanic or Latino (No
Race Information
Available
Native Hawaiian or
Other Pacific
Islander
Hispanic or Latino and
One or more races
More than one race
(Hispanic or Latino not Indicated) Unknown
Unduplicated Total Beneficiaries1,086,484 1,086,484 537,269 209,705 8,492 11,528 53,403 4,255 9,438 20,426 231,968
Inpatient hospital services73,875 73,875 33,248 13,989 543 588 2,689 584 401 1,236 20,597
Inpatient psychiatric facility services for U21
7,256 7,256 3,648 996 51 19 203 8 76 191 2,064
ICF services for Individuals with Intellectual Disabilities
1,611 1,611 1,019 294 4 5 13 2 2 6 266
SNF services (NF services)20,990 20,990 15,724 3,301 52 56 99 18 30 352 1,358
Physician services596,412 596,412 294,085 113,453 4,891 4,900 30,568 2,011 5,598 12,258 128,648
Dental services20,838 20,838 9,596 3,764 172 237 2,145 121 336 523 3,944
Other practitioner services185,094 185,094 94,292 33,981 1,549 1,590 10,817 352 1,944 3,616 36,953
Outpatient hospital services398,688 398,688 192,837 81,737 3,306 2,914 19,005 1,481 3,218 7,701 86,489
Clinical services437,831 437,831 202,499 82,654 3,221 3,768 26,984 1,931 4,967 9,578 102,229
Home health services5,410 5,410 2,811 1,176 30 25 77 7 14 45 1,225
Lab and x-ray services285,712 285,712 151,170 56,111 2,496 1,901 11,086 801 2,056 5,309 54,782
Prescribed drugs480,214 480,214 233,549 87,876 4,181 3,752 25,668 1,447 4,929 10,671 108,141
Other care233,090 233,090 117,568 44,802 1,646 1,871 11,823 815 2,158 4,322 48,085
NET Managed Care Fees984,572 984,572 479,410 192,656 7,696 10,590 47,657 3,837 8,347 18,340 216,039
Managed care fees529,050 529,050 243,209 99,269 3,807 4,761 33,830 1,962 6,276 11,416 124,520
Transportation44,001 44,001 20,847 10,112 366 197 1,027 115 200 724 10,413
Personal care services13,960 13,960 6,791 4,747 49 64 109 3 5 59 2,133
Targeted Case Management11,387 11,387 6,690 2,624 53 53 162 7 21 111 1,666
Rehabilitation services33 33 11 5 1 16
Therapy services48,724 48,724 21,303 6,677 246 349 2,428 90 548 1,038 16,045
Hospice services6,130 6,130 4,456 947 14 16 43 3 7 94 550
Prescribed drugs1,241 1,241 296 377 13 13 121 2 11 17 391
Nurse practitioner services27,759 27,759 14,417 5,669 212 152 1,429 49 254 567 5,010
Private duty nursing103 103 44 7 2 1 1 48
PCMH Care Coordination Payments411,079 411,079 187,399 77,427 2,941 3,810 26,010 969 5,027 9,252 98,244
Others1,000,087 1,000,087 483,575 193,519 8,115 10,939 51,427 4,006 9,065 19,276 220,165
DMS - 10
BENEFICIARIES OF MEDICAID SERVICES BY RACE
*** Total Count represents sum of individual counts of all races
***This report is the from the Claims data of beneficiaries who got services.
** Unduplicated count represents distinct count of individuals present in all race groups

ARKANSAS DHS STATISTICAL REPORTDIVISION OF MEDICAL SERVICES
SFY 2019
Private NH Public NH ICF/ID
Arkansas $18,211,610.19 $2,936,747.97 $8,493,598.78 $88,651.69 $217,309.10 $29,947,917.73Ashley $20,480,464.28 $3,184,332.61 $5,093,533.91 $287,739.30 $195,571.75 $29,241,641.85Baxter $29,827,984.64 $6,036,000.90 $10,705,260.50 $153,481.11 $46,722,727.15Benton $124,525,301.57 $20,502,277.42 $46,644,153.84 $905,587.69 $217,218.00 $192,794,538.52Boone $29,415,048.34 $5,062,013.53 $11,665,082.16 $558,985.97 $46,701,130.00Bradley $11,247,044.28 $1,856,864.41 $3,866,493.67 $23,912,824.72 $40,883,227.08Calhoun $3,766,665.42 $757,112.54 $69,792.38 $4,593,570.34Carroll $19,930,526.20 $2,651,185.62 $4,959,166.22 $512,871.98 $28,053,750.02Chicot $16,220,059.17 $2,323,361.05 $6,966,221.05 $25,509,641.27Clark $19,363,393.44 $3,033,767.99 $10,660,183.17 $30,250,304.44 $177,408.91 $63,485,057.95Clay $16,948,856.01 $2,417,907.94 $7,570,858.97 $365,828.80 $27,303,451.72Cleburne $20,393,116.86 $3,467,373.58 $8,251,988.62 $33,615.00 $32,146,094.06Cleveland $6,489,706.50 $992,561.60 $3,586,127.35 $11,068,395.45Columbia $19,461,281.70 $2,768,398.60 $11,495,060.82 $27,795.35 $33,752,536.47Conway $23,407,851.36 $3,492,696.16 $5,948,688.56 $667,671.09 $89,025.78 $33,605,932.95Craighead $99,963,595.53 $15,209,155.94 $31,733,253.16 $25,450,102.12 $218,348.12 $172,574,454.87Crawford $47,150,583.76 $9,094,299.83 $16,805,303.33 $854,341.78 $89,025.78 $73,993,554.48Crittenden $58,163,277.41 $9,673,194.92 $16,859,443.66 $1,019,814.10 $85,715,730.09Cross $19,451,086.87 $2,931,155.26 $6,606,174.06 $348,569.61 $3,673.08 $29,340,658.88Dallas $8,757,436.09 $1,084,062.88 $2,827,266.12 $556,354.64 $3,090,534.78 $16,315,654.51Desha $17,190,333.69 $2,598,482.73 $3,953,340.30 $131,608.12 $81,776.84 $23,955,541.68Drew $20,757,808.08 $2,533,034.41 $8,044,563.27 $390,538.12 $19,800.80 $31,745,744.68Faulkner $85,015,450.16 $15,338,593.91 $25,022,389.31 $122,123,857.45 $316,464.90 $247,816,755.73Franklin $12,299,226.40 $2,080,962.48 $8,514,929.77 $202,348.96 $23,097,467.61Fulton $11,282,736.12 $1,679,294.90 $6,321,470.82 $233,364.76 $19,516,866.60Garland $90,118,085.36 $16,682,164.48 $37,201,296.32 $970,504.86 $691,463.10 $145,663,514.12Grant $12,363,099.11 $2,112,392.06 $4,167,764.96 $287,739.30 $18,930,995.43Greene $44,484,808.57 $7,604,203.50 $15,948,838.02 $358,680.72 $72,927.90 $68,469,458.71Hempstead $23,167,517.83 $2,831,096.76 $9,653,301.64 $897,965.41 $120,398.10 $36,670,279.74Hot Spring $35,561,473.16 $4,798,469.30 $13,724,666.51 $299,438.10 $54,384,047.07Howard $13,409,579.84 $1,537,582.39 $7,606,098.61 $391,937.03 $22,945,197.87Independence $36,028,397.07 $5,697,100.63 $17,586,342.02 $533,668.47 $59,845,508.19Izard $13,612,046.47 $2,463,023.04 $8,249,559.39 $139,934.02 $24,464,562.92Jackson $17,469,456.43 $2,495,271.83 $9,360,801.51 $293,382.61 $29,618,912.38Jefferson $71,249,877.27 $10,645,575.35 $18,645,643.09 $2,364,552.97 $102,905,648.68Johnson $21,888,170.50 $3,948,604.34 $6,416,344.23 $297,356.25 $32,550,475.32Lafayette $7,346,679.85 $1,005,514.19 $3,178,406.51 $11,530,600.55Lawrence $19,552,518.59 $3,518,818.87 $13,423,574.24 $153,047.95 $36,647,959.65Lee $12,698,831.49 $1,189,904.81 $3,601,111.19 $17,489,847.49
MEDICAID PAYMENTS TO MEDICAL VENDORS
MEDICAID AND ARKids B PAYMENTS BY BENEFICIARY COUNTY
County Hospital/ Medical
Prescription Drugs Long Term Care TOTAL
DMS - 11

ARKANSAS DHS STATISTICAL REPORTDIVISION OF MEDICAL SERVICES
SFY 2019
Private NH Public NH ICF/ID
Lincoln $9,362,532.65 $1,807,489.80 $5,340,974.36 $51,798.05 $16,562,794.86Little River $7,984,971.83 $1,443,364.11 $7,044,863.02 $68,258.28 $16,541,457.24Logan $21,719,765.86 $3,612,594.05 $9,354,530.06 $32,926,096.13 $67,612,986.10Lonoke $49,793,639.55 $8,623,853.38 $28,822,387.52 $1,237,202.72 $6,415.50 $88,483,498.67Madison $12,847,519.06 $1,987,052.18 $2,204,537.54 $147,231.26 $17,186,340.04Marion $12,114,023.17 $2,303,802.34 $6,744,690.61 $278,927.84 $21,441,443.96Miller $31,204,514.44 $7,080,786.98 $13,378,424.97 $1,196,405.34 $77,154.72 $52,937,286.45Mississippi $48,605,101.26 $7,715,431.60 $11,700,130.55 $53,005.21 $174,741.27 $68,248,409.89Monroe $9,780,852.44 $1,694,500.09 $2,704,931.80 $270,150.98 $14,450,435.31Montgomery $6,327,809.14 $1,223,990.83 $4,816,230.94 $12,368,030.91Nevada $9,956,755.82 $1,988,850.39 $6,159,595.10 $18,105,201.31Newton $7,101,388.33 $956,494.13 $3,631,101.85 $11,688,984.31Ouachita $23,427,427.69 $3,655,361.81 $17,926,637.73 $72,598.03 $45,082,025.26Perry $8,716,454.31 $1,259,428.98 $3,199,377.32 $396,400.05 $89,025.78 $13,660,686.44Phillips $30,351,935.43 $5,900,691.78 $3,777,524.84 $1,178,590.74 $25,402.50 $41,234,145.29Pike $10,877,826.58 $1,778,276.24 $5,562,240.71 $18,218,343.53Poinsett $30,975,924.60 $5,696,042.65 $11,260,838.46 $227,511.22 $48,160,316.93Polk $14,928,921.76 $3,345,289.46 $9,588,463.01 $27,862,674.23Pope $56,678,007.51 $8,418,965.50 $18,462,316.65 $835,999.55 $84,395,289.21Prairie $5,988,979.00 $1,238,719.90 $9,509,471.24 $16,737,170.14Pulaski $386,413,542.07 $51,854,360.72 $97,993,752.82 $13,824,674.21 $8,603,401.34 $558,689,731.16Randolph $17,529,640.97 $2,754,173.35 $14,596,951.76 $34,880,766.08Saline $76,901,274.10 $12,054,125.52 $24,155,547.87 $90,434,883.72 $76,612.55 $203,622,443.76Scott $8,379,438.08 $2,179,815.82 $2,539,704.71 $329,060.07 $13,428,018.68Searcy $8,766,037.76 $848,706.77 $3,061,983.35 $12,676,727.88Sebastian $99,638,909.81 $19,802,226.07 $38,996,148.72 $2,207,589.99 $6,305,573.44 $166,950,448.03Sevier $13,956,910.68 $1,916,158.34 $3,332,093.19 $61,254.15 $77,441.46 $19,343,857.82Sharp $20,453,973.95 $2,675,942.32 $10,746,864.40 $478,762.43 $34,355,543.10St. Francis $32,855,509.71 $4,278,722.25 $3,614,674.85 $418,811.42 $41,167,718.23Stone $13,392,312.55 $1,462,774.93 $3,773,808.09 $18,628,895.57Union $31,837,018.71 $5,141,929.56 $20,416,560.53 $1,153,648.14 $120,786.29 $58,669,943.23Van Buren $14,735,591.47 $2,372,377.23 $5,992,722.01 $667,821.82 $23,768,512.53Washington $147,368,185.46 $20,795,184.74 $43,620,392.69 $2,396,652.01 $122,321.95 $214,302,736.85White $62,481,532.47 $12,189,442.96 $22,707,428.88 $1,584,883.90 $122,231.15 $99,085,519.36Woodruff $8,145,188.49 $1,275,117.02 $4,995,757.69 $14,416,063.20Yell $19,188,633.02 $2,911,676.77 $9,794,893.45 $53,664.15 $31,948,867.39State-Mississippi $36,181.75 $567.23 $36,748.98State-Texas $655.20 $655.20Other States $38,111.85 $536.56 $38,648.41
State Totals $2,549,533,984.14 $406,479,385.09 $932,956,645.33 $367,966,656.43 $22,051,744.36 $3,231,283,208.28
This is based on beneficiaries count from claims data paid in SFY2019Report is based on Federal Category of Service & Federal RaceSource: AME-DSS
MEDICAID PAYMENTS TO MEDICAL VENDORS
MEDICAID AND ARKids B PAYMENTS BY BENEFICIARY COUNTY
County Hospital/ Medical
Prescription Drugs Long Term Care TOTAL
DMS - 12

ARKANSAS DHS STATISTICAL REPORTDIVISION OF MEDICAL SERVICES
SFY 2019
Mandatory Services
Child Health Services (EPSDT) Early and Periodic Screening, Diagnosis and Treatment Under Age 21Family Planning Services and Supplies All AgesFederally Qualified Health Center (FQHC) All AgesHome Health Services All AgesHospital Services - Inpatient and Outpatient All AgesLaboratory and X-Ray All AgesCertified Nurse-Midwife Services All AgesMedical and Surgical Services of a Dentist All AgesNurse Practitioner (Pediatric, Family, Obstetric-Gynecologic and Gerontological) All AgesNursing Facility Services Age 21 and OlderPhysician Services All AgesRural Health Clinic (RHC) All AgesTransportation (to and from medical providers when medically necessary) All Ages
Optional Services
Ambulatory Surgical Center Services All AgesAudiological Services Under Age 21Certified Registered Nurse Anesthetist (CRNA) Services All AgesEarly Intervention Day Treatment (EIDT) Under Age 21Chiropractic Services All AgesDental Services All AgesAdult Developmental Day Treatment ( ADDT) Pre-School and Age
18 and OlderDevelopmental Rehabilitation Services Under Age 3Domiciliary Care Services All AgesDurable Medical Equipment All AgesEnd-Stage Renal Disease (ESRD) Facility Services All AgesHearing Aid Services Under Age 21Hospice Services All AgesHyperalimentation Services All AgesIndependentChoices Age 18 and OlderInpatient Psychiatric Services Under Age 21Intermediate Care Facility (ICF) Services All AgesLicensed Mental Health Practitioner Services Under Age 21Medical Supplies All AgesMedicare Crossovers All AgesNursing Facility Services Under Age 21Occupational, Physical and Speech Therapy Services Under Age 21
What Services are Covered by Arkansas Medicaid?
SERVICES COVERED BY ARKANSAS MEDICAID
The Arkansas Department of Human Services administers the Arkansas Medicaid program through the Division of MedicalServices. Arkansas Medicaid is detailed in the Arkansas Medicaid State Plan, Arkansas Medicaid Waiver Programs andthrough provider Manuals. The Centers for Medicare and Medicaid Services (CMS) administers the Medicaid Program forthe U.S. Department of Health and Human Services. CMS authorizes federal funding levels and approves each state'sState Plan and Waivers to ensure compliance with human services federal regulations.
How is Arkansas Medicaid Administered?
DMS - 13

ARKANSAS DHS STATISTICAL REPORTDIVISION OF MEDICAL SERVICES
SFY 2019
Optional Services
Orthotic Appliances All AgesPACE (Program of All-Inclusive Care for the Elderly) Age 55 and OlderPersonal Care Services All AgesPodiatrist Services All AgesPortable X-Ray All AgesPrescription Drugs All AgesPrivate Duty Nursing Services All AgesProsthetic Devices All AgesRehabilitative Hospital Services All AgesRehabilitative Services for:
• Persons with Mental Illness (RSPMI) All Ages• Persons with Physical Disabilities (RSPD), and Youth and Children Under Age 21
Respiratory Care Services Under Age 21School-Based Mental Health Services Under Age 21Targeted Case Management for:
• Children’s Services (Title V), SSI, TEFRA, EPSDT, Division of Children and Family Services,
and Division of Youth Services• Developmentally Disabled Adults All Ages• Adults Age 60 and Older• Pregnant Women All Ages
Ventilator Equipment All AgesVisual Care Services All Ages
Waivers Approved by the Centers for Medicare and Medicaid Services
ARChoices
Age 21 and Older, who without the waiver services would require an intermediate level of care in a nursing home; Individuals ages 21 through 64 must have a physical disability as determined through Social Security Administration or Medical Review Team.
Autism Waiver Age 18 Months through 6 years
Developmental Disabilities Services (DDS/Alternative Community Services) All Ages
Health Care Independence (Arkansas Works) Childless Adults Age 19-64 andParent/Caretakers19-64
Living Choices (Assisted Living) Age 21 and OlderNon-Emergency Transportation All AgesTEFRA Under Age 19
SERVICES COVERED BY ARKANSAS MEDICAID
Under Age 21
DMS - 14

ARKANSAS DHS STATISTICAL REPORTDIVISION OF MEDICAL SERVICES
SFY 2019
ARKids-BAge 0-18, Unborn Child
DMS - 15
What Services are Covered by Arkansas CHIP?

ARKANSAS DHS STATISTICAL REPORTDIVISION OF MEDICAL SERVICES
SFY 2019
Benefit Limitations on Services
••
•
•
•
•
••
•
•
NOTE: Any and all exceptions to benefit limits are based on medical necessity.
DMS - 16
SERVICES COVERED BY ARKANSAS MEDICAID
The Arkansas Medicaid Program does have limitations on the services that are provided. The major benefit limitations on services for adults (age 21 and older) are as follows:
12 visits to hospital outpatient departments allowed per State Fiscal Year (SFY).A total of 12 office visits allowed per SFY for any combination of the following: certified nurse-midwife, nurse practitioner, physician, medical services provided by a dentist, medical services furnished by an optometrist and Rural Health Clinics.
1 basic family planning visit and 3 periodic family planning visits per SFY. Family planning visits are not counted toward other service limitations.Lab and X-Ray services limited to total benefit payment of $500 per SFY for outpatient services, except for Magnetic
Resonance Imaging and cardiac catheterization and for Early and Periodic Screening, Diagnosis and Treatment (EPSDT) beneficiaries.3 pharmaceutical prescriptions are allowed per month. (Family planning and tobacco cessation prescriptions are not counted against benefit limit.) Extensions are considered up to a maximum of 6 prescriptions per month for beneficiaries at risk of institutionalization. Unlimited prescriptions are allowed for nursing facility beneficiaries and EPSDT beneficiaries under age 21. Beneficiaries receiving services through the Living Choices Assisted Living waiver may receive up to 9 medically necessary prescriptions per month. Medicare-Medicaid beneficiaries (dual eligible) receive their drugs through the Medicare Part D program as of January 1, 2006.
Co-insurance: Some beneficiaries must pay 10% of the first Medicaid-covered day of a hospital stay.
Beneficiaries in the “Working Disabled” aid category must pay 25% of the charges for the first Medicaid-covered day of Beneficiaries 18 years and older (except long term care) must pay $.50 – $3 of every prescription drug, and $2 on the dispensing fee for prescription services for eyeglasses. Beneficiaries in the Working Disabled aid category must pay a higher co-payment for these services and also must pay co-Payments for additional services.
Additional Information for Limitations Relating to Children
The families of some children with Medicaid coverage are responsible for co-insurance, co-payments, or premiums.
Co-insurance: ARKids First-B beneficiaries must pay 10% of the charges for the first Medicaid-covered day of inpatient hospital services and must also pay $10 per visit co-insurance for outpatient hospital services and 10% of Medicaid allowed cost per Durable Medical Equipment item.
Premiums: Based on family income, certain Tax Equity Fiscal Responsibility Act (TEFRA) beneficiaries whose custodial parent(s)’ income is in excess of 150% of the Federal Poverty level must pay a premium. TEFRA beneficiaries whose custodial parent(s)’ income is at or below 150% of the Federal Poverty level cannot be assessed a premium.

ARKANSAS DHS STATISTICAL REPORTDIVISION OF MEDICAL SERVICES
SFY 2019
Program Development and Quality Assurance (PD/QA)
Quality Assurance Activities for waiver programs include:
Medicaid Information Management (MIM)
The PD/QA Unit also develops and maintains the Arkansas Child Health Insurance Program (CHIP) State Plan. PD/QA isresponsible for coordinating the development and research of new 1115(a) demonstration waivers for the oversight ofcontractor technical writing of any provider policy manuals that may be developed for demonstration waiver programs, forthe completion of initial and renewal request applications for 1115(a) demonstration waiver programs and ensuring that theyare completed within federal guidelines, and for coordination of the approval process through both state and federalrequirements.
Leading development of new waivers programs.Communicating and coordinating with CMS regarding waiver program activities and requirements, including therequired renewal process.
Developing QA strategies and interagency agreements for the operation and administration of waiver programs and
MEDICAID ADMINISTRATIVE UNIT DESCRIPTIONS
The PD/QA Unit develops and maintains the Arkansas Medicaid State Plan, leads the development and research of writtenpolicy in rules and manuals for new programs, oversees contractor technical writing of provider policy manuals, coordinatesthe approval process through both state and federal authorities and coordinates efforts in finalizing covered programservices. The PD/QA Unit also leads development of new waiver programs and the resulting provider manuals. Because theDivision of Medical Services has administrative and financial authority for all Arkansas Medicaid waiver programs, PD/QA isresponsible for monitoring the operation of all Arkansas Medicaid waiver programs operated by other Divisions. PD/QAassures compliance with the Centers for Medicare and Medicaid Services (CMS) requirements for operating waiverprograms and monitors for key quality requirements.
Developing provider manuals for waiver programs.
Providing technical assistance to operating agencies regarding waiver program policies, procedures, requirements andcompliance.Performing case reviews, data analysis, and oversight activities to help identify problems and assure remediation forcompliance with CMS requirements.
The Medicaid Information Management (MIM) Unit is responsible for the operations and support of the Medicaid Management Information System (MMIS) which processes all Medicaid claims and provides Medicaid data for program management, research and care planning activities. The Unit serves as the customer support center in maintaining and operating the Information Technology (IT) infrastructure for the Division, including the Medicaid websites.
Arkansas Medicaid Enterprise (AME) Project Management OfficeThe Medicaid Management Information System (MMIS) Replacement Project, chartered by the Division, is to implement a new core MMIS, pharmacy point of sale, data warehouse, and decision support system that will modernize existing system functions and significantly enhance the goals of the MMIS, ensuring that eligible individuals receive the health care benefits that are medically necessary and that providers are reimbursed promptly and efficiently.
The data warehouse and Fraud and Abuse Detection sub-system for Program Integrity went into production in February of 2015 under a contract with Optum Government Solutions.
The Pharmacy system under Magellan Health went into production in March of 2015. The system paid 5,227,247 claims in SFY19 (July 1, 2018 - June 30, 2019) totaling $424,306,901.
DMS - 17
For State Fiscal Year 2019, MIM had received 21 FOIA or Legislative requests, 1,408 non-recurring reports, 493 recurring reports and 2 other reports. That brings a grand total of 1,924 reports for SFY 2019. The reports produced include information requested by the Arkansas Legislature, Governor’s office, press and other private entities seeking Medicaid performance and participation metrics. MIM works diligently to fulfill these requests while respectfully protecting the privacy of our members.

ARKANSAS DHS STATISTICAL REPORTDIVISION OF MEDICAL SERVICES
SFY 2019
DMS - 18
The new Core MMIS design, development, and implementation contract went into production on November 1, 2017 with Hewlett Packard Enterprise / DXC. The new Core system processed 27,404,707 claims in SFY19 and has processed over 57.2 million claims since it went live in November 2017.

ARKANSAS DHS STATISTICAL REPORTDIVISION OF MEDICAL SERVICES
SFY 2019
Medicaid Information Management
Medicaid Data Security Unit
Third Party Liability and Estate Recovery
Pre- and Post-Payment reviews of medical services;Prior authorization for Private Duty Nursing, hearing aids, hearing aid repair and wheelchairs;
DMS - 19
$ 18,115,285.12
$ 42,547,265.78
The Utilization Review (UR) section administers multiple medical programs and services. UR monitors the contracted QualityImprovement Organizations’ (QIO) performance for quality assurance. UR administers the following programs and activities:
Utilization Review
$ 24,431,980.66
MEDICAID ADMINISTRATIVE UNIT DESCRIPTIONS
As the payer of last resort, federal and state statutes require Medicaid agencies to pursue third party resources to reduceMedicaid payments. One aspect of Arkansas Medicaid cost containment is the Third Party Liability Unit of AdministrativeSupport. This unit pursues third party resources (other than Arkansas Medicaid) responsible for health care payments toArkansas Medicaid beneficiaries. These sources include health and liability insurance, court settlements, absent parentsand estate recovery. The savings for State Fiscal Year (SFY) 2019 were as follows:
Other Collections (Health & Casualty Insurance, Estate Recovery, Miller Trusts and Small Estates)
Cost Avoidance (Health Insurance)
Total Savings
SFY 2019
The Medicaid Data Security Unit works with the DHS Privacy Officer on Health Insurance Portability and Accountability Act(HIPAA) compliance in order to maintain the privacy and security of patient information and assist contractors with adheringto DHS policies and procedures. The Security Unit also monitors and performs technical audits on contractors andresearchers who use Medicaid data. A Data Security Committee evaluates requests to use Medicaid data for researchprojects and publications to ensure HIPAA compliance.
Data AnalyticsThe Medicaid Statistical Analytics and Management Unit is responsible for developing and managing workflow processes and projects related to Medicaid data. The unit evaluates new technologies to introduce to the Division in an effort to create efficiencies in time and effort as well as developing and overseeing the Department of Human Services Enterprise Change Control Management
Services and SupportThe Services and Support unit serves as the Division liaison with our Federal partner the Centers for Medicare and Medicaid Services (CMS). The unit creates and provides the Federal documentation necessary for Medicaid to receive Federal funding for all IT projects.
Federal funding provided by CMS is approved, allocated and tracked based on the Federal Fiscal Year (FFY) (October 1 – September 30). For FFY-2019 (Oct. 2018 – Sept. 2019), CMS approved over $193,844,951 towards the costs of various DHS Medicaid IT projects.

ARKANSAS DHS STATISTICAL REPORTDIVISION OF MEDICAL SERVICES
SFY 2019
SFY 2018 SFY 2019 SFY 2018 SFY 2019 SFY 2018 SFY 2019 SFY 2018 SFY 201928,601 ≈15,308 1,282 ≈5,596 ≈2,437 29,883 26,675
750 1,265 10 5 35 760 1,30516 41 2 7 18 48
524 426 12 48 536 474
1,178 1,203 282 343 1,460 1,546253 580 26 26 279 606230 509 26 19 256 528
SFY 2018 SFY 2019 SFY 2018 SFY 201938,268 37,089 Fair Hearings 635 2,638
54 65 Fair Hearings Held 138 4192,400 3,600 Patient Travel 39 46138 3 Patient Travel Dollars Expended $18,954.20 25,952363 235 ** 39 46
$18,954.20 $25,952
** Companion travel is higher than the beneficiary due to the beneficiary's age (up to age 2 may sit in companion's lap).
Companion Travel Dollars
Source: Division of Medical Services
Prior Authorizations
Approvals: Denials: Partial Approvals:
Medical Supplies
* EOMB
Incontinent Supplies
EOB Home Health
Pre-Pay Claim
Total Processed:
PCP Changes
Organ Transplant
PCP Closeouts
Prior authorizations and extension of benefits for the following programs: In-patient and Out-patient Hospitalization, Emergency room utilization, Personal Care for beneficiaries under the age of 21, ChildHealth Management Services, Therapy, Transplants, Durable Medical Equipment and Hyperalimentation services;Out-of-state transportation for beneficiaries for medically necessary services/treatment not available in-state;
Participate in both beneficiary and provider appeals and hearing process.
Durable Medical
New Hearing Aid requests
Private Duty NursingHearing Aid Repairs
SUMMARY
Interact with provider groups and levels of federal and state government, including the legislature and governor’s officeand
Assist interdepartmental units and other agency divisions regarding health care determinations related to specificrules, laws and policies affecting program coverage;Review of evolving medical technological information and contribute to policy changes and program coverage benefitsrelated to specific program responsibility;Analysis of information concerning reimbursement issues and assist with resolutions;Represent the department in workgroups at the state and local level;Conduct continuing evaluations and assessments of performance and effectiveness of various programs;
MEDICAID ADMINISTRATIVE UNIT DESCRIPTIONS
Utilization Review
Assure compliance of health care coverage benefits as required by regulation, rules, laws and local policy coveragedeterminations;Review of documentation supporting the medical necessity of requested services;Analysis of suspended claims requiring manual pricing;Review of billing and coding;
DMS - 20

ARKANSAS DHS STATISTICAL REPORTDIVISION OF MEDICAL SERVICES
SFY 2019
MEDICAID ADMINISTRATIVE UNIT DESCRIPTIONS
Program and Provider Management
Behavioral Health ProgramsThe Behavioral Health Unit is responsible for administering the Arkansas Medicaid behavioral health programs. This unit researchesand analyzes proposed policy initiatives, encourages stakeholder participation and recommends revisions to policy andprogramming. Other responsibilities include monitoring the quality of treatment services, prior authorization and benefit extensionprocedures by performing case reviews, data analysis and procedural activities to identify problems and assure compliance withArkansas Medicaid rules and regulations. These responsibilities are accomplished through the negotiation, coordination andassessment of the activities of the Behavioral Health utilization and peer review contracts. In addition to its role in auditing behavioralhealth programs, the peer review contractors develop and implement technical training and educational opportunities to providers.These opportunities are designed to assist providers in evaluating and improving their programs to offer the highest quality of care toArkansas Medicaid beneficiaries. The Behavioral Health Unit further collaborates and supports other Department of Human Servicesdivisions to design and implement a statewide transformation of the current behavioral health system in concurrence withimplementation of the Provider-Led Arkansas Shared Savings Entity initiative. The overarching goal of the Behavioral Health Unit isto be instrumental in the development of a successful, efficient and quality-driven system of care.
Provider Enrollment and Vision and Dental Programs
In addition to directly managing and administering the Medicaid and ARKids Vision and Dental programs, this unit is responsible forother administrative requirements of the Medicaid program such as: provider enrollment, provider screening, and deferredcompensation. The unit also directly responds to concerns and questions of providers and beneficiaries of Arkansas Medicaid andARKids services.
Electronic Health Records Unit (EHRU)
Arkansas Medicaid administers a financial incentive payments to providers, ensuring proper payments through auditing andmonitoring, and participating in statewide efforts to promote interoperability and meaningful use of Electronic Health Records (EHR)beginning 2011. The HIT provision of the American Recovery and Reinvestment Act (ARRA) of 2009 afford states and their Medicaidproviders an opportunity to leverage existing HIT efforts to achieve the vision of interoperable information technology for health care.
Under the direction of the Electronic Health Record Unit (EHRU), classes of Medicaid professionals are eligible to receive Medicaidincentive payments. Eligible professionals (EPs) include physicians, dentists, certified nurse-midwives, nurse practitioners, andphysician assistants who are practicing in Federally Qualified Health Centers (FQHCs) or Rural Health Clinics (RHCs). Eligiblehospitals that may participate are acute care hospitals and children’s hospitals. To receive the Medicaid financial incentive, providersmust be able to demonstrate certified adoption, implementation, or upgrading of EHR technology, followed in subsequent years bydemonstrated meaningful use. Payments or reimbursements of up to $42.500 may be provided to offset the cost associated withimplementing an EHR system to a participating clinic.
The EHRU’s key function is to coordinate oversight for providers statewide by addressing issues that arise from the EHR incentivepayment program. The EHRU identifies areas of risk in the eligibility determination, meaningful use, and payment processes andreviews that will mitigate the risk of making an improper payment. The EHRU conduct audits of providers attestation forms foreligibility, validation of meaningful use, and conducting post and pre-payment reviews.”
This unit manages multiple programs and services, primarily the Patient Centered Medical Homes program and PrimaryCare Case Management Program known as ConnectCare. The unit also manages several quality improvement projects suchas the Centers for Medicare and the Inpatient Quality Incentive program. The unit directly administers the Early and PeriodicScreening, Diagnosis and Treatment (EPSDT), ARKids First-B, CHIP, TEFRA, and Non-Emergency Transportationprograms.
Primary Care InitiativesPatient-Centered Medical Home and Transportation Programs
DMS - 21

ARKANSAS DHS STATISTICAL REPORTDIVISION OF MEDICAL SERVICES
SFY 2019
Non-Institutional –The Non-Institutional Section is responsible for the maintenance of reimbursement rates andassignment of all billing codes for both institutional and non-institutional per diems, services, supplies, equipmentpurchases and equipment rental for the following providers: Physician, Dental, Durable Medical Equipment, ARKids,Nurse Practitioner, Certified Nurse-Midwife, Child Health Management Services, Developmental Day Treatment ClinicServices, Other.
Institutional – The Institutional Section is responsible for processing: all necessary cost settlements for in-state andborder city Hospitals, Residential Treatment Units and Federally Qualified Health Clinics; calculating and reimbursingannual hospital Upper Payment Limit amounts, hospital quality incentive payments and hospital Disproportionate Sharepayments; calculating per diem reimbursement rates for Residential Treatment Centers; processing and implementingall necessary rate changes within Medicaid Management Information System for the above named providers andprocessing all necessary retroactive reimbursement rate change mass adjustments for these providers.
MEDICAID ADMINISTRATIVE UNIT DESCRIPTIONS
Contract Oversight
Program and Administrative Support
The contract Monitoring Unit oversees all contracts involving the Division of Medical Services and Arkansas Medicaid. The unit reviews the contracts to ensure the requirements for each contract are capable of being measured. The unit performs audits to review required documentation and to ensure the contractor is providing their services directed under the contract.
Financial Activities
The Financial Activities Unit of the Division of Medical Services (DMS) is responsible for the Division’s budgeting andfinancial reporting, including the preparation of internal management reports and reports to federal and state agencies. Thisunit also handles division-level activities related to accounts payable, accounts receivable and purchasing, as well asactivities to secure and renew administrative and professional services contracts.
Program Budgeting and Analysis
Program Budgeting and Analysis develops the budgets for all of Arkansas’ Medicaid waiver renewals and newly proposedArkansas Medicaid waiver programs. Depending on the type of waiver that is being renewed or proposed budget neutrality,cost effectiveness or cost neutrality is determined.
In addition to waiver budgeting, Program Budgeting and Analysis analyzes Arkansas Medicaid programs to determinewhether each program is operating within their budget and if program changes should be considered. This unit also performstrend and other financial analysis by type of service, provider, aid category, age of beneficiary, etc.
Provider ReimbursementProvider Reimbursement develops reimbursement methodologies and rates, identifies budget impacts for changes inreimbursement methodologies, coordinates payments with the Arkansas Medicaid Fiscal Agent and provides reimbursementtechnical assistance for the following Arkansas Medicaid providers:
Long Term Care (LTC) – The LTC Section reviews annual and semi-annual cost reports submitted by Nursing Facilitiesand Intermediate Care Facilities for Individuals with Intellectual Disabilities. The cost reports are reviewed for compliance with applicable state and federal requirements and regulations, including desk and on-site reviews. The LTC Sectionmaintains a database of the cost report information, which is used to evaluate cost and develop reimbursementmethodologies and rates. The LTC Section is also responsible for processing all necessary retroactive reimbursementrate change mass adjustments for these providers.
DMS - 22

ARKANSAS DHS STATISTICAL REPORTDIVISION OF MEDICAL SERVICES
SFY 2019
# Enrolled in PCMH
Total # Practices*
% Enrolled
# Enrolled in PCMH
Total # PCPs**
% Enrolled
# Enrolled in PCMH
Total # Beneficiaries***
% Enrolled
2014 123 259 47% 659 1,074 61% 295,000 386,000 76%
2015 142 250 57% 780 1,074 73% 317,000 386,000 82%
2016 179 250 72% 878 1,010 87% 330,000 414,000 80%
2017 192 252 76% 928 1,068 87% 356,000 421,000 85%2018 207 257 81% 943 1,101 86% 248,257 404,597 86%2019 216 315 69% 894 998 90% 309,352 365,318 85%
ARKANSAS MEDICAID PCMH PROGRAM PARTICIPATION
State Calendar
Year
Medical Practices Primary Care Physicians (PCPs) Medicaid Beneficiaries
The Arkansas Medicaid PCMH Program turned out to be a great success as illustrated by the following table:
MEDICAID ADMINISTRATIVE UNIT DESCRIPTIONSHealth Care InnovationThe Health Care Innovation (HCI) Unit is responsible for coordinating the operations and activities to design the Arkansas Health Care Payment ImprovementInitiative (AHCPII) and service delivery systems. The unit works with multi-payers, staff and contractors to design and deliver/implement two primary types ofpopulation-based health care payment systems:>Retrospective Episodes of Care for acute conditions; and>Patient Centered Medical Homes for chronic conditions.
In addition, HCI works to develop and coordinate improved payment systems infrastructure requirements and to facilitate stakeholder, provider and beneficiaryengagement through the APII.
Now in its fifth year of work, HCI continues its mission to improve the health of the population, enhance the patient care experience of care and reduce the cost ofhealth care. The goal is to move Arkansas’s health system from a fee-for-service model that rewards volume to an alternative payment model (APM) that rewardshigh-quality, effective outcomes for patients by aligning financial incentives for how care is delivered.
Patient-Centered Medical Homes (PCMH), while not a physical location, embody prevention and wellness efforts of patient-centered and coordinated care across allprovider disciplines. With the goal of promoting and rewarding prevention and early intervention, a coordinated team-based care and clinical innovation results inmore efficient delivery system of high-quality care.
PCMHs help achieve Arkansas’s triple aim: improving population health, enhancing the patient experience, and controlling the cost of care. PCMHs seek to do this byinvesting more in primary care. This means higher take-home pay for PCPs, and smoother practice processes and workflows.
* This total represents the number of medical practices that are eligible to participate in the PCMH Program. These practices are in the Medicaid Primary Case Management program and have at least 150 beneficiaries attributed to them.** This total represents the number of primary care physicians that are associated with these practices.*** This total represents the number of Medicaid beneficiaries that are assigned to these practices through the Medicaid Primary Case Management program.
In 2011, Arkansas Medicaid through the Health Care Innovation (HCI) unit started the process to transform Arkansas’ health care and payment system to a higher-quality and more cost-efficient system of care. Called the Arkansas Health Care Payment Improvement Initiative (AHCPII), this collaboration included many of the major private commercial insurance payers in the state. AHCPII’s leadership felt the collaboration included a large enough portion of the market that there would be a strong incentive for health care providers to achieve the objectives of more efficient and sustainable utilization of Medicaid funds, higher quality of care and improved patient satisfaction..
Working closely with hundreds of physicians, hospital executives, patients, families and advocates, the collaborators worked for nearly a year to design and build the new payment system. The result is a bold initiative tailored to the needs of Arkansas patients and providers. The initiative launched the first Episode of Care (EOC) in 2012, the Patient Centered Medical Home (PCMH) soon followed, and in 2017, Arkansas Medicaid launched the first Medical Neighborhood Performance Reports. This year, the initiative continues to evolve and expand into various value-based payment models and informational transparency efforts.
Active financial EOCs include asthma, cholecystectomy, chronic obstructive pulmonary disease, colonoscopy, coronary artery bypass graft, heart failure, perinatal, tonsillectomy, total joint replacement (hip and knee), upper respiratory infection-nonspecific, upper respiratory infection-pharyngitis and upper respiratory infection-sinusitis.
Active informational EOCs include appendectomy, hysterectomy, uncomplicated pediatric pneumonia and urinary tract infection. Informational EOCs currently in development are Crohn’s disease, diabetic ketoacidosis, lower back pain and percutaneous coronary intervention. Three EOCs are in the initial design phase: hospice oncology, kidney stones and migraine.Medical Neighborhood Performance Reports are currently available for appendectomy (pending release), uncomplicated pediatric pneumonia (pending release), upper respiratory infection and urinary tract infection (pending release).
Additional reports are being considered as more data become available. Plans are being made to provide a behavioral health cost contribution report for PCMH providers as well as quality of care reports.
To date for HCI, has produced 54,058 PAP reports through July 2018 reporting period that were delivered to 2,835 distinct PAPs. Of those reports, 33,095 are EOC level payment or performance reports, 8,478 are reconciliation reports, and 361 are informational reports. Approximately 3.6 billion claims have been processed through the engine for both EOC and PCMH. For EOC, those claims resulting in over 6.4 million episodes (before exclusions).
DMS - 23

ARKANSAS DHS STATISTICAL REPORTDIVISION OF MEDICAL SERVICES
SFY 2019
Continuity of Care and Coordination of Coverage
The Continuity of Care and Coordination of Coverage unit is responsible for coordinating DMS efforts in the implementation of the Health Care Independence Program and assisting with coordination of coverage for enrollees as they move in and out of Medicaid and transition to private health insurance programs. Additionally, this unit supports other Medicaid initiatives and coordinates with all areas within DMS, several other DHS Divisions, and other State agencies.
DMS - 24

ARKANSAS DHS STATISTICAL REPORTDIVISION OF MEDICAL SERVICES
SFY 2019
DMS - 25
PRESCRIPTION DRUG PROGRAM
The Prescription Drug Program, an optional Arkansas Medicaid benefit, was implemented in Arkansas in 1973. Under this program, eligible beneficiaries may obtain prescription medication through any of the 911 enrolled pharmacies in the state. During State Fiscal Year (SFY) 2019, a total of 174,346 Arkansas Medicaid beneficiaries used their prescription drug benefits. A total of 5.2 million prescriptions were reimbursed by Arkansas Medicaid for a cost of $424 million dollars, making the average cost per prescription approximately $81.17. An average cost for a brand name prescription was $403.77, accounting for 77% of expenditures. The average cost for a generic prescription was $21.24, accounting for 23% of expenditures.
The Prescription Drug Program restricts each beneficiary to a maximum of 3 prescriptions per month, with the capability of receiving up to 6 prescriptions by prior authorization. Beneficiaries under 21 years of age and certified Long Term Care beneficiaries are not restricted to the amount of prescriptions received per month. Persons eligible under the Assisted Living Waiver are allowed up to 9 prescriptions per month.
Beginning January 1, 2006, full benefit, dual-eligible beneficiaries began to receive drug coverage through the Medicare Prescription Drug Benefit (Part D) of the Medicare Modernization Act of 2003, in lieu of coverage through Arkansas Medicaid. Arkansas Medicaid is required to pay the Centers for Medicare and Medicaid Services (CMS) the State Contribution for Prescription Drug Benefit, sometimes referred to as the Medicare Part D Clawback. This Medicare Part D payment for SFY 2019 was $70,186,579.
Arkansas Medicaid reimbursement for prescription drugs is based on ingredient cost and a professional dispensing fee. Ingredient costs are established and based on the lesser of methodology using the National Average Drug Acquisition Cost (NADAC), Federal Upper Limit, Usual and Customary, or State Actual Acquisition Cost (SAAC). Arkansas Medicaid has a professional dispensing fee of $9.00 for brand and non-preferred brand medications and$10.50 for generic and preferred brand medications as established by the Division of Medical Services and approved by CMS. The professional dispensing fee is based upon surveys that determine an average cost for dispensing a prescription. The following table shows the average cost per prescription drug in the Arkansas Medicaid Program.
AVERAGE COST PER PRESCRIPTION DRUG SFY 2009-2019

ARKANSAS DHS STATISTICAL REPORTDIVISION OF MEDICAL SERVICES
SFY 2019
Arkansas 115 34 0 0 0 1 2 5 162 106 51 157Ashley 89 31 0 1 1 0 1 6 134 87 42 129Baxter 233 0 0 1 0 0 4 19 251 185 72 257Benton 871 6 4 9 2 0 16 62 831 642 328 970Boone 244 1 0 1 1 1 2 9 286 189 70 259Bradley 98 61 1 0 0 0 2 14 178 69 107 176Calhoun 1 0 0 0 0 0 0 0 2 1 0 1Carroll 107 1 1 0 1 0 3 14 147 86 41 127Chicot 56 57 1 1 0 0 1 9 121 80 43 123Clark 203 94 0 2 0 1 2 26 327 192 136 328Clay 152 2 0 0 0 0 4 16 149 115 57 172Cleburne 160 0 2 1 0 0 3 9 189 105 69 174Cleveland 51 14 0 0 1 0 0 5 81 47 24 71Columbia 132 95 0 0 0 0 4 10 288 157 84 241Conway 109 16 0 0 0 0 5 13 148 106 35 141Craighead 622 61 1 1 0 2 11 71 753 486 283 769Crawford 366 3 0 3 3 1 5 32 403 262 150 412Crittenden 151 164 1 1 0 1 7 15 329 204 134 338Cross 101 44 0 0 1 0 0 6 150 101 51 152Dallas 59 21 0 4 0 0 1 20 104 55 48 103Desha 38 33 0 0 0 0 1 8 59 33 46 79Drew 111 58 1 0 0 0 5 7 176 124 56 180Faulkner 749 137 4 4 2 1 16 109 921 543 478 1,021Franklin 162 3 0 0 0 0 1 13 168 111 68 179Fulton 156 0 1 0 0 0 0 11 147 116 52 168Garland 606 76 0 6 0 2 19 59 736 456 309 765Grant 89 5 1 0 0 0 1 2 105 65 31 96Greene 228 2 0 0 0 0 10 22 236 192 69 261Hempstead 146 67 0 0 0 0 3 9 177 147 77 224Hot Spring 195 35 0 0 0 0 8 19 224 165 92 257Howard 134 28 1 0 0 1 6 16 190 124 63 187Independence 332 10 0 0 0 1 12 35 390 263 124 387Izard 183 0 1 1 0 0 6 7 189 125 73 198Jackson 155 33 0 0 0 0 3 19 196 137 71 208Jefferson 179 235 1 3 0 0 10 22 484 280 168 448Johnson 113 2 0 1 0 0 0 12 148 99 29 128Lafayette 29 26 0 0 0 0 1 2 68 30 28 58Lawrence 221 4 0 1 0 0 5 9 195 151 89 240Lee 38 30 0 1 0 0 0 1 66 40 30 70Lincoln 91 25 0 0 0 0 1 9 135 83 43 126
Mal
e
Fem
ale
UNDUPLICATED LONG-TERM CARE CLIENTS *BY GENDER AND RACE
RACE GENDER
Cou
nty
Whi
te
Bla
ck
Nat
ive
Am
er.
Span
ish
Am
er.
Asi
an A
mer
.
Haw
aiia
n or
Pa
cific
Is
land
er
Oth
er
Unk
now
n
Tota
l
Tota
l
DMS - 26

Little River 127 26 0 1 0 0 2 4 156 104 54 158Logan 297 21 1 3 0 0 1 26 328 185 165 350Lonoke 448 74 0 0 1 0 4 37 475 365 204 569Madison 50 0 0 0 0 0 16 1 44 39 12 51Marion 134 0 1 0 1 0 2 13 195 93 66 159Miller 186 94 2 2 2 0 2 24 291 186 130 316Mississippi 151 85 0 1 0 0 0 24 243 159 109 268Monroe 30 24 0 0 0 0 3 4 58 33 26 59Montgomery 93 0 0 0 0 0 1 6 97 82 20 102Nevada 81 47 1 0 0 0 2 6 114 83 54 137Newton 63 0 0 0 0 0 4 4 67 42 25 67Ouachita 168 125 1 1 0 0 3 15 283 203 115 318Perry 63 0 0 0 0 0 0 7 69 49 22 71Phillips 35 54 0 0 0 0 4 2 93 58 34 92Pike 112 5 0 0 0 0 5 10 137 83 46 129Poinsett 223 22 0 0 0 0 11 10 234 165 89 254Polk 136 0 0 1 0 0 5 4 111 119 26 145Pope 370 7 0 0 0 0 7 24 359 297 107 404Prairie 107 18 1 0 1 0 0 8 104 70 69 139Pulaski 1,175 747 3 8 10 1 1 211 2,068 1,341 831 2,172Randolph 235 3 0 0 0 0 1 7 223 170 78 248Saline 704 93 5 2 5 2 5 64 684 517 364 881Scott 61 0 0 0 2 0 16 3 67 47 22 69Searcy 68 0 0 0 0 0 1 3 72 44 28 72Sebastian 761 51 3 12 11 1 0 103 893 617 340 957Sevier 62 2 0 1 0 1 19 6 84 52 23 75Sharp 161 2 1 0 0 0 1 7 139 110 64 174St. Francis 47 44 0 0 0 0 10 5 88 60 37 97Stone 68 0 0 0 0 0 3 5 94 49 24 73Union 245 135 0 2 0 0 8 33 413 268 157 425Van Buren 127 0 0 0 0 0 6 4 127 86 46 132Washington 891 17 5 18 8 0 12 78 944 656 369 1,025White 418 24 1 0 0 1 6 43 499 344 146 490Woodruff 66 28 0 0 0 0 3 1 98 59 38 97Yell 210 2 0 2 1 0 10 9 212 155 71 226
Total 16,048 3,264 46 96 54 18 355 1,563 20,206 13,549 7,832 21,381*Note: Unduplicated clients by county and facility. Duplication may occur when a resident changes facility and/or county.Source: 7860 DMS Annual Statistical Report for Long Term Care
RACE GENDER
Mal
e
Cou
nty
Whi
te
Bla
ck
Nat
ive
Am
er.
Span
ish
Am
er.
Asi
an A
mer
.
Haw
aiia
n or
Pa
cific
Is
land
er
Oth
er
Unk
now
n
Tota
l
Fem
ale
ARKANSAS DHS STATISTICAL REPORT DIVISION OF MEDICAL SERVICES
SFY 2019
UNDUPLICATED LONG-TERM CARE CLIENTS * BY GENDER AND RACE
Tota
l
DMS - 27

ARKANSAS DHS STATISTICAL REPORTDIVISION OF MEDICAL SERVICES
SFY 2019
NO. OF TOTAL TOTAL *FACIL. BEDS RECIPIENTS
226 24,358 18,3561 290 347
5 225 245
32 322 3505 990 1,035
Total Medicaid 269 26,185 20,333
Non-Medicaid NF Medicare 1 87 NF Private 1 105
Total Non-Medicaid 2 192
Total 271 26,377
Private NF 4,086,299 $642,413,868 $157.21 $34,997.49Arkansas Health Center 87,088 $41,990,770 $482.16 $121,010.86
Human Development Centers ICF/ID 329,664 $128,919,441 $391.06 $124,559.85
Private ICF/ID - Over 15 beds 55,790 $20,264,980 $363.24 $82,714.20
Private ICF/ID - 15 beds or less 84,548 $17,436,559 $206.23 $49,818.74
TOTAL 4,643,389 $851,025,617
FACILITY CLASSPATIENT
DAYS EXPENDITURESAVERAGE DAILY
PAYMENTS
AVG. ANNUAL PAYMENTS PER
INDIVIDUAL
CASH EXPENDITURES FOR LTC FACILITIES
Over 15 beds 363.24$ Private Adult 15 beds & Under 224.36$ HDC 391.06$
*Recipients reflect an unduplicated countof persons residing in specified facilitiesduring July 1, 2018 - June 30, 2019.
Private Pediatric
MEDICAID LONG-TERM CARE FACILITY PROGRAM STATISTICS
DISTRIBUTION OF PATIENTS BY LEVEL OF CARE WITH PER DIEM RATES
FACILITY AVERAGE WEIGHTED RATE BY FACILITY TYPE TYPE
Nursing Facilities Private Nursing Facilities 189.17$ Public-AHC 482.16$ ICF/ID Facilities
DMS - 28

ARKANSAS DHS STATISTICAL REPORT DIVISION OF MEDICAL SERVICES SFY
2019
Source: DSS Report
LTC MEDICAID EXPENDITURES
ICF/ID$22,051,744
2%
Private NF$932,956,645
94%
AHC$41,990,770
4%
Expenditures
ICF/IDPrivate NFAHC
595
17,414
347
LTC MEDICAID RECIPIENTS
Expenditures
ICF/IDPrivate NFAHC
DMS - 29
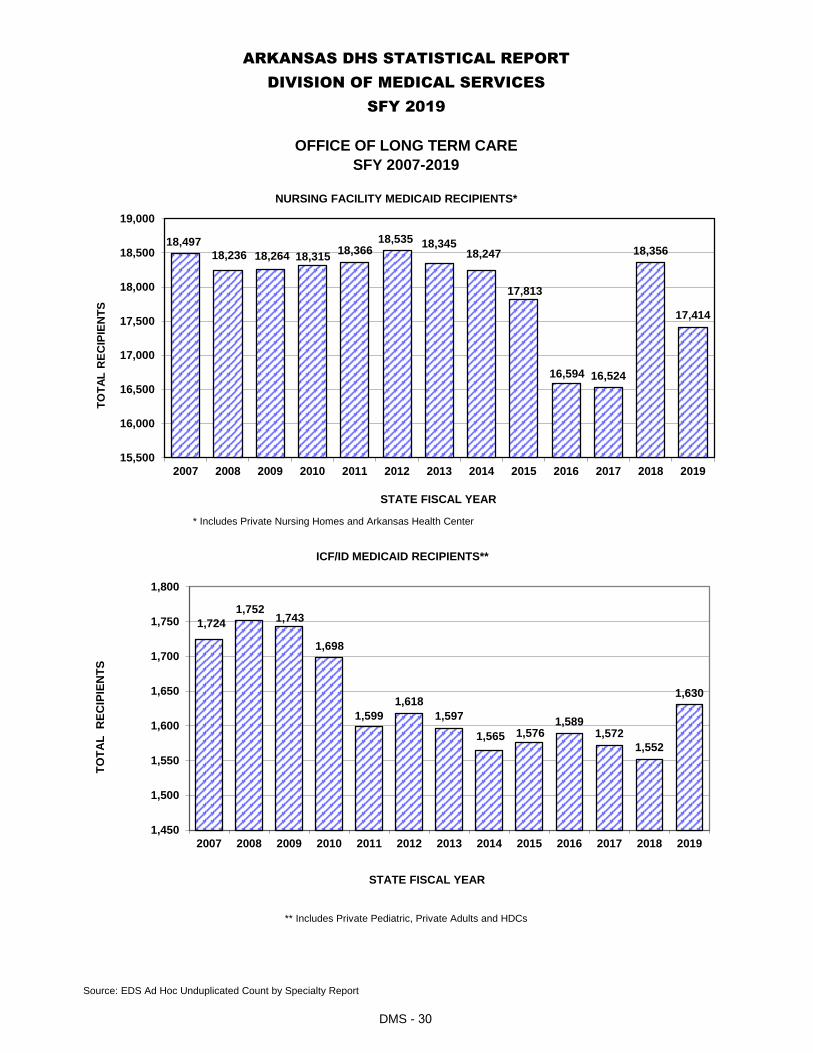
ARKANSAS DHS STATISTICAL REPORTDIVISION OF MEDICAL SERVICES
SFY 2019
Source: EDS Ad Hoc Unduplicated Count by Specialty Report
OFFICE OF LONG TERM CARESFY 2007-2019
* Includes Private Nursing Homes and Arkansas Health Center
** Includes Private Pediatric, Private Adults and HDCs
18,49718,236 18,264 18,315 18,366
18,535 18,34518,247
17,813
16,594 16,524
18,356
17,414
15,500
16,000
16,500
17,000
17,500
18,000
18,500
19,000
2007 2008 2009 2010 2011 2012 2013 2014 2015 2016 2017 2018 2019
TOTA
L R
ECIP
IEN
TS
STATE FISCAL YEAR
NURSING FACILITY MEDICAID RECIPIENTS*
1,7241,752
1,743
1,698
1,5991,618
1,5971,565 1,576
1,5891,572
1,552
1,630
1,450
1,500
1,550
1,600
1,650
1,700
1,750
1,800
2007 2008 2009 2010 2011 2012 2013 2014 2015 2016 2017 2018 2019
TOTA
L R
ECIP
IEN
TS
STATE FISCAL YEAR
ICF/ID MEDICAID RECIPIENTS**
DMS - 30

ARKANSAS DHS STATISTICAL REPORTDIVISION OF MEDICAL SERVICES
SFY 2019
Source: AFGM Report R-2242
OFFICE OF LONG TERM CARE
$501.2 $521.3 $537.4 $558.8$589.4 $614.7 $604.6 $621.0 $622.4 $653.0 $635.3
$683.3
$933.0
$0
$100
$200
$300
$400
$500
$600
$700
$800
$900
$1,000
2007 2008 2009 2010 2011 2012 2013 2014 2015 2016 2017 2018 2019
EXPE
ND
ITU
RES
STATE FISCAL YEAR
PRIVATE NURSING FACILITY EXPENDITURESSFY 2007-2019
MILLIONS
$932.96
$41.99
$128.92
$20.26 $18.97$0
$100
$200
$300
$400
$500
$600
$700
$800
$900
$1,000
Private NF Arkansas HealthCare AHC NF
HumanDevelopment
Centers HDCSICF/ID
Private ICF/ID Over15 beds
Private ICF/ID 15beds or less
EXPE
ND
ITU
RES
LTC FACILITY EXPENDITURES IN MILLIONS
DMS - 31

ARKANSAS DHS STATISTICAL REPORT DIVISION OF MEDICAL SERVICES SFY
2019
OFFICE OF LONG TERM CARESFY 2007-2019
Source: AFGM Report R-2242
$31.68 $33.16$34.31
$36.63$38.40
$49.23
$39.83 $38.95$41.29 $41.29
$41.29 $38.32$41.99
$0
$10
$20
$30
$40
$50
$60
2007 2008 2009 2010 2011 2012 2013 2014 2015 2016 2017 2018 2019
FAC
ILIT
Y EX
PEN
DIT
UR
ES
STATE FISCAL YEAR
ARKANSAS HEALTH CENTER
MILLIONS
$104.57$110.26
$104.84$115.27 $111.01
$121.42$115.70
$126.52$130.98
$124.95$131.77
$125.20 $128.92
$0
$20
$40
$60
$80
$100
$120
$140
2007 2008 2009 2010 2011 2012 2013 2014 2015 2016 2017 2018 2019
ICF/
MR
FAC
ILIT
Y EX
PEN
DIT
UR
ES
STATE FISCAL YEAR
HUMAN DEVELOPMENT CENTERSMILLIONS
DMS - 32

ARKANSAS DHS STATISTICAL REPORT DIVISION OF MEDICAL SERVICES SFY
2019
OFFICE OF LONG TERM CARESFY 2007-2019
Source: AFGM Report R-2242
17.7418.64 19.18 19.83
21.4522.69 22.97
24.00 24.51 25.04
27.79 27.67
20.26
$0.00
$5.00
$10.00
$15.00
$20.00
$25.00
$30.00
2007 2008 2009 2010 2011 2012 2013 2014 2015 2016 2017 2018 2019
PRIVATE ICF/ID FACILITY EXPENDITURES (OVER 15 BEDS)
EXPE
ND
ITU
RES
STATE FISCAL YEAR
Millions
17.66
20.0018.40 18.47
22.56 22.46 22.59 22.85 23.4424.77 24.77
23.46
18.97
$0.00
$5.00
$10.00
$15.00
$20.00
$25.00
$30.00
2007 2008 2009 2010 2011 2012 2013 2014 2015 2016 2017 2018 2019
PRIVATE ICF/ID FACILITY EXPENDITURES(15 BEDS OR LESS "ADULTS")
Millions
STATE FISCAL YEAR
EXPE
ND
ITU
RES
DMS - 33

ARKANSAS DHS STATISTICAL REPORTDIVISION OF MEDICAL SERVICES
SFY 2019
Source: HMVR-258J, EDS Unduplicated Count Specialty Report and UALR Institute for Economic Advancement
The number of Medicaid recipients in nursing facilities has decreased by .33% in the past five (5) years, while theestimated over-age-85 population has increased by approximately 9.01% during the same period. With the continuedexpansion of home and community based programs, those whose needs can be met in their own homes will continue tochoose that option.
ANALYSIS OF PRIVATE FACILITY EXPENDITURES
Arkansas Medicaid is a major provider of private nursing facility services, accounting for approximately 74.8% of alloccupied beds. Expenditures in SFY 2019 decreased by 1.82% from SFY 2018 with an increase of 6.25% over the pastfive (5) years.
UTILIZATION CONTROL AND NURSING FACILITY PAYMENTCLASSIFICATIONS
52.15 52.80 53.50 54.25
24.00 24.06 24.10 24.02
18.23 18.06 17.93 17.54
0
10
20
30
40
50
60
2013 2014 2015
IN T
HO
USA
ND
S
GROWTH OF PRIVATE NURSING FACILITY BEDS AND MEDICAID RECIPIENTS (SFY 2009-2013)
85+ Population Private NF Beds Medicaid Recipients
57.09
51.4 52.15 52.8 53.5
23.85 24.01 24.00 24.06 24.10
18.01 18.06 18.23 18.06 17.07
0
10
20
30
40
50
60
2010 2011 2012 2013 2014
IN T
HO
USA
ND
S
GROWTH OF PRIVATE NURSING FACILITY BEDS AND MEDICAID RECIPIENTS (SFY 2010-2014)
85+ Population Private NF Beds Medicaid Recipients
52.15 52.80 53.50 54.2555.91 56.83 57.80
24.00 24.06 24.10 24.02 24.1525.66 25.90
18.23 18.06 17.93 17.9316.00 16.00
18.00
0
10
20
30
40
50
60
2013 2014 2015 2016 2017 2018 2019
IN T
HO
USA
ND
S
GROWTH OF PRIVATE NURSING FACILITY BEDS AND MEDICAID RECIPIENTS (SFY 2013-2019)
85+ Population Private NF Beds Medicaid Recipients
DMS - 34

ARKANSAS DHS STATISTICAL REPORTDIVISION OF MEDICAL SERVICES
SFY 2019
255 2
Initial Medicaid Surveys Conducted 2
State Licensure Surveys Conducted 202
State Audits for Minimum Staffing 25
Facilities Cited with Substandard Quality of Care 33
Complaint Reports Received 1388
Complaint Surveys Conducted 1044 *
Complaint Surveys on Private Pay Facilities 1299
Standard Surveys Performed 268
Standard Follow Up Surveys 161
Life Safety Code Surveys 190
Life Safety Code Follow Ups 52
Complaint Reports Received 188
Complaint Surveys Completed 186
Complaint Surveys of Unlicensed Facilities 2
Source: HMVR-258J and EDS Unduplicated Count Specialty Report
Some complaints cross fiscal year timelines of reporting and investigation.
RCF/ADC/ADHC/PAHI/ALF I/ALF II/HCR
OFFICE OF LONG TERM CARESURVEY & CERTIFICATION
NURSING HOMES
Standard Surveys Performed New facilities Licensed/Certified
*Includes cases of multiple complaints investigated during a single survey.
DMS - 35
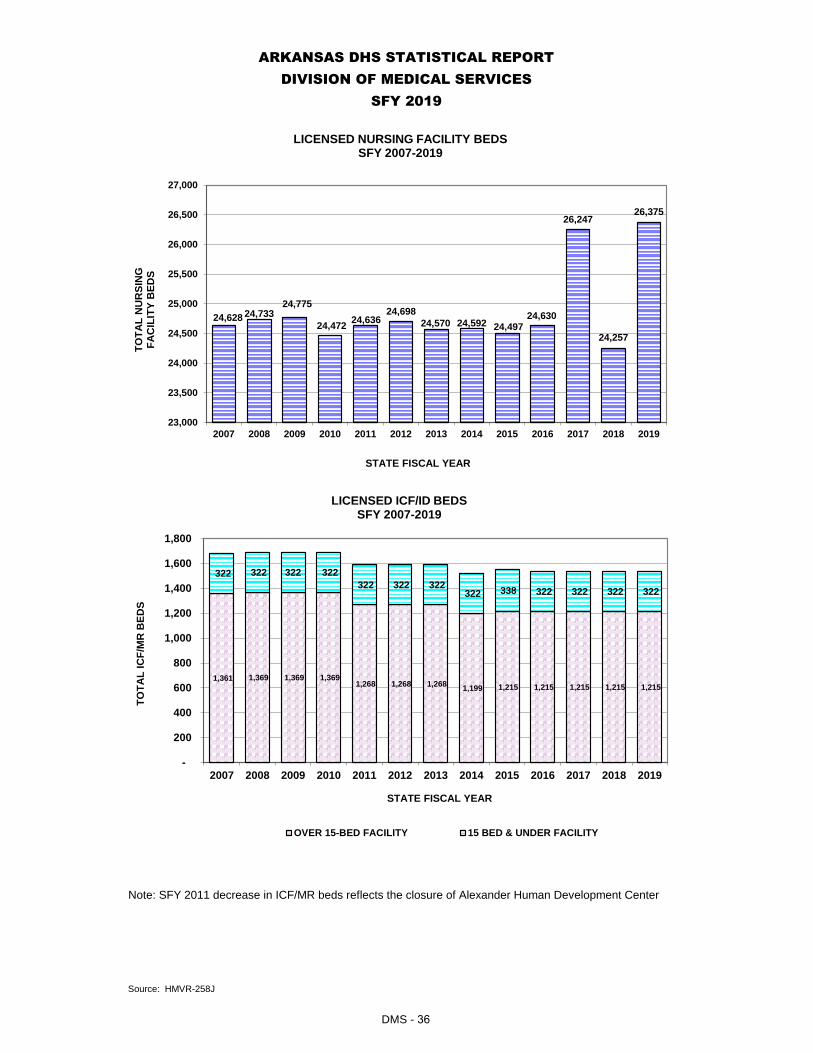
ARKANSAS DHS STATISTICAL REPORTDIVISION OF MEDICAL SERVICES
SFY 2019
Note: SFY 2011 decrease in ICF/MR beds reflects the closure of Alexander Human Development Center
Source: HMVR-258J
24,69824,570 24,592 24,497 24,630
26,247
24,257
26,375
23,000
23,500
24,000
24,500
25,000
25,500
26,000
26,500
27,000
2012 2013 2014 2015 2016 2017 2018 2019
TOTA
L N
UR
SIN
G
FAC
ILIT
Y B
EDS
STATE FISCAL YEAR
LICENSED NURSING FACILITY BEDS SFY 2003-2012
1,268 322 322 1,215 1,215 1,215 1,215 1,215
0
200
400
600
800
1,000
1,200
1,400
2012 2013 2014 2015 2016 2017 2018 2019
TOTA
L IC
F/M
R B
EDS
STATE FISCAL YEAR
LICENSED ICF/ID BEDS SFY 2003-2012
24,628 24,73324,775
24,472 24,63624,698
24,570 24,592 24,49724,630
26,247
24,257
26,375
23,000
23,500
24,000
24,500
25,000
25,500
26,000
26,500
27,000
2007 2008 2009 2010 2011 2012 2013 2014 2015 2016 2017 2018 2019
TOTA
L N
UR
SIN
G
FAC
ILIT
Y B
EDS
STATE FISCAL YEAR
LICENSED NURSING FACILITY BEDS SFY 2007-2019
1,361 1,369 1,369 1,369 1,268 1,268 1,268 1,199 1,215 1,215 1,215 1,215 1,215
322 322 322 322 322 322 322
322 338 322 322 322 322
-
200
400
600
800
1,000
1,200
1,400
1,600
1,800
2007 2008 2009 2010 2011 2012 2013 2014 2015 2016 2017 2018 2019
TOTA
L IC
F/M
R B
EDS
STATE FISCAL YEAR
LICENSED ICF/ID BEDS SFY 2007-2019
OVER 15-BED FACILITY 15 BED & UNDER FACILITY
DMS - 36

ARKANSAS DHS STATISTICAL REPORTDIVISION OF MEDICAL SERVICES
SFY 2019
* Does not include two (2) post acute head injury Residential Care Facility with sixty (60) beds.
Source: Residential Care Licensure Section
** Decrease in number of beds because some facilities closed and most converted to assisted living.
3,717
3,223 3,124 2,972 2,9182,702 2,673
2,449 2,441 2,439 2,236 2,114 2,114
-
500
1,000
1,500
2,000
2,500
3,000
3,500
4,000
2007 2008 2009 2010 2011 2012 2013 2014 2015 2016 2017 2018 2019
TOTA
L R
ESID
ENTI
ALC
ARE
BED
S
STATE FISCAL YEAR
RESIDENTIAL CARE BEDS* SFY 2007-2019
93
81 79 77 75
67 65 61 59 55 52
48 48
-
10
20
30
40
50
60
70
80
90
100
2007 2008 2009 2010 2011 2012 2013 2014 2015 2016 2017 2018 2019
TOTA
L R
ESID
ENTI
AL
CAR
E FA
CIL
ITIE
S
STATE FISCAL YEAR
RESIDENTIAL CARE FACILITIES**SFY 2007-2019
DMS - 37

ARKANSAS DHS STATISTICAL REPORTDIVISION OF MEDICAL SERVICES
SFY 2019
Source: Adult Day Care Licensure Section
25 2227 25 26 25 26
22 2226
19 21
29
910
10 1113 14 13
13 12
15
1213
6
0
5
10
15
20
25
30
35
40
45
2007 2008 2009 2010 2011 2012 2013 2014 2015 2016 2017 2018 2019
FAC
ILIT
IES
STATE FISCAL YEAR
ADULT DAY CARE FACILITIES SFY 2007-2019
ADULT DAY-CARE CENTER ADULT DAY HEALTH-CARE CENTER
611534 559 527 537 503 482 452 398 409 354
411537
188
183 178 197238 253 304
306281
372
285
377232
0
100
200
300
400
500
600
700
800
900
2007 2008 2009 2010 2011 2012 2013 2014 2015 2016 2017 2018 2019
FAC
ILIT
Y SL
OTS
STATE FISCAL YEAR
ADULT DAY CARE FACILITY SLOTS SFY 2007-2019
ADULT DAY-CARE CENTER ADULT DAY HEALTH-CARE CENTER
DMS - 38

Private SNF 58 $ 638,332,866.50 95.88% $ 636,701,628.00 Private SNF Crossover 59 $ 27,420,398.80 4.12% $ 27,350,326.88
Total Private NF (897/77) $ 665,753,265.30 100.00% $ 664,051,954.88 $ 664,051,954.88 Private NF
Public SNF (898/80) 63 38,301,728.56$ $ 38,301,728.56 $ 38,301,728.56 Arkansas Health Center
ICF/Infant Infirmaries (898/79) 27 27,414,525.95$ $ 20,065,600.98 $ 27,414,525.95 Private ICF/ID - Over 15 beds
Public - ICF 62 152,609,579.00$ 86.59% 128,795,119.35$ Human Development Centers ICF/ID
Public - ICF 62 23,639,641.00$ 13.41% 19,950,716.09$ Private ICF/ID - 15 beds or lessTotal (898/80) 62 $ 148,745,835.44 176,249,220.00$ 100.00% $ 180,702,733.00 148,745,835.44$
TOTAL 880,215,355.25$ 903,122,017.42$ 878,514,044.83$
Total 898/80 Expend 219,004,461.56$
Adjusted Total Expenditures
FACILITY CLASS IN STATISTICAL REPORT (Page 27)
CASH EXPENDITURES FOR LTC FACILITIESSFY 2019
PAGE 27 OF DMS STATISTICAL REPORT
CATEGORY OF SERVICE
COS
Expenditures from COS Detail Report -
Week 52
% of Total Expend
from COS Report
Expenditures from DSS Report - SFY
2019 - COS 62 Public ICF/MR
Breakout of COS 62
between HDCs and ICF/IDs Using DSS
ReportAASIS Expend by
Appropriation
DMS - 39

DIVISION OF PROVIDER SERVICES
AND QUALITY ASSURANCE
DPSQA - 1

DPSQA - 2
SFY19 STATISTICAL REPORTDIVISION OF PROVIDER SERVICES AND QUALITY ASSURANCE
The Division of Provider Services and Quality Assurance (DPSQA) is structured to centralize home- and community-based and long-term care provider certification, licensure, inspections, incident/complaint investigations, and quality assurance with a focus on streamlining and improving interactions with providers and ensuring the services our clients receive are of high quality.
DPSQA is organized into three complimentary work units: The Office of Long Term Care, the Community Services Licensure/Certification unit, and the Quality Assurance and Provider Engagement unit. While each work unit serves a unique role within the division, all units work collaboratively in a team-based approach.
OFFICE OF LONG TERM CARE
Each year, more than 25,000 Arkansans who have chronic, long-term medical needs require services in long-term care facilities. These individuals live in approximately 227 nursing facilities, 41 intermediate care facilities for individuals with intellectual disabilities and 12 psychiatric residential care facilities that are licensed to provide long-term care services in Arkansas.
Improving the quality of life for residents and protecting their health and safety through enforcing state and federal standards are primary goals of the Office of Long Term Care (OLTC). Using qualified health care professionals, OLTC inspects all facilities to ensure residents receive the care they need in a clean, safe environment and that they are treated with dignity and respect.
In addition to its role inspecting long-term care facilities, the OLTC provides training and educational opportunities to various health care providers to help ensure that facilities provide the highest level of care possible to long-term care residents. OLTC staff provided approximately 1,014 hours of continuing education through 163 workshops/seminars to staff members in the nursing home and assisted living industry during SFY19.

DPSQA Complaint Unit: (501) 320-6241OLTC Complaint Hotline: (800) 582-4887
*There is one adiditional private facility that does not recieve medicaid funding
DIVISION OF PROVIDER SERVICES AND QUALITY ASSURANCESFY19 STATISTICAL REPORT
OFFICE OF LONG TERM CARE (cont)
Since 1990, the federal long-term care program has had two levels of facility care under Medicaid. These levels of care are nursing facility services and intermediate care facility services for individuals with an intellectual disability (ICF/IID). Arkansas classifies state-owned facilities as public and all others as private. The Arkansas Health Center is a public nursing facility. The ICF/IID population is divided into the five (5) state-owned Human Development Centers, five (5) private pediatric facilities, and 31 facilities with fifteen (15) or less beds serving adults. The nursing facilities include one (1) public and two hundred and twenty-seven (226) private under Medicaid.*
The Medical Need Determination Unit processed approximately 2,327 Arkansas Medicaid nursing facility applications per month during SFY19. The unit processed 12,558 assessments; 2,598 reassessments; 2,668 changes of condition requests; 451 transfers; approx. 4,899 PASRR requests; and 4,160 hospice reviews. The unit processed 1,670 applications/reviews for ICF/IID, which includes 168 new assessments and 12 transfers during the fiscal year, and 1,490 reassessments. The unit completed 5,737 TEFRA applications and 195 Autism waiver applications. Additionally, the unit completed all eligibility reviews (assessments and reassessments) for the Division of Aging, Adult, and Behavioral Health Services for the ARChoices in Homecare waiver, the Living Choices waiver, as well as PACE program eligibility during SFY19
The OLTC Complaint Unit staffs a registered nurse and licensed social worker who record the initial intake of complaints against long-term care facilities. When this occurs, the unit performs an on-site complaint investigation. They are often able to resolve the issues with the immediate satisfaction of the involved parties. The unit received 1,364 nursing home complaints during SFY19 regarding care or conditions in facilities.
DPSQA - 3

Public
Private
#2432222719331364951
Park Place Group Home Private Nonprofit ICF/IID:
15 Bed or Less Facilities for Adults (31)
Easter Seals
DPSQA - 4
Complaint surveys conducted*
Arkansas Health Center Nursing Facility
Private Nonprofit ICF/IID Pediatric:Millcreek
Arkansas PediatricPrivate ICF/IID Pediatric facilities:
(for profit and nonprofit)Private Nursing Homes
New facilities licensed/certifiedInitial medicaid surveys conducted
*complaits include cases of multiple complaints investigated during a single survey. Some comlaints cross fiscal year timelines of reporting and investigation.
State audits for minimum staffingFacilities cited with substandard quality of care Complaint reports received
State licensure surveys conducted
DIVISION OF PROVIDER SERVICES AND QUALITY ASSURANCE
OFFICE OF LONG TERM CARE (cont)
Intermediate Care Facilities for Individuals with an Intellectual Disability (ICF/IID)
Arkadelphia Human Development Center Booneville Human Development Center
Nursing Facilities
Conway Human Development Center Jonesboro Human Development Center
Brownwood
SFY19 STATISTICAL REPORT
Warren Human Development Center
LONG TERM CARE SURVEY & CERTIFICATION
Nursing HomesStandard Federal Surveys performed

DPSQA - 5
DIVISION OF PROVIDER SERVICES AND QUALITY ASSURANCESFY19 STATISTICAL REPORT
COMMUNITY SERVICES LICENSURE & CERTIFICATION
The Community Services Licensure and Certification work unit provides similar functions to the Office of Long Term Care, although this unit is focused on improving the quality of life for home- and community-based (HCBS) clients and protecting their health and safety through enforcing state and federal standards. Using qualified professionals, this unit monitors all home- and community-based providers to ensure clients receive the services they need in a clean, safe environment and that they are treated with dignity and respect.
HCBS providers deliver an array of services that allow their clients to age in place or receive services in the least restrictive setting. The populations served by HCBS providers include the aging and physically disabled, individuals with intellectual and developmental disabilities, and individuals with mental health needs. These populations are served by the types of providers listed on the next page.
The HCBS Complaint Unit records the initial intake of complaints against home- and community-based providers. Complaints are prioritized and an on-site complaint investigation occurs. Staff are often able to resolve the issues with the immediate satisfaction of the involved parties. The unit received 437 complaints during SFY19.

*Includes Behavioral Health Agencies and Independently Licensed Practitioners
HCBS SURVEY & CERTIFICATION
Providers cited for Substandard Quality of Care 95
Complaint Surveys conducted 334Complaint Surveys of unlicensed facilities 5Hospital Civil Rights Surveys completed 135
Special visits (incl. enforcement) 56OBHS/Substance Abuse site visits* 513Complaint Reports received 437
Standard Follow-up Surveys performed 182Life Safety Code visits performed 181Life Safety Code follow-up visits performed 52
48
Independently Licensed PractitionerPersonal CarePost-Acute Head Injury FacilityResidential Care Facility
2204021
Residential Substance Abuse FacilityTargeted Case Management
DPSQA - 6
SFY19 STATISTICAL REPORT
Adult Day CareAdult Day Health CareAdult Developmental Day TreatmentARChoices in Homecare waiver
Assisted Living Facility
Standard Surveys performed 444
51125
303Behavioral Health AgencyCommunity and Environmental Support waiverEarly Intervention Day Treatment
2083
ALF Level IALF Level IIAlzheimer's Special Care Unit 21
92155
36195
Personal Emergency ResponseRespite
124
216
48
Attendant careEnvironmental ModificationHome Delivered Meals
22
11138517
DIVISION OF PROVIDER SERVICES AND QUALITY ASSURANCE
COMMUNITY SERVICES LICENSURE & CERTIFICATION (cont)
21Type of HCBS Provider # of Licensed/Certified Sites

DPSQA - 7
DIVISION OF PROVIDER SERVICES AND QUALITY ASSURANCESFY19 STATISTICAL REPORT
QUALITY ASSURANCE AND PROVIDER ENGAGEMENT
The Quality Assurance and Provider Engagement work unit supports the Office of Long Term Care and the Community Services Licensure and Certification work unit by serving as the lead for policy development and contract management, training providers on policy and program requirements, and serving as a resource to the public at large. This work unit also assists in processing criminal record checks for both long-term care and HCBS providers, reviewing and tracking self-reported incidents submitted by long-term care and HCBS providers, approving and monitoring Certified Nursing Assistant training programs across the state, tracking and processing licensure applications for Nursing Home Administrators, monitoring and quality control for the IndependentChoices, self-direction program, training and monitoring for providers serving clients under Part VI-B of the Individuals with Disabilities Education Act, and tracking and responding to Freedom of Information (FOI) requests.
Provider and stakeholder outreach and engagement occurs through various channels including one-on-one technical assistance, provider e-blasts/newsletters, presentations at provider association/membership meetings, regional town hall meetings, and webinars. The webinars and town hall meetings are supported through a contract with the Arkansas Foundation for Medical Care to provide training and technical assistance to both the long-term care and home- and community-based providers. During SFY19, we held 11 regional town hall meetings with 327 attendees and 37 webinars with 9,563 attendees.

DPSQA - 8
DIVISION OF PROVIDER SERVICES AND QUALITY ASSURANCESFY19 STATISTICAL REPORT
QUALITY ASSURANCE AND PROVIDER ENGAGEMENT (cont)
The Alternatives Plus unit ensures the civil rights of Arkansas nursing facility residents, as mandated by the 1999 Supreme Court Olmstead Decision. The Alternatives Plus unit provides options counseling to nursing facility residents at their request. Options counseling is provided during an initial in-person meeting between a member of the Alternatives Plus unit and the resident or the resident’s representative to discuss the resident’s goals of transitioning to a least restrictive community environment. Based on the expressed interest of the resident and/or their representative and the resident’s consumer choice goal, the Alternatives Plus unit explores, researches, secures, and connects the resident to relevant community resource information. Assistance with completing paperwork for application of services is provided. This unit continues to assist residents until a successful transition occurs. During SFY19, the Alternatives Plus unit successfully transitioned 702 nursing facility residents.
The Criminal Record Check program applies to licensed long-term care facilities (nursing facilities and ICF/IID), HCBS providers serving the aging and physically disabled population (Adult Day Care, Adult Day Health Care, and Assisted Living Facilities), developmental disability waiver (CES) providers, and the IndependentChoices, self-direction program. During SFY19, the unit processed 48,030 "state" record checks and 21,500 "federal" record checks for long-term care providers. A total of 630 disqualifications were issued as a result of both the state and federal record checks for long term care employees. In addition, this unit processed 8,707 “state” record checks and 977 “federal” record checks for Community and Employment Support waiver providers. A total of 66 disqualifications were issued. Lastly, this unit processed 1,775 “state” record checks for the IndependentChoices (self-direction) program, resulting in 36 caregiver disqualifications.

DPSQA - 9
DIVISION OF PROVIDER SERVICES AND QUALITY ASSURANCESFY19 STATISTICAL REPORT
QUALITY ASSURANCE AND PROVIDER ENGAGEMENT (cont)
The Certified Nursing Assistant (CNA) Training Program monitoring unit reviews and approves new CNA training programs including verifying instructor credentials, reviewing curriculum and course schedule, reviewing classroom space and materials, and verifying clinical site selections. This unit conducts annual monitoring for these CNA training programs and ad hoc monitoring to follow-up on complaints. During SFY19, there were 101 training/classroom locations across the state. In addition, this unit manages the statewide competency testing services for the CNA training programs and processes reciprocity transfers for Certified Nursing Assistants moving into or out of the state of Arkansas. This unit also contracts with Prometric, Inc. to maintain a registry of Certified Nursing Assistants in the state. At the end of SFY19, the Registry for Certified Nursing Assistants (CNAs) contained 28,809 active CNAs and 96,843 inactive.
The Nursing Home Administrator Licensure Unit processed renewals for 604 licensed administrators; reviewed 90 new Nursing Home Administrator license applications; issued 37 new licenses and one (1) temporary license; and restored six (6) licenses. Additionally, this unit administered the state nursing home administrator exam to 63 individuals. During SFY19, the Administrator-in-Training program trained 24 participants.
The FOI unit receives, tracks, and responds to Freedom of Information requests from the general public. See the table below for the SFY19 volume of work.
FOI requests processedTotal pages copiedLife Safety Code visits performed
290 186,151 181
Freedom of Information (FOI) Requests

-
-
IndependentChoices began as a consumer-directed Medicaid waiver for Medicaid eligible person age 18 and older who have a functional need for personal care services. On April 1st, 2008 the IndependentChoices program was approved by CMS as a state plan option within the Medicaid Personal Care Program. CMS also approved two home and community- based waiver services, Attendant Care and personal care, as eligible services offered through the IndependentChoices program. This consumer directed service offers a person a monthly budget based on his/her individual assessed need for personal assistance. Eligible persons are able to hire, train, supervise, and pay their own personal care aide and use a portion of their monthly budget to purchase goods and services that lessen human dependency needs. The IndependentChoices participant (or his/her designated Representative) will be assisted by a Support Coordinator who will coordinate enrollment, provide skills training, and assist with questions as they arise. The participant receives counseling and financial support services at no additional cost to the participant’s budget. During SFY19, the IndependentChoices program served 3,931 Medicaid clients.
DPSQA - 10
DIVISION OF PROVIDER SERVICES AND QUALITY ASSURANCESFY19 STATISTICAL REPORT
QUALITY ASSURANCE AND PROVIDER ENGAGEMENT (cont)
Information and Assistance is available to all older persons, their families, and friends. The service includes concrete information about services and benefits and where to obtain them. It may include assistance with referral to an agency providing the service or benefit and a follow-up to see if the service was satisfactory.
Outreach occurred at 50 events during SFY19, reaching 24,483 attendees. The Resource Center provides education and awareness of DHS publicly funded programs, including Medicaid Home and Community Based waiver programs, through statewide marketing and outreach at Senior Centers, Senior Health Fairs, and exhibits at various state conferences
Choices in Living Resource Center provides callers with information regarding long-term services and supports programs and services as well as referral to local assistance programs and organizations. The Resource Center targets seniors and adults with disabilities who are at risk of nursing home admission to help them access programs and services that will allow them to remain in the community and live as independently as possible.

The Special Monitoring Unit oversees providers special education and related services for children ages three (3) until they enter a kindergarten program in the Early Intervention Day Treatment (EIDT) programs that were previously Developmental Day Treatment Center Services (DDTCS). In SFY19, these services were provided to approximately 2,682 children by 48 EIDT providers in 73 sites across the state. The Division of Provider Services and Quality Assurance (DPSQA) was responsible for monitoring, training and technical assistance for the EIDT providers delivering special education and related services to meet the special education needs of a child. The provision of special education services is required to meet all components of the Individuals with Disabilities Education Act (IDEA) and standards established by the Arkansas Department of Education (ADE), Special Education Unit.
DPSQA - 11
Annual training was provided by DPSQA to ensure providers had the necessary information to comply with IDEA and ADE standards in the provision of special education and related services. Training was available in each area of the state, with a total of seven (7) sessions providing training for approximately 250 participants. Responsibility for the provision of special education and related services for children three (3) years of age and older in the EIDT programs became the responsibility of the local education agency effective July 1, 2019.
DIVISION OF PROVIDER SERVICES AND QUALITY ASSURANCESFY19 STATISTICAL REPORT
QUALITY ASSURANCE AND PROVIDER ENGAGEMENT (cont)

DPSQA Administration Expenditures
00 - Regular Salaries01 - Extra Help02 - Maintenance & Operations03 - Fringe Benefits06 - Overtime09 - Conference Fees and Travel10 - Professional Fees and Services
Sub-Total
DPSQA Programs
Medicaid Expansion TobaccoProvider Services Grants
- Sub-Total
TOTAL
- 15,450,159
2,369,529 3,235,541
- 28,075 21,614
DIVISION OF PROVIDER SERVICES AND QUALITY ASSURANCE
EXPENDITURES BY APPROPRIATION LINE ITEM
SFY19 STATISTICAL REPORT
9,759,523 35,877
983,060 7,600
990,660
16,440,819
DPSQA - 12


1.
2. Maximize the potential contributions made by consumers as citizens and taxpayers.
DSB serves consumers through three interdependent units: Field Services, Business and Technology Services, and the DSB Directors Office. These three service units were designed by the DSB Board to offer two advantages to the State of Arkansas:
ARKANSAS DHS STATISTICAL REPORTDIVISION OF SERVICES FOR THE BLIND
INTRODUCTIONSFY 2019
During the 1940's and early 1950's, rudimentary services for blind people were provided by "home teachers" who were employed by the Arkansas Department of Welfare. In 1955, services to blind people were transferred to the Arkansas Rehabilitation Services, then to the Department of Education.
Arkansas Rehabilitation Services for the Blind was created in 1965 by Arkansas Act 180. This Act established a Division of Rehabilitation Services for the Blind within the State Board for Vocational Education. All services for the blind were transferred to said Division from the Arkansas Rehabilitation Services.
Act 38 of 1971 transferred the functions, powers, and duties of the Rehabilitation Services for the Blind to the Department of Social and Rehabilitation Services (now the Department of Human Services) and placed them in the Division of Rehabilitation Services.
AGENCY HISTORY
Arkansas Act 393 of 1975 amended Arkansas Act 38 of 1971 to require that the functions, powers and duties of the Rehabilitation Services for the Blind be located within an Office for the Blind and Visually Impaired in the Division of Rehabilitation Services. Act 393 gave the Office for the Blind and Visually Impaired statutory authority and legal authority to promulgate rules, and established an Advisory Committee appointed by the Governor.
In 1983, a number of consumer, education, and service organizations identified a critical need for specialized services to visually impaired and blind Arkansans. In response to this concern, the Governor and Legislature established the Division of Services for the Blind (DSB) under Act 481. Although previously, Arkansas had offered separate services for blind and visually impaired persons, Act 481 provided that the agency should be governed by a policy-making board, the majority of whom must be blind persons. Within the past decade, DSB has been commended for innovative programming, consumer responsiveness, and consistently high performance in the rehabilitation of severely disabled persons.
DSB functions both as a direct service provider and as a consumer agent in locating and purchasing quality services (including medical and educational services; equipment or supplies related to self-sufficiency; job placement or employment services; etc.). All direct services are made available to consumers in their own communities.
Enhance the personal self-sufficiency of consumers eliminating costs associated with unnecessaryskilled care;
DSB-1

1.
2.
3.
Source: DSB Website
Employment - To assist Arkansans who are blind or visually impaired to secure or maintainemployment consistent with their skills, abilities, and interests;
Rehabilitation Teaching - To assist Arkansans who are blind or visually impaired to live asindependently as possible through the development of skills, accommodations, or adaptations thatare necessary to perform all activities of daily living;
Prevention of Blindness - To assist in preventing blindness by stabilizing vision, and, wherepossible, restoring vision.
The Arkansas Division of Services for the Blind is dedicated to the independence of Arkansans who are blind or visually impaired and is committed to the principle that these individuals have the right to make informed choices regarding where they live, where they work, how they participate in the community, and how they interact with others.
Within the constraints of state and federal laws and based on available funds, the Division of Services for the Blind fulfills its mission through the following goals:
Our mission is to work in partnership with these Arkansans by assisting them in obtaining the information they need to make informed choices and by providing them with access to services that increase their opportunities to live as they choose.
ARKANSAS DHS STATISTICAL REPORTDIVISION OF SERVICES FOR THE BLIND
PHILOSOPHY AND GOALS
INTRODUCTIONSFY 2019
DSB-2

WhiteBlack
417439
1216
60-6970+ 23
RACE
326Total
856
856
Total
Asian
HispanicIndian
279
Other
116
Total 856
ARKANSAS DHS STATISTICAL REPORTDIVISION OF SERVICES FOR THE BLIND
SFY 2019
DSB FIELD SERVICES
AGE RANGE14-2122-39
195133
40-4950-59
191
During the 2019 state fiscal year, DSB provided specialized services to blind and visually impaired persons through two major program units. Field Services offered vocational rehabilitation and independent living services to blind and severely visually impaired persons in their homes and communities throughout Arkansas. Business and Technology Services provided assessment of technological and job development needs, then prescribed equipment and training plans to meet those needs in a rapidly changing job market and business environment. The DSB Director’s Office supported the programs offered above through supplemental administrative services as well as operating the Arkansas Information Reading Services for the Blind Network.
Vocational Rehabilitation - The objective of the Vocational Rehabilitation (VR) program is to ensure that qualified blind and visually impaired persons work in appropriate careers and become as personally and economically independent as possible. The program assesses consumer needs, plans appropriate services based upon informed consumer choice, and develops and provides cost-effective services for individuals who are blind or severely visually impaired. Consumers usually range in age from 14 to 64. The vocational rehabilitation services provided are consistent with the strengths, resources, priorities, concerns, abilities, capabilities and informed choice of the disabled individual.
To be eligible for DSB services, the individual must have a visual disability. The visual disability must be a substantial impediment to employment. It must be determined that the individual with the visual disability can benefit from vocational rehabilitation services in the achievement of a vocational outcome. Additionally, the individual requires vocational rehabilitation services to prepare for, engage in, or retain gainful employment. After an individual is determined eligible for vocational rehabilitation, services are provided. In SFY 2019, DSB served 856 vocational rehabilitation consumers, of which 100% were severely disabled. Of this number, 102 blind or severely visually impaired individuals successfully achieved employment outcomes.
VOCATIONAL REHABILITATION (VR) DEMOGRAPHIC BREAKDOWN
Male 198466GENDER
Female
DSB-3

Consumer Technology - Like their sighted counterparts, blind college students, insurance agents, lawyers, social workers, ministers, physicians, etc., have multiple needs for computers and other technology. Computer systems with prescriptive sensory adaptations are developed by the Consumer Technology Program to enable blind and visually impaired individuals to access the information needed for success in their chosen professions.
169Other 1
86+Total
During SFY 2019, there were 413 visits made to the Consumer Technology Lab with technology specialists providing consultation and training to 169 individuals. Additionally, numerous public inquiries were made by agencies, businesses, and individuals interested in learning more about adaptive equipment for blind and visually impaired people. The Technology Lab has proven to be valuable in allowing blind individuals to have access to computers for the purpose of gaining experience in using adaptive equipment.
17
29
DSB BUSINESS AND TECHNOLOGY SERVICES
Total 169
121 Black
Indian 066-70 221
18
71-7576-80 23
5881-85
Asian 0
Total 169 Hispanic1061-65
WhiteFemale
149 55-60 10Male 48GENDER RACE
DSB FIELD SERVICES (CONTINUED)
AGE RANGE
The Older Blind Program provides in-home instructions in the activities of daily living to Arkansans, age 55 and older, who are blind, severely visually impaired or have a rapidly progressive visual impairment. The program assists eligible individuals by teaching independent living skills necessary to remain independent in their homes and communities. DSB, the DHS Division on Aging and Adult Services, and the Department of Health work together to support the independence of older blind persons within the state. During SFY 2019, the program served 169 older blind persons, including 100 under the federal grant contract and 69 served through in-kind services of World Services for the Blind (WSB). All 169 individuals served under the contract successfully completed their rehabilitation plans.
INDEPENDENT LIVING SERVICES FOR OLDER BLIND DEMOGRAPHIC BREAKDOWN
SFY 2019
ARKANSAS DHS STATISTICAL REPORTDIVISION OF SERVICES FOR THE BLIND
DSB-4

ARKANSAS DHS STATISTICAL REPORTDIVISION OF SERVICES FOR THE BLIND
SFY 2019
DSB BUSINESS AND TECHNOLOGY SERVICES (Continued)
Source: Division of Services for the Blind
Braille/Tape Production - This unit converts printed materials into Braille or large print according to the user's preference in order to comply with ADA requirements or the Federal Rehabilitation Act. Services are provided after identifying preference of media choice from the agency's staff, consumers and other professionals throughout the field of blindness: e.g. textbooks, operating manuals, meeting agendas/minutes, training packets, test for employment, etc. This is a unique service specifically designed to meet the blind and visually impaired individual's needs. The service is managed by a Library of Congress Certified Braille Transcriber. From July 1, 2018 through June 30, 2019, the Braille/Tape Production unit received a total of 215 requests for alternative format to print. One hundred ninety-seven (197) requests were made for Braille and nineteen (19) for large print, resulting in the production of 7,063 Braille pages; as well as 4,015 large print pages.
The DSB Director's Office provides administrative guidance and supplemental staff support to the previously mentioned programs in the form of policy development, staff development, and financial services. Additionally, it oversees the operation of the Arkansas Radio Reading Services for the Blind (AIRS).
AIRS radio has 3036 listeners on the web, <airs.aetn.org>, the largest concentration is in central Arkansas with 571. AIRS radio is also available on TV on the side band of AETN World, available on many cable systems. It is estimated there are about 100 listeners through those means. AIRS-Plus has 345 users making 2870 calls a month. AIRS plus is the telephone service (844-888-0981) which has about a third of the AIRS radio programs available on demand. It also has all the larger Arkansas newspapers (over 10000 circulation) including the Democrat Gazette, Jonesboro Sun, Conway, Hot Springs, Fayetteville, Pine Bluff, Fort Smith, Arkadelphia, 23 papers in all and about 20 magazines. AIRS plus is funded by the SSBG and DSB. Newsline has the top newspapers in the world. DSB’s state sponsorship provides the funding for the Democrat Gazette. Newsline users can listen on the phone or download to e-mail or onto select listening platforms such as Daisy. Newsline requires registration which is available to anyone with an NLS account and/or NFB membership, regardless of state sponsorship. According to NFB-supplied figures, Newsline has 34 users in Arkansas.
Vending Facility Program - The Vending Facility Program (VFP) provides self-employment business opportunities throughout the state for individuals who are interested in, and have the necessary skills for, private enterprise. The vending locations are managed by totally blind or legally blind persons who have been trained and licensed by the Division of Services for the Blind under the federal Randolph Sheppard Act. In addition to initial training, managers are also provided technical assistance, financial management services and upward mobility training. The program also assesses and recruits potential new locations. It equips locations, maintains and replaces equipment as needed, and provides initial stock inventory. In fiscal year 2019, $23,619.55 was personally spent by the vendors upgrading existing facilities. Licensed blind vendors operated 14 manned locations with sales of over $1.0 million dollars. There were also 16 mechanical vending locations on Arkansas highways generating income of $108,736.36. Vending managers earned commissions on sales totaling $327,537.00 an average of $23,395.50 annually.
DIRECTOR'S OFFICE
Volunteer Coordination - In SFY 2019, DSB volunteers participated in various activities with a total of 180.5 hours. Service was donated in the areas of management, direct services, advocacy, indirect services, special events, education and training, boards/commissions and advisory committee activities. A total of 68 volunteers donated time to DSB staff and consumers and various DSB and DHS projects.
Self-Employment - DSB also offers self-employment guidance for vocational rehabilitation consumers interested in starting their own business. The guidance consists of tools for business planning, counseling and guidance and technical assistance as needed. DSB served 10 consumers during SFY 2019.
DSB-5


ARKANSAS DHS STATISTICAL REPORTDIVISION OF YOUTH SERVICES
SFY 2019
1.
2.
3.
4.
5.
6.
7.
8.
9.
10.
INTRODUCTIONMission
All youth in DYS custody should be provided effective education and vocational trainingopportunities.
Funding allocation across residential and community-based services must be rebalanced.
All children and youth in the state should have equal opportunities for services and success,
Collboration with local school districts is critical to successful prevention, aftercare and re-entry for DYS youth.
Limited length of stay recommendations should recognize that effectiveness of treatment providing institutional settings is diminished after six months, not withstanding correctional and public safety goals.
Families, schools, law enforcement and courts need a wide array of service options, including graduated sanctions outside the courtroom.
The mission of the Division of Youth Services is to provide effective prevention, intervention and treatment programs to giveopportunities for success to families and children in Arkansas and to ensure public safety. Services will provide alternatives toconfinement or commitment to DYS and/or support transition of youth back into their homes, schools and communities.Treatment plans for both youth and families will rely on results of individualized risk and needs assessment, and promote positivegrowth, educational and vocational development, self-sufficiency, and accountability
VisionThe Arkansas Division of Youth Services works with judges, providers, schools, and other stakeholders to provide a continuum ofindividualized rehabilitative services and sanctions for at-risk and adjudicated youth and their families. Children and families inArkansas are safe and have the resources they need in their communities to help them succeed.
ValuesThis plan is based on a number of shared values and beliefs among stakeholders for juvenile justice reform:
Youth are best served in least-restrictive settings located close to home, when appropriate, evidence-based rehabilitative service are available and removing youth from the home should be the option of last resort.
Decision-making should be data-driven, and programs and services should be supported by data demonstrating their effectiveness in improving outcomes for youth and families.
Source: Division of Youth Services
Historic Overview of DYS
Treatment and placement decisions should be individualized, based on comprehensive, standardized assessment,and actively involve youth and families in the planning processes.
Effective community based services can reduce the use of confinement and commitment to DYS and result insignificant fiscal savings in state revenue.
In 2015, Act 1010 directs the Division of Youth Services of the Department of Human Services to establish the Youth JusticeReform Board to improve the effectiveness of the juvenile justice system and provide oversight of commitment reduction services.The Division of Youth Services and the Board were directed to develop a plan to reduce the use of secure confinement for youthwho do not present a serious risk to public safety, calculate savings from reductions in youthful offender commitments and DYSresidential populations and allow for the support and expansion of proven effective community based alternatives to secureconfinement.
Act 67 of 1917, the Arkansas Boys' Reform School was relocated to Pine Bluff.
Act 60 of 1937 established two additional "training" schools at Wrightsville and Fargo.
In 1985, Act 348 merged the Division of Youth Services with the Division of Children and Family Services until Act 1296 of 1993reestablished DYS as an independent division within DHS. The Division of Youth Services (DYS) was authorized by Act 1296 tobe "devoted entirely to handling the problems of youths involved in the juvenile justice system." DYS became operational inOctober 1993 and is responsible for client-specific programming and individual treatment programs, serious offender programs forviolent youth offenders, providing alternative community-based programming, and other services specified directly by Act 1296.
In 1968, the Department for Rehabilitative Services was assigned responsibility to administer "training" schools. The BentonServices Center was opened and controlled the diagnosis and intake responsibilities regarding the youth committed to statecustody.In 1971, Act 38 established the Department of Social and Rehabilitative Services (SRS), a forerunner to the current Departmentof Human Services (DHS). The Office of Juvenile Services was placed under the direction of the Director of SRS. In 1977, theDivision of Youth Services was formally created as a division within the present DHS.
Act 199 of 1905 established the first reform schools in Arkansas in Little Rock and Alexander, respectively.
DYS - 1

ARKANSAS DHS STATISTICAL REPORTDIVISION OF YOUTH SERVICES
SFY 2019
Vera Lloyd - Little Rock
A1 Community Empowerment Council, Inc. - Little Rock
Dermott Juvenile Correctional Facility
Specialized Services Programs
Phoenix Youth and Family Services - Crossett
Lewisville Juvenile Treatment Center
South Arkansas Youth Services, Inc. - MagnoliaSouthwest Arkansas Counseling & Mental Health Center - TexarkanaUnited Family Services, Inc. - Pine BluffYouth Bridge, Inc. - Fayetteville
Professional Counseling Associates - Lonoke
Source: Division of Youth Services
Arkansas State Hospital Unit, ASH - Little RockConsolidated Youth Services - Jonesboro
Mansfield Juvenile Treatment Center
Arkansas Juvenile Assessment & Treatment Center - Bryant, ARResidential Facilities
Youth Bridge - Fayetteville
Piney Ridge - FayettevilleRivendell Behavior Health Services - Benton
Mansfield Juvenile Treatment Center for Girls
South Arkansas Youth Services, Inc. - Magnolia
Dermott Juvenile Treatment Center
Colt Juvenile Treatment CenterHarrisburg Juvenile Treatment Center
Ouachita Children's Center - Hot SpringsHealth Resources of Arkansas, Inc. - Batesville
Consolidated Youth Services - Jonesboro
In SFY 2019, the Division of Youth Services contracted with Community Based Providers (CBP) for thefollowing services: Targeted Casework Management, Therapy, Diagnosis and Evaluation, Intensive CaseworkManagement, Interstate Compact, Emergency Shelter and Residential Treatment. In addition, the CommunityBased Providers provided sanction services that included Community Service Supervision, IntensiveSupervision and Tracking, Compliance Monitoring, Drug Screening, Day Services Level I, Day Services Level II,and Crisis Residential Treatment. Funding for community based services was allocated to each judicial district,with one contractor servicing each district. The providers in each district conducted a needs survey in order toprovide the services most beneficial to the youth in their individual areas. Aftercare services were provided inaccordance with ACT 1222, with quarterly reports submitted to the Legislative Committee on Children andYouth.The Division also contracts for Specialized Services including: Therapeutic Group Home Services,Comprehensive Residential Treatment Services in Psychiatric facilities, Sex Offender Treatment Services,Socialization/Recreation Services, Therapeutic Foster Care, Diagnosis and Evaluation and Therapy. TheResidential Facilities have a total of 282 beds contracted with DYS.
The Residential Facilities had direct expenses in the amount of $29,041,695.68. The Community BasedPrograms and Service Providers had direct expenses in the amount of $18,564,941.57. The SpecializedServices Programs had direct expenses in the amount of $1,733,731.06. With operational expenses in theamount of $6,378,627.69 with additional construction expenses of $603,014.64, total expenditures were$56,322,010.64.Community Based Programs and Services ProvidersComprehensive Juvenile Services - Fort Smith
Conway County Community Services, Inc. - MorriltonCounseling Clinic - BentonEast Arkansas Youth Services, Inc. - Marion
DYS - 2

ARKANSAS DHS STATISTICAL REPORTDIVISION OF YOUTH SERVICES
SFY 2019
Total Number of Commitments:
1 5
COMMITMENTS TO YOUTH SERVICES CENTERS*
8
1
22 4
4 8
7 2
6 20 1
1
4
1 9
Source: Division of Youth Services
2
350
8
0 5 3 17
*All commitments were counted even if a juvenile received one or more new commitment orders in the same case. Each wascounted as a new commitment.
21
1
0 1
15
8 9
7 2 0
1
1
28
2 2 6 1
2 12 0
3
2 0
0
1
1312
2
2 8
3 0 0 1
1 5 3
5
13 0 2 0 11
2 1
3 3 2 1 1 1
ARKANSAS
ASHLEY
BAXTERBENTON BOONE
BRADLEYCALHOUN
CARROLL
CHICOT
CLARK
CLAY
CLEBURNE
CLEVELAND
COLUMBIA
CONWAY
CRAIGHEAD
CRAWFORD
CROSS
DALLAS
DESHA
DREW
FAULKNER
FULTON
GARLAND
GRANT
GREENE
HEMPSTEAD
HOT SPRING
HOWARD
IZARD
JACKSON
JEFFERSON
JOHNSON
LAWRENCE
LEE
LINCOLN
LOGAN
LONOKE
MADISON
MARION
MILLER
MISSISSIPPI
MONROEMONTGOMERY
NEVADA
NEWTON
OUACHITA
PERRY
PHILLIPS
PIKE
POINSETT
POLK
POPE
PRAIRIE
PULASKI
RANDOLPH
ST. FRANCIS
SALINE
SCOTT
SEARCY
SEVIER
SHARP
STONE
UNION
VAN BUREN
WASHINGTON
WHITEWOODRUFF
YELL
INDEPENDENCE
SEBASTIAN
FRANKLIN
CRITTENDEN
LITTLE RIVER
LAFAYETTE
DYS - 3

ARKANSAS DHS STATISTICAL REPORTDIVISION OF YOUTH SERVICES
SFY 2019
Judicial Committing Judicial CommittingDistrict County By County District Total District County By County District Total
1st Cross 1 11th East Arkansas 4 4Lee 1Monroe 1 11th West Jefferson 22Phillips 4 Lincoln 0 22Saint Francis 1Woodruff 0 8 12th Sebastian 8 8
2nd Clay 1 13th Calhoun 0Craighead 11 Cleveland 1Crittenden 13 Columbia 8Greene 3 Dallas 2Mississippi 2 Ouachita 17Poinsett 1 31 Union 21 49
3rd Jackson 1 14th Baxter 1Lawrence 5 Boone 2Randolph 2 Marion 1Sharp 5 13 Newton 2 6
4th Madison 0 15th Conway 2Washington 13 13 Logan 2
Scott 15th Franklin 2 Yell 2 7
Johnson 0Pope 2 4 16th Cleburne 6
Fulton 16th Perry 0 Independence 8
Pulaski 28 28 Izard 1Stone 2 18
7th Grant 8Hot Spring 4 12 17th Prairie 0
White 12 128th North Hempstead 5
Nevada 3 8 18th East Garland 6 6
8th South Lafayette 1 18th West Montgomery 1Miller 15 16 Polk 1 2
9th East Clark 8 8 19th East Carroll 3 3
9th West Howard 7 19th West Benton 3 3Little River 0Pike 2 20th Faulkner 9Sevier 7 16 Searcy 0
Van Buren 0 910th Ashley 5
Bradley 1 21st Crawford 3 3Chicot 1Desha 9 22nd Saline 20 20Drew 2 18
23rd Lonoke 3 3
* Based on actual commitment orders regardless of case TOTAL * 350
Source: Division of Youth Services
Number of Commitments Number of Commitments
COMMITMENTS TO YOUTH SERVICES CENTERSBY JUDICIAL DISTRICT
DYS - 4

ARKANSAS DHS STATISTICAL REPORTDIVISION OF YOUTH SERVICES
SFY 2019
Source: Division of Youth Services
YOUTH SERVICES CENTERS COMMITMENTS
5 3 2153
97128 131
313
472
9 24 36
88124
148
21 1 0
451
5 1452
86116 115
12 2 0
402
5 1141
75 93 112
11 2 0
350
BY AGE
2016 2017 2018 2019
411 386339
292
61 65 63 58
472 451402
350
0
100
200
300
400
500
600
700
2016 2017 2018 2019
BY GENDER
MaleFemale
193242
1 0 24 0 12
472
188227
1 0 22 1 12
451
180 185
0 0 22 2 13
402
144 162
5 0 14 2 23
350
0
100
200
300
400
500
600
700
White Black Asian Bi-racial Hispanic Native American Other Total
BY RACE
2016 2017 2018 2019
DYS - 5

ARKANSAS DHS STATISTICAL REPORTDIVISION OF YOUTH SERVICES
SFY 2019
FelonyOffense 2009 2010 2011 2012 2013 2014 2015 2016 2017 2018 2019
Arson 1 4 5 0 0 1 2 4 1 2 2Battery, First Degree 6 4 3 2 1 2 6 5 2 3 5Burglary (d) 80 108 69 67 39 41 40 46 40 29 21Kidnapping 2 1 1 3 0 1 0 0 0 1 0Murder (a) (1) 2 0 3 2 1 1 0 1 0 1 0Rape (2) 23 16 16 19 9 13 17 15 3 12 9Robbery (b) 30 96 12 24 21 20 28 10 18 15 14
144 229 109 117 71 79 93 81 64 63 51
636 531 481 496 468 486 538 472 451 402 350
(a) Includes Capital, First Degree and Second Degree Murder.(b) Includes Aggravated Robbery and Robbery.(c) Includes Commitments for "Evaluation Only".(d) Includes Burglary Commercial and Residential. Data for years 2015 and above includes Aggravated Residential Burglary as of 2019.
(1) Includes Attempted Capital Murder, Conspiracy to Commit Capital Murder, Conspiracy to Commit Murder-Second Degree, and Criminal Attempt Murder-Second Degree.(2) Includes Criminal Attempted Rape.
Commitments By Offense Class
SFY Felonies Misdemeanors Violation*2009 4092010 3312011 3062012 3012013 1992014 2042015 2292016 2342017 2482018 2212019 185
Source: Division of Youth Services
145
472
102 63 350
451402
6561
* Violation includes aftercare violations, probation violations, or revocation of probation. Starting mid October 2012, DYS has been able to more accurately denote the youth committed for revocation of probation, probation violations, and aftercare violations.
165138120
016
150
179136137159
73
496468486538
State Fiscal Year
ADJUDICATED DELINQUENTS COMMITTED TO YOUTH SERVICES CENTERS
BY MOST SERIOUS FELONY OFFENSES SFY 2009 to 2019
Total636
Total Commitments of Selected Offenses
Total Commitments of All Offenses (c)
133
014
227186175
531481
DYS - 6

ARKANSAS DHS STATISTICAL REPORTDIVISION OF YOUTH SERVICES
SFY 2019
Offense TotalCategory Sex Y A B C D U Total A B C U* Total Offenses
Person Male 19 2 14 8 23 66 23 5 28 94Female 1 12 13 6 1 7 20Total 20 2 14 8 35 0 79 29 0 6 0 35 114
Property Male 2 26 17 30 75 23 1 24 99Female 3 6 9 5 1 6 15Total 2 0 26 20 36 0 84 28 2 0 0 30 114
Public Order Male 1 2 8 11 9 13 22 33Female 2 2 3 3 5Total 1 0 0 2 10 0 13 9 0 16 0 25 38
Drug Law Male 1 1 8 1 9 10Violation Female 0 1 1 1
Total 0 0 0 0 1 0 1 9 0 0 1 10 11
Other Male 2 4 6 2 48 50 56Female 1 1 2 15 15 17Total 0 0 2 1 5 0 8 0 0 2 63 65 73
Totals Male 22 2 42 27 66 159 63 1 20 49 133 292Female 1 4 21 26 12 1 4 15 32 58Total 23 2 42 31 87 0 185 75 2 24 64 165 350
Source: Division of Youth Services
ADJUDICATED DELINQUENTS COMMITTED TO YOUTH SERVICES CENTERS
The severity of the offense ranges from Felony classification Y being the most serious to Misdemeanor classification U being the least serious.
Felony Misdemeanor
BY CATEGORY OF OFFENSE AND SEVERITY
* The offenses of Revocation of Probation, Violation of Probation, and Aftercare Violation are all listed under the Misdemeanor classification U for purposes of this reporting chart.
DYS - 7

ARKANSAS DHS STATISTICAL REPORTDIVISION OF YOUTH SERVICES
SFY 2019
Offense OffenseClassification Grade Offense Title 2016 2017 2018 2019Felony Y Aggravated Robbery 6 13 11 9
Y Attempted Capitol Murder 0 0 1 0Y Battery - 1st Degree 0 0 0 2Y Kidnapping 0 0 1 0Y Murder - 1st Degree 1 0 0 0Y Rape 15 3 12 9A Criminal Attempt 1 0 1 2B Battering, Domestic - 1st Degree (Arrest Date After 7-28-95) 0 0 0 1B Battering, Domestic 2nd Degree 0 0 0 1B Battery - 1st Degree 5 2 3 2B Furnishing Prohibited Articles 0 0 2 0B Robbery 4 5 4 5B Sexual Assault - 2nd Degree 2 2 1 3B Terroristic Act 1 0 1 2C Battering, Domestic 2nd Degree 1 4 3 4C Furnishing Prohibited Articles 0 1 0 0C Make A Terrorist Threat 0 1 0 0C Manslaughter 0 0 0 1C Sexual Assault - 3rd Degree 2 1 0 2C Trans-Dstrbtn Mat Depct Child-1st Off 0 0 0 1D Agg Assault Employee Correctional Fac 1 1 2 1D Aggravated Assault 0 0 4 3D Aggravated Assault On Family Or Household Member (Arrest Date After 7-28-9 5 4 3 2D Battering, Domestic - 3rd Degree 1 1 2 1D Battery - 2nd Degree 14 18 17 8D Death Threat - School Employee Or Student 0 2 0 2D Endangering The Welfare Of A Minor In The 1st Degree 0 0 0 2D Leaving The Scene Of An Accident With Serious Injury Or Death 0 0 0 1D Sexual Assault - 2nd Degree 9 7 5 4D Sexual Assault - 4th Degree 2 0 0 0D Terroristic Threatening - 1st Degree 17 14 13 10D Voyeurism 0 0 0 1
87 79 86 79Source: Division of Youth Services
SFY 2016 to 2019
Total Felony Offenses
PRIMARY OFFENSES OF ADJUDICATED DELINQUENTSCOMMITTED TO YOUTH SERVICES CENTERS
OFFENSE AGAINST PERSON
DYS - 8

ARKANSAS DHS STATISTICAL REPORTDIVISION OF YOUTH SERVICES
SFY 2019
Offense OffenseClassification Grade Offense Title 2016 2017 2018 2019Misdemeanor A Assault - 1st Degree 1 4 1 2
A Assault Family Or Household Member 1st Degree (Arrest Date After 7-28-95) 0 1 0 1A Battering, Domestic - 3rd Degree (Arrest Date After 7-28-95) 6 11 6 9A Battering, Wife - 3rd Degree 1 0 0 0A Battery - 3rd Degree 18 19 10 9A Communicating False Alarm 0 1 1 1A Endangering Welfare Of Minor - 2nd Degree 0 0 0 1A Possession Of Sexually Explicit Digital Material 0 1 0 1A Sexual Assault - 4th Degree 0 0 1 0A Terroristic Threatening - 2nd Degree (Arrest Date After 8-13-93) 12 13 7 5B Assault - 2nd Degree 1 0 0 0B Assault Family Or Household Member 2nd Degree (Arrest Date After 7-28-95 1 0 1 0C Assault - 3rd Degree 2 1 2 4C Assault Family Or Household Member 3rd Degree (Arrest Date After 7-28-95) 2 1 2 2C Assault On Wife - 3rd Degree 0 1 0 0U Abuse Of A Teacher 1 1 0 0
45 54 31 35
132 133 117 114Source: Division of Youth Services
Total Commitments for Offense Against Person
Total Misdemeanor Offenses
PRIMARY OFFENSES OF ADJUDICATED DELINQUENTSCOMMITTED TO YOUTH SERVICES CENTERS
OFFENSE AGAINST PERSONSFY 2016 to 2019
DYS - 9

ARKANSAS DHS STATISTICAL REPORTDIVISION OF YOUTH SERVICES
SFY 2019
Offense OffenseClassification Grade 2016 2017 2018 2019Felony Y Aggravated Residential Burglary 2 1 1 1
Y Arson $100,000 Or More 0 0 1 1A Arson $15,000 But Less Than $100,000 0 1 0 0B Accomplice 0 0 0 5B Arson $5,000 But Less Than $15,000 1 0 1 1B Burglary (Arrest Date Prior 8-13-93) 2 0 2 0B Burglary, Residential (Arrest Date After 8-13-93) 31 33 14 16B Criminal Attempt 1 3 0 0B Forgery - 1st Degree 0 2 3 1B Theft By Receiving 0 0 1 0B Theft Of Property 1 8 0 3B Theft Of Property Obtained By Threat Of Serious Physical 0 0 7 0C Arson $2,500 But Less Than $5,000 2 0 0 0C Burglary, Commercial (Arrest Date After 8-13-93) 11 6 12 4C Criminal Attempt 2 2 1 1C Criminal Mischief - 1st Degree 1 4 1 1C Forgery - 2nd Degree 0 1 0 0C Fraudulent Use Of A Credit Card 2 1 0 1C Impairing Operatn Of Vital Public Faclty 0 3 1 1C Theft By Receiving 3 4 9 5C Theft Of Leased-Rented Property 0 0 0 1C Theft Of Property 15 18 18 6D Arson $500 But Less Than $2,500 1 0 0 0D Breaking Or Entering 25 20 23 20D Criminal Attempt 0 1 1 0D Criminal Mischief - 1st Degree 0 5 3 2D Criminal Mischief - 2nd Degree 0 4 1 0D Theft By Receiving 2 6 4 6D Theft Of Property 7 13 11 8D Thft Of Prop Lost-Mislaid-Del By Mistake 0 1 0 0
109 137 115 84Source: Division of Youth Services
SFY 2016 to 2019
Total Felony Offenses
PRIMARY OFFENSES OF ADJUDICATED DELINQUENTSCOMMITTED TO YOUTH SERVICES CENTERS
OFFENSE AGAINST PROPERTY
DYS - 10

ARKANSAS DHS STATISTICAL REPORTDIVISION OF YOUTH SERVICES
SFY 2019
Offense OffenseClassification Grade Offense Title 2016 2017 2018 2019Misdemeanor A Consol Offenses - Shoplifting Presump - Amount Of Theft 0 2 0 0
A Criminal Attempt 4 2 3 2A Criminal Mischief - 1st Degree 10 6 9 5A Criminal Mischief - 2nd Degree 1 4 0 3A Fraudulent Use Of A Credit Card 0 0 2 0A Shoplifting 1 2 0 0A Theft By Receiving 5 5 7 6A Theft Of Property 19 18 12 9A Unauthorized Use Of A Vehicle 11 4 6 3B Criminal Attempt 0 1 0 0B Criminal Mischief - 2nd Degree 1 0 5 1B Criminal Trespass 1 3 0 1C Criminal Trespass 0 0 1 0U Shoplifting 0 1 0 0U Unlawful Disruption Of Campus Activities 1 0 0 0
54 48 45 30
163 185 160 114Source: Division of Youth Services
Total Commitments for Offense Against Property
Total Misdemeanor Offenses
COMMITTED TO YOUTH SERVICES CENTERSOFFENSE AGAINST PROPERTY
SFY 2016 to 2019
DYS - 11

ARKANSAS DHS STATISTICAL REPORTDIVISION OF YOUTH SERVICES
SFY 2019
Offense OffenseClassification Grade Offense Title 2016 2017 2018 2019Felony Y Simult Poss Of Drugs And Firearms 3 0 1 1
B Unlaw Discharge Firearm Veh 2nd Degree 1 0 1 0C Escape - 3rd Degree 0 0 0 1C Failure To Appear 0 0 0 1C Fleeing 0 0 1 0D Absconding 6 7 9 5D Escape - 2nd Degree 0 0 1 0D Fleeing 1 1 2 0D Handgun Minor In Possession 2nd Offense 2 5 3 4D Handgun Poss Campus Inst Higher Education 0 1 0 1D Handgun Poss Pub School Property-Bus 1 1 0 0
Total Felony Offenses 14 15 18 13
Misdemeanor A Escape - 3rd Degree 1 0 0 0A Failure To Appear 1 0 0 0A Fleeing 1 1 0 0A Handgun Minor In Possession 1st Offense 5 2 2 6A Harassment (Arrest Date After 8-13-93) 2 1 1 1A Indecent Exposure 2 0 0 0A Obstructing Governmental Operations 1 3 0 0A Public Sexual Indecency 0 0 1 0A Resisting Arrest 4 2 2 2A Riot 0 1 0 0B Fleeing 0 1 0 0C Disorderly Conduct 21 9 17 14C Fleeing 2 1 1 1C Obstructing Governmental Operations 5 1 0 0C Public Intoxication 1 1 0 1U Contempt Of Court 1 1 0 0
Total Misdemeanor Offenses 47 24 24 25
61 39 42 38Source: Division of Youth Services
Total Commitments for Offense Against Public Order
PRIMARY OFFENSES OF ADJUDICATED DELINQUENTSCOMMITTED TO YOUTH SERVICES CENTERS
OFFENSE AGAINST PUBLIC ORDERSFY 2016 to 2019
DYS - 12

ARKANSAS DHS STATISTICAL REPORTDIVISION OF YOUTH SERVICES
SFY 2019
Offense OffenseClassification Grade Offense Title 2016 2017 2018 2019Felony C Delv, Poss, Manu, Etc Drug Paraphernalia 1 1 0 0
C Manufacture, Etc. Controlled Substance, Sch IV, V 1 0 0 0C Poss Ctrl-Cnft Sub W-O Presc-3rd Off 1 0 0 0C Poss, Etc Cntrft Sub W-Intent Sch I-V 0 1 0 0C Possession Controlled Substance Schedule I/II 2 0 0 0D Poss, Etc Cntrft Sub W-Intent Unclass Sch 1 0 0 0D Possession Controlled Substance Schedule I/II 1 2 1 0D Possession Controlled Substance Schedule VI 1 0 0 0D Possession Of Drug Paraphernalia 1 0 1 1
Total Felony Offenses 9 4 2 1
Misdemeanor A Delv, Poss, Manu Etc. Drug Paraphernalia Or Ctrfet Ctrl Subst 5 1 3 0A Poss Ctrl-Cnft Sub W-O Presc-1st Off 0 0 2 1A Poss Sch VI Ctrl Sub W/Purpose Del 0 0 2 0A Possession Controlled Substance Schedule III 5 4 4 1A Possession Controlled Substance Schedule IV/V 2 0 2 2A Possession Controlled Substance Schedule VI 1 0 3 5A Possession Of Marijuana 2 0 0 0B Adulterant Drug Test Or Possession Of Adulterants 0 0 1 0U Possession Of Drug Paraphernalia 0 0 0 1
Total Misdemeanor Offenses 15 5 17 10
Total Commitments for Drug Law Violation 24 9 19 11Source: Division of Youth Services
PRIMARY OFFENSES OF ADJUDICATED DELINQUENTSCOMMITTED TO YOUTH SERVICES CENTERS
DRUG LAW VIOLATIONSSFY 2016 to 2019
DYS - 13
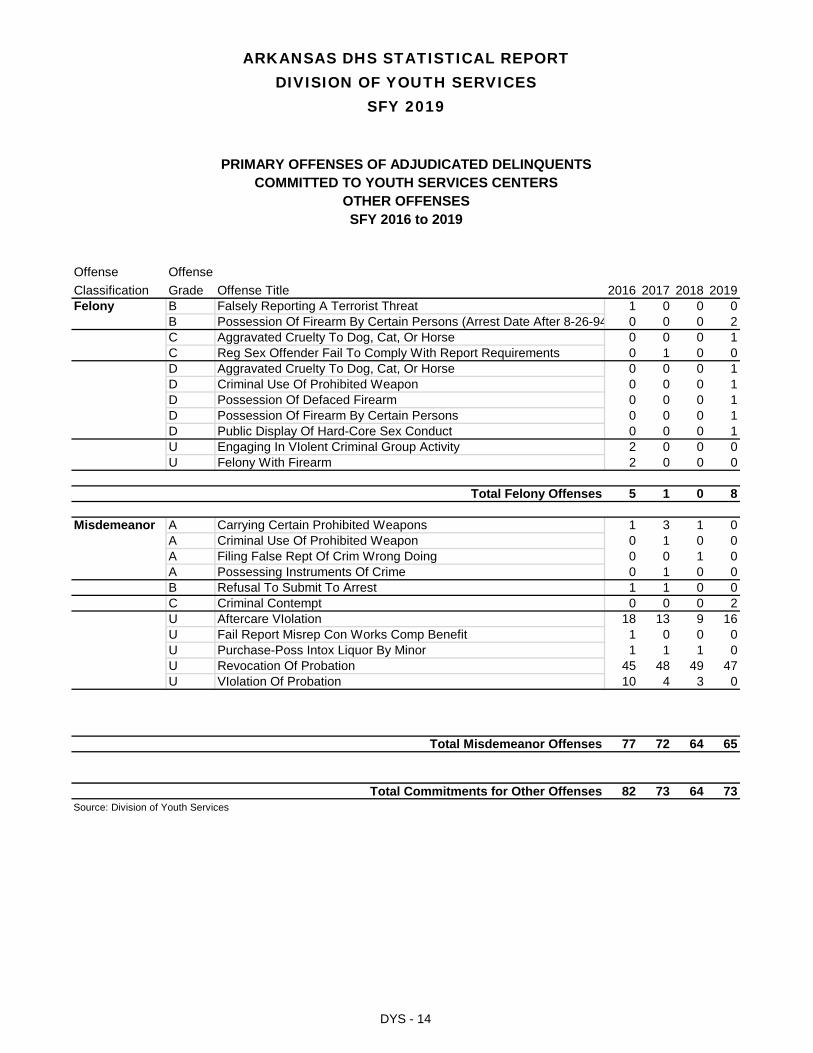
ARKANSAS DHS STATISTICAL REPORTDIVISION OF YOUTH SERVICES
SFY 2019
Offense OffenseClassification Grade Offense Title 2016 2017 2018 2019Felony B Falsely Reporting A Terrorist Threat 1 0 0 0
B Possession Of Firearm By Certain Persons (Arrest Date After 8-26-94 0 0 0 2C Aggravated Cruelty To Dog, Cat, Or Horse 0 0 0 1C Reg Sex Offender Fail To Comply With Report Requirements 0 1 0 0D Aggravated Cruelty To Dog, Cat, Or Horse 0 0 0 1D Criminal Use Of Prohibited Weapon 0 0 0 1D Possession Of Defaced Firearm 0 0 0 1D Possession Of Firearm By Certain Persons 0 0 0 1D Public Display Of Hard-Core Sex Conduct 0 0 0 1U Engaging In VIolent Criminal Group Activity 2 0 0 0U Felony With Firearm 2 0 0 0
Total Felony Offenses 5 1 0 8
Misdemeanor A Carrying Certain Prohibited Weapons 1 3 1 0A Criminal Use Of Prohibited Weapon 0 1 0 0A Filing False Rept Of Crim Wrong Doing 0 0 1 0A Possessing Instruments Of Crime 0 1 0 0B Refusal To Submit To Arrest 1 1 0 0C Criminal Contempt 0 0 0 2U Aftercare VIolation 18 13 9 16U Fail Report Misrep Con Works Comp Benefit 1 0 0 0U Purchase-Poss Intox Liquor By Minor 1 1 1 0U Revocation Of Probation 45 48 49 47U VIolation Of Probation 10 4 3 0
Total Misdemeanor Offenses 77 72 64 65
Total Commitments for Other Offenses 82 73 64 73Source: Division of Youth Services
PRIMARY OFFENSES OF ADJUDICATED DELINQUENTSCOMMITTED TO YOUTH SERVICES CENTERS
OTHER OFFENSESSFY 2016 to 2019
DYS - 14

ARKANSAS DHS STATISTICAL REPORTDIVISION OF YOUTH SERVICES
SFY 2019
Total Number of Prior CommitmentsSFY Sex Commitments 0 1 2 3 4 5 6 7+ N/A
2016 Male 411 311 79 15 6 0 0 0 0 0Female 61 45 12 2 2 0 0 0 0 0Total 472 356 91 17 8 0 0 0 0 0
Recommitment Rate = 25%Note: Based on all new commitment orders regardless of case.
2017 Male 386 287 70 25 2 2 0 0 0 0Female 65 51 13 1 0 0 0 0 0 0Total 451 338 83 26 2 2 0 0 0 0
Recommitment Rate = 25%Note: Based on all new commitment orders regardless of case.
2018 Male 339 245 71 18 5 0 0 0 0 0Female 63 48 12 2 1 0 0 0 0 0Total 402 293 83 20 6 0 0 0 0 0
Recommitment Rate = 27%Note: Based on all new commitment orders regardless of case.
2019 Male 292 207 59 19 6 1 0 0 0 0Female 58 43 10 5 0 0 0 0 0 0
Total 350 250 69 24 6 1 0 0 0 0
Recommitment Rate = 29%Note: Based on all new commitment orders regardless of case.
Source: Division of Youth Services
NUMBER OF ADJUDICATED DELINQUENTSRECOMMITTED TO YOUTH SERVICES CENTERS
SFY 2016 to 2019
DYS - 15

ARKANSAS DHS STATISTICAL REPORTDIVISION OF YOUTH SERVICES
SFY 2019
Facility Male Female TotalAcadia/Riverview Behavioral Health 4 0 4BHC - Pinnacle Pointe Hospital 7 1 8Centers for Youth and Families 1 0 1Consolidated Youth Services (ASAP) 10 0 10Destiny House 26 18 44Division of Behavioral Health Services 1 0 1Methodist Behavioral Hospital 2 0 2Oak Ridge Behavioral Care 1 0 1Piney Ridge Treatment Center 1 0 1Quapaw House (QH-TH) 7 0 7Springwoods Behavioral Health 2 0 2The Bridgeway 7 3 10UHS of Benton, Inc.dba Rivendell Behavioral Health Services 3 1 4Valley Behavioral Health System 5 5 10Vera Lloyd Presbyterian Home and Family Services, Inc. 17 18 35Woodridge Behavioral Care 14 1 15Youth Bridge, Inc. (SAT) 12 0 12Youth Bridge, Inc. (YBTH) 3 0 3
Total 123 47 170
A. Juvenile Correctional Facilities 131 daysB. Juvenile Treatment Centers 148 daysC. Specialized Placements 93 daysD. Juvenile Detention Centers 30 days
Serious Offender Program Male Female TotalArkansas Juvenile Assessment & Treatment Center 231 42 273Colt Juvenile Treatment Center 8 8Dermott Juvenile Correctional Facility (18-21) 69 69Dermott Juvenile Treatment Center 47 47Harrisburg Juvenile Treatment Center 37 24 61Lewisville Juvenile Treatment Center 66 66Mansfield Juvenile Treatment Center 78 35 113
Total 536 101 637
Source: Division of Youth Services
to Serious Offender Programs
Number of Admissions
NUMBER OF JUVENILES REFERRED TO SPECIALTY PROVIDER FACILITIES
Number of Placements
Average Length-of-Stay of Adjudicated Delinquents*
Number of Adjudicated Delinquents Admitted
DYS - 16
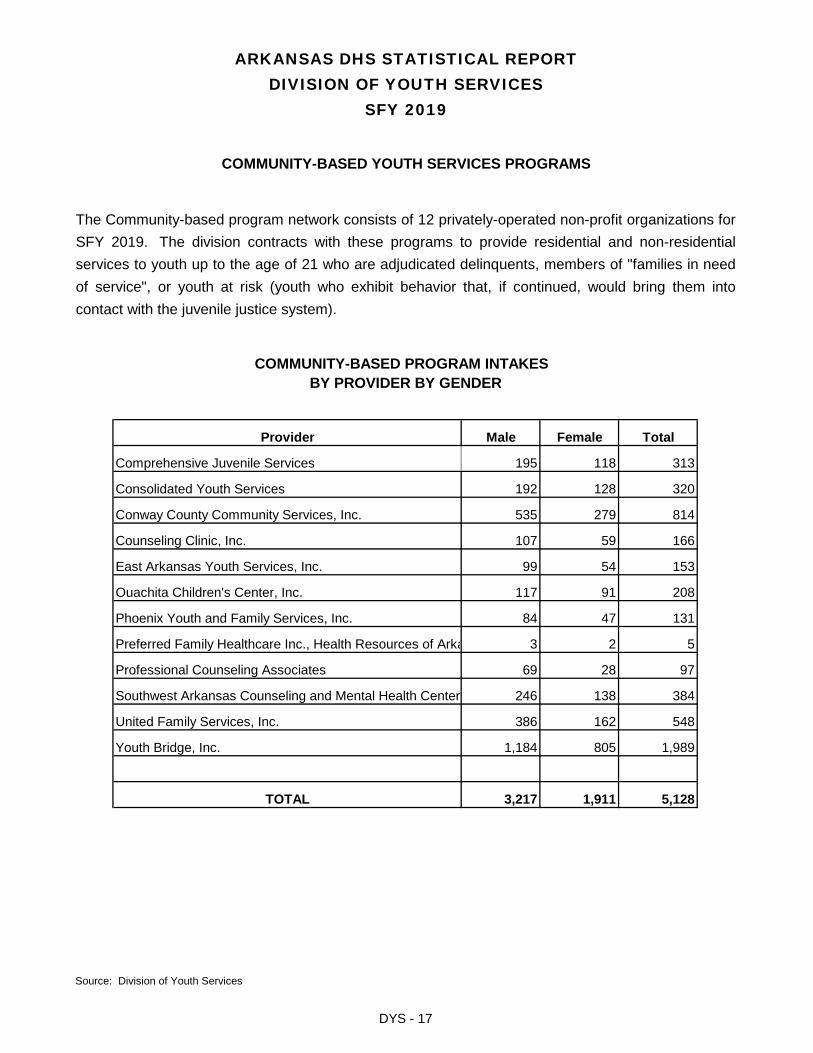
ARKANSAS DHS STATISTICAL REPORTDIVISION OF YOUTH SERVICES
SFY 2019
Provider Male Female Total
Comprehensive Juvenile Services 195 118 313
Consolidated Youth Services 192 128 320
Conway County Community Services, Inc. 535 279 814
Counseling Clinic, Inc. 107 59 166
East Arkansas Youth Services, Inc. 99 54 153
Ouachita Children's Center, Inc. 117 91 208
Phoenix Youth and Family Services, Inc. 84 47 131
Preferred Family Healthcare Inc., Health Resources of Arka 3 2 5
Professional Counseling Associates 69 28 97
Southwest Arkansas Counseling and Mental Health Center 246 138 384
United Family Services, Inc. 386 162 548
Youth Bridge, Inc. 1,184 805 1,989
TOTAL 3,217 1,911 5,128
Source: Division of Youth Services
COMMUNITY-BASED PROGRAM INTAKES BY PROVIDER BY GENDER
COMMUNITY-BASED YOUTH SERVICES PROGRAMS
The Community-based program network consists of 12 privately-operated non-profit organizations forSFY 2019. The division contracts with these programs to provide residential and non-residentialservices to youth up to the age of 21 who are adjudicated delinquents, members of "families in needof service", or youth at risk (youth who exhibit behavior that, if continued, would bring them intocontact with the juvenile justice system).
DYS - 17

ARKANSAS DHS STATISTICAL REPORTDIVISION OF YOUTH SERVICES
SFY 2019
AGE
12 & 18 & Total
Program Younger 13 14 15 16 17 Older IntakesComprehensive Juvenile Services 19 29 45 65 74 74 7 313Consolidated Youth Services 23 29 43 63 89 71 2 320Conway County Community Services, Inc. 105 72 124 170 150 150 43 814Counseling Clinic, Inc. 48 16 21 28 26 26 1 166East Arkansas Youth Services, Inc. 8 11 28 30 40 29 7 153Ouachita Children's Center, Inc. 27 24 43 37 37 36 4 208Phoenix Youth and Family Services, Inc. 16 14 20 30 32 17 2 131Preferred Family Healthcare Inc., Health Resources of Arkansas, Inc. 1 1 2 1 5Professional Counseling Associates 12 8 14 22 19 22 97Southwest Arkansas Counseling and Mental Health Center, Inc. 53 36 50 71 83 76 15 384United Family Services, Inc. 34 44 68 118 151 116 17 548
Youth Bridge, Inc. 816 149 206 246 263 278 31 1,989
TOTAL 1,162 432 662 881 966 896 129 5,128
Source: Division of Youth Services
COMMUNITY-BASED INTAKES BY AGE
DYS - 18

ARKANSAS DHS STATISTICAL REPORTDIVISION OF YOUTH SERVICES
SFY 2019
82
62
20
74
65
9
81
0
21
Source: Division of Youth Services
Number of Absconders (Youth on Probation or Parole)
Requests for Home Evaluation/Supervision Received by Arkansas from Other States
Probation Referrals
Parole Referrals
Number of Runaways Returned (Non-Delinquent Youth)
Number of Escapees (Youth Committed to Facility)
Requests for Home Evaluation/Supervision Sent by Arkansas to Other States
Probation Referrals
Parole Referrals
INTERSTATE COMPACT ON JUVENILES
The Interstate Compact on Juveniles (ICJ) was designed primarily for cases involving out-of-state runaways,escapees and absconders, and for the supervision of juveniles who have been adjudicated delinquent. Itprovides legal procedures for the return of runaways and makes it possible to place a juvenile on probation orparole in a state other than the one where the offense was committed with the assurance of supervision by theappropriate agencies of the state in which he/she is placed.
DYS - 19

ARKANSAS DHS STATISTICAL REPORTGLOSSARY
SFY2019
Compliance Monitoring/Electronic Monitoring (DYS) is a program which monitors a juvenile's presence in a particular location in order toenable the juvenile to remain in the home or return to the home, thus preventing institutionalization or re-institutionalization. Services are providedin accordance with an established plan of service and include contact with the juvenile to determine compliance with the plan.
Crisis Residential Treatment (DYS) includes intervention and stabilization of a juvenile in an existing facility that provides a structured setting,close supervision, and necessary interventions to allow the juvenile to return home. Services in a hardware secure facility are limited to fourteen(14) days per sanction. This service may include, but is not limited to, education and room and board.
Community Service Supervision (DYS) is a program that provides a site for community service work, supervision of the juvenile on the worksite by program staff, and reports to the court regarding compliance with the established case plan.
Adult Protective Services (DAABHS) protects and assists adults, age 18 and older, who are abused, neglected, or exploited, or anycombination thereof, and who are endangered as a result of lack of capacity or impaired from mental or physical disease or defect asthese terms are defined by Arkansas Statute.
ARKids First (DCO & DMS) provides health insurance to children who otherwise might not get medical care. The program offers two coverageoptions. ARKids A offers low-income children a comprehensive benefits package. ARKids B provides limited coverage for slightly higher incomefamilies. ARKids B requires a small co-pay for most services.
Commodity Distribution Program (DCO) processes and distributes raw commodities donated by the U.S. Department of Agriculture to schoolsand other eligible recipient agencies in Arkansas.
Alternative Community Services (DDS) ACS Waiver is a Medicaid home- and community-based waiver that serves individuals of all ages withdevelopmental disabilities, who, without these services, would have to live in an institution such as a nursing home or intermediate care facility forthe intellectually disabled (ICF/ID).
Americorps, also known as the domestic Peace Corps, engages Americans of all ages in service opportunities each year. AmeriCorps members serve with local nonprofits and community agencies, where they have the opportunity to teach adults to read, make neighborhoods safer, teach children how to be healthier, as well as respond to and assist in natural disasters. In Arkansas, AmeriCorps members have been able to serve over 80,000 people. Most of these AmeriCorps members serve with projects like Arkansas Garden Corps, Legal Aid of Arkansas, and Arkansas Future Teacher Initiative, as well as many others. Members can also serve in AmeriCorps*VISTA (Volunteers in Service to America), AmeriCorps*NCCC (the National Civilian Community Corps), and in Senior Corps in locations across America. Arkansas has AmeriCorps programs operating in all of its 75 counties.
Arkansas Medicaid Enterprise (AME) Project Management Office (DMS) The Medicaid Management Information System (MMIS)Replacement Project, chartered by the Division, is to implement a new core MMIS, pharmacy point of sale, data warehouse, and decision supportsystem that will modernize existing system functions and significantly enhance the goals of the MMIS, ensuring that eligible individuals receive thehealth care benefits that are medically necessary and that providers are reimbursed promptly and efficiently.
Community Services Block Grant - CSBG (DCO) is a state-administered federal anti-poverty program which supports services designed to help low-income individuals and families become self-sufficient (i.e., employment assistance, housing, childcare, food, etc.). Services are provided by 16 Community Action Agencies which cover all 75 counties in the state.
Day Services (DYS) provides educational and therapeutic services to juveniles who have been initially ordered such services by the court, as apart of a legally authorized Diversion Agreement, or as a sanction for non-compliance with a court order or an established Aftercare Plan. Thisservice is designed to enhance a youth's behavior, academic performance, and interpersonal skills in a structured setting, either in a group or in aone-to-one basis, based on an individual case plan.
Diagnosis and Evaluation (DYS) is assessment of the nature and extent of a youth's physical, emotional, educational and behavioral problemsand recommendations for treatment strategies to remedy the identified problems. The specific diagnostic services provided and level ofsophistication of reports produced are based on the individual needs of the referring agency. Allowable components are educational evaluation,social assessment, psychological evaluation, psychiatric evaluation, and consultation with the referring agency. Evaluations may also include amedical evaluation, if the assessment indicates a physical association with the emotional and/or behavioral problem(s).
Developmental Day Treatment Clinic Services (DDTCS) (DDS) is a program for adults age 21 (age to 21 if the person has a diploma/certificate of completion). Services are provided in a clinic setting on an out-patient basis. Services include evaluation, instruction in areas of self-help, socialization and communication to help the person to develop and retain skills related to their ability to live in the community. Options forspeech, physical, and occupational therapy are available.
Glossary-1

ARKANSAS DHS STATISTICAL REPORTGLOSSARY
SFY2019
Drug Screenings (DYS) is the collection and analysis of urine samples to determine if a youth is using drugs. May only be provided as asubordinate part of a sanction service for adjudicated delinquents or youth on aftercare status. This service may also be provided as Non-Sanction Drug Screening as a subordinate part of another service as a diversion from juvenile court or as court ordered for adjudicated Family InNeed of Services (FINS). The Sanction Services are limited to the length of time a sanction is imposed. The Non-Sanction Services are limited toa period not to exceed six (6) months per each court order.
Emergency Shelter (DYS) are services, including room and board, for youth whose circumstances or behavioral problems necessitate immediateremoval from their homes or for youth released from a youth services facility who need temporary placement in the community until long termresidential arrangements can be made. The purposes of Emergency Shelters are (1) to provide shelter for a period necessary to make morepermanent arrangements or (2) to provide a short-term alternative to secure detention. The extent and depth of the services provided to a youth inthe Emergency Shelter program will depend upon the individual needs of the youth and the referral source. Emergency shelter is limited to amaximum of sixty (60) days in any six month period. An order from Juvenile Court may supersede the stated time constraints.
Emergency Solutions Grant Program (DCO) assists local communities to improve the quality of life for the homeless by: (1) Providing grants forminor renovations, rehabilitation or conversion of buildings for the homeless, (2) Providing funds for payments of certain operating andmaintenance expenses, (3) Providing funds for essential social services expenses, and (4) Providing funds to be used for homeless preventionefforts. It also assists with rapid re-housing, homelessness prevention and street outreach efforts to assist the homeless.
Health Care Independence Program (DCO & DMS) provides Medicaid funding in the form of premium assistance to enable adults aged 19-64 to enroll in private health insurance plans offered through insureark.org.
Intensive Supervision and Tracking (DYS) is to provide intensive supervision and tracking services to juveniles who have been initially orderedthis service by the court or as a part of a legally authorized Diversion Agreement. The service may also be used as a sanction for non-compliancewith a court order or an established aftercare plan. The primary goal of this program is to support the youth in their homes primarily throughindividualized, consistently close supervision and monitoring. The service is available seven (7) days a week and may be performed at any hour ofthe day or night, depending on the situation.
Hyperalimentation (DMS) is the administration of nutrients by intravenous feeding especially to patients who cannot ingest food through thealimentary tract (the tubular passage that begins from mouth and functions in digestion and absorption of food and elimination of residual waste.)
Interstate Compact on Juveniles (DYS) provides for the supervision of out-of-state delinquent juveniles, provides for the return of runaways,provides authorized agreements for the cooperative institutionalization of special types of juveniles, and provides for the return of absconders andescapees. Allowable components include initial evaluation, supervision, follow-up reports, and discharge.
Long-Term Care (DCO & DMS) individuals who are residents of nursing homes may qualify for Medicaid if the care in the facility is medicallynecessary and they meet income, resource and other criteria.
The Interstate Compact Placement of Children (ICPC) Unit assist in moving children in need of foster care placement or adoption across statelines. When a child requires foster care or adoptive placement outside the resident state, DCFS shall use the ICPC process.
IndependentChoices (DAABHS) is a consumer-directed Medicaid waiver for Medicaid eligible persons age 18 and above who have amedical need for personal care service. This consumer directed service gives clients a monthly cash allowance in place of traditionalpersonal care. Eligible persons are able to choose, supervise and pay their own personal care aide and use some of the allowance topurchase goods and services related to personal care needs.
Intensive Casework Management (DYS) are services specifically designed for youth committed to a youth services facility operated by theDivision of Youth Services. This should provide a community evaluation that includes recommendations for release plans, services to families ofcommitted youth, advocacy on behalf of the youth, supervision, transportation, and follow-up. It may also include visiting youth at the YouthServices Center(s), under certain circumstances.
Intensive Casework Management For Serious Offenders (DYS) are services specifically designed for youth committed to the Division of YouthServices who have completed the residential phase of a serious offender program and who have been transferred back to the community.Services include, but are not limited to, recommendations for release plans, services to families of committed youth, advocacy on behalf of theyouth, supervision, transportation, and follow-up.
Low Income Home Energy Assistance Program (LIHEAP) (DCO) provides financial assistance to about 60,000 households each year to helpthem meet the costs of home energy i.e. gas, electricity, propane, etc. It also offers weatherization services and case management activitieswhich are designed to encourage and enable households to reduce their energy costs and thereby, their need for financial assistance.
Glossary-2

ARKANSAS DHS STATISTICAL REPORTGLOSSARY
SFY2019
•
•
Substance Abuse Services (DAABHS) The Division of Behavioral Health Services is the single state agency responsible for funding ofalcohol and drug prevention and treatment services, providing court ordered treatment, licensing of alcohol and drug treatmentprograms, the State Methadone Authority, administering the Drug and Alcohol Safety Educational Programs and providing training to
Medicaid Recipient (DMS) is a person who uses their Medicaid card to receive Medicaid services.
Pregnant Women - Limited Benefits (DCO & DMS) with income up to 209% of Federal Poverty Level may be eligible for limited coverage if theymeet eligibility criteria, including prenatal, delivery, postpartum and conditions, which may complicate the pregnancy. Coverage continues throughthe pregnancy and until the end of the month that the 60th day postpartum falls.
Targeted Casework Management (DYS) are services that assist an individual or family in accessing needed medical, social, educational, andother services appropriate to the needs of the individual/family. Targeted case management services include client intake, assessment, periodicreassessment, case plan development and review, service referral, coordination and advocacy, monitoring of client service utilization, recordkeeping and documentation of service contacts and client progress, and transportation.
Supplemental Nutrition Assistance Program (SNAP) (formerly the Food Stamp Program) (DCO) provides food assistance to eligiblehouseholds to cover a portion of a household’s food budget. In addition to food assistance, the program provides SNAP recipients with nutritioneducation, employment & training, and work experience in some cases.
Refugee Resettlement Program (DCO) assists newly arrived eligible refugees to assimilate into the American way of life, offering ongoingmedical services and financial assistance for up to eight months.
Residential Treatment (DYS) is twenty-four hour treatment services available for up to one year for each individual (recommended average: fourto six months), for youth whose emotional and/or behavioral problems, as diagnosed by a qualified professional, cannot be remedied in his or herown home. Room and board is limited to six months in a one-year period. An order from Juvenile Court may supersede the stated timeconstraints.
Restorative Justice (DYS) is the compensation to a crime victim by the offender. Restorative justice programs may take minor offenders as wellas serious offenders. This service may also be offered as Non-Sanction Restorative Justice programs but would then be limited to non-adjudicated youth as a diversion from adjudication by juvenile court. This program consists of two types of programs:
Cash: A program which assists the offender in obtaining employment and, in some cases, providessupervision to the juvenile to monitor the payment of restitution to the victim or the juvenile's employmentto ensure compliance with the established plan of service.
Restitution (Work for the Victim): A program that monitors a juvenile's work activities to compensate avictim. The service may include arrangement of scheduled activities, monitoring of work performed, andreports to the court or DYS regarding compliance with the established case plan. The program maymediate between the victim and the offender to determine the amount of restitution.
Special Nutrition Programs (DCCECE) provides reimbursement for well-balanced, nutritious meals served to individuals enrolled in the Childand Adult Care Food Program, National School Lunch Program, Special Milk Program, and the Summer Food Service Program.
Pregnant Women - Full Benefits (DCO & DMS) with minimal income based on AFDC rates may be eligible for full Medicaid coverage if they meet certain eligibility criteria. Coverage continues through the pregnancy and until the end of the month that the 60th day postpartum falls.
Medically Needy (DCO & DMS) is intended to provide medical services for categorically related individuals or families whose income and/orresources exceed the limits for cash assistance but are insufficient to provide medical care.
Medicaid (DAABHS & DMS) reimburses health care providers for covered medical services provided to eligible needy individuals incertain categories. Eligibility is determined based on income, resources, Arkansas residency, and other requirements.
Medicaid Eligible (DCO & DMS) is a person who has met the eligibility requirements to obtain Medicaid coverage.
Newborn Medicaid (DCO & DMS) provides 12 months continuous full coverage for those newborns up to age 1 whose mothers were Medicaid eligible at the time of the newborn's birth.
Parent/Caretaker Relative Medicaid (DCO & DMS) provides full Medicaid coverage to adults with minimal income based on AFDC rates who have related minor children living with them in the home.
Glossary-3
ARKANSAS DHS STATISTICAL REPORTGLOSSARY
SFY2019
The Emergency Food Assistance Program (TEFAP) (DCO) makes surplus and purchased agricultural commodities available to low incomehouseholds. The commodities are intended to supplement other foods and not serve as a household's sole or main food source.
Therapy (DYS) is a therapeutic relationship between the client and a qualified therapist for the purpose of accomplishing changes that areidentified as goals in the case plan through the use of various counseling techniques. Services to specific individuals may include individual, groupor family therapy, or consultation with the referral source as needed.
Work Pays (DCO) is an incentive program designed to encourage working TEA clients to remain employed after closure of the TEA case whileincreasing their hours of work and/or hourly wage. Families participating in Arkansas Work Pays will receive a monthly cash assistance paymentin the amount of $204 for up to 24 months, provided they meet the Work Pays eligibility requirements. This program was implemented in July2006.
Vocational Rehabilitation (DSB) objective is to ensure that qualified blind and visually impaired persons work in appropriate careers andbecome as personally and economically independent as possible.
Unborn Child (Pregnant Women) (DCO & DMS) provides limited coverage to the non-citizen pregnant woman whose child will be born in the U.S. Coverage continues through the pregnancy and until the end of the month that the 60th day postpartum falls.
Transitional Employment Assistance (TEA) (DCO & DMS) program is a time-limited assistance program to help needy families with childrenbecome more responsible for their own support and less dependent on public assistance. In addition to monthly cash assistance, employment-related services are provided to parents, including job-readiness activities, transportation assistance, childcare assistance, and other supportiveservices so that the parent can engage in work or education and training activities.
U-18 (DCO & DMS) is a Medical Assistance Only category intended to provide services to needy individuals under 18 years of age who meet theTEA income and resource requirements.
Glossary-4