Judd PhD 2013.pdf - This work is protected by copyright and ...
415
This work is protected by copyright and other intellectual property rights and duplication or sale of all or part is not permitted, except that material may be duplicated by you for research, private study, criticism/review or educational purposes. Electronic or print copies are for your own personal, non- commercial use and shall not be passed to any other individual. No quotation may be published without proper acknowledgement. For any other use, or to quote extensively from the work, permission must be obtained from the copyright holder/s.
-
Upload
khangminh22 -
Category
Documents
-
view
2 -
download
0
Transcript of Judd PhD 2013.pdf - This work is protected by copyright and ...

This work is protected by copyright and other intellectual property rights and duplication or sale of all or part is not permitted, except that material may be duplicated by you for research, private study, criticism/review or educational
purposes. Electronic or print copies are for your own personal, non-commercial use and shall not be passed to any other individual. No quotation may be published without proper acknowledgement. For any other use, or to
quote extensively from the work, permission must be obtained from the copyright holder/s.

An investigation into the role of dendrimers as potential enhancers of the dermal delivery of topically applied
chlorhexidine.
Amy Maryanne Judd
December 2013
Thesis submitted for degree of Doctor of Philosophy
Keele University

SUBMISSION OF THESIS FOR A RESEARCH DEGREE
Part I. DECLARATION by the candidate for a research degree. To be bound in the thesis
Degree for which thesis being submitted Doctor of Philosophy
Title of thesis An investigation into the role of dendrimers as potential enhancers of the dermal delivery of topically applied chlorhexidine.
Date of submission 31/10/13 Original registration date 21/09/09 (Date of submission must comply with Regulation 2D)
Name of candidate Amy Maryanne Judd
Research Institute ISTM Name of Lead Supervisor Dr. Gary Moss I certify that:
(a) The thesis being submitted for examination is my own account of my own research (b) My research has been conducted ethically. Where relevant a letter from the approving
body confirming that ethical approval has been given has been bound in the thesis as an Annex
(c) The data and results presented are the genuine data and results actually obtained by me during the conduct of the research
(d) Where I have drawn on the work, ideas and results of others this has been appropriately acknowledged in the thesis
(e) Where any collaboration has taken place with one or more other researchers, I have included within an ‘Acknowledgments’ section in the thesis a clear statement of their contributions, in line with the relevant statement in the Code of Practice (see Note overleaf).
(f) The greater portion of the work described in the thesis has been undertaken subsequent to my registration for the higher degree for which I am submitting for examination
(g) Where part of the work described in the thesis has previously been incorporated in another thesis submitted by me for a higher degree (if any), this has been identified and acknowledged in the thesis
(h) The thesis submitted is within the required word limit as specified in the Regulations
Total words in submitted thesis (including text and footnotes, but excluding references and appendices) 75, 622
Signature of candidate Date 19/11/13 Note Extract from Code of Practice: If the research degree is set within a broader programme of work involving a group of investigators – particularly if this programme of work predates the candidate’s registration – the candidate should provide an explicit statement (in an ‘Acknowledgments’ section) of the respective roles of the candidate and these other individuals in relevant aspects of the work reported in the thesis. For example, it should make clear, where relevant, the candidate’s role in designing the study, developing data collection instruments, collecting primary data, analysing such data, and formulating conclusions from the analysis. Others involved in these aspects of the research should be named, and their contributions relative to that of the candidate should be specified (this does not apply to the ordinary supervision, only if the supervisor or supervisory team has had greater than usual involvement).

Thesis Abstract
The reduction of bacteria on the skin results in prophylactic and therapeutic
benefits by reducing the occurrence of skin infections. Currently, chlorhexidine
digluconate, a conventional topical antiseptic, permeates the skin poorly leaving
viable opportunistic pathogens below the superficial layers of the stratum
corneum. The aim of this study was to use polyamidoamine (PAMAM) dendrimers
to enhance the topical delivery of chlorhexidine digluconate to improve its
antimicrobial efficacy.
This study has characterised the antimicrobial inhibition and mechanism of
action of PAMAM dendrimers against clinically relevant skin pathogens. This
thesis has showed that the PAMAM dendrimers antimicrobial effect is
concentration and generation dependent (i.e. increasing number of surface
groups) and that the mechanism of inhibition is through severe outer and inner
bacterial membrane permeabilisation and disruption. A topical skin pre-treatment
of various antimicrobial concentrations of PAMAM dendrimer followed by a clinical
dose of chlorhexidine digluconate (2% w/v aq soln.) resulted in a significant
increase in permeation of chlorhexidine digluconate in vitro using a Franz diffusion
cell model. This study also reports possible mechanisms of penetration
enhancement exerted by the PAMAM dendrimer and shows evidence that their
effect upon the skin is multifactorial. A novel time-of-flight secondary ion mass
spectrometry method was developed and employed that chemically mapped the
distribution of chlorhexidine digluconate within skin tissue after topical application.
The chemical distribution images showed an enhanced deposition of chlorhexidine
digluconate within the upper skin strata after topical application of PAMAM
dendrimer, supporting the Franz diffusion cell findings.
Further, this study investigated the co-application of PAMAM dendrimer-
chlorhexidine digluconate to the skin and found that a one-step application
significantly increased the deposition of chlorhexidine digluconate within the upper
skin strata. PAMAM dendrimers have the capacity to be versatile topically-applied
polyvalent biocides/drug delivery platforms that have many biomedical
applications.
iii
Abstract i
Contents iii
List of Figures xi
List of Tables xvii
List of Equations xx
List of Acronyms xxi
Acknowledgements xxv
Chapter One: General introduction. 1
1.0 Introduction 1
1.1 The barrier to topical drug delivery of antimicrobial compounds. 1
1.2 Topical and transdermal drug delivery. 6
1.3 Micro-flora of the skin. 10
1.4 Skin and soft tissue infections- invasion of pathogenic bacteria. 12
1.5 Chlorhexidine. 15
1.5.1 Contra-indications for the use of CHX. 24
1.6 Controlled release strategies used in the drug delivery of CHX. 26
1.6.1 Delivery of CHX from Hydrogels. 27
1.6.2 Polymeric CHX delivery systems. 30
1.6.3 Other strategies employed for enhanced delivery of CHX. 32
1.7 Nanomaterials used for topical and transdermal drug delivery. 32
1.8 Introduction to PAMAM dendrimers; the chosen novel strategy for
enhanced topical drug delivery. 38
1.8.1 Aims and objectives of the study. 46

iv
Chapter Two: A comprehensive study into the antimicrobial efficacy
and mechanism of action of PAMAM dendrimers against
opportunistic pathogens.
48
2.1.1 Advantages of antimicrobial dendrimers 48
2.1.2 Glycodendrimers 51
2.1.3 Dendrimers as biocides and antimicrobial carriers 52
2.1.4 Antimicrobial properties of native PAMAM dendrimers 55
2.1.5 Aims and objectives 58
2.2 Materials and methods. 59
2.2.1 Microdilution broth with viable count assay to determine inhibitory
concentration (IC50) 59
2.2.2 Membrane integrity study 62
2.2.3 Inner membrane permeabilisation assay 63
2.2.4 Scanning electron microscopy 64
2.2.5 Statistical analysis of microbiology results 66
2.3 Results 67
2.3.1 Microdilution broth with viable count assay to determine the
inhibitory concentration (IC50). 67
2.3.2 Membrane integrity study 74
2.3.3 Inner membrane permeabilisation assay 76
2.3.4 Scanning electron microscopy of bacteria challenged with various
generations and concentrations of PAMAM dendrimer 84
2.4 Discussion 88
2.5 Conclusion 100
Chapter Three: An investigation as to whether a PAMAM dendrimer
skin pre-treatment enhances the permeation and deposition of CHG
within porcine skin. 102
3.0 Introduction 102

v
3.1 Use of PAMAM dendrimers in transdermal and topical drug delivery
systems 102
3.1.2 Rationale for the investigation of a PAMAM dendrimer skin pre-
treatment to enhance the topical delivery of a model antiseptic,
chlorhexidine digluconate. 110
3.1.3 Aims and objectives 111
3.2 Materials and methods 111
3.2.1 Preparation of porcine ear epidermis and dermatomed porcine flank 112
3.2.2 Skin integrity check 114
3.2.3 The effect of PAMAM dendrimer pre-treatment on the in vitro
permeation on CHG using porcine epidermis. 114
3.2.4 Franz diffusion cell studies using porcine dermatomed skin for tape
stripping. 116
3.2.5 HPLC method and validation for the detection of CHG 117
3.2.6 Statistical data analysis 118
3.3 Results 119
3.3.0 In vitro Franz diffusion cell study investigating the effect of a PAMAM
dendrimer pre-treatment on the permeation on CHG using porcine
epidermis. 119
3.3.1 Franz diffusion cell studies using tape stripping to profile CHG within
porcine dermatomed skin 135
3.4 Discussion 146
3.5 Conclusion 153
Chapter Four: Elucidation of the interaction between PAMAM
dendrimers and porcine skin. 154
4.0 Introduction 154
4.0.1 Interaction between PAMAM dendrimers and the skin 154
4.0.2 Rationale for the investigation of a PAMAM dendrimer skin pre-
treatment interaction with the skin. 157
4.0.3 Aims and objectives 158

vi
4.1 Materials and methods 159
4.1.0 Measurement of Transepidermal Water Loss (TEWL) and
Transepithelial Resistance (TEER) after a PAMAM dendrimer treatment 159
4.1.1 Optical Coherence Tomography (OCT) analysis of the skin surface
after dosing with PAMAM dendrimers 160
4.1.2 Histological analysis of PAMAM dendrimer dosed porcine skin 162
4.1.3 Isolation of porcine SC 163
4.1.4 ATR-FTIR analysis of the interaction between PAMAM dendrimer
and porcine SC 164
4.1.5 Determination of skin cholesterol extraction by PAMAM dendrimers 164
4.1.6 Determination of skin protein extraction by PAMAM dendrimers 166
4.1.7 Statistical data analysis 168
4.2 Results section 169
4.2.0 Measurement of Transepidermal Water Loss (TEWL) and
Transepithelial Resistance (TEER) after application and removal of G3-
PAMAM-NH2 dendrimer. 169
4.2.1 Optical Coherence Tomography (OCT) to delineate the interactions
of PAMAM dendrimers with the porcine skin surface. 172
4.2.1.0 The effect of amine functionality of the PAMAM dendrimer on the
porcine skin surface 172
4.2.1.1 The effect of carboxyl functionality of the PAMAM dendrimer on
the porcine skin surface 175
4.2.1.2 The effect of the known tissue clearing agent glycerol on the
porcine skin surface 176
4.2.2 The transient nature of the PAMAM dendrimer’s effect on the skin 178
4.2.3 Histological analysis of PAMAM dendrimer dosed porcine skin 182
4.2.4 Determination of total cholesterol concentration extracted by
PAMAM dendrimer from porcine dermatomed skin. 184
4.2.5 Determination of skin protein concentration extracted by PAMAM
dendrimer from porcine dermatomed skin. 185
vii
4.2.6 ATR-FTIR analysis of the interaction between PAMAM dendrimers
and porcine SC 187
4.3 Discussion 197
4.4 Conclusion 208
Chapter Five: The use of time-of-flight secondary ion mass
spectrometry to map the distribution of CHG within tissue. 209
5.0 Introduction 209
5.0.1 Techniques available for imaging drug-skin deposition 209
5.0.2 Time-of-flight Secondary Ion Mass Spectrometry 212
5.0.3 Characteristics of ToF-SIMS 215
5.0.4 Aims and objectives 220
5.1.0 Materials and Methodology 221
5.1.1 Materials 221
5.1.2 Skin preparation 222
5.1.3 Diffusion (Franz-type) cell study 223
5.1.4 Sample preparation for ToF-SIMS analysis 224
5.1.5 ToF-SIMS analysis of porcine skin sections 224
5.1.6 Statistical analysis of data 225
5.2.0 Results 226
5.2.1 Method Development 226
5.2.1.1 Identification and analysis of fragment ions characteristic of
chlorhexidine digluconate (CHG). 226
5.2.2. ToF-SIMS analysis of chlorhexidine digluconate treated porcine skin
cryo-sections. 235
5.2.3 ToF-SIMS analysis of chlorhexidine digluconate treated porcine skin
tape strips. 240
5.3.0 Discussion 253
5.4 Conclusion 263
viii
Chapter Six: An investigation into the co-formulation of a PAMAM
dendrimer-CHG skin treatment and the development and
optimisation of a suitable topical formulation that will ultimately
deliver an increased concentration of CHG within the skin. 265
6.0 Introduction 265
6.0.1 PAMAM dendrimers’ interactions with small drug molecules 265
6.02 Rationale for the investigation of a topical preparation using a CHG-
PAMAM complex. 269
6.03 Aims and objectives 270
6.1 Materials and methods 271
6.1.0 Investigation into the interactions between chlorhexidine digluconate
and PAMAM dendrimers 271
6.1.1 Imaging and measurement of crystal formation 271
6.1.2 Matrix assisted laser desorption ionization Time of Flight (MALDI-
ToF) mass spectrometry 271
6.1.3 Single crystal X-ray diffraction 272
6.1.4 Formulation of the co-application (G3-PAMAM-NH2 dendrimer–CHG)
formulation 272
6.1.5 Recovery of CHG after addition of PAMAM dendrimer in occluded
and unoccluded conditions. 273
6.1.6 Microdilution broth with viable count assay to determine inhibitory
concentration (IC50) 273
6.1.7 Co-application of various dendrimer concentrations (G3-PAMAM-
NH2) formulated with CHG in an ethanolic vehicle to porcine epidermis. 274
6.1.8 Formulation development and characterisation 274
6.1.8.1 Measurement of the pH of the topical gel formulations 274
6.1.8.2 Measurement of the spreadability of the topical gel formulations 275
6.1.8.3 Extraction of CHG from formulations (drug content and uniformity) 275
6.1.8.4 Viscosity of topical gel formulations 276
6.1.8.5 Antimicrobial efficacy of topical gel formulations 276
ix
6.1.8.6 Attenuated total reflectance Fourier transform infra-red
spectroscopy (ATR-FTIR) of topical gel formulations 277
6.1.8.7 Percutaneous absorption of chlorhexidine digluconate from
selected formulations determined by tape stripping dermatomed porcine
skin after 24 h 278
6.1.9 Analysis of results 278
6.2 Results 279
6.2.1 Investigation into the interactions between chlorhexidine digluconate
and PAMAM dendrimers 279
6.2.2 Measurement of the melting point 283
6.2.3 Measurement of crystal lengths 283
6.2.4 MALDI-ToF analysis of precipitate 283
6.2.5 Single crystal x-Ray Diffraction (XRD) on precipitate 288
6.2.6 Formulation of CHG-PAMAM dendrimer 290
6.2.7 The effect of PAMAM dendrimer on the efficacy of CHG 292
6.2.8 Co-application of various dendrimer concentrations (G3-PAMAM-
NH2) formulated with CHG in an ethanolic vehicle, applied to porcine
epidermis 294
6.2.9 Formulation Development and characterisation 298
6.2.9.1 pH of formulations 301
6.2.9.2 Spreadability of formulations 302
6.2.9.3 Concentration of available CHG within formulation (CHG
concentration and uniformity). 305
6.2.9.4 Viscosity of formulations 306
6.2.9.5 Antimicrobial efficacy of formulations. 307
6.2.9.6 ATR-FTIR of formulations 309
6.2.9.7 Percutaneous absorption of chlorhexidine digluconate from
selected formulations determined by tape stripping dermatomed porcine
skin after 24 h 312

x
6.3 Discussion 315
6.4 Conclusion 336
Chapter Seven: Conclusions and general discussion 337
7.1 Summary of findings 337
7.2 Implications of research and future work 341
Appendix 346
References 350

xi
List of Figures
Figure 1.1 Schematic of a skin section. 5
Figure 1.2. A schematic of the permeation routes through the skin. 8
Figure 1.3. Large hair follicle showing Gram stained bacilli and cocci
deep within the follicle taken from an abdomen skin biopsy. 12
Figure 1.4. Chemical structure of CHX free base and its commonly
used salt CHG. 16
Figure 1.5 Schematic of commonly used nano-particulate topical and
transdermal drug delivery systems. 38
Figure 1.6 Chemical structure of a generation 3 Polyamidoamine
(PAMAM) dendrimer. 39
Figure 1.7. Generation 2, 4 and 6 PAMAM dendrimers observed as
molecular dynamic simulations. 40
Figure 1.8. Schematic of the synthetic steps for the divergent approach
in synthesising PAMAM dendrimers. 41
Figure 2.1. A reaction schematic showing the formation of O-
nitrophenol. 64
Figure 2.2 Inhibition of S. aureus against decreasing concentrations of
PAMAM dendrimer (μg/mL). 69
Figure 2.3. Graph illustrating the calculated IC50 (µg/mL)
concentrations. 70
Figure 2.4. Inhibition of E. coli challenged against decreasing
concentrations of G3-PAMAM-NH2 dendrimer (μg/mL). 72
Figure 2.5. Inhibition of G3.5-PAMAM-COOH dendrimer (μg/mL)
against S. aureus and E. coli. 73
Figure 2.6. Graphs illustrating the release of nuclear material from S.
aureus, S. epidermidis and E. Coli. 75
Figure 2.7. Graphs illustrating the relationship between concentration,
time and dendrimer generation on the inner membrane
permeabilisation of E. coli. 81
Figure 2.8. Graph illustrating the inner membrane permeabilisation of
E. coli at 60 minutes for a range of dendrimer concentrations. 82
xii
Figure 2.9. Graphs illustrating the effect of dendrimer generation and
time at specific concentrations on the inner membrane
permeabilisation of E. coli. 83
Figure 2.10. Scanning electron micrographs of S. aureus challenged
with PAMAM dendrimer. 85
Figure 2.10. Cont. 86
Figure 2.11. Scanning electron micrographs of E. coli challenged with
PAMAM dendrimer. 87
Figure 3.1 Mean concentration of CHG detected within the receptor
fluid over a 24 h time period after a range of skin pre-treatments. 132
Figure 3.2. Concentration of CHG within the epidermis at 24 h after a
range of skin pre-treatments. 132
Figure 3.3 Concentration of CHG absorbed within the receptor fluid at
24 h after various skin pre-treatments. 133
Figure 3.4. Photograph of the skin surface comparing the control to
skin dosed with PAMAM dendrimer. 134
Figure 3.5. Graph illustrating the cumulative mass of SC material on
individual tape strips for various skin pre-treatments. 136
Figure 3.6. Concentration profile of CHG detected on each tape
strip(s). 139
Figure 3.7 CHG concentrations extracted from tape strips and the
remaining skin after various skin pre-treatments. 145
Figure 4.1. Measurement of the barrier integrity of the skin before and
after dosing with PAMAM dendrimers. 171
Figure 4.2 OCT images of porcine skin dosed with various
concentrations of G3-PAMAM-NH2 dendrimer taken at various time
points. 173
Figure 4.3. OCT images of porcine skin dosed with the vehicle control
taken at various time points. 174
Figure 4.4 OCT images of porcine skin dosed with the G3.5-PAMAM-
COOH dendrimer and corresponding vehicle control taken at various
time points. 176

xiii
Figure 4.5 OCT images of porcine skin dosed with anhydrous glycerol
at various time points. 177
Figure 4.6. In situ OCT images of porcine skin dosed with anhydrous
glycerol. 177
Figure 4.7a OCT images showing porcine skin before, during and after
application of G3-PAMAM-NH2 dendrimer. 179
Figure 4.7b OCT images showing porcine skin after removal of applied
G3-PAMAM-NH2 dendrimer. 180
Figure 4.8. OCT image analysis of porcine dermatomed skin prior and post G3-PAMAM-NH2 treatment. 181
Figure 4.9. Graph showing pixel gray value against depth illustrating a
change in the gray values after application of G3-PAMAM-NH2
dendrimer (10 mM, 0.2 mL) compared to skin before treatment. 182
Figure 4.10. Haematoxylin and eosin stained porcine dermatomed skin
cryo-sections after application of PAMAM dendrimer, vehicle control
and an SDS positive control. 183
Figure 4.11 Concentration of total cholesterol (µg/mL) extracted from
the dermatomed porcine skin (400 µm) after a 24 h contact time under
occluded conditions. 185
Figure 4.12. Concentration of protein (µg/mL) extracted from the
dermatomed porcine skin (400 µm) after a 24 h contact time under
occluded conditions. 187
Figure 4.13 ATR-FTIR spectra of isolated native SC and isolated SC
dosed with PAMAM dendrimer and the corresponding vehicle control. 188
Figure 4.14. ATR-FTIR spectra of isolated SC dosed with 10 mM G3-
PAMAM-NH2 dendrimer overlaid with the vehicle control spectrum. 190
Figure 4.15 Graph illustrating the peak shift of the amide I band for 10
mM and 5 mM G3-PAMAM-NH2 dendrimer treated SC and for the
vehicle control treated SC. 192
Figure 4.16. Graph illustrating the peak shift of the amide II band for 10
mM G3-PAMAM-NH2 dendrimer treated SC and for the vehicle control
treated SC. 193
Figure 4.17 ATR-FTIR spectra corresponding to G3.5-PAMAM-COOH
(5 mM solution) and corresponding vehicle control applied to the SC. 194

xiv
Figure 4.18. Magnification of ATR-FTIR spectra demonstrating peak
shift after application of G3.5-PAMAM-COOH dendrimer to isolated SC
compared to vehicle controlled dosed SC. 195
Figure 4.19 Graph illustrating the peak shift at 2981 cm-1 after
application of G3.5-PAMAM-COOH dendrimer to SC compared to the
vehicle control treated SC. 196
Figure 5.1 Schematic of the analysis of a skin cryo-section by ToF-
SIMS. 214
Figure 5.2. Schematic of the SIMS process. 215
Figure 5.3 Identification of characteristic CHG markers. 227
Figure 5.4 Identification of the molecular ion for CHG. 228
Figure. 5.5 ToF-SIMS images of various secondary ions chosen as
markers for CHG. 230
Figure 5.6. Mass spectra illustrating the difference in mass resolution
between the two ToF-SIMS operating modes. 231
Figure 5.7. Imaging of selected CHG marker ions within the skin. 233
Figure 5.8. Histological analysis of skin sample after ToF-SIMS
analysis. 234
Figure 5.9 Magnified mass spectra of CHG marker ions within skin
tissue. 236
Figure 5.10. ToF-SIMS images of various CHG marker ions distributed
within the skin. 237
Figure. 5.11 ToF-SIMS images of CHG markers within the skin taken
in the burst alignment operating mode. 239
Figure 5.12 ToF-SIMS images of CHG marker ions and biomolecules
for 21 consecutive tape strips. 243
Figure 5.13. ToF-SIMS mass spectra of various CHG ion markers
distributed across the surface of various tape strips. 245
Figure. 5.14 ToF-SIMS images showing the distribution of CHG marker
ions across various tape strips. 246
Figure 5.15 Graphs showing the distribution of CHG throughout the SC
using two complementary techniques; HPLC and ToF-SIMS. 247

xv
Figure 5.16. ToF-SIMS images showing the distribution of CHG ion
markers throughout the upper skin strata after a PAMAM dendrimer
skin pre-treatment. 249
Figure 5.17. A comparison of ToF-SIMS images of various CHG
markers distributed within skin with and without a 24 h pre-treatment
with PAMAM dendrimer. 250
Figure 5.18. A graph showing the depth permeated by CHG (2% w/v)
with and without a G3-PAMAM-NH2 (10 mM, 0.2 mL) pre-treatment as
measured using SufaceLab 6 software. 252
Figure 6.1. Chemical structure of a PAMAM dendrimer and CHG. 280
Figure 6.2. Photograph of shard crystals formed on addition of CHG to
PAMAM dendrimer. 281
Figure 6.3. Photograph of short shard crystals emanating from a focal
core after addition of CHG to PAMAM dendrimer. 282
Figure 6.4. MALDI-ToF mass spectra of G3-PAMAM-NH2 dendrimer. 285
Figure 6.5. MALDI-ToF mass spectra of G3-PAMAM-NH2 and CHG
precipitate. 287
Figure 6.6. Chemical structure obtained from XRD analysis of a single
crystal of the precipitate. 389
Figure 6.7. Bar chart of percentage recovery of CHG from a co-
formulation of various concentrations of G3-PAMAM-NH2 and CHG. 291
Figure 6.8. Inhibition curves used to calculate the IC50 concentrations
of CHG alone in an ethanol: water (50:50) vehicle and for G3-PAMAM-
NH2 –CHG in an ethanol: water (50:50) vehicle. 293
Figure 6.9. Total concentration of CHG within the epidermis (µg/cm2) at
24 h after application of CHG alone, 0.5 mM, 1 mM and 10 mM
PAMAM dendrimer with CHG in an ethanol: water vehicle (50:50). 297
Figure 6.10. Total concentration of CHG absorbed within the receptor
fluid (µg/cm2) at 24 h after application of, 0.5 mM, 1 mM and 10 mM
PAMAM dendrimer and CHG alone. 298
Figure 6.11. RPM plotted with the viscosity (m.Pas) for formulation F
illustrating non Newtonian behaviour. 307
xvi
Figure 6.12. Photograph of an agar plate (cationic adjusted Mueller
Hinton agar) illustrating formulation F challenged against P. aeruginosa
using a modified agar cup method. 308
Figure 6.13. ATR-FTIR spectra of (a) a CHG (2% w/v) solution and (b)
Formulation a. 311
Figure 6.14 A possible schematic for the formation of the oxocarbon
anion detected within the single molecule crystal using XRD analysis. 319
Figure 6.15 Image showing the electrostatic potential plotted on an
electrostatic density image of CHX. 320

xvii
List of Tables
Table 1.1 A table of CHX containing topical antiseptic formulations available
within the UK. 21
Table 1.2. Theoretical physiochemical characteristics of PAMAM
dendrimers from generation 0-10. 42
Table 2.1. Calculated IC50 (μg/mL) with 95% confidence intervals against S.
aureus and E. coli including physicochemical characteristics of PAMAM
dendrimer that determines their antimicrobial ability. 68
Table 3.1 Percentage recovery of three concentrations of aqueous
chlorhexidine digluconate after 100 µl was spiked on to each compartment
of a Franz cell. 120
Table 3.2. Compartmental diffusion cell data of CHG concentration for the
control skin pre-treatment. 122
Table 3.3 Rate of absorption of CHG over 24 h after a control skin pre-
treatment. 123
Table 3.4. Compartmental diffusion cell data of CHG concentration after a
skin pre-treatment of G3-PAMAM-NH2 dendrimer (0.5 mM). 124
Table 3.5. Rate of absorption of CHG over 24 h after a skin pre-treatment of
G3-PAMAM-NH2 dendrimer (0.5 mM). 125
Table 3.6. Compartmental diffusion cell data of CHG concentration after a
skin pre-treatment of G3-PAMAM-NH2 dendrimer (1 mM). 126
Table 3.7. Rate of absorption of CHG over 24 h after a skin pre-treatment of
G3-PAMAM-NH2 dendrimer (1 mM). 127
Table 3.8. Compartmental diffusion cell data of CHG concentration after a
skin pre-treatment of G3-PAMAM-NH2 dendrimer (10 mM). 128
Table 3.9 Rate of absorption of CHG over 24 h after a skin pre-treatment of
G3-PAMAM-NH2 dendrimer (10 mM). 130
Table 3.10. Compartmental diffusion cell data (including tape strips) of CHG
concentration for the control skin pre-treatment. 141
Table 3.11. Compartmental diffusion cell data (including tape strips) of CHG
concentration after a vehicle control skin pre-treatment. 142
xviii
Table 3.12 Compartmental diffusion cell data (including tape strips) of CHG
concentration after a G3-PAMAM-NH2 dendrimer (1 mM) skin pre-
treatment. 143
Table 6.1 Crystal data obtained from XRD analysis. 288
Table 6.2. Percentage recovery of CHG after addition of PAMAM dendrimer
under occluded and unoccluded conditions. 291
Table 6.3. Percutaneous absorption (mass balance) of CHG within porcine
epidermis after a 24 h of CHG (2 % w/v) formulation in ethanol: water
(50:50). 295
Table 6.4 Percutaneous absorption (mass balance) of CHG within porcine
epidermis after a 24 h treatment with 0.5 mM-PAMAM dendrimer- CHG
formulation in Ethanol: water (50:50). 295
Table 6.5 Percutaneous absorption (mass balance) of CHG within porcine
epidermis after a 24 h treatment with 1 mM-PAMAM dendrimer- CHG
formulation in Ethanol: water (50:50). 296
Table 6.6 Percutaneous absorption (mass balance) of CHG within porcine
epidermis after a 24 h treatment with 10 mM-PAMAM dendrimer- CHG
formulation in Ethanol: water (50:50). 296
Table 6.7 Weight of constituents of formulations F-F4 with alteration of the
ethanol content of the formulation. 299
Table 6.8 Weight of constituents of formulations F4(a) to F6(a) with the
alteration of HPC content in formulation (mw of HPC was 100,000). 299
Table 6.9. Weight of constituents of formulations F7 and F8 with the
addition of glycerol. 300
Table 6.10. Measured pH for the formulations after a 1 in 10 dilution in
ultrapure water. 302
Table 6.11. Displays the calculated spreadability diameter of the
formulations after application of a known weight and time period. 304
Table 6.12. Recovered CHG from formulations after dissolving 1 g of each
formulation in ultra-pure water. 305
Table 6.13. Measured torque for increasing and then decreasing shear
rates for formulation F(a-c). 306

xix
Table 6.14. Diffusion zone of formulations challenged against the Gram
negative E. coli and P. aeruginosa and the Gram positive S. aureus. 309
Table 6.15 Concentration of CHG extracted from the different
compartments of the in vitro diffusion cell after dosing with formulation 4 for
24 h. 313
Table 6.16 Concentration of CHG extracted from the different
compartments of the in vitro diffusion cell after dosing with formulation 5 for
24 h. 314
Table 6.17 Concentration of CHG extracted from the different
compartments of the in vitro diffusion cell after dosing with formulation 6 for
24 h. 314
xx
Equation 2.1 Inhibition percentage calculation. 61
Equation 2.2 Calculation of IC50 concentration. 61
Equation 3.1 Calculation to normalise the concentration of drug on each
tape strip to the amount of SC on the corresponding tape. 117
Equation 4.1 Calculation of the limit of quantification (LOQ). 166
Equation 4.2 Calculation of the limit of detection (LOD). 166

xxi
Abbreviations
5-FU 5-Fluorouracil
8-MOP 8-Methoxypsoralene
AFM Atomic Force Microscopy
AMP Antimicrobial Peptide
ANOVA Analysis of Variance
ATCC American Type Culture Collection
ATP Adenosine Triphosphate
ATR-FTIR Attenuated Total Reflectance Fourier Transform
Infra-red spectroscopy
AUC Area Under Curve
CDC Centre for Disease Control
CFU Colony Forming Unit
CHG Chlorhexidine Digluconate
CHX Chlorhexidine (Base)
CLSI Clinical and Laboratory Standards Institute
CLSM Confocal Laser Scanning Microscopy
CMO Chief Medical Officer
CRM Confocal Raman Microscopy
DF Degrees of Freedom
DMSO Dimethylsulfoxide
DNA Deoxyribonucleic Acid
DOC Deoxycholate
DPPG Dipalmitoylphosphatidylglycerol
DPX Dibutyl Phthalate in Xylene
DSC Differential Scanning Calorimetry
EC50 Half Maximal Effective Concentration
xxii
EDTA Ethylenediaminetetraacetic Acid
EPSRC Engineering and Physical Sciences Research
Council
FDA Food and Drug Administration
G Generation
HCAI Healthcare Acquired Infection
HCEC Human Corneal Epithelial Cells
HEC Hydroxyethyl Cellulose
HEMA Hydroxyethyl Methacrylate
HPC Hydroxyl Propyl Cellulose
HPLC High Performance Liquid Chromatography
HPMC Hydroxyl Propyl Methyl Cellulose
IC50 Inhibitory Concentration at 50%
IPM Isopropyl Myristate
IR Infra Red
LOD Limits of Detection
LOQ Limits Of Quantification
LPS Lipopolysaccharide
LSD Least Significant Difference
MALDI IMS Matrix-Assisted Laser Desorption/Ionisation
Imaging Mass Spectrometry
MALDI TOF Matrix-Assisted Laser Desorption/Ionisation -
Time of Flight mass spectrometry
MCE Mixed Cellulose Esters
MHA Mueller-Hinton Agar
MHB Mueller-Hinton Broth
MIC Minimum Inhibitory Concentration
MRI Magnetic Resonance Imaging

xxiii
MRSA Multi-drug Resistant Staphylococcus aureus
NCHG Nanocomposite Biocompatible Hydrogels
NIPAM N-isopropylacrylamide
NSAID Non-steroidal Anti-inflammatory Drug
OCT Optimal Cutting Temperature
OCT Optical Coherence Tomography
OECD
Organisation for Economic Cooperation and
Development
ONPG Ortho-Nitrophenyl-β-Galactoside
PAMAM Polyamidoamine
PBS Phosphate-Buffered Saline
PEGDMA Polyethyleneglycol Dimethylacrylate
PEGDMA Polyethyleneglycol
PES Pig Ear Skin
PHA Polyhydroxyalkonoate
PITC Phenylisothiocyanate
PLGA Poly-lactic-co-glycolic acid
PNBCA Poly n-butylcyanoacrylate
PPI Poly(propylene imine)
PS-OCT Polarisation Sensitive Optical Coherence
Tomography
PVDF Polyvinyldifluoride
RH Relative Humidity
RI Refractive Index
RNA Ribonucleic Acid
ROI Region of Interest
ROS Reactive Oxygen Species
xxiv
RSD Relative Standard Deviation
SAXD Small Angle x-ray Diffusion
SC Stratum Corneum
SD Standard Deviation
SDS Sodium Dodecyl Sulphate
SEM Scanning Electron Microscope
SEM Standard Error of the Mean
SLN Solid Lipid Nanoparticles
SMZ Sulfamethoxazole
SSTI Skin and Soft Tissue Infection
TC Total Ion Count
TCA Trichloroacetic Acid
TEER Transepithelial Electrical Resistance
TEWL Trans-epidermal Water Loss
ToF-SIMS Time-of-Flight, Secondary Ion Mass
Spectrometry
TSA Tryptone Soya Agar
TSB Tryptone Soya Broth
UV Ultra Violet
UV - VIS Ultra Violet - Visible light
VC Vehicle Control
WHO World Health Organisation
XRD x - Ray Diffraction

xxv
Acknowledgements
I would like to thank Dr Ka-Wai Wan for the initial input into the project and
for the support within the first 18 months of my PhD. I would also like to thank Dr
Gary Moss for taking the project on half way through and for the supervision until
the end. I gratefully acknowledge the support and guidance of my co-supervisor
Professor Jon Heylings who was instrumental to the success of this project. I
would also like to thank everyone from DTL, my industrial collaborator, for their
hours of support, teaching and guidance, in particular Mr Dave Fox, Mr Thomas
Brackin, Ms Rebecca Burton, Mr Abbid Majid and Ann Pillai.
I am also appreciative of the technical expertise from the following people;
Dr Katherine Haxton (PAMAM dendrimer synthesis), Dr Ravi Pathak , Dr Mark
Cresswell and Mrs Gayle Wilson (all for their organic chemistry knowledge), Mr
David Griffiths (histology), Dr Dan Bray (statistics), Dr Andrew Morris and Dr Ellie
Wong (microbiology) and Mrs Karen Walker (SEM work). I would like to thank Dr
David Scurr from the University of Nottingham for his significant contribution with
the ToF-SIMS operation. I am also grateful to Dr Ying Yang for allowing me to use
her OCT and for the subsequent support in publishing the work.
I am indebted to the laboratory technicians; Ms Lynsey Wheeldon (for
lending me all manner of laboratory equipment), Mr Mark Arrowsmith (for use of
the ATR-FTIR) and to Mr Nigel Bowers for whom I owe a bottle of whiskey for
allowing me to descend upon his microbiology laboratory over the past three
summers.

xxvi
I also would like to thank Dr Tizzard from the National Crystallography Centre at
Southampton University for conducting the XRD analysis and the EPSRC Mass
Spectrometry centre at Swansea University for their MALDI-ToF analysis.
To the people who kept me sane (controversial) during the past 3.5 years;
Dr Stuart Jenkins (who had the misfortune to be seated next to me), Dr Joanna
Miest, Dr Doug Paton, Dr Andrew Morris, Dr Dan Bray, Lynsey Wheeldon, Tim
Hinchcliffe, Dr Clare Hoskins, Tracey Coppins, Sile Griffin, Alan Weighman, Chris
Adams, Sarah Harris and Dr Clare McArthur. I am eternally grateful for the support
of my family and my husband, David Holmes. Dave’s unwavering support and
patience has meant everything to me and I would never have reached this point
without him.

1
1.0 General introduction
1.1 The barrier to topical drug delivery of antimicrobial compounds.
Human skin is the largest organ of the body and plays a vital role as the
interface between the internal and external environments (Figure 1.1). The skin
protects the human body from the invasion of harmful exogenous chemicals,
microorganisms and even radiation. It has a multitude of functions including
thermoregulation and is an important sensory organ that can detect pressure, heat
and pain. It provides around 10 % of the body mass of an individual and covers
an area of approximately 1.7 m2 in adults, thus making it an accessible and large
surface area for the delivery of therapeutics (Williams, 2003). For efficacious
topical and transdermal drug delivery systems, a drug must permeate the Stratum
corneum (SC).
The SC, the outer layer of the skin, is only 15-20 µm thick, yet provides the
main barrier against the ingress of permeants (Hadgraft, 2001). It is sometimes
described as a ‘brick wall’ with anucleate keratinized corneocytes as the “bricks”
and the densely packed intercellular lipids making up the ‘mortar’ (Elias, 1983).
The corneocytes are elongated and flattened cells that are approximately
0.2-1.5 µm thick and have a diameter of 34-46 µm. It is the corneoctyes that
account for most of the weight of the SC as they are filled with keratin (Alibardi et
al. 2004). The corneocytes act as spacers and consist of a layer of lipids
covalently bound to the cell envelope that act as a scaffold for the extracellular
lipid matrix (Prausnitz and Langer, 2008). This acts as a template for the
organisation of the non-polar intercellular lipids. The intercellular lipids are
organised around the dense envelope of keratinized corneocytes. This tortuous
2
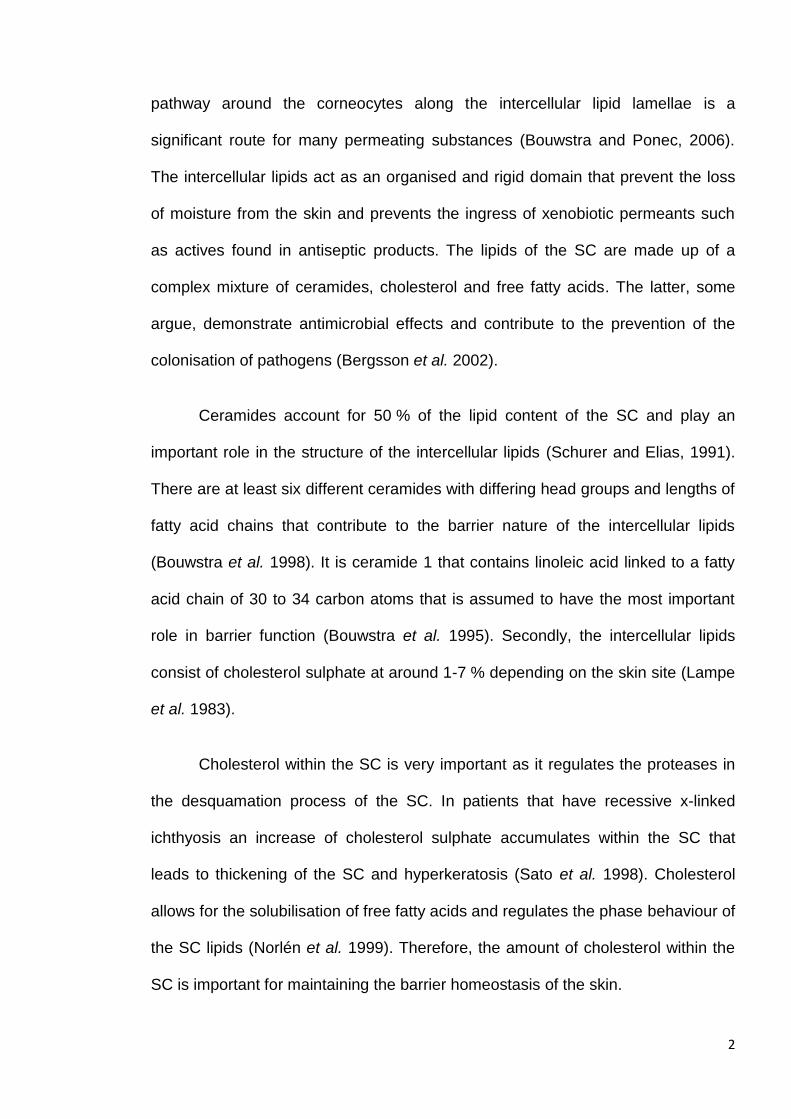
pathway around the corneocytes along the intercellular lipid lamellae is a
significant route for many permeating substances (Bouwstra and Ponec, 2006).
The intercellular lipids act as an organised and rigid domain that prevent the loss
of moisture from the skin and prevents the ingress of xenobiotic permeants such
as actives found in antiseptic products. The lipids of the SC are made up of a
complex mixture of ceramides, cholesterol and free fatty acids. The latter, some
argue, demonstrate antimicrobial effects and contribute to the prevention of the
colonisation of pathogens (Bergsson et al. 2002).
Ceramides account for 50 % of the lipid content of the SC and play an
important role in the structure of the intercellular lipids (Schurer and Elias, 1991).
There are at least six different ceramides with differing head groups and lengths of
fatty acid chains that contribute to the barrier nature of the intercellular lipids
(Bouwstra et al. 1998). It is ceramide 1 that contains linoleic acid linked to a fatty
acid chain of 30 to 34 carbon atoms that is assumed to have the most important
role in barrier function (Bouwstra et al. 1995). Secondly, the intercellular lipids
consist of cholesterol sulphate at around 1-7 % depending on the skin site (Lampe
et al. 1983).
Cholesterol within the SC is very important as it regulates the proteases in
the desquamation process of the SC. In patients that have recessive x-linked
ichthyosis an increase of cholesterol sulphate accumulates within the SC that
leads to thickening of the SC and hyperkeratosis (Sato et al. 1998). Cholesterol
allows for the solubilisation of free fatty acids and regulates the phase behaviour of
the SC lipids (Norlén et al. 1999). Therefore, the amount of cholesterol within the
SC is important for maintaining the barrier homeostasis of the skin.

3
Free fatty acids are products from the hydrolysis of phospholipids by
phospholipase and they consist of long chain (>18 carbon atoms) saturated
species (Fluhr et al. 2001). To investigate the importance of free fatty acids to the
skin barrier the production of free fatty acids was inhibited using 5-(tetradecyloxy)-
2-furancarboxylic acid to inhibit acetyl CoA carboxylase. The authors found that
the skin barrier was impaired by up to 50 % and recovery of the SC was
significantly delayed after disruption of the free fatty acids within the SC (Mao-
Qiang et al. 1993).
It has also been shown that the ratio of free fatty acids to cholesterol and to
ceramides is also of importance for the maintenance of the SC barrier function and
alteration of the ratio of free fatty acids found within the SC can increase the trans-
epidermal water loss (TEWL), an indicator of barrier impairment (Lavrijsen et al.
1995). The free fatty acids are also important in the maintenance of an ‘acid
mantle’ whereby the external SC has an acidic pH of 4 to 6 (Ohman and Vahlquist,
1994). Alterations to the pH of the SC results in a decrease in its barrier integrity
and cohesion. It was reported that if neutralisation of the SC occurs for only 3 h,
the skin barrier is impaired (Fluhr et al. 2001).
As well as the composition and molar ratios of the SC lipids, the phase
behaviour and therefore structural organisation is also important for the
maintenance of SC barrier integrity. Using small angle X-ray diffraction (SAXD) it
was found that in healthy human skin, SC lipids are structured in two lamellar
phases found in two periodicities of 6 nm, short periodicity phase and 13 nm, long
periodicity phase (Bouwstra et al., 1991). The characteristic 13 nm long periodicity
phase has been identified in many species’ lipid lamellar thus it is assumed that
4
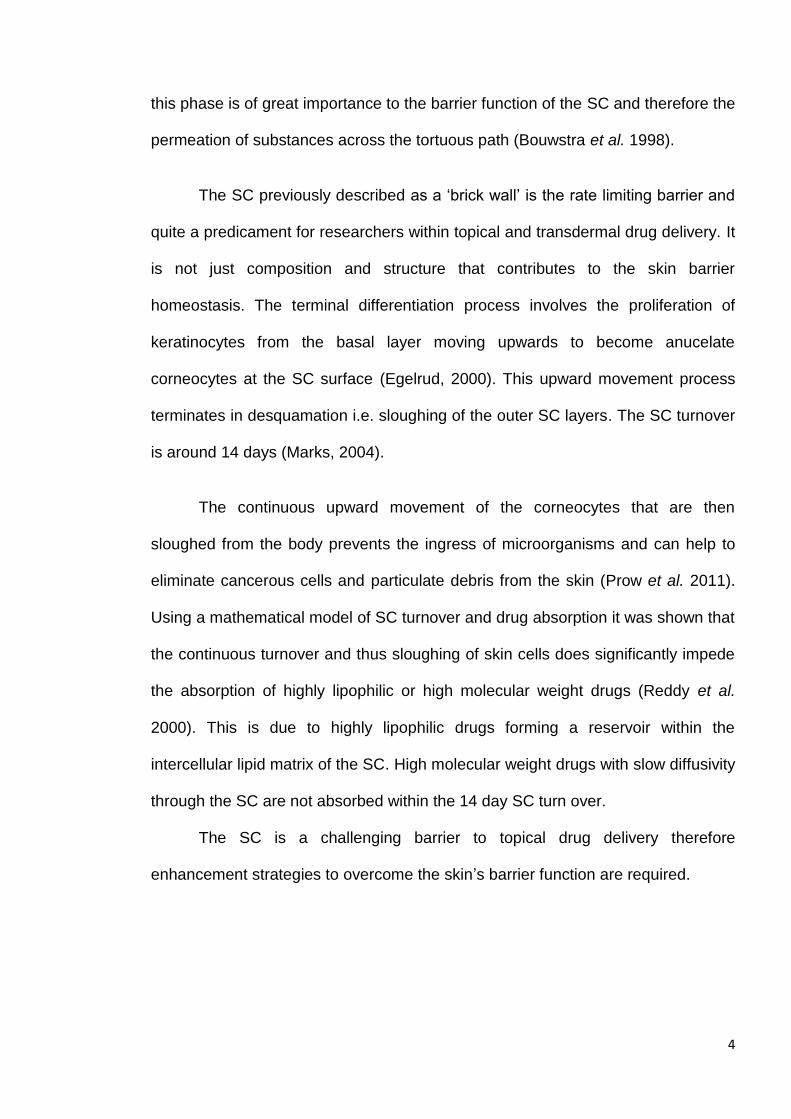
this phase is of great importance to the barrier function of the SC and therefore the
permeation of substances across the tortuous path (Bouwstra et al. 1998).
The SC previously described as a ‘brick wall’ is the rate limiting barrier and
quite a predicament for researchers within topical and transdermal drug delivery. It
is not just composition and structure that contributes to the skin barrier
homeostasis. The terminal differentiation process involves the proliferation of
keratinocytes from the basal layer moving upwards to become anucelate
corneocytes at the SC surface (Egelrud, 2000). This upward movement process
terminates in desquamation i.e. sloughing of the outer SC layers. The SC turnover
is around 14 days (Marks, 2004).
The continuous upward movement of the corneocytes that are then
sloughed from the body prevents the ingress of microorganisms and can help to
eliminate cancerous cells and particulate debris from the skin (Prow et al. 2011).
Using a mathematical model of SC turnover and drug absorption it was shown that
the continuous turnover and thus sloughing of skin cells does significantly impede
the absorption of highly lipophilic or high molecular weight drugs (Reddy et al.
2000). This is due to highly lipophilic drugs forming a reservoir within the
intercellular lipid matrix of the SC. High molecular weight drugs with slow diffusivity
through the SC are not absorbed within the 14 day SC turn over.
The SC is a challenging barrier to topical drug delivery therefore
enhancement strategies to overcome the skin’s barrier function are required.

5
Figure 1.1 Schematic of a skin section.
When considering the skin as a permeable drug delivery site, it should be
noted that there are many biomolecules within the skin that could potentially affect
the therapeutic drug or the excipients. These could include; free fatty acids,
waxes, glycerides, phospholipids, hydrocarbons (e.g. squalene) and also sterols.
Further, it is likely that Ca, Na, K, Cl, NH3, phosphate, thiocyanates, urea, uric acid,
creatine, amino acids, lactic acid, glucose and vitamins (Wheatley, 1963) and
(Rothman, 1954) will be encountered within the superficial layers of the SC by the
active drug and excipients in the formulation. Molecules naturally found on the skin
surface have the potential to interact with the formulation affecting its
bioavailability by forming insoluble complexes.
Eccrine gland
Sebaceous gland
Blood vessels
Subcutaneous
tissue
Dermis
Epidermis
Stratum corneum
Pore of
eccrine gland

6
1.2 Topical and transdermal drug delivery.
Drugs can permeate through three possible routes across the SC for
dermal absorption. The three routes are intercellular, intracellular and
transappendageal as illustrated in Figure 1.2 (Williams, 2003). It is the tortuous
intercellular channels of extruded lipid lamellae that are said to be the primary
route for the dermal delivery of lipophilic drugs (Stoughton, 1989). It is the only
continuous phase across the skin, though the long tortuous path length and dense
packing of ~10 lipid bilayers compacted between each corneocyte cell still
provides a significant permeability barrier (Karande et al., 2006). The stacking of
the corneocytes is also important as they dictate the tortuous path taken by the
drug (Christophers et al. 1974). The intercellular lipid channels are reported to be
between 0.4 – 40 nm in width and this characteristic prevents the ingress of high
molecular weight drugs and nanoparticles (Cevc and Vierl, 2010 and Van der
Merwe et al. 2006).
The transcellular pathway affords a polar route through the intact SC. For a
drug to penetrate the SC using the transcellular route it would be required to
diffuse across the hydrophilic, keratin filled environment of the corneocytes. The
corneocytes are surrounded by the extruded lipid lamellae therefore any
hydrophilic drug diffusing through the intracellular route would not only have to
traverse the aqueous environments of the corneocytes but also partition into the
lipid rich extracellular matrix (Williams, 2003). Though this would be the shortest
path length for a drug to traverse the SC, a limiting factor is that a drug would have
to partition into the corneocyte, diffuse across the corneocyte and then partition
back into the lipid bilayer before diffusing across the bilayer and partition back into

7
a corneocyte and so forth (Figure 1.2). The rate-limiting barrier for a hydrophilic
drug traversing the intracellular route is the lipid bilayer and would require a drug
to have an optimal hydrophilic, lipophilic balance (Heisig et al. 1996). It is for this
reason that hydrophilic drugs generally exhibit poor permeability across the SC
(Prausnitz et al. 2004).
The transappendageal route can include pilosebaceous units and apocrine/
eccrine sweat glands that emerge from the dermis that can be used by drugs to
avoid traversing the SC for drug absorption. Eccrine sweat glands are distributed
across the skin surface however their openings are very small and sensible sweat
is continuously being excreted from the gland. This would reduce the likelihood of
a drug to penetrate the skin using this path (Meiden et al. 2005). The
pilosebaceous units or the follicular route provide a pathway for the drug or vesicle
without the requirement to traverse the SC. The drug can permeate down the
follicle to the dermis where there is a concentration gradient due to a copious
blood supply allowing ‘sink’ conditions (Lauer et al. 1995).
Siddiqui et al. (1989) demonstrated that the transappendageal routes are
only minor contributors (5-10 %) in the steady state flux of steroids through
excised human skin implying that the follicular pathway for topical and transdermal
drug delivery systems is not significant. Recently Knorr et al. (2009), argued that
the calculation claiming that the follicular penetration route accounts for only 0.1 %
of the skin surface area and did not take into consideration that hair follicles
represent invaginations offering a significant increase in skin surface area for
permeants. The transappendageal or ‘shunt’ route is important for liposomes and
other vesicles that are too large to penetrate the SC (Lieb et al. 1992).

8
Fluorescently labelled polystyrene nanoparticles of various diameters were shown
to preferentially accumulate within the follicular openings of the skin (Alvarez-
Roman et al. 2004a and Alvarez-Roman et al. 2004b). Nanoparticles with a
320 nm diameter were shown to deliver a fluorescent dye more effectively than the
free solution if the skin was massaged after application (Lademann et al. 2007).
The authors suggested that the physical motion of the hairs pumped the
nanoparticles deeper within the follicle resulting in an enhanced delivery.
It is likely that the penetration pathways for topical and transdermal drug
delivery are not mutually exclusive but that a number contribute to the ingress of
the topically applied drugs and that it is dependent on the physiochemical
properties of a drug.
Figure 1.2. A schematic of the permeation routes through the skin. 1.3 Physicochemical influences on the topical delivery of drugs within and across the skin.

9
The physicochemical properties that can affect the permeation of drugs
within the skin are molecular mass, ionisation at physiological pH, the partition
coefficient and the solubility/melting point (Beetge et al. 2000). It is the partitioning
coefficient (log P) that determines how well a drug will partition into the SC and is
the governing factor in determining which pathway the drug will take through the
skin (Barry, 1987). Those with a high partition coefficient, i.e. hydrophobic drugs,
are likely to take the intercellular pathway where as those with a low partition
coefficient, hydrophilic drugs, will take the intracellular pathway. For a drug to be a
likely candidate for transdermal or topical delivery it would ideally have a balanced
hydrophilic/lipophilic character with a log P value of 2 or at the very least between
1 - 3 (Guy and Hadgraft, 1989 and Finnin and Morgan, 1999).
Beetge and co-workers (2000) demonstrated with a range of non-steroidal
anti-inflammatory drugs (NSAIDs) that with increasing log P values the blood-
plasma concentration values decreased, with a minor discrepancy between
indomethacin and ibuprofen that both have very similar log P values. The biocide
used in this project, chlorhexidine (CHX) has an octanol/water partition coefficient
of 0.754 (free base) and CHX digluconate (CHG) has a log P value of 0.037
(Farkas et al. 2007) therefore the free base and its salt do not possess an optimal
partition coefficient for topical drug delivery.
The molecular mass of a drug is also a major factor in its success as a
transdermally delivered drug. It is thought that one reason there are so few
transdermal drug delivery systems on the market is because there are so few ideal
therapeutic candidates <400 Daltons (Potts and Guy, 1992). There is said to be a
500 Dalton cut off for drugs to be able to be absorbed after topical application (Bos
10
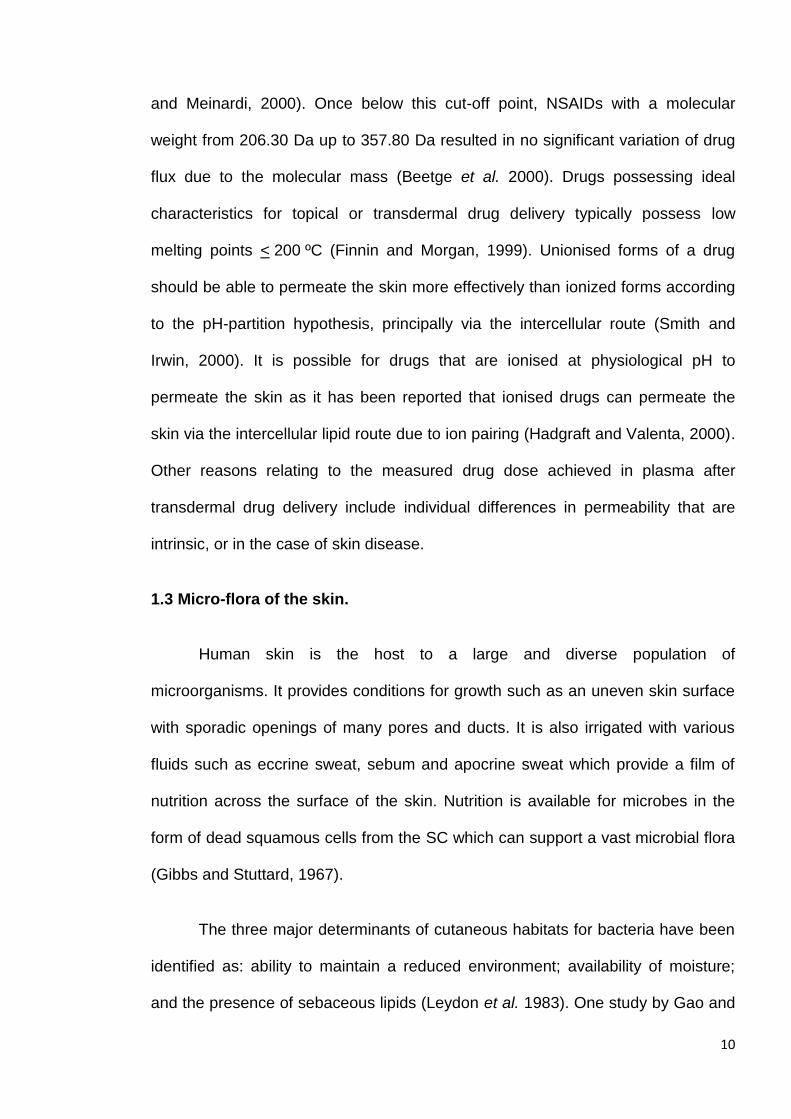
and Meinardi, 2000). Once below this cut-off point, NSAIDs with a molecular
weight from 206.30 Da up to 357.80 Da resulted in no significant variation of drug
flux due to the molecular mass (Beetge et al. 2000). Drugs possessing ideal
characteristics for topical or transdermal drug delivery typically possess low
melting points < 200 ºC (Finnin and Morgan, 1999). Unionised forms of a drug
should be able to permeate the skin more effectively than ionized forms according
to the pH-partition hypothesis, principally via the intercellular route (Smith and
Irwin, 2000). It is possible for drugs that are ionised at physiological pH to
permeate the skin as it has been reported that ionised drugs can permeate the
skin via the intercellular lipid route due to ion pairing (Hadgraft and Valenta, 2000).
Other reasons relating to the measured drug dose achieved in plasma after
transdermal drug delivery include individual differences in permeability that are
intrinsic, or in the case of skin disease.
1.3 Micro-flora of the skin.
Human skin is the host to a large and diverse population of
microorganisms. It provides conditions for growth such as an uneven skin surface
with sporadic openings of many pores and ducts. It is also irrigated with various
fluids such as eccrine sweat, sebum and apocrine sweat which provide a film of
nutrition across the surface of the skin. Nutrition is available for microbes in the
form of dead squamous cells from the SC which can support a vast microbial flora
(Gibbs and Stuttard, 1967).
The three major determinants of cutaneous habitats for bacteria have been
identified as: ability to maintain a reduced environment; availability of moisture;
and the presence of sebaceous lipids (Leydon et al. 1983). One study by Gao and

11
co-workers (2007) identified 182 species of microorganisms found on the skin
belonging to 8 different phyla. Of the 1,221 clones analysed, 54 % of them
belonged to the genera of Propionibacteria, Corynebacteria, Staphylococcus and
Streptococcus. The various layers of the skin host a diverse flora of commensual
and pathogenic bacteria, not just the superficial layers of the SC (Grice et al.
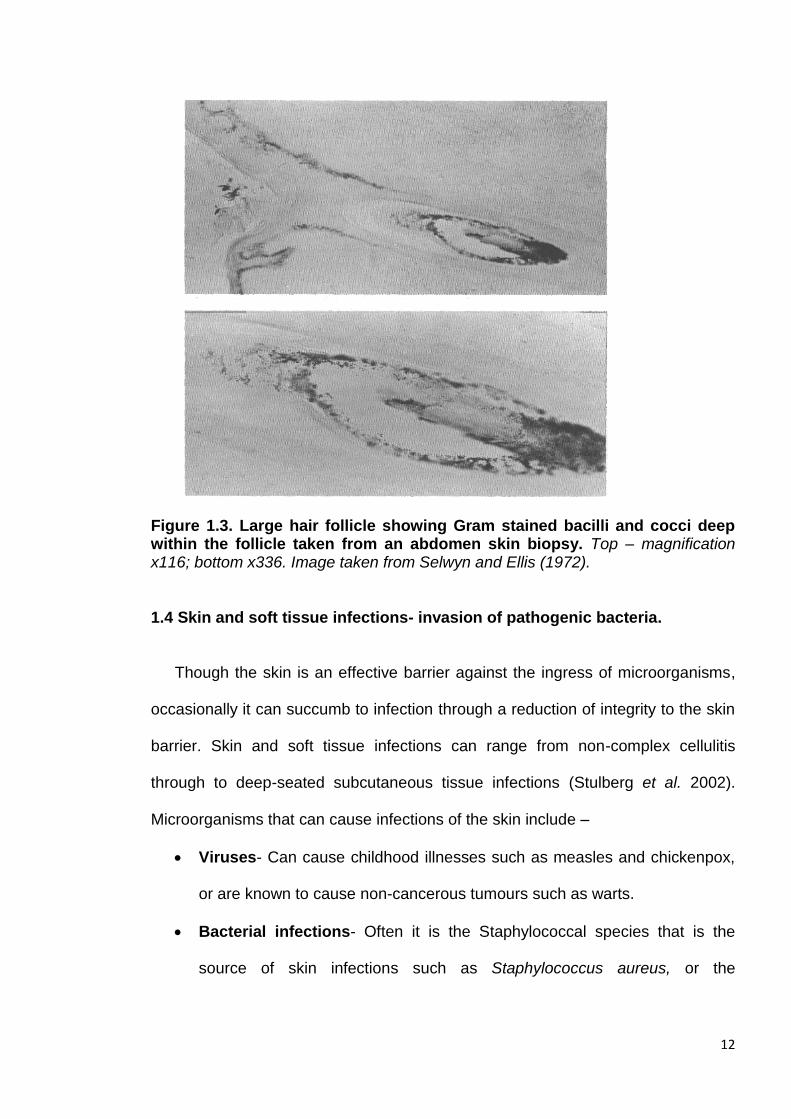
2008). The inaccessible proportion of bacteria (Figure 1.3) inhabiting the furrows
and appendages of the skin was termed “hidden” flora by Reybrouck (1986) and
this hidden flora remains undetected to conventional skin sampling such as
swabbing. The depth of hair bulbs and apocrine sweat glands that are thought to
be bacteria reservoirs are situated 400-700 µm (Figure 1.3) within the dermis
(Touitou, et al. 1998). A topically-applied antimicrobial compound must reach this
depth within the skin to reduce the resident microbial flora. Deep and efficient
antisepsis is required to prevent the repopulation of the skin surface. For bacteria
such as coagulase negative staphylococci (i.e. Methicillin-resistant
Staphylococcus aureus) this re-population would occur within hours after the skin
surface disinfection (Brown et al. 1989).
12
Figure 1.3. Large hair follicle showing Gram stained bacilli and cocci deep within the follicle taken from an abdomen skin biopsy. Top – magnification x116; bottom x336. Image taken from Selwyn and Ellis (1972).
1.4 Skin and soft tissue infections- invasion of pathogenic bacteria.
Though the skin is an effective barrier against the ingress of microorganisms,
occasionally it can succumb to infection through a reduction of integrity to the skin
barrier. Skin and soft tissue infections can range from non-complex cellulitis
through to deep-seated subcutaneous tissue infections (Stulberg et al. 2002).
Microorganisms that can cause infections of the skin include –
Viruses- Can cause childhood illnesses such as measles and chickenpox,
or are known to cause non-cancerous tumours such as warts.
Bacterial infections- Often it is the Staphylococcal species that is the
source of skin infections such as Staphylococcus aureus, or the
13
streptococcus species such as Streptococcus pyogenes. An example of a
skin infection caused by both of the aforementioned organisms is impetigo.
Fungal infections- Are very common. An example being ring worm that is
an infection of the keratin layer caused by Fungi imperfecti.
(Fitzpatrick et al. 2005)
Bacteria that have colonised the skin rarely cause infection if the individual is
not immuno-compromised (Hoffman, 2001). Dermatological infections have
multifactorial causes but generally older patients, very young patients or the
immuno-compromised are those at the greatest risk of developing an infection
(Pratt et al. 2005). Skin and soft tissue infections (SSTI’s) can arise from a
number of sources including animal or human bites, animal contact, infections due
to an immuno-compromised patient, or surgical site incision infections (Stevens et
al. 2005). With regards to the latter two sources, it is typically the patient’s own
resident microbial flora that invades and infects the epidermis (Dryden, 2009).
SSTI’s exist as a significant problem to inpatients as well as outpatients and are
increasingly acquired within the community (Rajan, 2012).
S. aureus is the most common pathogen identified as causing SSTI’s and is
the result of colonisation due to a breach of the skin barrier, i.e. surgical site
incision or trauma. If a patient is colonised by S. aureus they are at a higher risk of
obtaining a surgical site infection than those who are not, particularly when the
colonization density is greater than 1x10⁶ colony-forming units per anatomical site
(Paulson, 2002). A Study of dissemination of S. aureus after inoculation of the skin
in a mouse model by Hahn et al. (2009) showed that within six hours the pathogen
had invaded the tape-stripped epidermis and had disseminated rapidly to the
14
spleen and kidneys before severe cutaneous damage and complete necrosis of
the dermis 48 hours after inoculation. In humans from colonisation and thus
infection, typically of the subcutaneous plane, there is a three day incubation
period until the patient develops symptoms (Stone et al. 2000).
S. aureus is responsible for a range of minor non-complex infections such as
impetigo, folliculitis, subcutaneous abscesses and furnacles that would not require
systemic antibiotic therapy but a topical localised treatment. An example of a
severe infection as a result of S. aureus would be staphylococcal scalded skin
syndrome triggered by the microorganism’s associated exfoliative toxins. The
syndrome is characterised by the splitting of the epidermis just above the granular
layer resulting in excessive desquamation (Patel and Finlay, 2003). S. aureus α-
toxin enhances transient membrane permeability to large molecules and causes
vacuole formation and defects in mitochondrial enzymes resulting in a severe drop
of Adenosine-5'-triphosphate (ATP) within viable keratinocytes (Suriyaphol et al.
2009). Such SSTI’s could then develop into serious systemic infections such as
septicaemia, meningitis and osteomyelitis which could potentially lead to death as
a result of staphylococcal toxic shock syndrome (Iwatsuki et al. 2006). Increasing
antibiotic resistance, particularly with regards to S. aureus and Streptococcus
pyogenes to methicillin and erythromycin respectively, is of great concern as the
opportunistic pathogens are frequently responsible for complex STTI’s (Stevens et
al. 2005). Further, methicillin resistant Staphylococcus aureus (MRSA) is also now
the predominant cause of community-acquired SSTI’s (Eady and Cove, 2003 and
King et al. 2006). A bacterial skin infection can have serious consequences on a
patient’s health and can place additional stress and anxiety on the family. MRSA
bacteraemia cases with skin infection identified as the source, increased from

15
25 % to 32 % from October to December 2011 (Health Protection Agency, 2011).
On average, a single infection acquired in hospital costs between £4000 and
£10,000 and just 40 MRSA bacteraemia cases would incur an additional cost
between £160,000- £400,000 for that Trust (Department of Health, 2006).
With antibiotic resistance increasing amongst skin pathogens it is of paramount
importance to prevent SSTI’s through effective skin antisepsis. Also of great
importance is to develop novel strategies for the treatment of antibiotic resistant
strains of bacteria through mechanisms that are low risk for microbial acquisition of
resistance.
1.5 Chlorhexidine.
Chlorhexidine (CHX) is a cationic bisbiguanide that demonstrates a broad
spectrum of antimicrobial activity but exhibits low level toxicity to mammalian cells
(Figure 1.4). It has been used throughout the global healthcare sector since it was
first synthesised in 1954 by Rose and Swain (Davies et al. 1954). It also has a
strong affinity for the skin, thus it has been used extensively in topical antimicrobial
formulations (Denton, 1991). It is typically used as the digluconate, acetate or
hydrochloride salt form due to solubility issues with the free base. It is active
against an extensive range of microorganisms such as vegetative gram positive
and gram negative bacteria, fungi such as yeast, dermatophytes and some
lipophilic viruses (Ranganathan, 1996). CHX has a cationic charge at physiological
pH thus it has the ability to bind to negative surfaces such as the cell wall of
bacteria (Jones, 2007). For example the cell wall of S. aureus contains teichoic
acids that are highly anionic conferring a net negative charge over the cell
membrane (Gross et al. 2001). It is this strong affinity that allows CHX to retain low

16
toxicity towards mammalian cells whilst remaining biocidal against a broad range
of microorganisms.
The mechanism of action of CHX is bacterial cell membrane disruption. In
bacteriostatic concentrations, the binding of the biguanide groups of the drug to
the membrane phospholipids of the bacteria induces structural modifications that
allow the leakage of low molecular weight intracellular contents such as potassium
ions (Carlotti and Maffart, 1996). If the concentration of CHX is high, i.e.
bactericidal concentrations, it will cause a high degree of structural damage to the
cell membrane leading to cytoplasmic leakage and precipitation (Kuyyakamond
and Quesnel, 1992).
Figure 1.4. Chemical structure of CHX free base and its commonly used salt CHG. (a) Structure of CHX free base and (b) structure of CHG.
The physicochemical characteristics of CHX impart poor percutaneous
absorption characteristics within the skin. CHG is water-soluble and is typically
used in topical preparations. The physicochemical characteristics of CHG are not
ideal for percutaneous permeation as it is in the ionized form when topically
applied under physiological skin conditions (Smith and Irwin, 2000). CHG has a
molecular weight of 897.8 g/mol which exceeds the optimal molecular weight for
effective skin permeation that is described as a maximum of 500 g/mol (Bos and
(a) (b)

17
Meinardi, 2000). Furthermore, a log P (octanol/water) of 0.0133 is also less than
optimal for percutaneous absorption (Farkas et al. 2007) as outlined in Section
1.2. Typically when drugs are ionised at skin pH, counter ions are utilised to
neutralise the drug for enhanced deposition within the skin (Valenta et al. 2000).
This is not a viable option for CHX as many counter anions form insoluble salts
and neutralise CHX diminishing its antimicrobial properties (Denton, 1991).
Further, CHX and its salts have been shown to aggregate at concentrations above
> 40 mM therefore self-aggregation may contribute to the low skin penetration
observed for CHG (Zeng et al. 2009, Heard and Ashworth, 1968, and Perrin and
Witzke, 1971).
CHX is known for its poor permeability into human skin as demonstrated by
Karpanen et al. (2008). Using ex vivo human skin in a diffusion cell the authors
found that CHG only permeated to a high enough concentration to kill
microorganisms in the top 100 µm of the skin and below 300 µm the concentration
of CHG was less than 0.002 µg/mg tissue as detected by high performance liquid
chromatography (HPLC) (Karpanen et al. 2008). Lafforgue et al. (1997) used an
ex vivo rat skin model to demonstrate low permeation of CHG across and within
the rat skin. After a 48 h contact time, a concentration of 26 .63 ± 13.17 µg/cm2 of
CHG was detected within the whole rat skin and a concentration of 4.03 ±
0.6 µg/cm2 of CHG was detected within the receptor fluid. Wang et al. 1990
investigated the permeation of CHX phosphanilate (CHP), a new salt of CHX,
using ex vivo human skin in a static diffusion cell. After 48 h there was almost no
CHP that had permeated the intact SC, however in damaged skin with the SC
enzymatically removed CHP was detected throughout the skin strata and typically
remained within the dermis (Wang et al. 1990).
18
Percutaneous absorption of CHG in vivo was shown to be negligible after
researchers bathed neonatal rhesus monkeys in an 8 % CHG skin cleanser every
day for 90 days (twice the concentration used typically) (Gongwer et al. 1980). A
low concentration of CHG was detected within the skin 0.118 ± 0.051 µg/mg of
tissue (n=5) after 90 days. The absorption of CHG across new-born infants’ skin
was also investigated by venepuncture to obtain a blood sample after bathing the
babies with a CHG containing wash, hibiscrub® (4 % CHG). Low concentrations of
CHG almost at the limits of detection were detected within the blood serum
samples for 5 out of 24 babies tested. No toxicity was observed as a result
(Cowen et al. 1979). Further, in 1978 Chow et al. studied the distribution of CHX
radio-labelled with C-14 after topical application in an in vivo rat model. It was
found that over a 5 day period less than 5 % had been absorbed and the
radiolabelled CHX was excreted within the faeces (Chow et al. 1978). More
recently, Lee et al. (2011) studied the blood concentrations of CHX after
hospitalised children underwent daily CHX bathing. Though low levels of CHX
were detected in 15 % of the blood samples, there was no evidence that CHX
accumulates within the bloodstream of children as young as three months
following percutaneous absorption. This study was conducted on children with
intact skin. There are very few studies within the literature investigating the
percutaneous absorption of CHX despite the antimicrobial compound being widely
used within the healthcare sector across the globe. The studies carried out within
the literature show that CHX penetration within intact skin is minimal.
If topical antimicrobial compounds do not permeate the upper strata of the
skin in high enough concentrations, the bacteria in reservoirs found deep within
the dermal structures are potentially left viable. Viable opportunistic pathogens are
19
then free to directly infect the impaired epidermis. The reasons for the lack of skin
permeation for CHG are due to sub-optimal physiochemical characteristics for
topical drug delivery that includes; high molecular weight, polycationic charge and
a low log P. This is discussed in detail in the introduction to Chapter 3.0. Despite
poor skin permeation there are many products on the market in which CHX is the
active antimicrobial. Table 1.1 lists topical antiseptic preparations available on the
UK market as listed within Martindale: Drug reference (Sweetman, 2011). Though
none of the listed products contain a penetration enhancer per se, excipients such
as surfactants, glycerol, propanol and lipophilic perfumes (e.g. essential oils) found
within the formulations are known to act as penetration enhancers (Williams and
Barry, 2012). CHX has many applications including hand washing, pre-operative
skin preparation, vaginal antisepsis, gingivitis treatment and body washes for
prevention of SSTI’s (Milstone, 2008).
The Centre for Disease Control and Prevention (CDC) made
recommendations to use hand soap containing CHX due to its residual activity
reinforcing the effectiveness of CHX as a topical antiseptic (Boyce and Pittete,
2002). There are many cases highlighting the superior efficacy of CHX for
example CHX was incorporated into an alcohol hand rub and was successfully
implemented as part of a hand hygiene programme in an Australian hospital that
had an MRSA endemic. The study found that healthcare worker compliance to
hand hygiene had doubled within 12 months and the number of patients with
reported MRSA bacteraemia was reduced by 57 %. Clinical MRSA isolates had
also dropped by 40 % hospital-wide (Johnson et al. 2005). When compared to
povidone-iodine, CHG was shown to significantly reduce the number of vascular
20
catheter-related infections by 49 % when 4143 catheter insertions were studied
(Chaiyakunapruk et al. 2002).
More recent patient studies where CHX was successfully implemented to
combat infections include the significant reduction of periprosthetic hip arthroplasty
infections (Kapadia et al. 2013), and the reduction of multi-drug resistant
microorganism infections and hospital acquired bacteraemia cases (Climo et al.
2013). A detailed review of the scientific support for the use of CHX within the
healthcare sector can be found in Weinstein et al. (2008). CHX has repeatedly
been shown to significantly decrease the number of healthcare acquired infections
across hundreds of publications that act as evidence for the necessity of CHX as
an antiseptic in the health care sector (Milstone et al. 2008).

21
Table 1.1 A table of CHX containing topical antiseptic formulations available within the UK. All CHX containing topical antiseptic preparations that are currently available within the UK as listed within Martindale: The drug reference (Sweetman, 2011). Skin disinfectant
product Dosage form CHX salt and concentration
within formulation Skin
disinfection use
CHX listed as a single ingredient in commercially available topical preparations in the UK
Acriflex® Cream CHG 0.25 % (w/w) Burns and scalds
Cepton® Lotion CHG 0.1 % (w/v) Acne and spots
Wash CHG 1 % (w/v) Acne and spots
CX powder® Powder CHX acetate 1 % (w/w) Dusting powder for
general skin antisepsis
Eczmol® Cream CHG 1 % w/w Eczema
Hibiscrub® Liquid CHG 4 % (w/v) General skin disinfection
Hydrex® Liquid CHG 0.5 % (w/v) General skin disinfection
Savlon wound wash®
Liquid spray CHG 0.45 % (w/v) Wound cleansing
Spotoway® Cream CHG 1 % (w/w) Localised spot
treatment
Steripod CHG® Liquid CHG 1 % (w/v) General antisepsis
CHX listed as a multiple ingredient in commercially available topical preparations in the UK
Cathejell with lidocaine®
Gel CHX HCL 0.05 % (w/w) Anaesthetic
Chloroprep®
Liquid CHG 2 % (w/v) Pre-operative skin
antisepsis
Cyteal®
Liquid CHG 0.1 % (w/v) Liquid
Dermol® Cream CHX HCL 0.1 % (w/w) Eczema
Lotion CHX HCL 0.1 % (w/w)
Germolene® Cream CHG 0.25 % (w/v) Haemorrhoids
Hibi Hand Rub® Liquid CHG 2 % (w/w) General antisepsis
Instillagel® Gel CHG 0.25 % (w/w) Anaesthetic
Nystaform® Ointment CHX acetate 1 % (w/w) General antisepsis
Quinoderm® Liquid CHG 0.15 % (w/v) Acne and spots
Tisept® Liquid CHG 0.015 % (w/v) Wound cleansing
Torbetol®
Liquid CHG 0.75 % (v/v) Acne
Savlon antiseptic®
Cream CHG 0.1 % (w/w) General antisepsis
Liquid CHG 0.3 % (w/v) General antisepsis
22
Resistance to antimicrobial compounds including preservatives and
disinfectants is an increasing problem. Though resistance or reduced susceptibility
to CHX is rare it is being increasingly observed for the Pseudomonas species. It
was demonstrated that Pseudomonas stutzeri developed resistance to CHX
acetate after repeated exposure to sub-lethal concentrations in vitro. It is thought
that a decrease in susceptibility was due to alterations of the cell envelope
increasing its hydrophobicity. This strain has also developed a reduced
susceptibility to antibiotics and to other non-antibiotic compounds including
triclosan and cetylpyridinium chloride (Tattawasart et al. 1999). Further the same
group demonstrated that Pseudomonas aeruginosa also developed stable
resistance to CHX acetate on repeated exposure to sub-lethal concentrations. The
authors stated that Pseudomonas aeruginosa may develop resistance to CHX
from ‘residual’ concentrations and that the also Gram negative, Escherichia coli,
did not develop a reduced susceptibility (Thomas et al. 2000).
Other strains that have reduced susceptibility to CHX include the oral
pathogen Porphyromanas gingivalis that produced vesicles to bind to CHX
reducing the bacteria’s susceptibility to CHG (Grenier et al. 2007). It should also
be noted that contaminated CHX disinfectants have caused nosocomial infections
due to contamination with a range of resistant opportunistic pathogens including
Burkholderia stabalis (Heo et al. 2008), Serratia marcescens (Vigeant et al. 1998)
and Pseudomonas cepacia (Sobel et al. 1982). The occurrence of resistance or
lowered susceptibility of microorganisms to CHX is still very infrequent but the
aforementioned reports do highlight the requirement of sensible disinfectant use.
Concentrations that are significantly higher than the minimum inhibitory
concentrations should be used and care should be taken not to leave sub-lethal
23
concentrations as a residue. To avoid contamination issues strict aseptic
manufacturing practices, correct storage conditions and accurate dilutions with
sterile diluent should also be followed to prevent bacterial resistance.
There is also evidence of microbial degradation of CHX. Pseudomonas
species isolated from river bed sludge were shown to degrade CHX into a number
of intermediates (Tanaka et al. 2005). Copious use of CHX as a disinfectant
results in washing CHX into the waterways. It was found that the inhibitory
concentrations for these CHX intermediates increased ten-fold for a range of
bacteria when compared to the parent CHX. In the case of Pseudomonas
aeruginosa and Serratia marcescens CHX had a minimum inhibitory concentration
(MIC) of 100 µg/mL whilst the intermediates degraded by the Pseudomonas
species had a MIC of >1000 µg/mL (Tanaka et al. 2005 and Tanaka et al. 2006).
The products of microbial degradation of CHX were also isolated and identified
from an ultrasonic hand washer using three dimensional HPLC (Ogase et al.
1992). The causative and resistant strain was identified as Achromobacter
xylosoxidans and the authors suggested the presence of CHX degrading enzymes
degrade CHX into p-chloroaniline and p-chlorophenol. Though the studies
mentioned provide evidence for microbial degradation of CHX there are still limited
studies conducted in the area of investigating the microbial degradation of
antimicrobial compounds. Further, no studies have been conducted investigating
the effect that cutaneous enzymes have upon CHX.
Investigations into the efficacy of CHX particularly using time-kill assays is a
controversial area. Kampf has published many papers questioning the use of
CHX. In particular, Kampf (2008) made a bold statement calling for healthcare
24
workers to remove CHX from their formulations until further efficacy data is
available. He argues that the studies conducted in which the CDC based their
recommendations are flawed due to a lack of validity of the results. CHX salts at
different concentrations are known to be very difficult to neutralise (Kampf, 1998
and Kampf, 2006) and that all the studies conducted on the efficacy of CHX did
not validate the neutraliser step nor demonstrate the required efficacy. A
neutraliser validation study should always be conducted first before determining
the antimicrobial efficacy of a biocide within a particular time frame, e.g. European
study EN1500. Such preliminary data is rarely published although it is often
available by request from the author. Nevertheless, even if the neutraliser
validation study was neglected, the results should not be disregarded as the
compound still exhibits antimicrobial affects but just possibly not within the stated
time frame of the bacteria-CHG contact time (i.e. 30 seconds for the EN 1500
test). There are, however, an overwhelming number of studies within the literature
supporting the clinical use of CHX.
1.5.1 Contra-indications for the use of CHX.
CHX is routinely used in the healthcare sector as well as in consumer
products (e.g. mouthwash, hand sanitiser) and it appears to have a good record
with regards to minimal adverse reactions. In rare cases, typically after parenteral
or mucosal exposure to CHX, anaphylaxis has been observed. Krautheim et al.
(2004) published a comprehensive review on CHX anaphylaxis that details
26 case reports. More recently further case reports have been published (Khan et
al. 2011, Lloyd-Lavery and Reed, 2012 and Bae et al. 2008). Life threatening and
immediate adverse side effects are rare however there is a growing concern with

25
the use of CHX incorporated into medical devices such as catheters and medicinal
products; in October 2012, the MHRA (Medicines and Healthcare products
Regulatory Agency) released a safety alert regarding CHX incorporated products.
All allergic reactions to CHX must now be reported to the MHRA to determine
whether CHX should be incorporated into products that are exposed to mucosal
membranes or parenteral routes.
Minor adverse effects associated with CHX use on intact skin include
contact dermatitis; the prevalence of contact dermatitis caused by CHX is very
low. At St John’s Institute of Dermatology over a 19 year period there were only
five reported cases (Goon et al. 2004). In a further study sensitization and
dermatitis was investigated at the Turku University Hospital Dermatology
Department, where out of 7610 patients in the study only 26 patients were found to
sensitized to CHX (0.47 %) and CHX containing topical products were found to
have caused contact dermatitis in 5 patients (Liippo et al. 2011). Further,
infrequent cases of CHX causing photosensitivity have been reported (Wahlberg
and Wennersten, 1971), as well as contact urticaria (Wong et al. 1990).
CHX has a number of contra-indications; firstly it should not be used for
antisepsis before a lumbar puncture as it can cause damage to the meninges on
contact. It should also be avoided for use on the eyes and new tissue other than at
very low concentrations (<0.05 %) as it has been shown to be cytotoxic (Salami et
al. 2006). CHX must also never be used on the mucosa epithelia of the middle ear
as it can damage the cells of the middle ear thus demonstrating ototoxicity
(Igarashi and Oka 1988). After a number of case reports detailing the patients’

26
allergic response to CHX digluconate that had been incorporated into an antiseptic
urethral gel, it is now considered that CHX should not be applied to mucosal
surfaces of the body due to the possibility of inciting anaphylaxis (Jayatthillake et
al. 2003 and Okano et al. 1989). Irrespective of the rare anaphylaxis cases and
infrequent dermatitis cases documented there are a significant number of products
on the market containing CHX that have been used globally for over 2 decades;
even CHX containing chewing gum- CHewX® is available on the Swiss market
(Imfeld, 2006). CHX remains a low cost and effective antiseptic that is well
tolerated by consumers and patients across the world (Weinstein et al. 2008). The
benefits of the antibacterial compound clearly outweigh the risks.
1.6 Controlled release strategies used in the drug delivery of CHX.
To overcome conditions that are less than favourable for drug delivery
researchers have turned to colloids to enhance a drug’s therapeutic affect and to
allow targeted delivery. Most colloids can be modified for a tailored affect and
many have enhanced properties over conventional dosage forms.
To overcome the challenges in formulating CHX, such as adsorption to
surfaces, incompatibility with anionic components and poor skin permeation,
researchers have investigated ways to enhance the controlled and sustained
delivery of CHX to a localized target, i.e. the skin, root canal or biofilms.
Liposomes with encapsulated radiolabelled C14 CHX were optimised to determine
the most effective liposomal compositions, i.e. cationic or anionic constituents
(Jones et al. 1997). Liposomes (containing dipalmitoylphosphatidylglycerol
(DPPG), cholesterol and stearylamine) were shown to increase the delivery of
27
CHG to the biofilms of skin-associated opportunistic pathogens (Jones et al.
1997).
CHX-containing liposomes were developed in the early 1990’s. A patent on
liposomes containing either CHG or CHX diacetate or a naturally occurring
surfactant was published 15 years ago. The authors cited advantages as reduced
side effects and increase in the sustained release of CHG or CHX diacetate
(Gonzalez et al. 1998). The same authors then incorporated CHG containing
liposomes into skin cleansing tissues for use on the face (Gonzalez et al. 2000).
Human albumin microspheres were also shown to provide controlled and
sustained release of CHX dihydrochloride that exhibited enhanced efficacy against
Gram negative and Gram positive opportunistic pathogens that cause urinary tract
infections. The microspheres were also investigated as a biocidal catheter coating
(Egbaria and Freidman, 1990 (a) and 1990 (b)).
1.6.1 Delivery of CHX from Hydrogels.
Hydrogels are typically biodegradable, biocompatible and non-immunogenic
three dimensional cross-linked polymer networks that swell in the presence of
water (Bako et al. 2008). They can be designed to be pH or thermo sensitive for
controlled drug release (Zhao et al. 2009, Gupta et al. 2002 and Xu et al. 2006).
Their mucoadhesive and hydrophilic nature has been exploited for the controlled
and sustained release of CHX and CHG after topical application. They are
commonly investigated for the treatment or prevention of periodontal infection (Xia
et al. 2010, Vitkova et al. 2011 and Vitkova et al. 2013).

28
Bako and co-workers (2008) designed nanocomposite biocompatible
hydrogels (NCHG) for the sustained release of CHX once applied to periodontal
infection. Nanoparticles were formed from hydroxyethyl methacrylate (HEMA) and
polyethyleneglycol dimethylacrylate (PEGDMA) and were loaded with CHX. The
nanoparticles were then added to a matrix to form a hydrogel through
photopolymerization using the same monomers, and CHX was again incorporated
within the matrix. The NCHG allowed for the sustained release of CHX (release
over a 48 h period) when compared to the control hydrogel (24 h release period)
and it was found that 60 % of the loaded drug was released. The swelling of the
NCHG was observed to be much slower than the control hydrogel, though the
NCHG had a higher water adsorbing capacity (Bako et al. 2008).
Further Ma et al. (2007) developed a thermo-sensitive hydrogel (liquid at
room temperature then rapidly gels at body temperature) for the prolonged release
of CHG incorporated within β-cyclodextrin inclusion complex that were then added
to a chitosan matrix containing a growth factor recombined human bone
morphogenetic protein. The in vitro release profile for CHG was shown to be
sustained and controlled over a 1 month period from the NCHG. The authors
believe that the chitosan thermo-sensitive hydrogel may have vast potential for
treatment against periodontal infections (Ma et al. 2007). One strategy to prevent
infection has been to use thermo-sensitive hydrogels as wound dressings or to act
as a coating for medical devices (Jones et al. 2008). NIPAA based hydrogels were
incorporated with CHX diacetate (1 % w/w) and were shown to possess ideal
thermo-responsive behaviour resulting in antimicrobial properties through CHX
diacetate release. Pulsatile biocide release may aid the prevention of resistant

29
bacterial strains as it refrains from prolonged release of possible sub-lethal
concentrations of a biocide.
There are numerous hydrogel systems that have been developed for
enhanced topical skin delivery of CHX however very few have been tested using
an in vitro skin diffusion model. A thermo-sensitive vinyl-ether based hydrogel was
designed for CHX release and a high CHX acetate loading was achieved (~36 mg
of CHX per gram of gel). CHX acetate was released over a 27 day period in a
concentration that was above the MIC for two microorganisms found within the
human mouth Streptococcus mutans and Lactobacillus casei ( Kiremitçi et al.
2007).
Hydrogels containing porous (type I) collagen matrices were developed for
the sustained release of CHG (Sulea et al. 2011). It was determined that an
enhanced release of CHG occurred from slightly basic hydrogels when compared
to acidic hydrogels. The CHG release was also enhanced with increasing CHG
concentration within the porous collagen matrices within the hydrogel. Another
example of a hydrogel designed for CHG release is the chitosan hydrogel to
enhance the mucosal delivery of CHG (Şenel et al. 2000). Hydrogels containing
1-2 % chitosan were prepared and characterised to determine the antifungal
effects and release of CHG from the gels in vitro. Chitosan gels released CHG
over a 3 h period without a lag period as did chitosan based films resulting in a
prolonged release of CHG (Şenel et al. 2000). Reports of CHX having been
incorporated into various hydrogel systems are within the literature however there
does seem to be few studies using an in vitro diffusion cell model to characterise
the release into biological membranes (i.e excised skin). It would be of interest to
30
determine the efficacy of more hydrogel systems using ex vivo skin in diffusion
cells or in vivo studies.
1.6.2 Polymeric CHX delivery systems.
Polyurethane films inclusive of CHX acetate were also developed for
controlled drug delivery (Huynh et al. 2010). The authors showed that modulation
of CHX acetate release was possible depending on the structure of the
polyurethane films. It was determined that CHX acetate had no interaction with the
polyurethane as illustrated by differential scanning calorimetry (DSC) and
attenuated total reflectance Fourier transform infrared spectroscopy (ATR-FTIR)
and therefore sustained drug release was observed over 29 days. CHX and CHG
were incorporated within poly(lactic-co-glycolic acid) (PLGA) microspheres for
sustained release over a two week period. The addition of cyclodextrins reduced
the immediate burst release of CHG and CHX resulting in controlled release of
CHX for the prevention or treatment of periodontal disease (Yue et al. 2004).
Sustained release of CHX has been demonstrated by incorporation in to cold
cured polymerizing methylacrylate systems (Riggs et al. 2000). The sustained
release of CHX digluconate was achieved from a device coated in chitosan, poly
(lactic-co-glycolic acid) (PLGA), and polymethyl methacrylate (PMMA). By
controlling the pore size of the PLGA and PMMA upon the device they could
effectively control the release rate of CHX. (Lee et al. 2005a).
Delivery of CHX from poly (Є-caprolactone) nanocapsules to artificially
contaminated porcine skin achieved superior results compared to the CHX in free
solution (Lboutounne et al. 2002). The nanocapsules encapsulating CHX
preferentially accumulated into hair follicles, which act as bacteria reservoirs thus
31
ensuring targeted delivery. CHX loaded nanocapsules developed by Lboutounne
et al. (2002) were later formulated into a hand rub (Nanochlorex®) and tested
against the resident skin pathogen Staphylococcus epidermidis after
contamination onto ex vivo porcine skin (Nhung et al. 2007). Sustained
antimicrobial activity was observed for Nanochlorex® with a statistically increased
log10 reduction of S. epidermidis. Farkas et al. (2004) utilised a vesicular
phospholipid gel for the enhanced delivery of CHX. It was determined that
multilamellar lipid vesicles significantly enhanced the delivery of CHG across
dialysis membrane in a diffusion cell due to increased dispersity and fluidity.
More recently preparations containing polymeric thermo-sensitive modified
poly-N-isopropylacrylamides microspheres were investigated for the sustained
release of CHX base at different skin temperatures (Musial et al. 2012). The
polymeric system at skin temperature released CHX at around 60-130 minutes
after application. At a lower temperature the CHX was released and localised
between 80- 90 minutes. The system is an example of controlled release however
a long lag time may impede the delivery and localisation of CHX at the target site
of the skin.
There are many examples of colloidal CHX delivery systems and the benefits
of such colloid systems used in topical and transdermal drug delivery include:
Targeting of drugs to a localised infected area
Reducing drug degradation rates
Improving drug release profile
Minimising adverse effects on the skin
(Nhung et al. 2007)

32
1.6.3 Other strategies employed for enhanced delivery of CHX.
Other penetration enhancers have been used to increase the delivery of
CHG into the upper skin strata. Eucalyptus oil was shown to enhance the
penetration of CHG into the deeper layers of the skin (Karpanen et al. 2010). After
CHG (2% w/v) was dosed along with 50 % (v/v) of eucalyptus oil the concentration
of CHG within the top 100 µm of the skin after 30 minutes was
0.398 ± 0.076 µg/mg tissue (SEM) compared to 0.077 ± 0.015 µg/mg tissue (SEM)
when CHG was dosed alone (Karpanen et al. 2010) and (Karpanen et al. 2008).
Further, after 2 minutes a higher concentration of CHG was observed within the
skin after dosing CHG in a eucalyptus oil (10 % v/v) and isopropanol (70 % v/v)
vehicle (Karpanen et al. 2010). The same authors also compared the topical
delivery of CHG from aqueous and alcohol vehicles. It was reported that following
a two minute exposure the concentration of CHG recovered in the top 100 µm of
the skin was 0.023 ± 0.007 µg/mg tissue (mean ± SEM) and 0.157 ± 0.047 µg/mg
tissue (mean ± SEM) for CHG (2 % w/v) in a 70 % (v/v) isopropanol vehicle and
CHG (2 % w/v) in an aqueous solution (Karpanen et al. 2009). At 30 minutes there
was no statistical difference in the concentration of CHG within the skin after
application from an aqueous or alcoholic vehicle.
1.7 Nanomaterials used for topical and transdermal drug delivery.
Nanomaterials are increasingly being studied for use as topical and
transdermal drug delivery systems for improved drug delivery kinetics (Figure 1.5).
The nanoparticle skin delivery field is in its infancy but has the potential to yield
fruitful drug delivery systems. Conventional passive skin penetration enhancers
such as the chemical penetration enhancer azone and dimethylsulfoxide (DMSO)

33
and physical methods such as iontophoresis have not achieved commercial
success as a result of high cost or biocompatibility problems. Nanomaterials’
unique physiochemical properties exerted by their large surface area are
advantageous for use as a passive topical or transdermal drug delivery platform
(Bouchemal et al. 2004). Their constituents, for example lipids within liposomes
and surfactants within niosomes may penetrate the SC and act as a penetration
enhancer after nanoparticle ruption on the SC surface (Jain, 2012). These
constituents are known to fluidise the intercellular matrix and enhance drug
penetration within the skin (Benson, 2005). Further, nanoparticles may act as a
depot for sustained skin drug delivery or act as a rate limiting barrier deposited
across the SC surface for controlled release (Jain, 2012). Previously a range of
nanomaterials have been explored as drug delivery systems for the skin (Figure
1.5) in an attempt to obtain controlled and targeted drug delivery for enhanced
therapeutic efficacy.
Nanoemulsions (droplet size between 20-200 nm) are increasingly utilised
for the topical delivery of drugs due to advantages such as enhanced drug
solubility, good thermodynamic stability and enhanced skin penetration when
compared to conventional dosage forms (Sarker, 2005, Shakeel et al. 2007,
Shakeel et al. 2010 and Sakeena et al. 2010). Nanoemulsions enhanced the flux
of ketoprofen six fold compared to the control after application to mouse skin in
vitro (Kim et al. 2008). The authors suggested the permeation enhancement was
due to the impact of the particle’s size and a contributing factor may be due to the
incorporation of known penetration enhancers such as oils and surfactants.
Nanoemulsions also enhanced (between 5 and 15 fold when compared to control)
the topical delivery of the hydrophilic compound inulin in vitro using hairy mouse

34
skin (Wu et al. 2001). The authors believe the penetration enhancement of inulin
was due to co-transport of the drug via the follicular transport route (due to water-
in-oil nanoemulsions’ compatibility with sebum) and through surfactant-induced SC
perturbations. A full review on nanoemulsions was compiled by Shah and co-
workers (2010).
Nanocapsules are lipophilic droplets coated in a polymeric membrane to
form a vesicular polymeric drug carrier. Nanocapsules have a number of
advantageous properties for drug delivery; they are biocompatible and
biodegradable, they can act as a reservoir for sustained drug delivery, the drug is
encapsulated therefore localised tissue irritation is avoided, high drug loading
capability and the polymer coating offers protection from drug degradation
(Couvreur et al. 2006). Poly n-butylcyanoacrylate (PNBCA) nanocapsules with
encapsulated indomethacin (0.5 % w/v) were applied to excised rat skin in vitro.
After an 8 h contact time the cumulative concentration of indomethacin that had
permeated the rat skin after application encapsulated within the PNBCA
nanocapsules was ~9 times higher than when compared to the control (Miyazaki
et al. 2003). Further, poly(ε-caprolactone)-nanocapsules were encapsulated with
sunscreen (Parsol MCX) and were shown to exhibit enhanced photo-protection
when compared to a standard topical gel (Alvarez-Roman et al. 2001).
One strategy that has received a great deal of attention over the last three
decades for enhanced skin delivery of therapeutics is vesicular systems. Vesicles
aid the penetration of drugs into the SC but also reduce percutaneous absorption
for enhanced skin delivery of therapeutics by acting as a reservoir within the upper
skin strata (Lboutounne et al. 2004). Liposomes are microscopic phospholipid

35
bubbles with a lipid bilayer membrane as an outer structure (Torchilin, 2005).
Liposomes have been utilised for the enhanced topical skin delivery of many
therapeutic entities (Schreier and Bouwstra, 1994, Mezei and Gulasekharam,
1980, Tabbakhian et al. 2006, El Maghraby et al. 2008). There are a number of
proposed mechanisms of action of liposomes including: intact vesicular
penetration within the SC, a penetration enhancing effect caused by interaction of
the lipids within the endogenous SC lipids, the adsorption effect and preferential
accumulation of the liposomes within the transappendageal route (Elsayed et al.
2007).
More recently, adaptations of the classical liposome have been developed
using a range of constituent materials within the bilayer including; transfersomes
(Maghraby et al. 2001), niosomes (Balakrishnan et al. 2009), cubosomes
(Esposito et al. 2005) and ethosomes (Elsayed et al. 2006). All of the
aforementioned vesicles resulted in enhanced drug deposition within the upper
skin strata. Samad and co-workers wrote a comprehensive review on vesicular
drug delivery for enhanced topical drug delivery (Samad et al. 2007).
Solid lipid nanoparticles (SLNs) have been investigated since the early
nineties as an alternative to polymeric drug carriers. SLNs offer the advantages of
being biocompatible and biodegradable, a high surface area, protection of labile
drugs and they form an occlusive film across the skin surface for enhanced drug
deposition and skin hydration (Müller et al. 2002 and Mehnert and Mäder, 2001).
SLNs have been used to act as a topical drug carrier for enhanced deposition
within the upper skin strata for many compounds including vitamin A (Jenning et
al. 2000), sunscreen-oxybenzone (Wissing and Müller, 2002) and isotretinoin (Liu
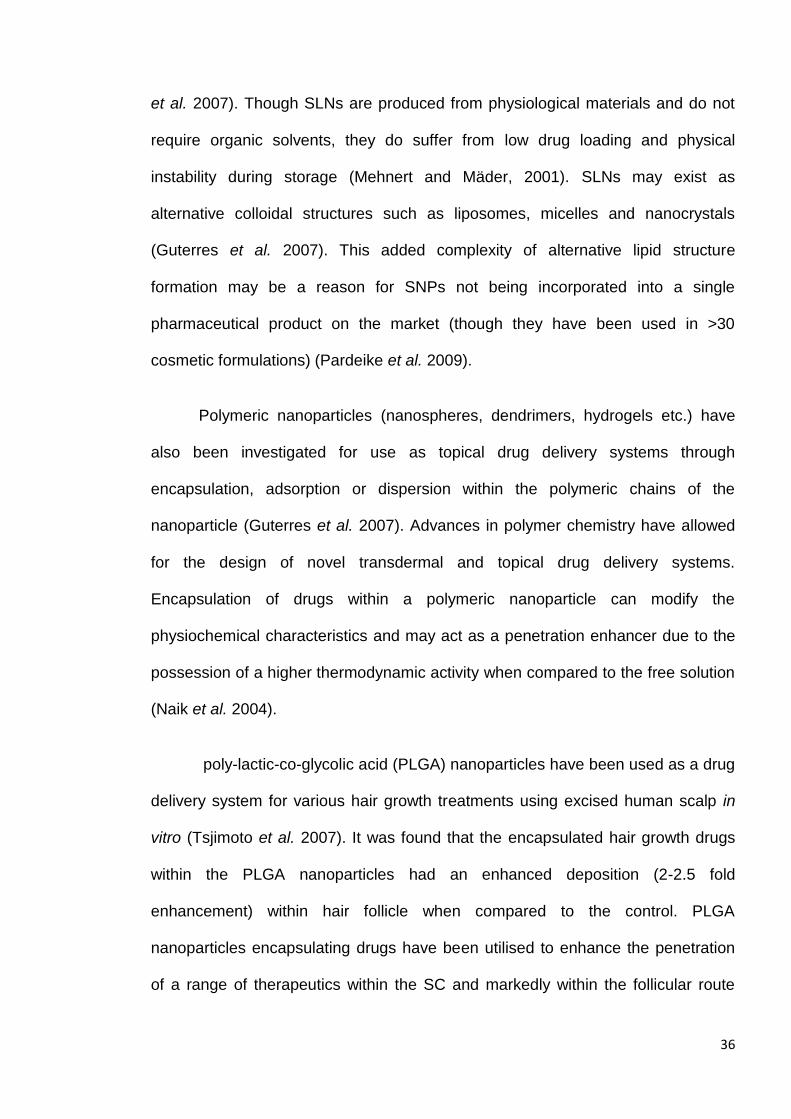
36
et al. 2007). Though SLNs are produced from physiological materials and do not
require organic solvents, they do suffer from low drug loading and physical
instability during storage (Mehnert and Mäder, 2001). SLNs may exist as
alternative colloidal structures such as liposomes, micelles and nanocrystals
(Guterres et al. 2007). This added complexity of alternative lipid structure
formation may be a reason for SNPs not being incorporated into a single
pharmaceutical product on the market (though they have been used in >30
cosmetic formulations) (Pardeike et al. 2009).
Polymeric nanoparticles (nanospheres, dendrimers, hydrogels etc.) have
also been investigated for use as topical drug delivery systems through
encapsulation, adsorption or dispersion within the polymeric chains of the
nanoparticle (Guterres et al. 2007). Advances in polymer chemistry have allowed
for the design of novel transdermal and topical drug delivery systems.
Encapsulation of drugs within a polymeric nanoparticle can modify the
physiochemical characteristics and may act as a penetration enhancer due to the
possession of a higher thermodynamic activity when compared to the free solution
(Naik et al. 2004).
poly-lactic-co-glycolic acid (PLGA) nanoparticles have been used as a drug
delivery system for various hair growth treatments using excised human scalp in
vitro (Tsjimoto et al. 2007). It was found that the encapsulated hair growth drugs
within the PLGA nanoparticles had an enhanced deposition (2-2.5 fold
enhancement) within hair follicle when compared to the control. PLGA
nanoparticles encapsulating drugs have been utilised to enhance the penetration
of a range of therapeutics within the SC and markedly within the follicular route

37
(Haddadi et al. 2008, Naik et al. 2004 and De Jalón et al. 2001). Further, various
other block co-polymers have been utilised to encapsulate drugs for skin delivery
(Rastogi et al. 2009 and Choi et al. 2012).
Polymeric drug delivery systems designed for skin delivery may take many
different forms. Conventional transdermal patches are typically based on a
polymeric matrix with the active drug dispersed or dissolved within the matrix
(Jones, 2004). The ratio and type of polymers used can be manipulated to control
the partitioning and diffusion of the compound from the patch into and across the
SC (Arora et al. 2002). Therapeutic polymers are also incorporated to act as an
anti-nucleant for the prevention of crystallisation of the drug when formulated into
a super-saturated topical formulation (Pellet et al. 1994 and Raghavan et al.
2000). Though on a micro-scale, it is worth mentioning the recent development of
polymeric microneedles that have been utilised for physical skin delivery to
circumvent the SC (Park et al. 2005, Lee et al. 2012, and Lee et al. 2008).
Polymeric microneedles have the advantage of being biodegradable,
biocompatible and cheaper to manufacture than their silicon counterparts (Van der
Maaden et al. 2012). A comprehensive state of the art review was recently
published on polymeric microneedles (Ochoa et al. 2012).
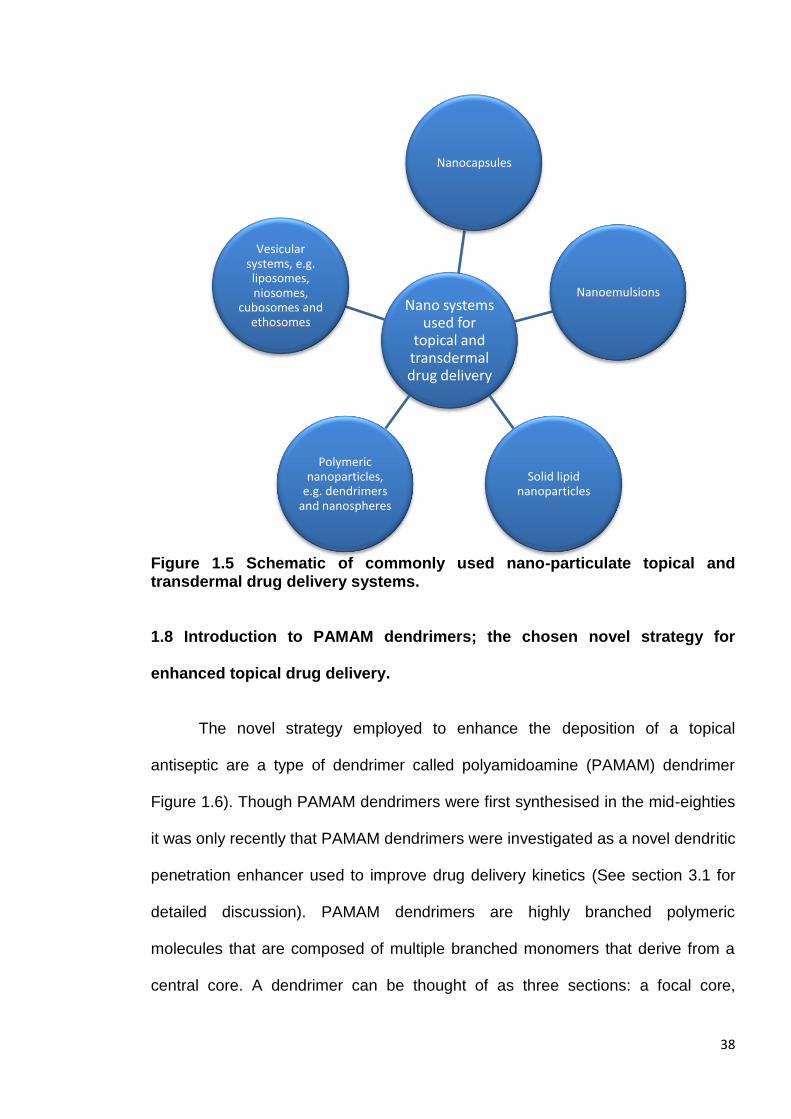
38
Figure 1.5 Schematic of commonly used nano-particulate topical and transdermal drug delivery systems.
1.8 Introduction to PAMAM dendrimers; the chosen novel strategy for
enhanced topical drug delivery.
The novel strategy employed to enhance the deposition of a topical
antiseptic are a type of dendrimer called polyamidoamine (PAMAM) dendrimer
Figure 1.6). Though PAMAM dendrimers were first synthesised in the mid-eighties
it was only recently that PAMAM dendrimers were investigated as a novel dendritic
penetration enhancer used to improve drug delivery kinetics (See section 3.1 for
detailed discussion). PAMAM dendrimers are highly branched polymeric
molecules that are composed of multiple branched monomers that derive from a
central core. A dendrimer can be thought of as three sections: a focal core,
Nano systems used for
topical and transdermal drug delivery
Nanocapsules
Nanoemulsions
Solid lipid nanoparticles
Polymeric nanoparticles,
e.g. dendrimers and nanospheres
Vesicular systems, e.g. liposomes, niosomes,
cubosomes and ethosomes
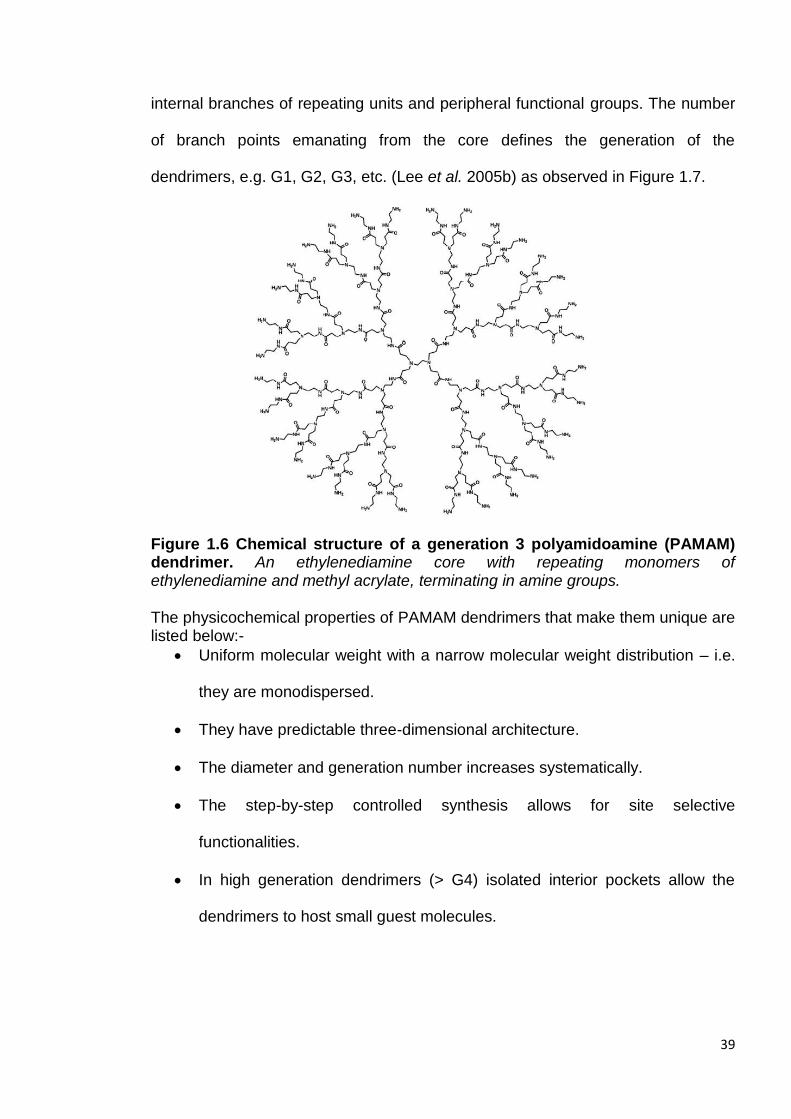
39
internal branches of repeating units and peripheral functional groups. The number
of branch points emanating from the core defines the generation of the
dendrimers, e.g. G1, G2, G3, etc. (Lee et al. 2005b) as observed in Figure 1.7.
Figure 1.6 Chemical structure of a generation 3 polyamidoamine (PAMAM) dendrimer. An ethylenediamine core with repeating monomers of ethylenediamine and methyl acrylate, terminating in amine groups. The physicochemical properties of PAMAM dendrimers that make them unique are listed below:-
Uniform molecular weight with a narrow molecular weight distribution – i.e.
they are monodispersed.
They have predictable three-dimensional architecture.
The diameter and generation number increases systematically.
The step-by-step controlled synthesis allows for site selective
functionalities.
In high generation dendrimers (> G4) isolated interior pockets allow the
dendrimers to host small guest molecules.
40
The solubility of dendrimers can be controlled by the peripheral functional
groups, e.g. by adding hydrophilic functional groups the water solubility can
be increased.
(Jang et al. 2009)
Figure 1.7. Generation 2, 4 and 6 PAMAM dendrimers observed as molecular dynamic simulations (Adapted from Maiti et al. 2004).
PAMAM dendrimers have been utilised within this investigation and they
are the most studied dendrimer within the literature. A search for the term ‘PAMAM
dendrimer’ on ScienceDirect retrieved 2,616 publications (March 2013). PAMAM
dendrimers can be commercially purchased from Dendritech in the US as they are
now manufactured on a kilogram scale. PAMAM dendrimers can also be
synthesised within the laboratory using a divergent method developed by Donald
Tomalia that was published in 1985 (Tomalia et al. 1985).The divergent method for
PAMAM dendrimer synthesis (aka Starburst® dendrimers) was first developed by
D. Tomalia in 1978 in the Dow chemical laboratories. It is a synthetic pathway of
iterative alkylation and amidation reactions; each resulting in one new generation
Generation 2 Generation 4 Generation 6
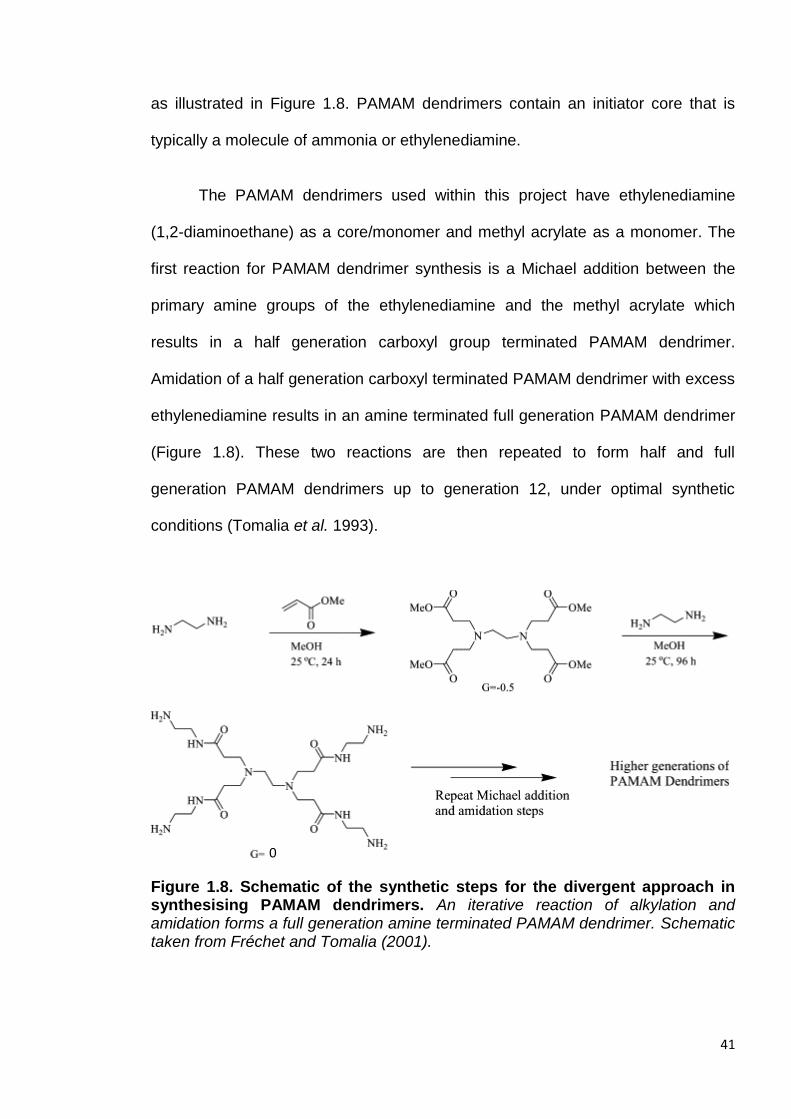
41
as illustrated in Figure 1.8. PAMAM dendrimers contain an initiator core that is
typically a molecule of ammonia or ethylenediamine.
The PAMAM dendrimers used within this project have ethylenediamine
(1,2-diaminoethane) as a core/monomer and methyl acrylate as a monomer. The
first reaction for PAMAM dendrimer synthesis is a Michael addition between the
primary amine groups of the ethylenediamine and the methyl acrylate which
results in a half generation carboxyl group terminated PAMAM dendrimer.
Amidation of a half generation carboxyl terminated PAMAM dendrimer with excess
ethylenediamine results in an amine terminated full generation PAMAM dendrimer
(Figure 1.8). These two reactions are then repeated to form half and full
generation PAMAM dendrimers up to generation 12, under optimal synthetic
conditions (Tomalia et al. 1993).
Figure 1.8. Schematic of the synthetic steps for the divergent approach in synthesising PAMAM dendrimers. An iterative reaction of alkylation and amidation forms a full generation amine terminated PAMAM dendrimer. Schematic taken from Fréchet and Tomalia (2001).
0

42
The physiochemical characteristics of PAMAM dendrimers can be found in
Table 1.2. The number of surface groups, in this case primary amine groups,
doubles and the molecular weight increases exponentially with each iterative step
of alkylation and amidation and thus an increase in the generation (Lothian-
Tomalia et al. 1997). The PAMAM dendrimers used within this thesis are
generations 2-5 with diameters ranging from 2.6-5.7 nm. The most commonly
used PAMAM dendrimer within this thesis is generation 3 that is 3.6 nm in
diameter (Table 1.2). For scale this is approximately equivalent to the diameter of
insulin and around half the diameter of a lipid bilayer (Esfand and Tomalia, 2001).
Table 1.2. Theoretical physiochemical characteristics of PAMAM dendrimers from generation 0-10. Table taken from Fréchet and Tomalia, 2001.
The in vitro toxicity of PAMAM dendrimers has been investigated in a
number of studies and the cytotoxicity appears to be dependent on the
concentration and generation (molecular weight and number of surface groups) of
the PAMAM dendrimer (Mukherjee and Byrne, 2012). It has been established that
cationic dendrimers are more toxic than their anionic counterparts (Jevprasephant

43
et al. 2003 and Duncan and Izzo, 2005). There is however a discrepancy between
the reported toxic concentrations of PAMAM dendrimers. Full generation cationic
PAMAM dendrimers above generation 1 were shown to be haemolytic at a
concentration of 1 mg/mL by Malik and co-workers (2000). Also the cytotoxicity
was measured as the IC50 concentration (mg/mL) after a 72 h MTT ((3-(4,5-
Dimethylthiazol-2-yl)-2,5-diphenyltetrazolium bromide) assay using B16F10 cells
(mouse melanoma cells). The IC50 concentration for G1, G2, G3 and G4-PAMAM-
NH2 was calculated as >2, >2, 0.05 and 0.05 mg/mL respectively. The lower
generation PAMAM dendrimers did not incite cytotoxicity up to a concentration of 2
mg/mL and this was also observed for the half generation carboxyl terminated
PAMAM dendrimers (Malik et al. 2000). A more recent in vitro study on rat red
blood cell lysis using G4-PAMAM-NH2 dendrimer showed no effects of haemolysis
up to a concentration of 10 µM L-1 over 24 h (Labieniec et al. 2008). When the
toxicity of PAMAM dendrimers was investigated using a lactate dehydrogenase
assay on caco-2 cell (human intestinal adenocarcinoma) monolayers G2-PAMAM-
NH2 and G3-PAMAM-NH2 dendrimers exhibited toxicity at a concentration of >10
and >0.1 mM respectively (Elsayed et al. 2002).
More recently, G4, G5 and G6-PAMAM-NH2 dendrimers were tested for
induction of cytotoxic responses as a product of the formation of reactive oxygen
species (ROS) after endocytosis (Mukherjee and Byrne, 2012). It was found that
these higher generation PAMAM dendrimers incited toxicity at a concentration of
1 mM due to the formation of ROS resulting in mitochondrial membrane disruption
(Mukherjee and Byrne, 2012). Calabretta et al. (2007) found no cytotoxicity for G5-
PAMAM-NH2 up to a concentration of 1 µg/mL against human corneal epithelial

44
cells (though below this concentration they exhibit antimicrobial properties against
P. aeruginosa) though at the highest tested concentration 10 µg/mL 25 % of
HCECs survived that was comparable to the positive control benzalkonium
chloride.
Few studies have been conducted in vivo on PAMAM dendrimer toxicology,
though when PAMAM dendrimers up to Generation 5 (G7-PAMAM-NH2 dendrimer
potentially induced problems as 1 in 5 mice died in that treatment group) were
injected into mice at a dose of 10 mg/kg-1 they appeared to be non-toxic (Bos and
Heegaard, 2004, Roberts et al. 1996 and Bourne et al. 2000). Chauhan et al.
(2010) and colleagues found G4-PAMAM-NH2 and G4-PAMAM-OH dendrimers to
be non-toxic in general after an in vivo study in mice at a low, medium and high
dosages. It was found that at the high concentration treatment group of
G4-PAMAM-NH2 dendrimer some toxicity was observed (i.e. declined glucose
levels) though this was seen to recover after a 15 day recovery time. A full review
on the toxicity of dendrimers was recently compiled by Jain and co-workers (Jain
et al. 2010).
With regards to the PAMAM dendrimer toxicity after application to the skin
surface, it is expected to be low as the PAMAM dendrimers’ penetration across or
within the skin is low (for a detailed discussion on the potential for PAMAM
dendrimers to penetrate the skin, see section 4.1) (Sun et al. 2012). As outlined in
Sections 1.1 and 1.2 the SC is a formidable barrier composed of anucleate
corneocytes and a dense intercellular lipid network that prevents the ingress of
large and highly charged macromolecules such as PAMAM dendrimers. Bos and
Meinardi (2001) stated that for significant transdermal drug delivery a permeating
45
compound must be below 500 Da in order to traverse the SC; a G3-PAMAM-NH2
dendrimer is ~6,909 Da. The toxicity of PAMAM dendrimers in vivo has not been
realised and it should also be considered that if a commercially available and
widely accepted ethanolic hand gel (60-80 % ethanol v/v) was applied to a cell
line, low cell viability would be the result and toxicity inferred.
Due to their unique physiochemical characteristics dendrimers have been
investigated for use in a wide range of biomedical applications. These include the
use as an improved magnetic resonance imaging (MRI) contrast agent through
covalent conjugation to, for example Gd(III)-diethylenetriamine (GD(III)-DTPA) or
GD(III)-tetracarboxymethyl-1,4,7,10-tetraazacyclododecane (GD(III)-DOTA)
(Venditto et al. 2005) and (Wiener et al. 2005). After conjugation of an MRI
contrast agent to a PAMAM dendrimer it was reported to result in increased blood
circulation times that allows for an extended imaging time frame. Another
advantage of the PAMAM conjugated MRI contrast agent was greater contrast and
enhanced images as PAMAM dendrimers possess high relaxivities (Wiener et al.
1996). PAMAM dendrimers have also found use as effective DNA transfecting
agents through electrostatic complexation of the primary amine groups on the
dendrimer surface and the negatively charged phosphate groups of the nucleic
acids (Bielinska et al. 1999 and Eichman et al. 2000). PAMAM dendrimers have
been used frequently as drug delivery agents and less commonly as biocides. A
detailed discussion on dendrimer-biocides can be found within the introduction in
Chapter 2. Further, the efficacy and suitability of PAMAM dendrimers as a topical
drug delivery system has been discussed in further detail within the introduction to
Chapter 3.

46
1.8.1 Aims and objectives of the study.
The prevalence of healthcare-acquired infections, in particular, multi-drug
resistant strains has given rise to considerable concern and the issue is
persistently highlighted by the media. There is a clear need for innovation in
infection control to enhance and increase the current armoury of anti-infective
agents (Davies, 2013). The aim of this project is to develop a novel topical
antimicrobial formulation that utilises dendritic architectures as a platform to
enhance the permeation of anti-infective agents into the skin. PAMAM dendrimers
have previously been shown to be antimicrobial (Calabretta et al. 2007 and Wang
et al. 2010) however their antimicrobial efficacy against opportunistic skin
pathogens and their mechanism of action have yet to be fully elucidated.
An objective of this study is to comprehensively assess their antimicrobial
efficacy and mechanism of action as it would be of great advantage for a topical
drug delivery platform to also possess antimicrobial properties against skin
pathogens. Central to the formulation is the PAMAM dendrimer and this thesis will
examine as to whether a PAMAM dendrimer skin pre-treatment and co-treatment
increases the distribution and localisation of the model drug, CHX within the upper
skin strata. Further, PAMAM dendrimers’ interactions with CHG and the skin will
also be investigated in an attempt to elucidate any enhancement effects.
The topical deposition of the CHG will be chemically mapped using a novel
time-of-flight secondary ion mass spectrometry (ToF-SIMS) method. To improve
the bioavailability of topically-applied formulations, the permeation pathway and
distribution of a drug and its excipients throughout the skin strata must be
understood. The method will reveal localisation of CHG to specific histological skin

47
compartments and to visualise any permeation enhancement effects elicited by
the application of PAMAM dendrimers.
The final objective of this thesis is to develop a stable formulation that
contains a clinically relevant concentration of CHG and a dendritic permeation
enhancer. The formulation will be assessed to ensure increased antimicrobial
efficacy against skin pathogens and to determine whether addition of the PAMAM
dendrimer enhances the deposition of CHG within the upper skin strata.
48
2.0 A comprehensive study into the antimicrobial efficacy and mechanism of action of PAMAM dendrimers against opportunistic pathogens.
2.1 Introduction
2.1.1 Advantages of antimicrobial dendrimers
An increasing number of bacteria are evolving into antibiotic-resistant strains
that are threatening our ability to treat infectious diseases within a primary, secondary
and community care setting (Rice, 2009). This growing trend of resistance has
depleted the armoury of available effective antibiotics. This is compounded by the fact
that the development of novel antibiotics offers the second lowest return on
investments (Walsh, 2000). The World Health Organisation (WHO) has declared
antibiotic resistance one of the three greatest threats to human health (WHO, 2001).
In March 2013, the chief medical officer (CMO) for England released a second
volume of her annual report into the state of public health in England, in which she
focused specifically on the burden of infections and antimicrobial resistance (Davies,
2013(a)). The CMO stated the burden of infectious diseases was estimated to cost
approximately £30 billion each year to the economy (Davies, 2012 (a)). In 2011,
infectious diseases had accounted for 7 % of all deaths and accounted for 8 % of all
hospital bed use in England (Davies, 2013 (b)).The same report showed that
Escherichia coli accounted for around 36 % of all bloodstream infections (bacteraemia)
and there was increasing emergence of multi-drug resistant strains. In cases of patient
mortality, multi-drug resistant E. coli accounted for 30 % whereas susceptible E. coli
49
strains accounted for 15 % (Davies, 2013 (b)). Further, the report stated that many of
the infections arise from the patient’s own microbial flora with the most prominent
pathogen being Staphylococcus aureus. S. aureus typically resides within the anterior
nares and perineum (Davis et al. 2004) and those patients colonised on admission are
at a greater risk of developing surgical site incision infections. It has also been shown
to spread epidemically between patients and can be transferred from staff to patients
(von Eiff et al.,2001).
The CMO calls for prevention strategies to stop colonisation from developing
into infection and one of the recommendations from the report emphasises the need
for further preventative strategies and that action is required at a national and local
level to combat antibiotic resistance (Davies, 2013 (b)). With increasing resistance and
little to combat complex infections, the availability of modern medical advancements
such as major surgery, dialysis, organ transplantation and chemotherapy are in
jeopardy (Cars et al. 2008).
To prevent a return to the pre-antibiotic era, design and delivery of antimicrobial
drugs with improved efficacy and avoidance of drug resistance are of paramount
importance. Innovative strategies as well as more efficient use of current antimicrobial
compounds are mandatory. Efforts in synthetic chemistry have focussed on identifying
orally bioavailable small-drug molecules utilising high throughput screening methods
(McCarthy, 2005). This effort has not yet translated into the availability of novel
antibiotics in the clinic. Biological targets, such as bacterial cell membranes, consist of
macromolecules that rely on polyvalent interactions in their binding (Mammen et al.
1998). Most biological targets are of a nano-scale (1-100 nm) therefore polyvalent
50
macromolecules of a nano-size may have increased biological efficacy when
compared to small-molecule drugs due to a match in scale and multivalent binding
(McCarthy, 2005). Nanoparticles offer unique advantages in antimicrobial therapy such
as a reduction in acute toxicity and avoidance of resistance via alternate mechanisms
of action (Weir et al. 2008). Nanoparticles (silver) within a 1-10 nm size range (G3-
PAMAM-NH2 having a diameter of 3.6 nm) were shown to have a greater direct
interaction with bacteria, suggesting a size dependency (Morones et al.2005).
Polyamidoamine (PAMAM) dendrimers have become the most widely investigated
dendrimers for a range of biomedical applications (Svenson, 2009, Esfand and
Tomalia, 2001 and Sajja et al. 2009).
Due to the highly branched and globular nature of dendrimers, they possess
unique properties enabling them to act as a multivalent biocide or a nano-platform for
antimicrobial drug delivery (Meyers et al.,2008). The uniform branching of dendrimers
provides a large surface area to volume ratio enabling high reactivity with micro-
organisms in vivo (Zhang et al.,2010). The highly localized and dense functional
groups on the dendrimer’s surface can be tailored for antimicrobial efficacy or for the
conjugation of targeting ligands to a variety of micro-organisms’ receptors (Tomalia et
al.,1990 and Gillies and Fréchet, 2005).
The strategies discussed in this chapter include the use of dendrimers as
delivery platforms for conventional antibacterial drugs, (Cheng et al. 2007(a) and
Kumar et al. 2006), competitive binding to bacteria and toxins to inhibit bacterial
adhesion (Joosten et al. 2004) and biocidal dendrimers without complexation or

51
conjugation to conventional biocides (Wang et al. 2010, Calabretta et al. 2007 and
Lopez et al. 2009).
2.1.2 Glycodendrimers
Glycodendrimers have been studied as to whether they prevent host-pathogen
adhesion and thus toxin transport into the host cell. Glycodendrimers typically have
saccharide residues on the surface though some may contain a sugar unit as a focal
core with emanating carbohydrate branches (Cloninger, 2002). The multivalent nature
of glycodendrimers has been exploited to improve their antimicrobial activity as the
bacteria and their toxins can preferentially bind to the sugar group pendants on the
surface of the glycodendrimer as opposed to the host cell in vitro (Mintzer et al. 2011).
Polypropylene imine (PPI) and PAMAM dendrimers have been modified by the
covalent conjugation of oligosaccharides (phenylisothiocyanate derivatised (PITC)
galb1-3galNAcb1-4[sialic acida2-3]-galb1-4glc residues) to the amine focal core.
These were then shown in vitro to inhibit the binding of the heat labile enterotoxin of E.
coli and require ~ 1000-fold lower concentration than that of the free oligosaccharide
to achieve the same binding efficacy (Thompson and Schengrund, 1997). The same
group also demonstrated that a PPI based glycodendrimer could beused to inhibit the
binding of both cholera toxins and heat labile enterotoxins to a murine fibroblast cell
line (Thompson and Schengrund, 1998). Since then, PPI and PAMAM dendrimers
have been modified with various oligosaccharides to inhibit the binding of a range of
pathogenic organisms or toxins (Joosten et al. 2004, Salminen et al. 2007 and Woller
et al. 2003).

52
2.1.3Dendrimers as biocides andantimicrobial carriers
Dendrimers are emerging as novel topical antimicrobial macromolecules
(Svenson and Tomalia, 2005). PAMAM dendrimers contain hydrophobic interior voids
in which small non-polar drug molecules maybe encapsulated (Cheng et al. 2007(b)).
PAMAM dendrimers also have a high density of surface functionalities allowing for the
conjugation or complexation of antimicrobial agents (Patri et al. 2002). The use of
dendrimers as antimicrobial drug delivery platforms offers a number of advantages
over conventional antimicrobial drugs including increased bioavailability, decreased
adverse side effects and increased deposition of the drug at target sites (Gardiner et
al. 2008). Due to the hydrophilic exterior, PAMAM dendrimers can increase the
solubility of hydrophobic drugs and this increase in solubility was shown to result in an
enhanced antimicrobial effect in vitro when compared to the drug in free solution (Ma
et al. 2007and Winnicka et al. 2011).
Silver ions have antimicrobial properties and is commonly utilised in the topical
treatment of infected wounds. Silver ion complexes of PAMAM dendrimers and silver-
PAMAM composites were shown to be effective antimicrobial compounds against, S.
aureus, E. coli and Pseudomonas aeruginosa in vitro as shown by Balogh et al.
(2001). Using a disc diffusion assay, they demonstrated that both compounds
displayed antimicrobial activity that was either comparable to, or enhanced, when
compared to standard silver nitrate solutions.
The aqueous solubility of sulfamethoxazole (SMZ), an antimicrobial
sulfonamide, was increased, in vitro, when PAMAM dendrimers were used as a carrier
53
system. An enhancement in antimicrobial activity was observed against E. coli. with a
four or eight-fold increase in the anti-bacterial activity of SMZ in a dendrimer solution
compared to pure SMZ dissolved in dimethylsulfoxide (DMSO) or a 0.01M NaOH
solution (Ma et al. 2007).
PAMAM dendrimers have been used to increase the aqueous solubility of both
nadifloxacin and prulifloxacin however the increased solubility only resulted in an
increase in the antimicrobial efficacy of prulifloxacin, as shown by Cheng et al.
(2007a). The authors proposed the enhanced antibacterial efficacy of pruifloxacin was
due to the PAMAM dendrimer’s disruption of the bacterial cell membrane allowing the
quinolone entry to the bacterial cytoplasm and as a result causing damage to
DNA.PAMAM dendrimers have also been investigated to determine whether they
increased solubility of the antimicrobial compound, triclosan. PAMAM dendrimer
generation 3 (PAMAM G-3) and phenylalanine conjugated PAMAM G-3 dendrimer
both failed to enhance the solubility of the antimicrobial compound (Gardiner et al.
2008). These studies suggest that PAMAM dendrimers may increase the solubility of
antimicrobial drugs but that this does not directly translate into an increased efficacy in
the case of nadifloxacin. In the case of triclosan the PAMAM dendrimer did not
enhance the solubility therefore this effect may be dependent on the physiochemical
interactions.
One strategy for producing dendrimer biocides is to synthesise them with
antimicrobial monomers or tailor the dendrimer to terminate in antimicrobial surface
groups.A single antimicrobial dendrimer offers the benefits of desirable cost of
manufacture and an acceptable toxicity and biocompatibility profile (McCarthy et al.

54
2005). A PPI dendrimer was functionalized with dimethyl dodecyl ammonium groups
for potent antimicrobial properties(Chen et al. 1999). The quaternary ammonium
functionalised dendrimer exhibited an EC50 of 12 µg/mL against E. coli, whilst its small
molecule counterpart displayed a MIC50 of 2000 µg/mL. The quaternary ammonium
functionalised dendrimer was also found to display antimicrobial activity against
S. aureus at 1 µg/mL for inhibition and 10 µg/mL for bactericidal effect.
Chen et al.(2000) used bioluminescence studies to determine the structure-
activity effects of the functionalised dendrimers and they discovered that the
generation number (G) affected the antimicrobial activity, in the decreasing potency of
G5 > G4 > G1 > G2 > G3. The increased potency of the higher generations was
attributed to the dense surface functionalisation with quaternary amines, but there was
a concurrent decrease in permeability into the bacterial cell probably owing to the
molecular weight and diameter of the dendrimers. G5 was found to achieve the
highest antimicrobial effect, with 64 quaternary amines at its surface and with a
molecular weight of 27578 Da. G1 was the third most potent, possessing only 4
surface quaternary amines and having a molecular weight of 1593 Da. This suggests
that the number of surface groups and molecular weight influences the biocidal activity
of dendrimers. When the antimicrobial activity was compared to that of a
hyperbranched linear polymer with the same number of functionalities, the dendrimer
exhibited a higher antimicrobial activity (Chen et al. 2000).Yang and Lopina (2003)
designed the PAMAM to be an antimicrobial agent itself rather than a carrier. The
group covalently conjugated penicillin V to G-2.5- and G-3-PEG-PAMAM dendrimers
via amide and ester linkages. The results of the study showed that the ester-linked

55
conjugates had antimicrobial activity against S. aureus but no synergistic or enhanced
antimicrobial effect was observed when compared to non-conjugated penicillin V
(Yang and Lopina, 2003).
2.1.4 Antimicrobial properties of native PAMAM dendrimers
PAMAM dendrimers are the most studied class of dendrimers, being the first
dendrimer structures to be synthesized (Tomalia et al. 1985). Despite extensive study
in biomedical applications such as drug delivery and imaging, PAMAM dendrimers’
antimicrobial effects without conjugation or complexation to a conventional
antimicrobial compound have only recently been discovered. Calabretta and
co-workers were the first to publish a study on unmodified PAMAM dendrimers’
antimicrobial properties against ocular pathogens and the authors found that the
amine terminated G-5 PAMAM dendrimer was extremely toxic to P.aeruginosa with
anEC50 of 1.5 ± 0.1 µg/mL and less so for S. aureus, 20.8 ± 3.4 µg/mL. It was
demonstrated that a partial coating of the amine groups with
poly(ethyleneglycol)(PEG) reduced the toxicity of the G5-PAMAM against human
corneal epithelial cells whilst retaining high toxicity against P. aeruginosa with a MIC50
of 0.9 ± 0.1 µg/mL. PEGylation of the G-5 PAMAM resulted in a further decrease in
efficacy against the Gram positive S. aureus (Calabretta et al. 2007).
The same group also published further data comparing the antimicrobial
properties of G-3 PAMAM-NH2 and G-5 PAMAM-NH2 and reported that even though
G-5 PAMAM-NH2 has a greater localization of amines at its surface compared to G-3
PAMAM, the potency was not increased. A microdilution broth assay measuring the

56
absorbance to calculate the MIC50 of G-3 PAMAM and G-5 PAMAM against S. aureus
was found to be 12.5 µg/mL for both generations. The equipotent result is surprising
as G-5 PAMAM has 96 more amine groups at its surface, theoretically. Again the
authors found that PEGylation of G-3 PAMAM decreased the potency against the
Gram negative P. aeruginosa and more markedly against Gram positive S. aureus.
This is likely due to the PEG chains shielding the protons of the amines therefore
reducing the cationic charge and thus limiting the antimicrobial effect (Lopez et al.
2009).
An in vitro and in vivo investigation of PAMAM dendrimers was conducted by
Wang and co-workers (Wang et al. 2010). G-4 PAMAM-OH, G-4 PAMAM-NH2, and G-
3.5 PAMAM-COOH were challenged against E. coli to determine the MIC50 using the
method outlined in Lopez et al. (2009). It was found that the in vitro MIC50for G-4
PAMAM-OH, G-4 PAMAM-NH2, and G-3.5 PAMAM-COOH was 5.4 mg/mL, 22.0
mg/mL and 3.8 µg/mL, respectively. The study investigated the effect of the PAMAM
dendrimers on the morphology of E. coli and the effects on the cell membrane
including the inner and outer membrane using scanning electron microscopy (SEM).
Whilst the preparation process for SEM may induce artifacts, the PAMAM treated
bacteria were compared to untreated bacteria that had undergone the same
preparative process. It was shown that G-4 PAMAM-NH2 and G-3.5 PAMAM-COOH
caused inner and outer membrane damage leading to lysis of the E. coli, whilst G-4
PAMAM-OH caused permeabilisation of the inner and outer membrane. Further, the in
vivo study showed that when G-4 PAMAM-OH was applied to the cervix of a guinea
pig, the intra-amniotic infection caused by contamination with E. coli was inhibited. The
57
amniotic fluid collected from different gestational sacs of infected guinea pigs post G-4
PAMAM-OH treatment failed to culture E. coli due to the antimicrobial effects of the
PAMAM in vivo (Wang et al. 2010). It has been postulated that PAMAM dendrimers
may act like antimicrobial peptides (AMPs) in that they disrupt the cell membranes
leading to cell lysis (Calabretta et al. 2007). The reduced activity against Gram positive
bacteria may be due to the different membrane composition as Gram positive bacteria
have a thick peptidoglycan cell wall and no outer-membrane compared to Gram
negative bacteria that have a phospholipid bilayer outer membrane. The studies
conducted within this chapter also confirm this hypothesis.
Whilst there have been many studies investigating dendrimers as carriers of
antimicrobial compounds or covalently conjugated antibiotics to a dendrimer, there are
comparatively few studies that have investigated the antimicrobial effects and the
mechanism of action of unmodified PAMAM dendrimers. The aforementioned studies
(Wang et al. 2010, Calabretta et al. 2007, and Lopez et al. 2009), mainly focused on
Gram negative bacteria and all selected to test only one or two PAMAM generations.
The studies have also used different methods for determining the IC50 and none have
used the antimicrobial susceptibility standard method or media. By utilising a
standardised method such as the clinical and laboratory standards institute (CLSI)
M162standard (Rennie, 2001),comparisons can be made between inter and intra
laboratory experiments when calculating antimicrobial susceptibilities. For example,
media deficient in magnesium or calcium cations may result in a much lower IC50 that
is an underestimate of the bacteria count as bacteria require divalent cations for
membrane stabilization (Reller et al. 1974 and Zimelis and Jackson, 1973). There is a
58
knowledge gap with regards to the antimicrobial efficacy and mode of action of a range
of PAMAM generations. To determine whether the antimicrobial efficacy is indeed
generation and thus size and charge related, a comprehensive study is required.
There have also been limited studies into challenging the PAMAM dendrimers against
Gram positive bacteria such as S. aureus and Staphylococcus epidermidis which are
known skin pathogens.
2.1.5 Aims and objectives
The aim was to fully investigate a range of PAMAM dendrimer generations
including amine and carboxyl terminated dendrimers against Gram positive and Gram
negative skin pathogens. The study was designed to illustrate any differences in
antimicrobial potency for different generations and thus differences in molecular
weights and surface charges. The investigation into the PAMAM dendrimers’
antimicrobial properties were achieved by using an adapted microdilution broth test
with a viable count assay modified from Calabretta et al. (2007). Morphological
changes to the cell membrane and cell wall due to the PAMAM dendrimers’ interaction
was observed using SEM. A cell membrane integrity study was conducted for a range
of skin pathogens. An inner membrane permeabilisation study was also employed to
determine generation and concentration effects on the PAMAM dendrimers’
membrane disruption potential. By characterising the dendrimers’ affect against skin
pathogens it is hoped that ultimately they can be formulated into a topical antimicrobial
drug delivery system.

59
2.2 Materials and methods
2.2.1 Microdilution broth with viable count assay to determine inhibitory
concentration (IC50)
Bacterial culture grade petri dishes, universals and pipette tips were all
purchased from Startstedt (Leicester, UK). Bacterial growth medium, Mueller-Hinton
agar (MHA) and Mueller-Hinton broth (MHB) were obtained from Oxoid (Basingstoke,
UK). The bacterial media MHA/MHB is a standardised growth media used for
antimicrobial susceptibility testing. The cation content (Mg2+ and Ca2+) was adjusted in
line with recommendations from the CLSI (Rennie, 2001). All salts used in diluents or
media were reagent grade and purchased from Fisher Scientific (Loughborough, UK).
S. aureus (ATCC 11832) and E. coli (ATCC 8277) were plated out on
respective cation adjusted MHA using a streak plate method to ensure growth of single
colonies. The inoculated MHA plates were inverted and incubated at 37°C ± 1°C for
18-24 hours in aerobic conditions. After incubation, 3-4 single colonies were swabbed
with a sterile loop and used to inoculate 10 ml of cation adjusted MHB which was then
incubated at 37°C ± 1°C for 18 hours. The dense overnight inoculum was then diluted
to an absorbance of 0.140 using a UV-Vis spectrophotometer (Hitachi, U1-900,
Berkshire, UK) to achieve an inoculum density of ~107 cells/mL. The bacterial cell
density at an optical density of 0.140 was confirmed by diluting the bacteria and
counting the cells using a haemocytometer. The inoculum was then further diluted in
cation adjusted MHB to achieve a test inoculum of 1x10⁵ cells/mL.

60
PAMAM dendrimers of various generations (G2-G5) purchased from
Sigma Aldrich (Dorset, UK) in varying concentrations in methanol were prepared at
concentrations ranging from 1-500 µg/mL in ultrapure sterile water. After dilution of the
stock in ultrapure sterile water the methanol content of the highest concentration of
PAMAM tested was 0.125 % (v/v). To ensure the low concentrations of methanol
present did not inhibit the bacteria a range of methanol concentrations higher than
those used within this assay was analysed for antimicrobial effect (data not shown).
The results showed that a concentration of up to 30 % methanol (v/v) in sterile
ultrapure water did not inhibit bacteria. Each PAMAM dendrimer concentration was
tested in triplicate and 50 µl of each solution was plated onto a sterile 96-well plate.
50 µl of the test bacteria inoculum was added to each well excluding 3 wells with
cation adjusted MHB and sterile water only as a sterility control. The inoculum and
PAMAM test solution of each well were then agitated 5 times with a pipette to mix
thoroughly. A growth control was tested in parallel without the addition of PAMAM
dendrimer and a positive control was included of gentamicin at 1 mg/mL. The 96-well
plate was then incubated at 37°C ± 1°C for 2 hours and shaken at 200 rpm.
After a 2 hour incubation period, each well (excluding sterility control) was
serially diluted 1:10 in cation adjusted MHB to achieve a range of dilutions down to
1:100,000. Each well was further agitated using a sterile pipette tip and 50 µL of each
dilution was plated onto a petri dish using the pour plate method with the addition of 25
mL of molten cation adjusted MHA at ~45°C. The plates were then inverted and
incubated for 18-24 h at 37°C ± 1°C in aerobic conditions. Post incubation, bacterial
colonies on each plate were manually counted using a click counter. The dilutions

61
where 30-300 colony forming units (CFUs) had grown for each growth control or
PAMAM test concentration were selected. Each test concentration was tested in
triplicate and the inhibition percentage was calculated using Equation 2.1. The data
was then plotted as a graph of log (inhibitor) versus normalized response to determine
the IC50 (Equation 2.2) using GraphPad Prism® version 5 (San Diego, USA).
Equation 2.1 Inhibition percentage calculation
Equation 2.2 Calculation of IC50concentration
The log (dose) response curve follows a sigmoidal curve and the data was
normalized to the growth control as 100 %. The normalized model forces the curve
from 0 % to 100 %. This is ideal for the calculation of the IC50 i.e. the concentration at
50 % growth inhibition. This model also does not assume a standard hill slope of 1.0
but fits the hill slope from the data therefore it is a variable slope model that is ideal
when there are many data points. The broth microdilution assays to calculate the IC50
concentrations were ran as n=9 therefore this model was ideal.

62
2.2.2 Membrane integrity study
S. aureus (ATCC 11832),S. epidermidis (ATCC 12228) E. coli (ATCC 8277)
were plated out on tryptone soya agar (TSA) plates using a streak plate method to
ensure growth of single colonies. The inoculated TSA plates were inverted and
incubated at 37°C ± 1°C for 18-24 hours in aerobic conditions. After the incubation
period 2-3 single colonies were removed using a sterile loop and used to inoculate
tryptone soya broth (TSB). The inoculated TSB was then incubated for 18 h at 37°C
± 1°C. Post incubation period the inoculated TSB was then centrifuged at 1000 x g for
10 mins to harvest the bacterial cells. The pellet was resuspended in1x phosphate-
buffered saline (PBS) (pH 7.4). This was centrifuged (as above) and the supernatant
discarded. The pellet was washed and resuspended in PBS and the absorbance was
adjusted to 0.7 at 420 nm to dilute the cells to a final test suspension. A 3 mL aliquot of
the final bacterial inoculum was added to a 3mL aliquot of the PAMAM dendrimer
solution at a concentration of 10 x the calculated IC50 for each respective PAMAM
dendrimer generation. The IC50 for PAMAM G=3 was calculated as 15.25µg/mL and
this concentration was used to determine whether the PAMAM dendrimer could incite
membrane damage.
At different time points (20, 40, 60, and 120 min) a 1.5 mL aliquot of the sample
was removed and immediately syringe filtered using a 0.22 µm syringe filter (Millipore
MCE sterile 33 mm filter, Watford, UK). Filtration removed the bacteria leaving a
particulate free supernatant to be analysed for the release of materials absorbing at
260 nm that was assessed with a UV spectrometer (Hitachi, U1-900, Berkshire, UK).

63
The absorbance at 260 nm was plotted against each time point using GraphPad
Prism® version 5 (San Diego, USA).
2.2.3 Inner membrane permeabilisation assay
Inner membrane permeabilisation was determined by the release of
cytoplasmic β-galactosidase from E. coli into the culture medium. E. coli was cultured,
harvested, and washed (as outlined previously) but re-suspended in 0.5 % NaCl as
opposed to PBS (pH 7.4). E. coli was re-suspended at an absorbance of 0.6 at 420 nm
and 100 µl of the test inoculum was transferred into each well of a 96-well plate. To
each well 100 µl of PAMAM dendrimer (generation 2, 3, 3.5, 4 and 5 at concentrations
of 0.1, 1, 5, 10, 25 and 50 µg/mL were added. Also 10 µl of a 30 mM ortho-nitrophenyl-
β-galactoside (ONPG) (Sigma - Dorset, UK) solution was added to each well. A blank
of E. coli with ONPG without PAMAM dendrimer was used as a negative control and a
vehicle control was also run in parallel.
The production of O-nitrophenol was measured every 2 minutes for 12 minutes
by monitoring the absorbance at 420 nm in a microplate reader (Biotek, Northstar,
Bedfordshire, UK). The optimal time points and duration were determined by a
preliminary assay. The study was repeated 3 times independently and the mean result
including standard deviation of absorbance at 420nm was plotted against the different
time points using GraphPad Prism® version 5 (San Diego, USA). Figure 2.1 illustrates
the hydrolysis of ONPG by β-galactosidase found within the E. coli cytoplasm to form
ortho-nitrophenol once the inner membrane has been permeabilised.

64
Figure 2.1. A reaction schematic showing the formation of O- nitrophenol. The scheme illustrates the hydrolysis of O-nitrophenyl-β-galactoside by cytoplasmic β-galactosidase into O- nitrophenol. The activity of β-galactosidase can be monitored by measuring the presence of the yellow compound O- nitrophenol at 420 nm using a spectrophotometer.
2.2.4 Scanning electron microscopy
S. aureus (ATCC 11832) and E. coli (ATCC8277) were cultured, harvested and
washed (as outlined above). The inoculum however was not resuspended at a lower
density, instead an overnight culture of ~108 cells/mL was used for the study to ensure
that bacterial cells were at a high enough density after the washes involved in electron
microscopy preparation methods. A 200 µl aliquot of a range of concentrations of
dendrimer from 1-200 µg/mL for G2, G3 and G4-PAMAM-NH2 and 0.0025-12.5 µg/mL
for G5-PAMAM-NH2were constituted. For G3.5-PAMAM-COOH dendrimer the
concentration range of solutions made were between 1-250 µg/mL. The PAMAM
dendrimer solutions (200 µl) were added to 200 µl of the bacterial inoculum and
OHOH2C
OH
OH
O
O2N
O
OH OH
OH
HOH2C
+
O2N
OH
+ H2O
galactosidase
- nitrophenyl - - galactosidase
(colourless substrate)
galactose nitrophenol
(yellow in colour)

65
incubated at 37°C ± 1°C for 2 hours and shaken at 200 rpm. After the incubation
period the bacteria were centrifuged at 10,000 x g for 10 mins, resuspended in PBS
(pH 7.4), centrifuged as above and the supernatant discarded. This was repeated 3
times to wash the harvested bacteria. The bacteria were then fixed in 2.5 %
glutaraldehyde in 0.1 M sodium cacodylate buffer (pH 7.4 containing 2mM CaCl2) for 2
hours on a low speed rotator.
Fixative was washed from the bacteria (as described above) in sodium
cacodylate buffer (pH 7.4 containing 2mM CaCl2) 3 times. A 100 µl aliquot of each
fixed sample was added to a poly-L-lysine coated cover slip. Various substrates were
tested including scanning electron microscopy filters (Millipore, Watford, UK) and
pelleted bacteria in sterile 1.5 mL tubes, but it was found that poly-L-lysine cover slips
retained the bacteria most effectively. The bacteria on the poly-L-lysine coated cover
slips were then post-fixed in a solution of 1 % osmium tetroxide in sodium cacodylate
buffer. After a 1 hour contact time the osmium tetroxide was removed by washing the
cover slips in sodium cacodylate buffer (pH 7.4 containing 2 mM CaCl2). The cover
slips were then submerged in 70 % ethanol and dehydrated at 4ºC for 6 days.
The samples were then further dehydrated for ten minutes each in 80 %, 90 %
and 100 % ethanol. To remove the solvent from the samples they were critical-point
dried to replace the 100 % ethanol with liquid CO2 under pressure. This was repeated
3 times to ensure all of the ethanol had been displaced from the samples. The liquid
CO2 was subsequently removed by increasing the temperature to 40ºC and the
pressure until the CO2 vaporised. Samples were securedto a scanning electron
microscope (SEM) stub mount using double-sided carbon tape. Samples were
66
carefully pressed down on to the stub to ensure efficient conductivity. Each sample
was sputtered with gold to ensure an even coating and the samples were then placed
in the high resolution (1.5 nm) field emission SEM (Hitachi, S4500).
2.2.5 Statistical analysis of results
All results within this section are reported as the mean ± SEM (standard error of
the mean). All inner membrane permeabilisation data passed the D’Agostino and
Pearson normality test (α = 0.05) using GraphPad Prism® version 5 (San Diego,
USA).The data obtained within the inner membrane permeabilisation assay was
analysed using a nested mixed model analysis in SPSS® version 19 IBM
corp®(Armonk, NY). The fixed effects were Time within concentration within dendrimer,
dendrimer and then concentration within dendrimer. Firstly the analysis was applied to
the four different generations of PAMAM dendrimer to establish any significant
differences between the inner membrane permeabilisation of E. coli between the four
tested PAMAM dendrimer generations. Then a least significant difference (LSD)
posttest was utilised to establish pairwise comparisons between the PAMAM
dendrimer generations. The output of the nested mixed model analysis also included
the mean absorbance for each concentration across all time points and the
corresponding 95 % confidence intervals. For the data displayed in Figure 2.8 a single
final time point of 60 minutes was chosen therefore a two-way ANOVA with a
Benferroni posttest was used to compare the two variables of dendrimer generation
and dendrimer concentration at that specific time point.

67
2.3 Results
2.3.1 Microdilution broth with viable count assay to determine the inhibitory
concentration (IC50).
The antimicrobial activity of PAMAM dendrimers was evaluated against
S. aureus and E. coli. The inhibitory effect of PAMAM dendrimers was determined by
calculating the IC50 against Gram positive and Gram negative bacteria (Table 2.1). All
of the PAMAM-NH2 dendrimers tested inhibited both strains of bacteria at low
concentrations (<27 μg/mL). Figure 2.2illustrates the percentage inhibition of S. aureus
against 4 generations of PAMAM-NH2 dendrimers at various dendrimer
concentrations. The inhibition curves illustrated in Figure 2.2 were used to calculate
the IC50 values (Figure 2.3). The IC50 values and physicochemical characteristics of
PAMAM dendrimers that may be related to their antimicrobial activity are shown in
Table 2.1. In order to inhibit 50 % of the S. aureus,G2-PAMAM-NH2 dendrimer
required >9 times the concentration that was required for G5-PAMAM-NH2. With
increasing PAMAM generation the concentration required to inhibit 50 % of S. aureus
decreases dramatically (Figure 2.2 and Table 2.1). For the lowest concentrations of
G2-PAMAM-NH2 and G5-PAMAM-NH2 tested, bacterial growth as opposed to
inhibition was observed when compared to the untreated growth control.
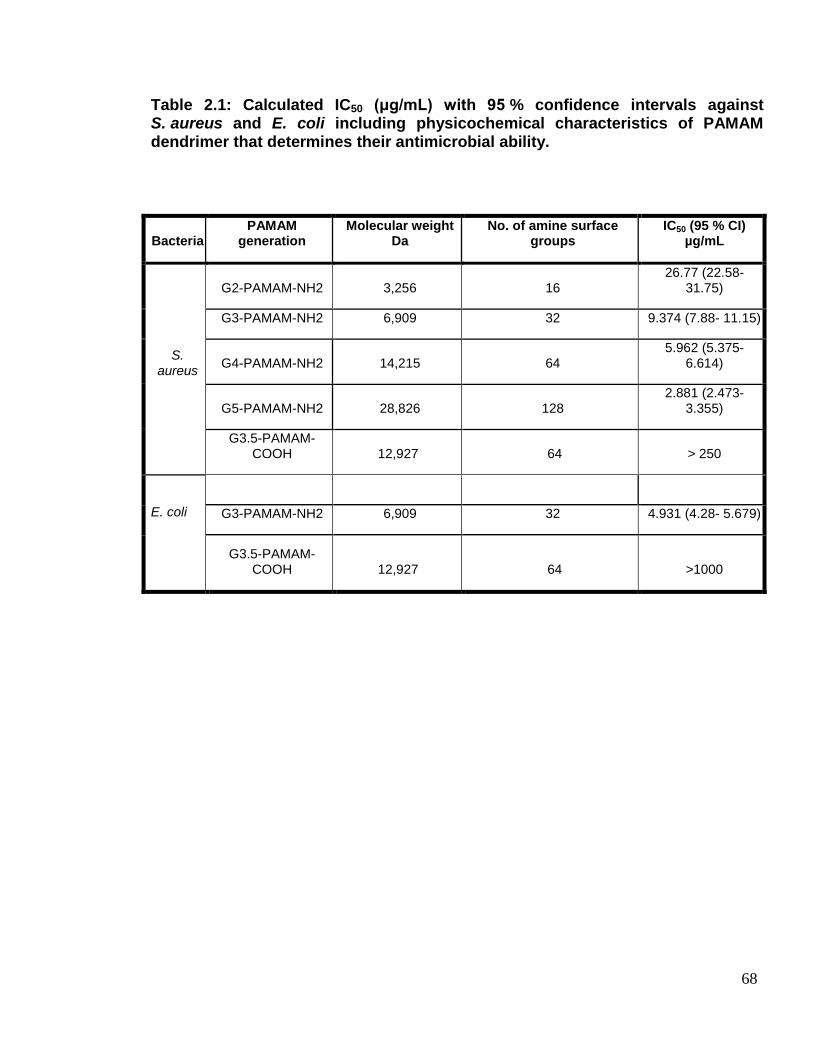
68
Table 2.1: Calculated IC50 (μg/mL) with 95 % confidence intervals against S. aureus and E. coli including physicochemical characteristics of PAMAM dendrimer that determines their antimicrobial ability.
Bacteria PAMAM
generation Molecular weight
Da No. of amine surface
groups IC50 (95 % CI)
µg/mL
S. aureus
G2-PAMAM-NH2 3,256 16 26.77 (22.58-
31.75)
G3-PAMAM-NH2 6,909 32 9.374 (7.88- 11.15)
G4-PAMAM-NH2 14,215 64 5.962 (5.375-
6.614)
G5-PAMAM-NH2 28,826 128 2.881 (2.473-
3.355)
G3.5-PAMAM-COOH 12,927 64 > 250
E. coli
G3-PAMAM-NH2 6,909 32 4.931 (4.28- 5.679)
G3.5-PAMAM-COOH 12,927 64 >1000
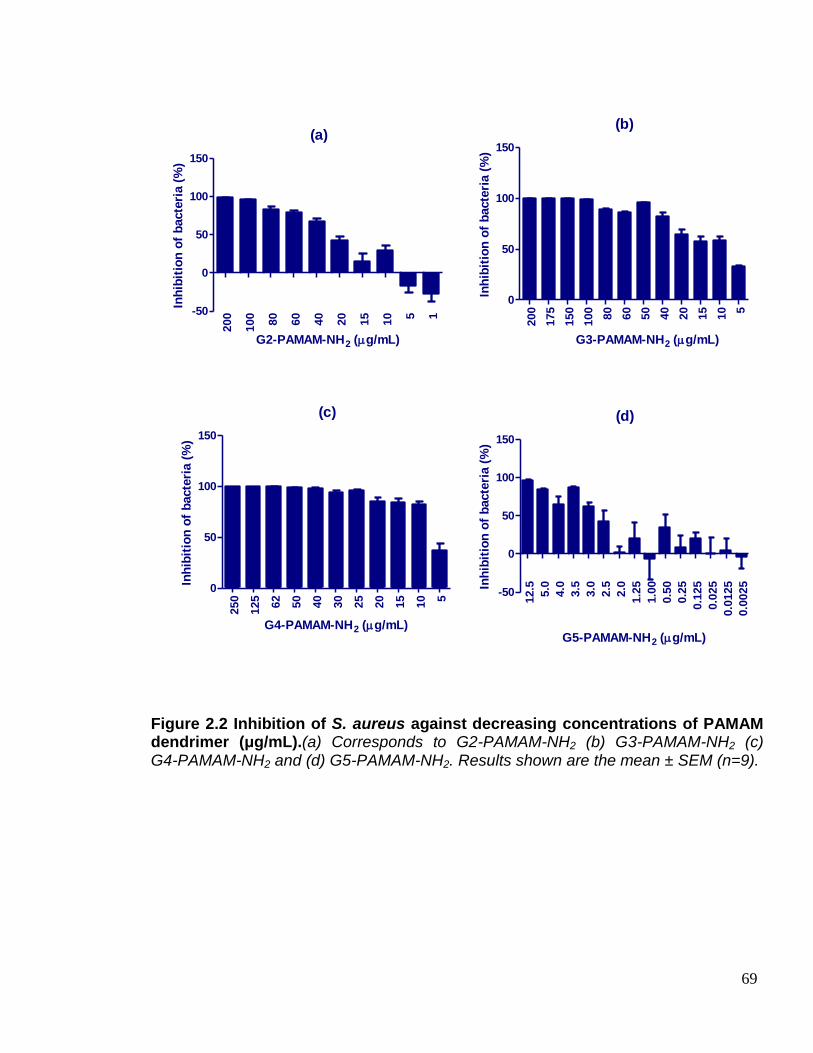
69
(a)
200
100
80
60
40
20
15
10 5 1-50
0
50
100
150
G2-PAMAM-NH2 (g/mL)
Inh
ibit
ion
of
bacte
ria (
%)
(b)
200
175
150
100
80
60
50
40
20
15
10 5
0
50
100
150
G3-PAMAM-NH2 (g/mL)
Inh
ibit
ion
of
bacte
ria (
%)
(c)
250
125
62
50
40
30
25
20
15
10 5
0
50
100
150
G4-PAMAM-NH2 (g/mL)
Inh
ibit
ion
of
bacte
ria (
%)
(d)
12.5
5.0
4.0
3.5
3.0
2.5
2.0
1.2
5
1.0
0
0.5
0
0.2
5
0.1
25
0.0
25
0.0
125
0.0
025
-50
0
50
100
150
G5-PAMAM-NH2 (g/mL)
Inh
ibit
ion
of
bacte
ria (
%)
Figure 2.2 Inhibition of S. aureus against decreasing concentrations of PAMAM dendrimer (μg/mL).(a) Corresponds to G2-PAMAM-NH2 (b) G3-PAMAM-NH2 (c) G4-PAMAM-NH2 and (d) G5-PAMAM-NH2. Results shown are the mean ± SEM (n=9).
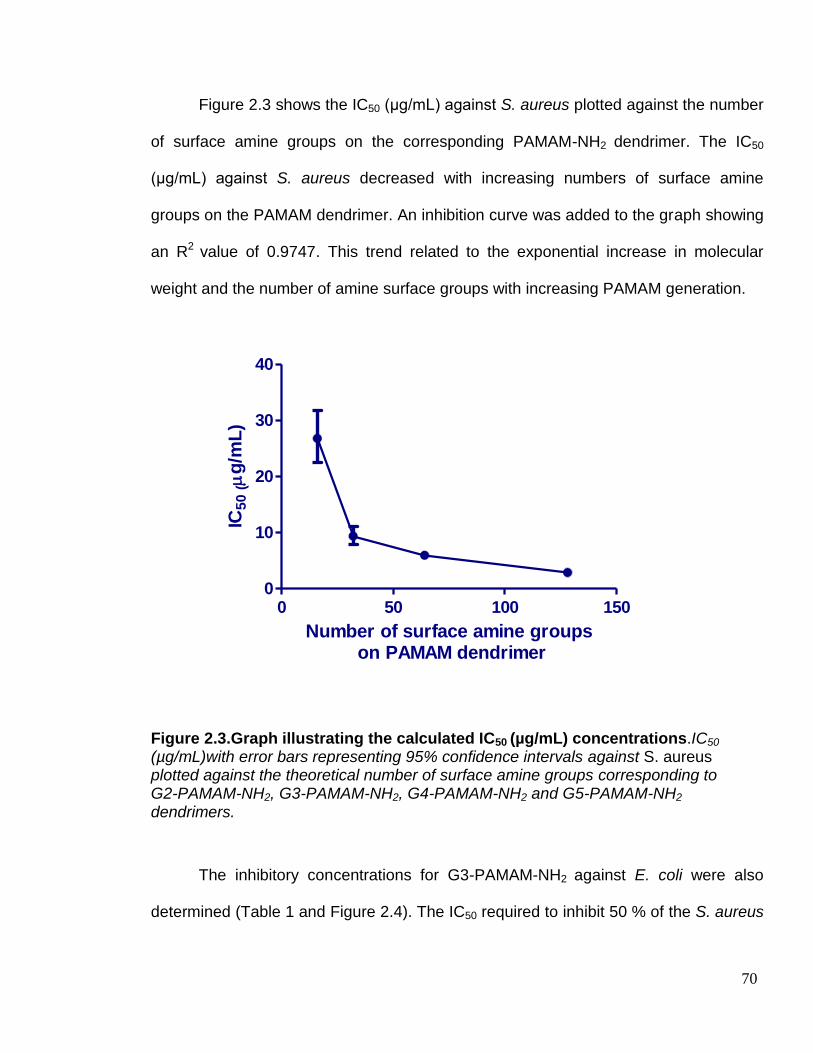
70
Figure 2.3 shows the IC50 (μg/mL) against S. aureus plotted against the number
of surface amine groups on the corresponding PAMAM-NH2 dendrimer. The IC50
(μg/mL) against S. aureus decreased with increasing numbers of surface amine
groups on the PAMAM dendrimer. An inhibition curve was added to the graph showing
an R2 value of 0.9747. This trend related to the exponential increase in molecular
weight and the number of amine surface groups with increasing PAMAM generation.
Figure 2.3.Graph illustrating the calculated IC50 (µg/mL) concentrations.IC50
(µg/mL)with error bars representing 95% confidence intervals against S. aureus plotted against the theoretical number of surface amine groups corresponding to G2-PAMAM-NH2, G3-PAMAM-NH2, G4-PAMAM-NH2 and G5-PAMAM-NH2 dendrimers.
The inhibitory concentrations for G3-PAMAM-NH2 against E. coli were also
determined (Table 1 and Figure 2.4). The IC50 required to inhibit 50 % of the S. aureus
0 50 100 1500
10
20
30
40
Number of surface amine groups on PAMAM dendrimer
IC5
0 (
g/m
L)
71
was ~2 fold higher than the concentration required to inhibit 50 % of the E. coli. The
G3-PAMAM-NH2 antimicrobial activity suggests that it is much more effective against
Gram negative bacteria than Gram positive bacteria in agreement with a previous
paper (Calabretta et al. 2007).
The antimicrobial activity of G3.5-PAMAM-COOH was also determined for each
bacteria, up to a concentration of 1000 μg/mL Figure 5 (a-b). When challenged with
S. aureus the carboxyl-terminated dendrimer inhibited the bacteria but the IC50 could
not be calculated. The inhibition varied from 10 % up to 40 % depending on the
G3.5-PAMAM-COOH concentration; the results produced were highly variable. The
results indicate that, to achieve an IC50 against S. aureus the concentration of
G3.5-PAMAM-COOH would have to be in excess of 250 μg/mL. Figure 5 (b) shows
the inhibition curve of G3.5-PAMAM-COOH challenged against E. coli.
At all concentrations tested the treated bacteria demonstrated growth as
opposed to inhibition when compared to the untreated control. It is for this reason that
the IC50 for G3.5-PAMAM-COOH challenged against E. coli could not be calculated as
it exceeds the highest concentration tested,1mg/mL.

72
Figure 2.4.Inhibition of E. coli challenged against decreasing concentrations of G3-PAMAM-NH2 dendrimer (μg/mL). Results shown are the mean ± SEM (n=9).
50
0
25
0
10
0
80
60
40
20
10 5 1
0
50
100
150
Concentration of G3-PAMAM-NH2 (g/mL)
Inh
ibit
ion
of
bacte
ria (
%)

73
Figure 2.5.Inhibition of G3.5-PAMAM-COOH dendrimer (μg/mL) against S. aureus and E. coli.(a) S. aureus against decreasing concentrations of G3.5-PAMAM-COOH dendrimer (μg/mL). Results shown are the mean ± SEM (n=9) as a consequence of three independent experiments. (b) E. coli challenged against decreasing concentrations of G3.5-PAMAM-COOH dendrimer (μg/mL). Results shown are the mean ± SEM (n=3).
1000 500 250 100 80 60 40 20 10 5 1
-300
-200
-100
0
100(b)
G3.5-PAMAM-COOH concentration (g/mL)
Inh
ibit
ion
of
bacte
ria (
%)
25
0.0
12
5.0
50
.0
37
.5
25
.0
12
.5
5.0
2.5
1.0-40
-20
0
20
40
60
(a)
G3.5-PAMAM-COOH concentration (g/mL)
Inh
ibit
ion
of
bacte
ria (
%)
74
2.3.2 Membrane integrity study
The release of intracellular nuclear material was measured for two
Gram-positive staphylococcal species including the resident skin microbe,
S. epidermidis and the Gram negative gut microbe, E. coli after being challenged with
5 times the calculated IC50 of G3-PAMAM-NH2 dendrimer. For all three bacterial
strains, the absorbance at 260 nm increased with time with a plateau at 80 minutes for
S. aureus (Figure 2.6 (a)) and 100 minutes for both S. epidermidis (Figure 2.6 (b)) and
E. coli (Figure 2.6 (c)) respectively. The absorbance increase for S. aureus showed a
sigmoidal relationship when plotted against time whereas with the absorbance for
S. epidermidis increased monotonically up to a plateau at 100 minutes. E. coli showed
a dramatic increase in absorbance over the first 60 minutes, a slight decrease in
absorbance at 80 minutes but increased to the highest absorbance reading taken
across all stains tested at 100 minutes.

75
Figure 2.6.Graphs illustrating the release of nuclear material from S.aureus, S. epidermidis and E. Coli. (a) Absorbance at 260 nm plotted against time for S. aureus challenged against G=3 x 5 IC50. (b) Absorbance at 260 nm plotted against time for S. epidermidis challenged against G=3 x 5 IC50. (c) Absorbance at 260 nm plotted against time for E. coli challenged against G=3 x 5 IC50. All results are displayed as (n=3) mean ± standard deviation. Negative control was the absorbance at 260 nm for the untreated bacteria group.
0
20
40
60
80
10
0
12
0
14
0
-0.01
0.00
0.01
0.02
0.03G3-PAMAM-NH2 dendrimer
Negative control
(a)
Time (min)
Ab
so
rban
ce (
260 n
m)
50 100 150
-0.02
0.00
0.02
0.04
0.06
0.08G3-PAMAM-NH2 dendrimer
Negative control
(b)
Time (min)
Ab
so
rban
ce (
260 n
m)
0 50 100 1500.00
0.02
0.04
0.06
0.08
0.10 G3-PAMAM-NH2 dendrimer
Negative control
(c)
Time (min)
Ab
so
rban
ce (
260 n
m)
76
2.3.3 Inner membrane permeabilisation assay
The inner membrane integrity of E. coli was determined chromogenically. E. coli
contains the enzyme β-galactosidase within the cytoplasm of the cell; if the integrity of
the inner membrane is compromised the β-galactosidase would be released from the
cytoplasm into the culture medium where it would hydrolyse the substrate
β-galactosidase (ONPG) into O- nitrophenol (Figure 2.1). The E. coli was added to
wells containing the chromogenic substrate ONPG and various concentrations of
PAMAM dendrimer. The production of O- nitrophenol was determined by measuring
the change in absorbance at 420 nm over time (Je and Kim, 2006). Due to the
possibility of substrate depletion, the measurements were taken within the first 12
minutes of PAMAM-bacteria contact (Silvestro et al. 2000). It was found that the
absorbance reached a plateau at around 20 minutes (data not shown).
A mixed model analysis of the data presented in Figure 2.7 illustrated a
significant difference in the inner membrane of permeabilisation of E. coli overall
between all four PAMAM-NH2dendrimers tested (F=79.8 (3, 1708) p<0.001). The
mean absorbance at 420 nm for G2-PAMAM-NH2, G3-PAMAM-NH2, G4-PAMAM-NH2,
and G5-PAMAM-NH2 was 0.222 (95 % CI: 0.221-0.224) 0.228 (95 % CI: 0.227-0.230),
0.228 (95 % CI: 0.226-0.229) and 0.214 (95 % CI: 0.213-0.216) respectively. An ad
hoc LSD test (pairwise comparisons of absorbance) revealed that there was a
significant difference in absorbance and thus inner membrane permeability between all
PAMAM dendrimers tested (df 1708, p<0.001) with the exception of G3-PAMAM-NH2

77
when compared to G4-PAMAM-NH2 in which no statistical significance was observed
between the two.
For G2-PAMAM-NH2 both concentration and time had an effect of the
absorbance at 420 nm and thus the inner membrane permeability of E. coli. Time had
a significant effect on the absorbance at 420 nm for all concentrations (df 427, for
1 µg/mL p<0.05 for concentrations 5-50 µg/mL p<0.001) with the exception of the
vehicle control containing no PAMAM dendrimer and the lowest concentration tested,
0.1 µg/mL. A pairwise comparison of the absorbance for each concentration of
G2-PAMAM-NH2 dendrimer found that all concentrations were statistically different
form the vehicle control (df 427, p<0.001) with the exception of 1 µg/mL. Further, all
concentrations were different from each other (df 427, p<0.001). Interestingly,
0.1 µg/mL was significantly different from vehicle control but 1 µg/mL was not. This
was because the mean absorbance of the vehicle control was 0.174 (95 %
CI: 0.170-0.178) however the mean absorbance for 0.1 µg/mL G3-PAMAM-NH2
dendrimer was much lower at 0.165 (95 % CI: 0.161-0.169). This trend of the vehicle
control having a higher absorbance than 0.1 µg/mL of PAMAM dendrimer was
observed across all generations tested.
For G3-PAMAM-NH2 dendrimer again time and concentration had a significant
effect on the absorbance at 420 nm. Time had a significant effect on the absorbance
at all concentrations (df 427, p<0.05 for a concentration of 1 µg/mL and p<0.001for
concentrations 5-50 µg/mL) with the exception of the vehicle control and again the
lowest concentration of the G3-PAMAM-NH2 dendrimer tested- 0.1 µg/mL. All
G3-PAMAM-NH2 concentrations were statistically different from one another and the

78
vehicle control (df 427, p<0.001) with the only exception being again, 1 µg/mL when
compared to the vehicle control. For G4-PAMAM-NH2 dendrimer, time had a significant
effect (df 427, p<0.001) on concentrations 5-50 µg/mL only and not at the lower
concentrations or the vehicle control. When comparing the concentration effects for
G4-PAMAM-NH2 dendrimer on the absorbance, all concentrations were significantly
different from one another (df 427, p<0.001) with the exception of the vehicle control,
0.1 and 1 µg/mL when compared to each other. For the G5-PAMAM-NH2 dendrimer
time had a significant effect on the absorbance at all concentrations (df 427, p<0.05 for
1 µg/mL and p<0.001 for 5-50 µg/mL) with the exception of the vehicle control and the
lowest concentration of 0.1 µg/mL.
After comparing the absorbance of all concentrations against each other and
the vehicle control there was a definite concentration dependency on the inner
membrane permeabilisation (df 427, p<0.05 when the vehicle control was compared to
1 µg/mL and p<0.001 for all other concentrations). The only exception was when the
absorbance for the concentrations 0.1 and 1.0 µg/mL of G5-PAMAM-NH2 dendrimer
was compared where no statistical difference was observed.
The inner membrane permeabilisation and thus production ofO-nitrophenol,
increased with increasing concentrations of the PAMAM dendrimer and with time
(Figure 2.7). For all four PAMAM-NH2 dendrimer generations tested, a concentration
as low as 5 μg/mL exhibited permeabilisation of the inner membrane at 12 minutes
(Figure 2.7). The production of O-nitrophenol was significantly different (p<0.001)
across the four PAMAM generations tested. The highest concentration tested
(50 μg/mL) demonstrated the highest increase in absorbance therefore inducing the
79
highest degree of inner membrane permeabilisation. The exception to this was the
G5-PAMAM-NH2 dendrimer. At a particular time point of 4-10 minutes, 25 μg/mL
solution of G5-PAMAM-NH2 dendrimer showed a higher absorbance at 420 nm and
thus O- nitrophenol production than at a 50 μg/mL concentration. G5-PAMAM-NH2
dendrimer also demonstrated a longer lag period for absorbance increase at 420 nm.
The trend observed, with respect to decreasing absorbance (based on the
mean across all time points for a specific concentration) was G2>G3>G5>G4 for
PAMAM concentrations of 5 μg/mL. At a higher dendrimer concentration of 50 μg/mL
the absorbance measurement trend in decreasing order was G3>G4>G2>G5. A
measurement was taken at 60 minutes to determine a final measurement
ofO-nitrophenol production (Figure 2.8).A two-way ANOVA with a Bonferroni post-test
was used to investigate the relationship between dendrimer generation and
concentration in O-nitrophenol production at a 60 minute time point. There was a
significant difference between the absorbance at 60 minutes for each dendrimer
generation tested (F=460.8, df 4,p<0.001) and also between the different
concentrations tested (F=1133, df 5,p<0.001). A Bonferroni posttest compared the
different PAMAM dendrimer generations at different concentrations. It was established
that even after 60 minutes there was no change in absorbance was observed for
concentrations below 5 μg/mL (p>0.05). There was significant difference in
absorbance when comparing all concentrations of each PAMAM generation to the
vehicle control (p<0.001) with the exception of 0.1 and 1 μg/mL of PAMAM dendrimer.
When the different PAMAM dendrimer generations were compared at various

80
concentrations there was no observed difference between generation 3 and
generation 5 dendrimer at all concentrations.
A generation effect was also confirmed when comparing the absorbance at
420 nm of various PAMAM dendrimer generations over 12 minutes (Figure 2.9). At a
dendrimer concentration of 10 μg/mL, the absorbance increase is very similar across
all generations tested with the exception of G5-PAMAM-NH2 showing a lag phase over
the first 8 minutes of the assay (Figure 2.9 (a)). At the higher concentration of
50 µg/mL (Figure 2.9 (b)) the absorbance reading was spread and the lag time of
G5-PAMAM-NH2 was more pronounced.

81
Figure 2.7.Graphs illustrating the relationship between concentration, time and dendrimer generation on the inner membrane permeabilisation of E. coli. Absorbance at 420 nm plotted against time in minutes for a range of dendrimer concentrations (0.1- 50 μg/mL). (a) corresponds to G2-PAMAM-NH2 treated E. coli, (b) G3-PAMAM-NH2 treated E. coli, (c) G4-PAMAM-NH2 treated E. coli and (d) G5-PAMAM-NH2 treated E. coli. Vehicle control is displayed as the untreated control group. All results shown represent the mean ± SEM (n=9) as a result of 3 independent experiments.
(b)
0.5 2 4 6 8 10 12
0.0
0.1
0.2
0.3
0.4
0.5vehicle control
0.1
1
5
10
25
50
Time (min)
Ab
so
rba
nc
e a
t 4
20
nm
g/mL
(a)
0.5 2 4 6 8 10 12
0.0
0.1
0.2
0.3
0.4vehicle control
0.1
1
5
10
25
50
g/mL
Time (min)
Ab
so
rba
nc
e a
t 4
20
nm
(d)
0.5 2 4 6 8 10 12
0.0
0.1
0.2
0.3
0.4
0.5vehicle control
0.1
1
5
10
25
50
Time (min)
Ab
so
rba
nc
e a
t 4
20
nm
g/mL
(c)
0.5 2 4 6 8 10 12
0.0
0.1
0.2
0.3
0.4
0.5vehicle control
0.1
1
5
10
25
50
Time (min)
Ab
so
rban
ce a
t 420 n
m
g/mL
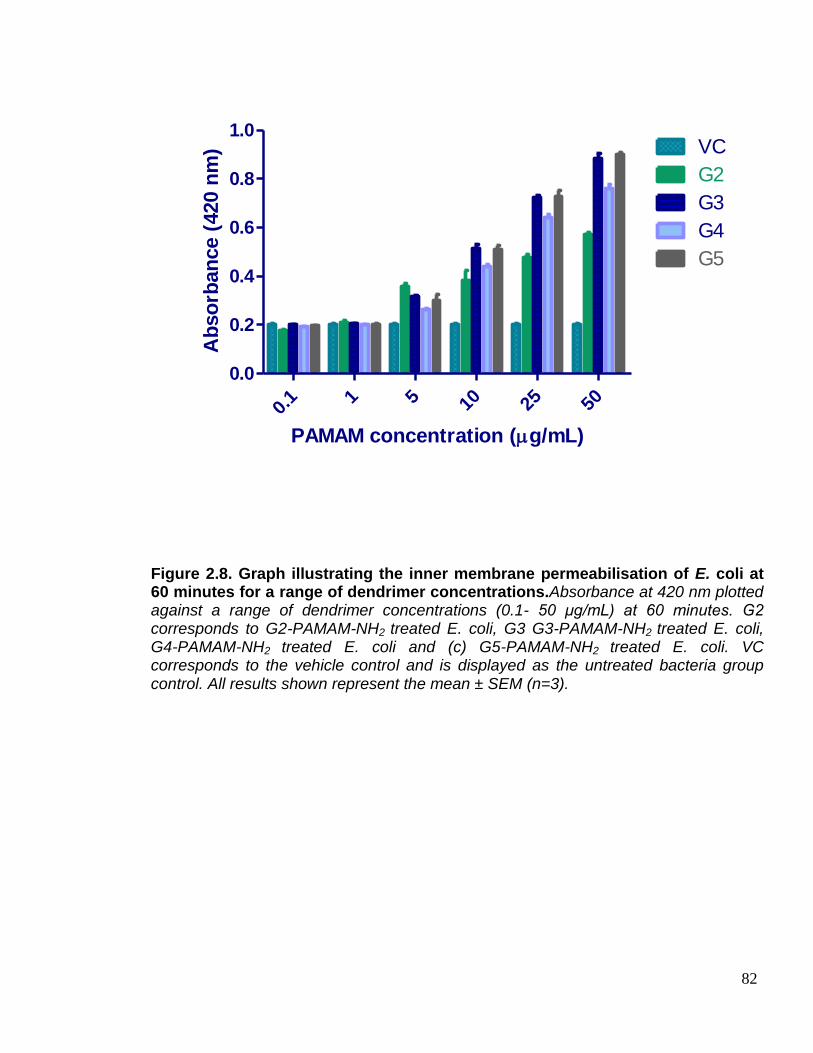
82
Figure 2.8. Graph illustrating the inner membrane permeabilisation of E. coli at 60 minutes for a range of dendrimer concentrations.Absorbance at 420 nm plotted against a range of dendrimer concentrations (0.1- 50 μg/mL) at 60 minutes. G2 corresponds to G2-PAMAM-NH2 treated E. coli, G3 G3-PAMAM-NH2 treated E. coli, G4-PAMAM-NH2 treated E. coli and (c) G5-PAMAM-NH2 treated E. coli. VC corresponds to the vehicle control and is displayed as the untreated bacteria group control. All results shown represent the mean ± SEM (n=3).
0.1 1 5 10 25 50
0.0
0.2
0.4
0.6
0.8
1.0VC
G2
G3
G4
G5
PAMAM concentration (g/mL)
Ab
so
rban
ce (
420 n
m)

83
Figure 2.9.Graphs illustrating the effect of dendrimer generation and time at specific concentrations on the inner membrane permeabilisation of E. coli. Absorbance at 420 nm plotted against time in minutes, (a) corresponds to each PAMAM generation at a concentration of 10 μg/mL challenged against E. coli, and (b) PAMAM generations at a concentration of 50 μg/mL challenged against E. coli. VC corresponds to the vehicle control and was displayed as the untreated bacteria group control. All results shown represent the mean ± SEM (n=9) as 3 independent experiments were conducted.
(b)
0.5 2 4 6 8 10 12
0.0
0.1
0.2
0.3
0.4
0.5PAMAM G-2-NH2
PAMAM G-3-NH2
PAMAM G-4-NH2
PAMAM G-5-NH2
vehicle control
Time (min)
Ab
so
rban
ce (
420 n
m)
(a)
0.5 2 4 6 8 10 12
0.0
0.1
0.2
0.3
0.4PAMAM G-2-NH2
PAMAM G-3-NH2
PAMAM G-4-NH2
PAMAM G-5-NH2
vehicle control
Time (min)
Ab
so
rban
ce (
420 n
m)

84
2.3.4 Scanning electron microscopy
The SEM images (Figure 2.10) highlight the membrane effects of PAMAM
dendrimers particularly with regards to the cocci-shaped S. aureus. Figure 2.10 (a-b)
shows that there was cytoplasmic debris around the untreated control however this
may have been a result of the SEM preparation process. When compared to the
G3-PAMAM-NH2 at a concentration of 5 times theIC50 (µg/mL) varying degrees of
membrane damage was observed from minor blebbing through to total destruction of
the cell membrane (Figure 2.10 (c-d)). This was also found to be the case with
G2-PAMAM-NH2 (Figure 2.10 (e-f)) and G5-PAMAM-NH2 (Figure 2.10 (g-h)). The SEM
images demonstrate the ability for G2-PAMAM-NH2 and G5-PAMAM-NH2 to cause
severe bacterial cell membrane damage including blebbing of cytoplasmic contents
from damaged cell membrane and complete cell lysis. Sheets of bacterial cell wall and
cytoplasmic content debris can be observed in the PAMAM treated bacteria images
(Figure 2.10 (a-h)). For G3.5-PAMAM-COOH at a concentration of 1 mg/mL (Figure
2.10(i-j)) there is no difference in bacterial cell morphology or changes to the integrity
of the bacterial cell membrane when compared to the untreated S. aureus group. The
damage to the S. aureus cell membrane and thus leakage of cytoplasmic contents
observed in the collected SEM images further supports the results determined in the
membrane integrity study see Section 2.3.2.
SEM images were also collected for the Gram negative, bacillus-shaped E. coli
bacteria. Figure 2.11 (a-b) shows the intact PAMAM untreated group micrographs.
Figure 2.11 (c-d) illustrates the G3-PAMAM-NH2 treated group. Damage to the
bacterial wall and cell membranes can be observed due to leakage and blebbing and

85
leakage of the cytoplasmic contents from the cell. The PAMAM dendrimer typically
targeted the polar regions of the E. coli rods; this effect can also be observed
elsewhere (Wang et al. 2010). Again, no changes in cell morphology were observed
for the G3.5-PAMAM-COOH at a concentration of 1 mg/mL. The damage caused by
the G3-PAMAM-NH2 dendrimer to the E. coli is consistent with the results of the
membrane integrity study in Sections 2.3.2 and the inner membrane permeabilisation
results in 2.2.3.
Figure 2.10.Scanning electron micrographs of S. aureus challenged with PAMAM dendrimer. (a) Represents untreated S. aureus at a magnification of x25k, scale bar represents 1.2 μm. (b) illustrates untreated S. aureus at a magnification of x30k, scale bar represents 1 μm. (c) S. aureus treated with G3-PAMAM-NH2 at a concentration of 5x calculated IC50 from section 2.3.1. magnification x30k and scale bar represents 1 μm. (d) S. aureus treated with G3-PAMAM-NH2 at a concentration of 5x calculated IC50 from section 2.3.1. magnification x30k and scale bar represents 1 μm.
a b
c d
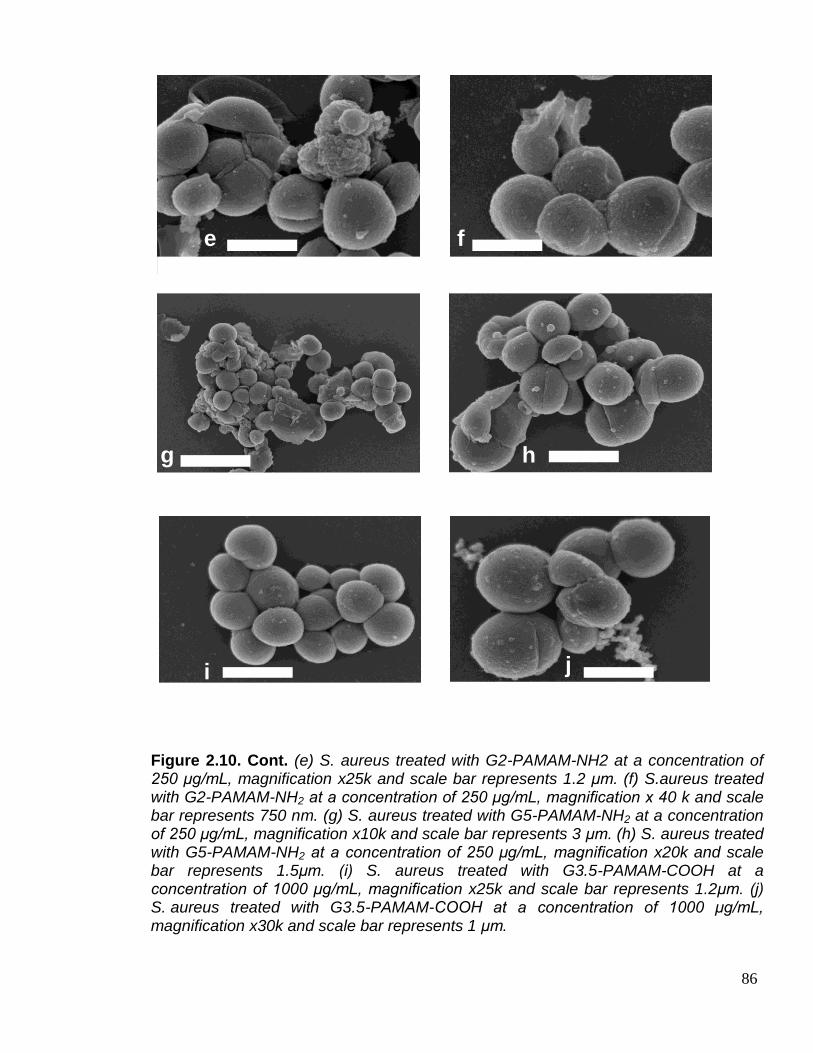
86
Figure 2.10. Cont. (e) S. aureus treated with G2-PAMAM-NH2 at a concentration of 250 μg/mL, magnification x25k and scale bar represents 1.2 μm. (f) S.aureus treated with G2-PAMAM-NH2 at a concentration of 250 μg/mL, magnification x 40 k and scale bar represents 750 nm. (g) S. aureus treated with G5-PAMAM-NH2 at a concentration of 250 μg/mL, magnification x10k and scale bar represents 3 μm. (h) S. aureus treated with G5-PAMAM-NH2 at a concentration of 250 μg/mL, magnification x20k and scale bar represents 1.5μm. (i) S. aureus treated with G3.5-PAMAM-COOH at a concentration of 1000 μg/mL, magnification x25k and scale bar represents 1.2μm. (j) S. aureus treated with G3.5-PAMAM-COOH at a concentration of 1000 μg/mL, magnification x30k and scale bar represents 1 μm.
e f
g h
i j

87
Figure 2.11.Scanning electron micrographs of E. coli challenged with PAMAM dendrimer.(a) E. coli untreated magnification x10 k scale bar scale bar represents 3 μm. (b) E. coli untreated magnification x40 k scale bar scale bar represents 750 nm. (c) E. coli treated G3-PAMAM-NH2 at a concentration of 5x calculated IC50 as determined in Section 2.3.1, magnification x15 k and scale bar represents 2 μm. (d) E. coli treated G3-PAMAM-NH2 at a concentration of 5x calculated IC50 as determined in Section 2.3.1, magnification x 50 k and scale bar represents 1 μm. (e) E. coli treated with 1000 μg/mL of G3.5-PAMAM-COOH magnification x15 k scale bar 2 μm. (f) E. coli treated with 1000 μg/mL of G3.5-PAMAM-COOH magnification x30 k scale bar 1. μm.
a b
c d
e f

88
2.4 Discussion
Although PAMAM dendrimers are biocidal there have been very few PAMAM
dendrimers that have been tested for antimicrobial activity hence the rationale for this
study. In order to develop more efficacious antimicrobial dendrimers it is of paramount
importance to determine the antimicrobial properties of a range of PAMAM dendrimers
including lower and higher generations and amine and carboxyl terminated groups. A
modified broth microdilution assay with a viable count was used to determine the
surviving bacterial numbers (Calabretta et al. 2007) after exposure to a range of
generations of PAMAM-NH2 and PAMAM-COOH. A modification to the growth media
was made to incorporate CLSI standardized growth media and a viable count assay
was performed for an accurate measurement of surviving bacterial numbers (Rennie,
2001).
Typically the number of surviving bacteria is measured by reading the
absorbance of each well (Zgoda and Porter, 2001), however the optical density
depends on the shape, strain and growth stage of the bacteria; it also takes into
account live and recently dead bacteria (Koch, 1994). After testing both methods it
was decided that a viable count, though laborious, was much more accurate. It was
found that after mixing the PAMAM dendrimer into the bacterial suspension a pellet
formed on the bottom of each test well and therefore an accurate optical density
measurement could not be taken.
Two skin pathogens, S. aureus and E. coli were tested against various
concentrations of PAMAM dendrimers. S. aureus and particularly its meticillin-resistant

89
counterpart, is a well recognised nosocomial pathogen that causes skin and soft-tissue
infections notably within immuno-compromised patients (Frazee et al. 2005, Leyden et
al. 2006 and Miller et al. 2007). The skin pathogen S. aureus is known to release a
number of pathogenic toxins including exfoliative toxin A that is the causative agent of
bullous impetigo and scalded skin syndrome (Amagai et al. 2000). E. coli is a
Gram-negative gut pathogen that can also be considered as a transient skin pathogen.
The microorganism was utilised as it has been shown to be transmitted from skin to
surfaces and vice versa resulting in the transmission of infections to
immune-compromised patients (Fryklundet al. 1995).
The calculated IC50values are shown in Table 2.1 along with the generation,
molecular weight and number of theoretical amine surface groups. A clear, generation-
dependent trend was observed when the IC50 of each PAMAM generation were plotted
against their respective theoretical number of surface amine groups. The term
‘theoretical’ is used as the PAMAM dendrimers were used as purchased and
occasionally structural defects can occur within the PAMAM dendrimer due to the
incompletion of the Michaél reaction in the divergent synthesis process (Liuand
Fréchet, 1999). Despite the possibility of structural defects, PAMAM dendrimers are
widely accepted as being uniform, monodispersed polymers and have been
characterized by a range of techniques including AFM (Li et al. 2000), MALDI-ToF
mass spectrometry (Peterson et al. 2003) and zone capillary electrophoresis (Peterson
et al. 2001).
There was an inverse correlation between the IC50 concentration and PAMAM
dendrimer generation (as shown in Figure 2.3). G2-PAMAM-NH2 that terminates in

90
18 amine groups required a ~10x higher concentration than G5-PAMAM-NH2 with
128 surface amine groups to inhibit 50 % of the bacteria. It was found that by
increasing the number of amine groups on the dendrimer surface the concentration
required to inhibit 50 % of the bacteria dramatically decreased. Enhanced
destabilization of bacterial membranes has been observed by increasing the number
of amino groups on a polycation (Katsu et al. 2002).
This, generation-dependent, trend observed was contrary to the findings
elsewhere in Lopez et al. 2009. The authors determined the minimum inhibitory
concentration (MIC) using a broth microdilution assay and after re-suspension of the
formed pellet in each well the optical density was used to determine the surviving
bacterial numbers. They found that the MIC for G3-PAMAM-NH2 and G5-PAMAM-NH2
against S. aureus was identical at 12.5 μg/mL. A distinction in MIC value for two
different PAMAM generations against P.aeruginosa as G3-PAMAM-NH2 and
G5-PAMAM-NH2 exhibited a MIC of 6.3 μg/mL and 12.5 μg/mL respectively. The
authors suggest the difference is due to the G3-PAMAM-NH2 dendrimer’s ability to
penetrate the cell more easily due to a lower molecular weight compared to
G5-PAMAM-NH2. One would assume that if the molecular weight was preventing the
penetration of the PAMAM dendrimer into the cell membrane of E. coli the same affect
would be observed for the penetration into the cell membrane of S. aureus. The MIC
values determined do not correlate to the calculated IC50 values determined in section
2.3.1 as MIC represents the lowest inhibitory concentration as exhibited by a sharp
decrease in absorbance whilst IC50 determines the concentration required to kill 50 %
91
of the bacteria. The two different mechanisms of defining the antimicrobial effect of
PAMAM dendrimers have shown opposing trends.
Another trend apparent from the results is that PAMAM dendrimers are more
effective against Gram-negative bacteria such as E. coli as shown in Table 2.1 Section
2.3.1. This has been noted elsewhere asG4-PAMAM-NH2 exhibited a higher biocidal
affect against P. aeruginosa than against the Gram-positive S. aureus (Calabretta et
al. 2007). E. coli is Gram-negative and has a very different cell wall structure and
composition compared to Gram-positive S. aureus. The main barrier to the ingress of
biocides is the outer membrane which for E. coli is exterior to a thin peptidoglycan
layer and the outer cell membrane. The outer membrane consists of
lipopolysaccharide (LPS), phospholipids and proteins (Nikaido, 1996). LPS carries a
high anionic charge at physiological pH due to the ionisable phosphoryl and carboxyl
groups (Beveridge, 1999). The polycationic nature of PAMAM dendrimers would
ensure high reactivity and affinity for the outer membrane due to strong electrostatic
forces. The high degree of interaction and disruption of the lipid bilayer of the outer
membrane with the polycationic PAMAM dendrimer is one possible explanation for the
enhanced antimicrobial efficacy observed for Gram negative bacteria in Section 2.3.1
and for G5-PAMAM-NH2tested against P. aeruginosa in Calabretta et al. (2007).
Previously PAMAM dendrimers have been shown to form nano-holes within the
lipid bilayer causing membrane permeabilisation and leakage of cytoplasmic contents
however the effect was transient and the membrane integrity returned on removal of
the G5-PAMAM-NH2 dendrimer (Hong et al. 2004 and Hong et al. 2006). Further other
polycationic compounds such as chitosan have been shown to disrupt and

92
permeabilise the outer membrane resulting in loss of barrier function (Helander et al.
2001).
Gram positive bacteria such as S. aureus do not have a protective outer
membrane but rather a dense cross-linked peptidoglycan layer with threads of anionic
teichoic acids consisting of repeating units of glycerol phosphate, glucosyl phosphate
and ribitol phosphate (Silhavy et al. 2010). The peptidoglycan layer is a dense mesh
network that is around 30 nm in thickness (Shockman and Barren, 1983). It regulates
the ingress of nutrients, controls stabilizing cations and offers protection from
antibiotics whilst maintaining osmotic pressure (Campbell et al. 2012).The sheer
thickness and density of the polyanionic mesh would offer the microorganism a degree
of protection from the penetration of PAMAM dendrimers. Though teichoic acids carry
a lesser anionic charge than LPS (Beveridge, 1999) they still confer a continuum
anionic charge across the bacterial cell wall resulting in an electrostatic attraction
between the Gram positive bacteria and the polycationic PAMAM dendrimers. The
difference in antimicrobial efficacy observed for Gram positive and Gram negative
bacteria is explained by their distinctive cell wall compositions.
Surprisingly, at the lower concentrations tested for G2-PAMAM-NH2 and
G5-PAMAM-NH2 PAMAM dendrimers, the number of bacteria was higher than in the
growth control. This could be due to the polycationic PAMAM dendrimer displacing the
membrane stabilizing cations (Ca2+ and Mg2+) and replacing them ensuring
stabilization of the cell membrane(Chen and Cooper, 2002). This
replacement-stabilization effect has been observed for ethylenediamine and other
polycations (Katsu et al. 2002). This is interesting as ethylenediamine is a key
93
component of PAMAM dendrimers and is even the compound at the focal core. For
G3.5-PAMAM-COOH the IC50 values for each microorganism are of a higher
concentration than those tested in section 2.3.1. The carboxyl terminated dendrimer
did inhibit S. aureus at most concentrations but the dendrimer did not inhibit 50 % of
the bacteria, even at a concentration of 250 μg/mL therefore it is likely that a much
higher concentration is required (Figure 2.5). Against E. coli the carboxyl terminated
dendrimer surprisingly enhanced the growth of bacteria when compared to the growth
control. This may be due to the growth control being inhibited by some means during
the experiment; further replicates would have to be conducted to confirm the observed
effect. Wang et al. (2010) tested G3.5-PAMAM-COOH’santimicrobial affect against
E. coli and found that very high concentrations of 6.25-100 mg/mL were required to
inhibit E. coli.
It is imperative to establish the mechanism of action of novel antimicrobial
compounds in order to fully exploit biocides, discover new bacterial targets, and
develop innovative biocidal strategies and to give an insight into possible mechanisms
of resistance. As the IC50 values calculated in Section 2.3.1 illustrate differing efficacies
for various PAMAM generations against Gram positive and Gram negative bacteria, it
was thought likely that the target for antimicrobial action is the cell membrane. The
cytoplasmic membrane is the target for most polycationic biocides resulting in
destabilization, leakage of cytoplasmic contents and precipitation of cytoplasm (Ikeda
et al. 1986, Ioannou et al. 2007 and Liu et al. 2004). Moreover, cytoplasmic membrane
disruption has been observed for quaternary ammonium functionalized poly(propylene
imine) dendrimers against both Gram positive and Gram negative bacteria (Chen and

94
Cooper, 2002). With regards to establishing interactions with the cytoplasmic
membrane, it appears that only G4-PAMAM-NH2 has been analysed against one strain
of bacteria, E. coli (Wang et al. 2010).
To assess as to whether PAMAM dendrimers impair the integrity of the
cytoplasmic contents of Gram positive and Gram negative bacteria, the leakage of
intracellular components was monitored over time. At bacteriostatic concentrations,
destabilization of the cytoplasmic membrane causes the loss of small ions such as
potassium and phosphate, and this affect is reversible. At bactericidal concentrations
leakage of DNA, RNA and other cytoplasmic contents over time occurs resulting in
either inhibition or cell death (Chen and cooper, 2002 and Joswick et al. 1971). The
cytoplasmic material that is released into the supernatant over time absorbs at 260 nm
and can therefore be measured to determine the membrane integrity. The results
indicate that G3-PAMAM-NH2 causes intracellular components to leak from S. aureus,
S. epidermidis and E. coli within a very short time frame of 20 minutes. The integrity of
the cytoplasmic membrane for all three bacterial strains is diminished with an increase
in 260 nm absorbing material detected within the first 80 minutes of the assay. At 80
minutes for the Staphylococci species and 100 minutes for the E. coli a plateau was
reached. This is indicative that precipitation and coagulation of nucleotides with the
high concentration of PAMAM dendrimer had occurred that has been observed with
other cations (Hugo and Longworth, 1964).
A differing profile of 260 nm absorbing material release was observed for each
bacterial strain. S. aureus and S. epidermidis resulted in an immediate release of
cytoplasmic material up to 80 minutes where a plateau was reached. For E. coli there

95
was a rapid release of cytoplasmic material up to 40 minutes and then a gradual
release from 40-120 minutes. This trend is analogous to the intracellular contents
release profile observed when S. aureus and E.coli was challenged with the
polycation, chitosan acetate (Liu et al. 2004). E. coli resulted in the highest recorded
absorbance that is in line with the increased antimicrobial efficacy of the
G3-PAMAM-NH2 against E. coli determined in Section 2.3.1. The differing release
profiles for Gram negative and Gram positive bacteria is due to the dissimilarity in the
cell wall structure and composition that the biocide must first penetrate before access
to the cytoplasmic membrane. These distinctions have been outlined in Section 2.3.1.
The results of the membrane integrity test suggest that the biocidal activity of
PAMAM dendrimers occurs over a very short time period of 80 minutes. The
intracellular release profiles are indicative of an antimicrobial compound that targets
bacterial cell membrane and its function, resulting in bacterial growth inhibition and cell
death (Wang et al. 2010). Further analysis into the PAMAM dendrimer’s interactions
with the bacterial membrane were studied (see Section 2.3.3 and 2.3.4).
The permeabilisation of the inner membrane of E. coli was investigated by
introducing a range of PAMAM dendrimer generations with a series of increasing
concentrations. The inner membrane consists of a complex proteome within a lipid
bilayer is formed principally from phosphatidyl ethanolamine, phosphatidyl glycerol and
to a lesser extent cardiolipin. The latter of the two membrane lipids carries an anionic
charge (Dowhan, 1997). The results in section 2.3.3 indicate that the polycation
PAMAM dendrimers have a strong affinity for the anionic inner membrane of E. coli.
The absorbance at 420 nm, corresponding to ο-nitrophenol, rapidly increased within

96
30 seconds for concentrations >10 μg/mL for G2- PAMAM-NH2, G3- PAMAM-NH2 and
G4- PAMAM-NH2. A lag time of 2 minutes was observed for G5- PAMAM-NH2 due to
the slower diffusion of the high molecular weight PAMAM dendrimer. PAMAM
dendrimers permeabilise and impair the inner membrane rapidly in a concentration
dependent manner. A concentration as low as 5 μg/mL of all PAMAM dendrimers
tested resulted in the production of O-nitrophenol and thus caused inner membrane
permeabilisation.
It was found that there was also a generation-dependent effect of the inner
membrane permeabilisation. Within the first 12 minutes the G3-PAMAM-NH2 and
G4-PAMAM-NH2 resulted in the highest absorbance at 420 nm. This is likely due to a
compromise between the number of surface amine groups and the molecular weight
for diffusion through the outer membrane to reach the inner membrane. At 60 minutes
however the absorbance at 420 nm for G3-PAMAM-NH2 and G5-PAMAM-NH2 was
comparable after the lag time that G5-PAMAM-NH2incurred due to its relative size and
molecular weight. Furthermore, at a low concentration of 5 μg/mL of PAMAM
dendrimer it was G2-PAMAM-NH2 that displayed the highest absorbance after
60 minutes. The lower molecular weight PAMAM dendrimer incited the highest degree
of inner membrane permeabilisation at the lower end of the concentration series
tested. This may be an indication that PAMAM dendrimers aggregate at higher
concentrations and for this reason diffusion throughout cell membrane and surface
area are reduced. These novel results signify that there is an important time,
concentration and generation dependent effect on the inner membrane
permeabilisation of E. coli. Wang et al. reported a lag time of 20 minutes for the
97
release of O-nitrophenol when G4-PAMAM-NH2 was tested at a single concentration.
This result seems anomalous when they reported leakage of intracellular components
within 20 minutes at the same PAMAM concentration (Wang et al. 2010). One would
expect that the integrity of the inner membrane must first be impaired before the
leakage of cytoplasmic contents can occur.
In order for the PAMAM dendrimer to contact the inner membrane the
dendrimer must have first destabilized and traversed the outer membrane of E. coli. A
number of cationic compounds have been reported to enhance the permeability of the
outer membrane (Piers et al. 1994, Minnock et al. 2000, Domadia et al. 2010 and
Katsu et al. 2002. The outer membrane is stabilized by Ca2+ and Mg2+ that have strong
electrostatic binding affinities towards the anionic LPS. If polycations such as PAMAM
dendrimers disturb or replace the stabilizing divalent cations, the integrity of the
non-fluid continuum of LPS will be impaired and thus more permeable to biocides
(Vaara, 1992 and Katsu et al. 1984). It has been observed that polycations with more
than 4 amino groups were very affective at removing Ca2+ but to cause further
membrane disruption bulky hydrophobic moieties were required (Katsu et al. 2002
and, Yasuda et al. 2004). PAMAM dendrimers have been shown to exhibit chelating
behavior of metal ions in aqueous solutions due to their high density of nitrogen
ligands along with amine terminal groups (Diallo et al. 2005 and Diallo et al. 2004). For
PAMAM dendrimers to perturb the inner membrane of E. coli, shown in Section 2.2.3,
the dendrimer must have first chelated, replaced and disturbed the stabilizing cations
resulting in a disrupted and permeable outer membrane (Chen and Cooper, 2002 and
Wang et al. 2010).
98
SEM is a method that has been used for decades to visualise the external
features of bacteria shown in 3D form (Khalab et al. 2008). As such, electron
microscopy has been used to study the structural and morphological changes induced
by a range of antimicrobial agents including chlorhexidine (Tattawasart et al. 2000 and
Khunkitti et al. 1998), silver nanoparticles (Kim et al. 2011) and tea tree oil (Carson et
al. 2002). Cell wall damage caused by PAMAM dendrimers was visualised using SEM,
supporting the membrane integrity and permeabilisation studies reported within
previous sections of this chapter. With regards to the effects visualised, the untreated
S. aureus illustrated blebbing of cytoplasmic material on the cell surface that had been
extruded from damaged cell membrane. Leaked cytoplasmic material, severe
membrane damage and even separation of the cell membrane from the cell was also
exhibited due to the irreversible damage caused by the different generations of
PAMAM dendrimers (Figure. 2.10). Unfortunately, there was also leaked cytoplasmic
content clustered around the bacterial cells observed in the untreated S. aureus which
is an artefact due to the SEM preparation procedure. It has been noted that
morphological changes are likely to occur due to repeated centrifugation during the
washing procedure (Kai et al. 1999). Though, the severity of membrane damage
observed for treated S. aureus was not observed in the untreated control group. This
degree and type of membrane damage has been observed in scanning electron
micrographs of S. aureus challenged with cationic lens biocides, polyquaternium-1 and
myristamidopropyl dimethylamine (Codling et al. 2005). Further, comparable
cytoplasmic membrane damage was observed for S. aureus when challenged with the
essential oil isolated from O. Vulgare (De Souza et al. 2010).

99
Marked release of cytoplasmic contents was also observed for E. coli due to
membrane damage inflicted by the G3-PAMAM-NH2 dendrimer (Figure. 2.11). Similar
extracellular membrane blebbing was observed on E. coli when the bacteria were
challenged with tea tree oil (Gustafson et al. 1998) and silver nanoparticles (Kai et al.
1999). Within the literature there was one instance where G4-PAMAM-NH2 was
challenged against E. coli and analysed by SEM after an eight hour contact time
(Wang et al. 2010). The authors observed a range of detrimental morphological effects
including ruptured cell walls, eroded cell membrane and shrinkage of bacterial cells
(Wang et al. 2010). An incubation time of two hours was utilised in Section 2.3.4
therefore a lower extent of morphological damage was observed.
The membrane damage depicted in the scanning electron micrographs is
consistent with the membrane integrity study that monitored the release of cytoplasmic
material from the cell membrane (Section 2.3.2). Leakage of cytoplasmic contents that
absorbs at 260 nm is a result of irreversible cell membrane damage that leads to cell
death. Intracellular ion homeostasis is integral to all living cells as they are required for
turgor pressure control, many metabolic processes and the divalent cations, Ca2+ and
Mg2+ are of paramount importance for maintaining cell wall stabilisation (Shabala et al.
2001 and De Souza et al. 2010). As membrane damage is observed in the scanning
electron micrographs, disruption of the stabilizing cations must have occurred. This
destabilisation affect was also observed in the membrane permeabilisation assay
(section 2.3.3). For both E. coli and S. aureus G3.5-PAMAM-COOH did not induce any
morphological damage at a concentration of 1 mg/mL. It has been proposed that
carboxyl terminated PAMAM dendrimers are antimicrobial, however only at very high

100
concentrations. The mechanism of action is conceivably due to the scavenging of the
stabilizing divalent cations leading to permeabilisation of the cell wall. The SEM
images provide supporting evidence that the mechanism of action of PAMAM
dendrimers is to target and disrupt the bacterial cell membrane.
2.5 Conclusion
Though unmodified PAMAM dendrimers have been shown to possess
antimicrobial properties (Calabretta et al. 2007, Lopez et al. 2009 and Wang et al.
2010) details on the antimicrobial properties of different generations, terminal
functionalities and mechanism of action were lacking in the literature. Trends regarding
PAMAM dendrimers’ antimicrobial effects were based on the analysis of only two
dendrimer generations. This gap in knowledge within the literature has been
addressed in order to develop more efficacious dendrimer biocides or dendrimer-
based formulations. The findings of the study indicate that unmodified amine-
terminated PAMAM dendrimers exhibit high antimicrobial potency at low
concentrations, but their potency is dependent on the generation of the PAMAM
dendrimer. Contrary to what has been published within the literature it was found that
the antimicrobial efficacy improved with increasing numbers of surface amines and
molecular weight. This finding correlates well with the results observed in the inner
membrane permeabilisation assay whereby, G5-PAMAM-NH2incited the greatest
membrane permeabilisation effect after 60 minutes possibly due to its high molecular
weight a lag time was observed. The findings also suggest that carboxyl terminated
PAMAM dendrimers are required in very high concentrations (> 1 mg/mL) in order to
observe bacterial inhibition. The study has confirmed that the antimicrobial efficacy is
101
dependent on generation, concentration and terminal functionalities. There was a
strong correlation between membrane disruption and the determined biocidal activity,
thus making it a key contributing mechanism of action.

102
3.0 An investigation as to whether a PAMAM dendrimer skin pre-treatment enhances the permeation and deposition of CHG within porcine skin. 3.0 Introduction
3.1 Use of PAMAM dendrimers in transdermal and topical drug delivery
systems
PAMAM dendrimers have previously been used as percutaneous absorption
enhancers for a number of topically applied therapeutics. This is due to their unique
physiochemical characteristics such as their monodispersed globular structure with
interior voids and dense surface functionalities (Uppuluri et al. 1998). PAMAM
dendrimers are ideal for therapeutic use due to their uniform size and structure
allowing for pharmacological reproducibility unlike their linear polymeric counterparts.
The interior voids within the PAMAM dendrimer may encapsulate low molecular
weight hydrophobic drugs for drug delivery (Morgan et al. 2006, Milhem et al. 2000
and Gupta et al. 2006). PAMAM dendrimers also have dense surface functionalities;
G4-PAMAM-NH2 consists of 64 primary amine groups at the periphery, which can be
utilised to electrostatically complex or to covalently conjugate a range of drugs to its
surface (Wang et al. 2010 and Cheng et al. 2008). These physiochemical properties
of PAMAM dendrimers allows for the protection of degradable drugs, increase the
aqueous solubility of drugs, and can allow for modified drug release, i.e. through
thermo or pH responsive properties (Sun et al. 2012, Zhao et al. 2011 and Criscione
et al. 2009).

103
Dendrimers, particularly PAMAM dendrimers, have been used for the delivery
of therapeutics across a range of biological membranes including Caco-2 cell
monolayers (Elsayed et al. 2002), rat intestine (Wiwattanapatapee et al. 2000 and Ke
et al. 2007), ocular drug delivery (Vandamme and Brobeck, 2005) and for the
transfection of genetic material (Eichman et al. 2000 and Shakhabazau et al. 2010).
In recent years the ability of PAMAM dendrimers to enhance the permeation
for the topical or transdermal delivery of therapeutics has been investigated. PAMAM
dendrimers have the ability to act as drug carriers by facilitating drug transport and
also by means of a physical perturbation of the skin barrier to enhance transdermal
drug delivery (Venuganti and Perumal, 2008). Chauhan et al (2003) used
G4-PAMAM-OH and G4-PAMAM-NH2 to enhance the permeation of indomethacin
across skin in vitro, a non-steroidal anti-inflammatory drug (NSAID) that permeates
the skin poorly. PAMAM dendrimers form a complex with indomethacin through
electrostatic and hydrophobic bonding. A solution of G4-PAMAM-NH2 (0.2 % w/v)
enhanced the in vitro permeation of indomethacin by a factor of 4.5, compared to the
drug in free solution. The dendrimers were shown to be an effective penetration
enhancer for the transdermal delivery of indomethacin.
The PAMAM dendrimer enhancement effect also translated well to in vivo
conditions. In a carrageenan-induced rat paw oedema model, pharmacokinetic data
highlighted a 1.6 and 1.5 fold increase for G4-PAMAM-NH2 and G4-PAMAM-OH
formulations respectively in % inhibition of paw volume. The authors proposed a
cyclodextrin-like mechanism for the enhanced flux of drug across the rat skin in that

104
the dendrimer acts as a drug carrier. Though the dendrimer-indomethacin complex
has a molecular weight too high to penetrate the stratum corneum (SC), the authors
suggest the enhancement compared to the drug in free solution is a result of the
dendrimer facilitating drug delivery to the SC in a solubilised form increasing the drug
partitioning into the SC. Within the study it was shown that the PAMAM dendrimer
enhanced the bioavailability of an NSAID by increasing the solubility and by
enhancing the flux of the drug across the skin in vitro and in vivo (Chauhan et al.
2003).
Other non-steroidal anti-inflammatory drugs in the case of ketoprofen and
diflusinal were also electrostatically complexed with PAMAM dendrimers to
significantly enhance the steady-state flux of both drugs across ex vivo rat skin in a
diffusion cell study (Chauhan et al. 2004). The solubility of both drugs was
dramatically enhanced resulting in an increased flux across the skin when compared
to the drugs in free solution. Again, this transdermal enhancement resulted in an
increase in bioavailability in vivo using the acetic acid induced writhing model in mice.
Blood-drug level studies were 2.73 times higher for ketoprofen-PAMAM complex and
2.48 times higher for diflusinal-PAMAM complex than the respective drug in free
solution (Chauhan et al. 2004).
Wang et al. created a novel polymeric drug delivery matrix using G3-PAMAM-
NH2 dendrimers combined with polyhydroxyalkonoate (PHA). When placed in a patch
design the model drug, tamsulosin hydrochloride, was successfully transdermally
delivered at a rate of 24.0 µg/cm2/day whilst the matrix without the presence of
105
PAMAM dendrimer has a delivery rate of only 15.7 µg/cm2/day in an in vitro study
using a snake skin membrane. Only the drug delivery system encompassing the
G3-PAMAM-NH2 dendrimer within the matrix achieved above the clinical aim of
20.0 µg/cm2/day, transdermal delivery of tamsulosin hydrochloride. The authors also
pre-dosed the skin with a G3-PAMAM-NH2 preparation to investigate the effect of the
dendrimer alone on the skin. It was found that the PAMAM dendrimer pre-dose
weakly enhanced the permeation of tamsulosin hydrochloride over a 24 hour time
frame. The same enhancement effect was not observed when the tamsulosin
hydrochloride was added directly to the snake skin in a PAMAM dendrimer solution
(G3-PAMAM-NH2, 7.5 mM). The authors believe that the PAMAM dendrimer’s
interaction with the drug prevented the PAMAM dendrimer’s interaction with the SC
and thus prevented the modulation of the skin surface (Wang et al. 2003).
These studies have used rat or snake skin as the model membrane for the
percutaneous absorption studies. Diffusion studies using ex vivo rat skin have
repeatedly shown the membrane to be significantly more permeable to a vast range
of drugs, particularly with regards to lipophilic drugs, when compared to human skin
membranes (Takeuchi et al. 2011, Barber et al. 1992 and Scott et al. 1987). For this
reason rodent models are considered a poor surrogate for human skin when
investigating the percutaneous absorption of drugs (Catz and Friend, 1990).
Previously shed snake skin has been shown to be unreliable and misleading for the
investigation of penetration enhancement as the membrane has been shown to
underestimate the enhancer’s effect when compared to human skin in vitro (Rigg and
Barry, 1990). Further, significant variability in the permeability of the model drug

106
progesterone was observed between the dorsal and ventral sites of snake skin (Haigh
et al. 1998). Shed snake skin though ethical is not considered an acceptable model
for human skin. It would be of interest to study the interactions of the previously
mentioned PAMAM dendrimer-NSAID complexes upon an accepted membrane
model such as ex vivo human or porcine skin. Though ex vivo human skin is
considered the gold standard, porcine skin is regarded as the closest surrogate
membrane for human skin in in vitro percutaneous absorption studies (Dick and Scott,
1992 and Chilcott et al. 2001). Pig flank skin has similar morphological properties and
hair follicle density to human skin and using skin from pigs of the same age, sex, site
of the body and gene pool ensures that the model is homogenous (Davies et al.
2004).
PAMAM dendrimers from G2.5-PAMAM-COOH up to G4-PAMAM-NH2 have
been utilised to enhance the solubility of 8-methoxypsoralene (8-MOP) after the drug
was encapsulated within the interior voids of the PAMAM dendrimer. The drug-
PAMAM complex formed with G3-PAMAM-NH2 delivered a higher flux of the 8-
methoxypsoralene into the skin and the receptor fluid in an in vitro model using
commercial polyvinyldifluoride (PVDF) membrane and pig ear skin (PES) membrane
(Borowska et al. 2010). The authors describe how the PAMAM dendrimer acts as a
carrier to an increased localised delivery whilst reducing the diffusion across the skin
compared to the 8-MOP in free solution. The increase in retention within the deeper
layers of the skin would allow for enhanced therapeutic effect for diseases such as
psoriasis and atopic eczema.

107
Venuganti and Perumal (2008), investigated PAMAM dendrimers as a
permeation enhancer of 5-fluorouracil when dosed from a range of vehicles. The
authors successfully increased the flux of 5-fluorouracil (5-FU) across ex vivo porcine
skin using a Franz-type diffusion cell model. A formulation containing a saturated
dispersion of a G4-PAMAM-NH2 – 5-FU complex resulted in a 1.77-fold and 1.38-fold
increase in flux for isopropyl myristate (IPM) and mineral oil, respectively when
compared 5-FU alone dispersed in IPM and mineral oil. There was no significant
increase in flux for the co-treatment applied in PBS when compared to the 5-FU
dosed alone in PBS. To delineate the PAMAM dendrimer’s interaction with the skin
membrane the authors also conducted a pre-dose PAMAM treatment. A G4-PAMAM-
NH2 preparation (0.2 mL, 1 mM) was dosed onto the skin for a 2, 12 and 24 h contact
period. Afterwards, the 5-FU was applied in an IPM formulation and a significant
increase in flux was observed for 5-FU and was found to be proportional to the
PAMAM dendrimer pre-treatment contact time. The pre-treatment of PAMAM
dendrimer resulted in a higher flux than the co-treatment application (Venuganti and
Perumal, 2008).
All of the vehicles were tested with PAMAM-5-FU and compared to 5-FU in the
same vehicle. There was a significant enhancement in drug flux across the skin with
the addition of PAMAM compared to the 5-FU in respective free solutions (with the
exception of PBS). The PAMAM dendrimer pre-treatment results within this study that
show ~ a tenfold increase in the penetration of CHG suggest that the PAMAM
dendrimer has a physical effect on modulating the skin barrier as the drug flux across
the skin was significantly higher for the pre-dose when compared to the co-dose

108
application. The enhancement in permeation was not due to the dendrimer-drug
interactions but due to the dendrimer-skin interactions.
PAMAM dendrimers were also shown to enhance the permeation of riboflavin
in an oil-in-water (o/w) emulsion two to three-fold across porcine ear epidermis and
polyvinyldifluoride membrane. The authors established that the G2-PAMAM-NH2
dendrimer was the most effective at enhancing the penetration of riboflavin. The
penetration enhancement was shown to be generation dependent and in decreasing
order of penetration enhancement was, G2 > G3 ≫ G2.5 > G3.5 > G4 across the
porcine epidermis (Filipowicz and Wolowiec, 2011). The authors believe that the
enhancement is due to the solubilisation of the poorly soluble drug and due to the
absorption of the PAMAM dendrimer. No mechanism or evidence for PAMAM
penetration was offered or eluded to. The assumption that PAMAM dendrimers, that
are large macromolecules, diffused ‘faster’ within the skin compared to the low
molecular weight riboflavin was based on the detection of a fluorophore and not the
native dendrimer. Fluorescein isothiocyanate was detected throughout the skin strata
however there was no evidence to suggest that the fluorophore was still attached to
the PAMAM dendrimer. Riboflavin has a molecular mass of 376.36 Da that is
~10 times smaller than G2-PAMAM-NH2 that has a molecular mass of 3256 Da.
The passive diffusion of a compound across the SC is governed by Fick’s
second law of diffusion that contains the diffusion coefficient of a compound (Williams
and Barry, 2012). The diffusion coefficient is dependent on the molecular size
therefore it is unlikely that macromolecule as large as a PAMAM dendrimer would

109
diffuse through a membrane that is approximately 2500 µm in thickness (Meyer and
Zschemisch, 2002) within a ten hour time frame. Therefore it is likely that it is the free
fluorophore that has readily penetrated the skin rather than the dendrimer with a
fluorophore attached, particularly in light of the 500 Da cut off for skin penetrants (Bos
and Meinardi, 2000).
As to whether the dendrimer itself permeates the skin remains a controversial
subject with very few investigations published in the literature. A recent study
established that generation 4 PAMAM dendrimers with various terminal functionalities
were limited to the superficial layers of the SC once topically applied (Venuganti et al.
2011). The authors found that -NH2 terminated PAMAM dendrimers penetrated
further within the SC than –COOH or -OH terminated PAMAM dendrimers. This may
be a result of the cationic PAMAM dendrimers causing perturbation of the intercellular
lipids through a range of mechanisms such as lipid extraction and/or fluidization
(Barry, 2004). Neutral surface engineered dendrimers were found not to penetrate the
SC of porcine skin (Küchler et al. 2009).
The degree of SC penetration of a dendrimer is severely limited due to the
dense surface charge, hydrophilicity and the excessive molecular weight (typically
>5000 Da) (Chauhan et al. 2003). The bulkiness of the macromolecule would
significantly impair the ability for a PAMAM dendrimer to diffuse through the SC. The
routes of drug penetration across the skin were discussed in detail within the general
introduction but it should be noted that the tortuous intercellular lipid channels are
between 0.5-40 nm wide (Cevc and Vierl, 2010 and Van der Merwe et al. 2006).

110
PAMAM dendrimers are hydrophilic and therefore diffusion across the SC along the
tortuous intercellular lipid pathway would be unlikely. With the possible aggregation
and coalescence of PAMAM dendrimers it is highly unlikely without a driving force
that PAMAM dendrimers (ranging from 1- 10 nm) would be able to passively
penetrate the SC past the superficial layers. There is a lack of free space for the
diffusion for large macromolecules due to the restrictive nature of the densely
organized intercellular lipids (Sun et al. 2012).
The advantage of high molecular weight, skin-surface modulating enhancers is
that they are less likely to generate irritation or an immuno-response unlike
conventional small molecular weight chemical enhancers that easily penetrate the
skin and cause irritation (Aoyagi et al. 1990). The mechanistic aspect of the PAMAM
dendrimer’s modulation of the skin surface will be discussed in the following chapter.
3.1.2 Rationale for the investigation of a PAMAM dendrimer skin pre-treatment
to enhance the topical delivery of a model antiseptic, chlorhexidine
digluconate.
The poor permeability of CHG within the skin has been discussed in detail in
Chapter 1. Increasing the deposition and permeation of CHG within the upper skin
(i.e. SC, viable epidermis and follicles) to increase biocide contact with the resident
bacteria would increase the efficacy. To increase the efficacy of CHG as an
antiseptic, a novel permeation enhancement strategy is required. PAMAM dendrimers
have been utilised as novel polymeric drug delivery systems for a variety of drugs
discussed in Section 3.0.1. Though PAMAM dendrimers have been shown to
111
enhance the solubility of antimicrobial compounds (Cheng et al. 2007a), until this
study an investigation into the potential use of PAMAM dendrimers as permeation
enhancers of a topically applied antiseptic had not been conducted. This chapter
investigates whether there is a permeation enhancement effect after a PAMAM
dendrimer pre-treatment for the model antiseptic, CHG.
3.1.3 Aims and objectives
The aim of this Chapter is to investigate as to whether a PAMAM dendrimer pre-
treatment enhances the permeation of CHG within porcine skin.
To achieve this aim a number of objectives were necessary:
(i) To conduct studies to determine whether a pre-treatment of
G3-PAMAM-NH2 enhanced the percutaneous absorption of CHG within
porcine heat-separated epidermis.
(ii) To determine whether any enhancement effect is proportional to the
PAMAM concentration of the pre-treatment application.
(iii) To characterise the enhanced permeation profile after a PAMAM dendrimer
pre-treatment within the SC by conducting a gravimetric tape strip assay on
dermatomed porcine skin.
3.2 Materials and methods
All in vitro percutaneous absorption studies within this Chapter were conducted using
the following regulatory protocols as a guide;
(i) OECD Test Guideline 428 (2004)- Skin absorption: In vitro method.

112
(ii) OECD Guidance Document No. 28 (2004)
The above method is accepted as a reliable standard for percutaneous absorption
studies and permits the use of porcine skin as a surrogate for human skin. In addition
to measuring the dermal absorption of CHG, a mass balance recovery of the drug in
the various compartments of the skin was determined at 24h.
3.2.1 Preparation of porcine ear epidermis and dermatomed porcine flank
The pig ears were obtained from a local abattoir prior to any steam cleaning
treatment. The skin was washed with distilled water and carefully shaved using
clippers so as not to damage the tissue. The ears were secured firmly by being
pinned down on a cork board. An incision around the outer edge of the pig ear was
made using a scalpel and, using tweezers to pull the skin taut, the scalpel was slowly
moved along the underside of the skin above the cartilage. The skin was slowly
separated from the cartilage and removed. It was then placed on foil and the
cartilage was disposed of. The skin was then placed in a beaker of stirring water at a
temperature of 60ºC for 60 seconds. After the 60 seconds the skin was pinned
securely to a cork board. The epidermis was removed from the dermis by gentle
scraping using the side of a spoon whilst keeping the skin taut with a pair of tweezers.
The epidermis was gently separated from the dermis and rolled up as it was removed
(Bhatti et al. 1988, Dick and Scott, 1992 and Scott and Clowes, 1992). At the end of
the pig ear, the epidermis was lifted from the dermis noting which side is the SC and
was floated on a tray of deep water. The epidermis was then captured on to a piece
of foil with the SC facing upwards and with the skin stretched out and with air bubbles

113
removed. The skin was then hung to dry at room temperature and once dried, labeled
and placed in a -20 ºC freezer until use (Davies et al. 2004).
Dermatomed skin was prepared from the flank of six week old pigs obtained
from a local abattoir prior to any steam cleaning treatment. The skin was washed with
distilled water and secured on to a wooden block. The skin was carefully shaved
using clippers and care was taken to not damage the tissue. The subcutaneous fat
was carefully removed using a scalpel and then the skin was dermatomed to a
thickness of 400 µm with an electric dermatome. It was then wrapped in aluminum foil
and frozen at -20°C until required.
Heat-separated porcine ear epidermis has been shown to be an excellent
surrogate for human epidermis for skin permeation studies as it has similar
morphological and permeability characteristics that are closer to that of a human
compared to a rodent model (Benech-Kieffer et al. 2000 and Schmook et al. 2001).
For studies using a tape stripping method to determine the drug permeation profile
within the different histological skin compartments (SC, epidermis and dermis),
dermatomed porcine flank has been shown to be an ideal surrogate for human skin.
Pig flank skin has similar morphological properties and hair follicle density to human
skin and also by using skin from pigs of the same age, sex and gene pool ensures
that the model is homogenous and therefore suitable for dermal absorption studies
and formulation optimisation (Davies et al. 2004).

114
3.2.2 Skin integrity check
The dermatomed or pig ear epidermis was punched out with a 3 cm diameter
punch and placed upon a stainless steel mesh support grid within a Franz cell, with
the SC facing upwards. The application site of the Franz cell was an area of 2.54 cm2.
To check the integrity of the skin, 4.5 mL of physiological saline (0.9 % w/w NaCl)
was added to the receptor chamber and 2 mL of physiological saline was added to
the donor chamber and placed in a circulating water bath on a submersible magnetic
stirrer at 32°C for 30 minutes. After the cells had equilibrated, the transepithelial
electrical resistance (TEER) was measured to check the integrity of the porcine skin.
Prior to readings being taken, the instrument was calibrated using a resistor. It has
been established that normal porcine skin in the Franz cells used should have an
electrical resistance reading of ≥ 3 KΩ to pass the integrity check (Davies et al. 2004).
Any diffusion cells that did not meet the integrity threshold were not included within
the studies. TEER was used as opposed to trans-epidermal water loss (TEWL) due to
the method being quicker whilst still correlating well with membrane integrity.
3.2.3 The effect of PAMAM dendrimer pre-treatment on the in vitro permeation
on CHG using porcine epidermis.
The diffusion cells that had passed the integrity check were removed from the
water bath and the skin surface was allowed to air dry for 2 h at ambient temperature.
4.5 mL of physiological saline was added to the receptor chamber of each Franz cell.
The Franz cells were placed in the water bath (32°C ± 1°C) on a submersible stirring
plate for 30 minutes and allowed to equilibrate. Both a G3-PAMAM-NH2

115
(0.5 mM-10 mM) and a 2 % (w/v) solution of CHG were prepared in distilled water
from a 20 % (w/v) solution of G3-PAMAM-NH2 and a 20 % (w/v) solution of CHG
respectively. Once the Franz cells had equilibrated, a 0.2 mL of G3-PAMAM-NH2
(0.5 mM-10 mM) was applied to the skin surface for a 24 h contact time or in the case
of the controls the vehicle was dosed without the presence of PAMAM dendrimer.
After a 24 h time period the PAMAM dendrimer layer was removed from the skin
surface by rinsing 2 mL aliquots of distilled water (10 mL in total) over the surface of
the dosed skin, taking care not to damage the skin. The vehicle control was treated in
an identical way and was also washed at 24 h. The skin surface was then blotted dry
with adsorbent paper and dosed with an infinite dose (1 mL) of the CHG solution
(2 % w/v). This was applied to the skin surface and left for a contact time of 24 h. At
various time points a 500 µL aliquot of receptor fluid was removed and replaced with
fresh physiological saline. After 24 h, excess CHG was removed from the skin surface
of each diffusion cell by rinsing with 2 mL aliquots of distilled water (10 mL in total)
over the surface of the dosed skin. The washings were placed in a labelled 25 mL
volumetric and made up to volume.
The pig ear epidermis was immediately placed into HPLC mobile phase (see
Section 3.2.5 for HPLC methodology section) for CHG extraction. The CHG from the
donor cells was also extracted in 10 mL of HPLC mobile phase overnight. The
following day the skin samples were agitated using a vortex mixer for 15 minutes and
sonicated for 15 minutes. An aliquot of the sample was syringe-filtered (0.2 µm,
15 mm diameter polypropylene filters, Fisher Scientific, Loughbrough, UK) and diluted
appropriately. The aliquots taken over the 24 h period were also filtered but not

116
diluted to prevent dilution below the limits of quantification. The samples were placed
in 2 mL HPLC vials with a soft septum and analysed by HPLC for the CHG content.
Only diffusion cells that had leaked upon dosing were not incorporated within the
results.
3.2.4 Franz diffusion cell studies using porcine dermatomed skin for tape
stripping.
The Franz cells were dosed as above in section 3.2.3 but the dermatomed skin
was also tape stripped at the end of the experiment. Gravimetric analysis of SC
content on the tape strips was conducted for each tape strip. Each tape strip was pre-
cut and allowed to sit at room temperature for 2 h to allow volatile adhesive
components to evaporate from the tape strip (Lademann et al. 2009). This is due to
the volatile components skewing the gravimetric analysis of the tape strips. The
weight of each tape strip was measured to 4 decimal places on a balance (Precisa,
262 SMA-FR, Milton Keynes, UK) before and after the tape strip was taken. A thin
plastic mask was placed around the dosed area (2.54 cm2) so that only SC material
that was treated would be removed on to the tape strip. Between each tape strip the
mask was cleansed in water and ethanol as to not contaminate the skin layers below.
Once 21 tape strips were taken they were pooled together; tape strips 1-3 were
analysed separately, tape strips 4-6, 7-10, 11-16 and strips 17-21 were pooled
together and CHG was extracted in 10 mL of HPLC mobile phase. The tape stripped
skin and donor chambers were also extracted in 10 mL of HPLC mobile phase. The
samples were left overnight and the following morning the time point aliquots were
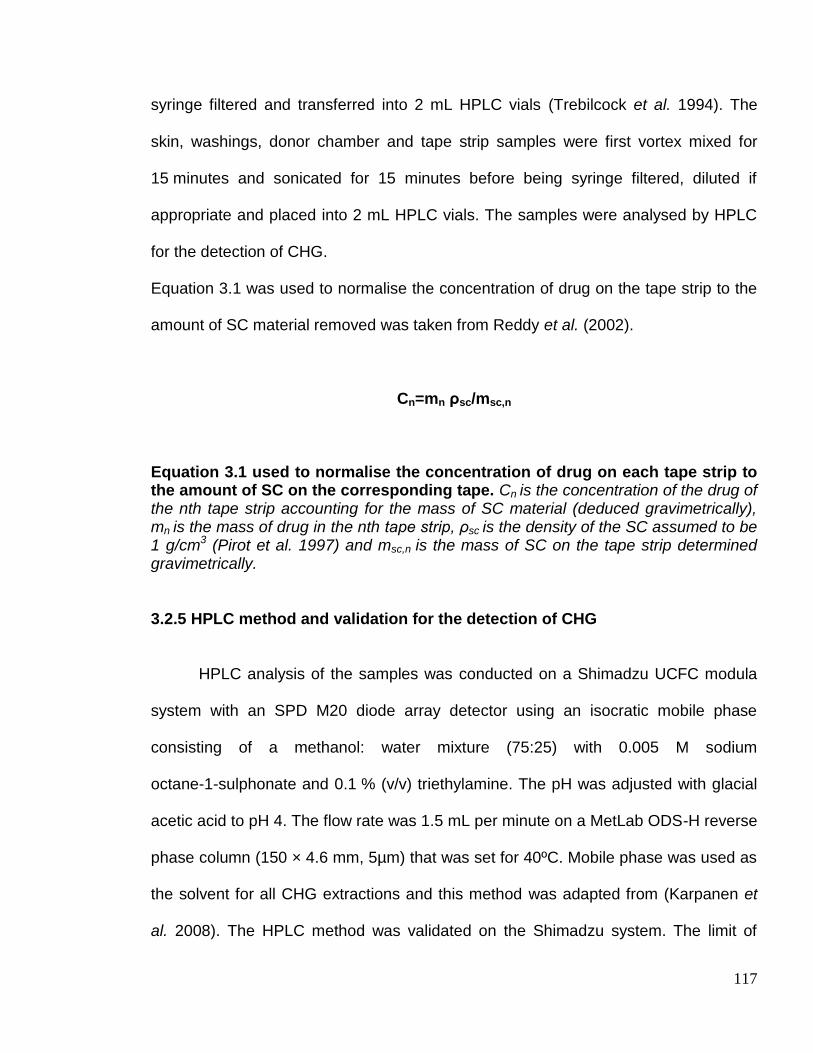
117
syringe filtered and transferred into 2 mL HPLC vials (Trebilcock et al. 1994). The
skin, washings, donor chamber and tape strip samples were first vortex mixed for
15 minutes and sonicated for 15 minutes before being syringe filtered, diluted if
appropriate and placed into 2 mL HPLC vials. The samples were analysed by HPLC
for the detection of CHG.
Equation 3.1 was used to normalise the concentration of drug on the tape strip to the
amount of SC material removed was taken from Reddy et al. (2002).
Cn=mn ρsc/msc,n
Equation 3.1 used to normalise the concentration of drug on each tape strip to the amount of SC on the corresponding tape. Cn is the concentration of the drug of the nth tape strip accounting for the mass of SC material (deduced gravimetrically), mn is the mass of drug in the nth tape strip, ρsc is the density of the SC assumed to be 1 g/cm3 (Pirot et al. 1997) and msc,n is the mass of SC on the tape strip determined gravimetrically.
3.2.5 HPLC method and validation for the detection of CHG
HPLC analysis of the samples was conducted on a Shimadzu UCFC modula
system with an SPD M20 diode array detector using an isocratic mobile phase
consisting of a methanol: water mixture (75:25) with 0.005 M sodium
octane-1-sulphonate and 0.1 % (v/v) triethylamine. The pH was adjusted with glacial
acetic acid to pH 4. The flow rate was 1.5 mL per minute on a MetLab ODS-H reverse
phase column (150 × 4.6 mm, 5µm) that was set for 40ºC. Mobile phase was used as
the solvent for all CHG extractions and this method was adapted from (Karpanen et
al. 2008). The HPLC method was validated on the Shimadzu system. The limit of
118
detection (LOD) was calculated to be 0.050 µg/mL and the limit of quantification
(LOQ) was calculated as 0.167 µg/mL. The relative standard deviation (RSD) % was
calculated for 6 repeats of the 10 µg/mL standard and was found to be 0.40 %. For
the skin assays conducted in this chapter the RSD % for each standard was <5 %
and the R2 value was 0.9999.
3.2.6 Statistical data analysis
All data is presented as the mean ± SEM unless otherwise stated and were
analysed using GraphPad Prism® version 5 (San Diego, USA). Prior to statistical
analysis all data were placed in to a histogram to check for normality. To compare the
mean total concentration of CHG detected within the porcine epidermis after various
skin pre-treatments (various PAMAM dendrimer concentrations and phys. saline), a
Kruskal Wallis ANOVA test (data was non-parametric) was conducted with p<0.05
representing significance (Section 3.3.0, Figure 3.2). A Kruskal Wallis ANOVA with a
Dunn’s post test to compare treatment groups was also performed to determine if
there was a different in total CHG concentration within the receptor fluid at 24 h for
the different skin pre-treatment groups (Section 3.3.0, Figure 3.3). In Section 3.3.1 A
Kruskal Wallis ANOVA was utilised to determine whether there was a significant
difference between the total CHG concentration extracted from the tape strips after
various skin pre-treatments with p<0.05 signifying statistical significance (Figure
3.7a). In Figure 3.7b a Kruskal Wallis test with a Dunn’s post test was employed to
determine whether there was a significant difference in CHG concentration within the
epidermis and dermis after various skin pre-treatments.
119
3.3 Results
3.3.0 In vitro Franz diffusion cell study investigating the effect of a PAMAM
dendrimer pre-treatment on the permeation on CHG using porcine epidermis.
CHG is known to adsorb on to a variety of surfaces including glass, cotton
wool and skin (Denton, 1991). In vitro Franz diffusion cell studies are often used to
provide mass balance data to determine the % recovery of a drug from the various
diffusion cell compartments. With the knowledge that CHG adsorbs strongly on to a
range of materials, a 100 µL aliquot of three different concentrations of CHG was
spiked onto the compartments of a Franz cell (Table 3.1). The % of recovered CHG
from each Franz cell compartment was very similar across the three concentrations
tested. The average coefficient of variance for each Franz cell compartment (n=3) for
the three CHG concentrations was 2.41 % suggesting that the adsorption of CHG
onto the surfaces is not concentration dependent but more likely surface area
dependent. The lowest % recovery was exhibited after spiking (a dose area of
2.54 cm2) porcine epidermis in which across the three CHG concentrations (1, 5 and
10 % w/v) was 84.78 ± 1.336, thus resulting in around a 15 % loss of CHG. Typically,
6.3 % of the total amount of CHG dosed on to a strip of adhesive tape (20 mm in
length) was not recovered. The percentage of dosed CHG that was not recovered
from the glass donor chamber was ~9 %. A provisional study was conducted whereby
silanised glass (silanised within the laboratory) was used in parallel to glassware that
had not undergone silanisation. Surprisingly, it was found that the silanisation process
of the glass did not enhance the recovery of the dosed CHG (data not shown). A

120
published silanisation protocol was used (Seed, 2001) though it is possible that the
chlorotrimethylsilane had not covered the whole surface area of the glassware.
Further, a range of adhesive tapes manufactured by different companies, in addition
to the conventional Scotch 3M tape, were investigated and a range of extraction
processes including length of time, solvent, agitation processes and temperature
were investigated (data not shown). The optimal extraction process that was
determined is outlined in section 3.2.3 and was found to be extraction in mobile phase
for 24 h at room temperature followed by 15 minutes of high speed vortex mixing and
15 minutes of sonication.
Table 3.1 Percentage recovery of three concentrations of aqueous chlorhexidine digluconate after 100 µl was spiked on to each compartment of a Franz cell.
CHG concentration
% Recovered of dose spiked onto Franz cell
compartments after 24 h
Epidermis Adhesive tape strip Donor chamber
1 % (w/v) CHG
dosed
88 94 93
84 92 91
86 94 91
Mean ± SEM 86.00 ± 1.16 93.33 ± 0.67 91.67 ± 0.67
5 % (w/v) CHG
dosed
88 91 91
82 94 88
81 91 93
Mean ± SEM 83.67 ± 2.19 92 ± 1.00 90.67 ± 1.45
10 % (w/v) CHG
dosed
84 92 88
86 97 94
84 94 91
Mean ± SEM 84.67 ± 0.67 94.33 ± 1.45 91.00 ±1.73

121
The in vitro dermal delivery and absorption of CHG applied after a range of
G3-PAMAM-NH2 skin pre-treatments can be found within this section. The data within
this section presents the distribution of CHG extracted from the diffusion cell
compartments (including the epidermis) and also the rate of the absorption within the
skin over 24 h. The data is illustrated as the concentration (µg/cm2) but also as the
percentage of applied dose for ease of interpretation. Table 3.2 shows the absorption
and distribution of CHG within the Franz cell system after a skin pre-treatment of
physiological saline (0.9 %) for 24 h (to act as a control for G3-PAMAM-NH2
dendrimer pre-treated skin). It was found that a mean concentration (815.13 ± 154.94
µg/cm2) of CHG applied to the skin was extracted from the glass donor chamber.
Therefore, ~10 % of the dosed CHG was possibly adsorbed onto the glass of the
donor chamber of the Franz cell. Over 50 % of the dosed CHG was removed on
washing the skin at 24 h leaving ~13 % of the dosed CHG absorbed. A very low
concentration of absorbed CHG was located within the receptor fluid (3.226 ±
1.622 µg/cm2, ~0.04 % of applied dose) and a mean concentration of 1030.668 ±
130.917 µg/cm2 that is ~13 % of the applied CHG was extracted from the porcine
epidermis. A mean total CHG recovery of 75.299 ± 8.715 % of the applied dose was
obtained therefore around 25 % of the dosed CHG is unaccounted for within the data
shown. Potential explanations for the loss of CHG and comparison of the total
recoveries compared to the spiking assay are outlined within the discussion.

122
Table 3.2. Compartmental diffusion cell data of CHG concentration for the control skin pre-treatment. Percutaneous absorption (mass balance) of CHG within porcine epidermis after a 24 h pre-treatment of physiological saline (NaCl 0.9 %). Mean ± SEM (n=15) is shown.
Sample (n=15)
CHG (µg/cm2)
Mean SEM
% of applied dose
Mean SEM
Donor chamber
815.13 154.94 10.35 1.97
Skin wash
4080.06 398.89 51.82 5.07
Epidermis
1030.67 130.92 13.09 1.66
Receptor fluid
3.23 1.62 0.041 0.02
Total recovered
5929.09 686.37 75.30 8.72
The rate of absorption of CHG was calculated after a physiological saline pre-
treatment in substitute of G3-PAMAM-NH2 dendrimer as a control. The mean rate of
CHG absorption was particularly slow over the 0-24h time period at 0.10 ±
0.02 µg/cm2/h. A 12 h lag phase was observed and the mean rate of absorption from
15-24 h was calculated to be 0.22 ± 0.10 µg/cm2/h. As observed within Table 3.2 &
3.3, CHG applied to skin alone has a slow rate of absorption and CHG was
demonstrated to permeate the epidermis poorly. In order to reduce the lag time and
increase the rate of absorption a PAMAM dendrimer pre-treatment was utilised in the
following studies within this Section.
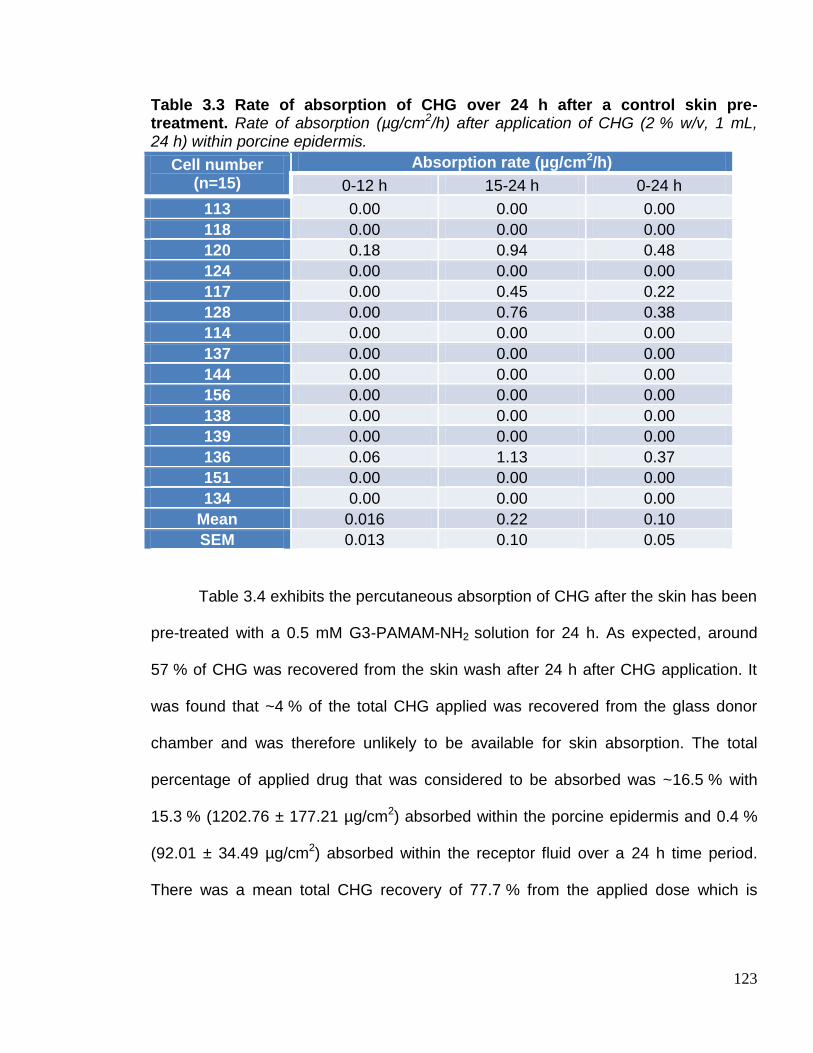
123
Table 3.3 Rate of absorption of CHG over 24 h after a control skin pre-treatment. Rate of absorption (µg/cm2/h) after application of CHG (2 % w/v, 1 mL, 24 h) within porcine epidermis.
Cell number (n=15)
Absorption rate (µg/cm2/h)
0-12 h 15-24 h 0-24 h
113 0.00 0.00 0.00
118 0.00 0.00 0.00
120 0.18 0.94 0.48
124 0.00 0.00 0.00
117 0.00 0.45 0.22
128 0.00 0.76 0.38
114 0.00 0.00 0.00
137 0.00 0.00 0.00
144 0.00 0.00 0.00
156 0.00 0.00 0.00
138 0.00 0.00 0.00
139 0.00 0.00 0.00
136 0.06 1.13 0.37
151 0.00 0.00 0.00
134 0.00 0.00 0.00
Mean 0.016 0.22 0.10
SEM 0.013 0.10 0.05
Table 3.4 exhibits the percutaneous absorption of CHG after the skin has been
pre-treated with a 0.5 mM G3-PAMAM-NH2 solution for 24 h. As expected, around
57 % of CHG was recovered from the skin wash after 24 h after CHG application. It
was found that ~4 % of the total CHG applied was recovered from the glass donor
chamber and was therefore unlikely to be available for skin absorption. The total
percentage of applied drug that was considered to be absorbed was ~16.5 % with
15.3 % (1202.76 ± 177.21 µg/cm2) absorbed within the porcine epidermis and 0.4 %
(92.01 ± 34.49 µg/cm2) absorbed within the receptor fluid over a 24 h time period.
There was a mean total CHG recovery of 77.7 % from the applied dose which is
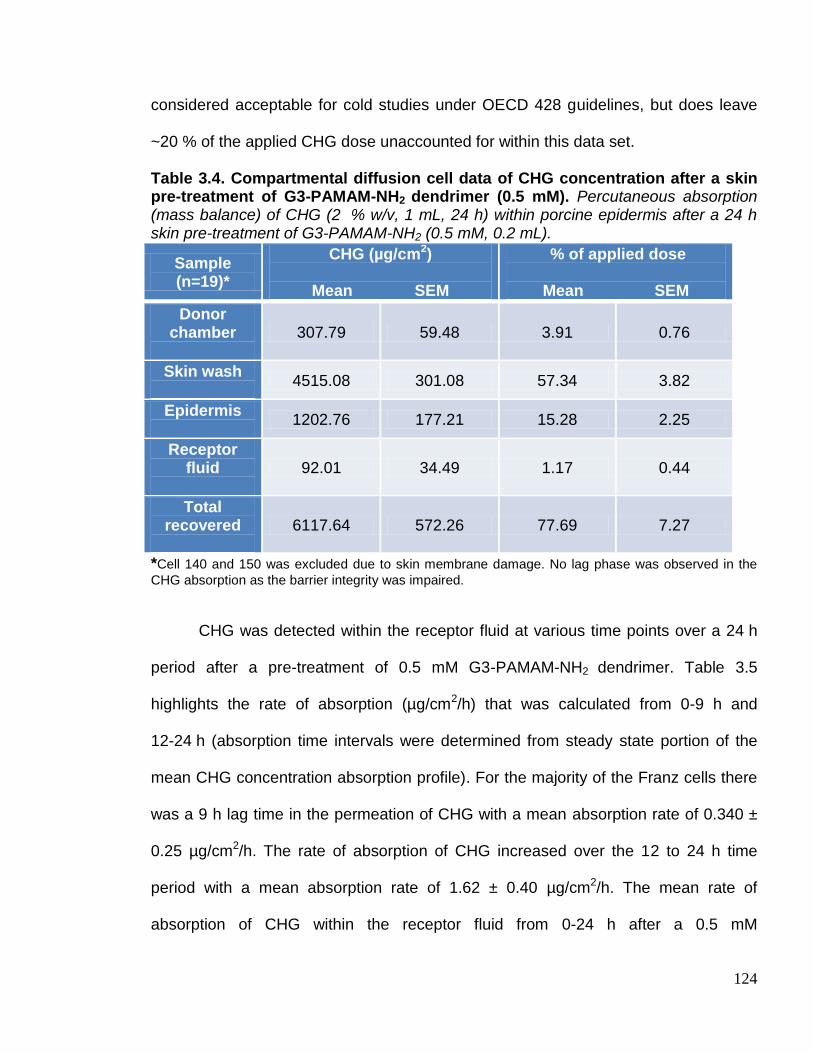
124
considered acceptable for cold studies under OECD 428 guidelines, but does leave
~20 % of the applied CHG dose unaccounted for within this data set.
Table 3.4. Compartmental diffusion cell data of CHG concentration after a skin pre-treatment of G3-PAMAM-NH2 dendrimer (0.5 mM). Percutaneous absorption (mass balance) of CHG (2 % w/v, 1 mL, 24 h) within porcine epidermis after a 24 h skin pre-treatment of G3-PAMAM-NH2 (0.5 mM, 0.2 mL).
Sample (n=19)*
CHG (µg/cm2)
Mean SEM
% of applied dose
Mean SEM
Donor chamber
307.79 59.48 3.91 0.76
Skin wash
4515.08 301.08 57.34 3.82
Epidermis
1202.76 177.21 15.28 2.25
Receptor fluid
92.01 34.49 1.17 0.44
Total recovered
6117.64 572.26 77.69 7.27
*Cell 140 and 150 was excluded due to skin membrane damage. No lag phase was observed in the
CHG absorption as the barrier integrity was impaired.
CHG was detected within the receptor fluid at various time points over a 24 h
period after a pre-treatment of 0.5 mM G3-PAMAM-NH2 dendrimer. Table 3.5
highlights the rate of absorption (µg/cm2/h) that was calculated from 0-9 h and
12-24 h (absorption time intervals were determined from steady state portion of the
mean CHG concentration absorption profile). For the majority of the Franz cells there
was a 9 h lag time in the permeation of CHG with a mean absorption rate of 0.340 ±
0.25 µg/cm2/h. The rate of absorption of CHG increased over the 12 to 24 h time
period with a mean absorption rate of 1.62 ± 0.40 µg/cm2/h. The mean rate of
absorption of CHG within the receptor fluid from 0-24 h after a 0.5 mM
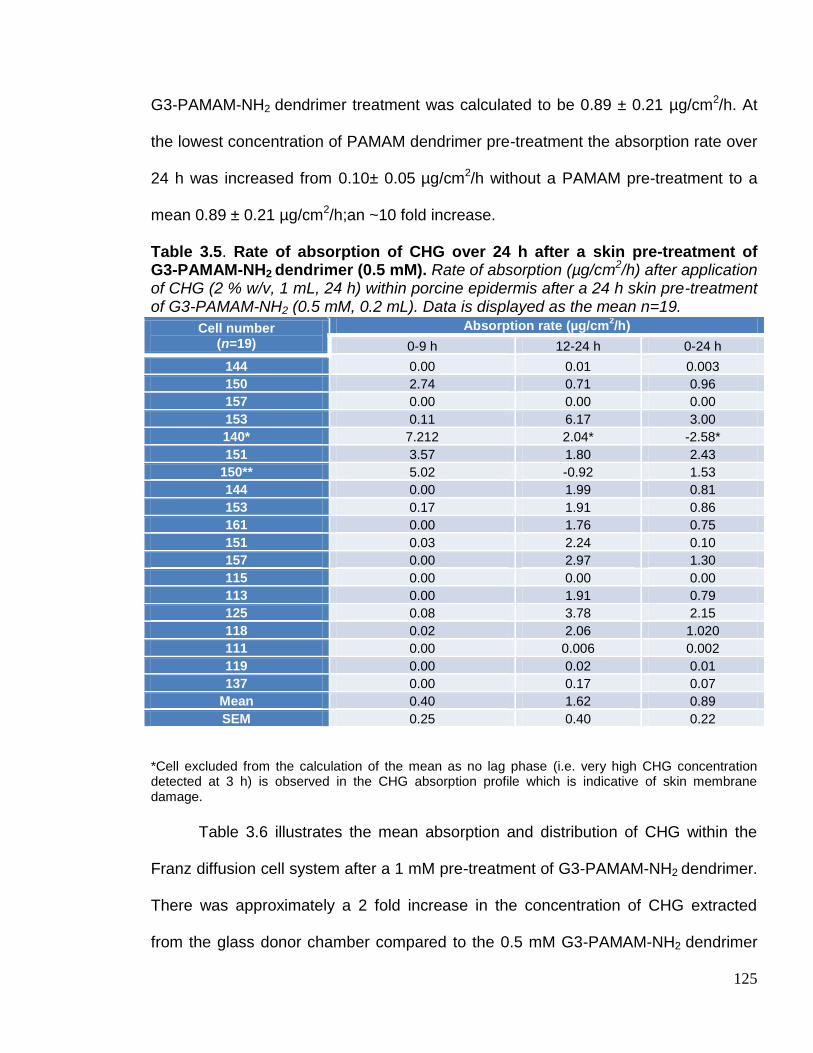
125
G3-PAMAM-NH2 dendrimer treatment was calculated to be 0.89 ± 0.21 µg/cm2/h. At
the lowest concentration of PAMAM dendrimer pre-treatment the absorption rate over
24 h was increased from 0.10± 0.05 µg/cm2/h without a PAMAM pre-treatment to a
mean 0.89 ± 0.21 µg/cm2/h;an ~10 fold increase.
Table 3.5. Rate of absorption of CHG over 24 h after a skin pre-treatment of G3-PAMAM-NH2 dendrimer (0.5 mM). Rate of absorption (µg/cm2/h) after application of CHG (2 % w/v, 1 mL, 24 h) within porcine epidermis after a 24 h skin pre-treatment of G3-PAMAM-NH2 (0.5 mM, 0.2 mL). Data is displayed as the mean n=19.
Cell number (n=19)
Absorption rate (µg/cm2/h)
0-9 h 12-24 h 0-24 h
144 0.00 0.01 0.003
150 2.74 0.71 0.96
157 0.00 0.00 0.00
153 0.11 6.17 3.00
140* 7.212 2.04* -2.58*
151 3.57 1.80 2.43
150** 5.02 -0.92 1.53
144 0.00 1.99 0.81
153 0.17 1.91 0.86
161 0.00 1.76 0.75
151 0.03 2.24 0.10
157 0.00 2.97 1.30
115 0.00 0.00 0.00
113 0.00 1.91 0.79
125 0.08 3.78 2.15
118 0.02 2.06 1.020
111 0.00 0.006 0.002
119 0.00 0.02 0.01
137 0.00 0.17 0.07
Mean 0.40 1.62 0.89
SEM 0.25 0.40 0.22
*Cell excluded from the calculation of the mean as no lag phase (i.e. very high CHG concentration detected at 3 h) is observed in the CHG absorption profile which is indicative of skin membrane damage.
Table 3.6 illustrates the mean absorption and distribution of CHG within the
Franz diffusion cell system after a 1 mM pre-treatment of G3-PAMAM-NH2 dendrimer.
There was approximately a 2 fold increase in the concentration of CHG extracted
from the glass donor chamber compared to the 0.5 mM G3-PAMAM-NH2 dendrimer
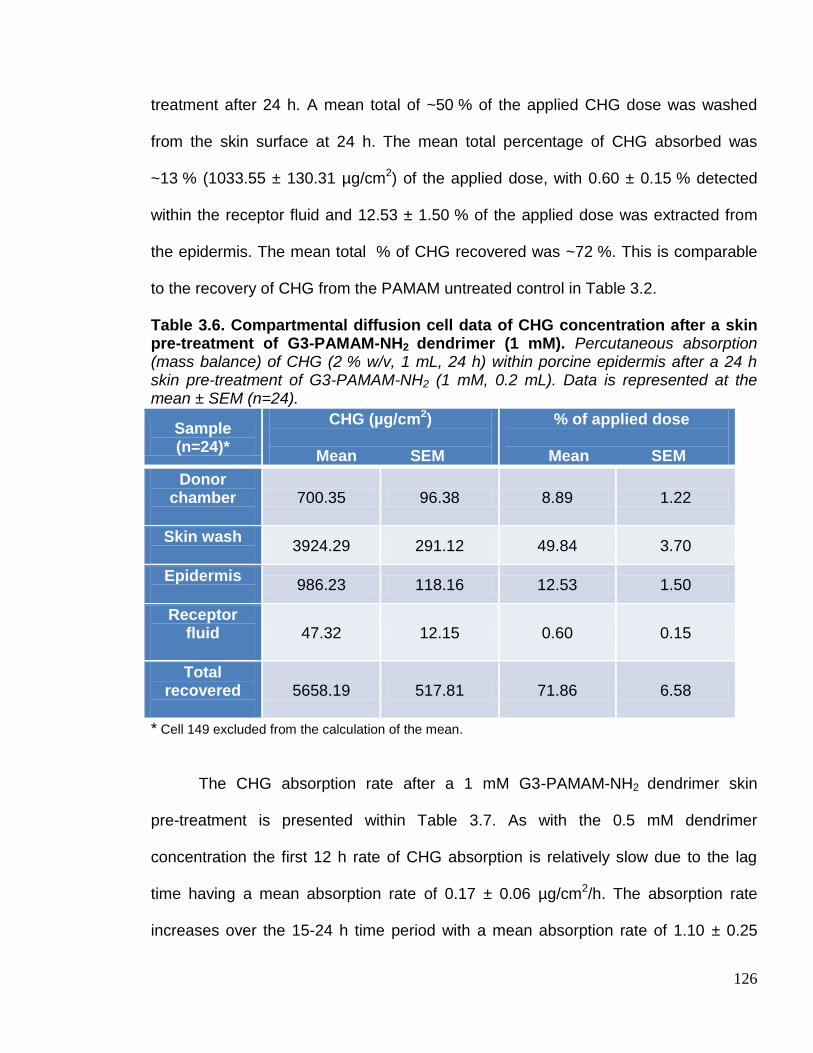
126
treatment after 24 h. A mean total of ~50 % of the applied CHG dose was washed
from the skin surface at 24 h. The mean total percentage of CHG absorbed was
~13 % (1033.55 ± 130.31 µg/cm2) of the applied dose, with 0.60 ± 0.15 % detected
within the receptor fluid and 12.53 ± 1.50 % of the applied dose was extracted from
the epidermis. The mean total % of CHG recovered was ~72 %. This is comparable
to the recovery of CHG from the PAMAM untreated control in Table 3.2.
Table 3.6. Compartmental diffusion cell data of CHG concentration after a skin pre-treatment of G3-PAMAM-NH2 dendrimer (1 mM). Percutaneous absorption (mass balance) of CHG (2 % w/v, 1 mL, 24 h) within porcine epidermis after a 24 h skin pre-treatment of G3-PAMAM-NH2 (1 mM, 0.2 mL). Data is represented at the mean ± SEM (n=24).
Sample (n=24)*
CHG (µg/cm2)
Mean SEM
% of applied dose
Mean SEM
Donor chamber
700.35 96.38 8.89 1.22
Skin wash
3924.29 291.12 49.84 3.70
Epidermis
986.23 118.16 12.53 1.50
Receptor fluid
47.32 12.15 0.60 0.15
Total recovered
5658.19 517.81 71.86 6.58
* Cell 149 excluded from the calculation of the mean.
The CHG absorption rate after a 1 mM G3-PAMAM-NH2 dendrimer skin
pre-treatment is presented within Table 3.7. As with the 0.5 mM dendrimer
concentration the first 12 h rate of CHG absorption is relatively slow due to the lag
time having a mean absorption rate of 0.17 ± 0.06 µg/cm2/h. The absorption rate
increases over the 15-24 h time period with a mean absorption rate of 1.10 ± 0.25
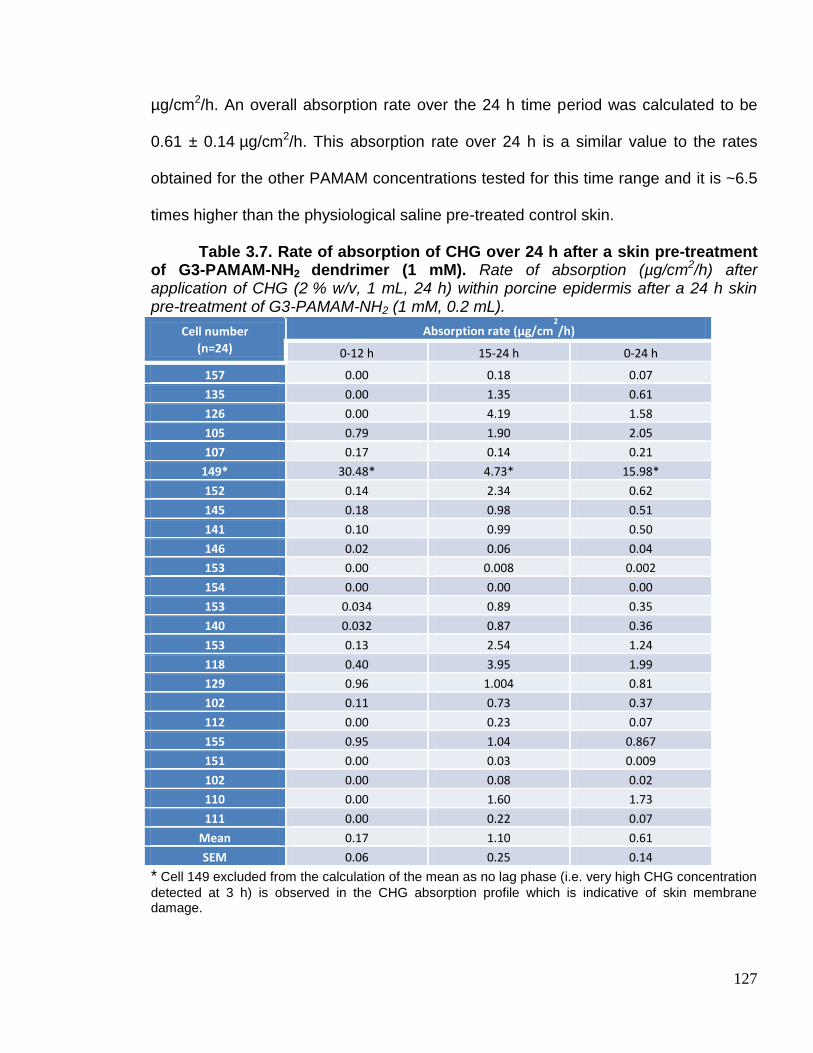
127
µg/cm2/h. An overall absorption rate over the 24 h time period was calculated to be
0.61 ± 0.14 µg/cm2/h. This absorption rate over 24 h is a similar value to the rates
obtained for the other PAMAM concentrations tested for this time range and it is ~6.5
times higher than the physiological saline pre-treated control skin.
Table 3.7. Rate of absorption of CHG over 24 h after a skin pre-treatment of G3-PAMAM-NH2 dendrimer (1 mM). Rate of absorption (µg/cm2/h) after application of CHG (2 % w/v, 1 mL, 24 h) within porcine epidermis after a 24 h skin pre-treatment of G3-PAMAM-NH2 (1 mM, 0.2 mL).
Cell number
(n=24)
Absorption rate (µg/cm2
/h)
0-12 h 15-24 h 0-24 h
157 0.00 0.18 0.07
135 0.00 1.35 0.61
126 0.00 4.19 1.58
105 0.79 1.90 2.05
107 0.17 0.14 0.21
149* 30.48* 4.73* 15.98*
152 0.14 2.34 0.62
145 0.18 0.98 0.51
141 0.10 0.99 0.50
146 0.02 0.06 0.04
153 0.00 0.008 0.002
154 0.00 0.00 0.00
153 0.034 0.89 0.35
140 0.032 0.87 0.36
153 0.13 2.54 1.24
118 0.40 3.95 1.99
129 0.96 1.004 0.81
102 0.11 0.73 0.37
112 0.00 0.23 0.07
155 0.95 1.04 0.867
151 0.00 0.03 0.009
102 0.00 0.08 0.02
110 0.00 1.60 1.73
111 0.00 0.22 0.07
Mean 0.17 1.10 0.61
SEM 0.06 0.25 0.14
* Cell 149 excluded from the calculation of the mean as no lag phase (i.e. very high CHG concentration
detected at 3 h) is observed in the CHG absorption profile which is indicative of skin membrane damage.
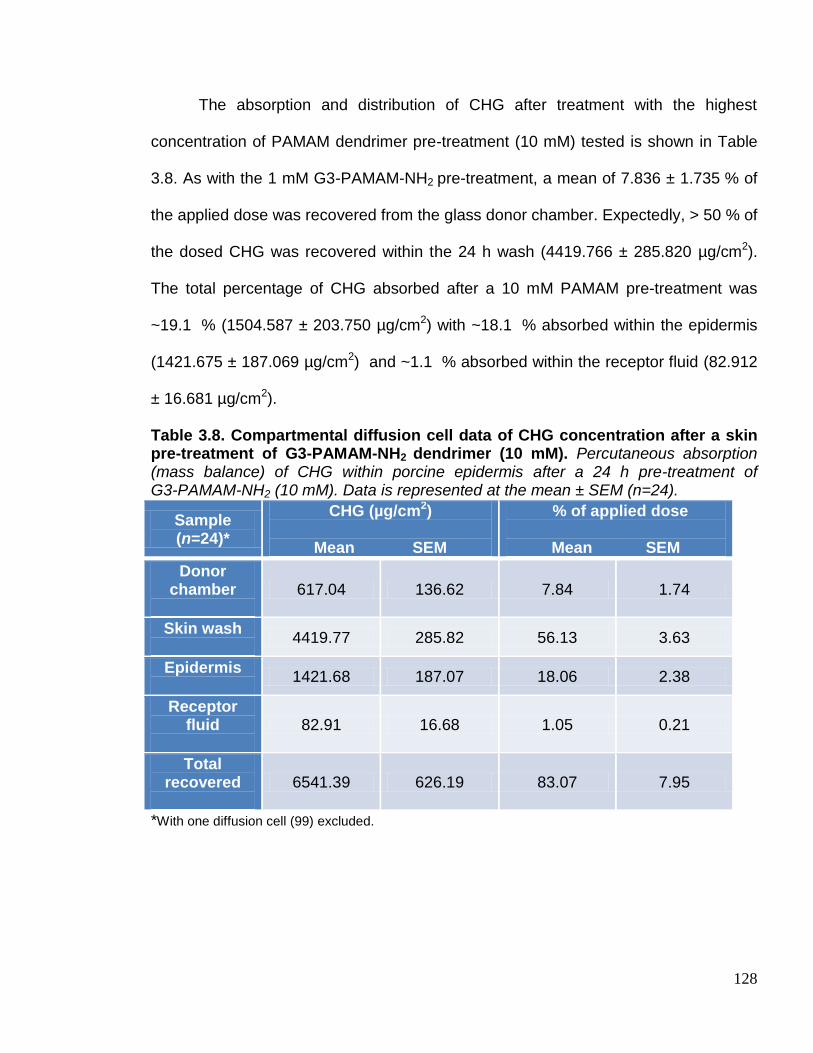
128
The absorption and distribution of CHG after treatment with the highest
concentration of PAMAM dendrimer pre-treatment (10 mM) tested is shown in Table
3.8. As with the 1 mM G3-PAMAM-NH2 pre-treatment, a mean of 7.836 ± 1.735 % of
the applied dose was recovered from the glass donor chamber. Expectedly, > 50 % of
the dosed CHG was recovered within the 24 h wash (4419.766 ± 285.820 µg/cm2).
The total percentage of CHG absorbed after a 10 mM PAMAM pre-treatment was
~19.1 % (1504.587 ± 203.750 µg/cm2) with ~18.1 % absorbed within the epidermis
(1421.675 ± 187.069 µg/cm2) and ~1.1 % absorbed within the receptor fluid (82.912
± 16.681 µg/cm2).
Table 3.8. Compartmental diffusion cell data of CHG concentration after a skin pre-treatment of G3-PAMAM-NH2 dendrimer (10 mM). Percutaneous absorption (mass balance) of CHG within porcine epidermis after a 24 h pre-treatment of G3-PAMAM-NH2 (10 mM). Data is represented at the mean ± SEM (n=24).
Sample (n=24)*
CHG (µg/cm2)
Mean SEM
% of applied dose
Mean SEM
Donor chamber
617.04 136.62 7.84 1.74
Skin wash
4419.77 285.82 56.13 3.63
Epidermis
1421.68 187.07 18.06 2.38
Receptor fluid
82.91 16.68 1.05 0.21
Total recovered
6541.39 626.19 83.07 7.95
*With one diffusion cell (99) excluded.

129
The absorption rate for CHG after a 10 mM G3-PAMAM-NH2 dendrimer skin
pre-treatment can be observed in Table 3.9. The first 0-12 h time period had a mean
observable absorption rate of 0.48 ± 0.14 µg/cm2/h which increased to 1.53 ± 0.32
µg/cm2/h at a time period of 15-24 h. Over a 24 h time period the CHG absorption
rate was calculated as 0.98 ± 0.19 µg/cm2/h. The CHG 0-24 h absorption rate for
10 mM PAMAM dendrimer was ~10 fold higher than for physiological saline pre-
treated skin. All PAMAM dendrimer skin pre-treatments exhibited a similar 0-24 h
CHG absorption profile with 0.5 mM, 1 mM and 10 mM exhibiting absorption rates of
0.89 ± 0.22, 0.61 ± 0.14 and 0.91 ± 0.19 µg/cm2/h respectively. Without a PAMAM
dendrimer pre-treatment the absorption of CHG over 24 h was only 0.10 ± 0.05
µg/cm2/h.

130
Table 3.9 Rate of absorption of CHG over 24 h after a skin pre-treatment of G3-PAMAM-NH2 dendrimer (10 mM). Rate of absorption (µg/cm2/h) after application of CHG (2 % w/v, 1 mL, 24 h) within porcine epidermis after a 24 h skin pre-treatment of G3-PAMAM-NH2 (10 mM, 0.2 mL).
Cell number (n=24)
Absorption rate (µg/cm2/h)
0-12 h 15-24 h 0-24 h
87 0.00 0.00 0.00
109 0.00 0.00 0.00
86 0.83 0.59 0.65
83 0.00 0.07 0.05
99* 14.81* 0.84* 5.41*
72 2.64 1.55 1.79
94 0.00 0.13 0.03
83 0.00 0.41 0.11
109 0.00 0.30 0.19
86 0.00 0.77 0.24
99 0.88 4.15 2.85
85 1.66 0.74 1.20
92 0.00 2.99 1.29
93 0.83 4.71 2.95
60 0.36 3.51 2.01
64 0.21 1.41 0.83
55 0.60 3.31 2.12
91 0.00 1.98 0.69
117 0.54 0.26 0.49
124 0.16 0.59 0.33
119 1.13 4.21 2.06
111 0.73 0.71 0.96
130 0.007 0.70 0.28
115 0.40 1.98 1.40
Mean 0.48 1.53 0.98
SEM 0.14 0.32 0.19
*Cell 99 excluded from the calculation of the mean as no lag phase is observed in the CHG absorption profile which is indicative of skin membrane damage.
A graph plotting the permeation profiles of CHG within the receptor fluid over a
24 h time period after all pre-treatment conditions is illustrated in Figure 3.1. When
CHG was dosed after a pre-treatment of physiological saline only 3.23 ± 1.62 µg/cm2
of CHG had permeated into the receptor fluid at 24 h and a 9 h lag time was
131
observed. The highest total concentration of CHG detected within the receptor fluid
was observed for 0.5mM G3-PAMAM-NH2 dendrimer pre-treated skin at 24 h (92.01 ±
34.49 µg/cm2) compared 1 mM G3-PAMAM-NH2 dendrimer pre-treated skin that
yielded the lowest concentration of CHG permeation within the receptor fluid (47.32 ±
12.15 µg/cm2). The concentration profile of CHG within the receptor fluid was very
similar across all PAMAM dendrimer concentrations tested up to a time period of 9 h.
There was a steady increase in the concentration of CHG up to 6 h where there is a
slight plateau until 12 h. The largest concentration increase was observed from the 12
to 24 h time period. Figure 3.2 illustrates the concentration of CHG extracted from
the epidermis after 24 h for all four skin pre-treatments. Though the 10 mM
G3-PAMAM-NH2 dendrimer skin pre-treatment yielded the highest CHG deposition
within the epidermis no significant difference was observed between the CHG
concentrations (µg/cm2) extracted from the epidermis for the four skin pre-treatment
groups (Kruskal Wallis ANOVA, p>0.05).

132
Figure 3.1 Mean concentration of CHG detected within the receptor fluid over a 24 h time period after a range of skin pre-treatments. Profile of amount of CHG absorbed (Mean ± SEM) over a 24 h time period after application of CHG (2 % w/v, 1 mL, 24 h) within porcine epidermis after a 24 h skin pre-treatment of Phys. saline (0.9 % NaCl, 0.2 mL) represented by turquoise circles, G3-PAMAM-NH2 (10 mM, 0.2 mL) represented by purple squares, G3-PAMAM-NH2 (1 mM, 0.2 mL) represented by dark blue triangles and G3-PAMAM-NH2 (0.5 mM, 0.2 mL) is represented by light blue inverted triangles.
Figure 3.2. Concentration of CHG within the epidermis at 24 h after a range of skin pre-treatments. Data is represented as the mean ± SEM. CHG was dosed in the same volume and concentration as the PAMAM treated groups after a 24 h pre-treatment of phys. saline. No statistical significance was observed between groups or treated and untreated (p>0.05).
2
0.5
mM
G3-
PAM
AM
-NH 2
1.0
mM
G3-
PAM
AM
-NH 2
10.0
mM
G3-
PAM
AM
-NH
Phys. s
alin
e
0
500
1000
1500
2000
PAMAM pre-treatment before application of CHG (2% w/v)
Co
ncen
trati
on
of
CH
G w
ith
in
ep
iderm
is (
g/c
m2)
10 20 30-20
0
20
40
60
80
1000.5 mM PAMAM dendrimer
1 mM PAMAM dendrimer
10 mM PAMAM dendrimer
Phys. saline
Time (h)
Mean
cu
mu
lati
ve c
on
cen
trati
on
of
CH
G
wit
hin
recep
tor
flu
id o
ver
24 h
(
g/c
m2)

133
The total concentration of CHG (mean ± SEM) detected within the receptor fluid at
24 h for a range of PAMAM dendrimer pre-treatments is displayed in graphical form in
Figure 3.3. The data was plotted as a histogram which revealed that the data was not
normally distributed. A Kruskal Wallis ANOVA with a Dunn’s post test confirmed that
for all three concentrations of G3-PAMAM-NH2 dendrimer skin pre-treatment tested,
the total concentrations of CHG absorbed within the receptor fluids at 24 h were
statistically different (p< 0.0001) from the physiological saline pre-treated skin. No
significant difference in the absorption of CHG at 24 h was observed between the
different PAMAM dendrimer concentrations tested (p>0.05)
Figure 3.3 Concentration of CHG absorbed within the receptor fluid at 24 h after various skin pre-treatments. Illustration of the (mean ± SEM) concentration of CHG permeated into the receptor fluid at 24 h (µg/cm2) against the PAMAM dendrimer pre-treatment post application of a 2 % CHG (w/v) solution. PAMAM dendrimer pre-treated skin was significantly different from the phys. saline pre-treated skin (p<0.0001).
**
**
***
0.5
mM
PAM
AM
den
drim
er
1 m
M P
AM
AM
den
drim
er
10 m
M P
AM
AM
den
drim
er
Phys
. sal
ine
0
50
100
150
To
tal
co
nce
ntr
ati
on
of
CH
G w
ith
in
re
ce
pto
r fl
uid
at
24
h (
g/c
m2)

134
After application of a PAMAM dendrimer solution to the skin it was noted that a
thin film formed once the vehicle had evaporated. The PAMAM dendrimer film was
tacky, transparent and viscous. Figure 3.4 illustrates the difference in appearance of
the skin surface of a vehicle control compared to that of PAMAM dendrimer dosed
skin. The PAMAM dendrimer film was found to be water soluble and was removed
from the skin surface by agitating water across the skin surface. Due to the
hygroscopic nature of PAMAM dendrimers it was not possible to determine the
transepidermal water loss (TEWL) of the layer to determine whether it could be
considered ‘breathable’ i.e. allows for TEWL.
Figure 3.4. Photograph of the skin surface comparing the control to skin dosed with PAMAM dendrimer. Franz cells with the donor chamber removed to reveal the epidermis. The Franz cell on the left was dosed with a vehicle control (H2O:MeOH) and the Franz cell on the right was dosed with a G3-PAMAM-NH2 dendrimer solution (10 mM, 0.2 mL). A dendrimer film across the skin surface is clearly visible on the right-hand-side.

135
3.3.1 Franz diffusion cell studies using tape stripping to profile CHG within
porcine dermatomed skin
The percutaneous absorption studies using porcine epidermis were used as a
screening approach to determine whether a PAMAM dendrimer pre-treatment would
enhance the permeation of chlorhexidine into the skin and which concentration would
be most effective. The concentration chosen to be taken forward to tape stripping
studies was the mid-range 1 mM solution of G3-PAMAM-NH2 dendrimer. The tape
stripping method is the gold standard in determining the distribution of a compound
within the SC (OECD, 2004). To fully remove the SC, 21 tape strips were removed
from each dosed Franz cell (Trebilcock et al. 1994) but were weighed before and after
so that gravimetric analysis could be used to determine the amount of SC removed
on each tape strip. The difference in weight of each tape strip was calculated to
determine the mass of SC material on each tape strip which was then plotted against
the tape strip number. A number of observations during this procedure are worthy of
note. At around tape strip 6 the skin became very moist therefore interstitial fluid was
being removed as well as SC on the tape strips and recorded within the mass data.
The moisture attributed to interstitial fluid also caused the epidermis to tear during the
tape stripping process, typically after the template had been placed over the dose
area and pressure applied to the tape strip. It is for this reason why 21 tape strips
were not obtained from the skin in every case.

136
Figure 3.5 illustrates the mean cumulative amount of SC material plotted
against the tape strip number. The skin that was dosed with a physiological saline
pre-treatment then dosed with CHG (2 % w/v) had a mean cumulative amount of SC
material of 12.24 ± 2.62 mg at tape strip 20. This was comparable to the dendrimer
solution vehicle control (H2O: MeOH) that had a cumulative total amount of 14.08 ±
3.27 mg at tape strip 19. The highest mass of SC material removed was after the skin
was pre-treated with the PAMAM dendrimer and a mean cumulative mass of 23.64 ±
8.11 mg was removed at tape strip 15. Also, it was noted that fewer tape strips were
taken from the PAMAM dendrimer pre-treated skin as the skin was prone to tear
during the procedure.
Figure 3.5. Graph illustrating the cumulative mass of SC material on individual tape strips for various skin pre-treatments. Cumulative mass of SC material (mg) plotted against tape strip number. Light blue circles represents dermatomed (400 µm) porcine skin dosed for 24 h with CHG (2 % w/v), green squares corresponds to skin pre-treated with a 1 mM solution of G3-PAMAM-NH2 dendrimer for 24 h before dosing with CHG (2 % w/v for 24 h). Dark blue triangles corresponds to the vehicle control (H2O:MeOH). The data points are presented as mean ± SEM (CHG n=21, PAMAM n= 13 and vehicle control n=3).
0 5 10 15 20 250
10
20
30
40
CHG without PAMAMdendrimer pretreatment
PAMAM dendrimerpre-treated
vehicle control
Tape strip No.
Cu
mu
lati
ve a
mo
un
t o
f
SC
mate
ria
l (m
g)
137
Figure 3.6. (a) illustrates the mean concentration of CHG extracted from the
corresponding tape strips resulting in a profile of the CHG distribution. The superficial
layers of the SC considered to be removed by tape strips 1-3 exhibited the highest
concentration of CHG after a PAMAM dendrimer pre-treatment. The first tape strip
(that is considered as having adsorbed CHG rather than having absorbed it) exhibited
an average CHG concentration of 4012.91 ± 919.34 µg/mL, 2339.76 ± 1131.10 µg/mL
and 1635.24 ± 296.84 (mean ± SEM) for PAMAM pretreated, vehicle control and
physiological saline pretreated respectively. The higher the tape strip number (and
thus the deeper within the SC) the lower the concentration of CHG was detected
across all treatment groups. For example, for tape strips 7-10 the mean concentration
of CHG extracted from the tape strips was 179.18 ± 63.06 µg/mL, 132.02 ±
6.35 µg/mL and 99.87 ± 23.29 µg/mL for PAMAM dendrimer pretreated, vehicle
control and physiological saline pretreated skin respectively. That is approximately a
20 fold decrease in CHG concentration when compared to tape strip 1, but would still
be considered a high biocidal concentration of CHG. As with tape strip 1 the PAMAM
dendrimer pretreated skin demonstrated the highest concentration of CHG for tape
strips 7-10, however a high variability was observed between each Franz cell. With
each successive tape strip removed from the skin (after ~tape strip 6) the moisture
content increased resulting in tearing of the epidermis. After the epidermis has torn
the remaining skin is removed from the Franz cell and the CHG is extracted from the
skin and the last tape strip which tore the epidermis is included with the skin
compartment. Comparisons between the CHG concentrations at the higher tape strip

138
numbers were not feasible due to the low sample number of the higher tape strips
due to tearing of the epidermis.
Figure 3.6 (b) illustrates the concentration of CHG calculated per mg of SC
material removed on the corresponding tape strip(s). The calculation used to account
for the weight of SC material can be found in section 3.2.4, Equation 3.1. If the
gravimetric analysis is taken into account a different CHG distribution profile is
observed within the SC (Figure 3.6 (b)). The profile appears rather irregular which
may be due to the issue of the moisture that was observed on tapes strips 6 and
upwards.

139
Figure 3.6. Concentration profile of CHG detected on each tape strips. (a) Concentration of CHG (µg/mg) extracted from tapes into a fixed volume of solvent. Extraction occurred after stripping 400 µm dermatomed skin after a pre-treatment for 24 h with a 1 mM PAMAM solution of G3-PAMAM-NH2 dendrimer, vehicle control and Phys. saline. (b) Concentration of CHG per mg of SC material weighed gravimetrically (µg/mg) after stripping 400 µm dermatomed skin after a pre-treatment for 24 h with a 1 mM PAMAM solution of G3-PAMAM-NH2 dendrimer, vehicle control and Phys. saline Data is represented at the mean ± SEM (CHG n=21, PAMAM n= 13 and vehicle control n=3).
1 2 34-
67-
10
11-1
6
17-2
1
0
500
1000
1500
2000Pre-treated PAMAM dendrimer
Vehicle control
CHG dosed alone
Tape strip No.
Co
ncen
trati
on
of
CH
G p
er
mg
of
str
atu
m c
orn
eu
m(
g/m
g)
b 1 2 3
4-6
7-10
11-1
6
17-2
1
0
2000
4000
6000
PAMAM pre-treated skin
vehicle control
CHG dosed alone
Tape strip No.
Co
ncen
trati
on
of
CH
G e
xtr
acte
d
fro
m t
ap
e s
trip
s (
g/m
L)
a

140
Table 3.10 illustrates the mean absorption and distribution of CHG within the
Franz cell system after a pre-treatment of physiological saline (0.9 % NaCl, 0.2 mL).
After the excess unabsorbed CHG was removed within the wash, in this case a mean
of 56.09 ± 6.56 % of applied dose (4416.09 ± 516.50 µg/cm2), the skin surface was
allowed to dry at ambient temperature. The skin was then tape stripped up to 21
times to remove the SC and assuming that the tape strips have removed the SC the
mean percentage of applied dose of CHG distributed throughout the SC was found to
be 16.49 ± 3.29 % (1298.03 ± 259.40 µg/cm2). The mean percentage of applied dose
considered to be absorbed at 24 h including tapes strips (SC), the remaining
epidermis/dermis and the concentration detected within the receptor fluid was
calculated to be 6.39 ± 1.18 % (503.10 ± 92.87 µg/cm2). Again ~5.5 % of the dosed
CHG was extracted from the glass donor chamber which is comparable to the CHG
adsorbed on to the donor chambers across the studies mentioned previously within
this section. A total recovery of ~85 % was achieved which is considered a good
recovery when using non radio-labeled drugs. This is a CHG recovery increase
of~10 % when compared to the epidermis study. This is due to an increased recovery
of CHG from the skin due to extraction of CHG using tape strips from the SC.

141
Table 3.10. Compartmental diffusion cell data (including tape strips) of CHG concentration for the control skin pre-treatment. Percutaneous absorption (mass balance) of CHG (2 % w/v, 1 mL, 24 h) within porcine dermatomed skin (400 µm thick) after a 24 h skin pre-treatment of phys. saline (0.9 % NaCl, 0.2 mL). Data is represented at the mean ± SEM (n=21).
Sample (n=21)
CHG (µg/cm2)
Mean SEM
% of applied dose
Mean SEM
Donor chamber
434.41 85.97 5.52 1.09
Skin wash
4416.09 516.50 56.08 6.56
Tape strips
1298.03 259.40 16.48 3.29
Epidermis/ dermis
503.10 92.85 6.39 1.18
Receptor fluid
0.02 0.02 0.0002 0.0002
Total recovered
6651.65 954.74 84.47 12.13
The percutaneous absorption and distribution of CHG within the Franz
diffusion cell after a pre-treatment for 24 h of the vehicle solution without PAMAM
dendrimer can be observed in Table 3.11. The concentration of CHG extracted from
the glass donor chamber is again typical of the previous studies and of the recovery
when the donor chamber was spiked. Also typical is the mean 48.41 ± 2.59 %
recovery of CHG within the skin wash at 24 h. The mean percentage of applied dose
recovered from the tape strips which are assumed to have removed the SC was
18.83 ± 6.87 % (1483.08 ± 540.78 µg/cm2). The mean percentage of applied dose of
CHG recovered from the tape strips (SC), epidermis/dermis, and receptor fluid for the
vehicle control was 27.95 ± 8.98 % (2200.4 ± 707.49 µg/cm2). This is a higher value
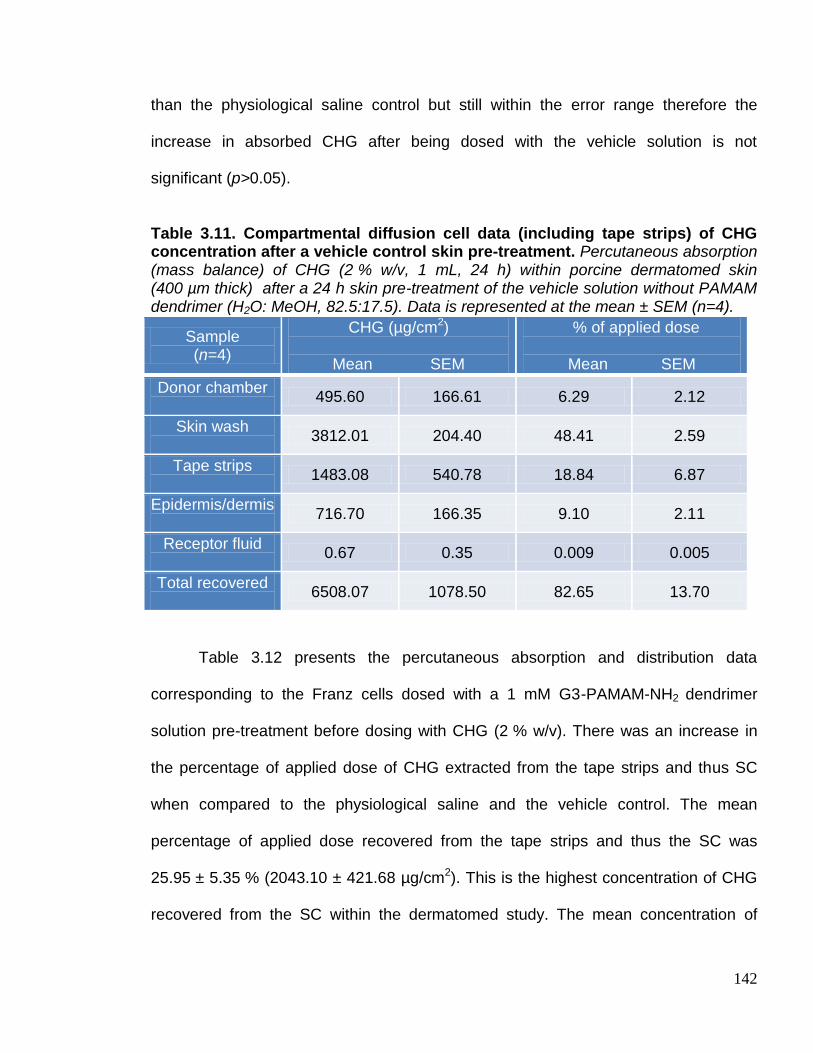
142
than the physiological saline control but still within the error range therefore the
increase in absorbed CHG after being dosed with the vehicle solution is not
significant (p>0.05).
Table 3.11. Compartmental diffusion cell data (including tape strips) of CHG concentration after a vehicle control skin pre-treatment. Percutaneous absorption (mass balance) of CHG (2 % w/v, 1 mL, 24 h) within porcine dermatomed skin (400 µm thick) after a 24 h skin pre-treatment of the vehicle solution without PAMAM dendrimer (H2O: MeOH, 82.5:17.5). Data is represented at the mean ± SEM (n=4).
Sample (n=4)
CHG (µg/cm2)
Mean SEM
% of applied dose
Mean SEM
Donor chamber
495.60 166.61 6.29 2.12
Skin wash
3812.01 204.40 48.41 2.59
Tape strips
1483.08 540.78 18.84 6.87
Epidermis/dermis
716.70 166.35 9.10 2.11
Receptor fluid
0.67 0.35 0.009 0.005
Total recovered
6508.07 1078.50 82.65 13.70
Table 3.12 presents the percutaneous absorption and distribution data
corresponding to the Franz cells dosed with a 1 mM G3-PAMAM-NH2 dendrimer
solution pre-treatment before dosing with CHG (2 % w/v). There was an increase in
the percentage of applied dose of CHG extracted from the tape strips and thus SC
when compared to the physiological saline and the vehicle control. The mean
percentage of applied dose recovered from the tape strips and thus the SC was
25.95 ± 5.35 % (2043.10 ± 421.68 µg/cm2). This is the highest concentration of CHG
recovered from the SC within the dermatomed study. The mean concentration of

143
CHG absorbed within the SC (tape strips), remaining epidermis/dermis and CHG
recovered from receptor fluid was 39.64 ± 7.25 % (3121.53 ± 570.88 µg/cm2). A mean
recovery of ~85 % of the total CHG applied to the skin was recovered.
Table 3.12 Compartmental diffusion cell data (including tape strips) of CHG concentration after a G3-PAMAM-NH2 dendrimer (1 mM) skin pre-treatment. Percutaneous absorption (mass balance) of CHG (2 % w/v, 1 mL, 24 h) within porcine dermatomed skin (400 µm thick) after a 24 h skin pre-treatment of G3-PAMAM-NH2 dendrimer (1 mM, 0.2 mL). Data is represented at the mean ± SEM (n=18).
Sample (n=18)
CHG (µg/cm2)
Mean SEM
% of applied dose
Mean SEM
Donor chamber
460.31 86.63 5.85 1.10
Skin wash
3142.01 401.61 39.90 5.10
Tape strips
2043.10 421.68 25.95 5.36
Epidermis/dermis
1077.50 148.99 13.68 1.89
Receptor fluid
0.94 0.21 0.012 0.002
Total recovered
6723.85 1059.11 85.39 13.45
When the skin was pre-treated with a 1 mM solution of G3-PAMAM-NH2 a
higher concentration of CHG was extracted from the total number of tape strips that is
assumed to represent the SC. A mean concentration of 2043.10 ± 421.61 µg/cm2 of
CHG was extracted from the tapes after a PAMAM dendrimer pre-treatment, 1483.08
± 540.78 µg/cm2 after a vehicle solution pre-treatment and 1298.03 ± 259.40 µg/cm2
was the mean CHG total extracted from all tape strips for physiological saline skin
pre-treatment (Figure 3.7 (a)). The PAMAM dendrimer pre-treatment yielded the
highest concentration of CHG from the total number of tape strips corresponding to

144
the SC compared to the treatment groups without the presence of the PAMAM
dendrimer. This enhancement effect is not statistically significant due to the high
inherent variability observed within this study.
Figure 3.7 (b) shows the mean concentration of CHG within the rest of the
epidermis and dermis after the tape stripping procedure. The CHG concentration
within the epidermis and dermis illustrates the same trend as Figure 3.7 (a) with
regards to the CHG concentration within the SC. After a PAMAM dendrimer
pre-treatment the concentration of CHG within the skin was statistically higher than
that of the skin that had been pre-treated with physiological saline. No statistical
difference was observed between the vehicle control and the negative physiological
saline control (p>0.05).

145
Figure 3.7 CHG concentrations extracted from tape strips and the remaining skin after various skin pre-treatments. (a) Graph plotting the mean total CHG extracted from the tape strips (µg/cm2) for each of the dermatomed skin (400 µm thick) pre-dose treatments. (b) Graph illustrating the mean total concentration (µg/cm2) of CHG extracted from the remaining epidermis and dermis after the SC had been removed by tape stripping. A non parametric Kruskal-Wallis test was conducted with a Dunn’s post-test. The median for all 3 groups differed significantly (p<0.05) and the Dunn’s multiple comparison post-test highlighted a statistically significant difference between the G3-PAMAM-NH2 skin pre-treatment with a phys. saline skin pre-treatment (p<0.05). Data represented as mean ± SEM.
pre-tr
eate
d
2
G3-
PAM
AM
-NH
vehic
le c
ontrol p
re-tre
ated
Phys
. sal
ine
pre-tre
ated
0
1000
2000
3000C
on
cen
trati
on
of
CH
G e
xtr
acte
d
fro
m t
ap
e s
trip
s (
g/c
m2)
a
pre
-trea
ted
2
G3-
PAM
AM
-NH
vehic
le c
ontrol p
re-tr
eate
d
Phys
. sal
ine
pre-tr
eate
d
0
500
1000
1500
Co
nc.
of
CH
G w
ith
in
th
e
ep
iderm
is/d
erm
is (
g/c
m2) * P <0.05 b
146
3.4 Discussion
The penetration enhancement effect of the PAMAM dendrimer was not
concentration-dependent. The data displayed within this chapter exhibited similar
activity over the concentration range of 1-10 mM of G3-PAMAM-NH2 dendrimer used
within the studies (Figure 3.3 showed no significant different between the PAMAM
dendrimer concentrations in penetration enhancement p>0.05). It was shown that a
PAMAM dendrimer pre-treatment (0.5 and10 mM) resulted in significant (~30 fold)
increase (p<0.0001) in the concentration of CHG within the receptor fluid at 24 h
(Figure 3.3). For a 1 mM G3-PAMAM-NH2 dendrimer skin pre-treatment ~16 fold
increase in CHG within the receptor fluid was observed though a high variability for
the study was observed also. This is likely due to inherent donor-donor skin variability
as 5 skin donors were utilised for the epidermis studies. Further, after a PAMAM
dendrimer pre-treatment the rate of CHG absorption over 24 h increased by
~6.5-10 fold. Increasing the concentration of the PAMAM dendrimer did not
proportionally increase the skin permeation of CHG. This effect was also reported for
the hydrophilic drug 5-fluorouracil after a G4-PAMAM-NH2 skin pre-treatment
(Venuganti and Perumal, 2009). This may be due to aggregation of the PAMAM
dendrimers at high concentrations (Klajnert and Epand, 2005).
It has been reported that a PAMAM dendrimer skin pre-treatment (24 h,
unoccluded) enhanced the permeation of the hydrophobic NSAID, tamsulosin
hydrochloride. A 7.5 mM solution of G3-PAMAM-NH2 in a chloroform vehicle resulted
in ~4 fold increase in the amount of Tamsulosin permeated across a snake skin

147
membrane when compared to the control (Wang et al. 2003). Further; a 1 mM
solution of G4-PAMAM-NH2 enhanced the permeation of the anti-cancer drug,
5-fluorouracil, into the skin with an increase in the permeability coefficient of the
hydrophilic drug by 4-fold in a mineral oil vehicle, 2.5 fold in isopropyl myristate
vehicle but decreased by half in phosphate buffered saline (Venuganti and Perumal,
2008). The permeability coefficient of the 5-fluorouracil increased after a PAMAM
dendrimer pre-treatment but only from a lipophilic vehicle. Within the study outlined in
Section 3.3.0 it was demonstrated that a PAMAM dendrimer pre-treatment (1-10 mM)
enhanced the permeation of CHG, a hydrophilic antiseptic, across porcine epidermis
from a hydrophilic vehicle. A comparison between the different species’ membrane
models used and their suitability for permeation are discussed in further detail in
chapters 4 and 6. Previously, PAMAM dendrimers had only been shown to enhance
the topical or transdermal delivery of hydrophobic drugs or hydrophilic drugs within a
hydrophobic vehicle. Further, this is the first study to investigate PAMAM dendrimers
as a topical penetration enhancer of an antiseptic to increase the exposure between
the biocide and resident bacteria.
A PAMAM dendrimer pre-treatment reduced the lag time required for CHG to
permeate the skin. Within the first 6 h it was the 10 mM PAMAM dendrimer solution
pre-treatment that exhibited the highest CHG absorption. At 9-24 h it was 0.5 mM
PAMAM dendrimer closely followed by 10 mM PAMAM dendrimer skin pre-treatment
concentrations that resulted in the highest absorbance of CHG within the receptor
fluid (Figure 3.1). This is also reflected in the calculated absorption rates of CHG
dosed alone in aqueous solution in which the rate over 15-24 h time period is

148
considerably higher than for the 0-12 h absorption rate. The lag time for CHG
permeation for the vehicle control was 12 h therefore the PAMAM dendrimer
significantly reduced the lag time and would therefore have a much quicker antisepsis
action. An efficacious antiseptic has been described by the Food and Drug
Administration (FDA) for healthcare antiseptic drug products as-
“a fast-acting [rapidly kills microorganisms], broad spectrum [kills a wide variety of microorganism species], persistent [suppresses regrowth of remaining microorganisms], antiseptic containing preparation that significantly reduces the number of microorganisms on
intact skin” (Federal Register, 1994 and Art, 2005).
Chlorhexidine digluconate possesses these attributes but has been shown to
permeate the skin very slowly with a 12 h lag time therefore by decreasing the lag
time with a PAMAM dendrimer pre-treatment the antisepsis of the deeper skin layers
would occur within a shorter time frame. This capability therefore fulfills the first
requirement of the FDA monograph more effectively and would result in an increased
efficacy. The pre-treatment of PAMAM dendrimer on porcine epidermis surprisingly
did not enhance the deposition of CHG significantly within the dermatological layer.
Figure 3.2 illustrates that a 10 mM PAMAM dendrimer skin pre-treatment did increase
the concentration of CHG within the epidermis but it was not statistically significant
when compared to the vehicle control. It appears that the PAMAM dendrimer skin
pre-treatment significantly enhanced the concentration of CHG across the skin
It was observed throughout the experiments that once the vehicle had
evaporated (ca. 3-6 h) a viscous and adhesive layer of G3-PAMAM-NH2 dendrimer
was deposited across the skin surface (Figure 3.4). This is due to the highly
hygroscopic nature of PAMAM dendrimers (Uppuluri et al. 1998) that extract water
149
from the surrounding environment to exist in a gel-like state. A dense PAMAM
dendrimer layer distributed across the skin surface may reduce the TEWL from the
skin causing skin hydration thus acting as a possible mechanism of enhancement for
the skin permeation of CHG.
Occlusion of the skin leading to increased hydration has been a known
mechanism of skin penetration for many years (Wester and Maibach, 1995 and
Roberts and Walker, 1993). The water content of the SC is typically 15-20 % dry
weight of tissue but can increase up to 400 % of the dry weight of tissue under
occlusion and increased humidity (Williams and Barry, 2012). Occlusion has been
utilised as a permeation enhancer for a range of therapeutics and biomolecules
including fluorescein isothiocyanate conjugated bovine serum albumin (Tan et al.
2009) and C14 acetylsalicylic acid (Fritsch et al. 1963). The mechanism that results in
the penetration enhancement of hydrated skin is not yet fully understood as no
evidence of swelling within the lipids has been found but pools of water altering the
micro-structure have been observed within the intercellular lipids using freeze fracture
electron microscopy (Van Hal et al. 1996). On hydration of the skin, corneocytes
within the centre of the SC become highly swollen increasing the cell volume
(Bouwstra et al. 2003). Hydrating the skin for permeation enhancement of a wide
range of therapeutics has been used for many years with regards to ointments and
occlusion, but it does not enhance the skin permeation of all compounds (Bucks and
Maibach, 1999). Further mechanisms of penetration enhancement by PAMAM
dendrimers are explored in the following chapter.

150
A tape stripping assay on porcine dermatomed skin established an increase in
the deposition of CHG within the SC (tape strips) and the remaining epidermis and
dermis. Gravimetric analysis was used to quantify the amount of SC material
removed with each tape strip. A template was used when tape stripping in order to
remove only SC material from the 2.54 cm2 dosed region. During the experiment it
was observed that at tape strip 6 and upwards a considerable portion of the weight
was moisture; possibly interstitial fluid from the viable epidermis or remaining receptor
fluid from underneath the skin. It has been shown that the SC hydration increases
from the outer SC towards the inner stratum granulosum interface (Bommannan et al.
1990) however it is unlikely that this would account for the degree of moisture
observed upon the later sequential tape strips. The cumulative amount of SC material
was calculated for the PAMAM dendrimer treated skin (G3-PAMAM-NH2, 1 mM),
vehicle control and for skin pre-dosed with physiological saline. The cumulative
weight of each tape strip for the vehicle control and the physiological saline pre-
treated skin were very similar with overlapping error bars (Figure 5). A considerable
increase in the cumulative weight of SC material removed with each tape strip was
observed after a PAMAM dendrimer skin pre-treatment. Also the number of tape
strips that were removed before the epidermis was torn decreased after application of
PAMAM dendrimer. This suggests that the PAMAM dendrimer caused a physical
effect upon the skin which resulted in the increased removal of SC material.
There are a number of reasons why the amount of SC material removed on a
single tape strip can vary. Inherent experimental conditions such as anatomical site,
age (Myer et al. 2006 and Lademann et al. 2009) and season of the skin donors were

151
accounted for as the skin was collected and prepared in parallel. Other extrinsic
variables include the amount of pressure applied to remove each tape strip, duration
of pressure applied and speed of tape strip removal (Löffler et al. 2004). These
variables were reduced as all the tape stripping was conducted by the author using
the same adhesive tape throughout and the same thumb to apply pressure to the skin
for an equal time period of 5 seconds. The increase in SC material removed from
each sequential tape strip for the PAMAM dendrimer pre-treatment is likely due to the
PAMAM dendrimer itself as the applied formulation can have a marked effect on the
tape stripping procedure (Schwarb et al. 1999 and Weighmann et al. 1999). PAMAM
dendrimers have been shown to interact with skin lipids (Venuganti et al. 2009) and
within chapter 4 G3-PAMAM-NH2 was shown to cause peak shifts of the amide I and
II bands indicating alteration of the protein-lipid organisation within the SC. This
physical effect upon the skin caused by the PAMAM dendrimer could explain the
increased mass of SC material observed upon each sequential tape strip.
Figure 3.6 (a) reports the concentration of CHG as a function of the tape strip
number. The concentration of CHG within the first 3 tape strips was highest in the
order of PAMAM dendrimer > vehicle control > physiological saline pre-treated skin.
The CHG concentration was slightly higher for the vehicle control for tape strips 4-6
but for tape strips 7-10 the PAMAM dendrimer pre-treated skin revealed a higher
concentration of CHG. The amount of SC material removed with increasing tape strip
number decreases as observed in Figure 3.5. Figure 3.6 (b) illustrates the same data
but normalises (Equation 3.1) the drug concentration to the weight of the SC
removed. The resulting permeation profile is irregular in nature which is likely due to

152
the inclusion of moisture within the gravimetric analysis, skewing the profile plot of
CHG within the SC. It is for this reason that further analysis such as calculation of
drug concentration as a function of SC depth was not pursued.
The results of the tape strip study (Tables 3.10-12) show that after a 1 mM
PAMAM dendrimer skin pre-treatment a higher concentration of CHG was extracted
from the tape strips (SC) and from the remaining epidermis and dermis (2043.095 ±
421.683 µg/cm2 and 1077.502 ± 148.991 µg/cm2 respectively). The CHG
concentration in decreasing order was PAMAM dendrimer > vehicle control >
physiological saline pre-treated skin for both tape strips (and thus SC) and for the
remaining epidermis and dermis (Figure 3.7). There was a statistically significant
increase in CHG concentration (p<0.05) within the epidermis and dermis when the
PAMAM pre-treated skin was compared to the physiological saline pre-treated skin.
The results indicate that the PAMAM dendrimer pre-treatment increases the
deposition of CHG within not only the superficial layers of the SC but also the
epidermis and dermis. The aim of this study was to increase the penetration and
retention of CHG within the skin and this has been demonstrated within the epidermis
and dermatomed percutaneous absorption studies within this section. An increase in
the deposition of CHG within the skin may improve antisepsis efficacy by increasing
the exposure of opportunistic pathogens to CHG (Karpanen et al. 2010).

153
3.5 Conclusion
The aim of this chapter was to determine whether a PAMAM dendrimer skin
pre-treatment would enhance the permeation and distribution of CHG within the
layers of porcine skin. This study was conducted to confirm that the PAMAM
dendrimer without the presence of CHG does have a physical interaction with the skin
resulting in a penetration enhancement effect. As PAMAM dendrimer pre-treatment
studies were conducted any dendrimer-CHG interactions resulting in an increased
permeation are shown not to be the only contributing factor to the increased skin
delivery of CHG observed. PAMAM dendrimers have previously been utilised as a
novel dendritic penetration enhancer of the hydrophilic compound 5-fluorouracil
(Venuganti and Perumal, 2008). There was a gap in the literature regarding their
application to other hydrophilic compounds such as CHG and their mechanism of
action. This chapter has established for the first time that a G3-PAMAM-NH2
dendrimer pre-treatment does indeed enhance the permeation of CHG through
porcine epidermis and also increases the concentration of CHG localized within the
upper skin strata.
This Chapter in its entirety illustrates how PAMAM dendrimers enhance the
distribution of CHG within the skin thus increasing the interaction of the conventional
biocide with opportunistic skin pathogens. This enhanced antisepsis could potentially
have significant benefits to the health care sector by means of reducing the
occurrence of nosocomial infectious diseases.

154
4.0. Elucidation of the interaction between PAMAM
dendrimers and porcine skin.
4.0 Introduction
4.0.1 Interaction between PAMAM dendrimers and the skin
The exact mechanism of enhanced topical and transdermal drug delivery is
still unknown but is suggested to be in varying degrees the following; a) action as
a drug release modifier thus increasing drug dissolution, b) preferential
accumulation within the appendages of the skin and c) impairing the barrier
function of the SC (Chapter 3 and Sun et al. 2012). PAMAM dendrimers have
been suggested as a drug release modifier that has a cyclodextrin like mechanism
in that they act as a carrier system for indomethacin (log P 4.3) (Wang et al. 2003).
As with PAMAM dendrimers, lipophilic drugs form an electrostatic or hydrophobic
complex with cyclodextrins that then increases the solubility of a drug within an
aqueous vehicle. This then results in an increase in the concentration of drug that
partition into the SC (Legendre et al. 1995). The drug that is encapsulated within
or complexed to nanoparticles such as PAMAM dendrimers and cyclodextrins are
in a solubilized form but are only poorly soluble within the aqueous vehicle. This
forms a high thermodynamic driving force once the nanoparticle has carried the
drug to the SC surface; on release the lipophilic drug partitions into the lipophilic
SC as opposed to dissolving within the aqueous vehicle.
The carrier mechanism for facilitating drug delivery to the SC would account
for the enhanced permeation of lipophilic drugs within the skin but not for
hydrophilic drugs therefore there must be other mechanisms at work. Another

155
example of this possible mechanism was given by Küchler et al. (2009) where it
was demonstrated that PAMAM dendrimers did not penetrate the SC but did
enhance the topical delivery of the lipophilic nile red (log P 3.8) by 8 fold within the
SC and 13 fold within the viable epidermis (Küchler et al. 2009).
A vehicle-dependent mechanism was proposed by Venuganti and
co-workers, who used potent vehicles such as IPM and mineral oil in conjunction
with lower generation PAMAM dendrimers to enhance the permeation of a
hydrophilic drug (Venuganti et al. 2008). Using potent solvents that impair the
barrier nature of the SC via fluidisation or extraction of skin components may aid
the ingress of lower generation PAMAM dendrimers within the SC. The synergism
between potent solvent and the dendrimers resulted in an increase in the
partitioning of the hydrophilic 5-Fluorouracil (log P -0.89) within the SC. The same
group demonstrated that the surface groups of the PAMAM dendrimer affected the
permeability coefficient of the 5-Fluorouracil in decreasing order of
G4-PAMAM-NH2 > G4-PAMAM-OH > G4-PAMAM-OH. They also revealed that
the enhancement in the drug permeability coefficient was inversely proportional to
the molecular weight of the PAMAM dendrimer. Further, structure-activity
relationship studies showed that increasing the concentration of the PAMAM
dendrimer did not proportionally increase the skin permeation of the 5-Fluorouracil
(Venuganti et al. 2009). This was also observed in Chapter Three, in that
increasing the concentration of G3-PAMAM-NH2 within the pre-treatment and co-
treatment does not result in a proportional increase in the permeation of CHG.
Cationic dendrimers have been shown to have a physical effect on the skin,
decreasing the barriers resistance. Cationic PAMAM dendrimers are protonated at

156
the pH of the skin surface which has a pH of 5 (Liu et al. 2009). It was previously
demonstrated using differential scanning calorimetry (DSC) and Raman
spectroscopy that the charged G4-PAMAM-NH2 dendrimers interact with the
hydrophilic head groups of phospholipids and can incorporate themselves within
the lipid bilayers, altering its structure and fluidity (Gardikis et al. 2006). This
interaction of cationic dendrimers with the hydrophilic and anionic components of
membranes can result in an increase in permeability (Hong et al. 2004 and Hong
et al. 2006). Shcharbin et al. (2006) also noted that PAMAM dendrimers can cause
alteration in the lipid architecture; the importance of the intercellular lipid
organisation as a property of the skin’s barrier was discussed in detail within the
general introduction. Cationic dendrimers were shown to interact with the
hydrophilic head groups of ceramides and fatty acids resulting in an increase in
the trans-epidermal water loss (TEWL) as a result of barrier disruption (Venuganti
et al. 2009). In mind of the PAMAM dendrimer skin pre-treatment as well as
physical perturbation of the skin components it should also be noted that the
cationic PAMAM dendrimers retained within the superficial layers of the SC may
alter the ionic charge and possibly hydrophobicity of the SC. The cationic PAMAM
dendrimers may act as a depot within the superficial layers of the SC for the
enhanced partitioning of hydrophilic or charged drugs within the SC.
Nanoparticles have been reported to preferentially accumulate within the
hair follicles of the skin. It was shown that due to the follicular penetration of
polystyrene nanoparticles, the topical delivery of nile red was enhanced when
compared to the dye in free solution (Alvarez-Roman et al. 2004(a) and Alvarez-
Roman et al. 2004(b). PAMAM dendrimers labeled with a fluorescein
isothiocyanate fluorophore were found to preferentially accumulate within follicles
157
found within the porcine skin. The follicular route may therefore heavily contribute
to the enhanced skin permeation of a drug complexed or encapsulated within a
nanoparticle including PAMAM dendrimers. It is possible that the cationic PAMAM
dendrimer acts as a depot within the follicles and aids penetration of large polar
molecules that would typically find it difficult to penetrate the intact SC.
Other mechanisms that may contribute to the penetration enhancement
effect include the extraction of skin components. Cyclodextrins have been shown
to remove SC lipids and proteins that would decrease the barrier nature of the skin
(Bentley et al. 1997). This mechanism of skin barrier impairment has not yet been
investigated for PAMAM dendrimers and will therefore be covered within this
Chapter. Hydration caused by the occlusion of the SC surface by viscous PAMAM
dendrimers and an increase in wettability and reduction of surface tension due to
the presence of PAMAM dendrimers should also be considered as a possible
contributing penetration enhancing effect.
4.0.2 Rationale for the investigation of a PAMAM dendrimer skin pre-
treatment interaction with the skin.
In the previous Chapter it was ascertained that PAMAM dendrimers act as
a penetration enhancer for CHG after a pre-treatment on the skin. This chapter
aims to assess the interactions that occur between the PAMAM dendrimer and the
skin using a range of techniques. It may be possible to design optimized PAMAM
dendrimers and formulations for topical or transdermal delivery of therapeutics
once the mechanism of penetration enhancement has been elucidated. This
chapter addresses whether a cationic PAMAM dendrimer skin treatment impairs
the SC barrier nature by increasing TEWL and decreasing the TEER. Further, a

158
number of novel strategies employed within this chapter include optical coherence
tomography (OCT) that is a non-destructive and non-invasive imaging system
capable of revealing structural changes within optical cross-sections of opaque
tissue with a thickness of up to 2 mm. This chapter undertakes an OCT
investigation in order to delineate the mechanisms of the interactions of PAMAM
dendrimers with the porcine skin surface.
A biochemical test for the determination of protein concentration was
conducted to determine whether PAMAM dendrimers extract skin components to
reduce the resistance for enhanced drug delivery. Moreover, the concentration of
cholesterol extracted from the SC by PAMAM dendrimers was determined through
solvent extraction and HPLC methods. To investigate the direct interactions
between the PAMAM dendrimer and the components of the SC, it is necessary to
first isolate the SC using proteolytic enzymes (Haigh and Smith, 1994). This then
allowed for the elucidation of the interactions between the dendrimer and SC using
attenuated total reflectance Fourier transform infra-red spectroscopy (ATR-FTIR).
4.0.3 Aims and objectives
The aim of this Chapter is to explore the skin modulation effects, i.e.
possible barrier alterations, after application of PAMAM dendrimer to porcine skin
that may aid the penetration of drugs within the skin.
To delineate the interactions between PAMAM dendrimer and porcine skin a
number of objectives to be addressed:

159
(i) A skin barrier integrity study before and after a PAMAM application
utilising both TEER and TEWL.
(ii) Non-invasive visualisation of the PAMAM dendrimer on the skin surface
by optical coherence tomography (OCT).
(iii) Classical histological analysis of cryo-sectioned dermatomed skin
sections after PAMAM dendrimer treatment.
(iv) Attenuated total reflectance Fourier transform infrared spectroscopy
(ATR-FTIR) analysis of the PAMAM-skin interactions
(v) To determine whether PAMAM dendrimers extract skin components, i.e.
cholesterol and skin lipids.
4.1 Materials and methods
4.1.0 Measurement of Transepidermal Water Loss (TEWL) and
Transepithelial Resistance (TEER) after a PAMAM dendrimer treatment
The barrier integrity was measured after dosing porcine skin with PAMAM
dendrimer for a 24 h contact time. The Franz cells were set-up as outlined in
Sections 3.1.1 and 3.1.2. The treated Franz cells were dosed with
G3-PAMAM-NH2 (10 mM) and the controls were dosed with the vehicle control
(water:methanol, 35:65) and sodium dodecyl sulphate (SDS) (5 % w/v, 0.2 mL) as
a positive control and were left for a 24 h contact time. After which, the
G3 PAMAM-NH2 was removed by rinsing with 2 mL aliquots of distilled water
(10 mL in total) over the surface of the dosed skin. When measuring the TEWL,
the Franz cells were left to dry at ambient temperature until the skin surface was
dry, typically around 3 h. The Franz cells were then placed in a humidity chamber
(Stuart Scientific incubator SI60, Bibby Scientific, Stone) where the relative

160
humidity (RH%) was controlled between 40-45% measured using a precision
hygrometer (Diplex, Meinheim, Germany) and at skin temperature of 32ºC
(Chilcott et al. 2002). The RH% was controlled by placing a 50 mL beaker of a
saturated solution of K2CO3 in distilled water within the humidity chamber (O’Brien,
1947). The Franz cells were left to equilibriate within the humidity chamber for a
minimum of 3 hours before the TEWL measurements were taken. TEWL was
measured on an Evaporimeter EP2 (Servo-med, Varburg, Sweden) within an
environmental chamber maintained at 32ºC and 40-45 % RH as the holding
humidity chamber. The sensor was placed over the skin so that it gently contacted
the skin surface for 45 seconds and then for a final 15 seconds an average TEWL
in g/m2/h was recorded with the standard deviation.
To measure the TEER after the G3-PAMAM-NH2 dose preparation had
been washed from the skin surface, 2 mL of physiological saline (0.9 % w/v) was
added to the donor compartment and the electrical resistance across the porcine
skin was measured as previously outlined in Section 3.2.1.
4.1.1 Optical Coherence Tomography (OCT) analysis of the skin surface after
dosing with PAMAM dendrimers
The diffusion cells that had passed the integrity check were removed from
the water bath and the skin surface was allowed to air dry for 2 h at ambient
temperature. 4.5 mL of physiological saline was added to the receptor chamber of
each Franz cell. The Franz cells were placed in the water bath (32°C ± 1°C) on a
submersible stirring plate for 30 minutes and allowed to equilibrate. Two
generations of PAMAM dendrimers, G3-PAMAM-NH2 and G3.5-PAMAM-COOH

161
(Sigma Aldrich, UK) in two concentrations, 5 mM and 10 mM, were applied in this
study. The vehicle solutions, the mixture of water and methanol in the ratio of
65:35 for G3-PAMAM-NH2, and 82.5:17.5 for G3.5-PAMAM-COOH have been
used as the control. 0.2 ml solution was placed on to the skin surface and
incubated for a given contact time before taking OCT images. Anhydrous glycerol
was applied to the skin surface as a positive control (0.2 mL). To determine
whether the PAMAM dendrimer reaction with the skin is reversible, the applied
PAMAM dendrimer layer was removed from the skin surface by rinsing 2 mL
aliquots of distilled water (10 mL in total) across the skin surface. Care was taken
not to impair the barrier of the skin. The skin surface was then blotted dry with
adsorbent paper.
To visualise the interaction of PAMAM dendrimers with the skin surface, a
custom built polarization sensitive OCT was used. A laboratory built bench-top
optic fibre-based time-domain polarization sensitive-OCT (PS-OCT) system was
used in this study which employed a 1300 nm superluminescence diode with a
bandwidth of 52 nm. The beam from the diode is sent through a polarizer, a
polarizer modulator and then split 50/50 by a 2x2 all-fibre beam splitter into a
sample and reference arm. After recombination, the polarized light is sent through
a polarization beam splitter. The interference fringes are detected with two
balanced detectors, for horizontal and vertical polarization. The system has an
axial resolution of 14 μm in free space and a penetration depth up to 2 mm. The
PS-OCT images were scanned at 100 Hz.(Bagnaninchi et al. 2007).

162
4.1.2 Histological analysis of PAMAM dendrimer dosed porcine skin
Haematoxylin and eosin are classical stains which have been used to
visualise morphological features of a vast range of biological tissue and cells.
Haematoxylin is used to stain the nuclei of cells dark blue whilst the counter-stain,
eosin stains the cytoplasm pink offering a great contrast. This staining technique
was used to visualise any morphological changes apparent within the SC after
dosing with G3-PAMAM-NH2 dendrimer for 24 h. G3-PAMAM-NH2 (10 mM,
0.2 mL), vehicle control (water:methanol, 65:35) and a SDS (5 % w/v, 0.2 mL)
positive control were dosed on to dermatomed skin mounted on Franz cells as
outlined in Section 3.2.3. The samples were cryo-sectioned as opposed to tape
stripped. The flank of the porcine skin was removed using a scalpel, leaving only
the dosed skin area. The samples were snap frozen in liquid nitrogen and then
embedded in optimal cutting temperature embedding material. They were placed
in the cryostat chamber set to a temperature of -28ºC before being sectioned in to
8 µm thick sections using a Leica CM1850 cryostat. Occasionally cryospray
(Cellpath, UK) was used to reduce the temperature of the anti-roll plate to prevent
the porcine skin slices from curling. The skin sections were then captured onto
poly-L-lysine covered microscope slides and rested in a trough of 3 % glacial
acetic acid in methanol (v/v) to fix the samples to the slide.
The skin sections were placed in a tray of haematoxylin and were left for
60 s. To remove excess haematoxylin, the samples were placed under a gentle
flow of warm tap water to act as a weak alkali to oxidise the hematoxylin to form
an insoluble blue aluminium haematin complex that stains the nuclei of the cells
dark blue (Cooksey, 2010). The sections were then differentiated in a 0.3 %
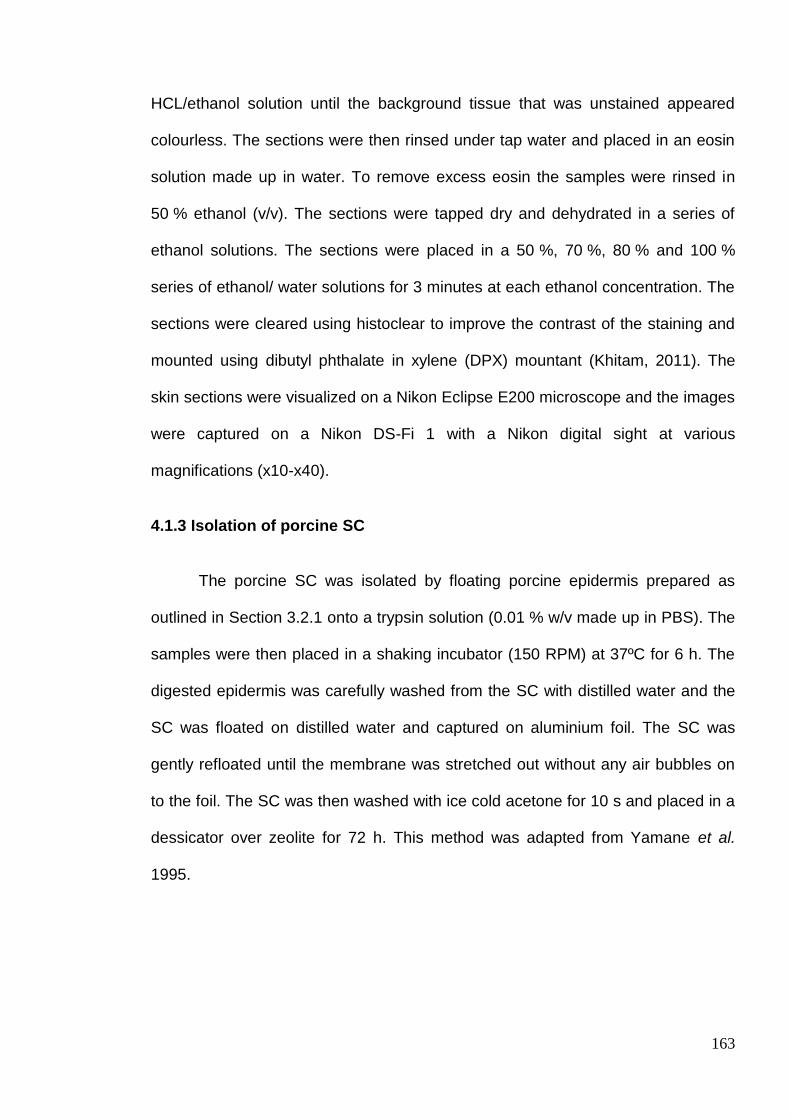
163
HCL/ethanol solution until the background tissue that was unstained appeared
colourless. The sections were then rinsed under tap water and placed in an eosin
solution made up in water. To remove excess eosin the samples were rinsed in
50 % ethanol (v/v). The sections were tapped dry and dehydrated in a series of
ethanol solutions. The sections were placed in a 50 %, 70 %, 80 % and 100 %
series of ethanol/ water solutions for 3 minutes at each ethanol concentration. The
sections were cleared using histoclear to improve the contrast of the staining and
mounted using dibutyl phthalate in xylene (DPX) mountant (Khitam, 2011). The
skin sections were visualized on a Nikon Eclipse E200 microscope and the images
were captured on a Nikon DS-Fi 1 with a Nikon digital sight at various
magnifications (x10-x40).
4.1.3 Isolation of porcine SC
The porcine SC was isolated by floating porcine epidermis prepared as
outlined in Section 3.2.1 onto a trypsin solution (0.01 % w/v made up in PBS). The
samples were then placed in a shaking incubator (150 RPM) at 37ºC for 6 h. The
digested epidermis was carefully washed from the SC with distilled water and the
SC was floated on distilled water and captured on aluminium foil. The SC was
gently refloated until the membrane was stretched out without any air bubbles on
to the foil. The SC was then washed with ice cold acetone for 10 s and placed in a
dessicator over zeolite for 72 h. This method was adapted from Yamane et al.
1995.

164
4.1.4 ATR-FTIR analysis of the interaction between PAMAM dendrimer and
porcine SC
To determine whether there are any conformational changes through direct
interactions between PAMAM dendrimers and isolated SC, ATR-FTIR spectra
were obtained and analysed for differences in PAMAM treated and untreated
samples. SC was isolated as previously outlined in section 4.1.3. After the drying
process a hole punch was used to punch out 5 mm disks of SC and the foil
backing was removed. Each sample was incubated at 32ºC in 200 µL of 10 and
5 mM solutions of G3-PAMAM-NH2, a 5 mM G3.5-PAMAM-COOH, respective
vehicle controls (water:methanol), and a PBS negative control. After a 24 h contact
time the SC was removed from the solutions and blotted dry on filter paper. Each
sample was placed on the diamond of the ATR attachment (GladiATR, Pike
Technologies, Wisconsin, USA) on a Thermo Scientific Nicolet iS10 (Hemel
Hempstead, UK). 32 scans were taken with an 8 cm-1 resolution. The spectra were
analysed using OMNIC software suite (Thermo Scientific, Hemel Hempstead, UK).
4.1.5 Determination of skin cholesterol extraction by PAMAM dendrimers
PAMAM dendrimers were incubated on the skin surface of porcine
dermatomed skin (400 µm thick) to determine whether skin cholesterol or skin
lipids were extracted during a 24 h time frame. Franz cells were set-up as outlined
in Sections 3.2.1-3.2.3 and 200 µL of a positive control (cholesterol: methanol,
3:2), a vehicle control (water:methanol, 65:35) and a 10 mM solution of
G3-PAMAM-NH2 dendrimer were applied to the skin. The Franz cells were kept
under occluded conditions with Vaseline rubbed around the top of the donor
chambers so that the taut parafilm was secure as to not leave gaps for the dosed

165
vehicle to evaporate. After a 24 h contact time at 32ºC ± 1ºC, 4 mL of physiological
saline (0.9 % w/v) was added to each of the donor chambers in 2 mL aliquots and
agitated over the skin surface with a Pasteur pipette. The 4 mL of physiological
saline was added to a vial that contained 4 mL of diethyl ether. The vials were
vortex mixed to agitate the solvent extraction and were left for a 4 h period. After
this, the 4 mL aqueous phase was decanted into a labeled vial and placed into the
fridge (4ºC ± 1ºC) until required.
The diethyl ether phase was centrifuged at 5000 RPM for 5 minutes and the
supernatant was decanted into a solvent cleansed vial. This was then blown down
under a stream of nitrogen until the ether had evaporated and reconstituted in
1 mL of isopropanol. The samples were then transferred into a clean and labeled
2 mL HPLC vial for HPLC analysis. This method was modified from an outlined
method found in Legendre et al. 1995. The HPLC method used to determine total
cholesterol content was an isocratic acetonitrile: isopropanol 50:50 mobile phase
at a flow rate 1 mL per min, the column oven temperature was set to 25°C
(Duncan et al. 1979). The injection volume was 50 µL and detector channel
wavelength used was set to 200 nm.
A cholesterol standard (Sigma Aldrich, Loughborough, UK) was used as
purchased and a series of standard solutions made up in isopropanol ranging from
1-100 µg/mL were used to validate the method on the Shimadzu HPLC described
previously in Section 3.2.5. The results of the validation assay can be found in
appendix 2. The standards were found to be linear over the concentration range
chosen (1-100 µg/mL) as shown by an R2 value of 0.9992 and were also found to
be reproducible with an RSD% of 1.15% for 6 replicate injections of the cholesterol

166
standard 25 µg/mL. The limit of quantification was calculated to be 1.186 µg/mL
using Equation 4.1 and the limit of detection was calculated to be 0.356 µg/mL
using Equation 4.2 (n=6).
Equation 4.1 Calculation of the limit of quantification. SD corresponds to the standard deviation and m corresponds to the gradient of the slope.
Equation 4.2 Calculation of the limit of detection. SD corresponds to the standard deviation and m corresponds to the gradient of the slope.
4.1.6 Determination of skin protein extraction by PAMAM dendrimers
The aqueous phases of the solvent extractions from section 4.19 were used
to determine the concentration of soluble proteins extracted from the skin by
PAMAM dendrimers. All chemicals used within the protein quantification assay
were used as purchased from Sigma Aldrich (Dorset, UK). A micro Lowry assay
with Peterson’s modification was used; the Lowry solution contains sodium
dodecylsulphate (SDS) which enables solubilisation of lipo-proteins (Lowry et al.
1951). Peterson’s modification was used to overcome interference from other
biomolecules such as amino acids, EDTA, sucrose by precipitating the protein in
deoxycholate (DOC) and trichloroacetic acid (TCA) (Peterson, 1977). The protein
quantification occured as a result of two chemical reactions; (i) biuret reaction, in
which alkaline cupric tartrate reagent forms complexes with the peptide bonds of
the protein and (ii) reduction of the Folin and Ciocalteu’s phenol reagent which
generates a deep purple colour. This colour change was monitored by measuring

167
the absorbance at a wavelength of 700 nm. Firstly, 1 mL protein standard (bovine
serum albumin) solutions were prepared in distilled water at a protein
concentration range of 50-400 µg/mL. 1 mL of each of the aqueous phase
dendrimer-skin extraction samples was transferred into a 2 mL snap cap tube.
Also, a blank of 1 mL of distilled water was also placed in a labeled 2 mL snap cap
tube. To the standards, blank and samples, 0.1 mL of a 0.15% DOC solution (w/v
aqueous solution) was added. The 2 mL snap cap tubes were then vortex mixed
and left to stand for 10 minutes. After a 10 minute contact time, 0.1 mL of a 72 %
(w/v) solution of TCA was added to each 2 mL snap cap tube and then each
sample was again vortex mixed and left for 10 minutes. After the protein had
precipitated the supernatant was decanted and removed.
The protein pellets were dissolved in 1 mL of Lowry reagent (5 % w/v
aqueous solution) and were then transferred into a test tube. 1 mL of distilled
water was used to wash the 2 mL snap cap tube and transferred into the
respective test tube. The samples were left to stand for 20 minutes to allow the
protein to dissolve. Then, 0.5 mL of Folin and Ciocalteu’s phenol reagent were
rapidly mixed into each test tube and the purple colouration was allowed to
develop for 30 minutes. Immediately after a 30 minute time point, 1 mL of the
standards, blank and samples were transferred to a quartz cuvette and the
absorbance at a wavelength of 700 nm was recorded. The BSA protein standards
were used to construct a calibration curve used to calculate the protein
quantification of the unknown dendrimer-skin extraction solutions. The R2 value of
the calibration curve was 0.9900.

168
4.1.7 Statistical data analysis
All data is presented as the mean ± SEM unless otherwise stated and were
analysed using GraphPad Prism® version 5 (San Diego, USA). Prior to statistical
analysis all data were placed in to a histogram to check for normality. To
determine whether the difference in TEER was significant, when comparing the
PAMAM dendrimer treated skin with the vehicle control treated skin, a Mann
Whitney test was conducted as the data was not normally distributed. The same
statistical analysis was also applied to determine if there was a significant
difference in TEWL comparing the PAMAM dendrimer treated skin with the vehicle
control treated skin (see section 4.2.0). In section 4.2.6 a Kruskal Wallis test was
conducted to determine whether a peak shift after application of 10 mM and 5 mM
G3-PAMAM-NH2 dendrimer to isolated SC is significantly different from the vehicle
control dosed SC (Figure 4.15). Further in section 4.2.6 a Mann Whitney test was
applied to the data in Figure 4.19. This was to determine whether the shift in peak
corresponding to the CH3 asymmetric stretch was significantly different between
the G3.5-PAMAM-COOH dendrimer treated SC and the vehicle control treated SC
(p<0.05).

169
4.2 Results section
4.2.0 Measurement of Transepidermal Water Loss (TEWL) and
Transepithelial Resistance (TEER) after application and removal of G3-
PAMAM-NH2 dendrimer.
The previous chapter showed that by pre-treating the skin with a PAMAM
dendrimer application, a significant increase in the CHG concentration can be
achieved within the skin. This section was conducted to establish a mechanism of
enhancement. TEWL and TEER are commonly used methods to determine any
changes to the integrity of the skin barrier. Both methods were utilised to illustrate
the change in TEWL or TEER after a 24 h contact time with the highest PAMAM
dendrimer solution tested (G3-PAMAM-NH2, 10 mM). Figure 4.1 shows the
change in TEWL and TEER that occurred after dosing the skin with a
G3-PAMAM-NH2 solution (10 mM, 0.2 mL) for 24 h and the vehicle solution (water:
methanol, 65:35, 0.2 mL) after a 24 h contact time. The mean change in TEER
when comparing pre-dose integrity to post dose integrity was 2.55 ± 0.53 kΩ for
G3-PAMAM-NH2 dendrimer (10 mM, 0.2 mL) compared to 2.45 ± 0.47 kΩ for the
vehicle control treated skin (mean ± SEM, n=18 ). A Mann Whitney test (U=162.0,
n=18, p>0.05 two-tailed) showed that there was no significant difference in TEER
(non-parametric data) between the PAMAM treated skin (median-2.23 kΩ) and the
vehicle control treated skin (2.04 kΩ). The mean change in TEWL when comparing
pre-dose integrity to post dose integrity was 2.76 ± 1.47 g/m2h for
G3-PAMAM-NH2 (10 mM, 0.2 mL) compared to 3.08 ± 1.31 g/m2h for the vehicle
control treated skin (mean ± SEM, n=18). A Mann Whitney test (U=129.0, n=18,
p>0.05, two-tailed) showed that there was no significant difference in TEWL (non-

170
parametric data) between the PAMAM treated skin (median-2.25 g/m2h) and the
vehicle control treated skin (median- 3.73 g/m2h).
The highest change in TEER and TEWL in the PAMAM dendrimer
treatment group corresponds to the same skin donor. A 5% SDS (w/v) solution
was also applied to Franz cells (n=3) as a positive control to indicate severe
damage to the skins barrier integrity. The positive control yielded a decrease in
TEER of 5.34 ± 0.82 kΩ and an increase in TEWL of 48.74 ± 4.32 g/m2h that
indicates the surfactant had caused an extensive reduction in skin barrier integrity
as anticipated.
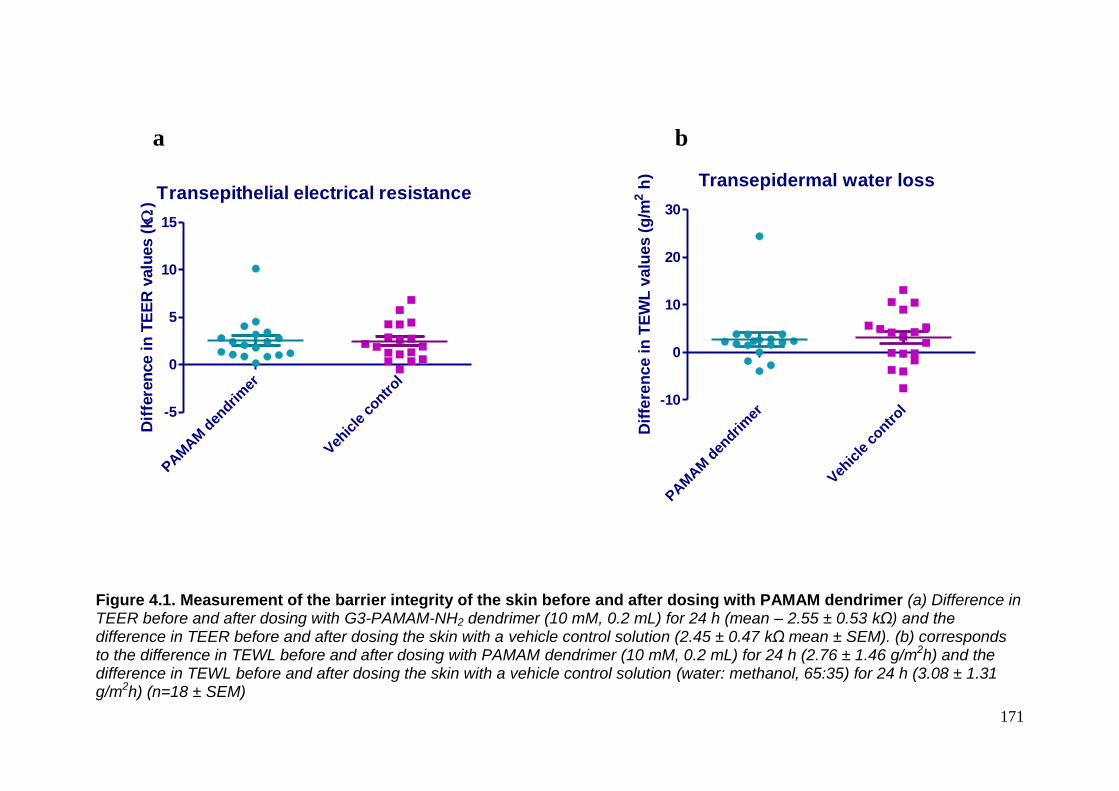
171
Figure 4.1. Measurement of the barrier integrity of the skin before and after dosing with PAMAM dendrimer (a) Difference in TEER before and after dosing with G3-PAMAM-NH2 dendrimer (10 mM, 0.2 mL) for 24 h (mean – 2.55 ± 0.53 kΩ) and the difference in TEER before and after dosing the skin with a vehicle control solution (2.45 ± 0.47 kΩ mean ± SEM). (b) corresponds to the difference in TEWL before and after dosing with PAMAM dendrimer (10 mM, 0.2 mL) for 24 h (2.76 ± 1.46 g/m2h) and the difference in TEWL before and after dosing the skin with a vehicle control solution (water: methanol, 65:35) for 24 h (3.08 ± 1.31 g/m2h) (n=18 ± SEM)
a b
Transepidermal water loss
PAM
AM
den
drim
er
Veh
icle
contr
ol-10
0
10
20
30
Dif
fere
nce in
TE
WL
valu
es (
g/m
2 h
)
Transepithelial electrical resistance
PAM
AM
den
drim
er
Veh
icle
contr
ol
-5
0
5
10
15
Dif
fere
nce i
n T
EE
R v
alu
es (
k )

172
4.2.1 Optical Coherence Tomography (OCT) to delineate the interactions of
PAMAM dendrimers with the porcine skin surface.
4.2.1.0 The effect of amine functionality of the PAMAM dendrimer on the
porcine skin surface
The OCT images shown in Figure 4.2 illustrate non-invasive imaging of
porcine dermatomed skin (400 µm in thickness). The plane of polarized light forms
a hyper-reflective entrance signal on the skin surface where the polarized light
reflects off the keratin of the corneocytes. In Figure 4.2 the untreated sample
shows this hyper-reflective band on the skin surface and also a reflective band on
the bottom of the dermatomed skin corresponding to the stainless steel support
grid of the Franz cell. The skin had been dosed with a 10 mM solution of
G3-PAMAM-NH2 (0.2 mL) and a 5 mM G3-PAMAM-NH2 (0.2 mL) shown in Figure
4.2 (a) and (b) respectively. After 30 minutes the constant entrance signal
observed in the untreated skin surface had sporadically disappeared. The
distribution of the entrance signal across the skin surface had significantly altered
as a consequence of a change in the refractive index (RI) due to the presence of
the PAMAM dendrimer. After a 20 hour contact time the water/methanol vehicle
had evaporated leaving a viscous G3-PAMAM-NH2 film. The distribution of the
entrance signal was sporadic as opposed to the constant entrance signal
observed for the untreated control image. Figure 4.2 (a) & (b) demonstrates the
skin surface at different time points and up to 6 h appears to be increasingly
undulated with a disrupted and dense entrance signal. Though, at 20 hours the
entrance signal disruption seems to recover. The distribution of the entrance signal
was altered at all PAMAM concentrations tested.

173
Figure 4.2 OCT images of porcine skin dosed with various concentrations of G3-PAMAM-NH2 dendrimer taken at various time points. (a) OCT images of G3-PAMAM-NH2 (0.2 mL, 10 mM) dosed porcine dermatomed skin (400 µm) imaged at different time points. A typical example illustrated is Franz cell sample 127 which is representative of the replicate samples (n=3) (b) OCT images of G3-PAMAM-NH2 (0.2 mL, 5 mM) dosed porcine dermatomed skin (400 µm) imaged at different time points. A typical example illustrated is Franz cell sample 153 which is representative of the replicate samples (n=3)
Entrance signal
Support grid
Skin

174
The skin dosed with a water:methanol vehicle that was equivalent to the
prepared PAMAM dendrimer solution did not alter the entrance signal on the skin
surface in comparison to untreated skin specimens. The intensity and distribution
of the entrance signal of the vehicle control treated skin samples typically
remained constant as shown in Figure 4.3, particularly at a 2 hour time period as
at this point the water:methanol vehicle had evaporated. This was due to the skin
samples being mounted on Franz cells that were incubated at a skin temperature
of 32ºC ± 1ºC between the imaging times. At the 6 hour and 20 hour time points
the ‘white layer’ of the entrance signal resembled that of the pre-dose image.
Figure 4.3. OCT images of porcine skin dosed with the vehicle control taken at various time points. Vehicle control (water: methanol, 65:35) dosed porcine dermatomed skin (400 µm) imaged at a range of time points. A typical example illustrated is Franz cell sample 150 which is representative of the replicate samples (n=3).
175
4.2.1.1 The effect of carboxyl functionality of the PAMAM dendrimer on the
porcine skin surface
Half generation 3.5 PAMAM dendrimers (G3.5-PAMAM-COOH) terminate
in carboxyl groups. G3.5-PAMAM-COOH dendrimers were also dosed on to the
skin to observe any changes after the alteration of the surface groups on the
optical characteristics of the skin. Figure 4.4 demonstrates the OCT images taken
after dosing the skin with 5 mM G3.5-PAMAM-COOH dendrimer at various time
points. The distribution of the entrance signal was disrupted after 30 minutes but
not to the extent that was observed for the amine terminated PAMAM dendrimers.
The entrance signal was very sporadic in distribution at 5.5 h after dosing with
G3.5-PAMAM-COOH. Figure 4.4 (b) illustrates the skin dosed with the vehicle
control and the hyper-reflective signal can be observed intact and remained the
same as the pre-dose sample.
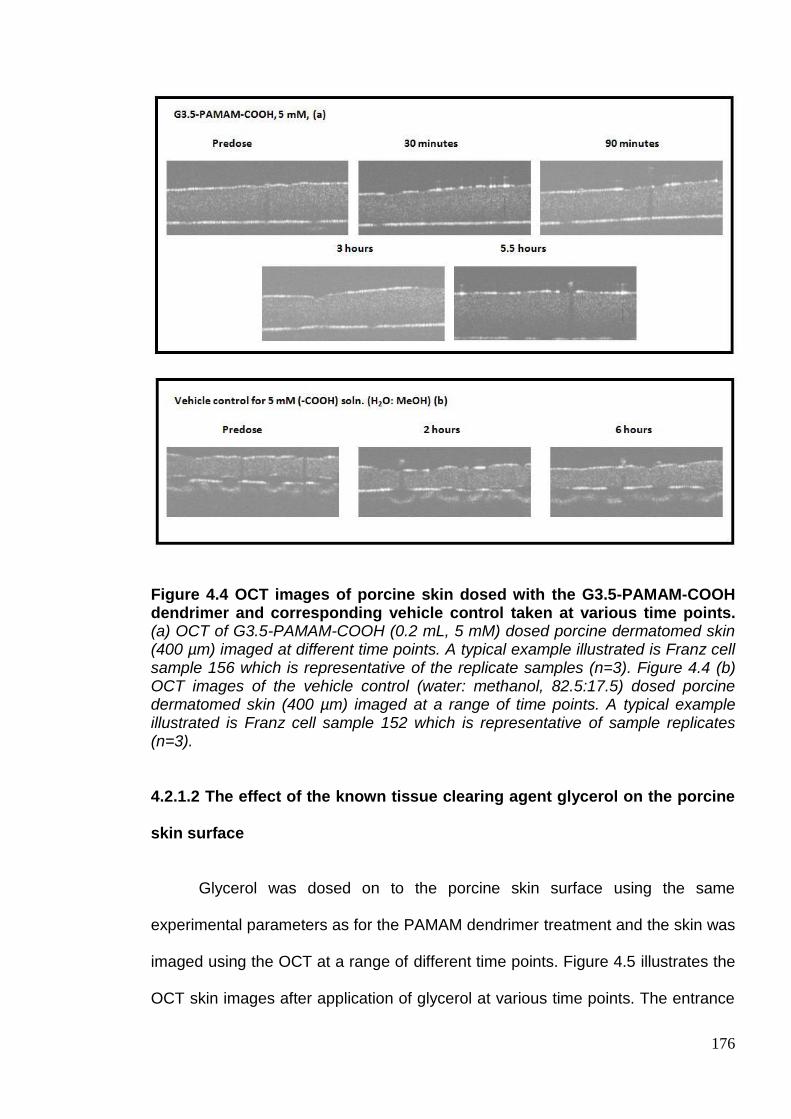
176
Figure 4.4 OCT images of porcine skin dosed with the G3.5-PAMAM-COOH dendrimer and corresponding vehicle control taken at various time points. (a) OCT of G3.5-PAMAM-COOH (0.2 mL, 5 mM) dosed porcine dermatomed skin (400 µm) imaged at different time points. A typical example illustrated is Franz cell sample 156 which is representative of the replicate samples (n=3). Figure 4.4 (b) OCT images of the vehicle control (water: methanol, 82.5:17.5) dosed porcine dermatomed skin (400 µm) imaged at a range of time points. A typical example illustrated is Franz cell sample 152 which is representative of sample replicates (n=3).
4.2.1.2 The effect of the known tissue clearing agent glycerol on the porcine
skin surface
Glycerol was dosed on to the porcine skin surface using the same
experimental parameters as for the PAMAM dendrimer treatment and the skin was
imaged using the OCT at a range of different time points. Figure 4.5 illustrates the
OCT skin images after application of glycerol at various time points. The entrance

177
signal disappeared from the skin surface after application of glycerol. The
alteration of the OCT image is clearly observed in the comparison of the untreated
skin with the skin treated with glycerol for a 15 minute contact time in Figure 4.6.
Figure 4.5 OCT images of porcine skin dosed with glycerol at various time points. Anhydrous glycerol (0.2 mL) dosed porcine dermatomed skin (400 µm) imaged at three time points. A typical example illustrated is Franz cell sample 112 which is representative of the replicate samples (n=3).
Figure 4.6. In situ OCT images of porcine skin dosed with glycerol. OCT images that correspond to (a) porcine dermatomed skin (400 µm) dosed with 0.2 mL of anhydrous glycerol and (b) image taken in situ after 15 minutes illustrating the ‘clearing’ of the tissue.
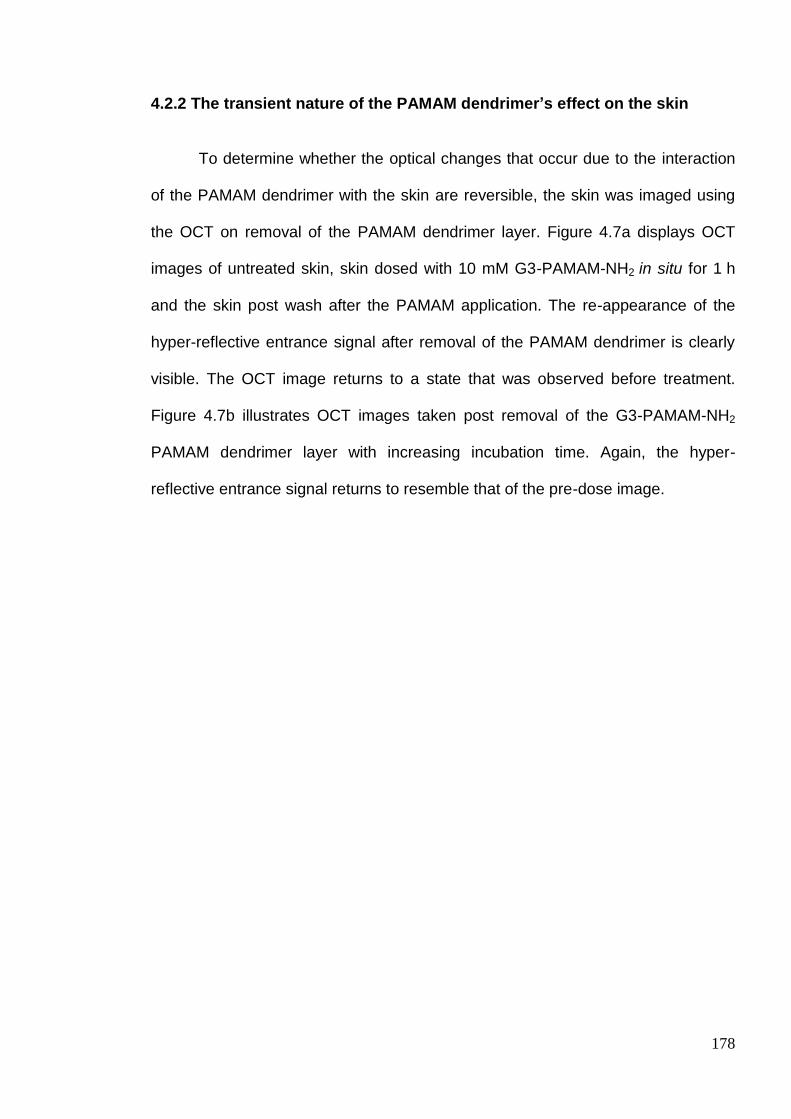
178
4.2.2 The transient nature of the PAMAM dendrimer’s effect on the skin
To determine whether the optical changes that occur due to the interaction
of the PAMAM dendrimer with the skin are reversible, the skin was imaged using
the OCT on removal of the PAMAM dendrimer layer. Figure 4.7a displays OCT
images of untreated skin, skin dosed with 10 mM G3-PAMAM-NH2 in situ for 1 h
and the skin post wash after the PAMAM application. The re-appearance of the
hyper-reflective entrance signal after removal of the PAMAM dendrimer is clearly
visible. The OCT image returns to a state that was observed before treatment.
Figure 4.7b illustrates OCT images taken post removal of the G3-PAMAM-NH2
PAMAM dendrimer layer with increasing incubation time. Again, the hyper-
reflective entrance signal returns to resemble that of the pre-dose image.
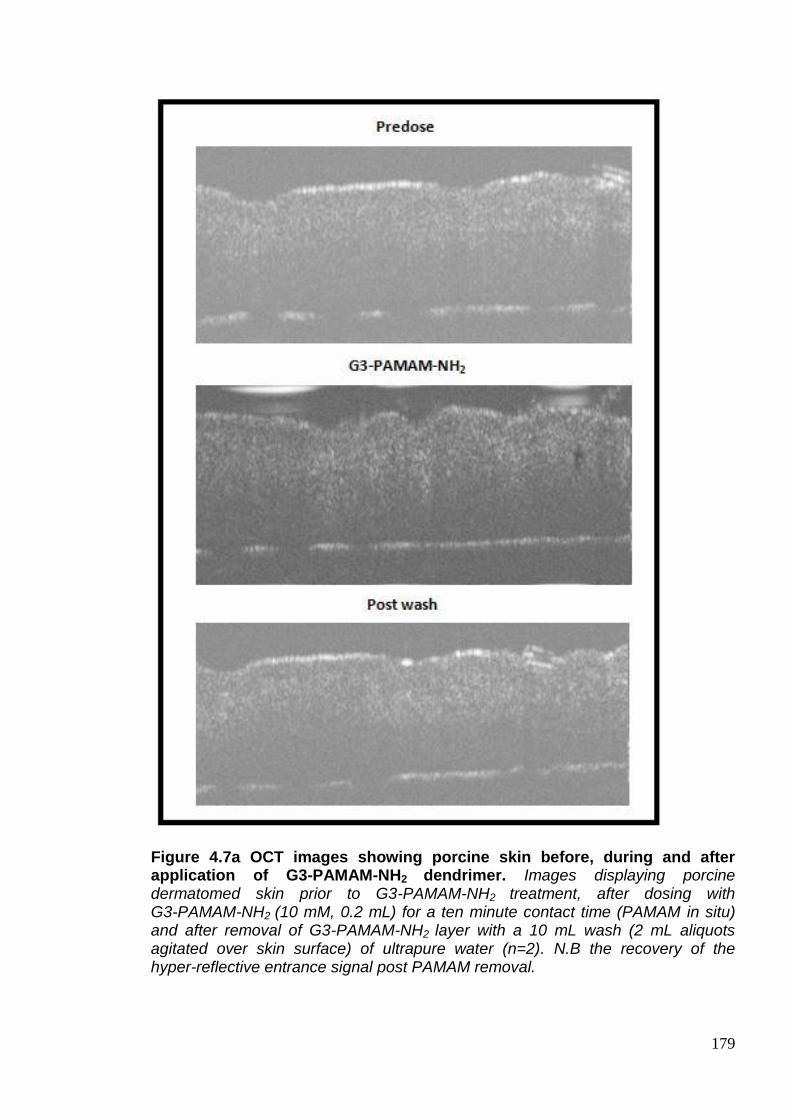
179
Figure 4.7a OCT images showing porcine skin before, during and after application of G3-PAMAM-NH2 dendrimer. Images displaying porcine dermatomed skin prior to G3-PAMAM-NH2 treatment, after dosing with G3-PAMAM-NH2 (10 mM, 0.2 mL) for a ten minute contact time (PAMAM in situ) and after removal of G3-PAMAM-NH2 layer with a 10 mL wash (2 mL aliquots agitated over skin surface) of ultrapure water (n=2). N.B the recovery of the hyper-reflective entrance signal post PAMAM removal.

180
Figure 4.7b OCT images showing porcine skin after removal of applied G3-PAMAM-NH2 dendrimer. Images displaying porcine dermatomed skin prior to G3-PAMAM-NH2 treatment, after dosing with G3-PAMAM-NH2 (10 mM, 0.2 mL) for a range of time points after removal of G3-PAMAM-NH2 layer with a 10 mL wash (2 mL aliquots agitated over skin surface) of ultrapure water (n=2). N.B the recovery of the hyper-reflective entrance signal post PAMAM removal.
The reduction in the pixel grey value (pixel intensity) was used to
investigate the optical changes to the skin caused by the application of the
PAMAM dendrimer solution. A Yellow line was placed at the same representative
co-ordinates (x=158, y=0) on both images and each had the contrast enhanced to
an equal degree of 0.4 % saturation of pixels. A grey value plot profile was
conducted along the yellow line to determine and changes to the intensity of the
skin tissue. The entrance signal can be observed where the light propagates the
skin at a depth of around 0.16 mm on the plots of Figure 4.8. This signal
decreases on dosing the skin with 0.2 mL of a 10 mM solution of G3-PAMAM-NH2
which is consistent across the whole PAMAM dosed data set. Figure 4.9
represents a plot of the pixel grey value at the depth of where the hyper-reflective
entrance signal is observed. It was found that there was a reduction in the pixel
grey value and profile after dosing the skin with PAMAM dendrimer when

181
compared to the pre-dose skin pixel grey values at the same depth. A grey scale
line plot could be a valuable method to semi-quantify the optical changes that
occur after application of a novel penetration enhancer such as PAMAM
dendrimers or a drug.
Figure 4.8. OCT image analysis of porcine dermatomed skin prior and post G3-PAMAM-NH2 treatment. (a) Corresponds to untreated porcine skin (b) after dosing with G3-PAMAM-NH2 (10 mM, 0.2 mL) for a contact time of 15 minutes. Image (c) corresponds to (a) and image (d) corresponds to image (b) with the contrast enhanced to an equal degree of 0.4% saturation of pixels (e) is a gray scale line plot of the untreated skin and (f) corresponds to a gray scale line plot of the G3-PAMAM-NH2 dosed skin. The yellow line was placed at co-ordinates x=158 and y=0 that was the location used to take a gray scale line plot on both (c) and (d).
182
Figure 4.9. Graph showing pixel gray value against depth illustrating a change in the gray values after application of G3-PAMAM-NH2 dendrimer (10 mM, 0.2 mL) compared to skin before treatment.
4.2.3 Histological analysis of PAMAM dendrimer dosed porcine skin
The haematoxylin and eosin stained the anucleate corneocytes of the SC
pink in contrast to the dark blue nuclei found within the viable epidermis and the
dermis. The micrographs of the stained skin sections illustrate slight morphological
differences in the structure of the SC. In Figure 4.10 (a-b) that was dosed with the
vehicle control, the SC appears intact. This is not observed for the G3-PAMAM-
NH2 dendrimer dosed skin (Figure 4.10 (c-d)) where the SC appears thin and
dense compared to that of the vehicle control. The SC of the PAMAM dendrimer
dosed skin sections again appears dissimilar to the surfactant damaged SC
(Figure 4.10 (e-f)). As expected the positive damage control in Figure 4.10 (e-f)
illustrates severe structural damage to the SC that would result in a significantly
impaired barrier. The SDS application had caused the layers of the SC to detach
from the viable epidermis (Figure 4.10 (f)).
0.12 0.14 0.16 0.18 0.20 0.22120
140
160
180
200Predose
PAMAM dosed 15 minute
contact time in situ
Depth (mm)
Pix
el
gre
y v
alu
e

183
Figure 4.10. Haematoxylin and eosin stained porcine dermatomed skin cryo-sections after application of PAMAM dendrimer, vehicle control and an SDS positive control. Images of the skin cryo-sections (400 µm depth, 8 µm thickness) were taken at a magnification of x 40. The skin was dosed for 24 h at 32ºC with (a-b) vehicle control (water: methanol, 65:35), (c-d) G3-PAMAM-NH2 (10 mM, 0.2 mL) and a positive control (e-f) SDS (5 % w/v, 0.2 mL).
a b
c d
e f
Control
PAMAM dendrimers dosed
SDS
184
4.2.4 Determination of total cholesterol concentration extracted by PAMAM
dendrimer from porcine dermatomed skin.
In Section 3.2.0 it was shown that there was no significant reduction to the
barrier integrity of the skin. It was then considered that perhaps the effect of the
PAMAM on the skin was more subtle or temporary as shown in Section 4.2.1 with
regards to the optical changes conferred by the PAMAM dendrimer on the skin
surface. These solutions were analysed for the presence of cholesterol (Figure
4.11). The mean concentration of cholesterol extracted from the skin was 1.486 ±
0.280 µg/mL (mean ± SEM, n=3) and 0.293 ± 0.142 µg/mL (mean ± SEM, n=10)
for the positive control and the G3-PAMAM-NH2 dendrimer solution respectively.
No cholesterol was detected within the vehicle solution. The cholesterol
concentrations for all treatment groups however are below the calculated LOQ
(1.186 µg/mL) therefore the results are only tentative (and as such no statistical
analysis was applied).

185
Figure 4.11 Concentration of total cholesterol (µg/mL) extracted from the dermatomed porcine skin (400 µm) after a 24 h contact time under occluded conditions. (a) positive control- (chloroform: methanol, 3:2) which extracted an average concentration of 1.486 ± 0.280 µg/mL of cholesterol (n=3 mean ± SEM ) (b) vehicle control- (water: methanol, 65:35) from which no cholesterol was detected (n=3 mean ± SEM) and (c) G3-PAMAM-NH2 (10 mM, 0.2 mL) that extracted on average 0.293 ± 0.142 µg/mL of cholesterol (n=10 mean ± SEM). No cholesterol was detected for the negative control (0.2 mL distilled water, n=3). The concentrations of cholesterol extracted from the skin by all treatment groups are however below the calculated LOQ. 4.2.5 Determination of skin protein concentration extracted by PAMAM
dendrimer from porcine dermatomed skin.
To establish whether a PAMAM dendrimer extracts protein from the skin
after application of a 10 mM G3-PAMAM-NH2 solution a Lowry assay with a
Peterson’s modification was conducted (Legendre et al. 1995). The Peterson’s
modification is a protein precipitation step (addition of DOC and TCA) that
removes the protein from all interfering substances such as ammonium sulphate,
guanine, urea, sucrose, detergents and also EDTA (Ethylenediaminetetraacetic
Posi
tive
contr
ol
Veh
icle
contr
ol
G3-
PAM
AM
-NH2
0.0
0.5
1.0
1.5
2.0
Extraction sample
Co
ncen
trati
on
of
tota
l
ch
ole
ste
rol
( g
/mL
)
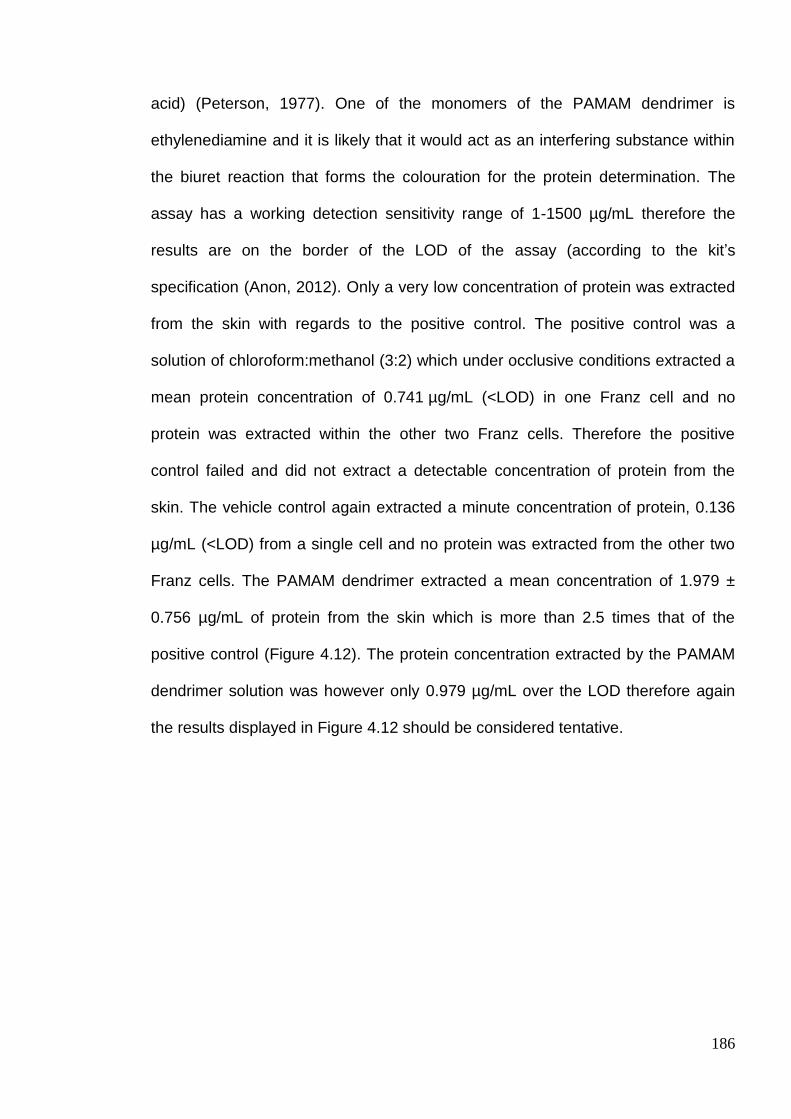
186
acid) (Peterson, 1977). One of the monomers of the PAMAM dendrimer is
ethylenediamine and it is likely that it would act as an interfering substance within
the biuret reaction that forms the colouration for the protein determination. The
assay has a working detection sensitivity range of 1-1500 µg/mL therefore the
results are on the border of the LOD of the assay (according to the kit’s
specification (Anon, 2012). Only a very low concentration of protein was extracted
from the skin with regards to the positive control. The positive control was a
solution of chloroform:methanol (3:2) which under occlusive conditions extracted a
mean protein concentration of 0.741 µg/mL (<LOD) in one Franz cell and no
protein was extracted within the other two Franz cells. Therefore the positive
control failed and did not extract a detectable concentration of protein from the
skin. The vehicle control again extracted a minute concentration of protein, 0.136
µg/mL (<LOD) from a single cell and no protein was extracted from the other two
Franz cells. The PAMAM dendrimer extracted a mean concentration of 1.979 ±
0.756 µg/mL of protein from the skin which is more than 2.5 times that of the
positive control (Figure 4.12). The protein concentration extracted by the PAMAM
dendrimer solution was however only 0.979 µg/mL over the LOD therefore again
the results displayed in Figure 4.12 should be considered tentative.

187
Figure 4.12. Concentration of protein (µg/mL) extracted from the dermatomed porcine skin (400 µm) after a 24 h contact time under occluded conditions. (a) positive control- (chloroform:methanol, 3:2) which extracted an average concentration of 0.741 ± 0.741 µg/mL of protein (n=3 ± SEM) (b) vehicle control- (water: methanol, 65:35) that extracted 0.1358 ± 0.1358 µg/mL (n=3 ± SEM) and (c) G3-PAMAM-NH2 (10 mM, 0.2 mL) that extracted 1.979 ± 0.756 µg/mL (n=9 ± SEM). No protein was detected for the negative control (0.2 mL distilled water, n=3). N.B LOD for the assay is 1 µg/mL.
4.2.6 ATR-FTIR analysis of the interaction between PAMAM dendrimers and
porcine SC
Figure 4.13 exhibits the stacked spectra of the PAMAM in aqueous solution,
the isolated SC alone and dosed with the vehicle control and the PAMAM
dendrimer solution. General peak changes to the spectra can be observed but
also the similarities between the aqueous PAMAM dendrimer spectrum and the
untreated isolated SC spectrum. The overall spectra have been utilised to focus on
specific peak shifts that are explained further in the Chapter. The peak
assignments for the PAMAM dendrimer spectrum (Figure 4.13 (a)) are 3250 &
3050 cm-1 corresponding to –NH-, 1450 cm-1 corresponding to –CH2- and 1650 &
Positive
contro
l
Vehic
le c
ontrol
G3-P
AM
AM
-NH2
0
2
4
6
8
Extraction sample
Co
nce
ntr
atio
n o
f p
rote
in (
g/m
L)

188
1550 cm-1 corresponding to the –HN-CO-. It was found that the –C(O)NH- peak of
the G3-PAMAM-NH2 PAMAM dendrimer overlaps with the amide I peak of the SC.
Figure 4.13 ATR-FTIR spectra of isolated native SC and isolated SC dosed with PAMAM dendrimer and the corresponding vehicle control. (a) Corresponds to an aqueous solution of G3-PAMAM-NH2 dendrimer (10 mM, 0.2 mL) (b) SC dosed with the vehicle control (water: methanol, 65:35, 0.2 mL), (c) untreated SC and (d) SC dosed with 10 mM G3-PAMAM-NH2.
2
Figure 4.14 represents three replicate spectra corresponding to
G3-PAMAM-NH2 dendrimer dosed SC and the red spectrum which corresponds to
the vehicle control. The spectra highlight a shift in amide I graph and amide II
which is possibly due to changes in the β-sheet (~1629 cm-1) structure of keratin
(Lin et al. 1996). There are no observable changes in the scissoring mode at 1454

189
cm-1 suggesting no alterations in the lateral chain packing. There is a peak shift in
the CH2 wagging mode with the PAMAM dendrimer dosed SC. The peak is at
1150 cm-1 but the vehicle control peak shifts to 1175 cm-1. A peak at 1410 cm-
1equates to CH2 bending present in the vehicle control SC (red) but not in the SC
that was dosed with PAMAM dendrimer.
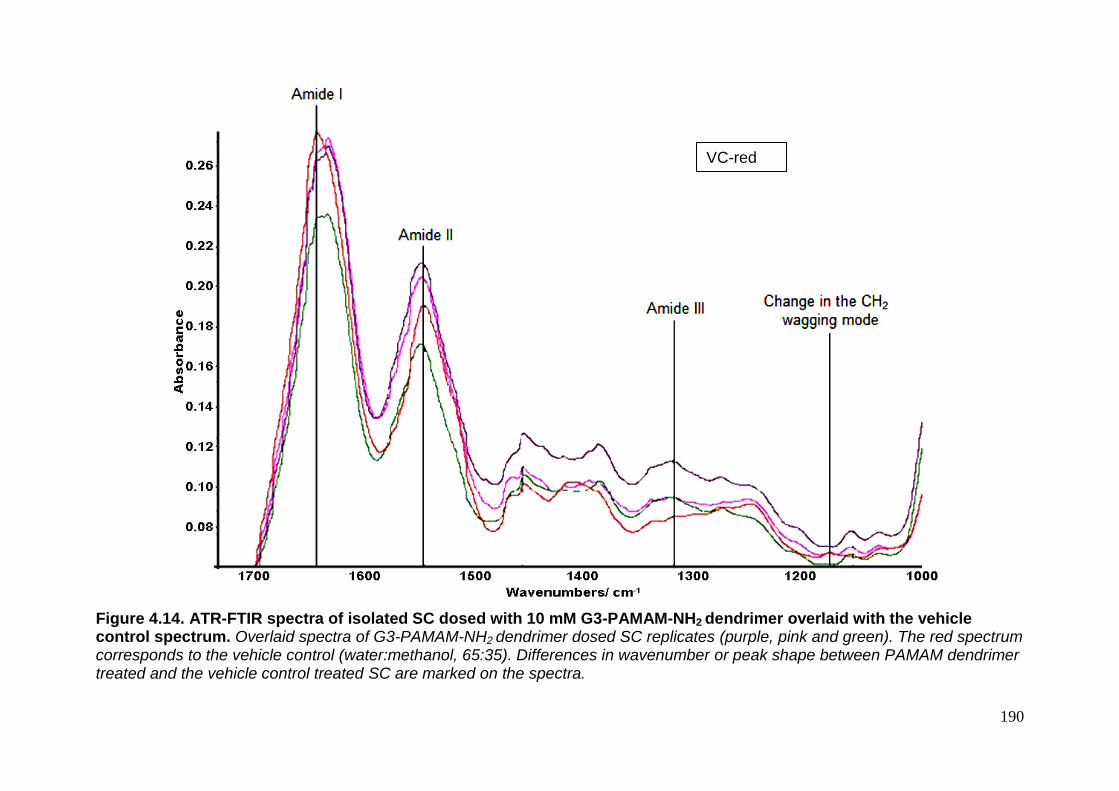
190
Figure 4.14. ATR-FTIR spectra of isolated SC dosed with 10 mM G3-PAMAM-NH2 dendrimer overlaid with the vehicle control spectrum. Overlaid spectra of G3-PAMAM-NH2 dendrimer dosed SC replicates (purple, pink and green). The red spectrum corresponds to the vehicle control (water:methanol, 65:35). Differences in wavenumber or peak shape between PAMAM dendrimer treated and the vehicle control treated SC are marked on the spectra.
VC-red VC-red

191
The wavenumber of the amide bond corresponding to the protein within the
SC was plotted against each treatment group to determine whether there was a
significant peak shift. Figure 4.15 demonstrates the shift in wavenumber from the
vehicle control for 5 mM and 10 mM G3-PAMAM-NH2 dendrimer treated SC. A
5 mM PAMAM dendrimer solution resulted in a shift of the amide band for two (out
of four replicates) of the SC samples as high variability within the 5 mM replicates
was observed. This may possibly be due to the 5 mM concentration being on the
cusp of the concentration that induces a shift in the amide I band. The SC was
isolated from a range of pig donors therefore possible donor or regional variations
in the SC may account for the split in amide I band shift observed for the 5 mM
PAMAM dendrimer concentration. Differences in the contact between the SC and
the diamond or possibly due to differences between the wavenumber or depths of
penetration (Grdadolnik, 2002) may account for variability observed between the
replicate samples. There was no statistically significant difference between the
peak shifts for 10 mM and 5 mM PAMAM dendrimer treated SC and the vehicle
control treated SC (Kruskal Wallis ANOVA, p>0.05).

192
Figure 4.15 Graph illustrating the peak shift of the amide I band for 10 mM and 5 mM G3-PAMAM-NH2 dendrimer treated SC and for the vehicle control treated SC. The data is presented as the mean ± SEM (n=4), a Kruskal Wallis ANOVA found no statistical significance (p>0.05).
The amine II band also saw a shift in wavenumber after treatment with a
10 mM G3-PAMAM-NH2 dendrimer solution when compared to that of the vehicle
solution treated (Figure 4.16). No shift in peak was observed for the 5 mM
G3-PAMAM-NH2 dendrimer solution. The amide II band is due to the N-H bending
vibration of the protein within the SC and C-N stretching vibration. This may be
evidence of a change in conformation.
G3-
PAM
AM
-NH2
trea
ted S
C, 1
0 m
M
G3-
PAM
AM
-NH2
trea
ted S
C, 5
mM
Veh
icle
contr
ol for
10 m
M s
oln
1620
1630
1640
1650
Waven
um
ber
cm
-1

193
Figure 4.16. Graph illustrating the peak shift of the amide II band for 10 mM G3-PAMAM-NH2 dendrimer treated SC and for the vehicle control treated SC. (n=4)
Carboxyl terminated PAMAM dendrimers (G3.5-PAMAM-COOH) were
dosed onto SC and analysed by ATR-FTIR also. Figure 4.17 illustrates the
differences to the peak shape and frequency shifts that correspond to the
G3.5-PAMAM-COOH dendrimer dosed SC. There is a peak shift of the CH2
scissoring peak at 1410 cm-1 where it alters when the SC was dosed with the
carboxyl terminated PAMAM dendrimer. A magnification of the peak shift at
2979 cm-1 illustrating G3.5-PAMAM-COOH dendrimer (5 mM, 0.2 mL) compared
to the vehicle control (Figure 4.18).
G3-
PAM
AM
-NH2
trea
ted S
C, 1
0 m
M
Veh
icle
contr
ol for 1
0 m
M s
oln
1544
1546
1548
1550
1552
Waven
um
ber
cm
2
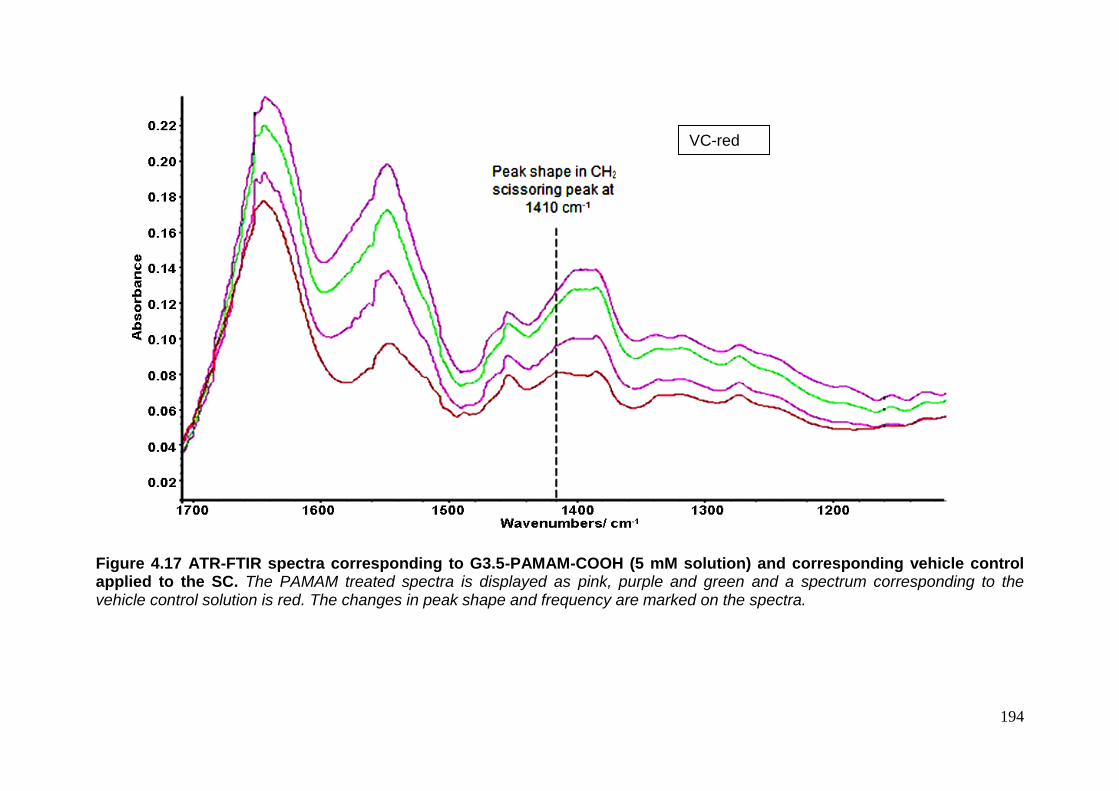
194
Figure 4.17 ATR-FTIR spectra corresponding to G3.5-PAMAM-COOH (5 mM solution) and corresponding vehicle control applied to the SC. The PAMAM treated spectra is displayed as pink, purple and green and a spectrum corresponding to the vehicle control solution is red. The changes in peak shape and frequency are marked on the spectra.
VC-red VC-red

195
Figure 4.18. Magnification of ATR-FTIR spectra demonstrating peak shift after application of G3.5-PAMAM-COOH dendrimer to isolated SC compared to vehicle controlled dosed SC. G3.5-PAMAM-COOH dendrimer (5 mM, 0.2 mL) dosed SC corresponds to the pink, purple and green spectra and a spectrum corresponding to the vehicle control solution dosed SC is displayed in red.
The wavenumber of the CH3 asymmetric stretch was plotted against the SC
treatment. Figure 4.19 demonstrates the shift in frequency of the CH3 asymmetric
stretch for the vehicle control treated SC compared to the G-3.5-PAMAM-COOH
dendrimer treated SC though this was not significantly different (Mann Whitney
test p>0.05).
0.055
0.060
0.065
0.070
0.075
0.080
0.085
0.090
0.095
0.100
Ab
so
rb
an
ce
2950 2960 2970 2980 2990 3000
Wavenumbers (cm-1)
VC-red

196
Figure 4.19 Graph illustrating the peak position of C-H stretch at 2981 cm-1 after application of G3.5-PAMAM-COOH dendrimer to SC compared to the vehicle control treated SC. The data is presented as the mean ± SEM (n=3).
Veh
icle
contr
ol
G3.
5-PA
MAM
-COOH
2970
2975
2980
2985
2990
Formulation applied to isolated stratum corneum
Waven
um
ber
cm
-1

197
4.3 Discussion
The studies within this section showed that a PAMAM dendrimer skin pre-
treatment enhanced the permeation and distribution of CHG within porcine skin.
The mechanism of action behind the PAMAM dendrimer’s effect upon the skin is
unknown. To determine whether PAMAM dendrimers impair the integrity of the
barrier of the skin the TEER and TEWL was measured. The TEER was used to
measure the electrical resistance across the skin to determine whether there was
a significant decrease in the resistance caused by the PAMAM dendrimer’s
application to the skin. No significant difference was observed between the TEER
determined before application and after application of PAMAM dendrimer (Figure
4.1 (a)). This suggests that no significant damage to the barrier nature of the skin
was sustained due to a contact time of 24 h with the highest concentration of
G3-PAMAM-NH2 dendrimer tested (10 mM).
Further to this, TEWL was also measured which has been utilised to
measure the damage incited by a range of skin penetration enhancers including
micro-needles (Badran et al. 2009), ethanol/propylene glycol solutions (Levang et
al. 1999), surfactants (Elmahjoubi, 2009) and terpenes (Gao and Singh, 1997).
Macroscopic damage to the skin would result in a sharp increase in the TEWL
measurements however damage to the skin’s barrier integrity on a micro scale
may not be detected by TEWL measurements (Netzlaff et al. 2006). Figure 4.1 (b)
illustrates the TEWL measurements recorded. It was found that the data was
spread around the mean. G3-PAMAM-NH2 dendrimer (10 mM) treated skin had a
mean measurement (mean ± SEM, n=18) of 2.71 ± 1.46 g/m2h and the untreated
skin control skin had a mean result of 3.08 ± 1.31 g/m2h. There was no statistically
198
significant difference between PAMAM treated skin and the control. There was
greater variability found within the TEWL data when compared to the TEER data.
The increase in variability for the TEWL measurements may be due to the
increase in variables such as temperature, humidity or due to interference from
residual (not removed after wash procedure) hygroscopic PAMAM dendrimer
bound to the superficial layers of the SC.
The results within this section from both TEER and TEWL studies are in
very good agreement in that the PAMAM dendrimer pre-treatment does not incite
significant macroscopic skin barrier impairment, however to the contrary Venuganti
and Perumal (2008 and 2009) reported a significant increase in TEWL and a
decrease in TEER. The authors reported a 40 % reduction in skin resistance after
application of cationic and neutral PAMAM dendrimers and a significant increase
in TEWL measurements (ratio mean ± SEM) of 2.9 ± 0.7 for G4-PAMAM-NH2
10 mM when normalized to pre-dendrimer value). However it is worth noting that
the study had a very low sample number of n=3 and the temperature of the
laboratory fluctuated by 6°C during the measurements. An increase of 7- 8°C in
temperature doubles the rate of TEWL in normal skin (Grice et al. 1971) and
TEER measurements are also significantly affected by changes in temperature
(Blume et al. 2010). A 40 % decrease in electrical resistance across the skin is a
substantial decrease in the barrier nature of the skin and was only observed in this
study for the SDS 5 % (w/v) positive control.
For the positive SDS control, visually it was apparent that the surfactant had
extensively damaged and permeabilised the skin lipids and protein. This was not
observed for the PAMAM dendrimer pre-treated skin which appeared intact

199
therefore a 40 % reduction in electrical resistance appears to be a very high value.
The authors do not mention whether the PAMAM dendrimer is still present on the
skin surface during the TEWL and TEER measurement or as to whether it has
been removed. As PAMAM dendrimers are strongly cationic and extremely
hygroscopic, measurement of the skins barrier integrity using TEER and TEWL in
the presence of the PAMAM dendrimer may give inaccurate results. This may
account for the opposing findings between the two studies.
The OCT images throughout this Chapter consistently demonstrate that the
PAMAM dendrimers have caused an interaction with the skin resulting in the
alteration of the hyper-reflective entrance signal on the skin surface. Two
hypotheses may explain the mechanism behind this. Firstly, it could be due to a
refractive index (RI) match (or close approximation the RI) that reduces the
random back scattering of light from the skin surface (Vargas et al. 1999). When
focusing a plane of light on to the skin surface to record the images, photons travel
within different media; from air across an interface into skin tissue which contains
interstitial fluid and a range of proteins and lipids. These skin components possess
significantly different refractive indices for example hydrated collagen found within
the dermis has an RI of around 1.43 (Wang et al. 1996). The major contributor to
the random scattering of photons is due to the filamentous keratin found within the
corneocytes of the epidermis and it has an RI of approximately 1.62 (Xu et al.
2003). Air has a RI of 1.000, and skin has an approximate average RI of 1.440
(Tearney et al. 1995), hence the strong reflective entrance signal at the skin-air
interface. PAMAM dendrimers (G3-PAMAM-NH2) have a RI of 1.367 at 20ºC
(compounds specification, Sigma-Aldrich). One possibility is that the PAMAM
dendrimer reduces the back-scattering of light and thus the mismatching of the RI

200
at the air-skin interface. This would result in a significant reduction to the hyper-
reflective entrance signal at the skin-air interface that has been observed
throughout the OCT studies. After application of the vehicle control to the skin,
there was no change in the hyper-reflective entrance signal. The vehicle control
was a water/methanol solution that has a RI of around 1.328 (Phillips, 2013). This
indicates that it is the PAMAM dendrimer that is influencing the optical changes
observed at the skin-air interface.
The second mechanism proposed by the author is that the changes occur
due to the hydration effect that the PAMAM dendrimers exert upon the skin. The
G3-PAMAM-NH2 dendrimer, could hydrate the skin for prolonged periods of time
because PAMAM dendrimers are very hygroscopic (Uppuluri et al. 1998) and are
known to adsorb moisture from the atmosphere (Topp et al. 1999). PAMAM
dendrimers may absorb water from the atmosphere and make it freely available at
the SC surface. Occlusion is another possible mechanism of skin hydration as a
result of the viscous PAMAM dendrimer layer distributed across the skin surface.
Either one or both of these hydration mechanisms would result in an increase in
SC hydration. Typically SC hydration results in an increase in the topical or
transdermal penetration of both hydrophilic and lipophilic drugs (Williams and
Barry, 2012). Previously, aqueous colloidal layers including films and hydrogels
have been utilised to enhance the topical delivery of drugs (Das et al. 2006 and
Luo et al. 2000). There is the possibility that the PAMAM dendrimer adsorbs
moisture from the SC. This would reduce the size of the corneocytes and result in
a lower permeation of topically applied drugs in particular hydrophilic drugs (Barry,
1987). This mechanism is unlikely however as the PAMAM dendrimers have

201
enhanced the deposition and penetration of CHG within the skin as discussed in
chapter three and five.
After a 20 hour contact time of PAMAM dendrimer dosed on to the skin
surface the water/methanol vehicle had evaporated leaving a viscous
G3-PAMAM-NH2 dendrimer layer. The strong reflective entrance signal was
sporadic in appearance at the air-skin interface. The sporadic disruption of the
entrance signal caused by the PAMAM dendrimer may be a result of preferential
accumulation of the PAMAM dendrimer within the skin furrows and undulations.
After application to the skin, polymeric nanoparticles were reported to be localised
within the furrows and pores of the skin with preferential accumulation detected
within the hair follicles (Alvarez-Román et al 2004a). Accumulation of amine
terminated PAMAM dendrimers within hair follicles was also shown using confocal
microscopy (Venuganti et al. 2011). The sporadic alteration to the optical
characteristics of the SC may be due to an uneven distribution of the dendrimers
across the skin surface. Another possible explanation for the intermittent entrance
signal is that PAMAM dendrimers self-aggregate when applied to the skin.
PAMAM dendrimer aggregation was observed using DSC when applied to model
membrane lipids (Klajnert and Epand, 2005).
The immediate surface reflection reduction effect has been observed
elsewhere for topically applied ointments and glycerol (Welzel, 2001). These
hyper-osmotic compounds such as paraffin oil, glycerol and petroleum have been
shown to be tissue clearing agents (Welzel et al. 2004). A clearing agent is a
compound that matches the refractive index of the tissue. Glycerol has an RI of
1.48 (Diaspro et al. 2002) and the refractive index of the skin was calculated to be

202
approximately 1.44 (Tearney, 1995). The clearing agent enhances the delineation
of the epidermis and the dermis and allows for a more detailed image of skin
appendages to be collected. It also allows for a deeper depth profile to be obtained
due to the reduction of random scattering. A white, hyper-reflective entrance signal
was not observed in the OCT images when dosed with glycerol with the exception
of the pre-dosed images. At the 90 minute contact time the underlying viable
epidermis becomes clearer and the structures of the skin become more
pronounced. This is due to the anhydrous glycerol matching the refractive index of
the viable epidermis, allowing enhanced visualisation of the skin. This effect of
reducing the random scattering has been noted elsewhere for glycerol and occurs
shortly after skin application (Vargas et al. 1999).
Azone, a known chemical skin-penetration enhancer, has also been shown
to act as a skin-clearing agent and reduces the back scattering of light within skin
tissue (Xu and Zhu, 2007). The PAMAM dendrimers may also partially act as a
clearing agent as the PAMAM dendrimer has a similar RI to that of glycerol and
the skin. After application of a PAMAM dendrimer solution to the skin surface, it
was apparent that the underlying morphology or microstructures of the epidermis
and dermis did not become clearer or more defined. This is expected as the
PAMAM dendrimers are large macromolecules (>2500 Da) and are not expected
to traverse the SC due to their high molecular weight and strong ionic charge.
PAMAM dendrimers have been shown to act as a penetration enhancer (chapter
three, Venuganti and Perumal, 2008, Chauhan et al. 2003 and Wang et al. 2003)
as has glycerol (Bettinger, 1998) for a range of topically applied drugs. The
PAMAM dendrimers’ (Topp et al. 1999) and glycerol’s (Hara and Verkman, 2003)
hygroscopic nature may result in skin tissue hydration. It has been noted that

203
hydration of skin tissue can reduce the refractive index (Knuttel and Boehlau-
Godau, 2000 and Sand et al. 2006). This study has also demonstrated a further
commonality between glycerol and PAMAM dendrimers in their ability to reduce
the light attenuation of the SC after topical application (Welzel, 2001).
The optical effect that the PAMAM dendrimer exerts upon the skin surface
appears to be temporary in nature and this is an important characteristic in a
topical penetration enhancer (Idson, 1971). After rinsing off the applied PAMAM
dendrimer, the strong reflective entrance signal on the interface of the skin re-
appeared on OCT images. A PAMAM dendrimer is a large macromolecule with
limited permeation capacity and is confined to the superficial layers of the SC. This
allows for a transient and reversible effect as shown throughout the OCT images.
This section provides further evidence that dendrimers are of benefit in the dermal
delivery of topical pharmaceuticals.
Light microscopy after haematoxylin and eosin (H&E) staining revealed no
major morphological changes to the SC (Figure 4.10). The only difference visible
between the vehicle control and the PAMAM dendrimer dosed skin was that the
SC appeared to be more compact. After PAMAM dendrimer application the SC
appears compact and dense which has been observed in clinical trials after
microdermabrasion (Shim et al. 2001) and after tretinoin treatment (Ellis et al.
1990). These studies however, were conducted in vivo over many weeks and
therefore the compaction is due to metabolic activity. As the dermatomed porcine
skin is ex vivo and is not metabolically active the compaction is due to an extrinsic
physical affect. That could be an artifact of the cryo-sectioning process though
cryo-sectioning compared to other sectioning techniques has been shown to result

204
in minimal tissue compression in the z axis (Gardella et al. 2003). Another
possibility is that the dense, aqueous and cationic PAMAM dendrimer layer causes
compaction of the SC and thus reduction of the path-length for the permeation of
CHG. This hypothesis would support the percutaneous absorption data in which
PAMAM dendrimers were shown to enhance the localization of CHG throughout
the dermatological layers of the skin. Further studies would be required to confirm
this hypothesis. After application of a 5 % SDS solution (w/w) the damage to the
SC was significant with disruption and severe disintegration to the SC layers. This
degree of alteration to the SC barrier was not observed after application of the
PAMAM dendrimer solution.
The barrier integrity, OCT and histology studies suggested that the PAMAM
dendrimer’s effect on the skin was not on a macro scale. Cyclodextrins are large
macromolecules that demonstrated to have a permeation enhancement effect
upon the skin. It has been reported that cyclodextrins can extract skin components
which may be a contributing mechanism of action to their drug penetration
enhancement effect (Legendre et al. 1995). Whilst the PAMAM dendrimer solution
did extract cholesterol (over 24 h) from the skin (0.293 ± 0.142 µg/mL), the positive
control extracted more than five times the concentration of cholesterol. The vehicle
control did not extract any detectable levels of cholesterol; this was expected as
lipid loss from the skin does not occur due to water: methanol solutions (Abrams et
al. 1993). Under all test concentrations only very low concentrations of cholesterol
below the calculated LOQ were detected; particularly when compared to the
cyclodextrin 2-hydroxypropyl β-cyclodextrin that extracted a concentration of
7 µg/cm2 of cholesterol from rat skin (Legendre et al. 1995). The total cholesterol
content of the SC is 38.8 % (w/w) (Walters and Roberts, 2005) therefore a minimal

205
concentration of cholesterol was extracted by the PAMAM dendrimer. Cholesterol
extraction due to the PAMAM dendrimer may be an almost insignificant
contributing factor to their drug penetration enhancement effect upon the skin. As
the positive control failed to extract a concentration of cholesterol above the LOQ,
extraction over a larger skin area (this study used 2.54 cm2 skin area) should be
examined in future work. Other possibilities include increasing the sensitivity of the
detection system or replacing the positive control with a more effective cholesterol
extractor.
To further investigate the skin’s modification as a result of contact with
PAMAM dendrimers a Lowry protein assay with a Peterson’s modification was
used to detect and quantify extracted protein from the skin. The concentrations
detected were again very low, the positive control yielded a protein concentration
below the LOD of the assay (1 µg/mL) of 0.741 µg/mL in only one Franz cell (n=3).
One would expect a higher concentration of protein extraction from the skin after a
24 h contact time with chloroform:methanol solution. The PAMAM dendrimer
solution yielded a concentration of protein >2.5 times that of the positive control.
The low concentrations of protein extracted are at the LOD which for bovine serum
albumin was calculated to be 3 µg/mL (Sözgen et al. 2006). This assay is however
sensitive to different protein compositions therefore diverse proteins result in
different absorbance values (Winters and Minchin, 2005). The results suggest that
the PAMAM dendrimer solution may extract a higher concentration of protein from
the skin than the positive control but as the results are at the LOD further studies
would have to be conducted for confirmation. Again the positive control failed to
yield a concentration of protein above the LOD and the PAMAM dendrimer
extracted protein only marginally over the LOD. For future assays a larger surface
206
area of skin should be utilised for the extraction procedure to ensure any protein
extracted is above the LOD.
ATR-FTIR was utilised in an attempt to elucidate the interactions between
the amine and carboxyl terminated PAMAM dendrimers and isolated SC. The
ATR-FTIR spectra did show some evidence of interaction between the PAMAM
dendrimer and the isolated SC. The amide I band arises from the C=O stretching
vibration and the amide II band arises from the C-N stretching and the N-H
bending (Shakeel et al. 2008). These correlate to the proteins of the SC. Shifts in
the amide bands are related to changes in the hydrogen bonding of the proteins to
the heads of the ceramides. It is this hydrogen bonding that affords support to the
bilayers of the intercellular lipids and thus plays an integral part of the skin’s barrier
properties (Panchagnula et al. 2005 and Moore et al. 2001). The polycationic
PAMAM dendrimers may have disrupted the network through competitive
hydrogen bonding with the amide head groups of the ceramides causing a shift in
the amide I and amide II bands. Terpenes which are also penetration enhancers
are thought to disrupt the hydrogen bonding due to competitive bonding between
the terpene and ceramide which results in lower activation energy required for
diffusing drug molecules (Jain et al. 2008). This mechanism may explain the
increase in permeation of CHG within the skin after a G3-PAMAM-NH2 dendrimer
pre-treatment.
Further, a peak shift was observed in the conformation sensitive CH2
wagging and scissoring modes after G3-PAMAM-NH2 dendrimer treatment. CH2
wagging modes are very sensitive to alterations in the chain and packing order of
lipids (Mendelsohn et al. 2000). This suggests that the G3-PAMAM-NH2 dendrimer
207
alters the packing and organisation of the intercellular lipids. Perturbation of the
skin lipids would result in an impaired SC and would thus result in an enhanced
topical drug delivery as observed for CHG within Chapter 3. A different change in
spectra was observed when the isolated SC was incubated with
G3.5-PAMAM-COOH dendrimer. For the amide I band it appears that there is a
shoulder peak resulting from the overlap of the amide I band with the -OH- peak
resulting from water within the sample. There was a change in the wavenumber of
the CH2 scissoring peak which corresponds to conformation changes to the
densely packed lipids (Bouwstra et al. 2003).
There was no difference in the wavenumber of the symmetric and
asymmetric methylene stretching modes at around 2850 and 2920 cm-1 for G3-
PAMAM-NH2 (when compared to the vehicle control) but a peak shift did occur
after application of G3.5-PAMAM-COOH (Figure 4.18) (Moore and Rerek, 2000).
There were frequency shifts when the native SC was compared to the G3-
PAMAM-NH2 vehicle control so that it is the water:methanol solution that disorders
the fatty acid and ceramide chains and not the cationic G3-PAMAM-NH2
dendrimer in this case. Figures 4.18 and 4.19 do however show that the carboxyl
terminated PAMAM dendrimer causes a shift in wavenumber (when compared to
the vehicle control) corresponding to disorder of the fatty acid and ceramide chains
(though this was not shown to be significant).
The ATR-FTIR spectra confirms that both amine and carboxyl terminated
PAMAM dendrimers exhibit a disordering effect of the intercellular lipid packing
and the hydrogen bonding of the SC proteins to the ceramide head groups. This

208
perturbation of the SC barrier may explain the enhanced drug deposition observed
in Chapter 3.
4.4 Conclusion
This Chapter addresses a number of gaps in the literature about the
mechanism of action of PAMAM dendrimers and their properties as penetration
enhancers. In the present work there was no observed PAMAM dendrimer
induced damage to the skin on a macro scale as illustrated by barrier integrity
studies including TEER, TEWL and histological analysis of haematoxylin and
eosin stained cryo-sectioned skin. It was determined that PAMAM dendrimers
extract negligible concentrations of cholesterol and protein from the skin. Though
the results obtained were below the LOQ extraction of skin components by the
dendrimer should not yet be ruled out may still be a minor contributing cause of
enhanced topical drug delivery. Disruption of the packing and organisation of the
SC lipids, hydrogen bonding between SC proteins and ceramide head groups was
made evident by the collected ATR-FTIR spectra. Further, the OCT images
suggest that the PAMAM dendrimers accumulate within the follicles and
undulations of the skin. The OCT images also allude to a transient PAMAM
dendrimer affect as the alterations to the optical characteristics of the SC
recovered after the PAMAM dendrimer was washed from the SC surface. This
Chapter has illustrated that it is likely there are a range of contributing factors that
allow for PAMAM dendrimers to act as topical and transdermal penetration
enhancers. This new information may aid the optimisation and design of future
dendritic architectures as a platform for efficacious topical and transdermal drug
delivery.

209
5.0 The use of time-of-flight secondary ion mass spectrometry to map the distribution of CHG within tissue. 5.0 Introduction
5.0.1 Techniques available for imaging drug-skin deposition
In order to develop more efficacious strategies towards effective topical
antisepsis it is imperative to first understand the localization and distribution of the
antimicrobial compound throughout the skin strata, following its application to the
skin, in order to determine whether the compound reaches the microbial reservoir.
This also stands for all topically applied compounds including antiperspirants,
antifungals, cosmetics that are applied to the skin intentionally, in addition to
pesticides and industrial chemicals that may come in contact with the skin during
normal use. Mapping the location of a compound in situ within a biological tissue as
complex as the skin, may also aid in elucidating the permeation pathway and
mechanism of action. Conventional diffusion studies, such as those conducted using
Franz-type skin diffusion cells, combined with tape stripping can yield informative
dermatopharmacokinetic data (N’Dri-Stempfer et al. 2009 and Alberti et al. 2001) for
topically applied drugs.
The existing gold standard is a tape stripping technique that was described in
Chapter 3. Whilst it is a widely accepted method for investigating the
dermatopharmacokinetics of topically applied drugs and chemicals where the method
has been validated in human volunteer studies (Trebilcock et al, 1994) there are
210
some methodological flaws leaving scope to develop alternative novel methods.
There is great inter-laboratory variability with regards to tape stripping methods and
the methods are also laborious and time-consuming (Marttin et al. 1996). There are
also difficulties in standardizing the tape stripping to determine the amount of a
compound in different layers of the epidermis due to the removal of varying amounts
of the stratum corneum (SC) (Van der Molan et al. 1997, Lademann et al. 2009 and
Dreher, 2007). Whilst there have been advances in quantifying SC material on each
tape strip, in a purely comparative sense, some tape stripping approaches are still
laborious and time consuming. Gravimetric analysis (Higo et al. 1993) and others
require destructive techniques, for example: a modified protein Lowry assay (Dreher
et al. 2005). Other protein quantification techniques require further analytical
equipment such as a microscope (Lindemann et al. 2003), spectroscopic equipment
(Weighmann et al. 2003) and an infra-red densitometer (Voegeli et al. 2007 and Hahn
et al. 2010). The ToF-SIMS technique is rapid in comparison and as well as detecting
the drug or biomolecules of interest, it also has means of only including SC material in
the analysis.
Imaging techniques that have been applied to mapping percutaneous
absorption include Confocal Laser Scanning Microscopy (CLSM) (Alvarez-Roman et
al. 2004), Infra Red (IR) imaging (Mendelsohn et al. 2006), Confocal Raman
Microscopy (Zhang et al. 2007), Stimulated Raman Scattering Microscopy (Saar et al.
2011) and Matrix-Assisted Laser Desorption/Ionisation - Time of Flight mass
spectrometry (MALDI-ToF) analysis. Confocal studies have the advantage of being
able to capture 3D optical images of the skin but the information obtained is based
211
upon a fluorophore, that may limit the application of the technique, particularly as
species often require fluorescent “tagging”. This restricts the number of compounds
that can be analyzed by confocal microscopy; fluorescently tagging a compound may
yield localization information within tissue that does not necessarily reflect that of the
native compound. IR and Raman microscopes have an achievable spatial resolution
(pixel size) of around 4-10 µm (Kazarian and Chan, 2013) and ~1 µm (Krafft et al.
2009), respectively.
Recently with the advent of stimulated Raman scattering microscopy, low
sensitivity and interference signals from the coherent non-resident background have
been overcome, therefore it now offers label-free, non-invasive and real-time skin
imaging (Freudiger et al. 2008). Stimulated Raman scattering microscopy is a
relatively new and non-destructive skin-imaging technique that has been used to
image skin drug delivery of retinoic acid, the distribution of DMSO (Freudiger et al.
2008) and the chemical distribution of ibuprofen and ketoprofen throughout
mammalian skin (Saar et al. 2011). Raman spectroscopy techniques offer the
advantages of being a non-invasive, 3D high resolution imaging technique
(Lademann et al. 2012). Mass spectral imaging techniques offer unparalleled
sensitivity. MALDI-ToF has been employed successfully to characterize the
deposition of pharmaceutical compounds within skin but again lacks the desired
spatial resolution (each pixel corresponds to 0.2 mm × 0.2 mm) (Bunch et al. 2004).
Within the Bunch et al. paper the mass spectrum obtained had to be overlaid onto a
haematoxylin and eosin stained skin Section, which may be considered somewhat
subjective. Whilst there is advanced MALDI software available to superimpose MALDI
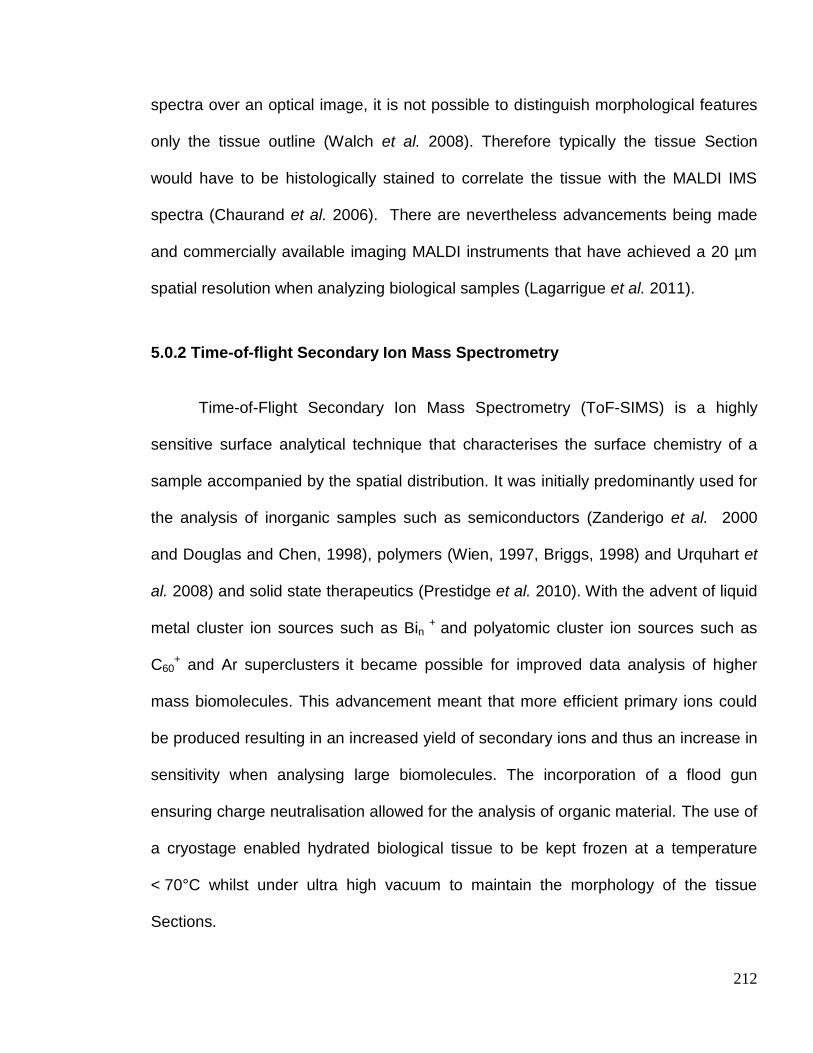
212
spectra over an optical image, it is not possible to distinguish morphological features
only the tissue outline (Walch et al. 2008). Therefore typically the tissue Section
would have to be histologically stained to correlate the tissue with the MALDI IMS
spectra (Chaurand et al. 2006). There are nevertheless advancements being made
and commercially available imaging MALDI instruments that have achieved a 20 µm
spatial resolution when analyzing biological samples (Lagarrigue et al. 2011).
5.0.2 Time-of-flight Secondary Ion Mass Spectrometry
Time-of-Flight Secondary Ion Mass Spectrometry (ToF-SIMS) is a highly
sensitive surface analytical technique that characterises the surface chemistry of a
sample accompanied by the spatial distribution. It was initially predominantly used for
the analysis of inorganic samples such as semiconductors (Zanderigo et al. 2000
and Douglas and Chen, 1998), polymers (Wien, 1997, Briggs, 1998) and Urquhart et
al. 2008) and solid state therapeutics (Prestidge et al. 2010). With the advent of liquid
metal cluster ion sources such as Bin + and polyatomic cluster ion sources such as
C60+ and Ar superclusters it became possible for improved data analysis of higher
mass biomolecules. This advancement meant that more efficient primary ions could
be produced resulting in an increased yield of secondary ions and thus an increase in
sensitivity when analysing large biomolecules. The incorporation of a flood gun
ensuring charge neutralisation allowed for the analysis of organic material. The use of
a cryostage enabled hydrated biological tissue to be kept frozen at a temperature
< 70°C whilst under ultra high vacuum to maintain the morphology of the tissue
Sections.

213
ToF-SIMS analysis involves rastering a pulsed primary ion beam onto the
sample surface that is supported by a cryostage in vacuo (Figure 5.1). This
bombardment of ions results in a collision cascade on the sample surface (~1 - 2 nm
of the outermost surface) resulting in the liberation of secondary ions (Figure 5.2).
These secondary ions are made up of monatomic and polyatomic particles, whole
molecules and fragment ions, some of which will carry a positive or negative charge
and many will remain neutral (Barnes et al. 2011). They occur due to a range of
processes including fragmentation, gaining of protons, loss of protons or less
frequently due to molecular re-arrangement. The charge of the ion is dependent on
the species’ ionisation efficiencies (Grams, 2007). The liberated secondary ions of
the same polarity and thus kinetic energy are then accelerated into the drift field of the
time-of-flight analyzer (Schueler, 1992). The secondary ions are separated according
to their mass-to-charge ratio, which is dependent on the time taken for the ion to
reach the detector. With the sputtering of charged species from the sample surface
an electron flood gun is used to then neutralise the sample (Barnes et al. 2011).
A significant benefit of utilising a ToF-analyser is that it can simultaneously
detect all secondary ions of the same polarity resulting in each pixel of the spatial
map representing a full mass spectrum (Belazi, 2009). As a result, ToF-SIMS has the
ability to characterise the spatial distribution of a compound within the surface of
complex tissue; this can yield information on the distribution of the drug within the
tissue and may allow elucidation of the mechanism of action (Benninghoven, 1994).

214
Figure 5.1 Schematic of the analysis of a skin cryo-Section by ToF-SIMS. Primary ions from a Bi3
+ are rastered onto the frozen skin Section surface and after a collision cascade, secondary ions are emitted. Those of the selected polarity are accelerated by an electric field into the flight path of a time-of-flight mass spectrometer in which the ion’s mass to charge ratio is determined. The detector receives chemical and spatial information therefore a chemical distribution image can be retrospectively built.
Primary ion source
Bi3+
Prepared skin cryo-Section (-80°C, ultra high vacuum)
ToF mass analyser
Mass spectrum
Secondary ions (+/-)
Chemical species distribution image
Detector
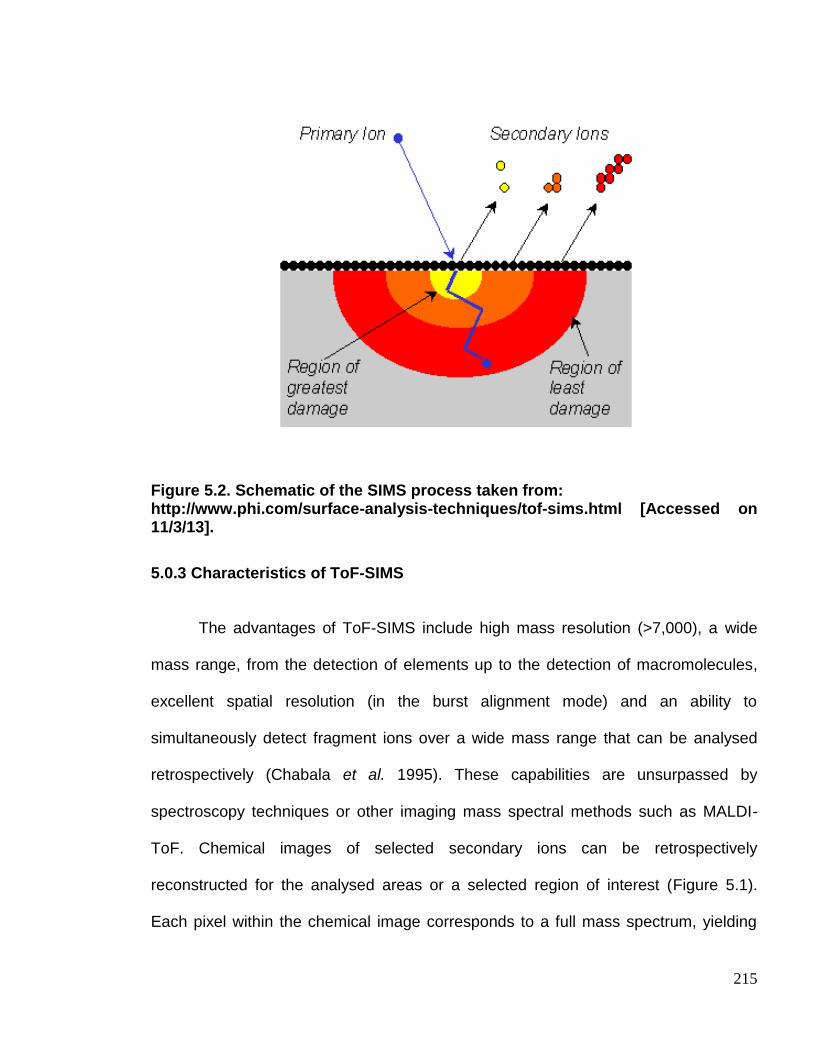
215
Figure 5.2. Schematic of the SIMS process taken from: http://www.phi.com/surface-analysis-techniques/tof-sims.html [Accessed on 11/3/13].
5.0.3 Characteristics of ToF-SIMS
The advantages of ToF-SIMS include high mass resolution (>7,000), a wide
mass range, from the detection of elements up to the detection of macromolecules,
excellent spatial resolution (in the burst alignment mode) and an ability to
simultaneously detect fragment ions over a wide mass range that can be analysed
retrospectively (Chabala et al. 1995). These capabilities are unsurpassed by
spectroscopy techniques or other imaging mass spectral methods such as MALDI-
ToF. Chemical images of selected secondary ions can be retrospectively
reconstructed for the analysed areas or a selected region of interest (Figure 5.1).
Each pixel within the chemical image corresponds to a full mass spectrum, yielding

216
substantial chemical and spatial information for each sample. The ability to analyse
the data retrospectively reduces the number of samples that would need to be tested,
particularly in light of new information. For example, if the ToF-SIMS analysis reveals
that a drug has a particular affinity for a specific biomolecule, previously obtained data
can be re-analysed incorporating that biomolecule. This capability would be ideal in
drug development and toxicology. Furthermore, as the ToF analyser detects all
secondary ions liberated of the same polarity, the technique has the potential for
analysing the localisation of not only the active therapeutic but also many other
components of a complex dose formulation. This has the potential for analysis of
excipients in parallel, e.g. in topical preparations the preservatives that may act as a
skin irritant, or visualisation of the distribution of silicones across the skin surface.
ToF-SIMS chemical distribution maps not only highlight the localization of an
exogenous compound within the tissue but can also profile the organic components of
the different histological compartments of the tissue sample, allowing the depth of
permeability to be estimated. The localization of the therapeutic agent within a
particular tissue layer or the binding to a particular biomolecule may elucidate a
drug’s permeation or any drug depot effects (Andanson et al. 2009 and Teichman et
al. 2005). This effect has been observed within this Chapter where CHG was shown
to be highly associated with the SC in both cryo-Sections of skin tissue and on tape
strips. Another benefit of the technique is that it is not dependent on the penetration of
a reagent or probe reactivity and is not adversely affected by background staining
(Malmberg et al. 2011). ToF-SIMS is the analysis of native molecules such as

217
un-labelled exogenous chemicals or endogenous biomolecules within un-fixed
organic tissue.
The limitations of ToF-SIMS include its inherent inability for quantification due
to matrix effects (Benninghoven, 1994). The yield of secondary ions is dependent on
the ionization energies of the various species analysed, i.e. the secondary ion yield
for a particular species is dependent on the strength of the bonding to the matrix
(Piantadosi and Smart, 2002). If the matrix is kept consistent then the secondary ion
yield should be proportional from sample to sample over a specific area for
comparison. When analysing samples as complex as biological tissue, only semi-
quantitative analysis is possible due to these matrix effects. ToF-SIMS is an analytical
technique and as such the system may incur instrumental drift (Thompson, 1991).
One limitation to the analysis of biological material is that ultra-high vacuum
conditions must be maintained throughout the analysis. To maintain morphology
cryo-preparation such as those techniques used in electron microscopy must be
utilised. Confirmation of the tissue structure integrity and cell morphology is however
possible by using conventional histological analysis after ToF-SIMS analysis (as
conducted within this Chapter).
Though ToF-SIMS analysis of biological samples is in its infancy, a broad
range of biologics have been analysed to date including; mouse adrenal gland cortex
(Malmberg et al. 2011), xenopus leavis oocytes (Fletcher et al. 2007), He La cells
(cervical cancer cell line) (Fletcher et al. 2008) and Sections of rat brain (Benabdellah
et al. 2010 and Nygren et al. 2005). Previous studies have been limited regarding

218
ToF-SIMS and skin tissue analysis. Previous studies included the analysis of the
incorporation of pseudo-ceramides into the SC delivered from a cosmetic formulation
(Okamoto, et al. 2006) and (Tanji et al. 2008). These studies used high resolution
chemical images of the skin surface to which the pseudo-ceramides had been applied
in order to demonstrate that synthetic pseudo-ceramides can effectively partition into
the SC. The analysis of the cosmetic formulation treated skin samples resulted in two
unique ion peaks that were unique to the pseudo-ceramides and were not present in
untreated samples. The unique fragment ions giving rise to the two additional ion
peaks were clearly attributed to the pseudo-ceramides as the peaks were not present
in the analysis of native ceramides. The difference in mass spectra between the
native and pseudo-ceramide was exploited by the authors to investigate the
incorporation of pseudo-ceramides within the SC. This study showed that ToF-SIMS
can provide valuable information regarding the distribution of cosmetic components
within the skin.
The application of ToF-SIMS to biomedical and biophysical applications has
been shown previously. For example, photo-ageing effects on skin, before and after
UV irradiation, were determined and changes in the ToF-SIMS chemical images of
key skin components such as collagen and lipid molecules within a cross Section of
human skin were reported (Lee et al. 2008). A ToF-SIMS study into the analysis of
human skin lipids has previously been conducted, where the authors characterised
the chemical distribution profile of skin lipids and vitamin E within normal human skin
(Belazi et al 2009). Despite these studies having produced novel and biomedically
relevant chemical distribution data for human skin, no subsequent follow up ToF-

219
SIMS studies have since been published. This Chapter outlines the use of analyzing
the localization of a common topically applied antiseptic and investigates a novel
permeation enhancer. There is great scope to further develop the ToF-SIMS method
from both an efficacy and toxicology point of view with wide ranging biomedical
applications discussed further in the Chapter.
Whilst CHG has been used extensively in topical antimicrobial formulations, it
has been shown in Franz cell diffusion studies to permeate into and across the skin
poorly (Lafforgue et al. 1997) and (Karpanen et al. 2008), leaving potential pathogens
viable within the deeper layers of the skin. To develop novel and efficacious
antisepsis strategies it is imperative to first understand the drugs deposition on the
skin surface and within the epidermis as little is understood about its distribution post
topical application. There is increasing interest in the development of suitable
protocols and applications for imaging techniques that do not require radiolabelling or
laborious sample preparation. ToF-SIMS has the potential to determine the
distribution of CHG and other topically applied antimicrobials to fully elucidate a
biocide’s permeation pathway. At the time of writing there are no published studies
investigating the application of ToF-SIMS to skin permeation and distribution of
therapeutic agents. Thus, this is the first time ToF-SIMS has been utilised to visualize
the distribution of a topical antiseptic applied to the skin.

220
5.0.4 Aims and objectives
The primary aim of this study was to use ToF-SIMS to map the distribution and
localization of a clinically relevant, topical dose of chlorhexidine digluconate (2 % w/v)
once applied to dermatomed porcine skin. In order to validate the results and ensure
no artifacts due to the cryo-preparation are involved, a tape stripping study was
undertaken in parallel with using cryo-Sectioned skin. These tape strips were also
analysed by ToF-SIMS to determine the potential application of combining
conventional tape stripping skin studies with a novel ToF-SIMS detection system.
The aims of this Chapter are as follows-
(i) To develop a simple and rapid method for dosing ex vivo porcine skin for
ToF-SIMS analysis.
(ii) To determine whether CHG can be distinguished from endogenous skin
components and whether unique fragment ions for the drug can be
detected.
(iii) To use the developed novel method to map the distribution and permeation
of CHG once topically applied to ex vivo porcine skin. Further, to establish
whether it is possible to make semi-quantitative measurements of CHG
ingress into the skin.
(iv) To combine the novel ToF-SIMS method with the widely accepted tape
strip method to determine whether a permeation profile could be created
from the ToF-SIMS analysis of individual tape strips. This may also be

221
developed further to allow for the measurement of ingress of exogenous
chemicals within the skin.
PAMAM dendrimers were shown to enhance the permeation of chlorhexidine in
Chapter 3. An additional aim of this Chapter was to visualize the permeation
enhancement effect of a PAMAM dendrimer pre-dose on the model antiseptic,
CHG. The ToF-SIMS method developed in this Chapter may be applied in the
analysis of the efficacy and localization of permeation enhancers.
5.1.0 Materials and Methodology
5.1.1 Materials
Chlorhexidine digluconate (CHG) 20 % (w/v) and NaCl for physiological saline
(0.9 % w/w) were purchased from Sigma Aldrich, UK. Tape stripping was performed
using Scotch tape, 3M, UK. Analytical grade methanol, chloroform and hexane were
obtained from Fisher, UK and were used to solvent-clean glass cover-slips prior to
sample mounting. De-gassed ultra pure water was used for the preparation of
receptor fluid and for skin surface washings. Skin integrity was measured using
Trans-Epithelial Electrical Resistance (TEER) LCR Databridge, Tansley, UK. Skin
Sectioning was conducted using a cryostat (Leica, CM1850). The temperature of the
cryostat chamber was found to be optimal for cryo-Sectioning skin Sections at -28°C.
Samples were embedded within OCT embedding material, supplied by Fisher
scientific, UK. OCT is an inert mounting medium containing 10.24 % (w/w) polyvinyl
alcohol 4.26 % (w/w) polyethylene glycol 85.5 % (w/w) non-reactive ingredients. As

222
the OCT embedding material is frozen on contact with the skin sample at -28°C there
should be minimal interaction between the mounting agent and tissue and is widely
considered inert.
5.1.2 Skin preparation
Skin was prepared from the flank of six week old pigs obtained from a local
abattoir prior to any steam cleaning treatment. The skin was washed with distilled
water and carefully shaved using clippers so as to not damage the integrity of the
tissue. The subcutaneous fat was carefully removed using a scalpel and then the skin
was dermatomed to a thickness of 400 µm with an electric dermatome. It was then
wrapped in aluminum foil and frozen at -20°C until required. The dermatomed skin
was then punched out with a 3 cm diameter punch and placed upon a stainless steel
mesh support grid within a Franz cell, with the SC facing upwards. To check the
integrity of the skin, 4.5 mL of physiological saline was added to the receptor chamber
and 2 mL of physiological saline was added to the donor chamber and placed in a
circulating water bath on a submersible magnetic stirrer at 32°C for 30 minutes. After
the cells had equilibrated, the TEER was measured to check the integrity of the
porcine skin. Prior to readings being taken, the instrument was calibrated using a
resistor. It has been established that healthy and intact porcine skin in Franz-type
cells used should have an electrical resistance reading of ≥ 3 KΩ to pass the integrity
check (Davies et al. 2004).
223
5.1.3 Diffusion (Franz-type) cell study
The diffusion cells that had passed the integrity check were removed and the
skin was allowed to air dry for 2 h at ambient temperature. 4.5 mL of physiological
saline was added to the receptor chamber of each Franz cell. The Franz cells were
placed in the water bath (32°C) on a submersible stirring plate for 30 minutes and
allowed to equilibrate. A 2 % (w/v) solution of CHG and a 10 mM solution of
G3-PAMAM-NH2 were prepared in distilled water from a 20 % (w/v) solution of CHG
and a 20 % (w/v) solution of G3-PAMAM-NH2 stock. Once the Franz-type cells had
equilibrated, the G3-PAMAM-NH2 (0.2 mL, 10 mM) was dosed for a 24 h contact
period. After 24 h the G3-PAMAM-NH2 was washed from the skin surface of each
diffusion cell by rinsing with 2 mL aliquots of distilled water (10 mL in total) over the
surface of the dosed skin. Once the skin surface was dry (left at ambient temperature
to dry for 2-3 h) an infinite dose (1 mL) of the CHG solution was applied to the skin
surface and left for a contact time of 24 h. Excess CHG was removed from the skin
surface of each diffusion cell by rinsing with 2 mL aliquots of distilled water (10 mL in
total) over the surface of the dosed skin, taking care not to damage the skin. The skin
was then allowed to air dry at ambient temperature, after which the Franz-type cells
were dismantled and the skin destined for the cryo-Section experiment was snap
frozen in liquid nitrogen. Skin samples intended for the tape stripping study were
stripped immediately after as described in Section 3.2.4 and as outlined elsewhere
(Trebilcock et al. 1994) and (OECD, 2004). Samples were then transported to the
cryostat and the ToF-SIMS instrument on dry ice.
224
5.1.4 Sample preparation for ToF-SIMS analysis
The frozen skin samples were mounted on a cryostat using Optimal Cutting
Temperature (OCT) embedding material. Vertical cross Sections of skin of an 8 µm
thickness were cut and placed on to a clean glass cover-slip (1 cm × 1 cm). The cover
slips were first rinsed in ultra-pure water followed by methanol, chloroform and lastly
hexane before the skin sample was loaded. For the tape strip experiment, 21 tape
strips were taken to remove the SC. The strips were then freeze-dried and placed on
a solvent-cleaned microscope slide ready for analysis.
5.1.5 ToF-SIMS analysis
Full credit for the ToF-SIMS analysis must go to Dr David Scurr at the
Laboratory of Biophysics and Surface Analysis at the School of Pharmacy, University
of Nottingham. ToF-SIMS was performed on a ToF-SIMS IV instrument (IONTOF,
GmbH, Münster, Germany) using a Bi3+ cluster primary ion source and a single-stage
reflectron analyzer. ToF-SIMS data was analysed using SufaceLab 6 software. The
cover-slip containing the samples was mounted onto a cryo-stage with a cold-finger
mechanism and frozen to -80°C using a liquid nitrogen cooling system. The mounted
skin samples were then exposed to an ultra high vacuum. A primary ion energy of
25 kV along with a pulsed target current of approximately 1 pA and post-acceleration
energy of 10 kV were employed throughout the analysis (Mains et al. 2011). The
primary ion dose density was maintained at less than 1 × 10¹² ions per cm2
throughout to ensure static conditions. Spectra were acquired in both the positive and
negative modes at a resolution of 256 × 256 pixels by scanning a primary beam over
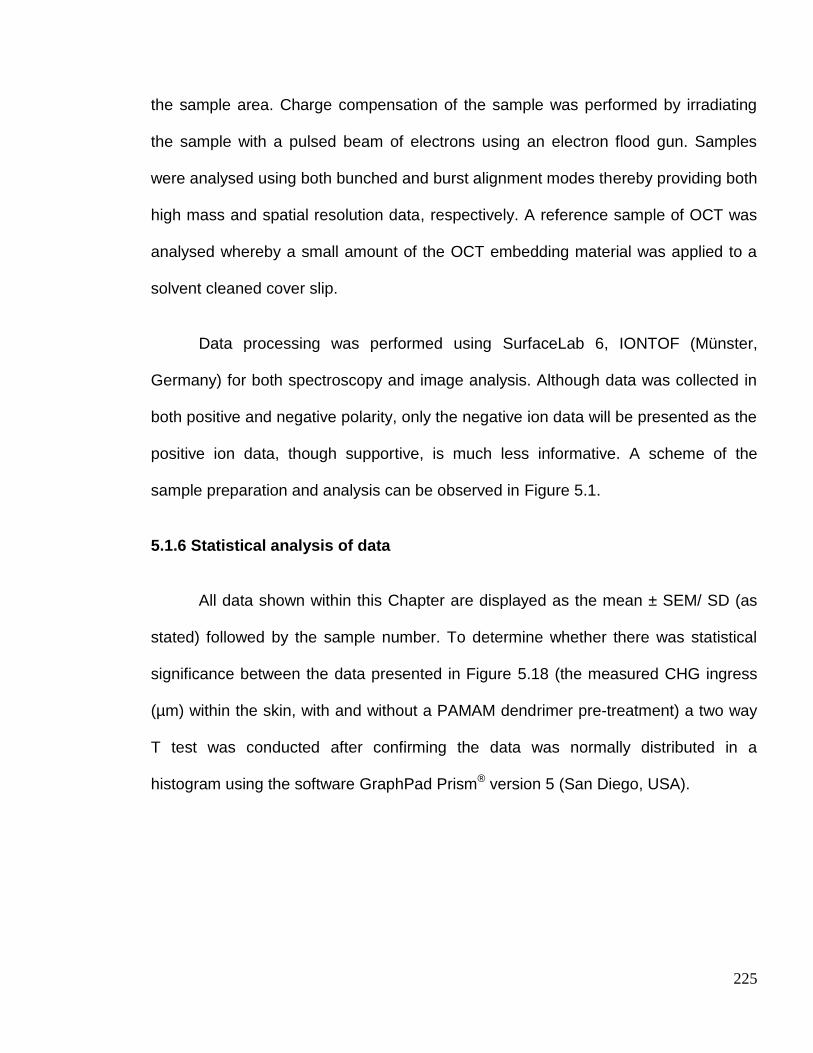
225
the sample area. Charge compensation of the sample was performed by irradiating
the sample with a pulsed beam of electrons using an electron flood gun. Samples
were analysed using both bunched and burst alignment modes thereby providing both
high mass and spatial resolution data, respectively. A reference sample of OCT was
analysed whereby a small amount of the OCT embedding material was applied to a
solvent cleaned cover slip.
Data processing was performed using SurfaceLab 6, IONTOF (Münster,
Germany) for both spectroscopy and image analysis. Although data was collected in
both positive and negative polarity, only the negative ion data will be presented as the
positive ion data, though supportive, is much less informative. A scheme of the
sample preparation and analysis can be observed in Figure 5.1.
5.1.6 Statistical analysis of data
All data shown within this Chapter are displayed as the mean ± SEM/ SD (as
stated) followed by the sample number. To determine whether there was statistical
significance between the data presented in Figure 5.18 (the measured CHG ingress
(µm) within the skin, with and without a PAMAM dendrimer pre-treatment) a two way
T test was conducted after confirming the data was normally distributed in a
histogram using the software GraphPad Prism® version 5 (San Diego, USA).

226
5.2.0 Results
5.2.1 Method Development
5.2.1.1 Identification and analysis of fragment ions characteristic of
chlorhexidine digluconate (CHG).
To discover fragment ions that are unique or characteristic of CHG,
dermatomed porcine skin (400 μm in thickness) was dosed with a 2 % solution of
CHG (w/v) overnight and unabsorbed CHG was washed from the skin surface. Once
analysed in the negative polarity an overview spectra corresponding to treated and
untreated skin was obtained (Figures 5.3 and 5.4). The overview spectra with an
equivalent scale were used to indicate characteristic ion peaks in the CHG treated
spectra that were more intense or were not present in the untreated spectra. The
peak corresponding to chlorine was highly prominent in the CHG treated skin
compared to the untreated skin. A peak at 151 atomic mass units (amu) was
documented within the overview spectrum (Figure 5.3 (a)) and was calculated to be
C7H4N2Cl- (m/z = 151). The structure of this fragment ion was determined (Figure 5.3
(b)) and it corresponded to a fragment of one of the aromatic branches of
chlorhexidine. This peak is not present for the untreated skin as observed in the
spectrum magnification (Figure 5.3 (c)). Survey spectra illustrating the ion peaks of a
higher mass (160-550 amu) contained the molecular ion ([M-H]-) for chlorhexidine
(Figure 5.4 (a)). At 505 amu a peak corresponding to the [M-H]- can be observed for
CHG treated skin but no ion peaks are observed for the untreated skin at this mass
(Figure 5.4 (b-c)). These characteristic element and fragment ions have been used as
a marker for CHG within this study.

227
Mass (u)20 40 60 80 100 120 140
-1x10
0.5
1.0
1.5
2.0
-1x10
0.5
1.0
1.5
2.0
Sca
led
In
ten
sity
Mass (u)150.0 150.5 151.0 151.5 152.0
-3x10
0.5
1.0
1.5
-3x10
0.5
1.0
1.5
Sca
led
In
ten
sityCl
NH
N-
CHG treated skin
Untreated skin
C7H4N2Cl-
Cl-
Cl-
Figure 5.3 (a) Identification of characteristic CHG markers. ToF-SIMS overview spectrum detected in the negative polarity of un-dosed porcine skin and skin dosed with a 2 % CHG (w/v) solution after a 24h contact time and wash. CHG markers, chlorine and C7H4N2Cl
- fragment ion can be observed.
Figure 5.3 (b) Structure of fragment ion unique to CHG identified from negative polarity overview spectra of CHG treated porcine skin.
Figure 5.3 (c) Magnification of CHG unique fragment ion within ToF-SIMS overview spectrum for un-dosed porcine skin and skin dosed with a 2 % CHG (w/v) solution after a 24 h contact time and wash.
Untreated skin
CHG treated skin
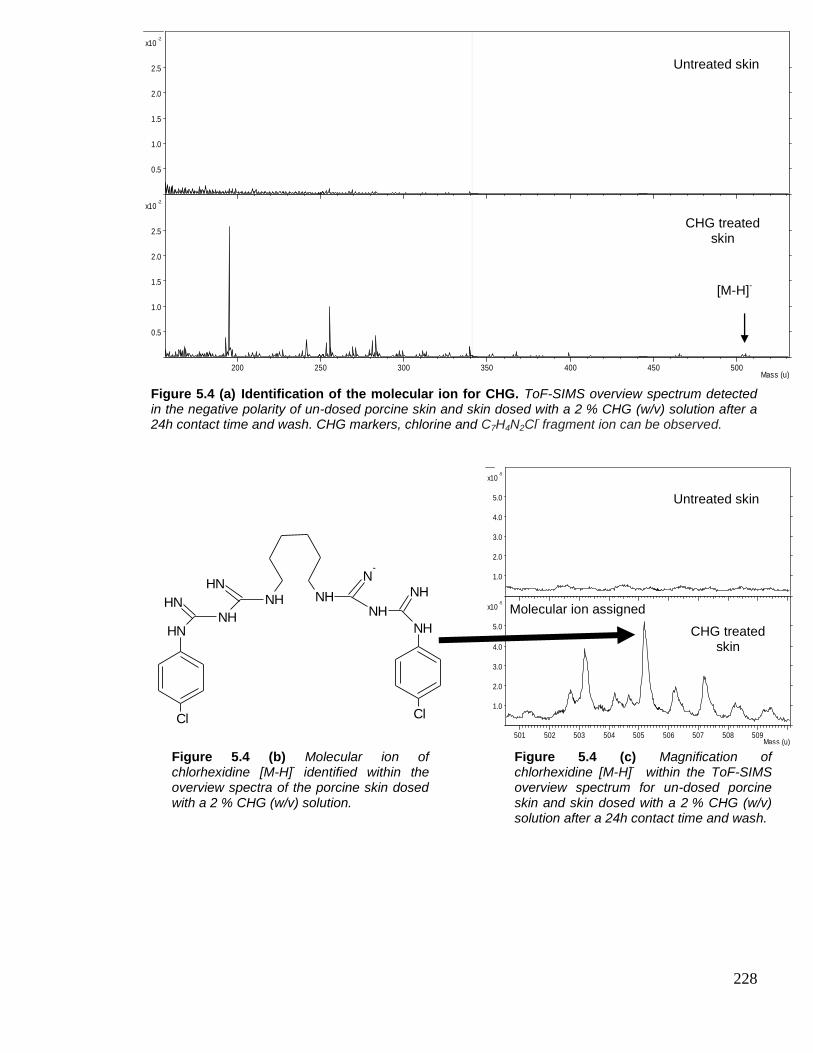
228
Figure 5.4 (a) Identification of the molecular ion for CHG. ToF-SIMS overview spectrum detected in the negative polarity of un-dosed porcine skin and skin dosed with a 2 % CHG (w/v) solution after a 24h contact time and wash. CHG markers, chlorine and C7H4N2Cl
- fragment ion can be observed.
Mass (u)200 250 300 350 400 450 500
-2x10
0.5
1.0
1.5
2.0
2.5
-2x10
0.5
1.0
1.5
2.0
2.5S
ca
led
In
ten
sity
Untreated skin
CHG treated skin
[M-H]-
Mass (u)501 502 503 504 505 506 507 508 509
-5x10
1.0
2.0
3.0
4.0
5.0
-5x10
1.0
2.0
3.0
4.0
5.0
Sca
led
In
ten
sity
NHNH
N-
NH
NHNH
NHNH
NHNH
Cl Cl
Molecular ion assigned
CHG treated skin
Untreated skin
[M-H]-
Figure 5.4 (b) Molecular ion of chlorhexidine [M-H]
- identified within the
overview spectra of the porcine skin dosed with a 2 % CHG (w/v) solution.
Figure 5.4 (c) Magnification of chlorhexidine [M-H]
- within the ToF-SIMS
overview spectrum for un-dosed porcine skin and skin dosed with a 2 % CHG (w/v) solution after a 24h contact time and wash.
CHG treated skin

229
To visualise the chosen markers from Figures 5.3 and 5.4, the chemical
distribution map of the selected markers were obtained from the surface of 2 % CHG
(w/v) dosed porcine skin. The justification for the use of porcine skin as a surrogate
for human skin was discussed previously in Chapter 3. It was observed that though
the ion intensity of chlorine was higher for the CHG treated skin it was still readily
observed on the surface of the untreated skin (Figure 5.5). The two markers,
C7H4N2Cl- (m/z = 151) and the [M-H]- C22N10H30Cl2 (m/z = 505) were visualized clearly
and were found to be distributed evenly across the skin surface. At the lower left hand
corner of the chemical distribution maps there is a shadow, even in the total ion
intensity chemical distribution maps. This is likely due to the uneven topography of
the skin surface and therefore may be out of the range of the pulsing primary ion
beam.
The difference in mass resolution for the two operating modes is evident using
the 37Cl- ion when shown in Figure 5.6. A compromise between high spatial resolution
and high mass resolution must be made by either analyzing the sample in the burst
alignment mode (high spatial resolution, low mass resolution) or the bunched mode
(high mass resolution, low spatial resolution). The ions indicative of the drug should
therefore be selected in the bunched mode to achieve the highest mass resolution for
fragment ion identification and assignment. All CHG markers were chosen from
spectra that were operated in the bunched mode.

230
Figure. 5.5 ToF-SIMS images of various secondary ions chosen as markers for CHG. ToF-SIMS images of Cl-, C7H4N2Cl- and [M-H]- of the negative control and 2 % CHG (w/v) dosed porcine dermatomed skin (400 µm thick). Data taken from skin surface after washing negative control and dosed skin surface with 10 mL of ultrapure water. Scale bar equates to 20 µm, TC represents the total ion count for the specific ion of interest.
Untreated
skin
CHG treated
skin
20.00 μm
totalMC: 816; TC: 4.006e+007
800
600
400
200
0
20.00 μm
37Cl-MC: 15; TC: 4.385e+005
15.0
12.5
10.0
7.5
5.0
2.5
0.0
20.00 μm
C7H4N2Cl-MC: 14; TC: 4.660e+004
14
12
10
8
6
4
2
0
20.00 μm
C26H33O10-MC: 5; TC: 4.839e+003
5.0
4.0
3.0
2.0
1.0
0.0
20.00 μm
totalMC: 705; TC: 2.550e+007
600
400
200
0
20.00 μm
37Cl-MC: 15; TC: 4.560e+005
15.0
12.5
10.0
7.5
5.0
2.5
0.0
20.00 μm
C7H4N2Cl-MC: 14; TC: 4.058e+005
14
12
10
8
6
4
2
0
20.00 μm
C26H33O10-MC: 5; TC: 1.966e+004
5.0
4.0
3.0
2.0
1.0
0.0
Total ion- Cl- C7H4N2Cl- C22N10H30Cl2-
-

231
Figure 5.6. Mass spectra illustrating the difference in mass resolution between the two ToF-SIMS operating modes. ToF-SIMS spectra of 37Cl- present in cryo-Sections (8 µm thick) of untreated control dermatomed porcine skin (400 µm) and skin dosed with 2 % CHG (w/v). The spectra were obtained in negative polarity using burst alignment and bunched mode to demonstrate the difference in observed mass resolution. The bunched mode can resolve 37Cl- and C3H
- ion peaks unlike the burst alignment mode.
Mass (u)36.80 36.85 36.90 36.95 37.00 37.05 37.10 37.15 37.20
-4x10
1.0
2.0
3.0
4.0
5.0
6.0
7.0
8.0
-4x10
1.0
2.0
3.0
4.0
5.0
6.0
7.0
8.0 Burst alignment mode- High spatial resolution low mass resolution.
Bunched mode- High mass resolution, low
spatial resolution.

232
To observe differences in the spatial resolution of the two operating modes, a
proof of concept study was conducted on a CHG-treated skin cryo-Section. It was
found that the integrity of the skin tissue was impaired due to the cryo-preparation
process and the SC had folded on to the dermis (Figure 5.7). In the bunched mode
the chemical distribution maps illustrate a high ion intensity for all CHG markers. The
high molecular weight [M-H]- ion also exhibited a strong ion intensity within the
displaced SC layer. Though the ion intensities of the CHG markers are prevalent, the
spatial resolution in the bunched mode is clearly lacking. The spatial resolution
achieved in the burst alignment mode is excellent as the morphology of the differing
histological skin layers can be observed (Figure 5.7). The high spatial resolution is
particularly distinguishable when compared to images obtained in the bunched mode
(Figure 5.7). The ion intensities of the CHG markers in the burst alignment mode are
not as high. The lack of mass resolution is exhibited by the difficulty in visualisation of
the [M-H]- ion in the burst alignment mode.
The chemical distribution images show that the skin Section was not intact.
Haematoxylin and eosin was used to stain the skin cryo-Section and a light
microscope with an attached camera was used to image the cryo-Sectioned skin.
Figure 5.8 illustrates the folding of the SC on to the dermis which is due to the
preparation process. This displacement of the SC was clearly identifiable in the
chemical distribution maps (Figure 5.7) and the haematoxylin and eosin staining was
found to be an easy technique to confirm the skin integrity.

233
Figure 5.7. Imaging of selected CHG marker ions within the skin. Various CHG ion marker chemical images of 2 % CHG (w/v) dosed porcine dermatomed skin (400 µm thick) vertically cryo-Sectioned into 8 µm thick Sections. Curling of the sample occurred when adsorbing the Section onto solvent cleaned coverslip (10 mm x 10 mm). Scale bar equates to 100 µm, TC is the total ion count for the specific ions of interest.
100.00 μm
7500.00u - MC: 868; TC: 2.551e+007
800
600
400
200
0
100.00 μm
34.97u - Cl-MC: 15; TC: 3.808e+005
15.0
12.5
10.0
7.5
5.0
2.5
0.0
100.00 μm
36.97u - 37Cl-MC: 15; TC: 1.567e+005
15.0
12.5
10.0
7.5
5.0
2.5
0.0
100.00 μm
151.01u - C7H4N2Cl-MC: 14; TC: 7.081e+004
14
12
10
8
6
4
2
0
100.00 μm
505.19u - C22H31N10Cl2-MC: 4; TC: 3.215e+003
4.0
3.0
2.0
1.0
0.0
100.00 μm
7500.00u - MC: 164; TC: 3.414e+006
150
125
100
75
50
25
0
100.00 μm
35.00u - Cl-MC: 13; TC: 4.409e+004
12
10
8
6
4
2
0
100.00 μm
37.01u - 37Cl-MC: 7; TC: 2.057e+004
7.0
6.0
5.0
4.0
3.0
2.0
1.0
0.0
100.00 μm
151.07u - C7H4N2Cl-MC: 6; TC: 6.123e+003
6.0
5.0
4.0
3.0
2.0
1.0
0.0
100.00 μm
505.19u - C22H31N10Cl2-MC: 4; TC: 1.138e+003
4.0
3.0
2.0
1.0
0.0
Bunched mode
Burst alignment mode
Total ion- content
Cl- 37Cl- C7H4N2Cl- C22H30N10Cl2-
2.551 e+007 3.808 e+005 1.567 e+005 7.081 e+004 3.215 e+003
3.419 e+006 4.409 e+004 2.057 e+004 6.123 e+003 1.138 e+003
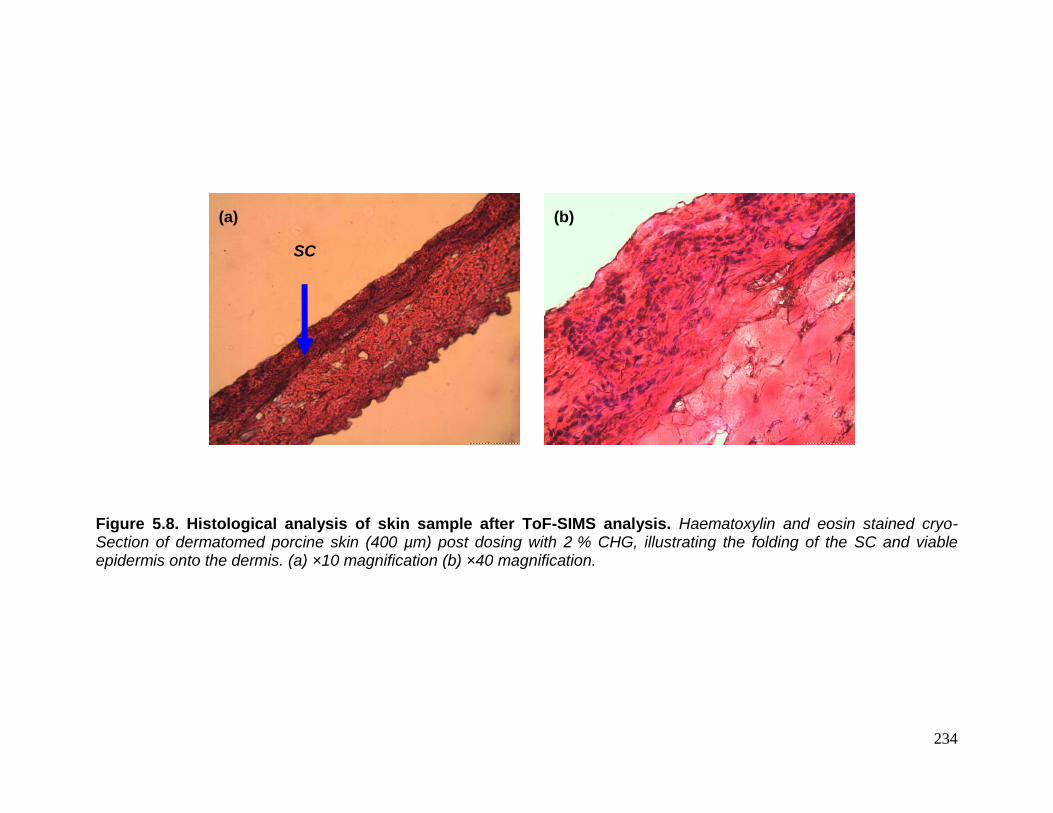
234
Figure 5.8. Histological analysis of skin sample after ToF-SIMS analysis. Haematoxylin and eosin stained cryo-Section of dermatomed porcine skin (400 µm) post dosing with 2 % CHG, illustrating the folding of the SC and viable epidermis onto the dermis. (a) ×10 magnification (b) ×40 magnification.
SC
(a) (b)

235
5.2.2. ToF-SIMS analysis of chlorhexidine digluconate treated porcine skin
cryo-Sections.
After identification and assignment of secondary ions indicative of CHG, cryo-
Sections of CHG treated skin and untreated skin were analysed by ToF-SIMS.
Figure 5.9 shows an example of the magnified mass spectra for the selected CHG
markers within dermatomed porcine skin. OCT that was used as an embedding
material for the cryo-Sectioning was also analysed in parallel as a reference material
to determine any peak overlap. Baseline noise can be observed for the OCT and the
untreated skin, however unsaturated ion peaks exhibiting high signal to noise
intensities for 37Cl-, C7H4N2Cl- (m/z = 151) and C22H30N10Cl2- (m/z = 505) were
detected for the CHG treated skin.
The chemical distribution images of three replicates and the untreated skin
cryo-Sections are shown in Figure 5.10. The two drug ion markers for CHG, 37Cl- and
C7H4N2Cl- (m/z = 151), can be observed within the SC. The highest ion intensity for
the drug markers was found to be in the superficial layers of the skin and the SC. No
significant signal intensity was detected for the drug markers within the lower
epidermis or the dermis. No ion intensity for either of the drug markers were observed
for the untreated skin Section. Figure 5.10 also illustrates the PO2- (m/z = 61)
distribution images that were utilised as a marker for the viable epidermis. The ion
PO2- (m/z = 61) was typically found distributed throughout the upper viable epidermis
and the ion intensity for the CHG markers were localised within the SC layers above
the ion intensity corresponding to the PO2- (m/z = 61) and thus the viable epidermis.
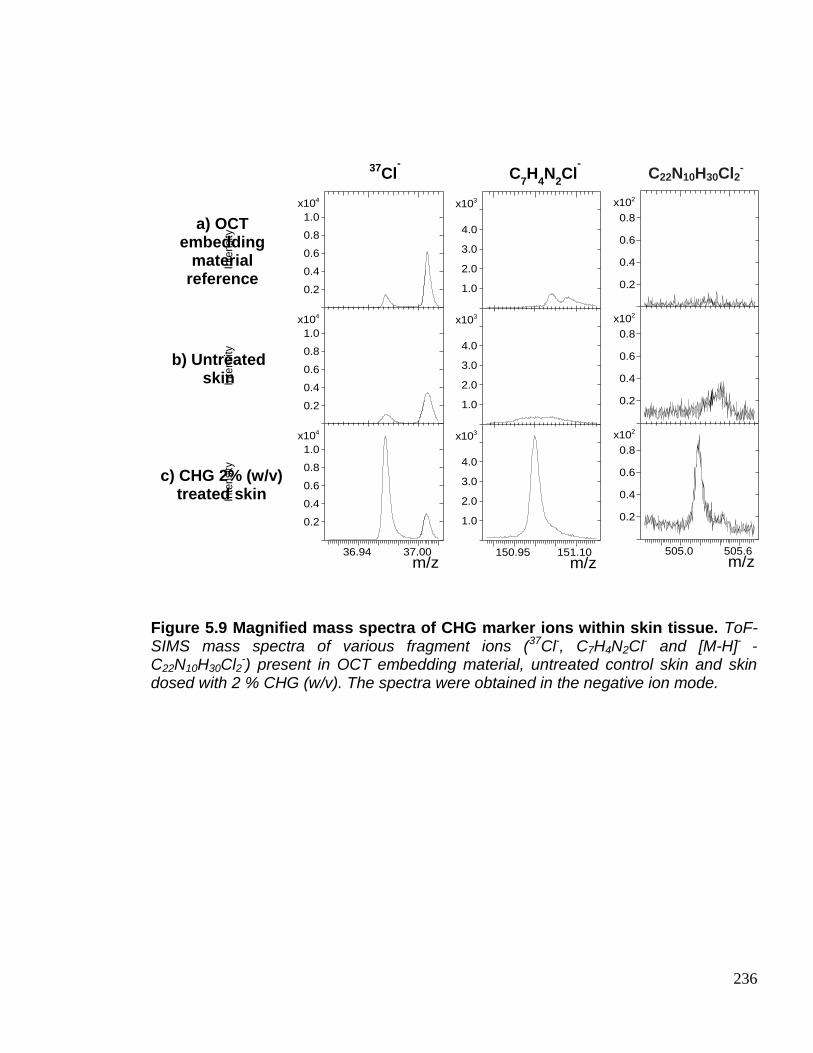
236
Figure 5.9 Magnified mass spectra of CHG marker ions within skin tissue. ToF-SIMS mass spectra of various fragment ions (37Cl-, C7H4N2Cl- and [M-H]- -C22N10H30Cl2
-) present in OCT embedding material, untreated control skin and skin dosed with 2 % CHG (w/v). The spectra were obtained in the negative ion mode.
m/z36.94 37.00
4x10
0.2
0.4
0.6
0.8
1.0
Inte
nsi
ty
4x10
0.2
0.4
0.6
0.8
1.0
Inte
nsi
ty
4x10
0.2
0.4
0.6
0.8
1.0In
tensi
ty
m/z505.0 505.6
2x10
0.2
0.4
0.6
0.8
2x10
0.2
0.4
0.6
0.8
2x10
0.2
0.4
0.6
0.8
m/z150.95 151.10
3x10
1.0
2.0
3.0
4.0
3x10
1.0
2.0
3.0
4.0
3x10
1.0
2.0
3.0
4.0a) OCT embedding
material reference
b) Untreated skin
c) CHG 2% (w/v) treated skin
37Cl- C
7H
4N
2Cl
- C22N10H30Cl2
-

237
Figure 5.10. ToF-SIMS images of various CHG marker ions distributed within the skin. ToF-SIMS images of various CHG markers of the negative control and 2 % CHG (w/v) dosed porcine dermatomed skin (400 µm thick), where the scale bar represents 100 µm, MC = maximum ion count per pixel and TC = total ion count for the specific ion of interest.
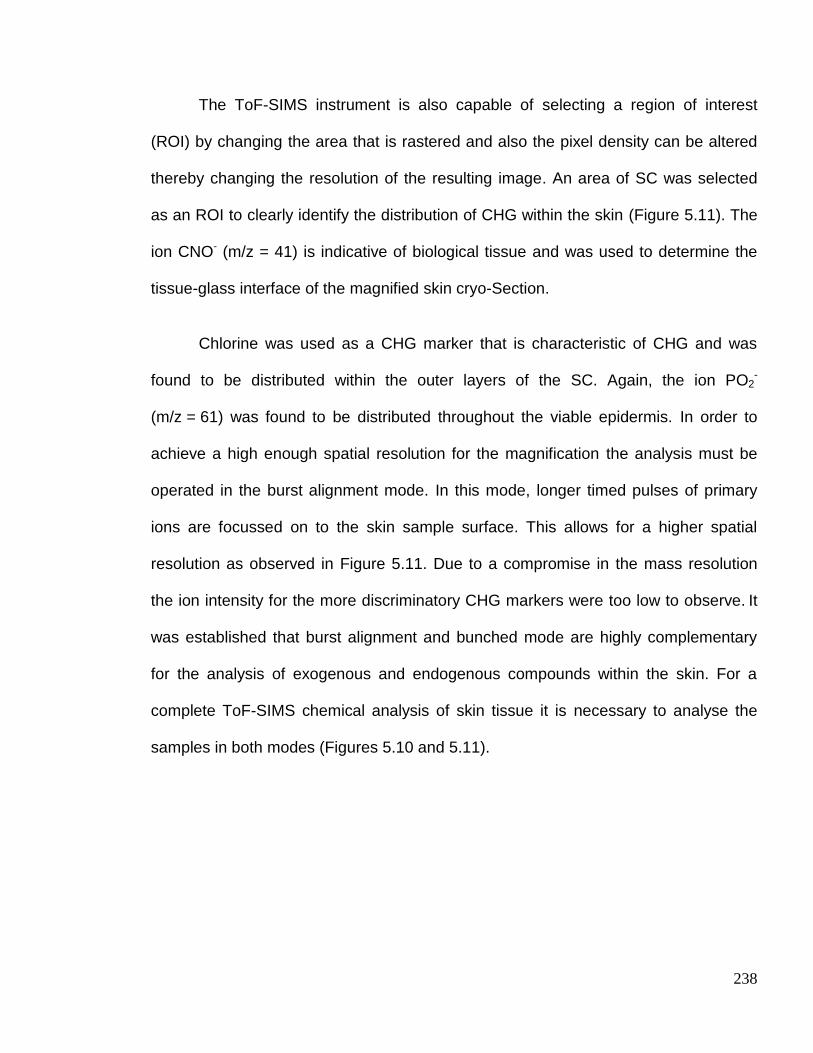
238
The ToF-SIMS instrument is also capable of selecting a region of interest
(ROI) by changing the area that is rastered and also the pixel density can be altered
thereby changing the resolution of the resulting image. An area of SC was selected
as an ROI to clearly identify the distribution of CHG within the skin (Figure 5.11). The
ion CNO- (m/z = 41) is indicative of biological tissue and was used to determine the
tissue-glass interface of the magnified skin cryo-Section.
Chlorine was used as a CHG marker that is characteristic of CHG and was
found to be distributed within the outer layers of the SC. Again, the ion PO2-
(m/z = 61) was found to be distributed throughout the viable epidermis. In order to
achieve a high enough spatial resolution for the magnification the analysis must be
operated in the burst alignment mode. In this mode, longer timed pulses of primary
ions are focussed on to the skin sample surface. This allows for a higher spatial
resolution as observed in Figure 5.11. Due to a compromise in the mass resolution
the ion intensity for the more discriminatory CHG markers were too low to observe. It
was established that burst alignment and bunched mode are highly complementary
for the analysis of exogenous and endogenous compounds within the skin. For a
complete ToF-SIMS chemical analysis of skin tissue it is necessary to analyse the
samples in both modes (Figures 5.10 and 5.11).
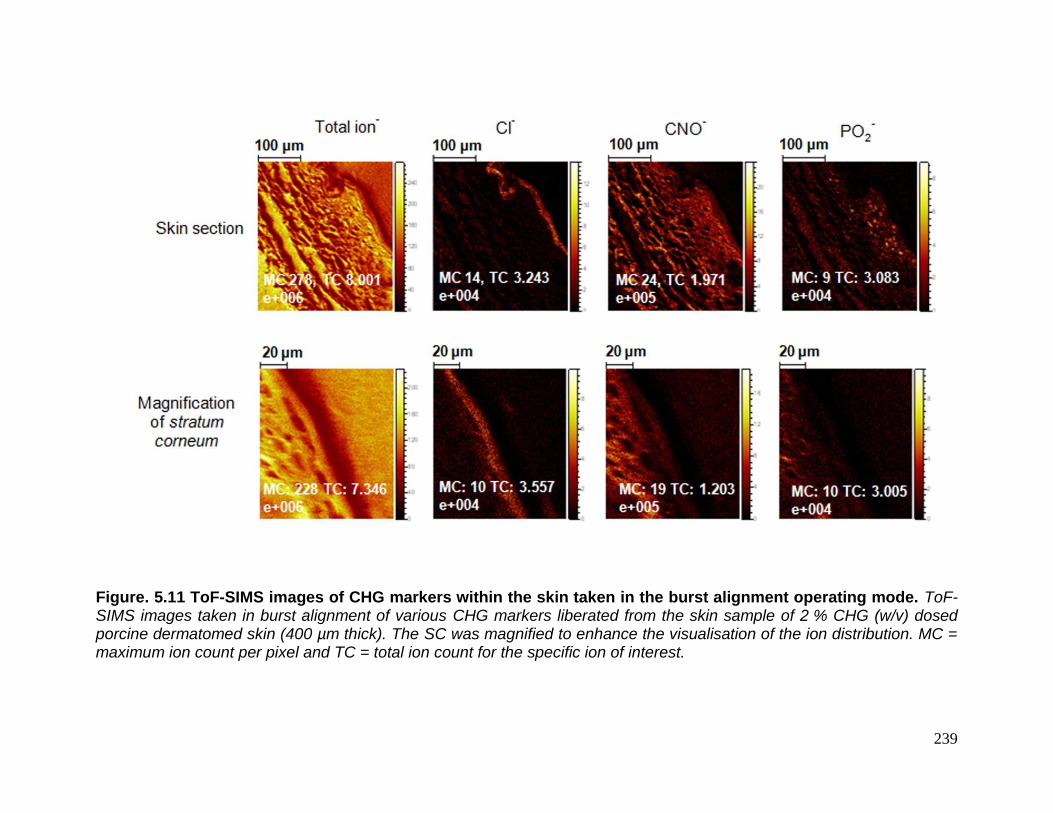
239
Figure. 5.11 ToF-SIMS images of CHG markers within the skin taken in the burst alignment operating mode. ToF-SIMS images taken in burst alignment of various CHG markers liberated from the skin sample of 2 % CHG (w/v) dosed porcine dermatomed skin (400 µm thick). The SC was magnified to enhance the visualisation of the ion distribution. MC = maximum ion count per pixel and TC = total ion count for the specific ion of interest.

240
5.2.3 ToF-SIMS analysis of chlorhexidine digluconate treated porcine skin tape
strips.
To characterise the ingress of CHG into the skin, a tape-stripping study was
conducted in parallel to the cryo-Section study. Once the unabsorbed CHG (2 % w/v)
was washed from the skin surface after a 24 h contact time, 21 tape strips were
removed from the skin. Each tape strip was analysed in series in the bunched mode
after being freeze dried to remove water from the SC material. To determine as to
whether there are any overlap ion peaks with regards to the tape strip adhesive and
the CHG ion markers an untreated control was analysed in parallel. Figure 5.12
illustrates the ion distribution maps for tape strips 1 to 21.
The control tapes at the top of the table show no intensity for the chosen CHG
ion markers with the exception of natural noise for 37Cl-. The intensity for the ion PO2-
is more marked for the control tape strips 1 and 2 than for the treated tape strips 1
and 2. All 21 tapes strips from the CHG treated skin sample show high ion intensity
for 37Cl- even at tape strip 21. The distribution of the ion intensity of C7H4N2Cl- (m/z =
151) is evenly distributed up to tapes strip 11 -14 where the distribution becomes
uneven but a higher signal intensity is observed. This sporadic but intense distribution
of C7H4N2Cl- (m/z = 151) on the tape strips then continues until the final tape strip.
Interestingly, from tape strip 14 and onwards the PO2- ion intensity signal increases as
the viable epidermis is approached (Figure 5.12). It can also be observed that there is
a general decrease of SC coverage on the tape strips with increasing tape strip
number.
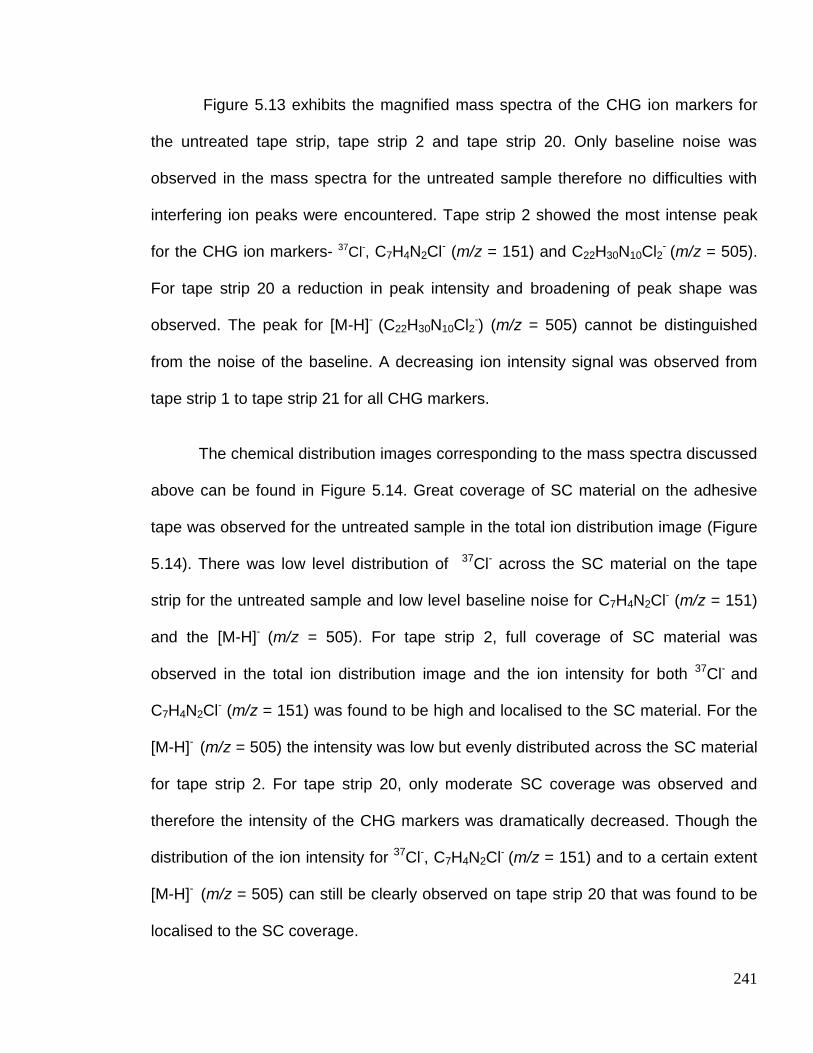
241
Figure 5.13 exhibits the magnified mass spectra of the CHG ion markers for
the untreated tape strip, tape strip 2 and tape strip 20. Only baseline noise was
observed in the mass spectra for the untreated sample therefore no difficulties with
interfering ion peaks were encountered. Tape strip 2 showed the most intense peak
for the CHG ion markers- 37Cl-, C7H4N2Cl- (m/z = 151) and C22H30N10Cl2- (m/z = 505).
For tape strip 20 a reduction in peak intensity and broadening of peak shape was
observed. The peak for [M-H]- (C22H30N10Cl2-) (m/z = 505) cannot be distinguished
from the noise of the baseline. A decreasing ion intensity signal was observed from
tape strip 1 to tape strip 21 for all CHG markers.
The chemical distribution images corresponding to the mass spectra discussed
above can be found in Figure 5.14. Great coverage of SC material on the adhesive
tape was observed for the untreated sample in the total ion distribution image (Figure
5.14). There was low level distribution of 37Cl- across the SC material on the tape
strip for the untreated sample and low level baseline noise for C7H4N2Cl- (m/z = 151)
and the [M-H]- (m/z = 505). For tape strip 2, full coverage of SC material was
observed in the total ion distribution image and the ion intensity for both 37Cl- and
C7H4N2Cl- (m/z = 151) was found to be high and localised to the SC material. For the
[M-H]- (m/z = 505) the intensity was low but evenly distributed across the SC material
for tape strip 2. For tape strip 20, only moderate SC coverage was observed and
therefore the intensity of the CHG markers was dramatically decreased. Though the
distribution of the ion intensity for 37Cl-, C7H4N2Cl- (m/z = 151) and to a certain extent
[M-H]- (m/z = 505) can still be clearly observed on tape strip 20 that was found to be
localised to the SC coverage.

242
As the SC coverage decreases and becomes sporadic in distribution the signal
intensity for CHG markers also significantly decreases. To obtain an accurate
distribution profile within the skin it was necessary to determine whether the CHG
markers’ ion intensity was decreasing due to a reduction of SC material being
recovered or whether it is a correct CHG distribution profile within the skin.
Using the SurfaceLab 6 software mass spectra and ion images can be acquired for
selected ROIs. This application was applied to the selection of SC material (ROI) and
to discount the tape strip background. The ROI selection was accomplished by
thresholding the very different chemical compositions of biological tissue contrasting
to the tape adhesive. Once an ROI had been selected the mass spectra and
distribution images were rebuilt for the total ion and CHG markers. The ion intensity of
the highly discriminatory CHG marker, C7H4N2Cl- was normalised to the total ion
within the ROI to obtain a representative ion intensity. This allowed for the
determination of an accurate permeation profile as the decrease of SC removal with
increasing tape strip number was accounted for.

243
totalMC: 694; TC: 2.286e+007
600
500
400
300
200
100
037Cl-MC: 15; TC: 7.936e+004
12.5
10.0
7.5
5.0
2.5
0.0C7H4N2Cl-MC: 14; TC: 1.593e+004
12
10
8
6
4
2
0C26H33O10-MC: 4; TC: 3.111e+003
3.0
2.0
1.0
0.0PO2-MC: 15; TC: 1.353e+005
12.5
10.0
7.5
5.0
2.5
0.0
totalMC: 640; TC: 2.171e+007
600
500
400
300
200
100
037Cl-MC: 15; TC: 7.996e+004
12.5
10.0
7.5
5.0
2.5
0.0C7H4N2Cl-MC: 14; TC: 1.417e+004
12
10
8
6
4
2
0C26H33O10-MC: 4; TC: 2.496e+003
3.0
2.0
1.0
0.0PO2-MC: 15; TC: 1.131e+005
12.5
10.0
7.5
5.0
2.5
0.0
totalMC: 606; TC: 2.436e+007
600
500
400
300
200
100
037Cl-MC: 15; TC: 4.486e+005
12.5
10.0
7.5
5.0
2.5
0.0C7H4N2Cl-MC: 14; TC: 3.204e+005
12
10
8
6
4
2
0C26H33O10-MC: 4; TC: 8.488e+003
3.0
2.0
1.0
0.0PO2-MC: 15; TC: 4.206e+004
12.5
10.0
7.5
5.0
2.5
0.0
totalMC: 580; TC: 2.328e+007
500
400
300
200
100
037Cl-MC: 15; TC: 4.687e+005
12.5
10.0
7.5
5.0
2.5
0.0C7H4N2Cl-MC: 14; TC: 2.826e+005
12
10
8
6
4
2
0C26H33O10-MC: 4; TC: 7.160e+003
3.0
2.0
1.0
0.0PO2-MC: 15; TC: 5.061e+004
12.5
10.0
7.5
5.0
2.5
0.0
totalMC: 1121; TC: 2.738e+007
1000
800
600
400
200
037Cl-MC: 15; TC: 4.970e+005
12.5
10.0
7.5
5.0
2.5
0.0C7H4N2Cl-MC: 14; TC: 2.740e+005
12
10
8
6
4
2
0C26H33O10-MC: 4; TC: 6.551e+003
3.0
2.0
1.0
0.0PO2-MC: 15; TC: 7.694e+004
12.5
10.0
7.5
5.0
2.5
0.0
totalMC: 705; TC: 2.416e+007
600
400
200
037Cl-MC: 15; TC: 4.003e+005
12.5
10.0
7.5
5.0
2.5
0.0C7H4N2Cl-MC: 14; TC: 2.187e+005
12
10
8
6
4
2
0C26H33O10-MC: 4; TC: 6.535e+003
3.0
2.0
1.0
0.0PO2-MC: 15; TC: 3.653e+004
12.5
10.0
7.5
5.0
2.5
0.0
totalMC: 640; TC: 2.574e+007
600
500
400
300
200
100
037Cl-MC: 15; TC: 4.401e+005
12.5
10.0
7.5
5.0
2.5
0.0C7H4N2Cl-MC: 14; TC: 2.189e+005
12
10
8
6
4
2
0C26H33O10-MC: 4; TC: 6.486e+003
3.0
2.0
1.0
0.0PO2-MC: 15; TC: 5.500e+004
12.5
10.0
7.5
5.0
2.5
0.0
totalMC: 1023; TC: 2.195e+007
1000
800
600
400
200
037Cl-MC: 15; TC: 4.212e+005
12.5
10.0
7.5
5.0
2.5
0.0C7H4N2Cl-MC: 14; TC: 2.201e+005
12
10
8
6
4
2
0C26H33O10-MC: 4; TC: 5.169e+003
3.0
2.0
1.0
0.0PO2-MC: 15; TC: 8.303e+004
12.5
10.0
7.5
5.0
2.5
0.0
totalMC: 562; TC: 2.136e+007
500
400
300
200
100
037Cl-MC: 15; TC: 4.080e+005
12.5
10.0
7.5
5.0
2.5
0.0C7H4N2Cl-MC: 14; TC: 2.065e+005
12
10
8
6
4
2
0C26H33O10-MC: 4; TC: 5.648e+003
3.0
2.0
1.0
0.0PO2-MC: 15; TC: 6.641e+004
12.5
10.0
7.5
5.0
2.5
0.0
totalMC: 853; TC: 2.162e+007
800
600
400
200
037Cl-MC: 15; TC: 3.978e+005
12.5
10.0
7.5
5.0
2.5
0.0C7H4N2Cl-MC: 14; TC: 2.042e+005
12
10
8
6
4
2
0C26H33O10-MC: 4; TC: 4.980e+003
3.0
2.0
1.0
0.0PO2-MC: 15; TC: 1.284e+005
12.5
10.0
7.5
5.0
2.5
0.0
totalMC: 588; TC: 2.083e+007
500
400
300
200
100
037Cl-MC: 15; TC: 4.128e+005
12.5
10.0
7.5
5.0
2.5
0.0C7H4N2Cl-MC: 14; TC: 2.196e+005
12
10
8
6
4
2
0C26H33O10-MC: 4; TC: 5.411e+003
3.0
2.0
1.0
0.0PO2-MC: 15; TC: 8.807e+004
12.5
10.0
7.5
5.0
2.5
0.0
totalMC: 977; TC: 2.050e+007
800
600
400
200
037Cl-MC: 15; TC: 4.308e+005
12.5
10.0
7.5
5.0
2.5
0.0C7H4N2Cl-MC: 14; TC: 2.270e+005
12
10
8
6
4
2
0C26H33O10-MC: 4; TC: 5.594e+003
3.0
2.0
1.0
0.0PO2-MC: 10; TC: 8.346e+004
8
6
4
2
0
totalMC: 845; TC: 2.040e+007
800
600
400
200
037Cl-MC: 15; TC: 4.148e+005
12.5
10.0
7.5
5.0
2.5
0.0C7H4N2Cl-MC: 14; TC: 2.418e+005
12
10
8
6
4
2
0C26H33O10-MC: 4; TC: 6.913e+003
3.0
2.0
1.0
0.0PO2-MC: 15; TC: 9.363e+004
12.5
10.0
7.5
5.0
2.5
0.0
totalMC: 846; TC: 2.040e+007
800
600
400
200
037Cl-MC: 15; TC: 3.769e+005
12.5
10.0
7.5
5.0
2.5
0.0C7H4N2Cl-MC: 14; TC: 2.030e+005
12
10
8
6
4
2
0C26H33O10-MC: 4; TC: 5.001e+003
3.0
2.0
1.0
0.0PO2-MC: 15; TC: 1.154e+005
12.5
10.0
7.5
5.0
2.5
0.0
Control Tape
strip
Control Tape
strip
Tape strip 1
Tape strip 2
Tape strip 3
Tape strip 4
Tape strip 5
Tape strip 6
Tape strip 7
Tape strip 8
Tape strip 9
Tape strip 10
Tape strip 11
Tape strip 12
Tape strip
sample Total ion
-
37
Cl-
C7H
4N
2Cl
-
[M-H]-
PO2-
244
Figure 5.12 ToF-SIMS images of CHG marker ions and biomolecules for 21 consecutive tape strips. ToF-SIMS images of various CHG specific ions and PO2
- of the negative control and tape strips 1-21 taken from 2 % CHG (w/v) dosed porcine dermatomed skin (400 µm thick), MC = maximum ion count per pixel and TC = total ion count for the specific ion of interest.
totalMC: 600; TC: 1.897e+007
500
400
300
200
100
037Cl-MC: 15; TC: 3.468e+005
12.5
10.0
7.5
5.0
2.5
0.0C7H4N2Cl-MC: 14; TC: 2.112e+005
12
10
8
6
4
2
0C26H33O10-MC: 4; TC: 5.807e+003
3.0
2.0
1.0
0.0PO2-MC: 15; TC: 5.900e+004
12.5
10.0
7.5
5.0
2.5
0.0
totalMC: 940; TC: 1.968e+007
800
600
400
200
037Cl-MC: 15; TC: 3.109e+005
12.5
10.0
7.5
5.0
2.5
0.0C7H4N2Cl-MC: 14; TC: 1.482e+005
12
10
8
6
4
2
0C26H33O10-MC: 4; TC: 3.433e+003
3.0
2.0
1.0
0.0PO2-MC: 15; TC: 1.639e+005
12.5
10.0
7.5
5.0
2.5
0.0
totalMC: 1224; TC: 2.005e+007
1200
1000
800
600
400
200
037Cl-MC: 15; TC: 2.511e+005
12.5
10.0
7.5
5.0
2.5
0.0C7H4N2Cl-MC: 14; TC: 9.695e+004
12
10
8
6
4
2
0C26H33O10-MC: 4; TC: 1.233e+003
3.0
2.0
1.0
0.0PO2-MC: 15; TC: 2.537e+005
12.5
10.0
7.5
5.0
2.5
0.0
totalMC: 638; TC: 2.012e+007
600
500
400
300
200
100
037Cl-MC: 15; TC: 3.872e+005
12.5
10.0
7.5
5.0
2.5
0.0C7H4N2Cl-MC: 14; TC: 1.661e+005
12
10
8
6
4
2
0C26H33O10-MC: 4; TC: 4.056e+003
3.0
2.0
1.0
0.0PO2-MC: 15; TC: 1.355e+005
12.5
10.0
7.5
5.0
2.5
0.0
totalMC: 1027; TC: 1.787e+007
1000
800
600
400
200
037Cl-MC: 15; TC: 2.471e+005
12.5
10.0
7.5
5.0
2.5
0.0C7H4N2Cl-MC: 14; TC: 1.041e+005
12
10
8
6
4
2
0C26H33O10-MC: 4; TC: 1.980e+003
3.0
2.0
1.0
0.0PO2-MC: 15; TC: 1.771e+005
12.5
10.0
7.5
5.0
2.5
0.0
totalMC: 1000; TC: 1.793e+007
800
600
400
200
037Cl-MC: 15; TC: 2.511e+005
12.5
10.0
7.5
5.0
2.5
0.0C7H4N2Cl-MC: 14; TC: 9.069e+004
12
10
8
6
4
2
0C26H33O10-MC: 4; TC: 1.076e+003
3.0
2.0
1.0
0.0PO2-MC: 15; TC: 2.248e+005
12.5
10.0
7.5
5.0
2.5
0.0
totalMC: 956; TC: 2.213e+007
800
600
400
200
037Cl-MC: 15; TC: 3.761e+005
12.5
10.0
7.5
5.0
2.5
0.0C7H4N2Cl-MC: 14; TC: 1.512e+005
12
10
8
6
4
2
0C26H33O10-MC: 4; TC: 2.903e+003
3.0
2.0
1.0
0.0PO2-MC: 15; TC: 1.842e+005
12.5
10.0
7.5
5.0
2.5
0.0
totalMC: 999; TC: 1.745e+007
800
600
400
200
037Cl-MC: 15; TC: 2.308e+005
12.5
10.0
7.5
5.0
2.5
0.0C7H4N2Cl-MC: 14; TC: 8.812e+004
12
10
8
6
4
2
0C26H33O10-MC: 4; TC: 1.363e+003
3.0
2.0
1.0
0.0PO2-MC: 15; TC: 2.018e+005
12.5
10.0
7.5
5.0
2.5
0.0
totalMC: 679; TC: 2.153e+007
600
500
400
300
200
100
037Cl-MC: 15; TC: 2.670e+005
12.5
10.0
7.5
5.0
2.5
0.0C7H4N2Cl-MC: 14; TC: 1.054e+005
12
10
8
6
4
2
0C26H33O10-MC: 4; TC: 2.217e+003
3.0
2.0
1.0
0.0PO2-MC: 15; TC: 1.813e+005
12.5
10.0
7.5
5.0
2.5
0.0
Tape strip 13
Tape strip 14
Tape strip 15
Tape strip 16
Tape strip 17
Tape strip 18
Tape strip 19
Tape strip 20
Tape strip 21
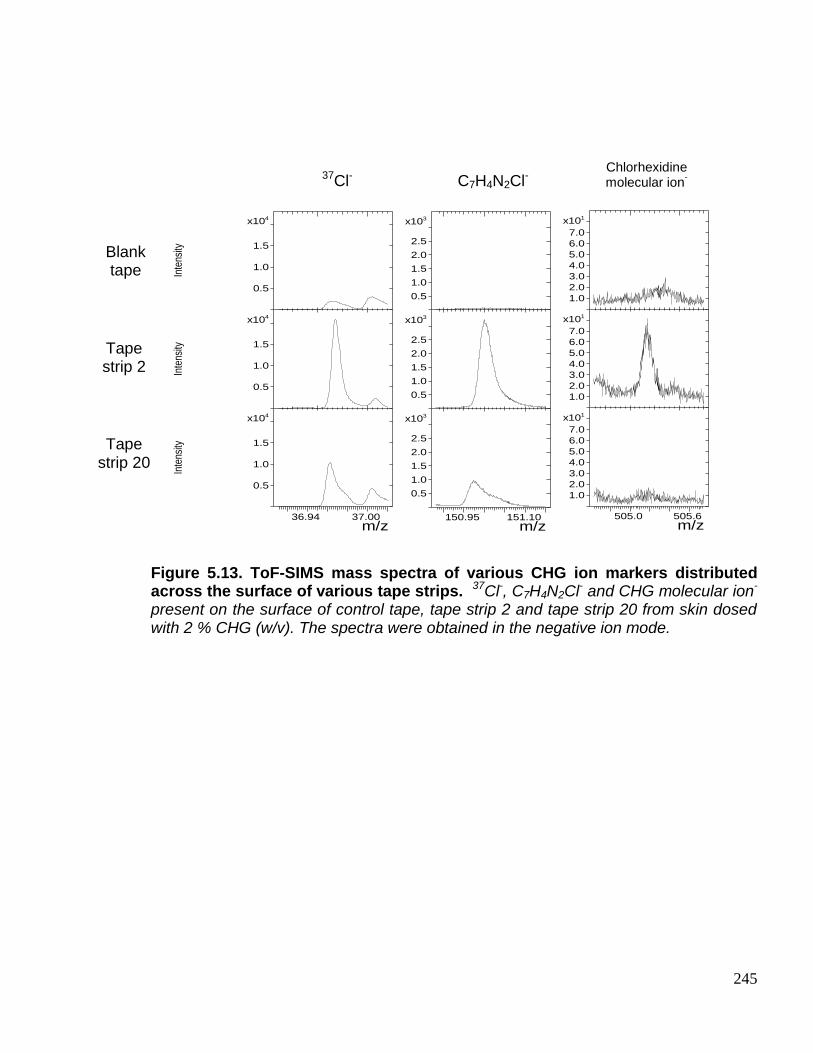
245
Figure 5.13. ToF-SIMS mass spectra of various CHG ion markers distributed across the surface of various tape strips. 37Cl-, C7H4N2Cl- and CHG molecular ion- present on the surface of control tape, tape strip 2 and tape strip 20 from skin dosed with 2 % CHG (w/v). The spectra were obtained in the negative ion mode.
m/z36.94 37.00
4x10
0.5
1.0
1.5
Inte
nsity
4x10
0.5
1.0
1.5
Inte
nsity
4x10
0.5
1.0
1.5
Inte
nsity
m/z505.0 505.6
1x10
1.0
2.0
3.0
4.0
5.0
6.0
7.0
1x10
1.0
2.0
3.0
4.0
5.0
6.0
7.0
1x10
1.0
2.0
3.0
4.0
5.0
6.0
7.0
m/z150.95 151.10
3x10
0.5
1.0
1.5
2.0
2.5
3x10
0.5
1.0
1.5
2.0
2.5
3x10
0.5
1.0
1.5
2.0
2.5
37Cl- C7H4N2Cl- Chlorhexidine molecular ion
-
Blank tape
Tape strip 2
Tape strip 20

246
Figure. 5.14 ToF-SIMS images showing the distribution of CHG marker ions across various tape strips. ToF-SIMS images of various CHG specific ions of the negative control and representative tape strips 2 and 20 taken from 2 % CHG (w/v) dosed porcine dermatomed skin (400 µm thick), MC = maximum ion count per pixel and TC = total ion count for the specific ion of interest.
The permeation profile obtained from the ROI on the tape strip was plotted on
a graph of C7H4N2Cl- (m/z = 151) ion intensity against the tape strip number. The
C7H4N2Cl- (m/z = 151) ion intensity decreased dramatically for the first 3 tape strips
but then from tape strip 4 to 11 a steady and slight fluctuation in the CHG marker
intensity was observed before a gradual ion intensity decrease from tape strip 16 to
21 (Figure 5.15 (b)). This trend was observed for all four samples analysed. This
profile was compared to the profile obtained from solvent extraction/ HPLC analysis
conducted in Chapter 3 (Figure 5.15 (a)). To ensure the concentration of CHG was
Tape strip
20
Blank tape
Tape strip 2
MC 694, TC 2.286 e+007
MC 15, TC 7.936 e+004
MC 14, TC 1.593 e+004
MC 4, TC 3.111 e+003
MC 580, TC 2.328 e+007
MC 15, TC 4.687 e+005
MC 14, TC 2.826 e+005
MC 4, TC 7.160 e+003
MC 999, TC 1.745 e+007
MC 15, TC 2.308 e+005
MC 14, TC 8.812 e+004
MC 4, TC 1.363 e+003
Total ion- Cl- C
7H
4N
2Cl
-
Chlorhexidine
molecular ion-
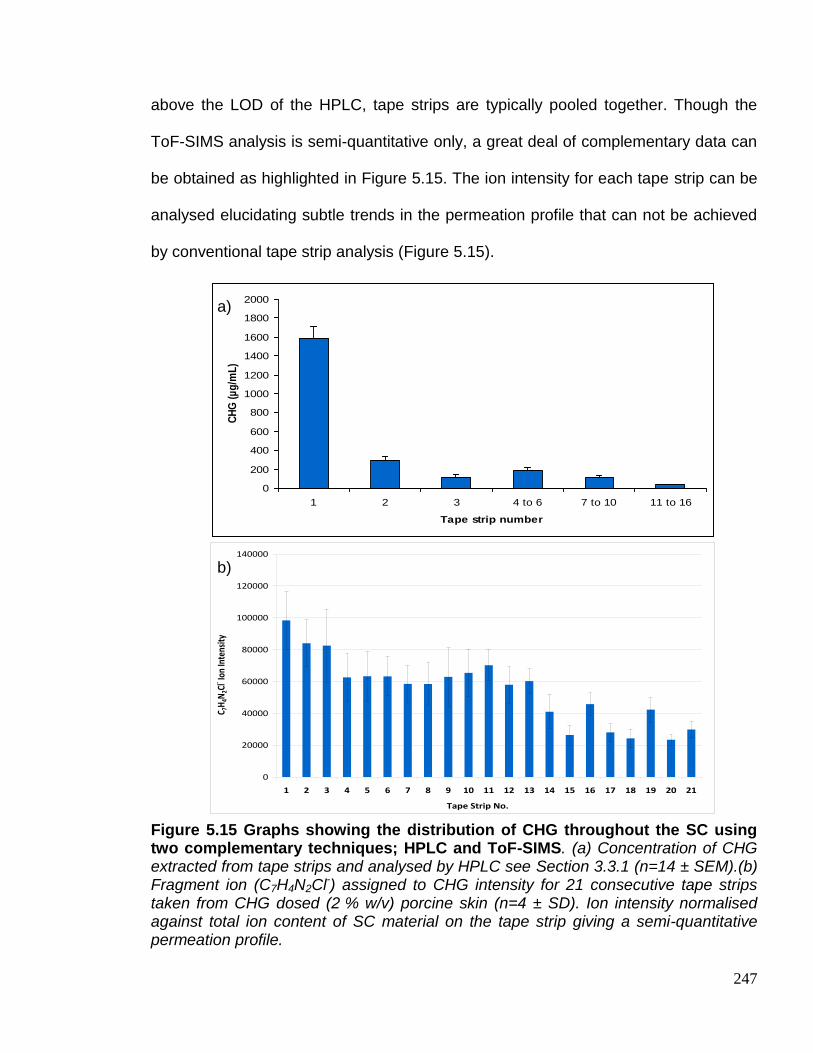
247
above the LOD of the HPLC, tape strips are typically pooled together. Though the
ToF-SIMS analysis is semi-quantitative only, a great deal of complementary data can
be obtained as highlighted in Figure 5.15. The ion intensity for each tape strip can be
analysed elucidating subtle trends in the permeation profile that can not be achieved
by conventional tape strip analysis (Figure 5.15).
Figure 5.15 Graphs showing the distribution of CHG throughout the SC using two complementary techniques; HPLC and ToF-SIMS. (a) Concentration of CHG extracted from tape strips and analysed by HPLC see Section 3.3.1 (n=14 ± SEM).(b) Fragment ion (C7H4N2Cl-) assigned to CHG intensity for 21 consecutive tape strips taken from CHG dosed (2 % w/v) porcine skin (n=4 ± SD). Ion intensity normalised against total ion content of SC material on the tape strip giving a semi-quantitative permeation profile.
0
20000
40000
60000
80000
100000
120000
140000
1 2 3 4 5 6 7 8 9 10 11 12 13 14 15 16 17 18 19 20 21
Tape Strip No.
C 7H
4N2C
l- Ion
Inte
nsity
0
200
400
600
800
1000
1200
1400
1600
1800
2000
1 2 3 4 to 6 7 to 10 11 to 16
Tape strip number
CH
G (
µg
/mL
)
a)
b)

248
Chapter 3 illustrated the use of PAMAM dendrimers as a novel permeation
enhancer for CHG. The novel ToF-SIMS method developed as outlined within this
Chapter was tested to determine whether it could be applied to observing the
permeation enhancement affect of chemical permeation enhancers. The chemical
distribution images were used to visualise the enhanced distribution and permeation
of CHG after a G3-PAMAM-NH2 pre-dose treatment (Figure 5.16). For the PAMAM
pre-treated skin a more intense distribution of all CHG markers was observed across
the upper skin strata. A very intense distribution of CHG markers 37Cl- and C7H4N2Cl-
was observed throughout the SC. When CHG was dosed without a G3-PAMAM-NH2
pre-treatment the ion intensity for the [M-H]- was lacking, however after a
G3-PAMAM-NH2 pre-treatment [M-H]- can be observed throughout the SC with good
contrast (Figure 5.16). All three replicates of G3-PAMAM-NH2 pre-treated skin dosed
with CHG (2 % w/v) support the results obtained in Chapter 3 in that PAMAM
dendrimers act as a permeation enhancer.
Comparison of the distribution images of the G3-PAMAM-NH2 pre-treated
compared to the CHG alone, clearly illustrates a much deeper permeation and
ingress of CHG into the upper skin strata. Figure 4.17 shows three replicates of the
C7H4N2Cl- distribution for G3-PAMAM-NH2 and non G3-PAMAM-NH2 treated side-by-
side, unmistakably the ion intensity is markedly increased for all three G3-PAMAM-
NH2 pre-treated skin Sections. The chemical distribution images have confirmed that
PAMAM dendrimers act as a permeation enhancer by visualising an enhanced topical
delivery of CHG (Figures 5.16 and 5.17).
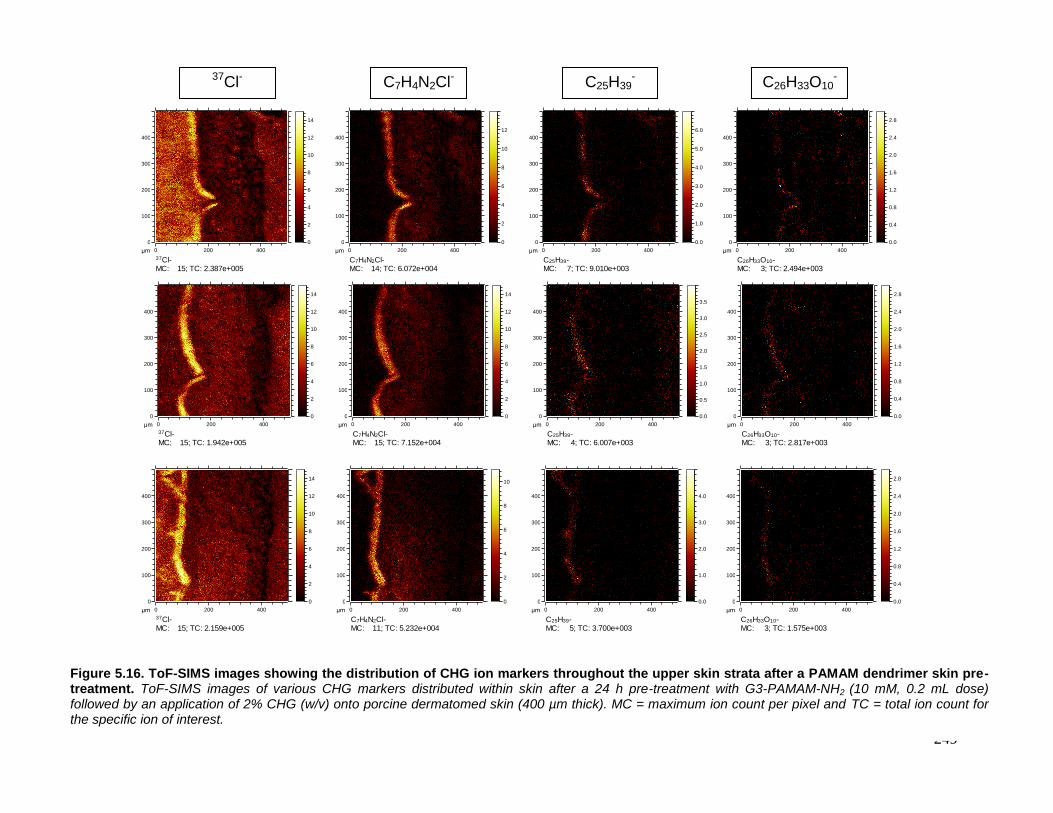
249
400
300
200
100
0
4002000μm
37Cl-MC: 15; TC: 2.387e+005
14
12
10
8
6
4
2
0
400
300
200
100
0
4002000μm
C7H4N2Cl-MC: 14; TC: 6.072e+004
12
10
8
6
4
2
0
400
300
200
100
0
4002000μm
C25H39-MC: 7; TC: 9.010e+003
6.0
5.0
4.0
3.0
2.0
1.0
0.0
400
300
200
100
0
4002000μm
C26H33O10-MC: 3; TC: 2.494e+003
2.8
2.4
2.0
1.6
1.2
0.8
0.4
0.0
400
300
200
100
0
4002000μm
37Cl-MC: 15; TC: 2.159e+005
14
12
10
8
6
4
2
0
400
300
200
100
0
4002000μm
C7H4N2Cl-MC: 11; TC: 5.232e+004
10
8
6
4
2
0
400
300
200
100
0
4002000μm
C25H39-MC: 5; TC: 3.700e+003
4.0
3.0
2.0
1.0
0.0
400
300
200
100
0
4002000μm
C26H33O10-MC: 3; TC: 1.575e+003
2.8
2.4
2.0
1.6
1.2
0.8
0.4
0.0
400
300
200
100
0
4002000μm
37Cl-MC: 15; TC: 1.942e+005
14
12
10
8
6
4
2
0
400
300
200
100
0
4002000μm
C7H4N2Cl-MC: 15; TC: 7.152e+004
14
12
10
8
6
4
2
0
400
300
200
100
0
4002000μm
C25H39-MC: 4; TC: 6.007e+003
3.5
3.0
2.5
2.0
1.5
1.0
0.5
0.0
400
300
200
100
0
4002000μm
C26H33O10-MC: 3; TC: 2.817e+003
2.8
2.4
2.0
1.6
1.2
0.8
0.4
0.0
37Cl-
C7H4N2Cl-
C25H39
-
C26H33O10
-
Figure 5.16. ToF-SIMS images showing the distribution of CHG ion markers throughout the upper skin strata after a PAMAM dendrimer skin pre-treatment. ToF-SIMS images of various CHG markers distributed within skin after a 24 h pre-treatment with G3-PAMAM-NH2 (10 mM, 0.2 mL dose) followed by an application of 2% CHG (w/v) onto porcine dermatomed skin (400 µm thick). MC = maximum ion count per pixel and TC = total ion count for the specific ion of interest.
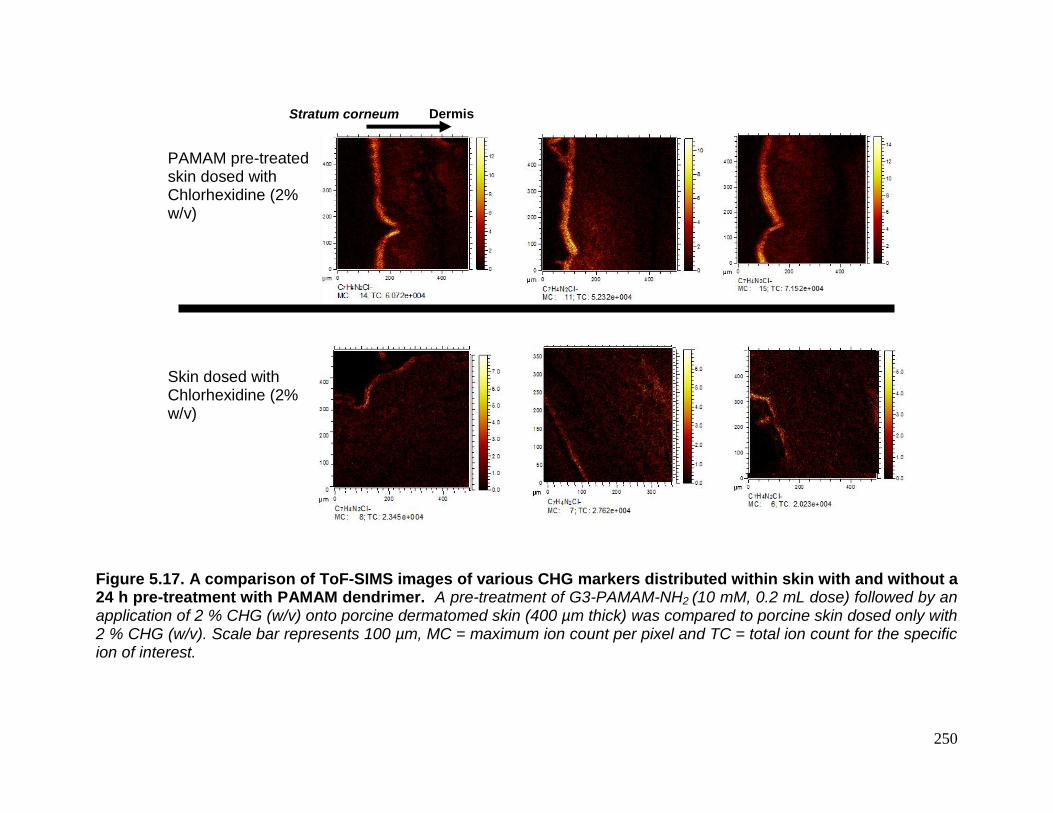
250
Figure 5.17. A comparison of ToF-SIMS images of various CHG markers distributed within skin with and without a 24 h pre-treatment with PAMAM dendrimer. A pre-treatment of G3-PAMAM-NH2 (10 mM, 0.2 mL dose) followed by an application of 2 % CHG (w/v) onto porcine dermatomed skin (400 µm thick) was compared to porcine skin dosed only with 2 % CHG (w/v). Scale bar represents 100 µm, MC = maximum ion count per pixel and TC = total ion count for the specific ion of interest.
PAMAM pre-treated skin dosed with Chlorhexidine (2% w/v)
Skin dosed with Chlorhexidine (2% w/v)
Stratum corneum Dermis

251
Another interesting feature of the ToF-SIMS is that is can also act as a
scanning electron microscope (SEM). The distance in which the CHG had permeated
was measured from the chemical distribution images using the SurfaceLab 6
software. The unique C7H4N2Cl- fragment ion was used as a marker for CHG ingress
for the G3-PAMAM-NH2 pre-treated skin samples and 37Cl- was used as a marker for
the CHG alone treated skin samples. This is due to the increase in intensity for the
CHG markers when pre-treated with G3-PAMAM-NH2, the 37Cl- signal was too intense
to accurately measure the permeation of the ingress and likewise for the samples
where CHG was dosed alone the intensity of C7H4N2Cl- was too low. The average
distance the CHG had permeated into the skin was found to be 32.22 μm ± 1.412 and
47.56 μm ± 3.980 for PAMAM untreated and PAMAM pre-treated skin. The results
are reported as the mean ± SEM and are an average of n=9. The average distance
the CHG had permeated after a G3-PAMAM-NH2 pre-treatment was found to be
statistically different from the skin samples where CHG was dosed alone (T test,
t=4.07, p<0.001).

252
Figure 5.18. A graph showing the depth permeated by CHG (2 % w/v) with and without a G3-PAMAM-NH2 (10 mM, 0.2 mL) pre-treatment as measured using SufaceLab 6 software. The Average measurement of ingress for PAMAM untreated and PAMAM treated samples were 32.22 μm ± 1.41 and 47.46 μm ± 3.91, respectively. Data is presented as the mean ± SEM (n=10). The permeation distance of CHG within the PAMAM pre-treated skin is statistically different from the PAMAM untreated skin as shown by a two tailed T test t=4.07, p<0.001.
0 20 40 60
PAMAM
No PAMAM
Ingress of CHG within the skin (M)
* *
253
5.3.0 Discussion
The ToF-SIMS technique provides a highly detailed mass spectral map of the
biological sample being analyzed (Wu et al. 2007). Biological material can yield
hundreds of secondary ions (Figure 5.2) making the interpretation difficult. This
intricacy occurs as a result of fragmentation of larger secondary ions liberated from
the complex biological sample surface. These complex spectra hold the detailed
chemical information about the composition, distribution and surface order of the
sample (Graham et al. 2006). In order to identify and assign secondary ion peaks, it is
imperative to run reference samples e.g. drug sample, embedding and substrate
materials, in order to understand characteristic spectral differences. Control biological
tissue should also be analysed in parallel (Piwowar et al. 2011). This enables for
accurate peak assignments of exogenous and endogenous molecules.
To study the deposition of CHG within the skin it was important to first
elucidate characteristic fragment ions unique and indicative to the presence of CHG.
The overview of the negative polarity spectra obtained (Figure 5.3(a)) illustrates the
secondary ion peaks detected having a mass range 1-160 (amu) from the surface of
dosed (2 % (w/v) solution of CHG) and un-dosed porcine skin. Chlorhexidine (Figure
5.4(b)) consists of two chlorinated aromatics; therefore chlorine might be an
anticipated ideal marker of the drug within the tissue. This was found not to be the
case and chlorine was only used as supplementary supporting data as the element is
abundant within tissue and is not unique to the presence of chlorhexidine. Chlorine is
observed in the un-dosed control skin surface as highlighted in the survey spectra

254
(Figure 5.4(a)) and associated chemical images (Figure 5.6). A fragment ion thought
to be characteristic of chlorhexidine was observed at 151 amu, with the proposed
secondary ion assignment C7H4N2Cl- (m/z = 151) (Figure 5.3). The magnification of
the overview spectra for this fragment ion (Figure 5.3(c)) highlights a potential issue
of analyzing biological tissue in that a low intensity endogenous peak is detected
within the skin tissue itself at 150.8 amu. Great care must be taken integrating the
151- C7H4N2Cl- (m/z = 151) fragment ion to prevent overlap, resulting in noise within
the spectral image (Figures 5.3 and 5.5). However, due to the high mass resolution,
peak identification and assignment is typically straightforward.
The overview spectrum (Figure 5.4(a)) highlights the C22N10H30Cl2
- [M-H]- ion
peak for chlorhexidine (m/z = 505). This molecular ion peak is clear evidence for the
identification and localization of chlorhexidine; however, due to the high molecular
weight the intensity is relatively low. The low ion intensity amongst the noise and
interference of complex biological substrates results in low chemical contrast and thus
impedes the ability to obtain detailed chemical images. Spectral images (Figure 5.5)
were generated after the secondary ion peaks were identified and assigned as CHG
markers. The spectral images visualize the distribution of chlorhexidine upon the
surface of dosed and un-dosed skin. The skin was analysed post-wash therefore the
presence of such intense ion intensity for CHG-assigned fragment ions and molecular
ions as observed in Figure 5.5 suggests that the cationic CHG strongly binds to the
superficial layers of the skin. The strong binding affinity of CHG to the skin protein has
been described elsewhere (Lim and Kam, 2008). It is clear in Figure 5.5 that Cl- is not
255
a strong candidate as a characteristic CHG marker due to its abundance upon the
skin surface, in contrast to the other selected markers, C7H4N2Cl- and [M-H] – .
ToF-SIMS analysis can be undertaken in two modes (the bunched mode, with
high mass resolution and low spatial resolution, or the burst alignment mode, with
high spatial resolution and low mass resolution). The differences in mass and spatial
resolution achievable in the two different operational modes are illustrated in Figures
5.6 and 5.7, respectively. The decrease in mass resolution associated with burst
alignment mode can result in the inability to discriminate one peak from another, as
exemplified in Figure 5.6 where the 37Cl- and C3H- ion peaks can not be resolved in
the burst alignment spectrum. Figure 5.6 illustrates the mass spectra obtained in both
operating modes for chlorine on the surface of the skin. The data obtained in the two
operating modes is highly complementary and together offer high mass resolution
and high spatial resolution. Sodhi, 2004 discussed the principles behind both
operating modes at great length (Sodhi, 2004).
Cryo-Sections of skin were investigated to determine the penetration depth
and the distribution of chlorhexidine within the skin. During the method development
process it became apparent that the sample preparation stage would be of
importance to the integrity and quality of the ToF-SIMS data achieved. Figure 5.7
demonstrates an artefact identified from the cryo-Sectioning process where the SC
had ‘curled’. When the skin is not effectively adsorbed onto the cover slip occasionally
the SC and upper viable epidermis fold over onto the dermis. The occurrence of this
issue is easily identifiable using the ToF-SIMS technique as the change in topography

256
is readily observable. The ToF-SIMS system can also act as a SEM that can be
utilised to check the tissue integrity. Further, complementary histology such as
haematoxylin and eosin staining can be performed following ToF-SIMS analysis
(Figure 5.8) to confirm tissue integrity or skin structures of interest. Although the
Sectioning of the skin sample in Figure 5.6 was found to be sub-standard due to
tissue curling, the drug markers assigned from the mass spectra analysed in the
bunched mode on the skin surface were found to be of high enough intensity to image
the deposition and distribution of CHX within the skin.
Once the sample preparation was optimised, to further validate the results,
reference materials of OCT embedding material and a standard solution of CHG were
analysed using ToF-SIMS in bunched mode (high mass resolution) revealing
characteristic fragment ions. The following mass peaks were assigned as
characteristic negative fragment ions within the skin corresponding to chlorhexidine
digluconate: chlorine (m/z = 35 and 37), C7H4N2Cl- (m/z = 151) and the [M-H]- ion
(m/z = 505). No secondary ion peaks corresponding to the OCT embedding material
overlapped with the secondary ions characteristic of the CHG. Figure 5.9 shows a
comparison of spectra demonstrating a range of secondary ions that illustrate that the
ion peaks are characteristic only of the CHG and are not inherent within the porcine
tissue Sections. The OCT embedding material and undosed control skin both show a
low intensity secondary ion peak for chlorine as it is abundant within the natural tissue
and environment. For this reason it would not act as a discriminatory peak for the
compound of interest. The higher molecular weight fragment ion, C7H4N2Cl- (m/z =
151) and the chlorhexidine molecular ion (m/z = 505) are very distinctive and unique

257
respectively to CHG and this specificity is confirmed by their absence in the controls
as shown in Figure 5.9. The selected CHG markers are in abundance within the
dosed tissue where a clear intensity peak is demonstrated in the mass spectrum of
Figure 5.9 (c).
It is possible to use the specific fragment ions to map the permeation of
chlorhexidine into dosed porcine tissue. Figure 5.10 shows the distribution and
localization of the CHG markers in dosed porcine skin and are absent within the
untreated skin. The chlorine (m/z = 37) ion intensity for the 2 % CHG (w/v) treated
skin sample is much higher and localized to the skin surface in contrast to the
untreated sample. The chlorhexidine-treated sample has a higher ion intensity within
the upper strata of the skin and there is a clear trend that with each skin sample
illustrated the chlorine and the C7H4N2Cl- ion (m/z = 151) are strongly associated with
the layers of the SC. The CHG characteristic ions are absent at a significant intensity
within the deeper skin strata. The explicit localization trend of the ions characteristic
of the CHG was observed repeatedly with the CHG 2 % (w/v) dosed porcine skin
samples (Figure 5.10, (b-d)). The three replicate samples dosed with CHG (Figure
5.10, (b-d)) illustrate a very similar distribution trend of CHG that implies
reproducibility of the method and a consistent distribution of CHG once topically
applied.
The chemical images obtained demonstrate the strong affinity that
chlorhexidine has for the skin as it binds to the SC (Aki and Kawasaki, 2004). The
lack of CHG associated ions within the deeper skin strata illustrates the need for a

258
permeation enhancement strategy in order to effectively neutralize bacteria found
below the superficial layers of the SC.
ToF-SIMS has the capability to simultaneously image molecular ions
associated with the applied compound and native fragment ions occurring within the
tissue. A phosphate ion intensity signal was also detected and imaged within the
viable epidermis that was utilised to compartmentalize the tissue Section into
histological components; in this case, to identify the distinction between the viable
epidermis and the SC. Phospholipids are not present in the SC due to the
cornification process as free esterified sterols accumulate instead (Elias et al. 2005,
Lampe et al. 1983 and Reinertson, and Wheatson 1959). This interesting feature may
aid the understanding of a dosed compound’s localization within a complex tissue or
highlight the presence of co-localization with native tissue molecules i.e. co-
localisation of penetrants within the SC, other dermatological layers or features of the
skin such as sebaceous glands.
To further investigate the localization of CHG within the skin, the samples were
analyzed using the burst alignment mode (high spatial resolution). Although the
overall mass resolution of the burst alignment mode spectra is reduced, each of the
characteristic ions for CHG can still be resolved. High resolution chemical images of
tissue samples were obtained and are shown in Figure 5.11. Once the ions of interest
are assigned in the high mass resolution spectra, the burst alignment mode can offer
a wealth of spatial information. For example, Figure 5.11 clearly shows the 37Cl- (m/z =
37) attributed CHG is strongly associated with the SC and the chlorine is clearly
259
observed at a relatively high intensity within the SC layers on the magnified burst-
alignment image (Figure 5.11). Again, only very low ion intensity for CHG markers
was observed within the deeper skin strata.
To confirm the ingress of the CHG into the upper skin strata as opposed to
being adsorbed to superficial outer layers, a conventional tape-stripping experiment
was conducted in parallel to the cryo-Sectioning experiments. To remove the SC, 21
tape strips were taken from the dosed and washed skin samples. They were then
freeze-dried and analysed using the method previously described (Section 5.5), to
visualize the distribution of the characteristic CHG ions across the surface of the tape
(Figure 5.12). An overview of the ion intensities for CHG markers 37Cl- and C7H4N2Cl-
(m/z = 151) can be observed on all tapes even on tape strip 21 (Figure 5.12). This
confirms what was observed within the skin cryo-Sections in that CHG is distributed
throughout the SC layer. Interestingly, from tape strips 9-13 there is an observed
increase in the signal intensity of the CHG ion marker C7H4N2Cl- (m/z = 151). The
applied compound CHG is hydrophilic in nature and this trend of CHG intensity that
increases at around tape strip 9 coincides with the SC water gradient. The SC water
content is typically around 15-30 % but dramatically increases to 70 % at a depth of
around 10-15 µm at the boundary layer of the SC-viable epidermis (Capsers et al.
2001). Speculatively, this may be the reason for the residual effect CHG pertains
once applied to the skin. It is possible that the SC acts as a depot or reservoir
particularly close to the SC-viable epidermis boundary layer where a higher water
content is observed. Moisture, however, does impede the tape stripping process as
the adhesive fails to adhere to the SC material in the presence of water.
260
As the tape stripping progresses deeper into the SC a decreasing mass of
material was removed from the sample with each tape strip removed, as observed in
Figures 5.12 and 5.14. A feature of the ToF-SIMS software is that a region of interest
(ROI) can be selected i.e. only the SC material. Once an ROI has been selected the
mass spectra can be re-analysed thus removing the background tape that contributes
to the overall image and mass spectrum. The intensity of the compound fragment ion
of interest within the selected ROI (SC material only) is normalized against the total
ion intensity count for the selected ROI. The ability to analyse only the SC material
can give a more accurate analysis of the drug deposition and absorption throughout
the layers of the SC and can thus confirm the substantivity of a compound within the
superficial layers of the skin.
There was a decreasing trend observed for the CHG content for the ROI on
tape strips 1 to 21. The C7H4N2Cl- (m/z = 151) fragment ion generally decreases with
the number of tape strips taken, with a small increase in ion intensity from tape strip 9
to 13. Tape strips 1 and 2 show a high concentration of C7H4N2Cl- (m/z = 151) that
may correspond to adsorbed chlorhexidine that was not completely washed from the
superficial layers of the SC due to strong adsorption with skin proteins. It is clear from
the tape strip experiment (Figures 5.12 and 5.14) that CHG is localized to the upper
layers of the SC that is consistent with the results obtained for the cryo-Sectioned
tissue (Figures 5.9 and 5.10). The strong binding within the upper skin strata and poor
permeation has also been observed elsewhere (Lafforgue et al. 1997) and (Karpanen
et al. 2008).
261
Typically, beyond tape strip 5, it would be normal to pool the tape strips
together (Trebilcock et al. 1994) in order to achieve a concentration higher than the
limit of detection (LOD) when using analytical instrumentation such as a high
performance liquid chromatography (HPLC). The LOD for CHG extracted form skin
Section samples using conventional HPLC assays were 0.016 µg/mL (Reinertson et
al. 1959) and 0.050 µg/mL (Carret et al. 1997). The ppm sensitivity of ToF-SIMS
(Chabala et al. 1995) circumvents this issue, where significant ion intensity can still be
observed at tape strip 20 (Figures 5.12 and 5.14). A semi-quantitative depth profile
was obtained from the ToF-SIMS analysis and compared to the depth profile obtained
from extracting the CHG and analysing the samples by HPLC (Figure 5.15). The
permeation profile obtained from analysing the tape strips by ToF-SIMS offers a
highly detailed profile as it is not limited by a high LOD due to the ppm sensitivity.
Subtle trends and fluctuations can be observed in the permeation profiles within the
SC that are not present when the tape strips are analysed by HPLC (Figure 5.15).
The enhanced detail achieved from ToF-SIMS analysis could help to establish the
dermatopharmacokinetics of a drug and would be an extremely powerful and
complementary technique when combined with quantitative HPLC tape strip studies.
The ToF-SIMS data has shown that CHG applied to the skin surface as a 2 %
w/w solution binds to the upper layers of the SC and demonstrates poor permeation
into the deeper tissues of the skin over the duration of the diffusion experiment. This
lack of permeation may lead to an inefficient reduction in the microbial flora of the
deeper skin strata as described in Section 1.4 (Brown et al. 1989), and also within the
skin appendages where propionibacteria and staphylococcal bacteria are found
262
(Touitou et al. 1998). This may suggest that the incorporation of a permeation
enhancer within a formulation may be required in order to provide a more
comprehensive reduction in the skin’s microflora, particularly below the SC. This is
particularly important for when the skin barrier is impaired such as prior to a surgical
site incision or in cases of skin conditions such as eczema or psoriasis.
In Chapter 3 it was shown that a G3-PAMAM-NH2 skin pre-treatment enhanced
the permeation of topically applied CHG. ToF-SIMS data was used to visualise the
permeation enhancement of CHG due to the pre-treatment with PAMAM dendrimer to
support the findings of the conventional Franz cell studies in Section 3.3.0 (Figures
5.16-18). G3-PAMAM-NH2 was also analysed by ToF-SIMS as a reference material.
The fragment ions detected that correspond to the dendrimer were not sufficiently
unique to be distinguished from the endogenous skin components. This is due to
PAMAM dendrimers being constituted of polymeric branches of amides and carboxyl
groups. As such no evidence of PAMAM permeation was detected. A clear intensity
increase of the CHG markers within the upper skin strata was observed (Figure 5.16).
This was attributed to the penetration enhancement effect of the PAMAM dendrimer.
When the PAMAM dendrimer-treated skin is compared to the skin treated with CHG
alone, the considerable penetration and deposition enhancement is clearly evident
(Figure 5.17). It is also possible to measure the permeation depth of a topically
applied compound using the SurfaceLab 6 software (Figure 5.18). A semi-quantitative
permeation depth was obtained from the chemical distribution images of the skin
Sections. A statistically significant (t=4.07, p<0.001) penetration depth increase was
observed after the skin was pre-treated with PAMAM dendrimer (Figure 5.18). After a
263
PAMAM dendrimer pre-treatment on average the CHG had permeated ~15 μm
further into the skin than without a PAMAM dendrimer pre-treatment.
The ToF-SIMS method developed and outlined within this Chapter has
successfully been applied to visualise the distribution and penetration of the
conventional topically applied antiseptic, CHG, and has established the effectiveness
of a novel dendrimer permeation enhancer. A higher concentration of CHG within
deeper layers of the upper skin strata may result in an increased reduction of
opportunistic pathogens within the skin. The ToF-SIMS method has wide ranging
potential applications including the ability to investigate the diffusivity of a drug within
the skin and the dermatopharmacokinetics of a topically applied drug. Other potential
biomedical applications include establishing biochemical differences between healthy
and diseased skin and the technique could also be applied to establish whether toxic
compounds such as pesticides are systemically absorbed after treatment to the skin
surface.
5.4.0 Conclusion
This study has demonstrated that ToF-SIMS is capable of providing rapid,
spatially-relevant data for a topically applied compound once dosed on to the skin.
Currently, the method is only semi-quantitative, and that is no different to a range of
other established skin visualization techniques, including classical histology and
spectroscopic methods. ToF-SIMS is a highly sensitive and powerful imaging
technique that in this study has shown itself to be highly complementary to
conventional Franz-type diffusion cell studies that measure skin penetration. In

264
addition, the ToF-SIMS approach has provided a detailed qualitative profile of CHG’s
permeation into the skin, particularly its penetration into the stratum corneum. This
investigation has also demonstrated that the ToF-SIMS technique can be applied to
observe the effects of a novel dendritic permeation enhancer (G3-PAMAM-NH2) of
CHG. This visualisation technique therefore shows great promise for the
characterisation of a compound’s skin permeation profile. This may in turn allow for
the development of more effective topical or transdermal formulations of
pharmaceutical compounds.
265
6.0 An investigation into the co-formulation of a
PAMAM dendrimer-CHG skin treatment and the
development and optimisation of a suitable topical
formulation that will ultimately deliver an increased
concentration of CHG within the skin.
6.0 Introduction
6.0.1 PAMAM dendrimers’ interactions with small drug molecules
Chapter 3 focused on a PAMAM dendrimer pre-treatment to investigate the
physical interactions between the dendrimer and the skin. This Chapter focuses of
a co-treatment of PAMAM dendrimer applied in a vehicle with CHG. A one step
application would be more convenient, cost-effective and enhance patient
compliance and adherence to treatment (Jorge et al. 2011).
Numerous research groups have investigated PAMAM dendrimers as a
topical or transdermal drug delivery system. The effects of PAMAM dendrimer skin
pre-treatment has been discussed in Section 3.1, this chapter will discuss the
co-application of PAMAM dendrimers with a range of small molecule drugs.
Co-application of ketoprofen and clonidine with G3-PAMAM-NH2 dendrimer
(0.373 µmol solution) within a transdermal patch did not result in an enhanced
transdermal drug delivery across an in vitro snake skin model (Wang et al. 2003a).
The same group also investigated the transdermal delivery of tamsulosin
complexed to G3-PAMAM-NH2 dendrimer however the co-application of the
PAMAM dendrimer with the drug did not enhance the permeation of the NSAID
across snake skin while the PAMAM dendrimer skin pre-treatment did. The
authors believe this is due to the interaction of the PAMAM dendrimer with the

266
drug as opposed to the enhancement effect caused by the PAMAM dendrimer’s
interaction with the skin (Wang et al. 2003b).
Conversely, the flux of indomethacin complexed with G4-PAMAM-NH2
dendrimer (0.2 % w/v) increased by an enhancement factor of 4.5 when compared
to that of the free drug across rat skin in an in vitro model. This flux increase was
also observed in vivo in a Wistar rat model with the dendrimer-drug complex
resulting in a [AUC]0-24h 2.27 times higher for G4-PAMAM-NH2 when compared to
the free drug (Chauhan et al. 2003). An enhanced accumulative concentration was
observed for G5-PAMAM-NH2 dendrimer complexed with both ketoprofen and
diflunisal in vitro from an aqueous rat model and in an in vivo rat model the
ketoprofen-PAMAM had a 2.73 time higher bioavailability and the diflusinal-
PAMAM had a 2.48 time higher bioavailability (Cheng et al. 2007). It is interesting
to note that in contrast to the Cheng et al. 2007 paper no enhancement was
observed for ketoprofen complexed to G3-PAMAM-NH2 across snake skin in a
chloroform/methanol vehicle (Wang et al. 2003a). The variation in results for the
PAMAM dendrimer-ketoprofen complex is likely due to the different model skin
membranes used. Pig and rat skin is acknowledged as a surrogate for human skin
by the OECD unlike snake skin which is used in the studies above (OECD, 2008).
Cnubben et al. have shown that rat skin is more permeable than human skin and
transdermal absorption in vivo in rats is 1.5-2.5 times higher than for human skin.
The same authors show that perfused pig ear epidermis is a good surrogate model
for human skin (Cnubben et al. 2002). Also, the studies utilise different PAMAM
dendrimer generations and concentrations throughout the studies.
267
PAMAM dendrimers co-applied with hydrophilic drugs have also resulted in
an enhancement in percutaneous absorption. Co-application of PAMAM
dendrimers with 5-Fluorouracil resulted in an increased flux of drug across the
porcine skin from a mineral oil and isopropyl myristate vehicle but not from PBS
(Venuganti and Perumal, 2008). Again it was found that a PAMAM dendrimer pre-
dose was more effective than simultaneous application of the PAMAM-drug.
Another hydrophilic drug simultaneously applied with PAMAM dendrimer was
riboflavin. A co-treatment of G2-PAMAM-NH2 and riboflavin in an oil in water
emulsion resulted in an increased permeation of riboflavin within porcine ear skin
(Filipowicz and Wolowiec, 2011).
PAMAM dendrimers have been formulated into a variety of drug delivery
systems. For example PAMAM dendrimers have been incorporated into a
polyhydroxyalkanoate matrix into a transdermal drug delivery patch that delivered
a clinical concentration of tamsulosin across the skin (Wang et al. 2003). Further,
Devarakonda et al. (2004) characterised hydrogels containing nifedipine,
G3-PAMAM-NH2/ G5-PAMAM-NH2 with hydroxyl propyl methyl cellulose (HMPC)
as a gelling agent. The authors discovered that the amount of nifedipine released
from the gels increased with increasing PAMAM dendrimer concentration. A
generation dependent effect was also observed with G5-PAMAM-NH2 resulting in
a higher flux of drug release when compared to G3-PAMAM-NH2. The dendrimer
also prevented recrystallization of the drug therefore inferring stability on the
formulation. The authors did not test the dendrimer containing hydrogels on an in
vitro skin model. A detailed review on dendrimers and their effects on the
pharmacodynamics and pharmacokinetics once complexed to drugs were
compiled by Cheng and Xu (2008).
268
More recent topical formulations including PAMAM dendrimers include a
hydrogel incorporating the antifungal, ketoconazole, and G2 and G3 PAMAM-NH2
and PAMAM-OH (Winnicka et al. 2012). The authors found that the PAMAM
dendrimers increased the solubility of ketoconazole and the PAMAM-NH2
dendrimers resulted in up to a 16 fold enhancement in antifungal properties. The
PAMAM-NH2 dendrimer incorporated hydrogel was found to out-perform the
commercially available ketoconazole formulations. Recently, PAMAM dendrimers
were also incorporated into a topical crème formulation with silver sulfadiazine and
silver nanoparticles for a novel topical treatment for burn-wound infections
(Strydom et al. 2012). The incorporation of PAMAM dendrimers exerted stability
within the formulation and also resulted in an enhanced antimicrobial efficacy.
Dendrimers have found a role in cosmetics and personal care topical
formulations. Unlike linear polymers, dendrimers are unique in that the intrinsic
viscosity increases with increasing molecular weight to a maximum after which the
viscosity decreases with molecular weight in a bell shaped curve (Tolia and Choi,
2008). This is an interesting characteristic that allows for high molecular weight
dendrimers to be easily formulated without issues with viscosity. There are a vast
number of patents which include amine terminated dendrimers due to their unique
characteristics. For example, Revlon filed a patent on amine terminated
dendrimers complexed with anti-acne molecules to treat acne vulgaris within a
cosmetically acceptable formulation (Wolf and Snyder, 1995). Starpharma have
also filed for a patent using amine terminated PAMAM dendrimers in deodorant
formulations as the water soluble active odour-reducing agent. This is because
some basic compounds have the ability to reduce body odour. PAMAM
dendrimers were shown to limit body odour for up to 20 hours (Forestier and

269
Rollat-Corval, 1999). PAMAM dendrimers are also covered in a patent filed by
L’Oreal which outlines a self-tanning formulation, which, combined with the active
dihydroxyacetone, forms a more natural looking tan (Allard and Forestier, 1998).
PAMAM dendrimers have wide ranging potential within topical drug delivery and
cosmetics and personal care.
The advantages of utilising PAMAM dendrimers within a dermatological
formulation discussed above are summarised below;
(i) Enhances the permeation of drugs within the skin (Venuganti and
Perumal 2008, Wang et al. 2003 and Filipowicz and Wolowiec, 2011).
(ii) Increases drug solubility and bioavailability (Devarakonda et al. 2004,
Milhem et al. 2000 and Yiyun et al. 2005).
(iii) Exhibits antimicrobial properties (Observed in Chapter 2 and Calabretta
et al. 2007 and Wang et al. 2010).
(iv) Exhibits anti-inflammatory properties (Chauhan et al. 2009).
(v) Has been shown to reduce irritation through binding to anionic
surfactants (Derici et al. 2005).
(vi) Odour absorbing properties (Forestier and Rollat-Corval, 1998).
(vii) Ideal intrinsic viscosity properties (Tolia and Choi, 2008).
(viii) Water soluble and compatible with organic solvents (Liu and Fréchet,
1999).
(ix) Good bioadhesion (Vandamme and Brobeck, 2005).
6.02 Rationale for the investigation of a topical preparation using a CHG-
PAMAM complex.
In Chapter 2, it was shown that a PAMAM dendrimer skin pre-treatment
enhanced the permeation of CHG within the upper skin strata. A PAMAM
270
dendrimer skin pre-treatment enhances the penetration of therapeutics across
the skin (Chapter 2, Wang et al. 2003, and Venuganti and Perumal, 2009)
though co-application of a drug with the dendrimer enhancer would be more
convenient in a one-step application. Various PAMAM dendrimer-drug
complexes are discussed in section 6.01 however no in vitro skin absorption or
drug-dendrimer interaction studies have been conducted on the co-application
of an antimicrobial compound-PAMAM dendrimer complex formulation.
Moreover, there are limited studies available within the literature where
PAMAM dendrimers have been formulated into a cosmetically acceptable
topical formulation (Winnicka et al. 2012 and Strydom et al. 2012).
6.03 Aims and objectives
The aim of this chapter is 2 fold; to firstly investigate whether a PAMAM
dendrimer-CHG co-application enhances the permeation of CHG within porcine
skin and secondly to develop a cosmetically acceptable formulation for the co-
application.
To achieve these aims a number of objectives were necessary;
(i) To investigate the interactions between G3-PAMAM-NH2 dendrimer and
CHG.
(ii) To conduct studies into determining whether a co-application of
G3-PAMAM-NH2 –CHG enhanced the percutaneous absorption of CHG
within porcine heat separated epidermis. To also determine whether any
enhancement effect is proportional to the PAMAM concentration within
the co-dose application.
271
(iii) To develop a formulation for the co-application of PAMAM dendrimer-
CHG that out performs formulations already available in terms of
antimicrobial efficacy but is still cosmetically acceptable. The properties
of the formulations will be characterised and then an optimal formulation
will be tested in an in vitro porcine percutaneous absorption model.
6.1 Materials and methods
6.1.0 Investigation into the interactions between chlorhexidine digluconate
and PAMAM dendrimers
6.1.1 Imaging and measurement of crystal formation
Within 12 h of contact G3-PAMAM-NH2 and CHG formed a precipitate in an
aqueous solution forming crystals. These crystals were then magnified and
imaged on a Leica light microscope (model- MZ8, Milton Keynes, UK) and the
crystals were illuminated using a cold light source (Schott light, KL1500,
Massachusetts, US). The images were captured on an attached Infinity X camera
(Lumenera, Ottawa, Canada). The length of crystals formed was measured using
a calibrated graticule on the microscope.
6.1.2 Matrix assisted laser desorption ionization Time of Flight (MALDI-ToF)
mass spectrometry
A 10 mg sample of vacuum dried (24 h on a high vacuum line) precipitate
was sent to the EPSRC National Mass Spectrometry Service Centre at Swansea
University. The sample was analysed on a Voyager De-STR (Applied biosystems)
with a nitrogen laser (λ=355 nm) using a 3-indoleacrylic acid, and a 1:1 ethanol:
acetonitrile matrix. The spectra were collected in positive linear mode.

272
6.1.3 Single crystal x-ray diffraction
A sample of the crystals in aqueous solution was sent to the UK National
Crystallography Service, University of Southampton. The diffractometer used was
the beamline I19 situated on an undulator insertion device with a combination of
double crystal monochromator, vertical and horizontal focussing mirrors and a
series of beam slits (primary white beam and either side of the focussing mirrors).
The experimental hutch (EH1) was equipped with a Crystal Logic 4-circle kappa
geometry goniometer with a Rigaku Saturn 724 charged coupled device (CCD)
detector and an Oxford Cryosystems Cryostream plus cryostat (80-500 K). The
beamline operates at 18 KeV.
6.1.4 Formulation of the co-application (G3-PAMAM-NH2 dendrimer–CHG)
formulation
The G3-PAMAM-NH2 dendrimer–CHG complex was stabilised in a water:
ethanol solution (varying in volume ratio from 10-90 % ethanol content) within
2 mL amber glass vials. The water used in the formulation was ultrapure and the
ethanol was HPLC grade (Fisher Scientific, Loughborough). The samples were left
for three months at ambient temperature. The ideal organic solvent/water mixture
was chosen based on the absence of precipitation.

273
6.1.5 Recovery of CHG after addition of PAMAM dendrimer in occluded and
unoccluded conditions.
G3-PAMAM-NH2 was added in varying concentrations (0.2 mL of 0.5, 1
and 10 mM) to CHG (0.2 mL, 2 % w/v) in a 50:50 ethanol:water vehicle in a 3 mL
vial. The samples were mixed and placed in a water bath at 32°C ± 1°C (skin
surface temperature) and were either occluded or unoccluded. The samples were
left for 24 h after which they were syringe filtered (0.2 µm, 15 mm diameter
polypropylene filters, Fisher Scientific, Loughbrough, UK) and diluted to an
appropriate level. An aliquot of each sample was removed and placed in a clean
quartz cuvette and after running a blank the absorbance at 254 nm was measured
on a UV-VIS Varian Cary® 50 Bio spectrometer (West Sussex, UK). The equation
of the line after analysing a series of CHG standards to form a calibration graph
was y=0.034x+0.321 which was linear over a concentration range of 0-100 µg/mL
(R2 = 0.9998).
6.1.6 Microdilution broth with viable count assay to determine inhibitory
concentration (IC50)
To determine whether the addition of the PAMAM dendrimer would result in
synergistic or antagonistic antimicrobial effects, a microdilution broth assay with a
viable count was conducted. The method is outlined fully in section 2.1.1. Various
concentrations ranging from 1-0.005 µg/mL of CHG in a 50:50 water: ethanol
vehicle and various concentrations of G3-PAMAM-NH2 dendrimer and CHG
(1-0.005 µg/mL) were tested against S. aureus.

274
6.1.7 Co-application of various dendrimer concentrations (G3-PAMAM-NH2)
formulated with CHG in an ethanolic vehicle to porcine epidermis.
The co-application was dosed onto porcine epidermis to determine whether
the addition of PAMAM dendrimer increases the permeation of CHG within the
skin. The method is outlined in full in Sections 3.2.1-3.2.3. Various concentrations
of G3-PAMAM-NH2 were tested (0.5-10 mM, 0.2 mL) in combination with CHG
(2 % w/v) in a 50:50 water:ethanol vehicle.
6.1.8 Formulation development and characterisation
A range of formulations were developed in high grade 30 mL glass
universals and the constituents were all HPLC or reagent grade. Each formulation
was created in triplicate. The ethanol used was HPLC grade (Fisher Scientific,
Loughborough, UK), the hydroxyl propyl cellulose (HPC, 100,000 mw) was
purchased from Sigma Aldrich (Dorset, UK), CHG (20 % w/v) was purchased from
Sigma Aldrich (Dorset, UK) also as was the glycerol and the dimethicone. All
formulations were mixed on a Retsch mm200 mixer mill (Castleford, UK) for 5
minutes at a frequency of 30 cycle per second and then left to stir over night at
200 RPM on a stirrer plate (Stuart, UC152, Stone, UK).
6.1.8.1 Measurement of the pH of the topical gel formulations
For each formulation 1 g was weighed out (Precisa, 262 SMA-FR, Milton
Keynes, UK) in to a clean conical flask (Grade A glassware, 25 mL) and was made
up to 10 g with ultra-pure water (SG, HYXO, Kerava, Finland). The conical flask
was swirled until the formulation had completely dissolved. The pH was measured
using a pH probe (HANA instruments, pH 210 microprocessor, Bedfordshire, UK)
275
that had been buffered to pH 4.1, 7.1 and 9.1 prior to use, the temperature was
accounted for (19.8 °C) by the inclusion of the temperature probe with the pH
probe. The pH was measured in triplicate.
6.1.8.2 Measurement of the spreadability of the topical gel formulations
The spreadability of the formulations was determined by weighing out 1 g of
the topical gel formulation onto a clean glass plate (20 x 20 cm) after which a top
plate (20 x 20 cm) was placed over the top of the bottom glass plate that had been
standardised to a weight of 132 g. After 60 seconds the diameter of the
formulation spread was measured in mm using a standard ruler (error ± 0.5 mm) in
the vertical and horizontal direction. The measurements were recorded and the
spreadability capacity was calculated using Equation 1. Again, the measurements
were taken in triplicate (Lardy et al. 2000 and Garg et al. 2002). The spreadability
of a commercially available alcohol hand gel ‘Safemate original’ (151 Products
Limited, Manchester, UK) was also measured in parallel for comparative reasons.
The ‘Safemate original’ gel contained ethyl alcohol 62 % as the active ingredient.
6.1.8.3 Extraction of CHG from formulations (drug content and uniformity)
To determine the concentration of CHG available within the formulation
(Shafiullah et al. 2005), CHG was extracted from 1 g of each formulation. In
triplicate 1 g of each formulation was weighed into a 100 mL volumetric flask
(grade A glassware) and made up to volume with ultra-pure water. The volumetric
flask was inverted until the formulation had dissolved. Then, 1 g of the diluted
solution was added to a 25 mL volumetric flask and made up to volume with ultra-
pure water and inverted ten times. A 1.5 mL aliquot was removed and placed in a
276
clean quartz cuvette and after running a blank the absorbance at 254 nm was
measured on a UV-VIS Varian Cary® 50 Bio spectrometer (West Sussex, UK).
This was repeated for each formulation and the percentage of CHG recovered was
calculated from a calibration curve created by measuring the absorbance of 6
CHG standards (1-50 µg/mL). The line equation was y=0.0321x+ 0.0154
(R2= 0.9991).
6.1.8.4 Viscosity of topical gel formulations
Before measurement of the rheology or viscosity of the formulations was
undertaken all formulations were placed in a vacuum for 2 h to ensure removal of
any trapped air bubbles. The rheology of the topical formulations (20 mL) was
measured from 1-12 RPM and back down from 12-2 RPM on a DV-E Brookfield™
system with an LV spindle set (Essex, UK). The accuracy of the calibrated DV-E
Brookfield™ system is ± 0.1 %.
6.1.8.5 Antimicrobial efficacy of topical gel formulations
A modified agar cup method (Orafidiya et al. 2001 and Wannachaiyasit and
Phaechamud, 2010) was utilised to determine the antimicrobial efficacy of the
formulations against three bacteria Staphylococcus aureus (ATCC 11832),
Escherichia coli (ATCC 8277) and pseudomonas aeruginosa (ATCC 10848). The
bacteria were cultured, harvested and diluted as outlined in Section 2.1.1. For
each bacteria, an inoculum of ~105 was achieved. Cation adjusted Mueller Hinton
agar (MHA) was poured into 90 mm petri dishes (25 mL) and allowed to cool at
room temperature. Once the agar was set a sterile borer was used to bore
3 x 10 mm holes within the agar of each petri dish. Each hole was labelled with the

277
formulation reference and the plate was labelled with the bacteria name. A 1 mL
syringe was used to add 0.1 mL of the gel formulation into the hole in the agar
taking care not to spill any formulation on the agar surface. Once each of the holes
in the agar had been filled, 0.2 mL of the inoculum (~105) was vortex mixed with
7 mL of molten MHA that had been cooled to 40 °C. The inoculated MHA was then
immediately poured on top of the agar plate and thus the holes filled with the
topical gels. Great care was taken as to not disturb the topical gels as the
inoculated MHA was poured very slowly. Once the top MHA layer had set the petri
dish was inverted and incubated at 37 °C for 24 h. Each formulation was made up
in triplicate and each formulation was tested in duplicate therefore for each
formulation (n=6) against each bacteria. After 24 h the zone of inhibition was
measured using a standard ruler (error ± 0.5 mm) and the average and standard
deviation as calculated.
6.1.8.6 Attenuated total reflectance Fourier transform infra-red spectroscopy
(ATR-FTIR) of topical gel formulations
Each formulation and the corresponding starting materials were measured
using the same ATR-FTIR as outlined in Section 4.1.4. After a background
spectrum was obtained, 50 µL of the topical gel was transferred onto the diamond
and immediately a spectrum was collected. Differences and similarities between
the starting materials and the formulations were recorded.
278
6.1.8.7 Percutaneous absorption of chlorhexidine digluconate from selected
formulations determined by tape stripping dermatomed porcine skin after
24 h
The permeation of CHG within dermatomed porcine skin was measured by
using a tape stripping procedure as previously detailed in Sections 3.2.3-3.2.4.
Three of the developed formulations were selected F4(a), F5 and F6 and 1 mL of
each formulation was placed on the skin surface of each Franz cell for 24 h (n=5).
6.1.9 Analysis of results
All data is presented as the mean ± SEM unless otherwise stated and were
analysed using GraphPad Prism® version 5 (San Diego, USA). Prior to statistical
analysis all data were placed in to a histogram to check for normality. To compare
the percentage recovery of CHG after addition of the PAMAM dendrimer under
occluded and uncoccluded conditions (section 6.2.6) a one way ANOVA with a
Dunnett’s post test was conducted (n=3). The calculation of the IC50 of the co-
formulation of G3-PAMAM-NH2 –CHG (section 6.2.7) was conducted as outlined in
section 2.2.1 (n=3). In section 6.2.8 a Kruskal-Wallis ANOVA with an ad hoc
Dunn’s test was used to show significance between the PAMAM dendrimer-CHG
co-treated skin compared to the CHG control (n=6) (Figure 6.9). Also in section
6.2.8, a one way ANOVA (normally distributed data) was conducted on the total
concentration of CHG (µg/cm2) detected within the receptor fluid at 24 h after co-
application of G3-PAMAM-NH2-CHG as well as CHG (n=6) (Figure 6.10). No post
test was conducted however due to p>0.05. In Section 6.2.9.2 a one way ANOVA
was conducted to confirm any significant difference between the spreadability
diameters as a function of altering the formulation compositions. Further, a
279
Tukey’s multiple comparison was utilised to determine specific significant
intracomparisons (p<0.05). A one way ANOVA analysis was also used in Section
6.2.9.3 to analyse the differences within the uniformity and concentration of CHG
within the formulation.
6.2 Results
6.2.1 Investigation into the interactions between chlorhexidine digluconate
and PAMAM dendrimers
A 10 mM solution of G3-PAMAM-NH2 was slowly added to a solution of a
clinically relevant concentration of CHG (2 % w/v) (Figure 6.1). Immediately on
contact it was observed that the solution had turned cloudy and after 6 h a
crystalline precipitation occurred. The precipitate was magnified and photographed
and the micrograph is illustrated in Figures 6.2 and 6.3. It was discovered that
shard crystals formed and that the crystal shape was dependent on the order of
addition. Crystal formation occurred at 10, 1 and 0.5 mM concentration of
G3-PAMAM-NH2. It was discovered that the crystal shape was dependent on the
order of addition for example Figure 6.2 shows the crystal formation when the
formulation was added in the following order: water-G3-PAMAM-NH2-CHG and
Figure 6.3 shows the crystal structure after an addition order of
CHG-G3-PAMAM-NH2 water.

280
Figure 6.1. Chemical structure of a PAMAM dendrimer and CHG (a) Chemical structure of G3-PAMAM-NH2 dendrimer linear formula: [NH2(CH2)2NH2]:(G=3);dendriPAMAM(NH2)32, molecular Weight: 6908.84 and (b) Chemical structure of chlorhexidine digluconate, molecular formula: C22H30Cl2N10.2(C6H12O7), molecular weight: 897.56.
(b)
(a)
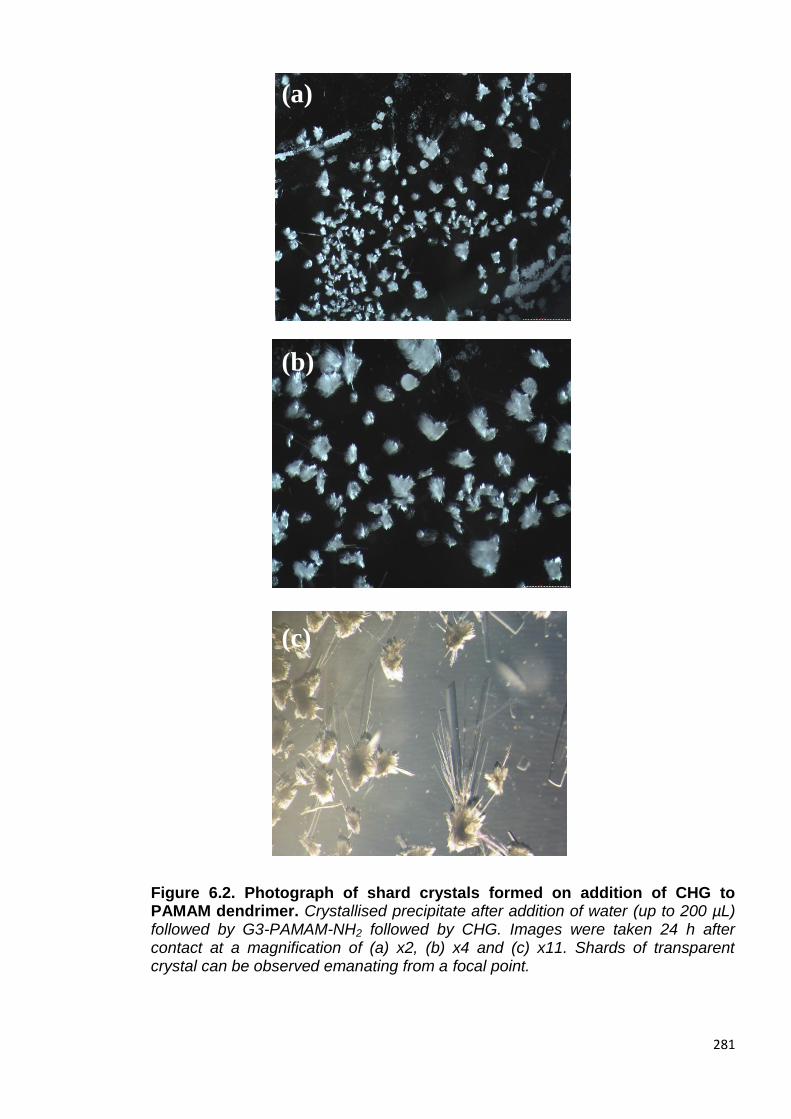
281
Figure 6.2. Photograph of shard crystals formed on addition of CHG to PAMAM dendrimer. Crystallised precipitate after addition of water (up to 200 µL) followed by G3-PAMAM-NH2 followed by CHG. Images were taken 24 h after contact at a magnification of (a) x2, (b) x4 and (c) x11. Shards of transparent crystal can be observed emanating from a focal point.
(a)
(b)
(c)
(c)

282
Figure 6.3. Photograph of short shard crystals emanating from a focal core after addition of CHG to PAMAM dendrimer. Crystallised precipitate after addition of CHG, G3-PAMAM-NH2 and then water (up to 200 µL). Images were taken 24 h after contact at a magnification of (a) x2, (b) x4 and (c) x11. Small shards of crystal emanating from a rounded single focal core much like that of petals of a flower can be observed.
(a)
(b)
(c)
(c)
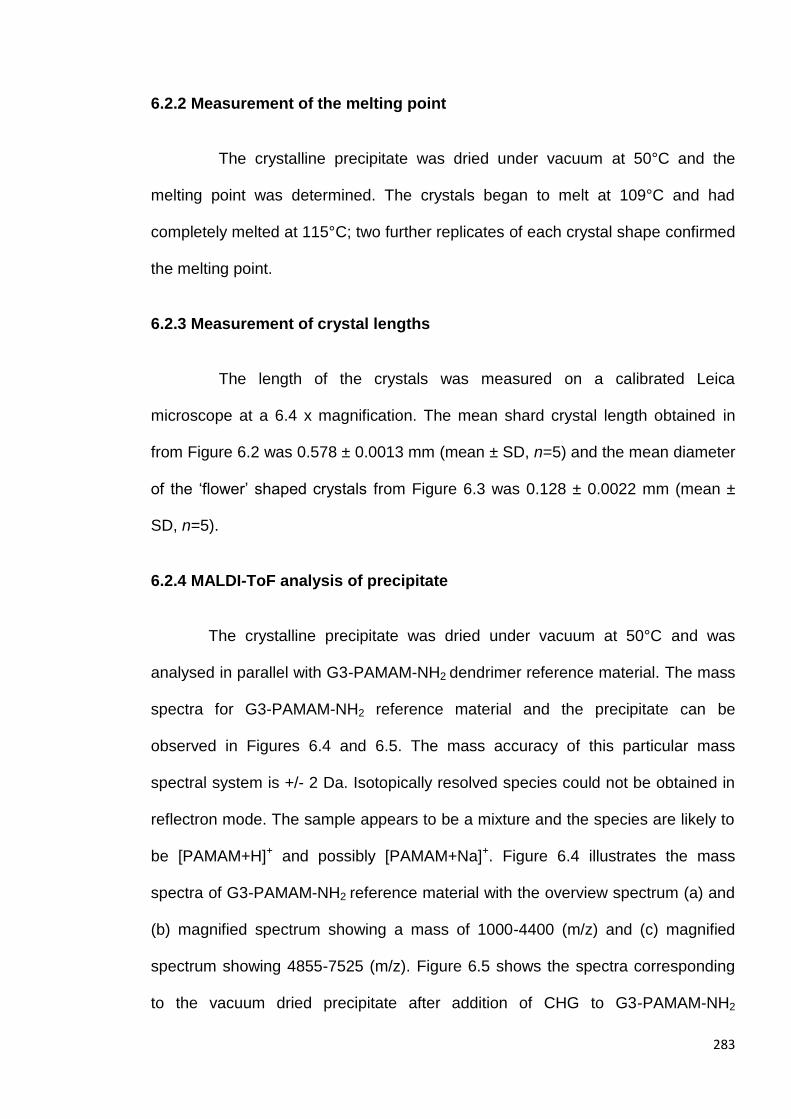
283
6.2.2 Measurement of the melting point
The crystalline precipitate was dried under vacuum at 50°C and the
melting point was determined. The crystals began to melt at 109°C and had
completely melted at 115°C; two further replicates of each crystal shape confirmed
the melting point.
6.2.3 Measurement of crystal lengths
The length of the crystals was measured on a calibrated Leica
microscope at a 6.4 x magnification. The mean shard crystal length obtained in
from Figure 6.2 was 0.578 ± 0.0013 mm (mean ± SD, n=5) and the mean diameter
of the ‘flower’ shaped crystals from Figure 6.3 was 0.128 ± 0.0022 mm (mean ±
SD, n=5).
6.2.4 MALDI-ToF analysis of precipitate
The crystalline precipitate was dried under vacuum at 50°C and was
analysed in parallel with G3-PAMAM-NH2 dendrimer reference material. The mass
spectra for G3-PAMAM-NH2 reference material and the precipitate can be
observed in Figures 6.4 and 6.5. The mass accuracy of this particular mass
spectral system is +/- 2 Da. Isotopically resolved species could not be obtained in
reflectron mode. The sample appears to be a mixture and the species are likely to
be [PAMAM+H]+ and possibly [PAMAM+Na]+. Figure 6.4 illustrates the mass
spectra of G3-PAMAM-NH2 reference material with the overview spectrum (a) and
(b) magnified spectrum showing a mass of 1000-4400 (m/z) and (c) magnified
spectrum showing 4855-7525 (m/z). Figure 6.5 shows the spectra corresponding
to the vacuum dried precipitate after addition of CHG to G3-PAMAM-NH2

284
dendrimer; (a) is an overview spectra, (b) magnification at 1000- 2475 (m/z) and
(c) magnification of spectrum at 5970- 7505 (m/z).
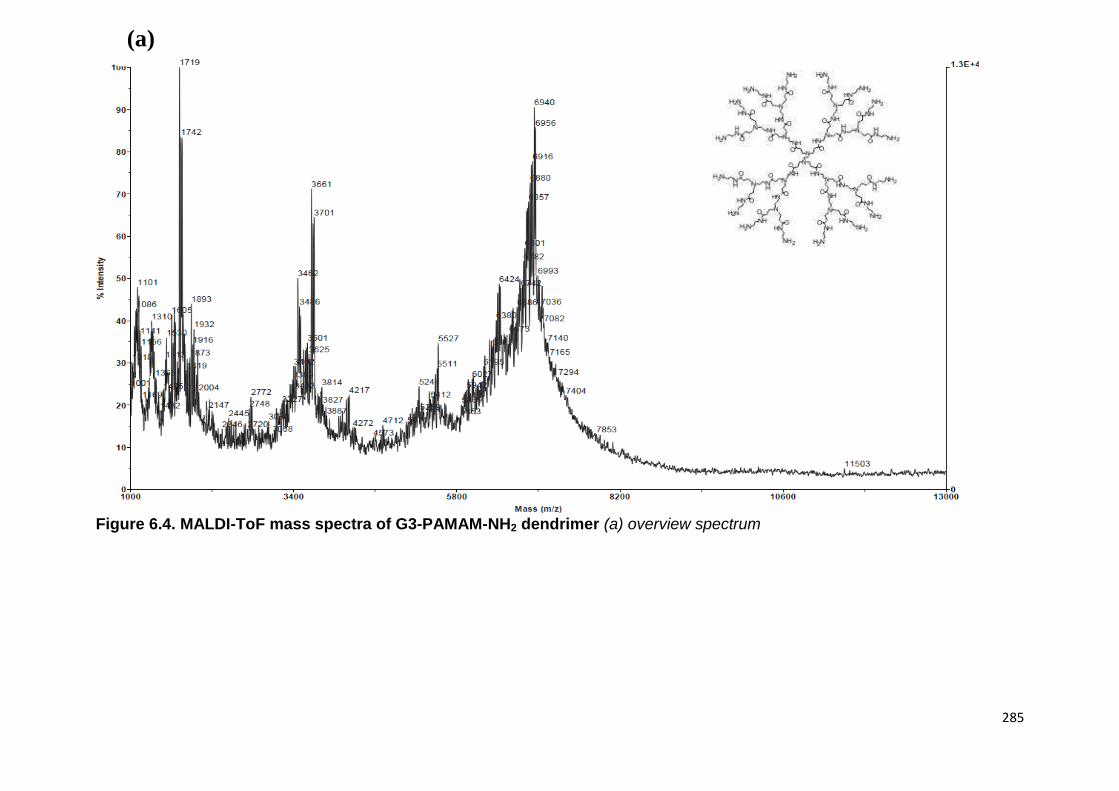
285
Figure 6.4. MALDI-ToF mass spectra of G3-PAMAM-NH2 dendrimer (a) overview spectrum
Theoretical molecular weight- 6909 Da
(a)

286
Figure 6.4. MALDI-ToF mass spectra of G3-PAMAM-NH2 dendrimer (b) magnified spectrum showing a mass of 1000-4400 (m/z) and (c) magnified spectrum showing 4855-7525 (m/z).
(b)
(c)
(b)
(c)

287
Figure 6.5. MALDI-ToF mass spectra of G3-PAMAM-NH2 and CHG precipitate (a) is an overview spectrum, (b) spectrum magnification at 1000- 2475 (m/z) and (c) magnification of spectrum at 5970- 7505 (m/z).
(b)
(c)
(a)
288
6.2.5 Single crystal x-Ray Diffraction (XRD) on precipitate
The XRD results of the crystalline precipitate analysis are illustrated below
in Table 6.1. The crystal system was found to be a monoclinic system that is a
rectangular prism with a parallelogram at its base. The crystal was a colourless
platelet and was found to have a molecular weight of 639.55 Da. The two nitrogen
atoms closest to the 4-chlorophenyl group are protonated. CHX (base), four water
molecules and an oxocarbon anion were detected within the crystal. For full details
on the XRD data please refer to Appendix 3 A structure built from the XRD data is
displayed in Figure 6.6 as a ball and stick structure.
Table 6.1 Crystal data obtained from XRD analysis.
Crystal data
Empirical formula C23H40Cl2N10O7
Formula weight 639.55
Crystal system Monoclinic
Crystal Platelet; Colourless
Crystal size 0.10 0.04 0.01 mm3

289
Figure 6.6 Chemical structure obtained from XRD analysis of a single crystal of the precipitate.
Red-oxygen
Blue-nitrogen
Green-chlorine
Grey-Carbon

290
6.2.6 Formulation of CHG-PAMAM dendrimer
On addition of CHG to a G3-PAMAM-NH2 dendrimer solution it was shown
that the CHG precipitates out of solution. Once the two components were added to
an ethanol:water solution (50:50), the co-dose formulation became stable. No
precipitate was observed over a 3 month period under occluded conditions, stored
away from light at ambient temperature. A lower percentage of CHG was
recovered from the unoccluded samples with the lowest being the control
containing only CHG and no PAMAM dendrimer (Table 6.2). Under unoccluded
conditions the formulation containing 0.5 mM G3-PAMAM-NH2 resulted in the
highest recovery of CHG from the formulation (59.22 ± 2.00 %) followed by 10 mM
(51.77 ± 2.63 %) and lastly 1 mM G3-PAMAM- NH2 dendrimer (47.25 ± 5.44 %).
This is compared to a recovery of only 34.44 ± 3.33 % for the formulation
containing no PAMAM dendrimer and only CHG. Under occluded conditions a
significantly higher recovery of CHG was observed for all formulations. The lowest
recovery was observed for the 10 mM G3-PAMAM-NH2 formulation at
79.24 ± 1.23 % but it was observed that the solution had turned white and
pearlescent in appearance. The 0.5 and 1 mM G3-PAMAM-NH2 dendrimer
formulations enhanced the recovery of CHG (85.94 ± 1.16 % and 92.56 ± 1.84 %
respectively) when compared to the control formulation that contained no PAMAM
dendrimer (84.27 ± 1.96 %).

291
Table 6.2 Percentage recovery of CHG after addition of PAMAM dendrimer under occluded and unoccluded conditions. Recovery of CHG from a co-formulation of various concentrations of G3-PAMAM-NH2 that were maintained in occluded or unoccluded conditions at 32°C ± 1°C (skin temperature) for 24 h.
* Formulation turned white and pearlescent.
Figure 6.7 displays the CHG recovery data in which the difference between
the occluded and unoccluded formulations is evident. A one way ANOVA with a
Dunnett’s post test (F=12.02, df=11, 332.8, p<0.05) showed a statistically
significant difference between the formulation without PAMAM dendrimer and the
1 mM G3-PAMAM-NH2. Further, statistical significance was observed between the
control and the 0.5 mM and 1 mM G3-PAMAM-NH2 (one way ANOVA with a
Dunnett’s post test F=7.046, df=11, 1126 and p<0.05). Interestingly under
occluded conditions only the 1 mM G3-PAMAM-NH2 dendrimer formulation
resulted in a significant CHG percentage recovery. Conversely under unoccluded
conditions it was only the 1 mM G3-PAMAM-NH2 dendrimer formulation that didn’t
result in a significant enhanced recovery of CHG.
Co-formulation
Percentage recovery of CHG from co-formulation (%)
Sample (n=3)
Unoccluded at 32°C Mean SEM
Occludded at 32°C Mean SEM
No PAMAM dendrimer
34.44 3.33 84.27 1.96
0.5 mM + CHG
59.22 2.00 85.94 1.16
1 mM + CHG 47.25 5.44 92.56 1.84
10 mM + CHG 51.77 2.63 79.24* 1.23
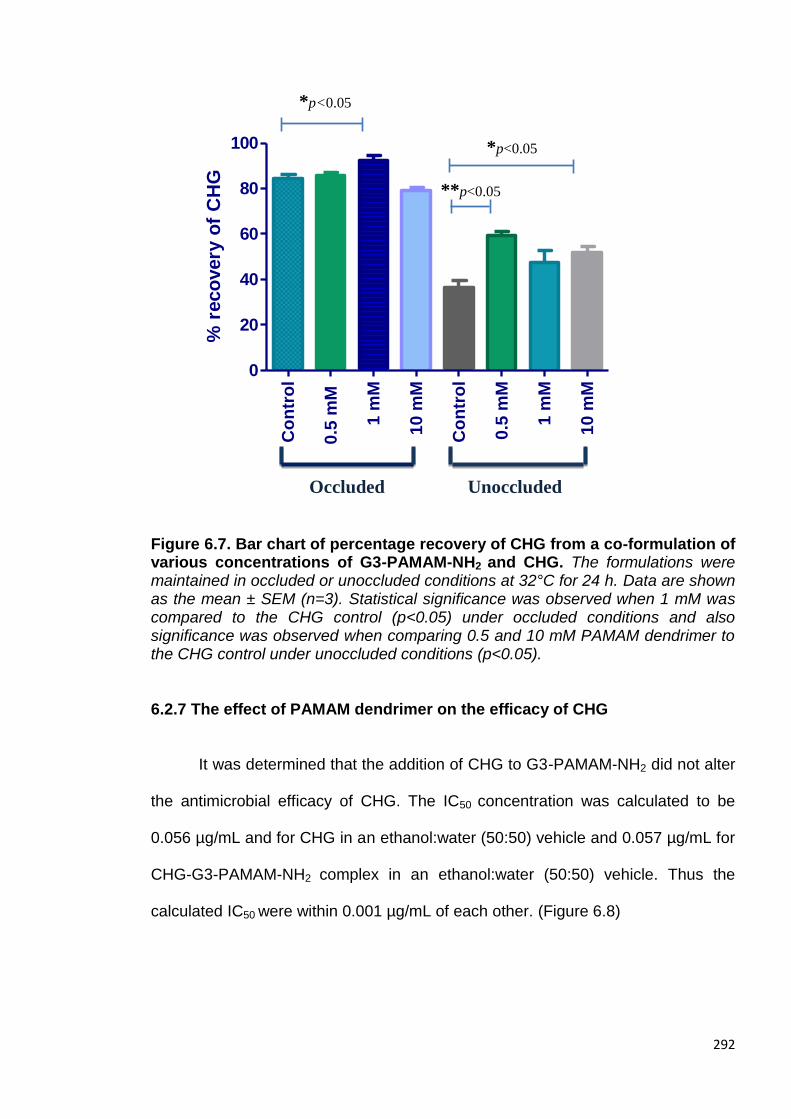
292
Figure 6.7. Bar chart of percentage recovery of CHG from a co-formulation of various concentrations of G3-PAMAM-NH2 and CHG. The formulations were maintained in occluded or unoccluded conditions at 32°C for 24 h. Data are shown as the mean ± SEM (n=3). Statistical significance was observed when 1 mM was compared to the CHG control (p<0.05) under occluded conditions and also significance was observed when comparing 0.5 and 10 mM PAMAM dendrimer to the CHG control under unoccluded conditions (p<0.05).
6.2.7 The effect of PAMAM dendrimer on the efficacy of CHG
It was determined that the addition of CHG to G3-PAMAM-NH2 did not alter
the antimicrobial efficacy of CHG. The IC50 concentration was calculated to be
0.056 µg/mL and for CHG in an ethanol:water (50:50) vehicle and 0.057 µg/mL for
CHG-G3-PAMAM-NH2 complex in an ethanol:water (50:50) vehicle. Thus the
calculated IC50 were within 0.001 µg/mL of each other. (Figure 6.8)
Co
ntr
ol
0.5
mM
1 m
M
10
mM
Co
ntr
ol
0.5
mM
1 m
M
10
mM
0
20
40
60
80
100
% r
eco
very
of
CH
G
Occluded Unoccluded
*p<0.05
*p<0.05
**p<0.05
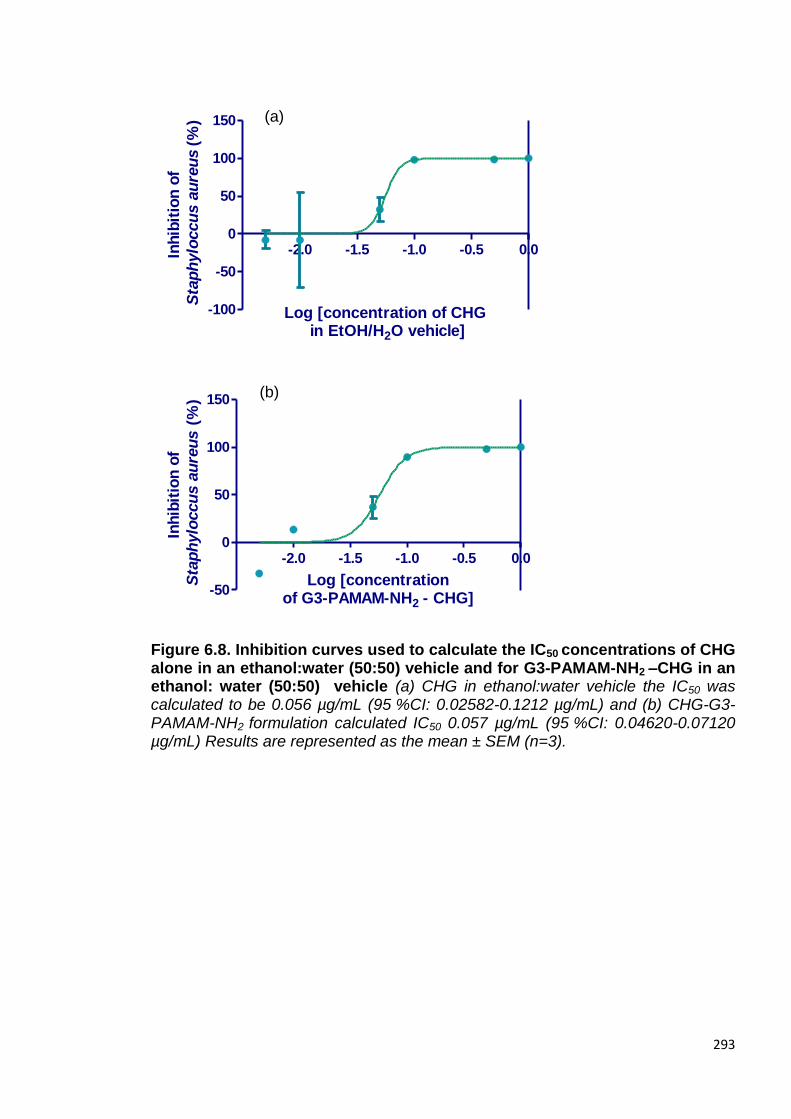
293
-2.0 -1.5 -1.0 -0.5 0.0
-100
-50
0
50
100
150
Log [concentration of CHG in EtOH/H2O vehicle]
Inh
ibit
ion
of
Sta
ph
ylo
ccu
s a
ure
us
(%)
-2.0 -1.5 -1.0 -0.5 0.0
-50
0
50
100
150
Log [concentrationof G3-PAMAM-NH2 - CHG]
Inh
ibit
ion
of
Sta
ph
ylo
ccu
s a
ure
us
(%
)
Figure 6.8. Inhibition curves used to calculate the IC50 concentrations of CHG alone in an ethanol:water (50:50) vehicle and for G3-PAMAM-NH2 –CHG in an ethanol: water (50:50) vehicle (a) CHG in ethanol:water vehicle the IC50 was calculated to be 0.056 µg/mL (95 %CI: 0.02582-0.1212 µg/mL) and (b) CHG-G3-PAMAM-NH2 formulation calculated IC50 0.057 µg/mL (95 %CI: 0.04620-0.07120 µg/mL) Results are represented as the mean ± SEM (n=3).
(a)
(b)
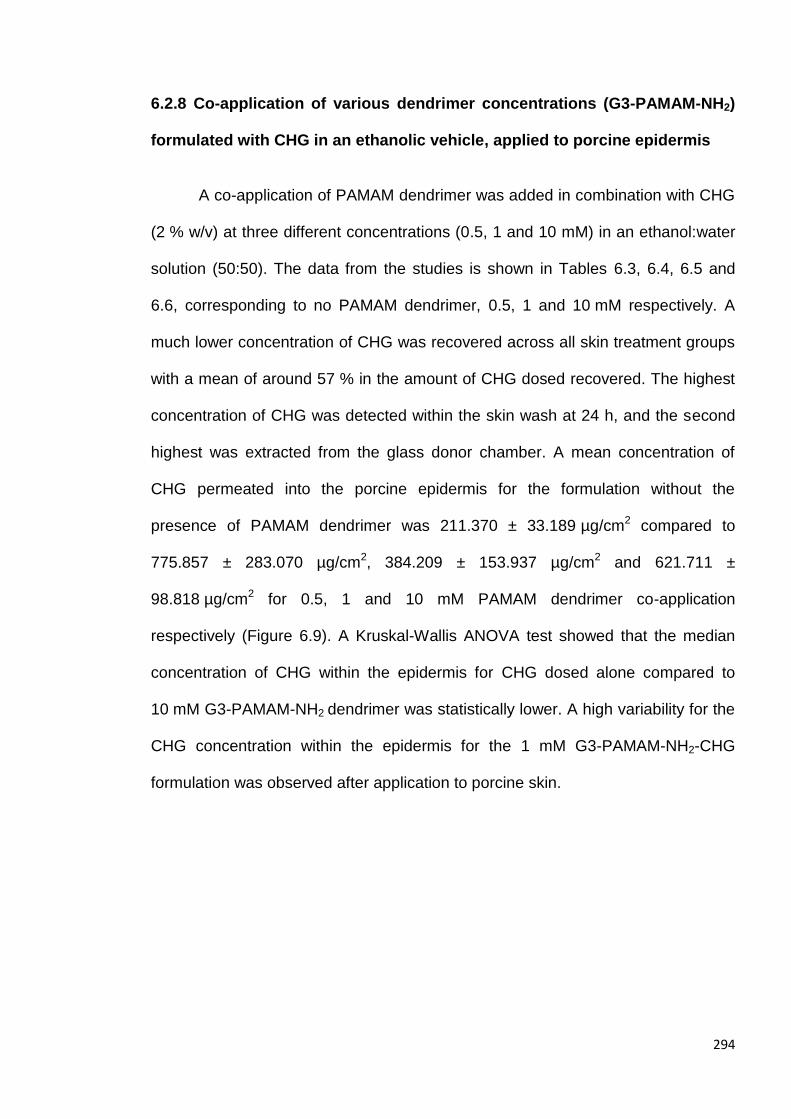
294
6.2.8 Co-application of various dendrimer concentrations (G3-PAMAM-NH2)
formulated with CHG in an ethanolic vehicle, applied to porcine epidermis
A co-application of PAMAM dendrimer was added in combination with CHG
(2 % w/v) at three different concentrations (0.5, 1 and 10 mM) in an ethanol:water
solution (50:50). The data from the studies is shown in Tables 6.3, 6.4, 6.5 and
6.6, corresponding to no PAMAM dendrimer, 0.5, 1 and 10 mM respectively. A
much lower concentration of CHG was recovered across all skin treatment groups
with a mean of around 57 % in the amount of CHG dosed recovered. The highest
concentration of CHG was detected within the skin wash at 24 h, and the second
highest was extracted from the glass donor chamber. A mean concentration of
CHG permeated into the porcine epidermis for the formulation without the
presence of PAMAM dendrimer was 211.370 ± 33.189 µg/cm2 compared to
775.857 ± 283.070 µg/cm2, 384.209 ± 153.937 µg/cm2 and 621.711 ±
98.818 µg/cm2 for 0.5, 1 and 10 mM PAMAM dendrimer co-application
respectively (Figure 6.9). A Kruskal-Wallis ANOVA test showed that the median
concentration of CHG within the epidermis for CHG dosed alone compared to
10 mM G3-PAMAM-NH2 dendrimer was statistically lower. A high variability for the
CHG concentration within the epidermis for the 1 mM G3-PAMAM-NH2-CHG
formulation was observed after application to porcine skin.

295
Table 6.3. Percutaneous absorption (mass balance) of CHG within porcine epidermis after a 24 h of CHG (2 % w/v) formulation in ethanol:water (50:50). Data is represented as the mean ± SEM (n=6) for each diffusion cell compartment for both the CHG concentration (µg/cm2) and for the percentage of dosed applied.
Table 6.4 Percutaneous absorption (mass balance) of CHG within porcine epidermis after a 24 h treatment with 0.5 mM-PAMAM dendrimer CHG formulation in ethanol:water (50:50). Data is represented as the mean ± SEM (n=6) for each diffusion cell compartment for both the CHG concentration (µg/cm2) and for the percentage of dosed applied.
Compartment
(n=6)
CHG (µg/cm2)
Mean SEM
% of applied dose
Mean SEM
Donor chamber
632.610 60.470 8.010 0.810
Skin wash 3189.095 355.540 40.500 1.440
Epidermis 211.370 33.189 2.684 0.421
Receptor fluid
9.100 2.087 0.116 0.026
Total recovered
4042.175 451.286 51.310 2.679
Compartment
(n=6)
CHG (µg/cm2)
Mean SEM
% of applied dose
Mean SEM
Donor chamber
910.700 144.835 11.623 1.815
Skin wash 2738.010 419.365 34.888 5.305
Epidermis 775.857 283.070 9.853 3.594
Receptor fluid
6.574 1.899 0.083 0.024
Total recovered
4431.141 849.169 56.447 10.738

296
Table 6.5 Percutaneous absorption (mass balance) of CHG within porcine epidermis after a 24 h treatment with 1 mM-PAMAM dendrimer- CHG formulation in ethanol:water (50:50). Data is represented as the mean ± SEM (n=6) for each diffusion cell compartment for both the CHG concentration (µg/cm2) and for the percentage of dosed applied.
Table 6.6 Percutaneous absorption (mass balance) of CHG within porcine epidermis after a 24 h treatment with 10 mM-PAMAM dendrimer- CHG formulation in ethanol:water (50:50). Data is represented as the mean ± SEM (n=6) for each diffusion cell compartment for both the CHG concentration (µg/cm2) and for the percentage of dosed applied.
Compartment
(n=6)
CHG (µg/cm2)
Mean SEM
% of applied dose
Mean SEM
Donor chamber
754.335 140.909 9.695 1.805
Skin wash 2980.024 266.673 37.800 3.487
Epidermis 621.711 98.818 7.895 1.255
Receptor fluid
17.980 2.407 0.228 0.030
Total recovered
4374.050 508.807 55.618 6.577
Compartment
(n=6)
CHG (µg/cm2)
Mean SEM
% of applied dose
Mean SEM
Donor chamber
1123.050 431.425 14.333 5.505
Skin wash 3600.000 621.857 45.786 7.999
Epidermis 384.209 153.937 4.879 1.954
Receptor fluid
9.047 5.076 0.115 0.064
Total recovered
5116.306 1212.295 65.113 15.522
297
Figure 6.9. Total concentration of CHG within the epidermis (µg/cm2) at 24 h after application of CHG alone, 0.5 mM, 1 mM and 10 mM PAMAM dendrimer with CHG in an ethanol: water vehicle (50:50). Data is presented as the mean ± SEM (n=6). A Kruskal-Wallis test with an ad hoc Dunn’s post test (histogram showed the data was non-parametric) derived that the medians between CHG and 10 mM-PAMAM-NH2 –CHG formulations were statistically different from one another (p<0.05).
The PAMAM dendrimer-CHG co-treatment did not result in a significant
increase in the concentration of CHG that had permeated the epidermis into the
receptor fluid at 24 h (Figure 6.10). Without the presence of PAMAM dendrimer a
total concentration of 9.100 ± 2.087 µg/cm2 of CHG was detected within the
receptor fluid at 24 h compared to 6.574 ± 1.899, 9.047 ± 5.076 and 17.980 ±
2.407 for 0.5, 1 and 10 mM of G3-PAMAM-NH2 respectively.
Application of the CHG in parallel to PAMAM dendrimer did not significantly
enhance the permeation through the epidermis into the receptor fluid but did
significantly increase the deposition of CHG within the epidermis for the 10 mM
G3-PAMAM-NH2-CHG co-treatment (p<0.05) (Figure 6.9). The total concentration
of CHG increased within the receptor fluid at 24 h with increasing concentration of
PAMAM dendrimer within the co-treatment. The total concentration of CHG within
* p<0.05
0
500
1000
1500
CHG
0.5 mM PAMAM-CHG
1 mM PAMAM-CHG
10 mM PAMAM-CHG
Treatment group
Co
nc.
of
CH
G w
ith
in
th
e
ep
iderm
is (
g/c
m2)

298
the receptor fluid at 24 h for 10 mM-PAMAM-NH2 dendrimer was ~2 x higher than
for the CHG dosed without PAMAM dendrimer (Figure 6.10).
Figure 6.10. Total concentration of CHG absorbed within the receptor fluid (µg/cm2) at 24 h after application of, 0.5, 1 and 10 mM PAMAM dendrimer and CHG alone. The dose preparation consisted of CHG in an ethanol:water vehicle (50:50) with the aforementioned PAMAM dendrimer concentrations. Data is presented as the mean ± SEM (n=6). No significant difference (p>0.05) was observed using a one-way ANOVA test (normally distributed data).
6.2.9 Formulation Development and characterisation
After formulating an alcoholic hand gel, an ointment, a cream and a lotion it
was decided that an alcohol hand gel would be the ideal formulation for a PAMAM
dendrimer-CHG complex. Alcohol hand gels are antimicrobial, widely used
clinically and the PAMAM dendrimer is likely to be more stable in an ethanolic
solution (according to the manufacturer’s specification). A range of alcohol gels
were formulated (20 g in total). Each formulation was formulated in triplicate see
below (Tables 6.7-9). No PAMAM dendrimer was added to the formulations in the
0.5
mM
PAM
AM
-CHG
1 m
M P
AM
AM
-CHG
10 m
M P
AM
AM
-CHG
CHG a
lone
0
5
10
15
20
25
Co
ncen
trati
on
of
CH
G w
ith
in
recep
tor
flu
id a
t 24 h
(
g/c
m2)

299
developmental stage until the formulations were optimised due to the high cost of
the dendrimer.
Table 6.7 Weight of constituents of formulations F-F4 with alteration of the ethanol content of the formulation.
In appearance formulation F4 turned cloudy after 12 h at room temperature.
It was observed that at concentrations above 75 % ethanol the CHG precipitates
out therefore an optimal concentration of 70 % ethanol was chosen (Table 6.7).
Table 6.8 Weight of constituents of formulations F4(a) to F6(a) with the alteration of HPC content in formulation (mw of HPC was 100,000).
Constituent Weight of constituent in formulation (F) in grams
F 4(a) F5 F6* F7* F6a
Ethanol (Absolute)
14 14 14 14 14
Hydroxy propyl
cellulose (HPC)
2 2.5 3.0 3.5 1.4
Water (ultrapure)
2 1.5 1 0.5 2.6
Chlorhexidine digluconate
2 2 2 2 2
Constituent
Weight of constituent in formulation (F) in grams
F (60 % EtOH)
F1 (65 % EtOH)
F2 (70 % EtOH)
F3 (75 % EtOH)
F4 (80 % EtOH)
Ethanol (Absolute)
12 13 14 15 16
Hydroxy propyl
cellulose (HPC)
1.6 1.6 1.6 1.6 1.6
Water (ultrapure)
4.4 3.4 2.4 1.4 0.4
Chlorhexidine digluconate
2 2 2 2 2

300
*It was observed that formulation F6 and F7 turned opaque immediately
(and the HPC had not dissolved after 24 h of shaking and 15 minutes of vigorous
mixing on a mixer mill) and were discarded. F6a was formulated with a lower HPC
concentration. The formulations were shaken overnight at 250 RPM to ensure the
HPC had dissolved. Table 6.8 shows the range of different HPC compositions
within the formulations.
Table 6.9. Weight of constituents of formulations F7 and F8 with the
addition of glycerol
Constituent
Weight of constituent in formulation (F) in grams
F 7 F8
Ethanol (Absolute)
14 14
Hydroxy propyl
cellulose 1.6 1.6
Water (ultrapure)
2.2 1.8
Chlorhexidine digluconate
2 2
Glycerol 0.2 0.6
Initial observations were that the formulations appeared stable (with the
exception of the noted formulations), were all transparent in appearance and had a
strong alcohol odour. In my personal experience when applied to the skin the
formulations were easy to spread across the skin surface and were fully
evaporated within 30-60 seconds of application. A thin, flexible and transparent
film was left on the surface of the skin which was again non-irritating and water
soluble (White, 1994). The film was formed due to an interaction between CHG
and the HPC in which the CHG acts as a plasticiser. The control formulation which
did not include CHG formed no film. The film formed with formulations 7 and 8 that
included glycerol and remained tacky for a prolonged period of time possibly due
301
to the hygroscopic nature of the glycerol (Table 6.9). The formulations that
contained dimethicone are not included as they were disregarded due to
effervescing on addition to the formulation.
The formulations were characterised by the following parameters-
Appearance
Odour
pH (1 in 10 dilution in ultrapure water)
Available CHG (uniformity of CHG concentration)
Spreadability diameters
Antimicrobial affect (modified agar cup method)
ATR-FTIR
Viscosity profile
6.2.9.1 pH of formulations
To ensure that the formulations were compatible with the skin, the pH was
determined for each formulation and can be found below in Table 6.10. All
formulations were found to be within the neutral range. A general trend was
observed where the pH decreased by 2.27 with increasing ethanol content (from
60-80 % ethanol) with formulations F-F4.

302
Table 6.10. Measured pH for the formulations after a 1 in 10 dilution in ultrapure water. The results are presented as the mean ± SD (n=3).
Formulation
Mean pH ± SD (n=3)
F 7.79 ± 0.02
F1 7.72 ± 0.03
F2 7.62 ± 0.07
F3 6.93 ± 0.07
F4 5.52 ± 0.14
F5 5.67 ± 0.06
F4(a) 7.04 ± 0.28
F6(a) 6.96 ± 0.01
F7 6.99± 0.07
F8 6.91 ± 0.07
Control no CHG (n=1) 7.04
Control no HPC (n=1) 6.93
6.2.9.2 Spreadability of formulations
The spreadability of the gel formulations were determined by measuring the
spread diameter under set conditions for each formulation (Table 6.11). The
highest mean diameter corresponded to the formulation with the lowest HPC
content (Formulation F6(a)). Formulation 4 and formulation 3 had the highest
ethanol content and therefore resulted in the second and third highest mean
spreadability diameters, respectively, after formulation 6(a) that consisted of the
lowest HPC polymer concentration. All formulations with Φ >70 mm are classified
as fluid gels. Formulation 4a and formulation 5 have a mean of 70 > Φ > 55 mm
and are therefore considered to be semi-fluid gels. This was anticipated as these
two formulations contained the highest HPC content and was therefore more
viscous resulting in a lower spreadability diameter. The addition of glycerol within
formulation 7 (mean diameter of 83.17 ± 1.17 mm) and formulation 8 (mean
diameter of 81.00 ± 2.79 mm) significantly increased the spreadability diameter

303
when compared to formulation 2 (mean diameter 76.17 ± 1.02) that had the same
composition minus the glycerol (p<0.05). A one way ANOVA confirmed that the
spreadability diameters were different as a function of altering the ethanol and
HPC content as well as the inclusion of glycerol (F=72.20, d=65, 345.7 p<0.05).
Intracomparisons were made by conducting a Tukey’s multiple comparison test.
There was no significant difference between formulations 4(a), 6(a) and 7 when
compared to the commercially available alcohol gel ‘Safemate original’ (p>0.05).
Based on a subjective personal experience the ‘Safemate original’ and
formulations with a comparable spreadability (formulations 4(a), 6(a) and 7) were
possibly the least favourable in terms of skin application as a lack of viscosity
resulted in the formulation running from the site of application. All of the
formulations tested however resulted in excellent skin coverage due to an
agreeable spreadability capacity.

304
Table 6.11. Displays the calculated spreadability diameter of the formulations after application of a known weight and time period. The spreadability diameter was calculated from a mean ± SEM (n=3).
Formulation Diameter ↕ (mm)
Mean ± SEM ↕ (mm)
Diameter ↔ (mm)
Mean ± SEM ↔ (mm)
Total mean ± SEM (mm)
Fa 69
73.33 ± 2.19
71
72.67 ± 0.88 73.00 ± 1.53 Fb 76 74
Fc 75 73
F1a 76
76.67 ± 0.67
79
77.67 ± 1.33 77.17 ± 1.00 F1b 78 79
F1c 76 75
F2a 75
75.33 ± 0.88
77
77.00 ± 1.16 76.17 ± 1.02 F2b 77 79
F2c 74 75
F3a 84
82.33 ± 1.20
87
85.00 ± 1.00 83.67 ± 1.10 F3b 80 84
F3c 83 84
F4a 86
84.67 ± 0.67
89
86.67 ± 1.20 85.67 ± 0.94 F4b 84 86
F4c 84 85
F4(a)a 70
70.00 ± 0.58
68
69.33 ± 0.88 69.67 ± 0.73 F4(a)b 71 71
F4(a)c 69 69
F5a 65
63.33 ± 0.88
63
63.67 ± 1.33 63.50 ± 1.11 F5b 65 64
F5c 61 63
F6(a)a 90
89.00 ± 0.58
90
89.67 ± 0.33 89.34 ± 0.46 F6(a)b 89 89
F6(a)c 88 90
F7a 83
82.67 ± 0.88
81
83.67 ± 1.45 83.17 ± 1.17 F7b 81 84
F7c 84 86
F8a 83
79.67 ± 2.40
85
82.33 ± 3.18 81.00 ± 2.79 F8b 81 86
F8c 75 76
control no CHG a
81
81.67 ± 0.67
82
82.33 ± 0.88 82.00 ± 0.78 b 83 81
c 81 84
‘Safemate’ a 89
87.67 ± 0.67
90
90.33 ± 0.88 89.00 ± 0.77 b 87 92
c 87 89
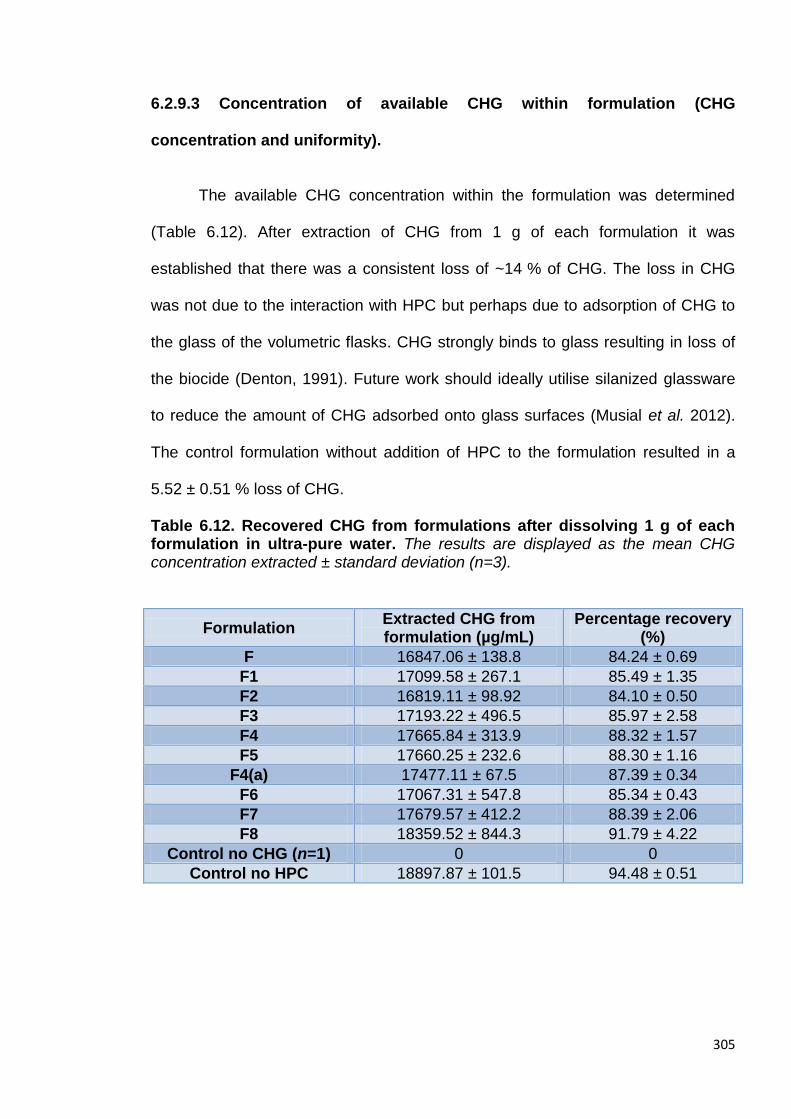
305
6.2.9.3 Concentration of available CHG within formulation (CHG
concentration and uniformity).
The available CHG concentration within the formulation was determined
(Table 6.12). After extraction of CHG from 1 g of each formulation it was
established that there was a consistent loss of ~14 % of CHG. The loss in CHG
was not due to the interaction with HPC but perhaps due to adsorption of CHG to
the glass of the volumetric flasks. CHG strongly binds to glass resulting in loss of
the biocide (Denton, 1991). Future work should ideally utilise silanized glassware
to reduce the amount of CHG adsorbed onto glass surfaces (Musial et al. 2012).
The control formulation without addition of HPC to the formulation resulted in a
5.52 ± 0.51 % loss of CHG.
Table 6.12. Recovered CHG from formulations after dissolving 1 g of each formulation in ultra-pure water. The results are displayed as the mean CHG concentration extracted ± standard deviation (n=3).
Formulation Extracted CHG from formulation (µg/mL)
Percentage recovery (%)
F 16847.06 ± 138.8 84.24 ± 0.69
F1 17099.58 ± 267.1 85.49 ± 1.35
F2 16819.11 ± 98.92 84.10 ± 0.50
F3 17193.22 ± 496.5 85.97 ± 2.58
F4 17665.84 ± 313.9 88.32 ± 1.57
F5 17660.25 ± 232.6 88.30 ± 1.16
F4(a) 17477.11 ± 67.5 87.39 ± 0.34
F6 17067.31 ± 547.8 85.34 ± 0.43
F7 17679.57 ± 412.2 88.39 ± 2.06
F8 18359.52 ± 844.3 91.79 ± 4.22
Control no CHG (n=1) 0 0
Control no HPC 18897.87 ± 101.5 94.48 ± 0.51

306
6.2.9.4 Viscosity of formulations
All formulations exhibited non Newtonian behaviour; a typical example is
illustrated in Table 6.13 and Figure 6.11 corresponding to formulation F (a-c).
Shear thinning was observed as the viscosity decreased with increasing RPM.
Figure 6.11 shows a plot of the viscosity (m.Pas) against the RPM. A hysteresis
was observed however it is not indicative of thixotropy but is due to the variability
observed between the replicate formulations as the error bars (SEM) overlap.
Despite measuring the viscosity under experimental conditions (temperature 19 ±
1°C) variability was observed between replicate formulations. The rate of
evaporation over a 10-15 minute period (an approximate time to conduct the
viscosity analysis) was minimal (<0.1 % loss in weight of the formulation). This
may have contributed to the variability observed however the effect would likely be
negligible.
Table 6.13. Measured torque for increasing and then decreasing shear rates for formulation F(a-c). The data is presented as the mean ± SEM (n=3).
RPM Viscosity (mPas)
Mean (n=3) SEM
2 1550.000 102.632
2.5 1510.000 104.083
3 1466.667 96.148
4 1373.000 120.000
5 1378.000 76.000
6 1366.667 73.277
10 1344.000 68.235
12 1312.000 63.319
12 1313.667 61.431
10 1318.000 61.830
6 1348.333 70.848
5 1362.000 77.149
4 1427.667 98.930
3 1513.333 97.696
2.5 1583.333 69.841
2 1586.667 113.186

307
Figure 6.11. RPM plotted with the viscosity (m.Pas) for formulation F illustrating non Newtonian behaviour. Data is represented as the mean ± SEM (n=3). 6.2.9.5 Antimicrobial efficacy of formulations.
It was necessary to determine whether CHG still exhibited antimicrobial
characteristics after interaction with HPC within the formulations. A modified agar
cup method was conducted and established that the formulations did possess
antimicrobial properties. Figure 6.12 is a photograph taken of a typical agar plate
after formulation F (n=3) was challenged against P. aeruginosa. A large inhibition
zone (halo effect) can be observed whereby the CHG had diffused through the
agar until a sub-lethal concentration was achieved. That is the point where P.
aeruginosa persists. In parallel with the formulations ‘Safemate’ original sanitising
gel was also tested using the same method; Safemate was the hand sanitiser
used after an antimicrobial hand wash in the microbiology laboratory. The
inhibitory zones were measured with a ruler (accuracy ± 0.5 mm) and recorded in
0 5 10 151000
1200
1400
1600
1800
RPM
Vis
co
sit
y (
m.P
as)
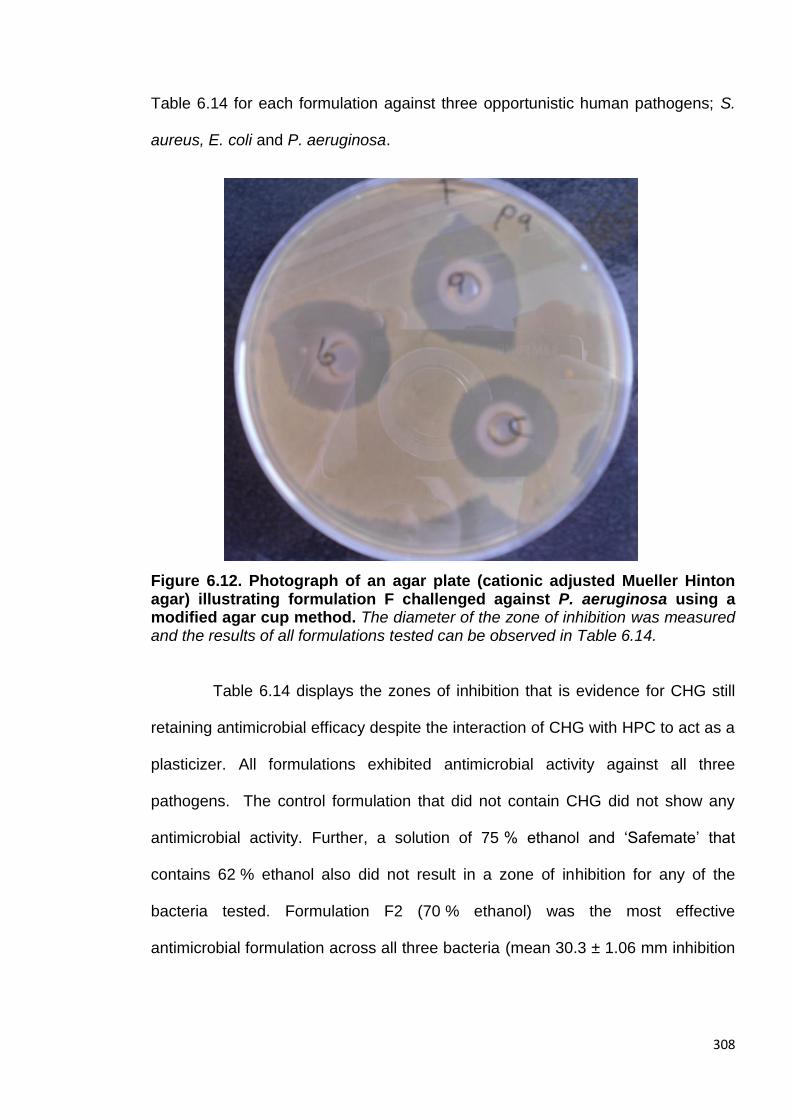
308
Table 6.14 for each formulation against three opportunistic human pathogens; S.
aureus, E. coli and P. aeruginosa.
Figure 6.12. Photograph of an agar plate (cationic adjusted Mueller Hinton agar) illustrating formulation F challenged against P. aeruginosa using a modified agar cup method. The diameter of the zone of inhibition was measured and the results of all formulations tested can be observed in Table 6.14.
Table 6.14 displays the zones of inhibition that is evidence for CHG still
retaining antimicrobial efficacy despite the interaction of CHG with HPC to act as a
plasticizer. All formulations exhibited antimicrobial activity against all three
pathogens. The control formulation that did not contain CHG did not show any
antimicrobial activity. Further, a solution of 75 % ethanol and ‘Safemate’ that
contains 62 % ethanol also did not result in a zone of inhibition for any of the
bacteria tested. Formulation F2 (70 % ethanol) was the most effective
antimicrobial formulation across all three bacteria (mean 30.3 ± 1.06 mm inhibition

309
zone across all three bacteria n=18), however there was no observable trend
between the formulation composition and antimicrobial efficacy.
Table 6.14. Diffusion zone of formulations challenged against the Gram negative E. coli and P. aeruginosa and the Gram positive S. aureus. The semi-quantitative results are presented as mean ± SD (n=6).
Zone of inhibition mm (mean ± SD, n=6)
Formulation Escherichia
coli Staphylococcus
aureus Pseudomonas
aeruginosa
F 24.50 ± 0.87 25.00 ± 0.87 23.83 ± 0.60
F1 24.00 ± 0.87 24.17 ± 0.33 24.33 ± 1.67
F2 28.50 ± 2.29 29.00 ± 0.16 33.33 ± 0.73
F3 19.33 ± 3.01 26.33 ± 1.59 20.00 ± 2.29
F4 19.00 ± 1.32 27.33 ± 0.67 20.17 ± 0.88
F5 20.50 ± 1.80 20.67 ± 0.17 24.17 ± 0.60
F4(a) 25.17 ± 0.76 20.50 ± 0.76 21.34 ± 0.72
F6 31.00 ± 1.32 26.33 ± 0.44 23.50 ± 0.58
F7 24.17 ± 0.76 26.17 ± 1.36 22.17 ± 0.17
F8 22.50 ± 1.73 25.17 ± 0.60 23.00 ± 0.50
Control- no CHG 0 0 0
Control-75 % EtOH
0 0 0
Safemate alcohol hand gel
0 0 0
6.2.9.6 ATR-FTIR of formulations
ATR-FTIR analysis was conducted to visualize the interactions between
CHG and HPC within the formulations. There are differences between the free
drug (Figure 6.13 (a)) and the formulation (F used as an example) Figure 6.13 (b).
Peaks corresponding to the C-H and C-O stretch of ethanol can be observed on
the spectra. Peaks corresponding to CHG shift when the CHG is formulated in
ethanol with HPC for example the C=N stretch peak for free CHG is found at
1633 cm-1 but in the formulation after interaction with HPC the C=N peak shifts to
1647 cm-1 (Shafiullah, 2005). The vibrational modes of the chlorophenyl group can
310
be observed at 1492-1533 cm-1 in Figure 6.13 (a) (Suci et al. 2001) but these
peaks change when the CHG is added within the formulation with HPC and a peak
at 1380 cm-1 is apparent. Figure 6.13 (b) also shows additional peaks
corresponding to the (aliphatic) C-H stretch for HPC and ethanol at 2975 and
2896 cm-1. Further, C-H bending due to the aromatic ring on CHG can be
observed at 878 cm-1 within the formulation that is not present in the CHG alone
spectrum. The minor peak shifts observed in the spectra in Figure 6.13 indicate an
interaction between CHG and HPC in the presence of ethanol and water. The
range of formulations were very similar when the spectra were overlaid therefore
no differences were observed in the spectra between formulations.
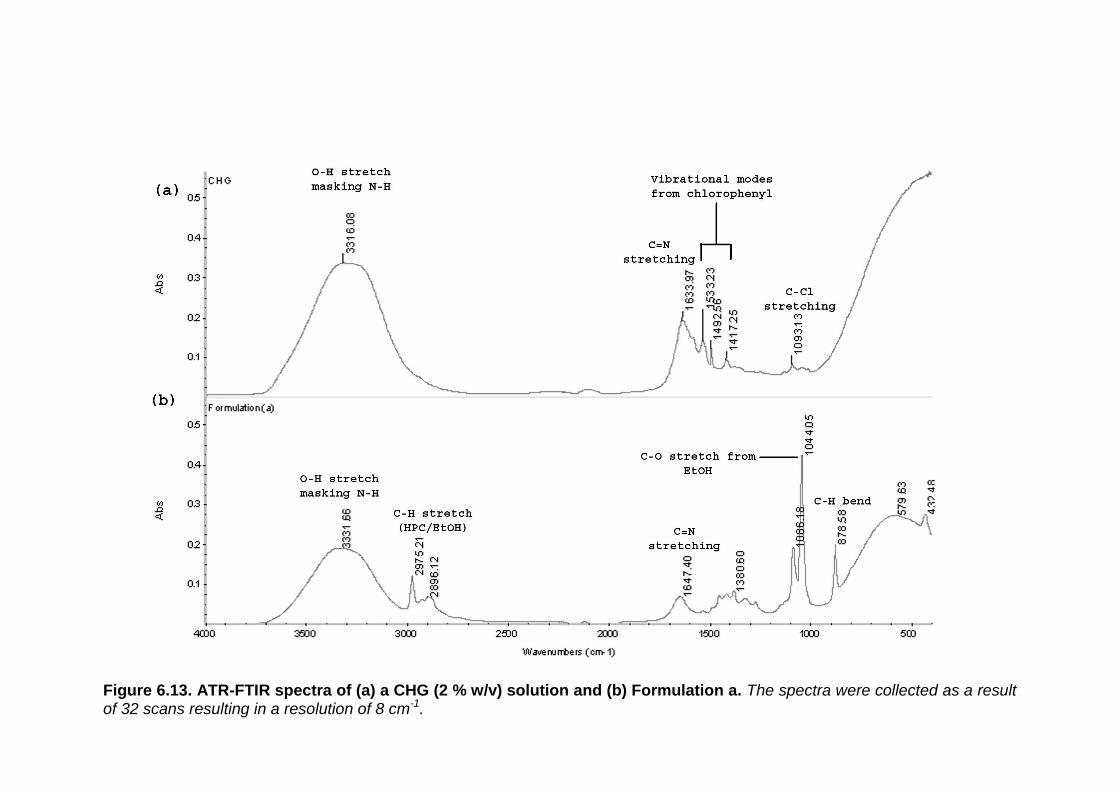
311
Figure 6.13. ATR-FTIR spectra of (a) a CHG (2 % w/v) solution and (b) Formulation a. The spectra were collected as a result of 32 scans resulting in a resolution of 8 cm-1.

312
6.2.9.7 Percutaneous absorption of chlorhexidine digluconate from selected
formulations determined by tape stripping dermatomed porcine skin after
24 h
The permeation of CHG within porcine dermatomed skin was determined
from the formulations F4, F5 and F6 (Tables 6.15, 6.16 and 6.17). Previously
within this chapter it was observed that the CHG interacts with HPC to form a
plasticizer that results in film formation after solvent evaporation. It was of interest
to the project to characterise the penetration of CHG into the skin from the film
formed across the skin surface. Across all three formulations tested, no CHG was
detected within the 21 tape strips removed from the SC or the remaining
epidermis/dermis. It was observed that after 6 h the solvents had evaporated
leaving a film across the skin. At 24 h it was attempted to remove the film by
washing the skin surface however hydration caused the film to become tacky and
removal by water was not sufficient. The films were then carefully removed from
the skin surface at 24 h using tweezers and the CHG was extracted from the film.
The highest concentration of CHG was recovered from the washed films. The
concentrations within the film were; 3110.062 ± 347.9 µg/cm2 for F4, 3561.948 ±
278.4 µg/cm2 for F5 and 3200.972 ± 298.4 µg/cm2 for F6. These concentrations
are equivalent to ~ 40 % of the applied CHG dose.
A high concentration of CHG was extracted from the glass donor chambers.
The mean concentration across the three formulations was 2589.71 ±
167.45 µg/cm2 that is equivalent to around 33 % of the applied dose of CHG. This
can be accounted for as it was observed that on deconstruction of the Franz cell a
proportion of the film was removed with the donor chamber. Attempts were made

313
to recover the film from the donor chamber however this was not achieved due to
the strong adhesion of the film to the glass. In previous studies conducted in
chapter 3 (section 3.3.0 and 3.3.1) the highest concentration of CHG was
recovered within the 24 skin wash. With regards to this study, only low
concentrations of CHG was recovered within the 24 h skin wash with an average
percentage of applied dose recovered of 6.03 ± 1.63 %. The mass recovery of
CHG was consistent with the CHG concentrations recovered from the formulations
under occluded conditions in section 6.2.6.
Table 6.15 Concentration of CHG extracted from the different compartments of the in vitro diffusion cell after dosing with formulation 4 for 24 h. Data is represented as the mean ± SEM (n=5) for each diffusion cell compartment for both the CHG concentration (µg/cm2) and for the percentage of dose applied.
Formulation F4 (n=5)
CHG (µg/cm2) Mean SEM
% of applied dose Mean SEM
Donor chamber 2603.558 211.921 33.065 2.691
Skin wash 355.3078 58.090 4.512 0.738
Film 3110.062 347.901 39.498 4.418
Epidermis & tape strips
<LOQ* <LOQ <LOQ <LOQ
Receptor fluid <LOQ <LOQ <LOQ <LOQ
Total recovered 6068.928 617.912 77.075 7.847
*Limit of quantification calculated from HPLC validation data found in appendix 1 using the equation 10*(STD/slope of line). LOQ was calculated to be 0.168 µg/mL.

314
Table 6.16 Concentration of CHG extracted from the different compartments of the in vitro diffusion cell after dosing with formulation 5 for 24 h. Data is represented as the mean ± SEM (n=5) for each diffusion cell compartment for both the CHG concentration (µg/cm2) and for the percentage of dose applied.
Table 6.17 Concentration of CHG extracted from the different compartments of the in vitro diffusion cell after dosing with formulation 6 for 24 h. Data is represented as the mean ± SEM (n=5) for each diffusion cell compartment for both the CHG concentration (µg/cm2) and for the percentage of dose applied.
Formulation F5
(n=5)
CHG (µg/cm2)
Mean SEM
% of applied dose
Mean SEM
Donor chamber 2560.291 101.621 32.516 1.290
Skin wash 714.382 473.923 9.073 6.019
Film 3561.948 278.400 45.237 3.536
Epidermis & tape strips
<LOQ <LOQ <LOQ <LOQ
Receptor fluid <LOQ <LOQ <LOQ <LOQ
Total recovered 6836.621 853.944 86.826 10.845
Formulation F6
(n=5)
CHG (µg/cm2)
Mean SEM
% of applied dose
Mean SEM
Donor chamber 2604.653 188.801 33.079 3.790
Skin wash 353.456 47.823 4.489 0.607
Film 3200.972 298.410 40.652 2.398
Epidermis and tape strips
<LOQ <LOQ <LOQ <LOQ
Receptor fluid <LOQ <LOQ <LOQ <LOQ
Total recovered 6159.081 535.034 78.22 6.795

315
6.3 Discussion
On addition of the PAMAM dendrimer to CHG a crystalline material formed in
aqueous solution. Different crystalline shapes and particle sizes confer different
physiochemical properties which can in turn effect the bioavailability of drugs
(Khankari and Grant, 1995). Crystallisation of the drug is also important in terms of
stability of any formulation. It is of paramount importance that the crystal structures
are fully characterised to not only understand the interaction between CHG and
the PAMAM dendrimer but to also understand the differences in crystal structures
formed and any possible effects on the bioavailability of the drug. Co-crystals of
water-drug molecules within an aqueous environment are important in determining
the stability of such hydrate crystal systems (Han, 2006). The crystals formed in
the hydro-methanolic solution on the addition of the CHG solution.
Two different crystal structures were observed depending on the order of
addition of the CHG, G3-PAMAM-NH2 dendrimer (in methanol) and the water
(Figures 6.2 and 6.3). Previously it has been shown that the water activity (energy
status of water within a system) is very important in the formation of such drug
crystals in an organic solvent and water mixture. The organic solvent and the
water mixture compositions affect the physical stability of the drug crystalline
phases. It has been shown to affect the nature of the crystallising drug phase for
drugs such as theophylline (Zhu et al. 1996) and ampicillin (Zhu and Grant, 1996).
As such the composition of the organic solvent and water mixtures are likely to
affect the crystallisation of CHG and may account for the differences observed in
Figures 6.2 and 6.3. Longer shards of microcrystalline material formed after there
was an initial excess of water whereas shorter shards radiating form a focal point

316
occurred as the PAMAM dendrimer was added to CHG in a reduced volume of
water before the addition of water up to full volume.
The aqueous solubility (% w/w) of CHG is >70 % (Farkas et al. 2001). It is
also soluble in alcohol(s), however the addition of CHG to neat alcohol(s) will
result in precipitation (Denton, 1991). The CHG was not added to neat alcohol as
the water was added to the dendrimer in methanol in the first instance before the
addition of CHG. CHG is soluble in water and methanol solutions. The control co-
formulation without the addition of PAMAM dendrimer did not form a crystalline
material. The crystal formation was therefore attributed to the addition of the G3-
PAMAM-NH2 dendrimer and crystal formation occurred at a range of dendrimer
concentrations (0.5- 10 mM). Figures 6.2 and 6.3 are micrographs illustrating the
differences in crystal shape and size after addition of the CHG in a differing order.
The length of the crystals was measured and the crystals formed in Figure 6.2
were on average 4.5 times longer than those formed in Figure 6.3. The crystals
formed were fully characterised. The melting points were obtained from vacuum-
dried crystalline material and were both determined to be between 109-115 °C;
CHX has a melting point between 132-136 °C (Lam et al. 1993). CHG does not
exist as a solid but as a viscous liquid therefore the melting point data may
suggest that the precipitate is not just a case of the CHX base having precipitated
out of solution.
A vacuum-dried sample of the crystalline precipitate and G3-PAMAM-NH2
dendrimer reference material was sent to the EPSRC National Mass Spectrometry
Centre for MALDI-ToF analysis to determine the molecular weight of the samples.
Figures 6.4 and 6.5 show the resulting spectra and it was determined that the
317
vacuum-dried sample was a mixture. It is possible that the G3-PAMAM-NH2
dendrimer in solution was dried in vacuo conditions onto the precipitate resulting in
a mixture of CHX and dendrimer. The theoretical molecular weight of
G3-PAMAM-NH2 dendrimer is 6909 Da but the spectra shows that the molecular
weight determined was 6940 Da for the reference material and 6938 Da for the
CHG-PAMAM mixture. The mass resolution of the system was ± 2 Da which may
account for the discrepancy between the two spectra. The observed species that
are higher in mass than the theoretical mass may be [PAMAM+K]+ or possibly
[PAMAM+Na]+ which are a result of ionisation of salt impurities within the sample
or they may be a result of a minor structural defect within the dendrimer (Peterson
et al. 2003).
The MALDI-ToF spectra indicating a mixture was sent for analysis therefore
in order to determine the actual composition of the crystalline material it was sent
for single crystal X-Ray diffraction analysis. The crystalline material was sent in
aqueous solution to the EPSRC National Crystallography Centre that was in turn
forwarded the sample to the Diamond beam line in Oxford. Table 6.1 and Figure
6.6 exhibit the crystal data and structure respectively. The XRD data clearly shows
the chlorhexidine structure which is associated with four water molecules and an
oxocarbon anion with a calculated molecular weight of 639.55 Da. The molecular
weight of the dosed CHG within the formulation was 897.8 Da, on removal of the
oxocarbon anion and the water molecule’s molecular weight the resulting
molecular weight is 507 Da that corresponds to the CHX base with two nitrogen
positions protonated. The XRD data shows that the digluconic acid is missing from
the structure and in its place are four water molecules and an oxocarbon anion. It
is possible that the polycationic PAMAM dendrimer had scavenged the gluconic
318
acid resulting in precipitation of the CHX base due to a lack of solubility in aqueous
solution (solubility; 0.008 % w/v in water, Farkas et al. 2001). The crystalline
precipitate may have occurred due to the oxocarbon anion (the counter ion)
forming a salt through an anion exchange group such as –NHR- present on the
CHX structure (Yoshimura, 2011). Further, another reason could be that the pH
was too high and that the counter ion-CHX base had precipitated out. The pH of
the G3-PAMAM-NH2-CHG co-formulation was ~ pH 9 as analysed by a standard
pH universal indicator test strip. It has previously been reported that the CHX base
can precipitate out in high pH conditions i.e. > pH 8 (Denton, 2000).
The results within this chapter have shown that a PAMAM dendrimer-CHG
complex does not form in aqueous solution but that the CHX loses its gluconic
acid salt, possibly through interaction with the polycationic PAMAM dendrimer or
possibly due to the high pH. No precipitate formed when the CHG was added to
the PAMAM dendrimer in ethanol, methanol or isopropanol. This is interesting as
the CHX free base is also practically insoluble in alcohols (Modak and Sampath,
2007). This result may question the proposed idea that the PAMAM dendrimer
scavenged the gluconic acid from the CHG as that would likely have occurred in
an alcoholic solution also. Previously, to graft gluconic acid to a G3-PAMAM-NH2
dendrimer a coupling agent (1-ethyl-3-(dimethylaminopropyl)carbodiimide) was
required in conjunction with an activating agent (N-Hydroxysuccinimide). The
coupling reaction was then left overnight in a sonicator to activate the
condensation reaction (Tao et al. 2013). The coupling agents are required as the
condensation reaction between a carboxylic acid such as that of gluconic acid and
an amine group such as that on the PAMAM dendrimer surface is a very slow
reaction. This suggests that the interaction demonstrated in Sections 6.2.1-6.2.5 is

319
likely to be an electrostatic interaction between the amine groups of the PAMAM
dendrimer and the carboxyl group of the gluconic acid.The presence of an
oxocarbon anion may indicate an interaction between the gluconic acid of CHG
with the PAMAM dendrimer. The carbonate anion (CO3)2- detected within the
crystal structure using XRD is due to the removal of all protons from a
corresponding acid carbonic acid (Moore and Khanna, 1991) that was possibly
provided by the gluconic acid (Figure 6.14).
Figure 6.14 A possible schematic for the formation of the oxocarbon anion detected within the single molecule crystal using XRD analysis.
There was an electrostatic interaction between the carbon anion and the
protonated nitrogen next to the 4-chlorophenyl due to the electron withdrawal
characteristic of this moiety. Four water molecules were also detected within the
crystal that was hydrogen bonded to the electron dense 4-chlorophenyl moiety.
The electrostatic potential of CHX can be observed in Figure 6.15. The red areas
OH
OH
O O
O-
O-
Loss of 2 protons
O
OH
OH
OH
OH
OH
OH
Possible fragmentation of gluconic acid
+ OH2

320
correspond to the delocalised positive charge of the amine groups on the
biguanide structure and the blue regions correspond to the electron dense
chlorophenyl moieties (Blackburn et al. 2007). Though only one molecule of CHX
was presented it is likely that the crystal structure is a repetitive pattern of CHX
with carbonate anions associated with any of the red areas corresponding to the
amines of the biguanide structure and water molecules that have hydrogen
bonded to the blue electron dense chlorophenyl groups.
Figure 6.15 Image showing the electrostatic potential plotted on an electrostatic density image of CHX. The structure is represented as space occupied by the Van Der Waals radius of the molecule. Green corresponds to neutral, blue corresponds to the strongest negative electrostatic potential and red corresponds to the strongest positive electrostatic potential. Taken from Blackburn et al. (2007).
In an ethanol-water solution no precipitate was formed on addition of
PAMAM dendrimer to CHG. No precipitate was formed for 3 months within a 50:50
water: ethanol vehicle, therefore this was the chosen vehicle for the co-dose
application. The recovery of CHG was determined for a variety of PAMAM
dendrimer concentrations under occluded and unoccluded conditions (Table 6.2).
At a skin surface temperature of 32°C ± 1°C under occluded conditions the

321
recovery of CHG was comparable to that of the control where PAMAM dendrimer
was absent (~10-20 % loss of CHG). The ~15 % loss of the dosed CHG in the
control solution without the PAMAM dendrimer (in occluded conditions) may be
due to degradation of the compound in light at 32°C ± 1°C. It is unlikely that such a
high loss of CHG would occur solely from adsorption on to the glass surface of the
vial. The lowest percentage recovery of CHG was at the higher 10 mM PAMAM
dendrimer concentration, but it was observed that the formulation had turned a
pearlescent white colour indicating precipitation of a constituent. Perhaps the
semi-solid formulation appeared pearlescent due to the dispersion of particles of
the incompatible polymer (excess G3-PAMAM-NH2 dendrimer) (Lu, 1986).
Under unoccluded conditions a low recovery of CHG was achieved for the
control corresponding to 2 % CHG (w/v) in an ethanol: water (50:50) vehicle. Only
34.44 ± 3.33 % of the dosed CHG was recovered at 24 h which was likely due to
evaporation of the vehicle at 32°C ± 1°C resulting in precipitation of CHG. Under
unoccluded conditions a higher concentration of CHG was recovered from the
CHG-PAMAM dendrimer formulations than from the control without the addition of
PAMAM dendrimer. For example, the addition of 0.5 mM PAMAM dendrimer to
2 % CHG (w/v) significantly enhanced (p<0.05) the percentage recovery of dosed
CHG by ~25 % (Figure 6.7). The extremely hygroscopic PAMAM dendrimer
possibly extracted atmospheric moisture allowing a higher concentration of CHG
to be dissolved within the hydrated PAMAM dendrimer layer rather than precipitate
into an insoluble salt or the CHX base.
It was established that the interaction between CHG and G3-PAMAM-NH2
dendrimer did not have synergistic nor antagonistic effects on the antimicrobial

322
efficacy of CHG. The calculated IC50 against S. aureus for the CHG-PAMAM
dendrimer was only 0.001 µg/mL higher than for the calculated IC50 for CHG in the
same water: ethanol (50: 50) vehicle. Therefore the PAMAM dendrimer does not
inhibit or enhance the antimicrobial efficacy of CHG in a co-formulation. The
PAMAM dendrimer did not enhance the antimicrobial efficacy of CHG because the
IC50 of CHG (0.056 µg/mL, 95 % CI: 0.02582-0.1212 µg/mL against S. aureus) is
much lower than the IC50 of G3-PAMAM-NH2 dendrimer (9.374 µg/mL 95 %
CI: 7.88-11.15 µg/mL against S. aureus within an ethanol:water vehicle). PAMAM
dendrimers have been observed to enhance the antimicrobial efficacy of silver
sulfadiazine (Strydom et al. 2012). This may be due to the biocide having a much
higher IC50 than the PAMAM dendrimer; silver sulfadiazine was shown to have an
IC50 of 85 µg/mL against S. aureus (Maple et al. 1992). Thus after the addition of
the PAMAM dendrimer, that has a calculated IC50 of 9.374 µg/mL (see Section
2.2.1), to the silver sulfadiazine it is not unexpected that the dendrimer would
enhance the antimicrobial efficacy.
The co-formulation was applied to porcine skin to determine whether the
PAMAM dendrimer would still act as a permeation enhancer of CHG when applied
in a one-step application as opposed to a skin pre-treatment. Previously in Section
6.2.6 it was shown that G3-PAMAM-NH2 enhanced the recovery of CHG under
unoccluded conditions. This was also observed after the co-dose formulation had
been applied to porcine skin in vitro for 24 h, though there was still a 37- 45 % loss
of CHG across all 3 PAMAM dendrimer concentrations. Without the presence of
PAMAM dendrimer there was ~49 % of the dosed CHG that was not recovered.
This is very low compared to the ~75-85 % of dosed CHG recovered after a
PAMAM dendrimer pre-treatment in sections 3.3.0 and 3.3.1 The low percentage
323
recovery of CHG may be due to a number of reasons; there is the possibility that
an increase in the permeation of CHG occurred within the epidermis due to the
penetration enhancement effects of the ethanolic vehicle and possibly due to the
action of the PAMAM dendrimer. The extraction procedure may not have been
effective in extracting CHG from the deeper layers of the porcine epidermis
therefore resulting in a reduction of CHG recovery and an underestimate of the
CHG concentration within the epidermis. Another possibility for the loss of CHG
could be that once the ethanol: water vehicle had evaporated, the interaction of
CHG with the PAMAM dendrimer in aqueous solution caused the loss of the
digluconic acid from the CHG resulting in the insoluble crystalline precipitate of
oxocarbon anion associated with the CHX base (Figure 4.16). This precipitate
would therefore be syringe filtered out and discarded before HPLC analysis
resulting in a high loss of applied CHG. This is also consistent with the recovery
values observed in Table 6.2 where the available CHG (after addition of PAMAM
dendrimer in unoccluded conditions) was found to approximately half the dosed
CHG concentration. It should be noted however that ~1 % CHG solution (w/v)
does still exhibit strong antimicrobial effects.
The one-step co-application did result in an increase in the concentration of
CHG within the skin for 0.5 and 10 mM G3-PAMAM-NH2 dendrimer (Figure 6.9). A
10 mM PAMAM dendrimer co-treatment with CHG resulted ~3 fold increase of
CHG within the epidermis that was statistically significant when compared to CHG
dosed alone (p<0.05). A high variability was observed for the 0.5 and 1 mM
PAMAM dendrimer-CHG formulations. This may be due to the inherent variability
between the two porcine donor skins utilised within the study. Another possible
explanation for the high variability may be due to the vehicle evaporating from the
324
skin at different rates (forming an unstable saturated solution) therefore leaving the
CHG and PAMAM dendrimer to form an insoluble salt at different time points.
Speculatively, perhaps the significant increase (p<0.05) of CHG within the
epidermis after a 10 mM G3-PAMAM-NH2- CHG co-application was due to the
PAMAM dendrimer acting as an anti-nucleant polymer. It is possible that the
10 mM PAMAM dendrimer solution retarded the formation of crystal growth for
longer as the vehicle evaporated from the skin. This would allow a prolonged time
frame for the CHG to permeate the skin compared to CHG dosed alone from an
ethanolic vehicle before the saturated solution becomes unstable. Perhaps the
saturated solution (caused by evaporation or skin absorption of the ethanolic
vehicle), which the 10 mM PAMAM dendrimer solution prolonged the stability of,
enhanced the flux of CHG into the skin due to the formulation possessing a high
thermodynamic activity (Kemken et al. 1992). This has been observed previously
for piroxicam in supersaturated solutions whereby HPC prevented the formation of
pseudopolymorphs such as the hydrate form of the drug that is less stable than
the anhydrous form in aqueous solution. The addition of the HPC within the
saturated solutions was shown to enhance the drug’s flux concentrations in vitro
using excised human skin as a membrane (Pellet et al. 1997).
A concentration increase of 564.487 µg/cm2 of CHG within the skin was
recorded for the 0.5 mM G3-PAMAM-NH2 dendrimer-CHG formulation when
compared to the CHG dosed alone. This however was not statistically significant
due to the high variability observed between each of the diffusion cells as
previously mentioned. There was no significant increase in the concentration of
CHG after a co-treatment with PAMAM dendrimer within the receptor fluid at 24 h

325
when compared to the control (Figure 6.10). The 10 mM-PAMAM-NH2 –CHG
formulation resulted in the highest CHG concentration within the receptor fluid at
24 h (17.980 ± 2.407 µg/mL) that was a marginal increase compared to CHG
dosed alone (9.100 ± 2.087 µg/mL). The concentrations of CHG detected within
the receptor fluid would still exhibit considerable antimicrobial inhibitory effects
(Odore et al. 2000).
The aim of the PAMAM dendrimer skin treatment is to increase the CHG
deposition within the skin to enhance the antiseptic’s efficacy. The CHG
concentrations detected within the epidermis were much lower for the co-treatment
than for the pre-treatment concentrations detailed in Chapter 3. For example when
comparing the no PAMAM dendrimer controls, the physiological saline pre-treated
skin followed by application of CHG 2 % (w/v) in aqueous solution resulted in
1030.668 ± 130.017 µg/mL of CHG within the epidermis whereas the CHG co-
treatment control (CHG dosed in a 50:50 ethanol: water vehicle) resulted in a CHG
concentration of 211.370 ± 33.189 µg/mL of CHG within the epidermis. The 24 h
pre-treatment of physiological saline before the addition of the CHG may have
contributed to the ~ 5 fold increase in CHG within the epidermis. Another possible
explanation for the increase may be due to the difference in vehicle that the CHG
is applied to the skin within. Karpanen et al. (2009) observed a significant
reduction (p=0.008) in the permeation of CHG within excised human full thickness
skin when CHG was delivered from a 70 % isopropanol vehicle when compared to
CHG delivered from an aqueous vehicle. Though alcohols are considered a
penetration enhancer (Benson, 2005) it appears that CHG permeates the skin in a
higher concentration when applied in an aqueous vehicle compared to an alcohol-
aqueous vehicle.

326
When developing a formulation inclusive of CHG it is important to first
consider the large number of CHX incompatible materials that would typically be
used within topical formulations. Chlorhexidine is considered to be compatible with
cationic materials such as PAMAM dendrimers but as observed in Section 6.2.1
compatibility is dependent on the vehicle and the nature of the second cationic
species (Denton, 2000). CHG is inactivated in the presence of non-ionic
surfactants and may form insoluble salts with inorganic anions including
phosphates and chlorides, carbonates, nitrates, sulphates and dyes. It is also
incompatible with organic anions, due to micelle formation, that includes many
soaps, sodium carboxymethyl cellulose, tragacanth and alginates (Larson, 1988).
Within a formulation CHG must retain its antimicrobial efficacy and not become
neutralised by incompatible detergents or anions.
A number of formulations were developed including a cream, lotion and
hydrogel however based on the skin feel, aesthetics, stability of CHG and
ultimately PAMAM dendrimer within the formulation, an alcohol hand gel was
chosen as an ideal formulation. PAMAM dendrimers are more stable long term in
ethanol than water (according to manufacturer’s specification) and ethanol also
has the advantage of being antimicrobial in its own right. Alcohol gels are also
readily accepted in the healthcare sector for use as an antiseptic (Larson et al.
2006) and have been used to reduce HCAIs within hospital wards (MacDonald et
al. 2004, Bischoff et al. 2000 and Girou et al. 2002). Alcohol gels are cost effective
(Johnson et al. 2005) and low risk with regards to contamination when compared
to other topical antiseptic strategies (Kampf et al. 2005). Alcohol gels have been
shown to be better tolerated and have even been used to reduce dermatitis

327
caused by antiseptic soaps (Pittet et al. 2000, Jungbauer et al. 2004 and Newman
and Seitz, 1990).
A range of alcohol gels were developed with HPC (hydroxypropyl cellulose,
~100,000 mw) as it is a cellulose derivative that has shown to be compatible with
CHG and is typically used in synergy within toothpastes (Lehmann, 2000).
Hydroxyethyl cellulose (HEC) has also been shown previously using Raman
spectroscopy to solubilise the protonated CHX (dication) that was a consequence
of protonation caused by a second polymer, polycarbophil within an aqueous
semi-solid formulation (Jones et al. 2000). The first variable to be optimised was
the concentration of ethanol. Formulations with a high ethanol concentration
possess the highest antimicrobial efficacy (i.e. 70-90 %), with the exception of
absolute ethanol (Kramer et al. 2002). At a concentration of 80 % and 75 %
ethanol the formulation turned cloudy on addition of HPC and CHG, even after
stirring for 24 h at 200 RPM followed by a 15 minute period of vigorous shaking in
a mixing mill, the CHG and HPC did not fully dissolve. Therefore the optimal
concentration of ethanol was determined to be 70 % as the CHG and HPC had
fully dissolved. This would be considered the lowest concentration that would be
considered an effective against a broad spectrum of microorganisms (Reynolds et
al. 2006). The consistency and viscosity are important parameters for a topical gel
in terms of acceptability by consumers (whether that be patients or healthcare
workers) and antimicrobial efficacy. It has been shown that antimicrobial activity is
lower for alcohol gels when compared to alcohol liquids due to the lower
concentration of ethanol within the formulation as a result of the inclusion of a
thickener (Pietsch, 2001). A thickener system may also inhibit the release of
alcohol in turn reducing the antimicrobial efficacy of the formulation (Maiwald,

328
2008 and Guilhermetti et al. 2010). It is for this reason that a number of
formulations were produced with a range of HPC concentrations (Table 6.8).
Further, to improve the perceived feeling of the formulations glycerol, a known
humectant that hydrates the skin, was incorporated as well as dimethicone.
Formulations including dimethicone were not used due to incompatibility as an
unknown gas effervesced from the sample.
The appearance of all formulations was determined by visual inspection; all
were transparent, free from particulates and fibres. All formulations had a strong
alcohol odour. The formulations was applied to the skin and unexpectedly after
evaporation of the solvents (ethanol: water) a transparent and flexible film formed
across the skin surface within 30-60 seconds of application (after physically
rubbing a thin layer of the formulation across the skin). The film formed containing
glycerol within the formulations was tacky and not agreeable with regards to
acceptability by a consumer. After a further patent search it was reported that HPC
is an ideal viscosifying agent that retards the evaporation of alcohol thus
increasing the exposure time to microorganisms. The formulations were described
as evaporation-stabilised (White, 1994). Also reported was an antimicrobial film
formation for the prevention of surgical site incision infections. The formulations
incorporated CHG and ethyl cellulose which was shown to interact and form a
plasticiser, CHG has a strong affinity for cellulose and its derivatives. The resulting
films that had formed were antimicrobial, allowed for TEWL and were ductile,
smooth and flexible (Khan and Hoang, 1998). An advantage of the CHG-HPC film
is that it is easily removed from laundry and would not decolourise and stain on
contact with sodium hydroxide which is a significant problem for the healthcare
laundry sector. The film-forming compositions developed within this chapter were

329
found to be covered by a patent however until this chapter there have not been
studies investigating the permeation of CHG from the films into skin.
The pH of all the formulations was determined to ensure compatibility with
the skin. The SC is described as an ‘acid mantle’ as the pH of the skin surface is
around 4.5-5.3 that increases with increasing depth into the SC (Fluhr and Elias,
2002). It is important the pH of the skin is not altered as the acidic pH plays an
integral part in the antimicrobial barrier of the skin (Schmid-Wendtner and Schmid-
Wendtner, 2007). The pH of the formulations varied from the highest being 7.787 ±
0.02 for formulation F to 5.517 ± 0.14 the lowest pH detected that corresponds to
formulation F4. Formulations F4 and F5 had a pH of around 5.5 which would be an
ideal and compatible pH for a topical skin preparation.
The spreadability of a formulation is an important factor not only in terms of
sensation upon application but also so that a user can spread an even layer
across the skin for optimal drug delivery (Garg et al. 2002). Acceptability of a
semisolid formulation is based upon a range of characteristics including;
greasiness, appearance, odour, stickiness, spreadability and sensation on
application (Barry and Grace, 1972). Efficacy and ultimately the success of a
semisolid formulation are also based on rheological properties, spreadability and
bioadhesion (Jones et al. 1997). Cellulose polymers such as HPC, sodium
carboxymethyl cellulose (Na CMC) and hydroxyethyl cellulose (HEC) exhibit a
range of excellent bioadhesive, textural and viscoelastic properties (Jones et al.
1997). The spreadability was measured to ensure the formulation’s behaviour was
optimised with a compromise between viscosity and thus retention upon the skin
for drug delivery but also spreadability and the stiffness of the formulation texture.

330
Measuring spreadability of a formulation upon skin is very difficult because
individuals apply a different pressure or motion on application however a parallel
plate method can be used to approximate the spreadability of a semisolid
formulation (Vennat et al. 1998 and Vennat et al. 1995). A simple study was
conducted as described elsewhere whereby the diameter of the spread was
measured under experimental conditions and interpreted against the following
terms; Φ >70 mm corresponds to a fluid gel, 70 > Φ > 55 mm would be classed as
a semi fluid gel and 55 > Φ > 47 mm a semi stiff gel (Lardy et al. 2000). All
formulations were classified as fluid gels with the exception of F4 and F5 that are
classified as semi-fluid gels. The gels were easy to spread across a volunteer’s
skin (the author) and high coverage and distribution was achieved. The
spreadability diameters were significantly different from one another depending on
the ethanol and HPC content and the inclusion of glycerol (p<0.05).
The available concentration of CHG within the formulations (to investigate
CHG concentration and uniformity) was determined by extracting CHG from 1 g of
each formulation as it is known that CHG interacts with HPC to act as a plasticiser
(Khan and Hoang, 1998). Across all formulations there was ~14 % deficit of CHG
not recovered from the formulation though a formulation inclusive of 1.72 % CHG
would still exhibit a strong antimicrobial effect. A percentage recovery of CHG from
a control formulation that did not include HPC yielded a CHG recovery at 94.48 ±
0.51 %. This suggests that the CHG-HPC interaction does not alone affect the
extraction of CHG from the formulations but that it may be due to adsorption on to
glass or ineffective extraction of CHG from formulation. The CHG concentration
and uniformity of the gels were comparable across all formulations as there was
no difference in CHG recovery as a function of formulation (p>0.05). The CHG

331
recoveries observed from the film formulations are comparable to that
demonstrated elsewhere from carbohydrate based films where the recovery of
CHG was between 76 – 87 % of applied dose (Shafiullah, 2005).
A formulation under an applied shear stress flow will occur at a shear
rate that is determined by the viscosity and/or the rheology (Morrison, 2001). The
gel formulations exhibited non Newtonian behaviour which means that there was a
non-linear relationship between the shear stress and the shear rate (Figure 6.11).
Table 6.13 shows the viscosity of formulation F(a) but as the formulations exhibit
non-Newtonian behaviour, the viscosity is not an absolute constant and
instantaneously changes depending on the shear conditions. The viscosity is not
an absolute constant and instantaneously changes depending on the shear
conditions. The viscosity of the formulations showed shear thinning, with viscosity
decreasing as the shear rate was increased. The viscosity modifier used in the
formulation was hydroxypropyl cellulose (HPC) polymer, which been shown
by Paradkar et al. 2009 to possess shear thinning properties. The process of
shear thinning was described by Osswald as a reduction of the entanglement of
the polymer chains as the shear force aligns them, allowing them to pass over one
another more readily and thus reducing the viscosity (Osswald, 1998). The
rheology of the HPC-CHG semi-solid formulations could not be fully characterised
as there was only a viscometer available for use.
The gel formulation’s antimicrobial efficacy was determined using a
modified agar cup method against three opportunistic pathogens (Orafidiya et al.
2001 and Wannachaiyasit and Phaechamud, 2010). The agar cup method
determines the diffusivity of an antimicrobial component from a topical preparation
332
added to a bore within standardised MHA (Figure 6.12). A zone of microbial
inhibition can be observed and the concentration of the antimicrobial compound
decreases logarithmically until a point is reached where bacterial growth occurs
(Bhende and Spangler, 2004). The zone of inhibition whereby the presence of
CHG is high enough to prevent microbial growth was measured in triplicate for
each formulation. All formulations were antimicrobial against the three
opportunistic pathogens tested; S. aureus, E. coli and P. aeruginosa. The zones of
inhibition were similar across all formulations and all bacteria were susceptible to
the formulations. The results indicate that CHG is not inactivated within the
formulations and still exhibits a strong inhibitory effect against Gram negative and
Gram positive bacteria.
The modified agar cup method is not suitable for measuring the
antimicrobial efficacy of instantaneous biocides such as alcohol solutions. As
Table 6.14 shows for the control and commercially available alcohol gel, the
alcohol had evaporated from the agar as opposed to diffusing through it so that it
does not inhibit microbial growth. The agar cup method is semi quantitative as with
the disk diffusion method as it is likely that the zone of inhibition is an
underestimate of the inhibitory effect of CHG. This is because of the presence of
inorganic components within the agar required by microorganisms for growth, such
as casein that contains calcium, phosphorous (Anon, 2013) and anionic
agaropectin chains within the agar (Samiey and Ashoori, 2012) that may be
incompatible with CHG. Further, the agar cup assay relies on the ability of the drug
to diffuse through the agar.

333
The interaction between CHG and HPC within the ethanolic formulation
was investigated using ATR-FTIR. It was observed that peaks corresponding to
CHG, notably the region at 1492-1533 cm-1 attributed to the chlorophenyl group,
are dramatically reduced in intensity and the peak shapes had altered on contact
with HPC. It has been reported that CHG binds to cellulosic material (Khan and
Hoang,. 1998) and as discussed below the interaction and affinity of CHG to the
HPC results in no permeation of CHG into the SC (see section 6.2.9.7). The strong
sorption of CHG to cellulose materials is because of electrostatic interactions
between the amine groups of CHG and the carboxylic acid groups of the cellulose
and in minor contribution, hydrogen bonding between the biguanide residues and
the para-chlorophenyl moieties of CHG with the hydroxyl groups of the cellulose
(Blackburn et al. 2007). The same authors also determined that at a high CHG
concentration there is evidence of monolayer and bilayer aggregation upon
cellulosic materials. The electrostatic and hydrogen bonding interactions between
CHG and HPC was likely to have caused the C=N stretching peak shift. The C=N
bonds on the biguanide moiety are protonated due to the electron withdrawing
nature of the para-chloropheynl group and is therefore the most likely site for
electrostatic interaction with the carboxyl groups of the cellulosic material HPC. A
minor contribution of the interaction is between the 4-chlorophenyl group and the
hydroxyl groups of the HPC (Yoshida forces) (Blackburn et al. 2007). The C-Cl
stretching observed in Figure 6.13 (a) for the free CHG is masked by the dominate
C-O stretch from the ethanol within the formulation therefore this interaction was
not evident ATR-FTIR spectrum.

334
After characterisation of the formulations they were then applied to porcine
dermatomed skin and a tape stripping assay was conducted to determine the
permeation of CHG within the skin from the films. Formulation 4(a), 5 and 6(a)
were chosen for the studies and after application of the topical gels to the porcine
skin it was noted that a thick film deposited across the skin surface after
evaporation of the vehicle. At 24 h a 10 mL wash (2 mL aliquots) of ultra-pure
water was agitated across the surface of the films in an attempt to remove any
excess drug not absorbed within the skin. Previously, for all other skin studies the
highest concentration of CHG was recovered from the 24 h wash (typically >50 %
of dose applied). For formulation 4(a) and 6(a) only ~5 % of the dosed CHG was
recovered from the 24 h wash and ~9 % of the applied CHG was detected within
the formulation 5 wash. This suggests that the CHG-HPC film formed strongly
retains the CHG. The highest concentration of CHG was extracted from the films
that were previously washed then prised from the skin surface using tweezers. It
was noted that on removal of the film superficial layers of the SC were also
removed because they adhered to the underside of the film.
Around a third of the dosed CHG was recovered from the glass donor
chamber. The reason for the high concentration associated with the donor
chamber was because the film had strongly adhered to the glass. Removal of the
film from the glass was only possible after the donor chamber was dissolved in
HPLC mobile phase as an extraction solvent overnight. No CHG was detected on
the tape strips removed from the SC or the remaining epidermis/dermis across all
three formulations. Further, no CHG was detected within the receptor fluid. The
data presented in Tables 6.15-17 indicates that the CHG is strongly associated
with HPC within the film adhered to the superficial layers of the SC. No CHG had
335
permeated into the SC and was thus confined to the skin surface interface. The
film forming alcohol gels did not enhance the deposition of CHG within the upper
skin strata but would have potential benefits for surgical incision antisepsis. The
antimicrobial film-forming formulations developed within this chapter would form a
‘breathable’, flexible and transparent protective layer from transient
microorganisms. The antimicrobial film could prevent skin infections by offering an
antimicrobial barrier to the colonisation of transient pathogens.
Previously, Khan and Hoang (1998) incorporated pluronic surfactants
within the film forming formulation (containing HEC) that aided the release of CHG.
Non-ionic surfactants although not incompatible can reduce the antimicrobial
efficacy of antiseptics depending on concentration and surfactant type (Denton,
1991). The next step in this study would be to add in a CHG compatible non-ionic
surfactant and test to determine if the surfactant added reduces the efficacy of
CHG. Once an optimised formulation is developed and fully characterised,
including measuring the tensile strength etc., then the PAMAM dendrimer may be
added and experiments could then be conducted into the stability, compatibility
and CHG release once applied to the skin in future work. Speculatively, perhaps
the polycationic PAMAM dendrimer would interact with the HPC becoming
immobilised within the film allowing for the skin permeation of CHG.
336
6.4 Conclusion
The objective of this chapter was to characterise the interaction between
CHG and G3-PAMAM-NH2 dendrimer. It was discovered that the choice of solvent
was an important factor with regards to instilling stability within the co-formulation.
The antimicrobial activity of CHG was not altered when combined with the
G3-PAMAM-NH2 dendrimer. It was observed that the co-application of
G3-PAMAM-NH2 dendrimer-CHG enhanced the deposition of CHG within the
upper skin strata. This has the potential to increase the contact between the
antiseptic and bacteria and, as such, increase the effectiveness of skin antisepsis.
The characterisation of the drug-dendrimer interactions may help to design more
efficient topical drug delivery platforms. A range of cosmetically acceptable
formulations were investigated for the co-application of the antiseptic and
dendrimer. Whilst these were not ideally suitable for the topical delivery of CHG,
they may well have significant potential as an effective approach in the prevention
or treatment of surgical site infections.
337
7.0 Conclusions and general discussion
7.1 Summary of findings
It has been shown within this thesis that PAMAM dendrimers are a novel
topical drug delivery platform of the model antiseptic, chlorhexidine digluconate.
The aims and objectives of my research have been addressed within this thesis
and are briefly summarised below.
Firstly, this investigation has established that PAMAM dendrimers are
antimicrobial without complexation or conjugation to a conventional antimicrobial
compound and that the mechanism of action is most likely due to bacterial
membrane permeabilisation/disruption (Chapter 2). In addition, PAMAM
dendrimers have been shown to enhance the permeation of CHG within porcine
skin by either skin pre-treatment or by co-application of CHG within a hydro-
ethanolic vehicle (Chapter 3 and 6). The mechanisms of action of the dendrimer-
enhanced penetration enhancement effect have been investigated. The effect is
likely to be multifactorial, including perturbation of intercellular lipids and hydration
of the stratum corneum (SC) (Chapter 4). Further elucidation of the dendrimer’s
action on the skin is required.
The key findings of this thesis include the confirmation that PAMAM
dendrimers are antimicrobial in their own right against the opportunistic skin
pathogens Staphylococcus aureus and Escherichia coli. The dendrimer’s
antimicrobial efficacy was shown to increase with increasing concentration and
also increases with increasing PAMAM dendrimer generation i.e. the number of
amine surface groups. SEM micrographs and cell membrane integrity studies
demonstrated that the mechanism of action of PAMAM dendrimers was severe

338
membrane permeabilisation and cell membrane disruption (Chapter 2). This was
shown to lead to leakage and precipitation of the bacterial cells’ cytoplasmic
contents resulting in inhibition and, in bactericidal concentrations, cell death. The
inner membrane permeabilisation assay was used to discover that the PAMAM
dendrimers’ effect was once again not only concentration dependent but also
generation dependent. G3-PAMAM-NH2 and G5-PAMAM-NH2 possessed a very
similar inner membrane permeabilisation effect that is due to a compromise
between the number of surface amine groups and molecular size and weight for
ease of diffusion into the bacterial cells. The inner membrane permeabilisation
assay also confirmed that PAMAM dendrimers diffuse within the bacterial cell after
reducing the integrity of the cell membrane.
This thesis has also established that a PAMAM dendrimer pre-treatment
significantly enhanced the permeation and deposition of the antiseptic CHG within
porcine skin compared to CHG pre-treated with physiological saline. An increase
in the concentration and depth of permeation of CHG within the skin will increase
the contact between the biocide and the flora within the skin layers. Disinfection of
deeper layers of the skin strata, as opposed to just the superficial layers of the SC,
as observed for conventional antiseptics, would reduce the microbial load of the
skin. The strategy to reduce the bio-burden of the skin through more effective
antisepsis may have considerable benefit to reduce the incidence of skin and soft
tissue infections.
It was observed that PAMAM dendrimers did not incite any major changes
in the skin integrity that significantly altered the TEER or TEWL measurements
that are indicative of significant damage to the barrier properties of the skin. The

339
ATR-FTIR analysis did however suggest that the PAMAM dendrimers may perturb
the intercellular lipid packing and organization due to observed peak shifts. The
suggested ultrastructural alterations such as lipid disorder within the SC barrier
were attributed to the presence of the PAMAM dendrimers (both G3-PAMAM-NH2
and G3.5-PAMAM-COOH) as made evident by the ATR-FTIR spectra.
Speculatively, this mechanism may be reversible on removal of the PAMAM
dendrimer as their size and charge retards their permeation into the skin resulting
in a transient effect. OCT imaging revealed that PAMAM dendrimers
(G3-PAMAM-NH2 and G3.5-PAMAM-COOH) temporarily reduced the attenuation
of light on the skin, for example through a reduction in the back-scattering of light
at the SC-air interface. This change in the optical characteristics at the air-skin
interface was shown to be temporary. A transient penetration enhancement effect
would be ideal as to not cause significant skin barrier impairment that may allow
for the ingress of other toxic xenobiotics or micro-organisms. Further
experimentation may determine if the temporary nature of the optical properties at
the SC-air interface transpires as a temporary penetration enhancement effect.
The OCT results also suggest that the PAMAM dendrimers are not evenly
distributed across the skin surface but accumulate within furrows and pores.
Future investigation into whether there are any changes in surface tension after
application of CHG with the PAMAM dendrimer would aid understanding of
deposition of the PAMAM dendrimer across the skin surface. The OCT images
suggest that PAMAM dendrimers (nanoparticles that are 3.6 nm in diameter) may
preferentially accumulate within the undulations of the skin. This effect after
application of PAMAM dendrimers to the skin has been previously observed using
confocal microscopy (Venuganti et al. 2011). The skin appendages act as a
340
bacterial reservoir (Selwyn and Elias, 1972) therefore accumulation of
antimicrobial dendrimers (observed with Chapter 2) within these follicles, pores
and furrows will aid skin disinfection. The PAMAM dendrimers may also be
exploited for the delivery of other drugs to the follicles such as anti-acne drugs,
anti-fungal drugs or hair re-growth drugs.
A novel ToF-SIMS method was developed to chemically map the
distribution and localisation of a topically applied drug within the skin. The ToF-
SIMS method was used to characterise the distribution of CHG once applied to the
skin and also to visualise and measure the enhanced permeation of CHG following
PAMAM/dendrimer skin pre-treatment. The ToF-SIMS images supported the
observations in the quantitative Franz cell studies with porcine skin and the in vitro
skin tape stripping studies. All the evidence gained within this study supports the
hypothesis that the PAMAM dendrimer acts as a penetration enhancer for CHG.
During the co-dose formulation development investigations a
microcrystalline precipitate formed on addition of CHG to a PAMAM dendrimer
solution. The crystals were fully characterised by MALDI-ToF and single crystal
XRD. It was found that in aqueous solution PAMAM dendrimers scavenge the
gluconic acid resulting in a carbon anion-CHX hydrate precipitate. It was
discovered that PAMAM dendrimers and CHG were stable when co-applied in a
hydro-ethanolic vehicle. The co-application of CHG and PAMAM dendrimers
enhanced the permeation of CHG within porcine skin. The degree of permeation
enhancement was found to be dependent on the PAMAM dendrimer’s
concentration within the co-dose formulation (Chapter 6). The only statistically
significant enhancement of CHG permeation within the epidermis (for the
341
co-application) was observed for the highest PAMAM dendrimer concentration
(10 mM G3-PAMAM-NH2). A series of hydro-ethanolic gel formulations were
developed with the ultimate aim of incorporating the co-application of CHG with
PAMAM dendrimers after optimisation. Antimicrobial film-forming alcohol gels
(without the presence of PAMAM dendrimers) were characterised and optimised
that would have potential use in pre-surgical incision skin disinfection.
7.2 Implications of research and future work
The implications of specific findings of this project have been discussed
within each relevant chapter. A number of the novel findings of the thesis
potentially have broader implications for topical drug delivery and the wider
Healthcare sector which will be discussed further. PAMAM dendrimers have been
used previously as drug carriers for topical or transdermal drug delivery for a very
limited range of therapeutics (Sun et al. 2012). The results presented within this
thesis investigate their use as a novel topical delivery platform for CHG. For this
reason, the permeation enhancement effect is seen in co-dosing but is not
specifically dependent on the drug-dendrimer interaction as the research within
this thesis has also shown that as a skin pre-treatment, PAMAM dendrimers
enhanced the penetration of subsequently applied CHG within the skin. This
illustrates a physical enhancement effect (and possibly a depot effect) due to
modulation of the superficial layers of the SC and not as a result of drug-dendrimer
interactions. It is therefore expected that a PAMAM dendrimer skin pre-treatment
will enhance the permeation of a vast range of topically applied therapeutics
including antimicrobial compounds.

342
There is also very little evidence that PAMAM dendrimers permeate the SC.
No evidence was observed for this within this thesis and it is suspected that this
limited permeation is due to the dense surface charge and the high molecular
weight of the PAMAM dendrimers. This would be an ideal property for a
penetration enhancer to possess so that irritation and toxicity problems are
avoided.
When synthesising any dendritic architecture inclusive of PAMAM
dendrimers there is great scope to tailor and functionalise the nanoparticles for
sustained and targeted release. For example, an anti-cancer dendritic pro-drug
comprising of G5-PAMAM-NH2 dendrimer functionalised with fluorescein
isothiocyanate (FITC) for fluorescent imaging, folic acid as an active targeting
ligand and the anti-cancer drug methotrexate for therapeutic effect were previously
designed (Gurdag et al. 2006). This pro-drug system was designed for injection
though there is scope for the pro-drug system to be exploited for topical and
transdermal drug delivery. For example the OCT data within this thesis showed
that the PAMAM dendrimers may accumulate within the undulations and pores of
the skin. This could be used as a passive targeted drug delivery mechanism to the
hair follicles. Additionally, a fluorescent tag conjugated to the PAMAM dendrimer
would enable visualisation of the complexed or conjugated dendrimer-drug’s
localisation and distribution. Further, esterase enzymes are distributed throughout
the SC and the viable epidermis (Lau et al. 2012 and Morris et al. 2009). The
resulting hydrolysis of esterase linkages once the dendrimer pro-drug had been
topically applied could be exploited to cleave the drug from the dendritic carrier
after distribution within the hair follicles or across the skin surface.
343
Drug-dendrimer interactions such as those that increase the solubility of a
drug may be responsible for an enhancing effect, as well as physical effects such
as perturbation of the intercellular lipid packing (as observed within the ATR-FTIR
work within this thesis). Further work would be required to fully elucidate the
multiple factors involved with regards to the PAMAM dendrimer’s skin penetration
enhancement effects. One approach could include investigations to delineate the
interactions of PAMAM dendrimers with SC lipids using atomic force microscopy
(AFM) and differential scanning calorimetry (DSC). These methods would further
clarify the dendrimers’ interactions with SC lipids. Elucidation of the mechanism of
action is imperative to optimise the design of synthetically tailored dendrimers
aimed at improving topical and transdermal delivery.
For a one step co-application of PAMAM dendrimers with CHG, a range of
hydro-ethanolic gels were first developed. It was discovered that due to the
electrostatic interactions and to a lower extent, hydrogen bonding between HPC
and CHG, no CHG was detected within the SC. The CHG was retained within the
films that had formed across the skin surface. Though the designed films were
shown to be unsuitable for the topical delivery of CHG they have the potential for
widespread application in forming an antimicrobial skin barrier prior to surgical site
incisions. It would also be of interest to investigate whether addition of the PAMAM
dendrimer in the film-forming formulation would react with the HPC instead of the
CHG to allow it to permeate into the upper skin strata. Whether or not the PAMAM
dendrimer would still act as a penetration enhancer whilst immobilised within a
polymeric film on the skin surface would also require further experimentation.
Once a formulation for the co-application had been determined and optimised it
would be of interest to perform a bioequivalence test to ascertain the efficacy of

344
the formulation containing PAMAM dendrimer against a commercially available
formulation.
The ToF-SIMS method used CHG as a model drug in this instance and as
such this method may be applied to a vast range of topically applied compounds.
This method would have significant benefits in determining whether pesticides on
contact with skin would permeate to the depth of the microcirculation of the viable
epidermis. This could conclude to a high sensitivity (femtomolar detection limit) as
to whether a pesticide would be available for systemic absorption. Further, the
method could also be utilised to determine the distribution of other topically applied
compounds and to reveal any co-localisation with specific biomolecules.
Information such as affinity for particular biomolecules and distribution within the
different histological tissue compartments can aid elucidation of mechanisms of
action. As such, more effective formulation strategies or physiochemical
alterations to drugs could be employed in light of such valuable chemical
distribution information. As ToF-SIMS also detects secondary ions from
endogenous biomolecules it would also be of interest to investigate biopsied skin
due to a range of pathologies and compare them to that of healthy skin. Chemical
distribution maps may aid characterisation of pathological conditions such as basal
cell carcinoma or psoriasis that could support the investigation into treatment or
prevention of such skin diseases.
The novel findings within this thesis, notably that the PAMAM dendrimer
acts as an effective topical biocide delivery platform and the ToF-SIMS method
developed to image this, have the potential for widespread biomedical
applications. One area that is clearly important in healthcare institutions is

345
effective antisepsis to reduce the incidence of skin and soft tissue infections. More
effective treatment regimes, including the approaches described in this thesis,
could have a positive impact on morbidity and mortality rates due to hospital-
acquired infections.
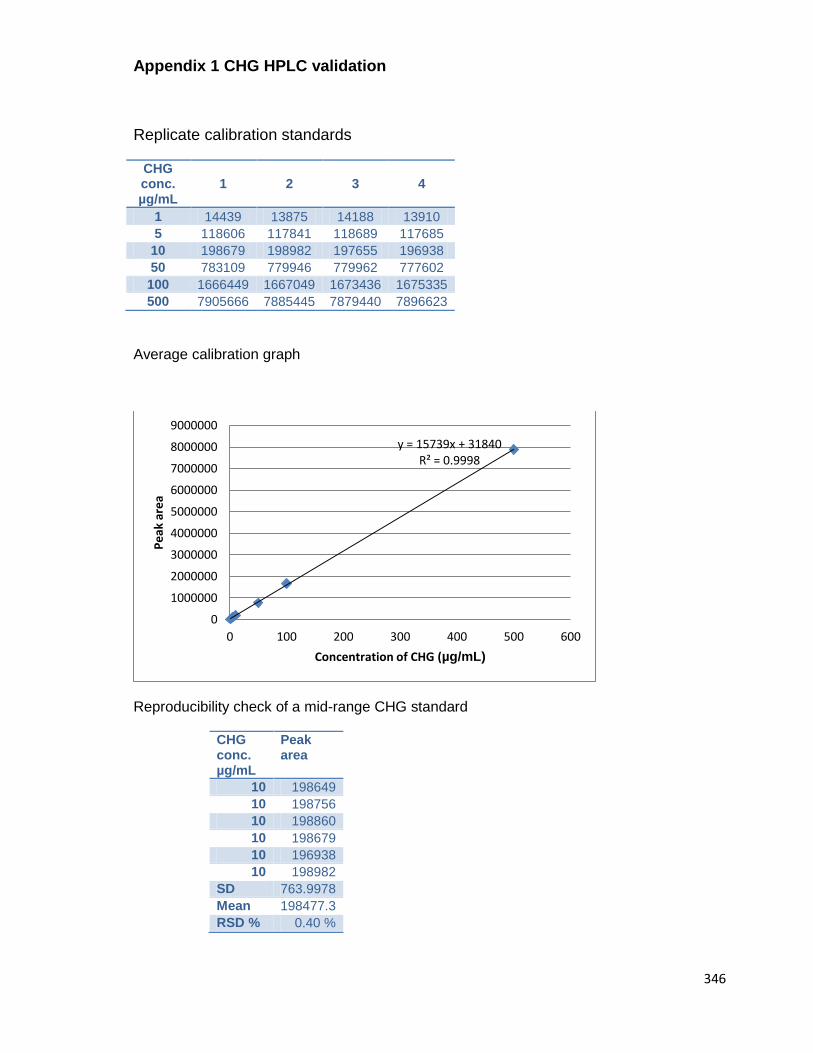
346
Appendix 1 CHG HPLC validation
Replicate calibration standards
CHG conc. µg/mL
1 2 3 4
1 14439 13875 14188 13910
5 118606 117841 118689 117685
10 198679 198982 197655 196938
50 783109 779946 779962 777602
100 1666449 1667049 1673436 1675335
500 7905666 7885445 7879440 7896623
Average calibration graph
Reproducibility check of a mid-range CHG standard
CHG conc. µg/mL
Peak area
10 198649
10 198756
10 198860
10 198679
10 196938
10 198982
SD 763.9978
Mean 198477.3
RSD % 0.40 %
y = 15739x + 31840 R² = 0.9998
0
1000000
2000000
3000000
4000000
5000000
6000000
7000000
8000000
9000000
0 100 200 300 400 500 600
Pe
ak a
rea
Concentration of CHG (µg/mL)

347
Appendix 2 Cholesterol HPLC validation
Replicate calibration standards
Cholesterol conc. µg/mL
1 2 3 4 5 6
1 11878 12242 10334 15904 15805.3 14312.3
5 53007 51986 55511.6 54474.5 54103.9 53571.3
10 106637 111163 107249.2 107995.9 107969.9 107880.4
25 252090 248911 Mis-
sample 249356.5 252602.1 253165
50 502508 492690 491906.5 488131.8 493188.9 490044.4
100 1038812 1020199 1044811 1035963 1044405 1040312
Average calibration graph
Reproducibility check of a mid-range CHG standard
Chol. Conc. µg/mL
Peak area
10 106637
10 111163
10 107249.2
10 107995.9
10 107969.9
10 107880.4
Mean 108149.2
SD 1568.926
RSD % 1.450705
y = 10283x - 1177.7 R² = 0.9992
0
200000
400000
600000
800000
1000000
1200000
0 20 40 60 80 100 120
Pe
ak a
rea
Cholesterol concentration (µg/mL)
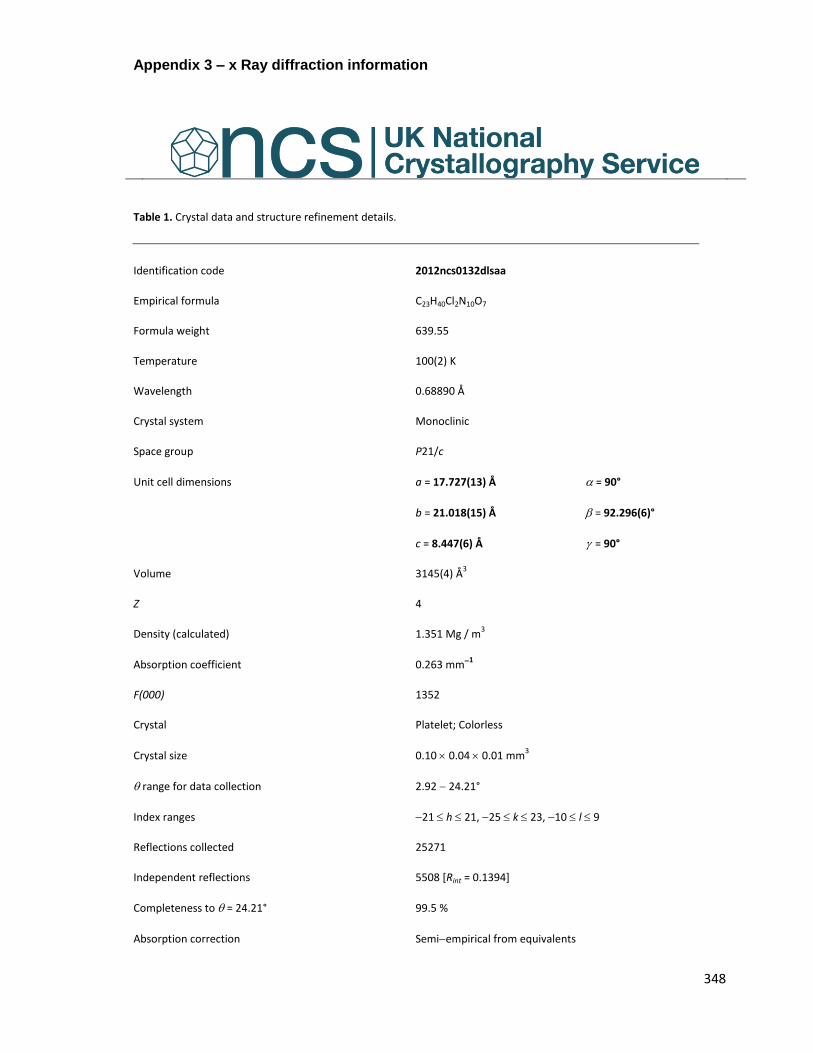
348
Appendix 3 – x Ray diffraction information
Table 1. Crystal data and structure refinement details.
Identification code 2012ncs0132dlsaa
Empirical formula C23H40Cl2N10O7
Formula weight 639.55
Temperature 100(2) K
Wavelength 0.68890 Å
Crystal system Monoclinic
Space group P21/c
Unit cell dimensions a = 17.727(13) Å = 90°
b = 21.018(15) Å = 92.296(6)°
c = 8.447(6) Å = 90°
Volume 3145(4) Å3
Z 4
Density (calculated) 1.351 Mg / m3
Absorption coefficient 0.263 mm1
F(000) 1352
Crystal Platelet; Colorless
Crystal size 0.10 0.04 0.01 mm3
range for data collection 2.92 24.21°
Index ranges 21 h 21, 25 k 23, 10 l 9
Reflections collected 25271
Independent reflections 5508 [Rint = 0.1394]
Completeness to = 24.21° 99.5 %
Absorption correction Semiempirical from equivalents
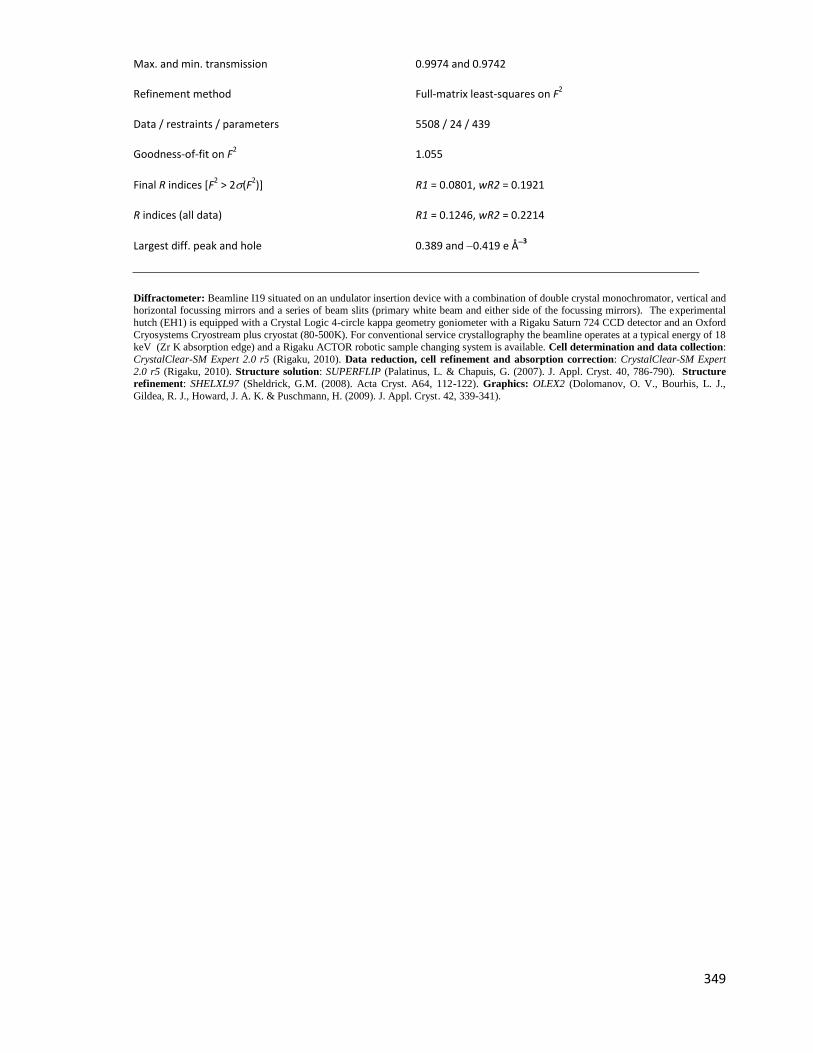
349
Max. and min. transmission 0.9974 and 0.9742
Refinement method Full-matrix least-squares on F2
Data / restraints / parameters 5508 / 24 / 439
Goodness-of-fit on F2 1.055
Final R indices [F2 > 2(F
2)] R1 = 0.0801, wR2 = 0.1921
R indices (all data) R1 = 0.1246, wR2 = 0.2214
Largest diff. peak and hole 0.389 and 0.419 e Å3
Diffractometer: Beamline I19 situated on an undulator insertion device with a combination of double crystal monochromator, vertical and horizontal focussing mirrors and a series of beam slits (primary white beam and either side of the focussing mirrors). The experimental
hutch (EH1) is equipped with a Crystal Logic 4-circle kappa geometry goniometer with a Rigaku Saturn 724 CCD detector and an Oxford
Cryosystems Cryostream plus cryostat (80-500K). For conventional service crystallography the beamline operates at a typical energy of 18
keV (Zr K absorption edge) and a Rigaku ACTOR robotic sample changing system is available. Cell determination and data collection:
CrystalClear-SM Expert 2.0 r5 (Rigaku, 2010). Data reduction, cell refinement and absorption correction: CrystalClear-SM Expert
2.0 r5 (Rigaku, 2010). Structure solution: SUPERFLIP (Palatinus, L. & Chapuis, G. (2007). J. Appl. Cryst. 40, 786-790). Structure
refinement: SHELXL97 (Sheldrick, G.M. (2008). Acta Cryst. A64, 112-122). Graphics: OLEX2 (Dolomanov, O. V., Bourhis, L. J.,
Gildea, R. J., Howard, J. A. K. & Puschmann, H. (2009). J. Appl. Cryst. 42, 339-341).

350
References
ABRAMS, K., HARVELL, J.D., SHRINER, D., WERTZ, P., MAIBACH, H., MAIBACH, H.I. and REHFELD, S., 1993. Effect of organic solvents on in vitro human skin water barrier function. Journal of Investigative Dermatology, 101(4), pp. 609-613.
AKI, H. and KAWASAKI, Y., 2004. Thermodynamic clarification of interaction between antiseptic compounds and lipids consisting of stratum corneum. Thermochimica Acta, 416(1-2), pp. 113-119.
ALBERTI, I., KALIA, Y.N., NAIK, A. and GUY, R.H., 2001. Assessment and prediction of the cutaneous bioavailability of topical terbinafine, in vivo, in man. Pharmaceutical Research, 18(10), pp. 1472-1475.
ALIBARDI, L., DOCKAL, M., REINISCH, C., TSCHACHLER, E. and ECKHART, L., 2004. Ultrastructural localization of caspase-14 in human epidermis. Journal of Histochemistry & Cytochemistry, 52(12), pp. 1561-1574.
ALLARD, D. and FORESTIER, S., 1998. Artificial tanning compositions, US Patent 6399048.
AL-REFU, K., 2011. General Methods in Preparation of Skin Biopsies for Haematoxylin & Eosin Stain and Immunohistochemistry, InTech open http://www.intechopen.com/books/skin-biopsy-perspectives/general-methods-in-preparation-of-skin-biopsies-for-haematoxylin-eosin-stain-and-immunohistochemistr [Accessed on 1/3/12].
ALVAREZ-ROMAN, R., NAIK, A., KALIA, Y.N., GUY, R.H. and FESSI, H., 2004. Enhancement of topical delivery from biodegradable nanoparticles. Pharmaceutical Research, 21(10), pp. 1818-1825.
ALVAREZ-ROMÁN, R., NAIK, A., KALIA, Y., GUY, R.H. and FESSI, H., 2004. Skin penetration and distribution of polymeric nanoparticles. Journal of Controlled Release, 99(1), pp. 53-62.
ALVAREZ-ROMÁN, R., NAIK, A., KALIA, Y., FESSI, H. and GUY, R.H., 2004. Visualization of skin penetration using confocal laser scanning microscopy. European Journal of Pharmaceutics and Biopharmaceutics, 58(2), pp. 301-316.
ALVAREZ-ROMÁN, R., BARRÉ, G., GUY, R.H. and FESSI, H., 2001. Biodegradable polymer nanocapsules containing a sunscreen agent: preparation and photoprotection. European Journal of Pharmaceutics and Biopharmaceutics,52(2), pp. 191-195.
ALVAREZ-ROMÁN, R., NAIK, A., KALIA, Y.N., GUY, R.H. and FESSI, H., 2004. Skin penetration and distribution of polymeric nanoparticles. Journal of Controlled Release, 99(1), pp. 53-62.
AMAGAI, M., MATSUYOSHI, N., WANG, Z., ANDL, C. and STANLEY, J., 2000. Toxin in bullous impetigo and staphylococcal scalded-skin syndrome targets desmoglein 1. Nature Medicine, 6(11), pp. 1275-1277.
ANDANSON, J., HADGRAFT, J. and KAZARIAN, S.G., 2009. Errata: In situ permeation study of drug through the stratum corneum using attenuated total reflection Fourier transform infrared spectroscopic imaging. Journal of Biomedical Optics, 14(3), pp. 039801-039801-1.
ANONYMOUS (2012) http://www.sigmaaldrich.com/etc/medialib/docs/
Sigma/Bulletin/tp0300bul.Par.0001.File.tmp/tp0300bul.pdf [online] [Accessed on 11/06/12]).
ANONYMOUS (2013)http://www.oxoid.com/UK/blue/prod_detail /prod_detail.asp?pr=Cm0337 [online][accessed on 24/2/13]

351
ANONYMOUS, Mueller-Hinton agar details [Homepage of Oxoid], [Online]. Available: http://www.oxoid.com/UK/blue/prod_detail/prod_detail.asp?pr=Cm0337 [02/24, 2013].
AOYAGI, T., TERASHIMA, O., SUZUKI, N., MATSUI, K. and NAGASE, Y., 1990. Polymerization of benzalkonium chloride-type monomer and application to percutaneous drug absorption enhancer. Journal of Controlled Release,13(1), pp. 63-71.
ARORA, P. and MUKHERJEE, B., 2002. Design, development, physicochemical, and in vitro and in vivo evaluation of transdermal patches containing diclofenac diethylammonium salt. Journal of pharmaceutical sciences, 91(9), pp. 2076-2089.
ART, G., 2005. Combination povidone-iodine and alcohol formulations more effective, more convenient versus formulations containing either iodine or alcohol alone: a review of the literature. Journal of Infusion Nursing,28(5), pp. 314-320.
BADRAN, M., KUNTSCHE, J. and FAHR, A., 2009. Skin penetration enhancement by a microneedle device (Dermaroller< sup>®</sup>) in vitro: Dependency on needle size and applied formulation. European Journal of Pharmaceutical Sciences, 36(4), pp. 511-523.
BAE, Y., PARK, C.S., LEE, J.K., JEONG, E., KIM, T., CHO, Y.S. and MOON, H., 2008. A case of anaphylaxis to chlorhexidine during digital rectal examination. Journal of Korean Medical Science, 23(3), pp. 526-528.
BAGNANINCHI, P., YANG, Y., ZGHOUL, N., MAFFULLI, N., WANG, R. and HAJ, A.E., 2007. Chitosan microchannel scaffolds for tendon tissue engineering characterized using optical coherence tomography. Tissue Engineering,13(2), pp. 323-331.
BAKO, J., SZEPESI, M., VERES, A.J., CSERHATI, C., BORBELY, Z.M., HEGEDUS, C. and BORBELY, J., 2008. Synthesis of biocompatible nanocomposite hydrogels as a local drug delivery system. Colloid and Polymer Science, 286(3), pp. 357-363.
BALAKRISHNAN, P., SHANMUGAM, S., LEE, W.S., LEE, W.M., KIM, J.O., OH, D.H., KIM, D., KIM, J.S., YOO, B.K. and CHOI, H., 2009. Formulation and in vitro assessment of minoxidil niosomes for enhanced skin delivery.International Journal of Pharmaceutics, 377(1), pp. 1-8.
BALOGH, L., SWANSON, D.R., TOMALIA, D.A., HAGNAUER, G.L. and MCMANUS, A.T., 2001. Dendrimer-silver complexes and nanocomposites as antimicrobial agents. Nano Letters, 1(1), pp. 18-21.
BARBER, E.D., TEETSEL, N.M., KOLBERG, K.F. and GUEST, D., 1992. A comparative study of the rates of< i> in vitro</i> percutaneous absorption of eight chemicals using rat and human skin. Fundamental and Applied Toxicology,19(4), pp. 493-497.
BARNES, T.J., KEMPSON, I.M. and PRESTIDGE, C.A., 2011. Surface analysis for compositional, chemical and structural imaging in pharmaceutics with mass spectrometry: A ToF-SIMS perspective. International Journal of Pharmaceutics, 417(1–2), pp. 61-69.
BARRY, B.W., 2004. Breaching the skin's barrier to drugs. Nature biotechnology, 22(2), pp. 165-167.
BARRY, B., 1987. Mode of action of penetration enhancers in human skin. Journal of Controlled Release, 6(1), pp. 85-97.
BARRY, B. and GRACE, A., 1972. Sensory testing of spreadability: Investigation of rheological conditions operative during application of topical preparations. Journal of Pharmaceutical Sciences, 61(3), pp. 335-341.

352
BEETGE, E., DU PLESSIS, J., MÜLLER, D.G., GOOSEN, C. and VAN RENSBURG, F.J., 2000. The influence of the physicochemical characteristics and pharmacokinetic properties of selected NSAID's on their transdermal absorption. International Journal of Pharmaceutics, 193(2), pp. 261-264.
BELAZI, D., 2009. Visualizing and profiling tissue lipids by ToF-SIMS imaging mass spectrometry.Thesis, Karolinska, Sweden.
BENABDELLAH, F., SEYER, A., QUINTON, L., TOUBOUL, D., BRUNELLE, A. and LAPRÉVOTE, O., 2010. Mass spectrometry imaging of rat brain sections: nanomolar sensitivity with MALDI versus nanometer resolution by TOF–SIMS. Analytical and Bioanalytical Chemistry, 396(1), pp. 151-162.
BENECH-KIEFFER, F., WEGRICH, P., SCHWARZENBACH, R., KLECAK, G., WEBER, T., LECLAIRE, J. and SCHAEFER, H., 2000. Percutaneous absorption of sunscreens in vitro: interspecies comparison, skin models and reproducibility aspects. Skin Pharmacology and Physiology, 13(6), pp. 324-335.
BENNINGHOVEN, A., 1994. Chemical-Analysis of Inorganic and Organic-Surfaces and Thin-Films by Static Time-Of-Flight Secondary-Ion Mass-Spectrometry (ToF-SIMS). Angewandte Chemie-International Edition in English,33(10), pp. 1023-1043.
BENSON, H.A.E., 2005. Transdermal drug delivery: penetration enhancement techniques. Current Drug Delivery, 2(1), pp. 23-33.
BENTLEY, M., VIANNA, R.F., WILSON, S. and COLLETT, J.H., 1997. Characterization of the influence of some cyclodextrins on the stratum corneum from the hairless mouse. Journal of Pharmacy and Pharmacology, 49(4), pp. 397-402.
BERGSSON, G., STEINGRIMSSON, O. and THORMAR, H., 2002. Bactericidal effects of fatty acids and monoglycerides on Helicobacter pylori. International Journal of Antimicrobial Agents, 20(4), pp. 258-262.
BETTINGER, J., GLOOR, M., PETER, C., KLEESZ, P., FLUHR, J. and GEHRING, W., 1998. Opposing effects of glycerol on the protective function of the horny layer against irritants and on the penetration of hexyl nicotinate.Dermatology, 197(1), pp. 18-24.
BEVERIDGE, T.J., 1999. Structures of gram-negative cell walls and their derived membrane vesicles. Journal of Bacteriology, 181(16), pp. 4725.
BHATTI, A., SCOTT, R. and DYER, A., 1988. In-vitro percutaneous absorption: pig epidermal membrane as a model for human skin. Journal of Pharmacy and Pharmacology, 40, pp. 45.
BHENDE, S. and SPANGLER, D., 2004. In vitro assessment of chlorhexidine gluconate-impregnated polyurethane foam antimicrobial dressing using zone of inhibition assays. Infection control and hospital epidemiology : the official journal of the Society of Hospital Epidemiologists of America, 25(8), pp. 664-667.
BIELINSKA, A.U., CHEN, C., JOHNSON, J. and BAKER JR, J.R., 1999. DNA complexing with polyamidoamine dendrimers: implications for transfection. Bioconjugate Chemistry, 10(5), pp. 843-850.
BISCHOFF, W.E., REYNOLDS, T.M., SESSLER, C.N., EDMOND, M.B. and WENZEL, R.P., 2000. Handwashing compliance by health care workers: the impact of introducing an accessible, alcohol-based hand antiseptic. Archives of Internal Medicine, 160(7), pp. 1017.
BLACKBURN, R.S., HARVEY, A., KETTLE, L.L., MANIAN, A.P., PAYNE, J.D. and RUSSELL, S.J., 2007. Sorption of chlorhexidine on cellulose: mechanism of binding and molecular recognition. The Journal of Physical Chemistry B,111(30), pp. 8775-8784.

353
BLUME, L., DENKER, M., GIESELER, F. and KUNZE, T., 2010. Temperature corrected transepithelial electrical resistance (TEER) measurement to quantify rapid changes in paracellular permeability. Die Pharmazie-An International Journal of Pharmaceutical Sciences, 65(1), pp. 19-24.
BOAS, U. and HEEGAARD, P.M.H., 2004. Dendrimers in drug research. Chemical Society Reviews, 33(1), pp. 43-63.
BOMMANNAN, D., POTTS, R.O. and GUY, R.H., 1990. Examination of stratum corneum barrier function in vivo by infrared spectroscopy. Journal of Investigative Dermatology, 95(4), pp. 403-408.
BOROWSKA, K., LASKOWSKA, B., MAGOŃ, A., MYSLIWIEC, B., PYDA, M. and WOŁOWIEC, S., 2010. PAMAM dendrimers as solubilizers and hosts for 8-methoxypsoralene enabling transdermal diffusion of the guest. International Journal of Pharmaceutics, 398(1–2), pp. 185-189.
BOS, J.D. and MEINARDI, M.M.H.M., 2000. The 500 Dalton rule for the skin penetration of chemical compounds and drugs. Experimental Dermatology, 9(3), pp. 165-169.
BOUCHEMAL, K., BRIANÇON, S., PERRIER, E. and FESSI, H., 2004. Nano-emulsion formulation using spontaneous emulsification: solvent, oil and surfactant optimisation. International Journal of Pharmaceutics, 280(1), pp. 241-251.
BOURNE, N., STANBERRY, L., KERN, E., HOLAN, G., MATTHEWS, B. and BERNSTEIN, D., 2000. Dendrimers, a new class of candidate topical microbicides with activity against herpes simplex virus infection. Antimicrobial Agents and Chemotherapy, 44(9), pp. 2471-2474.
BOUWSTRA, J.A., DE GRAAFF, A., GOORIS, G.S., NIJSSE, J., WIECHERS, J.W. and VAN AELST, A.C., 2003. Water distribution and related morphology in human stratum corneum at different hydration levels. Journal of Investigative Dermatology, 120(5), pp. 750-758.
BOUWSTRA, J.A., HONEYWELL-NGUYEN, P.L., GOORIS, G.S. and PONEC, M., 2003. Structure of the skin barrier and its modulation by vesicular formulations. Progress in Lipid Research, 42(1), pp. 1-36.
BOUWSTRA, J., GOORIS, G., BRAS, W. and DOWNING, D., 1995. Lipid organization in pig stratum corneum. Journal of Lipid Research, 36(4), pp. 685-695.
BOUWSTRA, J.A., GOORIS, G.S., VAN DER SPEK, JOOP A and BRAS, W., 1991. Structural investigations of human stratum corneum by small-angle X-ray scattering. Journal of Investigative Dermatology, 97(6), pp. 1005-1012.
BOUWSTRA, J.A., GOORIS, G., DUBBELAAR, F., WEERHEIM, A., IJZERMAN, A. and PONEC, M., 1998. Role of ceramide 1 in the molecular organization of the stratum corneum lipids. Journal of Lipid Research, 39(1), pp. 186-196.
BOUWSTRA, J.A. and PONEC, M., 2006. The skin barrier in healthy and diseased state. Biochimica et biophysica acta, 1758(12), pp. 2080.
BOYCE, J.M., PITTET, D. and HEALTHCARE INFECTION CONTROL PRACTICES ADVISORY COMMITTEE. SOCIETY FOR HEALTHCARE EPIDEMIOLOGY OF AMERICA. ASSOCIATION FOR PROFESSIONALS IN INFECTION CONTROL. INFECTIOUS DISEASES SOCIETY OF AMERICA. HAND HYGIENE TASK FORCE, 2002. Guideline for Hand Hygiene in Health-Care Settings: recommendations of the Healthcare Infection Control Practices Advisory Committee and the HICPAC/SHEA/APIC/IDSA Hand Hygiene Task Force. Infection control and hospital epidemiology : the official journal of the Society of Hospital Epidemiologists of America, 23(12 Suppl), pp. S3-40.
BRIGGS, D., 1998. Surface analysis of polymers by XPS and static SIMS. Cambridge University Press.

354
BROWN, E., WENZEL, R.P. and HENDLEY, J.O., 1989. Exploration of the Microbial Anatomy of Normal Human Skin by Using Plasmid Profiles of Coagulase-Negative Staphylococci: Search for the Reservoir of Resident Skin Flora [with Discussion]. The Journal of Infectious Diseases, 160(4), pp. 644-650.
BUCKS, D. and MAIBACH, H.I., 1999. 4 Occlusion Does Not Uniformly Enhance Penetration In Vivo. Drugs and the Pharmaceutical Sciences, 97, pp. 81-106.
BUNCH, J., CLENCH, M.R. and RICHARDS, D.S., 2004. Determination of pharmaceutical compounds in skin by imaging matrix-assisted laser desorption/ionisation mass spectrometry. Rapid Communications in Mass Spectrometry, 18(24), pp. 3051-3060.
CALABRETTA, M.K., KUMAR, A., MCDERMOTT, A.M. and CAI, C., 2007. Antibacterial activities of poly (amidoamine) dendrimers terminated with amino and poly (ethylene glycol) groups. Biomacromolecules, 8(6), pp. 1807.
CAMPBELL, J., SINGH, A.K., SWOBODA, J.G., GILMORE, M.S., WILKINSON, B.J. and WALKER, S., 2012. An Antibiotic That Inhibits a Late Step in Wall Teichoic Acid Biosynthesis Induces the Cell Wall Stress Stimulon in Staphylococcus aureus. Antimicrobial Agents and Chemotherapy, 56(4), pp. 1810-1820.
CARLOTTI, D. and MAFFART, P., 1996. Chlorhexidine. Pratique Medicale et Chirurgicale de l animan de compagnie, 31, pp. 553-563.
CARRET, L., REVERDY, M., LAFFORGUE, C., FALSON, F., FLEURETTE, J. and FRENEY, J., 1997. Kinetics of chlorhexidine on intact skin following a single application. Pathologie et Biologie, 45(9), pp. 737-740.
CARS, O., HÖGBERG, L.D., MURRAY, M., NORDBERG, O., SIVARAMAN, S., LUNDBORG, C.S., SO, A.D. and TOMSON, G., 2008. Meeting the challenge of antibiotic resistance. British Medical Journal, 337.
CARSON, C.F., MEE, B.J. and RILEY, T.V., 2002. Mechanism of action of Melaleuca alternifolia (tea tree) oil on Staphylococcus aureus determined by time-kill, lysis, leakage, and salt tolerance assays and electron microscopy.Antimicrobial Agents and Chemotherapy, 46(6), pp. 1914-1920.
CASE, D., 1977. Safety of hibitane I. Laboratory experiments. Journal of Clinical Periodontology, 4(5), pp. 66-72.
CASPERS, P.J., LUCASSEN, G.W., CARTER, E.A., BRUINING, H.A. and PUPPELS, G.J., 2001. In vivo confocal Raman microspectroscopy of the skin: noninvasive determination of molecular concentration profiles. Journal of Investigative Dermatology, 116(3), pp. 434-442.
CATZ, P. and FRIEND, D.R., 1990. Transdermal delivery of levonorgestrel. VIII. Effect of enhancers on rat skin, hairless mouse skin, hairless guinea pig skin, and human skin. International Journal of Pharmaceutics, 58(2), pp. 93-102.
CEVC, G. and VIERL, U., 2010. Nanotechnology and the transdermal route: A state of the art review and critical appraisal. Journal of Controlled Release, 141(3), pp. 277-299.
CHABALA, J.M., SONI, K.K., LI, J., GAVRILOV, K.L. and LEVISETTI, R., 1995. High-Resolution Chemical Imaging with Scanning Ion Probe Sims. International Journal of Mass Spectrometry and Ion Processes, 143, pp. 191-212.
CHAIYAKUNAPRUK, N., VEENSTRA, D.L., LIPSKY, B.A. and SAINT, S., 2002. Chlorhexidine compared with povidone-iodine solution for vascular catheter-site care: a meta-analysis. Annals of Internal Medicine, 136(11), pp. 792.
355
CHAUHAN, A.S., JAIN, N.K., DIWAN, P.V. and KHOPADE, A.J., 2004. Solubility enhancement of indomethacin with poly (amidoamine) dendrimers and targeting to inflammatory regions of arthritic rats. Journal of Drug Targeting,12(9-10), pp. 575-583.
CHAUHAN, A.S., SRIDEVI, S., CHALASANI, K.B., JAIN, A.K., JAIN, S.K., JAIN, N. and DIWAN, P.V., 2003. Dendrimer-mediated transdermal delivery: enhanced bioavailability of indomethacin. Journal of Controlled Release, 90(3), pp. 335-343.
CHAUHAN, A.S., JAIN, N.K. and DIWAN, P.V., 2010. Pre-clinical and behavioural toxicity profile of PAMAM dendrimers in mice. Proceedings of the Royal Society A: Mathematical, Physical and Engineering Science, 466(2117), pp. 1535-1550.
CHAUHAN, A.S., DIWAN, P.V., JAIN, N.K. and TOMALIA, D.A., 2009. Unexpected in vivo anti-inflammatory activity observed for simple, surface functionalized poly(amidoamine) dendrimers. Biomacromolecules, 10(5), pp. 1195-1202.
CHAURAND, P., NORRIS, J.L., CORNETT, D.S., MOBLEY, J.A. and CAPRIOLI, R.M., 2006. New developments in profiling and imaging of proteins from tissue sections by MALDI mass spectrometry. Journal of Proteome Research,5(11), pp. 2889-2900.
CHEN, C.Z., BECK-TAN, N.C., DHURJATI, P., VAN DYK, T.K., LAROSSA, R.A. and COOPER, S.L., 2000. Quaternary ammonium functionalized poly (propylene imine) dendrimers as effective antimicrobials: structure-activity studies. Biomacromolecules, 1(3), pp. 473-480.
CHEN, C.Z. and COOPER, S.L., 2002. Interactions between dendrimer biocides and bacterial membranes. Biomaterials, 23(16), pp. 3359-3368.
CHEN, C.Z., COOPER, S.L. and TAN, N.C.B., 1999. Incorporation of dimethyldodecylammonium chloride functionalities onto poly (propylene imine) dendrimers significantly enhances their antibacterial properties.Chemistry Communications, (16), pp. 1585-1586.
CHENG, Y., QU, H., MA, M., XU, Z., XU, P., FANG, Y. and XU, T., 2007(a). Polyamidoamine (PAMAM) dendrimers as biocompatible carriers of quinolone antimicrobials: an in vitro study. European Journal of Medicinal Chemistry,42(7), pp. 1032-1038.
CHENG, Y. and XU, T., 2008. The effect of dendrimers on the pharmacodynamic and pharmacokinetic behaviors of non-covalently or covalently attached drugs. European Journal of Medicinal Chemistry, 43(11), pp. 2291-2297.
CHENG, Y., XU, Z., MA, M. and XU, T., 2007(b). Dendrimers as drug carriers: applications in different routes of drug administration. Journal of Pharmaceutical Sciences, 97(1), pp. 123-143.
CHENG, Y., WU, Q., LI, Y. and XU, T., 2008. External electrostatic interaction versus internal encapsulation between cationic dendrimers and negatively charged drugs: which contributes more to solubility enhancement of the drugs? The Journal of Physical Chemistry B, 112(30), pp. 8884-8890.
CHENG, Y. and XU, T., 2008. The effect of dendrimers on the pharmacodynamic and pharmacokinetic behaviors of non-covalently or covalently attached drugs. European Journal of Medicinal Chemistry, 43(11), pp. 2291-2297.
CHILCOTT, R., JENNER, J., HOTCHKISS, S. and RICE, P., 2001. In vitro skin absorption and decontamination of sulphur mustard: comparison of human and pig‐ear skin. Journal of Applied Toxicology, 21(4), pp. 279-283.
CHOI, W.I., LEE, J.H., KIM, J., KIM, J., KIM, Y.H. and TAE, G., 2012. Efficient skin permeation of soluble proteins via flexible and functional nano-carrier. Journal of Controlled Release, 157(2), pp. 272-278.

356
CHOW, C.P., BUTTAR, H.S. and DOWNIE, R.H., 1978. Percutaneous absorption of chlorhexidine in rats. Toxicology letters, 1(4), pp. 213-216.
CHRISTOPHERS, E., WOLFF, H.H. and LAURENCE, E.B., 1974. The formation of epidermal cell columns. Journal of Investigative Dermatology, 62(6), pp. 555-559.
CLIMO, M.W., YOKOE, D.S., WARREN, D.K., PERL, T.M., BOLON, M., HERWALDT, L.A., WEINSTEIN, R.A., SEPKOWITZ, K.A., JERNIGAN, J.A., SANOGO, K. and WONG, E.S., 2013. Effect of daily chlorhexidine bathing on hospital-acquired infection. The New England journal of medicine, 368(6), pp. 533-542.
CLONINGER, M.J., 2002. Biological applications of dendrimers. Current Opinion in Chemical Biology, 6(6), pp. 742-748.
CNUBBEN, N.H.P., ELLIOTT, G.R., HAKKERT, B.C., MEULING, W.J.A. and VAN DE SANDT, J.J.M., 2002. Comparative in Vitro–in Vivo Percutaneous Penetration of the Fungicide ortho-Phenylphenol.Regulatory Toxicology and Pharmacology, 35(2), pp. 198-208.
CODLING, C.E., HANN, A.C., MAILLARD, J.Y. and RUSSELL, A., 2005. An investigation into the antimicrobial mechanisms of action of two contact lens biocides using electron microscopy. Contact Lens and Anterior Eye, 28(4), pp. 163-168.
COOKSEY, C., 2010. Hematoxylin and related compounds-an annotated bibliography concerning their origin, properties, chemistry, and certain applications. Biotechnic & Histochemistry, 85(1), pp. 65-82.
COUVREUR, R.G.P., 2006. Nanocapsules: preparation, characterization and therapeutic applications. Nanoparticulates As Drug Carriers, pp. 255.
COWEN, J., ELLIS, S.H. and MCAINSH, J., 1979. Absorption of chlorhexidine from the intact skin of newborn infants. Archives of Disease in Childhood, 54(5), pp. 379-383.
CRISCIONE, J.M., LE, B.L., STERN, E., BRENNAN, M., RAHNER, C., PAPADEMETRIS, X. and FAHMY, T.M., 2009. Self-assembly of pH-responsive fluorinated dendrimer-based particulates for drug delivery and noninvasive imaging.Biomaterials, 30(23), pp. 3946-3955.
DAS, M., BHATTACHARYA, A. and GHOSAL, S., 2006. Transdermal delivery of trazodone hydrochloride from acrylic films prepared from aqueous latex. Indian Journal of Pharmaceutical Sciences, 68(1), pp. 41.
DAVIES, D., WARD, R. and HEYLINGS, J., 2004. Multi-species assessment of electrical resistance as a skin integrity marker for in vitro percutaneous absorption studies. Toxicology in Vitro, 18(3), pp. 351-358.
DAVIES, S.C., 2013. Annual Report of the Chief Medical Officer, Volume Two, 2011, infections and the rise of antimicrobial resistance. Volume 2. London: Department of Health.
DAVIES, S.C., 2012. Annual Report of the Chief Medical Officer, Volume One, 2011, On the State of the Public’s Health. Volume 1. London: Department of Health.
DAVIES, G.E., FRANCIS, J., MARTIN, A.R., ROSE, F.L. and SWAIN, G., 1954. 1:6-Di-4'-chlorophenyldiguanidohexane (hibitane); laboratory investigation of a new antibacterial agent of high potency. British Journal of Pharmacology and Chemotherapy, 9(2), pp. 192-6.
DAVIS, K.A., STEWART, J.J., CROUCH, H.K., FLOREZ, C.E. and HOSPENTHAL, D.R., 2004. Methicillin-resistant Staphylococcus aureus (MRSA) nares colonization at hospital admission and its effect on subsequent MRSA infection.Clinical Infectious Diseases, 39(6), pp. 776-782.

357
DE JALÓN, E.G., BLANCO-PRIETO, M., YGARTUA, P. and SANTOYO, S., 2001. PLGA microparticles: possible vehicles for topical drug delivery. International Journal of Pharmaceutics, 226(1), pp. 181-184.
DE SOUZA, E.L., DE BARROS, J.C., DE OLIVEIRA, C.E.V. and DA CONCEIÇÃO, M.L., 2010. Influence of Origanum vulgare L. essential oil on enterotoxin production, membrane permeability and surface characteristics of Staphylococcus aureus. International Journal of Food Microbiology, 137(2), pp. 308-311.
DENTON, G.W., 2000. Chlorhexidine. In: S. BLOCK, ed, Disinfection, sterilization, and preservation 5th edn. Lippincott Williams & Wilkins, pp. 321.
DENTON, G. W.,1991 Chlorhexidine. In: S. BLOCK, ed, Disinfection, sterilization and preservation 4th
edn. pp. 274–289. Philadelphia: Lea and Febiger.
DEPARTMENT OF HEALTH, 2006. Code of practice for the prevention and control of healthcare associated infection. http://www.dh.gov.uk/en/Publicationsandstatistics/Publications/PublicationsPolicyAndGuidance/DH_4139336: Department of Health.
DERICI, L., HARCUP, J.P., HILL, S.P. and KHOSHDEL, E., 2009. Hair care composition comprising a dendritic macromolecule, WO2006018063, patent.
DEVARAKONDA, B., HILL, R.A. and DE VILLIERS, M.M., 2004. The effect of PAMAM dendrimer generation size and surface functional group on the aqueous solubility of nifedipine. International Journal of Pharmaceutics, 284(1), pp. 133-140.
DIALLO, M.S., CHRISTIE, S., SWAMINATHAN, P., BALOGH, L., SHI, X., UM, W., PAPELIS, C., GODDARD III, W.A. and JOHNSON JR, J.H., 2004. Dendritic chelating agents. 1. Cu (II) binding to ethylene diamine core poly (amidoamine) dendrimers in aqueous solutions. Langmuir, 20(7), pp. 2640-2651.
DIALLO, M.S., CHRISTIE, S., SWAMINATHAN, P., JOHNSON JR, J.H. and GODDARD III, W.A., 2005. Dendrimer enhanced ultrafiltration. 1. Recovery of Cu (II) from aqueous solutions using PAMAM dendrimers with ethylene diamine core and terminal NH2 groups. Environmental Science & Technology, 39(5), pp. 1366-1377.
DIASPRO, A., FEDERICI, F. and ROBELLO, M., 2002. Influence of refractive-index mismatch in high-resolution three-dimensional confocal microscopy. Applied Optics, 41(4), pp. 685-690.
DICK, I.P. and SCOTT, R.C., 1992. Pig ear skin as an in‐vitro model for human skin permeability. Journal of Pharmacy and Pharmacology, 44(8), pp. 640-645.
DOMADIA, P.N., BHUNIA, A., RAMAMOORTHY, A. and BHATTACHARJYA, S., 2010. Structure, interactions, and antibacterial activities of MSI-594 derived mutant peptide MSI-594F5A in lipopolysaccharide micelles: role of the helical hairpin conformation in outer-membrane permeabilization. Journal of the American Chemical Society, 132(51), pp. 18417-18428.
DOUGLAS, M. and CHEN, P., 1998. Quantitative trace metal analysis of silicon surfaces by ToF‐SIMS. Surface and Interface Analysis, 26(13), pp. 984-994.
DOWHAN, W., 1997. Molecular basis for membrane phospholipid diversity: why are there so many lipids? Annual Review of Biochemistry, 66(1), pp. 199-232.
DREHER, F., 2007. Quantification of stratum corneum removed by tape stripping. In: WILHELM K.P, ZHAI, H., AND MAIBACH, H.I, ed, Dermatotoxicology. seventh edn. CRC press Taylor and Francis group, pp. 343.
358
DREHER, F., MODJTAHEDI, B.S., MODJTAHEDI, S.P. and MAIBACH, H.I., 2005. Quantification of stratum corneum removal by adhesive tape stripping by total protein assay in 96-well microplates. Skin Research and Technology,11(2),.
DRYDEN, M.S., 2009. Skin and soft tissue infection: microbiology and epidemiology. International Journal of Antimicrobial Agents, 34(1), pp. 2.
DUNCAN, I.W., CULBRETH, P.H. and BURTIS, C.A., 1979. Determination of free, total, and esterified cholesterol by high-performance liquid chromatography. Journal of Chromatography B: Biomedical Sciences and Applications,162(3), pp. 281-292.
DUNCAN, R. and IZZO, L., 2005. Dendrimer biocompatibility and toxicity. Advanced Drug Delivery Reviews, 57(15), pp. 2215-2237.
EADY, E. and COVE, J., 2003. Staphylococcal resistance revisited: community-acquired methicillin resistant Staphylococcus aureus - an emerging problem for the management of skin and soft tissue infections. Current Opinion in Infectious Diseases, 16(2), pp. 103-124.
EBO, D.G., STEVENS, W.J., BRIDTS, C.H. and MATTHIEU, L., 1998. Contact allergic dermatitis and life-threatening anaphylaxis to chlorhexidine. Journal of Allergy and Clinical Immunology, 101(1), pp. 128-129.
EGBARIA, K. and FRIEDMAN, M., 1990. Sustained in vitro activity of human albumin microspheres containing chlorhexidine dihydrochloride against bacteria from cultures of organisms that cause urinary tract infections.Antimicrobial Agents and Chemotherapy, 34(11), pp. 2118-2121.
EGBARIA, K. and FRIEDMAN, M., 1990. Sustained release albumin microspheres containing antibacterial drugs: Effects of preparation conditions on kinetics of drug release. Journal of Controlled Release, 14(1), pp. 79-94.
EGELRUD, T., 2000. Desquamation in the stratum corneum. Acta Dermato Venereologica-Supplement, (208), pp. 44-45.
EICHMAN, J.D., BIELINSKA, A.U., KUKOWSKA-LATALLO, J.F. and BAKER JR, J.R., 2000. The use of PAMAM dendrimers in the efficient transfer of genetic material into cells. Pharmaceutical Science & Technology today, 3(7), pp. 232-245.
EL MAGHRABY, G., BARRY, B. and WILLIAMS, A., 2008. Liposomes and skin: from drug delivery to model membranes. European Journal of Pharmaceutical Sciences, 34(4), pp. 203-222.
ELIAS, P.M., 1983. Epidermal lipids, barrier function, and desquamation. Journal of Investigative Dermatology, 80, pp. 44s-49s.
ELLIS, C.N., WEISS, J.S., HAMILTON, T.A., HEADINGTON, J.T., ZELICKSON, A.S. and VOORHEES, J.J., 1990. Sustained improvement with prolonged topical tretinoin (retinoic acid) for photoaged skin. Journal of the American Academy of Dermatology, 23(4), pp. 629-637.
ELMAHJOUBI, E., FRUM, Y., ECCLESTON, G.M., WILKINSON, S.C. and MEIDAN, V.M., 2009. Transepidermal water loss for probing full-thickness skin barrier function: Correlation with tritiated water flux, sensitivity to punctures and diverse surfactant exposures. Toxicology in Vitro, 23(7), pp. 1429-1435.
EL-SAYED, M., GINSKI, M., RHODES, C. and GHANDEHARI, H., 2002. Transepithelial transport of poly (amidoamine) dendrimers across Caco-2 cell monolayers. Journal of Controlled Release, 81(3), pp. 355-365.

359
ELSAYED, M., ABDALLAH, O.Y., NAGGAR, V.F. and KHALAFALLAH, N.M., 2006. Deformable liposomes and ethosomes: mechanism of enhanced skin delivery. International Journal of Pharmaceutics, 322(1), pp. 60-66.
ELSAYED, M.M.A., ABDALLAH, O.Y., NAGGAR, V.F. and KHALAFALLAH, N.M., 2007. Lipid vesicles for skin delivery of drugs: Reviewing three decades of research. International Journal of Pharmaceutics, 332(1–2), pp. 1-16.
ESFAND, R. and TOMALIA, D.A., 2001. Poly (amidoamine)(PAMAM) dendrimers: from biomimicry to drug delivery and biomedical applications. Drug Discovery Today, 6(8), pp. 427-436.
ESPOSITO, E., CORTESI, R., DRECHSLER, M., PACCAMICCIO, L., MARIANI, P., CONTADO, C., STELLIN, E., MENEGATTI, E., BONINA, F. and PUGLIA, C., 2005. Cubosome dispersions as delivery systems for percutaneous administration of indomethacin. Pharmaceutical Research, 22(12), pp. 2163-2173.
FARKAS, E., SCHUBERT, R. and ZELKO, R., 2004. Effect of β-sitosterol on the characteristics of vesicular gels containing chlorhexidine. International Journal of Pharmaceutics, 278(1), pp. 63-70.
FARKAS, E., ZELKO, R., TÖRÖK, G., RÁCZ, I. and MARTON, S., 2001. Influence of chlorhexidine species on the liquid crystalline structure of vehicle. International Journal of Pharmaceutics, 213(1), pp. 1-5.
FARKAS, E., KISS, D. and ZELKO, R., 2007. Study on the release of chlorhexidine base and salts from different liquid crystalline structures. International journal of pharmaceutics, 340(1-2), pp. 71-75.
FEDERAL REGISTER, 1994. Topical Antimicrobial Drug Products for Over-the-Counter Human Use: Tentative Final Monograph for Health-Care Antiseptic Drug Products. Vol. 59, No. 116, p. 31402-52. 21 CFR Parts 333 and 369. edn. USA: Food and Drug Administration.
FILIPOWICZ, A. and WOŁOWIEC, S., 2011. Solubility and in vitro transdermal diffusion of riboflavin assisted by PAMAM dendrimers. International Journal of Pharmaceutics, 408(1), pp. 152-156.
FINNIN, B.C. and MORGAN, T.M., 1999. Transdermal penetration enhancers: applications, limitations, and potential. Journal of Pharmaceutical Sciences, 88(10), pp. 955-958.
FITZPATRICK, T.B., WOLFF, K., JOHNSON, R.A. and SUURMOND, D., 2005. Fitzpatrick's color atlas and synopsis of clinical dermatology. McGraw-Hill Medical Pub. New York.
FLETCHER, J.S., HENDERSON, A., BIDDULPH, G.X., VAIDYANATHAN, S., LOCKYER, N.P. and VICKERMAN, J.C., 2008. Uncovering new challenges in bio-analysis with ToF-SIMS. Applied Surface Science, 255(4), pp. 1264-1270.
FLETCHER, J.S., LOCKYER, N.P., VAIDYANATHAN, S. and VICKERMAN, J.C., 2007. TOF-SIMS 3D biomolecular imaging of Xenopus laevis oocytes using buckminsterfullerene (C-60) primary ions. Analytical Chemistry, 79(6), pp. 2199-2206.
FLUHR, J.W. and ELIAS, P.M., 2002. Stratum corneum pH: formation and function of the ‘acid mantle’. Exogenous Dermatology, 1(4), pp. 163-175.
FLUHR, J.W., KAO, J., JAIN, M., AHN, S.K., FEINGOLD, K.R. and ELIAS, P.M., 2001. Generation of free fatty acids from phospholipids regulates stratum corneum acidification and integrity. Journal of Investigative Dermatology,117(1), pp. 44-51.
FORESTIER, S. and ROLLAT-CORVOL, I., 1999. Deodorant composition and use thereof, US patent US6001342.

360
FRAZEE, B.W., LYNN, J., CHARLEBOIS, E.D., LAMBERT, L., LOWERY, D. and PERDREAU-REMINGTON, F., 2005. High prevalence of methicillin-resistant Staphylococcus aureus in emergency department skin and soft tissue infections. Annals of Emergency Medicine, 45(3), pp. 311-320.
FRÉCHET, J.M. and TOMALIA, D.A., 2001. Dendrimers and other dendritic polymers. Wiley New York.
FREUDIGER, C.W., MIN, W., SAAR, B.G., LU, S., HOLTOM, G.R., HE, C., TSAI, J.C., KANG, J.X. and XIE, X.S., 2008. Label-Free Biomedical Imaging with High Sensitivity by Stimulated Raman Scattering Microscopy. Science,322(5909),.
FRITSCH, W.C., STOUGHTON, R.B. and STAPELFELDT, A., 1963. The Effect of Temperature and Humidity on the Penetration of C14 Acetylsalicylic Acid in Excised Human Skin1. Journal of Investigative Dermatology, 41(5), pp. 307-311.
FRYKLUND, B., TULLUS, K. and BURMAN, L., 1995. Survival on skin and surfaces of epidemic and nonepidemic strains of enterobacteria from neonatal special care units. Journal of Hospital Infection, 29(3), pp. 201-208.
GAO, Z., TSENG, C., PEI, Z. and BLASER, M.J., 2007. Molecular analysis of human forearm superficial skin bacterial biota. Proceedings of the National Academy of Sciences, 104(8), pp. 2927-2932.
GAO, S. and SINGH, J., 1997. Mechanism of transdermal transport of 5-fluorouracil by terpenes: Carvone, 1,8-cineole and thymol. International Journal of Pharmaceutics, 154(1), pp. 67-77.
GARDELLA, D., HATTON, W.J., RIND, H.B., ROSEN, G.D. and VON BARTHELD, C.S., 2003. Differential tissue shrinkage and compression in the z-axis: implications for optical disector counting in vibratome-, plastic-and cryosections. Journal of Neuroscience Methods, 124(1), pp. 45-59.
GARDIKIS, K., HATZIANTONIOU, S., VIRAS, K., WAGNER, M. and DEMETZOS, C., 2006. A DSC and Raman spectroscopy study on the effect of PAMAM dendrimer on DPPC model lipid membranes. International Journal of Pharmaceutics, 318(1–2), pp. 118-123.
GARDINER, J., FREEMAN, S., LEACH, M., GREEN, A., ALCOCK, J. and D'EMANUELE, A., 2008. PAMAM dendrimers for the delivery of the antibacterial Triclosan. Journal of Enzyme Inhibition and Medicinal Chemistry, 23(5), pp. 623-628.
GARG, A., AGGARWAL, D., GARG, S. and SINGLA, A.K., 2002. Spreading of semisolid formulations: an update. Pharmaceutical Technology, 26(9), pp. 84-105.
GIBBS, B. and STUTTARD, L., 1967. Evaluation of skin germicides. Journal of Applied Microbiology, 30(1), pp. 66-77.
GILLIES, E.R. and FRECHET, J.M.J., 2005. Dendrimers and dendritic polymers in drug delivery. Drug Discovery today, 10(1), pp. 35-43.
GIROU, E., LOYEAU, S., LEGRAND, P., OPPEIN, F. and BRUN-BUISSON, C., 2002. Efficacy of handrubbing with alcohol based solution versus standard handwashing with antiseptic soap: randomised clinical trial. British Medicine Journal,325(7360), pp. 362.
GONGWER, L., HUBBEN, K., LENKIEWICZ, R., HART, E. and COCKRELL, B., 1980. The effects of daily bathing of neonatal rhesus monkeys with an antimicrobial skin cleanser containing chlorhexidine gluconate. Toxicology and Applied Pharmacology, 52(2), pp. 255-261.

361
GONZALEZ ENSENAT, P., MAIERHOFER, G., OLIVÉ, M.J. and ECHEVERRIA GARCIA, J.J., 1998. Chlorhexidine diacetate or chlorhexidine digluconate containing liposomes,US patent EP0613685.
GONZALEZ, E.P., 2000. Skin-cleaning towels impregnated with liposomes containing compositions, EU patent EP1000605.
GOON, A., WHITE, I., RYCROFT, R. and MCFADDEN, J., 2004. Allergic contact dermatitis from chlorhexidine. Dermatitis, 15(1), pp. 45-47.
GRAHAM, D.J., WAGNER, M.S. and CASTNER, D.G., 2006. Information from complexity: Challenges of TOF-SIMS data interpretation. Applied Surface Science, 252(19), pp. 6860-6868.
GRAMS, J., 2007. New trends and potentialities of ToF-SIMS in surface studies. Nova Science Pub Incorporated NEW YORK.
GRDADOLNIK, J., 2002. ATR-FTIR spectroscopy: Its advantage and limitations. Acta Chimica Slovenica, 49(3), pp. 631-642.
GRENIER, D., BERTRAND, J. and MAYRAND, D., 2007. Porphyromonas gingivalis outer membrane vesicles promote bacterial resistance to chlorhexidine. Oral Microbiology and Immunology, 10(5), pp. 319-320.
GRICE, K., SATTAR, H., SHARRATT, M. and BAKER, H., 1971. Skin temperature and transepidermal water loss. Journal of Investigative Dermatology, 57(2), pp. 108-110.
GRICE, E.A., KONG, H.H., RENAUD, G., YOUNG, A.C., BOUFFARD, G.G., BLAKESLEY, R.W., WOLFSBERG, T.G., TURNER, M.L., SEGRE, J.A. and NISC COMPARATIVE SEQUENCING, 2008. A diversity profile of the human skin microbiota. Genome Research, 18(7), pp. 1043-1050.
GROSS, M., CRAMTON, S.E., GÖTZ, F. and PESCHEL, A., 2001. Key Role of Teichoic Acid Net Charge inStaphylococcus aureus Colonization of Artificial Surfaces. Infection and Immunity, 69(5), pp. 3423-3426.
GUILHERMETTI, M., MARQUES WIIRZLER, L., CASTANHEIRA FACIO, B., DA SILVA FURLAN, M., CAMPO MESCHIAL, W., BRONHARO TOGNIM, M., BOTELHO GARCIA, L. and LUIZ CARDOSO, C., 2010. Antimicrobial efficacy of alcohol-based hand gels. Journal of Hospital Infection, 74(3), pp. 219-224.
GUPTA, P., VERMANI, K. and GARG, S., 2002. Hydrogels: from controlled release to pH-responsive drug delivery. Drug Discovery Today, 7(10), pp. 569-579.
GUPTA, U., AGASHE, H.B., ASTHANA, A. and JAIN, N., 2006. Dendrimers: novel polymeric nanoarchitectures for solubility enhancement. Biomacromolecules, 7(3), pp. 649-658.
GURDAG, S., KHANDARE, J., STAPELS, S., MATHERLY, L.H. and KANNAN, R.M., 2006. Activity of dendrimer-methotrexate conjugates on methotrexate-sensitive and-resistant cell lines. Bioconjugate Chemistry, 17(2), pp. 275-283.
GUSTAFSON, J., LIEW, Y., CHEW, S., MARKHAM, J., BELL, H., WYLLIE, S. and WARMINGTON, J., 1998. Effects of tea tree oil on Escherichia coli. Letters in Applied Microbiology, 26(3), pp. 194-198.
GUTERRES, S.S., ALVES, M.P. and POHLMANN, A.R., 2007. Polymeric nanoparticles, nanospheres and nanocapsules, for cutaneous applications. Drug Target Insights, 2, pp. 147.
GUY, R. and HADGRAFT, J., 1989. Structure-activity correlations in percutaneous absorption. Percutaneous Absorption, pp. 95-109.

362
HADDADI, A., ABOOFAZELI, R., ERFAN, M. and FARBOUD, E.S., 2008. Topical delivery of urea encapsulated in biodegradable PLGA microparticles: O/W and W/O creams. Journal of Microencapsulation, 25(6), pp. 379-386.
HADGRAFT, J. and VALENTA, C., 2000. pH, pKa and dermal delivery. International Journal of Pharmaceutics, 200, pp. 243-247.
HADGRAFT, J., 2001. Skin, the final frontier. International Journal of Pharmaceutics, 224(1-2), pp. 1-18.
HAHN, B.L., ONUNKWO, C.C., WATTS, C.J. and SOHNLE, P.G., 2009. Systemic dissemination and cutaneous damage in a mouse model of staphylococcal skin infections. Microbial Pathogenesis, 47(1), pp. 16-23.
HAHN, T., HANSEN, S., NEUMANN, D., KOSTKA, K., LEHR, C., MUYS, L. and SCHAEFER, U., 2010. Infrared densitometry: a fast and non-destructive method for exact stratum corneum depth calculation for in vitro tape-stripping.Skin Pharmacology and Physiology, 23(4), pp. 183-192.
HAIGH, J., BEYSSAC, E., CHANET, L. and AIACHE, J., 1998. In vitro permeation of progesterone from a gel through the shed skin of three different snake species. International Journal of Pharmaceutics, 170(2), pp. 151-156.
HAIGH, J.M. and SMITH, E.W., 1994. The selection and use of natural and synthetic membranes for in vitro diffusion experiments. European Journal of Pharmaceutical Sciences, 2(5), pp. 311-330.
HAN, J., 2006. Advances in Characterization of Pharmaceutical Hydrates. Trends in Bio/Pharmaceutical Industry, 3, pp. 25-29.
HARA, M. and VERKMAN, A., 2003. Glycerol replacement corrects defective skin hydration, elasticity, and barrier function in aquaporin-3-deficient mice. Proceedings of the National Academy of Sciences, 100(12), pp. 7360-7365.
HEALTH PROTECTION AGENCY, 2012. Quarterly Epidemiological Commentary: Mandatory MRSA, MSSA and E. coli bacteraemia, and C. difficile infection data (up to October – December 2011).http://www.hpa.org.uk/web/HPAweb&HPAwebStandard/HPAweb_C/1259151891722: Health Protection Agency.
HEARD, D. and ASHWORTH, R., 1968. The colloidal properties of chlorhexidine and its interaction with some macromolecules. Journal of Pharmacy and Pharmacology, 20(7), pp. 505-512.
HEISIG, M., LIECKFELDT, R., WITTUM, G., MAZURKEVICH, G. and LEE, G., 1996. Non steady-state descriptions of drug permeation through stratum corneum. I. The biphasic brick-and-mortar model. Pharmaceutical Research,13(3), pp. 421-426.
HELANDER, I., NURMIAHO-LASSILA, E.L., AHVENAINEN, R., RHOADES, J. and ROLLER, S., 2001. Chitosan disrupts the barrier properties of the outer membrane of Gram-negative bacteria. International Journal of Food Microbiology, 71(2), pp. 235-244.
HEO, S., KIM, S., JEONG, Y., BAE, I., JIN, J. and LEE, J., 2008. Hospital outbreak of Burkholderia stabilis bacteraemia related to contaminated chlorhexidine in haematological malignancy patients with indwelling catheters. Journal of Hospital Infection, 70(3), pp. 241.
HIGO, N., NAIK, A., BOMMANNAN, D.B., POTTS, R.O. and GUY, R.H., 1993. Validation of Reflectance Infrared-Spectroscopy as a Quantitative Method to Measure Percutaneous-Absorption In-Vivo. Pharmaceutical Research,10(10),.

363
HOFFMAN, P., 2001. Skin disinfection and acupuncture. Acupuncture in Medicine, 19(2), pp. 112-116.
HONG, S., BIELINSKA, A.U., MECKE, A., KESZLER, B., BEALS, J.L., SHI, X., BALOGH, L., ORR, B.G., BAKER JR, J.R. and HOLL, M.M.B., 2004. Interaction of poly (amidoamine) dendrimers with supported lipid bilayers and cells: hole formation and the relation to transport. Bioconjugate Chemistry, 15(4), pp. 774-782.
HONG, S., BIELINSKA, A.U., MECKE, A., KESZLER, B., BEALS, J.L., SHI, X., BALOGH, L., ORR, B.G., BAKER, J.R. and BANASZAK HOLL, M.M., 2004. Interaction of poly (amidoamine) dendrimers with supported lipid bilayers and cells: hole formation and the relation to transport. Bioconjugate Chemistry, 15(4), pp. 774-782.
HONG, S., LEROUEIL, P.R., ELIZABETH, K., PETERS, J.L., KOBER, M., ISLAM, M.T., ORR, B.G., BAKER JR, J.R. and HOLL, M.M.B., 2006. Interaction of polycationic polymers with supported lipid bilayers and cells: nanoscale hole formation and enhanced membrane permeability. Bioconjugate Chemistry, 17(3), pp. 728-734.
HUGO, W. and LONGWORTH, A., 1964. Effect of chlorhexidine diacetate on “protoplasts” and spheroplasts of Escherichia coli, protoplasts of Bacillus megaterium and the gram staining reaction of Staphylococcus aureus.Journal of Pharmacy and Pharmacology, 16(11), pp. 751-758.
HUYNH, T.T.N., PADOIS, K., SONVICO, F., ROSSI, A., ZANI, F., PIROT, F., DOURY, J. and FALSON, F., 2010. Characterization of a polyurethane-based controlled release system for local delivery of chlorhexidine diacetate.European Journal of Pharmaceutics and Biopharmaceutics, 74(2), pp. 255-264.
IDSON, B., 1971. Biophysical factors in skin penetration. Journal of the Society of. Cosmetic.Chemists, 22, pp. 615-618.
IGARASHI, Y. and OKA, Y., 1988. Vestibular ototoxicity following intratympanic applications of chlorhexidine gluconate in the cat. European Archives of Oto-Rhino-Laryngology, 245(4), pp. 210-217.
IKEDA, T., HIRAYAMA, H., YAMAGUCHI, H., TAZUKE, S. and WATANABE, M., 1986. Polycationic biocides with pendant active groups: molecular weight dependence of antibacterial activity. Antimicrobial Agents and Chemotherapy,30(1), pp. 132-136.
IMFELD,T., 2006. Chlorhexidine-containing chewing gum. Schweizer Monatsschrift Fur Zahnmedizin, 116(5), pp. 476.
IOANNOU, C.J., HANLON, G.W. and DENYER, S.P., 2007. Action of disinfectant quaternary ammonium compounds against Staphylococcus aureus. Antimicrobial Agents and Chemotherapy, 51(1), pp. 296-306.
IWATSUKI, K., YAMASAKI, O., MORIZANE, S. and OONO, T., 2006. Staphylococcal cutaneous infections: invasion, evasion and aggression. Journal of Dermatological Science, 42(3), pp. 203.
J.G.E.PHILLIPS, 2013-last update, National Physical Laboratory- Properties of organic compounds. [Homepage of National Physical Laboratory], [Online]. Available: http://www.kayelaby.npl.co.uk/chemistry/3_3/3_3.html[27/12, 2013].
JAIN, K.K., 2012. The Handbook of Nanomedicine. Springer New York.
JAIN, R., AQIL, M., AHAD, A., ALI, A. and KHAR, R.K., 2008. Basil oil is a promising skin penetration enhancer for transdermal delivery of labetolol hydrochloride. Drug Development and Industrial Pharmacy, 34(4), pp. 384-389.

364
JAIN, K., KESHARWANI, P., GUPTA, U. and JAIN, N.K., 2010. Dendrimer toxicity: Let's meet the challenge. International Journal of Pharmaceutics, 394(1–2), pp. 122-142.
JANG, W., KAMRUZZAMAN SELIM, K., LEE, C. and KANG, I., 2009. Bioinspired application of dendrimers: from bio-mimicry to biomedical applications. Progress in Polymer Science, 34(1), pp. 1-23.
JAYATHILLAKE, A., MASON, D.F.C. and BROOME, K., 2003. Allergy to chlorhexidine gluconate in urethral gel: report of four cases and reviewof the literature. Urology, 61(4), pp. 837.
JE, J.Y. and KIM, S.K., 2006. Chitosan derivatives killed bacteria by disrupting the outer and inner membrane. Journal of Agricultural and Food Chemistry, 54(18), pp. 6629-6633.
JENNING, V., GYSLER, A., SCHÄFER-KORTING, M. and GOHLA, S.H., 2000. Vitamin A loaded solid lipid nanoparticles for topical use: occlusive properties and drug targeting to the upper skin. European journal of Pharmaceutics and Biopharmaceutics, 49(3), pp. 211-218.
JEVPRASESPHANT, R., PENNY, J., JALAL, R., ATTWOOD, D., MCKEOWN, N. and D’EMANUELE, A., 2003. The influence of surface modification on the cytotoxicity of PAMAM dendrimers. International Journal of Pharmaceutics, 252(1-2), pp. 263-266.
JI, Q.X., ZHAO, Q.S., DENG, J. and LÜ, R., 2010. A novel injectable chlorhexidine thermosensitive hydrogel for periodontal application: preparation, antibacterial activity and toxicity evaluation. Journal of Materials Science: Materials in Medicine, 21(8), pp. 2435-2442.
JOHNSON, P.D.R., MARTIN, R., BURRELL, L.J., GRABSCH, E.A., KIRSA, S.W., O KEEFFE, J., MAYALL, B.C., EDMONDS, D., BARR, W. and BOLGER, C., 2005. Efficacy of an alcohol/chlorhexidine hand hygiene program in a hospital with high rates of nosocomial methicillin-resistant Staphylococcus aureus (MRSA) infection. Medical Journal of Australia, 183(10), pp. 509.
JONES, C.G., 2007. Chlorhexidine: is it still the gold standard? Periodontology 2000, 15(1), pp. 55-62.
JONES, D., 2004. Pharmaceutical applications of polymers for drug delivery.15(6) Rapra review, Smithers Rapra Technology. Shropshire, UK.
JONES, D.S., BROWN, A.F., WOOLFSON, A.D., DENNIS, A.C., MATCHETT, L.J. and BELL, S.E., 2000. Examination of the physical state of chlorhexidine within viscoelastic, bioadhesive semisolids using Raman spectroscopy.Journal of Pharmaceutical Sciences, 89(5), pp. 563-571.
JONES, D.S., LORIMER, C.P., MCCOY, C.P. and GORMAN, S.P., 2008. Characterization of the physicochemical, antimicrobial, and drug release properties of thermoresponsive hydrogel copolymers designed for medical device applications. Journal of Biomedical Materials Research Part B: Applied Biomaterials, 85(2), pp. 417-426.
JONES, D.S., WOOLFSON, A.D. and BROWN, A.F., 1997. Textural, viscoelastic and mucoadhesive properties of pharmaceutical gels composed of cellulose polymers. International Journal of Pharmaceutics, 151(2), pp. 223-233.
JONES, M.N., SONG, Y., KASZUBA, M. and REBOIRAS, M.D., 1997. The interaction of phospholipid liposomes with bacteria and their use in the delivery of bactericides. Journal of Drug Targeting, 5(1), pp. 25-34.
JOOSTEN, J.A.F., LOIMARANTA, V., APPELDOORN, C.C.M., HAATAJA, S., EL MAATE, F.A., LISKAMP, R.M.J., FINNE, J. and PIETERS, R.J., 2004. Inhibition of Streptococcus s uis Adhesion by Dendritic Galabiose Compounds at Low Nanomolar Concentration. Journal of Medicinal Chemistry, 47(26), pp. 6499-6508.
365
JORGE, L.L., FERES, C.C. and TELES, V.E., 2011. Topical preparations for pain relief: efficacy and patient adherence. Journal of Pain Research, 4, pp. 11.
JOSWICK, H.L., CORNER, T.R., SILVERNA.JN and GERHARDT, P., 1971. Antimicrobial Actions of Hexachlorophene - Release of Cytoplasmic Materials. Journal of Bacteriology, 108(1), pp. 492.
JUNGBAUER, F., VAN DER HARST, J., GROOTHOFF, J. and COENRAADS, P., 2004. Skin protection in nursing work: promoting the use of gloves and hand alcohol. Contact Dermatitis, 51(3), pp. 135-140.
KAI, J., SATOH, M. and TSUKIDATE, K., 1999. A new method for preparing electron microscopic specimens of Helicobacter pylori. Medical Electron Microscopy, 32(1), pp. 62-65.
KALAB, M., YANG, A.F. and CHABOT, D., 2008. Conventional Scanning Electron Microscopy of Bacteria. Infocus Magazine, (10), pp. 42-61.
KAMPF, G., 2008. What is left to justify the use of chlorhexidine in hand hygiene? Journal of Hospital Infection, 70, pp. 27-34.
KAMPF, G., 2006. Are biofilms relevant for skin disinfection? Journal of Hospital Infection, 63(1), pp. 106-108.
KAMPF, G., JAROSCH, R. and RÜDEN, H., 1998. Limited effectiveness of chlorhexidine based hand disinfectants against methicillin-resistant Staphylococcus aureus (MRSA). Journal of Hospital Infection, 38(4), pp. 297-303.
KAMPF, G., MCDONALD, C. and OSTERMEYER, C., 2005. Bacterial in-use contamination of an alcohol-based hand rub under accelerated test conditions. The Journal of Hospital Infection, 59(3), pp. 271-272.
KAPADIA, B.H., JOHNSON, A.J., DALEY, J.A., ISSA, K. and MONT, M.A., 2013. Pre-admission Cutaneous Chlorhexidine Preparation Reduces Surgical Site Infections In Total Hip Arthroplasty. The Journal of Arthroplasty, 28(3), pp. 490-493.
KARANDE, P., JAIN, A. and MITRAGOTRI, S., 2006. Relationships between skin's electrical impedance and permeability in the presence of chemical enhancers. Journal of Controlled Release, 110(2), pp. 307-313.
KARPANEN, T.J., CONWAY, B.R., WORTHINGTON, T., HILTON, A.C., ELLIOTT, T.S.J. and LAMBERT, P.A., 2010. Enhanced chlorhexidine skin penetration with eucalyptus oil. BMC Infectious Diseases, 10(1), pp. 278.
KARPANEN, T., WORTHINGTON, T., CONWAY, B., HILTON, A., ELLIOTT, T. and LAMBERT, P., 2009. Permeation of chlorhexidine from alcoholic and aqueous solutions within excised human skin. Antimicrobial Agents and Chemotherapy, 53(4), pp. 1717.
KARPANEN, T.J., WORTHINGTON, T., CONWAY, B.R., HILTON, A.C., ELLIOTT, T.S.J. and LAMBERT, P.A., 2008. Penetration of chlorhexidine into human skin. Antimicrobial Agents and Chemotherapy, 52(10), pp. 3633-3636.
KATSU, T., NAKAGAWA, H. and YASUDA, K., 2002. Interaction between polyamines and bacterial outer membranes as investigated with ion-selective electrodes. Antimicrobial Agents and Chemotherapy, 46(4), pp. 1073-1079.
KATSU, T., YOSHIMURA, S. and FUJITA, Y., 1984. Increases in permeability of Escherichia coli outer membrane induced by polycations. FEBS letters, 166(1), pp. 175-178.

366
KAZARIAN, S. and CHAN, A.K., 2013. ATR-FTIR spectroscopic imaging: recent advances and applications to biological systems. Analyst, 138, pp. 1940-1952.
KE, W., ZHAO, Y., HUANG, R., JIANG, C. and PEI, Y., 2007. Enhanced oral bioavailability of doxorubicin in a dendrimer drug delivery system. Journal of Pharmaceutical Sciences, 97(6), pp. 2208-2216.
KEMKEN, J., ZIEGLER, A. and MULLER, B.W., 1992. Influence of Supersaturation on the Pharmacodynamic Effect of Bupranolol After Dermal Administration using Microemulsions as Vehicle. Pharmaceutical research, 9(4), pp. 554-558.
KHAN, M.A. and HOANG, M.Q.,1998. Film-forming composition containing chlorhexidine gluconate, US5763412 US patent.
KHAN, R., KAZI, T. and O'DONOHOE, B., 2011. Near fatal intra-operative anaphylaxis to chlorhexidine—is it time to change practice? BMJ Case Reports 2011.
KHANKARI, R.K. and GRANT, D.J., 1995. Pharmaceutical hydrates. Thermochimica Acta, 248, pp. 61-79.
KHUNKITTI, W., HANN, A.C., LLOYD, D., FURR, J.R. and RUSSELL, A.D., 1998. Biguanide-induced changes in Acanthamoeba castellanii: an electron microscopic study. Journal of Applied Microbiology, 84(1), pp. 53-62.
KIM, B.S., WON, M., LEE, K.M. and KIM, C.S., 2008. In vitro permeation studies of nanoemulsions containing ketoprofen as a model drug. Drug Delivery, 15(7), pp. 465-469.
KIM, S.H., LEE, H.S., RYU, D.S., CHOI, S.J. and LEE, D.S., 2011. Antibacterial Activity of Silver-nanoparticles Against Staphylococcus aureus and Escherichia coli. Korean Journal Microbiolology Biotechnology, 39(1), pp. 77-85.
KING, M.D., HUMPHREY, B.J., WANG, Y.F., KOURBATOVA, E.V., RAY, S.M. and BLUMBERG, H.M., 2006. Emergence of community-acquired methicillin-resistant Staphylococcus aureus USA 300 clone as the predominant cause of skin and soft-tissue infections. Annals of Internal Medicine, 144(5), pp. 309.
KIREMITÇI, A.S., ÇIFTÇI, A., ÖZALP, M. and GÜMÜŞDERELIOĞLU, M., 2007. Novel chlorhexidine releasing system developed from thermosensitive vinyl ether‐based hydrogels. Journal of Biomedical Materials Research Part B: Applied Biomaterials, 83(2), pp. 609-614.
KLAJNERT, B. and EPAND, R., 2005. PAMAM dendrimers and model membranes: Differential scanning calorimetry studies. International Journal of Pharmaceutics, 305(1), pp. 154-166.
KNORR, F., LADEMANN, J., PATZELT, A., STERRY, W., BLUME-PEYTAVI, U. and VOGT, A., 2009. Follicular transport route–Research progress and future perspectives. European Journal of Pharmaceutics and Biopharmaceutics,71(2), pp. 173-180.
KNU, A. and BOEHLAU-GODAU, M., 2000. Spatially confined and temporally resolved refractive index and scattering evaluation in human skin performed with optical coherence tomography. Journal of Biomedical Optics, 5(1), pp. 83-92.
KOCH A.L., 1994. Growth Measurement. In: P.E.A. GERHARDT, ed, Methods for General and Molecular Bacteriology. American Society for Microbiology Washington, DC., pp. 248.
KRAFFT, C., STEINER, G., BELEITES, C. and SALZER, R., 2009. Disease recognition by infrared and Raman spectroscopy. Journal of Biophotonics, 2(1‐2), pp. 13-28.

367
KRAMER, A., RUDOLPH, P., KAMPF, G. and PITTET, D., 2002. Limited efficacy of alcohol-based hand gels. The Lancet, 359(9316), pp. 1489-1490.
KRAUTHEIM, A., JERMANN, T. and BIRCHER, A., 2004. Chlorhexidine anaphylaxis: case report and review of the literature. Contact Dermatitis, 50(3), pp. 113-116.
KÜCHLER, S., RADOWSKI, M.R., BLASCHKE, T., DATHE, M., PLENDL, J., HAAG, R., SCHÄFER-KORTING, M. and KRAMER, K.D., 2009. Nanoparticles for skin penetration enhancement–a comparison of a dendritic core-multishell-nanotransporter and solid lipid nanoparticles. European Journal of Pharmaceutics and Biopharmaceutics, 71(2), pp. 243-250.
KUMAR, P.V., ASTHANA, A., DUTTA, T. and JAIN, N.K., 2006. Intracellular macrophage uptake of rifampicin loaded mannosylated dendrimers. Journal of Drug Targeting, 14(8), pp. 546-556.
KUYYAKANOND, T. and QUESNEL, L.B., 1992. The mechanism of action of chlorhexidine. FEMS Microbiology Letters, 100(1), pp. 211-215.
LABIENIEC, M., ULICNA, O., VANCOVA, O., GLOWACKI, R., SEBEKOVA, K., BALD, E., GABRYELAK, T. and WATALA, C., 2008. PAMAM G4 dendrimers lower high glucose but do not improve reduced survival in diabetic rats. International Journal of Pharmaceutics, 364(1), pp. 142-149.
LADEMANN, J., JACOBI, U., SURBER, C., WEIGMANN, H.J. and FLUHR, J., 2009. The tape stripping procedure–evaluation of some critical parameters. European Journal of Pharmaceutics and Biopharmaceutics, 72(2), pp. 317-323.
LADEMANN, J., MEINKE, M., SCHANZER, S., RICHTER, H., DARVIN, M., HAAG, S., FLUHR, J., WEIGMANN, H.J., STERRY, W. and PATZELT, A., 2012. In vivo methods for the analysis of the penetration of topically applied substances in and through the skin barrier. International Journal of Cosmetic Science, 34(6), pp. 551-559.
LADEMANN, J., JACOBI, U., SURBER, C., WEIGMANN, H. and FLUHR, J., 2009. The tape stripping procedure–evaluation of some critical parameters. European Journal of Pharmaceutics and Biopharmaceutics, 72(2), pp. 317-323.
LADEMANN, J., RICHTER, H., TEICHMANN, A., OTBERG, N., BLUME-PEYTAVI, U., LUENGO, J., WEIß, B., SCHAEFER, U.F., LEHR, C. and WEPF, R., 2007. Nanoparticles--an efficient carrier for drug delivery into the hair follicles.European Journal of Pharmaceutics and Biopharmaceutics: official journal of Arbeitsgemeinschaft fur Pharmazeutische Verfahrenstechnik eV, 66(2), pp. 159.
LAFFORGUE, C., CARRET, L., FALSON, F., REVERDY, M. and FRENEY, J., 1997. Percutaneous absorption of a chlorhexidine digluconate solution. International Journal of Pharmaceutics, 147(2), pp. 243-246.
LAGARRIGUE, M., BECKER, M., LAVIGNE, R., DEININGER, S.O., WALCH, A., AUBRY, F., SUCKAU, D. and PINEAU, C., 2011. Revisiting Rat Spermatogenesis with MALDI Imaging at 20-μm Resolution. Molecular & Cellular Proteomics,10(3),.
LAM, Y., CHAN, D.C., RODRIGUEZ, S.Y., LINTAKOON, J.H. and LAM, T., 1993. Sensitive high-performance liquid chromatographic assay for the determination of chlorhexidine in saliva. Journal of Chromatography B: Biomedical Sciences and Applications, 612(1), pp. 166-171.
LAM, Y., CHAN, D.C., RODRIGUEZ, S.Y., LINTAKOON, J.H. and LAM, T., 1993. Sensitive high-performance liquid chromatographic assay for the determination of chlorhexidine in saliva. Journal of Chromatography B: Biomedical Sciences and Applications, 612(1), pp. 166-171.

368
LAMPE, M.A., BURLINGAME, A., WHITNEY, J., WILLIAMS, M.L., BROWN, B.E., ROITMAN, E. and ELIAS, P.M., 1983. Human stratum corneum lipids: characterization and regional variations. Journal of Lipid Research, 24(2), pp. 120-130.
LARDY, F., VENNAT, B., POUGET, M. and POURRAT, A., 2000. Functionalization of hydrocolloids: Principal component analysis applied to the study of correlations between parameters describing the consistency of hydrogels. Drug Development and Industrial Pharmacy, 26(7), pp. 715-721.
LARSON, E., 1988. Guideline for use of topical antimicrobial agents. American Journal of Infection Control, 16(6), pp. 253-266.
LARSON, E., GIRARD, R., PESSOA-SILVA, C.L., BOYCE, J., DONALDSON, L. and PITTET, D., 2006. Skin reactions related to hand hygiene and selection of hand hygiene products. American Journal of Infection Control, 34(10), pp. 627-635.
LAU, W.M., NG, K.W., SAKENYTE, K. and HEARD, C.M., 2012. Distribution of esterase activity in porcine ear skin; and the effects of freezing and heat separation. International Journal of Pharmaceutics, .
LAUER, A.C., LIEB, L.M., RAMACHANDRAN, C., FLYNN, G.L. and WEINER, N.D., 1995. Transfollicular drug delivery. Pharmaceutical Research, 12(2), pp. 179-186.
LAVRIJSEN, A., BOUWSTRA, J., GOORIS, G., WEERHEIM, A., BODDE, H. and PONEC, M., 1995. Reduced Skin Barrier Function Parallels Abnormal Stratum-Corneum Lipid Organization in Patients with Lamellar Ichthyosis. Journal of Investigative Dermatology, 105(4), pp. 619-624.
LBOUTOUNNE, H., CHAULET, J.F., PLOTON, C., FALSON, F. and PIROT, F., 2002. Sustained ex vivo skin antiseptic activity of chlorhexidine in poly (ϵ-caprolactone) nanocapsule encapsulated form and as a digluconate. Journal of Controlled Release, 82(2), pp. 319-334.
LBOUTOUNNE, H., GUILLAUME, Y., MICHEL, L., MAKKI, S., HUMBERT, P. and MILLET, J., 2004.
Study and development of encapsulated forms of 4, 5′, 8‐Trimethylpsoralen for topical drug delivery. Drug Development Research,61(2), pp. 86-94.
LEE, C.C., MACKAY, J.A., FRÉCHET, J.M.J. and SZOKA, F.C., 2005a. Designing dendrimers for biological applications. Nature Biotechnology, 23(12), pp. 1517-1526.
LEE, D., SPÅNGBERG, L.S., BOK, Y., LEE, C. and KUM, K., 2005b. The sustaining effect of three polymers on the release of chlorhexidine from a controlled release drug device for root canal disinfection. Oral Surgery, Oral Medicine, Oral Pathology, Oral Radiology, and Endodontology, 100(1), pp. 105-111.
LEE, J.W., PARK, J. and PRAUSNITZ, M.R., 2008a. Dissolving microneedles for transdermal drug delivery. Biomaterials, 29(13), pp. 2113-2124.
LEE, J.W., HAN, M. and PARK, J., 2012. Polymer microneedles for transdermal drug delivery. Journal of Drug Targeting, (00), pp. 1-13.
LEE, T.G., PARK, J., SHON, H.K., MOON, D.W., CHOI, W.W., LI, K. and CHUNG, J.H., 2008b. Biochemical imaging of tissues by SIMS for biomedical applications. Applied Surface Science, 255(4), pp. 1241-1248.
LEEMHS, A., HARLANMS, R., BREAUDMS, A.R., SPECKMPH, K., PERLMD, T.M., CLARKEPHD, W. and MILSTONEMD, A.M., 2011. Blood concentrations of chlorhexidine in hospitalized children undergoing daily chlorhexidine bathing.Blood, 32(4), pp. 395-397.
369
LEGENDRE, J., RAULT, I., PETIT, A., LUIJTEN, W., DEMUYNCK, I., HORVATH, S., GINOT, Y. and CUINE, A., 1995. Effects of β-cyclodextrins on skin: implications for the transdermal delivery of piribedil and a novel cognition enhancing-drug, S-9977. European Journal of Pharmaceutical Sciences, 3(6), pp. 311-322.
LEHMANN, R., 2000. Synergism in disinfectant formulation. In: S.S. BLOCK, ed, Disinfection, sterilization, and preservation. 5th edn. Lippincott Williams & Wilkins, pp. 465.
LEVANG, A.K., ZHAO, K. and SINGH, J., 1999. Effect of ethanol/propylene glycol on the in vitro percutaneous absorption of aspirin, biophysical changes and macroscopic barrier properties of the skin. International Journal of Pharmaceutics, 181(2), pp. 255-263.
LEYDEN, J.J., MARPLES, R.R. and KLIGMAN, A.M., 2006. Staphylococcus aureus in the lesions of atopic dermatitis. British Journal of Dermatology, 90(5), pp. 525-525.
LEYDON, J.J, MCGINLEY, K., WENSTER, G., 1983. Cutaneous microbiology. In: J. GOLDSMITH, ed, 1. Biochemistry and Physiology of the skin Volume II edn. New York: Oxford University Press.
LI, J., PIEHLER, L., QIN, D., BAKER JR, J., TOMALIA, D. and MEIER, D., 2000. Visualization and characterization of poly (amidoamine) dendrimers by atomic force microscopy. Langmuir, 16(13), pp. 5613-5616.
LIEB, L.M., RAMACHANDRAN, C., EGBARIA, K. and WEINER, N., 1992. Topical delivery enhancement with multilamellar liposomes into pilosebaceous units: I. In vitro evaluation using fluorescent techniques with the hamster ear model. Journal of Investigative Dermatology, 99(1), pp. 108-113.
LIIPPO, J., KOUSA, P. and LAMMINTAUSTA, K., 2011. The relevance of chlorhexidine contact allergy. Contact Dermatitis, 64(4), pp. 229-234.
LIM, K.-. and KAM, P.C.A., 2008. Chlorhexidine - pharmacology and clinical applications. Anaesthesia and Intensive Care, 36(4), pp. 502-512.
LIN, S., DUAN, K. and LIN, T., 1996. Simultaneous determination of the protein conversion process in porcine stratum corneum after pretreatment with skin enhancers by a combined microscopic FT-IR/DSC system.Spectrochimica Acta Part A: Molecular and Biomolecular Spectroscopy, 52(12), pp. 1671-1678.
LINDEMANN, U., WILKEN, K., WEIGMANN, H.J., SCHAEFER, H., STERRY, W. and LADEMANN, J., 2003. Quantification of the horny layer using tape stripping and microscopic techniques. Journal of Biomedical Optics, 8(4),.
LIU, H., DU, Y., WANG, X. and SUN, L., 2004. Chitosan kills bacteria through cell membrane damage. International Journal of Food Microbiology, 95(2), pp. 147-155.
LIU, J., HU, W., CHEN, H., NI, Q., XU, H. and YANG, X., 2007. Isotretinoin-loaded solid lipid nanoparticles with skin targeting for topical delivery. International Journal of Pharmaceutics, 328(2), pp. 191-195.
LIU, M. and FRÉCHET, J.M.J., 1999. Designing dendrimers for drug delivery. Pharmaceutical Science & Technology Today, 2(10), pp. 393-401.
LIU, Y., BRYANTSEV, V.S., DIALLO, M.S. and GODDARD III, W.A., 2009. PAMAM dendrimers undergo pH responsive conformational changes without swelling. Journal of the American Chemical Society, 131(8), pp. 2798-2799.
370
LLOYD-LAVERY, A. and REED, J., 2012. A case of chlorhexidine-induced anaphylaxis to mouthwash. British Journal of Dermatology, 167, pp. 143-143.
LÖFFLER, H., DREHER, F. and MAIBACH, H., 2004. Stratum corneum adhesive tape stripping: influence of anatomical site, application pressure, duration and removal. British Journal of Dermatology, 151(4), pp. 746-752.
LOPEZ, A.I., REINS, R.Y., MCDERMOTT, A.M., TRAUTNER, B.W. and CAI, C., 2009. Antibacterial activity and cytotoxicity of PEGylated poly (amidoamine) dendrimers. Molecular BioSystems, 5(10), pp. 1148-1156.
LOTHIAN-TOMALIA, M.K., HEDSTRAND, D.M., TOMALIA, D.A., PADIAS, A.B. and HALL, H., 1997. A contemporary survey of covalent connectivity and complexity. The divergent synthesis of poly (thioether) dendrimers. Amplified, genealogically directed synthesis leading to the de Gennes dense packed state. Tetrahedron, 53(45), pp. 15495-15513.
LOWRY, O.H., ROSEBROUGH, N.J., FARR, A.L. and RANDALL, R.J., 1951. Protein measurement with the Folin phenol reagent. Journal of biological chemistry, 193(1), pp. 265-275.
LU, P., 1986. Opaque pearlescent films containing dispersed incompatible polymer and polymeric interfacial agent., EP 0188123 EU patent.
LUO, Y., KIRKER, K.R. and PRESTWICH, G.D., 2000. Cross-linked hyaluronic acid hydrogel films: new biomaterials for drug delivery. Journal of Controlled Release, 69(1), pp. 169-184.
MA, M., CHENG, Y., XU, Z., XU, P., QU, H., FANG, Y., XU, T. and WEN, L., 2007. Evaluation of polyamidoamine (PAMAM) dendrimers as drug carriers of anti-bacterial drugs using sulfamethoxazole (SMZ) as a model drug.European Journal of Medicinal Chemistry, 42(1), pp. 93-98.
MA, Z., WANG, R., WU, Z., CHEN, D., ZHANG, B., HE, W., WANG, X., LIU, Q., XU, J. and ZHU, H., 2007. Preparation of functional chitosan thermosensitive hydrogel for slow release both rhBMP-2 and chlorhexidine. Sheng wu gong cheng xue bao = Chinese Journal of Biotechnology, 23(6), pp. 1049-54.
MACDONALD, A., DINAH, F., MACKENZIE, D. and WILSON, A., 2004. Performance feedback of hand hygiene, using alcohol gel as the skin decontaminant, reduces the number of inpatients newly affected by MRSA and antibiotic costs. Journal of Hospital Infection, 56(1), pp. 56-63.
MAGHRABY, G.M.E., WILLIAMS, A.C. and BARRY, B.W., 2001. Skin delivery of 5‐fluorouracil from ultradeformable and standard liposomes in‐vitro. Journal of Pharmacy and Pharmacology, 53(8), pp. 1069-1077.
MAINS, J., WILSON, C. and URQUHART, A., 2011. ToF-SIMS analysis of ocular tissues reveals biochemical differentiation and drug distribution. European Journal of Pharmaceutics and Biopharmaceutics, 79(2), pp. 328-333.
MAITI, P.K., CAGIN, T., WANG, G. and GODDARD III, W.A., 2004. Structure of PAMAM dendrimers: Generations 1 through 11. Macromolecules, 37(16), pp. 6236-6254.
MAIWALD, M., 2008. Alcohol-based hand hygiene and nosocomial infection rates. Alcohol, 29(6), pp. 579-580.
MALIK, N., WIWATTANAPATAPEE, R., KLOPSCH, R., LORENZ, K., FREY, H., WEENER, J.W., MEIJER, E.W., PAULUS, W. and DUNCAN, R., 2000. Dendrimers:: Relationship between structure and biocompatibility in vitro, and preliminary studies on the biodistribution of 125I-labelled polyamidoamine dendrimers in vivo. Journal of Controlled Release, 65(1–2), pp. 133-148.

371
MALMBERG, P., JENNISCHE, E., NILSSON, D. and NYGREN, H., 2011. High-resolution, imaging TOF-SIMS: novel applications in medical research. Analytical and Bioanalytical Chemistry, 399(8), pp. 2711-2718.
MAMMEN, M., CHOI, S.K. and WHITESIDES, G.M., 1998. Polyvalent interactions in biological systems: implications for design and use of multivalent ligands and inhibitors. Angewandte Chemie International Edition, 37(20), pp. 2754-2794.
MAO-QIANG, M., ELIAS, P.M. and FEINGOLD, K.R., 1993. Fatty acids are required for epidermal permeability barrier function. Journal of Clinical Investigation, 92(2), pp. 791.
MAPLE, P., HAMILTON-MILLER, J. and BRUMFITT, W., 1992. Comparison of the in-vitro activities of the topical antimicrobials azelaic acid, nitrofurazone, silver sulphadiazine and mupirocin against methicillin-resistant Staphylococcus aureus. Journal of Antimicrobial Chemotherapy, 29(6), pp. 661-668.
MARKS, R., 2004. The stratum corneum barrier: the final frontier. The Journal of Nutrition, 134(8), pp. 2017-2021.
MARTTIN, E., NEELISSENSUBNEL, M.T.A., DEHAAN, F.H.N. and BODDE, H.E., 1996. A critical comparison of methods to quantify stratum corneum removed by tape stripping. Skin Pharmacology, 9(1), pp. 69-77.
MCCARTHY, T.D., KARELLAS, P., HENDERSON, S.A., GIANNIS, M., O'KEEFE, D.F., HEERY, G., PAULL, J.R.A., MATTHEWS, B.R. and HOLAN, G., 2005. Dendrimers as drugs: discovery and preclinical and clinical development of dendrimer-based microbicides for HIV and STI prevention. Molecular.Pharmacology, 2(4), pp. 312-318.
MEHNERT, W. and MÄDER, K., 2001. Solid lipid nanoparticles: production, characterization and applications. Advanced Drug Delivery Reviews, 47(2), pp. 165-196.
MEIDAN, V.M., BONNER, M.C. and MICHNIAK, B.B., 2005. Transfollicular drug delivery—is it a reality? International Journal of Pharmaceutics, 306(1), pp. 1-14.
MENDELSOHN, R., REREK, M.E. and MOORE, D.J., 2000. Infrared spectroscopy and microscopic imaging of stratum corneum models and skin. Invited Lecture. Phys.Chem.Chem.Phys., 2(20), pp. 4651-4657.
MENDELSOHN, R., FLACH, C.R. and MOORE, D.J., 2006. Determination of molecular conformation and permeation in skin via IR spectroscopy, microscopy, and imaging. Biochimica Et Biophysica Acta-Biomembranes, 1758(7), pp. 923-933.
MEYER, W. and ZSCHEMISCH, N., 2002. Skin layer thickness at the ear of the domesticated pig, with special reference to the use of the ear integument for human dermatological research. Berl Munch Tierarztl Wochenschr,115, pp. 401-406.
MEYERS, S.R., JUHN, F.S., GRISET, A.P., LUMAN, N.R. and GRINSTAFF, M.W., 2008. Anionic amphiphilic dendrimers as antibacterial agents. Journal of the American Chemical Society, 130(44), pp. 1444-1445.
MEZEI, M. and GULASEKHARAM, V., 1980. Liposomes-a selective drug delivery system for the topical route of administration I. Lotion dosage form. Life Sciences, 26(18), pp. 1473-1477.
MILHEM, O., MYLES, C., MCKEOWN, N., ATTWOOD, D. and D’EMANUELE, A., 2000. Polyamidoamine Starburst® dendrimers as solubility enhancers. International Journal of Pharmaceutics, 197(1), pp. 239-241.

372
MILLER, L.G., QUAN, C., SHAY, A., MOSTAFAIE, K., BHARADWA, K., TAN, N., MATAYOSHI, K., CRONIN, J., TAN, J. and TAGUDAR, G., 2007. A prospective investigation of outcomes after hospital discharge for endemic, community-acquired methicillin-resistant and-susceptible Staphylococcus aureus skin infection. Clinical Infectious diseases, 44(4), pp. 483-492.
MILSTONE, A.M., PASSARETTI, C.L. and PERL, T.M., 2008. Chlorhexidine: Expanding the armamentarium for infection control and prevention. Clinical Infectious Diseases, 46(2), pp. 274-281.
MINNOCK, A., VERNON, D.I., SCHOFIELD, J., GRIFFITHS, J., PARISH, J.H. and BROWN, S.B., 2000. Mechanism of Uptake of a Cationic Water-Soluble Pyridinium Zinc Phthalocyanine across the Outer Membrane ofEscherichia coli.Antimicrobial Agents and Chemotherapy, 44(3), pp. 522-527.
MINTZER, M.A., DANE, E.L., O’TOOLE, G.A. and GRINSTAFF, M.W., 2011. Exploiting Dendrimer Multivalency To Combat Emerging and Re-Emerging Infectious Diseases. Molecular Pharmaceutics, 9(3), pp. 342-354.
MIYAZAKI, S., TAKAHASHI, A., KUBO, W., BACHYNSKY, J. and LÖBENBERG, R., 2003. Poly n-butylcyanoacrylate (PNBCA) nanocapsules as a carrier for NSAIDs: in vitro release and in vivo skin penetration. Journal of Pharmaceutical Science, 6(2), pp. 238-245.
MODAK, S.M. and SAMPATH, L.A., 2007. Antimicrobial Medical Devices Containing Chlorhexidine Free Base And Salt, EP1343547, EU patent .
MOORE, D.J., REREK, M.E. and MENDELSOHN, R., 2001. Role of ceramides 2 and 5 in the structure of the stratum corneum lipid barrier. International Journal of Cosmetic Science, 21(5), pp. 353-368.
MOORE, D.J. and REREK, M.E., 2000. Insights into the molecular organization of lipids in the skin barrier from infrared spectroscopy studies of stratum corneum lipid models. Acta Dermato Venereologica-Supplement, (208), pp. 16-22.
MOORE, M. and KHANNA, R., 1991. Infrared and mass spectral studies of proton irradiated H< sub> 2</sub> O CO< sub> 2</sub> ice: Evidence for carbonic acid. Spectrochimica Acta Part A: Molecular Spectroscopy, 47(2), pp. 255-262.
MORGAN, M.T., NAKANISHI, Y., KROLL, D.J., GRISET, A.P., CARNAHAN, M.A., WATHIER, M., OBERLIES, N.H., MANIKUMAR, G., WANI, M.C. and GRINSTAFF, M.W., 2006. Dendrimer-encapsulated camptothecins: increased solubility, cellular uptake, and cellular retention affords enhanced anticancer activity in vitro. Cancer Research, 66(24), pp. 11913-11921.
MORONES, J.R., ELECHIGUERRA, J.L., CAMACHO, A., HOLT, K., KOURI, J.B., RAMÍREZ, J.T. and YACAMAN, M.J., 2005. The bactericidal effect of silver nanoparticles. Nanotechnology, 16(10), pp. 2346.
MORRIS, A.P., BRAIN, K.R. and HEARD, C.M., 2009. Skin permeation and ex vivo skin metabolism of O-acyl haloperidol ester prodrugs. International Journal of Pharmaceutics, 367(1–2), pp. 44-50.
MORRISON, F.A., 2001. Understanding rheology. Oxford University Press, USA.
MUKHERJEE, S.P. and BYRNE, H.J., 2012. Polyamidoamine Dendrimer Nanoparticle Cytotoxicity, Oxidative Stress, Caspase Activation and Infammatory Response: Experimental Observation and Numerical Simulation.Nanomedicine: Nanotechnology, Biology and Medicine,9(2), pp.202-211.
MÜLLER, R.H., RADTKE, M. and WISSING, S.A., 2002. Solid lipid nanoparticles (SLN) and nanostructured lipid carriers (NLC) in cosmetic and dermatological preparations. Advanced Drug Delivery Reviews, 54, Supplement(0), pp. 131-155.

373
MUSIAL, W., VONCINA, B., PLUTA, J. and KOKOL, V., 2012. The Study of Release of Chlorhexidine from Preparations with Modified Thermosensitive Poly-N-isopropylacrylamide Microspheres. The Scientific World Journal, 2012.
MYER, K.A., DREHER, F., PELOSI, A., MIO, K., BERARDESCA, E. and MAIBACH, H.I.,2012. Adhesive tape stripping reveals differences in stratum corneum cohesion between Caucasians, Blacks, and Hispanics as a function of age. In: Dermatotoxicology 8
th edn. Ed. Farage and Maibach
CRC Press, New York.
NAIK, A., KALIA, Y.N., GUY, R.H. and FESSI, H., 2004. Enhancement of topical delivery from biodegradable nanoparticles. Pharmaceutical Research, 21(10), pp. 1818-1825.
N'DRI-STEMPFER, B., NAVIDI, W.C., GUY, R.H. and BUNGE, A.L., 2009. Improved Bioequivalence Assessment of Topical Dermatological Drug Products Using Dermatopharmacokinetics. Pharmaceutical Research, 26(2), pp.316-328.
NETZLAFF, F., KOSTKA, K.H., LEHR, C.M. and SCHAEFER, U.F., 2006. TEWL measurements as a routine method for evaluating the integrity of epidermis sheets in static Franz type diffusion cells in vitro. Limitations shown by transport data testing. European Journal of Pharmaceutics and Biopharmaceutics, 63(1), pp. 44-50.
NEWMAN, J.L. and SEITZ, J.C., 1990. Intermittent use of an antimicrobial hand gel for reducing soap-induced irritation of health care personnel. American Journal of Infection Control, 18(3), pp. 194-200.
NHUNG, D.T.T., FREYDIERE, A., CONSTANT, H., FALSON, F. and PIROT, F., 2007. Sustained antibacterial effect of a hand rub gel incorporating chlorhexdine-loaded nanocapsules (Nanochlorex®). International Journal of Pharmaceutics, 334(1), pp. 166-172.
NIKAIDO, H., 1996. Multidrug efflux pumps of gram-negative bacteria. Journal of Bacteriology, 178(20), pp. 5853.
NISHIOKA, K. and KATAYAMA, I., 2006. Histamine release in contact urticaria. Contact Dermatitis, 11(3), pp. 191-191.
NORLÉN, L., NICANDER, I., ROZELL, B.L., OLLMAR, S. and FORSLIND, B., 1999. Inter-and intra-individual differences in human stratum corneum lipid content related to physical parameters of skin barrier function in vivo.Journal of Investigative Dermatology, 112(1), pp. 72-77.
NYGREN, H., BORNER, K., HAGENHOFF, B., MALMBERG, P. and MANSSON, J.E., 2005. Localization of cholesterol, phosphocholine and galactosylceramide in rat cerebellar cortex with imaging TOF-SIMS equipped with a bismuth cluster ion source. Biochimica Et Biophysica Acta-Molecular and Cell Biology of Lipids, 1737(2-3), pp. 102-110.
OCHOA, M., MOUSOULIS, C. and ZIAIE, B., 2012. Polymeric microdevices for transdermal and subcutaneous drug delivery. Advanced Drug Delivery Reviews, 64(14), pp. 1603-1616.
ODORE, R., VALLE, V.C. and RE, G., 2000. Efficacy of chlorhexidine against some strains of cultured and clinically isolated microorganisms. Veterinary Research Communications, 24(4), pp. 229-238.
OECD ORGANISATION FOR ECONOMIC CO-OPERATION AND DEVELOPMENT, 2004. Guidance Document No. 28: The Conduct of Skin Absorption Studies. Paris, France.
OECD. PUBLISHING, 2008. OECD Science, Technology and Industry Outlook 2008. Organisation for Economic Co-operation and Development.

374
OGASE, H., NAGAI, I., KAMEDA, K., KUME, S. and ONO, S., 1992. Identification and quantitative
analysis of degradation products of chlorhexidine with chlorhexidine‐resistant bacteria with three‐dimensional high performance liquid chromatography. Journal of Applied Microbiology, 73(1), pp. 71-78.
OHMAN, H. and VAHLQUIST, A., 1994. In vivo studies concerning a pH gradient in human stratum corneum and upper epidermis. Acta Dermato-Venereologica, 74(5), pp. 375.
OKAMOTO, M., TANJI, N., KATAYAMA, Y. and OKADA, J., 2006. TOF-SIMS investigation of the distribution of a cosmetic ingredient in the epidermis of the skin. Applied Surface Science, 252(19), pp. 6805-6808.
OKANO, M., NOMURA, M., HATA, S., OKADA, N., SATO, K., KITANO, Y., TASHIRO, M., YOSHIMOTO, Y., HAMA, R. and AOKI, T., 1989. Anaphylactic symptoms due to chlorhexidine gluconate. Archives of Dermatology, 125(1), pp. 50.
ORAFIDIYA, L.O., OYEDELE, A., SHITTU, A. and ELUJOBA, A., 2001. The formulation of an effective topical antibacterial product containing Ocimum gratissimum leaf essential oil. International Journal of Pharmaceutics, 224(1-2), pp. 177-183.
OSSWALD, T., 1998. Polymer processing fundamentals. Hanser Verlag. Munich, Germany.
PANCHAGNULA, R., BOKALIAL, R., SHARMA, P. and KHANDAVILLI, S., 2005. Transdermal delivery of naloxone: skin permeation, pharmacokinetic, irritancy and stability studies. International Journal of Pharmaceutics, 293(1), pp. 213-223.
PARADKAR, A., KELLY, A., COATES, P. and YORK, P., 2009. Shear and extensional rheology of hydroxypropyl cellulose melt using capillary rheometry. Journal of Pharmaceutical and Biomedical Analysis, 49(2), pp. 304-310.
PARDEIKE, J., HOMMOSS, A. and MÜLLER, R.H., 2009. Lipid nanoparticles (SLN, NLC) in cosmetic and pharmaceutical dermal products. International Journal of Pharmaceutics, 366(1), pp. 170-184.
PARK, J., ALLEN, M.G. and PRAUSNITZ, M.R., 2005. Biodegradable polymer microneedles: fabrication, mechanics and transdermal drug delivery. Journal of Controlled Release, 104(1), pp. 51-66.
PATEL, G.K. and FINLAY, A.Y., 2003. Staphylococcal scalded skin syndrome: diagnosis and management. American Journal of Clinical Dermatology, 4(3), pp. 165-175.
PATRI, A.K., MAJOROS, I.J. and BAKER, J.R., 2002. Dendritic polymer macromolecular carriers for drug delivery. Current opinion in chemical biology, 6(4), pp. 466-471.
PAULSON, D.S., 2002. Handbook of Topical Antimicrobials: Industrial Applications in Consumer Products and Pharmaceuticals. CRC Press, New York.
PELLETT, M., DAVIS, A. and HADGRAFT, J., 1994. Effect of supersaturation on membrane transport: 2. Piroxicam. International Journal of Pharmaceutics, 111(1), pp. 1-6.
PELLETT, M.A., CASTELLANO, S., HADGRAFT, J. and DAVIS, A.F., 1997. The penetration of supersaturated solutions of piroxicam across silicone membranes and human skin in vitro. Journal of Controlled Release, 46(3), pp. 205-214.
PERRIN, J. and WITZKE, E., 1971. The aggregation of chlorhexidine digluconate in aqueous solution from optical rotatory dispersion measurements. Journal of Pharmacy and Pharmacology, 23(1), pp. 76-77.
375
PETERSON, G.L., 1977. A simplification of the protein assay method of Lowry et al. which is more generally applicable. Analytical Biochemistry, 83, pp. 346-356.
PETERSON, J., ALLIKMAA, V., SUBBI, J., PEHK, T. and LOPP, M., 2003. Structural deviations in poly (amidoamine) dendrimers: a MALDI-TOF MS analysis. European Polymer Journal, 39(1), pp. 33-42.
PETERSON, J., EBBER, A., ALLIKMAA, V. and LOPP, M., 2001. Synthesis and CZE analysis of PAMAM dendrimers with an ethylenediamine core, Proceedings-Estonian Academy of Sciences Chemistry 2001, TRUEKITUD OU, pp. 156-166.
PETERSON, J., ALLIKMAA, V., SUBBI, J., PEHK, T. and LOPP, M., 2003. Structural deviations in poly (amidoamine) dendrimers: a MALDI-TOF MS analysis. European Polymer Journal, 39(1), pp. 33-42.
PIANTADOSI, C. and SMART, R.S.C., 2002. Statistical comparison of hydrophobic and hydrophilic species on galena and pyrite particles in flotation concentrates and tails from TOF-SIMS evidence. International Journal of Mineral Processing, 64(1), pp. 43-54.
PIERS, K.L., BROWN, M.H. and HANCOCK, R., 1994. Improvement of outer membrane-permeabilizing and lipopolysaccharide-binding activities of an antimicrobial cationic peptide by C-terminal modification. Antimicrobial Agents and Chemotherapy, 38(10), pp. 2311-2316.
PIETSCH, H., 2001. Hand antiseptics: rubs versus scrubs, alcoholic solutions versus alcoholic gels. Journal of Hospital Infection, 48, pp. S33-S36.
PIROT, F., KALIA, Y.N., STINCHCOMB, A.L., KEATING, G., BUNGE, A. and GUY, R.H., 1997. Characterization of the permeability barrier of human skin in vivo. Proceedings of the National Academy of Sciences, 94(4), pp. 1562-1567.
PITTET, D., HUGONNET, S., HARBARTH, S., MOUROUGA, P., SAUVAN, V., TOUVENEAU, S. and PERNEGER, T.V., 2000. Effectiveness of a hospital-wide programme to improve compliance with hand hygiene. Lancet, 356(9238), pp. 1307-1312.
PIWOWAR, A., FLETCHER, J., LOCKYER, N. and VICKERMAN, J., 2011. Top-down approach to studying biological components using ToF-SIMS. Surface and Interface Analysis, 43(1-2), pp. 265-268.
POTTS, R.O. and GUY, R.H., 1992. Predicting skin permeability. Pharmaceutical Research, 9(5), pp. 663-669.
PRATT, R., HOFFMAN, P. and ROBB, F., 2005. The need for skin preparation prior to injection: point—counterpoint. British Journal of Infection Control, 6(4), pp. 18-20.
PRAUSNITZ, M.R. and LANGER, R., 2008. Transdermal drug delivery. Nature Biotechnology, 26(11), pp. 1261-1268.
PRAUSNITZ, M.R., MITRAGOTRI, S. and LANGER, R., 2004. Current status and future potential of transdermal drug delivery. Nature Reviews Drug Discovery, 3(2), pp. 115-124.
PRESTIDGE, C.A., BARNES, T.J. and SKINNER, W., 2010. Time‐of‐flight secondary‐ion mass spectrometry for the surface characterization of solid‐state pharmaceuticals. Journal of Pharmacy and Pharmacology, 59(2), pp. 251-259.
PROW, T.W., GRICE, J.E., LIN, L.L., FAYE, R., BUTLER, M., BECKER, W., WURM, E.M., YOONG, C., ROBERTSON, T.A. and SOYER, H.P., 2011. Nanoparticles and microparticles for skin drug delivery. Advanced Drug Delivery Reviews,63(6), pp. 470-491.
376
RAGHAVAN, S.L., TRIVIDIC, A., DAVIS, A.F. and HADGRAFT, J., 2000. Effect of cellulose polymers on supersaturation and in vitro membrane transport of hydrocortisone acetate. International Journal of Pharmaceutics, 193(2), pp. 231-237.
RAJAN, S., 2012. Skin and soft-tissue infections: Classifying and treating a spectrum. Cleveland Clinic Journal of Medicine, 79(1), pp. 57-66.
RANGANATHAN, N., 1996. Chlorhexidine. Handbook of disinfectants and antiseptics.New York, Marcel Dekker, pp. 235-264.
RASTOGI, R., ANAND, S. and KOUL, V., 2009. Flexible polymerosomes—An alternative vehicle for topical delivery. Colloids and Surfaces B: Biointerfaces, 72(1), pp. 161-166.
REDDY, M.B., STINCHCOMB, A.L., GUY, R.H. and BUNGE, A.L., 2002. Determining dermal absorption parameters in vivo from tape strip data. Pharmaceutical Research, 19(3), pp. 292-298.
REDDY, M.B., GUY, R.H. and BUNGE, A.L., 2000. Does epidermal turnover reduce percutaneous penetration? Pharmaceutical Research, 17(11), pp. 1414-1419.
REINERTSON, R.P. and WHEATLEY, V.R., 1959. Studies on the chemical composition of human epidermal lipids. The Journal of Investigative Dermatology, 32(1), pp. 49-59.
RELLER, L.B., SCHOENKNECHT, F.D., KENNY, M.A. and SHERRIS, J.C., 1974. Antibiotic susceptibility testing of Pseudomonas aeruginosa: selection of a control strain and criteria for magnesium and calcium content in media.Journal of Infectious Diseases, 130(5), pp. 454-463.
RENNIE, R., 2001. M32-P Evaluation of lots of Mueller Hinton broth for antimicrobial susceptibility testing; proposed guideline. first edn. USA: Clinical and Laboratory Standards Institute.
REYBROUCK, G., 1986. Handwashing and hand disinfection. The Journal of Hospital Infection, 8(1), pp. 5.
REYNOLDS, S.A., LEVY, F. and WALKER, E.S., 2006. Hand sanitizer alert. Emerging Infectious Diseases, 12(3), pp. 527.
RICE, L.B., 2009. The clinical consequences of antimicrobial resistance. Current Opinion in Microbiology, 12(5), pp. 476-481.
RIGG, P.C. and BARRY, B.W., 1990. Shed snake skin and hairless mouse skin as model membranes for human skin during permeation studies. Journal of Investigative Dermatology, 94(2), pp. 235-240.
RIGGS, P., BRADEN, M. and PATEL, M., 2000. Chlorhexidine release from room temperature polymerising methacrylate systems. Biomaterials, 21(4), pp. 345-351.
ROBERTS, J.C., BHALGAT, M.K. and ZERA, R.T., 1996. Preliminary biological evaluation of polyamidoamine (PAMAM) StarburstTM dendrimers. Journal of Biomedical Materials Research, 30(1), pp. 53-65.
ROBERTS, M. and WALKER, M., 1993. Water. The most natural penetration enhancer. Drugs and the Pharmaceutical Sciences, 59, pp. 1-30.
ROTHMAN, S., 1954. Physiology and biochemistry of the skin, University of Chicago Press. Chicago, USA.
SAAR, B.G., CONTRERAS-ROJAS, L.R., XIE, X.S. and GUY, R.H., 2011. Imaging Drug Delivery to Skin with Stimulated Raman Scattering Microscopy. Molecular Pharmaceutics, 8(3), pp. 969-975.
377
SAJJA, H.K., EAST, M.P., MAO, H., WANG, A.Y., NIE, S. and YANG, L., 2009. Development of Multifunctional Nanoparticles for Targeted Drug Delivery and Non-invasive Imaging of Therapeutic Effect. Current Drug Discovery Technologies, 6(1), pp. 43.
SAKEENA, M., FA, M., ZA, G., MM, K., AS, M. and MN, A., 2010. Formulation and in vitro evaluation of ketoprofen in palm oil esters nanoemulsion for topical delivery. Journal of Oleo Science, 59(4), pp. 223-228.
SALAMI, A.A., IMOSEMI, I.O., OWOEYE, O.O., SALAMI, A., IMOSEMI, I. and OWOEYE, O., 2006. A comparison of the effect of chlorhexidine, tap water and normal saline on healing wounds. International Journal of Morphology, 24(4), pp. 673-676.
SALMINEN, A., LOIMARANTA, V., JOOSTEN, J.A.F., KHAN, A.S., HACKER, J., PIETERS, R.J. and FINNE, J., 2007. Inhibition of P-fimbriated Escherichia coli adhesion by multivalent galabiose derivatives studied by a live-bacteria application of surface plasmon resonance. Journal of Antimicrobial Chemotherapy, 60(3), pp. 495-501.
SAMAD, A., SULTANA, Y. and AQIL, M., 2007. Liposomal drug delivery systems: an update review. Current Drug Delivery, 4(4), pp. 297-305.
SAMIEY, B. and ASHOORI, F., 2012. Adsorptive removal of methylene blue by agar: effects of NaCl and ethanol. Chemistry Central Journal, 6(1), pp. 14.
SAND, M., GAMBICHLER, T., MOUSSA, G., BECHARA, F., SAND, D., ALTMEYER, P. and HOFFMANN, K., 2006. Evaluation of the epidermal refractive index measured by optical coherence tomography. Skin Research and Technology,12(2), pp. 114-118.
SARKER, D.K., 2005. Engineering of nanoemulsions for drug delivery. Current Drug Delivery, 2(4), pp. 297-310.
SATO, J., DENDA, M., NAKANISHI, J., NOMURA, J. and KOYAMA, J., 1998. Cholesterol sulfate inhibits proteases that are involved in desquamation of stratum corneum. Journal of Investigative Dermatology, 111(2), pp. 189-193.
SCHMID-WENDTNER, M. and KORTING, H., 2007. pH and skin care. ABW Wissenschaftsverlag, Berlin, Germany. pp. 15-25.
SCHMOOK, F.P., MEINGASSNER, J.G. and BILLICH, A., 2001. Comparison of human skin or epidermis models with human and animal skin in in-vitro percutaneous absorption. International Journal of Pharmaceutics, 215(1), pp. 51-56.
SCHREIER, H. and BOUWSTRA, J., 1994. Liposomes and niosomes as topical drug carriers: dermal and transdermal drug delivery. Journal of Controlled Release, 30(1), pp. 1-15.
SCHUELER, B.W., 1992. Microscope imaging by time-of-flight secondary ion mass spectrometry. Microscopy Microanalysis Microstructures, 3, pp. 119-119.
SCHURER, N. and ELIAS, P., 1991. The biochemistry and function of stratum corneum lipids. Advances in Lipid Research, 24, pp. 27.
SCHWARB, F., GABARD, B., RUFLI, T. and SURBER, C., 1999. Percutaneous absorption of salicylic acid in man after topical administration of three different formulations. Dermatology, 198(1), pp. 44-51.
SCOTT, R.C. and CLOWES, H.M., 1992. In vitro percutaneous absorption experiments: a guide to the technique for use in toxicology assessments. Toxicology Mechanisms and Methods, 2(2), pp. 113-123.

378
SCOTT, R.C., DUGARD, P.H., RAMSEY, J.D. and RHODES, C., 1987. In vitro absorption of some o-phthalate diesters through human and rat skin. Environmental Health Perspectives, 74, pp. 223.
SEED, B., 2001. Silanizing glassware. Current Protocols in Immunology, pp. A. 3K.1-A. 3K.2.
SELWYN, S. and ELLIS, H., 1972. Skin Bacteria and Skin Disinfection Reconsidered. British medical Journal, 1(5793), pp. 136-&.
ŞENEL, S., IKINCI, G., KAŞ, S., YOUSEFI-RAD, A., SARGON, M. and HINCAL, A., 2000. Chitosan films and hydrogels of chlorhexidine gluconate for oral mucosal delivery. International Journal of Pharmaceutics, 193(2), pp. 197-203.
SHABALA, L., ROSS, T., NEWMAN, I., MCMEEKIN, T. and SHABALA, S., 2001. Measurements of net fluxes and extracellular changes of H+, Ca2+, K+, and NH4+ in Escherichia coli using ion-selective microelectrodes. Journal of Microbiological Methods, 46(2), pp. 119-129.
SHAFIULLAH, D., 2005. Formulation and evaluation of chlorhexidine mucoadhesive drug delivery systems, Rajiv Gandhi University of Health Sciences.
SHAH, P., BHALODIA, D. and SHELAT, P., 2010. Nanoemulsion: a pharmaceutical review. Systematic Reviews in Pharmacy, 1(1), pp. 24.
SHAKEEL, F., BABOOTA, S., AHUJA, A., ALI, J. and SHAFIQ, S., 2008. Skin permeation mechanism and bioavailability enhancement of celecoxib from transdermally applied nanoemulsion. Journal of Nanobiotechnology, 6(8).
SHAKEEL, F., BABOOTA, S., AHUJA, A., ALI, J., AQIL, M. and SHAFIQ, S., 2007. Nanoemulsions as vehicles for transdermal delivery of aceclofenac. AAPS Pharmaceutical Science and Technology, 8(4), pp. 191-199.
SHAKEEL, F. and RAMADAN, W., 2010. Transdermal delivery of anticancer drug caffeine from water-in-oil nanoemulsions. Colloids and Surfaces B: Biointerfaces, 75(1), pp. 356-362.
SHAKHBAZAU, A., ISAYENKA, I., KARTEL, N., GONCHAROVA, N., SEVIARYN, I., KOSMACHEVA, S., POTAPNEV, M., SHCHARBIN, D. and BRYSZEWSKA, M., 2010. Transfection efficiencies of PAMAM dendrimers correlate inversely with their hydrophobicity. International Journal of Pharmaceutics, 383(1), pp. 228-235.
SHCHARBIN, D., DRAPEZA, A., LOBAN, V., LISICHENOK, A. and BRYSZEWSKA, M., 2006. The breakdown of bilayer lipid membranes by dendrimers. Cellular & Molecular Biology Letters, 11(2), pp. 242-248.
SHIM, E.K., BARNETTE, D., HUGHES, K. and GREENWAY, H.T., 2001. Microdermabrasion: a clinical and histopathologic study. Dermatologic Surgery, 27(6), pp. 524-530.
SHOCKMAN, G.D. and BARREN, J., 1983. Structure, function, and assembly of cell walls of gram-positive bacteria. Annual Reviews in Microbiology, 37(1), pp. 501-527.
SIDDIQUI, O., ROBERTS, M. and POLACK, A., 1989. Percutaneous absorption of steroids: relative contributions of epidermal penetration and dermal clearance. Journal of Pharmacokinetics and Pharmacodynamics, 17(4), pp. 405-424.
SILHAVY, T.J., KAHNE, D. and WALKER, S., 2010. The bacterial cell envelope. Cold Spring Harbor perspectives in biology, 2(5),.
SILVESTRO, L., WEISER, J.N. and AXELSEN, P.H., 2000. Antibacterial and antimembrane activities of cecropin A in Escherichia coli. Antimicrobial Agents and Chemotherapy, 44(3), pp. 602-607.

379
SMITH, J. and IRWIN, W., 2000. Ionisation and the effect of absorption enhancers on transport of salicylic acid through silastic rubber and human skin. International Journal of Pharmaceutics, 210(1-2), pp. 69-82.
SOBEL, J.D., HASHMAN, N., REINHERZ, G. and MERZBACH, D., 1982. Nosocomial Pseudomonas cepacia infection associated with chlorhexidine contamination. The American Journal of Medicine, 73(2), pp. 183-186.
SODHI, R.N.S., 2004. Time-of-flight secondary ion mass spectrometry (TOF-SIMS): versatility in chemical and imaging surface analysis. Analyst, 129(6), pp. 483-487.
SÖZGEN, K., CEKIC, S.D., TÜTEM, E. and APAK, R., 2006. Spectrophotometric total protein assay with copper(II)–neocuproine reagent in alkaline medium. Talanta, 68(5), pp. 1601-1609.
STEVENS, D.L., BISNO, A.L., CHAMBERS, H.F., EVERETT, E.D., DELLINGER, P., GOLDSTEIN, E.J., GORBACH, S.L., HIRSCHMANN, J.V., KAPLAN, E.L. and MONTOYA, J.G., 2005. Practice guidelines for the diagnosis and management of skin and soft-tissue infections. Clinical Infectious Diseases, 41(10), pp. 1373-1406.
STONE, C.A., WRIGHT, H., DEVARAJ, V.S., CLARKE, T. and POWELL, R., 2000. Healing at skin graft donor sites dressed with chitosan. British Journal of Plastic Surgery, 53(7), pp. 601-606.
STOUGHTON, R., 1989. Percutaneous absorption of drugs. Annual Review of Pharmacology and Toxicology, 29(1), pp. 55-69.
STRYDOM, S.J., ROSE, W.E., OTTO, D.P., LIEBENBERG, W. and DE VILLIERS, M.M., 2012. Poly (amidoamine) dendrimer-mediated synthesis and stabilization of silver sulfonamide nanoparticles with increased antibacterial activity. Nanomedicine: Nanotechnology, Biology and Medicine,9(1), pp. 85-93.
STULBERG, D.L., PENROD, M.A. and BLATNY, R.A., 2002. Common bacterial skin infections. American Family Physician, 66(1), pp. 119-128.
SUCI, P.A., GEESEY, G.G. and TYLER, B.J., 2001. Integration of Raman microscopy, differential interference contrast microscopy, and attenuated total reflection Fourier transform infrared spectroscopy to investigate chlorhexidine spatial and temporal distribution in< i> Candida albicans</i> biofilms. Journal of Microbiological Methods, 46(3), pp. 193-208.
SULEA, D., ALBU, M.G., GHICA, M.V., BRAZDARU, L., LECA, M. and POPA, L., 2011. Characterization and in Vitro Release of Chlorhexidine Digluconate Contained in Type i Collagen Porous Matrices. Revue Roumaine De Chimie,56(1), pp. 65.
SUN, M., FAN, A., WANG, Z. and ZHAO, Y., 2012. Dendrimer-mediated drug delivery to the skin. Soft Matter, 8(16), pp. 4301-4305.
SURIYAPHOL, G., SARIKAPUTI, M. and SURIYAPHOL, P., 2009. Differential responses of cells from human skin keratinocyte and bovine mammary epithelium to attack by pore-forming< i> Staphylococcus aureus</i> α-toxin. Comparative Immunology, Microbiology and Infectious Diseases, 32(6), pp. 491-502.
SVENSON, S., 2009. Dendrimers as versatile platform in drug delivery applications. European Journal of Pharmaceutics and Biopharmaceutics, 71(3), pp. 445-462.
SVENSON, S. and TOMALIA, D.A., 2005. Dendrimers in biomedical applications—reflections on the field. Advanced Drug Delivery Reviews, 57(15), pp. 2106-2129.

380
SWEETMAN, S., ed, 2011. Martindale: The complete drug reference. 37th edn. London: Pharmaceutical Press.
TABBAKHIAN, M., TAVAKOLI, N., JAAFARI, M.R. and DANESHAMOUZ, S., 2006. Enhancement of follicular delivery of finasteride by liposomes and niosomes: 1. In vitro permeation and in vivo deposition studies using hamster flank and ear models. International Journal of Pharmaceutics, 323(1), pp. 1-10.
TAKEUCHI, H., MANO, Y., TERASAKA, S., SAKURAI, T., FURUYA, A., URANO, H. and SUGIBAYASHI, K., 2011. Usefulness of Rat Skin as a Substitute for Human Skin in the in Vitro Skin Permeation Study. Experimental Animals,60(4), pp. 373-384.
TAN, G., XU, P., LAWSON, L.B., HE, J., FREYTAG, L.C., CLEMENTS, J.D. and JOHN, V.T., 2009.
Hydration effects on skin microstructure as probed by high‐resolution cryo‐scanning electron microscopy and mechanistic implications to enhanced transcutaneous delivery of biomacromolecules. Journal of Pharmaceutical Sciences, 99(2), pp. 730-740.
TANAKA, T., ISHII, M., NAKANO, S., MORI, Y., YANO, Y., IIJIMA, T., TAKEDA, K. and KIDO, Y., 2006. Microbial degradation of disinfectants: two new aromatic degradation products of chlorhexidine, chlorhexidine aromatic degradation product (CHADP)-4 and CHADP-6, produced by Pseudomonas sp. strain No. A-3. Journal of Health Science, 52(1), pp. 58-62.
TANAKA, T., MURAYAMA, S., TUDA, N., NISHIYAMA, M., NAKAGAWA, K., MATSUO, Y., ISOHAMA, Y. and KIDO, Y., 2005. Microbial degradation of disinfectants. A new chlorhexidine degradation intermediate (CHDI), CHDI-C, produced by Pseudomonas sp. strain No. A-3. Journal of Health Science, 51(3), pp. 357-361.
TANJI, N., OKAMOTO, M., KATAYAMA, Y., HOSOKAWA, M., TAKAHATA, N. and SANO, Y., 2008. Investigation of the cosmetic ingredient distribution in the stratum corneum using NanoSIMS imaging. Applied Surface Science,255(4), pp. 1116-1118.
TAO, X., YANG, Y., LIU, S., ZHENG, Y., FU, J. and CHEN, J., 2013. Poly (amidoamine) dendrimer-grafted porous hollow silica nanoparticles for enhanced intracellular photodynamic therapy. Acta Biomaterialia, 9(1), pp. 85-93.
TATTAWASART, U., HANN, A., MAILLARD, J.Y., FURR, J. and RUSSELL, A., 2000. Cytological changes in chlorhexidine-resistant isolates of Pseudomonas stutzeri. Journal of Antimicrobial Chemotherapy, 45(2), pp. 145-152.
TATTAWASART, U., MAILLARD, J.-., FURR, J.R. and RUSSELL, A.D., 1999. Development of resistance to chlorhexidine diacetate and cetylpyridinium chloride in Pseudomonas stutzeri and changes in antibiotic susceptibility.Journal of Hospital Infection, 42(3), pp. 219-229.
TEARNEY, G., BREZINSKI, M., SOUTHERN, J., BOUMA, B., HEE, M. and FUJIMOTO, J., 1995. Determination of the refractive index of highly scattering human tissue by optical coherence tomography. Optics Letters, 20(21), pp. 2258-2260.
TEICHMANN, A., JACOBI, U., WEIGMANN, H., STERRY, W. and LADEMANN, J., 2005. Reservoir function of the stratum corneum: development of an in vivo method to quantitatively determine the stratum corneum reservoir for topically applied substances. Skin Pharmacology and Physiology, 18(2), pp. 75-80.
THOMAS, L., MAILLARD, J.-., LAMBERT, R.J.W. and RUSSELL, A.D., 2000. Development of resistance to chlorhexidine diacetate in Pseudomonas aeruginosa and the effect of a 'residual' concentration. Journal of Hospital Infection, 46(4), pp. 297-303.

381
THOMPSON, J.P. and SCHENGRUND, C.L., 1998. Inhibition of the adherence of cholera toxin and the heat-labile enterotoxin of< i> Escherichia coli</i> to cell-surface GM1 by oligosaccharide-derivatized dendrimers.Biochemical Pharmacology, 56(5), pp. 591-597.
THOMPSON, J.P. and SCHENGRUND, C.L., 1997. Oligosaccharide-derivatized dendrimers: defined multivalent inhibitors of the adherence of the cholera toxin B subunit and the heat labile enterotoxin of E. coli to GM1.Glycoconjugate Journal, 14(7), pp. 837-845.
THOMPSON, P.M., 1991. Quantitative surface analysis of organic polymer blends using a time-of-flight static secondary ion mass spectrometer. Analytical Chemistry, 63(21), pp. 2447-2456.
TOLIA, G.T. and CHOI, H.H., 2008. The role of dendrimers in topical drug delivery. Pharmaceutical Technology, 32(11), pp. 88-98.
TOMALIA, D.A., DEWALD, J.R., HALL, M.R., MARTIN, S.J. and SMITH, P.B., 1984. Preprints of the 1st SPSJ International Polymer Conference, Society of Polymer Science Japan, Kyoto. , pp. 64.
TOMALIA, D. and DURST, H., 1993. Genealogically directed synthesis: starburst/cascade dendrimers and hyperbranched structures. Supramolecular Chemistry I—Directed Synthesis and Molecular Recognition, , pp. 193-313.
TOMALIA, D.A. and FRÉCHET, J.M.J., 2001. Dendrimers and other dendritic polymers. Wiley, New York, USA.
TOMALIA, D.A., NAYLOR, A.M. and GODDARD III, W.A., 1990. Starburst dendrimers:
molecular‐level control of size, shape, surface chemistry, topology, and flexibility from atoms to macroscopic matter. Angewandte Chemie International Edition in English, 29(2), pp. 138-175.
TOMALIA, D., BAKER, H., DEWALD, J., HALL, M., KALLOS, G., MARTIN, S., ROECK, J., RYDER, J. and SMITH, P., 1985. A new class of polymers: Starburst-dendritic macromolecules. Polymer Journal, 17(1), pp. 117-132.
TOPP, A., BAUER, B.J., TOMALIA, D.A. and AMIS, E.J., 1999. Effect of solvent quality on the molecular dimensions of PAMAM dendrimers. Macromolecules, 32(21), pp. 7232-7237.
TORCHILIN, V.P., 2005. Recent advances with liposomes as pharmaceutical carriers. Nature Reviews Drug Discovery, 4(2), pp. 145-160.
TOUITOU, E., MEIDAN, V.M. and HORWITZ, E., 1998. Methods for quantitative determination of drug localized in the skin. Journal of Controlled Release, 56(1-3), pp. 7-21.
TREBILCOCK, K.L., HEYLINGS, J.R. and WILKS, M.F., 1994. In-Vitro Tape Stripping as a Model for In-Vivo Skin Stripping. Toxicology in Vitro, 8(4), pp. 665-667.
TSUJIMOTO, H., HARA, K., TSUKADA, Y., HUANG, C., KAWASHIMA, Y., ARAKAKI, M., OKAYASU, H., MIMURA, H. and MIWA, N., 2007. Evaluation of the permeability of hair growing ingredient encapsulated PLGA nanospheres to hair follicles and their hair growing effects. Bioorganic & Medicinal Chemistry Letters, 17(17), pp. 4771-4777.
UPPULURI, S., KEINATH, S.E., TOMALIA, D.A. and DVORNIC, P.R., 1998. Rheology of dendrimers. I. Newtonian flow behavior of medium and highly concentrated solutions of polyamidoamine (PAMAM) dendrimers in ethylenediamine (EDA) solvent. Macromolecules, 31(14), pp. 4498-4510.
URQUHART, A.J., TAYLOR, M., ANDERSON, D.G., LANGER, R., DAVIES, M.C. and ALEXANDER, M.R., 2008. TOF-SIMS analysis of a 576 micropatterned copolymer array to reveal surface moieties that control wettability. Analytical Chemistry, 80(1), pp. 135-142.
382
VAARA, M., 1992. Agents that increase the permeability of the outer membrane. Microbiological Reviews, 56(3), pp. 395-411.
VALENTA, C., SIMAN, U., KRATZEL, M. and HADGRAFT, J., 2000. The dermal delivery of lignocaine: influence of ion pairing. International Journal of Pharmaceutics, 197(1–2), pp. 77-85.
VAN DER MAADEN, K., JISKOOT, W. and BOUWSTRA, J., 2012. Microneedle technologies for (trans) dermal drug and vaccine delivery. Journal of Controlled Release, 161(2), pp. 645-655.
VAN DER MERWE, D., BROOKS, J., GEHRING, R., BAYNES, R., MONTEIRO-RIVIERE, N. and RIVIERE, J., 2006. A physiologically based pharmacokinetic model of organophosphate dermal absorption. Toxicological Sciences, 89(1), pp. 188-204.
VAN HAL, D.A., JEREMIASSE, E., JUNGINGER, H.E., SPIES, F. and BOUWSTRA, J.A., 1996. Structure of fully hydrated human stratum corneum: a freeze-fracture electron microscopy study. Journal of Investigative Dermatology,106(1), pp. 89-95.
VANDAMME, T.F. and BROBECK, L., 2005. Poly (amidoamine) dendrimers as ophthalmic vehicles for ocular delivery of pilocarpine nitrate and tropicamide. Journal of Controlled Release, 102(1), pp. 23-38.
VANDERMOLEN, R.G., SPIES, F., VANTNOORDENDE, J.M., BOELSMA, E., MOMMAAS, A.M. and KOERTEN, H.K., 1997. Tape stripping of human stratum corneum yields cell layers that originate from various depths because of furrows in the skin. Archives of Dermatological Research, 289(9), pp. 514-518.
VARGAS, G., CHAN, E.K., BARTON, J.K., RYLANDER, H.G. and WELCH, A.J., 1999. Use of an agent to reduce scattering in skin. Lasers in Surgery and Medicine, 24(2), pp. 133-141.
VENDITTO, V.J., REGINO, C.A.S. and BRECHBIEL, M.W., 2005. PAMAM dendrimer based macromolecules as improved contrast agents. Molecular Pharmaceutics, 2(4), pp. 302-311.
VENNAT, B., GROSS, D., POUGET, M., POURRAT, A. and POURRAT, H., 1995. Comparison of the physical stability of astringent hydrogels based on cellulose derivatives. Drug Development and Industrial Pharmacy, 21(5), pp. 559-570.
VENNAT, B., LARDY, F., ARVOUET-GRAND, A. and POURRAT, A., 1998. Comparative texturometric analysis of hydrogels based on cellulose derivatives, carraghenates, and alginates: Evaluation of adhesiveness. Drug Development and Industrial Pharmacy, 24(1), pp. 27-35.
VENUGANTI, V.V.K. and PERUMAL, O.P., 2009. Poly (amidoamine) dendrimers as skin penetration enhancers: Influence of charge, generation, and concentration. Journal of Pharmaceutical Sciences, 98(7), pp. 2345-2356.
VENUGANTI, V.V.K. and PERUMAL, O.P., 2008. Effect of poly (amidoamine)(PAMAM) dendrimer on skin permeation of 5-fluorouracil. International Journal of Pharmaceutics, 361(1-2), pp. 230-238.
VENUGANTI, V.V., SAHDEV, P., HILDRETH, M., GUAN, X. and PERUMAL, O., 2011. Structure-skin permeability relationship of dendrimers. Pharmaceutical Research, 28(9), pp. 2246-2260.
VIGEANT, P., LOO, V.G., BERTRAND, C., DIXON, C., HOLLIS, R., PFALLER, M.A., MCLEAN, A.P.H., BRIEDIS, D.J., PERL, T.M. and ROBSON, H.G., 1998. An outbreak of Serratia marcescens infections related to contaminated chlorhexidine. Infection Control and Hospital Epidemiology, pp. 791-794.
VITKOVA, Z., OREMUSOVA, J., VITKO, A. and BEZAKOVA, Z., 2011. Influence of Surfactants on Release of Chlorhexidine from Hydrogels. Tenside Surfactants Detergents, 48(1), pp. 48-52.

383
VITKOVA, Z., OREMUSOVA, J., HERDOVA, P. and KODADOVA, A., 2013. Release and Rheological Properties of Topical Drugs Part 1: Influence of the surfactant (benzethonium chloride) and temperature on the drug (chlorhexiding dihydrochloride) release kinetics. Tenside Surfactants Detergents, 50(1), pp. 39-44.
VOEGELI, R., HEILAND, J., DOPPLER, S., RAWLINGS, A.V. and SCHREIER, T., 2007. Efficient and simple quantification of stratum corneum proteins on tape strippings by infrared densitometry. Skin Research and Technology,13(3),.
VON EIFF, C., BECKER, K., MACHKA, K., STAMMER, H. and PETERS, G., 2001. Nasal carriage as a source of Staphylococcus aureus bacteremia. New England Journal of Medicine, 344(1), pp. 11-16.
WAHLBERG, J. and WENNERSTEN, G., 1971. Hypersensitivity and photosensitivity to chlorhexidine. Dermatology, 143(6), pp. 376-379.
WALCH, A., RAUSER, S., DEININGER, S.O. and HÖFLER, H., 2008. MALDI imaging mass spectrometry for direct tissue analysis: a new frontier for molecular histology. Histochemistry and cell biology, 130(3), pp. 421-434.
WALSH, C., 2000. Molecular mechanisms that confer antibacterial drug resistance. Nature, 406(6797), pp. 775-781.
WALTERS, K.A.R., M.S, 2005. The structure and function of the skin. In: K.A. WALTERS, ed, Dermatological and Transdermal Formulations. Volume 119 edn. Marcel Dekker, pp. 1-40.
WANG, B., NAVATH, R.S., MENJOGE, A.R., BALAKRISHNAN, B., BELLAIR, R., DAI, H., ROMERO, R., KANNAN, S. and KANNAN, R.M., 2010. Inhibition of bacterial growth and intramniotic infection in a guinea pig model of chorioamnionitis using PAMAM dendrimers. International Journal of Pharmaceutics, 395(1), pp. 298-308.
WANG, J.C., WILLIAMS, R.R., WANG, L. and LODER, J., 1990. In vitro skin permeation and bioassay of chlorhexidine phosphanilate, a new antimicrobial agent. Pharmaceutical Research, 7(10), pp. 995-1002.
WANG, X., MILNER, T.E., CHANG, M.C. and NELSON, J.S., 1996. Group refractive index measurement of dry and hydrated type I collagen films using optical low-coherence reflectometry. Journal of Biomedical Optics, 1(2), pp. 212-216.
WANG, Z., ITOH, Y., HOSAKA, Y., KOBAYASHI, I., NAKANO, Y., MAEDA, I., UMEDA, F., YAMAKAWA, J., KAWASE, M. and YAG, K., 2003. Novel transdermal drug delivery system with polyhydroxyalkanoate and starburst polyamidoamine dendrimer. Journal of Bioscience and Bioengineering, 95(5), pp. 541-543.
WANG, Z., ITOH, Y., HOSAKA, Y., KOBAYASHI, I., NAKANO, Y., MAEDA, I., UMEDA, F., YAMAKAWA, J., NISHIMINE, M., SUENOBU, T., FUKUZUMI, S., KAWASE, M. and YAGI, K., 2003. Mechanism of enhancement effect of dendrimer on transdermal drug permeation through polyhydroxyalkanoate matrix. Journal of Bioscience and Bioengineering, 96(6), pp. 537-540.
WANNACHAIYASIT, S. and PHAECHAMUD, T., 2010. Development of chlorhexidine thermosensitive gels as a mouth antiseptic. J Metals Materials Minerals, 20, pp. 165-168.
WEIGMANN, H.J., LADEMANN, J., MEFFERT, H., SCHAEFER, H. and STERRY, W., 1999. Determination of the horny layer profile by tape stripping in combination with optical spectroscopy in the visible range as a prerequisite to quantify percutaneous absorption. Skin Pharmacology and Physiology, 12(1-2), pp. 34-45.
384
WEIGMANN, H.J., LINDEMANN, U., ANTONIOU, C., TSIKRIKAS, G.N., STRATIGOS, A.I., KATSAMBAS, A., STERRY, W. and LADEMANN, J., 2003. UV/VIS absorbance allows rapid, accurate, and reproducible mass determination of corneocytes removed by tape stripping. Skin Pharmacology and Applied Skin Physiology, 16(4),.
WEINSTEIN, R.A., MILSTONE, A.M., PASSARETTI, C.L. and PERL, T.M., 2008. Chlorhexidine: expanding the armamentarium for infection control and prevention. Clinical Infectious Diseases, 46(2), pp. 274-281.
WEIR, E., LAWLOR, A., WHELAN, A. and REGAN, F., 2008. The use of nanoparticles in anti-microbial materials and their characterization. Analyst, 133(7), pp. 835-845.
WELZEL, J., REINHARDT, C., LANKENAU, E., WINTER, C. and WOLFF, H., 2004. Changes in function and morphology of normal human skin: evaluation using optical coherence tomography. British Journal of Dermatology,150(2), pp. 220-225.
WELZEL, J., 2001. Optical coherence tomography in dermatology: a review. Skin Research and Technology, 7(1), pp. 1-9.
WESTER, R. and MAIBACH, H., 1995. Penetration enhancement by skin hydration. Percutaneous Penetration Enhancers, CRC press, Boca Raton, FL.pp.21-28.
WHEATLEY, V.R., 1963. The nature, origin and possible functions of the cutaneous lipids, Proceedings Science Section. Toilet Goods Association, pp. 25-28.
WHITE, J.H., 1994. Alcohol-based antimicrobial compositions, US5288486 US patent.
WIEN, K., 1997. TOF-SIMS analysis of polymers. Nuclear Instruments and Methods in Physics Research Section B: Beam Interactions with Materials and Atoms, 131(1), pp. 38-54.
WIENER, E., AUTERI, F., CHEN, J., BRECHBIEL, M., GANSOW, O., SCHNEIDER, D., BELFORD, R., CLARKSON, R. and LAUTERBUR, P., 1996. Molecular dynamics of ion-chelate complexes attached to dendrimers. Journal of the American Chemical Society, 118(33), pp. 7774-7782.
WIENER, E., BRECHBIEL, M., BROTHERS, H., MAGIN, R., GANSOW, O., TOMALIA, D. and
LAUTERBUR, P., 2005. Dendrimer‐based metal chelates: A new class of magnetic resonance imaging contrast agents. Magnetic Resonance in Medicine, 31(1), pp. 1-8.
WILLIAMS, A.C. and BARRY, B.W., 2012. Penetration enhancers. Advanced Drug Delivery Reviews, 64, pp. 128-137.
WILLIAMS, A.C., 2003. Transdermal and topical drug delivery from theory to clinical practice. 1 Lambeth High Street, London.: Pharmaceutical Press.
WINNICKA, K., SOSNOWSKA, K., WIECZOREK, P., SACHA, P.T. and TRYNISZEWSKA, E., 2011. Poly (amidoamine) dendrimers increase antifungal activity of clotrimazole. Biological and Pharmaceutical Bulletin, 34(7), pp. 1129-1133.
WINNICKA, K., WROBLEWSKA, M., WIECZOREK, P., SACHA, P.T. and TRYNISZEWSKA, E., 2012. Hydrogel of ketoconazole and PAMAM dendrimers: formulation and antifungal activity. Molecules, 17(4), pp. 4612-4624.
WINTERS, A.L. and MINCHIN, F.R., 2005. Modification of the Lowry assay to measure proteins and phenols in covalently bound complexes. Analytical Biochemistry, 346(1), pp. 43-48.

385
WIWATTANAPATAPEE, R., CARREÑO-GÓMEZ, B., MALIK, N. and DUNCAN, R., 2000. Anionic PAMAM dendrimers rapidly cross adult rat intestine in vitro: a potential oral delivery system? Pharmaceutical Research, 17(8), pp. 991-998.
WOLF, B.A. and SNYDER, F., 1995. Cosmetic compositions having keratolytic and anti-acne activity, EP0696451, EU patent.
WOLLER, E.K., WALTER, E.D., MORGAN, J.R., SINGEL, D.J. and CLONINGER, M.J., 2003. Altering the strength of lectin binding interactions and controlling the amount of lectin clustering using mannose/hydroxyl-functionalized dendrimers. Journal of the American Chemical Society, 125(29), pp. 8820-8826.
WONG, W., GOH, C. and CHAN, K., 1990. Contact urticaria from chlorhexidine. Contact Dermatitis, 22(1), pp. 52-52.
WORLD HEALTH ORGANIZATION, 2001. Global Strategy for Containment of Antimicrobial Resistance. WHO/CDS/CSR/DRS/2001.2 (http://www.who.int/csr/resources/publications/drugresist/en/EGlobal_Strat.pdf, accessed 9 January 2012). Geneva: .
WU, H., RAMACHANDRAN, C., WEINER, N.D. and ROESSLER, B.J., 2001. Topical transport of hydrophilic compounds using water-in-oil nanoemulsions. International Journal of Pharmaceutics, 220(1), pp. 63-75.
WU, L., LU, X., KULP, K.S., KNIZE, M.G., BERMAN, E.S.F., NELSON, E.J., FELTON, J.S. and WU, K.J.J., 2007. Imaging and differentiation of mouse embryo tissues by ToF-SIMS. International Journal of Mass Spectrometry, 260(2-3), pp. 137-145.
XIA, L., JU, X., LIU, J., XIE, R. and CHU, L., 2010. Responsive hydrogels with poly(N-isopropylacrylamide-co-acrylic acid) colloidal spheres as building blocks. Journal of Colloid and Interface Science, 349(1), pp. 106-113.
XU, F., KANG, E. and NEOH, K., 2006. pH-and temperature-responsive hydrogels from crosslinked triblock copolymers prepared via consecutive atom transfer radical polymerizations. Biomaterials, 27(14), pp. 2787-2797.
XU, W., RANGER-MOORE, J.R., SABODA, K., SALASCHE, S.J., WARNEKE, J.A. and ALBERTS, D.S., 2003. Investigating sun-damaged skin and actinic keratosis with optical coherence tomography: a pilot study. Technology in Cancer Research & Treatment, 2(6),.
XU, X. and ZHU, Q., 2007. Evaluation of skin optical clearing enhancement with Azone as a penetration enhancer. Optics Communications, 279(1), pp. 223-228.
YAMANE, M., WILLIAMS, A. and BARRY, B., 1995. Effects of terpenes and oleic acid as skin penetration enhancers towards 5-fluorouracil as assessed with time; permeation, partitioning and differential scanning calorimetry.International Journal of Pharmaceutics, 116(2), pp. 237-251.
YANG, H. and LOPINA, S., 2003. Penicillin V-conjugated PEG-PAMAM star polymers. Journal of Biomaterials Science, Polymer Edition, 14(10), pp. 1043-1056.
YASUDA, K., OHMIZO, C. and KATSU, T., 2004. Mode of action of novel polyamines increasing the permeability of bacterial outer membrane. International Journal of Antimicrobial Agents, 24(1), pp. 67-71.
YIYUN, C., TONGWEN, X. and RONGQIANG, F., 2005. Polyamidoamine dendrimers used as solubility enhancers of ketoprofen. European Journal of Medicinal Chemistry, 40(12), pp. 1390-1393.

386
YOSHIMURA, K., 2011. Composition containing oxocarbon and use thereof, EP1845135, EU patent.
YUE, I.C., POFF, J., CORTÉS, M.E., SINISTERRA, R.D., FARIS, C.B., HILDGEN, P., LANGER, R. and SHASTRI, V.P., 2004. A novel polymeric chlorhexidine delivery device for the treatment of periodontal disease. Biomaterials,25(17), pp. 3743-3750.
ZANDERIGO, F., FERRARI, S., QUEIROLO, G., PELLO, C. and BORGINI, M., 2000. Quantitative TOF-SIMS analysis of metal contamination on silicon wafers. Materials Science and Engineering: B, 73(1), pp. 173-177.
ZENG, P., ZHANG, G., RAO, A., BOWLES, W. and WIEDMANN, T.S., 2009. Concentration dependent aggregation properties of chlorhexidine salts. International Journal of Pharmaceutics, 367(1–2), pp. 73-78.
ZGODA, J. and PORTER, J., 2001. A convenient microdilution method for screening natural products against bacteria and fungi. Pharmaceutical Biology, 39(3), pp. 221-225.
ZHANG, L., PORNPATTANANANGKUL, D., HU, C. and HUANG, C., 2010. Development of Nanoparticles for Antimicrobial Drug Delivery. Current Medicinal Chemistry, 17(6), pp. 585-594.
ZHANG, G., MOORE, D.J., SLOAN, K.B., FLACH, C.R. and MENDELSOHN, R., 2007. Imaging the prodrug-to-drug transformation of a 5-fluorouracil derivative in skin by confocal Raman microscopy. Journal of Investigative Dermatology, 127(5), pp. 1205-1209.
ZHAO, C., ZHUANG, X., HE, P., XIAO, C., HE, C., SUN, J., CHEN, X. and JING, X., 2009. Synthesis of biodegradable thermo-and pH-responsive hydrogels for controlled drug release. Polymer, 50(18), pp. 4308-4316.
ZHAO, Y., FAN, X., LIU, D. and WANG, Z., 2011. PEGylated thermo-sensitive poly(amidoamine) dendritic drug delivery systems. International Journal of Pharmaceutics, 409(1-2), pp. 229-236.
ZHU, H. and GRANT, D.J., 1996. Influence of water activity in organic solvent water mixtures on the nature of the crystallizing drug phase. 2. Ampicillin. International Journal of Pharmaceutics, 139(1), pp. 33-43.
ZHU, H., YUEN, C. and GRANT, D.J., 1996. Influence of water activity in organic solvent water mixtures on the nature of the crystallizing drug phase. 1. Theophylline. International Journal of Pharmaceutics, 135(1), pp. 151-160.
ZIMELIS, V.M. and JACKSON, G.G., 1973. Activity of aminoglycoside antibiotics against Pseudomonas aeruginosa: specificity and site of calcium and magnesium antagonism. Journal of Infectious Diseases, 127(6), pp. 663-669.