PhD Survey 2015
53
PhD Survey 2015 Experiences of PhD students at the University of Groningen E.M.C. Bouma PhD C.E. Vermue MSc J.F. Deinum PhD September 2015
-
Upload
khangminh22 -
Category
Documents
-
view
1 -
download
0
Transcript of PhD Survey 2015

PhD Survey 2015
Experiences of PhD students at the University of Groningen
E.M.C. Bouma PhDC.E. Vermue MScJ.F. Deinum PhD
September 2015

PhD Survey 2015 / 3
© 2016. Esther Bouma Educational Support and Innovation Center for Information Technology
University of Groningen the Netherlands Contact: [email protected]
No part of this book may be reproduced in any form, by print, photo print, microfilm or any other
means without the written permission of the Director of the Institute.
Niets uit deze uitgave mag worden verveelvoudigd en/of openbaar gemaakt door middel van
druk, fotokopie, microfilm of op welke andere wijze dan ook zonder voorafgaande schriftelijke
toestemming van de Directeur van het Instituut.
PrefaceThe Groningen Graduate Schools (GGS) started in 2009. A first extensive PhD student survey
assessing the motivation, satisfaction and training environment of the PhD students at the
University of Groningen was undertaken at the end of that year and published in 2010. Every
second year, the survey is repeated, with the present survey being the fourth in the series. All
of the surveys are published on our website (http://www.rug.nl/education/phd-programmes/
useful-information/phd-survey/).
Over the past six years, the number of PhD defences in Groningen has grown from 343 in
2009 to 501 in 2015. This is in line with the increase in the number of PhDs awarded in the
Netherlands, i.e., almost doubling in the past ten years. Dealing with this growth and at the
same time improving our training of PhD students remains a major challenge for both the
organization and capacity of the University. In this respect, the following goals were set: (1)
maintain the high quality of PhD dissertations, (2) improve the preparation of PhD students for
a job after completion of their PhD and (3) ensure that the vast majority of new PhD students
finish their training and are awarded a PhD (no unnecessary drop-out), preferably within the
allotted PhD project time. The Groningen Graduate Schools have endeavoured to realize these
goals over the past six years. Although there is definitely room for further improvement, we are
pleased to see that we are well on track, as discussed below.
We will begin by looking at some points not considered in the present survey, but which are
important in evaluating the outcome. Firstly, what can be said about the quality of PhD theses
in Groningen? Assessing the quality of a PhD thesis is a task assigned to individual supervisors
and an Assessment Committee. This is a tailored and dedicated exercise that generally works
well; however, it does not use strict but at best only semi-quantifiable criteria. Nevertheless,
some insights about the quality of the Groningen theses can be deduced from a meta-analysis,
as has been done by the Graduate School of Medical Sciences, one of the nine faculty Graduate
Schools within the GGS. The results have been reported in a self-evaluation as part of the
research assessment of UMCG and FMNS/GRIP in the framework of the SEP. This analysis found
that the quality of the dissertations, measured in terms of the number of published papers in
high impact journals, has significantly improved over the past six years. Thus, at least for this
large part of the University of Groningen, it can be concluded that despite the considerable
growth in the number of PhDs awarded (which was especially true for UMCG and FMNS/GRIP)
the quality of the theses remains very high and improving.
Secondly, with respect to the educational opportunities, it is true that the number of
educational modules that are offered has grown greatly over the past six years. However, as

PhD Survey 2015 / 5PhD Survey 2015 / 4
can be seen in the present survey, not all PhD students use these opportunities. With the start
of the PhD student scholarship programme in September 2016 a new educational framework
will be presented, the Career Perspective Series, and it is anticipated that this will give a further
boost to the PhD student training programme in Groningen, not only for scholarship PhD
students, but also for the Groningen PhD student community as a whole.
Thirdly, with respect to the completion rate of PhD students, present data show that this is
approximately 80%. This is a very good figure, but the number of PhD students who complete
their PhD within the allotted time remains quite low and definitely needs improvement.
Keeping the above points in mind, let’s move to the present survey. Looking at the results, we
are glad to see that our PhD students are quite positive about all of the items assessed, i.e., the
quality of the education provided, the ‘Training and Supervision Plan’, the Graduate School,
the supervision, the expertise available, contact possibilities and overall working conditions.
This positive appreciation was apparent from the start of the GGS as shown in the first survey,
but as can be seen in the table found in the appendix of the present survey, this appreciation
has further increased over the years, with a mean score of 3.1 (on a scale ranging from 1.0
to 4.0). In addition, as also mentioned previously, there are clear points for improvement.
These are: (1) decrease the time PhD students need to finish their PhD, (2) improve the way
information is provided, (3) increase the role of the Graduate Schools in the guidance of PhD
projects, with greater adherence to and regular updating of the Training and Supervision Plan,
and (4) broaden the post-PhD career-orientation opportunities during the programme. Most
of these recommendations have been suggested in earlier surveys. Although we have seen
improvements over the years, point 1 (not finishing in the allotted time), in particular, remains a
clear point of concern.
In summary, we take the outcomes of this and previous surveys seriously, since they are an
indication of whether PhD students appreciate our efforts to create the right scientific/
academic environment to flourish. We were happy to see the very positive outcomes, but will
remain focused on the points that need improvement.
I would like to thank all PhD students who completed the rather lengthy list of questions and,
last but not least, I would also like to thank Esther Bouma, Carlien Vermue, Jan Folkert Deinum
and Marjan Koopmans for their major contributions.
I found it very interesting to read this survey.
Prof. Lou de Leij
Dean Groningen Graduate Schools
Table of Contents Preface 3
Table of Contents 5
1 Management summary 9
2 Introduction 11
2.1 Background and research questions 11
2.2 About this report 12
3 Personal characteristics 13
3.1 Background characteristics of the PhD students 13
3.1.1 Gender and nationality 13
3.1.2 Educational background 14
3.2 Affiliation with the University of Groningen 15
3.2.1 Affiliation with the University’s Graduate Schools 17
3.3 PhD project phase 19
3.4 Summary of background characteristics 19
3.5 Motivation, skills and competences 20
3.5.1 Motivation 20
3.5.2 Skills and competences 21
4 PhD Project 27
4.1 Characteristics of the PhD project 27
4.1.1 Time span 27
4.1.2 Research proposal 29
4.1.3 Discontinuing the PhD 29
4.2 Education programme 31
4.3 Teaching activities 33
4.4 Information provided by the University of Groningen 37
4.5 Hora Finita 39
5 Supervision 41
5.1 Performance evaluation 41
5.1.1 Result and Development interview 41
5.1.2 Go/no-go interview 42
5.2 Training and Supervision Plan (TSP) 44
5.2.1 Quality and quantity requirements 45
5.2.2 Satisfaction with TSP 46
5.3 Graduate School 50
5.4 Supervisors 56
5.4.1 Satisfaction with supervision 56
5.4.2 Appreciations and frustrations supervision/supervisors 60

PhD Survey 2015 / 7
6 Work environment 65
6.1 Expertise and support 65
6.2 Contact with other PhD students 68
6.3 Work-related stress 69
6.4 Overall work satisfaction 72
7 Career development 75
7.1 Career orientation 75
7.2 Career training 77
7.3 Career development activities 79
7.4 Future career 80
8 PhD organizations 85
9 Conclusions and recommendations 87
9.1 Time span of the PhD project 87
9.2 Information provision and language difficulties 88
9.3 Training and Supervision Plan 89
9.4 Result and Development interview, first-year performance evaluation 90
9.5 Training for PhD students with teaching duties 90
9.6 Familiarity with Hora Finita 91
9.7 Supervision 91
9.8 Familiarity and satisfaction with the Graduate Schools 92
9.9 Career orientation 93
9.10 Working environment 93
10 Research accountability 95
10.1 Instrument 95
10.2 Response 96
10.3 Graduate School corrections 99
10.4 Analyses 100
11 Appendix 103

PhD Survey 2015 / 9
1 Management summaryThe overall picture presented by the 2015 PhD survey is positive. Significant improvements
are found in satisfaction with the Graduate Schools and the expertise available in the working
environment. Satisfaction with education and the organization and quality of supervision
show minor improvements, while satisfaction with the Training and Supervision Plan, contact
with PhD students and the overall work environment increased somewhat more, although
not significantly. Despite these improvements, many of the recommendations from 2013 still
require attention in order to achieve the high quality and standards of satisfaction that the
University desires.
PhD completion time, delay and drop-out are still points of concern as the average time
between start and thesis defence is about 61 months, 11 months more than the 4 years
and 3 months the University stipulates. In addition, this year’s survey reveals an increase in
the number of PhD students who do not expect to finish within the allotted time. Knowing
the factors that play a role in timely completion, delay and drop-out can lead to effective
interventions. Connecting the data of the current and the three previous PhD student surveys
with the PhD registration system, Hora Finita, could provide an opportunity to examine possible
explanatory factors for drop-out and delay.
The 2015 survey shows that three-quarters of the employed PhD students are engaged in
teaching and/or supervising. Most PhD students start with these tasks in, or after, their second
year and spend, on average, 14 hours per month (2 hours less than in 2013). The majority
(89%) report that teaching and supervising Bachelor’s and Master’s theses contributes to their
PhD project. This percentage has increased by 22% compared to 2013. About one-third report
not being very confident about their teaching abilities. Two-thirds of PhD students with actual
teaching duties report that they do not have sufficient training in teaching. Less than half of the
PhD students with teaching duties have attended the compulsory course ‘Training for Teaching
Assistants’ organized by the University of Groningen.
The percentage of PhD students who feel well informed about regulations and conditions
concerning their employment and scholarship has increased from 65% to 70%. About 20%
have experienced problems due to incomplete or incorrect information provided by the
University. Although problems due to information provision do not differ between Dutch and
non-Dutch PhD students, difficulties due to language problems do. Non-Dutch PhD students
report significantly more difficulties than Dutch PhD students (29% versus 8%). Moreover,
the former also report that they miss out on important information from the University (or the
Dutch government) when it is only provided in Dutch and they mention that they feel left out
when Dutch is the only language spoken on the work floor.

PhD Survey 2015 / 11PhD Survey 2015 / 10
The proportion of PhD students with a Training and Supervision Plan (TSP) has increased from
57% to almost 70%. The majority of TSPs include a research outline and a time schedule, but
two-thirds lack agreements about teaching and three-quarters lack details of thesis quantity
and quality requirements. Although 70% of the PhD students report they have sufficient
opportunities to revise their TSP, only one-third of PhD students in their second or third years
have updated their TSP so far.
Overall, PhD students are satisfied with the organization and the quality of the supervision.
However, 48% of PhD students have faced challenges or frustrations in relation to supervision.
Problems due to the low frequency of appointments with the supervisor and problems related
to the quality of supervision are most often mentioned. Similar to 2013, PhD students who are
in their final year are more critical about the quality of their supervision than PhD students who
have just started.
The overall satisfaction with the Graduate School has increased significantly compared to
2013. Despite the observation that familiarity with the Graduate School has increased in 2015,
familiarity with the role of the Graduate School has decreased. Attendance of the introduction
modules at the Graduate School is low (47%).
Satisfaction with the expertise available and support for PhD students within the department
has significantly increased compared to 2015. Despite this, about 25% of the PhD students are
not satisfied with the support provided by experts and fellow PhD students, especially during
the collection of data. PhD students are most satisfied with the contacts with their fellow PhD
students in their department. Satisfaction with contacts at the Graduate School, the University
of Groningen or in their field (national and international) is much lower.
The overall satisfaction with the work environment has slightly increased, although not
significantly. First-year PhD students are more satisfied with the overall work conditions than
are senior PhD students. Only 14% of the PhD students said they had not experience stress
during their PhD to date. Almost 40% report stress due to publication pressure and deadlines,
about 25% due to the complexity of the work and/or the overall workload, and 20% due to
contact with management and supervisors.
The number of PhD students who say they have explored future career options has seriously
increased from 45% in 2013 to 61% in 2015. One-quarter of the senior PhD students have
attended a career activity. The familiarity with the University’s training activities organized by
HR Experts and NEXT Career Services is very low. As in the previous PhD survey, most positions
aspired to are research and/or academic positions and 72% of the respondents believe that
finding their preferred job is an attainable goal.
2 IntroductionThis chapter provides information about the background of the PhD survey and the research
questions and concludes with an overview of the remainder of this document.
2.1 Background and research questionsIn 2009, the Board of the University formulated a number of goals relating to PhD projects: the
number of doctoral degrees awarded should increase to 550 a year by 2020, 75% of all PhD
students should graduate within five years and 85% should graduate within six years, and no
more than 12% of PhD students should drop out in the first year. Although graduation rates
are improving, the goals set in 2009 have not yet been reached (see Table 1).
Table 1. Description of PhD goals of the University of Groningen
Description GoalPhD degree in 2020 550
Graduation within 5 years 75%
Graduation within 6 years 85%
Drop out in first year < 12%
In addition to these quantitative goals, the University of Groningen wants to create the ideal
environment in which PhD students can develop the necessary skills for their research. The aim
of the PhD survey is to see how well we do in relation to the goals we have set ourselves.
The first PhD survey was conducted in 2009 to determine the state of affairs at that time. The
survey was repeated in 2011 to determine whether the attempts at improvement were on the
right track. In 2013, the survey was adjusted and several categories were added. Questions
about work-related stress and the online registration system, Hora Finita, were added in 2015.
The 2015 survey includes questions about the personal characteristics of the PhD student and
project, the organization and evaluation of the PhD project, the organization and quality of
supervision, satisfaction with the work environment and familiarity and satisfaction with career
development options and PhD organizations.

PhD Survey 2015 / 13PhD Survey 2015 / 12
The outcome of the 2015 PhD survey should help answer the following questions:
1. What is the current state of affairs with regard to personal factors, the PhD programme,
supervision and working conditions?
2. How satisfi ed are PhD students with these factors?
3. What changes can be discerned in PhD students’ background characteristics and their
satisfaction in comparison with previous years?
Reports of the previous three surveys can be found at: http://www.rug.nl/education/phd-
programme/general-information/phd-survey/).
2.2 About this reportThis report consists of ten chapters. The fi rst chapter provides a summary of the results, as well
as conclusions and recommendations for further improvement. The present chapter discusses
the background of the survey. Chapters 3 to 8 will discuss the themes distinguished in this
survey: personal characteristics, the PhD project, supervision, the working environment, career
development and PhD organizations. We examined changes in relation to the results of the
PhD surveys in previous years. Conclusions and recommendations can be found in Chapter
9, while information about the response rate and methods used can be found in Chapter 10.
An Appendix provides an overview of the mean scores on the satisfaction scales, as well as
the scores from 2009, 2011 and 2013 and a breakdown of the 2015 scores for the various
Graduate Schools.
3 Personal characteristicsThis chapter discusses the PhD students’ background characteristics, such as gender, age and
previous education. It also considers the type of affi liation that PhD students have with the
University of Groningen, as well as their motivation, skills and competences.
3.1 Background characteristics of the PhD students
3.1.1 Gender and nationalityA total of 53% of the respondents are female, which is representative for the PhD population
(see Chapter 10). The distribution of male and female respondents has not changed much over
the years. Similar to 2013, the average age (on 1 August 2015) is 29.5 years. The youngest
respondent was 21 and the oldest 64. Over half of the respondents are Dutch (54%), while 7%
were born in China, 5% in Germany and 3% came from India, Indonesia or Italy. The remaining
25% come from 82 other countries. There is a slight decrease in foreign-born respondents
compared to previous years (see Figure 1).
0%
20%
40%
60%
80%
100%
2009 2011 2013 2015
Male
Born in the Netherlands
Figure 1. Percentage of male and Dutch respondents in 2009, 2011, 2013 and 2015

PhD Survey 2015 / 15PhD Survey 2015 / 14
3.1.2 Educational backgroundThe majority (91.2%) of the respondents have a Master’s degree (or an equivalent: the ‘old’
doctoral degree). A little over one-quarter completed a Research Master’s programme (see
Figure 2). More than half of the respondents obtained their degree in either Mathematics and
Natural Sciences (36.6%) or Medical Sciences (27.1%) (see Figure 3). Almost half of the PhD
students obtained their degree at the University of Groningen (see Figure 4). PhD students who
obtained their degree at another Dutch university most often came from Utrecht University,
Radboud University Nijmegen and Vrije Universiteit Amsterdam.
7,1%
27,2%
56,9%
8,8%
Doctoral
Research Master
Master
Other
Figure 2. Degrees held by respondents before starting their PhD project
Figure 3. Discipline in which preliminary degree was obtained
48,6%
14,3%
15,6%
18,2%
3,4%
At the University of Groningen
At another Dutch university
At another European university
At a university outside Europe
Other
Figure 4. Place where preliminary degree was obtained
4,6%
13,9%0,3%
7,4%
21,7%
2,7%2,5%1,2%
36,6%
9,2%
Economics and Business
Behavioural and Social SciencesTheology and Religious StudiesArts
Medical Sciences
Law
Spatial Sciences
Philosophy
Mathematics and Natural SciencesOther

PhD Survey 2015 / 17PhD Survey 2015 / 16
3.2 Affi liation with the University of GroningenPhD students can have different types of affi liation with the University. Figure 5 shows the
percentages of the respondents in this survey for each of the different affi liation types, which
slightly differ from the categorization in the previous surveys. More than half of the PhD
students are employed at the University of Groningen, the University Medical Center Groningen
(UMCG) or by the Foundation for Fundamental Research on Matter (FOM). About 2% have a
different type of affi liation, such as joint affi liation between Groningen and another European
university, a resident/medical doctor, junior researcher, or university staff working full-time
on a PhD. The majority (85%) of the PhD students work full-time on their research. Those who
work part-time spend on average 29 hours per week on their PhD (with a minimum of 2 hours
and a maximum of 36).
To simplify group comparison, the nine categories shown in Figure 5 are divided into three
groups: a) employment (55.9%), b) scholarship (23.3%) and c) other (20.8%). Further analyses
according to affi liations are made between these three groups.
53.7%
22.2%.2
8,8%
14,6%
5,8%
5,7%
3,3%
3,9% 2,2%Employment by RUG or UMCG
Employment by FOM
Scholarship at RUG or UMCG
Scholarship other
MD/PhD student
Employment outside academia
University staff working part-time on PhD
Doing research in own time
Other
2.2%
Figure 5. Type of affi liation with the University of Groningen
3.2.1 Affi liation with the University’s Graduate SchoolsFigure 6 shows the affi liation with each of the nine Graduate Schools as mentioned by the PhD
students in the survey. In 2011, 12% of the respondents could not name their Graduate School.
This had decreased to 2% in 2013 and to 1.3% in 2015.
The Graduate Schools indicated by the PhD students in the survey were compared with the
University of Groningen Hora Finita registration system. Noticeable is the fact that 60 PhD
students indicated a different Graduate School. Of these 60 respondents, 31 thought they were
affi liated with the Graduate School of Medical Sciences when they were actually affi liated with
the Graduate School of Science, while this was the other way around for six respondents.
35,3%
32,0%
9,2%
8,7%
4,9%
3,2%3,2%
1,4%0,8%
1,3%
Science
Medical Sciences
Behavoural and Social Sciences
Humanities
Economics and Business
Spatial Sciences
Law
Theology & Religious Studies
Philosophy
I do not know
Figure 6. Respondents’ affi liation with Graduate Schools (as reported in the survey)

PhD Survey 2015 / 19PhD Survey 2015 / 18
Figure 7 shows the corrected affi liations based on Hora Finita. Further analyses on Graduate
School differences are based on these corrected numbers (see Chapter 10). Similar to 2011
and 2013, the majority of the PhD students are affi liated with the Graduate School of Medical
Sciences or the Graduate School of Science.
34,8%
34,0%
9,0%
9,0%
4,8%
3,2% 3,1%
1,4% 0,7%
Science
Medical Sciences
Behavoural and Social Sciences
Humanities
Economics and Business
Spatial Sciences
Law
Theology & Religious Studies
Philosophy
Figure 7. Affi liation with Graduate Schools (corrections based on Hora Finita)
3.3 PhD project phaseFigure 8 shows the project phase of the respondents: 29% are in their fi rst year, 45% in their
second or third year and 27% are in the fi nal phase of their project (fourth year or more).
30,5%
40,7%
28,8%
1st year
2nd/3rd year
4th/+ year
Figure 8. Phase of the PhD project
3.4 Summary of background characteristicsTable 2 summarizes the number of respondents (n), mean age, phase of the project and type
of affi liation with the University for each Graduate School. Since the Graduate School of
Philosophy has less than 15 respondents, no conclusions can be drawn from Table 2 for this
Graduate School.
PhD students from the Graduate School of Humanities are, on average, the oldest respondents,
while respondents from the Graduate School of Science are the youngest. The distribution
over the phases does not differ signifi cantly between the Graduate Schools; however, Law
and Humanities have the highest proportion of senior respondents (fourth year or more). The
majority of PhD students are employed (55%). The Graduate School of Spatial Sciences has the
highest proportion of scholarship PhD students while Economics and Business has the highest
proportion of employed PhD students.

PhD Survey 2015 / 21PhD Survey 2015 / 20
Table 2. Age, phase and affi liation by Graduate School
n Age % Phase % Affi liation
Mean 1st 2nd/3rd 4th Empl. Scholarship Other
Science 404 28.6 34.9 38.4 26.7 65.1 28.7 6.2
Medical Sciences
395 29.9 28.9 42.6 28.4 41.3 23.3 35.4
BSS 105 33.5 26.0 42.3 31.7 61.9 9.5 28.6
Humanities 104 33.7 26.2 35.9 37.9 56.7 15.4 27.9
SOM 56 29.6 33.9 44.6 21.4 71.4 16.1 12.5
Spatial Sciences
37 31.0 30.6 47.2 22.2 56.8 37.8 5.4
Law 36 30.1 22.2 30.6 47.2 66.7 30.6 2.8
Theol. Relig. Studies
16 33.2 25.0 56.3 18.8 43.8 12.5 43.8
Philosophy 8 29.1 25.0 62.5 12.5 87.5 12.5 0
Total RUG 1161 30.2 28.2 29.6 33.2 55.9 23.3 20.8
Note: BSS = Graduate School of Behavioural and Social Sciences, SOM = Graduate School of
Economics and Business, the Graduate School of Philosophy did not have enough respondents
to make meaningful conclusions.
3.5 Motivation, skills and competences
3.5.1 MotivationThe respondents were asked to report what motivated them to become a PhD student, and
the majority (94%) answered this open question. The motives of 1,084 respondents could
be divided into three categories: intrinsic, extrinsic and altruistic (see Figure 9). The majority
(80%) of the PhD students reported intrinsic motives for starting a PhD, while 16% listed
extrinsic motives fi rst. Examples of intrinsic motives include passion for research, curiosity,
personal development and interest in the subject, while examples of extrinsic motives include
a PhD being a requirement for an academic career, or better job opportunities. Four percent
reported altruistic reasons for starting the project: these PhD students want to make a
contribution to society or in their home country. Almost 10% of the PhD students gave two
reasons, of which the combination of an intrinsic and an extrinsic reason was most common.
80,6
16,4
3,0
Intrinsic
Extrinsic
Altruistic
Figure 9. Primary motivation for becoming a PhD student
3.5.2 Skills and competencesThe majority of the respondents felt they have developed the skills and competences required
of a researcher (see Table 3). These percentages were computed by combining the number of
PhD students who chose the options ‘agree’ or ‘strongly agree’. Overall, respondents are least
confi dent about their abilities to perform teaching activities, including supervising Bachelor’s
and Master’s theses, working in teams, instructing support staff and communicating to the
general public. These results are comparable with those from 2013.
Interestingly, skills and competences did not differ signifi cantly between the different PhD
phases (see Figure 10). More senior PhD students are more confi dent in their ability to ‘Publish
research results in academic journals’ and ‘Supervising students writing their theses’ than PhD
students who are in their fi rst years. However, this fi nding was only borderline signifi cant (p =
.06).

PhD Survey 2015 / 23PhD Survey 2015 / 22
Table 3. Abilities and skills developed by respondents
I have developed the following abilities/skills: PercentageFamiliarizing myself with the subject matter and theoretical framework of a
research project
98.7
Defi ning the subject matter and theoretical framework of a research project 96.1
Collecting, analysing and interpreting data both empirically and theoretically 95.7
Identifying, posing and resolving problems by formulating working
hypotheses and performing adequate studies
94.8
Publishing research results in academic journals 91.1
Understanding ethical conduct as a researcher, lecturer and professional,
including issues of intellectual property
90.9
Working in teams 76.5
Communicating to the general public 73.3
Supervising students writing Bachelor’s or Master’s theses 69.2
Preparing for teaching activities and performing them adequately 68.3
Instructing support staff 64.7
There are signifi cant differences according to affi liation type (Figure 11) and Graduate
School (Figure 12). Concerning affi liation type, most of the differences concern employed
PhD students and scholarship PhD students, except for ‘Preparing and performing teaching
activities’, for which employed PhD students feel most confi dent (it should be noted here that
scholarship PhD students are not allowed to teach). In addition, the skills necessary to ‘Work
in teams’ differed for all three affi liation categories: scholarship students agreed most often,
followed by employed PhD students.
PhD students from the Graduate School of Humanities, BSS and Economics and Business
agreed less often with the statements concerning being able to instruct staff, preparing and
performing teaching activities, supervising students and working in teams than PhD students
from the Graduate School of Science. PhD students from Economics and Business and
Humanities agreed less often on publishing research results, of which PhD students from the
Graduate Schools of Science and Medical Sciences agreed more often.
Language diffi cultiesMore than half of the PhD students have Dutch nationality and about 8% of these experienced
diffi culties due to language problems, compared to 29% of the PhD students with a non-Dutch
nationality. This difference is signifi cant (�2 = 87.2, p < .001). Problems mentioned by Dutch
PhD students mostly concerned writing and presenting in academic English (51%), problems
with general communication in English (37%) and problems due to the poor level of English
of international colleagues (12%). Problems reported by non-Dutch speakers were: general
communication in English (38%), problems with writing and presenting in academic English
(20%), social problems due to their own poor level of Dutch in the work space (12%) and in
their private lives (14%), problems due to the fact that Dutch is needed for their PhD work
(10%) and problems due to Dutch communication of government and the University (16%).
2,6
2,8
3
3,2
3,4
3,6
3,8
1st 2nd/3rd 4th/+
Familiarizing with my research project
Defining the subject and theoretical framework
Formulating working hypotheses and performing scientific studies
Working adequatly with data
Instructing support staff
Publishing research results
Preparing and performing teaching activities
Supervising students
Understanding ethical science issues
Communicating to the general public
Figure 10. No signifi cant differences in skills and competences by project phase

PhD Survey 2015 / 25PhD Survey 2015 / 24
0%
20%
40%
60%
80%
100%
Emp
loye
e
Sch
ola
rsh
ip
Oth
er
Emp
loye
e
Sch
ola
rsh
ip
Oth
er
Emp
loye
e
Sch
ola
rsh
ip
Oth
er
Emp
loye
e
Sch
ola
rsh
ip
Oth
er
Emp
loye
e
Sch
ola
rsh
ip
Oth
er
Emp
loye
e
Sch
ola
rsh
ip
Oth
er
Instructing support staff
Supervising students Understanding ethical issues
Communicating to the general public
Working in teams Preparing and performing teaching
activities
Strongly disagree Disagree Agree Strongly agree
Figure 11. Signifi cant differences in skills and competences by affi liation
0% 20% 40% 60% 80% 100%
HumBSS
Spat. ScTRS
SOMLaw
ScienceMed. Sc
HumBSS
Spat. ScTRS
SOMLaw
ScienceMed. Sc
HumBSS
Spat. ScTRS
SOMLaw
ScienceMed. Sc
HumBSS
Spat. ScTRS
SOMLaw
ScienceMed. Sc
HumBSS
Spat. ScTRS
SOMLaw
ScienceMed. Sc
HumBSS
Spat. ScTRS
SOMLaw
ScienceMed. Sc
HumBSS
Spat. ScTRS
SOMLaw
ScienceMed. Sc
Def
inin
g t
he
pro
ject
Wo
rkin
g a
deq
uat
ly
wit
h d
ata
Inst
ruct
ing
su
ppo
rt
staf
fP
ub
lish
ing
res
earc
h
resu
lts
Pre
par
ing
an
d
per
form
ing
tea
chin
g
acti
viti
esS
up
ervi
sin
g s
tud
ents
Wo
rkin
g in
tea
ms
Strongly disagree Disagree Agree Strongly agree
Figure 12. Signifi cant differences in skills and competences by Graduate School

PhD Survey 2015 / 27
4 PhD ProjectThis chapter discusses the characteristics of the PhD projects and considers a number of
themes, including PhD students’ training and their satisfaction with this, as well as their
teaching duties and the provision of information.
4.1 Characteristics of the PhD project
4.1.1 Time spanThe first issue to be addressed in this chapter concerns the confidence of PhD students in
being able to finish in time. Of the respondents, 41% believed they could finish on time (4%
less than in 2013), one-third were still uncertain and one-quarter thought finishing on time
was not feasible.
There are differences according to project phase: about 42% in phases 1 and 2 thought that
finishing on time was feasible, while over half of the PhD students in their final year (54%)
thought this was not. There are no differences between different affiliation categories. However,
there are differences between Graduate Schools (see Figure 13), although this is mainly due
to differences in the category ‘too early to say’, because when we examined the answer options
‘Yes’ and ‘No’ differences were no longer significant (p = .09). PhD students from Theology and
Religious Studies, Economics and Business, and Humanities were slightly more confident in
their ability to finish on time than PhD students from other Graduate Schools.
Overall, PhD students expected they would need, on average, 8.6 additional months to finish
their project. This is more than in the previous years (2013: 7.6 months; 2011: 6.6 months;
2009: 8.0 months). Scholarship PhD students claimed they would need 9 months, employed
PhD students 7 months and PhD students with another type of affiliation about 12 months.
Expected reasons for not finishing by the official end date are summarized in Table 4. In the
2015 survey, options were added to the list of possible reasons. PhD students could choose
all options as there was no maximum. The most often mentioned reason for delay was a too
ambitious research plan or a delay in the research. Comments made in the category ‘Other’
consist mostly of combinations of the predefined reasons.

PhD Survey 2015 / 29PhD Survey 2015 / 28
Table 4. Reasons for not fi nishing in time
Reason for not fi nishing in time PercentageThe research plan is too ambitious and/or the research is delayed 45.4
Unforeseen personal circumstances 24.4
Problems with supervision 21.3
I am encountering technical problems (software, laboratory) 17.8
I have diffi culty writing 16.8
I have diffi culty obtaining or analysing my data 16.5
Loss of personal motivation 11.7
I plan to use the full period of my appointment/scholarship to perform
research and start writing the thesis after that
10.2
I am spending too much time on the comments from reviewers/editors 10.2
I spend too much time on teaching activities 8.3
My workspace or laboratory moved to a different location 4.1
I have problems with colleagues 3.2
I do not have the right skills for this job 2.9
I took too many courses 0.6
Other 35.9
0%
20%
40%
60%
80%
100%
Hum BSS Spat. Sc TRS SOM Law Science Med. Sc
Yes No Too early to say
0%
20%
40%
60%
80%
100%
Hum BSS Spat. Sc TRS SOM Law Science Med. Sc
Yes No Too early to say
51,9
27,6
43,2
56,3 55,4
38,9 36,142
23,1
32,4
24,3
2517,9
22,223
27,3
25
4032,4
18,826,8
38,9 40,830,6
HUM BS S S PA T . S C TRS SOM LAW SCIENCE MED . S C
Yes No Tooearly tosay
Figure 13. Being able to fi nish in time by Graduate School
4.1.2 Research proposalPhD students start their project with different kinds of research proposals. These are presented
in Table 5, along with the percentages for each. The majority of the respondents had a
predetermined research proposal. The category ‘Other’ revealed that several PhD students
combined a predetermined research proposal with ideas of their own.
Table 5. Type of research proposal
Research proposal PercentageIt was a predetermined research proposal 29.3
It was a predetermined, externally funded research proposal 28.2
I was free to develop my own research proposal 23.1
I applied with my own research proposal 15.1
Other 3.8
4.1.3 Discontinuing the PhDIn 2015, 24% of the respondents considered discontinuing at some point. This is higher than
in 2013 (22%) but lower than in 2011 (27%). The thought of quitting in 2015 is comparable
to that in 2013 for the fi rst three years; however, there is an increase in and after the fourth
year (see Table 6). About 8% indicated that they thought about leaving at multiple stages in the
project.
Table 6. Percentage of all respondents who considered discontinuing
Stage in which discontinuing was considered
% 2009 % 2011 % 2013 % 2015
In the fi rst year 8.8 13.4 12.9 11.2
In the second
year
6.6 14.4 11.7 11.3
In the third year 2.3 9.0 6.7 7.0
In the fourth
year
0.5 2.8 2.6 3.3
After the fourth
year
* 1.5 1.0 2.1
At different
moments in my
PhD project
10.6 * * *
* Not included in the survey in that specifi c year

PhD Survey 2015 / 31PhD Survey 2015 / 30
Thoughts about quitting are mainly related to uncertainty about individual capabilities or the
PhD work itself, problems with supervision, the execution of the project or discontent with
the working conditions (see Table 7). These reasons are comparable to the results of 2013.
Almost 40% of the PhD students indicated one reason, while one-third indicated two reasons
and 17% indicated three reasons why they had thought about discontinuing their PhD. In
the category ‘Other’, respondents mentioned reasons such as personal circumstances or very
specifi c problems.
Table 7. Reasons for considering discontinuing the PhD
Reason for considering discontinuing PercentageUncertainty about my capabilities/PhD work 41.6
Problems with supervision 34.8
Problems with the execution of the project 34.1
Discontent with the working environment 32.6
Lost interest in the subject 14.7
Discontent with the working conditions/salary 13.3
Other 28.0
Of the PhD students, 14% regretted their decision to start a PhD. Almost half of the PhD
students were not sure about the benefi ts (‘I invested a lot and what will it get me?’) and others
would have liked a different topic (17%). Reasons mentioned in the category ‘Other’ were
unclear expectations, publication pressure, too little training, unfair treatment for bursary
students, disappointment in science or disappointment in the department.
4.2 Education programmePhD students were asked how many ECTS they have to earn as part of their PhD, which is on
average 24 ECTS. At the time of data collection, PhD students had earned about 14 ECTS in
about four courses. Figure 14 shows, per Graduate School, the average number of ECTS that
PhD students have to earn and the average total ECTS that they have earned so far.
0
5
10
15
20
25
30
35
Hum BSS Spat.Sc TRS SOM Law Science Med.Sc
Total ECTS
ECTS so far
Figure 14. Average total number of ECTS and average number of ECTS earned so far by
Graduate School
About one-fi fth of the PhD students had completed one course, one-third had completed two
to three courses and one-quarter more than three courses. PhD students in the middle of their
project had gained about 16 ECTS in about four courses and those in the fi nal stage had gained
23 ECTS in approximately fi ve courses.
PhD students were also asked about the type of courses they had completed. Over half of the
respondents attended at least one content-related course and/or one generic skills course (see
Table 8). Courses mentioned in the category ‘Other’ consisted of combinations of courses in the
predefi ned categories.

PhD Survey 2015 / 33PhD Survey 2015 / 32
Table 8. Educational activities completed by respondents
Educational activities PercentageContent-related courses, including statistics and methodology, etc. 49.0
Generic skills courses such as time-management and presentation, etc. 43.5
Introductory event organized by the Dean of Graduate Schools 32.4
Languages 25.9
Teaching skills 12.0
Career events for jobs inside academia 9.6
Career events for jobs outside academia 9.1
IT 7.6
Other 8.8
The satisfaction with educational activities was indicated by the following items:
• I am satisfied with the number of educational activities offered.
• I am satisfied with the quality of educational activities offered.
• I am satisfied with the diversity of educational activities offered.
• I am satisfied with the opportunities I have to participate in educational activities.
• Overall, I am satisfied with the educational activities in which I have taken part.
The average score was 3.0, which is the same as in 2013 and 2011. The Graduate School of
Theology and Religious Studies scored lowest, with an average score of 2.7, while the Graduate
School of Economics and Business scored highest, with an average of 3.1. There were no
differences between phase and affiliation. Differences between Graduate Schools are shown in
more detail in Figure 15.
Table 9 presents the satisfaction with the separate items (summation of strongly agree
+ agree). Overall, PhD students are highly satisfied (> 75%), except for the diversity of the
educational activities offered.
Table 9. Satisfaction with education
Education PercentageI am satisfied with the number of educational activities offered 79.6
I am satisfied with the quality of the educational activities offered 81.8
I am satisfied with the diversity of the educational activities offered 72.9
I am satisfied with the opportunities I have to participate in educational
activities
76.0
Overall, I am satisfied with the educational activities in which I have
participated
85.1
4.3 Teaching activitiesSince only employed PhD students are allowed to teach, we will only report in detail about this
particular group of PhD students (n = 649) in relation to this matter. About one-quarter of this
group did not have teaching or supervision tasks. When we take a closer look at this non-
teaching group, it is apparent that half consists of first-year PhD students.
PhD students who do teach usually perform supervisory duties or give small-scale lectures
(Table 10). On average, PhD students report spending 14 hours on teaching and supervising
each month; which is 2 hours less than reported in 2013.
Table 10. Percentage of teaching activities performed by employed PhD students
Teaching activities PercentageNo, I do not teach or supervise students 27.6
Yes, supervising students 50.4
Yes, small-scale courses (seminars/tutorials/‘werkcolleges’) 39.3
Yes, practicals (experimental work, lab work) 26.5
Yes, large-scale lectures (‘hoorcollege’) 12.2
PhD students who have teaching duties (n = 471) were asked if they received sufficient training
for these tasks and only one-third answers ‘yes’. In addition, PhD students were asked what kind
of training they received. They could choose from two options: ‘Training for teaching assistants’
(organized by the University of Groningen) or ‘Other’. In the case of the latter, PhD students
were asked to describe these forms of training or experience (see Table 11).

PhD Survey 2015 / 35PhD Survey 2015 / 34
The PhD students who reported not having received suffi cient training were asked for
additional comments, but only 20.2% of 331 PhD students gave a response to this request.
The majority (76.1%) said they did not receive any support from colleagues or their supervisor
(even when they asked) and 19.4% indicated not having received any information on how to
supervise students.
0%
20%
40%
60%
80%
100%
Hu
m
BS
S
Sp
at.S
c
TR
S
SO
M
Law
Sci
ence
Med
.Sci
ence
Hu
m
BS
S
Sp
at.S
c
TR
S
SO
M
Law
Sci
ence
Med
.Sci
ence
Hu
m
BS
S
Sp
at.S
c
TR
S
SO
M
Law
Sci
ence
Med
.Sci
ence
Hu
m
BS
S
Sp
at.S
c
TR
S
SO
M
Law
Sci
ence
Med
.Sci
ence
number of educational activities quality of the educational activities diversity of the educational activities opportunities to participate in educational activities
Strongly disagree Disagree Agree Strongly agree
Figure 15. Signifi cant differences in satisfaction with education between Graduate Schools
Table 11. Overview of training/experiences of employed PhD students with teaching
Training for teaching/supervising students PercentageTraining for teaching assistants, organized by the University 46.2
Experience from previous job 14.6
Feedback from supervisor 14.6
Teacher training for PhD students, organized by Graduate School 5.4
Training for teaching assistants, organized by another university 5.4
Basis Kwalifi catie Onderwijs 4.6
Other course 4.6
Master’s in Education or Master’s in Education & Communication 3.1
Feedback from colleagues 1.5
The majority (93.3%) of PhD students with teaching duties answered the question about
satisfaction with the amount of teaching. Table 12 shows that a little over 70% were satisfi ed
with the amount of time they spent on teaching or supervision. This table presents the mean
number of monthly hours of teaching duties for each group.
Table 12. Satisfaction with teaching and supervision
Opinion Percentage Monthly hours mean (SD)
I would like to teach/supervise less 13.9 24.5 (20.8)
I am satisfi ed with the amount of time
I spend teaching/supervising
72.2 15.2 (12.8)
I would like to teach/supervise more 13.9 10.1 (10.4)
PhD students were asked whether they thought that teaching and supervisory activities
contributed to their PhD project, and the majority (89.4%) answered positively, which is more
than in 2013 (67%). Table 13 presents the areas in which the teaching activities are believed
to contribute to the PhD project. The answers of PhD students who chose the option ‘Other’
can be categorized into: 1) explaining complex concepts clearly (24%), 2) improve skills such
as management, communication, teaching and supervision, (32%), 3) motivation and/or
fulfi lment (12%), 4) transfer knowledge (12%) and 5) working with students (20%).
PhD Survey 2015 / 37PhD Survey 2015 / 36
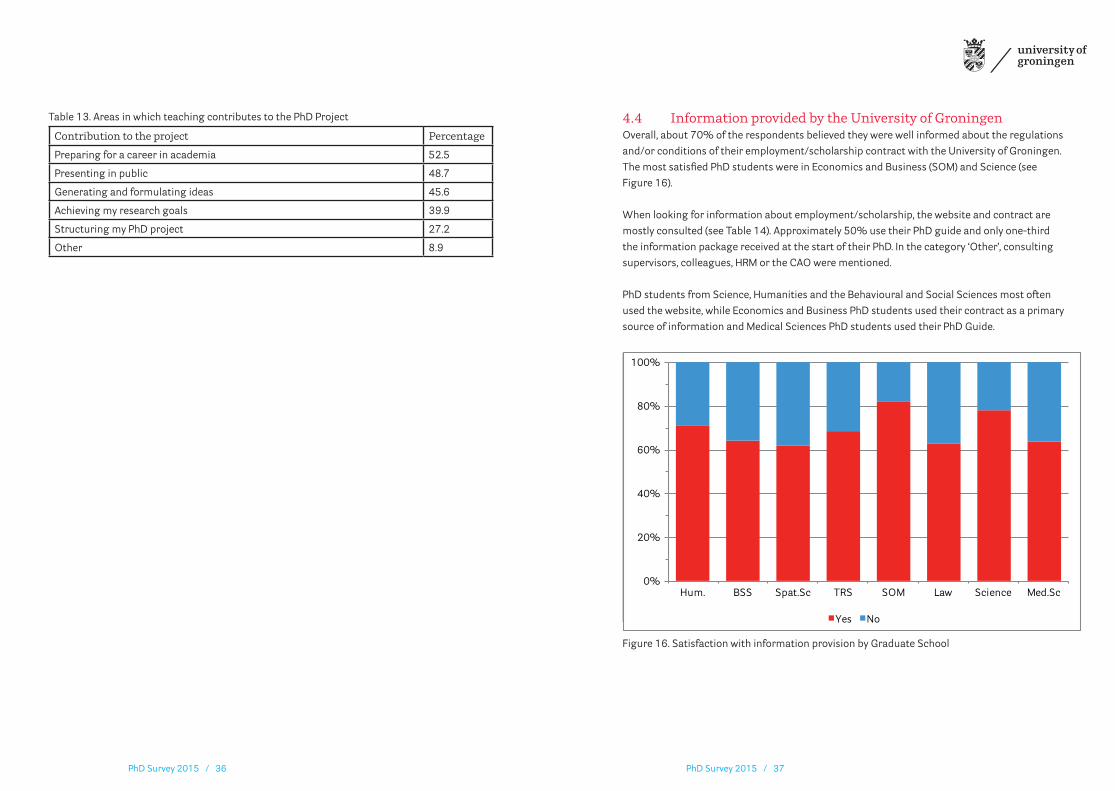
Table 13. Areas in which teaching contributes to the PhD Project
Contribution to the project PercentagePreparing for a career in academia 52.5
Presenting in public 48.7
Generating and formulating ideas 45.6
Achieving my research goals 39.9
Structuring my PhD project 27.2
Other 8.9
4.4 Information provided by the University of GroningenOverall, about 70% of the respondents believed they were well informed about the regulations
and/or conditions of their employment/scholarship contract with the University of Groningen.
The most satisfi ed PhD students were in Economics and Business (SOM) and Science (see
Figure 16).
When looking for information about employment/scholarship, the website and contract are
mostly consulted (see Table 14). Approximately 50% use their PhD guide and only one-third
the information package received at the start of their PhD. In the category ‘Other’, consulting
supervisors, colleagues, HRM or the CAO were mentioned.
PhD students from Science, Humanities and the Behavioural and Social Sciences most often
used the website, while Economics and Business PhD students used their contract as a primary
source of information and Medical Sciences PhD students used their PhD Guide.
0%
20%
40%
60%
80%
100%
Hum. BSS Spat.Sc TRS SOM Law Science Med.Sc
Yes No
0%
20%
40%
60%
80%
100%
Hum. BSS Spat.Sc TRS SOM Law Science Med.Sc
Yes No
0%
20%
40%
60%
80%
100%
Hum. BSS Spat.Sc TRS SOM Law Science Med.Sc
Yes No
Figure 16. Satisfaction with information provision by Graduate School

PhD Survey 2015 / 39PhD Survey 2015 / 38
Table 14. Information provision
Source of information PercentageWebsite 62.4
Contract 57.5
PhD guide 50.6
Information pack on arrival 32.9
Other 8.7
The majority of the respondents (80%) had not experienced diffi culties regarding information
provision. The diffi culties that were experienced mainly concerned issues with fi nances and
taxation, the vagueness of rights and policies (especially for scholarship PhD students) and
which courses can and/or should be followed. Some PhD students mentioned not having
received the information package and, just as in 2013, some negative remarks about
the website were made (unclear and incomplete information). The number of diffi culties
experienced was different between the Graduate Schools. PhD students from the Graduate
School of Humanities and the Graduate School of Medical Sciences indicated the most
problems, while those from Economics and Business (SOM) indicated the least (see Figure
17). There were no differences according to phase, nationality (Dutch versus non-Dutch) or
affi liation.
4.5 Hora FinitaIn 2015, questions about familiarity with the registration system, Hora Finita, were added to
the survey. Almost three-quarters (74%) of the PhD students said they were familiar with the
system and they were asked to answer three more questions about different aspects of Hora
Finita. Again, about three-quarters (77%) knew they could enter information about training
activities in Hora Finita and that formalities about their thesis defence were digitally accessible.
A slightly smaller number of respondents (66%) knew they could access their R&D interview
forms.
0%
20%
40%
60%
80%
100%
Hum. BSS Spat.Sc TRS SOM Law Science Med.Sc
Yes No
0%
20%
40%
60%
80%
100%
Hum. BSS Spat.Sc TRS SOM Law Science Med.Sc
Yes No
0%
20%
40%
60%
80%
100%
Hum. BSS Spat.Sc TRS SOM Law Science Med.Sc
Yes No
Figure 17. Diffi culties with information provision by Graduate School
Familiarity with Hora Finita differed between the Graduate Schools. PhD students from Medical
Sciences were most familiar with the system, while PhD students from BSS were least familiar
(see Figure 18). Familiarity also differed according to phase and affi liation: PhD students in the
fi nal stage of their project and PhD students with a scholarship were signifi cantly less familiar
with Hora Finita than their counterparts.

PhD Survey 2015 / 41PhD Survey 2015 / 40
0%
20%
40%
60%
80%
100%
Hum. BSS Spat.Sc TRS SOM Law Science Med.Sc
Yes No
0%
20%
40%
60%
80%
100%
Hum. BSS Spat.Sc TRS SOM Law Science Med.Sc
Yes No
0%
20%
40%
60%
80%
100%
Hum. BSS Spat.Sc TRS SOM Law Science Med.Sc
Yes No
Figure 18. Familiarity with Hora Finita by Graduate School
5 SupervisionSupervision is an essential part of a successful PhD project. This chapter fi rst considers the
performance evaluation in the regular Result and Development (R&D) interviews as well as
the go/no-go interview in the fi rst year. Subsequently, the Training and Supervision Plan (TSP)
will be discussed, followed by the supervision provided by the Graduate School. This chapter
concludes with the organization and quality of the supervision provided by the primary and
daily supervisor(s).
5.1 Performance evaluationAccording to University regulations, PhD students should have an annual Result and
Development interview. PhD students in their fi rst year (who have not yet completed a whole
year are not included in the following analyses).
5.1.1 Result and Development interviewOf the respondents who were in their second or subsequent year, 69% indicated that their
performance had been evaluated in a Result and Development (R&D) interview, while 17%
indicated that this was done irregularly, and the performance of 14% had not yet been
evaluated. These results are comparable to 2013 (68%, 21% and 11% respectively).
There are differences between Graduate Schools in relation to the R&D interview (see Figure
19). About one-quarter of the PhD students from the Graduate School of Medical Sciences
and between 15% and 20% of those from Humanities, Behavioural and Social Sciences (BSS),
Spatial Sciences and Law reported not having had an R&D interview. PhD students from the
Graduate School of Theology and Religious Studies (TRS), the Graduate School of Science and
the Graduate School of Economics and Business (SOM) most often reported that they had such
an evaluation.
PhD students in their second or third years have more often had an R&D interview (73.7%)
compared to those in their fourth or subsequent year (63.1%), with the latter group more often
indicating that they were evaluated irregularly (21.6%) or have not had such an interview at all
(15.3%).
More than three-quarters (76.5%) of the employed PhD students reported that they have
regular evaluation moments, compared to 67.6% of those with a scholarship and 53.1%
of PhD students with another type of affi liation. Of the employed PhD students, only 6.6%
reported not to have had a formal evaluation thus far, compared to 14.6% of the scholarship
PhD students and 32.8% of the PhD students with another type of affi liation.

PhD Survey 2015 / 43PhD Survey 2015 / 42
0%
20%
40%
60%
80%
100%
Hum. BSS Spat.Sci. TRS SOM Law Science Med.Sci.
No, so far my performance has not been evaluated formally
No, my performance is very irregularly evaluated
Yes, my performance is regularly evaluated
0%
20%
40%
60%
80%
100%
Hum. BSS Spat.Sci. TRS SOM Law Science Med.Sci.
No, so far my performance has not been evaluated formally
No, my performance is very irregularly evaluated
Yes, my performance is regularly evaluated
0%
20%
40%
60%
80%
100%
Hum. BSS Spat.Sci. TRS SOM Law Science Med.Sci.
No, so far my performance has not been evaluated formally
No, my performance is very irregularly evaluated
Yes, my performance is regularly evaluated
Figure 19. Performance evaluation by Graduate School
We asked the PhD students which people were present at their R&D interview. A majority of
the PhD students indicated that the main supervisor was present (see Table 15). In less than
10% of the interviews, a Graduate School delegate or an HR representative was present. People
mentioned in the category ‘Other’ were most often the head of the department/institute,
although in some cases another staff member or external advisor was mentioned.
Table 15. People present at R&D interview
People present at the R&D interview PercentagePrimary supervisor/co-supervisor 87.4
Daily supervisor 44.8
Graduate School delegate 8.9
Personnel department representative (HRM) 6.8
Other 5.2
5.1.2 Go/no-go interviewLess than three-quarters (69.8%) of PhD students in their second or later year have had a go/
no-go interview and there are differences between Graduate Schools (see Figure 20). The go/
no-go interviews are least common at the Graduate School of Medical Sciences. Furthermore,
PhD students with an employment status reported having a go/no-go interview most often
(85.5%), compared to PhD students with a scholarship (65.9%) and those with other types of
affi liation (34.5%).
0%
20%
40%
60%
80%
100%
Hum. BSS Spat.Sci. TRS SOM Law Science Med.Sci.
No Yes
0%
20%
40%
60%
80%
100%
Hum. BSS Spat.Sci. TRS SOM Law Science Med.Sci.
No Yes
0%
20%
40%
60%
80%
100%
Hum. BSS Spat.Sci. TRS SOM Law Science Med.Sci.
Yes No
Figure 20. Go/no go interview within the fi rst year by Graduate School
Table 16 lists the people present at the go/no-go interview. Over the years there has been an
increase in the attendance of the main supervisor and a Graduate School delegate, while a
decrease is observed in the attendance of an HRM representative. People mentioned in the
category ‘Other’ were most often the head of the department or institute and, in some cases,
another staff member, external advisor or even other PhD candidates.
Table 16. People present at go/no-go interview
People present at the go/no-go interview % 2011 % 2013 % 2015Primary supervisor/co-supervisor 84.6 81.0 92.3
Daily supervisor 45.2 57.6 47.6
Graduate School delegate 13.5 12.4 15.7
Personnel department representative (HRM) 21.3 17.4 10.5
Other 6.8 8.8 5.2

PhD Survey 2015 / 45PhD Survey 2015 / 44
5.2 Training and Supervision Plan (TSP)Since 2009, the proportion of PhD students with a formal Training and Supervision Plan (TSP)
has increased from 57% (in 2009 and 2011) and 63% (in 2013) to 69% in 2015. Similar to
2013, 18% of the PhD students reported they did not have a TSP and 13% were not sure.
There are signifi cant differences between Graduate Schools. Figure 21 presents the answers
to the question: ‘Do you have a Training and Supervision Plan?’ by Graduate School. At least
80% of the PhD students from Science, Economics and Business (SOM) and also Law had a TSP.
TSPs are least present among PhD students from the Medical Sciences. The data also revealed
a difference according to affi liation: about 75% of PhD candidates with a student or employee
status had a TSP compared to only 40% of the PhD students with another type of affi liation.
0%
20%
40%
60%
80%
100%
Hum. BSS Spat.Sci. TRS SOM Law Science Med. Sci.
I do not know
No
Yes
0%
20%
40%
60%
80%
100%
Hum. BSS Spat.Sci. TRS SOM Law Science Med. Sci.
I do not know
No
Yes
0%
20%
40%
60%
80%
100%
Hum. BSS Spat.Sci. TRS SOM Law Science Med. Sci.
Yes No I do not know
Figure 21. Percentage of PhD students with a TSP by Graduate School
PhD students with a TSP were asked how many months after the start of their project their TSP
was formalized. Almost 40% could not answer this question. The months mentioned by those
who could are divided in six categories (see Table 17). Two-thirds of the PhD students said that
their TSP was formalized within at least three months after the start.
Table 17. Formalization of TSP
Category PercentageI do not know 38.7
Before start 2.5
At start 10.3
Within the fi rst month after start 16.5
Within the second/third month after start 13.8
Between 4 and 12 months after start 16.6
After 12 months after start 1.6
A majority of TSPs include an explanation of the research content and design and information
about the time schedule (see Table 18). Only one-third include agreements concerning
teaching activities and only one-quarter about thesis requirements. In comparison with the
results of previous years, the TSP has become a more complete document. However, only one-
third of the PhD students in their second or third years said they updated their TSP regularly.
Table 18. Elements present in TSP
Elements in TSP PercentageResearch content and design 84.o
Time planning and time management 81.9
Educational activities 74.6
Number of contact hours with your supervisors 37.2
Evaluation and appraisal milestones 37.1
Number of teaching activities 32.3
PhD thesis requirements 25.0
5.2.1 Quality and quantity requirementsAs was done in previous surveys, PhD students were asked if formal quantity (e.g. number of
pages, chapters or articles) and quality (e.g. publishing in high-ranking journals) agreements
had been made. In 2009, over 60% of the respondents said that such requirements were
stipulated, but this decreased to 40% in 2011 and 32% in 2013. This year, 33% of the PhD
students said that formal quantity agreements were made and only 13% said this was done
concerning quality. The majority of PhD students who do have these formal agreements

PhD Survey 2015 / 47PhD Survey 2015 / 46
reported being very satisfi ed; only about 9% considered these agreements to be too
demanding (compared to 7% in 2013).
When we look at differences between the groups, we see differences in quantity requirements
according to phase and differences in quality agreements according to phase and affi liation.
Logically, PhD students who are further into their project more often mentioned quantity and
quality requirements than those who had just started. PhD students with an employment
status reported signifi cantly less often (19.0%) that quality agreements were made than PhD
students with a scholarship status (31.1%).
Just as in 2013, 14% of the respondents indicated they were familiar with the requirements
for a cum laude distinction for their dissertation. Of this 14%, half had the ambition to achieve
this distinction. The wish to achieve the cum laude distinction signifi cantly decreases with
the phase of the project: 61% of PhD students in their fi rst year versus 44% of those in their
second or third years and 33% in their fi nal years. There were no differences according to
affi liation or Graduate School.
5.2.2 Satisfaction with TSPTSP satisfaction was measured with the following fi ve items:
• My training and supervision plan serves as a good guideline throughout my PhD.
• Drawing up a training and supervision plan helps me plan my PhD project.
• I have suffi cient opportunities to revise my training and supervision plan when necessary.
• My training and supervision plan is evaluated regularly in a formal evaluation.
• Overall, I am satisfi ed with my training and supervision plan.
Generally speaking, the PhD students were moderately satisfi ed with their TSPs. The average
score was 2.7, which is lower than in 2013. PhD students with a scholarship and PhD students
in their fi rst, second or third years, were more satisfi ed than their counterparts.
Figure 22 shows the change in TSP satisfaction over time for the Graduate Schools that had
more than 15 respondents in every survey. The satisfaction of PhD students from the Graduate
School of Behavioural and Social Sciences has increased the most, although their score is still
the lowest, followed by Medical Sciences. Just as in 2013, PhD students from the Graduate
School of Science were most satisfi ed with their TSPs.
2
2,2
2,4
2,6
2,8
3
3,2
2009 2011 2013 2015
Humanities
BSS
SOM
Science
Med.Sci.
All PhD students
Figure 22. Mean scale score on TSP satisfaction by Graduate School in 2009, 2011, 2013 and
2015

PhD Survey 2015 / 49PhD Survey 2015 / 48
Table 19 presents the level of agreement (summation of highly agree + agree) with the
separate items of the TSP scale. About 40% agreed with the proposition that their TSP is
evaluated regularly in a formal evaluation, while about 60% thought the TSP was a good
guideline that could help in planning their PhD.
Table 19. Training and Supervision Plan
TSP PercentageMy training and supervision plan serves as a good guideline throughout
my PhD.
58.6
Drawing up a training and supervision plan helps me plan my PhD project. 64.7
I have suffi cient opportunities to revise my training and supervision plan
when necessary.
69.3
My training and supervision plan is evaluated regularly in a formal
evaluation.
39.8
Overall, I am satisfi ed with my training and supervision plan. 71.9
When taking a closer look at the separate items of the TSP satisfaction scale we see that there
are differences between the Graduate Schools. These differences are presented in Figure
23 and Figure 24. Differences on all items are also found according to project phase. Figure
25 reveals that PhD students who have just started are most satisfi ed. This fi nding can be
explained in two ways: 1) new PhD students are indeed more satisfi ed with the format of the
TSP or, 2) they are satisfi ed with their plan at the beginning of the project because they have
just written it.
0%
20%
40%
60%
80%
100%
Hu
m
BS
S
Sp
at. S
ci.
TR
S
SO
M
Law
Sci
ence
Med
. Sci
.
Hu
m
BS
S
Sp
at. S
ci.
TR
S
SO
M
Law
Sci
ence
Med
. Sci
.
Hu
m
BS
S
Sp
at. S
ci.
TR
S
SO
M
Law
Sci
ence
Med
. Sci
.
TSP provides a good guideline TSP helps me plan my PhD project Sufficient opportunities to revise TSP
Strongly agree Agree Disagree Strongly disagree
0%
20%
40%
60%
80%
100%
Hu
m
BS
S
Sp
at. S
ci.
TR
S
SO
M
Law
Sci
ence
Med
. Sci
.
Hu
m
BS
S
Sp
at. S
ci.
TR
S
SO
M
Law
Sci
ence
Med
. Sci
.
Hu
m
BS
S
Sp
at. S
ci.
TR
S
SO
M
Law
Sci
ence
Med
. Sci
.
TSP provides a good guideline TSP helps me plan my PhD project Sufficient opportunities to revise TSPStrongly agree Agree Disagree Strongly disagree
Figure 23. Signifi cant items of satisfaction with TSP by Graduate School (1)
0%
20%
40%
60%
80%
100%
Hum BSS Spat. Sci. TRS SOM Law Science Med. Sci. Hum BSS Spat. Sci. TRS SOM Law Science Med. Sci.
TSP regularly formally evaluated Overall satisfied with TSP
Strongly agree Agree Disagree Strongly disagree
0%
20%
40%
60%
80%
100%
Hum BSS Spat. Sci. TRS SOM Law Science Med. Sci. Hum BSS Spat. Sci. TRS SOM Law Science Med. Sci.
TSP regularly formally evaluated Overall satisfied with TSP
Strongly agree Agree Disagree Strongly disagree
0%
20%
40%
60%
80%
100%
Hum BSS Spat. Sci. TRS SOM Law Science Med. Sci. Hum BSS Spat. Sci. TRS SOM Law Science Med. Sci.
TSP regularly formally evaluated Overall satisfied with TSP
Strongly agree Agree Disagree Strongly disagree
Figure 24. Signifi cant items of satisfaction with TSP by Graduate School (2)

PhD Survey 2015 / 51
0% 20% 40% 60% 80% 100%
1st
2nd/3rd
4th+
1st
2nd/3rd
4th+
1st
2nd/3rd
4th+
1st
2nd/3rd
4th+
1st
2nd/3rd
4th+
TS
P p
rovi
des
a
go
od
gu
idel
ine
TS
P h
elp
s m
e p
lan
m
y P
hD
pro
ject
Su
ffic
ien
t o
pp
ort
un
itie
s to
re
vise
TS
PT
SP
reg
ula
rly
form
ally
eva
luat
edO
vera
ll s
atis
fied
w
ith
TS
P
Strongly disagree Disagree Agree Strongly agree
1st
2nd/3rd
4th+
1st
2nd/3rd
4th+
1st
2nd/3rd
4th+
1st
2nd/3rd
4th+
1st
2nd/3rd
4th+
TS
P p
rovi
des
a
go
od
gu
idel
ine
TS
P h
elp
s m
e p
lan
T
SP
hel
ps
me
pla
n
my
Ph
D p
roje
ct
Su
ffic
ien
t o
pp
ort
un
itie
s to
re
vise
TS
PT
SP
reg
ula
rly
form
ally
eva
luat
edfo
rmal
ly e
valu
ated
Ove
rall
sat
isfi
ed
wit
h T
SP
Strongly disagree Disagree Agree Strongly agree
0% 20% 40% 60% 80% 100%
1st
2nd/3rd
4th+
1st
2nd/3rd
4th+
1st
2nd/3rd
4th+
1st
2nd/3rd
4th+
1st
2nd/3rd
4th+
TS
P p
rovi
des
a
go
od
gu
idel
ine
TS
P h
elp
s m
e p
lan
m
y P
hD
pro
ject
Su
ffic
ien
t o
pp
ort
un
itie
s to
re
vise
TS
PT
SP
reg
ula
rly
form
ally
eva
luat
edO
vera
ll s
atis
fied
w
ith
TS
P
Strongly disagree Disagree Agree Strongly agree
Figure 25. Signifi cant items of satisfaction with TSP by phase
5.3 Graduate SchoolPhD students were asked if they were familiar with the role of their faculty’s Graduate School.
In 2015, 64% answered positively, which is less than in previous years (2013: 71%; 2011: 75%;
2009: 67%). Familiarity differs between the Schools (see Figure 26). The Graduate School
of Behavioural and Social Sciences was least known by its PhD students, as was the case in
previous years.
Familiarity also differs according to affi liation: PhD students with an employment affi liation are
a little more familiar with their Graduate School (68%) compared to those with scholarship
status (60%) or another type of affi liation (55%).
0%
20%
40%
60%
80%
100%
Hum. BSS Spat. Sci. TRS SOM Law Science Med. Sci.
Yes No
Figure 26. Familiarity with the Graduate School
A little less than half of the respondents (47%) who were familiar with the role of their
Graduate School attended an introductory module at the Graduate School (51% in 2013 and
43% in 2011). Graduate Schools differ signifi cantly in the percentage of participants who
attended these modules (see Table 20). The highest proportion was found for the Graduate
School of Humanities and the Graduate School of Law and the lowest percentage was found for
the Graduate School of Behavioural and Social Sciences.
Table 20. Graduate School Introduction module attendance
Graduate School PercentageHumanities 66.3
Behavioural and Social Sciences (BSS) 16.2
Spatial Sciences 29.7
Theology and Religious Studies 18.8
Economics and Business (SOM) 44.6
Law 66.7
Science 49.0
Medical Sciences 48.6

PhD Survey 2015 / 53PhD Survey 2015 / 52
Satisfaction with the Graduate School was measured using seven items rated on a four-point
Likert scale:
• I know whom I can turn to in the Graduate School when facing problems in general, e.g.
with my supervision or training.
• I am satisfied with the education provided by my Graduate School.
• I am satisfied with the way my Graduate School monitors and supports the supervision of
my PhD project.
• I am satisfied with the way in which my Graduate School monitors the progress of my PhD
project.
• My Graduate School provides for a stimulating study and research environment, which
allows for interaction and efficiency.
• My Graduate School provides me with adequate information (website, PhD guide).
• Overall, I am satisfied with how my Graduate School functions.
This scale score was only calculated for the PhD students who were familiar with the role of
their Graduate School (n = 730). The average score on this topic was 3.0, which is significantly
higher than the average score of 2.9 in 2013. The average score differs significantly
between Graduate Schools, affiliation and project phase. Similar to 2013, PhD students
with a scholarship and those at the beginning of their project were most satisfied with their
Graduate School. PhD students from the Graduate School of Economics and Business gave
their Graduate School the highest rating (3.3), while PhD students from the Graduate School
of Behavioural and Social Sciences were least satisfied (2.8). This means that there is a
relationship between familiarity with the role of the Graduate School and satisfaction with the
Graduate School, as was found in 2011.
Table 21 gives an overview of the percentage of PhD students who agreed or strongly agreed
with the propositions about the Graduate School. More than 80% were satisfied with the
education offered and the information provided, and most PhD students know who they can
turn to within their Graduate Schools when facing problems. However, PhD students were
less satisfied with the way the Graduate School monitors and supports the supervision and
progress of their PhD project.
Table 21. Satisfaction/familiarity with different roles of the Graduates Schools
Roles of the Graduate Schools PercentageI know whom I can turn to in the Graduate School when facing problems in
general, e.g. with my supervision or training
84.8
I am satisfied with the education provided by my Graduate School 84.0
I am satisfied with the way my Graduate School monitors and supports the
supervision of my PhD project
75.3
I am satisfied with the way in which my Graduate School monitors the
progress of my PhD project
72.5
My Graduate School provides for a stimulating study and research
environment, which allows for interaction and efficiency
75.2
My Graduate School provides me with adequate information (website, PhD
guide)
87.3
Overall, I am satisfied with how my Graduate School functions 88.0
When we look at the individual items of the satisfaction scale in more detail it becomes evident
that PhD students from the Graduate School of Economics and Business (SOM) are most
satisfied with their Graduate School: they give the highest satisfaction scores on all seven items
(see Figure 27 and Figure 28).
Significant differences according to phase and affiliation were also found, but not for all items.
PhD students with an employment status or a scholarship are more satisfied about whom they
can turn to in the Graduate School. This seems logical, since PhD students with other types of
affiliation are often not situated close to the Graduate School. PhD students with a scholarship
are significantly more satisfied with the educational activities provided by the Graduate School
compared to the others. Finally, PhD students who are further into their project are significantly
less satisfied with the way the Graduate School monitors and supports their supervision and
progress.

PhD Survey 2015 / 55PhD Survey 2015 / 54
0% 20% 40% 60% 80% 100%
Hum.BSS
Spat. Sci.TRS
SOMLaw
ScienceMed. Sci.
Hum.BSS
Spat. Sci.TRS
SOMLaw
ScienceMed. Sci.
Hum.BSS
Spat. Sci.TRS
SOMLaw
ScienceMed. Sci.
Hum.BSS
Spat. Sci.TRS
SOMLaw
ScienceMed. Sci.
Wh
o t
o t
urn
to
Edu
cati
on
Su
pp
ort
su
per
visi
on
Mo
nit
ors
pro
gre
ss
Strongly disagree Disagree Agree Strongly agree
Figure 27. Signifi cant items of satisfaction with Graduate School (1)
0% 20% 40% 60% 80% 100%
Hum.
BSS
Spat. Sci.
TRS
SOM
Law
Science
Med. Sci.
Hum.
BSS
Spat. Sci.
TRS
SOM
Law
Science
Med. Sci.
Hum.
BSS
Spat. Sci.
TRS
SOM
Law
Science
Med. Sci.
Res
earc
h e
nvi
ron
men
tIn
form
atio
nO
vera
ll s
atis
fact
ion
Strongly disagree Disagree Agree Strongly agree
0% 20% 40% 60% 80% 100%
Hum.
BSS
Spat. Sci.
TRS
SOM
Law
Science
Med. Sci.
Hum.
BSS
Spat. Sci.
TRS
SOM
Law
Science
Med. Sci.
Hum.
BSS
Spat. Sci.
TRS
SOM
Law
Science
Med. Sci.
Res
earc
h e
nvi
ron
men
tIn
form
atio
nO
vera
ll s
atis
fact
ion
Strongly disagree Disagree Agree Strongly agree
0% 20% 40% 60% 80% 100%
Hum.
BSS
Spat. Sci.
TRS
SOM
Law
Science
Med. Sci.
Hum.
BSS
Spat. Sci.
TRS
SOM
Law
Science
Med. Sci.
Hum.
BSS
Spat. Sci.
TRS
SOM
Law
Science
Med. Sci.
Res
earc
h e
nvi
ron
men
tIn
form
atio
nO
vera
ll s
atis
fact
ion
Strongly disagree Disagree Agree Strongly agree
Figure 28. Signifi cant items of satisfaction with Graduate School (2)

PhD Survey 2015 / 57PhD Survey 2015 / 56
5.4 SupervisorsPhD students were asked to indicate how many supervisors they have. The average number
is 2.9 (minimum 1, maximum 8), which is higher compared to 2013, when it was 2.3.
Respondents were also asked to distinguish between supervisors and daily supervisors. On
average the respondents had 2.0 supervisors (e.g. main supervisor, second supervisor) and 0.9
daily supervisors (e.g. postdocs, assistant professors). The majority of the PhD students had
an appointment with their primary supervisor at least once a month (see Table 22) and 67%
(Table 23) met at least once a week with their daily supervisors.
Table 22. Frequency of meetings with primary supervisors
Frequency PercentageDaily 5.4
Once a week 29.8
Once every two weeks 23.3
Monthly 30.2
Twice a year 8.8
Yearly 0.8
I have never had an appointment 0.7
Table 23. Frequency of meetings with daily supervisors
Frequency PercentageDaily 15.3
Once a week 51.2
Once every two weeks 21.8
Monthly 9.4
Twice a year 1.8
Yearly 0.0
I have never had an appointment 0.6
5.4.1 Satisfaction with supervisionSatisfaction with supervision was measured using 14 items divided into two categories, one
relating to the organization of supervision and one relating to the quality of supervision. All
items were scored on a four-point Likert scale. Compared to 2013, one new question was
added to the organization scale.
The seven items about the organization of supervision were:
• I am satisfied with the way my supervision is organized.
• At our meetings my supervisors are usually well prepared.
• I am satisfied with the number of meetings I have with my supervisor(s).
• I am satisfied with the number of meetings I have with my daily supervisor(s).
• When I need information at short notice, at least one of my supervisors is available.
• I have enough freedom to determine my own contribution to my research project.
• I have a clear picture of what I can expect of my primary supervisors/co-supervisors and
daily supervisors (new).
Compared to 2013, three new questions were added to the quality of supervision scale and one
item was not included in 2015. The eight items about the quality of supervision were:
• My supervisors provide me with adequate feedback.
• I feel my contributions to my PhD project are taken seriously (new).
• My supervisors support me in choosing educational activities which I find interesting.
• I am being stimulated by my supervisors to present my work at conferences.
• Generally speaking, my supervisors agree with each other on where my research should
be going.
• My supervisors make me feel enthusiastic about my project (new).
• My supervisors encourage me to expand my network of professional contacts (new).
The item that was excluded is:
• My supervisors show commitment to my project.
The organization of supervision scale had an average score of 3.3. This is a rather good score
and does not differ from the scores in 2013 and 2011. Most of the larger Graduate Schools do
not exhibit major differences across the four moments of measurement (see Figure 29). The
increase for Behavioural and Social Sciences and the decrease for Humanities and Economics
and Business are not significant. The 2015 satisfaction score for organization of supervision
did not differ between Graduate Schools, affiliation or phase.

PhD Survey 2015 / 59PhD Survey 2015 / 58
3
3,2
3,4
3,6
2009 2011 2013 2015
Humanities
Behavioural and Social Sciences
Economics and Business
Science
Medical Sciences
All PhD students
3
3,2
3,4
3,6
2009 2011 2013 2015
Humanities
Behavioural and Social Sciences
Economics and Business
Science
Medical Sciences
All PhD students
3
3,2
3,4
3,6
2009 2011 2013 2015
Humanities
Behavioural and Social Sciences
Economics and Business
Science
Medical Sciences
All PhD students
Figure 29. Mean scale score on satisfaction with organization of supervision by Graduate
School in 2009, 2011, 2013 and 2015
3
3,2
3,4
3,6
2009 2011 2013 2015
Humanities
Behavioural and Social Sciences
Economics and Business
Science
Medical Sciences
All PhD students
3
3,2
3,4
3,6
2009 2011 2013 2015
Humanities
Behavioural and Social Sciences
Economics and Business
Science
Medical Sciences
All PhD students
3
3,2
3,4
3,6
2009 2011 2013 2015
Humanities
Behavioural and Social Sciences
Economics and Business
Science
Medical Sciences
All PhD students
Figure 30. Mean scale score on satisfaction with quality of supervision by Graduate School in
2009, 2011, 2013 and 2015
Similar results were found for the quality of supervision, for which the average score was
3.3. This is a little higher compared to 2013 and 2011 (3.2), but not signifi cantly.1 The
average scores on the quality of supervision are to a large extent similar to the scores on the
organization of supervision, with most Graduate Schools’ scores rather stable over the years.
The increase for Behavioural and Social Sciences and the decrease for Sciences (see Figure 30)
are not signifi cant. The satisfaction score for supervision quality differs only according to phase
(see Figure 31); similar to 2013, the further into the project, the more critical PhD students
are about the quality of supervision. No differences were found between Graduate Schools or
affi liation.
Table 24 and Table 25 show the percentage of agreement (summation of ‘strongly agree’ and
‘agree’) with the propositions regarding supervision. Overall, it appears that PhD students
are satisfi ed with the organization and the quality of their supervision. PhD students are
least satisfi ed with the number of appointments with their daily supervisors and with their
supervisor’s support in relation to educational activities and network expansion.
Since problems with the frequency of supervision can have two sides, that is, too many or too
few appointments, we compared the frequency of appointments with the daily supervisor
between respondents who were not satisfi ed (highly disagree + disagree) with those who were
satisfi ed (highly agree + agree). Signifi cantly fewer frequent meetings with the daily supervisor
were found in the group that was not satisfi ed.
Table 24. Organization of supervision
Roles of the Graduate Schools PercentageI am satisfi ed with the way my supervision is organized 84.9
At our meetings my supervisors are usually well prepared 84.8
I am satisfi ed with the number of meetings I have with my supervisor(s) 86.8
I am satisfi ed with the number of meetings I have with my daily
supervisor(s)
75.1
When I need information at short notice, at least one of my supervisors is
available
91.0
I have enough freedom to determine my own contribution to my research
project
93.5
I have a clear picture of what I can expect of my primary supervisors/co-
supervisors and daily supervisors
88.8

PhD Survey 2015 / 61PhD Survey 2015 / 60
Table 25. Quality of supervision
Roles of the Graduate Schools PercentageMy supervisors provide me with adequate feedback 89.7
I feel my contributions to my PhD project are taken seriously 93.2
My supervisors support me in choosing educational activities which I find
interesting
75.6
I am being stimulated by my supervisors to present my work at conferences 85.6
Generally speaking, my supervisors agree with each other on where my
research should be going
82.4
My supervisors make me feel enthusiastic about my project 88.8
My supervisors encourage me to expand my network of professional contacts 77.4
Overall, I am satisfied with the supervision I receive 82.7
5.4.2 Appreciations and frustrations concerning supervision/supervisorsRespondents were asked what they appreciated most about their supervision. Table 26
summarizes their answers. The majority of the respondents appreciated the feedback,
expertise or support given by their supervisor(s). In the category ‘Other’, no new aspects were
mentioned. About three-quarters noted that they appreciated several or all aspects mentioned
in the predefined categories, while one-quarter noted that they did not appreciate any of
the aspects mentioned. PhD students were also asked which aspects of supervision they find
most challenging or frustrating. More than half of the respondents reported not to have faced
challenges or frustrations in relation to supervision (see Table 27), which is comparable to the
results of 2013. Almost all 124 comments made in the category ‘Other’ (see table) concerned
combinations of the predefined categories.
Table 26. Aspects PhD students appreciate most in the supervision
Appreciated most in supervision PercentageFeedback, expertise or support given by my supervisor(s) 50.2
Approachability/availability of my supervisor(s) 17.5
Commitment/enthusiasm of my supervisor(s) 13.3
Freedom in my project 13.0
Personal characteristics of my supervisor(s) or our personal relationship 3.9
Other 1.6
Table 27. Causes of challenges or frustrations in the supervision
Challenges/frustrations in supervision PercentageNone 51.6
Frequency of supervision 9.8
Quality and/or content of supervision 8.0
Too many or disagreeing supervisor(s) 5.7
Lack of expertise of my supervisor(s) 4.9
Lack of interest or lack of commitment of supervisor(s) 4.7
Personal fit with supervisor(s) 4.2
Other 11.6
Figure 32 presents the division over the eight challenges/frustration categories (see Table 22)
for each Graduate School. PhD students who do not experience frustrations or challenges with
their supervision (in grey) mainly belong to the Graduate School of Science and the Graduate
School of Economics and Business. Problems due to ‘Quality and/or content of supervision’ are
most mentioned by PhD students from the Medical Sciences, Spatial Sciences and Humanities.
Problems due to ‘Frequency of supervision’ were mostly reported by PhD students from
Science, Law, Economics and Business, Theology and Religious Studies (TRS) and Behavioural
and Social Sciences.

PhD Survey 2015 / 63PhD Survey 2015 / 62
0% 20% 40% 60% 80% 100%
1st
2nd/3rd
4th+
1st
2nd/3rd
4th+
1st
2nd/3rd
4th+
1st
2nd/3rd
4th+
1st
2nd/3rd
4th+
1st
2nd/3rd
4th+
1st
2nd/3rd
4th+
1st
2nd/3rd
4th+
Are
pre
par
eed
in
ou
r m
eeti
ng
s
Giv
e m
e ad
equ
ate
feed
bac
k
Tak
e m
y co
ntr
ibu
tio
ns
seri
ou
sly
Su
pp
ort
ed
uca
tio
nal
ac
tivi
ties
Enco
ura
ge
con
fere
nce
sA
gre
e w
ith
ea
cho
ther
Mak
e m
e en
thu
sias
tic
Enco
ura
ge
pro
fess
ion
al
con
tact
s
Strongly disagree Disagree Agree Strongly agree
0% 20% 40% 60% 80% 100%
1st
2nd/3rd
4th+
1st
2nd/3rd
4th+
1st
2nd/3rd
4th+
1st
2nd/3rd
4th+
1st
2nd/3rd
4th+
1st
2nd/3rd
4th+
1st
2nd/3rd
4th+
1st
2nd/3rd
4th+
Are
pre
par
eed
in
ou
r m
eeti
ng
sin
ou
r m
eeti
ng
s
Giv
e m
e ad
equ
ate
feed
bac
k
Tak
e m
y co
ntr
ibu
tio
ns
seri
ou
sly
Su
pp
ort
ed
uca
tio
nal
ac
tivi
ties
Enco
ura
ge
con
fere
nce
sA
gre
e w
ith
ea
cho
ther
Mak
e m
e en
thu
sias
tic
Enco
ura
ge
pro
fess
ion
al
con
tact
s
Strongly disagree Disagree Agree Strongly agree
0% 20% 40% 60% 80% 100%
1st
2nd/3rd
4th+
1st
2nd/3rd
4th+
1st
2nd/3rd
4th+
1st
2nd/3rd
4th+
1st
2nd/3rd
4th+
1st
2nd/3rd
4th+
1st
2nd/3rd
4th+
1st
2nd/3rd
4th+
Are
pre
par
eed
in
ou
r m
eeti
ng
s
Giv
e m
e ad
equ
ate
feed
bac
k
Tak
e m
y co
ntr
ibu
tio
ns
seri
ou
sly
Su
pp
ort
ed
uca
tio
nal
ac
tivi
ties
Enco
ura
ge
con
fere
nce
sA
gre
e w
ith
ea
cho
ther
Mak
e m
e en
thu
sias
tic
Enco
ura
ge
pro
fess
ion
al
con
tact
s
Strongly disagree Disagree Agree Strongly agree
Figure 31. Signifi cant items of satisfaction with quality of supervision by phase
0%
20%
40%
60%
80%
100%
Medical Sciences
ScienceLawEconomics and Business
Theology and Religious Sciences
Spatial Sciences
Behavioural and Social Sciences
Humanities
My supervisors' lack of expertise My supervisors' lack of interest/lack of commitment
Too many or disagreeing supervisors Personal relationship with supervisors
Quality and/or content of supervision Frequency of supervision
Something else Nothing
Figure 32. Causes of challenges and frustrations related to supervision by Graduate School

PhD Survey 2015 / 65
6 Work environmentIn this chapter we focus on the work environment of the PhD students. We will discuss their
satisfaction with the expertise and support within the department, their satisfaction with their
contact with peers, work-related stressors and their overall satisfaction with their work.
6.1 Expertise and supportFive items contributed to a satisfaction score relating to the students’ experience of expertise
and support in the department. In the first two PhD surveys, this score consisted of six items,
but since 2013 the items about access to books and journals have been combined into one. The
items concerning expertise and support were:
• A sufficient number of experts are available in my working environment to help me deal
with problems related to my project.
• I have regular (formal or informal) contact with fellow PhD students about my PhD project.
• I am a member of a research group that meets at least once every two weeks.
• I have good access to the books and journals that are relevant to my research topic.
• I received good support during the collection of my data.
In general, PhD students were satisfied with the expertise and support available in their
departments: the average score was 3.2 and thereby significantly higher compared to 2013.
Figure 33 presents the change in satisfaction over time for the Graduate Schools that had
more than 15 respondents in each survey. All Graduate Schools scored somewhat higher than
in 2013, but the Graduate School of Economics and Business exhibits the largest increase. Just
as in 2013, PhD students from the Graduate Schools of Humanities were least satisfied with
the expertise and support available and PhD students from Science were again most satisfied.
Table 28 shows the agreement (summation of highly agree + agree) with the separate
propositions. PhD students were most satisfied with the access to books and journals. Less
than 70% agreed they were a member of a research group that meets at least once every two
weeks. Less than 75% were satisfied with the support available from experts and fellow PhD
students in general, and specifically during the collection of data.

PhD Survey 2015 / 67PhD Survey 2015 / 66
2,8
3
3,2
3,4
2009 2011 2013 2015
Humanities
Behavioural and Social Sciences
Economics and Business (SOM)
Science
Medical Sciences
All PhD students
2,8
3
3,2
3,4
2009 2011 2013 2015
Humanities
Behavioural and Social Sciences
Economics and Business (SOM)
Science
Medical Sciences
All PhD students
2,8
3
3,2
3,4
2009 2011 2013 2015
Humanities
Behavioural and Social Sciences
Economics and Business (SOM)
Science
Medical Sciences
All PhD students
Figure 33. Mean scale score on satisfaction with expertise and support provided by the
Graduate School in 2009, 2011, 2013 and 2015
Table 28. Expertise and support in the working environment
Expertise and support PercentageA suffi cient number of experts are available in my working environment to help
me deal with problems related to my project
73.0
I have regular (formal or informal) contact with fellow PhD students about my
PhD project
74.9
I am a member of a research group that meets at least once every two weeks 65.3
I have good access to the books and journals relevant to my research 95.0
I received good support during the collection of my data 73.9
Signifi cant differences are present for specifi c items for both Graduate School and phase.
Figure 34 presents the signifi cant differences between PhD students from different Graduate
Schools on four of the fi ve items of the Expertise satisfaction scale. PhD students from SOM,
BSS and the Humanities indicated they were not a member of a research group that meets
frequently. Moreover, 35% of the Humanities PhD students were not satisfi ed with the
availability of experts. Figure 35 reveals signifi cant differences between the phases of the
project. Just as in 2013, PhD students who are further advanced in their project are more
critical about the expertise and support available in their department.
0%
20%
40%
60%
80%
100%
1st 2nd/3rd 4th+ 1st 2nd/3rd 4th+ 1st 2nd/3rd 4th+ 1st 2nd/3rd 4th+
Sufficient experts available
Regular contact with fellow PhD's
Member of reseach group with frequent
meetings
Support data collection
Strongly disagree Disagree Agree Strongly agree
0%
20%
40%
60%
80%
100%
1st 2nd/3rd2nd/3rd 4th+ 1st 2nd/3rd2nd/3rd 4th+ 1st 2nd/3rd2nd/3rd 4th+ 1st 2nd/3rd2nd/3rd 4th+
Sufficient experts available
Regular contact with fellow PhD's
Member of reseach group with frequent
meetings
Support data collection
Strongly disagree Disagree Agree Strongly agree
0%
20%
40%
60%
80%
100%
1st 2nd/3rd 4th+ 1st 2nd/3rd 4th+ 1st 2nd/3rd 4th+ 1st 2nd/3rd 4th+
Sufficient experts available
Regular contact with fellow PhD's
Member of reseach group with frequent
meetings
Support data collection
Strongly disagree Disagree Agree Strongly agree
Figure 34. Signifi cant items of satisfaction with expertise and support by Graduate School

PhD Survey 2015 / 69PhD Survey 2015 / 68
0%
20%
40%
60%
80%
100%
Hu
m.
BS
S
Sp
at. S
ci.
TR
S
SO
M
Law
Sci
ence
Med
. Sci
.
Hu
m.
BS
S
Sp
at. S
ci.
TR
S
SO
M
Law
Sci
ence
Med
. Sci
.
Hu
m.
BS
S
Sp
at. S
ci.
TR
S
SO
M
Law
Sci
ence
Med
. Sci
.
Hu
m.
BS
S
Sp
at. S
ci.
TR
S
SO
M
Law
Sci
ence
Med
. Sci
.
Sufficient experts available Regular contact with fellow PhD's
Member of reseach group with frequent meetings
Support data collection
Strongly disagree Disagree Agree Strongly agree
Figure 35. Signifi cant items of satisfaction with expertise and support by phase
6.2 Contact with other PhD studentsIn the 2009 and 2011 surveys, PhD students were asked about several aspects of their work
conditions. In 2013 and 2015, the decision was made to adjust this satisfaction scale to focus
more on the contact PhD students have with other PhD students and staff members and how
satisfi ed they are with these contacts. The items of the scale were:
I am satisfi ed with …
• my contact with other PhD students in my department.
• my contact with other PhD students in my Graduate School.
• my contact with other PhD students at the University of Groningen.
• my contact with other PhD students in my fi eld (nationally).
• my contact with other PhD students in my fi eld (internationally).
• my contact with other staff members in the research group.
Similar to 2013, the average score on this scale was 2.9, indicating moderate satisfaction with
the contact PhD students have with other groups of PhD students. No differences were found
for phase or affi liation. Signifi cant differences between Graduate Schools are seen in Figure 36.
PhD students from the Medical Sciences are most dissatisfi ed with the international contacts
they have with others in their fi eld, while Economics and Business PhD students are most
satisfi ed with the contact they have with others in their department. However, together with
BSS, PhD students from Economics and Business are most dissatisfi ed with the contact they
have within the University.
Table 29 shows the satisfaction with the different items (summation of highly agree + agree).
PhD students are most satisfi ed with their contact with PhD students in their department and
other staff members in the research group. The satisfaction with contact at their Graduate
School, the University of Groningen or in their fi eld (national and international) is much lower.
Table 29. Contact with other PhD students in the working environment
I am satisfi ed with… Percentage..my contact with other PhD students in my department 85.3
..my contact with other PhD students at my Graduate School 62.5
..my contact with other PhD students at the University of Groningen 53.7
..my contact with other PhD students in my fi eld (nationally) 56.0
..my contact with other PhD students in my fi eld (internationally) 53.9
..my contact with other staff members at my research group 79.4
6.3 Work-related stressThis year, a new question was added to assess the work areas in which PhD students experience
stress. Almost 40% experienced stress due to publication pressure and deadlines, and about
one-quarter felt stress due to the complexity of the work and the overall workload. One-
fi fth reported stress due to contact with management and supervisors (see Table 30 for an
overview of all areas). In the category ‘Other’, uncertainty about career prospects, combining
PhD work with other work, not fi nishing on time, presenting scientifi c work and unclear rules
and administrative issues were mentioned. Almost 14% reported that they did not experience
stress.

PhD Survey 2015 / 71PhD Survey 2015 / 70
Table 30. Areas of work-related stress
Category PercentagePressure to publish 39.8
Deadlines 36.3
The complexity of the work 26.1
Workload 25.2
Contact with management/supervisors 19.5
Pace of work 17.9
Working outside offi ce hours 17.8
Interruptions at work 17.2
Equipment/facilities with which you work 14.0
Content of the work 8.4
Signifi cant personal incidents 7.8
Teaching activities 7.4
Contact with colleagues 7.0
Inappropriate behaviour 6.4
Signifi cant work-related incidents 5.3
Other extracurricular activities 3.9
Contact with students 2.2
I do not experience stress 13.6
Other 7.8
0% 20% 40% 60% 80% 100%
Hum.BSS
Spat. Sci.TRS
SOMLaw
ScienceMed. Sci.
Hum.BSS
Spat. Sci.TRS
SOMLaw
ScienceMed. Sci.
Hum.BSS
Spat. Sci.TRS
SOMLaw
ScienceMed. Sci.
Hum.BSS
Spat. Sci.TRS
SOMLaw
ScienceMed. Sci.
Hum.BSS
Spat. Sci.TRS
SOMLaw
ScienceMed. Sci.
Hum.BSS
Spat. Sci.TRS
SOMLaw
ScienceMed. Sci.
in m
y d
epar
tmen
tin
my
Gra
du
ate
Sch
oo
lat
RU
Gin
my
fiel
d (n
atio
nal
ly)
in m
y fi
eld
(i
nte
rnat
ion
ally
)in
my
rese
arch
gro
up
Strongly disagree Disagree Agree Strongly agree
Med. Sci.Hum.
BSSSpat. Sci.
TRSSOM
LawScience
Med. Sci.Hum.
BSSSpat. Sci.
TRSSOM
LawScience
Med. Sci.Hum.
BSSSpat. Sci.
TRSSOM
LawScience
Med. Sci.Hum.
BSSSpat. Sci.
TRSSOM
LawScience
Med. Sci.Hum.
BSSSpat. Sci.
TRSSOM
LawScience
Med. Sci.
in m
y d
epar
tmen
tin
my
Gra
du
ate
Sch
oo
lat
RU
Gin
my
fiel
d (n
atio
nal
ly)
in m
y fi
eld
(i
nte
rnat
ion
ally
)in
my
rese
arch
gro
up
Strongly disagree Disagree Agree Strongly agree
0% 20% 40% 60% 80% 100%
Hum.BSS
Spat. Sci.TRS
SOMLaw
ScienceMed. Sci.
Hum.BSS
Spat. Sci.TRS
SOMLaw
ScienceMed. Sci.
Hum.BSS
Spat. Sci.TRS
SOMLaw
ScienceMed. Sci.
Hum.BSS
Spat. Sci.TRS
SOMLaw
ScienceMed. Sci.
Hum.BSS
Spat. Sci.TRS
SOMLaw
ScienceMed. Sci.
Hum.BSS
Spat. Sci.TRS
SOMLaw
ScienceMed. Sci.
in m
y d
epar
tmen
tin
my
Gra
du
ate
Sch
oo
lat
RU
Gin
my
fiel
d (n
atio
nal
ly)
in m
y fi
eld
(i
nte
rnat
ion
ally
)in
my
rese
arch
gro
up
Strongly disagree Disagree Agree Strongly agree
Figure 36. Satisfaction with contact with others by Graduate School

PhD Survey 2015 / 73PhD Survey 2015 / 72
6.4 Overall work satisfactionThe fi nal satisfaction scale in this chapter deals with the PhD students’ overall satisfaction with
their work. The three items for this scale were:
• Overall, I am satisfi ed with the content of my work.
• Overall, I am satisfi ed with my working environment.
• Overall, I am satisfi ed with my social relationships at work.
The average score was 3.3, which is rather good. Overall, 92.2% of PhD students were satisfi ed
with the content of their work, 87.8% were satisfi ed with the working environment and with
social relationships at work. Graduate Schools do not differ signifi cantly on overall work
satisfaction (see Figure 37), nor do PhD students with different types of affi liations. However,
PhD students in their fi rst year were signifi cantly more positive on all three items compared to
PhD students in later years (see Figure 38).
2,8
3
3,2
3,4
3,6
2009 2011 2013 2015
Humanities
Behavioural and Social Sciences
Economics and Business (SOM)
Science
Medical Sciences
All PhD students2,8
3
3,2
3,4
3,6
2009 2011 2013 2015
Humanities
Behavioural and Social Sciences
Economics and Business (SOM)
Science
Medical Sciences
All PhD students
2,8
3
3,2
3,4
3,6
2009 2011 2013 2015
Humanities
Behavioural and Social Sciences
Economics and Business (SOM)
Science
Medical Sciences
All PhD students
Figure 37. Mean score on satisfaction with work by Graduate School in 2009, 2011, 2013 and
2015
0%
20%
40%
60%
80%
100%
1st 2nd/3rd 4th+ 1st 2nd/3rd 4th+ 1st 2nd/3rd 4th+
Content Environment Social Relationships
Strongly disagree Disagree Agree Strongly agree
0%
20%
40%
60%
80%
100%
1st 2nd/3rd 4th+ 1st 2nd/3rd 4th+ 1st 2nd/3rd 4th+
Content Environment Social Relationships
Strongly disagree Disagree Agree Strongly agree
0%
20%
40%
60%
80%
100%
1st 2nd/3rd 4th+ 1st 2nd/3rd 4th+ 1st 2nd/3rd 4th+
Content Environment Social Relationships
Strongly disagree Disagree Agree Strongly agree
Figure 38. Mean score on satisfaction with work by phase

PhD Survey 2015 / 75
7 Career developmentThis chapter discusses the future prospects of PhD students. We focus fi rst on their current
orientation towards a future career and then on the desired job after graduation and the
feasibility of obtaining such a job.
7.1 Career orientationWhen we asked PhD students whether they were exploring future career options, 61.2%
said they were. It is not surprising that a greater number of PhD students in their fi nal year
are exploring future career options (61.8%) than those in their second or third years (8.2%).
Nevertheless, approximately 30% of the PhD students who had been working for one year
or less on their PhD research were already thinking about their career after graduation. PhD
student explorations differ between Graduate Schools (see Figure 39). PhD students from Law
and Humanities most often mentioned that they were exploring career options. Furthermore,
PhD students with a scholarship explore career options signifi cantly less often (54.2%) than
PhD students with an employment status (65.0%) and those with another type of affi liation
(58.9%).
0%
20%
40%
60%
80%
100%
Hum. BSS Spat.Sc TRS SOM Law Science Med.Sc
Yes No
0%
20%
40%
60%
80%
100%
Hum. BSS Spat.Sc TRS SOM Law Science Med.Sc
Yes No
0%
20%
40%
60%
80%
100%
Hum. BSS Spat.Sc TRS SOM Law Science Med.Sc
Yes No
Figure 39. Exploration of future career options by Graduate School
PhD students who were not yet exploring future career options were asked when they thought
they would do so. The results are presented in Figure 40.

PhD Survey 2015 / 77PhD Survey 2015 / 76
Yes61%
2%11%
43%
44%
No39%
Yes In the first year of my PhD project
In the second year of my PhD project In the third year of my PhD project
In the final year of my PhD project
Yes61%
2%11%
43%
44%
No39%
Yes In the first year of my PhD project
In the second year of my PhD project In the third year of my PhD project
In the final year of my PhD project
Yes61%
2%11%
43%
44%
No39%
Yes In the first year of my PhD project
In the second year of my PhD project In the third year of my PhD project
In the final year of my PhD project
Figure 40. Percentage of all respondents who explored a future career, or indication of when
they planned to start exploring future career
7.2 Career trainingOnly 30% of the respondents were familiar with the career training opportunities of the
University’s HR Experts department. In the 2015 survey, a new question was added to assess
the familiarity with NEXT Career Services of the University of Groningen and less than 20%
(18.0%) had heard of NEXT Career Services. Familiarity with career training activities organized
by HR and NEXT differs between the Graduate Schools (see Figure 41). Both HR and NEXT were
best known among PhD students from Humanities, Economics and Business and Behavioural
and Social Sciences.
0%
10%
20%
30%
40%
50%
60%
HR career services NEXT career services
Humanities
Behavioural and Social Sciences
Spatial Sciences
Theology and Religious Sciences
Economics and Business
Law
Science
Medical Sciences
All PhD students0%
10%
20%
30%
40%
50%
60%
HR career services NEXT career services
Humanities
Behavioural and Social Sciences
Spatial Sciences
Theology and Religious Sciences
Economics and Business
Law
Science
Medical Sciences
All PhD students
0%
10%
20%
30%
40%
50%
60%
HR career services NEXT career services
Humanities
Behavioural and Social Sciences
Spatial Sciences
Theology and Religious Sciences
Economics and Business
Law
Science
Medical Sciences
All PhD students
Figure 41. Familiarity with University of Groningen career services by Graduate School
PhD students with an employee status were more familiar with the career training
opportunities organized by HR and NEXT than PhD students with a scholarship status or
another type of affi liation (see Figure 42). Familiarity also differs according to phase. PhD
students in the fi nal stages of their project were more familiar with the activities organized
by HRM (see Figure 43); however, activities organized by NEXT were better known among PhD
students who had just started.

PhD Survey 2015 / 79PhD Survey 2015 / 78
0
5
10
15
20
25
30
35
40
45
HR career services NEXT career services
Employee
Scholarship
Other
0
5
10
15
20
25
30
35
40
45
HR career services NEXT career services
Employee
Scholarship
Other
0
5
10
15
20
25
30
35
40
45
HR career services NEXT career services
Employee
Scholarship
Other
Figure 42. Familiarity with career training activities organized by HRM and NEXT by affi liation
0
5
10
15
20
25
30
35
40
45
HR career services NEXT career services
1st
2nd/3rd
4th/+
0
5
10
15
20
25
30
35
40
45
HR career services NEXT career services
1st
2nd/3rd
4th/+
0
5
10
15
20
25
30
35
40
45
HR career services NEXT career services
1st
2nd/3rd
4th/+
Figure 43. Familiarity with career training activities organized by HRM and NEXT by phase
7.3 Career development activitiesA total of 158 respondents reported having attended a career development activity and,
similar to 2013, about one-quarter of this group consists of PhD students in the last stage of
their project. In addition to this difference according to phase there is a difference according
to affi liation: PhD students with an employment status (18.3%) signifi cantly attended more
activities than PhD students with a scholarship (8.5%) or other type of affi liation (6.6%). Almost
all PhD students who attended an activity mentioned the name of the activity. A summary of
these categories can be found in Table 31.
Table 31. Career activities attended
Career activities PercentageUniversity PhD Day 23.1
University HRM career course for PhD students and postdocs 15.7
Workshop (external) 13.4
Graduate School events 9.7
Career days (external) 9.0
Career course (external) 6.7
Course Future Science or Business 6.0
My career at a university of applied sciences 3.7
Beta Bedrijven dagen 3.0
NEXT workshop 3.0
Other University HRM course 1.5
FOM career training 1.5
Personal trainer/coach 1.5

PhD Survey 2015 / 81PhD Survey 2015 / 80
7.4 Future careerPhD students were asked about the kind of work they would prefer once they graduated and
what kind of work they expect they would do. Table 32 shows that all of the predefined options
are more aspired to than expected. This means that many PhD students are not very confident
about finding their preferred job. It also indicates that respondents do not think they would
have to accept a job that they do not prefer. As in the previous PhD survey, in general, most
positions aspired to are research and/or academic positions and the most preferred position is
a postdoctoral position
Table 32. Preferred and expected future work
Future work Preferred ExpectedPostdoctoral position in the Netherlands 39.7 25.4
Postdoctoral position abroad 37.3 29.8
Assistant professorship 24.6 9.2
Research position at a government institute
(e.g. at the CBS, CPB, etc.)
24.5 13.1
Commercial research position 24.1 16.7
Other position at a university 22.1 15.8
Teaching/lecturing position at an institute for
higher vocational education (HBO)
17.4 14.6
Consultancy 14.4 10.6
Policy advisor for the government 12.7 5.9
Management position 12.1 6.6
Setting up my own business 12.1 7.4
Other 17.5 17.3
We subsequently presented the respondents with a number of items concerning their future
prospects. Similar to 2013, 71.8% of the respondents believed that finding their preferred job
was an attainable goal, 3.8% were less confident and 24.4% did not have an opinion about the
feasibility of finding their preferred job. About one-third (32.1%) wanted to write a research
proposal for a position after their PhD (which is more than in 2013) compared to 22.9% who
did not and 44.9% that were not sure. The majority of the respondents were determined
to finish their dissertation before finding a full-time job (78.2%). This determination differs
according to phase: PhD students at the start and middle of their projects were more certain
(about 80%), compared to 67.7% in their final stage.
Comparable to 2013, the majority believed that his/her prospects after obtaining a PhD were
sufficient and that the doctoral title and the content of their project would be useful in their
future career (see Table 33). Worth noting is the finding that 60% of the PhD students believe
the University supports them with their future career planning, while only 30% said they were
aware of the activities organized by the University. Finally, two-thirds of the PhD students
reported that job opportunities at the University were not sufficient.
Significant differences on the agreement with these items were found for phase (see Figure 44)
and Graduate School (see Figure 45). PhD students who are further into their project were the
least confident that the title and content of their PhD would help them find a job. On the other
hand, senior PhD students agreed more often with the statement that the University supports
their future career planning and that there were sufficient job opportunities at the University.
Table 33. Items about future prospects
Future prospects PercentageOverall, I think my prospects after finishing my PhD are sufficient 82.5
Obtaining my PhD degree will help me find a job 86.4
The content of my PhD project is useful for my future career 85.5
The University supports me in my future career planning 55.9
There are sufficient job opportunities at this university after
completion of my PhD
31.6

PhD Survey 2015 / 83PhD Survey 2015 / 82
0%
20%
40%
60%
80%
100%
1st
2n
d/3
rd
4th
+
1st
2n
d/3
rd
4th
+
1st
2n
d/3
rd
4th
+
1st
2n
d/3
rd
4th
+
Obtaining my PhD degree will help me find a job.
The content of my PhD project is useful for my
future career.
The University supports me in my future career
planning.
There are sufficient job opportunities at
this University
Strongly disagree Disagree Agree Strongly agree
0%
20%
40%
60%
80%
100%
1st
2n
d/3
rd
4th
+
1st
2n
d/3
rd
4th
+
1st
2n
d/3
rd
4th
+
1st
2n
d/3
rd
4th
+
Obtaining my PhD degree will help me find a job.
The content of my PhD project is useful for my
future career.
The University supports me in my future career
planning.
There are sufficient job opportunities at job opportunities at
this University
Strongly disagree Disagree Agree Strongly agree
0%
20%
40%
60%
80%
100%
1st
2n
d/3
rd
4th
+
1st
2n
d/3
rd
4th
+
1st
2n
d/3
rd
4th
+
1st
2n
d/3
rd
4th
+
Obtaining my PhD degree will help me find a job.
The content of my PhD project is useful for my
future career.
The University supports me in my future career
planning.
There are sufficient job opportunities at
this University
Strongly disagree Disagree Agree Strongly agree
Figure 44. Signifi cant items of satisfaction with future prospect by phase
0% 20% 40% 60% 80% 100%
Hum.
BSS
Spat.Sc
TRS
SOM
Law
Science
Med. Science
Hum.
BSS
Spat.Sc
TRS
SOM
Law
Science
Med. Science
Hum.
BSS
Spat.Sc
TRS
SOM
Law
Science
Med. Science
Ob
tain
ing
my
Ph
D d
egre
e w
ill h
elp
me
fin
d a
job
.T
he
Un
iver
sity
su
pp
orts
me
in m
y fu
ture
car
eer
pla
nn
ing
.
Th
ere
are
suff
icie
nt
job
op
port
unit
ies
at t
his
Un
iver
sity
aft
er t
he
com
ple
tio
n o
f my
Ph
D.
Strongly disagree Disagree Agree Strongly agree
0% 20% 40% 60% 80% 100%
Hum.
BSS
Spat.Sc
TRS
SOM
Law
Science
Med. Science
Hum.
BSS
Spat.Sc
TRS
SOM
Law
Science
Med. Science
Hum.
BSS
Spat.Sc
TRS
SOM
Law
Science
Med. Science
Ob
tain
ing
my
Ph
D d
egre
e w
ill h
elp
me
Ob
tain
ing
my
Ph
D d
egre
e w
ill h
elp
me
fin
d a
job
.T
he
Un
iver
sity
su
pp
orts
me
in m
y fu
ture
car
eer
pla
nn
ing
.
Th
ere
are
suff
icie
nt
job
op
port
unit
ies
at t
his
Un
iver
sity
aft
er t
he
com
ple
tio
n at
th
is U
niv
ersi
ty a
fter
th
e co
mp
leti
on
of m
y P
hD
.
Strongly disagree Disagree Agree Strongly agree
0% 20% 40% 60% 80% 100%
Hum.
BSS
Spat.Sc
TRS
SOM
Law
Science
Med. Science
Hum.
BSS
Spat.Sc
TRS
SOM
Law
Science
Med. Science
Hum.
BSS
Spat.Sc
TRS
SOM
Law
Science
Med. Science
Ob
tain
ing
my
Ph
D d
egre
e w
ill h
elp
me
fin
d a
job
.T
he
Un
iver
sity
su
pp
orts
me
in m
y fu
ture
car
eer
pla
nn
ing
.
Th
ere
are
suff
icie
nt
job
op
port
unit
ies
at t
his
Un
iver
sity
aft
er t
he
com
ple
tio
n o
f my
Ph
D.
Strongly disagree Disagree Agree Strongly agree
Figure 45. Signifi cant items of satisfaction with future prospects by Graduate School

PhD Survey 2015 / 85
8 PhD organizationsThis chapter focuses on the familiarity with and activities of PhD organizations at the Graduate
Schools and the two local PhD organizations GOPHER (Groningen Organization for PhD
Education and Recreation) and GRIN (Groningen Graduate Interest Network).
Familiarity with the Graduate Schools’ PhD Council has slightly increased to 55%, compared
to 2013 (49%). Familiarity with GOPHER is greater than familiarity with GRIN. There are
differences between Graduate Schools (see Table 34). Moreover, employed PhD students are
more familiar with GOPHER than scholarship students and PhD students with another type of
affiliation. Finally, the more advanced the PhD students are in their project, the more familiar
they are with the Graduate Schools’ PhD organization.
Table 34. Familiarity with PhD organizations
Graduate School PhD Council Gopher GRIN Humanities 79.8 76.0 47.1
Behavioural and Social Sciences 39.0 50.0 20.2
Spatial Sciences 89.0 70.3 21.6
Theology and Religious Studies 56.3 56.3 18.8
Economics and Business 48.2 75.0 42.9
Law 94.4 66.7 36.1
Science 49.0 61.9 27.3
Medical Sciences 53.4 55.5 26.4
Total 54.9 60.6 28.8
The number of respondents who were satisfied with the number of activities and services
offered by the PhD organizations has increased from 73% in 2013 to 86% in 2015. There
is a significant difference between PhD students with a Dutch and a non-Dutch nationality
(9.3% versus 20.0% dissatisfied). About 10% of the PhD students who were not satisfied gave
reasons for their answer. Similar to 2013, PhD students indicated that they especially would
like more information about practical issues concerning their PhD and living in Groningen.
Social activities (cultural and sport) and general courses (academic writing, writing funding
applications) were also mentioned quite frequently.

PhD Survey 2015 / 87
9 Conclusions and recommendationsThe overall picture presented by the 2015 PhD survey is positive. Significant improvements in
satisfaction with the Graduate Schools and the expertise available in the working environment
were found. Based on the 2011 PhD survey, the Dean of Graduate Schools and the individual
Graduate Schools themselves have decided to focus on five themes in the upcoming years.
They are:
1. to decrease the time that PhD students need to finish their PhD
2. to improve information provision
3. to improve familiarity with the Graduate Schools and enlarge their role in the PhD
projects
4. to have all PhD students using a Training and Supervision Plan
5. to broaden career-orientation opportunities
The current status of these issues, and some other important findings from the 2015 survey,
will be addressed in the following sections.
9.1 Time span of the PhD projectCompared to 2013, a smaller percentage of PhD students indicated that they could finish their
project within time (41% in 2015 compared to 45% in 2013). The average additional time
expected to be needed has increased from 7.6 to 8.6 months. The main reasons for expecting
not to finish by the official end date were ‘a too ambitious research plan’ and ‘delay in the
research’.
Timely completion is influenced by many factors. One of these is the belief in one’s own ability
to finish within the allotted time. The self-fulfilling prophecy of being unable to finish in four
years must be avoided as much as possible. PhD students from Economics and Business as
well as the Humanities are significantly more confident in their ability to finish on time. In the
future, we intend to explore whether these PhD students indeed finish their theses in a shorter
time period than others.
In addition, more PhD students considered quitting in 2015 compared to 2013; especially in
the final stages of the project. The most often mentioned reasons were: ‘uncertainty about own
capabilities and the PhD work’,’ ‘supervision problems’, ‘executing the project’ or ‘discontent
with the working environment’. The 2011 survey recommended further investigation of the
reasons why PhD students dropped out but no further information has been gathered, so the
reasons for drop-out remain unclear.

PhD Survey 2015 / 89PhD Survey 2015 / 88
The average completion rate for a PhD is 61 months. Data from the current and past three PhD
student surveys provide an opportunity to examine factors involved in timely completion, delay
and drop-out. Knowing what factors play a role in delay and drop-out may result in intervention
strategies that have a twofold goal: to increase PhD satisfaction and to shorten completion
time. Preliminary analyses suggest that self-confidence, acquired research skills, teaching
duties, organization of the project, quality of supervision and satisfaction with the working
environment play a role.
Recommendations:
• HR advisors/Graduate Schools should organize exit interviews with all PhD students who
discontinue their PhD and collect and store this information centrally (e.g. in Hora Finita).
• Stimulate in-depth analysis concerning completion time, delay and drop-out of PhD
students in order to develop effective intervention strategies.
9.2 Information provision and language difficultiesInformation provision was another point of attention in the previous PhD surveys. The
percentage of PhD students who felt well informed about regulations and conditions of
employment or the scholarship has increased from 65% to 70%. Just as in previous years, the
information package that is handed out at the Graduate School introduction was not often
used as a source of information. In the present survey, it remains unclear whether PhD students
received such a package or not, or whether they simply did not use it. Although improvements
have been made, PhD students still mention that links on the University of Groningen websites
do not work properly. Especially non-Dutch PhD students report having experienced problems
due to poor information provision about finances, taxation and the vagueness of rights and
policies.
Although the satisfaction about information provision is not significantly different between
Dutch and non-Dutch PhD students, the latter do experience more difficulties due to language
problems. Non-Dutch PhD students report missing out on important information from the
University or the Dutch government when it is only provided in Dutch, and that they feel left
out when Dutch is the only language spoken on the work floor. Moreover, when asked about
satisfaction with activities offered by the Graduate Schools and local PhD organizations, some
non-Dutch PhD students mentioned that they would like to receive more information about
practical issues related to doing a PhD and living in Groningen/the Netherlands.
Recommendations:
• Ensure that every PhD student receives an information package at the start of their PhD
that contains clear and relevant information.
• Make sure that the information provided (on paper and online) is clear and non-
contradictory and keep the information up-to-date.
• Make sure relevant information is available in English for non-Dutch PhD students.
9.3 Training and Supervision PlanAfter the 2011 PhD survey, the Graduate Schools were tasked with ensuring that all of their
PhD students started their PhD with a Training and Supervision Plan. The Graduate Schools
endorsed the importance and usefulness of this document and were therefore motivated to
implement it. Although the proportion of PhD students with a TSP has increased from 57% to
almost 70% in 2015, the goal has not yet been reached. Almost 40% of PhD students did not
know when their TSP was formalized, while two-thirds of those who did, said it was within three
months after the start. Almost three-quarters of the PhD students with an employment or
scholarship affiliation have a TSP. PhD students from the Graduate School of Medical Sciences
are least likely to have a TSP. Around 60% of the PhD students thought that the TSP is a good
guideline that can help them plan their project.
TSPs are becoming increasingly detailed. Time planning and management are important
and influential factors in reducing the time PhD students require to finish their PhD. However,
regular updating of the TSP is still not standard: only one-third of the PhD students in their
second or third years have updated their TSP to date. In addition, teaching activities can delay
PhD completion time, so agreements about teaching should be formalized in a TSP. Only 30%
of the TSPs of employed PhD students contain such agreements. In addition, agreements about
quantity and quality requirements for the thesis are often also not present in the TSPs (33%
and 13%, respectively). In fact, PhD students have become less aware of quantity and quality
requirements, with PhD students in the first phase of their project being the least informed.
Satisfaction with the TSP has not change much compared to 2013, except for PhD students
from the Graduate School of Behavioural and Social Sciences, who are a little more satisfied,
while PhD students from Medical Sciences have become less satisfied. When PhD students are
further into their project they are also less satisfied with their TSP.

PhD Survey 2015 / 91PhD Survey 2015 / 90
Recommendations:
• Ensure that all PhD students have a TSP containing all the required elements to assist
them to plan and manage their project.
• More attention should be given to the formalization of thesis quantity and quality
requirements in the TSP.
• The Graduate Schools should assume a monitoring role in the annual update of TSPs.
9.4 Result and Development interview and first-year performance evaluationAlmost 70% of the respondents in their second or subsequent year reported that their
performance had been evaluated in a Results and Development (R&D) interview, which is
comparable to the prevalence in 2013. The performance of PhD students should be evaluated
after the first year in a go/no-go interview and almost 70% of the PhD students in their
second or subsequent year report that they had this interview. The go/no-go interview is
least common at the Graduate School of Medical Sciences. Also, the main supervisor was not
present at 10% of these interviews. In addition, attendance of a Graduate School delegate or
an HR representative is low (less than 16%). The presence of an HR representative is important
particularly in the case of a no-go decision to inform the PhD student about work-related
consequences of the no-go. A Graduate School representative is important to support the
supervisor in the process of formalizing the agreements, provide aftercare in the case of a no-
go and update information in Hora Finita.
Recommendation:
• Stimulate the attendance of both an HR and a Graduate School representative at the R&D
and go/no-go interviews.
9.5 Training for PhD students with teaching dutiesThree-quarters of the employed respondents are engaged in teaching activities, usually
performing supervisory duties or giving small-scale lectures, at a time cost on average of 14
hours per month. About 72% of the PhD students are satisfied with the amount of teaching;
the others would either like to teach less (14%) or more. The majority think that teaching
and supervisory activities contribute to their PhD project, which is an increase of about 20%
compared to 2013.
About one-third of the PhD students report not being very confident about their teaching
abilities. Two-thirds of PhD students with teaching duties report not having sufficient training.
Less than half of the PhD students with teaching duties have attended the obligatory course,
‘Training for Teaching Assistants’, organized by the University of Groningen.
Preliminary analyses show that PhD students involved in teaching activities are more likely to
be delayed compared to those without these duties. Of course, there are other factors that play
a role in PhD completion time, but learning how to prepare and perform teaching duties in an
effective way might pay-off for both the PhD student and the University.
Recommendations:
• PhD students should only be allowed to teach after completing the obligatory course
‘Training for Teaching Assistants’. The Graduate School could have a monitoring role in
this.
• If applicable, agreements about teaching activities should be formalized in the TSP.
9.6 Familiarity with Hora FinitaIn 2015, familiarity with the Hora Finita registration system was assessed. Almost three-
quarters of the respondents said they were familiar with the system and know that they can
enter details about training activities and access information about their thesis defence. A
slightly smaller number of PhD students knew they could access a summary of their Results &
Development interview. This might be explained partly by the finding that not all PhD students
have had such an interview.
Recommendation:
• The Graduate Schools should support both PhD students and supervisors in adding the
relevant information in a correct way into the Hora Finita registration system.
9.7 SupervisionSupervision is an essential part of a successful PhD project. The majority of the PhD students
have an appointment with their primary supervisor at least once a month and almost 70%
meet with their daily supervisor(s) at least once a week. In general, PhD students are satisfied
with the organization and quality of their supervision. PhD students are least satisfied with the
number of appointments with their daily supervisors and with their supervisor’s support with
educational activities and network expansion. Similar to 2013, the further into the project, the
more critical PhD students are about the quality of the supervision they received. There are no
significant differences between different affiliations or Graduate Schools.

PhD Survey 2015 / 93PhD Survey 2015 / 92
Feedback, expertise and support offered by the supervisors are, just as in previous years, the
most appreciated aspects. More than half of the respondents have not encountered challenges
or frustrations regarding their supervision. PhD students from Science and Economics and
Business and Science, in particular, report the absence of problems related to supervision. PhD
students who had experienced challenges or frustrations most often indicate the frequency
of supervision as the cause, which is apparently due to the relative low frequency of meetings
with their daily supervisor. After supervision frequency, problems related to the quality of
supervision are most often mentioned. Several studies have indicated the important role of the
supervisor as coach (e.g. Berger & de Jonge, 2005; Wadee et al., 2010) and some supervisors
would benefit from a course on effective PhD coaching.
Recommendations:
• Inform PhD students where they can anonymously report problems with supervisors,
colleagues or management (e.g. Graduate School, confidential advisor).
• Inform supervisors about the courses ‘Coaching PhD students’ or ‘Working with
international students’, organized by the University of Groningen.
• Performance of supervision tasks should be discussed at all supervisor’s R&D interviews.
9.8 Familiarity and satisfaction with the Graduate SchoolsAlthough the number of PhD students who do not know about their Graduate School has
dropped to 1.3%, familiarity with the role of the Graduate Schools has decreased from 75% to
67%. There are no differences according to Graduate School or phase of the PhD project, but
PhD students who attended the introductory module are more likely to be familiar with the role
of their Graduate School. Although familiarity has decreased, the overall satisfaction with the
Graduate Schools has increased significantly. However, about one-quarter of the PhD students
are not satisfied with the way the Graduate School monitors their progress. Similar to 2013,
PhD students from Economics and Business value their Graduate School most, while PhD
students from the Behavioural and Social Sciences are again most critical. More advanced PhD
students are also more critical and PhD students with a scholarship are most positive.
Recommendations:
• The Graduate Schools’ role and responsibilities should be made more explicit in the PhD
Guide and at the University Graduate School website.
• Information about the role of the Graduate Schools needs to reach all PhD students.
• Stimulate participation in the Graduate School introductory module.
• The Graduate School should inform senior PhD students more directly, for example by
email or telephone.
• The Graduate Schools should be more active in monitoring the progress of the PhD
project.
9.9 Career orientationAt the time of data collection, 61% of the respondents said they were exploring options for
their future career, which is a large increase compared to 2013 (45%). An interesting finding is
that, although 60% of the PhD students believed the University supports them with their future
career planning, familiarity with the University’s training opportunities is very low. Only 30%
of the respondents were familiar with the activities organized by the HR Experts department
and only 18% with those organized by NEXT career services. Activities are best known among
PhD students from Humanities, Economics and Business, and the Behavioural and Social
Sciences. Interestingly, PhD students in the final stages of their project are more familiar with
the activities organized by HR, while activities organized by NEXT are better known among PhD
students who have just started. Moreover, only 25% of the senior PhD students had attended
a career development activity (inside or outside the University of Groningen). Since job
opportunities at the University are not sufficient for all PhD students who would like to work
here, PhD students should start looking for alternative opportunities at the appropriate time.
Recommendations:
• Actively inform PhD students, especially those in their third and fourth years, about the
activities organized by HR and NEXT career development.
• Actively inform PhD students about the importance of a timely start to exploring future
career opportunities.
• Organize more activities in which PhD students can explore future career opportunities,
within and outside academia.
9.10 Working environmentSatisfaction with the expertise and support available in the PhD students’ departments has
significantly increased compared to 2015, but improvements are still needed. PhD students are
most satisfied with the access to books and journals. However, less than 70% reported being
a member of a research group that meets at least once every two weeks, and less than 75%
were satisfied with the support available from experts and fellow PhD students in general, and
specifically during the collection of data.

PhD Survey 2015 / 95PhD Survey 2015 / 94
Regarding contacts, PhD students are most satisfied with their contacts with other PhD
students in their department and with other staff members in the research group. The
satisfaction with contacts at their Graduate School, the University of Groningen or in their field
(national and international) is much lower.
Overall satisfaction with the work environment has slightly increased, although not
significantly. First-year PhD students in particular are more satisfied with the overall work
conditions compared to PhD students in their second or later years.
For the first time, the presence of work-related stress was assessed in the PhD student survey
and the majority of the PhD students report to have experienced, or to currently experience,
stress. One-third reported stress related to the pressure to publish and deadlines, and about
one-quarter reported stress due to the complexity of the work and/or the overall workload.
Finally, one-fifth of the PhD students experienced stress due to contact with management and
supervisors.
Recommendations:
• Supervisors should support their PhD students with expanding their national and
international network.
• Ask confidential advisors about the prevalence of work-related stress to assess the scale
of the problem from a different perspective.
10 Research accountabilityThis chapter examines the survey instrument, the reliability of the scales, the response group,
and ends with an explanation of the analyses.
10.1 InstrumentThe first PhD Student Survey was administered by the UOCG in 2009. The goal was to obtain
information about the circumstances in which PhD students conduct their research and the
degree of satisfaction with these circumstances. The PhD Thesis Supervision Questionnaire
used at the University of Manchester was taken as an exemplar. A few items were added to the
2011 survey relating to the PhD students’ motivation, skills and competences, as well as items
relating to abilities and skills that correspond to the position of researcher, as defined by the
University of Groningen. In 2013, several items about the cum laude distinction were added
and questions about research schools were removed. In 2015, new questions were added,
concerning familiarity with the Hora Finita registration system and NEXT Career Services and
questions about the experience of work-related stress. Changes have been made to two scales
with some items removed and/or added (see Chapter 5 about Supervision).
Reliability of the satisfaction scales
Several items were combined into satisfaction scale categories that measure one underlying
concept. The degree to which several items measure the same concept is represented in the
reliability of the scale, indicated by Cronbach’s alpha, which varies between 0 and 1. Reliability
between .60 and .90 can be regarded as reasonable to high. Table 35 shows the reliability
of items in the scales used in 2009, 2011, 2013 and 2015. The reliability of the two altered
scales improved from .86 to .88 (organization of supervision) and from .85 to .88 (quality of
supervision). Because most items and scales remained the same, the results of the 2015 PhD
Survey can be compared with the previous three surveys.

PhD Survey 2015 / 97PhD Survey 2015 / 96
Table 35. Reliability of original and adapted scales
Scale 2009 2011 2013 2015Satisfaction with educational activities .81 .88 .87 .85
Satisfaction with training and supervision plan .79 .88 .86 .86
Satisfaction with the Graduate School * .92 .90 .87
Organization of supervision** .83 .87 .88 .88
Quality of supervision*** .84 .89 .87 .87
Satisfaction with expertise .65 .73 .73 .75
Satisfaction with contacts .78 .83 .81 .86
General work satisfaction .68 .76 .82 .79
Notes: * Not measured in that specifi c year, **One new item was added in 2015, ***One item
was removed and three new items were added in 2015.
10.2 ResponseActive PhD students were traced in Hora Finita, with a total of 3,633 being sent a digital
invitation to participate in this survey. The email contained a link to the questionnaire. Three
reminders were sent to those who had not yet completed the questionnaire. Of the total, 472
could not be reached at the email address given, two indicated they were not PhD students
anymore, four respondents indicated that they were external PhD students and that the
questions were not applicable to their situation, and 316 started the survey but completed
less than two-thirds of the obligatory questions. A total of 1,161 PhD students completed the
questionnaire, which translates into a response rate of 35%, which is a little lower than in 2013
(39%).
Figure 46 shows the response rate per Graduate School and for the University (in purple). PhD
students from the Graduate Schools of Humanities, Spatial Sciences, Economics and Business
(SOM) and Science (all in green) make up a relatively larger proportion of the response sample
than PhD students from the other Graduate Schools (in red).
0%
5%
10%
15%
20%
25%
30%
35%
40%
45%
50%
Hum. Philos. BSS Spat.Sc. TRS SOM Law Science Med.Sci. RUG average
0%
5%
10%
15%
20%
25%
30%
35%
40%
45%
50%
Hum. Philos. BSS Spat.Sc. TRS SOM Law Science Med.Sci. RUG average
0%
5%
10%
15%
20%
25%
30%
35%
40%
45%
50%
Hum. Philos. BSS Spat.Sc. TRS SOM Law Science Med.Sci. RUG average
Figure 46. Response rate per Graduate School and deviation from the University response rate
Note: red: lower response than University average, green: similar or higher response than
University average.
A relatively large number of PhD students born outside the Netherlands fi lled in the
questionnaire (see Figure 47), while the distribution of males and females was roughly the
same as in the total population. In addition to this, a relatively large share of fi rst-year PhD
students and a relatively low share of senior PhD students participated in this year’s survey (see
Figure 48). However, the latter has no consequences for the year-to-year comparison because
the response rate per phase is comparable between 2015 and the previous years (see Table 36).

PhD Survey 2015 / 99PhD Survey 2015 / 98
0%
20%
40%
60%
80%
Male Born in the Netherlands
PhD population
Response sample
0%
20%
40%
60%
80%
Male Born in the Netherlands
PhD population
Response sample
0%
20%
40%
60%
80%
Male Born in the Netherlands
PhD population
Response sample
Figure 47. Percentage male and percentage born in the Netherlands, comparison between PhD
population and survey respondents
0%
20%
40%
60%
80%
1st 2nd/3rd 4th/+
SurveyPhDpopulation
0%
20%
40%
60%
80%
1st 2nd/3rd 4th/+
SurveyPhDpopulation
0%
20%
40%
60%
80%
1st 2nd/3rd 4th/+
SurveyPhDpopulation
Figure 48. Percentage PhD students by phase, comparison between PhD population and survey
respondents
Table 36. Response rate by phase and survey year
Response % 2011 % 2013 % 2015First 30 26 31
Second/third 48 45 41
Fourth or more 22 28 28
Total 42 39 35
10.3 Graduate School correctionsAlmost all respondents indicated a Graduate School to which they thought they belonged
(see Table 37). The Graduate School of the 15 respondents who did not know was traced in
Hora Finita. We noticed that 60 respondents (5%) indicated a different Graduate School in
the survey than the one registered in Hora Finita. One-third of this group was affi liated with
the Graduate School of Science but thought they were affi liated with the Graduate School of
Medical Sciences. In 89% of the mismatches we assigned the PhD student to the Graduate
School indicated in the Hora Finita system. The corrected Graduate School respondent
numbers are presented in Table 38 and Graduate School differences were examined
according to these numbers. As the minimum number of respondents per Graduate School
is 15, no conclusions can be drawn for the Graduate School of Philosophy, so the results are
not presented here. Nevertheless, data from these PhD students are included in the general
discussion.
Table 37. Graduate School numbers indicated by respondents in the survey
Graduate School n %Science 410 35.3
Medical Sciences 372 32.0
Behavioural and Social Sciences 107 9.2
Humanities 101 8.7
Economics and Business 57 4.9
Spatial Sciences 37 3.2
Law 37 3.2
Theology & Religious Studies 16 1.4
Philosophy 9 0.8
Not indicated 15 1.3
Total 1,161 100

PhD Survey 2015 / 101PhD Survey 2015 / 100
Table 38. Corrected Graduate School numbers
Graduate School n %Science 404 34.8
Medical Sciences 395 34.0
Behavioural and Social Sciences 105 9.0
Humanities 104 9.0
Economics and Business 56 4.8
Spatial Sciences 37 3.2
Law 36 3.1
Theology & Religious Studies 16 1.4
Philosophy 8 0.7
Total 1,161 100
10.4 AnalysesThe eight scales listed in Table 35 were used to determine the PhD students’ satisfaction with
the themes indicated. The total score for each scale was calculated by averaging the scores
on the items in each scale. All items were answered on a four-point Likert scale, where 1 =
‘strongly disagree’ and 4 = ‘strongly agree’. Sometimes the option ‘does not (yet) apply’ was
added. The scale scores varied between 1 and 4, with higher scores indicating a higher degree
of satisfaction. Items that do not fit into a satisfaction scale are discussed individually, and in
such cases we used a criterion of 80% to indicate that the PhD students were satisfied with the
situation.
For a number of items and scales we examined whether there were differences between certain
groups of PhD students. We analysed whether there were differences between PhD students
with an employee status, with a scholarship status and those with another type of affiliation
with the University; whether there were differences between Graduate Schools; and whether
there were differences between PhD students in their first, second or third, or fourth or higher
years.
This report only discusses the significant differences between the groups that emerged from
a Chi-square test or Analysis of Variance (ANOVA). As data from the 2009, 2011, 2013 and
2015 PhD surveys was available, comparisons could be made between the four surveys. This
was only done for the Graduate Schools that had 15 or more respondents in each survey year.
Differences between the years in mean scale scores were examined using ANOVA (see Table
39).

PhD Survey 2015 / 103
11 AppendixTable 39 Means scores over the years
Survey year 2009 2011 2013 2015Satisfaction with educational activities - 2.98 2.98 2.99
Satisfaction with training and supervision plan 2.75 2.65 2.77 2.96
Satisfaction with the Graduate School - 2.68 2.86 2.96
Organization of supervision 3.23 3.32 3.29 3.31
Quality of supervision 3.18 3.25 3.24 3.26
Satisfaction with expertise 3.01 3.13 3.10 3.18
Satisfaction with contacts - - 2.89 2.92
General work satisfaction 3.20 3.28 3.20 3.25
Black box: significantly higher in 2015 than in 2013, * = scale constituted of different items
between 2013 and 2015, - = not measured in that specific year
Table 40 Means scores per Graduate School in 2015
Graduate School Hum. BSS Spat. Sci. TRS SOM Law Sc. Med. Sci.Education 2.93 3.05 2.94 2.74 3.11 2.83 3.07 2.92
TSP 2.71 2.41 2.57 2.74 2.77 2.58 2.88 2.49
Graduate. School 2.88 2.79 2.82 3.07 3.28 3.05 3.01 2.89
Organisation sup. 3.27 3.27 3.30 3.27 3.41 3.31 3.32 3.30
Quality sup. 3.24 3.17 3.31 3.32 3.38 3.30 3.27 3.19
Expertise 3.05 3.12 2.99 3.13 3.23 2.96 3.26 3.19
Contacts 2.78 2.87 2.82 2.86 3.03 2.85 3.03 2.87
General work 3.15 3.26 3.28 3.33 3.30 3.26 3.28 3.22
Abbreviations: TSP = training and supervision plan, Hum = Humanities, BSS = Behavioural and
Social Sciences, Spat. Sci = Spatial Sciences, TRS = Theology and Religious Studies, SOM =
Economics and Business, Sc. = Science, Med. Sci. = Medical Sciences