AJ McCormick - PhD Thesis
268
Sink Regulation of Photosynthesis in Sugarcane By Alistair James McCormick Submitted in fulfilment of the academic requirements for the degree of Doctor of Philosophy in the School of Biological and Conservation Sciences, University of KwaZulu-Natal, Durban, South Africa July 2007 Supervisors: Derek A. Watt Michael D. Cramer
-
Upload
khangminh22 -
Category
Documents
-
view
1 -
download
0
Transcript of AJ McCormick - PhD Thesis

Sink Regulation of Photosynthesis in Sugarcane
By
Alistair James McCormick
Submitted in fulfilment of the academic requirements for the degree of
Doctor of Philosophy
in the School of Biological and Conservation Sciences,
University of KwaZulu-Natal, Durban, South Africa
July 2007
Supervisors:
Derek A. Watt
Michael D. Cramer

i
Abstract
The C4 plant, sugarcane (Saccharum spp. hybrids), accumulates sucrose to high
concentrations and, as a result, has been the focus of extensive research into the
biochemistry and physiology of sucrose accumulation. Despite this, the relationship
between source leaf photosynthetic rates and sucrose accumulation in the culm has not
been well documented. The observations that photosynthetic activity declines during
culm maturation in commercial cultivars and that high-sucrose accumulating ancestral
genoptypes photosynthesize at rates two-thirds of those of low-sucrose ancestral
Saccharum species indicate that source-sink communication may play a pivotal role in
determining sucrose yield.
The relationship between source and sink tissues in sugarcane was investigated using a
supply-demand paradigm, an approach novel in the study of the crop. The demand for
photosynthate from the primary culm growth sink was shown to be closely linked to
photosynthetic rates, sucrose export and the eventual physiological decline of source
leaves. Results from initial field experiments revealed that leaf assimilation rates were
negatively correlated with leaf hexose concentrations, but not those of sucrose. Further
manipulation of leaf sugar status, through sugar-feeding and cold-girdling techniques,
demonstrated the regulatory role of leaf sugar concentrations on photosynthetic activity,
thus revealing sucrose, and particularly hexose, as key signal molecules in the
modulation of the amount of photosynthate available for export to the sink. Gene
expression profiling, by means of array technologies, indicated that changes in leaf
sugar status and photosynthetic rates result in concurrent modifications in the
expression of several genes involved in fundamental metabolic pathways, including
photosynthesis, carbohydrate metabolism, stress response and sugar-signaling.
Notable amongst these, was the identification of a potential trehalose 6-phosphate (T6P)
sugar-signaling mechanism, thus implicating the trehalose pathway as a central
regulatory system in the communication of sink carbon requirements to the source leaf.
This study demonstrated that maturation of the culm results in a decreased demand for
sucrose, which invokes a sugar-mediated feedback signal to decrease leaf
photosynthetic supply processes. However, sugarcane leaves appear to retain the

ii
capacity to increase the supply of assimilate to culm tissues under conditions of
increased assimilate demand. Uncoupling of the signaling pathways that mediate
negative feedback between source and sink tissues may result in improved leaf
assimilation rates and, consequently, lead to increased sugarcane sucrose yields.

iii
Declaration
The research that forms the foundation of this thesis was conducted at the South African
Sugarcane Research Institute (SASRI), Mount Edgecombe, from January 2003 to April
2007 under the supervision of Dr Derek Watt (SASRI and University of KwaZulu-Natal)
and Prof. Michael Cramer (University of Cape Town).
These studies represent original work by the author and have not otherwise been
submitted in any form for any other degree or diploma to any other tertiary institution.
Alistair J. McCormick Date

iv
Foreword
This thesis is presented as a compilation of eight chapters. Research work is described
in Chapters 3, 4, 5, 6 and 7. Each of these chapters is written according to the style of
the journal to which the manuscript was submitted for publication.
Chapter 1: General Introduction.
Chapter 2: Literature Review.
Chapter 3: Sink strength regulates photosynthesis in sugarcane (McCormick AJ,
Cramer MD, Watt DA. 2006. New Phytologist 171: 759-770).
Chapter 4: Changes in leaf gene expression during a source-sink perturbation in
sugarcane (McCormick AJ, Cramer MD, Watt DA. 2007. Annals of Botany
doi:10.1093/aob/mcm258).
Chapter 5: Regulation of photosynthesis by sugars in sugarcane leaves (McCormick
AJ, Cramer MD, Watt DA. Journal of Plant Physiology; under review,
submitted August 2007).
Chapter 6: Sugar accumulation induces differential expression of genes related to
carbohydrate metabolism, photosynthesis and sugar-sensing: evidence for
a trehalose-related signaling mechanism in sugarcane leaves (McCormick
AJ, Cramer MD, Watt DA. Physiologia Plantarum; under review, submitted
November 2007).
Chapter 7: Culm sucrose accumulation promotes physiological decline of mature
leaves in sugarcane (McCormick AJ, Cramer MD, Watt DA. Field Crops
Research; in preparation for submission).
Chapter 8: General Discussion.
v
Acknowledgements
The author would like to express his gratitude and appreciation to everyone who
assisted him during this study. However, particular mention is deserved for those to
whom he is especially indebted:
Dr Derek Watt and Prof. Mike Cramer – for being exceptional supervisors and
providing the needed help at all the right times;
The South African Sugarcane Research Institute – for providing the financial support
and infrastructure for the study, as well as additional bursary funding;
The National Research Foundation – for providing the primary bursary that made this
study possible;
The Biotech Family – a special blend of youth and experience, you will all be missed.
vi
Contents
Chapter 1: General Introduction 1.1 Introduction 1 1.2 The source-sink relationship 3 1.3 Project aim 3 1.4 Broad project objectives 4 1.5 References 5 Chapter 2: Literature Review 2.1 Photosynthesis 9
2.1.1 The C3 and C4 pathways 9 2.1.2 Regulation of C3 photosynthesis 14 2.1.3 Regulation of C4 photosynthesis 15
2.2 Sugar metabolism: regulation and signaling mechanisms in the sucrolytic pathway 19 2.2.1 Introduction 19 2.2.2 Fructose bisphosphatase 20 2.2.3 Pyrophosphate-dependent phosphofructokinase 23 2.2.4 Sucrose phosphate synthase 24 2.2.5 Sucrose synthase 25 2.2.6 Invertases 28
2.2.6.1 Vacuolar acid invertase 29 2.2.6.2 Neutral invertase 30 2.2.6.3 Cell wall invertase 31
2.2.7 Hexokinase 33 2.2.8 Trehalose metabolism 35
2.3 The relationship between source and sink 38 2.3.1 Introduction 38 2.3.2 Phloem transport 39
2.3.2.1 Phloem loading 40 2.3.2.2 Phloem unloading 41
2.3.3 Sugar transporters 44 2.3.3.1 Disaccharide transporters 44 2.3.3.2 Monosaccharide transporters 46
2.3.4 Source-sink modeling 48 2.3.4.1 Sugarcane models 50
2.4 References 54
Chapter 3: Sink strength regulates photosynthesis in sugarcane 3.1 Summary 75 3.2 Introduction 75 3.3 Materials and methods 78
3.3.1 Plant material 78 3.3.2 Manipulation of sink capacity 79

vii
3.3.3 Sugar determination 79 3.3.4 Gas Exchange and fluorescence determinations 81 3.3.5 14CO2 labelling 82 3.3.6 Statistical analysis 83
3.4 Results 83 3.4.1 Effect of source: sink variations on sugar levels 83 3.4.2 Partial shading effect on 14C partitioning 84 3.4.3 Source leaf photosynthesis and sugar correlations 86
3.5 Discussion 92 3.6 Concluding remarks 96 3.7 References 97 Chapter 4: Changes in leaf gene expression during a source-sink perturbation in
sugarcane 4.1 Abstract 102 4.2 Background and aims 103 4.3 Methods 106
4.3.1 Plant material 106 4.3.2 Plant treatment 106 4.3.3 Sugar determination 107 4.3.4 Gas exchange and fluorescence determinations 107 4.3.5 Array target preparation 108 4.3.6 Array probe preparation and printing 109 4.3.7 Array querying and analysis 109 4.3.8 Statistical analysis 111
4.4 Key results 111 4.4.1 Effect of source: sink variations on sugars and photosynthesis 111 4.4.2 Hybridisation analysis of leaf transcript abundance 113 4.4.3 Correlation analysis 118
4.5 Discussion 120 4.6 Conclusions 125 4.7 References 126 4.8 Supplementary information 132 Chapter 5: Regulation of photosynthesis by sugars in sugarcane leaves 5.1 Abstract 137 5.2 Introduction 137 5.3 Materials and methods 140
5.3.1 Plant material 140 5.3.2 Leaf treatments 140 5.3.3 Sugar determination 141 5.3.4 Labelled sugar analysis 142 5.3.5 Gas exchange and fluorescence determinations 142 5.3.6 Statistical analysis 143
5.4 Results 143 5.4.1 Effects of dark treatment and subsequent leaf feeding 143 5.4.2 Sugar loading prior to darkness 146 5.4.3 Effects of a cold-girdle on whole leaf 152

viii
5.5 Discussion 155 5.6 Concluding remarks 158 5.7 References 159 Chapter 6: Sugar accumulation induces differential expression of genes related
to carbohydrate metabolism, photosynthesis and sugar-sensing: evidence for a trehalose-related signaling mechanism in sugarcane leaves
6.1 Summary 163 6.2 Introduction 164 6.3 Materials and methods 167
6.3.1 Plant material and treatment 167 6.3.2 Sugar determination 168 6.3.3 Gas exchange and fluorescence determinations 168 6.3.4 RNA preparation 169 6.3.5 Genechip array hybridisation 169 6.3.6 Statistical analysis 170
6.4 Results 171 6.4.1 Effects of cold-girdling on leaf sugar concentration 171 6.4.2 Effects of cold-girdling on leaf photosynthetic activity 171 6.4.3 Analysis of differentially expressed transcripts between control and cold-girdled leaf tissue 174 6.4.4 Response of photosynthesis- and carbohydrate metabolism-related genes to cold-girdling 176 6.4.5 Changes in expression of genes related to sugar transport and signaling, Pi metabolism and stress response 177
6.5 Discussion 181 6.5.1 Leaf sugar accumulation is associated with a decrease
in photosynthesis 182 6.5.2 Leaf sugar accumulation leads to a decrease in the
expression of photosynthesis-related genes 182 6.5.3 Leaf sugar accumulation disturbs glycolysis and sugar
partitioning, and induces a stress-related response 183 6.5.4 Trehalose metabolism – a potential sugar-signaling
mechanism in sugarcane 187 6.5.5 Evidence for Pi limitation and possible interactions
with trehalose 188 6.6 Concluding remarks 189 6.7 References 191 6.8 Supplementary material 199 Chapter 7: Culm sucrose accumulation promotes physiological decline of mature
leaves in sugarcane 7.1 Summary 217 7.2 Introduction 217 7.3 Materials and methods 220
7.3.1 Plant material 220 7.3.2 Plant treatment 220

ix
7.3.3 Sugar determination 221 7.3.4 14CO2 labelling 221 7.3.5 Gas exchange and fluorescence determinations 222 7.3.6 Statistical analysis 223
7.4 Results 223 7.4.1 Changes in sugar levels of defoliated and untreated plants 223 7.4.2 Effects of partial defoliation on 14C partitioning 226 7.4.3 Changes in source leaf photosynthesis 228 7.4.4 Correlations between sugars and photosynthesis 229
7.5 Discussion 232 7.5.1 Partial defoliation effected culm sucrose status
and carbon partitioning 232 7.5.2 Increased sink demand resulted in significantly increased
photosynthetic activity 233 7.5.3 The role of sugars in mediating sink-dependent changes
in leaf physiological status 234 7.5.4 Potential for influencing source-sink relations in sugarcane 235
7.6 Concluding remarks 236 7.7 References 237 Chapter 8: General Discussion 8.1 Supply and demand: a novel paradigm for the source-sink regulation of carbon accumulation in sugarcane 242 8.2 Concluding remarks 248 8.3 References 251

x
List of Abbreviations
�leaf leaf absorptance oC degrees Celsius
�g microgram
�l microlitre
�M micromolar
1,3PGA 1,3-bisphosphoglycerate
3PGA 3-phosphoglycerate
A photosynthetic assimilation
A340 absorbance at 340 nanometers
Aa assimilation in the absence of stomatal limitation
Ai assimilation in the presence stomatal limitation
AD; ADH alcohol dehydrogenase
ADP adenosine diphosphate
AGPase ADP-glucose pyrophosphorylase
Ald; ALD aldolase
ATP adenosine triphosphate
ATPase adenosine triphosphatase
BLAST Basic Local Alignment Search Tool
Ca ambient CO2
CA carbonic anhydrase
CAM crassulacean acid metabolism
CE carboxylation efficiency
cDNA complementary DNA
Ci intercellular CO2
CO2 carbon dioxide
CS chalcone synthase
CV co-efficient of variation
CWI cell wall invertase
d day
DEPC diethylpyrocarbonate
DHAP dihydroxyacetone phosphate
DNA deoxyribonucleic acid
dNTP deoxynucleotide triphosphate
DST disaccharide transporter
dT dioxythymidine

xi
E transpiration rate
E-value expect value
E4P erythrose-4-phosphate
EDTA ethylene diamine tetraacetic acid
EST expressed sequence tag
ETR electron transport rate
f fraction of absorbed quanta used by photosystem II
F1,6P fructose-1,6-bisphosphate
F2,6P fructose-2,6-bisphosphate
F6P fructose-6-phosphate
FBPase fructose bisphosphatase
Fm’ maximal fluorescence during a saturating light flash
Fs “steady-state” fluorescence
FW fresh weight
g gram
g relative centrifugal force
G1P glucose-1-phosphate
G3P glyceraldehyde-3-phosphate
G6P glucose-6-phosphate
G6PT glucose 6-phosphate/phosphate translocator
GPD; GPDH glyceraldehyde phosphate dehydrogenase
Gs stomatal conductance
h hour
H+ proton
HCO3- bicarbonate
HEPES 4-(2-hydroxyethyl)-1-piperazineethanesulfonic acid
hexose-P hexose phosphate
HPI hexose phosphate isomerase
HXK hexokinase
I incident photon flux density
INH inhibitor protein
IPB Institute of Plant Biotechnology
Jmax CO2 and light saturated photosynthesis
kJ kiloJoule
m meter
M molar
MAFF Ministry of Agriculture, Forestry and Fisheries

xii
MAPK mitogen-activated protein kinase
min minute
ml millilitre
mM millimolar
mmol millimoles
mRNA messenger RNA
MST monosaccharide transporter
MUP mitochondrial uncoupling protein
NAD oxidised nicotonamide-adenine dinucleotide (NAD+)
NADH reduced nicotonamide-adenine dinucleotide (NAD + H+)
NADP oxidised nicotonamide-adenine phosphate dinucleotide (NADP+)
NADPH reduced nicotonamide-adenine phosphate dinucleotide (NADPH
+ H+)
NADH-MD NADH-dependent malate dehydrogenase
NADP-MDH NADP-dependent malate dehydrogenase
NADP-ME NADP-malic enzyme
NCBI National Centre for Biotechnology Information
ng nanogram
NI neutral invertase
OAA oxaloacetate
PCR photosynthetic reduction cycle
PPase inorganic pyrophosphatase
Pi inorganic phosphate
PPi inorganic pyrophosphate
PEP phenolenolpyruvate
PEPc; PEPC phosphoenolpyruvate carboxylase
PFK 6-phosphofructokinase
PFP pyrophosphate-dependent phosphofructokinase
PGK; PGKase phosphoglycerate kinase
PGMase phosphoglucomutase
PPdK pyruvate orthophosphate dikinase
PRKase phosphoribulokinase
PSII photosystem II
R5P ribose-5-phosphate
RNA ribonucleic acid
RT room temperature
RT-PCR reverse transcription-polymerase chain reaction

xiii
R5P ribose-5-phosphate
Rd dark respiration
RPE ribulose phosphate epimerase
RPI ribose phosphate isomerase
Rubisco ribulose-1.5-bisphosphate carboxylase/oxygenase
Ru5P ribulose-5-phosphate
RuBP ribulose-1,5-bisphosphate
S1,7P sedoheptulose-1,7-bisphosphate
S6P sucrose-6-phosphate
S7P sedoheptulose-7-phosphate
SASRI South African Sugarcane Research Institute
SBPase sedoheptulose bisphosphatase
SDS sodium dodecyl sulphate
SE-CCC sieve element-companion cell complex
SNF1 sucrose non-fermenting enzyme
SnRK1 SNF1-related kinase
SPP sucrose phosphate phosphatase
SPS sucrose phosphate synthase
SuSy sucrose synthase
T6P trehalose-6-phosphate
TCA tricarboxylic acid cycle
TPI triose phosphate isomerase
TPP trehalose phosphate phosphatase
TPS trehalose phosphate synthase
TKase transketolase
Trase trehalase
triose-P triose phosphate
Tris 2-amino-2-(hydroxymethyl)-1,3-propanediol
UDP uridine diphosphate
UDPGlc uridine diphosphate-glucose
UTP uridine triphosphate
UTP-GD uridine triphosphate glucose dehydrogenase
UGPase uridine diphosphate-glucose pyrophosphorylase
UV ultra-violet
VAI soluble vacuolar acid invertase
X5P xylose-5-phosphate

Chapter 1: General Introduction
1
Chapter 1:
General Introduction
1.1 Introduction
Sugarcane (Saccharum L. spp. hybrids) is a major crop plant grown in both tropical and
subtropical regions throughout the world. The crop occupies an estimated area of 19.6
million hectares worldwide, with a total average annual production of 130 million metric
tons of sugar (Clay, 2004). Sugarcane accounts for more than 70% of sucrose
produced worldwide (Lunn & Furbank, 1999) and is also a source of molasses, fibre,
fertilizer and ethanol for fuel. The South African sugar industry is currently ranked 11th in
the world, producing approximately 2.5 million tons of sugar per season and generating
an annual estimated direct income of R6 billion (Anon, 2006). Sucrose production and
export in South Africa is thus a significant source of revenue, and improved yields
through scientific research is an important objective of the local industry.
Sugarcane has several unique characteristics that have resulted in the agricultural
success of the crop. The C4 Saccharum genus is classified as a member of the ‘tall
grasses’ family (Poaceae). This family includes genera that are amongst the most
photosynthetically efficient in the plant kingdom, in that some members are capable of
converting up to two percent of incident solar energy into biomass. Previous
assessments of the biophysiological capability of the sugarcane stem to accumulate
sucrose have estimated that the Saccharum complex is potentially capable of storing
approximately 30% sucrose on a fresh weight basis (Bull & Glasziou 1963, Moore, 1995;
Jackson, 2005). This limit has recently been challenged (Wu & Birch, 2007), indicating
that sugarcane culm may be able to attain even higher sugar contents.
During the past century, successful breeding strategies in South Africa have resulted in
substantial increases in sucrose yield on a tons/hectare basis. This initial trend has
been attributed to the overcoming of productivity barriers in both the source and sink
tissues (Moore et al., 1997). However, despite the continual introduction of new
varieties, sucrose yields have remained approximately constant since the 1970’s. This
phenomenon has been observed in other sugar industries and has been attributed to a
number of factors, including environmental constraints and the narrow genetic base of
germplasm available to breeding programmes (Grof & Campbell, 2001; Moore, 2005).

Chapter 1: General Introduction
2
In recent decades, improvements in sugarcane agriculture have been achieved almost
entirely through increases in cane yield, despite higher heritability of sucrose content
(Jackson, 2005). Jeanneau et al. (2002) has attributed the yield increase phenomenon
observed in C4 crops to an increase in leaf surface area and not an improved
performance of the source photosynthetic apparatus.
Importantly, current yields are still only 65% of the predicted capacity of sugarcane culm
tissue (Moore et al., 1997; Jackson, 2005). Therefore, there is considerable incentive for
sugar industries to develop and utilise new molecular techniques to act in concert with
conventional breeding programs to enhance sucrose accumulation in sugarcane.
However, when compared to C3 plants, only a relatively low number of molecular
biologists work on C4 species, with the view to improving crop performance. In ‘model’
plants such as Arabidopsis thaliana (L.) the wide availability of whole genome,
metabolome and proteome data (Gibon et al., 2006; Kolbe et al., 2006) has allowed C3
research to make enormous progress towards a better understanding of metabolic
regulation. Multifaceted online databases, such as genevestigator
(https://www.genevestigator.ethz.ch) (Zimmerman et al., 2004), will soon move
Arabidopsis studies into the advanced realms of systems biology (Trewavas, 2006). In
contrast, C4 species lag behind, with the majority of C4 research focusing on maize (Zea
mays L.) (Lunn & Furbank, 1999).
Numerous EST sequencing projects targeting sugarcane have provided the basis for
gene discovery and expression profiling studies (Carson & Botha 2002; Casu et al.
2004; Ma et al. 2004; Vettore et al. 2003). Suites of genes, whose expression is
correlated with various conditions, have been identified using cDNAs derived from these
collections, including sucrose accumulation in the culm (Carson et al. 2002; Casu et al.,
2004; Casu et al., 2007; Watt et al. 2005), cold stress (Nogueira et al. 2003) and methyl
jasmonate treatment (Bower et al. 2005). A commercial array system consisting of the
entire world collection of sugarcane ESTs has recently been compilled by Affymetrix
(Casu et al., 2007). Furthermore, at least two studies have thus far examined the
sugarcane metabolome (Rowher et al., 2003; Glassop et al., 2006). Thus, good
progress is being made towards a better understanding of the regulatory mechanisms
involved in sucrose metabolism and accumulation in sugarcane (Moore et al., 1997;
Casu et al., 2004).

Chapter 1: General Introduction
3
1.2 The source-sink relationship
In order to draw level with C3 plant research, sugarcane researchers will have to work
hard to augment their current knowledge base. One of the crucial advances will be a
better appreciation of the role of sugarcane leaves in the accumulation of sucrose in the
culm. Plant biomass accumulation is a complex feedback process, controlled by both
the photosynthetic apparatus (source) and the carbon storage tissues (sinks) (Ho, 1988).
The coordinate regulation of both source and sink activity is crucially important for plant
growth and may involve fine (substrate and allosteric) and coarse (gene expression)
regulation, mediated by specific sugar-signaling mechanisms (Rolland et al., 2006).
Increasing evidence from several species has highlighted the significant roles of the
major transport sugar, sucrose, and hexoses (glucose and fructose) in regulating the
interaction between source and sink systems (Pego et al., 2000; Rolland et al., 2002;
Franck et al., 2006; Rolland et al., 2006).
Sugarcane has evolved as a unique source-to-sink system, in that the major storage
tissue is also the growing stalk. Thus accumulated carbon must be partitioned in the
culm amongst growth, respiration and storage requirements. Regardless of leaf age or
environmental conditions, research has shown that the photosynthetic rate of sugarcane
leaves declines as the stalk matures (Amaya et al., 1995). However, partial defoliation
has been shown to not affect culm sucrose concentrations (Pammenter & Allison, 2002;
Gutiérrez-Miceli et al., 2004), suggesting that sugarcane leaves are capable of adapting
the supply of carbon based on the demand from sink tissues. Furthermore, under
conditions of reduced source leaf material (either through shading or defoliation), current
commercial sugarcane cultivars exhibit a preference towards sucrose accumulation, at
the expense of structural growth (Pammenter & Allison, 2002). The regulatory pathways
and physiological feedback limitations involved in these studies have not been
examined. In addition, the existence of a carbon-dependent relationship between
source and sink tissue in sugarcane is not yet resolved.
1.3 Project aims
i. To determine the relationship between photosynthesis and sugar biosynthesis in the
leaf, and the storage of sucrose in the maturing sugarcane culm.

Chapter 1: General Introduction
4
ii. To clarify the regulatory roles of the primary metabolites, sucrose and hexose (glucose
and fructose) in mediating the source-sink relationship and ascertain the involvement
of putative sugar signaling/sensing mechanisms related to carbohydrate metabolism
and photosynthesis in the leaf.
1.4 Broad project objectives
i. To determine if source leaf photosynthetic activity responds to changing demand for
carbon from culm sink tissues.
ii. To examine the putative roles of primary sugars, sucrose and hexoses in the
regulation of leaf photosynthetic activity.
iii. To analyse changes in expression of genes linked to carbohydrate metabolism and
photosynthesis in the leaf with the aim of identifying putative sugar signaling
mechanisms.
This novel study has combined the traditional strengths of physiology with the precision
of modern molecular biology techniques. The parallel analysis of phenotype and gene
transcript expression has provided a powerful methodology for examining the sugar-
mediated processes that link leaf photosynthetic activity to sucrose accumulation in
sugarcane. The knowledge generated from this project, together with that contained in
the international literature, will ultimately be used to devise a strategy to uncouple the
signaling pathway that mediates negative feedback between source and sink tissues.

Chapter 1: General Introduction
5
1.5 References
Amaya A, Cock JH, Hernandez A, Irvine J. 1995. Bioligía. In: Casselett C, Torres J,
Isaacs C, eds. El cultivo de la Ca�a en la zona azucarera de Colombia. Cali, Colombia:
Cenica�a, 31–62.
Anon. 2006. South African Sugar Industry Directory 2006/2007. South African Sugar
Association: SA, 2–3. (http://www.sugar.org.za).
Bull TA, Glasziou KT. 1963. The evolutionary significance of sugar accumulation in
Saccharum. Australian Journal of Biological Sciences 16: 737–742.
Bower NI, Casu RE, Maclean DJ, Reverter A, Chapman SC, Manners JM. 2005.
Transcriptional response of sugarcane roots to methyl jasmonate. Plant Science 168: 761–
772.
Carson DL, Botha FC. 2002. Genes expressed in sugarcane maturing internodal tissue.
Plant Cell Reports 20: 1075–1081.
Carson DL, Huckett BI, Botha FC. 2002. Sugarcane ESTs differentially expressed in
immature and maturing internodal tissue. Plant Science 162: 289–300.
Casu RE, Dimmock CM, Chapman SC, Grof CPL, McIntyre CL, Bonnett GD, Manners
JM. 2004. Identification of differentially expressed transcripts from maturing stem of
sugarcane by in silico analysis of stem expressed sequence tags and gene expression
profiling. Plant Molecular Biology 54: 503–517.
Casu RE, Jarmey J, Bonnett GD, Manners JM. 2007. Identification of transcripts
associated with cell wall metabolism and development in the stem of sugarcane by Affymetrix
GeneChip Sugarcane Genome Array expression profiling. Function and Integrative
Genomics 7: 153–167.
Clay J. 2004. Sugarcane. In: World agriculture and the environment. Washington D.C.: Island
Press.
Franck N, Vaast P, Genard M, Dauzat J. 2006. Soluble sugars mediate sink feedback
down-regulation of leaf photosynthesis in field grown Coffea arabica. Tree Physiology 26:
517–525.
Gibon Y, Usadel B, Blaesing OE, Kamlage B, Hoehne M, Tretheway R, Stitt M.
2006. Integration of metabolite with transcript and enzyme activity profiling during diurnal
cycles in Arabidopsis rosettes. Genome Biology DOI 10.1186/gb-2006-7-8-r76.
Glassop D, Roessner U, Bacic A, Bonnett GD. 2006. Changes in the sugarcane
metabolome with stem development. Are they related to sucrose accumulation? Plant and
Cell Physiology DOI 10.1093/pcp/pcm027.
Grof C, Campbell J. 2001. Sugarcane sucrose metabolism: scope for molecular
manipulation. Australian Journal of Plant Physiology 28: 1–12.
Gutiérrez-Miceli FA, Morales-Torres R, de Jesús Espinosa-Castañeda Y, Rincón-
Rosales R, Mentes-Molina J, Oliva-Llaven MA, Dendooven L. 2004. Effects of

Chapter 1: General Introduction
6
parital defoliation on sucrose accumulation, enzyme activity and agronomic parameters in
sugar cane (Saccharum spp.). Journal of Agronomy and Crop Science 190: 256–261.
Ho LC. 1988. Metabolism and compartmentation of imported sugars in sink organs in relation to
sink strength. Annual Review of Plant Physiology and Plant Molecular Biology 39: 355–378.
Jackson PA. 2005. Breeding for improved sugar content in sugarcane. Field Crops Research
92: 277–290.
Jeanneau M, Gousset-Dupont A, Lebouteiller B, Hodges M, Gerentes D, Perez P.
2002. Manipulation of PEPC levels in plants. Journal of Experimental Botany 53: 1837–
1845.
Kolbe A, Oliver SN, Fernie AR, Stitt M, van Dongen JT, Geigenberger P. 2006.
Combined transcript and metabolite profiling of Arabidopsis leaves reveals fundamental
effects of the thiol-disulfide status on plant metabolism. Plant Physiology 141: 412–422.
Lunn JE, Furbank RT. 1999. Sucrose biosynthesis in C4 plants. New Phytologist 143: 221–
37.
Ma HM, Sculze S, Lee S, Yang M, Mirkov E, Irvine J, Moore P, Paterson A, 2004.
An EST survey of the sugarcane transcriptome. Theoretical and Applied Genetics 108: 851–
863.
Moore PH. 1995. Temporal and spatial regulation of sucrose metabolism in the sugarcane
stem. Australian Journal of Plant Physiology 22: 661–679.
Moore PH. 2005. Integration of sucrose accumulation processes across hierarchical scales:
towards developing an understanding of the gene-to-crop continuum. Field Crops Research
92: 119–135.
Moore PH, Botha FC, Furbank RT, Grof CPL. 1997. Potential for overcoming physio-
biochemical limits to sucrose accumulation. In: B.A. Keating and J.R. Wilson, eds. Intensive
sugarcane production: meeting the challenges beyond 2000. CAB International: Wallingford,
141–155.
Nogueira FTS, de Rosa Jr VE, Menossi M, Ulian EC, Arruda P. 2003. RNA expression
profiles and data mining of sugarcane response to low temperature. Plant Physiology 132:
1811–1824.
Pammenter NW, Allison JCS. 2002. Effects of treatments potentially influencing the supply of
assimilate on its partitioning in sugarcane. Journal of Experimental Botany 53: 123–129.
Pego JV, Kortsee AJ, Huijser C, Smeekens SCM. 2000. Photosynthesis, sugars and the
regulation of gene expression. Journal of Experimental Botany 51: 407–416.
Rolland F, Baena-Gonzalez E, Sheen J. 2006. Sugar sensing and signaling in plants:
conserved and novel mechanisms. Annual Review of Plant Biology 57: 675–709.
Rolland F, Moore R, Sheen J. 2002. Sugar sensing and signaling in plants. The Plant Cell
14(suppl.): 185–205.
Rowher JM, Botha FC, Bosch S. 2003. The sugarcane metabolome. Proceedings of the
South African Sugar Technologists’ Association 77: 151–164.

Chapter 1: General Introduction
7
Trewavas T. 2006. A brief history of systems biology. The Plant Cell 18: 2420–2430.
Vettore AL, da Silva FR, Kemper EL, Souza GM, da Silva AM, Ferro MIT, Henrique-
Silva F, Giglioti EA, Lemos MVF, Coutinho LL, Nobrega MP, Carrer H, Franca
SC, Bacci Jr M, Goldman MHS, Gomes SL, Nunes LR, Camargo LEA, Siqueira
WJ, Van Sluys MA, Thiemann OH, Kuramae EE, Santelli RV, Marino CL, Targon
MLPN, Ferro JA, Silveira HCS, Marini Roberto PG, Martins VG, Goldman GH, de
Oliveira RC, Truffi D, Colombo CA, Rossi M, de Araujo PG, Sculaccio SA,
Angella A, Lima MMA, de Rosa VEJ, Siviero F, Coscrato VE, Machado MA,
Grivet L, Di Mauro SMZ, Nobrega FG, Menck CFM, Braga MDV, Telles GP, Cara
FAA, Pedrosa G, Meidanis J, Arruda P. 2003. Analysis and functional annotation of
an expressed sequence tag collection for tropical crop sugarcane. Genome Research 13:
2725–2735.
Watt DA, McCormick AJ, Govender C, Carson DL, Cramer MD, Huckett BI, Botha
FC. 2005. Increasing the utility of genomics in unraveling sucrose accumulation. Field
Crops Research 92: 149–158.
Wu L, Birch RG. 2007. Doubling sugar content in sugarcane plants modified to produce a
sucrose isomer. Plant Biotechnology Journal 5: 109–117.
Zimmerman P, Hirsch-Hoffmann M, Hennig L, Gruissem W. 2004. GENEVESTIGATOR.
Arabidopsis Microarray Database and Analysis. Plant Physiology 136: 2621–2632.

Chapter 2: Literature Review
8
Chapter 2:
Literature Review
Most higher plants, including sugarcane, fix carbon through photosynthesis and capture
it as carbohydrates in the form of sugars and starch. Assimilated carbon is then
translocated from source leaves, most often in the form of sucrose, through sieve tubes
or vascular bundles to sink organs for growth, development and storage. The metabolic
pathways involved are well known; however, a thorough understanding of the
mechanisms that regulate metabolic pathways, such as glycolysis and photosynthesis,
remains elusive (Benning & Stitt, 2004). Research into both local and long distance
control of carbon metabolism, and the integration thereof at the gene, protein and
metabolite levels, is ongoing, and a more integrated perception of how plants regulate
growth is gradually becoming apparent. The current review will examine present
knowledge of the regulation of carbon metabolism using a three-level hierarchical
approach. In this scheme, the metabolic pathways of photosynthesis can be considered
as the foundation, while carbohydrate metabolism and the numerous associated sensing
and signaling pathways act as the regulatory link between source and sink tissues (Fig.
2.1). Using this simplified schematic, the review will present a comprehensive
examination of the regulatory mechanisms involved in carbon-related plant growth.
Fig. 2.1 Schematic diagram illustrating the three levels of complexity involved in carbon-related
plant growth and which serve to structure Chapter 2.
Source-sink relationship
Carbohydrate metabolism
Photosynthesis
Source-sink relationship
Carbohydrate metabolism
Photosynthesis

Chapter 2: Literature Review
9
2.1 Photosynthesis
2.1.1 The C3 and C4 pathways
In the vast majority of higher plant species, photosynthetic assimilation of CO2 occurs by
the photosynthetic carbon reduction (PCR) cycle, otherwise known as the ‘dark
reactions’ of photosynthesis (Calvin, 1962). In the initial step of this process, CO2 is
fixed in the chloroplast of photosynthetically-active cells via ribulose-1.5-bisphosphate
carboxylase/oxygenase (Rubisco; EC 4.1.1.39), and converted into the three-carbon
compound 3-phosphoglycerate (3PGA). It is due to these three-carbon compounds that
this process is referred to as the C3 pathway (Fig. 2.2A). In total, the PCR cycle involves
eleven enzymes that catalyze a total of 13 reactions, which ultimately return carbon back
to regenerate the CO2-acceptor molecule ribulose-1,5-bisphosphate (RuBP). The PCR
cycle is responsible for the supply of triose phosphates (triose-P) derived from 3PGA to
the sucrose and starch pathways for basic growth and development (Raines, 2003). In
addition, the PCR cycle also supplies numerous pathways in the chloroplast, including
the shikimate pathway for biosynthesis of amino acids and lignin, isoprenoid
biosynthesis and the precursors for nucleotide metabolism and cell wall synthesis
(Lichtenthaler, 1999). Plants that utilize the C3 pathway are characterised by a single
chloroplast type that performs all the reactions that convert light energy into the chemical
energy that is used to fix C02. However, due to the inherent physiological limitations of
the C3 pathway, Rubisco may also catalyze the fixation of O2 in an energetically wasteful
process known as photorespiration, which competes directly with the fixation of CO2. It
is this balance between photorespiration and photosynthesis that largely determines the
efficiency with which C3 species accumulate carbon (Woodrow & Berry, 1988).
In comparison, the C4 pathway can best be described as a complex adaptation of the C3
pathway, whereby CO2 is initially fixed in the leaf by exterior mesophyll cells and then
transported to internalised bundle sheath cells. This cyclical reaction effectively
suppresses photorespiration by concentrating CO2 in the bundle sheath cells where
photosynthesis occurs exclusively, via the PCR cycle (Hatch & Slack, 1966) (Fig. 2.2B).
The key feature of C4 photosynthesis is the compartmentalisation of activities, typically
into these two specialised cells and chloroplast types. In all C4 plants, CO2 is initially
fixed by phophoenolpyruvate carboxylase (PEPc; EC 4.1.1.31) in the cytosol of
mesophyll cells to form the 4-carbon dicarboxylic acid oxaloacetate (OAA) (hence the
Chapter 2: Literature Review
10
name, C4). OAA is then converted into malate or aspartate, which diffuses into the
bundle sheath cells. Decarboxylation of these C4 acids results in CO2, which is then
refixed via Rubisco in the PCR cycle. Three distinct decarboxylation mechanisms have
evolved in C4 bundle sheath cells: (i) a chloroplastic NADP-malic enzyme that
decarboxylates malate to give pyruvate (NADPME-type); (ii) a mitochondrial NAD-malic
enzyme (NADME-type) and (iii) a cytosolic PEPc that produces phosphoenolpyruvate
(PEP) from OAA (PCK-type) (Hatch, 1987). The first type, which is exhibited by
sugarcane, predominantly translocates the C4 acid malate to the bundle sheath cells.
The main translocation product of the other two variants is aspartate, which is converted
to OAA by transamination.
Plants that photosynthesize via the C4 pathway include a variety of important crop
plants, including maize, sorghum (Sorghum bicolor L.) and sugarcane, a large portion of
the grass family (Poaceae) (David & Soreng, 1993), and, in addition, many species of
problematic weeds (Edwards & Huber, 1981). Leaves of C4 plants are typically
distinguished by extensive vascularisation (Kranz anatomy), where a ring of bundle
sheath cells surrounds each vein and an outer ring of mesophyll cells surrounds the
bundle sheath. By virtue of this arrangement, the mesophyll cells have been described
as ‘biochemical pumps’ which concentrate CO2 in the bundle sheath, creating an
estimated ten-fold increase over atmospheric concentrations (± 3.7 mmol mol-1) (Jenkins
et al., 1989). Kranz anatomy is not only credited with suppressing the oxygenase
activity of Rubisco, but it also permits the PCR cycle to function more effectively under
conditions of increased light and temperature (Hatch 1987). However, some
photorespiration does still occur in C4 species, albeit at a suppressed level, specifically
under conditions of high O2, low CO2, and high temperature (Dai et al., 1993; Maroco et
al., 1998).

Chapter 2: Literature Review
11
Fig. 2.2. Representations of the photosynthetic reduction (PCR) cycle in C3 plants (A) and the
C4 photosynthetic pathway in NADPME-types (B). Filled circles represent membrane
transporters (Further legend details provided overleaf).
ADPRuBisCO
CHLOROPLAST
CO2
NADPH
NADP+
StarchMetabolism
Ru5P
CytosolicSucrose
Metabolism
3PGA
1,3PGA
G3P
ATP
ADPPGKase
GPDHX5P
RPE
PRKase
RuBP ATP
F1,6PF6P
DHAP
TPI
Ald
FBPaseTKase
R5P
HCO3-
CA
E4P
S1,7P
S7P
Ald
SBPase
RPI
TKase
Pi
Pi
ADPRuBisCO
CHLOROPLAST
CO2CO2
NADPH
NADP+
StarchMetabolism
Ru5P
CytosolicSucrose
Metabolism
3PGA
1,3PGA
G3P
ATP
ADPPGKase
GPDHX5P
RPE
PRKase
RuBP ATP
F1,6PF6P
DHAP
TPI
Ald
FBPaseTKase
R5P
HCO3-
CA
E4P
S1,7P
S7P
Ald
SBPase
RPI
TKase
Pi
Pi
malate malate
pyruvate
triose-P
pyruvate
3PGA
PEP
OAANADP-MDH
PPdK
CHLOROPLAST
CYTOSOL
CHLOROPLAST
HCO3-
CA
PEP
OAA
NADP-ME
CO2
CO2
triose-P
NADPH NADP+
AMP ATP
NADP+
NADPH
PEPc
NADPH
Mesophyll Cell Bundle Sheath Cell
F6PPGK / GPDHATP
ADPSucrose
Metabolism
Starch Metabolism
F1,6P
RuBP
CYTOSOL
3PGA
PCR Cycle
NADP+
malate malate
pyruvate
triose-P
pyruvate
3PGA
PEP
OAANADP-MDH
PPdK
CHLOROPLAST
CYTOSOL
CHLOROPLAST
HCO3-
CA
PEP
OAA
NADP-ME
CO2CO2
CO2CO2
triose-P
NADPH NADP+
AMP ATP
NADP+
NADPH
PEPc
NADPH
Mesophyll Cell Bundle Sheath Cell
F6PPGK / GPDHATP
ADPSucrose
Metabolism
Starch Metabolism
F1,6P
RuBP
CYTOSOL
3PGA
PCR Cycle
NADP+

Chapter 2: Literature Review
12
Fig. 2.2. (Legend continuation from previous page)
(A) The PCR cycle, highlighting the metabolites and enzymes (italics) involved in sucrose and
starch metabolism, and ribulose-1,5-bisphosphate (RuBP) regeneration. Carbon dioxide
(CO2) released by carbonic anhydrase (CA; EC 4.2.1.1) is initially fixed by Rubisco (EC
4.1.1.39) to produce 3-phosphoglycerate (3PGA), which is phosphorylated to 1,3-
bisphosphoglycerate (1,3PGA) and reduced to glyceraldehyde-3-phosphate (G3P) by
phosphoglycerate kinase (PGKase; EC 2.7.2.3) and glyceraldehyde phosphate
dehydrogenase (GPDH; EC 1.2.1.13) respectively. Triose phosphate isomerase (TPI; EC
5.3.1.1) then catalyzes the conversion of G3P to dihydroxyacetone phosphate (DHAP).
These four triose-phosphate (triose-P) compounds (3PGA, 1,3PGA, G3P and DHAP) can be
exported from the chloroplast (in exchange for inorganic phosphate) for sucrose synthesis in
the cytosol. Alternatively, aldolase (Ald; EC 4.1.2.13) catalyzes DHAP to fructose-1,6-
bisphosphate (F1,6P) and fructose bisphosphatase (FBPase; EC 3.1.3.11) catalyzes F1,6P
to fructose-6-phosphate (F6P). F6P can be retained in the chloroplast for starch synthesis, or
used for RuBP regeneration. Transketolase (TKase; EC 2.2.1.1) catalyzes F6P to erythrose
4-phosphate (E4P), Ald catalyzes E4P to sedoheptulose 1,7-bisphosphate (S1,7P) and
sedoheptulose bisphosphatase (SBPase; EC 3.1.3.37) catalyzes S1,7P to sedoheptulose 7-
phosphate (S7P). TKase then splits S7P (seven carbons) to form ribose-5-phosphate (R5P)
(5 carbons) and xylose-5-phosphate (X5P) (2 carbons + G3P). R5P is catalyzed to ribulose-
5-phosphate (Ru5P) by ribose phosphate isomerase (RPI; EC 5.3.1.6), while X5P is
catalyzed to Ru5P by ribulose phosphate epimerase (RPE; EC 5.1.3.1). Ru5P is then
phosphorylated by phosphoribulokinase (PRKase; EC 2.7.1.19) to give RuBP.
(B) The CO2-concentrating mechanism of C4 plants using the NADPME-type pathway,
emphasizing the compartmentation of enzymes between mesophyll and bundle sheath cell
types. In the outer mesophyll cytosol, CO2 is converted by CA to HCO3- that is then fixed in
the form of OAA by phosphoenolpyruvate carboxylase (PEPc; EC 4.1.1.31). OAA is reduced
in the mesophyll chloroplast to form malate by NADP-malate dehydrogenase (NADP-MDH;
EC 1.1.1.82) and transported to chloroplast of the inner bundle sheath. Malate is then
decarboxylated by NADP-malic enzyme (NADP-ME; EC 1.1.1.40) to produce CO2 and
pyruvate. Phosphoenolpyruvate (PEP) is regenerated from pyruvate by pyruvate
orthophosphate dikinase (PPdK; EC 2.7.9.1) in the mesophyll chloroplast, while CO2 is fixed
by Rubisco in the PCR cycle within the bundle sheath chloroplast. In addition, 3PGA may be
shuttled back to the mesophyll for reduction to triose-P, which can be used for sucrose
synthesis (in the mesophyll cytosol) or recycled to the bundle sheath chloroplast.

Chapter 2: Literature Review
13
The significance of the characteristic C4 Kranz anatomy has recently been brought into
question, as evidence suggests that C4 photosynthesis can operate within a single
photosynthetic cell in certain aquatic and terrestrial plants (Voznesenskaya et al., 2001;
Leegood, 2002). Such cellular systems seem to be unique for each species, yet are still
expected to consist of highly organised internal compartmentations with low CO2
permeability to prevent leakage from the site of CO2 release (Leegood, 2002). In aquatic
Orcuttia species, this is achieved through the centripetal arrangement of mesophyll
chloroplasts, where the chloroplasts are placed at the greatest distance from the outside
environment (Keeley, 1998). In contrast, the CO2-concentrating mechanism in the
terrestrial plant Borszczowia aralocaspica has distinct cellular di-morphism, with NAD-
malic enzyme located in the mitochondria at one end of the cell while PEP is distributed
throughout the cytosol (Voznesenskaya et al., 2001). Many questions remain to be
answered concerning single cell C4 species and their evolution compared to the Kranz
anatomical structure, including whether they may provide useful models for engineering
C4 characteristics into C3 plants (Leegood, 2002).
Fossil records date the explosion of C4 plant biomass at some six to eight million years
ago, when CO2 concentrations fell to about 200 �mol mol-1 (Edwards et al., 2001).
Under the low CO2 and the warmer periods of the Palaezoic, the penalty for
photorespiration was exacerbated and provided C4 species a considerable competitive
edge over their C3 counterparts (Sage & Monson, 1999). The subsequent evolutionary
success of the C4 photosynthetic pathway can be accredited to improved water use
efficiency (WUE), nutrient efficiency and an increased photosynthetic capacity at high
temperature (Leegood, 2002). The four basic requirements for a typical C4 plant leaf can
be summarized as follows: (i) cell-specific location of enzymes required for C4
photosynthesis (i.e. PEPc in the mesophyll, and Rubisco in bundle sheath cells) with
complementary adjustments of photosystem and electron transport activities; (ii) barriers
to resist the diffusion of CO2 between the site of fixation by PEPc and sites of CO2
release and fixation by Rubisco; (iii) a novel set of cell-specific organelle metabolite
translocators; and (iv) a system of symplastic connectors between the spatially
separated sources and sinks of the 4-carbon acid transport metabolites (Edwards et al.,
2001).
Chapter 2: Literature Review
14
2.1.2 Regulation of C3 photosynthesis
The sequence of reactions in the PCR cycle of C3 plants has been known for some time,
although the mechanisms that regulate and co-ordinate enzyme activity are still not fully
understood. However, research over the past 15 years using transgenic tools, such as
“antisense” RNA technology, has brought to light a variety of novel regulatory aspects
regarding this important pathway (for detailed review see Raines, 2003). The primary
advantage of the RNA antisense technique is the precision with which the activity of a
single enzyme can be manipulated in vivo, without significantly altering the levels of
other cellular components (Furbank et al., 1996).
The highly regulated Rubisco enzyme has been previously hypothesized to catalyze the
rate-limiting step in photosynthesis (Farquhar & von Caemmerer, 1982) and various
transgenic studies have shown that Rubisco activity exerts high control over
photosynthetic carbon flux (Quick et al., 1991; Hudson et al., 1992). Under conditions of
high light and ambient CO2, Rubisco is a limiting enzyme in C3 plants (Furbank et al.,
1996). However, under varying and controlled light conditions, the high flux control co-
efficient of sedoheptulose bisphosphatase (SBPase; EC 3.1.3.37) has more recently
provided convincing evidence that SBPase in vivo is also a major determinant of
photosynthetic capacity in C3 systems (Harrison et al., 1998; Olcer et al., 2001; Raines
et al., 2000). Consequently, Rubisco and SBPase appear to be the dominant factors
influencing overall carbon assimilation rates in the PCR cycle.
In addition, transketolase (TKase; EC 2.2.1.1) and aldolase (Ald; EC 4.1.2.13), have
both been shown to potentially contribute to regulating carbon flux through the PCR
cycle (Haake et al., 1998, 1999; Henkes et al., 2001), suggesting that these enzymes
may fall into a ‘co-limiting’ category. Other enzymes previously thought to be ‘co-limiting’
include glyceraldehyde phosphate dehydrogenase (GPDH; EC 1.2.1.13), fructose
bisphophatase (FBPase; EC 3.1.3.11) and phosphoribulokinase (PRKase; EC 2.7.1.19)
(Furbank and Taylor, 1995); however, more recent data have discounted any significant
regulatory roles of these enzymes based on their low flux control co-efficients (Raines,
2003). Similarly, the chloroplastic enzyme carbonic anhydrase (CA; EC 4.2.1.1) also
falls into the ‘non-limiting’ category (Price et al., 1994).

Chapter 2: Literature Review
15
Transgenic efforts to manipulate the rate-limiting PCR cycle enzymes in vivo have
yielded exciting prospects for future metabolic modifications in C3 plants. For example,
expression of a bi-functional cyanobacterial Ald/SBPase enzyme in transgenic tobacco
(Nicotiana tabacum L.) has recently resulted in plants with a higher photosynthetic
capacity and increased height and dry weight (Miyagawa et al., 2001). Furthermore,
Raines (2003) has reported tobacco expressing an Arabidopsis SBPase with increased
photosynthetic capacity and plant biomass. Such results are promising and indicate that
increased yields in C3 plants through a single manipulation in the PCR cycle may soon
be realised.
2.1.3 Regulation of C4 photosynthesis
Beyond the complexity of the PCR cycle, determining which enzymes regulate flux in C4
photosystems is complicated by the cellular localisation of particular enzymes (Furbank
& Taylor, 1995). Thus, although the pathways of C4 photosynthesis have been resolved
(Hatch, 1987), much less progress has been made in unraveling the regulatory events
that govern C4 photosynthetic rates (Brown et al., 2005). Very little is known about how
C4 photosynthetic cell differentiation occurs, however, the position of cells relative to the
developing vein appears to determine their fate as either bundle sheath (closely
associated to the vein) or mesophyll (at least one cell away from the vein) cells (Nelson
& Langdale, 1992). The key regulatory enzymes of the NADPME-type C4 pathway are
shown in Fig. 1B. PEPc, NADP-malate dehydrogenase (NADP-MDH; EC 1.1.1.82) and
pyruvate orthophosphate dikinase (PPdK; EC 2.7.9.1) are located in the mesophyll cells
with PEPc in the cytosol and NADP-MDH and PPDK in the chloroplast, while NADP-
malic enzyme (NADP-ME; EC 1.1.1.40) is found in the chloroplast of bundle sheath cells
(Jeanneau et al., 2002). Furthermore, the gene expression and enzyme activities of the
three mesophyll enzymes in vivo have been shown to increase markedly under
illumination (Hatch, 1987), which suggests that these enzymes are potentially rate
limiting.
NADP-MDH has since been demonstrated to be a light-regulated enzyme that
undergoes reductive activation in the light via photosynthetic electron transfer and the
thioredoxin system (Buchanan, 1991). The enzyme is activated through thioredoxin by
the reduction of a disulphide bridge between two cysteine residues, and using site-
directed mutanogenesis, this pair of cysteine residues has been identified in the

Chapter 2: Literature Review
16
sorghum NADP-MDH enzyme (Issakidis, 1994). To assess the role of light activation of
NADP-MDH, mutant forms of NADP-MDH that are not inactivated through oxidation, and
thus are not inactivated in the dark, have been transformed into the C4 dicot Flaveria
bidentis (L.) and tobacco (Furbank & Taylor, 1995). Furthermore, suppression of NADP-
MDH activity using genetic co-suppression in transgenic Flaveria was investigated to
determine its effect on C4 photosynthetic flux (Trevanion et al., 1997). Under high light,
NADP-MDH activity could be reduced to 10% with little effect on carbon assimilation. At
low light even the most severely suppressed lines showed no change, however, the
activation state of NADP-MDH did increase accordingly to compensate for the reduced
amounts of available enzyme. Thus although NADP-MDH is far from limiting regarding
photosynthetic flux, its activity seems to correlate closely with photosynthesis at different
irradiances, confirming that the enzyme is subject to sophisticated control of its
activation state (Edwards et al., 2001).
PEPc is the primary CO2-fixing enzyme of the C4 pathway and its activity is regulated by
numerous metabolic effectors, including malate (feedback inhibition) glucose-6-phoshate
(G6P; activation), and a highly complex, light-dependent reversible phosphorylation
process (Bakrim et al., 1993). The latter reversible phosphorylation process is
performed by a protein-Ser kinase (PEPcK) (Bakrim et al., 1993), which alters the
functional and regulatory properties of PEPc. PEPcK effectively confers PEPc with
decreased sensitivity to malate, and increased activity under suboptimal levels of pH
(7.3) and substrate (PEP; 2.5 mM), while also increasing Vm and Ka for G6P (Chollet et
al., 1996). In Amaranthus edulis (L.), transgenically reduced PEPc transcription resulted
in an increase in PEPc phosphorylation status (Dever et al., 1997), suggesting that
Amaranthus has the capacity to adapt to a reduction in PEPc availability by modulating
the activity of the enzyme. Furthermore, in both sorghum and maize, blocking PEPcK
produced a marked inhibition of CO2 assimilation, indicating that phosphorylation is a
crucial event governing the mechanism of the C4 pathway (Bakrim et al., 1993). Thus,
although a low control coefficient is hypothesized for PEPc (Furbank et al., 1997), this
measurement may not represent a realistic indication of its overall role in photosynthetic
flux control.
Various attempts have been made to manipulate the level of PEPc in C4 plants
(Jeanneau et al., 2002), and furthermore, to introduce C4 PEPc into several C3 species,
including rice (Oryza sativa cv. Kitaake), potato (Solanum tuberosum L.) and tobacco

Chapter 2: Literature Review
17
(Kogami et al., 1994; Gehlen et al., 1996; Agarie et al., 2002). For C4 plants, PEPc
activity has been linked to the control of carbon flux in maize under water stressed
conditions (Rodriguez-Penagos & Munoz-Clares, 1999). Based on this observation,
transgenic studies either under- and over-expressing a sorghum PEPc in maize have
showed a significant improvement in CO2 fixation rates and a 30% improvement in WUE
under moderate drought conditions (Jeanneau et al., 2002). Elevated values of WUE
were accounted for by the capacity of the plants to better fix CO2 when the stomatal gas
conductance was reduced by water-limiting conditions (Jeanneau et al., 2002).
In C3 plants, PEPc is not involved in photosynthesis, but, instead, participates in the
anaplerotic pathway to replenish the citric acid cycle with C4 acids during amino acid
synthesis (via the Go/GOGAT cycle) and protein synthesis (Stitt, 1999). However, PEPc
is also considered to be involved in the refixation of CO2 evolved by mitochondrial
respiration (Wirth et al., 1977), such that increased PEPc activity in leaves might
contribute to a decrease in respiratory CO2 loss (Agarie et al., 2002). Attempts to
transgenically confer C4 charcteristics to improve yields in the C3 plants, through the
addition of C4 PEPc, have thus far provided the most tantalizing results in rice, where a
20% reduction in photosynthetic O2-inhibition was observed in plants expressing the C4-
specific maize PEPc (Ku et al., 1999). It was concluded that C3 plants possess the
necessary genetic machinery to express high levels of C4 specific genes, and that the
observed reduction in O2-inhibition was in part due to direct fixation of atmospheric CO2
by the maize PEPc. However, further analyses by Agarie et al. (2002) suggested that
the latter conclusion was not the case, as the observed reductions in O2-inhibition were
linked to lower carbon assimilation rates that were likely due to reduced levels of
available inorganic phosphate (Pi), owing to a lower expression of sucrose synthesis-
related enzymes in the PEPc transformants. Furthermore, increased PEPc activity was
correlated with increased respiration, due to an enhanced flux of malate into the citric
acid cycle (Agarie et al., 2001); a phenomenon that has also been observed in
transgenic potatoes (Gehlen et al., 1996).
PPdK is responsible for regenerating PEP for PEPc, and similar to PEPc and NADP-
MDH, it has also long been recognized as a light-activated enzyme (Hatch, 1987).
However, in contrast to PEPc, PPdK is inactivated by phosphorylation (Ashton et al.,
1984). The enzyme that regulates phosphorylation of PPdK (the PPdK regulatory
protein) catalyzes both the de-phosphorylation of the inactive enzyme and the reverse

Chapter 2: Literature Review
18
reaction. The PPdK regulatory protein is unusual, as ADP and not ATP is used as a
phosphate donor (Burnell et al., 1986). Although it is unclear how the PPdK regulatory
protein is controled, high pyruvate levels appear to block inactivation (Burnell et al.,
1986). Due to a low maximum extractable activity, PPdK was previously implicated as
having an important role in photosynthetic flux (Hatch, 1987). More recently however,
transgenic analysis of Flaveria with suppressed levels of PPdK has showed that, even at
high irradiances, PPdK is not dominant in controlling photosynthetic rates (Furbank et
al., 1997). With a control coefficient of 0.3, PPdK should only be considered a ‘co-
limiting’ enzyme.
The regulatory role of enzymes in the PCR cycle of C4 plants are not necessarily
comparable to C3 species, due to the compartmentation of the PCR cycle in C4 plants
and the physiology of the C4 CO2-concentrating mechanism. For example, the degree to
which Rubisco limits photosynthetic rates in C4 plants may be quite different to C3
species, where the enzyme is confirmed as rate-limiting (Stitt & Schulze, 1994). Rubisco
levels in C4 plants are up to 50% lower than C3 species, which is likely due to lower
Rubisco requirements, owing to the effectiveness of the ‘CO2 pump‘ system in C4
species (Hatch, 1987), and possibly due to a restriction of activity to the leaf bundle
sheath (Dengler & Nelson, 1999). Nevertheless, antisense reduction of Rubisco activity
in Flaveria has confirmed that, under a wide range of CO2 concentrations and light
levels, Rubisco activity exerts a high control over photosynthetic carbon flux (Furbank et
al., 1996). Even slight decreases in Rubisco have resulted in a substantial reduction in
photosynthetic rates, indicating that, despite the high CO2 levels attained in C4 bundle
sheath cells, there is sufficient Rubisco in Flaveria leaves to support maximum rates of
photosynthesis (Furbank et al., 1996). Reduced Rubisco levels were further linked to a
decrease in activity of enzymes involved in the mesophyll C4 cycle (Furbank et al.,
1996), suggesting the existence of a signaling system that coordinates both C3 and C4
cycles. The high control of C4 photosynthesis by Rubisco, as well as a reduced capacity
to alter Rubisco levels relative to C3 species, was further shown to be a disadvantage at
lower temperatures, and is perhaps symptomatic of the deficiency of C4 species to
inhabit cooler climates (Kubien et al., 2003).
The elusive regulatory mechanisms involved in C4 photosynthesis are slowly being
unravelled, such that our understanding of this complex system is growing steadily.
However, based on current knowledge, increased photosynthetic rates and crop yields

Chapter 2: Literature Review
19
through direct transgenic manipulation of the C4 photosynthetic pathway are unlikely at
present. The complexity and abundance of metabolic regulatory mechanisms associated
with Rubisco and PPdK, as well as other C4-related enzymes, are indicative of the
evolved optimization of the plant leaf photosynthetic machininery. The two enzymes
which exert the most control over carbon flux, Rubisco and PPdK, are also the most
expressed in the bundle sheath and mesophyll cells, respectively, thus the over-
expression these genes with current technologies would not be a trivial endeavour
(Furbank et al., 1997).
2.2 Sugar metabolism: regulation and signaling mechanisms in the sucrolytic
pathway
2.2.1 Introduction
In the majority of higher plant species, sucrose is the end-product of photosynthesis.
Sucrose is the dominant long-distance transport form of carbon and energy and has also
been shown to be a major participant of an intricate signaling network that regulates
overall plant growth and development (Winter & Huber, 2000; Rolland et al., 2002; Lunn
& MacRae, 2003; Koch, 2004; Gibson, 2005). Considerable research has been focused
on the mechanisms that control plant sucrose metabolism, and only now is the
complexity of this system emerging. This chapter aims to highlight current knowledge of
the regulatory points in this central metabolic pathway and to examine the signaling roles
played by the metabolites involved, including sucrose and hexose.
Sucrose synthesis is essentially the same in both C3 and C4 plants and is restricted to
the cytosol by compartmentation of key enzymes (Winter & Huber, 2000). In C4 species,
further compartmentation exists at the cellular level, with sucrose synthesis being
located primarily in the leaf mesophyll cells (Lunn & Furbank, 1999). Typically, sucrose
is initially synthesised in leaf tissue from triose-P exported out of the chloroplast in
exchange for Pi during the day, while at night, starch mobilisation provides the substrate
for sucrose biosynthesis, probably in the form of glucose which is derived from the
amylolytic breakdown of starch (Schleucher et al., 1998). During the day, several key
metabolic control points exist in the sucrolytic pathway (Fig. 2.3), which are discussed in
the following sections.

Chapter 2: Literature Review
20
2.2.2 Fructose bisphosphatase
During the active photosynthetic period, triose-P dihydroxyacetone phosphate (DHAP) is
converted to fructose-1,6-bisphosphate (F1,6P) by Ald and subsequently hydrolysed to
form fructose 6-phosphate (F6P) by either the cytosolic FBPase isozyme (EC 3.1.3.11)
or pyrophosphate-dependent phosphofructokinase (PFP; EC 2.7.1.90). While FBPase is
considered to be an important light-dependent control point in the pathway (Stitt et al.,
1987; Quick, 1996), studies on PFP down-regulation in potato and tobacco suggest that
PFP does not play an essential role in sucrose production (Hajirezaei et al., 1994; Paul
et al., 1995).
As the principle irreversible step towards the eventual synthesis of sucrose, cytosolic
FBPase activity is subject to a uniquely complex allosteric regulatory system (Stitt et al.,
1987; Quick, 1996). The activity of the enzyme is inhibited by decreases in the ratio of
F1,6P to Pi and the localised levels of AMP (Stitt et al., 1982). However, the inhibitory
capacity of these two factors on FBPase is further regulated by the concentration of
fructose 2, 6-bisphosphate (F2,6P). F2,6P has garnered much research interest over
the past 25 years as a key signaling molecule (Sabularse & Anderson, 1981; Stitt, 1990,
Nielsen et al., 2004).

Chapter 2: Literature Review
21
Fig. 2.3. Sucrose synthesis in the cytosol following export of triose-phosphate sugars from the
chloroplast. Enzymes shown in italics are cytosolic fructose bisphosphatase
(FBPase; EC 3.1.3.11), pyrophosphate-dependent phosphofructokinase (PFP; EC
2.7.1.90), the bifunctional fructose-2,6-bisphosphate (F2,6P) regulating protein F2KP
(Nielsen et al. (2004)), hexose-phosphate isomerase (HPI; EC 5.3.1.9),
phosphoglucomutase (PGMase; EC 5.4.2.2), uridine diphosphate-glucose
pyrophosphorylase (UGPase; EC 2.7.7.9) sucrose phosphate synthase (SPS; EC
2.4.1.14), sucrose phosphate phosphatase (SPP; EC 3.1.3.24), sucrose synthase
(SuSy; EC 2.4.1.13), hexokinase (HXK; EC 2.7.1.1). Metabolite abbreviations
indicate: triose-phosphates (triose-P), fructose-1,6-bisphosphate (F1,6P), fructose-
2,6-bisphosphate (F2,6P), fructose-6-phosphate (F6P), glucose-6-phosphate (G6P),
glucose-1-phosphate (G1P), uridine diphosphate-glucose (UDPGlc) and sucrose 6-
phosphate (S6P).
CYTOSOL
CHLOROPLAST
Triose-P
F1,6P
F6P
G6P
FBPase
HPI
PGMase
G1P
UGPase
UDPGlc
S6P Sucrose
SuSySPS
MitochondrialMetabolism
Pi
SPPGlucose
Fructose
INV
HXK
PCR CycleF2,6P
F2KP
PFP
CYTOSOL
CHLOROPLAST
Triose-P
F1,6P
F6P
G6P
FBPase
HPI
PGMase
G1P
UGPase
UDPGlc
S6P Sucrose
SuSySPS
MitochondrialMetabolism
Pi
SPPGlucose
Fructose
INV
HXKHXK
PCR CycleF2,6P
F2KP
PFP

Chapter 2: Literature Review
22
The regulation of F2,6P is catalyzed by a unique bifunctional enzyme which harbors both
synthesis (fructose-6-phosphate,2-kinase (F6P,2K; EC 2.7.1.105)) and degradation
(fructose 2,6-bisphosphatase (F26BPase; EC 3.1.3.46)) activities, and has subsequently
been termed F2KP by Nielsen et al. (2004). The overall activity of F2KP is regulated by
the levels of several primary metabolic intermediates, including triose-P, F6P, and Pi
(Stitt, 1990). As photosynthesis increases, triose-P export from the chloroplast reduces
F2,6P levels by inhibiting F6P,2K activity, while the decline of cytosolic Pi
simultaneously stimulates F26BPase and inhibits F6P,2K (Stitt et al., 1987). However,
at the end of the photoperiod, an increase in cytosolic hexose phosphates, resulting from
a decrease in light-dependent sucrose-phosphate synthase (SPS; EC 2.4.1.14) activity,
leads to an elevation in F2,6P levels. This results from the activation and inhibition of
F26BPase by F6P and F6P,2K, respectively (Cseke & Bechana, 1983). In this way, the
F2,6P system acts to depress sucrose production from triose-P in the dark and thus
protects the metabolite levels of the glycolytic pathway and Calvin cycle from depletion,
while also allowing sucrose synthesis and the recycling of Pi to be activated as
photosynthate becomes available (Stitt et al., 1987).
More recent studies have examined the regulation of the two components of the
bifunctional F2KP in more detail, and have shown that pyrophosphate (PPi) and PEP
strongly inhibit F6P,2K activity, while 6-phosphogluconate and F1,6P inhibit F26BPase
activity (Villadsen & Nielsen, 2001; Markham & Kruger 2002). Furthermore, pyruvate
has been shown to activate F6P,2K and inhibit F26BPase activities for F2KP in
Arabidopsis (Villadsen & Nielsen, 2001). Although the overall impact of these
metabolites on F2KP in vivo has yet to be observed, the multitude of regulatory factors
involved does suggest a novel control system that operates under circumstances other
than those of photosynthetic metabolism (Nielsen et al., 2004). Interestingly, transgenic
studies on potato with reduced FPBase levels have lower levels of F2,6P (Zrenner et al.,
1996), suggesting a counteracting effect to release the low levels of FBPase from
inhibition. Thus, although photosynthetic rates were still depressed, plants retained
normal growth rates. While the molecular basis of F26P regulation is understood, the
phosphoregulation of FP2K, and a proper understanding of the interactions between
FBPase and F2KP activity remain to be fully elucidated (Nielsen et al., 2004).

Chapter 2: Literature Review
23
2.2.3 Pyrophosphate-dependent phosphofructokinase
The importance of PFP as an additional component of metabolic regulation at the
F16P/F6P interconversion point remains a point of contention. Due to the low overall
levels of PFP measured in maize leaves plus the decline in PFP activity throughout leaf
development, it was initially suggested that the enzyme was not a major regulatory
component of sucrose production during photosynthesis (Kruger et al., 1986). PFP is
highly sensitive to F2,6P, which can lead to increased activity in both the sucrolytic and
glycolytic directions (Podestà & Plaxton, 2003). It is still not understood why PFP does
not interfere with the regulation exerted over FBPase, or what further metabolic effectors
may be involved (Nielsen et al., 2004).
A likely physiological role suggested for PFP is as a fine regulator of glycolysis,
gluconeogenesis or in PPi formation or removal (Stitt, 1990). Certain CAM species do
exhibit an increased activity of PFP during gluconeogenic carbon flux (Fahrendorf et al.,
1987). Additionally, in barley leaves, Fru-1,6-P2 is a potent allosteric activator of PFP
(Nielsen, 1995), providing support for the gluconeogenic role of PFP during sucrose
synthesis in young leaf tissue, where FBPase activity alone is reportedly insufficient
(Nielsen, 1992). PFP is also linked to various conditions of plant stress, such as Pi
deficiency, anoxia, or where adenosine triphosphate (ATP) conservation is
advantageous (Duff et al., 1989; Mertens et al., 1990; Perata & Alpi, 1993).
In sugarcane tissue, PFP has been suggested to have a more important function in plant
carbohydrate metabolism (Heldt, 1997; Suzuki et al., 2003), and furthermore to play a
key role in the process whereby sugarcane adjusts its growth as a function of sucrose
synthesis, export, import and utilisation (Groenewald & Botha, 2001; Suzuki et al., 2003).
Recently, transgenic sugarcane with reduced PFP levels was shown to have an
increased culm sucrose content (Groenewald & Botha, 2007), perhaps suggesting a
preference towards sucrose synthesis instead of glycolysis in these plants. Even a slight
adjustment to the increase of sucrose flux would be favourable in sugarcane culm, and
similar small changes have been detected in tobacco and potato (Nielsen & Stitt, 2001;
Hajirezaei et al., 1994).

Chapter 2: Literature Review
24
2.2.4 Sucrose phosphate synthase
The first step in the committed pathway of sucrose synthesis begins with F6P and UDP-
glucose, where SPS catalyses the synthesis of sucrose-6-phosphate (S6P), which is
then irreversibly hydrolysed to Pi and sucrose by sucrose-phosphatase (SPP; EC
3.1.3.24). Pi is then recycled back to the chloroplast for the continued supply of triose-P
to the cytosol (Lunn & ap Rees, 1990). As the rapid removal of Suc-6-P by a specific
and high activity phosphatase displaces the reversible SPS reaction from equilibrium in
vivo (Stitt et al., 1987), SPS activity is thought to contribute to the control of flux into
sucrose (Fernie et al., 2002). The expression of SPS is regulated by developmental,
environmental and nutritional signals and, at least in some cases, at the translational
level (Winter & Huber, 2000). Furthermore, it has been demonstrated that SPS activity
is inversely proportional to starch synthesis (Silvius et al., 1979; Huber & Isreal 1982),
and thus SPS may also play an inadvertent role in regulating starch formation (Kerr et
al., 1984; Fernie et al., 2002).
The expression of genes coding for SPS in maize and sugarcane are both light-
dependent and developmentally regulated (Cheng et al., 1996a; Sugiharto et al., 1997),
while the activity of the enzyme has been shown to be phosphoregulated by multiple
serine protein kinases and phosphatases in a variety of species (Lunn & Furbank, 1997;
Winter & Huber, 2000; Lunn & MacRae 2003). Phosphorylation has been implicated in
the diurnal modulation of SPS activity in both soybean (Glycine max L.) and tomato
(Lycopersicon esculentum Mill.), although the periods of fluctuation do differ between the
species (Kerr et al., 1985; Jones & Ort, 1997). Furthermore, there is evidence, based on
an SPP binding site on SPS, for an association between SPS and SPP (a putative SPS-
SPP complex) that might involve channeling of S6P (Echeverria et al., 1997; Lunn et al.,
2000). A further complex between SPS and UDP-glucose pyrophosphorylase (UGPase;
EC 2.7.7.9) has also been suggested (Toroser et al., 1998; Winter & Huber, 2000).
However, the composition, activity and regulation of such complexes remain to be
determined (Lunn & MacRae, 2003).
Thus far, SPS protein kinases comprise two types: an SNF1-related protein kinase
(SnRK1), which is so named due to a similarity to the sucrose non-fermenting 1 (SNF1)
protein kinase from yeast, and a calmodulin-like protein kinase (CPDK) (Winter & Huber,
2000). A detailed study by Huang and Huber (2001) has shown that SPS from dicots is

Chapter 2: Literature Review
25
primarily acted on by SnRK1, whereas both SnRK1 and CPDK could phosphorylate SPS
from monocots. Transgenic studies have further revealed that a maize SPS gene
expressed in tomato plants was active (Worrell et al., 1991). However, in similar
transgenic tobacco plants the enzyme was inactivated (Stitt & Sonnewald, 1995),
suggesting that the endogenous tobacco SPS protein kinases were capable of
phosphorylating maize SPS, but tomato protein kinases were not. This may be
indicative of the importance of other amino acid residues around the phosphorylation site
and at least some species specificity of the recognition sites of SPS for SPS protein
kinases. In spinach (Spinacia oleracea L.), SPS protein kinases have been found to be
inhibited strongly by G6P, while maize leaf SPS protein kinases are reported to be
strictly Ca2+-dependent, suggesting that changes in cytosolic Ca2+ concentration might
be involved in a signaling transduction pathway (McMichael et al., 1995).
Phosphorylation of a unique serine site on SPS has also been reported for spinach
leaves under osmotic stress (Huber & Huber, 1992).
More recent examinations of the complexity of expression of different SPS isoforms
within a single species (Komatsu et al., 1999; Langenkamper et al., 2002; Chen et al.,
2005) revealed the need to re-examine certain previous interpretations of the enzyme,
due to the assumption of ‘uniformity’ for SPS activity or expression levels being
measured. It is now known that at least three families of SPS exist, with monocot/dicot
divisions within each family, and it is predicted that at least one member of each family is
expressed in an individual plant, although one isoform may predominate (Lunn &
Macrae, 2003). For example, a reassessment of work done by Worrel et al. (1991)
might show that maize SPS is less likely to be down-regulated by protein
phosphorylation if it comes from a different family to the predominant form in the target
species. Furthermore, several species have been shown to express at least two
isoforms for SPP (Lunn et al., 2000; Lunn, 2003), although the reasons for such
multiplicity remain to be discovered. Future work on SPS and SPP will need to take the
diversity of their isoforms into account.
2.2.5 Sucrose synthase
Several recent reviews have discussed the hypothesis that sucrose metabolism lies at
the heart of a sensitive, self regulatory developmental system in plants, such that
sucrose and its constituents (glucose and fructose) act not only as the substrates in

Chapter 2: Literature Review
26
carbon metabolism, but also as signaling molecules for regulating several aspects of
primary plant metabolism and growth (Loretti et al., 2001; Rolland et al., 2002; Koch,
2004; Gibson, 2005). If such is the case, then the control of this system will begin with
the synthesis and degradation of sucrose. The cleavage of sucrose may proceed by
one of two enzymatic pathways. The non-reversible invertase (EC 3.2.1.26) reaction
produces glucose and fructose via sucrose hydrolysis. Alternatively, the cleavage of
sucrose into fructose and uridine diphosphate-glucose (UDPGlc) may be catalyzed by
sucrose synthase (SuSy; EC 2.4.1.13). The difference between these two reactions is
significant, as cleavage by invertase comparably produces twice as many hexoses,
while the products of SuSy initiate the fewest hexose-based signals (Wobus & Weber,
1999; Koch 2004). Such signals may be detrimental to tissues undergoing differentiation
or maturation, and SuSy has been shown to predominate over invertase during such
stages of organ development (King et al., 1997; Wobus & Weber, 1999; Fernie &
Willmitzer, 2002). The SuSy reaction is reversible, and there is also clear evidence from
feeding experiments with labelled sugars that both SPS and SuSy pathways contribute
to sucrose synthesis (Geigenberger & Stitt, 1991). It is suggested that the combined
operation of these pathways with the invertase degradative pathway allows the cell to
respond sensitively to both variations in sucrose supply and cellular demand for carbon
for biosynthetic processes (Geigenberger et al., 1997).
The crucial role of SuSy in carbon partitioning has been demonstrated in several
species, including potato, tomato, carrot (Daucus carota L.), cotton (Gossypium hirsutum
L.) and sugarcane (Zrenner et al., 1995; D’Aoust et al., 1999; Sturm & Tang, 1999;
Botha & Black, 2000; Ruan et al., 2003). SuSy is implicated in several important
physiological process including starch synthesis (Nguyen-Quoc & Foyer, 2001), cell wall
synthesis (Déjardin et al., 1997; Chourey et al., 1998), plant source-sink relations
(Zrenner et al., 1995), phloem loading and unloading (Hänggi & Fleming, 2001) and
response to anoxia (Ricard et al., 1998). Concerning the latter, SuSy has been shown to
operate more effectively under conditions of low oxygen compared to invertase (Zeng et
al., 1999). Furthermore, recent evidence from transgenic potato has indicated that a
normal developmental shift to sucrose cleavage by SuSy in growing tubers is beneficial
to adenylate balance, starch biosynthesis and respiratory costs (Bologa et al., 2003).
Thus, the functional significance of SuSy as opposed to invertase is likely to be
particularly important in the low-oxygen conditions of growing sinks, where it can help to
conserve adenylate usage through production of UDPGlc instead of hexoses, compared

Chapter 2: Literature Review
27
to invertase which utilizes ATP. This role for SuSy may be of particular interest with
regards to sugar accumulation in sugarcane, as the internal physiology of mature
internodal tissues is likely to be hypoxic (Watt, unpublished results). The regulatory
importance of SuSy activity for sucrose synthesis in young sugarcane internodes has
been discussed and modeled (Botha & Black, 2000; Schäfer et al., 2004), however, the
regulatory function of SuSy in older tissue has yet to be fully examined. Due to the
correlation between peak activity of SuSy, as well as acid invertase during internode
elongation, both enzymes are likely to be involved in the elongation growth process
(Lingle, 1999).
An additional role for SuSy in phloem loading and unloading was initially based on
consistent observations of localisation of SuSy expression to mature phloem cells in leaf
tissues (Nolte & Koch, 1993). Although a report by Hänggi and Fleming (2001)
concluded that there is a specific exclusion of SuSy transcript and protein accumulation
from the sink phloem tissue of young maize leaves, more recent work has
immunolocalised the enzyme to sieve-tube elements, as well as to companion cells
(Wächter et al., 2003). SuSy has now been observed in close proximity with the sieve-
tube plasma membrane and a phloem specific ATPase that is believed to aid sucrose
transport and compartmentalization (Wächter et al., 2003). Besides being favorable
under the anoxic conditions found in phloem tissues (van Dongen et al., 2003), SuSy
has been suggested to play a role in the direct supply of UDPGlc for the rapid wound
induced biosynthesis of callose plugs (Wächter et al., 2003).
Thus far, three isoforms of the SuSy gene have been identified in monocot species and
two in dicot species (Fu et al., 1995; Huang et al., 1996). These genes have different
spatial and temporal expression (Koch, 2004), are differentially regulated at the
transcriptional and translational levels and are likely to perform different metabolic
functions (Fu et al., 1995; Chourey et al., 1998; Déjardin et al., 1999). Expression may
also vary according to tissue type and the carbohydrate metabolic state (Winter & Huber,
2000). The maize SuSy isoform Sh1, for example, is maximally expressed under
carbohydrate-limiting conditions (0.2% compared to 2% glucose), whereas the
expression of sus1 is induced by increasing glucose concentrations (Hellman et al.,
2000). Sh1 also responds rapidly to low oxygen levels, with marked increases in both
mRNA levels and enzyme activity especially under conditions of modest oxygen
depletion (i.e. 3% oxygen) (Zeng et al., 1998).

Chapter 2: Literature Review
28
On the protein level, SuSy is strictly a cytosolic enzyme, which can occur as a
membrane associated and as a soluble form, where the latter may interact with the actin
cytoskeleton and cellular membranes (Winter et al., 1998; Hardin et al., 2004).
Regulation of the membrane associated form has been linked to posttranslational
modification by reversible phosphorylation (Winter et al., 1997), although the
physiological significance of this is still unclear. Nevertheless several mechanisms that
tightly control the activation and turnover of SuSy through phosphorylation by SnRKs
and CPDKs have now become apparent. The first phosphorylation step (at the serine
15 residue) that is involved in activating the enzyme may be catalyzed by either kinase
type (Huber et al., 1996), however, this initial phosphorylation step is implicated in
predisposing the enzyme to phosphorylation at a second site (serine 170).
Phosphorylation of the second site can be catalyzed by CPDKs, but not SnRKs (Hardin
et al., 2003). This second phosphorylation step, in turn, targets the enzyme for ubiquitin-
mediated degradation via the proteosome (Hardin et al., 2003). In addition, the
ubiquitin-mediated pathway of SuSy breakdown may be inhibited if the second
phosphorylation site is blocked by the binding of an additional protein, known as
ENOD40, which was initially discovered in soybean root nodules (Kouchi et al., 1999;
Rohrig et al., 2002; Hardin et al., 2003). The protective role of ENOD40 proteins has
been linked to the control of vascular function, phloem loading and assimilate import
(Hardin et al., 2003). For example, ENOD40 mRNA expression is elevated at sites of
high sink activity and at points of rapid unloading in the phloem (Rohrig et al., 2002;
Hardin et al., 2003).
2.2.6 Invertases
As mentioned in section 2.2.5, the invertases catalyze the irreversible cleavage of
sucrose into the two hexoses glucose and fructose, utilizing ATP and forming twice as
many hexoses as SuSy in the process. The resulting shift in the sucrose:hexose ratio,
and consequent signaling from sugar sensors, has been shown to alter the expression of
diverse genes (Koch, 1996; Wobus & Weber, 1999; Sturm & Tang; 1999). Thus,
invertases are involved in a wide variety of metabolic processes affecting plant
development (Koch, 2004).

Chapter 2: Literature Review
29
The invertases are a family of �-fructosidase enzymes that differ in pH optimum for
activity (neutral or acidic) and solubility. The three major isoforms are cytosolic neutral
invertase (NI), soluble vacuolar acid invertase (VAI) and insoluble cell wall invertase
(CWI), which differ in both localization and function (Quick, 1996; Link et al., 2004). Both
VAI and CWI are of exceptional metabolic importance, as they are the only known
enzymes able to cleave sucrose in extracellular compartments such as the vacuole (VAI)
and apoplastic space (CWI) (Link et al., 2004). However, the role of NI has previously
been considered as a less important “maintenance” enzyme, involved in sucrose
degradation when the activities of VAI and SuSy are low (Winter & Huber, 2000).
Nevertheless, several recent studies in sugarcane have suggested that NI may play a
prominent role in sucrose accumulation (Bosch et al., 2004; Mao et al., 2005).
2.2.6.1 Vacuolar acid invertase
The primary function of VAI can be characterized in terms of cell turgor regulation and
the control of sugar balance in reproductive tissues and mature tubers (Greiner et al.,
1999; Sturm & Tang, 1999). VAI is also known to play a prominent role in both sucrose
import and sugar signaling (Sturm & Tang, 1999), particularly during the initiation of sink
growth and cell wall expansion, when there is a high need for sucrose hydrolysis
(Richardo & ap Rees, 1970; Tymowska-Lalanne & Kreis, 1998). Several studies in
sugarcane have linked VAI activity to the elongation and expansion rates of maturing
internodes (Glasziou & Bull, 1965; Lingle, 1999).
The expression of VAI is dependent on a multitude of signals, including sugars
(particularly hexoses), hormones and other environmental stimuli (Koch, 1996; Walker et
al., 1997; Koch 2004). A variety of studies have examined environmental signals,
including the influence of gravity and indole acetic acid on bending stems (Long et al.,
2002), cold treatment on the sweetening of tubers (Greiner et al., 1999), and drought
and abscisic acid on hexose concentrations in leaves (Trouverie et al., 2003). The
repression of VAI expression during drought has also been linked to carbon resource
management during reproduction (Andersen et al., 2002). As sucrose cleavage in the
early phase of maize kernel growth has been shown to be predominantly controlled by
VAI before the up-regulation of other sucrose metabolism genes, the onset of water
stress often causes younger kernels to abort, thus giving preferentiality to the survival
and development of more mature kernels (Andersen et al., 2002).

Chapter 2: Literature Review
30
A variety of gene isoforms exist for VAI, which have been shown to have different
developmental and tissue specific expression patterns. The precise function of each
isoform remains to be fully elucidated. For example, the maize VAI isoform Ivr1 is up-
regulated by sugar depletion, whereas Ivr2 exhibits increased expression levels when
sugar supply is abundant (Koch, 1996). Furthermore, Ivr2 is up-regulated in the leaves
of drought stressed plants (Trouverie et al., 2003), but down-regulated in the ovaries and
young kernels under similar conditions (Andersen et al., 2002). Ivr2 is also highly
expressed in various plant organs including root tips, prop roots, mature anther, silk,
kernel base and adult leaves under water stress (Koch 1996), while Ivr1 is mainly
expressed in mature anther, and to a lesser degree in silk, kernel crown and root tips
(Koch 1996; Xu et al., 1996; Kim et al., 2000a). In species other than maize, a
considerable variation of VAI activity has been observed, particularly in photosynthesis
of fully expanded leaves (Huber, 1989). Furthermore, Huber (1989) has demonstrated
that only species with a low VAI activity accumulate sucrose in leaves, as an end
product of photosynthesis (Huber, 1989). As sugarcane favours accumulation of
photoassimilate in the form sucrose, a limited activity for VAI in sugarcane leaves is
expected.
Several intriguing advances have been made in identifying novel regulators of VAI at the
protein level, including the discovery of a pre-vacuolar regulatory system in Arabidopsis
(Rojo et al., 2003). Prior to delivery in the vacuole, VAI may be compartmentalized for
extended periods in a vacuole-associated endomembrane vesicle known as the
precursor protease vesicle (PPV). The PPV is also home to an inactive form of a
vacuolar processing enzyme (VPEy protease), which may be released into the vacuole
together with VAI. VPEy protease auto-activates upon entering the vacuole and can
then target VAI for degradation. Thus, the PPV compartment not only plays a role in
regulating the time at which VAI activity commences, but also controls its vulnerability to
subsequent turnover by VPEy protease (Rojo et al., 2003).
2.2.6.2 Neutral invertase
The soluble neutral invertases (NI) are involved in cytosolic sucrose hydrolysis. In
comparison to studies on other invertases, NI has been largely neglected (Hawker,
1985). However, the enzyme has since been purified and characterized for a variety of

Chapter 2: Literature Review
31
species (Chen & Black, 1992; Lee & Sturm, 1996; Vorster & Botha, 1998; Rose & Botha,
2000). The cycling of carbon between sucrose and hexoses, as a result of simultaneous
synthesis and degradation of sucrose, has since been demonstrated in the cytosol of
sink tissue in several species, including sugarcane (Geigenberger et al., 1991; Whittaker
& Botha, 1997; Nguyen-Quoc & Foyer, 2001). This ‘futile cycling’ of sucrose is believed
to be primarily responsible for overall sucrose accumulation in sugarcane, which may be
mediated by SuSy and/or NI (Batta & Singh, 1986). A more recent correlation between
hexose levels and NI in younger tissue has suggested that the enzyme could contribute
to the supply of hexoses in younger culm tissue, implicating the enzyme as an important
component of growth metabolism (Rose & Botha, 2000; Mao et al., 2005). cDNAs
encoding an enzyme with neutral/alkaline invertase activity have been cloned in poison
rye grass (Lolium temulentum Lam. Kuntze.) and carrot (Gallagher & Pollock, 1998;
Sturm et al., 1999). However, further cloning from other species will be required to elicit
whether the neutral/alkaline invertases cover more than one family of enzymes.
Transcripts of NI have been found in all sugarcane tissues, albeit at relatively low levels
(Bosch et al., 2004). The highest levels of NI expression and activity were observed in
maturing culm, where sucrose was low and hexoses were high, with decreasing activity
as the culm matures (Rose & Botha, 2000). A similar trend in distribution was seen in
carrot, where the highest steady state levels of NI favoured young, actively growing
tissues (Sturm et al., 1999). The relationship between NI and its substrates throughout
the sugarcane growth season is still not clear (Batta & Singh, 1986; Rose & Botha,
2000). This has led to the suggestion that NI activity may only be linked to local
environmental and cyclic factors, rather than development and maturation (Rose &
Botha, 2000).
2.2.6.3 Cell wall invertase
The insoluble CWI is ionically bound to the extracellular cell wall and consequently plays
a key role in phloem unloading and assimilate uptake, specifically in sink tissues where
an apoplastic step is involved (Roitsch et al., 2003; Koch, 2004). As CWI cleaves
apoplastic sucrose, it ensures a steep concentration gradient of sucrose from source to
sink (Escherich, 1980), and has consequently implicated as a pivotal component in
establishing such metabolic sinks (Roitsch et al., 1995). Furthermore, the enzyme has
been implicated in maintaining a strong source-sink relationship (Roitsch et al., 2003).

Chapter 2: Literature Review
32
The role of CWI has been shown to be highly prominent in developing seeds and pollen,
where a gap in plasmodesmatal connections between cells has been shown to exist,
and apoplasmic sugar transfer is prominent (Wobus & Weber 1999). However, if at least
some sucrose moves across the cell wall space, CWI can additionally influence sinks
where the plasmodesmatal connections remain intact, such as in developing carrot root
and potato tubers (Sturm & Tang, 1999, Wächter et al., 2003). The importance of CWI
in sugar partitioning has also been examined using a maize mutant (miniature1) which,
due to an abolishment of endosperm specific CWI, showed a small seed phenotype
(Cheng et al., 1996b). Similarly, antisense inhibition of CWI in carrot resulted in the
arrestment of tap-root formation (Tang et al., 1999). In both cases, provision of
apoplasmic hexoses was required for normal development.
A variety of isoforms of the CWI family have been isolated (Roitsch et al., 2003). Similar
to SuSy, CWI isoforms exhibit highly tissue-specific mRNA expression patterns. In
maize, four isoforms that differ greatly in expression locales have been identified thus far
(Incw1, Incw2, Incw3 and Incw4) (Qin et al., 2004). Expression of Incw3 and Incw4 is
very low in grain, as it is detectable only by reverse transcription-polymerase chain
reaction (RT-PCR) (Kim et al., 2000b). In tomato, the expression of CWI isoform Lin7 is
observed solely in anther tapetum cells and pollen grains (Godt & Roitsch, 1997).
Anther-specific isoenzymes of CWI are furthermore evident in both tobacco and potato
(Maddison et al., l 999; Goetz et al., 2001), indicating the crucial function for extracellular
invertases in providing carbohydrates to the male gametophyte. Recently, antisense
reductions of CWI in pollen have demonstrated the important role of CWI in maintaining
male fertility (Roitsch et al., 2003).
Several regulatory mechanisms have been revealed for CWI, including tissue specific
expression (Cheng et al., 1999), differential transcript formation (Cheng et al., 1999),
exon skipping (Bournay et al., 1996) and stimulation of activity by a variety of
phytohormones (Roitsch et al., 2003). Importantly, CWI expression and enzyme activity
are also modulated by sugars. Roitsch et al. (1995) observed higher enzyme activity
and increased levels of CWI mRNA in the presence of sucrose and glucose using
photoautotrophic suspension cultures of Chenopodium rubrum (L.), whereas various
isoforms of CWI have been up-regulated by glucose in tobacco and Arabidopsis
(Krausgrill et al., 1998; Tymowska-Lalanne and Kreis, 1998), and by sucrose in tomato
(Godt & Roitsch, 1997). More recently, research in tomato suspension cultures has

Chapter 2: Literature Review
33
observed up-regulation of a CWI isoform using non-metabolizable sucrose analogues,
such as palatinose, turanose and flourosucrose (Sinha et al., 2002). However, both
turanose and palatinose are synthesised by plant pathogens, indicating that the
invertase response may be linked to stress related stimuli, rather than a unique sugar-
signaling mechanism. Nevertheless, as both metabolizable sugars and stress-related
carbohydrate stimuli have been shown to regulate CWI expression, CWI is potentially an
important marker gene for the analysis of converging signaling pathways (Roitsch et al.,
2003).
CWI activity is regulated through a protein-protein binding complex between CWI and
invertase inhibitor proteins (INH) (Krausgrill et al., 1998; Greiner et al., 1999).
Expression analysis of CWI and INH has indicated that, at certain stages of plant
development, CWI activity is down-regulated by INH, the latter operating as a regulatory
switch (Krausgrill et al., 1998). INH was originally isolated and purified to homogeneity
from tobacco leaves, while the genes encoding the INH have been cloned from
Arabidopsis and tobacco (Greiner et al., 1999). Recently, the isolation of INH-type
isoforms in several plant species has provided evidence that independent INH-systems
regulate both CWI and VAI activities (Greiner et al., 2000; Link et al., 2004). Although
the exact physiological mechanism of INH is still unclear, one possibility is that INH may
function to modulate CWI activity under adverse conditions, such as maintenance of a
minimal, critical sucrose concentration during sugar starvation (Winter & Huber, 2000).
2.2.7 Hexokinase
In plant tissues, the ratio of sucrose to hexose concentrations is an important metabolic
signal that affects almost every aspect of plant development, including programmed cell
death (Balibrea Lara et al., 2004; Koch, 2004). The invertases, and to a lesser degree
SuSy, are involved in maintaining the sucrose:hexose ratio. However, sugar sensors,
such as hexokinase (HXK; EC 2.7.1.1), play a principal regulatory role in sensing sugar
status and initiating signaling cascades that influence overall plant metabolism.
Although initially questioned (Halford et al., 1999), the involvement of HXK in sugar
sensing has now been widely accepted (Moore & Sheen, 1999, Loreti et al., 2001;
Rolland et al., 2002; Harrington & Bush, 2003).

Chapter 2: Literature Review
34
Sugars are important regulators of gene expression. Sheen (1990) initially demonstrated
in maize protoplasts that glucose, or sucrose, was able to repress the expression of
photosynthetic genes in higher plants. Subsequent studies led to the hypothesis that the
sugar signal was perceived by HXK (Jang & Sheen, 1994; Koch, 1996; Jang & Sheen,
1997). Although a variety of sugars and sugar analogs have been examined, only
substrates that were phosphorylated by HXK resulted in the expected gene expression
changes (Jang & Sheen, 1994). Phosphorylated hexose did not represent a signal for
the plant, as demonstrated by the inability of glucose-6-phosphate, introduced into
protoplasts via electrophoresis, to elicit the same effect as glucose (Jang & Sheen,
1994). Based on these results, it is thus likely the de-phosphorylated form of glucose
that initiates the HXK signal. Furthermore, mannoheptulose, a competitive inhibitor of
HXK, blocked the regulatory effects of all sugars (Koch, 1996). The role of HXK as a
putative sensor of hexose signaling was further clarified using sense and antisense
constructs of the Arabidopsis HXK isoforms Hxk1 and Hxk2 (Jang et al., 1997). Plants
that overexpressed HXK genes exhibited glucose hypersensitive characteristics,
whereas antisense plants were hyposensitive (Jang et al., 1997). Together, these data
supported the hypothesis that HXK is the putative sensor for hexose signaling.
To isolate the hexose signaling feature of HXK, Moore et al. (2003) uncoupled the
phosphorylation activity of the enzyme from its sensing/signaling activity by generating
point mutations in the catalytic domains of the protein. Upon engineering a synthetic
Hxk1 isoform, which was not capable of hexose phosphorylation yet still exhibited
glucose sensing activity, the protein construct was transferred to an Arabidopsis Hxk1
knockout mutant (glucose insensitive2-1) [gin2-1]). Although typically exhibiting broad
growth defects during both glucose-dependent reproductive and vegetative stages of
development, gin2-1 mutants carrying the synthetic Hxk1 construct showed significantly
restored growth and development, thus confirming a pivotal role for HXK in glucose
signal transduction (Moore et al., 2003). These results also show that glucose signaling
is not the result of the accumulation or depletion of downstream metabolic products, or
of changes in the ATP:ADP ratio, as has been suggested (Jang & Sheen, 1997).
Furthermore, as HXK-mediated glucose signaling is not depended on its catalytic
activity, HXK appears to play two functionally distinct roles in plant metabolism
(Harrington & Bush, 2003).

Chapter 2: Literature Review
35
Many factors surrounding the HXK-glucose signaling function remain to be uncovered.
As the binding site of glucose for glucose phosphorylation is not necessarily the same
site involved in glucose signaling (Moore et al., 2003), the precise location of the
signaling mechanism needs to be isolated (Harrington & Bush, 2003). Furthermore,
whether HXK senses free glucose in a linear, concentration-dependent manner, or
whether it is a flux sensor that senses either upward or downward deviations from a
fixed or dynamic set point, needs to be resolved (Koch, 1996). Although several other
protein kinases and phosphatases are implicated as secondary messengers in yeast
(Rolland et al., 2002; Rolland et al., 2006), their roles in higher plant systems are
speculative, and other proteins could also be involved. In addition, very little is known
about the intracellular or tissue specific localisation of the various HXK isoforms, or the
relationship, if any, between HXK and other HXK-like enzymes, such as fructokinase or
glucokinase, which are also implicated in sugar sensing (Pego & Smeekens, 2000;
Loretti et al., 2001; Hoepfner & Botha, 2003). Thus, although the function of HXK has
been revealed, it seems that a complex cascade system, perhaps involving several other
proteins and metabolites, must still be elucidated (Harrington & Bush, 2003).
2.2.8 Trehalose metabolism
An important role for the trehalose metabolic pathway in regulating a HXK-independent,
sugar-signaling system has recently emerged (Pellny et al., 2002; Eastmond et al., 2003;
Paul & Pellny, 2003; Paul, 2007) (Fig. 2.4). Previously, the trehalose pathway was not
thought to be universal in plant species (Goddijn & Smeekens, 1998). A reason for this
may lie in the fact that trehalose metabolites are found only in very low amounts in
species other than resurrection plants, where their accumulation to high levels enables
protection from desiccation (Wingler, 2002). Previously, the inability to detect trehalose
even lead to the suggestion that most higher plants had lost the ability to produce it
(Crowe et al., 1992). However, the activity of trehalase, an enzyme responsible for the
breakdown of trehalose to glucose, was found to be present in numerous plants (Müller
et al., 1995). Subsequent application of an inhibitor of trehalase successfully
demonstrated detectable levels of trehalose in both tobacco and potato (Goddijn et al.,
1997).
Similar to sucrose, trehalose is typically produced in a two-step process (Fig. 2.4).
Firstly, the synthesis of trehalose-6-phosphate (T6P) from UDP-glucose and G6P is

Chapter 2: Literature Review
36
catalyzed by trehalose 6-phosphate synthase (TPS; EC 2.4.1.15). T6P is then
dephosphorylated to trehalose by trehalose 6-phosphate phosphatase (TPP; EC
3.1.3.12) (Rolland et al., 2006). Functional genes encoding TPS and TPP have been
detected in Arabidopsis (Blázquez et al., 1998; Vogel et al., 1998; Vogel et al., 2001),
while T6P has been found in tobacco in the low �M range (Pellny et al., 2002).
Fig. 2.4. Trehalose synthesis pathway and model for its relationship with regulating
photosynthetic capacity (modified from Paul & Pellny, 2003). Enzymes indicated
include trehalose phosphate synthase (TPS; EC 2.4.1.15), trehalose phosphate
phosphatase (TPP, EC 3.1.3.12), trehalose phosphate hydrolase (TPH; EC 3.2.1.93),
Trehalase (Trase; EC 3.2.1.28).
The regulatory role of the trehalose pathway in sugar signaling has now been examined
in several plant systems. In Arabidopsis, external application of even small
concentrations of trehalose has resulted in significant physiological changes, such as
inhibition of root elongation (Wingler et al., 2000). Previous transgenic research in
tobacco plants expressing the E. coli otsA and otsB genes, encoding TPS and TPP
respectively, has produced effects consistent with an impact on sugar signaling (Paul et
al., 2001). Further research has shown that transgenic plants expressing the otsA gene
have smaller darker green leaves and greater photosynthetic capacity per unit leaf area
than wild types, while plants expressing the otsB gene have larger and paler leaves with
lower photosynthetic capacity (Pellny et al., 2002). Although producing no measurable
T6P
G6PTrehalose
UDPGlc
TPS TPP
TPH
Glucose
Trase
Photosynthetic capacity
Glycolytic flux carbon:nitrogen balance
T6P
G6PTrehalose
UDPGlc
TPS TPP
TPH
Glucose
Trase
Photosynthetic capacity
Glycolytic flux carbon:nitrogen balance

Chapter 2: Literature Review
37
trehalose in transgenic leaves, the genetic modifications did perturb T6P levels, with
increased photosynthetic capacity correlating with an increase in T6P content (Pellny et
al., 2002). Controlled alterations of T6P levels by expressing combinations of E. coli
trehalose metabolism genes have since clearly demonstrated that T6P is indispensable
for carbohydrate utilization for growth in Arabidopsis (Schluepmann et al., 2003). The
exact mechanisms whereby T6P influences carbon metabolism are still unclear, since
unlike in yeast, T6P is not an inhibitor of HXK activity (Eastmond et al., 2002). This
indicates that T6P may be involved in a HXK-independent sugar-signaling pathway
(Eastmond et al., 2003).
A further interesting development has been the identification and isolation of a single
gene system for the production of trehalose. In the basidiomycete fungi, Grifola
frondosa, trehalose may also be synthesized directly from glucose and glucose-1-
phosphate by a novel trehalose synthase (Saito et al., 1998; Zhang & Zheng, 1999).
Transgenic transfer of the gene into tobacco and sugarcane resulted in plants that
accrued high levels of trehalose and exhibited increased drought and salt tolerance
(Zhang et al., 2005; Zhang et al., 2006). Transgenic sugarcane had no obvious
morphological changes and no growth inhibition in the field, whilst exhibiting an
increased tolerance of drought and improved yield under drought conditions (Zhang et
al., 2006). Although the exact physiological effects of trehalose in this system are not
known, these results demonstrate that sugarcane may tolerate high amounts of
trehalose. This raises interesting questions regarding the sensitivity of the trehalose
signaling system between different plant species.
Although the mechanisms of trehalose and T6P regulation in higher plants requires
further investigation, it appears the T6P may perturb glycolytic carbon flow and the
carbon: nitrogen balance implicated in the regulation of leaf photosynthesis (Paul &
Pellny 2003; Paul, 2007). Further research has also shown that the TPS gene is
required during embryogenesis, where it appears to enable Arabidopsis embryos to
respond to sucrose (Eastmond et al., 2002). These findings implicate the trehalose
pathway in an even broader sugar-sensing role.

Chapter 2: Literature Review
38
2.3 The relationship between sink and source
2.3.1 Introduction
A firm grasp of the control mechanisms of photosynthesis (see section 2.1) and sucrose-
related plant growth (see section 2.2) may clarify certain facets of plant metabolism;
however, without knowledge of the interrelationship between the leaf and growing
regions of the plant, a proper understanding of how plant development is regulated
cannot be fully realised. Carbon assimilation is a function of the balance between the
supply by leaf photosynthesis and the demand from growth processes. As such, to
properly conceptualise the manner in which plants assimilate and partition carbon, an
understanding of the paradigm of ‘sink’ and ‘source’ tissues is required.
The hypothesis that photoassimilate accumulation plays a role in regulating
photosynthesis rates is not new. Such a connection was initially highlighted by
Boussingault (1868), who suggested the existence of a putative link between leaf
(sources) and storage tissues (sinks), instead of a one-way relationship. Close co-
ordination of source photosynthetic activity with carbon demand of sink organs has now
been clearly demonstrated in several species, where a decrease in assimilation rate is
observed when sink demand for carbohydrate is limited (Gucci et al., 1994; Iglesias et
al., 2002; De Groot et al., 2003; Quilot et al., 2004; Franck et al., 2006). As plants are
sessile, autotrophic organisms, the need to integrate metabolism and growth with
external environmental signals is crucial. To do so efficiently, plants must rigorously
coordinate both source activity and sink demand, or else risk a fatal ‘economic crisis’
from over-investing in either one or the other. This involves both fine (substrate and
allosteric) and coarse (gene expression) regulation, as well as specific sugar-signaling
mechanisms (Rolland et al., 2006).
The elucidation of a regulatory relationship between the demand for carbon from
growing areas of the plant and the supply from leaves has become a novel and exciting
field of molecular and physiological research (Wardlaw, 1990; Pego et al., 2000; Paul &
Foyer, 2001; Rolland et al., 2002; Paul et al., 2001; Paul & Pellny, 2003). Evidence
increasingly supports a sink-dependent relationship (Paul & Foyer, 2001), whereby the
demand for carbon from sink tissues, or sink-strength, influences the net photosynthetic
activity and carbon status of source organs (Paul et al., 2001). However, the dominant

Chapter 2: Literature Review
39
mechanisms through which the sink regulates the source appear not to be simple linear
pathways, but rather a set of complex networks with many points of reciprocal feedback
control, which together determine the limits within which photosynthesis can be
productive and underpin the source-sink interaction (Paul & Foyer, 2001; Minchin &
Lacointe, 2004; Rolland et al., 2006).
The precise metabolic mechanisms that give rise to feedback control are still not fully
understood (Paul & Pellny, 2003). However, recognition of the role of sugar transporters
and associated regulatory metabolic enzymes in the loading and unloading of sucrose in
the phloem has led to the proposition of several models that serve to illustrate the
carbon transport pathways between source and sink tissue. Using the source-sink
paradigm, this chapter will discuss existing understanding of the physiological and
metabolic means by which plants regulate carbon partitioning and accumulation.
Furthermore, it will highlight current mechanistic modeling efforts to predict the observed
complexity of the source-sink relationship, with particular reference to sugarcane
models.
2.3.2 Phloem transport
Long-distance transport of carbohydrates between sources and sinks occurs in specific
cells of the vascular system called the phloem sieve elements. During development,
most organelles (including vacuoles and nuclei) of sieve elements are degraded,
resulting in an intimate connection via numerous branched plasmodesmata with
neighboring phloem companion cells, which in turn supply energy and proteins to the
sieve elements (Williams et al., 2000, Stadler et al., 2005). Phloem transport functions
via bulk flow, where accumulation of sugars inside the sieve element-companion cell
complex (SE-CCC) results in the osmotic uptake of water which then drives sap along
the sieve tube. The unloading of sugars at the sink results in a loss of water, and thus a
gradient of pressure is maintained (Williams et al., 2000). Despite the occurrence and
importance of other phloem solutes, such as amino acids, raffinose and stachyose,
hexitols, inorganic ions and the most recently identified component, fructans (Wang &
Nobel, 1998), sucrose is the osmotically dominant compound in the sieve tube sap of
most species, including sugarcane (Hartt et al., 1963; Huber et al., 1993; Komor, 2000).
Thus, in these species, sucrose is not only the main transport metabolite, but also the

Chapter 2: Literature Review
40
primary contributor to the osmotic driving force for phloem translocation (Hellman et al.,
2000).
2.3.2.1 Phloem loading
Recently, there have been several advances in understanding of the processes involved
in phloem loading at the source (Lalonde et al., 2003; van Bel, 2003; Minchin & Lacointe,
2004). Depending on species, phloem loading is now believed to involve an apoplastic
step, a symplastic step, or both, between the site of sucrose synthesis and the sieve
tubes involved in transport (Komor, 2000). Apoplastic loading involves flow of sucrose
from the leaf mesophyll into the apoplastic space in the vicinity of the vascular tissue,
from where it is actively taken up across the cell membrane by sugar transporter
proteins into the SE-CCC, or directly into the sieve element (Hellman et al., 2000;
Minchin & Lacointe, 2004). However, with symplastic loading, sucrose flows from cell-
to-cell to the SE-CCC entirely through plasmodesmata, probably via diffusion, and thus
does not cross the membrane (van Bel & Gamalei, 1992). However, it should be noted
that plasmodesmata are not simply intracellular ‘holes’ which facilitate passive transport,
but rather dynamic, complex structures through which the transport of macromolecules
is highly regulated (Lucas et al., 1993). An association of cytoskeletal elements, such as
actin- and myosin-like proteins, with plasmodesmatal structures has been demonstrated
(White et al., 1994; Radford & White, 1998). These cytoskeletal elements may play a
role in the targeting and transport of macromolecules through the plasmodesmata
(Radford and White, 1998).
As most studies of the leaf have revealed that the sucrose concentration in the sieve
tube sap is higher than in the mesophyll, active transport is likely to be involved at the
loading site (Komor, 2000). Similar to other active transport processes, the rate of active
sucrose export would thus depend on the sucrose concentration in the leaves according
to Michaelis-Menton-type kinetics (Komor, 2000). In soybean, such a linear relationship
between sucrose content in the leaf and net export rate has been shown by manipulating
sucrose content with varying light intensities (Fader & Koller, 1983). A similar 14CO2-
labelling study was undertaken using leaves of a variety of species, with particular
emphasis on the difference between C3 and C4 plants (Grodzinski et al., 1998). C4
plants were clearly shown to have higher leaf solute concentrations and export rates
(Grodzinski et al., 1998).

Chapter 2: Literature Review
41
In C4 plants, such as sugarcane, where a two cell-type (exterior mesophyll and interior
bundle sheath) configuration exists, sucrose is still produced primarily in the mesophyll
(Lunn & Furbank, 1997). Thus, in C4 plants, sucrose must additionally pass through the
bundle sheath cells to be loaded into the phloem through either a plasmodesmatal or
apoplastic step, or both (Fig. 2.5) (Lunn & Furbank, 1999; Walsh et al., 2005). However,
in sugarcane, the conducting cells of the phloem are not connected to other cells of the
leaf by plasmodesmata (Robinson-Beers & Evert, 1991), suggesting that phloem loading
occurs from the apoplast (Rae et al., 2005a).
2.3.2.2 Phloem unloading
Phloem unloading in most species is believed to favour symplastic movement, through
plasmodesmata linking the cells in the sink region (Minchin & Lacointe, 2002). In
immature potato tubers, phloem unloading is predominately apoplastic, although the
onset of tuber development and starch accumulation is accompanied by a switch to
symplastic transfer of solutes to storage parenchyma cells (Viola et al., 2001). The
destination of the symplastic flow is not the terminal sieve elements, but rather within the
receiver cells, where the sink osmotic pressure is kept low by metabolic utilization of the
carbohydrates or conversion into less osmotically active polymorphic forms, such as
starch (Minchin & Lacointe, 2002). Growing evidence indicates that the region of highest
flow resistance is not within the transport phloem linking sources and sinks, but rather
within the symplastic pathway of the receiver cells (Gould et al., 2004; Walsh et al.,
2005).
Importantly, symplastic unloading rarely operates independently, as the pathway of
unloading in storage tissues, in which soluble sugars are accumulated, often includes an
apoplastic step at the periphery of the phloem or in subsequent cell layers (Lalonde et
al., 2003). A preference for apoplastic unloading has been demonstrated in tomato and
developing fruits by the movement of tracer dyes (Patrick, 1997). Thus, in sugarcane,
where sugars accumulate in tissues that are relatively mature, the apoplastic pathway
may be pre-eminent (Rae et al., 2005a; Rae et al., 2005b). The sugarcane culm
contains high levels of apoplastic sucrose (Hawker & Hatch, 1965; Welbaum & Meinzer,
1990), which suggests that sucrose is unloaded from the phloem complex directly into
the apoplast. Sucrose is then cleaved in the apoplast by CWI and taken up by
surrounding parenchyma storage tissues, where it may be re-synthesized (Patrick,

Chapter 2: Literature Review
42
1997). At culm maturity, the concentration of sucrose would generate very high turgor
pressures, if retained in the parenchyma cells. Measurements of turgor, wall
extensibility and membrane conductivity in sugarcane parenchyma tissue have
suggested that low turgor is maintained by partitioning of solutes between the symplastic
and apoplastic compartments (Moore & Cosgrove, 1991).
An added complexity occurs within the sugarcane culm due to the structure of the
vascular bundles, which are surrounded by a sheath of lignified fibre cells that serves to
isolate the xylem water from the apoplast of culm storage tissues (Fig. 2.5) (Jacobsen et
al., 1992; Welbaum & Meinzer, 1990). As the culm matures, the sheath cell layers
progressively lignify to form a barrier to apoplastic movement of solutes during the
period of sucrose accumulation (Jacobsen et al., 1992). Thus, sucrose probably cannot
reach the parenchyma cells through a purely apoplastic path (Rae et al., 2005a). The
symplastic passage of sucrose through the fiber sheath has been examined by Walsh et
al. (2005) and is suggested to be a likely point of rate limitation in sucrose transport from
phloem to storage parenchyma. Upon export from the vascular bundle, it is possible that
sucrose may then move symplastically throughout the parenchyma, as has been
partially demonstrated by tracer dyes (Rae et al., 2005b). However, in order to maintain
a gradient for sucrose flow, sucrose may be excluded from the symplastic continuum by
export to the apoplast or into the vacuole (Rae et al., 2005a). Backflow of apoplastic
sucrose into the vascular system would then be restricted by the hydrophobic nature of
the lignified and suberized cell walls surrounding the vascular bundle, thus forming an
isolated apoplastic compartment (Jacobsen et al., 1992). Consequently, a
comprehensive model for sucrose unloading in sugarcane should incorporate both
symplastic and apoplastic transfer.

Chapter 2: Literature Review
43
Fig. 2.5. Possible pathways for sucrose flux from source to sink in sugarcane. Sucrose is
produced in the source mesophyll and either loaded symplastically via the bundle
sheath or exported to the apoplasm and imported into the sieve element companion
cell complex (SE-CCC). Sucrose leakage and re-uptake may occur along the SE-CCC.
Sucrose may then be unloaded in the culm sink symplastically through the fibre sheath,
whereupon it flows from cell-to-cell through the plasmodesmata. Alternatively, sucrose
may be exported from the symplastic continuum and then actively removed from the
apoplast by surrounding parenchyma tissue via sugar transporter proteins (�), or
hydrolyzed to hexoses, taken up via hexose transporters (�), and then resynthesized
within the cell. Interconversion of sucrose and hexoses (‘futile cycling’) may co-exist
within the vacuole and/or cytoplasm, and even indirectly extend into the apoplastic
space due to sugar transporter activity (modified from Hellman et al., 2000 and Rae et
al., 2005b).
sucroseSymplastic unloading
sucrose
symplastic transfer
sucrosein apoplast
sucrose
CWIhexoses
hexoses
VACUOLE
sucrosesucrolytic pathway
sucrose
CYTOPLASM
hexoses
C
C
sucrose
sucrose
symplastic transfer
sucrose
CYTOPLASM
Apoplastic loading
Symplastic loading
sucrolytic pathway
hexoses
VAI
sucrosehexoses
CVAI
Parenchyma
sucrose
VACUOLE
Mesophyll Bundle Sheath
SOURCE
SINK
SE-CCC
sucrose sucrose
sucroseSymplastic unloading
sucrose
symplastic transfer
sucrosein apoplastsucrosein apoplast
sucrose
CWIhexoses
hexoses
VACUOLE
sucrosesucrolytic pathway
sucrose
CYTOPLASM
hexoses
C
C
sucrosesucrose
sucrose
symplastic transfer
sucrose
CYTOPLASM
Apoplastic loading
Symplastic loading
sucrolytic pathway
hexoses
VAI
sucrosehexoses
CVAI
Parenchyma
sucrose
VACUOLE
Mesophyll Bundle Sheath
SOURCE
SINK
SE-CCC
sucrosesucrose sucrose

Chapter 2: Literature Review
44
2.3.3 Sugar transporters
Sugar transporter proteins play a pivotal role in carbon supply pathways via regulating
the membrane transport of carbon assimilates, as well as their distribution throughout
the plant. As discussed in chapter 2.3.2, sucrose loading may occur symplastically,
although sucrose is often released from source mesophyll cells and actively loaded from
the apoplastic space into the SE-CCC (Hellman et al., 2000; Williams et al., 2000).
Plasma membrane sucrose-H+ symporters are fundamental to this process. Sucrose
unloading can also occur via a symplastic or apoplastic route, which is often species-
specific and can depend on the developmental stage of organs or tissues (Williams et
al., 2000). Within the apoplastic pathway, sink parenchyma may either import sucrose
directly from the apoplast via sucrose-H+ symporters, or alternatively as hexoses via
monosaccharide-H+ co-transporters after sucrose hydrolysis by CWI.
Sugar transporters are categorised into two family types, viz. monosaccharide (MST)
and disaccharide (DST) transporters, with several forms existing within each family. In
addition, depending on plant species, each transporter may be expressed at different
developmental stages and under varying environmental conditions in different tissues
(Williams et al., 2000). Although DSTs and MSTs share little homology at the amino
acid level, expression studies in yeast and Xenopus oocytes on some of the family
members have suggested that both families function as proton symporters (Sauer et al.,
1990; Sauer & Stolz, 1994; Boorer et al., 1996; Zhou et al., 1997). Generally the DSTs
are highly specific for sucrose, although some have been shown to transport maltose
(Lemoine, 2000). MSTs, on the other hand, display broader substrate specificity,
transporting a range of hexoses and pentoses (Büttner & Sauer, 2000; Hellman et al.,
2000).
2.3.3.1 Disaccharide transporters
The primary role of DSTs is reported to be the apoplastic loading and long-distance
transport of sucrose from the source. DST proteins are found in the companion cells of
the SE-CCC complex (Stadler & Sauer, 1996) and the sieve element itself (Kühn et al.,
1997). Notably, DSTs found in the sieve elements have been shown to result from gene
transcription in the companion cell, however, the precise signals and mechanisms that
regulate their final destination remain to be uncovered (Williams et al., 2000; Stadler et

Chapter 2: Literature Review
45
al., 2005). In Solanaceae species, DST mRNA is localized in the sieve elements,
suggesting that transcription occurs in the companion cells and might be followed by
transportation of the mRNA through the plasmodesmata and translation within the sieve
element (Kühn et al., 1997).
The first complete cDNAs for DST genes were isolated from spinach (SoSUT1) and
potato (StSUT1) using yeast complementation (Reismeier et al., 1992; 1993). Both
genes showed high genetic similarity (Reismeier et al. 1993). The importance of SUT1-
type DSTs in sucrose translocation was further demonstrated in potato and tobacco
using antisense technology (Reismeier et al., 1993; Bürkle et al., 1998). Transgenic
potato plants with lowered SUT1 expression have reduced tuber yields and accumulate
sugars in mature leaves (Reismeier et al., 1993), while transgenic tobacco plants have a
dwarf phenotype and show drastically impaired ability to export sugars from leaves
(Bürkle et al., 1998). Several SUT1-type genes have since been isolated and their
tissue-specific expression patterns analysed from a variety of plants (Kühn et al., 1999;
Williams et al., 2000). As DSTs continue to be expressed in phloem tissue, an additional
role for phloem-localised SUT1 homologues might be in the retrieval of sucrose lost to
the apoplast from leaking sieve elements along the translocation pathway (Lemoine et
al., 1996; Lalonde et al., 2003). Notably, a sucrose-retrieval DST has been identified in
tissues surrounding the mature culm vascular bundles in sugarcane (ShSUT1) (Rae et
al., 2005b). Recent characterization studies have indicated that ShSUT1 may play an
important role in the accumulation of sucrose, even though it exhibits a relatively low
affinity for the substrate (Reinders et al., 2006).
Additional DST homologues have been identified, but are not as well documented as
SUT1-type transporters. A total of nine DST homologues are known in the Arabidopsis
genome, however, most have not been characterised in detail (Eckhart, 2003). The role
of SUT2 (sometimes referred to as SUC3) homologues is still not clearly defined, as they
do not appear to have a high affinity for sucrose (Eckhart, 2003). It is debatable whether
their roles are linked to sucrose transport or a putative sucrose sensing function
(Eckhart, 2003).
There are several mechanisms that have been proposed for the regulation of DST
transcription and activity, including a phosphorylation-dephosphorylation system in sugar
beet (Beta vulgaris L.), perhaps via SnRK1- or CPDK-type kinases (Roblin et al., 1998).

Chapter 2: Literature Review
46
In rice, a local lipid-based modification of DST activity has been postulated (Delrot et al.,
2000). Different regulatory systems may also affect DST transcript levels, depending on
the transporter homologue and expression location (Williams et al., 2000). An analysis
of two DSTs genes in carrot (DcSUT1 and DcSUT2) showed expression, albeit at
different levels, in both source leaf tissue and non-photosynthetic sink tissues (Shakya &
Sturm, 1998). Although DcSUT1 was predominately expressed in leaf, the expression of
DCSUT1 and DcSUT2 was linked to photosynthesis, and transport activity appeared to
be regulated in a diurnal fashion (Kühn et al., 1997; Shakya & Sturm, 1998). However,
in root tissues DcSUT1 and DcSUT2 showed no diurnal fluctuation, with DsSUT2
exhibiting much higher steady-state transcript levels (Shakya & Sturm, 1998). As
DcSUT2 expression was found in both sink phloem and parenchyma tissue, it is still not
known whether this transporter is involved in phloem unloading or import of sucrose into
parenchyma cells (Shakya & Sturm, 1998). A similar study of CitSUT1 and CitSUT2
expression patterns in citrus suggested that CitSUT2 is more strongly linked to sink
activity, whereas CitSUC1 is believed to be primarily involved in phloem loading and
may be regulated by sugars, perhaps via the HXK-mediated signaling pathway (Li et al.,
2003).
2.3.3.2 Monosaccharide transporters
Most reports have located MST to sink tissues (Sauer & Stadler, 1993; Williams et al.,
2000). Studies have suggested that monosaccharide transport is a moderately flexible
system for carbohydrate allocation, as the MST family is regulated by numerous
mechanisms, including phytohormones, abiotic stress and wounding (Truernit et al.,
1996; Ehne� & Roitsch 1997). Furthermore, MST activities have been identified from
several species for a variety of substrates, including D-glucose, 3-O-methyl-glucose
(3Omeg), 2-deoxy-D-gluose, D-mannose and D-fructose (for review see Hellman et al.,
2000). Cloning of the first higher plant MSTs was accomplished by heterologous
hybridisation with hexose transporter genes from the green alga, Chlorella kessleri
(Sauer & Tanner, 1989; Sauer et al., 1990). Numerous genes and gene subfamilies
from several species have since been isolated (Lalonde et al., 1999; Williams et al.,
2000; Johnson et al., 2006)
The regulation of MST expression suggests that these membrane proteins function in
hexose uptake in sink tissues, specifically an apoplastic mechanism for phloem or post-

Chapter 2: Literature Review
47
phloem unloading (Sauer & Stadler, 1993). This mechanism is particularly pertinent in
symplastically isolated sinks, such as developing pollen and seeds, which do not have
plasmodesmatal connections to the surrounding tissue (Weber et al., 1997; Schneidereit
et al., 2003). In Vicia faba (L.) seed embryos, the MST VfSTP1 is expressed specifically
in the mitotically active parenchyma, indicating that this transporter serves to supply
substrate for metabolism (Weber et al., 1997). Once sucrose is released from the
phloem it may then be hydrolyzed by extracellular CWI and subsequently taken up into
sink cells by the corresponding MST (Lalonde et al., 1999). An expected requirement for
this mechanism in plants might be the mutual regulation of expression for CWI and MST
genes. This has been demonstrated in Chenopodium cell suspension cultures (Ehneß &
Riotsch, 1997) and more recently in soybean seedlings (Dimou et al., 2005), indicating
the presence of a regulatory network to control the co-ordination of different protein
activities in the process of phloem unloading (Roitsch & Gonzalez, 2004). Sugarcane is
also believed to unload sucrose into the apoplast, where it is cleaved by CWI to produce
hexoses, which are then taken up by MSTs in culm parenchyma cells (Rae et al.,
2005a). This contention supports previous evidence provided by sugarcane cell
suspension studies, which express high levels of CWI and take up reducing sugars but
not sucrose (Komor et al., 1981).
MSTs are also associated with defense-responses following infection by micro-
organisms. The expression of Arabidopsis transporter AtSTP4 has been linked to the
transportation of monosaccharides into sink tissues, especially under stress conditions
(Truernit et al., 1996). However, induction of AtSTP4 is also observed during plant and
fungal biotrophic interaction (Fotopoulos et al., 2003). The signaling pathway and
putative role of this transporter is still unclear, but it is suggested that an increase in
carbohydrates into infected tissues may assist the activation of defense systems, or
serve to recover sugars from the apoplast and thus reduce the loss of carbohydrates to
the pathogen (Williams et al., 2000). Interestingly, MSTs have even been detected in
the plasma membrane vesicles of sugar beet leaves (Tubbe & Buckhout, 1992). The
function of these transporters may be to prevent the accumulation of hexose in the
source apoplast, however this hypothesis has not yet been fully tested.

Chapter 2: Literature Review
48
2.3.4 Source-sink modeling
To fully understand the mechanisms and regulation involved in complex physiological
processes, such as the accumulation and partitioning of carbon in plants, information on
every facet of the system, including the complex interactions amongst components, is
required. As this knowledge is often not readily available, the ability to characterise and
predict the actions of such systems is often best accomplished through the construction
of simplified simulation models. The application of simulation models in agriculture is
widespread across a variety of industries, all of which input a number of measured
environmental and crop-related factors, with the aim of predicting future growth and yield
values (Jones & Richie, 1990; Chapman et al., 1993; McCown et al., 1996; Dhakhwa et
al., 1997; Singels & Bezuidenhout, 2002).
The partitioning of carbon in crops is an important yield factor. Although comprising a
large body of experimental data, previous work on carbon partitioning has not readily
encompassed a detailed mechanistic understanding of the source-sink relationship
(Wardlaw, 1990). Instead, a variety of empirical carbon allocation models have been
developed, which incorporate partitioning algorithms derived from observational data
(Marcelis et al., 1998; Lacointe, 2000; Le Roux et al., 2001). The algorithmic approach
is effective in simulating carbon partitioning within the range of conditions appropriate to
calibration data, but is much less successful for extrapolating into other conditions, and
gives no insight as to the processes involved (Bancal & Soltani, 2002; Minchin &
Lacointe, 2004). To advance the calibration data sets to encompass, for example,
different locations, environments and crop management practices, it has been
suggested that the mechanistic understanding of partitioning is an essential foundation
for more complex models (Thornley, 1998; Bancal & Soltani, 2002; Minchin & Lacointe,
2004).
Previously, a mechanistic model was formulated by Thornley (1972) for quantifying root:
shoot ratios, and comprised a simple transport-resistance (TR) archetype to describe
carbon translocation through the phloem between a single source and sink. The TR
model used parameters based on the now widely accepted Münch theory, which
described the formation of a solution flow by an osmotically generated pressure gradient
(Minchin et al., 1993). Münch theory states that the solute flow rate between source and
sink is proportional to the hydrostatic pressure between source and sink (�P), and

Chapter 2: Literature Review
49
inversely proportional to the pathway length (L) (Lacointe, 2000). Using Van Hoff’s
osmotic equation to describe the relationship between solute concentration C and the
osmotically generated hydrostatic pressure P, the solute flow rate can be expressed as
Js = constant RC∆× , where the resistance R is proportional to L (Minchin & Lacointe,
2004). Thus, distance effects, such as sink being supplied by the nearest available
source, are qualitatively explained using the resistance term (Lacointe, 2000).
According to a critique by Thornley (1998), the TR model should ideally be the starting
point of all plant growth models.
However, the TR model proposed by Thornley (Thornley, 1972) is not without
shortcomings. For example, to maintain a constant pressure gradient the model
requires the phloem to be non-leaking, with osmotic flow only occurring at the source
and sink regions; an assumption which is unrealistic given current knowledge of phloem
physiology (van Bel, 2003). Furthermore, several parameters are difficult to estimate
(Minchin et al., 1993). Nevertheless, the basic TR model has since been improved in
several respects, including phloem loading parameters, possible changes in sap
viscosity with solute concentration, and the ability to model two or more sinks
simultaneously (Minchin et al., 1993; Bancal & Soltani, 2002). Regarding the latter
enhancement, unloading of assimilate at sink regions was incorporated using Michaelis-
Menten kinetics specified by the maximum unloading rate (Vm) and a Michaelis constant
(Km) (Minchin et al., 1993). This approach was used to explain and quantify sink priority,
or sink strength, for both equivalent and non-equivalent sinks, based on changes in sink
function (vm), changes in R, or source function (C at source) (Minchin et al., 1993). This
modified model has since been tested and validated in supplementary experiments
(Minchin & Thorpe, 1996; Minchin et al., 2002), and has also clarified the results of
several published studies involving cold-girdling between source and sinks, which
previously explained the observed changes in partitioning according to a presumed, but
as yet unidentified, biochemical signal (Grusak & Lucas, 1985; Pickard et al., 1993).
Minchin et al. (1993) predicted that adjustments in partitioning were, in fact, due to
changes in the common pathway flow resistance, as the lowered temperatures caused
partial blockage of the phloem pathway. Interestingly, these new outcomes
demonstrated that solute flow into sinks is not just a property of the sink strength, but
rather of the source, pathway and sink properties combined (Minchin & Lacointe, 2004).

Chapter 2: Literature Review
50
Metabolic control theory (MCT) is additionally a highly effective mechanistic modeling
tool for unraveling complex systems (Kacser & Burns, 1973; Fell, 1997). Research has
demonstrated that plants are highly adept at ‘buffering’ changes in the levels of various
metabolites wrought via transgenic manipulation, including attempts to increase sucrose
accumulation in sugarcane (Ma et al., 2000; Groenewald & Botha, 2007). This is most
likely a result of the difficulty in detecting correlations between enzyme activity and flux
in plants (Stitt & Sonnewald, 1995). In yeast, MCT studies of glycolysis have suggested
that rate-limiting enzymatic steps do not exist, but rather that the control of flux is shared
among all enzymes in the metabolic system (Schaaf et al., 1989). In MCT, the extent to
which any catalytic step (e.g. an enzyme-catalyzed reaction) controls a steady state
variable (flux or concentration) is quantified by a ‘control coefficient’ (Kholodenko et al.,
1995). Control analysis of the interactions between control coefficients in a metabolic
system allows for the identification of the significant affectors of that system. MCT
provides a powerful, theoretical method for not only identifying, but also testing the
points of control in metabolically complex systems, for example, establishing correlations
between enzyme activity and carbon flux in plants. Using thermodynamic and kinetic
data of the appropriate enzymes, Rohwer & Botha (2001) utilized this approach to detect
the steps in glycolysis that most affect futile cycling of sucrose in the sugarcane culm.
Results indicated that HXK and NI had the highest positive control efficients, implying
increased futile cycling upon an increase in activity of those enzymes. Although limited
to a single internode and only incorporating cytosolic reactions, this analytical technique
provided a novel way to examine the dynamics of a complex system involving numerous
fluxes and metabolic intermediates (Rohwer & Botha, 2001). Currently, this model is
being extended to include the cell vacuole and possibly interactions with the phloem
involving sucrose transport and unloading. It may thus be a useful tool for combining
with the TR model to examine source-sink relations down to the localized activity of sink
and/or source enzymes.
2.3.4.1 Sugarcane models
Sugarcane growth simulation models have been used by sugar industries for several
decades. Presently, there are two main models used throughout the world: the South
African model, CANEGRO (Inman-Bamber, 1995), and the Australian model APSIM-
Sugarcane (Keating et al., 1995). The origins of CANEGRO date back to the early
seventies with the development of the equations for photosynthesis and respiration

Chapter 2: Literature Review
51
(McCree, 1970, Inman-Bamber & Thompson, 1989). CANEGRO has since greatly
evolved to include, among others, components for carbon simulation, crop development,
energy and water simulation (Inman-Bamber & Kiker, 1997). Conversely, the APSIM-
Sugarcane model is an advancement of two previous models (AUSCANE and EPIC),
which not only addresses soil erosion, crop productivity and economic factors, but also
models soil water and nitrogen (Probert et al., 1998). Both models represent the
collected efforts of a large number of agronomists, physiologists and programmers.
In the past, such sugarcane simulation models have not included a mechanistic
approach for predicting sucrose yield and purity, but have, instead, relied on empirical
calibration factors (O’Leary, 2000). This approach was considered a more practical
alternative, primarily due to the lack of knowledge regarding carbon partitioning in
sugarcane (Muchow et al., 1996). Furthermore, sugar accumulation was not the main
factor contributing to the development of these models. APSIM-Sugarcane is based on
an agronomically soil-centric modeling system (Keating & Huth, 1995), while CANEGRO
was originally designed to help determine the optimal harvesting age due to the
widespread predation of sugarcane by the stalk borer Eldana saccharina in the South
African sugar industry (Inman-Bamber, 1995). As such, both models have shown
limitations in ability to accurately predict sucrose yield, due to both an apparent lack in
complexity and mechanistic explanation (Keating et al., 1999; O’Leary, 2000; Singels &
Bezuidenhout, 2002).
A more mechanistic source-sink approach was originally pursued by Inman-Bamber
(unpublished data) for the CANEGRO model, but without success. However, based on
the limitations of contemporary sugarcane models, it has since been suggested that the
inclusion of a source-sink component may improve the accuracy of sucrose predictions
(O’Leary, 2000). Recently, a model for dry matter partitioning, based on environment-
linked rate changes in partitioning, rather than just states, such as crop age or time of
year, has been suggested (Singels & Bezuidenhout, 2002). This model attempts to
bring source-sink dynamics into the CANEGRO model by basing growth algorithms on a
variety of source-sink concepts and definitions. The exact meaning of sink strength is
still contentious (Ho, 1988; Chamont, 1993), however Singels & Bezuidenhout (2002)
have included several aspects of the sink to develop partitioning variables for this model.
Sugarcane stalks are defined in terms of sink activity (SSR), sink capacity (FCAP) and
sucrose sink strength (�SUC). FCAP represents the potential structural growth when

Chapter 2: Literature Review
52
source strength is not limited, while SRR represents the ability of the crop to fill the
FCAP. The product of SSR and FCAP result in the overall structural sink strength of the
stalk (�FNS), such that �SUC can be defined by the equation �SUC = �SK – �FNS,
where �SK represent the daily change in stalk mass. Interestingly, in this model, source
strength is defined as the ability of crop canopy to export carbon to the stalk, and thus
�SK can be taken as the accumulated source strength over the crop life span and is
thus a reflection of source history (Singels & Bezuidenhout, 2002).
Validation tests for this source-sink model showed large improvements in both stalk and
sucrose mass predictions. Inclusion of partitioning variables into the CANEGRO model
has since been suggested to improve yield forecasting, and management support for
harvest and irrigation Furthermore, in the model, changes in daily environmental
conditions cause a fluctuation in FCAP, allowing the model to simulate subtle sink-
related responses to external factors, such as water stress and temperature shifts on a
large scale (Singels & Bezuidenhout, 2002).
That model represents a step forward towards accurate modelling of the complexities of
the source-sink relationship in sugarcane. Instead of relying simply on plant states, the
model has introduced the concept of rate changes in carbon accrual and partitioning.
Currently however, the model does not include variables accounting for competition for
carbon between roots, stalk and meristematic tissue, or possible feedback from those
sinks. Such improvements may be of particular help in predicting yield changes
resulting from Eldana infestation or crop performance on different soils. As such, FCAP
fluctuations may be linked not only to environmental shifts, but also internal changes in
metabolism.
Future advancement in modeling the source-sink relationship may include a more
detailed understanding of sink demand at the enzymatic level (Rohwer & Botha, 2001).
However, a mechanistic model of any system needs to be done with a thorough
awareness of the processes involved. This requires prudent use of applied knowledge
regarding what to include and what to leave out. For example, if too many of the
included parameters are estimated by fitting to observations, a model can be made to
perform in any way (Minchin & Lacointe, 2004). As such, a minimalist description of a
complex system is often the recommended approach to identify the dominant regulatory
processes (Young, 1999; Minchin & Lacointe, 2004). It will be fascinating to see how

Chapter 2: Literature Review
53
future models will include both physiological measurements and the ever-increasing
wealth of molecular data to interpret and predict plant growth and development.

Chapter 2: Literature Review
54
2.4 References
Agarie S, Miura A, Sumikura R, Tsukamoto S, Nose A, Arima S, Matsuoka M,
Miyao-Tokutomi. 2002. Overexpression of C4 PEPC caused O2-insensitive photosynthesis
in transgenic rice plants. Plant Science 162: 257–265.
Agarie S, Sasaki H, Matsuoka M, Miyao-Tokutomi M. 2001. Overexpression of C4
phosphoenolpyruvate carboxylase increased carbon isotope discrimination in transgenic rice
plants. Plant Production Science 4: 311–312.
Andersen MN, Asch F, Wu Y, Jensen CR, Naested H, Mogensen VO, Koch Ke.
2002. Soluble invertase expression is an early target of drought stress during the critical,
abortion-sensitive phase of young ovary development in maize. Plant Physiology 130: 591–
604.
Ashton AR, Burnell JN, Hatch MD. 1984. Regulation of C4 photosynthesis: inactivation of
pyruvate, Pi dikinase by ADP-dependent phosphorylation and activation by phosphorolysis.
Archives of Biochemistry and Biophysics 230: 492–503.
Bakrim N, Prioul J-L., Deleens E, Rocher J-P, Arrio-Dupont M, Vidal J, Gadal P,
Chollet R. 1993. Regulatory phosphorylation of C4 phosphoenolpyruvate carboxylase.
Plant Physiology 101: 891–897.
Balibrea Lara ME, Garcia MG, Fatima T, Ehneß R, Lee TK, Proels R, Tanner W,
Roitsch T. 2004. Extracellular invertase is an essential component of cytokine-mediated
delay of senescence. The Plant Cell 16: 1276–1287.
Bancal P, Soltani F. 2002. Source-sink partitioning. Do we need Münch? Journal of
Experimental Botany 53: 1919–1928.
Batta SK, Singh R. 1986. Sucrose metabolism in sugar cane grown under varying climatic
conditions: synthesis and storage of sucrose in relation to the activities of sucrose
synthetase, sucrose phosphate synthase and invertase. Phytochemistry 25: 2431–2437.
Benning C, Stitt M. 2004. Physiology and metabolism. Reacting to the full complexity of
metabolic pathways in a postgenomic era. Current Opinion in Plant Biology 7: 231–234.
Blázquez MA, Santos E, Flores C, Martínez Zapater JM, Salinas J, Gancedo C. 1998.
Isolation and molecular characterization of the Arabidopsis TPS1 gene, encoding trehalose-
6-phosphate synthase. The Plant Journal 13: 685–689.
Bologa KL, Fernie AR, Leisse A, Louriero ME, Geigenberger P. 2003. A bypass of
sucrose synthase lead to low internal oxygen and impaired metabolic performance in growing
potato tubers. Plant Physiology 132: 2058–2072.
Bosch S, Grof CPL, Botha FC. 2004. Expression of neutral invertase in sugarcane. Plant
Science 166: 1125–1133.
Botha FC, Black KG. 2000. Sucrose phosphate synthase and sucrose synthase activity
during maturation of internodal tissue in sugarcane. Australian Journal of Plant Physiology
27: 81–85.

Chapter 2: Literature Review
55
Boorer KJ, Loo DDF, Frommer WB, Wright EM. 1996. Transport mechanisms of the
cloned potato H+/sucrose cotransporter StSUT1. The American Society for Biochemistry and
Molecular Biology 271: 25139–25144.
Bournay AS, Hedley PE, Maddison A, Waugh R, Machray GC. 1996. Exon skipping
induced by cold stress in a potato invertase gene transcript. Nucleic Acid Research 24:
2347–2351.
Boussingault JB. 1868. Agronomie, chimie agricole et phsyiologie. 2nd ed. Mallet Bachelier,
Paris: France, 236–312.
Brown NJ, Parsley K, Hibberd JM. 2005. The future of C4 research – maize, Flaveria or
Cleome? Trends in Plant Science 10: 215–221.
Buchanan BB. 1991. Regulation of CO2 assimilation in oxygenic photosynthesis: The
ferredoxin/thioredoxin system. Archives of Biochemistry and Biophysics 288: 1–8.
Bürkle L, Hibberd JM, Quick WP, Kühn C, Hirner B, Frommer WB. 1998. The H+-
sucrose co-transporter NtSUT1 is essential for sugar export from tobacco leaves. Plant
Physiology 118: 59–68.
Burnell JN, Jenkins CLD, Hatch MD. 1986. Regulation of C4 photosynthesis: A role for
pyruvate in regulating pyruvate, Pi dikinase activity in vivo. Australian Journal of Plant
Physiology 13: 203–210.
Büttner M, Sauer N. 2000. Monosaccharide transporters in plants: structure, function and
physiology. Biochimica et Biophysica Acta 1465: 263–272.
Calvin M. 1962. The path of carbon in photosynthesis. Science 3507: 879–889.
Chapman SC, Hammer GL, Meinke H. 1993. A sunflower simulation model. I: Model
development. Agronomy Journal 85: 725–735.
Chen JQ, Black CC. 1992. Biochemical and immunological properties of alkaline invertase
isolated from sprouting soybean hypocotyls. Archives of Biochemistry and Biophysics 295:
61–69.
Chen S, Hajirezaei M, Börnke F. 2005. Differential expression of sucrose-phosphate
synthase isoenzymes in tobacco reflects their functional specialization during dark-governed
starch mobilization in source leaves. Plant Physiology 139: 1163–1174.
Cheng WH, Im KH, Chourey PS. 1996a. Sucrose-phosphate synthase expression at the cell
and tissue level is coordinated with sucrose sink-to-source transition in maize leaf. Plant
Physiology 111: 1021–1029.
Cheng WH, Talliercio EW, Chourey PS. 1996b. The miniature1 seed locus of maize
encodes a cell wall invertase required for normal development of endosperm and maternal
cells in the pedicel. The Plant Cell 8: 971–983.
Cheng WH, Burrus M, Audran J-C. 1999. Sugars modulate an unusual mode of control of
the cell-wall invertase gene (Incw1) through its 3’ untranslated region in a cell suspension
culture of maize. Proceedings of the National Academy of Sciences (USA) 96: 10512–
10517.

Chapter 2: Literature Review
56
Chollet R, Vial J, O’Leary MH. 1996. Phosphoenolpyruvate carboxylase: a ubiquitous,
highly regulated enzyme in plants. Annual Review of Plant Physiology and Plant Molecular
Biology 47: 273–298.
Chourey PS, Taliercio EW, Carlson SJ, Ruan YL. 1998. Genetic evidence that the two
isoenzymes of sucrose synthase present in developing maize endosperm are critical, one for
cell wall integrity and the other for starch biosynthesis. Molecular and General Genetics 259:
88–96.
Crowe JH, Hoekstra FA, Crowe LM. 1992. Anhydrobiosis. Annual Review of Physiology
54: 579–599.
Cseke C, Buchanan BB. 1983. An enzyme synthesising fructose-2,6-bisphosphate occurs in
leaves and is regulated by metabolite effectors. FEBS Letters 155: 139–142.
Dai Z, Ku MSB, Edwards GE. 1993. C4 photosynthesis: the C02-concentrating mechanism
and photorespiration. Plant Physiology 103: 83–90.
D’Aoust MA, Yelle S, Nguyen-Quoc B. 1999. Antisense inhibition of tomato fruit sucrose
synthase decreases fruit setting and the sucrose unloading capacity of young fruit. The Plant
Cell 11: 2407–2418.
Davis JI, Soreng RJ. 1993. Phylogenetic structure in the grass family (Poaceae) as inferred
from chloroplast DNA restriction site variation. American Journal of Botany 80: 1444–1454.
De Groot CC, Van Den Boogaard R, Marcelis LF, Harbison J, Lambers H. 2003.
Contrasting effects of N and P deprivation on the regulation of photosynthesis in tomato
plants in relation to feedback limitation. Journal of Experimental Botany 54: 1957–1967.
Déjardin A, Rochat C, Wuillèm S, Delmer D. 1997. Contribution of sucrose synthase,
ADP-glucose pyrophosphorylase and starch synthase to starch synthesis in developing pea
seeds. Plant, Cell and Environment 20: 1421–1430.
Delrot S, Atanassova R, Maurousset L. 2000. Regulation of sugar, amino acid and peptide
plant membrane transporters. Biochim Biophys Acta 1465: 281–306.
Dengler NC, Nelson T. 1999. Leaf structure and development on C4 plants. In: Sage RF,
Monson RK, eds. C4 Plant Biology. Academic Press, Toronto: Canada, 133–172.
Dever LV, Bailey KJ, Leegood RC, Lea PJ. 1997. Control of photosynthesis in Amaranthus
edulis mutants with reduced amounts of PEP carboxylase. Australian Journal of Plant
Physiology 24: 469–476.
Dhakhwa BG, Campbell CL, LeDuc SK, Cooter EJ. 1997. Maize growth: assessing the
effects of global warming and CO2 fertilization with crop models. Agricultural and Forest
Meteorology 87: 253–272.
Dimou M, Flemetakis E, Delis C, Aivalakis G, Spyropoulos KG, Katinakis P. 2005.
Genes coding for a putative cell-wall invertase and two putative monosaccharide/H+
transporters are expressed in roots of etiolated Glycine max seedlings. Plant Science 169:
798–804.

Chapter 2: Literature Review
57
Duff SMG, Moorhead GBG , Lefebvre DD, Plaxton WX. 1989. Phosphate starvation
inducible ‘bypasses’ of adenylate and phosphate dependent glycolytic enzymes in Brassica
nigra suspension cells. Plant Physiology 90: 1275–1278.
Eastmond PJ, Li Y, Graham IA. 2003. Is trehalose-6-phosphate a regulator of sugar
metabolism in plants? Journal of Experimental Botany 54: 533–537.
Eastmond PJ, van Dijkens AJH, Spielman M, Kerr A, Dickinson H, Jones JDG,
Smeekens S, Graham IA. 2002. Trehalose-6-phosphate synthase 1, which catalyzes the
first step in trehalose synthesis, is essential for Arabidopsis embryo maturation. The Plant
Journal 29: 225–237.
Echeverria E, Salvucci ME, Gonzalez P, Paris G, Salerno G. 1997. Physical and kinetic
evidence for an association between sucrose-phosphate synthase and sucrose-phosphate
phosphatase. Plant Physiology 115: 223–227.
Eckhart NA. 2003. The function of SUT2/SUC3 sucrose transporters: the debate continues.
The Plant Cell 14: 1259–1262.
Edwards GE, Furbank RT, Hatch MD, Osmond CB. 2001. What does it take to be C4?
Lesson from the evolution of C4 photosynthesis. Plant Physiology 125: 46–49.
Edwards GE, Huber SC. 1981. The C4 pathway. In: Hatch, MD, Boardman N, eds. The
biochemistry of plants, Vol. 8 (Photosynthesis). Academic Press, San Diego: USA, 237–281.
Ehneß R, Roitsch T. 1997. Co-ordinated induction of mRNAs for extracellular invertase and a
glucose transporter in Chenopodium rubrum. Plant Journal 11: 539–548.
Escherich W. 1980. Free space invertase, its possible role in phloem unloading. Berichte der
Deutschen Botanischen Gesellschaft 93: 363–378.
Fader GM, Koller HR. 1983. Relationships between carbon assimilation, partitioning, and
export in leaves of two soybean cultivars. Plant Physiology 73: 297–303.
Fahrendorf T, Holtum JAM, Mukherjee U, Latsko E. 1987. Fructose-2, 6-bisphosphate,
carbohydrate partitioning and crassulacean acid metabolism. Plant Physiology 84: 182–187.
Farquhar GD, von Caemmerer S. 1982. Modelling of photosynthetic response to
environmental conditions. In: Lang OL, Nobel PS, Osmond CB, Ziegler H, eds.
Encyclopedia of Plant Physiology, New Series, Physiological Plant Ecology II, Vol 12B.
Springer-Verlang, Berlin: Germany, 549–587.
Fernie JF, Willmitzer L, Trethewey RN. 2002. Sucrose to starch: a transition in molecular
plant physiology. Trends in Plant Science 7: 35–41.
Franck N, Vaast P, Genard M, Dauzat J. 2006. Soluble sugars mediate sink feedback
down-regulation of leaf photosynthesis in field grown Coffea arabica. Tree Physiology 26:
517–525.
Fotopoulos V, Gilbert MJ, Pittman JK, Marvier AC, Buchanan AJ, Sauer N, Hall JL,
Williams LE. 2003. The monosaccharide transporter gene, AtSTP4, and the cell-wall
invertase, Atβfruct1, are induced in Arabidopsis during infection with the fungal biotroph
Erysiphe cichoracearum. Plant Physiology 132: 821–829.

Chapter 2: Literature Review
58
Fu H, Kim S-Y, Park. 1995. A potato Sus3 sucrose synthase gene contains a context-
dependent 3’ element and a leader intron with both positive and negative tissue-specific
effects. The Plant Cell 7: 1395–1403.
Furbank RT, Chitty JA, Jenkins CLD, Taylor WC, Trevanion SJ, von Caemmerer S,
Ashton AR. 1997. Genetic manipulation of key photosynthetic enzymes in the C4 plant
Flaveria bidentis. Australian Journal of Plant Physiology 24: 477–485.
Furbank RT, Chitty JA, von Caemmerer S, Jenkins CLD. 1996. Antisense RNA inhibition
of RbcS gene expression reduces rubisco level and photosynthesis in the C4 plant Flaveria
bidentis. Plant Physiology 111: 725–734.
Furbank RT, Taylor WC. 1995. Regulation of photosynthesis in C3 and C4 plants: a molecular
approach. The Plant Cell 7: 797–807.
Gallagher JA, Pollock CJ. 1998. Isolation and characterization of a cDNA clone from Lolium
temulentum L. encoding for a sucrose hydrolytic enzyme which shows alkaline/neutral
invertase activity. Journal of Experimental Botany 49: 789–795.
Gehlen J, Panstruga R, Smets H, Merkelbach S, Kleines M, Porsch P, Fladung M,
Becker I, Rademacher T, Hausler RE, Hirsch HJ. 1996. Effects of altered
phosphoenolpyruvate carboxylase activities on transgenic C3 plant Solanum tuberosum.
Plant Molecular Biology 32: 831–848.
Geigenberger P, Stitt M. 1991. Sucrose synthase catalyses a readily reversible reaction in
vivo in developing potato tubers and other plant systems. Planta 189: 329–339.
Geigenberger P, Reimholz R, Geiger M, Merlo L, Canale V, Stitt M. 1997. Regulation
of sucrose and starch synthesis in potato tubers in response to short-term water deficit.
Planta 201: 502–518.
Gibson SI. 2005. Control of plant development and gene expression by sugar signaling.
Current Opinion in Plant Biology 8: 93–102.
Glasziou KT, Bull TA. 1965. The relation between total invertase activity and internode
expansion in sugarcane stalks. Proceedings of the International Society of Sugar Cane
Technologists 12: 575–581.
Goddijn OJM, Smeekens S. 1998. Sensing trehalose biosynthesis in plants. The Plant
Journal 14: 143–146.
Goddijn OJM, Verwoerd TC, Voogd E, Krutwagen RW, de Graaf PT, van Dun K,
Poels J, Ponstein AS, Damm B, Pen J. 1997. Inhibition of trehalase activity enhances
trehalose accumulation in transgenic plants. Plant Physiology 113: 181–190.
Godt DE, Roitsch T. 1997. Differential regulation of a tomato invertase gene family suggests
an important function of extracellular isoenzymes in establishing and maintaining sink
metabolism. Plant Physiology 115: 273–282.
Goetz M, Godt DE, Guivach A, Kahmann U, Chriqui D, Roitsch T. 2001. Induction of
male sterility in plants by metabolic engineering of the carbohydrate supply. Proceedings of
the National Academy of Science (USA) 98: 6522–6527.

Chapter 2: Literature Review
59
Gould N, Thorpe MR, Minchin PEH, Pritchard J, White. 2004. Solute is imported to
elongating root cells of barley as a pressure driven-flow of solution. Functional Plant Biology
31: 391–397.
Greiner S, Köster U, Lauer K, Rosenkranz H, Vogel R, Rausch T. 2000. Plant
invertase inhibitors: expression in cell culture and during plant development. Australian
Journal of Plant Physiology 27: 807– 814.
Greiner S, Rausch T, Sonnewald U, Herbers K. 1999. Ectopic expression of a tobacco
invertase inhibitor homolog prevents cold-induced sweetening of potato tubers. Nature
Biotechnology 17: 708–711.
Grodzinski B, Jaio J, Leonardos ED. 1998. Estimating photosynthesis and concurrent
export rates in C3 and C4 species at ambient and elevated CO2. Plant Physiology 117: 207–
215.
Groenewald J-H, Botha FC. 2001. Down regulating pyrophosphate-dependent
phosphofructokinase (PFP) in sugarcane. Proceedings of the International Society of Sugar
Cane Technologists 24: 592–594.
Groenewald J-H, Botha FC. 2007. Down regulation of pyrophosphate: fructose 6-phosphate
1-phosphotransferase (PFP) activity in sugarcane enhances sucrose accumulation in
immature internodes. Transgenic Research DOI 10.1007/s11248-007-9079-x
Grusak MA, Lucas WJ. 1985. Cold-inhibited phloem translocation in sugarbeet. II.
Characterization and localization of the slow-cooling response. Journal of Experimental
Botany 36: 745–755.
Gucci R, Corelli-Grappadelli L, Tustin S, Ravaglia G. 1994. The effect of defruiting at
different stages of fruit development on leaf photosynthesis of ‘Golden Delicious’ apples.
Tree Physiology 15: 35–40.
Haake V, Geiger M, Walch-Liu P, Engels C, Zrenner R, Stitt M. 1999. Changes in the
aldolase activity of wild-type potato plants are important for acclimation to growth irradiance
and carbon dioxide concentration, because plastid aldolase exerts control over the ambient
rate of photosynthesis across a range of growth conditions. Plant Journal 17: 479–489.
Haake V, Zrenner R, Sonnewald U, Stitt M. 1998. A moderate decrease of plastid aldolase
activity inhibits photosynthesis, alters the levels of sugars and starch and inhibits growth in
potato. Plant Journal 14: 147–157.
Hajirezaei M, Sonnewald U, Viola R, Carlisle S, Dennis D, Stitt M. 1994. Transgenic
potato plants with strongly decreased expression of pyrophosphate: fructose-6-phosphate
phosphotransferase show no visible phenotype and only minor changes in metabolic fluxes in
their tubers. Planta 192: 16–30.
Halford NG, Purcell PC, Hardie DG. 1999. Is hexokinase really a sugar sensor in plants?
Trends in Plant Science 4: 117–120.

Chapter 2: Literature Review
60
Hänggi E, Fleming AJ. 2001. Sucrose synthase expression pattern in young maize leaves:
implications for phloem transport. Planta 214: 326–329.
Hardin SC, Tang G-Q, Scholz A, Holtgraewe D, Winter H, Huber SC. 2003.
Phosphorylation of sucrose synthase at serine 170: occurrence and possible role as a signal
for proteolysis. Plant Journal 35: 588–603.
Hardin SC, Winter H, Huber SC. 2004. Phosphorylation of the amino-terminus of maize
sucrose synthase in relation to membrane association and enzyme activity. Plant Physiology
134: 1427–1438.
Harrison EP, Willingham NM, Lloyd JC, Raines CA. 1998. Reduced sedoheptulose-1,7-
bisphosphatase in transgenic tobacco lead to decreased photosynthetic capacity and altered
carbon partitioning. Planta 204: 27–36.
Harrington GN, Bush DR. 2003. The bifunctional role of hexokinase in metabolism and
glucose signaling. The Plant Cell 15: 2493–2496.
Hartt CE,, Kortchak HP, Forbes AJ, Burr GO. 1963. Translocation of C14 in sugarcane.
Plant Physiology 38: 305–318.
Hatch MD. 1987. C4 photosynthesis: a unique blend of modified biochemistry anatomy and
ultrastructure. Biochimica et Biophysica Acta 895: 81–106.
Hatch MD, Slack CR. 1966. Photosynthesis by sugar cane leaves. A new carboxylation
reaction and the pathway of sugar formation. Biochemistry Journal 101: 103–111.
Hawker JS, Hatch MD. 1965. Mechanism of sugar storage by mature stem tissue of
sugarcane. Physiologia Plantarum 18: 444–453.
Hawker JS. 1985. Sucrose. In: Dey PM, Dixon RA, eds. Biochemistry of storage
carbohydrates in green plants. Academic Press, New York: USA, 1–51.
Heldt HW. 1997. Polysaccharides. In: Plant Biochemistry & Molecular Biology. Oxford
University Press Inc., NY: USA, 219–246.
Hellman H, Barker L, Funk D, Frommer. 2000. The regulation of assimilate allocation and
transport. Australian Journal of Plant Physiology 27: 583–594.
Henkes S, Sonnewald U, Willmitzer L. 2001. A small decrease of plastid transketolase
activity in antisense tobacco transformants has dramatic effects on photosynthesis and
phenylpropanoid metabolism. Plant Cell 13: 535–551.
Ho LC. 1988. Metabolism and compartmentation of imported sugars in sink organs in relation to
sink strength. Annual Review of Plant Physiology and Plant Molecular Biology 39: 355–378.
Hoepfner SW, Botha FC. 2003. Expression of fructokinase isoforms in the sugarcane culm.
Plant Physiology and Biochemistry 41: 741–747.
Huang JW, Chen JT, Yu WP, Shyur LG, Wang AY, Sung HY, Lee PD, Su JC. 1996.
Complete structures of three rice sucrose synthase isogenes and differential regulation of
their expression. Bioscience, Biotechnology, and Biochemist 60: 233–239.

Chapter 2: Literature Review
61
Huang JW, Huber SC. 2001. Phosphorylation of synthetic peptides by a CDPK and plant
SNF1-related protein kinase. Influence of proline and basic amino acid residues at selected
positions. Plant and Cell Physiology 42: 1079–1087.
Huber JL, Isreal DW. 1982. Biochemical basis for partitioning of photosynthetically fixed
carbon between starch and sucrose in soybean (Glycine max Merr.) leaves. Plant
Physiology 69: 691–696.
Huber JL, Huber SC. 1992. Site-specific serine phosphorylation of spinach leaf sucrose-
phosphate synthase. Biochemical Journal 283: 877–882.
Huber SC. 1989. Biochemical mechanism for regulation of sucrose accumulation in leaves
during photosynthesis. Plant Physiology 91: 656–662.
Huber SC, Huber JL, Laio PC, Gage DA, McMichael RW, Chourey PS, Hanna LC,
Koch KE. 1996. Phosphorylation of serine-15 of maize leaf sucrose synthase. Plant
Physiology 112: 793–802.
Huber SC, Huber JL, Pharr DM. 1993. Assimilate partitioning and utilization in source and
sink tissues. In: Pollock CJ, Farrar JF, Gordon AJ, eds. Carbon partitioning within and
between organisms. BIOS Scientific Publishers Ltd, Oxford: UK, 1–25.
Hudson GS, Evans JR, von Caemmerer S, Arvidsson YBC, Andrews TJ. 1992.
Reduction of ribulose-1,5-bisphosphate carboxylase/oxygenase content by antisense RNA
reduces photosynthesis in transgenic tobacco plants. Plant Physiology 98: 294–302.
Iglesias DJ, Lliso I, Tadeo FR, Talon M. 2002. Regulation of photosynthesis through
source: sink imbalance in citrus is mediated by carbohydrate content in leaves. Physiologia
Plantarum 116: 563–572.
Issakidis E, Saarinen M, Decottignies P, Jacquot J-P, Cretin C, Gadal P, Miginiac-
Maslow M. 1994. Identification and characterization of the second regulatory disulphide
bridge of recombinant sorghum leaf NADP-malate dehydrogenase. Journal of Biological
Chemistry 269: 3511–3517.
Inman-Bamber NG. 1995. CANEGRO: Its history, conceptual basis, present and future uses.
In: Robertson, MG, ed. Research and modelling approaches to assess sugarcane
production opportunities and constraints. Workshop proceedings, University of Queensland,
Brisbane: Australia, 31–34.
Inman-Bamber NG, Kiker G. 1997. CANEGRO 3.10. DSSAT verson 3.1 1998 distribution
software. IBSNAT, University of Hawaii, Honolulu: USA.
Inman-Bamber NG, Thompson GD. 1999. Models of dry matter accumulation by sugarcane.
Proceedings of the South African Sugarcane Technologists’ Association 63: 212–216.
Jacobsen KR, Fisher DG, Maretzki A, Moore PH. 1992. Developmental changes in the
anatomy of the sugarcane stem in relation to phloem unloading and sucrose storage.
Botanica Acta 105: 70–80.

Chapter 2: Literature Review
62
Jeanneau M, Vidal J, Gousset-Dupont A, Lebouteiller B, Hodes M, Gerentes D,
Perez P. 2002. Manipulating PEPC levels in plants. Journal of Experimental Botany 53:
1837–1845.
Jenkins CLS, Furbank RT, Hatch MD. 1989. Mechanisms of C4 photosynthesis. A model
describing the inorganic carbon pool in bundle sheath cells. Plant Physiology 55: 468–474.
Jang JC, Leon P, Zhou L, Sheen J. 1997. Hexokinase as a sugar sensor in higher plants.
The Plant Cell 9: 5–19.
Jang JC, Sheen J. 1994. Sugar sensing in higher plants. The Plant Cell 6: 1665–1679.
Jang JC, Sheen J. 1997. Sugar sensing in higher plants. Trends in Plant Science 2: 208–
214.
Johnson DA, Hill, JP, Thomas MA. 2006. The monosaccharide transporter gene family in
land plants is ancient and shows differential subfamily expression and expansion across
lineages. BMC Evolutionary Biology 6: DOI 10.1515/BC.1999.116
Jones JW, Richie JT. 1990. Crop Growth Models. In: Management of Farm Irrigation
Systems. American Society of Agricultural Engineers, St. Joseph: USA, 93–122.
Jones TL, Ort DR. 1997. Circadian regulation of sucrose phosphate synthase activity in
tomato by protein phosphorylation. Plant Physiology 113: 1167–1175.
Keating BA, Huth N. 1995. APSIM: A framework for modelling sugarcane production
systems. In: Robertson, MG, ed. Research and modelling approaches to assess
sugarcane production opportunities and constraints. Workshop proceedings, University of
Queensland, Brisbane: Australia, 71–79.
Keating BA, Robertson MG, Muchow RC, Huth NI. 1999. Modelling sugarcane
production systems I. Development and performance of the sugarcane module. Field Crops
Research 61: 253–271.
Keeley JE. 1998. C4 photosynthetic modifications in the evolutionary transition from land to
water in aquatic plants. Oecologica 116: 85–97.
Kerr PS, Huber SC, Isreal DW. 1984. Effect of N-source on soybean leaf sucrose
phosphate synthase, starch formation, and whole plant growth. Plant Physiology 75: 483–
488.
Kerr PS, Rufty TW, Huber SC. 1985. Endogenous rhythms in photosynthesis, sucrose
phosphate synthase activity, and stomatal resistance in leaves of soybean (Glycine max [L.]
Merr.). Plant Physiology 77: 275–280.
Kholodenko BN, Molenaar D, Schuster S, Heinrich R, Westerhoff HV. 1995. Defining
control coefficients in non-ideal metabolic pathways. Biophysical Chemistry 56: 215–226.
Kim J-Y, Mahé A, Brangeon J, Prioul J-L. 2000a. A maize vacuolar invertase, Ivr2, is
induced by water stress. Organ/tissue specificity and diurnal modulation of expression. Plant
Physiology 124: 71–84.

Chapter 2: Literature Review
63
Kim J-Y, Mahé A, Guy S, Brangeon J, Roche O, Chourey PS, Prioul J-L. 2000b.
Characterisation of two members of the maize gene family, Incw3 and Incw4, encoding cell-
wall invertases. Gene 245: 89–102.
King SP, Lunn JE, Furbank RT. 1997. Carbohydrate content and enzyme metabolism in
developing canola siliques. Plant Physiology 114: 153–160.
Koch KE. 1996. Carbohydrate-modulated gene expression in plants. Annual Review of Plant
Physiology and Plant Molecular Biology 47: 509–540.
Koch KE. 2004. Sucrose metabolism: regulatory mechanisms and pivotal roles in sugar sensing
and plant development. Current Opinion in Plant Biology 7: 235–246.
Kogami M, Shono M, Koike T, Yanigisawa S, Izui K, Sentoku N, Tanifuji S,
Uchiyama H, Toki S. 1994. Molecular and physiological evaluation of transgenic tobacco
plants expressing a maize phosphoenolpyruvate carboxylase gene under the control of the
cauliflower mosaic virus 35S promoter. Transgenic Research 3: 287–296.
Komatsu A, Takanokura Y, Moriguchi T, Omura M, Akihima T. 1999. Differential
expression of three sucrose-phosphate synthase isoforms during sucrose accumulation in
citrus fruits. Plant Science 140: 169–178.
Komor E. 2000. Source physiology and assimilate transport: the interaction of sucrose
metabolism, starch storage and phloem export in source leaves and the effects on sugar
status in phloem. Australian Journal of Plant Physiology 27: 497–505.
Komor E, Thom M, Maretski A. 1981. The mechanism of sugar uptake by sugarcane
suspension cells. Planta 153: 181–192.
Kouchi H, Takane K, So RB, Ladha JK, Reddy PM. 1999. Rice ENOD40: isolation and
expression analysis in rice and transgenic soybean root nodules. Plant Journal 18: 121–129.
Krausgrill S, Greiner S, Koster U, Vogel R, Rausch T. 1998. In transformed tobacco
cells the apoplasmic invertase inhibitor operates as a regulatory switch of cell wall invertase.
The Plant Journal 13: 275–280.
Kruger NJ, Hemmingsen SM, Dennis DT. 1986. Distribution of pyrophosphate:fructose 6-
phosphate phosphotransferase in maize leaves. Plant Physiology 81: 12–16.
Ku MSB, Agarie S, Nomura M, Fukayama H, Tsuchida H, Ono K, Hirose S, Toki S,
Miyao M, Matsuoko M. 1999. High-level expression of maize phosphoenolpyruvate
carboxylase in transgenic rice. Nature Biotechnology 17: 76–80.
Kubien DS, von Caemmerer S, Furbank RT, Sage RF. 2003. C4 photosynthesis at low
temperature. A study using transgenic plants with reduced amounts of Rubisco. Plant
Physiology 132: 1577–1585.
Kühn C, Barker L, Burkle L, Frommer WB. 1999. Update on sucrose transport in higher
plants. Journal of Experimental Botany 50: 935–953.
Kühn C, Franceschi VR, Schulz A, Lemoine R, Frommer WB. 1997. Localization and
turnover of sucrose transporters in enucleate sieve elements indicate macromolecular
trafficking. Plant Physiology 132: 1577–1585.
Chapter 2: Literature Review
64
Lacointe A. 2000. Carbon allocation among tree organs: a review of basic processes and
representation in functional-structural tree models. Annals of Forest Science 57: 521–533.
Lalonde S, Boles E, Hellmann H, Barker L, Patrick JW, Frommer WB, Ward JM.
1999. The dual function of sugar carriers: transport and sugar sensing. The Plant Cell 11:
707–726.
Lalonde S, Tegeder M, Throne-Holst M, Frommer WB, Patrick, JW. 2003. Phloem
loading and unloading of sugars and amino acids. Plant, Cell and Environment 26: 37–56.
Langenkamper G, Fung RWM, Newcomb RD, Atkinson RG, Gardner RC, MacRae EA.
2002. Sucrose phosphate synthase genes in plants belong to three different families.
Journal of Molecular Evolution 54: 322–332.
Lee HS, Sturm A. 1996. Purification and characterization of neutral and alkaline invertase
from carrot. Plant Physiology 112: 1513–1522.
Leegood RC. 2002. C4 photosynthesis: principles of CO2 concentration and prospects for its
introduction into C3 plants. Journal of Experimental Botany 53: 581–590.
Lemoine R. 2000. Sucrose transporters in plants: update on function and structure. Biochimica
et Biophysica Acta 1465: 246–262.
Le Roux X, Lacointe A, Escobar-Gutiérrez A, Le Dizès S. 2001. Carbon-based models of
individual tree growth: a critical appraisal. Annals of Forest Science 58: 469–506.
Li CY, Shi JX, Weiss D, Goldschmidt EE. 2003. Sugars regulate sucrose transport gene
expression in citrus. Biochemical and Biophysical Research Communications 306: 402–407.
Lichtentahler HK. 1999. The 1-deoxy-d-xylulose-5-phosphate pathway of isoprenoid
biosynthesis in plants. Journal of Experimental Botany 48: 345–347.
Lingle SE. 1999. Sugar metabolism during growth and development in sugarcane internodes.
Crop Science 39: 480–486.
Link M, Rausch T, Greiner S. 2004. In Arabidopsis thaliana, the invertase inhibitors
AtC/VIF1 and 2 exhibit distinct target enzyme specificities and expression profiles. FEBS
Letters 573: 105–109.
Long JC, Shao W, Rashotte AM, Muday GK, Huber SC. 2002. Gravity-stimulated
canges in auxin and invertase expression in maize pulvinal cells. Plant Physiology 128: 591–
602.
Loreti E, de Bellis L, Alpi A, Perata P. 2001. Why and how do plants sense sugars?
Annals of Botany 88: 803–812.
Lucas W, Ding B, van der Schoot C. 1993. Plasmodesmata and the supracellular nature of
plants. New Phytologist 125: 435–476.
Lunn JE. 2003. Sucrose-phosphatase gene families in plants. Gene 303: 187–196.
Lunn JE, ap Rees T. 1990. Apparent equilibrium constant and mass-action ratio for sucrose-
phosphate synthase in seeds of Pisum sativum. Biochemical Journal 267: 739–743.
Chapter 2: Literature Review
65
Lunn JE, Ashton AR, Hatch MD, Heldt HW. 2000. Purification, molecular cloning, and
sequence analysis of sucrose-6F-phosphate phosphohydrolase from plants. Proceedings of
the National Academy of Science (USA) 97: 12914–12919.
Lunn JE, Furbank RT. 1997. Localisation of sucrose-phosphate synthase and starch in
leaves of C4 plants. Planta 202: 106–111.
Lunn JE, Furbank RT. 1999. Sucrose biosynthesis in C4 plants. New Phytologist 143: 221–
237.
Lunn JE, MacRae E. 2003. New complexities in the synthesis of sucrose. Current Opinion in
Plant Biology 6: 208–214.
Ma H, Albert HA, Paull R, Moore PH. 2000. Metabolic engineering of invertase activities in
different subcellular compartments affects sucrose accumulation in sugarcane. Australian
Journal of Plant Physiology 27: 1021–1030.
Maddison AI, Hedeley PE, Meyer RC, Aziz N, Davidson D, Machray GC> 1999.
Expression of tandem invertase genes associated with sexual and vegetative growth cycles
in potato. Plant Molecular Biology 41: 741–751.
Mao L, Que F, Wang G. 2005. Sugar metabolism and involvement of enzymes in sugarcane
(Saccharum officinarum L.) stems during storage. Food Chemistry 98: 338–342.
Marcelis LFM, Heuvelink E, Goudriaan J. 1998. Modelling biomass production and yield of
horticultural crops: a review. Scientia Horticulturae 74: 83–111.
Markham JE, Kruger NJ. 2002. Kinetic properties of bifunctional 6-phosphofructo-2-
kinase/fructose-2, 6-bisphosphatase from potato. European Journal of Biochemistry 269:
1267–1277.
Maroco JP, Ku MSB, Lea PJ, Dever LV, Leegood RC, Furbank RT Edwards GE.
1998. Oxygen requirements and inhibition of C4 photosynthesis. Plant Physiology 116: 823–
832.
McCown RL, Hammer GL, Hargreaves JNG, Holzworth DP, Freebairn DM. 1996.
APSIM: a novel software system for model development, model testing and simulation in
agricultural systems research. Agricultural Systems 50: 255–271.
McCree KJ. 1970. An equation for the rate of respiration of white clover plants grown under
controlled conditions. In: Setlik, I, ed. Prediction and measurement of photosynthetic
productivity. PUDOC, Wageningen: Germany, 221–229.
McMichael RW, Kochansky J, Klein RR, Huber SC. 1995. Characterization of the
substrate specificity of sucrose-phosphate synthase protein kinase. Archives of Biochemistry
and Biophysics 321: 71–75.
Mertens E, Larondelle Y, Hers H-G. 1990. Induction of pyrophosphate: fructose 6-
phosphate 1-phosphotransferase by anoxia in rice seedlings. Plant Physiology 93: 584–587.
Minchin PEH, Lacointe A. 2004. New understanding on phloem physiology and possible
consequences for modelling long-distance carbon transport. New Phytologist 166: 771–779.
Chapter 2: Literature Review
66
Minchin PEH, Thorpe MR. 1996. What determines carbon partitioning between competing
sinks? Journal of Experimental Botany 47: 1293–1296.
Minchin PEH, Thorpe MR, Farrar JF. 1993. A simple mechanistic model of phloem
transport which explains sink priority. Journal of Experimental Botany 44: 947–955.
Minchin PEH, Thorpe MR, Farrar JF. 2002. Source–sink coupling in young barley plants
and control of phloem loading. Journal of Experimental Botany 53: 1671–1676.
Miyagawa, Y, Tamoi M, Shigeoka S. 2001. Overexpression of a cyanobacterial fructose-
1,6-sedoheptulose-1,7-bisphosphate in tobacco enhances photosynthesis and growth.
Nature Biotechnology 19: 965–969.
Moore BD, Sheen J. 1999. Plant sugar sensing and signaling: A complex reality. Trends in
Plant Science 4: 250.
Moore B, Zhou L, Rolland F, Hall Q, Cheng W-H, Liu Y-X, Hwang I, Jones T, Sheen
J. 2003. Role of Arabidopsis glucose sensor HXK1 in nutrient, light, and hormonal signaling.
Science 300: 332–336.
Moore PH, Cosgrove DJ. 1991. Developmental changes in cell and tissue water relations
parameters in storage parenchyma of sugarcane. Plant Physiology 96: 794–801.
Muchow RC, Robertson MJ, Wood AW. 1996. Growth of sugarcane under high input
conditions in tropical Australia. II. Sucrose accumulation and commercial yield. Field Crops
Research 48: 27–36.
Müller J, Aeschbacher RA, Wingler A, Boller T, Wiemken A. 2001. Trehalose and
trehalase in plants: recent developments. Plant Science 112: 1–9.
Nelson T, Langdale JA. 1992. Patterns of leaf development in C4 plants. The Plant Cell 1:
3–13.
Nielsen TH. 1992. Differences in fructose-2,6-bisphosphate metabolism between sections of
developing barley leaves. Physiologia Plantarum 84: 577–583.
Nielsen TH. 1995. Fructose 1,6-bisphosphate is an allosteric activator of pyrophosphate:
fructose-6-phosphate 1-phosphotransferase expression. Plant Physiology 108: 69–73.
Nielsen TH, Rung JH, Villadsen D. 2004. Fructose 2,6-bisphosphate: a traffic signal in plant
metabolism. Trends in Plant Science 9: 556–563.
Nielsen TH, Stitt M. 2001. Tobacco transformants with strongly decreased expression of
pyrophosphate:fructose-6-phosphate expression in the base of their young growing leaves
contain much higher levels of fructose-2,6-bisphosphate but no major change in fluxes.
Planta 214: 106–116.
Nguyen-Quoc B, Foyer CH. 2001. A role for “futile cycles” involving invertase and sucrose
synthase metabolism of tomato fruit. Journal of Experimental Botany 52: 881–889.
Nolte KD, Koch KE. 1993. Companion-cell specific localization of sucrose synthase in zones
of phloem loading and unloading. A role for “futile cycles” involving invertase and sucrose
synthase metabolism of tomato fruit. Plant Physiology 101: 899–905.

Chapter 2: Literature Review
67
Olcer H, Lloyd JC, Raines. 2001. Photosynthetic capacity is differentially affected by
reductions in sedoheptulose-1,7-bisphosphate activity during leaf development in tobacco.
Plant Physiology 125: 982–989.
O’Leary GJ. 2000. A review of three sugarcane simulation models with respect to their
prediction of sucrose yield. Field Crops Research 68: 97–111.
Patrick JW. 1997. Phloem unloading: sieve element unloading and post-sieve element
transport. Annual Review of Plant Physiology and Plant Molecular Biology 48: 191–222.
Paul MJ. 2007. Trehalose 6-phosphate. Current Opinion in Plant Biology 10: 303–309.
Paul MJ, Foyer CH. 2001. Sink regulation of photosynthesis. Journal of Experimental Botany
52: 1383–1400.
Paul MJ, Pellny TK. 2003. Carbon metabolite feedback regulation of leaf photosynthesis and
development. Journal of Experimental Botany 54: 539–547.
Paul MJ, Pellny TK, Goddijn O. 2001. Enhancing photosynthesis with sugar signals.
Trends in Plant Science 6: 197–200.
Paul MJ, Sonnewald U, Hajirezaei M, Dennis D, Stitt M. 1995. Transgenic tobacco
plants with strongly decreased expression of pyrophosphate: fructose-6-phosphate
phosphotransferase do not differ significantly from wild type in photosynthate partitioning,
plant growth or their ability to cope with limited phosphate, limiting nitrogen and suboptimal
temperatures. Planta 196: 277–283.
Pego JV, Kortsee AJ, Huijser C, Smeekens SCM. 2000. Photosynthesis, sugars and the
regulation of gene expression. Journal of Experimental Botany 51: 407–416.
Pego JV, Smeekens SCM. 2000. Plant fructokinases: a sweet family get-together.
Trends in Plant Science 5: 531–536.
Pellny TK, Goddijn OJM, Paul MJ. 2002. Unravelling the role of trehalose-6-phosphate in
metabolic signalling. Society for Experimental Biology Annual Main Meeting, Swansea:
Wales.
Perata P, Alpi A. 1993. Plant responses to anaerobiosis. Plant Science 93: 1–17.
Pickard WF, Minchin PEH, Thorpe MR. 1993. Leaf export and partitioning of changes
induced by short-term inhibition of phloem transport. Journal of Experimental Botany 44:
1491–1496.
Podestà FE, Plaxton WC. 2003. Fluorescence study of ligand binding to potato tuber
pyrophosphate-dependent phosphofructokinase: evidence for competitive binding between
fructose-1,6-bisphosphate and fructose-2,6-bisphosphate. Archives of Biochemistry and
Biophysics 414: 101–107.
Price GD, von Caemmerer S, Evans JR, Yu J-W, Lloyd J, Oja V, Kell P, Harrison K,
Gallagher A, Badger MD. 1994. Specific reduction of chloroplastic carbonic anhydrase
activity by antisense RNA in transgenic tobacco plants has a minor effect on photosynthetic
CO2 assimilation. Planta 193: 331–340.

Chapter 2: Literature Review
68
Probert ME, Dimes JP, Keating BA, Dalal RC, Strong WM. 1998. APSIM’s water and
nitrogen modules and simulation of the dynamics of water and nitrogen in fallow systems.
Agricultural Systems 193: 331–340.
Qin L, Trouverie J, Chateau-Joubert S, Simond-Côte E, Thévenot C, Prioul JL. 2004.
Involvement of the Ivr2-invertase in the perianth during maize kernel development under
water stress. Plant Science 166: 371–379.
Quick WP. 1996. Sucrose metabolism in sources and sinks. In: Zamski E, Schaffer AA,
eds. Photoassimilate Distribution in Plants. Marcel Dekker, New York: USA, 115–156.
Quick WP, Schurr U, Schiebe R, Schulze ED, Rodermel SR, Bogorad L, Stitt M.
1991. Decreased ribulose-1,5-bisphosphate carboxylase-oxygenase in transgenic tobacco
transformed with “antisense” RbsC. I. Impact on photosynthesis in ambient growth
conditions. Planta 183: 542–554.
Quilot B, Genard M, Kervella J. 2004. Leaf saturated phtosynthesis for wild and cultivated
peach genotypes and their hybrids: A simple mathematical modelling analysis. Journal of
Horticultural Science and Biotechnology 79: 546–553.
Radford J, White, R. 1998. Localization of a myosin-like protein to plasmodesmata. The
Plant Journal 14: 743–750.
Rae AL, Grof CPL, Casu, RE, Bonnett GD. 2005a. Sucrose accumulation in the
sugarcane stem: pathways and control points for transport and compartmentation. Field
Crops Research 92: 159–163.
Rae AL, Perroux J, Grof CPL. 2005b. Sucrose partitioning between vascular bundles and
storage parenchyma in the sugarcane stem: a potential role for the ShSUT1 sucrose
transporter. Planta 220: 817–825.
Raines CA. 2003. The Calvin cycle revisited. Photosynthesis Research 75: 1–10.
Raines CA, Harrison EP, Olcer H, Lloyd JC. 2000. Investigating the role of the thiol-
regulated enzyme sedoheptulose-1,7-bisphosphate in the control of photosynthesis.
Physiologia Plantarum 110: 303–308.
Reinders A, Sivitz AB, Hsi A, Grof CPL, Perroux JM, Ward JM. 2006. Sugarcane
ShSUT1: analysis of sucrose transport activity and inhibition by sucralose. Plant, Cell and
Environment 29: 1871–1880.
Reismeier JW, Willmitzer L, Frommer WB. 1992. Isolation and characterization of a
sucrose carrier cDNA from spinach by functional expression in yeast. EMBO Journal 11:
4705–4713.
Reismeier JW, Hirner B, Frommer WB. 1993. Expression of the sucrose transporter from
potato correlates with the sink-to-source transition in leaves. Plant Cell 5: 1591–1598.
Ricard B, Van Toai T, Chourey P, Saglio, 1998. Evidence for the critical role of sucrose
synthase for anoxic tolerance of maize roots using a double mutant. Plant Physiology 116:
1323–1331.

Chapter 2: Literature Review
69
Richardo CPP, ap Rees T. 1970. Invertase activity during development of carrot roots.
Phytochemistry 9: 239–247.
Robinson-Beers K, Evert RF. 1991. Ultrastructure of and plasmodesmatal frequency in
mature leaves of sugarcane. Planta 184: 291–306.
Roblin G, Sakr Soulaiman, Bonmort J, Delrot S. 1998. Regulation of a plant plasma
membrane sucrose transporter by phosphorylation. FEBS Letters 424: 165–168.
Rodriguez-Penagos JL, Munoz-Clares R. 1999. Response of phosphoenolpyruvate
carboxylase from maize leaves to moderate water deficit. Journal of Plant Physiology 155:
631–638.
Rohrig H, Schmidt J, Miklashevichs E, Schell J, John M. 2002. Soybean ENOD40
encodes two peptides that bind to sucrose synthase. Proceedings of the National Academy
of Science (USA) 99: 1915–1920.
Rohwer JM, Botha FC. 1998. Analysis of sucrose accumulation in the sugar cane culm on the
basis of in vitro kinetic data. Biochemistry Journal 358: 437–445.
Roitsch T, Bittner M, Godt DE. 1995. Induction of apoplastic invertase of Chenopodium
rubrum by D-glucose and a glucose analog and tissue-specific expression suggest a role in
sink-source regulation. Plant Physiology 108: 285–294.
Roitsch T, Balibrea ME, Hofmann M, Proeis R, Sinna AK. 2003. Extracellular invertase:
key metabolic enzyme and PR protein. Journal of Experimental Botany 54: 513–524.
Roitsch T, Gonzalez MC. 2004. Function and regulation of plant invertases: sweet
sensations. Trends in Plant Science 9: 606–613.
Rojo E, Zhouhar J, Carter C, Kovaleva V, Raikhei NV. 2003. A unique mechanism for
protein processing and degradation in Arabidopsis thaliana. Proceedings of the National
Academy of Science (USA) 100: 7389–7394.
Rolland F, Baena-Gonzalex E, Sheen J. 2006. Sugar sensing and signaling in plants:
conserved and novel mechanisms. Annual Review of Plant Biology 57: 675–709.
Rolland F, Moore R, Sheen J. 2002. Sugar sensing and signaling in plants. The Plant Cell
14(suppl.): 185–205.
Rose S, Botha FC. 2000. Distribution patterns of neutral invertase and sugar content in
sugarcane internodal tissues. Plant Physiology and Biochemistry 38: 819–824.
Ruan Yl, Llewellyn DJ, Furbank RT. 2003. Suppression of sucrose synthase gene
expression respresses cotton fiber initiation, elongation and seed development. The Plant
Cell 15: 952–964.
Sabularse DC, Anderson RL. 1981. D-fructose 2,6-bisphosphate. A naturally occurring
activator for inorganic pyrophosphate: D fructose-6-phosphate 1-phosphotranferase in plants.
Biochemical and Biophysical Research Communications 103: 848–855.
Sage RF, Monson RK. 1999. C4 plant biology. Academic Press, San Diego: USA.

Chapter 2: Literature Review
70
Saito K, Kase T, Takahashi E, Horinouchi S. 1998. Purification and characterization of a
trehalose synthase from the basidiomycete Grifola frondosa. Applied and Environmental
Microbiology 64: 4340–4345.
Sauer N, Caspari T, Klebl F, Tanner W. 1990. Functional expression of the Chlorella
hexose transporter in S. pombe. Proceedings of the National Academy of Sciences (USA)
87: 7949–7950.
Sauer N, Stadler R. 1993. A sink specific H+/monosaccharide co-transporter from Nicotiana
tabacum: cloning and heterlogous expression in baker’s yeast. The Plant Journal 4: 601–
610.
Sauer N, Stolz J. 1994. SUC1 and SUC2: two sucrose transporters from Arabidopsis thaliana;
expression and characterization in baker's yeast and identification of the histidine-tagged
protein. The Plant Journal 6: 67–77.
Sauer N, Tanner W. 1989. The hexose carrier from Chlorella. cDNA cloning of a eukaryotic
H+-cotransporter. FEBS Letters 259: 43–46.
Schäfer WE, Rohwer JM, Botha FC. 2004. A kinetic study of sugarcane sucrose synthase.
European Journal of Biochemistry 271: 3971–3977.
Schaaf I, Heinisch J, Zimmermann FK. 1989. Overproduction of glycolytic enzymes in
yeast. Yeast 5: 285–290.
Schleucher J, Vanderveer PJ, Sharkey TD. 1998. Export of carbon from chloroplasts at
night. Plant Physiology 118: 1439–1445.
Schneidereit A, Scholz-Starke J, Büttner M. 2003. Functional characterization and
expression analyses of the glucose-specific AtSTP9 monosaccharide transporter in pollen of
Arabidopsis. Plant Physiology 133: 182–190.
Schluepmann H, Pellny T, van Dijken A, Smeekens S, Paul M. 2003. Trehalose 6-
phosphate is indispensable for carbohydrate utilization and growth in Arabidopsis thaliana.
Proceedings of the National Academy of Sciences (USA) 100: 6849–6854.
Shakya R, Sturm A. 1998. Characterization of source- and sink-specific sucrose/H+
symporters from carrot. Plant Physiology 118: 1473–1480.
Sheen J. 1990. Metabolic repression of transcription in higher plants. The Plant Cell 2: 1027–
1038.
Singels A, Bezuidenhout CT. 2002. A new method of simulating dry matter partitioning in the
Canegro sugarcane model. Field Crops Research 78: 151–164.
Sinha AK, Hofmann MG, Romer U, Köckenberger W, Elling L, Roitsch T. 2002.
Metabolizable and non-metabolizable sugars activate different signal transduction pathways
in tomato. Plant Physiology 128: 1480–1489.
Silvius JE, Chatterton NJ, Kremer DF. 1979. Photosynthate partitioning in soybean leaves
at two irradiance levels. Comparative responses of acclimated and unacclimated leaves.
Plant Physiology 64: 872–875.

Chapter 2: Literature Review
71
Stadler R, Sauer N. 1996. The Arabidopsis thaliana AtSUC2 gene is specifically expressed in
companion cells. Botanica Acta 109: 299–306.
Stadler R, Wright KM, Lauterbach C, Amon G, Gahrtz M, Feuerstein A, Oparka KJ,
Sauer N. 2005. Expression of GFP-fusions in Arabidopsis companion cells reveals non-
specific protein trafficking into sieve elements and identifies a novel post-phloem domain in
roots. The Plant Journal 41: 319–331.
Stitt M. 1990. Fructose 2,6-bisphosphate as a regulatory molecule in plants. Annual Review of
Plant Physiology and Plant Molecular Biology 41: 153–185.
Stitt M. 1999. Nitrate regulation of metabolism and growth. Current Opinion in Plant Biology 2:
178–186.
Stitt M, Huber SC, Kerr PS. 1987. Control of photosynthetic sucrose formation. In: Hatch
MD, Boardman NK, eds. The Biochemistry of Plants. Academic Press, New York: USA,
208–214.
Stitt M, Mieskes G, Söling H-D, Heldt HW. 1982. On a possible role of fructose 2,6-
bisphosphate in regulating photosynthetic metabolism in leaves. FEBS Letters 145: 217–
222.
Stitt M, Schulze E-D. 1994. Does Rubisco control the rate of photosynthesis and plant
growth? Plant, Cell and Environment 17: 465–487.
Stitt M, Sonnewald U. 1995. Regulation of metabolism in transgenic plants. Annual Review
of Plant Physiology and Plant Molecular Biology 46: 341–368.
Sturm A. 1999. Invertases. Primary structures, functions and roles in plant development and
sucrose partitioning. Plant Physiology 121: 1–7.
Sturm A, Tang G-Q. 1999. The sucrose-cleaving enzymes of plants are crucial for
development, growth and carbon partitioning. Plant Physiology 121 599–608.
Sugiharto B, Sakakibara H, Sumadi, Sugiyama T. 1997. Differential expression of two
genes for sucrose-phosphate synthase in sugarcane: molecular cloning of the cDNAs and
comparative analysis of gene expression. Plant Cell Physiology 38: 961–965.
Suzuki J, Mutton MA, Ferro MIT, Lemos MVF Pizauro JM, Mutton MJR, Maruo SMZ.
2003. Putative pyrophosphate phosphofructose 1-kinase genes identified in sugar cane may
be getting energy from pyrophosphosphate. Genetics and Molecular Research 4: 376–382.
Tang GQ, Luscher M, Sturm A. 1999. Antisense repression of vacuolar and cell wall
invertase in transgenic carrot alters early development and sucrose partitioning. The Plant
Cell 11: 177–189.
Thevelein JM, Hohmann S. 1995. Trehalose synthase: guard to the gate of glycolysis in
yeast? Trends in Biochemical Sciences 20: 3–9.
Thornley JHM. 1972. A balance quantitative model for root:shoot ratios in vegetative plants.
Annals of Botany 36: 431–441.
Thornley JHM. 1998. Modelling shoot[ratio]root relations: the only way forward? Annals of
Botany 81: 165–171.

Chapter 2: Literature Review
72
Toroser D, Athwal GS, Huber SC. 1998. Site-specific regulatory interaction between
spinach leaf sucrose-phosphate synthase and 14-3-3 proteins. FEBS Letters 435: 110–114.
Trevanion SJ, Furbank RT, Ahton AR. 1997. NADP malate dehydrogenase in the C4 plant
F. bidentis: cosense suppression of activity in mesophyll and bundle sheath cells and
consequences for photosynthesis. Plant Physiology 113: 1153–1165.
Truernit E, Schmid J, Epple P, Illig J, Sauer N. 1996. The sink-specific and stress-
regulated Arabidopsis STP4 gene: enhanced expression of a gene encoding a
monosaccharide transporter by wounding, elicitors, and pathogen challenge. Plant Cell 8:
2169–2182.
Tubbe A, Buckhout TJ. 1992. In vitro analysis of the H+-hexose symporter on the plasma
membrane of sugarbeets (Beta vulgaris L.). Plant Physiology 99: 945–951.
Trouverie J, Thenenol C, Rocher J-P, Sotta B, Prioul J-L. 2003. The role of abscisic
acid in the response of a specific vacuolar invertase to water stress in the adult maize leaf.
Journal of Experimental Botany 54: 2177–2188.
Tymowska-Lalanne Z, Kreis M. 1998. The plant invertases: physiology, biochemistry, and
molecular biology. Advances in Botanical Research 28: 71–117.
van Bel AJE. 2003. The phloem: a miracle of ingenuity. Plant Cell and Environment 26: 125–
149.
van Bel AJE, Gamalei YV. 1992. Ecophysiology of phloem loading in source leaves. Plant,
Cell and Environment 15: 256–270.
van Dongen JT, Schurr U, Pfister M, Geigenberger P. 2003. Phloem metabolism and
function have to cope with low internal oxygen. Plant Physiology 131: 1529–1543.
Villadsen D, Nielsen TH. 2001. N-terminal truncation affects the kinetics and structure of
fructose-6-phosphate 2-kinase/fructose-2,6-bisphosphatase from Arabidopsis thaliana.
Biochemistry Journal 359: 591–597.
Viola R, Roberts AG, Haupt S, Gazzini S, Hancock RD Marmiroli N, Machray GC,
Oparka KJ. 2001. Tuberization in potato involves a switch from apoplastic to symplastic
phloem unloading. The Plant Cell 13: 385–398.
Vogel G, Aeschbacher RA, Muller J, Boller T, Wiemken A. 1998. Trehalose-6-
phosphate phosphatases from Arabidopsis thaliana: identification by functional
complementation of the tps2 mutant. The Plant Journal 13: 673–683.
Vogel G, Fiehn O, Jean-Rhichard-dit-Bressel L, Boller T, Wiemken A, Aeschbacher
RA, Wingler A. 2001. Trehalose metabolism in Arabidopsis: occurrence of trehalose and
molecular cloning and characterization of trehalose-6-phosphate synthase homologues.
Journal of Experimental Botany 414: 1817–1826.
Vorster DJ, Botha FC. 1998. Partial purification and characterization of sugarcane neutral
invertase. Phytochemistry 49: 651–655.
Voznesenskaya EV, Franceschi VR, Kiirats O, Freitag H, Edwards GE. 2001. Kranz
anatomy is not essential for terrestrial C4 plant photosynthesis. Nature 414: 543–546.

Chapter 2: Literature Review
73
Wächter R, Langhans M, Aloni R, Götz S, Weilmünster A, Koops A, Temguia L,
Mistrik I, Pavlovkin J, Rascher U, Schwalm K, Koch KE, Ulrich CI. 2003.
Vascularization, high-volume solution flow, and localized roles for enzymes of sucrose
metabolism during tumorigenesis by Agrobacterium tumefaciens. Plant Physiology 133:
1024–1037.
Walker RP, Winter AL, Pollock CJ. 1997. Purification and characterisation of invertases
from leaves of Lolium temulentum L. New Phytologist 135: 259–266.
Walsh KB, Sky RC, Brown SM. 2005. The anatomy of the pathway of sucrose unloading
within the sugarcane stalk. Functional Plant Biology 32: 367–374.
Wang N, Nobel PS. 1998. Phloem transport of fructans in the crassulacean acid metabolism
species Agave deserti. Plant Physiology 116: 709–714.
Wardlaw IF. 1990. The control of carbon partitioning in plants. New Phytologist 116: 341–381.
Weber H, Borisjuk L, Heim U, Sauer N, Wobus U. 1997. A role for sugar transporters
during seed development: molecular characterization of a hexose and a sucrose carrier in
fava bean seeds. Plant Cell 9: 895–908.
Welbaum GE, Meinzer FC. 1990. Compartmentation of solutes and water in developing
sugarcane stalk tissue. Plant Physiology 93: 1147–1153.
White R, Badelt K, Overall R, Velt M. 1994. Actin associated with plasmodesmata.
Protoplasma 180: 169–184.
Whittaker A, Botha FC. 1997. Carbon partitioning during sucrose accumulation in sugarcane
internodal tissue. Plant Physiology 115: 1651–1659.
Williams LE, Lemoine R, Sauer N. 2000. Sugar transporters in higher plants – diversity of
roles and complex regulation. Trends In Plant Science 5: 283–290.
Wingler, A, Fritzius T, Wiemken A, Boller T, Aeschbacher RA. 2000. Trehalose
induces the ADP-glucose pyrophosphorylase gene, ApL3, and starch synthesis in
Arabidopsis. Plant Physiology 124: 105–114.
Wingler, A. 2002. The function of trehalose biosynthesis in plants. Phytochemistry 60: 437–
440.
Winter H, Huber JL, Huber SC. 1997. Membrane association of sucrose synthase: changes
during the graviresponse and possible control by protein phosphorylation. FEBS Letters 420:
151–155.
Winter H, Huber JL, Huber SC. 1998. Identification of sucrose synthase as an actin binding
protein. FEBS Letters 430: 205–208.
Winter H, Huber SC. 2000. Regulation of sucrose metabolism in higher plants: localisation
and regulation of activity of key enzymes. Critical Reviews in Plant Sciences 19: 31–67.
Wirth E, Kell GJ, Fischbeck G, Latzko E. 1977. Enzyme activities and products of CO2
fixation in various photosynthetic organs of wheat and oat. Planta 114: 219–226.
Wobus U, Weber H. 1999. Sugars as signal molecules in plant seed development. Journal of
Biological Chemistry 390: 937–944.

Chapter 2: Literature Review
74
Woodrow IE, Berry JA. 1988. Enzyme regulation of photosynthetic CO2 fixation in C3 plants.
Annual Review of Plant Physiology and Plant Molecular Biology 39: 533–594.
Worrell AC, Bruneau JM, Summerfelt K, Boersig M, Voelker TA. 1991. Expression of
maize sucrose phosphate synthase in tomato alters leaf carbohydrate partitioning. Plant Cell
3: 1121–1130.
Xu J, Avigne WT, McCarty DR, Koch KE. 1996. A similar dichotomy of sugar modulation
and developmental expression affects both paths of sucrose metabolism: evidence from a
maize invertase gene family. The Plant Cell 8: 1209–1220.
Zeng Y, Wu Y, Avigne WT, Koch KE. 1998. Differential regulation of sugar-sensitive
sucrose synthases by hypoxia and anoxia indicate complementary transcriptional and
posttranslational responses. Plant Physiology 116: 1573–1583.
Zeng Y, Wu Y, Avigne WT, Koch KE. 1999. Rapid repression of maize invertases by low
oxygen. Invertase/sucrose synthase balance, sugar signaling potential, and seedling
survival. Plant Journal 121: 599–608.
Zhang SZ. Zheng XQ. 1999. Cloning and sequencing of the gene encoding trehalose
synthase. Chinese Journal of Tropical Crops 5: 21–25.
Zhang SZ. Yang BP, Feng CL, Tang HL. 2005. Genetic transformation of tobacco with
trehalose synthase gene from Grifola frondosa enhances the resistance to drought and salt in
tobacco. Journal of Integrative Plant Biology 47: 579–587.
Zhang SZ. Yang BP, Feng CL, Chen RK, Luo JP, Cai WW, Liu FH. 2006. Expression
of the Grifola frondosa trehalose synthase gene and improvement of drought-tolerance in
sugarcane (Saccharum officinarum L.). Journal of Integrative Plant Biology 48: 453–459.
Zhou JJ, Theodoulou N, Sauer N, Sanders D, Miller AJ. 1997. A kinetic model with
ordered cytoplasmic dissociation for SUC1, an Arabidopsis H+/sucrose cotransporter
expressed in Xenopus oocytes. Journal of Membrane Biology 159: 113–125.
Zrenner R, Salanbout M, Willmitzer L, Sonnewald U. 1995. Evidence of the crucial role of
sucrose synthase for sink strength using transgenic potato plants (Solanum tuberosum L.).
Plant Journal 7: 97–107.
Zrenner R, Krause KP, Apel P, Sonnewald U. 1996. Reduction of the cytosolic fructose
1,6-bisphosphatase in transgenic potato plants limits photosynthetic sucrose biosynthesis
with no impact on plant growth and tuber yield. Plant Journal 9: 671–681.

Chapter 3: Sink strength regulates photosynthesis in sugarcane
75
Chapter 3:
Sink strength regulates photosynthesis in sugarcane
3.1 Summary
• The relationship in sugarcane between photosynthetic source tissue and sink
material was examined through manipulation of the sink:source ratio of field-
grown Saccharum spp. hybrid cv. N19 (N19).
• To enhance sink-strength, all leaves, except for the third fully-expanded leaf,
were enclosed in 90% shade cloth for varying periods of time. Variations in
sucrose, glucose and fructose concentrations were measured and the effects of
shading on the leaf gas exchange and fluorescence characteristics recorded.
Changes in carbon partitioning due to shading were examined based on the
uptake and translocation of fixed 14CO2.
• Following a decline in sucrose concentrations in young internodal tissue and
shaded leaves, significant increases in the CO2 saturated photosynthetic rate
(Jmax), carboxylation efficiency (CE) and electron transport rate were observed in
unshaded leaves after 8 d of shading treatment.
• It was concluded that up-regulation of source leaf photosynthetic capacity is
correlated with a decrease in assimilate availability to acropetal culm sink tissue.
Furthermore, a significant relationship was revealed between source hexose
concentration and photosynthetic activity.
Keywords: C4, partitioning, photosynthesis, sink, source, sucrose, sugarcane
3.2 Introduction
The accumulation of phenomenal levels of sucrose by sugarcane has been the focus of
intense study (Moore, 1995; Lakshmanan et al., 2005; Moore, 2005). Sugarcane is a C4
species that accumulates high sucrose concentrations in the mature internodes with less
accumulation in younger internodes. The differences in sucrose accumulation between
young and mature culm tissues are the consequence of varying rates of cycling of
sucrose between vacuole, cytosol and apoplasm (Sacher et al., 1963; Batta & Singh,
1986). Much research has focussed on culm-specific processes (Whittaker & Botha,
Chapter 3: Sink strength regulates photosynthesis in sugarcane
76
1997; Casu et al., 2003; Walsh et al., 2005), but the integration of source
(photosynthetic) and storage (culm) processes in plants is still not fully understood (Koch
et al., 2000; Pego et al., 2000).
For many plant species, the activities of source photosynthetic production and sink
growth appear to be closely co-ordinated, such that a balance is maintained between
source supply and sink demand (Wardlaw, 1990; Ho, 1992; Foyer et al., 1995).
Evidence increasingly supports a sink-dependent relationship (Paul & Foyer, 2001),
whereby sink-strength influences the net photosynthetic activity and carbon status of
source organs (Paul et al., 2001). Apart from possible feedback through product
accumulation, there is increasing evidence that the activity of photosynthesis-related
enzymes and expression of associated gene transcripts is modified by sink demand
(Sheen, 1990; Sheen, 1994; Black et al., 1995; Koch, 1996; Pego et al., 2000; Paul &
Foyer, 2001; Rolland et al., 2002).
Although there have been limited studies on sugarcane focusing on the relationship
between source and sink tissue (Marcelis, 1996; Pammenter & Allison, 2002), in various
other plant species the dominant influence of sink activity on source photosynthesis and
carbon partitioning has been demonstrated. In Solanum tuberosum, a high sink demand
in the form of rapidly growing tubers caused increased rates of photosynthesis (Dwelle
et al., 1981) and enhanced translocation of photosynthate (Moorby, 1978). Removal of
the tubers led to a marked decrease in net photosynthesis due to the imbalance
between source and sink activity (Nosberger & Humphries, 1965). Irrespective of the
presence or absence of water stress conditions, plants with artificially lowered sink-
strength (tuber excised) accumulated carbohydrate in the leaves and displayed a
considerably reduced maximum photosynthetic rate (Amax), electron transport rate (ETR)
and quantum yield (Fv/Fm) (Basu et al., 1999). Cold girdling of the leaves of Citrus
unshiu to reduce carbon export and defruiting have also reduced rates of photosynthesis
(A), and this reduction coincided with an accumulation of carbohydrate in the source leaf
(Iglesias et al., 2002). Sugar accumulation in leaves also represses the expression of
photosynthetic genes (Sheen, 1990). In transgenic Nicotiana tabacum leaves, the
expression of a yeast invertase in the cell wall resulted in increased carbohydrate
content, especially soluble sugars, which gradually inhibited photosynthetic levels as
sugars accumulated (Von Schaewen et al., 1990; Stitt et al., 1991). Similarly, mature

Chapter 3: Sink strength regulates photosynthesis in sugarcane
77
leaves of Spinacia oleracea supplied with glucose through the transpiration stream lost
Rubisco activity over a 7 d period (Krapp et al., 1991).
In sugarcane, the sucrose accumulating processes within the maturing stem are likely to
be strong sinks for photoassimilate (Marcelis, 1996). Sucrose accumulation in the
sugarcane culm has recently been shown to receive high priority in the allocation of
assimilates (Pammenter & Allison, 2002). Coincidently, large differences in
photosynthetic rates have, in the past, been reported for individual sugarcane leaves
related to the age of the plant, with young plants typically assimilating at significantly
higher rates than older plants (Hartt & Burr, 1967; Bull & Tovey, 1974). Gross
photosynthesis has been found to be lower in eight-month-old sugarcane plants
compared to four-month-old plants, regardless of the light intensity (Allison et al., 1997).
Another study reported that three-month-old sugarcane exhibited photosynthetic rates of
45 �mol m-2 s-1 under intense illumination, while young leaves on ten-month-old plants
only photosynthesised at 25 �mol m-2 s-1 (Amaya et al., 1995).
In plants, sugar status modulates and coordinates growth and development (Smeekens,
2000) and, although the regulatory role of sugar on photosynthesis and metabolism is
well known, progress has only recently been made in determining the molecular
mechanisms of sugar sensing and signaling (Rolland et al., 2002; Gibson, 2005).
Components of sugar sensing systems that have been identified include glucose,
sucrose and trehalose sensing systems. For example, hexokinase (HXK) functions as a
glucose sensor that modulates gene expression and sucrose non-fermenting 1 (Snf1)-
related protein kinases (SnRKs), which are known to have diverse functions in carbon
metabolism and sugar signaling (Rolland et al., 2002). Since the details of sink
regulation of photosynthetic source relations in C3 plants are only now emerging, the
picture is even less clear in the more complex C4 species, such as sugarcane. In part,
regulation of C4 photosynthesis is achieved through compartmentation of the process
between mesophyll and bundle sheath cells and control of metabolite transfers through a
set of cell-specific organelle metabolite translocators (e.g. dicarboxylic acid transporters)
together with symplastic connections (Edwards et al., 2001). Various specialisations
have been demonstrated for C4 leaf carbon metabolism, including bundle sheath cell-
specific storage of starch for a range of species (Downton & Tregunna, 1968; Laetsch,
1971; Lunn & Furbank 1997) and preferential localisation of genes involved in sucrose
biosynthesis in the mesophyll cells (Lunn & Furbank, 1999). Studies continue to

Chapter 3: Sink strength regulates photosynthesis in sugarcane
78
uncover new aspects of the control mechanisms involved in C4 photosynthesis (Kubien
et al., 2003; von Caemmerer et al., 2005), however little is known about the unique
regulatory interactions that determine assimilatory flux in C4 plants, such as sugarcane.
However, many of the controls elucidated for C3 systems also operate in C4 plants
(Sheen, 2001); for example carbamylation of Rubisco by Rubisco activase has been
shown to be essential for photosynthesis in the C4 dicot, Flaveria bidentis (von
Caemmerer et al., 2005).
The existence of a sugar-dependent relationship between source and sink tissues in
sugarcane could represent a potentially fundamental limiting factor for sucrose
accumulation in the stalk and consequently play a major role in overall sucrose
accumulation and crop yield. In the current study, the relationship between
photosynthetic source tissue and sink material was examined through manipulation of
sink demand and total sink-strength in field-grown sugarcane. To artificially increase
sink-strength by manipulating the sink:source ratio, all leaves, except for the third fully
expanded leaf, were enclosed in 90% shade cloth. In this way leaves that served as
source were converted to sinks, producing an overall increase in plant sink-size. The
effects on gas exchange characteristics and PSII efficiency were investigated and
changes in photosynthesis were explained on the basis of leaf sugar levels and
variations in sugar partitioning based on the uptake of a 14CO2 label.
3.3 Materials and methods
3.3.1 Plant material
Nine- to twelve-month-old field-grown Saccharum spp. (L.) hybrid cv. N19 (N19)
cultivated at Mount Edgecombe, KwaZulu-Natal, South Africa, on a 5 x 15 m plot was
used in this study, which was conducted during summer (December 2004). The plot
was located on a north-east facing slope with a gradient of ca. 10o.

Chapter 3: Sink strength regulates photosynthesis in sugarcane
79
3.3.2 Manipulation of sink capacity
To increase plant sink:source ratios, all leaves except the third fully-expanded leaf (leaf
6) (Fig. 3.1) were covered in a black sleeve constructed from 90% shade cloth. Leaf 6
was chosen as the most suitable intermediate between mature and maturing stalk
tissue. Shade cloth was selected so as not to totally impede gas flow to the plant or to
elicit changes in photomorphogenesis. Treated plants were selected based on similar
height and stalk width, and were separated by at least two unshaded plants to negate
potential shading effects of the shade cloth on neighboring plants. Treatments were
applied between 1 and 14 d prior to the measurements and sampling, effectively
rendering leaf 6 the sole light receiving source for photosynthetic carbon assimilation for
this variable period prior to analysis. Light conditions were measured regularly
throughout the experiment using a LI-6400 portable photosystem unit (LI-COR
Biosciences Inc., Nebraska, USA) to ensure that leaf 6 from control and partially shaded
plants received similar levels of light exposure. These plants that had been shaded for
variable periods of time were compared to “control” plants that were not shaded.
3.3.3 Sugar determination
Following shading treatments for 1, 3, 6 and 14 d, treated and unshaded plants (n=7)
were concurrently harvested at 12h00. In this way, all plants were exposed to the same
environmental factors immediately prior to harvest. To decrease the risk of potential
sucrose hydrolysis, time taken between harvest and processing was kept to a minimum.
Stalks were kept intact and internodes 4, 6, 8, 10 and 12 were excised sequentially from
top to bottom. The rind was removed and the underlying tissue, spanning the core to the
periphery of the entire internode, was cut into small pieces (ca. 2 x 5 mm). Leaf material
representing the meristematic leaf roll (designated leaf 0), first fully-expanded leaf
(designated leaf 3) and third fully expanded leaf (designated leaf 6) was sliced thinly.
Tissues were then milled in an A11 Basic Analysis Mill (IKA, Staufen, Germany) and
frozen in liquid nitrogen (–196o C). The samples were stored in 50 ml centrifuge tubes at
–80o C. Prior to analysis, leaf and culm tissues were incubated overnight in 20 volumes
of sugar extraction buffer (30 mM HEPES [pH 7. 8], 6 mM MgCl2 and ethanol 70% [v/v])
at 70o C. Extracts were centrifuged for 10 min at 23 200 g and sucrose, fructose and

Chapter 3: Sink strength regulates photosynthesis in sugarcane
80
Fig. 3.1. The upper section of a sugarcane stalk showing leaves 1 to 9 and internodes 1 to 9.
Leaves are consecutively numbered and attached to the bottom of their
corresponding internode. The third fully-expanded leaf (leaf 6) is indicated in
brackets. Adapted from van Dillewijn (1952).

Chapter 3: Sink strength regulates photosynthesis in sugarcane
81
glucose concentrations in the supernatant measured by means of a spectrophotometric
enzymatic coupling assay modified from Jones et al. (1977). The phosphorylation of
glucose by hexokinase/glucose-6-phosphate dehydrogenase (EC 1.1.1.49) (Roche
Mannheim, Germany) and fructose by phosphoglucose isomerase (EC 5.3.1.9) (Roche)
was quantified by following the reduction of NADP+ to NADPH at 340 nm (A340).
Absorbance measurements and data analysis were conducted on a Synergy HT Multi-
Detection Microplate Reader (Biotek Instrument, Inc., Winooki, VT, USA) using KC4
software (Biotek Instrument, Inc), respectively.
3.3.4 Gas exchange and fluorescence determinations
A LI-6400 portable photosystem unit was used to measure photosynthetic assimilation
(A), transpiration rate (E), stomatal conductance (Gs), intercellular CO2 concentration (Ci)
and leaf temperature of leaf 6 between 9h00 and 12h00. Comparative measurements
were performed on the day of harvest for plants that were unshaded or had previously
been partially shaded for 1 to 14 d (n=4). Partially shaded plants were further measured
over a period of 2, 4 and 8 d (n=4). The latter experiment was repeated at least once to
confirm results. The response of A to Ci (A:Ci) was measured by varying the external
CO2 concentration from 0 to 1 000 �mol mol-1 under a constant photosynthetically active
radiation (PAR) of 2 000 �mol m-2 s-1. An equation ( )( ) ceaA ibC −−= −1 was fitted to the
A:Ci data using least squares. The portion of the curve where the slope approaches
zero due to limitation in the supply of substrate (ribulose-1,5-bisphosphate), which is
equivalent to the CO2- and light-saturated photosynthetic rate(Jmax) (Lawlor, 1987), was
calculated from this equation (a, Jmax; b, curvature parameter; c, dark respiration (Rd)).
Linear regression was performed on the data between a Ci of 0 and 200 �mol mol-1 to
determine the efficiency of carboxylation (CE; Lawlor, 1987). The assimilation rate in the
absence of stomatal limitations (Aa) was as calculated as A interpolated from the
response curve at Ci = 380 �mol mol-1.
Chlorophyll fluorescence was determined concurrently with A:Ci gas exchange
measurements using the LI-6400-40 Leaf Chamber Fluorometer (LI-COR Biosciences
Inc.). A saturating pulse of red light (0.8 s, 6 000 µmol m-2 s-1) was applied to determine
the maximal fluorescence yield (Fm’) at varying external CO2 concentrations (0 - 1 000
�mol mol-1). The electron transport rate (ETR), defined as the actual flux of photons
Chapter 3: Sink strength regulates photosynthesis in sugarcane
82
driving photosystem II (PSII) was calculated from leaffIFm
FsFmETR α�
�
���
� −='
', where Fs is
“steady-state” fluorescence (at 2 000 �mol m-2 s-1), Fm’ is the maximal fluorescence
during a saturating light flash, f is the fraction of absorbed quanta used by PSII, typically
assumed to be 0.4 for C4 plant species (Edwards & Baker, 1993), I is incident photon
flux density and �leaf is leaf absorptance (0.85, LI-COR manual). The component
fluorescence variables were derived as described by Maxwell & Johnson (2000).
3.3.5 14CO2 labelling
The influence of shading treatments on carbon allocation was measured by supplying
leaf 6 of unshaded and partially shaded plants (4 d and 10 d) (n=3) with 14CO2 using a
protocol modified from Hartt et al. (1963). A portion of leaf (5 x 20 cm) weighing
approximately 5 g was sealed in an air-inflated polythene bag containing 50 �l NaH14CO3
(specific activity, 55 mCi mmol-1, ICN Radiochemicals, Irvine, CA, USA) to which 1 ml
10% (v/v) lactic acid was added to release 14CO2. The sealed bags were then gently
palpated to ensure equilibration of released 14CO2 and even distribution of uptake over
the leaf surface. After 1 h, bags were removed and a leaf disc (ca. 10 mg) of the
labelled region of leaf 6 was excised and stored in liquid nitrogen. The plants were
harvested 24 h after 14CO2 supply and tissue samples milled in an A11 Basic Analysis
Mill (IKA) and incubated overnight in twenty volumes of sugar extraction buffer (30 mM
HEPES [pH 7. 8], 6 mM MgCl2 and ethanol 70% [v/v]) at 70oC. The radioactivity in the
70% (v/v) alcohol-soluble component was measured with a Tri-Carb Liquid Scintillation
Analyzer (Packard, Massachusetts, USA) using Ultima GoldTM XR (Packard, Milford, MA,
USA).
Labelled sugars in the 70% alcohol-soluble component were spotted onto 10 x 20 cm
silica gel plates (Merck, Darmstadt, Germany) using a semi-automatic Thin Layer
Chromatography (TLC) sample applicator (Linomat 5, CAMAG, Muttenz, Switzerland)
and fractionated using a mobile phase consisting of 50% ethyl acetate (v/v), 25% acetic
acid (v/v), and 25% filter-sterilized water for 3 h. Silica plates were dried at 70oC for 10
min, sealed in polyethylene film and exposed to high-resolution phosphor screens
(Packard). After 24 h exposure, the images on the phosphor screens were captured and
analysed by means of a Cyclone Storage Phosphor Screen imaging system (Packard)
using Optiquant Ver. 03.10 (Packard).

Chapter 3: Sink strength regulates photosynthesis in sugarcane
83
3.3.6 Statistical analysis
Results were subjected to analysis of variants (ANOVA) or Student’s t tests to determine
the significance of difference between responses to treatments. When ANOVA was
performed, Tukey's honest significant difference (HSD) post-hoc tests were conducted to
determine the differences between the individual treatments (SPSS Ver. 11.5, SPSS
Inc., Chicago, IL, USA). SPSS was also used to calculate the Pearson’s correlation
coefficients for correlation analyses.
3.4 Results
3.4.1 Effect of source: sink variations on sugar levels
Glucose concentrations in the unshaded leaf (leaf 6) declined over the duration of the
shading treatment (Fig. 3.2), whereas fructose concentrations remained constant until
day 6, declining subsequently. Apart from a temporary increase in sucrose after 6 d,
there were no changes in sucrose concentration in leaf 6. Sucrose concentrations in
shaded leaf 3 decreased over the initial 24 h period, and then remained constant at 21
µmol g-1 (Fig. 3.2). No significant changes were observed in glucose or fructose levels
of leaf 3 over time.
Internodes above and below leaf 6 responded differently to the shading treatment,
although internode 6 had consistently higher concentrations of hexoses and sucrose
than internode 4 (Fig. 3.2). A comparable decline in sucrose levels over time was seen
in both internodes 4 and 6; however, this trend was stronger in internode 4. There were
no significant changes in hexose concentrations in internodes 4 and 6.
Sucrose levels in mature internodes (internode 8, 10 and 12) were consistently highest
in internode 12, followed by internodes 10 and 8 (Fig. 3.2). Sucrose concentrations
decreased at day 3 across all mature internodes, followed by a sharp increase at day 6.
This trend was more substantial in internodes closer to leaf 6. Hexose levels in
internodes 8 and 10 also declined significantly during the course of the time treatments
while hexose levels in internode 12 remained constant throughout. Levels of hexose in

Chapter 3: Sink strength regulates photosynthesis in sugarcane
84
mature internodes were consistently highest in internode 8, followed by internodes 10
and 12 respectively.
Fig. 3.2. Glucose, fructose and sucrose (µmol g-1 FW) measurements for field-grown N19
plants that were unshaded (0 d) and partially shaded (leaf 6 not shaded) for 1, 3, 6
and 14 d prior to sampling (n=7). All plants were harvested and processed
concurrently. Sugar levels are shown for leaf 6 and leaf 3; internode 4 and internode
6; internode 8, internode 10 and internode 12. Letters above the SE bars indicate
whether the treatment had a significant influence within each tissue type (P<0.05) as
determined by ANOVA followed by Tukey’s honestly significant difference (HSD)
tests.
3.4.2 Partial shading effect on 14C partitioning
The 14C detected in a sample of leaf 6 immediately after the 1 h feeding period was
statistically indistinguishable between the sample groups (unshaded, 4d or 10 day
partially shaded) although variations might have been anticipated due to variation in total
0
20
40
60
80
1 2 3
asa
0
5
10
15
20
25
Leaf 3 Leaf 6
Glu
cose
(�
mo
l g-1
)
0
4
8
12
L3 L6
Fru
cto
se (�
mo
l g-1
)
0
20
40
60
80
100
1 2as
a
0
20
40
60
1 2
asa
0
20
40
60
Leaf 3 Leaf 6
Su
cro
se (�
mo
l g-1
)
0
20
40
60
Internode 4 Internode 6
asa
0
30
60
90
120
1 2 3
asa
0
200
400
600
Internode 8 Internode 10 Internode 12as
a
Unshaded1 Day3 Day6 Day14 Day
b
a
aa ab
a
b
a
b bb b
a a
a
aa
a
a a
a
a
a
a
ab
bcc
aa a a
b
a aa
aa
a aa
a
a
a a a
a
aa aa
a
a
aa
a
a
a
a
a
a
b
aaa
aa
a
a
abab
bab
ab
a
abb
aab
ab
a a a
ab
b
abab
a
ab
ba aa a
aa
ac bcc
a
a
a
b
a
a
a
ab
a
0
20
40
60
80
1 2 3
asa
0
5
10
15
20
25
Leaf 3 Leaf 6
Glu
cose
(�
mo
l g-1
)
0
4
8
12
L3 L6
Fru
cto
se (�
mo
l g-1
)
0
20
40
60
80
100
1 2as
a
0
20
40
60
1 2
asa
0
20
40
60
Leaf 3 Leaf 6
Su
cro
se (�
mo
l g-1
)
0
20
40
60
Internode 4 Internode 6
asa
0
30
60
90
120
1 2 3
asa
0
200
400
600
Internode 8 Internode 10 Internode 12as
a
Unshaded1 Day3 Day6 Day14 Day
Unshaded1 Day3 Day6 Day14 Day
b
a
aa ab
a
b
a
b bb b
a a
a
aa
a
a a
a
a
a
a
ab
bcc
aa a a
b
a aa
aa
a aa
a
a
a a a
a
aa aa
a
a
aa
a
a
a
a
a
a
b
aaa
aa
a
a
abab
bab
ab
a
abb
aab
ab
a a a
ab
b
abab
a
ab
ba aa a
aa
ac bcc
a
a
a
b
a
a
a
ab
a

Chapter 3: Sink strength regulates photosynthesis in sugarcane
85
leaf size and weight (Table 3.1). After the 24 h chase period, the amount of 14C in leaf 6
was significantly less in the shaded than in the unshaded treatments. The allocation of 14C labelled assimilate to the leaf roll and leaf 3 (shaded) increased with increased
duration of shading. Likewise, the amount of 14C allocated to internodes 4 also
increased with increased duration of shading. In contrast, the amount of label in
internode 8 was reduced by shading, while internode 10 received a small amount of
label, which was not influenced by the shading treatment. The amount of 14C recovered
from internode 12 was negligible (data not shown).
Shading (4 d and 10 d) prior to 14CO2 exposure reduced the amount of sucrose retained
by leaf 6. However, labelled hexose levels in leaf 6 only showed a significant reduction
in plants previously shaded for 10 d (Fig. 3.3). Shading caused a significant increase in 14C allocation to sucrose in the leaf roll, leaf 3 and in internodes 4 and 6. In contrast,
there was a reduction in allocation to sucrose in internode 8 after 4 d of shading.
Changes in 14C-hexose concentrations were generally smaller than the changes in 14C-
sucrose. However, shading increased 14C allocation to hexoses in leaf 3 and internode
6, but reduced allocation to 14C-hexose in internode 8.
Table 3.1. Incorporation and distribution of a 14C label in field-grown sugarcane plants that were
either unshaded or previously partially (leaf 6 not shaded) shaded for either 4 or 10 d
prior to exposure to 14CO2. The plants were supplied with 100 �Ci 14CO2 to leaf 6
followed by a 24 h chase period. The means ± standard errors (kBq g-1 FW, n=3) are
followed by letters indicating for each tissue type whether the treatments had a
significant influence (P<0.05) as determined by ANOVA followed by Tukey's honest
significant difference (HSD) tests.
Tissue Unshaded 4 days 10 days
Leaf 6 * (kBq g-1 FW) 789.3 ± 146 a 668.6 ± 114 a 569 ± 38 a
Internode 4 1.5 ± 0.7 a 2.2 ± 0.5 a 2.7 ± 0.3 b
Internode 6 1.7 ± 0.9 a 2.6 ± 0.8 a 2.4 ± 0.5 a
Internode 8 2.7 ± 0.1 a 0.8 ± 0.1 b 1.1 ± 0.4 b
Internode 10 0.8 ± 0.4 a 0.9 ± 0.1 a 0.8 ± 0.3 a
Leaf Roll 1.5 ± 0.4 a 3 ± 0.3 b 5 ± 1.3 b
Leaf 3 0.3 ± 0.1 a 3.2 ± 2.3 a 6.1 ± 1.0 b
Leaf 6 55.5 ± 6.8 a 32.3 ± 12.4 a 32.9 ± 1.8 b
Leaf 6* samples taken directly after labelling.
FW, fresh weight.
Chapter 3: Sink strength regulates photosynthesis in sugarcane
86
3.4.3 Source leaf photosynthesis and sugar correlations
Photosynthetic gas exchange characteristics and leaf chlorophyll fluorescence activities
were determined on leaf 6 of unshaded plants and plants partially shaded for 1, 3, 6 and
14 d (Fig. 3.4). For partially shaded plants, a striking increase in both photosynthetic
assimilation (A) and electron transport rate (ETR) across all Ci values was observed over
the duration of the shading. Interestingly, plants shaded for 6 d exhibited a 37% higher
Jmax compared to day 3 (Fig. 3.4). This was associated with a significant increase in leaf
sucrose levels between day 3 and 6 (Fig. 3.2). The gas exchange variables and leaf
ETR variables derived from A:Ci and ETR:Ci curves increased over the duration of the
shading treatment (Table 3.2). After 8 d, significant increases in the substrate-limited
photosynthetic rate (Jmax, 42%) and carboxylation efficiency (CE, 28%) were observed in
comparison to unshaded plants, while the assimilation rate (A) and assimilation rate in
the absence of stomatal limitation (Aa) were 48% and 51% higher, respectively, than in
unshaded plants. The ETR of leaf 6 at ambient CO2 was also elevated by 29% after 8 d.

Chapter 3: Sink strength regulates photosynthesis in sugarcane
87
Fig. 3.3. Allocation of 14C label (Bq g-1) to hexose and sucrose pools of various tissues for
field-grown N19 sugarcane plants either unshaded or previously partially (leaf 6 not
shaded) shaded for 4 or 10 d prior to exposure to 14CO2 (n=3). Bars represent
labelled hexose or sucrose 24 h after label incorporation (mean ± SE). See Table 3.1
for 14CO2 labelling details. Letters above SE bars indicate whether the treatment had
a significant (P<0.05) influence within each tissue type as determined by ANOVA
followed by post-hoc Tukey's honest significant difference (HSD) tests.
0
5000
10000
15000
20000
25000
30000
35000
Leaf 6
0
5000
10000
15000
20000
25000
30000
35000
40000
Leaf 6
0
500
1000
1500
2000
2500
3000
3500
4000
4500
Leaf Roll Leaf 3 Int 4 Int 6 Int 8 Int 10
Suc
rose
(Bq
g-1)
b
b
b
aa
b
a
a
a
aa
b b
b
ba
a
a
a
a
a
a
bb
Unshaded
4 Day
10 Day
0
200
400
600
800
1000
1200
1400
Leaf Roll Leaf 3 Int 4 Int 6 Int 8 Int 10
Hex
ose
(Bq
g-1)
a aa
aa
b
a aaa
bb
a
b b a
a a
00
Hex
ose
(Bq
g-1 )
Suc
rose
(B
qg-
1)
0
5000
10000
15000
20000
25000
30000
35000
Leaf 6
0
5000
10000
15000
20000
25000
30000
35000
40000
Leaf 6
0
500
1000
1500
2000
2500
3000
3500
4000
4500
Leaf Roll Leaf 3 Int 4 Int 6 Int 8 Int 10
Suc
rose
(Bq
g-1)
b
b
b
aa
b
a
a
a
aa
b b
b
ba
a
a
a
a
a
a
bb
Unshaded
4 Day
10 Day
0
200
400
600
800
1000
1200
1400
Leaf Roll Leaf 3 Int 4 Int 6 Int 8 Int 10
Hex
ose
(Bq
g-1)
a aa
aa
b
a aaa
bb
a
b b a
a a
00
Hex
ose
(Bq
g-1 )
Suc
rose
(B
qg-
1)

Chapter 3: Sink strength regulates photosynthesis in sugarcane
88
Fig. 3.4. Changes in photosynthetic CO2 assimilation (�mol m2 s-1) and photosynthetic
electron transport rate (ETR) for unshaded leaf 6 versus intercellular CO2
concentration (Ci, �mol mol-1) for different times (1 to 14 d) from initiation of shading
for both unshaded and partially shaded (all leaves shaded except for leaf 6) twelve-
month-old field-grown N19 sugarcane (n=4). Measurements were made at an
average ambient RH of 44.6% ± 3.6 and an irradiance of 2000 �mol m-2 s-1.
0
5
10
15
20
25
30
35
40
0 100 200 300 400 500 600
Ci (�mol mol-1)
A (�
mol
m-2
s-1
)
0
20
40
60
80
100
120
140
0 100 200 300 400 500 600
Ci (�mol mol-1)
ET
R (�
mol
m-2
s-1
)
00
5
10
15
20
25
30
35
40
0 100 200 300 400 500 600
Ci (�mol mol-1)
A (�
mol
m-2
s-1
)
0
20
40
60
80
100
120
140
0 100 200 300 400 500 600
Ci (�mol mol-1)
ET
R (�
mol
m-2
s-1
)
0
6 Day14 Day
Unshaded1 Day3 Day6 Day14 Day
Unshaded1 Day3 Day

Chapter 3: Sink strength regulates photosynthesis in sugarcane
89
Table 3.2. Variables from A:Ci curves based on gas exchange analysis and leaf fluorescence of
leaf 6 from unshaded and partially (leaf 6 not shaded) shaded (2, 4 and 8 d) twelve-
month-old field-grown N19 sugarcane: substrate supply limited assimilation (Jmax),
dark respiration (Rd), carboxylation efficiency (CE), photosynthetic rate in the
presence (Ai) and absence of stomatal limitation (Aa), stomatal conductance (Gs),
intercellular CO2 concentration at ambient CO2 (Ci at Ca = 380) and electron transport
rate (ETR) at Ca = 380. Measurements were performed over a period of 8 d at an
ambient RH of 35.9% ± 0.8 (mean ± SE) and an irradiance of 2000 �mol m-2 s-1. The
shade treatment values are the mean ± SE (n=4) and are followed by letters
indicating for each tissue type whether the treatments had a significant influence
(P<0.05), as determined by ANOVA followed by Tukey's honest significant difference
(HSD) tests. For each measurement, unshaded plants were measured as controls,
but there were no significant differences between the photosynthetic parameters for
the unshaded plants over time and thus the overall mean ± SE (n=12) is presented
for this group.
Photosynthetic parameter Unshaded 2d 4d 8d
Jmax (�mol m-2 s-1) 22.7 ± 2.0 a 23.4 ± 1.1 a 29.7 ± 4.5 a 32.2 ± 0.7 b
Rd (�mol m-2 s-1) 3.7 ± 0.8 a 2.2 ± 0.3 a 2.6 ± 0.3 a 2.3 ± 0.4 a
CE (mmol m-2 s-1) 129 ± 36.6 a 130 ± 39 a 153 ± 34 a 164.5 ± 5.4 b
Aa (�mol m-2 s-1) 18 ± 2.5 a 19.3 ± 0.7 a 21.2 ± 0.4 b 27.1 ± 0.6 b
Ai (�mol m-2 s-1) 13.8 ± 2.6 a 14.2 ± 1.1 a 16.3 ± 3.0 a 20.4 ± 0.5 b
Gs (mmol m-2 s-1) 131 ± 26 a 137 ± 10 a 119 ± 27 a 145 ± 7 a
Ci at Ca = 380 (�mol mol-1) 162 ± 11.8 a 168 ± 9 a 167 ± 19 a 187 ± 17 a
ETR at Ca = 380 (�mol mol-1) 55 ± 6.2 a 62 ± 3.0 a 67 ± 8.1 a 71 ± 2.0 b
A comparison between changes in sugar levels and photosynthetic activity variables of
unshaded leaf 6 over 14 d of shading treatment further revealed a strong negative
correlation between hexose concentrations in source leaf tissue, and Jmax and CE (Fig.
3.5). This relationship was not evident for these variables with sucrose. Further
analysis revealed significant relationships between sucrose and hexose concentrations,
and leaf 6 photosynthesis levels in the internodal tissue sampled (Table 3.3; Fig. 3.6).
All sampled internodes produced a positive correlation between glucose and fructose
levels. Immature sink tissue (internodes 4 and 6) was characterised by decreased
sucrose levels which were correlated with an increase in Jmax (and CE for internode 4)
over the 14 d period. The decreased hexose concentrations in internode 8 were
negatively correlated with both sucrose and photosynthetic variables Jmax and CE, while

Chapter 3: Sink strength regulates photosynthesis in sugarcane
90
the increased levels of sucrose in mature internodes (10 and 12) were positively
correlated with changes in CE.
Fig. 3.5. Correlations between sugar concentration (hexose and sucrose) and photosynthetic
gas exchange variables (substrate supply limited assimilation, Jmax; carboxylation
efficiency, CE) for leaf 6 of field-grown sugarcane (hybrid cv. N19) either unshaded (0
d) or partially shaded 1, 3, 6, 14 d. J max
(µm
ol m-2
s-1
)
15
20
25
30
35
40
45
50
Sucrose (µmol g-1)
35 40 45 50 55 60 65
Hexose (µmol g-1)
0 2 4 6 8 10 12
CE
(mol m
-2 s
-1)
0
100
200
300
400
500
R2 = 0.878
R2 = 0.755 R2 = 0.099
R2 = 0.016
J max
(µm
ol m
-2s-1
)C
E (m
mol
m-2
s-1)
Hexose (µmol g-1) Sucrose (µmol g-1)
J max
(µm
ol m-2
s-1
)
15
20
25
30
35
40
45
50
Sucrose (µmol g-1)
35 40 45 50 55 60 65
Hexose (µmol g-1)
0 2 4 6 8 10 12
CE
(mol m
-2 s
-1)
0
100
200
300
400
500
R2 = 0.878
R2 = 0.755 R2 = 0.099
R2 = 0.016
J max
(µm
ol m
-2s-1
)C
E (m
mol
m-2
s-1)
Hexose (µmol g-1) Sucrose (µmol g-1)

Chapter 3: Sink strength regulates photosynthesis in sugarcane
91
Table 3.3. Bivariate Pearson’s correlation coefficients between sugar concentrations (sucrose,
glucose, fructose) of leaf or culm tissue and photosynthetic variables Jmax and CE
(see Table 3.2 for variable declarations) of leaf 6 for field-grown N19 sugarcane
either unshaded or partially shaded for between 1 and 14 d. Significance levels (P)
are reported for the Pearson’s correlation coefficients (in brackets).
Leaf 6 Leaf 3 Int 4 Int 6 Int 8 Int 10 Int 12
Glucose:Fructose 0.66 (0.00) 0.79 (0.00) 0.85 (0.00) 0.96 (0.00) 0.74 (0.00) 0.76 (0.00) 0.82 (0.00)
Sucrose:Hexose -0.34 (0.04) -0.61 (0.00) -0.36 (0.03)
Hexose:Jmax -0.67 (0.00) 0.39 (0.02) -0.36 (0.04)
Hexose:CE -0.74 (0.00) 0.37 (0.03) -0.35 (0.04)
Sucrose:Jmax -0.61 (0.00) -0.34 (0.04)
Sucrose:CE -0.59 (0.00) 0.40 (0.02) 0.38 (0.03)
Fig. 3.6. Diagram illustrating the relationship between changes in sugar concentrations and
leaf photosynthetic activity. Arrows represent significant (P<0.05) linear correlations
between paired variables, according to Pearson’s correlation coefficient analysis.

Chapter 3: Sink strength regulates photosynthesis in sugarcane
92
3.5 Discussion
Although sucrose concentrations in internodes followed the well-established pattern of
greater sucrose concentration in older internodes (Whittaker & Botha, 1997), the
manipulation of sink-strength through partial shading produced significant changes in
plant sugar levels and assimilate partitioning. In general, young internodal tissue was
characterized by low levels of hexose and shading treatments produced a decrease in
sucrose over time. This trend was more evident in the youngest internode sampled
(internode 4) than in internode 6, which may be due to the location of internode 6 relative
to leaf 6, and/or the lower rate of sucrose accumulation observed in younger internodal
tissue (Whittaker & Botha, 1997). Overall, shading produced an initial (day 3) decrease
in sucrose concentrations in internodes 10 and 12. Shading also resulted in a reduced
sucrose concentration in shaded leaf 3 after 24 h that was sustained for the duration of
the treatments. The relatively short period of time taken to reduce sucrose levels in both
shaded leaf and internodal tissue indicated that, for sugarcane, partial shading was a
practical means to evaluate the effects of changes in sink demand on the remaining
unshaded source material.
Leaf 6 of unshaded plants distributed more 14C to internode 8 than internodes 6, 4, 10
and 12 (in order of diminishing distribution). Thus shading of the entire plant, except leaf
6, would seem likely to reduce the sugar levels in all other internodes more significantly
than internode 8. Label analyses of partially shaded plants further revealed a significant
shift in 14C partitioning to immature culm and shaded leaf tissue. Distribution of 14C
allocated to sucrose followed a similar pattern to total 14CO2 distribution, while trends for
labelled sucrose and hexoses were generally comparable (Fig. 3.3), indicating sucrose
and hexose as the two major pools for labelled assimilate.
The observed shifts in assimilate partitioning for partially shaded plants emphasise the
roles of phloem loading at the source (van Bel, 1993; 2003) and unloading at the sink
(Patrick, 1997; Walsh et al., 2005) as crucial links in the sink:source relationship (Kühn
et al., 1999). Shading treatments produced a significant drop in the total sucrose pools
of shaded leaf and immature culm tissue, while 14C analysis confirmed a shift in
assimilate partitioning to these tissues, which are typically not supplied by leaf 6
(MacDonald, 2000). Plants partially shaded for 4 d showed 14C allocation patterns for
treated plants prior to any significant change in photosynthesis in leaf 6, while 10 d

Chapter 3: Sink strength regulates photosynthesis in sugarcane
93
shaded plants showed distribution after adaptation of leaf 6 to changes in sink demand.
The increased allocation of leaf 6-derived 14C to the leaf roll and leaf 3 of shaded plants
further indicated prioritisation of young leaf tissues as sinks for carbon from leaf 6. This
change in typical leaf 6 partitioning patterns not only indicated a sink-strength-related
response to the decreasing levels of sucrose measured in young shaded leaf tissue, but
also a change in physiological state from source to sink. Such an event is not
uncommon in infected leaves following pathogen attack, where an increase of import to
the infected sites occurs (Farrar, 1992; Wright et al., 1995; Ayres et al., 1996), but has
not yet been reported in shading experiments. While no overall change in sucrose was
observed in leaf 6 after shading for 14 d, a decreased level of 14C-labelled sucrose after
24 h was evident in plants shaded for both 4 d and 10 d. As partial shading did not
produce any significant variation in stomatal conductance in leaf 6, reduced labelled
sucrose might be indicative of increased sucrose turnover and a higher assimilate
transport rate in the phloem of treated plants. This study has thus illustrated the ability
of the phloem transport of sugarcane to respond to changes in environment and alter
assimilate translocation patterns between various sink and source tissues. These
results substantiate the role of sucrose as a signaling molecule in assimilate partitioning
(Chiou & Bush, 1998), however, the signaling mechanisms which link phloematic,
apoplastic and intracellular sucrose concentrations remain to be fully elucidated (Gibson,
2005).
The changes observed in sugar levels over time in maturing internodes (8, 10 and 12;
Fig. 3.2) are indicative of the many complex factors influencing the overall physiological
environment of the plant in shading treatments. Although partial shading produced an
acropetal shift in assimilate partitioning from leaf 6 to younger internodes and young leaf
tissue, the effect of this on the overall sugar content of mature internodes would be
further confounded by the acclimation of leaf 6 to increased sink demand over time and
the overall drop in available assimilate for the entire plant. Shading treatments would
additionally influence plant water relations. Assuming that water loss from shaded
leaves was reduced, this would increase water potential (�P) and possibly reduce the
flow of nutrients to culm and leaf tissue. This could influence shaded leaf and root
metabolic activities which could in turn reduce the overall demand for CH2O and
consequently affect carbon accumulation in mature internodes which typically supply
root tissue. As a number of factors may thus affect mature internodal tissue under the
present shading treatment, more detailed study is required before accurately interpreting

Chapter 3: Sink strength regulates photosynthesis in sugarcane
94
the observed changes and correlations between sugar levels and photosynthesis
observed.
Significant increases in photosynthetic rate, carboxylation efficiency and PSII efficiency
were measured in leaf 6 over the duration of the shading treatment. A significant linear
relationship was further elucidated between maximum photosynthetic assimilation rates
(Jmax) of leaf 6 and decreasing levels of sucrose in immature culm tissue (internodes 4
and 6) over the partial shading time treatments. This supports evidence that decreased
sucrose at the sink is a likely physiological signal to the source for increased assimilate
requirements (van Bel, 2003). A similar effect has previously been observed in pot-
grown sugarcane plants, where partial defoliation resulted in only small decreases in
culm dry mass (Pammenter & Allison, 2002). However, the dramatic photosynthetic
increase in leaf 6 observed here may have been compounded by the sustained
presence and required maintenance of other leaves. Furthermore, the depletion or
excess of sugars has previously been shown to respectively activate or repress the
expression of genes for photosynthetic components and ultimately influence
photosynthesis itself (Stitt, 1991; Krapp et al., 1993; Van Oosten & Besford, 1994; 1995;
Basu et al., 1999). The plasticity of leaf assimilation capacity over time observed in
sugarcane may thus be linked to regulation of C4 leaf metabolism at the molecular level,
such as regulatory phosphorylation of PEPc activity (Vidal & Chollet, 1997) and/or
adjustments in several other C4 photosynthetic control mechanisms (Furbank & Taylor,
1995). It is important to note that this study has ‘simulated’ an increase in plant sink
strength via an increased demand for carbon from leaf 6. Thus, although it is feasible
that the overall sink activity of internodal tissue my have, in fact, declined due to the lack
of source supply, this research has provided evidence for the physiological ability of the
source to adapt to increased sink requirements. The Saccharum complex is potentially
capable of storing more than 25% sucrose on a fresh weight basis (Bull & Glasziou,
1963; Moore et al., 1997). As this estimate is still almost double current commercial
yields (Grof & Campbell, 2001), further understanding of source regulation may assist in
the eventual utilisation of a greater portion of the potential sink strength of sugarcane.
Interestingly, no relationship was observed between sucrose levels in either unshaded or
shaded leaves, and photosynthesis in this study. These results are comparable to
studies on maize leaves, where changing sucrose concentrations were shown to have
no significant short-term feedback inhibitory effects on the synthesis of sucrose itself in

Chapter 3: Sink strength regulates photosynthesis in sugarcane
95
the leaf (Lunn & Furbank, 1997). Instead, a strong negative correlation was found
between hexose and photosynthetic gas exchange variables Jmax and CE in unshaded
leaf 6, which implicated hexoses, rather than sucrose, as possible signal factors involved
in photosynthetic feedback regulation. In the past, hexoses have been shown to be
inhibitors of photosynthesis (Goldschmidt & Huber, 1992). For example, the external
supply of glucose (50 mM) to excised Spinacea oleracea leaves over 4 d lead to
inhibition of the light harvesting complex (LHC) II-encoding chlorophyll a/b binding
protein (cab) genes and a 60% decrease in Rubisco content (Kilb et al., 1995). Thus in
sugarcane, a decreased leaf glucose pool could constitute a signal of increased demand
from sinks. More recently, hexoses have been shown to play an important role in
regulating photosynthesis and leaf development (Ehness et al., 1997; Paul & Pellny,
2003). Hexokinase has been implicated as a putative receptor (Jang et al., 1997),
however, the mechanisms involved in hexokinase sensing remain contentious. It has
also been demonstrated that glucose itself, and not an analogous phosphorylated
metabolite, may be the primary signal that interacts with some putative receptor involved
in transduction of the carbohydrate signal (Ehness et al., 1997). Progress has been
made (Rolland et al., 2002), but further efforts will be required to fill in the gaps in this
complex network, especially for C4 species. Compared to C3 species, relatively little is
known about the control of sugar biosynthesis in the leaves of C4 plants, however, sugar
induced changes in gene expression are likely to be as important in C4 as in C3 in
balancing sink:source interactions (Lunn & Furbank, 1999).
Although it is likely that the hexose concentrations in the leaf tissue are under strict
metabolic control, it will ultimately be difficult to elucidate the actual mechanisms of
hexose responses, as sugars can act by affecting osmotic potentials as well as by
functioning as signal molecules (Gibson, 2005). This may be further complicated by the
interactions between carbon and nitrogen levels in leaf developmental processes (Paul
& Pellny, 2003). For instance, the application of moderate (111 mM) concentrations of
glucose stimulates the senescence of Arabidopsis, but only under limited nitrogen
conditions (Wingler et al., 2004). Furthermore, since most plants can synthesise
sucrose when fed with hexoses, it is difficult to attribute the effects of hexoses to their
direct sensing, as sucrose sensing could possibly occur. However, our correlations
indicate that, although sucrose must play a key role in regulating sink assimilate
partitioning, hexoses may be a more proximal component of the signaling mechanism
between photosynthetic source activity and sink requirements in sugarcane. The

Chapter 3: Sink strength regulates photosynthesis in sugarcane
96
regulatory effects of hexose sensors such as HXK are well documented in C3 plants
(Rolland et al., 2002) and may provide a useful starting point for examining the control of
photosynthesis in C4 sugarcane.
3.6 Concluding remarks
Sugarcane, like other plants, exhibits a robust soluble carbohydrate-dependent
relationship between source and sink tissue based on assimilate demand and
partitioning needs. This study has provided good evidence for a sink-dependent
relationship between source and sink tissues as well as an important role for sugars in
this relationship. Further study will be required to substantiate the molecular basis of
these correlations, specifically the observed effects of hexose on photosynthesis, as the
molecular pathways involved in regulating such a relationship are not yet fully
understood. Future research may include comparison of different sugarcane cultivars,
however, the general patterns observed here with the model N19 hybrid are likely to
pertain for other cultivars. The existence of sink regulation of source activity in
sugarcane should inform biotechnological efforts to modify culm metabolism to improve
sugar accumulation. The fact that sink demand limits source activity indicates that the
signal feedback system reporting sink sufficiency and regulating source activity may be
important loci for investigation/modification in sugarcane. We are currently attempting to
elucidate which genes and enzymes in sugarcane leaves are responsive to changes in
the sink:source ratio, with particular emphasis on links between photosynthesis and
sugar sensing/signaling.
Chapter 3: Sink strength regulates photosynthesis in sugarcane
97
3.7 References
Allison JCS, Williams HT, Pammenter NW. 1997. Effect of specific leaf nitrogen on
photosynthesis of sugarcane. Annals of Applied Biology 63: 135–144.
Amaya A, Cock JH, Hernandez A, Irvine J. 1995. Bioligía. In: Casselett C, Torres J,
Isaacs C, eds. El cultivo de la Ca�a en la zona azucarera de Colombia. Cali, Colombia:
Cenica�a, 31–62.
Ayres PG, Press MC, Spencer-Phillips PTN. 1996. Effects of pathogens and parasites on
source/sink relationships. In: Zamski E, Schaffer AA, eds. Photoassimilate distribution in
plants and crops. New York: Marcel Decker, 479–499.
Basu PS, Sharma A, Garg ID, Sukumaran NP. 1999. Tuber sink modifies photosynthetic
response in potato under water stress. Environmental and Experimental Botany 42: 25–29.
Batta SK, Singh R. 1986. Sucrose metabolism in sugar cane grown under varying climatic
conditions: synthesis and storage of sucrose in relation to the activities of sucrose
synthetase, sucrose phosphate synthase and invertase. Phytochemistry 25: 2431–2437.
Black CC, Loboda T, Chen J, Sung S. 1995. Can sucrose cleavage enzymes serve as
markers for sink strength and is sucrose a signal molecule during plant sink development?
American Society of Plant Physiologists 1995: 49–64.
Bull TA, Glasziou KT. 1963. The evolutionary significance of sugar accumulation in
Saccharum. Australian Journal of Biological Sciences 16: 737–742.
Bull TA, Tovey DA. 1974. Aspects of modelling sugar cane growth by computer simulation.
Proceedings of the International Society of Sugar Cane Technologists 165: 1021–1032.
Casu RE, Grof CPL, Rae AL, McIntyre CL, Dimmock CM, Manners JM. 2003.
Identification of a novel sugar transporter homologue strongly expressed in maturing stem
vascular tissues of sugarcane by expressed sequence tag and microarray analysis. Plant
Molecular Biology 52: 371–386.
Chiou TJ, Bush DR. 1998. Sucrose is a signal molecule in assimilate partitioning.
Proceedings of the National Academy of Science (USA) 95: 4784–4788.
Downton WJS, Tregunna EB. 1968. Carbon dioxide compensation – its relation to
photosynthetic carboxylation reactions, systematics of the Gramineae, and leaf anatomy.
Canadian Journal of Botany 46: 207–215.
Dwelle RB, Kleinkopf GE, Pavek JJ. 1981. Stomatal conductance and gross photosynthesis
of potato (Solanum tuberosum L.) as influenced by irradiance, temperature and growth stage.
Potato Research 24: 49–59.
Edwards GE, Baker NR. 1993. Can CO2 assimilation in maize leaves be predicted accurately
from chlorophyll fluorescence analysis? Photosynthesis Research 37: 89–102.
Edwards GE, Furbank RT, Hatch MD, Osmond CB. 2001. What does it take to be C4?
Lessons from the evolution of C4 photosynthesis. Plant Physiology 125: 46–49.

Chapter 3: Sink strength regulates photosynthesis in sugarcane
98
Ehness R, Ecker M, Godt DE, Roitsch T. 1997. Glucose and stress independently
regulate source and sink metabolism and defense mechanisms via signal transduction
pathways involving protein phosphorylation. The Plant Cell 9: 1825–1841.
Farrar JF. 1992. The whole plant: carbon partitioning during development. In: Pollock CJ,
Farrar, JF, Gordon AJ, eds. Carbon partitioning within and between organisms. Oxford:
Bios Scientific Publishers Limited, 163–179.
Foyer CH, Chaumont M, Murchie E, Galtier N, Ferrario S. 1995. End-product
modulation of carbon partitioning with a view to improved biomass production. In: Madore
MA, Lucas WJ, eds. Carbon partitioning and source-sinks interactions in plants. Rockville:
American Society of Plant Physiologists, 45–55.
Furbank RT, Taylor WC. 1995. Regulation of photosynthesis in C3 and C4 plants: a molecular
approach. The Plant Cell 7: 797–807.
Gibson SI. 2005. Control of plant development and gene expression by sugar signaling.
Current Opinion in Plant Biology 8: 93–102.
Goldschmidt EE, Huber SC. 1992. Regulation of photosynthesis by end-product
accumulation in leaves of plants storing starch, sucrose, and hexose sugars. Plant
Physiology 99: 1443–1448.
Grof CPL, Campbell JA. 2001. Sugarcane sucrose metabolism: scope for molecular
manipulation. Australian Journal of Plant Physiology 28: 1–12.
Hartt CE, Burr GO. 1967. Factors affecting photosynthesis in sugarcane. Proceedings of the
International Society of Sugar Cane Technologists 12: 590–609.
Hartt CE, Kortchak HP, Forbes AJ, Burr GO. 1963. Translocation of C14 in sugarcane.
Plant Physiology 38: 305–318.
Ho LC. 1992. The possible effects of sink demand for assimilate on photosynthesis. In: Murata
N, ed. Research in photosynthesis, vol. IV. Dordrecht: Kluwer Academic Publishers, 729–
736.
Iglesias DJ, Lliso I, Tadeo FR, Talon M. 2002. Regulation of photosynthesis through
source: sink imbalance in citrus is mediated by carbohydrate content in leaves. Physiologia
Plantarum 116: 563–572.
Jang J-C, León P, Zhou L, Sheen J. 1997. Hexokinase as a sugar sensor in higher plants.
The Plant Cell 9: 5–19.
Jones MGK, Outlaw WH, Lowry OH. 1977. Enzymic assay of 10-7 to 10-14 moles of sucrose
in plant tissues. Plant Physiology 60: 379–383.
Kilb B, Wietoska H, Godde D. 1995. Changes in the expression of photosynthetic genes
precede loss of photosynthetic activities and chlorophyll when glucose is supplied to mature
spinach leaves. Plant Science 115: 225–235.
Koch KE. 1996. Carbohydrate-modulated gene expression in plants. Annual Review of Plant
Physiology and Molecular Biology 47: 509–540.

Chapter 3: Sink strength regulates photosynthesis in sugarcane
99
Koch KE, Ying Z, Wu Y, Avigne WT. 2000. Multiple paths of sugar-sensing and a
sugar/oxygen overlap for genes of sucrose and ethanol metabolism. Journal of Experimental
Botany 261: 3193–3199.
Krapp A, Hofmann B, Schäfer C, Stitt M. 1993. Regulation of the expression of rbcS and
other photosynthetic genes by carbohydrates: a mechanism for the ‘sink’ regulation of
photosynthesis? The Plant Journal 3: 817–828.
Krapp A, Quick WP, Stitt W. 1991. Ribulose-1,5-bisphosphate carboxylase-oxygenase,
other Calvin cycle enzymes and chlorophyll decrease when glucose is supplied to mature
spinach leaves via the transcription stream. Planta 186: 58–59.
Kubien DS, von Caemmerer S, Furbank, RT, Sage, RF. 2003. C4 photosynthesis at low
temperature. A study using transgenic plants with reduced amounts of Rubisco. Plant
Physiology 132: 1577–1585.
Kühn C, Barker L, Bürkle L, Frommer W-B. 1999. Update on sucrose transport in higher
plants. Journal of Experimental Botany 50: 935–953.
Laetsch WM. 1971. Chloroplast structural relationships in leaves of C4 plants. In: Hatch MD,
Osmond CB, Slatyer RO, eds. Photosynthesis and photorespiration. New York: Wiley
Interscience, 323–349.
Lakshmanan P, Geijskes RJ, Aitken KS, Grof CLP, Bonnett GD, Smith GR. 2005.
Sugarcane biotechnology: the challenges and opportunities. In Vitro Cellular and
Developmental Biology 41: 345–363.
Lawlor DW. 1987. Photosynthesis: metabolism, control and physiology. Harlow, UK: Longman
Scientific and Technical.
Lunn JE, Furbank RT. 1997. Localisation of sucrose-phosphate synthase and starch in
leaves of C4 plants. Planta 202: 106–111.
Lunn JE, Furbank RT. 1999. Sucrose biosynthesis in C4 plants. New Phytologist 143: 221–
237.
MacDonald Z. 2000. The metabolic fate of sucrose in intact sugarcane internodal tissue. MSc
Thesis, School of Life and Environmental Sciences, University of KwaZulu Natal, Durban,
South Africa.
Marcelis LFM. 1996. Sink strength as a determinant of dry matter partitioning in the whole plant.
Journal of Experimental Botany 47: 1281–1291.
Maxwell K, Johnson GN. 2000. Chlorophyll fluorescence - a practical guide.
Journal of Experimental Botany 51: 659–668.
Moorby J. 1978. The physiology of growth and tuber yield. In: Harris PM, ed. Potato Crop:
The Scientific Basis for Improvement. New York: Wiley, 153–194.
Moore PH. 1995. Temporal and spatial regulation of sucrose metabolism in the sugarcane
stem. Australian Journal of Plant Physiology 22: 661–679.

Chapter 3: Sink strength regulates photosynthesis in sugarcane
100
Moore PH. 2005. Integration of sucrose accumulation processes across hierarchical scales:
towards developing an understanding of the gene-to-crop continuum. Field Crops Research
92: 119–135.
Moore PH, Botha FC, Furbank RT, Grof CPL. 1997. Potential for overcoming
physio-biochemical limits to sucrose accumulation. In: Keating BA, Wilson JR, eds.
Intensive sugarcane production: meeting the challenges beyond 2000. Wallingford: CAB
International, 141–155.
Nosberger J, Humphries EC. 1965. The influence of removing tubers on dry matter
production and net assimilation rate of potato tubers. Annals of Botany 29: 579–588.
Pammenter NW, Allison JCS. 2002. Effects of treatments potentially influencing the supply of
assimilate on its partitioning in sugarcane. Journal of Experimental Botany 53: 123–129.
Patrick JW. 1997. Phloem unloading: sieve element unloading and post-sieve element
transport. Annual Review of Plant Physiology and Plant Molecular Biology 48: 191–222.
Paul MJ, Foyer, CH. 2001. Sink regulation of photosynthesis. Journal of Experimental Botany
52: 1381–1400.
Paul MJ, Pellny TK. 2003. Carbon metabolite feedback regulation of leaf photosynthesis and
development. Journal of Experimental Botany 54: 539–547.
Paul MJ, Pellny TK, Goddijn O. 2001. Enhancing photosynthesis with sugar signals.
Trends in Plant Science 6: 197–200.
Pego JV, Kortsee AJ, Huijser C, Smeekens SCM. 2000. Photosynthesis, sugars and the
regulation of gene expression. Journal of Experimental Botany 51: 407–416.
Rolland F, Moore B, Sheen J. 2002. Sugar sensing and signaling in plants. Plant Cell 14
(suppl.): 185–205.
Sacher JA, Hatch MD, Glasziou KT. 1963. Sugar accumulation cycle in sugarcane. III.
Physical and metabolic aspects of cycle in immature storage tissue. Plant Physiology 38:
348–354.
Sheen J. 1990. Metabolic repression of transcription in higher plants. The Plant Cell 2: 1027–
1038.
Sheen J. 1994. Feedback control of gene expression. Photosynthesis Research 39: 427–438.
Sheen J. 2001. Signal transduction in maize and Arabidopsis mesophyll protoplasts. Plant
Physiology 127: 1466–1475.
Smeekens S. 2000. Sugar-induced signal transduction in plants. Annual Review of Plant
Physiology and Plant Molecular Biology 51: 49–81.
Stitt M. 1991. Rising CO2 levels and their potential significance for carbon flow in
photosynthetic cells. Plant, Cell and Environment 14: 741–762.
Stitt M, Von Schaewen A, Willmitzer L. 1991. ‘Sink’ regulation of photosynthetic
metabolism in transgenic tobacco plants expressing yeast invertase in their cell wall involves
a down-regulation of the Calvin cycle and an up-regulation of glycolysis. Planta 183: 40–50.

Chapter 3: Sink strength regulates photosynthesis in sugarcane
101
van Bel AJE. 1993. Strategies of phloem loading. Annual Review of Plant Physiology and
Plant Molecular Biology 44: 253–282.
van Bel AJE. 2003. The phloem, a miracle of ingenuity. Plant Cell and Environment 26: 125–
149.
Van Oosten JJ, Besford RT. 1994. Sugar feeding mimics effect of acclimation to high CO2:
rapid downregulation of RuBisCO small subunit transcripts, but not of the large subunit
transcripts. Journal of Plant Physiology 143: 306–312.
Van Oosten JJ, Besford RT. 1995. Some relationships between the gas exchange,
biochemistry and molecular biology of photosynthesis during leaf development of tomato
plants after transfer to different carbon dioxide concentrations. Plant, Cell and Environment
18: 1253–1266.
Vidal J, Chollet R. 1997. Regulatory phosphorylation of C4 PEP carboxylase. Trends in Plant
Science 6: 230–237.
Van Dillewijn C. 1952. Growth. General, grand period, growth formulae. In: van Dillewijn C,
ed. Botany of sugarcane, Vol 1. Netherlands: Veenen and Zonen, 97–162.
von Caemmerer S, Hendrickson L, Quinn V, Vella AG, Millgate, Furbank RT. 2005.
Reductions of Rubisco Activase by antisense RNA in the C4 plant Flaveria bidentis reduces
Rubisco carbamylation and leaf photosynthesis. Plant Physiology 137: 747–755.
Von Schaewen A, Stitt M, Schmidt R, Sonnewald U, Willmitzer L. 1990. Expression of
a yeast-derived invertase in the cell wall of tobacco and Arabidopsis plants leads to
accumulation of carbohydrate and inhibition of photosynthesis and strongly influences growth
and phenotype of transgenic tobacco plants. EMBO Journal 9: 3033–3044.
Walsh KB, Sky RC, Brown SM. 2005. The anatomy of the pathway of sucrose unloading
within the sugarcane stalk. Functional Plant Biology 32: 367–374.
Wardlaw IF. 1990. The control of carbon partitioning in plants. New Phytologist 116: 341–381.
Whittaker A, Botha FC. 1997. Carbon partitioning during sucrose accumulation in sugarcane
internodal tissue. Plant Physiology 115: 1651–1659.
Wingler A, Marès M, Pourtau N. 2004. Spatial patterns and metabolic regulation of
photosynthetic parameters during leaf senescence. New Phytologist 161: 781–789.
Wright DPA, Baldwin BC, Shepard MC, Scholes JD. 1995. Source/sink relationships in
wheat leaves infected with powdery mildew. I. Alterations in carbohydrate metabolism.
Physiological and Molecular Plant Physiology 47: 237–253.
Chapter 4: Gene expression during a source-sink perturbation
102
Chapter 4:
Changes in leaf gene expression during a source-sink perturbation
in sugarcane
4.1 Abstract
In crops other than sugarcane there is good evidence that the size and activity of carbon
sinks influence source activity via sugar-related regulation of the enzymes of
photosynthesis, an effect that is partly mediated through coarse regulation of gene
expression. In the current study, leaf shading treatments were used to perturb the
source-sink balance in nine-month-old Saccharum spp. hybrid cv. N19 (N19) by
restricting source activity to a single mature leaf. Changes in leaf photosynthetic gas
exchange variables and leaf and culm sugar concentrations were subsequently
measured over a 14 d period. In addition, the changes in leaf gene response to the
source-sink perturbation were measured by reverse Northern hybridisation analysis of
an array of 128 ESTs related to photosynthetic and carbohydrate metabolism. Sucrose
concentrations in immature culm tissue declined significantly over the duration of the
shading treatment, while a 57% and 88% increase in A and ETR, respectively, were
observed in the source leaf. Several genes (27) in the leaf displayed a greater than two-
fold change in expression level, including the up-regulation of several genes associated
with C4 photosynthesis, mitochondrial metabolism and sugar transport. Changes in
gene expression levels of several genes, including Rubisco (EC 4.1.1.39) and
hexokinase (HXK; EC 2.7.1.1), correlated with changes in photosynthesis and tissue
sugar concentrations that occurred subsequent to the source-sink perturbation. These
results indicate that sink demand may limit source activity through a kinase-mediated
sugar-signaling mechanism that correlates to a decrease in source hexose
concentrations, which, in turn, correlate with increased expression of genes involved in
photosynthesis and metabolite transport. The signal feedback system reporting sink
sufficiency and regulating source activity may be a potentially valuable for target for
future genetic manipulation to increase sugarcane sucrose yield.
Keywords: hexose, gene, leaf, photosynthesis, sucrose, sugarcane

Chapter 4: Gene expression during a source-sink perturbation
103
4.2 Background and aims
Sugarcane (Saccharum L. spp. hybrids) is the most important source of sucrose
worldwide and accounts for more than 70% of global sucrose production (Lunn and
Furbank, 1999). It has been suggested that the accumulation of high concentrations of
sucrose in sugarcane is regulated principally at the level of the sink, where the balance
between simultaneous synthesis and degradation of sucrose, often referred to as futile-
cycling, is believed to be responsible for overall sucrose accumulation (Sacher et al.,
1963; Batta and Singh, 1986; Whittaker and Botha, 1997). The high sucrose level (up to
650 mM) in storage tissues of some Saccharum spp. hybrids (Welbaum and Meinzer,
1990) makes it an important model genus in the study of the interactions between
source (leaf) and sink (culm) tissues. However, sugarcane presents a major challenge
for such studies, as sucrose is stored in the culm parenchyma tissue and not in
specialized storage organs. As such, identifying and interpreting events regulating
sucrose partitioning is hampered by the fact that the storage organs are also the primary
growth sink.
In addition to improving biomass yield, increasing the concentration of sucrose in the
culm is a key objective of most sugarcane breeding programmes. However, recent
improvements to sugarcane varieties have been achieved almost entirely through
increased cane yield rather than increased culm sucrose content (Jackson, 2005).
Attempts to increase sucrose accumulation depend on a thorough understanding of
sucrose metabolism, transport and source-sink interactions that govern sucrose
accumulation. Despite extensive research, the dynamics and interactions amongst
these processes are not well characterised and are only beginning to be explored
(Carson and Botha, 2002; Watt et al., 2005; Casu et al., 2007).
Strategies to increase sucrose concentrations in sugarcane have focused on the
manipulation of single enzymes involved in culm sucrose metabolism, primarily those
catalyzing sucrolytic reactions (Lakshmanan et al., 2005). These genes include those
encoding the various isoforms of invertases (EC 2.7.1.90) (Ma et al., 2000; Botha et al.,
2001) and pyrophosphate-dependent phosphofructokinase (PFP; EC 2.7.1.90)
(Groenewald and Botha, 2007). The mixed success of these attempts may be due to
the ability of plants to physiologically compensate for small changes in their genetic
environment (Halpin et al., 2001; Luguang and Birch, 2007). A kinetic model of sucrose

Chapter 4: Gene expression during a source-sink perturbation
104
metabolism in sugarcane culm tissue, developed by Rohwer and Botha (2001), predicts
only a limited control on sucrose metabolism for individual genes widely regarded as
having a crucial regulatory role. Generally, control over a metabolic flux is shared by
several enzymes of a pathway and large increases in flux cannot be expected from the
manipulation of single enzymes, but rather several sites on the pathway (Fell and
Thomas, 1995). Without a better understanding of the underlying mechanisms that
govern feedback regulation, both within metabolic pathways and between source and
sink activity, it may prove difficult to identify potential targets for the effective
manipulation of stalk sucrose content.
A key step in understanding the control of sucrose accumulation in sugarcane will be to
unravel the complex metabolic and signaling networks that mediate the source-sink
relationship. The physiological nature of this relationship has previously been examined
in C3 (Fellows et al., 1979; Wright et al., 1995; Basu et al., 1999; Borrás and Otegui,
2001; Minchin et al., 2002; Franck et al., 2006) and C4 species (McCormick et al., 2006
[Chapter 3]) and good evidence now exists to support a sink-dependent relationship,
whereby carbon levels in storage organs influence the net photosynthetic activity and
carbon assimilation of source leaf tissues (Paul and Foyer, 2001; Paul and Pellny,
2003). There is also increasing evidence that the activity of photosynthesis-related
enzymes and expression of associated gene transcripts in the leaf, among others, are
modified by the local status of the primary transport sugar, sucrose, and/or its
constituent hexoses (Pego et al., 2000; Rolland et al., 2002; Franck et al., 2006).
However, the mechanisms whereby sugars act to regulate source gene expression are
just beginning to be discovered (Rolland et al., 2002; Gibson, 2005), and for C4 plants,
including sugarcane, these remain relatively unexamined (Lunn and Furbank, 1999). It
is essential that research into source-sink relationships in C4 plants is directed towards
the identification of regulatory elements unique to C4 plants and examines metabolism
across hierarchical scales, from the molecular (transcript, enzyme and metabolites) to
the crop level (Edmeades et al., 2004).
Study of sugarcane physiology has revealed that the demand for carbon from source
tissues is related to the sucrose concentration and age and condition of sugarcane
culms (Hartt and Burr, 1967; Marcelis, 1996). Gross photosynthesis is higher in eight-
month-old sugarcane plants compared to four-month-old plants, regardless of light
intensity (Allison et al., 1997). Furthermore, three-month-old sugarcane leaves have
Chapter 4: Gene expression during a source-sink perturbation
105
photosynthetic rates of 45 �mol m-2 s-1 under intense illumination, while young leaves of
ten-month-old plants have a maximum rate of 25 �mol m-2 s-1 (Amaya et al., 1995).
Investigations using partial defoliation and shading techniques, revealed the existence of
a bias in carbon allocation during growth towards culm sucrose accumulation, at the
expense of structural growth (Pammenter and Allison, 2002). Gutiérrez-Miceli et al.
(2004) have additionally demonstrated that partial defoliation of sugarcane plants
produces no significant change in culm sucrose concentration compared to control
plants, indicating that the remaining intact leaves were capable of maintaining a nominal
supply of carbon based on the demand from sink tissues. In a recent study in which
source activity was limited to a single leaf by a shading treatment, a significant increase
in photosynthetic rates was observed in the sole source leaf, which was, in turn,
negatively correlated with sucrose concentrations in the immature culm tissue
(McCormick et al., 2006 [Chapter 3]). Although providing good evidence for sink-
regulation of photosynthesis in sugarcane, these studies did not address the molecular
mechanisms that mediate communication between the source and sink in sugarcane.
Good progress has been made recently in the use of expressed sequence tags (ESTs)
as a tool to examine gene expression in sugarcane. EST analysis has been used to
examine gene expression behaviour during culm development, with associated
increases in sucrose accumulation (Carson and Botha 2002; Grivet and Arruda, 2002;
Casu et al., 2004; Watt et al., 2005). However, while such approaches provide valuable
information, they may be ineffective as a sole means to identify factors regulating
sucrose storage in the sugarcane culm (Watt et al., 2005). Focus on gene regulation
during culm maturation does not provide insights into feed-back mechanisms that may
operate between the culm and leaf. Hence, experimental systems that permit the study
of the expression of genes associated with carbohydrate metabolism in parallel to that of
overall plant physiological responses may provide a means to detect mechanisms that
mediate the relationship between source and sink tissues (Edmeades et al., 2004).
In the current study on mature sugarcane plants, shading treatments were used to
restrict source activity to a single leaf, thereby perturbing the source-sink balance. Gas
exchange variables and tissue sugar concentrations were measured in parallel to
reverse Northern macroarray analysis, which was used to determine relative changes in
mRNA expression levels in the sole source leaf over 14 day period following the source-
sink perturbation. A set of ESTs representing 128 genes of photosynthesis and

Chapter 4: Gene expression during a source-sink perturbation
106
carbohydrate metabolism was used in the gene expression analyses, which were
subsequently correlated to changes in photosynthesis and tissue sugar concentrations.
This study represents an attempt to determine the changes in the expression of
carbohydrate metabolism-related genes that are associated with a source-sink
perturbation.
4.3 Methods
4.3.1 Plant material
Twelve-month-old field-grown Saccharum spp. hybrid cv. N19 (N19), cultivated at Mount
Edgecombe, KwaZulu-Natal, South Africa on a 5 x 15 m plot, was used in this study,
which was conducted during December 2004. The plot was located on a north-east
facing slope with a slope of ca. 10o. Tissue from the third fully expanded leaf (leaf 6) and
culm tissue (internodes 4–6) were sampled as described previously (McCormick et al.,
2006 [Chapter 3]). The harvested material was immediately frozen in liquid nitrogen (–
196oC). The frozen tissue was then reduced to powder using an A11 Basic Analysis Mill
(IKA) and stored in 50ml polypropylene centrifuge tubes (Corning®) at –80oC until used
for further experimentation.
4.3.2 Plant treatment
To modify plant source-sink balance, all leaves except leaf 6 of seven plants per
treatment were enclosed in a black sleeve made of 90% shade cloth. Shade cloth was
used so as not to totally impede gas flow to the plant or to cause photomorphogenic
effects. Treatments were carried out for 1, 3, 6 and 14 d, effectively rendering leaf 6 the
sole light receiving source for photosynthetic carbon assimilation over these periods.
Treated plants were selected based on similar height and stalk width, and were
separated by at least two unshaded plants to negate potential shading effects of the
shade cloth on neighbouring plants. Control plants were completely unshaded. Light
conditions were checked daily throughout the experiment using a LI-6400 portable
photosystem unit (LI-COR Biosciences Inc., Lincoln, NE, USA) to ensure that leaf 6 from
control and treated plants received similar levels of light exposure. The start of the

Chapter 4: Gene expression during a source-sink perturbation
107
shading treatments was staggered so that leaves and culms from all treatments were
harvested on the same day at 12h00.
4.3.3 Sugar determination
Approximately 100 mg powdered tissue was incubated overnight at 70oC in 10 volumes
of sugar extraction buffer consisting of 30 mM HEPES (pH 7. 8), 6 mM MgCl2 and
ethanol 70% (v/v). Extracts were centrifuged for 10 min at 23 200 g and sucrose,
fructose and glucose concentrations in the supernatant measured by means of a
spectrophotometric enzymatic-coupled assay modified from Jones et al. (1977). The
phosphorylation of glucose by hexokinase/glucose-6-phosphate dehydrogenase (EC
1.1.1.49) (Roche, Mannheim, Germany) and fructose by phosphoglucose isomerase (EC
5.3.1.9) (Roche) was quantified by following the reduction of NADP+ to NADPH at 340
nm (A340). Absorbance measurements and data analysis were conducted on a Synergy
HT Multi-Detection Microplate Reader using KC4 software (Biotek Instrument, Inc.,
Vermont, USA).
4.3.4 Gas exchange and fluorescence determinations
A LI-6400 portable photosystem unit (LI-COR Biosciences Inc., Lincoln, NB, USA) was
used to measure photosynthetic assimilation (A), transpiration rate (E), stomatal
conductance (Gs), intercellular CO2 concentration (Ci) and leaf temperature of the source
leaf. Gas exchange measurements were made on 2 cm2 portions of leaf tissue. Light
was provided by a red/blue LED light source (LI-COR Biosciences Inc.) at photon
irradiance of 2 000 �mol m-2 s-1. All leaf measurements were performed at a constant
leaf temperature of 28oC.
Measurements were performed between 9h00 and 12h00 on the day of harvest for
plants that were unshaded or had previously been partially shaded for 1 to 14 d (n=4).
The response of A to Ci (A:Ci) was measured by varying the external CO2 concentration
from 0 to 1 000 �mol mol-1 under a constant photosynthetically active radiation (PAR) of
2 000 �mol m-2 s-1. An equation ( )( ) ceaA ibC −−= −1 was fitted to the A:Ci data using
least squares. The portion of the curve where the slope approached zero due to
limitation in the supply of substrate (ribulose-1,5-bisphosphate), which is equivalent to
the CO2- and light-saturated photosynthetic rate (Jmax) (Lawlor, 1987), was calculated

Chapter 4: Gene expression during a source-sink perturbation
108
from this equation (a, Jmax; b, curvature parameter; c, dark respiration (Rd)). Linear
regression was performed on the data between a Ci of 0 and 200 �mol mol-1 to
determine the efficiency of carboxylation (CE) (Lawlor, 1987). The assimilation rate in
the absence of stomatal limitations (Aa) was as calculated as A, interpolated from the
response curve at Ci = 380 �mol mol-1.
Chlorophyll fluorescence was determined concurrently with gas exchange
measurements using the LI-6400-40 Leaf Chamber Fluorometer (LI-COR Biosciences
Inc.). A saturating pulse of red light (0.8 s, 6000 µmol m-2 s-1) was applied to determine
the maximal fluorescence yield (Fm’) at varying external CO2 concentrations (0 – 1 000
�mol mol-1). The electron transport rate (ETR), defined as the actual flux of photons
driving photosystem II (PSII) was calculated from leaffIFm
FsFmETR α�
�
���
� −='
', where Fs is
“steady-state” fluorescence (at 2 000 �mol m-2 s-1), Fm’ is the maximal fluorescence
during a saturating light flash, f is the fraction of absorbed quanta used by PSII, typically
assumed to be 0.4 for C4 plant species (Edwards and Baker, 1993), I is incident photon
flux density and �leaf is leaf absorptance (0.85, LI-COR manual). The component
fluorescence variables were derived as described by Maxwell and Johnson (2000).
4.3.5 Array target preparation
Target cDNA populations were prepared using mRNA isolated from leaf 6 of unshaded
plants (control) and partially shaded plants where leaf 6 was the sole source leaf for 1, 3,
6 and 14 d. Total RNA was extracted using a modified extraction protocol from Bugos et
al. (1995). RNA concentration and quality were calculated from ultra-violet (UV)
spectrophotometric absorbance measurements using standard photometric equations
(Beckman DU-7500 spectrophotometer, USA) and confirmed via agarose gel
electrophoresis (Ingelbrecht et al., 1998). RNA samples from each time treatment (n=6)
were then pooled. To permit accurate and quantifiable comparisons between the array
signal intensities produced from each sample, RNA samples (100 �g) were then spiked
with two internal mRNA standards, A. thaliana Rubisco activase (RCA; GenBank
accession no. X14212) and A. thaliana Rubisco large subunit (rbcL; GenBank accession
no. U91966), each at 0.5 ng as per the SpotReport®-3 Array Validation System
(Stratagene, La Jolla, CA, USA). Poly A+ RNA (mRNA) was isolated from each RNA
sample using a Dynabeads Oligo (dT)25 mRNA Purification kit (Dynal, Oslo, Norway).

Chapter 4: Gene expression during a source-sink perturbation
109
Single stranded (ss) cDNA fragments, radiolabelled with a �33P dCTP (Amersham
BioSciences, UK), were then generated from each mRNA population (1 �g) using a
LabelStarTM Array Kit (QIAGEN, Hilden, Germany). Unincorporated dNTPs were
removed with a LabelStarTM Array Cleanup Module (QIAGEN).
4.3.6 Array probe preparation and printing
A suite of 128 carbohydrate metabolism and photosynthesis-related expressed
sequence tags (ESTs) were collected to probe cDNA populations synthesised from total
leaf mRNA [Supplementary Information]. EST homologies were confirmed by gel
analysis and random partial sequence analysis. Sequences were cross-referenced to
the accession numbers of the putative identities contained within the National Centre of
Biotechnological Information (NCBI) GenBank database (www.ncbi.nlm.nih.gov). Arrays
were printed onto a positively charged nylon Hybond-N+ membrane (Amersham,
Germany) by means of a 96-pin manual gridding device (V&P Scientific Inc., San Diego),
which facilitated the transfer of aliquots (2 µl) of each sample at a final concentration of
10 ng. For replication, aliquots of each probe were delivered to two adjacent addresses
on the array at two randomly selected locations, permitting a total of four query events
per probe. External standards were integrated into each array (10 ng), including three
heterologous bacterial genes encoding a -endotoxin crystal protein (cry1A(b)),
phosphothricin acetyltransferase (bar) and �-glucoronidase (gus), and human Cot-1
DNA®, with the latter standard being from the SpotReport®-3 Array Validation System.
Furthermore, two internal standards (RCA and rbcL, SpotReport®-3 Array Validation
System) were included at final concentrations of 1, 10, 50 or 100 ng. Membranes were
air-dried and the probe DNA cross-linked by means of short-wavelength UV-radiation
(120 kJ.cm-1) (Hoefer UV-Crosslinker). The arrays were then wrapped in filter paper,
sealed in polyethylene film and stored at RT until required.
4.3.7 Array querying and analysis
Array membranes were incubated for approximately 18 hours in 20ml Church and
Gilbert buffer (0.5 M sodium phosphate (pH 7.2); 7% (w/v) SDS; 0.94 mM EDTA)
(Church and Gilbert, 1984) containing 10 µg ml-1 denatured fragmented salmon or
herring sperm DNA (Sigma-Aldrich Inc., MO, USA). Incubation was performed at 65o C
in 300 ml volume hybridisation bottles within a Hybaid Micro-4 rotary hybridisation oven

Chapter 4: Gene expression during a source-sink perturbation
110
(Hybaid Ltd., UK). After prehybridisation, the original solution was discarded and an
aliquot of fresh, pre-warmed (65oC) hybridisation buffer containing the cDNA target
population was added in the absence of denatured salmon or herring sperm DNA.
Following overnight hybridisation at 65oC, the membranes were washed twice in aliquots
of 1X SSC (155 mM tri-sodium citrate; 150 mM NaCl), 0.1% (w/v) SDS solution for 10–
20 min until unbound labelled target cDNA were removed.
Arrays were exposed to high-resolution Cylcone phosphor screens (Packard Instruments
Company, Connecticut, USA) and captured by means of a CycloneTM Storage Phosphor
Screen imaging system (Packard Instruments Company). Array images were analysed
using QuantArray® MicroArray Analysis Software (version 3.0, Packard Bioscience).
This software was used to quantify the spot hybridisation intensity and corresponding
background intensity for each of the probes contained on the array membranes in
response to each querying event. Images were visually inspected to identify spots with
poor morphology or high local background. These spots were flagged and omitted from
further analysis. Array data sets, representing spot and background intensity values,
were then imported into Excel spreadsheets for evaluation and comparative analysis.
Overall background consistency was validated by confirming that the coefficient of
variation (CV) for the mean background intensity between all query events was less than
10% for each array data set. Based on the average ratio of background to spot intensity
of external standard query events, a lower intensity-specific threshold was established
(Yang et al., 2002), below which probe query events were excluded from further
analysis. Following individual background subtraction from query events, replicate query
events were compared and excluded from inter-array comparison if their CV exceeded
5%. Standard curves were then generated for each treatment group from signal
intensity data derived from the internal standard query events (Fig. 4.1). To normalise
between data from differing arrays, the equation ��
���
� −
= abI
eCln
was used, where I is
average query event intensity and C is expression level relative to the internal control (a
and b are curvature parameters). FiRe software was used to detect differential
expression between treatments (FiRe Ver. 2.2, Fribourg, Switzerland) (Garcion et al.,
2006). To reduce the possibility of generating false-positive results, only query events
with a greater than two-fold change in expression between treatments were considered
for further correlation analysis.

Chapter 4: Gene expression during a source-sink perturbation
111
4.3.8 Statistical analysis
Results were subjected to analysis of variants (ANOVA) or Student’s t tests to determine
the significance of difference between responses to treatments. When ANOVA was
performed, Tukey's honest significant difference (HSD) post-hoc tests were conducted to
determine the differences between the individual treatments (SPSS Ver. 11.5, SPSS
Inc., Illinois, USA). SPSS was also used to calculate the Pearson’s correlation
coefficients for correlation analyses.
Fig. 4.1. Standard curves generated from the average log intensity values of two mRNA
standards that were spiked into the total cDNA population during the array query
events (A. thaliana Rubisco activase (RCA) and Rubisco large subunit (rbcL)). Each
array contained DNA probe standards at concentrations of 1, 10, 50 and 100 ng.
The SE bars represent the average of four intensity values. Curvature parameters a
and b were used for normalisation between array data sets.
4.4 Key results
4.4.1 Effect of source: sink variations on sugars and photosynthesis
Sugars levels, photosynthetic gas exchange characteristics and leaf chlorophyll
fluorescence activities were determined on the sole source leaf of the partially shaded
2.5
2.6
2.7
2.8
2.9
3
3.1
3.2
3.3
3.4
3.5
0 0.5 1 1.5 2
log conc. of standard poly A+ RNA (ng)
log
inte
nsity
Control
1 d
3 d
6 d
14 d
a b R2
Control 0.26 2.69 0.99 1 d 0.20 2.58 0.99 3 d 0.31 2.63 0.99 6 d 0.20 2.64 0.98 14 d 0.19 2.73 0.99
2.5
2.6
2.7
2.8
2.9
3
3.1
3.2
3.3
3.4
3.5
0 0.5 1 1.5 2
log conc. of standard poly A+ RNA (ng)
log
inte
nsity
Control
1 d
3 d
6 d
14 d
2.5
2.6
2.7
2.8
2.9
3
3.1
3.2
3.3
3.4
3.5
0 0.5 1 1.5 2
log conc. of standard poly A+ RNA (ng)
log
inte
nsity
Control
1 d
3 d
6 d
14 d
a b R2
Control 0.26 2.69 0.99 1 d 0.20 2.58 0.99 3 d 0.31 2.63 0.99 6 d 0.20 2.64 0.98 14 d 0.19 2.73 0.99

Chapter 4: Gene expression during a source-sink perturbation
112
plants and the corresponding leaf of control plants at days 1, 3, 6 and 14. Hexose
concentrations in leaf 6 of partially shaded plants declined over the duration of the
shading treatment (Fig. 4.2). Apart from an increase in sucrose detected at 6 d, there
were no significant changes in sucrose concentration in leaf 6. In immature internodal
tissue, a decline in sucrose over time was observed, while there were no significant
changes in hexose concentrations.
A significant increase in maximum photosynthetic assimilation rates (Jmax), carboxylation
efficiency (CE) and electron transport rate (ETR) measured at ambient CO2 (380 �mol
m2 s-1) were observed over the duration of the source-sink perturbation (Table 4.1). Of
note is that plants shaded for 6 d exhibited a 37% higher Jmax compared to day 3, which
was associated with a significant increase in leaf sucrose levels over the same period
(Fig. 4.2).
Fig. 4.2. Comparison of sugar levels in the leaves and immature culm of plants subjected to a
source-sink perturbation. Hexose and sucrose (µmol g-1 FW) measurements for
field-grown plants that were completely unshaded (control) and those in which all but
leaf 6 (sole source leaf) were shaded for 1, 3, 6 and 14 d prior to sampling (n=7). All
plants were harvested and processed concurrently. Sugar levels are shown for leaf 6
and immature culm tissue (internodes 4–6). Letters above the SE bars indicate
whether the treatment had a significant influence within each tissue type (P<0.05) as
determined by ANOVA followed by Tukey’s honestly significant difference (HSD)
tests.
0
5
10
15
20
25
Leaf 6
Hex
ose
(�m
ol g
-1)
0
20
40
60
80
100
Immature avg
0
20
40
60
Leaf 6
Suc
rose
(�m
ol g
-1)
0
20
40
60
Immature avg
asa
control
Leaf 6 Immature Culm Tissue
aba
ab
bc
c
aba
abab
cb
aa a
aa
aba a
b
a
6 d1 d 3 d 14 d control 6 d1 d 3 d 14 d
0
5
10
15
20
25
Leaf 6
Hex
ose
(�m
ol g
-1)
0
20
40
60
80
100
Immature avg
0
20
40
60
Leaf 6
Suc
rose
(�m
ol g
-1)
0
20
40
60
Immature avg
asa
control
Leaf 6 Immature Culm Tissue
aba
ab
bc
c
aba
abab
cb
aa a
aa
aba a
b
a
6 d1 d 3 d 14 d control 6 d1 d 3 d 14 d

Chapter 4: Gene expression during a source-sink perturbation
113
Table 4.1. Variables from A:Ci curves based on photosynthetic gas exchange and chlorophyll
fluorescence variables following a source-sink perturbation. Measurements were
taken on leaf 6 of plants in which all the other leaves had been shaded for 1, 3, 6 and
14 d. The control represents measurements taken on leaf 6 of the plants not
subjected to shading treatments. All measurements were taken on the same day.
Abbreviations are as follows: substrate supply limited assimilation (Jmax), dark
respiration (Rd), carboxylation efficiency (CE), photosynthetic rate in the presence (Ai)
and absence of stomatal limitation (Aa), stomatal conductance (Gs), intercellular CO2
concentration at ambient CO2 (Ci at Ca = 380) and electron transport rate (ETR) at Ca
= 380. Measurements were performed at an ambient RH of 44.6% ± 3.6 (mean ±
SE) and an irradiance of 2000 �mol m-2 s-1. Values represent means ± SE (n=4) and
are followed by letters indicating whether treatment time had a significant influence
(P<0.05), as determined by Student’s t tests.
Control 1d 3d 6d 14d
Jmax (�mol m2 s-1) 25.2 ± 2.6 a 22.3 ± 4.5 a 28.7 ±3.2 a 38.4 ± 3.4 b 39.6 ± 0.1 b
Rd (�mol m2 s-1) 3.8 ±.0.9 a 2.3 ± 0.3 a 2.5 ±.0.8 a 3.7 ± 0.4 a 3.1 ± 1 a
CE (mmol m2 s-1) 159 ± 47 a 120 ± 36 a 231 ±.34 a 343 ± 72 b 326 ± 21.1 b
Aa (�mol m2 s-1) 19.8 ±2.2 a 17.5 ± 1.3 a 26 ±2.5 a 32.9 ± 3.2 b 36 ± 1 b
Ai (�mol m2 s-1) 13.2 ±1.2 a 11.7 ± 1.9 a 20.3 ± 0.6 b 20.9 ± 0.8 b 21.3 ± 1.7 b
Gs (mmol m2 s-1) 154 ± 10 a 132 ± 12 a 177 ± 32 a 194 ± 19 a 147 ± 11 a
Ci at Ca=380 (�mol mol-1) 125.8 ± 43.2 a 183 ± 30.1 a 131.7 ± 27.9 a 153.4 ± 37.8 a 119.8 ± 25.8 a
ETR at Ca=380 (�mol mol-1) 41.4 ± 7.6 a 46.4 ± 3.3 a 73.7 ± 2.6 b 87.7 ± 9.6 b 78 ± 6.2 b
4.4.2 Hybridisation analysis of leaf transcript abundance
Changes in transcript abundance of selected genes in the source leaf were monitored
following the source-sink perturbation induced by the partial shading treatment.
Macroarrays were prepared bearing 128 cDNA probes (ESTs), derived primarily from
graminaceous species, with known involvement in carbohydrate and photosynthetic
metabolism (Table 4.2, [Supplementary Information]). The genes represented on the
array were specifically selected to target metabolic activities most likely to be involved in
the source-sink relationship. The expression of this set of genes was monitored in leaf 6
of the control plants and in the plants in which all other leaves were shaded at day 1, 3,
6 and 14.

Chapter 4: Gene expression during a source-sink perturbation
114
Table 4.2. Functional classification of ESTs used in gene expression analysis. The number of
genes cited reflect both different genes and variants of single genes.
General classification of gene product function
Number of genes under analysis
Cell Wall Biosynthesis 9
Sugar Sensing and Signaling 12
Carbon (Starch) Metabolism 5
Sucrose Metabolism 23
Glycolysis 20
Triose-phosphate metabolism 13
Photosynthesis 16
Mitochondrial metabolism 13
Sugar Transport 17
Hybridisation between total cDNA populations from leaf 6 and the gene probes on the
array was highly consistent between replicate query events. Comparison of the average
intensities generated from replicate query events produced R2 values > 0.99 for each
treatment, indicating consistent target-probe hybridisation (Fig. 4.3). Following the
implementation of a low threshold cutoff, background subtraction and CV analysis, a
total of 116 valid gene query events (89.9 %) were produced. The majority of query
events did not exhibit any substantial difference in hybridisation signal intensity between
array data sets. However, 27 ESTs showed a 2 to 9 fold change in intensity over time
(Table 4.3). Within this group, the majority (22) displayed increased hybridisation
intensity, indicating an overall up-regulation of expression in leaf tissue over time.
Within the gene categories represented on the macroarray, a number of trends were
evident. During the source-sink perturbation there was a general trend towards the up-
regulation of genes encoding products involved in photosynthesis, mitochondrial
metabolism and sugar transport (Fig. 4.4). Expression of genes within other EST
categories showed little change over time.

Chapter 4: Gene expression during a source-sink perturbation
115
Fig. 4.3. Comparison of probe-target hybridisation intensities of replicate macroarray query
events. Log data represent signal intensities of leaf 6 total cDNA populations
hybridized to 128 probes on the macroarray. The data represent the average probe
hybridisation of two adjacent probes compared to a second set placed probe pair at
another location on the array. Intensity values below the lower threshold value
(shown in grey) were excluded from data analysis.
= 0.99572.5
2.6
2.7
2.8
2.9
3
3.1
3.2
3.3
3.4
3.5
R2
Control
R2 = 0.99372.5
2.6
2.7
2.8
2.9
3
3.1
3.2
3.3
3.4
log
inte
nsity
(ave
rage
que
ry e
vent
2)
Day 3
R2
= 0.99422.5
2.6
2.7
2.8
2.9
3
3.1
3.2
3.3
3.4
Day 1
R2 = 0.99022.5
2.6
2.7
2.8
2.9
3
3.1
3.2
3.3
3.4
Day 6
R2 = 0.99472.5
2.6
2.7
2.8
2.9
3
3.1
3.2
3.3
3.4
2.5 2.6 2.7 2.8 2.9 3 3.1 3.2 3.3 3.4 3.5
log intensity (average query event 1)
Day 14
= 0.99572.5
2.6
2.7
2.8
2.9
3
3.1
3.2
3.3
3.4
3.5
R2
Control
= 0.99572.5
2.6
2.7
2.8
2.9
3
3.1
3.2
3.3
3.4
3.5
R2
R2
Control
R2 = 0.99372.5
2.6
2.7
2.8
2.9
3
3.1
3.2
3.3
3.4
log
inte
nsity
(ave
rage
que
ry e
vent
2)
R2 = 0.9937R2 = 0.99372.5
2.6
2.7
2.8
2.9
3
3.1
3.2
3.3
3.4
log
inte
nsity
(ave
rage
que
ry e
vent
2)
Day 3
R2
= 0.99422.5
2.6
2.7
2.8
2.9
3
3.1
3.2
3.3
3.4
Day 1
R2
= 0.99422.5
2.6
2.7
2.8
2.9
3
3.1
3.2
3.3
3.4
Day 1
R2 = 0.99022.5
2.6
2.7
2.8
2.9
3
3.1
3.2
3.3
3.4
Day 6
R2 = 0.99022.5
2.6
2.7
2.8
2.9
3
3.1
3.2
3.3
3.4
Day 6
R2 = 0.99472.5
2.6
2.7
2.8
2.9
3
3.1
3.2
3.3
3.4
2.5 2.6 2.7 2.8 2.9 3 3.1 3.2 3.3 3.4 3.5
log intensity (average query event 1)
Day 14
R2 = 0.99472.5
2.6
2.7
2.8
2.9
3
3.1
3.2
3.3
3.4
2.5 2.6 2.7 2.8 2.9 3 3.1 3.2 3.3 3.4 3.5
log intensity (average query event 1)
Day 14

Chapter 4: Gene expression during a source-sink perturbation
116
Many of the ESTs that depicted an increase in expression over time were homologous to
genes associated with the C4 photosynthetic pathway (Table 4.3). Overall, this EST
group showed a 5-fold increase in mRNA abundance (Fig. 4.4), while, within this group,
NADP-dependent malic enzyme (NADPME; EC 1.1.1.40) and pyruvate orthophosphate
dikinase (PPdK; EC 2.7.9.1) showed the greatest increase in expression during the
source-sink perturbation. Two ESTs related to mitochondrial metabolism, viz. malate
dehydrogenase (MDH; EC 1.1.1.82) and citrate synthase (CS; EC 2.3.3.1), exhibited
increased expression, as did triose metabolism-related ESTs for fructose bisphosphate
aldolase (ALD; EC 4.1.2.13) and glyceraldehyde phosphate dehydrogenase (GPDH; EC
1.2.1.12). Increased expression levels were also observed for six ESTs homologous to
putative transporter proteins, including three putative monosaccharide transporters, an
ADP/ATP plastidic transporter and two triose phosphate transporters.
Included in the small group of five ESTs that were down-regulated were those
representing fructokinase (FK; EC 2.7.1.4) and hexokinase (HXK; EC 2.7.1.1) (Table
4.3). In addition, ESTs homologous to a mitogen-activated protein kinase (MAPK; EC
2.7.1.37), UTP-glucose dehydrogenase (UTP-GD; EC 1.1.1.22) and alcohol
dehydrogenase (AD; EC 1.1.1.1) showed reduced expression levels during the
perturbation.
Fig. 4.4. Average fold changes in gene expression per functional category over time ( 1d; �
3d; � 6d; � 14d) in the sole source leaf of partially shaded sugarcane plants
compared to an unshaded control. See Table 4.2 for EST quantities per category
and Supplementary Information for EST details.
0
0.5
1
1.5
2Cell wall biosynthesis
Fol
d ch
ange
in o
vera
ll ge
ne
expr
essi
on
Sugar signalling and sensing Carbon metabolism (starch) Sucrolysis and glycolysis
0
0.5
1
1.5
2
2.5
3Triose phosphate metabolism
Fold
cha
nge
in o
vera
ll ge
ne
expr
essi
on
Photosynthesis Mitchondrial metabolism Sugar transporters
6 d1 d 3 d 14 d 6 d1 d 3 d 14 d 6 d1 d 3 d 14 d 6 d1 d 3 d 14 d
6 d1 d 3 d 14 d6 d1 d 3 d 14 d6 d1 d 3 d 14 d6 d1 d 3 d 14 d0
0.5
1
1.5
2Cell wall biosynthesis
Fol
d ch
ange
in o
vera
ll ge
ne
expr
essi
on
Sugar signalling and sensing Carbon metabolism (starch) Sucrolysis and glycolysis
0
0.5
1
1.5
2
2.5
3Triose phosphate metabolism
Fold
cha
nge
in o
vera
ll ge
ne
expr
essi
on
Photosynthesis Mitchondrial metabolism Sugar transporters
6 d1 d 3 d 14 d 6 d1 d 3 d 14 d 6 d1 d 3 d 14 d 6 d1 d 3 d 14 d
6 d1 d 3 d 14 d6 d1 d 3 d 14 d6 d1 d 3 d 14 d6 d1 d 3 d 14 d

Chapter 4: Gene expression during a source-sink perturbation
117
In some instances, not all ESTs assigned the same identity displayed consistent
changes in expression. For example, only one of the six sucrose synthase (SuSy; EC
2.1.4.13) ESTs (AU173014) showed a greater than 2-fold increase in expression, while
only one of the three MAPK ESTs showed reduced expression. This could be due to
significant sequence divergence between the ESTs isolated from different species, or
alternatively, these ESTs may represent distinct isogenes or gene family members
particular to specific tissues.
Table 4.3. Fold changes in gene expression between leaf 6 mRNA of an unshaded plant
(control) and leaf 6 (sole source leaf) at days 1, 3, 6 and 14 following a source-sink perturbation induced by partial shading. Putative ID indicates the homology match of the particular EST probe referenced to accession number records of the National Centre of Biotechnological Information (NCBI) GenBank database (www.ncbi.nlm.nih.gov). See Supplementary Information further details.
Putative ID Accession No. Fold change Up regulated Day 1 Day 3 Day 6 Day 14
ATP/ADP transporter CD423751 0.6 2.4 1.9 9.1
Fructose bisphosphate aldolase AW745533 1.0 1.9 1.8 2.9
Glyceraldehyde-P dehydrogenase BG947834 1.7 4.1 2.0 3.4
PQ0178 0.9 2.1 1.5 1.9
Malate dehydrogenase AU093830 1.2 1.4 1.5 2.5
NADP-dependent malic enzyme CN136258 0.9 2.3 1.3 3.6
CN146318 0.7 3.0 2.1 8.1
Phenolenolpyruvate carboxylase AU088696 0.8 1.3 0.8 2.2
BG158755 0.9 2.7 2.4 4.3
psbA chloroplast protein CD212978 0.9 1.7 1.5 3.2
Pyruvate orthophosphate dikinase CF071996 0.6 2.6 2.5 8.5
Rubisco (large subunit) AW678375 0.3 1.1 1.2 3.0
Rubisco (small subunit) CN150664 0.9 2.7 1.5 2.4
Rubisco activase BM318446 1.1 1.2 1.4 2.2
Rubisco transition peptide CN142383 1.1 4.4 3.4 6.9
Citrate synthase BE363510 1.6 3.9 1.6 2.3
Sucrose synthase AU173014 1.6 1.8 1.2 2.6
Sugar transporter (monosaccharide) CD231617 1.1 3.5 4.9 6.7
AU163471 0.9 1.9 1.1 3.0
AU094600 0.9 1.3 1.3 2.0
Triose phosphate transporter CN149774 1.0 3.6 2.4 4.3
CN149403 1.1 3.0 3.1 3.0
Down regulated
Alcohol dehydrogenase AU091741 1.0 1.1 1.4 2.3
Fructokinase CN140006 1.1 1.0 1.2 2.0
Hexokinase AU057562 1.0 1.1 1.4 2.2
Mitogen-activated protein kinase CN132740 1.1 0.9 1.2 2.0
UDP-glucose dehydrogenase AA525658 1.1 1.2 1.4 2.0

Chapter 4: Gene expression during a source-sink perturbation
118
4.4.3 Correlation analysis
To uncover possible regulatory events induced in leaf 6 by the source-sink perturbation,
the observed changes in photosynthesis, sugar concentration and gene expression over
time were subjected to Pearson’s correlation analyses. With regard to photosynthesis
and sugar concentrations, a strong negative correlation between hexose concentrations
in source leaf tissue, and Jmax and CE was revealed (Table 4.4). This relationship was
not evident for sucrose. Furthermore, significant correlations between sucrose and
hexose concentrations in immature culm tissue and leaf 6 photosynthesis levels were
observed. Immature sink tissues were characterised by decreased sucrose levels which
were correlated with an increase in Jmax over the 14 d period.
Of the 27 genes that exhibited marked changes in expression over time in leaf 6, 20
showed strong correlations to leaf 6 photosynthetic variables (Jmax and CE) and leaf 6
hexose concentrations (Table 4.4). Within this group no correspondence was evident
with leaf sucrose concentrations, however, nine genes showed significant correlation
with the decreasing sucrose levels observed in immature culm tissue although a
secondary correlation through leaf hexose may be indicated. Notably, these included
ESTs homologous to the C4 photosynthetic enzymes phosphoenolpyruvate carboxylase
(PEPC; EC 4.1.1.31), NADPME and PPdK, and two putative transporter proteins.

Chapter 4: Gene expression during a source-sink perturbation
119
Table 4.4. Bivariate Pearson’s correlation coefficients between leaf 6 photosynthetic variables
Jmax and CE (see Table 4.1 for variable declarations), leaf 6 and immature culm
sugar concentrations (hexose and sucrose) and gene expression data of leaf 6 from
either unshaded plants or partially shaded plants (sole source leaf 6) between 1 and
14 d. Significance levels (P) are reported for the Pearson’s correlation coefficients (in
brackets). Absent values indicate genes that were up or down regulated but not
significantly correlated.
Leaf 6
Jmax CE CE 0.979 (0.00) Leaf 6 - hexose - 0.694 (0.00) - 0.655 (0.00) Leaf 6 - sucrose Immature culm - hexose 0.336 (0.04) Immature culm - sucrose - 0.372 (0.03)
Leaf 6 Immature Culm Up regulated Accession
No. Jmax CE Hexose Sucrose ATP/ADP transporter CD423751 0.708 (0.00) 0.621 (0.00) 0.631 (0.00) - 0.487 (0.03) Fructose bisphosphate aldolase AW745533 0.827 (0.00) 0.799 (0.00) - 0.675 (0.00) Glyceraldehyde-P dehydrogenase BG947834 PQ0178 Malate dehydrogenase AU093830 0.772 (0.00) 0.699 (0.00) - 0.632 (0.01) - 0.478 (0.03) NADP-dependent malic enzyme CN136258 0.618 (0.01) 0.587 (0.01) - 0.565 (0.01) - 0.515 (0.02) CN146318 0.730 (0.00) 0.662 (0.00) - 0.651 (0.00) - 0.493 (0.03) Phenolenolpyruvate carboxylase AU088696 0.514 (0.02) 0.581 (0.01) - 0.542 (0.01) - 0.485 (0.03) BG158755 0.826 (0.00) 0.815 (0.00) - 0.630 (0.00) psbA chloroplast protein CD212978 0.775 (0.00) 0.719 (0.00) - 0.649 (0.00) - 0.465 (0.04) Pyruvate orthophosphate dikinase CF071996 0.775 (0.00) 0.699 (0.00) - 0.647 (0.00) - 0.452 (0.05) Rubisco (large subunit) AW678375 0.785 (0.00) 0.706 (0.01) - 0.664 (0.00) Rubisco (small subunit) CN150664 0.826 (0.00) 0.815 (0.01) - 0.489 (0.00) Rubisco activase BM318446 0.830 (0.00) 0.744 (0.01) - 0.648 (0.00) Rubisco transition peptide CN142383 0.789 (0.00) 0.783 (0.00) - 0.603 (0.01) Citrate synthase BE363510 Sucrose synthase AU173014 Sugar transporter (monosaccharide) CD231617 0.946 (0.00) 0.934 (0.00) - 0.668 (0.00)
AU163471 0.591 (0.01) 0.555 (0.01) - 0.563 (0.01) - 0.532 (0.02) AU094600 0.819 (0.00) 0.774 (0.00) - 0.685 (0.00) Triose phosphate transporter CN149774 0.683 (0.00) 0.716 (0.00) - 0.501 (0.00) CN149403 0.683 (0.00) 0.716 (0.00) - 0.501 (0.00) Down regulated Alcohol dehydrogenase AU091741 Fructokinase CN140006 Hexokinase AU057562 - 0.730 (0.00) - 0.605 (0.01) 0.576 (0.01) Mitogen-activated protein kinase CN132740 UDP-glucose dehydrogenase AA525658 - 0.561 (0.01) - 0.449 (0.04) 0.511 (0.02) 0.5 (0.03)

Chapter 4: Gene expression during a source-sink perturbation
120
4.5 Discussion
Disturbance of the source-sink balance by partial shading of all source leaves, bar one,
produced significant changes in the sugar levels of the leaf and subtending internodes
(Fig. 4.2), as well as in photosynthetic activity of the single unshaded leaf (Table 4.1), in
which significant increases in photosynthetic rate, carboxylation efficiency and PSII
efficiency were observed. Conversely, shading treatments resulted in decreased
sucrose levels in the young immature internodal tissue. A significant negative linear
relationship was observed between maximum photosynthetic assimilation rates (Jmax) of
the source leaf and sucrose concentrations in these immature internodes (Fig. 4.2; Table
4.4). These observations support reports that reduced carbon supply to sink tissue is a
physiological signal to the source of increased assimilate demand (van Bel, 2003).
Partial defoliation has been shown to produce a similar effect in sugarcane, which
results in preferential partitioning of available carbon to sucrose culm storage
(Pammenter and Allison, 2002). Partial defoliation also has no effect on overall plant
sucrose yields (Gutiérrez-Miceli et al., 2004), suggesting that the assimilation capacity of
sugarcane leaves is robust and flexible and can readily adjust carbon supply relative to
sink demand. In contrast to defoliation studies, the marked increases in photosynthesis
resulting from the source-sink perturbation achieved in this study may have been
exacerbated by the continued presence of other leaves. Previous work has shown a
significant increase in partitioning of a 14C label to shaded leaves, indicating that these
leaves were converted to additional sinks during shading treatments (McCormick et al.,
2006 [Chapter 3]).
A strong negative correlation was observed between hexose concentrations and Jmax
and CE in unshaded source leaves. In contrast, no relationship was observed between
source leaf sucrose levels and photosynthesis (Table 4.4). This suggests that hexoses,
rather than sucrose, may participate in a feed-back system for photosynthetic regulation.
This contention is supported by observations from maize (Zea mays L) in which sucrose
concentrations were shown to have no significant short-term feedback inhibitory effects
on the synthesis of sucrose itself in leaf tissue (Lunn and Furbank, 1999). Furthermore,
hexoses have been shown to inhibit photosynthesis in numerous C3 species and
consequently are believed to play a significant role in regulating carbon accumulation
and leaf development (Goldschmidt and Huber, 1992; Kilb et al., 1995; Ehness et al.,
1997; Paul and Pellny, 2003). A decreased leaf hexose pool may serve as a signal for

Chapter 4: Gene expression during a source-sink perturbation
121
increased sink demand, and also reduce negative feedback regulation of photosynthesis
(Foyer, 1987), an effect which has been observed previously in sugarcane (McCormick
et al., 2006 [Chapter 3]). Due to the compartmentation of enzymes between mesophyll
and bundle sheath cells in C4 species (Edward et al., 2001), the regulation of sucrose
accumulation and signaling mechanism may be more complex than for C3 species.
Nevertheless, sugar-mediated regulation of gene expression may be as important in C4
as in C3 species for maintaining the balance between the source and sink activity (Lunn
and Furbank, 1999).
In the current study, physiological and metabolic effects of a source-sink perturbation
have been examined in parallel to changes in the expression of genes associated with
photosynthesis and carbohydrate metabolism. To permit comparison of replicate array
query events within each array, the hybridisation signal intensity values for each EST
probe were normalised amongst replicates. To compare array data generated by
replicate array hybridisations a method for the normalisation of hybridisation signal
intensity data was used. An internal standard was introduced into the leaf RNA samples
prior to cDNA synthesis and labelling and then used to normalise hybridisation signal
intensity data amongst replicate query events. This is an improved means of
normalisation compared to standard, comparative normalisation techniques, such as
generation of relative expression values (Cui and Churchill, 2003) in which all measured
values are divided by the sum of the values and then compared between arrays. This
latter method is not ideal as it is based on the assumption that the amount of mRNAs per
sample is constant (Velculescu et al., 1999). A further drawback is that large changes in
relative gene expression may impact on the expression of unchanged genes, leading to
the generation of false-positive results (Yang et al., 2002). In contrast to such analytical
approaches, the method used in this study provides a more stringent approach to the
detection of specific changes in gene expression.
During photosynthesis in NADPME-type C4 species, such as sugarcane, malate is
translocated to bundle sheath cells where NADPME catalyses its decarboxylation (Lunn
and Hatch, 1995; Edwards et al., 2001). The three key enzymes of C4 photosynthesis,
viz. PPdK, PEPC and NADPME, are strongly regulated by light (Hatch, 1992; Furbank
and Taylor, 1995). However, only PEPC has previously been shown to respond to
changing sugars levels (Chollet et al., 1996; Sima and Desjardins, 2001). This study
has revealed an increase in gene expression of all three of these enzymes, as well as an

Chapter 4: Gene expression during a source-sink perturbation
122
increase in expression of Rubisco (both RbcL and RbcS) and Rubisco-related proteins
(Table 4.3). Increased abundance of these transcripts correlated to an increase in
photosynthetic activity and decreasing leaf hexose concentrations (Table 4.4). These
observations indicate that hexoses may play a key role in regulating the expression of
these enzymes. Sheen (1990) demonstrated that supplying maize protoplasts with
glucose or sucrose lead to the repression of genes encoding products involved in
photosynthesis. The depletion or accumulation of sugars has further been shown to
activate or repress, respectively, the expression of genes for photosynthetic components
of a variety of C3 species and ultimately influence photosynthesis itself (Krapp et al.,
1993; Krapp and Stitt, 1995; Van Oosten and Besford, 1994, 1995; Basu et al., 1999).
However, there are few reports describing the effects of sugar levels on the expression
of genes encoding components of photosynthesis specific to C4 plants, and results from
C3 studies may not always be pertinent to C4 species. For example, in Spinacia
oleracea (L.) the expression of rbcS, and consequently Rubisco protein activity, has
been shown to be regulated by leaf sugar concentrations (Krapp et al., 1991). These
results are not easily comparable to C4 species, where Rubisco levels are typically only
50% of those of C3 plants on a chlorophyll basis (Lunn and Furbank, 1999).
Furthermore, in C4 species sucrolytic and photosynthetic activities are localised in
mesophyll and bundle sheath cells, respectively (Lunn and Furbank, 1997). Maize, in
particular, shows a strong asymmetric distribution of activities, with cytosolic sucrose
phosphate synthase (SPS; EC 2.4.1.14), sucrose phosphate phosphatase (SPP; EC
3.1.3.24) and fructose 1,6-bisphosphatase (FBPase; EC 3.1.3.11) predominantly
localized in the mesophyll (Downton and Hawker, 1973; Furbank et al., 1985), indicating
that sucrose is synthesized almost exclusively in the mesophyll of maize source leaves.
In the current study, decreased levels of hexose were correlated with increased
expression of several photosynthesis-related genes (Table 4.4). Drawing on information
obtained from studies of maize it also appears likely that in sugarcane, it is a hexose-
regulated signal originating primarily in mesophyll cells, which serves to regulate PEPC
expression levels (Fig. 4.5). As PEPC has previously been shown to respond to sugars
(Chollet et al., 1996; Sima and Desjardins, 2001), PEPC may influence signaling
cascades that ultimately result in the up-regulation of C4 photosynthesis under conditions
of decreased cytosolic hexose. Of note is that hexoses have been implicated in the
regulation of source metabolism via signal transduction pathways involving protein
phosphorylation via MAPK activities (Ehness et al., 1997). In the present study, MAPK

Chapter 4: Gene expression during a source-sink perturbation
123
expression was down-regulated, however, due to the wide variety of signaling pathways
that are associated with MAPKs (Jonak et al., 1996; Lee et al., 2001; Zhang and Klessig,
2002), it is difficult to pinpoint the specific role of this enzyme during the source-sink
perturbation (Fig. 4.5). Regulation of C4 leaf photosynthesis has been suggested to
involve phosphorylation of the PEPC enzyme (Duff and Chollet; 1995; Vidal and Chollet,
1997). Further metabolic and gene expression analyses in sugarcane will aim to
examine the post-transcriptional regulation of PEPC by PEPC kinase (Jeanneau et al.,
2002) and possible co-mediation by MAPKs and hexoses.
Increased photosynthetic activity was correlated with an increase in several transporter
proteins, including a putative ATP/ADP transporter and two triose phosphate
transporters (Table 4.3). Attempts to increase sucrose metabolism in transgenic C3
Oryza sativa (Kitaake) by over-expression of maize PEPC have previously been shown
to result in no change in leaf sucrose, but rather a decreased availability of Pi and
increased consumption of cytosolic triose phosphate into malate (Agarie et al., 2002). In
C4 plants this phenomenon may be alleviated by a co-ordinated increase in the supply of
cytosolic Pi and triose phosphate when photosynthetic activity increases. Sucrose
produced in the mesophyll must however, additionally pass through the bundle sheath
cells to be loaded into the phloem through either a symplastic or apoplastic, or both
(Lunn and Furbank, 1999; Walsh et al., 2005). In sugarcane, the conducting cells of the
phloem have been shown not to be connected to other cells of the leaf by
plasmodesmata (Robinson-Beers and Evert, 1991). This suggests that phloem loading
occurs from the apoplast in sugarcane leaves (Rae et al., 2005). Under conditions of
increased photosynthesis and sucrose export, the observed increase in expression of
sugar transporter proteins (Table 4.3) is not unexpected, and may be required to
efficiently meet increased sink demand.
Hexokinase and FK were down-regulated during the shading treatments. It has been
proposed that both enzymes participate in sugar sensing and signaling in plants (Pego
and Smeekens, 2000; Rolland et al., 2006), particularly HXK, which showed positive
correlation with decreasing hexose concentrations (Table 4.4). The role of HXK as a
putative sensor of hexose signaling was examined by Jang et al. (1997) using sense and
antisense constructs of the Arabidopsis HXK isoforms Hxk1 and Hxk2. Those authors
reported that plants over-expressing HXK genes exhibited glucose hypersensitive
characteristics, whereas antisense plants were hyposensitive. The results of this study

Chapter 4: Gene expression during a source-sink perturbation
124
together with those of Jang et al. (1997) support the hypothesis that HXK is a putative
sensor for hexose signaling. More recently, Moore et al. (2003) demonstrated that point
mutations in the catalytic domains of HXK resulted in an engineered protein that
exhibited no phosphorylation activity, while still being capable of glucose signaling
activity. This indicates that HXK may play two functionally distinct roles, at least in C3
plants (Harrington and Bush, 2003). Two FK isoforms have been isolated and
characterised in sugarcane (Hoepfner and Botha, 2004) but little is known about HXK.
Further research will be required to clarify the nature of the relationship observed
between HXK and hexose concentration (Table 4.4; Fig. 4.4).
Fig. 4.5. The C4 NADP-ME pathway of photosynthesis in sugarcane. Arrows within circles
indicate the changes in metabolite and gene expression levels during a source-sink
perturbation. The negative correlation observed between hexose and PEPC is
indicated. Abbreviations: 3PGA – 3-phosphoglycerate; HXK – hexokinase (EC
2.7.1.1); MAPK – mitogen activated protein kinase (EC 2.7.1.37); NADP-ME –
NADP-malic enzyme (EC 1.1.1.40); OAA – oxaloacetate; PEP –
phosphoenolpyruvate; PEPC – phosphoenolpyruvate carboxylase (EC 4.1.1.31);
PPdK – pyruvate orthophosphate dikinase (EC 2.7.9.1); RuBP – ribulose
bisphosphate; triose-P – triose phosphate.
3PGA
malate malate
pyruvate
3PGA
pyruvatePEP
OAA
PPdK
CHLOROPLAST
CYTOSOL
CHLOROPLAST
HCO3-
PEP
OAA
NADPME
CO2
AMP ATP
NADP+
NADPH
Mesophyll Cell Bundle Sheath Cell
RuBP
CYTOSOL
PCR Cycle
CO2
Glycolysis and
sucrosemetabolism
sucrose
APOPLASM
hexose
PEPC
Rubisco
cell wall
+
+
+
+
MAPK / HXK ?
triose-P
-
3PGA
malate malate
pyruvate
3PGA
pyruvatePEP
OAA
PPdK
CHLOROPLAST
CYTOSOL
CHLOROPLAST
HCO3-
PEP
OAA
NADPME
CO2CO2
AMP ATP
NADP+
NADPH
Mesophyll Cell Bundle Sheath Cell
RuBP
CYTOSOL
PCR Cycle
CO2CO2
Glycolysis and
sucrosemetabolism
sucrose
APOPLASM
hexose
PEPC
Rubisco
cell wall
+
+
+
++
MAPK / HXK ?
triose-P
--

Chapter 4: Gene expression during a source-sink perturbation
125
The observed increases in photosynthetic rates (Table 4.1) were statistically correlated
with a reduction in hexose content and changes in the expression of several genes
(Table 4.4). Although changes in gene expression are indicative of coarse regulation,
further study will be required to confirm whether expression patterns correlate to enzyme
activity, which may change substantially as a result of post-translational control. Recent
studies in Arabidopsis have indicated that changes in carbohydrates may initiate a
significant gene signaling response that does not necessarily lead to long-term changes
in plant behaviour (Stitt et al., 2006). Furthermore, analysis of whole tissue sugars
levels does not necessarily relate to the precise sugar concentration in the cells actually
responding to the signaling. However, the strong correspondence between
photosynthesis, hexose and gene expression demonstrated in the present study and the
similarity of these responses to those reported in C3 plants (Krapp et al., 1991; Krapp et
al., 1993; Franck et al., 2006) provides evidence for hexose as an important signaling
molecule in C4 sugarcane.
4.6 Conclusions
This is the first report for sugarcane in which physiological and metabolic changes during
a source-sink perturbation have been examined in parallel to changes in leaf gene
expression patterns. The work has revealed a strong relationship between source and
sink tissues, where demand for carbon from sinks affects source leaf photosynthetic
activity, metabolite levels and gene expression. Future research will include a closer
examination of the expression patterns of several of the genes highlighted in the current
study. This will include comparative expression analysis among different sugarcane
cultivars to gauge the extent to which the changes in gene expression observed in this
study pertain to other varieties. Clarification of how the sink acts to regulate source
activity in sugarcane will provide researchers with additional potential targets for
manipulation towards improving sucrose yield. The observation that sink demand limits
source activity indicates that the signal feedback system reporting sink sufficiency and
regulating source activity may be a potentially valuable for target for genetic
manipulation. This study has demonstrated that increased carbon demand from the sink
results in increased photosynthetic rates at the source. The communication of this
relationship appears to correlate to a decrease in source hexose concentrations, and
increased expression of genes involved in C4 photosynthesis and metabolite transport.
Chapter 4: Gene expression during a source-sink perturbation
126
4.7 References
Agarie S, Miura A, Sumikura R, Tsukamoto S, Nose A, Arima S, Matsuoka M,
Miyao-Tokutomi M. 2002. Overexpression of C4 PEPC caused O2-insensitive
photosynthesis in transgenic rice plants. Plant Science 162: 257–265.
Allison JCS, Williams HT, Pammenter NW. 1997. Effect of specific leaf nitrogen on
photosynthesis of sugarcane. Annals of Applied Biology 63: 135–144.
Amaya A, Cock JH, Hernandez A, Irvine J. 1995. Bioligía. In: Casselett C, Torres J,
Isaacs C, eds. El cultivo de la Ca�a en la zona azucarera de Colombia. Cali, Colombia:
Cenica�a, 31–62.
Basu PS, Sharma A, Garg ID, Sukumaran NP. 1999. Tuber sink modifies photosynthetic
response in potato under water stress. Environmental and Experimental Botany 42: 25–29.
Batta SK, Singh R. 1986. Sucrose metabolism in sugar cane grown under varying climatic
conditions: synthesis and storage of sucrose in relation to the activities of sucrose
synthetase, sucrose phosphate synthase and invertase. Phytochemistry 25: 2431–2437.
Borrás L, Otegui ME. 2001. Maize kernel weight response to post-flowering source-sink ratio.
Crop Science 49: 1816–1822.
Botha FC, Sawyer, BJB, Birch RG. 2001. Sucrose metabolism in the culm of transgenic
sugarcane with reduced soluble acid invertase activity. Proceedings of the International
Society of Sugar Cane Technologists 24: 588–591.
Bugos RC, Chiang VL, Zhang XH, Campbell ER, Podila GK, Campbell WH. 1995.
RNA isolation from plant tissues recalcitrant to extraction in guanidine. Biotechniques 19:
734–737.
Casu RE, Dimmock CM, Chapman SC, Grof CPL, McIntyre CL, Bonnett GD, Manners
JM. 2004. Identification of differentially expressed transcripts from maturing stem of
sugarcane by in silico analysis of stem expressed sequence tags and gene expression
profiling. Plant Molecular Biology 54: 503–517.
Casu RE, Jarmey J, Bonnett GD, Manners JM. 2007. Identification of transcripts
associated with cell wall metabolism and development in the stem of sugarcane by Affymetrix
GeneChip Sugarcane Genome Array expression profiling. Function and Integrative
Genomics 7: 153–167.
Carson DL, Botha FC. 2002. Genes expressed in sugarcane maturing internodal tissue.
Plant Cell Reports 20: 1075–1081.
Chollet R, Vidal J, O’Leary H. 1996. Phosphoenolpyruvate carboxylase: a ubiquitous, highly
regulated enzyme in plants. Annual Review of Plant Physiology and Plant Molecular Biology
47: 273–298.
Cui X, Churchill GA. 2003. Statistical tests for differential expression in cDNA microarray
experiments. Genome Biology 4: 210.

Chapter 4: Gene expression during a source-sink perturbation
127
Downton WJS, Hawker JS. 1975. Enzymes of starch and sucrose metabolism in Zea mays
leaves. Phytochemistry 12: 1551–1556.
Duff SMG, Chollet R. 1995. In Vivo Regulation of Wheat-Leaf Phosphoenolpyruvate
Carboxylase by Reversible Phosphorylation. Plant Physiology 197: 775–782.
Edmeades GO, McMaster GS, White JW, Campos H. 2004. Genomics and the
physiologist: bridging the gap between genes and crop response. Field Crops Research 90:
5–18.
Ehness R, Ecker M, Godt D, Roitsch T. 1997. Glucose and stress independently regulate
source/sink relations and defense mechanisms via signal transduction pathways involving
protein phosphorylation. Plant Cell 9: 1825–1841.
Edwards GE, Baker NR. 1993. Can CO2 assimilation in maize leaves be predicted accurately
from chlorophyll fluorescence analysis? Photosynthesis Research 37: 89–102.
Edwards GE, Franceschi VR, Ku MSB, Voznesenskaya EV, Pyankov VI, Andreo CS.
2001. Compartmentation of photosynthesis in cells and tissues of C4 plants. Journal of
Experimental Botany 52: 577–590.
Fell DA, Thomas S. 1995. Physiological control of metabolic flux: the requirement for multisite
modulation. Biochemical Journal 311: 35–39.
Fellows RJ, Egli DB, Leggett JE. 1979. Rapid changes in translocation patterns in soybean
following source-sink alterations. Plant Physiology 64: 652–655.
Foyer CH. 1987. The basis for source-sink interaction in leaves. Plant Physiology and
Biochemistry 25: 649–657.
Franck N, Vaast P, Génard M, Dauzat J. 2006. Soluble sugars mediate sink feedback
down-regulation of leaf photosynthesis in field-grown Coffea arabica. Tree Physiology 26:
517–525.
Furbank RT, Stitt M, Foyer CH. 1985. Intercellular compartmentation of sucrose synthesis
in leaves of Zea mays L. Planta 164: 172–178.
Furbank RT, Taylor WC. 1995. Regulation of photosynthesis in C3 and C4 plants: a
molecular approach. The Plant Cell 7: 797–807.
Garcion C, ApplimethFRI, Metraux JP. 2006. FiRe and microarrays: a fast answer to
burning questions. Trends in Plant Science 11: 320–321.
Gibson SI. 2005. Control of plant development and gene expression by sugar signaling.
Current Opinion in Plant Biology 8: 93–102.
Goldschmidt EE, Huber SC. 1992. Regulation of Photosynthesis by End-Product
Accumulation in Leaves of Plants Storing Starch, Sucrose, and Hexose Sugars. Plant
Physiology 99: 1443–1448.
Grivet L, Arruda P. 2002. Sugarcane genomics: depicting the complex genome of an
important tropical crop. Current Opinion in Plant Biology 5: 122–127.

Chapter 4: Gene expression during a source-sink perturbation
128
Groenewald J-H, Botha FC. 2007. Down-regulation of pyrophosphate: fructose 6-phosphate
1-phosphotransferase (PFP) activity in sugarcane enhances sucrose accumulation in
immature internodes. Transgenic Research DOI 10.1007/s11248-007-9079-x
Gutiérrez-Miceli FA, Morales-Torres R, de Jesús Espinosa-Castañeda Y, Rincón-
Rosales R, Mentes-Molina J, Oliva-Llaven MA, Dendooven L. 2004. Effects of
partial defoliation on sucrose accumulation, enzyme activity and agronomic parameters in
sugar cane (Saccharum spp.). Journal of Agronomy and Crop Science 190: 256–261.
Halpin C, Barakate A, Askari, BM, Abbot JC, Ryan MD. 2001. Enabling technologies for
manipulating multiple genes on complex pathways. Plant Molecular Biology 47: 295–310.
Harrington GN, Bush DR. 2003. The bifunctional role of hexokinase in metabolism and
glucose signaling. The Plant Cell 15: 2493–2496.
Hartt CE, Burr GO. 1967. Factors affecting photosynthesis in sugarcane. Proceedings of the
International Society of Sugar Cane Technologists 12: 590–609.
Hatch MD. 1992. C4 photosynthesis: an unlikely process full of surprises. Plant and Cell
Physiology 33: 333–342.
Ingelbrecht IL, Mandelbaum CI, Mirkov TE. 1998. Highly sensitive northern hybridization
using a rapid protocol for downward alkaline blotting of RNA. BioTechniques 25: 420–425.
Jackson PA. 2005. Breeding for improved sugar content in sugarcane. Field Crops Research
92: 277–290.
Jang JC, Sheen J. 1997. Sugar sensing in higher plants. Trends in Plant Science 2: 208–
214.
Jeanneau M, Vidal J, Gousset-Dupont A, Lebouteiller B, Hodges M, Gerentes D,
Perez P. 2002. Manipulating PEPC levels in plants. Journal of Experimental Botany 53:
1837–1845.
Jonak C, Kiegerl S, Ligterink W, Barker PJ, Huskisson NS, Hirt H. 1996. Stress
signaling in plants: A mitogen-activated protein kinase pathway is activated by cold and
drought. Proceeding of the National Academy of Sciences (USA) 93: 11274–11279.
Jones MGK, Outlaw WH, Lowry OH. 1977. Enzymic assay of 10-7 to 10-14 moles of sucrose
in plant tissues. Plant Physiology 60: 379–383.
Kilb B, Wietoska H, Goode D. 1995. Changes in the expression of photosynthetic genes
precede loss of photosynthetic activities and chlorophyll when glucose is supplied to mature
spinach leaves. Plant Science 115: 225–235.
Krapp A, Hofmann B, Schäfer C, Stitt W. 1993. Regulation of the expression of rbcS and
other photosynthetic genes by carbohydrates: a mechanism for the ‘sink regulation’ of
photosynthesis? The Plant Journal 6: 817–828.
Krapp A, Quick WP, Stitt W. 1991. Ribulose-1,5-bisphosphate carboxylase-oxygenase,
other Calvin cycle enzymes and chlorophyll decrease when glucose is supplied to mature
spinach leaves via the transcription stream. Planta 186: 58–59.

Chapter 4: Gene expression during a source-sink perturbation
129
Krapp A, Stitt W. 1995. An evaluation of direct and indirect mechanisms for the “sink-
regulation” of photosynthesis in spinach: Changes in gas exchange, carbohydrates,
metabolites, enzyme activities and steady-state transcript levels after cold-girdling source
leaves. Planta 195: 313–323.
Lakshmanan P, Geijskes RJ, Aitken KS, Grof CLP, Bonnett GD, Smith GR. 2005.
Sugarcane biotechnology: the challenges and opportunities. In Vitro Cellular and
Developmental Biology 41: 345–363.
Lawlor DW. 1987. Photosynthesis: metabolism, control and physiology. Harlow, UK: Longman
Scientific and Technical.
Lee S, Hirt H, Lee Y. 2001. Phosphatidic acid activates a wound-activated MAPK in Glycine
max. The Plant Journal 26: 479–486.
Luguang W, Birch RG. 2007. Doubling sugar content in sugarcane plants modified to produce
and isomer. Plant Biotechnology Journal 5: 109–117.
Lunn JE, Furbank RT. 1997. Localisation of sucrose-phosphate synthase and starch in
leaves of C4 plants. Planta 202: 106–111.
Lunn JE, Furbank RT. 1999. Sucrose biosynthesis in C4 plants. New Phytologist 143: 221–
37.
Lunn JE, Hatch MD. 1995. Primary partitioning and storage of photosynthate in sucrose and
starch in leaves of C4 plants. Planta 197: 385–391.
Ma H, Albert HA, Paull R, Moore PH. 2000. Metabolic engineering of invertase activities in
different subcellular compartments affects sucrose accumulation in sugarcane. Australian
Journal of Plant Physiology 27: 1021–1030.
Maxwell K, Johnson GN. 2000. Chlorophyll fluorescence - a practical guide.
Journal of Experimental Botany 51: 659–668.
Marcelis LFM. 1996. Flower and fruit abortion in sweet pepper in relation to source and sink
strength. Journal of Experimental Botany 55: 2261–2268.
McCormick AJ, Cramer MD, Watt DA. 2006. Sink strength regulates photosynthesis in
sugarcane. New Phytologist 171: 759–770.
Minchin PEH, Thorpe MR, Farrar JF, Koroleva OA. 2002. Source-sink coupling in young
barley plants and control of phloem loading. Journal of Experimental Botany 53: 1671–1676.
Moore B, Zhou L, Rolland F, Hall Q, Cheng W-H, Liu Y-X, Hwang I, Jones T, Sheen
J. 2003. Role of Arabidopsis glucose sensor HXK1 in nutrient, light, and hormonal signaling.
Science 300: 332–336.
Pammenter NW, Allison JCS. 2002. Effects of treatments potentially influencing the supply of
assimilate on its partitioning in sugarcane. Journal of Experimental Botany 53: 123–129.
Paul MJ, Foyer, CH. 2001. Sink regulation of photosynthesis. Journal of Experimental Botany
52: 1381–1400.
Paul MJ, Pellny TK. 2003. Carbon metabolite feedback regulation of leaf photosynthesis and
development. Journal of Experimental Botany 54: 539–547.
Chapter 4: Gene expression during a source-sink perturbation
130
Pego JV, Kortsee AJ, Huijser C, Smeekens SCM. 2000. Photosynthesis, sugars and the
regulation of gene expression. Journal of Experimental Botany 51: 407–416.
Pego JV, Smeekens SCM. 2000. Plant fructokinases: a sweet family get-together.
Trends in Plant Science 5: 531–536.
Rae AL, Grof CPL, Casu, RE, Bonnett GD. 2005. Sucrose accumulation in the sugarcane
stem: pathways and control points for transport and compartmentation. Field Crops
Research 92: 159–163.
Robinson-Beers K, Evert RF. 1991. Ultrastructure of and plasmodesmatal frequency in
mature leaves of sugarcane. Planta 184: 291–306.
Rolland F, Moore B, Sheen J. 2002. Sugar sensing and signaling in plants. Plant Cell 14
(suppl.): 185–205.
Rolland F., Baena-Gonzalez E, Sheen J. 2006. Sugar sensing and signaling in plants:
conserved and novel mechanisms. Annual Review of Plant Biology 57: 675–709.
Rohwer J, Botha FC. 2001. Analysis of sucrose accumulation in the sugarcane culm on the
basis of in vitro kinetic data. Biochemical Journal 358: 437–445.
Sacher JA, Hatch MD, Glasziou KT. 1963. Sugar accumulation cycle in sugarcane III.
Physical and metabolic aspects of cycle in immature storage tissue. Plant Physiology 38:
348–354.
Sheen J. 1990. Metabolic repression of transcription in higher plants. The Plant Cell 2: 1027–
1038.
Sima DB, Desjardins Y. 2001. Sucrose supply enhances phosphoenolpyruvate carboxylase
phosphorylation level in in vitro Solanum tuberosum. Plant Cell and Organ Tissue 67: 235–
242.
Stitt, M, Gibon Y, Lunn JE, Piques M. 2006. Multilevel genomics analysis of carbon
signalling during low carbon availability: coordinating the supply and utilization of carbon in a
fluctuating environment. Functional Plant Biology 34: 526–549.
van Bel AJE. 2003. The phloem, a miracle of ingenuity. Plant Cell and Environment 26: 125–
149.
van Oosten JJ, Besford RT. 1994. Sugar feeding mimics effect of acclimation to high CO2 -
rapid down regulation of RuBisCO small subunit transcripts but not of the large subunit
transcripts. Journal of Plant Physiology 143: 306–312.
Vidal J, Chollet R. 1997. Regulatory phosphorylation of C4 PEP carboxylase. Trends in Plant
Science 6: 230–237.
Velculescu VE, Madden SL, Zhang L, Lash AE, Yu J, Rago C, Lal A, Wang CJ,
Beaudry GA, Ciriello KM, Cook BP, Dufault MR, Ferguson AT, Gao Y, He TC,
Hermeking H, Hiraldo SK, Hwang PM, Lopez MA, Luderer HF, Mathews B,
Petroziello JM, Polyak K, Zawel L, Kinzler KW. 1999. Analysis of human
transcriptomes. Nature Genetics 23: 387–388.

Chapter 4: Gene expression during a source-sink perturbation
131
Walsh KB, Sky RC, Brown SM. 2005. The anatomy of the pathway of sucrose unloading
within the sugarcane stalk. Functional Plant Biology 32: 367–374
Watt DA, McCormick AJ, Govender C, Carson DL, Cramer MD, Huckett BI, Botha
FC. 2005. Increasing the utility of genomics in unraveling sucrose accumulation. Field
Crops Research 92: 149–158.
Welbaum GE, Meinzer FC. 1990. Compartmentation of solutes and water in developing
sugarcane stalk tissue. Plant Physiology 93: 1147–1153.
Whittaker A, Botha FC. 1997. Carbon partitioning during sucrose accumulation in sugarcane
internodal tissue. Plant Physiology 115: 1651–1659.
Wright DP, Bladwin BC, Shephard MC, Scholes JD. 1995. Source-sink relationships in
wheat leaves infected with powdery mildew. 1. Alteration in carbohydrate metabolism.
Physiology and Molecular Plant Pathology 47: 237–253.
Yang IV, Chen E, Hasseman JP, Liang W, Frank BC, Wang S, Sharov V, Saeed AI,
White J, Li J, Lee NH, Yeatman TJ, Quackenbush J. 2002. Within the fold:
assessing differential expression measures and reproducibility in microarray assays.
Genome Biology 3: research0062.1–research0062.
Zhang S, Klessig DF. 2002. MAPK cascades in plant defense signaling. Trends in Plant
Science 6: 520–527.

Chapter 4: Gene expression during a source-sink perturbation
132
4.8 Supplementary information
Photosynthesis- and carbohydrate metabolism related ESTs selected for expression
analysis. EST identity was established by sequence homology searches with known
gene sequences in the National Centre of Biotechnological Information (NCBI) GenBank
database (www.ncbi.nlm.nih.gov). The Expect (E) value is the statistical indicator of the
significance of the match between query and database sequence. Gene categories are
classified below.
General classification of gene product
function
Gene
category
Number of genes
under analysis
Cell Wall Biosynthesis A 9
Sugar Sensing and Signaling B 12
Carbon (Starch) Metabolism C 5
Sucrose Metabolism D 23
Glycolysis E 20
Triose-phosphate metabolism F 13
Photosynthesis G 16
Mitochondrial metabolism H 13
Sugar Transport I 17
Putative Identity EC No. Accession No.
Gene Category
Source E Value Protein Definition
Aconitate hydratase 4.2.1.3 AU161681 H Oryza sativa 9.00E-22 Aconitase A [Oryza sativa (japonica cultivar-group)]
ADP-glucose pyrophosphorylase
2.7.7.33 AU172987 C Oryza sativa 4.00E-05 ADP-glucose pyrophosphorylase [Oryza sativa (japonica cultivar-group)]
ADP-glucose pyrophosphorylase
2.7.7.27 AU174515 C Oryza sativa 1.00E-20 ADP-glucose pyrophosphorylase [Oryza sativa (japonica cultivar-group)]
Alcohol dehydrogenase 1.1.1.1 AU091741 E Oryza sativa 5.00E-52 alcohol dehydrogenase [Oryza sativa (japonica cultivar-group)]
Alcohol dehydrogenase 1.1.1.1 AU161221 E Oryza sativa 6.00E-26 alcohol dehydrogenase [Oryza sativa (japonica cultivar-group)]
Alcohol dehydrogenase 1.1.1.1 AU093048 E Oryza sativa 8.00E-12 alcohol dehydrogenase [Oryza sativa (japonica cultivar-group)]
Alcohol dehydrogenase 1.1.1.1 AA269289 E Saccharum officinarum
1.00E-37 alcohol dehydrogenase [Saccharum officinarum]
Alcohol dehydrogenase 1.1.1.1 CN149616 E Sorghum bicolor
2.00E-86 alcohol dehydrogenases [Oryza sativa (japonica cultivar-group)]
Aldolase 4.1.2.13 AU092513 F Oryza sativa 2.00E-41 aldolase C-1 [Oryza sativa]
Aldolase 4.1.2.13 not published
F Saccharum officinarum
n/a n/a
ATP/ADP transporter 2.7.1.40 AU057209 I Oryza sativa 3.00E-81 putative plastidic ATP/ADP transporter [Oryza sativa (japonica cultivar-group)]
Beta glycanase 3.1.2.6 BM330896 A Sorghum bicolor
2.00E-52 glucan endo-1,3-beta-glucosidase [Zea mays]
Cellulase 3.2.1.4 CD230179 A Sorghum bicolor
3.00E-36 cellulase [Sorghum bicolor]
Cellulose synthase 2.4.1.12 AI216932 A Saccharum officinarum
5.00E-52 cellulose synthase [Zea mays].
Cellulose Synthase 2.4.1..12 CN147740 A Sorghum bicolor
0.14 cellulose synthase [Sorghum bicolor]

Chapter 4: Gene expression during a source-sink perturbation
133
Chlorophyll a/b binding protein
3.6.3.52 CN148954 G Sorghum bicolor
5.00E-138 chlorophyll a-b binding protein [Zea mays]
Chlorophyll a/b binding protein
3.6.3.52 CN136692 G Sorghum bicolor
6.00E-138 chlorophyll a-b binding protein [Zea mays]
Citrate Lyase 4.1.3.6 AU093499 H Oryza sativa 3.00E-42 ATP citrate-lyase beta [Oryza sativa (japonica cultivar-group)]
Citrate synthase 2.3.3.1 C25436 H Oryza sativa 1.00E-37 Citrate synthase, glyoxysomal precursor (GCS) [Oryza sativa (japonica cultivar-group)]
Citrate synthase 2.3.3.1 BE363510 H Sorghum bicolor
7.00E-66 citrate synthase [Oryza sativa (japonica cultivar-group)]
Enolase 4.2.1.11 AA080586 F Saccharum officinarum
2.00E-52 Enolase 2 (2-phosphoglycerate dehydratase 2) [Zea mays]
Enolase 4.2.1.11 AA080586 F Saccharum officinarum
2.00E-52 enolase (2-phosphoglycerate dehydratase) [Zea mays]
Enolase 4.2.1.11 CN130620 F Sorghum bicolor
1.00E-147 enolase [Zea mays]
Enolase 4.2.1.11 AU085839 F Oryza sativa 1.20E+00 enolase [Oryza sativa (japonica cultivar-group)]
Enolase 4.2.1.11 AU063290 F Oryza sativa 2.00E-51 enolase [Oryza sativa (japonica cultivar-group)]
Fructokinase 2.7.1.4 CN140006 B Sorghum bicolor
8.00E-99 fructokinase 2 [Zea mays]
Fructose bisphosphatase
3.1.3.11 AU095636 C Oryza sativa 6.00E-85 sedoheptulose-1,7-bisphosphatase precursor [Oryza sativa (indica cultivar-group)]
Fructose bisphosphatase
3.1.3.11 J04197 C Rattus norvegicus
0.0 6-phosphofructo-2-kinase/fructose-2,6-biphosphatase 1 [Rattus norvegicus]
Fructose bisphosphatase
3.1.3.11 BG159258 C Sorghum bicolor
6.00E-77 fructose-1,6-bisphosphatase [Oryza sativa (japonica cultivar-group)]
Fructose bisphosphate aldolase
4.1.2.13 AW745533 F Sorghum bicolor
2.00E-31 Fructose-1,6-bisphosphate aldolase [Oryza sativa (japonica cultivar-group)]
Glucokinase 2.7.1.1 CD427137 B Sorghum bicolor
1.60E-01 glycosyl hydrolase [Oryza sativa (japonica cultivar-group)]
Glucose phosphate adenyltransferase
2.7.7.27 CN133916 A Sorghum bicolor
7.00E-65 Glucose-1-phosphate adenylyltransferase [Triticum aestivum]
Glyceraldehyde phosphate dehydrogenase
1.2.1.12 AU085851 F Oryza sativa 2.00E-104 NAD-dependent aldehyde dehydrogenase [Oryza sativa (japonica cultivar-group)]
Glyceraldehyde phosphate dehydrogenase
1.2.1.12 PQ0178 F Saccharum officinarum
1.00E-05 glyceraldehyde phosphate dehydrogenase [Zea mays]
Glyceraldehyde phosphate dehydrogenase
1.2.1.12 BG947834 F Sorghum bicolor
7.00E-86 NAD-dependent aldehyde dehydrogenase [Oryza sativa (japonica cultivar-group)]
Hexokinase 2.7.1.1 AU057562 B Oryza sativa 3.00E-55 hexokinase 1 [Oryza sativa (japonica cultivar-group)]
Hexokinase 2.7.1.1 AW286992 B Sorghum bicolor
8.00E-36 hexokinase [Zea mays]
Hexose phosphate isomerase
5.3.1.9 AU174802 E Oryza sativa 4.00E-51 Glucose-6-phosphate isomerase [Oryza sativa (japonica cultivar-group)]
Invertase 3.2.1.26 CD425062 D Sorghum bicolor
1.00E-41 cell wall invertase [Sorghum bicolor]
Invertase 3.2.1.26 CD211376 D Sorghum bicolor
0.14 beta-fructofuranosidase [Sorghum bicolor]
Invertase 3.2.1.26 CD230086 D Sorghum bicolor
0.074 vacuolar acid invertase [Oryza sativa (japonica cultivar-group)]
Invertase 3.2.1.26 BG933362 D Sorghum bicolor
1.2 soluble acid invertase [Saccharum robustum]
Invertase 3.2.1.26 CN149463 D Sorghum bicolor
0.63 acid beta-fructofuranosidase [Sorghum bicolor]
Invertase 3.2.1.26 AU063804 D Oryza sativa 5.00E-47 apoplastic invertase [Oryza sativa (japonica cultivar-group)]
Invertase 3.2.1.26 C71989 D Oryza sativa 2.00E-46 vacuolar acid invertase [Oryza sativa (japonica cultivar-group)]
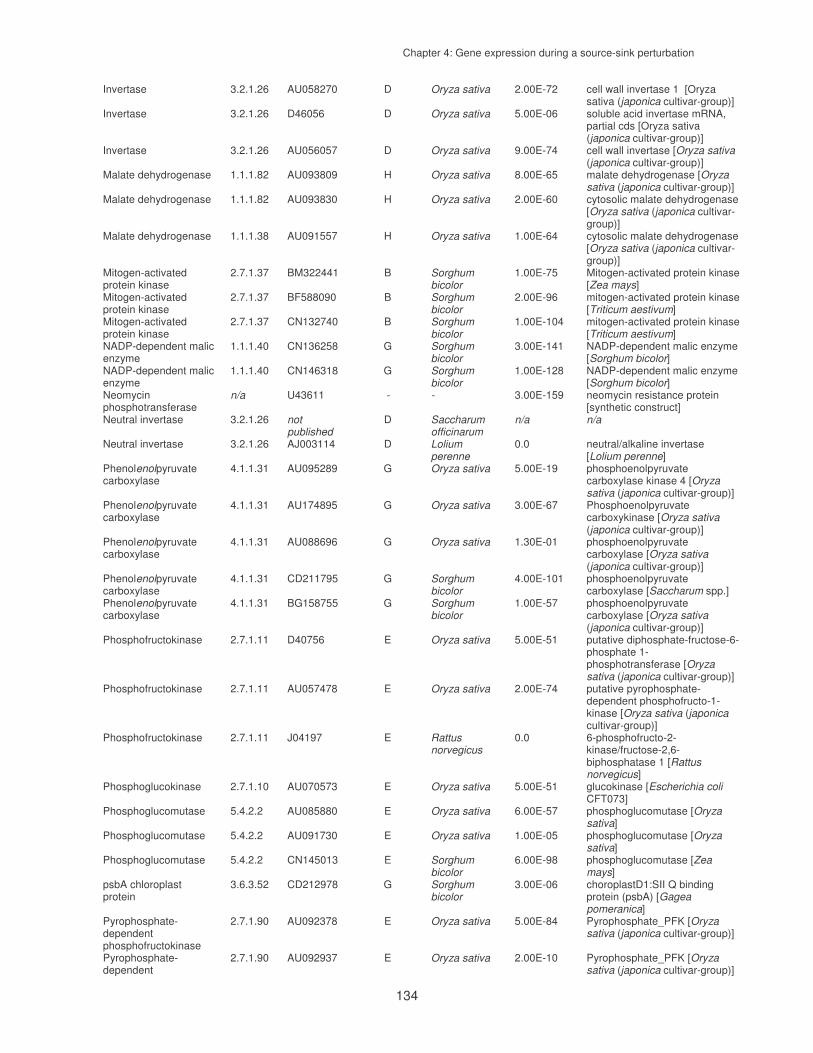
Chapter 4: Gene expression during a source-sink perturbation
134
Invertase 3.2.1.26 AU058270 D Oryza sativa 2.00E-72 cell wall invertase 1 [Oryza sativa (japonica cultivar-group)]
Invertase 3.2.1.26 D46056 D Oryza sativa 5.00E-06 soluble acid invertase mRNA, partial cds [Oryza sativa (japonica cultivar-group)]
Invertase 3.2.1.26 AU056057 D Oryza sativa 9.00E-74 cell wall invertase [Oryza sativa (japonica cultivar-group)]
Malate dehydrogenase 1.1.1.82 AU093809 H Oryza sativa 8.00E-65 malate dehydrogenase [Oryza sativa (japonica cultivar-group)]
Malate dehydrogenase 1.1.1.82 AU093830 H Oryza sativa 2.00E-60 cytosolic malate dehydrogenase [Oryza sativa (japonica cultivar-group)]
Malate dehydrogenase 1.1.1.38 AU091557 H Oryza sativa 1.00E-64 cytosolic malate dehydrogenase [Oryza sativa (japonica cultivar-group)]
Mitogen-activated protein kinase
2.7.1.37 BM322441 B Sorghum bicolor
1.00E-75 Mitogen-activated protein kinase [Zea mays]
Mitogen-activated protein kinase
2.7.1.37 BF588090 B Sorghum bicolor
2.00E-96 mitogen-activated protein kinase [Triticum aestivum]
Mitogen-activated protein kinase
2.7.1.37 CN132740 B Sorghum bicolor
1.00E-104 mitogen-activated protein kinase [Triticum aestivum]
NADP-dependent malic enzyme
1.1.1.40 CN136258 G Sorghum bicolor
3.00E-141 NADP-dependent malic enzyme [Sorghum bicolor]
NADP-dependent malic enzyme
1.1.1.40 CN146318 G Sorghum bicolor
1.00E-128 NADP-dependent malic enzyme [Sorghum bicolor]
Neomycin phosphotransferase
n/a U43611 - - 3.00E-159 neomycin resistance protein [synthetic construct]
Neutral invertase 3.2.1.26 not published
D Saccharum officinarum
n/a n/a
Neutral invertase 3.2.1.26 AJ003114 D Lolium perenne
0.0 neutral/alkaline invertase [Lolium perenne]
Phenolenolpyruvate carboxylase
4.1.1.31 AU095289 G Oryza sativa 5.00E-19 phosphoenolpyruvate carboxylase kinase 4 [Oryza sativa (japonica cultivar-group)]
Phenolenolpyruvate carboxylase
4.1.1.31 AU174895 G Oryza sativa 3.00E-67 Phosphoenolpyruvate carboxykinase [Oryza sativa (japonica cultivar-group)]
Phenolenolpyruvate carboxylase
4.1.1.31 AU088696 G Oryza sativa 1.30E-01 phosphoenolpyruvate carboxylase [Oryza sativa (japonica cultivar-group)]
Phenolenolpyruvate carboxylase
4.1.1.31 CD211795 G Sorghum bicolor
4.00E-101 phosphoenolpyruvate carboxylase [Saccharum spp.]
Phenolenolpyruvate carboxylase
4.1.1.31 BG158755 G Sorghum bicolor
1.00E-57 phosphoenolpyruvate carboxylase [Oryza sativa (japonica cultivar-group)]
Phosphofructokinase 2.7.1.11 D40756 E Oryza sativa 5.00E-51 putative diphosphate-fructose-6-phosphate 1-phosphotransferase [Oryza sativa (japonica cultivar-group)]
Phosphofructokinase 2.7.1.11 AU057478 E Oryza sativa 2.00E-74 putative pyrophosphate-dependent phosphofructo-1-kinase [Oryza sativa (japonica cultivar-group)]
Phosphofructokinase 2.7.1.11 J04197 E Rattus norvegicus
0.0 6-phosphofructo-2-kinase/fructose-2,6-biphosphatase 1 [Rattus norvegicus]
Phosphoglucokinase 2.7.1.10 AU070573 E Oryza sativa 5.00E-51 glucokinase [Escherichia coli CFT073]
Phosphoglucomutase 5.4.2.2 AU085880 E Oryza sativa 6.00E-57 phosphoglucomutase [Oryza sativa]
Phosphoglucomutase 5.4.2.2 AU091730 E Oryza sativa 1.00E-05 phosphoglucomutase [Oryza sativa]
Phosphoglucomutase 5.4.2.2 CN145013 E Sorghum bicolor
6.00E-98 phosphoglucomutase [Zea mays]
psbA chloroplast protein
3.6.3.52 CD212978 G Sorghum bicolor
3.00E-06 choroplastD1:SII Q binding protein (psbA) [Gagea pomeranica]
Pyrophosphate-dependent phosphofructokinase
2.7.1.90 AU092378 E Oryza sativa 5.00E-84 Pyrophosphate_PFK [Oryza sativa (japonica cultivar-group)]
Pyrophosphate-dependent
2.7.1.90 AU092937 E Oryza sativa 2.00E-10 Pyrophosphate_PFK [Oryza sativa (japonica cultivar-group)]

Chapter 4: Gene expression during a source-sink perturbation
135
phosphofructokinase
Pyrophosphate-dependent phosphofructokinase
2.7.1.90 U12337 E Giardia lamblia
0.0 diphosphate-fructose-6-phosphate 1-phosphotransferase [Giardia lamblia ATCC 50803]
Pyrophosphate-dependent phosphofructokinase
2.7.1.90 M67447 E Propionibacterium
0.0 PFP [Propionibacterium freudenreichii subsp.]
Pyrophosphate-dependent phosphofructokinase
2.7.1.90 not published
E Saccharum officinarum
Pyruvate carboxylase 6.4.1.1 C97133 H Oryza sativa 5.00E-43 Pyruvate carboxylase [Oryza sativa (japonica cultivar-group)]
Pyruvate dehydrogenase
1.2.1.51 AA269174 H Saccharum officinarum
3.00E-44 pyruvate dehydrogenase [Oryza sativa (japonica cultivar-group)]
Pyruvate kinase 2.7.1.40 AU092584 H Oryza sativa 7.00E-04 pyruvate kinase [Arabidopsis thaliana]
Pyruvate kinase 2.7.1.40 AU093283 H Oryza sativa 1.00E-76 cytosolic pyruvate kinase [Oryza sativa (japonica cultivar-group)]
Pyruvate orthophosphate dikinase
2.7.9.1 CF071996 H Sorghum bicolor
3.00E-76 pyruvate phosphate dikinase [Sorghum bicolor]
Rubisco 4.1.1.39 AW678375 G Sorghum bicolor
1.00E-102 RuBisCO large subunit [Saccharum hybrid cultivar SP-80-3280]
Rubisco 4.1.1.39 CN150664 G Sorghum bicolor
2.00E-85 RuBisCO small subunit [Saccharum sp.]
Rubisco 4.1.1.39 BG556089 G Sorghum bicolor
7E-65 rubisco small subunit [Avena clauda]
Rubisco 4.1.1.39 BE593723 G Sorghum bicolor
3.00E-140 RuBisCO large subunit [Saccharum sp.]
Rubisco activase 6.3.4.- BM318446 G Sorghum bicolor
7.00E-92 RuBisCO chloroplast precursor (RuBisCO activase) [Zea mays]
Rubisco transition peptide
n/a CN142383 G Sorghum bicolor
6.00E-84 ribulose-1,5-bisphosphate carboxylase (RuBPC) precursor [Zea mays]
Succinate dehydrogenase
1.3.5.1 AU174356 H Oryza sativa 2.00E-34 succinate dehydrogenase subunit 3 [Oryza sativa (japonica cultivar-group)]
Sucrose phosphate phosphatase
3.1.3.24 AU095442 D Oryza sativa 1.00E-126 sucrose-phosphate phosphatase [Oryza sativa (japonica cultivar-group)]
Sucrose phosphate phosphatase
3.1.3.24 CD424766 D Sorghum bicolor
0.32 sucrose-phosphatase [Medicago truncatula]
Sucrose phosphate synthase
2.4.1.14 AU094286 D Oryza sativa 2.00E-51 sucrose phosphate synthase [Oryza sativa (japonica cultivar-group)]
Sucrose synthase 2.4.1.13 AA080610 D Saccharum officinarum
2.00E-82 sucrose synthase 3 [Zea mays]
Sucrose synthase 2.4.1.13 AA080610 D Saccharum officinarum
2.00E-82 sucrose synthase [Zea mays].
Sucrose synthase 2.4.1.13 AA080634 D Saccharum officinarum
4.00E-29 sucrose synthase [Oryza sativa (japonica cultivar-group)]
Sucrose synthase 2.7.1.40 CD235994 D Sorghum bicolor
2.00E-85 sucrose synthase-2 [Saccharum officinarum].
Sucrose synthase 2.4.1.13 AU094024 D Oryza sativa 5.00E-70 sucrose synthase [Oryza sativa (japonica cultivar-group)]
Sucrose synthase 2.4.1.13 AU175062 D Oryza sativa 8.00E-82 sucrose synthase [Oryza sativa (japonica cultivar-group)]
Sucrose synthase 2.4.1.13 AU173014 D Oryza sativa 2.00E-82 sucrose synthase 2 (Sucrose-UDP glucosyltransferase 2) [Zea mays]
Sugar transporter 2.7.1.40 AU163425 I Oryza sativa 2.00E-53 sucrose transporter [Oryza sativa (japonica cultivar-group)]
Sugar transporter 2.7.1.40 AU094600 I Oryza sativa 4.00E-45 monosaccharide transporter [Oryza sativa (japonica cultivar-group)]
Sugar transporter 2.7.1.40 AU163471 I Oryza sativa 3.00E-47 monosaccharide transporter [Oryza sativa (japonica cultivar-group)]
Sugar transporter 2.7.1.40 AU070945 I Oryza sativa 5.00E-09 sucrose transporter [Oryza sativa (indica cultivar-group)]

Chapter 4: Gene expression during a source-sink perturbation
136
Sugar transporter 2.7.1.40 AU093407 I Oryza sativa 7.00E-87 putative alpha-glucosidase [Oryza sativa (japonica cultivar-group)]
Sugar transporter 2.7.1.40 AU056954 I Oryza sativa 8.00E-44 monosaccharide transporter 3 [Oryza sativa (japonica cultivar-group)]
Sugar transporter 2.7.1.40 CD424204 I Sorghum bicolor
5.00E-45 sucrose transporter [Zea mays]
Sugar transporter 2.7.1.40 CD423751 I Sorghum bicolor
3.00E-130 putative plastidic ATP/ADP transporter [Oryza sativa (japonica cultivar-group)]
Sugar transporter 2.7.1.40 CD204613 I Sorghum bicolor
1.00E-41 sugar transporter [Oryza sativa (japonica cultivar-group)]
Sugar transporter 2.7.1.40 BG054361 I Sorghum bicolor
6.00E-67 putative high pI alpha-glucosidase [Oryza sativa (japonica cultivar-group)]
Sugar transporter 2.7.1.40 CD231617 I Sorghum bicolor
8.00E-84 monosaccharide transporter [Oryza sativa (japonica cultivar-group)]
Sugar transporter 2.7.1.40 AW680302 I Sorghum bicolor
0.35 sucrose transporter [Oryza sativa (japonica cultivar-group)]
Sugar transporter 3.2.1.26 BE597399 I Sorghum bicolor
2.00E-63 sugar transporter [Oryza sativa (japonica cultivar-group)]
Sugar transporter 2.7.1.40 CF482398 I Sorghum bicolor
3.00E-04 sucrose transporter [Oryza sativa (japonica cultivar-group)]
Trehalose phosphate phosphatase
3.1.3.12 AU101936 B Oryza sativa 5.00E-64 trehalose phosphate phosphatase [Oryza sativa (japonica cultivar-group)]
Trehalose phosphate phosphatase
3.1.3.12 AU166371 B Oryza sativa 3.00E-78 trehalose phosphate phosphatase [Oryza sativa (japonica cultivar-group)]
Trehalose phosphate synthase
2.4.1.15 AU092582 B Oryza sativa 1.00E-19 trehalose-6-phosphate synthase [Oryza sativa (japonica cultivar-group)]
Trehalose phosphate synthase
2.4.1.15 AF007778 B Saccharum officinarum
3.00E-28 trehalose phosphate synthase [Arabidopsis thaliana]
Trehalose phosphate synthase
2.4.1.15 BI643732 B Sorghum bicolor
1.00E-105 putative trehalose-6-phosphate synthase/phosphatase [Oryza sativa (japonica cultivar-group)]
Triose phosphate isomerase
5.3.1.1 AU164627 F Oryza sativa 5.00E-58 triosephosphate isomerase [Oryza sativa (japonica cultivar-group)]
Triose phosphate isomerase
5.3.1.1 AA577653 F Saccharum officinarum
2.00E-27 triose phosphate-isomerase [Triticum aestivum]
Triose phosphate translocator
2.7.1.40 CN149774 I Sorghum bicolor
4.00E-128 triose phosphate/phosphate translocator [Zea mays]
Triose phosphate translocator
2.7.1.40 CN149403 I Sorghum bicolor
2.00E-117 triose phosphate/phosphate translocator [Zea mays]
UDP glucose dehydrogenase
1.1.1.22 not published
A Saccharum officinarum
UDP-glucose dehydrogenase
1.1.1.22 D39326 A Oryza sativa 2.00E-32 UDP-glucose 6-dehydrogenase [Oryza sativa (japonica cultivar-group)]
UDP-glucose dehydrogenase
1.1.1.22 AA525658 A Saccharum officinarum
1.00E-39 UDP-glucose 6-dehydrogenase [Oryza sativa (japonica cultivar-group)]
UDP-glucose glucosyltransferase
2.4.1.35 AW745467 E Sorghum bicolor
7.00E-09 UDP-glucose glucosyltransferase [Sorghum bicolor]
UDP-glucose pyrophosphorylase
2.7.7.9 AU032651 E Oryza sativa 6.00E-05 UDP-glucose pyrophosphorylase [Oryza sativa (japonica cultivar-group)]
UTP-glucose phosphate uridyltransferase
2.7.7.23 CD220905 A Sorghum bicolor
5.00E-84 UTP-glucose-1-phosphate uridylyltransferase [Oryza sativa (japonica cultivar-group)]
Vacuolar pyrophosphorylase
2.7.7.27 D13472 D Hordeum vulgare
0.0 pyrophosphate pyrophosphatase [Hordeum vulgare]

Chapter 5: Regulation of photosynthesis by sugars in sugarcane leaves
137
Chapter 5:
Regulation of photosynthesis by sugars in sugarcane leaves
5.1 Abstract
In sugarcane increased sink demand has previously been shown to result in increased
photosynthetic rates that are correlated with a reduction in leaf hexose concentrations.
To establish whether sink-limitation of photosynthesis is a result of sugar accumulation
in the leaf, cold-girdling and excision techniques were used to modify leaf sugar
concentrations in pot-grown sugarcane. Cold-girdling (5oC) increased sucrose and
hexose levels and resulted in a decline of photosynthetic rates over 5 d (48% and 35%
decline in A and ETR, respectively). In excised leaves that were preincubated in
darkness for 3 h, sucrose accumulation was reduced but accumulated again upon
transfer to the light, while hexose concentrations remained lower than in controls (7.7
�mol mg-1 FW vs 18.6 �mol mg-1 FW hexose in controls). Furthermore, a 66% and 59%
increase in A and ETR, respectively, was observed compared to controls maintained in
the light. Sugar-induced changes in photosynthesis were independent of changes in
stomatal conductance. This study demonstrated similarities in the effects on
photosynthesis of altered leaf sucrose concentrations and those previously reported for
the culm. In addition, this work supports the contention that hexoses, rather than
sucrose, are responsible for the modulation of photosynthetic activity.
Keywords: hexose, leaf, photosynthesis, source, sucrose, sugarcane
5.2 Introduction
Although sugarcane is the primary source of the world’s sugar, little is known about the
regulation of leaf (source) photosynthetic rates by and the sugar-status of the culm (sink)
(McCormick et al., 2006 [Chapter 3]). However, in other species, the carbon demands of
sinks have been shown to govern the overall photosynthetic rates (Sheen, 1994; Basu et
al., 1999; Iglesias et al., 2002; Paul & Foyer, 2001). Recent improvements in sugarcane
yields have been almost entirely through increased cane yield, rather than increases in
culm sucrose content. Sugarcane sucrose content has not increased significantly for
several decades (Jackson, 2005). Attempts to increase sugar content through the

Chapter 5: Regulation of photosynthesis by sugars in sugarcane leaves
138
modification of plant genes involved in sugar metabolism have also been unsuccessful
(Lakshmanan et al., 2005), indicating the possibility that inappropriate gene targets were
selected for modification or that there is sufficient metabolic control redundancy to buffer
against increases in stored sucrose through the manipulation of single genes (Wu &
Birch, 2007). The underlying mechanisms that govern feedback regulation between
source and sink tissues are thus likely to be important in attempts to manipulate stalk
sucrose content.
Pammenter and Allison (2002) have demonstrated through measurement of structural
and non-structural (i.e. sucrose) dry mass components that both partial defoliation and
shading result in a bias towards sugarcane culm sucrose accumulation, at the expense
of structural growth of the stem. The sucrose accumulating processes within the
maturing sugarcane stem result in a strong sink-demand for photoassimilate (Marcelis,
1996; McCormick et al., 2006 [Chapter 3]). Significant differences in photosynthetic
rates have been reported for individual sugarcane leaves related to the age of the plant,
with young plants typically assimilating at significantly higher rates than older plants
(Hartt & Burr, 1967; Bull & Tovey, 1974). Young leaves of three-month-old sugarcane
photosynthesised faster (45 �mol m-2 s-1) than similar young leaves on ten-month-old
plants (25 �mol m-2 s-1; Amaya et al., 1995). Whole plant photosynthetic rates were also
lower in eight-month-old sugarcane plants than in four-month-old plants, regardless of
the light intensity (Allison et al., 1997). The reason that the photosynthetic rate is
dependent on plant age is probably due to the accumulation of sucrose in the culms of
older plants (McCormick et al., 2006 [Chapter 3]). Partial defoliation of sugarcane was
not effective in reducing culm sucrose concentration (Gutiérrez-Miceli et al., 2004). This
indicates that the remaining photosynthetic capacity was sufficient to respond to sink
demand.
Co-ordination between sink demand and source activity is the result of feedback
mediated through the carbohydrate concentration in mature source leaves (Roitsch,
1999; Paul & Foyer, 2001; Paul & Pellny 2003). Although the molecular control
mechanisms in sugarcane are still not fully known, studies in C3 crops have indicated
that that photosynthetic activity is strongly linked to a sugar sensing/signaling
mechanism based on the local status of the primary transport sugar, sucrose, and/or its
constituent hexoses (Abdin et al., 1998; Rolland et al., 2002; Gibson, 2005; Franck et al.,
2006). The correlation between carbon assimilation and electron transport observed in

Chapter 5: Regulation of photosynthesis by sugars in sugarcane leaves
139
both C3 and C4 plants (Edwards & Walker, 1983; Earl & Tollenaar, 1998; Flexas et al.,
2002) indicates that both the ‘light’ and ‘dark’ reactions of photosynthesis are mutually
dependent on such regulation. The regulatory roles of several photosynthetic enzymes
have been studied using knockout mutants and antisense transformants of the C4
species Flaveria bidentis (L.) (Furbank & Taylor, 1995); however, there are as yet no
reports documenting the control of sucrose synthesis in the leaves of C4 plants (Lunn &
Furbank, 1999; Rolland et al., 2006). Furthermore, the majority of C4 studies have
focused on maize. Due to the localisation of sucrose biosynthesis in the mesophyll cells,
which is uncommon in other C4 species, maize cannot be used as a universal model for
understanding the regulatory role of sugars in C4 leaves (Lunn & Furbank, 1997a).
Further investigation is thus required to properly understand sugar-related regulation in
other C4 crop species such as sugarcane.
Cold-girdling of plant tissues, such as stem or leaf, has previously been reported to
decrease or inhibit phloem transport, thus causing an accumulation of carbohydrate in
tissues above the girdle (Michin et al. 1983; Krapp et al., 1993). Previous studies have
successfully used cold-girdling to examine the relationship between carbohydrate
accumulation and a subsequent decrease in leaf photosynthesis on a variety of C3
plants, including spinach, tobacco and potato (Krapp et al., 1993; Krapp & Stitt, 1994;
Koch, 1996). However, Lunn & Furbank (1997a) showed that increasing the sucrose
content in C4 maize leaves to levels found at the end of the light period had little or no
effect on partitioning, and concluded that feedback inhibition by sucrose itself does not
play a significant role in maize leaves. Conversely in Amaranthus edulis (L.), blocking
the export of sucrose by cooling the stems led to large increases in sucrose and an
inhibition of photosynthesis, suggesting that mechanisms do exist in some C4 species for
feedback inhibition by sucrose (Blechschmidt-Schneider et al., 1989).
Modification of culm sugar concentrations by leaf shading demonstrated that sink
demand for carbon strongly influenced leaf photosynthetic rates and carbon partitioning,
possibly through leaf hexose depletion (McCormick et al., 2006 [Chapter 3]). Whole
plant shading has complex effects including possible influences on transpiration and
thus transport of nutrients and hormones within the plant. In the research reported here,
leaf hexose and sucrose concentrations were manipulated by exposure of excised
leaves to darkness, loading of excised leaves with sucrose and hexoses and by cold-
girdling intact leaves in order to characterise the regulation of photosynthesis by leaf

Chapter 5: Regulation of photosynthesis by sugars in sugarcane leaves
140
sugar levels. It was concluded that sugarcane photosynthesis was strongly controlled by
the concentrations of hexoses in the leaf tissue and that culm sucrose concentration was
likely to moderate photosynthesis by influencing leaf hexose concentrations through
modification of the rate phloem transport from leaf to culm.
5.3 Materials and methods
5.3.1 Plant material
Nine-month-old pot-grown Saccharum spp. (L.) hybrid cv. N19 (N19) cultivated at Mount
Edgecombe, KwaZulu-Natal (SASRI) was selected for leaf analyses (May 2006). Plants
(4-5 stools per pot) were grown in 15 L pots containing mixed soil (composted bagasse,
river sand, vermiculite, in a ratio of 3:1:0.1). Plants were irrigated using a drip irrigation
system twice daily and initially grown outside in a semi-enclosed area that provided
shelter from extreme wind conditions. Plants were then moved to a temperature
controlled greenhouse (maintained at 28oC) and allowed to acclimate for 1 week. The
2nd and 3rd fully expanded leaves (McCormick et al., 2006 [Chapter 3]) were used for
experiments which were carried out within the glasshouse.
5.3.2 Leaf treatments
Cold-girdles were attached to leaves in the morning (8h00) and maintained at 5oC for a
period of 5 d. The girdle consisted of 0.75 cm diameter soft PVC tubing, firmly clamped
around each leaf 30 cm from the leaf base. Cooled water (5oC) was then pumped
through the tubing using a Grant LTD6G cooling bath (Grant Instruments, Barrington,
Cambridge, UK). Both untreated (n=4) and girdled (n=4) leaves were harvested
simultaneously and immediately frozen in liquid nitrogen at intervals over the treatment
period. Photosynthetic rates and sugar concentrations of the leaves were routinely
measured (see below).
Leaves were cut under deionised water (pH 7.0) and then re-cut again under water
approximately 5 cm above the previous cut. Leaves were placed in clear 50 ml
centrifuge tubes containing 20 ml water and some of the leaves moved into a 95%
shade cloth chamber (1–10 µmol m-2 s-1) for 3 h (9h00–12h00). Following removal from

Chapter 5: Regulation of photosynthesis by sugars in sugarcane leaves
141
the shade-chamber into sunlight, each set was placed in either a 20 ml solution of 5 mM
sucrose, 5 mM sorbitol or H2O. The leaves were sampled to allow measurement of
sugar concentrations and the photosynthetic rates of the leaves measured (n=4 per
treatment).
To increase leaf sucrose concentrations to those found at 15h00 under field conditions
(50–60 �mol g-1 FW), excised leaves were pre-fed a 167 mM sucrose solution for 1 h
(8h00–9h00). The sugar concentration [C] required for the leaf to accumulate the
necessary sucrose levels during the 1 h period was estimated from
)()()()(][)(
)(][ 122
11
−−
−−
×××=hmLionTranspiratmareaLeaf
htimegmolsucroseFinalgWeightLeafLmolC . All variables
were calculated empirically using data gathered from leaves. To account for
endogenous sucrose accumulation rates, the measured sucrose accumulation for the
leaf during a 1 h photoperiod (ca. 10 �mol g-1 FW h-1) were subtracted from [C]. The
supplied sucrose solution contained 14C sucrose label (5 kBq ml-1; specific activity = 601
mCi mmol-1; Amersham Biosciences, Buckinghamshire, UK). Following loading, the
leaves (n=4 per treatment) were placed in darkness for 3 h and then transferred to light,
following which photosynthetic variables and sugars levels were measured. Changes in
distribution of the 14C label between sucrose and hexoses over time were determined
using thin layer chromatography. Similarly, leaves were also loaded with either glucose
or fructose solution (50 mM) to increase hexose levels to measured peak diurnal
concentrations (15 �mol g-1 FW). The glucose or fructose solution contained 14C
glucose (7.4 kBq ml-1; specific activity = 317 mCi mmol-1; Amersham Biosciences) or 14C
fructose, respectively (7.4 kBq ml-1; specific activity = 306 mCi mmol-1; Amersham
Biosciences).
5.3.3 Sugar determination
Leaf samples were milled in an A11 Basic Analysis Mill (IKA, Staufen, Germany) and
stored at -80oC prior to analysis. Approximately 100 mg powdered tissue was incubated
overnight in 10 volumes of sugar extraction buffer containing 30 mM HEPES (pH 7. 8), 6
mM MgCl2 and ethanol 70% (v/v) at 70oC. Extracts were centrifuged for 10 min at 23
200 g and sucrose, fructose and glucose concentrations in the supernatant measured by
means of a spectrophotometric enzymatic coupling assay used previously (McCormick
et al., 2006 [Chapter 3]). The phosphorylation of glucose by hexokinase/glucose-6-

Chapter 5: Regulation of photosynthesis by sugars in sugarcane leaves
142
phosphate dehydrogenase (EC 1.1.1.49) (Roche, Mannheim, Germany) and fructose by
phosphoglucose isomerase (EC 5.3.1.9) (Roche) was quantified by following the
reduction of NADP+ to NADPH at 340 nm (A340). Absorbance measurements and data
analysis were conducted on a Synergy HT Multi-Detection Microplate Reader using KC4
software (Biotek Instrument, Inc., Vermont, USA).
5.3.4 Labelled sugar analysis
Labelled sugar containing extracts (150 �l) were evaporated to dryness in an Eppendorf
Concentrator 5301 (Eppendorf AG, Hamburg, Germany) and resuspended in 15 �l H2O.
Sub-samples (5 �l) were spotted onto 10 x 20 cm silica gel plates (Merck, Darmstadt,
Germany) using a semi-automatic Thin Layer Chromatography (TLC) sample applicator
(Linomat 5, CAMAG, Muttenz, Switzerland) and fractionated using a mobile phase
consisting of 50% ethyl acetate (v/v), 25% acetic acid (v/v) in filtered water (0.45 micron
pore size membrane filter) over 3 h. Silica plates were dried at 70oC for 10 min, sealed
in polyethylene film and exposed to high-resolution phosphor screens (Type: SR;
Packard, Canberra Company, Japan). After 24 h exposure, the images on the phosphor
screens were captured and analysed by means of a Cyclone Storage Phosphor Screen
imaging system using Optiquant Ver. 03.10 (Packard).
5.3.5 Gas exchange and fluorescence determinations
Gas exchange measurements were made on 2 cm2 portions of leaf tissue using a
portable gas exchange system (LI-6400, LI-COR Biosciences Inc., Nebraska, USA).
Light was provided by a red/blue LED light source (LI-COR Biosciences Inc.) at photon
irradiance of 1500 �mol m-2 s-1. All leaf measurements were done under ambient CO2
conditions (370 �mol mol-1) at a maintained leaf temperature of 28oC. Gas exchange
variables measured include photosynthetic assimilation (A), transpiration rate (E),
stomatal conductance (Gs), and intercellular CO2 (Ci).
Chlorophyll fluorescence was determined concurrently with gas exchange
measurements using the LI-6400-40 Leaf Chamber Fluorometer (LI-COR Biosciences
Inc.). A saturating pulse of red light (0.8 s, 6 000 µmol m-2 s-1) was applied to determine
the maximal fluorescence yield (Fm’). The electron transport rate (ETR), defined as the
actual flux of photons driving photosystem II (Maxwell & Johnson, 2000) was calculated
Chapter 5: Regulation of photosynthesis by sugars in sugarcane leaves
143
as leaffIFm
FsFmETR α�
�
���
� −='
', where Fs is “steady-state” fluorescence (at 2 000 µmol m-2
s-1), Fm’ is the maximal fluorescence during a saturating light flash, f is the fraction of
absorbed quanta used by photosystem II, typically assumed to be 0.4 for C4 plant
species (Edwards & Baker, 1993), I is incident photon flux density and �leaf is leaf
absorptance (0.85, LI-COR manual).
5.3.6 Statistical analysis
Results were subjected to analysis of variance (ANOVA) or Student’s t tests to
determine the significance of difference between responses to treatments. When
ANOVA was performed, Tukey's honest significant difference (HSD) post-hoc tests were
conducted to determine the differences between the individual treatments (SPSS Ver.
11.5, SPSS Inc., Illinois, USA).
5.4 Results
5.4.1 Effects of dark treatment and subsequent leaf feeding
Sugarcane leaves maintained in light accumulated high concentrations of sucrose (ca.
55 µmol g-1 FW) during the measured period (Fig. 5.1). Hexose concentrations also
increased throughout the morning, reaching a plateau at midday and then decreased
after 14h00. Both photosynthetic assimilation (A) and photosynthetic electron transport
(ETR) of control plants decreased from midday onwards. The dark-treated leaves had
reduced sucrose (13.4 ± 0.4 µmol g-1 FW) and hexose (12.6 ± 0.1 µmol g-1 FW)
concentrations compared to control leaves (44.3 ± 4.4 µmol g-1 FW sucrose; 22 ± 1 µmol
g-1 FW hexose) at 12h00. Following return to the light, the rate of sucrose accumulation
of dark-treated leaves was higher than the initial sucrose accumulation rates of controls
and 3-fold higher than sucrose accumulation for the controls during the same time period
(data not shown). Hexose concentrations were lower in dark-treated leaves than in
control leaves at 12h00 (Fig. 5.1). During the 3 h following the dark treatment, the
hexose concentrations in leaves supplied with H2O or 5 mM sorbitol decreased
compared to control leaves and leaves that received 5 mM sucrose.

Chapter 5: Regulation of photosynthesis by sugars in sugarcane leaves
144
Dark-treated leaves that received either H2O or 5 mM sorbitol had significantly increased
A and ETR compared to control leaves maintained in light (Fig. 5.1; Table 5.1). In
contrast, photosynthetic rates of dark-treated leaves that received 5 mM sucrose were
not different from those of controls. The changes in photosynthetic rate induced by
darkness, sorbitol and sucrose supply were not associated with significant changes in
stomatal conductance, transpiration or intercellular CO2 concentration (Table 5.1).

Chapter 5: Regulation of photosynthesis by sugars in sugarcane leaves
145
Fig. 5.1. Changes in sucrose (µmol g-1 FW), hexose (µmol g-1 FW), assimilation rate (A) (µmol
m-2 s-1) and electron transport rate (ETR) (µmol m-2 s-1) in excised sugarcane leaves
(n=4) over time. Samples include a control maintained in daylight (�) (9h00–15h00)
and three dark-treatments (9h00–12h00). Following dark-treatment, leaves were
placed in sucrose (5 mM) (�), sorbitol (5 mM) (�) or water (). Dark-treated leaves
were allowed 1 h to adapt to light conditions before photosynthetic readings were
taken.
sorbitolwatersucrosecontrol
9h00 10h00 11h00 12h00 13h00 14h00 15h00
10
20
30
40
50
60
70
Suc
rose
(�
mol
mg
-1F
W)
0
0
5
10
15
20
Hex
ose
(�m
olm
g-1
FW
)
0
5
10
15
20
25
30
A(�
mol
m-2
s-1)
0
20
40
60
80
100
120
Time
ETR
(�
mol
m-2
s-1)
sorbitolwatersucrosecontrol
sorbitolwatersucrosecontrol
sorbitolwatersucrosecontrol
9h00 10h00 11h00 12h00 13h00 14h00 15h00
10
20
30
40
50
60
70
Suc
rose
(�
mol
mg
-1F
W)
10
20
30
40
50
60
70
Suc
rose
(�
mol
mg
-1F
W)
Suc
rose
(�
mol
mg
-1F
W)
0
0
5
10
15
20
Hex
ose
(�m
olm
g-1
FW
)
0
0
5
10
15
20
Hex
ose
(�m
olm
g-1
FW
)H
exos
e (�
mol
mg
-1F
W)
0
5
10
15
20
25
30
A(�
mol
m-2
s-1)
0
5
10
15
20
25
30
A(�
mol
m-2
s-1)
A(�
mol
m-2
s-1)
0
20
40
60
80
100
120
Time
ETR
(�
mol
m-2
s-1)
0
20
40
60
80
100
120
Time
ETR
(�
mol
m-2
s-1)
ETR
(�
mol
m-2
s-1)
sorbitolwatersucrosecontrol
sorbitolwatersucrosecontrol
9h00 10h00 11h00 12h00 13h00 14h00 15h00
10
20
30
40
50
60
70
Suc
rose
(�
mol
mg
-1F
W)
0
0
5
10
15
20
Hex
ose
(�m
olm
g-1
FW
)
0
5
10
15
20
25
30
A(�
mol
m-2
s-1)
0
20
40
60
80
100
120
Time
ETR
(�
mol
m-2
s-1)
sorbitolwatersucrosecontrol
sorbitolwatersucrosecontrol
sorbitolwatersucrosecontrol
9h00 10h00 11h00 12h00 13h00 14h00 15h00
10
20
30
40
50
60
70
Suc
rose
(�
mol
mg
-1F
W)
10
20
30
40
50
60
70
Suc
rose
(�
mol
mg
-1F
W)
Suc
rose
(�
mol
mg
-1F
W)
0
0
5
10
15
20
Hex
ose
(�m
olm
g-1
FW
)
0
0
5
10
15
20
Hex
ose
(�m
olm
g-1
FW
)H
exos
e (�
mol
mg
-1F
W)
0
5
10
15
20
25
30
A(�
mol
m-2
s-1)
0
5
10
15
20
25
30
A(�
mol
m-2
s-1)
A(�
mol
m-2
s-1)
0
20
40
60
80
100
120
Time
ETR
(�
mol
m-2
s-1)
0
20
40
60
80
100
120
Time
ETR
(�
mol
m-2
s-1)
ETR
(�
mol
m-2
s-1)
sorbitolwatersucrosecontrol
sorbitolwatersucrosecontrol

Chapter 5: Regulation of photosynthesis by sugars in sugarcane leaves
146
Table 5.1. Variables based on gas exchange analysis and leaf fluorescence of excised leaves
from untreated (control) and dark-treated (9h00–12h00) at 15h00: photosynthetic
rate (A), and electron transport rate (ETR) stomatal conductance (Gs), transpiration
rate (E) and intercellular CO2 concentration CO2 (Ci). Dark-treated leaves were
either maintained in H2O or placed in sucrose (5 mM) or sorbitol (5 mM) at 12h00.
Measurements were taken at an ambient RH of 55.6% ± 0.9 (mean ± SE) and an
irradiance of 1500 �mol m-2 s-1 and CO2 concentration of 370 �mol mol-1. The
shade treatment values are the mean ± SE (n=4) and are followed by letters
indicating whether treatments had a significant influence (P<0.05), as determined
by ANOVA followed by Tukey's honest significant difference (HSD) tests.
Control Dark-Treated (sucrose) Dark-Treated (sorbitol) Dark-Treated (H20)
A (�mol m-2 s-1) 16.2 ± 1.6 a 18.9 ± 1.9 a 28.35 ± 1.9 b 26.9 ± 2.1 b
ETR (�mol m-2 s-1) 69.3 ± 4.3 a 76.18 ± 8.3 a 111.6 ± 7.3 b 110.3 ± 11 b
Gs (mol m-2 s-1) 157 ± 22 a 168 ± 23 a 198 ± 26 a 251 ± 47 a
E (mmol m-2 s-1) 3.56 ± 0.41 a 3.9 ± 0.4 a 4.4 ± 0.58 a 4.8 ± 0.7 a
Ci (�mol mol-1) 172.6 ± 18.4 a 161.5 ± 11.5 a 124.3 ± 17.2 a 161.3 ± 14.1 a
5.4.2 Sugar loading prior to darkness
Pre-feeding leaves with sucrose successfully elevated sucrose concentrations to 46.36 ±
2.8 µmol g-1 FW within 1 h (Fig. 5.2). During the 3 h incubation in darkness, sucrose
decreased slightly (ca. 5 µmol g-1 FW), while the concentration of hexoses in the
sucrose-loaded leaves increased. After the dark treatment, sucrose concentrations of
sucrose-loaded leaves increased only slightly in the light to 50.1 ± 2.1 µmol g-1 FW at
15h00. Hexose concentrations in sucrose-loaded leaves remained higher than controls
for the remainder of the experiment, even though hexose in fed leaves decreased upon
return to light. The sucrose concentration in the dark-treated leaves supplied with water
remained low until being returned to light, whereupon sucrose accumulation increased
markedly. Hexose concentrations of plants suppled with water remained lower than
those of controls or sucrose-loaded leaves during the light period (12h00–15h00).
The 14C-sucrose derived from 14C-sucrose supplied to leaves decreased after the
feeding period, while the 14C-hexose pool derived from 14C-sucrose increased (Fig. 5.3).
Labelled hexoses were increased significantly by 12h00, indicating conversion of 14C-
sucrose during the dark treatment to 14C-hexose. The increase of unlabelled hexose
Chapter 5: Regulation of photosynthesis by sugars in sugarcane leaves
147
(Fig. 5.2) in sucrose-loaded leaves was thus likely due to the conversion of sucrose to
hexose during the dark period.
The photosynthetic rates (A and ETR) of dark-treated leaves supplied with water were
significantly higher than those of controls upon return to light (Fig. 5.2; Table 5.2). The
decreases in photosynthetic rates observed in these leaves were smaller than the
previous experiment (Fig. 5.1), possibly due to the accumulation of photosynthate during
the initial loading period (8h00–9h00) (Fig. 5.2). Hexoses and sucrose concentrations
were increased in sucrose-loaded leaves. In these leaves the increased photosynthesis
as a consequence of the dark treatment was eliminated.

Chapter 5: Regulation of photosynthesis by sugars in sugarcane leaves
148
Fig. 5.2. Effects of pre-feeding sugarcane leaves with sucrose on sucrose (µmol g-1 FW),
hexose (µmol g-1 FW), assimilation rate (A) (µmol m-2 s-1) and electron transport rate
(ETR) (µmol m-2 s-1). After 1 h feeding (8h00–9h00), fed (�) and non-fed (�) samples
(n=4) were placed in darkness for 3 h. A control was maintained in daylight (�) for
the duration of the experiment. Dark-treated leaves were allowed 1 h to adapt to light
conditions before photosynthetic readings were taken.
watersucrosecontrol
0
10
20
30
40
50
60
Suc
rose
(�
mol
mg
-1F
W)
0
5
10
15
20
25
30
35
Hex
ose
(�m
olm
g-1F
W)
0
5
10
15
20
-2-1
A(�
mol
ms
)
8h00 9h00 10h00 11h00 12h00 13h00 14h00 15h000
20
40
60
80
100
Time
ETR
(�
mol
m-2
s-1)
watersucrosecontrol
watersucrosecontrol
0
10
20
30
40
50
60
Suc
rose
(�
mol
mg
-1F
W)
0
10
20
30
40
50
60
Suc
rose
(�
mol
mg
-1F
W)
Suc
rose
(�
mol
mg
-1F
W)
0
5
10
15
20
25
30
35
Hex
ose
(�m
olm
g-1F
W)
0
5
10
15
20
25
30
35
Hex
ose
(�m
olm
g-1F
W)
Hex
ose
(�m
olm
g-1F
W)
0
5
10
15
20
-2-1
A(�
mol
ms
)
0
5
10
15
20
-2-1
A(�
mol
ms
)A
(�m
olm
s)
8h00 9h00 10h00 11h00 12h00 13h00 14h00 15h000
20
40
60
80
100
Time
ETR
(�
mol
m-2
s-1)
8h00 9h00 10h00 11h00 12h00 13h00 14h00 15h000
20
40
60
80
100
Time
ETR
(�
mol
m-2
s-1)
ETR
(�
mol
m-2
s-1)
watersucrosecontrol
watersucrosecontrol
0
10
20
30
40
50
60
Suc
rose
(�
mol
mg
-1F
W)
0
5
10
15
20
25
30
35
Hex
ose
(�m
olm
g-1F
W)
0
5
10
15
20
-2-1
A(�
mol
ms
)
8h00 9h00 10h00 11h00 12h00 13h00 14h00 15h000
20
40
60
80
100
Time
ETR
(�
mol
m-2
s-1)
watersucrosecontrol
watersucrosecontrol
0
10
20
30
40
50
60
Suc
rose
(�
mol
mg
-1F
W)
0
10
20
30
40
50
60
Suc
rose
(�
mol
mg
-1F
W)
Suc
rose
(�
mol
mg
-1F
W)
0
5
10
15
20
25
30
35
Hex
ose
(�m
olm
g-1F
W)
0
5
10
15
20
25
30
35
Hex
ose
(�m
olm
g-1F
W)
Hex
ose
(�m
olm
g-1F
W)
0
5
10
15
20
-2-1
A(�
mol
ms
)
0
5
10
15
20
-2-1
A(�
mol
ms
)A
(�m
olm
s)
8h00 9h00 10h00 11h00 12h00 13h00 14h00 15h000
20
40
60
80
100
Time
ETR
(�
mol
m-2
s-1)
8h00 9h00 10h00 11h00 12h00 13h00 14h00 15h000
20
40
60
80
100
Time
ETR
(�
mol
m-2
s-1)
ETR
(�
mol
m-2
s-1)
watersucrosecontrol
watersucrosecontrol

Chapter 5: Regulation of photosynthesis by sugars in sugarcane leaves
149
Fig. 5.3. Allocation of 14C label (Bg g-1) to sucrose (�) and hexose (�) pools of excised leaves
(pot-grown sugarcane plants) (n=4) following feeding with 14C sucrose (1 h).
Immediately after feeding, leaves were placed in darkness for 3 h. Letters above SE
bars indicate whether the treatment had a significant (P<0.05) influence as
determined by ANOVA followed by post-hoc Tukey's honest significant difference
(HSD) tests.
a
abab
ab
a
b bb
ab
9h00 10h00 11h00 12h00 13h00 14h00 15h00 0
50
100
150
200
250
300
350
400
Time
900
1000
1100
1200
1300
1400
1500
1600
14C
labe
l (B
qg
)-1
b
Sucrose
Hexose
a
abab
ab
a
b bb
ab
9h00 10h00 11h00 12h00 13h00 14h00 15h00 0
50
100
150
200
250
300
350
400
Time
900
1000
1100
1200
1300
1400
1500
1600
14C
labe
l (B
qg
)-1
b
Sucrose
Hexose
Sucrose
Hexose

Chapter 5: Regulation of photosynthesis by sugars in sugarcane leaves
150
Table 5.2. Gas exchange analysis and leaf fluorescence variables for excised leaves of
untreated (control) and dark-treated (9h00–12h00) at 15h00. See Table 5.1 for
variable details. Dark-treated leaves were either maintained in H2O or loaded with
sucrose (167 mM) for 1 h prior to dark treatment. Measurements were taken at an
ambient RH of 54.4% ± 2.64 (mean ± SE) and an irradiance of 1500 �mol m-2 s-1 and
CO2 concentration of 370 �mol mol-1. The shade treatment values are the mean ±
SE (n=4) and are followed by letters indicating whether treatments had a significant
influence (P<0.05), as determined by ANOVA followed by Tukey's honest significant
difference (HSD) tests.
Control Dark-Treated (sucrose-loaded) Dark-Treated (H2O)
A (�mol m-2 s-1) 13.64 ± 1.16 a 13.67 ± 1.44 a 20.2 ± 2.5 b
ETR (�mol m-2 s-1) 64.9 ± 2.7 a 67.9 ± 6.8 a 87 ± 6 b
Gs (mmol m-2 s-1) 166 ± 31 a 170 ± 24 a 202 ± 11 a
E (mmol m-2 s-1) 3.55 ± 0.76 a 4.06 ± 0.46 a 4.21 ± 0.16 a
Ci (�mol mol-1) 201 ± 17.6 a 218.3 ± 9.9 a 186 ± 23 a
Hexose-loading suppressed A and ETR similarly to sucrose-loading (Fig. 5.4). However,
changes in the tissue hexose concentrations in both the glucose- and fructose-loaded
leaf tissue were not readily observable due to the interconversion of hexose and sucrose
(Fig. 5.4; Fig. 5.5). More than half of supplied 14C glucose and 14C fructose was in the
form of 14C sucrose after the initial 1 h of feeding (53% and 60% for glucose- and
fructose-loaded, respectively). During the dark treatment, the production of sucrose
from 14C hexose of leaves pre-loaded with either glucose or fructose was further
increased at the expense of the hexose pool.

Chapter 5: Regulation of photosynthesis by sugars in sugarcane leaves
151
Fig. 5.4. Effects of pre-feeding sugarcane leaves with glucose or fructose on sucrose (µmol g-1
FW), hexose (µmol g-1 FW), assimilation rate (A) (µmol m-2 s-1) and electron transport
rate (ETR) (µmol m-2 s-1). After 1 h feeding (8h00–9h00), samples pre-fed with
glucose (�) or fructose (�) and non-fed (�) samples (n=4) were placed in darkness
for 3 h. A control was maintained in daylight (�) for the duration of the experiment.
Dark-treated leaves were allowed 1 h to adapt to light conditions before
photosynthetic readings were taken.
fructosewater
glucosecontrol
�
0
10
20
30
40
50
60
70
Suc
rose
(�
mol
mg-
1FW
)
0
5
10
15
20
25H
exos
e (�
mol
mg-
1F
W)
0
5
10
15
20
25
A (�
mol
m-2
s-1 )
8h00 9h00 10h00 11h00 12h00 13h00 14h00 15h000
20
40
60
80
100
Time
ETR
(�
mol
m-- 22
s-1 )
fructosewater
glucosecontrol
� fructosewater
glucosecontrol
� fructosewater
glucosecontrol
�
0
10
20
30
40
50
60
70
Suc
rose
(�
mol
mg-
1FW
)
0
10
20
30
40
50
60
70
Suc
rose
(�
mol
mg-
1FW
)
0
5
10
15
20
25H
exos
e (�
mol
mg-
1F
W)
0
5
10
15
20
25H
exos
e (�
mol
mg-
1F
W)
0
5
10
15
20
25
A (�
mol
m-2
s-1 )
0
5
10
15
20
25
A (�
mol
m-2
s-1 )
8h00 9h00 10h00 11h00 12h00 13h00 14h00 15h000
20
40
60
80
100
Time
ETR
(�
mol
m-- 22
s-1 )
waterglucosefructosecontrol
fructosewater
glucosecontrol
�
0
10
20
30
40
50
60
70
Suc
rose
(�
mol
mg-
1FW
)
0
5
10
15
20
25H
exos
e (�
mol
mg-
1F
W)
0
5
10
15
20
25
A (�
mol
m-2
s-1 )
8h00 9h00 10h00 11h00 12h00 13h00 14h00 15h000
20
40
60
80
100
Time
ETR
(�
mol
m-- 22
s-1 )
fructosewater
glucosecontrol
� fructosewater
glucosecontrol
� fructosewater
glucosecontrol
�
0
10
20
30
40
50
60
70
Suc
rose
(�
mol
mg-
1FW
)
0
10
20
30
40
50
60
70
Suc
rose
(�
mol
mg-
1FW
)
0
5
10
15
20
25H
exos
e (�
mol
mg-
1F
W)
0
5
10
15
20
25H
exos
e (�
mol
mg-
1F
W)
0
5
10
15
20
25
A (�
mol
m-2
s-1 )
0
5
10
15
20
25
A (�
mol
m-2
s-1 )
8h00 9h00 10h00 11h00 12h00 13h00 14h00 15h000
20
40
60
80
100
Time
ETR
(�
mol
m-- 22
s-1 )
waterglucosefructosecontrol
waterglucosefructosecontrol

Chapter 5: Regulation of photosynthesis by sugars in sugarcane leaves
152
Fig. 5.5. Allocation of 14C label (Bg g-1) supplied in the form of 14C fructose (left) or 14C glucose
(right) to the sucrose (�,�) and hexose (�,) pools of excised sugarcane leaves over
time. Following feeding (1 h), leaf samples (n=4) were placed in darkness for 3 h.
Letters above SE bars indicate whether the treatment had a significant (P<0.05)
influence as determined by ANOVA followed by post-hoc Tukey's honest significant
difference (HSD) tests.
5.4.3 Effects of a cold-girdle on whole leaf
Cold-girdling of intact leaves induced an overall increase in both sucrose and hexose
concentrations above the girdle compared to ungirdled (control) leaves during the
treatment (Fig. 5.6). Sucrose concentrations were increased in the girdled leaves 7 h
after girdling (15h00). To account for the time of day, leaves were sampled for sugar
analysis consistently at this time of day for the remainder of the experiment. After 55 h
cold-girdling sucrose concentrations were 2-fold higher than those of ungirdled leaves
(114 ± 3.5 µmol g-1 FW). Hexose levels also rose significantly in cold-girdled leaves,
reaching peak concentrations 3-fold higher after 79 h (30.3 ± 1.9 µmol g-1 FW). After
103 h, however, sucrose and hexose had decreased to similar levels observed in
ungirdled leaves.
Photosynthetic rates were measured daily at 13h00 (Fig. 5.7). Ungirdled leaves had an
average A of 21.8 ± 0.7 µmol m2 s-1 and ETR of 84.7 ± 0.9 µmol m2 s-1 which did not
change significantly over the duration of the experiment. In cold-girdled leaves, A and
ETR declined progressively over time, reaching minima of 11.6 ± 0.7 �mol m2 s-1 and
a a aa
a
a
bbb b b
bb b
bab
ab
ab
a
a
A Fructose B Glucose
9h00 10h00 11h00 12h00 13h00 14h00 15h00 9h00 10h00 11h00 12h00 13h00 14h00 15h00 0
200
400
600
800
1000
1200
1400
Time
Bq
g-1
0
200
400
600
800
1000
1200
1400
Time
Bq
g-1
Sucrose
Hexose
a a aa
a
a
bbb b b
bb b
bab
ab
ab
a
a
A Fructose B Glucose
9h00 10h00 11h00 12h00 13h00 14h00 15h00 9h00 10h00 11h00 12h00 13h00 14h00 15h00 0
200
400
600
800
1000
1200
1400
Time
Bq
g-1
0
200
400
600
800
1000
1200
1400
Time
Bq
g-1
a a aa
a
a
bbb b b
bb b
bab
ab
ab
a
a
A Fructose B Glucose
9h00 10h00 11h00 12h00 13h00 14h00 15h00 9h00 10h00 11h00 12h00 13h00 14h00 15h00 0
200
400
600
800
1000
1200
1400
Time
Bq
g-1
0
200
400
600
800
1000
1200
1400
Time
Bq
g-1
Sucrose
Hexose
Sucrose
Hexose

Chapter 5: Regulation of photosynthesis by sugars in sugarcane leaves
153
56.8 ± 3.3 �mol m2 s-1, respectively after 79 h. Cold-girdled leaf Gs and transpiration
rates did not differ from the ungirdled control until 79 h, after which they showed a
significant decrease.
Fig. 5.6. Sucrose and hexose concentrations for cold-girdled (5oC) (�) and ungirdled (�)
leaves of sugarcane plants over time. Letters above SE bars indicate whether the
cold-girdling treatment (n=4) was significantly different from ungirdled controls
(P<0.05) as determined by Student’s t tests.
Control
Girdled
0
20
40
60
80
100
120
140
Suc
rose
(�m
olg
-1 F
W)
a
a
aa
ab
a
a
a
a
b bb a
0
5
10
15
20
25
30
0 20 40 60 80 100 120
Time (h)
Hex
ose
(�m
olg-
1FW
)
a
a
a
aa
b
aa
a
a
ab b
b
Control
Girdled
ControlControl
GirdledGirdled
0
20
40
60
80
100
120
140
Suc
rose
(�m
olg
-1 F
W)
a
a
aa
ab
a
a
a
a
b bb a
0
20
40
60
80
100
120
140
Suc
rose
(�m
olg
-1 F
W)
a
a
aa
ab
a
a
a
a
b bb a
0
5
10
15
20
25
30
0 20 40 60 80 100 120
Time (h)
Hex
ose
(�m
olg-
1FW
)
a
a
a
aa
b
aa
a
a
ab b
b
0
5
10
15
20
25
30
0 20 40 60 80 100 120
Time (h)
Hex
ose
(�m
olg-
1FW
)
a
a
a
aa
b
aa
a
a
ab b
b

Chapter 5: Regulation of photosynthesis by sugars in sugarcane leaves
154
Fig. 5.7. Gas exchange analysis and leaf fluorescence variables of cold-girdled and ungirdled
(control) leaves taken at 13h00, over a 5 day period. See Table 5.1 for variable
details. Measurements were taken at an ambient RH of 56.3% ± 1.6 (mean ± SE)
and an irradiance of 1500 �mol m-2 s-1 and CO2 concentration of 370 �mol mol-1.
Values are the mean ± SE (n=4) and are followed by letters indicating whether cold-
girdling treatments had a significant influence (P<0.05) as determined by Student’s t
tests.
A(�
mol
ms
)
0
40
80
120
160
200
0 1 2 3 4 5
Time (d)
Ci(�
mol
mol
-1)a
a
aa
a
a
ab
a
a
40
50
60
70
80
90
ETR
(�m
olm
-2s-1
)
b
a aa a a
b
b
a
a
0 1 2 3 4 5
Time (d)
a
b
a
a
a
a
a
aaa
0
0.05
0.1
0.15
0.2
Gs
(mol
ms
)
0
5
10
15
20
25
30
a
b
a
a
aa
b
b
a
a
ControlGirdled
-2-1
-2-1
A(�
mol
ms
)
0
40
80
120
160
200
0 1 2 3 4 5
Time (d)
Ci(�
mol
mol
-1)a
a
aa
a
a
ab
a
a
40
50
60
70
80
90
ETR
(�m
olm
-2s-1
)
b
a aa a a
b
b
a
a
0 1 2 3 4 5
Time (d)
a
b
a
a
a
a
a
aaa
0
0.05
0.1
0.15
0.2
Gs
(mol
ms
)
0
5
10
15
20
25
30
a
b
a
a
aa
b
b
a
a
0
5
10
15
20
25
30
a
b
a
a
aa
b
b
a
a
ControlGirdledControlGirdled
-2-1
-2-1

Chapter 5: Regulation of photosynthesis by sugars in sugarcane leaves
155
5.5 Discussion
Sugar concentrations in sugarcane leaves increased rapidly on exposure to light.
Sugarcane leaves have been shown to primarily accumulate and also export sucrose
during the photoperiod (Hartt & Kortchack 1963; Lunn & Hatch, 1995; Du et al., 2000).
Sucrose is readily exported from sugarcane leaves, with up to 80% of assimilate
reportedly being exported immediately at midday (Du et al., 2000). The accumulation of
sucrose in intact leaves represents a balance between the rate of synthesis and the rate
of export. Sugar depletion by dark incubation subsequently stimulated photosynthesis.
The effects of dark-depletion of sugars on photosynthesis were compared with the
effects of pre-loading leaves with sucrose, glucose or fructose. Pre-loading with sugars
negated the stimulatory effects of darkness on photosynthetic activity. When leaves
were dark-treated to deplete leaf sugar concentrations, the photosynthetic activity in
those pre-loaded with 5 mM sucrose was similar to that of leaves continuously supplied
with light (Fig. 5.4). In contrast, photosynthesis of dark-treated leaves supplied with 5
mM sorbitol was increased compared to leaves continuously supplied with light (Fig.
5.1). This indicated that the observed suppression of photosynthesis by 5 mM sucrose
was not due to an osmotic signal, but rather a possible consequence of sugar-sensing
(Gibson, 2005).
Conversion of 14C-sucrose into 14C-hexoses occurred rapidly and thus differentiation
between photosynthetic responses to hexoses and sucrose was not possible (Fig. 5.3).
Leaves pre-loaded with glucose also rapidly converted 14C-glucose to 14C-sucrose (Fig.
5.5). Photosynthetic inhibition due to increased sucrose may thus be a result of
sensitivity to the increased abundance of the hydrolytic products of sucrose. The
localised activity of the sucrose-hexose interconversion enzyme, sucrose synthase
(SuSy; EC 2.4.1.13), within vascular tissues has been discussed previously (Claussen et
al., 1985; Wachter et al., 2003). SuSy may play an important signaling role by regulating
the concentrations of apoplastic sugars. These results cannot effectively discriminate
between hexose and sucrose-signaling, however they do substantiate the role of these
sugars as signaling molecules that act to regulate sugarcane source activity. Although
much progress has been made, the molecular bases of sugar-based signaling systems
are still not clearly understood (for recent review see Rolland et al., 2006). Similarly, the
signaling mechanisms which link phloematic, apoplastic and intracellular sugar
concentrations remain to be fully elucidated (Gibson, 2005).

Chapter 5: Regulation of photosynthesis by sugars in sugarcane leaves
156
In addition to leaf excision experiments, cold-girdling was used to manipulate leaf sugar
concentrations since this retains an intact xylem and nutrient supply system. Cold-
girdling resulted in a significant increase in sucrose and hexose concentrations in
sugarcane leaves and a concurrent decrease in both A and ETR rates over time (Fig.
5.6; 5.7). The inhibition of photosynthetic activity, observed in previous cold-girdling
work, has been attributed to carbohydrate-induced changes in the expression of genes
associated with the light-harvesting apparatus and enzymes in the pathway of CO2
assimilation (Koch, 1996). Krapp & Stitt (1994) observed a decline in rbcS expression
that ultimately led to significant decreases in Rubisco activity. In Chenopodium rubrum
(L.) cell cultures fed with glucose, the repression of rbcS was observed only until the
glucose supply was exhausted, whereupon rbcS transcript levels began to recover
(Krapp et al. 1993). This recovery preceded any significant decrease in the internal
carbohydrate content, indicating that processes related to sugar transport or the
metabolism of carbohydrate were acting as the trigger (Krapp et al. 1993). As
sugarcane is known to cycle hexose and sucrose (Whittaker & Botha, 1997), it is difficult
to attribute these regulatory effects to any particular sucrolytic enzyme. In addition,
sugar transporters specific to either hexose or sucrose may prove interesting candidates
for future study of source-sink regulation.
Although sugar levels remained high during the initial 55 h days of cold-girdling, both
sucrose and hexose levels dropped after 103 h of cold-girdling (Fig.5.6). The rates of A
and ETR declined over the period of cold-girdling (Fig. 5.7). The decline in sucrose and
hexose concentrations after 79 h may have been due to severely restricted
photosynthesis and consequent remobilization of vacuolar sucrose for respiration.
However, the mechanical/biochemical effects of cold-girdling, are still contentious, and
cold-girdling effectiveness seems to vary between species (Hannah et al., 2001). Peuke
et al. (2006) concluded that long-term cold-girdling may cause carbohydrate
accumulation by leaching sucrose from the phloem and inhibiting normal retrieval by
sucrose transporters, such as the recently identified sucrose carrier RcSCR1
(Eisenbarth & Weig, 2005), instead of simply inhibiting mass flow. Long-term adaptation
to cold-girdling treatment also cannot be excluded (Peuke et al., 2006; Hannah et al.,
2001). Although A and ETR decreased soon after application of the cold-girdle, E and
Gs only decreased significantly after 103 h of cold-girdling. This indicates that the initial
influence of the cold-girdle was through biochemical modulation of photosynthesis,
rather than simply through control of stomata.

Chapter 5: Regulation of photosynthesis by sugars in sugarcane leaves
157
Stomata have long been known to play an important role in regulating the capacity of
mesophyll tissue to fix carbon (Wong et al., 1979). The correlation between Gs and A
has been well studied under conditions of water stress (Sharkey et al., 1990; Ort et al.,
1994; Lawlor, 1995), however, the degree to which other processes, such as metabolic
damage or down regulation, co-limit photosynthesis are widely debated (Flexas &
Medrano, 2002). In transgenic Nicotiana tabacum (L.) with reduced levels of Rubisco no
discernible change in Gs was observed even though assimilation rates were significantly
reduced (von Caemmerer et al., 2004). In the current study, sugar-induced changes in
A were not dependent on Gs. This suggests that sugars may affect sugarcane leaf
photosynthetic activity through metabolic signaling processes, such as hexokinase-
mediated regulation (Rolland & Sheen, 2005).
In model C3 species, such as Arabidopsis thaliana, sucrose, glucose and fructose are
known to play pivotal roles in regulating source activities (Rolland et al., 2006).
Photosynthesis and export appear to be up-regulated under low sugar conditions, while
a co-ordinate increase in sink activity has been observed when source carbon is
abundantly available (Bläsing et al., 2005; Roitsch et al., 1999). Much less is known
about the role of these sugars in determining photosynthesis in the leaves of C4 plants
(Lunn & Furbank, 1999). In the present study, sugarcane leaves appeared to typically
operate below their maximum achievable photosynthetic rates, which were readily
increased by limiting leaf sucrose accumulation through a relatively short period of
darkness. Dark treatment led to an increase in leaf A and ETR (Table 5.1; 5.2), which
may be indicative of a robust regulatory link between photosynthesis and leaf sucrose
status. Furthermore, this supports previous evidence that the photosynthetic activity of
sugarcane leaves is highly adaptive to the perceived demand for photosynthate from
sink tissues (Gutiérrez-Miceli et al., 2004; McCormick et al., 2006 [Chapter 3]). The
observed increases in the rate of leaf sucrose accumulation in dark-treated leaves may
be due partly to the light dependent-activation of sucrose phosphate synthase (EC
2.4.1.14), which is reported to have increased affinity for UDP-glucose in
monocotyledonous species, and an additional lack of inhibition by Pi due to depleted
triose-P concentrations following low light conditions (Lunn & Furbank, 1997b).
Hexose concentrations in untreated sugarcane leaves generally followed the ambient
glasshouse light conditions, reaching a peak at midday, and then declining (Fig 5.1; 5.2;
5.4). A similar diurnal change in hexose sugars has been previously observed in C4

Chapter 5: Regulation of photosynthesis by sugars in sugarcane leaves
158
maize leaves (Kalt-Torres et al., 1987), indicating that hexose may play an important role
in regulating diurnal daily photosynthetic activity in leaves of C4 species. Conversely,
hexose levels decreased over time in dark-treated leaves with elevated photosynthetic
activities. These results are similar to those of previous source-sink experiments using
partial shading, where sugarcane leaves with increased photosynthetic capacity
exhibited a corresponding reduction in hexose (McCormick et al., 2006 [Chapter 3]).
Although sucrose is the primary product of photosynthesis, many sugar-signaling effects
on growth and metabolism can be attributed to its hydrolytic hexose products (Rolland et
al., 2006). Along with the activity of hexokinase (EC 2.7.1.1), hexoses have previously
been implicated as key components in the regulation of photosynthesis and leaf
development (Ehness et al., 1997; Paul & Pellny, 2003). In mature leaves of Spinacia
oleracea (L.), glucose has been shown to repress both expression and translation of
genes and proteins associated with photosynthesis (Krapp et al., 1991; Kilb et al., 1995).
Furthermore, over-expression of cell wall invertase (EC 3.2.1.26) in mature leaves
tobacco has been demonstrated to result in an accumulation of leaf carbohydrates and a
consequent decrease in rbsS transcript levels (Von Schaewen, 1990). We therefore
suggest that hexose concentrations may constitute a signal that, as in other species
(Krapp et al., 1991; Kilb et al., 1995; Roitsch et al., 1995; Dekkers et al., 2004),
modulates leaf photosynthetic activity in sugarcane.
5.6 Concluding remarks
Results from cold girdling, dark treatments, sucrose- and hexose-loading experiments
have demonstrated the existence of a significant relationship between sugar
concentrations and photosynthesis in sugarcane leaf tissue, indicating that sugar
signaling is important in regulating leaf metabolism. Attempts to increase sucrose
accumulation in sugarcane must take into account the fact that source-sink feedback
mechanisms control photosynthesis in sugarcane. The ability of sugarcane to
accumulate large concentrations of sucrose in the culm may be due to a relative
insensitivity of photosynthesis to culm sucrose concentrations.

Chapter 5: Regulation of photosynthesis by sugars in sugarcane leaves
159
5.7 References
Abdin OA, Zhou X, Coulman BE, Cloutier D, Faris MA, Smith DL. Effects of sucrose
supplementation by stem injection on the development of soybean plants. Journal of
Experimental Botany 49: 2013–2018.
Allison JCS, Williams HT, Pammenter NW. 1997. Effect of specific leaf nitrogen on
photosynthesis of sugarcane. Annals of Applied Biology 63: 135–144.
Amaya A, Cock JH, Hernandez A, Irvine J. 1995. Bioligía. In: Casselett C, Torres J,
Isaacs C, eds. El cultivo de la Ca�a en la zona azucarera de Colombia. Cali, Colombia:
Cenica�a, 31–62.
Basu PS, Sharma A, Garg I.D, Sukumaran NP. 1999. Tuber sink modifies photosynthetic
response in potato under water stress. Environmental and Experimental Botany 42: 25–29.
Bindon KA, Botha FC. 2002. Carbon allocation to the insoluble fraction, respiration and triose
–phosphate cycling in the sugarcane culm. Physiologia Plantarum 116: 12–19.
Blechschmidt-Schneider S, Ferrar P, Osmond CB. 1989. Control of photosynthesis by the
carbohydrate level in leaves of the C4 plant Amaranthus edulis L. Planta 177: 515–525.
Bull TA, Tovey DA. 1974. Aspects of modelling sugar cane growth by computer simulation.
Proceedings of the International Society of Sugar Cane Technologists 165: 1021–1032.
Dekkers BJ, Schuurmans JA, Smeekens SC. 2004. Glucose delays seed germination in
Arabidopsis thaliana. Planta 218: 579–588.
Du YC, Nose A, Kondo A, Wasano K. 2000. Diurnal changes in photosynthesis in
sugarcane leaves. II. Enzyme activities and metabolite levels relating to sucrose and starch
metabolism. Plant Production Science 3: 9–16.
Earl HJ, Tollenaar M. 1998. Relationship between thylakoid electron transport and
photosynthetic CO2 uptake in leaves of three maize (Zea mays L.) hybrids. Photosynthetic
Research 58: 245–257.
Edwards G, Walker, D. 1983. C3, C4: mechanisms and cellular and environmental regulation
of photosynthesis. London: Oxford, 156–160.
Edwards GE, Baker NR. 1993. Can CO2 assimilation in maize leaves be predicted accurately
from chlorophyll fluorescence analysis? Photosynthesis Research 37: 89–102.
Edwards GE, Furbank RT, Hatch MD, Osmond CB. 2001. What does it take to be C4?
Lessons from the evolution of C4 photosynthesis. Plant Physiology 125: 46–49.
Ehness R, Ecker M, Godt DE, Roitsch T. 1997. Glucose and stress independently
regulate source and sink metabolism and defense mechanisms via signal transduction
pathways involving protein phosphorylation. The Plant Cell 9: 1825–1841.
Eisenbarth DA, Weig AR. 2005. Sucrose carrier RcSCR1 is involved in sucrose retrieval, but
not sucrose unloading in growing hypocotyls of Ricinus communis L. Plant Biology 7: 98–
103.

Chapter 5: Regulation of photosynthesis by sugars in sugarcane leaves
160
Flexas J, Escalona JM, Evain S, Gulías J, Moya I, Osmond CB, Medrano H. 2002.
Steady-state chlorophyll fluorescence (Fs) measurements as a tool to follow variations of net
CO2 assimilation and stomatal conductance during water-stress in C3 plants. Physiologia
Plantarum 114: 231–240.
Flexas J, Medrano H. 2002. Drought-inhibition of photosynthesis in C3 plants: stomatal and
non-stomatal limitations revisited. Annals of Botany 89: 183–189.
Franck N, Vaast P, Génard M, Dauzat J. 2006. Soluble sugars mediate sink feedback
down-regulation of leaf photosynthesis in field-grown Coffea arabica. Tree Physiology 26:
517–525.
Furbank RT, Taylor WC. 1995. Regulation of photosynthesis in C3 and C4 plants: a molecular
approach. The Plant Cell 7: 797–807.
Gibson SI. 2005. Control of plant development and gene expression by sugar signalling.
Current Opinion in Plant Biology 8: 93–102.
Gutiérrez-Miceli FA, Morales-Torres R, de Jesús Espinosa-Castañeda Y, Rincón-
Rosales R, Mentes-Molina J, Oliva-Llaven MA, Dendooven L. 2004. Effects of
parital defoliation on sucrose accumulation, enzyme activity and agronomic parameters in
sugar cane (Saccharum spp.). Journal of Agronomy and Crop Science 190: 256–261.
Hannah MA, Iqbal MJ, Sanders FE. 2001. Adaptation to long-term cold-girdling in
genotypes of common bean (Phaseolus vulgaris L.). Journal of Experimental Botany 52:
1123–1127.
Hartt CE, Burr GO. 1967. Factors affecting photosynthesis in sugarcane. Proceedings of the
International Society of Sugar Cane Technologists 12: 590–609.
Hartt CE, Kortchak HP. 1966. Sugar gradients and translocation of sucrose in detached
blades of sugarcane. Plant Physiology 39: 460–474.
Hatch MD. 1987. C4 photosynthesis: a unique blend of modified biochemistry anatomy and
ultrastructure. Biochimica et Biophysica Acta 895: 81–106.
Iglesias DJ, Lliso I, Tadeo FR, Talon M. 2002. Regulation of photosynthesis through
source: sink imbalance in citrus is mediated by carbohydrate content in leaves. Physiologia
Plantarum 116: 563-572.
Jackson PA. 2005. Breeding for improved sugar content in sugarcane. Field Crops Research
92: 277–290.
Kalt-Torres W, Kerr PS, Usuda H, Huber SC. 1987. Diurnal changes in maize leaf
photosynthesis. Plant Physiology 83: 283–288.
Kilb B, Wietoska H, Godde D. 1995. Changes in the expression of photosynthetic genes
precede loss of photosynthetic activities and chlorophyll when glucose is supplied to mature
spinach leaves. Plant Science 115: 225–235.
Koch, KE. 1996. Carbohydrate-modulated gene expression in plants. Plant Physiology and
Plant Molecular Biology 47: 509–540.
Chapter 5: Regulation of photosynthesis by sugars in sugarcane leaves
161
Krapp A, Quick WP, Stitt W. 1991. Ribulose-1,5-bisphosphate carboxylase-oxygenase,
other Calvin cycle enzymes and chlorophyll decrease when glucose is supplied to mature
spinach leaves via the transcription stream. Planta 186: 58–59.
Krapp A, Hofmann B, Schafer C, Stitt M. 1993. Regulation of the expression of rbcS and
other photosynthetic genes by carbohydrates: a mechanism for the ‘sink regulation’ of
photosynthesis? The Plant Journal 3: 817–828.
Krapp A, Stitt M. 1995. An evaluation of direct and indirect mechanisms for the “sink
regulation” of photosynthesis in spinach: Changes in gas exchange, carbohydrates,
metabolites, enzyme activities and steady state transcript levels after cold-girdling leaves.
Planta 195: 313–323.
Lakshmanan P, Geijskes RJ, Aitken KS, Grof CLP, Bonnett GD, Smith GR. 2005.
Sugarcane biotechnology: the challenges and opportunities. In Vitro Cellular and
Developmental Biology 41: 345–363.
Lawlor DW. 1995. The effects of water deficit on photosynthesis. In: Smirnoff N, ed.
Environment and Plant Metabolism. Flexibility and Acclimation. Oxford: BIOS Scientific
Publishers.
Lunn JE, Furbank RT. 1997a. Localisation of sucrose-phosphate synthase and starch in
leaves of C4 plants. Planta 202: 106–111.
Lunn JE, Furbank RT. 1997b. Adenosine 5’-triphosphate-mediated activation of sucrose-
phosphate synthase in bundle sheath cells of C4 plants. Planta 202: 249–256.
Lunn JE, Furbank RT. 1999. Sucrose biosynthesis in C4 plants. New Phytologist 143: 221–
237.
Lunn JE, Hatch MD. 1995. Primary partitioning and storage of photosynthate in sucrose and
starch in leaves of C4 plants. Planta 197: 385–391.
Marcelis LFM. 1996. Flower and fruit abortion in sweet pepper in relation to source and sink
strength. Journal of Experimental Botany 55: 2261–2268.
Marcelis LFM. 1996. Sink strength as a determinant of dry matter partitioning in the whole plant.
Journal of Experimental Botany 47: 1281–1291.
Maxwell K, Johnson GN. 2000. Chlorophyll fluorescence - a practical guide. Journal of
Experimental Botany 51: 659–668.
McCormick AJ, Cramer MD, Watt DA. 2006. Sink strength regulates photosynthesis in
sugarcane. New Phytologist 171: 759–770.
Minchin PEH, Thorpe MR. 1983. A rate of cooling response in phloem translocation. Journal of
Experimental Botany 34: 529–536.
Ort DR, Oxborough K, Wise RR. 1994. Depression of photosynthesis in cropswith water
deficit. In: Baker NR, Bowyer eds. Photoinhibition of photosynthesis from molecular
mechanism to the field. Oxford: BIOS Scientific Publishers.
Pammenter NW, Allison JCS. 2002. Effects of treatments potentially influencing the supply of
assimilate on its partitioning in sugarcane. Journal of Experimental Botany 53: 123–129.

Chapter 5: Regulation of photosynthesis by sugars in sugarcane leaves
162
Paul MJ, Foyer, CH. 2001. Sink regulation of photosynthesis. Journal of Experimental Botany
52: 1381–1400.
Paul MJ, Pellny TK. 2003. Carbon metabolite feedback regulation of leaf photosynthesis and
development. Journal of Experimental Botany 54: 539–547.
Peuke AD, Windt C, Van As H. 2006. Effects of cold-girdling on flows in the transport
phloem in Ricinus communis: is mass flow inhibited? Plant Cell and Environment 29: 15–25.
Rae AL, Grof CPL, Casu RE, Bonnett GD. 2005. Sucrose accumulation in the sugarcane
stem: pathways and control points for transport and compartmentation. Field Crops
Research 92: 159–163.
Roitsch T, Bittner M, Godt, DE. 1995. Induction of apoplastic invertase of Chenopodium
rubrum by D-glucose and a glucose analog and tissue-specific expression suggest a role in
sink-source regulation. Plant Physiology 108: 285–294.
Roitsch T. 1999. Source-sink regulation by sugar and stress. Current Opinion in Plant Biology
2: 198–206.
Rolland F, Baena-Gonzalez E, Sheen J. 2006. Sugar sensing and signaling in plants:
conserved and novel mechanisms. Annual Review of Plant Biology 57: 675–709.
Rolland F, Moore B, Sheen J. 2002. Sugar sensing and signaling in plants. Plant Cell 14:
185–205.
Rolland F, Sheen J. 2005. Sugar sensing and signalling networks in plants. Biochemical
Society Transactions 33: 269–271.
Sharkey TD. 1990. Water stress effects on photosynthesis. Photosynthetica 24: 651.
Sheen J. 1994. Feedback control of gene expression. Photosynthesis Research 39: 427–438.
von Caemmerer S, Lawson T, Oxborough, Baker NR, Andrews TJ, Raines CA. 2004.
Stomotal conductance does not correlate with photosynthetic capacity in transgenic tobacco
woth reduced amounts of Rubisco. Journal of Experimental Botany 55: 1157–1166.
Wachter R, Langhans M, Aloni R, Gotz S, Weilmunster A, Koops A, Temguia L,
Mistrik I, Pavlovkin J, Rascher U, Schwalm K, Koch KE, Ullrich CI. 2003.
Vascularization, high-volume solution flow, and localized roles for enzymes of sucrose
metabolism during tumorigenesis by Agrobacterium tumefaciens. Plant Physiology 133:
1024–1037.
Whittaker A, Botha FC. 1997. Carbon partitioning during sucrose accumulation in sugarcane
internodal tissue. Plant Physiology 115: 1651–1659.
Wong SC, Cowan IR, Farquhar GD. 1979. Stomatal conductance correlates with
photosynthetic activity. Nature 282: 424–426.
Wu L, Birch RG. 2007. Doubling sugar content in sugarcane plants modified to produce a
sucrose isomer. Plant Biotechnology Journal 5: 109–117.

Chapter 6: Sugar-mediated regulation of photosynthesis
163
Chapter 6:
Sugar accumulation induces differential expression of genes related to
carbohydrate metabolism, photosynthesis and sugar-sensing: evidence for
a trehalose-related signaling mechanism in sugarcane leaves
6.1 Summary
• In sugarcane, photosynthetic activity has been shown to be regulated by the demand
for carbon from sink tissues. There is evidence, from other plant species, that sink-
limitation of photosynthesis is facilitated by sugar-signaling mechanisms in the leaf
that affect photosynthesis through regulation of gene expression.
• To manipulate leaf sugar levels, field-grown sugarcane leaves were cold-girdled
(5oC) for 80 h. During this time, sucrose and hexose concentrations above the girdle
increased by 77% and 81%, respectively. Conversely, leaf photosynthetic activity
(A) and electron transport rates (ETR) decreased by 66% and 54%, respectively.
• Expression profiling by means of an Affymetrix GeneChip Sugarcane Genome Array
was used to identify genes responsive to the cold-girdling treatment (56 h). A
number of genes (73) involved in fundamental metabolic pathways, including
photosynthesis, carbohydrate metabolism, and sugar-signaling, were identified as
being differentially expressed.
• Decreased expression of genes related to photosynthesis and increased expression
of genes involved in glycolytic carbon partitioning, cell wall synthesis, phosphate
metabolism and stress were observed. Furthermore, trehalose phosphate
phosphatase (TPP; EC 5.3.1.1) and trehalose 6-phosphate synthase (TPS; EC
2.4.1.15) were up- and down-regulated, respectively, indicating a role for trehalose 6-
phosphate (T6P) as a putative sugar-sensor in sugarcane leaves.
Keywords: cold-girdling, expression profiling, genes, leaf, photosynthesis, sugar,
sugarcane, trehalose.

Chapter 6: Sugar-mediated regulation of photosynthesis
164
6.2 Introduction
Sugarcane (Saccharum L. spp. hybrids) is the primary resource for world sucrose
production (Lunn & Furbank, 1999; Wu & Birch, 2007) and, hence, considerable efforts
are being made to improve sugarcane biomass production and sucrose yields (Jackson,
2005). Previously varietal improvement relied on crossing and selection, but now new
molecular techniques are being used in concert with these more conventional
approaches to increase crop yields (Huckett & Botha, 1995; Ma et al., 2000; Leibbrandt
& Snyman, 2003; Wu & Birch, 2007). Research into the regulation of carbohydrate
metabolism in model C3 plants, such as Arabidopsis thaliana (L.), has advanced
significantly in recent years (Bläsing et al., 2005; Franco-Zorrilla et al., 2005; Gibon et
al., 2006; Müller et al., 2007). In contrast, the study of C4 plants has lagged behind, with
the majority of work focusing on maize (Zea mays L.) (Lunn & Furbank, 1999; Lee et al.,
2002; Sawers et al., 2007). Consequently, the regulatory mechanisms involved in
sugarcane sucrose metabolism and accumulation are still relatively uncharacterised
(Grof & Campbell, 2001; Casu et al., 2004; Watt et al., 2005).
In a variety of species, the photosynthetic activity of source leaves appears to be
dependent on the demand for carbon from sink tissues (Basu et al., 1999; Paul & Foyer,
2001; Minchin et al., 2002; Paul & Pellny, 2003). Previous work in C3 plants, using cold-
girdling and sugar feeding techniques, has demonstrated the limiting effects of increased
leaf sugar concentrations on chlorophyll content, Rubisco expression and activity, and
overall photosynthetic rates (Krapp et al., 1991; Schäfer et al., 1992; Krapp & Stitt, 1995;
Iglesias et al., 2002). Evidence increasingly shows that the interactions between source
and sink systems are regulated by levels of the major transport sugar, sucrose, and/or
its constituent hexoses (Pego et al., 2000; Rolland et al., 2002; Franck et al., 2006).
Several sugar-sensing mechanisms are suggested to be involved in regulating
photosynthesis (Rolland et al., 2006). Hexokinase (HXK; EC 2.7.1.1) is a glucose
sensor that is believed to function for both glucose phosphorylation (i.e. in glycolysis)
and glucose signaling (Harrington & Bush, 2003; Rolland et al., 2006). Analysis of the
activity of two catalytically inactive constructs of the Arabidopsis AtHXK1 gene has
revealed that HXK plays an integral role in growth promotion, independent of its ATP-
binding function (Moore et al., 2003). The activity of HXK has been detected in the
cytosol, the chloroplast stroma and even the nucleus (Moore et al., 2003; Yanagisawa et

Chapter 6: Sugar-mediated regulation of photosynthesis
165
al., 2003; Giese et al. 2005), which suggests a prominent role for the enzyme in several
intracellular sugar-sensing pathways. However, the characterisation of several
transporter genes, such as a proton-sucrose symporter in sugar-beet whose expression
is regulated by sucrose and not hexose (Vaughan et al., 2002), indicate the existence of
a HXK-independent, sucrose-specific signaling pathway (Rolland et al., 2006).
Furthermore, studies of trehalose sugar-signaling suggest that the phosphorylated
product of trehalose 6-phosphate synthase (TPS; EC 2.4.1.15), trehalose 6-phosphate
(T6P), mediates an essential, HXK-independent signaling process in higher plants
(Eastmond et al., 2003; Schluepmann et al., 2003; Paul, 2007). Recently, changes in
leaf sugar levels have been shown to lead to rapid changes in T6P content, indicating
that T6P can act as a signal for the sugar status of source tissues (Lunn et al., 2006).
The limited activity of TPS observed in Arabidopsis has suggested that control of the
system could be exerted mainly at the level of T6P breakdown, by trehalose phosphate
phosphatase (TPP; EC 5.3.1.1) (Ramon & Rolland, 2007). The modification of the
trehalose pathway, in both C3 and C4 species, has since been shown to impact positively
on several aspects of crop physiology, including gross photosynthetic activity, relative
growth rates and drought tolerance (Pellny et al. 2004; Satoh-Nagasawa et al., 2006;
Karim et al., 2007).
In addition to the role of sugar sensors, inorganic phosphate (Pi) could facilitate a
regulatory link between sugars and photosynthetic source activity (Paul & Pellny, 2003).
Several enzymes directly involved in photosynthesis, such as chloroplastic ATPase, are
sensitive to Pi concentration and are inhibited if Pi availability decreases (Pammenter et
al., 1993). Under conditions of increased leaf carbohydrate accumulation, the excessive
accumulation of Pi in phosphorylated sugar intermediates, such as triose or hexose-
phosphates, may limit the availability of Pi turnover between the chloroplast and cytosol,
and thus restrict photosynthetic activity (Pieters et al., 2001; Paul & Pellny, 2003).
Recent work has demonstrated that the expression of Pi-starvation responsive genes in
Arabidopsis is stimulated by increased sucrose (Franco-Zorrilla et al., 2005; Müller et al.,
2007). Conversely, several sugar responsive genes, including TPS, have been shown
to respond to changes in Pi (Müller et al., 2007). Together, these studies indicate a
strong link between Pi and sugar signaling mechanisms, at least in C3 species.
Transgenic Arabidopsis plants over-expressing inorganic pyrophosphatase (PPase; EC
3.6.1.1) exhibited significant increases in Pi, sugar concentrations and an associated
decrease in photosynthetic rates, suggesting an important regulatory role for PPase in
Chapter 6: Sugar-mediated regulation of photosynthesis
166
maintaining an optimal PPi: Pi ratio (Lee et al., 2005). However, the sensitivity of
different species to negative photosynthetic feedback based on changes in leaf sugar
status, and the extent of further interactions with Pi, may vary considerably (Krapp &
Stitt, 1995). The regulatory roles of sugar-linked sensing mechanisms in C4 species are
even less well characterised, and require further investigation.
In sugarcane, large differences in photosynthetic rates have been previously observed
for individual sugarcane leaves related to the age of the plant, with young plants typically
assimilating at significantly higher rates than older plants (Hartt & Burr, 1967; Bull &
Tovey, 1974; Amaya et al., 1995; Allison et al., 1997). The reason that the
photosynthetic rate is dependent on plant age is probably due to the accumulation of
sucrose in the culms of older plants (McCormick et al., 2006 [Chapter 3]). Gutiérrez-
Miceli et al. (2004) have reported that partial defoliation of sugarcane has no significant
effect in reducing culm sucrose concentration, indicating that the remaining
photosynthetic capacity was sufficient to adapt to sink demand. The flexibility of
photosynthetic activity in sugarcane leaves was recently investigated using a partial
shading technique where all but one source leaf was covered in shade cloth (McCormick
et al., 2006 [Chapter 3]). The sole leaf exhibited a significant increase in photosynthetic
activity, while the observed partitioning patterns of carbon in the culm were indicative of
increased sink demand. Furthermore, a strong negative correlation was revealed
between leaf hexose concentrations and photosynthesis in the sole source leaf,
suggesting that hexose is involved in regulating the source-sink dynamic (McCormick et
al., 2006 [Chapter 3]). This suggests that HXK or HXK-independent mechanisms, such
as trehalose metabolism, may play a role in mediating source photosynthetic rates in
sugarcane.
Expressed sequence tag (EST) analysis has been widely used in attempts to identify
genes associated with the regulation of sucrose accumulation during sugarcane culm
development (Arruda, 2001; Carson et al., 2002; Casu et al., 2003; 2004). These
collections have been brought together as an Affymetrix Genechip Sugarcane Genome
Array bearing 255 964 ESTs (Casu et al., 2007). This system provides a powerful tool
for the profiling of quantitative changes in sugarcane gene expression in response to
developmental and environmental cues. One such application is the clarification of the
roles of particular genes and gene networks in the feedback regulation of sugarcane
photosynthesis. The current study has implemented a cold-girdling technique in field-

Chapter 6: Sugar-mediated regulation of photosynthesis
167
grown sugarcane leaves to examine the feedback relationship between source
photosynthetic activity and the status of leaf sugar concentrations. In addition,
associated changes in leaf transcript abundance were analysed using the Affymetrix
GeneChip Sugarcane Genome Array. Cold-girdling induced accumulation of sugars in
the leaf and the concurrent decline in photosynthetic activity was related to significant
changes in the expression of several genes encoding products involved in carbohydrate
metabolism, photosynthesis, sugar transport and stress response. Furthermore, TPP
and TPS expression were up- and down-regulated, respectively, which provided
evidence for the existence of a T6P sugar-signaling mechanism in sugarcane leaves. In
addition, the array data indicated a potential mechanistic limitation imposed by excess
source sugar accumulation on Pi availability and photosynthetic activity.
6.3 Materials and methods
6.3.1 Plant material and treatment
Twelve-month-old field-grown Saccharum spp. (L.) hybrid cv. N19 (N19) cultivated at
Mount Edgecombe, KwaZulu-Natal (SASRI) were used in the study, which was
conducted in November, 2006. Plants were grown on a 5 x 15 m plot located on a north-
east facing slope with a gradient of ca. 10o. Two weeks prior to cold-girdling treatment,
plants were irrigated 2–3 times per week to ensure adequate hydration. For all leaf
studies, the second and third fully expanded leaves were used (McCormick et al., 2006
[Chapter 3]). The experiment was staggered, so that cold-girdles were attached to
leaves (n=10) every morning (8h00) for a period of 4 d, and all leaves were collected at
15h00 on the final day. The girdle consisted of 0.75 cm (diameter) soft plastic tubing,
firmly clamped around each leaf, approximately 30 cm from the leaf base. Cooled water
maintained at 5oC was then pumped through the tubing using a Grant LTD6G cooling
bath (Grant Intruments, Barrington, Cambridge, UK). At harvest, leaf samples 10 cm
above the cold-girdle were immediately frozen in liquid nitrogen (–196oC) and
subsequently milled in an A11 Basic Analysis Mill (IKA, Staufen, Germany). Ground
leaf tissue was stored at –80oC in 50 ml centrifuge tubes prior to analysis.
Chapter 6: Sugar-mediated regulation of photosynthesis
168
6.3.2 Sugar determination
Approximately 100 mg powdered tissue was incubated overnight in 10 volumes of a
buffer containing 30 mM HEPES (pH 7. 8), 6 mM MgCl2 and ethanol 70% (v/v) at 70oC.
Extracts were centrifuged for 10 min at 23 200 g and sucrose, fructose and glucose
concentrations in the supernatant measured by means of a spectrophotometric
enzymatic coupling assay described previously (McCormick et al., 2006 [Chapter 3]).
The phosphorylation of glucose by hexokinase/glucose-6-phosphate dehydrogenase
(EC 1.1.1.49) (Roche, Mannheim, Germany) and fructose by phosphoglucose isomerase
(EC 5.3.1.9) (Roche) was quantified by following the reduction of NADP to NADPH at
340 nm (A340). Absorbance measurements and data analysis were conducted on a
Synergy HT Multi-Detection Microplate Reader using KC4 software (Biotek Instrument,
Inc., Vermont, USA).
6.3.3 Gas exchange and fluorescence determinations
Gas exchange measurements were made on 2 cm2 portions of leaf tissue using a
portable gas exchange system (LI-6400, LI-COR Biosciences Inc., Nebraska, USA).
Light was provided by a red/blue LED light source (LI-COR Biosciences Inc.) at photon
irradiance of 2 000 �mol m-2 s-1. All leaf measurements were done under ambient CO2
conditions (380 �mol mol-1) at a leaf temperature of 28oC between 10h00 and 12h00.
Gas exchange variables measured include photosynthetic assimilation (A), transpiration
rate (E), stomatal conductance (Gs), intercellular CO2 concentration (Ci) and leaf
temperature. Comparative measurements (n=8) were performed on the day of harvest
for leaves that were cold-girdled or untreated. Furthermore, readings were taken daily
during the cold-girdling treatment to measure photosynthetic consistency in untreated
leaves. To contrast photosynthetic rates in untreated leaves and leaves cold-girdled for
74 h (n=4), the response of A to Ci (A:Ci) was measured by varying the external CO2
concentration from 0 to 1 000 �mol mol-1 under a constant photosynthetically active
radiation (PAR) of 2 000 �mol m-2 s-1. An equation ( )( ) ceaA ibC −−= −1 was fitted to the
A:Ci data using least squares. The portion of the curve where the slope approaches
zero due to limitation in the supply of substrate (ribulose-1,5-bisphosphate), which is
equivalent to the CO2- and light-saturated photosynthetic rate (Jmax) (Lawlor, 1987), was
calculated from this equation (a, Jmax; b, curvature parameter; c, dark respiration (Rd).

Chapter 6: Sugar-mediated regulation of photosynthesis
169
Linear regression was performed on the data between a Ci of 0 and 200 �mol mol-1 to
determine the efficiency of carboxylation (CE; Lawlor, 1987).
Chlorophyll fluorescence was determined concurrently with gas exchange
measurements using the LI-6400-40 Leaf Chamber Fluorometer (LI-COR Biosciences
Inc.). A saturating pulse of red light (0.8 s, 6 000 µmol m-2 s-1) was applied to determine
the maximal fluorescence yield (Fm’) at varying external CO2 concentrations (0 – 1 000
�mol mol-1). The electron transport rate (ETR), defined as the actual flux of photons
driving photosystem II (PSII) was calculated from leaffIFm
FsFmETR α�
�
���
� −='
', where Fs is
“steady-state” fluorescence (at 2 000 �mol m-2 s-1), Fm’ is the maximal fluorescence
during a saturating light flash, f is the fraction of absorbed quanta used by PSII, typically
assumed to be 0.4 for C4 plant species (Edwards & Baker, 1993), I is incident photon
flux density and �leaf is leaf absorptance (0.85, LI-COR manual). The component
fluorescence variables were derived as described by Maxwell & Johnson (2000).
6.3.4 RNA preparation
Total RNA was extracted from individual untreated leaves (n=4) and leaves cold-girdled
for 56 h (n=4) using the extraction protocol of Bugos et al. (1995). RNA concentration
and quality were calculated from ultra-violet (UV) spectrophotometric absorbance
measurements at 260 nm and 260:280 nm, respectively (Beckman DU-7500
spectrophotometer, USA) and assessed for integrity via gel electrophoresis (Ingelbrecht
et al., 1998). All RNA samples were stored at –80oC until required.
6.3.5 GeneChip array hybridisations
Transcript abundances in each leaf RNA sample were analysed using Affymetrix
Genechip Sugarcane Genome Arrays (Affymetrix, Inc., Santa Clara, CA, USA). All
labelling, hybridisations of biotinylated cRNA to the array chips and data collection were
performed by the Australian Genome Research Facility (AGRF, Melbourne, VIC,
Australia). Total RNA was checked for quality and integrity using a Bioanalyser 2100
and the NanoChip protocol according to the manufacturer’s directions (Agilent
Technologies, Palo Alto, CA, USA). Labelled target used in hybridisations was
generated from 15 �g of total RNA using the One-Cycle Eukaryotic Target Labeling

Chapter 6: Sugar-mediated regulation of photosynthesis
170
Assay. Hybridisations, washing staining and scanning were performed as specified in
the manufacturer’s protocol (Affymetrix, Inc.). The scanner operating software, GCOS,
converted the signal on each array into a DAT file, which was then used to generate
CEL and CHP files for analysis.
6.3.6 Statistical analysis
Gas exchange data and sugar measurements were subjected to analysis of variants
(ANOVA) or Student’s t tests to determine the significance of differences amongst
responses to treatment. When ANOVA was performed, Tukey's honest significant
difference (HSD) post-hoc tests were conducted to determine the differences between
the individual treatments (SPSS Ver. 11.5, SPSS Inc., Illinois, USA).
Microarray statistical analysis was performed using GeneSpring GX 7.3 (Agilent
Technologies, USA) at the Australian Genome Research Facility Ltd. (Queensland,
Australia). Raw data files were analysed firstly by Robust Multiarray Analysis (RMA)
normalisation (Irizarry et al., 2003), which was subsequently normalised, per gene, to the
median. Normalised expression levels were then compared between treatment and
control data sets (Supplementary Figure 6.1). A fold change (greater than two-fold)
between treatment and control was used to identify biological significance. ANOVA was
then performed to flag differentially expressed genes between control and treatment
(P<0.05). The provided GenBank number corresponding to each differentially
expressed probe set was assessed for putative protein identity using the BLASTX
function (Altschul et al., 1997) within the National Centre of Biotechnological Information
(NCBI) GenBank database (http://www.ncbi.nlm.nih.gov). These results were further
cross-checked and compared to supplementary tables provided by Casu et al. (2007).
Genes were then categorised into their accepted metabolic pathways or a suitable
metabolic category as defined by the Kyoto Encyclopedia of Gene and Genomes (KEGG
- http://www.genome.ad.jp/kegg/) and EMBL-EBI protein database (Interpro -
http://www.ebi.ac.uk/interpro/).

Chapter 6: Sugar-mediated regulation of photosynthesis
171
6.4 Results
6.4.1 Effects of cold-girdling on leaf sugar concentrations
In untreated sugarcane leaves, sucrose concentrations increased from 8.4 ± 0.9 �mol g-1
in the morning (9h00) to 53.7 ± 3.4 �mol g-1 in the afternoon (16h00) (Fig. 6.1). Hexose
(glucose and fructose) concentrations also increased during the morning, reaching a
plateau at midday and then decreasing thereafter. Afternoon measurements of sucrose
and hexoses did not differ significantly during the experiment, indicating a consistent
diurnal pattern amongst untreated leaves. Conversely, in cold-girdled leaves, sucrose
concentrations continued to increase over time, reaching 99.4 ± 9.6 �mol g-1 after 56 h
(Fig. 6.1). Following 8 h of cold-girdling treatment, leaf hexoses were significantly
increased compared to untreated controls. The concentrations of hexose in cold-girdled
leaves declined over time, but remained significantly higher than controls until 80 h.
6.4.2 Effects of cold-girdling on leaf photosynthetic activity
Gas exchange and fluorescent activity of untreated sugarcane leaves measured under
ambient conditions did not differ significantly throughout the experiment, producing
average A and ETR values of 24.4 ± 0.6 �mol CO2 m-2 s-1 and 133 ± 14.3 �mol CO2 m-2
s-1, respectively (Table 6.1). In contrast, cold-girdled leaves exhibited a significant
reduction in photosynthetic activity over the duration of the treatment; after 74 h of cold-
girdling, A and ETR declined to levels of 66 % and 54 % below untreated leaves,
respectively (Table 6.1). Cold-girdled leaves also showed reduced E and Gs over time,
although the changes in E were not as pronounced as those of A and ETR.
The gas exchange and ETR variables derived from A:Ci and ETR:Ci curves of leaves
cold-girdled for 74 h were substantially lower than control leaves (Fig. 6.2). Significant
reductions in the substrate-limited photosynthetic rate (Jmax, 66%) and carboxylation
efficiency (CE, 84%) were further observed in comparison to untreated controls.

Chapter 6: Sugar-mediated regulation of photosynthesis
172
Fig. 6.1. Sucrose, glucose and fructose concentrations for cold-girdled (5oC) (�) and ungirdled
(control) (�) leaves of sugarcane plants over time. Letters above SE bars indicate
whether the cold-girdling treatment (n=5) was significantly different from controls
(P<0.05) as determined by Student’s t-tests.
0
0
2
4
6
8
10
gluc
ose
(�m
ol g
-1)
a
a
a
a
a
b
a
b
a
b
a
a
0
2
4
6
8
10
5 15 25 35 45 55 65 75 85
Time (hr)
fruct
ose
(�m
ol g
-1)
a
a
a
a
a
b
a
b
a
b
a
a
Control
Cold-Girdled
20
40
60
80
100
sucr
ose
(�m
ol g
-1)
a
a a
b a
a
a
b
a
b
a
b
120
0
0
2
4
6
8
10
gluc
ose
(�m
ol g
-1)
a
a
a
a
a
b
a
b
a
b
a
a
0
0
2
4
6
8
10
gluc
ose
(�m
ol g
-1)
0
2
4
6
8
10
gluc
ose
(�m
ol g
-1)
a
a
a
a
a
b
a
b
a
b
a
a
0
2
4
6
8
10
5 15 25 35 45 55 65 75 85
Time (hr)
fruct
ose
(�m
ol g
-1)
a
a
a
a
a
b
a
b
a
b
a
a
0
2
4
6
8
10
5 15 25 35 45 55 65 75 85
Time (hr)
fruct
ose
(�m
ol g
-1)
0
2
4
6
8
10
5 15 25 35 45 55 65 75 85
Time (hr)
fruct
ose
(�m
ol g
-1)
a
a
a
a
a
b
a
b
a
b
a
a
Control
Cold-Girdled
20
40
60
80
100
sucr
ose
(�m
ol g
-1)
a
a a
b a
a
a
b
a
b
a
b
120Control
Cold-Girdled
Control
Cold-Girdled
20
40
60
80
100
sucr
ose
(�m
ol g
-1)
a
a a
b a
a
a
b
a
b
a
b
120

Chapter 6: Sugar-mediated regulation of photosynthesis
173
Table 6.1. Gas exchange analysis and leaf fluorescence variables for untreated leaves (control)
and leaves cold-girdled for different periods of time: photosynthetic rate (A), electron
transport rate (ETR), stomatal conductance (Gs), transpiration rate (E) and
intercellular CO2 concentration CO2 (Ci). Measurements were taken at an ambient
RH of 37.4% ± 3.9 (mean ± SE) and an irradiance of 2000 �mol m-2 s-1 and CO2
concentration of 370 �mol mol-1. The values for cold-girdled leaves are the mean ±
SE (n=8) and are followed by letters indicating whether treatments had a significant
influence (P<0.05), as determined by ANOVA followed by Tukey's honest significant
difference (HSD) tests. For the duration of the cold-girdling treatment, untreated
controls were measured daily, but as no significant differences were detected over
time, the overall mean ± SE (n=32) is presented for this group.
cold-girdled leaves control
0 hr 24 hr 48 hr 72 hr
A (�mol m-2 s-1) 24.4 ± 0.6 a 24.2 ± 1.2 a 15.1 ± 0.9 ab 10.9 ± 1 bc 8.2 ± 0.85 c
ETR (�mol m-2 s-1) 133.13 ± 14 a 127 ± 10 a 73.6 ± 5.4 b 61.3 ± 4.4 b 60.1 ± 3.9 b
Gs (mmol m-2 s-1) 160 ± 22 a 162 ± 8 a 123 ± 7 b 107 ± 10 b 93 ± 8 b
E (mmol m-2 s-1) 4.3 ± 0.19 a 4.2 ± 0.21 a 3.2 ± 0.18 b 2.8 ± 0.2 b 2.6 ± 0.2 b
Ci (�mol mol-1) 121.6 ± 27 a 101.9 ± 4 a 151.1 ± 9 b 185.7 ± 12 bc 209.5 ± 10 c

Chapter 6: Sugar-mediated regulation of photosynthesis
174
Fig. 6.2. Changes in photosynthetic CO2 assimilation (�mol m-2 s-1) and photosynthetic
electron transport rate (ETR) of leaves cold-girdled for 50 h and ungirdled (control)
leaves versus intercellular CO2 concentration (Ci, �mol mol-1) in twelve-month-old
field-grown sugarcane (n=4). Substrate supply limited assimilation (Jmax) and
carboxylation efficiency (CE) for each treatment are indicated. Measurements were
made at an average ambient RH of 35.3% ± 1 and an irradiance of 2000 �mol m-2 s-1.
6.4.3 Analysis of differentially expressed transcripts between control and cold-girdled
leaf tissue
Genechip Sugarcane Genome Array analysis was performed on total RNA derived from
individual cold-girdled (56 h) and control leaf samples. Each treatment contained four
replicates and each sample was hybridised separately to the array. Of the total 8 236
sugarcane probe sets compared between the cold-girdling treatment and control, 673
were significantly differentially expressed (Fig. 6.3). The variation between replicate leaf
samples (‘natural’ variation) within these probe sets produced an average coefficient of
variation (CV) of 17% and 18.3% for controls and cold-girdled samples, respectively
(data not shown).
Probe set gene identities were confirmed by BLAST analysis and then, where
appropriate, classified to a broad group of general metabolic categories (Table 6.2;
Supplementary Table 6.1). A total of 246 probe sets were identified as either a
‘hypothetical protein’ by BLAST analysis or with ‘unknown function’ according to the
0
5
10
15
20
25
30
35
40
0 100 200 300 400 500 600
Ci (�mol mol -1)
A(�
mol
m -2
s -1
)
0
20
40
60
80
100
120
140
ETR
(�
mol
m -2
s -1
)
A (control)
A (cold-girdled)
ETR (control)
ETR (cold-girdled)
Jmax = 37.7 ± 4.4 (�mol m-2 s-1)
Jmax = 12.5 ± 1.4 (�mol m-2 s-1)
CE = 174.3 ± 31(mmol m-2 s-1)
CE = 28.5 ± 12 (mmol m-2 s-1)0
5
10
15
20
25
30
35
40
0 100 200 300 400 500 600
Ci (�mol mol -1)
A(�
mol
m -2
s -1
)
0
20
40
60
80
100
120
140
ETR
(�
mol
m -2
s -1
)
A (control)
A (cold-girdled)
ETR (control)
ETR (cold-girdled)
0
5
10
15
20
25
30
35
40
0 100 200 300 400 500 600
Ci (�mol mol -1)
A(�
mol
m -2
s -1
)
0
20
40
60
80
100
120
140
ETR
(�
mol
m -2
s -1
)
0
5
10
15
20
25
30
35
40
0 100 200 300 400 500 600
Ci (�mol mol -1)
A(�
mol
m -2
s -1
)
0
20
40
60
80
100
120
140
ETR
(�
mol
m -2
s -1
)
A (control)
A (cold-girdled)
ETR (control)
ETR (cold-girdled)A (control)A (control)
A (cold-girdled)A (cold-girdled)
ETR (control)ETR (control)
ETR (cold-girdled)ETR (cold-girdled)
Jmax = 37.7 ± 4.4 (�mol m-2 s-1)
Jmax = 12.5 ± 1.4 (�mol m-2 s-1)
CE = 174.3 ± 31(mmol m-2 s-1)
CE = 28.5 ± 12 (mmol m-2 s-1)

Chapter 6: Sugar-mediated regulation of photosynthesis
175
classification of Casu et al. (2007). A further 96 probe sets did not fit into the above
categories and were thus grouped under ‘miscellaneous metabolism’. In order to focus
array results on events related to leaf carbohydrate and photosynthetic status, a total of
140 probe sets in six categories were specifically targeted for further analysis: i)
carbohydrate metabolism, ii) photosynthesis (light and dark reactions); iii) sugar
signaling, transport and Pi metabolism, iv) mitochondrial metabolism, v) cell wall
metabolism and vi) stress response. Within these groups, a total of 73 gene identities
were represented (Table 6.3).
Fig. 6.3. Expression of genes during a cold-girdling treatment in sugarcane leaves. Genes
that were significantly differentially expressed are indicated in black. Data is arranged
along dimensions of biological (expression fold change between the controls and
treatment) and statistical significance value (P<0.05) based on a Students t-test of
differences between replicates (n=4). The x-axis indicates biological impact of the
change, while the y-axis indicates the statistical evidence, or reliability of the change.

Chapter 6: Sugar-mediated regulation of photosynthesis
176
Table 6.2. General categorisation of putative gene function of 673 differentially expressed probe
sets identified by microarray analysis in leaves (n=4) cold-girdled for 56 h. The
number of genes cited reflects both different genes and variants of single genes.
General categories of gene function Probe sets in category
Carbohydrate metabolism 13
Mitochondrial metabolism 5
C4 photosynthesis (light and dark) 46
Sugar transport, signaling and Pi metabolism 11
Cell wall metabolism 23
Stress response 42
Hormone response 13
DNA, RNA transcription and binding 43
Lipid, phospholipid and fatty acid synthesis 22
Other transporters 15
Amino acid and protein metabolism 74
Heavy metal metabolism 11
Cytoskeletal metabolism 13
Miscellaneous metabolism 96
Unknown 246
6.4.4 Response of photosynthesis- and carbohydrate metabolism-related genes to
cold-girdling
Probe sets associated with carbohydrate metabolism that were up-regulated included
genes coding for three enzymes that regulate the fate of triose-phosphate, viz. fructose-
1,6-bisphosphate aldolase (FBPase; EC 4.1.2.13), triose phosphate isomerase (TPI; EC
5.3.1.1) and glyceraldehyde-3-phosphate dehydrogenase (GPD; EC 1.2.1.12) (Table
6.3). Genes that were down-regulated include pyrophosphate-dependent
phosphofructokinase (PFP; EC 2.7.1.90) and a cell wall invertase (CWI; EC 3.2.1.26)
isoform, Incw4. Several genes related to starch metabolism were also up-regulated,
including ADP-glucose pyrophosphorylase, (AGPase; EC 2.7.7.27), which exhibited a
twelve-fold increase in expression.
All genes associated with the light and dark reactions of photosynthesis were down-
regulated (Table 6.3). Notably, for the dark reactions this included both the large and
small subunit of Rubisco (EC 4.1.1.39), and the C4 photosynthesis-related genes NADP-
dependent malate dehydrogenase (NADP-MD; EC 1.1.1.82) and NADP-dependent
malic enzyme (NADP-ME; EC 1.1.1.40), located in the mesophyll and bundle sheath

Chapter 6: Sugar-mediated regulation of photosynthesis
177
chloroplasts, respectively. Genes related to the light reactions comprised the largest
group of down-regulated genes, which included several subunits of chloroplastic
ATPase, NADH dehydrogenase and photosystem I and II. Photosystem I subunit O was
the most down-regulated (22-fold) of all identified differentially expressed probe sets.
The expression of three genes associated with mitochondrial processes were up-
regulated in response to the cold-girdling treatment (Table 6.3). Tricarboxylic acid (TCA)
cycle enzyme NADH-dependent malate dehydrogenase (NADH-MD; EC 1.1.1.37),
which catalyses the production of oxaloacetate (OAA) from malate, was up-regulated, as
were two isoforms of mitochondrial uncoupling protein (MUP). All genes identified as
related to cell wall metabolism and synthesis displayed increased expression. These
comprised 10 genes, including callose synthase and several isoforms of cellulose
synthase.
6.4.5 Changes in expression of genes related to sugar transport and signaling, Pi
metabolism and stress response
A total of eleven probe sets constituting seven genes with putative roles in sugar trans-
membrane transport, sugar signaling mechanisms and Pi metabolism were identified as
differentially expressed (Table 6.3). The sugar transporters encoded by these genes
consisted of a sugar transporter of unknown function (PST Type 2a), a putative hexose
transporter and a glucose 6-phosphate/phosphate translocator (G6PT). All transporters
were up-regulated; however, G6PT was, on average, expressed at levels three-fold
higher than hexose transporters. In addition, PPase and two probe sets identified as Pi
translocators were found to be up-regulated. Two genes related to trehalose
metabolism, TPS and TPP, were down- and up-regulated, respectively.
Numerous genes (22) with both known and putative involvement in stress response
were identified during expression analysis, the majority of which were up-regulated
(Table 6.3). These include alcohol dehydrogenase (ADH; EC 1.1.1.1), chalcone
synthase (CS; EC 2.3.1.74) and a proteinase inhibitor. Notably, one of the highest up-
regulated (23-fold) probe sets identified in this category was jacalin, a carbohydrate-
binding lectin. Down-regulated genes include the beta subunit of SNF1-related kinase
(SnRK1; EC 2.7.11.1). Furthermore, two probe sets representing a gene that encodes
mitogen-activated protein kinase (MAPK; EC 2.7.11.24), were up- and down-regulated.

Chapter 6: Sugar-mediated regulation of photosynthesis
178
This contrasting change in expression was likely to be due to these probe sets
representing distinct isogenes or gene family members particular to specific tissues.
Table 6.3. Putative gene identity and fold-change of 140 differentially regulated probe sets,
constituting 73 genes, in sugarcane leaves cold-girdled for 56 h. Genes are
classified into the following metabolic processes: i) carbohydrate metabolism
(glycolysis and starch metabolism), ii) mitochondrial metabolism, iii) photosynthesis
(light and dark reactions), iv) sugar signaling, transport and Pi metabolism, v) cell wall
metabolism and vi) stress response. Arrows indicate the degree of up- or down-
regulation for each probe set. The protein EC number is provided where appropriate.
No. Putative identity Probe set EC Genbank Fold change
Carbohydrate metabolism
Glycolysis
1 fructose-1,6-bisphosphate aldolase SofAffx.1015.1.S1_s_at 4.1.2.13 CF574067 2.4 �
Sof.3192.2.S1_at CA206457 2.3 �
2 glyceraldehyde-3-phosphate dehydrogenase Sof.2554.1.S1_at 1.2.1.12 CA093039 2.1 �
Sof.3865.1.S1_at CA196594 2.5 �
3 cell wall invertase SofAffx.1973.1.S1_at 3.2.1.26 BU925731 0.4 �
4 pyrophosphate-dependent 6-phosphofructose-1-kinase Sof.3023.2.S1_a_at 2.7.1.90 CA208800 0.4 �
Sof.3023.1.S1_s_at CA070403 0.4 �
5 triosphosphate isomerase Sof.2883.1.S1_at 5.3.1.1 CA147454 3.1 �
Starch metabolism
6 1,4-alpha-glucan branching enzyme Sof.2109.1.S1_a_at 2.4.1.18 CA202596 2.9 �
7 ADP-glucose pyrophosphorylase Sof.4578.1.S1_a_at 2.7.7.27 CA151666 12.8 ���
8 beta-amylase Sof.1235.1.S1_at 3.2.1.2 CA169143 5.2 ��
9 isoamylase Sof.4751.1.S1_at 3.2.1.68 CA289034 8.2 ���
10 phosphorylase Sof.1216.1.S1_at 2.4.1.1 CA169622 8.8 ���
Mitochondrial metabolism
1 mitochondrial malate dehydrogenase (NADH-dependent) Sof.3353.1.S1_at 1.1.1.37 CA181748 3.0 �
2 mitochodrial transcription termination factor Sof.1026.1.S1_at - CA265014 0.5 �
Sof.1026.2.S1_at CA161102 0.3 �
3 mitochondrial uncoupling protein 1 SofAffx.14.1.S1_at - AY644460 2.4 �
Sof.2009.1.S1_at CA170908 2.1 �
C4 photosynthesis and related metabolic components
Light reactions
1 ATP synthase CF0 A chain gene SofAffx.2196.1.S1_at 3.6.3.14 50198865-69 0.3 �
ATP synthase CF0 A chain gene SofAffx.2171.1.S1_at 50198865-59 0.3 �
ATP synthase CF0 C chain gene SofAffx.2188.1.S1_at 50198865-61 0.4 �
ATP synthase CF0 C chain gene SofAffx.2186.1.S1_at 50198865-60 0.4 �
ATP synthase CF1 beta chain gene SofAffx.2118.1.S1_at 50198865-70 0.2 ��
2 chlorophyll a/b-binding protein Sof.4725.1.S1_at - CA186676 0.3 ��
Sof.3564.1.S1_at CA298559 0.5 �

Chapter 6: Sugar-mediated regulation of photosynthesis
179
Sof.3564.1.S1_a_at CA298559 0.4 �
3 cytochrome P450 Sof.2722.1.S1_at 1.14.14.1 CA174395 0.4 �
Sof.1713.2.S1_at CA068881 0.1 ���
Sof.1713.1.A1_at CA068965 0.1 ���
4 cytochrome b6 f complex subunit VIII gene SofAffx.2164.1.S1_at - 50198865-54 0.3 �
5 cytochrome biogenesis protein gene SofAffx.2179.1.S1_at - 50198865-22 0.4 �
6 geranylgeranyl hydrogenase Sof.2428.1.S1_at - CA223413 0.4 �
Sof.3048.1.A1_s_at CA105372 0.4 �
7 magnesium chelatase SofAffx.56.1.S1_at - CF577098 0.3 �
SofAffx.1150.1.S1_at CF573280 0.3 �
Sof.4426.1.A1_at CA067637 0.3 ��
9 NADH dehydrogenase subunit 1 SofAffx.2184.1.S1_at 1.6.99.3 50198865-27 0.4 �
NADH dehydrogenase subunit 1 SofAffx.2185.1.S1_at 50198865-28 0.5 �
NADH dehydrogenase subunit 4 SofAffx.2180.1.S1_at 50198865-23 0.5 �
NADH dehydrogenase subunit 5 SofAffx.2177.1.S1_at 50198865-20 0.4 �
NADH dehydrogenase subunit 7 SofAffx.2187.1.S1_at 50198865-29 0.4 �
9 photosystem I P700 apoprotein A1 gene SofAffx.2191.1.S1_at - 50198865-64 0.3 ��
10 photosystem I reaction center subunit XI Sof.3556.1.S1_at - CA274385 0.2 ��
SofAffx.748.1.S1_at CF574993 0.4 �
11 photosystem I subunit O Sof.2003.2.S1_a_at - CA300310 0.05 ���
12 photosystem I subunit VII gene SofAffx.2181.1.S1_at - 50198865-24 0.4 �
13 photosystem I subunit VIII gene SofAffx.2122.1.S1_at - 50198865-72 0.4 �
14 photosystem II 47 kDa protein gene SofAffx.2146.1.S1_at - 50198865-86 0.5 �
15 photosystem II oxygen evolving complex Sof.3600.1.S1_at - CA280949 0.2 ��
Sof.3585.1.S1_at - CA251032 0.3 ��
16 protochlorophyllide reductase Sof.2965.1.S1_at 1.3.1.33 CA195783 0.2 ��
Dark reactions
1 chloroplastic malate dehydrogenase (NADP-dependent) SofAffx.151.1.S1_at 1.1.1.82 CF577213 0.4 �
2 NADP-dependent malic enzyme Sof.2259.3.S1_x_at 1.1.1.40 CA093639 0.2 ��
Sof.2259.3.S1_at CA093639 0.2 ��
Sof.2259.2.A1_s_at CA093726 0.4 �
Sof.2259.1.S1_x_at CA192976 0.4 �
3 phosphoglycerate kinase (chloroplastic) Sof.3174.2.S1_at 2.7.2.3 CA085978 0.3 ��
Sof.3174.1.S1_at CA194701 0.4 �
4 RuBisCO SofAffx.93.1.S1_at 4.1.1.39 CF577137 0.1 ���
RuBisCO large subunit-binding protein Sof.4352.2.S1_a_at CA247421 0.4 �
RuBisCO large subunit-binding protein Sof.4352.1.S1_at CA257279 0.5 �
5 RuBisCO small subunit Sof.3568.1.S1_at CA275587 0.1 ���
RuBisCo subunit binding-protein beta subunit SofAffx.880.1.S1_s_at CF574395 0.5 �
RuBisCo subunit binding-protein beta subunit SofAffx.880.1.S1_at CF574395 0.5 �
Sugar signaling, transport, and Pi metabolism
1 glucose-6-phosphate/phosphate- transporter Sof.161.1.S1_at - CA109224 9.7 ���
Sof.3931.2.A1_s_at - CA295728 8.7 ���
2 sugar transporter (putative hexose) SofAffx.1960.1.S1_at - BU925715 2.4 �
3 sugar transporter type 2a (putative) SofAffx.8.1.S1_at - AY165599 3.0 �
4 trehalose 6-phosphate synthase Sof.4223.1.S1_at 2.4.1.15 CA176198 0.2 ��
SofAffx.974.1.S1_at CF573831 0.3 ��
5 trehalose-phosphatase Sof.3105.2.A1_at 3.1.3.12 CA086449 3.6 �

Chapter 6: Sugar-mediated regulation of photosynthesis
180
6 inorganic pyrophosphatase Sof.3119.2.S1_at 3.6.1.1 CA111104 3.7 �
SofAffx.1668.1.S1_s_at CF571565 4.4 ��
7 phosphate translocator SofAffx.1399.1.S1_at CF572284 4.4 ��
Sof.4652.1.S1_at CA227092 3.1 �
Cell wall metabolism
1 beta-expansin Sof.3272.3.A1_a_at - CA248491 2.3 �
2 caffeic acid 3-O-methyltransferase SofAffx.314.1.S1_s_at 2.1.1.68 CF572353 2.4 �
Sof.3584.1.S1_at AJ231133 2.3 �
3 callose synthase Sof.3815.1.S1_a_at 2.4.1.34 CA196999 2.2 �
4 cellulose synthase Sof.4824.2.S1_a_at 2.4.1.12 CA250044 2.6 �
Sof.3525.1.S1_at CA254294 2.9 �
Sof.3822.1.S1_at CA221011 2.8 �
Sof.2699.1.S1_a_at CA244798 3.3 �
Sof.5033.1.S1_at CA148942 4.9 ��
SofAffx.1961.1.S1_s_at BU925771 5.1 ��
Sof.3361.1.S1_x_at CA134516 5.0 ��
5 endo-1,4-beta-glucanase Sof.1249.1.S1_at 3.2.1.4 CA105799 7.0 ��
Sof.1249.2.S1_at CA265758 3.1 �
Sof.4805.1.S1_at CA218775 5.1 ��
Sof.4805.2.S1_a_at CA219099 2.4 �
6 endo-1,3-beta-glucanase Sof.3799.1.A1_a_at 3.2.1.6 CA085569 2.2 �
7 chitinase Sof.2983.1.S1_at 3.2.1.14 CA181562 5.8 ��
Sof.2983.1.S1_a_at CA181562 5.3 ��
SofAffx.1726.1.S1_s_at CF571539 6.8 ��
8 pectin acetylesterase Sof.4115.1.S1_at 3.1.1.6 CA244283 3.9 �
9 UDP-D-glucuronate decarboxylase Sof.4204.3.S1_a_at 4.1.1.35 CA254458 2.1 �
10 xyloglucan endo-beta-1,4-glucanase SofAffx.1583.1.S1_at CF571758 4.5 ��
Sof.3569.1.S1_at CA074575 2.1 �
Stress response
1 alcohol dehydrogenase SofAffx.1881.1.S1_at 1.1.1.1 CF571023 3.3 �
Sof.3021.1.S1_at CA065880 2.3 �
2 aldehyde dehydrogenase Sof.488.2.S1_at 1.2.1.3 CA148351 2.2 �
Sof.488.1.A1_at CA204366 2.3 �
3 chalcone synthase Sof.702.1.S1_at 2.3.1.74 BU103687 5.4 ��
4 cold acclimation protein SofAffx.400.1.S1_at - CF575714 2.2 �
Sof.3467.1.S1_s_at CA267486 4.0 �
Sof.3467.1.S1_at CA267486 3.5 �
5 cold induced - low temperature and salt responsive
protein SofAffx.125.1.S1_s_at - CF575717 2.7 �
Sof.4293.1.S1_at BQ535164 2.7 �
SofAffx.125.3.S1_x_at CF574964 3.0 �
SofAffx.125.1.S1_x_at CF575717 2.1 �
SofAffx.125.2.S1_at CF572632 2.4 �
6 flavodoxin Sof.19.1.S1_at 1.19.6.1 CA093296 0.5 �
7 glutamate decarboxylase Sof.3466.1.A1_at 4.1.1.15 CA270299 2.7 �
Sof.3466.2.S1_at CA171450 3.0 �
8 heat shock like protein Sof.2216.1.A1_at - CA093476 0.5 �
9 jacalin Sof.676.1.S1_at - CA135644 22.7 ���
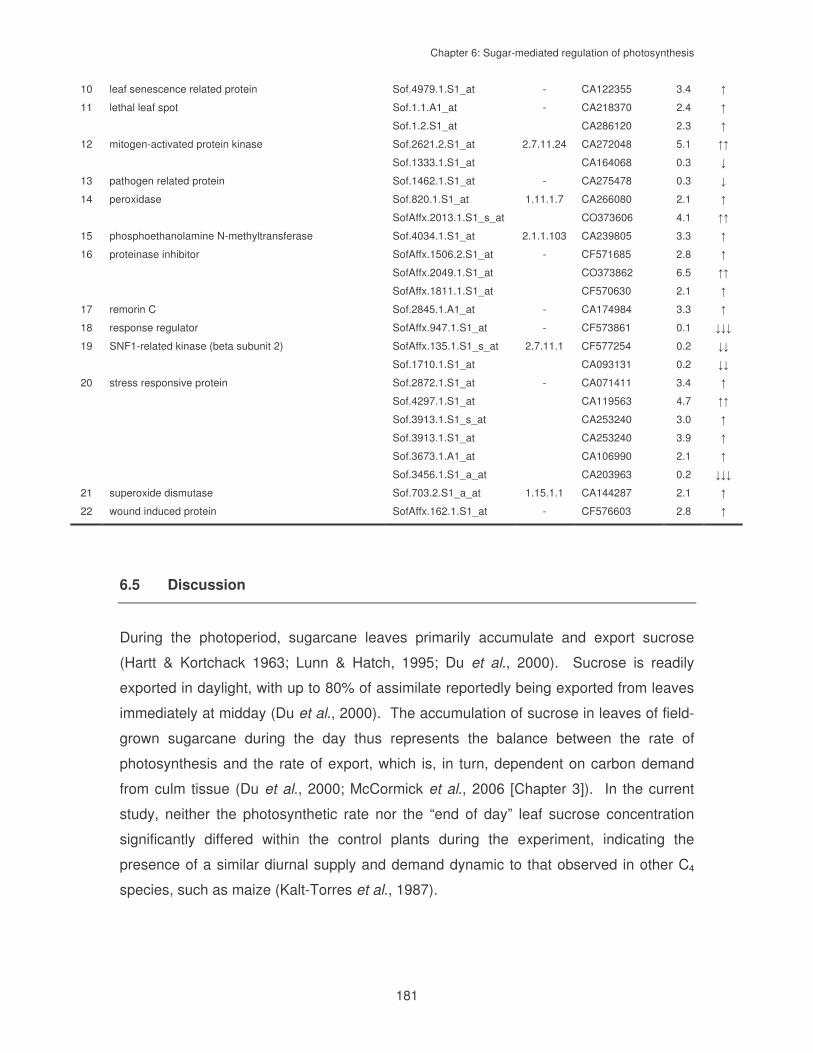
Chapter 6: Sugar-mediated regulation of photosynthesis
181
10 leaf senescence related protein Sof.4979.1.S1_at - CA122355 3.4 �
11 lethal leaf spot Sof.1.1.A1_at - CA218370 2.4 �
Sof.1.2.S1_at CA286120 2.3 �
12 mitogen-activated protein kinase Sof.2621.2.S1_at 2.7.11.24 CA272048 5.1 ��
Sof.1333.1.S1_at CA164068 0.3 �
13 pathogen related protein Sof.1462.1.S1_at - CA275478 0.3 �
14 peroxidase Sof.820.1.S1_at 1.11.1.7 CA266080 2.1 �
SofAffx.2013.1.S1_s_at CO373606 4.1 ��
15 phosphoethanolamine N-methyltransferase Sof.4034.1.S1_at 2.1.1.103 CA239805 3.3 �
16 proteinase inhibitor SofAffx.1506.2.S1_at - CF571685 2.8 �
SofAffx.2049.1.S1_at CO373862 6.5 ��
SofAffx.1811.1.S1_at CF570630 2.1 �
17 remorin C Sof.2845.1.A1_at - CA174984 3.3 �
18 response regulator SofAffx.947.1.S1_at - CF573861 0.1 ���
19 SNF1-related kinase (beta subunit 2) SofAffx.135.1.S1_s_at 2.7.11.1 CF577254 0.2 ��
Sof.1710.1.S1_at CA093131 0.2 ��
20 stress responsive protein Sof.2872.1.S1_at - CA071411 3.4 �
Sof.4297.1.S1_at CA119563 4.7 ��
Sof.3913.1.S1_s_at CA253240 3.0 �
Sof.3913.1.S1_at CA253240 3.9 �
Sof.3673.1.A1_at CA106990 2.1 �
Sof.3456.1.S1_a_at CA203963 0.2 ���
21 superoxide dismutase Sof.703.2.S1_a_at 1.15.1.1 CA144287 2.1 �
22 wound induced protein SofAffx.162.1.S1_at - CF576603 2.8 �
6.5 Discussion
During the photoperiod, sugarcane leaves primarily accumulate and export sucrose
(Hartt & Kortchack 1963; Lunn & Hatch, 1995; Du et al., 2000). Sucrose is readily
exported in daylight, with up to 80% of assimilate reportedly being exported from leaves
immediately at midday (Du et al., 2000). The accumulation of sucrose in leaves of field-
grown sugarcane during the day thus represents the balance between the rate of
photosynthesis and the rate of export, which is, in turn, dependent on carbon demand
from culm tissue (Du et al., 2000; McCormick et al., 2006 [Chapter 3]). In the current
study, neither the photosynthetic rate nor the “end of day” leaf sucrose concentration
significantly differed within the control plants during the experiment, indicating the
presence of a similar diurnal supply and demand dynamic to that observed in other C4
species, such as maize (Kalt-Torres et al., 1987).

Chapter 6: Sugar-mediated regulation of photosynthesis
182
6.5.1 Leaf sugar accumulation is associated with a decrease in photosynthesis
The application of a cold-girdle to leaves effectively disrupted the balance between
export and fixation of carbon (Fig. 6.1). Similar to results from leaf cold-girdling
experiments conducted in other species (Krapp et al., 1993; Krapp & Stitt, 1995; Iglesias
et al., 2002), accumulation of sugars, in the form of hexose and sucrose, was linked to a
severe depression in photosynthetic rates, including A, ETR, Jmax and CE. A similar
decline in photosynthesis has also been observed when glucose was fed to detached
Spinacia oleracea (L.) leaves (Krapp et al., 1991). Similarly, cold-girdling of Spinacia
leaves resulted in a decrease in A soon after the application of the cold-girdle, while no
significant effect on E and Gs was observed (Krapp & Stitt, 1995). In the current study, E
and Gs were significantly lower after 24 h, although this change was not as marked as
that observed for A and ETR, which continued to decline until 72 h (Table 6.1). This
suggests that the cold-girdle influenced photosynthesis through biochemical modulation,
rather than simply through control of stomata.
6.5.2 Leaf sugar accumulation leads to a decrease in the expression of
photosynthesis-related genes
Changes in cold-girdled leaf gene expression are a result of the accumulation of the
end-products of photosynthesis and the consequent disruption in the homeostasis of the
source-sink regulatory mechanisms (Smeekens, 2000; Paul & Foyer, 2001). The
accumulation of leaf carbohydrates has previously been shown to repress the
expression of genes involved in photosynthesis, and furthermore, to disturb the carbon:
nitrogen balance through changes in the investment of nitrogen into the photosynthetic
machinery (Paul & Driscoll, 1997; Paul & Pellny, 2003). In cold-girdled Spinacia leaves,
the accumulation of sugars resulted in a concurrent decrease in the expression of
transcripts coding for Rubisco (rbcS), chlorophyll-a-binding protein (cab) and the D-
subunit of thylakoid ATP synthase (atpD) (Krapp & Stitt, 1995). Decreased Rubisco
levels have been shown to limit photosynthesis (Quick et al., 1991), while an inverse
correlation between Rubisco activity and glucose concentration has been reported
(Krapp et al., 1991).
In the present study, the accumulation of leaf sugars resulted in the down-regulation of
21 photosynthesis-related genes, including those mentioned above, comprising genes

Chapter 6: Sugar-mediated regulation of photosynthesis
183
associated with the C4 photosynthetic pathway, photosystems I and II, and the PCR
cycle (Table 6.3). It is likely that sugar-mediated down-regulation of photosynthesis in
C3 species occurs via an intracellular mechanism, as both photosynthesis and sucrose
synthesis occur in the same cell. However, in C4 plants, sucrolytic and photosynthetic
activities are localised in mesophyll and bundle sheath cells, respectively (Fig. 6.4),
although the extent of this separation varies between species (Lunn & Furbank, 1997).
Work in maize, a C4 relative of sugarcane, has demonstrated that the sucrolysis and
glycolysis-related enzymes, sucrose phosphate synthase (SPS; EC 2.4.1.14), sucrose
phosphate phosphatase (SPP; EC 3.1.3.24) and FBPase, are predominantly localized in
the cytosol of mesophyll cells (Downton and Hawker, 1973; Furbank et al., 1985),
indicating that sucrose is synthesized almost exclusively in the mesophyll of maize
source leaves. Thus the putative sugar-signaling pathways limiting photosynthesis in
the current cold-girdling study are likely to be different to those observed in work on C3
species (Krapp et al., 1993; Krapp & Stitt, 1995; Iglesias et al., 2002).
6.5.3 Leaf sugar accumulation disturbs glycolysis and sugar partitioning, and induces a
stress-related response
The observed increases in FBPase, TPI and GPD, and co-ordinate decrease in PFP
expression (Table 6.3), indicate a decrease in partitioning of imported chloroplastic
triose-phosphate (triose-P) towards hexose and sucrose production with a shift towards
alternative biosynthetic processes (Fig. 6.4). The overall increase in expression of all
genes identified as involved in cell wall metabolism further suggests an increase in
carbon partitioning to other activities under conditions of excess sugar abundance. In
addition, the up-regulation of NADH-MD and MUP expression are indicative of an
increase in glycolytic flux towards mitochondrial metabolism. Notably, increases in MUP
activity are associated with increased conversion of pyruvate to citrate within the TCA
cycle (Smith et al., 2004) and increased tolerance to oxidative stress, specifically from
photorespiration (Sweetlove et al., 2006). This suggests that changes in mitochondria-
related genes in the current study are likely a direct response to the cold-girdling
treatment.
Numerous genes involved in stress response were also up-regulated. Davies and
Robinson (2000) have suggested that the considerable changes in osmotic pressure and
water potential that occur during grape berry ripening may result in transcription of genes

Chapter 6: Sugar-mediated regulation of photosynthesis
184
involved in stress management. Thus, it is possible that abiotic stresses accompanying
high accumulation of leaf sugars observed in the current study resulted in the increased
expression of stress-related genes, as has been seen during sugarcane culm maturation
(Carson et al., 2002). However, past studies have demonstrated that the expression of
several of the stress response genes, including ADH (Denis, 1987), CS (Tsukaya et al.,
1991) and proteinase inhibitors (Johnson & Ryan, 1990), is regulated by sugars, in
particular, glucose. Furthermore, expression of a jacalin gene was recently shown to be
induced though glucose feeding in Arabidopsis (Masclaux-Daubresse et al., 2007). The
up-regulation of these genes in the current study thus strongly suggests that stress- and
sugar-sensing mechanisms may interact and operate within similar signaling pathways
in sugarcane. It has been suggested that a common phosphorylating signal transduction
pathway may exist for sugar and stress signaling (Ehness et al., 1997).

Chapter 6: Sugar-mediated regulation of photosynthesis
185
Fig. 6.4. The separation of glycolysis and photosynthesis in a C4 system. A putative signaling
role for trehalose 6-phosphate (T6P) is shown. Boxes in grey illustrate genes that were up (+) or down (-) regulated in sugarcane leaves cold-girdled for 56 h. Importantly, the availability of mesophyll triose-P for recycling Pi back to the PCR cycle in the bundle sheath is indicated. Abbreviations: 3PGA – 3-phosphoglycerate; hexose-P – hexose phosphates, DAP - dihydroxyacetone phosphate; GPD - glyceraldehyde-3-phosphate dehydrogenase (EC 1.2.1.12); G6PT – glucose 6-phosphate/phosphate translocator; hex-P – hexose phosphate; NADH-MD – NADH-dependent malate dehydrogenase (EC 1.1.1.37); NADP-MD – NADP-dependent malate dehydrogenase (EC 1.1.1.82); NADP-ME – NADP-dependent malic enzyme (EC 1.1.1.40); OAA – oxaloacetate; PEP – phosphoenolpyruvate; PGK - phosphoglycerate kinase (EC 2.7.2.3); PPdK – pyruvate orthophosphate dikinase (EC 2.7.9.1); RuBP – ribulose bisphosphate; TPS - trehalose phosphate synthase (EC 2.4.1.15); TPP - trehalose phosphate phosphatase (EC 5.3.1.1); triose-P – triose phosphate; triosphosphate isomerase (EC 5.3.1.1).
3PGA PCR cycle
PFP
CYTOSOL
CHLOROPLAST
Hex-P
MITOCHONDRIA
DAP 3PGATPI
GPD
Mesophyll Bundle sheath
3PGA
Rubisco
malate
NADP-ME
CO2
Krebs cycle
Sucrose metabolism
Cell wall metabolism
Triose- P
Triose-P
malate
malate
Triose-PPGK
CHLOROPLAST
CYTOSOL
OAA
OAANADP-MD
NADH-MDpyruvate
PEP
CO2
PEP
+
_
_
_
_
_
++
+
TPS
TPPT6P
_ +
Trehalose_
FBPase
Starch metabolism
++
Hexose metabolism
Hex-P
+
+
+
G6PT
3PGA PCR cycle
PFP
CYTOSOL
CHLOROPLAST
Hex-P
MITOCHONDRIA
DAP 3PGATPI
GPD
Mesophyll Bundle sheath
3PGA
Rubisco
malate
NADP-ME
CO2CO2
Krebs cycle
Sucrose metabolism
Cell wall metabolism
Triose- P
Triose-P
malate
malate
Triose-PPGK
CHLOROPLAST
CYTOSOL
OAA
OAANADP-MD
NADH-MDpyruvate
PEP
CO2CO2
PEP
++
__
__
__
__
__
++++
++
TPS
TPPT6P
__ ++
Trehalose__
FBPase
Starch metabolism
++++
Hexose metabolism
Hex-P
++
++
++
G6PT

Chapter 6: Sugar-mediated regulation of photosynthesis
186
The CWI isoform Incw4, a putatively unbound apoplastic CWI (Kim et al., 2000), was
significantly down-regulated (Table 6.3). The expression of CWI has previously been
linked to a variety of tissue specific, sugar sensing-mechanisms and stress related
stimuli (Sinha et al., 2002). Nicotiana tabacum (L.) over-expressing CWI reportedly
exhibits an accumulation of leaf carbohydrates and a consequent decrease in rbsS
transcript levels (Von Schaewen, 1990). In the present study, down-regulation of Incw4
was likely a response to the accumulation of apoplastic hexose. The corresponding up-
regulation of a sugar transporter suggests the presence of an additional ‘mopping up’
mechanism for hexose (and sucrose), perhaps to assist in re-partitioning excess carbon
into different pathways.
The locations of the identified sugar transport genes and associated mechanisms of
regulation remain unclear. However, the expression of putative sugar transporter (PST
type 2a) transcripts has previously been identified within phloem companion cells and
primarily linked to the maintenance of sugar fluxes (Casu et al., 2003). In yeast,
membrane bound receptors closely related to sugar transporters are used to sense
external sugar concentrations and activate a signal transduction pathway leading to the
regulation of transporter gene expression (Lalonde et al., 1999). As sugar transporters
are known to play a key role in sugar partitioning and are linked to intracellular sugar
signaling mechanisms regulating photosynthesis in higher plants (Lalonde et al., 1999;
Williams et al., 2000), the up-regulation of sugar transporters in the current study may
facilitate a dual role; firstly, to partition excess sugars to the phloem or intracellular
storage compartments, and secondly, to initiate a signal to down-regulate photosynthetic
carbon accumulation. Notably, the signal tranduction kinases, MAPK and SnRK1, also
exhibited differential expression in response to the cold-girdling treatment. Whereas
SnRK1 has frequently been proposed to be involved in sugar responses leading to
transcriptional regulation of genes involved in carbohydrate metabolism (Toroser et al.,
2000; Tiessen et al., 2003), MAPKs are associated with the transduction of intracellular
signals by extracellular targets (Roitsch et al., 2003). Thus, the changes in the
expression of these genes observed in this work could be indicative of an associated
sugar-stress induced signaling cascade between apoplast and cytosol (Ehness et al.,
1997; Rolland et al., 2002).

Chapter 6: Sugar-mediated regulation of photosynthesis
187
6.5.4 Trehalose metabolism – a potential sugar-signaling mechanism in sugarcane
A novel sugar-signaling system in sugarcane leaves is evident from the observed
changes in two genes related to trehalose metabolism, viz. TPS and TPP (Table 6.3).
The trehalose pathway has previously been characterised in sugarcane (Glasziou &
Gayler, 1969; Bosch, 2005; Glassop et al., 2007), although those studies examined the
effects of trehalose on culm sucrose accumulation. After initially being identified as
playing a role in sensing carbon status in yeast (Blásquez et al., 1993), T6P, and not
trehalose, is now implicated as a key sugar-sensing component involved in several
aspects of plant growth and development (Eastmond et al., 2003; Paul, 2007; Ramon &
Rolland, 2007). T6P does not appear to interact with HXK in higher plant species,
including sugarcane (Bosch, 2005), suggesting that trehalose metabolism is a HXK-
independent signaling pathway (Eastmond et al., 2002). Notably, the present microarray
data did not indicate any significant response from genes related to HXK or fructokinase
(EC 2.7.1.4). It is possible that HXK signaling does not play as prominent a role in sugar
sensing in sugarcane, as in C3 species (Graham et al., 1994; Jang & Sheen, 1994;
Moore et al., 2003). However, the present work has examined regulation only at the
transcript level, and further enzymatic analysis will be required to identify whether
allosteric regulation of HXK activity occurs. Based on the abundance of work
demonstrating the role of HXK in glucose signaling (for review see Rolland et al., 2006),
a sensing function in sugarcane is not unlikely.
In the current study, the observed changes in TPS and TPP may have led to a decrease
in T6P concentrations. Based on results from several recent studies, changes in T6P
may have significant effects on sugar partitioning and the regulation of photosynthesis in
sugarcane leaves (Fig. 6.4). Whereas increased T6P levels obtained through over-
expression of TPS in transgenic tobacco, has resulted in enhanced photosynthetic
capacity per unit leaf area (Paul et al., 2001); in transgenic Arabidopsis and tobacco,
increased expression of TPP has revealed that T6P depletion is associated with an
accumulation of sugar phosphates, decreased ATP levels and reduced photosynthetic
rates (Paul et al., 2001; Schluepmann et al., 2003). The precise mechanisms which link
T6P signaling to changes in photosynthetic activity are still unresolved, however, it is
suggested that T6P is a conduit for communicating sugar status in the cytosol to the
chloroplast (Pellny et al., 2005; Paul, 2007). Nevertheless, as sucrose metabolism and
photosynthesis are, to some extent, separated in C4 plants (Lunn & Furbank, 1997;

Chapter 6: Sugar-mediated regulation of photosynthesis
188
1999), the signaling pathway involving T6P in sugarcane may differ considerably from C3
species.
Down-regulation of TPS, with an associated reduction in T6P concentrations, has been
shown to result in an accumulation of sugars and starch, and increased cell wall
deposition in Arabidopsis embryos (Gomez et al., 2006). In particular, the direct redox
activation of AGPase by T6P has confirmed a role for T6P in regulating starch synthesis
(Kolbe et al., 2005). In the current work, the expression of AGPase and other starch-
related genes were significantly increased, demonstrating that T6P may be involved in
regulating source partitioning between sugars and starch in sugarcane leaves (Fig. 6.4).
The accumulation of starch, as opposed to sucrose, is not well documented in
sugarcane, and only constitutes a small fraction (17%) of daily leaf carbon accumulation
(Du et al., 2000). As such, the observed changes in starch-related genes were
unexpected. However, the putative involvement of T6P in regulating sugar, starch and
photosynthetic activity, as seen in other species (Paul et al., 2001; Schluepmann et al.,
2003), identifies trehalose genes as strong potential targets for manipulating the
availability of sucrose for export from leaves (Fig. 6.4).
6.5.5 Evidence for Pi limitation and possible interactions with trehalose
The array data obtained in this study provided evidence of a further Pi–related, negative
feedback effect on photosynthetic capacity in sugarcane. In leaves, the rate of end-
product accumulation largely determines the rate at which Pi is recycled back to the
reactions of photosynthesis (Pieters et al., 2001; Paul & Pellny, 2003). However, under
conditions of excess carbon abundance, the accumulation of Pi within phosphorylated
hexose and triose pools can act to suppress photosynthetic activity (Stitt & Quick, 1989)
(Fig. 6.4). The G6PT gene is not typically expressed in photosynthetic tissue (Lloyd &
Zakhleniuk, 2004); however, in the current cold-girdling experiment, large increases in
G6PT expression, in addition to increases in Pi translocator expression, were observed
(Table 6.3). Similar increases in G6PT were previously found in sucrose accumulating
Arabidopsis pho3 mutants, suggesting that the regulation of Pi transport may represent
an alternative mechanism for balancing the chloroplastic and cytosolic Pi pools (Lloyd &
Zakhleniuk, 2004). Alternatively, up-regulation of G6PT expression may be a means to
alleviate hexose accumulation in the chloroplast, resulting from sugar-mediated
feedback limitation of triose-P export. However, the increase in expression of PPase in

Chapter 6: Sugar-mediated regulation of photosynthesis
189
the present study does indicate a possible supplementation of cytosolic Pi supply at the
expense of pyrophosphate (PPi) (Table 6.3) (Lee et al., 2005). Notably, during the cold-
girdling treatment, the initial accumulation of leaf hexose declined after 8 h over the
duration of the experiment, while sucrose declined after 56 h (Fig. 6.1). This may be
indicative of adaptation by cold-girdled leaves to changes in carbon balance through the
partitioning excess sugars into other pathways (Peuke et al., 2006), possibly as an
additional mechanism to increase Pi availability.
Evidence for close interactions between Pi and sugar-signaling pathways now exists
(Müller et al. 2007). Pi status has been shown to affect the sugar-mediated,
transcriptional regulation of genes related to carbohydrate metabolism and
photosynthesis, including AGPase and the small subunit of Rubisco (Nielsen et al.,
1998; Ciereszko et al., 2001). Similar to results from the present study, alterations in
gene expression associated with Pi-related metabolism have been linked to changes in
TPS/TPP gene expression in sucrose accumulating Arabidopsis mutants (Lloyd &
Zakhleniuk, 2004). Low T6P concentrations are associated with high levels of
phosphorylated sugar intermediates and low ATP levels, whereas high T6P is
associated with the opposite (Paul, 2007; Schluepmann et al., 2007). Müller et al.
(2007) have recently provided further evidence for a positive correlation between T6P
and Pi levels in Arabidopsis plants, as TPS expression was shown to increase under
conditions of Pi abundance. Although the regulatory mechanisms that link Pi and sugar
sensors are likely different in C4 plants compared to model C3 species, the current work
provides evidence for a transcript-related interaction between Pi- and trehalose-
metabolism in sugarcane. However, to confirm this relationship additional work will be
required, at both the enzymatic and metabolite levels.
6.6 Concluding remarks
Photosynthetic rates in sugarcane leaves are regulated by the demand for carbon from
sink tissues. Sink demand, in turn, determines the sugar status of the source. The
observed accumulation of sugars, particularly hexoses, in cold-girdled leaves has
provided strong evidence for a sink-dependent, sugar-based negative feedback effect on
photosynthetic activity. Concurrent analyses of changes in gene expression indicate a
link between sugar status and the regulation of transcripts involved in a variety of
Chapter 6: Sugar-mediated regulation of photosynthesis
190
different metabolic process, including stress response, carbohydrate metabolism and
photosynthesis. These data indicate that feedback regulation may operate through
several routes. In particular, T6P, Pi and sugar transporters appear to play key roles in
regulating sugarcane source leaf production and export. Future metabolic work should
concentrate on the individual, and possibly integrated, roles of these targets. As export
rates in sugarcane leaves are reportedly high, preliminary results from the current study
suggest that appropriate increases in T6P levels could result in an improvement in
source photosynthetic rates and overall sink sucrose accumulation.

Chapter 6: Sugar-mediated regulation of photosynthesis
191
6.7 References
Allison JCS, Williams HT, Pammenter NW. 1997. Effect of specific leaf nitrogen on
photosynthesis of sugarcane. Annals of Applied Biology 63: 135–144.
Amaya A, Cock JH, Hernandez A, Irvine J. 1995. Bioligía. In: Casselett C, Torres J,
Isaacs C, eds. El cultivo de la Ca�a en la zona azucarera de Colombia. Cali, Colombia:
Cenica�a, 31–62.
Altschul SF, Madden TL, Schaffer AA, Zhang Z, Miller W, Lipman DJ. 1997. Gapped
BLAST and PSI-BLAST: a new generation of protein database search programs. Nucleic
Acids Research 25: 3389–3402.
Arruda P. 2001. Sugarcane transcriptome. A landmark in plant genomics in the tropics.
Genetic and Molecular Biology 24: 1–4.
Basu PS, Sharma A, Garg ID, Sukumaran NP. 1999. Tuber sink modifies photosynthetic
response in potato under water stress. Environmental and Experimental Botany 42: 25–29.
Bläsing OE, Gibon Y, Günther M, Höhne M, Morcuende R, Osuna D, Thimm O,
Usadel B, Scheible WR, Stitt M. 2005. Sugars and Circadian Regulation Make Major
Contributions to the Global Regulation of Diurnal Gene Expression in Arabidopsis. The Plant
Cell 17: 3257–3281.
Blásquez MA, Lagunas, R, Gancedo C, Gancedo JM. 1993. Trehalose-6-phosphate, a
new regulator of yeast glycolysis that inhibits hexokinases. FEBS Letters 329: 51–54.
Bosch S. 2005. Trehalose and carbon partitioning in sugarcane. PhD thesis. Institute of Plant
Biotechnology, University of Stellenbosch, South Africa.
Bugos RC, Chiang VL, Zhang XH, Campbell ER, Podila GK, Campbell WH. 1995.
RNA isolation from plant tissues recalcitrant to extraction in guanidine. Biotechniques 19:
734–737.
Bull TA, Tovey DA. 1974. Aspects of modelling sugar cane growth by computer simulation.
Proceedings of the International Society of Sugar Cane Technologists 165: 1021–1032.
Carson DL, Huckett BI, Botha FC. 2002. Sugarcane ESTs differentially expressed in
immature and maturing internodal tissue. Plant Science 162: 289–300.
Casu RE, Dimmock CM, Chapman SC, Grof CPL, McIntyre CL, Bonnett GD, Manners
JM. 2004. Identification of differentially expressed transcripts from maturing stem of
sugarcane by in silico analysis of stem expressed sequence tags and gene expression
profiling. Plant Molecular Biology 54: 503–517.
Casu RE, Grof CPL, Rae AL, McIntyre CL, Dimmock CM, Manners JM. 2003.
Identification of a novel sugar transporter homologue strongly expressed in maturing stem
vascular tissues in sugarcane by expressed sequence tag and microarray analysis. Plant
Molecular Biology 52: 371–386.
Casu RE, Jarmey J, Bonnett GD, Manners JM. 2007. Identification of transcripts
associated with cell wall metabolism and development in the stem of sugarcane by Affymetrix
Chapter 6: Sugar-mediated regulation of photosynthesis
192
GeneChip Sugarcane Genome Array expression profiling. Functional and Integrative
Genomics 7: 153–167.
Ciereszko I, Johnsson H, Hurry V, Kleczkowski LA. 2001. Phosphate status affects the
gene expression, protein content and enzymatic activity of UDP-glucose pyrophosphorylase
in wild-type and pho mutants of Arabidopsis. Planta 212: 598–605.
Davies C, Robinson SP. 2000. Differential screening indicates a dramatic change in mRNA
profiles during grape berry ripening. Cloning and characterization of cDNAs encoding
putative cell wall and stress response genes. Plant Physiology 122: 803–812.
Denis CL. 1987. The effects of ADR1 and CCR1 gene dosage on the regulation of the glucose-
repressible alcohol dehydrogenase from Saccharomyces cerevisiae. Molecular and General
Genetics 208: 101–106.
Du YC, Nose A, Kondo A, Wasano K. 2000. Diurnal changes in photosynthesis in
sugarcane leaves. II. Enzyme activities and metabolite levels relating to sucrose and starch
metabolism. Plant Production Science 3: 9–16.
Eastmond PJ, Li Y, Graham IA. 2003. Is trehalose-6-phosphate a regulator of sugar
metabolism in plants? Journal of Experimental Botany 54: 533–537.
Eastmond PJ, van Dijken AJ, Spielman M, Kerr A, Tissier AF, Dickinson HG, Joens
JD, Smeekens SC, Graham IA. 2002. Trehalose-6-phosphate synthase 1, which
catalyses the first step in trehalose synthesis, is essential for Arabidopsis embryo maturation.
The Plant Journal 29: 225–235.
Edwards GE, Baker NR. 1993. Can CO2 assimilation in maize leaves be predicted accurately
from chlorophyll fluorescence analysis? Photosynthesis Research 37: 89–102.
Ehness R, Ecker M, Godt DE, Roitsch T. 1997. Glucose and stress independently
regulate source and sink metabolism and defense mechanisms via signal transduction
pathways involving protein phosphorylation. The Plant Cell 9: 1825–1841.
Franck N, Vaast P, Genard M, Dauzat J. 2006. Soluble sugars mediate sink feedback
down-regulation of leaf photosynthesis in field-grown Coffea arabica. Tree Physiology 26:
517–525.
Franco-Zorrilla JM, Martin AC, Leyva A, Paz-Ares J. 2005. Interaction between
Phosphate-Starvation, Sugar, and Cytokinin Signaling in Arabidopsis and the Roles of
Cytokinin Receptors CRE1/AHK4 and AHK3. Plant Physiology 138: 847–857.
Gibon Y, Blaesing OE, Hannemann J, Carillo P, Höhne M, Hendriks JHM, Palacios
N, Cross J, Selbig J, Stitt M. 2006. A robot-based platform to measure multiple
enzyme activities in Arabidopsis using a set of cycling assays: comparison of changes of
enzyme activities and transcript levels during diurnal cycles and in prolonged darkness. The
Plant Cell 16: 3304–3325.
Giese JO, Herbers K, Hoffmann M, Klosgen RB, Sonnewald U. 2005. Isolation and
characterization of a novel plastidic hexokinase from Nicotiana tabacum. FEBS Letters 579:
827–831.

Chapter 6: Sugar-mediated regulation of photosynthesis
193
Glasziou KT, Gayler KR. 1969. Sugar transport: occurrence of trehalose activity in sugar
cane. Planta 85: 299–302.
Glassop D, Roessner U, Bacic A, Bonnett GD. 2007. Changes in the sugarcane
metabolome with stem development. Are they related to sucrose accumulation? Plant Cell
Physiology 48: 573–584.
Gomez LD, Baud S, Gilday A, Li Y, Graham I. 2006. Delayed embryo development in
the Arabidopsis trehalose-6-phosphate synthase 1 mutant is associated with altered cell wall
structure, decreased cell division and starch accumulation. The Plant Journal 46: 69–84.
Graham IA, Denby KJ, Leaver CJ. 1994. Carbon catabolite repression regulates glyoxylate
cycle gene expression in cucumber. The Plant Cell 6: 761–772.
Groenewald J-H, Botha FC. 2007. Down-regulation of pyrophosphate: fructose 6-phosphate
1-phosphotransferae (PFP) activity in sugarcane enhances sucrose accumulation in
immature internodes. Transgenic Research DOI 10.1007/s11248-007-9079-x
Grof CPL, Campbell J. 2001. Sugarcane sucrose metabolism: scope for molecular
manipulation. Australian Journal of Plant Physiology 28: 1–12.
Gutiérrez-Miceli FA, Morales-Torres R, de Jesús Espinosa-Castañeda Y, Rincón-
Rosales R, Mentes-Molina J, Oliva-Llaven MA, Dendooven L. 2004. Effects of
parital defoliation on sucrose accumulation, enzyme activity and agronomic parameters in
sugar cane (Saccharum spp.). Journal of Agronomy and Crop Science 190: 256–261.
Harrington GN, Bush DR. 2003. The bifunctional role of hexokinase in metabolism and
glucose signaling. The Plant Cell 15: 2493–2496.
Hartt CE, Burr GO. 1967. Factors affecting photosynthesis in sugarcane. Proceedings of the
International Society of Sugar Cane Technologists 12: 590–609.
Hartt CE, Kortchak HP. 1966. Sugar gradients and translocation of sucrose in detached
blades of sugarcane. Plant Physiology 39: 460–474.
Huckett BA, Botha FC. 1995. Stability and potential use of RAPD markers in a sugarcane
genealogy. Euphytica 86: 117–125.
Iglesias DJ, Lliso I, Tadeo FR, Talon M. 2002. Regulation of photosynthesis through
source: sink imbalance in citrus is mediated by carbohydrate content in leaves. Physiologia
Plantarum 116: 563–572.
Ingelbrecht IL, Mandelbaum CI, Mirkov TE. 1998. Highly sensitive northern hybridization
using a rapid protocol for downward alkaline blotting of RNA. BioTechniques 25: 420–425.
Irizarry RA, Bolstad BM, Collin F, Cope LM, Hobbs B, Speed TP. 2003. Summaries of
Affymetrix GeneChip probe level data. Nucleic Acid Research 4: (e15)1–8.
Jackson PA. 2005. Breeding for improved sugar content in sugarcane. Field Crops Research
92: 277–290.
Jang JC, Sheen J. 1994. Sugar sensing in higher plants. The Plant Cell 6: 1665–1679.
Johnson R, Ryan CA. 1990. Wound-induced potato inhibitor II genes: enhancement of
expression by sucrose. Plant Molecular Biology 14: 527–536.

Chapter 6: Sugar-mediated regulation of photosynthesis
194
Jones MGK, Outlaw WH, Lowry OH. 1977. Enzymic assay of 10-7 to 10-14 moles of sucrose
in plant tissues. Plant Physiology 60: 379–383.
Kalt-Torres W, Kerr PS, Usuda H, Huber SC. 1987. Diurnal changes in maize leaf
photosynthesis. Plant Physiology 83: 283–288.
Karim S, Aronsson H, Ericson H, Pirhonen M, Leyman B, Welin B, Mäntylä E, Palva
ET, Van Dijck P, Holmström KO. 2007. Improved drought tolerance without undesired
side effects in transgenic plants producing trehalose. Plant Molecular Biology DOI
10.1007/s11103-007-9159-6
Kim J-Y, Mahé A, Guy S, Brangeon J, Roche O, Chourey PS, Prioul J-L. 2000.
Characterisation of two members of the maize gene family, Incw3 and Incw4, encoding cell-
wall invertases. Gene 245: 89–102.
Krapp A, Hofman B, Schäfer C, Stitt M. 1993. Regulation of the expression of rbcS and
other photosynthetic genes by carbohydrates: mechanism for the sink regulation of
photosynthesis? The Plant Journal 3: 817–828.
Krapp A, Quick WP, Stitt W. 1991. Ribulose-1,5-bisphosphate carboxylase-oxygenase,
other Calvin cycle enzymes and chlorophyll decrease when glucose is supplied to mature
spinach leaves via the transcription stream. Planta 186: 58–59.
Krapp A, Stitt M. 1995. An evaluation of direct and indirect mechanisms for the “sink
regulation” of photosynthesis in spinach: Changes in gas exchange, carbohydrates,
metabolites, enzyme activities and steady state transcript levels after cold-girdling leaves.
Planta 195: 313–323.
Kolbe A, Tiessen A, Schluepmann H, Paul M, Ulrich S, Geigenberger P. 2005.
Trehalose 6-phosphate regulates starch synthesis via post-translational redox activation of
ADP-glucose pyrophosphorylase. Proceedings of the Nation Academy of Sciences USA 102:
11118–11123.
Lalonde S, Boles E, Hellmann H, Barker L, Patrick JW, Frommer WB, Ward JM.
1999. The dual function of sugar carriers: transport and sugar sensing. The Plant Cell 11:
707–726.
Lawlor DW. 1987. Photosynthesis: metabolism, control and physiology. Harlow, UK: Longman
Scientific and Technical.
Lee JW, Lee DS, Bhoo SH, Jeon JS, Lee YH, Hahn TR. 2005. Transgenic Arabidopsis
plants expressing Escherichia coli pyrophosphatase display both altered carbon partitioning
in their source leaves and reduced photosynthetic rates. Plant Cell Reports 24: 374–382.
Lee JM, Williams ME, Tingey SV, Rafalski AJ. 2002. DNA array profiling of gene
expression changes during maize embryo development. Functional & Integrative Genomics
2: 13–27.
Leibbrandt NB, Snyman SJ. 2003. Stability of Gene Expression and Agronomic Performance
of a Transgenic Herbicide-Resistant Sugarcane Line in South Africa. Crop Science 43: 671–
677.

Chapter 6: Sugar-mediated regulation of photosynthesis
195
Lloyd JC, Zakhleniuk OV. 2004. Responses of primary and secondary metabolism to sugar
accumulation revealed by microarray expression analysis of the Arabidopsis mutant, pho3.
Journal of Experimental Botany 55: 1221–1230.
Lunn JE, Furbank RT. 1997. Localisation of sucrose-phosphate synthase and starch in
leaves of C4 plants. Planta 202: 106–111.
Lunn JE, Furbank RT. 1999. Sucrose biosynthesis in C4 plants. New Phytologist 143: 221–
37.
Lunn JE, Feil R, Hendriks JHM, Gibon Y, Morcuende Osuna D, Scheible WR. Carillo
P, Hajirezaei MR, Stitt M. 2006. Sugar-induced increases in trehalose 6-phosphate are
correlated with redox activation of ADPglucose pyrophosphorylase and higher rates of starch
synthesis in Arabidopsis thaliana. Biochemistry Journal 397: 139–148.
Lunn JE, Hatch MD. 1995. Primary partitioning and storage of photosynthate in sucrose and
starch in leaves of C4 plants. Planta 197: 385–391.
Ma H, Albert HA, Paull R, Moore PH. 2000. Metabolic engineering of invertase activities in
different subcellular compartments affects sucrose accumulation in sugarcane. Australian
Journal of Plant Physiology 27: 1021–1030.
Masclaux-Daubresse C, Purdy S, Lemaitre T, Pourtau N, Taconnat L, Renou JP,
Wingler A. 2007. Genetic variation suggests interaction between cold acclimation and
metabolic regulation of leaf senescence. Plant Physiology 143: 434–446.
Maxwell K, Johnson GN. 2000. Chlorophyll fluorescence - a practical guide.
Journal of Experimental Botany 51: 659–668.
McCormick AJ, Cramer MD, Watt DA. 2006. Sink strength regulates photosynthesis in
sugarcane. New Phytologist 171: 759–770.
Minchin PEH, Thorpe MR, Farrar JF, Koroleva OA. 2002. Source–sink coupling in young
barley plants and control of phloem loading. Journal of Experimental Botany 53: 1671–1676.
Moore B, Zhou L, Rolland F, Hall Q, Cheng W-H, Liu Y-X, Hwang I, Jones T, Sheen
J. 2003. Role of Arabidopsis glucose sensor HXK1 in nutrient, light, and hormonal signaling.
Science 300: 332–336.
Müller R, Morant M, Jarmer H, Nilsson L, Nielsen TH. 2007. Genome-wide analysis of
the Arabidopsis transcriptome reveals interaction of phosphate and sugar metabolism. Plant
Physiology 143: 156–171.
Nielsen TH, Krapp A, Röber-Schwarz U, Stitt M. 1998. The sugar-mediated regulation of
genes encoding the small subunit of Rubisco and the regulatory subunit of ADP glucose
pyrophosphorylase is modified by phosphate and nitrogen. Plant Cell and Environment 21:
443–454.
Pammenter NW, Loreto F, Sharkey TD. 1993. End-product feedback effects on
photosynthetic electron transport. Photosynthesis Research 35: 5–14.
Paul MJ. 2007. Trehalose 6-phosphate. Current Opinion in Plant Biology 10: 303–309.

Chapter 6: Sugar-mediated regulation of photosynthesis
196
Paul MJ, Driscoll SP. 1997. Sugar repression of photosynthesis: the role of carbohydrates in
signalling nitrogen deficiency through source:sink imbalance. Plant, Cell and Environement
20: 110–116.
Paul MJ, Foyer, CH. 2001. Sink regulation of photosynthesis. Journal of Experimental Botany
52: 1381–1400.
Paul MJ, Pellny TK. 2003. Carbon metabolite feedback regulation of leaf photosynthesis and
development. Journal of Experimental Botany 54: 539–547.
Paul MJ, Pellny TK, Goddijn IJM. 2001. Enhancing photosynthesis with sugar signals.
Trends in Plant Science 6: 197–200.
Pego JV, Kortsee AJ, Huijser C, Smeekens SCM. 2000. Photosynthesis, sugars and the
regulation of gene expression. Journal of Experimental Botany 51: 407–416.
Pellny TK, Ghannoum O, Conroy JP, Schluepmann H, Smeekens S, Andralojc J,
Krause KP, Goddijn O, Paul MJ. 2005. Genetic modification of photosynthesis with E.
coli genes for trehalose synthesis. Plant Biotechnology 2: 71–82.
Peuke AD, Windt C, Van As H. 2006. Effects of cold-girdling on flows in the transport
phloem in Ricinus communis: is mass flow inhibited? Plant Cell and Environment 29: 15–25.
Pieters AJ, Paul MJ, Lawlor DW. 2001. Low sink demand limits photosynthesis under Pi
deficiency. Journal of Experimental Botany 52: 1083–1091.
Roitsch T, Balibrea ME, Hofmann M, Proeis R, Sinna AK. 2003. Extracellular invertase:
key metabolic enzyme and PR protein. Journal of Experimental Botany 54: 513–524.
Ramon M, Rolland F. 2007. Plant development: introducing trehalose metabolism. Trends in
Plant Science 12: 185–188.
Rolland F, Baena-Gonzalez E, Sheen J. 2006. Sugar sensing and signaling in plants:
conserved and novel mechanisms. Annual Review of Plant Biology 57: 675–709.
Rolland F, Moore B, Sheen J. 2002. Sugar sensing and signaling in plants. The Plant Cell
14: 185–205.
Satoh-Nagasawa N, Nagasawa N, Malcober S, Sakai H, Jackson D. 2006. A trehalose
metabolic enzyme controls inflorescence architecture in maize. Nature 441: 227–230.
Sawers RJH, Liu P, Anufrikova K, Hwang JT, Brutnell TP. 2007. A multi-treatment
experimental system to examine photosynthetic differentiation in the maize leaf. BMC
Genomics 8: 1–13.
Schäfer C, Simper H, Hofmann B. 1992. Glucose feeding results in co-ordinated changes
of chlorophyll content, ribulose-1,5-bisphosphate carboxylase/oxygenase activity and
photosynthetic potential in photoautotrophic suspension-cultured cells of Chenopodium
rubrum. Plant, Cell and Environment 15: 343–350.
Schluepmann H, van Dijken A, Smeekens S, Paul M. 2003. Trehalose-6-phosphate is
indispensable for carbohydrate utilization and growth in Arabidopsis thaliana. Proceedings of
the National Academy of Sciences USA 100: 6849–6854.

Chapter 6: Sugar-mediated regulation of photosynthesis
197
Sinha AK, Hofmann MG, Romer U, Köckenberger W, Elling L, Roitsch T. 2002.
Metabolizable and non-metabolizable sugars activate different signal transduction pathways
in tomato. Plant Physiology 128: 1480–1489.
Smeekens S. 2000. Sugar-induced signal transduction in plants. Annual Review of Plant
Physiology and Plant Molecular Biology 51: 49–81.
Smith AM, Ratcliffe RG, Sweetlove LJ. 2004. Activation and function of mitochondrial
uncoupling protein in plants. Journal of Biochemistry 279: 51944–51952.
Stitt M, Quick WP. 1989. Photosynthetic carbon partitioning: its regulation and possibilities for
manipulation. Physiologica Plantarum 77: 633–641.
Sweetlove LJ, Lytovchenko A, Morgan M, Nunes-Nesi A, Taylor NL, Baxter CJ,
Eickmeier I, Fernie AR. 2006. Mitochondrial uncoupling protein is required for efficient
photosynthesis. Proceedings of the National Academy of Sciences USA 103: 19587–19592.
Tiessen A, Prescha K, Branscheid A, Palacios N, McKibbin R, Halford NG,
Geigenberger P. 2003. Evidence that SNF1-related kinase and hexokinase are involved in
separate sugar-signalling pathways modulating post-translational redox activation of ADP-
glucose pyrophosphorylase in potato tubers. The Plant Journal 35: 490–500.
Toroser D, Plaut Z, Huber SC. 2000. Regulation of a plant SNF1-related protein kinase by
glucose-6-phosphate. Plant Physiology 123: 403–411.
Tsukaya H, Ohshima T, Naito S, Chino M, Komeda Y. 1991. Sugar-dependent
expression of the CHS-A gene for chalcone synthase from petunia in transgenic Arabidopsis.
Plant Physiology 97: 1414–1421.
Vaughan MW, Harrington GN, Bush DR. 2002. Sucrose-mediated transcriptional regulation
of sucrose symporter activity in the phloem. Proceedings of the National Academy of
Sciences USA 99: 10876–10880.
Von Schaewen A, Stitt M, Schmidt R, Sonnewald U, Willmitzer L. 1990. Expression of
a yeast-derived invertase in the cell wall of tobacco and Arabidopsis plants leads to
accumulation of carbohydrate and inhibition of photosynthesis and strongly influences growth
and phenotype of transgenic tobacco plants. EMBO Journal 9: 3033–3044.
Watt DA, McCormick AJ, Govender C, Carson DL, Cramer MD, Huckett BI, Botha
FC. 2005. Increasing the utility of genomics in unraveling sucrose accumulation. Field
Crops Research 92: 149–158.
Whittaker A, Botha FC. 1999. Pyrophosphate:D-fructose-6-phosphate 1-phosphotransferase
activity patterns in relation to sucrose across sugarcane varieties. Physiologica Plantarum
107: 379–386.
Williams LE, Lemoine R, Sauer N. 2000. Sugar transporters in higher plants - a diversity of
roles and complex regulation. Trends in Plant Science 5: 283–290.
Wu L, Birch RG. 2007. Doubled sugar content in sugarcane plants modified to produce a
sucrose isomer. Plant Biotechnology Journal 5: 109–117.

Chapter 6: Sugar-mediated regulation of photosynthesis
198
Yanagisawa S, Yoo SD, Sheen J. 2003. Differential regulation of EIN3 stability by glucose
and ethylene signalling in plants. Nature 425: 521–525.
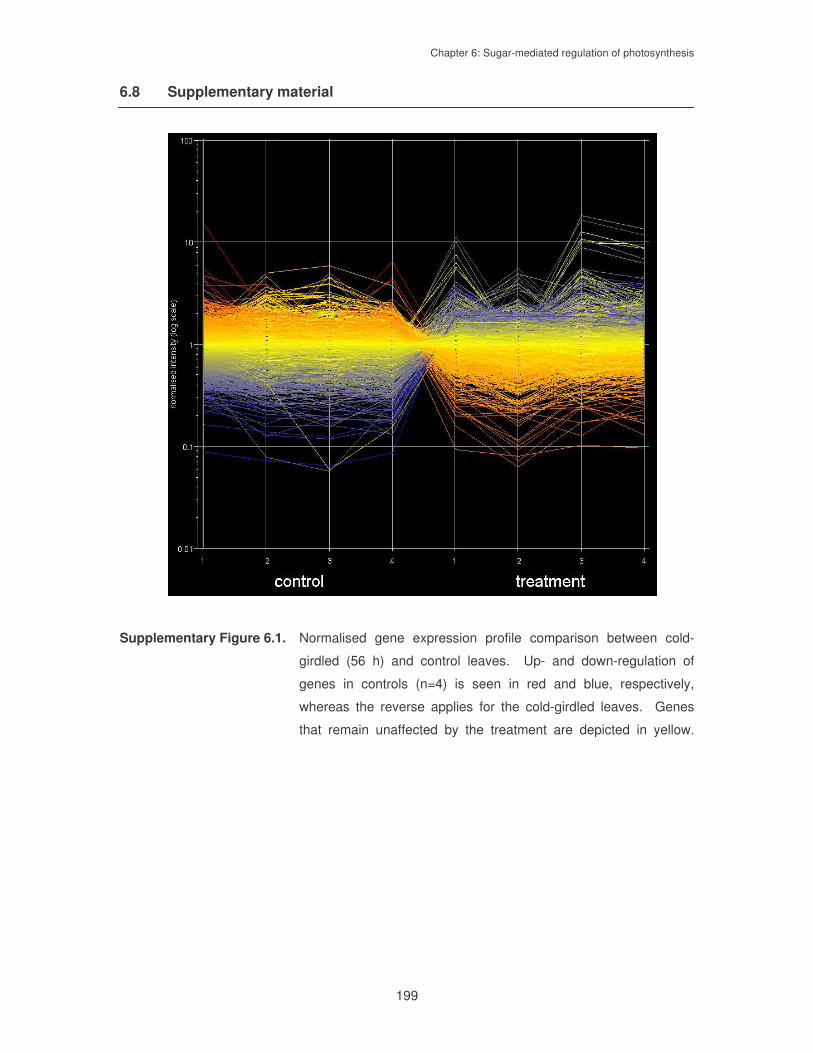
Chapter 6: Sugar-mediated regulation of photosynthesis
199
6.8 Supplementary material
Supplementary Figure 6.1. Normalised gene expression profile comparison between cold-
girdled (56 h) and control leaves. Up- and down-regulation of
genes in controls (n=4) is seen in red and blue, respectively,
whereas the reverse applies for the cold-girdled leaves. Genes
that remain unaffected by the treatment are depicted in yellow.

Chapter 6: Sugar-mediated regulation of photosynthesis
200
Supplementary Table 6.1. List of probe sets differentially expressed during the cold-girdling treatment. Putative identity was assigned using the BLASTX function within the National
Centre of Biotechnological Information (NCBI) GenBank database (http://www.ncbi.nlm.nih.gov). Where E values are absent, probe sets homology was
matched to those assigned by Casu et al. (2007). Fold changes indicate statistical significance values (P<0.05) as determined by ANOVA (n=4).
No. Gene Name Fold change EC p-value Genbank Putative Identity Homology E value
Carbohydrate metabolism (cytosolic)
1 SofAffx.1015.1.S1_s_at 2.439 4.1.2.13 0.014 CF574067 fructose-1,6-bisphosphate aldolase Oryza sativa (japonica cultivar-group) 0.069
2 Sof.3192.2.S1_at 2.314 4.1.2.13 0.001 CA206457 fructose-1,6-bisphosphate aldolase Oryza sativa (japonica cultivar-group) 6.00E-11
3 Sof.2554.1.S1_at 2.084 1.2.1.12 0.002 CA093039 glyceraldehyde-3-phosphate dehydrogenase
Oryza sativa (japonica cultivar-group) 7.00E-58
4 Sof.3865.1.S1_at 2.534 1.2.1.12 0.000 CA196594 glyceraldehyde-3-phosphate dehydrogenase Zea mays 6.00E-55
5 SofAffx.1973.1.S1_at 0.44 3.2.1.26 0.003 BU925731 invertase (cell wall - Incw4) Zea mays 9.00E-26
6 Sof.3023.2.S1_a_at 0.358 2.7.1.90 0.009 CA208800 pyrophosphate-dependent 6-phosphofructose-1-kinase
Oryza sativa (japonica cultivar-group) 4.00E-121
7 Sof.3023.1.S1_s_at 0.416 2.7.1.90 0.002 CA070403 pyrophosphate-dependent 6-phosphofructose-1-kinase
Oryza sativa (japonica cultivar-group) 2.00E-71
8 Sof.2883.1.S1_at 3.14 5.3.1.1 0.000 CA147454 triosphosphate isomerase Oryza sativa (japonica cultivar-group) 2.00E-17
Starch metabolism
1 Sof.2109.1.S1_a_at 2.927 2.4.1.18 0.001 CA202596 1,4-alpha-glucan branching enzyme Zea mays 1.00E-49
2 Sof.4578.1.S1_a_at 12.78 2.7.7.27 0.000 CA151666 ADP-glucose pyrophosphorylase Oryza sativa (japonica cultivar-group) 4.00E-18
3 Sof.1235.1.S1_at 5.236 3.2.1.2 0.003 CA169143 beta-amylase Zea mays 8.00E-53
4 Sof.4751.1.S1_at 8.18 3.2.1.68 0.000 CA289034 isoamylase Arabidopsis thaliana 3.00E-16
5 Sof.1216.1.S1_at 8.834 2.4.1.1 0.000 CA169622 phosphorylase Oryza sativa (japonica cultivar-group) 2.00E-42
Mitochondrial metabolism
1 Sof.3353.1.S1_at 3.025 1.1.1.37 0.001 CA181748 malate dehydrogenase(NADH+ dependent) Arabidopsis thaliana ----
2 Sof.1026.1.S1_at 0.454 - 0.000 CA265014 mitochodrial transcription termination factor
Oryza sativa (japonica cultivar-group) 7.00E-61
3 Sof.1026.2.S1_at 0.317 - 0.008 CA161102 mitochondrial transcription terminator factor Arabidopsis thaliana ----
4 SofAffx.14.1.S1_at 2.39 - 0.010 AY644460 mitochondrial uncoupling protein 1 Saccharum officinarum 7.00E-144

Chapter 6: Sugar-mediated regulation of photosynthesis
201
5 Sof.2009.1.S1_at 2.066 - 0.000 CA170908 mitochondrial uncoupling protein 2 Saccharum officinarum 5.00E-24
C4 photosynthesis and related metabolic components
Light reactions
1 SofAffx.2196.1.S1_at 0.305 3.6.3.14 0.007 50198865-69 ATP synthase CF0 A chain gene Saccharum hybrid cultivar ----
2 SofAffx.2171.1.S1_at 0.332 3.6.3.14 0.000 50198865-59 ATP synthase CF0 A chain gene Saccharum hybrid cultivar ----
3 SofAffx.2188.1.S1_at 0.396 3.6.3.14 0.001 50198865-61 ATP synthase CF0 C chain gene Saccharum hybrid cultivar ----
4 SofAffx.2186.1.S1_at 0.415 3.6.3.14 0.001 50198865-60 ATP synthase CF0 C chain gene Saccharum hybrid cultivar ----
5 SofAffx.2118.1.S1_at 0.229 3.6.3.14 0.001 50198865-70 ATP synthase CF1 beta chain gene Saccharum hybrid cultivar ----
6 Sof.4725.1.S1_at 0.287 - 0.000 CA186676 chlorophyll a/b-binding protein Zea mays 8.00E-60
7 Sof.3564.1.S1_at 0.456 - 0.000 CA298559 chlorophyll a/b binding protein LHCII type III Hordeum vulgare 7.00E-26
8 Sof.3564.1.S1_a_at 0.42 - 0.000 CA298559 chlorophyll a/b binding protein LHCII type III Hordeum vulgare 7.00E-26
9 Sof.2722.1.S1_at 0.36 1.14.14.1 0.000 CA174395 cytochrome P450 Arabidopsis thaliana 2.00E-04
10 Sof.1713.2.S1_at 0.0924 1.14.14.1 0.000 CA068881 cytochrome P450 Triticum monococcum 2.00E-45
11 Sof.1713.1.A1_at 0.119 1.14.14.1 0.000 CA068965 cytochrome P450 Arabidopsis thaliana ----
12 SofAffx.2164.1.S1_at 0.301 - 0.002 50198865-54 cytochrome b6 f complex subunit VIII gene Saccharum hybrid cultivar ----
13 SofAffx.2179.1.S1_at 0.448 - 0.002 50198865-22 cytochrome biogenesis protein gene Saccharum hybrid cultivar ----
14 Sof.2428.1.S1_at 0.35 - 0.004 CA223413 geranylgeranyl hydrogenase Oryza sativa (japonica cultivar-group) 2.00E-54
15 Sof.3048.1.A1_s_at 0.435 - 0.001 CA105372 geranylgeranyl hydrogenase Triticum aestivum 2.00E-29
16 SofAffx.56.1.S1_at 0.307 - 0.006 CF577098 magnesium chelatase Saccharum hybrid cultivar ----
17 SofAffx.1150.1.S1_at 0.315 - 0.001 CF573280 magnesium chelatase Saccharum hybrid cultivar ----
18 Sof.4426.1.A1_at 0.276 - 0.006 CA067637 magnesium chelatase Saccharum hybrid cultivar ----
19 SofAffx.2184.1.S1_at 0.39 1.6.99.3 0.001 50198865-27 NADH dehydrogenase subunit 1 Saccharum hybrid cultivar ----
20 SofAffx.2185.1.S1_at 0.453 1.6.99.3 0.000 50198865-28 NADH dehydrogenase subunit 1 Saccharum hybrid cultivar ----
21 SofAffx.2180.1.S1_at 0.459 1.6.99.3 0.000 50198865-23 NADH dehydrogenase subunit 4 Saccharum hybrid cultivar ----
22 SofAffx.2177.1.S1_at 0.366 1.6.99.3 0.014 50198865-20 NADH dehydrogenase subunit 5 Saccharum hybrid cultivar ----
23 SofAffx.2187.1.S1_at 0.445 1.6.99.3 0.010 50198865-29 NADH dehydrogenase subunit 7 Saccharum hybrid cultivar ----
24 SofAffx.2191.1.S1_at 0.292 - 0.000 50198865-64 photosystem I P700 apoprotein A1 gene Saccharum hybrid cultivar ----
25 Sof.3556.1.S1_at 0.249 - 0.000 CA274385 photosystem I reaction center subunit XI Hordeum vulgare 6.00E-54
26 SofAffx.748.1.S1_at 0.398 - 0.000 CF574993 photosystem I reaction center subunit XI, Oryza sativa (japonica cultivar- 4.00E-07

Chapter 6: Sugar-mediated regulation of photosynthesis
202
hloroplast precursor group)
27 Sof.2003.2.S1_a_at 0.0461 - 0.000 CA300310 photosystem I subunit O gene Arabidopsis thaliana ----
28 SofAffx.2181.1.S1_at 0.358 - 0.001 50198865-24 photosystem I subunit VII gene Saccharum hybrid cultivar ----
29 SofAffx.2122.1.S1_at 0.379 - 0.001 50198865-72 photosystem I subunit VIII gene Saccharum hybrid cultivar ----
30 SofAffx.2146.1.S1_at 0.453 - 0.001 50198865-86 photosystem II 47 kDa protein gene Saccharum hybrid cultivar ----
31 Sof.3600.1.S1_at 0.224 - 0.000 CA280949 photosystem II oxygen evolving complex Arabidopsis thaliana ----
32 Sof.3585.1.S1_at 0.269 - 0.012 CA251032 photosystem II oxygen evolving complex Arabidopsis thaliana ----
33 Sof.2965.1.S1_at 0.205 0.000 CA195783 Protochlorophyllide reductase Zea mays 3.00E-22
Dark reactions
1 SofAffx.151.1.S1_at 0.354 1.1.1.82 0.000 CF577213 chloroplastic malate dehydrogenase (NADP-dependent) Saccharum spontaneum 0.014
2 Sof.2259.3.S1_x_at 0.22 1.1.1.40 0.000 CA093639 NADP-dependent malic enzyme Sorghum bicolor 1.00E-41
3 Sof.2259.3.S1_at 0.207 1.1.1.40 0.001 CA093639 NADP-dependent malic enzyme Sorghum bicolor 1.00E-41
4 Sof.2259.2.A1_s_at 0.38 1.1.1.40 0.001 CA093726 NADP-dependent malic enzyme Sorghum bicolor 2.00E-38
5 Sof.2259.1.S1_x_at 0.397 1.1.1.40 0.000 CA192976 NADP-dependent malic enzyme Zea mays 7.00E-38
6 Sof.3174.2.S1_at 0.297 2.7.2.3 0.000 CA085978 phosphoglycerate kinase (chloroplastic) Spinacia oleracea 2.00E-103
7 Sof.3174.1.S1_at 0.397 2.7.2.3 0.012 CA194701 phosphoglycerate kinase (chloroplastic) Oryza sativa (japonica cultivar-group) 7.00E-71
8 SofAffx.93.1.S1_at 0.114 4.1.1.39 0.002 CF577137 RuBisCO Saccharum hybrid cultivar ----
9 Sof.4352.2.S1_a_at 0.402 4.1.1.39 0.000 CA247421 RuBisCO large subunit-binding protein Zea mays 5.00E-107
10 Sof.4352.1.S1_at 0.465 4.1.1.39 0.005 CA257279 RuBisCO large subunit-binding protein Zea mays 2.00E-71
11 Sof.3568.1.S1_at 0.078 4.1.1.39 0.001 CA275587 RuBisCO small subunit Zea mays 5.00E-30
12 SofAffx.880.1.S1_s_at 0.5 4.1.1.39 0.001 CF574395 RuBisCo binding-protein beta subunit Zea mays 3.00E-15
13 SofAffx.880.1.S1_at 0.48 4.1.1.39 0.002 CF574395 RuBisCo binding-protein beta subunit Zea mays 3.00E-15
Sugar signaling, transport, and Pi metabolism
1 Sof.161.1.S1_at 9.716 - 0.000 CA109224 glucose-6-phosphate/hosphate- transporter
Oryza sativa (japonica cultivar-group) 2.00E-55
2 Sof.3931.2.A1_s_at 8.656 - 0.000 CA295728 glucose-6-phosphate/phosphate-translocator
Oryza sativa (japonica cultivar-group) 5.00E-13
3 SofAffx.1960.1.S1_at 2.399 - 0.000 BU925715 sugar transporter (putative hexose) Oryza sativa (japonica cultivar-group) 1.00E-42
4 SofAffx.8.1.S1_at 3.002 - 0.002 AY165599 sugar transporter type 2a (putative) Saccharum hybrid cultivar 0.00E+00
5 Sof.4223.1.S1_at 0.218 2.4.1.15 0.008 CA176198 trehalose 6-phosphate synthase Oryza sativa 1.00E-27
6 SofAffx.974.1.S1_at 0.278 2.4.1.15 0.000 CF573831 trehalose 6-phosphate synthase Oryza sativa (japonica cultivar-group) 2.00E-24
7 Sof.3105.2.A1_at 3.645 3.1.3.12 0.002 CA086449 trehalose-phosphatase Oryza sativa (japonica cultivar- 2.00E-67

Chapter 6: Sugar-mediated regulation of photosynthesis
203
group)
8 Sof.3119.2.S1_at 3.722 3.6.1.1 0.001 CA111104 inorganic pyrophosphatase Beta vulgaris 0.55
9 SofAffx.1668.1.S1_s_at 4.392 3.6.1.1 0.003 CF571565 inorganic pyrophosphatase Saccharum hybrid cultivar ----
10 SofAffx.1399.1.S1_at 4.43 0.000 CF572284 phosphate translocator Saccharum hybrid cultivar ----
11 Sof.4652.1.S1_at 3.1 0.000 CA227092 phosphate translocator Oryza sativa (japonica cultivar-group) 3.00E-25
Cell wall metabolism
1 Sof.3272.3.A1_a_at 2.335 - 0.000 CA248491 beta-expansin Triticum aestivum 0.002
2 SofAffx.314.1.S1_s_at 2.37 2.1.1.68 0.000 CF572353 caffeic acid 3-O-methyltransferase Saccharum hybrid cultivar ----
3 Sof.3584.1.S1_at 2.314 2.1.1.68 0.001 AJ231133 caffeic acid 3-O-methyltransferase Saccharum officinarum 0.0
4 Sof.3815.1.S1_a_at 2.239 2.4.1.34 0.002 CA196999 callose synthase Oryza sativa (japonica cultivar-group) 2.00E-13
5 Sof.4824.2.S1_a_at 2.591 2.4.1.12 0.000 CA250044 cellulose synthase Solanum tuberosum 8.00E-46
6 Sof.3525.1.S1_at 2.866 2.4.1.12 0.005 CA254294 cellulose synthase Arabidopsis thaliana 6.00E-63
7 Sof.3822.1.S1_at 2.788 2.4.1.12 0.001 CA221011 cellulose synthase catalytic subunit 11 Zea mays 1.00E-88
8 Sof.2699.1.S1_a_at 3.273 2.4.1.12 0.003 CA244798 cellulose synthase catalytic subunit 12 Zea mays 2.00E-56
9 Sof.5033.1.S1_at 4.892 2.4.1.12 0.002 CA148942 cellulose synthase-2 Zea mays 5.00E-42
10 SofAffx.1961.1.S1_s_at 5.116 2.4.1.12 0.002 BU925771 cellulose synthase-4 Zea mays 8.00E-52
11 Sof.3361.1.S1_x_at 5.044 2.4.1.12 0.005 CA134516 cellulose synthase-6 Zea mays 8.00E-05
12 Sof.1249.1.S1_at 6.954 3.2.1.4 0.000 CA105799 endo-1,4-beta-glucanase Triticum aestivum 6.00E-19
13 Sof.1249.2.S1_at 3.12 3.2.1.4 0.000 CA265758 endo-1,4-beta-glucanase Hordeum vulgare 5.00E-54
14 Sof.4805.1.S1_at 5.091 3.2.1.4 0.001 CA218775 endo-1,4-beta-glucanase Oryza sativa (japonica cultivar-group) 6.00E-08
15 Sof.4805.2.S1_a_at 2.415 3.2.1.4 0.000 CA219099 endo-1,4-beta-glucanase Oryza sativa (japonica cultivar-group) 1.00E-115
16 Sof.3799.1.A1_a_at 2.186 3.2.1.6 0.000 CA085569 endo-1,3-beta-glucanase Oryza sativa (japonica cultivar-group) 1.00E-80
17 Sof.2983.1.S1_at 5.779 3.2.1.14 0.000 CA181562 chitinase Oryza sativa (japonica cultivar-group) 2.00E-15
18 Sof.2983.1.S1_a_at 5.295 3.2.1.14 0.000 CA181562 chitinase Oryza sativa (japonica cultivar-group) 2.00E-15
19 SofAffx.1726.1.S1_s_at 6.816 3.2.1.14 0.000 CF571539 chitinase Saccharum hybrid cultivar ----
20 Sof.4115.1.S1_at 3.868 3.1.1.6 0.000 CA244283 pectin acetylesterase Oryza sativa (japonica cultivar-group) 5.00E-42
21 Sof.4204.3.S1_a_at 2.063 4.1.1.35 0.001 CA254458 UDP-D-glucuronate decarboxylase Oryza sativa (japonica cultivar-group) 4.00E-71
22 SofAffx.1583.1.S1_at 4.515 3.2.1.151 0.000 CF571758 xyloglucan endo-beta-1,4-glucanase Oryza sativa (japonica cultivar-group) 3.00E-40
23 Sof.3569.1.S1_at 2.124 3.2.1.151 0.000 CA074575 xyloglucan endo-beta-1,4-glucanase Oryza sativa (japonica cultivar- 1.00E-17

Chapter 6: Sugar-mediated regulation of photosynthesis
204
group)
Stress response
1 SofAffx.1881.1.S1_at 3.343 1.1.1.1 0.000 CF571023 alcohol dehydrogenase Saccharum hybrid cultivar ----
2 Sof.3021.1.S1_at 2.313 1.1.1.1 0.000 CA065880 alcohol dehydrogenase Miscanthus sinensis 4.00E-65
3 Sof.488.2.S1_at 2.203 1.2.1.3 0.000 CA148351 aldehyde dehydrogenase Zea mays 9.00E-68
4 Sof.488.1.A1_at 2.28 1.2.1.3 0.000 CA204366 aldehyde dehydrogenase Zea mays 5.00E-62
5 Sof.702.1.S1_at 5.366 2.3.1.74 0.001 BU103687 chalcone synthase Triticum aestivum 0
6 SofAffx.400.1.S1_at 2.151 0.000 CF575714 cold acclimation protein Triticum aestivum 2.00E-19
7 Sof.3467.1.S1_s_at 3.991 0.000 CA267486 cold acclimation protein Triticum aestivum 6.00E-28
8 Sof.3467.1.S1_at 3.532 0.000 CA267486 cold acclimation protein Triticum aestivum 6.00E-28
9 SofAffx.125.1.S1_s_at 2.713 0.000 CF575717 cold induced, low temperature and salt responsive protein Pennisetum glaucum 3.00E-21
10 Sof.4293.1.S1_at 2.726 0.002 BQ535164 cold induced, low temperature and salt responsive protein Arabidopsis thaliana 7.00E-17
11 SofAffx.125.3.S1_x_at 2.965 0.000 CF574964 cold induced, low temperature and salt responsive protein Pennisetum glaucum 3.00E-21
12 SofAffx.125.1.S1_x_at 2.082 0.000 CF575717 cold induced, low temperature and salt responsive protein Arabidopsis thaliana 1.00E-15
13 SofAffx.125.2.S1_at 2.441 0.005 CF572632 cold induced, low temperature and salt responsive protein Solanum tuberosum 8.00E-16
14 Sof.19.1.S1_at 0.482 1.19.6.1 0.012 CA093296 flavodoxin Medicago truncatula 6.00E-30
15 Sof.3466.1.A1_at 2.687 4.1.1.15 0.000 CA270299 glutamate decarboxylase Oryza sativa (japonica cultivar-group) 1.00E-31
16 Sof.3466.2.S1_at 2.966 4.1.1.15 0.001 CA171450 glutamate decarboxylase Oryza sativa (japonica cultivar-group) 4.00E-107
17 Sof.2216.1.A1_at 0.478 0.002 CA093476 heat shock like protein Arabidopsis thaliana 6.00E-47
18 Sof.676.1.S1_at 22.67 0.004 CA135644 jacalin Oryza sativa (japonica cultivar-group) 1.00E-14
19 Sof.4979.1.S1_at 3.405 0.000 CA122355 leaf senescence related protein Oryza sativa (japonica cultivar-group) 1.00E-18
20 Sof.1.1.A1_at 2.439 0.000 CA218370 lethal leaf spot Zea mays 7.00E-27
21 Sof.1.2.S1_at 2.317 0.000 CA286120 lethal leaf-spot Zea mays 7.00E-137
22 Sof.2621.2.S1_at 5.089 2.7.11.24 0.000 CA272048 mitogen-activated protein kinase Saccharum officinarum 1.00E-13
23 Sof.1333.1.S1_at 0.315 2.7.11.24 0.025 CA164068 mitogen-activated protein kinase Saccharum officinarum 1.00E-08
24 Sof.1462.1.S1_at 0.306 0.002 CA275478 pathogen related protein Arabidopsis thaliana ---
25 Sof.820.1.S1_at 2.132 1.11.1.7 0.006 CA266080 peroxidase Oryza sativa (japonica cultivar-group) 3.00E-30
26 SofAffx.2013.1.S1_s_at 4.104 1.11.1.7 0.003 CO373606 peroxidase Zea mays 1.00E-20
27 Sof.4034.1.S1_at 3.316 2.1.1.103 0.000 CA239805 phosphoethanolamine N- Zea mays 2.00E-38
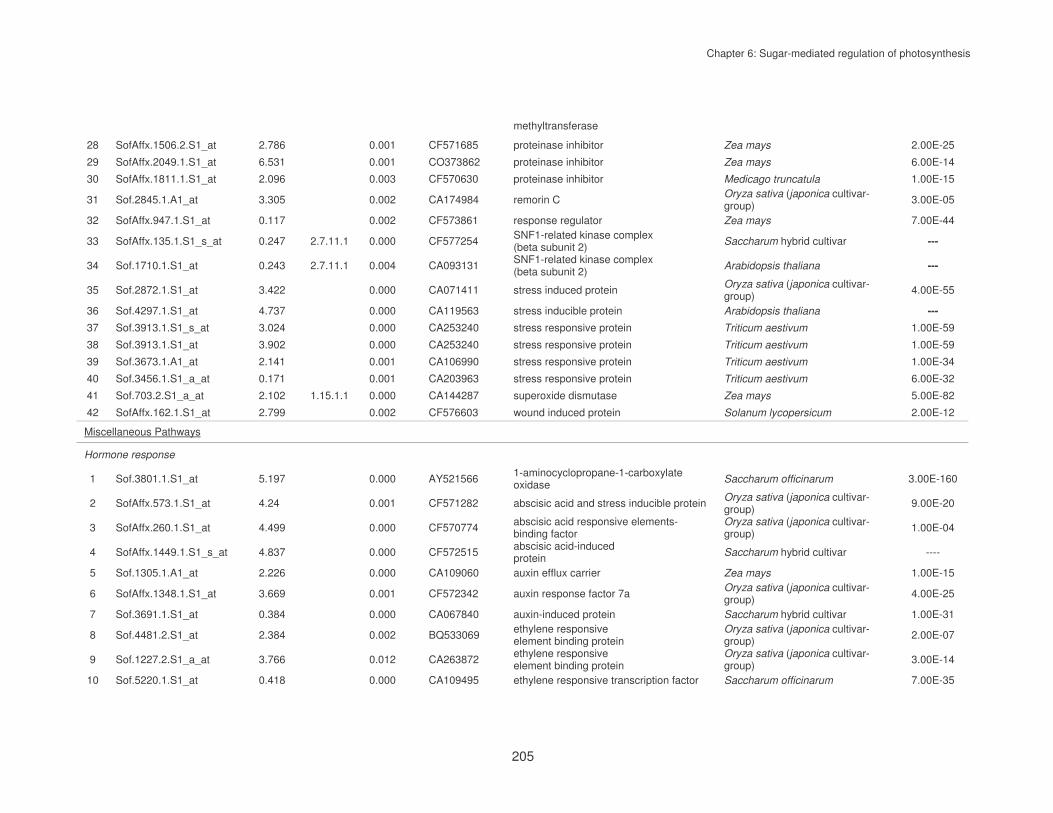
Chapter 6: Sugar-mediated regulation of photosynthesis
205
methyltransferase
28 SofAffx.1506.2.S1_at 2.786 0.001 CF571685 proteinase inhibitor Zea mays 2.00E-25
29 SofAffx.2049.1.S1_at 6.531 0.001 CO373862 proteinase inhibitor Zea mays 6.00E-14
30 SofAffx.1811.1.S1_at 2.096 0.003 CF570630 proteinase inhibitor Medicago truncatula 1.00E-15
31 Sof.2845.1.A1_at 3.305 0.002 CA174984 remorin C Oryza sativa (japonica cultivar-group) 3.00E-05
32 SofAffx.947.1.S1_at 0.117 0.002 CF573861 response regulator Zea mays 7.00E-44
33 SofAffx.135.1.S1_s_at 0.247 2.7.11.1 0.000 CF577254 SNF1-related kinase complex (beta subunit 2) Saccharum hybrid cultivar ---
34 Sof.1710.1.S1_at 0.243 2.7.11.1 0.004 CA093131 SNF1-related kinase complex (beta subunit 2) Arabidopsis thaliana ---
35 Sof.2872.1.S1_at 3.422 0.000 CA071411 stress induced protein Oryza sativa (japonica cultivar-group) 4.00E-55
36 Sof.4297.1.S1_at 4.737 0.000 CA119563 stress inducible protein Arabidopsis thaliana ---
37 Sof.3913.1.S1_s_at 3.024 0.000 CA253240 stress responsive protein Triticum aestivum 1.00E-59
38 Sof.3913.1.S1_at 3.902 0.000 CA253240 stress responsive protein Triticum aestivum 1.00E-59
39 Sof.3673.1.A1_at 2.141 0.001 CA106990 stress responsive protein Triticum aestivum 1.00E-34
40 Sof.3456.1.S1_a_at 0.171 0.001 CA203963 stress responsive protein Triticum aestivum 6.00E-32
41 Sof.703.2.S1_a_at 2.102 1.15.1.1 0.000 CA144287 superoxide dismutase Zea mays 5.00E-82
42 SofAffx.162.1.S1_at 2.799 0.002 CF576603 wound induced protein Solanum lycopersicum 2.00E-12
Miscellaneous Pathways
Hormone response
1 Sof.3801.1.S1_at 5.197 0.000 AY521566 1-aminocyclopropane-1-carboxylate oxidase Saccharum officinarum 3.00E-160
2 SofAffx.573.1.S1_at 4.24 0.001 CF571282 abscisic acid and stress inducible protein Oryza sativa (japonica cultivar-group) 9.00E-20
3 SofAffx.260.1.S1_at 4.499 0.000 CF570774 abscisic acid responsive elements-binding factor
Oryza sativa (japonica cultivar-group) 1.00E-04
4 SofAffx.1449.1.S1_s_at 4.837 0.000 CF572515 abscisic acid-induced protein Saccharum hybrid cultivar ----
5 Sof.1305.1.A1_at 2.226 0.000 CA109060 auxin efflux carrier Zea mays 1.00E-15
6 SofAffx.1348.1.S1_at 3.669 0.001 CF572342 auxin response factor 7a Oryza sativa (japonica cultivar-group) 4.00E-25
7 Sof.3691.1.S1_at 0.384 0.000 CA067840 auxin-induced protein Saccharum hybrid cultivar 1.00E-31
8 Sof.4481.2.S1_at 2.384 0.002 BQ533069 ethylene responsive element binding protein
Oryza sativa (japonica cultivar-group) 2.00E-07
9 Sof.1227.2.S1_a_at 3.766 0.012 CA263872 ethylene responsive element binding protein
Oryza sativa (japonica cultivar-group) 3.00E-14
10 Sof.5220.1.S1_at 0.418 0.000 CA109495 ethylene responsive transcription factor Saccharum officinarum 7.00E-35

Chapter 6: Sugar-mediated regulation of photosynthesis
206
11 Sof.2770.2.S1_at 2.412 0.000 CA151741 F-box protein Arabidopsis thaliana 2.00E-23
12 Sof.774.1.S1_at 2.256 0.000 CA264879 squalene monooxygenase Oryza sativa (japonica cultivar-group) 1.00E-29
13 Sof.1176.1.A1_at 0.421 0.001 CA168983 sterol-4-methyl-oxidase Arabidopsis thaliana 3.00E-22
DNA, RNA translation and binding
1 Sof.2740.1.S1_a_at 2.05 0.000 CA241080 adenosine kinase Zea mays 2.00E-62
2 Sof.677.1.S1_at 2.367 0.000 CA145110 cytidine deaminase Zea mays 3.00E-76
3 Sof.2480.1.A1_at 3.851 0.000 CA257103 DNA binding protein / transcription factor Arabidopsis thaliana 2.00E-41
4 SofAffx.1392.1.S1_at 2.014 0.000 CF572343 DNA binding protein / transcription factor Oryza sativa 0.019
5 Sof.2220.2.S1_at 2.197 0.002 CA093730 DNA binding protein / transcription factor Oryza sativa (japonica cultivar-group) 5.00E-08
6 Sof.4509.1.S1_at 2.436 0.005 CA131481 endonuclease Oryza sativa (japonica cultivar-group) 9.00E-10
7 Sof.4028.2.S1_at 0.437 0.007 CA122909 histone H2A Arabidopsis thaliana ---
8 Sof.4028.1.S1_a_at 0.361 0.001 CA243079 histone H2A Zea mays 1.00E-18
9 Sof.4025.1.S1_s_at 0.383 0.000 CA077455 histone H2A Oryza sativa (japonica cultivar-group) 8.00E-39
10 Sof.3707.1.S1_at 0.293 0.003 CA133751 histone H3 Arabidopsis thaliana ---
11 Sof.4148.1.S1_s_at 0.414 0.000 CA128434 histone H4 Citrus jambhiri 7.00E-40
12 SofAffx.294.1.S1_s_at 2.125 0.007 CF576446 methyltransferase (cycloartenol 24-C) Oryza sativa (japonica cultivar-group) 4.00E-19
13 Sof.2550.1.A1_at 0.407 0.012 CA250420 methyltransferase (SAM-dependent)
Oryza sativa (japonica cultivar-group) 1.00E-34
14 Sof.190.2.S1_a_at 2.087 0.001 CA105999 methyltransferase (sterol 24-C) Zea mays 2.00E-54
15 Sof.190.1.S1_at 2.296 0.000 CA106090 methyltransferase (sterol 24-C) Zea mays 2.00E-53
16 Sof.2519.2.S1_a_at 0.48 0.001 CA188257 nucleasome/chromatin assembly factor Zea mays 2.00E-52
17 Sof.1127.1.A1_at 0.361 0.006 CA109222 nucleoside phosphatase Oryza sativa (japonica cultivar-group) 5.00E-40
18 Sof.3246.1.S1_at 0.488 0.002 CA294015 ribosomal 40S protein S1 Arabidopsis thaliana ---
19 Sof.1180.1.S1_at 2.168 0.001 CA297203 ribosomal 60S protein L3 Arabidopsis thaliana ---
20 SofAffx.774.1.S1_at 0.444 0.002 CF574872 ribosomal 30S protein (plastid-specific) Oryza sativa (japonica cultivar-group) 3.00E-14
21 SofAffx.2108.1.S1_s_at 0.454 0.016 50198865-8 ribosomal 50S protein Saccharum hybrid cultivar ---
22 SofAffx.765.1.S1_s_at 0.439 0.001 CF574890 ribosomal 50S protein Arabidopsis thaliana ----
23 Sof.1465.1.A1_s_at 0.301 0.000 CA296516 ribosomal 50S protein L12 Arabidopsis thaliana ----
24 Sof.2851.1.S1_at 0.307 0.001 CA122843 ribosomal 50S protein L17 Arabidopsis thaliana ----

Chapter 6: Sugar-mediated regulation of photosynthesis
207
25 SofAffx.50.1.S1_s_at 0.407 0.000 CF577168 ribosomal 50s protein L9, chloroplast
Oryza sativa (japonica cultivar-group) 2.00E-14
26 SofAffx.2101.1.S1_at 0.423 0.000 50198865-1 ribosomal protein L14 gene Saccharum hybrid cultivar ---
27 SofAffx.2133.1.S1_at 0.409 0.000 50198865-43 ribosomal protein L2 gene Saccharum hybrid cultivar ---
28 SofAffx.2142.1.S1_at 0.405 0.000 50198865-82 ribosomal protein L33 gene Saccharum hybrid cultivar ---
29 SofAffx.2109.1.S1_s_at 0.44 0.000 50198865-30 ribosomal protein S15 gene Saccharum hybrid cultivar ---
30 SofAffx.2169.1.S1_at 0.436 0.000 50198865-58 ribosomal protein S2 gene Saccharum hybrid cultivar ---
31 SofAffx.2192.1.S1_at 0.365 0.001 50198865-65 ribosomal protein S4 gene Saccharum hybrid cultivar ---
32 SofAffx.2189.1.S1_at 0.453 0.012 50198865-62 ribosomal S14 gene Saccharum hybrid cultivar ---
33 SofAffx.886.1.S1_s_at 0.147 0.000 CF574293 transcription factor Saccharum hybrid cultivar ---
34 SofAffx.886.1.S1_at 0.161 0.010 CF574293 transcription factor Saccharum hybrid cultivar ---
35 SofAffx.578.1.S1_at 0.129 0.000 CF575469 transcription factor Saccharum hybrid cultivar ---
36 SofAffx.331.1.S1_s_at 4.999 0.001 CF576113 transcription factor Saccharum hybrid cultivar ---
37 Sof.4439.1.A1_at 0.274 0.000 CA273789 transcription factor Arabidopsis thaliana ----
38 Sof.3562.2.S1_at 0.147 0.033 CA206226 transcription factor Arabidopsis thaliana ----
39 Sof.1709.1.S1_at 0.418 0.000 CA090536 transcription factor Triticum aestivum 5.00E-07
40 Sof.308.1.S1_at 2.698 0.000 CA123026 transformer-SR ribonucleoprotein Arabidopsis thaliana ----
41 Sof.1330.1.A1_at 2.102 0.000 CA093269 zinc finger protein Oryza sativa (japonica cultivar-group) 7.00E-44
42 Sof.3479.1.A1_at 2.142 0.000 CA183562 zinc finger protein Oryza sativa (japonica cultivar-group) 3.00E-61
43 Sof.1494.1.A1_at 0.218 0.000 CA106996 zinc finger protein Oryza sativa 5.00E-17
Lipid, phospholipid and fatty acid (mitochondrial beta-oxidation pathway) metabolism
1 SofAffx.864.1.S1_s_at 2.267 0.000 CF574204 acyl carrier protein Zea mays 9.00E-26
2 SofAffx.411.1.S1_at 0.165 0.002 CF575893 acyl carrier protein Saccharum hybrid cultivar ---
3 Sof.2976.1.S1_at 2.243 0.004 CA194677 acyl carrier protein Zea mays 2.00E-32
4 Sof.4346.1.A1_at 0.342 0.010 CA186650 Acyl-coenzyme A oxidase Oryza sativa (japonica cultivar-group) 1.00E-64
5 Sof.4349.1.S1_at 0.481 0.007 CA065884 acyltransferase Arabidopsis thaliana 5.00E-59
6 Sof.3883.1.S1_at 2.808 0.001 CA233387 annexin Medicago truncatula 3.00E-06
7 Sof.3504.1.S1_at 2.449 0.015 CA208201 annexin p33 Zea mays 5.00E-32
8 Sof.1329.1.S1_at 2.586 0.000 CA269127 enoyl-[acyl-carrier protein] reductase Oryza sativa (japonica cultivar-group) 3.00E-44

Chapter 6: Sugar-mediated regulation of photosynthesis
208
9 Sof.4079.1.S1_at 2.295 0.004 CA123071 enoyl-CoA hydratase Oryza sativa (japonica cultivar-group) 6.00E-52
10 Sof.3291.1.S1_at 0.464 0.001 CA291308 esterase/lipase Oryza sativa (japonica cultivar-group) 8.00E-18
11 Sof.3284.1.S1_s_at 3.346 0.000 CA163837 lipid binding protein Arabidopsis thaliana 3.00E-12
12 Sof.3284.1.S1_at 3.19 0.015 CA163837 lipid binding protein Arabidopsis thaliana 3.00E-12
13 Sof.1025.1.S1_a_at 3.878 0.000 CA160989 lipid binding protein Arabidopsis thaliana 1.00E-12
14 Sof.3597.1.S1_at 4.765 0.000 CA242934 lipid-transfer protein Oryza sativa (japonica cultivar-group) 2.00E-31
15 Sof.3427.2.S1_at 5.801 0.006 CA085551 myo-inositol 1-phosphate synthase Zea mays 1.00E-70
16 Sof.3427.1.S1_at 4.332 0.005 CA256860 myo-inositol 1-phosphate synthase Zea mays 2.00E-69
17 SofAffx.699.1.S1_s_at 6.966 0.001 CF574629 Myo-inositol-1-phosphate synthase Zea mays 6.00E-18
18 SofAffx.699.1.S1_at 4.306 0.000 CF574629 myo-inositol-1-phosphate synthase Oryza sativa (japonica cultivar-group) 6.00E-18
19 SofAffx.1050.1.S1_at 3.089 0.004 CF573411 plant lipase Oryza sativa (japonica cultivar-group) 2.00E-37
20 Sof.3444.2.S1_a_at 3.165 0.002 CA271402 plant lipase Oryza sativa (japonica cultivar-group) 7.00E-80
21 Sof.1440.1.S1_at 3.231 0.000 CA284296 plant lipase Oryza sativa (japonica cultivar-group) 1.00E-67
22 Sof.450.1.S1_at 5.409 0.001 CA293588 Undecaprenyl pyrophosphate synthetase Oryza sativa (japonica cultivar-group) 4.00E-45
Miscellaneous. transporters
1 Sof.4946.1.S1_a_at 8.281 0.000 CA200693 ADP-ribosylation factor Arabidopsis thaliana 1.00E-15
2 Sof.1342.1.S1_at 5.503 0.000 CA275595 amino acid transporter Arabidopsis thaliana ---
3 SofAffx.221.1.S1_at 4.212 0.003 CF575182 amino acid transporter Arabidopsis thaliana 3.00E-20
4 Sof.4831.1.S1_at 2.673 0.001 CA286162 anion transporter Arabidopsis thaliana 7.00E-24
5 Sof.110.1.A1_at 2.774 0.000 CA128659 ATPase (kinesin-organelle transport) Oryza sativa (japonica cultivar-group) 0.031
6 Sof.131.1.S1_at 0.429 0.000 CA125461 ATPase-like protein Sorghum bicolor 3.00E-10
7 SofAffx.597.1.S1_at 2.101 0.000 CF575528 cation transporter Arabidopsis thaliana 6.00E-14
8 SofAffx.1947.1.S1_at 0.155 0.000 CF570474 efflux transporter Saccharum hybrid cultivar ---
9 Sof.5080.1.A1_at 4.567 0.000 CA277004 heavy metal transport Oryza sativa (japonica cultivar-group) 4.00E-05
10 Sof.3268.2.S1_x_at 6.021 0.002 CA285541 heavy metal transport Oryza sativa (japonica cultivar-group) 4.00E-10
11 Sof.1082.1.S1_at 2.226 0.000 CA148697 nitrate transporter Oryza sativa (japonica cultivar-group) 4.00E-44
12 SofAffx.766.1.S1_at 2.433 0.001 CF574742 potassium transporter Oryza sativa (japonica cultivar-group) 0.12

Chapter 6: Sugar-mediated regulation of photosynthesis
209
13 Sof.3602.1.S1_at 0.451 0.001 CA295007 protein translocase/ protein transporter Arabidopsis thaliana 3.00E-18
14 Sof.234.1.S1_at 6.969 0.019 CA085096 protein transport protein Arabidopsis thaliana ---
15 Sof.1342.1.S1_s_at 5.2 0.000 CA275595 transmembrane amino acid transporter Oryza sativa (japonica cultivar-group) 1.00E-38
Amino acid and protein metabolism
1 Sof.2944.1.S1_at 10.64 0.000 CA122418 3-deoxy-D-arabino-heptolosonate-7-phosphate synthetase
Oryza sativa (japonica cultivar-group) 2.00E-40
2 Sof.521.1.S1_at 2.28 0.002 CA067649 3-phosphoshikimate 1-carboxyvinyltransferase Zea mays 2.00E-51
3 SofAffx.704.1.S1_at 0.468 0.000 CF574659 amino acid permease Arabidopsis thaliana 1.00E-08
4 Sof.4252.1.S1_a_at 11.6 0.000 CA133575 aminotransferase (alanine) Arabidopsis thaliana ---
5 Sof.4252.2.S1_a_at 5.001 0.000 CA137135 aminotransferase (alanine) Zea mays 6.00E-86
6 Sof.1326.2.S1_at 0.493 0.001 CA145855 aminotransferase (alanine) Oryza sativa (japonica cultivar-group) 9.00E-100
7 Sof.1288.2.S1_at 2.075 0.000 CA266448 aminotransferase (ornithine) Oryza sativa (japonica cultivar-group) 2.00E-81
8 Sof.1288.2.S1_a_at 2.516 0.001 CA266448 aminotransferase (ornithine) Oryza sativa (japonica cultivar-group) 2.00E-81
9 Sof.1981.1.S1_at 3.382 0.000 CA135406 aminotransferase (tyrosine) Oryza sativa (japonica cultivar-group) 8.00E-65
10 SofAffx.1146.1.S1_at 4.589 0.000 CF573503 beta-alanine-pyruvate aminotransferase Arabidopsis thaliana ----
11 Sof.1173.1.S1_at 3.274 0.002 CA137663 beta-alanine-pyruvate aminotransferase Oryza sativa (japonica cultivar-group) 4.00E-48
12 AFFX-Sof-r2-Bs-lys-M_at 0.48 0.000 AFFX-Sof-r2-Bs-lys-M diaminopimelate decarboxylase Bacillus subtillis ----
13 AFFX-Sof-r2-Bs-lys-5_at 0.464 0.001 AFFX-Sof-r2-Bs-lys-5 diaminopimelate decarboxylase Bacillus subtillis ----
14 AFFX-Sof-r2-Bs-lys-3_at 0.495 0.006 AFFX-Sof-r2-Bs-lys-3 diaminopimelate decarboxylase Bacillus subtillis ----
15 AFFX-r2-Bs-lys-M_at 0.47 0.007 AFFX-r2-Bs-lys-M diaminopimelate decarboxylase Bacillus subtillis ----
16 AFFX-r2-Bs-lys-5_at 0.439 0.001 AFFX-r2-Bs-lys-5 diaminopimelate decarboxylase Bacillus subtillis ----
17 AFFX-r2-Bs-lys-3_at 0.444 0.020 AFFX-r2-Bs-lys-3 diaminopimelate decarboxylase Bacillus subtillis ----
18 AFFX-LysX-M_at 0.488 0.001 AFFX-LysX-M diaminopimelate decarboxylase Bacillus subtillis ----
19 AFFX-LysX-5_at 0.465 0.002 AFFX-LysX-5 diaminopimelate decarboxylase Bacillus subtillis ----
20 AFFX-LysX-3_at 0.471 0.004 AFFX-LysX-3 diaminopimelate decarboxylase Bacillus subtillis ----
21 SofAffx.1369.1.S1_s_at 2.806 0.000 CF572085 glutamate synthase (NADH dependent) Oryza sativa (japonica cultivar-group) 4.00E-34
22 SofAffx.1369.1.S1_at 2.832 0.000 CF572085 glutamate synthase (NADH dependent) Oryza sativa (japonica cultivar-group) 4.00E-34
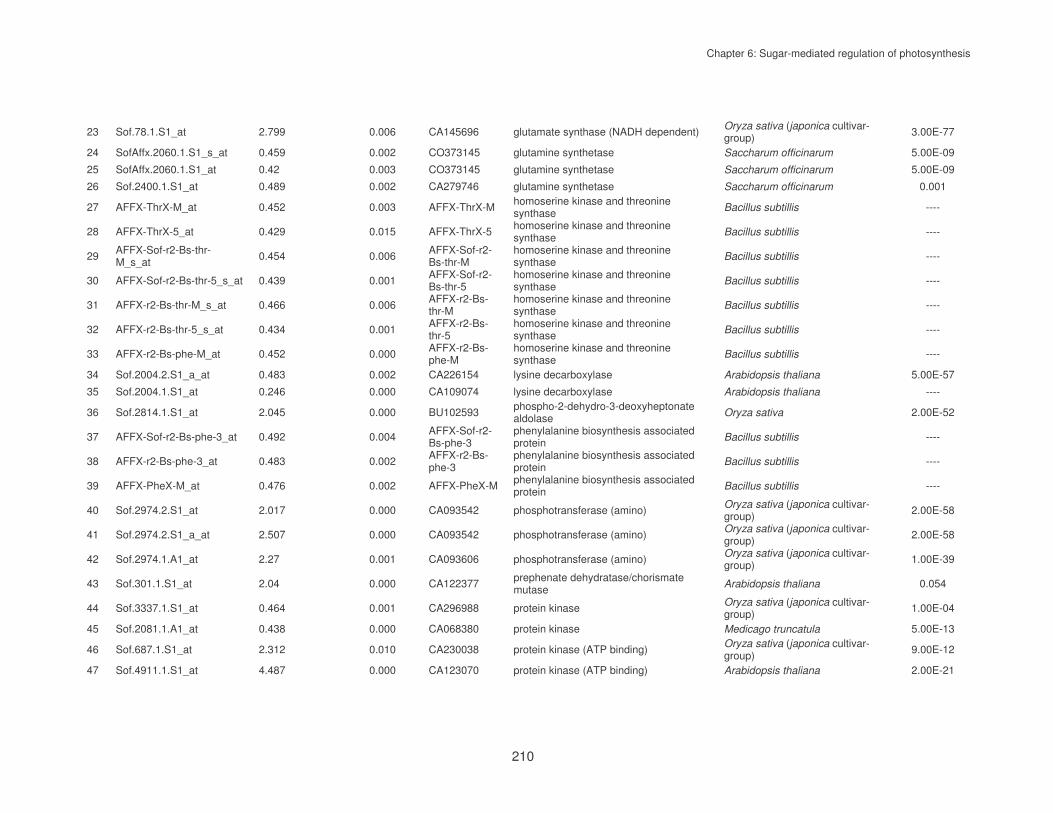
Chapter 6: Sugar-mediated regulation of photosynthesis
210
23 Sof.78.1.S1_at 2.799 0.006 CA145696 glutamate synthase (NADH dependent) Oryza sativa (japonica cultivar-group) 3.00E-77
24 SofAffx.2060.1.S1_s_at 0.459 0.002 CO373145 glutamine synthetase Saccharum officinarum 5.00E-09
25 SofAffx.2060.1.S1_at 0.42 0.003 CO373145 glutamine synthetase Saccharum officinarum 5.00E-09
26 Sof.2400.1.S1_at 0.489 0.002 CA279746 glutamine synthetase Saccharum officinarum 0.001
27 AFFX-ThrX-M_at 0.452 0.003 AFFX-ThrX-M homoserine kinase and threonine synthase Bacillus subtillis ----
28 AFFX-ThrX-5_at 0.429 0.015 AFFX-ThrX-5 homoserine kinase and threonine synthase Bacillus subtillis ----
29 AFFX-Sof-r2-Bs-thr-M_s_at 0.454 0.006 AFFX-Sof-r2-
Bs-thr-M homoserine kinase and threonine synthase Bacillus subtillis ----
30 AFFX-Sof-r2-Bs-thr-5_s_at 0.439 0.001 AFFX-Sof-r2-Bs-thr-5
homoserine kinase and threonine synthase Bacillus subtillis ----
31 AFFX-r2-Bs-thr-M_s_at 0.466 0.006 AFFX-r2-Bs-thr-M
homoserine kinase and threonine synthase Bacillus subtillis ----
32 AFFX-r2-Bs-thr-5_s_at 0.434 0.001 AFFX-r2-Bs-thr-5
homoserine kinase and threonine synthase Bacillus subtillis ----
33 AFFX-r2-Bs-phe-M_at 0.452 0.000 AFFX-r2-Bs-phe-M
homoserine kinase and threonine synthase Bacillus subtillis ----
34 Sof.2004.2.S1_a_at 0.483 0.002 CA226154 lysine decarboxylase Arabidopsis thaliana 5.00E-57
35 Sof.2004.1.S1_at 0.246 0.000 CA109074 lysine decarboxylase Arabidopsis thaliana ----
36 Sof.2814.1.S1_at 2.045 0.000 BU102593 phospho-2-dehydro-3-deoxyheptonate aldolase Oryza sativa 2.00E-52
37 AFFX-Sof-r2-Bs-phe-3_at 0.492 0.004 AFFX-Sof-r2-Bs-phe-3
phenylalanine biosynthesis associated protein Bacillus subtillis ----
38 AFFX-r2-Bs-phe-3_at 0.483 0.002 AFFX-r2-Bs-phe-3
phenylalanine biosynthesis associated protein Bacillus subtillis ----
39 AFFX-PheX-M_at 0.476 0.002 AFFX-PheX-M phenylalanine biosynthesis associated protein Bacillus subtillis ----
40 Sof.2974.2.S1_at 2.017 0.000 CA093542 phosphotransferase (amino) Oryza sativa (japonica cultivar-group) 2.00E-58
41 Sof.2974.2.S1_a_at 2.507 0.000 CA093542 phosphotransferase (amino) Oryza sativa (japonica cultivar-group) 2.00E-58
42 Sof.2974.1.A1_at 2.27 0.001 CA093606 phosphotransferase (amino) Oryza sativa (japonica cultivar-group) 1.00E-39
43 Sof.301.1.S1_at 2.04 0.000 CA122377 prephenate dehydratase/chorismate mutase Arabidopsis thaliana 0.054
44 Sof.3337.1.S1_at 0.464 0.001 CA296988 protein kinase Oryza sativa (japonica cultivar-group) 1.00E-04
45 Sof.2081.1.A1_at 0.438 0.000 CA068380 protein kinase Medicago truncatula 5.00E-13
46 Sof.687.1.S1_at 2.312 0.010 CA230038 protein kinase (ATP binding) Oryza sativa (japonica cultivar-group) 9.00E-12
47 Sof.4911.1.S1_at 4.487 0.000 CA123070 protein kinase (ATP binding) Arabidopsis thaliana 2.00E-21

Chapter 6: Sugar-mediated regulation of photosynthesis
211
48 Sof.4465.1.S1_a_at 2.727 0.001 CA066873 protein kinase (ATP binding) Oryza sativa (japonica cultivar-group) 2.00E-94
49 Sof.3922.3.S1_a_at 0.342 0.000 CA162299 protein kinase (calcium-dependent) Zea mays 4.00E-44
50 Sof.2799.2.S1_at 2.735 0.000 CA296007 protein phosphatase 2C Hordeum vulgare 1.00E-24
51 Sof.1143.2.S1_at 2.987 0.000 CA228512 protein phosphatase 2C Oryza sativa (japonica cultivar-group) 3.00E-41
52 Sof.2799.3.S1_at 2.036 0.001 CA131632 protein phosphatase 2C Arabidopsis thaliana 2.00E-33
53 Sof.934.1.S1_at 0.419 0.004 CA159968 serine / threonine kinase Oryza sativa (japonica cultivar-group) 5.00E-54
54 Sof.2538.3.S1_at 0.388 0.007 CA157758 serine / threonine kinase Sorghum bicolor 8.00E-86
55 Sof.2538.2.S1_at 0.424 0.014 CA156919 serine / threonine kinase Sorghum bicolor 4.00E-54
56 Sof.2538.1.A1_at 0.43 0.000 CA249568 serine / threonine kinase Sorghum bicolor 2.00E-20
57 SofAffx.1839.1.S1_at 0.336 0.011 CF570918 serine / threonine kinase Saccharum hybrid cultivar ---
58 Sof.2621.3.A1_a_at 5.246 0.000 CA267619 serine / threonine kinase Sorghum bicolor 0.001
59 Sof.1250.2.S1_a_at 2.357 0.000 CA170162 serine / threonine kinase Sorghum bicolor 2.00E-18
60 SofAffx.72.1.S1_at 2.763 0.001 CF576672 serine / threonine kinase Oryza sativa (japonica cultivar-group) 8.00E-22
61 SofAffx.45.1.S1_at 2.295 0.003 CF577437 serine / threonine kinase Oryza sativa (japonica cultivar-group) 4.00E-06
62 Sof.680.1.S1_at 2.047 0.001 CA080210 serine / threonine kinase Oryza sativa (japonica cultivar-group) 1.00E-49
63 Sof.4465.1.S1_at 2.243 0.000 CA066873 serine / threonine kinase Oryza sativa (japonica cultivar-group) 2.00E-94
64 Sof.2120.1.A1_at 2.674 0.010 CA141566 serine / threonine kinase Oryza sativa (japonica cultivar-group) 7.00E-18
65 Sof.1568.1.A1_at 0.404 0.000 CA070399 serine / threonine kinase receptor precursor
Oryza sativa (japonica cultivar-group) 3.00E-54
66 Sof.2799.1.S1_at 2.742 0.006 CA196644 serine / threonine phosphatase Arabidopsis thaliana 1.00E-34
67 Sof.1143.1.S1_at 2.694 0.000 CA090531 serine / threonine phosphatase Oryza sativa (japonica cultivar-group) 9.00E-24
68 Sof.2054.1.S1_at 2.143 0.000 CA087269 serine carboxypeptidase Oryza sativa (japonica cultivar-group) 2.00E-33
69 Sof.3249.1.S1_at 3.102 0.000 CA230383 serine hydrolase Oryza sativa (japonica cultivar-group) 1.00E-86
70 Sof.3361.2.S1_a_at 6.839 0.004 CA174854 serine protease Zea mays 2.00E-27
71 Sof.4877.2.S1_at 0.491 0.001 CA152550 shikimate kinase (ATP binding) Oryza sativa (japonica cultivar-group) 9.00E-93
72 Sof.4877.2.S1_a_at 0.494 0.003 CA152550 shikimate kinase (ATP binding) Oryza sativa (japonica cultivar-group) 9.00E-93
73 Sof.2632.1.S1_at 3.143 0.002 CA148334 threonine aldolase (amino acid transport) Oryza sativa (japonica cultivar-group) 4.00E-56
74 SofAffx.40.2.S1_at 2.483 0.000 CF577373 tyrosine phosphatase Oryza sativa (japonica cultivar- 7.00E-40
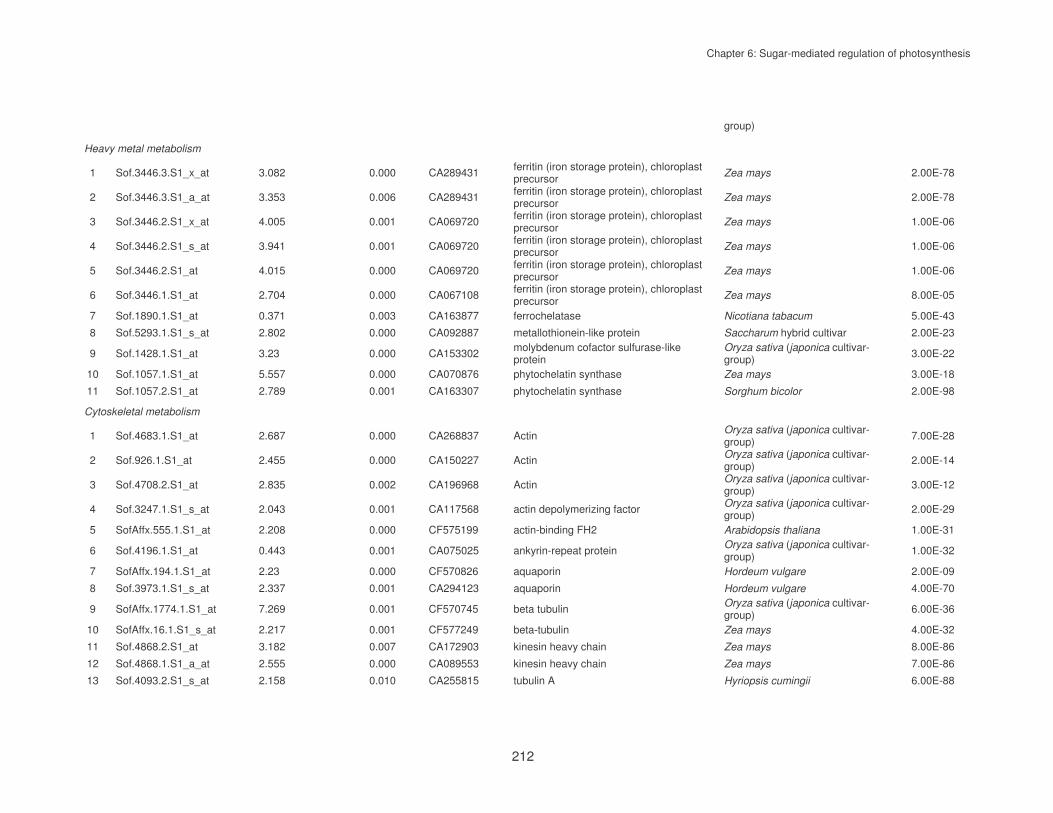
Chapter 6: Sugar-mediated regulation of photosynthesis
212
group)
Heavy metal metabolism
1 Sof.3446.3.S1_x_at 3.082 0.000 CA289431 ferritin (iron storage protein), chloroplast precursor Zea mays 2.00E-78
2 Sof.3446.3.S1_a_at 3.353 0.006 CA289431 ferritin (iron storage protein), chloroplast precursor Zea mays 2.00E-78
3 Sof.3446.2.S1_x_at 4.005 0.001 CA069720 ferritin (iron storage protein), chloroplast precursor Zea mays 1.00E-06
4 Sof.3446.2.S1_s_at 3.941 0.001 CA069720 ferritin (iron storage protein), chloroplast precursor Zea mays 1.00E-06
5 Sof.3446.2.S1_at 4.015 0.000 CA069720 ferritin (iron storage protein), chloroplast precursor Zea mays 1.00E-06
6 Sof.3446.1.S1_at 2.704 0.000 CA067108 ferritin (iron storage protein), chloroplast precursor Zea mays 8.00E-05
7 Sof.1890.1.S1_at 0.371 0.003 CA163877 ferrochelatase Nicotiana tabacum 5.00E-43
8 Sof.5293.1.S1_s_at 2.802 0.000 CA092887 metallothionein-like protein Saccharum hybrid cultivar 2.00E-23
9 Sof.1428.1.S1_at 3.23 0.000 CA153302 molybdenum cofactor sulfurase-like protein
Oryza sativa (japonica cultivar-group) 3.00E-22
10 Sof.1057.1.S1_at 5.557 0.000 CA070876 phytochelatin synthase Zea mays 3.00E-18
11 Sof.1057.2.S1_at 2.789 0.001 CA163307 phytochelatin synthase Sorghum bicolor 2.00E-98
Cytoskeletal metabolism
1 Sof.4683.1.S1_at 2.687 0.000 CA268837 Actin Oryza sativa (japonica cultivar-group) 7.00E-28
2 Sof.926.1.S1_at 2.455 0.000 CA150227 Actin Oryza sativa (japonica cultivar-group) 2.00E-14
3 Sof.4708.2.S1_at 2.835 0.002 CA196968 Actin Oryza sativa (japonica cultivar-group) 3.00E-12
4 Sof.3247.1.S1_s_at 2.043 0.001 CA117568 actin depolymerizing factor Oryza sativa (japonica cultivar-group) 2.00E-29
5 SofAffx.555.1.S1_at 2.208 0.000 CF575199 actin-binding FH2 Arabidopsis thaliana 1.00E-31
6 Sof.4196.1.S1_at 0.443 0.001 CA075025 ankyrin-repeat protein Oryza sativa (japonica cultivar-group) 1.00E-32
7 SofAffx.194.1.S1_at 2.23 0.000 CF570826 aquaporin Hordeum vulgare 2.00E-09
8 Sof.3973.1.S1_s_at 2.337 0.001 CA294123 aquaporin Hordeum vulgare 4.00E-70
9 SofAffx.1774.1.S1_at 7.269 0.001 CF570745 beta tubulin Oryza sativa (japonica cultivar-group) 6.00E-36
10 SofAffx.16.1.S1_s_at 2.217 0.001 CF577249 beta-tubulin Zea mays 4.00E-32
11 Sof.4868.2.S1_at 3.182 0.007 CA172903 kinesin heavy chain Zea mays 8.00E-86
12 Sof.4868.1.S1_a_at 2.555 0.000 CA089553 kinesin heavy chain Zea mays 7.00E-86
13 Sof.4093.2.S1_s_at 2.158 0.010 CA255815 tubulin A Hyriopsis cumingii 6.00E-88

Chapter 6: Sugar-mediated regulation of photosynthesis
213
Other metabolic events
1 SofAffx.1850.1.S1_at 0.486 0.000 CF570594 1-deoxy-D-xylulose 5-phosphate reductoisomerase Zea mays 9.00E-21
2 AFFX-Sof-r2-Bs-dap-5_at 0.488 0.000 AFFX-Sof-r2-Bs-dap-5
acetyl-CoA-carboxylase ligase (birA) gene Bacillus subtillis ----
3 Sof.3744.1.S1_at 2.723 0.000 CA234593 ankyrin Arabidopsis thaliana ----
4 Sof.569.2.S1_a_at 0.295 0.010 CA293295 aspartic proteinase Arabidopsis thaliana ----
5 Sof.973.1.A1_at 2.532 0.000 CA161592 aspartyl protease Oryza sativa (japonica cultivar-group) 0.001
6 Sof.3025.1.A1_at 2.933 0.000 CA069871 AT-hook DNA-binding protein Oryza sativa (japonica cultivar-group) 2.00E-13
7 SofAffx.2145.1.S1_s_at 0.472 0.000 50198865-85 ATP-dependent chloroplast protease Saccharum hybrid cultivar ----
8 Sof.602.1.A1_at 0.089 0.001 CA140765 beta glucanase Triticum aestivum (bread wheat) 3.00E-06
9 Sof.4235.1.S1_a_at 5.409 0.000 CA231339 beta-galactosidase Oryza sativa (japonica cultivar-group) 4.00E-41
10 Sof.962.2.S1_at 0.383 0.005 CA155393 beta-lactamase Arabidopsis thaliana 2.00E-103
11 Sof.2798.1.S1_at 2.211 0.000 CA181553 Ca2+/H+-exchanging protein Oryza sativa (japonica cultivar-group) 1.00E-08
12 Sof.5318.1.S1_at 0.383 0.000 BQ531226 Ca2+-binding protein Triticum aestivum 7.00E-28
13 SofAffx.762.1.S1_at 2.088 0.005 CF574946 calmodulin binding protein Arabidopsis thaliana 1.00E-04
14 Sof.2146.1.S1_at 2.228 0.033 CA065753 calmodulin binding protein Oryza sativa (japonica cultivar-group) 4.00E-27
15 Sof.3347.2.S1_at 4.091 0.001 CA122155 CCT domain containing protein Oryza sativa (japonica cultivar-group) 3.00E-57
16 Sof.4448.2.S1_at 0.499 0.002 CA269147 chloroplast inner envelope protein Oryza sativa (japonica cultivar-group) 1.00E-97
17 SofAffx.2124.1.S1_at 0.381 0.001 50198865-74 chloroplast membrane protein A Saccharum hybrid cultivar ----
18 Sof.2816.1.S1_at 3.6 0.002 CA240158 delta-1-pyrroline-5-carboxylate synthetase
Oryza sativa (japonica cultivar-group) 2.00E-08
19 SofAffx.800.1.S1_s_at 0.388 0.002 CF573822 disease resistance protein Hordeum vulgare 4.00E-59
20 Sof.970.1.S1_a_at 2.321 0.010 BQ533251 dTDP-glucose 4,6-dehydratase Oryza sativa (japonica cultivar-group) 2.00E-19
21 Sof.4150.1.S1_at 2.755 0.001 CA290341 early light-inducible protein Triticum aestivum 9.00E-09
22 Sof.3713.2.S1_x_at 2.028 0.003 CA229648 exostosin Oryza sativa (japonica cultivar-group) 3.00E-50
23 Sof.1606.1.A1_at 5.323 0.001 CA233374 exostosin Oryza sativa (japonica cultivar-group) 2.00E-58
24 Sof.3590.1.S1_at 4.405 0.000 CA148883 fasciclin-like protein Triticum aestivum 3.00E-57
25 SofAffx.313.1.S1_at 3.176 0.002 CF572801 flavonoid 3'-hydroxylase Triticum aestivum 8.00E-08
26 Sof.4795.1.S1_at 0.409 0.003 CA288421 glutamate-1-semialdehyde aminotransferase
Oryza sativa (japonica cultivar-group) 3.00E-09

Chapter 6: Sugar-mediated regulation of photosynthesis
214
27 Sof.4848.1.S1_a_at 0.363 0.000 CA076526 glutathione S-transferase Zea mays 1.00E-63
28 Sof.5183.1.A1_at 0.454 0.000 CA069866 glutathione S-transferase Zea mays 2.00E-54
29 Sof.1666.2.S1_x_at 0.314 0.000 CA218291 glycerophosphodiester phosphodiesterase
Oryza sativa (japonica cultivar-group) 4.00E-55
30 Sof.1666.2.S1_at 0.407 0.006 CA218291 glycerophosphodiester phosphodiesterase
Oryza sativa (japonica cultivar-group) 4.00E-55
31 Sof.1243.1.S1_at 0.453 0.032 CA260453 glycine dehydrogenase Pisum sativum 3.00E-20
32 Sof.4382.1.S1_at 2.564 0.018 CA076530 glycine dehydrogenase Oryza sativa (japonica cultivar-group) 6.00E-66
33 SofAffx.590.1.S1_at 2.277 0.001 CF575358 glycolate oxidase Oryza sativa (japonica cultivar-group) 3.00E-17
34 SofAffx.1366.1.S1_at 2.285 0.001 CF572238 glycoprotein 3-alpha-L-fucosyltransferase Saccharum hybrid cultivar ----
35 Sof.2023.2.S1_at 0.479 0.000 BQ534217 GTP cyclohydrolase Oryza sativa (japonica cultivar-group) 4.00E-72
36 Sof.2023.2.S1_a_at 0.465 0.001 BQ534217 GTP cyclohydrolase Oryza sativa (japonica cultivar-group) 4.00E-72
37 Sof.4424.1.S1_at 3.174 0.001 CA293999 haloacid dehalogenase-like hydrolase Oryza sativa (japonica cultivar-group) 2.00E-40
38 Sof.434.2.S1_at 3.002 0.039 CA260585 haloacid dehalogenase-like hydrolase Oryza sativa (japonica cultivar-group) 2.00E-53
39 Sof.434.1.A1_at 2.098 0.000 CA133757 haloacid dehalogenase-like hydrolase Oryza sativa (japonica cultivar-group) 4.00E-05
40 Sof.833.1.A1_a_at 0.412 0.022 CA270500 haloacid dehalogenase-like hydrolase Oryza sativa (japonica cultivar-group) 7.00E-41
41 Sof.4394.1.A1_at 2.203 0.000 CA104142 harpin-induced protein Oryza sativa (japonica cultivar-group) 3.00E-38
42 SofAffx.495.1.S1_at 6.832 0.002 CF575662 harpin-induced protein Oryza sativa (japonica cultivar-group) 4.00E-05
43 Sof.3967.2.S1_a_at 2.524 0.001 CA265436 HR-like lesion-inducing Oryza sativa (japonica cultivar-group) 8.00E-50
44 Sof.5330.1.A1_at 3.532 0.000 CA090956 Hsp70 protein Oryza sativa (japonica cultivar-group) 2.00E-18
45 SofAffx.409.1.S1_at 2.264 0.005 CF575858 hydroxyanthranilate hydroxycinnamoyltransferase
Oryza sativa (japonica cultivar-group) 5.00E-41
46 Sof.2296.1.A1_at 2.53 0.000 CA210265 Hydroxycinnamoyl coenzyme A-quinate transferase Prunus mume 7.00E-16
47 Sof.1497.2.S1_a_at 0.392 0.001 CA112568 hypersensitive-induced response protein Zea mays 2.00E-91
48 Sof.1497.1.S1_at 0.449 0.006 CA164474 hypersensitive-induced response protein Zea mays 7.00E-31
49 Sof.5265.1.A1_s_at 2.091 0.042 CA201098 hypoxia-responsive family protein Citrus sinensis 7.00E-13
50 Sof.2341.1.S1_at 2.093 0.000 CA141276 hypoxia-responsive family protein Citrus sinensis 6.00E-18
51 Sof.5015.1.S1_a_at 0.385 0.007 CA065869 KED-like protein Zea mays 2.00E-20
52 Sof.1537.2.S1_at 0.361 0.003 CA186293 leucine zipper transcription factor Oryza sativa (japonica cultivar-group) 7.00E-88

Chapter 6: Sugar-mediated regulation of photosynthesis
215
53 Sof.3557.1.S1_a_at 0.353 0.000 CA153687 light-induced protein Lolium perenne 1.00E-16
54 SofAffx.10.1.S1_at 2.185 0.007 L13655 membrane protein Saccharum hybrid cultivar 2.00E-147
55 Sof.5020.1.S1_at 2.064 0.000 CA253086 methionine synthase Sorghum bicolor 2.00E-76
56 Sof.470.1.A1_at 0.431 0.000 CA070188 methylase Oryza sativa (japonica cultivar-group) 8.00E-37
57 SofAffx.1998.1.S1_at 2.139 0.012 CO373068 multi antimicrobial extrusion protein Oryza sativa (japonica cultivar-group) 4.00E-48
58 Sof.4918.1.A1_at 2.425 0.001 CA201075 multi antimicrobial extrusion protein Oryza sativa (japonica cultivar- Oryza sativa (japonica cultivar-group)group)
2.00E-11
59 Sof.2262.1.S1_at 0.474 0.008 CA245123 N-acetylglucosaminyltransferase Oryza sativa (japonica cultivar- Oryza sativa (japonica cultivar-group)group)
4.00E-29
60 Sof.2262.2.S1_a_at 0.412 0.000 CA266083 N-acetylglucosaminyltransferase Oryza sativa (japonica cultivar-group) 3.00E-57
61 SofAffx.304.1.S1_at 4.306 0.000 CF576287 NADPH oxidase Oryza sativa (japonica cultivar-group) 3.00E-34
62 Sof.4627.1.S1_at 4.1 0.000 CA210996 NADPH oxidase Oryza sativa (japonica cultivar-group) 3.00E-33
63 Sof.5000.2.S1_a_at 2.048 0.000 CA105019 nonclathrin coat protein Zea mays 1.00E-73
64 Sof.1213.1.S1_at 2.193 0.021 CA255843 O-acetyltransferase Arabidopsis thaliana 6.00E-34
65 Sof.1611.1.A1_at 2.37 0.001 CA068161 oxidoreductase Arabidopsis thaliana 1.00E-37
66 Sof.751.2.S1_at 0.278 0.000 CA144595 oxidoreductase Arabidopsis thaliana ---
67 Sof.4713.1.A1_at 0.491 0.000 CA231851 oxidoreductase Medicago truncatula 3.00E-35
68 SofAffx.733.1.S1_at 0.236 0.003 CF574561 pentatricopeptide (PPR) repeat-containing protein Saccharum hybrid cultivar ----
69 SofAffx.533.1.S1_at 0.393 0.000 CF575318 peptidyl-prolyl cis-trans isomerase Arabidopsis thaliana 2.00E-47
70 Sof.5015.1.S1_at 0.434 0.001 CA065869 peroxisomal membrane protein Oryza sativa (japonica cultivar-group) 5.00E-61
71 Sof.2292.1.A1_at 0.384 0.001 CA201095 peroxisomal membrane protein Oryza sativa (japonica cultivar-group) 1.00E-55
72 Sof.5015.2.S1_at 0.485 0.002 CA274216 peroxisomal membrane protein Oryza sativa (japonica cultivar-group) 4.00E-13
73 Sof.3603.1.S1_s_at 3.337 0.029 CA067811 phenylalanine ammonia-lyase Oryza sativa (japonica cultivar-group) 1.00E-46
74 Sof.3100.1.S1_at 2.419 0.002 CA234511 phenylalanine ammonia-lyase Oryza sativa (japonica cultivar-group) 2.00E-30
75 Sof.3419.1.A1_at 3.187 0.026 CA230737 phytosulfokine-alpha 1 precursor Triticum aestivum 2.00E-04
76 Sof.4293.2.S1_s_at 3.085 0.000 BQ537007 plasma membrane integral protein Arabidopsis thaliana ----
77 SofAffx.893.1.S1_at 0.482 0.000 CF574158 pore-forming toxin-like protein Hfr-2 Triticum aestivum 7.00E-10
78 Sof.4058.1.S1_at 5.142 0.000 CA128360 proline rich protein Arabidopsis thaliana ----

Chapter 6: Sugar-mediated regulation of photosynthesis
216
79 Sof.3524.2.S1_at 0.439 0.001 CA184235 pseudo-response regulator 95 homologue
Oryza sativa (japonica cultivar-group) 1.00E-95
80 Sof.4601.1.S1_at 2.421 0.000 CA169316 purple acid phosphatase Oryza sativa (japonica cultivar-group) 2.00E-32
81 Sof.3476.1.S1_a_at 3.723 0.000 CA265648 rapid alkalinization factor Oryza sativa (japonica cultivar-group) 8.00E-11
82 Sof.3476.2.S1_x_at 2.434 0.000 CA181867 rapid alkalinization factor Oryza sativa (japonica cultivar-group) 5.00E-13
83 Sof.5197.2.S1_a_at 0.382 0.014 CA111700 RING-finger (Really Interesting New Gene) protein Capsicum annuum 6.00E-11
84 Sof.2517.1.S1_at 2.407 0.001 CA174457 Rop1 small GTP binding protein Zea mays 1.00E-51
85 Sof.4769.1.S1_at 3.248 0.023 CA135439 secretory carrier membrane protein Oryza sativa (japonica cultivar-group) 5.00E-53
86 Sof.2889.1.S1_at 3.744 0.001 CA244470 secretory carrier membrane protein Oryza sativa (japonica cultivar-group) 3.00E-26
87 Sof.3971.2.S1_a_at 2.103 0.000 CA265321 secretory carrier-associated membrane protein Arabidopsis thaliana 8.00E-26
88 Sof.2383.1.A1_at 0.426 0.000 CA213987 signal recognition particle protein Oryza sativa (japonica cultivar-group) 8.00E-47
89 SofAffx.738.1.S1_at 2.023 0.000 CF575031 strictosidine synthase Oryza sativa (japonica cultivar-group) 2.00E-16
90 Sof.4841.2.S1_a_at 3.113 0.001 CA111464 succinate-semialdehyde dehydrogenase Arabidopsis thaliana 1.00E-79
91 Sof.4841.1.S1_at 2.655 0.000 CA093279 succinate-semialdehyde dehydrogenase Magnetospirillum magneticum 6.00E-59
92 Sof.1786.1.A1_at 0.355 0.000 CA218473 TPR domain containing protein Oryza sativa (japonica cultivar-group) 6.00E-20
93 Sof.3285.1.S1_at 0.458 0.000 CA068473 translation elongation factor Oryza sativa (japonica cultivar-group) 8.00E-49
94 Sof.4530.1.S1_at 2.23 0.010 CA219604 translation initiation factor Salinispora tropica 0.56
95 Sof.267.1.A1_at 0.463 0.001 CA194629 TUB protein Arabidopsis thaliana ----
96 SofAffx.91.1.S1_at 3.487 0.001 CF577273 vesicle soluble NSF attachment protein acceptor Saccharum hybrid cultivar ----

Chapter 7: Culm sucrose accumulation promotes leaf senescence
217
Chapter 7:
Culm sucrose accumulation promotes physiological decline of
mature leaves in sugarcane
7.1 Abstract
Photosynthetic activity in C4 sugarcane has been suggested to be regulated by the
demand for photoassimilate from sink tissues, including culm storage of sucrose and
other components of the plant (e.g. roots). This study examined the extent to which sink
demand effects source activity and regulates leaf turnover in field-grown sugarcane. To
increase sink demand on selected leaves, plants were defoliated apart from the
immature leaf before the first fully expanded leaf (2nd leaf) and the mature 8th leaf.
Changes in leaf gas exchange and fluorescence characteristics were recorded for both
leaves over a 28 d period. Furthermore, variations in sucrose and hexose
concentrations in leaf and culm tissues were measured. The affects of partial defoliation
were examined based on the fixation of 14CO2 and translocation of radio-labelled
photosynthate. A decrease in internodal sucrose concentrations in partially defoliated
plants was associated with significant increases over time in assimilation (A) and
electron transport rates (ETR) for both leaf 2 and 8. Conversely, culm sucrose
accumulation in control plants was related to a decline in photosynthetic rates in leaf 8
during the treatment period. It was concluded that leaf physiological ageing in
sugarcane is promoted by sucrose accumulation during culm maturation, and that the
feedback effect on leaf physiology which leads to leaf senescence is a consequence of
decreased sink demand. Results indicated that the signaling mechanisms regulating the
decline in leaf photosynthetic activity are likely hexose-mediated.
Keywords: hexose, leaf, photosynthesis, senescence, sink, source, sucrose, sugarcane
7.2 Introduction
Sugarcane (Saccharum L. spp. hybrids) is a tropical C4 crop characterised by its ability
to store sucrose at levels up to 650 mM (Welbaum & Meinzer, 1990). As sucrose is
stored in the stalk (culm) parenchyma tissue and not in specialized storage organs,
sugarcane represents a complex source-sink system. Close co-ordination of source

Chapter 7: Culm sucrose accumulation promotes leaf senescence
218
photosynthetic activity with carbon demand of sinks is apparent in many plant species,
including sugarcane, where a decrease in source photosynthetic assimilation rates is
observed when sink demand for carbohydrate is limited (Amaya et al., 1995; Gucci et al.,
1994; Basu et al., 1999; Iglesias et al., 2002; De Groot et al., 2003; Quilot et al., 2004;
Franck et al., 2006). Conversely, photosynthetic rates have been shown to increase
when sink carbon requirements are higher (Dosskey et al., 1990; Jeschke & Hilpert,
1997; McCormick et al., 2006 [Chapter 3]). Together, these studies strongly suggest the
source-sink relationship in plants is sink-regulated (Paul & Foyer, 2001, Watt et al.,
2005). Studies from C3 crops indicate that the metabolic control of source activity by
sink demand is the result of a sugar-mediated feedback signal, which responds to the
status of the primary transport sugar, sucrose, and its catalytic hexose products (Abdin
et al., 1998; Rolland et al., 2002; Gibson, 2005, Franck et al., 2006). The involvement of
several sugar-sensing systems has since been revealed in a number of species (Paul &
Pellny, 2003; Rolland et al., 2006; Paul, 2007).
Sucrose accumulation within the maturing sugarcane stem is likely the result of a strong
sink-demand for photoassimilate (Marcelis, 1996), however, the activity of the source
leaves is closely linked to culm maturity, with young plants typically assimilating at
significantly higher rates than older plants (Hartt & Burr, 1967; Bull & Tovey, 1974).
Three-month-old sugarcane leaves have been shown to assimilate at rates of 45 �mol
m-2 s-1 under intense illumination, while young leaves on ten-month-old plants only fixed
CO2 at only 25 �mol m-2 s-1 (Amaya et al., 1995). Gross photosynthesis is reportedly
lower in eight-month-old sugarcane plants compared to four-month-old plants,
regardless of leaf age and light intensity (Allison et al., 1997). However, in a recent
report where all but one leaf of sugarcane plants was shaded, a significant increase in
both the maximum photosynthetic rate (Jmax) and carboxylation efficiency (CE) in the
unshaded source leaf was observed over time (McCormick et al., 2006 [Chapter 3]). A
negative correlation between leaf hexose concentration and photosynthetic rates was
found, indicating that hexose may play a key role in regulating the perceived demand for
carbon from the sink (McCormick et al., 2006 [Chapter 3]). Furthermore, Gutiérrez-
Miceli et al. (2004) have recently demonstrated that partial defoliation does not
significantly influence culm sucrose concentrations, which indicates a substantial
flexibility in the assimilation rates of the remaining intact leaves towards meeting the
carbon demands of the sink. Together, these studies suggest that photosynthetic

Chapter 7: Culm sucrose accumulation promotes leaf senescence
219
capacity in sugarcane leaves is determined by the carbon requirements of the culm
(McCormick et al., 2006 [Chapter 3]).
The processes of leaf appearance, expansion and eventual senescence are closely
correlated in sugarcane (Robertson et al., 1998; Inman-Bamber, 2004), and the
dynamics of this relationship are affected by both environmental and metabolic factors.
Agronomic studies have extensively documented both environmental and climatic factors
effecting leaf turnover, including temperature (Inman-Bamber, 1994; Robertson et al.,
1998), soil pH (Plaut et al., 2000) and water stress (Inman-Bamber, 2004; Smit &
Singels, 2006). Restriction of water availability (a practice known as ‘drying off’) or
application of ripening agents, are often implemented in agricultural practices to increase
overall culm sucrose levels prior to harvest (Donaldson, 1999; Inman-Bamber, 2004).
Although a metabolic understanding of the physiological aspects of this practice is
limited, it has been suggested that sugarcane culm under conditions of stress favours
the partitioning of source assimilate to sucrose storage over expansive growth
(Pammenter & Allison, 2002; Inman-Bamber, 2004). Manipulation of sink carbon
partitioning by water deficit has been shown to result in significantly increased culm
sucrose content (Inman-Bamber & Smith, 2005). During the ‘artificial’ water-deficit-
induced maturation period prior to harvest, a decrease in leaf appearance and increased
senescence of older leaves results in a decline in green leaves per stalk (Inman-Bamber,
2004; Inman-Bamber & Smith, 2005). The senescence of leaves in ripening sugarcane
may be partly due to a perturbation of source-sink signaling resulting from an increase in
sucrose accumulation in the culm. However, it is difficult to isolate this phenomenon
from stress responses induced by water deficit or chemical ripeners. Although leaf
turnover is well documented in sugarcane agriculture, the metabolic factors regulating
leaf photosynthesis are not well characterized. Moreover, the possible impact of sink
demand on leaf senescence processes, and consequent interaction with leaf sugar-
signaling mechanisms (Wingler et al., 2006), has not been investigated in sugarcane.
The current study used a partial defoliation technique to examine the relationship
between source leaf development and culm sink tissues in twelve-month-old, field-grown
sugarcane plants over a period of approximately one month (28 d). Changes in
photosynthetic rates and sugar concentrations in leaves and culm of plants completely
defoliated except for two leaves, an immature leaf (leaf 2) and an older leaf nearing
senescence (leaf 8) (McCormick et al., 2006 [Chapter 3]), were compared to non-
Chapter 7: Culm sucrose accumulation promotes leaf senescence
220
defoliated plants (controls) over time. Furthermore, the carbon allocation patterns in the
culm of a 14C label supplied to these leaves following 27 d of partial defoliation were
examined. This work demonstrated the ability of sink demand to determine source leaf
photosynthetic capacity, leaf carbon partitioning and the onset of leaf senescence in
sugarcane. Decreased hexose levels observed in leaves of defoliated plants indicated
that a hexose-mediated signal may play a role in triggering leaf senescence in
sugarcane.
7.3 Materials and methods
7.3.1 Plant material
A 5 x 15 m plot of twelve-month-old field-grown Saccharum spp. (L.) hybrid cv. N19
(N19), cultivated at Mount Edgecombe, KwaZulu-Natal (SASRI), South Africa (29° 42’S,
31° 2’ E, 96 m), was used in this study during March, 2007. The plot was located on a
north-east facing slope with a gradient of ca. 10o.
7.3.2 Plant treatment
Sugarcane plants were randomly selected for defoliation or as controls within two rows
(15 m) of the selected plot. To minimise mutual shading effects, every second row of
cane was cut-back, as well as every second stool within the remaining rows. The plot
was irrigated (26 mm) a week prior to the commencement of the experiment and every
week at the same rate for the duration of the investigation. The plot was not irrigated
during the second week due to a substantial rainfall event (57 mm). Plants (n=20) were
completely defoliated except for the leaf prior to the first fully formed dewlap (leaf 2) and
leaf 8, as described by McCormick et al. (2006) (Chapter 3). During the experiment, leaf
growth in defoliated plants was restricted by trimming every week to limit the available
photosynthetic source material to these two leaves, however the central leaf bundle was
kept intact, so as not to disturb the sink represented by this region. Leaf 2 and leaf 8
were marked on a set of intact control plants (n=20). Light conditions were measured
regularly throughout the experiment using a LI-6400 portable photosystem unit (LI-COR
Biosciences Inc., Nebraska, USA) to ensure that leaf 2 and 8 from control and treated
plants received similar levels of light exposure. Plants were harvested (n=5) for sugar

Chapter 7: Culm sucrose accumulation promotes leaf senescence
221
analysis every 8 d at 14h00. When harvested, leaf and separated internode samples
were immediately frozen in liquid nitrogen (–196o C) and then milled in an A11 Basic
Analysis Mill (IKA, Staufen, Germany) and stored at –80oC until analysis.
7.3.3 Sugar determination
Approximately 100 mg powdered sample tissue was incubated overnight in 10 volumes
of sugar extraction buffer containing 30 mM HEPES (pH 7. 8), 6 mM MgCl2 and ethanol
70% (v/v) at 70oC. Extracts were centrifuged for 10 min at 23 200 g and sucrose,
fructose and glucose concentrations in the supernatant measured by means of a
spectrophotometric enzymatic coupling assay as described previously (McCormick et al.,
2006 [Chapter 3]). The phosphorylation of glucose by hexokinase/glucose-6-phosphate
dehydrogenase (EC 1.1.1.49) (Roche, Mannheim, Germany) and fructose by
phosphoglucose isomerase (EC 5.3.1.9) (Roche) was quantified by following the
reduction of NADP+ to NADPH at 340 nm (A340). Absorbance measurements and data
analysis were conducted on a Synergy HT Multi-Detection Microplate Reader (Biotek
Instrument, Inc., Vermont, USA) using KC4 software (Biotek Instrument, Inc),
respectively.
7.3.4 14CO2 labelling
The influence of defoliation on carbon allocation after 27 d was measured by supplying
leaf 2 or 8 (n=6) with 14CO2 using a protocol modified from Hartt et al. (1963). A portion
of leaf (5 x 20 cm) weighing approximately 5 g was sealed in a cylindrical glass tube (10
dm3) containing 50 �l NaH14CO3 (specific activity, 60 mCi mmol-1, Amersham
Biosciences, UK) to which 1 ml 10% (v/v) lactic acid was added to release 14CO2. The
glass tubes were initially covered in a black bag (5 min) to ensure equilibration of
released 14CO2 and even distribution of uptake over the leaf surface. After 45 min, tubes
were removed and a leaf disc (ca. 100 mg) of the labelled region of leaf 2 or 8 was
excised and stored in liquid nitrogen. The plants were harvested 24 h after 14CO2 supply
and tissue samples milled in an A11 Basic Analysis Mill and incubated overnight in
twenty volumes of sugar extraction buffer made from 30 mM HEPES (pH 7. 8), 6 mM
MgCl2 and ethanol 70% (v/v) at 70oC. The radioactivity in the 70% (v/v) alcohol-soluble
component was measured with a Tri-Carb Liquid Scintillation Analyzer (Packard, Milford,
MA, USA) using Ultima GoldTM XR (Packard).

Chapter 7: Culm sucrose accumulation promotes leaf senescence
222
7.3.5 Gas exchange and fluorescence determinations
Every 5 d, for a period of 25 d, gas exchange measurements were made on 2 cm2
portions of leaf tissue using a LI-6400 portable photosystem. Light was provided by a
red/blue LED light source (LI-COR Biosciences Inc.) at photon irradiance of 2 000 �mol
m-2 s-1. All leaf measurements were taken under ambient CO2 conditions (370 �mol mol-
1) at a constant leaf temperature of 28oC. Gas exchange variables measured included
photosynthetic assimilation (A), transpiration rate (E), stomatal conductance (Gs),
intercellular CO2 (Ci) and leaf temperature at ambient CO2 (370 �mol mol-1).
After 28 d, the response of A to Ci (A:Ci) was measured for leaf 2 and leaf 8 of defoliated
and control plants (n=4) by varying the external CO2 concentration from 0 to 1 000 �mol
mol-1 under a constant photosynthetically active radiation (PAR) of 2 000 �mol m-2 s-1.
An equation ( )( ) ceaA ibC −−= −1 was fitted to the A:Ci data using least squares. The
portion of the curve where the slope approaches zero due to limitation in the supply of
substrate (ribulose-1,5-bisphosphate), which is equivalent to the CO2- and light-
saturated photosynthetic rate (Jmax) (Lawlor, 1987), was calculated from this equation (a,
Jmax; b, curvature parameter; c, dark respiration (Rd)). Linear regression was performed
on the data between a Ci of 0 and 200 �mol mol-1 to determine the efficiency of
carboxylation (CE; Lawlor, 1987). The assimilation rate in the absence of stomatal
limitations (Aa) was as calculated as A interpolated from the response curve at Ci = 380
�mol mol-1.
Chlorophyll fluorescence was determined concurrently with gas exchange
measurements using the LI-6400-40 Leaf Chamber Fluorometer (LI-COR Biosciences
Inc.). A saturating pulse of red light (0.8 s, 6 000 µmol m-2 s-1) was applied to determine
the maximal fluorescence yield (Fm’) at varying external CO2 concentrations (0 - 1 000
�mol mol-1). The electron transport rate (ETR), defined as the actual flux of photons
driving photosystem II (PSII) was calculated from leaffIFm
FsFmETR α�
�
���
� −='
', where Fs is
“steady-state” fluorescence (at 2 000 �mol m-2 s-1), Fm’ is the maximal fluorescence
during a saturating light flash, f is the fraction of absorbed quanta used by PSII, typically
assumed to be 0.4 for C4 plant species (Edwards & Baker, 1993), I is incident photon
flux density and �leaf is leaf absorptance (0.85, LI-COR manual). The component
fluorescence variables were derived as described by Maxwell & Johnson (2000).
Chapter 7: Culm sucrose accumulation promotes leaf senescence
223
7.3.6 Statistical analysis
Results were subjected to analysis of variants (ANOVA) to determine the significance of
difference between responses to treatments. When ANOVA was performed, Tukey's
honest significant difference (HSD) post-hoc tests were conducted to determine the
differences between the individual treatments (SPSS Ver. 11.5, SPSS Inc., Illinois,
USA). SPSS was also used to calculate the Pearson’s correlation coefficients for
correlation analyses.
7.4 Results
7.4.1 Changes in sugar levels of defoliated and untreated plants
Hexose levels in leaves 2 and 8 of partially defoliated plants decreased significantly
(36% and 48% decrease in leaves 2 and 8, respectively) compared to corresponding
leaves of untreated controls over the duration of the treatment (Fig. 7.1). Leaf sucrose
concentrations were, on average, slightly higher in leaves of partially defoliated plants
after 12 d, but only significantly so at 20 d and 28 d for leaf 2 and 8, respectively.
In both partially defoliated and controls plants, culm sugar concentrations followed
similar patterns, with older internodes characterised by increased sucrose
concentrations (Fig. 7.2). During the treatment period, changes in culm sugar
concentrations differed depending on internode maturity. Immature internodes
(internodes 3 – 6) exhibited a small, but significant decline in sucrose (Fig. 7.3).
Conversely, sucrose concentrations in mature internodes (internodes 7 – 10) increased
over time, but only significantly so in control plants. This resulted in defoliated plants
accumulating significantly lower culm sucrose concentrations during the treatment period
(Fig. 7.2). Mature internodes of control plants were characterised by an overall decline
in hexose concentrations (Fig. 7.3). However, this trend was not as clearly apparent in
the partially defoliated plants, in which no significant decrease in hexose levels was
observed over time.

Chapter 7: Culm sucrose accumulation promotes leaf senescence
224
Fig. 7.1. Hexose and sucrose (µmol g-1 FW) concentrations for leaf 2 and 8 from field-grown
sugarcane plants kept partially defoliated or untreated (controls) for a 28 d period
(n=5). Letters above the SE bars indicate whether defoliation had a significant
influence compared to controls (P<0.05) as determined by ANOVA.
Leaf 2
0
10
20
30
40
50
0 5 10 15 20 25
time (d)
sucr
ose
(�m
ol g
-1 F
W)
defoliatedcontrol
Leaf 8
0 5 10 15 20 25 30
time (d)
a
a
a
a
a
a
hexo
se (�
mol
g -1
FW
)
0
2
4
6
8
10
12
14
a
b
a
a
a
a
a
b
a
b
a
b
a
a
a
a
a
a
a
b
a
a
a
a
a
aa
a
a
a a
b
a
a
Leaf 2
0
10
20
30
40
50
0 5 10 15 20 25
time (d)
sucr
ose
(�m
ol g
-1 F
W)
0
10
20
30
40
50
0 5 10 15 20 25
time (d)
sucr
ose
(�m
ol g
-1 F
W)
defoliatedcontroldefoliatedcontrol
Leaf 8
0 5 10 15 20 25 30
time (d)
0 5 10 15 20 25 30
time (d)
a
a
a
a
a
a
hexo
se (�
mol
g -1
FW
)
0
2
4
6
8
10
12
14
hexo
se (�
mol
g -1
FW
)
0
2
4
6
8
10
12
14
a
b
a
a
a
a
a
b
a
b
a
b
a
a
a
a
a
b
a
b
a
b
a
a
a
a
a
a
a
b
a
a
a
a
a
aa
a
a
a a
b
a
a

Chapter 7: Culm sucrose accumulation promotes leaf senescence
225
Fig. 7.2. Sugar distribution patterns for hexose and sucrose (µmol g-1 FW) in internodes 3 – 10
of field-grown sugarcane plants over a 28 d period. Plants were either defoliated
except for leaf 2 and 8 or untreated (controls) (n=5). Values represent the average
concentration (n=5) within each internode over four time points (4, 12, 20 and 28 d).
Letters above the SE bars indicate whether defoliation had a significant influence
compared to controls (P<0.05) as determined by ANOVA.
0
20
40
60
80
100
120
controldefoliated
internode
sucr
ose
(�m
ol g
-1F
W)
hexo
se (�
mol
g-1
FW)
0
40
80
120
160
3 4 5 6 7 8 9 10
a
a
a
a
a
b
a
a
a
b
a
b
a
b
a
b
a
a
a
a
a
a
a
a
a
a
a
b
a
b
a
b
0
20
40
60
80
100
120
0
20
40
60
80
100
120
controldefoliatedcontroldefoliated
internode
sucr
ose
(�m
ol g
-1F
W)
hexo
se (�
mol
g-1
FW)
0
40
80
120
160
3 4 5 6 7 8 9 10
a
a
a
a
a
b
a
a
a
b
a
b
a
b
a
b
0
40
80
120
160
3 4 5 6 7 8 9 10
a
a
a
a
a
b
a
a
a
b
a
b
a
b
a
b
a
a
a
a
a
a
a
a
a
a
a
b
a
b
a
b

Chapter 7: Culm sucrose accumulation promotes leaf senescence
226
Fig. 7.3. Average hexose and sucrose (µmol g-1 FW) concentrations of immature (3 – 6) or
mature (7 – 10) internodes for partially defoliated or untreated (control) field-grown
sugarcane plants over time (28 d). Treatment values are the mean ± SE of four
internodes (n=20) and are followed by letters indicating whether a significant change
(P<0.05) was observed over time for partially defoliated or control plants, as
determined by ANOVA followed by Tukey's honest significant difference (HSD) tests.
7.4.2 Effects of partial defoliation on 14C partitioning
The levels of fixed 14C detected in samples of leaves 2 and 8 immediately after the 45
min feeding period were statistically indistinguishable between the control and partially
defoliated sample groups (leaf 2 and 8) (Table 7.1). However, following the 24 h chase
period the amount of 14C in labelled leaf 2 and 8 of partially defoliated plants was
significantly less than in similar labelled leaves of untreated plants.
0 5 10 15 20 25 30
0
20
40
60
80
100
120
hexo
se (�
mol
g-1
FW)
controldefoliated
0
20
40
60
80
100
120
140
0 5 10 15 20 25
sucr
ose
(�m
ol g
-1F
W)
a
ab abba
bb
b
a
aa
a
aa
ab
b
a aa
b
aa
b
a
a
aa
a
a a
ab
b
Immature Mature
time (d) time (d)
0 5 10 15 20 25 30
0
20
40
60
80
100
120
hexo
se (�
mol
g-1
FW)
controldefoliated
0
20
40
60
80
100
120
140
0 5 10 15 20 25
sucr
ose
(�m
ol g
-1F
W)
a
ab abba
bb
b
a
aa
a
aa
ab
b
a aa
b
aa
b
a
a
aa
a
a a
ab
b
Immature Mature
0 5 10 15 20 25 300 5 10 15 20 25 30
0
20
40
60
80
100
120
0
20
40
60
80
100
120
hexo
se (�
mol
g-1
FW)
controldefoliatedcontroldefoliated
0
20
40
60
80
100
120
140
0 5 10 15 20 25
sucr
ose
(�m
ol g
-1F
W)
a
ab abba
bb
b
0
20
40
60
80
100
120
140
0 5 10 15 20 25
sucr
ose
(�m
ol g
-1F
W)
a
ab abba
bb
b
a
aa
a
aa
ab
b
a aa
b
aa
b
a
a
aa
a
a a
ab
b
Immature Mature
time (d) time (d)

Chapter 7: Culm sucrose accumulation promotes leaf senescence
227
In all plants, carbon allocation from leaf 2 and 8 to mature internodes was higher than to
immature internodes, indicating that larger sinks acquire more assimilate per unit mass
(Table 7.1). Carbon partitioning to immature internodes was higher in both labelled leaf
2 sample groups (control and defoliated) compared to the labelled leaf 8 control group.
However, a significant increase in allocation of 14C from leaf 2 to older internodes (9 and
10) occurred in partially defoliated plants. In contrast, 14C from leaf 8 of defoliated plants
exhibited significant increases in acropetal translocation to immature internodes 3, 4,
and 5 (Table 7.1).

Chapter 7: Culm sucrose accumulation promotes leaf senescence
228
Table 7.1. Incorporation and distribution of a 14C label in field-grown sugarcane plants that were
either untreated or partially defoliated (not leaf 2 and 8) for 28 d. Plants were
supplied with 100 �Ci 14CO2 to leaf 2 (top) or 8 (bottom) followed by a 24 h chase
period. The means ± standard errors (n=6) are followed by letters indicating for each
tissue type whether the treatments had a significant influence (P<0.05) as determined
by ANOVA.
Control Defoliated
Leaf 2
Leaf 2* (KBq g-1 FW) 468 ± 71 a 531 ± 55 a
Leaf 2 24.2 ± 2.5 a 7.3 ± 0.7 b
Leaf 8 0.3 ± 0.01 a 0.02 ± 0.0 b
Internode 3 (KBq int-1 FW) 0.6 ± 0.1 a 0.5 ± 0.2 a
Internode 4 1.5 ± 0.1 a 1.9 ± 0.7 a
Internode 5 4.2 ± 0.3 a 3.1 ± 0.8 a
Internode 6 5.9 ± 0.5 a 6.4 ± 0.7 a
Internode 7 10.4 ± 2.1 a 12 ± 1.3 a
Internode 8 12.4 ± 1.7 a 15.9 ± 4.8 a
Internode 9 9.9 ± 0.6 a 14.2 ± 0.7 b
Internode 10 7.3 ± 1.5 a 17.8 ± 3.4 b
Leaf 8
Leaf 8* (KBq g-1 FW) 599 ± 54 a 472 ± 98 a
Leaf 2 0.02 ± 0.0 a 0.07 ± 0.0 a
Leaf 8 24.1 ± 0.5 a 12.8 ± 1.6 b
Internode 3 (KBq int-1 FW) 0.2 ± 0.1 a 0.6 ± 0.1 b
Internode 4 0.4 ± 0.1 a 1.3 ± 0.3 b
Internode 5 1.6 ± 0.6 a 3.5 ± 0.2 b
Internode 6 6.9 ± 2 a 8.5 ± 1.7 a
Internode 7 17.5 ± 5.3 a 23.1 ± 6.6 a
Internode 8 20 ± 3.8 a 26 ± 0.3 a
Internode 9 16.8 ± 2.5 a 21.5 ± 3.9 a
Internode 10 21.6 ± 1.6 a 20.1 ± 2.5 a
Leaf 2* and 8* samples taken directly after labelling.
FW, fresh weight.
7.4.3 Changes in source leaf photosynthesis
Photosynthetic gas exchange characteristics and leaf chlorophyll fluorescence activities
were determined on leaves from partially defoliated plants and untreated controls plants
(Fig. 7.4). Both leaf 2 and 8 from partially defoliated plants exhibited increased A (51%
and 84% increase in leaf 2 and 8, respectively) and ETR (32% and 85% increase in leaf

Chapter 7: Culm sucrose accumulation promotes leaf senescence
229
2 and 8, respectively) over time compared to controls (Fig. 7.4). Conversely, A and ETR
declined over time in leaf 8 of control plants, while leaf 2 did not show any significant
change. Due to homogeneity of available ambient light to both treatments, the observed
increases in photosynthetic rates in partially defoliated plants could not be attributed to a
release from canopy shading. Of note is that Ci and Gs increased over the duration of
the experiment in all leaves measured, however this increase was generally more
prominent in leaves from defoliated plants. Furthermore, several of the gas exchange
variables derived from A:Ci curves, including Jmax and CE, measured after 28 d of
defoliation were significantly higher in both leaf 2 and 8 compared to the same leaves on
controls plants (Table 7.2). However, exceptions for this trend were Ci (measured at
ambient CO2) and Rd, which were not significantly different between leaf treatments
(Table 7.2).
7.4.4 Correlations between sugars and photosynthesis
In both control and partially defoliated plants, hexose and sucrose concentrations in
mature culm were negatively correlated, but not in immature culm (Table 7.3).
Photosynthetic rates in leaf 2 and leaf 8 of control plants exhibited contrasting
correlations with sucrose and hexose concentrations measured in immature and mature
culm, respectively. Leaf sucrose concentrations were negatively correlated with A in
control leaf 2, and positively correlated in control leaf 8. Notably, no links were observed
between photosynthetic rates and leaf hexose concentrations in control plants.
The partial defoliation treatment resulted in a negative correlation between
photosynthetic rates and leaf hexose concentrations in both leaf 2 and 8, while no
correlation was found with leaf sucrose (Table 7.3). Although photosynthetic rates in leaf
8 were negatively correlated with hexose in immature culm, no other culm correlations
were found for this leaf.

Chapter 7: Culm sucrose accumulation promotes leaf senescence
230
Fig. 7.4. Change in gas exchange variables of leaf 2 and 8 of partially defoliated and ntreated
(control) field-grown sugarcane plants: assimilation rate (A), electron transport rate
(ETR), intercellular CO2 concentration (Ci) and stomatal conductance (Gs).
Measurements were performed over a period of 28 d at an ambient RH of 42.6% ±
1.7 (mean ± SE) and an irradiance of 2000 �mol m-2 s-1. Treatment values are the
mean ± SE (n=5) and are followed by letters indicating, for leaf 2 and 8, whether a
significant change (P<0.05) was observed over time in leaves of partially defoliated or
control plants, as determined by ANOVA followed by Tukey's honest significant
difference (HSD) tests.
0
20
40
60
80
100
120
140
160
ETR
(�
mol
m-2
s-1 )
a a a aa
ab
abcbc
c
a
0
50
100
150
200
Ci(�
mol
mol
-1)
a
abb b
a
ab
a
abb
a
controldefoliated
0
0.05
0.1
0.15
0.2
0.25
0.3
0 5 10 15 20 25
Time (d)
Gs
(mol
m-2
s-1 )
a
bc
c
d
a
b
ab
ab ba
0
5
10
15
20
25
30
35
40
45
A(�
mol
m-2
s-1 )
a
b
bcc
d
a aa a
a
Leaf 2 Leaf 8
a
ab
c
bc
a
ab
a
b
ba
a aab
b
a
ab
ab b
aba
aab ab
abb
bc
a
ab
c
ab
0 5 10 15 20 25 30
Time (d)
aba ab
b
ab
aa
abb
b
0
20
40
60
80
100
120
140
160
ETR
(�
mol
m-2
s-1 )
a a a aa
ab
abcbc
c
a
0
20
40
60
80
100
120
140
160
ETR
(�
mol
m-2
s-1 )
a a a aa
ab
abcbc
c
a
0
50
100
150
200
Ci(�
mol
mol
-1)
a
abb b
a
ab
a
abb
a
0
50
100
150
200
Ci(�
mol
mol
-1)
a
abb b
a
ab
a
abb
a
controldefoliated
0
0.05
0.1
0.15
0.2
0.25
0.3
0 5 10 15 20 25
Time (d)
Gs
(mol
m-2
s-1 )
a
bc
c
d
a
b
ab
ab ba
0
0.05
0.1
0.15
0.2
0.25
0.3
0 5 10 15 20 25
Time (d)
Gs
(mol
m-2
s-1 )
a
bc
c
d
a
b
ab
ab ba
0
5
10
15
20
25
30
35
40
45
A(�
mol
m-2
s-1 )
a
b
bcc
d
a aa a
a
Leaf 2
0
5
10
15
20
25
30
35
40
45
A(�
mol
m-2
s-1 )
a
b
bcc
d
a aa a
a
Leaf 2 Leaf 8
a
ab
c
bc
a
ab
a
b
ba
a
ab
c
bc
a
ab
a
b
ba
a aab
b
a
ab
ab b
aba
a aab
b
a
ab
ab b
aba
aab ab
abb
bc
a
ab
c
ab
aab ab
abb
bc
a
ab
c
ab
0 5 10 15 20 25 30
Time (d)
aba ab
b
ab
aa
abb
b
0 5 10 15 20 25 30
Time (d)
aba ab
b
ab
aa
abb
b

Chapter 7: Culm sucrose accumulation promotes leaf senescence
231
Table 7.2. Variables from A:Ci curves based on gas exchange analysis and leaf fluorescence of
leaf 2 and 8 from field-grown sugarcane plants partially defoliated for 28 d or
untreated controls: substrate supply limited assimilation (Jmax), dark respiration (Rd),
carboxylation efficiency (CE), photosynthetic rate in the presence (Ai) and absence of
stomatal limitation (Aa), intercellular CO2 concentration at ambient CO2 (Ci at Ca =
370) and electron transport rate (ETR) at Ca = 370. Measurements were performed
at an ambient RH of 40.9% ± 2.2 (mean ± SE) and an irradiance of 2000 �mol m-2 s-1.
The treatment values are the mean ± SE (n=5) and are followed by letters indicating
whether partial defoliation had a significant influence (P<0.05), as determined by
ANOVA.
Leaf 2 Leaf 8
Control Defoliated Control Defoliated
Jmax (�mol m2 s-1) 35.9 ± 4.4 a 44.3 ± 2.7 b 24.8 ± 2.6 a 35.1 ± 2.5 b
Rd (�mol m2 s-1) 4 ± 0.6 a 3.4 ± 0.3 a 2.8 ± 0.2 a 3.4 ± 1.2 a
CE (mmol m2 s-1) 220.3 ± 47 a 263 ± 10 a 100.1 ± 7 a 185.5 ± 16 b
Aa (�mol m2 s-1) 29.3 ± 4.2 a 40.5 ± 2.3 b 20.9 ± 2 a 31.1 ± 3.3 b
Ai (�mol m2 s-1) 25.7 ± 3.4 a 32 ± 1.3 b 16.6 ± 0.6 a 25.3 ± 3.1 b
Ci at Ca=370 (�mol mol-1) 123 ± 15.8 a 133 ± 10.9 a 176 ± 6.9 a 144 ± 22 a
ETR at Ca=370 (�mol mol-1) 90.8 ± 12.6 a 140 ± 8.2 b 69.6 ± 10.8 a 104 ± 7.3 b
Table 7.3. Bivariate Pearson’s correlation coefficients between sugar concentrations (sucrose,
hexose), assimilation rate (A) of leaf 2 and 8 from field-grown sugarcane either
untreated controls (left) or partially defoliated except for leaf 2 and leaf 8 (right) over a
28 d period. Immature and mature culm values represent the average sugar
concentrations of internodes 3 - 6 and 7-10, respectively, for each treatment.
Significance levels (P) are reported for the Pearson’s correlation coefficients (in
brackets).
Control Defoliated
Leaf 2 Immature
Culm Mature Culm Leaf 2 Immature
Culm Mature Culm Sucrose:Hexose -.89 (0.00) -.93 (0.00)
Sucrose:A -.55 (0.01) -.52 (0.01) .55 (0.01) -.73 (0.00) .48 (0.02)
Hexose:A .47 (0.04) -.66 (0.01) -.48 (0.03) -.47 (0.03)
Leaf 8 Leaf 8
Sucrose:A .57 (0.01) .59 (0.01) -.66 (0.00)
Hexose:A -.56 (0.01) .69 (0.01) -.51 (0.02) -.58 (0.01)

Chapter 7: Culm sucrose accumulation promotes leaf senescence
232
7.5 Discussion
7.5.1 Partial defoliation effected culm sucrose status and carbon partitioning
Manipulations of the source-sink balance though a partial defoliation treatment resulted
in reduced rates of culm sucrose accumulation during the 28 d ripening period (Fig. 7.2,
7.3). Changes in culm sucrose content were comparable to those observed in a
previous study where the source-sink balance was manipulated by shading all leaves
but one, resulting in only a single leaf for source supply (McCormick et al., 2006 [Chapter
3]). Previously, partial defoliation in sugarcane (i.e. removal of half the leaves) has been
shown to not have a long-term negative effect on the sucrose content (Pammenter &
Allison, 2002; Gutiérrez-Miceli et al., 2004). The significant changes in culm sucrose
levels observed in this study may be a result of the intensity of the defoliation treatment.
The defoliation treatment resulted in significant changes in leaf assimilate partitioning. In
control plants, 14C analyses confirmed that sugarcane leaves export assimilate primarily
in a basipetal direction (MacDonald, 2000), with leaf 2 allocating more carbon to
immature internodes when compared to leaf 8 (Table 7.1). Leaf 8 was characterised by
significantly increased partitioning of carbon to young culm tissues, likely as a response
to increased demand from immature sink tissues due to reduced supply from other
sources. However, neither leaf 2 nor 8 exhibited a decrease in the supply of carbon to
mature internodes, with leaf 2 showing significantly increased basipetal partitioning
compared to control (Table 7.1). These data suggest that carbon supply to the active
sinks (i.e. leaf bundle and roots) was maintained during partial defoliation treatment,
possibly at the expense of allocation to culm sucrose accumulation.
In the partially defoliated plants, both leaf 2 and 8 had significantly reduced levels of 14C
label after 24 hr compared to controls (Table 7.1), indicating an increase in sucrose
export for source leaves of plants with increased sink demand. Thus, although the
destination of assimilate from source leaves is typically linked to the location of the leaf
(MacDonald, 2000), the current study demonstrates that sugarcane phloem loading and
transport system is capable of rapidly adapting to changing sink demand and priority,
similar to C3 species (Minchin et al., 2002; Vaughn et al., 2002). In sugarcane, the
export of carbon at the source and import at the sink is a current and active area of
research (Walsh et al., 2005; Rae et al., 2005a). Unlike C3 species, C4 plants primarily

Chapter 7: Culm sucrose accumulation promotes leaf senescence
233
produce sucrose in the mesophyll (Lunn & Furbank, 1997; 1999), thus exported
assimilate must additionally pass through the bundle sheath cells to be loaded into the
phloem. Phloem loading and unloading appear to involve an apoplastic step in
sugarcane (Walsh et al. 2005; Rae et al., 2005a), suggesting that the activity of sugar
transporters may be crucial in regulating the sugarcane source-sink relationship (Rae et
al., 2005b).
7.5.2 Increased sink demand resulted in significantly increased photosynthetic activity
Partial defoliation resulted in significant changes in gas exchange characteristics and
fluorescence in the remaining source leaves (Fig. 7.4, Table 7.2). Based on the
observed reductions in culm sugar content (Fig. 7.2) and changes in carbon partitioning
(Table 7.1), the increases in A, ETR, Jmax and CE in leaves from partially defoliated
plants are likely a result of increased assimilate demand from sink tissues (Ho, 1992;
Wardlaw, 1990; McCormick et al., 2006 [Chapter 3]). Notably, changes in Ci and Gs
were not as pronounced as those observed for A and ETR (Fig. 7.4), suggesting that
photosynthesis in defoliated plants was up-regulated through biochemical modulation,
rather than simply through control of stomata. Culm sucrose accumulation in partially
defoliated plants was reduced compared to controls (Fig. 7.2, 7.3), which indicates that
the observed increase in photosynthetic activity in leaf 2 and 8 was likely to facilitate, not
only increased culm demand, but also demand from additional sinks previously supplied
by excised leaves (e.g. roots, shoot meristematic region).
In the N19 sugarcane hybrid cultivar used in the current study, leaf senescence
commenced between leaf 8 and 10, when the adjacent internode sink exceeded 120 –
150 �mol g-1 FW sucrose (Fig. 7.2). The decline of photosynthetic activity in leaf 8 of
control plants was negatively correlated with mature culm sucrose concentrations (Table
7.3), indicating that the culm ripening process, and consequent accumulation of sucrose,
resulted in a negative feedback down-regulation of leaf photosynthetic rates. In a recent
study, where transgenic sugarcane plants were made to produce an additional sucrose
isomer, source leaves were characterised by increased photosynthetic rates and
enhanced sucrose loading rates, while leaf senescence was delayed by 15 – 20 days
(Wu & Birch, 2007). This suggests that sink demand, rather than sugar status per se,
mediates the source-sink relationship in sugarcane, and furthermore, receives some
priority during the process of leaf senescence in sugarcane.

Chapter 7: Culm sucrose accumulation promotes leaf senescence
234
Although the physiological decline in leaf 8 activity observed in the current study was
associated with accumulation of culm sucrose, significant changes in culm hexose status
were also measured in control plants. In sugarcane culm tissues, hexose levels have
been shown to peak in young maturing internodes, but then subside, while sucrose
concentrations increase as the internodes get older (Whittaker & Botha, 1997;
McCormick et al., 2006 [Chapter 3]). This pattern was observed in the current study
(Fig. 7.2, 7.3), however further correlations were observed between leaf age,
photosynthetic rates and culm sugar concentrations (Table 7.3). In mature internodal
tissues, the negative correlation between culm hexose and sucrose concentrations
indicates that the balance between these sugars may be tightly controlled (Table 7.3), a
phenomenon that has been observed previously (McCormick et al., 2006 [Chapter 3]).
The sucrose: hexose ratio is an important metabolic signal which affects almost every
aspect of plant development, including programmed cell death (Wobus & Weber, 1999;
Koch, 2004). Notably, in the current study culm hexose concentrations did not
significantly decrease in mature internodes of partially defoliated plants during the culm
ripening period (Fig. 7.3). These results suggest that the sensing mechanisms signaling
the decline of physiological activity in older leaves may result not only from the
accumulation of culm sucrose, but also the changing sucrose: hexose ratio (Paul &
Foyer, 2001; Iglesias et al., 2002; Koch, 2004).
7.5.3 The role of sugars in mediating sink-dependent changes in leaf physiological
status
Aside from a slight decline in leaf 8 sucrose in control plants after 28 d, leaf sucrose
levels were similar between treatments during the experiment (Fig. 7.1). However, both
leaf 2 and 8 from partially defoliated plants were characterised by a decrease in hexose
concentrations compared to control plants over time (Fig. 7.1). A significant negative
correlation between leaf hexose concentrations and A in partially defoliated plants
provided evidence for the involvement of hexose in facilitating the regulatory signal
between sink demand and photosynthetic activity (Table 7.3) (Pego et al., 2000;
McCormick et al., 2006 [Chapter 3]). This relationship was not observed in control
plants, suggesting that, in sugarcane, leaf hexose concentrations are carefully
maintained under normal conditions. In plants, hexose appears to have extensive
interactions with several key source regulatory mechanisms. Increases in leaf hexose

Chapter 7: Culm sucrose accumulation promotes leaf senescence
235
has been shown to directly affect the expression of enzymes related to sucrose and
starch synthesis (Koch, 1996), sugar transporters (Chiou & Bush, 1998) and
photosynthesis (Sheen, 1990; Krapp et al., 1993; Krapp & Stitt, 1995).
More recently, the role of sugars in integrating environmental signals during the
regulation of leaf senescence has been highlighted (Wingler et al., 2006). The
accumulation of sugars in non-senescent leaves, through sugar feeding or cold-girdling
treatments, has been shown to lead to decreased photosynthetic rates and chlorophyll
content, and down-regulation of transcript expression and activities of enzymes related
to photosynthesis (von Schaewen et al., 1990; Krapp et al., 1991; 1993; Krapp & Stitt;
1995). However, the precise involvement of sugar-mediated repression of genes and
enzymes in the regulation of natural senescence is less clear (Feller & Fischer, 1994), as
senescence is also co-regulated by several additional factors, including the leaf carbon:
nitrogen ratio (Masclaux et al., 2000; Wingler et al., 2004), light (Dijkwel et al., 1997) and
plant growth regulators (Jang et al., 1997; Wingler et al., 1998; Pourtau et al., 2004). In
evergreen broad leaf species, leaf age has further been implicated as a possible factor
affecting physiological decline as older leaves are characterised by increased cell wall
thickening and intracellar CO2 diffusion limitations (Damesin et al., 1998; Miyazawa et
al., 2003). The interactions between leaf sugar signaling, sink demand, and these
additional factors, remain to be explored in sugarcane. However, results from the current
study suggest that hexose play an important role in co-regulating several leaf systems in
sugarcane, including photosynthesis, phloem loading, sugar signaling and senescence.
7.5.4 Potential for influencing source-sink relations in sugarcane
Improved sucrose yields through artificial ripening have been attributed to a better
understanding of the source-sink mechanisms (Inman-Bamber & Smith, 2005).
However, results following water stress or application of chemical ripeners have
indicated that ripening treatments manipulate the partitioning of sink assimilate, and not
source photosynthetic activity (Inman-Bamber, 2004; Inman-Bamber & Smith, 2005).
Similarly, increased culm sucrose content following the practice of ‘topping’, an artificial
ripening technique where the entire leaf bundle is removed, is likely due to the lack of
carbon demand from the absent meristematic sink. Thus, current techniques to increase
sink sucrose only focus on one half of the system, and do not engage the supply
pathway of the primary carbon source leaf.

Chapter 7: Culm sucrose accumulation promotes leaf senescence
236
Although the current study demonstrates that culm maturation is linked the physiological
decline and eventual senescence in mature leaves, results further indicated that mature
leaves readily increase the supply of assimilate under conditions of increased sink
demand (Fig. 7.4). Renewed focus on the manipulation of regulatory leaf signaling
components to increase photosynthetic rates and sustain mature leaf photosynthetic
activity may result in further increases in culm sucrose yields. Based on current data
and previous work (McCormick et al., 2006 [Chapter 3]), a useful starting point should be
hexose sensors, such as hexokinase or the trehalose metabolic pathway, which are well
documented in C3 plants (Dai et al., 1999; Rolland et al., 2002; Rolland et al., 2006;
Paul, 2007; Ramon & Rolland, 2007).
7.6 Concluding remarks
Photosynthetic rates in sugarcane leaves are determined by the demand for carbon from
sink tissues. As leaves and culm mature, the accumulation of culm sucrose typically
results in a feedback signal leading to a decline in leaf carbon assimilation and the onset
of leaf senescence. However, mature sugarcane leaves retain the resources to
significantly increase photoassimilate availability under conditions of increased sink
demand. The sink-dependent feedback mechanisms which regulate source
photosynthetic activity appear to be linked to leaf hexose status, indicating that the
targeting of hexose-mediating sugar signaling systems should inform biotechnological
efforts to modify metabolism for the improvement of culm sucrose accumulation.

Chapter 7: Culm sucrose accumulation promotes leaf senescence
237
7.7 References
Abdin OA, Zhou X, Coulman BE, Cloutier D, Faris MA, Smith DL. Effects of sucrose
supplementation by stem injection on the development of soybean plants. Journal of
Experimental Botany 49: 2013–2018.
Allison JCS, Williams HT, Pammenter NW. 1997. Effect of specific leaf nitrogen on
photosynthesis of sugarcane. Annals of Applied Biology 63: 135–144.
Amaya A, Cock JH, Hernandez A, Irvine J. 1995. Bioligía. In: Casselett C, Torres J,
Isaacs C, eds. El cultivo de la Ca�a en la zona azucarera de Colombia. Cali, Colombia:
Cenica�a, 31–62.
Basu PS, Sharma A, Garg ID, Sukumaran NP. 1999. Tuber sink modifies photosynthetic
response in potato under water stress. Environmental and Experimental Botany 42: 25–29.
Bull TA, Tovey DA. 1974. Aspects of modelling sugar cane growth by computer simulation.
Proceedings of the International Society of Sugar Cane Technologists 165: 1021–1032.
Chiou TJ, Bush DR. 1998. Sucrose is a signal molecule in assimilate partitioning.
Proceedings of the National Academy of Science (USA) 95: 4784–4788.
Damesin C, Rambal S, Joffre R. 1998. Seasonal and annual changes in leaf 13C in two co-
occurring Mediterranean oaks: relations to leaf growth and drought progression. Functional
Ecology 11: 177–189.
Dai N, Schaffer A, Petreikov M, Shahak Y, Giller Y, Ratner K, Levine A, Granot D.
1999. Overexpression of Arabidopsis hexokinase in tomato plants inhibits growth, reduces
photosynthesis, and induces rapid leaf senescence. The Plant Cell 11: 177–189.
Dijkwel PP, Huijser C, Weisbeck PJ, Chua NH, Smeekens SCM. 1997. Sucrose control
of phytochrome A signaling in Arabidopsis. The Plant Cell 9: 583–595.
De Groot CC, Van Den Boogaard R, Marcelis LF, Harbison J, Lambers H. 2003.
Contrasting effects of N and P deprivation on the regulation of photosynthesis in tomato
plants in relation to feedback limitation. Journal of Experimental Botany 54: 1957–1967.
Donaldson, RA. 1999. Sugarcane ripening in South Africa: Review of the last decade.
Proceedings of the International Society of Sugar Cane Technologists 23: 8–12.
Dosskey MK, Linderman RG, Boersma L. 1990. Carbon-sink stimulation of photosynthesis
in Douglas fir seedlings by some ectomycorrhizas. New Phytologist 115: 269–274.
Edwards GE, Baker NR. 1993. Can CO2 assimilation in maize leaves be predicted accurately
from chlorophyll fluorescence analysis? Photosynthesis Research 37: 89–102.
Feller U, Fischer A. 1994. Nitrogen metabolism in senescing leaves. CRC Critical Reviews in
Plant Science 13: 241–273.
Franck N, Vaast P, Génard M, Dauzat J. 2006. Soluble sugars mediate sink feedback
down-regulation of leaf photosynthesis in field-grown Coffea arabica. Tree Physiology 26:
517–525.

Chapter 7: Culm sucrose accumulation promotes leaf senescence
238
Gibson SI. 2005. Control of plant development and gene expression by sugar signalling.
Current Opinion in Plant Biology 8: 93–102.
Gucci R, Corelli-Grappadelli L, Tustin S, Ravaglia G. 1994. The effect of defruiting at
different stages of fruit development on leaf photosynthesis of ‘Golden Delicious’ apples.
Tree Physiology 15: 35–40.
Hartt CE, Burr GO. 1967. Factors affecting photosynthesis in sugarcane. Proceedings of the
International Society of Sugar Cane Technologists 12: 590–609.
Hartt CE, Kortchak HP, Forbes AJ, Burr GO. 1963. Translocation of C14 in sugarcane.
Plant Physiology 38: 305–318.
Ho LC. 1992. The possible effects of sink demand for assimilate on photosynthesis. In: Murata
N, ed. Research in photosynthesis, vol. IV. Dordrecht: Kluwer Academic Publishers, 729–
736.
Iglesias DJ, Lliso I, Tadeo FR, Talon M. 2002. Regulation of photosynthesis through
source: sink imbalance in citrus is mediated by carbohydrate content in leaves. Physiologia
Plantarum 116: 563-572.
Inman-Bamber NG, Smith DM. 2005. Water relations in sugarcane and response to water
deficits. Field Crops Research 92: 185–202.
Inman-Bamber NG. 1994. Temperature and seasonal effects on canopy development and light
interception of sugarcane. Field Crops Research 36: 41–51.
Inman-Bamber NG. 2004. Sugarcane water stress criteria for irrigation and drying off. Field
Crops Research 89: 107–122.
Jang JC, Leon P, Zhou L, Sheen J. 1997. Hexokinase as a sugar sensor in higher plants.
The Plant Cell 9: 5–19.
Jeschke WD, Hilpert A. 1997. Sink-stimulated photosynthesis and sink-dependent increase
in nitrate uptake: nitrogen and carbon relations of the parasitic association Cuscuta reflexa-
Ricinus communis. Plant Cell and Environment 20: 47–56.
Koch KE. 1996. Carbohydrate-modulated gene expression in plants. Annual Review of Plant
Physiology and Molecular Biology 47: 509–540.
Koch KE. 2004. Sucrose metabolism: regulatory mechanisms and pivotal roles in sugar
sensing and plant development. Current Opinion in Plant Biology 7: 235–246.
Krapp A, Hofmann B, Schäfer C, Stitt M. 1993. Regulation of the expression of rbcS and
other photosynthetic genes by carbohydrates: a mechanism for the ‘sink’ regulation of
photosynthesis? The Plant Journal 3: 817–828.
Krapp A, Quick WP, Stitt W. 1991. Ribulose-1,5-bisphosphate carboxylase-oxygenase,
other Calvin cycle enzymes and chlorophyll decrease when glucose is supplied to mature
spinach leaves via the transcription stream. Planta 186: 58–59.
Krapp A, Stitt M. 1995. An evaluation of direct and indirect mechanisms for the “sink
regulation” of photosynthesis in spinach: Changes in gas exchange, carbohydrates,

Chapter 7: Culm sucrose accumulation promotes leaf senescence
239
metabolites, enzyme activities and steady state transcript levels after cold-girdling leaves.
Planta 195: 313–323.
Lawlor DW. 1987. Photosynthesis: metabolism, control and physiology. Harlow, UK: Longman
Scientific and Technical.
Lunn JE, Furbank RT. 1997. Localisation of sucrose-phosphate synthase and starch in
leaves of C4 plants. Planta 202: 106–111.
Lunn JE, Furbank RT. 1999. Sucrose biosynthesis in C4 plants. New Phytologist 143: 221–
237.
MacDonald Z. 2000. The metabolic fate of sucrose in intact sugarcane internodal tissue. MSc
Thesis, School of Life and Environmental Sciences, University of KwaZulu Natal, Durban,
South Africa.
Marcelis LFM. 1996. Sink strength as a determinant of dry matter partitioning in the whole plant.
Journal of Experimental Botany 47: 1281–1291.
Masclaux C, Valadier MH, Brugiére N, Morot-Guadry JF, Hirel B. 2000.
Characterization of the source/sink transition in tobacco (Nicotiana tabacum L.) shoots in
relation to nitrogen management and leaf senescence. Planta 221: 510–518.
Maxwell K, Johnson GN. 2000. Chlorophyll fluorescence - a practical guide.
Journal of Experimental Botany 51: 659–668.
McCormick AJ, Cramer MD, Watt DA. 2006. Sink strength regulates photosynthesis in
sugarcane. New Phytologist 171: 759–770.
Minchin PEH, Thorpe ME, Farrar JF, Koroleva OA. 2002. Source-sink coupling in young
barley plants and control of phloem loading. Journal of Experimental Botany 53: 1671–1676.
Miyazawa SI, Makino A, Terashima I. 2003. Changes in mesophyll anatomy and sink-
source relationships during leaf development in Quercus glauca, an evergreen tree showing
delayed leaf greening. Plant, Cell and Environment 24: 279–291.
Pammenter NW, Allison JCS. 2002. Effects of treatments potentially influencing the supply of
assimilate on its partitioning in sugarcane. Journal of Experimental Botany 53: 123–129.
Paul MJ. 2007. Trehalose 6-phosphate. Current Opinion in Plant Biology 10: 303–309.
Paul MJ, Foyer, CH. 2001. Sink regulation of photosynthesis. Journal of Experimental Botany
52: 1381–1400.
Paul MJ, Pellny TK. 2003. Carbon metabolite feedback regulation of leaf photosynthesis and
development. Journal of Experimental Botany 54: 539–547.
Pego JV, Kortsee AJ, Huijser C, Smeekens SCM. 2000. Photosynthesis, sugars and the
regulation of gene expression. Journal of Experimental Botany 51: 407–416.
Plaut Z, Meinzer FC, Federman E. 2000. Leaf development, transpiration and ion uptake
and distribution in sugarcane cultivars grown under salinity. Plant and Soil 218: 59–69.
Pourtau N, Marès M, Purdy S, Quentin N, Ruël A, Wingler A. 2004. Interactions of
abscisic acid and sugar signalling in the regulation of leaf senescence. Planta 219: 765–772.

Chapter 7: Culm sucrose accumulation promotes leaf senescence
240
Quilot B, Genard M, Kervella J. 2004. Leaf saturated phtosynthesis for wild and cultivated
peach genotypes and their hybrids: A simple mathematical modelling analysis. Journal of
Horticultural Science and Biotechnology 79: 546–553.
Rae AL, Grof CPL, Casu, RE, Bonnett GD. 2005a. Sucrose accumulation in the
sugarcane stem: pathways and control points for transport and compartmentation. Field
Crops Research 92: 159–163.
Rae AL, Perroux J, Grof CPL. 2005b. Sucrose partitioning between vascular bundles and
storage parenchyma in the sugarcane stem: a potential role for the ShSUT1 sucrose
transporter. Planta 220: 817–825.
Ramon M, Rolland F. 2007. Plant development: introducing trehalose metabolism. Trends in
Plant Science 12: 185–188.
Robertson MJ, Bonnett GD, Hughes RM, Muchow RC, Campbell JA. 1998.
Temperature and leaf area expansion of sugarcane: integration of controlled-environment,
field and model studies. Australian Journal of Plant Physiology 25: 819–828.
Rolland F, Baena-Gonzalez E, Sheen J. 2006. Sugar sensing and signaling in plants:
conserved and novel mechanisms. Annual Review of Plant Biology 57: 675–709.
Rolland F, Moore B, Sheen J. 2002. Sugar sensing and signaling in plants. The Plant Cell
14: 185–205.
Sheen J. 1990. Metabolic repression of transcription in higher plants. The Plant Cell 2: 1027–
1038.
Smit MA, Singels A. 2006. The response of sugarcane canopy development to water stress.
Field Crops Research 98: 91–97.
Vaughn MW, Harrington GN, Bush DR. 2002. Sucrose-mediated transcriptional regulation
of sucrose symporters activity in the phloem. Proceedings of the National Academy of
Sciences 99: 10876–10880.
Von Schaewen A, Stitt M, Schmidt R, Sonnewald U, Willmitzer L. 1990. Expression of
a yeast-derived invertase in the cell wall of tobacco and Arabidopsis plants leads to
accumulation of carbohydrate and inhibition of photosynthesis and strongly influences growth
and phenotype of transgenic tobacco plants. EMBO Journal 9: 3033–3044.
Walsh KB, Sky RC, Brown SM. 2005. The anatomy of the pathway of sucrose unloading
within the sugarcane stalk. Functional Plant Biology 32: 367–374.
Wardlaw IF. 1990. The control of carbon partitioning in plants. New Phytologist 116: 341–381.
Watt DA, McCormick AJ, Govender C, Carson DL, Cramer MD, Huckett BI, Botha
FC. 2005. Increasing the utility of genomics in unraveling sucrose accumulation. Field
Crops Research 92: 149–158.
Welbaum GE, Meinzer FC. 1990. Compartmentation of solutes and water in developing
sugarcane stalk tissue. Plant Physiology 93: 1147–1153.
Whittaker A, Botha FC. 1997. Carbon partitioning during sucrose accumulation in sugarcane
internodal tissue. Plant Physiology 115: 1651–1659.
Chapter 7: Culm sucrose accumulation promotes leaf senescence
241
Wingler A, von Schaewen A, Leegood RC, Lea PJ, Quick PW. 1998. Regulation of leaf
senescence by cytokinin, sugars and light. Plant Physiology 116: 329–335.
Wingler A, Marès M, Pourtau N. 2004. Spatial patterns and metabolic regulation of
photosynthetic parameters during leaf senescence. New Phytologist 161: 781–789.
Wingler A, Purdy S, MacLean JA, Pourtau N. 2006. The role of sugars in integrating
environmental signals during the regulation of leaf senescence. Journal of Experimental
Botany 57: 391–399.
Wobus U, Weber H. 1999. Sugars as Signal Molecules in Plant Seed Development. Journal
of Biological Chemistry 380: 937–944.
Wu L, Birch RG. 2007. Doubled sugar content in sugarcane plants modified to produce a
sucrose isomer. Plant Biotechnology Journal 5: 109–117.

Chapter 8: General Discussion
242
Chapter 8:
General Discussion
8.1 Supply and demand: a novel paradigm for the source-sink regulation of
carbon accumulation in sugarcane
Almost all higher plant systems can be defined as an integrated organization of
photosynthetic carbon sources (i.e. leaves) and non-photosynthetic carbon consuming
sink tissues. Plant growth can thus be viewed as a function of the balance between the
supply of carbon from the source and carbon demand from sinks. Sugarcane represents
a somewhat unique source-sink system, for two reasons: 1) storage of assimilate at
exceptionally high concentrations is in the form of sucrose which is an osmotically active
solute whereas most plants store insoluble polysaccharides such as starch; and 2)
storage occurs in non-specialised parenchyma culm tissue. In order to increase sucrose
yields in this crop, sugar industries around the globe have encouraged the development
and utilisation of new molecular techniques to act in concert with conventional
sugarcane breeding programs (e.g. Carson & Botha 2002; Casu et al., 2007; Wu &
Birch, 2007). Although much progress has been made in understanding the fate of
sucrose in the culm and the mechanisms that regulate sucrose accumulation, little or no
progress has been made in improving sucrose accumulation in the culm.
To-date, most efforts to manipulate sucrose concentrations by transgenesis have
targeted single genes encoding putative rate-limiting sucrolytic enzymes in the culm (Ma
et al. 2000; Botha et al., 2001; Watt et al., 2005; Groenewald & Botha, 2007). However,
these attempts have, thus far, met with little success. This may be attributed to
increasing the potential for sucrose accumulation in culm tissue to the maximum by
conventional breeding (Grof & Campbell, 2001); however, several reports indicate while
current sugarcane cultivars appear to accumulate sucrose to maximum levels, the
potential exists for substantial further gains (Bull & Glasziou 1963; Moore et al., 1997;
Wu & Birch, 2007). This suggests that future strategies to increase sugarcane via
transgenic manipulation may require a broader understanding of the processes involved
in sucrose accumulation (Watt et al., 2005).
There are several physiological factors that may limit the accumulation of sucrose in
sugarcane: i) leaf photosynthetic rates and carbon partitioning into different pools; ii)

Chapter 8: General Discussion
243
phloem loading in the leaf and unloading in the culm; iii) culm metabolism, including
membrane transport, and sucrose partitioning, turnover and re-mobilisation; and iv)
developmental constraints, such as duration and timing of maturation (Moore et al.,
1997). Notably, the active loading and unloading of sucrose from the phloem by sugar
transporters are suggested as pivotal rate-limiting processes for sucrose accumulation in
sugarcane (Lalonde et al., 2003; Walsh et al., 2005). However, an additional constraint
to crop yields may result from the ‘sensitivity’ of source photosynthesis to sink demand.
Co-ordination between source leaf photosynthetic rates and culm sink sucrose
accumulation has been known for sometime. For example, Saccharum spontaneum
(L.), a low sucrose accumulator, has a 30% higher photosynthetic rate compared to
higher sucrose accumulating Saccharum spp. (L.) hybrids (Irvine, 1975). More recently,
sugarcane leaf shading studies have shown that the demand for carbon from culm sinks
resulted in increased rates of photosynthesis and sucrose export in source tissues
(McCormick et al., 2006 [Chapter 3]), indicating that photosynthetic rates are typically
limited by culm requirements. It has been suggested that sucrose accumulation in
sugarcane may be regulated by the demand of sink tissues (Watt et al., 2005).
Nevertheless, the relationship between source photosynthetic rates and sink demand in
sugarcane is not well documented, and several important questions remain to be
answered. What are the precise signaling mechanisms whereby the requirements of the
sink may be transmitted to the source? How does the source sense these signals? How
is this relationship effected between dissimilar cultivars or under different environmental
conditions? To address these questions, a paradigm of an integrated supply and
demand system should be employed, where an awareness of both source and sink
activities is used to understand carbon flux and accumulation processes (Minchin &
Lacointe, 2004).
In C3 plants, there is ample evidence for source response to sink requirement (Basu et
al., 1999; Iglesias et al., 2004; Franck et al., 2006), a relationship which has been shown
to be regulated by several sugar-sensitive feedback systems (Rolland et al., 2006; Paul,
2007). Sugar-induced feedback inhibition of photosynthesis overrides regulation of
photosynthesis by light, tissue type, and developmental stage (von Schaewen et al.,
1990; Krapp et al., 1993; Sheen, 1994). Previously, the accumulation of photo-
assimilate at the source, through application of sugar feeding or cold-girdling techniques,
has been shown to lead to a feedback effect on leaf sucrose metabolism and

Chapter 8: General Discussion
244
photosynthetic activity (Krapp et al., 1993; Krapp & Stitt, 1995). Furthermore, a
disruption in the ‘product export pathway’, through the over-expression of a yeast-
derived invertase in the cell walls of tobacco leaves, resulted in a negative affect on the
phloem loading, which led to an increase in leaf sugar concentrations, photosynthetic
inhibition, and a limitation of overall growth (Stitt et al., 1991). In addition, removal of
sink demand by excising the growing tuber has been shown to lead to decrease
photosynthetic rates in potato (Basu et al., 1999). A subsequent decline in
photosynthetic rates following sugar accumulation in excised and intact sugarcane
leaves (Chapter 5 and 6), has further corroborated the existence of sugar-sensing
systems in C4 crops. Together, these studies indicate that, although local sugar-sensing
mechanisms are active at the source, the principal intermediate linking the supply and
demand pathway is the phloematic transport product, sucrose.
The source-sink relationship between leaf and culm can be thought of as being similar to
a factory production line (Fig. 8.1A). Production at the source must be carefully
regulated by consumption demand, or else the product will either deplete or accumulate
(Hofmeyr & Cornish-Bowden, 2000). Thus, in this model the control of flux through the
system is not only regulated by demand, but also by the sensitivity of supply to demand.
Studies of glycolysis in yeast have indicated that rate-limiting enzymatic steps do not
exist, but rather that the control of flux is shared among all enzymes in the metabolic
system (Schaaf et al., 1989; Fell, 1996). Furthermore, the control of flux has been
shown to be regulated by uptake of glucose into the cell (Galazzo & Bailey, 1990; Bisson
et al., 1993), suggesting that the ability to sense and receive carbon limits system
capacity, and not the individual components within (Hofmeyr & Cornish-Bowden, 2000).
It is possible that the import and immobilisation of sucrose to vacuolar storage in culm
parenchyma cells may act to as an additional demand component, and furthermore
maintain a high sink demand for sucrose, resulting in the extraordinary sucrose yields
observed in sugarcane (Fig. 8.1B). In this model, changes in sink activity (i.e. storage
and demand) would result in adjustments in the rates of symplastic and apoplastic
phloem loading and flow processes (Lalonde et al., 2003). This would, in turn, feedback
on the source sucrose pool, thus regulating supply.

Chapter 8: General Discussion
245
Fig. 8.1. A metabolic supply-demand system in conventional plants (a), and in plants with high
carbon accumulation, such as sugarcane (b). Modified from Hofmeyr and Cornish
Bowden (2000) (Elsevier, with permission).
If sucrose is considered as the intermediate linking supply and demand processes, a low
demand will result in the demand pathway controlling the flux of sucrose through the
overall system (Fig. 8.2) (Hofmeyr & Cornish-Bowden, 2000). In sugarcane, it is likely
that the demand pathway is typically saturated and exerts little control over the
concentration of sucrose. However, feedback control from the demand pathway will limit
sucrose production, even though the concentration of sucrose is largely controlled by the
supply. In order to increase sucrose concentration in the system a reduction in the
elasticity of the supply is required, such that supply is less sensitive to inhibition by its
sucrose product (Fig. 8.2).
supply demand
light
CO2
Sucrose(phloem)
storage
- growth- respiration
B
supply demand
light
CO2
Sucrose(phloem)
- growth- respiration
A
supply demand
light
CO2
Sucrose(phloem)Sucrose(phloem)
storage
- growth- respiration
B
supply demand
light
CO2
Sucrose(phloem)Sucrose(phloem)
- growth- respiration
A

Chapter 8: General Discussion
246
Fig. 8.2. The steady state behaviour of a supply-demand system (modified from Hofmeyr &
Cornish Bowden, 2000) (Elsevier, with permission). Black lines indicate inhibition
(solid) and no inhibition (dashed) of supply by its product p. To decrease inhibition of
supply by demand, the elasticity, or insensitivity, of the supply pathway must be
increased (red).
In some species, a lowered ‘sensitivity’ to source sugar accumulation has been
demonstrated. Photosynthetic rates in C4 Flaveria bidentis (L.) and C3 tobacco
(Nicotiana tabacum L.) remained unaffected when sucrose concentrations were
increased 2 – 3 fold through sugar feeding (Furbank et al., 1997). Furthermore, spinach
and rye grass, can accumulate a greater than 50-fold increase in normal source leaf
sucrose concentrations before limiting photosynthesis or growth (Housley & Pollock,
1985; Goldschmidt & Huber, 1992; Krapp & Stitt, 1995). Conversely, tomato and
Arabidopsis are highly sensitive to leaf sucrose accumulation and are characterized by
severe photoinhibition and growth retardation (Goldschmidt & Huber, 1992; Furbank et
al., 1997). However, several Arabidopsis mutants have been identified as insensitive to
high glucose (Zhou et al., 1998) or sucrose (Pego et al., 2000), or both (Laby et al.,
2000), indicating that inhibition by sugars can be uncoupled from feedback mechanisms
regulating growth and development.
Chapter 8: General Discussion
247
Sugarcane source leaves are characterized by the accumulation of sucrose during the
diurnal period (Du et al., 2000; McCormick et al., 2006 [Chapter 3]) and high sucrose
concentrations in the culm sink. Based on supply-demand analysis of relationship
between source and sink tissues in sugarcane (Hofmeyr & Cornish-Bowden, 2000), it is
possible that sugarcane does not accumulate high sucrose to simply supply a high sink
demand, but rather that that a decreased sensitivity to the sugar-feedback mechanisms
at the source has been inadvertently selected for in sugarcane agriculture. This implies
that the rates of carbon accumulation in sugarcane may be dependent, at least partially,
on source leaf supply. Moreover, sugarcane leaves appear to have great capacity for
adapting to increased demand from culm sinks. Under conditions of limited source
supply, through partial shading or defoliation treatments, significant increases in
photosynthetic rates have been observed in the remaining source leaves, while mature
culm sucrose status was not significantly affected (Pammenter & Allison, 2002,
Gutiérrez-Miceli et al., 2004, McCormick et al., 2006 [Chapter 3]). Furthermore, culm
sucrose storage appears to receive priority in the partitioning of assimilate above
respiratory and growth requirements (Pammenter & Allison, 2002; Inman-Bamber &
Smith, 2005). In immature culm tissues, this phenomenon may be limited by the futile
cycling of sugars between the vacuole and cytosol (Whittaker & Botha, 1997). However,
as cytosolic and vacuolar invertase activities declines as the culm matures (Zhu et al.,
1997; Rose & Botha, 2000), the effect of futile cycling on sucrose demand is likely less
prominent in older internodes. The primary role of invertases in both source and sink
tissues (Goldschmidt & Huber, 1992, Zhu et al., 1997; Rose & Botha, 2000), indicates
that the hexose products of sucrose may be important in sugar-signaling.
Recently, transgenic sugarcane producing an additional sucrose isomer has
demonstrated a doubling of sugar content (Wu & Birch, 2007). Furthermore, source leaf
photosynthetic rates were significantly increased and leaf senescence was delayed by
15 – 20 days (Wu & Birch, 2007). This study corroborates the previously observed
innate capacity of source leaves to augment supply under conditions of increased sink
demand (McCormick et al., 2006 [Chapter 3]), and furthermore, indicates that culm
tissues in current cultivars possess the capacity to store more sucrose. Thus, the
successful manipulation of sucrose yield in sugarcane may not necessitate an increase
in culm demand, as has been previously attempted (Ma et al. 2000; Botha et al., 2001;
Groenewald & Botha, 2007), but rather an uncoupling of the signal pathways that
mediate negative feedback between source and sink tissues.

Chapter 8: General Discussion
248
In conclusion, current knowledge suggests that up-regulating culm sucrose accumulation
will require a down-regulation of signaling mechanisms that limit leaf photosynthesis.
The source leaf is an appropriate target due to the considerable malleability of the
carbon supply pathway (McCormick et al., 2006 [Chapter 3]; Wu & Birch, 2007). As the
partitioning of carbon to sucrose or fiber (i.e growth) differs substantially between
sugarcane cultivars and environmental conditions, it is likely that changes to signaling
mechanisms will require appropriate adjustment. However, if supply is increased and
not taken up by storage tissues due to physiological limitations, such as osmotic
thresholds or constraints in the uptake process, it is likely that only bigger stalks will
suffice to increase sugarcane sucrose yields. Several sugar-signaling mechanisms have
been documented (Rolland et al., 2006; Paul, 2007) and, thus far, evidence indicates
hexokinase (HXK; EC 2.7.1.1), sugar transporters, and the trehalose metabolic pathway
as suitable targets for further investigation.
8.2 Concluding remarks
The current study has examined the nature of the relationship between source and sink
tissues in sugarcane, with emphasis on the identification of mechanisms that contribute
to the modulation of leaf photosynthetic activity. Initial analyses indicated that demand
for carbon from culm sinks was closely linked to the rates of photosynthesis and sucrose
export in source leaves (Chapters 3 and 7). The observed increases in photosynthetic
rates were shown to correlate negatively with concentrations of leaf hexose, but not
sucrose. Together, these results highlighted the integrated relationship amongst leaf
photosynthetic rates, leaf sugar status, and culm demand. Reduced leaf hexose
concentrations were further implicated in delaying the onset of senescence (Chapter 7),
indicating that hexoses play a potentially important role in leaf turnover. Additional
study, using a macroarray bearing a defined set of carbohydrate metabolism and
photosynthesis related ESTs, revealed that the decrease in leaf hexoses correlated to
an increase in expression of several genes related to C4-photosynthesis and sugar
transport, including, PEPC, Rubisco, a monosaccharide transporter and a triose
phosphate translocator (Chapter 4). A further correlation amongst changes in
photosynthesis, leaf hexose concentrations and HXK, provided evidence for the
involvement of a putative HXK-dependent sugar-sensing mechanism (Harrington &
Bush, 2003).

Chapter 8: General Discussion
249
To explore the relationship between leaf sugar status and photosynthesis, excised
sugarcane leaves were fed sucrose or hexoses, which resulted in an increase in leaf
sugars and a decrease in leaf photosynthetic rates (Chapter 5). Conversely, when leaf
sugar levels were suppressed through shading, photosynthetic rates were significantly
increased upon return to light. Notably, a concurrent suppression of leaf hexose
concentrations was observed, while no significant differences were found in stomatal
conductance between treatments, indicating that photosynthesis was constrained by
biochemical restrictions, rather than stomatal limitation. This work provided additional
evidence of a direct role for sucrose and hexose in modulating leaf photosynthetic rates
(Krapp et al., 1993; Chiou & Bush, 1998; Gibson, 2005), which suggests that these
sugars are key signal molecules in regulating the carbon supply between source and
sink tissues in sugarcane.
The relationship between sugars and photosynthesis in intact sugarcane leaves was
further investigated using a leaf cold-girdling technique (Chapters 5 and 6). In these
experiments, increased sugar accumulation resulted in a decline in leaf assimilation
rates and fluorescent activity over time, in both greenhouse- and field-grown sugarcane.
An analysis of gene expression in cold-girdled field-grown sugarcane, using a
commercial microarray technique, identified significant changes within several diverse
metabolic pathways. These included decreased expression of genes related to
photosynthesis, and an increase in expression of genes involved in glycolytic carbon
partitioning, cell wall metabolism, Pi cycling, stress response and sugar signaling
(Chapter 6). These results were indicative of the integrated feedback role of sugars
status on several pathways, possibly via a common phosphorylating signal transduction
pathway (Ehness et al., 1997; Müller et al., 2007). Thus, photosynthesis may be
modulated by several different routes in sugarcane. Changes in the expression of Pi-
related genes, further suggested that leaf photosynthetic rates were limited by the
depletion of cytosolic Pi availability, due to the accumulation of sugars and
phosphorylated intermediates (Paul & Pellny, 2003). Although no significant change in
HXK gene expression were observed, respective up- and down-regulation of TPP and
TPS provided evidence for a T6P-mediated sugar-signaling mechanism in sugarcane
leaves.
Notably, limited changes in expression of sucrolysis-related genes implicated in
regulating carbon flux, such as SPS and SuSy, were observed from macroarray and
Chapter 8: General Discussion
250
microarray expression data (Chapters 4 and 6). However, in both studies a potential
transcriptional regulation of glycolysis mediated through FBPase and GPD was
apparent. This suggests that, at the transcript level, the initial uptake and distribution of
triose-P into the glycolytic cycle may be more closely modulated than downstream
processes. However, based on the reported roles of SPS and SuSy in leaves of other
species, subsequent post-translational and allosteric regulation of SPS and SuSy is
highly likely. Future research into source-sink relations in sugarcane should not only
focus on the identity of putative regulatory genes and gene networks, but also examine
the relationship between metabolic events across hierarchical scales (transcript, enzyme
and metabolites) and the consequent impact on crop performance (Edmeades et al.,
2004; Sinclair & Purcell, 2005).

Chapter 8: General Discussion
251
8.3 References
Basu PS, Sharma A, Garg ID, Sukumaran NP. 1999. Tuber sink modifies photosynthetic
response in potato under water stress. Environmental and Experimental Botany 42: 25–29.
Bisson LF, Coons DM, Kruckeburg AL, Lewis D. 1993. Yeast sugar transporters. Critical
Reviews in Biochemistry and Molecular Biology 28: 259–308.
Botha FC, Sawyer, BJB, Birch RG. 2001. Sucrose metabolism in the culm of transgenic
sugarcane with reduced soluble acid invertase activity. Proceedings of the International
Society of Sugar Cane Technologists 24: 588–591.
Bull TA, Glasziou KT. 1963. The evolutionary significance of sugar accumulation in
Saccharum. Australian Journal of Biological Sciences 16: 737–742.
Carson DL, Huckett BI, Botha FC. 2002. Sugarcane ESTs differentially expressed in
immature and maturing internodal tissue. Plant Science 162: 289–300.
Casu RE, Jarmey J, Bonnett G, Manners J. 2007. Identification of transcripts associated
with cell wall metabolism and development in the stem of sugarcane by Affymetrix GeneChip
Sugarcane Genome Array expression profiling. Function and Integrative Genomics 7: 153–
167.
Chiou TJ, Bush DR. 1998. Sucrose is a signal molecule in assimilate partitioning.
Proceedings of the National Academy of Science (USA) 95: 4784–4788.
Du YC, Nose A, Kondo A, Wasano K. 2000. Diurnal changes in photosynthesis in
sugarcane leaves. II. Enzyme activities and metabolite levels relating to sucrose and starch
metabolism. Plant Production Science 3: 9–16.
Edmeades GO, McMaster GS, White JW, Campos H. 2004. Genomics and the
physiologist: bridging the gap between genes and crop response. Field Crops Research 90:
5–18.
Ehness R, Ecker M, Godt DE, Roitsch T. 1997. Glucose and stress independently
regulate source and sink metabolism and defense mechanisms via signal transduction
pathways involving protein phosphorylation. The Plant Cell 9: 1825–1841.
Fell D. 1996. Understanding the control of metabolism. Portland Press, Oxford: UK.
Franck N, Vaast P, Génard M, Dauzat J. 2006. Soluble sugars mediate sink feedback
down-regulation of leaf photosynthesis in field-grown Coffea arabica. Tree Physiology 26:
517–525.
Furbank RT, Pritchard J, Jenkins CLD. 1997. Effects of endogenous sucrose feeding on
photosynthesis in the C3 plant tobacco and the C4 plant Flaveria bidentis. Australian Journal
of Plant Physiology 24: 291–299.
Housley TL, Pollock CJ. 1985. Photosynthesis and carbohydrate metabolism in detached
leaves of Lolium temulentum L. New Phytologist 99: 499–507.

Chapter 8: General Discussion
252
Galazzo JL, Bailey JE. 1990. Fermentation pathway kinetics and metabolic flux control in
suspended and immobilized Saccharomyces cerevisiae. Enzyme and Microbial Technology
12: 162–172.
Gibson SI. 2005. Control of plant development and gene expression by sugar signaling.
Current Opinion in Plant Biology 8: 93–102.
Goldschmidt EE, Huber SC. 1992. Regulation of photosynthesis by end-product
accumulation in leaves of plants storing starch, sucrose and hexose sugars. Plant
Physiology 99: 1443–1448.
Groenewald J-H, Botha FC. 2007. Down-regulation of pyrophosphate: fructose 6-phosphate
1-phosphotransferae (PFP) activity in sugarcane enhances sucrose accumulation in
immature internodes. Transgenic Research DOI 10.1007/s11248-007-9079-x
Grof CPL, Campbell JA. 2001. Sugarcane sucrose metabolism: scope for molecular
manipulation. Australian Journal of Plant Physiology 28: 1–12.
Gutiérrez-Miceli FA, Morales-Torres R, de Jesús Espinosa-Castañeda Y, Rincón-
Rosales R, Mentes-Molina J, Oliva-Llaven MA, Dendooven L. 2004. Effects of parital
defoliation on sucrose accumulation, enzyme activity and agronomic parameters in sugar
cane (Saccharum spp.). Journal of Agronomy and Crop Science 190: 256–261.
Harrington GN, Bush DR. 2003. The bifunctional role of hexokinase in metabolism and
glucose signaling. The Plant Cell 15: 2493–2496.
Hofmeyr JHS, Cornish-Bowden A. 2000. Regulating the cellular economy of supply and
demand. FEBS Letters 476: 47–51.
Iglesias DJ, Lliso I, Tadeo FR, Talon M. 2002. Regulation of photosynthesis through
source: sink imbalance in citrus is mediated by carbohydrate content in leaves. Physiologia
Plantarum 116: 563-572.
Inman-Bamber NG, Smith DM. 2005. Water relations in sugarcane and response to water
deficits. Field Crops Research 92: 185–202.
Irvine JE. 1975. Relations of photosynthetic rates and leaf canopy characters to sugarcane
yield. Crop Science 15: 671–676.
Krapp A, Hofman B, Schäfer C, Stitt M. 1993. Regulation of the expression of rbcS and
other photosynthetic genes by carbohydrates: mechanism for the sink regulation of
photosynthesis? The Plant Journal 3: 817–828.
Krapp A, Stitt M. 1995. An evaluation of direct and indirect mechanisms for the “sink
regulation” of photosynthesis in spinach: Changes in gas exchange, carbohydrates,
metabolites, enzyme activities and steady state transcript levels after cold-girdling leaves.
Planta 195: 313–323.
Laby RJ, Kincaid MS, Kim D, Gibson SI. 2000. The Arabidopsis sugar-insensitive mutants
sis4 and sis5 are defective in abscisic acid synthesis and response. The Plant Journal 23:
587–596.

Chapter 8: General Discussion
253
Lalonde S, Tegeder M, Throne-Holst M, Frommer WB, Patrick JW. 2003. Phloem
loading and unloadin of sugar and amino acids. Plant,Cell and Environment 26: 37–56.
Ma H, Albert HA, Paull R, Moore PH. 2000. Metabolic engineering of invertase activities in
different subcellular compartments affects sucrose accumulation in sugarcane. Australian
Journal of Plant Physiology 27: 1021–1030.
McCormick AJ, Cramer MD, Watt DA. 2006. Sink strength regulates photosynthesis in
sugarcane. New Phytologist 171: 759–770.
Minchin PEH, Lacointe A. 2004. New understanding on phloem physiology and possible
consequences for modelling long-distance carbon transport. New Phytologist 166: 771–779.
Moore PH, Botha FC, Furbank RT, Grof CPL. 1997. Potential for overcoming
physio-biochemical limits to sucrose accumulation. In: Keating BA, Wilson JR, eds.
Intensive sugarcane production: meeting the challenges beyond 2000. Wallingford: CAB
International, 141–155.
Müller R, Morant M, Jarmer H, Nilsson L, Nielsen TH. 2007. Genome-wide analysis of
the Arabidopsis transcriptome reveals interaction of phosphate and sugar metabolism. Plant
Physiology 143: 156–171.
Pammenter NW, Allison JCS. 2002. Effects of treatments potentially influencing the supply of
assimilate on its partitioning in sugarcane. Journal of Experimental Botany 53: 123–129.
Paul MJ. 2007. Trehalose 6-phosphate. Current Opinion in Plant Biology 10: 303–309.
Paul MJ, Pellny TK. 2003. Carbon metabolite feedback regulation of leaf photosynthesis and
development. Journal of Experimental Botany 54: 539–547.
Pego JV, Kortsee AJ, Huijser C, Smeekens SCM. 2000. Photosynthesis, sugars and the
regulation of gene expression. Journal of Experimental Botany 51: 407–416.
Rolland F, Baena-Gonzalez E, Sheen J. 2006. Sugar sensing and signaling in plants:
conserved and novel mechanisms. Annual Review of Plant Biology 57: 675–709.
Rose S, Botha FC. 2000. Distribution patterns of neutral invertase and sugar content in
sugarcane internodal tissues. Plant Physiology and Biochemistry 38: 819–824.
Schaaf I, Heinisch J, Zimmermann FK. 1989. Overproduction of glycolytic enzymes in
yeast. Yeast 5: 285–290.
Sheen J. 1994. Feedback control of gene expressions. Photosynthesis Research 39: 427–438.
Sinclair TR, Purcell LC. 2005. Is a physiological perspective relevant in a ‘genocentric’ age?
Journal of Experimental Botany 56: 2777–2782.
Stitt M, Von Schaewen A, Willmitzer L. 1991. “Sink”-regulation of photosynthetic
metabolism in transgenic tobacco plants expressing yeast invertase in their cell wall involves
a decrease of the Calvin cycle enzymes and an increase of glycolytic enzymes. Planta 183:
40–50.
Trewavas T. 2006. A brief history of systems biology. The Plant Cell 18: 2420–2430.
von Schaewen A, Stitt M, Schmidt R, Sonnewald U, Willmitzer L. 1990. Expression of
a yeast-derived invertase in the cell wall of tobacco and Arabidopsis plants leads to

Chapter 8: General Discussion
254
accumulation of carbohydrate and inhibition of photosynthesis and strongly influences growth
and phenotype of transgenic tobacco plants. EMBO Journal 9: 3033–3044.
Walsh KB, Sky RC, Brown SM. 2005. The anatomy of the pathway of sucrose unloading
within the sugarcane stalk. Functional Plant Biology 32: 367–374.
Watt DA, McCormick AJ, Govender C, Carson DL, Cramer MD, Huckett BI, Botha
FC. 2005. Increasing the utility of genomics in unraveling sucrose accumulation. Field
Crops Research 92: 149–158.
Whittaker A, Botha FC. 1997. Carbon partitioning during sucrose accumulation in sugarcane
internodal tissue. Plant Physiology 115: 1651–1659.
Wu L, Birch RG. 2007. Doubled sugar content in sugarcane plants modified to produce a
sucrose isomer. Plant Biotechnology Journal 5: 109–117.
Zhou L, Jang JC, Jones TL, Sheen J. 1998. Glucose and ethylene signal transduction
crosstalk revealed by an Arabidopsis glucose-insensitive mutant. Proceedings of the
National Academy of Sciences (USA) 95: 10294–10299.
Zhu YJ, Komor E, Moore PH. 1997. Sucrose Accumulation in the Sugarcane Stem Is
Regulated by the Difference between the Activities of Soluble Acid Invertase and Sucrose
Phosphate Synthase. Plant Physiology 115: 609–616.