INTERNATIONAL PASSENGER SURVEY IN INDIA 2015-16
219
INTERNATIONAL PASSENGER SURVEY IN INDIA 2015-16 Study Commissioned by: Ministry of Tourism, Government of India Prepared by: PROF. ASHIS SENGUPTA, PRINCIPAL INVESTIGATOR & MEMBERS OF THE CORE IPS TEAM Indian Statistical Institute, Kolkata
-
Upload
khangminh22 -
Category
Documents
-
view
4 -
download
0
Transcript of INTERNATIONAL PASSENGER SURVEY IN INDIA 2015-16

INTERNATIONAL PASSENGER
SURVEY IN INDIA
2015-16
Study Commissioned by:
Ministry of Tourism, Government of India
Prepared by:
PROF. ASHIS SENGUPTA, PRINCIPAL INVESTIGATOR
& MEMBERS OF THE CORE IPS TEAM
Indian Statistical Institute, Kolkata

List of Abbreviations ............................................................................................................. II Forewords ........................................................................................................................... III Executive Summary ....................................................................................................................... 3 Chapter A - Introduction Genesis of IPS ......................................................................................................................... 11 Aims and their Formalizations ............................................................................................... 15 Chapter B - Sampling Scheme & Estimation Methodology Definitions ............................................................................................................................. 19 Sampling Design ..................................................................................................................... 20 Scrutiny, Lot Quality Sampling for Error Reduction ............................................................... 23 Packages Developed and Accessed for Data and Error Analyses .......................................... 23 Chapter C - International Recommendation, Other Practices & Data Fusion UNWTO Recommendations: An overview ............................................................................. 29 Countries Conducting International Passenger Survey .......................................................... 33
Data Fusion ............................................................................................................................. 39 Chapter D - Survey Findings Major Findings: Foreigners and Outbound Indians ............................................................... 43
Section I: Foreigners 1. Demographic Findings ............................................................................................ 44 2. Socio-Economic Findings ........................................................................................ 58 3. Travel Pattern ... ..................................................................................................... 62 4. Expenditure Pattern ............................................................................................... 69 5. Satisfaction Level .................................................................................................... 77 6. Non-Monetary Transaction Findings ...................................................................... 80 7. Motivating Factors ................................................................................................. 80 8. Overall Experience.................................................................................................. 86
Section II: Outbound 1. Demographic Findings ............................................................................................ 88 2. Socio- Economic Findings ....................................................................................... 90 3. Travel Pattern ......................................................................................................... 92 4. Expenditure Pattern ............................................................................................... 94
Chapter E - Conclusion, Limitations and Way Forward Conclusion, Limitations and Way Forward ............................................................................ 99
Acknowledgements .................................................................................................................. 103 Appendix Appendix A : Estimation Procedure & Formulae ....................................................................... 109 Appendix B : Itemized Top 20 Tables ......................................................................................... 119 Appendix B : Sample Tables ....................................................................................................... 131 Appendix C : Glossary ................................................................................................................ 167 Appendix D : IPSF & IPSO Schedules .......................................................................................... 177 Appendix E : Schedule of International Air Travelers Program, USA ......................................... 191 Appendix F : Codes ..................................................................................................................... 201 Appendix G : On-Site Photos ...................................................................................................... 215
Page
Contents

INTERNATIONAL PASSENGER SURVEY IN INDIA 2015-16
II
List of Abbreviations
Abbreviation Meaning
BAA British Airports Authority
BoI Bureau of Immigration India
CAA Civil Aviation Authority, UK
CAPI Computer Assisted Personal Interviewing
DIAC Department of Immigration and Citizenship
FTA Foreign Tourist Arrival
IPS International Passenger Survey
IPSF International Passenger Survey Foreigner
IPSO International Passenger Survey Outbound
IRTS International Recommendations for Tourism Statistics
ISI Indian Statistical Institute, Kolkata
IVS International Visitor Survey
MoT Ministry of Tourism, Govt. of India
NTTO National Travel and Tourism Office
ONS Office of National Statistics
SIAT Survey of International Air Travelers
TSA Tourism Satellite Account
UNWTO United World Tourism Organization
III
FOREWORDS
The present International Passenger Survey (IPS) 2015-2016 was
commissioned to Indian Statistical Institute, with Professor Ashis SenGupta
of its Applied Statistics Unit, as the Principal Investigator, by Ministry of
Tourism (MoT), Government of India, New Delhi. This was taken up by the
same team on its successful completion of the previous IPS 2010-2011.
The experiences gathered from the last IPS greatly enriched the present
one. However, there were new areas of coverage in terms of both
departure ports, e.g. Dabolin (Goa) and Amritsar, as well as topics, e.g.
code-sharing, travel insurance, etc. which were introduced in the present
one. In this respect the support from MoT, has been outstanding. It is
understandable that a national survey spanning over a year is bound to
face troubled waters, ranging from natural catastrophes, administrative
hurdles with changing requirements, and other events arising out of force-
de-majeure. The dedicated team worked beyond the call of duty,
sometimes throughout the night and around the clock as in the case of
data collection and processing, and put forward exemplary efforts to
expedite the preparation of the results. It is expected that the readers will
not only find found the summary tables in this report directly of use, but will
also lead them to evolve innovative methodologies for solving challenging
problems of great national relevance. The team members of this IPS feel
proud and privileged to be a part of this novel exercise and look forward to
its utilizations for the benefit of our great nation.
(Ashis SenGupta) Principal Investigator International Passenger Survey 2015-2016 26 April 2018


EXECUTIVE SUMMARY
INTERNATIONAL PASSENGER SURVEY
2015-16


INTERNATIONAL PASSENGER SURVEY IN INDIA 2015-16
3
Executive Summary (ES) of the Report
In this section, a brief overview of the report for International Passenger Survey (IPS) 2015-16 is provid-
ed, and the definitions and concepts, scope of the work, sampling design, international recommendations,
findings from the survey, limitations, suggestions and way forward are touched. Specifically, as regards
the findings from this IPS 2015-16, all the tables as per the Work Order of Ministry of Tourism (MoT),
Govt. of India are provided. The graphs and further tables which could help understand the aims of the
survey better are also displayed. Concise and significant comments on the important findings of this sur-
vey accompany these tables and graphs. All the percentages displayed were computed, where relevant,
based on the list of top 20 countries (in terms of FTA to India as provided by MoT). Researchers who
need to analyze the data further, will find these additional summarizations helpful.
ES 1 Introduction
ES 1.1 What is meant by the word ‘Tourism’? UN World Tourism Organization, of which India is one of the
member country, states “Tourism refers to the activity of visitors. A visitor is a traveler taking a trip to a
main destination outside his/her usual environment for less than a year, for any main purpose (business,
leisure or other personal purpose) other than to be employed by a resident entity in the country or place
visited”.
ES.1.2 Second Tourism Satellite Account (TSA) for India, 2009-10, gives a similar definition of tourism as giv-
en in the above paragraph.
ES 1.3 IPS 2010 -2011 recognizes/explains it as “To explore is humane. For centuries human beings are travel-
ing in pursuit of newness and knowledge, for pleasure and trade. This has resulted in unearthing of new
lands, new cultures and great avenues for trade. The new world order has given this movement of people
in general the name ‘Tourism’”.
ES 1.4 For the International Passenger Survey (IPS) 2015-2016, an ‘International Passenger’ is defined as a
Tourist among the Foreigners. A Tourist is defined as a resident of a country other than India and whose
duration of stay in India was more than one day but less than one year. Such individuals as defined above
constituted the sampling units for the IPS Foreigner (IPSF) schedule. For Outbound Indians however,
such constraint on the duration of their stay abroad was not imposed on sampling units defined for the
IPS Outbound (IPSO) schedules.
ES 1.5 Here are some notable differences between the current IPS and IPS 2003:
i. In the IPS 2003, approximately 30,000 samples were collected, which included foreign nationals travel-
ling to India, outbound Indians, and transit passengers. The FTAs (Foreign Tourist Arrivals) in India
were 2.73 million in 2003 (Source: Indian Tourism Statistics 2015). However, in the IPS conducted in
2010-11, and in 2015-16, transit passengers were not included in the sample. Most importantly, the IPS
conducted in 2015-16 collected 56,700 samples, which after certain verifications were reduced to the fi-
nal working sample size of 56,687.
ii. IPS 2003 used systematic sampling scheme to select the weeks of survey. Whereas both IPSs 2010-11
and 2015-16 used Midzuno’s sampling scheme to do the same. Also, IPS 2010-11 and IPS 2015-16 used
Rao -Hartley-Cochran scheme to select Airports and Land ports.
INTERNATIONAL PASSENGER SURVEY IN INDIA 2015-16
4
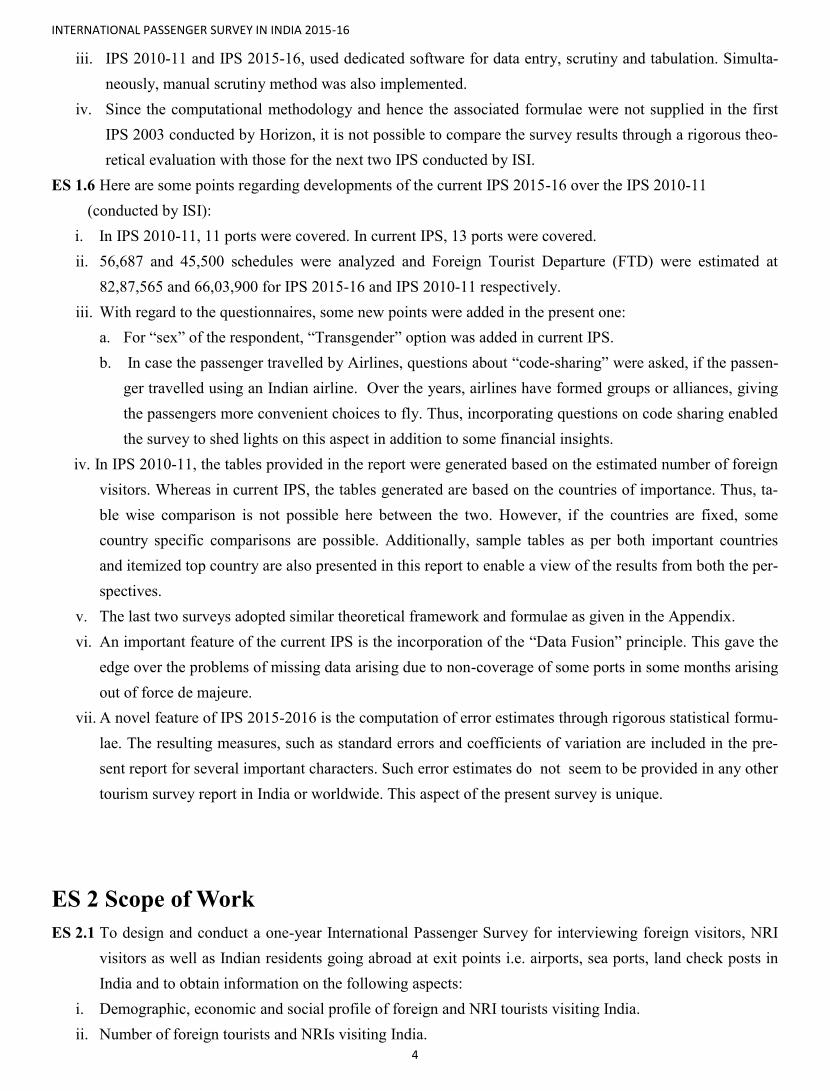
iii. IPS 2010-11 and IPS 2015-16, used dedicated software for data entry, scrutiny and tabulation. Simulta-
neously, manual scrutiny method was also implemented.
iv. Since the computational methodology and hence the associated formulae were not supplied in the first
IPS 2003 conducted by Horizon, it is not possible to compare the survey results through a rigorous theo-
retical evaluation with those for the next two IPS conducted by ISI.
ES 1.6 Here are some points regarding developments of the current IPS 2015-16 over the IPS 2010-11
(conducted by ISI):
i. In IPS 2010-11, 11 ports were covered. In current IPS, 13 ports were covered.
ii. 56,687 and 45,500 schedules were analyzed and Foreign Tourist Departure (FTD) were estimated at
82,87,565 and 66,03,900 for IPS 2015-16 and IPS 2010-11 respectively.
iii. With regard to the questionnaires, some new points were added in the present one:
a. For “sex” of the respondent, “Transgender” option was added in current IPS.
b. In case the passenger travelled by Airlines, questions about “code-sharing” were asked, if the passen-
ger travelled using an Indian airline. Over the years, airlines have formed groups or alliances, giving
the passengers more convenient choices to fly. Thus, incorporating questions on code sharing enabled
the survey to shed lights on this aspect in addition to some financial insights.
iv. In IPS 2010-11, the tables provided in the report were generated based on the estimated number of foreign
visitors. Whereas in current IPS, the tables generated are based on the countries of importance. Thus, ta-
ble wise comparison is not possible here between the two. However, if the countries are fixed, some
country specific comparisons are possible. Additionally, sample tables as per both important countries
and itemized top country are also presented in this report to enable a view of the results from both the per-
spectives.
v. The last two surveys adopted similar theoretical framework and formulae as given in the Appendix.
vi. An important feature of the current IPS is the incorporation of the “Data Fusion” principle. This gave the
edge over the problems of missing data arising due to non-coverage of some ports in some months arising
out of force de majeure.
vii. A novel feature of IPS 2015-2016 is the computation of error estimates through rigorous statistical formu-
lae. The resulting measures, such as standard errors and coefficients of variation are included in the pre-
sent report for several important characters. Such error estimates do not seem to be provided in any other
tourism survey report in India or worldwide. This aspect of the present survey is unique.
ES 2 Scope of Work
ES 2.1 To design and conduct a one-year International Passenger Survey for interviewing foreign visitors, NRI
visitors as well as Indian residents going abroad at exit points i.e. airports, sea ports, land check posts in
India and to obtain information on the following aspects: i. Demographic, economic and social profile of foreign and NRI tourists visiting India.
ii. Number of foreign tourists and NRIs visiting India.
INTERNATIONAL PASSENGER SURVEY IN INDIA 2015-16
5
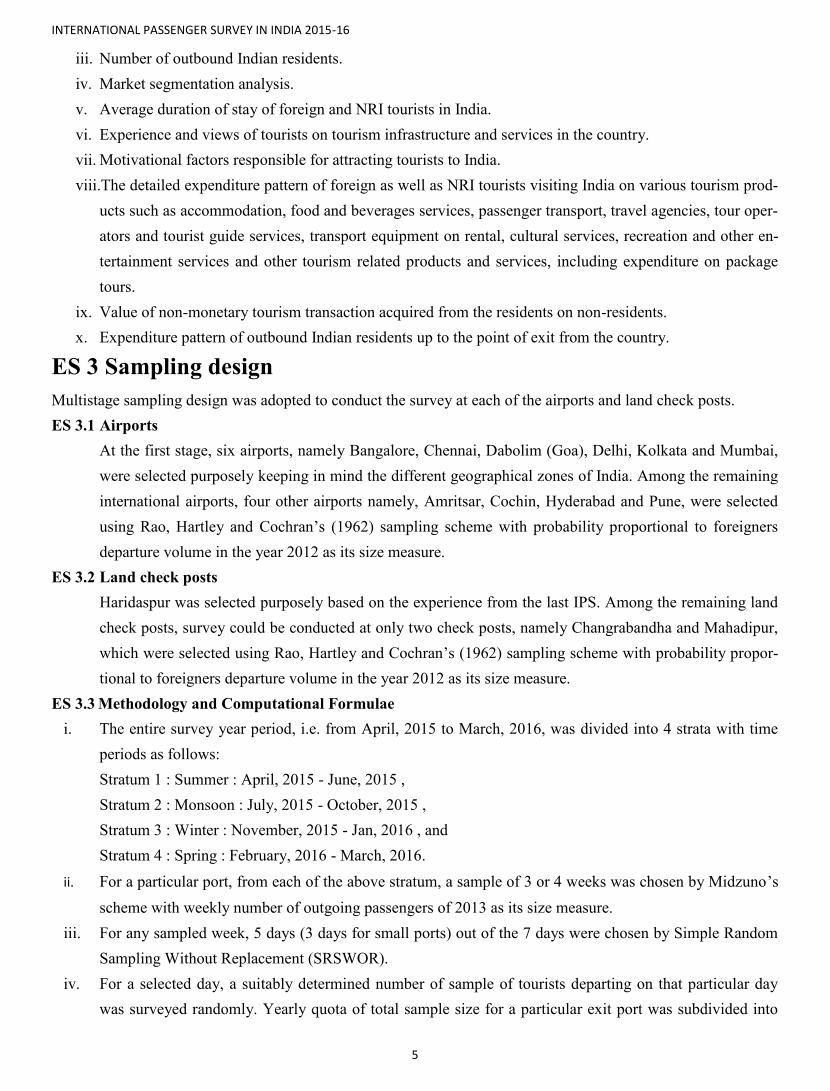
iii. Number of outbound Indian residents.
iv. Market segmentation analysis.
v. Average duration of stay of foreign and NRI tourists in India.
vi. Experience and views of tourists on tourism infrastructure and services in the country.
vii. Motivational factors responsible for attracting tourists to India.
viii.The detailed expenditure pattern of foreign as well as NRI tourists visiting India on various tourism prod-
ucts such as accommodation, food and beverages services, passenger transport, travel agencies, tour oper-
ators and tourist guide services, transport equipment on rental, cultural services, recreation and other en-
tertainment services and other tourism related products and services, including expenditure on package
tours.
ix. Value of non-monetary tourism transaction acquired from the residents on non-residents.
x. Expenditure pattern of outbound Indian residents up to the point of exit from the country.
ES 3 Sampling design
Multistage sampling design was adopted to conduct the survey at each of the airports and land check posts.
ES 3.1 Airports
At the first stage, six airports, namely Bangalore, Chennai, Dabolim (Goa), Delhi, Kolkata and Mumbai,
were selected purposely keeping in mind the different geographical zones of India. Among the remaining
international airports, four other airports namely, Amritsar, Cochin, Hyderabad and Pune, were selected
using Rao, Hartley and Cochran’s (1962) sampling scheme with probability proportional to foreigners
departure volume in the year 2012 as its size measure.
ES 3.2 Land check posts
Haridaspur was selected purposely based on the experience from the last IPS. Among the remaining land
check posts, survey could be conducted at only two check posts, namely Changrabandha and Mahadipur,
which were selected using Rao, Hartley and Cochran’s (1962) sampling scheme with probability propor-
tional to foreigners departure volume in the year 2012 as its size measure.
ES 3.3 Methodology and Computational Formulae
i. The entire survey year period, i.e. from April, 2015 to March, 2016, was divided into 4 strata with time
periods as follows:
Stratum 1 : Summer : April, 2015 - June, 2015 ,
Stratum 2 : Monsoon : July, 2015 - October, 2015 ,
Stratum 3 : Winter : November, 2015 - Jan, 2016 , and
Stratum 4 : Spring : February, 2016 - March, 2016.
ii. For a particular port, from each of the above stratum, a sample of 3 or 4 weeks was chosen by Midzuno’s
scheme with weekly number of outgoing passengers of 2013 as its size measure.
iii. For any sampled week, 5 days (3 days for small ports) out of the 7 days were chosen by Simple Random
Sampling Without Replacement (SRSWOR).
iv. For a selected day, a suitably determined number of sample of tourists departing on that particular day
was surveyed randomly. Yearly quota of total sample size for a particular exit port was subdivided into

INTERNATIONAL PASSENGER SURVEY IN INDIA 2015-16
6
the four strata in proportion to the corresponding total departure volume of 2013. Then each stratum-wise
quota for a particular exit port was allocated to weekly quota as proportional to the corresponding weekly
total departure volume of 2013. Similarly, weekly quota of total sample size for a particular exit port was
allocated to daily quota as proportional to the daily departure volume of 2013.
v. Multipliers were obtained by following the principle of Ratio method. Where population figures were
supplied, e.g. by BoI, the base values were taken as these. However, where such values were not supplied,
e.g. in case of NRIs, a version of the Ratio method was adopted wherein sample estimates were used for
the base values. The latter method invites two-fold estimation, and naturally the corresponding estimates
of the population parameters are subject to higher variabilities (and hence, possibly, less precision).
ES 3.4 Packages Developed and Accessed for Data and Error Analyses
The data-entry package developed by the previous IPS-team of ISI was modified and made more robust
and user-friendly for the current IPS. This helped to detect/correct errors and to maintain homogeneity in
the collected data sets. Additionally, several computer programs were also developed to enable error
checks to a larger degree. Program for multiway table generation is one of the additions. The required
tables were generated through that package and have been included in this report. R programming envi-
ronment was used extensively for cross validation of the results, calculations, etc.
ES 4 International Recommendations
ES 4.1 International Recommendations for Tourism Statistics 2008 (IRTS 2008), provides a comprehensive
methodological framework for collection and compilation of tourism statistics in all countries, irrespec-
tive of the level of development of their statistical systems. Its primary beneficiaries are the national sta-
tistical officers and the national tourism administrators involved in the compilation of tourism statistics.
IRTS 2008 also contains a wealth of information that might be of interest to data users who would like to
understand better the nature of tourism data. In addition, general guidance is provided with respect to data
sources and data compilation methods.
ES 4.2 Wherever and whenever feasible, adherence to the recommendations provided by UNWTO has been en-
sured.
ES 4.3 Data Fusion: Data Fusion is defined as the science of synthesizing raw data from several sources to
generate more meaningful information that can be of greater value than single source data.
ES 4.4 The implementation of this modern concept in the current IPS has been attempted. It was necessary to
gather experience from a country already conducting alike surveys. For the same, USA was chosen to
learn the methodology being adopted there for conducting International Passenger Survey. It was ob-
served that the survey was conducted in USA annually as compared to the quinquennial survey being car-
ried out in India. The passenger survey in USA requires distribution of questionnaires in contrast to the
schedule and interview method being adopted in India. The forms used there are multilingual and more
user friendly, which may provide an extension to the method used by India. However, in this case, it may
be remarked that the interview method would appear/prove to be more effective with the element of in-
sistence on part of interviewers being involved, thus yielding/eliciting higher response form the passen-
gers responding.
INTERNATIONAL PASSENGER SURVEY IN INDIA 2015-16
7
ES 4.5 Computations for the IPS-type survey of USA are done separately by an agency different from the data-
collecting organization.
ES 4.6 Data from other months beyond the initially targeted ones was fused, i.e. logically and statistically amal-
gamated, with the previously collected data to overcome the problem of missing data. This is done under
the mild assumption that the trend in the responses of the passengers interviewed will not be vitiated sig-
nificantly over a short period.
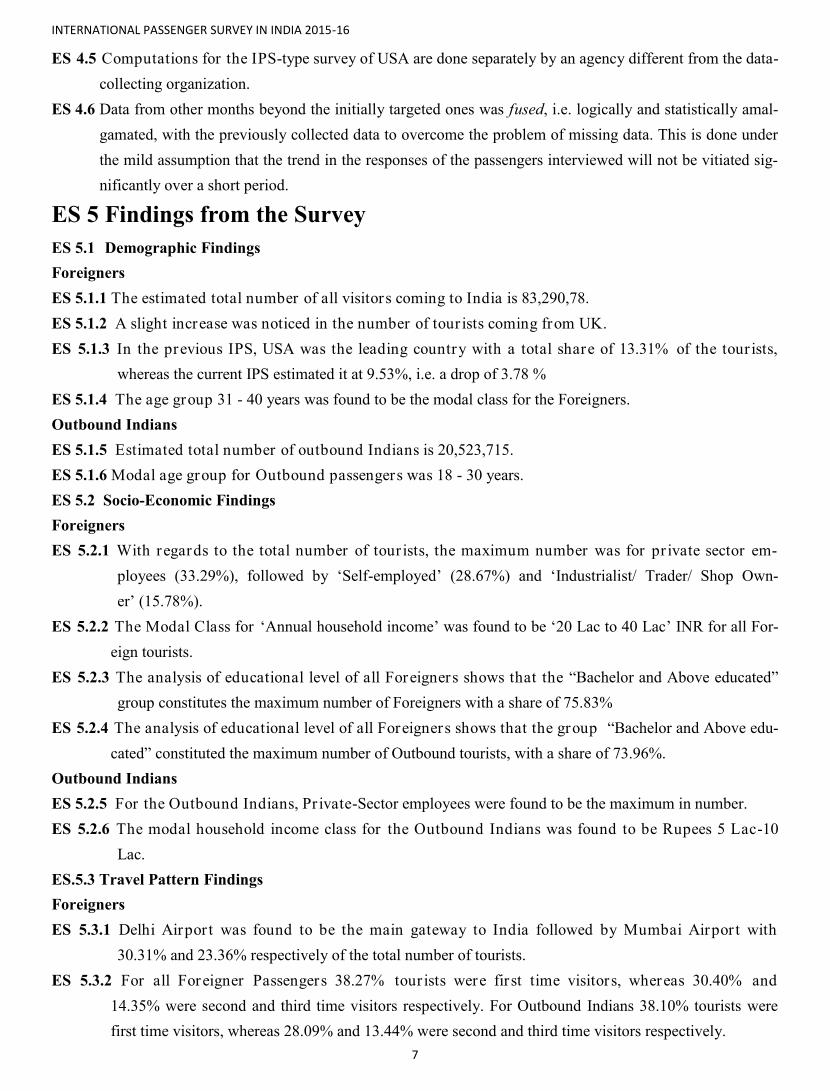
ES 5 Findings from the Survey
ES 5.1 Demographic Findings
Foreigners
ES 5.1.1 The estimated total number of all visitors coming to India is 83,290,78.
ES 5.1.2 A slight increase was noticed in the number of tour ists coming from UK.
ES 5.1.3 In the previous IPS, USA was the leading country with a total share of 13.31% of the tour ists,
whereas the current IPS estimated it at 9.53%, i.e. a drop of 3.78 %
ES 5.1.4 The age group 31 - 40 years was found to be the modal class for the Foreigners.
Outbound Indians
ES 5.1.5 Estimated total number of outbound Indians is 20,523,715.
ES 5.1.6 Modal age group for Outbound passengers was 18 - 30 years.
ES 5.2 Socio-Economic Findings
Foreigners
ES 5.2.1 With regards to the total number of tour ists, the maximum number was for pr ivate sector em-
ployees (33.29%), followed by ‘Self-employed’ (28.67%) and ‘Industrialist/ Trader/ Shop Own-
er’ (15.78%).
ES 5.2.2 The Modal Class for ‘Annual household income’ was found to be ‘20 Lac to 40 Lac’ INR for all For-
eign tourists.
ES 5.2.3 The analysis of educational level of all Foreigners shows that the “Bachelor and Above educated”
group constitutes the maximum number of Foreigners with a share of 75.83%
ES 5.2.4 The analysis of educational level of all Foreigners shows that the group “Bachelor and Above edu-
cated” constituted the maximum number of Outbound tourists, with a share of 73.96%.
Outbound Indians
ES 5.2.5 For the Outbound Indians, Pr ivate-Sector employees were found to be the maximum in number.
ES 5.2.6 The modal household income class for the Outbound Indians was found to be Rupees 5 Lac-10
Lac.
ES.5.3 Travel Pattern Findings
Foreigners
ES 5.3.1 Delhi Airpor t was found to be the main gateway to India followed by Mumbai Airpor t with
30.31% and 23.36% respectively of the total number of tourists.
ES 5.3.2 For all Foreigner Passengers 38.27% tour ists were fir st time visitors, whereas 30.40% and
14.35% were second and third time visitors respectively. For Outbound Indians 38.10% tourists were
first time visitors, whereas 28.09% and 13.44% were second and third time visitors respectively.
INTERNATIONAL PASSENGER SURVEY IN INDIA 2015-16
8
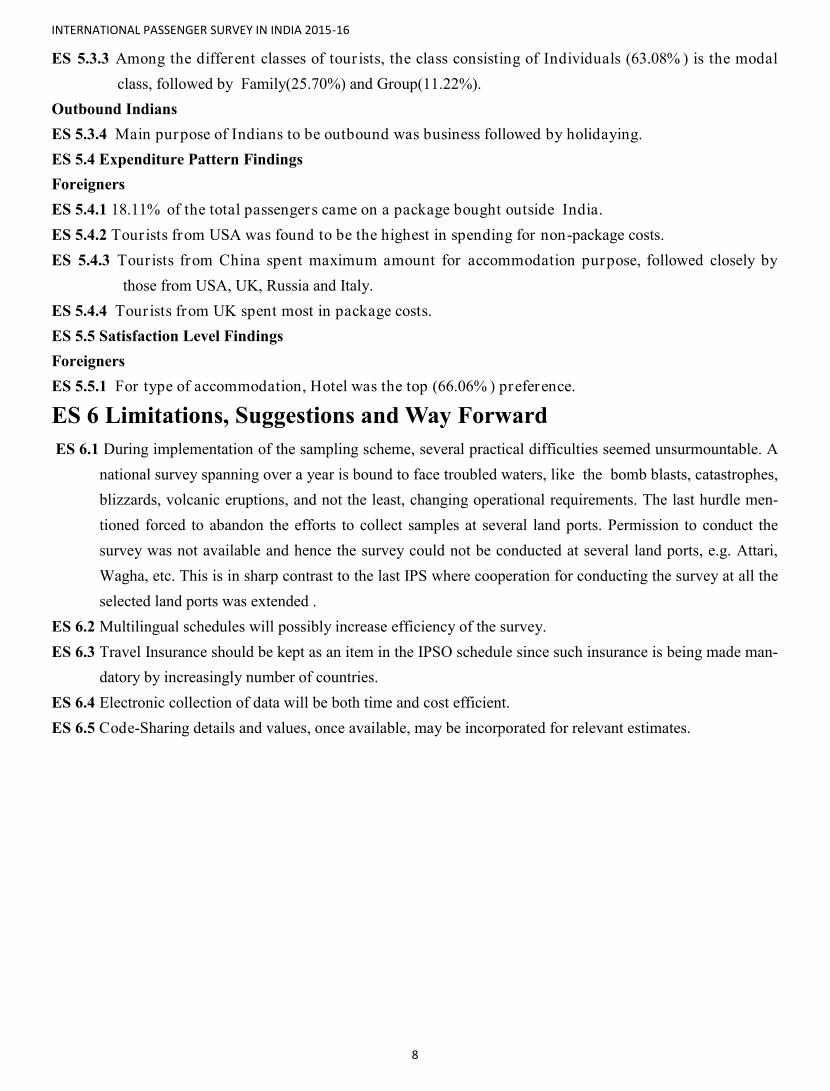
ES 5.3.3 Among the different classes of tour ists, the class consisting of Individuals (63.08% ) is the modal
class, followed by Family(25.70%) and Group(11.22%).
Outbound Indians
ES 5.3.4 Main purpose of Indians to be outbound was business followed by holidaying.
ES 5.4 Expenditure Pattern Findings
Foreigners
ES 5.4.1 18.11% of the total passengers came on a package bought outside India.
ES 5.4.2 Tourists from USA was found to be the highest in spending for non-package costs.
ES 5.4.3 Tourists from China spent maximum amount for accommodation purpose, followed closely by
those from USA, UK, Russia and Italy.
ES 5.4.4 Tourists from UK spent most in package costs.
ES 5.5 Satisfaction Level Findings
Foreigners
ES 5.5.1 For type of accommodation, Hotel was the top (66.06% ) preference.
ES 6 Limitations, Suggestions and Way Forward
ES 6.1 During implementation of the sampling scheme, several practical difficulties seemed unsurmountable. A
national survey spanning over a year is bound to face troubled waters, like the bomb blasts, catastrophes,
blizzards, volcanic eruptions, and not the least, changing operational requirements. The last hurdle men-
tioned forced to abandon the efforts to collect samples at several land ports. Permission to conduct the
survey was not available and hence the survey could not be conducted at several land ports, e.g. Attari,
Wagha, etc. This is in sharp contrast to the last IPS where cooperation for conducting the survey at all the
selected land ports was extended .
ES 6.2 Multilingual schedules will possibly increase efficiency of the survey.
ES 6.3 Travel Insurance should be kept as an item in the IPSO schedule since such insurance is being made man-
datory by increasingly number of countries.
ES 6.4 Electronic collection of data will be both time and cost efficient.
ES 6.5 Code-Sharing details and values, once available, may be incorporated for relevant estimates.

CHAPTER A
INTRODUCTION


INTERNATIONAL PASSENGER SURVEY IN INDIA 2015-16
11
A.1 Genesis of IPS
What is meant by the word ‘Tourism’? United Nations World Tourism Organization (UNWTO), of which
India is one of the important members, states “Tourism refers to the activity of visitors. A visitor is a traveler
taking a trip to a main destination outside his/her usual environment for less than a year, for any main purpose
(business, leisure or other personal purpose) other than to be employed by a resident entity in the country or
place visited”.
Tourism is a demand-based concept since it is a temporary activity which arises when a resident/non-
resident decides to undertake a visit outside his/her usual environment that involves overnight stay and ceases
once the visitor returns to his/her usual place of stay. It is difficult to explain the term with a single view.
TSA for India, 2009-10, provides a further view-point, by observing that the decision of the tourist to
make a visit generates additional demand for goods and services, which are provided from the supply side ei-
ther through increased domestic production or through imports. Therefore, tourism can also be viewed from
the supply side though it is primarily a demand based concept. These two aspects give rise to a number of al-
ternate definitions of tourism. Some of the definitions available in the public domain and also quoted in the
above TSA are:
Movement of people to, and their stay in, various destinations.
Travel for recreational, leisure, or business purposes.
Temporary movement of people to destinations outside their normal places of work and resi-
dence, the activities undertaken during their stay in those destinations, and the facilities created to
cater to their needs.
The sum of the phenomena and relationships arising from the interaction of tourists, business
suppliers, host governments and host communities in the process of attracting and hosting these
tourists and other visitors.
A collection of activities, services and industries that delivers a travel experience, including trans-
portation, accommodation, eating and drinking establishments, retail shops, entertainment busi-
nesses, activity facilities, and other hospitality services provided for individuals or groups travel-
ling away from home.
A set of productive activities that cater mainly to visitors.
The previous IPS summarizes Tourism as follows: “To explore is humane. For centuries human beings
are traveling in pursuit of newness and knowledge, for pleasure and trade. This has resulted in unearthing of
new lands, new cultures and great avenues for trade. The new world order has given this movement of people
in general the name `Tourism'”.
It should be noted that, India (or more generally, the Indian sub-continent) has always attracted people
from different regions throughout the world. The rich cultural heritage, diverse geographical regions, ethnic
diversities and enormous natural resources flourished this land to the fullest. Different civilizations, different
schools of thoughts, integration of diverse communities over a long period of time and their mutual synthesis
have composed a magnum opus of the east.

INTERNATIONAL PASSENGER SURVEY IN INDIA 2015-16
12
India thus glitters as a place of interest to tourists. This very interest opens the gateway of India for them,
for the purpose of knowledge, leisure, shopping and business. India has unique events, fairs and festivals,
some of which are well established, such as Pushkar, Desert Festival at Jaisalmer, Kumbh Mela, and so on.
Business travel is also a form of tourism and typically occurs in urban environment.
The World Tourism Organization (WTO) defines tourists as people who “travel to and stay in places out-
side their usual environment for more than twenty-four (24) hours and not more than one consecutive year, for
leisure, business and other purposes not related to the exercise of being actively remunerated from within the
place visited”. Persons whose duration of visit is less than twenty-four hours are called ‘Same day tourists’ or
‘Excursionists’. India also follows the same definition of Tourist. (Refs.: Recommendations on Tourism Statis-
tics, UN-WTO- series M no. 83, WTO, 1994)
Tourism achieved a new dimension with the changing world order. Everyone is becoming the citizens of
a new global village. The speedy communications made it possible to reach anywhere in this world within a
few hours. And thus a separate economy has grown much further with this developing global tourism. Many
countries are investing in this sector, developing the infrastructure. Several multinational corporations are also
investing in different fields of the tourism economy with their attractive packages, security insurances and
many other comfort assurances. From India, large number of people have started travelling to abroad for edu-
cation, trade and pleasure every year.
Tourism sector is a major employment generation field. Especially in India, a huge number of people are
engaged in various sectors of tourism. In some remote villages of the Himalayan region, a whole village en-
gaged in collective eco-tourism efforts, that also attracts huge number of foreign passengers willing for an eco-
friendly stay. On the other hand, the hotel-guest house business, trekking tour operators, travel guiding agen-
cies, etc. require a large number of skilled, semi-skilled and multi-lingual persons. In India, a significant por-
tion of the poor population is involved in the tourism business. The previous IPS, quoting the United Nations
conference on trade and development, 2010, states that female participation in the tourism field is 70% and
half of all tourism workers are below 25 years. The TSA for India, 2009-10 reports that the tourism industry
provides a direct employment of estimated 23.4 million of jobs sharing 4.4% of the total, whereas, the indirect
employment was estimated to be 54.5 million jobs.
Infrastructure is the basis of the prosperity of tourism business. In order to attract people from first world
countries it is essential to provide a good service of basic amenities such as availability of hotels, food, local
transport, good condition of roads, medical facilities, information and supportive local authorities etc.
A large number of countries are investing in the developing infrastructure of the tourism industry which is
making tourism a key driver of socio-economic growth through the creation of jobs and enterprises, infrastruc-
ture development and export revenue earned. In this context, in TSA for India, 2009-10, it is observed,
“Service activities, within which tourism is mainly embedded and not separately identified in the national ac-
counts, dominate the Indian economy. Services contribute 59.0 per cent of gross domestic product (GDP) at
factor cost and have been consistently growing at over 9 per cent during the last few years. Services GDP grew
at 9.4 per cent as compared to 6.9 per cent growth in the economy at overall level in 2011-12.” Tourism is one
of the key drivers of service sector growth. According to the second TSA, 2009-10, tourism GDP accounted
for 3.7 per cent of GDP in terms of direct impact and 6.8 per cent of GDP when indirect effects are included,

INTERNATIONAL PASSENGER SURVEY IN INDIA 2015-16
13
bringing it to one of the top sectors of Indian economy in terms of contribution to GDP. In terms of employ-
ment, this TSA showed that direct share of employment in tourism service industries is 4.4 per cent and if in-
direct share is also included, this goes up to 10.2 per cent. Within the non-agriculture employment, tourism
had a share of 9.7 per cent in employment and if indirect share is included, the share goes up to 22.6 per cent.
This implies almost every 4th to 5th person employed in non-agricultural activities is directly or indirectly en-
gaged in tourism activities.
UNWTO Barometer November 2016 depicts India with a 16% increase in outbound travel, hence show-
ing strong demand for outbound travel.
Government of India in recent times has made multiple attempts to boost the tourism sector of the coun-
try. Ministry of Tourism, Govt. of India, with its popular ‘Incredible India’ campaign has introduced
‘Swachchh Bharat, Swachchh Paryatan’ (Clean India, Clean Tourism) campaign. Different infrastructural
fields are boosted with handsome investments.
Tourism Satellite Accounts (TSAs) are essential to measure all forms of tourism in the country and thus
bridging the data gap. A TSA provides for macro-economic aggregates that describe the size and the economic
contribution of different forms of tourism, data on tourism consumption, how the demand is met by domestic
supply and imports and detailed production accounts of the tourism industries including linkages with other
productive economic activities. For computing a TSA, data requirements include (I) data on Inbound tourism
which comprises of activities of nonresident visitors within the country on inbound trips (II) Outbound tourism
which covers activities of resident (domestic) travellers at abroad as part of an outbound trip and (III) Domes-
tic tourism which comprises of activities of resident visitors within the country as part of a domestic trip.
International passenger survey (IPS) is one of the important components of TSA. In IPS, the details of
the inbound and outbound tourism as mentioned above as points (I) and (II) are surveyed, combined and in-
ferred for a particular time frame.
In 2003-2004, similar IPS was conducted by Horizon, being commissioned by MoT. The survey covered
four major airports (Chennai, Delhi, Kolkata and Mumbai), 10 other airports (Ahmedabad, Amritsar, Banga-
lore, Goa, Hyderabad, Kochi, Kozhikode, Thiruvananthapuram, Trichy and Varanasi) and three land posts
(Haridaspur, Raxaul, Sonauli). It was carried out for one year, one week in each month (January- December-
2003) in respect of major airports and for six months (one week in each month) in respect of other airports and
land posts. A sample of 30000 tourists was surveyed. The total sample of 30,000 tourists comprised 18,000
foreign nationals, 10,000 Indian Nationals and 2,000 transit passengers.
A stratified two-stage sampling was adopted for the selection of passengers for the survey. Each of the
selected exit point was treated, as a stratum and first level of sampling was time sampling. In the case of four
airports, namely Chennai, Delhi, Kolkata and Mumbai, 52 weeks of the year were grouped into 13 periods of 4
weeks each. A week in each period was systematically selected by selecting a random number between one
and four and taking four as interval of selection. Each period of 13 weeks was assigned to one of the four air-
ports at random.
In the case of other exit ports, one week each was selected both in peak season (November to January)
and in lean season (April to June) at random. For Goa two weeks were selected between October and February
at random.
INTERNATIONAL PASSENGER SURVEY IN INDIA 2015-16
14
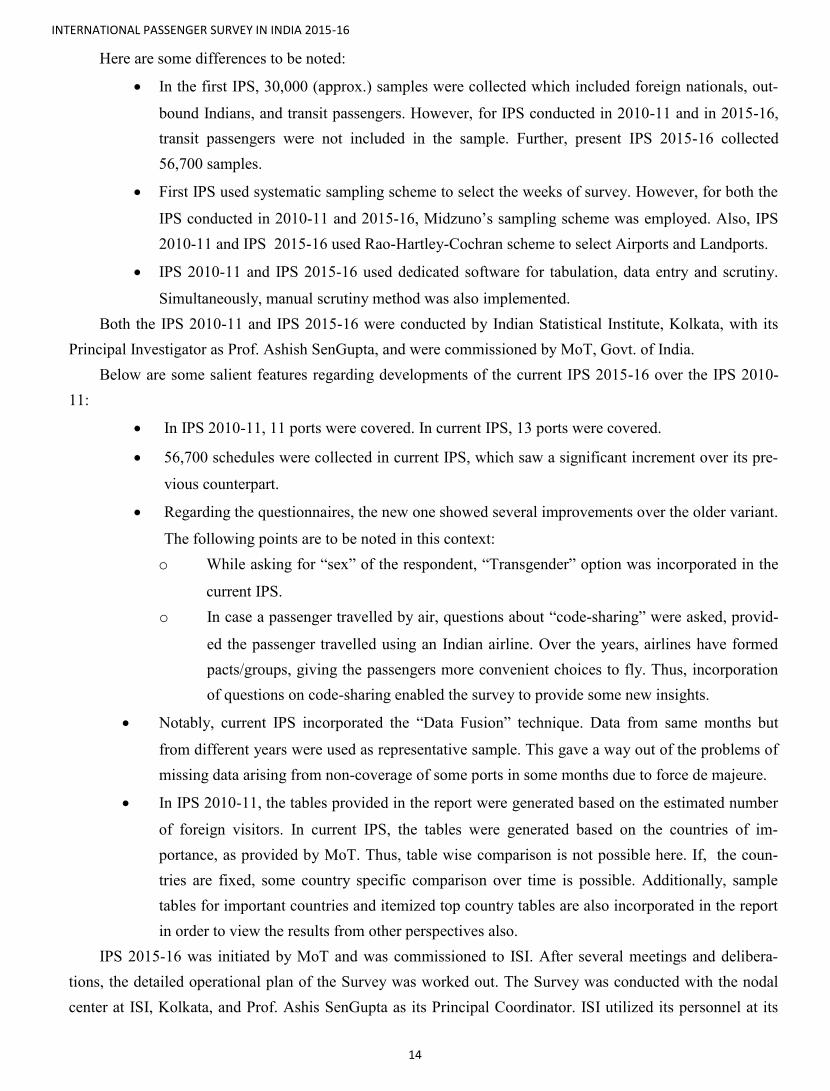
Here are some differences to be noted:
In the first IPS, 30,000 (approx.) samples were collected which included foreign nationals, out-
bound Indians, and transit passengers. However, for IPS conducted in 2010-11 and in 2015-16,
transit passengers were not included in the sample. Further, present IPS 2015-16 collected
56,700 samples.
First IPS used systematic sampling scheme to select the weeks of survey. However, for both the
IPS conducted in 2010-11 and 2015-16, Midzuno’s sampling scheme was employed. Also, IPS
2010-11 and IPS 2015-16 used Rao-Hartley-Cochran scheme to select Airports and Landports.
IPS 2010-11 and IPS 2015-16 used dedicated software for tabulation, data entry and scrutiny.
Simultaneously, manual scrutiny method was also implemented.
Both the IPS 2010-11 and IPS 2015-16 were conducted by Indian Statistical Institute, Kolkata, with its
Principal Investigator as Prof. Ashish SenGupta, and were commissioned by MoT, Govt. of India.
Below are some salient features regarding developments of the current IPS 2015-16 over the IPS 2010-
11:
In IPS 2010-11, 11 ports were covered. In current IPS, 13 ports were covered.
56,700 schedules were collected in current IPS, which saw a significant increment over its pre-
vious counterpart.
Regarding the questionnaires, the new one showed several improvements over the older variant.
The following points are to be noted in this context:
o While asking for “sex” of the respondent, “Transgender” option was incorporated in the
current IPS.
o In case a passenger travelled by air, questions about “code-sharing” were asked, provid-
ed the passenger travelled using an Indian airline. Over the years, airlines have formed
pacts/groups, giving the passengers more convenient choices to fly. Thus, incorporation
of questions on code-sharing enabled the survey to provide some new insights.
Notably, current IPS incorporated the “Data Fusion” technique. Data from same months but
from different years were used as representative sample. This gave a way out of the problems of
missing data arising from non-coverage of some ports in some months due to force de majeure.
In IPS 2010-11, the tables provided in the report were generated based on the estimated number
of foreign visitors. In current IPS, the tables were generated based on the countries of im-
portance, as provided by MoT. Thus, table wise comparison is not possible here. If, the coun-
tries are fixed, some country specific comparison over time is possible. Additionally, sample
tables for important countries and itemized top country tables are also incorporated in the report
in order to view the results from other perspectives also.
IPS 2015-16 was initiated by MoT and was commissioned to ISI. After several meetings and delibera-
tions, the detailed operational plan of the Survey was worked out. The Survey was conducted with the nodal
center at ISI, Kolkata, and Prof. Ashis SenGupta as its Principal Coordinator. ISI utilized its personnel at its

INTERNATIONAL PASSENGER SURVEY IN INDIA 2015-16
15
various centers nationwide, e.g. Bangalore, Chennai, Delhi, Hyderabad and Mumbai and also engaged faculty
members of Cochin University of Science And Technology (CUSAT)- Cochin, Delhi University, Goa Institute
of Management in Goa, and Savitribai Phule Pune University (erstwhile Pune University).
A.2 Aims and their Formalizations
After several deliberations between ISI and MoT team members, the modalities of the survey were for-
mulated along with a draft proposal about the estimated cost of the survey. Consequent to elaborate discus-
sions with the officials from Ministry of Tourism, the formal plan and budget of the Survey were finalized.
The aims or data requirements formulated by Ministry of Tourism were as following:
i. Demographic, economic and social profile of foreign and NRI tourists visiting India.
ii. Number of foreign tourists and NRIs visiting India.
iii. Number of outbound Indian resident tourists.
iv. Market segmentation analysis.
v. Average duration of stay of foreign and NRI tourists in India.
vi. Experience and views of tourists on tourism infrastructure and services in the country.
vii. Motivational factors responsible for attracting tourist to India.
viii. The detailed expenditure pattern of foreign as well as NRI tourists visiting India on various
tourism products such as accommodation, food and beverages services, passenger
transport, travel agencies, tour operators and tourist guide services, transport equipment on
rental, cultural services, recreation and other entertainment services and other tourism re-
lated products and services, including expenditure on package tours.
ix. Value of non-monetary tourism transaction acquired from the residents on non-residents.
x. Expenditure pattern of outbound Indian resident tourists up to the point of exit from the
country.
The data was collected as per the items mentioned above.


CHAPTER B
SAMPLING SCHEME
&
ESTIMATION METHODOLOGY


INTERNATIONAL PASSENGER SURVEY IN INDIA 2015-16
19
B.1. Definitions
Some statistical terms discussed in this chapter are elaborated below.
B.1.1 Population: In statistics, a population is a set of similar items or events which is of interest for some ques-
tion or experiment. A statistical population can be a group of actually existing objects or a hypothetical
and potentially infinite group of objects conceived as a generalization from experience.
B.1.2 Sample: In statistics and quantitative research methodology, a sample is a set of data collected and/or se-
lected from a statistical population by a defined procedure. The elements of a sample are known as sample
points, sampling units or observations. The number of sampling units in a sample is called sample size.
B.1.3 Sampling frame: Sampling frame is the list of population units from which a sample of units will be
drawn and this may be people, households, organizations, or other units of analysis.
B.1.4 Sampling error: A sampling error is a statistical error that occurs when an analyst does not select
a sample that represents the entire population of data and the results found in the sample do not represent
the results that would be obtained from the entire population.
B.1.5 Sampling Scheme: A sampling scheme is a detailed description of what data will be obtained and how
this will be done.
B.1.6 Estimator: In statistics, an estimator is a rule for calculating an estimate of a given quantity based on
observed data.
B.1.7 Bias of an Estimator: The bias of an estimator is the difference between this estimator's expected value
(i.e. the long-run average value of repetitions of the experiment it represents) and the true value of the pa-
rameter being estimated. An estimator or decision rule with zero bias is called unbiased estimator. Oth-
erwise the estimator is said to be biased estimator.
B.1.8 Mean Square error: In order to compare a biased estimator with an unbiased estimator , or two esti-
mators with different amount of bias, a useful criterion is the mean square error (MSE) of the esti-
mate. The mean squared error (MSE) of an estimator measures the average of the squares of the er -
rors or deviations—that is, the difference between the estimator and what is estimated.
B.1.9 Random Sampling: Random sampling is data collection in which every person in the population has
a chance of being selected which is known in advance. Random samples are always strongly preferred, as
only random samples permit statistical inference.
B.1.10 Multistage Sampling Design: Multistage sampling refers to sampling plans where the sampling is car-
ried out in stages using smaller and smaller sampling units at each stage. Multistage sampling creates a
more representative sample of the population than a single sampling technique.
B.1.11 Probability proportional to size: If the sampling units vary considerably in a known size measure
variable and the main variable of interest is well positively correlated with that known size measure varia-
ble, a simple random or a systematic sample of units does not produce a good estimate. This is due to the
high variability of units for the characteristics under study. Probability proportional to size (PPS) sam-

INTERNATIONAL PASSENGER SURVEY IN INDIA 2015-16
20
pling includes a number of sample selection methods in which the probability of selection for a sampling
unit is directly proportional to a size measure, giving larger clusters a greater probability of selection and
smaller clusters a lower probability.
B.1.12 Stratum: Let the total population be divided into non-overlapping subgroups. Then each of the sub-
groups is called a stratum, and two or more subgroups are called strata.
B.1.13. Simple random sampling: Simple random sampling (SRS) is a method of selection of a sample com-
prising of n number of sampling units out of the population having N number of sampling units such that
every sampling unit has an equal chance of being chosen. Simple random sampling without replacement
(SRSWOR) is a method of selection of n units out of the N units one by one such that a sampling
unit that has been drawn is removed from the population for all subsequent draws. In case of simple ran-
dom sampling method with replacement (SRSWR) all the random numbers are accepted ever if
repeated more than once.
B.1.14. Inclusion probability: In the theory relating to sampling from finite populations, the inclusion
probability of an element or member of the population is its probability of becoming part of the sample
during the drawing of a single sample.
B.1.15. Multiplier: A multiplier is a factor of proportionality that is used to multiply with the observed sample
value of a variable of interest to produce the estimate of the population total of that variable.
B.1.16. Sample selection Bias: Sample selection bias is a type of bias caused by choosing non-random data
for statistical analysis. The bias exists due to a flaw in the sample selection process, where a subset of the
data is systematically excluded due to a particular attribute. The exclusion of the subset can influence
the statistical significance of the test, or produce distorted results.
B.2 Sampling design
B.2.1 Multistage sampling design for each of the airpor ts and land check posts is adapted to cover the sur-
vey. Stratification of the population is used to obtain a sample that best represents the entire population
being studied. The advantages of stratification are given below:
It minimizes sample selection bias.
It ensures certain segments of the population are not overrepresented or underrepresented.
Airports
B.2.2 At the fir st stage, six airpor ts, namely Bangalore, Chennai, Dabolim (Goa), Delhi, Kolkata and
Mumbai, were selected purposely keeping in mind the different geographical zones of India. Among the
remaining international airports, four other airports namely, Amritsar, Cochin, Hyderabad and Pune, were
selected using Rao, Hartley and Cochran’s (1962) sampling scheme with probability proportional to for-
eigners departure volume in the year 2012 as its size measure.
Land check posts
B.2.3 Haridaspur was selected purposely based on the exper ience from the last IPS. Among the remaining
land check posts, survey could be conducted at only two check posts, namely Changrabandha and Mahadi-
INTERNATIONAL PASSENGER SURVEY IN INDIA 2015-16
21
pur, which were selected using Rao, Hartley and Cochran’s (1962) sampling scheme with probability pro-
portional to foreigners departure volume in the year 2012 as its size measure. Approval for conducting the
survey at other selected landports was not communicated to ISI.
Methodology
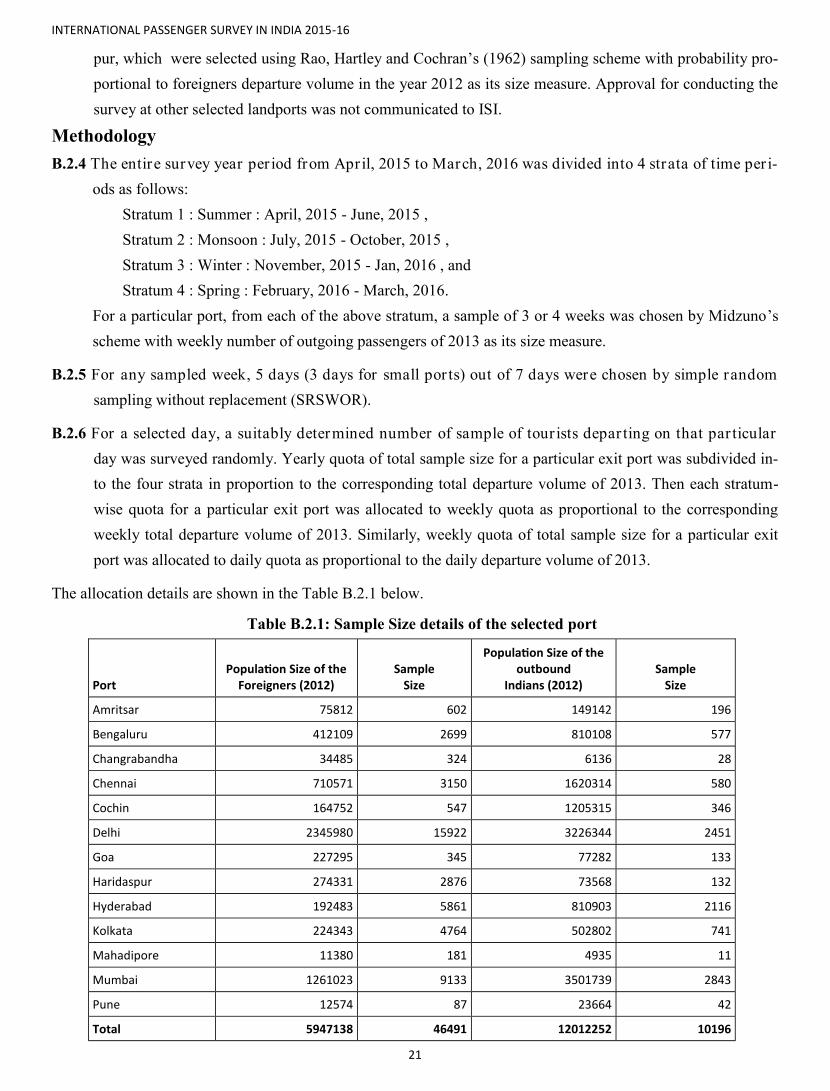
B.2.4 The entire survey year per iod from April, 2015 to March, 2016 was divided into 4 strata of time per i-
ods as follows:
Stratum 1 : Summer : April, 2015 - June, 2015 ,
Stratum 2 : Monsoon : July, 2015 - October, 2015 ,
Stratum 3 : Winter : November, 2015 - Jan, 2016 , and
Stratum 4 : Spring : February, 2016 - March, 2016.
For a particular port, from each of the above stratum, a sample of 3 or 4 weeks was chosen by Midzuno’s
scheme with weekly number of outgoing passengers of 2013 as its size measure.
B.2.5 For any sampled week, 5 days (3 days for small por ts) out of 7 days were chosen by simple random
sampling without replacement (SRSWOR).
B.2.6 For a selected day, a suitably determined number of sample of tour ists depar ting on that par ticular
day was surveyed randomly. Yearly quota of total sample size for a particular exit port was subdivided in-
to the four strata in proportion to the corresponding total departure volume of 2013. Then each stratum-
wise quota for a particular exit port was allocated to weekly quota as proportional to the corresponding
weekly total departure volume of 2013. Similarly, weekly quota of total sample size for a particular exit
port was allocated to daily quota as proportional to the daily departure volume of 2013.
The allocation details are shown in the Table B.2.1 below.
Port Population Size of the
Foreigners (2012) Sample
Size
Population Size of the outbound
Indians (2012) Sample
Size
Amritsar 75812 602 149142 196
Bengaluru 412109 2699 810108 577
Changrabandha 34485 324 6136 28
Chennai 710571 3150 1620314 580
Cochin 164752 547 1205315 346
Delhi 2345980 15922 3226344 2451
Goa 227295 345 77282 133
Haridaspur 274331 2876 73568 132
Hyderabad 192483 5861 810903 2116
Kolkata 224343 4764 502802 741
Mahadipore 11380 181 4935 11
Mumbai 1261023 9133 3501739 2843
Pune 12574 87 23664 42
Total 5947138 46491 12012252 10196
Table B.2.1: Sample Size details of the selected port
INTERNATIONAL PASSENGER SURVEY IN INDIA 2015-16
22
Estimation procedure
B.2.7 It is to be noted that the sampling design contains the Rao, Har tley and Cochran ’s (RHC, 1962)
scheme, Midzuno’s scheme and SRWOR scheme. Brief discussions are presented below about RHC
scheme and Midzuno’s scheme separately.
Rao, Hartley and Cochran’s (RHC, 1962) scheme
B.2.8 For a sample of size n, this method fir st forms n random groups of units, one unit to be drawn from
each group. Here N units of the population are distributed to form n non-overlapping groups with Nᵢ units
each by simple random sampling without replacement (SRSWOR) out of the N units such that the sum of
all units of all random groups equals the number of population unit N. Optimal group sizes as suggested by
Rao, Hartley and Cochran (1962) are as equal as possible. Then from each random group a unit is selected
with probability proportional to size sampling scheme. The units are selected with probability proportional
to the value of an auxiliary variable, called as size measure. This process is independently repeated for the
n groups. Thus finally a sample of size n is obtained.
B.2.9 The mathematical expressions for unbiased estimators of population total and population var iance
are given in the Appendix.
B.2.10 The Rao, Har tley, Cochran scheme has the following advantages:
Finding the inclusion probabilities to estimate the population total and population variance is not needed.
Variance estimator formula always yields non-negative variance estimates.
Midzuno’s (1952) sampling scheme
B.2.11 In this scheme, the fir st unit is chosen out of N population units by probability propor tional to some
particular size measures. The rest (n − 1) units are chosen by SRSWOR out the remaining (N − 1) units.
Thus a sample of size n is obtained.
B.2.12 The mathematical expressions for unbiased estimators of population total and population var iance
are given in the Appendix.
B.2.13 The Midzuno’s scheme has the following advantage:
Midzuno’s scheme has inclusion probabilities such that Yates and Grundy's variance estimator formula of
Horvitz Thomson estimator of population mean always yields non-negative variance estimates.
B.2.14 Multipliers were obtained by following the pr inciple of Ratio method. Where population figures
were supplied, e.g. by BoI, the base values were taken as these. However, where such values were not supplied,
e.g. in case of NRIs, a version of the Ratio method was adopted wherein sample estimates were used for the base
values. The latter method invites two-fold estimation, and naturally the corresponding estimates of the population
parameters are subject to higher variabilities (and hence, possibly, lower precision).

INTERNATIONAL PASSENGER SURVEY IN INDIA 2015-16
23
B.3 Scrutiny, Lot Quality Sampling for Error Reduction
B.3.1 Scrutiny is an essential part of any survey. Specially, in a large scale survey like IPS, it is mandatory as
number of data points are huge and also divided in multiple stages. So to reach a reliable inference one
need to check consistency at every level as far as possible. One part of the process includes a thorough
check followed by coding each response to numeric. It consumes time but cannot be overlooked. In the
process of data entry, both manual and program-based checks have been devised. Cross checks were en-
forced to the extent it was possible. After the data was entered, again manual and program-based checks
were conducted to a large extent. Principle of Lot Quality Acceptance sampling was considered, which
invoked as little as 10% sampling for rejection (i.e. re-checking) of the entire lot.
B.3.2 Computer Programing were devised to locate noticeable peculiarities in the large data framework.
B.4 Packages Developed and Accessed for Data and Error Analyses
B.4.1 The data-entry package developed by the previous IPS-team of ISI was modified and made more robust
and user-friendly for the current IPS. This helped to detect/correct errors and to maintain homogeneity in
the collected data sets. Additionally, several computer programs were also developed to enable error
checks to a larger degree. Program for multiway table generation is one of the additions. Tables as re-
quired by MoT were generated through that package and are presented in this report. Extensive use of the
R programming environment was also implemented at frequent stages for cross validations of the results,
different calculations etc.
B.4.2 Accuracy of an estimator is of prime importance. A measure of this accuracy is thus mandatory. This
method was adopted in the previous IPS also. In this respect, the present report makes a maiden attempt to
present such important measures, in terms of standard error and coefficient of variation. The coefficient of
variation (in percentage) of any estimated total is defined as (Standard error of the total / Estimate of the
total) x 100. The smaller the value of the coefficient of variation, more accurate is the estimator.
Two error analysis tables are presented below.
INTERNATIONAL PASSENGER SURVEY IN INDIA 2015-16
24
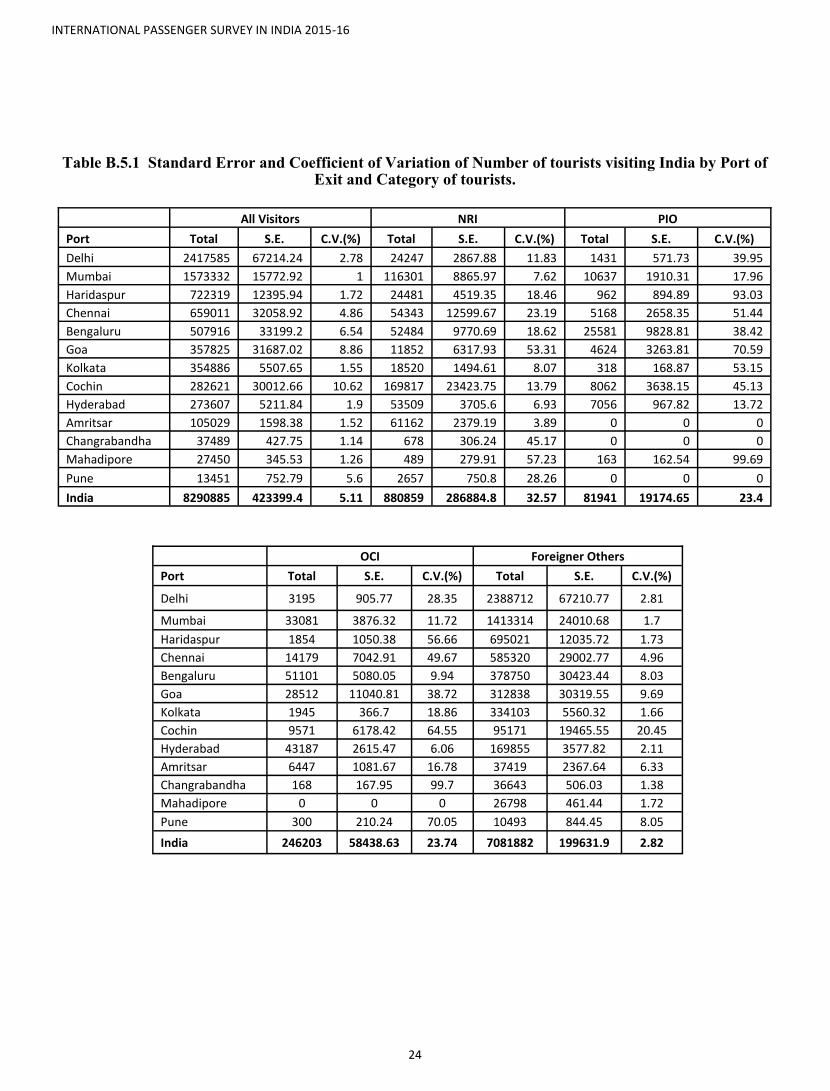
Table B.5.1 Standard Error and Coefficient of Variation of Number of tourists visiting India by Port of Exit and Category of tourists.
All Visitors NRI PIO
Port Total S.E. C.V.(%) Total S.E. C.V.(%) Total S.E. C.V.(%)
Delhi 2417585 67214.24 2.78 24247 2867.88 11.83 1431 571.73 39.95
Mumbai 1573332 15772.92 1 116301 8865.97 7.62 10637 1910.31 17.96
Haridaspur 722319 12395.94 1.72 24481 4519.35 18.46 962 894.89 93.03
Chennai 659011 32058.92 4.86 54343 12599.67 23.19 5168 2658.35 51.44
Bengaluru 507916 33199.2 6.54 52484 9770.69 18.62 25581 9828.81 38.42
Goa 357825 31687.02 8.86 11852 6317.93 53.31 4624 3263.81 70.59
Kolkata 354886 5507.65 1.55 18520 1494.61 8.07 318 168.87 53.15
Cochin 282621 30012.66 10.62 169817 23423.75 13.79 8062 3638.15 45.13
Hyderabad 273607 5211.84 1.9 53509 3705.6 6.93 7056 967.82 13.72
Amritsar 105029 1598.38 1.52 61162 2379.19 3.89 0 0 0
Changrabandha 37489 427.75 1.14 678 306.24 45.17 0 0 0
Mahadipore 27450 345.53 1.26 489 279.91 57.23 163 162.54 99.69
Pune 13451 752.79 5.6 2657 750.8 28.26 0 0 0
India 8290885 423399.4 5.11 880859 286884.8 32.57 81941 19174.65 23.4
OCI Foreigner Others
Port Total S.E. C.V.(%) Total S.E. C.V.(%)
Delhi 3195 905.77 28.35 2388712 67210.77 2.81
Mumbai 33081 3876.32 11.72 1413314 24010.68 1.7
Haridaspur 1854 1050.38 56.66 695021 12035.72 1.73
Chennai 14179 7042.91 49.67 585320 29002.77 4.96
Bengaluru 51101 5080.05 9.94 378750 30423.44 8.03
Goa 28512 11040.81 38.72 312838 30319.55 9.69
Kolkata 1945 366.7 18.86 334103 5560.32 1.66
Cochin 9571 6178.42 64.55 95171 19465.55 20.45
Hyderabad 43187 2615.47 6.06 169855 3577.82 2.11
Amritsar 6447 1081.67 16.78 37419 2367.64 6.33
Changrabandha 168 167.95 99.7 36643 506.03 1.38
Mahadipore 0 0 0 26798 461.44 1.72
Pune 300 210.24 70.05 10493 844.45 8.05
India 246203 58438.63 23.74 7081882 199631.9 2.82

INTERNATIONAL PASSENGER SURVEY IN INDIA 2015-16
25
Table B.5.2 Standard Error and Coefficient of Variation of Number of tourists visiting India by Port of Exit and Educational Level
All Visitors Illiterate School Level
Port Total S.E. C.V.(%) Total S.E. C.V.(%) Total S.E. C.V.(%)
Delhi 2415112 67208.56 2.78 3368 1182.94 35.12 97178 32382.28 33.32
Mumbai 1573038 24933.76 1.59 6080 1564.2 25.73 78521 6361.54 8.1
Haridaspur 726907 12429.88 1.71 51246 5079.65 9.91 317976 10512.16 3.31
Chennai 656750 31979.06 4.87 9619 4812.17 50.03 52763 10489.62 19.88
Bengaluru 507879 33199.39 6.54 385 177.46 46.04 39910 17089.65 42.82
Goa 381239 32383.4 8.49 206 106.63 51.7 68960 15456.45 22.41
Kolkata 353306 5496.31 1.56 2062 411.3 19.95 38053 2518.72 6.62
Cochin 282621 30012.66 10.62 995 547.44 55.04 38017 5906.9 15.54
Hyderabad 273550 5212.45 1.91 1146 397.29 34.67 5866 742.27 12.65
Amritsar 104269 1635.9 1.57 1053 436.73 41.46 38090 2382.25 6.25
Changrabandha 37489 427.75 1.14 3296 614.02 18.63 19572 1111.42 5.68
Mahadipore 27450 345.53 1.26 4547 766.92 16.87 14019 1063.85 7.59
Pune 13451 752.79 5.6 0 0 0 0 0 0
India 8311158 423970.7 5.1 132057 34467.27 26.1 1038211 96817.25 9.33
Bachelor & Above Others
Port Total S.E. C.V.(%) Total S.E. C.V.(%)
Delhi 1887271 49119.81 2.6 427295 34473.87 8.07
Mumbai 1434539 24606.49 1.72 53898 4278.14 7.94
Haridaspur 324299 10857.51 3.35 33387 3627.8 10.87
Chennai 513099 27917.7 5.44 81269 12712.59 15.64
Bengaluru 454956 27980.67 6.15 12627 6780.27 53.69
Goa 234893 26560.45 11.31 77180 18525.86 24
Kolkata 281861 5280.88 1.87 31329 2195.23 7.01
Cochin 203112 26217.35 12.91 40497 15641.74 38.62
Hyderabad 256168 4831.3 1.89 10370 2166.73 20.89
Amritsar 60430 2389.85 3.95 4695 898.65 19.14
Changrabandha 13307 1010.75 7.6 1315 393.21 29.9
Mahadipore 8141 970.2 11.92 743 329.79 44.38
Pune 10082 878.72 8.72 3368 774.02 22.98
India 6289838 394776.7 6.28 851052 81117.08 9.54


CHAPTER C
INTERNATIONAL RECOMMENDATIONS,
OTHER PRACTICES & DATA FUSION


INTERNATIONAL PASSENGER SURVEY IN INDIA 2015-16
29
C.1 UNWTO Recommendations: An overview
The International Recommendations for Tourism Statistics 2008(IRTS 2008) provides a comprehensive
methodological framework for collection and compilation of tourism statistics in all countries irrespective of the
level of development of their statistical systems. Its primary audience is the staff of national statistical offices and
national tourism administrations involved in the compilation of tourism statistics. The publication also contains a
wealth of information that might be of interest to data users who would like to understand better the nature of
tourism data. In addition, general guidance is provided with respect to data sources and data compilation meth-
ods, as mentioned in its Foreword.
C.1.1 Development and Needs for Tourism Statistics
Tourism is a social, cultural and economic phenomenon related to the movement of people to places out-
side their usual place of residence, pleasure being the usual motivation. The activities carried out by a visitor may
or may not involve a market transaction, and may be different from or similar to those normally carried out in
his/her regular routine of life. If they are similar, their frequency or intensity is different when the person is trav-
elling. These activities represent the actions and behaviors of people in preparation for and during a trip in their
capacity as consumers.
Tourism has an impact on the economy, the natural and built environment, the local population at the
places visited and the visitors themselves. Owing to this range of impacts and the wide spectrum of stakeholders
involved, there is a need for a holistic approach to tourism development, management and monitoring. This ap-
proach is supported by the World Tourism Organization (UNWTO) in order to formulate and implement national
and local tourism policies. Having more and reliable statistics is essential for policymakers to make effective
decisions. Only with sufficient and adequate data that generate credible statistics it would be possible to under-
take different types of analysis of tourism. This is essential in order to evaluate the different aspects of tourism
and to support and improve policy and decision-making. Tourism statistics are necessary for designing marketing
strategies, strengthening inter-institutional relations, evaluating the efficiency and effectiveness of management
decisions and measuring tourism throughout the national economy.
IRTS 2008 focuses on the activities carried out by visitors and on measuring them with both monetary
and non-monetary indicators. Its purpose is to provide a common reference framework for countries to use in the
compilation of tourism statistics. General guidance with respect to data sources and data compilation methods is
also provided.
The present focus is on the economic perspective and from this perspective tourism is defined as the ac-
tivities of persons, identified as visitors. A visitor is someone who is travelling under certain conditions (para. 2.9
of IRTS 2008), namely, for holiday, leisure and recreation, business, health, education or other purposes.

INTERNATIONAL PASSENGER SURVEY IN INDIA 2015-16
30
Tourism comprises the activities of all these categories of visitors. This scope is much broader than the
traditional perception of tourists, which includes only those travelling for leisure. The notion of activities encom-
passes all the actions of visitors in preparation for a trip or while on a trip. It is not restricted to what are often
considered “typical” tourism activities, such as sightseeing, sunbathing, visiting sites, and practicing or watching
sports ( para. 3.17 of IRTS 2008). Being a visitor is a transient situation; once the trip is over, the individual loses
his/her condition of being a visitor.
As a demand-side phenomenon, the economic contribution of tourism has to be approached from the ac-
tivities of visitors and their impact on the acquisition of goods and services. However, it can also be viewed from
the supply side, and tourism will then be understood as a set of productive activities that cater mainly to visitors
or for which an important share of their main output is consumed by visitors. These two aspects, as well as em-
ployment in the tourism industries, is considered in International Recommendations for Tourism Statistics 2008.
For International comparability, countries are encouraged to compile both demand and supply side tour-
ism statistics in line with International Recommendations 2008. This may ensure a better information-base for
analysis of tourism and its economic contributions.
Concepts, definitions, classifications and indicators presented in International Recommendations 2008
may be viewed to form the foundation of the system of tourism statistics. These should be used as references for
coordination, reconciliation and interpretation of the information in the area of tourism, although these infor-
mation might extend beyond the still restricted domain which these Recommendations allude to.
It emphasizes that the measurement of key variables in tourism statistics (trips, visitors, expenditure, tour-
ism supply, employment, etc.) must take account of the complexity of tourism arising out of its cross-cutting na-
ture. Such measurements should also incorporate the specificities of each different form of tourism statistics.
These should be used as references for coordination, reconciliation and interpretation of the information in the
area of tourism, although these information might extend beyond the still restricted domain which these Recom-
mendations allude to.
It emphasizes that the measurement of key variables in tourism statistics (trips, visitors, expenditure, tour-
ism supply, employment, etc.) must take account of the complexity of tourism arising out of its cross-cutting na-
ture. Such measurements should also incorporate the specificities of each different form of tourism.
C.1.2 The Demand Perspective: Basic Concepts and Definitions
Tourism is introduced as a subset of travel and more precisely defines some related concepts and termi-
nology, such as that of country of residence, place of usual residence and the usual environment. These defini-
tions have been used in the conduct of IPS 2015-16. It also clarifies notions such as those of tourism trips and
visits, and introduces the different forms of tourism. It emphasizes that the main aim of tourism statistics is to
identify visitors from other subsets of travelers.
INTERNATIONAL PASSENGER SURVEY IN INDIA 2015-16
31
As per IRTS 2008, sample size and design are strongly related to the significance and accuracy of the var-
iables to be estimated. In this connection, the unequal distribution of tourism over the national territory and the
high degree of heterogeneity of the population in terms of its tourism behavior need to be taken into considera-
tion.
C.1.3 The Demand Perspective: Characterization of Visitor and Tourism Trips
Characterization of visitors and of tourism trips are discussed as a part of the recommendations. It is sug-
gested that with respect to socio-demographic characteristics, ILO and United Nations Educational, Scientific
and Cultural Organization (UNESCO) international standards should be used, as adjusted by countries. In line
with the recommendations of IRTS 2008, the questionnaire used for IPS 2015-16, captures these socio-
demographic characteristics of the respondent in Section 2 of the Schedule.
IRTS 2008 points out that tourism trips may be characterized by the following:-
a. Main purpose;
b. Types of “tourism product”;
c. Duration of a trip or visit;
d. Origin and destination;
e. Modes of transport;
f. Types of accommodation.
The IPS 2015-16 gathers similar information in Section 3 of the Schedule and has been termed as Visit Profiles .
C.1.4 The Demand Perspective: Tourism Expenditure
Next, consider the activity of visitors from the point of view of tourism expenditure is dealt with. In order
to be able to relate demand by visitors to the supply in the economy, it recommends that “information be collect-
ed not only on the total value of tourism expenditure, but also on the components of this total”. The classifica-
tion recommended for collection of tourism expenditures data is according to their purpose. The most common
way of finding out from visitors about their expenditure is to ask them to group the expenditures according to
their purpose. This should be done so as to facilitate the linkage to the Classification of Individual Consumption
by Purpose (COICOP), an international classification of products linked to Central Product Classification (CPC)
and mostly used for the description of personal consumption in general statistics and surveys concerning house-
holds.
The survey carried out by the ISI adopts this recommendation of the IRTS 2008 and has incorporated the
relevant questions in Section 4 of the schedule. Details of expenditure for Last Place of Night Halt (LPNH) and
the entire tour with appropriate sub-classifications have been collected.
INTERNATIONAL PASSENGER SURVEY IN INDIA 2015-16
32
It is recommended that wherever surveys break-up expenditure data on goods and services are collected,
this information be cross-classified with relevant characteristics of the visitors or travel party and/or of the trip
(purpose of the trip, place of stay, organization of the trip, length of the stay, etc.). While this might impose strin-
gent requirements in terms of the size of the sample and its design, it is key to making full use of the information
collected. Further, it suggests that countries include a specific expenditure module in surveys of inbound visitors,
either at the border or at any other place where they can be observed.
C.1.5 Classification of Products and Productive Activities for Tourism
Considered next “the standard classifications of products and productive activities that need to be used in
order to be able to harmonize observations made within the demand approach and the supply approach at the na-
tional level, and in order to develop internationally comparable economic measurements and aggregates at a cer-
tain level of breakdown of products and productive activities”. It provides “recommendations for the classifica-
tion of products and productive activities required for tourism measurement and analysis that would be both in-
ternationally comparable and nationally relevant. The classifications refer to (a) products, mainly (though not ex-
clusively) those belonging to tourism expenditure, and (b) productive activities that are the basis for defining
tourism industries”.
C.1.6 Main focus
The main focus next is on those goods and services directly acquired by visitors that are part of individual
consumption expenditure incurred by households (the scope of the COICOP classification) and main productive
activities serving visitors and in direct contact with them. It will also consider valuables that might be acquired
by visitors. Hence, it excludes goods that belong to tourism investment or services provided as support services
to producers or strongly related to tourism but not acquired directly by visitors, such as promotion and adminis-
trative services and consulting services for tourism development.
C.1.7 Employment in Tourism Industries
The concepts and definitions of employment in tourism industries and its basic categories, major classifi-
cations and measures are then described.
It is recommended that in order to adequately analyze employment in the tourism industries, countries
should collect the key variables for each of the tourism industries as identified earlier and for the tourism indus-
tries as a whole. In IPSF though employment figures for tourism industries are not directly collected, the auxilia-
ry variables as defined through the expenditures corresponding to these industries can certainly shed light on the
nature and extent of such employment.
Most of the above recommendations which were relevant to IPS 2015-16, were adopted directly or indi-
rectly through the IPSF schedule. Further, derived tables can be obtained from the principle ones (or, raw
data supplied separately) given in this report. These may shed useful light on several items in IPS for fur-
ther research.
INTERNATIONAL PASSENGER SURVEY IN INDIA 2015-16
33
C.2 Countries Conducting International Passenger Survey
India is an official member of the United Nations World Tourism Organization (UNWTO) since 1975.
Many countries (a 2010 study showed a total of 60 countries then were on the TSA practice) now provide their
inbound tourism data/statistics with the other UNWTO member countries for the sake of development of the
tourism sector worldwide. This sharing not only includes data but also provides a study through the different
methodologies and inferential techniques adopted by different countries. In this report of the International Pas-
senger Survey of India, the major points of the reports of three other countries conducting IPS, namely Austral-
ia, UK, and USA, along with brief comments are summarized below.
C.2.1 International Visitor Survey (IVS) of Australia Some points regarding IVS of Australia are given below:
Conducted by Tourism Research Australia.
Total sample size of this survey: 40,000 proportionately stratified inbound passengers.
Prior to the year 2005, the total sample size surveyed was 20,000.
The sample size was increased in 2005 to enhance the estimates for smaller states, territories and
regions. The concerned authority had remarked that they had increased the reliability of the estimates
with this 100% increment of the sample size.
Airports surveyed - Sydney, Melbourne, Brisbane, Cairns, Perth, Adelaide, Darwin and Gold Coast
of Australia.
A passenger of age more than 15 is interviewed by Computer Assisted Personal Interviewing (CAPI)
in the departure lounges.
Survey designed in four languages - English, Japanese, Mandarin and Korean.
Total number of questions asked: approximately 100.
Results Frequency: Quarterly.
Last published results can be found in http://www.tra.gov.au/research/latest-ivs-report.html of June
2016, summarized in the form of charts and excel tables for the results.
To achieve a good estimate, the surveyed data is weighted to data on international visitor numbers
over the period, provided by the Department of Immigration and Citizenship (DIAC). The variables
used in weighting the data are i. country of residence
ii. state of arrival
iii. main purpose of journey
iv. airport of departure
v. age and sex of visitor.
They give reliability estimates of the inferences they provide. In their language, “The results given in the
IVS are based on a sample, rather than a census, of international visitors to Australia. As with all sample sur-

INTERNATIONAL PASSENGER SURVEY IN INDIA 2015-16
34
veys, the results are subject to sampling variability, and therefore may differ from figures that would be obtained
if all international visitors to Australia had been included in the survey.
A measure of the possible degree of difference is given by the relative standard error of the survey and its
associated confidence interval, which indicate the extent to which an estimate might vary by chance from the
true figure because only a sample of the population was included . . . The IVS relative standard errors were cal-
culated using the Complex Survey Sampling module in SPSS V14.0. Estimates of variation are based on sam-
pling with replacement principles and makes allowances for the IVS stratification. The covariance and estimates
output from this program were then regressed with a log transformation using Ordinary Least Squares (OLS)
regression to achieve three independent models (for visitors, nights and expenditure).”
(Ref: http://www.tra.gov.au/research/international-visitor-survey.html)
They also used statistical software R to obtain the models.
The summary report presented for the last quarter June 2016 states “International visitors to Australia
spent a record $38.1 billion in the year ending June 2016 – 14% or $4.7 billion more than the previous year. The
number of visitors aged 15 years and over reached 7.2 million, increasing by 680,000 (10%), while nights were
up 5% to 248 million. Thirteen of Australia’s top 20 markets had record visitor numbers during the year. The
holiday and education segments underpinned the strong growth for the year. Combined, these segments account-
ed for 66% of total trip spend by international visitors to Australia.”
(Ref: http://www.tra.gov.au/documents/ivs/IVS_one_pager_June2016.pdf ).
They found USA and China to be the main contributor to their tourism sector in terms of holiday. China
is also leading in education-tourism sector in Australia. The top 5 markets are found to be China, UK, USA, NZ
and Japan. In the summary they presented a current i.e. quarterly trends for the above said period. The “Current Trends” from their report are noted in the following
Nights spent in hotels, motels and resorts increased 9% to 27.5 million on the back of strong growth
in the holiday segment, while nights spent at guest houses and bed and breakfast increased 29% to 1.3
million
Spending on inclusive package travel grew strongly by 22% to $4.5 billion
First-time visitor numbers were up by 12% and return visitors by 10%
Backpacker visitor numbers increased slightly, up by 2% to 611,900
Growth in travel party type was highest for adult couples, and friends and family travelling together,
both increasing by 16% to 1.5 million and 804,200 respectively. The no. of visitors travelling alone
increased by 7% to 3.7 million and accounted for 52% of all arrivals.
The quarterly estimation procedure of IVS helps to monitor the changes of the tourism sector more pro-
foundly. A detail description of the methodology can help to understand their estimation and weighing proce-
dure better.
INTERNATIONAL PASSENGER SURVEY IN INDIA 2015-16
35
C.2.2 International Passenger Survey (IPS) of UK
Some notable points regarding the IPS of UK are as below:
IPS in UK has been continuing since 1961.
Conducts between 700,000 to 800,000 interviews per year
250,000 are used to evaluate the estimates
Study is conducted by Office of National Statistics (ONS), UK.
Survey is conducted over all major airports of UK, sea ports and at Eurostar terminals and on Eu-
rotunnel shuttle trains.
International Passenger Survey User Guide (Volume 1) Background & Methodology (2014), published by
ONS gives a detailed view of the Background and History of IPS, UK, Design and Data collection, changes in
methodology, the questionnaire, information on Data processing, Quality of IPS, Publications etc. The weighing
basis is the total number of departing passenger from a specific port on the survey period. These are provided by
the Civil Aviation Authority (CAA), Department for Transport, Eurostar, Eurotunnel, British Airports Authority
(BAA) and some airports.
(Ref. link: http://webarchive.nationalarchives.gov.uk/20160105160709/http://www.ons.gov.uk/ons/guide-
method/method-quality/specific/travel-and-transport-methodology/international-passenger-survey-methodology/
ips-user-guide-volume-1--background---methodology.pdf)
Sampling Design: The user guide provided by ONS states, “The IPS sample is stratified to ensure it is
representative by mode of travel (air, sea or tunnel), port or route, and time of day. The frequency of sampling
within each stratum is determined according to the variability of tourist expenditure and interviewing cost consid-
erations. For example, where the expenditure quoted on a particular route varies greatly across respondents, a
higher sampling frequency is used to ensure that the variability of expenditure is captured”.
A multi-stage sample design is carried out separately for air, sea and tunnel travel. “This involves ran-
domly sampling a given port or entry/exit route on: (a) a given day; (b) within a given time of the day (this is re-
ferred to as a ‘shift’); and then (c) within the shift passengers are systematically selected at fixed intervals from a
random start and interviewed”. The sampling design plan is further stratified by weekday /weekend to capture the
different patterns of the passenger traffic ensuring different allocation shifts.
The regularity in IPS helps them to develop the sampling design day by day. A major change has been
adopted on 2009. According to them the new scheme is more migrant focused and balanced in terms of the routes
that migrants frequently use. Development in methodology is very frequent due to regularity and continuous re-
view. They use additional source of data for the routes IPS does not cover. These are UK residents on cruises de-
parting from or arriving at UK shores, Channel Islands expenditure and receipts from tourism, from the Econom-
ic Advisor’s office in Jersey, rail fares purchased by overseas visitors to the UK and UK visitors abroad before
the start of their visit, and estimates of travel across the land border between Northern Ireland and the Irish Re-
public, from the Irish Central Statistical Office.
Prior to the year 1999, information was also provided regarding travel on air and sea routes between the
UK and the Irish Republic. However, since 1999, the air and sea routes have been covered by the IPS sample.
The information gathered from these sources are added to the total derived from IPS. About the strength of the

INTERNATIONAL PASSENGER SURVEY IN INDIA 2015-16
36
survey design, the user guide states, “The IPS uses a two-stage stratified random sample to produce efficient esti-
mates of UK passenger traffic. Random sampling eliminates systematic bias by giving all passengers an equal
chance to be selected”. The detailed explanations of the design and estimation procedure with variance estimation
can be found in Merad (2014)
(Ref: IPS Sampling and Estimation Methodology, Survey Methodology and Statistical Computing Division, Of-
fice for National Statistics,
link: http://webarchive.nationalarchives.gov.uk/20160105160709/http://www.ons.gov.uk/ons/guide-method/
method-quality/specific/travel-and-transport-methodology/international-passenger-survey-methodology/
international-passenger-survey-sampling-and-methodology-2014.pdf).
ONS provides regularly the IPS estimates provisionally on monthly and quarterly basis and annual estimates pub-
lished as travel trends (link: https://www.ons.gov.uk/peoplepopulationandcommunity/leisureandtourism ).
In Travel trends 2015:
Main findings: the trend in inbound passenger to UK figured out as “In 2015, overseas residents made 36.1
million visits to the UK, 5.1% higher than in 2014.
(link: https://www.ons.gov.uk/peoplepopulationandcommunity/leisureandtourism/articles/traveltrends/2015)
There was an increase in the number of visits to the UK by overseas residents for the fifth consecutive year in
2015, and the highest number of visits since the International Passenger Survey (IPS) began in 1961. The sur-
vey also shows the highest recorded visitor spending (without adjusting for inflation).
Earnings from visits to the UK reached a record level of spending in the UK of £22.1 billion, they increased
by £0.2 billion (1.0%) compared with 2014, before inflation.
The number of nights spent in the UK by overseas visitors rose to 273.1 million, an increase of 3.2% com-
pared with the previous year. Visits from North America, Europe and “Other Countries” (countries outside
Europe and North America) increased in 2015 by 9.6%, 4.1% and 6.6% respectively. Spending by North
American residents and “Other Countries” also grew by 2.9% and 3.9%, however, spending by visitors from
Europe showed a decline of 1.4%.
Holidays remain the main reason for visits to the UK, accounting for 13.9 million visits, a rise of 2.1% com-
pared with 2014. Business visits and visits to friends and family both showed growths of 7.1%.
A record 18.6 million overnight visits to London were made by overseas residents in 2015, an increase of 1.2
million (6.8%) from 2014, and £11.9 billion was spent on these visits.
Overnight visits to the rest of England grew by 6.9% to 15.2 million. Visits to Wales rose by 4.0% in 2015,
however, visits to Scotland decreased by 4.0%”. Different tables including year-wise trends, characteristic of
visits, confidence interval of the estimates can be found from the link given above.
Response rate is very crucial in any kind of sample survey. IPS UK studies the response rate over time. It
has been seen in 2015 the rate is 78.4%, which can be considered quite good.
The question of accuracy of the 2015 report has been dealt with in the revision policy guided by ONS.
Two points from that report are quoted below,
I. “The main series are seasonally adjusted. This aids interpretation by identifying seasonal patterns and
calendar effects and removing them from the unadjusted data. The resulting figures give a more accu-
rate indication of underlying movements in the series.”

INTERNATIONAL PASSENGER SURVEY IN INDIA 2015-16
37
II. “The estimates produced from the IPS are subject to sampling errors that result because not every trav-
eller to or from the UK is interviewed on the survey. Sampling errors are determined both by the sam-
ple design and by the sample size - generally speaking, the larger the sample supporting a particular
estimate, the proportionately smaller is its sampling error. The survey sample size is approximately
70,000 per quarter.”
No doubt that the regularity has helped the development of IPS, UK in every area.
Ref: Merad Salah (2014). IPS Sampling and Estimation Methodology. Survey Methodology and Statistical
Computing Division, Office for National Statistics.
C.2.3 Review of International Air Travelers Program, USA
This is the US version of the international passenger survey which gathers information on the passenger
travelers in the U.S. - overseas and U.S. - Mexican markets (Canada is excluded). The data is gathered on a
monthly basis regularly since January 1983. The survey is available in 12 languages, keeping in mind the flow of
the various lingual tourists in USA and is self-administered by the passengers who wishes to be surveyed. Na-
tional Travel and Tourism Office (NTTO) conducts this program.
The details can be found in the link http://travel.trade.gov/research/programs/ifs/index.html. This link
gives details of the program and publication. About the selection procedures, it states the following: “Sample se-
lection is made, on a random basis, of scheduled flights (clusters) from among all participating airlines that de-
part the U.S. to overseas or Mexican destinations.
A computer program selects a random sample of flights to be surveyed from an electronic database of
scheduled airline flights. Major charter carriers are also included in the program. The number of flights sampled
proportionately reflects the total number of flights offered by carrier and the dispersion of flights by destination”.
The survey schedules are collected in on board flight and in the departing lounge.
They also pilot tested E-survey manual in the course of survey, “NTTO and its contractor (CIC Research,
Inc.) have tested several electronic approaches to the Survey with the intent of replacing the paper-based system
when appropriate. In 2015, 2014 and 2012 the tests were done pre-flight departure; in 2008 the test was conduct-
ed during the booking process”.
(Ref. link: http://travel.trade.gov/research/programs/ifs/description.asp ).
“The E-SIAT tablet test yielded approximately eight (8) completed responses per flight compared to the
current, paper-based method, which produces from 10 – 14 surveys per flight. The results do not warrant the im-
mediate adoption of the tablet methodology approach as a replacement for the current approach. However, the
results were positive enough to warrant additional testing of this method. The major caveats are that the tablet
approach requires more field service interaction than the legacy (paper) method and appears to increase passen-
ger response time”—is written on the result of the E-survey method conducted at Los Angeles International Air-
port (LAX).
(link: http://travel.trade.gov/research/programs/ifs/documents/TabletTestReport-April2016.docx )
The contractor (field survey conducting authority) processes the filled-in survey kit, that includes verifi-
cation, coding, data entry, foreign language translation etc. They obtain a quality control method for the data in-
tegrity. Census data is taken as the weights to the survey data.
INTERNATIONAL PASSENGER SURVEY IN INDIA 2015-16
38
The link http://travel.trade.gov/outreachpages/inbound.general_information.inbound_overview.asp pro-
vides detail results on Travel and Tourism Statistics (Inbound) for the year 2014-16. 2014-15 includes all type of
estimates on demographic profile, market profile, top 10 market listing, region wise tourist flow etc. Similarly
outbound analysis can be found here:
Link: http://travel.trade.gov/outreachpages/outbound.general_information.outbound_overview.asp .
Historical profiles, trend analysis etc. are also provided separately. The National Travel and Tourism Of-
fice Statistical Policy for Visitation Estimates of International Travel to the United States of America states “The
policy of the National Travel and Tourism Office (NTTO) is to release visitation estimates only for those destina-
tions in which a sample of 400 or more respondents was collected from the Survey of International Air Travelers
(SIAT), based upon a single year's interviews.
A random sample of 400 respondents (rounded) would yield a 95 percent confidence level with a plus or
minus 5 percentage point variance. The NTTO's survey methodology is not a random sample but, is based upon a
stratified, two-stage cluster sample. The NTTO statistical policy was implemented to raise the level of confidence
in the survey estimates and takes into account input from the National Council of State Travel Directors, State
Researchers Group, and other industry clients”.
(Ref. link: http://home.cicresearch.com/AviationAndAirlines/NonRes/NR_Policy_from_NTTO.asp)
The monthly data provided over year helps to understand the change pattern in the tourism sector. Top 10
markets of 2015 gives, in visitation Canada leads the table though it is 10% lesser than the previous year, where-
as in spending, China leads the table with the increment of 15% from the previous year. A brief and bulleted
presentation helps the layman to understand the top 10 market of USA tourism sector.
(Ref: http://travel.trade.gov/pdf/2015-Top-10-Markets.pdf )
The market profile of India shows the total arrivals of Indian citizens, which was 599,000 in 2008 in-
creased to 1,126,000 in 2015. Percentage change is calculated to be 88%. Total expense which was $6718 in
2008 increased 76% to $11806 in 2015.
(Ref: http://travel.trade.gov/outreachpages/download_data_table/2015_India_Market_Profile.pdf)
Purpose of trip drops from 2014 value in the case of Business, Education, Health treatment and other sec-
tors.
Reports on different profiles can be found separately for the countries like Argentina, Australia, Belgium,
Brazil, Canada, Chile, Denmark, China, Colombia, Ecuador, France, Germany, India, Ireland, Italy, Ja-
pan, Mexico (air), Netherlands, New Zealand, Panama, Singapore, South Korea, Spain, Sweden, Switzer-
land, Taiwan, United Kingdom. Region wise and sector wise analysis are also available.
A brief summary of the IPS survey conducted by three major countries is presented. There are differ-
ences in methodology and estimation procedures. A comparison with IPS-India methods requires a more
detailed study of not only the implementational but also the computational methodologies. To rate these
individual methods on a comparative scale based on only the materials provided online may not be judi-
cious.

INTERNATIONAL PASSENGER SURVEY IN INDIA 2015-16
39
C.3 Data Fusion
C.3.1 Data Fusion is defined as the process of synthesizing raw data from several sources to generate more
meaningful information that can be of greater value than single source data. Data fusion is the process of
integration of multiple data and knowledge representing the same real-world object into a consistent, ac-
curate, and useful representation. The goal of data fusion is to combine relevant information from two or
more data sources into a single one that provides a more accurate description than any of the individual
data sources. It has three categories viz. low, intermediate or high.
C.3.2 Low level data fusion combines raw data from different sources to create new raw data with the hope that
fused data is more informative and synthetic than the original data.
C.3.3 Synthetic Data: Synthetic data are "any production data applicable to a given situation that are not ob-
tained by direct measurement" according to the McGraw-Hill Dictionary of Scientific and Technical
Terms where Craig S. Mullins, an expert in data management, defines production data as "information
that is persistently stored and used by professionals to conduct business processes."
C.3.4 Synthetic data are generated to meet specific needs or certain conditions that may not be found in the
original, real data. This can be useful when designing any type of system because the synthetic data are
used as a simulation or as a theoretical value, situation, etc. This allows to take into account unexpected
results and provides a basic solution or remedy, if the results prove to be unsatisfactory. Synthetic data are
often generated to represent the authentic data and allows a baseline to be set.
C.3.5 Data Fusion Classifications: There are var ious types of Data Fusion classifications. One of the main
classifications provided by Dasarathy(1997) is described below. It is composed of the following five cate-
gories:
(1) Data In-Data Out (DAI-DAO): This type is the most basic or elementary data fusion method
that is considered in classification. This type of data fusion process inputs and outputs raw data; the results
are typically more reliable or accurate. Data fusion at this level is conducted immediately after the data is
gathered from the sensors. The algorithms employed at this level are based on signal and image processing
algorithms;
(2) Data In-Feature Out (DAI-FEO): At this level, the data fusion process employs raw data from the
sources to extract features or characteristics that describe an entity in the environment;
(3) Feature In-Feature Out (FEI-FEO): At this level, both the input and output of the data fusion pro-
cess are features. Thus, the data fusion process addresses a set of features with to improve, refine or obtain
new features. This process is also known as feature fusion, symbolic fusion, information fusion or interme-
diate-level fusion;
(4) Feature In-Decision Out (FEI-DEO): This level obtains a set of features as input and provides a
set of decisions as output. Most of the classification systems that perform a decision based on a sensor’s
inputs fall into this category of classification;
(5) Decision In-Decision Out (DEI-DEO): This type of classification is also known as decision fusion.
It fuses input decisions to obtain better or new decisions.

INTERNATIONAL PASSENGER SURVEY IN INDIA 2015-16
40
C.3.6 The implementation of this modern concept in the current IPS has been attempted in two ways. First, it
was necessary to gather experiences from a country already conducting alike surveys. For the same, a vis-
it was conducted to the USA, which conducts IPS-type surveys regularly, to learn the methodology adopt-
ed by them for the survey. It was observed that the survey was conducted in USA annually as compared
to the quinquennial survey being carried out in India. The passenger survey in USA requires collection of
filled-in schedules in contrast to the interview method for filling the schedules as being adopted in India.
The forms used there are multilingual and more user friendly, which may provide an extension to the
method used by India. However, in this case, it may be remarked that the interview method would appear/
prove to be more effective with the element of insistence on part of interviewers being involved, thus
yielding/eliciting higher response form the passengers responding.
Next, data from other months beyond the target ones are fused, i.e. logically and statistically amalgamat-
ed, with the previously collected data to overcome the problem of missing data. This is done under the
mild assumption that the trend in the passengers interviewed will not be vitiated significantly over a short
period.
. References:
1. Federico Castanedo, “A Review of Data Fusion Techniques”, The Scientific World Journal, 2013.
2. B. V. Dasarathy, “Sensor fusion potential exploitation-innovative architectures and illustrative applica-
tions,” Proceedings of the IEEE, vol. 85, no. 1, pp. 24–38, 1997.

CHAPTER D
SURVEY FINDINGS


INTERNATIONAL PASSENGER SURVEY IN INDIA 2015-16
43
D. Major Findings: Foreigners and Outbound Indians
D.1 Two distinct groups of International Passengers are considered: Foreigners (NRI + PIO + OCI + For-
eigner Others) and Outbound Indians Tables are constructed for each of the two groups for both sample
data (depicted by ‘S’ in the numbering of the tables) and also for the estimated population. Since the
sample tables are based on the raw data, these tables are placed at the end in the Appendix section. The
estimated tables are of prime interest. Here, the top 20 countries given in such tables as displayed in each
table were suggested by MoT. Some Item wise tables (depicted by ‘I’ in the numbering of the tables) are
also given in the Appendix section. There the top 20 countries displayed in each table were obtained by
ordering (descending order) with respect to the particular characteristic pertinent to that table.
D.2 For the tables, percentages are made from the total for each group of all the visitors. ‘Total Number’ in
the following tables shows the total of the 20 countries (either provided by MoT or the top 20). ‘Total
(%)’ shows the total of the column wise percentages of the specified 20 countries. ‘Others’ represents the
total of the remaining countries other than the specified 20 countries. ‘Grand Total’ represents the total
of all the countries. For categorised tables, the percentages are calculated on the basis of row wise totals.
For all charts, ‘Others’ is used to represent the aggregate of that countries who are giving negligible con-
tribution to the total of the 20 countries provided by MoT.
D.3 The findings are presented in terms of tables, charts and summarized comments as per different sub-
groups. The sub groups are :
1. Demographic Findings 2. Socio-Economic Findings 3. Travel Pattern
4. Expenditure Pattern 5. Satisfaction Level 6. Non-Monetary Transaction
Findings 7. Motivating Factors 8. Overall Experience
D.4 Multipliers were obtained by following the principle of Ratio method. However, where such values were
not supplied, e.g. in case of NRIs, a version of the Ratio method was adopted where in sample estimates
were used for the base values. The latter method invites two-fold estimation, and naturally the corre-
sponding estimates of the population parameters are subject to higher variabilities (and hence, possibly,
less precision)
D.5 The theoretical perspectives are given below:
i. Stratification of the population is used to maintain the homogeneity of the population.
ii. To reflect importance, Multistage sampling scheme with corresponding size measure is used here.
iii. To achieve unbiased estimator, allocation measure and multipliers are used as detailed in Appendix
B.
These perspectives are same in general for all the tables with obvious Charts corresponds to the specific
table.

INTERNATIONAL PASSENGER SURVEY IN INDIA 2015-16
44
D.I: Foreigners
D.I.1 Demographic Findings
One of the aims of the IPS is to get the information about the demographic profile of the tourists. Like to estimate
how many foreigners and NRI come to India every year, the gender distribution and the age distribution of the
visitors. The tables are respectively Table 1, Table 2 and Table 3. Age is given in the complete years. Marital sta-
tus of the visitors is given in Table 4. There are 4 types of marital Status – Never Married, Currently Married,
Widowed and Divorced / Separated. The tourists are divided into 4 categories – NRI, PIO, OCI and Foreigner
Others. The tourists are divided into 4 categories – NRI, PIO, OCI and Foreigner Others. Tables are made for
each category. ‘All Visitors’ shows the total of these 4 categories. Table 1 shows the estimated percentage distri-
bution of all visitors for all categories by country of normal residence. The corresponding bar charts are given
after the table.
From the above Table 1, it is noticed that the total estimated number of visitors from all the countries coming
to India is 8329078. But, the total of the 4 categories is not equal to 8329078. The interpretation of this discrepancy
is that it arises due to non-response of that particular category.
It is observed that for the group ‘NRI’, the 3 countries contributi, USA and Oman.
Table 1. Estimated Percentage Distribution of NRI, PIO, OCI, Foreigner Others and All Visitors
by Country of Normal Residence
Country of Normal Residence NRI PIO OCI Foreigner Others All Visitors
Afghanistan 0.15 0.02 0.00 0.09 0.09
Australia 1.03 1.51 11.18 4.18 4.01
Bangladesh 3.61 3.14 1.04 16.40 14.53
Canada 1.75 0.47 1.17 1.29 1.32
China 0.60 12.68 2.20 2.08 2.03
France 0.79 0.10 3.94 5.72 5.06
Germany 0.43 1.42 2.39 4.69 4.16
Italy 0.65 1.42 0.03 1.63 1.47
Japan 0.82 0.34 1.23 4.85 4.25
Malaysia 2.82 7.37 7.04 3.90 3.90
Nepal 0.40 0.08 0.45 0.98 0.89
Oman 6.02 1.80 2.15 1.02 1.58
Pakistan 0.00 0.00 0.00 0.05 0.04
Republic of Korea 0.01 0.00 0.04 0.20 0.17
Russia 0.08 1.42 0.27 2.82 2.43
Singapore 10.86 5.32 7.04 4.12 4.92
Sri Lanka 0.46 0.80 0.74 2.53 2.23
Thailand 1.40 0.81 3.46 1.96 1.93
UK 3.78 9.59 13.87 10.06 9.61
USA 6.49 3.90 13.89 9.82 9.49
Other Countries 57.87 47.78 27.88 21.61 25.89
Total (%) 100.00 100.00 100.00 100.00 100.00
Total Number 880859 81941 246203 7081882 8329078

INTERNATIONAL PASSENGER SURVEY IN INDIA 2015-16
45
It is observed that for the group ‘NRI’, the 3 countries contributing the most are Singapore, USA and Oman. For the group ‘Foreigner Others’, the top 3 contributing countries are Bangladesh, UK and USA. If ‘All Visitors’
is considered then the three countries contributing most are Bangladesh, USA and UK.
‘Total Number’ represents the total of the top 20 countries.
Chart 1a: Estimated Percentage Distribution of NRI by Country of Normal Residence
Here, the category “Other” includes Afghanistan, Pakistan, Republic of Korea and Russia. These countries
had negligible contribution to the estimated percentage distribution of NRI’s. Thus these were clubbed in or-
der to present a clear and better represented graph.
Chart 1b: Estimated Percentage Distribution of PIO by Country of Normal Residence
Here, the category “Other” includes Afghanistan, Pakistan, Republic of Korea, France and Nepal. These
countries had negligible contribution to the estimated percentage distribution of PIO’s.

INTERNATIONAL PASSENGER SURVEY IN INDIA 2015-16 DRAFT REPORT
46
Here, the category “Other” includes Afghanistan, Pakistan and Republic of Korea. These countries had negli-
gible contribution to the estimated percentage distribution of Foreigner Others.
Chart 1c: Estimated Percentage Distribution of OCI by Country of Normal Residence
Here, the category “Other” includes Afghanistan, Pakistan, Republic of Korea, Italy and Russia. These coun-
tries had negligible contribution to the estimated percentage distribution of OCI’s.
Chart 1d: Estimated Percentage Distribution of Foreigner Others by Country of Normal Residence

INTERNATIONAL PASSENGER SURVEY IN INDIA 2015-16
47
Table 2: Estimated Percentage Distribution of NRI, PIO, OCI, Foreigner Others by Gender
Category NRI PIO
Country of Normal Male Female Transgender Total Male Female Transgender Total Residence Number Number
Afghanistan 100.00 0.00 0.00 1343 0.00 100.00 0.00 19
Australia 54.30 45.70 0.00 9049 90.71 9.29 0.00 1239
Bangladesh 83.42 16.58 0.00 31818 3.20 96.80 0.00 2576
Canada 66.23 33.77 0.00 15435 13.42 86.58 0.00 389
China 92.68 7.32 0.00 5302 8.58 91.42 0.00 10387
France 15.20 84.80 0.00 6940 100.00 0.00 0.00 85
Germany 78.21 20.28 1.51 3828 0.00 100.00 0.00 1165
Italy 70.95 29.05 0.00 5687 100.00 0.00 0.00 1165
Japan 88.50 11.50 0.00 7183 22.29 77.71 0.00 278
Malaysia 83.10 16.58 0.32 24828 97.90 2.10 0.00 6040
Nepal 89.61 10.39 0.00 3499 71.86 28.14 0.00 69
Oman 25.62 70.48 3.90 53070 100.00 0.00 0.00 1473
Pakistan NA NA NA 0 NA NA NA 0
Republic of Korea 100.00 0.00 0.00 54 NA NA NA 0
Russia 52.89 47.11 0.00 665 0.00 100.00 0.00 1165
Singapore 76.14 23.55 0.31 95625 72.87 27.13 0.00 4360
Sri Lanka 76.01 23.99 0.00 4014 69.85 30.15 0.00 657
Thailand 73.92 26.08 0.00 12331 92.80 0.00 7.20 666
UK 68.51 29.79 1.70 33260 98.78 1.22 0.00 7860
USA 71.76 28.06 0.18 57177 53.07 46.93 0.00 3197
Total (20 countries) 67.08 32.07 0.85 371107 57.52 42.37 0.11 42786
Others 78.87 20.86 0.27 509160 73.67 26.33 0.00 39155
Grand Total 73.90 25.59 0.51 880267 65.24 34.70 0.06 81941
Category OCI Foreigner Others
Country of Normal Male Female Transgender Total Male Female Transgender Total
Residence Number Number
Afghanistan NA NA NA 0 93.96 6.04 0.00 6468
Australia 75.30 24.70 0.00 27525 67.59 32.39 0.02 295730
Bangladesh 55.05 44.95 0.00 2560 86.40 13.53 0.07 1161173
Canada 75.40 24.60 0.00 2874 66.35 32.99 0.66 91314
China 63.38 36.62 0.00 5419 71.36 28.52 0.12 147470
France 36.69 63.31 0.00 9693 64.05 35.90 0.05 404829
Germany 80.84 19.16 0.00 5875 69.35 30.44 0.21 332466
Italy 100.00 0.00 0.00 64 54.26 45.32 0.43 115504
Japan 14.30 85.70 0.00 3027 68.88 31.00 0.12 343730
Malaysia 92.73 6.81 0.47 17330 72.86 27.10 0.04 276453
Nepal 72.13 27.87 0.00 1109 61.46 38.54 0.00 69256
Oman 85.91 14.09 0.00 5298 92.55 7.45 0.00 72146
Pakistan NA NA NA 0 86.78 13.22 0.00 3689
Republic of Korea 100.00 0.00 0.00 87 84.83 15.17 0.00 14338
Russia 86.30 13.70 0.00 668 51.94 48.03 0.03 199582
Singapore 85.69 14.31 0.00 17324 76.90 22.53 0.57 292077
Sri Lanka 73.85 26.15 0.00 1818 76.67 23.14 0.19 179267
Thailand 89.06 10.94 0.00 8525 76.54 23.35 0.11 138851
UK 66.17 33.83 0.00 34158 66.46 33.49 0.05 712270
USA 85.54 13.57 0.89 34198 73.72 26.16 0.13 695012
Total (20 countries) 75.62 24.17 0.22 177552 72.92 26.96 0.13 5551626
Others 81.39 18.48 0.13 68651 74.37 25.46 0.18 1528963
Grand Total 77.22 22.58 0.19 246203 73.23 26.63 0.14 7080589

INTERNATIONAL PASSENGER SURVEY IN INDIA 2015-16
48
Category All Visitors
Country of Normal Male Female Transgender Total Residence Number
Afghanistan 94.77 5.23 0.00 7830
Australia 67.95 32.03 0.02 333542
Bangladesh 86.08 13.86 0.07 1198127
Canada 66.38 33.07 0.54 110011
China 67.90 31.99 0.10 168578
France 62.62 37.33 0.05 421547
Germany 69.41 30.37 0.22 343333
Italy 55.49 44.11 0.40 122419
Japan 68.78 31.11 0.12 354217
Malaysia 75.17 24.74 0.09 324651
Nepal 62.97 37.03 0.00 73933
Oman 65.45 32.98 1.57 131986
Pakistan 86.78 13.22 0.00 3689
Republic of Korea 84.98 15.02 0.00 14479
Russia 51.76 48.22 0.03 202080
Singapore 77.05 22.47 0.48 409386
Sri Lanka 76.60 23.22 0.18 185757
Thailand 77.07 22.80 0.13 160372
UK 66.86 33.03 0.12 787548
USA 74.00 25.83 0.16 789584
Total (20 countries) 72.54 27.29 0.17 6143071
Others 75.65 24.16 0.19 2145929
Grand Total 73.34 26.48 0.18 8289000
Table 2 (Cont.): Estimated Percentage Distribution of All Visitors by Gender
Table 2 and Charts 2a-2d display that the total number of visitors for the 20 countries is 6143071. These
show that 72.54% of the total foreigner visitors are Male while 27.29% are Female and only 0.17% is
Transgender. The row wise total is 100%.
‘Total’ represents the total of the 20 countries provided by MoT. ‘Others’ represents the total of remaining
countries other than the provided countries. Grand Total shows the total of all the countries.
Chart 2a: Estimated Percentage Distribution of Gender of NRI by Country of Normal Residence

INTERNATIONAL PASSENGER SURVEY IN INDIA 2015-16
49
Hereafter, countries missing in Charts are to be interpreted as contributing negligibly to the related categories.
Chart 2c: Estimated Percentage Distribution of Gender of OCI by Country of Normal Residence
Chart 2b: Estimated percentage Distribution of Gender of PIO by Country of Normal Residence

INTERNATIONAL PASSENGER SURVEY IN INDIA 2015-16
50
Chart 2d: Estimated Percentage Distribution of Gender of Foreigner Others by Country of Normal Residence
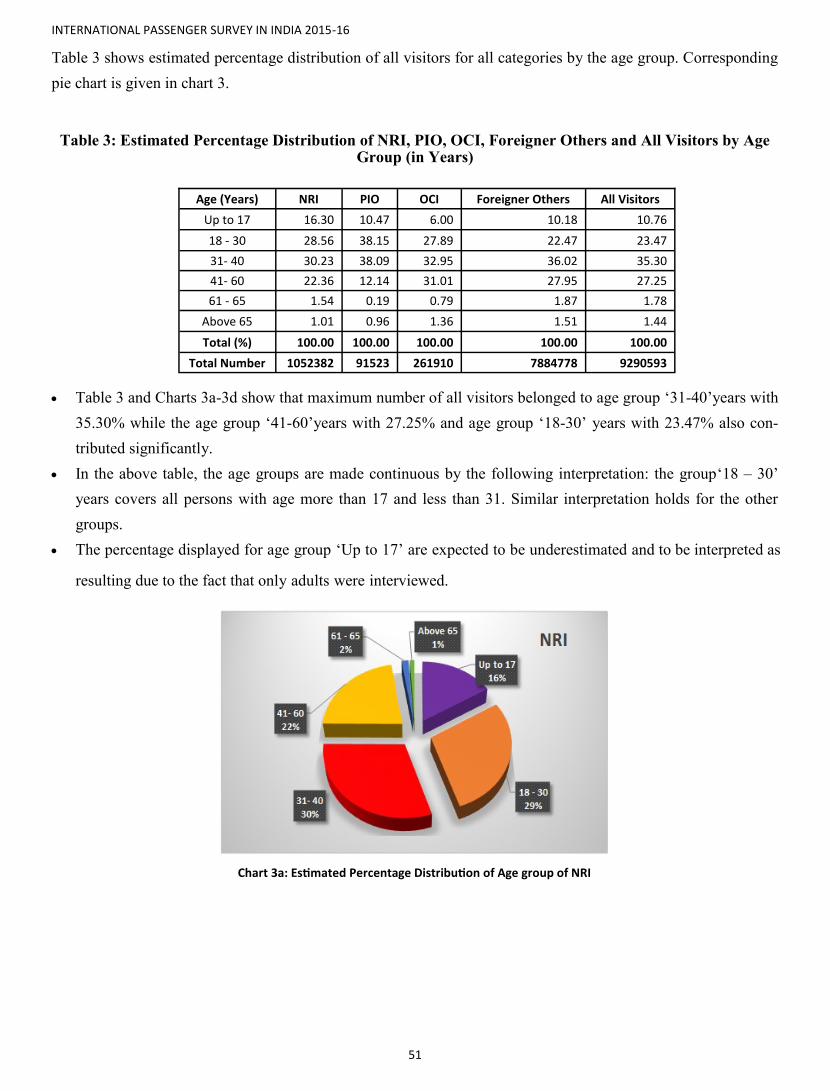
INTERNATIONAL PASSENGER SURVEY IN INDIA 2015-16
51
Table 3 shows estimated percentage distribution of all visitors for all categories by the age group. Corresponding
pie chart is given in chart 3.
Table 3: Estimated Percentage Distribution of NRI, PIO, OCI, Foreigner Others and All Visitors by Age Group (in Years)
Table 3 and Charts 3a-3d show that maximum number of all visitors belonged to age group ‘31-40’years with
35.30% while the age group ‘41-60’years with 27.25% and age group ‘18-30’ years with 23.47% also con-
tributed significantly.
In the above table, the age groups are made continuous by the following interpretation: the group‘18 – 30’
years covers all persons with age more than 17 and less than 31. Similar interpretation holds for the other
groups.
The percentage displayed for age group ‘Up to 17’ are expected to be underestimated and to be interpreted as
resulting due to the fact that only adults were interviewed.
Age (Years) NRI PIO OCI Foreigner Others All Visitors
Up to 17 16.30 10.47 6.00 10.18 10.76
18 - 30 28.56 38.15 27.89 22.47 23.47
31- 40 30.23 38.09 32.95 36.02 35.30
41- 60 22.36 12.14 31.01 27.95 27.25
61 - 65 1.54 0.19 0.79 1.87 1.78
Above 65 1.01 0.96 1.36 1.51 1.44
Total (%) 100.00 100.00 100.00 100.00 100.00
Total Number 1052382 91523 261910 7884778 9290593
Chart 3a: Estimated Percentage Distribution of Age group of NRI
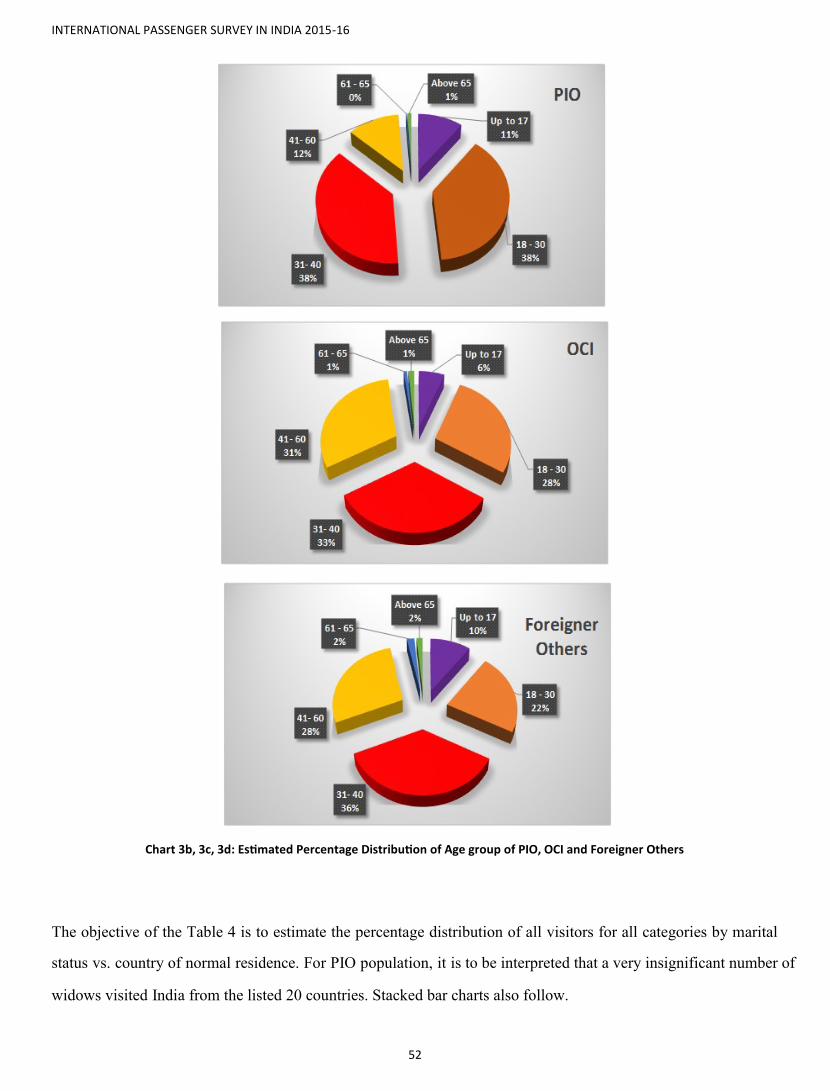
INTERNATIONAL PASSENGER SURVEY IN INDIA 2015-16
52
Chart 3b, 3c, 3d: Estimated Percentage Distribution of Age group of PIO, OCI and Foreigner Others
The objective of the Table 4 is to estimate the percentage distribution of all visitors for all categories by marital
status vs. country of normal residence. For PIO population, it is to be interpreted that a very insignificant number of
widows visited India from the listed 20 countries. Stacked bar charts also follow.
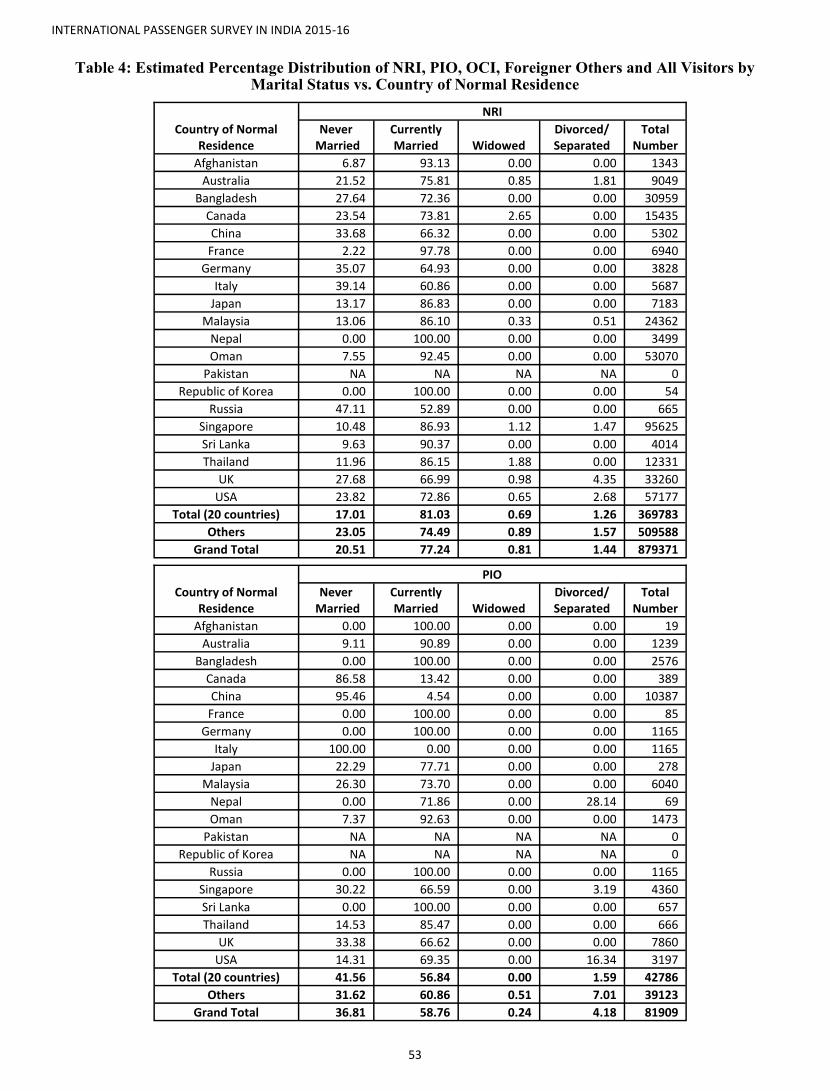
INTERNATIONAL PASSENGER SURVEY IN INDIA 2015-16
53
Table 4: Estimated Percentage Distribution of NRI, PIO, OCI, Foreigner Others and All Visitors by Marital Status vs. Country of Normal Residence
Country of Normal Residence
NRI
Never Married
Currently Married Widowed
Divorced/ Separated
Total Number
Afghanistan 6.87 93.13 0.00 0.00 1343
Australia 21.52 75.81 0.85 1.81 9049
Bangladesh 27.64 72.36 0.00 0.00 30959
Canada 23.54 73.81 2.65 0.00 15435
China 33.68 66.32 0.00 0.00 5302
France 2.22 97.78 0.00 0.00 6940
Germany 35.07 64.93 0.00 0.00 3828
Italy 39.14 60.86 0.00 0.00 5687
Japan 13.17 86.83 0.00 0.00 7183
Malaysia 13.06 86.10 0.33 0.51 24362
Nepal 0.00 100.00 0.00 0.00 3499
Oman 7.55 92.45 0.00 0.00 53070
Pakistan NA NA NA NA 0
Republic of Korea 0.00 100.00 0.00 0.00 54
Russia 47.11 52.89 0.00 0.00 665
Singapore 10.48 86.93 1.12 1.47 95625
Sri Lanka 9.63 90.37 0.00 0.00 4014
Thailand 11.96 86.15 1.88 0.00 12331
UK 27.68 66.99 0.98 4.35 33260
USA 23.82 72.86 0.65 2.68 57177
Total (20 countries) 17.01 81.03 0.69 1.26 369783
Others 23.05 74.49 0.89 1.57 509588
Grand Total 20.51 77.24 0.81 1.44 879371
Country of Normal Residence
PIO
Never Married
Currently Married Widowed
Divorced/ Separated
Total Number
Afghanistan 0.00 100.00 0.00 0.00 19
Australia 9.11 90.89 0.00 0.00 1239
Bangladesh 0.00 100.00 0.00 0.00 2576
Canada 86.58 13.42 0.00 0.00 389
China 95.46 4.54 0.00 0.00 10387
France 0.00 100.00 0.00 0.00 85
Germany 0.00 100.00 0.00 0.00 1165
Italy 100.00 0.00 0.00 0.00 1165
Japan 22.29 77.71 0.00 0.00 278
Malaysia 26.30 73.70 0.00 0.00 6040
Nepal 0.00 71.86 0.00 28.14 69
Oman 7.37 92.63 0.00 0.00 1473
Pakistan NA NA NA NA 0
Republic of Korea NA NA NA NA 0
Russia 0.00 100.00 0.00 0.00 1165
Singapore 30.22 66.59 0.00 3.19 4360
Sri Lanka 0.00 100.00 0.00 0.00 657
Thailand 14.53 85.47 0.00 0.00 666
UK 33.38 66.62 0.00 0.00 7860
USA 14.31 69.35 0.00 16.34 3197
Total (20 countries) 41.56 56.84 0.00 1.59 42786
Others 31.62 60.86 0.51 7.01 39123
Grand Total 36.81 58.76 0.24 4.18 81909

INTERNATIONAL PASSENGER SURVEY IN INDIA 2015-16
54
Table 4 (Contd.): Estimated Percentage Distribution of NRI, PIO, OCI, Foreigner Others and All Visitors by Marital Status vs. Country of Normal Residence
Country of Normal Residence
OCI
Never Married
Currently Married Widowed
Divorced/ Separated
Total Number
Afghanistan NA NA NA NA 0
Australia 73.45 26.55 0.00 0.00 26923
Bangladesh 40.76 59.24 0.00 0.00 2560
Canada 42.83 57.17 0.00 0.00 2874
China 0.67 99.33 0.00 0.00 5419
France 62.21 37.79 0.00 0.00 9693
Germany 9.98 90.02 0.00 0.00 5875
Italy 100.00 0.00 0.00 0.00 64
Japan 1.16 98.84 0.00 0.00 3027
Malaysia 8.23 89.75 2.03 0.00 17330
Nepal 20.05 79.95 0.00 0.00 1109
Oman 9.61 86.90 0.00 3.49 5298
Pakistan NA NA NA NA 0
Republic of Korea 0.00 100.00 0.00 0.00 87
Russia 0.00 100.00 0.00 0.00 668
Singapore 13.58 85.33 1.10 0.00 17324
Sri Lanka 31.10 68.90 0.00 0.00 1818
Thailand 11.61 88.39 0.00 0.00 8525
UK 40.90 48.03 1.17 9.90 31933
USA 18.58 77.95 0.75 2.71 33596
Total (20 countries) 31.11 65.78 0.67 2.45 174123
Others 10.48 89.32 0.16 0.04 68611
Grand Total 25.28 72.43 0.52 1.77 242734
Country of Normal Residence
Foreigner Others
Never Married
Currently Married Widowed
Divorced/ Separated
Total Number
Afghanistan 11.44 88.56 0.00 0.00 6468
Australia 29.96 61.84 6.40 1.80 294640
Bangladesh 17.40 81.21 1.15 0.25 1147652
Canada 26.52 68.13 0.99 4.36 90920
China 21.80 74.27 1.90 2.03 144476
France 27.12 63.77 0.71 8.40 401403
Germany 38.16 58.69 1.18 1.96 328996
Italy 32.30 64.06 1.59 2.06 115504
Japan 23.52 75.15 0.57 0.75 343032
Malaysia 19.26 77.20 1.27 2.27 276126
Nepal 25.77 73.84 0.00 0.39 69256
Oman 24.20 75.48 0.25 0.07 72146
Pakistan 40.48 59.52 0.00 0.00 3689
Republic of Korea 39.64 56.33 0.00 4.03 14338
Russia 34.13 62.70 1.13 2.03 199461
Singapore 17.71 79.82 1.35 1.11 289671
Sri Lanka 22.42 76.36 0.85 0.37 177043
Thailand 26.39 71.17 0.82 1.62 138326
UK 25.84 64.14 2.61 7.42 709561
USA 24.74 69.22 2.87 3.17 693846
Total (20 countries) 24.34 71.14 1.76 2.76 5516553
Others 26.84 70.19 0.99 1.98 1520180
Grand Total 24.88 70.93 1.59 2.59 7036733

INTERNATIONAL PASSENGER SURVEY IN INDIA 2015-16
55
Table 4(Contd.): Estimated Percentage Distribution of NRI, PIO, OCI, Foreigner Others and All Visitors by Marital Status vs. Country of Normal Residence
Table 4 and Charts 4a-4d give that the total number of visitors for the 20 countries is 6103245. These show
that 24.21% of the total foreigners are Never-married, 71.48% are Currently-married, 1.66% are widowed
and 2.65% are Divorced/Separated.
Country of Normal Residence
All Visitors
Never Married
Currently Married Widowed
Divorced/ Separated
Total Number
Afghanistan 10.63 89.37 0.00 0.00 7830
Australia 33.18 59.47 5.71 1.65 331850
Bangladesh 17.68 80.97 1.11 0.24 1183748
Canada 26.74 68.45 1.20 3.62 109617
China 26.11 70.46 1.66 1.77 165584
France 27.51 63.74 0.68 8.07 418121
Germany 37.51 59.45 1.15 1.90 339863
Italy 33.29 63.27 1.50 1.94 122419
Japan 23.12 75.60 0.56 0.73 353519
Malaysia 18.34 78.48 1.21 1.97 323858
Nepal 24.44 75.17 0.00 0.39 73933
Oman 16.73 82.95 0.14 0.18 131986
Pakistan 40.48 59.52 0.00 0.00 3689
Republic of Korea 39.25 56.75 0.00 3.99 14479
Russia 33.87 63.01 1.12 2.00 201958
Singapore 15.97 81.58 1.27 1.17 406980
Sri Lanka 22.15 76.68 0.82 0.36 183533
Thailand 24.44 73.31 0.86 1.40 159847
UK 26.60 63.63 2.45 7.32 782613
USA 24.37 69.85 2.61 3.17 787816
Total (20 countries) 24.21 71.48 1.66 2.65 6103245
Others 25.50 71.66 0.93 1.91 2137502
Grand Total 24.55 71.53 1.46 2.46 8240747
Chart 4a: Estimated Percentage Distribution of Marital Status of NRI by Country of Normal Residence
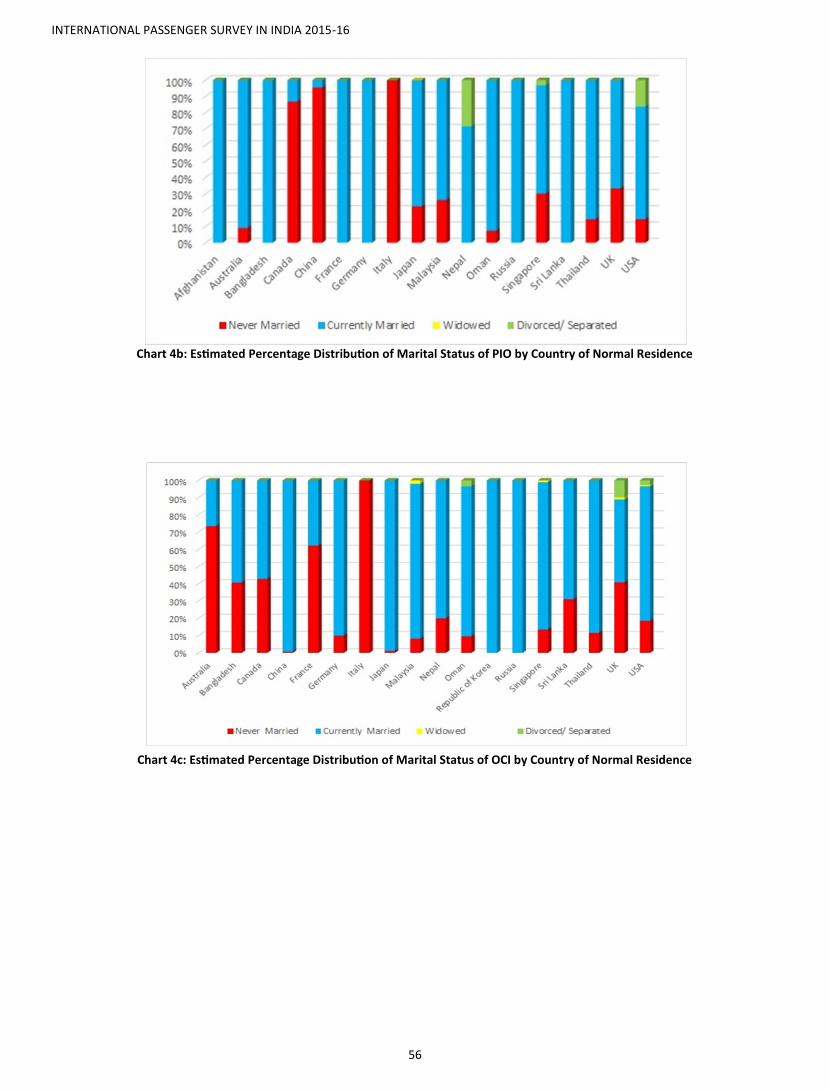
INTERNATIONAL PASSENGER SURVEY IN INDIA 2015-16
56
Chart 4b: Estimated Percentage Distribution of Marital Status of PIO by Country of Normal Residence
Chart 4c: Estimated Percentage Distribution of Marital Status of OCI by Country of Normal Residence

INTERNATIONAL PASSENGER SURVEY IN INDIA 2015-16
57
Chart 4d: Estimated Percentage Distribution of Marital Status of Foreigner Others by Country of Normal Residence

INTERNATIONAL PASSENGER SURVEY IN INDIA 2015-16
58
D.I.2. Socio-Economic Findings
The socio-economic profile of the visitors is very important for this survey. Educational background of the visi-
tors is given in Table 5. There are 4 groups – ‘Illiterate’, ‘School level’, ‘Bachelor & Above’ and ‘Other’. Infor-
mation about Occupation and various Income groups are given in the Table 6 and Table 7 respectively. Income
groups are divided into several categories so that one can get more accurate information of the income profile of
the Outbound Indians. Income groups are given in INR.
Next, the information regarding the educational qualification of the visitors are shown in Table 5 and Charts 5a-
5d. Pie charts are given below.
Education Level NRI PIO OCI Foreigner Others All Visitors
Illiterate 1.49 1.82 0.19 1.65 1.59
School level 16.84 7.67 9.15 11.94 12.34
Bachelor and above 69.34 81.87 88.35 76.13 75.83
Other 12.33 8.64 2.31 10.28 10.24
Total (%) 100.00 100.00 100.00 100.00 100.00
Total Number 878240 81941 245625 7066760 8272566
Table 5: Estimated Percentage Distribution of NRI, PIO, OCI, Foreigner Others and All Visitors by Education Level
Table 5 and Charts 5a-5d display that maximum number of visitors are ‘Bachelor and above’ (75.83%) and
minimum number of visitors are ‘Illiterate’ (1.59%).
NRI
Chart 5a: Estimated Percentage Distribution of Educational Status for NRI
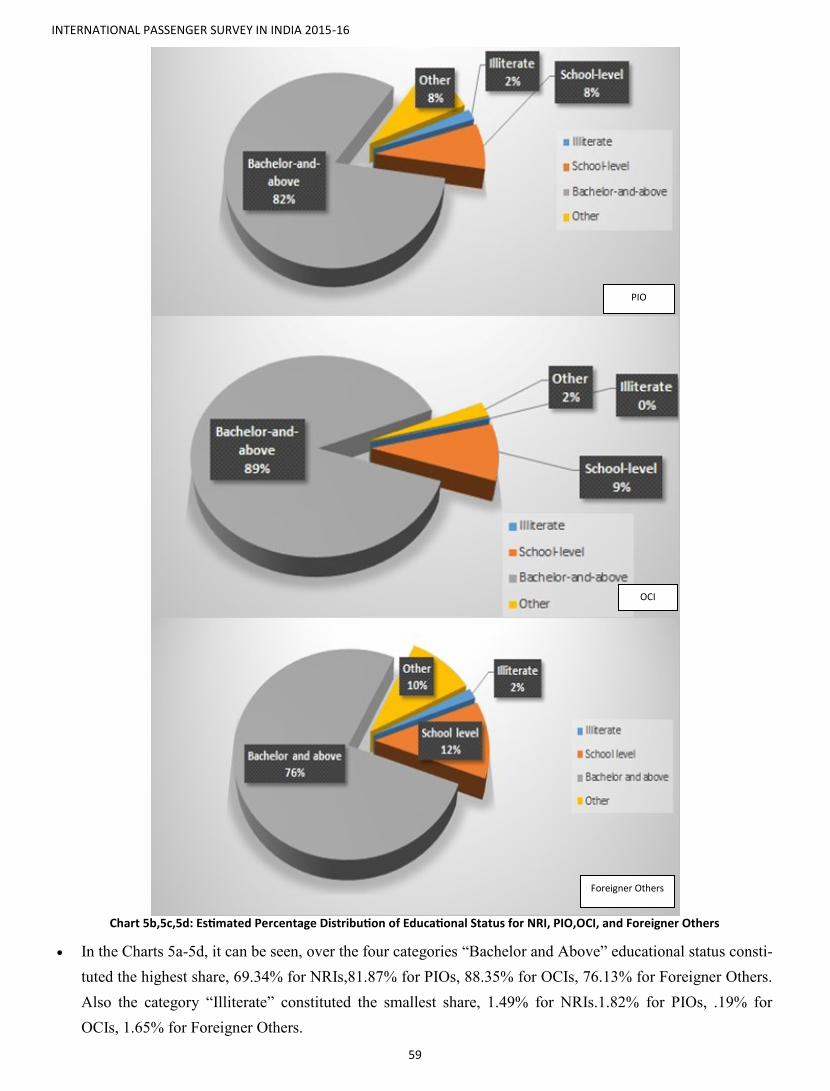
INTERNATIONAL PASSENGER SURVEY IN INDIA 2015-16
59
Chart 5b,5c,5d: Estimated Percentage Distribution of Educational Status for NRI, PIO,OCI, and Foreigner Others
PIO
OCI
Foreigner Others
In the Charts 5a-5d, it can be seen, over the four categories “Bachelor and Above” educational status consti-
tuted the highest share, 69.34% for NRIs,81.87% for PIOs, 88.35% for OCIs, 76.13% for Foreigner Others.
Also the category “Illiterate” constituted the smallest share, 1.49% for NRIs.1.82% for PIOs, .19% for
OCIs, 1.65% for Foreigner Others.
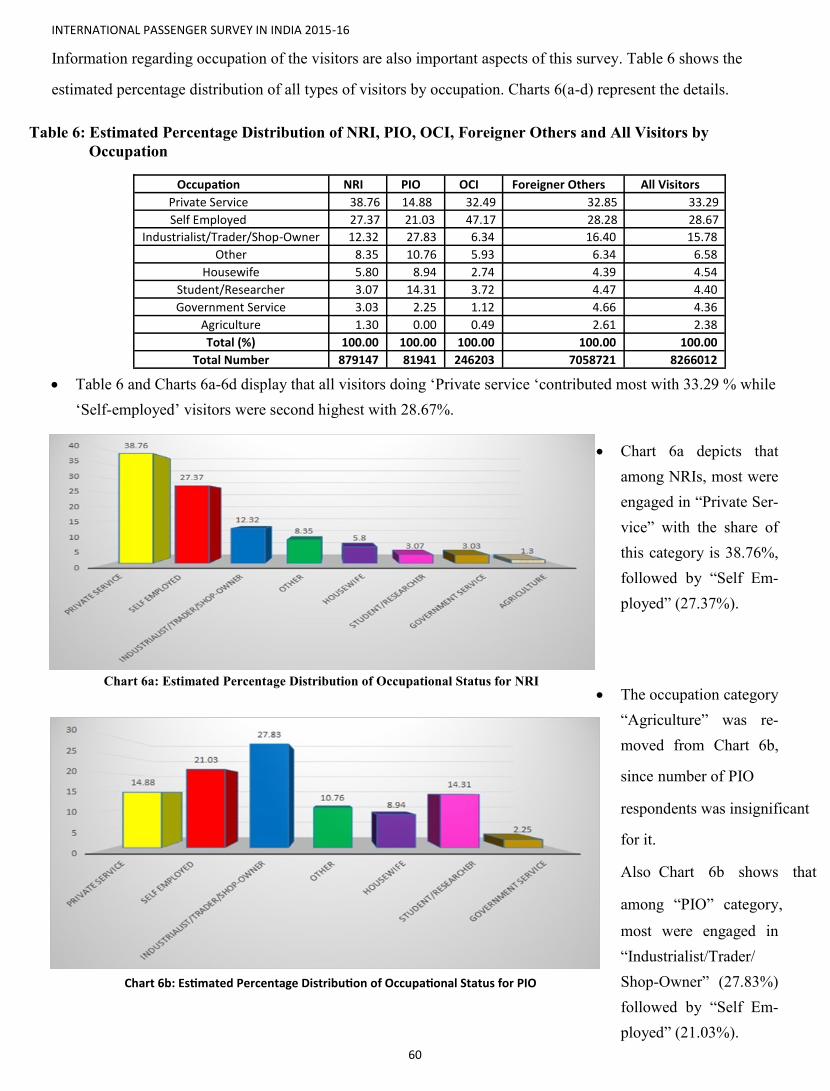
INTERNATIONAL PASSENGER SURVEY IN INDIA 2015-16
60
Information regarding occupation of the visitors are also important aspects of this survey. Table 6 shows the
estimated percentage distribution of all types of visitors by occupation. Charts 6(a-d) represent the details.
Table 6: Estimated Percentage Distribution of NRI, PIO, OCI, Foreigner Others and All Visitors by
Occupation
Occupation NRI PIO OCI Foreigner Others All Visitors
Private Service 38.76 14.88 32.49 32.85 33.29
Self Employed 27.37 21.03 47.17 28.28 28.67
Industrialist/Trader/Shop-Owner 12.32 27.83 6.34 16.40 15.78
Other 8.35 10.76 5.93 6.34 6.58
Housewife 5.80 8.94 2.74 4.39 4.54
Student/Researcher 3.07 14.31 3.72 4.47 4.40
Government Service 3.03 2.25 1.12 4.66 4.36
Agriculture 1.30 0.00 0.49 2.61 2.38
Total (%) 100.00 100.00 100.00 100.00 100.00
Total Number 879147 81941 246203 7058721 8266012
Table 6 and Charts 6a-6d display that all visitors doing ‘Private service ‘contributed most with 33.29 % while
‘Self-employed’ visitors were second highest with 28.67%.
Chart 6a depicts that
among NRIs, most were
engaged in “Private Ser-
vice” with the share of
this category is 38.76%,
followed by “Self Em-
ployed” (27.37%).
Chart 6a: Estimated Percentage Distribution of Occupational Status for NRI The occupation category
“Agriculture” was re-
moved from Chart 6b,
since number of PIO
respondents was insignificant
for it.
Also Chart 6b shows that
among “PIO” category,
most were engaged in
“Industrialist/Trader/
Shop-Owner” (27.83%)
followed by “Self Em-
ployed” (21.03%).
Chart 6b: Estimated Percentage Distribution of Occupational Status for PIO

INTERNATIONAL PASSENGER SURVEY IN INDIA 2015-16
61
Chart 6c displays the
occupational status of
OCIs. It reveals that
most OCIs were “Self
Employed” (47.17%)
followed by “Private
Service” (32.49%).
Chart 6c: Estimated Percentage Distribution of Occupational Status for OCI
Chart 6d: Estimated Percentage Distribution of Occupational Status for Foreigner Others
Table 7: Estimated Percentage Distribution of NRI, PIO, OCI, Foreigner Others and All Visitors by Household Income (in INR)
Income (INR) NRI PIO OCI Others Total
Up to 100000 5.03 7.58 1.21 6.39 6.06
100000-500000 15.48 10.49 7.50 17.40 16.76
500000-1000000 25.09 8.38 11.42 12.50 14.01
1000000-2000000 20.66 26.33 16.31 12.62 13.88
2000000-4000000 11.73 11.22 33.35 20.15 19.45
4000000-6000000 7.71 19.09 14.24 12.92 12.36
6000000-8000000 2.95 2.07 5.54 5.84 5.43
Above 8000000 11.35 14.84 10.43 12.18 12.05
Total (%) 100.00 100.00 100.00 100.00 100.00
Total Number 753882 57730 198795 4979358 5989765
Table 7 and Chart 7 show the estimated percentage distribution of all foreigner visitors by Household Income
group.

INTERNATIONAL PASSENGER SURVEY IN INDIA 2015-16
62
Table 7 shows that the visitors belonging to the income group (in INR) ‘2000000-4000000’contributed most
with 19.45 % while visitors in `100000-500000’ were second highest with 16.76%.
Chart 7: Estimated Percentage Distribution of Income of All Visitors
Chart 7 shows that among the category “NRI” the income group “500000-1000000” constitutes the largest part
with 25.09% of the NRIs belonging to this group. Similarly, for “PIO” category “1000000-2000000” is the larg-
est group with 26.33% OCIs belonging to this group. For “OCI” and “Foreigner Other” categories the income
group “2000000-4000000” forms the largest part with 33.35% OCIs and 20.15% Foreigner Others respectively.
D.I.3 Travel Pattern
Travel pattern of the visitors is one of the prime interests of this project. In this section, this item is highlighted:
how they plan trips. eg. with family, individual or in groups (Table 9), how many times they have come here
(Table 11), which ports they use generally to visit here (Table 8), what are the main purposes to visit India (Table
10: a-e), availing package tour or not (Table 12), average duration of the visitors (Table 13) etc. Average duration
in India is given in days only.
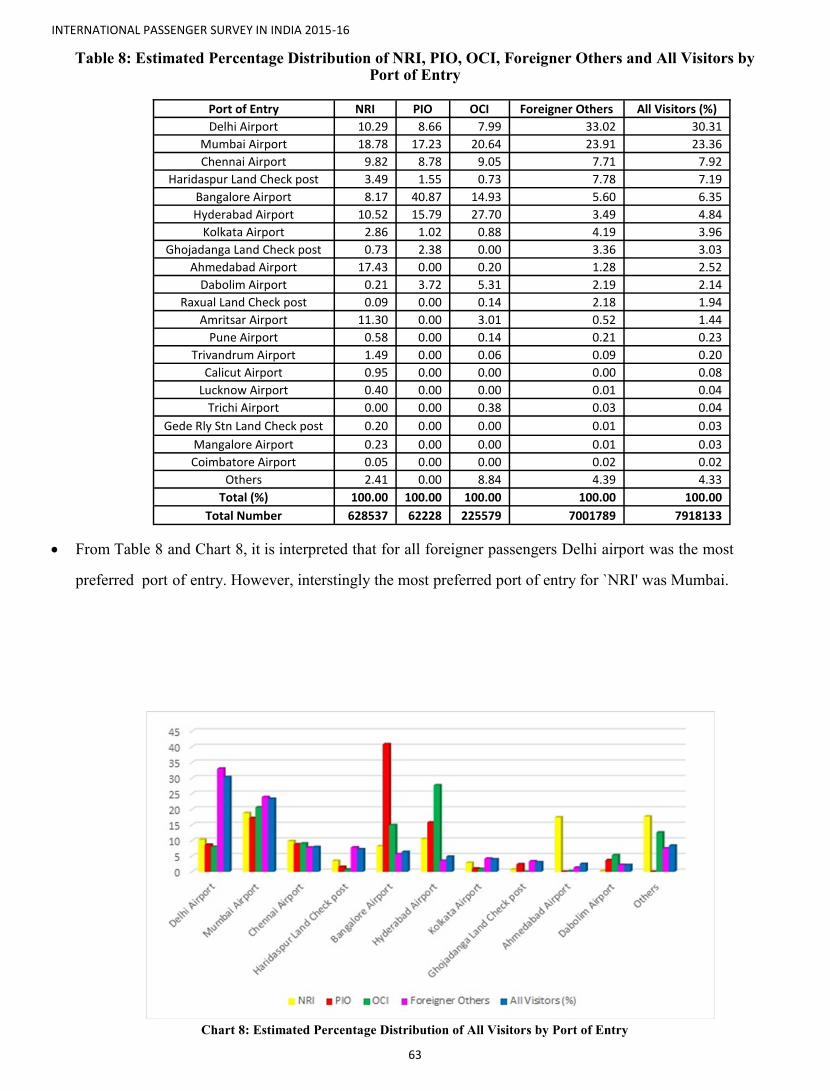
INTERNATIONAL PASSENGER SURVEY IN INDIA 2015-16
63
Table 8: Estimated Percentage Distribution of NRI, PIO, OCI, Foreigner Others and All Visitors by Port of Entry
Port of Entry NRI PIO OCI Foreigner Others All Visitors (%)
Delhi Airport 10.29 8.66 7.99 33.02 30.31
Mumbai Airport 18.78 17.23 20.64 23.91 23.36
Chennai Airport 9.82 8.78 9.05 7.71 7.92
Haridaspur Land Check post 3.49 1.55 0.73 7.78 7.19
Bangalore Airport 8.17 40.87 14.93 5.60 6.35
Hyderabad Airport 10.52 15.79 27.70 3.49 4.84
Kolkata Airport 2.86 1.02 0.88 4.19 3.96
Ghojadanga Land Check post 0.73 2.38 0.00 3.36 3.03
Ahmedabad Airport 17.43 0.00 0.20 1.28 2.52
Dabolim Airport 0.21 3.72 5.31 2.19 2.14
Raxual Land Check post 0.09 0.00 0.14 2.18 1.94
Amritsar Airport 11.30 0.00 3.01 0.52 1.44
Pune Airport 0.58 0.00 0.14 0.21 0.23
Trivandrum Airport 1.49 0.00 0.06 0.09 0.20
Calicut Airport 0.95 0.00 0.00 0.00 0.08
Lucknow Airport 0.40 0.00 0.00 0.01 0.04
Trichi Airport 0.00 0.00 0.38 0.03 0.04
Gede Rly Stn Land Check post 0.20 0.00 0.00 0.01 0.03
Mangalore Airport 0.23 0.00 0.00 0.01 0.03
Coimbatore Airport 0.05 0.00 0.00 0.02 0.02
Others 2.41 0.00 8.84 4.39 4.33
Total (%) 100.00 100.00 100.00 100.00 100.00
Total Number 628537 62228 225579 7001789 7918133
From Table 8 and Chart 8, it is interpreted that for all foreigner passengers Delhi airport was the most
preferred port of entry. However, interstingly the most preferred port of entry for `NRI' was Mumbai.
Chart 8: Estimated Percentage Distribution of All Visitors by Port of Entry

INTERNATIONAL PASSENGER SURVEY IN INDIA 2015-16
64
Some ports were removed from the Chart 8 as they had insignificant contribution in terms of their use as port
of entry. These ports are Trivandrum Airport, Calicut Airport, Pune Airport, Raxaul Land Port, Lucknow Air-
port, Trichy Airport, Gede Railway Station Land Check Post, Mangalore Airport, Coimbature Airport, Amrit-
sar Airport. These were clubbed into the group “Others” for a better and clearer representation of the graph.
Table 9 is used to present the travel pattern of the visitors, e.g. whether they are coming as individuals or with
family or in a group.
Table 9: Estimated Percentage Distribution of NRI, PIO, OCI, Foreigner Others and All Visitors by Travel Pattern
vs. Country of Normal Residence
Country of Normal Resi-dence
NRI PIO
Individual Family Group Total
Number Individual Family Group Total
Number
Afghanistan 4.84 95.16 0.00 1343 100.00 0.00 0.00 19
Australia 62.99 37.01 0.00 9049 92.06 4.06 3.88 1239
Bangladesh 81.92 9.88 8.20 31818 3.20 96.80 0.00 2576
Canada 73.55 25.19 1.25 15435 100.00 0.00 0.00 389
China 66.83 7.57 25.59 5302 11.53 3.95 84.52 10387
France 13.12 86.88 0.00 6940 100.00 0.00 0.00 85
Germany 68.05 16.05 15.90 3828 100.00 0.00 0.00 1165
Italy 91.52 7.37 1.11 5687 100.00 0.00 0.00 1165
Japan 35.63 16.92 47.45 7183 100.00 0.00 0.00 278
Malaysia 69.18 28.29 2.53 24828 69.71 28.92 1.37 6040
Nepal 22.74 61.61 15.65 3499 71.86 28.14 0.00 69
Oman 92.22 5.57 2.20 53070 100.00 0.00 0.00 1473
Pakistan NA NA NA 0 NA NA NA 0
Republic of Korea 100.00 0.00 0.00 54 NA NA NA 0
Russia 42.52 10.37 47.11 665 100.00 0.00 0.00 1165
Singapore 57.89 39.70 2.41 95625 60.62 36.87 2.51 4360
Sri Lanka 71.83 28.17 0.00 4014 83.35 6.29 10.36 657
Thailand 70.44 22.33 7.23 12331 54.83 7.20 37.97 666
UK 78.34 20.26 1.40 33260 65.36 34.64 0.00 7860
USA 79.00 18.91 2.09 57177 76.56 23.44 0.00 3197
Total (20 Countries) 70.98 24.78 4.24 371107 55.06 23.11 21.83 42786
Others 80.82 17.08 2.09 509752 85.20 13.02 1.78 39155
Grand Total 76.68 20.32 3.00 880859 69.46 18.29 12.25 81941
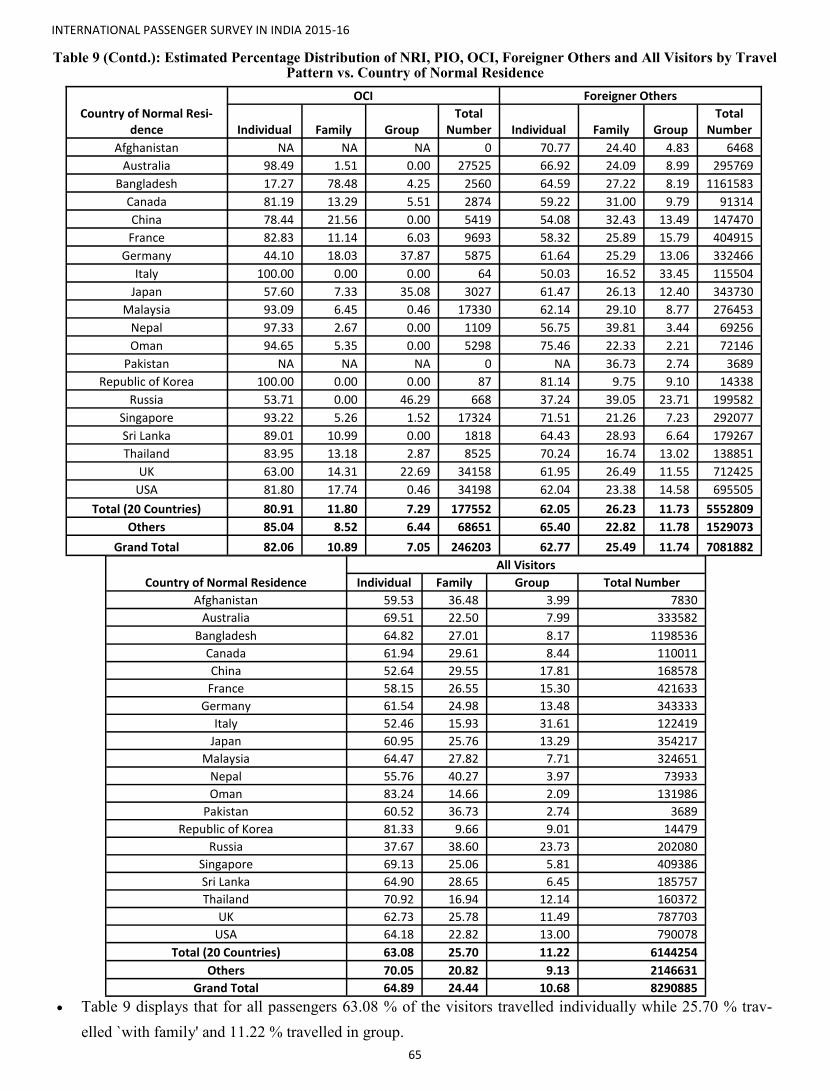
INTERNATIONAL PASSENGER SURVEY IN INDIA 2015-16
65
Table 9 (Contd.): Estimated Percentage Distribution of NRI, PIO, OCI, Foreigner Others and All Visitors by Travel Pattern vs. Country of Normal Residence
Country of Normal Resi-dence
OCI Foreigner Others
Individual Family Group Total
Number Individual Family Group Total
Number
Afghanistan NA NA NA 0 70.77 24.40 4.83 6468
Australia 98.49 1.51 0.00 27525 66.92 24.09 8.99 295769
Bangladesh 17.27 78.48 4.25 2560 64.59 27.22 8.19 1161583
Canada 81.19 13.29 5.51 2874 59.22 31.00 9.79 91314
China 78.44 21.56 0.00 5419 54.08 32.43 13.49 147470
France 82.83 11.14 6.03 9693 58.32 25.89 15.79 404915
Germany 44.10 18.03 37.87 5875 61.64 25.29 13.06 332466
Italy 100.00 0.00 0.00 64 50.03 16.52 33.45 115504
Japan 57.60 7.33 35.08 3027 61.47 26.13 12.40 343730
Malaysia 93.09 6.45 0.46 17330 62.14 29.10 8.77 276453
Nepal 97.33 2.67 0.00 1109 56.75 39.81 3.44 69256
Oman 94.65 5.35 0.00 5298 75.46 22.33 2.21 72146
Pakistan NA NA NA 0 NA 36.73 2.74 3689
Republic of Korea 100.00 0.00 0.00 87 81.14 9.75 9.10 14338
Russia 53.71 0.00 46.29 668 37.24 39.05 23.71 199582
Singapore 93.22 5.26 1.52 17324 71.51 21.26 7.23 292077
Sri Lanka 89.01 10.99 0.00 1818 64.43 28.93 6.64 179267
Thailand 83.95 13.18 2.87 8525 70.24 16.74 13.02 138851
UK 63.00 14.31 22.69 34158 61.95 26.49 11.55 712425
USA 81.80 17.74 0.46 34198 62.04 23.38 14.58 695505
Total (20 Countries) 80.91 11.80 7.29 177552 62.05 26.23 11.73 5552809
Others 85.04 8.52 6.44 68651 65.40 22.82 11.78 1529073
Grand Total 82.06 10.89 7.05 246203 62.77 25.49 11.74 7081882
Country of Normal Residence
All Visitors
Individual Family Group Total Number
Afghanistan 59.53 36.48 3.99 7830
Australia 69.51 22.50 7.99 333582
Bangladesh 64.82 27.01 8.17 1198536
Canada 61.94 29.61 8.44 110011
China 52.64 29.55 17.81 168578
France 58.15 26.55 15.30 421633
Germany 61.54 24.98 13.48 343333
Italy 52.46 15.93 31.61 122419
Japan 60.95 25.76 13.29 354217
Malaysia 64.47 27.82 7.71 324651
Nepal 55.76 40.27 3.97 73933
Oman 83.24 14.66 2.09 131986
Pakistan 60.52 36.73 2.74 3689
Republic of Korea 81.33 9.66 9.01 14479
Russia 37.67 38.60 23.73 202080
Singapore 69.13 25.06 5.81 409386
Sri Lanka 64.90 28.65 6.45 185757
Thailand 70.92 16.94 12.14 160372
UK 62.73 25.78 11.49 787703
USA 64.18 22.82 13.00 790078
Total (20 Countries) 63.08 25.70 11.22 6144254
Others 70.05 20.82 9.13 2146631
Grand Total 64.89 24.44 10.68 8290885
Table 9 displays that for all passengers 63.08 % of the visitors travelled individually while 25.70 % trav-
elled `with family' and 11.22 % travelled in group.

INTERNATIONAL PASSENGER SURVEY IN INDIA 2015-16
66
The principal purpose of the present visit is depicted in Table 10(a-e). Table 10(a) represents such information
as for NRI, Table 10(b) for PIO, Table 10(c) for OCI, Table 10(d) for Foreigner Others and Table 10(e) forall the visitors. Age groups are given in completed years.
Table 10(a): Estimated Percentage Distribution of NRI Visitors by Principal Purpose of Visit vs. Age Group
Age (in Years) 18-30 31-40 41-60 61-65 Above 65 Total
Purpose of Visit
Social 48.44 37.89 52.90 29.68 72.90 45.47
Holidaying/Leisure/Recreation 36.28 35.49 25.07 13.90 20.06 32.70
Business 7.69 19.94 17.09 39.82 6.49 15.13
Health Medical 2.48 2.45 1.76 14.53 0.00 2.50
Education Training 4.64 1.64 0.38 0.00 0.00 2.36
Religious Activities 0.47 0.60 2.65 2.07 0.55 1.05
Shopping 0.00 1.98 0.15 0.00 0.00 0.78
Games Sports 0.00 0.01 0.00 0.00 0.00 0.01
Invited by India 0.00 0.00 0.00 0.00 0.00 0.00
Total (%) 100.00 100.00 100.00 100.00 100.00 100.00
Total Number 298018 315998 198261 16174 10556 839007
Table 10(b): Estimated Percentage Distribution of PIO Visitors by Principal Purpose of Visit vs. Age Group
Age (in Years) 18-30 31-40 41-60 61-65 Above 65 Total
Purpose of Visit
Holidaying/Leisure/Recreation 23.97 57.02 39.06 0.00 47.62 40.18
Social 19.07 19.46 29.66 67.95 27.64 20.88
Business 14.55 18.00 14.44 0.00 0.00 15.80
Education Training 29.05 0.91 0.00 0.00 0.00 12.83
Health Medical 10.93 0.48 8.04 0.00 0.00 5.99
Religious Activities 2.43 4.13 6.73 0.00 24.74 3.97
Shopping 0.00 0.00 2.07 32.05 0.00 0.35
Games Sports 0.00 0.00 0.00 0.00 0.00 0.00
Invited by India 0.00 0.00 0.00 0.00 0.00 0.00
Total (%) 100.00 100.00 100.00 100.00 100.00 100.00
Total Number 34914 34405 11115 178 877 81489
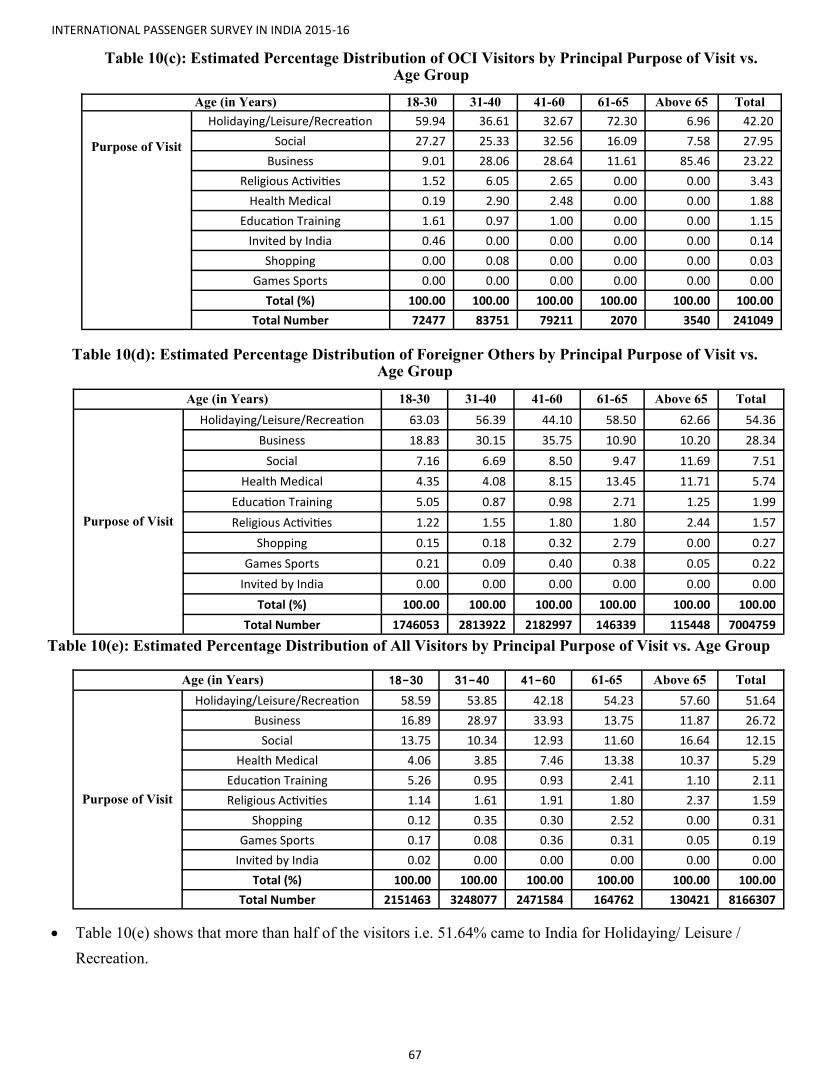
INTERNATIONAL PASSENGER SURVEY IN INDIA 2015-16
67
Table 10(d): Estimated Percentage Distribution of Foreigner Others by Principal Purpose of Visit vs. Age Group
Age (in Years) 18-30 31-40 41-60 61-65 Above 65 Total
Purpose of Visit
Holidaying/Leisure/Recreation 63.03 56.39 44.10 58.50 62.66 54.36
Business 18.83 30.15 35.75 10.90 10.20 28.34
Social 7.16 6.69 8.50 9.47 11.69 7.51
Health Medical 4.35 4.08 8.15 13.45 11.71 5.74
Education Training 5.05 0.87 0.98 2.71 1.25 1.99
Religious Activities 1.22 1.55 1.80 1.80 2.44 1.57
Shopping 0.15 0.18 0.32 2.79 0.00 0.27
Games Sports 0.21 0.09 0.40 0.38 0.05 0.22
Invited by India 0.00 0.00 0.00 0.00 0.00 0.00
Total (%) 100.00 100.00 100.00 100.00 100.00 100.00
Total Number 1746053 2813922 2182997 146339 115448 7004759
Table 10(c): Estimated Percentage Distribution of OCI Visitors by Principal Purpose of Visit vs. Age Group
Age (in Years) 18-30 31-40 41-60 61-65 Above 65 Total
Purpose of Visit
Holidaying/Leisure/Recreation 59.94 36.61 32.67 72.30 6.96 42.20
Social 27.27 25.33 32.56 16.09 7.58 27.95
Business 9.01 28.06 28.64 11.61 85.46 23.22
Religious Activities 1.52 6.05 2.65 0.00 0.00 3.43
Health Medical 0.19 2.90 2.48 0.00 0.00 1.88
Education Training 1.61 0.97 1.00 0.00 0.00 1.15
Invited by India 0.46 0.00 0.00 0.00 0.00 0.14
Shopping 0.00 0.08 0.00 0.00 0.00 0.03
Games Sports 0.00 0.00 0.00 0.00 0.00 0.00
Total (%) 100.00 100.00 100.00 100.00 100.00 100.00
Total Number 72477 83751 79211 2070 3540 241049
Table 10(e): Estimated Percentage Distribution of All Visitors by Principal Purpose of Visit vs. Age Group
Age (in Years) 18-30 31-40 41-60 61-65 Above 65 Total
Purpose of Visit
Holidaying/Leisure/Recreation 58.59 53.85 42.18 54.23 57.60 51.64
Business 16.89 28.97 33.93 13.75 11.87 26.72
Social 13.75 10.34 12.93 11.60 16.64 12.15
Health Medical 4.06 3.85 7.46 13.38 10.37 5.29
Education Training 5.26 0.95 0.93 2.41 1.10 2.11
Religious Activities 1.14 1.61 1.91 1.80 2.37 1.59
Shopping 0.12 0.35 0.30 2.52 0.00 0.31
Games Sports 0.17 0.08 0.36 0.31 0.05 0.19
Invited by India 0.02 0.00 0.00 0.00 0.00 0.00
Total (%) 100.00 100.00 100.00 100.00 100.00 100.00 Total Number 2151463 3248077 2471584 164762 130421 8166307
Table 10(e) shows that more than half of the visitors i.e. 51.64% came to India for Holidaying/ Leisure /
Recreation.
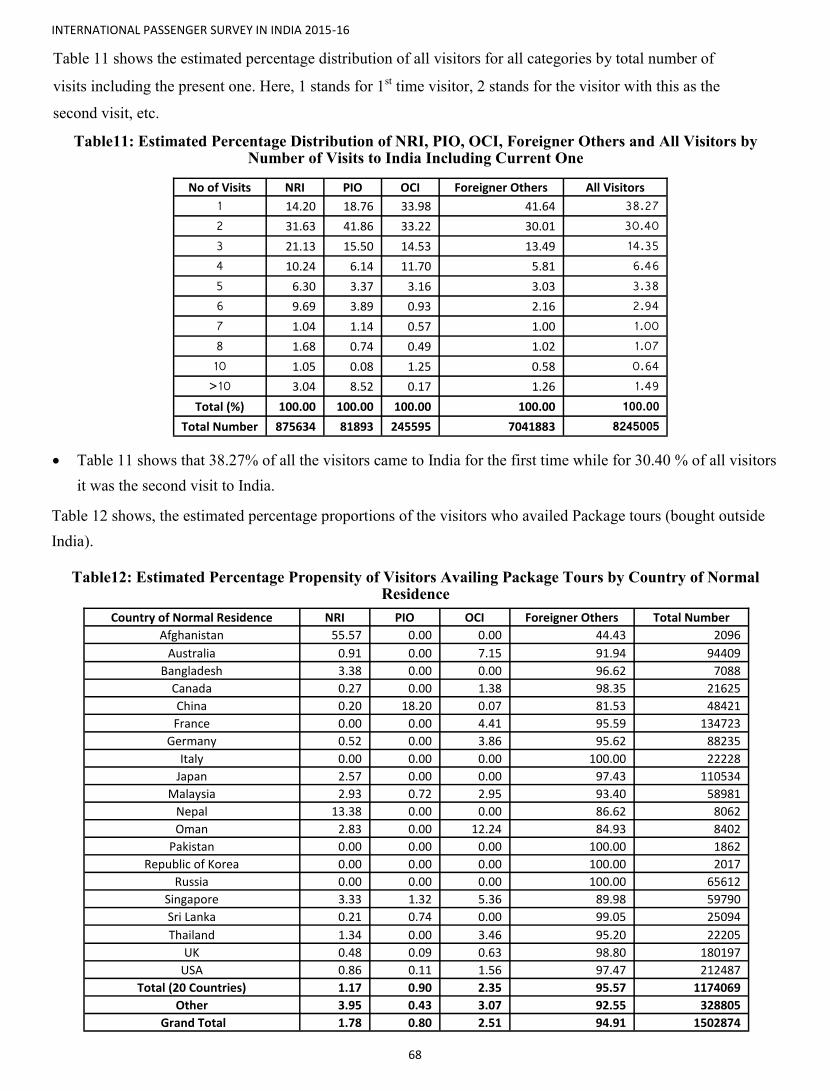
INTERNATIONAL PASSENGER SURVEY IN INDIA 2015-16
68
Table 11 shows the estimated percentage distribution of all visitors for all categories by total number of
visits including the present one. Here, 1 stands for 1st time visitor, 2 stands for the visitor with this as the
second visit, etc.
Table11: Estimated Percentage Distribution of NRI, PIO, OCI, Foreigner Others and All Visitors by Number of Visits to India Including Current One
No of Visits NRI PIO OCI Foreigner Others All Visitors
1 14.20 18.76 33.98 41.64 38.27 2 31.63 41.86 33.22 30.01 30.40 3 21.13 15.50 14.53 13.49 14.35 4 10.24 6.14 11.70 5.81 6.46 5 6.30 3.37 3.16 3.03 3.38 6 9.69 3.89 0.93 2.16 2.94 7 1.04 1.14 0.57 1.00 1.00 8 1.68 0.74 0.49 1.02 1.07 10 1.05 0.08 1.25 0.58 0.64 >10 3.04 8.52 0.17 1.26 1.49
Total (%) 100.00 100.00 100.00 100.00 100.00 Total Number 875634 81893 245595 7041883 8245005
Table 11 shows that 38.27% of all the visitors came to India for the first time while for 30.40 % of all visitors
it was the second visit to India.
Table 12 shows, the estimated percentage proportions of the visitors who availed Package tours (bought outside
India).
Country of Normal Residence NRI PIO OCI Foreigner Others Total Number
Afghanistan 55.57 0.00 0.00 44.43 2096
Australia 0.91 0.00 7.15 91.94 94409
Bangladesh 3.38 0.00 0.00 96.62 7088
Canada 0.27 0.00 1.38 98.35 21625
China 0.20 18.20 0.07 81.53 48421
France 0.00 0.00 4.41 95.59 134723
Germany 0.52 0.00 3.86 95.62 88235
Italy 0.00 0.00 0.00 100.00 22228
Japan 2.57 0.00 0.00 97.43 110534
Malaysia 2.93 0.72 2.95 93.40 58981
Nepal 13.38 0.00 0.00 86.62 8062
Oman 2.83 0.00 12.24 84.93 8402
Pakistan 0.00 0.00 0.00 100.00 1862
Republic of Korea 0.00 0.00 0.00 100.00 2017
Russia 0.00 0.00 0.00 100.00 65612
Singapore 3.33 1.32 5.36 89.98 59790
Sri Lanka 0.21 0.74 0.00 99.05 25094
Thailand 1.34 0.00 3.46 95.20 22205
UK 0.48 0.09 0.63 98.80 180197
USA 0.86 0.11 1.56 97.47 212487
Total (20 Countries) 1.17 0.90 2.35 95.57 1174069
Other 3.95 0.43 3.07 92.55 328805
Grand Total 1.78 0.80 2.51 94.91 1502874
Table12: Estimated Percentage Propensity of Visitors Availing Package Tours by Country of Normal Residence

INTERNATIONAL PASSENGER SURVEY IN INDIA 2015-16
69
Table 12 displays that 95.57% of all visitors (for the 20 countries provided by MoT) who availed the pack-
age tour are ‘Foreigner Others’.
To understand the travel pattern, average duration of stay is very important. The estimated average duration of the
visitors coming from the 20 countries (top 20 countries in terms of Foreign Tourist Arrivals to India) is given
next in Table 13.
Table 13: Estimated Average Duration of Stay (in Days) by Country of Normal Residence for NRI, PIO, OCI, Foreigner Others and All Visitors
It can be interpreted from Table 13 shows that, on the average, a visitor with the largest duration (25 days) stay in India came from Oman.
Country of Normal Residence NRI PIO OCI Foreigner Others All Visitors
Afghanistan 22 3 0 11 13
Australia 22 20 27 13 14
Bangladesh 16 31 13 14 14
Canada 22 26 35 15 17
China 12 7 6 10 10
France 23 10 18 13 13
Germany 13 14 29 16 16
Italy 37 20 92 17 18
Japan 37 5 5 12 13
Malaysia 31 19 43 15 18
Nepal 8 4 42 10 11
Oman 33 31 64 16 25
Pakistan 0 0 0 10 10
Republic of Korea 3 0 3 12 12
Russia 10 7 32 16 16
Singapore 20 28 42 14 17
Sri Lanka 9 29 64 13 13
Thailand 20 15 50 14 17
UK 18 17 27 14 15
USA 24 24 36 13 15
Others 30 17 41 17 21
All countries 27 17 35 14 16
D.I.4 Expenditure Pattern
The main objective of IPS is to estimate the expenditure pattern of the tourists. All types of expenditures are giv-
en. All expenditures are average expenditure per person and given in INR. Average Package Cost, Average Non
Package Cost are given in Table 14. Table 15 shows the average expenditures for all categories and all the fac-
tors. Table 16-21 represent the country wise average expenditures for Accommodation, Food, Transport, Shop-
ping, Amusement and Medical Facilities respectively. Tables are presented in the next page.
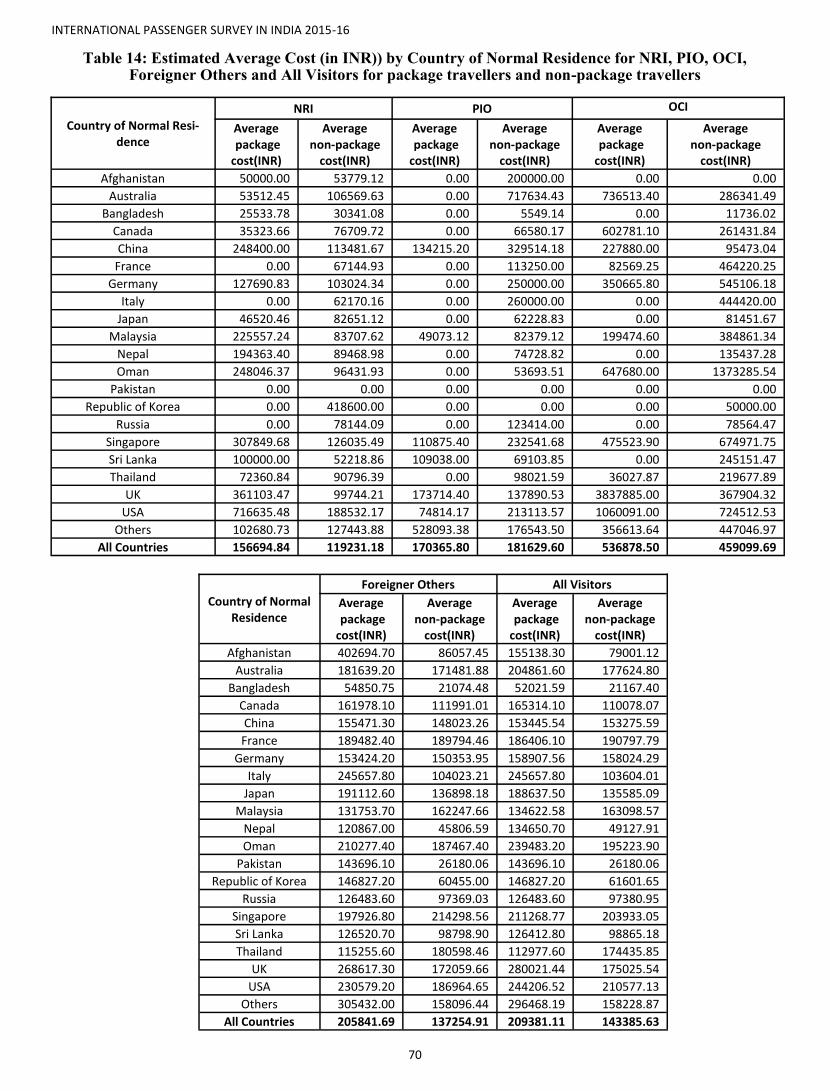
INTERNATIONAL PASSENGER SURVEY IN INDIA 2015-16
70
Table 14: Estimated Average Cost (in INR)) by Country of Normal Residence for NRI, PIO, OCI, Foreigner Others and All Visitors for package travellers and non-package travellers
Country of Normal Resi-dence
NRI PIO OCI
Average package cost(INR)
Average non-package
cost(INR)
Average package cost(INR)
Average non-package
cost(INR)
Average package cost(INR)
Average non-package
cost(INR)
Afghanistan 50000.00 53779.12 0.00 200000.00 0.00 0.00
Australia 53512.45 106569.63 0.00 717634.43 736513.40 286341.49
Bangladesh 25533.78 30341.08 0.00 5549.14 0.00 11736.02
Canada 35323.66 76709.72 0.00 66580.17 602781.10 261431.84
China 248400.00 113481.67 134215.20 329514.18 227880.00 95473.04
France 0.00 67144.93 0.00 113250.00 82569.25 464220.25
Germany 127690.83 103024.34 0.00 250000.00 350665.80 545106.18
Italy 0.00 62170.16 0.00 260000.00 0.00 444420.00
Japan 46520.46 82651.12 0.00 62228.83 0.00 81451.67
Malaysia 225557.24 83707.62 49073.12 82379.12 199474.60 384861.34
Nepal 194363.40 89468.98 0.00 74728.82 0.00 135437.28
Oman 248046.37 96431.93 0.00 53693.51 647680.00 1373285.54
Pakistan 0.00 0.00 0.00 0.00 0.00 0.00
Republic of Korea 0.00 418600.00 0.00 0.00 0.00 50000.00
Russia 0.00 78144.09 0.00 123414.00 0.00 78564.47
Singapore 307849.68 126035.49 110875.40 232541.68 475523.90 674971.75
Sri Lanka 100000.00 52218.86 109038.00 69103.85 0.00 245151.47
Thailand 72360.84 90796.39 0.00 98021.59 36027.87 219677.89
UK 361103.47 99744.21 173714.40 137890.53 3837885.00 367904.32
USA 716635.48 188532.17 74814.17 213113.57 1060091.00 724512.53
Others 102680.73 127443.88 528093.38 176543.50 356613.64 447046.97
All Countries 156694.84 119231.18 170365.80 181629.60 536878.50 459099.69
Country of Normal Residence
Foreigner Others All Visitors
Average package cost(INR)
Average non-package
cost(INR)
Average package cost(INR)
Average non-package
cost(INR)
Afghanistan 402694.70 86057.45 155138.30 79001.12
Australia 181639.20 171481.88 204861.60 177624.80
Bangladesh 54850.75 21074.48 52021.59 21167.40
Canada 161978.10 111991.01 165314.10 110078.07
China 155471.30 148023.26 153445.54 153275.59
France 189482.40 189794.46 186406.10 190797.79
Germany 153424.20 150353.95 158907.56 158024.29
Italy 245657.80 104023.21 245657.80 103604.01
Japan 191112.60 136898.18 188637.50 135585.09
Malaysia 131753.70 162247.66 134622.58 163098.57
Nepal 120867.00 45806.59 134650.70 49127.91
Oman 210277.40 187467.40 239483.20 195223.90
Pakistan 143696.10 26180.06 143696.10 26180.06
Republic of Korea 146827.20 60455.00 146827.20 61601.65
Russia 126483.60 97369.03 126483.60 97380.95
Singapore 197926.80 214298.56 211268.77 203933.05
Sri Lanka 126520.70 98798.90 126412.80 98865.18
Thailand 115255.60 180598.46 112977.60 174435.85
UK 268617.30 172059.66 280021.44 175025.54
USA 230579.20 186964.65 244206.52 210577.13
Others 305432.00 158096.44 296468.19 158228.87
All Countries 205841.69 137254.91 209381.11 143385.63
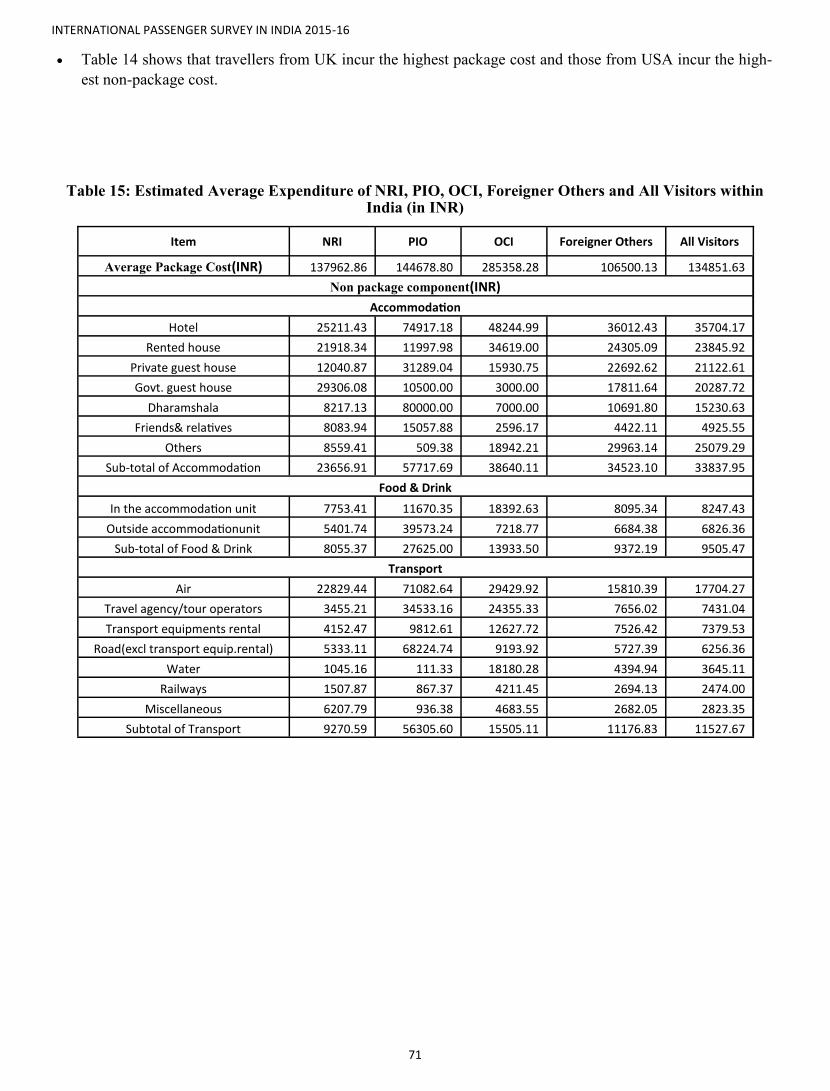
INTERNATIONAL PASSENGER SURVEY IN INDIA 2015-16
71
Table 15: Estimated Average Expenditure of NRI, PIO, OCI, Foreigner Others and All Visitors within India (in INR)
Item NRI PIO OCI Foreigner Others All Visitors
Average Package Cost(INR) 137962.86 144678.80 285358.28 106500.13 134851.63
Non package component(INR)
Accommodation
Hotel 25211.43 74917.18 48244.99 36012.43 35704.17
Rented house 21918.34 11997.98 34619.00 24305.09 23845.92
Private guest house 12040.87 31289.04 15930.75 22692.62 21122.61
Govt. guest house 29306.08 10500.00 3000.00 17811.64 20287.72
Dharamshala 8217.13 80000.00 7000.00 10691.80 15230.63
Friends& relatives 8083.94 15057.88 2596.17 4422.11 4925.55
Others 8559.41 509.38 18942.21 29963.14 25079.29
Sub-total of Accommodation 23656.91 57717.69 38640.11 34523.10 33837.95
Food & Drink
In the accommodation unit 7753.41 11670.35 18392.63 8095.34 8247.43
Outside accommodationunit 5401.74 39573.24 7218.77 6684.38 6826.36
Sub-total of Food & Drink 8055.37 27625.00 13933.50 9372.19 9505.47
Transport
Air 22829.44 71082.64 29429.92 15810.39 17704.27
Travel agency/tour operators 3455.21 34533.16 24355.33 7656.02 7431.04
Transport equipments rental 4152.47 9812.61 12627.72 7526.42 7379.53
Road(excl transport equip.rental) 5333.11 68224.74 9193.92 5727.39 6256.36
Water 1045.16 111.33 18180.28 4394.94 3645.11
Railways 1507.87 867.37 4211.45 2694.13 2474.00
Miscellaneous 6207.79 936.38 4683.55 2682.05 2823.35
Subtotal of Transport 9270.59 56305.60 15505.11 11176.83 11527.67
Table 14 shows that travellers from UK incur the highest package cost and those from USA incur the high-
est non-package cost.

INTERNATIONAL PASSENGER SURVEY IN INDIA 2015-16
72
Item NRI PIO OCI Foreigner Others All Visitors
Non package component(INR) Shopping
Gems and jewellery etc. 13146.21 9328.12 50325.15 8038.83 9158.26
Clothing and garments 9294.29 14966.15 26347.51 7273.51 8081.21
Alcohol 3163.28 5259.20 17605.12 5200.10 5409.36
Processed food 3074.79 6235.22 14662.75 3219.13 3623.30
Footwear/leather goods 2542.11 2729.64 8607.18 3398.38 3433.16
Travel related consumer goods 2808.41 6362.37 7372.92 2529.78 2771.10
Tobacco products 3592.77 3297.18 8874.23 2307.60 2621.25
Books, journals etc. 1539.27 1533.96 10519.40 2128.84 2158.68
Toiletries 1632.86 2111.90 4046.32 2072.96 2020.18
Others 15845.70 2070.32 22973.02 5483.50 7014.40
Subtotal of Shopping 19190.09 23976.99 63876.48 14959.07 16494.75
Recreation, religious, cultural, sporting activities
Sporting activities 1866.45 3933.40 6944.24 2853.65 2995.89
Entry fee to and
other exp. at religious sites 2156.07 9892.95 18760.18 2455.71 2877.63
Entry fee & others expenses
at cultural sites 2680.13 4292.56 7276.52 2174.01 2283.39
Cinema, theatre, amusements 1249.43 1074.52 5482.89 1729.38 1820.93
Sub-total of Recreation,religious,
cultural, sporting 2480.89 3031.93 14991.12 4174.85 4370.86
Medical and health related activities
Medical accessories 7564.49 11646.12 16682.94 4965.13 6365.97
Medicine 5846.74 3531.26 19400.70 4560.43 5368.45
Other health related services 5217.96 897.92 9602.31 7295.27 7889.54
Sub-total of Medical
and health related activities 8151.01 5499.20 23116.04 7454.72 8344.65
Others(non-packages) 79426.06 12918.48 54535.24 17395.18 48877.54
Total average cost of
non-package component 48693.88 111659.42 100718.29 50665.82 52231.63
Total average cost of package+
non-package component 55274.79 126933.33 195445.25 56234.83 60261.63
Table 15(Contd.): Estimated Average Expenditure of NRI, PIO, OCI, Foreigner Others and All Visitors within India (in INR)
‘All Visitors’ spend most of the money for accommodation purpose. NRI, PIO and Foreigner Others all
spend most on Accommodation while OCI spend most on Shopping. PIO spend more money for Accommo-
dation, Food & drinks and Transport than NRI, OCI and Foreigner Others. OCI spend more money for Shop-
ping, Recreation and Medical facilities than NRI, PIO and Foreigner Others.

INTERNATIONAL PASSENGER SURVEY IN INDIA 2015-16
73
Table 16: Estimated Average Expenditure (in INR) on Accommodation during Entire Tour by Country of Normal Residence
Table 17: Estimated Average Expenditure (in INR) of Food during Entire Tour by Country of Normal
Table 16 shows that among the 20 countries, China contributed the most in “Accommodation” sector, fol-
lowed by USA for all visitors.
Country of Normal Residence NRI PIO OCI Foreigner Others All Visitors
Afghanistan 2128.36 12000.00 0.00 17441.73 13998.41
Australia 3910.51 19752.60 1770.01 25141.18 22897.67
Bangladesh 4320.06 144.71 5123.15 4011.72 4008.63
Canada 7533.87 13417.01 19002.59 26119.60 23395.84
China 21352.23 132582.40 36924.50 29567.56 34023.56
France 932.72 0.00 12214.36 24225.06 23252.07
Germany 24081.29 80000.00 8638.20 24606.55 25469.93
Italy 13293.27 0.00 130000.00 27775.69 26999.62
Japan 29840.65 45349.19 29429.48 24700.59 24830.87
Malaysia 10658.16 10041.00 23993.32 26799.96 25156.20
Nepal 17667.17 20635.59 779.64 15580.92 15536.68
Oman 7064.71 56849.67 27277.69 12315.17 11442.69
Pakistan 0.00 0.00 0.00 5838.97 5838.97
Republic of Korea 25000.00 0.00 33000.00 21263.52 21337.47
Russia 11140.27 29000.00 7371.77 27739.65 27662.26
Singapore 7432.52 19872.05 28227.19 22893.86 18568.33
Sri Lanka 14282.71 20639.34 6155.73 14333.36 14289.07
Thailand 19202.58 31824.78 8686.80 22287.00 21374.83
UK 8637.46 21666.80 21094.06 28925.63 27564.92
USA 10172.95 12089.01 21380.69 29710.61 27884.68
Others 9536.52 22822.34 19167.49 22156.93 18836.28
All Countries 9182.59 31240.32 18056.50 21347.31 20032.60
Country of Normal Residence NRI PIO OCI Foreigner Others All Visitors
Afghanistan 1632.53 0.00 0.00 4630.22 3950.44
Australia 3568.74 1907.82 8873.18 5363.78 5498.60
Bangladesh 1514.11 356.18 856.88 1817.22 1805.63
Canada 5873.20 26454.66 3346.32 9459.29 8895.81
China 12779.10 28471.60 4564.52 5810.19 6918.16
France 1866.33 0.00 5033.48 9116.23 8806.94
Germany 7919.62 0.00 1275.61 7401.81 7469.91
Italy 2496.25 10000.00 12000.00 8041.36 7826.47
Japan 5430.76 668.65 3788.12 6442.00 6404.50
Malaysia 7866.85 2685.79 5402.66 6806.43 6765.06
Nepal 11952.04 9046.62 623.71 4353.43 4728.57
Oman 6041.66 22401.91 6524.31 4418.24 5175.14
Pakistan 0.00 0.00 0.00 3223.30 3223.30
Republic of Korea 5000.00 0.00 10000.00 6083.78 6100.80
Russia 7839.41 0.00 2507.33 9546.22 9491.88
Singapore 3012.68 3760.53 7716.12 4984.48 4486.72
Sri Lanka 2848.93 3885.96 2123.83 3322.92 3306.48
Thailand 4158.00 8879.75 1400.75 5751.48 5407.97
UK 7720.89 825.80 10664.61 10444.05 10517.46
USA 5997.24 6079.05 4675.62 8001.61 7708.53
Others 6495.11 26250.41 3282.36 6567.40 6773.00
All Countries 5791.60 17090.47 5397.74 6351.16 6393.79
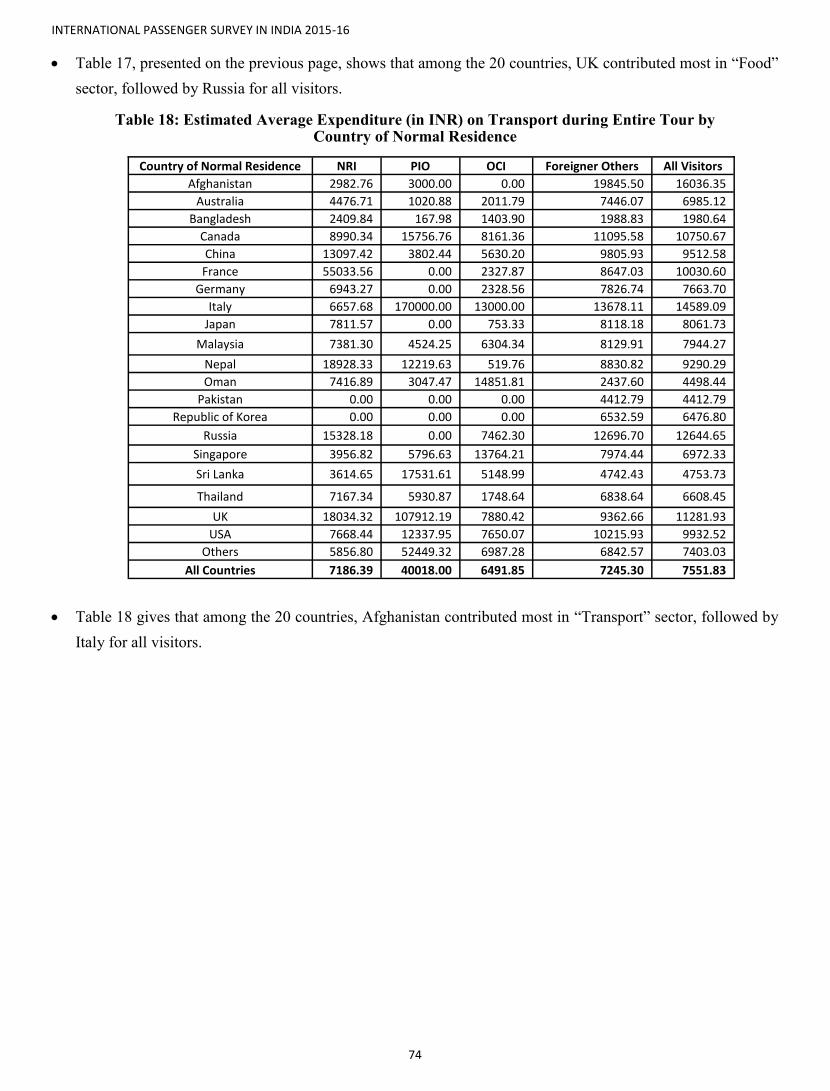
INTERNATIONAL PASSENGER SURVEY IN INDIA 2015-16
74
Table 17, presented on the previous page, shows that among the 20 countries, UK contributed most in “Food”
sector, followed by Russia for all visitors.
Table 18: Estimated Average Expenditure (in INR) on Transport during Entire Tour by Country of Normal Residence
Table 18 gives that among the 20 countries, Afghanistan contributed most in “Transport” sector, followed by
Italy for all visitors.
Country of Normal Residence NRI PIO OCI Foreigner Others All Visitors
Afghanistan 2982.76 3000.00 0.00 19845.50 16036.35
Australia 4476.71 1020.88 2011.79 7446.07 6985.12
Bangladesh 2409.84 167.98 1403.90 1988.83 1980.64
Canada 8990.34 15756.76 8161.36 11095.58 10750.67
China 13097.42 3802.44 5630.20 9805.93 9512.58
France 55033.56 0.00 2327.87 8647.03 10030.60
Germany 6943.27 0.00 2328.56 7826.74 7663.70
Italy 6657.68 170000.00 13000.00 13678.11 14589.09
Japan 7811.57 0.00 753.33 8118.18 8061.73
Malaysia 7381.30 4524.25 6304.34 8129.91 7944.27
Nepal 18928.33 12219.63 519.76 8830.82 9290.29
Oman 7416.89 3047.47 14851.81 2437.60 4498.44
Pakistan 0.00 0.00 0.00 4412.79 4412.79
Republic of Korea 0.00 0.00 0.00 6532.59 6476.80
Russia 15328.18 0.00 7462.30 12696.70 12644.65
Singapore 3956.82 5796.63 13764.21 7974.44 6972.33
Sri Lanka 3614.65 17531.61 5148.99 4742.43 4753.73
Thailand 7167.34 5930.87 1748.64 6838.64 6608.45
UK 18034.32 107912.19 7880.42 9362.66 11281.93
USA 7668.44 12337.95 7650.07 10215.93 9932.52
Others 5856.80 52449.32 6987.28 6842.57 7403.03
All Countries 7186.39 40018.00 6491.85 7245.30 7551.83

INTERNATIONAL PASSENGER SURVEY IN INDIA 2015-16
75
Table 19: Estimated Average Expenditure (in INR) on Shopping during Entire Tour by Country of Normal Residence
Country of Normal Residence NRI PIO OCI Foreigner Others All Visitors
Afghanistan 2531.08 30000.00 0.00 16780.10 13605.51
Australia 11089.80 17425.16 31760.24 13341.55 14384.60
Bangladesh 4467.70 763.80 1321.89 5013.67 4942.97
Canada 24514.32 10951.74 28912.55 15758.67 17216.94
China 14097.01 11518.13 5694.17 13767.81 13482.46
France 3731.49 11500.00 40793.94 19507.17 19380.65
Germany 12915.62 0.00 30075.72 11933.01 12212.26
Italy 28135.00 10000.00 26000.00 16211.49 16665.84
Japan 11415.32 0.00 1682.77 12178.38 12091.96
Malaysia 20519.20 7399.64 24025.31 14600.99 15307.75
Nepal 28096.95 19317.79 66104.39 9275.26 10924.46
Oman 11905.11 44883.61 382641.57 9608.37 22930.67
Pakistan 0.00 0.00 0.00 10267.35 10267.35
Republic of Korea 8211.00 0.00 0.00 8979.53 8929.81
Russia 7444.66 0.00 39891.96 17261.64 17222.84
Singapore 9328.87 28011.84 38615.05 17244.12 15826.15
Sri Lanka 9231.17 19879.67 21637.42 7391.63 7558.65
Thailand 14183.04 19414.78 14734.56 9463.15 10166.97
UK 28800.00 3242.32 51130.53 16151.77 17688.66
USA 17750.73 15003.53 61503.90 18627.86 20428.75
Others 15347.99 28780.09 44547.24 11016.93 13279.64
All Countries 14948.33 19302.19 47925.85 12571.07 13717.26
Table 19 gives that among the 20 countries, Oman contributed most in “Shopping” sector, followed by
USA for all visitors.
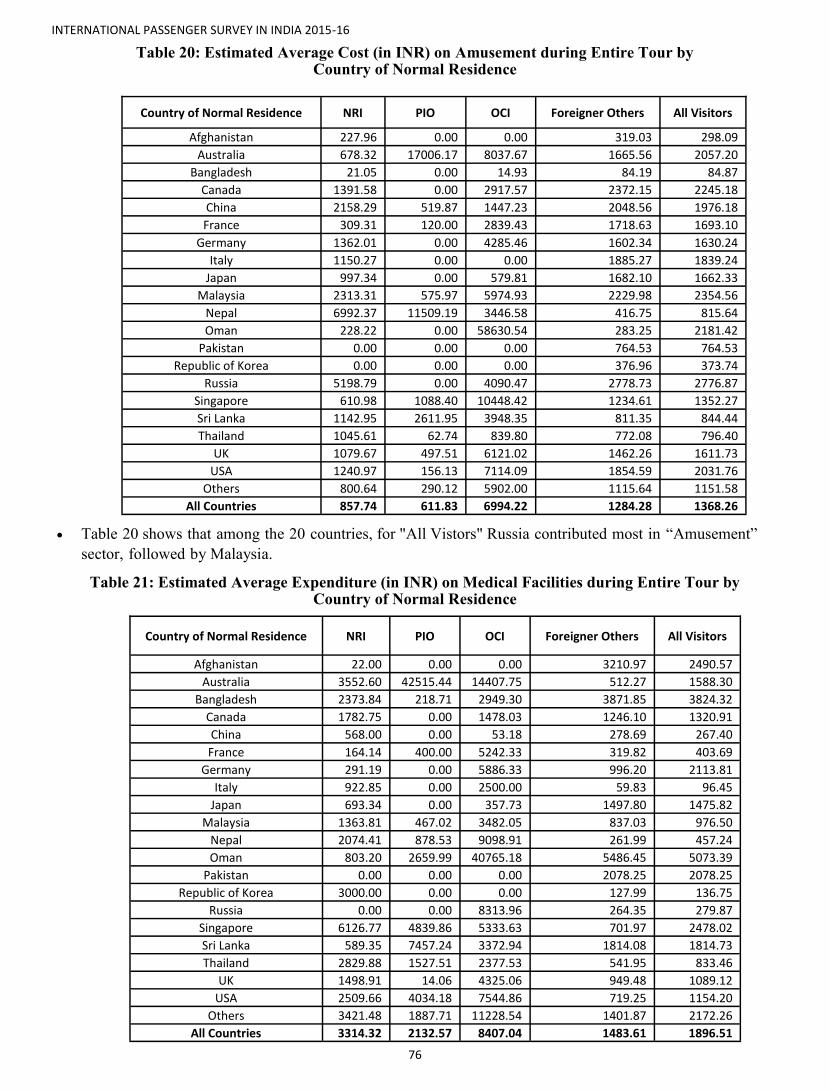
INTERNATIONAL PASSENGER SURVEY IN INDIA 2015-16
76
Table 20: Estimated Average Cost (in INR) on Amusement during Entire Tour by Country of Normal Residence
Country of Normal Residence NRI PIO OCI Foreigner Others All Visitors
Afghanistan 227.96 0.00 0.00 319.03 298.09
Australia 678.32 17006.17 8037.67 1665.56 2057.20
Bangladesh 21.05 0.00 14.93 84.19 84.87
Canada 1391.58 0.00 2917.57 2372.15 2245.18
China 2158.29 519.87 1447.23 2048.56 1976.18
France 309.31 120.00 2839.43 1718.63 1693.10
Germany 1362.01 0.00 4285.46 1602.34 1630.24
Italy 1150.27 0.00 0.00 1885.27 1839.24
Japan 997.34 0.00 579.81 1682.10 1662.33
Malaysia 2313.31 575.97 5974.93 2229.98 2354.56
Nepal 6992.37 11509.19 3446.58 416.75 815.64
Oman 228.22 0.00 58630.54 283.25 2181.42
Pakistan 0.00 0.00 0.00 764.53 764.53
Republic of Korea 0.00 0.00 0.00 376.96 373.74
Russia 5198.79 0.00 4090.47 2778.73 2776.87
Singapore 610.98 1088.40 10448.42 1234.61 1352.27
Sri Lanka 1142.95 2611.95 3948.35 811.35 844.44
Thailand 1045.61 62.74 839.80 772.08 796.40
UK 1079.67 497.51 6121.02 1462.26 1611.73
USA 1240.97 156.13 7114.09 1854.59 2031.76
Others 800.64 290.12 5902.00 1115.64 1151.58
All Countries 857.74 611.83 6994.22 1284.28 1368.26
Table 21: Estimated Average Expenditure (in INR) on Medical Facilities during Entire Tour by Country of Normal Residence
Country of Normal Residence NRI PIO OCI Foreigner Others All Visitors
Afghanistan 22.00 0.00 0.00 3210.97 2490.57
Australia 3552.60 42515.44 14407.75 512.27 1588.30
Bangladesh 2373.84 218.71 2949.30 3871.85 3824.32
Canada 1782.75 0.00 1478.03 1246.10 1320.91
China 568.00 0.00 53.18 278.69 267.40
France 164.14 400.00 5242.33 319.82 403.69
Germany 291.19 0.00 5886.33 996.20 2113.81
Italy 922.85 0.00 2500.00 59.83 96.45
Japan 693.34 0.00 357.73 1497.80 1475.82
Malaysia 1363.81 467.02 3482.05 837.03 976.50
Nepal 2074.41 878.53 9098.91 261.99 457.24
Oman 803.20 2659.99 40765.18 5486.45 5073.39
Pakistan 0.00 0.00 0.00 2078.25 2078.25
Republic of Korea 3000.00 0.00 0.00 127.99 136.75
Russia 0.00 0.00 8313.96 264.35 279.87
Singapore 6126.77 4839.86 5333.63 701.97 2478.02
Sri Lanka 589.35 7457.24 3372.94 1814.08 1814.73
Thailand 2829.88 1527.51 2377.53 541.95 833.46
UK 1498.91 14.06 4325.06 949.48 1089.12
USA 2509.66 4034.18 7544.86 719.25 1154.20
Others 3421.48 1887.71 11228.54 1401.87 2172.26
All Countries 3314.32 2132.57 8407.04 1483.61 1896.51
Table 20 shows that among the 20 countries, for "All Vistors" Russia contributed most in “Amusement”
sector, followed by Malaysia.
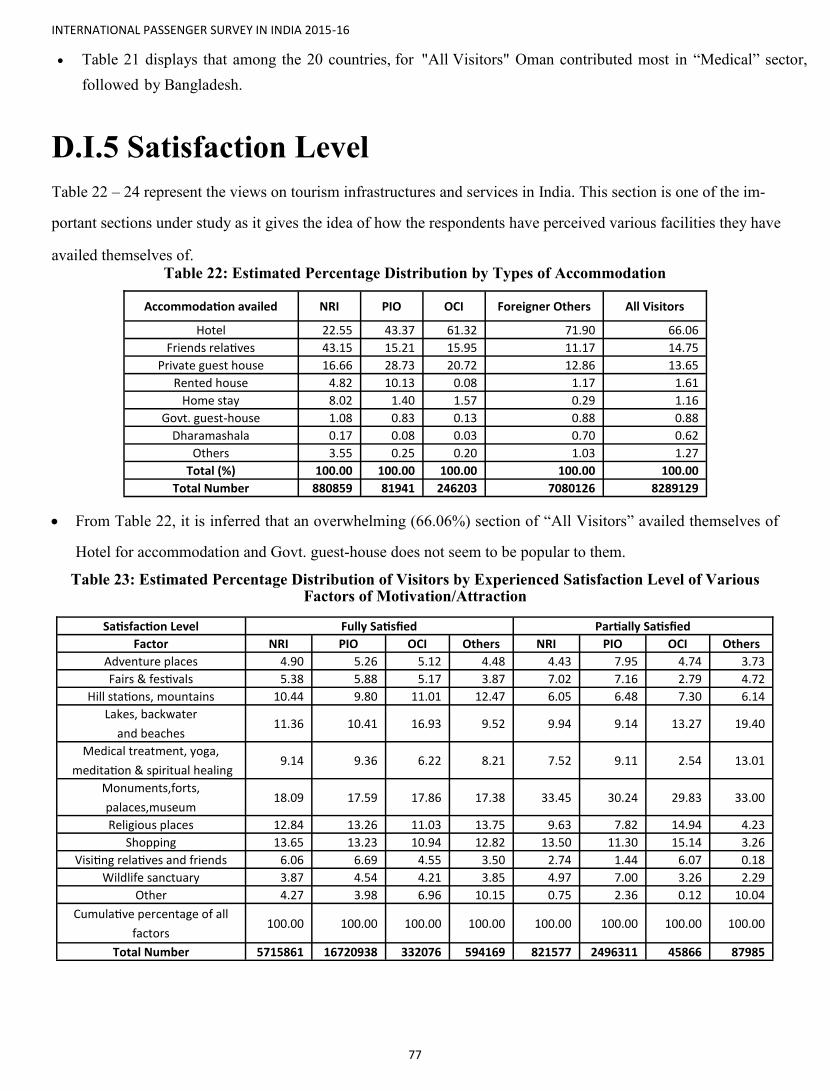
INTERNATIONAL PASSENGER SURVEY IN INDIA 2015-16
77
D.I.5 Satisfaction Level
Table 22 – 24 represent the views on tourism infrastructures and services in India. This section is one of the im-
portant sections under study as it gives the idea of how the respondents have perceived various facilities they have
availed themselves of. Table 22: Estimated Percentage Distribution by Types of Accommodation
Accommodation availed NRI PIO OCI Foreigner Others All Visitors
Hotel 22.55 43.37 61.32 71.90 66.06
Friends relatives 43.15 15.21 15.95 11.17 14.75
Private guest house 16.66 28.73 20.72 12.86 13.65
Rented house 4.82 10.13 0.08 1.17 1.61
Home stay 8.02 1.40 1.57 0.29 1.16
Govt. guest-house 1.08 0.83 0.13 0.88 0.88
Dharamashala 0.17 0.08 0.03 0.70 0.62
Others 3.55 0.25 0.20 1.03 1.27
Total (%) 100.00 100.00 100.00 100.00 100.00
Total Number 880859 81941 246203 7080126 8289129
From Table 22, it is inferred that an overwhelming (66.06%) section of “All Visitors” availed themselves of
Hotel for accommodation and Govt. guest-house does not seem to be popular to them.
Table 23: Estimated Percentage Distribution of Visitors by Experienced Satisfaction Level of Various Factors of Motivation/Attraction
Satisfaction Level Fully Satisfied Partially Satisfied
Factor NRI PIO OCI Others NRI PIO OCI Others
Adventure places 4.90 5.26 5.12 4.48 4.43 7.95 4.74 3.73
Fairs & festivals 5.38 5.88 5.17 3.87 7.02 7.16 2.79 4.72
Hill stations, mountains 10.44 9.80 11.01 12.47 6.05 6.48 7.30 6.14
Lakes, backwater
and beaches 11.36 10.41 16.93 9.52 9.94 9.14 13.27 19.40
Medical treatment, yoga,
meditation & spiritual healing 9.14 9.36 6.22 8.21 7.52 9.11 2.54 13.01
Monuments,forts,
palaces,museum 18.09 17.59 17.86 17.38 33.45 30.24 29.83 33.00
Religious places 12.84 13.26 11.03 13.75 9.63 7.82 14.94 4.23
Shopping 13.65 13.23 10.94 12.82 13.50 11.30 15.14 3.26
Visiting relatives and friends 6.06 6.69 4.55 3.50 2.74 1.44 6.07 0.18
Wildlife sanctuary 3.87 4.54 4.21 3.85 4.97 7.00 3.26 2.29
Other 4.27 3.98 6.96 10.15 0.75 2.36 0.12 10.04
Cumulative percentage of all
factors 100.00 100.00 100.00 100.00 100.00 100.00 100.00 100.00
Total Number 5715861 16720938 332076 594169 821577 2496311 45866 87985
Table 21 displays that among the 20 countries, for "All Visitors" Oman contributed most in “Medical” sector,
followed by Bangladesh.

INTERNATIONAL PASSENGER SURVEY IN INDIA 2015-16
78
Table 23(Contd.): Estimated Percentage Distribution of Visitors by Experienced Satisfaction Level of Various Factors of Motivation/Attraction
Satisfaction Level Not Satisfied No Comment
Factor NRI PIO OCI Others NRI PIO OCI Others
Adventure places 4.64 14.39 10.43 1.34 7.11 11.31 42.81 6.80
Fairs & festivals 4.34 7.27 0.00 0.00 7.23 9.53 0.00 6.14
Hill stations, mountains 9.65 4.23 0.00 0.00 11.25 14.66 5.62 24.87
Lakes, backwater
and beaches 34.28 11.54 0.00 48.46 10.14 14.13 0.00 0.00
Medical treatment, yoga,
meditation & spiritual healing 2.78 7.74 0.78 0.60 12.86 8.71 0.00 5.03
Monuments,forts,
palaces,museum 17.74 15.34 3.04 0.00 14.73 13.99 0.00 33.32
Religious places 4.64 4.59 5.37 1.34 9.62 7.18 22.70 8.10
Shopping 9.82 16.41 27.07 48.26 9.43 5.17 0.00 1.12
Visiting relatives and friends 1.73 2.81 42.88 0.00 0.69 3.87 0.00 0.00
Wildlife sanctuary 7.87 14.28 10.43 0.00 16.82 10.94 28.87 14.62
Other 2.51 1.40 0.00 0.00 0.12 0.51 0.00 0.00
Cumulative percentage of all
factors 100.00 100.00 100.00 100.00 100.00 100.00 100.00 100.00
Total Number 56587 400839 12688 5403 74805 355871 1362 2914
From Table 23, we interpret that the highest level, only 18.09% (sixth cell), of "Fully Satisfied" corresponds
to NRI for the factor ‘Monuments, forts, palaces, museum’, while that (48.46%) for "Not Satisfied" corresponds to
Others for the factor "Lakes, backwater and beaches .
Table 24(a): Estimated Percentage Distribution of Visitors by Experienced Level of Satisfaction for Various Factors Related to Tourism Infrastructure
Satisfaction Level Fully satisfied Partially Satisfied
Factor NRI PIO OCI Others NRI PIO OCI Others
Accommodation tariff 6.51 6.53 6.43 5.48 3.53 3.04 1.02 6.92
Foreign Money transaction 5.44 5.66 7.49 9.87 5.11 7.58 7.53 11.50
Good sanitary & health condition 7.80 8.15 10.51 5.20 13.69 14.52 5.01 12.17
Personal security & safety 19.38 19.67 21.45 16.67 20.02 16.93 15.79 33.89
Reasonable Cost 11.86 11.66 9.75 6.92 8.39 9.47 10.47 12.67
Service (including food) 14.61 14.86 13.97 13.94 16.77 14.45 11.63 5.67
Shopping facilities 11.31 11.20 9.01 12.28 10.51 12.19 19.77 6.74
Sightseeing facilities 10.56 9.88 8.06 13.36 8.09 10.52 10.99 6.36
Spatial security 6.30 6.21 3.57 7.41 7.98 5.49 9.78 2.52
Tourist guides 6.23 6.18 9.76 8.87 5.91 5.81 8.01 1.56
Cumulative percentage of all factors 100.00 100.00 100.00 100.00 100.00 100.00 100.00 100.00
Total Number 5942838 17399246 375320 596871 934834 2586075 48215 85582
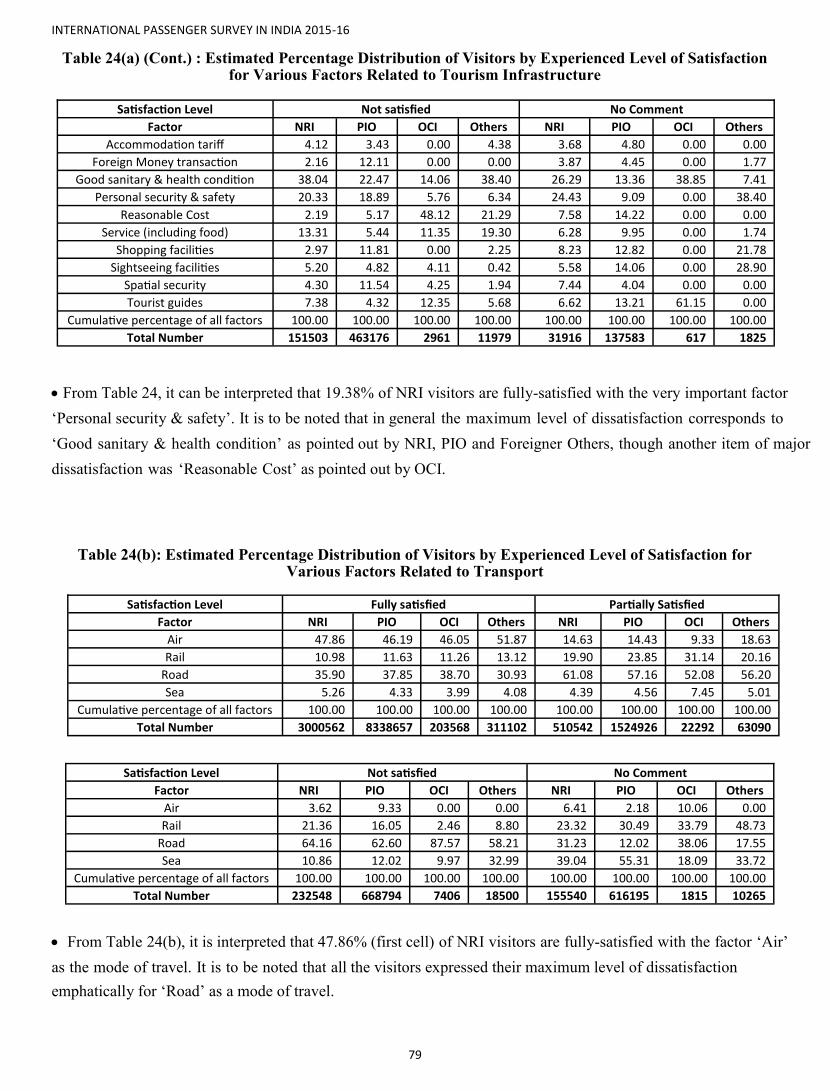
INTERNATIONAL PASSENGER SURVEY IN INDIA 2015-16
79
Table 24(a) (Cont.) : Estimated Percentage Distribution of Visitors by Experienced Level of Satisfaction for Various Factors Related to Tourism Infrastructure
Satisfaction Level Not satisfied No Comment
Factor NRI PIO OCI Others NRI PIO OCI Others
Accommodation tariff 4.12 3.43 0.00 4.38 3.68 4.80 0.00 0.00
Foreign Money transaction 2.16 12.11 0.00 0.00 3.87 4.45 0.00 1.77
Good sanitary & health condition 38.04 22.47 14.06 38.40 26.29 13.36 38.85 7.41
Personal security & safety 20.33 18.89 5.76 6.34 24.43 9.09 0.00 38.40
Reasonable Cost 2.19 5.17 48.12 21.29 7.58 14.22 0.00 0.00
Service (including food) 13.31 5.44 11.35 19.30 6.28 9.95 0.00 1.74
Shopping facilities 2.97 11.81 0.00 2.25 8.23 12.82 0.00 21.78
Sightseeing facilities 5.20 4.82 4.11 0.42 5.58 14.06 0.00 28.90
Spatial security 4.30 11.54 4.25 1.94 7.44 4.04 0.00 0.00
Tourist guides 7.38 4.32 12.35 5.68 6.62 13.21 61.15 0.00
Cumulative percentage of all factors 100.00 100.00 100.00 100.00 100.00 100.00 100.00 100.00
Total Number 151503 463176 2961 11979 31916 137583 617 1825
From Table 24, it can be interpreted that 19.38% of NRI visitors are fully-satisfied with the very important factor
‘Personal security & safety’. It is to be noted that in general the maximum level of dissatisfaction corresponds to
‘Good sanitary & health condition’ as pointed out by NRI, PIO and Foreigner Others, though another item of major
dissatisfaction was ‘Reasonable Cost’ as pointed out by OCI.
Table 24(b): Estimated Percentage Distribution of Visitors by Experienced Level of Satisfaction for Various Factors Related to Transport
Satisfaction Level Fully satisfied Partially Satisfied
Factor NRI PIO OCI Others NRI PIO OCI Others
Air 47.86 46.19 46.05 51.87 14.63 14.43 9.33 18.63
Rail 10.98 11.63 11.26 13.12 19.90 23.85 31.14 20.16
Road 35.90 37.85 38.70 30.93 61.08 57.16 52.08 56.20
Sea 5.26 4.33 3.99 4.08 4.39 4.56 7.45 5.01
Cumulative percentage of all factors 100.00 100.00 100.00 100.00 100.00 100.00 100.00 100.00
Total Number 3000562 8338657 203568 311102 510542 1524926 22292 63090
Satisfaction Level Not satisfied No Comment
Factor NRI PIO OCI Others NRI PIO OCI Others
Air 3.62 9.33 0.00 0.00 6.41 2.18 10.06 0.00
Rail 21.36 16.05 2.46 8.80 23.32 30.49 33.79 48.73
Road 64.16 62.60 87.57 58.21 31.23 12.02 38.06 17.55
Sea 10.86 12.02 9.97 32.99 39.04 55.31 18.09 33.72
Cumulative percentage of all factors 100.00 100.00 100.00 100.00 100.00 100.00 100.00 100.00
Total Number 232548 668794 7406 18500 155540 616195 1815 10265
From Table 24(b), it is interpreted that 47.86% (first cell) of NRI visitors are fully-satisfied with the factor ‘Air’
as the mode of travel. It is to be noted that all the visitors expressed their maximum level of dissatisfaction
emphatically for ‘Road’ as a mode of travel.

INTERNATIONAL PASSENGER SURVEY IN INDIA 2015-16
80
D.I.6 Non-Monetary Transaction Findings Value of non-monetary tourism transaction acquired from the residents on non residents is given in Table 25. The
amount is given in INR. This section will provide an idea about the how non-monetary transactions take place in
terms of various gifts given/received.
Table 25: Estimated Value of Non-Monetary Tourism Transaction (in INR)
Gifts Given Gifts Received
Category Average of Estimated
Amount (INR) Average of Estimated
Amount (INR)
NRI 41839.45 21516.11
PIO 11492.41 22541.00
OCI 43977.22 34449.59
Foreigner Others 12745.85 8829.68
Total 20982.14 13864.95
D.I.7 Motivating Factors Table 26-29 (a,b) are given to show the motivating factors responsible for attracting tourists to India. Rank tables
are given here to compare the factors.
Table 26: Estimated Percentage Distribution of Visitors by Perceived Expectation Level of Various Factors of Motivation/Attraction
Rank Rank 1 Rank 2
Factor NRI PIO OCI Others NRI PIO OCI Others
Adventure places 1.57 0.60 0.53 2.33 3.04 3.83 1.22 2.65
Fairs & festivals 1.74 1.06 10.06 3.76 4.05 6.63 1.25 10.23
Hill stations, mountains 7.35 1.33 10.73 59.00 18.42 14.88 10.03 23.45
Lakes, backwater and beaches
9.46 5.59 18.67 4.37 11.42 12.84 18.38 11.98
Medical treatment, yoga, meditation & spiritual healing
7.60 6.65 10.37 3.65 6.76 9.76 8.46 6.98
Monuments,forts, palaces,museum
33.87 71.93 15.98 16.97 16.90 21.65 6.94 30.36
Religious places 8.32 2.93 3.81 1.48 14.07 10.71 6.54 4.18
Shopping 8.07 2.54 7.36 2.20 14.16 13.91 42.36 6.02
Visiting relatives and friends 10.04 1.08 2.52 0.14 5.71 2.37 0.80 0.06
Wildlife sanctuary 1.23 0.71 4.36 4.33 3.09 2.37 3.87 4.09
Other 10.75 5.58 15.61 1.77 2.38 1.05 0.15 0.00
Cumulative percentage of all
factors 100.00 100.00 100.00 100.00 100.00 100.00 100.00 100.00
Total Number 6789939 1044581 24961 41626 5900842 579133 93173 67717
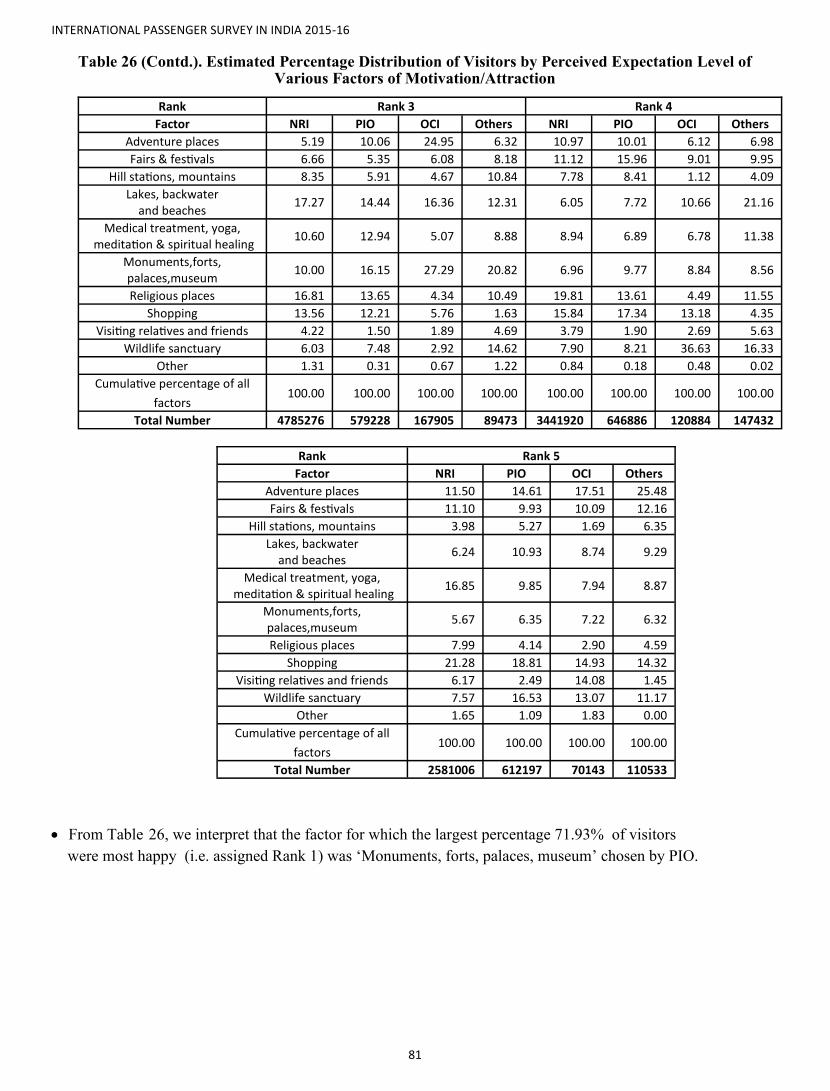
INTERNATIONAL PASSENGER SURVEY IN INDIA 2015-16
81
Table 26 (Contd.). Estimated Percentage Distribution of Visitors by Perceived Expectation Level of Various Factors of Motivation/Attraction
Rank Rank 3 Rank 4
Factor NRI PIO OCI Others NRI PIO OCI Others
Adventure places 5.19 10.06 24.95 6.32 10.97 10.01 6.12 6.98
Fairs & festivals 6.66 5.35 6.08 8.18 11.12 15.96 9.01 9.95
Hill stations, mountains 8.35 5.91 4.67 10.84 7.78 8.41 1.12 4.09
Lakes, backwater and beaches
17.27 14.44 16.36 12.31 6.05 7.72 10.66 21.16
Medical treatment, yoga, meditation & spiritual healing
10.60 12.94 5.07 8.88 8.94 6.89 6.78 11.38
Monuments,forts, palaces,museum
10.00 16.15 27.29 20.82 6.96 9.77 8.84 8.56
Religious places 16.81 13.65 4.34 10.49 19.81 13.61 4.49 11.55
Shopping 13.56 12.21 5.76 1.63 15.84 17.34 13.18 4.35
Visiting relatives and friends 4.22 1.50 1.89 4.69 3.79 1.90 2.69 5.63
Wildlife sanctuary 6.03 7.48 2.92 14.62 7.90 8.21 36.63 16.33
Other 1.31 0.31 0.67 1.22 0.84 0.18 0.48 0.02
Cumulative percentage of all
factors 100.00 100.00 100.00 100.00 100.00 100.00 100.00 100.00
Total Number 4785276 579228 167905 89473 3441920 646886 120884 147432
Rank Rank 5
Factor NRI PIO OCI Others
Adventure places 11.50 14.61 17.51 25.48
Fairs & festivals 11.10 9.93 10.09 12.16
Hill stations, mountains 3.98 5.27 1.69 6.35
Lakes, backwater and beaches
6.24 10.93 8.74 9.29
Medical treatment, yoga, meditation & spiritual healing
16.85 9.85 7.94 8.87
Monuments,forts, palaces,museum
5.67 6.35 7.22 6.32
Religious places 7.99 4.14 2.90 4.59
Shopping 21.28 18.81 14.93 14.32
Visiting relatives and friends 6.17 2.49 14.08 1.45
Wildlife sanctuary 7.57 16.53 13.07 11.17
Other 1.65 1.09 1.83 0.00
Cumulative percentage of all
factors 100.00 100.00 100.00 100.00
Total Number 2581006 612197 70143 110533
From Table 26, we interpret that the factor for which the largest percentage 71.93% of visitors were most happy (i.e. assigned Rank 1) was ‘Monuments, forts, palaces, museum’ chosen by PIO.

INTERNATIONAL PASSENGER SURVEY IN INDIA 2015-16
82
Table 27. Motivating Factors by Estimated Weighted Rank
Table 28(a). Estimated Percentage Distribution of Visitors by Perceived Importance Level for Various Factors Related to Tourism Infrastructure
Factor Percentages of respondents assigning
Weighted Rank Rank1 Rank2 Rank3 Rank4 Rank5
Monuments, forts, palaces, museum 57.01 21.40 11.85 6.07 3.67 1.78
Visiting relatives and friends 43.25 21.92 13.61 9.63 11.59 2.24
Hill stations, mountains 20.29 44.99 16.96 12.38 5.38 2.38
Lakes, backwater and beaches 23.76 25.99 31.88 10.16 8.21 2.53
Religious places 17.42 26.27 26.25 23.11 6.96 2.76
Medical treatment, yoga, meditation & spiritual healing
23.16 18.40 23.54 14.82 20.07 2.90
Shopping 15.87 26.39 20.08 18.68 18.99 2.99
Fairs & festivals 7.99 17.15 22.05 30.72 22.08 3.42
Wildlife sanctuary 6.94 14.90 25.78 28.97 23.42 3.47
Adventure places 7.30 13.12 22.71 29.50 27.38 3.57
In Table 27, percentages are calculated by row total for each factor. Each cell gives the percentage of visi-
tors who assigned the displayed rank to the corresponding factor. For example, the first cell implies that
57.01% of all visitors were most happy, (i.e. assigned Rank 1) with the factor ‘Monuments, forts, palaces,
museum’. Similarly, 20.29% of all visitors were happiest, (i.e. assigned Rank 1) with factor ‘Hill stations,
mountains’ while the majority of them (44.99%) were 2nd most happy with it.
For each factor, Weighted Rank was calculated using the weights as the percentages corresponding to the
ranks. For example, Weighted rank for Monuments, forts, palaces, museum
= (57.01*1+21.40*2+11.85*3+6.07*4+3.67*5)/100 = 1.78
From the last column it is inferred that, the factor that most (least) motivated the visitors was ‘Monuments,
forts, palaces, museum’ (‘Adventure places’).
Rank Rank 1 Rank 2
Factor NRI PIO OCI Others NRI PIO OCI Others
Accommodation tariff 4.08 2.18 0.43 0.00 5.13 1.95 1.13 8.83
Foreign Money transaction 3.37 2.49 35.63 0.99 3.37 3.01 0.57 2.63
Good sanitary & health condition 3.61 14.21 18.45 36.14 8.59 12.37 23.83 6.36
Personal security & safety 46.66 45.80 34.05 34.01 11.21 18.94 42.41 6.15
Reasonable Cost 9.29 4.19 0.74 0.51 8.82 6.64 2.39 3.02
Service (including food) 10.49 9.96 2.84 3.71 18.49 19.92 5.88 16.97
Shopping facilities 7.22 8.83 0.37 17.76 10.56 8.85 3.56 4.05
Sightseeing facilities 9.60 6.74 3.78 0.97 13.62 11.09 6.66 19.29
Spatial security 2.73 3.93 3.19 2.91 13.44 12.01 10.17 7.71
Tourist guides 2.95 1.67 0.52 3.00 6.77 5.22 3.40 24.99
Cumulative percentage of all factors 100.00 100.00 100.00 100.00 100.00 100.00 100.00 100.00
Total Number 6571835 462082 95155 16537 6013888 727657 125647 22689
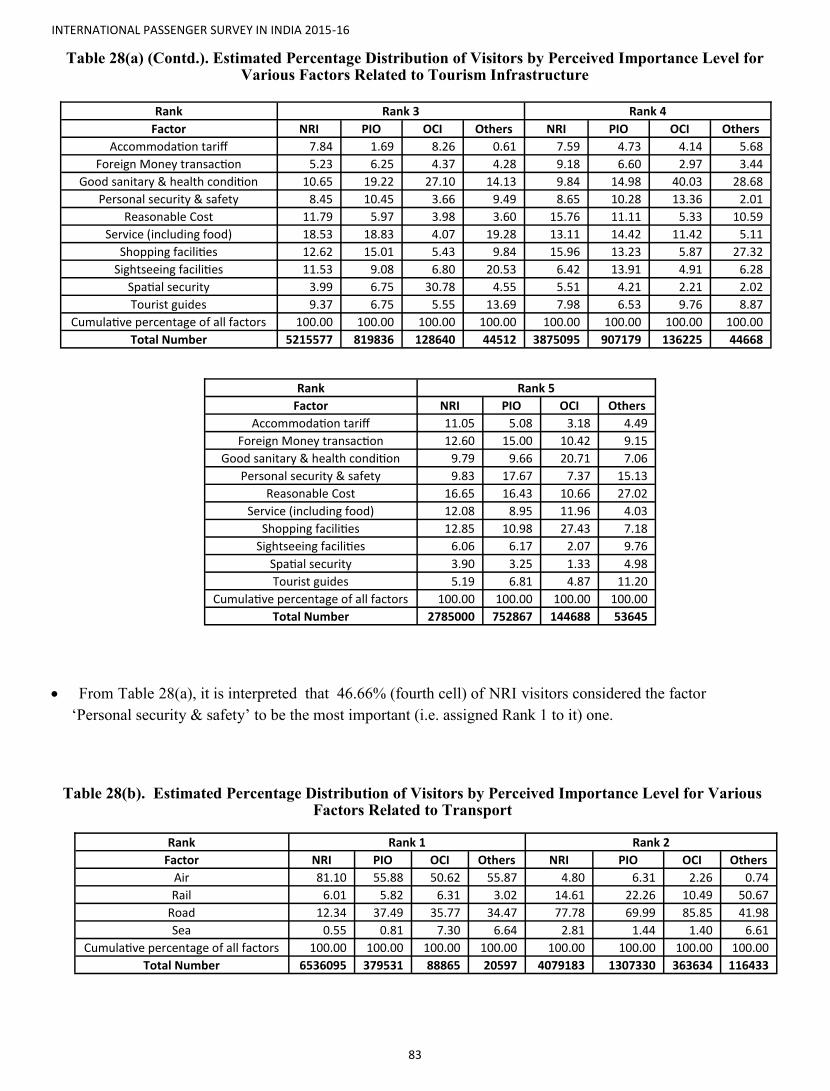
INTERNATIONAL PASSENGER SURVEY IN INDIA 2015-16
83
Table 28(a) (Contd.). Estimated Percentage Distribution of Visitors by Perceived Importance Level for Various Factors Related to Tourism Infrastructure
From Table 28(a), it is interpreted that 46.66% (fourth cell) of NRI visitors considered the factor
‘Personal security & safety’ to be the most important (i.e. assigned Rank 1 to it) one.
Table 28(b). Estimated Percentage Distribution of Visitors by Perceived Importance Level for Various Factors Related to Transport
Rank Rank 3 Rank 4
Factor NRI PIO OCI Others NRI PIO OCI Others
Accommodation tariff 7.84 1.69 8.26 0.61 7.59 4.73 4.14 5.68
Foreign Money transaction 5.23 6.25 4.37 4.28 9.18 6.60 2.97 3.44
Good sanitary & health condition 10.65 19.22 27.10 14.13 9.84 14.98 40.03 28.68
Personal security & safety 8.45 10.45 3.66 9.49 8.65 10.28 13.36 2.01
Reasonable Cost 11.79 5.97 3.98 3.60 15.76 11.11 5.33 10.59
Service (including food) 18.53 18.83 4.07 19.28 13.11 14.42 11.42 5.11
Shopping facilities 12.62 15.01 5.43 9.84 15.96 13.23 5.87 27.32
Sightseeing facilities 11.53 9.08 6.80 20.53 6.42 13.91 4.91 6.28
Spatial security 3.99 6.75 30.78 4.55 5.51 4.21 2.21 2.02
Tourist guides 9.37 6.75 5.55 13.69 7.98 6.53 9.76 8.87
Cumulative percentage of all factors 100.00 100.00 100.00 100.00 100.00 100.00 100.00 100.00
Total Number 5215577 819836 128640 44512 3875095 907179 136225 44668
Rank Rank 5
Factor NRI PIO OCI Others
Accommodation tariff 11.05 5.08 3.18 4.49
Foreign Money transaction 12.60 15.00 10.42 9.15
Good sanitary & health condition 9.79 9.66 20.71 7.06
Personal security & safety 9.83 17.67 7.37 15.13
Reasonable Cost 16.65 16.43 10.66 27.02
Service (including food) 12.08 8.95 11.96 4.03
Shopping facilities 12.85 10.98 27.43 7.18
Sightseeing facilities 6.06 6.17 2.07 9.76
Spatial security 3.90 3.25 1.33 4.98
Tourist guides 5.19 6.81 4.87 11.20
Cumulative percentage of all factors 100.00 100.00 100.00 100.00
Total Number 2785000 752867 144688 53645
Rank Rank 1 Rank 2
Factor NRI PIO OCI Others NRI PIO OCI Others
Air 81.10 55.88 50.62 55.87 4.80 6.31 2.26 0.74
Rail 6.01 5.82 6.31 3.02 14.61 22.26 10.49 50.67
Road 12.34 37.49 35.77 34.47 77.78 69.99 85.85 41.98
Sea 0.55 0.81 7.30 6.64 2.81 1.44 1.40 6.61
Cumulative percentage of all factors 100.00 100.00 100.00 100.00 100.00 100.00 100.00 100.00
Total Number 6536095 379531 88865 20597 4079183 1307330 363634 116433

INTERNATIONAL PASSENGER SURVEY IN INDIA 2015-16
84
Table 28(b) (Contd.). Estimated Percentage Distribution of Visitors by Perceived Importance Level for Various Factors Related to Transport
From Table 28(b), we interpret that 81.10% (first cell) of NRI visitors considered the factor‘ Air’ as the most
important mode of transport (i.e. assigned Rank 1 to it).
Table 29(a). Importance of Tourism Infrastructure by Estimated Weighted Rank
In Table 29(a), percentages are calculated by row total for each factor. Each cell gives the percentage of visi-
tors who assigned the displayed rank to the corresponding factor. For example, the first cell implies that
59.30% of all visitors considered the factor ‘Personal security & safety’ as the most important (i.e. assigned
Rank 1) factor. Similarly, 11.13% of all visitors considered the factor ‘Spatial security’ as the most important
(i.e. assigned Rank 1) factor, while the majority of them (50.29 %) considered it as the 2nd most important.
For each factor, Weighted Rank was calculated as was done for Table 27.
From the last column it is inferred that, the factor that most (least) important to the visitors was ‘Personal se-
curity & safety’ (‘Foreign Money Transaction’).
Rank Rank 3 Rank 4
Factor NRI PIO OCI Others NRI PIO OCI Others
Air 8.47 3.69 4.90 0.79 1.36 2.51 0.12 2.16
Rail 38.15 46.51 28.51 69.03 14.28 19.51 11.16 6.86
Road 32.59 43.13 55.64 11.98 37.86 33.74 37.24 9.72
Sea 20.79 6.67 10.95 18.20 46.50 44.24 51.48 81.26
Cumulative percentage of all factors 100.00 100.00 100.00 100.00 100.00 100.00 100.00 100.00
Total Number 828306 321205 356704 203356 471968 124940 120385 445886
Factor Percentages of respondents assigning
Weighted Rank Rank1 Rank2 Rank3 Rank4 Rank5
Personal security & safety 59.30 15.51 9.57 8.00 7.62 1.89
Sightseeing facilities 23.12 31.68 24.09 13.35 7.76 2.51
Spatial security 11.13 50.29 16.86 14.12 7.61 2.57
Service (including food) 17.49 30.05 26.88 15.56 10.02 2.71
Tourist guides 11.21 25.13 30.80 21.31 11.54 2.97
Shopping facilities 15.92 21.62 24.32 23.29 14.85 3.00
Good sanitary &health condition 12.18 23.78 28.11 21.79 14.13 3.02
Reasonable Cost 19.56 18.06 20.80 22.44 19.14 3.04
Accommodation tariff 16.05 18.79 24.96 19.87 20.33 3.10
Foreign Money transaction 15.44 13.05 19.18 24.35 27.97 3.36
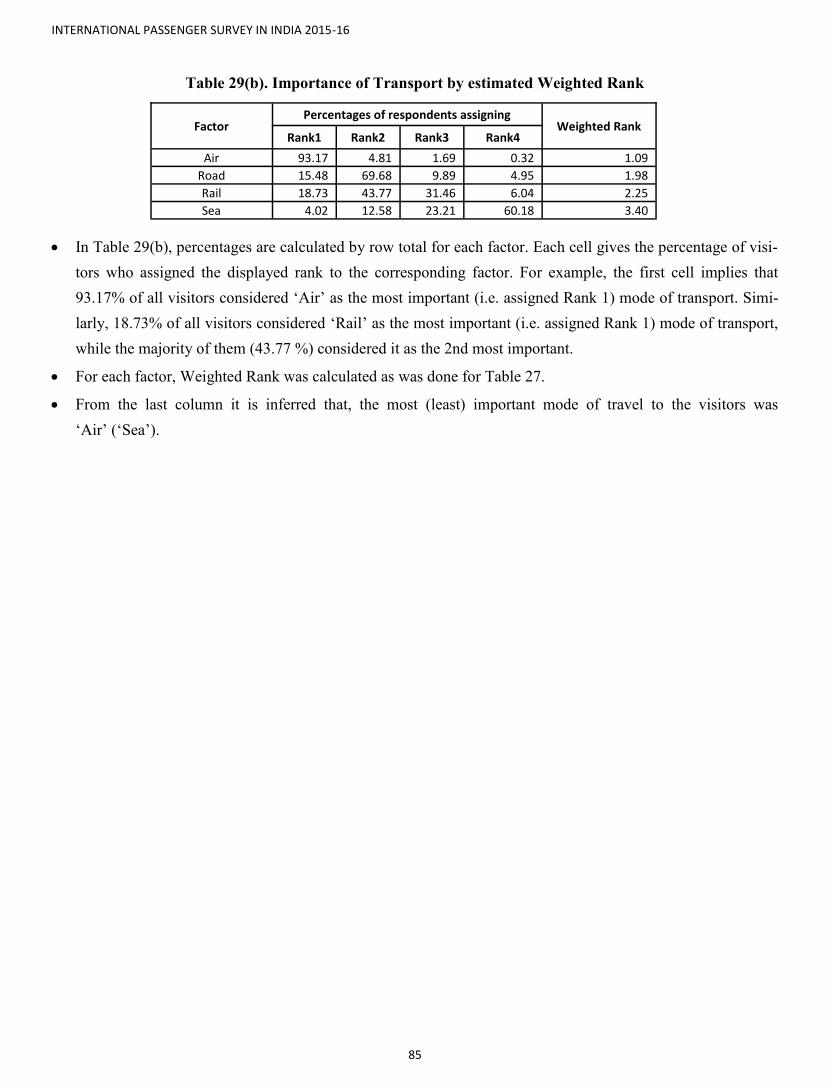
INTERNATIONAL PASSENGER SURVEY IN INDIA 2015-16
85
Table 29(b). Importance of Transport by estimated Weighted Rank
In Table 29(b), percentages are calculated by row total for each factor. Each cell gives the percentage of visi-
tors who assigned the displayed rank to the corresponding factor. For example, the first cell implies that
93.17% of all visitors considered ‘Air’ as the most important (i.e. assigned Rank 1) mode of transport. Simi-
larly, 18.73% of all visitors considered ‘Rail’ as the most important (i.e. assigned Rank 1) mode of transport,
while the majority of them (43.77 %) considered it as the 2nd most important.
For each factor, Weighted Rank was calculated as was done for Table 27.
From the last column it is inferred that, the most (least) important mode of travel to the visitors was
‘Air’ (‘Sea’).
Factor Percentages of respondents assigning
Weighted Rank Rank1 Rank2 Rank3 Rank4
Air 93.17 4.81 1.69 0.32 1.09
Road 15.48 69.68 9.89 4.95 1.98
Rail 18.73 43.77 31.46 6.04 2.25
Sea 4.02 12.58 23.21 60.18 3.40
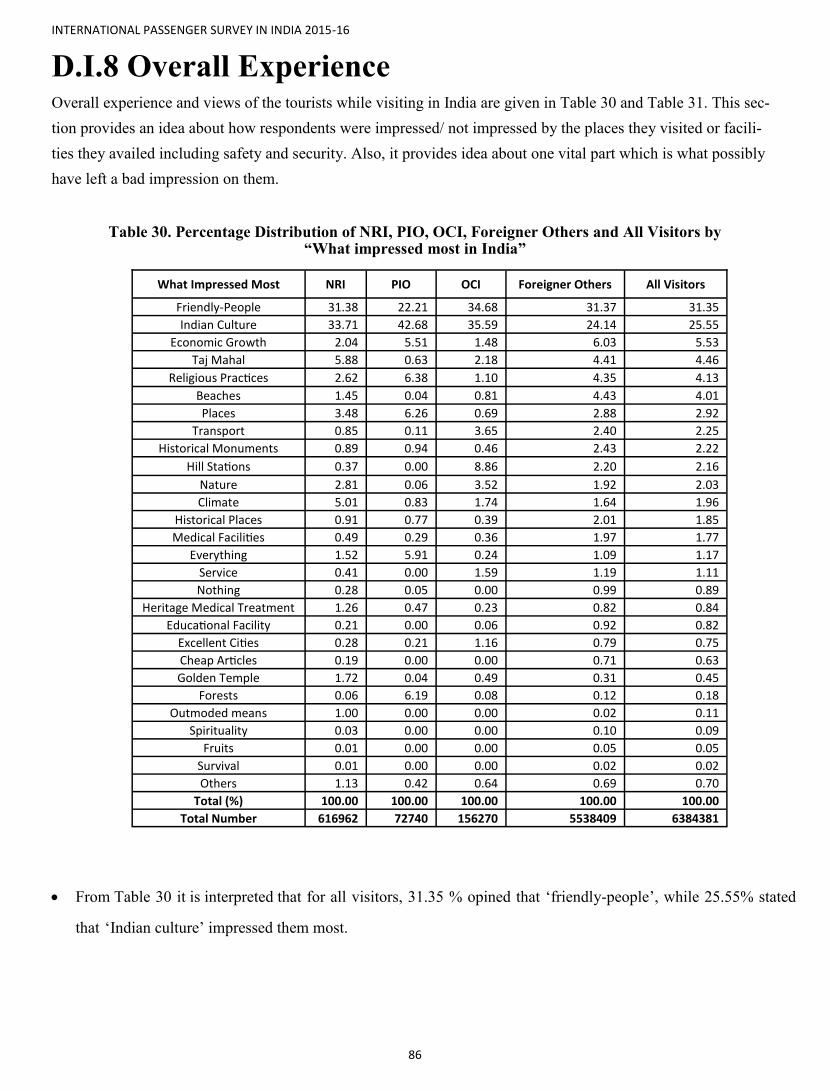
INTERNATIONAL PASSENGER SURVEY IN INDIA 2015-16
86
D.I.8 Overall Experience
Table 30. Percentage Distribution of NRI, PIO, OCI, Foreigner Others and All Visitors by “What impressed most in India”
From Table 30 it is interpreted that for all visitors, 31.35 % opined that ‘friendly-people’, while 25.55% stated
that ‘Indian culture’ impressed them most.
Overall experience and views of the tourists while visiting in India are given in Table 30 and Table 31. This sec-
tion provides an idea about how respondents were impressed/ not impressed by the places they visited or facili-
ties they availed including safety and security. Also, it provides idea about one vital part which is what possibly
have left a bad impression on them.
What Impressed Most NRI PIO OCI Foreigner Others All Visitors
Friendly-People 31.38 22.21 34.68 31.37 31.35
Indian Culture 33.71 42.68 35.59 24.14 25.55
Economic Growth 2.04 5.51 1.48 6.03 5.53
Taj Mahal 5.88 0.63 2.18 4.41 4.46
Religious Practices 2.62 6.38 1.10 4.35 4.13
Beaches 1.45 0.04 0.81 4.43 4.01
Places 3.48 6.26 0.69 2.88 2.92
Transport 0.85 0.11 3.65 2.40 2.25
Historical Monuments 0.89 0.94 0.46 2.43 2.22
Hill Stations 0.37 0.00 8.86 2.20 2.16
Nature 2.81 0.06 3.52 1.92 2.03
Climate 5.01 0.83 1.74 1.64 1.96
Historical Places 0.91 0.77 0.39 2.01 1.85
Medical Facilities 0.49 0.29 0.36 1.97 1.77
Everything 1.52 5.91 0.24 1.09 1.17
Service 0.41 0.00 1.59 1.19 1.11
Nothing 0.28 0.05 0.00 0.99 0.89
Heritage Medical Treatment 1.26 0.47 0.23 0.82 0.84
Educational Facility 0.21 0.00 0.06 0.92 0.82
Excellent Cities 0.28 0.21 1.16 0.79 0.75
Cheap Articles 0.19 0.00 0.00 0.71 0.63
Golden Temple 1.72 0.04 0.49 0.31 0.45
Forests 0.06 6.19 0.08 0.12 0.18
Outmoded means 1.00 0.00 0.00 0.02 0.11
Spirituality 0.03 0.00 0.00 0.10 0.09
Fruits 0.01 0.00 0.00 0.05 0.05
Survival 0.01 0.00 0.00 0.02 0.02
Others 1.13 0.42 0.64 0.69 0.70
Total (%) 100.00 100.00 100.00 100.00 100.00
Total Number 616962 72740 156270 5538409 6384381

INTERNATIONAL PASSENGER SURVEY IN INDIA 2015-16
87
Table 31. Percentage Distribution of NRI, PIO, OCI, Foreigner Others and All Visitors by “Reasons for Dissatisfaction”
Table 31 shows that for all foreigner visitors, the primary (32.66%) reason for dissatisfaction was ‘Traffic-
Chaos’, while the 2nd most (28.46%) one was ‘Pollution’.
Reasons for Dissatisfaction NRI PIO OCI Foreigner
Others All Visitors (%)
Traffic Chaos 36.78 81.03 48.50 27.69 32.66
Pollution 11.75 6.25 30.17 32.33 28.46
Bad-People 24.75 0.00 13.16 10.18 10.85
Poor Sanitary Conditions 0.73 12.05 8.17 10.28 9.48
Poor Infrastructure 8.95 0.00 0.00 5.75 5.57
Poor Railways 1.50 0.00 0.00 6.48 5.46
Poverty 0.00 0.00 0.00 2.92 2.40
Personal Insecurity 14.18 0.00 0.00 0.40 1.68
Poor Airport 0.00 0.00 0.00 1.58 1.30
Lack of Work Culture 0.00 0.67 0.00 1.15 1.00
Spatial Insecurity 0.00 0.00 0.00 0.40 0.33
Unethical Traders 1.36 0.00 0.00 0.18 0.28
Poor maintain of Beaches 0.00 0.00 0.00 0.33 0.27
Corruption 0.00 0.00 0.00 0.30 0.24
Poor maintain of Hill Stations 0.00 0.00 0.00 0.03 0.02
Total (%) 100.00 100.00 100.00 100.00 100.00
Total Number 12668 9667 1523 109556 133414
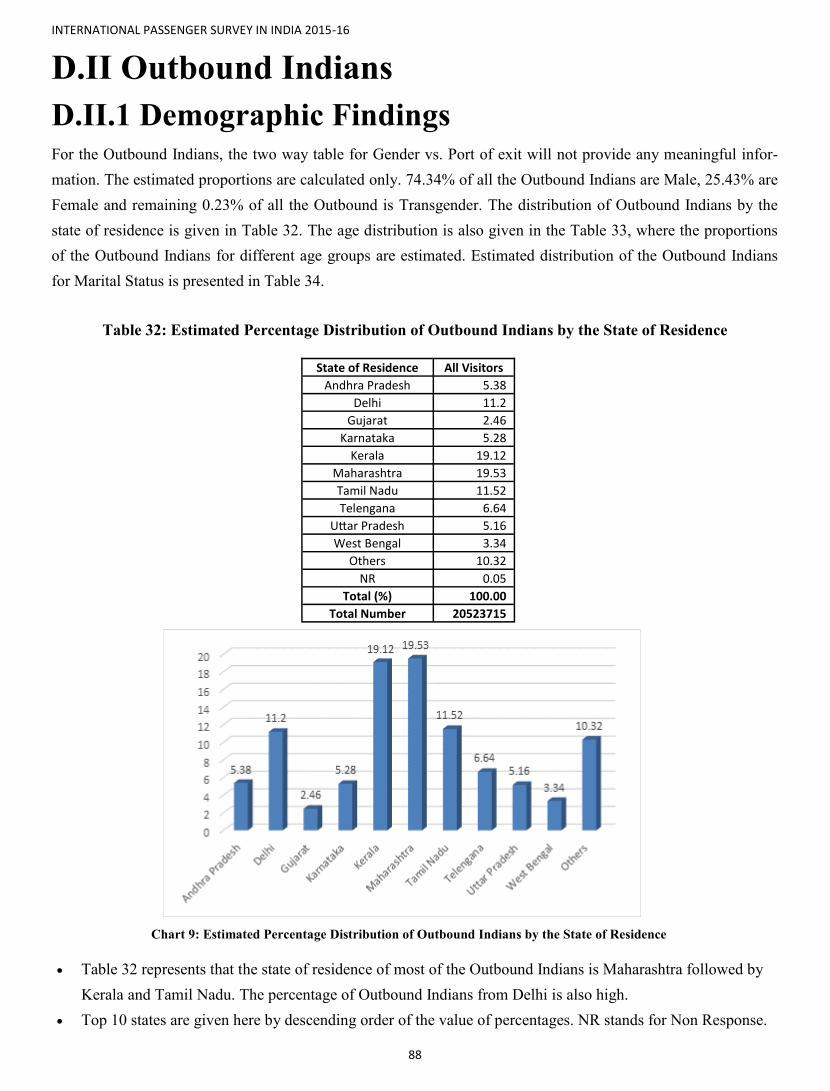
INTERNATIONAL PASSENGER SURVEY IN INDIA 2015-16
88
D.II Outbound Indians
D.II.1 Demographic Findings
For the Outbound Indians, the two way table for Gender vs. Port of exit will not provide any meaningful infor-
mation. The estimated proportions are calculated only. 74.34% of all the Outbound Indians are Male, 25.43% are
Female and remaining 0.23% of all the Outbound is Transgender. The distribution of Outbound Indians by the
state of residence is given in Table 32. The age distribution is also given in the Table 33, where the proportions
of the Outbound Indians for different age groups are estimated. Estimated distribution of the Outbound Indians
for Marital Status is presented in Table 34.
Table 32: Estimated Percentage Distribution of Outbound Indians by the State of Residence
State of Residence All Visitors
Andhra Pradesh 5.38
Delhi 11.2
Gujarat 2.46
Karnataka 5.28
Kerala 19.12
Maharashtra 19.53
Tamil Nadu 11.52
Telengana 6.64
Uttar Pradesh 5.16
West Bengal 3.34
Others 10.32
NR 0.05
Total (%) 100.00
Total Number 20523715
Table 32 represents that the state of residence of most of the Outbound Indians is Maharashtra followed by
Kerala and Tamil Nadu. The percentage of Outbound Indians from Delhi is also high.
Top 10 states are given here by descending order of the value of percentages. NR stands for Non Response.
Chart 9: Estimated Percentage Distribution of Outbound Indians by the State of Residence
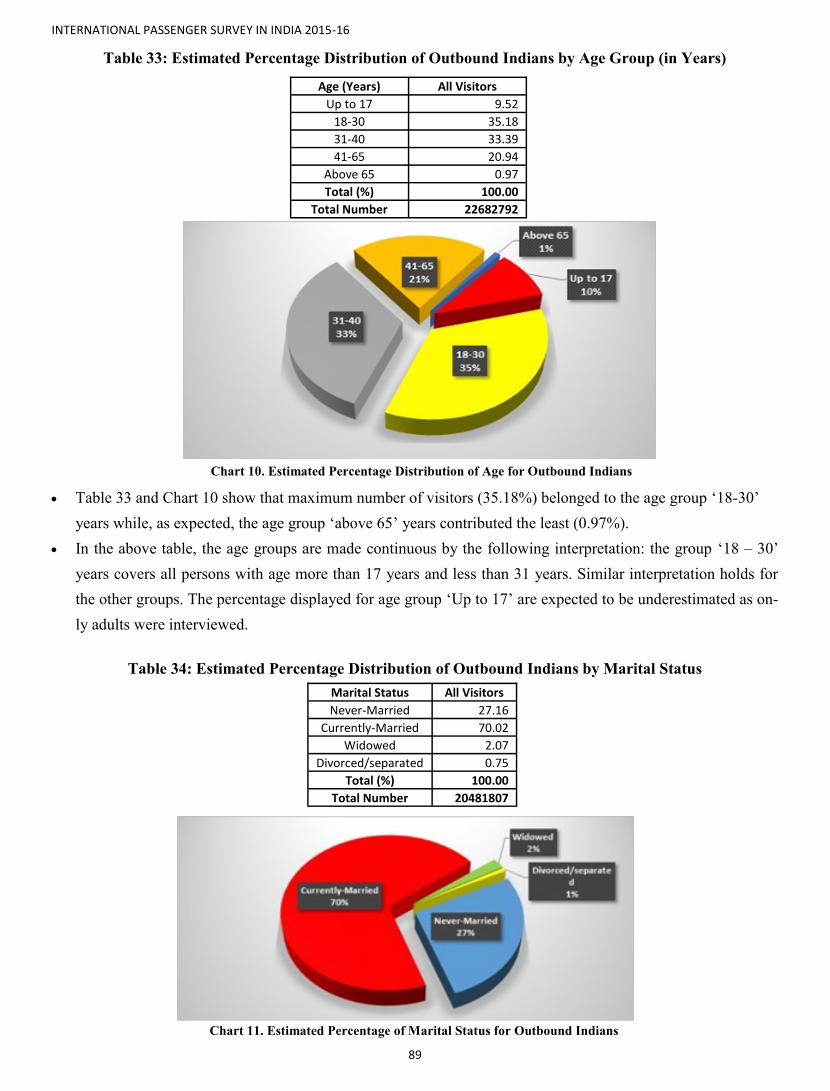
INTERNATIONAL PASSENGER SURVEY IN INDIA 2015-16
89
Table 33: Estimated Percentage Distribution of Outbound Indians by Age Group (in Years)
Chart 10. Estimated Percentage Distribution of Age for Outbound Indians
Table 33 and Chart 10 show that maximum number of visitors (35.18%) belonged to the age group ‘18-30’
years while, as expected, the age group ‘above 65’ years contributed the least (0.97%).
In the above table, the age groups are made continuous by the following interpretation: the group ‘18 – 30’
years covers all persons with age more than 17 years and less than 31 years. Similar interpretation holds for
the other groups. The percentage displayed for age group ‘Up to 17’ are expected to be underestimated as on-
ly adults were interviewed.
Table 34: Estimated Percentage Distribution of Outbound Indians by Marital Status
Chart 11. Estimated Percentage of Marital Status for Outbound Indians
Age (Years) All Visitors
Up to 17 9.52
18-30 35.18
31-40 33.39
41-65 20.94
Above 65 0.97
Total (%) 100.00
Total Number 22682792
Marital Status All Visitors
Never-Married 27.16
Currently-Married 70.02
Widowed 2.07
Divorced/separated 0.75
Total (%) 100.00
Total Number 20481807

INTERNATIONAL PASSENGER SURVEY IN INDIA 2015-16
90
D.II.2 Socio-Economic Findings
Table no. 34 and Chart 11 show that 70.02% of Outbound Indians are married currently, this is followed by
those who are never married with a share of 27.16%.
In this part, the Estimated distribution of the Outbound Indians for Education Level (Table 35), Occupation
(Table 36) and various Income groups (Table 37) are exhibited. Income groups are divided into several catego-
ries so that one can get more accurate information of the income profile of the Outbound Indians. Income
groups are given in INR.
Table 35: Estimated Percentage Distribution of Outbound Indians by Education Level
Education Level All Visitors
Illiterate 2.28
School Level 15.35
Bachelor and above 73.96
Other 8.41
Total (%) 100.00
Total Number 20510768
Chart 12: Estimated Percentage of Educational Level for Outbound Indians
Table 35 and Chart 12 show that 73.96% of all Outbound Indians have Education level ‘Bachelor and
above’ and only 2.28% are ‘Illiterate’.
Table 36: Estimated Percentage Distribution of Outbound Indians by Occupation
Occupation All Visitors
Private Service 35.02
Self employed 24.20
Industrialist 12.76
Student/Researcher 9.21
Housewife 7.41
Government Service 4.25
Agriculturist 0.83
Others 6.32
Total (%) 100.00
Total Number 20479743
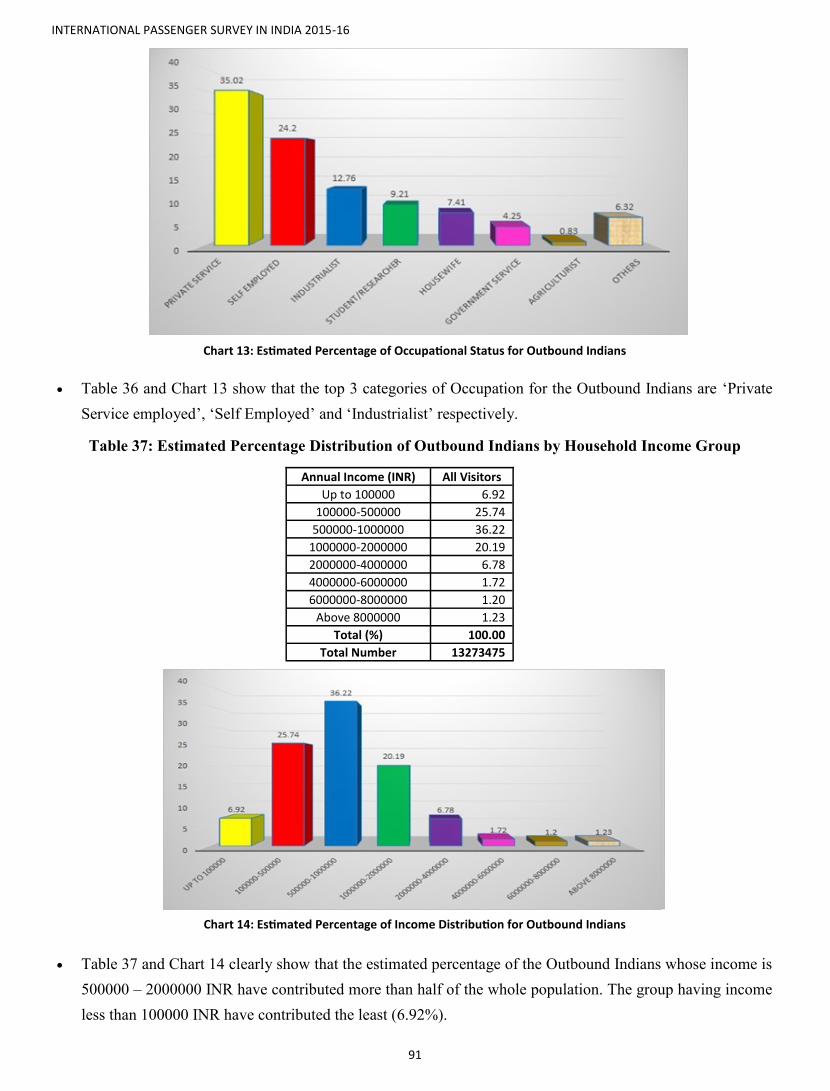
INTERNATIONAL PASSENGER SURVEY IN INDIA 2015-16
91
Chart 13: Estimated Percentage of Occupational Status for Outbound Indians
Table 36 and Chart 13 show that the top 3 categories of Occupation for the Outbound Indians are ‘Private
Service employed’, ‘Self Employed’ and ‘Industrialist’ respectively.
Table 37: Estimated Percentage Distribution of Outbound Indians by Household Income Group
Annual Income (INR) All Visitors
Up to 100000 6.92
100000-500000 25.74
500000-1000000 36.22
1000000-2000000 20.19
2000000-4000000 6.78
4000000-6000000 1.72
6000000-8000000 1.20
Above 8000000 1.23
Total (%) 100.00
Total Number 13273475
Chart 14: Estimated Percentage of Income Distribution for Outbound Indians
Table 37 and Chart 14 clearly show that the estimated percentage of the Outbound Indians whose income is
500000 – 2000000 INR have contributed more than half of the whole population. The group having income
less than 100000 INR have contributed the least (6.92%).

INTERNATIONAL PASSENGER SURVEY IN INDIA 2015-16
92
D.II.3 Travel Pattern
The different purposes of the present visit of the Outbound Indians are given in Table 38. How many times the
Outbound Indians have visited abroad, that distribution is also given here in Table 39. Table 40 shows how
many of the outbound passengers are travelling individually of with family or in groups. This section will ena-
ble one to understand the travel pattern of Outbound Indians. The expected duration of staying in abroad for the
Outbound Indians is exhibited in Table 41. This table on ‘purpose of visit’ will focus on some pertinent points
regarding ‘how’ and ‘why’ Indians travel abroad.
Table 38: Estimated Percentage Distribution of Outbound Indians by Principal Purpose of Present Visit
Principal Purpose of visit All Visitors
Business 34.81
Holidaying/Leisure/Recreation
30.08
Social 13.66
Education/Training 5.45
Religious activities 3.46
Job on foreign deputation 1.13
Health/Medical 0.52
Shopping 0.14
Games/Sports 0.08
Others 10.67
Total (%) 100.00
Total Number 20523715
Chart 15: Estimated Percentage Distribution of Principal Purpose of Visit for Outbound Indians
Table 38 and Chart 15 show that the top 3 purposes of visit for the Outbound Indians are Business, Holi-
daying and Social respectively.
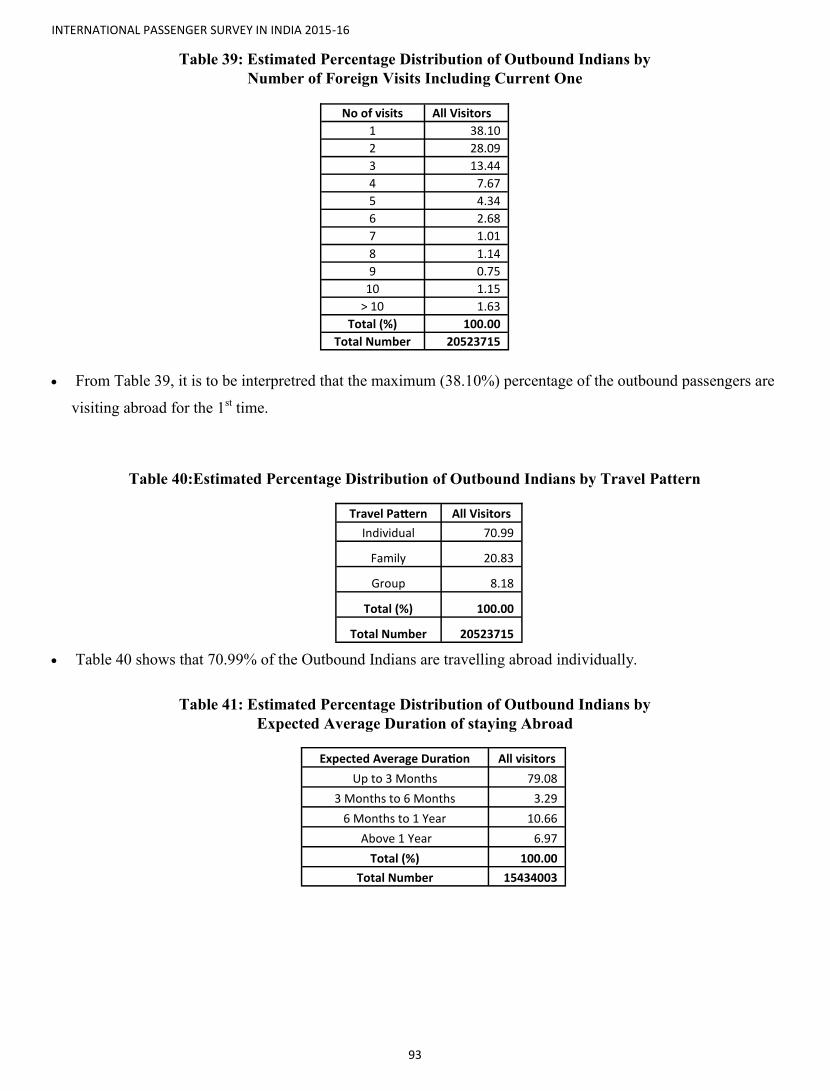
INTERNATIONAL PASSENGER SURVEY IN INDIA 2015-16
93
Table 39: Estimated Percentage Distribution of Outbound Indians by
Number of Foreign Visits Including Current One
No of visits All Visitors
1 38.10
2 28.09
3 13.44
4 7.67
5 4.34
6 2.68
7 1.01
8 1.14
9 0.75
10 1.15
> 10 1.63
Total (%) 100.00
Total Number 20523715
From Table 39, it is to be interpretred that the maximum (38.10%) percentage of the outbound passengers are
visiting abroad for the 1st time.
Table 40:Estimated Percentage Distribution of Outbound Indians by Travel Pattern
Table 40 shows that 70.99% of the Outbound Indians are travelling abroad individually.
Table 41: Estimated Percentage Distribution of Outbound Indians by
Expected Average Duration of staying Abroad
Travel Pattern All Visitors
Individual 70.99
Family 20.83
Group 8.18
Total (%) 100.00
Total Number 20523715
Expected Average Duration All visitors
Up to 3 Months 79.08
3 Months to 6 Months 3.29
6 Months to 1 Year 10.66
Above 1 Year 6.97
Total (%) 100.00
Total Number 15434003
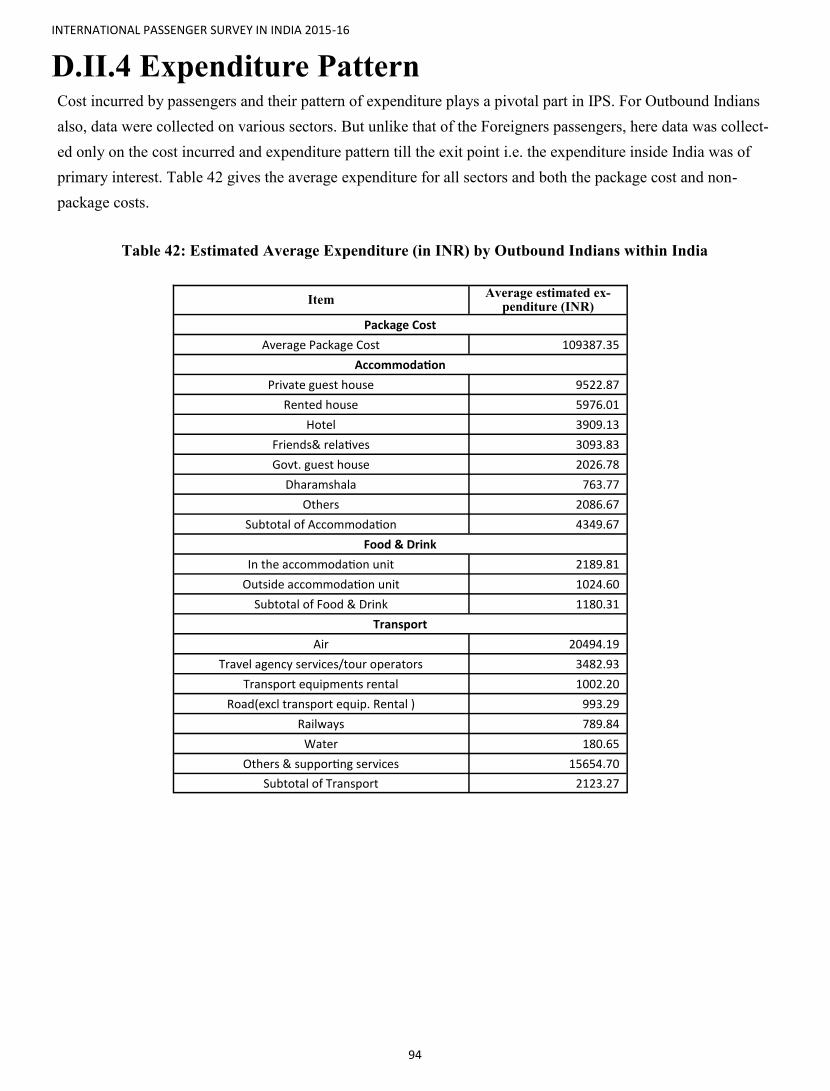
INTERNATIONAL PASSENGER SURVEY IN INDIA 2015-16
94
D.II.4 Expenditure Pattern Cost incurred by passengers and their pattern of expenditure plays a pivotal part in IPS. For Outbound Indians
also, data were collected on various sectors. But unlike that of the Foreigners passengers, here data was collect-
ed only on the cost incurred and expenditure pattern till the exit point i.e. the expenditure inside India was of
primary interest. Table 42 gives the average expenditure for all sectors and both the package cost and non-
package costs.
Table 42: Estimated Average Expenditure (in INR) by Outbound Indians within India
Item Average estimated ex-
penditure (INR)
Package Cost
Average Package Cost 109387.35
Accommodation
Private guest house 9522.87
Rented house 5976.01
Hotel 3909.13
Friends& relatives 3093.83
Govt. guest house 2026.78
Dharamshala 763.77
Others 2086.67
Subtotal of Accommodation 4349.67
Food & Drink
In the accommodation unit 2189.81
Outside accommodation unit 1024.60
Subtotal of Food & Drink 1180.31
Transport
Air 20494.19
Travel agency services/tour operators 3482.93
Transport equipments rental 1002.20
Road(excl transport equip. Rental ) 993.29
Railways 789.84
Water 180.65
Others & supporting services 15654.70
Subtotal of Transport 2123.27

INTERNATIONAL PASSENGER SURVEY IN INDIA 2015-16
95
Table 42 (Contd.): Estimated Average Expenditure (in INR) by Outbound Indians within India
Item Average estimated ex-
penditure (INR)
Shopping
Gems and jewellery etc. 5809.00
Clothing and garments 5501.62
Tobacco products 3020.13
Alcohol 2401.37
Footwear/leather goods 1875.06
Processed food 1866.85
Travel related consumer goods 1674.77
Toiletries 1143.61
Books, journals etc. 886.05
Others 1787.31
Subtotal of Shopping 6979.80
Recreation, religious, cultural, sporting
Entry fee & others expenses at cultural sites 898.21
Sporting activities 811.60
Cinema,theatre,amusements 745.04
Entry fee to and other exp. at religious. sites 622.01
Subtotal of Recreation, religious, cultural, sporting 980.44
Medical and health related activities
Medicine 2830.08
Medical accessories 2083.93
Other health related services 1780.00
Subtotal of Medical and health related activities 2964.99
Others non-packages 8069.49
Total average cost of Non package component 7319.37
Total average cost of Package + non package com-ponent
12413.06
From Table 42 it is interpreted that as expected the average expenditure is highest for Shopping (Rs.6979.80),
followed by Accommodation (Rs.4349.67).


CHAPTER E
CONCLUSION, LIMITATIONS AND
WAY FORWARD

INTERNATIONAL PASSENGER SURVEY IN INDIA 2015-16
99
E. Conclusions, Limitations and Way Forward
E.1 During implementation of the present scheme, several practical difficulties became unsurmountable. A na-
tional survey spanning over more than a year is bound to face troubled waters, like airport cutouts for reno-
vations, bomb blasts, catastrophes, blizzards, volcanic eruptions, and not the least, changing operational re-
quirements.
E.2 The last hurdle mentioned above, i.e. changes in operational requirements imposed by the authorities con-
cerned, forced to abandon the efforts to collect data at several landports, inspite of attempts by MoT to
overcome it. Permission to conduct the survey could not be made available . Hence, the survey could not
be conducted at several landports, e.g. Attari, Wagha, etc. This was in sharp contrast to the last IPS where
cooperation for conducting survey at the landports was extended.
.
E.3 On the operational side, the following may further be noted:
1. The attempts to get answers to “Annual Income” met with cold shoulders often. This item should be
replaced by a categorical variable.
2. The IPSF questionnaire for the large-scale national survey has become even longer than the previous
one, with inclusion of several pertinent new questions. However, the schedule needs to be shortened
to get quality data - it is too long for most passengers.
3. As in the previous IPS, this survey had no better luck during e.g. December - January nationally and
Monsoon periods in Mumbai and Kolkata. Since, this cycle has now become well established, alter-
native plans for collection of data need to be made for the known periods of major disruptions in air
travel.
4. Interim small-scale surveys should be conducted by MoT (in the line of Special Rounds of surveys
conducted by NSSO on specific themes) exclusively on special topics, e.g. expenditure details.
5. A mid-term (say 2.5 years after the large-scale), mid-sized survey should be conducted at selected
ports to capture the trend and variabilities.
6. Special Satellite survey, which was being planned to collect data on items which are only sparsely
available from the passengers, e.g. expenditures covered by companies or agencies, need to be con-
ducted. However, this exercise cannot be done simultaneously with the main IPS. A suitable time
frame should be worked out for it.
7. As was felt in the last IPS, on-site digitized electronic mode of collection of data should be intro-
duced. This would greatly facilitate data base management, early data processing and early prepara-
tion of analysis of report. Further, this method would also enhance archiving and e-governance of
time-critical large-scale IPS reports of Ministry of Tourism.
E.4 On the theoretical side, the following need to be considered:
1. BoI data should be accessed for NRIs. These would help forming sharper multipliers and hence better
estimates of the items relevant to this section of the passengers.

INTERNATIONAL PASSENGER SURVEY IN INDIA 2015-16
100
2. Prior information on the extent of homogeneity of visitors at each port of exit is of great use. The ef-
fective allocation of sample sizes may be done based on this information to capture the variabilities
more rigorously and hence obtain efficient estimators. At some of the exit airports, e.g. Amritsar, it
was found during the survey that most of the passengers had very similar characteristics in terms of
expenditure details within each port. Such information as well as very scanty and irregular volume
have prompted to abandon sampling from some newly emerging airports, e.g. Guwahati and Patna.
3. To overcome the problem of “Missing Data”, techniques from Data Fusion have been tried. Further
modern techniques for imputation of data should be studied to identify the optimal one, specifically
for the large-scale survey. As also mentioned in the report of the last IPS, this becomes imperative
not only for `Missing' values, but also for `Combined' values. The latter arise e.g. when the category
`Others' in the expenditure table is filled by data corresponding to not only the `Others' as listed in
the table but also when the respondent is able to give the values for only a few of the sub-items and
then refers to `Others' as the remaining listed items including the `Others' listed at the end.
4. The list of top countries as supplied by MoT can lead to difficulty in interpretations for such items as
for which their performances are very poor – almost nil in in several cases. Pakistan is one such
country.
5. Identification of Outliers and Contaminated populations must be done objectively.
6. Trimmed estimation technique was adopted to provide reasonably robust estimates. Alternative ro-
bust estimators compared to the average need to be explored. No guideline on this important aspect is
available. MoT may specify the tolerable limits of upper and lower trimming in this respect.
7. Theoretical exercises on the relative gain of such estimators as mentioned in item 6 above need to be
taken up.
8. Instead of frequency data on outgoing passengers, data on incoming passengers was received. This
gap needs to be filled up, as otherwise certain assumptions have to be used to justify the theoretical
approach for estimation.
9. Multilingual schedules will possibly increase efficiency of the survey.
10. Travel Insurance should be added as an item in the IPSO schedule. This important aspect has been
totally ignored in all international surveys. It is obvious that a significant monetary contribution is
made by this item to Tourism.

ACKNOWLEDGEMENTS


103
INTERNATIONAL PASSENGER SURVEY IN INDIA 2015-16
Acknowledgments
The Principal Investigator Prof. Ashis SenGupta likes to express his deep
appreciation to Prof. B.K. Roy, the Director, ISI, at the time of acceptance of this
project and Prof. S. Bandopadhyay, the current Director, ISI, for their exemplary
support and encouragements with conducting of IPS. The Heads and Professors-
in-Charge of the Applied Statistics Unit and Applied Statistics Division have also
extended their cooperations and are duly thanked hereby. I would like to thank
the Secretary, Ministry of Tourism (MoT), for the patience and understanding in
extending the time needed, due to reasons beyond our control, for conducting as
also for preparing the report on IPS. It is indeed a great pleasure to put on
record the exemplary help and cooperation extended by the members of MoT
involved with this project including : Ms. Rashmi Verma, Secretary; Shri Satyajeet
Rajan, Director General; Dr R K Bhatnagar, Ex ADG(MR); Shri S M Mahajan, Ex
ADG(MR); Ms. Mini Prasannakumar, Director(MR); Ms. Neha Srivastava, Deputy
Director; Shri Shailesh Kumar, Deputy Director; Ms. Anila Kumari T, Assistant
Director; Ms. Nikita Garg, Assistant Director; Ms. Anshika Bhatnagar, Assistant
Director and Shri S K Mohanta, Programmer. The authorities at all the airports
and landports where IPS could be conducted had extended their support to us
and I express my deep gratitude to them, in particular to the Airport Directors at
Amritsar, Delhi, Goa, Kolkata and Mumbai airports. I am deeply indebted to the
Nodal Coordinators for their untiring and sincere participations in IPS: Prof. Ajit
Chaturvedi, Dept. of Statistics, Delhi University, Delhi; Ms. Meena Parulekar, Goa
Institute of Management, Goa; Prof. T.V. Ramanathan, Head, Dept. of Statistics,
SP Pune University, Pune; Prof. P.G. Sankaran, Head, Dept. of Statistics, Cochin
University of Science and Technology, Kochi, and our ISI colleagues: Dr. G.
Ravindran, ISI, Chennai; Mr. H.M. Rajashekara, ISI, Bangalore and Dr. A. Sarkar,
ISI, Mumbai. No word can suffice for expressing my heartfelt thanks to Mr. C.H.
Sastry, Ex Prof-in-Charge, Applied Statistics Division, ISI, Kolkata, currently at
Hyderabad, without whose indefatigable efforts the survey at Hyderabad,
Bangalore and Goa could not have been conducted. It is a deep pleasure to
acknowledge the profuse help and exemplary sense of attachment exhibited at
Kolkata, our main center, by the core team members of IPS: Dr. Kajal Dihidar,
Ms. Roma Choudhury Sahu, Mr. Amiya Das, Mr. Dilip Chaturvedi - all of Applied
Statistics Unit (ASU), Dr. Md. Zafar Anis of SQC and OR Unit and Dr. Shankar
Dihidar of BIR Unit. Also Mr. Amit Paria and Mr. Shankar Behera of ASU deserve
to be thanked profusely. The project linked personnel of IPS including Mr. Kunal
Basu, Mr. Amitava Mitra, Mr. Aritra Banerjee, Ms. Sangeeta Ghosh, Mr. Saheb
Jaiswal and the staff of ASU had also extended their supports and are gratefully
acknowledged. The interviewers as well as the personnel for scrutiny and data
entry have spent sleepless nights to expedite the processing of the data and
achieve our goal – their contributions are deeply appreciated. Finally, without the
invaluable cooperations of Mr. A. Biswas, Director’s Office, and of our Accounts
section, it could have been quite difficult to complete this IPS project now.

INTERNATIONAL PASSENGER SURVEY IN INDIA 2015-16
104

APPENDIX

Appendix A
Estimation Procedure & Formulae


109
INTERNATIONAL PASSENGER SURVEY IN INDIA 2015-16 DRAFT REPORT
AA.1 Estimation procedure It is to be noted that the sampling design contains the Rao, Hartley and Cochran’s (RHC, 1962) scheme, Midzu-no’s scheme and SRWOR scheme. Before giving the detailed estimation formulae by the multistage estimator, discussions are presented below about RHC scheme and Midzuno’s scheme separately.
AA.2 Rao, Hartley and Cochran’s (RHC, 1962) scheme
Let 1
(0 1, 1)N
i ii
p p=
< < =∑ be the normed size measures.
n groups are formed with iN units in the ith group by simple random sampling without replacement (SRSWOR) out of the N units such that, writing nΣ as sum over n groups, .n iN NΣ = Optimal group sizes as given by Rao et al.(1962) are
[ ]iNNn
= for i = 1, 2, ..., k
= [ ] 1Nn
+ for i= k + 1, . . . , n.
k is to be determined by solving n iN NΣ = .
The normed size measures of the iN units falling in the ith group be denoted by 1 2( , , , )ii i iNp p p… and by iQ the
sum of those normed size measures. Then a unit ki say, is chosen from the ith group with probability /
ki ip Q . This is independently repeated across the n groups. Thus a sample of size n is obtained. For simplicity, the value obtained from the selected unit of ith group is callled as iy and the normed size mea-sure corresponding to the selected unit from ith group as ip .
RHC’s unbiased estimator for 1Ni iY y== Σ is
in i
i
Qt yp
= Σ and 2
2
( )( 1)
jn i iN N i j
i j
yN N yV t p pN N p p
Σ − = Σ Σ − − ,
where N NΣ Σ denotes the summation over non-repeated pairs of N population units.
RHC (1962) have given a uniformly non-negative unbiased estimator of the variance V (t) as
22
2 2( ) ( ) jn i in n i j
n i i j
yN N yV t v t Q QN N p p
Σ − = = Σ Σ − −Σ ,
where n nΣ Σ denotes the summation over non-overlapping pairs of n groups.
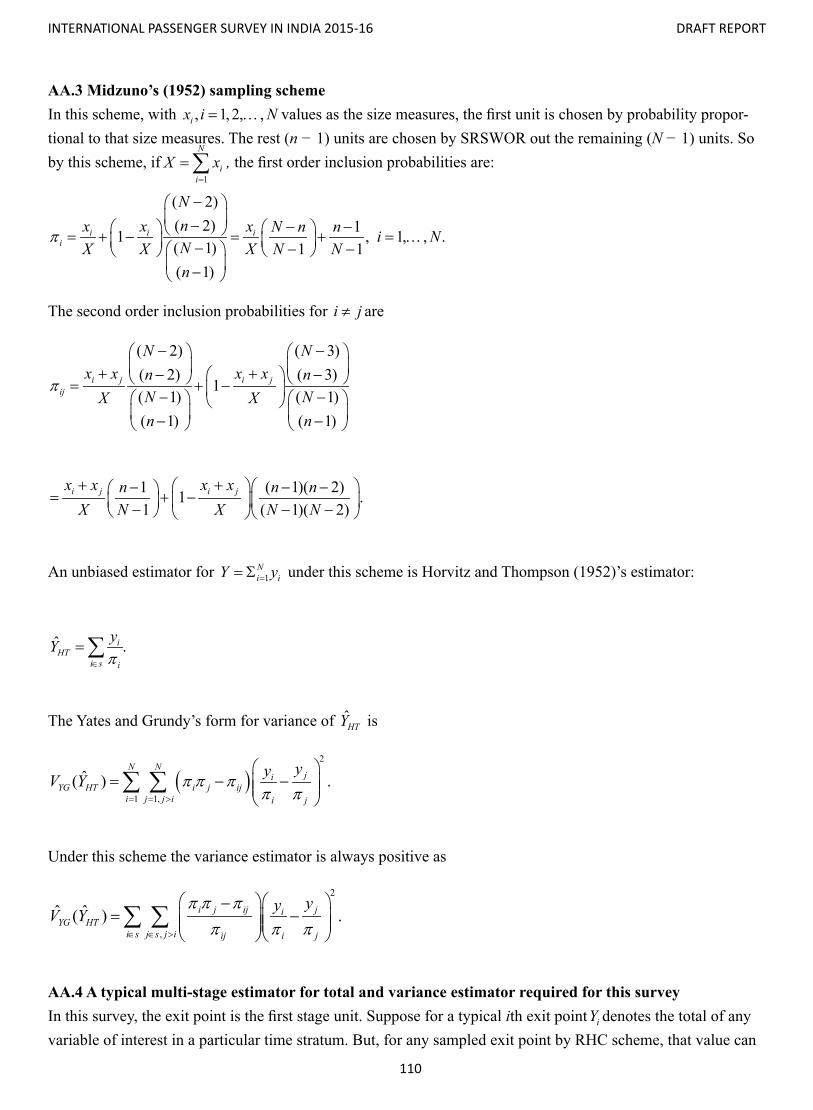
INTERNATIONAL PASSENGER SURVEY IN INDIA 2015-16 DRAFT REPORT
110
AA.3 Midzuno’s (1952) sampling scheme In this scheme, with , 1, 2, ,ix i N= … values as the size measures, the first unit is chosen by probability propor-tional to that size measures. The rest (n − 1) units are chosen by SRSWOR out the remaining (N − 1) units. So by this scheme, if
1
N
ii
X x=
=∑ , the first order inclusion probabilities are:
( 2)( 2) 11 , 1, , .( 1) 1 1( 1)
i i ii
Nnx x x N n n i NNX X X N Nn
π
− − − − = + − = + = … − − − −
The second order inclusion probabilities for i j≠ are
( 2) ( 3)( 2) ( 3)
1( 1) ( 1)( 1) ( 1)
i j i jij
N Nx x x xn n
N NX Xn n
π
− − + +− − = + − − − − −
1 ( 1)( 2)1 .1 ( 1)( 2)
i j i jx x x xn n nX N X N N+ + − − − = + − − − −
An unbiased estimator for 1Ni iY y== Σ under this scheme is Horvitz and Thompson (1952)’s estimator:
ˆ .iHT
i s i
yYπ∈
=∑
The Yates and Grundy’s form for variance of HTY is
( )2
1 1,
ˆ( ) .N N
jiYG HT i j ij
i j j i i j
yyV Y π π ππ π= = >
= − −
∑ ∑
Under this scheme the variance estimator is always positive as
2
,
ˆ ˆ( ) .i j ij jiYG HT
i s j s j i ij i j
yyV Yπ π π
π π π∈ ∈ >
−= −
∑ ∑
AA.4 A typical multi-stage estimator for total and variance estimator required for this survey In this survey, the exit point is the first stage unit. Suppose for a typical ith exit point iY denotes the total of any variable of interest in a particular time stratum. But, for any sampled exit point by RHC scheme, that value can

111
INTERNATIONAL PASSENGER SURVEY IN INDIA 2015-16 DRAFT REPORT
not be obtained directly. So, in the above estimator t, iy ’s will not be directly ascertainable. To estimate, iy for a typical ith sampled first stage unit i.e. ith sampled port, three-stage Midzuno - SRSWOR -SRSWOR scheme is employed.
For a particular time period, suppose im weeks are chosen out of iM weeks by Midzuno’s scheme with weekly number of tourists outgoing in 2008 as size measures. Let iwY denotes the total of the variable of interest for asampled week, say week w.
To estimate iwY , next suppose that iwm number of days is chosen by SRSWOR out of 7iwM = days in the wth selected week.
Suppose iwdY denotes the total of any particular variable y of interest for dth sampled day, of the sampled week.Let iwdM denotes the total number of tourists (immigration figure obtained from MoT for the sake of estima-tion). To estimate iwdY , information from iwdm tourists are collected with equal probabilities and without repe-tition. Suppose the sample observations are , 1, ,iwdt iwdy t m= … .
So, iwdty denotes a typical observation for tth sampled tourist for dth sampled day for wth sampled week of a particular time period for ith sampled exit point.
An unbiased estimator for the total for a dth sampled day of the wth sampled week for ith sampled exit point and a variance estimator are given by
1
iwdmiwd
iwd iwdttiwd
MY ym =
= ∑(1.1)
and
( )22
1
1 1 1 ,1
iwdm
iwd iwd iwdt iwdtiwd iwd iwd
v M y ym m M =
= − − −
∑(1.2)
where 1 .
iwdm
iwdtt
iwdiwd
yy
m==∑
An unbiased estimator for the total for a sampled week w for ith sampled exit point and a variance estimator are given by
1
iwmiw
iw iwddiw
MY Ym =
= ∑(2.1)

INTERNATIONAL PASSENGER SURVEY IN INDIA 2015-16 DRAFT REPORT
112
and
( )22
1 1
1 1 1 ,1
iw iwm miw
iw iw iwd iw iwdd diw iw iw iw
Mv M Y y vm m M m= =
= − − + −
∑ ∑(2.2)
1 .
iwm
iwdd
iwiw
Ywhere y
m==∑
Next, the estimator for iY for a particular time stratum, say, st1 and a variance estimator are given by
1( ) iwi st
w s iw
YYπ∈
=∑(3.1)
and
2
1,
( . ) iw iw iww iw iw iwi st
w s w s w w w siww iw iw iw
Y Y vv π π ππ π π π
′ ′ ′
′ ′∈ ∈ > ∈′ ′
−= − + ∑ ∑ ∑
(3.2)
Here iwπ denotes the first order inclusion probabilities of wth selected week in ith exit point and iwwπ ′ denotes the second order inclusion probabilities for weeks w w′≠ in ith exit point.
For all the four time stratums, 1( )i stY ,
2 3 4( ) , ( ) , ( )i st i st i stY Y Y with the corresponding variance estimates as
1 2 3( ) , ( ) , ( )i st i st i stv v v and 4( )i stv are estimated..
Then the population total for ith selected port for the entire year is estimated as
1 2 3 4( ) ( ) ( ) ( )i i st i st i st i stY Y Y Y Y= + + +(3.3)
with the corresponding variance estimate as
1 2 3 4( ) ( ) ( ) ( ) . i i st i st i st i stv v v v v= + + +(3.4)
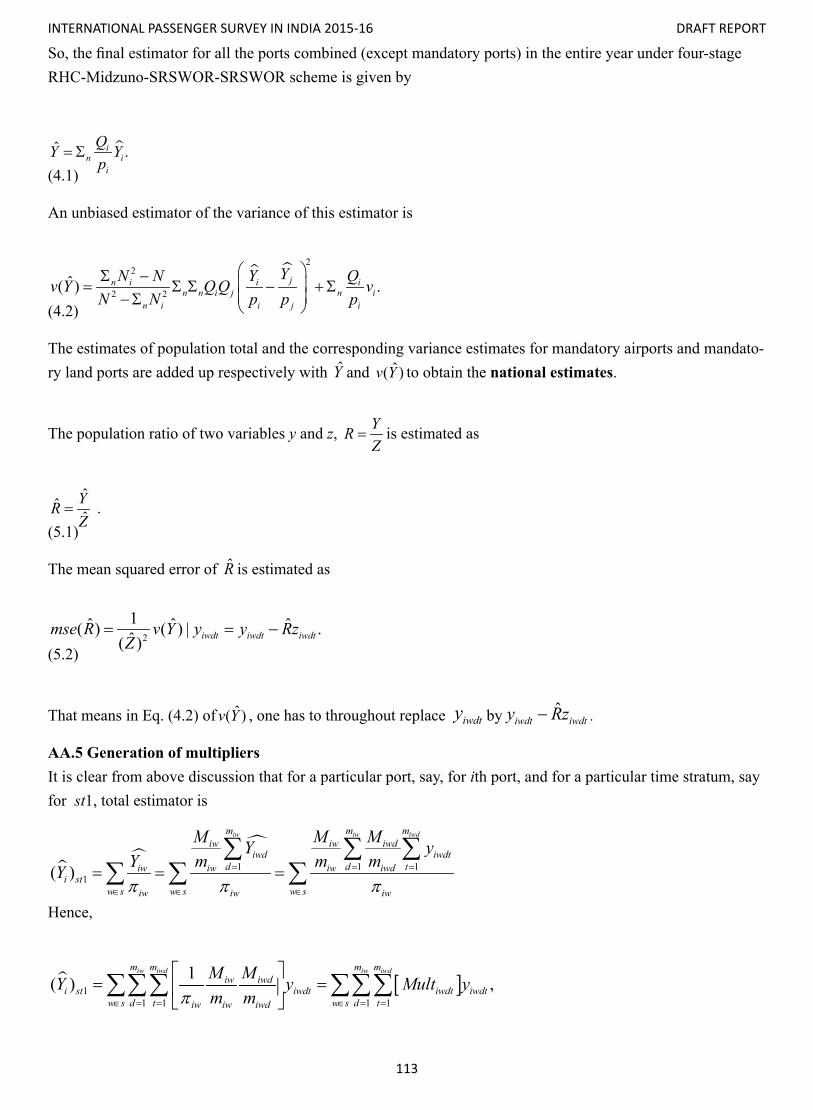
113
INTERNATIONAL PASSENGER SURVEY IN INDIA 2015-16 DRAFT REPORT
So, the final estimator for all the ports combined (except mandatory ports) in the entire year under four-stage RHC-Midzuno-SRSWOR-SRSWOR scheme is given by
ˆ .in i
i
QY Yp
= Σ(4.1)
An unbiased estimator of the variance of this estimator is
22
2 2ˆ( ) .jn i i i
n n i j n in i i j i
YN N Y Qv Y Q Q vN N p p p
Σ − = Σ Σ − +Σ −Σ (4.2)
The estimates of population total and the corresponding variance estimates for mandatory airports and mandato-ry land ports are added up respectively with Y and ˆ( )v Y to obtain the national estimates.
The population ratio of two variables y and z, YRZ
= is estimated as
.ˆ ˆˆ YRZ
=(5.1)
The mean squared error of R is estimated as
2
1ˆ ˆ ˆ( ) ( ) | .ˆ( ) iwdt iwdt iwdtmse R v Y y y RzZ
= = −(5.2)
That means in Eq. (4.2) of ˆ( )v Y , one has to throughout replace iwdty by ˆiwdt iwdty Rz− .
AA.5 Generation of multipliers It is clear from above discussion that for a particular port, say, for ith port, and for a particular time stratum, say for st1, total estimator is
1 1 11( )
iw iw iwdm m miw iw iwd
iwd iwdtd d tiw iw iw iwd
i stw s w s w siw iw iw
M M MY yY m m mYπ π π
= = =
∈ ∈ ∈
= = =∑ ∑ ∑
∑ ∑ ∑Hence,
[ ]11 1 1 1
1( ) ,iw iwd iw iwdm m m m
iw iwdi st iwdt iwdt iwdt
w s d t w s d tiw iw iwd
M MY y Mult ym mπ∈ = = ∈ = =
= =
∑∑∑ ∑∑∑

INTERNATIONAL PASSENGER SURVEY IN INDIA 2015-16 DRAFT REPORT
114
where 1 iw iwd
iwdtiw iw iwd
M MMultm mπ
= ,
is called the multiplier for the observation iwdty . To obtain national estimate of total, along with this multiplier iwdtMult , the port-wise multipliers i
i
Qp
is multi-plied, where for mandatory ports this value is 1.0.
Appendix B
Itemized Top 20 Tables


INTERNATIONAL PASSENGER SURVEY IN INDIA 2015-16
119
Table I1. Estimated Percentage Distribution of NRI, PIO, OCI, Foreigner Others and All Visitors by
Country of Normal Residence
From the above Table I1, it is observed that for the group ‘NRI’, the 3 countries contributing the most are
UAE, Singapore and USA. For the group ‘PIO’, the top 3 countries are UAE, China and UK; for the group
‘OCI’, the 3 countries with highest percentages are UAE, USA, UK; and lastly for the group ‘Foreigner Oth-
ers’, the top 3 countries are Bangladesh, UK, USA. Considering the ‘All visitors’ column, it is observed that
the most contributing three countries are Bangladesh, UAE, UK.
The number of foreigners of a certain group coming from a specific country can be obtained by multiplying
its percentage with the corresponding ‘Total Number’ given in the table.
‘Total Number’ represents the total of the top 20 countries. ‘Others’ represents the total of remaining coun-
tries other than the provided countries. Grand Total shows the total of all the countries.
Country of Normal Residence NRI PIO OCI Foreigner Others Total
Australia 1.03 1.51 11.18 4.18 4.01
Bangladesh 3.61 3.14 1.04 16.40 14.53
Canada 1.75 0.47 1.17 1.29 1.32
China 0.60 12.68 2.20 2.08 2.03
France 0.79 0.10 3.94 5.72 5.06
Germany 0.43 1.42 2.39 4.69 4.16
Hong Kong 0.82 0.20 2.76 2.26 2.09
Italy 0.65 1.42 0.03 1.63 1.47
Japan 0.82 0.34 1.23 4.85 4.25
Malaysia 2.82 7.37 7.04 3.90 3.90
Oman 6.02 1.80 2.15 1.02 1.58
Russia 0.08 1.42 0.27 2.82 2.43
Singapore 10.86 5.32 7.04 4.12 4.92
Sri Lanka 0.46 0.80 0.74 2.53 2.23
Sweden 0.06 0.00 0.00 1.14 1.04
Switzerland 0.18 0.08 0.65 1.17 1.04
Thailand 1.40 0.81 3.46 1.96 1.93
UAE 37.60 22.69 14.49 5.81 9.57
UK 3.78 9.59 13.87 10.06 9.61
USA 6.49 3.90 13.89 9.82 9.49
Others 19.76 24.92 10.46 12.55 13.34
Total (%) 100.00 100.00 100.00 100.00 100.00
Total Number 880859 81941 246203 7081882 8290885
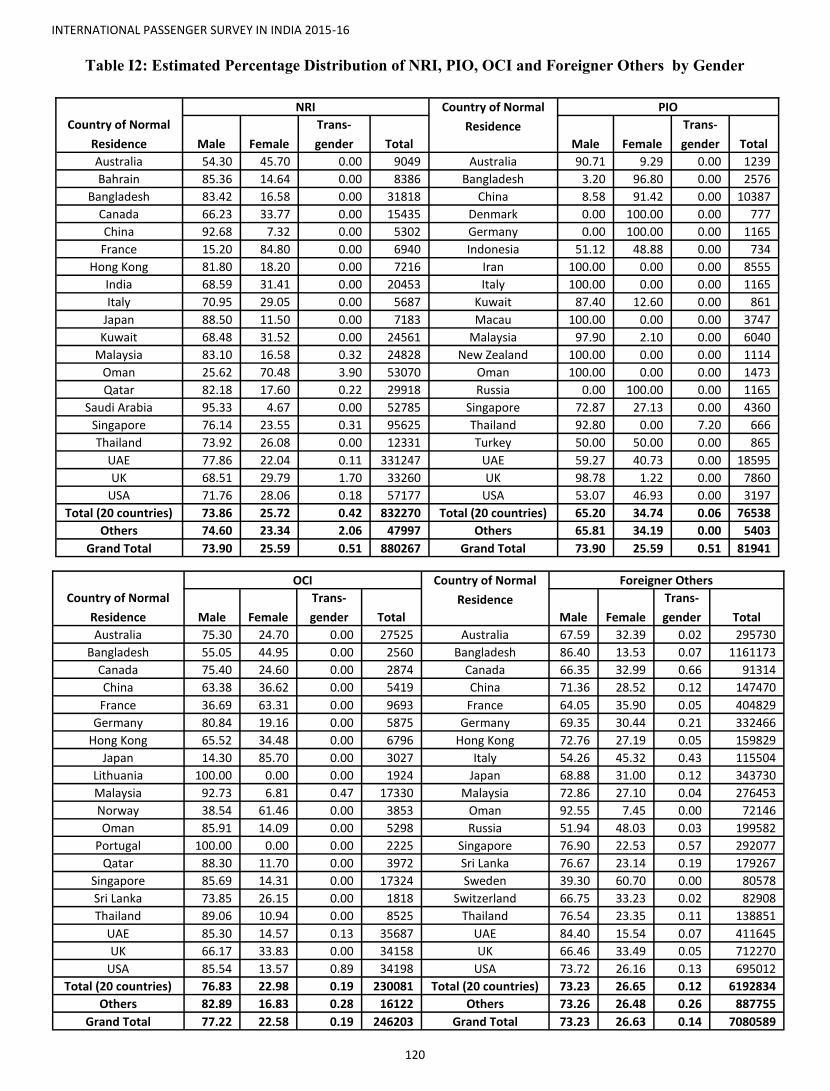
INTERNATIONAL PASSENGER SURVEY IN INDIA 2015-16
120
Table I2: Estimated Percentage Distribution of NRI, PIO, OCI and Foreigner Others by Gender
Country of Normal
Residence
NRI Country of Normal
Residence
PIO
Male Female
Trans-
gender Total Male Female
Trans-
gender Total
Australia 54.30 45.70 0.00 9049 Australia 90.71 9.29 0.00 1239
Bahrain 85.36 14.64 0.00 8386 Bangladesh 3.20 96.80 0.00 2576
Bangladesh 83.42 16.58 0.00 31818 China 8.58 91.42 0.00 10387
Canada 66.23 33.77 0.00 15435 Denmark 0.00 100.00 0.00 777
China 92.68 7.32 0.00 5302 Germany 0.00 100.00 0.00 1165
France 15.20 84.80 0.00 6940 Indonesia 51.12 48.88 0.00 734
Hong Kong 81.80 18.20 0.00 7216 Iran 100.00 0.00 0.00 8555
India 68.59 31.41 0.00 20453 Italy 100.00 0.00 0.00 1165
Italy 70.95 29.05 0.00 5687 Kuwait 87.40 12.60 0.00 861
Japan 88.50 11.50 0.00 7183 Macau 100.00 0.00 0.00 3747
Kuwait 68.48 31.52 0.00 24561 Malaysia 97.90 2.10 0.00 6040
Malaysia 83.10 16.58 0.32 24828 New Zealand 100.00 0.00 0.00 1114
Oman 25.62 70.48 3.90 53070 Oman 100.00 0.00 0.00 1473
Qatar 82.18 17.60 0.22 29918 Russia 0.00 100.00 0.00 1165
Saudi Arabia 95.33 4.67 0.00 52785 Singapore 72.87 27.13 0.00 4360
Singapore 76.14 23.55 0.31 95625 Thailand 92.80 0.00 7.20 666
Thailand 73.92 26.08 0.00 12331 Turkey 50.00 50.00 0.00 865
UAE 77.86 22.04 0.11 331247 UAE 59.27 40.73 0.00 18595
UK 68.51 29.79 1.70 33260 UK 98.78 1.22 0.00 7860
USA 71.76 28.06 0.18 57177 USA 53.07 46.93 0.00 3197
Total (20 countries) 73.86 25.72 0.42 832270 Total (20 countries) 65.20 34.74 0.06 76538
Others 74.60 23.34 2.06 47997 Others 65.81 34.19 0.00 5403
Grand Total 73.90 25.59 0.51 880267 Grand Total 73.90 25.59 0.51 81941
Country of Normal
Residence
OCI Country of Normal
Residence
Foreigner Others
Male Female
Trans-
gender Total Male Female
Trans-
gender Total
Australia 75.30 24.70 0.00 27525 Australia 67.59 32.39 0.02 295730
Bangladesh 55.05 44.95 0.00 2560 Bangladesh 86.40 13.53 0.07 1161173
Canada 75.40 24.60 0.00 2874 Canada 66.35 32.99 0.66 91314
China 63.38 36.62 0.00 5419 China 71.36 28.52 0.12 147470
France 36.69 63.31 0.00 9693 France 64.05 35.90 0.05 404829
Germany 80.84 19.16 0.00 5875 Germany 69.35 30.44 0.21 332466
Hong Kong 65.52 34.48 0.00 6796 Hong Kong 72.76 27.19 0.05 159829
Japan 14.30 85.70 0.00 3027 Italy 54.26 45.32 0.43 115504
Lithuania 100.00 0.00 0.00 1924 Japan 68.88 31.00 0.12 343730
Malaysia 92.73 6.81 0.47 17330 Malaysia 72.86 27.10 0.04 276453
Norway 38.54 61.46 0.00 3853 Oman 92.55 7.45 0.00 72146
Oman 85.91 14.09 0.00 5298 Russia 51.94 48.03 0.03 199582
Portugal 100.00 0.00 0.00 2225 Singapore 76.90 22.53 0.57 292077
Qatar 88.30 11.70 0.00 3972 Sri Lanka 76.67 23.14 0.19 179267
Singapore 85.69 14.31 0.00 17324 Sweden 39.30 60.70 0.00 80578
Sri Lanka 73.85 26.15 0.00 1818 Switzerland 66.75 33.23 0.02 82908
Thailand 89.06 10.94 0.00 8525 Thailand 76.54 23.35 0.11 138851
UAE 85.30 14.57 0.13 35687 UAE 84.40 15.54 0.07 411645
UK 66.17 33.83 0.00 34158 UK 66.46 33.49 0.05 712270
USA 85.54 13.57 0.89 34198 USA 73.72 26.16 0.13 695012
Total (20 countries) 76.83 22.98 0.19 230081 Total (20 countries) 73.23 26.65 0.12 6192834
Others 82.89 16.83 0.28 16122 Others 73.26 26.48 0.26 887755
Grand Total 77.22 22.58 0.19 246203 Grand Total 73.23 26.63 0.14 7080589

INTERNATIONAL PASSENGER SURVEY IN INDIA 2015-16
121
Table I2 (cont.): Estimated Percentage Distribution of All visitors by Gender
Country of Normal Resi-
dence
All Visitors
Male Female Transgender Total
Australia 67.95 32.03 0.02 333542
Bangladesh 86.08 13.86 0.07 1198127
Canada 66.38 33.07 0.54 110011
China 67.90 31.99 0.10 168578
France 62.62 37.33 0.05 421547
Germany 69.41 30.37 0.22 343333
Hong Kong 72.88 27.08 0.04 174001
Italy 55.49 44.11 0.40 122419
Japan 68.78 31.11 0.12 354217
Malaysia 75.17 24.74 0.09 324651
Oman 65.45 32.98 1.57 131986
Russia 51.76 48.22 0.03 202080
Singapore 77.05 22.47 0.48 409386
Sri Lanka 76.60 23.22 0.18 185757
Sweden 39.59 60.41 0.00 81076
Switzerland 67.28 32.70 0.02 86199
Thailand 77.07 22.80 0.13 160372
UAE 81.13 18.78 0.08 797173
UK 66.86 33.03 0.12 787548
USA 74.00 25.83 0.16 789584
Total (20 countries) 73.11 26.74 0.16 7181588
Others 74.88 24.82 0.30 1107412
Grand Total 73.34 26.48 0.18 8289000
Table I2 shows that 73.34% of the total visitors are Male, while 26.48% are Female and only 0.18% is
Transgender.
‘Total’ represents the total of the top 20 countries. ‘Others’ represents the total of remaining countries other
than the provided countries. Grand Total shows the total of all the countries.
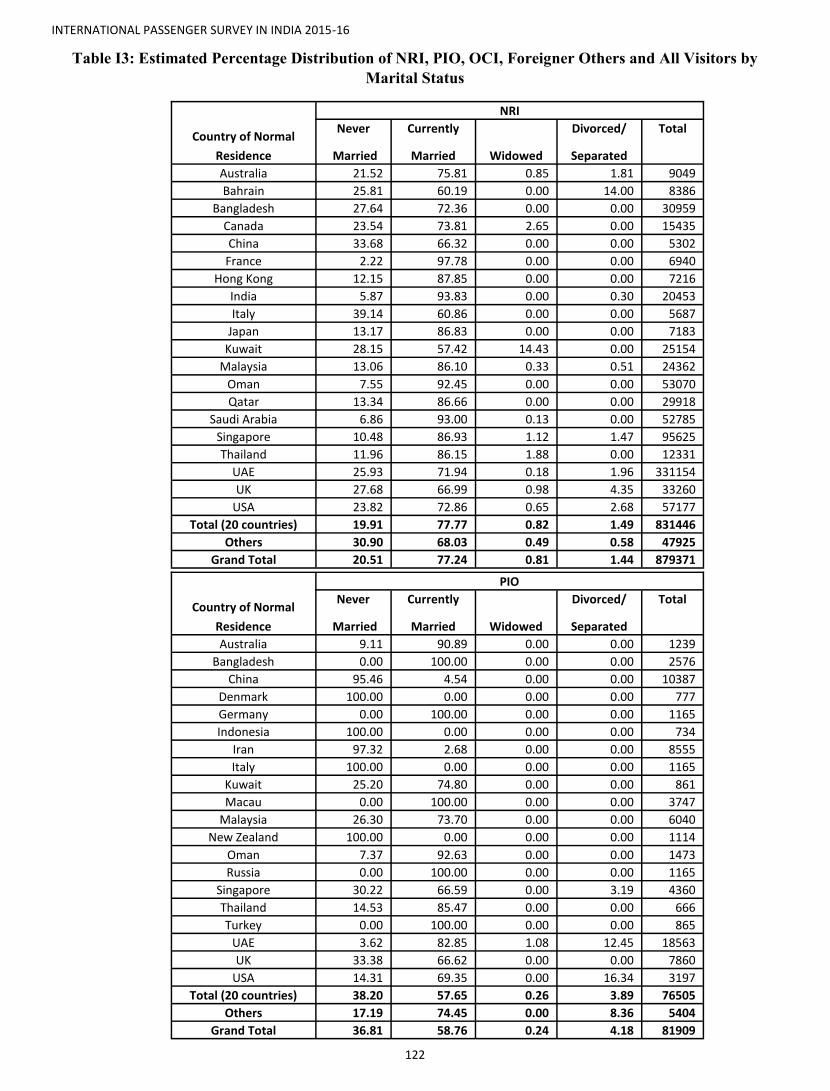
INTERNATIONAL PASSENGER SURVEY IN INDIA 2015-16
122
Table I3: Estimated Percentage Distribution of NRI, PIO, OCI, Foreigner Others and All Visitors by
Marital Status
Country of Normal
Residence
NRI
Never
Married
Currently
Married Widowed
Divorced/
Separated
Total
Australia 21.52 75.81 0.85 1.81 9049
Bahrain 25.81 60.19 0.00 14.00 8386
Bangladesh 27.64 72.36 0.00 0.00 30959
Canada 23.54 73.81 2.65 0.00 15435
China 33.68 66.32 0.00 0.00 5302
France 2.22 97.78 0.00 0.00 6940
Hong Kong 12.15 87.85 0.00 0.00 7216
India 5.87 93.83 0.00 0.30 20453
Italy 39.14 60.86 0.00 0.00 5687
Japan 13.17 86.83 0.00 0.00 7183
Kuwait 28.15 57.42 14.43 0.00 25154
Malaysia 13.06 86.10 0.33 0.51 24362
Oman 7.55 92.45 0.00 0.00 53070
Qatar 13.34 86.66 0.00 0.00 29918
Saudi Arabia 6.86 93.00 0.13 0.00 52785
Singapore 10.48 86.93 1.12 1.47 95625
Thailand 11.96 86.15 1.88 0.00 12331
UAE 25.93 71.94 0.18 1.96 331154
UK 27.68 66.99 0.98 4.35 33260
USA 23.82 72.86 0.65 2.68 57177
Total (20 countries) 19.91 77.77 0.82 1.49 831446
Others 30.90 68.03 0.49 0.58 47925
Grand Total 20.51 77.24 0.81 1.44 879371
Country of Normal
Residence
PIO
Never
Married
Currently
Married Widowed
Divorced/
Separated
Total
Australia 9.11 90.89 0.00 0.00 1239
Bangladesh 0.00 100.00 0.00 0.00 2576
China 95.46 4.54 0.00 0.00 10387
Denmark 100.00 0.00 0.00 0.00 777
Germany 0.00 100.00 0.00 0.00 1165
Indonesia 100.00 0.00 0.00 0.00 734
Iran 97.32 2.68 0.00 0.00 8555
Italy 100.00 0.00 0.00 0.00 1165
Kuwait 25.20 74.80 0.00 0.00 861
Macau 0.00 100.00 0.00 0.00 3747
Malaysia 26.30 73.70 0.00 0.00 6040
New Zealand 100.00 0.00 0.00 0.00 1114
Oman 7.37 92.63 0.00 0.00 1473
Russia 0.00 100.00 0.00 0.00 1165
Singapore 30.22 66.59 0.00 3.19 4360
Thailand 14.53 85.47 0.00 0.00 666
Turkey 0.00 100.00 0.00 0.00 865
UAE 3.62 82.85 1.08 12.45 18563
UK 33.38 66.62 0.00 0.00 7860
USA 14.31 69.35 0.00 16.34 3197
Total (20 countries) 38.20 57.65 0.26 3.89 76505
Others 17.19 74.45 0.00 8.36 5404
Grand Total 36.81 58.76 0.24 4.18 81909

INTERNATIONAL PASSENGER SURVEY IN INDIA 2015-16
123
Table I4 (Contd.): Estimated Percentage Distribution of NRI, PIO, OCI, Foreigner Others and All Visitors
by Marital Status
Country of Normal
Residence
OCI
Never
Married
Currently
Married Widowed
Divorced/
Separated
Total
Australia 73.45 26.55 0.00 0.00 26923
Bangladesh 40.76 59.24 0.00 0.00 2560
Canada 42.83 57.17 0.00 0.00 2874
China 0.67 99.33 0.00 0.00 5419
France 62.21 37.79 0.00 0.00 9693
Germany 9.98 90.02 0.00 0.00 5875
Hong Kong 8.44 91.56 0.00 0.00 6796
Japan 1.16 98.84 0.00 0.00 3027
Lithuania 0.00 100.00 0.00 0.00 1924
Malaysia 8.23 89.75 2.03 0.00 17330
Norway 61.46 38.54 0.00 0.00 3853
Oman 9.61 86.90 0.00 3.49 5298
Portugal 0.00 100.00 0.00 0.00 2225
Qatar 7.41 92.59 0.00 0.00 3972
Singapore 13.58 85.33 1.10 0.00 17324
Sri Lanka 31.10 68.90 0.00 0.00 1818
Thailand 11.61 88.39 0.00 0.00 8525
UAE 5.34 94.36 0.30 0.00 35647
UK 40.90 48.03 1.17 9.90 31933
USA 18.58 77.95 0.75 2.71 33596
Total (20 countries) 26.05 71.51 0.56 1.88 226613
Others 14.48 85.34 0.00 0.19 16121
Grand Total 25.28 72.43 0.52 1.77 242734
Country of Normal
Residence
Foreigner Others
Never
Married
Currently
Married Widowed
Divorced/
Separated
Total
Australia 29.96 61.84 6.40 1.80 294640
Bangladesh 17.40 81.21 1.15 0.25 1147652
Canada 26.52 68.13 0.99 4.36 90920
China 21.80 74.27 1.90 2.03 144476
France 27.12 63.77 0.71 8.40 401403
Germany 38.16 58.69 1.18 1.96 328996
Hong Kong 19.12 79.49 0.59 0.80 159829
Italy 32.30 64.06 1.59 2.06 115504
Japan 23.52 75.15 0.57 0.75 343032
Malaysia 19.26 77.20 1.27 2.27 276126
Oman 24.20 75.48 0.25 0.07 72146
Russia 34.13 62.70 1.13 2.03 199461
Singapore 17.71 79.82 1.35 1.11 289671
Sri Lanka 22.42 76.36 0.85 0.37 177043
Sweden 35.58 63.95 0.00 0.48 80578
Switzerland 32.97 63.31 1.82 1.90 81136
Thailand 26.39 71.17 0.82 1.62 138326
UAE 12.77 86.34 0.68 0.21 411132
UK 25.84 64.14 2.61 7.42 709561
USA 24.74 69.22 2.87 3.17 693846
Total (20 countries) 23.65 72.16 1.66 2.52 6155477
Others 33.51 62.32 1.11 3.05 881256
Grand Total 24.88 70.93 1.59 2.59 7036733
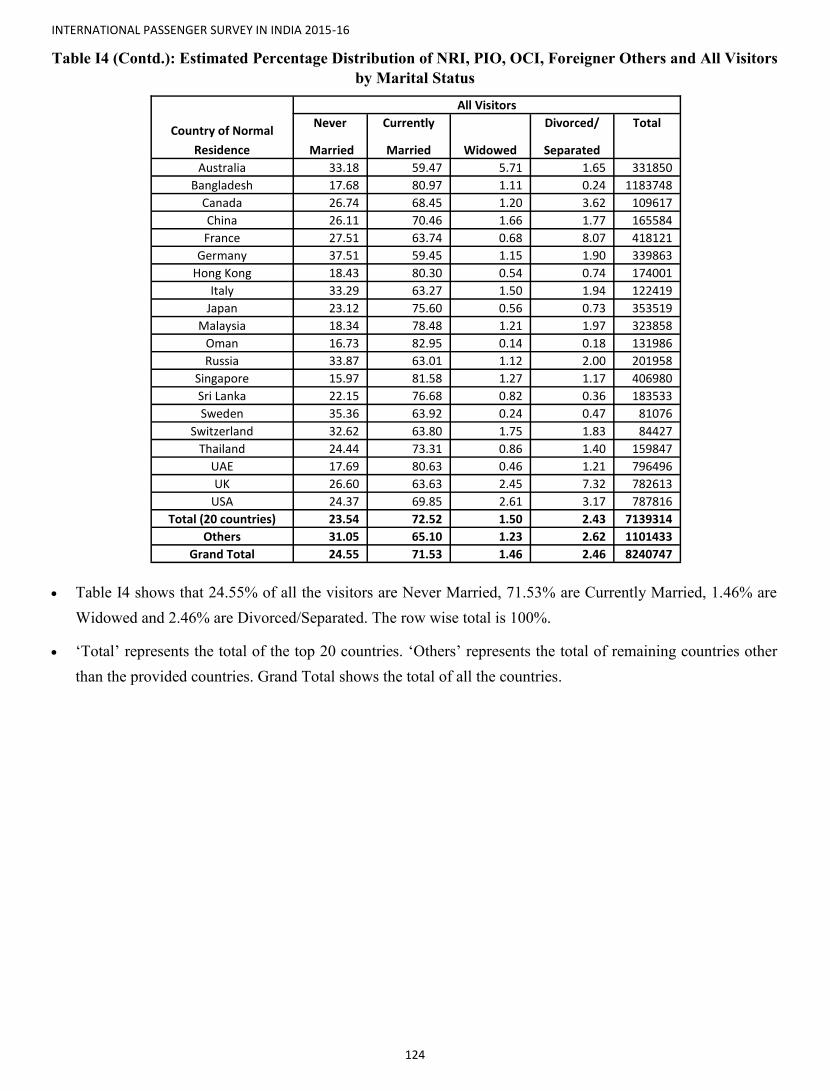
INTERNATIONAL PASSENGER SURVEY IN INDIA 2015-16
124
Table I4 (Contd.): Estimated Percentage Distribution of NRI, PIO, OCI, Foreigner Others and All Visitors
by Marital Status
Country of Normal
Residence
All Visitors
Never
Married
Currently
Married Widowed
Divorced/
Separated
Total
Australia 33.18 59.47 5.71 1.65 331850
Bangladesh 17.68 80.97 1.11 0.24 1183748
Canada 26.74 68.45 1.20 3.62 109617
China 26.11 70.46 1.66 1.77 165584
France 27.51 63.74 0.68 8.07 418121
Germany 37.51 59.45 1.15 1.90 339863
Hong Kong 18.43 80.30 0.54 0.74 174001
Italy 33.29 63.27 1.50 1.94 122419
Japan 23.12 75.60 0.56 0.73 353519
Malaysia 18.34 78.48 1.21 1.97 323858
Oman 16.73 82.95 0.14 0.18 131986
Russia 33.87 63.01 1.12 2.00 201958
Singapore 15.97 81.58 1.27 1.17 406980
Sri Lanka 22.15 76.68 0.82 0.36 183533
Sweden 35.36 63.92 0.24 0.47 81076
Switzerland 32.62 63.80 1.75 1.83 84427
Thailand 24.44 73.31 0.86 1.40 159847
UAE 17.69 80.63 0.46 1.21 796496
UK 26.60 63.63 2.45 7.32 782613
USA 24.37 69.85 2.61 3.17 787816
Total (20 countries) 23.54 72.52 1.50 2.43 7139314
Others 31.05 65.10 1.23 2.62 1101433
Grand Total 24.55 71.53 1.46 2.46 8240747
Table I4 shows that 24.55% of all the visitors are Never Married, 71.53% are Currently Married, 1.46% are
Widowed and 2.46% are Divorced/Separated. The row wise total is 100%.
‘Total’ represents the total of the top 20 countries. ‘Others’ represents the total of remaining countries other
than the provided countries. Grand Total shows the total of all the countries.

INTERNATIONAL PASSENGER SURVEY IN INDIA 2015-16
125
Table I9: Estimated Percentage Distribution of NRI, PIO, OCI, Foreigner Others and All visitors by
Travel Pattern
Country of Normal Residence
NRI Country of Normal Residence
PIO
Individual Family Group Total Individual Family Group Total
Australia 62.99 37.01 0.00 9049 Australia 92.06 4.06 3.88 1239
Bahrain 99.32 0.00 0.68 8386 Bangladesh 3.20 96.80 0.00 2576
Bangladesh 81.92 9.88 8.20 31818 China 11.53 3.95 84.52 10387
Canada 73.55 25.19 1.25 15435 Denmark 100.00 0.00 0.00 777
China 66.83 7.57 25.59 5302 Germany 100.00 0.00 0.00 1165
France 13.12 86.88 0.00 6940 Indonesia 100.00 0.00 0.00 734
Hong Kong 67.65 20.40 11.95 7216 Iran 100.00 0.00 0.00 8555
India 99.35 0.65 0.00 20453 Italy 100.00 0.00 0.00 1165
Italy 91.52 7.37 1.11 5687 Kuwait 95.62 4.38 0.00 861
Japan 35.63 16.92 47.45 7183 Macau 100.00 0.00 0.00 3747
Kuwait 71.60 14.91 13.49 25154 Malaysia 69.71 28.92 1.37 6040
Malaysia 69.18 28.29 2.53 24828 New Zealand 100.00 0.00 0.00 1114
Oman 92.22 5.57 2.20 53070 Oman 100.00 0.00 0.00 1473
Qatar 85.87 13.17 0.96 29918 Russia 100.00 0.00 0.00 1165
Saudi Arabia 92.97 5.71 1.31 52785 Singapore 60.62 36.87 2.51 4360
Singapore 57.89 39.70 2.41 95625 Thailand 54.83 7.20 37.97 666
Thailand 70.44 22.33 7.23 12331 Turkey 50.00 0.00 50.00 865
UAE 78.34 20.65 1.01 331247 UAE 77.34 22.08 0.58 18595
UK 78.34 20.26 1.40 33260 UK 65.36 34.64 0.00 7860
USA 79.00 18.91 2.09 57177 USA 76.56 23.44 0.00 3197
Total (20 Countries) 77.15 20.10 2.75 832862 Total (20 Countries) 68.92 18.25 12.82 76538
Others 68.51 24.20 7.28 47997 Others 77.11 18.79 4.13 5403
Grand Total 76.68 20.32 3.00 880859 Grand Total 69.46 18.29 12.25 81941
Country of Normal Residence
OCI Country of Normal
Residence
Foreigner Others
Individual Family Group Total Individual Family Group Total
Australia 98.49 1.51 0.00 27525 Australia 66.92 24.09 8.99 295769
Bangladesh 17.27 78.48 4.25 2560 Bangladesh 64.59 27.22 8.19 1161583
Canada 81.19 13.29 5.51 2874 Canada 59.22 31.00 9.79 91314
China 78.44 21.56 0.00 5419 China 54.08 32.43 13.49 147470
France 82.83 11.14 6.03 9693 France 58.32 25.89 15.79 404915
Germany 44.10 18.03 37.87 5875 Germany 61.64 25.29 13.06 332466
Hong Kong 78.84 2.37 18.79 6796 Hong Kong 61.71 28.72 9.57 159829
Japan 57.60 7.33 35.08 3027 Italy 50.03 16.52 33.45 115504
Lithuania 100.00 0.00 0.00 1924 Japan 61.47 26.13 12.40 343730
Malaysia 93.09 6.45 0.46 17330 Malaysia 62.14 29.10 8.77 276453
Norway 40.00 0.00 60.00 3853 Oman 75.46 22.33 2.21 72146
Oman 94.65 5.35 0.00 5298 Russia 37.24 39.05 23.71 199582
Portugal 100.00 0.00 0.00 2225 Singapore 71.51 21.26 7.23 292077
Qatar 79.86 18.09 2.04 3972 Sri Lanka 64.43 28.93 6.64 179267
Singapore 93.22 5.26 1.52 17324 Sweden 26.85 47.16 25.99 80578
Sri Lanka 89.01 10.99 0.00 1818 Switzerland 53.42 35.13 11.45 83018
Thailand 83.95 13.18 2.87 8525 Thailand 70.24 16.74 13.02 138851
UAE 89.39 9.51 1.10 35687 UAE 75.28 17.87 6.85 411645
UK 63.00 14.31 22.69 34158 UK 61.95 26.49 11.55 712425
USA 81.80 17.74 0.46 34198 USA 62.04 23.38 14.58 695505
Total (20 Countries) 81.79 10.95 7.26 230081 Total (20 Countries) 62.35 26.01 11.64 6194127
Others 85.91 9.97 4.12 16122 Others 65.71 21.87 12.42 887755
Grand Total 82.06 10.89 7.05 246203 Grand Total 62.77 25.49 11.74 7081882
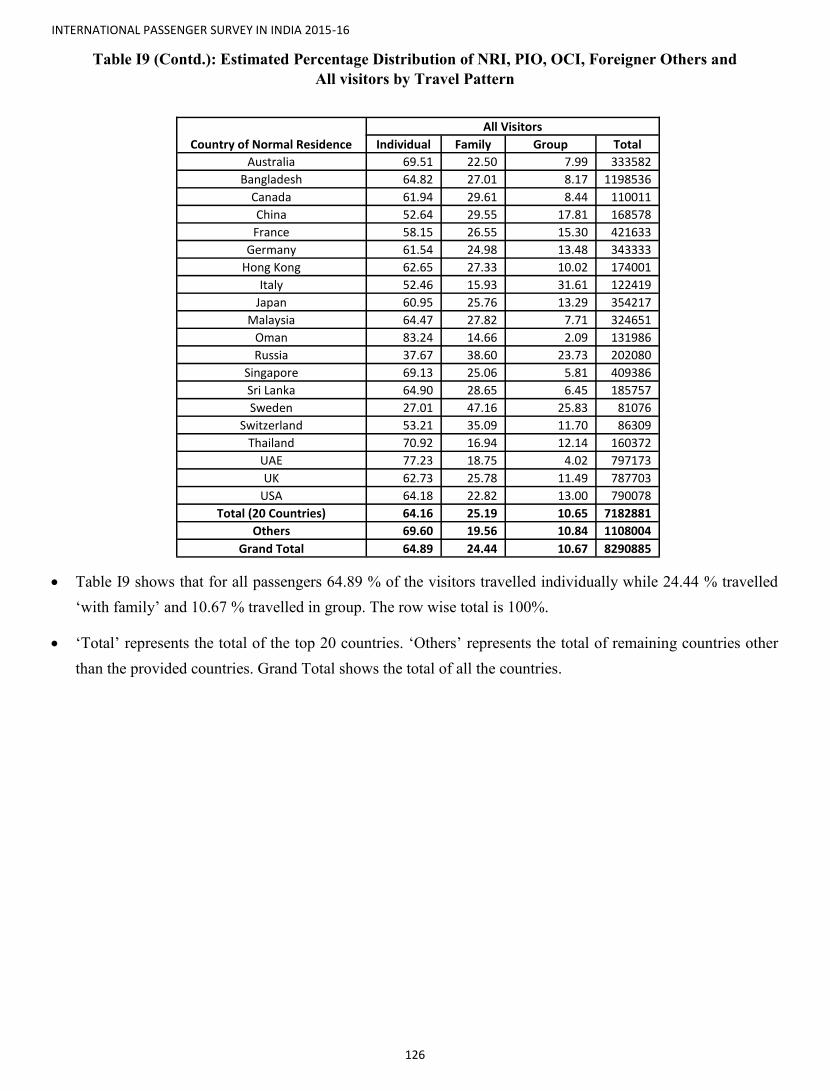
INTERNATIONAL PASSENGER SURVEY IN INDIA 2015-16
126
Table I9 (Contd.): Estimated Percentage Distribution of NRI, PIO, OCI, Foreigner Others and
All visitors by Travel Pattern
Country of Normal Residence
All Visitors
Individual Family Group Total
Australia 69.51 22.50 7.99 333582
Bangladesh 64.82 27.01 8.17 1198536
Canada 61.94 29.61 8.44 110011
China 52.64 29.55 17.81 168578
France 58.15 26.55 15.30 421633
Germany 61.54 24.98 13.48 343333
Hong Kong 62.65 27.33 10.02 174001
Italy 52.46 15.93 31.61 122419
Japan 60.95 25.76 13.29 354217
Malaysia 64.47 27.82 7.71 324651
Oman 83.24 14.66 2.09 131986
Russia 37.67 38.60 23.73 202080
Singapore 69.13 25.06 5.81 409386
Sri Lanka 64.90 28.65 6.45 185757
Sweden 27.01 47.16 25.83 81076
Switzerland 53.21 35.09 11.70 86309
Thailand 70.92 16.94 12.14 160372
UAE 77.23 18.75 4.02 797173
UK 62.73 25.78 11.49 787703
USA 64.18 22.82 13.00 790078
Total (20 Countries) 64.16 25.19 10.65 7182881
Others 69.60 19.56 10.84 1108004
Grand Total 64.89 24.44 10.67 8290885
Table I9 shows that for all passengers 64.89 % of the visitors travelled individually while 24.44 % travelled
‘with family’ and 10.67 % travelled in group. The row wise total is 100%.
‘Total’ represents the total of the top 20 countries. ‘Others’ represents the total of remaining countries other
than the provided countries. Grand Total shows the total of all the countries.

INTERNATIONAL PASSENGER SURVEY IN INDIA 2015-16
127
Table I12: Estimated Percentage Propensity of Visitors Availing Package Tours by
Country of Normal Residence
Country of Normal Residence NRI PIO OCI Foreigner Others All Visitors
Australia 0.91 0.00 7.15 91.94 94409
Canada 0.27 0.00 1.38 98.35 21625
China 0.20 18.20 0.07 81.53 48421
France 0.00 0.00 4.41 95.59 134723
Germany 0.52 0.00 3.86 95.62 88235
Hong Kong 0.00 0.00 0.95 99.05 42748
Italy 0.00 0.00 0.00 100.00 22228
Japan 2.57 0.00 0.00 97.43 110534
Malaysia 2.93 0.72 2.95 93.40 58981
Russia 0.00 0.00 0.00 100.00 65612
Singapore 3.33 1.32 5.36 89.98 59790
South Africa 0.69 0.00 0.00 99.31 13334
Spain 0.00 0.00 0.00 100.00 17779
Sri Lanka 0.21 0.74 0.00 99.05 25094
Sweden 2.15 0.00 0.00 97.85 16812
Switzerland 0.00 0.00 3.14 96.86 32890
Thailand 1.34 0.00 3.46 95.20 22205
UAE 15.83 0.41 11.71 72.05 38526
UK 0.48 0.09 0.63 98.80 180197
USA 0.86 0.11 1.56 97.47 212487
Total (20 countries) 1.35 0.83 2.49 95.33 1306630
Others 4.66 0.64 2.64 92.04 196245
Grand Total 1.78 0.80 2.51 94.91 1502874
Table I12 displays that 94.91% of all visitors who availed the package tour are ‘Foreigner Others’. Here
row wise total is 100%.
‘Total’ represents the total of the top 20 countries. ‘Others’ represents the total of remaining countries other
than the provided countries. Grand Total shows the total of all the countries.
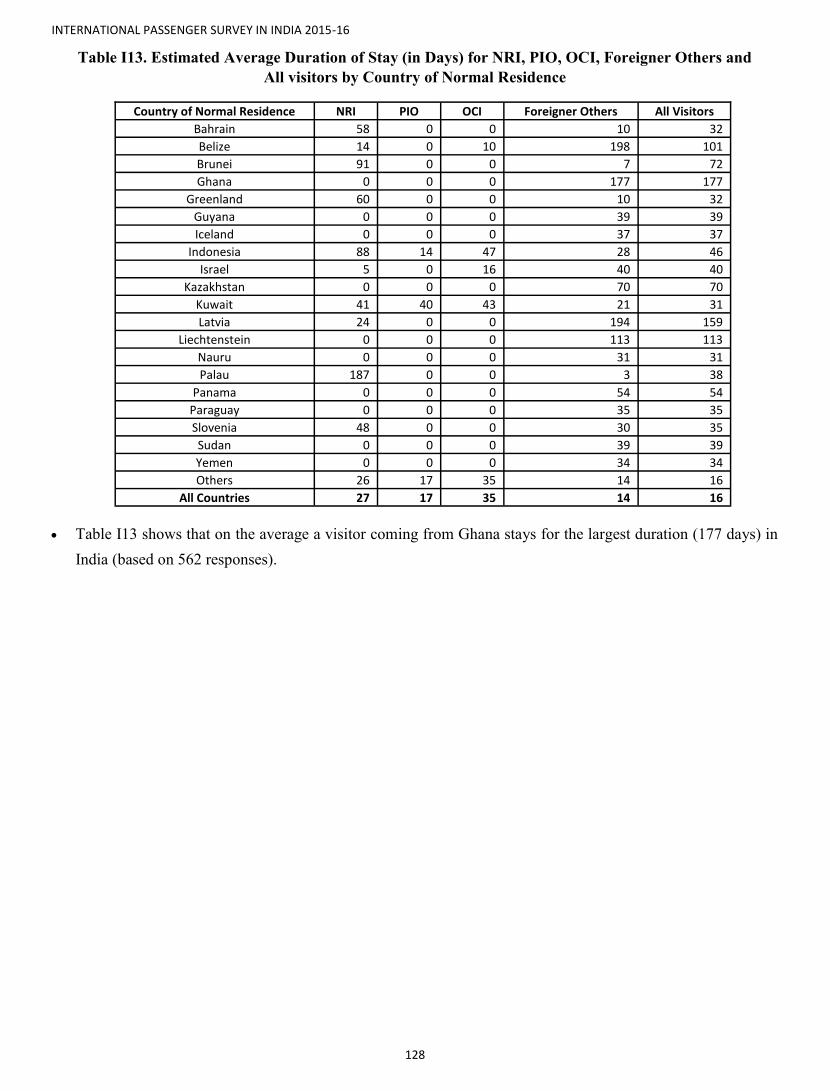
INTERNATIONAL PASSENGER SURVEY IN INDIA 2015-16
128
Table I13. Estimated Average Duration of Stay (in Days) for NRI, PIO, OCI, Foreigner Others and
All visitors by Country of Normal Residence
Country of Normal Residence NRI PIO OCI Foreigner Others All Visitors
Bahrain 58 0 0 10 32
Belize 14 0 10 198 101
Brunei 91 0 0 7 72
Ghana 0 0 0 177 177
Greenland 60 0 0 10 32
Guyana 0 0 0 39 39
Iceland 0 0 0 37 37
Indonesia 88 14 47 28 46
Israel 5 0 16 40 40
Kazakhstan 0 0 0 70 70
Kuwait 41 40 43 21 31
Latvia 24 0 0 194 159
Liechtenstein 0 0 0 113 113
Nauru 0 0 0 31 31
Palau 187 0 0 3 38
Panama 0 0 0 54 54
Paraguay 0 0 0 35 35
Slovenia 48 0 0 30 35
Sudan 0 0 0 39 39
Yemen 0 0 0 34 34
Others 26 17 35 14 16
All Countries 27 17 35 14 16
Table I13 shows that on the average a visitor coming from Ghana stays for the largest duration (177 days) in
India (based on 562 responses).
Appendix C
Sample Tables

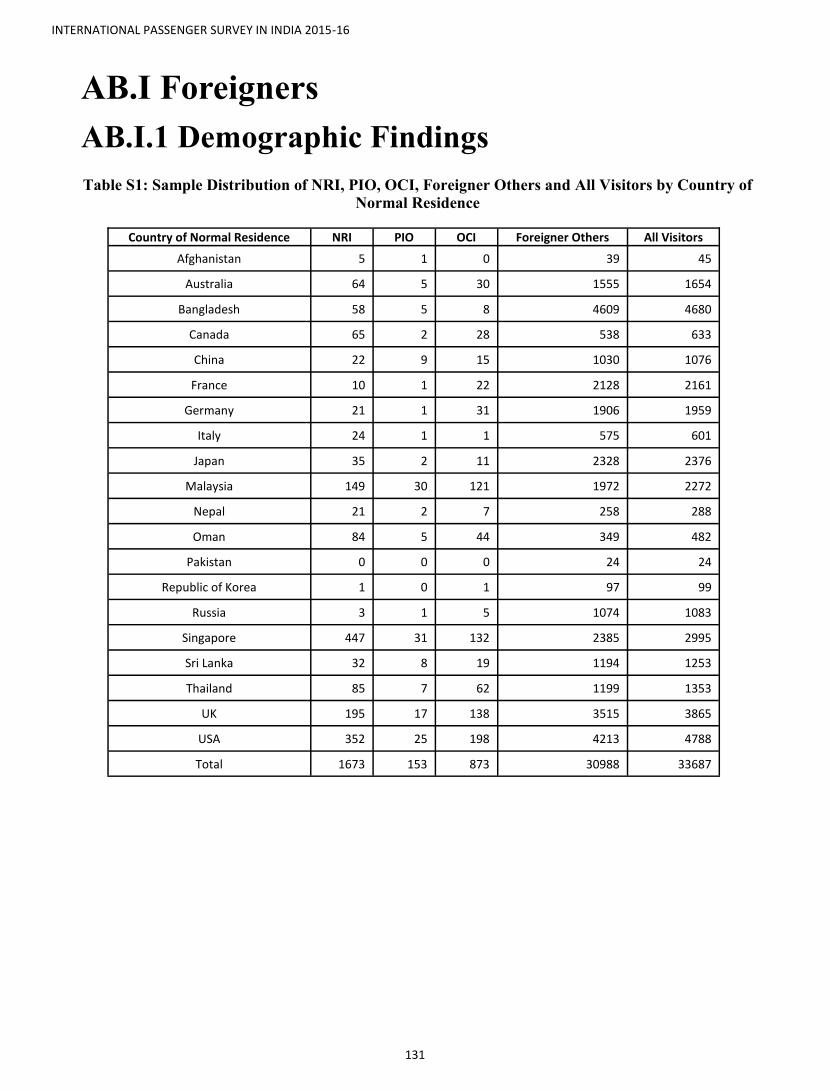
INTERNATIONAL PASSENGER SURVEY IN INDIA 2015-16
131
AB.I Foreigners
AB.I.1 Demographic Findings
Table S1: Sample Distribution of NRI, PIO, OCI, Foreigner Others and All Visitors by Country of
Normal Residence
Country of Normal Residence NRI PIO OCI Foreigner Others All Visitors
Afghanistan 5 1 0 39 45
Australia 64 5 30 1555 1654
Bangladesh 58 5 8 4609 4680
Canada 65 2 28 538 633
China 22 9 15 1030 1076
France 10 1 22 2128 2161
Germany 21 1 31 1906 1959
Italy 24 1 1 575 601
Japan 35 2 11 2328 2376
Malaysia 149 30 121 1972 2272
Nepal 21 2 7 258 288
Oman 84 5 44 349 482
Pakistan 0 0 0 24 24
Republic of Korea 1 0 1 97 99
Russia 3 1 5 1074 1083
Singapore 447 31 132 2385 2995
Sri Lanka 32 8 19 1194 1253
Thailand 85 7 62 1199 1353
UK 195 17 138 3515 3865
USA 352 25 198 4213 4788
Total 1673 153 873 30988 33687

INTERNATIONAL PASSENGER SURVEY IN INDIA 2015-16
132
Table S2: Sample Distribution of NRI, PIO, OCI, Foreigner Others and All Visitors by
Gender
Country of Normal Residence
NRI PIO
Male Female Trans- gender
Male Female Trans- gender
Afghanistan 5 0 0 0 1 0
Australia 43 21 0 3 2 0
Bangladesh 51 7 0 2 3 0
Canada 50 15 0 1 1 0
China 20 2 0 4 5 0
France 9 1 0 1 0 0
Germany 14 6 1 0 1 0
Italy 21 3 0 1 0 0
Japan 30 5 0 1 1 0
Malaysia 123 25 1 28 2 0
Nepal 19 2 0 1 1 0
Oman 67 16 1 5 0 0
Pakistan 0 0 0 0 0 0
Republic of Korea 1 0 0 0 0 0
Russia 2 1 0 0 1 0
Singapore 354 92 1 22 9 0
Sri Lanka 26 6 0 6 2 0
Thailand 6 0 1 6 0 1
UK 146 46 3 15 2 0
USA 281 70 1 18 7 0
Total 1268 318 9 114 38 1
Country of Normal Residence
OCI Foreigner Others
Male Female Trans- gender
Male Female Trans- gender
Afghanistan 0 0 0 36 3 0
Australia 26 4 0 1095 457 2
Bangladesh 6 2 0 3968 635 4
Canada 20 8 0 348 186 4
China 8 7 0 739 289 2
France 16 6 0 1476 645 6
Germany 23 8 0 1355 548 3
Italy 1 0 0 403 167 5
Japan 5 6 0 1621 706 1
Malaysia 107 13 1 1506 464 2
Nepal 6 1 0 226 32 0
Oman 38 6 0 324 25 0
Pakistan 0 0 0 22 2 0
Republic of Korea 1 0 0 81 16 0
Russia 4 1 0 602 471 1
Singapore 104 28 0 1885 489 11
Sri Lanka 15 4 0 947 243 4
Thailand 52 10 0 895 301 3
UK 100 38 0 2537 971 6
USA 163 32 3 3049 1153 9
Total 695 174 4 23115 7803 63
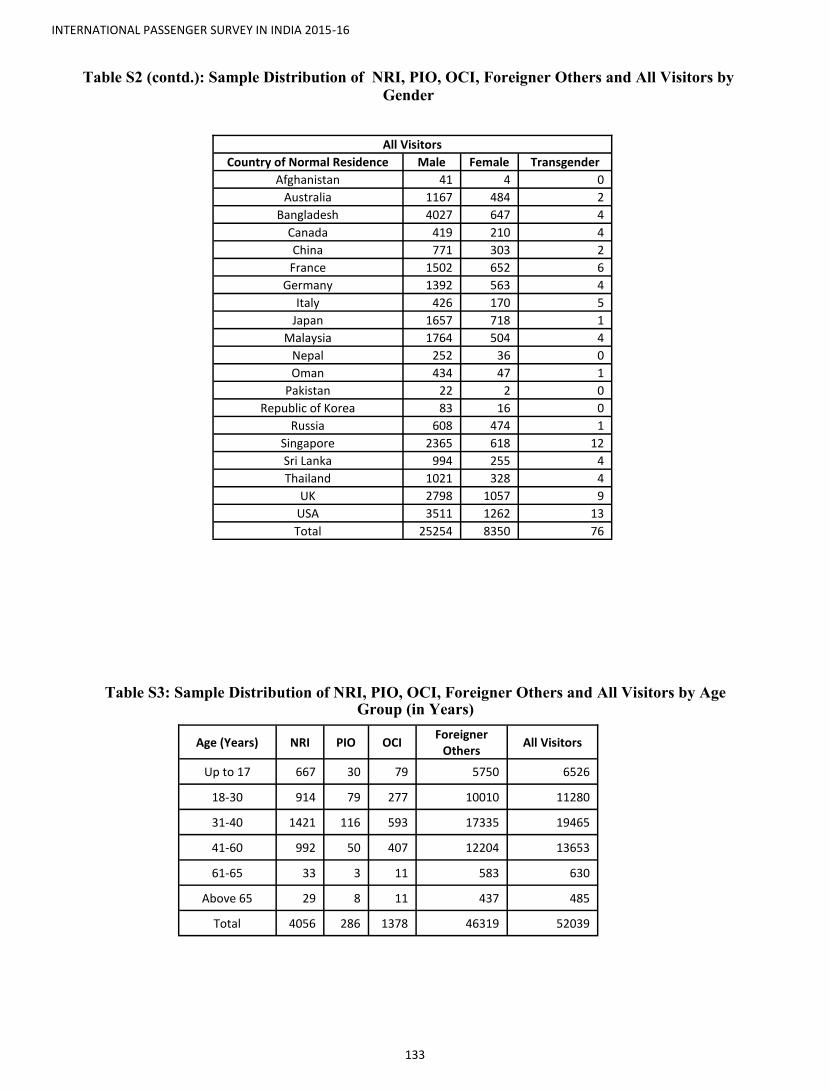
INTERNATIONAL PASSENGER SURVEY IN INDIA 2015-16
133
Table S2 (contd.): Sample Distribution of NRI, PIO, OCI, Foreigner Others and All Visitors by
Gender
Table S3: Sample Distribution of NRI, PIO, OCI, Foreigner Others and All Visitors by Age Group (in Years)
All Visitors
Country of Normal Residence Male Female Transgender
Afghanistan 41 4 0
Australia 1167 484 2
Bangladesh 4027 647 4
Canada 419 210 4
China 771 303 2
France 1502 652 6
Germany 1392 563 4
Italy 426 170 5
Japan 1657 718 1
Malaysia 1764 504 4
Nepal 252 36 0
Oman 434 47 1
Pakistan 22 2 0
Republic of Korea 83 16 0
Russia 608 474 1
Singapore 2365 618 12
Sri Lanka 994 255 4
Thailand 1021 328 4
UK 2798 1057 9
USA 3511 1262 13
Total 25254 8350 76
Age (Years) NRI PIO OCI Foreigner
Others All Visitors
Up to 17 667 30 79 5750 6526
18-30 914 79 277 10010 11280
31-40 1421 116 593 17335 19465
41-60 992 50 407 12204 13653
61-65 33 3 11 583 630
Above 65 29 8 11 437 485
Total 4056 286 1378 46319 52039
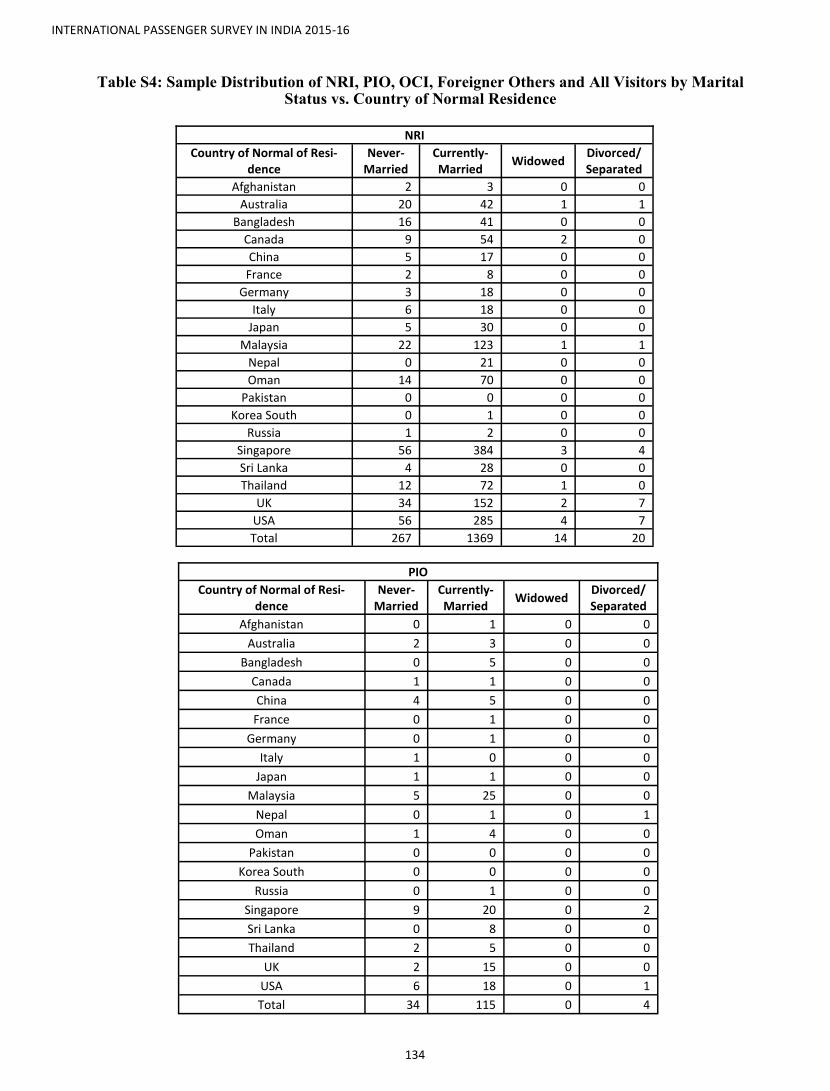
INTERNATIONAL PASSENGER SURVEY IN INDIA 2015-16
134
Table S4: Sample Distribution of NRI, PIO, OCI, Foreigner Others and All Visitors by Marital Status vs. Country of Normal Residence
NRI
Country of Normal of Resi-dence
Never-Married
Currently-Married
Widowed Divorced/ Separated
Afghanistan 2 3 0 0
Australia 20 42 1 1
Bangladesh 16 41 0 0
Canada 9 54 2 0
China 5 17 0 0
France 2 8 0 0
Germany 3 18 0 0
Italy 6 18 0 0
Japan 5 30 0 0
Malaysia 22 123 1 1
Nepal 0 21 0 0
Oman 14 70 0 0
Pakistan 0 0 0 0
Korea South 0 1 0 0
Russia 1 2 0 0
Singapore 56 384 3 4
Sri Lanka 4 28 0 0
Thailand 12 72 1 0
UK 34 152 2 7
USA 56 285 4 7
Total 267 1369 14 20
PIO
Country of Normal of Resi-dence
Never-Married
Currently-Married
Widowed Divorced/ Separated
Afghanistan 0 1 0 0
Australia 2 3 0 0
Bangladesh 0 5 0 0
Canada 1 1 0 0
China 4 5 0 0
France 0 1 0 0
Germany 0 1 0 0
Italy 1 0 0 0
Japan 1 1 0 0
Malaysia 5 25 0 0
Nepal 0 1 0 1
Oman 1 4 0 0
Pakistan 0 0 0 0
Korea South 0 0 0 0
Russia 0 1 0 0
Singapore 9 20 0 2
Sri Lanka 0 8 0 0
Thailand 2 5 0 0
UK 2 15 0 0
USA 6 18 0 1
Total 34 115 0 4
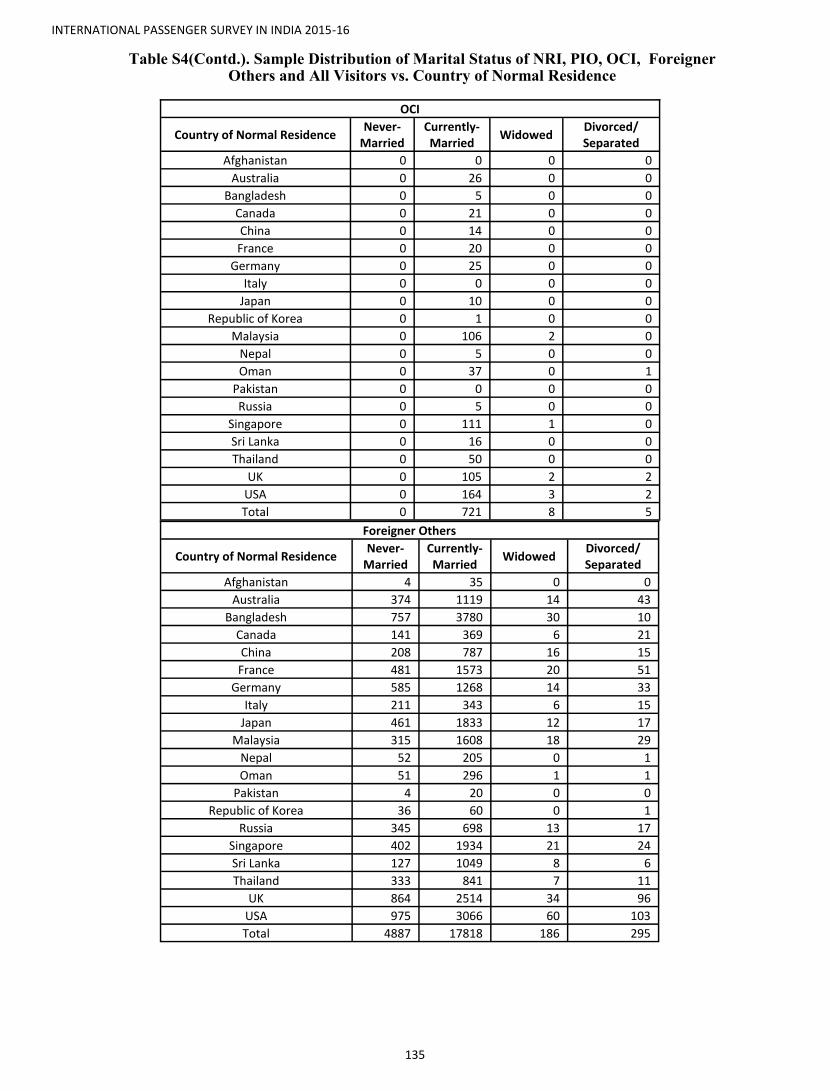
INTERNATIONAL PASSENGER SURVEY IN INDIA 2015-16
135
Table S4(Contd.). Sample Distribution of Marital Status of NRI, PIO, OCI, Foreigner Others and All Visitors vs. Country of Normal Residence
OCI
Country of Normal Residence Never-
Married Currently-Married
Widowed Divorced/ Separated
Afghanistan 0 0 0 0
Australia 0 26 0 0
Bangladesh 0 5 0 0
Canada 0 21 0 0
China 0 14 0 0
France 0 20 0 0
Germany 0 25 0 0
Italy 0 0 0 0
Japan 0 10 0 0
Republic of Korea 0 1 0 0
Malaysia 0 106 2 0
Nepal 0 5 0 0
Oman 0 37 0 1
Pakistan 0 0 0 0
Russia 0 5 0 0
Singapore 0 111 1 0
Sri Lanka 0 16 0 0
Thailand 0 50 0 0
UK 0 105 2 2
USA 0 164 3 2
Total 0 721 8 5
Foreigner Others
Country of Normal Residence Never-
Married Currently-Married
Widowed Divorced/ Separated
Afghanistan 4 35 0 0
Australia 374 1119 14 43
Bangladesh 757 3780 30 10
Canada 141 369 6 21
China 208 787 16 15
France 481 1573 20 51
Germany 585 1268 14 33
Italy 211 343 6 15
Japan 461 1833 12 17
Malaysia 315 1608 18 29
Nepal 52 205 0 1
Oman 51 296 1 1
Pakistan 4 20 0 0
Republic of Korea 36 60 0 1
Russia 345 698 13 17
Singapore 402 1934 21 24
Sri Lanka 127 1049 8 6
Thailand 333 841 7 11
UK 864 2514 34 96
USA 975 3066 60 103
Total 4887 17818 186 295

INTERNATIONAL PASSENGER SURVEY IN INDIA 2015-16
136
Table S4 (Contd.). Sample Distribution of Marital Status of All Visitors vs. Country of Normal
Residence
All Visitors
Country of Normal Resi-dence
Never-Married
Currently-Married
Wid-owed
Divorced/ Separated
Afghanistan 6 39 0 0
Australia 399 1190 15 44
Bangladesh 776 3831 30 10
Canada 158 445 8 21
China 218 823 16 15
France 485 1602 20 51
Germany 594 1312 14 33
Italy 219 361 6 15
Japan 468 1874 12 17
Korea South 36 62 0 1
Malaysia 355 1862 21 30
Nepal 54 232 0 2
Oman 72 407 1 2
Pakistan 4 20 0 0
Russia 346 706 13 17
Singapore 487 2449 25 30
Sri Lanka 134 1101 8 6
Thailand 359 968 8 11
UK 928 2786 38 105
USA 1065 3533 67 113
Total 7163 25603 302 523
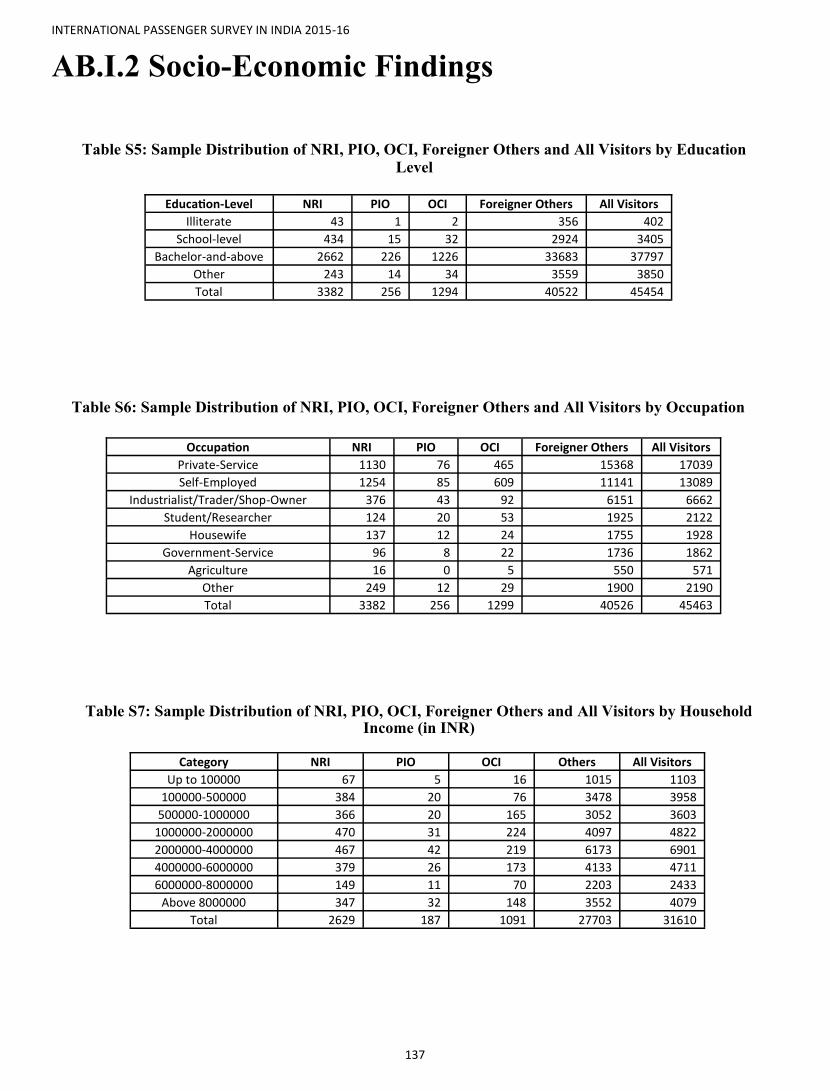
INTERNATIONAL PASSENGER SURVEY IN INDIA 2015-16
137
AB.I.2 Socio-Economic Findings
Table S5: Sample Distribution of NRI, PIO, OCI, Foreigner Others and All Visitors by Education
Level
Table S6: Sample Distribution of NRI, PIO, OCI, Foreigner Others and All Visitors by Occupation
Table S7: Sample Distribution of NRI, PIO, OCI, Foreigner Others and All Visitors by Household Income (in INR)
Education-Level NRI PIO OCI Foreigner Others All Visitors
Illiterate 43 1 2 356 402
School-level 434 15 32 2924 3405
Bachelor-and-above 2662 226 1226 33683 37797
Other 243 14 34 3559 3850
Total 3382 256 1294 40522 45454
Occupation NRI PIO OCI Foreigner Others All Visitors
Private-Service 1130 76 465 15368 17039
Self-Employed 1254 85 609 11141 13089
Industrialist/Trader/Shop-Owner 376 43 92 6151 6662
Student/Researcher 124 20 53 1925 2122
Housewife 137 12 24 1755 1928
Government-Service 96 8 22 1736 1862
Agriculture 16 0 5 550 571
Other 249 12 29 1900 2190
Total 3382 256 1299 40526 45463
Category NRI PIO OCI Others All Visitors
Up to 100000 67 5 16 1015 1103
100000-500000 384 20 76 3478 3958
500000-1000000 366 20 165 3052 3603
1000000-2000000 470 31 224 4097 4822
2000000-4000000 467 42 219 6173 6901
4000000-6000000 379 26 173 4133 4711
6000000-8000000 149 11 70 2203 2433
Above 8000000 347 32 148 3552 4079
Total 2629 187 1091 27703 31610

INTERNATIONAL PASSENGER SURVEY IN INDIA 2015-16
138
AB.I.3 Travel Pattern
Table S8: Sample Distribution of NRI, PIO, OCI, Foreigner Others and All Visitors by Port of Entry
Table S9: Sample Distribution of NRI, PIO, OCI, Foreigner Others and All Visitors by
Travel Pattern vs. Country of Normal Residence
Port-of-Entry NRI PIO OCI Foreigner Others Total
Delhi Airport 403 39 139 15090 15671
Mumbai Airport 756 77 263 9874 10970
Hyderabad Airport 699 66 503 2921 4189
Kolkata Airport 270 8 33 3344 3655
Chennai Airport 208 22 63 2666 2959
Bangalore Airport 252 27 230 2082 2591
Haridaspur Land 34 2 5 2435 2476
Amritsar Airport 308 0 29 163 500
Ghojadanga Land 4 1 0 174 179
Dabolim Airport 5 1 4 127 137
Ahmedabad Airport 44 0 2 85 131
Pune Airport 21 0 3 101 125
Trivandrum Airport 12 0 1 27 40
Jaipur Airport 0 0 0 17 17
Trichi Airport 0 0 1 16 17
Sonauli Land 1 0 0 15 16
Attari Rail Land 1 0 0 14 15
Gede Rly Stn Land 2 0 0 13 15
Calicut Airport 10 0 0 3 13
Coimbatore Airport 2 0 0 11 13
Others 76 0 14 1208 1298
Total 3108 243 1290 40386 45027
NRI
Country of Normal Residence Individual Family Group
Afghanistan 2 3 0
Australia 46 18 0
Bangladesh 46 9 3
Canada 32 32 1
China 14 3 5
France 7 3 0
Germany 12 5 4
Italy 21 2 1
Japan 19 9 7
Malaysia 109 35 5
Nepal 11 9 1
Oman 64 16 4
Pakistan 0 0 0
Republic of Korea 1 0 0
Russia 1 1 1
Singapore 269 163 15
Sri Lanka 22 10 0
Thailand 61 19 5
UK 126 64 5
USA 237 105 10
Total 1100 506 67

INTERNATIONAL PASSENGER SURVEY IN INDIA 2015-16
139
Table S9 (Contd.): Sample Distribution of NRI, PIO, OCI, Foreigner Others and All Visitors by
Travel Pattern vs. Country of Normal Residence
PIO
Country of Normal Residence Individual Family Group
Afghanistan 1 0 0
Australia 3 1 1
Bangladesh 2 3 0
Canada 2 0 0
China 2 3 4
France 1 0 0
Germany 1 0 0
Italy 1 0 0
Japan 2 0 0
Malaysia 24 5 1
Nepal 1 1 0
Oman 5 0 0
Pakistan 0 0 0
Republic of Korea 0 0 0
Russia 1 0 0
Singapore 22 8 1
Sri Lanka 6 1 1
Thailand 4 1 2
UK 13 4 0
USA 20 5 0
Total 78 23 10
OCI
Country of Normal Residence Individual Family Group
Afghanistan 0 0 0
Australia 27 3 0
Bangladesh 4 3 1
Canada 19 7 2
France 15 5 2
Germany 22 8 1
Hong Kong 37 3 4
Japan 7 2 2
Malaysia 109 10 2
Nepal 6 1 0
Oman 40 4 0
Pakistan 0 0 0
Qatar 34 3 1
Republic of Korea 1 0 0
Russia 4 0 1
Singapore 118 10 4
Sri Lanka 16 3 0
Thailand 50 8 4
UK 104 30 4
USA 177 18 3
Total 790 118 31

INTERNATIONAL PASSENGER SURVEY IN INDIA 2015-16
140
Table S9 (Contd.): Sample Distribution of NRI, PIO, OCI, Foreigner Others and All Visitors by
Travel Pattern vs. Country of Normal Residence
Foreigner Others
Country of Normal Residence Individual Family Group
Afghanistan 28 9 2
Australia 1001 390 164
Bangladesh 2774 1449 386
Canada 305 169 64
China 570 316 144
France 1169 696 263
Germany 1169 467 270
Japan 1331 704 293
Malaysia 1248 564 160
Nepal 205 42 11
Oman 232 96 21
Pakistan 13 8 3
Republic of Korea 76 10 11
Russia 352 456 266
Singapore 1696 502 187
Sri Lanka 748 391 55
Thailand 827 202 170
United Arab Emirates 2335 546 181
UK 2252 867 396
USA 2717 1065 431
Total 21048 8949 3478
All Visitors
Country of Normal Resi-dence
Individual Family Group
Afghanistan 31 12 2
Australia 1077 412 165
Bangladesh 2826 1464 390
Canada 358 208 67
China 597 326 153
France 1192 704 265
Germany 1204 480 275
Italy 397 113 91
Japan 1359 715 302
Malaysia 1490 614 168
Nepal 223 53 12
Oman 341 116 25
Pakistan 13 8 3
Republic of Korea 78 10 11
Russia 358 457 268
Singapore 2105 683 207
Sri Lanka 792 405 56
Thailand 942 230 181
UK 2495 965 405
USA 3151 1193 444
Total 21029 9168 3490

INTERNATIONAL PASSENGER SURVEY IN INDIA 2015-16
141
Table S10 (a): Sample Distribution of NRI Visitors by Purpose of Visit vs. Age Group
Table S10 (b): Sample Distribution of PIO Visitors by Purpose of Visit vs. Age Group
Age (in Years) 18-30 31-40 41-60 61-65 Above 65 Total
Purpose of
Visit
Social 285 571 483 16 10 1365
Holidaying-Leisure
-Recreation 441 414 232 6 13 1106
Business 108 363 208 6 4 689
Education-Training 53 11 6 0 0 70
Health-Medical 7 29 20 2 0 58
Religious-Activities 6 18 24 3 1 52
Shopping 0 3 2 0 0 5
Games-Sports 0 1 0 0 0 1
job-on-Foreign-
Deputation 0 0 0 0 0 0
Invited-by-India 0 0 0 0 0 0
Others 0 0 0 0 0 0
Total 900 1410 975 33 28 3346
Age (in Years) 18-30 31-40 41-60 61-65 Above 65 Total
Purpose of
Visit
Holidaying-Leisure-
Recreation 37 36 15 0 2 90
Sociaa 15 27 15 2 4 63
Business 9 36 11 0 0 56
Religious-Activities 6 9 6 0 2 23
Education-Training 10 4 0 0 0 14
Health-Medical 2 2 1 0 0 5
Shopping 0 0 2 1 0 3
Games-Sports 0 0 0 0 0 0
job-on-Foreign-
Deputation 0 0 0 0 0 0
Invited-by-India 0 0 0 0 0 0
Others 0 0 0 0 0 0
Total 79 114 50 3 8 254

INTERNATIONAL PASSENGER SURVEY IN INDIA 2015-16
142
Table S10(c): Sample Distribution of OCI Visitors by Purpose of Visit vs. Age Group
Table S10 (d): Sample Distribution of Foreigner Other Visitors by Purpose of Visit vs. Age Group
Age (in Years) 18-30 31-40 41-60 61-65 Above 65 Total
Purpose of
Visit
Holidaying-Leisure-
Recreation 165 238 161 8 4 576
Business 44 172 139 2 4 361
Social 42 124 72 1 3 242
Religious-Activities 8 27 15 0 0 50
Education-Training 11 7 8 0 0 26
Health-Medical 2 11 5 0 0 18
Shopping 0 2 0 0 0 2
Invited-by-India 1 0 0 0 0 1
Games-Sports 0 0 0 0 0 0
job-on-Foreign-
Deputation 0 0 0 0 0 0
Others 0 0 0 0 0 0
Total 273 581 400 11 11 1276
Age (in Years) 18-30 31-40 41-60 61-65 Above 65 Total
Purpose of
Visit
Holidaying-Leisure
-Recreation 6426 9502 5122 268 243 21561
Business 1866 5551 4821 122 46 12406
Social 551 1080 950 65 69 2715
Health-Medical 260 512 796 89 43 1700
Education-Training 577 157 99 9 5 847
Religious-Activities 157 327 249 20 18 771
Shopping 23 47 38 4 0 112
Games-Sports 21 22 16 1 1 61
Invited-by-India 0 1 0 0 0 1
job-on-Foreign-
Deputation 0 0 0 0 0 0
Others 0 0 0 0 0 0
Total 9881 17199 12091 578 425 40174
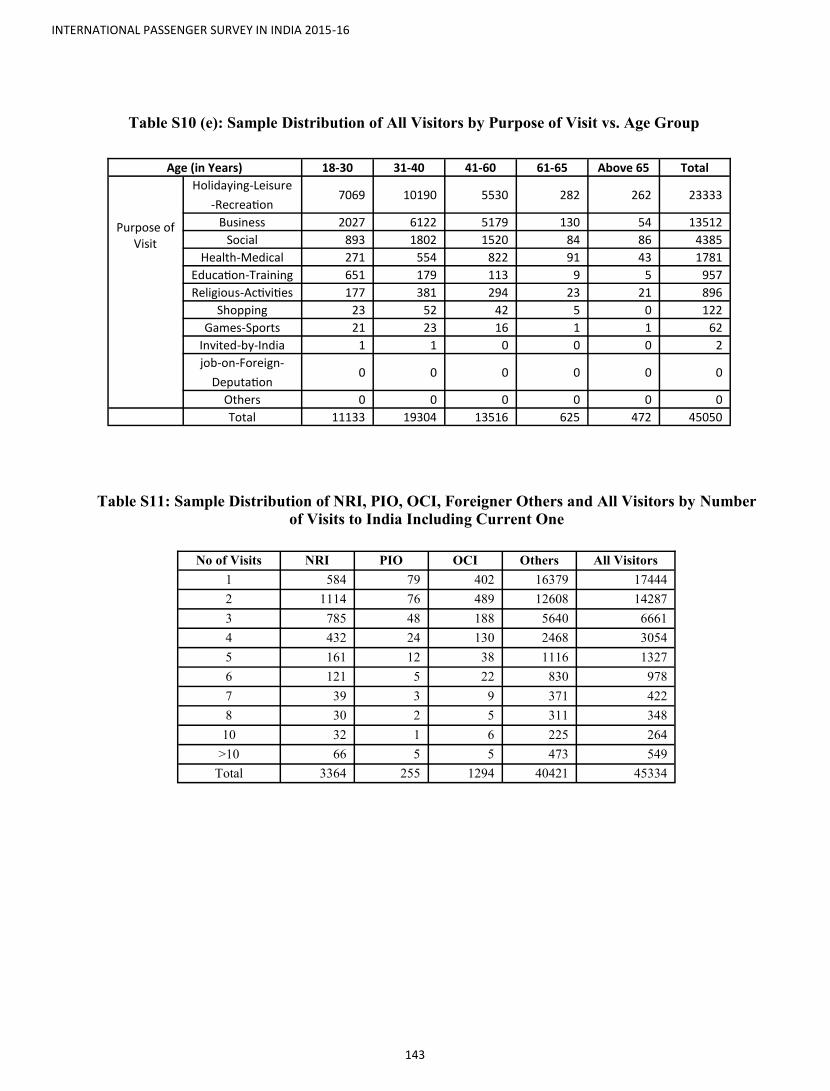
INTERNATIONAL PASSENGER SURVEY IN INDIA 2015-16
143
Table S10 (e): Sample Distribution of All Visitors by Purpose of Visit vs. Age Group
Table S11: Sample Distribution of NRI, PIO, OCI, Foreigner Others and All Visitors by Number
of Visits to India Including Current One
Age (in Years) 18-30 31-40 41-60 61-65 Above 65 Total
Purpose of
Visit
Holidaying-Leisure
-Recreation 7069 10190 5530 282 262 23333
Business 2027 6122 5179 130 54 13512
Social 893 1802 1520 84 86 4385
Health-Medical 271 554 822 91 43 1781
Education-Training 651 179 113 9 5 957
Religious-Activities 177 381 294 23 21 896
Shopping 23 52 42 5 0 122
Games-Sports 21 23 16 1 1 62
Invited-by-India 1 1 0 0 0 2
job-on-Foreign-
Deputation 0 0 0 0 0 0
Others 0 0 0 0 0 0
Total 11133 19304 13516 625 472 45050
No of Visits NRI PIO OCI Others All Visitors
1 584 79 402 16379 17444
2 1114 76 489 12608 14287
3 785 48 188 5640 6661
4 432 24 130 2468 3054
5 161 12 38 1116 1327
6 121 5 22 830 978
7 39 3 9 371 422
8 30 2 5 311 348
10 32 1 6 225 264
>10 66 5 5 473 549
Total 3364 255 1294 40421 45334
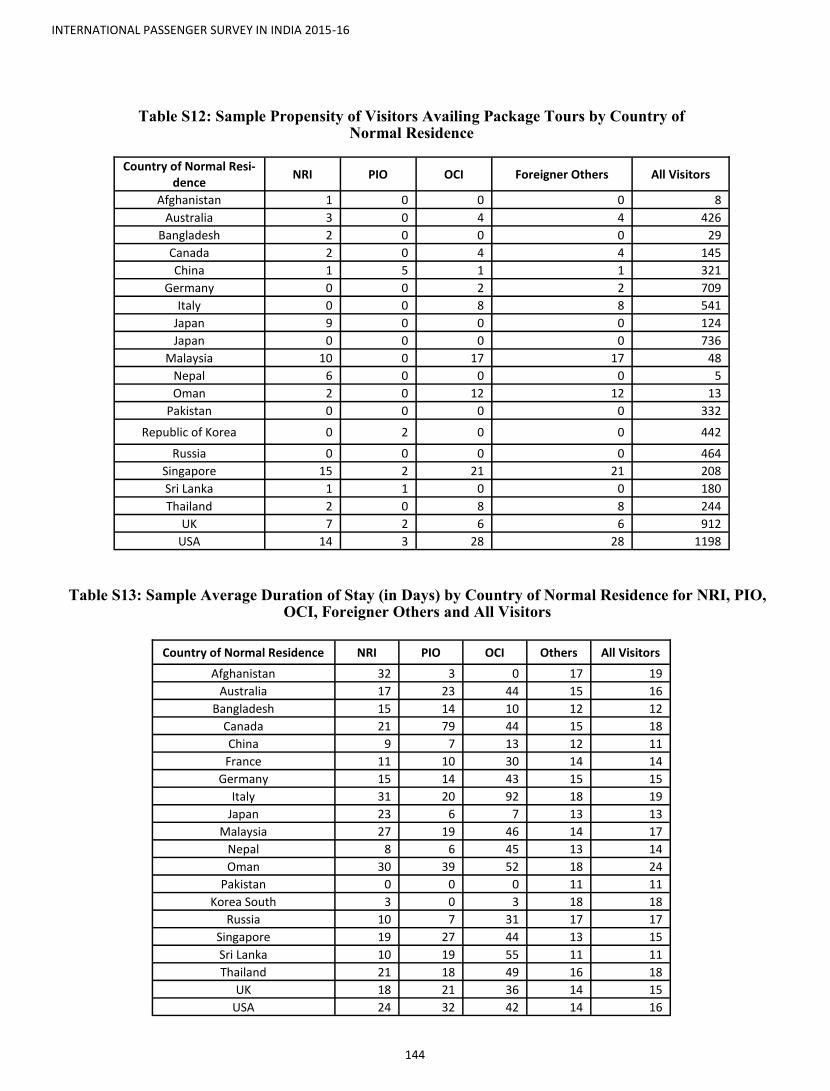
INTERNATIONAL PASSENGER SURVEY IN INDIA 2015-16
144
Table S12: Sample Propensity of Visitors Availing Package Tours by Country of Normal Residence
Table S13: Sample Average Duration of Stay (in Days) by Country of Normal Residence for NRI, PIO, OCI, Foreigner Others and All Visitors
Country of Normal Resi-dence
NRI PIO OCI Foreigner Others All Visitors
Afghanistan 1 0 0 0 8
Australia 3 0 4 4 426
Bangladesh 2 0 0 0 29
Canada 2 0 4 4 145
China 1 5 1 1 321
Germany 0 0 2 2 709
Italy 0 0 8 8 541
Japan 9 0 0 0 124
Japan 0 0 0 0 736
Malaysia 10 0 17 17 48
Nepal 6 0 0 0 5
Oman 2 0 12 12 13
Pakistan 0 0 0 0 332
Republic of Korea 0 2 0 0 442
Russia 0 0 0 0 464
Singapore 15 2 21 21 208
Sri Lanka 1 1 0 0 180
Thailand 2 0 8 8 244
UK 7 2 6 6 912
USA 14 3 28 28 1198
Country of Normal Residence NRI PIO OCI Others All Visitors
Afghanistan 32 3 0 17 19
Australia 17 23 44 15 16
Bangladesh 15 14 10 12 12
Canada 21 79 44 15 18
China 9 7 13 12 11
France 11 10 30 14 14
Germany 15 14 43 15 15
Italy 31 20 92 18 19
Japan 23 6 7 13 13
Malaysia 27 19 46 14 17
Nepal 8 6 45 13 14
Oman 30 39 52 18 24
Pakistan 0 0 0 11 11
Korea South 3 0 3 18 18
Russia 10 7 31 17 17
Singapore 19 27 44 13 15
Sri Lanka 10 19 55 11 11
Thailand 21 18 49 16 18
UK 18 21 36 14 15
USA 24 32 42 14 16

INTERNATIONAL PASSENGER SURVEY IN INDIA 2015-16
145
Table S14: Sample Average Cost (in INR) by Country of Normal Residence for NRI, PIO, OCI, For-eigner Others and All Visitors for package travelers and non-package travelers
AB.I.4 Expenditure Pattern
Country of Normal Residence
NRI PIO OCI
Average Package
Cost
Average Non Pack-age Cost
Average Package
Cost
Average Non Package Cost
Average Package
Cost
Average Non Package Cost
Afghanistan 50000.00 75500.00 0.00 200000.00 0.00 0.00
Australia 95541.67 237364.00 0.00 675850.00 2312896.00 526650.59
Bangladesh 34350.00 201297.07 0.00 12558.64 0.00 18653.85
Canada 35301.00 57239.89 0.00 174500.00 936108.20 302509.05
China 248400.00 154986.77 351504.00 439444.17 227880.00 95137.78
France 0.00 85266.89 0.00 113250.00 153437.00 1348627.92
Germany 130047.50 131256.76 0.00 250000.00 189934.50 916600.13
Italy 0.00 75449.44 0.00 260000.00 0.00 444420.00
Japan 74618.00 79764.46 0.00 65000.00 0.00 83513.62
Malaysia 329752.92 418600.00 75695.00 0.00 250449.05 50000.00
Nepal 216250.00 347807.99 0.00 40732.20 0.00 1520240.80
Oman 184056.00 0.00 0.00 0.00 1029919.29 0.00
Pakistan 0.00 114212.73 0.00 100488.70 0.00 434509.38
Republic of Korea 0.00 93869.63 0.00 72000.00 0.00 126893.75
Russia 0.00 51875.00 0.00 123414.00 0.00 80081.60
Singapore 497464.62 197898.43 112175.00 414252.15 325503.79 898083.71
Sri Lanka 100000.00 67741.28 109038.00 41722.89 0.00 271851.67
Thailand 81550.00 126690.91 0.00 65612.50 35358.13 278609.21
UK 410763.00 132929.52 205626.67 894501.05 2817552.83 687008.84
USA 529882.00 367935.07 69410.00 420922.26 1269421.58 961270.21
Country of Normal Residence
Foreigner Others All Visitors
Average Pack-age Cost
Average Non Package Cost
Average Package Cost
Average Non Package Cost
Afghanistan 248850.13 87186.28 209080.10 87493.00
Australia 181605.53 259669.25 201948.25 264142.40
Bangladesh 45086.00 32797.30 44673.08 34468.15
Canada 190242.52 134380.74 202295.09 131073.43
China 130096.64 119335.05 132287.25 122011.21
France 189996.91 175225.12 189906.72 184341.90
Germany 174466.18 257301.56 174507.94 267206.89
Italy 234671.17 129460.07 234671.17 128106.08
Japan 145791.80 202409.43 145032.32 200235.26
Korea South 171922.10 77266.38 175638.00 80174.41
Oman 119153.60 460325.89 132546.21 514728.95
Pakistan 215523.55 44522.76 313270.15 44522.76
Malaysia 137857.14 238695.93 137857.14 236686.60
Nepal 106046.07 70551.79 106046.07 73809.03
Russia 163227.40 127238.65 163227.40 126935.02
Singapore 195456.28 270364.11 208694.03 282153.53
Sri Lanka 89377.15 136864.51 89455.81 136465.58
Thailand 120687.95 252709.34 117622.62 244096.44
UK 229284.16 244499.69 241547.01 256215.43
USA 266274.95 236645.82 285455.53 273856.08

INTERNATIONAL PASSENGER SURVEY IN INDIA 2015-16
146
Table S15: Sample Average Expenditure (in INR) of NRI, PIO, OCI, Foreigner Others and All Visitors within India
Item NRI PIO OCI Foreigner Others All Visitors
Average Package Cost 146017.24 126422.17 268053.73 120556.85 146073.85
Non Package Components
Accommodation
Hotel 36270.58 59899.56 79614.19 36965.51 37678.67
Rented house 19458.33 11953.50 29454.55 23852.68 23629.35
Private guest house 13895.56 31230.00 31627.31 21654.72 21134.52
Govt. guest house 24027.78 10500.00 3000.00 19619.24 19930.40
Dharamshala 6318.74 80000.00 7000.00 16577.47 15818.69
Friends & relatives 7006.26 23200.00 7714.29 4884.59 5439.09
Others 10298.82 533.33 24761.50 22430.78 20116.13
Sub-total of Accommodation 30443.11 54248.42 74849.46 35694.88 36056.51
Food & Drink
In the accommodation unit 8566.70 12602.43 22327.21 7822.12 8044.02
Outside accommodation unit 5626.90 10107.78 14653.41 6050.43 6110.57
Sub-total of Food & Drink 8071.06 11889.61 19467.68 8667.25 8752.58
Transport
Air 13782.54 33606.42 40118.79 14480.24 14761.06
Transport equipment’s rental 5422.48 15022.50 23553.85 7348.20 7426.92
Travel agency services/tour oper-ators 3533.53 25577.89 34642.95 7000.52 7138.83
Road(excluding transport equip-ment’s rental 4864.53 21557.34 21893.14 5968.70 6091.47
Water 3125.94 3309.60 43333.35 4317.93 5196.30
Railways 2489.02 1589.19 9918.98 2837.65 2832.09
Miscellaneous 3940.21 3549.20 3927.64 3521.56 3549.98
Subtotal of Transport 8739.63 26567.93 34190.88 11786.65 11813.14

INTERNATIONAL PASSENGER SURVEY IN INDIA 2015-16
147
Table S15(Contd.): Sample Average Expenditure (in INR) of NRI, PIO, OCI, Foreigner Others and All Visitors within India
Item NRI PIO OCI Foreigner Others All Visitors
Shopping
Gems and jewellery etc. 12610.31 23241.39 21940.95 8338.69 8830.94
Clothing and garments 9499.48 18207.61 24408.82 7918.58 8506.36
Alcohol 5067.55 12081.33 20781.52 4769.28 5101.18
Processed food 4412.52 13688.50 11976.57 3438.21 3882.61
Footwear /leather goods 3394.71 7574.47 8734.85 3554.39 3681.17
Travel related consumer goods 3532.04 14358.55 8665.76 2762.71 3004.04
Tobacco products 5564.56 5026.17 11974.36 2228.51 2651.33
Toiletries 3505.56 11516.00 6330.88 2312.40 2464.15
Books, journals etc. 2122.55 2295.71 8722.45 2136.34 2225.81
Others 15285.01 2380.56 16506.58 5629.45 6724.99
Subtotal of Shopping 21478.66 40854.80 51693.63 16912.81 18100.33
Recreation, religious, cultural, sporting
Sporting activities 2565.52 3722.22 10301.52 2549.88 2671.91
Entry fee to and other exp. at religious sites 3239.68 6511.97 13206.58 2373.49 2612.48
Entry fee & others expenses at cultural sites 3228.43 5082.65 4074.75 2244.57 2314.10
Cinema,theatre,amusements 1474.70 2114.23 8286.31 1653.95 1871.05
Sub-total of Recreation, religious, cultural, sporting 3044.55 5713.09 12219.69 4226.74 4393.84
Medical and health related activities
Medical accessories 7355.84 12807.69 7222.14 5239.70 5648.24
Medicine 4390.18 11842.42 15348.77 4776.74 5264.89
Other health related services 5778.64 1510.53 6882.47 9721.13 9268.86
Sub-total of Medical and health related activities 6858.49 15085.44 14314.88 8119.19 8365.62
Others(non-packages) 37975.07 20580.00 31360.00 23909.78 26376.83
Total of Non Package Average Cost 47070.25 87248.06 101957.19 52340.74 53216.62
Total Non Package Average Cost+ Total Package Cost 59819.16 122334.97 240492.59 60281.22 64811.91

INTERNATIONAL PASSENGER SURVEY IN INDIA 2015-16
148
Table S16: Sample Average Cost (in INR) of Accommodation of Entire Tour by Country of Normal Residence
Table S17: Sample Average Cost (in INR) of Food of Entire Tour by Country of Normal Residence
Country-Normal-Residence NRI PIO OCI Foreigner Others All Visitors
Afghanistan 16875.00 12000.00 0.00 15188.04 15351.65
Australia 7213.05 5000.00 5056.76 25564.54 24348.54
Bangladesh 5690.57 690.91 4257.14 5063.42 5061.19
Canada 5971.69 50000.00 11812.10 22816.63 20310.44
China 23166.67 42216.67 31257.11 24111.61 24308.91
France 8388.89 0.00 8923.08 23551.35 23343.17
Germany 14879.31 80000.00 7630.43 24236.10 23881.61
Italy 9629.63 0.00 130000.00 25195.29 24751.71
Japan 37869.39 52000.00 24615.38 24395.47 24593.73
Malaysia 14283.50 12086.49 34892.67 22891.07 22693.79
Nepal 19934.67 22000.00 3750.00 21361.95 20841.03
Oman 9568.47 88250.80 30083.73 16135.32 16552.54
Pakistan 0.00 0.00 0.00 11234.87 11234.87
Republic of Korea 25000.00 0.00 33000.00 27238.01 27269.19
Russia 6525.00 29000.00 13600.00 32089.05 31980.73
Singapore 9529.01 27714.17 36917.88 22956.77 21070.06
Sri Lanka 13043.48 15003.22 7375.00 14307.57 14200.05
Thailand 13280.25 20625.00 15444.23 19359.03 18762.94
UK 7315.83 7684.24 33786.77 26648.80 25735.69
USA 9006.093 12516.13 33571.22 25860.37 24677.87
Country-Normal-Residence NRI PIO OCI Foreigner Others All Visitors
Afghanistan 250.00 0.00 0.00 2243.98 1955.16
Australia 708.46 0.00 1081.08 2609.59 2491.97
Bangladesh 332.86 318.18 0.00 541.30 537.76
Canada 1412.97 2000.00 1448.80 2870.31 2628.78
China 2907.41 6763.33 2223.16 2326.83 2367.16
France 1111.11 0.00 707.69 2345.15 2324.50
Germany 1517.24 0.00 46.74 2290.91 2244.60
Italy 0.00 0.00 12000.00 2530.09 2450.17
Japan 3285.71 0.00 1538.46 2658.44 2661.44
Malaysia 2361.97 219.68 7361.43 2115.89 2321.08
Nepal 3781.33 2666.67 1250.00 2179.71 2300.26
Oman 446.61 28560.00 6509.12 1566.97 1924.85
Pakistan 0.00 0.00 0.00 3185.53 3185.53
Republic of Korea 5000.00 0.00 0.00 3653.67 3633.25
Russia 0.00 0.00 2800.00 3970.01 3955.94
Singapore 1484.79 2772.31 3338.75 2052.86 2005.20
Sri Lanka 1434.78 1054.44 583.33 1587.70 1570.00
Thailand 775.93 250.00 2192.31 2145.47 2043.17
UK 2518.02 2803.14 1900.08 2646.88 2614.82
USA 1103.17 322.58 3890.01 2474.25 2400.27

INTERNATIONAL PASSENGER SURVEY IN INDIA 2015-16
149
Table S18: Sample Average Cost (in INR) of Transport of Entire Tour by Country of Normal Residence
Table S19: Sample Average Cost (in INR) of Shopping of Entire Tour by Country of Normal Residence
Country-Normal-Residence NRI PIO OCI Foreigner Others All Visitors
Afghanistan 8820.00 3000.00 0.00 16289.63 15130.16
Australia 6123.60 4000.00 1980.27 9123.10 8858.62
Bangladesh 2584.79 445.45 2746.43 2561.24 2558.50
Canada 7346.86 26000.00 6069.00 10217.43 9723.13
China 12183.33 24558.17 5852.11 8664.38 8804.32
France 11468.00 0.00 911.54 8778.44 8727.72
Germany 6814.28 0.00 1286.96 7597.92 7481.87
Italy 7548.15 170000.00 13000.00 11566.16 11633.07
Japan 8158.16 0.00 2807.69 8221.21 8196.39
Malaysia 7744.69 4042.22 8302.66 6849.74 6934.71
Nepal 22341.33 12333.33 2500.00 8215.92 9334.50
Oman 5772.65 2392.60 24850.14 4398.80 6077.32
Pakistan 0.00 0.00 0.00 13684.63 13684.63
Republic of Korea 0.00 0.00 0.00 7321.75 7192.16
Russia 9575.00 0.00 12500.00 10181.60 10181.05
Singapore 5398.84 8345.65 18903.39 8196.83 8077.00
Sri Lanka 4127.17 8131.44 4250.00 5777.79 5732.76
Thailand 5663.70 4550.00 3971.92 7025.97 6780.77
UK 6284.53 21095.48 10872.82 9795.44 9680.84
USA 6793.56 12066.61 13383.83 8644.63 8671.58
Country-Normal-Residence NRI PIO OCI Foreigner Others All Visitors
Afghanistan 12798.75 30000.00 0.00 13974.41 14079.49
Australia 14189.97 22306.67 49153.32 16759.26 17179.59
Bangladesh 6706.00 6236.36 3076.43 9321.63 9277.79
Canada 21593.40 19000.00 28659.55 14763.38 16179.04
China 14235.26 40145.83 14419.58 13363.92 13583.78
France 7088.89 11500.00 60732.65 19455.68 19714.88
Germany 18192.34 0.00 27562.28 14460.83 14712.88
Italy 36370.37 10000.00 26000.00 10388.06 11321.32
Japan 11258.24 0.00 8361.54 12937.39 12891.12
Malaysia 17670.28 12485.81 27382.15 15209.07 15826.51
Nepal 28021.33 20000.00 77854.75 15099.47 17690.88
Oman 15171.86 28118.80 116359.33 10724.68 19150.39
Pakistan 0.00 0.00 0.00 8515.82 8515.82
Republic of Korea 8211.00 0.00 0.00 9348.11 9255.32
Russia 7480.00 0.00 46440.00 19046.11 19085.36
Singapore 14454.02 47240.22 38511.39 18277.06 18695.34
Sri Lanka 11821.74 13205.33 20040.25 9458.76 9654.01
Thailand 13214.33 18418.75 14666.58 10637.84 11036.72
UK 23426.86 20745.29 47080.54 20605.09 21666.88
USA 20257.13 21637.58 48383.78 19111.51 20226.10
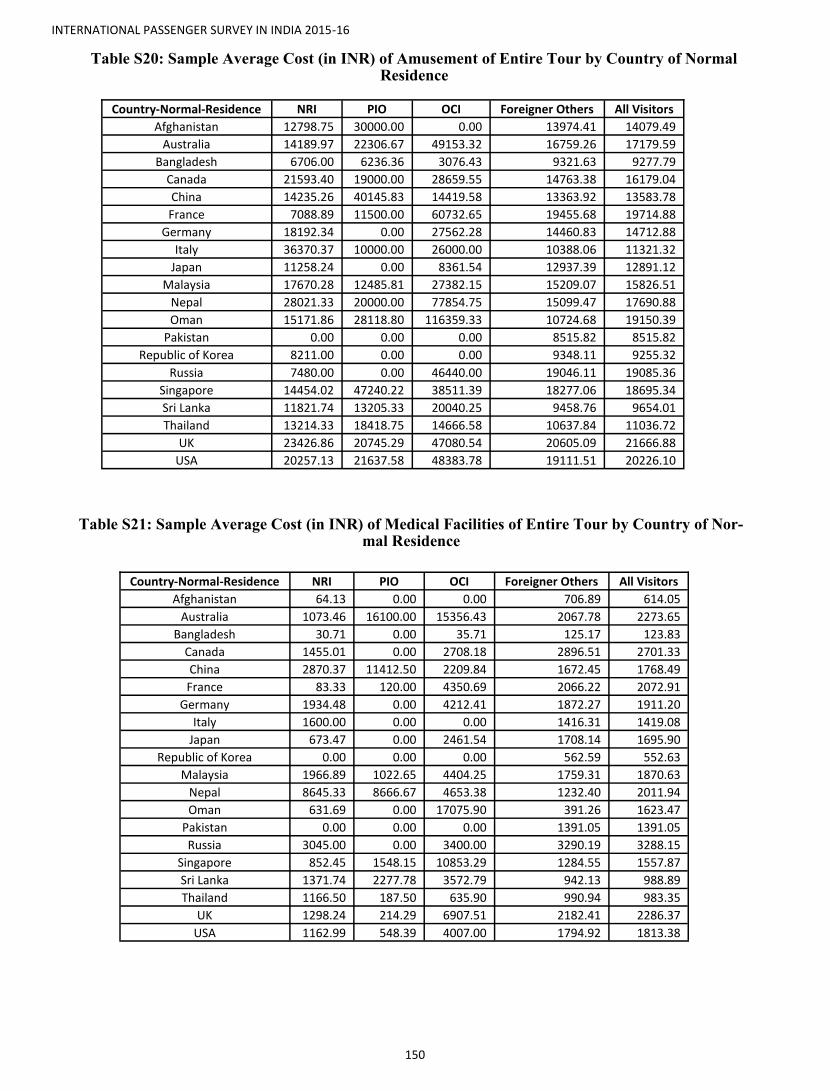
INTERNATIONAL PASSENGER SURVEY IN INDIA 2015-16
150
Table S20: Sample Average Cost (in INR) of Amusement of Entire Tour by Country of Normal Residence
Table S21: Sample Average Cost (in INR) of Medical Facilities of Entire Tour by Country of Nor-mal Residence
Country-Normal-Residence NRI PIO OCI Foreigner Others All Visitors
Afghanistan 12798.75 30000.00 0.00 13974.41 14079.49
Australia 14189.97 22306.67 49153.32 16759.26 17179.59
Bangladesh 6706.00 6236.36 3076.43 9321.63 9277.79
Canada 21593.40 19000.00 28659.55 14763.38 16179.04
China 14235.26 40145.83 14419.58 13363.92 13583.78
France 7088.89 11500.00 60732.65 19455.68 19714.88
Germany 18192.34 0.00 27562.28 14460.83 14712.88
Italy 36370.37 10000.00 26000.00 10388.06 11321.32
Japan 11258.24 0.00 8361.54 12937.39 12891.12
Malaysia 17670.28 12485.81 27382.15 15209.07 15826.51
Nepal 28021.33 20000.00 77854.75 15099.47 17690.88
Oman 15171.86 28118.80 116359.33 10724.68 19150.39
Pakistan 0.00 0.00 0.00 8515.82 8515.82
Republic of Korea 8211.00 0.00 0.00 9348.11 9255.32
Russia 7480.00 0.00 46440.00 19046.11 19085.36
Singapore 14454.02 47240.22 38511.39 18277.06 18695.34
Sri Lanka 11821.74 13205.33 20040.25 9458.76 9654.01
Thailand 13214.33 18418.75 14666.58 10637.84 11036.72
UK 23426.86 20745.29 47080.54 20605.09 21666.88
USA 20257.13 21637.58 48383.78 19111.51 20226.10
Country-Normal-Residence NRI PIO OCI Foreigner Others All Visitors
Afghanistan 64.13 0.00 0.00 706.89 614.05
Australia 1073.46 16100.00 15356.43 2067.78 2273.65
Bangladesh 30.71 0.00 35.71 125.17 123.83
Canada 1455.01 0.00 2708.18 2896.51 2701.33
China 2870.37 11412.50 2209.84 1672.45 1768.49
France 83.33 120.00 4350.69 2066.22 2072.91
Germany 1934.48 0.00 4212.41 1872.27 1911.20
Italy 1600.00 0.00 0.00 1416.31 1419.08
Japan 673.47 0.00 2461.54 1708.14 1695.90
Republic of Korea 0.00 0.00 0.00 562.59 552.63
Malaysia 1966.89 1022.65 4404.25 1759.31 1870.63
Nepal 8645.33 8666.67 4653.38 1232.40 2011.94
Oman 631.69 0.00 17075.90 391.26 1623.47
Pakistan 0.00 0.00 0.00 1391.05 1391.05
Russia 3045.00 0.00 3400.00 3290.19 3288.15
Singapore 852.45 1548.15 10853.29 1284.55 1557.87
Sri Lanka 1371.74 2277.78 3572.79 942.13 988.89
Thailand 1166.50 187.50 635.90 990.94 983.35
UK 1298.24 214.29 6907.51 2182.41 2286.37
USA 1162.99 548.39 4007.00 1794.92 1813.38
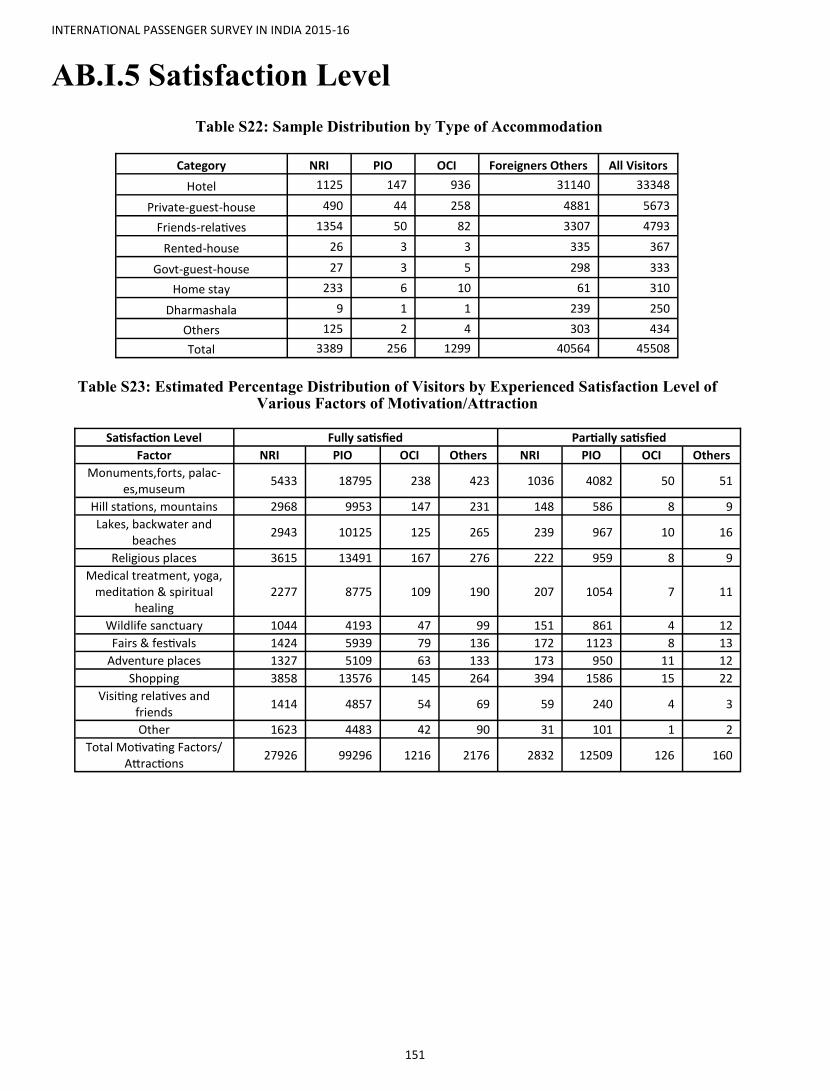
INTERNATIONAL PASSENGER SURVEY IN INDIA 2015-16
151
AB.I.5 Satisfaction Level
Table S22: Sample Distribution by Type of Accommodation
Table S23: Estimated Percentage Distribution of Visitors by Experienced Satisfaction Level of Various Factors of Motivation/Attraction
Category NRI PIO OCI Foreigners Others All Visitors
Hotel 1125 147 936 31140 33348
Private-guest-house 490 44 258 4881 5673
Friends-relatives 1354 50 82 3307 4793
Rented-house 26 3 3 335 367
Govt-guest-house 27 3 5 298 333
Home stay 233 6 10 61 310
Dharmashala 9 1 1 239 250
Others 125 2 4 303 434
Total 3389 256 1299 40564 45508
Satisfaction Level Fully satisfied Partially satisfied
Factor NRI PIO OCI Others NRI PIO OCI Others
Monuments,forts, palac-es,museum
5433 18795 238 423 1036 4082 50 51
Hill stations, mountains 2968 9953 147 231 148 586 8 9
Lakes, backwater and beaches
2943 10125 125 265 239 967 10 16
Religious places 3615 13491 167 276 222 959 8 9
Medical treatment, yoga, meditation & spiritual
healing 2277 8775 109 190 207 1054 7 11
Wildlife sanctuary 1044 4193 47 99 151 861 4 12
Fairs & festivals 1424 5939 79 136 172 1123 8 13
Adventure places 1327 5109 63 133 173 950 11 12
Shopping 3858 13576 145 264 394 1586 15 22
Visiting relatives and friends
1414 4857 54 69 59 240 4 3
Other 1623 4483 42 90 31 101 1 2
Total Motivating Factors/Attractions
27926 99296 1216 2176 2832 12509 126 160

INTERNATIONAL PASSENGER SURVEY IN INDIA 2015-16
152
Table S23(contd.). Estimated Percentage Distribution of Visitors by Experienced Satisfaction Level of Various Factors of Motivation/Attraction
Table S24 (a): Sample Distribution of Visitors by Experienced Level of Satisfaction for Various Factors Related to Tourism Infrastructure
Satisfaction Level Not Satisfied No Comment
Factor NRI PIO OCI Others NRI PIO OCI Others
Monuments,forts, palac-es,museum
32 160 2 0 50 249 0 4
Hill stations, mountains 24 123 0 0 21 133 1 3
Lakes, backwater and beaches
37 290 0 3 22 144 0 0
Religious places 29 130 3 1 21 133 1 1
Medical treatment, yoga, meditation & spiritual
healing 13 133 2 1 26 159 0 2
Wildlife sanctuary 28 117 2 0 36 175 1 2
Fairs & festivals 19 128 0 0 26 157 0 3
Adventure places 17 104 2 1 37 173 2 3
Shopping 21 115 2 2 21 113 0 1
Visiting relatives and friends
5 37 1 0 5 34 0 0
Other 5 20 0 0 1 7 0 0
Total Motivating Factors/Attractions
230 1357 14 8 266 1477 5 19
Satisfaction Level Fully Satisfied Partially Satisfied
Factor NRI PIO OCI Others NRI PIO OCI Others
Personal security & safety
5808 20387 249 475 559 2140 24 27
Spatial security 1693 6389 92 151 170 684 11 10
Sightseeing facilities 2978 10259 116 272 260 1173 11 16
Tourist guides 1576 6565 86 151 192 956 13 6
Service (including food) 4902 16182 171 380 406 1563 25 27
Good sanitary & health condition
2290 8239 84 186 390 1607 8 22
Shopping facilities 3541 12354 137 248 329 1493 12 25
Reasonable Cost 3622 12283 143 247 342 1336 17 24
Foreign Money transac-tion
1536 6004 71 97 305 1092 7 17
Accommodation tariff 2279 7362 73 163 139 544 5 14
Total Importance and Satisfaction Level on
non-transport 30225 106024 1222 2370 3092 12588 133 188

INTERNATIONAL PASSENGER SURVEY IN INDIA 2015-16
153
Table S24(a)(contd.). Sample Distribution of Visitors by Experienced Level of Satisfaction for Various Factors Related to Tourism Infrastructure
Table S24 (b): Sample Distribution of Visitors by Experienced Level of Satisfaction for Various Factors Related to Transport
Satisfaction Level Not Satisfied No Comment
Factor NRI PIO OCI Others NRI PIO OCI Others
Personal security & safety
74 184 2 2 19 56 0 1
Spatial security 31 131 1 1 8 41 0 0
Sightseeing facilities 28 188 1 1 11 86 0 1
Tourist guides 30 136 2 2 15 120 1 0
Service (including food) 45 153 2 1 8 93 0 1
Good sanitary & health condition
163 349 2 10 18 76 1 2
Shopping facilities 33 162 0 3 14 100 0 1
Reasonable Cost 20 112 3 2 9 83 0 0
Foreign Money transac-tion
20 122 0 0 11 56 0 1
Accommodation tariff 20 63 0 3 5 28 0 0
Total Importance and Satisfaction Level on
non-transport 464 1600 13 25 118 739 2 7
Satisfaction Lev-el
Fully Satisfied Partially Satisfied
Factor NRI PIO OCI Others NRI PIO OCI Oth-ers
Air 7434 25656 294 562 197 753 9 11
Rail 1232 4417 52 62 450 1996 26 51
Sea 506 1793 18 37 81 359 6 6
Road 5550 19382 214 377 1162 4357 48 99
Total Importance and Satisfaction
Level on transport
14722 51248 578 1038 1890 7465 89 167
Satisfaction Level Not Satisfied No Comment
Factor NRI PIO OCI Others NRI PIO OCI Others
Air 23 137 0 0 24 91 1 0
Rail 201 785 1 9 133 682 4 8
Sea 94 517 8 4 381 1863 4 13
Road 650 2286 15 33 117 384 7 7
Total Importance and Satisfaction
Level on transport 968 3725 24 46 655 3020 16 28

INTERNATIONAL PASSENGER SURVEY IN INDIA 2015-16
154
AB.I.6 Non-monetary Transaction Findings
Table S25: Estimated Value of Non-Monetary Tourism Transaction (in INR)
AB.I.7 Motivating Factors
Table S26: Sample Distribution of Visitors by Perceived Expectation Level of Various Factors of Motivation/Attraction
Gifts Given Gifts Received
Category Average of Estimated-Amount
(INR)
Average of Estimated Amount
(INR)
NRI 67282.23 24211.55
PIO 34978.63 54546.59
OCI 79169.00 51360.37
Others 15432.44 11456.55
Total 27292.21 17904.80
Rank Rank 1 Rank 2
Factor NRI PIO OCI Others NRI PIO OCI Others
Monuments,forts,palaces,museum 13936 4148 34 61 5727 287 49 95
Hill stations, mountains 3081 96 10 11 6503 327 68 59
Lakes, backwater and beaches 2499 159 14 11 4083 304 119 31
Religious places 2841 126 6 5 4753 231 63 23
Medical treatment, yoga, meditation & spiritual healing
2332 115 7 7 1961 147 36 15
Wildlife sanctuary 409 57 7 8 900 95 24 22
Fairs & festivals 554 73 3 5 1414 134 17 28
Adventure places 589 60 2 2 898 117 13 17
Shopping 3736 173 9 6 4506 270 22 5
Visiting relatives and friends 3155 44 2 1 1431 49 5 1
Other 5041 44 6 4 572 24 2 0
Total Motivating Factors/Attractions 38173 5095 100 121 32748 1985 418 296
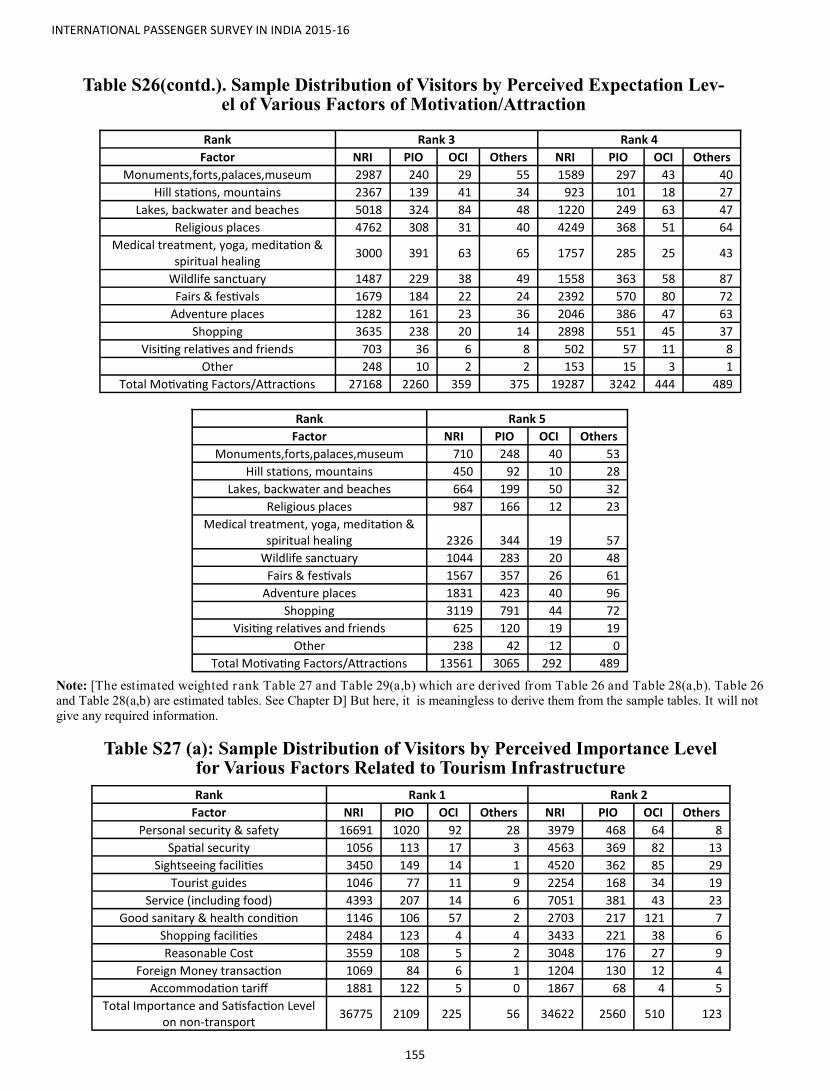
INTERNATIONAL PASSENGER SURVEY IN INDIA 2015-16
155
Table S26(contd.). Sample Distribution of Visitors by Perceived Expectation Lev-el of Various Factors of Motivation/Attraction
Table S27 (a): Sample Distribution of Visitors by Perceived Importance Level for Various Factors Related to Tourism Infrastructure
Rank Rank 3 Rank 4
Factor NRI PIO OCI Others NRI PIO OCI Others
Monuments,forts,palaces,museum 2987 240 29 55 1589 297 43 40
Hill stations, mountains 2367 139 41 34 923 101 18 27
Lakes, backwater and beaches 5018 324 84 48 1220 249 63 47
Religious places 4762 308 31 40 4249 368 51 64
Medical treatment, yoga, meditation & spiritual healing
3000 391 63 65 1757 285 25 43
Wildlife sanctuary 1487 229 38 49 1558 363 58 87
Fairs & festivals 1679 184 22 24 2392 570 80 72
Adventure places 1282 161 23 36 2046 386 47 63
Shopping 3635 238 20 14 2898 551 45 37
Visiting relatives and friends 703 36 6 8 502 57 11 8
Other 248 10 2 2 153 15 3 1
Total Motivating Factors/Attractions 27168 2260 359 375 19287 3242 444 489
Rank Rank 5
Factor NRI PIO OCI Others
Monuments,forts,palaces,museum 710 248 40 53
Hill stations, mountains 450 92 10 28
Lakes, backwater and beaches 664 199 50 32
Religious places 987 166 12 23
Medical treatment, yoga, meditation & spiritual healing 2326 344 19 57
Wildlife sanctuary 1044 283 20 48
Fairs & festivals 1567 357 26 61
Adventure places 1831 423 40 96
Shopping 3119 791 44 72
Visiting relatives and friends 625 120 19 19
Other 238 42 12 0
Total Motivating Factors/Attractions 13561 3065 292 489
Note: [The estimated weighted rank Table 27 and Table 29(a,b) which are der ived from Table 26 and Table 28(a,b). Table 26 and Table 28(a,b) are estimated tables. See Chapter D] But here, it is meaningless to derive them from the sample tables. It will not
give any required information.
Rank Rank 1 Rank 2
Factor NRI PIO OCI Others NRI PIO OCI Others
Personal security & safety 16691 1020 92 28 3979 468 64 8
Spatial security 1056 113 17 3 4563 369 82 13
Sightseeing facilities 3450 149 14 1 4520 362 85 29
Tourist guides 1046 77 11 9 2254 168 34 19
Service (including food) 4393 207 14 6 7051 381 43 23
Good sanitary & health condition 1146 106 57 2 2703 217 121 7
Shopping facilities 2484 123 4 4 3433 221 38 6
Reasonable Cost 3559 108 5 2 3048 176 27 9
Foreign Money transaction 1069 84 6 1 1204 130 12 4
Accommodation tariff 1881 122 5 0 1867 68 4 5
Total Importance and Satisfaction Level on non-transport
36775 2109 225 56 34622 2560 510 123
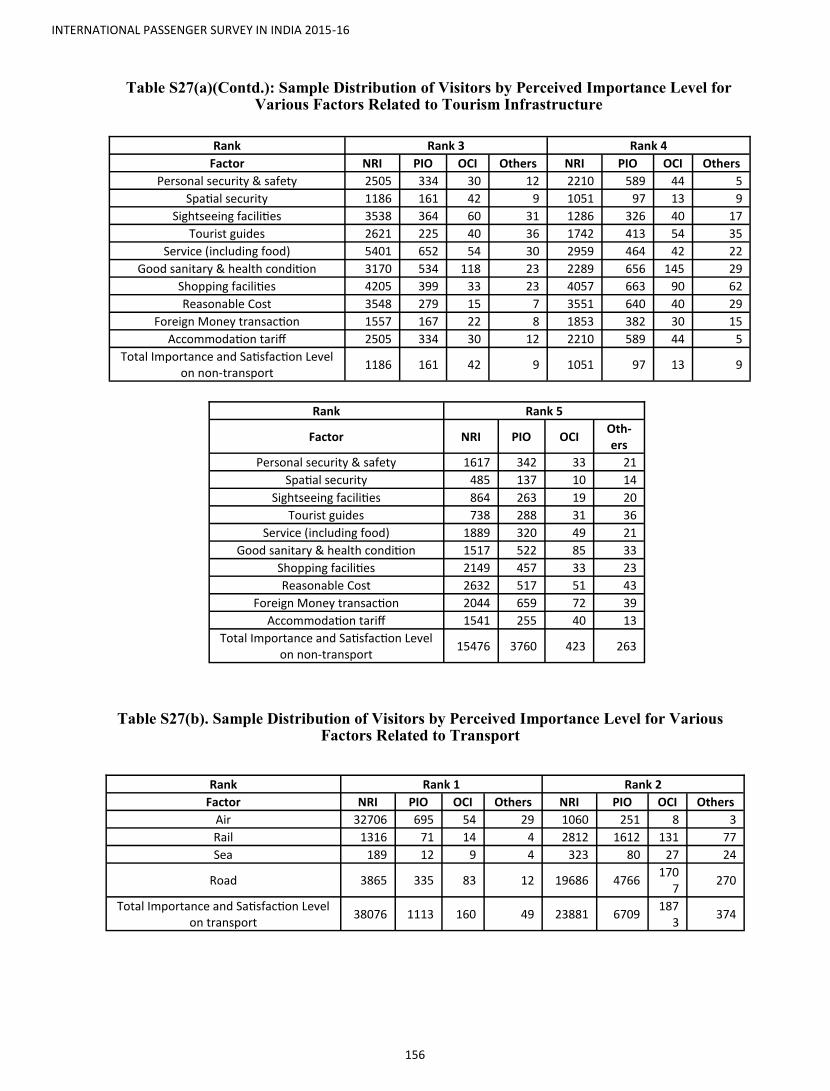
INTERNATIONAL PASSENGER SURVEY IN INDIA 2015-16
156
Table S27(a)(Contd.): Sample Distribution of Visitors by Perceived Importance Level for Various Factors Related to Tourism Infrastructure
Table S27(b). Sample Distribution of Visitors by Perceived Importance Level for Various Factors Related to Transport
Rank Rank 3 Rank 4
Factor NRI PIO OCI Others NRI PIO OCI Others
Personal security & safety 2505 334 30 12 2210 589 44 5
Spatial security 1186 161 42 9 1051 97 13 9
Sightseeing facilities 3538 364 60 31 1286 326 40 17
Tourist guides 2621 225 40 36 1742 413 54 35
Service (including food) 5401 652 54 30 2959 464 42 22
Good sanitary & health condition 3170 534 118 23 2289 656 145 29
Shopping facilities 4205 399 33 23 4057 663 90 62
Reasonable Cost 3548 279 15 7 3551 640 40 29
Foreign Money transaction 1557 167 22 8 1853 382 30 15
Accommodation tariff 2505 334 30 12 2210 589 44 5
Total Importance and Satisfaction Level on non-transport
1186 161 42 9 1051 97 13 9
Rank Rank 5
Factor NRI PIO OCI Oth-ers
Personal security & safety 1617 342 33 21
Spatial security 485 137 10 14
Sightseeing facilities 864 263 19 20
Tourist guides 738 288 31 36
Service (including food) 1889 320 49 21
Good sanitary & health condition 1517 522 85 33
Shopping facilities 2149 457 33 23
Reasonable Cost 2632 517 51 43
Foreign Money transaction 2044 659 72 39
Accommodation tariff 1541 255 40 13
Total Importance and Satisfaction Level on non-transport
15476 3760 423 263
Rank Rank 1 Rank 2
Factor NRI PIO OCI Others NRI PIO OCI Others
Air 32706 695 54 29 1060 251 8 3
Rail 1316 71 14 4 2812 1612 131 77
Sea 189 12 9 4 323 80 27 24
Road 3865 335 83 12 19686 4766 170
7 270
Total Importance and Satisfaction Level on transport
38076 1113 160 49 23881 6709 187
3 374
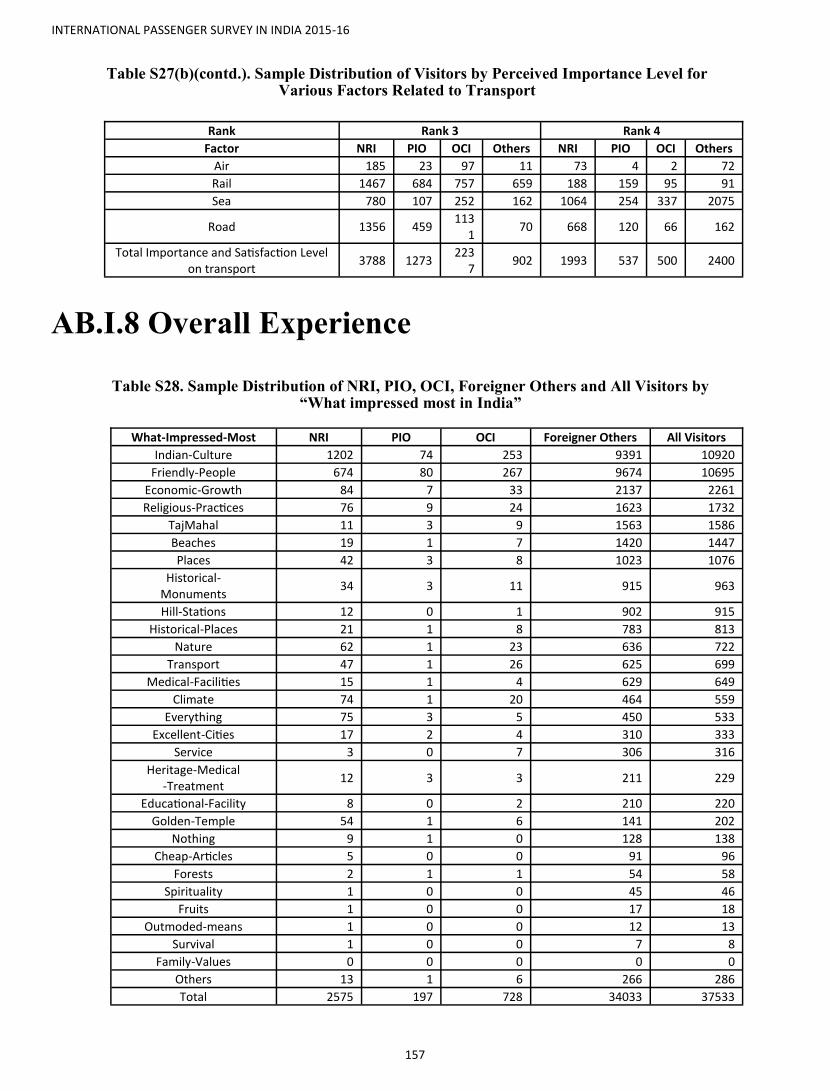
INTERNATIONAL PASSENGER SURVEY IN INDIA 2015-16
157
Table S27(b)(contd.). Sample Distribution of Visitors by Perceived Importance Level for Various Factors Related to Transport
AB.I.8 Overall Experience
Table S28. Sample Distribution of NRI, PIO, OCI, Foreigner Others and All Visitors by “What impressed most in India”
Rank Rank 3 Rank 4
Factor NRI PIO OCI Others NRI PIO OCI Others
Air 185 23 97 11 73 4 2 72
Rail 1467 684 757 659 188 159 95 91
Sea 780 107 252 162 1064 254 337 2075
Road 1356 459 113
1 70 668 120 66 162
Total Importance and Satisfaction Level on transport
3788 1273 223
7 902 1993 537 500 2400
What-Impressed-Most NRI PIO OCI Foreigner Others All Visitors
Indian-Culture 1202 74 253 9391 10920
Friendly-People 674 80 267 9674 10695
Economic-Growth 84 7 33 2137 2261
Religious-Practices 76 9 24 1623 1732
TajMahal 11 3 9 1563 1586
Beaches 19 1 7 1420 1447
Places 42 3 8 1023 1076
Historical- Monuments
34 3 11 915 963
Hill-Stations 12 0 1 902 915
Historical-Places 21 1 8 783 813
Nature 62 1 23 636 722
Transport 47 1 26 625 699
Medical-Facilities 15 1 4 629 649
Climate 74 1 20 464 559
Everything 75 3 5 450 533
Excellent-Cities 17 2 4 310 333
Service 3 0 7 306 316
Heritage-Medical -Treatment
12 3 3 211 229
Educational-Facility 8 0 2 210 220
Golden-Temple 54 1 6 141 202
Nothing 9 1 0 128 138
Cheap-Articles 5 0 0 91 96
Forests 2 1 1 54 58
Spirituality 1 0 0 45 46
Fruits 1 0 0 17 18
Outmoded-means 1 0 0 12 13
Survival 1 0 0 7 8
Family-Values 0 0 0 0 0
Others 13 1 6 266 286
Total 2575 197 728 34033 37533

INTERNATIONAL PASSENGER SURVEY IN INDIA 2015-16
158
Table S29. Sample Distribution of NRI, PIO, OCI, Foreigner Others and All Visitors by “Reasons of Dissatisfaction”
Reasons of Dissatisfaction NRI PIO OCI Foreigner Others All Visitors
Pollution 7 2 4 259 272
Traffic-Chaos 13 2 3 114 132
Bad-People 8 0 2 93 103
Poor-Sanitary -Conditions
2 1 1 41 45
Poverty 0 0 0 11 11
Poor-Railways 2 0 0 8 10
Lack-of-Work- Culture
0 1 0 7 8
Poor-Airport 0 0 0 8 8
Poor-Infrastructure 1 0 0 6 7
Personal-Insecurity 1 0 0 4 5
Unethical-Traders 1 0 0 3 4
Poor-maintain- of-Beaches
0 0 0 3 3
Spatial-Insecurity 0 0 0 1 1
Poor-maintain -of-Hill-Stations
0 0 0 1 1
Corruption 0 0 0 1 1
Poor-Road 0 0 0 0 0
Poor-maintain -of-Monuments
0 0 0 0 0
Slum-Dwellers 0 0 0 0 0
Others 0 0 0 0 0
Total 35 6 10 560 611
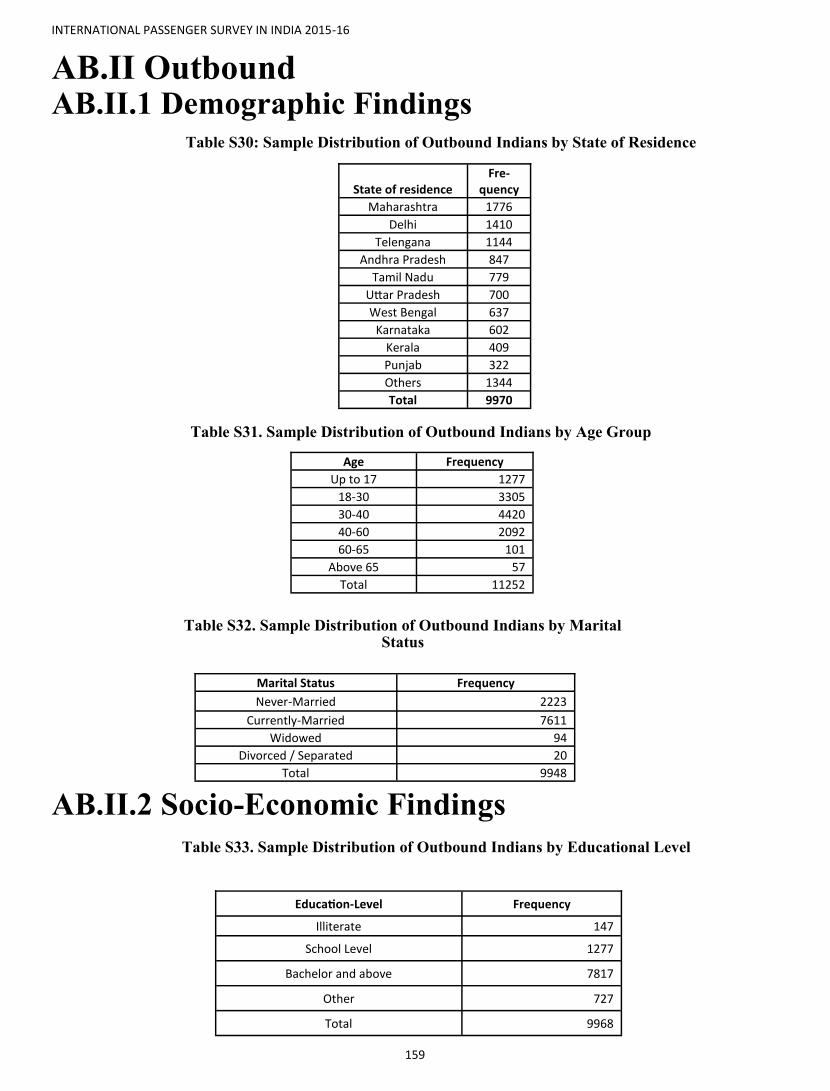
INTERNATIONAL PASSENGER SURVEY IN INDIA 2015-16
159
AB.II.2 Socio-Economic Findings
AB.II Outbound AB.II.1 Demographic Findings
Table S31. Sample Distribution of Outbound Indians by Age Group
Age Frequency
Up to 17 1277
18-30 3305
30-40 4420
40-60 2092
60-65 101
Above 65 57
Total 11252
Table S32. Sample Distribution of Outbound Indians by Marital Status
Marital Status Frequency
Never-Married 2223
Currently-Married 7611
Widowed 94
Divorced / Separated 20
Total 9948
Table S33. Sample Distribution of Outbound Indians by Educational Level
Education-Level Frequency
Illiterate 147
School Level 1277
Bachelor and above 7817
Other 727
Total 9968
Table S30: Sample Distribution of Outbound Indians by State of Residence
State of residence Fre-
quency
Maharashtra 1776
Delhi 1410
Telengana 1144
Andhra Pradesh 847
Tamil Nadu 779
Uttar Pradesh 700
West Bengal 637
Karnataka 602
Kerala 409
Punjab 322
Others 1344
Total 9970
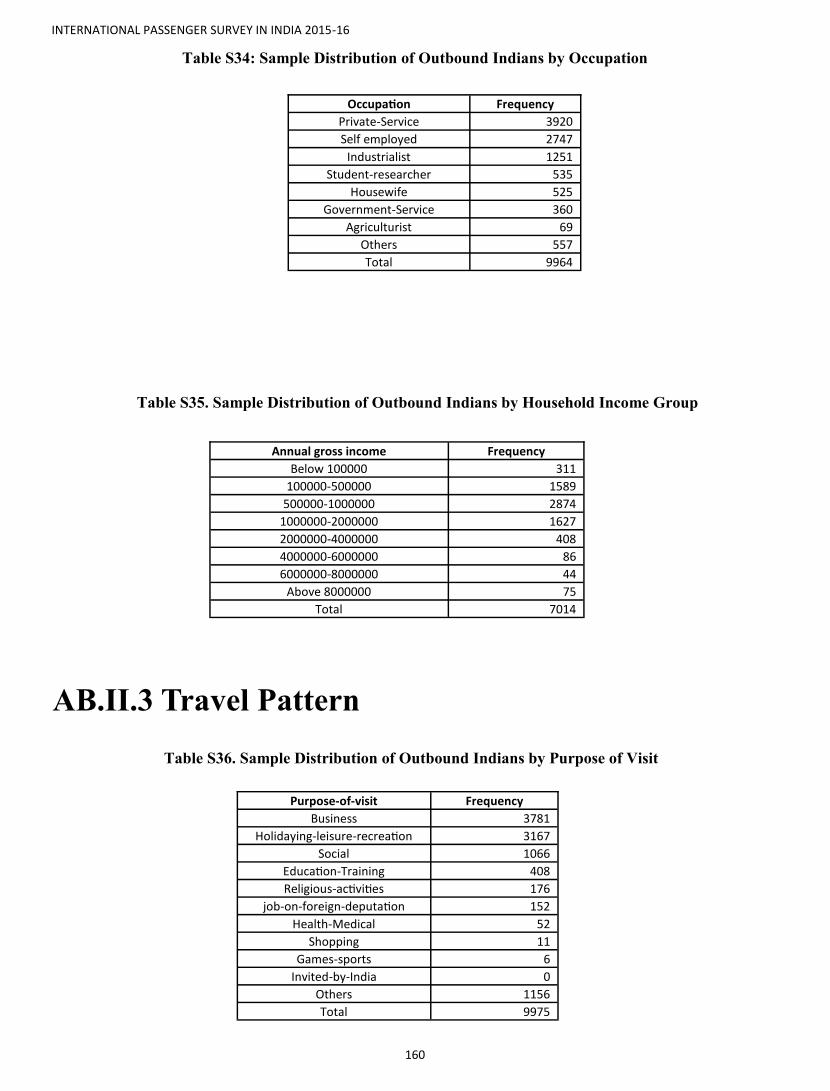
INTERNATIONAL PASSENGER SURVEY IN INDIA 2015-16
160
Table S35. Sample Distribution of Outbound Indians by Household Income Group
AB.II.3 Travel Pattern
Table S36. Sample Distribution of Outbound Indians by Purpose of Visit
Annual gross income Frequency
Below 100000 311
100000-500000 1589
500000-1000000 2874
1000000-2000000 1627
2000000-4000000 408
4000000-6000000 86
6000000-8000000 44
Above 8000000 75
Total 7014
Purpose-of-visit Frequency
Business 3781
Holidaying-leisure-recreation 3167
Social 1066
Education-Training 408
Religious-activities 176
job-on-foreign-deputation 152
Health-Medical 52
Shopping 11
Games-sports 6
Invited-by-India 0
Others 1156
Total 9975
Table S34: Sample Distribution of Outbound Indians by Occupation
Occupation Frequency
Private-Service 3920
Self employed 2747
Industrialist 1251
Student-researcher 535
Housewife 525
Government-Service 360
Agriculturist 69
Others 557
Total 9964
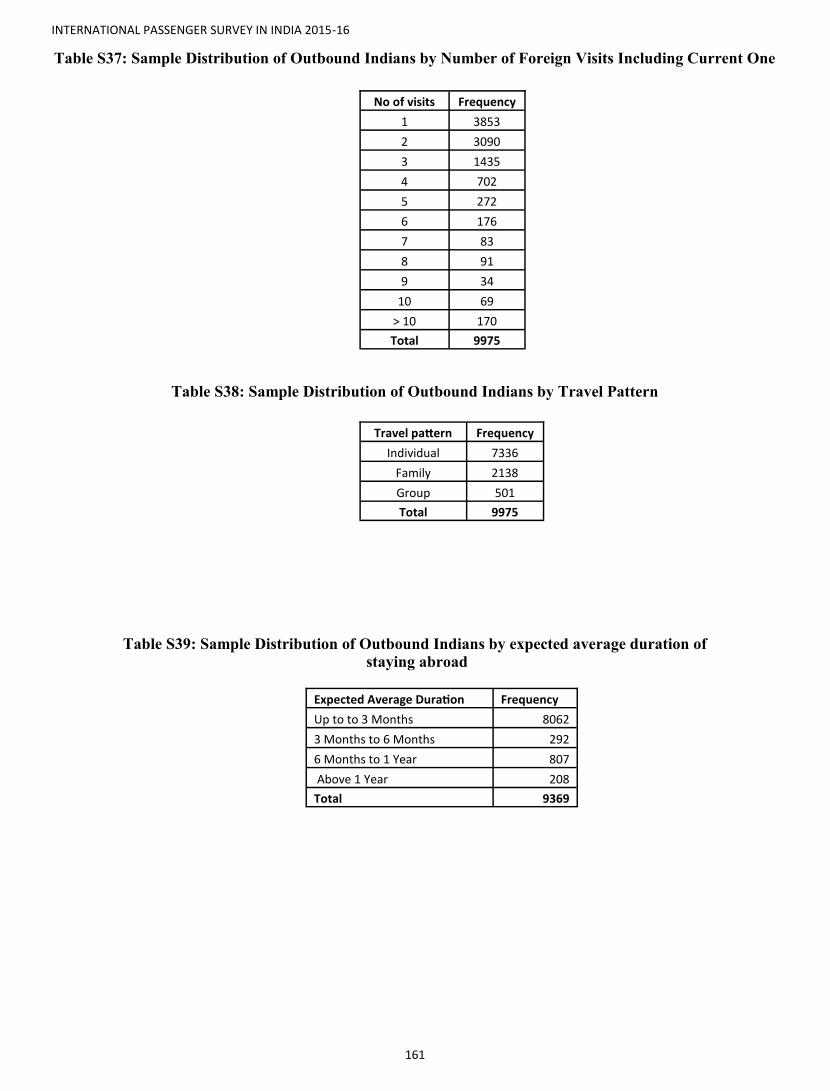
INTERNATIONAL PASSENGER SURVEY IN INDIA 2015-16
161
Table S37: Sample Distribution of Outbound Indians by Number of Foreign Visits Including Current One
No of visits Frequency
1 3853
2 3090
3 1435
4 702
5 272
6 176
7 83
8 91
9 34
10 69
> 10 170
Total 9975
Table S38: Sample Distribution of Outbound Indians by Travel Pattern
Travel pattern Frequency
Individual 7336
Family 2138
Group 501
Total 9975
Table S39: Sample Distribution of Outbound Indians by expected average duration of
staying abroad
Expected Average Duration Frequency
Up to to 3 Months 8062
3 Months to 6 Months 292
6 Months to 1 Year 807
Above 1 Year 208
Total 9369

INTERNATIONAL PASSENGER SURVEY IN INDIA 2015-16
162
AB.II.4 Expenditure Pattern
Table S40. Sample Average Expenditure (in INR) by Outbound Indians within India
Item Average Estimated Expenditure
Average Package Cost
Package Cost 64510.08
Accommodation
Rented house 6617.22
Private guest house 6434.47
Hotel 4943.24
Friends & relatives 4482.81
Govt. guest house 2365.00
Dharmshala 1131.48
Others 1363.33
Sub-total of Accommodation 4905.69
Food & Drink
In the accommodation unit 2011.81
Outside accommodation unit 1128.74
Sub-total of Food & Drink 1287.36
Transport
Air 16167.37
Travel agency services/tour operators 2295.31
Road(excl. transport equip.rental 1328.27
Railways 1206.57
Transport equipment’s rental 1067.23
Water 640.82
Other & supporting services 14631.94
Subtotal of Transport 2529.74
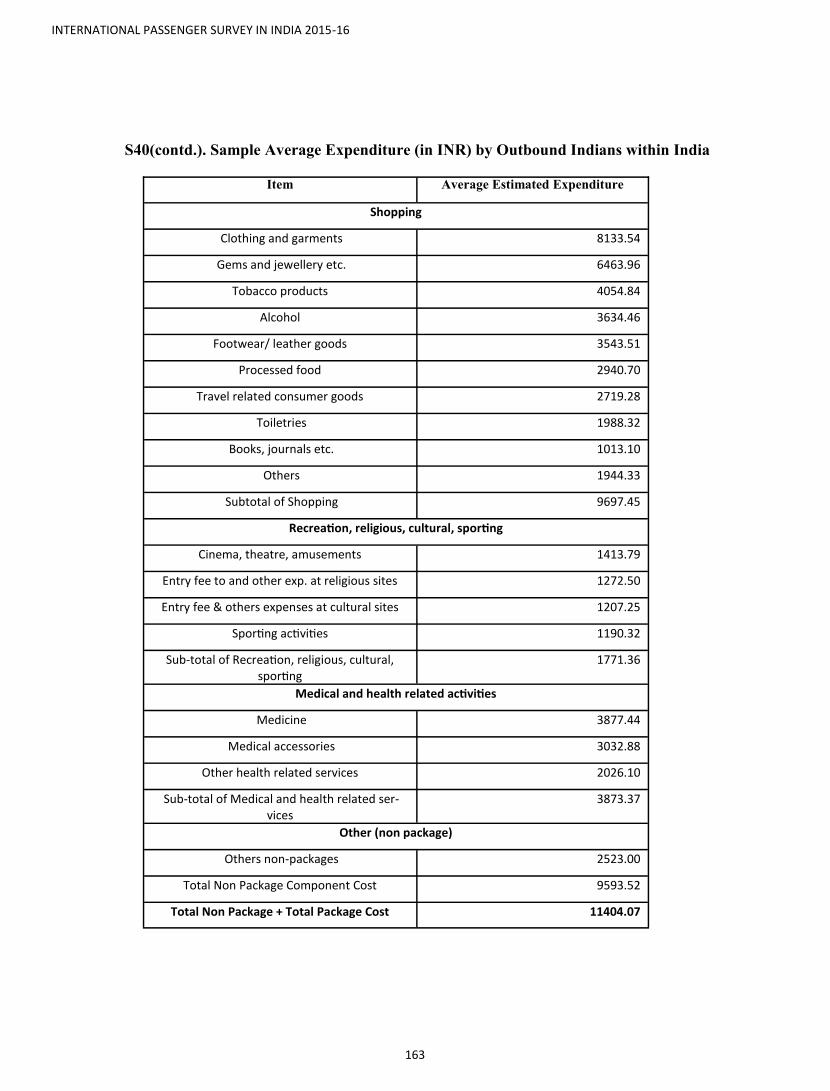
INTERNATIONAL PASSENGER SURVEY IN INDIA 2015-16
163
S40(contd.). Sample Average Expenditure (in INR) by Outbound Indians within India
Item Average Estimated Expenditure
Shopping
Clothing and garments 8133.54
Gems and jewellery etc. 6463.96
Tobacco products 4054.84
Alcohol 3634.46
Footwear/ leather goods 3543.51
Processed food 2940.70
Travel related consumer goods 2719.28
Toiletries 1988.32
Books, journals etc. 1013.10
Others 1944.33
Subtotal of Shopping 9697.45
Recreation, religious, cultural, sporting
Cinema, theatre, amusements 1413.79
Entry fee to and other exp. at religious sites 1272.50
Entry fee & others expenses at cultural sites 1207.25
Sporting activities 1190.32
Sub-total of Recreation, religious, cultural, sporting
1771.36
Medical and health related activities
Medicine 3877.44
Medical accessories 3032.88
Other health related services 2026.10
Sub-total of Medical and health related ser-vices
3873.37
Other (non package)
Others non-packages 2523.00
Total Non Package Component Cost 9593.52
Total Non Package + Total Package Cost 11404.07


Appendix D
Glossary


INTERNATIONAL PASSENGER SURVEY IN INDIA 2015-16
167
AC.1 DEFINITIONS FOLLOWED IN INDIA
AC.1.1 ARRIVALS:
The data presented in this publication refer to the number of arrivals of tourists/visitors and not to the number
of persons. An individual who makes multiple trips to the country is counted each time as a new arrival. This
is also true in the case of Indian nationals going abroad.
AC.1.2 FOREIGN VISITORS:
A Foreign visitor is any person visiting the country on a foreign passport whose main purpose of visit is other
than the exercise of an activity remunerated from within the country or establishment of residence in the
country This definition covers two segments of visitors: ‘Tourists’ and ‘Same Day Visitors’.
AC.1.3 FOREIGN TOURIST:
AC.1.3.1 A foreign tourist is a person visiting India on a foreign passport, staying at least twenty four hours
in the country, the purpose of whose journey can be classified under one of the following head-
ings:
Leisure (recreation, holiday, health, study, religion and sport)
Business, family mission, meeting.
AC.1.3.2 The following are not regarded as ’foreign tourists’:
Persons arriving with or without a contract, to take up an occupation or engage in activities remunerated
from within the country;
Persons coming to establish residence in the country;
‘Same Day Visitors’ i.e. temporary visitors staying less than twenty four house in the country (including
travellers on cruises).
AC.1.4 EXCURSIONIST:
A visitor in accordance with the foregoing definition and staying less than 24 hours in the country is treat-
ed as ‘Same Day Visitor’ or ‘Excursionist’.
AC.1.5 CRUISE PASSENGER:
A visitor, as defined above, who arrives in the country aboard a cruise ship and does not spend a night at
an accommodation establishment in the country is treated as a cruise passenger.
AC.1.6 PORTS:
Ports are the points of entry of foreign visitors into India. At present, these are seventy two ports. The list
of the ports which are surveyed is given below.

INTERNATIONAL PASSENGER SURVEY IN INDIA 2015-16
168
AC.1.6.1 Airports : Delhi, Mumbai, Chennai, Kolkata, Bengaluru, Hyderabad, Dabolim, Amritsar, Pune and
Cochin.
AC.1.6.2 Land Checkposts : Haridaspur, Changrabandha and Mahadipore.
AC.1.7 REGIONS:
The regional classification of countries, used for the presentation of data in the publication, is as follow-
ing:
Africa comprises the continent of Africa including, Egypt and the adjoining islands.
Australasia includes Australia, New Zealand, Fiji and the Pacific Island groups like French Polynesia, Pa-
pua New Guinea, New Caledonia etc.
East Asia comprises China, Hongkong, Japan, Korea, Macau, etc.
West Asia comprises countries in the Middle East including Turkey, Cyprus and Persian Gulf countries
excluding Iran.
South Asia includes Iran, Afghanistan, Sri Lanka, Maldives and countries of the Indian sub continent.
South East Asia comprises countries of Indo-China including Myanmar and ASEAN countries.
North America includes Canada and the U.S.A.
Central and South America comprises countries in the Central and South America, and the Caribbean Is-
lands.
Eastern Europe comprises all the countries of former Soviet Union , Yugoslavia , Czechoslovakia, Hunga-
ry , Poland, etc.
Western Europe includes all the countries of Europe excluding East European countries, Turkey and Cy-
prus.
AC.1.8 DOMESTIC TOURIST:
AC.1.8.1 A domestic tourist is a person who travels within the country to a place other than his usual place
of residence and stays at hotels or other accommodation establishments run on commercial basis or
in dharamshalas / sarais / musafirkhanas / agrashalas / choultris etc. for duration of not less than 24
hours or one night and for not more than 12 months at a time for any of the following purposes:-
Pleasure (holiday, leisure, sports, etc.);
Pilgrimage, religious and social functions;
Business conferences and meetings; and
Study and health.
INTERNATIONAL PASSENGER SURVEY IN INDIA 2015-16
169
AC.1.8.2 The following are not regarded as domestic tourists:
Persons arriving with or without a contract to take up an occupation or engage in activities remunerated
from within the State/Centre.
Persons coming to establish more or less permanent residence in the State/Centre.
Persons visiting their hometowns or native places on leave or a short visit for meeting relations and
friends, attending social and religious functions etc. and staying in their own homes or with relatives and
friends and not using any sight seeing facilities.
Foreigners resident in India.
AC.1.9 INDIAN NATIONALS GOING ABROAD:
Any person going abroad with an Indian passport is regarded as an Indian national going abroad irrespec-
tive of the purpose and the destination.
AC.1.10 TRAVEL RECEIPTS/FOREIGN EXCHANGE EARNINGS FROM TOURISM:
These are receipts of the country as a result of consumption expenditure, i.e. payments made for goods
and services acquired, by foreign visitors in the economy out of foreign currency brought by them.
AC.1.11 ACCOMMODATION ESTABLISHMENTS:
Places in which rooms are provided to tourists for stay, and classified as hotels, tourist bungalows, travel-
lers’ lodges, youth hostels, etc. APPROVED HOTELS: Hotels which conform to certain laid down stand-
ards on physical features, standards of facilities and other services are approved by the Tourism Depart-
ments of Central and State Governments and are known as approved hotels. These are graded variously as
five star deluxe, five star, four star, etc.
Hotel: A hotel is an establishment that provides paid lodging, usually on a shor t -term basis. At times,
hotels provide a number of additional guest services such as restaurant, swimming pool, childcare, salon,
spa, laundry etc.
Private guest house: These are the accommodation units owned and managed by pr ivate entrepre-
neurs/ bodies. Examples are Youth Hostels run by YMCA, YWCA, Guest Houses run by NGOs etc.
Govt. guest house: These are the accommodation units owned and managed by Central or State
Governments/ local bodies. Examples are Circuit Houses, Panchayat Bhavans, different State Guest
Houses like Andhra Bhavan, Maharashtra Bhavan, etc. in Delhi, NizamPalace in Kolkata, Government
Youth Hostels, etc.
Dharamshala: A Dharamshalais a rest house usually for accommodation of visitors dur ing their
pilgrimage. It is generally a dormitory for pilgrims located near religious places. Accommodation may be
free or at some charge.
Rented house: This type of accommodation unit is any par t or whole of any residential unit which is
rented to tourists and is owned solely or jointly by an individual or a group of individuals.
Friends & relatives: The respondent dur ing a tr ip stayed in their fr iends’ or relatives’ house.
INTERNATIONAL PASSENGER SURVEY IN INDIA 2015-16
170
AC.1.12 OCCUPANCY RATE:
The occupancy rate refers to the ratio between available capacity (in terms of rooms or beds) and the ex-
tent to which it is used. Occupancy is worked out on the basis of number of rooms occupied by both do-
mestic and international tourists.
AC.1.13 CATEGORY :
AC.1.13.1 Non-resident Indian (NRI) : A citizen of India who holds an Indian passpor t and has
temporarily emigrated to another country for six months or more for employment, residence, education or
any other purpose.
AC.1.13.2 Person of Indian Origin (PIO) : A person of Indian origin or ancestry who was or whose an-
cestors were born in India or other states but have Indian ancestry but is not a citizen of India and is the
citizen of another country. A PIO might have been a citizen of India and subsequently taken the citizen-
ship of another country.
AC.1.13.3 Overseas Citizen of India (OCI) : If the person was a citizen of India on 26 January 1950 or at
any time thereafter; or belonged to a territory that became part of India after 15 August 1947; or is the
child or grandchild of a person described above; and has never been a citizen of Pakistan or Bangladesh;
and has had no involvement in serious offences like drug trafficking, moral turpitude, terrorist activities
or anything leading to imprisonment of more than a year.
AC.1.14 ETHNICITY :
Asian refers to the people belonging to the social group related to the continent of Asia.
Hispanic is an ethnicity of people of country her itage that speak the Spanish language, in some defi-
nitions, to ancient Roman Hispania, which roughly comprised the Iberian Peninsula including the contem-
porary states of Andorra, Portugal, and Spain and the Crown Colony or British Overseas Territories of
Gibraltar.
Caucasians are the humans from the Caucasus region, the border of Europe and Asia, situated be-
tween the Black and the Caspian seas.
Black Africans are the persons who are defined as belonging to a " black" ethnicity in their par ticu-
lar country, typically having a degree of Sub-Saharan African ancestry, or who are perceived to be dark-
skinned relative to other "racial groups".
AC.1.15 EDUCATION :
Illiterate means who is unable to read and write.
School level indicates who has passed class XI or is metr ic passed.
Bachelor & above means graduates, post graduates, Ph.D and above. A person will be considered to
have technical education if he or she holds any degree, diploma, or certificate in some profession or

INTERNATIONAL PASSENGER SURVEY IN INDIA 2015-16
171
branch of technical or technological subject ssuch as any branch of engineering, medicine, printing, pho-
tography, agriculture, forestry, fishing, mining and other manufacturing process or for having any
knowledge of machine.
AC.1.16 CODE SHARING :
Reciprocal agreement through which two or more airlines offer their passengers one-booking, one-ticket,
and (if there is no stopover) one check-in flight to a destination only one of them serves (with no loss of
frequent-flier mileage). In this arrangement, the airlines share (for all legs of the flight) the same two-
letter code that identifies the carrier in the Global Distribution System (GDS) used by travel agents.
If two or more airlines are connected internationally, then the type of code sharing will be Internation-
al.
If two or more airlines are connected with in its own country, then the type of code sharing will be Do-
mestic.
If two or more airlines are connected internationally and domestically also, then the type of code shar-
ing will be Both.
AC.1.17 SHOPPING :
Clothing and garments: This includes expenditure on clothes, viz. dhoti, sar i, chaddar , dupatta,
shawl, lungi, etc; readymade garments like shirt, trousers, pyjama, ladies suit, coats etc.; knitted gar-
ments like sweater, pullover, cardigan, etc; bed sheet, bed cover, blanket, pillow, quilts etc; socks,
gloves, caps, knitting wool, towel and similar items.
Processed food: This item includes expenditure incurred on tea, coffee, beverages like cold
drinks, fruit juices, etc; bakery products like biscuits, cake, pastry, etc.; salted refreshment, prepared
sweets, pickle, sauce, jam, jelly etc. and similar items. Items covered here are foods that are not pur-
chased or consumed as regular breakfast, lunch or dinner during the trip .However; items purchased
during the trip for future consumption are to be covered here.
Tobacco products: Expenditure on items likes pan, supar i, lime, katha , bidi, cigarette, gutkha, pan
masala, etc. related to the trip should be recorded against this item.
Alcohol: This item includes expenditure incurred on all kinds of alcoholic dr inks like beer , for-
eign liquors, country liquors, etc.
Travel Related consumer goods: Expenditure incurred on items like suitcases, trunk, hand bag, other
travel goods; spectacles, sunglasses, pen, lock, umbrella, radio, Walkman, torch, batteries, etc.; photo-
graphic equipment like film, video cassette, CD, tripod, etc.; sports items, toys, etc. (except footwear)
will be covered under this item. Even the expenditure incurred on items of high unit value like cars,
computers, etc. related to a trip should be included if those are used for consumption purpose and not
for productive purpose.
Footwear: All types of footwear like rubber footwear , leather footwear , cloth footwear etc. will
be covered under this item.
INTERNATIONAL PASSENGER SURVEY IN INDIA 2015-16
172
Toiletries: all types of toiletr ies like toilet soap, washing soap, washing powder , hair oil, sham-
poo, cosmetics; tooth paste, tooth brush, tooth powder; talcum powder, face cream, deodorants, per-
fume, etc.; shaving equipments like shaving blade, shaving stick, razor, shaving cream, aftershave lo-
tion, etc. and similar items will be covered under this item.
Gems and jewellery: All expenses on gems and on jewellery, ir respective of their unit cost, in-
curred for the trip are to be covered here.
Books, journals, magazines, stationery, etc: Expenditure on books, magazines, newspaper , library and
other stationery purchased for the trip is to be recorded here.
AC.1.18 AMUSEMENT :
Cinema, theatre, amusements, etc.: This includes entry fees and all other incidental expenditure
like tips, joyrides, etc. incurred during a trip on cinema, theatre, amusement park, juggling show, mag-
ic show, circus etc.
Entry fee to and other expenses at religious sites: This includes darshanfees, dakshinafor priests,
expenditure on offerings, etc. It does not include donation to religious trusts, alms, etc. at those reli-
gious places.
Entry fee to and other expenses at cultural sites: This includes entry fees to various archaeological
sites, museums, historical places, etc. Expenditure on entry tickets for light and sound shows, etc. at
various historical places like LalQuila, Golkunda Fort, Mysore palace, Victoria Memorial, etc. will al-
so be covered.
Sporting activities: This includes entry fees or tickets for watching spor ting events both outdoor
and indoor, like football, cricket, table tennis, etc. Expenditure for participating in adventure sports like
para-gliding, rafting, rock climbing etc. is also to be included here.
AC.2 INTERNATIONAL DEFINITIONS
AC.2.1 TOURISM:
The activities of persons traveling to and in places outside their usual environment for not more than one
consecutive year for leisure, business and other purposes.
AC.2.2 DOMESTIC TOURISM:
Residents of a given country traveling only within that country.
AC.2.3 INBOUND TOURISM:
In relation to a given country non-residents traveling to that country.
AC.2.4 OUTBOUND TOURISM:
In relation to a given country, residents traveling to another country.

INTERNATIONAL PASSENGER SURVEY IN INDIA 2015-16
173
AC.2.5 INTERNAL TOURISM:
Domestic and inbound tourism.
AC.2.6 NATIONAL TOURISM:
Domestic and Outbound Tourism.
AC.2.7 INTERNATIONAL TOURISM:
Inbound and Outbound Tourism.
AC.2.8 VISITORS:
All type of travellers engaged in tourism are described as Visitors, and as such as the term represents the
basic concept for the whole system of tourism statistics.
AC.2.9 INTERNATIONAL VISITORS:
Any person who travels to a country other than that in which is his/her usual residence, but outside his/her
usual environment,for a period not exceeding 12 months and whose main purpose of visit is other than the
exercise of an activity remunerated from within from within the country visited.
AC.2.10 INTERNATIONAL VISITORS INCLUDE:
Tourists (overnight visitors): Visitors who stay at least one night in a collective of pr ivate ac-
commodation in the country visited.
Same Day Visitors: Visitors who do not spend a night in a collective or pr ivate accommoda-
tion in the country visited. This definition includes passengers of cruise ships who return to the
ship every night to sleep on board even though the ship remains in port for several days. Also in-
cluded in this group are, by extension, owners or passengers of Yachts, and passengers on a group
tour accommodated in a train.
Domestic Visitors: Any person residing in a country who travels to a place within the coun-
try, outside his/her usual environment ,for a period not exceeding 12 months, and whose main pur-
pose of visit is other than the exercise of an activity remunerated from within from within the
place visited.
AC.2.11 DOMESTIC VISITORS INCLUDE:
Tourists (overnight visitors): Visitors who stay at least one night in a collective or pr ivate
accommodation in the place visited.
Same Day Visitors: Visitors who do not spend one night in a collective or pr ivate accommo-
dation in the place visited.

Appendix E
IPSF & IPSO schedules

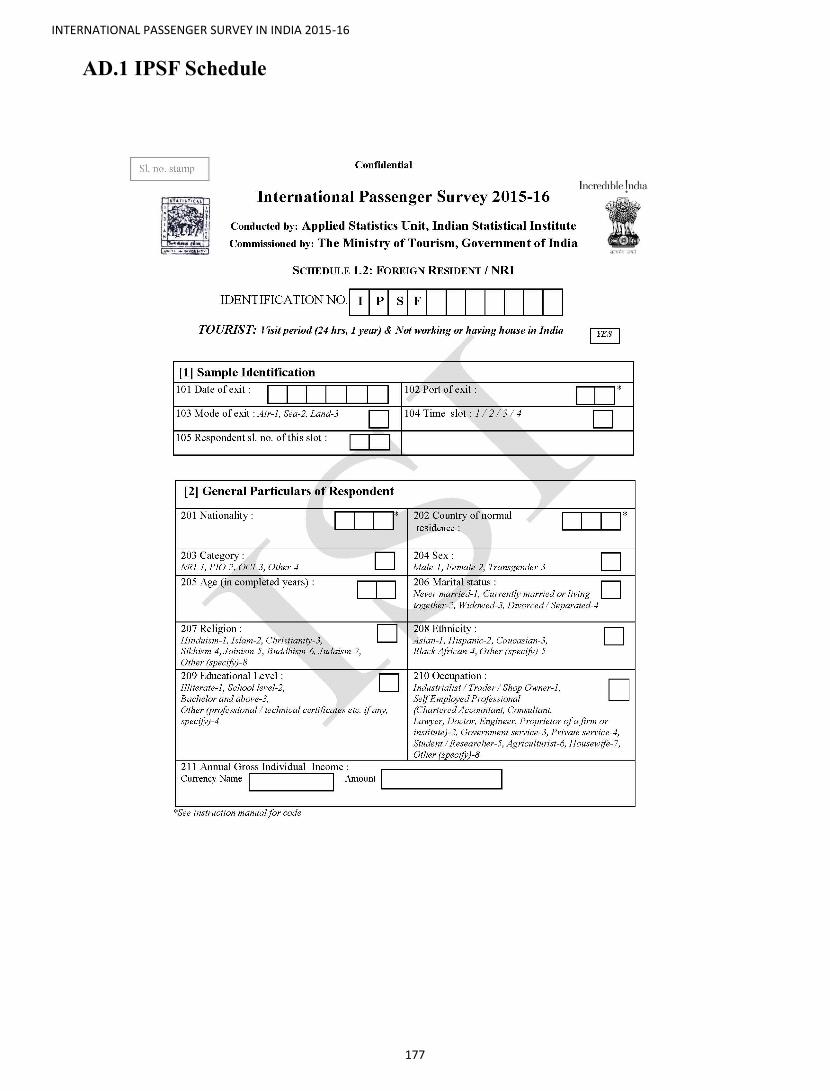
INTERNATIONAL PASSENGER SURVEY IN INDIA 2015-16
177
AD.1 IPSF Schedule

INTERNATIONAL PASSENGER SURVEY IN INDIA 2015-16
178
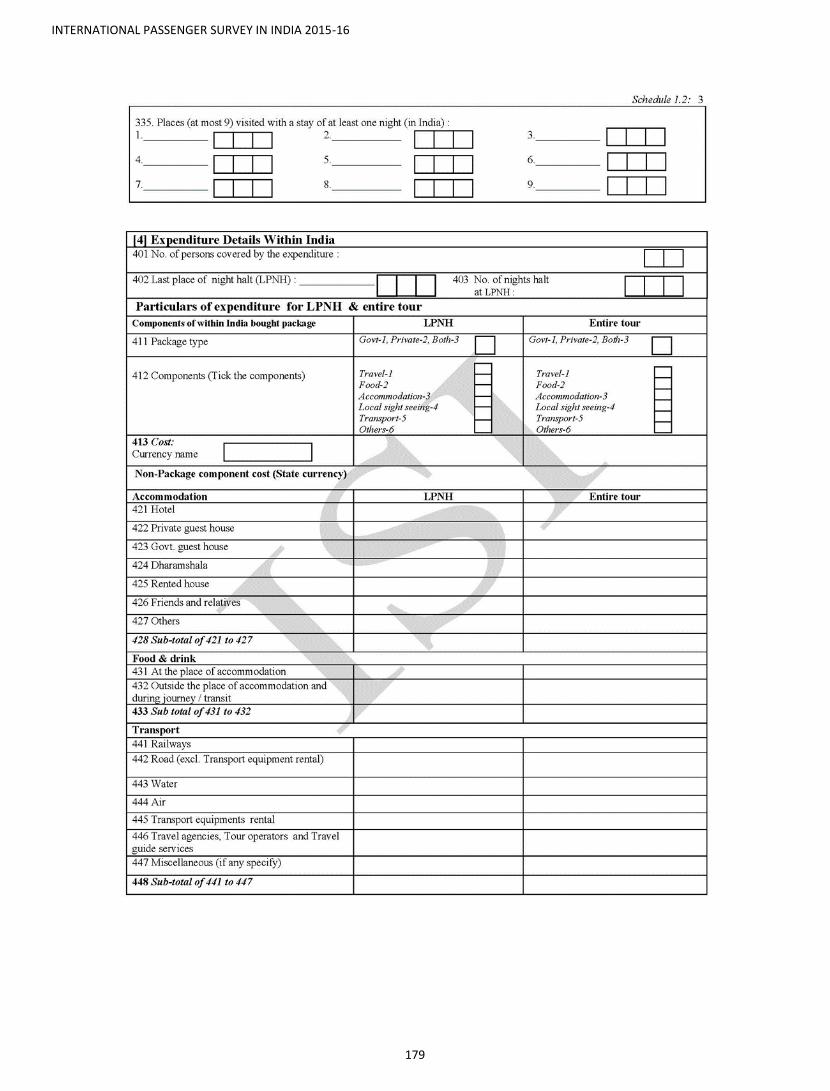
INTERNATIONAL PASSENGER SURVEY IN INDIA 2015-16
179

INTERNATIONAL PASSENGER SURVEY IN INDIA 2015-16
180
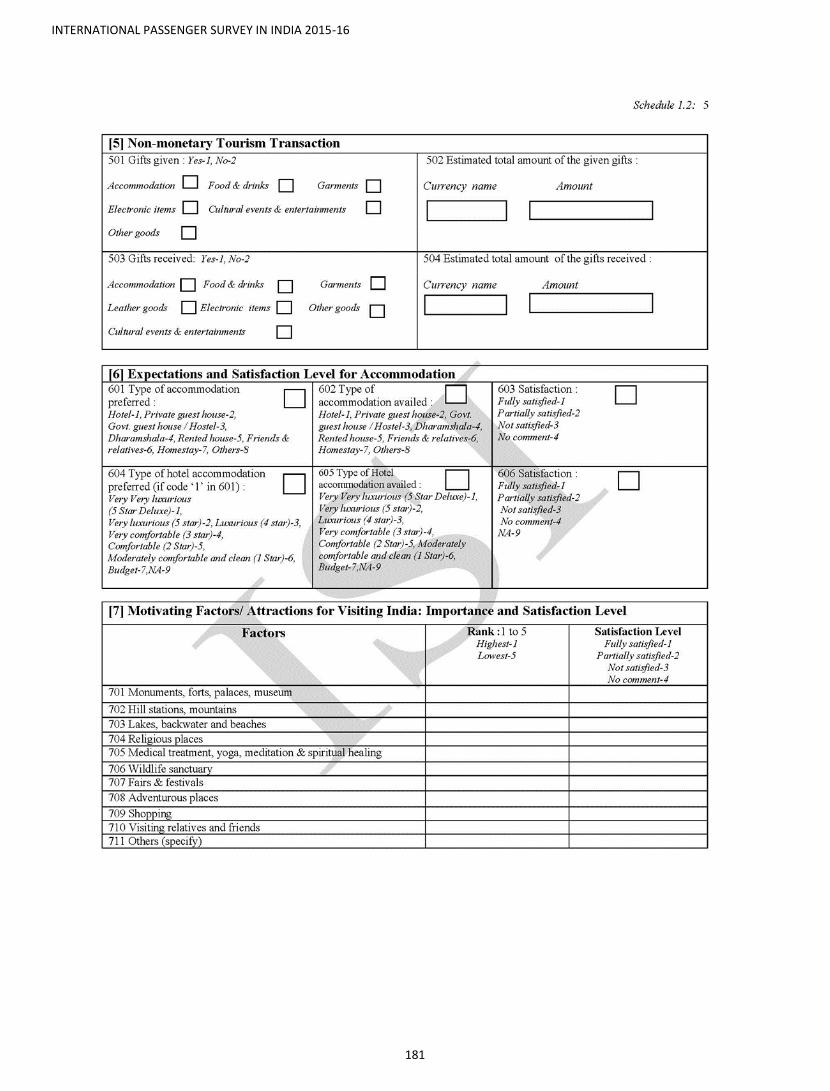
INTERNATIONAL PASSENGER SURVEY IN INDIA 2015-16
181
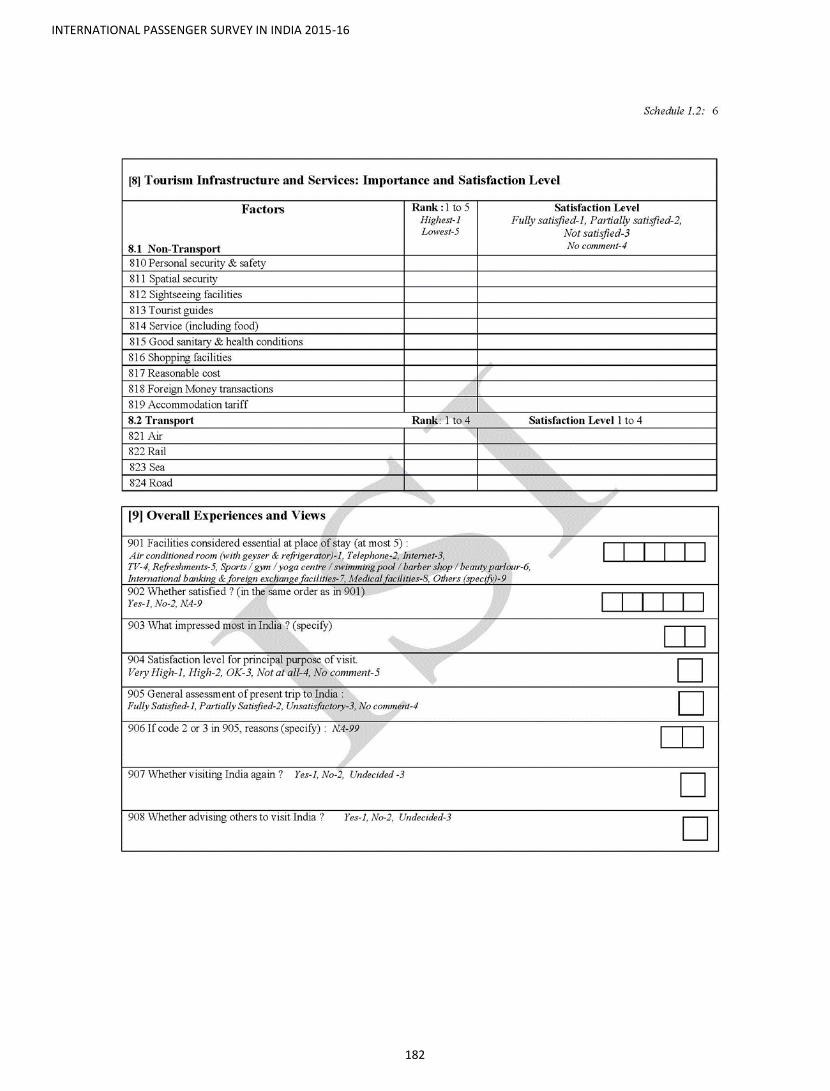
INTERNATIONAL PASSENGER SURVEY IN INDIA 2015-16
182

INTERNATIONAL PASSENGER SURVEY IN INDIA 2015-16
183

INTERNATIONAL PASSENGER SURVEY IN INDIA 2015-16
184
AD.2 IPSO Schedule
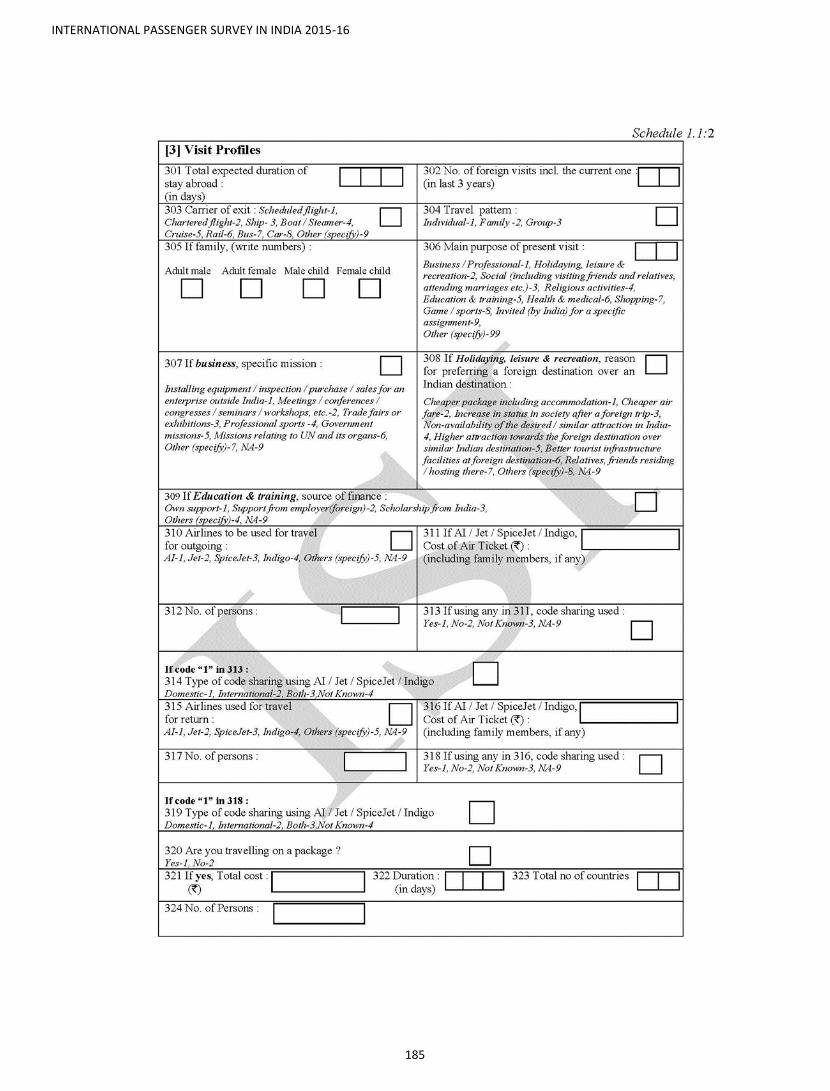
INTERNATIONAL PASSENGER SURVEY IN INDIA 2015-16
185
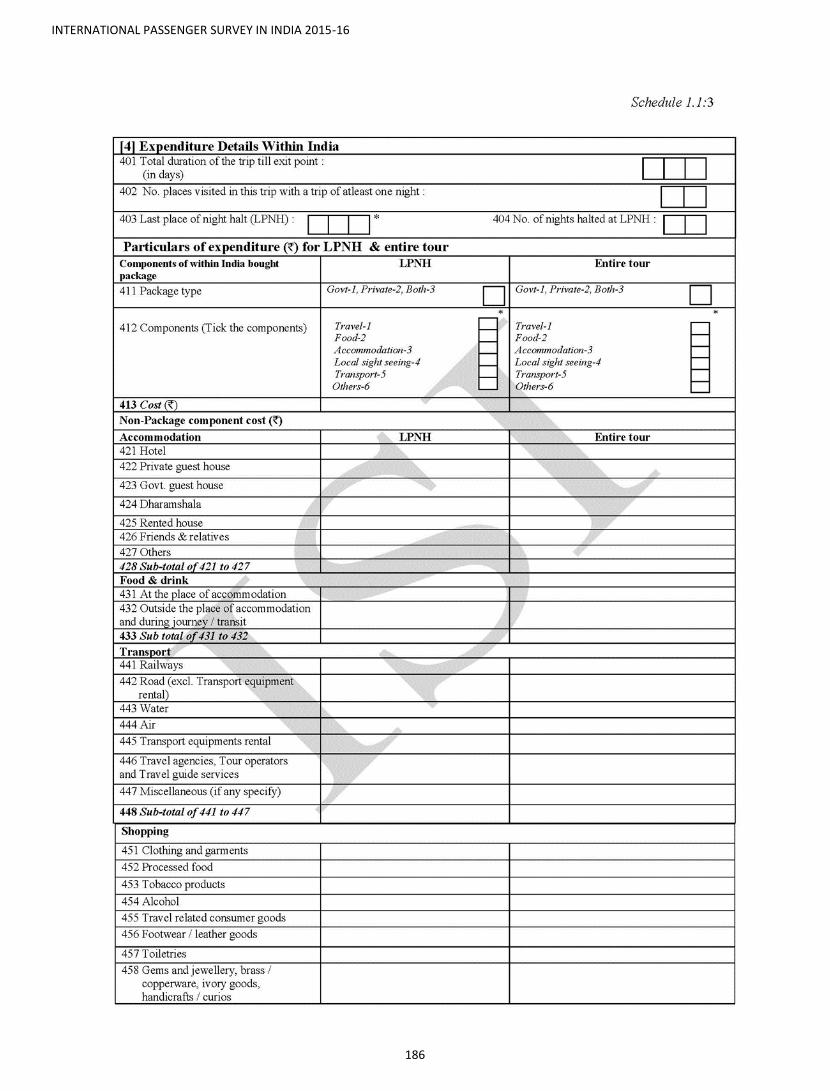
INTERNATIONAL PASSENGER SURVEY IN INDIA 2015-16
186
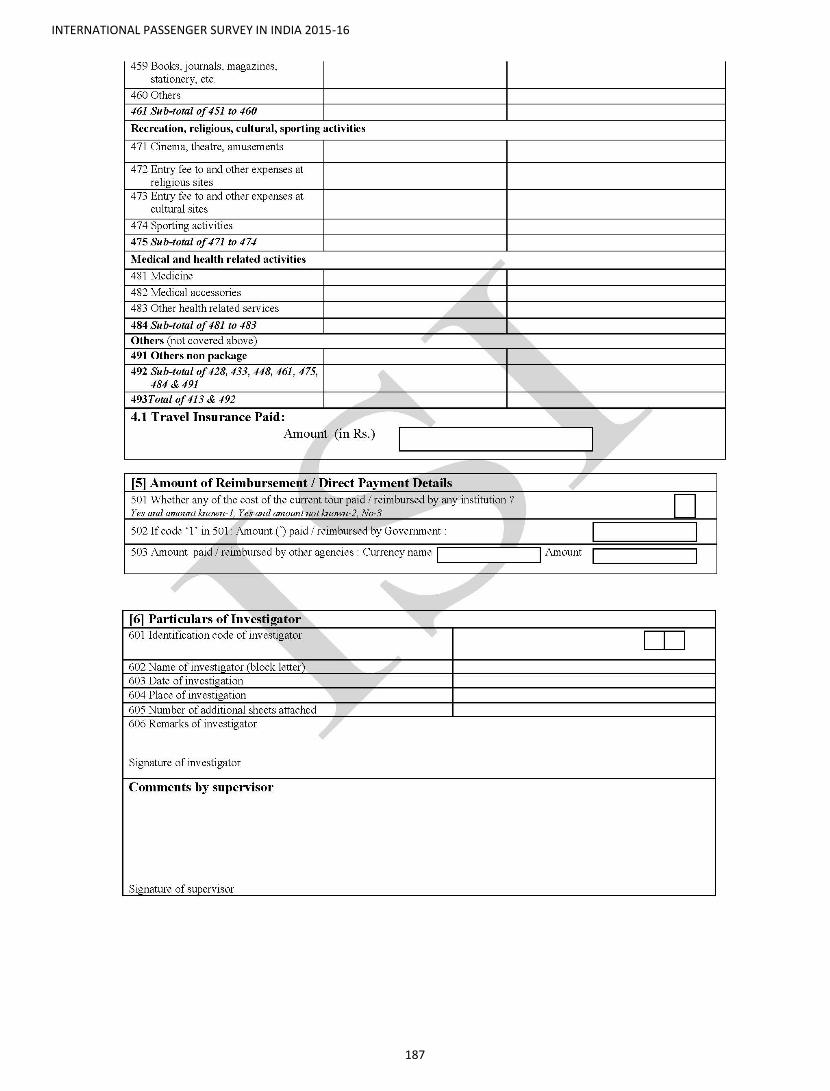
INTERNATIONAL PASSENGER SURVEY IN INDIA 2015-16
187

Appendix F
Schedule of International Air Travelers Program, USA


INTERNATIONAL PASSENGER SURVEY IN INDIA 2015-16
191

INTERNATIONAL PASSENGER SURVEY IN INDIA 2015-16
192

INTERNATIONAL PASSENGER SURVEY IN INDIA 2015-16
193

INTERNATIONAL PASSENGER SURVEY IN INDIA 2015-16
194
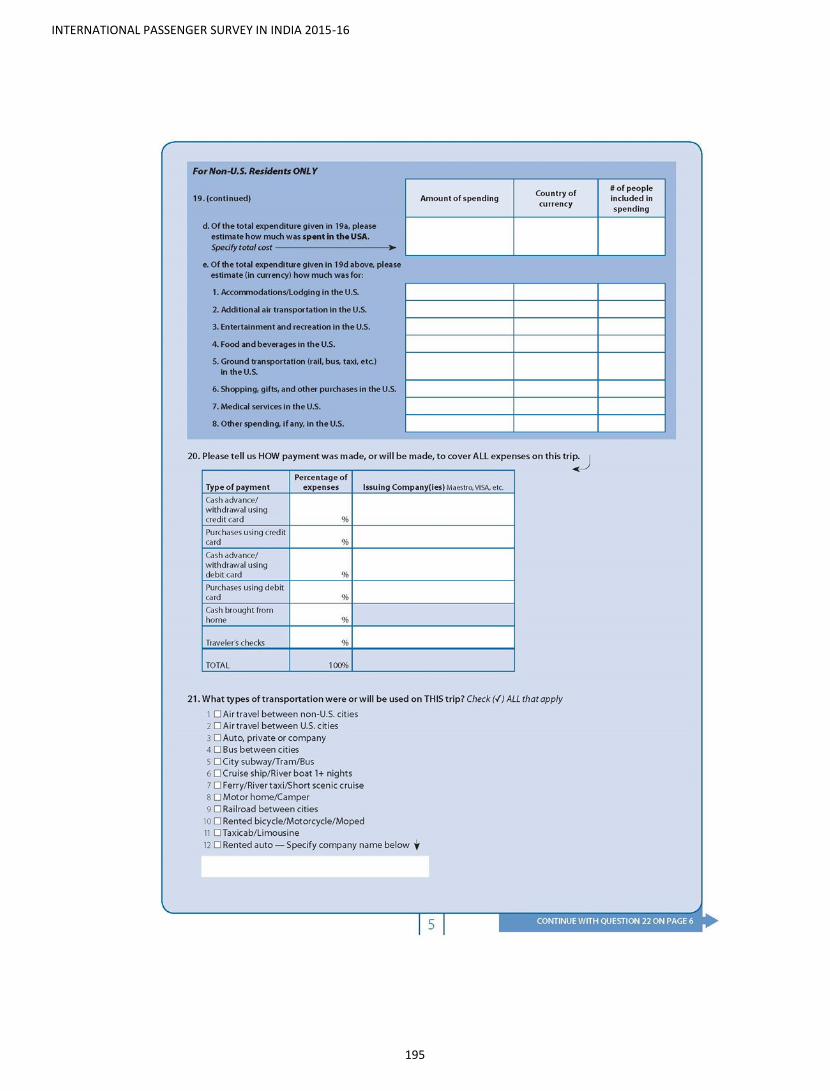
INTERNATIONAL PASSENGER SURVEY IN INDIA 2015-16
195
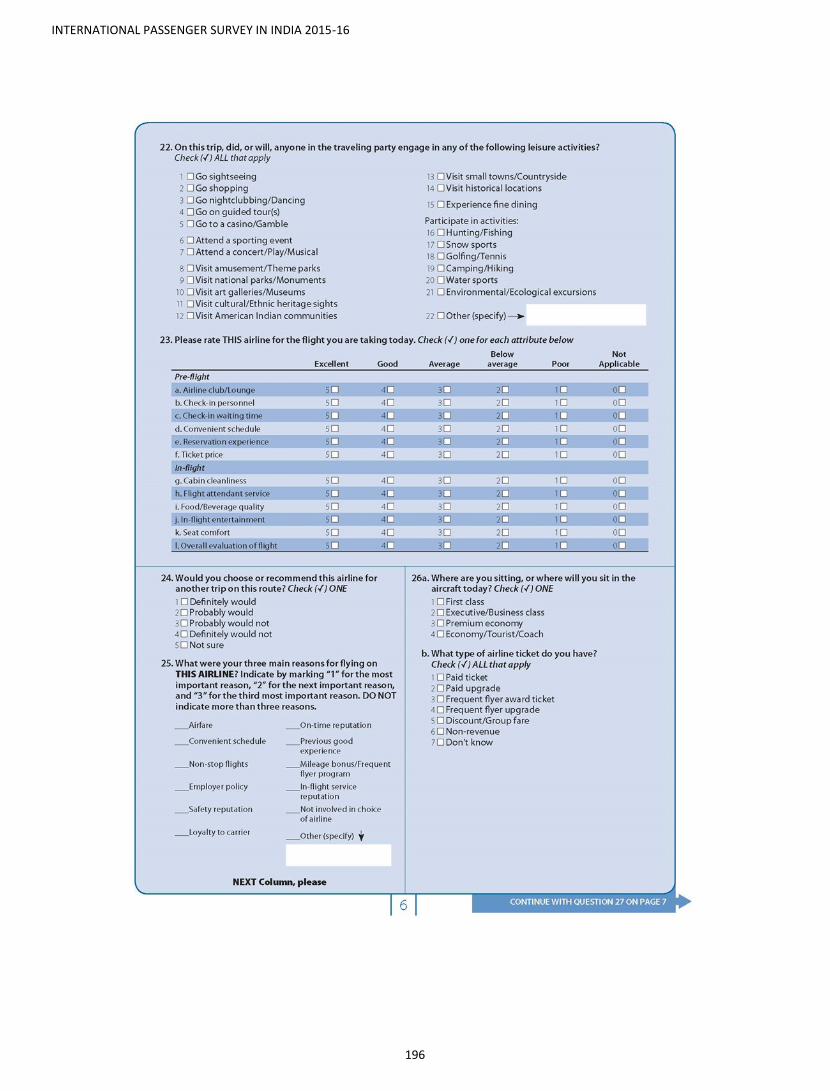
INTERNATIONAL PASSENGER SURVEY IN INDIA 2015-16
196

INTERNATIONAL PASSENGER SURVEY IN INDIA 2015-16
197

INTERNATIONAL PASSENGER SURVEY IN INDIA 2015-16
198

Appendix G
CODES


INTERNATIONAL PASSENGER SURVEY IN INDIA 2015-16
201
Port Name Type of Port Code
Delhi Airport 01
Mumbai Airport 02
Dabolim Airport 03
Chennai Airport 04
Bangalore Airport 05
Kolkata Airport 06
Hyderabad Airport 07
Cochin Airport 08
Pune Airport 09
Amritsar Airport 10
Guwahati Airport 11
Madurai Airport 12
Haridaspur Land Checkposts 13
Mahadipur Land Checkposts 14
Attari Road Land Checkposts 15
Attari Rail Land Checkposts 16
Sonauli Land Checkposts 17
Munabao Land Checkposts 18
Changrabandha Land Checkposts 19
Mumbai Sea Port 20
Cochin Sea Port 21
1.PORT OF EXIT

INTERNATIONAL PASSENGER SURVEY IN INDIA 2015-16
202
COUNTRY CODE COUNTRY CODE COUNTRY CODE
Afghanistan 1 Gibraltar 78 Oman 155
Albania 2 Greece 79 Pakistan 156
Algeria 3 Greenland 80 Palau 157
American Samoa 4 Grenada 81 Panama 158
Andorra 5 Guam 82 Papua New Guinea 159
Angola 6 Guatemala 83 Paraguay 160
Anguilla 7 Guernsey 84 Peru 161
Antigua and Barbuda 8 Guinea-Bissau 85 Philippines 162
Argentina 9 Guinea 86 Pitcairn Island 163
Armenia 10 Guyana 87 Poland 164
Aruba 11 Haiti 88 Portugal 165
Australia 12 Heard & McDonald Islands 89 Puerto Rico 166
Austria 13 Honduras 90 Qatar 167
Azerbaijan 14 Hong Kong 91 Romania 168
Bahamas 15 Hungary 92 Russia 169
Bahrain 16 Iceland 93 Rwanda 170
Bangladesh 17 India 94 Samoa (Western) 171
Barbados 18 Indonesia 95 Samoa (America) 172
Belarus 19 Iran 96 San Marino 173
Belgium 20 Iraq 97 São Tomé and Príncipe 174
Belize 21 Ireland 98 Saudi Arabia 175
Benin 22 Isle of Man 99 Sénégal 176
Bermuda 23 Israel 100 Serbia 177
Bhutan 24 Italy 101 Seychelles 178
Bolivia 25 Jamaica 102 Sierra Leone 179
Bosnia-Herzegovina 26 Japan 103 Singapore 180
Botswana 27 Jersey 104 Slovakia 181
Brazil 28 Jordan 105 Slovenia 182
British Indian Ocean Territory 29 Kazakhstan 106
Solomon Is-lands 183
Brunei 30 Kenya 107 Somalia 184
Bulgaria 31 Kiribati 108 South Africa 185
Burkina Faso 32 Korea, North 109 South Sudan 186
Burundi 33 Korea, South 110 Spain 187
Cambodia 34 Kuwait 111 Sri Lanka 188
Cameroon 35 Kyrgyzstan 112 St. Helena 189
Canada 36 Laos 113 St. Kitts and Nevis 190
Cape Verde 37 Latvia 114 St. Lucia 191
Cayman Islands 38 Lebanon 115 St. Vincent and the Grenadines 192
2.COUNTRY
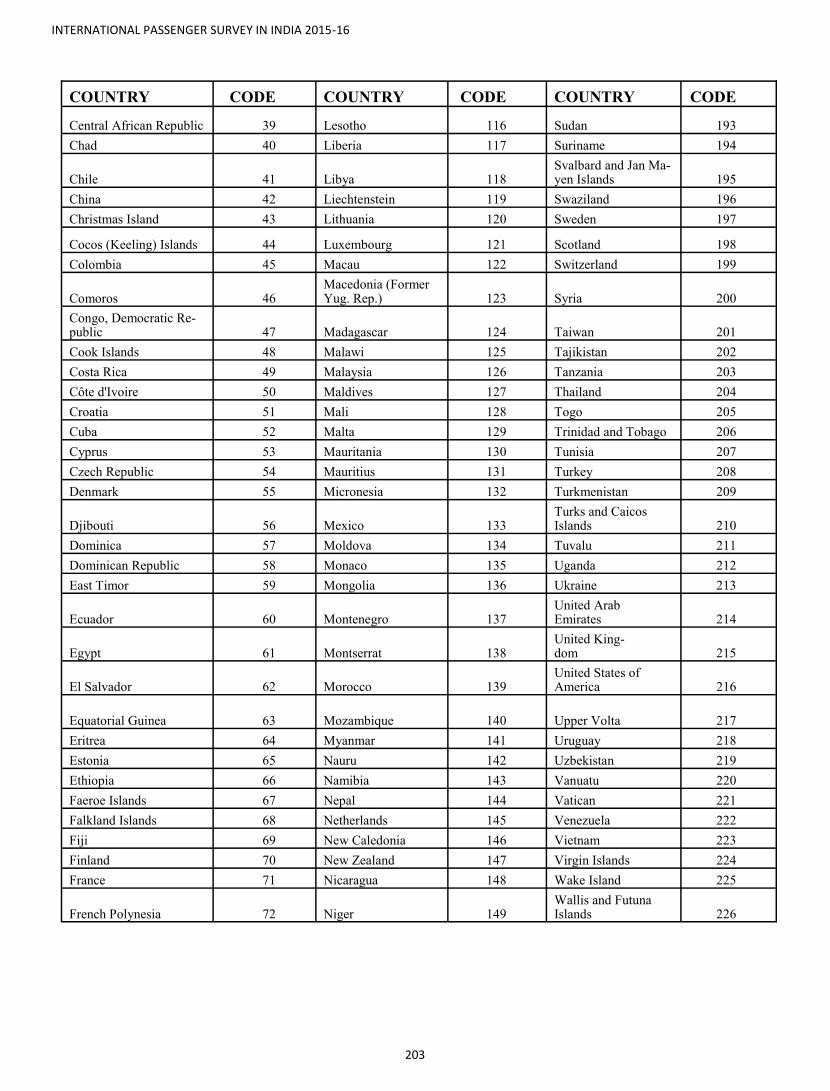
INTERNATIONAL PASSENGER SURVEY IN INDIA 2015-16
203
COUNTRY CODE COUNTRY CODE COUNTRY CODE
Central African Republic 39 Lesotho 116 Sudan 193
Chad 40 Liberia 117 Suriname 194
Chile 41 Libya 118 Svalbard and Jan Ma-yen Islands 195
China 42 Liechtenstein 119 Swaziland 196
Christmas Island 43 Lithuania 120 Sweden 197
Cocos (Keeling) Islands 44 Luxembourg 121 Scotland 198
Colombia 45 Macau 122 Switzerland 199
Comoros 46 Macedonia (Former Yug. Rep.) 123 Syria 200
Congo, Democratic Re-public 47 Madagascar 124 Taiwan 201
Cook Islands 48 Malawi 125 Tajikistan 202
Costa Rica 49 Malaysia 126 Tanzania 203
Côte d'Ivoire 50 Maldives 127 Thailand 204
Croatia 51 Mali 128 Togo 205
Cuba 52 Malta 129 Trinidad and Tobago 206
Cyprus 53 Mauritania 130 Tunisia 207
Czech Republic 54 Mauritius 131 Turkey 208
Denmark 55 Micronesia 132 Turkmenistan 209
Djibouti 56 Mexico 133 Turks and Caicos Islands 210
Dominica 57 Moldova 134 Tuvalu 211
Dominican Republic 58 Monaco 135 Uganda 212
East Timor 59 Mongolia 136 Ukraine 213
Ecuador 60 Montenegro 137 United Arab Emirates 214
Egypt 61 Montserrat 138 United King-dom 215
El Salvador 62 Morocco 139 United States of America 216
Equatorial Guinea 63 Mozambique 140 Upper Volta 217
Eritrea 64 Myanmar 141 Uruguay 218
Estonia 65 Nauru 142 Uzbekistan 219
Ethiopia 66 Namibia 143 Vanuatu 220
Faeroe Islands 67 Nepal 144 Vatican 221
Falkland Islands 68 Netherlands 145 Venezuela 222
Fiji 69 New Caledonia 146 Vietnam 223
Finland 70 New Zealand 147 Virgin Islands 224
France 71 Nicaragua 148 Wake Island 225
French Polynesia 72 Niger 149 Wallis and Futuna Islands 226
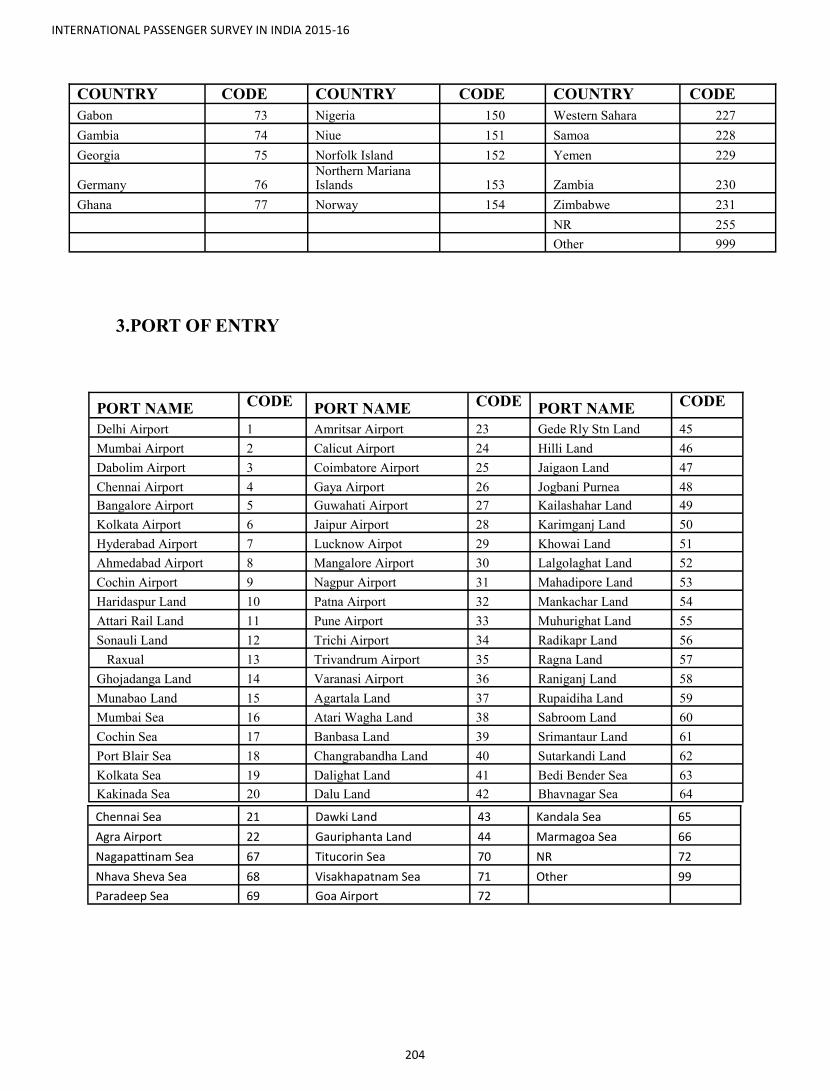
INTERNATIONAL PASSENGER SURVEY IN INDIA 2015-16
204
COUNTRY CODE COUNTRY CODE COUNTRY CODE
Gabon 73 Nigeria 150 Western Sahara 227
Gambia 74 Niue 151 Samoa 228
Georgia 75 Norfolk Island 152 Yemen 229
Germany 76 Northern Mariana Islands 153 Zambia 230
Ghana 77 Norway 154 Zimbabwe 231
NR 255
Other 999
PORT NAME CODE
PORT NAME CODE
PORT NAME CODE
Delhi Airport 1 Amritsar Airport 23 Gede Rly Stn Land 45
Mumbai Airport 2 Calicut Airport 24 Hilli Land 46
Dabolim Airport 3 Coimbatore Airport 25 Jaigaon Land 47
Chennai Airport 4 Gaya Airport 26 Jogbani Purnea 48
Bangalore Airport 5 Guwahati Airport 27 Kailashahar Land 49
Kolkata Airport 6 Jaipur Airport 28 Karimganj Land 50
Hyderabad Airport 7 Lucknow Airpot 29 Khowai Land 51
Ahmedabad Airport 8 Mangalore Airport 30 Lalgolaghat Land 52
Cochin Airport 9 Nagpur Airport 31 Mahadipore Land 53
Haridaspur Land 10 Patna Airport 32 Mankachar Land 54
Attari Rail Land 11 Pune Airport 33 Muhurighat Land 55
Sonauli Land 12 Trichi Airport 34 Radikapr Land 56
Raxual 13 Trivandrum Airport 35 Ragna Land 57
Ghojadanga Land 14 Varanasi Airport 36 Raniganj Land 58
Munabao Land 15 Agartala Land 37 Rupaidiha Land 59
Mumbai Sea 16 Atari Wagha Land 38 Sabroom Land 60
Cochin Sea 17 Banbasa Land 39 Srimantaur Land 61
Port Blair Sea 18 Changrabandha Land 40 Sutarkandi Land 62
Kolkata Sea 19 Dalighat Land 41 Bedi Bender Sea 63
Kakinada Sea 20 Dalu Land 42 Bhavnagar Sea 64
3.PORT OF ENTRY
Chennai Sea 21 Dawki Land 43 Kandala Sea 65
Agra Airport 22 Gauriphanta Land 44 Marmagoa Sea 66
Nagapattinam Sea 67 Titucorin Sea 70 NR 72
Nhava Sheva Sea 68 Visakhapatnam Sea 71 Other 99
Paradeep Sea 69 Goa Airport 72

INTERNATIONAL PASSENGER SURVEY IN INDIA 2015-16
205
4. PLACE
Places by States
Andhra Pradesh
Hyderabad-1; Visakhapatnam-2; Vijayawada-3;Rajahmundri-4;Kakinada-5; Guntur-6; Warangal-7;
Tirupati-8
Arunachal Pradesh
Akashiganga-50; Bhismaknagar-51; Bomdila-52; Itanagar-53; Malinithan-54; Namdapha-55; Para-
shuram Kund-56
Assam
Barpeta-76; Bongaigaon-77; Dhubri-78; Dibrugarh-79; Digboi-80; Diphu-81; Duliajan-82; Goalpa-
ra-83; Golaghat-85; Guwahati-86; Haflong-87; Hailakandi-88; Jorhat-89; Karimganj-90; Kokrajhar
-91; Lakhimpur-93; Mangaldoi-94; Nagaon-95; Nalbari-96; Rangia-97; Sibsagar-98; Tezpur-99;
Tinsukia-100; Dishpur-75
Bihar
Ara-101; Barauni-102; Bhagalpur-103; Biharsarif-104; Chapra-105; Danapur-106; Darbhanga-107;
Gaya-109; Katihar-110; Kishanganj-111; Munger-112; Muzaffarpur-113; Patna-114; Purnia-115;
Sitamarhi-116; Bodh Gaya-117; Sarnath-118
Chhattisgarh
Ambikapur-126; Bastar-127; Bhilai-128; Bilaspur-129; Chirmiri-130; Dantewada-131; Dhamatri-
132; Durg-133; Jagdalpur-134;Janjgir-Champa-135;Jashpur 136;Kabirdham-137;Kanker-
138;Korba-139;Koriya-140;Mahasamund 141;Narayanpur-142;Raigarh-143;Raipur-144;
Rajnandgaon-145
Goa
Bicholam-151;Mapusa-152;Margao-153;Mollem-154;Mormugao Harbour-155;Old Goa-156;Panaji
Gujarat
Ahmedabad-176;Amreli-177; Anand-178;Banaskantha 179;Bharuch-180;Bhavnagar-
181;Bhuj;182;Dahod-183;Dang-184;Gandhinagar-185;Jamnagar-186;Junagadh-187;Kandla-
188;Karamsad-189;Kheda-190;Narmada-191;Navsari-192;Panchmahal-193;Patan-194;Porbandar-
195;Rajkot-196;Sabarkantha-197;Surat-198;Surendranagar-199;Tapi-200;Vadodara-201;Valsad-
202;Kutch-203
Haryana
Ambala-225;Bhiwani-226;Faridabad-227;Fatehabad-228; Gurgaon-229;Hansdehar-230;Hissar-
231;Jhajjar-232;Jind-233;Karnal-234;Kurukshetra-235;Mahendragarh-236;Mewat-237;Panipat-
238;Rohtak-239,Yamunanagar-240;Sonipat-241

INTERNATIONAL PASSENGER SURVEY IN INDIA 2015-16
206
Himachal Pradesh
Chail-251; Chamba-252; Dalhousie-253; Dharamshala-254; Joginder Nagar-255; Kangra-256;
Kasauli-257; Kinnaur-258; Kullu-259; Lahaul & Spiti-260; Manali-261, Mandi-262; Mc Leod-
ganj-263; Palampur-264; Rewalsar-265; Shimla-266; Rotang-267
Jammu & Kashmir
Akhnoor-276; Dras-277; Gulmarg-278; Jammu-279; Khilanmarg-280; Leh Ladakh-281;
Jharkhand
Bokaro Steel City-300; Chirkunda-301; Deoghar-302; Dhanbad-303; Giridih-304; Hazaribag-
Karnataka
Badami-326; Bangalore-327; Belgaum-328; Bellary-329; Belur-330; Bider-331; Bijapur-332;
Chikkamagaluru-333; Chitradurga-334; Coorg-335; Gulbarg-336; Hampi-337; Hassan-338;
Hospet-339; Hubli-340; Mangalore-341; Mysore-342; Raichur-343; Shimoga-344; Tumkur-345;
Udupi-346; Ooty-347
Kerala
Alappuzha-375; Chettikulangara-376; Kannur-377; Kochi-378; Kottayam-379; Kovalam-380;
Kozhikkode-381; Malayattoor-382; Munnar-383; Parumala-384; Sabarimala-385; Thekkadi-
386; Thiruvananthapuram-387; Thrissur-388; Varkala-389; Tripunithura-390; Ernakulam-391
Madhya Pradesh
Bhopal-401; Burhanpor-402; Guna-403; Gwalior-404; Indore-405; Jabalpur-406; Rewa-407;
Sagar-408; Ujjain-409; Khajuraho-410; Sanchi-411; Orchha-412
Maharashtra
Amravati-426; Aurangabad-427; Chandrapur-428; Jalgaon-429; Khandala-430; Mahabaleshwar
-431; Mumbai-432; Nagpur-433; Nashik-434; Pune-435; Ratnagiri-436; Sangli-437; Solapur-
438; Thane-439; Navi Mumbai-440; Shirdi-441; Ajanta-442; Ellora-443; Alibag-444; Lavasa-
445; Kolhapur-446
Manipur
Bishnupur-475; Chandel-476; Churachandpur-477; Imphal-478; Senapati-479; Tamenglong-480;
Ukhrul-481
Meghalaya
Baghmara-500; Barapani-501; Jowai-502; Karimganj-503; Laitkor-504; Nongpoh-505;
Mizoram
Aizawl-525; Champai-526; Kolasib-527; Lawngtlai-528; Lunglei-529; Mamit-530
Nagaland
Dimapur-550; Dzukou Valley-551; Kohima-552; Longleng-553; Longwa-554; Mokokchung-
555; Mon-556; Peren-557; Phek-558; Shanghanyu-559; Tuensang-560; Wokha-561
Orissa
Balasore-575; Bhubaneswar-576; Cuttack-577; Dhenkanal-578; Jeypore-579; Pipli-580;
Raghurajpur-581; Satyabadi-582; Bhawanipatna-583; Chandipur-584; Dhauli-585; Gopalpur-
586; Keonjhar-587; Lalitgiri-588; Udaygiri-589; Ratnagiri-590; Puri-591; Samabalpur-592; Ta-
tapani-593; Rourkella-594
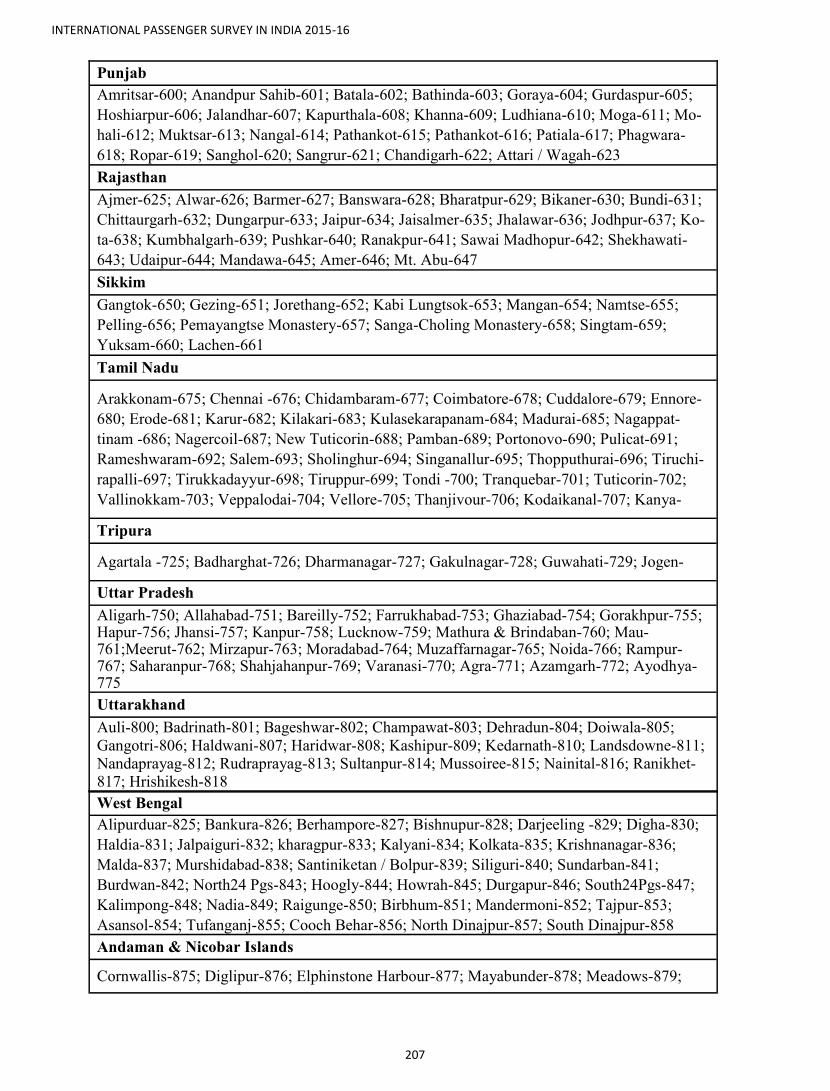
INTERNATIONAL PASSENGER SURVEY IN INDIA 2015-16
207
Punjab
Amritsar-600; Anandpur Sahib-601; Batala-602; Bathinda-603; Goraya-604; Gurdaspur-605;
Hoshiarpur-606; Jalandhar-607; Kapurthala-608; Khanna-609; Ludhiana-610; Moga-611; Mo-
hali-612; Muktsar-613; Nangal-614; Pathankot-615; Pathankot-616; Patiala-617; Phagwara-
618; Ropar-619; Sanghol-620; Sangrur-621; Chandigarh-622; Attari / Wagah-623
Rajasthan
Ajmer-625; Alwar-626; Barmer-627; Banswara-628; Bharatpur-629; Bikaner-630; Bundi-631;
Chittaurgarh-632; Dungarpur-633; Jaipur-634; Jaisalmer-635; Jhalawar-636; Jodhpur-637; Ko-
ta-638; Kumbhalgarh-639; Pushkar-640; Ranakpur-641; Sawai Madhopur-642; Shekhawati-
643; Udaipur-644; Mandawa-645; Amer-646; Mt. Abu-647
Sikkim
Gangtok-650; Gezing-651; Jorethang-652; Kabi Lungtsok-653; Mangan-654; Namtse-655;
Pelling-656; Pemayangtse Monastery-657; Sanga-Choling Monastery-658; Singtam-659;
Yuksam-660; Lachen-661
Tamil Nadu
Arakkonam-675; Chennai -676; Chidambaram-677; Coimbatore-678; Cuddalore-679; Ennore-
680; Erode-681; Karur-682; Kilakari-683; Kulasekarapanam-684; Madurai-685; Nagappat-
tinam -686; Nagercoil-687; New Tuticorin-688; Pamban-689; Portonovo-690; Pulicat-691;
Rameshwaram-692; Salem-693; Sholinghur-694; Singanallur-695; Thopputhurai-696; Tiruchi-
rapalli-697; Tirukkadayyur-698; Tiruppur-699; Tondi -700; Tranquebar-701; Tuticorin-702;
Vallinokkam-703; Veppalodai-704; Vellore-705; Thanjivour-706; Kodaikanal-707; Kanya-
Tripura
Agartala -725; Badharghat-726; Dharmanagar-727; Gakulnagar-728; Guwahati-729; Jogen-
Uttar Pradesh
Aligarh-750; Allahabad-751; Bareilly-752; Farrukhabad-753; Ghaziabad-754; Gorakhpur-755; Hapur-756; Jhansi-757; Kanpur-758; Lucknow-759; Mathura & Brindaban-760; Mau-761;Meerut-762; Mirzapur-763; Moradabad-764; Muzaffarnagar-765; Noida-766; Rampur-767; Saharanpur-768; Shahjahanpur-769; Varanasi-770; Agra-771; Azamgarh-772; Ayodhya-775
Uttarakhand
Auli-800; Badrinath-801; Bageshwar-802; Champawat-803; Dehradun-804; Doiwala-805;
Gangotri-806; Haldwani-807; Haridwar-808; Kashipur-809; Kedarnath-810; Landsdowne-811; Nandaprayag-812; Rudraprayag-813; Sultanpur-814; Mussoiree-815; Nainital-816; Ranikhet-817; Hrishikesh-818
West Bengal
Alipurduar-825; Bankura-826; Berhampore-827; Bishnupur-828; Darjeeling -829; Digha-830;
Haldia-831; Jalpaiguri-832; kharagpur-833; Kalyani-834; Kolkata-835; Krishnanagar-836;
Malda-837; Murshidabad-838; Santiniketan / Bolpur-839; Siliguri-840; Sundarban-841;
Burdwan-842; North24 Pgs-843; Hoogly-844; Howrah-845; Durgapur-846; South24Pgs-847;
Kalimpong-848; Nadia-849; Raigunge-850; Birbhum-851; Mandermoni-852; Tajpur-853;
Asansol-854; Tufanganj-855; Cooch Behar-856; North Dinajpur-857; South Dinajpur-858
Andaman & Nicobar Islands
Cornwallis-875; Diglipur-876; Elphinstone Harbour-877; Mayabunder-878; Meadows-879;
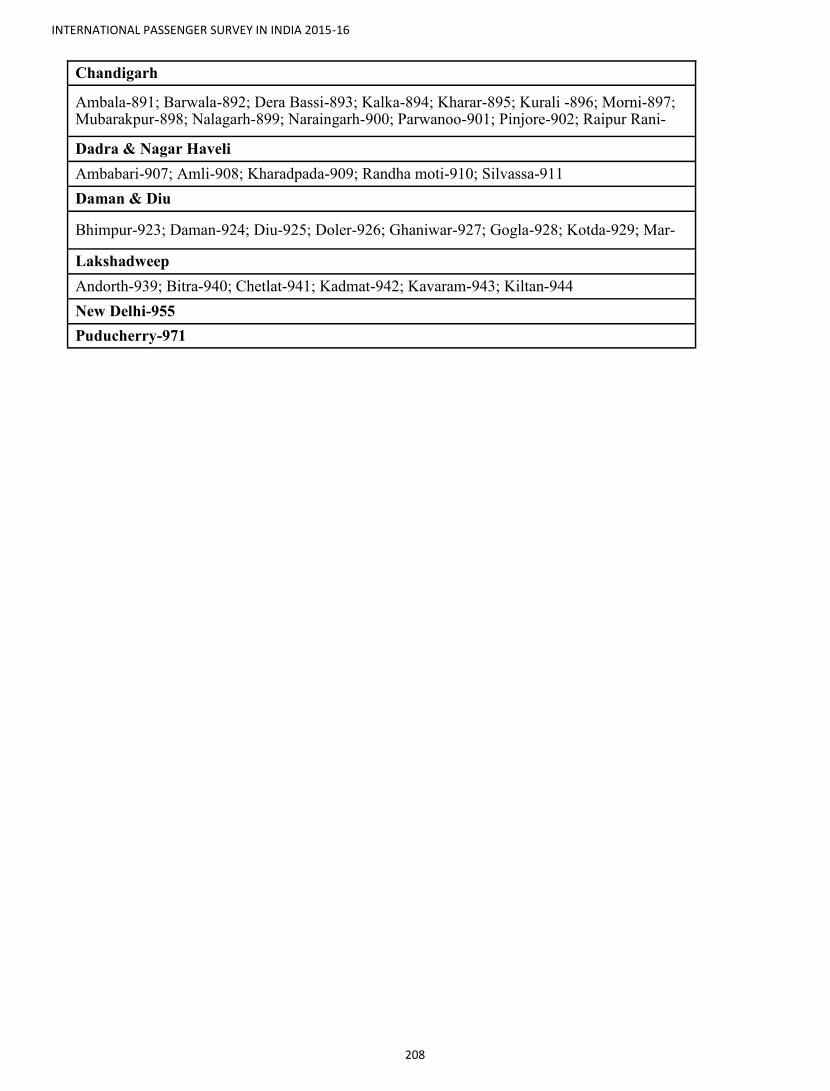
INTERNATIONAL PASSENGER SURVEY IN INDIA 2015-16
208
Chandigarh
Ambala-891; Barwala-892; Dera Bassi-893; Kalka-894; Kharar-895; Kurali -896; Morni-897; Mubarakpur-898; Nalagarh-899; Naraingarh-900; Parwanoo-901; Pinjore-902; Raipur Rani-
Dadra & Nagar Haveli
Ambabari-907; Amli-908; Kharadpada-909; Randha moti-910; Silvassa-911
Daman & Diu
Bhimpur-923; Daman-924; Diu-925; Doler-926; Ghaniwar-927; Gogla-928; Kotda-929; Mar-
Lakshadweep
Andorth-939; Bitra-940; Chetlat-941; Kadmat-942; Kavaram-943; Kiltan-944
New Delhi-955
Puducherry-971

INTERNATIONAL PASSENGER SURVEY IN INDIA 2015-16
209
FACTORS CODE ITEM INCLUDES
Goodness of People 1 Friendly people, helpful people, good natured people, hu-manity, Simplicity, Hospitality, Others
Indian Culture 2 Diversity of culture, old cultural values, tribes, variety of food, variety of clothing, Rituals in marriages, Languages & Traditions, heritage, food, festivals others
Climate 3 Rainy season, variety of seasons, others
Economic growth 4 Business, economic conditions, markets, shopping facili-ties, excellent malls, others
Heritage medical treatment
5 Ayurveda, homeopathy, unani, yoga, others
Historical monu-ments
6 Includes all type of monuments except Taj Mahal
Taj Mahal 7 Taj Mahal
Golden temple 8 Golden temple
Family values 9 Relationships
Survival in adverse conditions
10 Poverty, poor people, disparity in income of people, beg-gars, unemployment, Slums, others
Transport & travel 11 Traffic, various modes of transport, good railway net-work, air travel , roads, communication, others
Educational facili-ties
12 Opportunity for education in Universities, Colleges, Premier institutions,o thers
Religious practices 13 Hindu temples, Buddhist places, Aarti at Varanasi, others
Excellent cities 14 Chandigarh, Delhi, Bengaluru, Mumbai,Kolkata,others
Hill stations 15 Anything related with hills
Forests 16 Anything related with forests
Beaches 17 Goa, Kerala and anything linked to beaches
Affordable living conditions
18 Cheap articles, low food prices, affordable accommoda-tion Hotels.
Use of outmoded means
19 Rickshaw, Tongah, old agricultural modes, others
Medical facilities 20 Excellent hospitals, Good Doctors
Fruits & vegetables 21 Mangoes
Spirituality 22
Everything 23
Nothing 24
Nature 25
Historical Place 26
Places 27
Service 28
5. “WHAT IMPRESSED MOST IN INDIA”
Tourist Place 29 Tourist spot, tourist place, tourist destination.
Amusement Place 30 Zoo, Science city, Niccopark, and others
Others 99

INTERNATIONAL PASSENGER SURVEY IN INDIA 2015-16
210
REASONS CODE ITEM INCLUDES
Bad people 1
Clumsy people, unhygienic people, uncooperative people, cheating people, uninteresting people, un-friendly people, others
Pollution 2
Air pollution, water pollution, noise pollution, unhy-gienic food, food adulteration, crowded places, oth-ers
Poor sanitary conditions 3 Dirty toilets & lavatories, inadequate number of toi-lets, defecation in open places, others
Unethical traders 4 Too much bargaining, hoodwinking foreigners, oth-ers
Lack of work culture 5 Undisciplined workers, poor service, inefficiency, insincere workers, others
Personal insecurity 6 Pick pocketing, fear of robbery, fear of cheating, fear of being killed for money, others
Spatial insecurity 7 Lack of law and order, frequent processions and ral-lies, strikes, terror strikes, others
Traffic chaos 8 Undisciplined traffic, lack of transport facilities, oth-ers
Poor road conditions 9 Dirty roads, congested roads, less road space, poor maintenance of roads, others
Poor airports 10
Poor sanitary conditions, misbehaving offi-cials ,clumsy immigration and customs handling, lack of international standard, others
Poor railways network 11
Unpunctual trains, inadequate information system, poor sanitary conditions, lack of security, lack of hygienic food, dirty and poor railway stations, oth-ers
Poor maintenance of histori-cal monuments
12 Dilapidated monuments, lack of amenities around the places, dirtiness, others
Poor maintenance of hill sta-tions
13
Poor maintenance of beaches and other tourist places
14
Slum dwellers 15
Corruption 16
Poor infrastructure in villages and small cities
17 Load shedding , kuchha roads, lack of amenities, others
Poverty 18
Others 99
6.“REASONS FOR DISSATISFACTION”

INTERNATIONAL PASSENGER SURVEY IN INDIA 2015-16
211
State/ UT Abbreviation Code State/ UT Abbreviation Code
Andaman and Nicobar AN 01 Lakshadweep LD 19
Andhra Pradesh AP 02 Madhya Pra- MP 20
Arunachal Pradesh AR 03 Maharashtra MH 21
Assam AS 04 Manipur MN 22
Bihar BR 05 Meghalaya ML 23
Chandigarh CH 06 Mizoram MZ 24
Chhattisgarh CG 07 Nagaland NL 25
Dadra and Nagar Haveli DN 08 Orissa OR 26
Daman and Diu DD 09 Puducherry PY 27
Delhi DL 10 Punjab PB 28
Goa GA 11 Rajasthan RJ 29
Gujarat GJ 12 Sikkim SK 30
Haryana HR 13 Tamil Nadu TN 31
Himachal Pradesh HP 14 Tripura TR 32
Jammu and Kashmir JK 15 Uttar Pradesh UP 33
Jharkhand JH 16 Uttarakhand UK 34
Karnataka KA 17 West Bengal WB 35
Kerala KL 18 Telangana TL 36
7. STATE
8. MOTHER TONGUE
Mother Tongue
Code Mother Tongue
Code Mother Tongue
Code
Asamia 01 Konkani 09 Sanskrit 17 Bengali 02 Maithili 10 Santali 18 Bodo 03 Malayalam 11 Sindhi 19 Dogri 04 Manipuri 12 Tamil 20 Gujarati 05 Marathi 13 Telugu 21 Hindi 06 Nepali 14 Urdu 22 Kannada 07 Odia 15 Marwari 23 Kashmiri 08 Punjabi 16 Bhojpuri 24 English
25

INTERNATIONAL PASSENGER SURVEY IN INDIA 2015-16
212
9. FOREIGN MONEY EXCHANGE RATE
Foreign Currency per INR
2015
Currency Mar Apr May Jun Jul Aug Sep Oct Nov Dec
Australian Dollar 47.8 51.2 48.7 49.1 46.7 47.4 46.1 46 46.8 48.2
Bangaladeshi Taka 0.8 0.8 0.8 0.8 0.8 0.8 0.9 0.8 0.9 0.9
Canadian Dollar 49.2 53 51.2 51.4 49.3 50.1 49 49.7 49.6 48.7
Chinese Yuan 10.1 10.2 10.3 10.3 10.3 10.4 10.4 10.3 10.3 10.3
Danish Krone 9.1 9.5 9.4 9.6 9.4 9.9 9.9 9.6 9.4 9.8
Euro 67.6 70.8 69.7 71.7 70 74 74.1 71.8 70.2 73.2
GBP 92.6 98.1 97.6 100.3 100 101.8 99.9 100.1 100.4 100.6
Hongkong Dollar 8.1 8.2 8.2 8.2 8.3 8.5 8.5 8.4 8.5 8.6
Israeli N. S. 15.8 16.5 16.5 16.9 17 16.8 16.8 16.9 16.9 17.3
Japanese Yen 0.5 0.5 0.5 0.5 0.5 0.5 0.6 0.5 0.5 0.6
Kuwaiti Dinar 208 210.8 210.4 210.5 211.5 218.9 218 215.9 217.5 220.6
Malaysian Ringgit 16.8 18 17.5 16.9 16.8 15.9 14.8 15.1 15.2 15.5
Nepalese Taka 0.6 0.6 0.6 0.6 0.6 0.6 0.6 0.6 0.6 0.7
New Zealand Dollar 47 49.1 45.7 43.8 42.3 42.8 41.9 43.7 42.6 45.3
Omani Rial 162.3 164.8 165.6 165.4 166.6 171.7 171.1 170 171.8 173.8
Pakistani Rupee 0.6 0.6 0.6 0.6 0.6 0.6 0.6 0.6 0.6 0.6
Russian Ruble 1.1 1.3 1.2 1.2 1.1 1 1 1 1 0.9
Saudi Riyal 16.7 16.9 17 17 17.1 17.6 17.6 17.5 17.6 17.8
Singapore Dollar 45.4 48.2 47.3 47.3 46.6 47 46.1 46.6 46.5 47.6
South Korean Won 0.1 0.1 0.1 0.1 0.1 0.1 0.1 0.1 0.1 0.1
Sri Lanka Rupee 0.5 0.5 0.5 0.5 0.5 0.5 0.5 0.5 0.5 0.5
Swedish Krona 7.3 7.6 7.5 7.8 7.4 7.8 7.9 7.7 7.6 7.9
Swiss Franc 64.5 67.7 67.6 68.8 66.1 68.7 67.8 66 64.8 67.5
Thai Baht 1.9 1.9 1.9 1.9 1.8 1.8 1.8 1.8 1.8 1.9
Turkish Lira 24 24 24 23.6 23 22.6 21.7 22.3 23.1 22.6
UAE Dirham 17 17.3 17.4 17.3 17.5 18 17.9 17.8 18 18.2
US Dollar 62.5 63.5 63.7 63.7 64.1 66.2 65.9 65.5 66 66.9
The rates displayed below have been compiled using various sources as applicable, for eg. http://www.xe.com/
currencyconverter/, http://www.usforex.com/currency-converter, https://www.google.com/finance/converter.
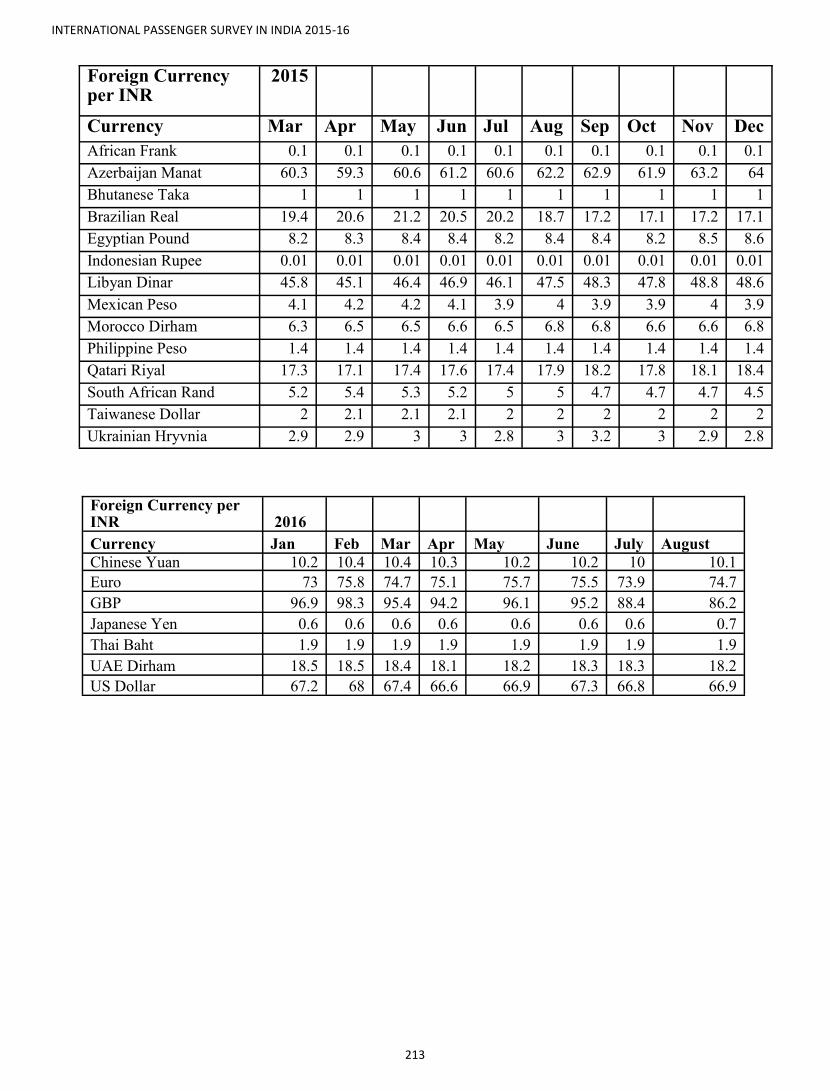
INTERNATIONAL PASSENGER SURVEY IN INDIA 2015-16
213
Foreign Currency per INR
2015
Currency Mar Apr May Jun Jul Aug Sep Oct Nov Dec
African Frank 0.1 0.1 0.1 0.1 0.1 0.1 0.1 0.1 0.1 0.1
Azerbaijan Manat 60.3 59.3 60.6 61.2 60.6 62.2 62.9 61.9 63.2 64
Bhutanese Taka 1 1 1 1 1 1 1 1 1 1
Brazilian Real 19.4 20.6 21.2 20.5 20.2 18.7 17.2 17.1 17.2 17.1
Egyptian Pound 8.2 8.3 8.4 8.4 8.2 8.4 8.4 8.2 8.5 8.6
Indonesian Rupee 0.01 0.01 0.01 0.01 0.01 0.01 0.01 0.01 0.01 0.01
Libyan Dinar 45.8 45.1 46.4 46.9 46.1 47.5 48.3 47.8 48.8 48.6
Mexican Peso 4.1 4.2 4.2 4.1 3.9 4 3.9 3.9 4 3.9
Morocco Dirham 6.3 6.5 6.5 6.6 6.5 6.8 6.8 6.6 6.6 6.8
Philippine Peso 1.4 1.4 1.4 1.4 1.4 1.4 1.4 1.4 1.4 1.4
Qatari Riyal 17.3 17.1 17.4 17.6 17.4 17.9 18.2 17.8 18.1 18.4
South African Rand 5.2 5.4 5.3 5.2 5 5 4.7 4.7 4.7 4.5
Taiwanese Dollar 2 2.1 2.1 2.1 2 2 2 2 2 2
Ukrainian Hryvnia 2.9 2.9 3 3 2.8 3 3.2 3 2.9 2.8
Foreign Currency per INR 2016
Currency Jan Feb Mar Apr May June July August
Chinese Yuan 10.2 10.4 10.4 10.3 10.2 10.2 10 10.1
Euro 73 75.8 74.7 75.1 75.7 75.5 73.9 74.7
GBP 96.9 98.3 95.4 94.2 96.1 95.2 88.4 86.2
Japanese Yen 0.6 0.6 0.6 0.6 0.6 0.6 0.6 0.7
Thai Baht 1.9 1.9 1.9 1.9 1.9 1.9 1.9 1.9
UAE Dirham 18.5 18.5 18.4 18.1 18.2 18.3 18.3 18.2
US Dollar 67.2 68 67.4 66.6 66.9 67.3 66.8 66.9
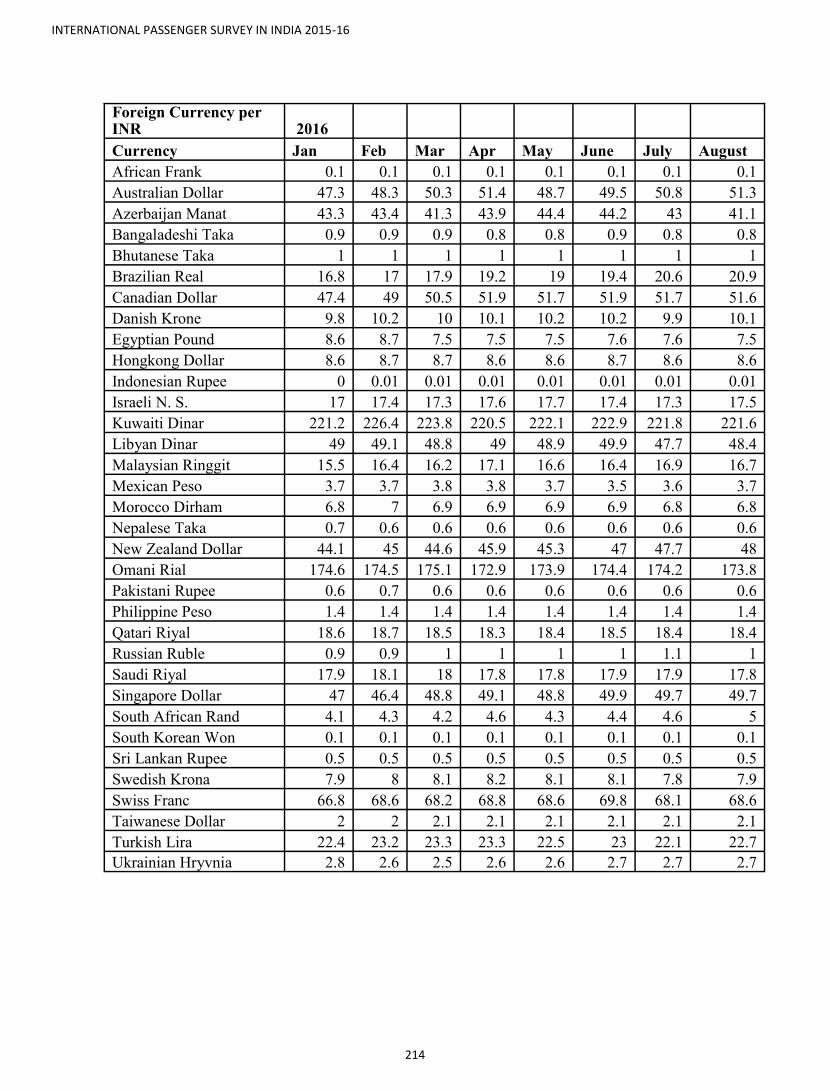
INTERNATIONAL PASSENGER SURVEY IN INDIA 2015-16
214
Foreign Currency per INR 2016
Currency Jan Feb Mar Apr May June July August
African Frank 0.1 0.1 0.1 0.1 0.1 0.1 0.1 0.1
Australian Dollar 47.3 48.3 50.3 51.4 48.7 49.5 50.8 51.3
Azerbaijan Manat 43.3 43.4 41.3 43.9 44.4 44.2 43 41.1
Bangaladeshi Taka 0.9 0.9 0.9 0.8 0.8 0.9 0.8 0.8
Bhutanese Taka 1 1 1 1 1 1 1 1
Brazilian Real 16.8 17 17.9 19.2 19 19.4 20.6 20.9
Canadian Dollar 47.4 49 50.5 51.9 51.7 51.9 51.7 51.6
Danish Krone 9.8 10.2 10 10.1 10.2 10.2 9.9 10.1
Egyptian Pound 8.6 8.7 7.5 7.5 7.5 7.6 7.6 7.5
Hongkong Dollar 8.6 8.7 8.7 8.6 8.6 8.7 8.6 8.6
Indonesian Rupee 0 0.01 0.01 0.01 0.01 0.01 0.01 0.01
Israeli N. S. 17 17.4 17.3 17.6 17.7 17.4 17.3 17.5
Kuwaiti Dinar 221.2 226.4 223.8 220.5 222.1 222.9 221.8 221.6
Libyan Dinar 49 49.1 48.8 49 48.9 49.9 47.7 48.4
Malaysian Ringgit 15.5 16.4 16.2 17.1 16.6 16.4 16.9 16.7
Mexican Peso 3.7 3.7 3.8 3.8 3.7 3.5 3.6 3.7
Morocco Dirham 6.8 7 6.9 6.9 6.9 6.9 6.8 6.8
Nepalese Taka 0.7 0.6 0.6 0.6 0.6 0.6 0.6 0.6
New Zealand Dollar 44.1 45 44.6 45.9 45.3 47 47.7 48
Omani Rial 174.6 174.5 175.1 172.9 173.9 174.4 174.2 173.8
Pakistani Rupee 0.6 0.7 0.6 0.6 0.6 0.6 0.6 0.6
Philippine Peso 1.4 1.4 1.4 1.4 1.4 1.4 1.4 1.4
Qatari Riyal 18.6 18.7 18.5 18.3 18.4 18.5 18.4 18.4
Russian Ruble 0.9 0.9 1 1 1 1 1.1 1
Saudi Riyal 17.9 18.1 18 17.8 17.8 17.9 17.9 17.8
Singapore Dollar 47 46.4 48.8 49.1 48.8 49.9 49.7 49.7
South African Rand 4.1 4.3 4.2 4.6 4.3 4.4 4.6 5
South Korean Won 0.1 0.1 0.1 0.1 0.1 0.1 0.1 0.1
Sri Lankan Rupee 0.5 0.5 0.5 0.5 0.5 0.5 0.5 0.5
Swedish Krona 7.9 8 8.1 8.2 8.1 8.1 7.8 7.9
Swiss Franc 66.8 68.6 68.2 68.8 68.6 69.8 68.1 68.6
Taiwanese Dollar 2 2 2.1 2.1 2.1 2.1 2.1 2.1
Turkish Lira 22.4 23.2 23.3 23.3 22.5 23 22.1 22.7
Ukrainian Hryvnia 2.8 2.6 2.5 2.6 2.6 2.7 2.7 2.7
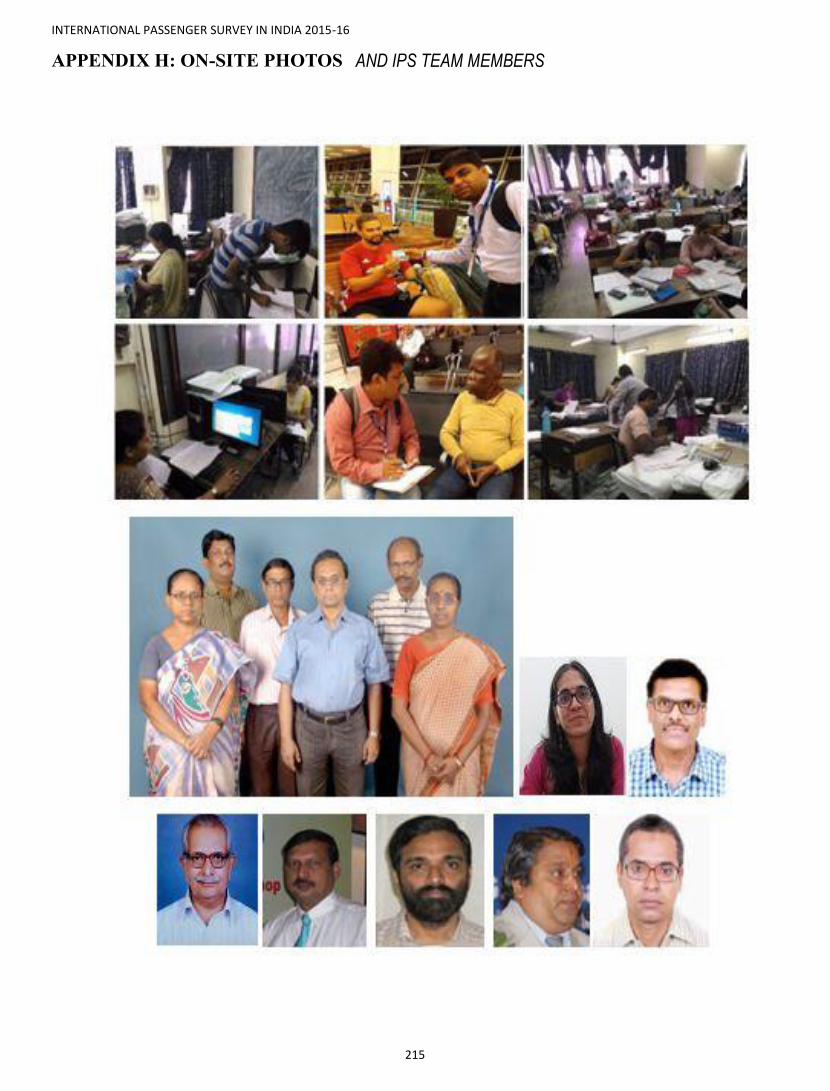
INTERNATIONAL PASSENGER SURVEY IN INDIA 2015-16
215
APPENDIX H: ON-SITE PHOTOS AND IPS TEAM MEMBERS
user
Typewritten text
user
Typewritten text