General Report, Part-I-A, Series-16, Orissa - Linguistic Survey ...
318
CENSWS qF INDIA, 1971 SERIES 16 ORISSA GENERAL REPORT B. TRIPATHI of the Indian Administrath'e Service Director of Operations J Orissa
-
Upload
khangminh22 -
Category
Documents
-
view
0 -
download
0
Transcript of General Report, Part-I-A, Series-16, Orissa - Linguistic Survey ...
CENSWS qF INDIA, 1971
SERIES 16
ORISSA
GENERAL REPORT
B. TRIPATHI
of the Indian Administrath'e Service Director of Cen~us OperationsJ Orissa
'CENSUS OF INOlA, 1971 . SERIES-16
ORISSA PART I-A

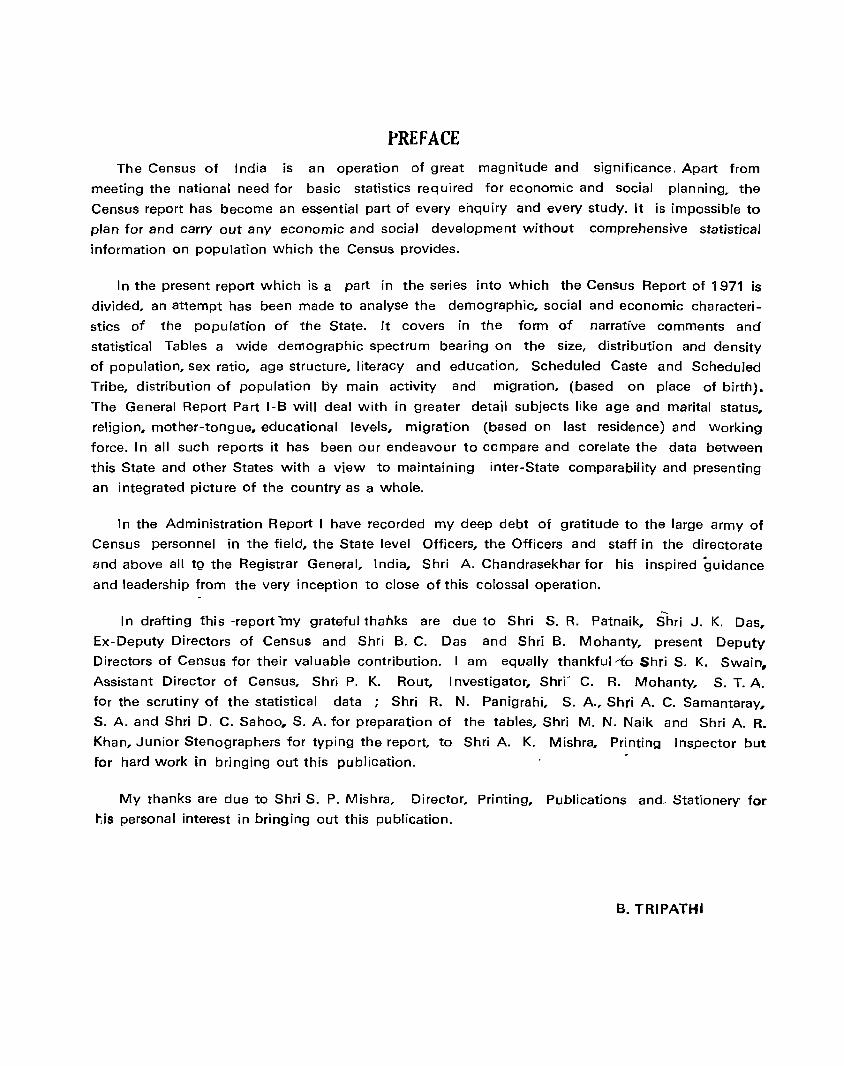
PREFACE
The Census of India is an operation of great magnitude and significance, Apart from
meeting the national need for basic statistics required for economic and social planning, the
Census report has become an essential part of every enquiry and every study. It is impossible to
plan for and carry out any economic and social development without comprehensive statistical
information on population which the Census provides.
In the present report which is a part in the series into which the Census Report of 1971 is
divided, an attempt has been made to analyse the demographic, social and economic characteri
stics of the population of the State. it covers in the form of narrative comments and
statistical Tables a wide demographic spectrum bearing on the size, distribution and density
of population, sex ratio, age structure, literacy and education, Scheduled Caste and Scheduled
Tribe, distribution of population by main activity and migration, (based on place of birth).
The General Report Part I-B will deal with in greater detail subjects like age and marital status,
religion, mother-tongue, educational levels, migration (based on last residence) and working
force. In all such reports it has been our endeavour to compare and corelate the data between
this State and other States with a view to maintaining inter-State comparability and presenting
an integrated picture of the country as a whole.
In the Administration Report I have recorded my deep debt of gratitude to the large army of
Census personnel in the field, the State level Officers, the Officers and staff in the directorate
and above all tg the Registrar General, India, Shri A. Chandrasekhar for his inspired guidance
and leadership from the very inception to close of this colossal operation.
In drafting this -reporCmy grateful thanks are due to Shri S. R. Patnaik, Shri J. K. Das,
Ex-Deputy Directors of Census and Shri B. C. Das and Shri B. Mohanty, present Deputy
Directors of Census for their valuable contribution. I am equally thankful-1o Shri S. K. Swain,.
Assistant Director of Census, Shri P. K. Rout, Investigator, Shri" C. R. Mohanty, S. T. A
for the scrutiny of the statistical data ; Shri R. N. Panigrahi, S. A, Shri A C. Samantaray,
S. A. and Shri D. C. Sahoo .. S. A. for preparation of the tables, Shri M. N. Naik and Shri A. R.
Khan, Junior Stenographers for typing the report, to Shri A. K. Mishra, Printing Inspector but
for hard work in bringing out this publication.
My thanks are due to Shri S. P. Mishra, Director, Printing, Publications and- Stationery for
jjis personal interest in bringing out this publication.
B. TRIPATHI

CHAPTERS· :_
IV
v
VI
VII
VIII
IX
X
ANNEXURE:
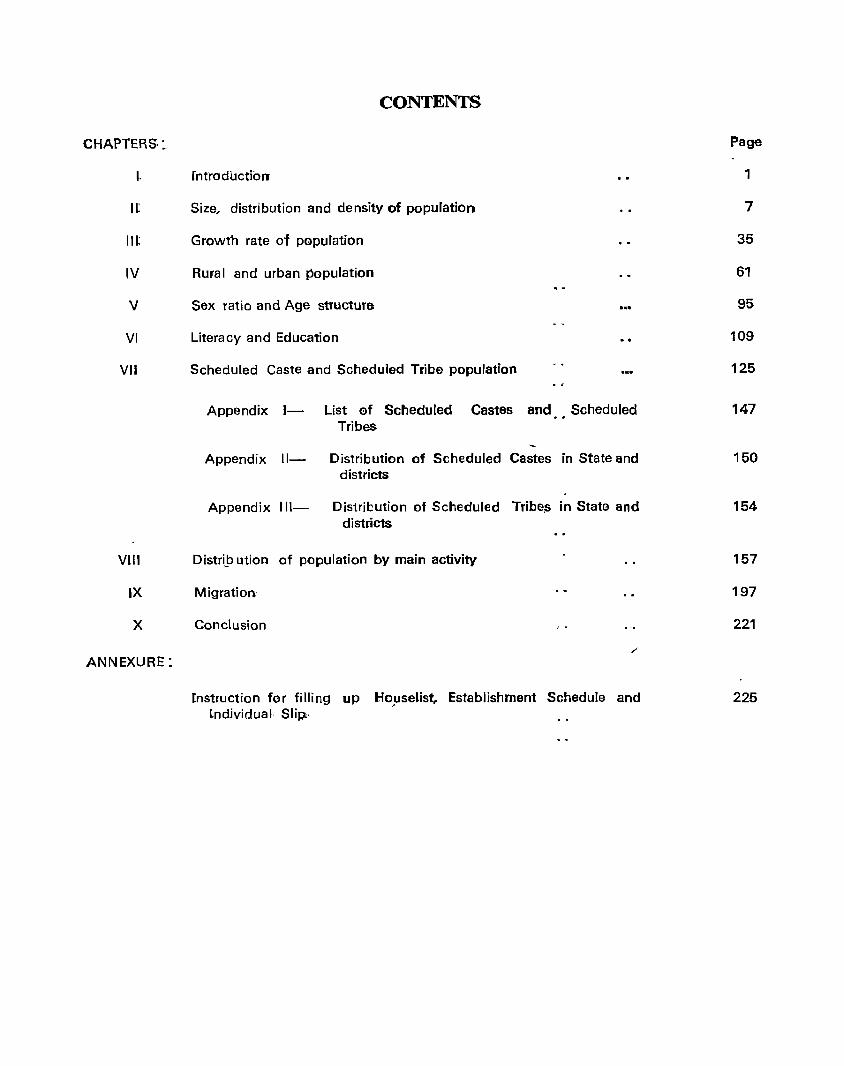
CONTENTS
rntroduction
Size, distribution and density of population
Growth rate of population
Rural and urban population
Sex ratio and Age structure
Literacy and Education
Scheduled Caste and Scheduled Tribe population
Appendix 1- List of Scheduled Castes and Scheduled Tribes
Appendix 11- Distribution of Scheduled Castes in State and districts
Appendix 111- Distribution of Scheduled Tribes in State and districts
Distri_b utioll of population by main activity
Migration:
Conclusion
[nstruction far filling up HO,uselist.. Establishment Schedule and Lndividual- Slip.·
Page
1
7
35
61
95
109
125
147
150
154
157
197
221
225

1971 CENSUS PUBLICATIONS-ORISSA
( All the Census publications of this State will bear Series No. 16)
Part
Part I-A
Part I-B
Part I·C
Part " Part II-A
Part II-A Supplement
Part II-B
Part II-C (i)
Part II-C (ii)
Part II-D
Part III
Part IV
Part V
Part VI
Part VI-A
Part VI-B
Part VI-C Part VII
Part VIII
Part VIII-A
Part VIII-B
Part IX
Part IX-A
Part X
Part X-A
Part X-B
. Part X-C
MISCELLANEOUS
General Report on the Census. subdivided into three Sub-parts, viz.
First part of the General Report covering distribution, growth. and density of population, sex ratio, Rural and Urban differentials, broad literacy rates, population of Scheduled Castes and Scheduled Tribes, broad economic categories, etc. (the present volume ).
rThe second part covering detailed analysis of the demographic, social, cultural and migration patterns.
Subsidiary Tables
Census Tables on Population subdivided into :
General Population Tables
General Population Tables ( Standard Urban Areas
Economic Tables
Tables showing distribution of population by Mother-tongue and Religion, Scheduled Castes and Scheduled Tribes.
Other Social and Cultural Tables and Fertility Tables
Migration Tables
Establishment Report and Tables
Housing Report and Tables
Special ~ables and Ethnographic Notes on Scheduled Castes and Scheduled Tribes
Town Directory, Survey Rep'orts on Towns and Villages, subdivided into:
Town Directory
Special Survey Reports all selected Towns
Survey Reports on selected Villages Special Report on Graduates ·and Technical Personnel (All India
Publication)
Administration Report (For official use only) subdivided into:
Administration Report-Enumeration
Administration Report-Tabulation
Census Atlas
Administrative Atlas
District Census Handbook (a State Government Publication) subdivi. ded into:
Town and Village Directory
Town and Villagewise Primary Census Abstract
Analytical Report and Administration statements and Distrl'ct Census Tables-.. -;- ~(fof 13 districts)
Special studies and other Reports and Tables (will be published as special paper as and when they are ready.)
A PORTRAIT OF POPULATION, ORISSA, 1971 (A Popular version) Pocket Book of Population Statistics.
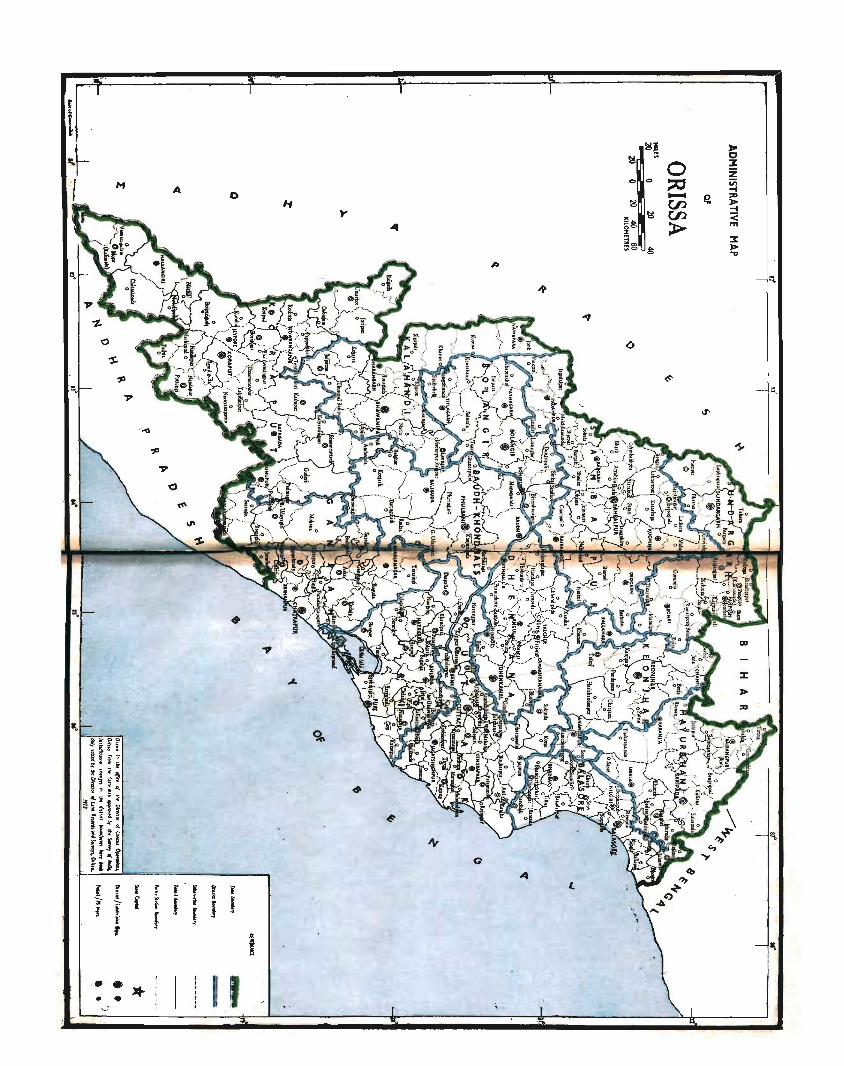
ADMINISTRATIVE MAP
OF
ORISSA
" i T t ,
r {
•• lIt-• •
~ i-,-.. ~ ..
A
i f I f I I f .. ..
~l ,.. ::; c
:z 0 z ::::a ~
e '" - ~ Ul :;: Ul
I)
m > :z > ...., $
i' J ..

INTRODUCfION
In the pUblication programme of the 1971 census, the General Report (particularly Part I-A) is perhaps the most important from the point of view of data-users. This volume analyses the main demographic, social, cultural and economic characteristics of the 1971 census; the data presented are mostly based upon a 100 per cent count. In this report, census data covered by the following tables are analysed.
Full Count tables-A-I, A-II, A-III, A-IV, A-V, Primary census abstract, B-1 Part A, B-IL C-VIII (parts A & B) and D-I (estimated).
-General Report Part I-B will be more specialised in its analysis mostly based on cross-tabulation of the data and also touch upon subjects like marital status, religion, mother-tongue, educational levels, migration, an examination of the working force from different standpoints, etc.
The eleventh decennial censuS' of India-the fourth for Orissa as a separate state-was undertaken between 10 March 1971 and 4 April 1971, the sunrise of 1 April being the reference date. Indian census is said to be the largest operation of its kind in the world. It was governed by the Census Act of 1948· Every census operation IS carried out in two phases, viz., (i) house numbering and houselisting and (ii) enumeration. Before the operations for the 1971 census were taken in hand, a great deal of preliminary preparations were made at the national level. The census schedules finally adopted for 1971 were (a) Houselist, (17) E~tabJishment schedule and (c) Individual slip.
The houselist was intended to provide a complete list of all census houses and households in every village and town and also the approximate popUlation. This schedule was canvassed during 1970 and formed the basis for the fixing of census enumerators' blocks in such a way as to ensure complete coverage without omission or overlapping of the hoqseholds. Since 1 Census-l]
1961 this houselist has served as a kind of 40using census schedule. ~ Particulars of the purposes for which census houses are used, the material of wall and roof of each census house, whether the census households lived in owned or rented houses, the name of head of household and the number of members in each household were collected. The bouselist of 1971 by and large followed the 1961 pattern. The improvements are that in respect of vacant houses, the reasons for vacancy are ascertained. At the 1961 census, a number of dilapidated houses and sometimes even vacant sites were allotted house numbers and shown as vacant; this gave a misleading impression that a number of houses were vacant. If the head of a household belonged to a scheduled caste or scheduled tribe it is specifically recorded as such. The households engaged in cultivation are recorded as such so that the list may form a frame for any sample survey of agricultural households.
In the 1961 houselist some simple data on houses used as factories or workshops were collected. The establishment schedule was a new schedule developed for the 1971 census. It covers all kinds of establish· ]lents, viz., manufacturing, trade or other establishments where people work. An "Establishment" is defined as a place where goods are produced or manufactured not solely for domestic consumption or where servicing and/or repairing is done such as factory, workshop or household industry or servicing and/or repair workshop or a place where retail or wholesale business is carried on or commercial services are rendered or an office, public or private or a plaCe of entertainment or where educational, religiOUS, social or entertainment services are rendered. It is necessary that in all these places one or more persons should be actually working.
The establishment schedule gathers particulars on whether the establishment is a government, quasigovernment, private or co-operative institution and average number of persons working. If it was a household industry, registered factory or unregistered ,
workshop, the description of products processed or servicing done, type of power used, if it was a trade establishment the description of goods bought or sold and if retail or wholesale and if used as other establishment its description such as an office, hotel, theatre, etc. are also ascertained.
This sch~dule is expected to yield very useful data particularly in regard to the unorganised sector, classifying the establishments by the size of employment and fhe industrial or trade categories and correlating the power used and size of empioyment. The establishment schedule will also serve as a very good frame for any type of future sample survey. It may, however, be remembered that the schedule covers only the establishments run within the building which is listed and will not cover open air establishments or itinerant establishments with no r~gular building.
The individual slip
This was the basic schedule of the 1971 population census and it contained-l-7 questions covering the following
1. Name
2. Relationship to head
3. Sex
4. Age
5. Marital status
6. For currently married women only:
(a) Age at marriage
(b) Any child born in the last one year
7. Birth place:
(~) Place of birth
(b) Rural/Urban
(c) District
(d) State/Country
8. Last residence:
(a) Place of last residence
(b) Rural/Urban
(c) District
(d) State/Countr,y
9. Duration of residence at the village or town of enumeration
2
10. Religion
11. Scheduled caste or scheduled tribe
12. Literacy
13. Educational level
14. Mother-tongue
15. Other languages
16. Main activity:
(a) Broad category
(i) Worker
(ii) Non-worker
(b) Place of work (name of village/town)
(c) Name of establishment
(d) Nature of industry, trade, profession or service
(e) Description of work
(f)' Class of worker
17. Secondary work :
(a) Broad category
(b) Place of work (name of village/town)
(c) Name of establi.shment
(d) Nature of industry, trade, profession or service
(e) Description of work
ef) Class of worker
The new features of the 1971 individual slip as compared to that of 1961 were : (i) an attempt was made to collect data on current fertility (ii) migrational particulars with reference to the place of last residence are collected which are expected to yield valuable and realistic data on internal migration (iii) considerable departure is made ill respect of the economic questions. The main activity of a person is ascertained according as he spends his time basically as a worker producing goods and services or as a non-worker. For regular work in trade, profession, service or business, the reference period is the week prior to the date of enumeration and for seasonal work such as agriculture the last one year. The person is categorised according to the main activity returned by an individual. Where a person who is basically a
non-worker such as a student or house-wife does make some marginal contribution to work, that secondary work is recorded in question 17. Experience of the 1961 census had shown that census was not a proper agency to collect reliable data on unemployment as such. Therefore the 1971 census does not ask a question on unemployment directly but the unemployed are expected to fall in the residuary category of non-workers and data ip respect of them will be provided which has to be utilised subject to all its limitations. A copy of each of the schedules and instructions for filling them are given in an annexure at the end of this book.
The entire census operation was organised in six successive stages, viz.,
(1) Delimitation of census divisions,
(2) Building up of the census hierarchy,
(3) House-numbering and houselisting,
(4) Training of personnel,
(5) Actual census count from 10 March 1971 to 31 March 1971 and
(6) Reporting of the provisional census figures.
Delimitation of census divisions
A 'freeze' order, banning jurisdictional changes in the administrative units of the state with effect from 1 January 1970 till the close of the census operations was obtained sufficiently in advance from the state government. Some jurisdictional changes in respect of two districts and five police stations were however notified by the state government just on the eve of the 'freeze'. By this time, the delimitation of houselisting blocks had almost been completed. The work had to be done afresh in the light of the altered jurisdictions. Village registers, police station maps and district maps affected by the notification had also to be prepared again.
The need for finding an alternative to the police station as a charge was underscored by the experience of preceding censuses. Fortunately, the tahsil is, by and "large, co-terminous with the police station boundaries. For this reason as also because the tahsil has acquired a permanent status and is manned by relatively senior and experienced officers, the tahsil was chosen as the rural census charge and the Tahsildar as the Charge Officer. Nevertheless, the independence of the police station as a sub-unit for the presentation of census data has been retained. Towns and large villages showing urban characteristics specially
3
designated as census towns formed urban charges and were placed in charge of the Executive Officer and Block Development Officer respectively.
The enumerator's block generally consisted of a population of 750 in rural areas and 600 in urban areas. Basically every village, big or small, was treated as an independent censuS" block. In some cases bigger villages were split into more than one enumerator's block depending on area, nature of terrain and population. Similarly, in some other areas, two or more small villages were combined to constitute the jurisdiction of one enumerator while each such village continued to remain as an inde. pendent block. In towns, the ward was split to form enumerators' blocks in terms of the above yardstick. The supervisor's circle more or less covered the jurisdiction of five enumerators.
The 1971 census saw for the first time, the appointment of the Block Development Officer as Additional Charge Officer and the Sub-Inspector of Schools and the Revenue Supervisor of tahsils as SubCharge Officer. Almost the entire cadre of enumerators was made up of local school teachers. Extension Officers of blocks, teachers of high or middle schools, clerks of local offices, etc., functioned as supervisors.
House-numbering and houselisting
In every village and town, all the houses, residential as well as non-residential were numbered according to a systematic scheme of house-numbering and the number allotted to each house is marked fairly prominently on the door of each house. A notional map is prepared showing the location of -residential areas. The household; that is, the group of persons living in a house and taking their food from . a common kitchen, will bear that house number. If there are more than one household in a house each of the households was allotted a sub-number to the house number in which the households live. Then all the houses and the households are listed in a uniform schedule, i. e., the houselist. The schedule, as already explained provides the frame for the demarcation of the census enumerator's block in a way that a fairly uniform workload is put on the enumerator. Along with the houselisting all the establishments are also listed on a separate schedule as has been indicated.
The house-numbering and houselisting was conducted in Orissa in February-March 1970.
Census count
The reference date for the census enumeration of 1971 was the sunrise of 1 April 1971. The census enumerator actually started work on the 10 March 1971 and continued till 31 March and all persons were enumerated at the places where they resided, i. e., at their houses and not at the places of their work such as in offices, factories or shops. All houseless persons,
4
boat-dwellers, etc., were enumerated on the night of 31 March 1971. During the subsequent three days, i.-e., 1 April to 3 April 1971, the enumerator made a quick revisit to all households and brought the enumeration up-to-date as at sunrise of 1 April i. e., the reference date. In the military areas of Charbatia and Chandipur, enumeration was taken up through enumerators and supervisors appointed from among the military staff.
ORISSA-A BRIEF HISTORICAL PERSPECTIVE
Orissa was known at different times by different names like Kalinga, Utkal and Odra. Hedged in between the kingdoms of Anga and Vanga, Kalinga was a -powerful kingdom which distinguished itself as a pioneer in maritime activities and established a number of colonies overseas. Kharavela, one of the most powerful monarchs of ancient India, belonged to Kalinga and was known for his empire-buildinK It was during his reign that the mighty empire of Kalinga registered its high-water -lllark and extended along the Bay of Bengal from the mouth of the Godavari to the banks of the Ganga. After A. D. 7th century the Kalinga empire deClined. Orissa as an independent entity came into being in the 10th century under the Kosala Guptas who later were known as Kesari kings and ruled till the end of the 14th century. Subsequently the kingdom of Orissa flourished under many powerful rulers, the important being Kapilendra Deva, Purushottama beva and Pratapa Rudra Deva, the Suryavamsi kings. Besides their military prowess, these rulers were great patrons of art and learning. Most of them proved 'to be great builders. Lalatendu Kesar i built ~the Lingaraj temple of Bhubaneswar in the mid-ninth century. Chola Ganga Deva built the famous Jagannath temple at Puri towards the later part of the 12th century. Narasinha Deva earned immortal fame by building the Konarka temple in the 13th c~ntury. Mukunda Deva built the Barabati fort in the 16th century.
Later on, Orissa came under the Pathan Sultans of Bengal and the Moghul emperors of Delhi between the sixteenth and eighteenth centuries. Towards the middle of the eighteenth century, it was ceded to the Marathas by Alivardi Khan, nawab of Beng~l. For the next half century, it remained under thesuzerainty of the Marathas. In 1803, it was annexed by'the British and attached to the province of Bengal. Tn 1804, a board of two Commissioners was appointed to adiminister this territory. In 1805, it was consti-
tuted into the district of Cuttack, but in 1823, the area was divided into 3 regulation districts of Cuttack, Balasore and Puri and 17 non-regulation tributary mahals administered by native chiefs under the overall supervision and responsibility of a Commissioner. In 1835, the tributary chief of Baudh ceded Khondmals, while Angul was annexed in 1847. In 1905, the district of Sambalpur was transferred from the Central provinces to Orissa. In the same year, the five tributary states of Patna, Kalahandi, Sonepur, Bamara and Rairakhol were transferred from the Centra} provinces to Orissa while the states of Gangapur and Bonai were transferred from Chhotnagapur division.
Thus, at the turn of the century, Orissa was merely a division of Bengal presidency and consisted of 5 districts, viz., Cuttack, Puri, Balasore, Angulcum-Khondmals and Sambalpur. Besides, there were 24 feudatory states. In 1912, Bihar and Orissa province was formed out of Bengal presidency. This composite province continued till 1936 when Orissa assumed the status of a separate province with six districts, viz., Cuttack, Puri, Balasore, Sambalpur, Ganjam and Koraput. The old district of AngulKhondmals was split and merged in Cuttack and Ganjam respectively. Ganjam district of Orissa constituted a portion of the pre-existing Ganjam district of Madras presidency, viz., Ganjam agency and a large area' of the Ganjam plains excluding Chicacole, Ichhapur, Sompeta and Tekkali. -'fhe areas of Orissa province as in 1936 was 32,198 square miles. A large portion of Vizagapatam agency constituted Koraput district. Sambalpur district gained Khariar zamindari and a portion of Borasambar zamindari of the Central provinces which became the Nawapara subdivision.
No territorial -changes in the constitution of the state or districts took place for over ten years. In 1948 and 1949, all the princely states of Orissa merged with the rest of Orissa. This administrative change
was legalised on the 1 August 1949 when the 24 exstates were formally merged with the province under the States Merger (Governor's Provinces) Order, 1949, increasing the area of the state to what it now is (155,782 Sq. Kms.).
The ex-states of Athgarh, Tigiri~, Baramba and Narsingpur joined Cuttack district. Nilgiri joined Balasore district ; Nayagarh, Daspalla, Khandpara and Ranpur joined Puri district'; and Bamra and Rairakhol joined Sambalpur district. The Angul subdivision of Cuttack district was separated from that district. This subdivision and the feudatory states of Dhenkanal, TaIcher, Pallahara, Athmallik and Hindol were constituted into Dhenkanal .district. The Khondmals and Balliguda agency areas of Ganjam district were taken out and together with the ex-state of Baudh formed the district of Baudh-Khondmals. The Nawapara subdivision was separated from Sambalpur district and was put together with the ex-state of Kalahandi to form another district named Kalahandi. The two ex-states of Keonjhar and Mayurbhanj formed each a separate district with' their names as such. The ex-states of Sonepur and Patna were formed into one district, namely, Bolangir while the ex-states of Gangpur and Bonai together formed' the present Sundargarh district. Thus, 13 district had been carved out after the merger of the ex-princely states. No change took place in the state or district boundaries during the decade 1951-61. There were ·some slight changes in the "boundaries of the districts and the lower administrative units between 1961 and 1971.
Sambalpur district-The Riamal police station which fell within two subdivisions, viz., Kuchinda and Deogarh in 1961, now comes under Deogarh subdivision. Gourpali police station was renamed J amankira with the jurisdiction remaining the same.
'A new subdivision, namely, Padampur was formed with 7 police stations of Bargarh subdivision.
Sundargarh district-A new police station, namely, Kalunga was created in Panposh subdivision comprising 58 vilages lying to the west of the river Brahmani in Raghunathpali police station of the same subdivision. Five villages of Bisra police station were transferred to Plant Site police station (2 parts of Rourkela city). Sarsarabalang police station in this -district was renamed Tikayatpali the jurisdiction remaining the same.
5
Keonjhar district-A new police station, -namely, J oda was created with 98 villages of defunct Chamakpur police station and 3 villages of Barbil police station. The rest 38 villages of the defunct Chamakpur pollce station were merged in Champua police station.
Cuttack district-After the 1961 census, two more subdivisions, namely, Jagatsinghpur and Banki have been carved out of Cuttack sadar subdivision. Thus, against 4 subdivisions in this district there are now 6 subdivisions. Besides, there has been a slight cha11ge in the district bOllndary which is briefly indicated below:
(a) Two villages, Kabatabandha and Goliamuhapatna were transferred from Gondia police station of Dhenkanal district to Dharmasala police station of Cuttack district. Till 1961 those two villages were shown under Gondia police station of Dhenkanal district though they were in fact enclaves within Dharmasala police station of Jajpur subdivision.
(b) A portion of Gania police station of Puri district, viz., the Jorum Pargana (consisting of 35 villages) situated at the northern bank of the river Mahanadi was inclUded in Narsingpur police station. Again 31 villages of Kakatpur police station of Puri district were transferred to Balikuda police station of Cuttack district.
(c) 28 villages of sadar police station of Cuttack district were transferred to Capital police station (Bhubaneswar) of Puri district.
Over and above the boundary changes, some adjustments were made in the boundar~es of some Police stations. 109 villages of Jagatsinghpur police tation were put under Gobindpur police station
and in exchange 77 villages of Gobindpur police station were transferred to Jagatsinghpur police station.
Dhenkanal district-For convenience of administration, villages Kabatabandha and Goliamuhapatna of Gondia police station were -transferred to Dharmasala police station of Cuttack district. Two villages viz., Nuagan and Kodala of Angul police station were transferred to Balimi police station in Hindol subdivision and one village, viz., Hitinda of Dhenkana police station was placed under Rasol polise station in Hindol subdivision.

Baudh-Khondmals district-The Daringibadi police station area was split into two, comprising two police stations, viz., Daringibadi and Bamunigam. The latter was constituted with 116 villages of Daringi.· badi police station.
Bolan~ir district-There was an adjustment in the jurisdiction between the Kantabanji and Turekela police stations and the creation of the new police station Bangomunda in place of Turekela. 91 village; out of the Kantabanji police station were formed into a separate police station known as Bangomunda. The rest of the villages of the pre-existing Kantabanji police station together with the entire area of Turekela police station were brought under one police station which was named Kantabanji.
Kalahandi district-Kashipur police station of Sadar subdivision was placed under the Rayagada subdivision of Koraput district for administrative easons._
6
Koraput district-Out of the former Nowrangapur subdivision were carved three subdivisions, viz., Nowrangapur, Jeypore and Malkangiri. Rayagada subdivision was split into the Rayagada and Gunupur subdivisions. Three new police stations were formed. viz., Mudulipada poliCe station from Mathili policestation, Raighar police station from Umarkot police station and Chit;akonda police station from Malkangiri police station. The Kashipur police station of Kalahandi district was brought under Rayagada subdivision.
Ganjam district-48 villages of Mohana police station were transferred to Bodogodo police station.
Puri di)trict-Some portions of this district were transferred to the Cuttack district. Details have been mentioned against Cuttack district.
The jurisdiction of Mayurbhanj and Balasore districts remained unchanged.
CHAPTER II
SIZE, DISTRIBUTION AND DENSITY OF POPULATION
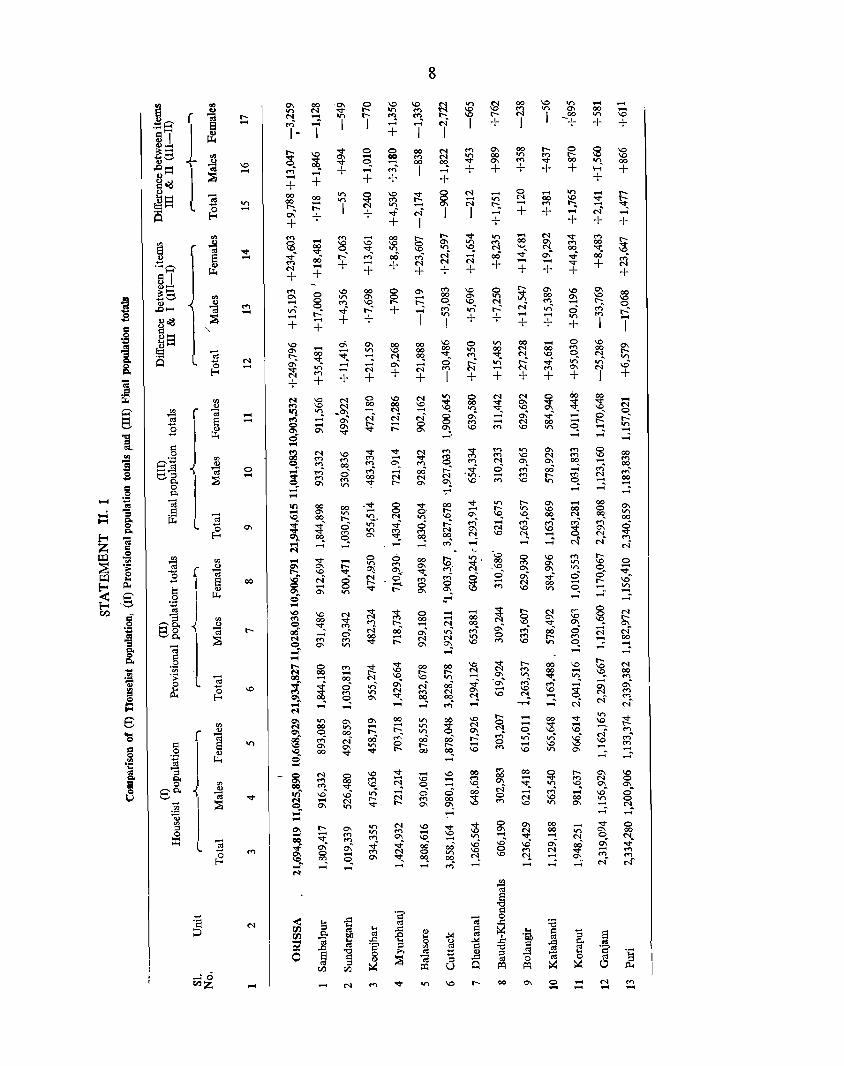
The population of Orissa according to the 1971 census was 21,944,615 as at sunrise of 1 April- 1971.
Of this, 11,041,083 were males and 10,903,532 females.
In February-March 1970, the census organisation took up hoe-numbering and houselisting operations hroughout Orissa as a part of the 1971 population census. A rough count of population (as on 1 March 1970) was taken along with these operations according to which the total population of Orissa was 21,694,819. Soon after the census operations in 1971, the provisional population figures for the state struck on the basis of enumerators' abstracts as annOUOli ced by the Director of Census on 15 April 1971
was 21,934,827. The final figure for the 1971
census arrived at the end of sorting and tabulation was 21,944,615.
The rise in population between houselisting and the final population count works out to 1'15 per cent. The difference (9,788) between the provisional population -figure and the final population figure was ve ry little.
Statement ILl gives the population figures as revealed at the three stages.
The Planning Commission had entrusted the task of working out a set of population projections for India and the states to an expert committee under the chairmanship of the Registrar General, India in 1958. The quinquennial projections of population as computed by the committee for Orissa were as follows:
Total Males Females 1971 21,992,400 11,048,500 10,943,900 1976 24,571,000 12,378,000 12,193,000 19~1 26,878,700 13,569,300 13,309,400 1986 28,697,900 14,499,000 14,198,900
It may be seen that the population figuresas projected by the committee for 1971 exceeded the real count in 1971 by only 47,785 (0'22 per cent).
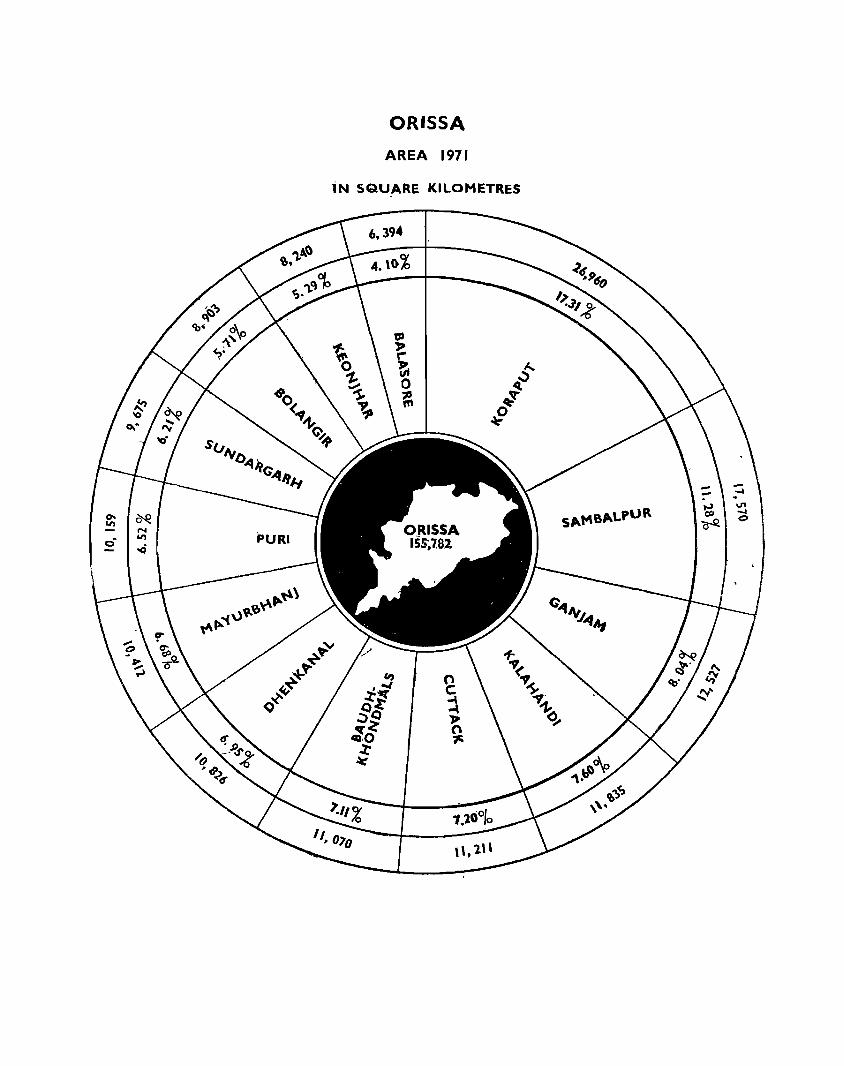
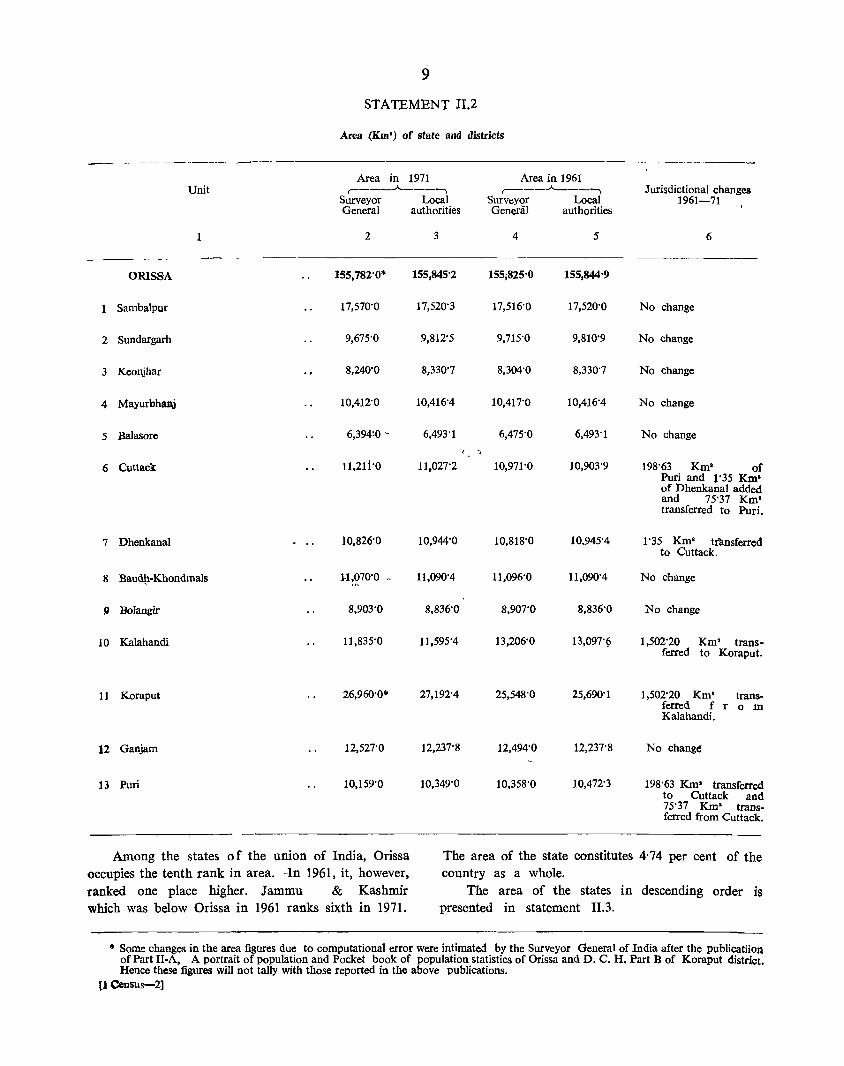
Area of the state and districts
According to the figures received from the Surveyor General, India, the area of the state is 155,782
sq. kms. This along with the district,wise area figures for the state received from the same source and reported in statement 11.2 should be taken as provisional The corresponding figures for the: districts and for units bselow the districts were collected separately from the local revenue authorities. The statement shows that there i~ some difference between these two sets of figures. This discrepancy might be ascribed to the differing methods of computation adopted by the two agencies. The estimates of the state revenue authorities are based on cadastral survey while that of the Survey of India is derived with the help of a planimeter whicrr gives a vertical projection of the area of a district the boundary of which has been plotted on a Survey of India sheet.
Statement 11.2 gives hoth these sets of figures for the state and the districts as in 1961 and 1971.
A marginal decrease in the area figures (43 sq. kms.) for the state as a whole is disceniible in the Survey of India figures for 1961 and 1971 though during the decade, tb.ere has been no change in the boundary of the state. Similar differences in the area figures of the districts received from this source may be attributed to revised computations in some cases or real area changes in others or both.
I J
l
(
1
J
l
[
J
l
'"
1
\D ,..,
on ,..,
~ ,..,
.... ,..,
~ -,.., -o -
\D
-
~ ...; -+ 00 00 r-0\ +
.... '" -'" -+
00
~ +
-00 '<:I:_ 00 -+ o 8 r-: ,.., +
\D
~ ~ .... '" o 00 ,..,
* ~
on 00 o ~ 00
r-~ ~ -
-'" ;'j!; I
! + on It"'I
I
~ r-+ \D It"'I .... ..; + d, -'<:I:_ ,.., ,.., +
00 on r-:. o f')
o ~ -~ g It"'I
~ I
o -q -+
~ +
-~ ...; ,.., + 00
'" \D r-: +
'" on ,.., ,.., N
+
00 \D It"'I
00 +
o ~ +
00
~ 0\ +
'" -r-:. i 00 00 ~ ,.., N
+
-\D o o .... '" \D ,.., \D
8
00 o ~ -
.... 00 o ...; on
I \D
~ o M
I
~ -00 on 00 ...;
~ I
~ ,.., N
I
~ +
'" 00
'" +
-It"'I r-:. ,.., +
00
00 .... N
I
00 It"'I M
+ o ~ + ,.., 00
"'" ..; ,.., +
--o
'" -\D
00 -'<:I:_ -N \D
\D It"'I
I
r-~ +
-00 M
+
'" 00 M
'" -+
-00 \0 ..; M
+
'" ~ ...; \D ,.., -
00 00 ,.., gi -~
o -
~ + It"'I
~ -+
\D
'" -o on
+ o ('<)
o ~ +
~ ,.., ,.., o ~
M M 00 ~ <"l o ~
-00 N
g N M It"'I
'" o -o ~
r-" \D
'" o ('<)
q -
--
-00 on
+
-::!; M +
\D 00 N
'" 1
N -
--\D
+ \J:) \D 00
+
~ -+
00 \D o r-: ,.., I
,.., N o
&:i -,.., 00 M 00 ,.; 00 -,..,
"" ,..,

ORISSA
POPULATION 1971
ORISSA
AREA 1971
-IN SQU,ARE KILOMETRES
9
STATEMENT II.2
Area (Km') of state and districts
Area in 1971 Area in 1961 Unit ,------"----" ,-----"----" Jurisdictional changes
Surveyor Local Surveyor Local 1961-71 General authorities General authorities
2 3 4 5 6
ORISSA 155,782'0* 155,845'2 155;825'0 155,844'9
Sambalpur 17,570'0 17,520'3 17,516'0 17,520'0 No change
2 Sundargarh 9,675'0 9,812'5 9,715'0 9,810'9 No change
J Keonjhar 8,240'0 8,330'7 8,304'0 8,330'7 No change
4 Mayurbham 10,412'0 10,416'4 10,417'0 10,416'4 No change
5 Balasore 6,394:0 - 6,493'1 6,475'0 6,493'1 No change ( -.
6 Cuttack 11,21i'0 11,027'2 10,971'0 10,903'9 198'63 Km' of Puri and 1'35 Krn' of DhenkanaI added and 75'37 Km' transferred to Puri.
7 Dhenkanal 10,826'0 10,944'0 10,818'0 10,945"4 1'35 Km' transferred to Cuttack.
8 Baud!l-Khondmals 1-1~~70'0 - 11,090'4 11,096'0 11,090'4 No change
9 Bolangir 8,903'0 8,836'0 8,907'0 8,836'0 No change
10 Kalahandi 11,835'0 11,595'4 13,206'0 13,097'9 1,502'20 Km' trans-ferred to Koraput.
11 Koraput 26,960'0· 27,192'4 25,548'0 25,690'1 1,502'20 Km' trans-ferred f r 0 m Kalahandi.
12 Ganjam 12,527'0 12,237'8 12,494'0 U,237'8 No change!
13 Puri 10,159'0 10,349'0 10,358'0 10,472'3 198'63 Km' transferred to Cuttack and 75'37 Km' trans-ferred from Cuttack,
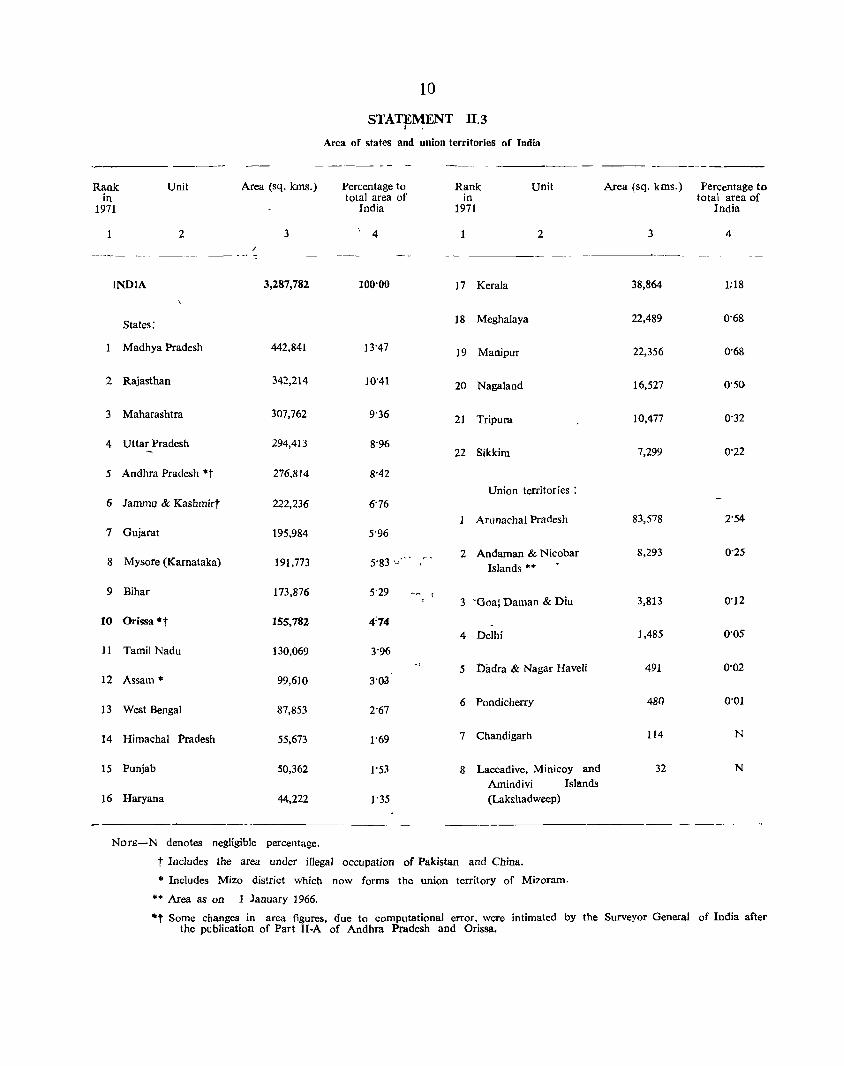
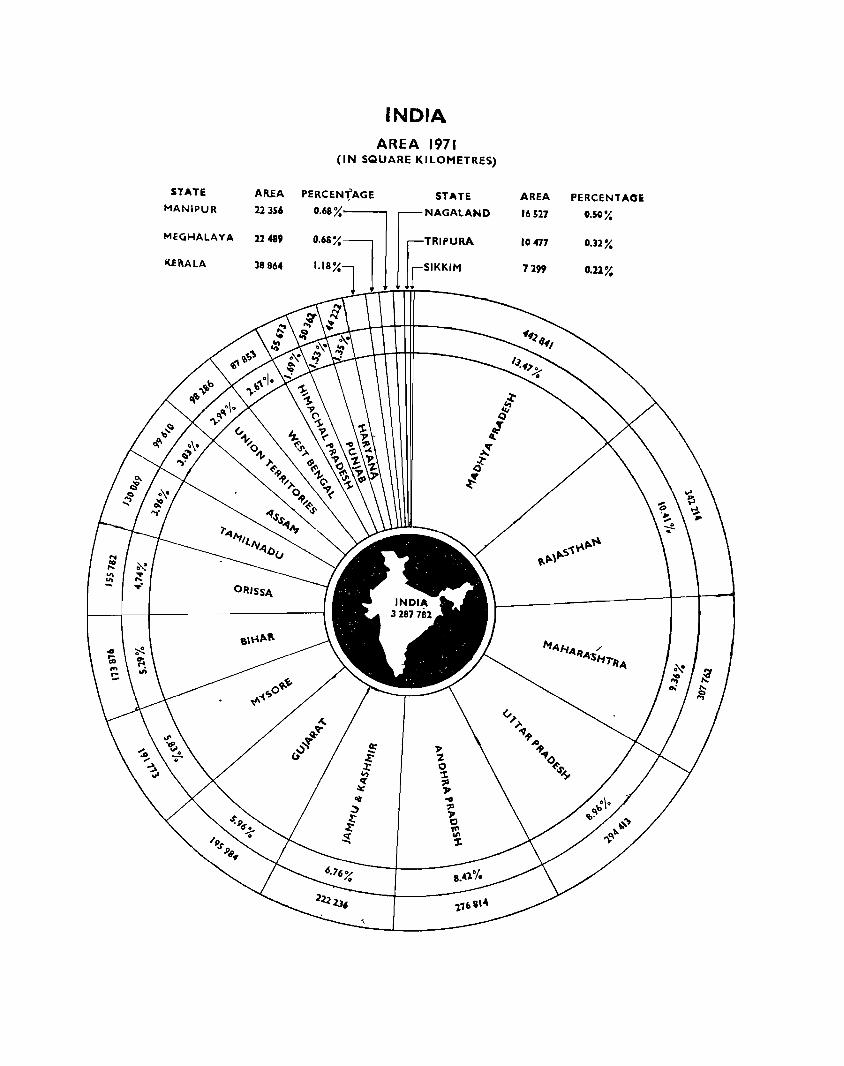
Among the states 0 f the union of India, Orissa occupies the tenth rank in area. -In 1961, it, however, ranked one place higher. Jammu & Kashmir which was below Orissa in 1961 ranks sixth in 1971.
The area of the state constitutes 4'74 per cent of the country as a whole,
The area of the states in descending order is presented in statement II,3.
• Some changes in the area figures due to computational error were intimated by the Surveyor General of India after the publicatiioll of Part II-A, A portrait of population and Pocket book of population statistics of Orissa and D. C, H. Part B of Koraput district, Hence these figures will not tally with those reported in the above publications,
[1 Census-2]
10
STATEMENT II.3 , Area of states and union territories of India
----- - ------ -- -- -
Rank Unit Area (sq. kms.) Percentage to Rank Unit in total area of in
1971 India 1971
2 3 ; 4 2 /
_~w _______
INDIA 3,287,782 100'00 17 Kerala
States: 18 Meghalaya
Madhya Pradesh 442,841 13'47 19 ManiplIr
2 Rajasthan 342,214 ]0'41 20 Nagaland
3 Maharashtra 307,762 9'36 21 Tripllra
4 Uttar Pradesh 294,413 8'96 22 Sikkim
5 Andhra Pradesh ·t 276,814 8'42
Union territories: 6 Jammu & Kashmirt 222,236 6'76
Arunachal Pradesh 7 Gujarat 195,984 5'96
." 2 Andaman & Nicobar 8 Mysore (Karnataka) 191,773 5'83 v Islands **
9 Bihar 173,876 5'29 3 -Goa; Daman & Diu
to Orissa .t 155,782 4:74 4 Delhi
11 Tamil Nadu 130,069 3'96
5 Ditdra & Nagar HaveIi 12 Assam • 99,610 3'03
13 West Bengal 87,853 2'67 6 Pondicherry
14 Himachal Pradesh 55,673 1'69 7 Chandigarh
15 Punjab 50,362 1'53 8 Laccadive, Minicoy and Amindivi Islands
16 Haryana 44,222 1'35 (Lak~hadweep)
NorE-N denotes negligible percentage.
t Includes the area under illegal occupation of Pakistan and China.
• Includes Mizo district which now forms the union territory of Mi70ram .
.... Area as on 1 January ]966.
-------Area (sq. kms.) Percentage to
total area of India
3 4
38,864 1:18
22,489 0'68
22,356 0'68
16,527 0'50
10,477 0'32
7,299 0'22
83,578 2'54
8,293 0'25
3,8]3 0'12
1,485 0'05
491 0'02
480 0'01
114 N
32 N
·t Some changes in area figures, due to computational error, wcre intimated by the Surveyor General of India after the publication of Part H-A of Andhra Pradesh and Orissa.
STATE AR.fA
MANIPUR 22 356
MECiHALAYA 22489
IUi\ALA 38864
INDIA AREA 1971
(IN SQUARE KILOMETRES)
AREA PERCENTAOi
16527 0.50%
10477 0.32%
7299 0.22%
INDIA POPULATION J971
STATE POPULATION PERCENTAGE STATE POPULATION PERCENTAGE-
TRIPURA 1556342 1072 753 D.20%
HIMACHAL PRADESH 3460434 I oil 699 0.18%
JAMMU & KASHMIR 4616632 516449 0.09%
UNION TERRITORIES 6341051 SIIt-KIM 209843 0.04%
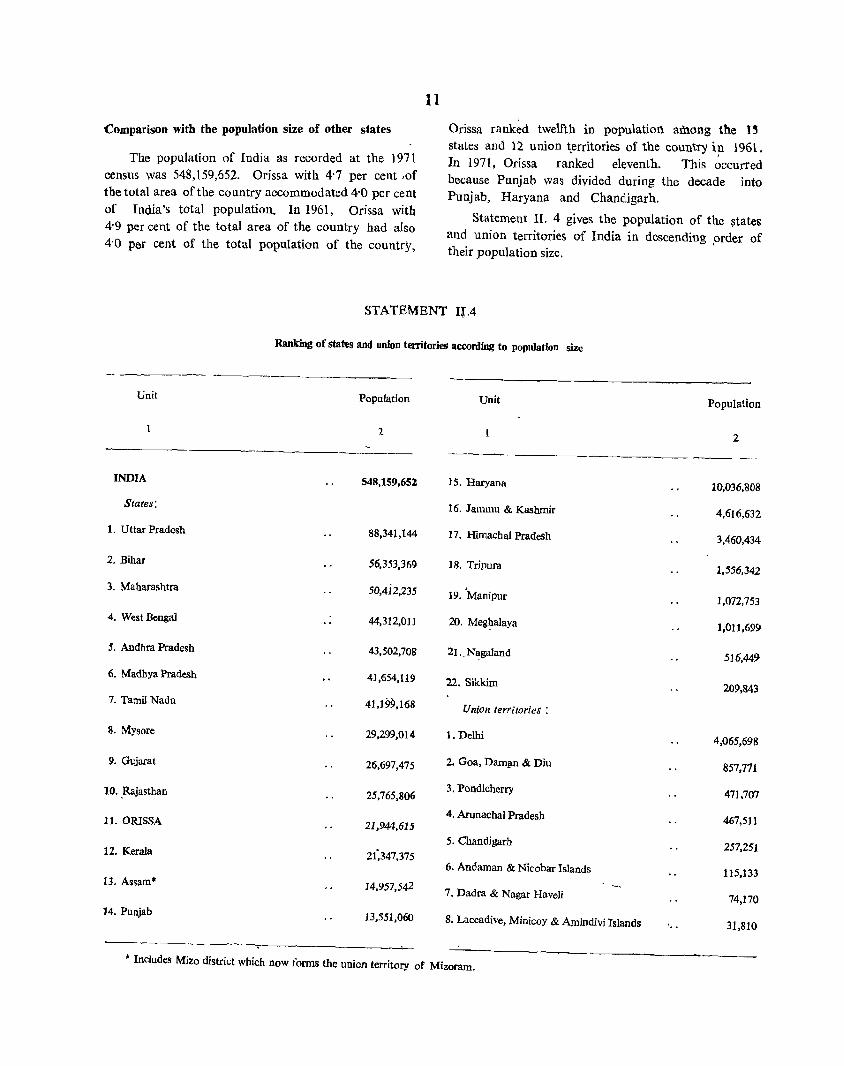
Comparison with the population size of other states
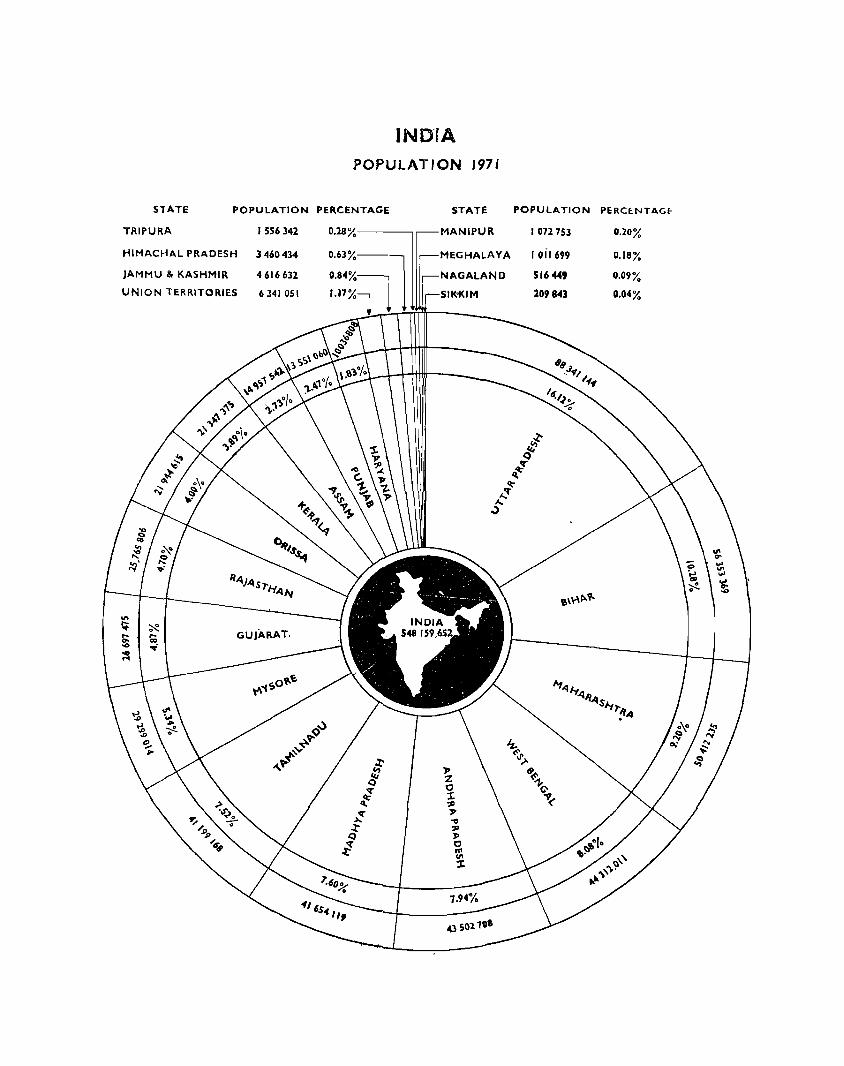
The population of India as recorded at the 1971 census was 548,159,652. Orissa with 4'7 per cent .of the total area of the country accommodated 4'0 per cent of India's total population. In 1961, Orissa with 4'9 per cent of the total area of the country had also 4'0 per cent of the total population of the country,
II
Orissa rank~d twelfth in populatioli among the l5 states and 12 union ~erritories of the country i~ 1961. In 1971, Orissa ranked eleventh. This occurred because Punjab was divided during the decade into Punjab, Haryana and Chandigarh.
Statement II. 4 gives the population of the ~tates and union territories of India in descending ,order of their popUlation size.
STATEMENT Il.4
Ranking of states and union territories according to population size
Unit PopulatIon Unit Population
1 2 2
INDIA 548,159,652 15. Haryana 10,036,808
States: 16. Jammu & Kashmir 4,616,632
1. Uttar Pradesh 88,341,144 17. HimaChal Pradesh 3,460,434
2. Bihar 56,353,369 18. Tripura 1,556,342
3. Maharashtra 50,4i2,235 19. 'Manipur 1,072,753
4. West Bengal 44,312,011 20. Meghalaya 1,011,699
5. Andhra Pradesh 43,502,708 21.. N~galand 516,449
tl. Madhya Pradesh 41,654,119 22. Sikkim 209,843
7. Tamil Nada 41,199,168 Union territories:
8. Mysore 29,299,014 1. Delhi 4,065,698
9. Gujarat 26,697,475 2. Goa, Dam~n & Diu 857,771
10 .. Rajasthan 25,765,806 3. Pondicherry
471,707
4. AunJnachalPradesh 11. ORISSA 21,944,615 467,511
5. Chandigarh 12. KeraIa 2(347,375
257,251
6. Andaman & Nicobar Islands 13. Assam· 14,957,542
7. Dadra & Nagar Haveli
115,133
74,170 14. Punjab 13,551,060 8. Laccadive, Minicoy & Amindivi Islands 31,810
• InCludes Mizo district which now forms the union territory of Mizoram.
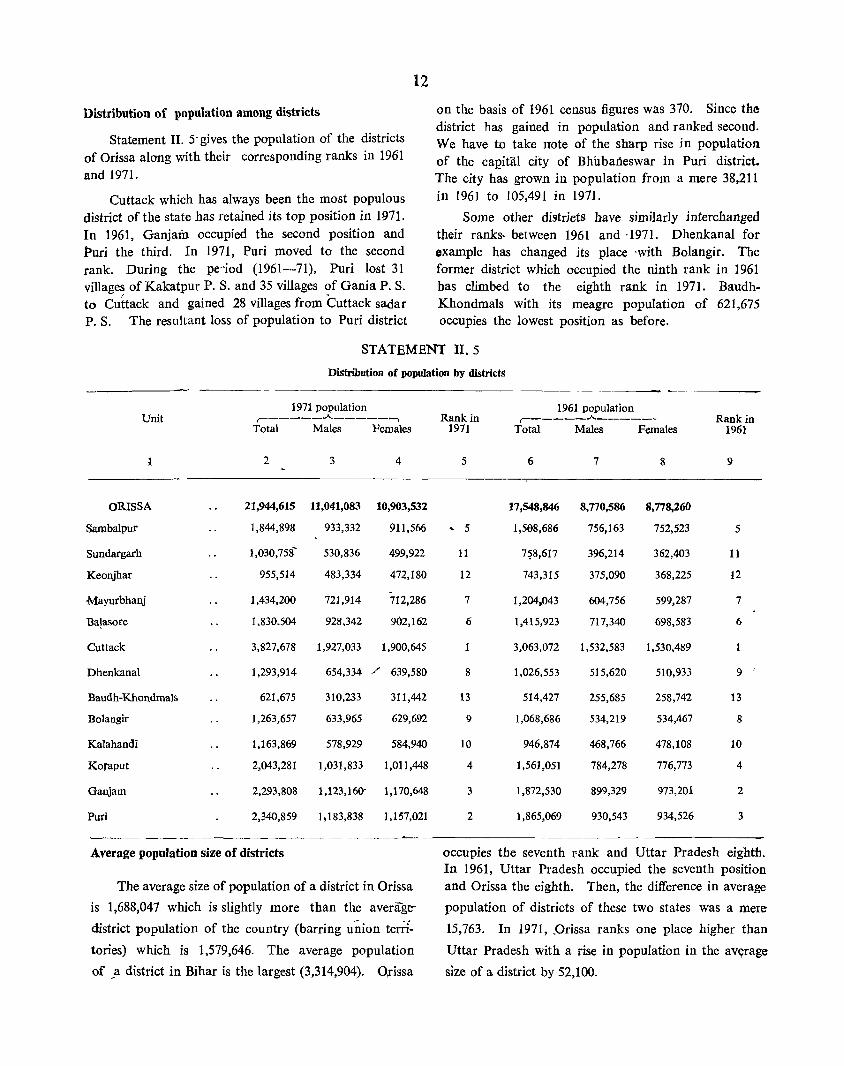
Distribution of population among districts
Statement II. 5- gives the population of the districts of Orissa along with their corresponding ranks in 1961 and 1971.
Cuttack which has always been the most populous district of the state has retained its top position in 1971. In 1961, Ganjam occupied the second position and l>uri the third. In 1971, Puri moved to the second rank. During the pdod (1961-71), Puri lost 31 villages of Kakatpur P. S. and 35 villages of Gania P. S. to Cuttack and gained 28 villages from Cuttack sadar P. S. The resultant loss of population to Puri district
12
on the basis of 1961 census figures was 370. Since the district has gained in population and ranked second. We. have to take note of the sharp rise in population of the ca12itiU city of Bhilbaneswar in Puri district. The city has grown in population from a mere 38,211 in 1961 to 105,491 in 1971.
Some other districts have similarly interchanged their ranks- between 1961 and ·1971. Dhenkanal for example has changed its place 'with Bolangir. The former district which occupied the ninth rank in 1961 has climbed to the eighth rank in 1971. BaudhKhondmals with its meagre population of 621,675 occupies the lowest position as before.
STATEMENT II. 5
Distribution of population by districts
1971 population Unit
,-_____ .A. _____ ........
Total Males Females
2 3 4
ORISSA 21,944,615 11,041,083 10,903,532
Sambalpur 1,844,898 933,332 911,566
Sundargarh 1,030,758- 530,836 499,922
Keonjhar 955,514 483,334 472,180
Mayurbhanj 1,434,200 721,914 712,286
Ba!a.<;ore 1,830.504 928,342 902,162
Cuttack 3,827,678 1,927,033 1,900,645
Dhenkanal 1,293,914 654,334 / 639,580
Baudh-Khondmals 621,675 310,233 311,442
Bolangir 1,263,657 633,965 629,692
Kalahandi 1,163,869 578,929 584,940
Koraput 2,043,281 1,031,833 1,011,448
Ganjam 2,293,808 1,123,160- 1,170,648
Puri 2,340,859 1,183,838 1,157,021
Average population size of districts
The average size of population of a district in Orissa
is 1,688,047 which is slightly more than the average
district population of the country (burring union terri
tories) which is 1,579,646. The average population
of _a district in Bihar is the largest (3,314,904). O.rissa
1961 population Rankin
,-_____ .A. ______ Rankin
1971 Total Males Females 1961
5 6 7 8 9
17,548,846 8,770,586 8,778,260
.. 5 1,598,686 756,163 752,523 5
11 7~8.617 396,214 362,403 11
12 743,315 375,090 368,225 12
7 1,204,043 604,756 599,287 7
6 1,415,923 717,340 698,583 6
3,063,072 1,532,583 1,530,489
8 1,026,553 515,620 510,933 9 ,
13 514,427 255,685 258,742 13
9 1,068,686 534,219 534,467 8
10 946,874 468,766 478,108 10
4 1,561,051 784,278 776,773 4
3 1,872,530 899,329 973,201 2
2 1,865,069 930,543 934,526 3
occupies the seventh rank and Uttar Pradesh eighth. In 1961, Uttar Pradesh occupied the seventh position and Orissa the eighth. Then, the difference in average
population of districts of these two states was a mere
15,763. In 1971, .Orissa ranks one place higher than
Uttar Pradesh with a rise in popUlation in the av¥rage
size of a district by 52,100.

POPULATION IN OO,OOO's
CUTTACK
PURl .... -= .. 340 •• 5. 3 1,183,838
"TI 1,157.021
GANJAH
KORAPUT
SAMBALPUR
BALASORE
... --.. " ..... 3 I 123,160
."
"'~""'3.21' 3 ." 1.011 ..... 8
... _, ........ ~ ,33.1]1 ." '11.566
... ~'.UO,5 ... ~ '18,341 ." f02,I61
... ~',434,200 MAYURBHANJ 3~
." 712.286
~-="293'9f4 OHENKANAL 3 ~~ 654.134 ." '39;_
"'~I'Z63.'51 BOLANGIR 3~'13."5
." 619,691
"U
KALAHANOI ~ "TI
."
SUNOARGARH X ."
i:KEONJHAR
BAUOH'KHO .... OMALS
l~,~ ~>.);
~m -
III
~ '.163,86' ,
57','29 II 5 .... ' .. 0
~ 1.030.758
~ 530,116 III "".'22
"" : . ." m :t )I> r-m VI
-0 0 "'0 C ,... > ... -0 Z
0 "TI
m » n :z:: 0 en ... ::0 -n ....
:1/' at to(
:z ." m en
~ :0 m r- VI >< m 0 VI Z
«II


13
STATEMENT II.6
Number of districts above or below average population of district for each state (1971)
---_.-------~-State
1
Andhra Pradesh Assam* Bihar Gujarat Haryana Himachal Pradesh Jammo & Kashmir Kerala Madhya Pradesh Maharashtra Manipur Meghalaya Mysore Nagaland Orissa Punjab Rajasthan Sikkim Tamil Nadu Tripura Uttar Pradesh West Bengal
Average population of a district
2
2,071,558 1,495,754
3,314,904 1,405,130 1,433,830
346,043 461,663
2,134,738
968,700 1,938,932
214,551 505,850
1,542,053 172,150
1,688,047 1,231,915
990,993
52,461 2,942,798
.518,781
1,635,947 2,769,501
Rankin 1971
3
5 .10
1 12
11 19 18
4 15
6 20
17 9
21
7 13 14 22 . 2
16
8 3
No. of districts
above average
4
9 7 9
10 4 3 4 4
16
11 1 1 8 2 6 5
12 2 8
23 6
Total population of districts in Col. 4
23,387,606 14,169,795
37,684,865 19,184,731 7,607,154
2,282,509 3,167,444
9,359,769 22,740,777 28,397,893
763,260 605,084
17,500,155 348,207
14,181,028 7,933,389
16,558,978
144,406 29,567,574
751,605
53,389,324 26,835,969
No. of districts
below average
6
12 3 8 9 3 7 6 6
27 1,5
4 1
11 1 7 6
14
2 6 2
31 10
Total population of districts. in Col. 6
7
20,115,102 787,747
18,668,504 7,512,744 2,429,654
1,177,925 1,449,188
11,987,606 18,913,342 22,014,342
309,493 406,615
11,798,859 168,242
7,763,587
5,617,671 9,206,828
65,437 11,631,594
804,737 34,951,820 17,476,042
No. of districts
which are within 25% (+)or(-) of average pOPulation
8
12 4 8 8 3
10 20
18
2 6 3
5 7
11 2 6 2
27
5
Total population of districts
in Col. 8
9
23,944,387 6,p67,790
25,341,821 10,788,74l-4,591,308
21,347,375
18;219.~78
33,850,528
],011,~99
8,998,.268 516,~49
8,4~6,797
8,835,208
1l,2~8,831 1-11,208
18,048,109
804,737 42,757,274
13,608,62?
---------------------~--------------~--------------------------------------------.
The state average for Orissa is 1,688,067. Five districts are within 25 per cent of the average. Sambalpur, Balasore and Koraput are within 25 per cent above the average and Mayurbhanj and Dhenkanal are within the same limits but below the average. Eight
out of thirteen districts lie be}:Ond 25 per cent on either side of the average. Six districts lie within 50 per cent-2 above and 4 below. The variations, therefore, from the average are fairly large and the clustering around the average is rather insignificant.
STATEMENT II.7
Districts of Qrissa arranged on both siiles of state average
Above average ,-___________ --..A._. ___________ --,
Above 50 % Within 50 % Within 25 %
1
Cuttack (3,827,678)
2
Ganjam (2,293,808)
Puri (2,340,859)
3
Sambalpur (1,844,898)
Balasore (1,830,504)
Koraput (2,043,281)
Belo\'!' ,average r-------------~------------~
Within 25% Within 50% Above 50%
4
Mayurbhanj (1,434,200)
Dhenkanal (1,293,914)
5
Sundargarh (1,030,7581· _
Keonjhar (955,514)
Bolangir (1,263,657)
Kalahandi (1,163,869)
6
Baudh-Khondrnals (621,675)
* Includes Mizo district which now forms the union territory of MizQram.
14
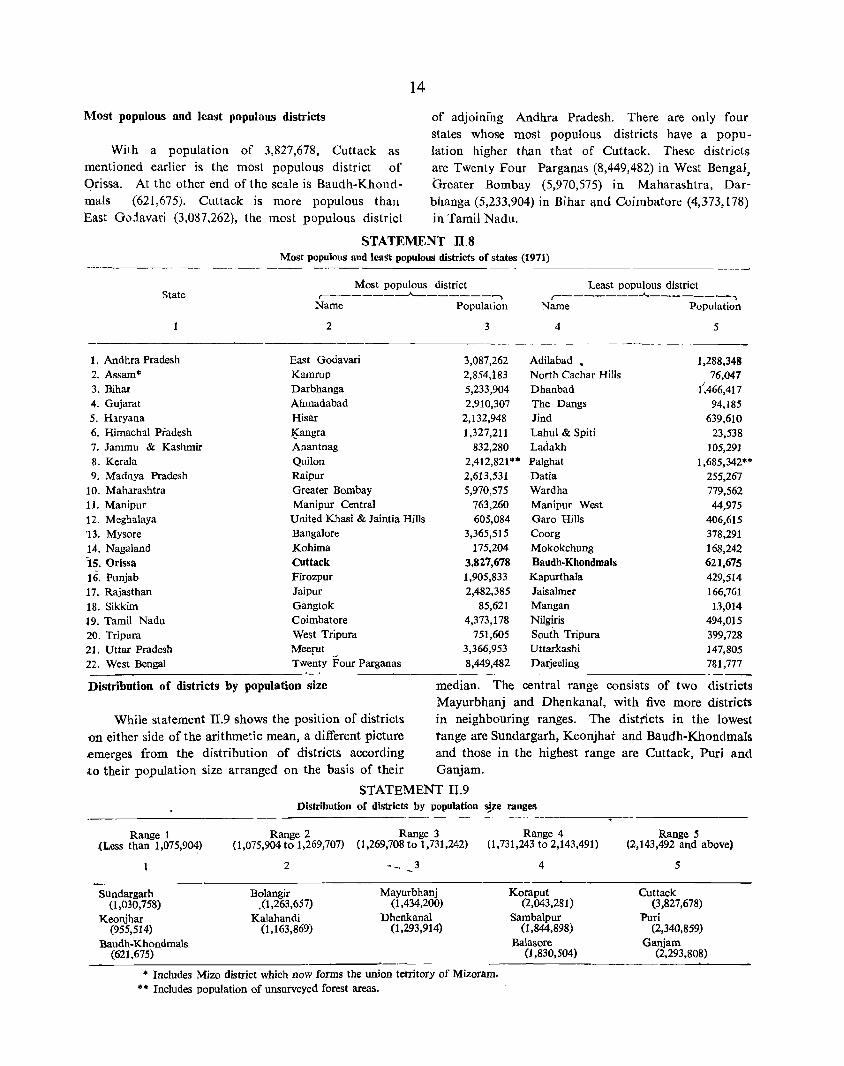
Most populous and least populous districts of adjoining Andhra Pradesh. There are only four states whose most populous districts have a population higher than that of Cuttack. These distrjcts are Twenty Four Parganas (8,449,482) in West Bengal, Greater Bombay (5,970,575) in Maharashtra, Darbhanga (5,233,904) in Bihar and Coimbatore (4,373,178) in Tamil Nadu.
With a population of 3,827,678, Cuttack as mentioned earlier is the most populous district of qrissa. At the other end of the scale is Baudh-Khondmals (621,675). Cut tack is more populous than East G<>iavari (3,087,262), the most populous district
STATEMENT II.8 Most populous and least populouS districts of states (1971)
---------- ------------------------------------------:Most populous district Least populous district
State ~ ________ -A-------~ ~-------~-------~
1. Andhra Pradesh 2. Assam'" 3. Bihar 4. Gujarat 5. Haryana 6. Himachal Pradesh 7. Jammu & Kashmir 8. Kerala 9. Madhya Pradesh
10. Maharashtra 11. Manipur 12. Meghalaya 13. Mysore 14. Nagaland ~15. Orissa
16. Punjab 17. Rajasthan 18. Sikkim 19. Tamil Nadu 20. Tripura 21. Uttar Pradesh 22. West Bengal
Name
2
East Godavari Kamrup Darbhanga Ahmadabad Hisar Ifangra Anantnag Quilon Raipur Greater Bombay Manipur Central United Khasi & Jaintia Hills Bangalore Kohima Cuttack Firozpur Jaipur Gangtok Coimbatore West Tripura Meerut Twenty Four Parganas
Population Name Population
3 4 5
3,087,262 Adilabad 1,288,348 2,854,183 North Cachar Hills 76,047 5,233,904 Dhanbad 1~466,417 2,910,307 The Dangs 94,185
2,132,948 Jind 639,610 1.327,211 Lahul & Spiti 23,538
832,280 Ladakh 105,291 2,412,821"· Palghat 1,685,342·" 2,613,531 Datia 255,267 5,970,575 Wardha 779,562
763,260 Manipur West 44,975 605,084 Garo Hills 406,615
3,365,515 Coorg 378.291 175,204 Mokokchung 168,242
~.827,678 Baudh-Khondmals 621,675 1,905,833 Kapurthala 429,514 2,482,385 Jaisalmer 166,761
85,621 Mangan 13,014 4,373,178 Nilgiris 494,015
751,605 South Tripura 399,728 3,366,953 Uttarkashi 147,805 8,449,482 Darjeeling 781,777
------------------------------~~--------~--------------------------------------------~------
Distribution of districts by PQPulation size median. The central range consists of two districts Mayurbhanj and Dhenkanal, with five more districts
While statement II.9 shows the position of districts in neighbouring ranges. The districts in the lowest on either side of the arithmetic mean, a different picture range are Sundargarh, Keonjhat and Baudh-Khondmals .emerges from the distribution of districts according and those in the highest range are Cuttack, Puri and to their population size arranged on the basis of their Ganjam.
STATEMENT 11.9 Distribution of districts by population size ranges
Range 3 Range 4 Range 1 Range 2 {Less than 1,075,9~) 0,075,904 to 1,269,707) 0,269,708 to 1,731,242) (1,731,243 to 2,143,491)
2 3 ~
Sundargarh Bolangir Mayurbhanj (1,030,758) .(1,263,657) (I,434,200)
Keonjhar Kalahandi Dhenkanal (955,514) (1,163,869) (1,293,914)
Baudh-Khondmals (621,675)
* Includes Mizo district which now forms the union territory of Mizoram. ** Includes population of unsurveyed forest areas.
4
Koraput (2,043,281)
Sambalpur (1,844,898)
Balasore (1,830,504)
Range 5 (2,143,492 and above)
5
Cuttack (3,827,678)
Puri (2,340,859)
Ganjam (2,293,808)
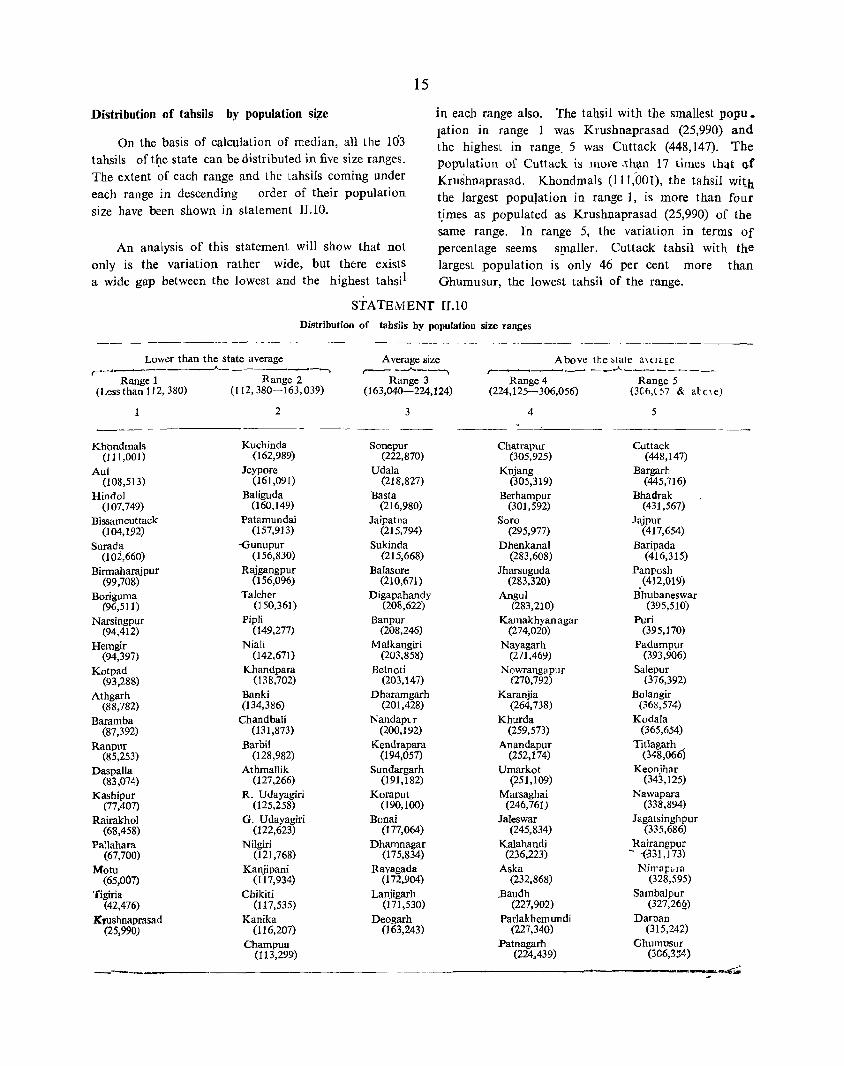
Distribution of tahsils by population si~e
On the basis of calculation of median, aU the 10'3 tahsils of tJ:le state can be distributed in five size ranges. The extent of each range and the tahsils coming under each range in descending order of their population size have been shown in statement n.lO.
An analysis of this statement will show that not only is the variation rather wide, but there exists a wide gap between the lowest and the highest tahsil
15
in each range also. The tahsil with the smallest popu. lation in range 1 was Krushnaprasad (25,990) and the highest in range. 5 was Cuttack (448,147). The popUlation of Cuttack is more .thi;tn 17 times that of Krushnaprasad. Khondmals (111;001), the tahsil with the largest population in range 1, is more than four t}mes as populated as Krushnaprasad (25,990) of the same range. In range 5, the variation in terms of percentage seems s!_llaller. Cuttack tahsil with the largest population is only 46 per cent more than Ghumusur, the lowest tahsil of the range.
STATEMENT II.IO
Distribution of tahsils by population size rangfS
-- ~--. ------ --_ _- -----Lower than the state average Average size Above tte stale aHnfe
~~--------~---------~ ,--- ---"'---~ r-""-------- - _..,A..~~_... _______
Range 1 Range 2 Range 3 Range 4 Range 5 (Less than 112,380) (112,380-163,039) (163,040-224,124) (224,125-306,056) (3C6,C)7 & al:c\e)
2 3 4 5
---- -~-- -----
Khondmals Kuchinda Sonepur Chatrapur Cuttack (111,001) (162,989) (222,870) (305,925) (448,147)
Aul leypore Udala Kojang Bargarh (108,513) (161,091) (218,827) (305,319) (445,716)
Hind01 Baliguda Basta Berhampur Bhadrak (107,749) (160,149) (216,980) (301,592) (431,567)
Bissamcuttack Patamundai Jaipatna Soro Jajpur (104,192) (157,913) (215,794) (295,977) (417,654)
Surada -(Junupur Sukinda Dhenkanal Baripada (102,660) (156,830) (215,668) (283,608) (416,315)
Birmaharajpur Rajgangpur Balasore Jharsuguda Panposh (99,708) (156,096) (210,671) (283,320) (412,019)
Boriguma Talcher Digapahandy Angul Bhubaneswar (96,511) (J 50,361) (208,622) (283,210) (395,510)
Narsingpur PipJi Banpur Kamakhyan agar Puri (94,412) (149,277) (208,246) (274,020) (395,170)
Hemgir Niali Malkangiri Nayagarh Padampur (94,397) (142,671) (203,858) (271,469) (393,906)
Kotpad Khandpara Betnoti Nowrangapur Salepur (93,288) (138,702) (203,147) (270,792) (376,392)
Athgarh Banki Dharamgarh Karanjia Bolangir (88,782) (134,386) (201,428) (264,738) (36~,574)
Baramba ChandbaIi Nandaplr Khurda Kodala (87,392) (131,873) (200,192) (259,573) (365,654)
Ranpur Barbil Kendrapara Anandapur Titlagarh 6j (85,253) (128,982) (194,057) (252,174) (348,06
Daspalla Athmallik Sundargarh Umarkot Keonjhar (83,074) (127,266) (191,182) <251,109) (343,125)
Kashipur R. Udayagiri Koraput Marsaghai Nawapara (77,407) (125,258) (190,100) (246,761) (338,894)
Rairakhol G. Udayagiri Bonai laleswar Jagatsinghpur (68,458) (122,623) (177,064) (245,834) (335,686)
Pallahara Nilgiri Dhamnagar Kalahandi Rairangpur (67,700) (121,768) (175,834) (236,223) - -(-331,173)
Motu Kanjipani Rayagada Aska Nirraj:cra (65,007) (117,934) (172,904) (232,868) (328,595)
Tigiria Chikiti Lanjigarh ]3audh SambaJpur (42,476) (117,535) (171,530) (227,902) (327,26§)
Krushnaprasad Kanika Deogarh Parlakhemundi Darpan (25,990) (116,207) (163,243) (227,340) (315,242)
Champua .Patnagarh Ghumusur (113,299) (224.439) (306,3~4)
--~
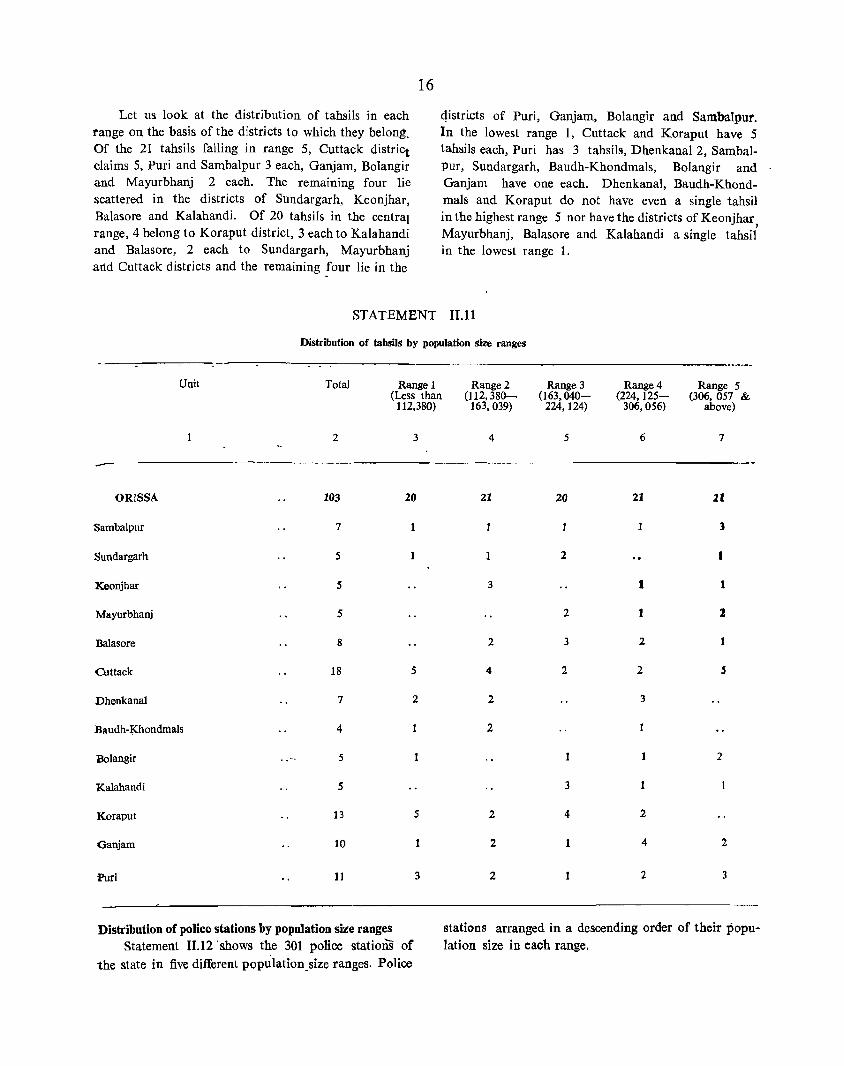
Let us look at the distribution of tahsils in each range on the basis of the districts to which they belong. Of the 21 tahsils falling in range 5, Cuttack district claims 5, Puri and Sambalpur 3 each, Ganjam, Bolangir and Mayurbhanj 2 each. The remaining four lie scattered in the districts of Sundargarh, Keonjhar, Balasore and Kalahandi. Of 20 tahsils in the central range, 4 belong to Koraput district, 3 each to Kalahandi and Balasore, 2 each to Sundargarh, Mayurbhanj and Cuttack districts and the remaining [our lie in the
16
qistricts of Puri, Ganjam, Bolangir and Sambalpur. In the lowest range 1, Cuttack and Koraput have 5 tahsils each, Puri has 3 tahsils, Dhenkanal 2, Sambalpur, Sundargarh, Baudh-Khondmals, Bolangir and Ganjam have one each. Dhenkanal, Baudh-Khondmals and Koraput do not have even a single tahsil in the highest range 5 nor have the districts of Keonjhar, Mayurbhanj, Balasore and Kalahandi a single tahsil in the lowest range 1.
STATEMENT II.lI
Distribution of tahsils by population size ranges
Unit
ORISSA
Sambalpur
Sundargarh
Keonjhar
Mayurbhanj
Balasore
Cuttack
Dhenkanal
Baudh-~hondmals
Bolangir
Kalahandi
Koraput
Ganjam
Pari
Total
2
103
7
5
5
5
8
18
7
4
5
5
13
10
11
Range 1 (Less than
112,380)
3
20
1
5
2
5
3
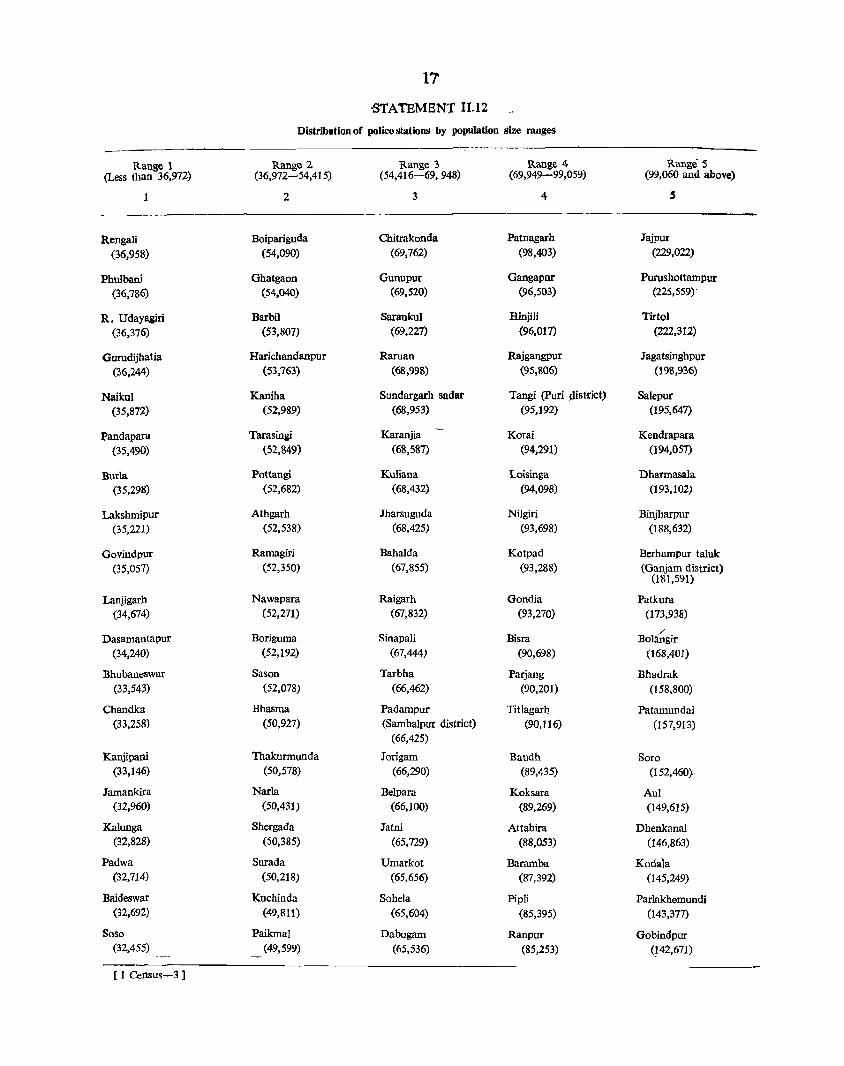
Distribution of police stations by population size ranges Statement II.12 'shows the 301 police stations of
the state in five different population_size ranges. Police
Range 2 (112,38Q-.
163,039)
4
21
3
2
4
2
2
2
2
2
Range 3 (163,040-
224,124)
5
20
2
2
3
2
3
4
1
1
Range 4 (224,125-
306,056)
6
21
1
I
2
2
3
2
4
2
Range 5 (306,057 &
above)
7
21
3
I
1
1
S
2
2
3
stations arranged in a descending order of their popu-lation size in each range.
17'
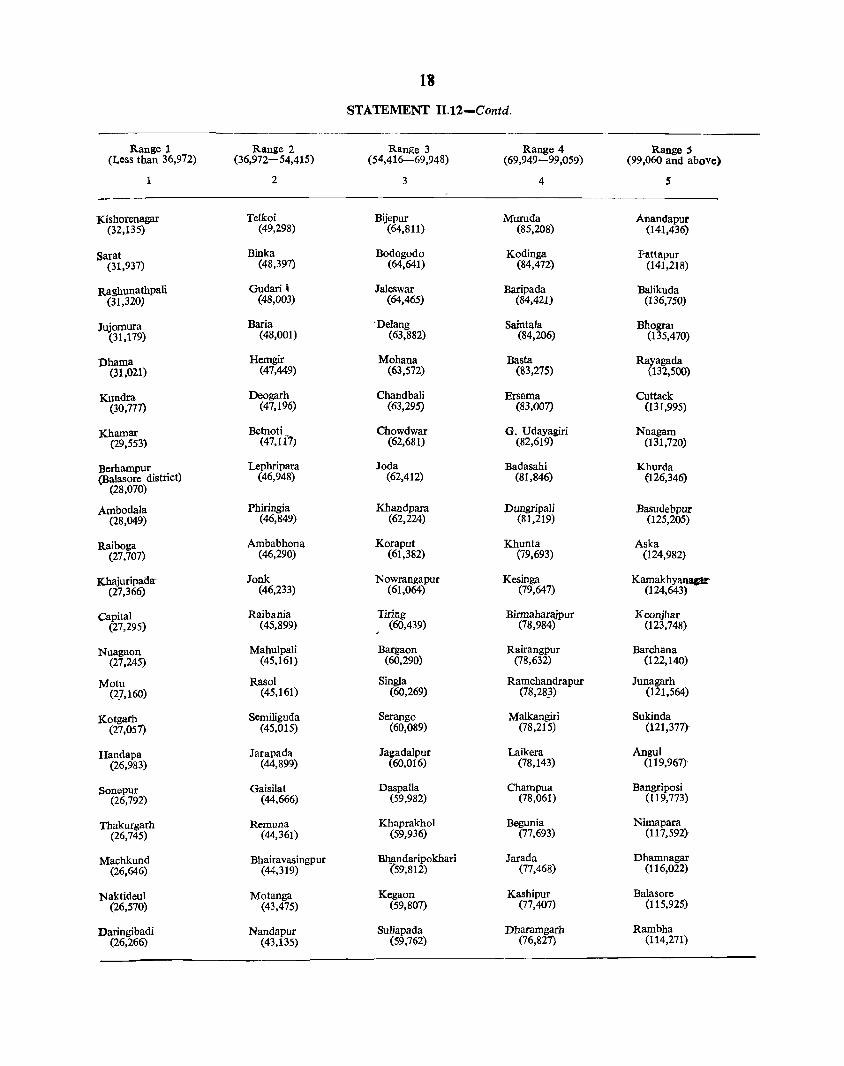
-STATEMENT II.12
Distribution of police stations by population size ranges
Range 1 Range 2 Range 3 Range 4 Range 5 (Less than 36,972) (36,972-54,415) (54,416-69,948) (69,949-99,059) (99,060 and above)
1 2 3 4 5
Rengali Boipariguda Chitrakonda Patnagarh Jajpur
(36,958) (54,090) (69,762) (98,403) (229,022)
Phulbani Ghatgaon Gunupur Gangapur Purnshottampur
(36,786) (54,040) (69,520) (96,503) (225,559)'
R. Udayagiri Barbil Sarankul Hinjili Tirtol
(36,376) (53,807) (69,227) (96,017) (222,312)
Gurndijhatia Harichandanpur Raman Rajgangpur Jagatsinghpur
(36,244) (53,763) (68,998) (95,806) (198,936)
Naikol Kaniha Sundargarh sadar Tangi (Puri pist1"ict) Saiepur (35,872) (52,989) (68,953) (95,192) (195,647)
Pandapara Tarasingi Karanjia Korai Kendrapara (35,490) t52,849) (68,587) (94,291) (194,057)
Buda Pottangi Kuliana Loisinga Dharmasala (35,298) (52,682) (68,432) (94,098) (193,102)
Lakshmipur Athgarh Jharsuguda Nilgiri Binjharpur (35,221) (52,538) (68,425) (93,698) (188,632)
Govindpur Ramagiri Bahalda Kotpad Berhampur taluk (35,057) (52,350) (67,855) (93,288) (Ganjam district)
(181,591)
Lanjigarh Nawapara Raigarh Gondia Patkura (34,674) (52,271) (67,832) (93,270) (173,938)
Dasamantapur Boriguma Sinapali Bisra ,/
Boifmgir (34,240) (52,192) (67,444) (90,698) (168,401)
Bhubaneswar Sason Tarbha Parjang Bhadrak (33,543) (52,078) (66,462) (90,201) (158,800)
Chandka Bhasma Padampur Titlagarh Patamundai (33,258) (50,927) (Sambaipur district) (90,116) (157,913)
(66,425)
Kanjipani Thakurmunda Jorigam Baudh Soro (33,146) (50,578) (66,290) (89,435) (152,460)-
lamankira Narla Beipara Koksara Aui (32,960) (50,431) (66,100) (89,269) (149,615)
Kaiunga Shergada Jatni Attabira Dhenkanai (32,828) (50,385) (65,729) (88,053) (146,863)
Padwa Surada Umarkot Baramba Kodala (32,714) (50,218) (65,656) (87,392) (145,249)
Baideswar Kuchinda Sohela Pipli Parlakhemundi (32,692) (49,811) (65,604) (85,395) (143,377)
Soso Paikmal Dabugam Ranpur Gobindpur (32,455) (49,599) (65,536) (85,253) (142,671)
[ 1 Census-3 ]
18
STATEMENT II.12-Contd.
Range 1 Range 2 Range 3 Range 4 Range :; (Less than 36,972) (36,972-54,41 5) (54,416-69,948) (69,949-99,059) (99,060 and above)
2 3 4 5
Kisl10renagar Telkoi Bijepur Muruda Anandapur (32,135) (49,298) (64,811) (85,208) (141,436)
Sarat Binka Bodogodo Kodinga rattapur (31,937) (48,397) (64,641) (84,472) (141,218)
Raghunathpali Gudari ij Jaleswar Baripada Balikuda (31,320) (48,003) (64,465) (84,421) (136,750)
Jujomura Baria ·Delang Saintala Bhogral (31,179) (48,001) (63,882) (84,206) (135,470)
Dhama Hemgir Mohana Basta Rayagada (31,021) (47,449) (63,572) (83,275) (132,500)
Kundra Deogarh Chandbali Ersama Cuttack (30,777) (47,196) (63,295) (83,007) (131,995)
Khamar Betnoti_ Chowdwar G. Udayagiri Nnagam (29,553) (47,117) (62,681) (82,619) (131,720)
Bcrhampur Lephripara Joda Badasahi Khurda (Balasore district) (46,948) (62,412) (81,846) (126,346)
(28,070)
Ambodala Phiringia Khandpara Dungripali Basudebpur (28,049) (46,849) (62,224) (81,219) (125,205)
Raiboga Ambabhona Koraput Khunta Aska (27,707) (46,290) (61,382) (79,693) (124,982)
Khajuripad:r Jook Nowrangapur Kesinga Kamakhyanqar-(27,366) (46,233) (61,064) (79,647) (124,643)
Capital Raibania Tiring Birmaharajpur Keonjhar (27,295) (45,899) (60,439) (78,984) (123,748)
Nuagaon Mahulpali Bargaon Rairangpur Barchana (27,245) (45,161) (60,290) (78,632) (122,140)
Motu Rasol Singla Ramchandrapur Junagarh (27,160) (45,161) (60,269) (78,28}) (121,564)
Kotgarh Semiliguda Serango Malkangiri Sukinda (27,057) (45,015) (60,089) (78,215) (121,377)-
Handapa Jarapada JagadaJpur Laikera Augul (26,983) (44,899) (60,016) (78,143) (119,967)-
Sonepur Gaisilat Daspalla Champua Bangriposi (26,792) (44,666) (59,982) (78,061) (119,773)
Thakurgarh Remuna Khaprakhol Begunia Nirnapara (26,745) (44,361) (59,936) (77,693) (117,592)-
Machkund Bhairavasingpur Bhf:s~ft~okhari Jarada Dhamnagar (26,646) (44,319) (77,468) (116,022)
Naktideul Motanga Kegaon Kashipur Balasore (26,570) (43,475) (59,807) (77,407) (115,925)
Daringibadi Nandapur Suliapada Dharamgarh Rambha (26,266) (43,135) (59,762) (76,827) (114,271)
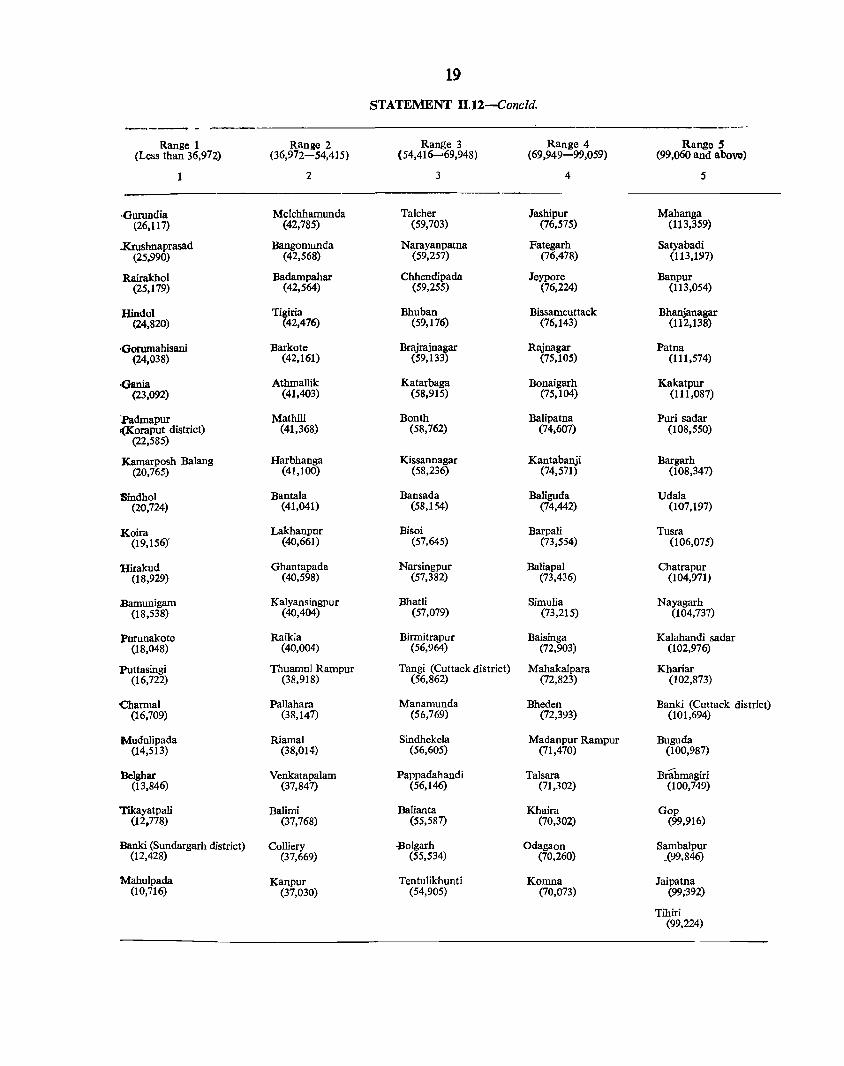
19
STATEMENT II.12-Concld.
----- -Range 1 Range 2 Range 3 Range 4 Range 5
(Less than 36,972) (36,972-54,415) (54,41 t)......69,948) (69,949-99,059) (99,060 and above)
1 2 3 4 5
,Gurundia Melchhamunda Talcher Jashipur Mahanga (26,117) (42,785) (59,703) (76,575) (113,359)
..Krushnaprasad Bangomunda Narayanpatna Fategarh Satyabadi (25,990) (42,568) (59,257) (76,478) (113,197)
Rairakhol Badampahar Chhendipada Jeypore Banpur (25,179) (42,564) (59,255) (76,224) (113,054)
Hindol Ti .. Bhuban Bissamcuttack Bhanjanagar (24,820) ~~~476) (59,176) (76,143) (112,138)
<iorumahisani Barkote Brajrajnagar Rajnagar Patna (24,038) (42,161) (59,133) (75,105) (111,574)
<Jania Athmallik Katarbaga Bonaigarh Kakatpur (23,092) (41,403) (58,915) (75,104) (111,087)
l'admapur Mathili Bonth Balipatna Puri sadar «Koraput district) (41,368) (58,762) (74,607) (108,550)
(22,585)
Kamarposh Balang Harbhanga Kissannagar Kantabanji Bargarh (20,765) (41,100) (58,236) (74,571) (108,347)
Sindhol Bantala Bansada Baliguda Udala (20,724) (41,041) (58,154) (74,442) (107,197)
Koira Lakhanpur Bisoi Barpali Tusra (19,156)" (40,661) (57,645) (73,554) (106,075)
Hirakud Ghantapada Narsingpur Baliapal Chatrapur (18,929) (40,598) (57,382) (73,436) (104,971)
Bamunigam Kalyansingpur Bhatli Simulia Nayagarh (18,538) (40,404) (57,079) (73,215) (104,737)
Purunakote Raikia Birmitrapur Baisinga Kalahandi sadar (18,048) (40,004) (56,964) (72,903) (102,976)
Puttasingi Thuamul Rampur Tangi (Cuttack district) Mahakalpara Khariar (16,722) (38,918) (56,862) (72,823) (102,873)
Charmal Pallahara Manamunda Bheden Banki (Cuttack district) (16,709) (38,147) (56,769) (72,393) (101,694)
Mudulipada Riamal Sindhekela Madallpur Rampur Buguda (14,513) (38,014) (56,605) (71,470) (100,987)
Belghar Venkatapalam Pappadahandi Talsara Brahmagiri (13,846) (37,847) (56,146) (71,302) (100,749)
Tikayatpali Balimi Balianta Khaira Gop (12,778) (37,768) (55,587) (70,302) (99,916)
Banki (Sundargarh district) Colliery -Bolgarh Odagaon Sambalpur (12,428) (37,669) (55,534) (70,260) .(99,846)
Mahulpada Kanpur Tentulikhunti Komna Jaipatna (10,716) (37,030) (54,905) (70,073) (99;392)
Tihiri (99,224)

Density· of the state over time The density of population per sq. km. for Orissa
has increased from 66 in 1901 to 141 in the 1971
census. The increase in density of the state from decade to decade since 1901 is given in statement II.13.
STATEMENT 11.13
Change in density of population per sq. km. from 1901 to 197i
Year Density Year Density
1 2 1 2
1901 66 1941 88
1911 '73 1951 94
1921 72 1961 113'
1931 80, 1971 14~
The density of population of Orissa is quite low when compared to that in other states of ""'the union. Twelve states record a higher density of population than Orissa. -The state to top the list is Kerala (549)
followed by West Be1?-gal (504), Bihar (324) and Tamil Nadu '(317). The states·- showip.g a very low densitY of population are Meghalaya (45), Nagaland '(31) and Sikkim (29). .
STATEMENT JI.14
'States ~nged according to density of population (1971)
Unit Density Unit Density
2 1 2
INDIA t 177 11. Assam * 150
1. Kerala 549 12. Tripura 149
2. West Bengal 504 13. OriSsa 141
3. Bihar 324 14. Gujarat 136
4. Tamil Nadu 317 15. I'yfadhya Pradesh 94
5. Uttar Pradesh 300 16. Rajasthan 75
6. Punjab 269 17. Himachal Pradesh 61
7. Haryana 227 18. Manipur 48:
19. Jammu & Kashmir N.A. 164
20. Meghalaya 45 -8. Maharashtra
9. Andhra Pradesh 157 21. Nagaland 31
10. Mysore 153 22. Sikkim 29
t While working out the density, the area and population of Jammu & Kashmir have been excluded as comparable data are not available.
* Includes Mizo district which now forms the union-ten-nory of Mizoram.
N. A-Not available
_,
.~ <
'.
Q:I
.~ ---1-
oS>
~ '_ ,
Q ;::
. ..r 0-
z~ 6-
« 0 Ui ~ ii l- II! $~
.4-en .q:
~ -I ~ ;;
VJ ::l I- ., a. ld ~ ..... 0 a. a:
Q '" c:: ... u. II! 0 0 is
~
0 >- ..... I-
'" z w a
"" '-
.~
" J.. H
"II ~
... rc ~
i o .J
" w
~~Il ... ... "Z o i= ct .... J ... o ..
0-
l! o .0 ct ..
-s. .,. ~
0
A
..
II
'=
'"
d-
0. ~.-l ~ ';
4L
~
§~ ~ 0
~ 'g
~
4
Iv I

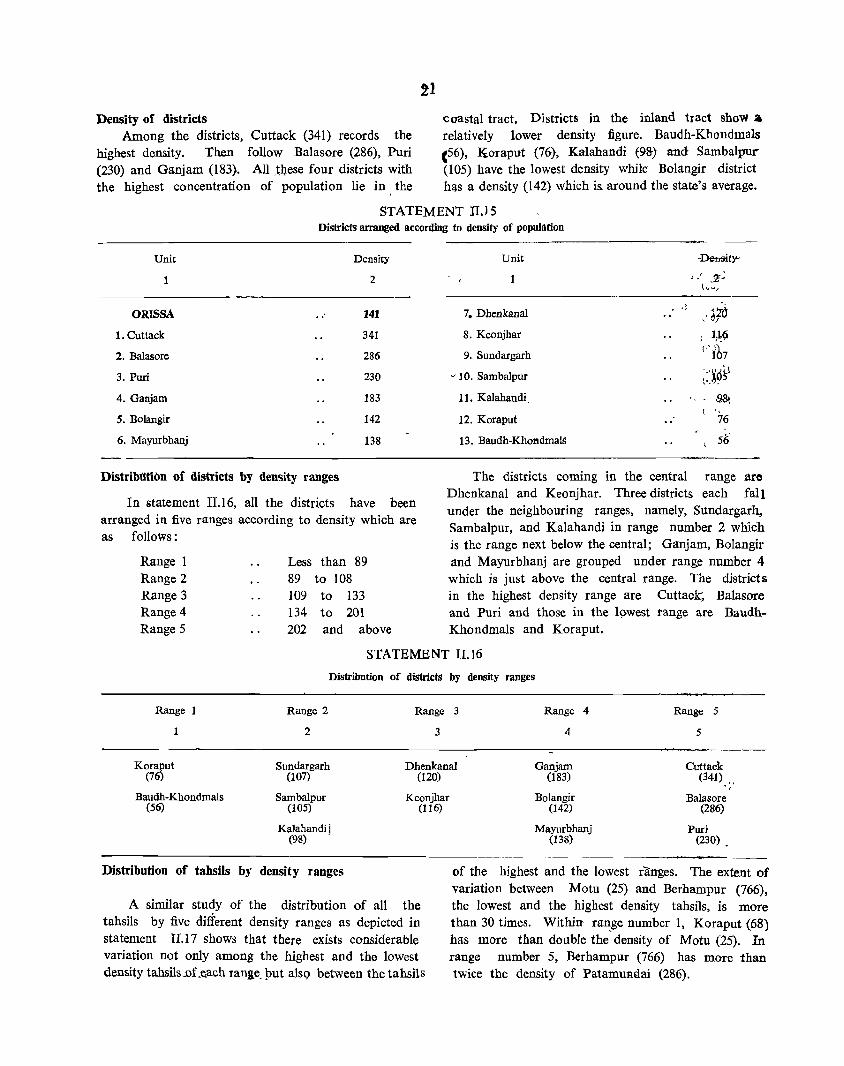
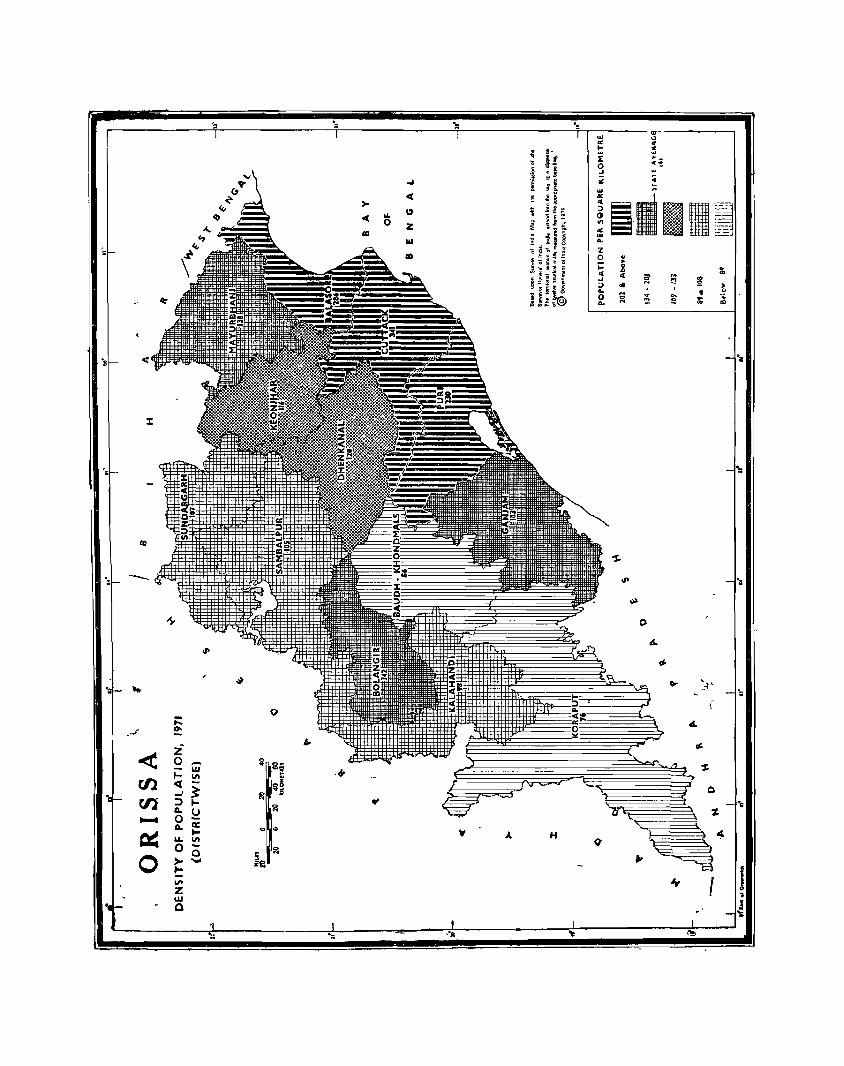
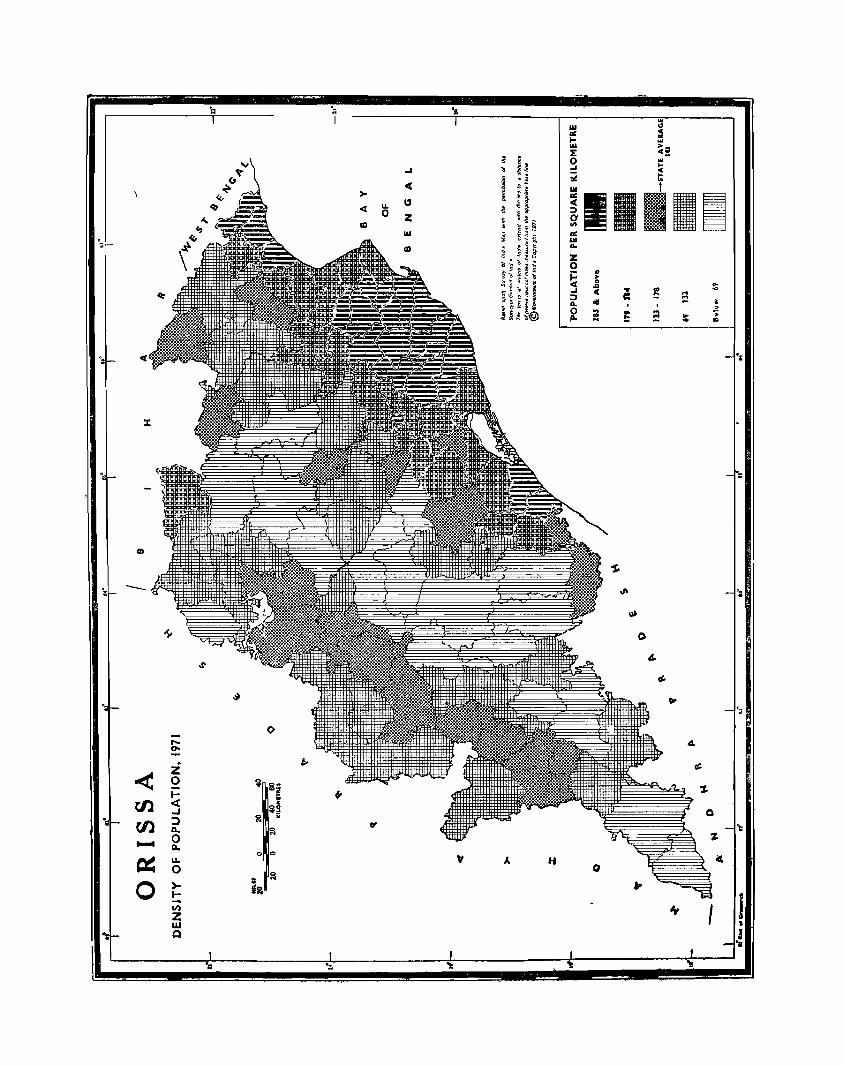
Density of districts Among the districts, Cuttack (341) records the
highest density. Then follow Balasore (286), Puri (230) and Ganjam (183}. All Jb.ese four districts with the highest concentration of population lie in, the
coastal tract. Districts in the inland tract show.a relatively lower density figure. Baudh-Khondmals (56), &oraput (76}, Kalahandi (9&) and Sambalpul." (lOS) have the lowest density while Bolangir district h~s a density (142) which is around the state's average.
STATEMENT IV 5 DiStricts arranged according to density of popuIllfion
Unit Density
1 2
ORISSA .. 141
1. Cuttack 341
2. Balasore 286
3. Puri 230
4. Ganjam 183
5. Bolangir 142
6. Mayurbhanj 138
Distribtltion of districts by density ranges
In statement II.16, all the districts have been arranged in five ranges according to density which are as follows:
Range 1 Less than 89 Range 2 89 to 108 Range 3 109 to 133 Range 4 134 to 201 Range 5 202 and above
Unit
7. Dbenkanal
8. Keonjhar
9. Sundargarh
J 10. Sambalpur
11. Kalabandi,
12. Koraput
13. Baudh-Khondmals
"
,fZIJ " ... }
; 1:~(i
j"{()7
"'''~11 \"~'
The districts coming in the central range arc Dhenkanal and Keonjhar. Three districts each fall under the neighbouring ranges, namely, Sl1ndargarh, Sambalpur, and Kalahandi in range number 2 which is the range next below the central; Ganjam, Bolangir and Mayurbhanj are grouped under ranRe number 4 which is just above the central range. The districts in the highest density range are Cuttack, Balasore and Puri and those in the ls:>west range are BaudhKhondmals and Koraput.
STATEMENT II.16
Distribution of districts by density ranges
Range 1 Range 2 Range 3 Range 4 Range 5
2 3 4 5
Koraput (76)
Sundargarh (107)
Dhenkanal (120)
Ganjam (183)
Cuttack (341) . ~ ,
Baudh-KhondmaIs (56)
Sambalpur (105)
Keonjhar (116)
Bolangir (142)
Balasore (286)
Kalahandij (98)
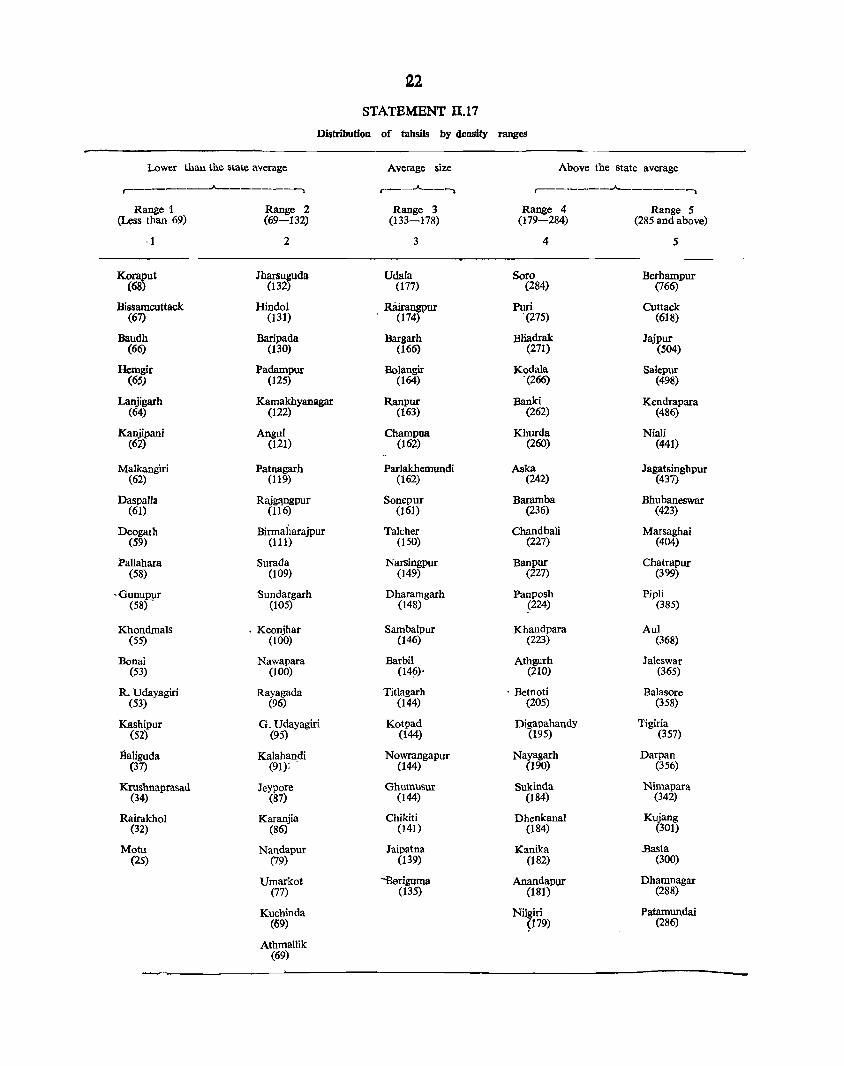
Distribution of tahsils by density ranges
A similar study of the distribution of all the tahsils by five different density ranges as depicted in statement II.17 shows that there exists considerable variation not only among the highest and the lowest density tahsils..oLeach range.l:mt alsQ between the tahsi1$
Mayurbhanj (138)
Purl (230) •
of the highest and the lowest r3:nges. The extent of variation between Motu (25) and Berhampur (766),
the lowest and the highest density tahsils, is more than 30 times. Within ra~ge number 1, Koraput (68) has more than double the density of Motu (25). In range number 5, Berhampur (766) has more than twice the density of Patamundai (286).
22
STATEMENT U.17
Distribution of tahsiIs by density ranges
Lower thau the state average Average size Above the state average .-______ A _______ ~ .... __ .A. __ ~ .-_____ A ______ ~
Range 1 Range 2 Range 3 Range 4 Range 5 (Less than 69) (69-132) (133-178) (179-284) (285 and above)
·1 2 3 4 5
Koraput Jharsuguda Udala Soro Berharnpur (68) (132) (177) (284) (766)
Bissarncuttack Hindol Rliirangpur Pari Cuttack (67) (131) (174) ·(275) (618)
Baudh Baripada Bargarh Bliadrak lajpur (66) (130) (166) (271) (504)
Hemgir Padampur Bolangir Kodala Salepur (65) (125) (164) ·(266) (498)
Lanjigarh Kamakhyanagar Ranpur Banki Kendrapara (64) (122) (163) (262) (486)
Kanjipani Angul Charnpua Khurda Niali (62) (121) (162) (260) (441)
Malkangiri Patnagarh Parlakhemundi Aska lagatsinghpur (62) (119) (162) (242) (437)
Daspalla RajglYlSPur Sonepur Baramba Bhubaneswar (61) (116) (161) (236) (423)
Deogath Birmaharajpur Talcher Chandbali Marsaghai (59) (111) (150) (227) (404)
Pallahara Surada Narsingpur Banpur Chatrapur (58) (109) (149) (227) (399)
-Gunupur -Sundargarh Dharamgarh Panposh PipJi (58) - (105) (148) .(224) (385)
Khondmals . Keonjhar Sambalpur Khandpara Aul (55) (100) (146) (223) (368)
Bonai Nawapara Barbil Athgarh laleswar (53) (100) (146)' (210) (365)
R. Uday.agiri Rayagada Titlagarh . Betnoti Balasore (53) (96) (144) (205) (358)
Kashipur G. Udayagiri Kotpad Digapahandy Tigiria (52) (95) (144) (195) (357)
Baliguda Kalahandi Nowrangapur Nayagarh Darpan (37) (91): . (144) (190) (356)
Krushnaprasad Jeypore Ghumusur Sukinda Nimapara (34) (87) (144) (184) (342)
RairakhoI Karanjia Chikiti Dhenkanal Kujang (32) (86) (141) (184) (301)
Motu Nandapur Jaipatna Kanika ..Basta (25) (79) (139) (182) (300)
Umarkot "'Beri.guma Anandapur Dharnnagar (77) (135) (181) (288)
Kuchinda Nilgiri Patamundai (69) q79) (286)
AthmaIIik (69)
'"
... < > ... 1:1 < 0 Z
CD 1&1 . CD
z 0
" ;: .. ... 0 < .., ... .. ... ..I " !:: ,..
:J ~ ::! l A- ce , 0
0 .. I!: !:! .. ;; GO .. cD ~ .. ':
; '"
..y
oS'
~ '; ';
-" 0. 4.
< Z 0 j::
" '1.
r.Jl <t ...I 0
'11 en :J 0.. 'I:
...... 0 a.
~ u. 0
~
0 )0-I-CI)
Z w
", I I 'I
Q .i "l;
'11 ~
. - -

A distribution of the number of tahsils by density ranges according to districts shows that none of the tahsils in the districts of Baudh-Khondmals, Bolangir, Kalahandi, Koraput and Sambalpur belongs to the two highest ranges of 4 and 5. Dhenkanal, Mayurbhanj, Keonjhar and Sundargarh have only one tahsil .each in range 4 but none in range 5. None of the 8 tahsils of Balasore belongs to the first three low density ranges and none of the tahsils of Cuttack district falls within the first two low density ranges. ,here is no tahsil in .Bolangir or Mayurbhanj district ~hich belongs to range 1.
Of the 21 tahsils in range 5, 12 belong to Cuttack district, 4 .to Balasore. 3 to Puri and 2 tq. Ganjam
23
district. These four coastal districts claim all the 21 tahsils in the highest density range. Of the 2rtansiTs belonging to the next lower range, Cuttack and Puri between them account for 5 tahsils each, Balasore has 4, Ganjam has 3 and the remaining 4 belong to the districts of Sundargarh, Keonjhar, Mayurbhanj and Dhenkanal. At the other end, there are 19 tahsils under the lowest density range. Of these, 6 belong to Koraput, 3 to Baudh-Khondmals, 2 each to Puri, Sambalpur and Sundargarh and one each to l(eonjhar, Dhenkanal, Kalahandi and Ganjam. In the central range, almost all the districts are represented equitably except Sundargarh, Balasore and BaudhKhondmals.
STATEMENT 1l.18
Nuuiber of tahSils by density ranges
Total Range 1 Range 2 Range 3 Range 4 Range 5 ~4B5 and
above) Uni1 (Less than 69) (69-132) (133-178) (179-lb4J
2
ORISSA 103
Sambalpur 7
Sundargarh 5
Keonjhar 5
Mayurbhanj 5
Balasore 8
Cuttack 18
Dhenkanal 7
Baudh-Khondmals 4
Bolangir 5
Kalahandi 5
Koraput 13
Ganjam 10
Puri 11
Looking at the pattern of variation of population density among tahsils of the state, the salient point seems to be that a large proportion of the tahsils belonging to coastal districts fall in the high density ranges. Conversely, a large percentage of the tahsils belonging to the inland tract come under the low density ranges. But to assume that the population density of a tahsil is inversely related to its distance from the coast may not be correct. The shade of density which grows paler as one goes from the coastal to the central inland tract again assumes a denser hue
6
2
4
1
2
4
1
3
2
3
3
1
3
5
7
21
12
2
3
as one proceeds further inland into tahsils bordering on the state's boundary.
In statement iLl9 three different bunches of tahsils have been :picked up for analysis: the first gro~ contains all tahsils bo!dering on the sea coast, the second group contains those tha~ are located in the central inland tract and the third comprises tahsiis which are situated farthest from the coast arid on the state's boundary., For comparability, all these three groups of tahsils have been arranged under the same set of density ranges.
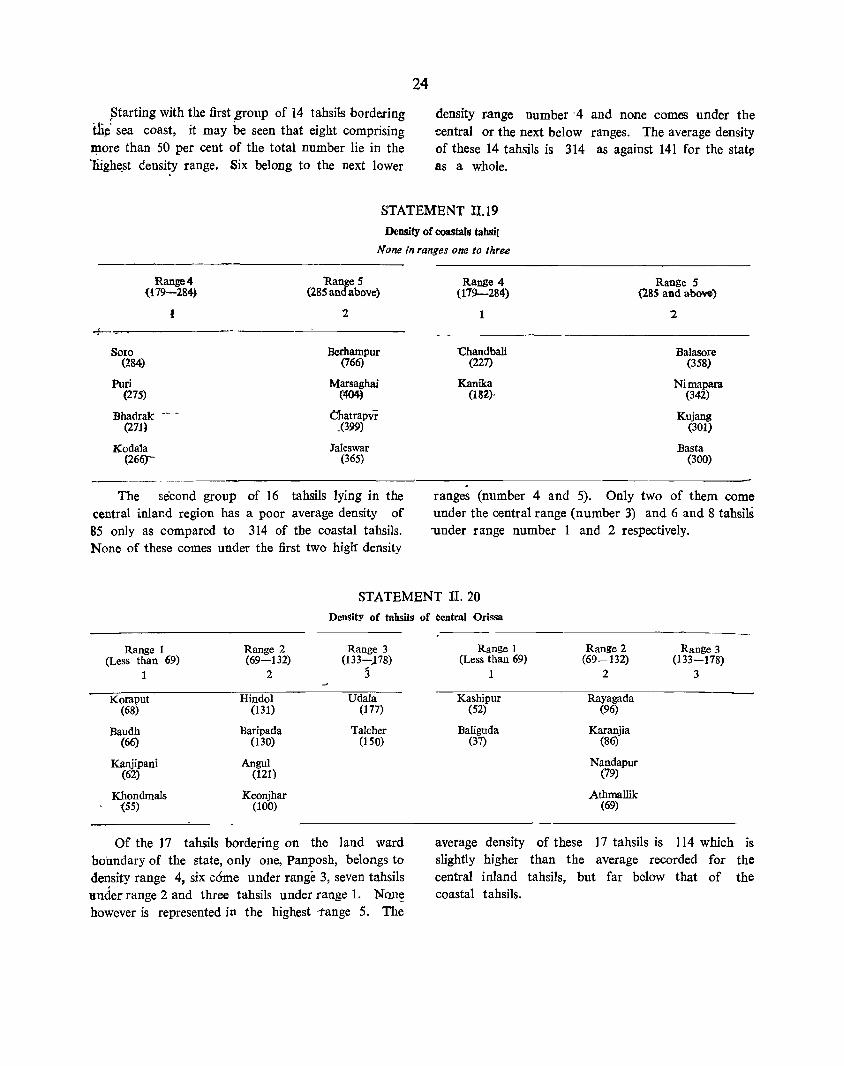
~tarting with the first ;1P"oup of 14 tahsils bordering ili~' sea coast, it may be seen that eight comprising ~ore than 50 per cent of the total number lie in the ·fugh~st density range. Six belong to the next lower
24
density range number'4 and none comes under the ~entral or the next below ranges. The average density of these 14 tahsils is 314 as against 141 for the stat~ as a whole.
STATEMENT II.19
Density of coastals tahsil
None in ranges one to three
Range 4 {!79-284}
Ra~e5 (2.85 an above)
I '2
Soro Berhampur (284) (766)
Purl Marsaghai (275) (<<>4)
Bhadrak Chatrapvr (2m ,(399)
Kodala laleswar (266) (365)
The second group of 16 tahsils lying in the central inland region has a poor average density of 85 only as compared to 314 of the coastal tahsils. None of these comes under the first two high density
Range 4 Range 5 (179-284) (2SS and above)
1 '2
'Chandbali Balasore (227) (358)
Kanika Nimapara (llll) (342)
Kujang (301)
Basta (300)
ranges (number 4 and 5). Only two of them come under the central range (number 3) and 6 and 8 tahsils -under range number 1 and 2 respectively.
STATEMENT II. 20
Density of tahsils of ~entral Orissa
Range 1 Range 2 Range 3 (Less than 69) (69-132) (133-)78)
1 2 3
Koraput Hindol Udala (68) (131) (117)
Baudh Baripada Talcher (66) (130) (150)
Kanjipani AnguJ (62) (121)
Khondmals Keonjhar -(55) (100)
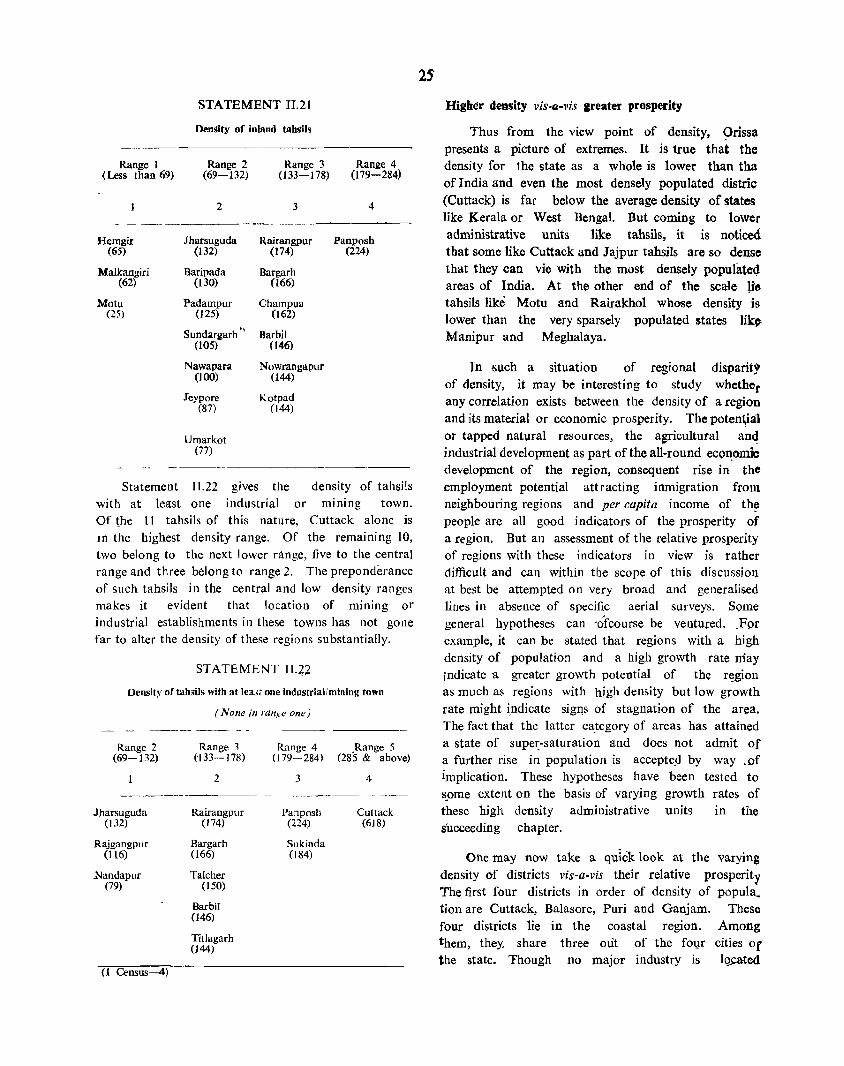
Of the 17 tahsils bordering on the land ward boundary of the state, only one, Panposh, belongs to density range 4, six c6me under range 3, seven tahsils under range 2 and three tahsils under range 1. No.n~ however is represented in the highest 1'ange 5. The
Range 1 Range 2 Range 3 (Less than 69) (69-132) (133-178)
1 2 3
Kashipur Rayagada (52) (96)
Baliguda Karanjia (37) (86)
Nandapur (79)
Athmallik (69)
average density of these 17 tahsils is 114 which is slightly higher than the average recorded for the central inland tahsils, but far below that of the coastal tahsils.
Range I < Less than 69)
- -_-
fJemgir (65)
Malkangiri (62)
Motu (25)
STATEMENT n.21
Density of inland tahsils
Range 2 (69-132)
2
Jharsuguda (132)
Baripada (130)
Padampur (125)
Sundar2arh'l (lOS)
Nawapara (100)
Jeypore (87)
Umarkot (77)
Range 3 (133-178)
3
Rairangpur (174)
Bargarh (166)
Champml (162)
Barbil (146)
Nowrangapur (144)
Kotpad (144)
Range 4 (179-284)
4
Panposh (224)
----------
Statemeot 11.22 gives the density of tahsils with at least one industrial or mining town. Of \he 11 tahsils of this nature, Cuttack alone is In the highest density range. Of the remaining 10, two belong to the next lower range, five to the central range and three belong to range 2. The preponderance of such tahsils in the central and low density ranges makes it evident that location of mmll1g or industrial establishments in these towns has not gone far to alter the density of these regions substantially.
STATEMENT lL22
Density of tah,ils with at lea~t one industrial/mining town
Range 2 (69-132)
Jharsuguda (132)
Rajgangplir (116)
.Nandapur (79)
(1 Census-4)
( None ill range one)
Range 3 (-133-178)
2
Rairangplir (174)
Bargarh (166)
Talcher (150)
Barbil (146)
Titlagarh (144)
Range 4 .Range 5 (179-284) (285 & above)
3
Panposh (224)
Sukinda (l84)
4
Cuttack (6J8)
Higher density vis-a-vis greater prosperity
Thus from the view point of density, 9rissa presents a picture of extremes. It is true that the density for the state as a whole is lower than tha of India and even the most densely populated distric (Cuttack) is far below the average density of states like Kerala or West Bengal. But coming to lower administrative units like tahsils, it is noticed that some like Cuttack and Jajpur tahsils are so dense that they can vie with the most densely populateeJ areas of India. At the other end of the scale Ue tahsils like Motu and Rairakhol whose density is lower than the very sparsely populated states lik~
Manipur and Meghalaya.
Tn such a situation of regional disparit, of density, it may be interesting to study whether any correlation exists between the density of a region and its material or economic prosperity. The poten~al or tapped natural resources, the agricultural an4 industrial development as part of the all-round eco:qomic development of the region, consequent rise in the employment potential attracting inmigration from neighbouring regions and per capita income of th!l people are all good indicators of the prosperity of a region. But an assessment of the relative prosperity of regions with these indicators in view is rather difficult and can within the scope of this discussion at best be attempted on very broad and generalised lines in absence of specific aerial surveys. Some general hypotheses can 'of course be ventured. .For example, it can be stated that regions with a high density of population and a high growth rate may indicate a greater growth potential of the r~gion
as much as regions with high density but low growth rate might i_ndicate sigqs of stagnation of the area. The fact that the latter ca_tegory of areas has attained a state of supe~-saturation and does not admit of a further rise in population is accepteji by way .of implication. These hypotheses have been tested to s_ome extent on the basis of varying growth rates of these high density administrative units in the sUcceeding chapter.
One may now take a quiCK look at the varying density of districts vis-a-vis their relative prosperity The first four districts in order of density of popula. tion are Cuttack, Balasore, Puri and Ganjam. These four districts lie in the coastal region. Among them, they, share three out of the f01;1r cities of the state. Though no major industry is l~ed
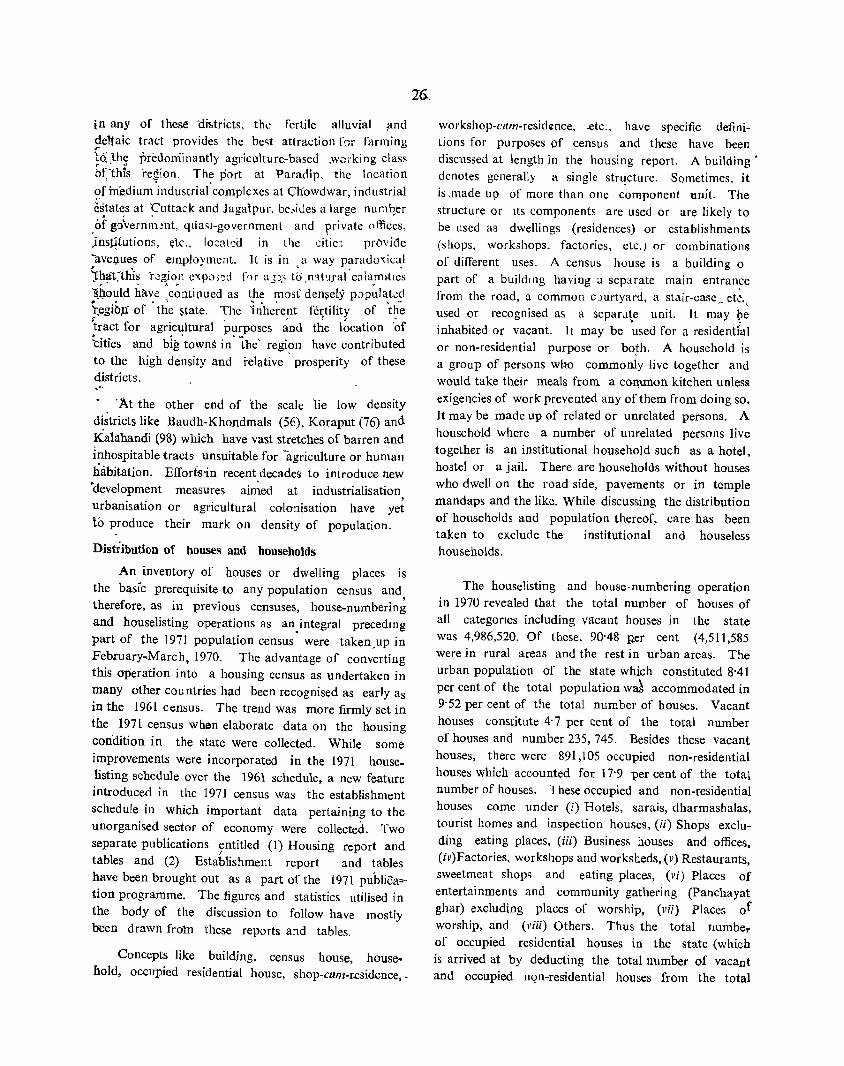
in any of these ai'f>tricts, the fertile alluvial ;lnd deltaic tract provides the be~t attraction fSf farming ,. Lei: the predominantly agricultllre,.based .working class bf:thi~ 'region. The port at Paradip. the location ofinedium 'industria(complexes at Chowdwar, i ndllstrial 6states at 'ClIttack and JagalpuL be.,ides a large nllmqcr of go\rern~1!nt, qtiasl-government and private offices, 'insJ;1tutions, eic., 10;:::l(co in the citic3 proviae . ,
-ave.Q.ues of employment. It is in a way parado".:ical ~ha1:this f..!gion c".:p,))~d hr a:;~.> t~ ,n1t'lral'calamH:le's sh~uld have: 'c~nti{1ued as the most' den~ely p;)p~laL.:d ~~gib.li of . the ~tate. The 1nhe~ent fertility of th~ r: I" r r" -tract for agricultural purposes and the location 'of ~ities and big'towns in' the' region have contributed to the high density and relative' prosperity of these districts. ,'_
. At the other end of 'the scale 1ie low density districts like Baudh-Khondmals (56), Koraput (76) and Kalahandi (98) which have vast stretches of barren and inhospitable tracts unsuitable for agriculture or human habitation. Effort:S-in recent decades to introduce new 'development measures ai~ed at industrialisation , urbanisation or agricultural colonisation have yet tb produce their mark on density of population.
Distribution of houses and households
An inventory of houses or dwelling places is the basic prerequisite to any population census and therefore, as in previous censuses, house-numbering and houselisting operations as an_integral precedlllg part of the ] 971 population census were taken ,up in February...March, 1970. The advantage of converting this operation into a housing census as undertaken in many other countries had been recognised as early as in the 1961 census. The trend was more firmly set in the 1971 census when elaborate data on the housing condition in the state were collected. While some improvements were incorporated in the 1971 houselisting schedule over the 1961 schedule, a new feature introduced in the 1971 census was the establishment schedule in which important data pertaining to the unorganised sector of economy were collected. Two separate publications entitled (1) Housing report and
I
tables and (2) Establishment report and tables have been brought out as a part of the 1971 publica .... tion programme. The figures and statistics utilised in the body of the discussion to follow have mostly been drawn from these reports and tables.
Concepts like building, census house, house. hold, occupied residential house, shop.-cum-r.esidence,.
26.
workshop-cllm-resid~nce, .etc" have specific definitions for purposes of census and these have been discussed at length in the housing report. A building' denotes generally a si ngle strl!cture. Sometimes. it is ,made up of more than one component nnit. The structure or Its components are used or are likely to be used as dwellings (residences) or establishments (shops, workshops. factories. etc.) or combinations of different uses. A census house is a building 0
part of a buildmg having a separate main entran~e
from the road, a common c)urtyard, a stair-casc., etc-" used or recognised as a separ<lte unit. [t may ~e
inhabited or vacant. It may be used for a residenti'al or non-residential purpose or bo~h, A household is a group of persons who commonly live together and would take their meals from a COIlllllon kitchen unless exigencies of work prevented any of them from doing so . It may be made up of related or unrelated persons. A household where a number of unrelated persons live together is an institutional household such as a hotel, hostel or a jail. There are households without houses who dwell on the road side, pavements or in temple mandaps and the like. While discussing the distribution of households and population thereof, care has been taken to exclude the institutional and houseless households.
The houselisting and house· numbering operation in 1970 revealed that the total number of houses of all categones including vacant houses in the state was 4,986,520. Of these, 90-48 l1Cr cent (4,511,585 were in rural areas and the rest in urban areas. The urban population of the state which constituted 8'41 per cent of the total population wa~ accommodated in 9'52 per cent of the total number of houses. Vacant houses constitute 4· 7 per cent of the total number of houses and number 235, 745. Besides these vacant houses, there were 891,105 occupied non-residential houses which accounted for 17'9 per cent of the total number of houses. These occupied and non-residential houses come under (i) Hotels, sarais, dharmashalas, tourist homes and inspection houses, (ii) Shops excluding eating places, (iii) Business houses and offices, (iv)Factories, workshops and worksheds, (v) Restaurants, sweetmeat shops and eating places, (vi) Places of entertainments and community gathering (Panchayat ghar) excluding places of worship, (vii) Places of worship, and (viii) Others. Thus the total tmmbe,. of occupied residential houses in the state (which is arrived at by deducting the total number of vacant and occupied llqn-residential houses from the total
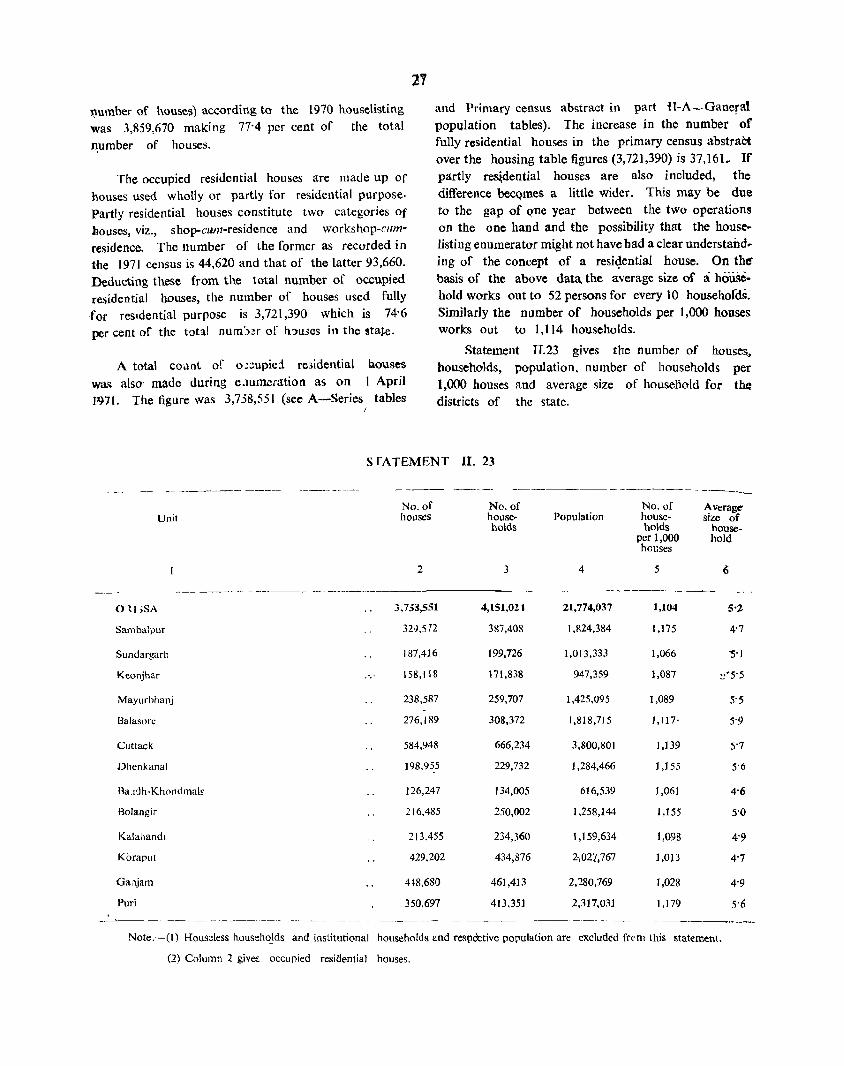
27
"umber of houses) according to the 1970 house\isting was 3,859,670 making 77'4 per cent of the total ~umber of houses.
and Primary census abstract in part H-A-Ganeral population tables). The increase in the number of fully residential houses in the primary census abstract over the housing table figures (3,721,390) is 37,161~ If partly re~dential houses are also included, the difference bocQmes a little wider. This may be due to the gap of Q'ne year between the two operations on the one hand and the possibility that the house~ listing enumerator might not have had a clear understand .. ing of the concept of a resigential house. On the basis of the above data. the average size of a household works out to 52 persons for every 10 househofdsr Similarly the number of households per 1,000 houses works out to 1,114 households.
The occupied residential houses are made up of houses used whoUy or partly for residential purpose· Partly residential houses constitute two categories Of llouses, viz., shop-cum-residence and workshop-c1I/11-residence. The number of the former as recorded in the 1971 census is 44.620 and that of the latter 93,660.
Deducting these from the total number of occupied residential houses, the number of houses used fully
-for resIdential purpose is 3,721,390 which is 74'6 per cent of tlte total num',nr of h,:>uses in the state.
A total counl of o;;;upie:l re3idential was also, made during e.lUrneration as on 1971. The figure was 3,758,551 (see A-Series
houses I April
tables
Statement n.23 gives the number of houses, households, population, number of households per 1,000 houses and average size of household for' the districts of the state.
S fATEMENT U. 23
-~ - ------- ------ -------- ---- ----------------- - -----No,of No. of No.uf Average'
Unit hOLlses hOuse- Population house- size of holds holds house-
per 1,000 hold houses
2 3 4 5 (,
---~--- -- ------_ -------- ---------011 ;SA 3,733,551 4,151,02 , 21,774,037 1,104 5'2
Sambaiplif 3N,572 387,403 J ,824,384 1,175 4'7
Slindargarh 187,416 199,726 1,013,333 1,066 -S'1
Keonjhar 158,118 171,838 947,359 1,087 ~'5'5
Mayurbhanj 238,587 259,707 1,425.095 1,089 5'S
Balasorc 276.189 308,372 1,818,715 1,117' 5'9
Cuttack 584,948 666,234 3,800,801 1,139 5'7
Dhenkanal 198,9~5 229,732 1,284,466 ] ,] 55 5'6
Ba,dh-Khondmalf 126,247 134,005 616,539 ],06] 4'6
Bolangir 216,485 250,002 1,258,144 1,155 S'O
Kalahandl 213,455 234,360 1,159,634 1,098 4'9
Koraplit 429,202 434,876 2,02],767 1,013 4'7
Ga:ljam 4l8,680 461,413 2,280,769 1,028 4'9
Puri 350,697 413,351 2,317,031 1,179 5'6
Note,-(I) Hous;:less househoJds and institutional households and respCttive population are exclud(!d ff('m this statement.
(2) Column 2 give~ occupied residential hOllses.
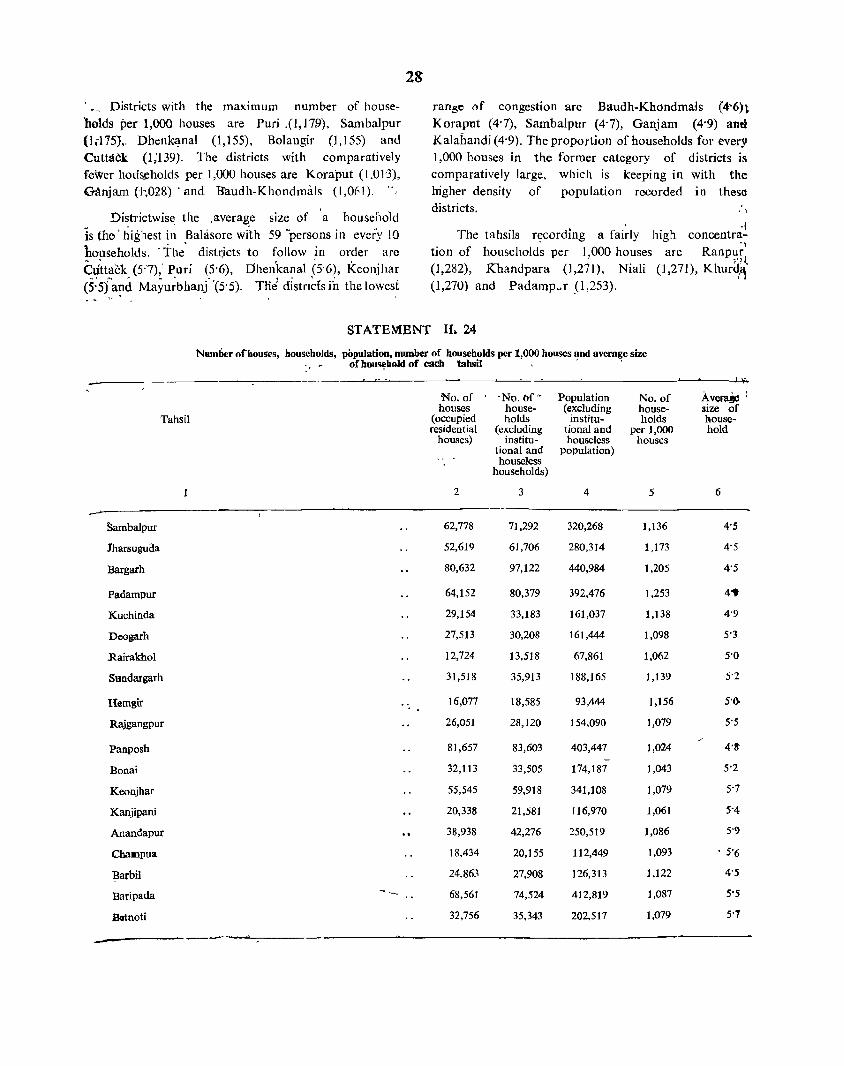
Districts with the maximum number of housebolds per 1,000 houses are Puri .(I,J79), Sambalpur (hIlS)., Dhenk~nal (1,155), Bolangir (1.155) and Cutttlck (1;139). The districts with comparatively fewer hOlfs.eholds per 1,000 houses are Koraput (1,01'3), Ganjam (1"',028) . and Haudh-Khondmals (1,01' I).
Districtwise the ,average size of 'a household is tho' highest il~ Balasore with 59 -persons in every [0 households. -The' distdcts to follow in order are Crittack (5'7),' Purl (5'6), Ohenkanal (5'6), Keonjhar (5:5fa?d MaYu;bhanj' '(5' 5). Tnt{ distn~{s ih the lowest ~... H
range of congestion are Baudh-Khondmals (4'6h Koraput (4'7), Sambalpur (4'7), Ganjam (4'9) and Kalahandi (4'9), The proportion of households for every 1,000 houses in the former category of districts is comparatively large, which is keeping in with the higher density of population recorded in these districts, ·1
, .{ The tahsils r€?cording a fairly high. concentra-
-)
tion of households per 1,000 houses are Ranpur, )'j~
(1,282), .R.handpara (1,271), Niali (1,271), Khur~~ (1,270) and Padamp" r .(1,253).
ST ATEMBNT II. 24
Number of houses, households, pOpulation, number of houSeholds per 1,000 houses and average size " _ of hou~hold of each tahsil . - .
-J.-.>i.,
No. of -No, ttf" Population No, of Avera8e : houses house- (excluding house- size of
Tahsil (occupied holds institu- holds kouse-residential (excluding tiona! and pel' 1,000 hold
houses) institu- houseless houses tional and population) ,. houseless households)
2 3 4 5 6
Samba1pur 62,778 71,292 320,268 1,136 4'5
Tharsuguaa 52,619 61,706 280,314 1)73 4'5
Bargarh 80,632 97,122 440,984 1,205 4'5
Padampur 64,152 80,379 392,476 1,253 4'9
Kuchinda 29,154 33,183 161,037 1,138 4'9
Deogarh 27,513 30,208 161,444 1,098 5'3
Rairakhol 12,724 13,518 67,861 1,062 5'0
Sundargarh 3 t ,518 35,913 188,]65 1,139 5'2
Hemgir 16,077 18,585 93,444 1,156 5'()o
Rajgangpur 26,051 28,120 154,090 1,079 5'S
Panposh 81,657 83,603 403,447 1,024 4'!t
Bonai 32,113 33,505 174,181 1,043 5'2
Keonjhar 55,545 59,918 341,108 ],079 5'7
Kanjipani 20,338 21,581 116,970 1,061 5'4
Anandapur 38,938 42,276 250,519 1,086 5'9
Challlpua ]8,434 20,155 112,449 1,093 ' 5'6
BarbH 24,863 21,908 126,313 1,122 4'5
Baripada 68,561 74,524 412,819 1,087 5'S
Botnoti 32,756 35,343 202,517 1,079 5'1
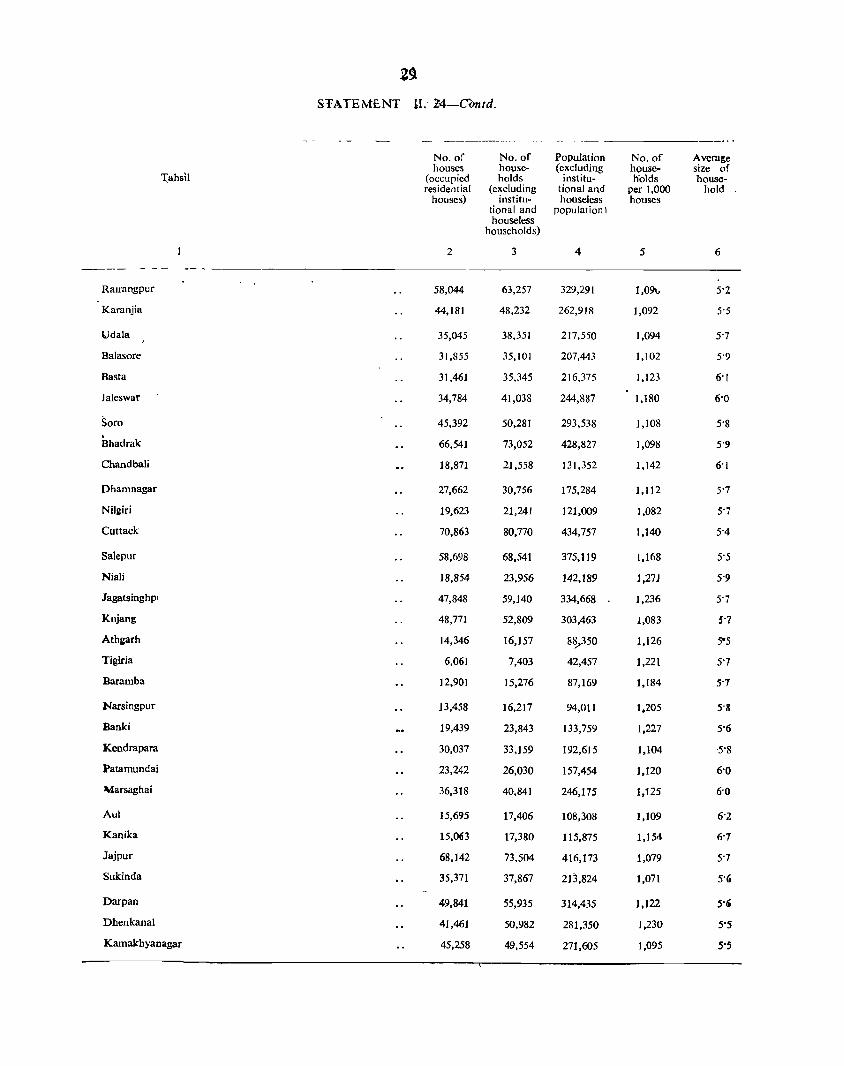
STATEMENT 11.' 24-COntd.
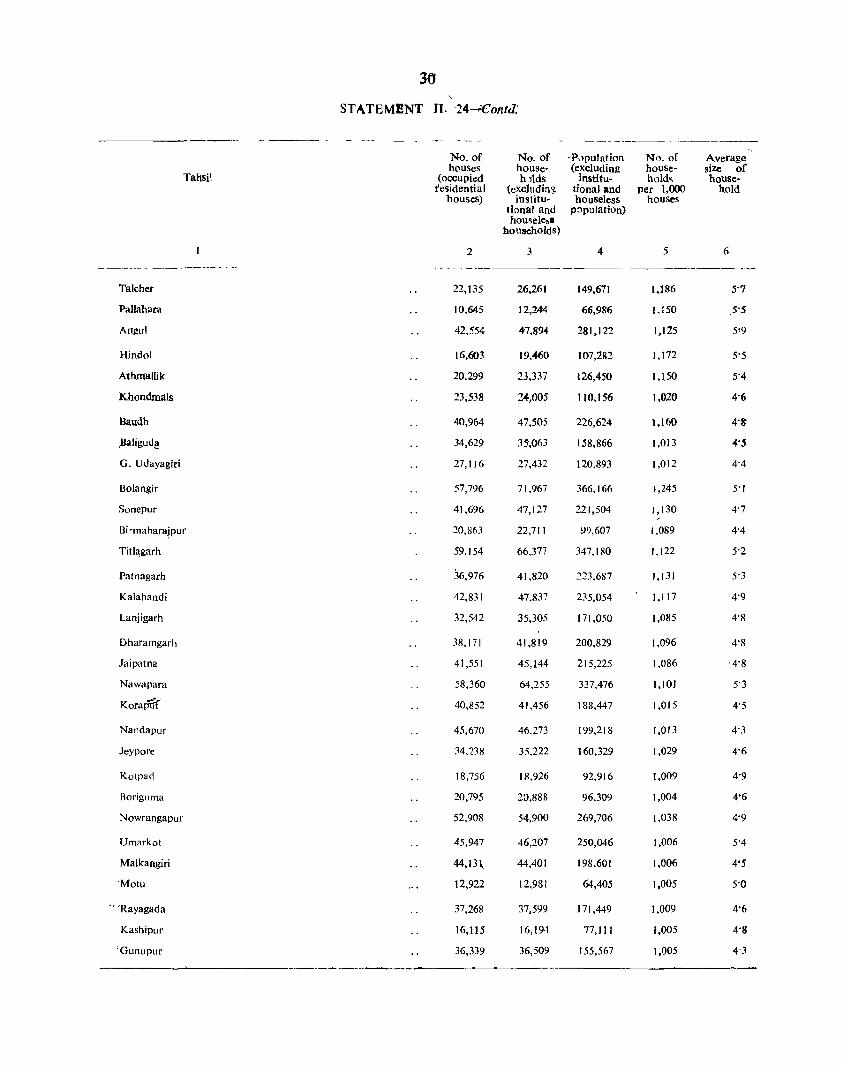
30'
STATEMENT II. . 24-.€ontd:
_._-----~-----
No. of No. of ~Pl)pulation No. of Average houses house- (excluding house- size of
Tahsil (occupied hJtds institu- h()ld~ house-J'e~idential (excluding tional and per 1,000 hold
11Ouses) inslitu- houseless houses tional and p~)pulation) housele,1
houaellolds)
2 3 4 5 6
------ -- - ~ - ---_. -- --- -__ -------- ~---
Talcher 22,135 26,261 149,671 1,186 5'7
Pallahata 10,645 12,244 66,986 I,J50 5'5
Artgul 42,554 47,894 281,122 1,125 5'9
Hindol 16,603 19,460 107,282 1,172 5'5
Atlunallik 20,299 23,337 126,450 I,LSO 5-4
Khondmals 23,538 24,005 110,156 1,020 4'6
Baudh 40,964 47,505 226,624 1,160 4'~
.JJaligud!l 34,629 35,063 158,866 I.OJ3 4'5
G. Udayagiri 27,116 27,432 120.893 1,012 4-4
Bolangir 57,796 71,967 366.166 1,245 5-1
Sonepur 41,696 47,127 221,504 1,130 4-7
Bi 'maharajpur ::!O,863 22,711 99,607 1.089 4-4
Titla,garh 59,154 66.377 347.180 1,122 5'2
Patnagarh .16,976 41,820 123.687 1,131 S-J
Kalahandi 42.831 47.837 235,054 1,117 4'9
Lanjigarh 32.542 35,305 171.050 1,085 4'8
Dharamgarh 38.171 41,819 200,829 1,096 4'8
Jaipatna 41,551 45,144 215,225 1,086 -4-8
Nawapara 58,360 64,255 337,476 1,101 5-3
KoraPii'f 40,852 41,456 188,447 1,015 4-5
Nandapur 45,670 46,273 199,218 1,013 4-3
Jeypore ~4,238 35,222 160,329 1,029 4-6
Kotpad 18,756 18,926 92,916 1,009 4-9
Boriguma 20,795 20,888 96,309 1,004 4'6
Nowrangapuf 52,908 54,900 269,706 1,038 4-9
Umarkot 45,947 46,207 250,046 1,006 5-4
Malkangiri 44,13\ 44,401 198,601 1,006 4·5
'Motu 12,922 12,981 64,405 1,005 5'0
'. 'Rayagada 37,268 37,599 171,449 1,009 4'6
Kashipur 16,115 16,194 77,111 1,005 4'8
'Gunupur 36,339 36,509 155,567 1,005 4'3 ___ d ____ ~ .. ~
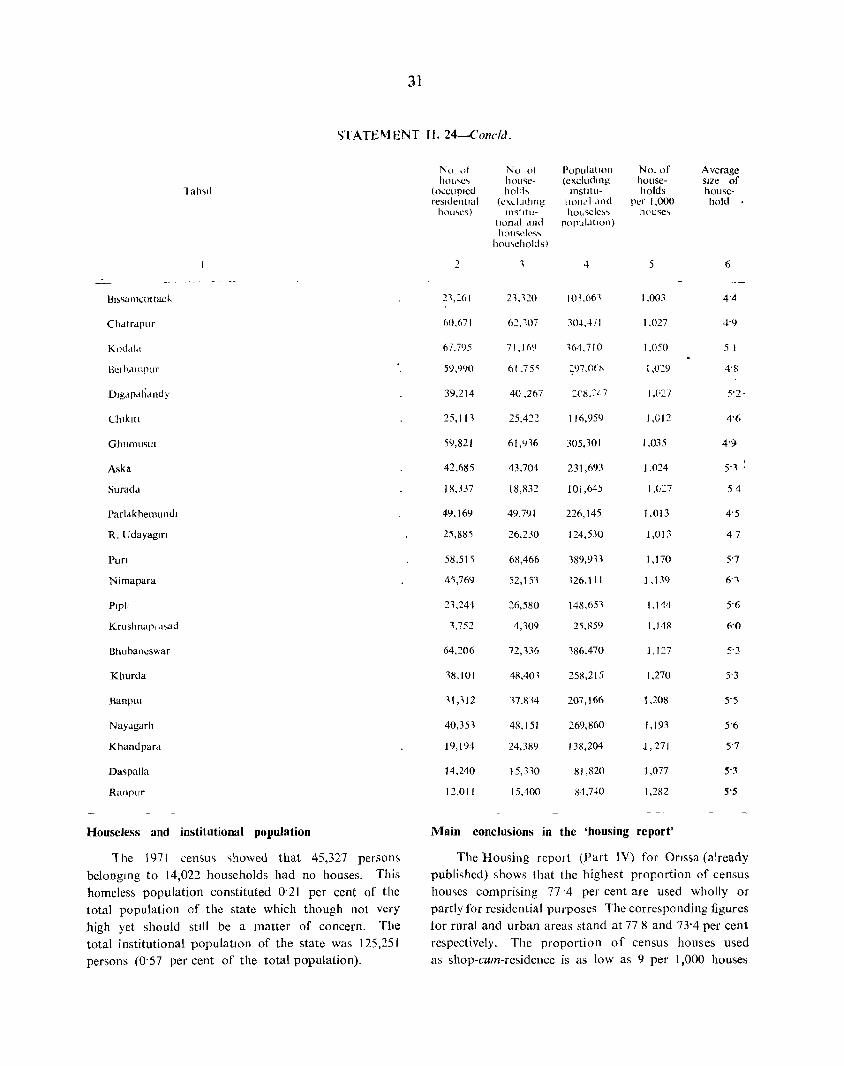
31
~TAT£I\1ENT fl. 24-Conc/d.
1 alNI
Chdtrdplir
Ikl hdtnpUr
Ghlllllll~lIl
Aska
SlIraJd
Pari<lkhcmundJ
R. Udayagm
PUT!
Nimapara
Bhubaneswar
Khurda
BanplII
Nayagarh
Khandpard
Da~palla
Ranpur
Houseless and institutional population
The 1971 ce11SU<; ,>howed that 45,327 perSon:-belongmg to 14,022 households had no houses. This homeless population constituted 0'21 per cent of the total population of the state which though not very high yet should stIll be a matter of concern. The total institutional populatIOn of the state was 125,251 persons (0'57 per cent of the total population).
No ,11 hOl,'C,
(oC(.;uplcd reSidential hOll"c~)
2
21,261
6(),67 I
67,795
59,990
39,214
25,111
59,821
42,685
18,337
49,169
25,885
58,51 ')
45,769
21,244
1,752
64,206
18,101
31,112
40,351
19,[94
14,240
12,01 [
No 01 hou~ehold,
(c"LluJlng ln~(ltu
Ilonal and hOll~lc~ ...
hou\c!1olds)
21,120
62, ,07
71,16l)
6[ ,75~
40,267
25.422
61,916
43.704
18.832
49,79 [
26.230
68,466
52,151
26,580
4,109
72,136
48,401
17,814
48,[51
24,38l)
15,310
15,400
Population (exdudlOg
Il1Stltulion,' I ,md hOl.,cie".,
IWpuldllon)
4
[01.661
304,471
164.710
116,959
305.301
23[ ,693
101,645
226, [45
124,530
189,913
126,111
148,651
25,859
186,470
258,215
207,166
269,860
[ 38,204
8[ ,820
84.740
No. of households
per [,000 h('u~c.,
5
[,003
[,027
1,050
1,0:9
1,«27
1,012
[,035
1,024
1,(;:::'7
1,013
1,013
1,170
1,139
1.144
1,14R
1,127
1,270
1,208
1,193
J,271
1,077
1,282
Main conclusions in the 'housing report'
Average size of house-hold
6
5 I
4'8
5'2 .
4'5
47
5'3
5'5
5'5
The Housing repolt (Part IV) for Onssa (already published) shows that the highest proportion of census hou')es comprising 77'4 per cent are used wholly or partly for residential purposes The corresponding figures tor rural and urban areas stand at 77 8 and 73'4 per cent respectively. The proportion of census houses used as shop-cum-residence is as low as 9 per 1,000 houses

in the state: 8 in rural areas and 17 in urban. There
are 824 shop-cum-residences in rural areas as against 176 in urban to every 1,000 shop-ClfI1l-residence~
in the ~tate. This shows that there are more than four times as many such houses in urban areas as
there are in rural.
There are 19 workshop-cllm-residences per 1,000
census houses in the state. The rural/urban distribution is 19 rural and 14 urban. ]n contrast to shop('unt-residences. the proportion of workshop-cumresidences is higher in rural areas than in urban areas. Ou1 of every 1,000 workshop-clIm-residences, 928 are located in rural areas and only 72 in urban.
If the use of houses other than fOf residential purposes is any index of the relative economic and social condition of the area, it may be seen that only six houses per 1,000 population in the state constitute
workshops and factories together with workshop(·lIm-residences. Taking the house:; u~ed as shop~
(excluding eating houses) and shop-clIm-residence, together. they con~titutc 5'6 per J ,000 population. In respect of busilll.'&' houses and offices the proportion is one per 1.000 population in th~ state as a whole.
The percentage of vacant hou~es in the statt' i~
4·7 which is much lower compared to state~ like Rajasthan (12'7). Jammu & Kashmir (S'6), Mysore (8'0). I<erala (7' I). Tamil Nadu (7'0) and Punjab ((d).
:\1atcrial of wall and roof
Mud continue~ to be the most commonly lI')ed material for \\Iall through out Ihe ,tate; 3].::; per cent or : he hOllse'> in the urban areas have mud walls and 74'2
per cent in rural. There has been, howe\ er. a decrea~e in the pro pOI tion or mud wall house, (about I point) in the rural arca~ and II point'> ill the urban areas from 1961 to 1971. The decrease in the lauer calegol y or houses ha~ been compensated by a corre~ponding
increase in the proportion of house~ with burnt bricks. There has abo been a marked decrease in the proportion of house', with wall~ made of gras'>. leave~.
reeds or bamboo both in the rural and urban areas during the la~t decade.
Seventy four pe!" cent of the houses in the rural area~ and 33 per cent in the urban areas have grass, leaves, reeds or bamboo, mud. unburnt bricks or wood a~ wall material and grass, leaves, reeds, bamboo, thatch, mud. unburnt bricks or wood as the roof material. 17 per cent of the houses in the rural areas and 15
32
per cent in urban areas have grass. leaves, reeds or bamboo, mud, unburnt bricks as wall material and tiles, slate, shingle, corrugated iron. zinc or other
metal sheets. asbestos cement sheets, brick, lime,. stone and R. B. C. / R. C. C. as the roof material. Six per cent of the houses in the rural areas and 46
per cent in the urban areas have houses with burnt bricks, G. I. sheets. stone, cement as wall material and tiles, slate, shingle, corrugated iron, zinc or other metal sheets, asbestos cement sheets, brick. lime, stone and R. B. C. / R. C. C. as the roof material. The avove figures show that the majority of the houses ill
the state and particularly in the rural areas still use very cheap ami fragile material for walls and roof~.
Households allt! Damber of teoms occllpied
According to the 1971 cenSllS. 32 per cent of tlle households occupied census houses with one room while 37 per cent of the households were living in census houses with 2 rooms. Tho~e o.::cupying hOLl"es with 3 room~ stood al 15 per cent, with 4 rooms ~\
9 per cellt a.nd t hose occupying ~ rooms or more at 7 per cent. The households occupying 2 roomed hou.,e~
were therefore the large~t ~ingle group. In urban area~ the bulk of the population (40 per cent) lived in one-roomed house~. whereas in the rural area~ t wo
roomed houses Were preferred by the majority of the hOllsehold~ en per cent).
While for one-ro~1l11ed hou,es. there were 408
persons for every I 00 household~ in the ,tate for I\\o-roomed hou~e" the corre,p,)'Kiing number wa" only 249. The same for 100 hOl"ehold" with 3 rooms, 4 rooms and 5 fl)0ll1~ and abOve \\erc 194. 168 and 1?-7 respecti\(:I).
The room-member ratio is somewhal be: leI' In
llrh'!11 2rea~ than in rural for all cJtegories of hOll,ehold~. For one-roomed housc~ in urbcUl area~,
1 here are 363 person~ for every 100 hou ~,:ho!Ji> as compared to 414 fo .. the rural area~. The corresponding tlgures fo: the urban and rural are." for t woroomed households are 241 and 250 respecliwly.
As again,>t 32 per cent of the households occupying census hOJ~es with one room, 37 per cent with two rooms and 15 per cent with three 1'00111'> in 1971, the corrc~~ollding proportion for these three ca'egor'es of houses were 32. 37 and 15 respectively In 1961. Coming to the room-member ratio, there were 3'82 persons per room in ollc-roomed households in 1961.
This has gone lip 10 4'08 in 1971. Similarly 2'28
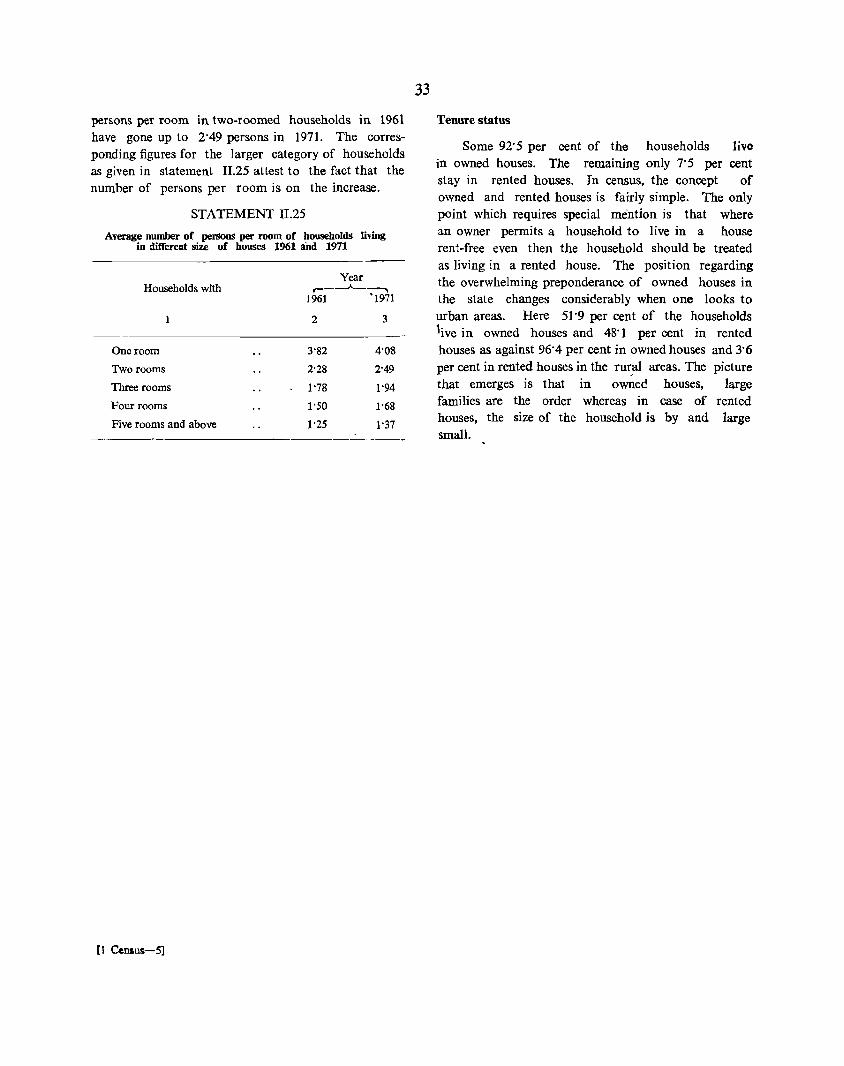
persons per room in two-roomed households in 1961 have gone up to 2'49 persons in 1971. The corresponding figures for the larger category of households as given in statement II.25 attest to the fact that the number of persons per room is on the increase.
STATEMENT II.25
Average number of perSons pee room of householdS living in different size of houSeS 1961 and 1971
Households with
One room
Two rooms
Three rooms
Four rooms
Five rooms and above
[1 Census-5]
Year ,...--....... --.....,
1961 "1971
2 3
3'82 4'08
2'28 2"49
1'78 1'94
1'50 1'68
1'25 1'37 -----------
33
Tenure status
Some 92'S per cent of the households live in owned houses, The remaining only 7' 5 per cent stay in rented houses, In census, the concept of owned and rented houses is fairly simple, The only pOint which requires special mention is that where an owner permits a household to live in a house rent-free even then the household should be treated as living in a rented house. The position regarding the overwhelming preponderance of owned houses in the state changes considerably when one looks to urban areas. Here 51'9 per cent of the households live in owned houses and 48'1 per cent in rented houses as against 96'4 per cent in owned houses and 3'6 per cent in rented houses in the ru~al areas. The picture that emerges is that in owned houses, large families are the order whereas in case of rented houses, the size of the household is by and large small.

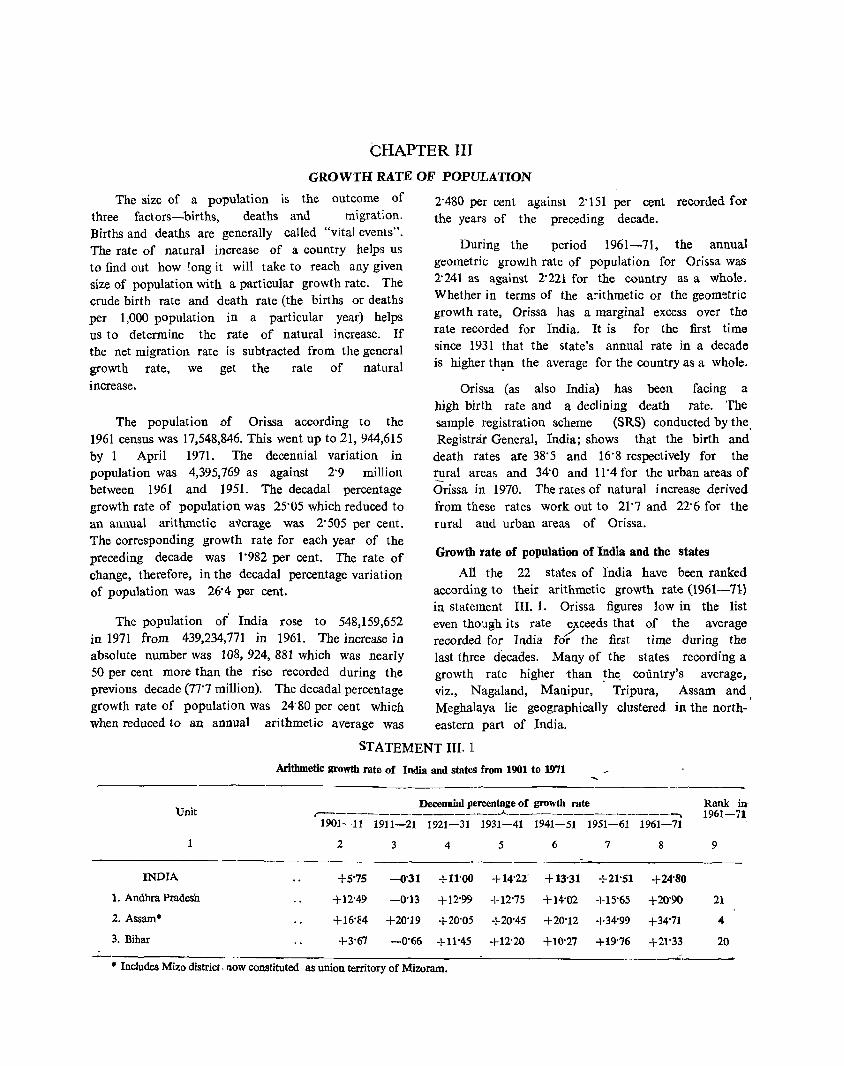
CHAPTER III
GROWTH RATE OF POPULATION
The size of a population is the outcome of three factors-births, deaths and mlgration. Births and deaths are generally called "vital events". The rate of natural increase of a country helps us to find out how long it will take to reach any given size of population with a particular growth rate. The crude birth rate and death rate (the births or deaths per 1,000 population in a particular year) helps uS to determine the rate of natural increase. If the net migration rate is subtracted from the general growth rate, we get the rate of natural increase.
The population of Orissa according to the 1961 census was 17,548,846. This went up to 21,944,615 by 1 April 1971. The decennial variation in population was 4,395,769 as against 2'9 million between 1961 and 1951. The decadal percentage growth rate of population was 25"05 which reduced to an annual arithmetic average was 2'505 per cent. The corresponding growth rate for each year of the preceding decade was 1'982 per cent. The rate of change, therefore, in the decadal percentage variation of population was 26'4 per cent.
The population or" India rose to 548,159,652 in 1971 from 439,234,771 in 1961. The increase in absolute number was 108,924,881 which was nearly 50 per cent more than the rise recorded during the previous decade (7Yl million). The decadal percentage growth rate of population was 24'80 per cent which when reduced to an annual arithmetic average was
2'480 per cent against 2'151 per cent recorded for the years of the preceding decade.
During the period 1961-71, the annual geometric growlh rate of population for Orissa was 2'241 as against 2'221 for the country as a whole. Whether in terms of the arithmetic or the geometric growth rate, Orissa has a marginal excess over the rate recorded for India. It is for the first time since 1931 that the state's annual rate in a decade is higher th~n the average for the country as a Whole.
Orissa (as also India) has been facing a high birth rate and a declining death rate. The sample registration scheme (SRS) conducted by the. Registrar General, India; shows that the birth and
death rates are 38'5 and 16'8 respectively for the rural areas and 34'0 and 11'4 for the urban areas of Orissa in 1970, The rates of natural increase derived from these rates work out to 21'7 and 22'6 for the rural and urban areas of Orissa.
Growth rate of population of India and the states
All the 22 states of India have been ranked according to their arithmetic growth rate (1961-71) in statement III. 1. Orissa figures low in the list even though its rate exceeds that of the average
./ recorded for India for the first time during the last three decades. Many of the states recording a growth rate higher than ~h~ country's average, viz., Nagaland, Manipur, Tripura, Assam and Meghalaya lie geographically clustered in the northeastern part of India.
STATEMENT III. 1
Arithmetic growth rate of India and stateS from 1901 to 1971
Decennial percentage of growth rate Rank in-Unit ~----------------~---------------~ 1961-71
1901~11 1911-21 1921-31 1931-41 1941-51 1951-61 1961-71
1 2 3 4 5 6 7 8 9
INDIA +5'75 -0'31 +11'00 + 14'2Z' +13'31 +21"51 +24'80
1. Andhra Pradesh +12"49 -0'13 +12'99 +12'75 +14'02 +15'65 +20'90 21
2. Assam· +16'84 +20'19 +20'05 +20'45 +20'12 +34'99 +34'71 4
3. Bihar +3'67 -0'66 +11'45 +12'20 +10'27 +19'76 +21'33 20
• Includes Mizo district. now constituted as union territory of Mizoram,
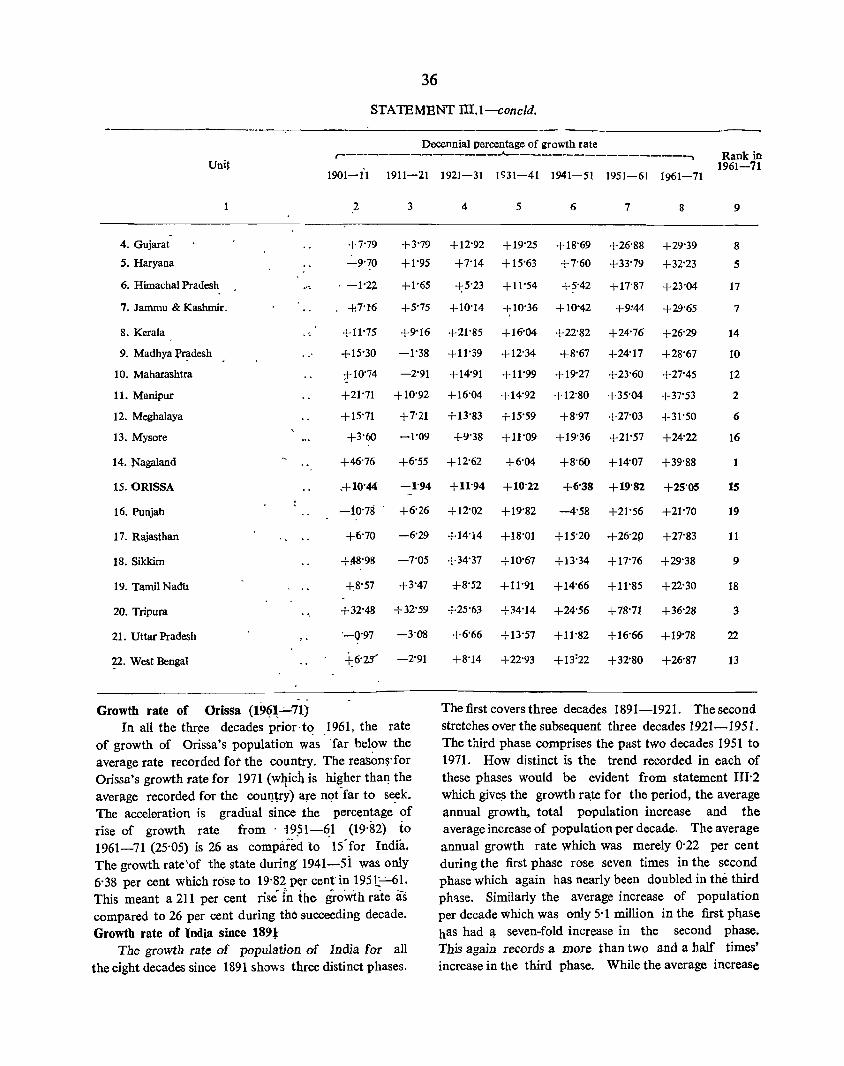
36
STATEMENT III,l-concld,
Decennial percentage of growth rate r--------------~---------------~ Rank in
Unil 1901-11 1911-21
1 2 3
-4. Gujarat +7"79 +3'79
5. Haryana -9'70 +1'95
6. HimachalPradesh . -1'2~ +1'65
7. Jammu & Kashrnir. +.7'16 +5'75
8. Kerala " +11'75 +9'16
9, Madhya Pr~desh +15'30 -1'38
10, Maharashtra :+10'74 -2'91
11. Manipur +21'71 +10'92
12, Meghalaya +15'71 +7'21
13. Mysore +3'60 -1'09
14. Nagaland +46'76 +6'55
15. ORISSA .+10'44 -1'94
16. Punjab -10'?!! +6'26
17. Rajasthan +6'70 -6'29
18. Sikkirn +~8'98 -7'05
19, Tamil NadU +8'57 +3'47
20, Tripura +32'48 +32'59
21. Uttar Pradesh '-0'97 -3'08
~2. West Bengal +6'2S" -2'91
Growth rate of Orissa (19~~_;_71) In all the thr,ee decades prior·tc! .1961, the rate
of growth of Orissa's population was 'far below the average rate recorded fot the country. The rea'Son$'for Orissa's growth rate for 1971 (w4ich is higher thaI). the average recorded for the couI).try) are n~t-far to se.ek. The acceleration is gradual since the percentage of rise of growth rate from' ·19.51-~1 (19'82) to 1961-71 (25'05) is 26 as compared to IS-for India, The growth rate\of the state during 1941-si was only 6'38 per cent which rOSe to 19'82 per cent in 19St-"-61. This meant a 211 per cent rise tn the growth rate as compared to 26 per cent during the succeeding decade. Growth rate of India since 1891:
The growth rate of population of India for all the eight decades since 1891 shows three distinct phases,
1961-71 1921-31 1<;31-41 1941-51 1951-61 1961-71
4 5 6 7 8 9
+12'92 +19'25 +18'69 +26'88 +29'39 8
+7'14 +15'63 +7'60 +33'79 +32'23 5
-+;5'23 +11'54 +5'42 +17'87 +23'04 17
+10'14 +10'36 +10'42 +9'44 +29'65 7
+21'85 +16'04 +22'82 +24'76 +26'29 14
+11'39 +12'34 +8'67 +24'17 +28'67 10
+14'91 +11'99 +19'27 +23'60 +27'45 12
+16'04 +14'92 +12'80 +35'04 +37'53 2
+13'83 +15'59 +8'97 +27'03 +31'50 6
+9'38 +11'09 +19'36 +21'57 +24'22 16
+12'62 +6'04 +8'60 +14'07 +39'88 1
+11'94 +10'22 +6'38 +19'82 +25'05 15
+12'02 +19'82 -4'58 +21'56 +21'70 19
+14'14 +18'01 +15'20 +26'20 +27'83 11
+34'37 +10'67 +13'34 +17'76 +29'38 9
*8'52 +11'91 +14'66 +11'85 +22'30 18
+25'63 +34'14 +24'56 +78'71 +36'28 3
+6'66 +13'57 +11'82 +16'66 +19'78 22
+8'14 +22'93 +13:22 +32'80 +26'87 13
The first covers three decades 1891-1921. The second stretches over the subsequent three decades 1921-1951. The third phase comprises the past two decades 1951 to 1971. How distinct is the trend recorded in each of these phases would be evident from statement 111'2 which give!> the growth rate for the period, the average annual growth, total population increase and the average increase of population per decade, The average annual growth rate which was merely 0'22 per cent during the first phase rose seven times in the second phase which again has nearly been doubled in the third phlise, Similarly the average increase of population per decade which was only 5·1 million in the first phase has had ~ seven-fold increase in the second phase. This again records a more than two and a half times' increase in the third phase. While the average increase
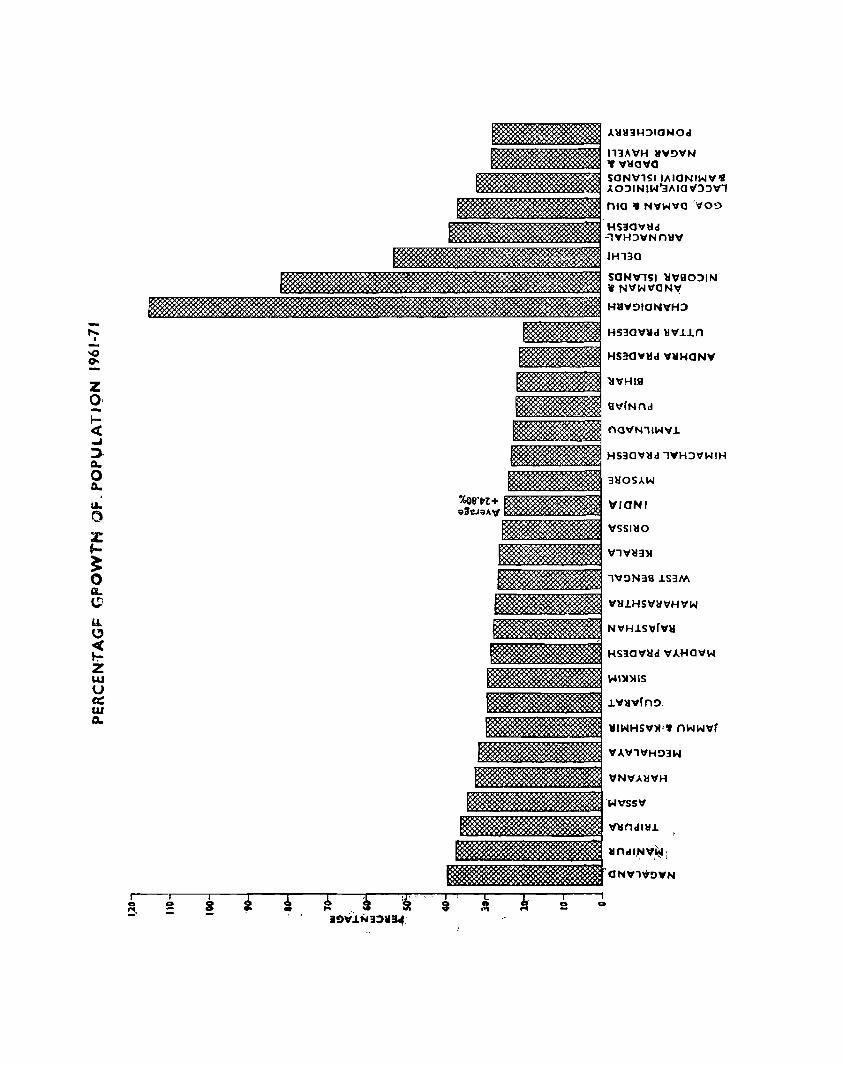
..... I
1 .,. ~.
1 2
1 8
[
~ 1 2
J.'II1I:lH:ll0l'olOd
113A\'H ~V!)VN If \''110'10 SON\,'SII'dON1W'It. J.O:llNIW'3Al0 1f:l::l'lf1
nlo • N,,"''I10 ''I10~
HS:lO'l1\1d -1VH:lVNnllV
JH130
SON~SI lI\'BO:JIN " ",VW'I10N\'
HUV!)ION"H::>
HS30V\ld 'II'I.1..1.n
HSl!OWl:Id VHHONV
H530'l1l1d lVH::>'I1W1H
3'1105AW
ViaNI
\'551'110
'\,!>N38 lS3M
V1I1HS'(flHtH'II'W
HS:lO\''IId \'AHO'ltW
lIIWH5'11)1''I nWWVr
'W\'5S\'
VlIndUll.
ONV1'1)o!)YN

.VI 140 o o o 0-o
z o i= 100 ct ..J ::;) Q.
o 80 a.
60
10
DECENNIAL VARIATION IN POPULATION OF OR-'SSA 1901 .. 71
.971 .961 1951 1941 1'31 1921 1911 1901
-RURAL •• URBAN
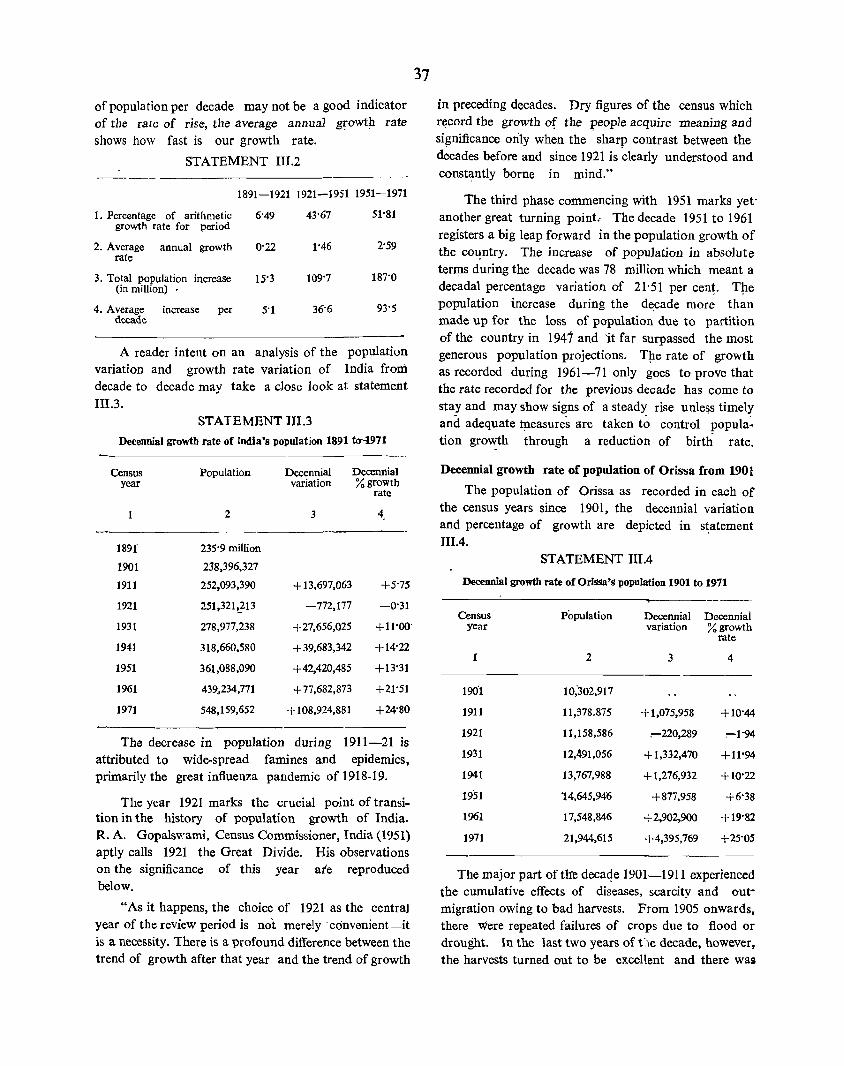
of population per decade may not be a good indicator of the rate of rise, the average annual gfowtP. rate shows how fast is our growth rate,
STATEMENT III.2 ----- -----------------
1891-1921 1921--1951 1951-1971
1. Percentage of arithmetic 6'49 43'67 51'81 growth rate for period
2, Average annual growth 0'22 1'46 2'59 rate
3, Total population increase 15'3 109'7 187'0 (in million)
4. Average increase per 5'1 36'6 93'5 decade
A reader intent on an analysis of the population variation and growth rate variation of India from decade to decade may take a close look at statement III.3,
STATEMENT IU,3 Decennial growth rate of India's population 189110--1971
Census Population year
Decennial Decennial variation % growth
rate
1 2 3 4,
1891 235'9 million
1901 238,396,327
1911 252,093,390 + 13,697,063 +5'75
1921 251,3212-13 -772,177 -0'31
1931 278,977,238 +27,656,025 +11'00'
1941 318,660,580 +39,683,342 +14'22
1951 361,088,090 +42,420,485 +13'31
1961 439.234,771 +77,682,873 +21'51
1971 548,159,652 + 108,924,881 +24'80
The decrease in population during 1911-21 is attributed to wide-spread famines and epidemics, primarily the great influenza pandemic of 1918-19,
The year 1921 marks the crucial point of trans ition in the history of population growth of India, R, A. Gopalswami, Census Commissioner, India (1951) aptly calls 1921 the Great Divide, His observations on the significance of this year ate reproduced below,
"As it happens, the choice of 1921 as the centra) year of the review period is not merely 'convenient -it is a necessity, There is a profound difference between the trend of growth after that year and the trend of growth
37
in preceding decades, Dry figures of the census which r«,?cord the growth of the :reople acquire meaning and significance only when the sharp contrast between the ~cades before and since 1921 is ~lear1y understood and const~ntly borne in mind,"
The third phase commencing with 1951 marks yetanother great turning point.- The decade 1951 to 1961 registers a big leap forward in the population growth of the co~ntry, The increase of popUlation in a~solute ten:)ls during the decade was 78 million which meant a decadal percentage variation of 21'51 per cen~, Tp.e population increase during the d~cade more than made up for the loss of population due to partition of the country in 1947 and 'it far surpassed the most generous population projections, Tp.e rate of growth as recorded during 1961-71 only goes to prove that the rate recorded for the previous decade has come to stay and may show signs of a steady rise unle~s timely and adequate tp.easures are taken to control popula~ tion gro~th through a reduction of birth rate,
Decennial growth rate of popUlation of Orissa from 1901
The popUlation of Orissa as recorded in each of the census years since 1901, the decennial variation and percentage of growth are depicted In statement I1I,4.
STATEMENT I1I.4
Decennial growth rate of Orissa's popUlation 1901 to 1971
Census Population year
1 2
190'1 10:302,917
1911 11,378,875
1921 11,158,586
1931 12,491,056
1941 13,767,988
1951 '14,645,946
1961 17,548,846
1971 21,944,615
Decennial Decenniai variation % growth
rate
3 4
+1,075,958 +10'44
:-220,289 :-1'94
+1,332,470 +11'94
+1,276,932 +10'22
+877,958 +6'38
+2,902,900 +19'82
+4,395,769 +25'05
The major part oft.lte -decaqe 1901-1911 experienced the cumulative effects of diseases, scarcity and outmigration owing to bad harvests, From 1905 onwards, there were repeated failures of crops due to flood or drought, In the last two years of be decade, however, the harvests turned out to be excellent and there was
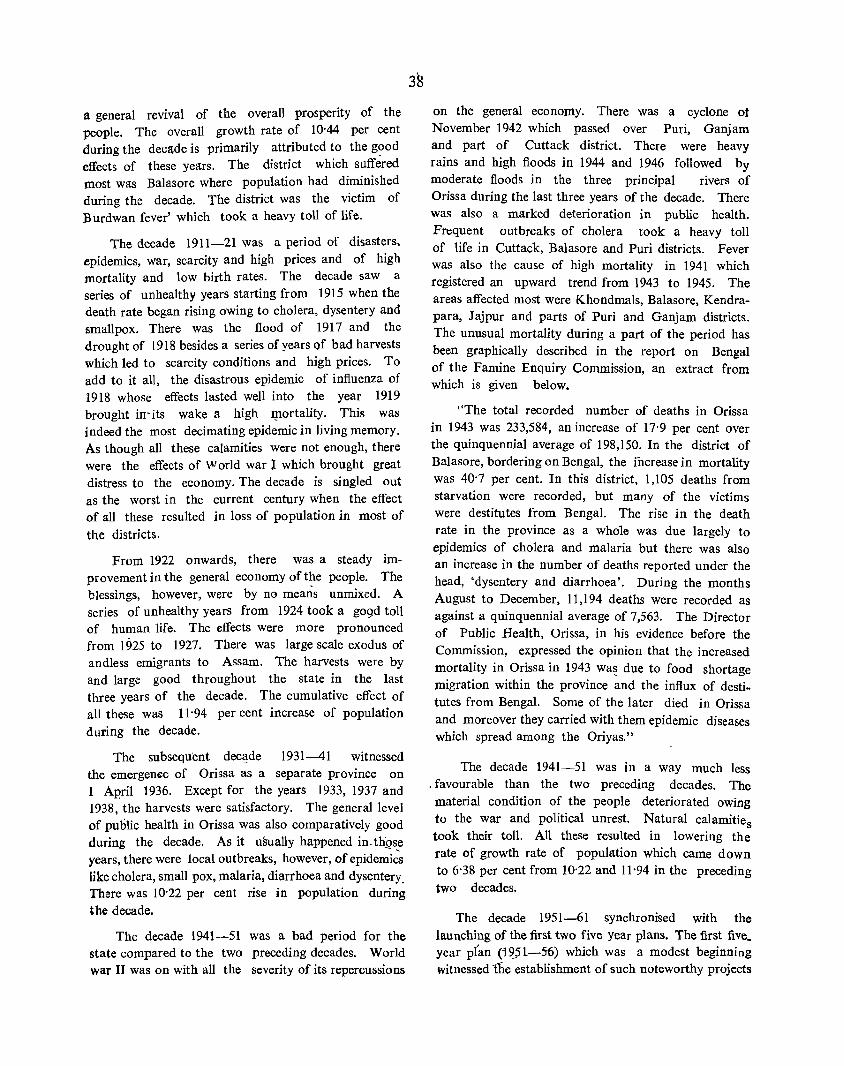
a general revival of the overall prosperity of the people. The overall growth rate of 10'44 per cent during the decade is primarily attributed to the good effects of these years. The district which suffered most was Balasore where population had diminished during the decade. The district was the victim of Burdwan fever' which took a heavy toll of life.
The decade 1911-21 was a period of disasters, epidemics, war. scarcity and high prices and of high mortality and low birth rates. The decade saw a series of unhealthy years starting from 1915 when the death rate began rising owing to cholera, dysentery and smallpox. There was the flood of 1917 and the drought of 1918 besides a series of years of bad harvests which led to scarcity conditions and high prices. To add to it all, the disastrous epidemic of influenza of 1918 whose effects lasted well into the year 1919 brought in- its wake a high J!1ortality. This was indeed the most decimating epidemic in living memory. As though all these calamities were not enough, there were the effects of VU orld war I which brought great distress to the economy. The decade is singled out as the worst in the current century when the effect of all these resulted in loss of population in most of
the districts.
From 1922 onwards, there was a steady improvement in the general economy of the people. The blessings, however, were by no means unmixed. A series of unhealthy years from 1924 took a g09d toll of human life. The effects were more pronounced from 1925 to 1927. There was large scale exodus of andless emigrants to Assam. The harvests were by and large good throughout the state in the last three years of the decade. The cumulative effect of all these was 11'94 per cent increase of population during the decade.
The subsequent decl!de 1931-41 witnessed the emergenee of Orissa as a separate province on 1 April 1936. Except for the years 1933, 1937 and 1938, the harvests were satisfactory. The general level of public health in Orissa was also comparatively good during the decade. As it usually happened in. those years, there were local outbreaks, however, of epide~i~ like cholera, small pox, malaria, diarrhoea and dysentery. There was 10'22 per cent rise in popUlation during the decade.
The decade 1941-51 was a bad period for the state compared to the two preceding decades. World war II was on with all the severity of its repercussions
on the general economy. There was a cyclone ot November 1942 which passed over Puri, Ganjam and part of Cuttack district. There were heavy rains and high floods in 1944 and 1946 followed by moderate floods in the three principal rivers of Orissa during the last three years of the decade. There was also a marked deterioration in public health. Frequent outbreaks of cholera took a heavy toll of life in Cuttack, Balasore and Puri districts. Fever was also the cause of high mortality in 1941 which registered an upward trend from 1943 to 1945. The areas affected most were Khondmals, Balasore, Kendrapara, Jajpur and parts of Puri and Ganjam districts. The unusual mortality during a part of the period has been graphically described in the report on Bengal of the Famine Enquiry Commission, an extract from which is given below.
"The total recorded number of deaths in Orissa in 1943 was 233,584, an increase of 17'9 per cent over the quinquennial average of 198,150. In the district of Balasore, bordering on Bengal, the increase in mortality was 40'7 per cent. In this district, 1,105 deaths from starvation were recorded, but many of the victims were destitutes from Bengal. The rise in the death rate in the province as a whole was due largely to epidemics of cholera and malaria but there was also an increase in the number of deaths reported under the head, 'dysentery and diarrhoea'. During the months August to December, 11,194 deaths were recorded as against a quinquennial average of 7,563. The Director of Public Health, Orissa, in his evidence before the Commission, expressed the opinion that the increased mortality in Orissa in 1943 wa~ due to food shortage migration within the province and the influx of destitutes from Bengal. Some of the later died in Orissa and moreover they carried with them epidemic diseases which spread among the Oriyas."
The decade 1941-51 was in a way much less . favourable than the two preceding decades. The material condition of the people deteriorated owing to the war and political unrest. Natural calamitie s took their toll. All these resulted in lowering the rate of growth rate of population which came down to 6'38 per cent from 10'22 and 11'94 in the preceding two decades.
The decade 1951-61 synchronised with the launching of the first two five year plans. The first five_ year plan ('1~51-5'6) which was a modest beginning witnessed The establishment of such noteworthy projects
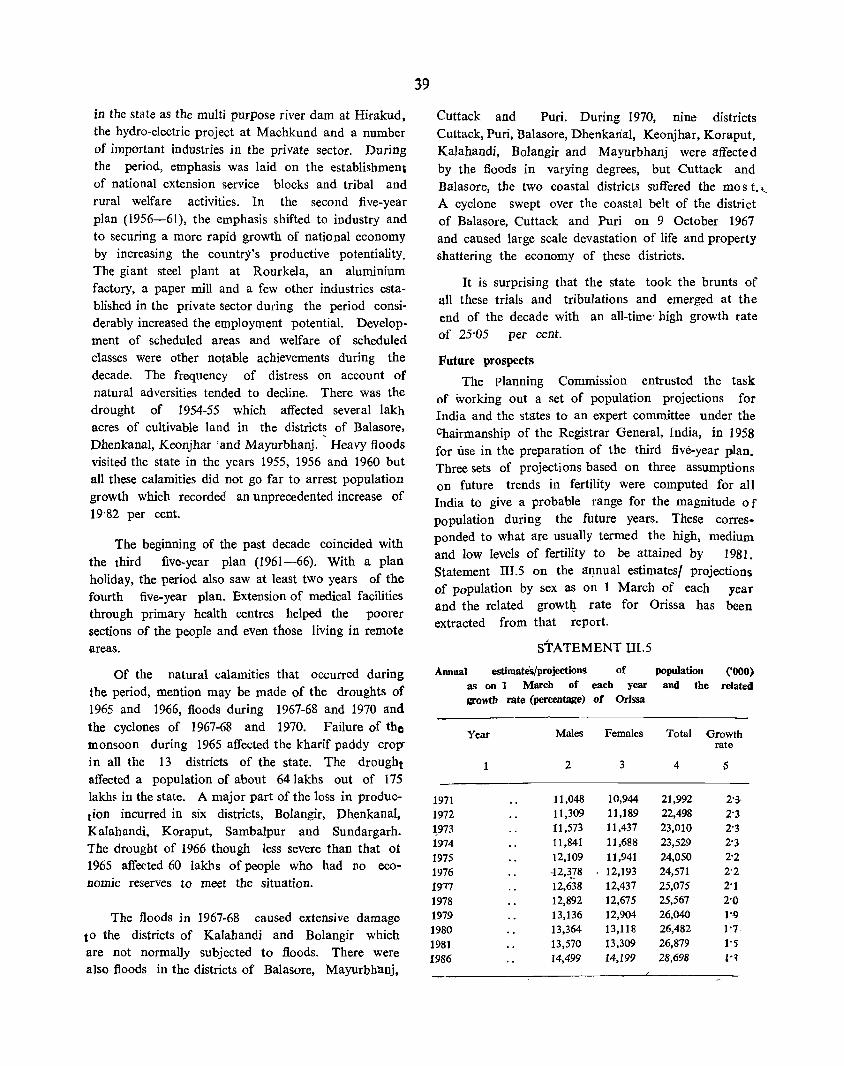
in the state as the multi purpose river dam at Hirakud, the hydro-electric project at Machkund and a number of important industries in the private sector. During the period, emphasis was laid on the establishment of national extension service blocks and tribal and rural welfare activities. In the second five-year plan (1956-61), the emphasis shifted to iudustry and to securing a more rapid growth of national economy by increasing the countrfs productive potentiality. The giant steel plant at Rourkela, an aluminium factory, a paper mill and a few other industries established in the private sector during the period considerably increased the employment potential. Development of scheduled areas and welfare of scheduled classes were other notable achievements during the decade. The frequency of distress on account of natural adversities tended to decline, There was the drought of 1954-55 which affected several lakh acres of cultivable land in the districts of Balasore, Dhenkanal, Keonjhar 'and Mayurbhanj, Heavy floods visited the state in the years 1955, 1956 and 1960 but all these calamities did not go far to arrest population growth which recorded an unprecedented increase of 19'82 per cent.
The beginning of the past decade coincided with the third five-year plan (1961-66). With a plan holiday, the period also saw at least two years of the fourth five-year plan, Extension of medical facilities through primary health centres helped the poorer sections of the people and eVen those living in remote areas.
Of the natural calamities that occurred during the period, mention may be made of the droughts of 1965 and 1966, floods during 1967-68 and 1970 and the cyclones of 1967-68 and 1970. Failure of the monsoon during 1965 affected the kharif paddy crop' in all the 13 districts of the state. The drought affected a popUlation of about 64 lakhs out of 175 lakh~ in the state. A major part of the loss in production incurred in six districts, Bolangir, Dhenkanal, Kalahandi, Koraput, Sambalpur and Sundargarh. The drought of 1966 though less severe than that ot 1965 affected 60 lakhs of people who had no economic reserves to meet the situation.
The floods in 1967-68 caused extensive damage to the districts of Kalahandi and Bolangir which are not normally subjected to floods. There were also floods in the districts of Balasore, Mayurbh"anj,
39
Cuttack and Puri. During 1970, nine districts Cuttack, Puri, Balasore, Dhenkarial, Keonjhar, Koraput, Kalahandi, Bolangir and Mayurbhanj were affected by the floods in varying degrees, but Cuttack and Balasore, the two coastal districts suffered the mo s t. '-.. A cyclone swept over the coastal belt of the district of Bhlasore, Cuttack and Puri on 9 October 1967 and caused large scale devastation of life and property shattering the economy of these districts.
It is surprising that the state took the brunts of all these trials and tribulations and emerged at the end of the decade with an all-time' high growth rate of 25'05 per cent.
Future prospects
The planning Commission entrusted the task of working out a set of population projections for India and the states to an expert committee under the Chairmanship of the Registrar General, India, in 1958 for use in the preparation of the third five-year plan. Three sets of projections based on three assumptions on future trends in fertility were computed for all India to give a probable range for the magnitude 0 f population during the future years. These corresponded to what are usually termed the high, medium and low levels of fertility to be attained by 1981. Statement IlLS on the al}.nual estimates! projections of population by sex as on 1 March of each year and the related growt!! rate for Orissa has been extracted from that report.
STATEMENT IlLS
Annual estimateS/projections of
1971 1972 1973 1974 1975 1976 19;7 1978 1979 1980 1981 1986
as on 1 March of each year growth rate (percentage) of Orissa
Year Males Females
2 3
11,048 10,944 11,309 11,189 It,573 11,437 11,841 11,688 12,109 11,941 -12,:[78 12,193 12,638 12,437 12,892 12,675 13,136 12,904 13,364 13,118 13,570 13,309 14,499 14,199
population and the
('000)
related
Total Growth rate
4 5
21,992 2'3. 22,498 2'3 23,010 2'3 23,529 2'3 24,050 2'2 24,571 2'2 25,075 2"1 25,567 2'0 26,040 1'-9 26,482 1'7· 26,879 1'5 28,698 '"
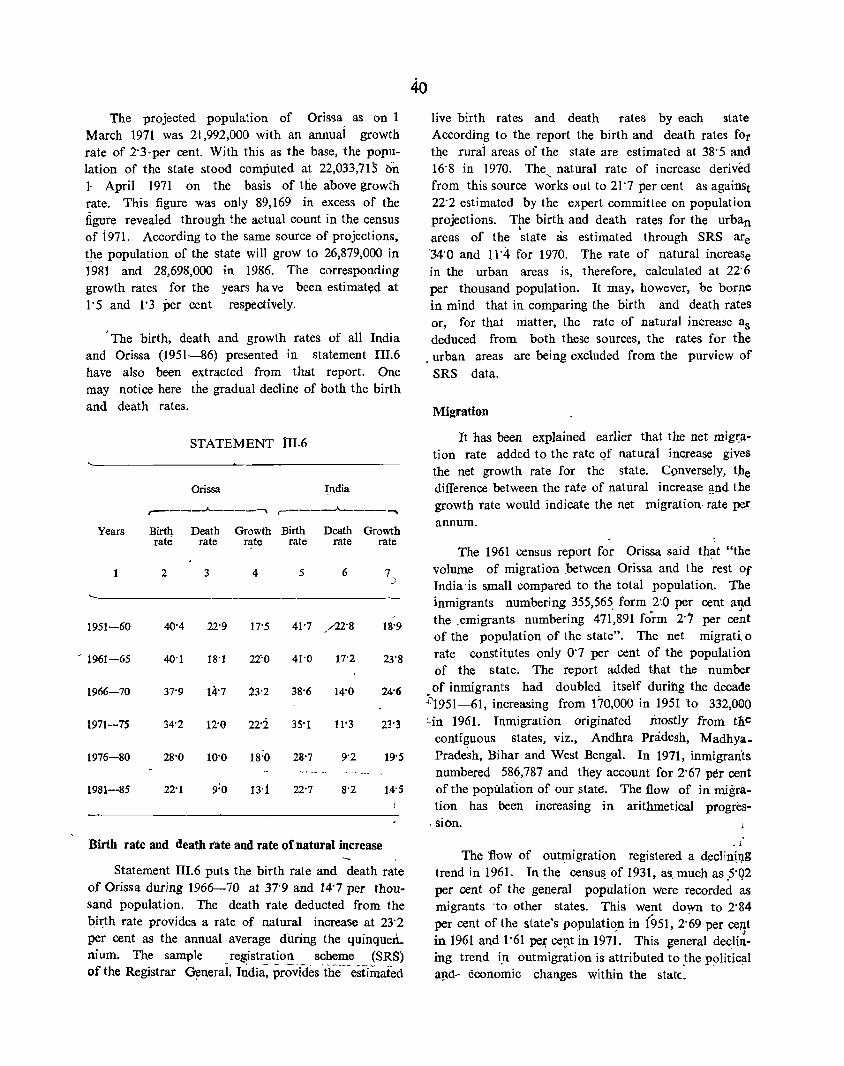
The projected population of Orissa as on 1 March 1971 was 21,992,000 with an annuai growth rate of 2'3'per cent, With this as the base, the population of the state stood computed at 22,033,71) on ]. April 1971 on the basis of the above growth rate, This figure was only 89,169 in excess of the figure revealed through the actual count in the census of t971. According to the same source of projections, ~e population of the state will grow to 26,879,000 in 1981 and 28,698,000 in 1986, The corresponding growth rates for the years ha ve been estimat~d at I' 5 and I' 3 per cent respectively,
I The birth, death and growth rates of all India and Orissa (1951-86) presented in statement 111.6 have also been extracted from that report, One may notice here the gradual decline of both the birth and death rates,
STATEMENT tn,6
Orissa India
~----~----~ ,----~~---~
Years Birth Death Growth Birth Death Growth rate rate rate rate rate rate
2 3 4 5 6 7,
1951-60 40'4 22'9 17'5 18'9
J 1961-65 40'1 18'1 22'0 41'0 17'2 23'S
1966-70 37'9 14'7 23'2 38'6 14'0
1971-15 34'2 12'0 35'1 11'3 23'3
1976-80 28'0 10'0 18'0 28'7 9'2 19'5
1981---85 8'2
Birth rate and death tate and rate of natural increase
Statement nI.6 puts the birth rate and death rate of Orissa during 1966-70 at 37'9 and 14'7 per thousand population, The death rate deducted from the qi~th rate provides a rate of natural increase at 23'2 per cent as the annual average dhring the quinquen.. nium, The sample registration scheme (SRS) of the Registrar General, India~ provides 'ihe--esi"imated
40 live birth rates and death rates by each state According to the report the birth and death rates for t4e rurai areas of the state are estimated at 38'S and 16'8 in 1970, The natural rate of increase derived .... from this source works out to 21 '7 per cent as againSt 22'2 estimated by the expert committee on population projections, The birth and death rates for the urban areas of the 'state as estimated through SRS are '34'0 and 11'4 for 1970, The rate of natural increaSe in the urban areas is, therefore, calculated at 22'6 per thousand popUlation, It may, however, be bor~e in mind that in comparing the birth and death rateS or, for that matter, the rate of natural increase as deduced from both these sources, the rates for the
• urban areas are being excluded from the purview of SRS data,
Migration
It has been explained earlier that the net migt:ation rate added to the rate qf natural increase gives the net growth rate for the state, Cpnversely, tJIe difference between the rate of natural increase ~nd the growth rate would indicate the net migration- rate per annum,
The 1961 census report for Orissa said that "the volume of migration ,between Orissa and the rest Of India ·is small compared to the total population, The inmigrants numbering 355,565 form 2:0 per cent and the ,emigrants numbering 471",891 form 2'7 per ce~t of the popUlation of the state", The net migrati, 0
rate constitutes only 0'7 per cent of the population of the state, The report added that the number of inmigrants had doubled itself durihg the decade
;:'1951-61, increasing from 170,000 in 1951 to 332,000 :..in 1961. Inmigration originated mostly from the
contiguous states, viz" Andhra Pradesh, MadhyaPrade"sh, Bihar and West Bengal. In 1971, inmigrants numbered 586,787 and they account for 2'67 per cent of the population of our ~tat~. The flow of in migration has been increasing in arithmetical progres-
, sion,
, i
The flow of outmigration registered a d.eclinj~g trend in 1961. In the censu~ of 1931, as, much as .5'Q2 per cent of the general population were recorded as migrants ,to other states, This went down to 2'84 per cent of the state's populati~n in (951, 2'69 per ce,qt in 1961 and 1'61 per cevt in 1971. This general dec1i~ing trend i,n outmigration is attributed to ,the p~litical a!ld- economic changes within the state.
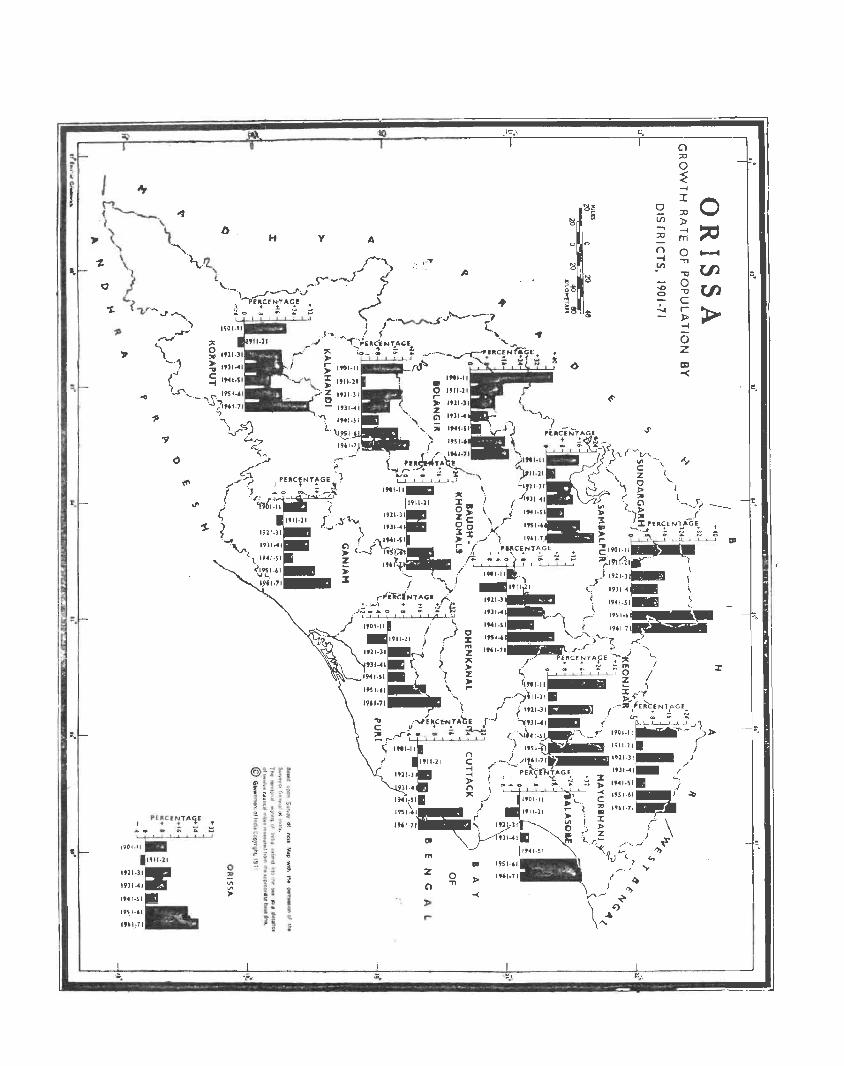
-f
0 I 0 ;:0
H
Vl ..., 1> ;:0
-f
" m y <> n 0
-f ......
win "TI
"C til a.
~ 0 0 "C til c .:.., r- > »
-f
o
0 Z
G:I -<
()
w.
=.
19S I·6I
1961-11 ... iJ.
co
"' • Z 0 C'I "" »0
-< ,. »
r
~.

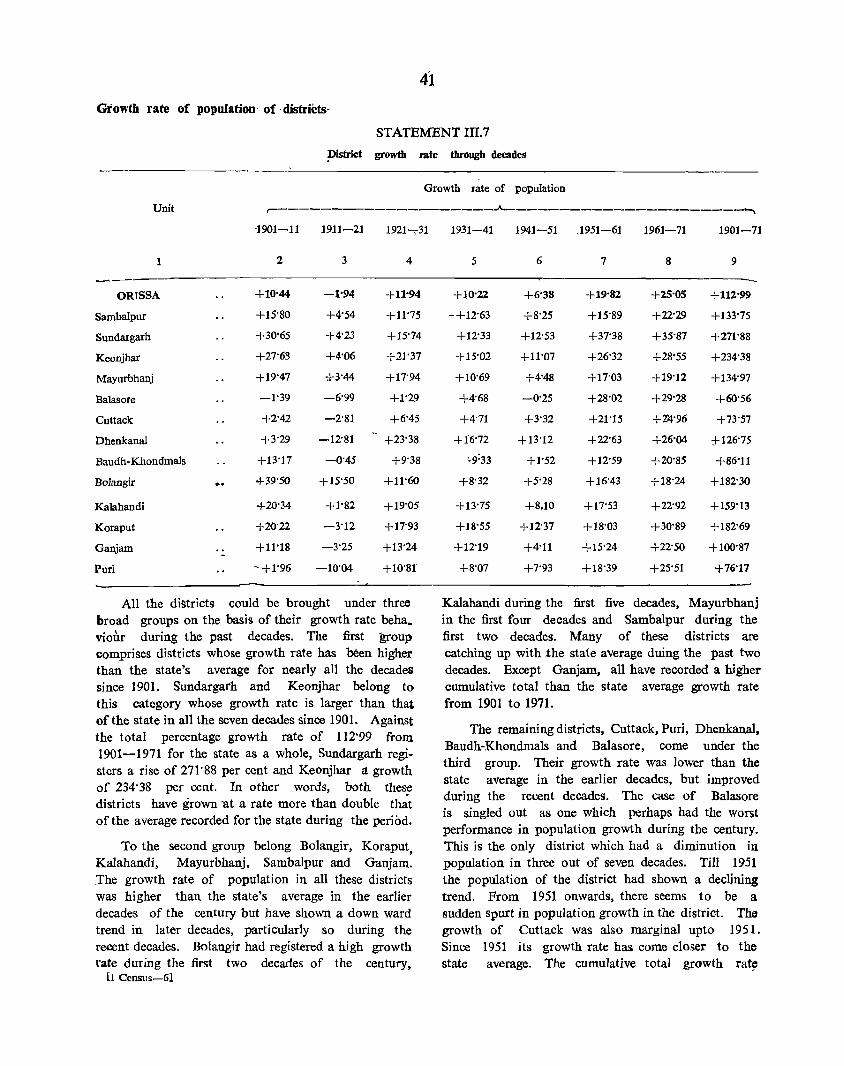
Growth rate of population' of, districts-
STATEMENT III.7
District growth rate through decades
Growth rate of population
Unit ,--------------------~----------------------~ -1901-11 1911-21 1921-;-31
1 2 3 4
ORISSA +10'44 -1'94 +11'94
Sambalpur +15'80 +4'54 +11'75
Sundargarh +30'65 +4'23 +15'74
Keonjhar +27'63 +4'06 +21'37
Mayurbhanj +19"47 -;1-3"44 +17'94
Balasore -1'39 -6'99 +1'29
Cuttack +2'42 -2'81 +6'45
Dhenkanal +3'29 -12'81 +23'38
Baudh-Khondmals +13'17 -0'45 +9'38
Bolangir +39'50 +15'50 +11'60
Kalahandi +20'34 +1'82 +19'05
Koraput +20'22 -3'12 +17'93
Ganjam .. +11'18 -3'25 +13'24 -Purl -+1'96 -10'04 +10'81
All the districts could be brought under three broad groups on the basis of their growth rate beha. viour during the past decades. The first group comprises districts whose growth rate has been higher than the state's average for nearly all the decades since 1901. Sundargarh and Keonjhar belong to this category whose growth rate is larger than that of the state in all the seven decades since 1901. Against the total percentage growth rate of 112'99 from 1901-1971 for the state as a whole, Sundargarh registers a rise of 271'88 per cent and Keonjhar a growth of 234'38 per cent. In other words, both thes~
districts have grown 'at a rate more than double that of the average recorded for the state during the period,
To the second group belong Bolangir, Koraput, Kalahandi, Mayurbhanj, Sambalpur and Ganjam. The growth rate of population in all these districts was higher than the state's average in the earlier decades of the century but have shown a down ward trend in later decades, particularly so during the recent decades. BOlangir had regIstered a high growth rate during the first two decades of the century,
II Census-61
1931-41 1941-51 ,1951-61 1961-71 1901-71
5 6 7 8 9
-+10'22 +6'38 +19'82 +25'05 +112'99
-+12'63 +8'25 +15'89 +22'29 +133'75
+12'33 +12'53 +37'38 +35'87 +271'88
+15'02 +11'07 +26'32 +28'55 +234'38
+10'69 +4'48 +17'03 +19'12 +134'97
+4'68 -0'25 +28'02 +29'28 +60'56
+4'71 +3'32 +21'15 +Z4'96 +73'57
+16'72 +13'12 +22'63 +26'04 +126'75
'-9:33 +1'52 +12'59 +20'85 +86'11
+8'32 +5'28 +16'43 +18'24 +182'30
+13'75 +8.10 +17'53 +22'92 +159'13
+18'55 +12'37 +18'03 +30'89 +182'69
+12'19 +4'11 +15'24 +22'50 +100'87
+8'07 +7'93 +18'39 +25'51 +76'17
Kalahandi during the first five decades, Mayurbhanj in the first four decades and Sambalpur during the first two decades. Many of these districts are catching up with the state average duing the past two decades. Except Ganjam, all have recorded a higher cumulative total than the state average growth rate from 1901 to 1971.
The remaining districts, Cuttack, Puri, Dhenkanal, Baudh-Khondmals and Balasore, come under the third group. Their growth rate was lower than the state average in the earlier decades, but improved during the recent decades. The case of Balasore is singled out as one which perhaps had the worst performance in popUlation growth during the century. This is the only district which had a diminution in population in three out of seven decades. Till 1951 the population of the district had shown a declining trend. From 1951 onwards, there seems to be a sudden spurt in population growth in the district, The growth of Cuttack was also marginal upto 1951. Since 1951 its growth rate ha~ come closer to the state average, The cumulative total growth rate
from 1901-71 of each of these two districts is about half that of the average for the state.
We may now proceed with a review of the growth of population in the districts of Orissa group by group on the basis of the classification outlined above. The review is confined to the period 1901-1971. The census population figures have been adjusted from 1901 onwards to the 1971 territorial limits' of the districts.
Sundargarh ranks eleventh in population and tenth in area among the districts of Orissa. The population which was 277,173 in 1901 increased to 1,030,758 in 1971-a rise 271'88 per cent during the last 70 years. The period 1901-11 was by and large a satisfactory decade. With the scope for agricultural expansion which provided adequate stimulus for inmigration from the neighbouring areas, the railway line, constructed within the district helped to take the local agricultural produce to outside markets. The population gain during the decade, therefore, amounted to 30'65 per cent which was the second highest in the state, next only to Bolangir, The first se~en years of the subs~quent decade (1911-21) were good but the last three years saw bad harvest!!.. and loss of population due to epidemics. The result was a 4'23 per cent :rise ·of population which seems satisfactory in the background of the loss of population in a number of districts, The period from. 1921:- 31 saw satisfactory public health conditions, The expansion of the rail.way lin~ to ·Birmitrapur in 1922 and the development -of limestone and manganese mines along with slltisfactory crop conditions, resulted in a 15'74 per cent growth during the decade. The tempo was kept up during the follOWing decades 1931-41 and 1941-51 notwithstmlding floods in 1943, the overall effects of the war and rising prices. The decade 1951-61 is greatly significant for the district as during the period there was remarkable indu~trial development. Establishment of a cement factory at Rajgangpur and'the giant steel plant at Rourkela were the most noteworthy features. To add to it, construction of a fertiliser plant at Rourkela and development of mining industry in Birmitrapur and other areas of the district added to economic prosperity. Agricultural prosperity combined with industrialisation in a big way resulted in a phehomenaL 37'38 per cent rise for the district which was almosf double tile, average recorded for the s.tate. The pace of development f in the district seems to have gone hand in hand with the rate of growth of popu-
lation which has' been maintained at 35'87 per cent during 1961-71.
Keonjhar ranks twelfth in population and in area. Since 1901 its popUlation has increased from 285,758 to 955,514 (234'38 per cent). The first decade (1901-11) which was one of overall prosperity for the district resulted in the growth of population at 27'63 per cent. The subsequent decade 1911-21 which was rather devastating for other districts Was much less so for the district which had a small increase of 4'06 per cent: The period 1921-31 was one oT quick recovery from the ill-effects of the previous decade. Satisfactory crop conditions and improvement in public health far outweighed the effects of the heavy flood in the Baitarani in 1927 and the increase of population was maintained at 21'37 per cent. The subsequent decade 1931- 41 saw out. breaks of smallpox and cholera along with bumper crops in 1936-37. This was followed by partial drought in 1938 and 1939. In spite of these ups and downs, the population increased by 15'02 per cent. There were bad crops due to deficient rainfall in many of the years during the subsequent decade (1941-51). Smallpox and cholera in 1947 to(}k a heavy toll of life. This was reflected in the moderate increase of 11'07 per cent. The decade, 1951-61 was a comparatively prosperous period when the district went through the process of agricultural and industrial development. Apart from the establishment of nationaf ext'ension service blocks throughout the state which greatly helped agricultural development, the mining industry at Barbil developed along with the establishment of a mining school and a college at Keonjhar, Road communications developed extensively for transport of ores. There was a resultant increase of 26' 32 per cent which has risen to 28'55, during the decade 1961-71.
We come to the second category of districts. Bolangir ranks eleventh in size and ninth in population, Its population which was 447,625 in 1901 reached 1,263,657 in 1971 (a rise of 182'}O per cent during these 70 years), Agricultural prosperity during 1901-11 and the development of road communications improved the material conditions of the people Many of them returned to the district from out side Orissa where they had gone during the disastrous famine of 1889-1900. Tht; increase of 39'50 per
-cent during the aecade was the highest in the state. The same was the case \ in the subsequent decade of 1911-21 when the district recorded the highest growth
rate of 15'50 among all the districts of the sta.te. There were sporadic outbreaks of cholera, smallpox and influenza and yet the dist~ict recorded a growth rate of 15' 50- per cent. The next 30 years witnessed a slow decline" til1 1951 when the three decadal perce:rltage variations were 11'60, 8'32 and 5'28 respectively. This, however, looked up again in 1951-61 when the benefits of the Hirakud irrigation system were extended to Dungripali and Binka police stations of Sonepur subdivision. Railway communication between Sambalpur and Titlagarh started during the decade. Extension blocks were set up along with construction of a number of minor irrigation projects. The district recorded a growth rate of 16'43 per cent which rose to 18'24 during 1961-71.
Koraput, the biggest district in size, ranks fourth in population. The decade 1901-11 was a period of general prosperity, barring a localised famine in Bissamcuttack in 1910. There was a 20'22 per cent rise in population during the decade. The situation changed in 1911-21 when epidemics took ~ heavy toll. There was a reduction of population by 3'12 per cent. From 1921 onwards, the growth rate has been steady. During 1934-41 a new railway line connecting Vizianagram and Raipur passing within tile district was opened. New roads were laid, the important _one being the KoraputRayagada road. The high flood in the- Vamsadhara in 1938 and the sever~ outbreak of cholera in "1945, 1949 and 1950 did not cause any substantial set-back fo the rise in popUlation which was 18'55 and 12'37 during 1931- 41 and 1941-51. During 1951-61 Koraput saw multi-sided development. The Machkund Hydro:electric project and Dandakaranya development were the twC) major schemes besides establishment of N. E. S. blocks along with various other schemes of economic development. There was a population rise of 18'03 per cent during the decade· In 1961- 71, the major development in the district was the establishment of an aero-engine factory at Sunabeda, besides other small development measures. The district has recorded a 30'89 per cent growth rate which is the second highest in the state next only to Sundargarh.
The district of Kalahandi stands fourth in area and tenth in population size. Its population in 1901 was 449,137 which has grown to 1,163,869 in 1971-an overall growth of 159'13 per cent. The first decade of the century (1901-1i) saw a general state of prosperity, good harvests and low rents.
43
The availability of culturable waste lands provided an incentive for the 'influx of the cultivators from the neighbouring areas of" Madras and the central provinces. The district recorded a rise of 20'34 per cent in population, The next decade, as in other areas of the state, brought epidemics like influenza and cholera. The district saw a marginal increase of 1'82 per cent. The next decade (1921-31) .witnessed occasional distress caused by epidemics but there were good harvests. Construction of the RaiputVizianagram railway line passing through this area and the abolition of 'Begar' and 'Bahabandha' improved the material condition of the people. The district therefore recorded a high growth rate of 19'05 per cent. This however declined during the two subsequent decades ending in 1951. The rising prices of food articles owing to the war and low agricultural yields due to vagaries of the monsoon got reflected in the low population rise of 8' 10 per cent during 1941-51. The decade 1951-61 had the good effects of the planned economic development particularly in the rural areas through introduction of community deVelopment and national extension services and minor irrigation works. There was also a marked improvement in general health. The growth of population increased to 17'53 in 1951-61 which again rose to 22'92 per cent during the last decade (1961-71).
The district of Mayurbhanj ranks eighth in area and seventh in population size. Its population has risen from 610,383 -in 1901 to 1,434,200 in 1971-a rise of 134'97 per cent. During 1901-11, two railway lines, one connecting Baripada town with Rupsa railway station and the other connecting the mines at Gorumahisani with the work site of the Tare iron and steel company were built. The growth rate during the decade was fairly high at 19'47 per cent In 1911-21, new roads were built and the railway line was extended. The iron mines in Bamanghati subdivision were opened. But poor harvests from 1913 to 1951 and the influenza epidemic of 1918 caused large scale mortality. The net growth rate during the period was 3'44 per cent. The two subsequent decades 1921-31 llBd _1~1-41 were fairly good except for occasional epidemics and the va~aries of the monsoon. Low prices of agricultural produce c?ustrd economic depression from 1937-39. The district, therefore, registered a growth rate of 4'48 per cent during 1941-51. The decade 1951-61 h,ad the effects of the two plan periods. This was a peri9d
: ,(,)f·.econoqUq 'prosp~rity and, ov~rall satisfact~l)' con~i, ~igns:in public health. rh~ district .recorde~ a gr'?wth
r~te of. 17:0_3 J>~r ~nt· d!lring the decade which in9reased' to 1!)'12 during the last decade (1961-71).
'Sanlbalpur' is the second largest distr'ict in size and ranks fifth in population. From 789,258 persons in 1901, its population has risen up to '1,844,898 in 1971. The district suffered from famine during the closing years qf the llineteenth century but the recovery was rapid during '1901-11 when a high !>irth rate with successive years of good harvests resulted in a 15'80 per (.;ent rise in population. The next decade 1911-21 saw the effects of cholera and influenza. Added to this; there were floods during the closing years of the decade. All these resulted in a low grC?wth rate of 4'54 per cent. The growth rate during the subsequent three decades 1921-51 was, however, steady. Development of mines and the establishment of a paper mill at Brajrajnagar marked the beginning of industriali~ation in the district. Work on the Hirakud dam started in 1946 and the large scale construction attracted immigrants. The establishment of the Indiari aluminiUm factory and other ancillary industries at Hirakud, the engineering and medical colleges at Burla and the construction of a railway line connecting Sambalpur and Titl~garh were' other notable events during 1951-61. All these resulted in a high growth rate of 15'89 per cent during 1951-61 which rose .to 22'29 per cent 9.uring 1961-71.
-; [[G~njam ranks third in area and population. -Statfin~: With a population of 1,141,963 in/, 1901, -:'li~ pbpwll.'tion <has growh to 2,293,808 in 1971- a ~. riiie 6f('tocf. 87 'Per 'Cent. ''fhis is slightly below the '~te~"" growtli recorded for the -State as a; whole .2 willcR' is 1:12'99 ~er cenU During 190'1-11, the district ~ rec~6re(f ~at'isfact~rily from 'the effects of famine. A l~cc;tlis~d ~. famine in ,the agency tracts \ of Parlakhemundi and Bemampur taluks in 1908-1909 was controlled in time. The district had· a population gain of 11'18 per .cent during the deoode. The subsequent decade 1911-21 witnessed Dad crops and u~satisfactory public health 'conditions. Apart from the epidemic of influenza- in 1918, thetaluks ofGhumusur, Kodala and Chatrapur were affeCted by famine. The decade, therefore, ended with a population loss oy 3'25 per cent. The district thereafter continued to maintain a satisfactory growth rate tili the end of 1941. The first half of the decade 1941-51 experienced total failure of crops. Malaria and cholera also caused heavy mortality. The growth of population during
this- decade w,a& 4)1 per. cent. 1\s was the case with other di~tricts, pl~nnea economic d\,:velopment and availability or' curative and preventive medical facilitites helped the population of the district to main tain a high grOWth rate of 15'24 during 1951-61 and 22'50 in 1961-71 though these rates were lower than the state average.
Districts belonging to the third category whose rates were lower than the state average in the earlier decades of the century have shown considerable improvement during recent decades. C)lttack, the most populous district in the state, occupies the fifth rank in area. Starting with 2,205,296 persons in 1901, its popUlation has risen to 3,827,678 in 1971. The overall growth is only 73'57 per cent which is far below the state average. The growth of population in this district has been marginal for all the five ,decades from 1901-51. The entire period presents a sorry tale of cyclones, floods, saline water
. inundation, damage to crops, outbreak of epidemics and other distresses. The cumulative effect of all these was a very low growth rate ranging between 2 and 6 per cent per decade except for 1911-2f when, like many other district,. there was a net population loss in this district. Since 1951, the population of this district is picking up. Control of malaria and establishment of medical colleges and other health centres helped in reducing the mortality rates. Besides, agriculture received a fill up during the first plan period which also witnessed the emergence of Chowdwar as an industrial town with the establishment of industries such as paper, textiles, tubes, etc Other noteworthy events within the district were the coriimencement of construction of the road-bridges
"bn the Mahanadi' ahd "Birupa and an express highway connecting the Sukinda mining area with Faradip port. The construction of the- Paradip port for tbe ~xport or' iron ore was a very important landniark 1lle decade was not without occasional distress like the bursting of the embankment locally known as 'Dalaighai' in 1955. But this could not neutralise the overall prosperity in the district which led the population to register an all-time high record rise of 21'15 per cent which far exceeded the state average tor the decade. The tempo has been kept up during 1961-71 when the district had a decadal growth of 24'96 per cent close to the average for the state.
Puri occupies the ninth rank in area and the second position according to population size. Its population has grown from 1,328,753 in 1901 to 2,340,859 in 1971.
The decadal ;growth has .been .16·J 7 per cent, Which is rather clos-e' to' that recorded for Cuttack. The
,. story or' population growth of 'both these distr~cts appears to have been similar since 1901. There were successive failure of crops for four years from 1904 and heavy mortality resulted from the outbreak of cholera in 1908. It was mainly owing to the good crops and satisfactory heaith conditions in the last two years of the decade that the district recorded a marginal rise of 1·96 per cent of population during the decade. The subsequent decade 1911-21 which was divastating for other districts was more So for this district where except for the period 1913-16, the whole of the decade was a period of misery and distress. partial failure of crops in 1917 followed by the deadly outbreak of influenza in 1918 sent up the death rate ·to 47·7 per mille. In 1919, it touched an unprecedented 70' 3 per mille. The district, therefore, recorded a population loss, the highest in the state next only to Dhenkanal during the decade. The subsequent three decades 1921-51 were comparatively free from natural calamities except for sporadic attacks of smallpox, cholera and malaria. .The decade "\Vitnessed a growth rate of 10·81 per cellt in 1921-31 declining slowly to 7'93 per cent in 1941-51. _The growth_ of population during the subsequent decades f(om 195}-11 has be_c~ in line with that of other districts, possibly the effect of planned economi c development and improvement in general public health.
Balasore is the -smallest-. .district. ·in. _Qrissa_ ilL area but ranks sixth in population. With 1,140,10? personsIn 19o1~ its popillatibfi l1as gl't>WItto 1,830,'584' in 1971., The growth rate is 60·56 per cent f()r alL.the seven decades. The record of ,-population growth of this. district is. .the .poorest in. the state tho~gh as a coasta1-district like Cuttack) Puri and Ganja~, its pattern of pppulation growih should have proceeded on identical lines. The district can be singled (;n~t as one which suffered a net population loss of .31,32.1 between 1901-1941. In fact out of the five decades from 1901 to 1951, the district suffered -lleavy p~pulation loss for three decades. The rise in population in the remaining two decades was marginal. Among the many reasons responsible for this were the drought in 1915 and 1916, failure of crops in 1918 followed by the disastrous influenza epidemic, prevalence of malaria for years, inadequate rainfall in 1934, 1935 and 1939, floods in 1933 and 1940 and outbreak of epidemics like cholera and fever in the year 1935, 1936
45
J'j.p-d.) 939. :r)1~ sfverity.of" !he .. cys:lone in J9~~ wl!ich devl:\stated extens,lve areas )ind caus~<! h~,avy' 10s~ to crops and repetition of the calanlltY in the. succ~eding y~ar of f943 by a strong easte~ly wind which ca1\se~ saline inundation of crops ip 1944 are other reason~. Yet the district, recorded an all-time high. grow~h tate of 28·02 per cent during 1951-61 which not oilly was the second highest for the state but far exceeded the state average. The performance has been repeated in 1961-71 when the district had a growth rate ?f 29·28 per cent which was -the third highest in the state and much in excess of the state average. How much of this can be attributed to eradication of malaria and availability of general health facilities and how much to the effects of planned economic development is a matter for more intensive study.
The district of Dhenkanal ranks seventh in area and eighth in population size. Its population has grown from 570, 641 in 1901 to 1,293,914 in 1971, resulting in II
total growth of 126'75 per cent. During 1901-11, thC1. district recorded a marginal increase in all areas except in Dhenkanal subdivision where the population diminished on account of the 'Khuda' famine of -1~08 and cholera. Angul suffered a populatio n loss owing to short harvest.s and scarcity of food. The decade 1911-21 was bad for the district as it was for the whole of the state. Along with failure of rain which affected tl1e food crops, cholera, smallpox and ino:t:e particularly, .the influenza epidemic of 1918 took a heavy toll.
'lhe-district suffered the heaviest population loss in tedll.s" of perceilfage (-12·81) for the whole state· During 1921-31, the distrIct recuperated maFvellously and registered a rise of 23·38 per cent which was the
. hlghest in the state fortne aecaae: The Ta'lchet"coalfields- were ·opened and the railway connecting this locality tvith Cuttack was laid. Crops were yery satisfactory.- Road communiGations were also improved. The growth rate was somewhat lower in th~ r-ext qecade (1931-:41) because of the spread of malaria in an epidemic· form. The rate again declined during the subsequent decade 1941-51. The district has recorded a higher growth rate than the state average in both the decaoes 'from 1951 to 1911.
Baudh-Khondma1s occupies the sixth rank in area but ca'mes last in population- size. Its population started with 334,036 persons in t901 and rose to 621,675 in 1971. The net rise during these seven decades is thus 86·11 per cent, which is far below the state average. The district had a moderate rise of 13·17 per cent during 1901-11. There was a failure of

~ango and mohua crops in 1907 and 1908 which caused considerable ,distress to the scheduled tribes who are numerous in the district. The decade 1911-21 witnessed repeated failures of crops whicl\ le~ to the famine in 1919 in the southern parts of the district. This was followed, however, by a speedy recovery when during the subsequent decade 1921-31, public health conditions improved along with the general crop condition, resulting in a total gain of 9'38 per cent during the decade. This rate- was maintained
.during 1931-41 in spite of epidemics. The decade 1941-51 was perhaps the worst because of shortage of foodstuffs and marked deterioration in public health conditions, when the district recorded a very marginal rise of 1'52 per cent. Ev~n in 1951-61 the district recorded the lowest riSe in the state of 12'59 per cent. The growth rate went up to 20'85 per cent in 1961-71.
Broad conclusions on trends of growth rates
Thus while the coastal districts of Puri, Cuttack and Balasore suffered the most in the earlier decades, almost all the districts faced badly during 1911-21 when seven of the thirteen districts experienced a negative growth rate. Compared to the coastal districts, the distress seems to have been much less in the inland districts of Sambalpur, Sundargarh, Keonjhar, Mayurbhanj, Bolangir and Kalahandi. The decade 1941-51 was another period like 1911-21. The second world
war, natural calamities and epidemics substantially retarded population growth. Only one district, Balasore suffered a loss but the rate of growth in many other districts was marginaL If 1921 is held as the year of the Big Divide for the population of India as a whole, thc::_ same does not hold good for Orissa where -p~ulation growth during 1941-51 was as low as 6'38 per cent. It is from 1951 that Orissa attained a steady rate of population growth. It tried to catch up with the all-India average during 1951-61 and marched a step forward in 1961-71. Among the districts, Sundargarh and Keonjhar have had a high and steady growth rate for- most of the decades. Their overall growth rate for all the seven decades have, therefore, been the highest. Both -these districts have made notable strides in industrialisation and mining. But how much of this has gone to improve the growth rate is a matter for detailed f'..tudy.
The state average growth and distribution of districts
Statement 1l1.8 arranges the districts in five convenient ranges of growth rate for all the decades since 1901. Here the large number of districts in the lowest range during 1911-1921 'catches attention. Balasore district has figured in the lowest range thrice. None of the districts is found in the lowest range after 1951.
STATEMENT Ill. ~
Decade
1
1901-1911
1911-1921
DIStribution of districts by growth >rate of population 190f-1911 to 1961-1971
/
Distributiofi in each range of decennial growth rate of population ~-------------~---------~--------------------~ Range 1 Range 2 Range 3 Range 4 Range 5
(Less than O%) (Up to 10%) (10'01-20'OOYJ (20'01-30'OO%) (30·01 %+)
2
Balasore
Dhenkanal
Pori
Balasore
Ganjam
Koraput
Cnttack
Baudh-Khondmals
3
Pori
Cuttack
Dhenkanal
Kalahandi
Mayurbhanj
Keonjhar
Sundargatlr -
Sambalpur
4
Ganjam
Baudh-Khondmals
Sambalpur Maynrbhanj
Bolangir
5
Komput
Kalahandi
Keonjhar
6
Sundargarh
Bolangir
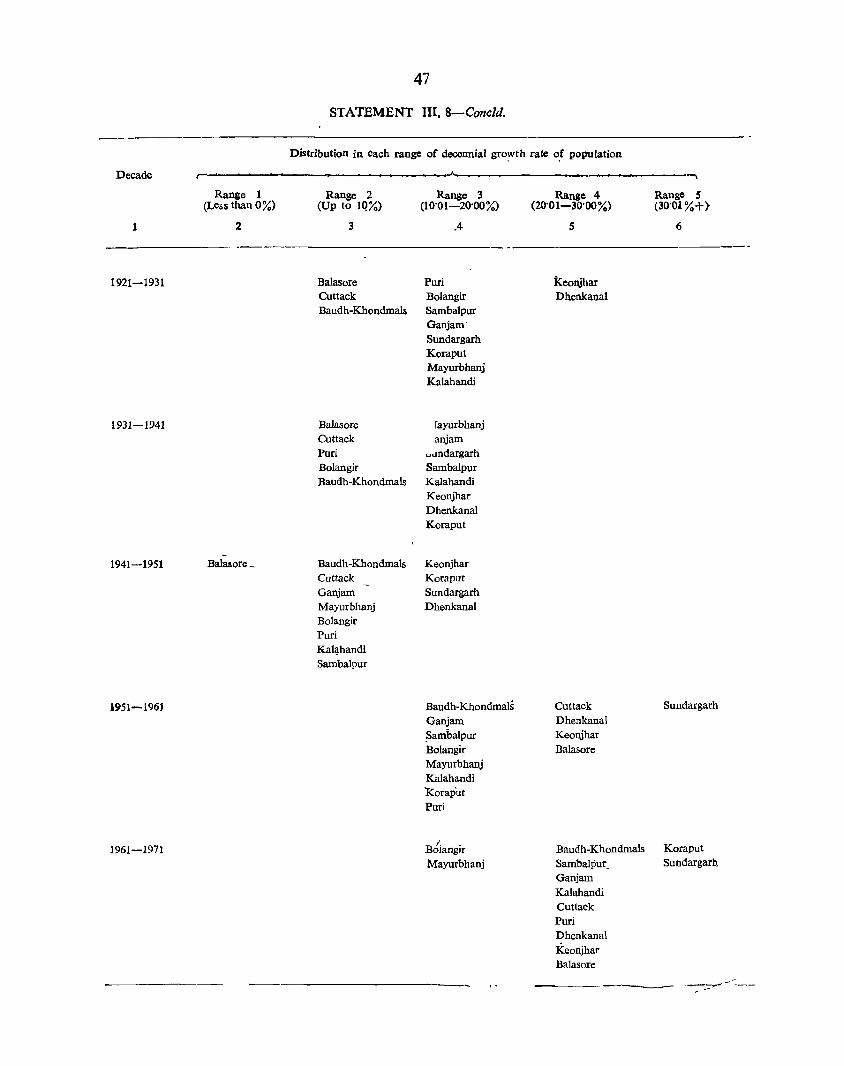
Decade
1
1921-1931
1931-1941
1941-1951
1951-196J
1961-1971
47
STATEMENT III,8-Concld.
Distribution in each range of decennial gro:nth rate o.f population
r-----------~----------------------,A---------------------------------~ Range 1
(Less than 0%)
2
-Balaaore_
Range 2 (Up to IQ%)
3
Balasore Cuttack Baudh-Khondmals
Balasore Cuttack Puri Bolangir Baudh-Khondmals
Baudh-Khondmals Cuttack Ganjam Mayurbhanj Bolangir Puri Kal~handi
Sambalpur
Range 3 (10'01-20'00%)
.4
Purl Bolangir Sambalpur Ganjam' Sundargarh Koraput Mayurbhanj Kalahandi
rayurbhanj anjam
.... mdargarh Sambalpur Kalahandi Keonjhar Dhenkanal Koraput
Keonjhar Koraput Sundargarh Dhenkanal
Baudh-Khondmals Ganjam ~ambalpur Bolangir Mayurbhanj Kalahandi Koraput Puri
B6iangir Mayurbhanj
Range 4 (20'01-30'00%)
5
Keonjhar Dhenkanal
Cuttack Dhenkanal Keonjhar Balasore
Baudh-Khondmals Sambalput_ Ganjam Kalahandi Cuttack Puri Dhenkanal Keonjhar Balasore
Range 5 (30'01%+)
6
Sundargarh
Koraput Sundargarh
.~----:.-.-

All the districts have been classified into Six ranges districts of Bolangir and Mayurbhanj whose growth basing on growJh_p~rform::l.llce during 1_961-1971 r~te in t~e e_arlier decade§ of t4e century far exceeded in statement III.9. It has been in.dicated earlier that the state average have now been listed in the lowest during this period the districts of Bolangir (+ iS024), range number. At -the other extreme, there is Balasore Mayurbhan] -C+f90i2j, Bauah-Khondmals (+20oB5), whose growth perIOrmanff: In almost all the decades Sambalpur (+22°29), Ganjam (+22·50), KalahanOi up to 1951 was far below the state averageo The district ( + 22°92f -an(l Cuttack (+24°96) recorded a growth now rides the cresto Sundargarh has unifromly rate iower than the state average. On the other hand maintained its high growth rate for almost all the decades the districts of Puri (+25°51), Dhenkanal (+26°04), I and has ranked first among the districts during the Keonjhar (+28· 55), Balasore (+ 29'28), Koraput last two decades. This district, along with Koraput (+300 89) and Sundargarh (+35·87) registered a which ranks next in order in growth rate has seen brisk growth rate higher than the state averageo The development activities during the decade (1961-71).
STATEMENT III.9
Distribution of districts by growth rate of population 1961-1971 (State average+2S00S per cent)
Range 2 Range 3 Range 1 (Less than 19 0 42YJ (19"42-22036%). (22037-23094%)
1
Bolangir
Mayurbhanj
Growth rate of tahsils
2 3
Baudh-Khondmals Glnjam
Sambalpur Kalahandi
Statement III.10 gives the distribution of tahsils by growth rates in six ranges basing on their growth during 1961-71. None of the tahsils recorded a negative growth rate nor a very low growth rate. Most of the 23 tahsils coming under the low growth rate range 4 belong to inland districts while those in the average growth rate range 3 lie dispers~d -in both inland and coastal districts. Of the 13 tahsils in the high growth range, eight belong to coastal districts. Most of these t1hsils embrace either a mining or industrial area or a town with a.sizeable population.
Range 4 (23'95-25 0 86%)
4
Cattack
Puri
Range 5 (25°87-29°16%)
5
Dhenkanal
Keonjhar
Range 6 (29 0 17%+)
6
Balasore
Koraput
Sundargarh
Of the five tahsils showing a very high growth rate three, vizo, Umarkot, Malkangiri and Motu lie clustered in the qistrict of Koraput. These three tahsils have absorbed many displaced persons from the erstwhile East Pakistan. Otherwise, these three tahsils are habitats of the tribal population whose overall _growth rate in the state has been lower than the average recorded for the general population. The remaining two tahsils in this category are Panposh and Barbil, Barbil has been the scene of brisk mining activity and Panposh tahsil of considerable industrial development during the last decade.
STATEMENT 111.10 Distribution of tahsils by growth rate (1961-1971)
Very high growth rate (45 % and above)
Panposh
Barbil
Umarkot
Malkangiri
Motu
High growth rate (44°9-30°0%)
2
Deogarh
Rairakhol
Kanjipani
Balll;llore
Soro
ChandbaJi
Average growth rate (290 9-200 0%)
3
Sambalpur -Hargarh
Kuchinda
Sundargarh
Hemgir
Rajgangpur
Low growth rate Very low growth rate (19 0 9-j'OY.,) (less than j %)
4 5
Jharsuguda
Padampur
Champua
Betnoti
Rairangpur
Karanjia
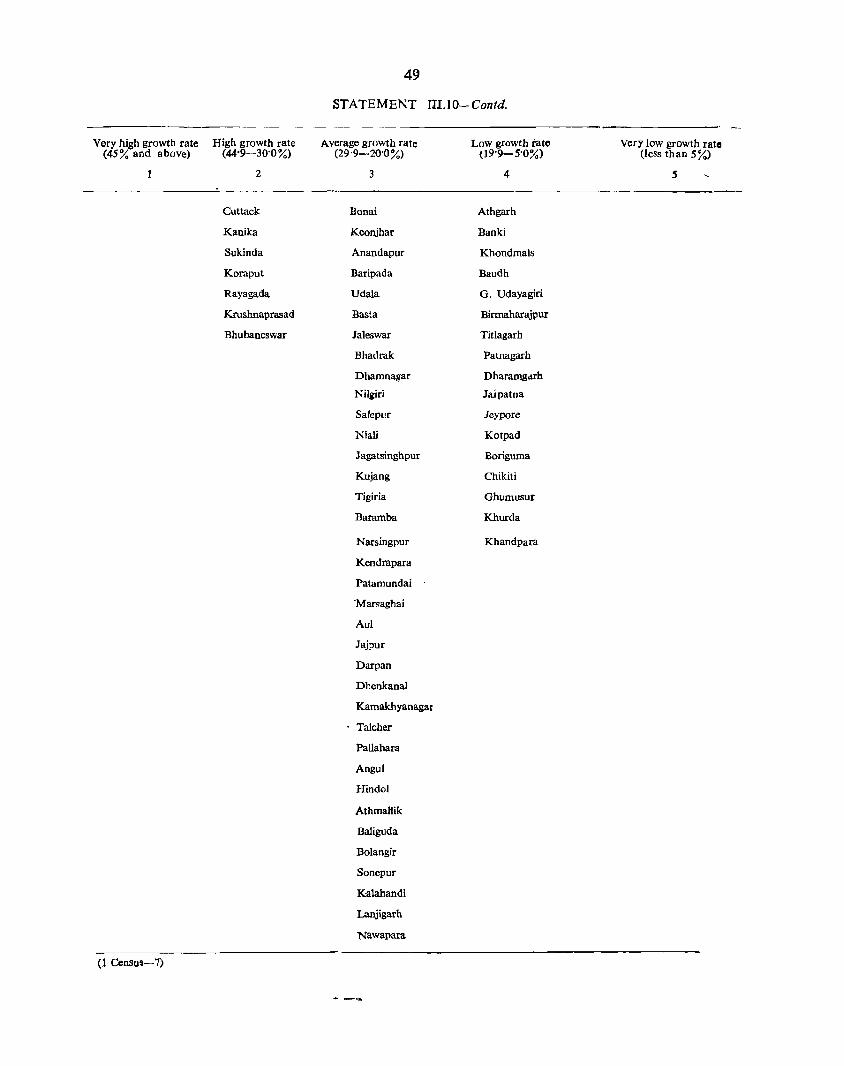
Very high growth rate (45% and above)
(1 Censu$-7)
High growth rate (44·9-30·0%)
2
Cuttack
Kanika
Sukinda
Koraput
Rayagada
Krushnaprasad
Bhubaneswar
49
STATEMENT III.10-Contd.
Average growth rate (29·9-20·0%)
3
Bonai
Keonjhar
Anandapur
Baripada
Udala
Basta
Jaleswar
Bhadrak
Dhamnagar
Niliiri
Salepur
Niall
Jagatsinghpur
Kujang
Tigiria
Baramba
Narsingpur
Kendrapara
Patamundai
·Marsaghai
Aul
Jajpur
Darpan
Dhenkanal
Kamakhyanagat
Talcher
Pallahara
Angul
HindQI
AthmaHik
Baliguda
Bolangir
Sonepur
Kalahandi
Lanjigarh
Nawapara
Low growth rate (19·9-5·0%)
4
Athgarh
Banki
Khondmals
Baudh
G. Udayagiri
Birmaharajpur
Titlagarh
Patnagarh
Dharamgdrh
Jaipatna
Jeypore
Kotpad
Boriguma
Chikiti
Ghumusur
Khurda
Khandpara
Very low growth rate (less than 5%)
S
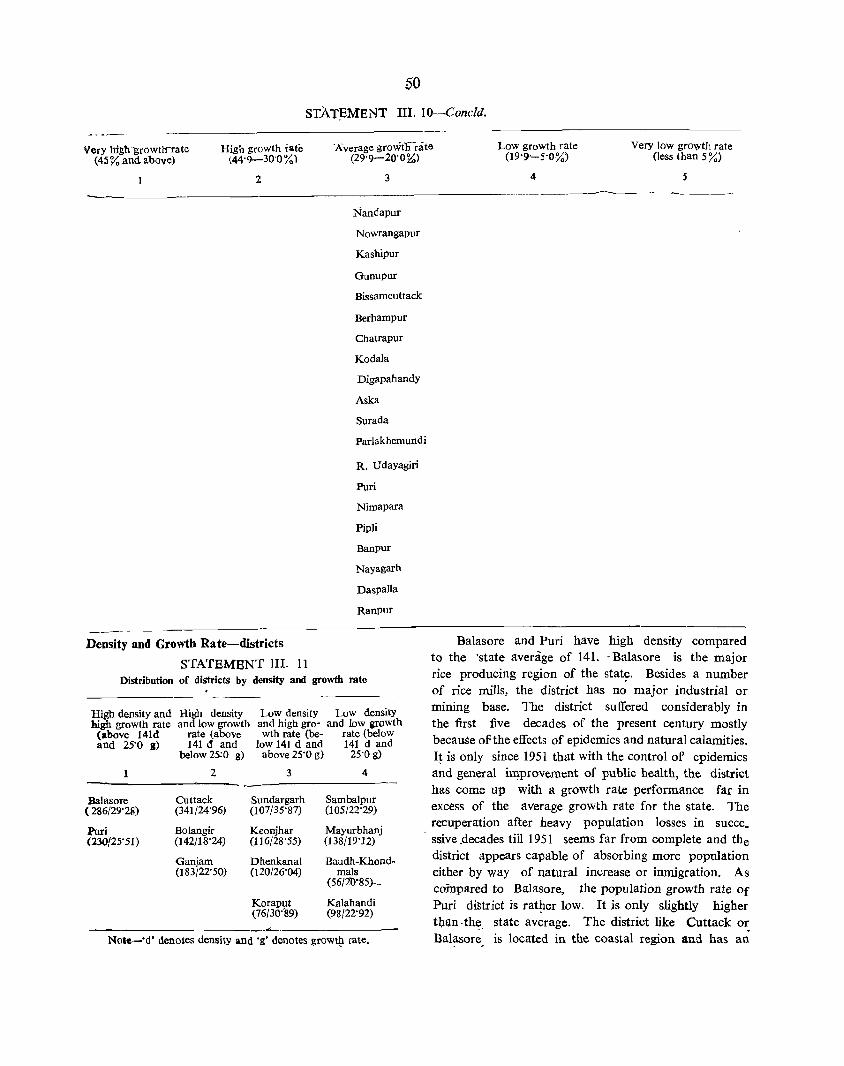
STAT;EMENT III. lO-Concld,
Very high -growtJ:nate (45X,andabove)
High growth rate '.44'9-30'0%)
Average growt'l1'rate (29'9-20'0%)
Low growth rate (19'9'-5'0%)
Very low gro\Vth rate (less than 5:Yo)
2 3 4 5
----------------------------~ ~ - -----Nandapur
Nowrangapur
Kashipur
Gunupur
Bissamcuttack
Berhampur
Chatrapur
Kodala
Digapahandy
Aska
Surada
Parlakhemundi
R, Udayagiri
Puri
Nimapara
Pipli
Banpur
Nayagarh
DaspaUa
Ranpur
Density and Growth Rate-districts
STATEMENT JII. 11 Distribution of districts by density and growth rate
High density and High density high growth rate and low growth
(above 141d rate (above and 25'0 g) 141 d and
below 25:0 g)
1 2
Balasore Cuttack ( 286/29'28) (341/24'96)
Low density Low density and high gro- and low growth wth rate (be- rate (below
low 141 d and 141 d and above 25'0 g) 25'0 g)
3 4
Sundargarh Sambalpur (107/35'87) (105/22'29)
Pori Bolangir Keonjhar Mayurbhanj (23()/25' 51) (142/18'24) (116/28'55) (138/19'12)
Ganjam Dhenkanal BaLldh-Khond-(183/22'50) (t20/26'04) mals
(56/10'85)-
Koraput Kalahandi (76/30''89) (98/22'92) ,..._._-------
No'e-'d' denotes density and 'g' denotes growtll rate,
Balasore and Puri have high density compared to the 'state average of 141. ,Balasore is the major rice producing region of the stat~, Besides a number of rice mills, the district has no major industrial or mining base, The district suffered considerably in the first five decades of the present century mostly because ofthe effects of epidemics and natural calamities, I! is only since 1951 that with the control of epidemics and general improvement of public health, the district has come up with a growth rate performance far in excess of the average growth rate for the state. The recuperation after heavy population losses in succe. ssive .decades till 1951 seems far from complete and the district appears capable of absorbing more population either by way of natural increase or inmigration, As compared to Balasore, the population growth rate Of Puri district is rat~er low, It is only slightly higher t4an ,the, state average. The district like Cuttack or Bal~sor~r is located in the coastal region and has an:
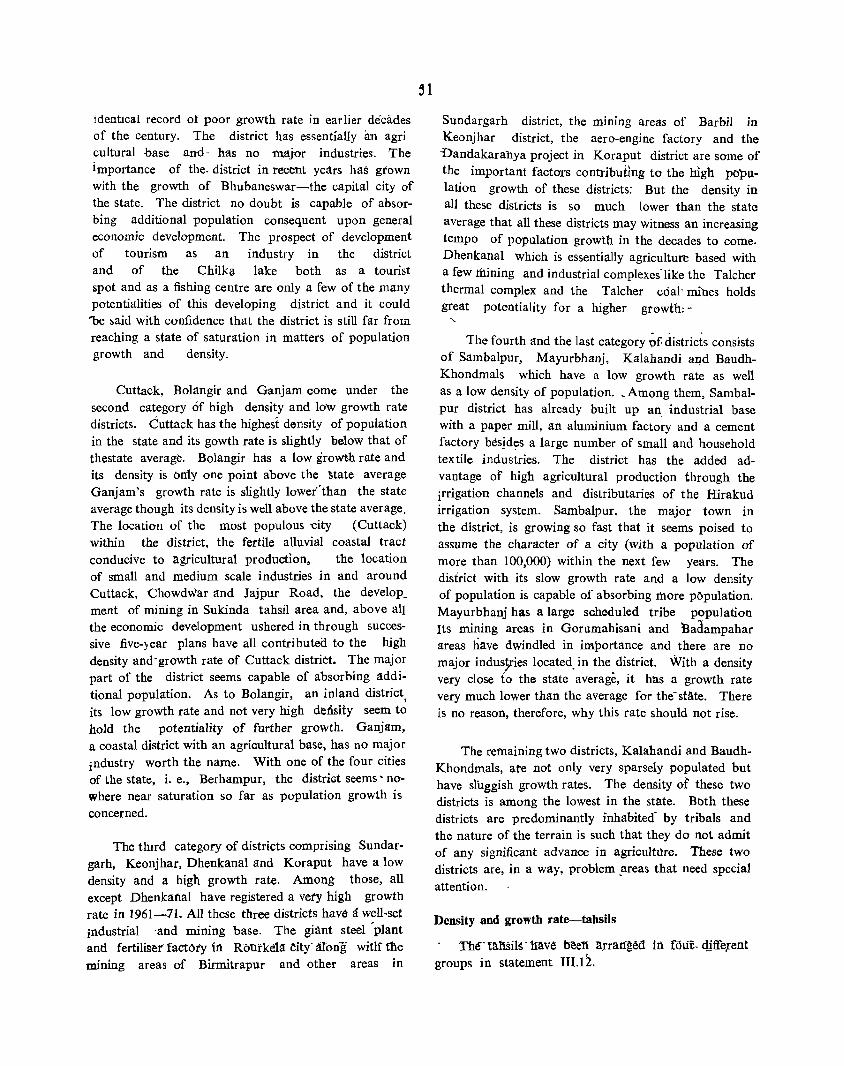
identical record of poor growth rate in earlier decades of the century. The district has essentially an agri cultural base and- has no major industries. -The importance of the. district in recent years has grown with the growth of Bhubaneswar-the capital city of the state. The district no doubt is capable of absorbing additional population consequent upon general economic development. The prospect of development of tourism as an industry in the district and of the Chilka lake both as a tourist spot and as a fishing centre are only a few of the many potentialities of this developing district and it could
"be said with confidence that the district is still far from reaching a state of saturation in matters of population growth and density.
Cuttack, Bolangir and Ganjam come under the second category 6f high density and low growth rate districts. Cuttack has the highest density of population in the state and its gowth rate is slightly below that of thestate average. Bolangir has a low growth rate and its density is only one point above the state average Ganjam's growth rate is slightly lower"than the state average though its density is well above the state average. The location of the most populous -city (Cuttack) within the district, the fertile alluvial coastal tract conducive to agricultural production, the location of small and medium scale industries in and around Cuttack, Chowdwar and Jajpur Road, the develop_ ment of mining in Sukinda tahsil area and, above all the economic development ushered in through successive five-year plans have all contributea to the high density and' growth rate of Cuttack district. The major part of the district seems capable of absorbing additional population. As to Bolangir, an inland district, its low growth rate and not very high density seem to hold the potentiality of further growth. Ganjam, a coastal district with an agricultural base, has no major industry worth the name. With one of the four cities of the state, i. e., Berhampur, the distriot seems' nowhere near saturation so far as population growth is concerned.
The thIrd category of districts comprising Sundargarh, Keonjhar, Dhenkanal and Koraput have a low density and a high growth rate. Among those, all except Dhenkanal have registered a very high growth rate in 1961-71. All these three districts have Ii well-set industrial 'and mining base. The giant steel 'plant anti fertiliser factoty ill Rourke1~ city' aTong witli the mining areas of Birmitrapur and other areas in
Sl
Sundargarh district, the mining areas of Barbil in Keonjhar district, the aero-engine factory and the -Dandakarahya project in Koraput district are some of the important factors conttibuilng to the mgh po}:>ulation growth of these districts: But the density in all these districts is so much lower than the state average that all these districts may witness an increasing tempo of population growth in the decades to come. Dhenkanal Which is essentially agriculture based with a few mining and industrial complexes"like the Talcher thermal complex and the Talcher coal'mihes holds great potentiality for a higher gtClwth:-
The fourth and the last category pf districts consists of Sambalpur, Mayurbhanj, Kalahandi a~d BaudhKhondmals which have a low growth rate as well as a low density of population. _ Among them, Sambalpur district has already built up an. industrial base with a paper mill, an aluminium factory and a cement factory besid~s a large number of small and household textile industries. The district has the added advantage of high agricultural production through the irrigation channels and distributaries of the Hirakud irrigation system. Sambalpur, the major town in the district, is growing so fast that it seems poised to assume the character of a city (with a population of more than 100,000) within the next few years. The district with its slow growth rate and a low density of popUlation is capable of absorbing more p()pulation. Mayurbhanj has a large scheduled tribe popUlation Its mining areas in Gorumahisani and Badampahar areas have dwindled in importance and there are no major indusjries located. in the district. With a density very close to the state average, it has a growth rate very much lower than the average for the- state. There is no reasoli, therefore, why this rate should not rise.
The remaining two districts, Kalahandi and BaudhKhondmals, ate not only very sparsely populated but have sluggish growth rates. The density or these two districts is among the lowest in the state. Both these districts are predominantly inhabited· by tribals and the nature of the terrain is such that they do not admit of any significant advance in agriculture. These two districts are, in a way, problem ,areas that need special
attention.
Density and growth rate-tahsils
The-lal1.Sils" have ~en A.rranged in fOut. djlfeJent groups in statement IIUl.
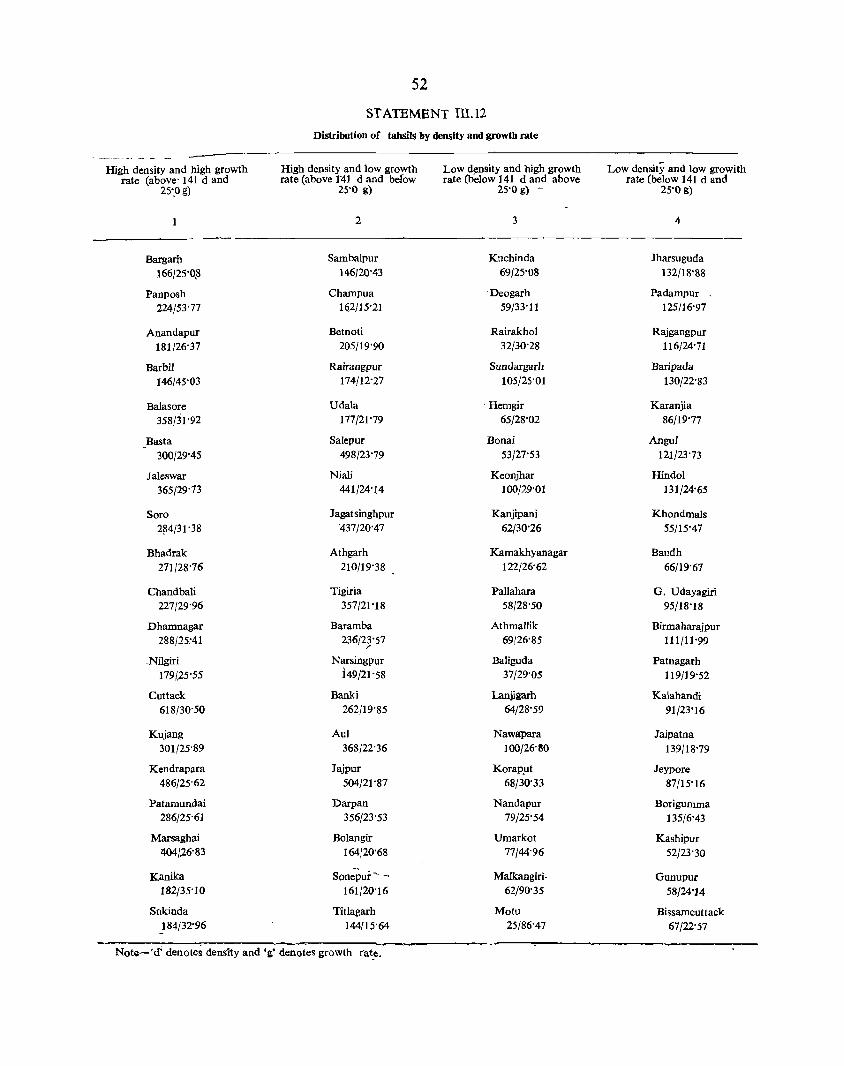
High density and high growth rate (above' 141 d and
25',0 g)
1
Bargarp 166/2S'Q8
Panposh 224/53'77
Anandapur 181/26'37
Barbi! 146/45'03
Balasore 358/31'92
Basta 300/29'45
laleswar 365/29'73
Soro 2~4/31'38
Bhadrak 271/28'76
Chandbali 227/29'96
Dhamnagar 288/25:41
,Nilgiri 179[25'55
Cuttack 618/30'50
Kujang 301/25'119
Kendrapara 486/25'62
Patamundai 286/25"61
Marsaghai 1104/.26'83
Kanika 182/35'10
Sukinda 184/32'96
52
ST ATEMENT IH.12
Distribution of tabSiIs by density and growth rate
High density and low growth rate (above 1"41 d and below
25"0 g)
2
Sambalpur 1 46r20'43
Champua 1Q2/15'21
Betnoti 205/19'90
Rairangpur 174/12'27
Udala 177/21'79
Salepur 498/23'79
Niali 441/24'14
Jagatsinghpur '437/20'47
Athgarh 210/19'38
Tigiria 357/21'18
Baramba 236/2}."57
Narsingpur 149/21'58
Banki 262/19'85
Aul 368/22'36
Jajpur 504/21'87
Darpan 356/23'53
Bolangir 164/20'68
Sonepur- -161/20'16
Titlagarh 144/15'64
Low density and high growth rate (below 141 d and above
25'0 g) ~
3
Kuchinda 69/25'08
'Deogarh 59/33'11
Rairakhol 32/30'28
Sundargarh 105/25'01
'Hemgir 65/28'02
Bonai 53/27'53
Keonjhar 100/29'01
Kanjipani 62/30'26
Kamakhyanagar 122/26'62
Pallahara 58/28'50
Athmallik 69/26'85
Baliguda 37/29'05
Lanjigarh 64/28'59
Nawapara 100/26'110
Korap.ut 68/30'33
Nandapur 79/25'54
Umarkot 77/44'96
Malkangiri. 62/90'35
Motu 25/86'47
Note-'d; denotes density and '~. denotes growth (at.e.
Low density and low growith rate (below 141 d and
25'0 g)
4
Jharsuguda 132/18'88
Padampur 125/16'97
Rajgangpur 116/24'71
Baripada 130/22'83
Karanjia 86/19'77
AnguJ
121/23'73
Hindol 131/24'65
Khondmals 55/15'47
Baudh 66/19'67
G. Udayagiri 95/18'18
Birmaharajpur 111/11'99
Patnagarh 119/19'52
Kalahandi 91/23'16
Jaipatna 139118'79
Jeypore 87/15'16
Borigumma 135/6"43
Kashipur 52/23'30
Gunupur 58/24'14
Bissamcuttack 67/22'57
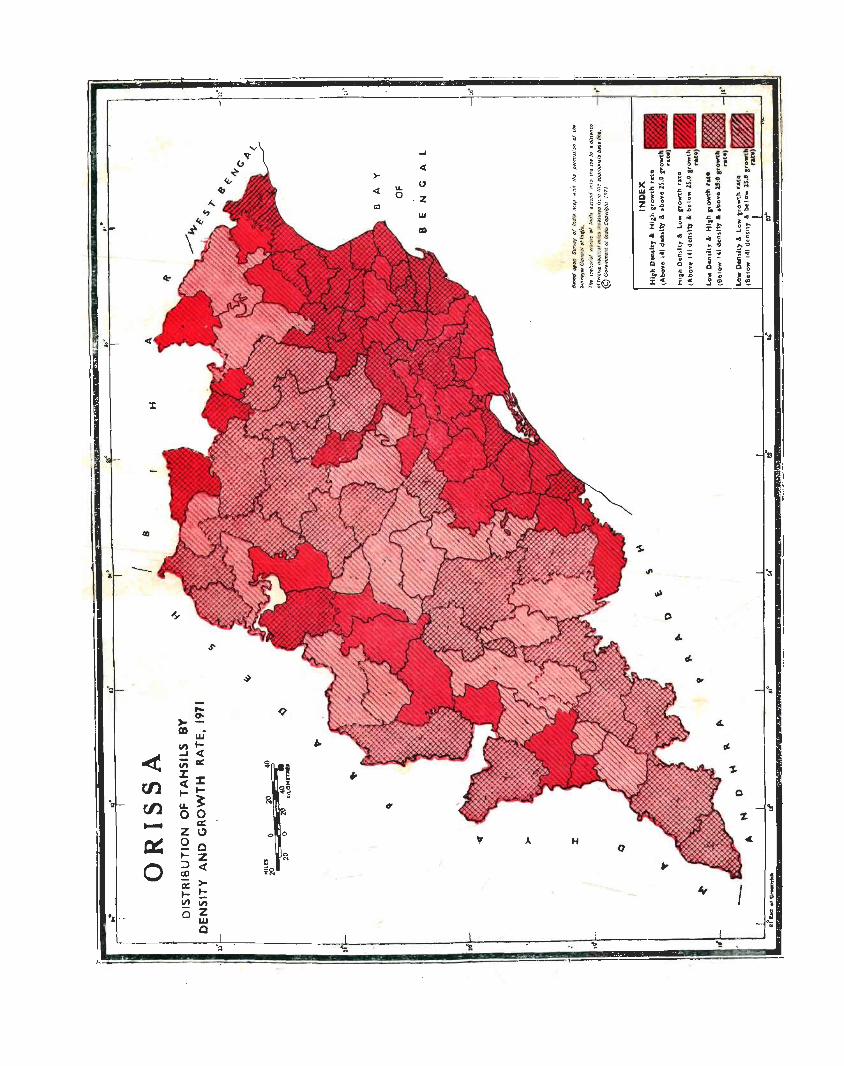
'"
.~
III
0, of! ':1
~
0
~ .$'
d-
~ o. 0; 0;
~
.... q o->-CD w
d-.,,1-
0
< _, <S:
~ ! u:;«
"
Xx ~~
~
en <S:I-~ I-~
C
~ fIl u.. 0
" A H 0
o a:: ...... Z " <:> '"
J
~ Qc 0
I
... I- Z II
1
0 :> « i~ en a:: >-l- I-1/1 1/1
~ - Z ., .. , o w
Q
0:l ':: "!: ~

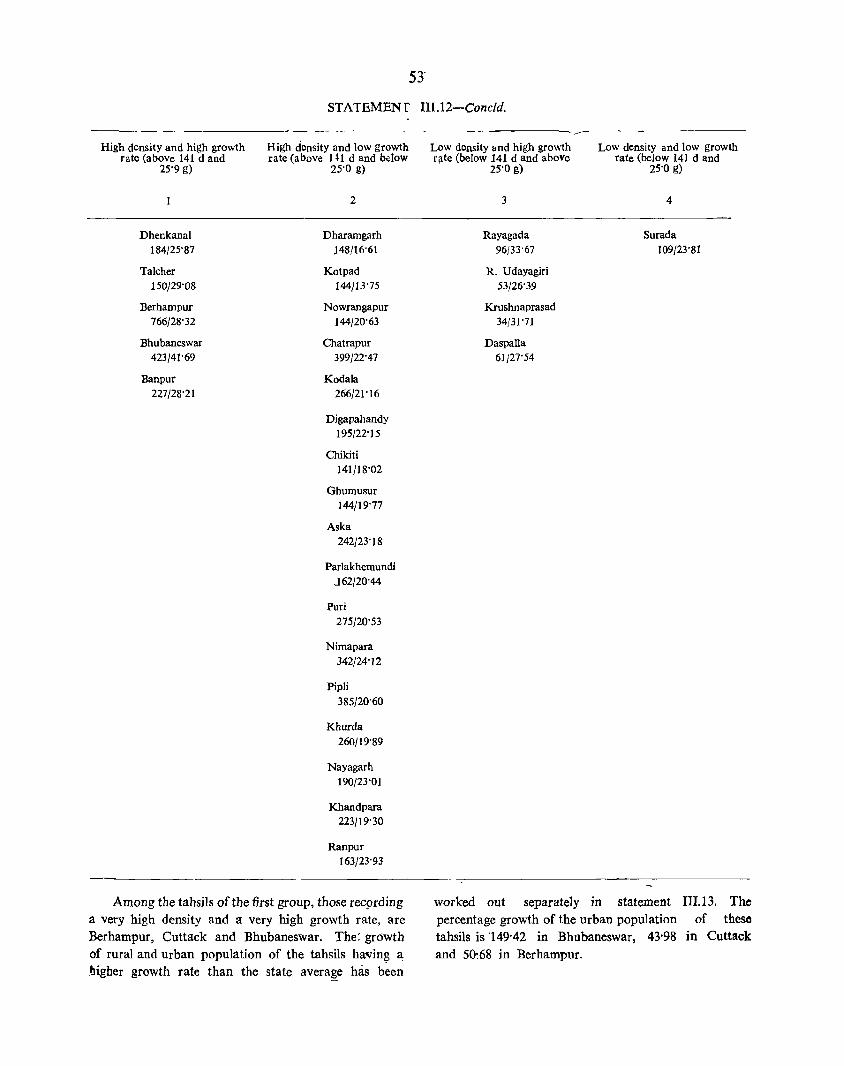
53"
STATEMENf nU2-Cone/d,
High density and high growth rate (above 141 d and
25'9 g)
Dhenkanal 184/25'87
Talcher 150/29'08
Berhampur 766/28'32
Bhubaneswar 423/41'69
Banpur 227/28'21
High density and low growth rate (above 1 ~ 1 d and below
25'0 g)
2
Dharamgarh 148/16'61
Kotpad 144/13'75
Nowrangapur 144/20'63
Chatrapur 399/22'47
Kodala 266/21'16
Digapahandy 195/22'15
Chikiti 141/18'02
Ghumusur 144/19'77
Aska 242/23'18
Parlakhemundi J62/20'44
Puri 275/20'53
Nimapara 342/24'12
Pipli 385/20'60
Khurda 260/19'89
Nayagarh 190/23'01
Khandpara 223/19'30
Ranpur 163/23'93
Among the tahsils of the first group, those rec9rding a very high density and a very high growth rate, are Berhampur, Cuttack and Bhubaneswar, The: grbwth of rural and urban population of the tahsils having ~ bigber growth rate than the state average has b~en
Low density and high growth rlite (below 141 d and above
25'0 g)
3
Rayagada 96/33"67
R, Udayagiri 53/26'39
Krushnaprasad 34/31'71
Daspalla 61/27'54
Low density and low growth rate (below 141 d and
25'0 g)
4
Surada 109/23'81
worked out separately in statement III.} 3, The percentage growth of the urban population of these tahsils is '149'42 in Bhubaneswar, 43'98 in Cuttack and 50:68 in Berhampur,

STATEMENT 1I1:13
Population growth rate of tahsils having the higher growth rate than the state average during 1961-')1
! (A~erage growth rart! 0/ st~te +25'05 per cent) _,___
Rank in Tahsil Growth rate of population 1961-71
~ _____________ A ____________ ~
Total Rural Urban
~ 3 4 5
1 Malkangiri +90'35 +83:36 (Malkangiri census town newly formed
in 1971)
2 Motu +86'47 +86'47
3 Panposh +53'77 +34'3<) +81'36
4 Barbi! +45'03 +25'43 +115'59
5 Umarkot +44'96 +39'29 (Umarkot NAC newly formed in 1971)
6 Bhubaneswar +41'69 +15'68 +149"42
7 Kanika +35'10 +35'10 -8 Rayagada +33'67 +28'76 +72'42
9 Deogarh +33'11 +33'28 +30'22
10 Sukinda +32'96 +29'19 +131'19
11 Balasore +31'9~ +30'7'5 +36'27
12 KrushnaDrasad +31'71 +31'71
13 Sot( +31'38 +39'48 (Soro declassified in 1971) ..
14 Cuttack +30'50 +18'77 +43'98
15 Koraput +30'33 +21'82 +188'23
16 Rairakhol +30'28 +30'28
17 Kanjipani +30~26 +30'26
18 Chandbali +29'96 +35'95 -28'59
19 Jaleswpr +29'73 +33'37 -34'22
20 Basta +29'45 +29'45
21 Talcher +29'08 +27'90 +44'76
22 Baliguda +29'05 +29'05
23 Keonjhar +29'01 +27'81 +53'20
24 Bhadrak +28'76 +26'20 +60'12
25 Lanjigarh +28'59 +28'59
26 Pallahara +28'50 +28'50
27 Berhampor +28'32 +16'68 +50'68
28 BanflUt +28'21 +28'21 " .
29 Hemgir ;:\-28'02" +28'02
30 Daspalla +27'54 +27'54
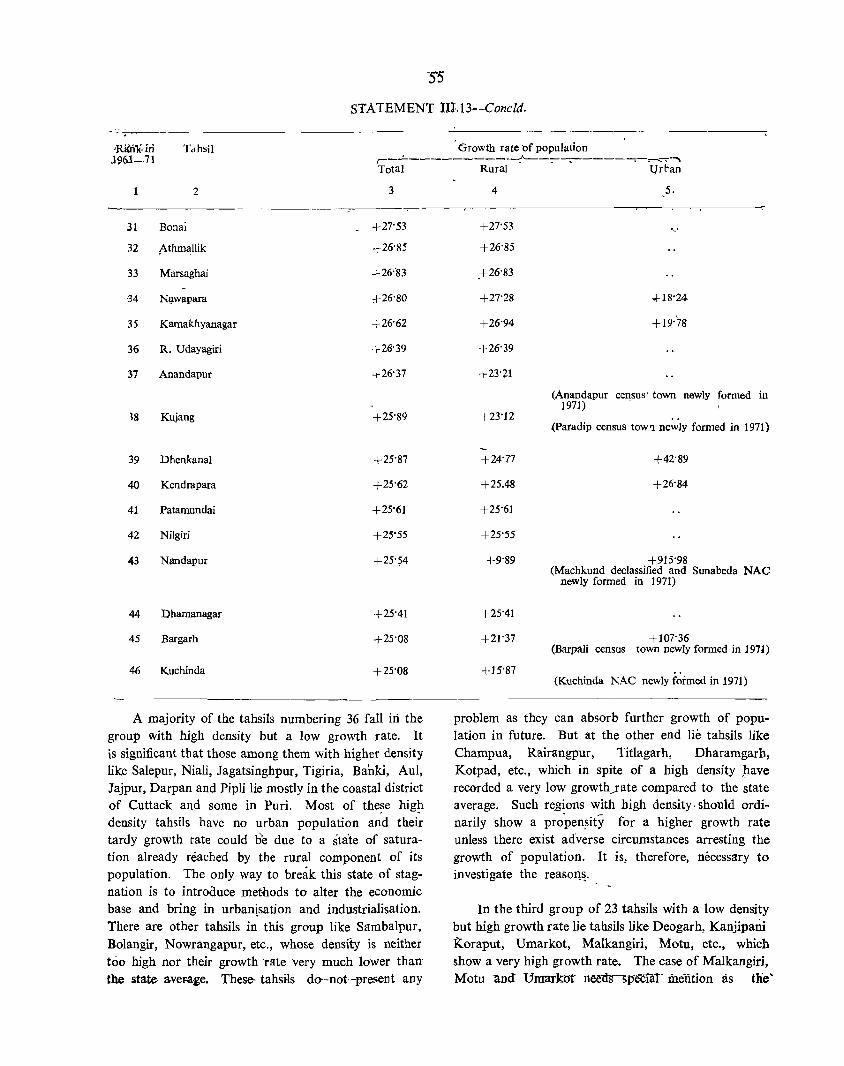
S5
STATEMENT 1ll.13-Concld.
'R1ID1i-iri Tdhsil Growth ratc of population 1961-71 r--_:_-------...----~--:__-... -----~-~--::- .. ~
Total Rural {,Jrt-qn
1 2 3
31 Bonai +27'53
32 t\thmaIlik +26'85
33 Marsaghai +26:83
{l4 N~wapara +26'80
35 Kamakhyanagar +26'62
36 R. Udayagiri +26'39
37 Anandapur +26'37
l8 Kujang +25'89
39 Dhenkanal +25'87
40 Kendrapara +25'62
41 Patamundai +25'61
42 Nilgiri +25'55
43 Nandapur +25'54
44 Dhamanagar +25'41
45 Bargarh +25'08
46 Kuchinda +25'08
A majority of the tahsils numbering 36 fan iIi the group with high density but a low growth rate. It is significant that those among them with higher density like Salepur, Niali, Jagatsinghpur, Tigiria, Ba'nki, Aul, Jajpur, Darpan and Pipli lie mostly in the coastal district of Cuttack and some in Puri. Most of the~e hig~ density tahsils have no urban population and their tardy growth rate could lie due to a state of saturation already reached by the rural component of its population. The only way to break this state of stagnation is to introduce methods to alter the economic base and bring in urbani.sation and industrialisation. There are other tahsils in this group like Sambalpur, Bolangir, Nowrangapur, etc., whose density is neither t60 high nor their growth tate very much lower than' the state a.ver.age. These- tahsils do--not-present any
4
+27'53
+26'85
.+26'83
+27'28
+26'94
+26'39
+23';1.1
+23'12
+24'77
+25.48
+25"61
+25'55
+9'89
+25'41
+21'37
+15'87
5.
(Anandapur ceI!sus' town newly formed in 1971)
{Paradip census tOW'l newly formed in 1971)
+42'89
+26'84
+915'98 (Machkund declassified and Sunabeda NAC
newly formed in 197])
+107'36 (BarpaIi census town newly formed in 1971)
(Kuchinda NAC newly formed in 1971)
problem as they can absorb further growth of population in future. But at the other end lie tahsils like Champua, Rairangpur, Titlagarh, Dharamgarh, Kotpad, etc., which in spite of a high density pave recorded a very low growth_rate compared to the state average. Such r~gions with high density. should ordinarily show a propen~ity for a higher growth rate unless there exist adverse circumstances arresting the growth of popUlation. It is, therefore, necessary to investigate the reasoll~.
In the third group of 23 tahsils with a low density but high growth rate lie tahsils like Deogarh, Kanjiparu Koraput, Umarkot, Malkangiri, Motu, etc., which show a very high growth rate. The case of Malkangiri, Motu and Umarkor ne&trs~ mention as the'
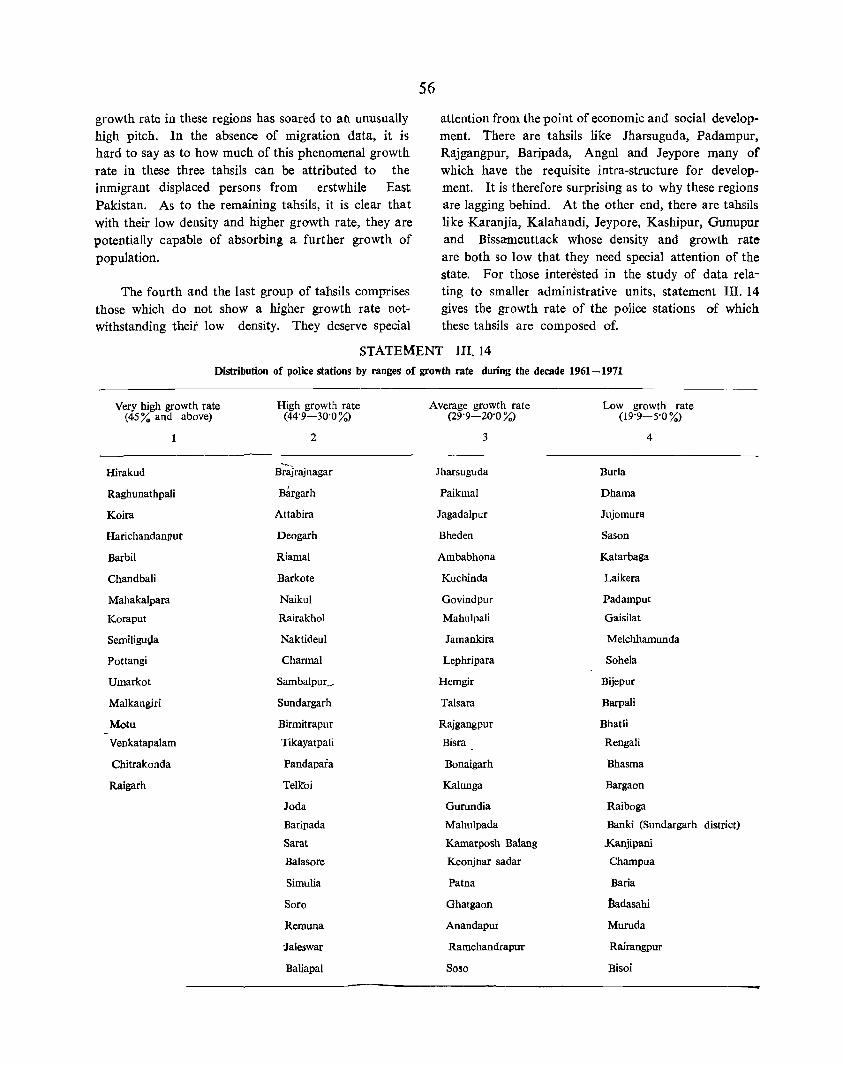
growth rate in these regions has soared to an. unusually high pitch. In the absence of migration data, it is hard to say as to how much of this phenomenal growth rate in these three tahsils can be attributed to the inmigrant displaced persons from erstwhile East Pakistan. As to the remaining tahsils, it is clear that with their low density and higher growth rate, they are potentially capable of absorbing a further growth of population.
The fourth and the last group of tahsils comprises those which do not show a higher growth rate notwithstanding their low density. They deserve special
56
attention from the point of economic and social develop. ment. There are tahsils like Jharsuguda, Padampur, Rajgangpur, Baripada, Angul and Jeypore many of which have the requisite intra-structure for deVelopment. It is therefore surprising as to why these regions are lagging behind. At the other end, there are tahsils like Karanjia, Kalahandi, Jeypore, Kashipur, Gunupur and Bissamcuttack whose density and growth rate are both so low that they need special attention of the state. For those interested in the study of data relating to smaller administrative units, statement III. 14 gives the growth rate of the police stations of which these tahsils are composed of.
STATEMENT III. 14
Distribution of police stations by ranges of growth rate during the decade 1961-1971
Very high growth rate (45 % and above)
Hirakud
Raghunathpali
Koira
Harichandanpur
Barbil
Chandbali
Mahakalpara
Koraput
Semiiigu\l.a
Pottangi
Umarkot
Malkangiri
M",tu
Venkatapalam
Chitrakonda
Raigarh
High growth rate (44·9-30·0%)
2
B;a}rajnagar
B~rgarh
Attabira
Deogarh
Riamal
Barkote
Naikul
Rairakhol
Naktideul
Charmal
Sambalpur_
Sundargarh
Birmitrapur
Tikayatpali
Pandapara
Telkoi
Joda
Baripada
Sarat
Balasore
Simulia
Soro
Remuna
:Jaleswar
BaJiapal
Average growth rate Low growth rate (29·9-20·0%) (19·9-5·0%)
3 4
Jharsuguda Burla
Paikmal Dhama
Jagadalpur Jujomura
Bheden Sason
Ambabhona Katarbaga
Kuchinda Laikera
Govindpur Pad ampul
Mahulpali Gaisilat
Jamankira Melchhamunda
Lephripara Sohela
Hemgir Bijepur
Talsara Barpali
Rajgangpur Bhatli
Bisra Rengali
Bonaigarh Bhasma
Kaiunga Bargaon
Gurundia Raiboga
Mahulpada Banki (Sundargarh
Kamarposh Balang .Kanjipani
Keonjnar sadar Champua
Patna Baria
Ghatgaon tJadasahi
Anandapur Muruda
Ramchandcapur Rairangpur
S050 Bisoi
district)
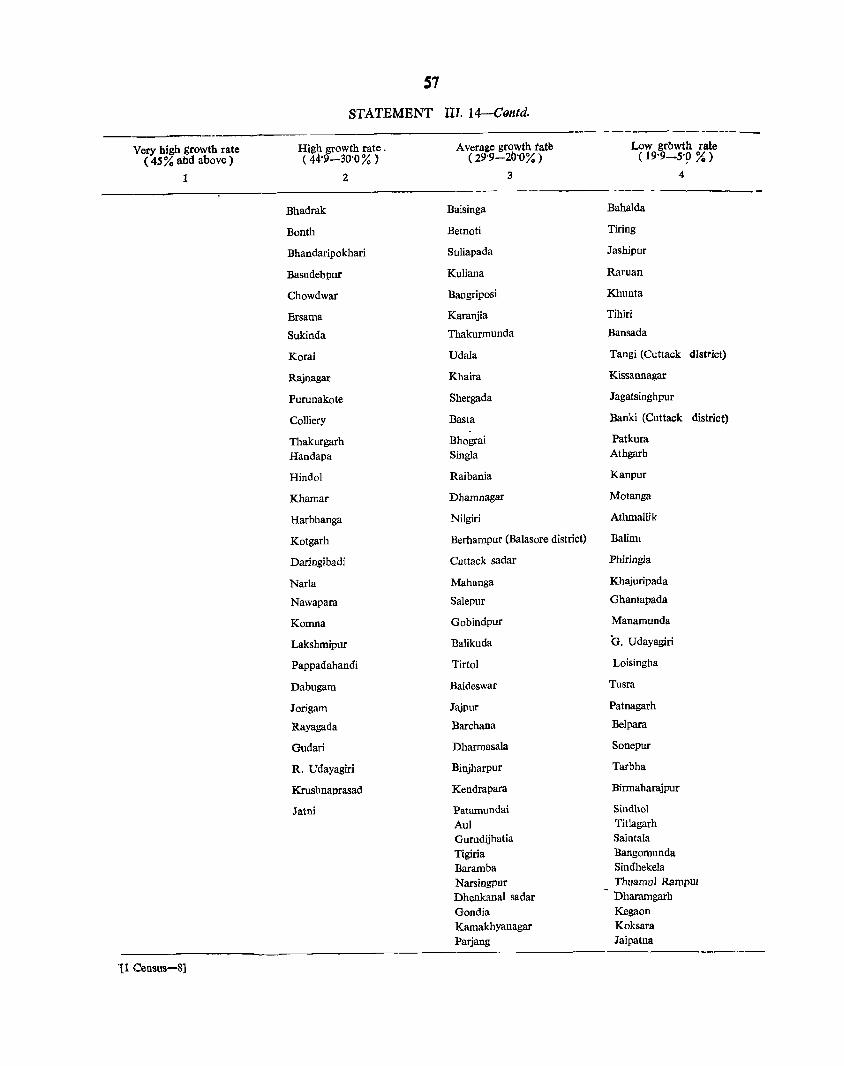
57
STATEMENT III. 14-CQntd. ------------_
Very high growth rate High growth rate. Average growth tate Low grbwth rate ( 4S % aM above) (44'1)-30'0% ) ( 29'9-20'0% ) ( 19'9~5'9 %)
1 2 3 4 --- -
Bhadrak Baisinga Bahalda
Bonth Betnoti Tiring
Bhandaripokhari Suliapada Jashipur
Basudebpur Kuliana Raruan
Chowdwar Bangriposi Khunta
Ersama Karanjia Tihiri
Sukinda Thakurmunda Bansada
Korai UdaIa Tangi (Cuttack dIstrict)
Rajnagar Khaira Kissannagar
Purunakote Shergada Jagatsinghpur
Colliery Basta Banki (Cuttack district)
Thakurgarh Bhograi Patkura
Handapa Singla Athgarh
Hindol Raibania Kanpur
Khamar Dhamnagar Motanga
Harbhanga NiIgiri Athmallik
Kotgarh Berhampur (Balasore district) Baliml
Daringibadi Cuttack sadar Phiringia
Narla Mahanga Khajuripada
Nawapara Salepur Ghantapada
Korona Gobindpur Manamunda
Lakshmipur Balikuda G. Udayagiri
Pappadahandi Tirtol Loisingha
Dabugam Baideswar Tusra
Jorigam Jajpur Patnagarh
Rayagada Barchana Belpara
Gudari Dharmasala Sonepur
R. Udayagiri Binjharpur Tarbha
Krushnaprasad Kendrapara Birmaharajpur
Jatni Patamundai Sindhol
AuI Titlagarh Gurudijhatia Saintala
Tigiria Bangomunda Baramba Sindhekela Narsingpur Thuamul RampUl Dhenkanal sadar Dharamgarh
Gondia Kegaon Kamakhyanagar Koksara Parjang Iaipatna
11 Census-8]
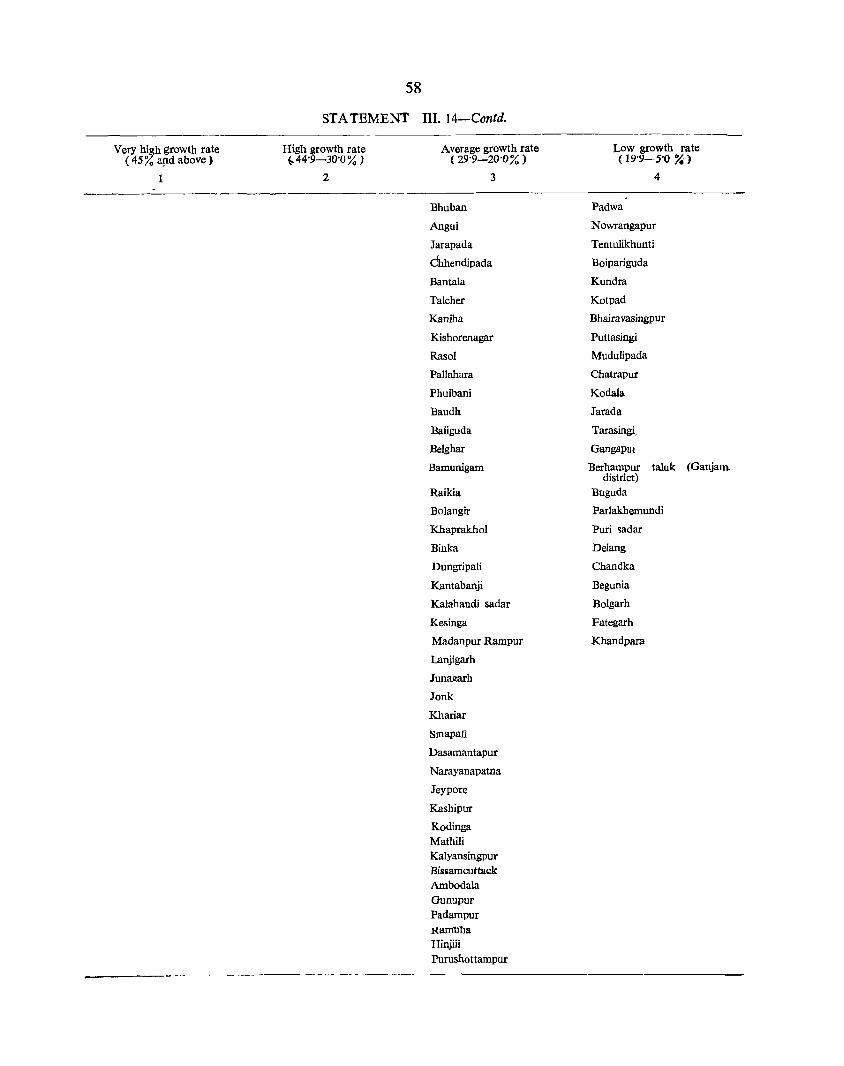
S8
STATEMENT Ill. 14-Contd.
Very h!Sh growth rate (45% a!1d above)
1
High growth rate ~ 44'9-30'0 % )
2
------ .-------------- -- ----_.
Average growth rate ( 29'9-20'0% )
3
Bhuban
Angul
Jarapada
chhendipada
Bantala
Talcher
Kaniha
Kishorenagar
Rasol
Pallahara
Phulbani
Baudh
BaJiguda
Belghar
Bamunigam
Raikia
Bolangir
Khaprakhol
Binka
Dungripali
Kantabanji
Kalahandi sadar
Kesinga
Madanpur Rampur
Lanjigarh
Junagarh
Jonk
Khariar
Slllapali
Dasamantapur
Narayanapatna
Jeypore
Kashipur
Kodinga Mathili Kalyansingpur Bissamcuttack Ambodala Gunupur Padampur Ramblla Hinjiii Purushottampur
Low growth rate ( 19'9-5'0 ~ )
4
Padwa
Nowrangapur
Tentulikhunti
Boipariguda
Kundra
Kotpad
Bhairavasingpur
Puttasingi
Mudulipada
Chatrapur
Kodala
Jarada
Tarasingi,
GangapUI
Berhampur taluk (Ganjam. district)
Buguda
Parlakhemundi
Puri sadar
Delang
Chandka
Begunia
BoIgarh
Fategarh
Khandpara
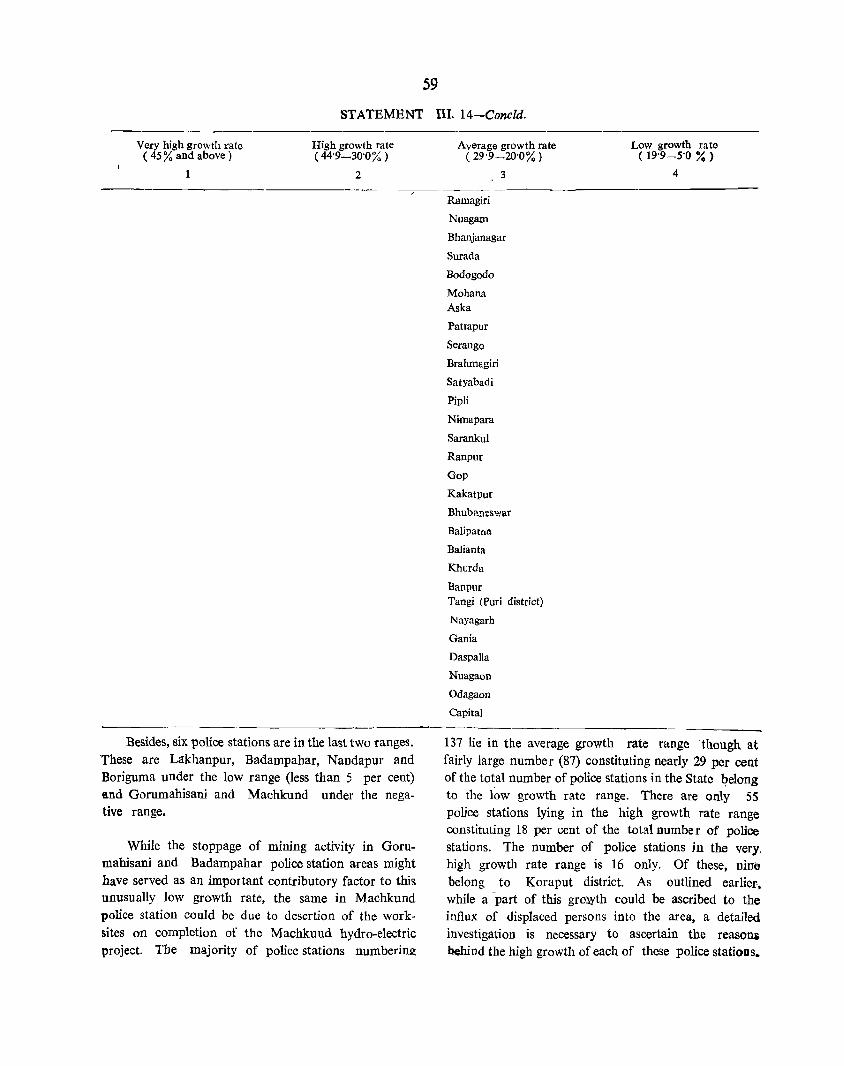
59
STATEMENT Ill. 14-Concld.
Very high growth rate ( 45% and above)
1
High growth rate ( 44'9-30'0% )
2
Besides, six police stations are in the last two ranges. These are Lakhanpur, Badampahar, Nandapur and Boriguma under the low range (less than 5 per cent) and Gorumahisani and Machkund under the negative range.
While the stoppage of mining activity in Gorumahisani and Badampahar police station areas might have served as an important contributory factor to this unusually low growth rate, the same in Machkund police station could be due to desertion of the worksites on completion of the Machkund hydro-electric project. The majority of police stations numbering
Average growth rate ( 29'9-20'0%)
3
Ramagiri
Nuagam
Bhanjanagar
Surada
Bodogodo
Mohana Aska
Pattapur
Serango
Brahmagiri
Satyabadi
Pipli
Nimapara
Sarankul
Ranpur
Gop
Kakatpur
Bhub?.!lI:swar
Balipatna
Balianta
Khurda
Banpur Tangi (puri district)
Nayagarh
Gania
Daspalla
Nuagaon
Odagaon
Capital
Low growth rate ( 19'9 -5'0 % )
4
137 lie in the average growth rate range though at fairly large number (87) constituting nearly 29 per cent of the total number of police stations in the State belong to the low growth rate range. There are only S5 police stations lying in the high growth rate range constituting 18 per cent of the total numbe r of police stations. The number of police stations in the very, high growth rate range is 16 only. Of these, nine belong to Koraput district. As outlined earlier, while a -part of this growth could he ascribed to the influx of displaced persons into the area, a detailed investigation is necessary to ascertain the reaSOlla behind the high growth of each of these police statioDs.

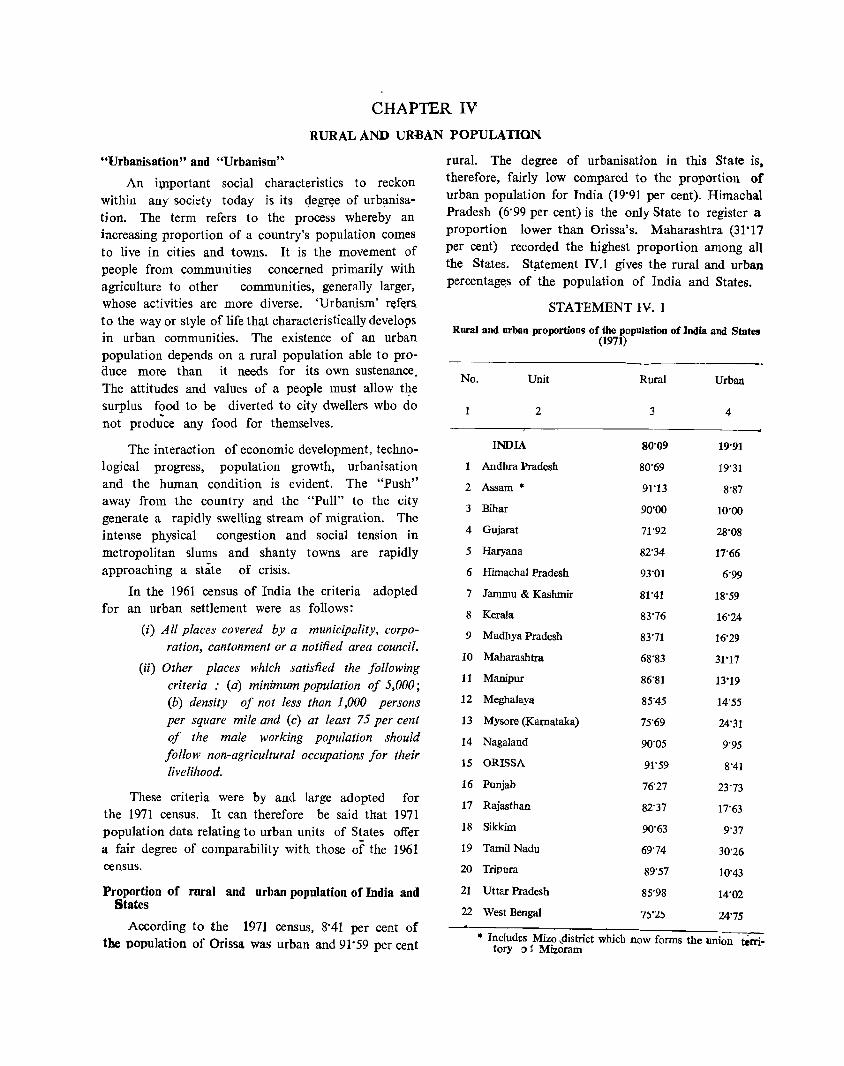
CHAPTER IV
RURAL AND URBAN POPULATION
"Urbanisation" and "Urbanism"
An i~portant social characteristics to reckon within any society today is its qegr~e of urb~nisation, The term refers to the process whereby an increasing proportion of a country's population comes to live in cities and towns, It is the movement of people from communities concerned primarily with agriculture to other communities, generally larger, whose activities are more diverse, 'Urbanism' refer!:\. to the way or style of life that characteristically develops in urban communities, The existence of an urban population depends on a rural population able to produce more than it needs for its own sustenance, The attitudes and values of a people must allow t~e surplus food to be diverted to city dwellers who do not prodti'ce any food for themselves,
The interaction of economic development, technological progress, population growth, urbanisation and the human condition is evident, The "Push" away from the country and the "Pull" to the city generate a rapidly swelling stream of migration, The intense physical congestion and social tension in metropolitan slums and shanty towns are rapidly approaching a state of crisis,
In the 1961 census of India the criteria adopted for an urban settlement were as follows:
(i) All places covered by a municipality, corporation, cantonment or a notified area council,
(ii) Other places which satisfied the following criteria " (a) minimum population of 5,000; (b) density of not less than 1,000 persons per square mile and (c) at least 75 per cent of the male working population should follow non-agricultural occupations for their livelihood,
These criteria were by and large adopted for the 1971 census, It can therefore be said that 1971 population data relating to urban units of States offer a fair degree of comparability with those of the 1961 census,
Proportion of rural and urban population of India and States
According to the 1971 census, 8'41 per cent of the population of Orissa was urban and 91'59 per cent
rural. The degree of urbanisation in this State is. therefore, fairly low compared to the proportion of urban population for India (19'91 per cent), Himachal Pradesh (6'99 per cent) is the only State to register a proportion lower than Orissa's, Maharashtra (31'17 per cent) recorded the highest proportion among all the States, St_;:ttement IV.1 gives the rural and urban percentage,s of the popUlation of India and States,
STATEMENT IV, 1
Rural and urban proportions of the popUlation of India and States (1971)
No, Unit Rural Urban
2 3 4
INDIA 80'09 19'91
Andhra Pradesh 80'69 19'31
2 Assam * 91'13 8'87
3 Bihar 90'00 10'00
4 Gujarat 71'92 28'08
5 Haryana 82'34 17'66
6 Himachal Pradesh 93'01 6'99
7 Jammu & Kashmir 81'41 18'59
8 Kerala 83'76 16'24
9 Madhya Pradesh 83'71 16'29
10 Maharashtra 68'83 31'17
11 Manipur 86'81 13'19
12 Meghalaya 85'45 14'55
13 Mysore a<arnataka) 75'69 24'31
14 Nagaland 90'05 9'95
15 ORISSA 91'59 8'41
16 Punjab 76'27 23'73
17 Rajasthan 82'37 17'63
18 Sikkim 90'63 9'37
19 Tamil Nadu 69'74 30'26
20 Tripura 89'57 10'43
21 Uttar Pradesh 85'98 14'02
22 West Bengal 7Y'l.':J 24'75
• Includes Miz~ ,district which now forms the union tory (l j MlZoram
terri-
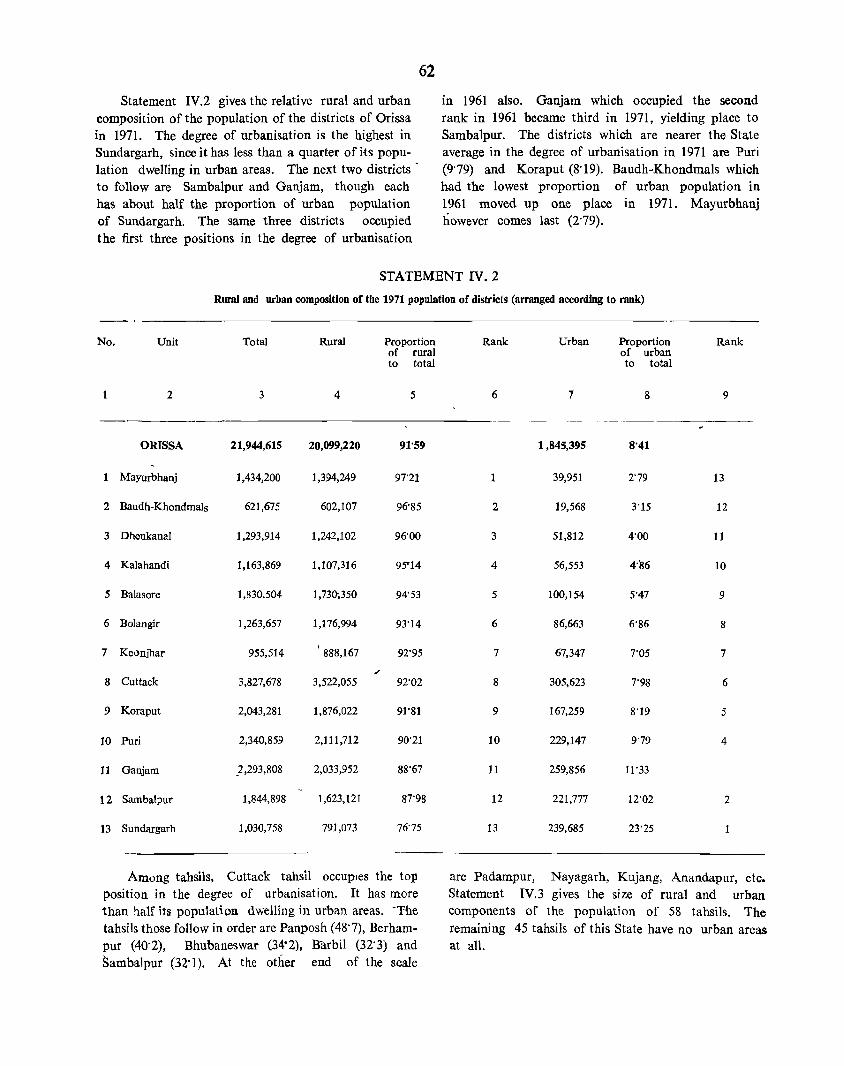
Statement IV,2 gives the relative rural and urban composition of the population of the districts of Orissa in 1971. The degree of urbanisation is the highest in Sundargarh, since it has less than a quarter of its population dwelling in urban areas, The next two districts -to follow are Sambalpur and Ganjam, though each has about half the proportion of urban population of Sundargarh, The same three districts occupied the first three positions in the degree of urbanisation
62
in 1961 also, Ganjam which occupied the second rank in 1961 became third in 1971, yielding place to Sambalpur, The districts which are nearer the State average in the degree of urbanisation in 1971 are Puri (9'79) and Koraput (8'19), Baudh-Khondmals which had the lowest proportion of urban popUlation in 1961 moved up one place in 1971. Mayurbhanj however comes last (2'79),
STATEMENT IV. 2
Rural and urban composition of the 1971 population of districts (arranged according to rank)
No, Unit Total
2 3
ORISSA 21,944,615
1 Mayurbhanj 1,434,200
2 Baudh-Khondmals 621,675
3 DhenkanaI 1,293,914
4 Kalahandi 1,163,869
5 Balasorc 1,830,504
6 Bolanglr 1,263,657
7 Keonjhar 955,514
8 Cuttack 3,827,678
9 Koraput 2,043,281
10 Puri 2,340,859
11 Ganjam _2 ,293,808
12 Sambalpur 1,844,898
13 Sundargarh 1,030,758
Rural
4
20,099,220
1,394,249
602,107
1,242,102
1,107,316
1,730,350
1,176,994
888,167
3,522,055
1,876,022
2,111,712
2,033,952
1,623,121
791,073
Proportion of rural to total
5
91'59
97'21
96'85
96'00
95'14
94'53
93'14
92'95
92'02
91'81
90'21
88'67
87'98
76'75
Among tahsils, Cuttack tahsil OCCUpIes the top position in the degree of urbanisation, It has more than half its population dwelling in urban areas, 'The tahsils those follow in order are Panposh (48'7), Berhampur (40'2), Bhubaneswar (34'2), Barbil (32' 3) and Sambalpur (32'1), At the other end of the scale
Rank Urban
6 7
1,845,395
1 39,951
2 19,568
3 51,812
4 56,553
5 100,154
6 86,663
7 67,347
8 305,623
9 167,259
10 229,147
11 259,856
12 221,777
13 239,685
Proportion of urban to total
8
8'41
2'79
3'15
4'00
5'47
6'86
7'05
7'98
8'19
9'79
11'33
12'02
23'25
Rank
9
13
12
11
10
9
8
7
6
5
4
2
are Padampur, Nayagarh, Kujang, Anandapur, etc. Statement IV,3 gives the size of rural and urban components of the population of 58 tahsils, The remaining 45 tahsils of this State have no urban areas at all,

63
STATEMENT IV, 3,
Rural and urban composition of the population of tahsils (1971)
Rank in Tahsil Rural Percentage Urban Percentage Rank in proportion of rural of urban proportion of rural to total to total of urban population population
2 3 4 5 6 7
------Padampur 386,557 98'1 7,349 1'9 58
2 Nayagarh 266,260 98'1 5,209 1'9 5;
3 Kujang 298,614 97'8 6,705 2'2 56
4 Anandapur 245,862 97'5 6,312 2'5 55
5 Jaleswar 239,123 97'3 6,711 2'7 54
6 Angul 274,157 96'8 9,053 3'2 33
7 Rairangpur 319,947 96'6 11;226 3'4 52
8 Malkangiri 196,364 96'3 7,494 3'7 51
9 Baudh 219,011 96'-1 8,891 3'9 50
10 Dharamgarh 193,552 96'1 7,876 3'9 49
11 Umarkot 241,283 96'1 9,826 3'9 48
12 Jajpur 400,947 96'0 16,707 4'0 47
13 Kamakhyanagar 262,670 95'9 11,350 4'1 46
14 Patn~garh 214,354 95'5 10,085 4'5 45
15 Nawapara 322,017 95'0 16,877 5'0 44
16 Chandbali 125,156 94'9 6,717 5'1 43
17 Nowranga]:ur 257,053 94'9 13,739 5'1 42
18 Deogarh 154,337 94'5 8,906. 5'S 41
19 Aska 219,914 94'4 12,954 5'6 40
20 Keonjhar 323,785 94'4 19,340 5'6 39
21 Khurda 243,694 93'9 15,879 6'1 3&
22 Sukinda 201,822 93'6 13,846 6'4 37
23 Sonepur 208,369 93'5 14,501 6'S 36
24 Baripada 387,590 93'1 28,725 6'9 35
25 Dhenkanal 263,993 93'1 19,615 6'9 34
26 _Banki 125,090 93'1 9,296 6'9 33
27 Bargarh 413,834 92'8 31,882 7"2 32
28 Kuchinda 150,978 92'6 12,011 7'4 31
29 Kodala 338,686 92'6 26,968 _ 7'4 30
30 Titlagarh _S21,737 92'4 26,329 7'6 29
31 Talcher 138,567 92'2 11.794 7'8 28 .... 32 Ghumusur 281,740 92'0 24,614 8'0 27
33 Sundargarh li3,938 91'0 17,244 9'0 26
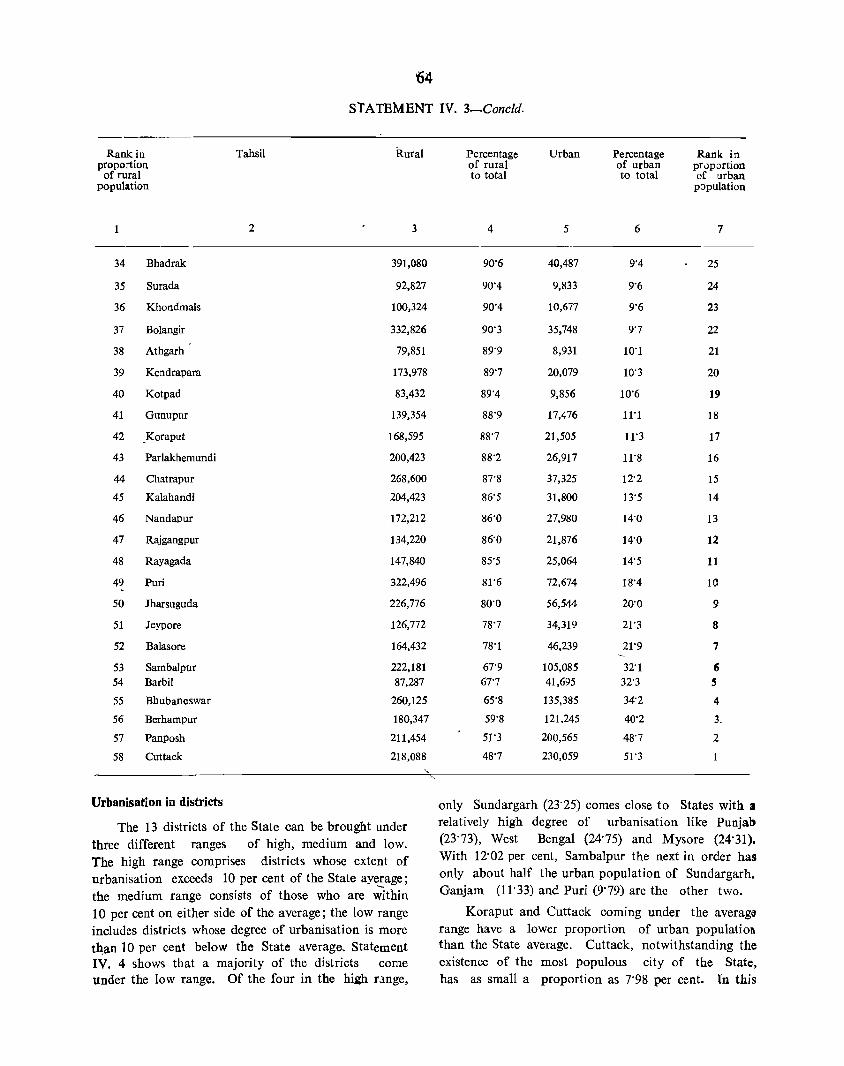
Urbanisation in districts
The 13 districts of the State can be brought under three different ranges of high, medium and low. The high range comprises districts whose extent of urbanisation exceeds 10 per cent of the State ayerage; the medium range consists of those who are ~t1iin 10 per cent on either side of the average; the low range includes districts whose degree of urbanisation is more tQ.an 10 per cent below the State average. Statement IV. 4 shows that a majority of the districts come under the low range. Of the four in the high rlnge,
only Sundargarh (23·25) comes close to States with a relatively high degree of urbanisation like Punjab (23·73), West Bengal (24·75) and Mysore (24·31). With 12·02 per cent, Sambalpur the next in order has only about half the urban population of Sundargarh. Ganjam (11·33) and Puri (9·79) are the other two.
Koraput and Cuttack coming under the averaga range have a lower proportion of urban populatio1\ than the State average. Cuttack, notwithstanding the existence of the most populous city of the State, has as small a proportion as 7·98 per cent. In this
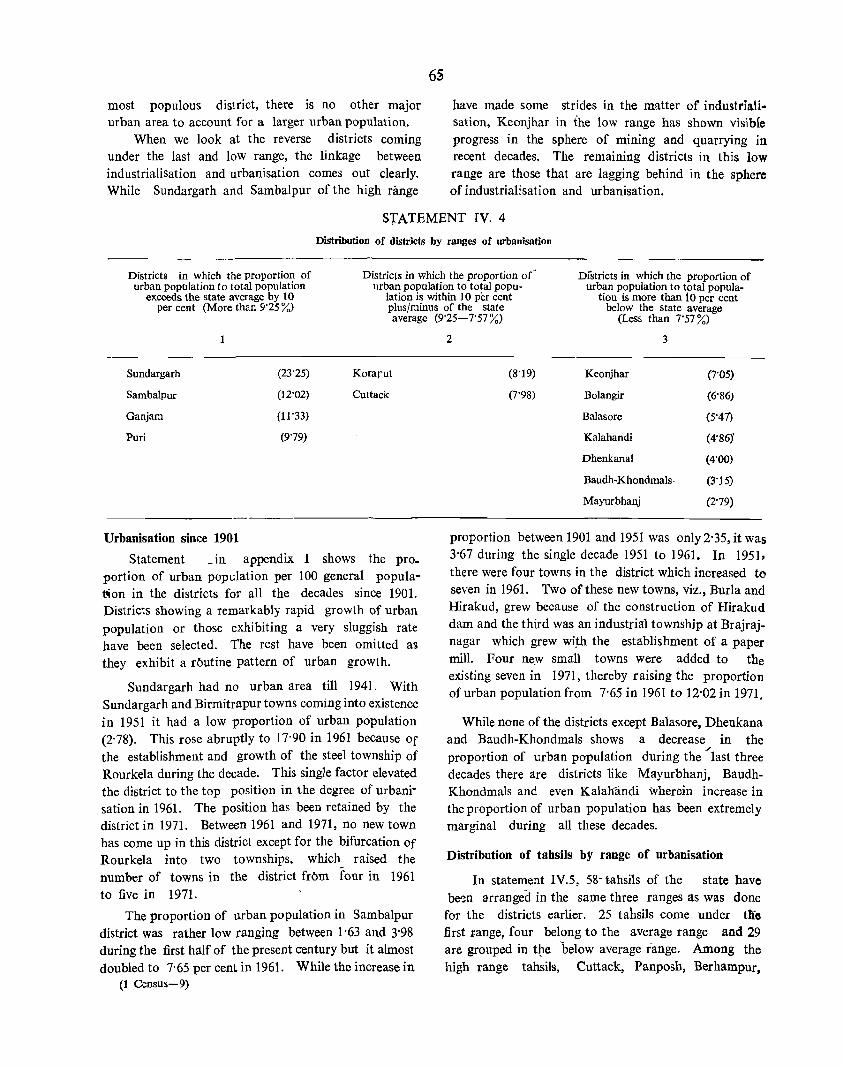
most populous district, there is no other major urban area to account for a larger urban population.
When we look at the reverse districts coming under the last and low range, the linkage between industrialisation and urbanisation comes out clearly. While Sundargarh and Sambalpur of the high range
6~
have made some strides in the matter of industriati· sation, Keonjhar in the low range has shown visibfe progress in the sphere of mining and quarrying in recent decades. The remaining districts in this low range are those that are lagging behind in the sphere of industrialisation and urbanisation.
STATEMENT IV. 4
Distribution of districts by ranges of urbanisation
Districts in which the proportion of urban population to total population
exceeds the state average by 10 per cent (More than 9'25 %)
Districts in which the proportion of' urban population to total popu
lation is within 10 per cent plus/minus of the state average (9'25-7'57 %)
Districts in which the proportion of urban population to total popula
tion is more than 10 per cent below the state average
(Less than 7'57%)
Sundargarh (23'25) Korarut
Sambalpur (12'02) Cuttack
Ganjam (11'33)
Puri (9'79)
Urbanisation since 1901
Statement _in appendix I shows the pro. portion of urban population per 100 general populanon in the districts for all the decades since 1901. Districts showing a remarkably rapid growth of urban population or those exhibiting a very sluggish rate have been selected. The rest have been omitted as they exhibit a rbutine pattern of urban growth.
Sundargarh had no urban area till 1941. With Sundargarh and Birmitrapur towns coming into existence in 1951 it had a low proportion of urban population (2'78). This rose abruptly to 17'90 in 1961 because Of the establishment and growth of the steel township of Rourkela during the decade. This single factor elevated the di§trict to the top position in the degree of urbanisation in 1961. The position has been retained by the district in 1971. Between 1961 and 1971, no new town has come up in this district except for the bifurcation Of Rourke1a into two townships. which_ raised the number of towns in the district from four in 1961 to five in 1971.
The proportion of urban population in Sambalpur district was rather low ranging between 1'63 and 3'98 during the first half of the present century but it almost doubled to 7'65 per centin 1961. While the increase in
(1 Census-9)
2 3
(8'19) Keonjhar (7'05)
(7'98) Bolangir (6'86)
Balasore (5'47)
Kalahandi (4'86)'
Dhenkanal (4'00)
Baudh-Khondmals, (3'15)
Mayurbhanj (2'79)
proportion between 1901 and 1951 was only 2'35, it was 3'67 during the single decade 1951 to 1961. In 1951, there were four towns in the district which increased to seven in 1961. Two of these new towns, viz., Burla and Hirakud, grew because of the construction of Hirakud dam and the third was an industrial township at Brajrajnagar which grew wij:h the establishment of a paper mill. Four ne)\' small towns were added to the existing seven in 1971, thereby raising the proportion of urban population from 7'65 in 1961 to 12'02 in 1971.
While none of the districts except Balasore, Dhenkana and Baudh-Khondmals shows a decrease in the
-' proportion of urban population during the last three decades there are districts like Mayurbhanj, BaudhKhondmals and even Kalanandi wherein increase in the proportion of urban population has been extremely marginal during all these decades,
Distribution of tahsils bY range of urbanisation
In statement IV.5, 58- tahsils of the state have be~n arranged in the same three ranges as was done
for the districts earlier. 25 tahsils come under tile first }:ange, four belong to the average range and 29 are grouped in tlle below average range. Among the high range tahsils, Cuttack, Panposh, Berhampur.
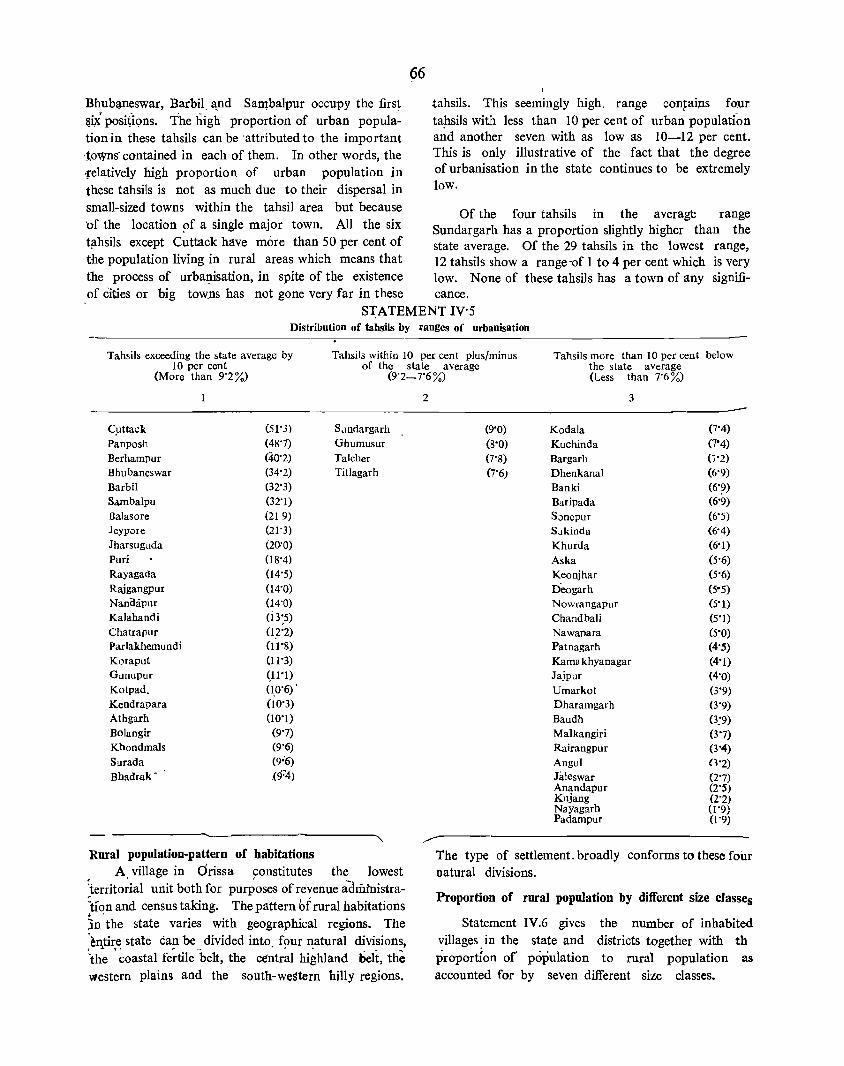
Bhubij.neswar, Barbila,_nd Sa1I!balpur occupy the first ~ii positi<;ms. The high proportion of urban population in these tahsils can be 'attributed to the important -towns' contained in each of them. In other words, the -relatively high proportion of urban population in these tahsils is not as much due to their dispersal in
66
tahsils. This seemingly high, range con~aips fO,llr tapsils with less than 10 per cent of urban population and another seven with as low as 10-12 per cent. This is only illustrative of the fact that the degree of urbanisation in the state continues to be extremely low.
small-sized towns within the tahsil area but because Of the four tahsils in the average range 'of the location ~f a single major town. All the six Sundargarh has a proportion slightly higher than the tflhsils except Cuttack have more than SO per cent of state average, Of the 29 tahsils in the lowest range, the population living in rural areas which means that 12 tahsils show a range 'of 1 to 4 per cent which is very the process of urbanisation, in spite of the existence low. None of these tahsils has a town of any signifi-of Cities or big towns has not gone very far in these cance.
SI:ATEMENT IV'S Distribution of tahsils by ranges of urbanisation
Tahsils exceeding the state average by 10 per cent
(More than 9'2 %)
Tahsils within 10 per cent plus/minus of the state average
(9'2-7'6%)
Tahsils more than 10 per cent below the state average (Less than 7'6 %)
CJ.lttack (51'3) S . .mdargarh Panposh (48'7) Ghumusur Berhampur (40'2) Talcher Bhubaneswar (34'2) Titlagarh Barbil (32'3) Sambalpu (32'1)
Balasore (21 9)
JeYPole (21'3) Jharsugllda (20'0) Puri (18'4) Rayagada (14'5) Rajgangpur (14'0) NanQapur (14'0) Kalahandi (i3:5) Chatrapur (l~'2)
Parlakhemundi 01'8) Koraput (11'3) Gunupur (11"1) Kotpad. 0.0'6)' Kendrapara (10'3) Athgarh (10'1) BOlangir (9'7) Khondmals (9'6)
Surada (9~6)
Bhadrak - .(974)
Rural population-pattern of habitations A village in drissa constitutes the lowest
~territo;ial unit both for pur;oses of revenue adrilinistra::t10n and census taking, The pattern bi rural habitations 3n'the state varies with geographical regions, The :elltiJ:~ state ca? be '. divided into, f~)Ur ~atural divisions, 'the coastal fertile belt, the central highland belt, the western plains and the south-western hilly regions,
2 3
(9'0) Kodala (7'4)
(8'0) Kuchinda (7"4)
(7'8) Bargarh (7'1)
(7'6) Dhenkanal (6'9)
Banki (6'?) Baripada (6'9) S;)nepur (6'5) SJkinda (6'4)
Khurda (6'1)
Aska (5'6) Keonjhar (5'6) Deogarh (5°5) Nowrangapur (5'1)
Chandbali (5'1) Nawapara (5'0) Patnagarh (4'5) Kama khyanagar (4'1) Jajpur (4'0) Umarkot (3'9)
Dharamgarh (3'9)
Baudh (3:9) Malkangiri (3'7) Rairangpur (3'4) Angul (1'2) Jilleswar (2'7) Anandapur (2'5) Kujang (2'2) Nayagarh 0'9) Padampur 0'9)
The type of settlement. broadly conforms to these four natural divisions,
Proportion of rural population by different size cJasses
Statement IV,6 gives the number of inhabited villages. in the state and districts together with th proportion or population to rural population as accounted for by seven different size classes,
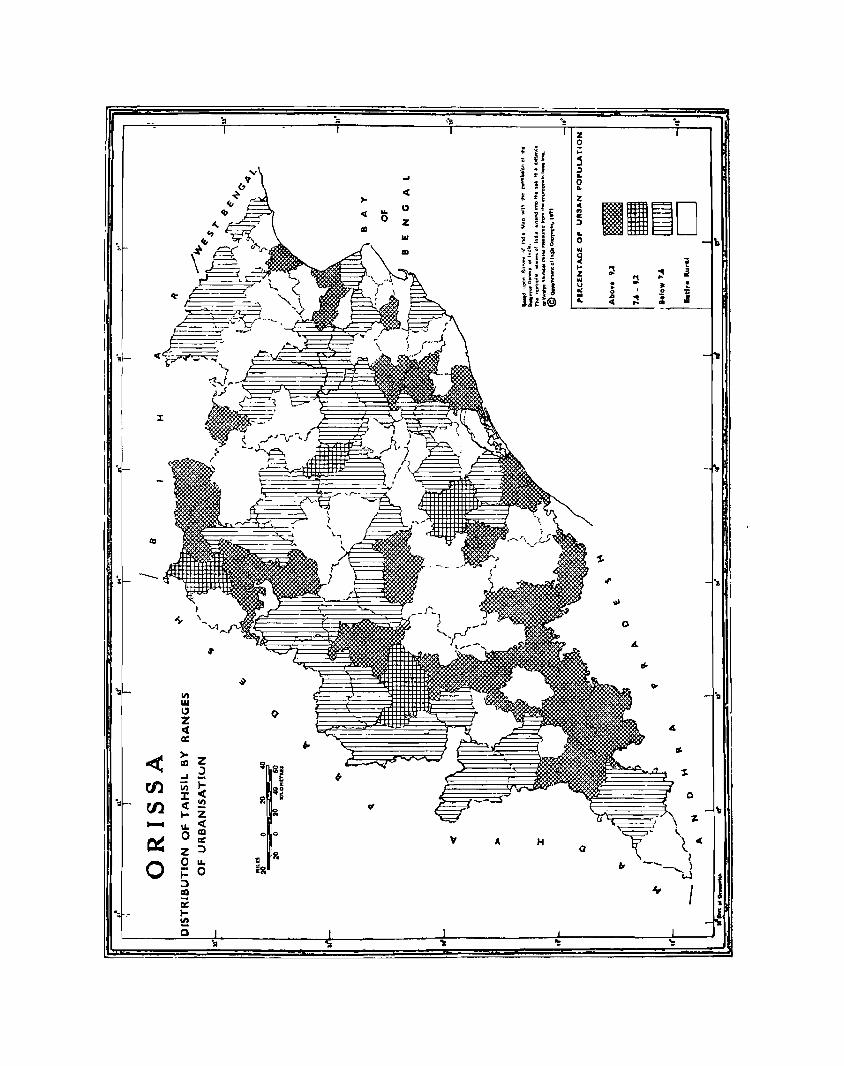
I I I I i
I
.
•
<:1- of
.~
.:
._ ,'"
c:: o
lit Ul l:)
Z < a:
)0 Z ~ ,)
lit lX oC( ct l!! I- Z u.. <I: o ~ Z :::> o u.. ... 0 :::> CO -a: I!!! o
":l
'II
" '"je
_,
"" )-
~
'" ... 0 Z
III III
III
Q
~ i~ %
*~ Iil ..
" o 0
A.
:I 80 i80
"e "= z 0
~ ;: ~
~ i1 j i
~ I .:I .J . " ..
1 : i 0 : g '" ! £ e Z
II~D .. C " .l_ .,
.. 11 ~ Ii 0:
~ ~ -j ::I ~ ." ~ i I ..
'II 0 ;~ (;! i III
!: II i ~ f ~ ~ "t ~
"' U) i .. '5 Z ~ .. i~ 1 : oJ . ~
. U ... 0 j 'PI '" 0 .. III ...
~ lfl.@ II.
" •
o
"' "-
:t-
o
" ~
a ot H
~ J J
~
1
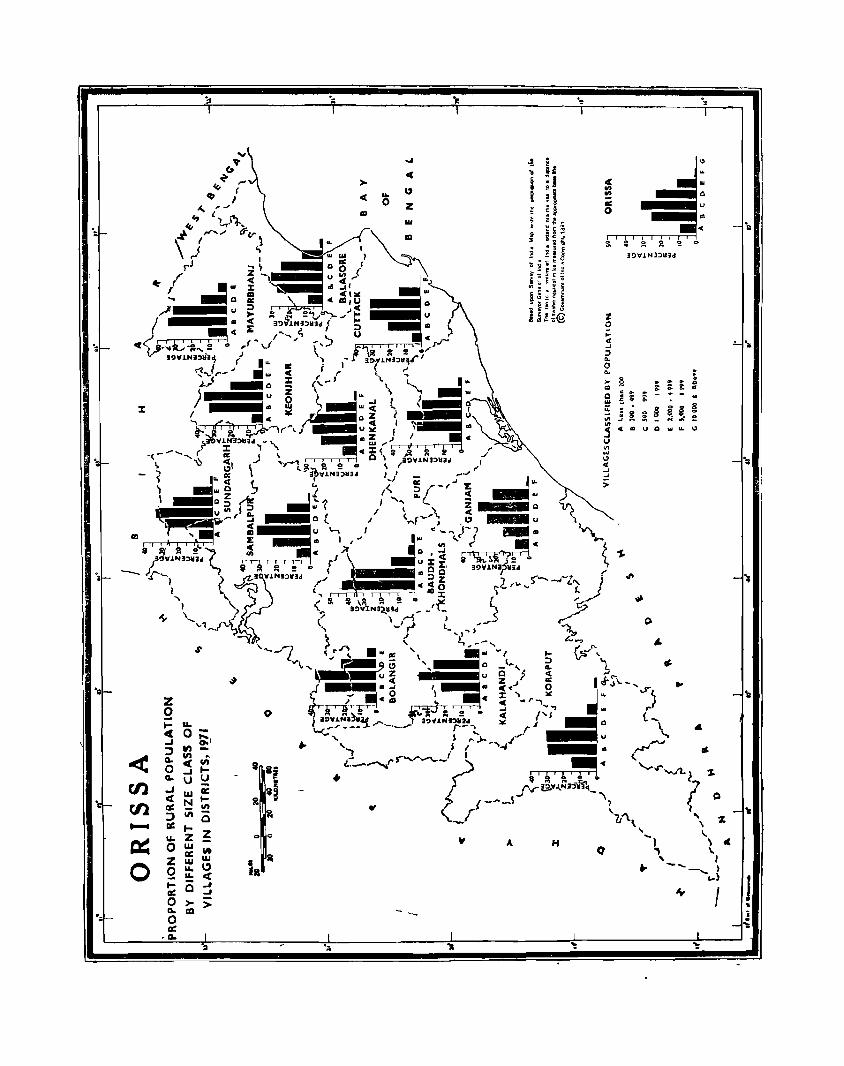
."
...... a:: u.
0 " H
0 Z 0 I-m:: 0 D-0. 0
-_ m::
• a,. '::1
C II> on
3
7.
" ... cr _J
:::> f1.
o ..
o
0 N
. ...
g: ~ : ..
..
~
. . : : . ..
..
~
0
U
II>
'1:;
• 'lI
I J ..
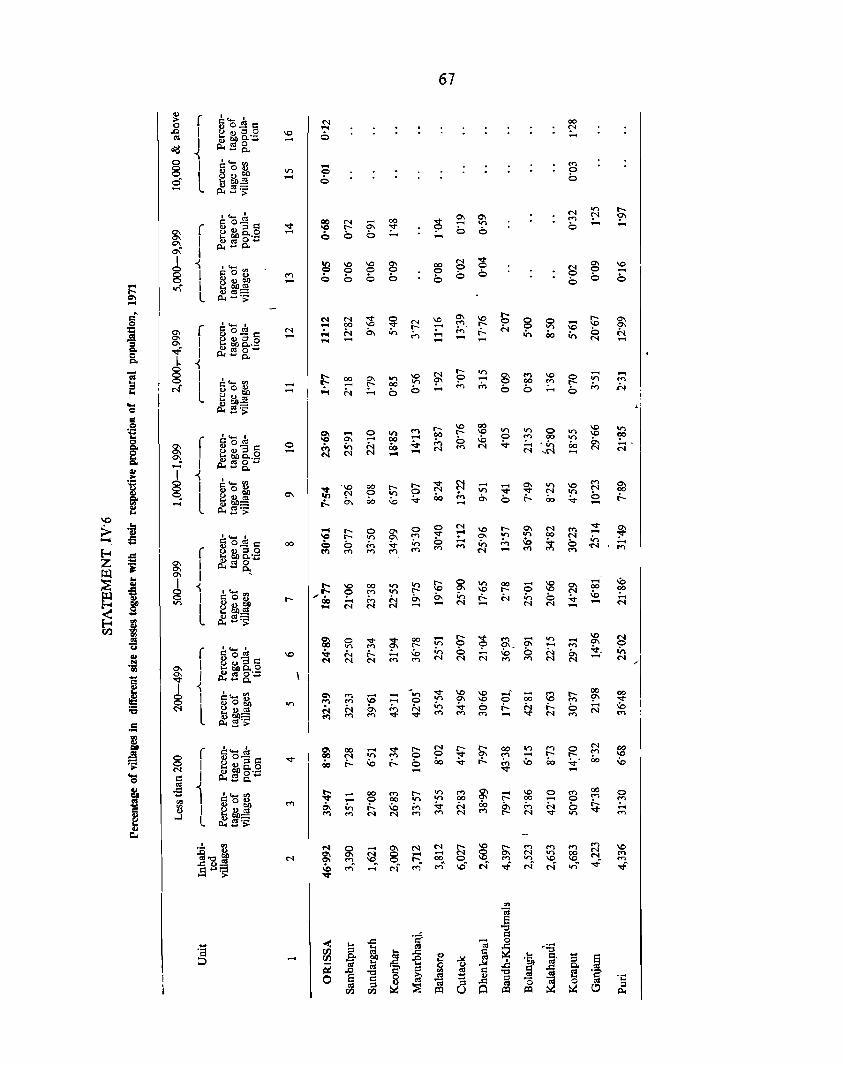
.S
i .... Q
j
1
[ I
~ I
L
[ I I
-< I
l [ I I
-< I
l
[ I
~ I
l
[ I I ~ I
l [ I I ~ I
l ( I
~ I I l
.... ....
o ....
00
N .... <0
I:: " . QC) ....
10 o b
N 00
M ....
00
M
.... '" .;., N
r-r--b C1'l
10 9 .... N
00 N r-..
.... ....
.;., .....
on 00
b
10 on b
III C1'l 00 ..... 00 .~ .... .....
67
00 o b
10 .... ;...
.... on .;., N
'" .... b
10 r--b .....
N .... ;.. .....
o '" .;., N
r-o b N
00 r--M
C1'l 00 b
..... o .;., N
_- .... o 00
t CJ
Vl .... \0
10 00
~
00 ~ ....
'" o b
III on 00 ....
'" N b ....
.... 00 \0 ....
00 '?' .... N
10 .... b
on 00 ;... N
'" 00
r-..
o '7' .... '"
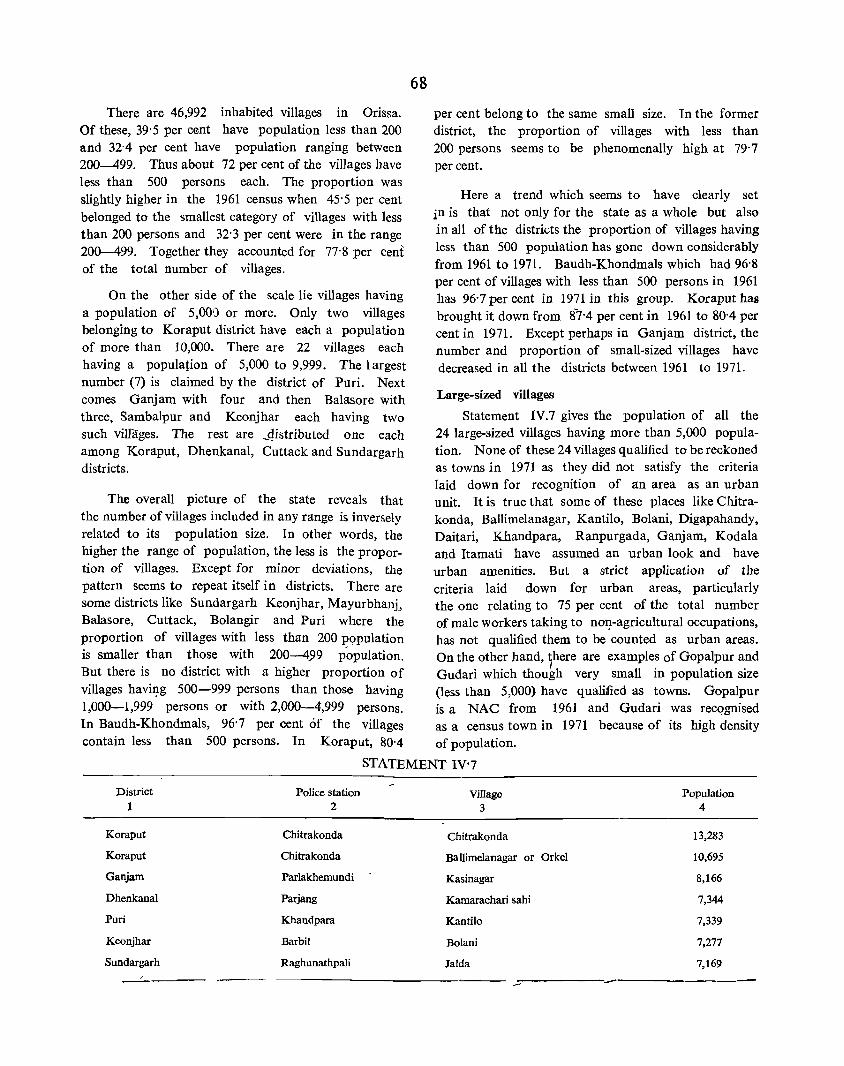
There are 46,992 inhabited villages in Orissa. Of these, 39' 5 per cent have population less than 200 and 32'4 per cent have population ranging between 200-499. Thus about 72 per cent of the villages have less than 500 persons each. The proportion was slightly higher in the 1961 census when 45'5 per cent belonged to the smallest category of villages with less than 200 persons and 32'3 per cent were in the range 200-499. Together they accounted for n'8 per ceni of the total number of villages.
On the other side of the scale lie villages having a population of 5,000 or more. Only two villages belonging to Koraput district have each a population of more than 10,000. There are 22 villages each having a population of 5,000 to 9,999. The largest number (7) is claimed by the district of Puri. Next comes Ganjam with four and then Balasore with three, Sambalpur and Keonjhar each having two such villages. The rest are _4istributed one each among Koraput, Dhenkanal, Cuttack and Sundargarh districts.
68
per cent belong to the same small size. In the former district, the proportion of villages with less than 200 persons seems to be phenomenally high at 79'7 percent.
Here a trend which seems to have clearly set in is that not only for the state as a whole but also in all of the districts the proportion of villages having less than 500 population has gone down considerably from 1961 to 1971. Baudh-Khondmals which had 96'8 per cent of villages with less than 500 persons in 1961 has 96'7 per cent in 1971 in this group. Koraput has brought it down from 87'4 per cent in 1961 to 80'4 per cent in 1971. Except perhaps in Ganjam district, the number and proportion of small-sized villages have decreased in all the districts between 1961 to 1971.
Large-sized villages
Statement IV.7 gives the population of all the 24 large-sized villages having more than 5,000 population. None of these 24 villages qualified to be reckoned as towns in 1971 as they did not satisfy the criteria laid down for recognition of an area as an urban
The overall picture of the state reveals that unit. It is true that some of these places like Chitra-the number of villages included in any range is inversely konda, Ballimelanagar, Kantilo, Bolani, Digapahandy, related to its population size. In othet words, the Daitari, Khandpara, Ranpurgada, Ganjam, Kodala higher the range of population, the less is the prop or- and Itamati have assumed an urban look and have tion of villages. Except for minor deviations, the urban amenities. But a strict application of the pattern seems to repeat itself in districts. There are criteria laid down for urban areas, particularly some districts like Sundargarh Keonjhar, Mayurbhanj, the one relating to 75 per cent of the total number Balasore, Cuttack, Bolangir and Puri where the of male workers taking to n01!-agricultural occupations, proportion of villages with less than 200 P9Pulation has not qualified them to be counted as urban areas. is smaller than those with 200-439 popUlation. On the other hand, there are examples of Gopalpur and But there is no district with a higher proportion of Gudari which thou~h very small in population size villages havi1!g 500-999 persons than those having (less than 5,000) have quali.:fied as towns. Gopalpur 1,000-1,999 persons or with 2,000-4,999 persons. is a NAC from 1961 and Gudari was recqgnised In Baudh-Khondmals, 96'7 per cent of the villages as a census town in 1971 because of its high density contain less than 500 persons. In Koraput, 80"4 of population.
STATEMENT IV'7
District Police station Village Population 1 2 3 4
Koraput Chitrakonda Chitrakonda 13,283
Koraput Chitrakonda Ballimelanagar or Orkel 10,695
Ganjam Parlakhemundi Kasinagar 8,166
Dhenkanal Parjang Kamarachari sahi 7,344
Puri Khandpara Kantilo 7,339
Keonjhar Barbil Bolani 7,277
Sundargarh Raghunathpali lalda 7,169
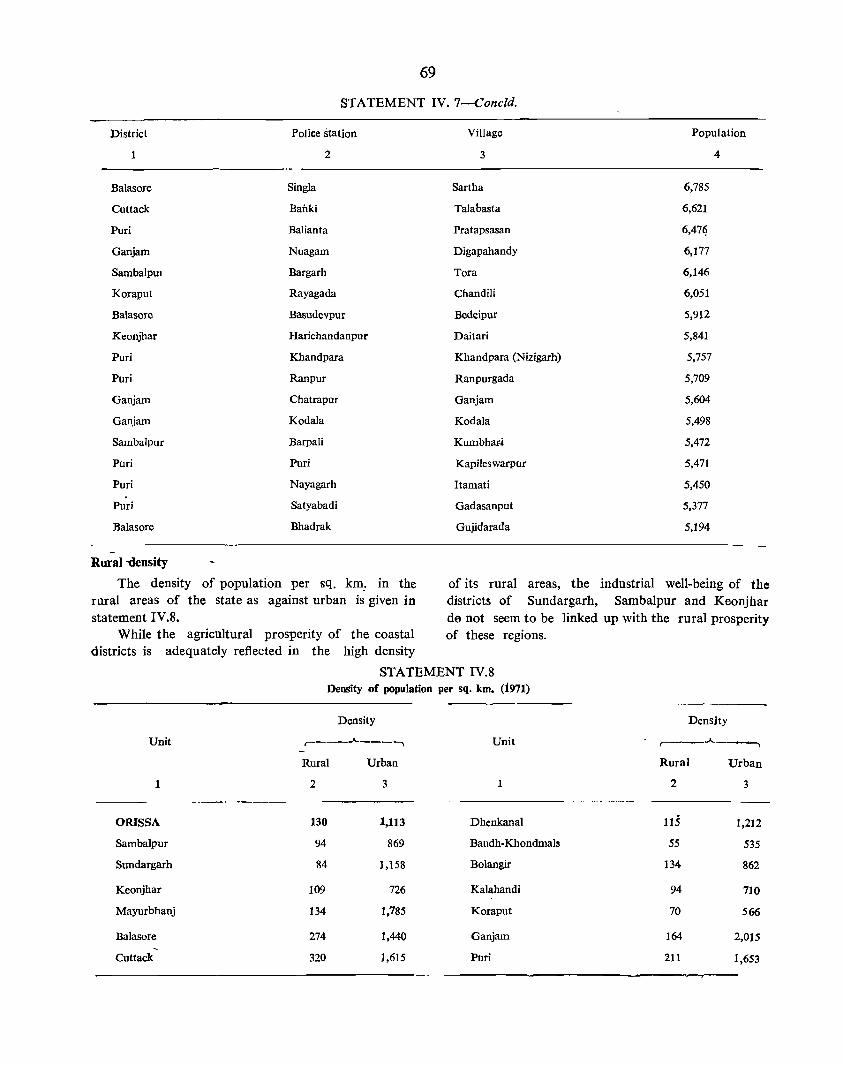
69
STATEMENT IV. 7-Concld.
District Police station
1 2
Balasore Singla
Cuttack Bailki
Puri Balianta
Ganjam Nuagam
SambaIpUl Bargarh
Koraput Rayagada
Balasore Basudevpur
Keonjhar Harichandanpur
Puri Khandpara
Puri Ranpur
Ganjam Chatrapur
Gal\jam Kodala
Sarnbalpur Barpali
Puri Puri
Puri Nayagarh
Puri Satyabadi
Balasore Bhadrak
Rural -density
The density of population per sq. km: in the rural areas of the state as against urban is given in statement IV.8.
While the agricultural prosperity of the coastal districts is adequately reflected in the high density
Village Population
3 4
Sartha 6,785
Talabasta 6,621
Pratapsasan 6,47~
Digapahandy 6,177
Tora 6,146
ChandiIi 6,051
Bedeipur 5,912
Daitari 5,841
Khandpara (Nizigarh) 5,757
Ranpurgada 5,709
Ganjam 5,604
Kodala 5,498
Kurnbhaa 5,472
Kapileswarpor 5,471
Itamati 5,450
Gadasanput 5,377
Gujidarada 5,194
of its rural areas, the industrial well-being of the districts of Sundargarh, Sambalpur and Keonjhar de not seem to be linked up with the rural prosperity of these regions.
STATEMENT IV.8 Density of population per sq. km. (1971) ~
Density Density
Unit r----.A.---'-, Unit ,--__ .A. __ --,
Rural Urban Rural Urban
1 2 3 1 2 3
ORISSA 130 1,113 Dhenkanal 115 1,212
Sambalpur 94 869 Baudh-Khondmals 55 535
Sundargarh 84 1,158 Bolangir 134 862
Keonjhar 109 726 Kalahandi 94 710
Mayurbhanj 134 1,785 Koraput 70 566
Balasore 274 1,440 Ganjam 164 2,015
Cuttack 320 1,615 Pori 111 1,653
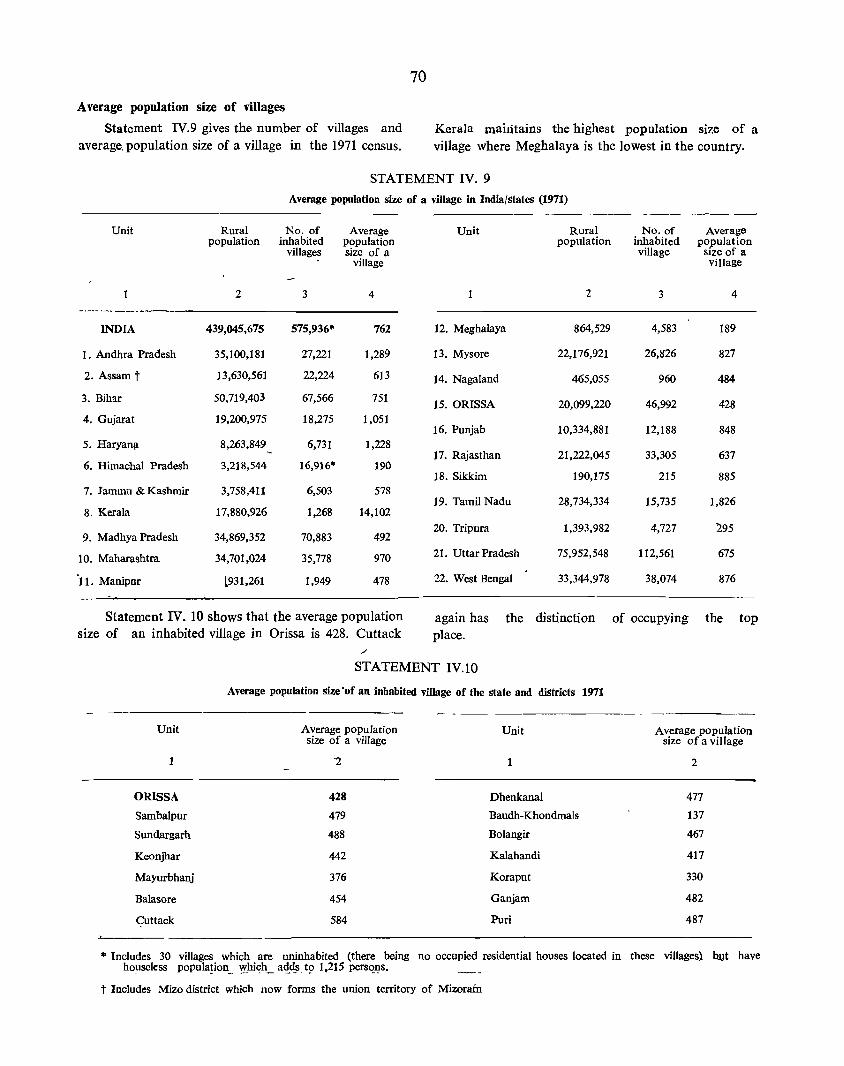
70
Average population size of villages
Statement IV.9 gives the number of villages and Kera]a maintains the highest population size of a average. population size of a village in the 1971 census. village Where Meghalaya is the lowest in the country.
STATEMENT IV. 9
Average population size of a village in India/states (1971)
Unit Rural No. of Average Unit Rural No. of Average population inhabited population population inhabited population
villages size of a village size of a village village
2 3 4 2 3 4 -.~" .. - ._.._.---.-
INDIA 439,045,675 575,936* 762 12. Meghalaya 864,529 4,583 189
1. Andhra Pradesh 35,100,181 27,221 1,289 13. Mysore 22,176,921 26,826 827
2. Assam t 13,630,561 22,224 613 14. Nagaland 465,055 960 484
3. Bihar 50,719,403 67,566 751 15. ORISSA 20,099,220 46,992 428
4. Gujarat 19,200,975 18,275 1,051 16. Punjab 10,334,881 12,188 848
5. Haryan!;l 8,263,849 6,731 1,228 17. Rajasthan 21,222,045 33,305 637
6. Himachal Pradesh 3,218,544 16,916* 190 18. Sikkim 190,175 215 885
7. Jammu & Kashmir 3,758,411 6,503 578 19. Tamil Nadu 28,734,334 15,735 1,826
8. Kerala 17,880,926 1,268 14,102
9. Madhya Pradesh 34,869,352 70,883 492 20. Tripura 1,393,982 4,727 '195
10. Maharashtra 34,701,024 35,778 970 21. Uttar Pradesh 75,952,548 112,561 675
-II. Manipur 1931,261 1,949 478 22. West Bengal 33,344,978 38,074 876
Statement IV. 10 shows that the average population
size of an inhabited village in Orissa is 428. Cuttack again has the distinction of occupying the top
place.
" STATEMENT IV.lO
Average population size·of an inhabited village of the state and districts 1971
Unit Average population Unit Average population size of a village size of a village
1 "2 1 2
ORISSA 428 Dhenkanal 477
Sambalpur 479 Baudh-Khondmals 137
Sundargarh 488 Bolangir 467
Keonjhar 442 Kalahandi 417
Mayurbhanj 376 Koraput 330
Balasore 454 Ganjam 482
«uttack 584 Puri 487
* Includes 30 villages which are uninhabited (there being no occupied residential houses located in these villages) bJ.!t have houselcss popula!ion_ ~_hi~h._ a~~_s.t!? 1,215 persCl~s.
t Includes Mizo district which now forms the union territory of Mizorafn
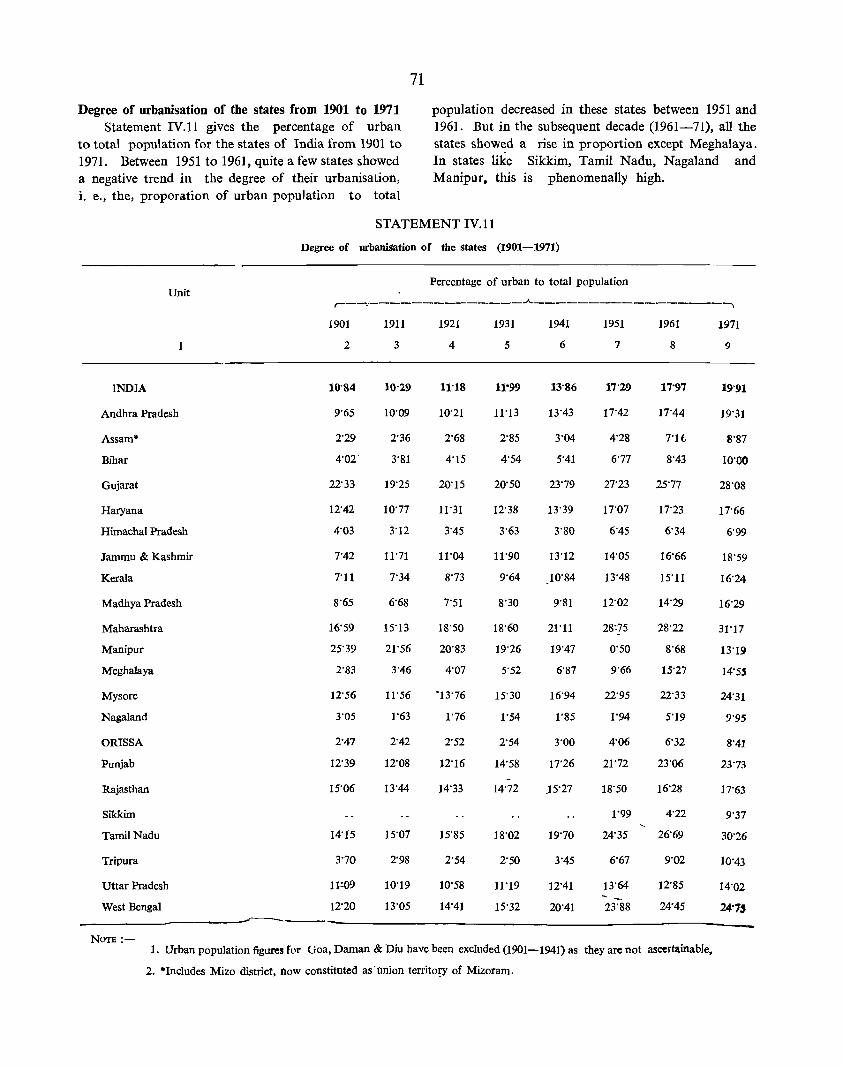
Degree of urbanisation of the states from 1901 to 1971 Statement IV,II gives the percentage of urban
to total population for the states of India from 1901 to 1971. Between 1951 to 1961, quite a few states showed a negative trend in the degree of their urbanisation, i, e" the, proporation of urban population to total
71
population decreased in these states between 1951 and 1961. But in the subsequent decade (1961-71), all the states showed a rise in proportion except Meghalaya, In states like Sikkim, Tamil Nadu, Nagaland and Manipur. this is phenomenally high,
STATEMENT IV,l1
Degree of urbanisation of the states (1901-1971)
Percentage of urban to total population Unit
~-~--------------~-----------------~
1
INDIA
Andhra Pradesh
Assam*
Bihar
Gujarat
Haryana
Himachal Pradesh
Jammu & Kashmir
Kerala
Madhya Pradesh
Maharashtra
Manipur
Meghalaya
Mysore
Nagaland
ORISSA
Punjab
Rajasthan
Sikkim
Tamil Nadu
Tripura
Uttar Pradesh
West Bengal
1901
2
10'84
9'65
22'33
12'42
4'03
7'42
7'11
8'65
16'59
25'39
2'83
12'56
3'05
2'47
12'39
15'06
14'15
3'70
1~09
12'20
1911
3
10'29
10'09
2'36
3'81
19'25
10'77
3'12
11'71
7'34
6'68
15'13
21'56
3'46
11'56
1'63
2'42
12'08
13'44
15'07
2'98
10'19
13'OS
1921
4
11'18
10'21
2'68
4'15
20'15
11'31
3'45
11'04
8'73
7'51
18'50
20'83
4'07
'13'76
1'76
2'52
J.2·16
14'33
15'85
2'54
10'58
14'41
1931
5
11'99
11'13
2'85
4'54
20'50
12'38
3'63
11'90
9'64
8'30
18'60
19'26
5'52
15'30
1'54
2'S4
14'S8
14'72
18'02
2'SO
11'19
15'32
1941
6
13'86
13'43
3'04
S'41
23'79
13'39
3'80
13'12
10'84
9'81
21'11
19'47
6'87
16'94
1'85
3'00
17'26
J5'27
19'70
3'45
12'41
20'41
1951
7
17'29
]7'42
4'28
6'77
27'23
17'07
6'45
14'05
13'48
12'02
28:75
0'50
9'66
22'95
1'94
4'06
21'72
18'50
1'99
24'35
6'67
13'64
23'88
1961
8
17'97
17'44
7'16
8'43
25'77
17'23
6'34
16'66
15'11
14'29
28'22
8'68
15'27
22'33
5'19
6'32
23'06
16'28
4'22
26'69
9'02
12'85
24'45
1971
9
19'91
19'31
8'87
10'00
28'08
17'66
6'99
18'59
16'24
16'29
31'17
13'19
14'55
24'31
9'95
8'41
23'73
17'63
9'37
30'26
10'43
14'02
24'15
----------------------~--------------------------------------------------------NCYrE :-
1. Urban population figures for Ooa, Daman & Diu have been excluded (1901-1941) as they are not ascertainable,
2, ·Includes Mizo district, now constituted as'union territo!y of Mizoram.
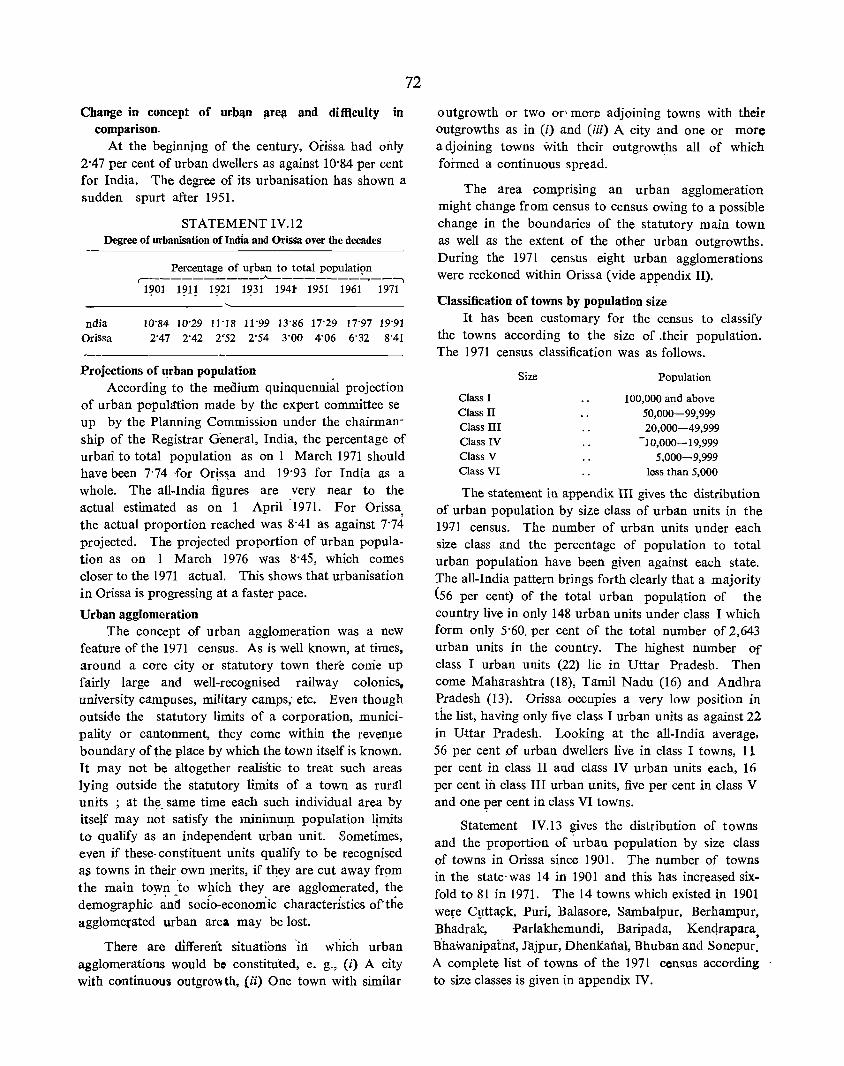
Change in concept of utbllD !lre!l and difllculty in comparison,
72
At the beginnjng of the century, OriSsa had oo.1y 2'47 per cent of urban dwellers as against 10'84 per cent for India, The degree of its urbanisation has shown a sudden spurt after 1951.
STATEMENT IV,12 Degree of urbanisation of India and Orissa over the decades
ndia Orissa
Percentage of urban to total population ~----------~--------~--~
1?01 1?1! 1~21 1~31 194t 1951 1961 1971
10'84 10'29 11'18 11'99 13'86 17'29 17'97 19'91 2'47 2'42 2'"52 2'54 3'00 4'06 6'32 8'41
Projections of urban population According' to the medium quinquenni~l projection
of urban popuhttion made by the expert committee se up by the Planning Commission under the chairmanship of the Registrar Gemeral, India, the percentage of urban to total population as on 1 March 1971 should have been 7'74 for Or~s~a and 19'93 for India as a whole, The all-India figures are very near to the actual estimated as on 1 April '1971. For Orissa , the actual proportion reached was 8'41 as against 7'74 projected, The projected proportion of urban population as on 1 March 1976 was 8'45, which comes closer to the 1971 actual. This shows that urbanisation in Orissa is progressing at a faster pace.
Urban agglomeration The concept of urban agglomeration was a new
feature of the 1971 census, As is well known, at times, around a core city or statutory town there come up fairly large and well-recognised railway colonies, university campuses, military camps; etc. Even though outside the statutory limits of a corporation, municipality or cantonment, they come within the revenJ,le boundary of the place by which the town itself is known. It may not be altogether realistic to treat such areas lying outside the statutory limits of a town as rural units ; at the, same time each such individual area by itself may not satisfy the minimuJ? popUlation limits to qualify as an independent urban unit. Sometimes, even if these- constituent units qualify to be recognised as towns in their own merits, if they are cut away fr9m the main town to which they are agglomerated, the demographic' and socio-economic characteristics of'the agglomerated urban area may be lost.
There are differen1 situations 'ili" which urban agglomerations would be constituted, e. g" (i) A city with continuous outgrow th, (ii) One town with similar
outgrowth or two or'more adjoining towns with their outgrowths as in (i) and (iii) A city and one or more a djoining towns with their outgrowths all of which formed a continuous spread,
The area comprising an urban agglomeration might change from census to census owing to a possible change in the boundaries of the statutory main town as well as the extent of the other urban outgrowths. During the 1971 cen&us eight urban agglomerations were reckoned within Orissa (vide appendix II).
'Classification of towns by population size It has been customary for the census to classify
the towns according to the size of .their population. The 1971 census classification was as follows.
Class I Class II Class III Class IV Class V Class VI
Size Population
100,000 and above 50,000-99,999 20,000-49,999
-10,000-19,999 5,000-9,999
less than 5,000
The statement in appendix III gives the distribution of urban population by size class of urban units in the 1911 census. The number of urban units under each size class and the percentage of population to total urban population have been given against each state, The all-India pattern brings forth clearly that a majority (56 per cent) of the total urban popul~tion of the country live in only 148 urban units under class I which form only 5'60, per cent of the total number of 2,643 urban units in the country. The highest number Of class I urban units (22) lie in Uttar Pradesh. Then come Maharashtra (18), Tamil Nadu (16) and Andhra Pradesh (13), Orissa occupies a very low position in the list, having only five class I urban units as against 22 in Uttar Pradesh, Looking at the all-India average, 56 per cent Df urban dwellers live in class I towns, 11 per cent in class II and class IV urban units each, 16 per cent in class III urban units, five per cent in class V and one :per cent in class VI towns,
Statement IV,13 gives the distribution of towns and the proportion of urban population by size class of towns in Orissa since 1901. The number of towns in the state' was 14 in 1901 and this has increased sixfold to 81 in 1971. The 14 towns which existed in 1901 were C!ltta~k, Puri, Balasore, Sambalpur, Berhampur, Bhadrak, -Parlakhemundi, Baripada, Kenqrapara, B'hawanipatna, Jhjpur, Dhenl(anal, Bhuban and Sonepur. A complete list of towns of the 1971 census according to size classes is given in appendix IV.

1901
DISTRIBUTION OF URBAN POPULAT!ON BY SIZE CLASS OF TOWNS
(ORISSA)
r-:.-:::-=--
- r --
1911 1921 1931 1941 196( 1971
Class I Class II Class III Class IV Class V Class VI (100,000 8r Aboye)(SO,OOO-99t9")(20;00CJ...49t999)(lO~OOO.19,999) (5,000.9.999) (Less than S,OOO)

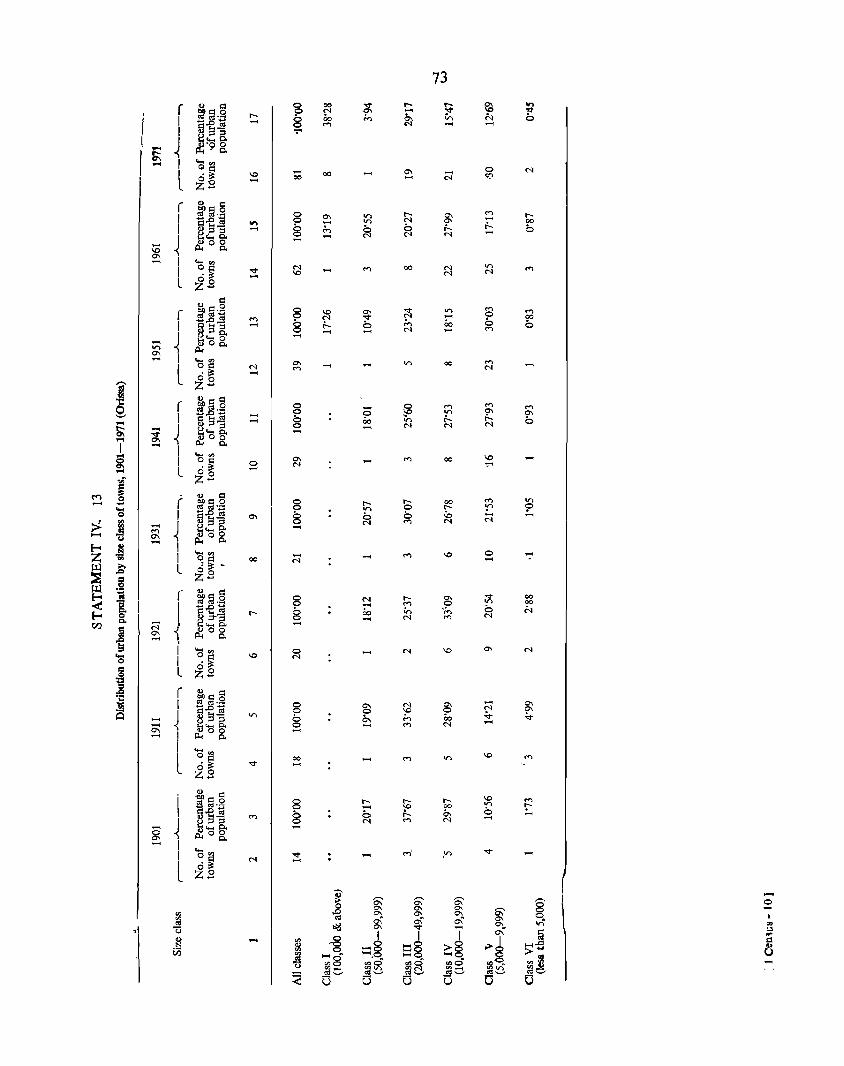
73
[ ~r:lg ~ 00 '3. r-- r-- '" ~ ,
l-N - -::r \0
I (Ij (lj0_ 00 ...,
~ M
I 5~1 - II") 0 M - -I -..
~ ~ .... 0-- &:09 8.
I S; .... I .... '" I ~~ \0 - 00 '" .... 0
l Z2 .... 00 ..... N <':l
( ~r:lg I
(Ij (ljo_ 0 '" II") I- '" M I-..... .0 ~
'" 0 ..... II") N '"
..... 00
I ~!3'3 ..... 8 M ~ 0 t- r- 0
~ ~ '-< g. ..... ('l N ..... .....
\0 p.,0o-
'" ..... I .... '" I ~~ "<T N M 00 N II")
\0 N N
l °0 -z-CI> r:l
( 0l)r:l09 0 \0 '" ;:1i II") M ..... 52t; M ~
N "<T ..... 0 00
I ~!3& - t- o M 00 0 0 I - ..... ..... N ..... .....
..... "''Cl ° II") ~ ~ 0-
'" I ..... 'Cla I N '" II") 00 ...,
oil: - M M
l 00
i z .... ~ [
0r:lr:l ~_gog 0 ;::; 0 M
..., M
...... I Q~~ - ? ~ II") '" '" ... ..... 0 00 II") r- t- o ~ - I 8 .... 6. 0 ..... N N N
-g, ..... ... ~ ~oo I .....
I p., 0-... .... '"
~ I 0r:l 0 ~ ..... 00 \0 -l oil: ..... .,.. ... °0 v; z .... M ~ CI> r:l ...... .s ( QIlr:lO 0 I- 8 00 M II") ....
I ~2'-= 0 on I- '[l ? 0 u!3-E '" 8 0 0 \0 ..... -> j ..... I N ..... N N
'"" ~ .... 0- -.....
'" ~ ~08. OJ ..... E-< .~ I .... '" Z I ~ ~ - 00 - ..... M \0 0 ':' IlJ ;;.. l
N .....
)1 .... ZE = IlJ C> 0:.:: ( CI> r:l
~ 1 ~§09 0 N I- '" ~ 00
I .... ,0 .... 0 ..... ..... 0 00
E-< { 8 !:l--3 I- 8 00 in 'M 0 M I'lo N M N
rn
~ ~ ....... 0- ..... - ~08.
I .... '" 0 N \0 '" 'S I ~~ \0 N
= l ZE ~ = ( :S ~r:lg
~ I cd cd'- 0 0\ N ~ ;;::l '" I do£~ II") 0 ? 'P 0\
..... ~
8::s'3 0 ~ «, 00 "<T ~ ..... ~f- ~ 0 M N -0\ ..... I p.,08. -
I ~d I 00 M II") \0 M
l ci~ "<T
z ....
i CI> r:l i~09 8 l- I- I- \0 ...,
V)
I r:l,o .... ..... 'P 00 0 0;-
8"'~ M 8 ~ I- ~ -~
::S::S M .....
~ ~~ C! .....
..... I p.,08.
I ~~ "<T M ,II") "<T ..... I
N .....
l ZE
~ Q\' Q\' Q\' ~,
I 0
° 8 '" .g '" '" '" Q\' '" '" '" til 0\ 0\ 0\ '"
0 (Ij .n-o ~ '" "<T ..... "'K '"
I I I 0\ 1ii ~
~ '" .~ ,>~ ;;
£ ..... 8 ::::8 >8 0-;.<:1 0 > .... e>
~ ':8 -oq 0-;0 ..... 0 m& '" U
",0 ClIO "'0 ~! "'- "'II") at!, "'- "'II")
~ 0""" o;S ...... oos ...... 0 ...... 0 u 0
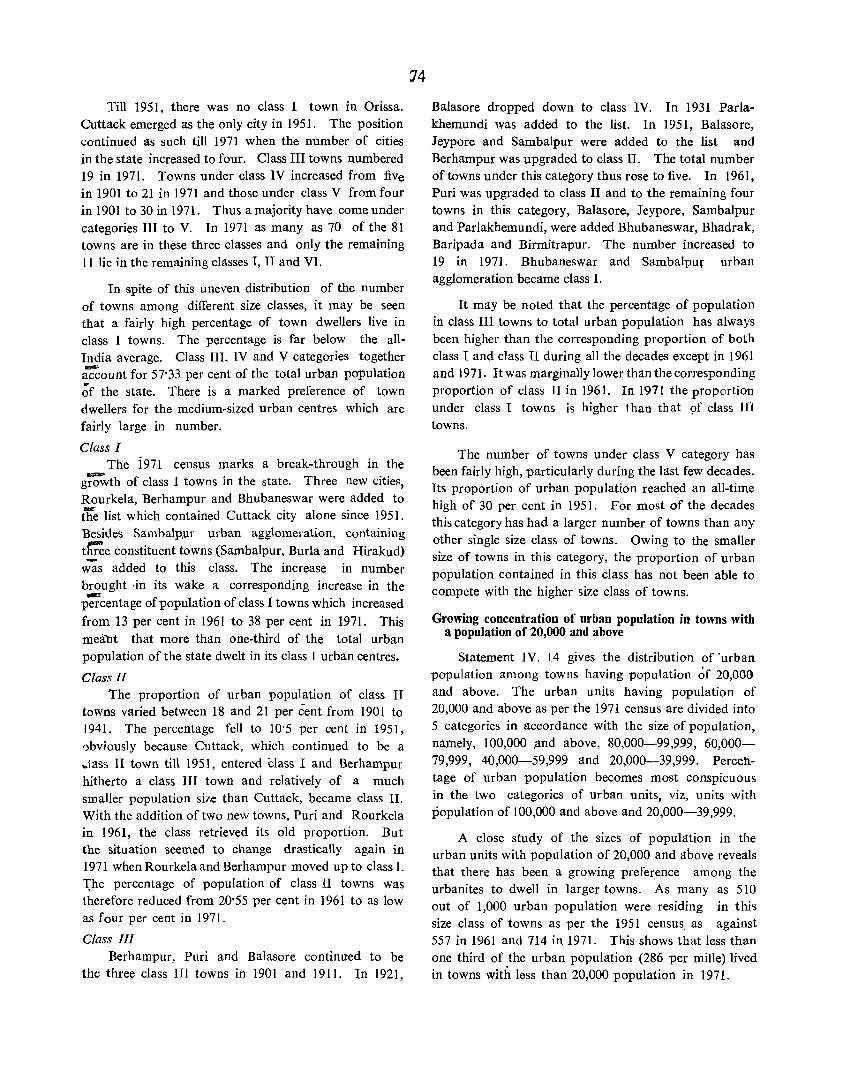
Till 1951, there was no class I town in Orissa. Cuttack emerged as the only city in 1951. The position continued as such till 1971 when the number of cities in the state increased to four. Class III towns numbered 19 in 1971. Towns under class IV increased from five in 1901 to 21 in 1971 and those under class V from four in 1901 to 30 in 1971. Thus a majority have come under categories III to V. In 1971 as many as 70 of the 81 towns are in these three classes and only the remaining ll1ie in the remaining classes I, II and VI.
In spite of this uneven distribution of the number of towns among different size classes, it may be seen that a fairly high percentage of town dwellers live in class I towns. The percentage is far below the all~
India average. Class III, IV and V categories together ac;;ount for 57·33 per cent of the total urban population ~f the state. There is a marked preference of town dwellers for the medium-sized urban centres which are fairly large in number.
Class I The i971 census marks a break-through in the
g~th of class I towns in the state. Three new cities, Rourkela, Berhampur and Bhubaneswar were added to {he list which contained Cuttack city alone since 1951. Besides Sambalp.ur urban agglomeration, containing t~e constituent towns (Sambalpur, Burla and Hirakud) .;as added to this class. The increase in number brought ·in its wake a corresponding increase in the -percentage of population of class I towns which increased from 13 per cent in 1961 to 38 per cent in 1971. This me:iht that more than one-third of the total urban population of the state dwelt in its class I urban centres.
Class II The proportion of urban population of class II
towns varied between 18 and 21 per cent from 1901 to 1941. The percentage fell to 10·5 per cent in 1951, ')bviously because Cuttack, which continued to be a .. lass II town till 1951, entered Class I and Berhampur hitherto a class III town and relatively of a much smaller population size than Cuttack, became class II. With the addition of two new towns, Puri and Rourke1a in 1961, the class retrieved its old proportion. But the situation seemed to change drastically again in 1971 when Rourkela and Berhampur moved up to class 1.
J:he percentage of population of class II towns was therefore reduced from 20·55 per cent in 1961 to as low as four per cent in 1971.
Class III Berhampur, Puri and Balasore continued to be
the; three class III towns in 1901 and 1911. In 1921,
14
Balasore dropped down to class IV. In 1931 Par1a.khemundi was added to the list. In 1951, Ba1asore, J eypore and Samba1pur were added to the list and Berhampur was upgraded to class II. The total number of towns under this category thus rose to five. In 1961, Puri was upgraded to class II and to the remaining four towns in this category, Balasore, Jeypore, Sambalpur and Parlakhemundi, were added Bhubaneswar, Bhadrak, Baripada and Birmitrapur. The number increased to 19 in 1971. Bhubaneswar and Sambalpuf urban agglomeration became class I.
It may be noted that the percentage of population in class III towns to total urban population has always been higher than the corresponding proportion of both class I and class II during all the decades except in 1961 and 1971. It was marginally lower than the corresponding proportion of class II in 196 I. In 1971 the proportion under class I towns is higher than that 9f class III towns.
The number of towns under class V category has been fairly high, particularly during the last. few decades. Its proportion of urban population reached an all-time high of 30 per cent in 1951. For most of the decades this category has had a larger number of towns than any other single size class of towns. Owing to the smaller size of towns in this category, the proportion of urban population contained in this class has not been able to compete with the higher size class of towns.
Growing concentration of urban popUlation in towns with a population of 20,000 and above
Statement IV. 14 gives the distribution of ·urban population among towns having population ~f 20,GOO and above. The urban units having population of 20,000 and above as per the 1971 census are divided into 5 categories in accordance with the size of population, namely, 100,000 ,and above, 80,000-99,999, 60,000-79,999, 40,000-59,999 and 20,000-39,999. Percefltage of urban population becomes most conspicuous in the two categories of urban units, viz, units with population of 100,000 and above and 20,000-39,999.
A close study of the sizes of population in the urban units with population of 20,000 and above reveals that there has been a growing preference among the urbanites to dwell in larger towns. As many as 510 out of 1,000 urban population were residing in this size class of towns as per the 1951 census, as against 557 in 1961 and 714 in 1971. This shows that less than one third of the urban population (286 per mille) lived in towns with less than 20,000 population in 1971.
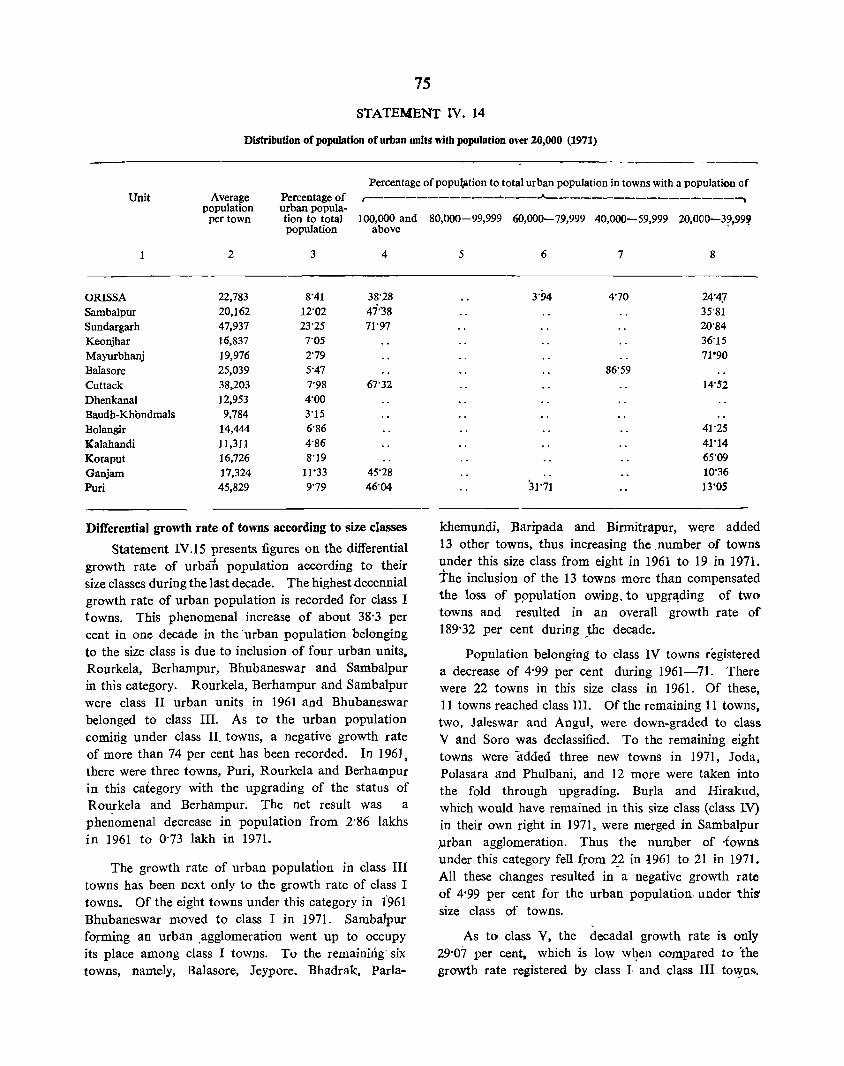
75
STATEMENT IV, 14
Distribution of population of urban units with population over 20,000 (1971)
Percentage of popul,ation to total urban population in towns with a population of Unit Average Percentage of
~ ___________ ~ ___ A-________________ ~
population urban popula-per town tion to total 100,000 and
population above
2 3 4
ORISSA 22,783 8'41 38'28 Sambalpur 20,162 12'02 47-38 Sundargarh 47,937 23'25 71'97 Keonjhar 16,837 7'05
Mayurbhanj 19,976 2'79 Balasore 25,039 5'47 Cuttack 38,203 7'98 67'32
Dhenkanal 12,953 4'00 Baudh-Khondmals 9,784 3'15
Bolangir 14,444 6'86
Kalahandi 11,311 4'86 Koraput 16,726 8'19 Ganjam 17,324 11'33 45'28
Puri 45,829 9'79 46'04
Differential growth rate of towns according to size classes
Statement IV.l5 presents figures on the differential growth rate of urba1t population according to their size classes during the last decade. The highest.decennial growth rate of urban population is recorded for class I towns, This phenomenal increase of about 38"3 per cent in one decade in the 'urban population belonging to the size class is due to inclusion of four urban units. Rourkela, Berhampur, Bhubaneswar and Sambalpur in this category. Rourkela, Berhampur and Sambalpur were class II urban units in 1961 and Bhubaneswar belonged to class III. As to the urban population coming under class II. towns, a negative growth rate of more than 74 per cent has been recorded. In 196], there were three towns, Puri, Rourkela and Berhampur in this category with the upgrading of the status of Rou_rkela and Berhampur. The net result was a phenomenal decrease in population from 2'86 lakhs in 1961 to 0'73 lakh in 1971.
The growth rate of urban population in class III towns has been next only to the growth rate of class I towns. Of the eight towns under this category in 1961 Bhubaneswar moved to class I in 1971. Sambalpur forming an urban ,agglomeration went up to occupy its place among class I towns. To the remainirig' six towns, namely, Balasore, Jeypore, Bhadrak, ParIa-
80,000-99,999 60,000-79,999 40,000-59,999 20,OO0-3~,99!l
5 6 7 8
3'94 4'70 24'47 35'81 20'84 36'15 71·90
86'59 14'52
41'25 41"14 65'09 10'36
31'71 13'OS
khemundi, Baripada and Birmitrapur, were added 13 other towns, thus increasing the .number of towns under this size class from eight in 1961 to 19 in 1971. the inclusion of the 13 towns more than compensated the loss of pppulation owing. to upgra,ding of two towns and resulted in an overall growth rate of 189'32 per cent during Jhe dec~de,
Population belonging to class IV towns registered a decrease of 4'99 per cent during 1961-71. There were 22 towns in this size class in 1961. Of these, 11 towns reached class III. Of the remaining 11 towns. two, Jaleswar and Angul, were down-graded to class V and Soro was declassified. To the remaining eight towns were -added three new towns in 1971, Joda, Polasara and Phulbani, and 12 more were taken into the fold through upgrading. Burla and Hirakud, which would have remained in this size class (class LV) in their own right in 1971, were merged in Sambalpur ,urban agglomeration. Thus the number of -towns under this category fell (rom 2,2 in 1961 to 21 in 1971. All these changes resulted in a negative growth rate of 4'99 per cent for the urban population. under thiS' size class of towns.
As to class V, the decadal growth rate is only 29'07 per cent. which is low wl}.en compared to 'the growth rate registered by class I and class III to..yus..
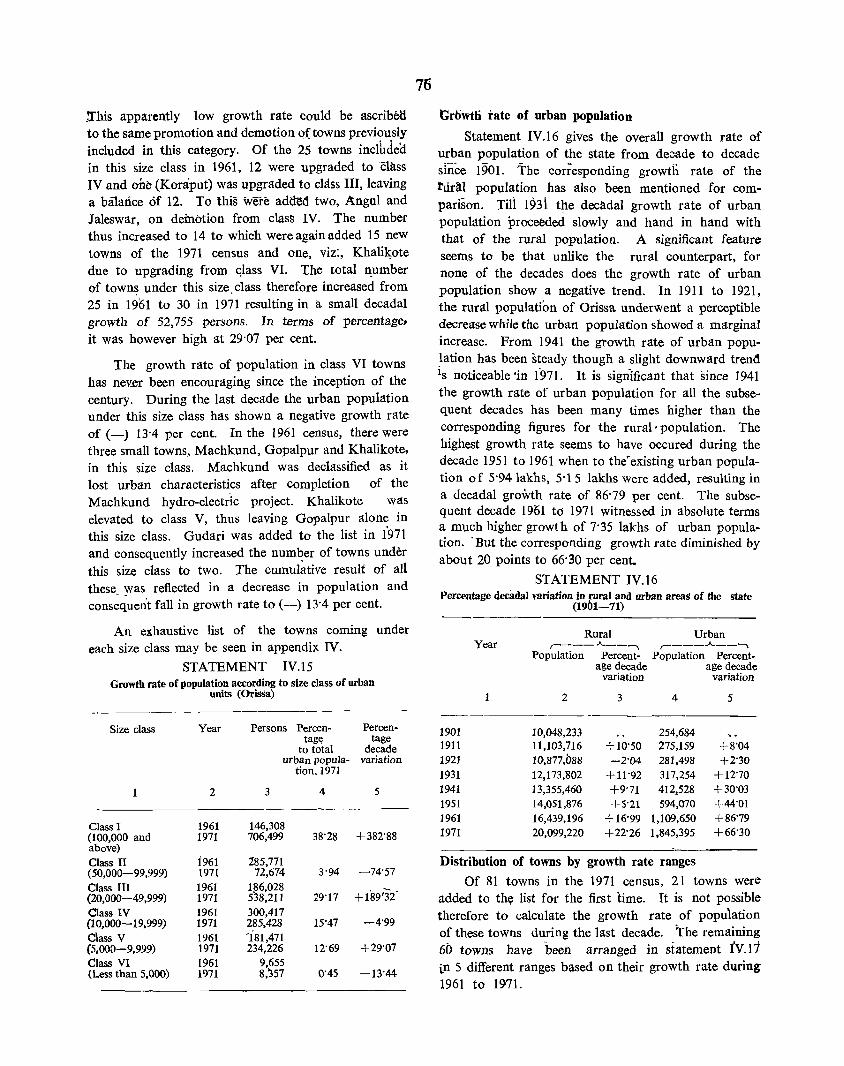
:Ihis apparently low growth rate could be ascribetl to the same promotion and demotion Q( towns previ<;>usly included in this category. Of the 25 towns inclhded in this size class in 1961, 12 were upgraded to Class IV and one (Koniput) was upgraded to class III, leaving a balance Of 12. To this were addt!d two, Angul and Jaleswar, on demotion from class IV. The number thus increased to 14 to which were again added 15 neW towns of the 1971 census and one, viz:, Khali~ote due to upgrading from ~lass VI. The total n_umber of towns under this size, class therefore increased from 25 in 1961 to 30 in 1971 resulting in a small decadal growth of 52,755 persons. In terms of percentage# it was however high at 29'07 per cent.
The growth rate of population in class VI towns has nev~r been encouraging since the inception of the century, During the last decade the urban population under this size class has shown a negative growth rate of (-) 13'4 per cent, In the 1961 census, there were three small towns, Machkund, Gopalpur and Khalikote, in this size class. Machkund was declassified as it lost urban characteristics after completion of the Machkund hydro-electric project. Khalikote was elevated to class V, thus leaving Gopalpur alone in this size class, Gudari was added to the list in 1971 and consequently increased the num~er of towns under this size class to two. The cumulative result of all these_ y,'as reflected in a decrease in population and consequent fall in growth rate to (-) 13"4 per cent.
An exhaustive list of the towns coming under each size class may be seen in appendix IV.
STATEMENT IV.15 Growth rate of population according to size class of urban
units (Orissa)
Size class Year
2
Class I 1961 (100,000 and 1971 above) Class II 1961 (50,000-99,999) 1971 Class III 1961 (20,000-49,999) 1971 Class IV 1961 (10,000-19,999) 1971 Class V 1961 (5.000-9,999) 1971 Class VI 1961 (Less than 5.000) 1971
Persons Percentag<;
to total urban popula
tion, 1971
3 4
146,308 706,499 38'28
285,771 72,674 3'94
186,028 538,211 29'17 300,417 285,428 15'47 'i81,471 234,226 12'69
9,655 8.357 0'45
Percentage
decade variation
5
+382'88
-74'57
+189'32 _
-4'99
+29'07
-13'44
75
Gr6wtli rate of urban popUlation
Statement IV.16 gives the overall growth rate of urban population of the state from decade to decade since 1901. The corresponding growtii rate of the ttidtl population has also been mentioned for comparison. Tili 1931 tlte decMal growth rate of urban population proceMed slowly and hand in hand with that of the rural population. A significant feature seems to be that unlike the rural counterpart, for none of the decades does the growth rate of urban population show a negative trend. In 1911 to 1921, the rural populatIon of Orissa underwent a perceptible decrease while the urban population showed a marginal increase. From 1941 the growth rate of urban population has been steady though a slight downward trend is noticeable 'in (971. It is signIficant that since 1941 the growth rate of urban population for all the subsequent decades has been many times higher than the corresponding figures for the rural· population, The highest growth rate seems to have occured during the decade 1951 to 1961 when to ther existing urban population of 5'94Iakhs, 5·15 lakhs were added, resulting in a decadal groWth rate of 86'79 per cent. The subsequent decade 1901 to 1971 witnessed in absolute terms a much higher growt h of 7'35 lakhs of urban population, . But the corresponding growth rate diminished by about 20 points to 66'30 per cent.
STATEMENT IV.16 Percentage decadal variation in rural and urban areas of the state
(1901-71)
Rural Urban Year
,-___ A.. __ -, ,-___ ..A.. __ -,
Population Percent- Population Percent-age decade age decade
variation variation
2 3 4 5
1901 10,048,233 254,684 1911 11,103,716 +10'50 275,159 +8'04 1921 10,877,088 -2'04 281,498 +2·30 1931 12,173,802 +11'92 317,254 +12'70 1941 13,355,460 +9·71 412,528 +30'03 1951 14,051,876 +5'21 594,070 +44'01 1961 16,439,196 +16·99 1,109,650 +86·79 1971 20,099,220 +22'26 1,845,395 +66'30
Distribution of towns by growth rate ranges
Of 81 towns in the 1971 census, 21 towns were added to th¥ list for the first time. It is not possible therefore to calculate the growth rate of population of these towns during the last decade, The remaining 60 towns have been arranged in statement tV.11 in 5 different ranges based on their growth rate during 1961 to 1971.
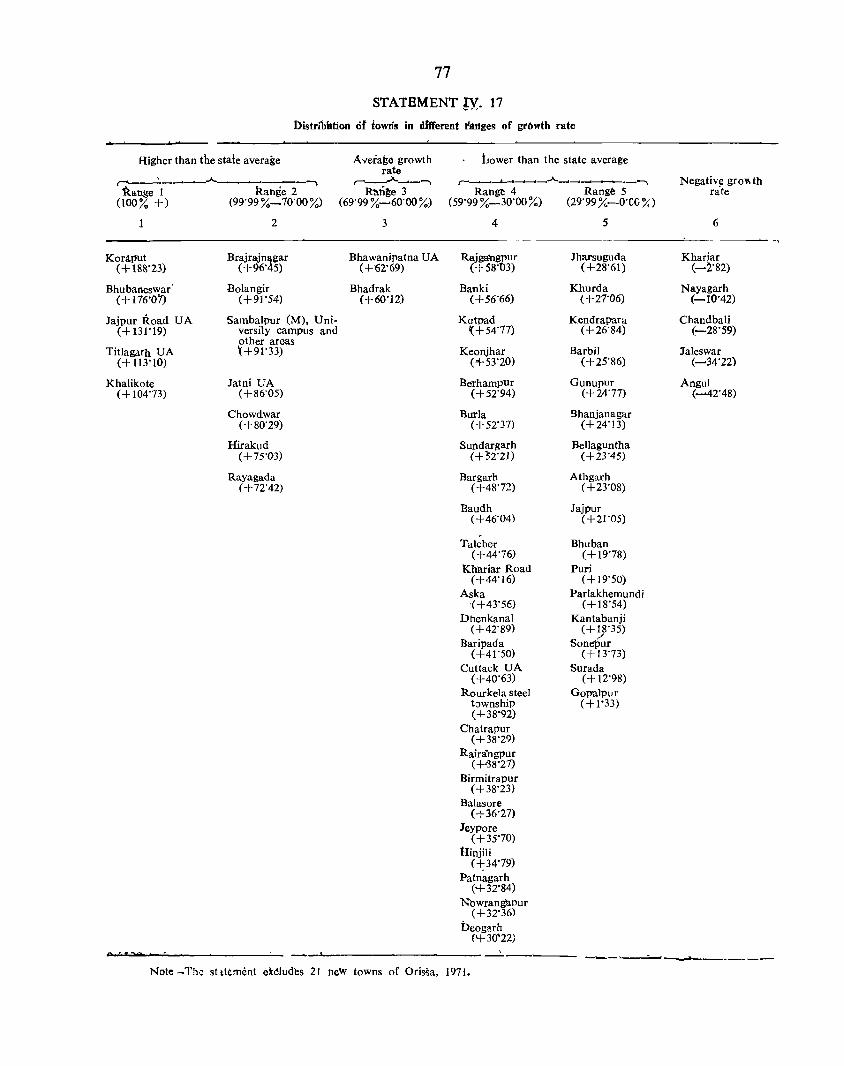
77
STATBMENT !y. 17
OistribiatioI1 of towns in different r'l1rtges of growth rate
Higher than the stale average .. __ ......:... _____ _A._ __ __,__. __ ~
Range 1 Rahge 2 (100% +) (99'99%-70'00%)
1
Kora}1Ut (+18fr23)
Bhubaneswar' (+176'01)
Jajpur Road UA (+131'19)
Titlagarh UA (+113'10)
Khalikote (+104'73)
2
Brajrajn~gar (+96'45)
Bolangir (+91'54)
Sambalpur (M), University campus and other areas X +91'33)
Jatni UA (+86'05)
Chowdwar (+80'29)
Hirakud (+75'03)
Rayagada (+72'42)
A verake growth rate
r-__ J,.~_-....
R1\h~e 3 (69'99 %~60'OO %)
3
Bhawanipatna UA ( +'62'69)
Bhadrak (+60'12)
Lower than the state average ~ ___ ~ _____ _A._ ___________ ~
Range 4 Rangll 5 (59'99 %-30'00 %) (29'99 _%-O'C(J /,;,)
4
Rajgangpur (+58'03)
Banki (+56'66)
K()tDad (+54'77)
Keonjhar (;-53'20)
Berhampur (+52'94)
Burla (+52'37)
Sutldargarh (+52'21)
Bargarh (+48'72)
Baudh (+46'04)
Talcher (+44'76)
Kha.riar Road (+44'16)
Aska (+43'56)
Dhenka,nal (+42'89)
Baripada (+41'S0)
Cuttack UA (+40'63)
Rourkela steel t::>wnship (+38'92)
Chatrapur (+38'29)
Rairangpur (+'38'27)
Birmitrapur (+38'23)
Balasore (+36'27)
Jeypore (+35'70)
Hinjili ( -+;34'79)
Patnagarh (+32'84)
Nbwrangapur (+32'36)
Deogarh ('-1-30'22)
5
Jharsuguda (+28'61)
Khurda (+27'06)
Kendrapara (+26'84)
Barbil (+25'86)
Gunupur (+24'77)
Bhanjanagar (+24'13)
Bellaguntha (+23'45)
Athga.rh (+23'08)
Jajpur ( +21'05)
Bhuban ( +19'78)
Puri (+ 19'50)
Parlakhemundi (+18'54)
Kantabanji (+18'35)
./ Sone1Jur
(+13'73) Sura.da
(+ 12'98) Gopalpur
(+1'33)
Negative groVl th ra'te
6
Khariar <--;2:82)
Nayagarh (-10'42)
Chandbali (-28'59)
1aleswar (~34'22)
Angul (~42'48)
--::.-.._-------Note -The sLltement ex~ludes 21 heW towns of OrisSa, 1971.
The highest growth rate range contains five towns. Koraput, a district headquarters town, ·occupies the topmost place (188 per cent). This.town rose in status from class V in 1961 to class III in 1971. Though the reasons for .this spectacular~y h~g~ growth rate are difficult to spell out, one which seems obvious is the unusually large expansion of the muilicipal limits during the last decade. From 7'77 sq. km. in 1961, the municipal' area has-gone-up to 97' 12-sq. i<ro. The total rise in population during the decade is by more than 14,000. Bhubaneswar too .experienced a big leap forward from class III to class I. The increase in .area was considerable-from 50'25 sq. km. in 1961 to 65'03 sq. km .. in 1971. Jajpur Road urban agglomeration which comes third in this range has increased in area from 12'7 sq.km. in 1961 to 22'4 sq.km. in 1971. ,But the high growth rate registered by this urban agglomeration cannot, however, be fully explained away by area expansion. A look at the corresponding growth rate of Jajpur Road notified area council shows that the growth rate of population lying within the municipal limits was 80'4 per cent during the decade. This town developing around a railway station has assumed importance after estab~ishment of the ferro-chrome plant. Titlagarh urban agglomeration seems to be a similar case. Its high growth rate during the decade owes partly to the high growth of population within municipal limits and partly to addition of new areas to the urban agglomeration. Khalikote, a small census town of 1961 which continued to be so in 1971, increased its area from 0'26 sq. km. to 8'55 sq. km. The growth rate of 104'7 which was by way of addition of only 3,524 persons could be due to area expapsion.
Of the 7 towns included in the second range, Brajrajnagar is at the top. It is a small industrial town of class III which was recognjsed as a notilled area council during the decade. It was a census town in 1961 with only 7'77 sq. lan. of area which increased to 41'44 sq. km. in 1971. A part of this high growth might be due to increased in area and the other part because of the paper mi1llocated within the town which might have helped' in increasing urbanisation. The remaining six towns in this range had each experienced an increase in area though apart from this, various other factors might as well have contributed .,th!l high growth rate of these towns. Bolangir, th,e district headquarters, almost doubled its area from 15'5 sq.km. in 1961 to 31'1 sq. km. in 197,]. With no apparent evidence of a~:( ._in<!l}s!!j~l gr:9}VtlLin .. the.. municipal t own it has had a high growth rate of 91'5 per cent
78
'in' ·1971 as compared to 36'8 per cent'in the preceding <;lec~de. Sambalpur urban agglomeration excluding the townships. of Burla . .and Hirakud includes the univ~rsity campus and a few other areas which lie o~tside Sambalpur municipal limits. The area of this part of -the agglomeration has increased from 20'7 sq.km in 1961 to 46'1 sq.km. in 1971. The consequent growth rate has been 91'3 per cent as contrasted to 65~4 per cent during the previous decade (1951-61). Jatni, a railway junction, has increased its area from 12'95 sq. km. in 1961 to 15'82 sq. km. in 1971. Its growth rate of population within the original census township is only 56 per cent, which is less than the gt;'owth rate recorded for the previous decade (61'08 per cent). It is the inclusion of the out growth-Bikasnagar areawhich has contributed to the high growth Tate of 86 per cent for t he agglomeration in 1971. Chowdwar basically an industrial township with a paper mill, textiles, tubes, tiles and other factories increased in area from 9'32 sq. km. in 1961 to 31'08 sq. km. in 1971. The growth rate of population is fairly high (80'3 per cent) which might be the result of industrial growth a.nd inclusion of new areas. Hirakud NAC also had increased its area in 1971 but factors like esta blishment of the aluminium plant and other factories in the area could be responsible for the high growth rate of 75 per cent for the township. Rayagada, a class III township in Koraput district, with a paper mill, also experienced an increase in area and the decadal growth rate of population of 72'42 per cent far exceeded the rate recorded for the previous decade (54'88 per cent),
Only two towns, Bhawanipatna urban agglomeration and Bhadrak, come under the average g~owth rate. Of the two ranges next below the average, the maximum number of 25 towns come under the range which record a growth rate of 30 to 60 per cent. None of these towns has had any sign of industrial develop~ ment during 1961-71 except Rajgangpur, Bargarh, Talcher and Rourkela steel township. Rajgangpur a municipal town with a cement factory maintained its area constant from 1961 to 1971. Its decadal growth rate of 58 per cent is not far below the average. Talcher, which is the seat of a thermal power station, coal mines and the proposed fertiliser plant, maintained a constant area also. The growth rate of 44'76 per cent during 1961 to 1971 in spite of this growth potential. does not appear to be up to the mark. Rourkela steel township, which in 1971 constitutes a part of the urban- agglomeration, was-not recognised as a· separate town in 1961 when the entire town was taken as one
single entity. In 1971, however, with the establishment of t""I3' NACs, one for the steel township and the other for the civil township, both were reckoned as separate urban entities though they were brought under the banner of Rourkela urban agglomeration. While the urban agglomeration has recorded a very high growth rate of 91 per cent, the same for the steel township has been as low as 39 per cent. It seems plausible that after establishment and operation of the steel mill, the steel township has fairly stabilised its growth while the growth in population has spread up to the civil township which forms its
"uburb.
Five towns, Khariar, Nayagarh, Chandbali, Jaleswar and Angul, present a negative growth rate. Chandbali and Jaleswar have each undergone some diminution in area. The reasons for negative growth rate of the remaining three towns, Nayagarh, Khariar and Angul, deserve investigation. There are no apparent reasons why the population should have decreased during the decade in these two townships notwithstanding a constant area having been maintained from 1961 to 1971.
Classification of town'> according to functional characteristics
In the 1971 census, the working population was categorised into nine broad categories.
They were:
1. Cultivator
11. Agricul1.ural labourer
III. Livestock, forestry, fishing, hunting and plantations, orchards and allied activities
IV. Mining and quarrying
V (0). Manufacturing, processing, servicing and repairs at household industry
V (b). Manufacturing. processing. servicing and repairs other than household industry
VI. Construction
VIr. Trade and commerce
VI IT. Transport, storage and communications
IX. Other services
For the purpose of determining the predominant functional character of a town, these categories have been combined and regrouped into the following five functional classifications:
(i) Primary activities (categories T, II, III and TV)
(ii) Industry (categories V (u), V (b) and VI)
79
(iii) Trade and commerce (category VIl)
(il') Transport (category VIII) and
(v) Service (category IX)
If a town's workers under one of the occupations form 40 per cent or more of the total workers, it will be a monofunctionaF: town, e. g., industrial town or service town. If the percentage is less than 40, the next predominant occupation is taken into account so that the total of the two may come to 60 per cent or above. Such a town may be designated as a bi-functional town. e. g., industrial-cum-service or commercial-cum-service. If the total does not come up to-60 per cent, the third predominant occupation is taken into account and such a town is designated as multifunctional, e. g., industrial-cum- service-clIm- commercial.
All the 81 towns of the 1971 census have;: bee;:n classified on the basj~ of the above principles. Details of this classification may be seen at appendix V Accordi ng to this, 34 towns are mono-functional, 19 towns are bi-functional and the rest are multifunctional. ~o distinct trend seems to have set in to draw a correlation betwecn the functional classification of towns and their respective growth rates. Each class of towns includes some recording a very high growth rate and some recording a low growth rate. In this state where clear trends of urbanisation and industrialisation have yet to appear, it may perhaps be necessary to evaluate the growth rate of each town on an assessment of its hi~tory and other objective factors contributing to its growth rate rather than analysing the rates for a particular class of town having one or more predominant functional characteristics.
Decennial growth rate of popUlation of each town, (1901-71)
Statement IV.IS gives the decadal growth rate of population of each of the towns in Orissa since 1901 Cuttack city has had a consistently steady growth rate, since 190 I. Except for the decade 1911-21 when the growth of population of the entire state suffered on account of influenza, this premier city recorded a steadily continuing high growth rate from decade to decade. It is only during the last two decades (1951-71) that the growth rate for the city, though below the average growth rate recorded for the state has held steady. In class II, Sambalpur town shows the trend of a stabilising growth rate at 66 per cent which is very close to the state average. This city unlike many others -had not suffered a negative
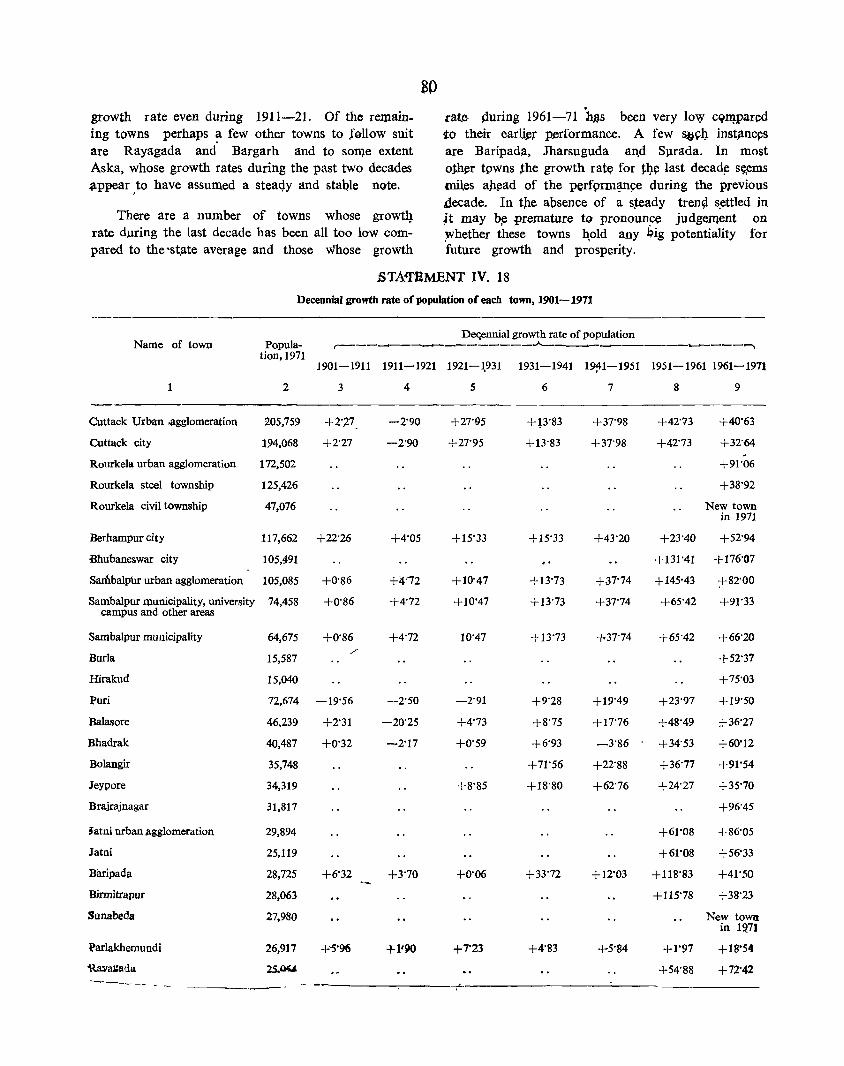
growth rate even during 1911-21. Of the remaining towns perhaps ~ few other towns to .fellow suit are Rayagada and Bargarh and to sOlI).e extent Aska, whose growth rates during the past two decades .appear ,to have assumed a stea<Jy and stable UQte,
There are a number of towns whose growt!! rate during the last decade has been all too low compared to the'st,ate average and those whose growth
80 cat.e- puring 1961-71 '~s been very loW C9lI).p3red to their earlj~r performance, A few ~C]]. instjlnc~s
are Baripada, Jharsuguda al1,d Sllrada, In most ojher towns the growth ratc( for tl:}.c last decad~ sY,ems miles auad of the perf9rm~n~e during the previous decade. In tpe apsence of a sjeady tren~ s_ettled in ;t may b~ premature tQ pronoun~e judgeJl}ent on ,whether these towns ~old any qig potentiality for future growth and prosperity.
BTAq'BMENT IV. 18
Decennial growth rate of population of each town, 1901-1971
De«ennial growth rate of population Name of town Popula
tjon, 1971 ~-------~--------~--~~------~---~
J901--1911 1911--1921 1921--\931 1931--1941 1~1--1951 1951--1961 1961--1971
1
Cuttack Urban .agglomeration
Cuttack city
Rourkela urban agglomeration
Rourkela steel township
Rourkela civil township
Berhampur city
Bhubaneswar city
2
205,759
l.94,068
172,502
125,426
47,076
3
+2P +2'27
117,662 +22'26
105,491
Sambalpur urban agglomeration 105,085
Sambalpur municipality, university 74,458 campus and other areas
+0'86
+0'86
Sambalpur municipality 64,675 +0'86
Buria
Hirakud
Puri
Balasore
Bhadrak
Bolangir
Jeypore
Brajrajnagar
if atni urban _agglomeration
Jatni
Baripada
Birmitrapur
Sunabeda
Parlakhemundi
'Ray~ada
15,587
15,040
72,674 --19'56
46,239 +2'31
40,487 +0' 32
35,748
34,319
31,817
29,894
25,119
28,725
28,063
27,980
26,917
2S.~
+6'32
+5'96
4
--2'90
--2'90
+4'05
+W72
+4'72
+4'72
--2'50
--20'25
--2'17
+3'70
5
+27'95
+27'95
+15'33
+10'47
+10'47
10'47
--2'91
+4'73
+0'59
+8'85
+0'06
+7'23
6
+13'83
+13"83
+15'33
+13'73
+13'73
+13'73
+9'28
+8'75
+6'93
+71'56
+18'80
+33'72
+4'83
7
+37"98
+37'98
+43'20
+37'74
+37'74
+37'74
+19'49
+17'76
-3'86
+22'88
+62'76
+12'03
+5'84
8
+42'13
+42'73
+23"40
9
+40'63
+32'64 ,
+91'06
+38'92
New town in 1971
+52'94
+131"41 +176'07
+145-43
+65'42
+65'42
+23'97
+48'49
+34'53
+36'77
+24'27
+61'08
+61'08
+118'83
+115'78
+1'97
+54'88
:+-82'00
+91'33
+66'20
+52'37
+75'03
+19'50
:t36'27
+60'12
+91'54
+35'70
+96'45
+86'05
+56'33
+41'50
+38'23
New town in 1~71
+18'54
+72"42
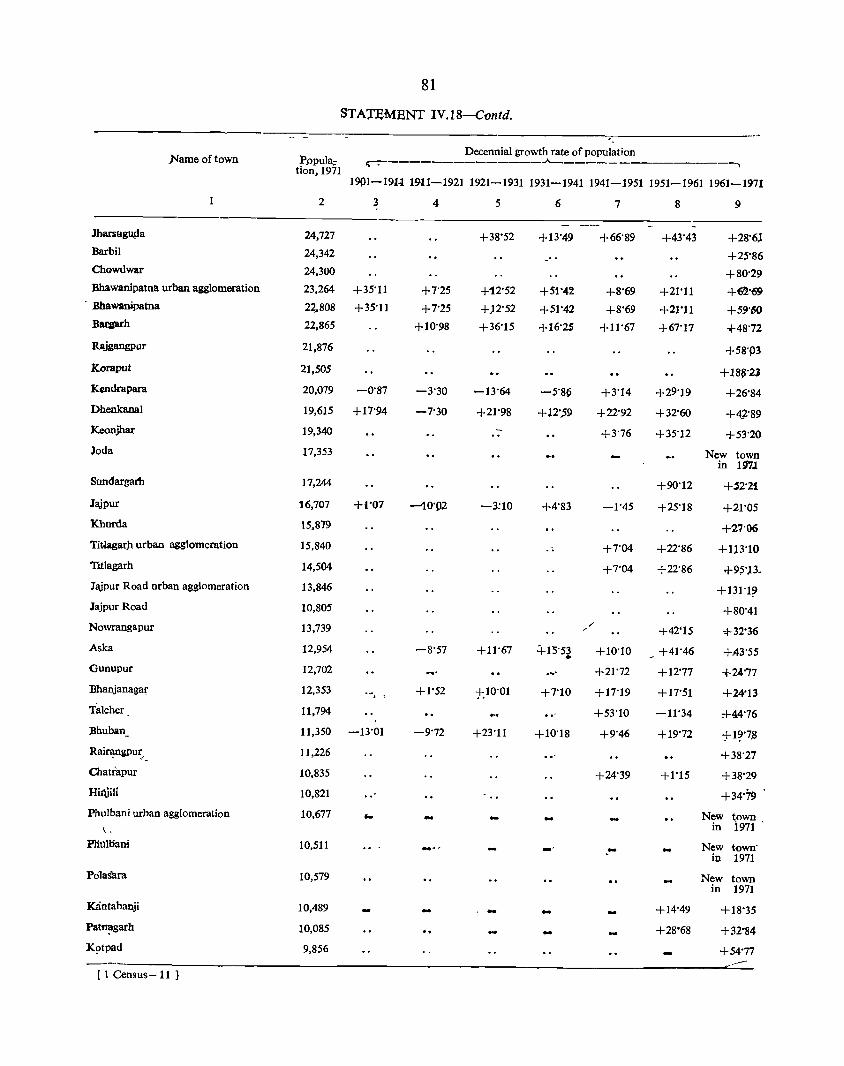
81
STArEMENT IV.lS-CQntd.
Name of town P.opula;; Decennial growth rate of population
tion,1971 ~~--------------~----------------~
19P1-19lJ 1911-1921 1921-1931 1931-1941 1941-1951 1951-1961 1961-1971
2 3 4 5 6 7 8 9
.Jllanl:lgu.\la 24,727 +38'52 +13'49 +66'89 +43'43 +28'6l Barbil 24,342 +2~'86 ChQwdwar 24,300 +80'29 Bhawanipatna urban agglomeration 23,264 +35'11 +7'25 +12'52 +51'42. +8'69 +21'11 +@'69
. Bbawanipatna 2~808 +35'11 +7'25 +)2'52 +51'42 +8'69 +21'11 +59'60 Baqpuh 22,865 +10'98 +36'15 +t6'25 +11'67 +67'17 +48'72
Rajgangpur 21,876 +58'1)3
Koraput 21,505 +18$'23 Kcndrapara 20,079 -0'87 -3'30 -13'64 -5'8§ +3'14 +29'19 +26'84
Dhenkanal 19,615 +17'94 -7'30 +21'98 +12',59 +22'92 +32'60 +4l'89 Keonjhar 19,340 +3'76 +35'12 +53'20
Joda 17,353 New town in 19'7J
Sundargal'h 17,244 +90'12 +.52'21
Jajpur 16,707 +1'07 -10'P2 -3:10 +4'83 -1'45 +25'18 +21'05
Khurda 15,879 +27'06
Titlagar:h urban agglomeration 15,840 .. +7'04 +22'86 +1)3'10
Titlagarh 14,504 +7'04 +22'86 +9$')3.
Jajpur Road urban agglomeration 13,846 +131'1~
Jajpur Road 10,805 +80'41
Nowrangapur 13,739 ;'
+42'15 -t-32'36 ~
Aska 12,954 -8'57 +11'67 +15'53 +10'10 +41'46 +.43'55 • Gunupur 12,702 ..... +21'72 +12'77 +24'77
Bhanjanagar 12,353 '.' , > +1'52 j)O'Ol +7'10 +17'19 +17'51 +24'13
Talcher 11,794 +53'10 -11'34 +4.4'76
Bhuban_ 11,350 -13'01 -9'72 +23'11 +10'18 +9'46 +19'72 +1?'7,8
Rair~gpu~ 11,226 +38'27
Chatrapur 10,835 +24'39 +1'15 +38'29
Hil\iili 10,821 +34'79
Phulbani urban agglomeration 10,677 .. - New \O9~1 in I. ,
Plitll15ani 10,511 _. - New town·
in 1971
PolaSilra 10,579 New town in 1971
Kantabanji 10,489 +14'49 +18'35
Patn:'garh 10,085 +28"68 +32"84
K~tpad 9,856 +54'77
---[ 1 Census-II}
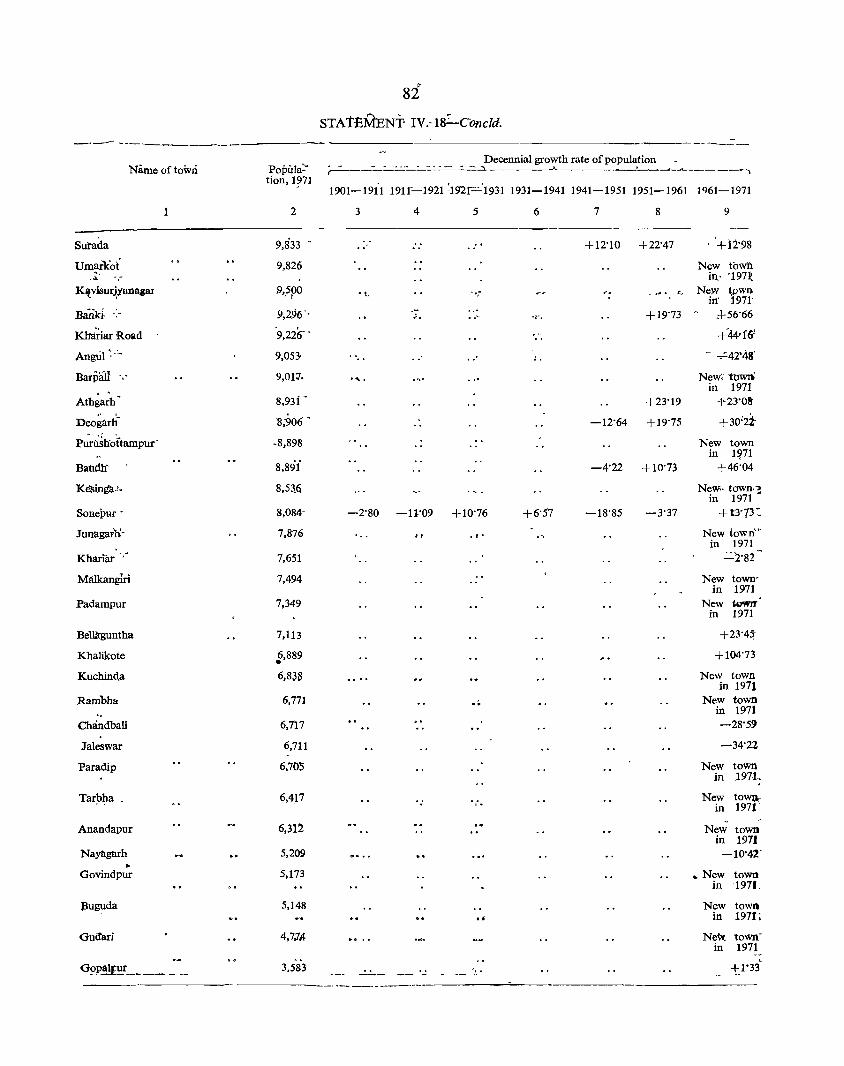
---------Name of town
Surada
Umaikot' .~.
Kl!v.isur~yana.ar
BaIik~
Klt'liriar Road
Angtil :.:..
Barpall .
Athgarh -" I
Deogarh-
Pu~lfoftampur '
Sonepur .
Junagarn-
Khanar
MaIkangiri
Padampur
BelUrgun,tha
Khalikote
Kuchinc\a
Rambha '.
Cluindbali
Ja1eswar
Paradip
Anandapur
Nayl\garh . Govindpur
Gui!ari
1
Popilla: tion,1?71
2
9,833 -
9,826
9,,5PO
9,296'
'9,226- -
9,053<
9,01:7.
8,93r
1l;906 -
.8,898
8,89i
8,53Ji
8,084-
7,876
7,651
7,494
7,349
7,113
~,889
6,8JB
6,771
6,117
6,711
6,705
6,4,17
6,311
5,209
5,173
5,148
4,7.7A
3,583
82 STAtEMENT" IV,-lS'::_COncld,
--------Decennial growth rate of population _
;'-:_ __ :_=--:~"::...,_':"'_~::"":::-_~--:::_"l-_____ ,..A._ _______ ' __ __"'~ ____ ~
1901-1911-191f-1921 ~192r':':':193-1 1931-1941 1941-1951 1951-1961 1<)61-1971
3 4 5 6
.. '
. ....
-2'80 -11'09 +10'76
.r· .~
..
'"
7
+12'10
8
+22'47
9
+12'98
New town in,' '197t
, ,_, ~. New t,pwn irt' 1971'
+ 19'73 - '+56'66
+'44'!6'
- "";:42°48'
New:' town in 1971
+23'19 +23"'08
-12'64 +19'75 +30:21·
-4'22 + 10'73
New town in 1~71
+46'04
NeW'· town" in 1971 ~
-18'85 -3'37 +t3'73:
New town,r in 1971
"::"'2'82
New town' in 1971
New i~ in 1971
+23"4~
+104'73
New town in 1971
New town in 1971 -28'59
-34'22
New town in 197J.~ ,
New tow~ in 1971
New town in 1971 -10'42'
.. New town in -1971.
New town in 197f;
NeW. townin 1971
+1'33
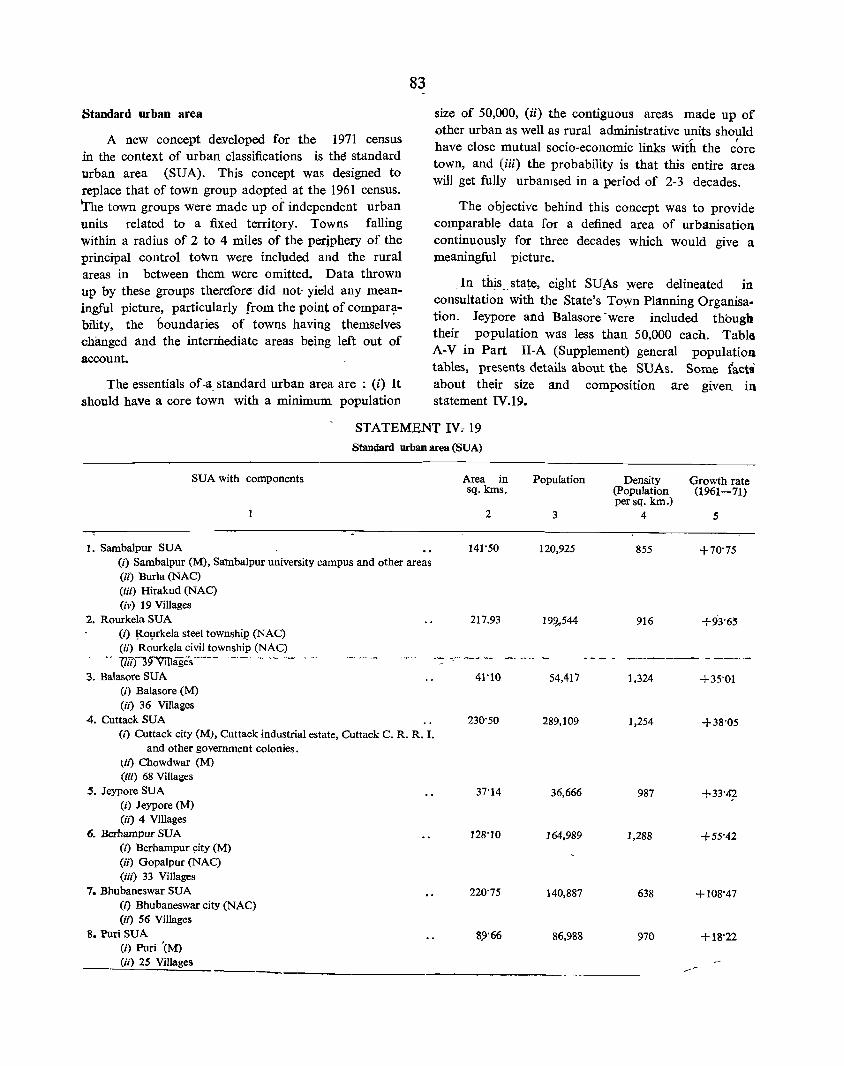
Standard urban area
A new concept developed for the 1971 census in the context of urban classifications is the standard urban area (SUA). This concept was designed to replace that of town group adopted at the 1961 census. The town groups were made up of independent urban units related to a fixed territ!)ry. Towns falling within a radius of 2 to 4 miles of the periphery of the principal control town were included and the rural areas in between them were omitted. Data thrown up by these groups therefore" did not- yield any meaningful picture, particularly from the point of compar~bility, the boundaries of towns having themselves changed and the intermediate areas being left out of account.
The essentials of -a. standard urban area are : (i) It should have a core town with a minimum population
83
size of 50,000, (ii) the contiguous areas made up of other urban as well as rural administrative units should
/' f
have close mutual socio-economic links with the core town, and (iii) the probability is that this entire area will get fully urbamsed in a period of 2-3 decades.
The objective behind this concept was to provide comparable data for a defined area of urbanisation continuously for three decades which would give a meaningful picture.
"II! th!s __ ~~!e, eight SUf._s :were delineated in consultation with the State's To~n Planning Organisation. Jeypore and Balasore 'were included though their population was less than 50,000 each. Table A-V in Part II-A (Supplement) general popUlation tables, presents details about the SUAs. Some facts about their size and composition are given in statement IV.19.
STATEMENT IV, 19
Standard urban area (SUA)
SUA with components
1. Sambalpur SUA (i) Sambalpur (M), Salnbalpur university campus and other areas (ii) Burla (NAC) (iii) Hirakud (NAC) (iv) 19 Villages
2. Rourkela SUA (I) ~o¥rkela steel townshil? (NAC) (ii) Rourkela civil township (NAC)
~ - tlll)39Villages ---. ----.- -- -- - ._--
3. Balasore SUA (i) Balasore (M)
(ii) 36 Villages 4. Cuttack SUA
(i) Cuttack city (M), Cuttack industrial estate, Cuttack C. R. R. I. and other government colonies.
Vl) Chowdwar (M) (iii) 68 Villages
5. Jeypore SUA (i) Jeypore (M) (ii) 4 Villages
6. Berhampur SUA (i) Berhampur city (M) (ii) Gopalpur (NAC) (iii) 33 Villages
7. Bhubaneswar SUA (i) Bhubaneswar city (NAC) (ii) 56 Villages
8. Puri SUA (i) Pori '(M) (ii) 25 Villages
Area in sq. kms.
2
141'50
217.93
41'10
230'50
37'14
128'10
220'75
89'66
Population Density Growth rate (population (1961-71) per sq. km.)
3 4 5
120,925 855 +70'75
19~544 916 +93'65
54,417 1,324 + 35'01
289,109 1,254 +38'05
36,666 987
164,989 1,288 +55'42
140,887 638 +108'47
86,988 970 +18'22
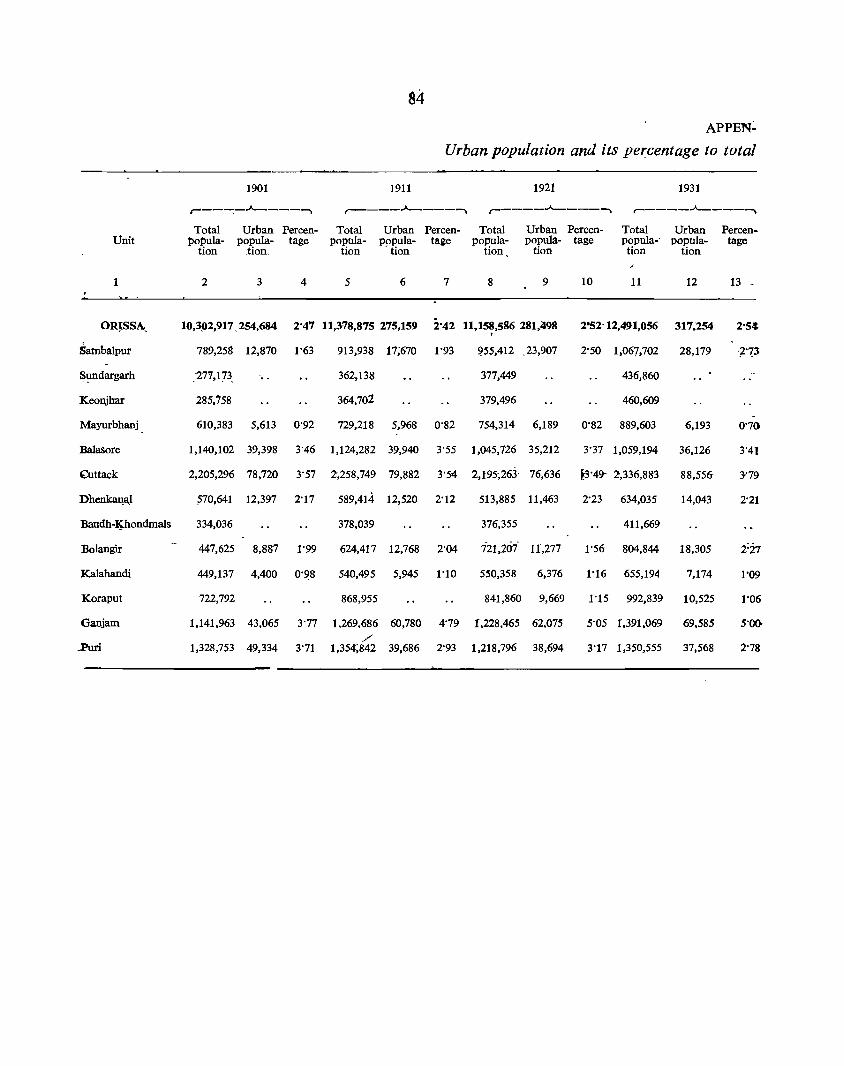
84 APPE~
Urban population and its per.centage to total
1901 1911 1921 1931
r---~-Jo.------, r-----Jo.------, r-----Jo.------, r-----.A..-----,
Total Urban Percen- Total Urban Percen- Total Urban Percen- Total Urban Percen-Unit tlopula- popula- tage popula- popula- tage popula- popula- tage popula-" popula- tage
tion tiou. tion -tion tion tion tion tion
1 2 3 4 5 6 7 8 9 10 11 12 13 -
ORJSSA_ 10,392,917.254,684 2'47 11,3-78,875 275,159 2'42 11,15~,586 281,498 2·52"12,491,056 317.-254 2'54
Satnbalpur 789,258 12,870 1'63 913,938 17;670 1'93 ~55,412 ,23,907 2'50 1,067.702 28,179 "713
S!IDdargarh '277,173, 362,138 377,449 436,860
Keonjhar 285,758 364,702 379,496 460,609
Mayurbhanj 610,383 5,613 0'92 729,218 5,968 0'82 754,314 6,189 0'82 889,603 6,193 0'70
Balasore 1,140,102 39,398 3'46 1,124,282 39,940 3'55 1,045,726 35,212 3'37 1,059,194 36,126 3'41
Olttack 2,205,296 78,720 3'57 2",258,749 79,882 3'54 2,195;263- 76,636 f3'49- 2,336,883 88,556- 3'79
Dhe~aJ ~70,641 12,397 2'17 589,414 12,520 2'12 513,885 11,463 2'23 634,035 14,043 2'21
Baudh-~hondmals 334,036 378,039 376,355 411,669
Bolangir 447,625 8,887 1'99 624,417 12,768 2'04 721,207 11,277 1'56 804,844 18,305 i27
Kalahandi 449,137 4,400 0'98 540,495 5,945 1'10 550,358 6,376 1'16 655,194 7,174 1'09
Koraput 722,792 868,955 841,860 9,669 1'15 992,839 10,525 1'06
Ganjam 1,141,963 43,065 3'77 1,269,686 60,780 4'79 1,228,465 62,075 5'05 1,391,069 69,585 S',DO-/'
..Purl 1,328,753 49,334 3'71 1,354;842 39,686 2'93 1,218,796 38,694 3'17 1,350,555 37,568 2'78
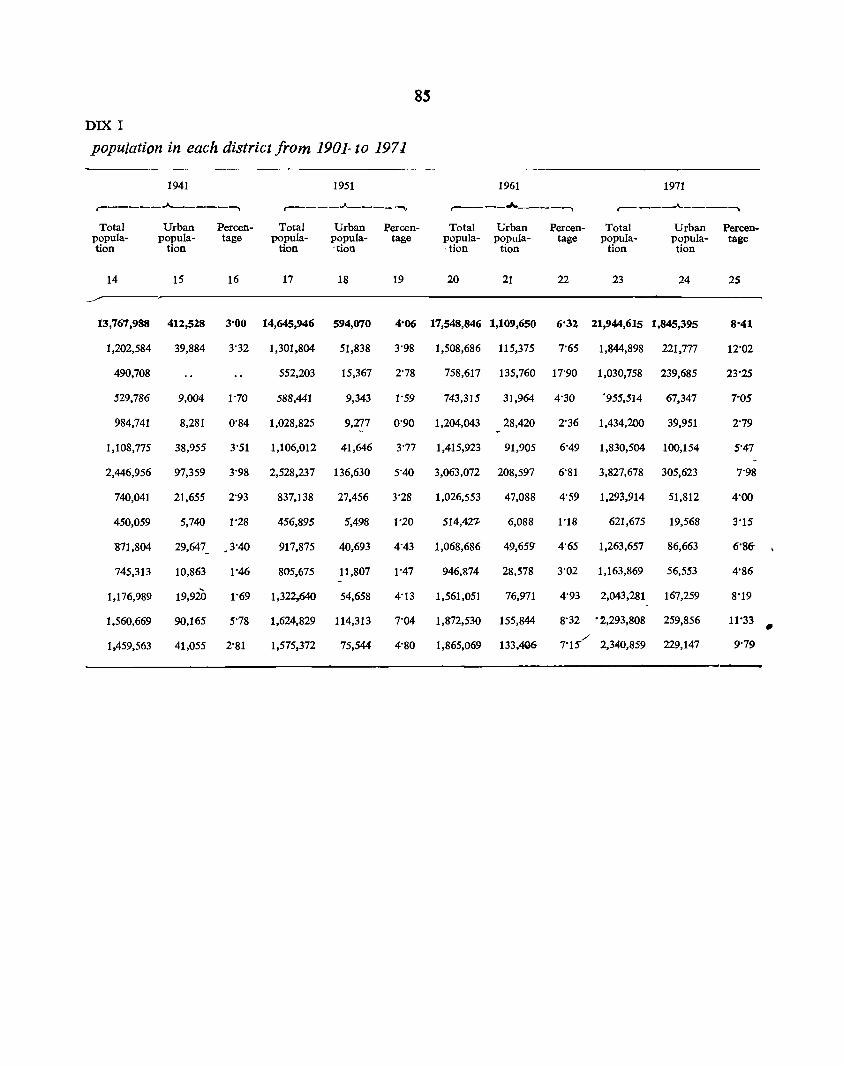
8S
DIX I
population in each district from 1901· to 1971
1941 1951 1961 1971
r------A-.-----, r------"----- '""", r-----.A.----........ .---_____..A..---........ Total Urban Percen- Total Urban Percen- Total Urban Percen- Total Urban Percen-
popula- popula- tage popula- popula- tage popula- popula- tage popula- popula- tage tion tion tion -tion -tion tion tion tion
14 15 16 17 18 19 20 21 22 23 24 25
13,767,988 412,528 3'00 14,645,946 594,070 4'06 17,548,846 1,109,650 6'32 21,944,615 1,845,395 8'41
1,202,584 39,884 3'32 1,301,804 51,838 3'98 1,508,686 115,375 7'65 1,844,898 221,777 12'02
490,708 552,203 15,367 2'78 758,617 135,760 17'90 1,030,758 239,685 23'25
529,786 9,004 1"70 588,441 9,343 1'59 743,315 31,964 4'30 '955,514 67,347 7'05
984,741 8,281 0'84 1,028,825 9,277 0'90 1,204,043 28,420 2'36 1,434,200 39,951 2'79
1,108,775 38,955 3'51 1,106,012 41,646 3'77 1,415,923 91,905 6'49 1,830,504 100,154 5"47
2,446,956 97,359 3'98 2,528,237 136,630 5"40 3,063,072 208,597 6'81 3,827,678 305,623 7'98
740,041 21,655 2'93 837,138 27,456 3'28 1,026,553 47,088 4'59 1,293,914 51,812 4'00
450,059 5,740 1'28 456,895 5',498 t'20 514,421- 6,088 1'18 621,675 19,568 3'15
E'71,804 29,647_ .3'40 917,875 40,693 4'43 1,068,686 49,659' 4'65 1,263,657 86,663 6'86
745,313 10,863 1"46 805,675 11,807 1'47 946,874 28,578 3'02 1,163,869 56,553 4'86
1,176,989 19,920 1'69 1,322,.640 54,658 4'13 1,561,051 76,971 4'93 2,043,281 167,259 8'19
1,560,669 90,165 5'78 1,624,829 114,313 7'04 1,872,530 155,844 8'32 '2,293,808 259,856 11'33 , 1,459,563 41,055 2'81 1,575,372 75,544 4'80 1,865,069 133,406
/' 7'1S' 2,340,859 229,147 9'79
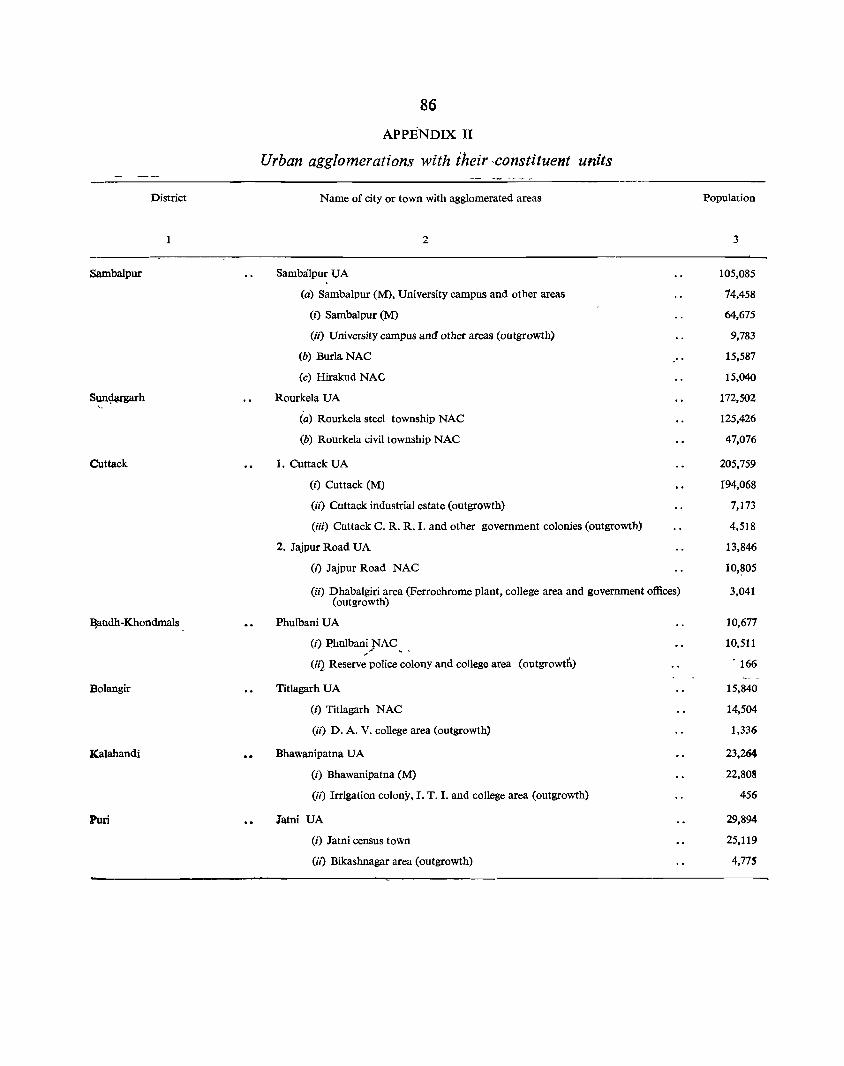
District
Sambalpur
Sun<:l~arh ..
Cottack
~audh-Khondmals
Bolangir
Kalahandi
Pori
86
APPENDIX II
Urban agglomerations with iheir -constituent units
Name of city or town with agglomerated areas
Samba]pur UA
(a) Sambalpur (M), University campus and other areas
(i) Sambalpur (M)
(ii) University campus and other areas (outgrowth)
(b) Burla NAC
(c) Hirakud NAC
Rourkela UA
(a) Rourkela steel township NAC
(b) Rourkela civil township NAC
1. Cuttack UA
(i) Cuttack (M)
(ii) Cuttack industrial estate (outgrowth)
(iii) Cuttack C. R. R. I. and other government colonies (outgrowth)
2. Jajpur Road UA
(i) Jajpur Road NAC
(ii) Dhabalgiri area (Ferrochrome plant, college area and government offices) (outgrowth)
l'hulbani UA
(i) Phulbani NAC ,,/ ~ .
(ii2 Reserve police colony and college area (outgrowth)
Titlagarh UA
(i) Titlagarh NAC
(ii) D. A. V. college area (outgrowth)
Bhawanipatna UA
(i) Bhawanipatna (M)
(ii) Irrigation colony, r. T. I. and college area (outgrowth)
Jatni UA
(i) Jatni census town
(ii) Bikashnagar area (outgrowth)
l'opulation
3
105,085
74,458
64,675
9,783
15,587
15,040
172,502
125,426
47,076
205,759
194,068
7,173
4,518
13,846
10,~OS
3,041
10,677
10,511
• 166
15,840
14,504
1,336
23,264
22,808
456
29,894
25,119
4,775
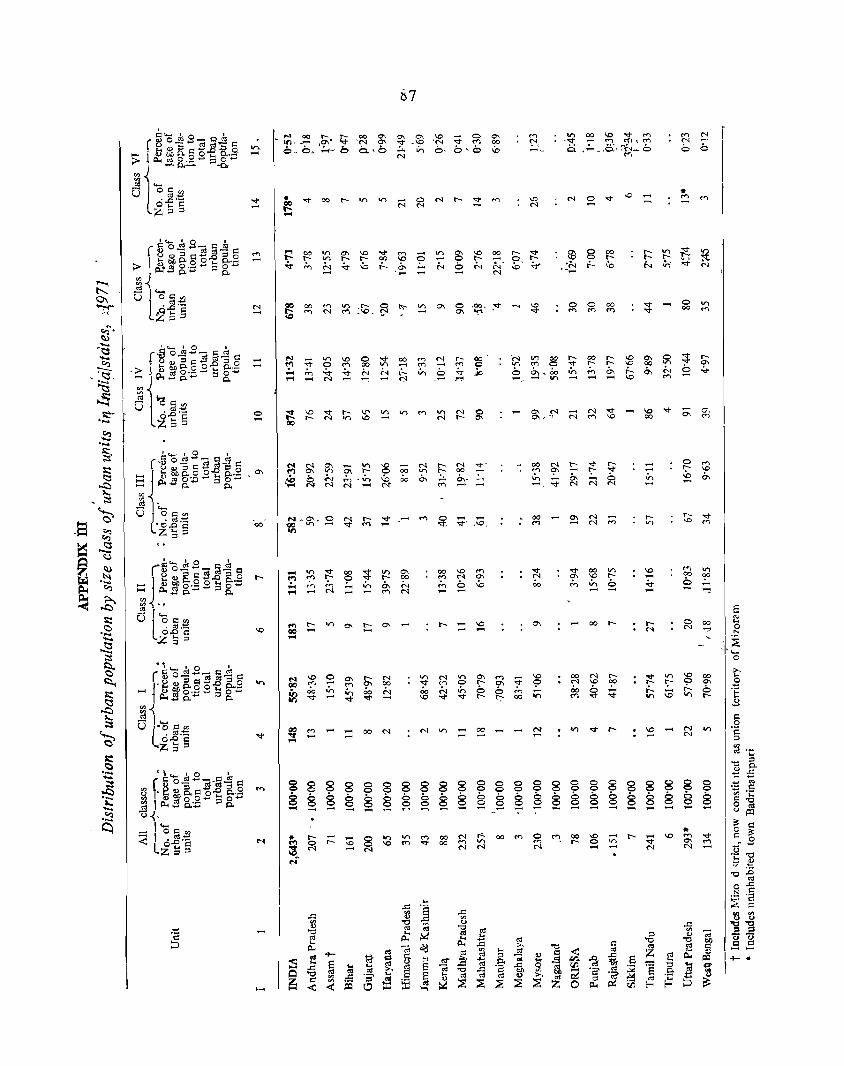
N --......
00
C'\ 0\ \0 0 '<:t.'C 'N '<:t !"l ~ ~ O~ 0'0 N
o '<:t 00 00 V) ,.....
~ ~ t
V) -~ ~ :!-~ a..~ ,........; f'I") ....-1~ .....-!
$ 8 .:~ i--
~ ~ ~ !;: ~ f::: 6 ~ .. Oo .n ('4") ~ --*_ ......i I/') .......! ....-1 .-t
.... N
00 r-
~ ~ :£ ~ ~ 9 9 ~ ~ ~ g g ~ ;n
00 N r-• ~ \0 ~
~ ~ ~
00 N N V'I
-,..... .;.,
o V) 00 <'l
c;, <'l
~ ~ ~ ~ t; \0 t> g
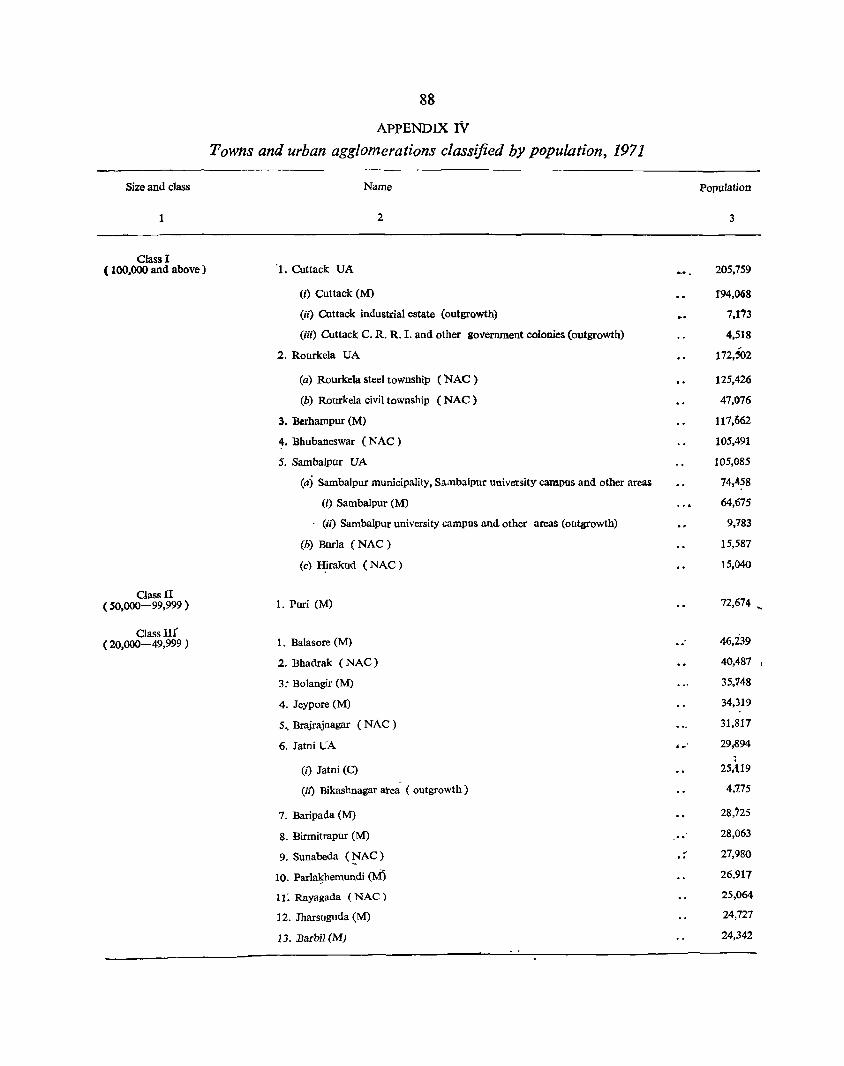
Size and class
1
Class I ( 100,000 and above)
Class II (50,000-99,999 )
ClassUr ( 20,000-49,999 )
88
APPENDIX IV Towns and urban agglomerations classified by population, 1971
Name
2
'1. Cuttack VA
(i) Cuttack (M)
(ii) Cuttack industrial estate (outgrowth)
(iii) Cuttack C. R. R. 1. and other government colonies (outgrowth)
2. Rourkela VA
(a) Rourkela steel township (NAC)
(b) Rourkela civil township (NAC)
3. Berhampur (M)
~. Bhubaneswar (NAC)
5. Sambalpur VA
(a) Sambalpur municipality, Sambalpur university campus and other areas
(i) Sambalpur (M)
(ii) Sambalpur university campus and other areaS (outgrowth)
(b) Borla (NAC)
(c) H;irakud (NAC)
1. Puri (M)
1. Balasore (M)
2. Bhadrak (NAC)
3: Bolangir (M)
4. Jeypore (M)
S •• Brajrajnagar (NAC)
6. Jatni UA
(i) Jatni (C)
(ii) Bikashnagar area (outgrowth)
7. Baripada (M)
8. Birmitrapnr (M)
9. Sunabeda (~AC)
10. Parlal>hemundi (M)
11: Rayagada (NAC)
12. Jharsuguda (M)
13. Barbil (M)
._ ..
Population
3
205,759
1'94,~8
7,173
4,518
172,502
125,426
47,076
117,662
105,491
105,085
74,458
64,675
9,783
15,587
15,040
72,674 ..
46,239
40,487 I
35,148
34,319 . 31,817
29~94
25,U9
4,175
28,725
28,063
27,980
26.917
25,064
24,727
24,342
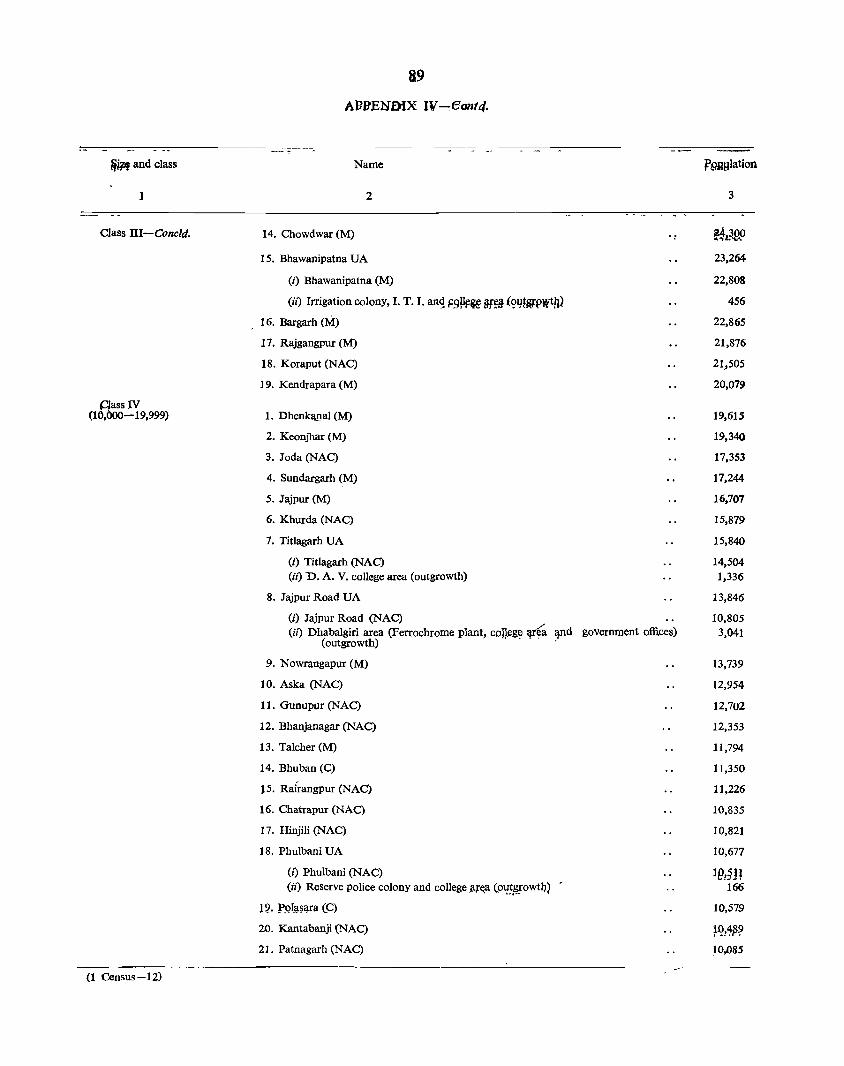
~iM and class
1
Class ill-Cone/d.
{:lass IV (10,000-19,999)
(1 Census-12)
89
Name
2
14. Chowdwar (M) ./
15. Bhawanipatna VA
(i) Bhawanipatna (M)
(ii) Irrigation colony,!. T. 1. an<! P9jl~ie Mfi} ('?lJfIUPwth)
16. Bargarh eM) 17. Rajgangpur (M)
18. Koraput (NAC)
19. Kendrapara (M)
1. Dhenk!l!1al (M)
2. Keonjhar (M)
3. Joda (NAC)
4. Sundargarh (M)
5. Jajpur (M)
6. Khurda (NAC)
7. Titlagarh VA
(i) Titlagarh (NAC) (ii) n. A. V. college area (outgrowth)
8. Jajpur Road VA
(i) Jajpur Road (NAC) (ii) Dhabalgiri area (Ferrochrome plant, CDneg~ ~ lpld government offices)
(outgrowth)
9. Nowrangapur (M)
10. Aska (NAC)
11. Gunupur (NAC)
12. Bhanjanagar (NAC)
13. Talcher (M)
14. Bhuban (C)
J5. Ralrangpur (NAC)
16. Chatrapur (NAC)
17. Hinjili (NAC)
18. Phulbani VA
(t) Phulbani (NAC) (ii) Reserve police colony and college Jif~a (o~~,~owtl}) ,
J!? }'.<?I_lJ~lJra (C)
20. Kantabanji (NAC)
21. Patnagarh (NAC)
r9RHIation
3
23,264
22,808
456
22,865
21,876
21,505
20,079
19,615
19,340
17,353
17,244
16,707
15,879
15,840
14,504 1,336
13,846
10,805 3,041
13,739
12,954
12,702
12,353
11,794
11,350
11,226
10,835
10,821
10,677
10,579
}{}/~~?
10,.085
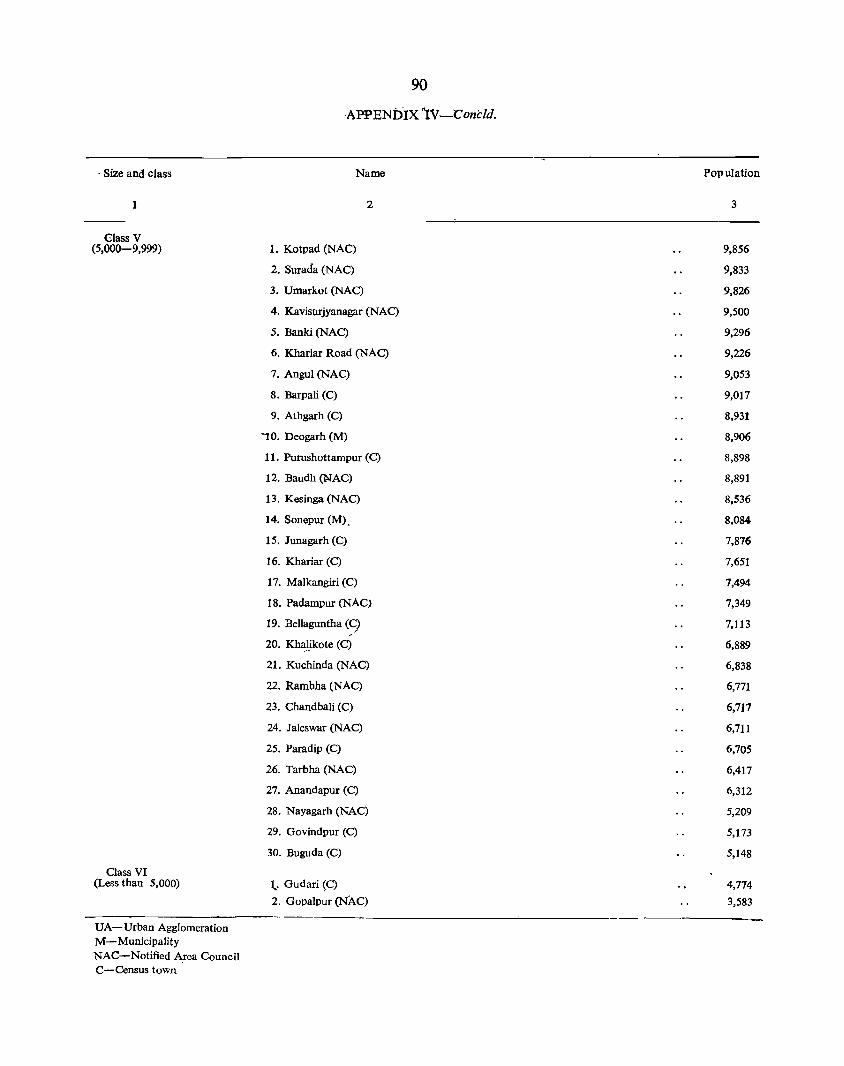
90
·APPENDIX ~lV..__conCld.
- Size and class Name Population
1 2 3
Class V (5,000-9,999) 1. Kotpad (NAC) 9,856
2. Surada (NAC) 9,833
3. Umarkot (NAC) 9,826
4. Kavisurjyanagar (NAC) 9,500
5. Banki (NAC) 9,296
6. Khariar Road (NAC) 9,226
7. Angul (NAC) 9,053
8. Barpali (C) 9,017
9. Athgarh (C) 8,931
'"10. Deogarh (M) 8,906
11. Purushottampur (C) 8,898
12. Baudh (NAC) 8,891
13. Kesinga (NAC) 8,536
14. Sonepur (M). 8,084
15. Junagarh (C) 7,876
16. Khariar (C) 7,651
17. Malkangiri (C) 7,494
18. Padampur (NAC) 7,349
19. Bellaguntha (C) .'
7,113 ~
20. Khalikote (C) 6,889
21. Kuchinda (NAC) 6,838
22. Rambha (NAC) 6,771
23. Chandbali (C) 6,717
24. Jaleswar (NAC) 6,711
25. Paradip (C) 6,705
26. Tarbha (NAC) 6,417
27. Anandapur (C) 6,312
28. Nayagarh (NAC) 5,209
29. Govindpur (C) 5,173
30. Buguda (C) 5,148
Class VI (Less than 5,000) 1.- Gudari (C) 4,774
2. Gopalpur (NAC) 3,583
UA-Urban Agglomeration M-Municipality NAC-Notified Area Council C-Census town

~J;
It~o c .e~ .... c;; u 10 'P <'"I 10 - 00 0 0 0 c;> .t- 10
~~~Ei 0 00 - ;.., a, f- a, ~ ~ v.. .... 00 00 - "<I" "<I" "<I" «> "<I" '<f' "<I" "<I"
""'" 00
~'o
OS ... of: ~ OS
<U ... -~
] 8." "i '" ~ os "" ·s ... :s
~ .~ ~ os i! '" "0 -"i os '60 co
-§ os 1:1 5 i .c "" ~ tIl.8 'g :; ~ (G '1:: :s ·c 6 ~ of 0 ..c:: 0 Ii! ..c::
~ en os ~ ~ ~ z ~
...; N <"i ..t- v) \C) r--: 00 0\ 0 ....; N - - -~~s f3 i:!~Q3~ 00 M
g~~.8~ N "<I"
.2 ~"O <-:I .:= .~ ;. - ... . ~ ....
u 100, " ~ .~ 1:: ~ ~ e 0",
~ ~ i ~~ r-~ 8 ~.s
p.., ~ ~ <» E-< - .... ~ = ~ • a~.81 ~ .~ <» .... IJJ os,;.: c;;., ~ " 5!56-~ 10 ~ -u ~~~.8~ ..:; : ., .....
> ~o c;) c.c=
es .... ! 0 .~ .... Z <:> ";j ~ ~ -= '; ~ 8:: c;) ~
~ ~
-< ~ ... ~ <» 8-&0) 1 I;! ~ <Il
C t:I .,,,,0 .... ~ ClOt- ~ "<I" 10 M -~ .... !:!~QC;;~ i:o v.. t: ~ - ~o;;>o'" .... "<I" .... ~ " ... ~+-~ ! <::) ... ~'o~ . _ .... .... u 8 t:I
oS 1 ~ I :<I !:l = ~ ~ ~ ~'" ~ ~ ~t ~ III !;l~ M 0i! & 'tI
'-.) :So ~ ~ ~
'ti_ I ~ ~ 00 a ~-...; N <"i ..t-
ae::lo '" ~!J+~-t I"- "<I" M 0 00 - 0 "<I" 00 10 00 VI ....
~ ..... 0\ -I~~£~~ M b i:o ;.., ;.... ;.... 00 M ~ M ~ f- ;.... 00 ~ ;.... i:--"<I" 00 "<I" I"- .q- .,., 10 "<I" .q- '4> "<I" .,., -"<I" 10
..... e,+ ~ p..,o
... >. :s
.:~ - -Q.
:~ 8
~~ os 1 os :s 0
1 - :g 0.-'tI ] ~ ~ § "5 0 ~ os OSClO - := d
~ .~ -d ~s 0-
~ ..c:: 'tI '§:S os :g OIl ~ .c ~ '" ~ ~ fa' '" co d -g e 0
~ .<:: :s 8 8 :s 0) os ~ 'i1 I:i 0 :s :s .~:::s
if ~ :::0: Q < ~ ,:l:, ~ ~ ~ ~ p.., p.., ~ ~._.
....; , . ..t- J.6 00 0\ 8 ....; N <"i ~ v) 10 r-: N M· v) r--: .... - - - -
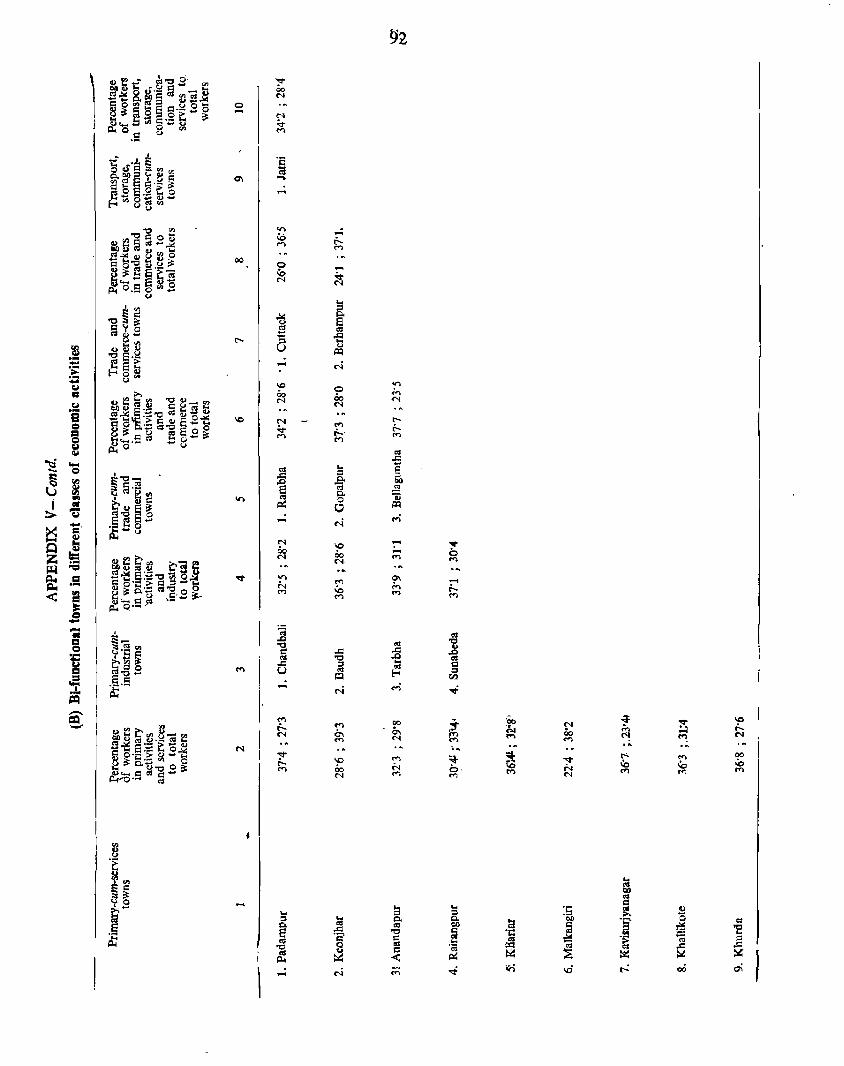
~2
1 ~tt: .e-g 2 ~ '<t
<'3..10: 8. ",._ <'3 - «) 00
'E~",1:§ :l~~ N
8 ~ e ~ E 6'~ ~ ~ 0 ....
N ; ~ "ti E'-'" !l. ....... 0- 0 -<t-°.5 u '"
t"I
. t:~ ... ,!. e '8-OQ,>r:l:::."", ~ AbO;::I't"'r:l 0\ ;g e ~ r:l'~ ~ e~ .9 to f-o"'8~~""
"O"d ~ .... \Q ....
~i:.'l§:;;~~ .... t-.. '" '" ... M
~-g.gt8~ . "' 00
0 ~ ~b S'~"a >D
.... ~'O.!3 ~ ~E
N ~ U ...
'",
'O§r:l ;::I
..10: A C .... Cl: u e cubS g <'3
(:!'" - -e .§ out: a 0
'0 E._ ~ .... I:Et:: ...; N :e E-<8~ -u \Q 0 'r' t:: oi:.'l~i!l '0"'_<1>
00 00 ...,
U N N .... ~~ E:€'C a t g n N
a '5 Cl"§.~ ;~ E B~ \Q N ..... e -<t-
...., t-..
1:1 u~r:lC) <'3E°B: t-... e t~·- ~ !:: Q-
.... <'1 ...,
U j:40 u QJ t<I
~ ..... .r:: - e «I ... -~ E'O- ;::I r:l
~ ~ A ;:I
t) ::: §.~ "a bO
rIl <'l
I III') 'r ~~ «I A ~ .. ~~§ ~ ~
0 IXl ~ '(3 0
-;;. ~ I: 0-...; N ~
~ QJ -u
Q ~ N '0- .... ....
z as £:,,,, »-; 9 00 00 .... b .- N
N ..., ....
~ '1;1 t<I.lIIll~ t:-t .s d" ,-;:"0 ~ o~ lr> Q\
CI.I ~'§:~ (;'0.'; !) N ....,
M ....
< ~ ~ ... c ~ .8 ... ~-.... .:0 .... t-..
<'l <'l
~ j:4 O.·_ -.. , ~ 1:1 !S- oD '" 0 ;:.~ '" '0 '" '0
d ..d .r:: «)
t t,til ~ oD os '0 of «I ..d ; 1:1 «I.e B u ~
c ;::I
~ .6.5 I::Q tI,l , ~
...; N ~ .... ....
IX!
e M
~ 'Co ~ o i:.'l£:'<I> s-", t-.. ..., co N -,; '0
N 0-. 0-. ~ 00 t-.. ~Jil ",.!!.;;:g ~ ..., N t"I - N ..., .... 'E l:J.5·~ ~~..Io: .,. .~
u
CI.I B: ..... _ l:J '.c <'\ ~ ~ ..... 00
~ Atj 0 B: ..... ~ <'\
......... = .:I'g- ..., 00 h b N \c \c .:0 Il-vo'_ t<I N
..., ...., ...., N <"l ...., ....
'" .~ ~ ='" :; .. ~ ao CIO - '" ~-
... ... ·c d ... ::I ::: ~ E ::: !i1 Cl. Cl. '60 .5 a «I OIl ~ -~ 0:1
..d '0 2 Iii ..10: 'C ... '6' ·c :== tloI «I a «S ..101 .;; ;;; ~ '0 a ';_j :>:: ~ '" ~ ~
«I .r:l
!l. ::.::: P::: ~ ~ ~
...; N <'\ ~ lh ..0 t-= cO oi
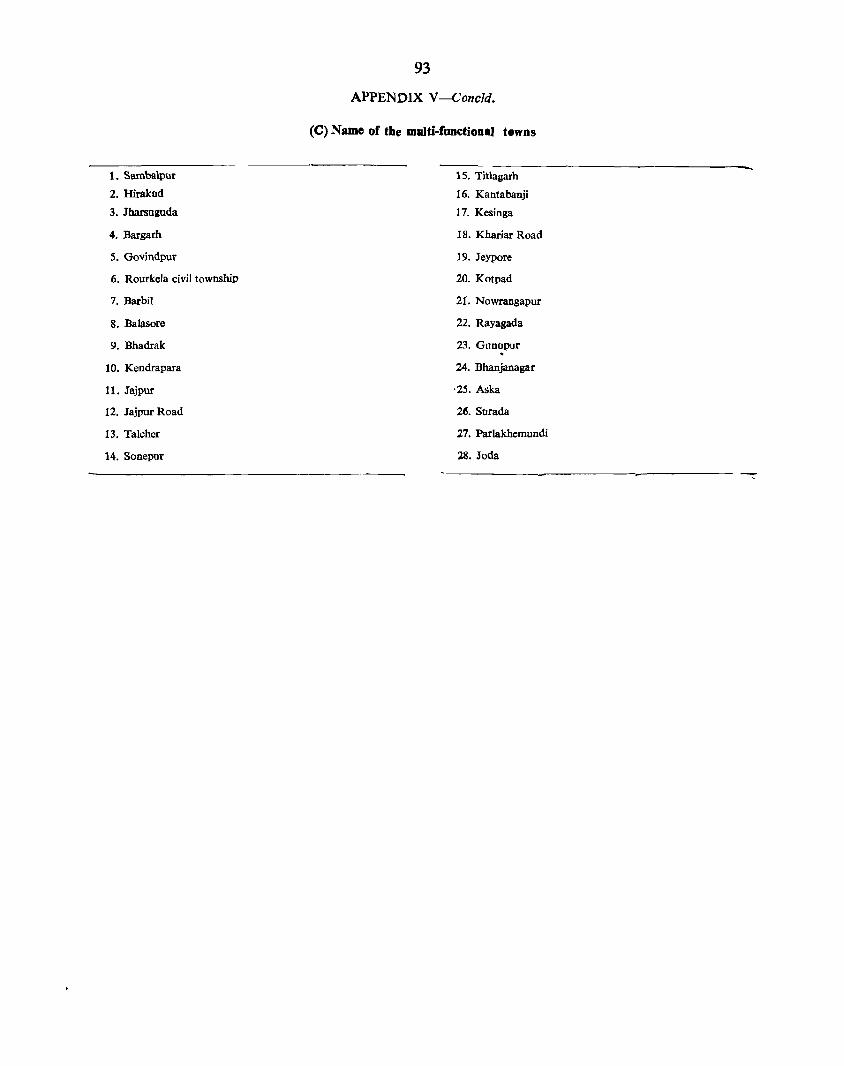
1. Sambalpur
2. Hirakud
3. Jharsuguda
4. Bargarh
5. Govindpur
6. Rourkela civil township
7. Barbil
8. Balasore
9. Bhadrak
10. Kendrapara
11. Jajpur
12. Jajpur Road
13. Talcher
14. Sonepur
93
APPENDIX V-Concld.
(C) Name of the multi-functional towns
15. Titlagarh
16. Kantabanji
17. Kesinga
18. Khariar Road
19. Jeypore
20. Kotpad
21. Nowrangapur
22 .. Rayagada
23. Gunupur . 24. Bhanjanagar
,25. Aska
26. Surada
27. Parlakhemundi
lll. Joda


'CHAPTER V SEX RATIO AND AGE STRiUCTURE
Sex compos.ition has a direct effect on the incidence of birth, death and marriage. It influences migration and work participation. T11-e relation between the number of males and females in a population is described as the sex ratio. In the Indian census, it is expressed in terms of the munber of f~m~les per 1,000 males. If the Propol;tion between males and females at ~irth is greatly disturbed in any country even in a single generation, it could throw society out of gear.
Up to 1961 Orissa was one of the few states in India which had a surplus female' population. Yet the surplus female population had been persistently declining since 1921.
Year Sex ratio
1901 1,03i 1911 1,056 1921 1,086 1931 1,067 1941 J,053 1951 1,022 1961 1,001 1971 988
The all India ratio in the 1971 census was 930 females per 1,000 males. The country's sex ratio has always been below par.
Yeap SeJl.ratio 1881 954 1891 958 1901 972· 1911 964 1921 955 1931 950* 1941 945* 1951 946 1961 941 1971 930
As early as 1931, the situation led Dr. J. H. Hutton, the Census Commissioner, to observe 'The figure of population of India by sex shows a further continuation of the steady fall in the proportion of females to males that has been going on since 1901. The female ' infant < is definitely better equipped by nature for survival than the male; but in India the advantages she has at birth are probably neutralised in infancy by comparative neglect and in adolescenc~ by the strain of bearing children too early and too often.'
*Excludes Pondicherry
Statement V.I' shows the sex ratio in India Md other states as revealed by the 1971 ceniUS.
STATEMENT V.l
Unit Sex ratio
1 2
INDIA 930
• 1 Andhra Pradesh 977 2 Assamt 897 3 Bihar
9S4 4 Gujarat 934 5 Haryana 867 6 Himachal Pradesh 958 7 Jammu & Kashmir 878 8 Kel'l!la /1,016 9 Madhya Pradesh 941 10 Maharashtra 930
11 Manipur 980
12 Meghalaya 942 13 Mysore (Karnataka) 957 ~14 Nagaland
871 15 ORISSA 865
16 Punjab 865 17 Rajasthan 911
18 Sikkim 863 19 Tamil Nadu 978 20 Tripura 943 21 Uttar Pradesh 879 22 West Bengal 891
Union territories :
1 Andaman and Nicobar Is1ands 644 2 Arunachal Pradesh 861 3 Chandigarh 749 4 Dadra and Nagar Haveli 1,007
5 Delhi 801 6 Goa, Daman and Diu 989 7 La£;cadive, Minicoy and Amindivi Islands 978 (Lakshadweep)
8 Pondicherry 989
Demographers are inclined to treat a divergence in sex rati6 up to 50 points either way as the limit of tolerance. Viewed from this standpoint, there are ,seven states (bes1des - Kerala) whose sex ratio may be considered as safe. In the fore-front among these states is Orissa with a sex ratio of 988 followed by Manipur (980), Tamil Nadu (978), Andhra 'Pradesh (977), Himachal Pradesh (958), Mysore (957)
tlnc1tides Mizo district now constituted as u]liol1 territorY of MizoIam.
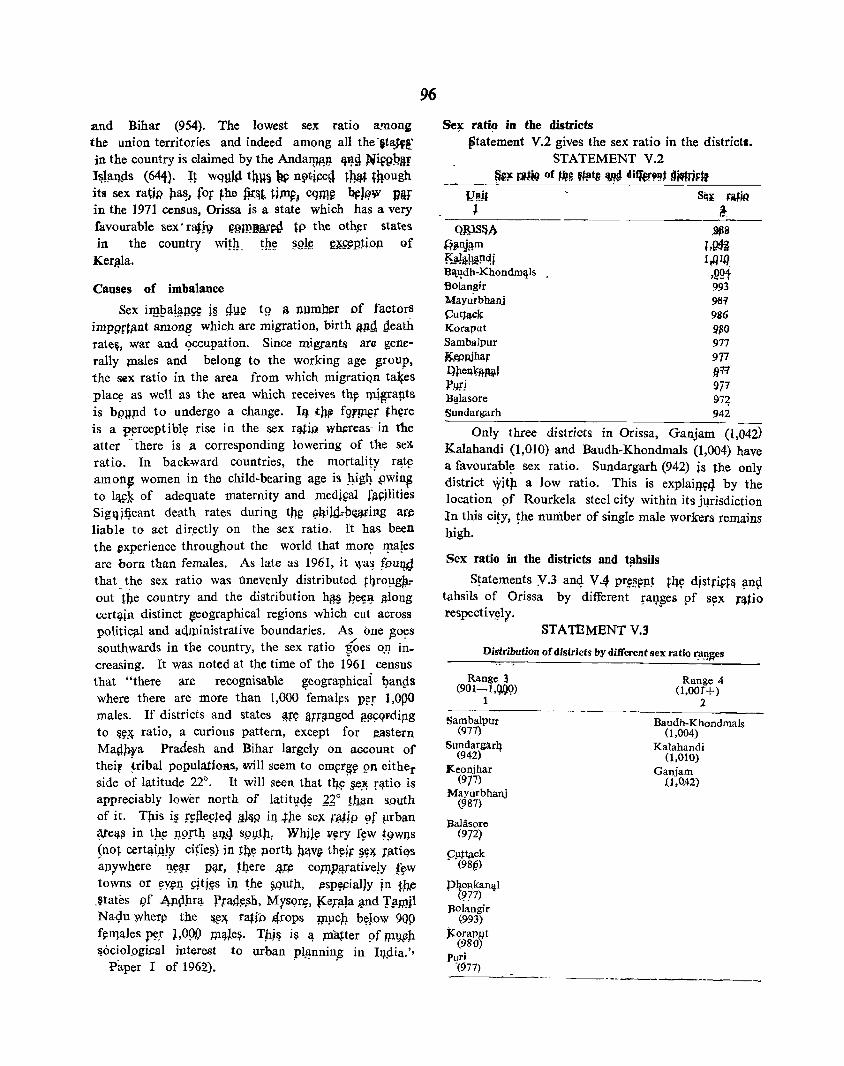
and Bihar (954). The lowest sex ratio a.'uong the union territories and indeed among all the -§t~,~· in the country is claimed by the Anda~f!p 1l~9 Nif99ilf l!!lilJ+.ds (641). n wqW~ tlH!§ ~ n~t,ipeQ tAA~ though its sex ra~jp pa~1 for ~he fi.r.~t. tiP"f1 cqm$i bFJ~\¥ Pi!T in the 1971 census, Orissa is a state which has a very favourable sex' ratro fl~mBM~g, tp the othpr states in the country wi!h_ !b~ §Q]!; ~g:p.HpJl of
Kera.Ja.
Causes of imbalance
Sex imbalance is gy~ to a number of factors impgrtimt ;~;;;_~·-whi;h are ~igration, birth illl!l geath Tate~, war and ,?ccupation. Since migrants are gene· rally Plales and belong to the working age ~roup,
the sex ratio in the area from which migratiQn ta~es plac~ as well as the area which receives th~ IJlj¥;rapts is bpllPd to undergo a change. III tJ:l.~ fgl'~r th~re is a pprceptiblt;: rise in the sex TlJ,till wb:reas- in the atter - there is a corresponding lowering of the seX ratio. In backward countries, the mortality ra;tl! amon~ women in the child-bearing age is higq_' ~winp to ll}.p~ of adequate maternity and medi¥al fa.pjlities SigllHicant death rates during t~ ~lliW:pcml'iltg are liable to act dir~ctly on the sex ratio. It has been the ~xperience throughout the world that mor~ ~a!es are born than females. As late as 1961, it \ya~ foutyJ that the sex ratio was tlllevcnly distributed t4ro~gp,. .. out t4e country and the distribution hi!§ J?e~Jl. ~long cert~in distinct seographical regions which cut across politicfLl and administrative boundaries. As one _go~s southwards in the country, the sex ratio (oes OJ). in. creasing. It was noted at the time of the 1961 census that "there are recognisable geographicai ~an£ls where there are more than 1,000 'fema4!s p~r 1,OPO males. If districts and states !H"\, flrmnged i!!3p<?fdipg to &~~ ratio, a curious pattern, except for f,l.astern Mag}lya Pradesh and Bihar largeiy on Mcount of their ~ribal populations, will seem to emt:l'~~ gn either side of latitude 22°. It will seen that tlw §e,~ r<1iio is appreciably lower north of latitl,!q5? 2~o !h.(Jn south of it. Tpis i§ n:fle~te4 .ilJlig ill .fpe se,x fMip f,lf prban ~e~~ in tp.~ ,m>rt4 !_I.l)9 sPl}jp, Whj}~ v~ry f~w ~gwns
~not cert~inJy ci(ieli) jn tlw 11ortl). fl.a,.v&: th~if §,JS. r,ati(}s anywhere I).~~r Mr, ~Q.ere JJ:r~ CO)l}.pl!Tative~y f~w
towns or ~Y~I). pitj~s il). the ~ut}l, ~sp~iaIJy jn t~ _~tates gf 4p.p.}1fl! rra.4~.sli, MysQr~, l(_eJil}a ~nd 'film.jl Na-c,lu ~her~ tbe ~~~ raUb ,4rops W)lch. b~~ow 90P f$!11lales~.r 1.09.9 w~Je~. TjJ.j& is q. platter 9f 1PlW}l liOciol.ogical interest to urban pl.~nnin_g in Ilfp.ia."
Paper I of 1962).
96
Se~ rati~ in the districts ~tatement V.2 gives the sex ratio in the districts.
STATEMENT V.2
§~~ rlU9 of th~ 'tiltS lfmJ diife'9~ ,U$;s:f!
Q}'p'S&h ,9j!3
"1ilnj~m 1,g$. Kll-!il!t£lclj 1 ~ Itl Bl\.4dh-Khondm~ls ,QQt Bolangir 993 }layurbhanj 9B~ ~utta,ck: 986 Koraput !I~O
Sambalpur 977 ~~njhaf 977 QrellJl'iUl\'J JfFl Pm:} 971 Bqlasore 97~
Sundargarh 942
Only three districts in Orissa, Ganjam (1,042) Kalahandi (1,010) and Baudh-Khondmals (1,004) have a favourabl~ sex ratio. Sundargarh (942) js the only district \fit)1 a low ratio. This is explaini4 by the location 9f Rourkela steel city within its jqrisdiction ln this ci~y, ~he number of single male workers remains high.
Sex ratio in the districts and t!lhsils
S!atements y.3 anq V.4- pr~§~!1t t4~ djstript& ~n~ tahsils of Orissa by different raq,ges pf s~x f~tio respectiv,~Iy. •
STATEMENT V.3
Distribution of districts by different sex ratio r~~~es
Range ~ (901-1,Q.9Q)
1
Sambalpur (971)
Sundargarl1 (942)
Keonjhar (977)
Mayurbhanj (987)
Bahisore (972)
9Jlttack (98§)
P4enkanllJ {'!77)
BOlangir (993)
Jeorapyt (980)
Puri -«()77)
Range 4 (1,00T+)
2
Baudh-Khondmals (1,004)
Kalahandi (1,010)
Ganjam .(1,0,42)
-----------------
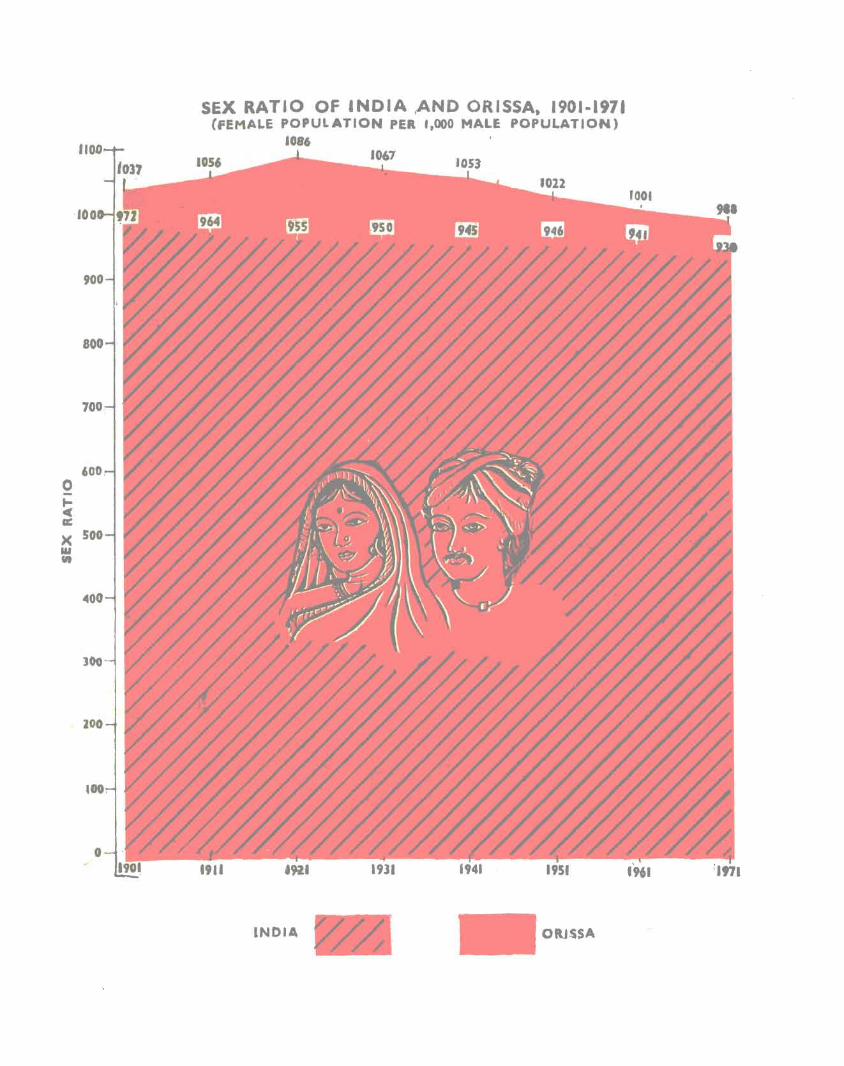
o -le II:
)( 1&1 8t
·.0
SEX RATIO OF INDIA ,AND ORISSA. 1901-197. (fEMALE POPULATION PER 1,000 MALE POPULATION)
1086
INDIA OIU$$A

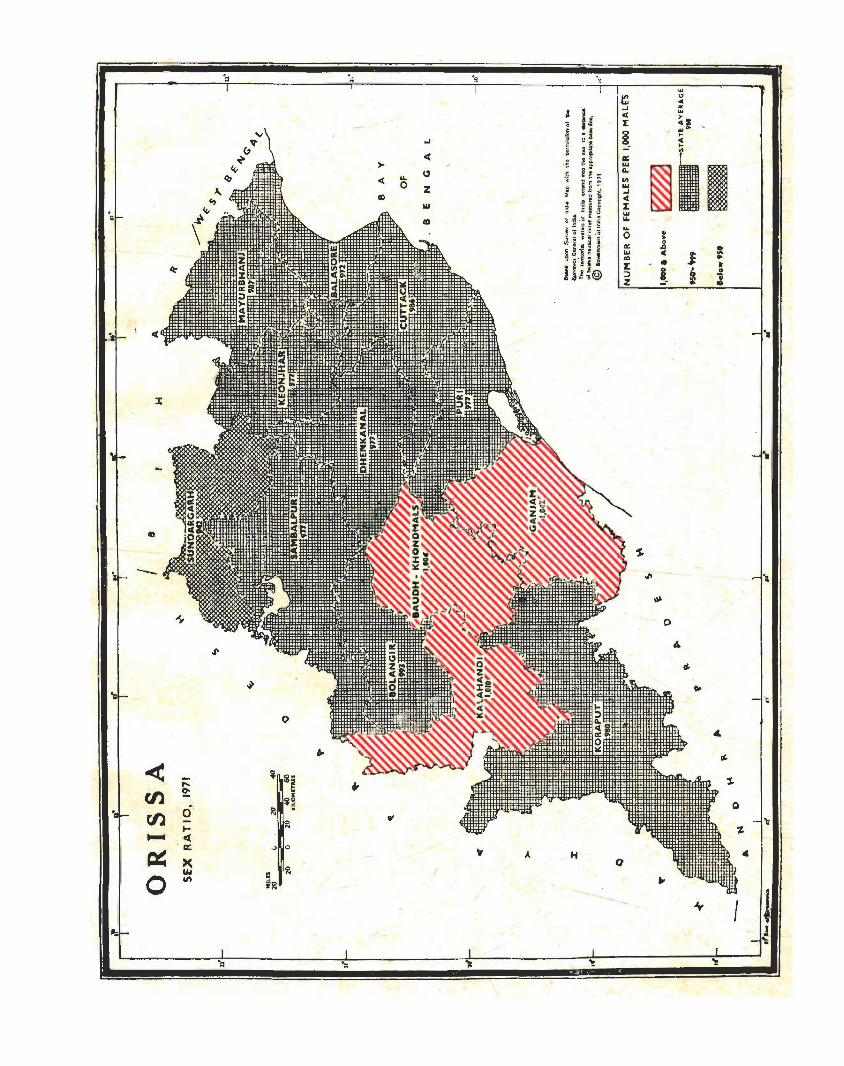
, :;
i
< ,.. (Il 2:
fIl cf ... ..... C(
' 0:
~ X '" 0 en
* i~ E
~g
~ ;;
0 .. .;) 0
::I ~
i~
';:;
><
0'
... o
«
" z
" A
I
H 0
j "' .. !
•

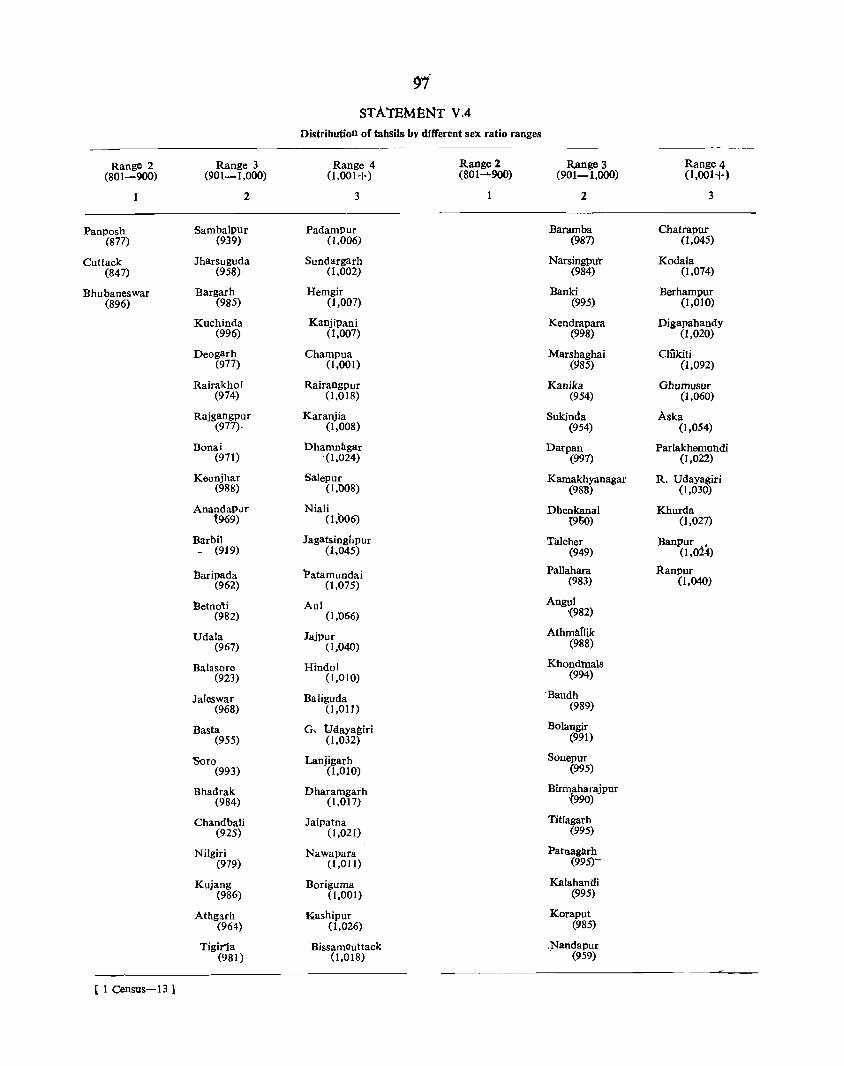
91
STATEMENT V.4 Distribution of tahsils bV different sex ratio ranges
Range 2 Range 3 Range 4 Range 2 Range 3 Range 4 (801-900) (901-1,000) (1.001+) (801~900) (901-1,000) (1,001+)
2 3 1 2 3
Panposh Sambalpur Padampur Baramba Chatrapur (877) (939) (1,006) (987) (1,045)
Cuttack Jharsuguda Sundargarh NarsinglJu'r Kodala (847) (958) (1,002) (984) (1,074)
Bhubaneswar Bargarh Hemgir Banki Berhampur (896) (985) (1,007) (995) (1,010)
Kuchinda Kanjipani Kendrapara Digapahandy (996) (1,007) (998) (1,020)
Deogarh Champua Marshaghai Chlkiti (977) (I ,001) (985) (1,092)
Rairakhol Rairangpur Kanika Ghumusor (974) (1,018) (954) (1,060)
Rajgangpur Karanjia SUkinda Aska (977)- (1,008) (954) (1,054)
Bonai Dhamnhgar Datpan ParIakhemondi (971) ·(1,024) (997) (1,022)
Keonjhar Salepur Kamakhyanagar R. Udayagiri (988) (l,t>08) (98'8) (1,030)
AnandaPur Niali DhenkanaI Khurda t969) (1,b06) {9f;0) (1,027)
Barbil J agatsinghpur Talcher Banpur • - (919) (1,045) (949) (1,024)
J3aripada Patamundai Pallahara Ranpur (962) (1,075) (983) (1,040)
Betnoli AuI Angul (982) (l,'O66) "(982)
Udala Jajpur Athmltflik (967) (1,040) (988)
Balasore Hindol Khondmals (923) (1,010) (994)
Jaleswar Baliguda -Baudh (968) (1,011) (989)
Basta G, tJdaya~iri Bolangir (955) (1,032) (991)
Soro Lanjigarh Sonepur (993) (1,010) (995)
Bhadrak Dharamgarh Birmaharajpor (984) (1,017) ~990)
Chand bali Jaipatna TitIagarh (925) (1,021) (995)
Nilgiri Nawapara Patnagllrh (979) (1,011) (995)-
Kujang Boriguma Kalahandi (986) (1,001) (995)
Athgarh Kashipur Koraput (964) (1,026) (985)
Tigiria Bissamauttack .Nandapur (981) (1,018) . (959)
[ 1 Census-13 ]

98
STATEMENT V·4-Concld.
Range 2 (801-900)
Range 3 (90-1,000)
2
Jeypore (978)
Kotpad (988)
Nowrangapur (989)
Umarkot (975)
Malkangiri (922)
Motu (983)
Rayagada (995)
Gunupur (995)
Range 4 (1,001+
3
As already discussed, no district in Orissa comes under the __ first (up to 800) and second (801-900) ranges. Ten out of the 13 districts fall in the third range (901-1,000). The remaining three come under the fourth range and have a surplus of females. The sex ratio obtaining in all the districts is quite neat the 1,000 mark either plus or minus.
Out of tlie 103 tahsils in Orissa there is none in the first range (up to 800) and only three Panposh Cuttack and Bhubaneswar, come in the seconq range (801-900J. There are 64 tahsils in the third range (901-1,000). All the 13 districts have some tahsils in this range. Even the female surplus districts of Ganjam and Kalahandi contribute one tahsil each, .1-6 this range. There are 36 tahsils in the fou).:th range with • surplus females over males. Here again, all districtS of the state except Bolangir contribute at least one ahsil each to this range (All the five tahsils of Bolangir district are in the third range). Even the fema'e deficient district of Suhdargarh has contributed two tahsils to range 4 while the secona most female deficient district of Balasore has contributed one. It is thus seen that out of 103 tahsils there is none in the first range, 62 per cent belong to the third range (901-1,000), 35 per cent belong to the fourth range while rest come within the second range.
Taking the three most female·deficient tahsiis into consideration we find that each of these tahsils has within its jurisdiction a city. A city generally has a predominance of males mainly owing to inmigration of male workers from other areas on account of jobs.
Range 2 Range 3 Range 4 (801-900) (901-1,000) (1,001+)
2 3
Surada (995)
Puri (970)
Nimapara (984)
Pipli (994)
Krushnaprasad (985)
Nayagarh (979)
Khandpara (996)
Daspalla (994)
_----Cuttack tahsil has a low sex ratio (847). This could be explained by the possibility that the bulk of its male population are single, having left their spouses behind at home. With a sex ratio of 877, Panposh tahsil which has the city of Rourkela within its jurisdiction appears slightly better than Cuttack tahsil. This could be due to the comparatively better housing facilities available to the popUlation in Rourkela. Bhubaneswar tahsil has a sex ratio of 896. This tahsil has in its area the state's capital city of Bhubaneswar in which a very large number of men are employed. The low sex ratio in this city cou ld be due to the fact that a number of employees have either not been able to secure housing accommodation Or prefer to stay single.
Among the tahsils which have a comparatively high sex ratio (range 4) Chikiti tahsil in Ganjam district has the highest sex ratio with 1,092 females per 1,000 males. The other tahsils are Patamundai (1,075), Koda1a (1,074), Aul (1,066), Ghumusur (1,060), Aska (1,054), Chatrapur (1,045) and Jagatsingh_ pur (1,045). It is but natural that Ganjam district which has the highest sex ratio among the districts contributes five tahsils among the first eight. The other three tahsils in this group all belong to the district of Cuttack -a district that is below par i~ its sex ratio while the female surplus districts of Kalahandi and Baudh-Khondmals do not have any of their tahsils in this group. This is perhaps because the sex ratio in the tahsi1s of these two districts is bJ.lanced while that among the tahsils in the district of Cuttacl~ exhibit a wide fluctuation. In fact Cuttack tahsi 1
has the lowest sex ratio with 847 while Patamundai tahsil in the same district has the second highest sex ratio 0,075) even though the two are situated within
80 miles of each other.
Rural-urban distribution of sexes
Statement V.5 gives the number of females pet 1,000 males in the state and the districts with a rurall urban break-up.
STATEMENT V.S
Rural-urban sex ratio of Orissa and districts
Unit
ORISSA
Sarnbalpur
Sundargarh
Keonjhar
Maynrbhanj
Balasore
Cuttack
Dhenkanal
Baudh-Khondrnals
Bolangir
Kalahandi
Koraput
Ganjam
,Puri
Sex ratio , ______ .A-_______ -....
Total Rural Urban
2 3 4
988 1,002 845
977 995 849
942 993 790
977 988 839
987 991 840
972 979 848
986 1,007 772
977 986 797
1,004 1,009 865
993 999 923
1,010 1,014 939
980 985 931
1,042 1,054 ?55
977 1,000 788
99
While the general sex ratio of the state stands at 988, divided on rural and urban basis, the picture
takes on a different complexion. The rural areas show 1,002 females per 1,000 males whereas in the urban areas the figure is as low as 845 females per 1,000 males.
Five districts have a favourable sex ratio in their rural areas. These are Ganjam (1,054), Kalahandi (1,014), Baudh-Khondmals (1,009), Cuttack (1,007) and Puri (1,000). In the rural areas of Bolangir district • the sex ratio is 999. Cut tack and Puri districts which, in the general population, showed an adverse sex ratio have a_female .predominant population in their rural
areas. Even among the other districts, the sex ratio in their respective rural areas takes on a more favourable aspect than their respective general sex ratios.
In fine, the sex ratio in the rural areas of the districts is so favourable to females that even the district of 13alasore having tlie lowest sex ratio in the rural ar~as among the districts has as high a figure as 979 per 1,000 males.
For the urban areas, the state sex ratio stands at 845. The sex ratio is uniformly below par in thc urban areas of every district. With this limitation the district presenting the most favourable sex ratio in its urban areas is Ganjam (955). It is followed by Kalahandi (939), Koraput (931) and Bolangir (923). All the other districts have, in their urban areas, a sex ratio ranging between 800 and 900 excepting Dhenkanal (797), Sundargarh (790), Puri (788) ·and Cuttack (772). The districts of Cuttack and Puri reveal the lowest sex ratio in their respective urban areas.
Sex ratio in towns of different size classes
Statement V.6 gives the sex ratio of urban popUlation of the state for the different size classes of towns.
STATEMENT V.6
Sex ratio of urban population in different size ~es of towns in the state
Size class of towns Sex r fti /
1 2 .---- ---
I 792
II 860
III 863
IV 893
V 905
VI 988
NOTE : The size class of urban population includes ufl agglomeration basing on table A-IV.
The class size of the ,towns and their sex ratio are in inverse proportion. The higher the classification of a town, the lower is its sex ratio.
Sex ratio in towns according to functional characteristics
Statement V.7 gives the sex ratio of different towns arranged according to their functional classii.
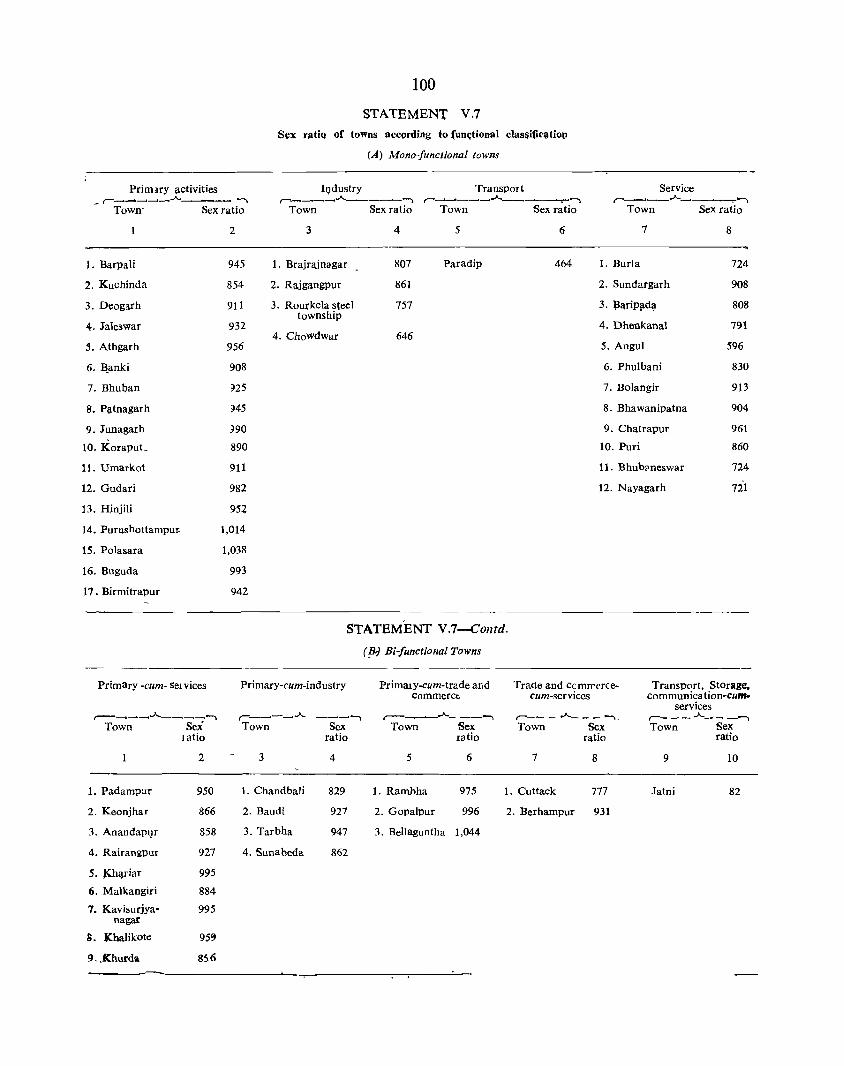
Primuy activities
100
STATEMEN'l' V.7
Sex ratiQ of towns acc()rding to (un.,tional clas~ific3tiO,{l
(A) Mono-functional towns
lQdustry Transport Service r-_____ ....A...__. __ ......
- Town' Sex ratio
r-____ ....A... _____ ~ r-_____ ..A.. ___ ~~ r-_..__ __ .,A.. _ ____, __ -_ ......
1
1. Barpali
2. Kuchinda
3. Deogarh
4. Jale':!war
5. Athgarh
6. :&anki
7. Bhuban
8. P~tnagarh
9. Junagarh
10. KorapuL
11. Umarkot
12. Gudari
13. Hinjili
14. PurushottampUl:
15. Polasara
16. Buguda
17 • Birmitrapuf
Primary -cum- Sel vices
r--~~_.A. ____ ......
Town Sei latio
2
1. Padampur 950
2. Keonjhar 866
3. AnandaPl)r 858
4. Rairangpur 927
5. J(hllriar 995
6. Malkangiri 884
7. Kavisurjya- 995 nagar
g. lChalikote 95~
9. ,Khurda 8;6
Town Sex ratio Town Sex ratio Town Sex ratio
2 3 4 5 6 7 8
945 1. Brajr~nagar 807 Paradip 464 1. Burla 724
854 2. Rajgangpur 861 2. Sundargarh 908
911 3. Rourkela steel 757 3. lJarip!Ld~ 808 township
932 4. Dhenkanal 791 4. Chowdwar 646
956 5. Angul 596
908 6. Phulbani 830
925 7. Bolangir 913
945 8. Bhawanipatna 904
}90 9. Chatrapur 961
890 10. Puri 860
911 11. Bhub:meswar 724
982 12. Nayagarh 121
95Z
1,014
1,038
993
942
STATEMENT V.7-Contd.
Primary-cum-industry
(_~_~.A. __ ~ ......
Town Sex ratio
3 4
1. Chandbali 829
2. Baudt 927
3. Tarbha 947
4. Sunabeda 862
(!l-i Bi-/unctional Towns
PrimaIy-cum-trade and commerct
r----..,._-----.. Town Sex
5
1. Rambha
2. Gopalpur
wtio
6
975
996
3. Bellaguntha 1,044
Trade and Ccmrrercecum-services
r-~-' _ .A. ___ .......
Town Sex
7
1. Cuttack
2. Berhampur
ratio
8
777
931
Transport, Storage, communica tion-cum
services r-- __ .A. ____ ......
Town Sex ratio
9 10
Jatni 82

STATEMENT V.7-Col'tckJ.
(ej Multi-functional towns
Town 'Sex ratio
1. Sambalpur
2. Hirakud
3. Jharsuguda
4. Bargarh
5. Govindpur
6. Rourkela civil township
7. Barbil
8. Joda
9. Balasore
10. Bhadrak
11. Kendrapara
12. Jajpur
13. Jajpur Road
14. Talcher
15. Sonepur
16. Titlagarh
17. Kantabanji
18. Kesinga
19. Khariar Road
20. Jeypore
21. Kotl'ad
22. Nowrangapur
23. Rayagada
24. Gunupur
25. Bhanjanagar
26. Aska
27. Surada
28. Parlakhemundi
2
838
847
893
854
929
72S
794
870
832
8~8
884
873
684
868
943
896
927
923
961
959
1,029
974
939
975
916
957
943
980
Statement V. 7 makes it clear that industrial towns, regardless of population, have a low sex ratio. So far as the industrial town of Chowdwar is concerned, the sex ratio is much lower than that in the other industrial towns because in addition to its industries. Chowdwat town also has a large establishment known as the aviation research centre
101
employing "a large number of persons, most of whom live singly. Rourkela steel town has a low sex ratio of 757 because the population of this town is highly industriaHse<l and is sustained by the steel plant.
In the service towns, a large section of thl; population is employed in government offices and allied estabHshments. A study of the sex ratio of this class of towns shows that Burla and Bhubaneswar have the lower sex ratio (724). Bhubaneswar is the capital of the state. Burla is a small town but has gained in importance owing to the location of a medical college and an engineering coll~ge.
The students of the colleges are mostly single males. Nayagarh, a subdivisional town has a sex ratio that is slightly lower at 721. In this class of towns Chatrapur has the most favourable sex ratio at 961. This could be due to two reasons. The first is that fundamental reason of Ganjam having the highest female sur~~s population among the districts while the second is that in this small district headquarters town, a large number of male employees commute from Berhampur which is at a distance of only 20 kilometre. The sex ratio of the other towns in this category does not vary much from the state average for the urban areas. Among all service towns, Angul has the lowest sex ratio (596), which appears to be out of all proportions to its functional classification. It has a number of institutions like the police training college, the foresters' training school, the teachers training college, etc. whose population is predominantly male.
So far as business cla~s towns (including thC>se multi-functional towns one of whose functions is trade and business) are concerned, we find that Bargarh, Jharsuguda, Titlagarh, Kendrapar a Bhadr~k and Jajpur have an almost similar sex ratio. The sex ratio in Kantabanji and Kesinga, both businesS towns of Kalahandi district, is on the high side probably because both these towns are situated in a district that has a high sex ratio. Further, the in-mjgration of a large number of female labourers from the adjoining areas of Madhya Pradesh might hl!-ve something to 'do with the relatively high sex ratio in these towns.
While analysing the sex ratio in t~ towns accordirtg to their functionaJ classification we should bear in mi.nd one factor, vjz, that the pgpulatioJl of Orissa is mainly rural anq m~ny of its 81 tOWIl$.
still have fural undertones. Unless urbanisation jn-

a state has advanced to a high degree, polarisation of its towns into separate categories strictly in accordance' with their functions is not realistic. In any case, nascent urban units can not generally be mOnofunctional. Therefore, the abc?'Ve analysis of the sex ratio of the population of towns according to
102
functional classification could by deemed merely as roug~.
Sex ratio .in large towns
Statement V. 8 presents the sex ratio in the larger towns of the state.
STATEMENT V. 8
Town
CLASS I
Cuttack urban agglomeration
Rourkela steel to~nship (city)
Berha.mpur city
Bhubaneswar city
CLASS II
Puri
Sambalpur including university campus and other areas
CLASS III
Rourke1a civil township
Balasore
Bhadrak
Bohngir
Jeypore
Sex ratio
2
774'
751
931
724
860
847
725
832
853
913
959
Orissa has only four class I toWns or cities:' Of these, the lowest sex ratio (724) Occurs in Bhubaneswar and the.highest in Berhampur (931). Berhampur happens to be in a female predominant district.
The sex ratio in the two class II towns, Sambalput: and Puri, stands at 847 and 860 respectively. Tfiis figure more or less accords witn the state .figure for the urban areas.
Among the class III and class IV towns which between themselves comprise the majority of the towns in the state, the sex ratio does not appear to have any relationship with the size class of a)own. Some of the class IV towns show a much lower sex ratio than many class III towns. Jharsuguda, a class III town with a population of 24,727, has a sex ratio of 893 whereas Jajpur Road, a class IV town with only a population of 10,805, has a sex ratio of 684: Bolangir, a class \11 town with a
Town
CLASS IIl-Concld.
Brdjrajnagar
Jatni urban agglomeration
Baripada
, Birmitrapur
Sunabeda
Parlakhemundi
Rayagada
Jharsuguda
Barbi!
Chowdwar
Bhawanipatna urban agglcmeraticn
Bargarh
Rajgangpur
Koraput
Kendrapara
Sex ratio
2
807
831
808
942
862
980
939
893
,94
646
9Gl
854
861
890
884
population ot 35,748, has a sex ratio of 913 whereas Dhenkanal, a class IV town with a population of 19,615, showS a comparatively low sex ratio of 791. From among 20 class III towns and 23 class IV towns the lowest sex ratio (646) occurs in Chowdwar, a class III town followed by Jajpur Road, a class IV town (684). The highest sex ratio among these towns (class III and IV) is shown by Polasara, a class IV town of Ganjam district, with the figure of 1,038. Among all the towns under considC(ration, Polasara alone has a sex ratio above par. The second highest sex ratio again' goes to a town in Ganjam district, Parlakhemundi (980). The low sex ratio of Chowdwar town has already- been commented upon. Jajpur Road has a low sex ratio becau~e it bas co~siderable trading and mining activity· anda ttracts single male workers. The high sex ratio of ParlaklJ.emundi and Polasara is in keeping with the high sex ratio of the district of Ganjam.
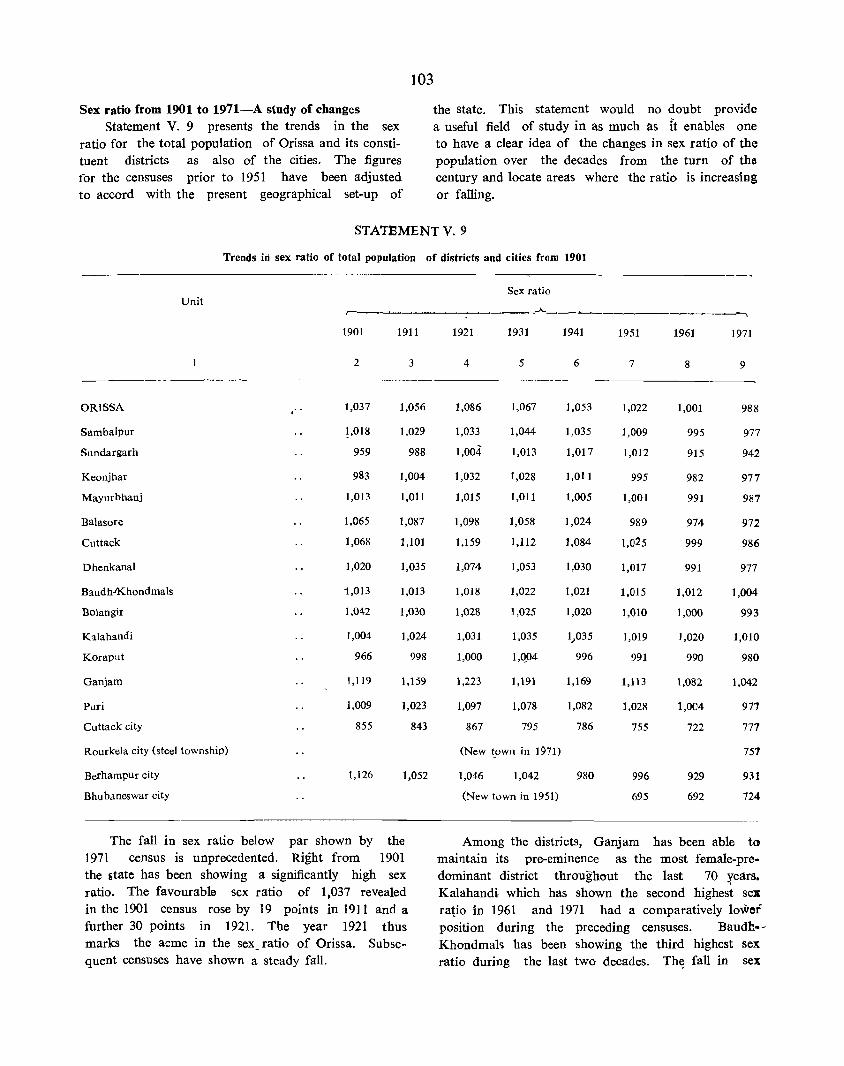
)03
Sex ratio from 1901 to 1971-A sludy of changes Statement V. 9 presents the trends in the sex
ratio for the total population of Orissa and its constituent districts as also of the cities. The figures for the censuses prior to 1951 have been adjusted to accord with the present geographical set-up of
the state. This statement would no doubt provide a useful field of study in as much as it enables one to have a clear idea of the changes in sex ratio of the population over the decades from the turn of the century and locate areas where the ratio is increasing or falling.
STATBMENTV.9
Trends in sex ratio of total population of districts and cities from 1901
Sex ratio Unit r-__ ~~ ______ ~ ____ .A.
----,
1901 1911
2 3
ORISSA 1,037 1,056
Sambalpur 1,018 1,029
Sundargarh 959 988
Keonjhar 983 1,004
Mayurbhanj 1,013 1,011
Balasore 1,065 1,087
Cuttack 1,068 1,101
Dhenkanal 1,020 1,035
Baudh.IKhondmals 1,013 1,013
BOlangir 1,042 1,030
K'llahandi 1,004 1,024
Koraput 966 998
Ganjam 1,119 1,159
Puri 1,009 1,023
Cuttack city 855 843
Rourkela city (steel township)
Berhampur city 1,126 1,052
Bhubaneswar city
The fall in sex ratio below par shown by the 1971 census is unprecedented. Right from 1901 the state has been showing a significantly high sex ratio. The favourable sex ratio of 1,037 revealed in the 1901 census rose by 19 points in 1911 and a further 30 points in 1921. The year 1921 thus marks the acme in the sex_ ratio of Orissa. Subsequent censuses have shown a steady fall.
1921 1931 1941 1951 1961 1971
4 5 6 7 8 9
1,086 1,067 1,053 1,022 1,001 988
1,033 1,044 1,035 1,009 995 977
1,004 1,013 1,017 1,012 915 942
1,032 1,028 1,011 995 982 977
1,015 1,011 1,005 1,001 991 987
1,098 1,058 1,024 989 974 972
1,159 1,112 1,084 1,025 999 986
1,074 1,053 1,030 1,017 991 977
1,018 1,022 t,021 1,015 1,012 1,004
1,028 1,025 1,020 I,Q10 1,000 993
1,031 1,035 1,,035 1,019 1,020 1,010
1,000 I,Q04 996 991 990 980
1,223 1,191 1,169 1,113 1,082 1,042
1,097 1,078 1,082 1,028 1,OC4 971
867 795 786 755 722 771
(New lown in 11)71) 757
1,046 1,042 980 996 929 931
(New town in 1951) 695 692 724
Among the districts, Ganjam has been able t() maintain its pre-eminence as the most female-predominant district throughout the last 70 ~ears.
Ka1ahandi which has shown the second highest sex ratio In 1961 and 1971 had a comparatively lower position during the preceding censuses. Baudh-Khondmal<; bas been showing the third highest sex ratio during the last two decades. Th~ fall in sex
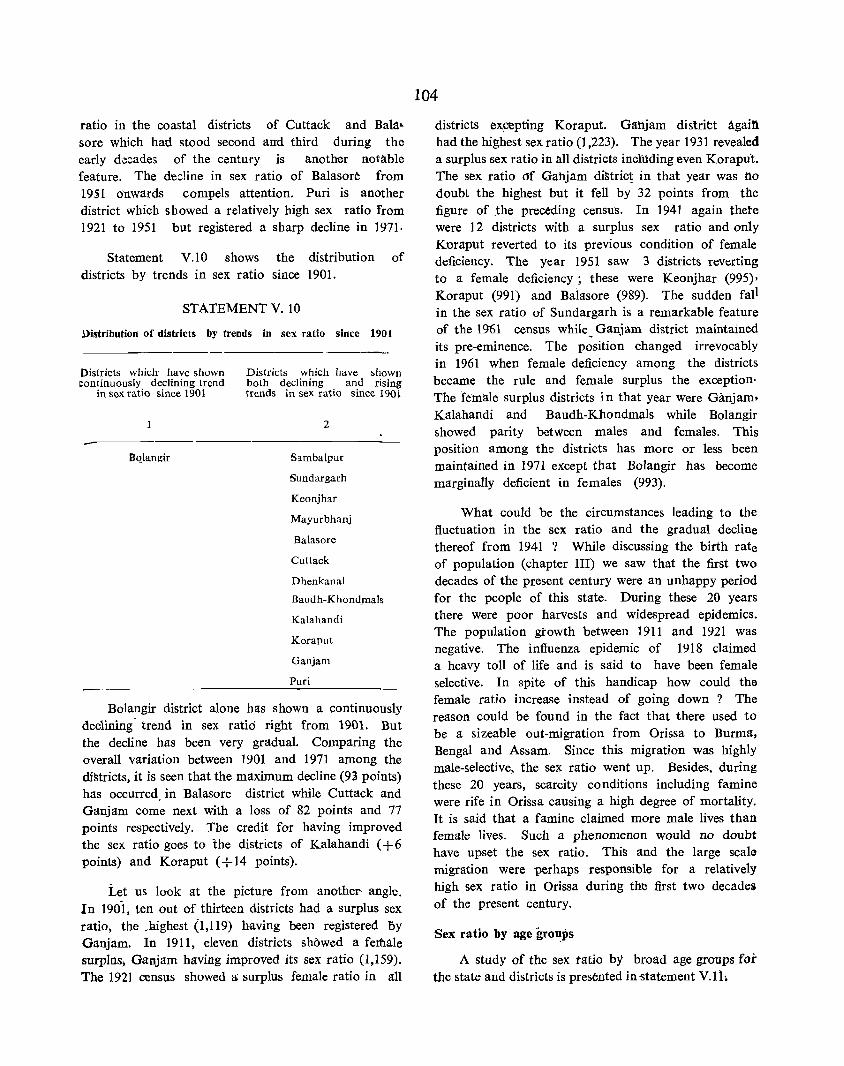
ratio in the coastal districts of Cuttack and Ba1::t~
sore which had stood second ami third during the early de:::ades of the century is another notEl.ble feature. The dedine in sex ratio of Balasore from 19.)1 onwards compels attention. Puri is another district which showed a relatively high sex ratio from 1921 to 1951 but registered a sharp decline in 1971·
Statement V.lO shows the distribution of districts by trends in sex ratio since 1901.
STATEMENT V. 10
/i)istribution of districts by trends in sex ratio since 1901
Districts which have shown continuously declining trend
in sex ratio since 1901
BQlangir
Districts which have shown both declining and nstng trends in sex ratio since 1901
2
S3.mbalpur
Sundargarh
Keonjhar
Mayurbhanj
Balasore
Cuttack
Dhenkanal
Baudh-KhondJIlals
Kalahandi
Koraput
Ganjam
Puri
Bolangir district alone has shown a continuously declining· trend in sex ratio right from 1901. But the decline has been very gradua1. Comparing the overall variation between 1901 and 1971 among the districts. it is seen that the maximum decline (93 points) has occurred. in Balasore district while Cuttack and Ganjam come next with a loss of 82 points and 77 points respectively. The credit for having improved the sex ratio goes to the districts of Kalahandi (+ 6 points) and Koraput (+14 points).
Let us look at the picture from anotheI' angle. In 190-1, ten out of thirteen districts had a surplus sex ratio, the .highest (1,119) having been registered oy Ganjam. In 1911, eleven districts showed a feIflale surplus, Ganjam having improved its sex ratio (1,159). The 1921 census showed a surplus female ratio in all
104
districts ex~pting Koraput. Ganjam distritt Again had the highest sex ratio (1.223). The year 1931 revealed a surplus sex ratio in all districts inclUding even Korapu't. The sex ratio df Ganja.m distric~ in that year was no doubt the highest but it fell by 32 points from the figure of _the prectding census. In 1941 again thete were 12 districts with a surplus sex ratio and only Koraput reverted to its previous condition of female deficiency. The year 1951 saw 3 districts reverting to a female deficiency; these were Keonjhar (995)' Koraput (991) and Balasore (989). The sudden fall in the sex ratio of Sundargarh is a remarkable feature of the 1961 census while_ Ganjam district maintained its pre-eminence. The position changed irrevocably in 1961 when female deficiency among the districts became the rule and female surplus the exception. The [elnale surplus districts in that year were Ganjam. Kalahandi and Baudh-Khondmals while Bolangir showed parity between males and females. This position among the districts has more or less been maintained in 1971 except that Bolangir has become marginally deficient in females (993).
What could be the circumstances leading to the fluctuation in the sex ratio and the gradual decline thereof from 1941 ? While discussing the birth rate of population (chapter III) we saw that the first two decades of the present century were an unhappy period for the people of this state. During these 20 years there were poor harvests and widespread epidemics. The population growth between 1911 and 1921 was negative. The influenza epidemic of 1918 claimed a heavy toll of life and is said to have been female selective. In spite of this handicap how could the female ratio increase instead of going down? The reason could be found in the fact that there used to be a sizeable out-migration from Orissa to Burma, Bengal and Assam. Since this migration was highly male-selective, the sex ratio went up. Besides, during these 20 years, scarcity conditions including famine were rife in Orissa causing a hi~h degree of mortality. It is said that a famine claimed more male lives than female lives. Such a phenomenon would no doubt have upset the sex ratio. This and the large scale migration were perhaps responsible for a relatively high sex ratio in Orissa during the first two decadei of the present century.
Sex ratio by age gro~ps
A study of the sex tatio by broad age groups fot the state and districts is presented in "Statement V.l1~
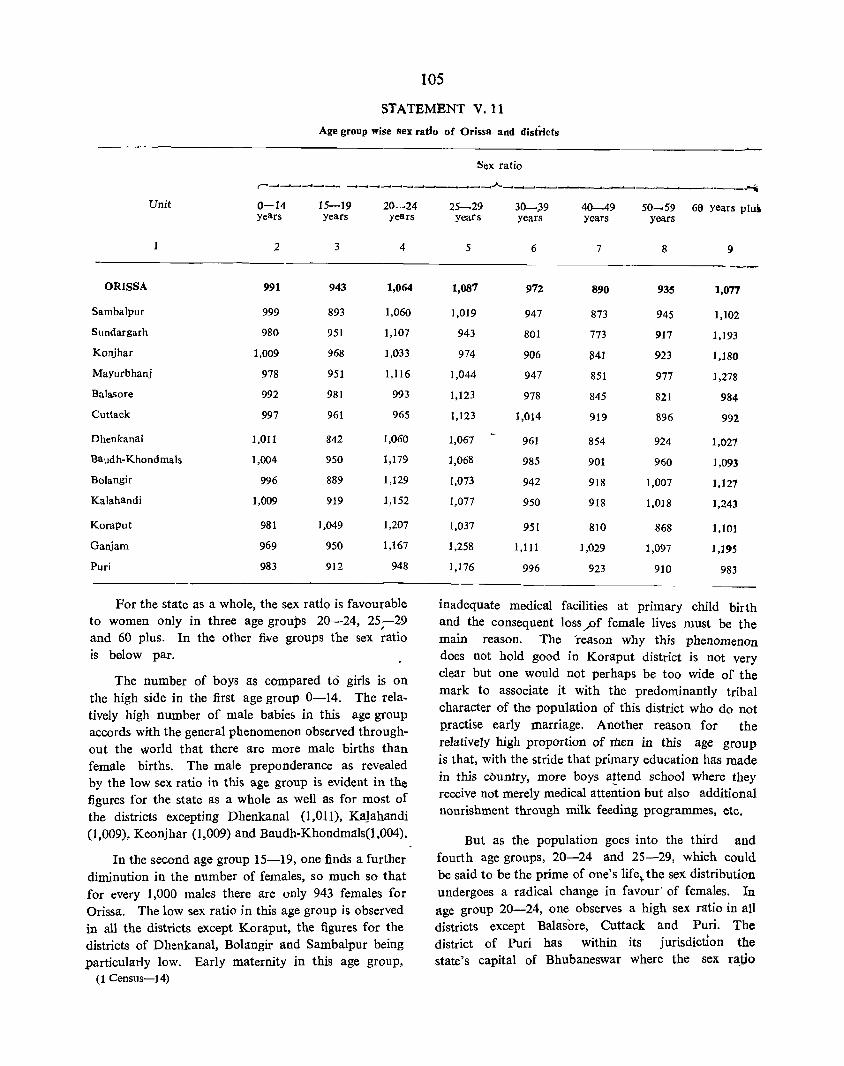
105
STATEMENT V. 11
Age group wise sex ratio of Orissa and districts
---Sex ratio
~-----------~--------~--~--~~---~~----~-~ Unit 0-14 15-19 20-24
Years years years
2 3 4
ORISSA 991 943 1,064
Sambalpur 999 893 1,060
Sundargarh 980 951 1,107
Konjhar 1,009 968 1,033
Mayurbhanj 978 951 1,116
Balasore 992 981 993
Cuttack 997 961 965
Dhenkanal 1,011 842 1,060
Baudh-Khondmals 1,004 950 1,179
Bolangir 996 889 1,129
Kalahandi 1,009 919 ],152
Koraput 981 1,049 1,207
Ganjam 969 950 1,167
Puri 983 912 948
For the state as a whole, the seX ratio is favourable to women only in three age groups 20-24, 25-29 and 60 plus. In the other five groups the sex ~atio is below par.
The number of boys as compared t6 girls is on the high side in the first age group 0-14. The relatively high number of male babies in this age group accords with the general phenomenon observed throughout the world that there are more male births than female births. The male preponderance as revealed by the low sex ratio in this age group is evident in the figures for the state as a whole as well as for most of the districts excepting Dhenkanal (1,011), KaJahandi (1,009), Keonjhar (1,009) and Baudh-Khondmals(I,004).
In the second age group 15-19, one finds a further diminution in the number of females, so much so that for every 1,000 males there are only 943 females for Orissa. The low sex ratio in this age group is observed in all the districts except Koraput, the figures for the districts of Dhenkanal, Bolangir and Sambalpur being particularly low. Early maternity in this age group,
(l Census-14)
25-29 30~.;39 40-49 50-59 60 years pIui years years years years
5 6 7 8 9
1,087 972 890 935 1,077
1,019 947 873 945 1,102
943 801 773 917 1,193
974 906 841 923 ],180
],044 947 851 977 1,278
1,123 978 845 821 984
1,123 1,014 919 896 992
1,067 961 854 924 1,027
1,068 985 901 960 ],093
1,073 942 918 1,007 1,127
],077 950 9]8 ],018 1,243
1,037 951 810 868 1,101
1,258 1,111 1,029 1,097 1,195
1,176 996 923 910 983
inadequate medical facilities at primary child birth and the consequent loss ~f female lives must be the main reason. The 'reason why this phenomenon does not hold good in Koraput district is not very clear but one would not perhaps be too wide of the mark to associate it with the predominantly tribal character of the population of this district who do not PJactise early marriage. Another reason for the relativelY high proportion of rilen in this age group is that, with the stride that primary education has made in this cOuntry, more boys a!tend school where they receive not merely medical attention but also additional nourishment through milk feeding programmes, etc.
But as the population goes into the third and fourth age groups, 20-24 and 25-29, which could be said to be the prime of one's life~ the sex distribution undergoes a radical change in favour· of females. In age group 20-24, one observes a high sex ratio in all districts except Balasore, Cuttack and PurL The district of Puri has within its jurisdiction the state's capital of Bhubaneswar where the sex ra_tio
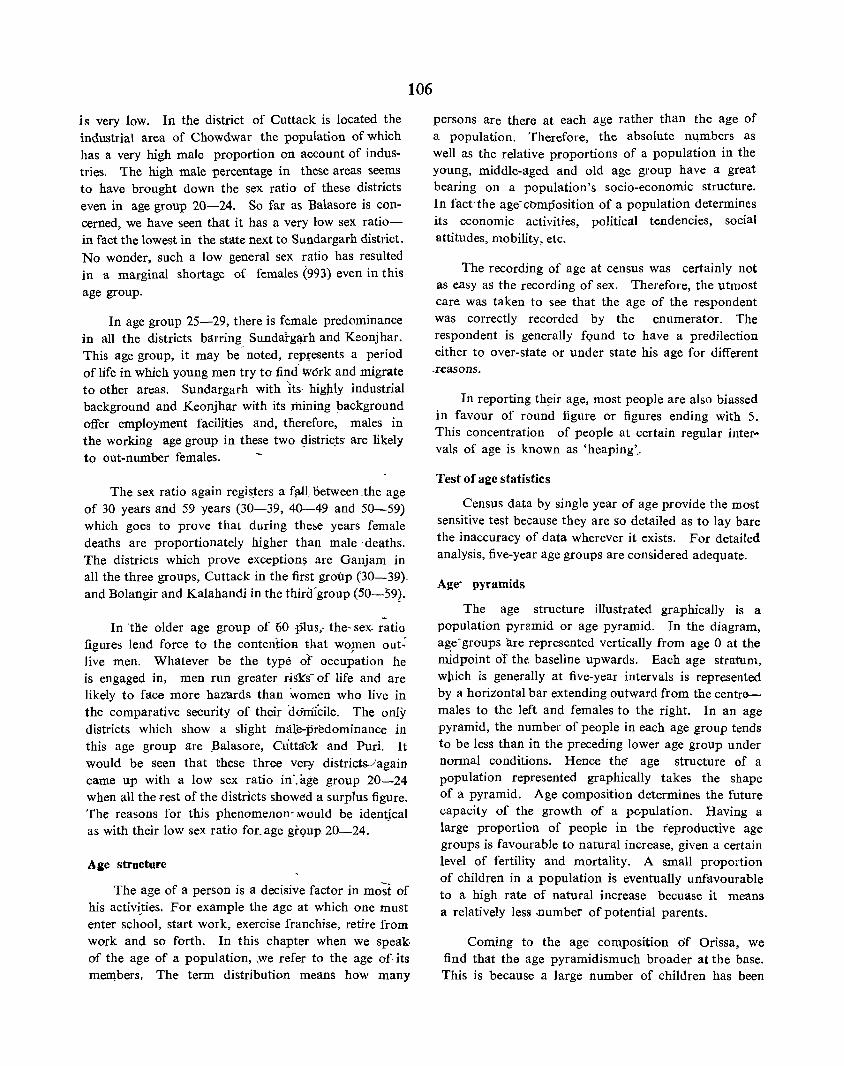
is very low. In the district of Cuttack is located the industrial area of Chowdwar the population of which has a very high male proportion on account of industries. The high male percentage in these areas seems to have brought down the sex ratio of these districts even in age group 20-24. So far as Balasore is concerned, we have seen that it has a very low sex ratioin fact the lowest in the state next to Sundargarh district. No wonder, such a low general sex ratio has resulted in a marginal shortage of females (993) even in this
age group.
In age group 25-29, there is female predominance in all the districts barring Sundarg~rh and Keonjhar. This age group, it may be- noted, repJ;"esents a period of life in which young men try to find work and migrate to other areas. Sundargarh with Its· hig)1ly industrial background and Keonjhar with its mining background offer employment facilities and, therefore, males in the working age group in these two 9istric~s are likely to out-number females.
The sex ratio again regis.ters a f;1.11.. oetween .the age of 30 years and 59 years (30-39, 40--49 and 50-59) which goes to prove that during these years female deaths are proportionately higher than male' deaths. The districts which prove exception:> are Ganjam in all the three groups, Cuttack in the first group (30-39). and Bolangir and Kalahandi in the thircI"group (50-59).
In "tlie older age group of 60 plus,- the- sex· ratio figures lend force to the contentioR that wo~en out: live men. Whatever be the type of occupation he is engaged in, men run greater riSks- of life and are likely to face more hazards than women who live in the comparative security of their domicile. The only districts which show a slight male-predominance in this age group are _Balasore, Cutta'c1c and Puri. It would be seen that these three ver-y distri9Wagain came up with a low sex ratio in', age group 20-24 when all the ·rest of the districts showed a surplus figure. The reasons for this phenomenon- ;would be identjcal as with their low sex ratio for. age grQup 20-24.
Age structurc
106
The age of a person is a decisive 'factor in mo;i of his activi_ties. For example the age at which one must enter school, start work, exercise franchise, retire from work and so forth. In this chapter when we speak· of the age of a population, we refer to the age of its members. The term distribution means how many
persons are there at each age rather than the age of a population. Therefore, the absolute n~mbers as well as the relative proportions of a population in the young, middle-aged and old age group have a great bearing on a population's socio-economic structure. In fact"the age- cl)mposition of a population determines its economic activities, political tendencies, social attitudes, mobility, etc.
The recording of age at census was certainly not as easy as the recording of sex. Therefore, the utmost care was taken to see that the age of the respondent was correctly recorded by the enumerator. The respondent is generally fQund to have a predilection either to over-state or under state his age for different .reasons.
In reporting th~ir age, most people are also biassed in favour of round figure or figures ending with S. This concentration of people at certain regular interB vals of age is known as 'heaping' ..
Test of age statistics
Census data by single year of age provide the most sensitive test because they are so detailed as to lay bare the inaccuracy of data wherever it exists. For detailed analysis, five-year age groups are considered adequate.
Age- pyramids
The age structure illustrated graphically is a popUlation pyramid or age pyramid, In the diagram, a~e'groups are represented vertically from age 0 at the midpoint oT the; baseline upwards, Each age stratum, wpich is generally at five-year intervals is represented by a horizontal bar extending outward from the centremales to the left and females to the right. In an age pyramid, the number of people in each age group tends to be less than in the preceding lower age group under normal conditions. Hence the- age structure of a population represented graphically takes the shape of a pyramid. Age composition determines the future capacity of the growth of a pvpulation. Having a large proportion of people in the reproductive age groups is favourable to natural increase, given a certain level of fertility and mortality. A small proportion of children in a population is eventually unfavourable to a high rate of natural increase becuase it means a relatively less .number of potential parents.
Coming to the age' composition of Orissa, we find that the age pyramidismuch broader at the base. This is because a large number of children has been
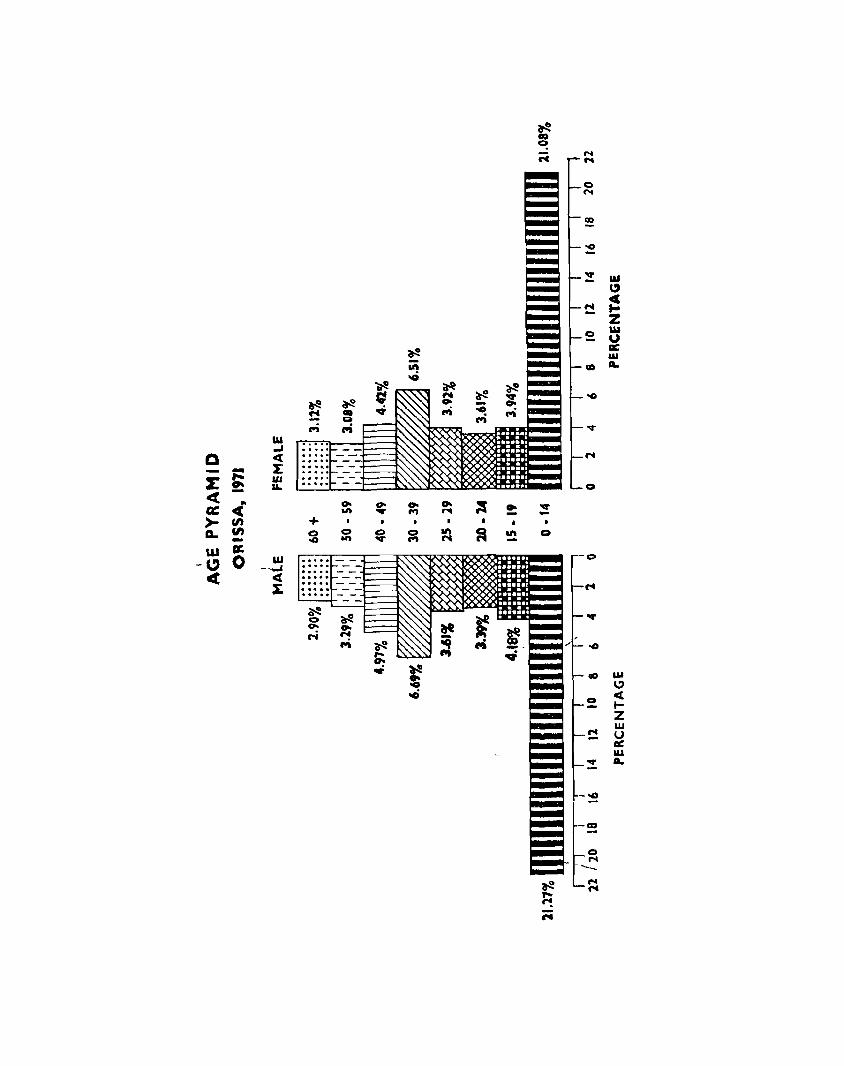
~ co 0
N No
0 N
!:!
:2
~ w ~
f'C C ... - Z
2 '" u a:: au
G) .. -0
~ !:! 1"1 """ W
.J Q ex N
- - J:: J:
,... w ~ u. 0
< C 0- 0- 0- 0- :s a:: .. .. "" ... 1"1 r4 - ->- en + I ,
a. fI) 0 0 0 0 ~ ~ 1ft 0 - -0 "" .. 1"1
W a::
-" 0 w 0
-~
ct ex :£ ....
~ ... 0 0-
N -0
CI &II \-'
0 ct - ... Z
f'C W V - c.: w ... ..
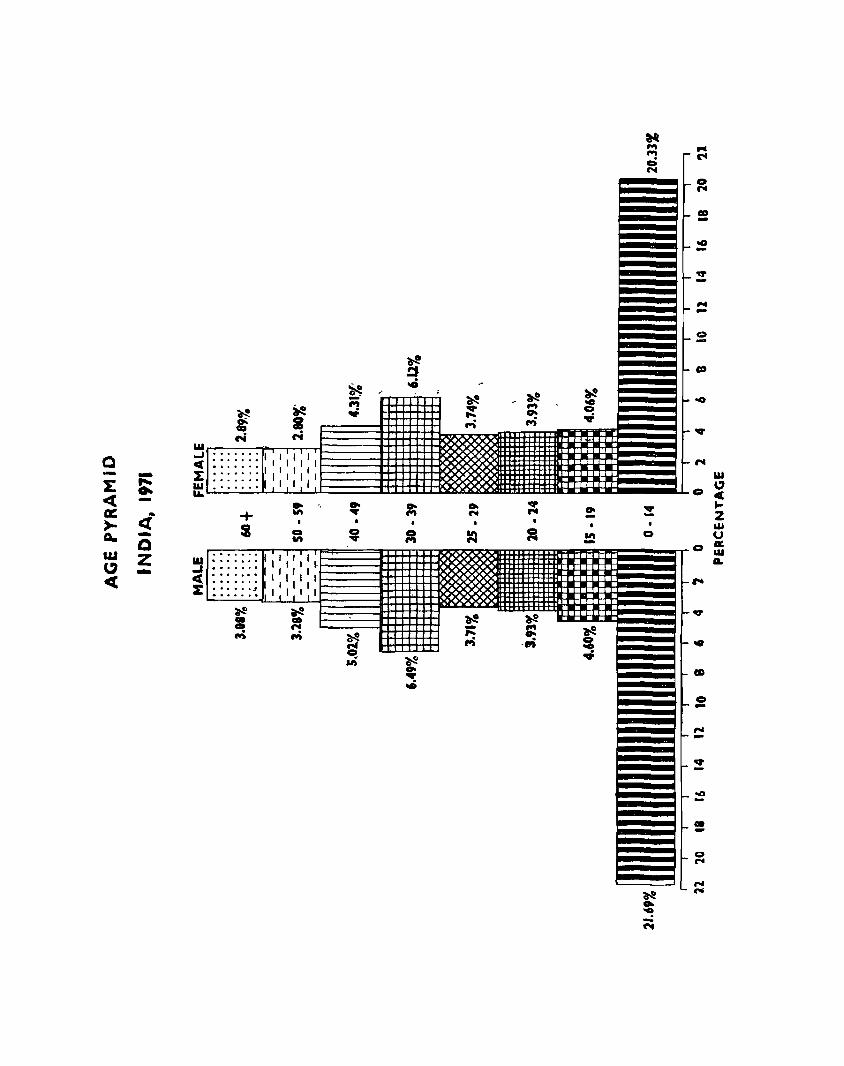
~ GO N
........... Q .............. ............ - - ............. 1: ~ <t - I : : : : : : :
cr:: <1.->- + 0- -0 W
" z
cc -.............. .............. ............. ............ ............. ............ ........... -. ~ .. 0 fWi
~ a ri
,,,,,,,, , , , , ,',',',' ..
In
• o In
',',',',
L.: ,_
L-
"
, , '[' I , , ,','-" ',',' ~ -N ..;
~ ~
~ .' .0 _. "'" ..
.. ... .. o ""
-
tj 0 aft ~
Do ... ..
-
~ , ~ ~ ~
~
~ ,., . .. 0- 0
M ...; 'filii
.. ~ ~ v ~
Do -2 N In -
~
~ (X
"" » ~ ~ -,.. ~ ~ I"i .f'i 0
00 ..
0 N
--.. -• 0
,..
~
I-
>-
f-
"" I-
>-
o N
CD -.. -~ -roe
o -
00
-~
~,...
i I
"" ~
~
~
l-
f-
IoU
o '" C ... Z UoI U
o a: r.u ~
,..
o -
-_ ~--~o roo
[ ~
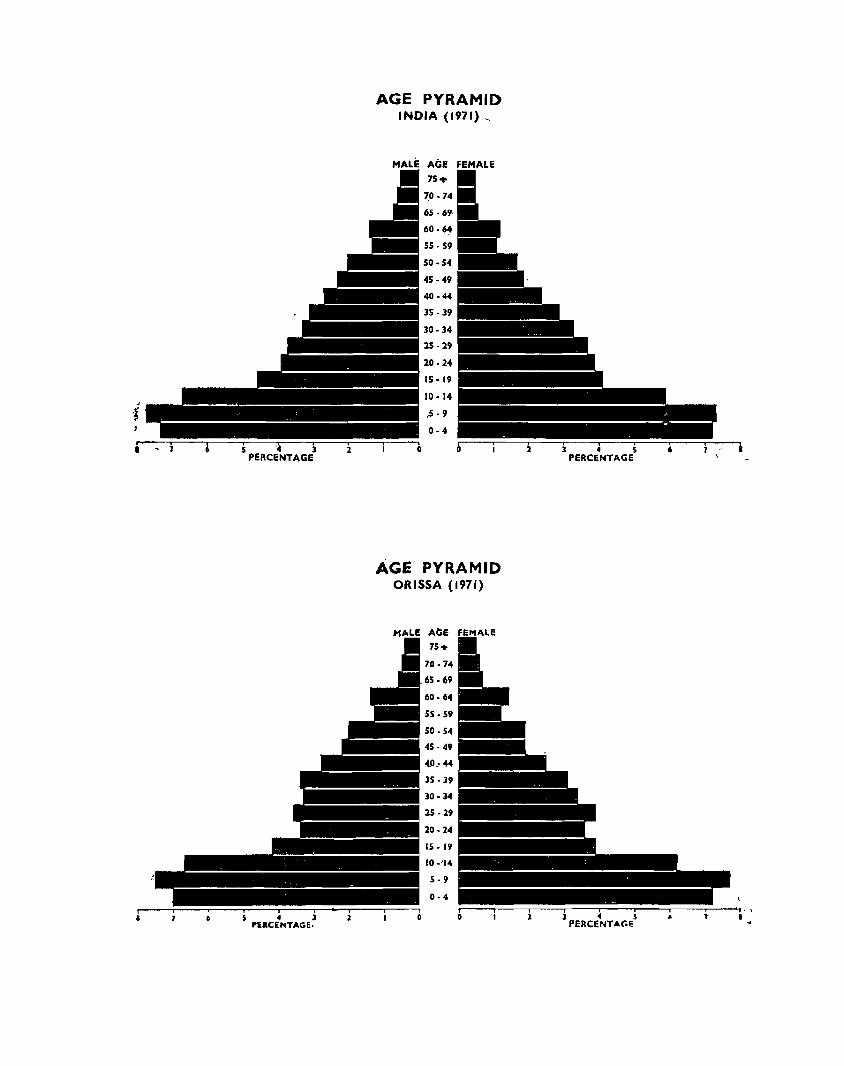
4 l 2 PlRCENTAGE.
AGE PYRAMID INDIA (1971) ,
AGE FEMALE
75+
7_0.74
65·6'1-
60.~
S5·59
50· S4
45·4'1
40.44
35.39
30·34
25 ·2'1
20.24
15·19
10·14
.s.'I 0·4
AGE PYRAMID ORISSA (1971)
AGE
75+
70·74
65·69
60· 64
55.59
50.54
45·49
4.0: 44
1S·39
30. ].t
25 ·29
20·24
15·1'1
10 ·'14
5-9
0-4
0
•

added to the population every year. A 'young' population, which is the characteristic of Orissa and India has in it the seeds of rapid increase. A country with a 'young population' has a greater proportion of its population in the younger age group and these youngsters as they advance in years bring about a higher capacity for reproduction thereby bringing into the country many more ) ( IlIhgsters.
The dependency ratio is the proportion of a population which is in the relatively unproductive ages. This ratio is something of an index showing the drain on the resources of a country, specially its man-power resources. Many countries in the world have high dependency ratios mainly because of a high proportion of youngsters. In Orissa the population under this age group (42·35 per cent) is slightly higher than t~e corresponding figure for all-India. The economically advanced countries have a proportion which does not exceed 30 per cent in this age group. The population in this age group represents an economically unproductive segment and yet costs the nation considerabl!! expenditure. Being the future of the nation, this section of the population has to be housed, fed, clothed and educated.
107
Perhaps equally unproductive and equally expensive for the nation is the-third age group consisting of persons 60 years old and above. Having outlived their productive period, the people in this age group have to be provided with hospitals, institutions for the old, welfare schemes, pensions and so on. The proportion of such persons in Orissa is marginally higher than that of India.
The adult age group represents the cream of a nation. Its main characteristics are that this age group is biologically the most reproductive, ec.onomically the most productive and also happens to be the most mobile among the age groups. Furthermore, on the shoulder of this age group devolves the responsibility of looking after the othe:r two unproductive age groups. The higher the proportion of persons in this age group in the population, the greater is the likelihood of a country's economic prosperity. While 51·6'1 per cent of Orissa's population is in this age group, the corresponding figure for all India is marginally higher at 51·99 per cent. To make the aemographic transition, a nation has got to take steps to modify its age composition so as to have a greater percentage in the working age group and correspondingly less in the first and third age groups the dependents.

CHAPTER VI
LITERACY AND EDUCATION
As per the United Nations document 'Principles and Recommendations for National Population Census' (ST/STAT/SER.M/27) literacy is explained as follows:
"For census purposes, literacy is defined as the ability both to read with understanding and to write a short statement on everyday life in any language. A person capable of reading only should be considered illiterate. Also, a person capable only of reading and writing figures and his own name should be -considered illiterate. Since literacy is defined as the ability both to read and write, a single questionnaire item on this topic is considered adequate. X X X Data on literacy should be collected for all persons 15 years of age and over. If a lower age limit is used for collection, all tabulations not cross-classified by age should be subdivided at thjs age so as to facilitate international comparison."
In India the definition of literacy accords with the above principles enunciated by the United Nations as the following definition of literacy adopted at the 1971 census would show:
"A person who can both read and write with understanding in any language is( to be taken as literate. A person who can merely read but cannot write is not a literate" .
Instructions given to the census enumerator in regard to filli.ng up the questions on literacy are reproduced below :
It is not necessary that a person who is literate should have received any formal education or should have passed any minimum educational standard.
For a person who is literate that is, who can both read and write, record 'L' in the triangle against question 12. If there is any doubt about a person's ability to read or write, the test that may be applied for reading is his/her ability to read any portion of the printed matter in the enumerator's instructions and similarly for writing he/she should be able to write a simple letter. Ability merely to sign one's name is not adequate to quaiify a person as being able to write with understanding. -If a person claims to be literate in some other language with which the enumerator is not acquainted, the respondent's word has to be taken as correct. Other members of the household may also be able to testify to the literacy of the person enumerated.
For a person who is illiterate that is who can neither read nor write or can merely read but cannot write, in 'any language~ write '0' in the triangle against question 12. All children o.f the age of 4 years or less should _..
be treated as illiterate even if the child is going to a school and ma~ have picked up reading and writing a few odd words.
Literacy in Orissa and other states (1971)
As per the 1971 census, literacy in Orissa stands at 30'53 -per cent. For computing the degree of literacy, infants in age group 9-4 have been excluded\~ Statement VI.l gives the literacy figures for the states; and union territories of the country for 1971.
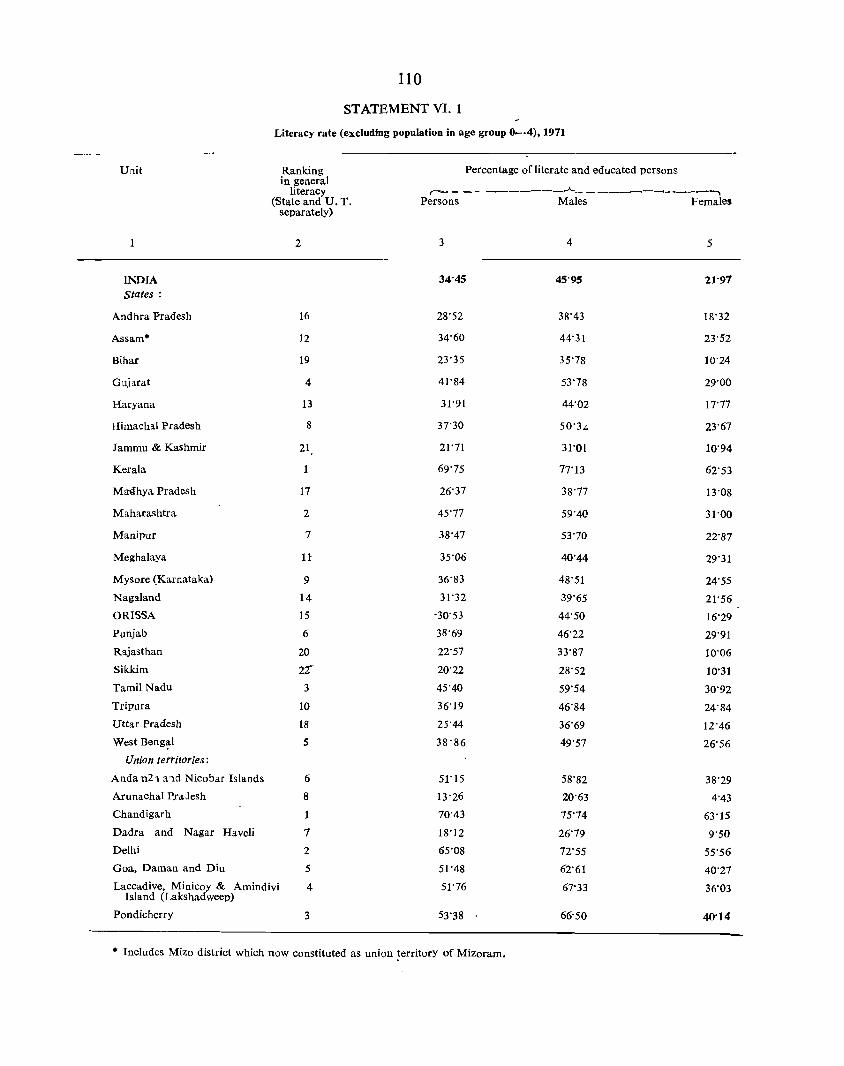
110
STATEMENT VI. 1
Literacy rate (excluding population in age group 0--4), 1971
Unit Ranking Percentage of literate and educated persons. in general
~----------~-------~-~--~ literacy (State and U _ T, Persons Males Females
separately)
2 3 4 5
INDIA 34°45 45°95 21'97 States:
Andhra Pradesh 16 28°52 38'43 18°32
Assam· 12 34°60 44°31 23'52
Bihar 19 23°35 35°78 10°24
Guja.rat 4 41°84 53°78 29°00
Haryana 13 31°91 44°02 17°77
Himacha.l Pradesh 8 37°30 50'3..<: 23'67
Jammu & Kashmir 21 21°71 31°01 10°94
Kerala 1 69°75 77"13 62°53
Ma4hya Pradesh 17 26°37 38°17 13°08
Maharashtra 2 45°77 59'40 31'00
Manipur 7 38°47 53°70 22°87
Meghalaya 11 35°06 40°44 29°31
Mysore (Karnataka) 9 36°83 48°51 24°55
Nagaland 14 31°32 39°65 21°56
ORISSA 15 -30°53 44°50 16°29
Punjab 6 38°69 46°22 29°91
Rajasthan 20 22°57 33°87 10'06
Sikkim 2r 20°22 28°52 10'31
Tamil Nadu 3 45'40 59'54 30°92
Tripura 10 36'19 46°84 24°84
Uttar Pradesh 18 25°44 36'69 12°46
West Beng~l 5 38°86 49'57 26'56
Union territories:
Anda n21 a'ld Nicoba.r Islands 6 51'15 58'82 38°29
ArunachalP~ajesh 8 13'26 20'63 4'43
Chandigarh 1 70'43 75'74 63'15
Dadra and Nagar Haveli 7 18'12 26'79 9'50
Delhi 2 65'08 72'55 55'56
Goa, Daman and Diu 5 51'48 62'61 40'27
Laccadive, Minicoy & Amindivi 4 51'76 67'33 36'03 Island (Lakshadweep)
Pondicherry 3 53'38 66°50 40°14
... Includes Mizo district which now constituted as union !erritorY of Mizoram,

<II \II Z ell 1&1
0 \Q .... ... ~ "" c "" J: .... J: YO II. II.. . , II. J: II.. .
srs II • 16'81 J:
D"fl It..
O·S II 1111I .... tmf0.. J:
01'91 II.
0..-'111111 1IIII 1111111 II.
,£'n: J<. JV<.. ~ I: U'ft L
69'11 111111 III II II.
tl'Lt ~ VVVVV<. I: Do
11:18 II II I i 11111 II.
L9'L£ "'tt
.9·EI III 11111 IIIII II II.
"N I: Do
5\0'5' III IIIIIIII 11111I111II II 1 rlI TIm u.. Q ~ XX :t
~ 55'6E
LI'IE
"ra [j m I llTT ~ VVV<.XYV<
L
II II.
JV< I: II.
J,(14WO"
fGNVHY1V"
CNYH1Ufn.lYW
1I1!)NV'OB
S1VWONOH" -Honva
1"NY)lN3HQ
H"'W~'IIVONn~
YSSI¥O

Among the states, we find that Kerala with a literacy figure of 69·75 per cent is .way ahead of the other states. Second in rank but far far behind is Maharashtra (45"77) and Tamil Nadu (45"40)· Orissa stands in the lower half, occupying the 15th place. Andhra Pradesh, Madhya Pradesh, Uttar Pradesh and Bihar have much lower literacy rates.
Considering literacy rates for the male population among the states we find that Kerala, Tamil Nadu, Maharashtra and Gujarat maintain the first four positions as in the case of the general literacy rates. Orissa registers an improvement by four places and stands eleventh. As regards female literacy, the all-India average is a mere 21·97 per cent while in Kerala it is 62·53. Maharashtra (31"0) again stands second for female literacy but at half of Kerala. There are a few states whose relative positions have registered a fall in the realm of female literacy when compared with male literacy. Orissa belongs to this category in as much as it o-ccupies the 16th place among the states for female literacy as against 11th for male literacy. Manipur occupies the 5th place among the states for male literacy and it goes down to the 12th place in female literacy.
Literacy rate among districts, Orissa The proportiou_ of literates in the districts of
Orissa by male, female and total and the ranking is shown in statement VI. 2.
STATEMENT VI. 2 Literacy rates of state and districts, 1971
(Population of age group 0-4 is excluded)
Ranking in
general literacy
1
1 2
Unit
2
ORISSA Cuttack Puri
3 Balasore 4 Sundargarh 5 Sambaipur-6 Dhenkanal 7 Ganjam 8 Keonjhar 9 Baudh-Khondmals
10 Bolangir 11 Mayurbhanj 12 Kalahandi 13 Koraput
Percentage of literates and educated persons
r-------A------~ Persons Males Females
3 4 5
30·53 44·50 16·29 42·56 58·03 26·80 41·18 57·92 23·98 39·55 55·40 23·04 31·55 43"42 lS·77 31·17 46·42 15"45 30·S6 46·54 14·70 28"80 44"77 13"64 24·96 37·67 11·71 23"19 38·53 7"86 23"03 37·13 8"69 21"17 32"73 9-40 16·10 26·56 5·43 12·47 18·91 5"85
111
Taking the total population, excluding the population in age group 0-4 it is seen that the highest literacy rate occurs in the district of Cuttack (42·56) followed by the two other coastal districts of Puri (41"18) and Balasore (39"55). Koraput (12·47) has the lowest literacy rate in the state_ The proportion of literate persons appears to have a direct relation with the number of educational institutjons in the district.
STATEMENT VI. 3
Distribution of educatidnal institutiolls am()ng distriets
Unit
ORISSA
Sambalpur
Sundargarh
Keonjhar
Mayurbhanj
Balasore
Cuttack
Dhenkanal
Baudh-Khondmals
Bolangir
Kalahandi
Koraput
Ganjam
Puri
Total no. of educational institutions
2
33,S31
2,S40
1,599
1,361
2,155
3,197
6,095
2,001-
1,452
1,935
1,655
3,118
3,278
3,145
Percentage distribution of educational institutions among
districts
3
100"00
8·40
4·72
4"02
6·37
9·45
IS"02
5"91
4·29
5"72
4·89
9"22
9·69
no
Source-District statistical hand book, 1971
Cuttack has the largest number of educational institutions (6,095) for any district in the state. Ganjam district comes second (3,278). Koraput also has (3, 118) educational institutions, but has the lowest literacy rate among the districts. The correlation between the number of educational institutions and literacy rate can be considered when the population size and the area of the districts are "comparable. It is the per capita number of educational institutions whleh ~enerally acts as an indeX to the literacy in a district. Otherwise the districts of Sundargarh and Keonjhar with a relatively small ~ber of educational institutions would not have occupied the foyrth and eighth positions respectively in literacy rate.
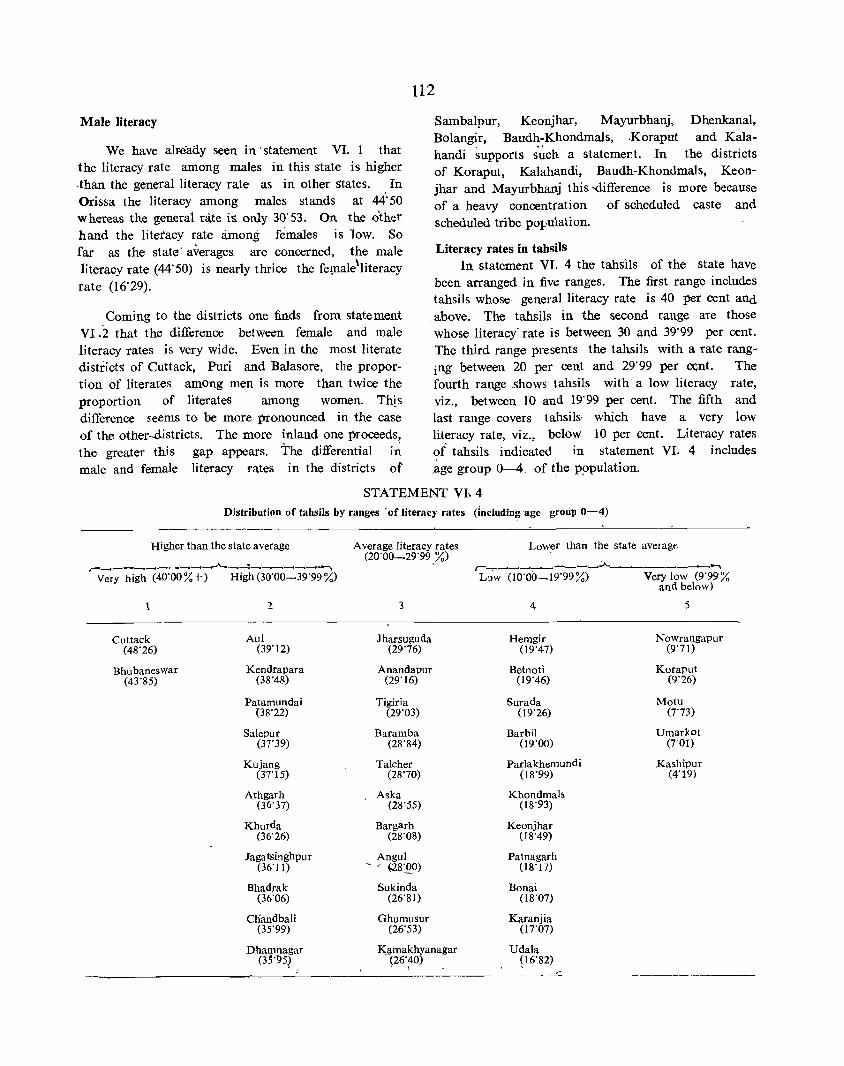
112
Male literacy
We have alr-eady seen in' statement VI. 1 that the literacy rate among males in this state is higher ,than the general literacy rate as in other states, In Orissa the literacy among males stands at 44' 50 whereas the general ra.te is. only 30' 53, On the other hand the litetacy rate among females is low, So far as the state' averages are concerned, the male literacy rate (44' 50) is nearly thrice the fe!llale\literacy rate (16'29),
Coming to the districts one finds from statement VI ,2 that the difference between female and male literacy rates is very wide, Even in the most literate districts of Cut tack, Puri and Balasore, the proportion of literates among men is more than twice the proportion of literates among women, This difference seems to be more pronounced in the case of the other~istricts, The more inland one proceeds, the greater this gap appears, The differential i~ male and female literacy rates in the districts of
Sambalpur, Keonjhar, Mayurbhanj, Dhenkanal, Bolangir, Baudh-Khondmals, ,Koraput and Kalahandi supports s~ch a statement. In the districts of Koraput, Kalahandi, Baudh-Khondmals, Keonjhar and Mayurbhanj this -difference is more because of a heavy concentration of scheduled caste and scheduled tribe pOl-,ulation,
Literacy rates in tahsils In statement VI. 4 the tahsils of the state have
been arranged in five ranges, The first range includes tahsils whose, general literacy rate is 40 per cent alld
. above, The tahsils in the second range are those whose literacy" rate is between 30 and 39'99 per cent, The third range presents the tahsils with a rate ranging between 20 per cent and 29'99 per cent. The fourth range ,shows tahsils with a low literacy rate, viz" between 10 and 19'99 per cent, The fifth and last range covers tahsils, which have a very low literacy rate, viz" below 10 per cent, Literacy rates or' tahsils indicated in statement VI. 4 includes ,~ge group 0-4, of t,he p~pulation,
STATEMENT VL 4 Distribution of tahsils by ranges 'of literacy rates (including 'age grotill 0-4)
Higher than the state average
,-_-------~-.A..--=-------...., Very high (40'00 % +) High (30'00-39'99 %)
1 2
Cuttack Aul (48'26) (39'12)
Bhubaneswar Kendrapara (43'85) (38'48)
Patamundai {3S'22)
Salepur (37'39)
Kujang (37'15)
Athgarh (36'37)
Khurda (36'26)
Jagatsinghpur (36'11)
Bhadrak (36'06)
Cnandbali (35'99)
Dhamnagar (3;'95,
Average literacy rates (20'00-29'99,%)
3
Jharsuguda (29'76)
Anandapur (29'16)
Tigiria (29'03)
Baramba (28'84)
Talcher (28'70)
Aska (28'55)
Bargarh (28'08)
AnguI - _' ~:QO)
Sukinda (26'SI)
Ghumusur (26'53)
K;amakhyanagar (26'40) ,
Lower than the state averagf,
r-_ _..__, _ __,_-_---.l:,;..___,__, _____ -.r_...., L~w (10'00-19'99%) Very low (9'99%
and below)
4 5
Hemgir NOwTangapur (19'47) (9'71)
Betnoti Koraput (19'46) (9'26)
Surada Motu (19'26) (7'73)
BarbiI Umarkot (19'00) (7'01)
Parlakhemundi Kashipur (18'99) (4'19)
KhondmaIs (18'93)
Keonjhar (18'49)
Patnagarh (18'17)
Bonai (18'07)
Karanjia (17'07)
Udala (16'82)
- -

~ ~ .~ '" .. c
~ l-
• 0
" ... l-
i t 0 .J
1 I-
et i ::z ~ It
Sg~IIIID CI i £ ;::. I et ... ~ e s·~ ~::: 0 ., ..c.. z i if ., ... ~ "'0
'1; ~ £ : <8 0 ... - \ ID " i- H ... . ti E ~ I) ..
c 0 ~ : g j% ~ i '" g: l- e =: .:
&~ !I z ... !: ~ ... .. ~ .. u
~ g H !@ '" ~ ~ 0 4- ... ~ :;: ::: 2
~ ... III
': ':
:r
.~
III
1:-
'z -- <II
\10)
~ /' ()
• .t /_
• ~ .. ":I
'g
"" C> )0 ~
4 a:I
"'" In 0. .. fI. ..I :;) -< ..
II) en 0 ~ Se X IoU a:: 4-Ul "' .... 0 E ... "'w g
~ ... r:n. u.. G:c>
" "I; Q )0< ..... u Zc(1' <> 0
" 4 ~ 00=0 H t:~c> q
R
0 :J-Z &I III ... - iR
J - Q 0:: :J
Iv I ... ..I !!! 0 , Q Z
:. , • ";;. "!

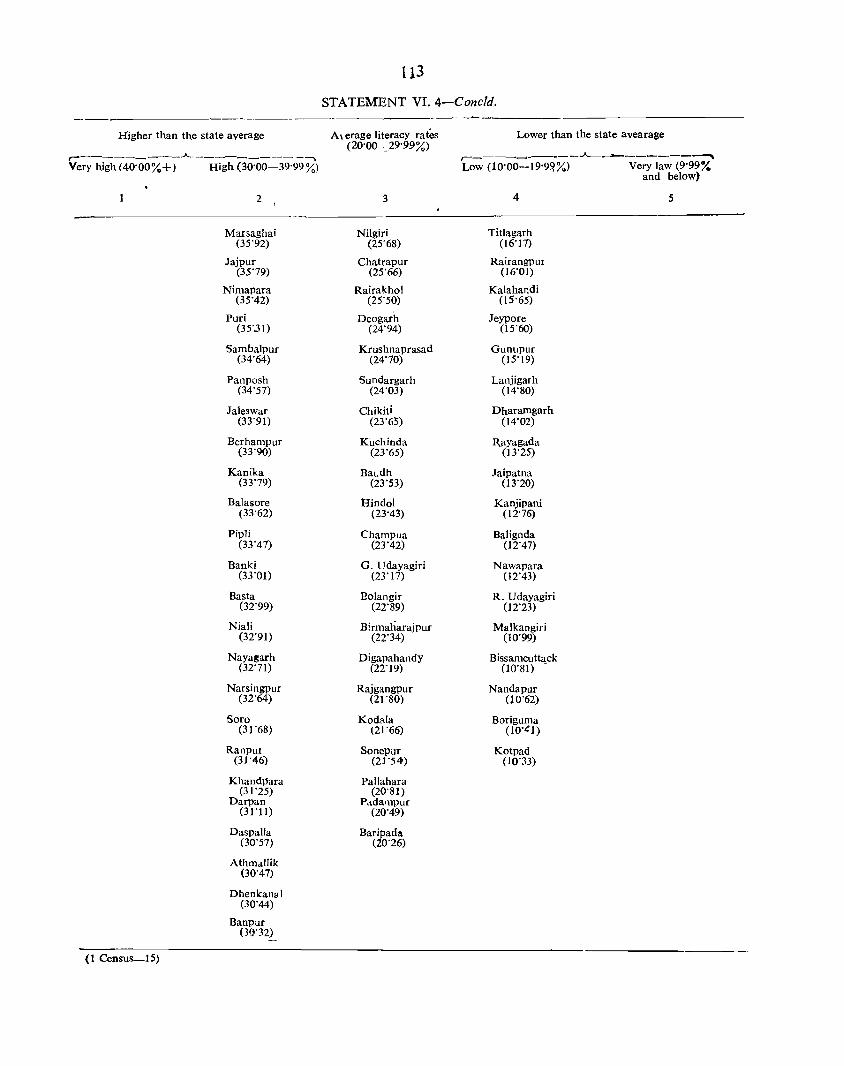
Higher than the state average
r------_---..A..-----_--- ----..,. Very high (40'00%+) High (30'00-39'99 %)
2
Marsaghai (35'92)
Jajpur (35"79)
Nimapara (35'4Z)
Puri (35"31)
Sambalpur (34'64)
Panposh (34'57)
Jaleswar (33'91)
Berhampur (33'90)
Kanika (33'79)
Balasore (33"62)
Pipli (33'47)
Banki (33'01)
Basta (32'99)
Niali (32'91)
Nayagarh (32'71)
Narsingpur (32'64)
Soro (31'68)
RanpUl (31'46)
Khand~ara (31'25)
Darpan (31"11)
Daspalla (30'57)
Athmallik (30'47)
Dhenkan:JI (30'44)
Banpur (31}'32)
(1 Census_IS)
STATEMENT VI. 4-Concld,
A, erage literacy rates (20'00----=29'99 %)
3
Nilgiri (25'68)
Chatrapur (25'66)
Rairakhol (Z5'50)
Deogarh (Z4'94)
Krushnaprasad (Z4'70)
Sundargarh (Z4'03)
Chikiti (Z3'63)
Kuchinda (Z3'65)
Bat-dh (Z3'S3)
Hindol (Z3"43)
Champua (23'42)
G, Udayagiri (23'17)
Bolangir (22'89)
Birmaharajpur (22'34)
DigapahandY (2Z'19)
Rajgangpur (Zl'80)
Kodala (ZI'66)
Sonepur (ZI'54)
Pallahara (ZO"81)
Padampur (ZO'49)
Bar~adll ( 0'26)
Lower than the state avearage
,-_---~---.. - _...A... _ ____,_.. ______ _......
Low (10'00-19'9~%) Very law (9'99% and below)
4 5
Titlagarh (16'17)
Rairangpm (16'01)
Kalahandi (15'65)
Jeypore (15"60)
Gunupur (15"19)
Lanjigarh (14"80)
Dharamgarh (14'OZ)
RJtyagada (13'25)
Jaipatna (13'ZO)
Kanjipani (12'76)
Baligoda (12'47)
Nawapara (12'43)
R, Udayagiri (12'23)
Malkangiri (10'99)
Bissamcutt~ck (10'81)
Nandapur (10'62)
Boriguma (10'41)
Kotpad (10"33)
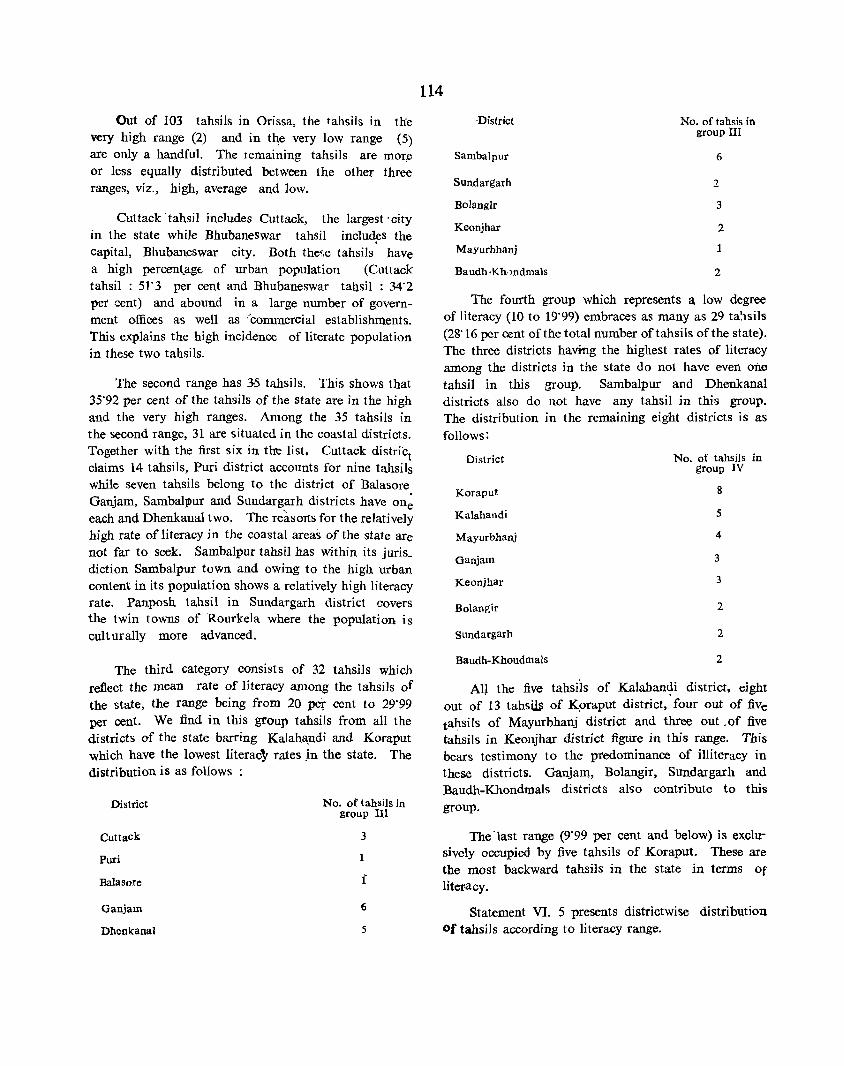
Out of 103 tahsils in Orissa, the tahsils in the very high range (2) and in th,e very low range (5) are only a handful. The Iemaining tahsils are mor,e or less equally distributed between the other three ranges, viz., high, average and low.
Cuttack'tahsil includes Cuttack, the largest 'city in the state while Bhubaneswar tahsil inc1ud~s the capital, Bhubaneswar city. Both the~e tahsils have a high percentagE of urban population (Cuttack tahsil: 51"3 per cent and Bhubaneswar tahsil: 34'2 pel' cent) and abound in a large number of government offices as well as 'commercial establishments. This explains the high incidence of literate popUlation in these two tahsils.
The second range has 3-5 tahsils. This shows that 35'92 per cent of the tahsils of the state are in the high and the very high ranges. Among the 35 tahsils in the second range, 31 are situated in the coastal districts. Together with the first six in tire list, Cuttack district claims 14 tahsils, Puri district accounts for nine tahsils while seven tahsils belong to the district of Balasore Ganjam, Samballllur and Sundargarh districts have on; each and Dhenkanal two. The reasons for the relatively high rate of literacy in the coastal areas of the state arc not far to seek. Sambalpur tahsil has within its juris_ diction Sambalpur town and owing to the high urban content in its population shows a relatively high literacy rate. Panposh tahsil in Sundargarh district covers the twin towns of Rourkela where the popUlation is culturally more advanced.
The third category consists of 32 tahsils which reflect the mean rate of literacy among the tahsils of the state, the range being from 20 per cent to 29'99
per cent. We find in this group tahsils from all the districts of the state barring Kalaha,ndi and Koraput which have the lowest literac~ rates ,in the state. The distribution is as follows
District No. of tahsils in group III
Cuttack 3
Puri
Balasore f
Ganjam 6
Dhenkanal 5
114
-District No. of tahsis in group III
Sambalpur 6
SUndargarh 2
Bolanglr 3
Keonjhar 2
Mayurbhanj 1
Baudh·Kh,mdmals 2
The fourth group which represents a low degree of literacy (10 to 19'99) embraces as many as 29 ta~lsils (28'16 per cent of the total number oftahsils of the state). The three districts having the highest rates of literacy among the districts in the state do not have even one tahsil in this woup. Sambalpur and Dhenkanal districts also do 110t have any tahsil in this group. The distribution in the remaining eight districts is as follows:
District No. of tahsils in group IV
Koraput 8
Kalahandi 5
Mayurbhanj 4
Ganjam 3
Keonjhar 3
Bolangir 2
Sundargarh 2
Baudh-Khondmals 2
AIJ the five tahsiis of Kalahandi district, eight out of 13 tahsih> of K~raput district, four out of five tahsils of Mayurbhanj district and three out .of five tahsils in Keonjhar district figlire in this range. This bears testimony to the predominance of illiteracy in these districts. Ganjam, Bolangir, Sundargarh and Baudh-Khondmals districts also contribute to this group.
The -last range (9'99 per cent and below) is exclusively occupied by five tahsils of Koraput. These are the most backward tahsils in the state in terms Of literacy.
Statement VI. 5 presents districtwise distribution Of tahsils according to literacy range.
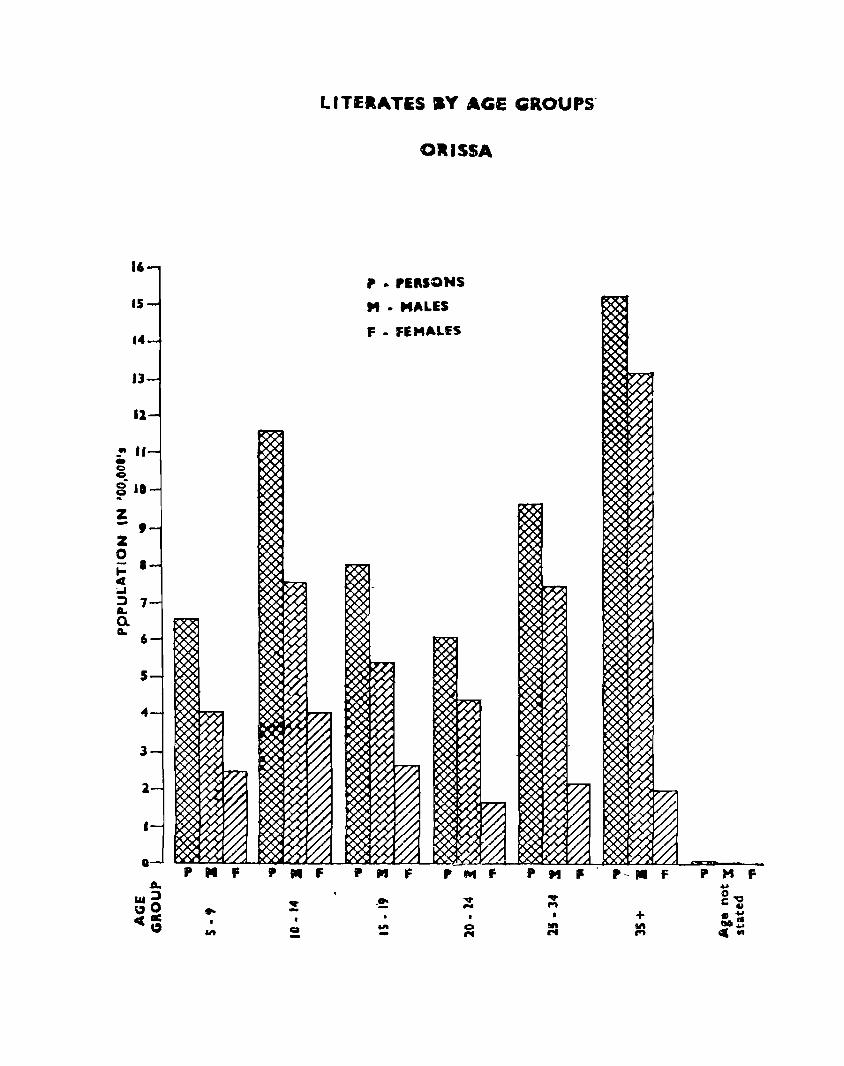
16
15
14
Jl
z - , Z o - . t-CI ..., :l 7 L 0. Go
Go. &U:l ,,0 c(1C
"
~
P
~ yY
~ W
.~ W
~ ~ ~~ III F , ... .. :! • • ..., ca -
LITERATES .Y AGE GROUPS
ORISSA
, • 'E"SONS
" • MALES ~ F • FEMALES
-
~ ~
~>< (9(. ).').-'
W
/1'.
~ )1>-'
~ ~ ~ ~ ~ ~ ~ I'>t'
~ ~ ~ ~ ~ ~ ~ ~ ~ ~ ~ ~ ~ W f • III F , ... f P M I' p- .. F P M F ...
-!: ..,. ... 00g roo M C U
• • G + . ... -~ 1ft 0 !1ft 1ft - ,.. ,.. M e lll
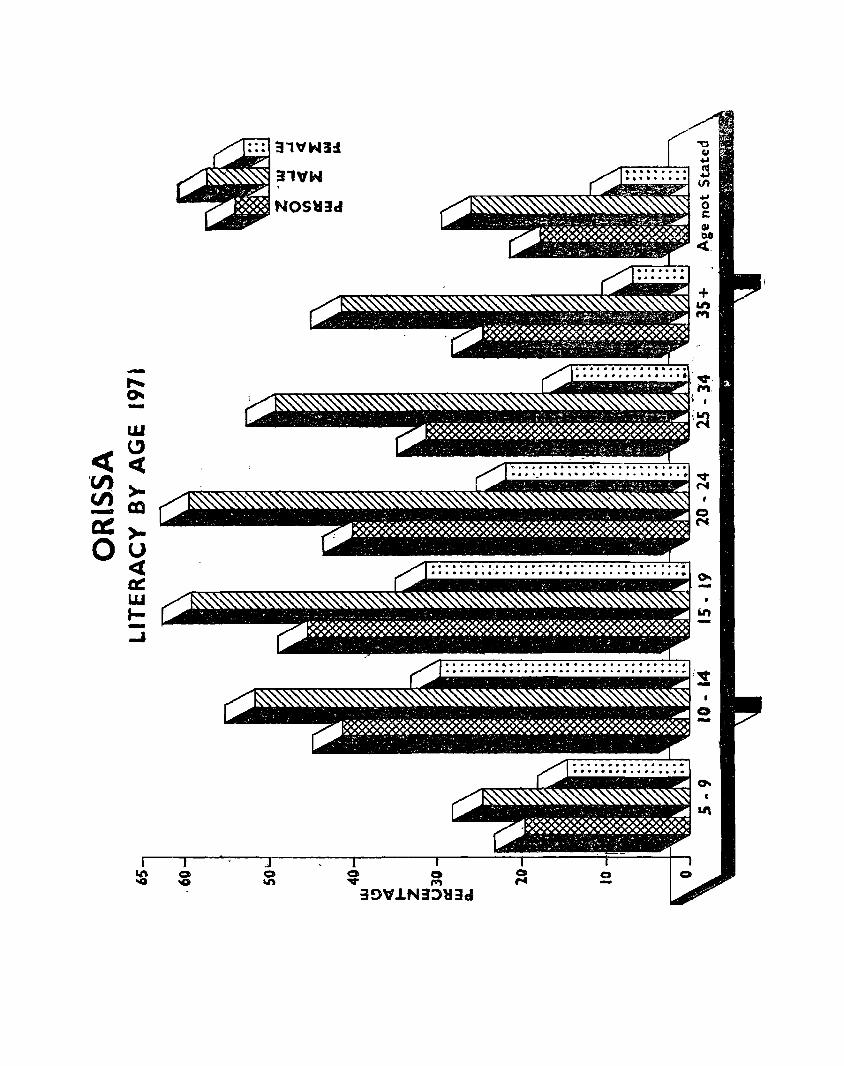
« 'en v; -a: 0
-,...... 0--W ~ c(
>-t:a
>-U <I: a:: w J---I
~'''H!~
~~3'VW
NOS~3d
o ..., M
39V.lN3::>H!ld
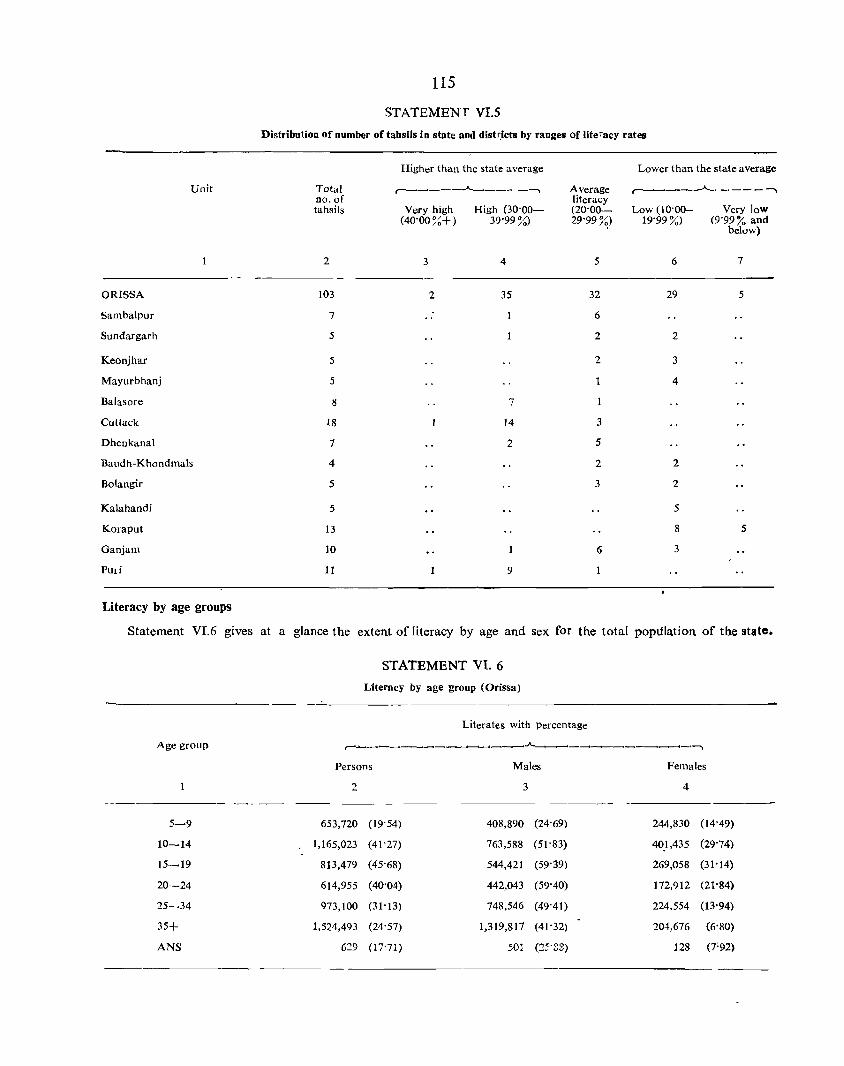
Unit
ORISSA
Sambalpur
Sundargarh
Keonjhar
Mayurbhanj
Balasore
Cuttack
Dhenkanal
Balldh-Khondmals
Bolangir
Kalahandi
Koraput
Ganjam
PUli
Literacy by age groups
115
STATEMENf VI.5
Distribution of number of tahsils in state and distrjcts by ranges of literacy rates
Total no,of tahsils
2
103
7
5
5
5
1l
18
7
4
5
5
13
10
11
Higher than the stat~ average
Very high High (30'00-(40'00 % + ) 39'99 %)
3 4
2 35
7
14
2
9
Average literacy (20'00-29'99~)
5
32
6
2
2
3
5
2
3
6
Lower than the state average r-----______ ....A-_____ ~
Low (10'00-19'99%)
6
29
2
3
4
2
2
5
8
3
Vcry low (9'99% and
below)
7
5
5
Statement VI.6 gives at a glance the extent of literacy by age and sex for the total popdlation of the state.
STATEMENT VI. 6
Literacy by age group (Orissa)
Literates with Percentage
Age group ,.-.......... ________ __. _ ___..j, ____ .A--.l__. ______________ ~_"\
Persons Males Females
2 3 4
'-,-- ----- -
5~9 653,720 (19'54) 408,890 (24'69) 244,830 (14'49)
10-14 1,165,023 (41'27) 763,588 (51'83) 40.1,435 (29'74)
15~19 813,479 (45'68) 544,421 (59'39) 269,058 (31'14)
20--24 614,955 (40'04) 442,043 (59'40) ]72,912 (21'84)
25-34 973,100 (31'13) 748,546 (49'41) 224,554 (13-94)
35+ 1,524,493 (24'57) 1,319,817 (41'32) 204,676 (6'80)
ANS 629 (17'71) 501 (.:!SoSS) 128 (7'92)
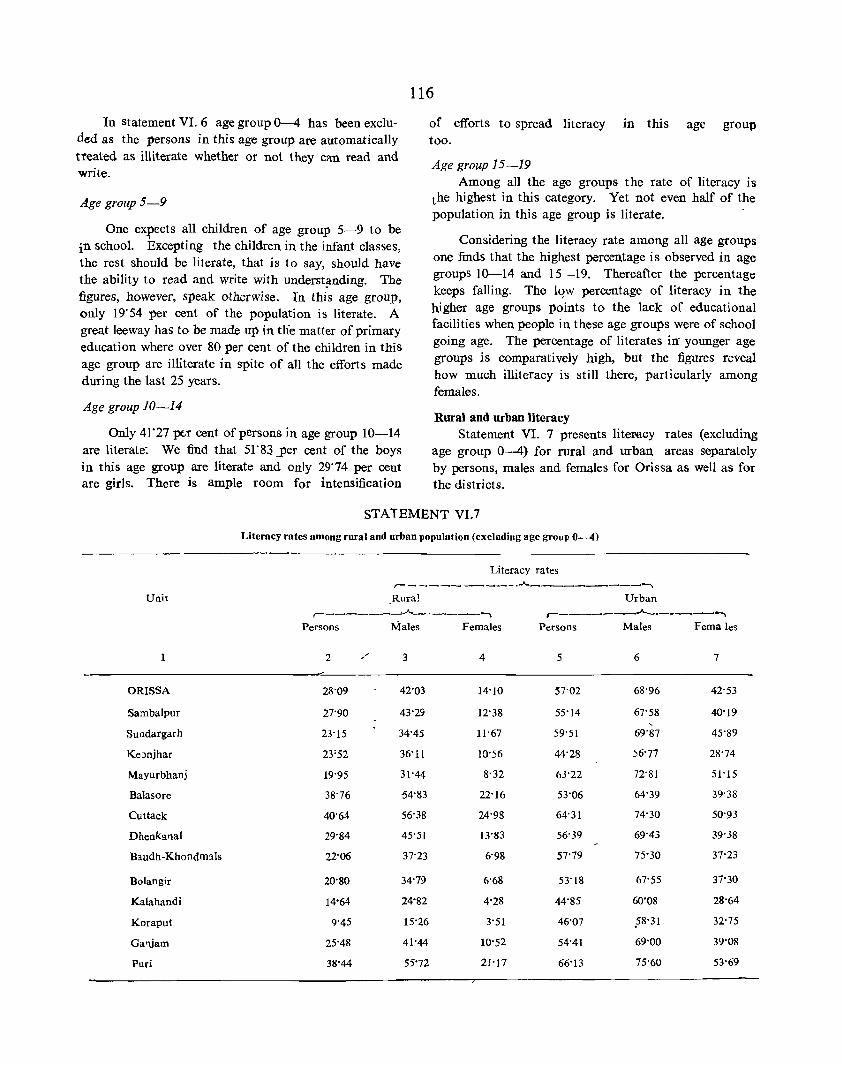
116
In statement VI. 6 age group 0-4 has been excluded as the persons in this age group are automatically treated as illiterate whether or not they can read and write.
Age group 5-9
One expects all children of age group 5-9 to be in school. Excepting the children in the infant classes, the rest should be literate, that is to say, should have the ability to read and write with underst!lnding. The figures, however, speak otherwise. In this age group, only 19·54 per cent of the population is literate. A great leeway has to be made up in tlie matter of primary education where over 80 per cent of the children in this age group are illiterate in spite of all the efforts made during the last 25 years.
Age group 10-14
Only 41"27 pt,r cent of persons in age group 10-14 are literate: We find that 5r8~_j)er cent of the boys in this age group are literate and only 29·74 per cent are girls. There is ample room for intensification
of efforts to spread literacy in this age group too.
Age group 15-19 Among all the age groups the rate of literacy is
the highest in this category. Yet not even half of the population in this age group is literate.
Considering the literacy rate among all age groups one finds that the highest percentage is observed in age groups 10-14 and 15-19. Thereafter the percentage keeps falling. The l~w percentage of literacy in the higher age groups points to the lack of educational facilities when people in these age groups were of school going age. The percentage of literates in- younger age groups is comparatively high, but the figures reveal how much illiteracy is still there, particularly among females.
Rural and urban literacy Statement VI. 7 presents literecy rates (excluding
age group 0-4) for rural and urban areas separately by persons, males and females for Orissa as well as for the districts.
STAT EMENT VI. 7
Literacy ratcs among rural and urban population (excluding age group ()- 4)
Literacy fates ,-- --------- . ..;...,------------'-.,.
Unit Rural Urban r-~~----~..A.. ____ ~ _ _.. ~---_~--..A..----~~
Persons Males Females Persons Males Ferna les
2 ./ 3 4 5 6 7
ORISSA 28-09 42·03 14·10 57-02 68-96 42-53
Sarnbalpur 27·90 43·29 12·38 55·14 67·58 40·19 ,
SULldargarh 23·15 34·45 11·67 59·51 69-87 45'89
Ke::mjhar 23'52 36·11 10·56 44·28 56·77 28·74
Mayurbhanj 19·95 31·44 8-32 63-22 n·81 51-15
Balasore 38·76 54·83 22-16 53·06 64-39 39-38
Cuttack 40·64 56·38 24-98 64·31 74·30 50·93
Dhenkanal 29·84 45·51 13·83 56·39 69'43 39·38
Baudh-Khondmals 22·06 37-23 6·98 57-79 75·30 37-23
Bolangir 20·80 34"79 6·68 53·18 67·55 37·30
Kalahandi 14'64 24·82 4·28 44·85 60·08 28·64
Koraput 9·45 15·26 3·51 46·07 .58·31 32·75
Ga'ljarn 25·48 41·44 10·52 54·41 69·00 39·08
Puri 38·44 55·72 21·17 66·13 75·60 53·69
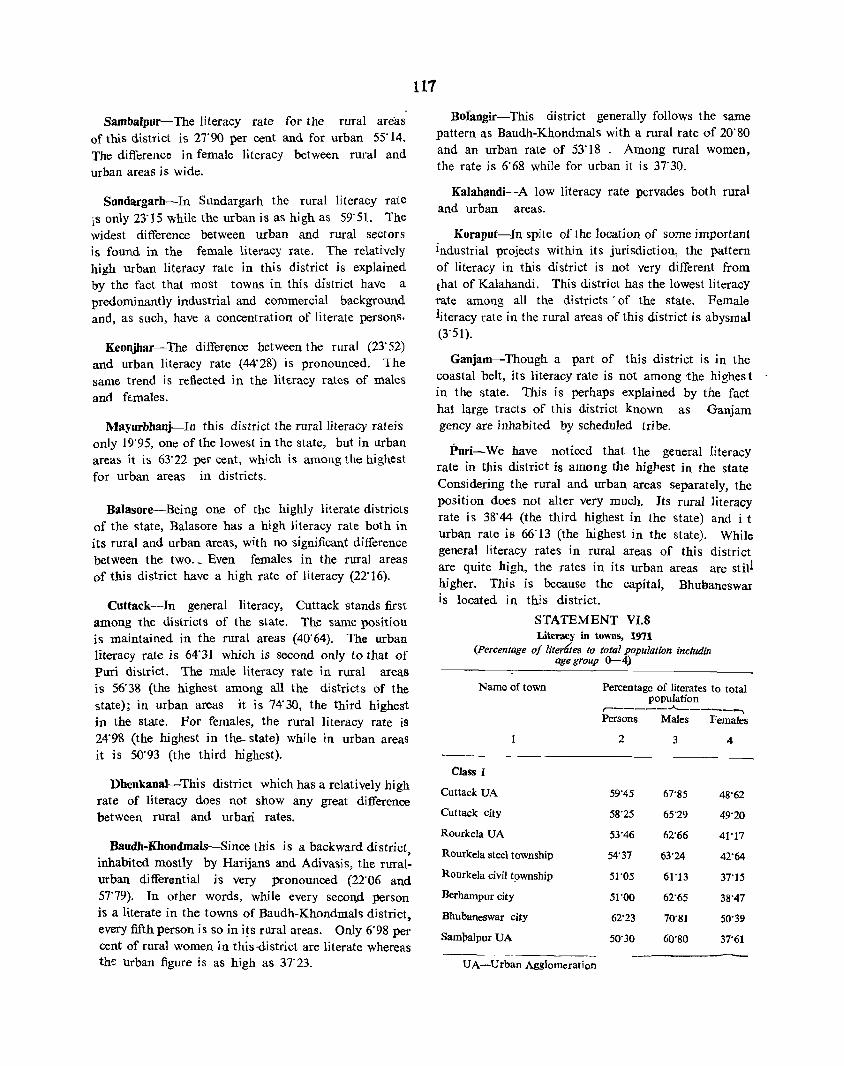
Sambalpur-The literacy rate for the rural areas of this district is 21'90 per cent and for urban 55' 14, The difference in female literacy between rural and urban areas is wide,
Sundargarh-In Sundargarh the rural literacy rate is only 23'15 while the urban is as high as 59'51. The widest difference between urban and rural sectors is found in the female literacy rate, The relatively high urban literacy rate in this district is explained by the fact that most towns in this district have a predominantly industrial and commercial background and, as such, have a concentration of literate persons,
Keonjhar-The difference between the rural (23' 52) and urban literacy rate (44'28) is pronounced, The same trend is reflected in the literacy rates of males and females,
MayurhhaQj-In this district the rural literacy rateis only 19'95, one of the lowest in the state, but in urban areas it is 63'22 per cent, which is among the highest for urban areas in districts,
Balasore-Being one of the highly literate districts of the state, Balasore has a high literacy rate both in its rural and urban areas, with no significant difference between the two, _ Even females in the rural areas of this district have a high rate of literacy (22'16),
Cuttack-In general literacy, Cuttack stands first among the districts of the state, The same position is maintained in the rural areas (40'64), The urban literacy rate is 64'31 which is second only to that of puri district, The male literacy rate in rural areas is 56'38 (the highest among all the districts of the state); in urbaJl areas it is 74'30, the third highest in the state, For females, the rural literacy rate is 24'98 (the highest in the- state) while in urban areaS it is 50'93 (the third highest),
Dbenkanal-This district which has a relatively high rate of literacy does not show any great difference between rural and urbari rates,
Baudh-Khondmals-Since this is a backward district inhabited mostly by Harijans and Adivasis, the rural: urban differential is very pronounced (22'06 and 57'79), In other words, while every second person is a literate in the towns of Baudh-Khondmals district , every fifth person is so in i~s rural areas, Only 6'98 per cent of rural women in this-district are literate whereas the urban figure is as high as 37'23,
111
Bofangir-This district generally follows the '3ame pattern as Baudh-Khondmals with a rural rate of 20'80 and an urban rate of 53'18, Among rural women, the rate is 6'68 while for urban it is 37'30,
Kalahandi-A low literacy rate pervades both rural and urban areas,
Koraput-In spite of the location of some important industrial projects within its jurisdiction, the J)attern of literacy in this district is not very different from that of Kalahandi, This district has the lowest literacy rate among all the districts -of the state. Female literacy rate in the rural areas of this district is abysmal (3'51),
Ganjam-Though a part of this district is in the coastal belt, its literacy rate is not among -the highes t in the state, This is perhaps explained by the fact hat large tracts of this district known as Ganjam gency are inhabited by scheduled tribe,
Puri-We have noticed that the general literacy rate in this district is among the higpest in the state Considering the rural and urban areas separately, the J)osition does not alter very much, Its rural literacy rate is 38'44 (the third highest in the state) and i t
urban rate is 66'13 (the highest in the state), While general literacy rates in rural areas of this district are quite high, the rates in its urban areas are still higher, This is because the capital, Bhubaneswar is located in this district,
STATEMENT VI8 Literacy in towns, 1971
(Percentage 0/ litertltes to total population includin age group 0-4)
Name of town
1
Class I
Cuttack VA
Cuttack city
Rourkela VA
Rourkela steel township
Rourkela civil t9wnship
Berhampur city
Bhubaneswar city
Sampalpur VA
UA-Urban Agglomeration
Percentage of literates to total popUlation
.------""'--------, Persons Males Females
2 3 4
59'45 67'85 48'62
58'25 65'29 49'20
53'46 62'66 41'17
54'37 63'24 42'64
51'05 61'13 37'15
51'00 62'65 38'47
62'23 70'81 50'39
50'30 60'80 37'61
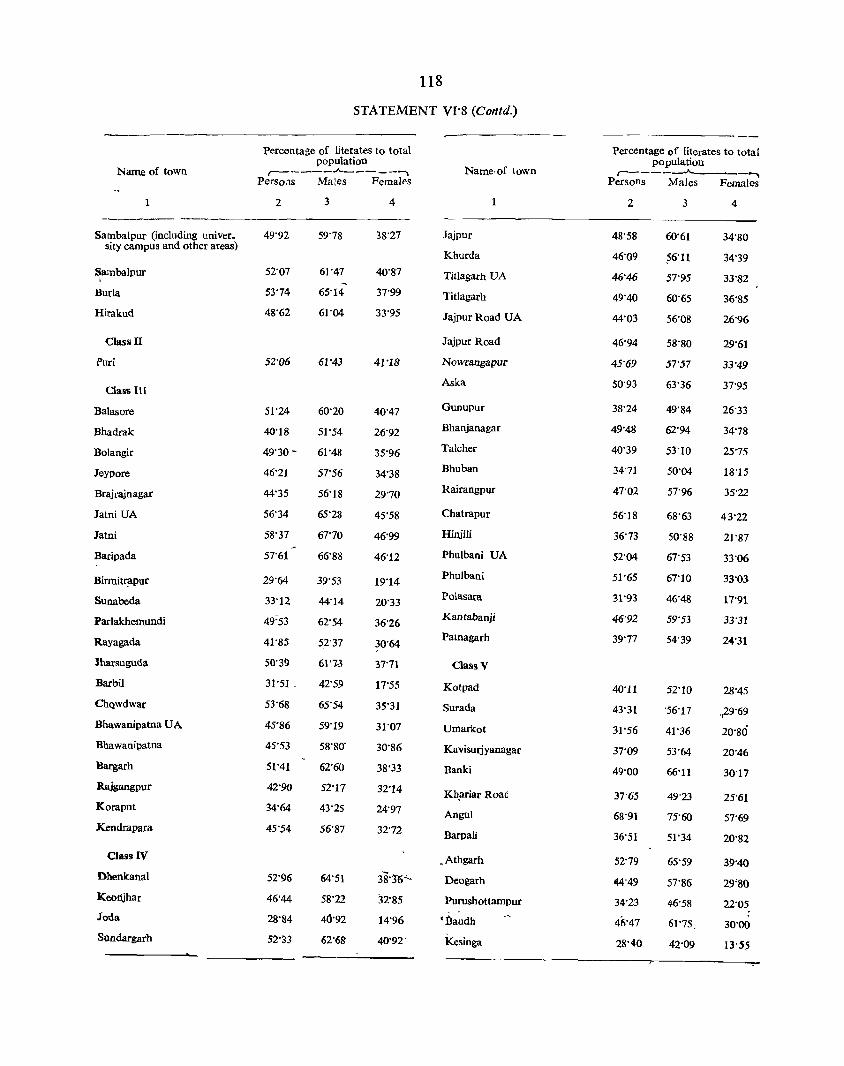
Name of town
1
Sambalpur (including univer_ sity campus and other areas)
Sambalpur I
Burla
Hirakud
Classn
{'uri
ClasllllI
Balasore
Bhadrak
Bolangir
Jeypore
Brajrajnagar
Jatni UA
Jatni
Baripada
Birmitrapur
Sunabeda
Parlakhemundi
Rayagada
Jharsuguda
Barbil
ChQwdwar
Bhawanipatna U A
Bhawanipatna
Bargarh
Rajgangpur
Koraput
Kendrapara
Class IV
Dhenkanal
Keonjhar
Jolla
Sandargarh
118
STATEMENT VI'S (Contd.)
Percentage of literates to total population , _____ .A. ____ - ........
Perso,lS Males Females
2
49'92
52'07
53'74
48'62
52'06
3
59'78
61'47 -
65'14
61'04
61'43
51'24 60'20
40'18 51'54
49' 30 - 61"48
46'21 57'56
44'35 56'18
56'34 65'28
58'37 67"10
57'61 66'88
29'64 39'53
33'12 44'14
49~53 62'54
41'85 5,2'37
50'39
31'51 _
53'68
45'86
45'53
51'41
42'90
34'64
45'54
52'96
46'44
28'84
52'33
61'13
42'59
65'54
59'19
58'80'
62'60
52'17
43'25
56'87
64'51
58'22
40'92
62'68
4
38'27
40'87
37'99
33'95
41'18
40'47
26'92
35'96
34'38
29'70
45'58
46'99
46'12
19'14
20'33
36'26
30'64
37'71
17'55
35'31
31'07
30'86
38'33
32'14
24'97
32'72
38'3'6'-
32"85
14'96
40'92'
Name-of town
1
Jajpur
Khurda
Titlagarh UA
Titlagarh
Jajpur Road UA
Jajpur Road
Nowrangapur
Aska
Gunupur
Bhanjanagar
Talcher
Bhuban
Rairangpur
Chatrapur
Hinjili
Phulbani UA
Pholbani
Polasara
Kantabanji
Patnagarh
Class V
Kotpad
Surada
Umarkot
Kavisurjyanagar
Banki
Kh~riar Roae
Angol
Barpali
_Athgarh
Deogarh
Purushottampur
tBaudh
Kesinga
Percentage of literates to total population
,--- .A._ ___ ,--.
Persons Males Females
2
48'58
46'09
46'46
49'40
44'03
46'94
45'69
50'93
38'24
49'48
40'39
34'71
47'02
56'18
36'73
52'04
51'65
31'93
46'92
39'77
40'11
43'31
31'56
37'09
49'00
37'65
68'91
36'51
52'79
44'49
34'23
46'47
28'40
3
60'61
?6'11
57'95
60'65
56'08
58'80
57'57
63'36
49'84
62'94
53'10
50'04
57'96
68'63
50'88
67'53
67'10
46'48
59'53
54'39
52'10
'56'17
41'36
53'64
66'11
49'23
75'60
51'34
65'59
57'86
46'58
61'75
42'09
4
34'80
34'39
33'82
36'85
26'96
29'61
33'49
37'95
26'33
34'78
25'75
18'15
35'22
43'22
21'87
33'06
33'03
17'91
33'31
2 ... ·31
28'45
,,29'69
20'80
20'46
30'17
25'61
57'69
20'82
39'40
29'80
22'05
30'00
13'55
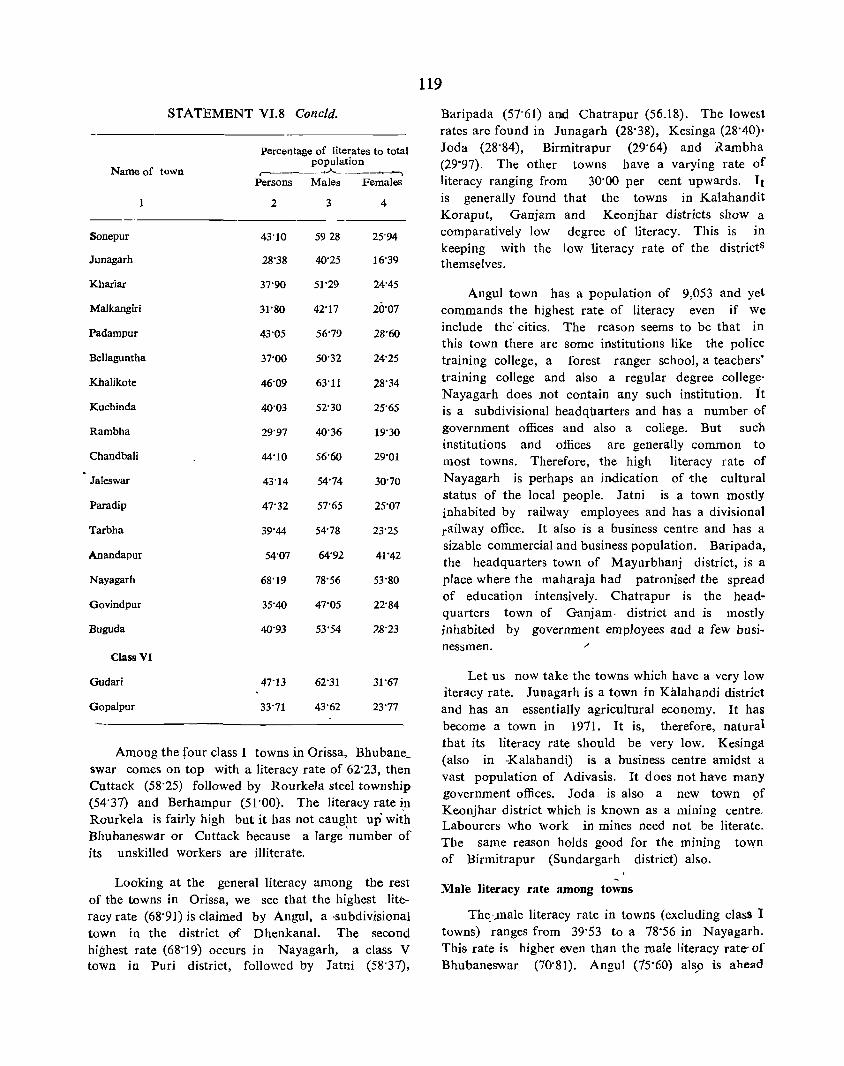
STATEMENT VI.8 Coneld.
Percentage of literates to total
Nameof town population .. .A. __ ~_.,
Persons Males Females
1 2 3 4
---'--------------Sonepur 43'10 5928 25'94
Junagarh 28'38 40'25 16'39
Khariar 37'90 51'29 24'45
Malkangiri 31'80 42'17 20'07
Padampur 43'05 56'79 28'60
Bellaguntha 37'00 50'32 24'25
Khalikote 46'09 63'11 28'34
Kuchinda 40'03 52'30 25'65
Rambha 29'97 40'36 19'30
Chandbali 44'10 56'60 29'01
laleswar 43'14 54'74 30'70
Paradip 47'32 57'65 25'07
Tarbha 39'44 54'78 23'25
Anandapur 54'07 64'92 41'42
Nayagarh 68'19 78'56 53'80
Govindpur 35'40 47'05 22'84
Buguda 40'93 53'54 7,8'23
Class VI
Gudari 47'13 62'31 31'67
Gopalpur 33'71 43'62 23'77
Among the four class I towns in Orissa, Bhubane_ swar comes on top with a literacy rate of 62'23, then Cuttack (58'25) followed by Rourkela steel towllShip (54'37) and Berhampur (51'00). The literacy rate i,n Rourkela is fairly high but it has not caugpt up' with Bhubaneswar or Cuttack because a large number of its unskilled workers are illiterate,
Looking at the general literacy among the rest of the towns in Orissa, we see that the highest literacy rate (68'91) is claimed by Angul, a ·subdivisional town in the district of Dhenkanal. The second highest rate (68"19) occurs in Nayagarh, a class V town in Puri district, folloY,cd by Jatni (58'37),
119
Baripada (57'61) and Chatrapur (56.18). The lowest rates are found in Junagarh (28'38), Kesinga (28'40), Joda (28'84), Birmitrapur (29'64) and 'Kambha (29'97), The other towns have a varying rate of literacy ranging from 30'00 per cent upwards, It is generally found that the towns in Kalahandit Koraput, Ganjam and Keonjhar districts show a comparatively low degree of literacy, This is in keeping with the low literacy rate of the districtS themselves,
Angul town has a population of 9,053 and yet commands the highest rate of literacy even if we include the' cities, The reason seems to be that in this town there are some institutions like the police training college, a forest ranger school, a teachers' training college and also a regular degree college· Nayagarh does )1ot contain any such institution, it is a subdivisional headquarters and has a number of government offices and also a college, But such institutions and offices are generally common to most towns, Therefore, the high literacy rate of Nayagarh is perhaps an indication of {he cultural status of the local people, J atni is a town mostly inhabited by railway employees and has a divisional railway office, It also is a business centre and has a sizable commercial and business population, Baripada, the headquarters town of Mayurbhanj district, is a place where the maharaja had patronised the spread of education intensively. Chatrapur is the headquarters town of Ganjam, district and is mostly inhabited by government employees and a few busi-nessmen, ,/
Let us now take the towns which have a very low iteracy rate, Junagarh is a town in Kalahandi district and has an essentially agricultural economy. It has become a town in 1911. It is, therefore, natural that its literacy rate should be very low. Kesinga (also in -Kalahandi) is a business centre amidst a vast popUlation of Adivasis, It does not have many government offices. Joda is also a new town 9f Keonjhar district which is known as a mining centre, Labourers who work in mines need not be literate. The same reason holds good for the mining town of Birmitrapur (Sundargarh district) also,
-Male literacy rate among towns
Th~)l1ale literacy rate in towns (excluding class I towns) ranges from 39'53 to a 18'56 in Nayagarh, This rate is higher even than the male literacy rate- of Bhubaneswar (70'81). Angul (15'60) aJs,o is ahead
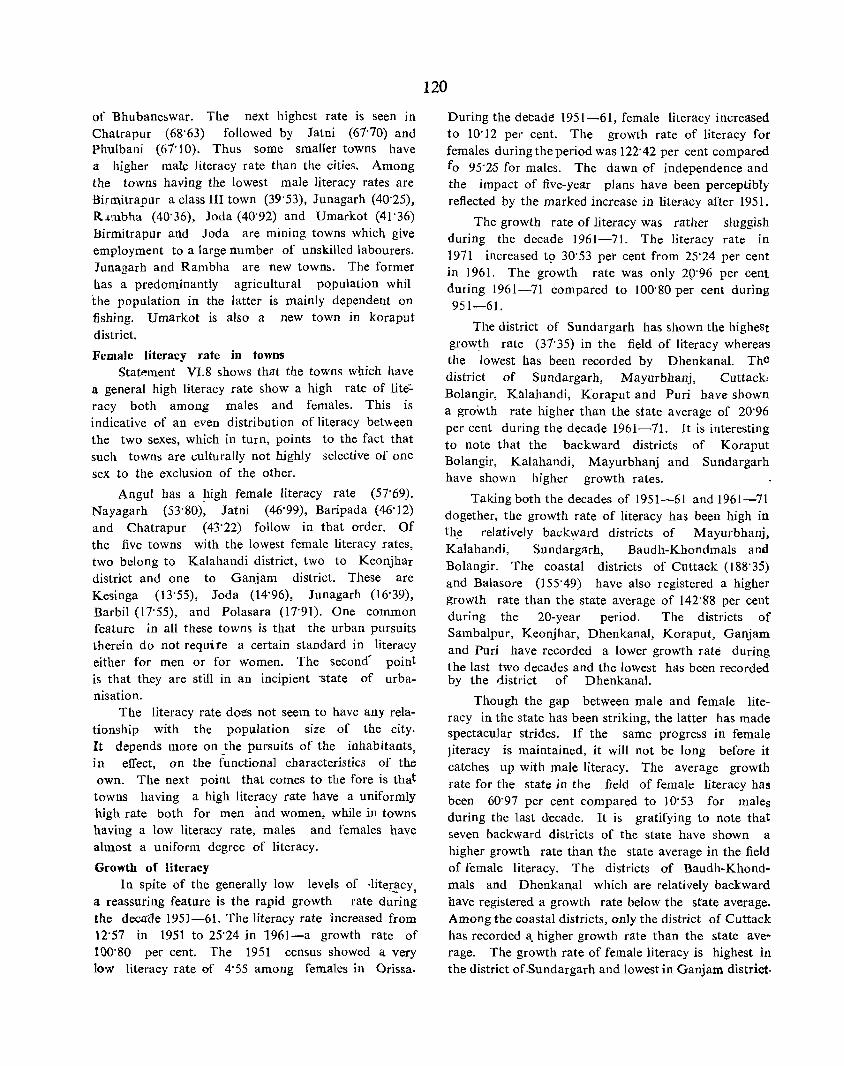
of Bhubaneswar. The next highest rate is seen in Chatrapur (68'63) followed by Jatni (61'70) and Phulbani (61'10). Thus some smaller towns have a higher male literacy rate than the cities. Among the towns having the lowest male literacy rates are Birmitrapur a class III town (39'53), Junagarh (40'25), Rll1lbha (40'36), Joda (40'92) and Umarkot (41'36) ilirmitrapur artd Joda are mining towns which give employment to a large number of unskilled labourers. Junagarh and Rambha are new towns. The former has a predominantly agricultural population whil the population in the latter is mainly dependent on fishing. Umarkot is also a new town in koraput district.
Female literacy rate in towns StatP.'ment VI.8 shows that the towns which have
a general high literacy rate show a high rate of lite: racy both among males and females. This is indicative of an even distribution of literacy between the two sexes, which in turn, points to the fact that such towns are culturally not highly selective of one sex to the exclusion of the other.
Angul has a ~ligh female literacy rate (57'69). Nayagarh (53'80), Jatni (46'99), Baripada (46'12) and Chatrapur (43'22) follow in that order. Of the five towns with the lowest female literacy rates, two belong to Kalahandi district, two to Keonjhar district and one to Ganjam district. These are Kesinga (13'55), Joda (14'96), Junagarh (16'39), Barbil 07'55), and Polasara (17'91). One common feature in all these towns is that the urban pursuits therein do not require a certain standard in literacy either for men or for women. The second' point is that they are still in an incipient -state of urbanisation.
The literacy rate does not seem to have any relationship with the population size of the city. It depends more on the pursuits of the inhabitants, in effect, on the functional characteristics of the own. The next point that comes to the fore is that towns having a high literacy rate have a uniformly high rate both for men and women, while in towns having a low literacy rate, males and females have almost a uniform degree of literacy.
Growth of literacy In spite of the generally low levels of .liteQlcy,
a reassuring feature is the rapid growth rate during the decade 1951-61. The literacy rate increased from 12'57 in 1951 to 25'24 in 1961-a growth rate of 100'80 per cent. The 1951 census showed a very low literacy rate of 4' 55 among females in Orissa.
120
During the decade 1951-61, female literacy increased to 10'12 per cent. The growth rate of literacy for females during the period was 122'42 per cent compared fo 95'2-5 for males. The dawn of independence and the impact of five-year plans have been perceptibly reflected by the marked increase in literacy after 1951.
The growth rate of literacy was rather sluggish during the decade 1961-71. The literacy rate in 1971 increased t9 30'53 per cent from 25"24 per cent in 1961. The growth rate was only 29'96 per cent during 1961-71 compared to 100'80 per cent during 951-61.
The district of Sundargarh has shown the highest growth rate (31'35) in the field of literacy wherea<s the lowest has been recorded by Dhenkanal. The district of Sundargarh, Mayurbhanj, Cuttack, Bolangir, Kalahandi, Koraput and Puri have shown a growth rate higher than the state average of 20'96 per cent during the decade 1961-11. It is interesting to note that the backward districts of Koraput Bolangir, Kalahandi, Mayurbhanj and Sundargarh have shown higher growth rates.
Taking both the decades of 1951-61 and 1961-71 dogether, the growth rate of literacy has been high in the relatively backward districts of Mayurbhanj, Kalahandi, Sundargarh, Bandh-Khondmals and Bolangir. The coastal districts of Cuttack (188'35) and Balasore (155'49) have also registered a higher growth rate than the state average of 142'88 per cent during the 20-year period. The districts of Sambalpur, Keonjhar, Dhenkanal, Koraput, Ganjam and Puri have recorded a lower growth rate during the last two decades and the lowest has been recorded by the district of Dhenkanal.
Though the gap between male and female literacy in the state has been striking, the latter has made spectacular strides. If the same progress in female literacy is maintained, it will not be long before it catches up with male literacy. The average growth rate for the state in the field of female literacy has been 60'97 per cent compared to 10'53 for males during the last decade. It is gratifying to note that seven backward districts of the state have shown a higher growth rate than the state average in the field of female literacy. The districts of Baudh-Khondmals and Dhenkan,al which are relatively backward have registered a growth rate below the state average. Among the coastal districts, only the district of Cuttack has recorded a. higher growth rate than the state ave~
rage. The growth rate of female literacy is highest in the district of-Sundargarh and lowest in Ganjam district·

.::1 .~ .!!
: , _. ~ Ii ~ .i~
'" I • I :JI ,.. l -.
"' u. " ;t 0 £ J i z o •
III ~ is III • ~ E
::; i j£ 1 0;;
cD i ~ • g-
iH i .. i w __
8.j~ • iP 1 .: J~ @
": II> °z .. z: C ..
0 ... 12 ~ c
lI: .. J: .. .. ... II. ~ ...
=
'" - ":Ii
~
1- 0
4-~ "1 ,
_\"'1-r
--~ ~ rr' ct< ...
.. x , o~ •
:; j ....~,
III 0 ~?
.... 2: C( r ..... i "' :0:: ,..J z: "
.. ..J Z
_,.-oJ
<t ,.
< I-'- 0 .., -.
~ :::I ~ .... .... is . u - 0 x a:- t;
ell lI'J .. '" :::I z 0- !i§ - '" ~
0 51 tfJ III a:
0
>=' I- ;:: " " < III 'I:
...... U a: « CI 'Z.
...: III ...I "' 0:: ex:: !: :::I .. .. UoI .... ... .,. " A H Co
0 q ... II. ... a 0
0 ::; 0 1&1 ;a III ~
.. CI
~ i "" I 1 z ... . _ cJ
,
f J ._
...-OR ":; .. ~ ~


,\'I 21
STATEMENT VI,9
Growth rate of literacy, 1951, 1961 and 1971
(Excluding agegrvup 0-4 population)
Literacy rate (%) Growth rate of literacy (%)
Unit P r--__ ..A.,...__ ____ ~
r---' ..A. _____ ---..-~
M F 1951 '" 1961 1971 1951-61 1961-71 1951-71
1 2 3 4 5 (; , 7 8
ORISSA P 12'57 25'24 30'53 100'80 20'96 142'88 M 20'62 40'26 44'50 95'25 10'53 115'81 F 4'55 10'12 • 16'29 122'42 60'97 258'02
Sambalpur P 14'31 26'29 31'17 83'72 18'56 117'82 M 25'46 42'50 46'42 66'93 9'22 82'33 F 3'80 9'90 15'45 160'53 56'06 306'58
'5undargarh P 9'05 22'97 31'55 153'81 37'35 248'62 M 14'16 35'09 43'42 147'81 23'74 206'64 _ F 3'83 9'45 18'77 46'74 98'62 390'08
Keonjhar p 11'20 20'85 24'96 86'16 19'71 122'86 M 19'19 34'36 37'67 79'05 9'63 !)6'30 F 2'83 6'95 11'71 45'58 68'49 3'13'78
Mayurbhanj P 4'83 16'72 21'17 246'17 26'61 338'30 M 8'58 17'93 32'73 225'52 17'19 281'47 F 1'10 5'35 9'40 386'36 75'70 754'55
Balasore p 15'48 34'79 39'55 124'74 13'68 155'49 M 21'66 53'67 55'40 147'78 3'22 155'77 F 9'05 -15'14 23'04 67'29 52'18 154'59
Cuttack P 14'76 34'63 42'56 134'62 22'90 188'35 _M 22'33 52'87 58'03 136'77 ~'76 159'87
F 7'10 16'26 26'80 129'01 f'82 277"46
DhenkanaI P 17'20 27'74 30'86 61'28 '25 79'42 M 31'70 45'76 46'54 44'35 '70 46'81 F 3'21 9'38 14'70 192'21 ;'72 357'94
I Baudh-Khondmals P 8'12 20'54 23'19 152'96 '90 185'59
M 14'60 36'20 38'53 147'95 6'44 161'90 F 1'44 4'96 7'86 244'44 58'47 445'83
Bolangir P 7'25 16'88 23'03 32'83 36'43 217'66 M 13'49 28'10 3'1'13 12'75 29'37 175'24 F 0'98 4'93 8'69 103'06 76'27 786'73
Kala.handi P 3'78 13'08 16'10 t46'03 23'0'9 325'93 M 6'73 23'08 26'56 Z42'94 15'08 294-'65 F 0'17 3'22 5'43 118'18 68'63 605'19
'Koraput P 6'04 9'49 12'47 57'12 31'40 106'46 M 9'50 15'35 18'91 61'58 23'19 9905 F 2'49 .3'43 5'85 37'75 70'55 134'94
Ganjam P 14'12 25'09 28'80 77'69 14'79 103'97 M 24'33 42'03 44'71 71'75 6'52 84'01 F 4'82 9'63 13'64 99'79 41'64 182'99
-Puri p 22'34 34'01 41'llr 52'24 21'08 84'33 M 36'46 52'58 57'92 44'21 10'16 58'86 F 8'07 15'37 23'98 90'46 56'02 197'15
'" Figures based on 10% sample, [1 Censu~61J
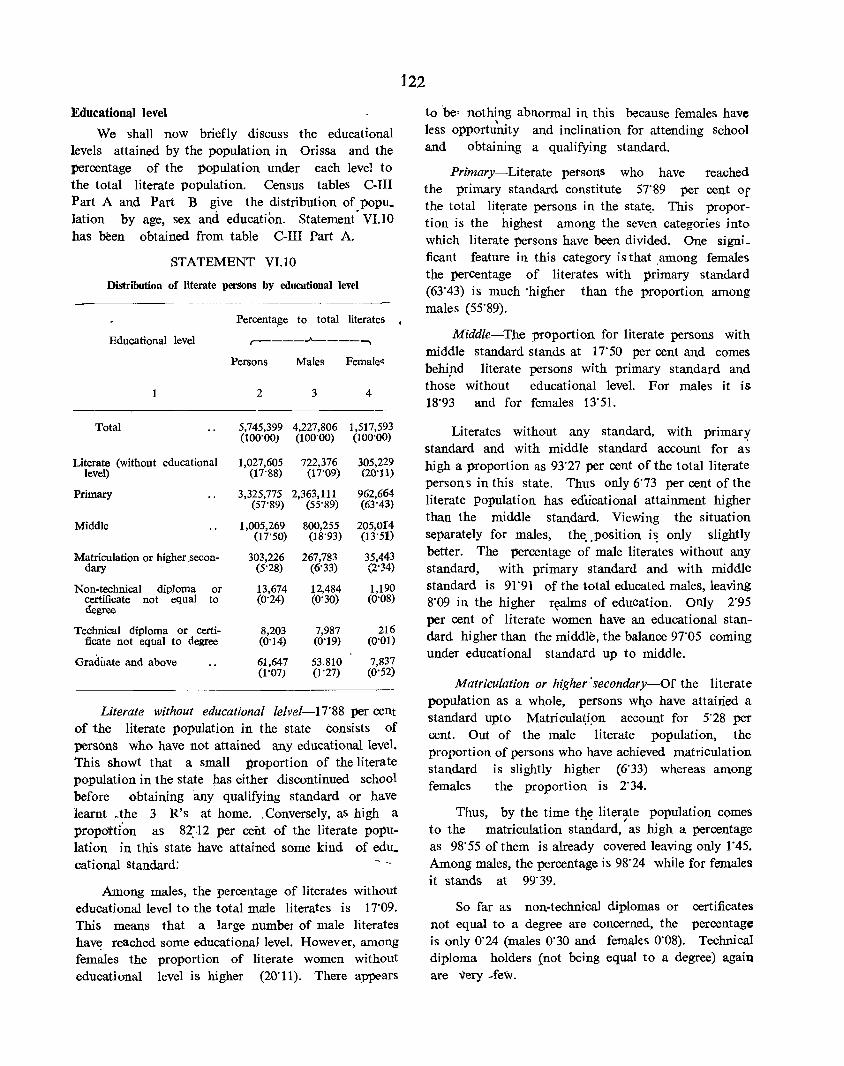
Educational level
We shall now briefly discuss the educational levels attained by the population in Orissa and the percentage of the population under each level to the total literate population. Census tables C-JII Part A and Part B give the distribution of popu_ lation by age, sex and education. Statement' VI.10 has been obtained from table C-III Part A.
STATEMENT VI.lO
Distribution of literate perSons by educational level
Percenta~e to total literates
Educational level ,-____ .A.. ____ ......,
Persons Males Female~
1 2 3 4
Total 5,745,399 4,227,806 1,517,593 (100'00) (100'00) (100'00)
Literate (without educational 1,027,605 722,376 305,229 level) (17"88) (17'09) (20'11)
Primary 3,325,775 2,363,111 962,664 (57'89) (55'89) (63"43)
Middle 1,005,269 800,255 205,014 (17'50) (18'93) (13'51)
Matriculation or higher ,secon- 303,226 267,783 35,443 dary (5'28) (6'33) {2'34)
Non-technical diploma or 13,674 12,484 1,190 certificate not equal to (0'24) (0'30) (0'08) degree
Technical diploma or certi- 8,203 7,987 216 ficate not equal to degree (0'14) (0'19) (0'01)
Graduate and above 61,647 53,810 7,837 (1'07) (1'27) (0'52)
Literate without educational lelvel-I7'88 per cent of the literate population in the state consists of personS who have not attained any educational level. This showt that a small proportion of the literate popUlation in the state has either discontinued school before obtaining any qualifying standard or have learnt rthe 3 R's at home, .Conversely, as high a propolt{on as 8~12 per cent of the literate population in this state have attained some kind of edu. cational Standard: - -
Among males, the percentage of literates without educational level to the total mme literates is 17'09, This means that a large number of male literates hav~ reached some educational level. However, among females the proportion of literate women without educational level is higher (20'11), There appe-ars
122
to 'be' nothing abnormal in this because females have less opportu'nity and inclination for attending school and obtaining a qualifying standard,
Primary-Literate petsortS who have reached the primary standard constitute 57'89 per cent Of the total literate persons in the stat~. This proportion is the highest among the seven categories into which literate persons have been divided. One signi_ ficant feature in this category is that among females the percentage of literates with primary standard (63'43) is much 'higher than the proportion among males (55'89).
Middle-The proportion for literate persons with middle standard stands at 17'50 per cent and comes behi,nd literate persons with primary standard and those without educational level. For males it is 18'93 and for females 13'51.
Literates without any standard, with primary standard and with middle standard account for a~ high a proportion as 93'27 per cent of the total literate person s in this state. Thus only 6'73 per cent of the literate population has ediicational attainment higher than the middle standard, Viewing the situation separately for males, the. ,position i~ only slightly better, The percentage of male literates without any standard, with primary standard and with middle standard is 91'91 of the total educated males, leaving 8'09 in the higher r~lms of education. only 2'95 per cent of literate women have an educational standard higher than the middle, the balance 97'05 coming under educational standard up to middle,
Matriculation or higher-'secondary-Of the literate population as a whole, persons wh.o have attained a standard upto Matricula-~i.on account for 5"28 per cent. Out of the male literate population, the proportion of persons who have achieved matriculation standard is slightly higher (6'33) whereas among females the proportion is 2'34.
Thus, by the time the literate population comes to the matriculation st~dard,' as high a percentage as 98'55 of them is already covered leaving only 1'45. Among males, the percentage is 98'24 while for females it stands at 99'39,
So far as non-technical diplomas or certificates not equal to a degree are concerned, the percentage is only 0'24 (males 0'30 and females 0'08), Technical diploma holders inot being equal to a degree) again are very -feW.
Graduate and above-This represents the cream of the intelligentsia of the state and includes graduates of technical and non-technical disciplines and constitutes 1'07 per cent of the total literate population in the state. Male degree-holders comprise 1'27 per cent of the total male literate popUlation whereas female degree-holders constitute 0'52 per cent of the total female literates.
Of the total population in this state, 70 per cent is illiterate. Among the remaining 30 per cent as high a proportion as 93'27 per cent has not gone beyond the middle standard; (91"91 among males and 97"05 per cent among females). Coming to the stage
123
of matriculation, It IS noticed that a proportion Of 98'55 per cent of the literate persons is already covered (98'24 per cent for males and 99'39 per cent for females). Post-matric education (not necessarily university because there are some who have gone in for diploma courses in technical institutions) accounts for only 1"45 per cent of the literates (1'76 per cent for males and 0'61 for females).
A fuller analysi.s of educational level of different age groups, the rural/urban differentials and the distribution of educational levels among workers in different categories of work will be made in Part I-B.


125
CHAPTER VII
SCHEDULED CASTE AND SCHEDULED TRIBE POPULATION
Articles 341 of the constitution of I udia lays down that the president may with respect to any state or UT specify by public notification, the castes, races or tribes or parts of groups within the castes, races or tribes which shall for the purposes of the constitution be deemed to be scheduled castes in relation to that state or UT as the case may be. Parliament may by law jnclude jn or exclude from the list of scheduled castes any caste, race or tribe or part of or group within any caste, race or tribe_ A similar provision exists in article 342 of the constitution for the scheduled tribes. According to the scheduled castes and scheduled tribes lists (modification) order. 1956, and subsequent notifications, there are 62 scheduled tribes and 94 scheduled castes in Orissa (Vide appendix I). In Orissa, the area restriction applies only to one scheduled caste named Kuli in Sambalpur district. Its population in Sambalpur is fairly small and as such it did not present any problem of lJnderenumeration of castes in the state. There is no area restriction with regard to scheduled tribes in the state.
Synonyms and generic names
Many of the scheduled castes and scheduled tribes call themselves or are locally known by various synonyms and generic names. The enumerator in the 1971 census was instructed to enter the synonym or generic name of a caste or a tribe only if it found a place in the list furnished to him. He was specially cautioned not to write general names like 'Harijan', 'Achhut' or 'Adivasi'. If a person merely claimed to be a scheduled -caste or tribe but said that he did not belong to any of the notified communities applicable to the area, he would not be entered as a scheduled caste or scheduled tribe. Notwithstanding these instructons if the returns were in general terms like 'Harijan', ~Achbut' or 'Adivasi', instructions were issued at the time of editing the enumeration slips to treat such entries as 'unspecified -scheduled caste or scheduled tribe', as the case might be.
Distribution of scheduled castes
The total population of SC in Orissa according to the 1971 census was 3,310,854 as against 2,763,858 in 1961. While they formed 15-75 per cent of the total population in 1961, their proportion stands slightly reduced to 15'09 per cent in 1971..
STATEME~T VILl
SC population in states and UTs (1971)
Unit rotal SC
population
2
INDIA
States:
80,005,398
1. Andhra Pradesh
2. Assam * 3. Bihar
4. Gujarat
5. Haryana
6. Hiruachal Pradesh
7. Jammu & Kashmir
8. Kerala
9. Madhya Pradesh 10. Maharashtra 11. Manipur 12. Meghalaya 13. Mysore (Karnataka) 14. Nagaland
15. ORISSA
16. Punjab 17. Rajasthan 18. Sikkim 19. Tamil Nadu 20. Tripura 21. Uttar Pradesh 22. West Bengal
Union Territories:
1. Andaman and Nicobar Islands
2_ Arunachal Pradesh 3. Chandigarh 4. Dadra and Nagar
Haveli 5. Delhi 6. Goa, Daman &
Diu 7. Laccadive, Mini
coy & Amindivi Islands (Lakshadweep)
8. Pondicherry
5,774,548
912,639
7,950.652
1,825,432
1,895,933
769,572
381,277
1.772,168
5,453,690 3,025,761
16,376 3,887
3,850,034
3,310,854
3,348,217 4,075,580
9,502 7,315,595
192,860 18,548,916
8,816,028
339 29,073
1,332
635,698 16,514
72,921
Percentage Percentage of India s S.C. of S.C, population population
3
100'00
7'22
1-14
9'94
2'28
2'37
0'96
0'48
2'22
6'82 3'78 0'02 0'01 4'81
4'14
4'19 5"09
0'01 9'14 0'24
23'18 11'02
N 0'04
N
0'79 0'02
0'09
4
14'60
13'21
6'10
14'11
6'84
18'89
22'24
8'26
8'30
13'09 6'00 1'53 0'38
13'14
15'09
24'71 15'82 4'53
17'76 12'39 21'06 19'90
0''()7, 11'30 1'80
15'64 1'93
15.46
* Includes Mizo district which now forms the union territory of Mizoram
N -Negligible percentage

~126
In terms of the proportion of SC population of the state to the total SC population of India, Orissa occupies the tenth rank with 4'14 per cent. The corresponding proportion of SC in 1961 among all these states was high~r exc~.pt _ in West Bengal and Madhya Pradesh. It, may be, worthwhile to investigate the reason for this declining proportion of SC in eight states containing such a high proportion of SC population of India.
The, SC population figures of states in 1971 which experienced area changes during the decade are not strictly comparable with those of 1961. In statement VII. 2, the area of states in 1971 has been accepted as the basis while giving the percentage of SC in different states for 1961 and 1971.
STATEMENT VII.2
Percentage of SC population in 1961 and 1971 of each state
Unit
INDIA Andhra Pradesh .Assam * Bihar Gujarat Haryana Himachal Pradesh Jammu & Kashmir • Kerala Madhya Pradesh ~aharashtra
Manipur
Meghalaya
Mysore
Nagaland
ORISSA
Punjab
Rajasthan
Sikkim
Tamil Nadu
Tripura
Uttar Pradesh
West Bengal
Percentage of SC .to , total population
r---__ ...A.. ___ -.,
1961 1971
2 3
14'67 14'60
13'82 13'27 6'59 6'10
14'00 l4'11 6'63 6'84
17'97 18'89 22'89 22'24 7'98 8'26 8'49 8'30
13'14 13'09 5'63 6'00
1'71 1'53
0'16 0'38
Ij'22 13'14
0'03
15'75 15'09
22'33 24'71
16'67 15'82
4'53
18'01 l7'76
10'48 12'3~
20'88 21'00
19'73 19'90
-
• Includes Mizo district which now forms the 'union territory of Mizoram.
Another way of looking at the population for SC is to find out as to what proportion they form in each state of the total population of the same state For the country as a whole, the SCs form 14'60 per cent of the total population ,of the country. It means that roughly there is one person among every seven who is a member of a scheduled caste. The proportion seems to be the highest in Punjab (24'71). Orissa occupies the eighth position (15'09). Its percentage is slightly higher than the all-India average.
A comparison of these figures with those of 1961 (statement VII.2) reveals that in certain states like Punjab, Tripura, Haryana, Uttar Pradesh, West Bengal, Maharashtra, Jammu & Kashmir, Meghalaya Gujarat and Bihar, the proportion has gone up margi nally from 1961 to 1971 while in many other state like Tamil Nadu, Rajasthan, Orissa, Mysore, Kerala and Andhra Pradesh, this has declined. The rate of decline seems to be fairly high in Rajasthan, Himachal Pradesh and Otissa.
Sikkim, the 22nd state of the Indian Republic contributed no Sc population in the 1961 census as no castes were scheduled for this state till 1961. 'Three castes, namely, Kami, Damai, and Sarki, were scheduled in Sikkim by the representation of Sikkim subjects regulation (1966) and they form 4'53 per cent of the total population of the state in the 1971 census. There has been no return in 1971 for SCs in Nagaland, A. & N. Islands and L. M. & A. Islands as no caste has been scheduled by the President for the above state and UTs.
Distribution of scheduled tribes The scheduled tribe population of India in 1971
stood at 38,015,162 against 30,172,221 in 1961, The statement VII.3 gives the distribution of scheduled tribe population and their proportion among states in 1971.
STATEMENT VII.3
ST population in states and UTs (1971)
Total ST Percentage Percentage Unit population ofIndia's ST of ST
population population
2 3 4
INDIA 38,015,162 100'00 6'94 States:
h Andhra Pradesh 1,657,657 4'36 3'81 2. Assam * 1,919,947 5'05 12'84 3. Bihar 4,932,767 12'98 8'75
* Includes Mizo district which now forms th~ union territory of Mizoram.
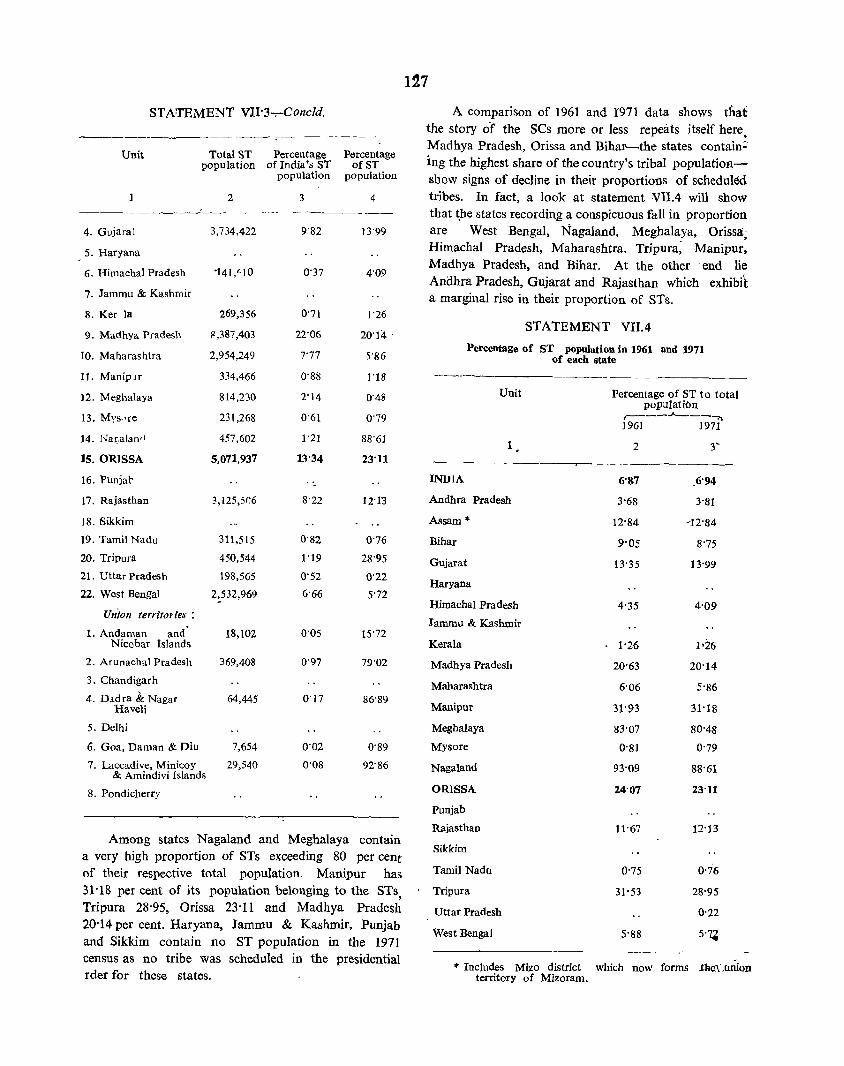
Unit
STATEMENT VII·3-,-Concld.
Total ST Percentage population ofIndia's ST
population
2 3
Percentage ofST
population
4
--------4. Gujarat
5. Haryana
6. Himachal Pradesh
7. Jammu & Kashmir
8. Ker la
9. Madhya Pradesh
10. Maharashtra
11. Manipur
12, Meghalaya
13. Mys,'re
14, Na~,alan"
IS, ORISSA
16, Punja\1
17, Rajasthan
18, Sikkim
3,734,422
'141,<'10
269,356
R,387,403
2,954,249
334,466
814,230
231,268
457,602
5,071,937
3,125,5r.6
19, Tamil Nadu 311,515
20, Tripura 450,544
21. Uttar Pradesh 198,565
22, West Bengal 2,532,969
Union territories:
1. Andaman and' 18,102 Nicobar Islands
2, Arunachal Pradesh 369,408
3. Chandigarh
4, D.ldra &: Nagar Haveli
5, Delhi
6, Goa, Daman & Diu
7, Laccadive, Minicoy & Amindivi Islands
8, Pondicherry
64,445
7,654
29,54Q
9'82 13'99
0'37 4'09
0'71 1'26
22'06 20'14 .
7'77 5'86
0'88 1'18
2'14 0'48
0'61 0'79
1'21 88'6J
13'34 23'11
.
8'22 12'13
0'82 0'76
1'19 28'95
0'52 0'22
6'66 5'72
0'05 15'72
0'97 79'02
0'17 86'89
0'02 0'89
0'08 92'86
Among states Nagaland and Meghalaya contain a very high proportion of STs exceeding 80 per cent of their respective total population, Manipur has 31'18 per cent of its popUlation belonging to the STs, Tripura 28'95, Orissa 23'11 and Madhya Pradesh 20'14 per cent. Haryana, Jammu & Kashmir, Punjab and Sikkim contain no ST population in the 1971 census as no tribe was scheduled in the presidential rder for these states.
127
A comparison of 1961 and r971 data shows that the story of the SCs more or less repeats itself here Madhya Pradesh, Orissa and Bihar-the states contain:' ing the highest share of the country's tribal population___" show signs of decline in their proportions of scheduled tribes. In fact, a look at statement Vil.4 will show that ~he states recording a conspicuous fall in proportion are West Bengal, Nagaland, Meghalaya, Orissa' , Himachal Pradesh, Maharashtra, Tripura; Manipur, Madhya Pradesh, and Bihar. At the other 'end lie Anohra Pradesh, Gujarat and Rajasthan which exhibj't a marginal rise in their proportion of STs.
STATEMENT VIlA
Percentage of ST population in 1961 and 1971 of each state
Unit
1
INUIA
Andhra Pradesh
Assam '"
Bihar
Gujarat
Haryana
Himachal Pradesh
Jammu & Kashmir
Kerala
Madhya Pradesh
Maharashtra
Manipur
Meghalaya
Mysore
Nagaland
ORISSA
Punjab
Rajasthan
Sikkim
Tamil Nadu
Tripura
Uttar Pradesh
West Bengal
Percentage of ST to total populatiOn
r---- ....... ---...,.., 1961 1971
2 3'
6'S7 ,6'94
3'68 3'81
12'84 -12'84
9'05 S'75
13'35 13'99
4'35 4'09
1'26 1'26
20'63 20'14
6'06 5'86
31'93 31'18
83'07 80'48
0'81 0'79
93'09 88'61
24-07 23'11
11'67 12'13
0'75 0-76
31'53 28'95
0'22
5'88 5'7,.
'" Includes Mizo district which now forms JbeLuriion territory of Mizoram.
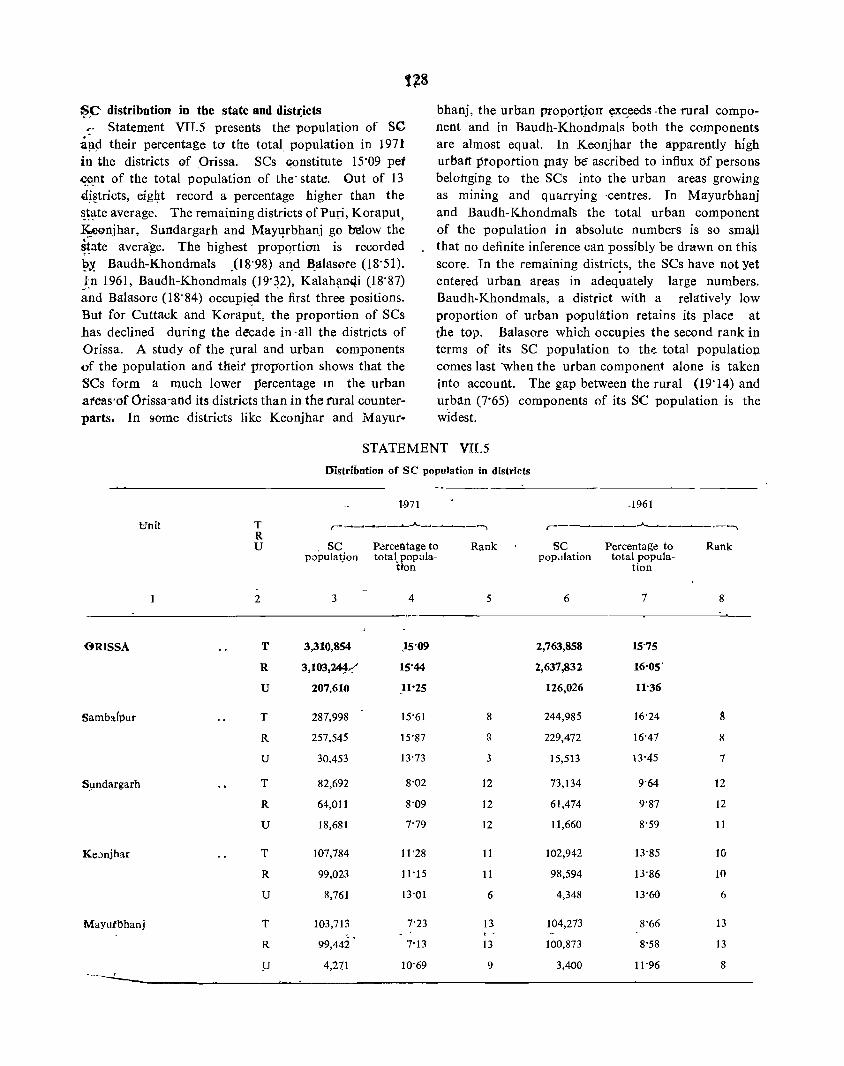
~p distribution in the state and dist..;icts r' Statement VII.5 presents the population of SC
a~!l their percentage to the total population in 1971 in the districts Qf .orissa. SCs ,!onstitute 15"09 pet c..e_nt of the total population of the- state. Out of 13 Q~~tricts, eig~t record a percentage higher than the ~~~te average. The remaining districts ofPuri, Korapul, KCQnjhar, Sundargarh and Mayurbhanj go b"elow the ~~ate avera;ge. The highest propqrtian is recorded YY. Baudh-Khondmals .(18'98) a~d Balasote (18'51). J:n 1961, Baudh-Khondmals (l9'~2), Kalah~n4i (18"87) and Balasore (18'84) occupi~d the first three positions. But for Cuttack and Koraput, the proportion of SCs has declined during the decade in -all the districts of Orissa. A study of the ~ural and urban components of the population and theil' proportion shows that the SCs form a much lower percentage III the urban at'eas"of Orissa-artd its districts than in the tural counterparts. In some districts like Keonjhar and Ivlayur-
bhanj, the urban prop.or~ioll €!xc_eeds -the rural component and in Baudh-Khondmals both the components are almost equal. In Keonjhar the apparently high urban proportion Play be ascribed to influx of persons belonging to the SCs into the urban areas growing as mining and quarrying ·centres. In Mayurbhanj and Baudh-Khondmal~ the total urban component of the population in absolute numbers is so smaJ} that no definite inference can possibly be drawn on this score_ In the remaining distric~s, the SCs have not yet entered urban areas in adequately large numbers. Baudh-Khondmals, a district with a relatively low proportion of urban population retains its place at the top. Balasore which occupies the second rank in terms of its SC population to the total populatioJ;l comes last when the urban component alone is taken into account. The gap between the rural (19'14) and u~ban (7·65) components of its SC population is the widest.
STATEMENT VII_5
Bnit
6RISSA
sambalpur
S!lndargarh
Ke;)njhar
Mayutbhanj
T R U
2
T
R
u
T
R
U
T
R
U
T
R
U
T
R
p
ffistribution of SC population in districts
SC poPulat.ion
3
3,310,854
3,103,244...(
207,610
287,998
257,545
30,453
82,692
64,011
18,681
107,784
99,023
8,761
103,713
99,442"
4,211
1-971
Percentage to total popula
Hon
4
)5'09
15'44
_11·25
15'61
15'87
13'73
8'02
8'09
7'79
11'28
11'15
13'01
7'23
7'13
10-69
Rank
5
8
!l
3
12
12
12
11
11
6
13-
13
9
.1961
r---~--~-..A._.,-----.--..
SC Percentage to Rank population total popula-
tion
6 7
2,763,858 15'75
2,637,832 16·05'
126,026 11"36
244,985 16'24
229,472 16'47
15,513 13'45
73,134 9-64
61,474 9'87
11,660 8'59
102,942 13-85
98,594 13-86
4,348 13'60
104,273 8'66
100,873 8'58
3,400 11-96
8
8
8
7
12
12
11
10
10
6
13
13
8
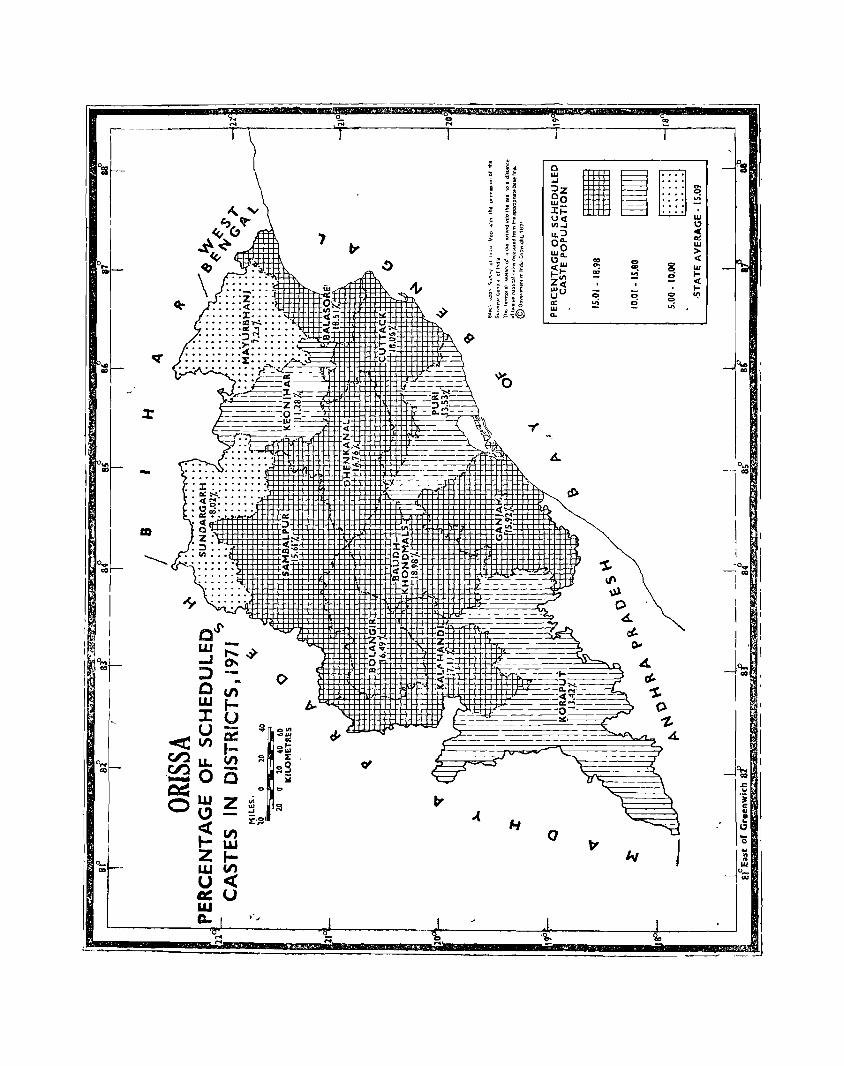
I 0,.. ;-...
~~ 4;f
I ~
;r
I
I 0 ... I-100 -
1
1 I
l: j:f ~..:t-_N ~ Z~ cr.'" >4' I!I
d).
(}
_~ I
I
I
I
I JO.r I
1100
I
I I

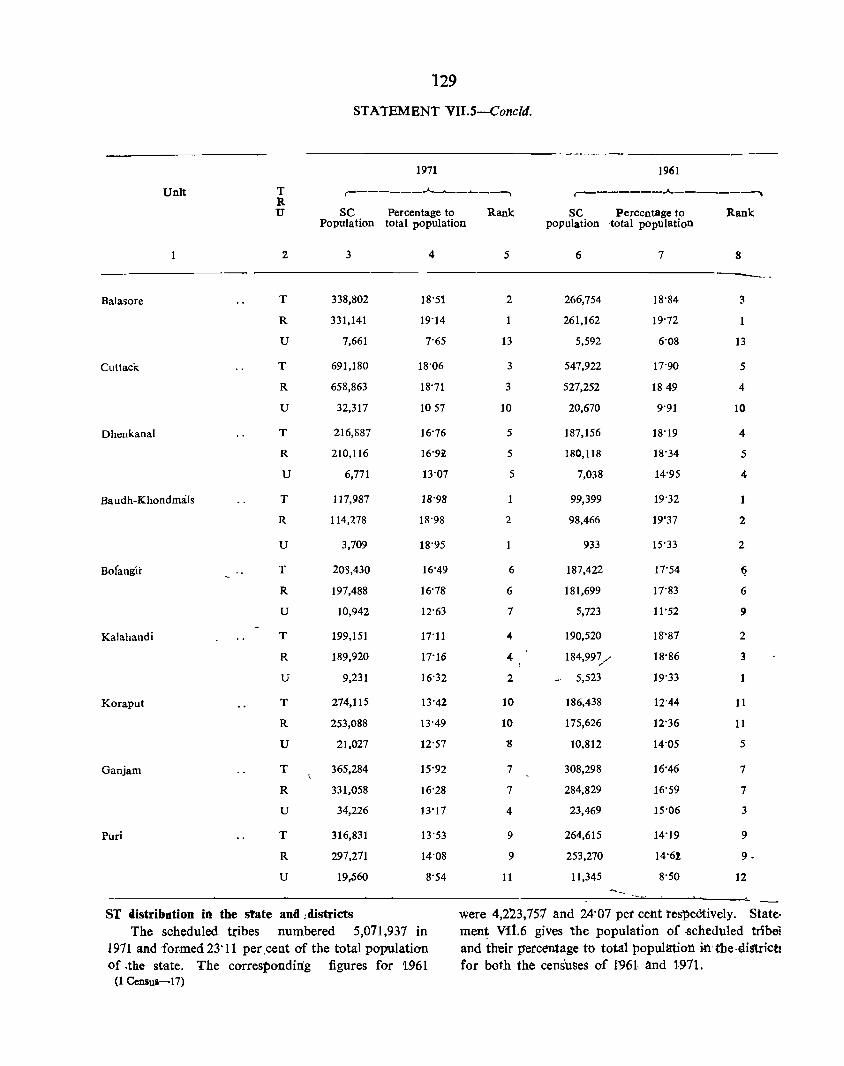
129
ST AiEMENT VII,5-Concld,
1971 1961
Unit T r-------."J...,--........ --~ ~------~-------~ R U SC Percentage to Rank SC Percentage to Rank
Population total population population -total population
1 2 3 4 5 6 7 8 ---Balasore T 338,802 18'51 2 266,754 18'84 3
R 331,141 19'14 261,162 19'72
U 7,661 7'65 13 5,592 6'08 13
Cuttack: T 691,180 18'06 3 547,922 11"90 5
R 658,863 18'71 3 527,252 1849 4
U 32,317 1057 10 20,670 9'91 10
Dhenkana.1 T 216,887 16'76 5 187,156 18'19 4
R 210,116 16'9l 5 ISO,lIS IS'34 5
U 6,771 13'07 5 7,038 14'95 4
Baudh-Khondma:Is T 117,987 18'98 99,399 19'32
R 114,278 IS'98 2 98,466 19'37 2
U 3,709 18'95 933 15'33 2
Bofilllgir T 203,430 16'49 6 187,422 17'54 (?
R 197,488 16'78' 6 181,699 17'83 6
U 10,942 12'63 7 5,723 11'52 9
Kalahandi T 199,151 17'11 4 190,520 18'87 2
R 189,920 17'15 4 184,99~/ 18'86 3
U 9,231 16'32 2 5,523 19'33 1
Koraput T 274,115 13'42 10 186,438 12'44 11
R 253,088 13'49 10 175,626 12'36 11
U 21,027 12'57 '8 10,812 14'05 5
Ganjam T 365,284 15'92 7 308,298 16'46 7
R 331,058 16'28 7 284,829 16'59 7
U 34,226 13'17 4 23,469 15'06 3
Puri T 316,831 13'53 9 264,615 14'19 9
R 297,271 14'08 9 253,270 14"61 9·
U 19,560 8'54 11 11,345 8'50 12 -_ ST distribution in the state and ;districts were 4,2'23,751 and 24'07 pet cent tes,()eCtively, State'
The scheduled tribes numbered 5,071,937 in ment VI1.6 gives the population of -scheduled tdbe: 1971 and formed 23'11 per,cent of the total population and their p'ercentage to total t>opuHttiotl m.' the-district! of ,the state, The corresponding figures for 1.961 for both the censuses of 1961, and 1971,
(1 Census-17)
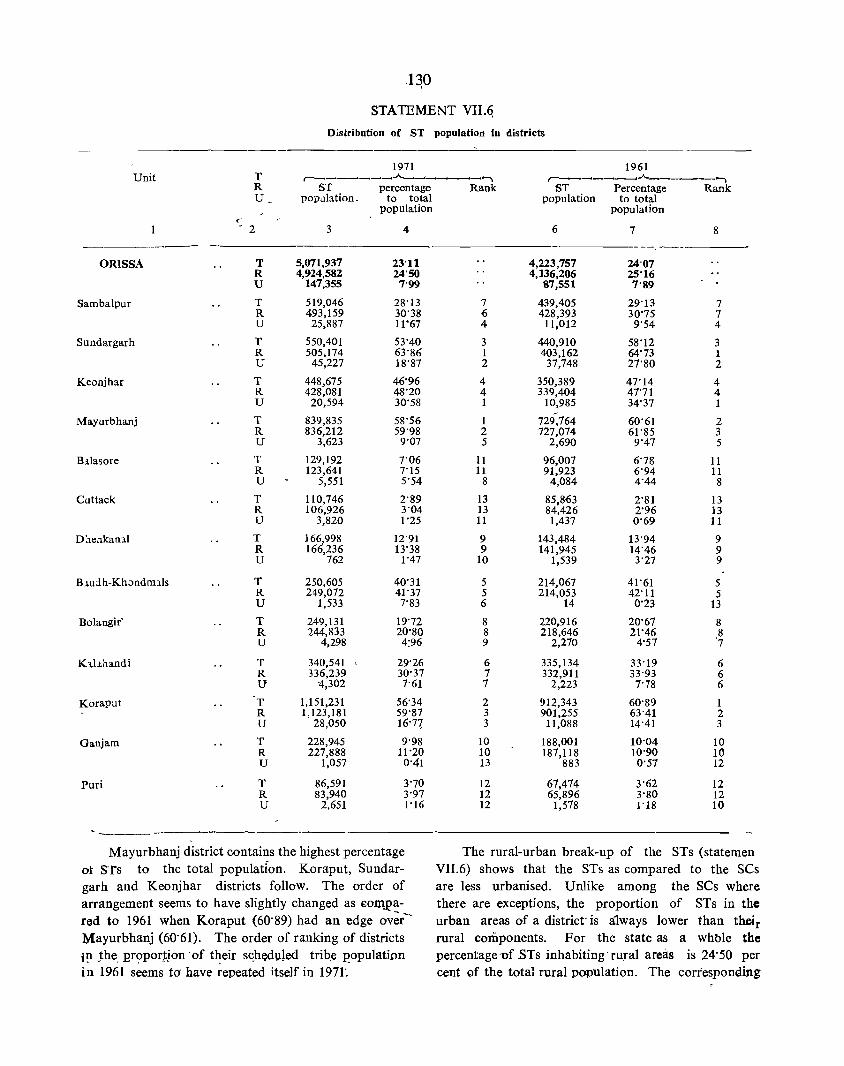
qo STATEMENT VII.(i
Distribution of ST population in districts
-----------_.
1971 1961 Unit T
R U
~-----~-~~-----~ ~~ ______ A ______ ~
1ST percentage Rank ST Percentage Rank
ORISSA
Sambalpur
Sundargarh
Keonjhar
Mayurbhanj
B.liasol'e
Cuttack
B.lUih-Khondmlls
Bolangir'
Kllahandi
Koraput
Ganjam
Puri
r - 2
T R U
T R U
T R U
T R U
T R U
T R U
T R U
T R U
T R U
T R U
T R U
T R U
T R U
T R U
pOjJlIlation. to total
3
5,071,937 4,924,582
147,355
519,046 493,159 25,887
550,401 505,174
45,227
448,675 428,081
20,594
839,835 836,212
3,623
129,192 123,641
5,551
110,746 106,926
3,820
166,998 166,236
762
250,605 249,072
1,533
249,131 244,833
4,298
340,541 ' 336,239
'4,302
1,151,231 1,123,181
28,050
228,945 227,888
1,057
86,591 83,940
2,651
population
4
23'11 24'50
7'99
28'13 30'38 11'67
53'40 63'86 18'87
46'96 48'20 30'58
58'56 59'98
9'07
7'06 7'15 5'54
2'89 3'04 1'25
12'91 13'38
1'47
40'31 41'37 7'83
19'72 20'80 4:96
29'26 30'37 7'61
56'34 59'87 16'77
9'98 11'20
0'41
3'70 3'97 1'16
Mayurbhanj district contains the highest percentage ot S'fs to the total population, Koraput, Sundargarh and Keonjhar districts follow, The order of arrangement seems to have slightly changed as €omJ?ared to 1961 when Koraput (60'89) had an edge ov~Mayurbhanj (6{)'61), The order of ranking of districts i!l .the. nroportjon 'of t~eir sqh~d\,lled trib.e ~opulati_on in 1961 seems to' have repeated itself in 1971',
7 6 4
3 1 2
4 4 1
1 2 5
11 11
8
13 13 11
9 9
10
5 5 6
8 8 9
6 7 7
2 3 3
10 10 13
12 12 12
population to total population
6 7 8
---------4,223,757 4,136,206
87,551
439,405 428,393
11,012
440,910 403,162
37,748
350,389 339,404
10,985
729,764 727,074
2,690
96,007 91,923
4,084
85,863 84,426 1,437
143,484 141,945
1,539
214,067 214,053
14
220,916 218,646
2,270
335,134 332,911
2,223
912,343 901,255
11,088
188,001 187,118
883
67,474 65,896
1,578
24'07 25'16 7'89
29'13 30'75 9'54
58'12 64'73 27'80
47'14 47'71 34'37
60'61 61'85 9'47
6'78 6'94 4'44
2'81 2'96 0'69
13'94 14'46 3'27
41'61 42'11
0'23
20'67 21'46
4'57
33'19 33'93 7'78
60'89 63'41 14'41
10'04 10'90 0'57
3'62 3'80 1'18
7 7 4
3 1 2
4 4 1
2 3 5
11 11 8
13 13 11
9 9 9
5 5
13
8 8 7
6 6 6
1 2 3
10 10 12
12 12 10
The rural-urban break-up of the STs (statemen VI1.6) shows that the STs as compared to the SCs are less urbanised, Unlike among the SCs where there are exceptions, the proportion of STs in the urban areas of a district'is a1ways lower than their rural components, For the state as a whtlle the percentage 'of BTs inhabiting'rural areas is 24'50 per cent of the total rural population, The cortesponaing
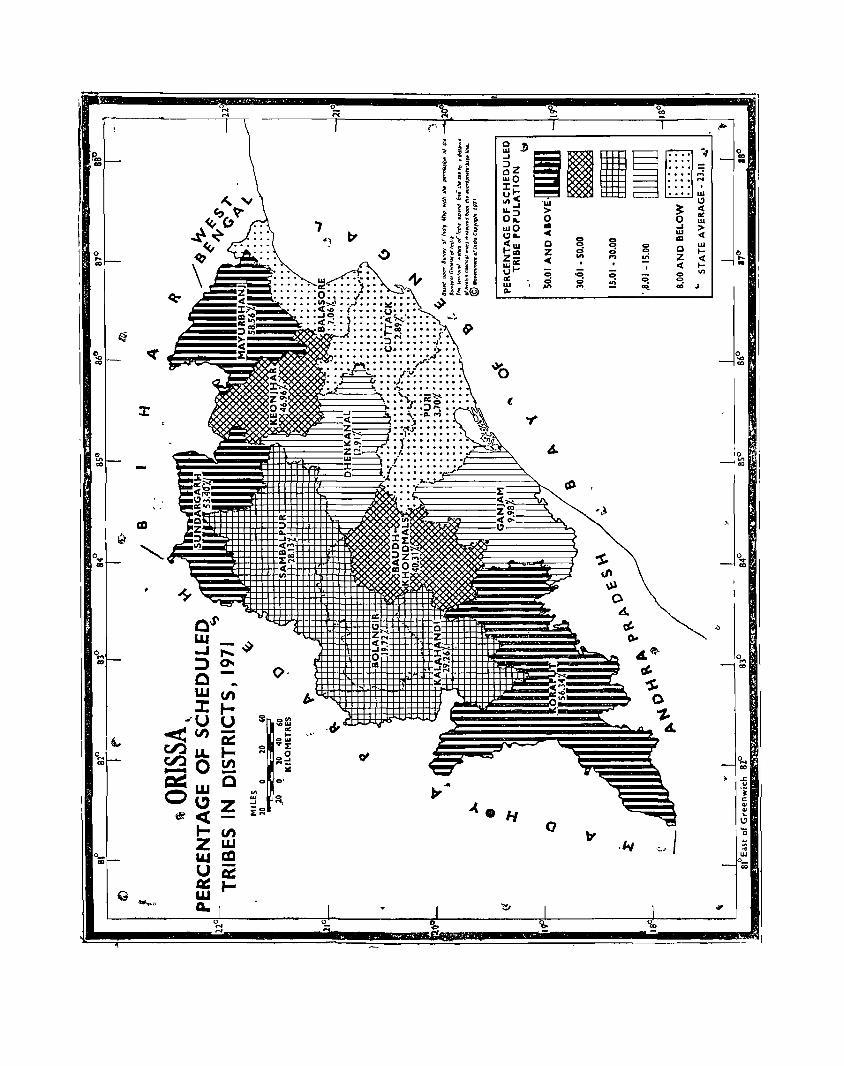
~v
I
\
<v ">" 'it"
I ~~
'7 ~<v .. : ::: ~j b'
\ ~
C?o co
:r
;2~~11~[J'::: ~~~ ~ 1:.... • ••• = -:;: ~ :::: :::i ..... ...1 'W ••••• o~ > .•.. w
wO 0 ".. ~ <w 0 ~!!! z ~~ ~ a: w Do.
o
." C> .,; ,.,
."
'" .,;
~ o ...I W ID o Z <
, '0
___, '" OJ
~
o

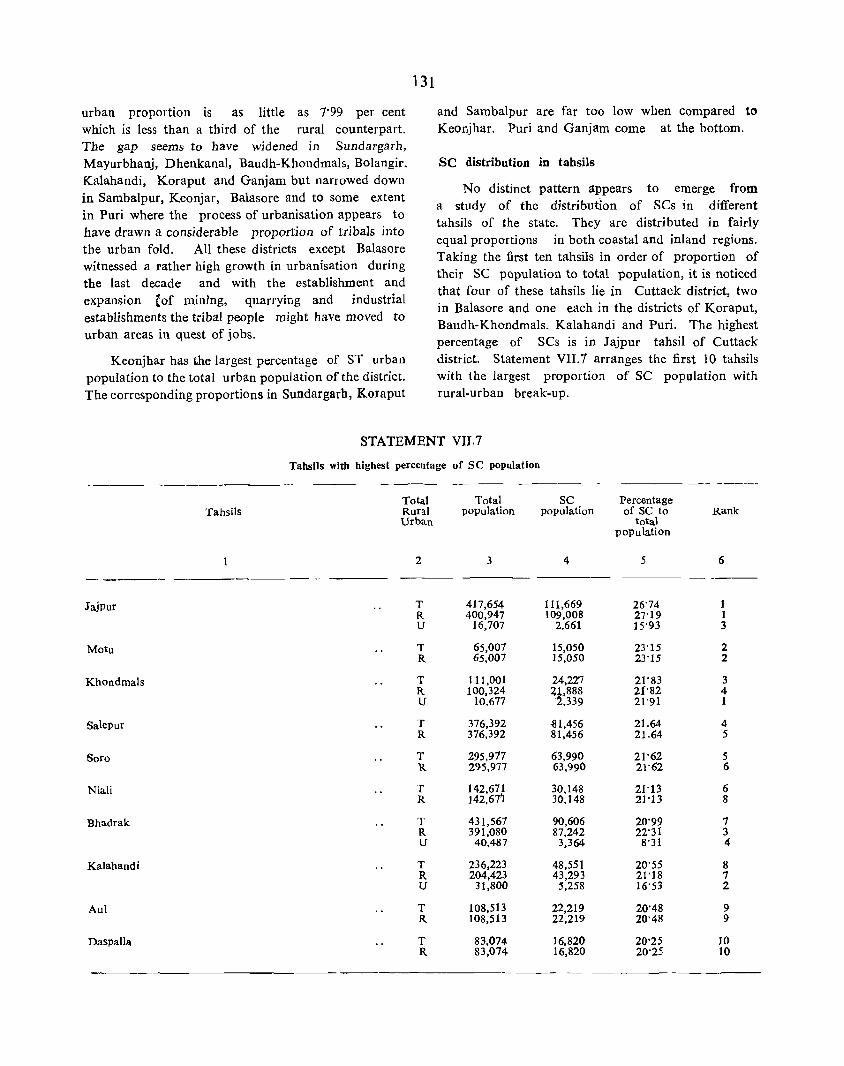
urban proportion is as little as 7·99 per cent which is less than a third of the rural counterpart. The gap seems to have widened in Sundargarh, Mayurbhanj, Dhenkanal, Baudh-Khondmals, Bolangir, Kalahandi, Koraput and Ganjam but narrowed down in Sambalpur, Keonjar, Balasore and to some extent in Puri where the process of urbanisation appears to have drawn a considerable proportion of tribals into the urban fold. All these districts except Balasore witnessed a rather high growth in urbanisation during the last decade and with the establishment and expansion Lof mining, quarrying and industrial establishments the tribal people might have moved to urban areas in quest of jobs.
Keonjhar has the largest percentage of ST urban population to the total urban population of the district. The corresponding proportions in Sundargarh, Koraput
131
and Sambalpur are far too low when compared to Keonjhar. Puri and Ganjam come at the bottom.
SC distribution in tabsils
No distinct pattern appears to emerge from a study of the distribution of SCs in different tahsils of the state. They are distributed in fairly equal proportions in both coastal and inland regions. Taking the first ten tahsils in order of proportion of their SC population to total population, it is noticed that four of these tahsils lie in Cuttack district, two in Balasore and one each in the districts of Koraput, Baudh-Khondmals, Kalahandi and Puri. The highest percentage of SCs is in Jajpur tahsil of Cuttack district. Statement VII.7 arranges the first 10 tahsils with the largest proportion of SC popUlation with rural-urban break-up.
STATEMENT VIJ.7
Tahsils with highest percentage of se popUlation
----- _---_. - ------Total Total SC Percentage
Tahsils Rural population population of SC to Rank Urban total
population
1 2 3 4 5 6
------ ---.-
JajPur T 417,654 111,669 26'74 1 R 400,947 109,008 27'19 1 U 16,707 2,661 15'93 3
Motu T 65,007 15,050 23'15 2 R 65,007 15,050 23'15 2
Khondmals T Ill,OOI 24,227 21'83 3 R 100,324 4l,888 2('82 4 U 10,677 2.,339 21'91 1
Salepur T 376,392 -81,456 21.64 4 R 376,392 81,456 21.64 5
Sora T 295,977 63,990 21'62 5 R 295,977 63,990 21'62 6
Niali T 142,671 30,148 21'13 6 R 142,67'1 30, J48 21'13 8
Bhadrak T 431,567 90,606 20'99 7 R 391,080 87,242 22'31 3 U 40,487 3,364 S'31 4
Kalahandi T 236,223 48,551 20'55 8 R 204,423 43,293 21'18 7 U 31,800 5,258 16'53 2
Aul T 108,513 22,219 20'48 9 R 108,513 22,219 20'48 9
Daspalla T 83,074 16.820 20'25 10 R 83,074 16,820 20'25 10
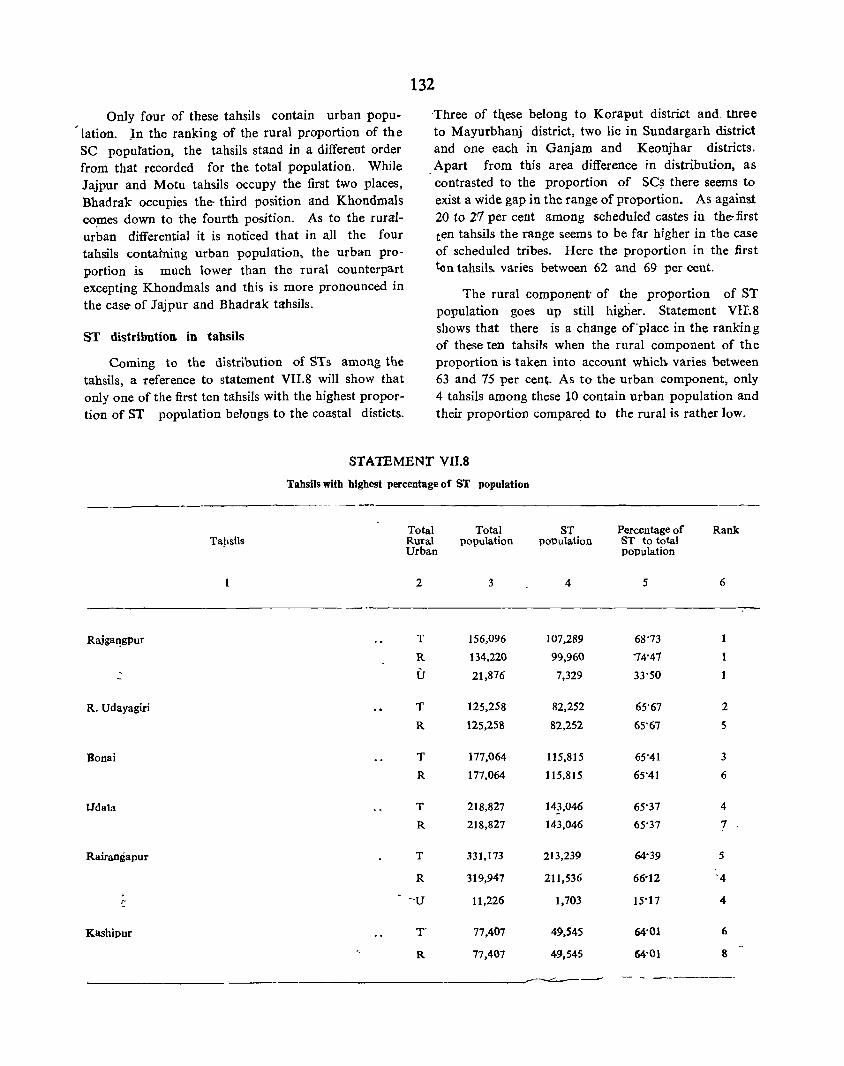
Only four of these tahsils contain urban population. In the ranking of the rural proportion of th e SC population, the tahsils stand in a different order from that recorded for the total population. While Jajpur and Motu tahsils occupy the first two places, Bhadrak occupies the- third position and Khondma1s comes down to the fourth position. As to the rura-Iurban differential it is noticed that in all the four tahsils containing urban population, the urban proportion is much lower than the rural counterpart excepting Khondmals and this is more pronounced in the cas~ of Jajpur and Bhadrak tahsils.
ST distribution. in tabsils
Coming to the distribution of STs among the tahsils, a reference to statement VII.S will show that only one of the first ten tahsils with the highest proportion of ST population belongs to the coastal disticts.
132
Three of t.lJ.ese belong to Koraput district and. three to Mayurbhanj district, two lie in Sundargarh district and one each in Ganjam an~ Keonjhar districts.
,Apart from this area difference in distribution, as contrasted to the proportion of SC~ there seems to exist a wide gap in the range of proportion. As against 20 to 2'7 per cent among scheduled castes in the-first ten tahsils the range seems to be far higher in the case of scheduled tribes, Here the proportion in the first ten tahsils. varies between 62 and 69 per cent.
The rural component· of the proportion of ST population goes up still higher. Statement VIES shows that there is a change or-place in the ranking of these ten tahsils when the rural component of the proportion is taken into account which varies between 63 and 75 per cent. As to the urban component, only 4 tahsils among these 10 contain urban population and their proportion compared to the rural is rather low.
STATEMENl'VII.S
Ta.j:lsils
Rajgal!gpur
R. Udayagiri
Donai
Udala
Rairangapur
"
Kashipur
Tahsils with highest percentage of ST population
Total Rural Urban
2
T
R
iT
T
R
T
R
T
R
T
R
-U
T'
R
Total popula.tion
3
156,096
134,220
21,876
125,258
125,258
177,064
17"/,064
218,827
218,827
331,173
319,947
11.226
77,407
77,407
ST popula.tion
4
107,289
99,960
7,329
82,252
82,252
115,815
115,815
143,046
143,046
213,239
211,536
1,703
49,545
49,545
~-
Percentage of ST to total population
5
68'73
"74'41
33'50
65"67
65'67
65"41
65'41
65'37
65"37
64·39
66·12
15'17
64'01
64'01
Rank
6
2
5
3
6
4
7
5
'4
4
6
8
~ -- --------
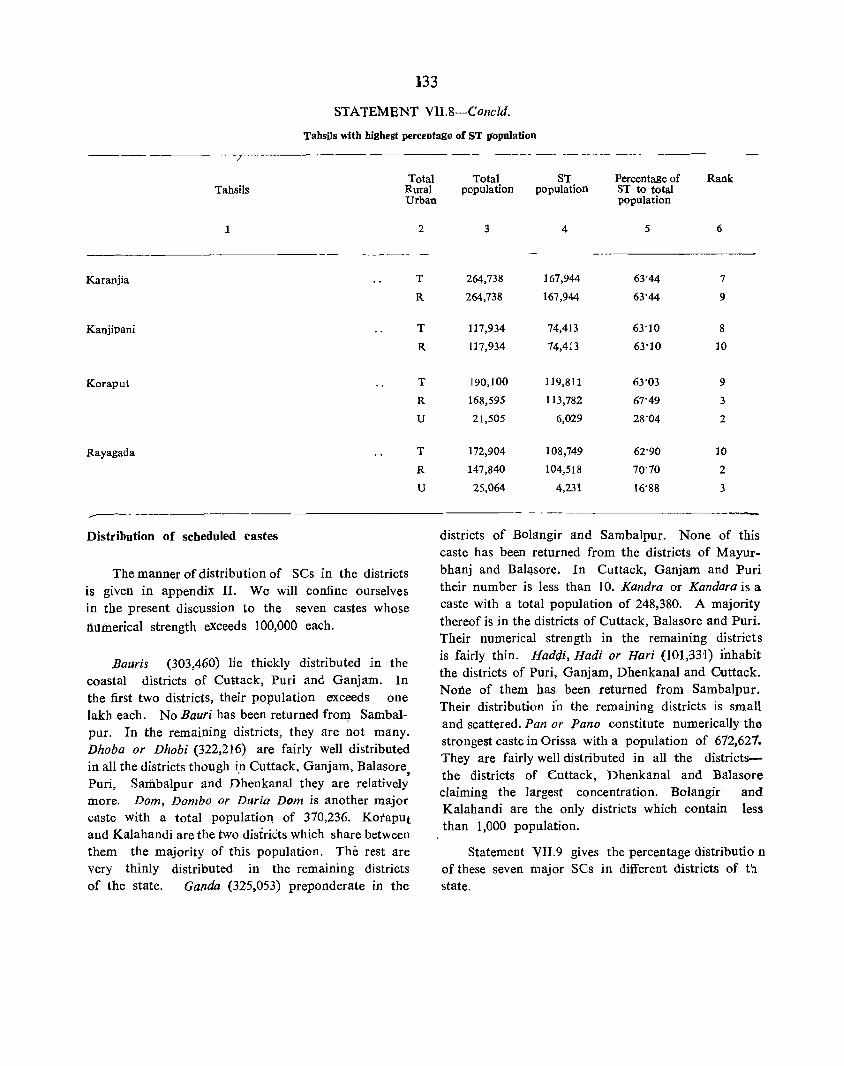
133
STATEMENT VII.8-Concld.
Tahsils with highest percentage of ST I1opulation
----------~ --- -------
Tahsils Total
Rural Urban
1
Karanjia
Kanjipani
Koraput
Rayagada
-------Distribution of scheduled castes
The manner of distribution of SCs in the districts is given in appendix II. We will confine ourselves in the present discussion to the seven castes whose l1UI'nerical strength exceeds 100,000 each.
JJauris (303,460) lie thickly distributed in the coastal districts of Cuttack, Puri and Ganjam. In the first two districts, their population exceeds one lakh each. No Bauri has been returned fro~ Sambalpur. In the remaining districts, they are not many. Dhoba or Dhobi (322,216) are fairly well distributed in all the districts though in Cuttack, Ganjam, Balasore Puri, Sarilbalpur and Dhenkanal they are relativel; more. Dom, Dombo or Duria Dom is another major caste with a total populatioQ of 310,236. KOl'aput and Kalahandi are the two districts which share between them the majority of this population. The rest are very thinly distributed in the remaining districts of the state. Ganda (325,053) preponderate in the
2
T
R
T
R
T
R
U
T
R
U
Total population
3
264,738
264,738
117,934
117,934
190,100
168,595
21,505
172,904
147,840
25,064
ST population
4
167,944
167,944
74,413
74,413
119,811
113,782
6,029
108,749
104,518
4,231
Percentage of ST to total population
5
63'44
63'44
63'10
63'10
63'03
67'49
28'04
62'90
70'70
16'88
Rank
6
7
9
8
10
9
3
2
10
2
3
districts of Bolangir and Sambalpur. None of this caste has been returned from the districts of Mayurbhanj and Bal~sore. In Cuttack, Ganjam and Puri their number is less than 10. Kandra or Kandara is a caste with a total population of 248,380. A majority thereof is in the districts of Cuttack, Balasore and Puri. Their numerical strength in the remaining districts is fairly thin. Hadcji, Hadi or Hari (101,33:1) fnhabit the districts of Puri, Ganjam, Dhenkanal and Cuttack. Nolie of them has been returned from Sambalpur. Their distribution in the remaining districts is small and scattered. Pan or Pano constitute numerically the strongest caste in Orissa with a population of 612,621. They are fairly well distributed in all the districtsthe districts of Euttack, Dhenkanal and Balasore claiming the largest concentration. Bolangir and Kalahandi are the only districts which contain less than 1,000 population.
Statement VI1.9 gives the percentage distributio n of these seven major SCs in different districts of th state.
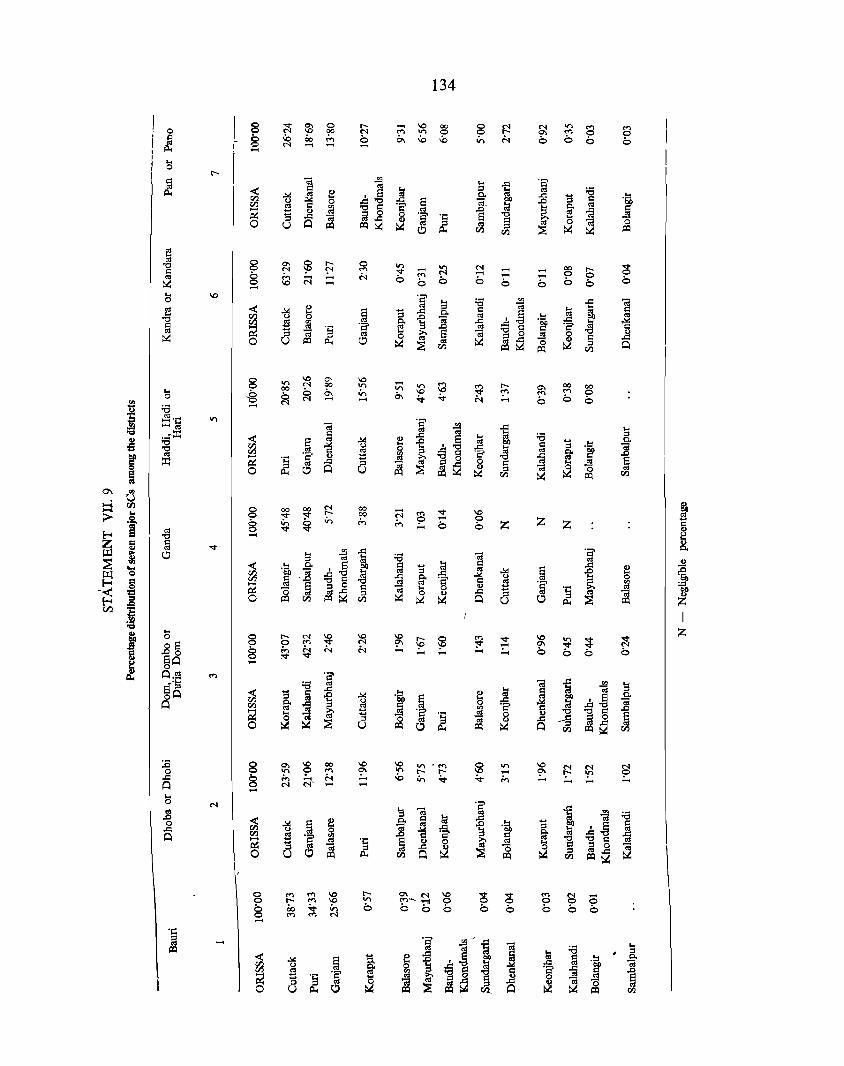
.....
8 8 .....
8 8 .....
8 8 .....
o co M ......
M o ......
\0 0\ ;... .....
134
<"l '<I" o ..... ;... 0
N ...... o
...... ..... o
z
...... ...... o
z
<"l o o
co o o
8 o
co co <"l 0 o 0
J J z
..... o o
8 o
j til
Distribution of scheduled tribes
The scheduled castes and scheduled tribes lists (modification) order, 1956 includes 62 scheduled tribes for Orissa. The district wise distribution of 62 STs for Orissa is given in appendix III. For our discussion here we will take up only the tribes which have a population of more than a lakh each.
Bathudis have a population of 130,792 in the state; 92 per cent of the population is shared by the districts of Mayurbhanj and Keonjhar. Next comes Balasore with a small percentage of population and then. Cuttack. The tribe has either not been returned at all or their number is less than 20 in the remaining 9 districts Of the tate. Bhottada or Dhotada lie concentrated in the district of Koraput which alone claims about 98 per cent. Another 1·98 per cent is in the district of Kalahandi. Bhuiya or Bhuyan constitute another major tribe in the state with a population of 188,212. They lie heavily concentrated in the districts .of Sundargarb, Keonjhar, Mayurbhanj and Sambalpur. Their representation in the remaining districts is marginal. Bhumij have a population of 146,978. The districts of Mayurbhanj (65·82 per cent), Balasore (18·91 per cent) and Keonjbar (7·26 per cent) contain the major part of the population. The rest are scattered in the remaining district~ of the state. Next to Kbond, Kond or Kandha, the Gond or Gondo are numerically the strongest in the state with a population of 499,267' The districts of Kalahandi, Sambalpur, Bolangir' Koraput and Keonjhar account for the major part of the population. The range or distribution in the districts of Dhenkanal, Mayurbhanj, Sundargarh and Keonjhar varies between 4 and 11 per cent of the states' population. Their proportion of distribution in the remaining districts is fairly low. Kharia or Kharian with a population of 120,483 are concentrated in the districts of Sundargarh, Sambalpur and Mayurbhanj (together 92 per cent). The distribution in the remaining districts is fairly thin. Khond, Kond or Kandha including Nanguli Kandha and Sitha Kandha together account for 869,965. The tribe is numerically the strongest in the state and is concentrated in the districts of Koraput,
135
Baudh-Khondmals and Kalahandi. Bolangir, Ganjam Puri, Sambalpur and Dhenkanal togetQ.er accou nt for 23 per cent of the population. Their proportion of distribution in the remaining districts is low. Kisan (180,025) constitutes a major tribe of Sambalpur and Sundargarh districts. Both the districts together account for 92·73 per cent of the population. Another 5·85 per cent is in the district of Dhenkanal and 1·36 per cent in Keonjhar. The tribe is absent in the district of Balasore. Its distribution in the remaining districts is marginal. Kolhas (309,588) inhabit mostly thc districts. of M ayurbhanj and Keonjhar. These districts together account for 82 per cent of its population. The rest lie scattered in the remaining districtis of the state except Baudh-Khondmals. The Munda, Munda-Lohara or Munda-Mahalis (222,117) is concen trated in Sundargarh, Sambalpur and Keonjhar. These three districts together account for more than 82 per cent of its population. 85 per cent of the Oraons (with a population of 164,619) are inhabitants of Sundargarh district. Another 11·80 per cent is in Sambalpur. Its proportion in the remaining districts is very small. Some 206,699 Parojas have been returned in the state in 1971 out of which 93·73 per cent were in the district of Koraput alone and another 6·22 per cent in the district of Kalahandi. These two districts together account for almost the entire population Sambalpur, Sundargarh, Keonjhar, Balasore, Dhenka~ nal, Bolangir and Cuttack have small numbers. The tribe has not been returned at all from the remaining districts. Santals (452,953) constitute the main tribe in the districts of Mayurbhanj, Balasore and Keonjhar. These districts together account for more thart 97 per cent of the Santal population. In the remaining districts, they lie sparsely sprinkled. Saora, Savar, saura or Sahara (342,757) are fairly well distributed throughout the state though the concentration is in Ganjam. Sambalpur, Puri and Koraput. The tribe has been returned from all the districts of the state -each claiming more than a thousand population. Shabar or Lodha (240,344) lies well distributed in all the districts of Orissa except Sundargarh and Baudh-Khondmals. The districts of Kalahandi, Koraput, Ganjam, Cuttack and Dhenkanal claim the majority of the tribe.
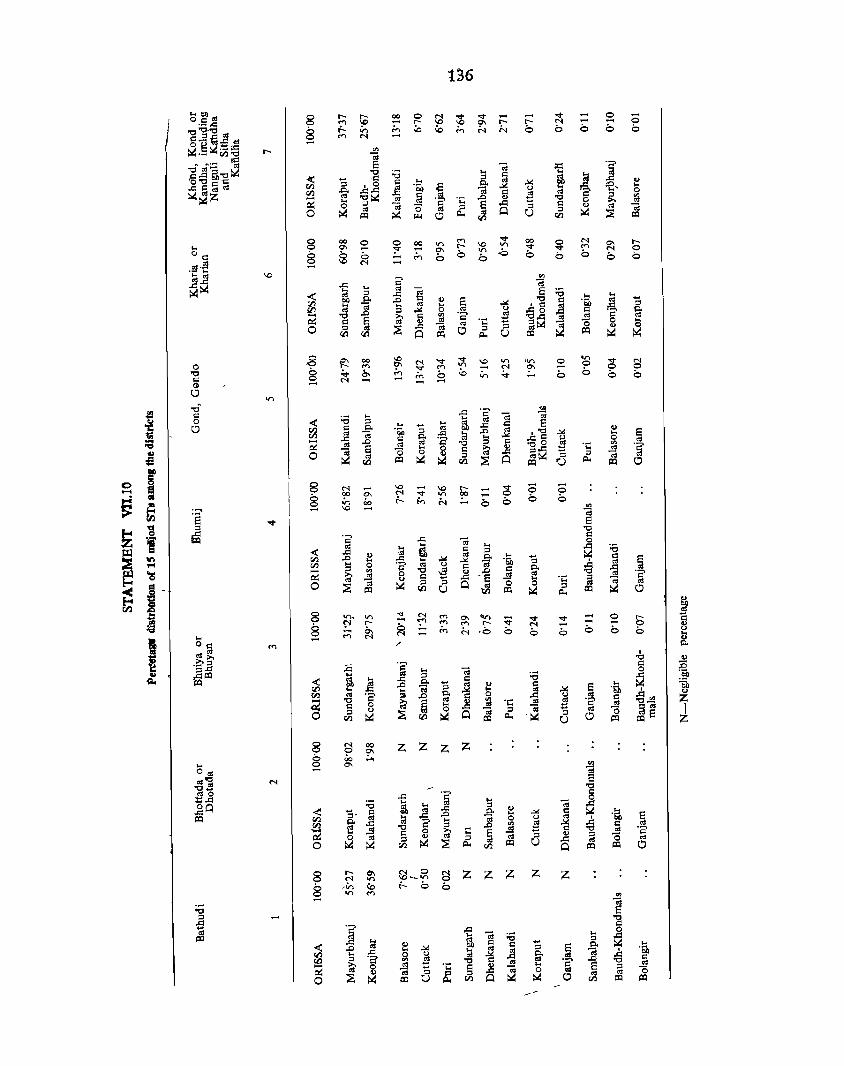
136
~~01 8 I"'- (Q 00 0 <"'I V V - - v - ~ 0 .-.c: .... - l"'- 'D 'D 0\ l"'- I"'- <"'I ..... ", -g.", 01 § t- or, M \0 \0 M N N 0 0 0 0 0 I':-~..c aI
.... <"'I -o g .t:::t:: I"'- <Il ~._ Vl", OJ
"ci= ~ a OJ .= .~ ~..<:l ~",~ 'g ;0 ... a ...
] « "'5 ::I gL ..c <> O"'d'l': ,0 ""
... ~ ~
.>0: 'e, ... ..<:ldalol Vl jg '5jj .>0: u ...
Vl ~ ..c..c e 01 .§' 0 ~~z ]~ a ..0
01 '0 ~ <Il ..... .... as .~ '0:; :g ~ ~ 0 OJ -0 ::I E ..c d ~ as
0 ~ aI
:><: j:I.., aI t:l CJ ::I ~ ~ Pol 0 Vl Vl ,:Q
8 00 0 0 00 .... -.:t 00 0 <"'I 0\ t-V> l"'- 'D V> -.:t .... ... 0'1 ~ Y ..... 0\ on .0 -.:t <"'I 0 °d 0 ~ <::> ..... M b b b b b b b b sg.;g ~ <"'I ..... .... .a 'D
i:i $
~~ ~ ... aI as ~ a ;a < ::I ..c ... ...
00 A ..0 <l) 8 .>0: ", d '5jj aI '5 ~ ... OJ ... as .. ,1:1 aI ;>=:
aI ::I .>0: 0 as u ..co ~ ~ '6' ~ .... ", ..0 ;>., "" '" '6' E 't:I..c ~ d 8 '"
.., ~ '" .. '5 ~::.: ~
0 .. 0 ::I aI ~ ..c ::I
., 0
Vl Vl t:l ,:Q 0 j:I.., CJ ,:Q ,:Q ~ ~
.8 ~ 00 'D <"'I "l" -.:t 'D on 'v> 0 V\ ~ N
0 .... 0\ .". .... V> ..... N 0\ ..... 0 0
", b ~ 0-, M M <::> \0 or, ~ - <::> <::> b b 0 5 ..... N ..... -0
II .a ..c '2 ... § ;a ... ... aI OJ OJ
u <: ::I .. gL 4:l 8 i 0 "" ~
... ... as ;>=: <> CIl ~
'5jj ::I ..c a ..0 '" _Q'g ~ ... e Vl ~ ... .>0: 0
:; ..... ..0 "" '2 ::I I': aI
~ aI '0 '0 0 '0::. '" .§' ~ 8 '0
... 0 1:1 ~ ~ aQ ~ as
~ 0 aI 0
~ ::I ::I ::I OJ ~ Vl ,:Q ::.: ell ~ t:l ,:Q 'U p., ,:Q 0
l1li = C> ~ 8 N ..... 'D
~ ''D I"'- ..... -.:t 0 0 ...... • b 00 0\ N on ~ ..... 0 b b
~ '" 0 or, 00 t- &, N <::> <::> '" H . ...., ..... 'D ..... OJ
rIl 's v e
~ 1:1
~ '0
Q . ...., d
'i "" ..c OJ 0
'" .. a :3 .... ..c ;a
f,;Q <: .c:: ,"" ::I ~ <l) ,.e. ... ... d §
~ It) IZl ..0 .. ..c ... .>0: .>0: '5jj ::I _Q
~ ... IZl !:l 0 '2 .@l u d '" A "S .... <Il ~ ..8 ..0 I': ", 0g
~ >. aI 0 I': '8 ~ '" '0::. ~ OJ '5 ... OJ '" OJ ::I t:l Q 0 = 0 ::E ~ .Jl ::I ~ 0 .,e- ,:Q Vl CJ ,:Q ~ j:I.., ,:Q
f-4 - 1ilJ C'Il ~ 8 ;::!; ~ on. on N .... 0\ <v> ..... ~ I"'-
! ..... ~ -.:t ;::!; 8 ~ I"'- 0
.... .... l"'- N ..... 0 ..... ,:,., ;.... M N ·0 b b <::> b 0 <:. u N ti
I ... - .... N °d ;' A
~~ . '0 ~ ._ .§
..Ci .~ d :So .. OJ 0 .. ~,:Q .... ::I ;a Q ~ ~ gL ... .c:: ,.e. ; l .f! ..0 ~ OJ 1:1 E 0Q ... .... tIS .>0: .... as ~ .Q", {/J '" '6' ::I ..0 A ] 0 ..c '" ; ..... ", ~ § aI '"
._ .a 2 '6' ",-« ""
0 E: .; .. ge i CI) ::I aI '0 0 ::I ~ ::E ~ Q p., .::.: ::I
" IZl Cll lXl CJ ,:Q ,:Q
8 ~ 00 z z z Z 0\ <:. 00 ;...,
'" ... 0 0\ 001 ..... OJ ",'10 13 ",s ", 010 .c:: .~
d ~.c:: .. 0
~Q ;a a ... ::I OJ §
~ "'5. I': os .c:: .e- <> .>0: 1:1 06L ..c ..0 .. 8 ,:Q aI a ... .2 0 u '" .Q i!l ~ ..c 6' ::I '" aI .>0: d '" 01 '0 0 ;>., 0::. E '" ~ 1:1 ", '" '2 ~ OJ 1:1 '" OJ CI) ::I '0 0 ::I ~ ::I ..c '"
aI 0 ~ ~ IZl ::E p., Jl ,:Q CJ Q ,:Q ,:Q 0
8 t- CI'I N 0 ~ z z z z Z N V> 'D_on
<:. ,or, \0 t- <:. <:. ~ V> ....
~ ;a .§
'2 "8 d ..c
OJ ... 0 ,:Q aI .... ti ;a :I Q <: ..c <l) "" d ...
~ ...
..0 aI ... .>0: aI ::I E '5jj .c:: ... ] :§ Vl .... 0 u aI ~ A aI Vl ::I '6' '" S ", '" '6' "8 1:1 ..... >. 0 ~
. _ I': ..8 ,:g ... ::I aI
~ '" "'5 ... aI 0 01 '0 ~ ~
::I '" as 0 ~ ,:Q CJ IZl t:l :><: ~ 0 Vl lXl lXl
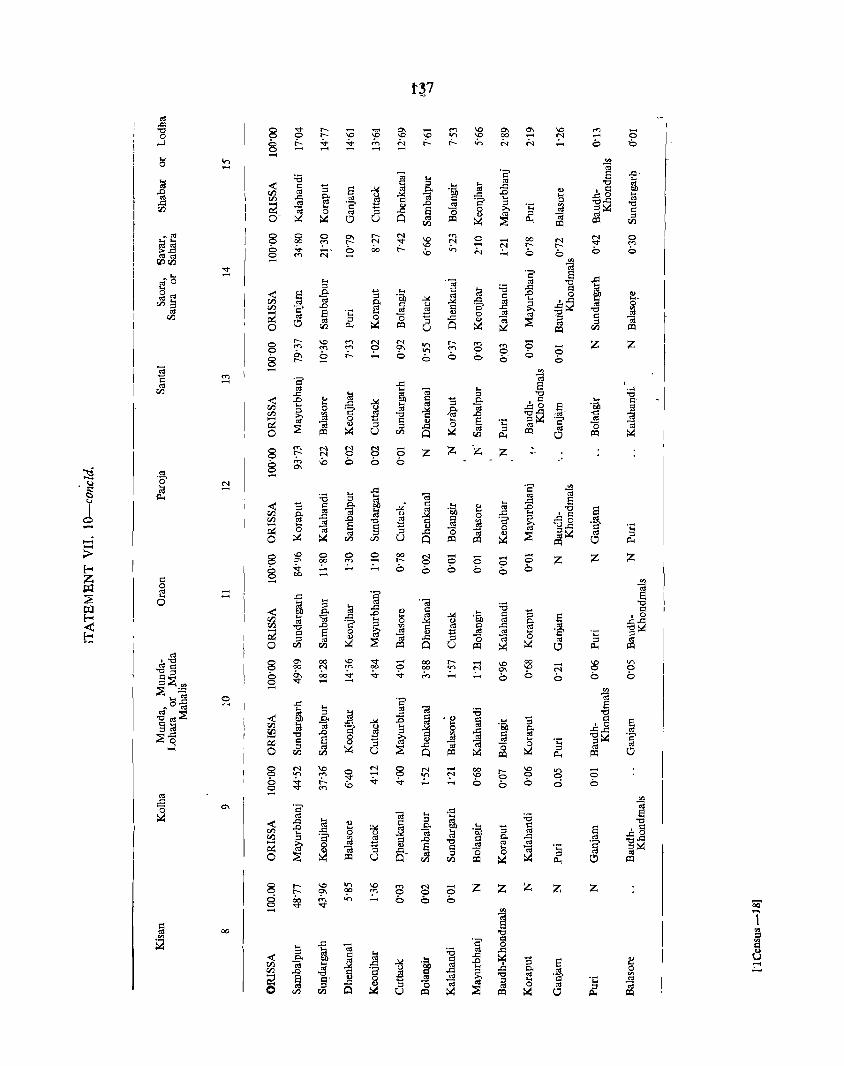
t~7
0:1 .c "'" t-- .... .." 0'1 ..., 10 0'1 0'1 10 ..., "0 8 G 0 0 0 t-- 10 10 10 .,., 10 00 .... ~ -...J 6 t-
"'" ~ ;.., ~ t- t- .;.., h h 6 -0 0 ...., ..... .... ....
$ " .,., ..... '" :a ";;j 'a- s .c. ,_, ,_,
l;J « ~ ::s a '" "0 ~ ~ ::; s ~ '" ~ .1: .c <I) ,§ .D ~ 0:1 ..><: Ill) .c .D .... ...
~ V'l .c f? '" s ~ Q 'a- '" 0 .c:.c " ...... oj ....... .D ~
::s Vl -g~ "0 ~ ~ ~ "
c ::; ... E 0 >. .;::
'" ~ '" .c ~ ~
:J ~ pa :s o~ ~ ~ 0 u ~ '" II:! Il-o V'l V'l II:!
-'" 8 0 0 0'1 "- N 10 "" 0 .... 00 ~ ~ 0
I aa 00 <;> t-- ~ "'" 10 N ....
~ t--...,
>..<:: 0 "'" ;::j' 0 00 t- \0 .;.., h 6 0 0 0 oj oj ~ ..., .... ....
'" ~'iJ ~ ;::!; 'a- s .rO ,_, .~ '" "0 ~ l .... ::s
Q ... :a ..<:: g 0", < E ..& ::; .... oj oj ~ .D bl) Q)
oj ..... V'l oj Po. '01 .!.( ..><: .c oj ... ;§~ a .....
V'l::s '" .D C (.) c '2 ..<:: ~ ~ V'l '2 '" '" S "0 0:1 ~ S .;::
" (3 <I) 0 ~ '" ~ ..$
r rn oj
'" ::s ::; .c ~ ~
':J ::s 01
'" ~ ~ '" 0 ~ p.., II:! U ~ II:! CZl II:!
"- \0 M $ N "- ..... 0 Z Z 0 M M M 0'1 .,.,
'" M .....
t
0 .,., 0 0 0
§ '" ~ t- o 0 0 b- e; 0 0 r-~ Vl
I:: M 'a- ~ ..... .c S '" oj .... ";;j 1:l ~
-I CZl .c .... £b "0 « .D .. '" ~
c ::; ~ ,c .... c' .... ..... .c ... oj .cO ,~ . '01 01 rn ::s 0 'a- £
oj 11 ,g. 'g~ ..:: .; rn >. ~ "0 .D ...... '"
0 ~ <I) ... E .;:: 'a- ~ ~ ~ ~ ~ ::s 0 '" ~ U ::s .c ~ 0:1 ::s II:!
oj ~ I 0 II:! rn ~ ~ Jl.< 0 ~
8 .....
~ M g 0 Z Z Z Z t-- 0
§ ;.., \0 " " " ~ 0'1
01
" '0' N 'a- ...
5 ~ ..... .... .c ~ ;.a .... ~ '" <.l Il-o ::s ~ ~ .... .c S
I < "5 ~ ..& .d ... .. til .D "0 ~ til 01 ..... til '01 .... .c .... rn §' 01 (.) ..><: 0 ,~
0 ~ .c ,.Q '0
~ ~ c
~ '2 ~ .co ...... til § ~ "O.c 'a- .;:: B C; ~ <I) 0 oj c.:: ::s .c C; ~ ;:;E ::s~ 01 ::s ..... 0 ~ ~ rn rn ~ II:! II:! ~ 0 p.., -;;> 8 \0 0 0 ~ 00 N ..... 0 0 0 Z Z Z '" 00 <;> t-- 0 0
!:-< 8 ~ ;... ;...
" (;> " " (;> (;> 00 ..... Z § - Vl
(,lJ ~ 01 o§ E ~ .... .c .c; 0 .... ~ ;.a "0
III « ~ Po. ] .c <I) c .... .... ~
!:-< .... "Cd .D (5 '" ..><: 'Ell j ::s E ,0 rn til 'a- ~ ..><: (.) Po. .c.c < CZl "0 "S ~ 5 0:1 a til 01 -g~ C2 0 :::: '" .... '2 .;::
t: Q
~ C; .c ::s "0 ~ 0 ::s oj ;:;E ~
til ::s 0:1 0 CZl rn II:! ~ U II:! 0 Il-o II:!
oj , '0
8 0'1 00 \0 "'" - 00 r- .... \0 00 .... '" V') oj~ 00 N M 00 0 00 V) <;'l 0'1 \0 N 0 0 "O;:l
" '" 00 ~ "r ~ M 2:> " 2:> 2:> (:;, §:a",
...... .... ~ "'" ...... .....
;:;;: :.:: .!!l • til ~ 'a- S ~..<:: .c ... C; • t'CS
~ oj :a "0 .aoj;:;E ::s a .c « Po. ~ • <I)
] ::; ~ E c~ ... C; .rl .!.( ,£:J t'CS 0 .1: Ji] rn 0:1 .~' () 5 ..><: gf Po. 0:1 ::S.c ~ '0 ~ ~ ~
~ oj
'g~ "g ;:;Eo ~ ~ >. ..s ~ 2 .... .;::
~ 0:1
~ .....l ::s oj ;:;E 0 ::s oj 0 rn rn U ~ II:! II:! Il-o II:! 0
g ~ \0 ~
N g N .... 00 t-- \0 V') .... ..., .... .,., ~ \0 0 0 0 0 0
"'" t- \0 ~
"'" ;... .... 0 0 0 0 0
0 "'" ..... ~
.... til
'a- ~ (3 0'1 ..<:: E ~ 0:1 ] .... .... :a .c .... <I) ::s \lb '0 < '" ~ ~ .... .... c E Ji§ V'l
,.Q ..<:: " '" .... '6iJ :::t til .... () ..><: rn :::t 'a- gj ~ ~ ,£:J 01 C Po. .c 0:1 "O.c ...... >. 0 <I) S "0 til '" 0:1 'a- ~~ c.:: ~ c .... ~ ...
~ ~ ::s B' (3 0 0:1
0 II:! U '" ::s ~ ~
::s C!i II:! ~ rn II:! Il-o
0 t-- \0 .,., \0 M 8 .... z z z z z 0 r:-- 9' 00 <;> 0 0
0 00 ..... .;.., ..... 0 0 0 OQ 0 "'" "'" ..... '" 1 ] ~
'" 0:1 00 "0 ;:I '" 'a- S '" ~ ,_, ] Oi ;.a 0:1
~ .8 < ::s ~ ,_,
..<:: ..& Oll 01 11 ..><: .... ~ ,.Q "5 S <I) ..... CZl 0:1 .... ..><: .~ til .... Ji ....
rn '" '8' ~ .c Po. 0:1 0 .;:_, ,.Q '0 C ::s "0 01 '" ~ ~ "'. .8 ~
0:1 ~ ::I .... 'a- ... ~ ~ .... ::s ~ ;:;E 01 0 0:1 Ii! rn V'l CI U II:! ~ II:! ~ 0 II:!

Growth rate of SCs
The growth rate of SCs has not kept pace with that of the general population in quite a few states during 1961-71. While for India as a whole and states like Madhya Pradesh ~nd Mysore, the decline in the growth rate as compared to the general population has been marginal, is it Is rather pronounced in states like Andhra Pradesh, Assam, Himachal Pradesh, Kerala, Manipur, Orissa, Rajasthan and Tamil Nadu. Among the remaining states, Gujarat, Haryana~ Jammu & Kashmir, Maharashtra, Meghalaya, Punjab and Tripura have higher rates than the growth rate of their general population. ' Statement VI!.I) gives the growth rate of SCs among states as compared to the general population from 1961-71.
STATEMENT VII. 11 Growth rate of SCs (1961-71) for India and states '
Growth rate (1961-71) Unit
,-___ .A.-___ -,
Scheduled General Castes population
1 2 3
INDIA +24'20 +24'80
1. Andhra Pradesh +16'10 +20'90
2. Assam* +24'76 1+34'71
3. Bihar +22'25 +21'31
4. Gujarat +33'51 +29'39
5. Haryana +38'98 +32'23
6. Himachal Pradesh +19'~3 +23'04
7. Jammu & Kashmir +34'19 +29"65
8. Kerala +2~51 +26'29 I
9. Madhya Pradesh +28'23 +~'67
10. Maharashtra +35'87 . +27'45
11. Manipur +22'43 +37'53
12. Meghalaya ·208'25 +31'50
13. Mysore +23'51 +24'22
14. Nagaland +39'88
15. ORISSA +19'79 +25'05
16. Punjab +34'64 +21'70
17. Rajasthan +21'31 +27'8'3
18. Sikkim +29'38
19. Tamil Nadu +20'57 "'-F22-30
20. Tripura +61'09 +36'28 .. 21. Uttar Pradesh +20'45 +19'78
22. West Bengal +27'95 +26'87
* Includes Mizo district which now forms the uni~n territory of Mizoram.
138
Growth rate of STs
The all-India average growth rate of STs is distinctly at a higher level than that recorded by the general population. Similar is the case with Andhra Pradesh Gujarat, Keral, Rajasthan and Tamil Nadu. Haryana' Jammu & Kashmir, P~njab and Sikkim contain n; ST popUlation. Turning to the other end of the scale, the faU in rate of growth among STs in Tripura during the last decade (1961-71) is pronounced. Except Assam, the fall in growth rate is fairly more pronounced in Bihar, Himachal Pradesh, Madhya Pradesh, Maharashtra, Manipur, Meghalaya, Mysore, Nagaland, Orissa and West Bengal.
STAT:E:MENT VII. 12 Growth rate of STs (1961-71) for India and states
Growth rate (1961-71) Unit
,-____ .A. ____ -,
Scheduled General Tribes population
1 2 3
INDIA +25"99 -24'80
1. Andhra Pradesh +25'17 +20'90
2. Assam* +34'67 +34'71
3. Bihar +17'32 +21'33
4. Gujarat +35'58 +29'39
5. Haryana +32'23
6. Himachal Pradesh +15'76 +23'04
7. Jammu & KasJunir +29'65
8. Kerala +26'60 +26'29
9. Madhya Pradesh +25'59 +28'67
10. Maharashtra +23'24 +27"45
11. Manipur +34'30 +37'53
12. Meghalaya +27'39 +31'50
13. Mysore +20'39 +24'22
14. Nagaland +33'14 +39'88
15. ORISSA +20'08 +25'05
16. Punjab +21'70
17. Rajasthan +32'92 +27'83
18. Sikkim +29'38
19. Tamil Nadu +23'62 +22'30
20. Tripura +25'13 +3~'28
21. UttarPradesh +J9'78
22. West Bel1gal +23'31 +26'B7
of Mizo di, tramdistriet which now forms the union territory of Mizaram ___ -

Growth rate of SCs among districts
Except for Cuttack and Koraput, the growth rate of scheduled castes duri.ng 1961-71 is lower than that of the general population in all the districts, Cuttack and Koraput account for 20'88 and 8'28 per cent of the total scheduled castes population of the state, Among the other districts the decline in growth rate is fairly well pronounced in Sundargarh, Keonjhar, Mayur_ bhanj, Dhenkanal, Bolangir, Kalahandi and Puri. In the districts of Ganjam, Balasore and Sambalpur, the declining trend also seems well set, Of these districts, perhaps the worst case is that of Mayurbhanj which contains 3'13 per cent of the total SC population of the state, Against a 19'12 per cent growth rate registered by the general popUlation of the district, its SC population showed a negative growth rate of (-) 0'54 per cent, In Keonjhar, against 28'55 per cent growth rate for the general popUlation, it is only 4'70 per cent for the SCs, The relative fall in rate in the districts of Sundargarh, Dhenkanal and Kalahandi is similarly pronounced,
STATEMENT VII, 13
Growth rate of general and SC popUlation during 1961-71 in state and districts
Unit
1
----,---
ORISSA Sarobalpur SUndargarh Keonjhar Mayurbhanj Balasore Cut tack Dhenkanal Baudh-Khondmals Bolangir Kalahandi Koraput Ganjaro Puri
---Growth rate of
~---_,A.. _____ ..,
General scheduled population caste
population
2 3
+25'05 +19'79 i-22' 29 +17'56 1-35'87 +13'07 +28'55 +4'70 +]9'12 - -0'54 +29'28 -t-27'01 +24'96 +26'15 +26'04 +15'89 -t-20'85 +18'70 +18'24 +11'21 +22'92 -+- 4'53 +30'89 +47'03 +22'50 +18'48 +25'51 +19'73
-Growth rate of STs among districts
One notices a similar decline in the growth rate of STs as compared to the general population though the extent of decline does not seem as depressing as in the case of SCs. Only the districts
139
of Balasore, Cuttack and Puri exhibited a growth rate higher than that of the general population' But all these districts together account for only 6'44 per cent of the total ST popUlation of the state, It is true that none of the districts has recorded a negative growth rate for the STs du~ing the decade, but in districts like Sundargarh, Dhenkanal and Kalahandi, the fall in growth rate is marked. Sundargarh (53'40) and Kalahandi (29'26) contain a high percentage of ST population, In Dhenkanal, it is 12'91 per cent,
STATEMENT VII, 14
Growth rate of general and ST popUlation during 1961-71 in st ate and distric ts
Growth rate of Unit
~ ____ --A---____ ..,
General Scheduled population tribe
population
2 3
---- ---- -
ORISSA -+-25'05 +20'08 Sambalpur -I- 22'29 +18'12 Sundargarh -t-3S'87 +24'83 Keonjhar +28'55 +28'05 Mayurbhanj +19'12 +15'08 Balasore +29'28 + 34'57 Cuttack +24'96 +28-98 Dhenkanal +26'04 +16'39 Baudh-Khondmals t20'85 +17'07 Bolangir +18'24 +12'77 Kalahandi +22'92 +1'61 Koraput +30'89 +26'18 Ganjaro +22'50 +21'78 Puri +25'51 +28'33
Growth rate of major SCs
In the above background, it may be worthwhile to examine the growth rate of individual scheduled castes particularly those whose population in a district is more than 100,000, In Cuttack district, Pan or Pano, Kandra or Kandara and Bauri has more than 100,000 population each, Their growth rates during 1961-71 is 14'53, 22'07 and 24'49 respectively against the growth rate of 24'96 for the general popUlation as a whole, In Puri, against a 25'51 per cent growth rate for the general population, the Bauris who are fairly strong in the district recorded a growth rate of 19'35 per cent, In the districts of Kalahandi and Koraput against the general population growth rate of 22'92 and 30'8, respectively, the Dom, Dombo or Duria Dom registered rates as low as 15'62 and 19'05 respectively, The decline in growth rate is marked among Ganda in the districts of Bolangir and Samba1pur where they are

l~O
fairly populous. In these distriCts, against a' 'general -growth rate -of 18'24 and 22-29 respectively, this caste :iecor'ds a growth rate of (-) 4'10 and 0-89 per cent 'respectively,
STATEMENT VII, 15
Growth rate of SCs having more than one lakh population in the districts
District
Cuttack
Puri
Kalahandi
Koraput
Sambalpur
Bolangir
Cuttack
1
Dhenkanal
.,
.,
--
Caste
2
... Bauri
Bauri
Growth rate (1961-71)
3
+24'49
+19-35
Dam, Dombo or Duria +15-62 Dom
Dom, Dombo or Duria +19-05 Dom
Ganda +0-89
Ganda -4-10
Kandra or Kandara +22-07
Pan or Pano +14'53
Pan orPano +13-77
Growth rate of major STs
Turning to, the tribes in Koraput district, the Bhottada or Dhotada, Khond, Kond or Kandh!l including Nanguli Kandha and Sitha Kandha and Paroja record a growth rate of 20-94, 12-10 and 34-77 respectively as against a 30-89 per cent growth rate of general population of Koraput_ Bhottada 9f Dhotada and Khond, Kond or Kandha including Nanguli Kandha and Sitha Kandha have registered a much lower growth rate than that of the general population. Similarly in the district of Kalahandi, the Gond, Gondo and Khond, Kond or Kandha including Nanguli Kandha and Sitha
,Kandha record a growth fate of 35'54 and (-) 10'57 per cent respectively as against 22'92 per cent for the general population. While Khond, Kond or Kandha 'including _Nanguli Kandha and Sitha Kandha have .recorded a Jaw growth rate in the I~tricts of BaudhKhondmals (12'22 per cent) gnd Koraput (12'10 per
'cent)" their: negaj:ive growth, rate in 'the -district of Kalahandi is'in a .way· pltenonienal. How much -of this differenti!ll growth rate' bf the same. tribe 'in" adjoining districts can be ascribed t6· the. 'tnitisfer of Kashipur tahsil from Kalahantli ~istr.ict .to Koraput district during the de,cade (1961-71)= and how milch tne rest 'to
. other factors requlres"'study: Anotlier· instance of negative :growth rat.e seenIs to be that of Mundas in
Sundargarh. Mundas and' Oraons, the two most .preponderant tribes in Sundargarh district, have recorded growth rateS of (...:._) 2'30 and 22' 5Trespectively as against .the· relatively high 'geheral' population rate of 35'87 per cent. The Santals and Kolhas of Mayurbhanj have gone up by 5'64 per,. cent and 15'69 per cent respec-ively. The growth rate of the general population in
_this district during the last decade (1961-71) is 19'12 per cent. The Santals constitute one of the major tribes of Orissa. The Kolhas of Keonjhar have recorded a growth rate of 264'67 per cent as against 28'55 for the general population in the district. The same tribe, on the other hand, registered a growth rate of 15'69 per cent in the district of Mayurbhanj. There ,are three tribes, in the Scheduled Tribes Lists (Modification) Order bearing the names Kol, Kolah-Kol-Loharas and Kolha. Their respective population in Keonjhar in 1961 were 46,180, Nil and 31,71.5 as against 329 (Kol), 683. (Kolah-Kol~Loharas) and 115,655 (Kolha) in 971. A part at least of this high growth rate of Kolhas in Keonjhar may be attributed to erroneous classification of these tribes ·bearing almost similar names. The ~aora, Savar, Saura or Sahara of Ganjam record a moderately high growth rate of 24'07 per cent as against 22'50 for the general population of the district.
STATEMENT VII. 16 Grow h rate of STs having more than one Jakh population
in the districts
District
Koraput Kalahandi Baudh-Khondmals
Kalahandi ..
Koraput
Keonjhar
Mdyurbhanj Sundargarh
• :{(.or_!lp~t
. Maytirbhanj,
Ganjam
Tribe Growth rate (1961-71)
2 3
Bhottada or Dhotada +20'94 Gond, Gondo +35'54 Khond, Kond or Kandha +12'22
including Nanguli , Kandha and Sitha
Kandha Khond, Kond or Kandha -l.o·S7
including Nanguli Kandha and Sitha Kandha
Khond, Kond or Kandha +12'10 including Nanguli Kandha and Sitha Kandha
-Kolha +264'67
Kolha +15'69 Munda -2'30
, 'oraon. +22'57
ParoJa +34'77
Santal +5'64
Saora, Savar,- Saura or +24'07 S~~ap~, : ;:
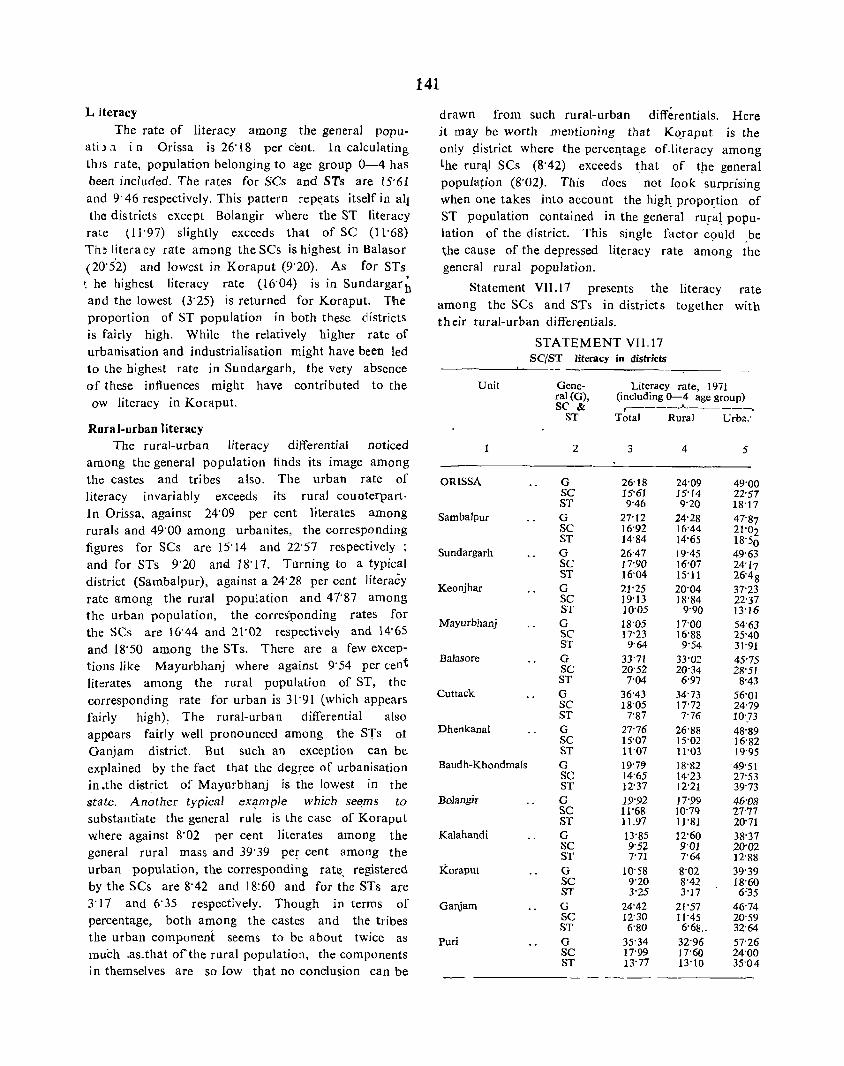
Literacy
The rate of literacy among the general popuati) ,1 in Orissa is 26'18 per cent. In calculating thts rate, population belonging to age group 0-4 has been included. The rates for SCs and STs are 15"61 and 9' 46 respectively. This pattern rep~ats itself in all the districts except Bolangir where the ST literacy rate (11'97) slightly exceeds that of SC (11'68) Th~ literacy rate among the SCs is highest in Balasor (20'5'2) and lowest in Koraput (9'20). As for STs \ he highest literacy rate (16'04) is in Sundargarb and the lowest (3'25) is returned for Koraput. The proportion of ST population in both these districts is fairly high. While the relatively higher rate of urbanisation and industrialisation might have been led to the highest rate in Sundargarh, the very absence of these influences might have contributed to the ow literacy in Koraput.
Rural-urban literacy The rural-urban literacy differential noticed
among the general population finds its image among the castes and tribes also. The urban rate of literacy invariably exceeds its rural counterpart· In Orissa, against 24'09 per cent literates among rurals and 49'00 among urbanites, the corresponding figures for SCs are 15'14 and 22'57 respectively; and for STs 9'20 and 18'17. Turning to a typical district (Sambalpur), against a 24'28 per cent literacy rate among the rural population and 41'87 among the urban population, the corresponding rates for the SCs are lu'44 and 21'02 respectively and 14'65 and 18'50 among the STs. There are a fewexceptions like Mayurbhanj where against 9'54 per cent literates among the rural population of ST, the corresponding rate for urban is 31'91 (which appears fairly high): The rural-urban differential also appears fairly well pronounced among the STs 01 Ganjam district. But such an exception can be explained by the fact that the degree of urbanisation in .the district of Mayurbhanj is the lowest in the state, Another typical ex?mple which se(}_ms to substantiate the general rule is the case of Koraput where against 8'02 per cent literates among the general rural mass and 39'39 pe~ cent among the urban population, the corresponding rate. registered by the SCs are 8'42 and 18:60 and for the STs are 3'11 and 6' 35 respectively. Though in terms of percentage, both among the castes and the tribes the urban component seems to be about twice as much .as_that of the rural population, the components in themselves are so low that no conclusion can be
141
drawn from such rural-urban differentials. Here it may be worth mentioning that Kqraput is the only pistrict where the percel1tage of-literacy among the rur~l SCs (8'42) exceeds that of tpe general population (8"02). Tbis does not look surprising when one takes into account the high, propo~tion of ST population contained in the general ru!a~ population of the district. This single factor could be the cause of the depressed lit~racy rate among the general rural population.
Statement VII.l7 presents the literacy rate among the SCs and STs in districts together with th eir rural-urban differentials.
STATEMENT VU.!7 SC/ST literacy in districts
Unit Gene- Literacy rate, 1971 ral(G), (including 0-4 age group) SC' & r-----..A---------,
ST Total Rural Urba:
2 3 4 5
ORISSA G 26'18 24'09 49'00 SC 15'61 15'14 22'57 ST 9'46 9'20 18'17
Sambalpur G 27'12 24'28 47'87 SC 16'92 16'44 21'°2 ST 14'84 14'65 18'50
Sundargarh G 26'47 19'45 49'63 SC 17'90 16'07 24'17 ST 16'04 15'11 26'48
Keonjhar G 21'25 20'04 37'23 SC 19'13 18'84 22'37 ST 10'05 9'90 13'16
Mayurbhanj G 18'05 17'00 54'63 SC 17'23 16'88 25'40 ST 9'64 9'54 31'91
BaJasore G 33'71 33'02 45"75 SC 20'52 20'34 28'51 ST 7'04 6'97 8'43
Cuttack G 36"43 34'73 56'01 SC 18'05 17'72 24'79 ST 7'87 7'76 10}3
Dhenkanal G 27'76 26'88 48'89 SC 15'07 15'02 16'82 ST 11'07 11'03 19'95
Baudh-Khondma1s G 19'79 18'82 -49'51 SC 14'65 14'23 27'53 ST 12'37 12'21 39'73
Bolangir G 19'92 17'99 46'08 SC 11'68 10'79 27'77 ST 11.97 11'81 20'71
Kalahandi G 13'85 12'60 38'37 SC 9'52 9'01 20'02 ST 7'71 7'64 12"88
Koraput G 10'58 8'02 39'39 SC 9'20 8'42 18'60 ST 3'25 3'17 6:35
Ganjam G 24'42 21'57 46'74 SC 12'30 "'45 20'59 ST 6'80 6'68., 32'64
Puri G 35'34 32'96 57'26 SC 17'99 17'60 24'00 ST 13"77 13'10 35'04
-- -~--
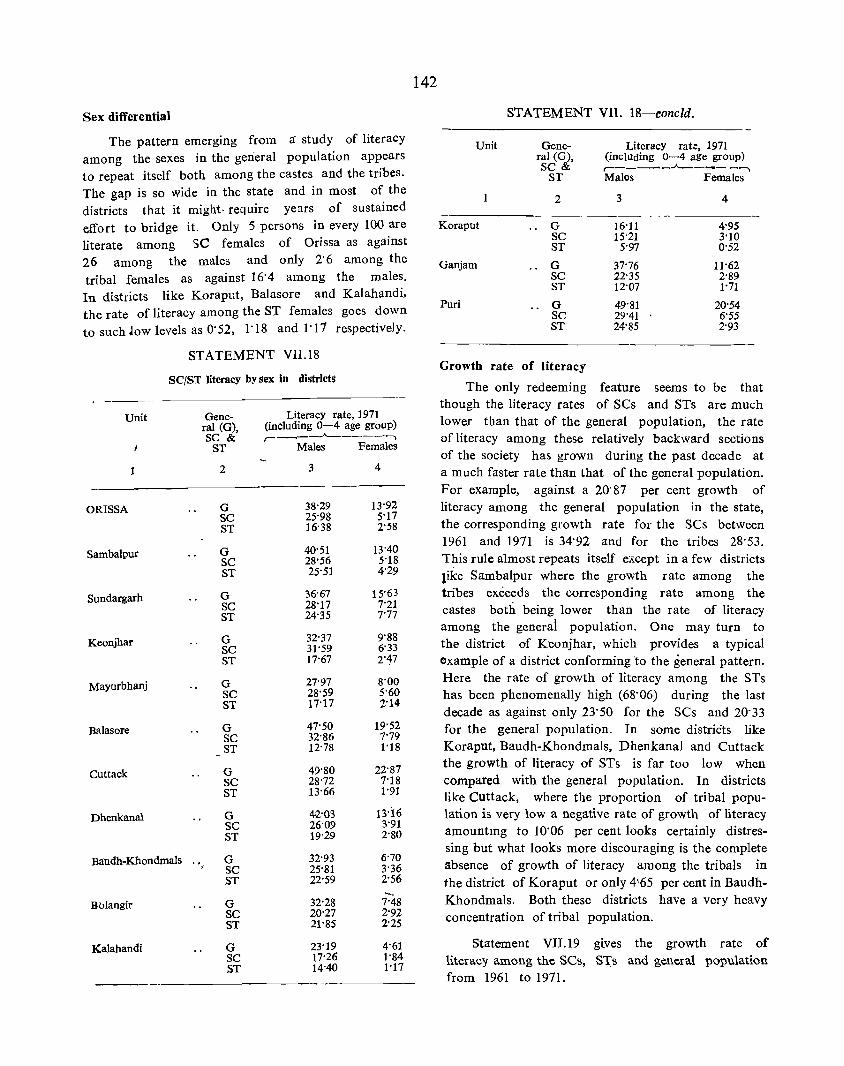
Sex differential
The pattern emerging from a: study of literacy among the sexes in the general population appears to repeat itself both among the castes and the tribes. The gap is so wide in the state and in most of the districts that it might- require years of sustained effort to bridge it. Only 5 persons in every 100 are literate among SC females of Orissa as against 26 among the males and only 2'6 among the tribal females as against 16'4 among the males. In districts like Koraput, Balasore and Kalahandi, the rate of literacy among the ST females goes down to such~ow levels as 0'52, 1'18 and 1'11 respectively.
Unit
1
ORISSA
Sambalpur
Sundargarh
Keonjhar
Mayurbhanj
Balasore
Cuttack
Dhenkanal
STATEMENT VII.18
SCjST literacy by sex in districts
General (G), SC &
ST
2
G SC ST
G SC ST
G SC ST
G SC ST
G SC ST
G SC ST
G SC ST
G SC ST
LiteracY rate, 1971 (inCluding 0-4 age group) ,-_--.A.-----...
Males Females
3 4
38-29 13'92 25'98 5'17 16'38 2'58
40'51 13'40 28'56 S'18 25'51 4'29
36-67 15'63 28'17 7"21 24'35 7'77
32'37 9'88 31'59 6'33 17'67 2'47
27'97 8'00 28'59 5"60 17'l7 2'14
47'50 19'52 32'86 7'79 12'78 1'18
49'80 22'87 28'72 7'18 13'66 1'91
4-2'03 13'16 26'09 3'91 19'29 2'80
Baudh-Khondmals ", G SC ST
32'93 25'81
6'70 3'36
Bulangir
Kalahandi
G SC ST
G SC ST
22'59
32'28 20'27 21'85
23'19 17'26 14"40
2'56
--7'48 2'92 2'25
4'61 1'84 1'17
142
STATEMENT VII. 18-concld.
Unit Gene- Literacy rat:, 1971 ral (0), (including 0-4 age group) SC &
,-_____ .A. _____ ......
ST Males Females
1 2 3 4
Koraput 0 16'11 4'95 SC 15'21 3'10 ST 5'97 0'52
Ganjam .. G 37'76 11'62 SC 22'35 2'89 ST 12"07 1'71
Puri G 49'81 20'54 SC 29'41 6'55 ST 24'85 2'93
Growth rate of literacy
The only redeeming feature seems to be that though the literacy rates of SCs and STs are much lower than that of the general population, the rate of literacy among these relatively backward sections of the society has grown during the past decade at a much faster rate than that of the general population. For example, against a 20'87 per cent growth of literacy among the general population in the state, the corresponding growth rate for the SCs between 1961 and 1911 is 34'92 and for the tribes 28'53. This rule almost repeats itself except in a few districts like Sambalpur where the growth rate among the tribes exceeds the corresponding rate among the castes both being lower than the rate of literacy among the generai population. One may turn to the district of Keonjhar, which provides a typical example of a district conforming to the general pattern. Here the rate of growth of literacy among the STs has been phenomenally high (68'06) during the last decade as against only 23'50 for the SCs and 20'33 for the general population. Tn some distriCts like Koraput. Baudh-Khondmals, Dhenkanal and Cuttack the growth of literacy of STs is far too low when compared with the general population. In districts like Cuttack, where the proportion of tribal population is very Iowa negative rate of growth of literacy amountmg to 10'06 per cent looks certainly distressing but what looks more discouraging is the complete absence of growth of literacy among the tribals in the district of Koraput or only 4',65 per cent in BaudhKhondmals. Both these districts have a very heavy concentration of tribal population.
Statement VII.19 gives the growth rate of literacy among the SCs, Srs and general popUlation from 1961 to 1971.
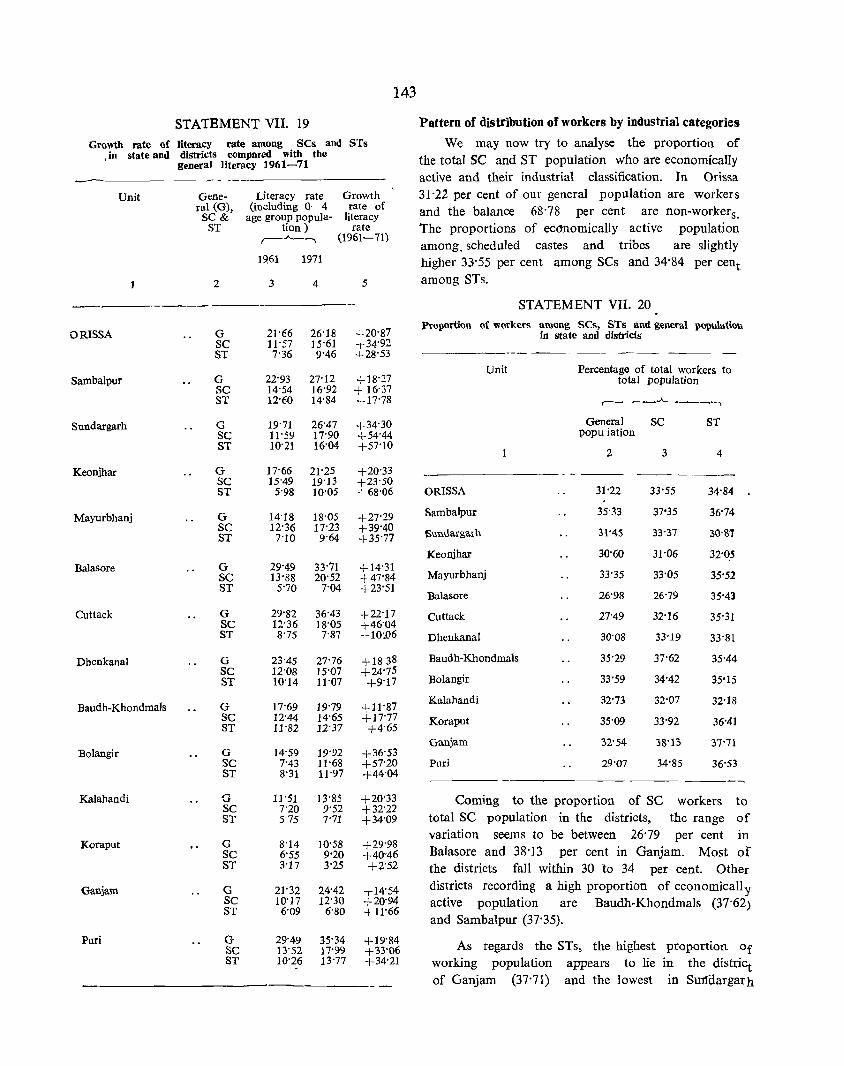
143
STATEMENT VII, 19
Growth rate of literacy rate among SCs and STs ~ in state and districts compared with the
general literacy 1961-71
Unit
ORISSA
SambaJpur
Sundargarh
Keonjhar
Mayurbhanj
Ba1asore
Cuttack
Dhenkana1
Baudh-Khondmals
Bo1angir
Kalahandi
Koraput
Ganjam
Puri
-- --------------General (G), SC&
ST
2
G SC ST
G SC ST
G SC ST
G SC ST
G SC ST
G SC ST
G SC ST
G SC ST
G SC ST
G SC ST
{J
SC ST
G SC ST
G SC ST
G SC ST
Literacy rate (including 0-4
age group population) ,_.A._......,
Growth rate of
literacy rate
(1961-71)
19.61 1971
3
21'66 11-57 7-36
22-93 14-54 12-60
19-71 11-59 10-21
17-66 15-49
5-98
14-18 12-36
7-10
29-49 13-88
5-70
29-82 12-36 8-75
23-45 12-08 10-14
17-69 12-44 11-82
14-59 7-43 8-31
11-51 7'20 5-75
8'14 6-55 3-17
21-32 10-17
6-09
29-49 13"52 10'26
4
26-18 15"61 9-46
27-12 16-92 14-84
26-47 17-90 16'04
21-25 19-13 10-05
18'05 17-23 9-64
33-71 20-52
7-04
36-43 18-05 7-87
27-76 15-07 11-07
19-79 14'65 12-37
19-92 11-68 11-97
13-85 9-52 7-71
10-58 9'20 3-25
24-42 12-30
6'80
35-34 17'99 13'77
5
+20-87 -r 34-92 +28-53
+18-27 + 16-37 _17-78
+34-30 +54-44 +57-10
+20-33 +23-50 +68'06
+27'29 +39-40 +35-77
+14'31 -+ 47'84 +23'51
+22-17 +46-04 -10:06
+1838 +24-75 +9'17
+11-87 +17'77 +4-65
+36'53 +57'20 +44'04
+20'33 +32'22 +34-09
+29'98 +40"46 +2'52
-r14-54 +20'94 -t 11-66
+19-84 +33-06 +34'21
Pattern of distribution of workers by industrial categories
We may now try to analyse the proportion of the total SC and ST population who are economically active and their industrial classification_ In Orissa 31-22 per cent of our general population are workers and the balance 68-78 per cent are non-workers, The proportions of economically active population among, scheduled castes and tribes are slightly higher 33'55 per cent among SCs and 34-84 per cent among STs_
STATEMENT VII, 20
Proportion of workers amcng SCs, STs and general population in state and districts
Unit
ORISSA
Sambalpur
SUlldargarn
Keonjhar
Mayurbhanj
Balasore
Cuttack
Dhenkanal
Baudh-Khondmals
Bolangir
Kalahandi
Koraput
Ganjam
Puri
Percentage of total workers to total population
General SC popu iation
2 3
31'22
35'33
31-45
30-60
33-35
26-98
27"49
30-08
35-29
33'59
32'73
35-09
32-54
29'07
33'55
37-35
33-37
31'06
33'05
26'79
32'16
33-19
37'62
34'42
32'07
33'92
38-13
34-85
ST
4
34-84
36'74
30-S1
32-~S
35'52
35'43
35-31
33'81
35'44
35-15
32'18
36'41
37-71
36'53
Coming to the proportion of SC workers to total SC population in the districts, the range of variation seems to be between 26-79 per cent in Balasore and 38'13 per cent in Ganjam_ Most of the districts fall within 30 to 34 per cent. Other districts recording a high proportion of economically active population are Baudh-Khondmals (37-62) and Sambalpur (37'35),
As regards the STs, the highest proportion Of working population appears to lie in the district of Ganjam (37'71) and the lowest in Sundargarh
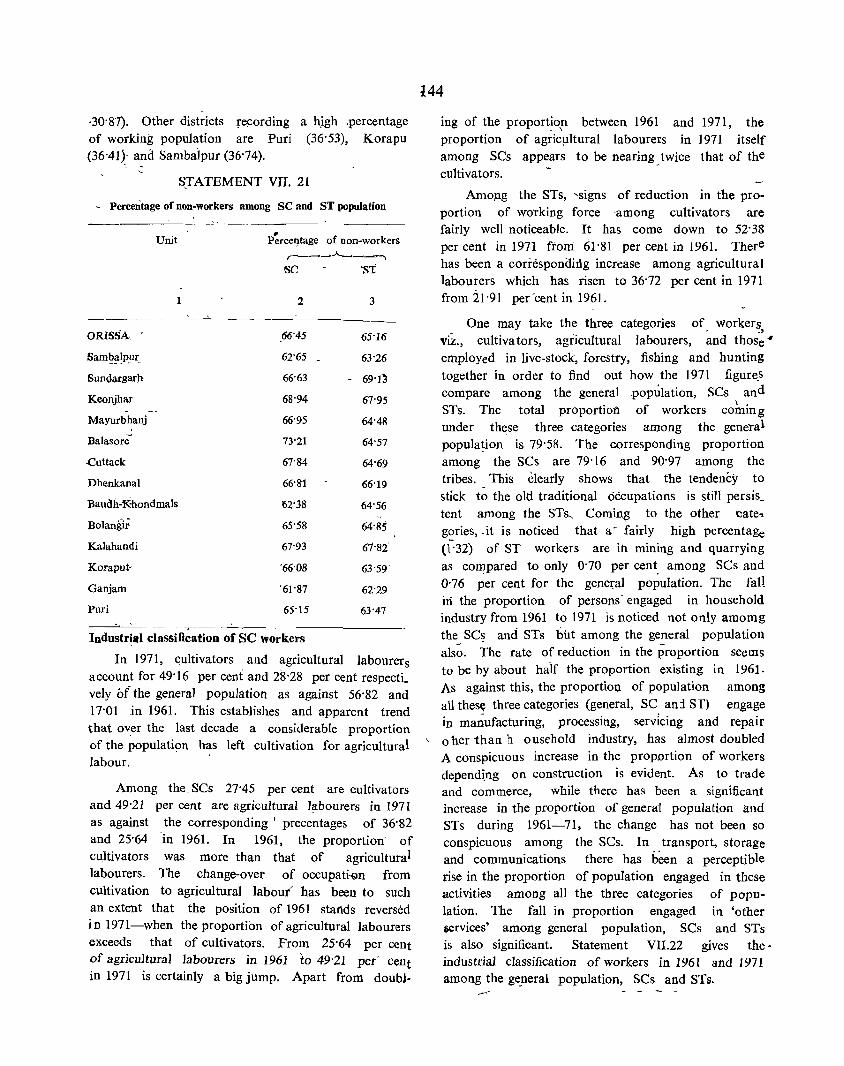
,30'87). Other districts re~ording
of working population are Puri (36'41~,- a~a Sambalpur (36'74).
a h,igh ,percentage (36'53), Korapu
SJ'ATEMENT VII. 21
- Percentage of non-workers among SC and ST population
ORISSA
SamIJ~!ppr_
SunQargar)l
Keonjhar
Mayurbhanj
Balasore
Unit
.cuttack
Dhenkanal
Baudh-~hondmals
Bolangi;
Kalahandi
Koraput:
Ganjam
Puri
P~rceJ?tage of non-workers r--~-"---~~......,
Be 'st
2 3
.66'45 65'16
62'65 - 63'26
66'63 - 69'f~
68'94 67-95
66'95 64'48
73'21 64'57
67'84 64'69
66'81 66'19
152'38 64'56
65'58 64'85
67'93 61-82
'66'08 63'59
'61'87 62'29
65'15 63'47
Industrial classification of SC workers
In 1971, c;ultivators and agricultural labourers account for 49'16 per cent and 28'28 per cent respectL vely of the general population as against 56'82 and 17'01 jn 1961. This establishes and apparent trend that over the last decade a considerable proportion of the populati9n has left cultivation for agricultural labour.
Among the, SCs 27'45 per cent are cultivators and 49'21 per cent are agricultural labourers in 1971 as against the corresponding I precentages of 36'82 and 25'64 -in 1961. In 1961, the proportion' of cl!ltivators was more than that of agricultural labourers. The change-over of occupatioogn from cultivation to agricultural labour' has been to such an extent that the position of 1961 stands reversed in 1971-when the proportion of agricultural labourers exceeds that of cultivators. From 25'64 per cent of agricultural labourers in 1961 to 49'21 per' cent in 1971 is certainly a big jump. Apart from doub)-
144
iug of the proportiop between 1961 and 1971, the proportion of agric!lItural labourers in 1971 itself among SCs appears to be nearing, twice that of the cultivators,
Amopg the STs, 'signs of reduction in the proportion of working force among cultivators are fairly well noticeable. It has come down to 52' 38 per cent in 1971 fiom 61'81 per cent in 1961. There has been a corresponding increase among agricultural labourers which has risen to 36'72 per cent in 1971 from 21'91 per 'cent in 1961.
One may take the three categories of worker~,
viz., cultivators, agricultural labourers, and thOSe #
employed in live-stock, forestry, fishing and hunting together in order to find out how the 1971 figure,S compare among the general .population, SCs and
\ . STs, The total proportion of workers comIng under these three categories among the_ general popula~ion is 79'58. The corresponding proportion among the SCs are 79'16 and 90'97 among the tribes, This clearly shows that the tendency to stick to the old traditional occupations is still persis_ tent among the STs, Comin~ to the other cate .. gories, .it is noticed that a- fairly high percentage (1-'32) of ST workers are ih mining and quarrying as compared to only 0'70 per cent, among SCs and 0'76 per cent for the gene(al population, The fall iIi the proportion of persons-engaged in household industry from 1961 to 1971 is noticed not only amomg the SC~ and STs but among the general population als~, The rate of reduction in the proportion seems to be by about haif the proportion existing in 1961· As against this, the proportion of population among aU thes~ three categories (general, SC anj Sf) engage in ma~ufacturing, processing, serVIcing and repair o her than 11 ousebold industry, has almost doubled A conspicuous increase in the proportion of workers depend~ng on construction is evident, As to trade and commerce, while there has been a significant increase in the proportion of general population and STs during 1961-71, the change has not been so conspicuous among the SCs. In transport, storage and communications there has b~en a perceptible rise in the proportion of population engaged in these activities among all the three categories of population. The fall in proportion engaged in 'other services' among general popUlation, SCs and STs is also significant. Statement VII. 22 gives the· industrial classification of workers in 1961 and 1971 among the geperal population, SCs and STs.
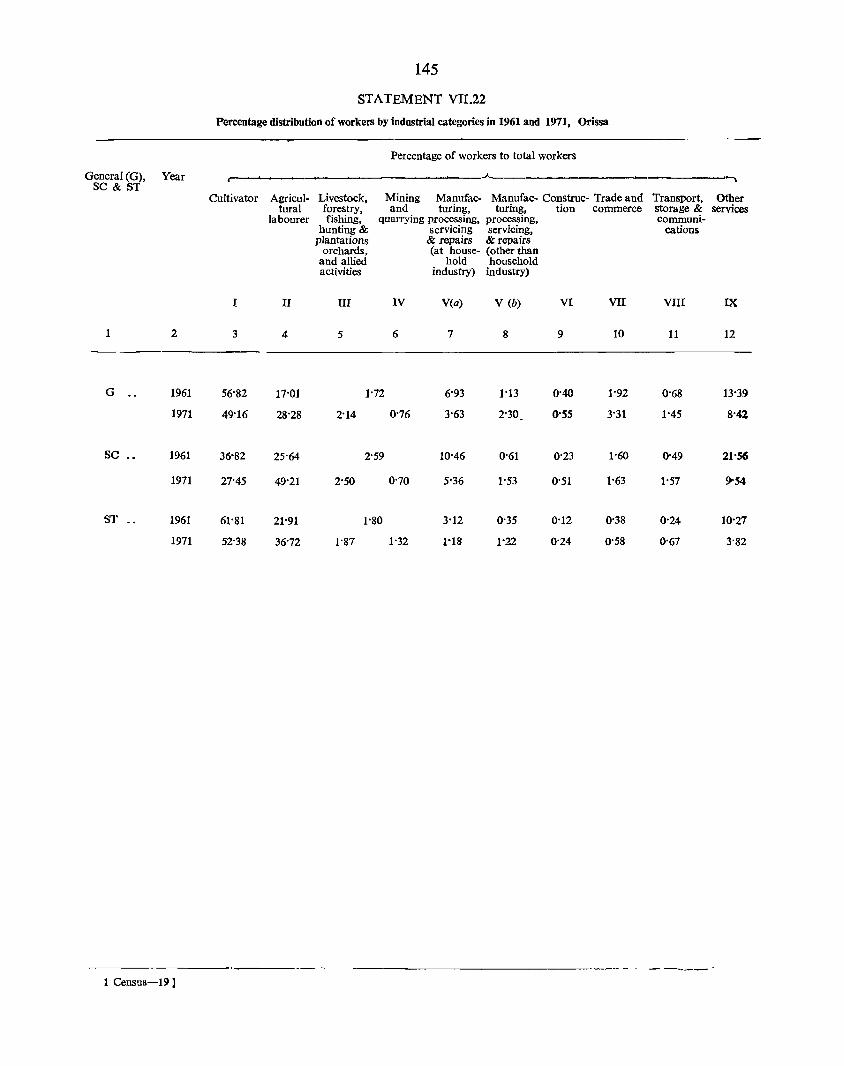
145
STATEMENT VII.22
Percentage distribution of workers by industrial categories in 1961 and 1971, Orissa
Percentage of workers to total workers
General (G), Year SC & ST
.A__ "l
Cultivator Agricul- Livestock, Mining Manufac- Manufac- Construc- Trade and Transport, Other tural forestry, and turing, turing, tion commerce storage & services
labourer fishing, quarrying processing, processing, communi-hunting & servicing servicing, cations
plantations & repairs & repairs orchards, (at house- (other than
and allied hold household activities industry) industry)
I II III IV V(a) V (b) VI VII VIII IX
1 2 3 4 5 6 7 8 9 10 11 12
G .. 1961 56'82 17'01 1'72 6'93 1'13 0'40 1'92 0'68 13'39
1971 49'16 28'28 2'14 0'76 3'63 2'30 0'55 3'31 1"45 8'41
SC •• 1961 30'82 25'64 2'59 10'46 0'61 0'23 1'60 0'49 21'56
1971 27'45 49'21 2'50 0'70 5'36 1'53 0'51 1'63 1'57 !)o54
ST .• 1961 61'81 21'91 1'80 3'12 0'35 0'12 0'38 0'24 10·27
1971 52'38 36'72 1'87 1'32 1·18 1'22 0'24 0'58 0'67 3'82
---------------_. __ .- -- - - ----1 Census-I9 I

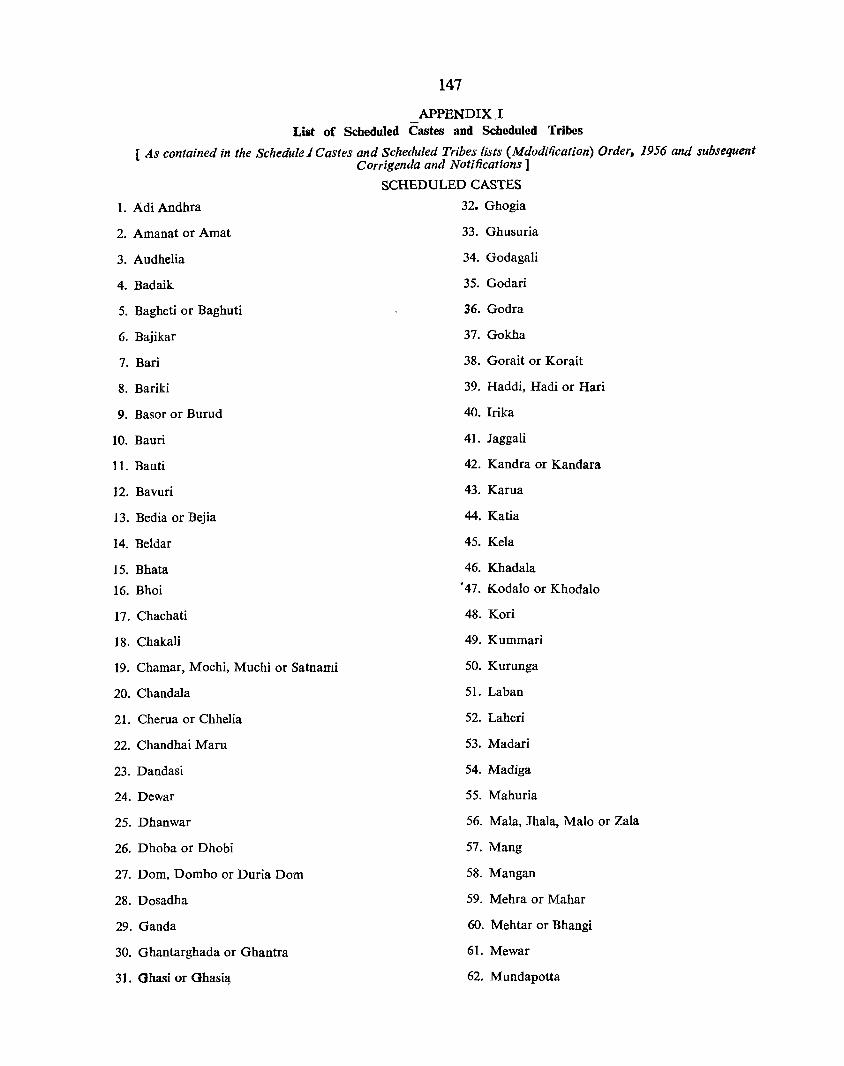
147
APPENDIX.I List of Scheduled Castes and Scheduled Tribes
[ As contained in the Schedule J Castes and Scheduled Tribes lists (Mdodification) Order, 1956 and subsequent Corrigenda and Notifications]
SCHEDULED CASTES
1. Adi Andhra 32. Ghogia
2. Amanat or Amat 33. Ghusuria
3. Audhelia 34. Godagali
4. Badaik 35. Godari
5. Bagheti or Baghuti 36. Godra
6. Bajikar 37. Gokha
7. Bari 38. Gorait or Korait
8. Bariki 39. Haddi, Hadi or Hari
9. Basor or Burud 40. Irika
10. Bauri 41. Jaggali
11. Bauti 42. Kandra or Kandara
12. Bavuri 43. Karua
13. Bedia or Bejia 44. Katia
14. Beldar 45. Kela
15. Bhata 46. Khadala
16. Bhoi • 47. Kodalo or Khodalo
17. Chachati 48. Kori
18. Chakali 49. Kummari
19. Chamar, Mochi, Muchi or Satnami 50. Kurunga
20. Chandala 51. Laban
21. Cherua or Chhelia 52. Laheri
22. Chandhai Maru 53. Madari
23. Dandasi 54. Madiga
24. Dewar 55. Mahuria
25. Dhanwar 56. Mala, Jhala, Malo or Zala
26. Dhoba or Dhobi 57. Mang
27. Dom, Dombo or Duria Dom 58. Mangan
28. Dosadha 59. Mehra or Mahar
29. Ganda 60. Mehtar or Bhangi
30. Ghantarghada or Ghantra 61. Mewar
31. Ohasi or Ohasi!j. 62. Mundapotta
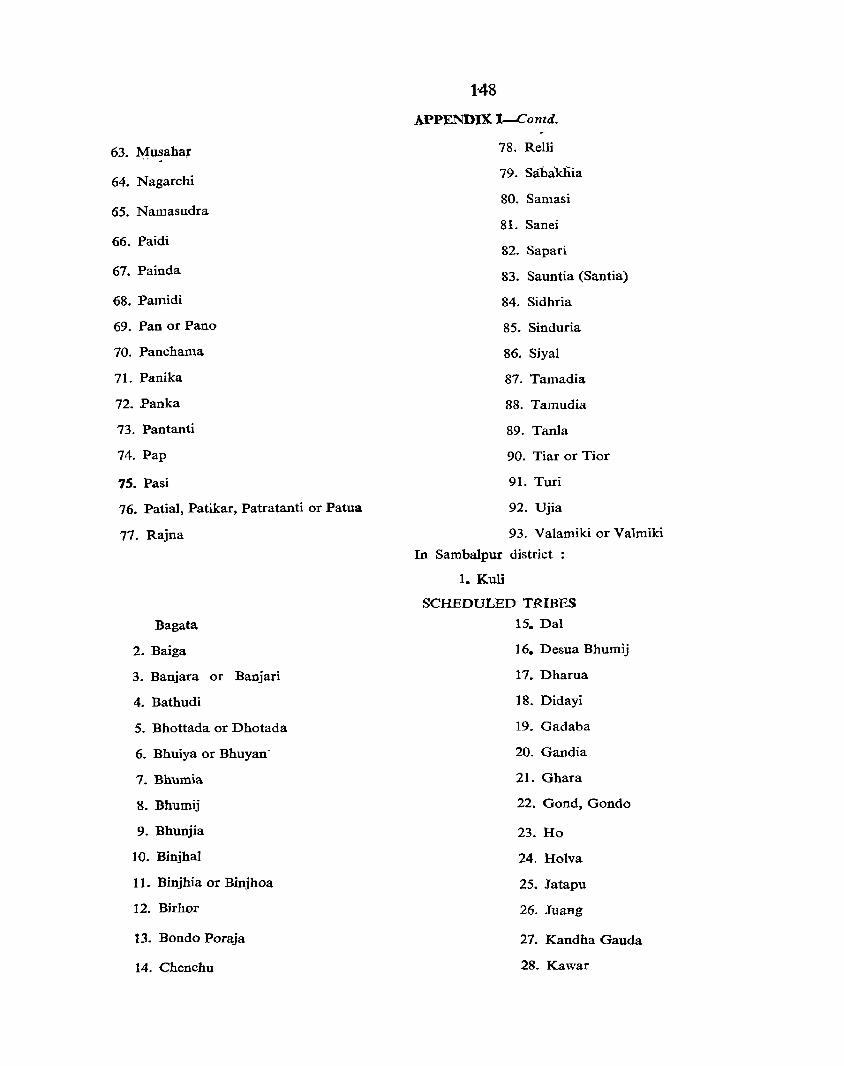
63. ¥u~ahaf
64. Nagarchi
65. Namasudra
66. Paidi
61. Painda
68. Pamidi
69. Pan or Pano
70. Panchama
11. Panika
72. Panka
73. Pantanti
74. Pap
75. Pasi
76. Patial, Patikar, Patratanti or Patua
77. Rajna
Bagata
2. Baiga
3. Banjara or Banjari
4. Bathudi
5. Bhottada or Dhotada
6. Bhuiya or Bhuyan-
1. Bhumia
8. Bhumij
9. Bhunjia
10. BinjhaJ
11. Binjhia or Binjhoa
12. Birhor
13. Bondo Poraja
14. Chenchu
148
APPENDIX l-Co ntd.
78. Relli
79. Sabaknia
80. Samasi
8l. Sanei
82. Sapari
83. Sauntia (Santia)
84. Sidhria
85. Sinduria
86. Siyal
81. Tamadia
88. Tamudia
89. TanIa
90. Tiar or Tior
9l. Turi
92. Ujia
93. Valamiki or Valmiki
In Sambalpur district
1. Kuli
SCHEDULED TRIBES
15. Dal
16. Desua Bhumij
11. Dharua
18. Didayi
19. Gadaba
20. Gandia
21. Ghara
22. Gond, Gondo
23. Ho
24. Holva
25. Jatapu
26. Juang
27. Kandha Gauda
28. Kawar
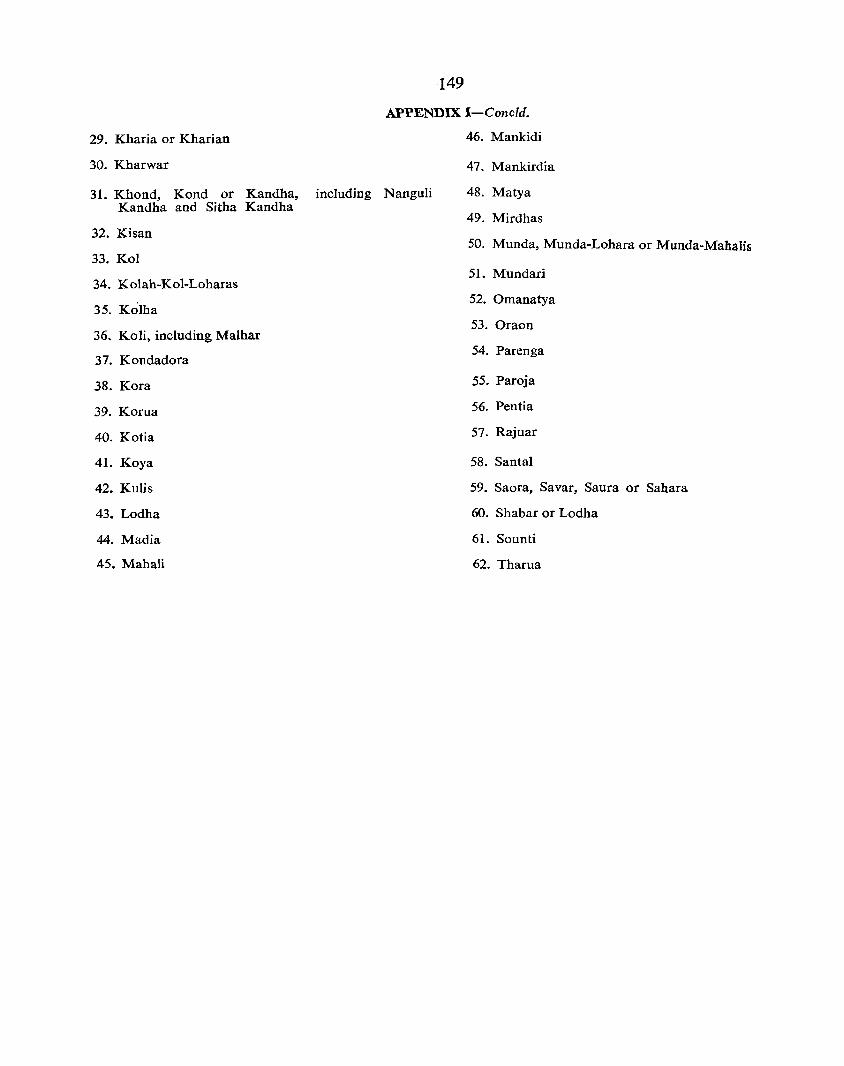
149
29. Kharia or Kharian
APPENDIX I-Concld.
46. Mankidi
30. Kharwar
31. Khond, Kond or Kandha, including Nanguli Kandha and Sitha Kandha
32. Kisan
33. Kol
34. Kolah-Kol-Loharas
35. Kolha
36. Koli, including Malhar
37. Kondadora
38. Kora
39. Korua
40. Kotia
41. Koya
42. Kulis
43. Lodha
44. Madia
45. Mahali
47. Mankirdia
48. Matya
49. Mirdhas
50. Munda, Munda-Lohara or Munda-Mahalis
51. Mundari
52. Omanatya
53. Oraon
54. Parenga
55. Paroja
56. Pentia
57. Rajuar
58. Santa!
59. Saora, Sayar, Saura or Sahara
60. Shabar or Lodha
61. Sounti
62. Tharua

..... .....
o
co
tN
N
co '-0 00
..... .....
N
150
'tl = .... = t:Q .... o .... o ~
t:Q
'" 00
00
00 \0
~
-OC)
00 v
"0 -
N 00 .....
..... tV'>
N o ("4.,
o 0\
co &
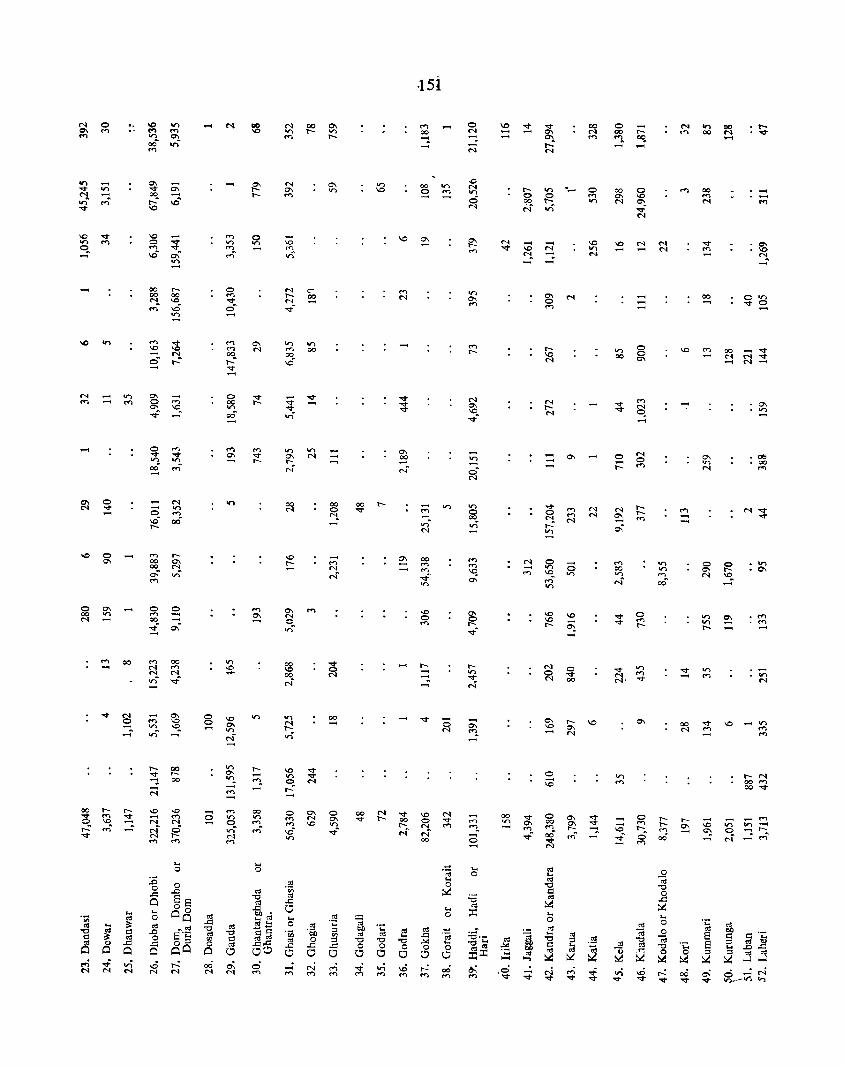
M 0 0\ ..... .....
....
o ""'" ....
o 0\
00
j ~
.... :::t 0\ V) ....
00 ...... 00 00
N '" ('f"')'" ~ .,.,
r- 00 "<t ,_ ~ 00 .... M
.... o
... M
g ....
.... o -
00 N
.,., I.e> -
o V)
0\ N
.... o
N 0\ .....
00 N
I.e> r....
.,., 00
"<t ....
.... ....
00
~ ....
00 ....
00 "<t
0\ 00 .... oN
.... V) ..... .... ~f
I.e> o .....
.... o
00 M
o N ....
.,., o 00 v)
.... ,., ""!. .... o .... .... o
00 V)
0\ \0 ...
25 on
\0
.,., 00
.... .... \0
~ ....
o \0 0'1
~
....
.-;
o o 0\
0'1
N M
,..._ ,..._ <'l 00
<"l .... ....
00 M
00 ...., M
00
0'1 In M
o 0'1 M
00 M ...
0"" ",,"0
.-;
.... .,., M
,..._ M 00 .....
00 """
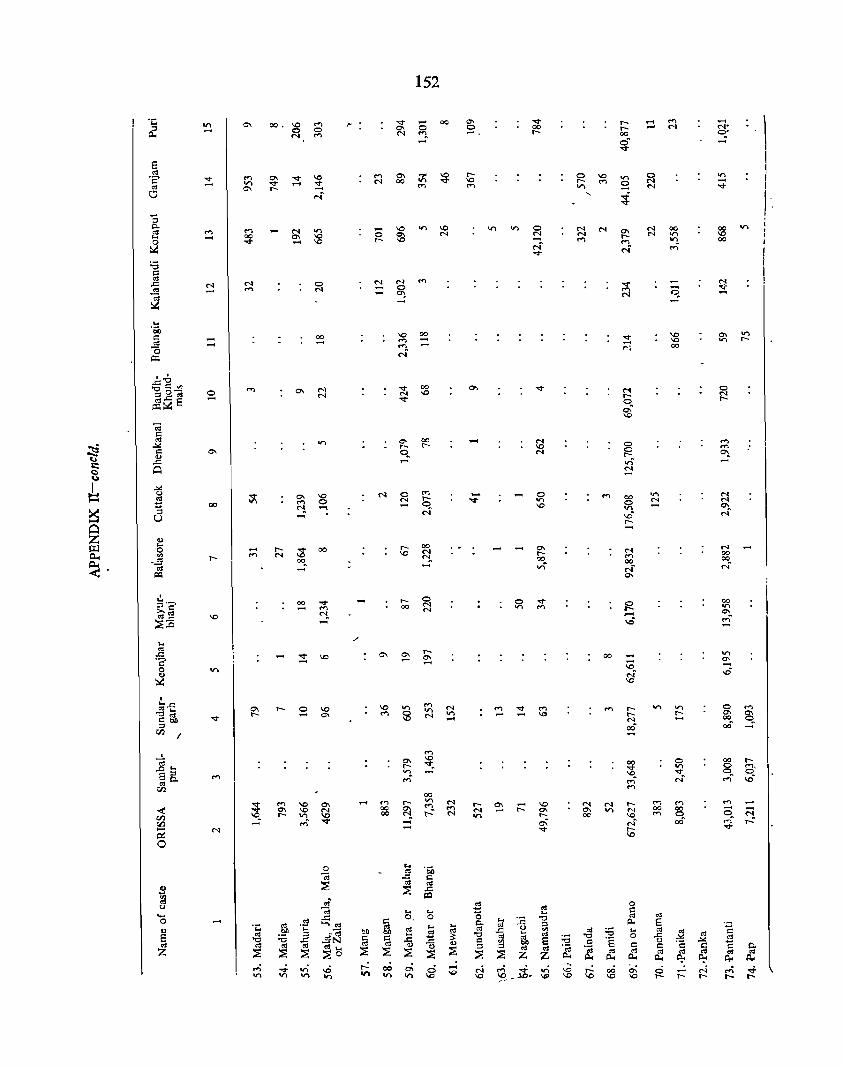
v ....
M ....
.... ....
00
M 00 v
r-
..., 0\ r-
v ....
00 ....
.,., 10 10
o N
00 .....
00
""" 1.0 ....
.... o r-
N .... ....
M 00 00
00 on
0\ 00
152
1.0 00 M .... ..., ..... N
rOO
0\ .....
r-~ .... ....
.... 0,
oj .... -'5 ::E 0\ .,.,
00 10
00 1".
00 N "!. .....
r-0\ ....
00
N on .....
Cl'\ o -.
--..,.
M ....
0\
o on
.... r-
oj .... "0 ::s ~ e oj
z :a .~
' . 10 1.0
o ron
N 0\ OC
oj "0 CI
.~
...: 1.0
10 M
00 .... .... 10
~
r.... N 00'
.... .....
10 10 00
V) .... -
M 00 o 00
00 V)
10 00
N 00 00 N
o 0\ 00 00'

153
on .,.. N .,.. 00 '"""
V'I
~ 00 \0 .,., .... ~
.,.. '<i' .... S; 0\ 0, ~
.,., 00
.... on -<'l II") .., ~ ...,. or;
<'l
'<i' .... 00 '" .... ~ t- <'l \0 N 0 ....
00 0\ <'l 00 II") 00 ~ on
":. ...... '<i'
<'l
.... 00 .... ", . 0\.
.... M
~ 'It ~ <'l .... r- oo 00 ~
0\ \0
<'l 0- .... .... r-. '"
.... '" N
..; tr\
~
0\ <'l 0\ on t-
'<i' N r-\0 ...... ....
N '""" .... N <'\ ..... '" on 00 ....
..... '" .... '" .... ..... IN ·00 "l.
\0 C'I
..., ~ 00 <'l \0 ~
V ,...., ~ ~ .., "' . V)
00 .... t-
...... § .... .... 00 00
\0 .... 0 0
\0
.... .... '<I;. M .., 0\ ..... 'Ii .>, .... '"i3 0
0 '<i' .... 0 ~
on on .... '" v ~ 0, N G
~
N N on 0, 00 .... ... .... r-
N -..... II") v 0,. .... \0 t-• ;~ ..... M t- "" '" ...
::l ,.e. os
.... 8 0, .... on ....
Cl'I 0\ ...... ...... 0 .... '" .0
.... '<t V) t- oo '<i' M $ 8
V'I ..., \0 V N .... ....
ri !i t-.:' '" rJ'J ....
,Q
• \0 lQ '" .... .... V> 0 0 ~ '""" rt:l
r- M '" V 00
on .... "!. or; M 00
v5 ....
.... .... \0 t- $ ...... t- N .... V '"
8. ~
00 <'\ \0 00
'"! I/) \0
,...., N ...,
'" .... I/) v 00 ~ t- r- I/) I/) \0 V N I/) ....
.... .... on ,...., <'l .... "<j-
on .,., V
\0 M 00 N \0 M
M. \0
0 00 on .,.,
'It \0 on
V V <'l ~
.,., 00
00 0 \0 on "l. N M ...... ..; ~
~ .... .... ~. \0 \0 it .... <'l \0 '"
on N 0 N 0 00 00 .... '<i' \0 0,
00 .... \0 0 '<i' on 0 M \0 '" '" '" \0 00 ~ .,., v
'<i'. 0\ 0\ .,., V V) ~ '1. on "'. V ..; V on 0').
'<i' ~ .... <'l .,.; '" M ..; ... ..... '\0
..., ..... .... ..... ,...., N M
<'l
:.;4
~a 5~
~ ll'!e;
--. >-'" '';::
8 0';:: c:: ... ...
0 <'l
...:Ia '" 0 1
"'0; o~ ~
o~ .!!J '" f:=; :;; 'd ."
..c Ow .:! .:1:! ~ ... o~
... a O_~
~ ...: .~
... '" os 0 ~
I ... ",
~ £ '" 00 i:l ... ::> <ii
os ·c :;; 8 ..c: '" 8 8 ] ~ '"
u a ",0.., o~ '"
C ~ :l :g C >. ::> § "; ;g 8-
." JJ os "i ~ ~ b f-
0.., 0.., ~ :n IZl r;I: <Il <Il rJ5 rJ5 E-< E-< >- ~ a -4 ...: 00 0\ ...; ,;. .,;. .,.; ..0 r-: ~ ~ 0\ N . 0
~
!:! t- o M C> .... ..
r- ro- r- oo 00 ex: 00 00 00 0<- 00 0- '" 0\
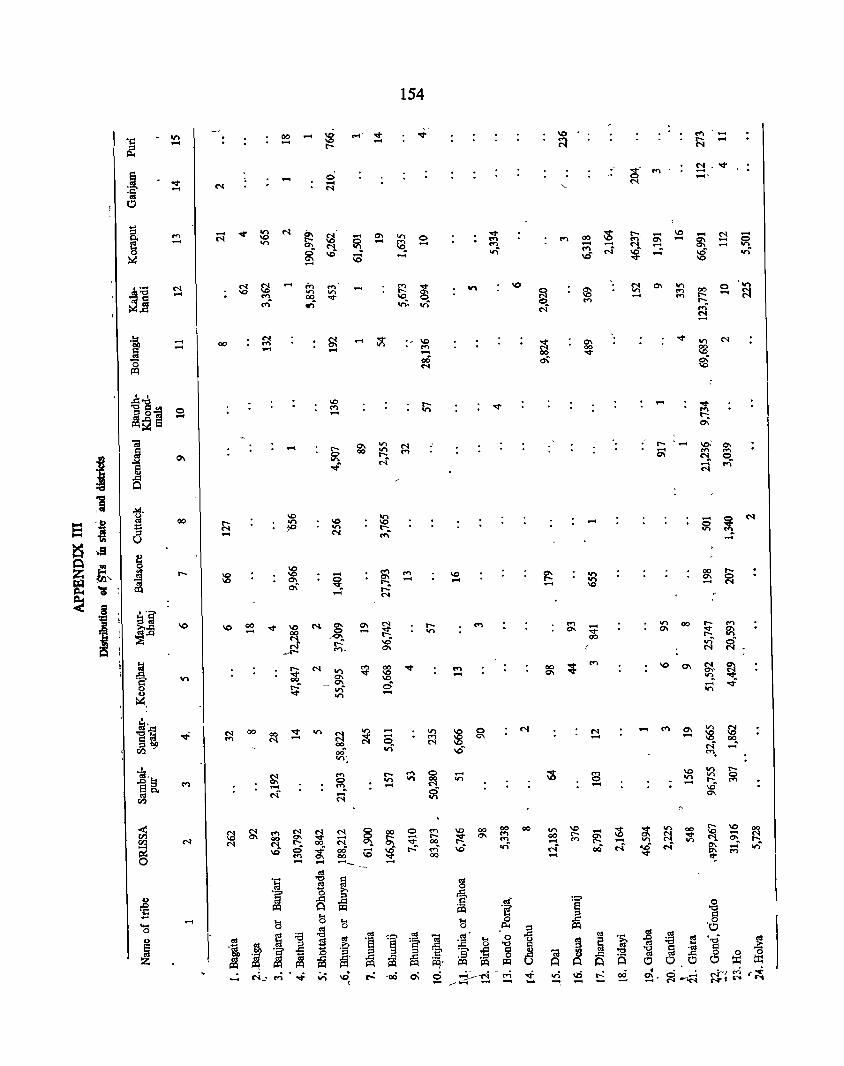
I ,1
<') ....
N ....
.... ....
o ....
00
....
r
.... N
00
N -
00 ....
00
00 ....
....
....
v ....
o .... N
ID <') ....
C1\ -
.... .,., -~ ~ 00 ....
00
~ 00 ID -_ -
.~ ~~ ..c:: ..c:: P=l P=l r-: ·00
154
o ....
. .
ID -
.... VI
00 C1\
00 <') .... .,.;
00
00 C1\
VI 00 .... N ....
00 $ .... .... ~ N
....
N ....
,.., o ....
.... ~ 00
VI C1\
ID ....
00
<') 0\ ....
00 0\ -
-....
N .... ....
o ....
S N
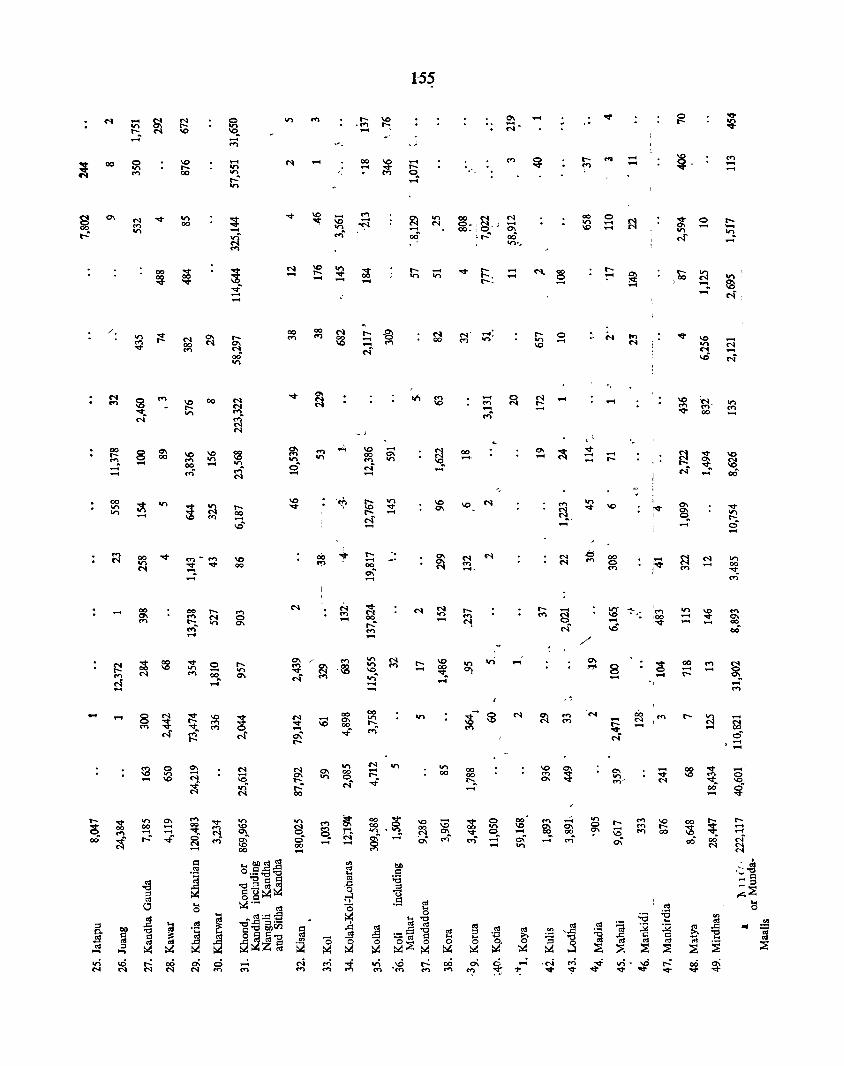
co
- -
'I) 00 .... r-:
'" 00
'I) 00
00
! .... ....
\0 00
.... \0
00 0'1 00 ~
r..... 00
0\ .....
1-55
,.J
..... q .....
r.....
..... 'I)
\0
'"
'I) 00
,',
00 -
o :9. .... .....
.... ....
00' \0 .... 0\ .,..
r- 0 an _ \0
C\ -
, ,
,.
, ' v -.....
o .... ....
r....
"
....
8 ....
--
'_
I
"'" I
r)00
.,.. .... ....
co .... r-
co \0
o ....
N .... 00
M ....
.... ....
.... .... ....
.... t'l .... <'i
.... ~ o .... .... .... o
~
..
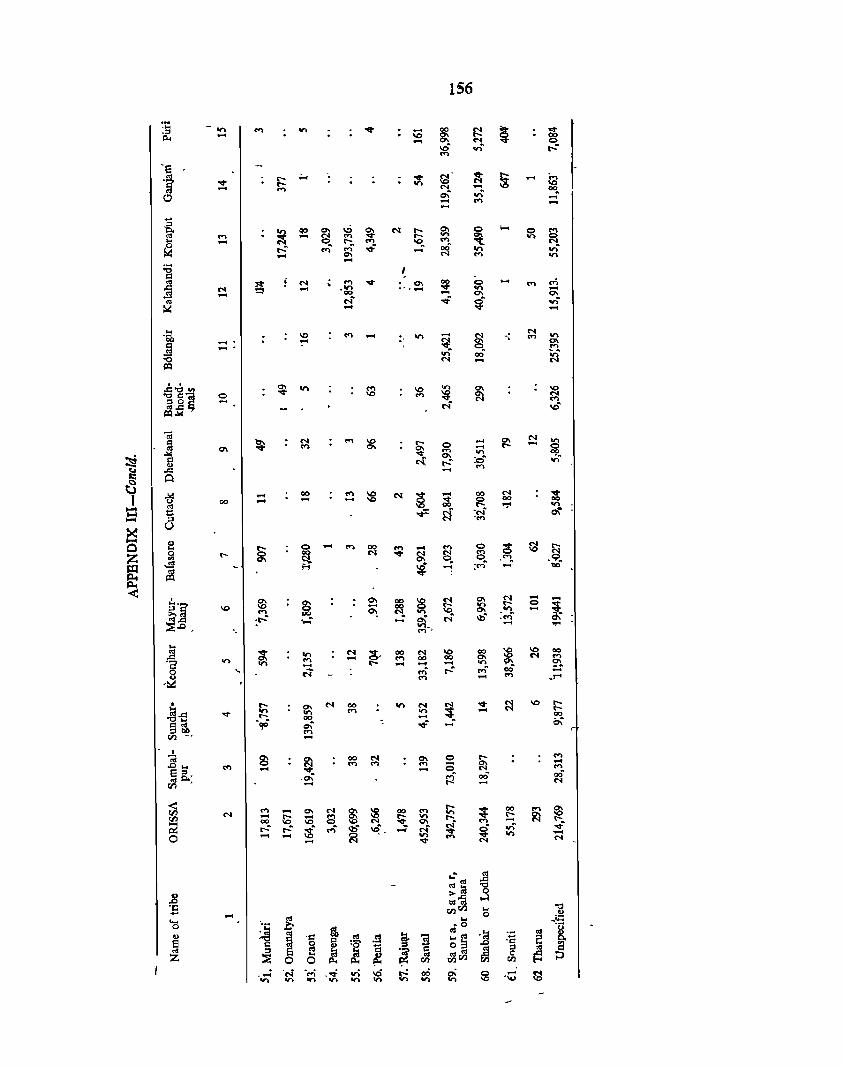
156
~i:
'" ~ ~ ,::I VI "II" - 00
~ ~ Il.4 - \Q ~ ..... 0 \Q~ .,; r-!' M
'~ r- ;... ~ ~ ! ~ ....
'§ v r- on \Q - M N ~ 0 0\ .,; ..... ..... ...... ..... ...... ... -&
~ qo 0\ ..0 ~ N r-. ~ ~
;..., 0 a '" .... ... ~ M ~
.,., .... ~ - r- M ..... N
r-!' ..... sf ~ .... 00 .,.. .,; .... N M .,., .... ;a
~ I') 0 '" g N M ..s- 0'1 00 ..... M .e:: M .... .:2 . .. ~ .... ::!; .,., .... -~ .... 0'1 0'1
'" N~ ..; ~ .,;
:.< .... ......
·a \Q ..... .... .,.. ...... ~ -\
N on : .... I') .... ':'" ~ 0'1
cd ...... ....
:0 .,; 00 on N .... N
~
J::~ fJ'J 0'1 .,.. .... \0
.,., 0'1 \C)
""I'll 0 "I!' \Q M ~ 0'1 N
a] ...... N .... ~.loII
N~ \C)~
-a N § ~ N M \Q r- ... 0\ II'>
, 0\ M 0\ ~ 0 ... r-. ...... 0
::!Si ,.>0;
.., .,., C!'~
j c-i 0\ :0 r-!' II'>
U ...... M
II:: A ~ , ~ .... 00 M ~ N
~ ...... 00 N ~
00 ...... ..... - v ~ 00 00
= cd 00 '":" on ~ ~ :~ ~ - ::l
~ U
0 f r- 0 .... ..... 00 .... .... M 0 C!; ~ r-
Z a r- ~ ~ N "I!' ~ S~ 8 N
." "1. .9~ ~
~ cd
!'1 '4 ...... :M' ...... 00
~
, $ 0\ 00 ~ f:! 0\ N ...... -~.~ \Q ~ ...... 00 ~
r- 0
~ .... DO ~ N~ Vl "l. on -«I.e:: ;r-!' .,..; .... si, N \l)~ :~ :::;..0 .....
..... '
a ~ on N g- oo N \Q 00 ~ \Q 00
.e:: on M - M 00 00 0\ N .... "2 .,.. ...... ...... .... - VI 9'~ ~ a N M t-!' ..... ~ 00 .., ..... ... M J"'
-::;:: , r-. 0'1 N 00 on N ~(
V ~ \0 r-
,a.e:: v on on .... on ...... r-r- oo - 00
§~, . .p 0\ "- ~ 0\ ....
Vl -...!.
~ <IS 0\ 00 N 0\ 0 ~
.... .0 .... ..... ~
.... ..... M ...... .... e l5.. ...... 0 ....
.0\ M oo~ 00 rill • - t-" ...... N
< ..... r- oo ~~ ~ N
... 0'1 N $ ~ 00 M Vl ; .... - lQ - .... Si VI r-~
r- 0\ 00 \Q 0 0'1 M ...... N
0.:: r-: r-: ~ M ~ '4'. -- N ~ 0 .,; ..s-O ...... .... ~ on V on '""' ...... V
M N N
:;~ «I .e:: ""
.8 ~~ .3 "5 VlVl .... "" ... 0
.., .... ~
.... ~l a l !1 ~O .., :a. cd
'la -:;:: 0:1
g .S:! «I .!! ~ ~~ ~ e § 0
~ :0'
~ ::l ..0 'I') a
'" El e ,f ~ ] ~ z ~ '" ",'" P 0 0 Vl tIll'll til til .- N '''; .~ on 16 " 00 ~ f25 _.
~ on on ..... on '" .... on '" '\U

157
CHAPTER VIII
DISTRIBUTION OF POPULATION BY MAIN ACIT't'ITY
Classification of economic activity in census statistics is done in two stages: (a) determining whether a perso!l works (is engaged in some economically productive activity) or does not and (b) showing what sort of work (or non-working activity) he is engaged in. The population is thus divided broadly on the basis of the activity of people into two categories-workers and non-workers.
There are two methods of collecting economic ~aracteristics-the gainful worker approach and the labour force approach. The former is based on the idea that each person has more or less a stable func_ tional role either as a breadwinner or as a house-wife or a student, etc. This role is independent of any other activity of any individual during a brief intet:val of time. The labour force !lPproach, on the other hand, is based on the individual's activities during a definite time interval.
In the gainful worker apporach, the data are supposed to be less influenced by temporary conditionS during the enumeration period while the labour force approach is claimed to give a better approximation of ,labour supply and can usefully and easily be linked to employment statistics. Since it is also based on a particular period of time, it can be more objectiv~IY ~eilned than usual status. In short, according to the .gainful worker approach, the economically active are those who report their usual occupation to the census whereas according to the labour force approach, the economically active population represents the number of people actual!y at work or seeking work during some particular short period. Thus, for the labour force the date of employment must be exactly specified but for the gainful work the basis of classification is the customary role of each person during some indefinite period. The system adopted in India in 1961 and 1971 is a variant of the labour force apprach.
Changing concept of economicaJly active population in India
The concept of economically active population has been in a state of flux in Ind:a :n consonance
with the changing economio scene. At a census, every individual is categorised basically as a worker or as a non-worker. Unfortunately it has not been possible to evolve a universally applicable definition of "work". Certain definitions of economic activity recommended by international bodies such as the I. L. 0: may be all right for certain countries with organised economies. At each census in India, we have been trying to benefit by the shortcomings of the previous definitions and making an effort to see if one ·could get as realistic a picture as possible. The concept was sought to be improved upon, on the advice of economic experts and users of census data in a bid to give a truer picture of the economic activity of the population.
In 1971, every person was asked what his main -activity was', thai is, how he engaged himself mostly. 'For the purpose 'of this question, all persons got divided into two broad streams of main activity, namely, (1) workers and (2) non-workers according as the type of main activity that" the person returned himself as engaged in mostly. A 'worker' was a person
'whose main activity was partic'pation in any economically productive work by his physical or mental activity. Work involved not only actual work but effective supervision and direction of work. The reference period was one week prior to the date of enumeration in the case of regular work in trade, profession, service or business. If a person had participated in any such regular work on anyone of the days during this reference period and this had been returned as his main activity, the person was categorised accordingly. A person who normally worked but had been absent from work during this reference period on account of illness, travel, holiday, temporary breakdown, strike, etc., -was treated as engaged in regular work in which he would have otherwise been employed but for his temporary absence. Persons under training sl.\ch as apprentices with or withoUt stipends or wages were considered as economically active and recorded as working. A person who had merely been offered work but had not actuagy joined it was not treated as engaged in work.
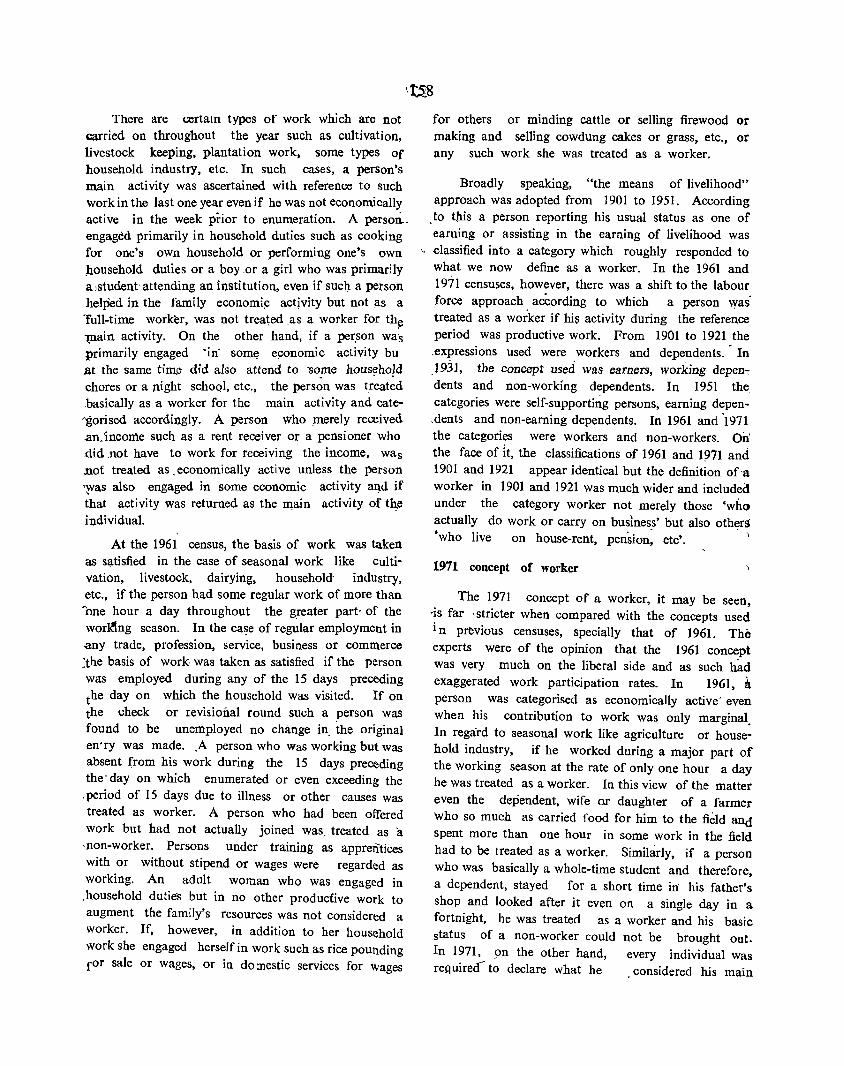
There are certam types of work which are not carried on throughout the year such as cultivation, livestock keeping, plantation work, some types of household industry, etc. In such cases, a person's main activity was ascertained with reference to such work in the last one year even if he was not economically active in the week prior to enumeration. A petsoa. engaged primarily in household duties such as cooking for one's own household or performing one's own JIousehold duties or a boy.or a girl who was primarily a ,student· attending an institution, even if suc}J. a person helped in the family economip actjvity but not as a TuB-time worker, was not treated .as a worker for thp 1,llain activity. On the other hand, if a per.son was primarily engaged °in' SOm~ e~onomic activity bu At the same tim.e did also attend to -some hous~ho!d
chores or a night school, etc., the pers~n was treated .basically as a worker for the main activity and cate'-gorised accordingly. A person who merely received .an.'income such as a rent receiver or a pensioner who did .not have to work for receiving the income, was not treated as . economically active unless the person '~as also engaged in some economic activity a~d if that activity was returned as the main activity of tl:;e individual.
At the 1961 census, the basis of work was taken as sl,ltisfied in the case of seasoual work like cultivation, livestock, dairying, household- industry, etc., if the person had some regular work of more than nne hour a day throughout the greater part· of the worl~ng season. In the ca~e of regular employmeut in -any trade, profession, service, business or commerce :the basis of work was taken as satisfied if the person was employed during any of the 15 days preceding the day on which the household was visited. If on the check or revisioiial round such a ,Person was found to be unemployed no change in the original en'ry was made .. A person who Was working but was absent from his work during the 15 days preceding the' day on which enumerated or even exceeding the
. period of 15 days due to illness or other causes was treated as worker. A person who had been offered work but had not actually joined was. treated as a ·non-worker. Persons under training as apprentices with or without stipend or wages were regarded as working. An adult woman who was engaged in ,household duties but in no other productive work to augment the family'S resources was not considered a worker. If, however, in addition to her household work she engaged herself in work such as rice pounding rOT sale or wages, or in do J1estic services for wages
for others or minding cattle or selling firewood or making and selling cowdung cakes or grass, etc., or any such work she was treated as a worker.
Broadly speaking, "the means of livelihood" approach was adopted from 1901 to 1951. According
. to tbis a person reporting his usual status as one of earning or assisting in the earning of livelihood was .classified into a category which roughly responded to what we now define as a worker. In the 1961 and 1971 censuses, however, there was a shift to the labour force approach acCording to which a person was' treated as a worker if his activity during the reference period was productive work. From 1901 to 1921 the .expressions used were workers and dependents. In 1931, the concept used was earners, working depen-:
dents and non-working d~pendents. In 1951 th~
categories were self-supporting persons, earning depen,dents and non-earning dependents. In 1961 and '1971 the categories were workers and non-workers. On the face of it, the classifications of 1961 and 1~71 and 1901 and 1921 appear identical but the definition of a worker in 1901 and 1921 was much wider and included under the category worker not merely those 'who actually do work or carry on business' but also others 'who live on house-rent, pension: etc'. ' )
1971 concept of worker
The 1971 concept of a worker, it may be seen, ois far ·stricter when compared with the concepts used in previous censuses, specially that of 1961. The experts were of the opinion that the 1961 concept was very much on the liberal side and as such had exaggerated work participation rates. In 1961, a person was categorised as economically active' even when his contribution to work was only marginal. In regard to seasonal work like agriculture or household industry, if he worked during a major part of the working season at the rate of only one hour a day he was treated as a worker. In this view of the matter even the dependent, wife o.r daughter of a farmer who so much as carried food for him to the field and spent more than one hour in some work in the field had to be treated as a worker. Simihirly, if a person who was basically a whole-time student and therefore. a dependent, sta.yed for a short time in his father's shop and looked after it even on a single day in a fortnight, he was treated as a worker and his basic status of a non-worker could not be brought out. In 1971, 9n the other hand, every individual was required- to declare what he considered his main

activity. If he returned himself as an economically active 'worker' he was classified in anyone of the four categrics as (1) cultivator, (2) agricultural labourer, (3) in household industry or (4) in any other work. when a person returned himself as a nonworker in the inain category, he was required to say if he was engaged in household duties, was a student, a retired person or a rentier, a dependent, a beggar or a vagrant, inmate of a charitable or penal instL tution or other non-worker such as being mostly an unemployed person. In addition to this, every nonworker was asked to mention if he or she did any secondary work. Such a question was itftended to bring out marginal contribution to work made by persons who declared themselves as non-workers.
The deficiency noticed in the 1961 cencept of a worker was sought to be rectified in the definition adopted at the 1971 census. This definition was adopted at a special meeting of the Planning Commission held on . 24 May 1969 which observed :
"The concept of worker and non-worker came up for detailed consideration. The reference period proposed for the 1971 census was one week for regular work and last working season for seasonal work. For regular work an individual would be classified as a worker if he had put in gainful work on anyone day of the previous week. For seasop.al work, an individual was proposed to be ·classified as worker if he had put i.n regularly at l~ast half normal .days work during the major part of the last working season. At the 1961 census the reference period for regular work was a fortnight and for seasonal work a person was deemed a worker if he put in at least one hour work a day during the major part of the working season" .
"It was felt that the concept of worker at the 1961 census tended. to inflate workers as persons who were basically non-workers like housewives, students etc., were included in the category of workers eve~ though their participation was very marginal. The concept of half a day's normal work proposed for the 1971 census for seasonal work was also consL dered not realistic. While the reference period of one week was all right for regular work, what was essential was that every person should be basically classified according to his/her main activity, particularly those not engaged in regular work. Certain activities like cultivation, agricultural labour, etc., are not carried out throughout the year. Therefore, a person enumerated should be asked to state what
'159
liis-'tnainT activity was and even if he was not engaged in that r activity 'during the reference period of one week, if he had engaged himself in the main activ_ity reported by him in the course of the' last one yearj that shall be treated as his main' activity. In the case of persons who are basically occupied as house workers, students, rent receivers, etc., they should be classified as such for their main activity. If they were also engaged in some economic activity, obviously not to the same extent as full-time workers, that activity should be ascertained under the head of secon· dary work. The secondary work, if any, of those who are basically classified as workers will also be ascertained" .
The following decisions were taken at the meeting ~n respect of the 1971 individual slip :
"Cix) Every person will be categorised with respect to the main activity as reported by him.
(x) Persons who are basically students, house workers, rent receivers, etc., will be classi~
fied accordingly for their main activity, Any gainful activity that these individual~ may have but not on the scale of full-time workers will be shown under secondary work.
(xi) Census data may not provide data on under or un-employment as such".
'The instruCtions to the enumerators in regard to question 16 and 17 have been reproduced in an al}nexure at the end of the book. Temporary change:.s in. avocatio!! ar~ very few in Orissa, particularly in the rural areas where the occupational pattern is more or less stratified. In regard to filling in question 17 relating to secondary work, there was not much of a difficulty because the enumerator was instructed to PUt the question to all persons whether they were workers or non-workers in the main category and there was no reason why they would have failed to put this question to the respondent. Yet we may recall some misgivings in certain quarters conceJt'l.ing this matter. Some have suggested that the number of secondary workers enumerated in 1971 was very small. There is not the leas.t evidence in p0ssessioq of census authorities alleging any omission on the part of the enumerator to put question 17 to the respondent. Therefore, it is difficult to support the contention of certain persons that the main source of variation in the work participation ~ate as disclosed by the 1971 and the 1961 census figures lies in the under-enumeration of marginal workers-persons who are treated as secondary workers according to th~
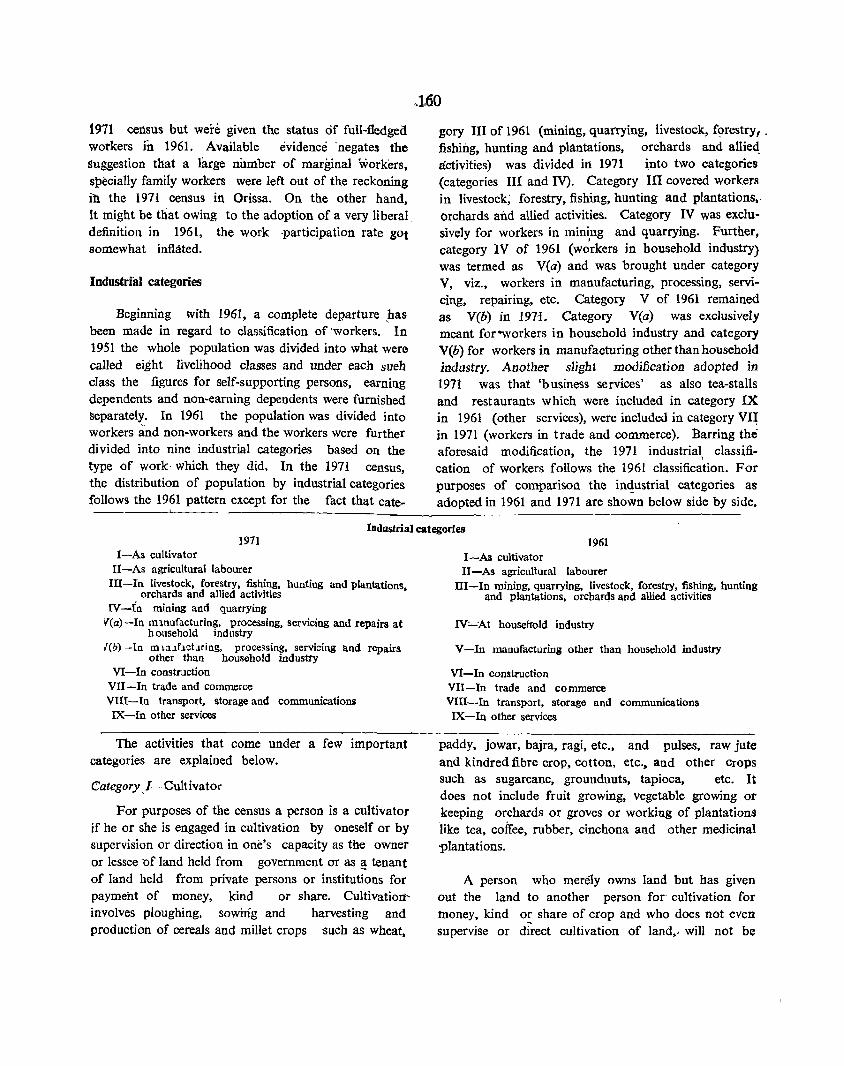
1971 census but were given the status of full-fledged workers in 1961. Available evidence 'negates the Suggestion that a liuge number of marginal workers, s}Jecially family workers were left out of the reckoning ih the 1971 census in Orissa. On the other hand, it might be that owing to the adoption of a very liberal, definition in 1961, the work ,participation rate gOt somewhat inflated.
Industriill categories
gory III of 1961 (mining, quarrying, livestock, fl?restrYf . fishing, hunting and plantations, orchards and allied: activities) was divided iIi 1971 ~nto two categories (categories III and IV). Category III covered workers in livestock; forestry, fishing, hunting and plantations" orchards and allied activities. Category IV was exclusively for workers in min~ng and quarrying. Further, category IV of 1961 (workers in household industry) was termed as V(a) and was brought under category V, viz., workers in manufacturing, processing, servicing, repairing, etc. Category V of 1961 remained
Beginning with 1961, a complete departure ,has as Y(b) in 1971. Category Yea) was exclusively been IJlade in regard to classification of 'workers. In meant for "Workers in household industry and category 1951 the whole popUlation was divided into what were V(b) for workers in manufacturing other than household called eight livelihood classes and under each sueb industry. Another slight modification adopted in class the figures for self-supporting persons, earning 1971 was that 'business services' as also tea-stalls dependents and non-earning dependents were furnished and restaurants which were included in category IX separately. In 1961 the population was divided into in 1961 (other services), were included in category VI~ workers and non-workers and the workers were further in 1971 (workers in trade and commerce). Barring the divided into nine industrial categories based on the aforesaid modification, the 1971 industrial, classifi-type of work which they did. In the 1971 census, cation of workers follows the 1961 classification. For the distribution of population by industrial categories purposes of comparison the inqustrial categories as follows the 1961 pattern except for the fact that cate- adopted in 1961 and 1971 are shown below side by side.
----------------------Industrial categories
1971 I-As cultivator
II-As agricultural labourer III-In livestock, forestry, fishing, hunting and plantations,
orchards and allied activities . IV -In mining and quarrying
'{Cal -In mlnufacturing, processing, servicing and repairs at household industry
reo) -In m m~flct.lring, processing, servicing and repairs other than household industty
VI-In construction VII-In trade and commerce VIII-In transport, storage and communications IX-In other services
The activities that come under a few important categories are explained below.
Category, I-Cultivator
For purposes of the census a person is a cultivator if he or she is engaged in cultivation by oneself or by supervision or direction in one's capacity as the owner or lessee 'Of land held from government or as ~ tenant of land held from private persons or institutions for payment of money, kind or share. Cultivation" involves ploughing, sowing and harvesting and production of cereals and millet crops such as wheat,
1961 I-As cultivator II -As agricultural labourer
III-In mining, quarrying, livestock, forestry, fishing, hunting and plantations, orcharc}s and allied activities
IV'-At houseltold industry
V-In manufacturing other than household industry
VI-In construction VII-In trade and commerce VIII-In transport, storage and communications IX-In other services
paddy, jowar, bajra, ragi, etc., and pulses, raw jute and kindred fibre crop, cotton, etc., and other Crops such as sugarcane, groundnuts, tapioca, etc. It does not include fruit growing, vegetable growing or keeping orchards or groves or working of plantations like tea, coffee, rubber, cinchona and other medicinal -plantations.
A person who mere1y owns land but has given out the land to another person for cultivation for money, kind or share of crop and who does not even supervise or direct cultivation of land,. will not be
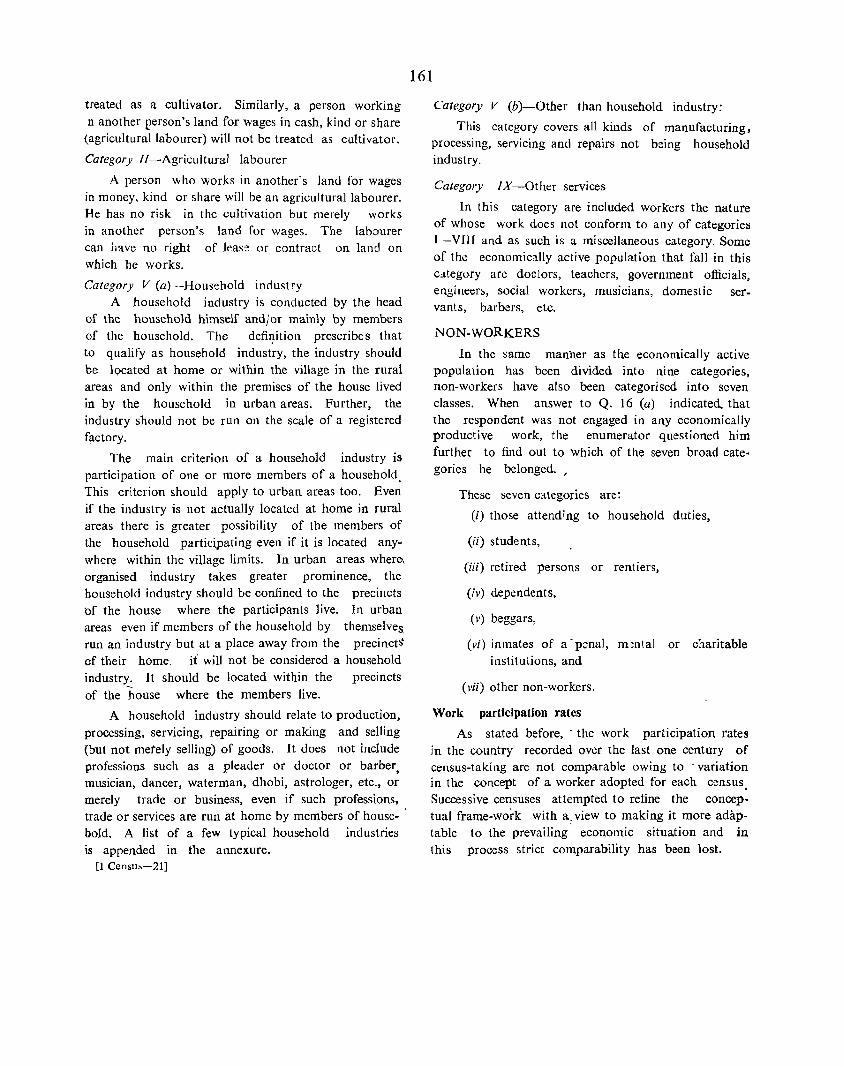
treated as a cultivator. Similarly, a person working n another person's land for wages in cash, kind or share
(agricultural labourer) will not be treated as cultivator.
Category ll-Agricultural labourer
A person who works in another's land for wages in money, kind or share will be an agricultural labourer. He has no risk in thc cultivation but merely works in another person's land for wages. The labourer can have no right of lease or contract on land on which he works.
Category V (a) --Household industry A household industry is conducted by the head
of the household himself and/or mainly by members of the household. The defi'}ition prescribes that to qualify as household industry, the industry should be located at home or within the village in the rural areas and only within the premises of the house lived in by the household in urban areas. Further, the industry should not be run on the scale of a registered f~ctory.
The main criterion of a household industry is participation of one or more members of a household. This criterion should apply to urban areas too. Even if the industry is not actually located at home in rural areas there is greater possibility of the members of the household participating even if it is located any~
where within the village limits. In urban areas where, organised industry takes greater prominence, the household industry should be confined to the precincts bf the house where the participants live. In urban areas even if members of the household by themselves. run an industry but at a place away from the precinctS of their home, it will not be considered a household industr~ It should be located within the precincts of the house where the members live.
A household industry should relate to production, processing, servicing, repairing or making and seIling (but not metely seIling) of goods. It does not include professions such as a pleader or doctor or barber, musician, dancer, waterman, dhobi, astrologer, etc., or merely trade or business, even if such professions, trade or services are run at home by members of housebold. A list of a few typical household industries is appended in the annexure.
[l Censu>-21j
161
Category V (b)-Other than household industry:
This category covers all kinds of manufacturing, processing, servicing and repairs not being household industry.
Category IX-Other services
In this category are included workers the nature of whose work does not conform to any of categories I -VHf and as such is a miscellaneous category. Some of the economically active population that fall in this category are doctors, teachers, government officials, engineers, social workers, musicians, domestic servants, barbers, etc.
NON-WORKERS
In the same manher as the economically active population has been divided into nine categories, non-workers have also been categorised into seven classes. When answer to Q. 16 (a) indicated. that the respondent was not engaged in any economically productive work, the enumerator questioned him further to find out to which of the seven broad categories he belonged. /
These seven categories are:
(i) those attending to household duties,
(ii) students,
(iii) retired persons or rentiers,
(iv) dependents,
(v) beggars,
(vi) inmates of a' p;:mal, m !ntai or charitable institutions, and
(vii) other non-workers,
Work participation rates
As stated before, . the work participation rates in the country recorded over the last one century of census-taking are not comparable owing to . variation in the concept of a worker adopted for each census. Successive censuses attempted to refine the conceptual frame-work with a. view to making it more adaptable to the prevailing' economic situation and in this process strict comparability has been lost.
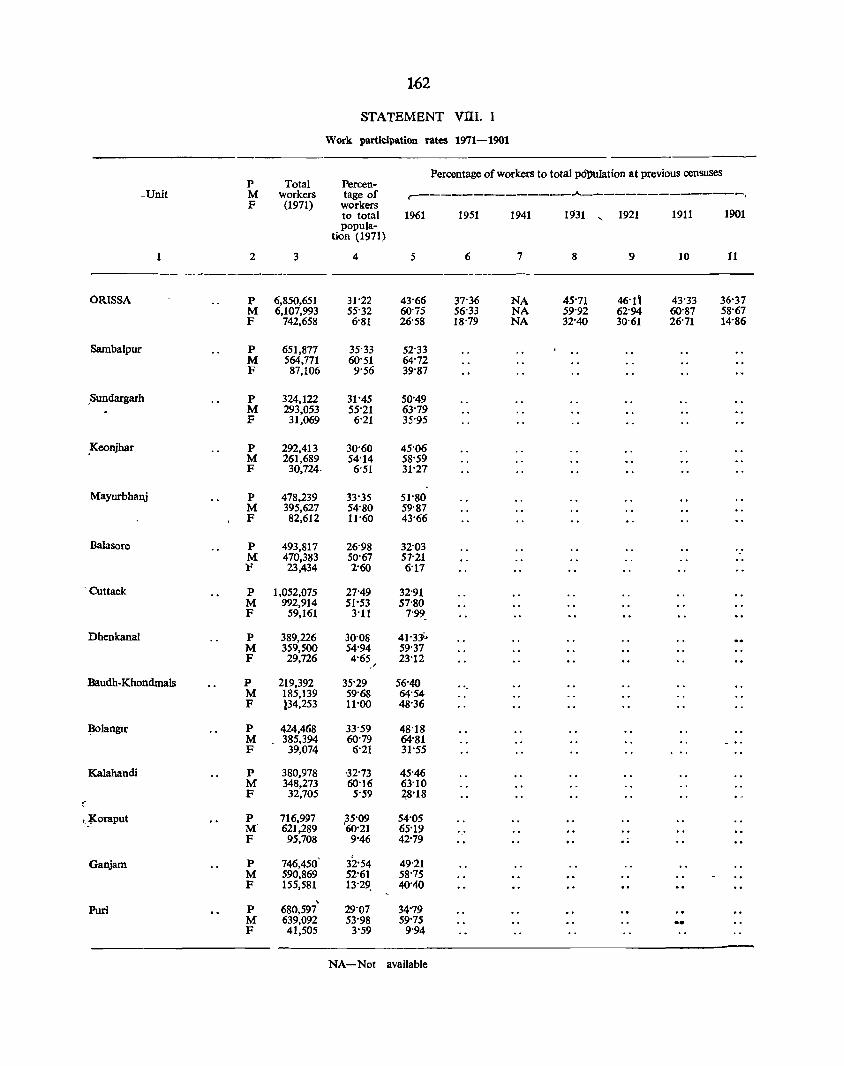
1,62
STATEMENT VITI,l
Work participation rates 1971-1901
Percentage of workers to total po~lation at previous censuses P Total Percen-
-Unit M workers tage of ~-------------~---------------, F (1971) workers
to total 1961 1951 1941 1931 .... 1921 1911 1901 popula-
tion (1971)
2 3 4 5 6 7 8 9 10 11
ORISSA p 6,850,651 31'22 43'66 37'36 NA 45'71 46'1' 43'33 36'37 M 6,107,993 55'32 60'75 56'33 NA 59'92 62'94 60'87 58'67 F 742,658 6'81 26'58 18'79 NA 32'40 30'61 26'71 14'86
Sambalpur p 651,877 35'33 52'33 M 564,771 60'51 64'72 F 87,106 9'56 39'87
.Sundargarh p 324,122 31'45 50'49 M 293,053 55"21 63'79 F 31,069 6'21 35'95
,Keonjhar P 292,413 30'60 45'06 M 261,689 54'14 58'59 F 30,724· 6'51 31'27
Mayurbhanj p 478,239 33'35 51'80 M 395,627 54'80 59'87 F 82,612 11'60 43'66
Balasore p 493,817 26'98 32'03 M 470,383 50'67 57"21 }:i 23,434 2'60 6'11
. Cuttack p 1,052,075 27"49 32'91 M 992,914 51'53 57'80 F 59,161 3'11 7'99
Dhenkanal p 389,226 30'08 41'33'-M 359,500 54'94 59'37 F 29,726 4'65 23'12
,/
Baudh-Khondmals P 219,392 35'29 56'40 M 185,139 59'68 64'54 F .34,253 11'00 48'36
~langir P 424,468 33'59 48'18 M . 385,394 60'79 64'81 F 39,074 6'21 31'55
Kalahandi P 380,978 '32'73 45"46 M 348,273 60'16 63'10 F 32,705 5'59 ~8'18
(
l~oraput P 716,997 35'09 54'05 M' 621,289 '60'21 65'19 F 95,708 9'46 42'79 .,
, Ganjam p 746,450 32'54 49'21
M 590,869 52'61 58'15 F 155,581 13'29. 40'40
~
Purl P 680,597 29'07 34'79 M 639,092 53'98 59'75 .. F 41,505 3'59 9'94
NA-Not available
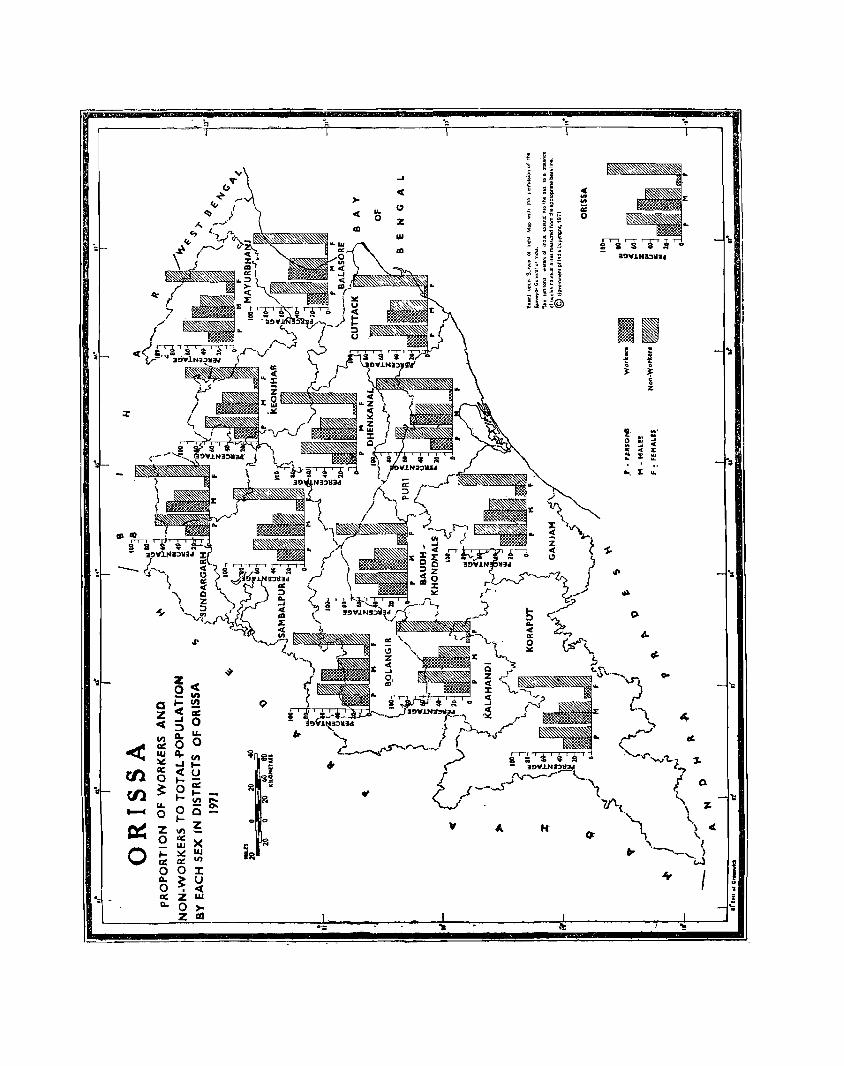
'., '"
~ ! ..
:;j: .2 j ; E .. ~ ~ ~a c ~ ! ~ '" ... 5 :it 1. _ ii: • lj ~ 0
i
f i it iH :; 31!)Y.LNil3I1U
! : ~ i ~ IH ] ~~@
II ':
". X ...
'So
.~ <It
,.a.
-s.. Q,
.,. I;..
Cs"1 .... I... If$.
~
,.,
z< t.s\..·_
'\.S"t_ 0-
Q." ;
a 1-(1) ~ r1
z <a;: 1,. .....
« 50 \ ~
II) Q. u.. ,..,>
< a:: o 0 _,...
~
w ~ II) ~ ~E
<.. :It! ..J I-
i'1ii'&i~' .'-v-..r,,, .. /l..}
CIl ct: c( U - 31!)Y~NI3I131.
l.
0 E
I- 'i~ r. _,.. ..... -l ..,.
~ 0 a:: ~ ii ..;~ '-, ( ~
en I- --. ....s 1 I- !!! .... 1<1
~ u..
, "I:
0 0- 7/\ - 0 Q '\ Z
I-~ '" '"
''1,. \
~ Z .n W It. tt '\, i..\ oCt
0 IX: W )( I:l 1<1
q; \..
0 I- :It! w i~ '_ I
a:: 0:: In .. -. )
a 0 J: -'-w
1 Q., ~ u J'r I 0 . c( " 1 '. 0:: Z W 0.. a >-z In
0.; ..

It would be seen from statement VIII.] that the work participation rates as recorded in 1971, are significantly lower than those recorded in 1961. In 1961 the overalJ rate was 43'66 per cent; this registered an abrupt fall to 31'22 per cent in 1971 So far as these rates among males arc concerned, the fall (from 60'75 per cent in 1961 to 55'32 per cent in 1971) does not appear to be very pronounced wherea5 the work participation rates among women has come down to nearly one-fourth (from 26'58 per cent III
1961 to 6'81 per cent in 1971).
This striking difference between the rates shown by the 1961 and 1971 censuses can be traced, as already discussed, to the definition of a worker. A large segment of the population who were recorded as worhrs in 1961 on the basis of a liberal definition could 110t be recorded as such in 1971 and as a result there has been a fall in .the work participation rates.
It would be interesting to compare the 1971 figures with those of the preceding censuses to ascertain if the figures of any census come close to those of ]971. We find that between 1961 and 1901, the lowest work participation rates recorded were in 1901 (36'37 per cent) and 1951 (37'36 per cent) ; the rates for both these censuses, however, are still higher than the rates of 1971. The definition of worker adopted in 1901 and 195] are given' below.
In 1901, the population was divided into 'actual worker' and 'dependcnt'. The term ~actual worker' included all persons who actually did work or carried on business, whether personally or by means of servant or who lived on house rent, pension, etc. The persons who were not actual workers were 'dependents'. As per the 1951 census, ihe population was divided into three categories, viz., (a) 'self-supporting person', (b) 'earning dependent' and (c) 'non-earning dependent'. Where a person was in receipt of an income and that income was sufficient at least for his own maintenance, then such a person was recorded as a 'self-supporting person' regardless of whether the income derived was in cash or in kind. Individuals who were not self-supprting persons were dependentseither earning dependent or non-earning dependent. To determine whether the dependent was earning or n6n-earning, the test was whether he had a regular income or· not. Where the income was not adequate to support him, the person was considered an earning dependent while a· person who did not have any income, be it in cash or in kind, was considered a non-earning dependent.
163
Work participation rates in districts
At the district level it is seen that in the 1971 census, the highest work participation rates for males· and females taken together are recorded by Sambalpur district (35'33) while the second and third position go to Baudh-Khondmals (35'29) and Koraput (35'09). The districts that come next are Bolangir (33'59), M'!-yurbhanj (33'35) and Kalahandi (32'73) The other remaining districts have comparatively low work participation rates, the lowest being Balasore (26'98), Cuttack (27'49) and Puri (29'07). The districts which have shown a high rate of work participation are generally the districts which are economically considered less advanced. Again, most of these districts are in western and southern Orissa mC!stly inhabited by scheduled cas~es and scheduled tribes. It is well known that work participation rates among the scheduled caste and scheduled tribe households are much higher compared to other households because more female members in a scheduled caste or scheduled tribe household contribute to the family income than among the rest of the population. Contrarywise the lowest work participation 'rates occur in the districts which are probably the most advanced! viz., Balasore, -Cuttack and Puri districts. It is in these three districts that a bulk of the production of the state takes place and also the general economic condition of the people is much better compared to that in the Adivasi districts. Balasore and Cuttack districts have been classified under category II as per the economic classification undertaken by the census organisation in 1961 whereas
, Sundargarh district has been classified as category III while the other districts have been classified under the lowest category.
National classification of industries and occupations
According to the tabulation plan fOf the 1971 census, there are 19 economic tables in B-series as against 14 in 1961. A noteworthy feature of the economic tabl~s adopted since 1961 is the systematic classification of 1ndustries and occupations. Till 1951 no distinction was made 'between industry and occupation and the economic classification' adopted for presenting the data was a combination of bot,h. In 1961 the industrial classification was c1ear1y 4istinguished from the occupational classification. The primary classification in which data were grouped was industrial classification in which workers were divided into nine industrial categories with nonworkers as the tenth category. The system was
known as the Indian Standard Industrial Classification (ISIC) evolved in 1958 by the Directorate . General of Employment and Training. The following extract from National Industrial Classification, 1970 may be of interest.
"In the 1961 census, the Indian Standard Industrial Classif?cation '(ISIC) evolved in 1958 by the Directorate deneral of Employment and Training was used. There has been a variety ~f industrial classifications iri India such as Labour Bureau's industrial classification of factories, Standard Indu. strial Classification evolved by the Central Statistical Organisation, etc. While attempts have been made in several cases to bring these classifications in line with the ISIC these have produced different versions depending on the nature of tht respective needs. An attempt at evolving a Standard Industrial Classification was made when an interdepartmental meeting, In which all concerned departments of the central government alongwith other important userS were represented, was held in April, 1964 to consider the subject. After a detailed consideration of genreral principles for a Standard Industrial Classification, the meeting appointed a technical committee consisting of representatives of the Registrar General, India, Directorate General of Employment and Training, Ministries of Internal Trade and Industry and the Central Statistical Organisatjon (CSO) to work out a thre~-digit leve.1 standard classification of industries. In the meantime, the statistical office of the United Nations was also considering the_.,revision of the ISIC, 1968. This was ready in September, 1968 and it was circulated by the CSO among all concerned organisations inviting their suggestions. After a number of meetings of the representatives of these organisations, the National Industrial Classification (NIC) 1970 was finalised. This has been adopted by the office of the Regi strar General, India, with suitable modification,
Lik~ the ISIC-1969, the National Classification attempts to go up tog~theit economic activities which are akin in terms of the process ad ol>ted , the raw materials used and the finished products produced. The classification does not draw any distinction -according to the type of ownership or type of economic organisation. And except in cases like textiles etc., where traditional processes of production are in vogUe in significan~ measu~es, the classification does not endeavour to distinguish between various modes of operation as for instance, using power or not using
164
power factory or household, large-scale or small-scale. 'Identification of the special features of the Indian economy, where in certain sectors traditional processing is substantial, has been attempted in the two-digit and three-digit levels in the NIC 1970.
The basis of classification being the nature of economic activity carried on in an establishment, it follows that the unit of classification should be an establishment. The term 'establishment' may be defined as an economic unit which is engaged in one or predominately one kind of 2.ctivity usually at a single physical location under single ownership or control. A firm or enterprise may have more than one establishment either on the same location or on different locations engaged either in'the same economic activity or in different economic activities. In either case, each establishment is to be counted separately and classified appropriately. It is also likely that some establishments are engaged in more than oneeconomic activity. To the extent possible, it is desirable to treat each technical unit, or ancillary unit or welfare unit, engaged in a different type of activity as a separate establishment. Examples of technical units are the departments of textile mills which spin yarn, weave cloth, and dye the cloth or departments of a meat packing plant which produce lard, lure, bacon or can meat. Clearest examples of ancillary units are central administration offices, warehouses, garages, repair shop]) and electric power plants which primarily serve their parent units. Examples of welfare units are schools or dispensaries r~n by, say, steel mills for the benefit of their employees. Where it is not possible to separate technical, ancillary and welfdre units from their parent, establishments, the establishment will have to be clas~ified into one or other of the minor groups in the classification ·according to the major activity of the establishment. The major activity of the establishment should generally be ,ascertained by reference to value added by the production of different products or services ;ende!'ed or net revenue derived from the various activities. Where such an assessment is not possible, the classification. may be determined in terms of gross revenue attributable to the products or services put out by the establishment. the number of persons employed ()U
various activities or the proportion of ll\bour-cost assignable to those activities whichever Qlay be Convenient and appropriate. Where the. integration 9f activities in an establishment and in the ca.se of.a factory producing pulp as well)is paper, the calssifjcation will have to depend on the final product
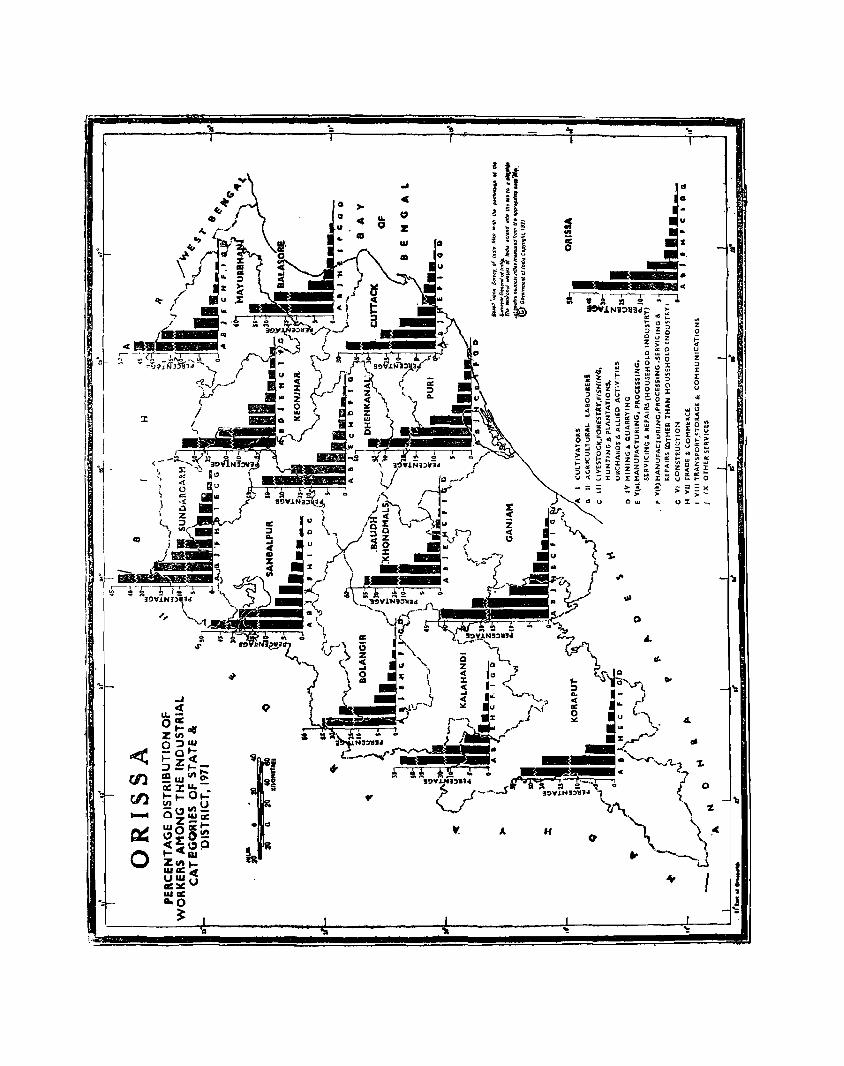
Q ,.. III .. ... u 0
l
.,j
C
" Z UI 0
H
III ..
'" I

irrespectiv,; of the magnitude of the value added at different lGvels of production. In the Indian economy, it sometimes becomes necessary to classify by industry persons who are own-account workers, as in the censuSes of population and sample surveys of households. In such cases the distinction between industrial and occupational clas"ifications becomes blurred. In the case of such own-account workers, it is desirable to classify them under industries appropriately akin to their oC(;upations.
The National Industrial Classification (NIC) 1970 consists of
10 Divisions (at the first digit level);
66 Major groups (at ttc second digit level); and
385 Minor groups (at the third digit level).
While adopting the NIC 1970, the offic~ of the Registrar General, India has made a modific2tion in the classification of 'Repairing' or 'Repair-Service'esta blishrnent".
So far as the occupations are concerned, varfous occllpations have bean classified into .divieyions, groups and families, the: classification having been arrived at taking into account the basic task inv<?lved in each occupation. A three-digit code system has been adopted for this classification in which the first digit represents the division, the second digit occupational group and the third digit occupational family. There were 8 occupational divisions, 95 occupational groups and 462 occupational families. The system is based on the international standard classification of occupations which was slightly modified to suit Indian conditions. The classification and the code numbers however lend themselves to international corilpari son.
While the above is a brief description of the presentation of the econ(jmic data relating to the 1971 census in Part !-B of the general report, what is attempted in this report is a general discussion on the broad industrial categorisation in respect of the main activity of the population.
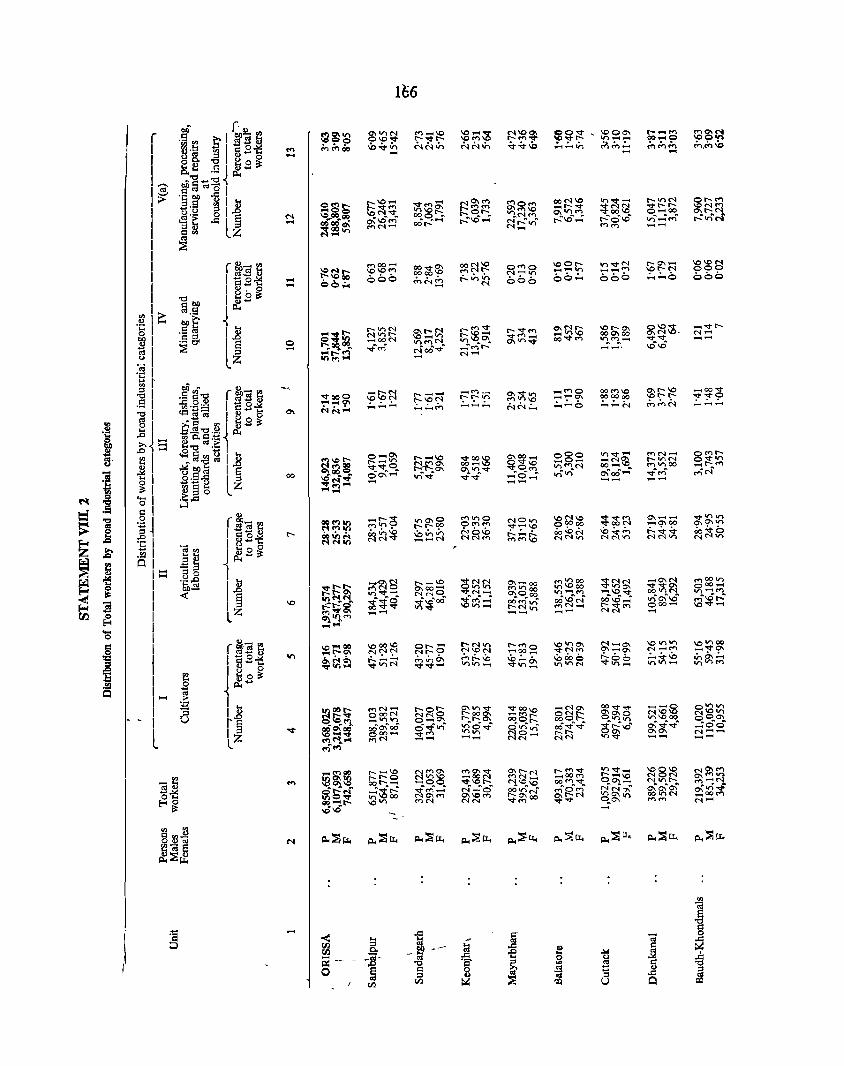
, ...... , , l
-.... o .....
00
\0
166
~~;;t , ~s~ _ ..... '" CI. .... ;'" .....
"''<1"-~~$ .. 0\00---
\0\0<'1 000 000
I
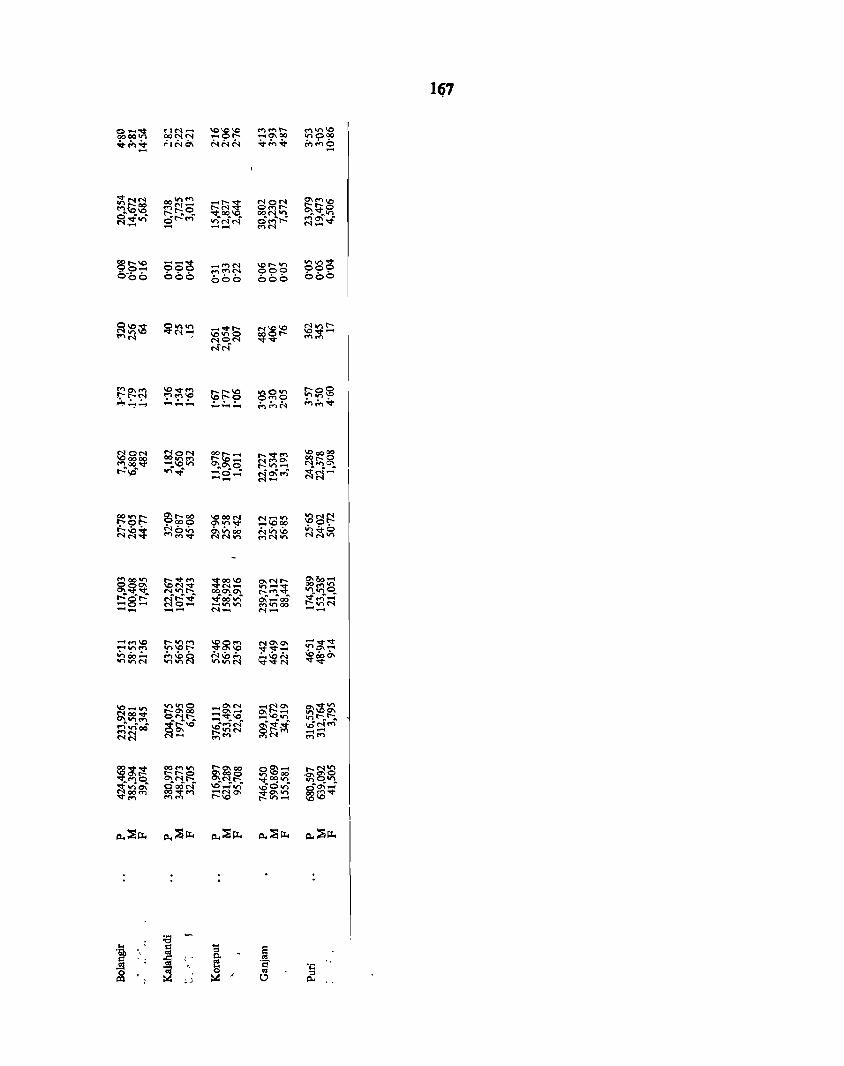
Uj7
VNN co""..., _r--~ gg~ 0-.""10 ""r-oo ~~q r-M S;~O 1:').1010 ""t0C!. • OON1I'l •• 1I'l o •• d'r-..., d'",,'r-" I'<> 0-. • N~'" ""NM N_"" - -- I'<>M
9b~ oo~ _I'<>N 1Or--1I'l :S:S~ 0-00 000 ..,""N 000 000 000 000
~IO$ 0",,,, _vr-- M'CI.O N",r--M~ "<I"N-; 'C"'O 00 Or- 1.0",,-
MOM "<tV "''''' NN
~O'I"" 'C"<t"" fi3~~ ",0'" r-oO
~~;:: ~~'!' 0..,0 ""V)'C -..... - --- Mf.r,~ .... ;...~
~£~ NON 00r-_ r--"<t"" 'COC OO CO",.., r-'C_ M"'O- ~~~ ""00"" -\000 0'10\0 r-OO-r::..,; vl..¢ =g~ No;'", t~..;
M-
~9~ ~r-oo 'COOM M-1I'l taEl~ <'-l~'? '?I'!'~ _'Coo
:G~~ ~~:t: ""g~ 0\1I'l00 NV,\o NMIO ..,M",
""0010 ~~~ :t:co'C O'INr- 0'100-&~~
N_ ~~~
00",,'" N '" r- 000'10-. 10",0
r::d'r:: ~~:! ~cO"'; 0'1-00 ;t~ri -0- -1010 ...., 10 00 -- _ .... M _ M_ --
..... (4""\\0 r- "''''' ~g~ MO'IO'I ...... v"" -",,,,, ",,'Or-- "<tV_ ~~~ Va 00':'" ~n~~ tl~~ ~\OM ",,~O'I "".,.,N vN
\0_", "''''0 =~~ ~~~ "'$'" ~oo"'" bg)~ .-f~ ... ~ ..... 'CIO :gr-;.~ M"*l.~ i:;;-6' -o1ri~ o;'tf.-~ \C)~t'f') ",,1000 N~ N .... ~"" gN"" M""
~~tt OOM'" r--O'IOO o~- r--M'" S;~g 0'1000 "'00 00 >~g;~ .. ~q O'INr--
"'to~ ~"'O'I ooON 'C ... ....:-"' .. 60;'''; -.:t~M 00 "<t<"> ~(C10\ \00,10 oo ..... v "" .... r:t1,f)...-4 10'"
1).,~tI. 1).,:::StI. 1).,~tI. 1l.:::StI. 1l.:::StI.
:a ... '~ fa ~ E
~ e- 0:1
~ 'd' 'I: 0 0 0:1 ,:e IX) ~ ,,~ ~ 0
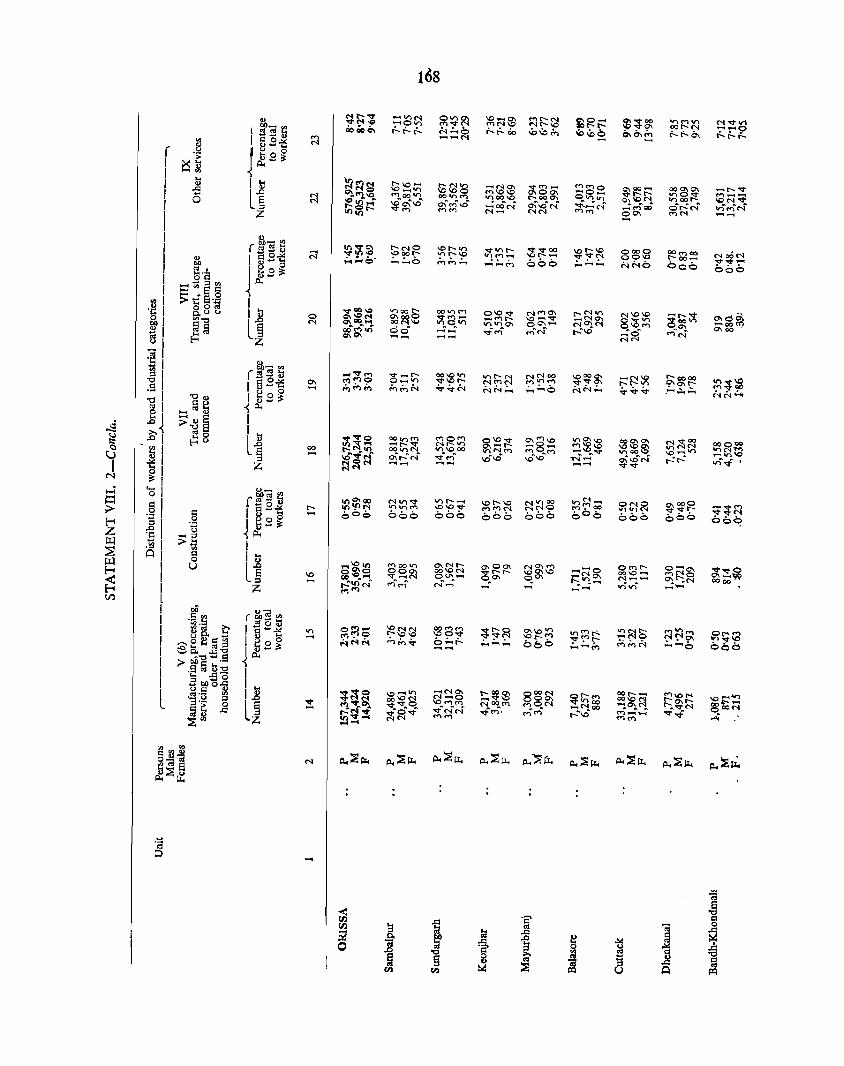
~I .;:; I all 21 ~I
]1 ~I
!I 81 bl »-< .01
- t I ~I 01 ~I '01
(
.~ 1 01 ~I .1a I °1
I I r L I I I I I I I I
l
'13 ::;,
,..., N
'" ,...,
00 ,...,
r,...,
,...,
168
-< c:Il
~ c:Il ~ -~ .;- e.o 0 <IS .0 "0
~ !3 til til
.~
!a il ~ .<::
~ 0 .S'
~ 0 u
::is ~ !Xl
0000 0010 NNO
ONO In"'N 000
~ a
~ 8
"0 = ~
0
~ ~ :§ ::: u
~ .<:: Q !Xl
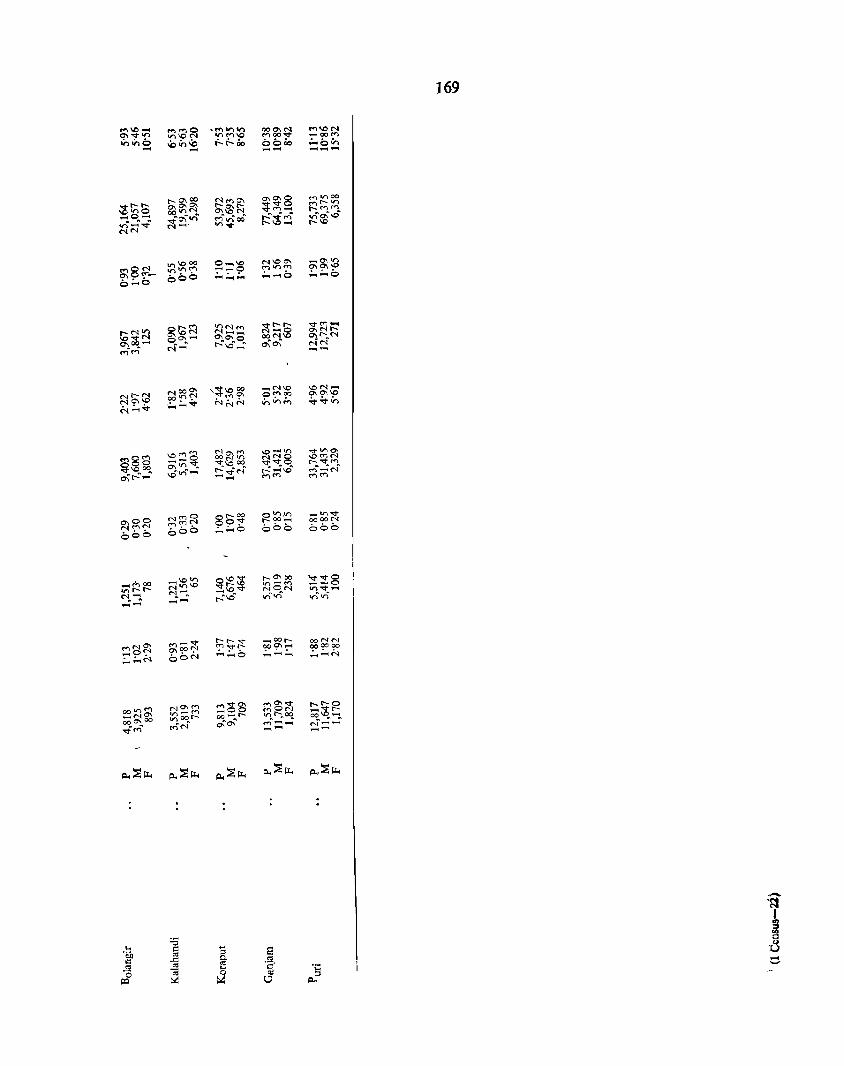
169
\2;1'1' 1'0'1 00 NMO'I 0'10'18 (T)"'OO O'IO'I~ 1'0\1' MI''''
"'0 ~~'" O\ION ~;S; ..... o:-(T)M
..... 0- M"'v)oO ~~M ",O'I'v:; V) .. ....-j"~ ~ ..... "' ... 1'10 .... 0:-10 ('IN
~8~ ",10 00 O,_,\C NIOO'I ..... 0\'" ",,,,,.., ~~9
",,,,,.., 0\0\10
0;"0 00 0 -....... ;"' __ 0 ~~O
r--N'" ~to~ "'N", ~I'I' ~M_ N __
0\<'11' \C~N 00'1- ~.~O,
oo;::lg 0\1'('1
O\ ... ~.....-I " . a; a; NN <"1M
('I ..... '0_ ,_, ......
NI'N NooO\ '~IO 00 ...... N'O 'ON_
000;>':'1 N;:;~ 0""00 0\0'110
('10\'0 .o.n~ ","","or. M;""'" ~"f""'t~
M8M '0"""" NO\M 10 .... '" """'0\
c;v:;~ OON'" NNO 'OMN
~'O~ ~IO°O "": "<1"" c:. r-"<I"M
o\r-.:'~ v:;jtr)"'"f""'t ~~("',f r--IO ~_;N _
",<"I ,..,M
0\00 NM~ 81'00 0"''''' _"'''<I" 0"<1" 1'00_ 0000('01
NMN 660 ;...~b 000 000 00 0
....-1M 00 .... 10'" ~\O.". 1'0\00 -~"<I"8 N"''O r-IO ",- ....
",1'1' ..... 10"<1" NON tn~..-4 ~ ... -:. N-
" " t-!'IO" ",,,, lI")li') _ .... --
MN~ M-""" I'r-"<I" _001' ooNN O\ooN S"'l'o;:t"t:' ~9',:"" 00 00 00
:~~ OON - ..... 0 .......... _ ;"'~N
OO",M NO\ ..... ..,'<1"0\ ",,0\'<1" ~t;g _NO\ "'_ ..... ...... 00 ""ON
",oor- 00-1' .,..r-oo 00'0-000\00 ci:a\ . ' " " ' " "<I""M M'M"'
"" ..... _ ('01- ...... _- --
P-c~~ P-c~~ p.,~~ p.,~~ P-c::g~
-~ ~
..... :0 '6b I':i ::; 8
Q
C<l
~ ',lS
1:1 ..<:: C<l
.$ .$ -a' .;:: 0 ~
0 ~ ::;I
:;:!.
>C ~ P-c

For Orissa as a whole the highest proportion of wOlken is concentrated in category I (cultivators) with 49-16 Fer cer,t ar:d categOIy n (agricuitural labourers) with 28'28 rer ceLt. Workers in livestock, forestry, fishing, hunting and plantations, orchards and allied activities constitute another 2'14 per cent while those engaged in mining and quarrying are 0'76 per cent of the total workers. Thus the total number of workers who are engaged in the primary-sector comes to 80'34 per cent. 1he rest (19'66) of the workers are distributed among the other categories, viz., household industry (3'63), indu:;try other than household industry (2'30), construction (0'55), trade and commerce (3'31), transport, storage and communications (1-45) and other services (8'42). From this pattern of distribution it is manifest that Orissa is far -from having an industrial economy and mainly depends on the agricultural sector which employs over 8 workers out of every 10.
Position in districts The distribution of workers at the district level does
not show any signjficar.t departure from that of the state as a whole. In Sambalpur, workers under industryV (a) and V (b)-are much higher than the state average.
In Sundargarh, the primary sector (I, II, III and IV) accounts for 65'60 per cent of the total workers and this is the lowest proportion of workers in the primary sector among all the districts of the state. Workers under category V (b) are as high as 10'68 per cent of the total workers whereas it is only 3'76 per cent in Sambalpur, the next highest. On account of the industrial background of Sundargarh, the proportion under cate_
/
gory VII (trace aLd ccrrmerce: 4'48 per cent) and category VIII (transport, storage and communications: 3-:6 per ceLt) as well as category IX (other services: 12'30 Fer cent) is significantly higher than the proportion of workers under these three categories obtaining in the <lther districts.
In Keonjhar district there is a preponderance under category IV (mining and quarrying: 7'38 per cent)_
The proportion of agricultural labourers in Mayurbhanj district is the highest among all the districts of the state and is probably explained by the high proportion of Adivasi population, in this district. The district of Mayurbhanj occupies the thirs! position with 4'7~ per cent of the total workers engaged in household industry. The percentage of workers under category V (b) (industries other than household industry) is abysmally low
.at 0'69 per cent.
In Balasore, one of the best rice producing districts cf the state, workers under category I is as high as
170
56'46 per cent and workers under category iI (agricultural labourers) form 28'06 per cent.
Cuttack with a largely agricultural economy has also a relatively fair representation of workers in other categories.
Dhenkanal has the highest proportion of workers (3'69) under category III among all districts. This is probably due to the fact that Kendu leaf grows in abundance in this district and attracts a large number of workers.
Baudh-Khondmals, a relatively backward district, is predominantly agricultural with 55'16 per cent of total workers under category 1. This is the second highest prOFoltion among all the districts. Workers under category II are also fairly high (28'94 per cent).
I
Bolangir district, with a large !lumber of traditional handicrafts (including handloom) next only to Sambalpur in the proportion (4'80) of its workers under category V (a), has the lowest representation of workers (5'93 per cent) under category IX.
Kalahandi has the lowest percentage of workers (0'01) under mining and quarrying and the third lowest (next to Mayurbhanj and Bolangir) under category VI (0'32 per cent).
Koraput, another tribal district, has a high percentage of workers under category VI (construction). This. could be due to a brisk constructional activity goi!:g on in this district on account of Dandakaranya, Sunabeda Aero-engine factory., Balimela hydro-electric project, etc.
It is in category VII (trade and commerce) that the district of Ganjam comes out prominently; 5'01 per cent of its workers, the highest proportion among the workers. in the districts, are in this category. Workers undercategory IX (other services) are also many (10'38 per cent).
Puri district occupies the second position in the state with regard _to workers under categories III, VII and IX. The last two categories claim a large representation because the district has a number of tourist centres, important of which are the temple of Lord Jagannath at Puri, the many temples at Bhubaneswar and the Sun Temple at Konarka. The location of Bhubaneswar in this district has also relevance.
Distribution of workers in rural areas
Statement VIII.3 presents districtwise data on the" distribution of workers by industrial category specifically for rural areas in the state.
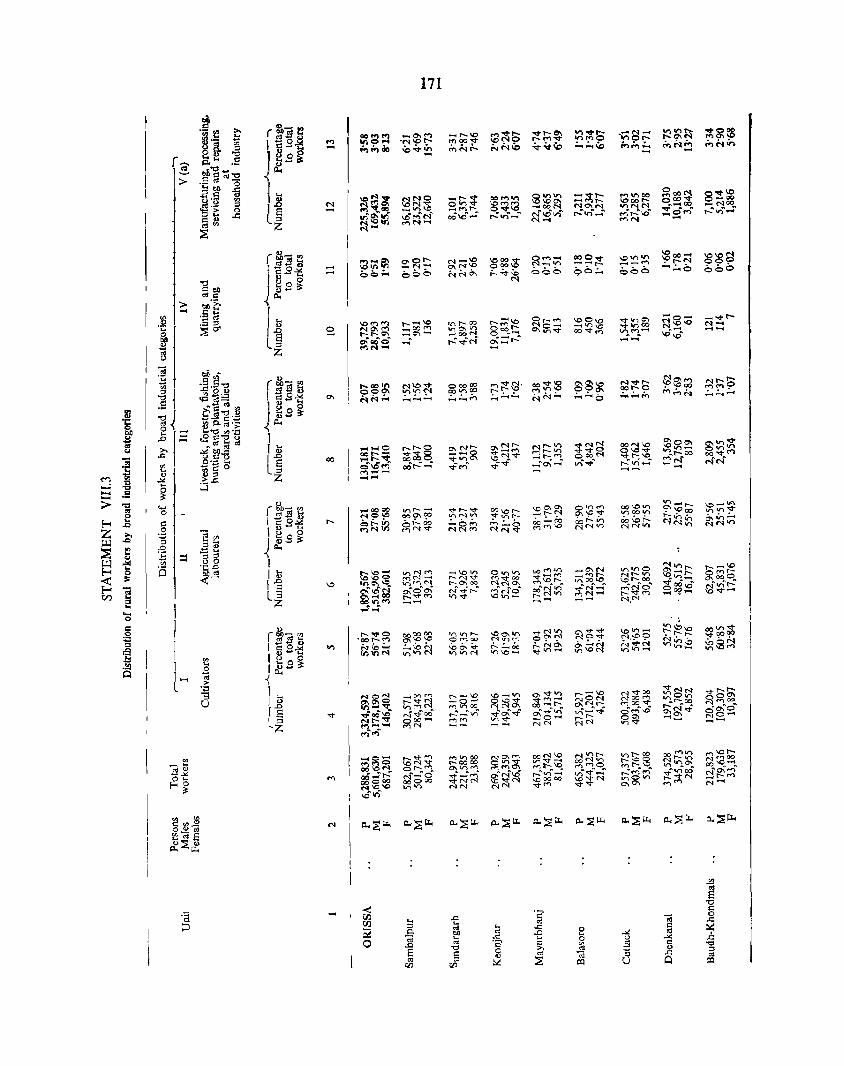
1 J
I
I (-
.., -
00
\0
171
_1.0'" r---N...r r- e. 00 N~r-'" I{)v
r--IO -0-~""lOO .. r--_'" ,..,M ....,-
.'" 0-, '" ~V)c-~
t-~Co I{) I.e ....
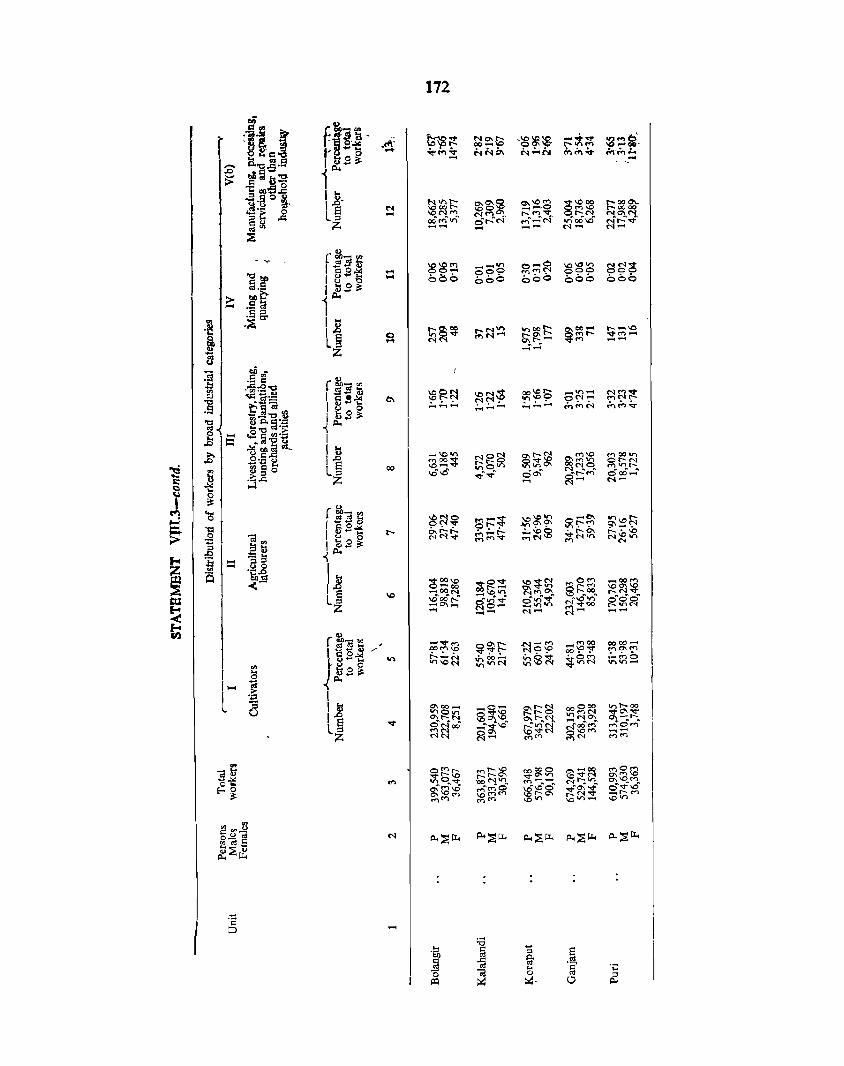
-..... <:: ::>
-...
co
-
172
.... .6i)
~ j:Q
:.a "5 §
~ p.
'" .... e,j 0
~ ~-
s .~
'" CI
0000-..,., a- '" :~i'*Io .,., ..... -
.;: ::l ~
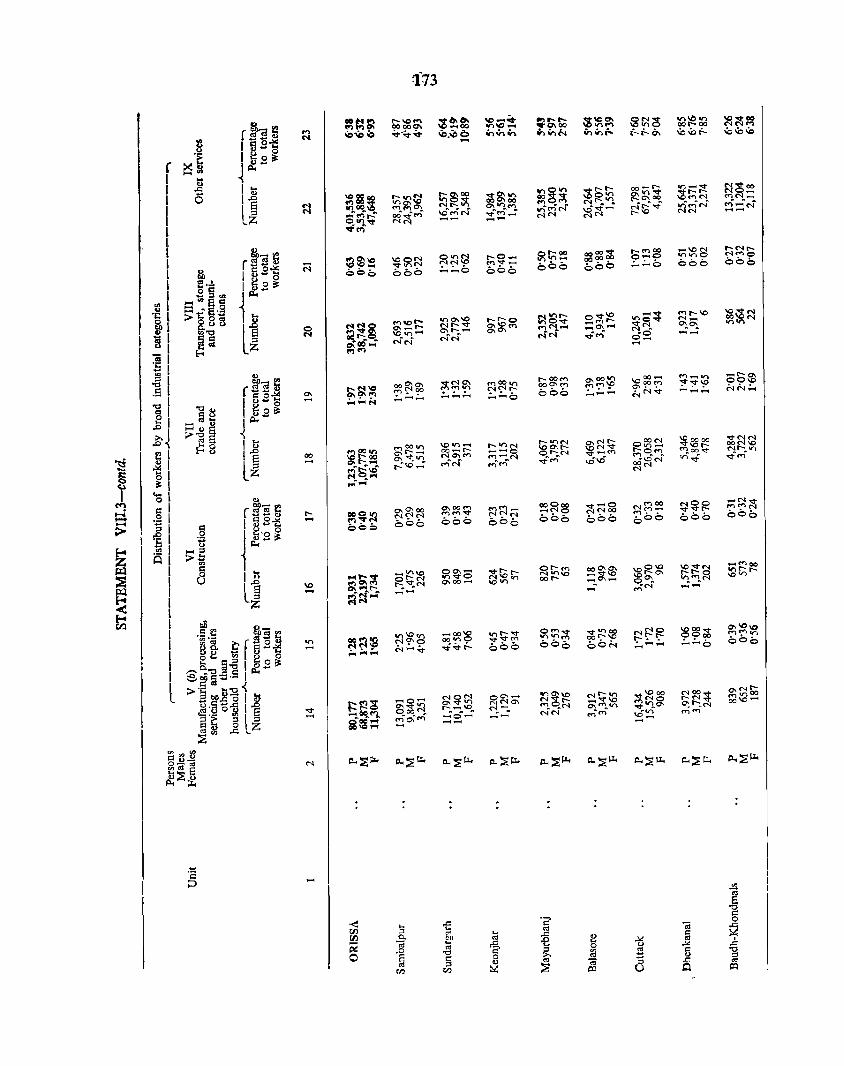
f I
I I I I I I 1
~ I . .: I ~I ~I 5 I ~I 1n1 .al .s I ",I
CIS I BI .0
1 $-{ ~I ~I ~I ~I "01 =1
.Sl I ]1 . .: I .~ I Al
I I I I
I I I I I I I L
.t:: I'l ;J
'" -co
r---\0 -
-< 00 00 P2 0
173
.... ::l 0.
";;j
"8 CIS
en
~ e '0 I'l
of ·2 0
'" ... C\S ";;j
~ 00 CIS .r: <!) ~ ... .r: -e ~ C\S
.. C\S
'" ·2
~ 0 u ~ ..c:
c:: 0 .$ g ~ 'g
::l '" ~ ~ C\S C\S
P=I P=I

r t ,I
'I I I
I II
I I I
I ,\
i I , I I I I
" I I [ I , I
! i 1 , , I
l
-N
o ~
0--00
\0 -
174
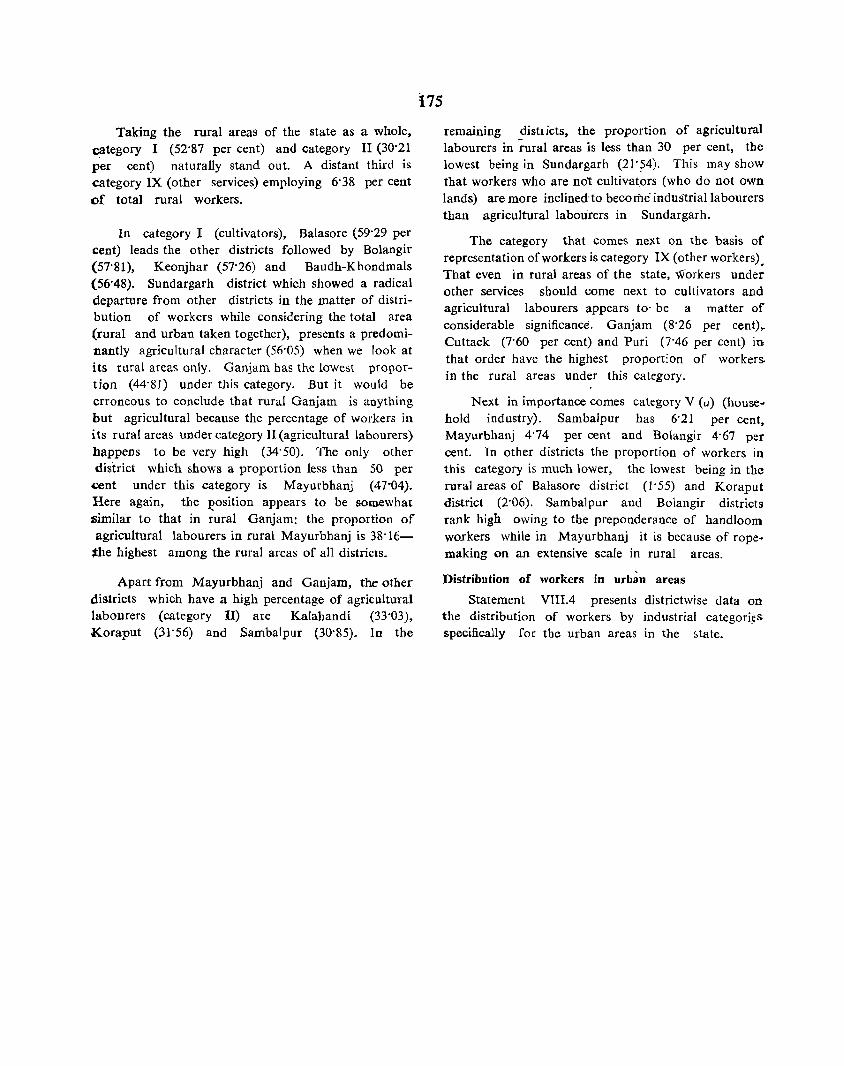
Taking the rural areas of the state as a whole, category I (52-87 per cent) and category II (30-21 per cent) naturally stand out_ A distant third is category IX (other services) employing 6-38 per cent of total rural workers_
In category I (cultivators), Balasore (59-29 per cent) leads the other districts followed by Bolangir (57-81), Keonjhar (57-26) and Baudh-Khondmals (56-48)_ Sundargarh district which showed a radical departure from other districts in the matter of distribution of workers while considering the total area (rural and urban taken together), presents a predominantly agricultural character (56-05) when we look at its rural areas only, Ganjam has the lowest proportion (44-S1) under this category, But it would be erroneous to conclude tbat rural Ganjam is anything but agricultural because the percentage of workers in its rural areas under category II (agricultural labourers) happens to be very high (34-50), The only other district which shows a proportion less than 50 per
cent under this category is Mayurbhanj (47'04). Here again, the l?osition appears to be somewhat t;imilar to that in rural Ganjam: the proportion of agricultural labourers in rural Mayurbhanj is 38-16-
the highest among the rural areas of all districts.
Apart from Mayurbhanj and Ganjam, the other districts which have a high percentage of agricultural labourers (category II) are Kalahandi (33-03), Koraput (31'56) and SambaJpur (30'85). In the
175
remaIDlng distlicts, the proportion of agricultural labourers in rural areas is less than 30 per cent, the lowest being in Sundargarh (21-?4), This may show that workers who are not cultivat_ors (who do not own lands) are more inclined to become industrial labourers than agricultural labourers in Sundargarh_
The category that comes next on the basis of representation of workers is category IX ( other workers). That even in rural areas of the state, workers under other services should come next to cultivators and agricultural labourers appears to- be a matter of considerable significance_ Ganjam (8'26 per cent),. Cuttack (7'60 per cent) and Puri (7-46 per cent) in. that order have the highest proportion of workers. in the rural areas under this category_
Next in importance comes category V (u) (house~
hold industry)_ Sambalpur has 6'21 per cent, Mayurbhanj 4'74 per cent and Bolangir 4-67 per cent, In other districts the proportion of workers in this category is much lower, the lowest being in the rural areas of Balasore district (1-55) and Koraput district (2-06)_ Sambalpur and Bolangir districts rank high owing to the preponderance of handloom workers while in Mayurbhanj it is because of ropemaking on an extensive scale in rural areas_
Distribution of workers in urb~D areas
Statement VUI.4 presents districtwise data on the distribution of workers by industrial categori~s
specifically for the urban areas in the ~tate_
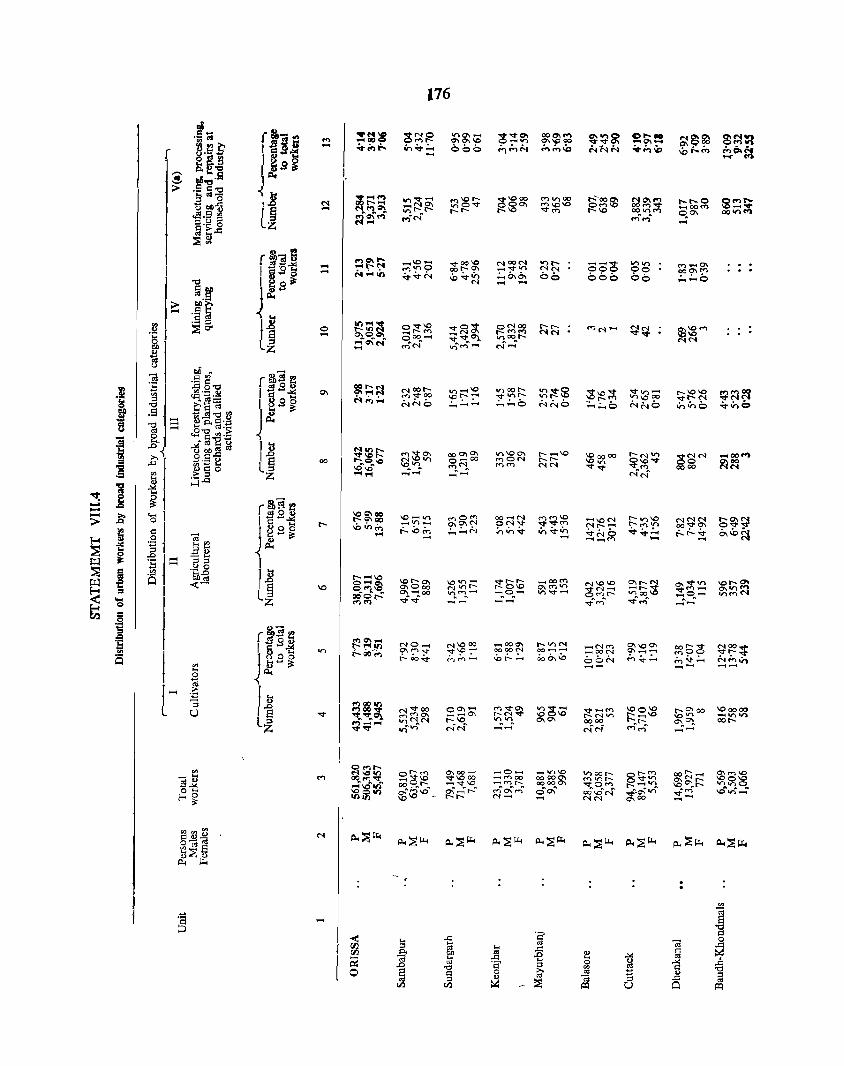
f~ I
.... -o ....
00
176
..... 0 _ _ MOO
_Mt-~o\~ N_
j 1:1 o
i
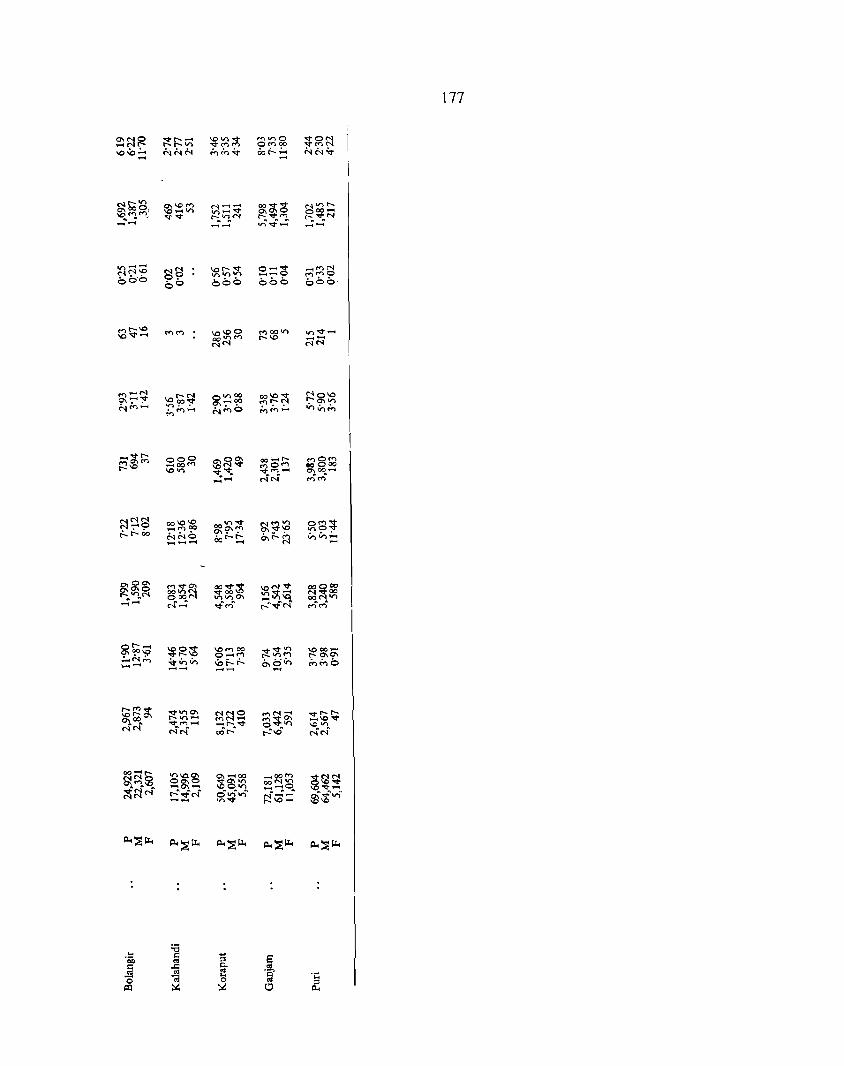
177
o\Ng -.tt'-- \OV"l-.t ..... V"l0 ~ON
~~.:... t'- t'- V"l v .......... 0 ..... 00 ,<."<;'1 ",hh MM-<t Oof...:: NN"" ....
("ojt'-V"l 0\1.0 ..... <'1-- ~(i!;CI; NV"lt-0\000) \O_V"l V"l-'<I' 000
-\0"' ..... ~'<I' "' .. VJ. M ,....'<1'''> r;, ~N . . ' v)~"'; _- _- --
",-- Ng \Ot'-~ 0-'<1' _ ..... N
N<;'I~ bbo __ 0
",MO 0o'0 0, 000 000' 0 0
..... ,_\D ..... '" \0\00 MOOV"l V"l'<l' ... \0'<1'- 00V"l'" t'-\O ;l;i "'IN
..... _M \ObO~ 0",00 ~~~
NO\O 0\';"'''- O\';""IC?O ~~~ NM~ .,.." .
, M- h"'O M"'-.,...
.... '<1''' 000 01°0\ OO~,..... ~8:;} MOl'" _00'" \0"''<1' MO'" t'-\O \0 V"l "<1''<1;. -.::tf'<1~ 0--00-
~- NN Mt1"')"'
~('j('j 0010\0 00"''<1' M ..... V"l ~?~ _0
f....-f:...00 _",00 o--.9't;"! 01'<1'10 hho .,_,_
"'~~ """,,---- 00 _ ....
0. 0 0\ MVO'! ~~;g- IOMV 00000 0\0'10 q~~ ",,"<1'- N'<I'OO t'-V')N """,0\ -",,\Q. ~N..Y') . . _-("oj- ..,f~ " • ..,f<'f ..........
~t'- .... ~1'2\b \0 ..... 00 v"<I'''' \000-~~;;: O_M ,_""..., ,,0\0\
~~.n 1Di'--t-. ~~~ MMO ..... - .... -,....",'<1' -.t""'" NNO ..... N ..... ~to~ ~~ .. O\ ,_ "'- MN- c;~~ -.t ..... _ _,,-.t \0'" ("ojN NN oat'-· r-:IIS NC'.f
oo-,_ "" \0. 0\ "'_00 ~~~ CI;~.~ ~~~ 00\0 \b "''''' t~N· -0--- 0"" ~~q 10""-r-:..,fN 6"';V')" N-- $i"'; -- V') -.t ,_\O-
~~~ p..~~ p..~~ p..~~ p..~~
... ;a .. s:: e 'Oil o:j ::s t:: .c: 0. o:j
~ ~ ~ 'a' .;:: 0 0 o:j ::s ~ ~ ~ 0 p..

"S ;:J
0\ ...
00 ...
..... ...
\C) ...
or> ...
..,. ...
-< rIl rIl ,_ ~ 0
178
.. £ ::l '" ... ~ f!l '" ..c:
'" "g-'6 "0 s:: ~ '" ::l
rn rn _-
OOON .... 0 ..........
"~ ..c: ,D .. ::l
~ ::E.
e 0
~ ~
.!!J
'" 8 "0 a
-; 0
c ~ ,.I.Il '" "5 5 "" 8 ..c: a 0 ~
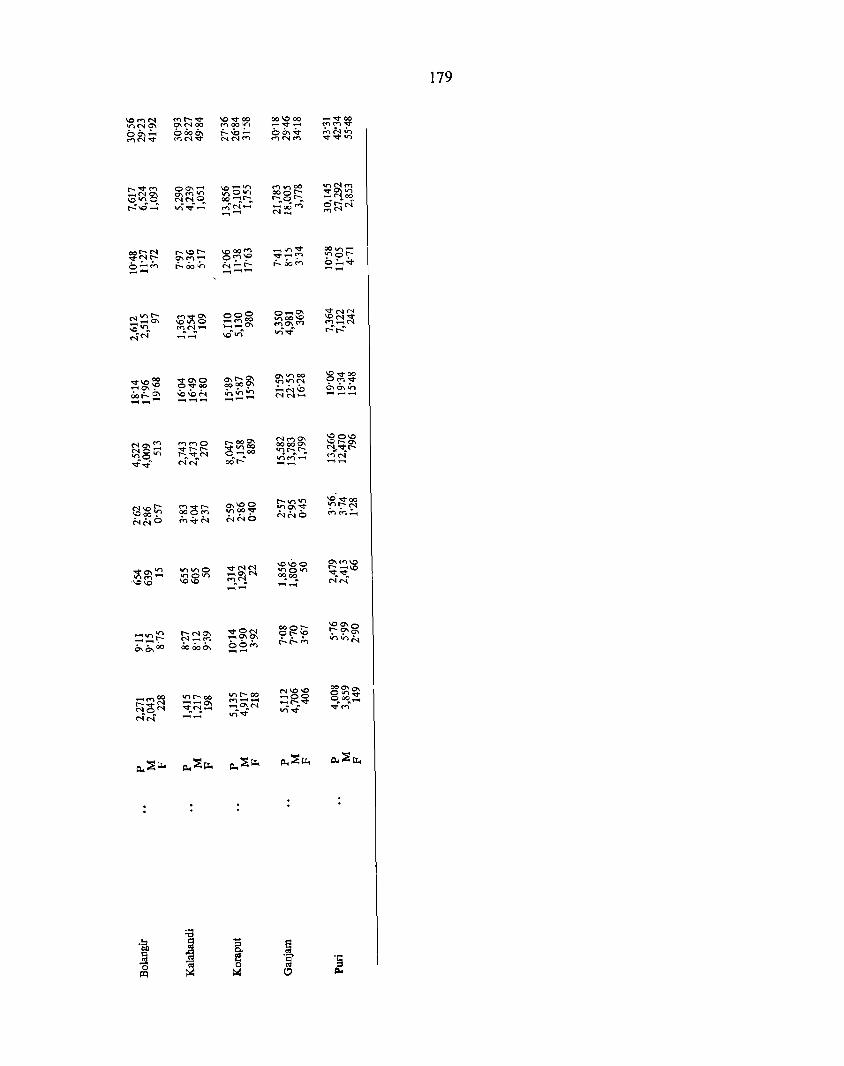
179
",....,N ....,r-v "'vOO 00'" 00 IrlNO\ 0\<"'100 ....,oolrl
_voo
00.;"" 0000. f.."'~ ~"<t_ "''''''<t
....,N"<I" ""'N"<I" <'IN'" 00...,. ~~:r. ,.-,N...., v"<l"lrl
r-"<I"<'"l 00\ ..... \0 ..... '" ....,,,,00 IrlN....,
\Ol;l~ 0\(')1rl 1rl01rl NNO
000r- VO\'"
r:-:~~ 00 ..... r- r-;.Or-.. .....NCO
v)'¢.,~ ~N~ """"'oOM O'r-:N' .......... <"'1_ (')N
~N~ r-",r- ",00"-' _Irl"<l" 001rl ..... 0\,.-, .... 9~'!J .,.~<:'
b~~ t--Oo';" b~~ .......... N ..... r- r-oo(') .....-- .........
NIrlr- (')"<1"0\ 000 0 ..... 0\ $~~ ..... _0\ "'1rl0 ..... <'"lCO ",00'" \O"l. (r) .. C"'!_,,",", ..... _0\ ,.-,0\"" .., ..... N'N .......... -0", "'..,f r-:r-:
"<1"",00 VO\O 0\1--0\ 0\"'00 "'''<1"00
....-40\"'P Ovoo 00000\ IrlIrlN O<'"lV
OOr-O'\ \o\oM .o-n-n ;""M\o ~"'.n .............. ............. -..... - NN ..... ..... ..........
~~~ (')(')0 r-000\ N<'"lO\ "'0'"
~.~N C5 1rl00 00000\ 1Or-0\
"'0 00 ..... 00 Irlr-r-- N.;-V ... t--
..,f..,f NN' oO'r-"' V)M'..;' <'"IN .......... ..........
N",r- ;;3C5M 0\",0 I--Irllrl v:i"<l" 00
~OO~ 1rl00"<l" "'0\"<1" ~~;:! MM O r.,"rh hMO hhb
VO\Irl ...,,,,0 ",,"NN \0..00 0\<'>",
.~~ ..... V) 0 '" .....0\('1 1rl0'" f:d::;\O
\0\0 M .. rt 0000 .. N'N' .......... ..... -.... "'''' r-NO\ '<j-ON 000r- ~~a; ......... r- N ..... <'"l _0\0\ 01--10
~~Oo 0000,,", bor., t--t--r., 'O"'M .........
..... <'"l00 "'r-OO ",1--00 1'>1\0\0 00\0\
Nc;f;i .......... 0\ <'"l ......... ..... 00 0"'''<1"
""tN .. -c ..... O\N ....... t-.. ..:::t q~-c
N'M ......... ",..,f 10",," "<I"<'"l
Il<~~ Il<~fl.. j:l.,::;;~ Il<~u.. 1l<~f,I.,
:a '6L 1iI ....
;::I El ~ -;j c. e '" 0 "iii 0
.~
~ ~ ~ ~ 0
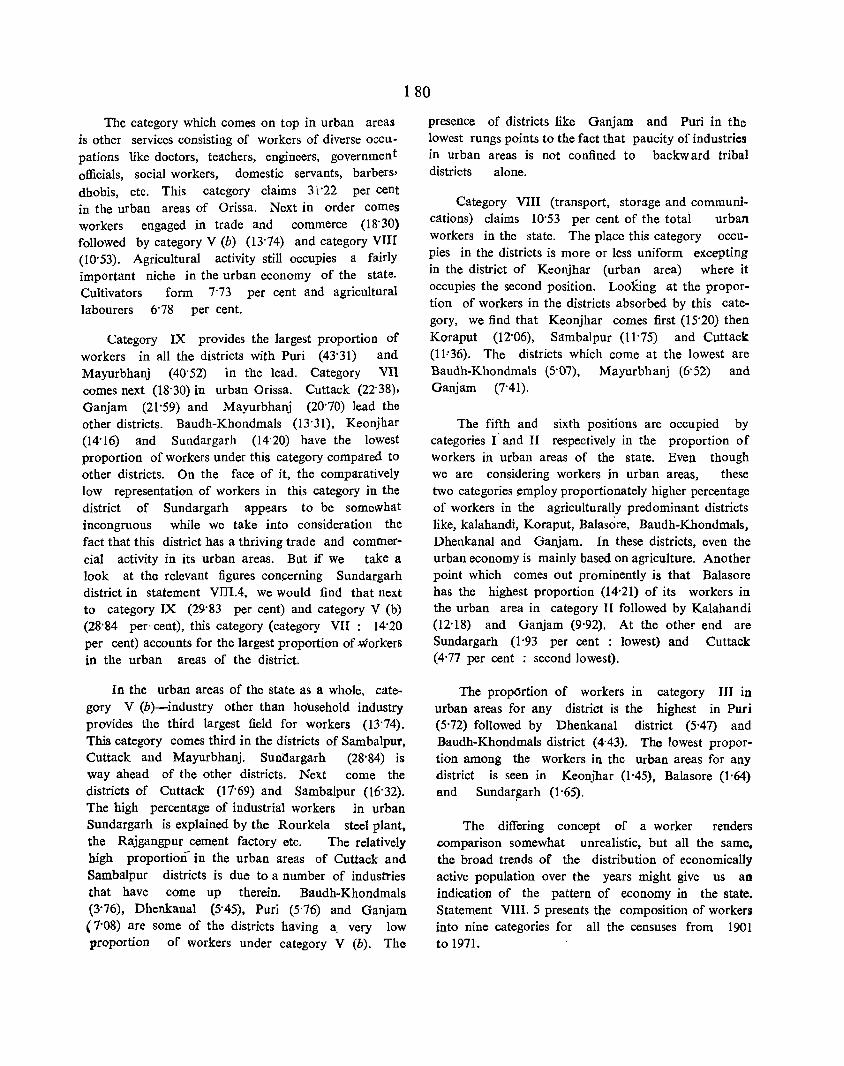
180
The category which comes on top in urban areas is other services consisting of workers of diverse occupations like doctors, teachers, engineers. government officials, social workers, domestic servants, barbers, dhobis, etc, This category claims 31'22 per cent in the urban areas of Orissa, Next in order comes workers engaged in trade and commerce (18' 30) followed by category V (b) (13'74) and category VIII (10'53), Agricultural activity still occupies a fairly important niche in the urban economy of the state, Cultivators form 7'73 per cent and agricultural labourers 6'78 per cent,
Category IX provides the largest proportion of workers in all the districts with Puri (43'31) and Mayurbhanj (40'52) in the lead, Category Vll comes next (18'30) in urban Orissa, Cuttack (22'38). Ganjam (21'59) and Mayurbhanj (20'70) lead the other districts, Baudh-Khondmals (13'31), Keonjhar (14'16) and Sundargarh (14'20) have the lowest proportion of workers under this category compared to other districts, On the face of it, the comparatively low representation of workers in this category in the district of Sundargarh appears to be somewhat incongruous while we take into consideration the fact that this district has a thriving trade and commercial activity in its urban areas, But if We take a look at the relevant figures concerning Sundargarh district in statement VITI.4, we would find that next to category IX (29'S3 per cent) and category V (b) (2S'S4 per' cent). this category (category VII: 14'20 per cent) accounts for the largest proportion of workers in the urban areas of the district.
In the urban areas of the state as a whole, category V (b)-industry other than hOUsehold industry provides the third largest field for workers (13'74). This category comes third in the districts of Sambalpur, Cuttack and Mayurbhanj, Sunaargarh (2S'84) is way ahead of the other districts, Next come the districts of Cuttack (11' 69) and Sambalpur (16' 32), The high percentage of industrial workers in urban Sundargarh is explained by the Rourkela steel plant, the Rajgangpur cement factory etc, The relatively high proportion in the urban areas of Cuttack and Sambalpur districts is due to a number of industries that have come up therein, Baudh-Khondmals (3'76), Dhenkanal (5'45), Puri (5'76) and Ganjam (1'OS) are some of the districts having l\ very low proportion of workers under category V (b), The
presence of districts like Ganjam and Puri in the lowest rungs points to the fact that paucity of industries in urban areas is not confined to backward tribal districts alone,
Category VIII (transport, storage and communications) claims 10'53 per cent of the totai urban workers in the state. The place this category occupies in the districts is more or less uniform excepting in the district of Keonjhar (urban area) where it occupies the second position. Looking at the proportion of workers in the districts absorbed by this category, we find that Keonjhar comes first (15'20) then Koraput (12'06), Sambalpur (11'75) and Cu1tack (11,'36). The districts which come at the lowest are Baudh-Khondmals (5'07), Mayurbhanj (6'52) and Ganjam (7'41),
The fifth and sixth positions are occupied by categories r' and II respectively in the proportion of workers in urban areas of the state. Even though we are considering workers in urban areas, these two categories ymploy proportionately higher percentage of workers in the agriculturally predominant districts like, kalahandi, Koraput, Balasore, Baudh-Khondmals, Dhenkanal and Ganjam. In these districts, even the urban economy is mainly based on agriculture. Another point which comes out prominently is that Balasore has the highest proportion (14'21) of its workers in the urban area in category II followed by Kalahandi (12'18) and Ganjam (9'92). At the other end are Sundargarh (1 '93 per cent : lowest) and Cuttack (4'77 per cent : second lowest),
The proportion of workers in category III in urban areas for any district is the highest in Puri (5'72) followed by Dhenkanal district (5'47) and Baudh-Khondmals district (4'43). The lowest proportion among the workers in the urban areas for any district is seen in Keonjhar (1'45), Balasore (1'64) and Sundaq~arh 0'65).
The differing concept of a worker renders comparison somewhat unrealistic, but all the same. the broad trends of the distribution of economically active population over the years might give us an indication of the pattern of economy in the state. Statement VIII. 5 presents the composition of workers into nine categories for all the censuses from 1901 to 1971.

181
STATEMENT VJlI, 5
Percentage distribution of workers among different categories of 1971. compared with previous censuses *, Orissa
Category of workers 1971 1961 1951 1931 1921 1911 1901
1 2 3 4 5 6 7 8
Total workers 100'00 100'00 100'00 100'00 100'00 100'00 100'00
I. Cultivators 49'16 56'82 51'90 37'23 48'62 47'60 49'58
II, Agricultural labourers 28'28 17'01 18'46 26'22 20'00 21'60 6'27
III. Livestock, forestry, fishing, hunting and 2'14 1'37) plantations, orchards and allied activities l
~ 2'50 4'75 5'3:> 4'95 5'25
IV, Mining and quarrying 0'76 0'35) I
V (a), Manufacturing, processing, servicing and 3'63 6'93) repairs (household industry) I
>- 7'68 7'97 10'75 10'54 12'90
V (b), Manufacturing, processing, servicing repairs (other than household industry)
and I
2'30 1'13)
VI.- Construction 0-55 0-40 0-89 0-50 0-64 0'42 0'43
VII. Trade and commerce 3'31 1'92 4'40 4'41 6'11 6'07 5'84
VIII. Transport, storage and communications 1'45 0'68 0-65 0'29 0'46 0'55 0'55
IX, Other services 8'42 13'39 13'52 18'63 8-12 8'27 19'18
-------- ---- -- - ---------
What strikes one is the significant drop in the proportion of cultivators from 56'82 per cent in 1961 to 49'16 per cent in 1971. The former is the highest figure of the proportion of cultivators to total workers during the past seven decades, The lowest proportion (37'23) was recorded in 1931. Notwithstanding these variations, category I has all along been the one category which has employed the largest proportion of workers,
Looking at category II (agricultural labourers) one is struck by the tremendous variation in the figures recorded by successive censuses, In 1901 the proportion of agricultural workers to total workers in Orissa was as low as 6-27 per cent, In 1911 and 1921, it hovered around 20 per cent whily in 1931 it shot up to 26'22 per cent (we saw that in this census the proportion of cultivators to the total workers was as low as 37'23 per cent), In 1951 and 1961, the proportion of workers under category II to total workers was under 20 per cent but again in 1971 it came to an unprecedented 28'28 per cent, This figure when compared to the corres-
- -----
ponding figure of 1961 (17'01) comes as something of a surprise because, if anything, the 1961 figure (17-01) should have possibly come further down in terms of the less liberal definition adopted in 1971. This abnormal increase in the proportion of agricultural labourers to total workers can not be viewed as a healthy development in the economy of the country,
Categories III and IV (these were one category till 1961) accounted for as low as 1'72 per cent of the total workers in 1961 whereas the corresponding figure in 1971 has increased to 2'90 per cent.
Next comes an important sphere of economic activity. viz,. industry. Till 1951 manufacturing, processing, servicing and repairs was treated as only one category, but since 1961 these have been treated separately as household industries and industries otB:er than household industries. Here again, the figures seem to point to a retrograde trend in the proportion of workers employed under industry to total workers. In 190!, the proportion of workers in industry to total workers was as high as 12'90 per cent. In the
*(1) Absolute figures of previous censuses are taken from 1961 General report, Orissa, (2) Figures for 1941 Census are not available,
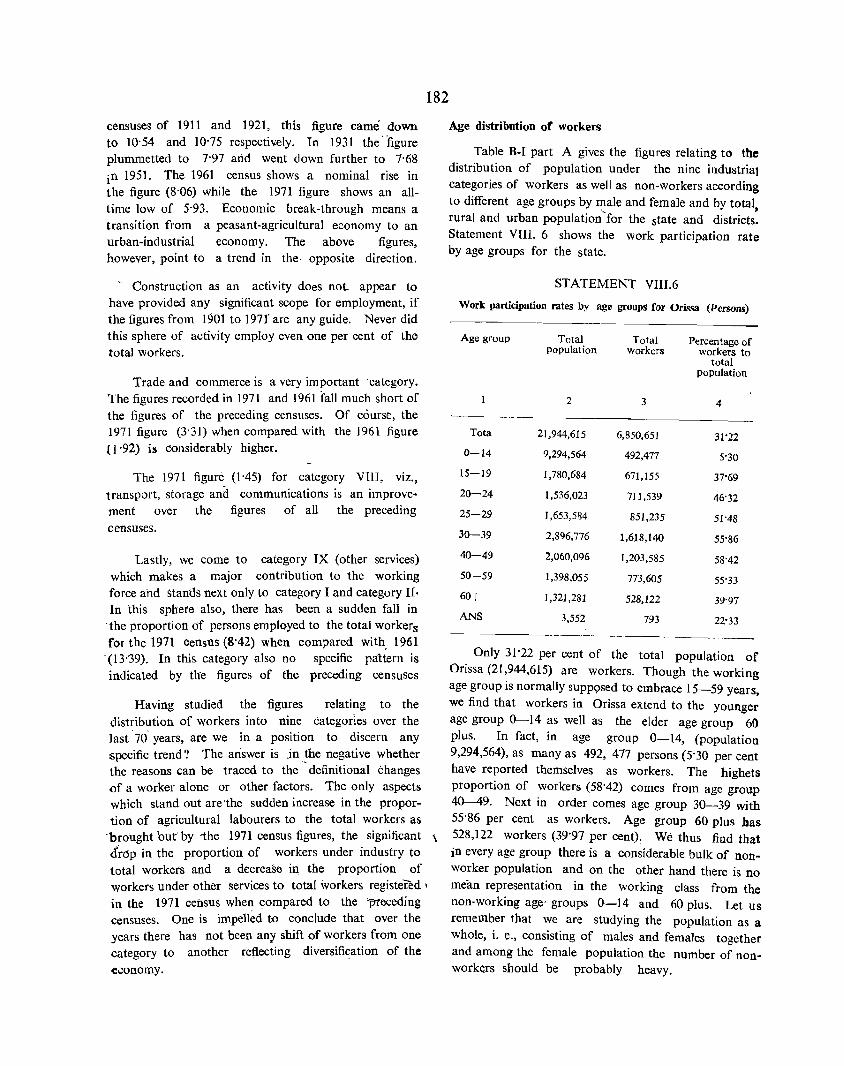
182
censuses of 1911 and 1921, this figure came down to 10'54 and 10'75 respecti'lle)y. In 1931 the' figure plummetted to 7'97 and went down further to 7'68 in 1951. The 1961 census shows a nominal rise in the figure (8'06) while the 1971 figure shows an alltime low of 5'93. Economic break-through means a transition from a peasant-agricultural economy to an urban-industrial economy. The above figures, however, point to a trend in the· opposite direction.
o Construction as an activity does not appear 10
have provided any significant scope for employment, if the figures from 1901 to 1971' are any guide. Never did this sphere of activity employ even one per cent of the total workers.
Trade and commerce is a very important 'category. The figures recorded in 1971 and 1961 fall much short of the figures of the preceding censuses. Of course, the 1971 figure (3'31) when compared with the 1961 figure (j '92) is considerably higher.
The 1971 figure (1'45) for category VllI, viz., transport, storage an'(l. communications is an improve· ment over the figures of all the preceding censuses.
Lastly, we come to category IX (other services) which makes a major contribution to the working force and stands next only to category I and category II· In this sphere also, there has been a sudden fall in
'the proportion of persons employed to the total workers for the 1971 Census (8'42) when compared with, 1961 (13-39), In this category also no specific pattern is indicated by the figures of the preceding censuses
Having studied the figures relating to the distribution of workers into nine categories over the last' 70· years, are we in a position to discern any specific trend? The answer is .in the negative whether the reasons can be traced to the - definitional changes ()f a worker alone or other factors. The only aspects which stand out arethe sudden increase in the propor· tion of agricultural labourers to the total workers as
'bro'ught 'out by -the 1971 census figures, the significant \ drop in the proportion of workers under industry to total workers and a decrease iq the proportion of workers under other services to total workers registered I
in the 1971 census when compared to the }Jl'eceding censuses. One is impelled t<> conclude that over the years there has not been any shift of workers from one category to another reflecting diversification of the economy.
Age distribution of workers
Table B-I part A gives the figures relating to the distribution of population under the nine industrial categories of workers as well as non-workers according to different age groups by male and female and by total , , rural and urban population for the state and districts. Statement VIII. 6 shows the work participation rate by age groups for the state.
STATEMENT VIII.6
Work participation rates by age groups for Orissa (Persons)
Age group
Tota
0-14
15-19
20-24
25-29
30-39
40-49
50-59
60+
ANS
Total population
2
21,944,615
9,294,564
1,780,684
1,536,023
1,653,584
2,896,776
2,060,096
1,398,055
1,321,281
3,552
Total workers
3
6,850,651
492,477
671,155
711,539
851,235
1,618,140
1,203,585
773,605
528,122
793
Percentage of workers to
total population
4
31'22
5'30
37·69
46'32
51'48
55'86
58'42
55'33
39'97
22'33
Only 3 j ·22 per cent of the total population of Orissa (21,944,615) are workers, Though the working age group is normally SUPP9sed to embrace 15-59 years, we find that workers in Orissa extend to the younger age group 0-14 as well as the elder age group 60 plus. In fact, in age group 0-14, (population 9,294,564), as many as 492, 477 persons (5'30 per cent have reported themselves as workers. The highets proportion of workers (58'42) comes from age group 40--49. Next in order comes age group 30-39 with 55'86 per cent as workers. Age group 60 plus has 528,122 workers (39'97 per cent): We thus find that in every age group there is a considerable bulk of nonworker population and on the other hand there is no mean representation in the working class from the non-working age' groups 0-14 and 60 plus. Let us remember that we are studying the popUlation as a whole, i. e., consisting of males and females together and among the female population the number of non. workers should be probably heavy.
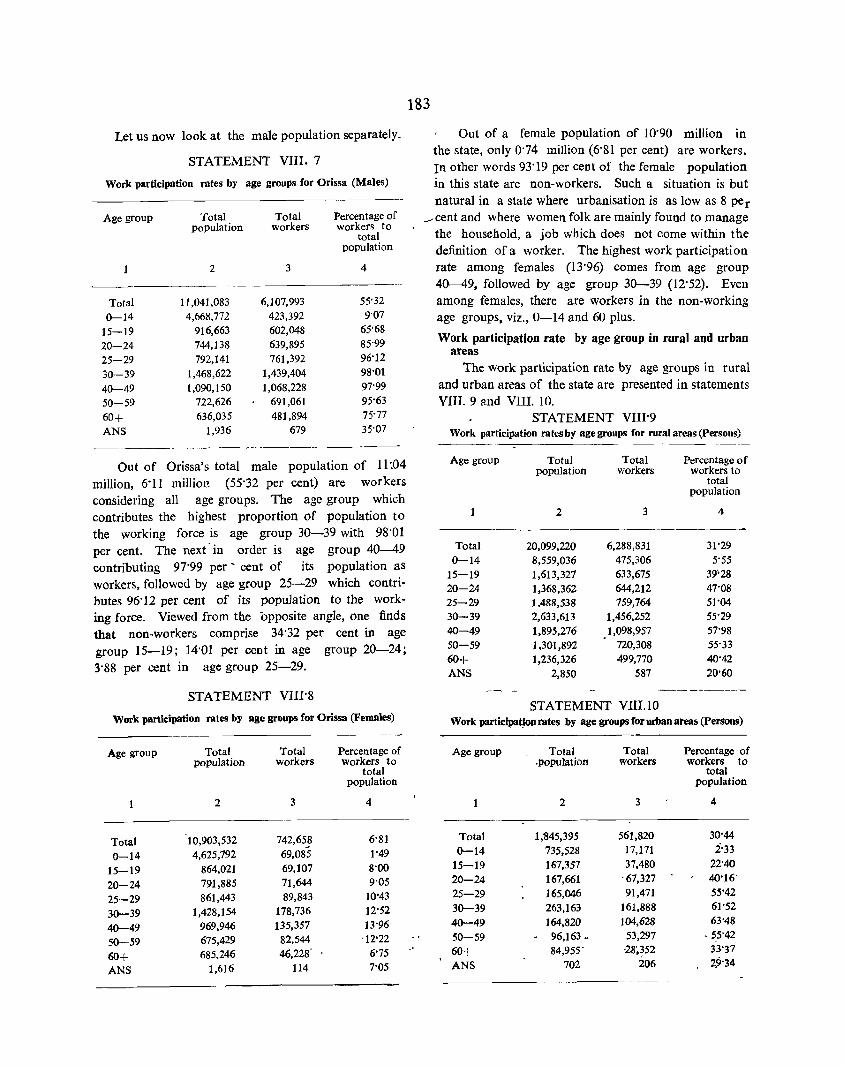
Let us now look at the male population separately,
STATEMENT VIII, 7
Work participation rates by age groups for Orissa (Males)
Age group
Total 0-14
15-19 20-24 25-29 30-39 40-49 50-59 60+ ANS
Total population
2
11,041,083 4,668,772
916,663 744,138 792,141
1,468,622 1,090,150
722,626 636,035
1,936
Total Percentage of workers workers to
total population
3 4
6,107,993 55'32 423,392 9'07
602,048 65'68 639,895 85'99 761,392 96'12
1,439,404 98'01 1,068,228 97'99
691,061 95'63 481,894 75'77
679 35'07
Out of Orissa's total male population of 11 :04 million, 6'11 millio!! (55'32 per cent) are workers considering all age groups, The age group which contributes the highest proportion of population to the working force is age group 30-39 with 98'01 per cent, The next -in order is age group 40-49 contributing 97'99 per - cent of its population as workers, followed by age group 25-29 which contributes 96'12 per cent of its population to the working force, Viewed from the opposite angle, one finds that non-workers comprise 34'32 per cent in age group 15-19; 14'01 per cent in age group 20-24; 3'88 per cent in age group 25-29,
STATEMENT VIII'S
Work participation rates by age groups for Orissa (Females)
Age group Total Total Percentage of population workers workers to
total population
2 3 4
Total 10,903,532 742,658 6'81
0-14 4,625,792 69,085 1'49
15-19 864,021 69,107 8'00
20-24 791,885 71,644 9'05
25-29 861,443 89,843 10'43
30-39 1,428,154 178,736 12'52
40-49 969,946 135,357 13'96
50-59 675,429 82,544 -12'22
60+ 685,246 46,228' 6'75
ANS },616 114 7'05
183
Out of a female population of 10'90 million in the state, only 0'74 million (6'81 per cent) are workers, In other words 93'19 per cent of the female population in this state are non-workers, Such a situation is but natural in a state where urbanisation is as low as 8 per
..-' cent and where women folk are mainly found to manage the household, a job which does not Come within the definition of a worker, The highest work participation rate among females (13'96) comes from age group 40-49, followed by age group 30-39 (12'52), Even among females, there are workers in the non-working age groups, viz" 0-14 and 60 plus,
Work participation rate by age group in rural and urban areas
The work participation rate by age groups in rural and urban areas of the state are presented in statements VIII. 9 and VIII, 10,
STATEMENT VIII'9 Work participation rates by age groups for rural areas (Persons)
Age group
Total 0-14
15-19 20-24 25-29 30-39 40-49 50-59 60+ ANS
Total Total population workers
2 3
20,099,220 6,288,831 8,559,036 475,306 1,613,327 633,675 1,368,362 644,212 1,488,538 759,764 2,633,613 1,456,252 1,895,276 1,098,957 1,301,892 720,308 1,236,326 499,770
2,850 587
STATEMENT VIII.lO
Percentage of workers to
total population
4
31'29 5-55
39'28 47'08 51'04 55'29 57'98 55-33 40'42 20'60
Work participation rates by age groups for urban areas (Persons)
Age group
1
Total 0-14
15-19 20-24 25-29 30-39 40-49 50-59 60+ ANS
Total ,population
2
1,1345,395 735,528 167,357 167,661 165,046 263,163 164,820
. 96,163. 84,955'
702
Total Percentage of workers workers to
total population
3 4
561,820 30'44 17,171 2'33 37,480 22'40
-67,327 40'16' 91,471 55'42
161,888 61'52 104,628 63"48
53,297 - 5,5'42 -28;352 33'37
206 2.9'34

The overall work participation rate-for the total rural population is 31'29 per cent whereas for urban areas it is slightly lower (30'44). In the first age group (0-14), the rural areas show a 5'55 per cent work
-participation rate whereas in urban areas it is much lower (2'33)_ This is but natural because urban areas have better facilities for primary education and urban parents are more conscious about the education of their children. In age group 20-24, 47'08 per cent are workers in rural areas and 40'16 in urban areas. The lower incidence of workers in this age group in urban areas appears significant. While there is reason to suppose that many persons in this age group in towns might still be pursuing their college study or getting ready for seeking employment, yet a good number of them might be without work. In the next age group 25-29 it is in urban areas that the percentage of workers is higher (55'42) than in rural areas -<S.l·_94). The maximum proportion of workers for any single age
184
group-be it in rural or urban areas--comes from age group 40-49. In the non-working age group 60 plus, the percentage of population who actually do work is higher in rural areas (40'42) than in urban (33'37),
Comparing the distribution of workers in differ~nt ; age groups in rural and 'Urban areas, one finds that in
age group 25-29 which represents the prime working age, a larger proportion of the population works in urban than in rural areas, In the non-working age groups and the age group which is just on the threshold of the working age (15-19) the proportion of workers in rural areas is higher than in urban,-
Distribution of workers in each industiral category by age groups for total population.
Let us now examine the distribution of workers in each industrial category according to age groups, Statement VIII' I 1 gives such distributio n in respect of the total population, i.e., for rural and urban area combined.
STATEMENT VllUl
Industrial categoryof workers
All workers
I -Cultivators
II-Agricultnrallabourers :
III~Livestock. forestry, fishing, hunting and plantations, orchards and allied activities·
IV':_;Mining and quarrying
V(a)-Manufact uri n g, processing, servicing and repairs (at household industry)
Distribution of workers in each industria] categoiy by age groups (Tota))
Proportion per 1,000 of workers
Persons! Total Males workers Total 0-14 15-19 20-24 25-29 30-39 40-49 50-59 60+
Females
2
P M F
P M p'
P M F
P M F
P' M F
pM F
3
6,850,651 6,107;993
742,658
3,368,025 3,219,678
148,347
1,937,574 1,547,:77
390,297
146,923 132,836 14,087
51,701 37,844 13,857
248,610 188,803
59,807
4
1,000 1,000 1,000
5
71'89 69'32 93'02
6 7 8 9 10 11
97'97 103'86 124-26 236'20 175'69 112'92 98'57 104'76 124'65 235'66 174'89 113'14 93'05 96:47 120'98 240'67 182'26 111'15
12
77'09 78-90 62'25
1,000 1,000 1,000
45-55 45'34 49'91
81'67 82'79 57'35
92'27 1\2'56 232'73 192'00 136-83 106-32 93'33 113'28 232'29 190'50 136'03 106'37 69'18 96'91 242'29 224'66 154'19 105'40
1,000 119'16 141'62 112-98 119'42 217'45 151'95 1,000 123-36 149'65 115'49 117'48 211'22 146'92 1,000 102'49 109'77 103'04 127'09 24i'19 171'90
1,000 290'66 112'79 1,000 280'92 116'82 1,000 382'48 74'82
80'27 82'16 62.47
95'80 174'40 126,15 97'50 176'40 126.54 79'72 155'53 122.45
1,000 1,000 1,000
21'43 59'94 115'88 198'51 354'98 175'90 11'63 40'43 103'27 194'90 369'01 196'17
'48'21 113'23 1'50'32 208'34 316'66 120'52
88'55 86'23 97'75
75'50 75'51 75'46
60'48 69'87 34'85
1,000 1,000 1,000
53'69 44'13 83'87
86'03 101'66 86'48 192'78 84'61 98'13
119'38 246'51 191'80 120'52 119'67 248'32 193'86 121'30 118'46 240'79 185'30 118'18
48'82 49'61 45'69
44-24 43-97 46-78
12'65 14'51
7'58
80'26 83'33 70'56
ANS
13
0'12 0'11 0'15
0'07 0-07 0'11
0'05 0'04 0'08
0'19 0'18 0'29
0'23 0'21 0'29
0'12 0'13 0'10
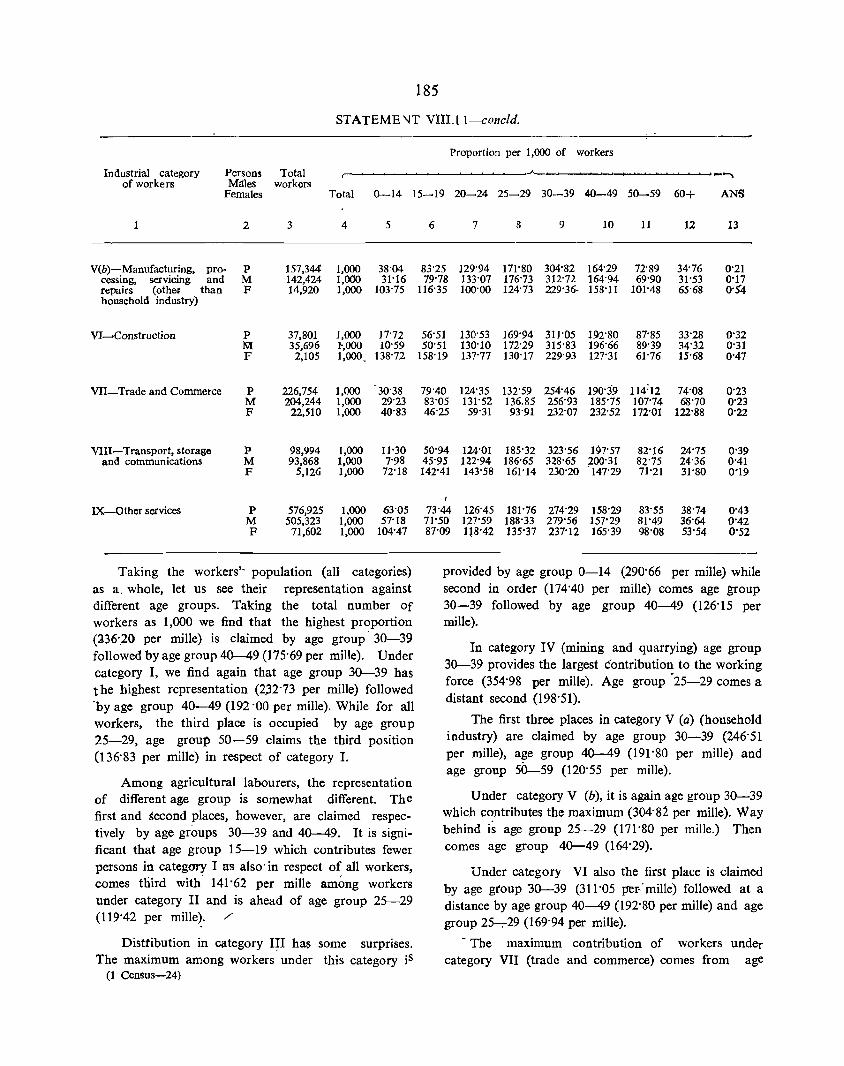
185
STATEME \JT v:m,L l-concld,
Proportion per 1,000 of workers
Industrial category Persons Total --, of workers Males workers
Females Total 0-14 15-19 20-24 25-29 30-39 40-49 50-59 60+ ANS
2 3 4 5
V(b)-. Manufact':ll',ing, pro- P 157,344 1,000 38'04 cessmg, serVIClOg and M 142,424 1,000 31'16 repairs (othe~ than F 14,920 1,000 103'75 household industry)
VI-Construction P 37,801 1,000 17'72 M 35,696 1',000 10'59 F 2,105 1,000, 138'72
VII-Trade and Commerce P 226,754 1,000 30'38 M 204,244 1,000 29'23 F 22,510 1,000 40'83
VIII-Transport, storage P 98,994 1,000 11'30 and communications M 93,868 1,000 7'98
F 5,126 1,000 72'18
IX-Other services P 576,925 1,000 63'05 M 505,323 1,000 57'18 F 71,602 1,000 104'47
Taking the workers'- population (all categories) as a, whole, let us see their representation against different age groups, Taking the total number Of workers as 1,000 we find that the highest proportion (J36',20 per mille) is claimed by age group' 30-39 followed by age group 40-49 (175'69 per mille), Under category I, we find again that age group 30-39 has the highest representation (2,32'73 per mille) followed 'by age group 40-49 (192 '~O per mille), While for all workers, the third place is occupied by age group 25-29, age group 50-59 claims the third position (136'83 per mille) in respect of category 1.
Among agricultural labourers, the representation of different age group is somewhat different, Th e first and second places, however, are claimed respectively by age groups 30-39 and 40-49, It is significant that age group 15-19 which contributes fewer persons in category I as also' in respect of all workers, comes third with' 141'62 per mille among workers under category II and is ahead of age group 25-29 (119'42 per mille), /'
Disttibution in category I~I has some surprises, The maximum among workers under this category is
(1 Census-24)
6 7 8 9 10 11 12 13
83'25 129'94 171'80 304'82 164'29 72'89 34'76 0'21 79'78 133'07 176'73 312'72 164'94 69'90 31'53 0'17
116'35 100'00 124'73 229'36· 158'11 101'48 65'68 0'.)'4
56'51 130'53 169'94 311'05 192'80 87'85 33'28 0'32 50'51 130'10 172'29 315'83 196'66 89'39 34'32 0'31
158'19 137'77 130'17 229'93 127'31 61'76 15'68 0'47
79'40 124'35 132'59 254'46 190'39 114:12 74'08 0'23 83'05 131'52 136,85 256'93 185'75 107'74 68'70 0'23 46'25 59'31 93'91 232'07 232'52 172'01 122'88 0'22
50'94 124'01 185'32 323'56 197'57 82'16 24'75 0'39 45'95 122'94 186'65 328'65 ~OO'31 82'75 24'36 0'41 142'41 143'58 161'14 230'20 147'29 71'21 31'80 0'19
73'44 126'45 181'76 274'29 158'29 83'55 38'74 0'43 71'50 127'59 188'33 279'56 157'29 81'49 36'64 0'42 87'09 118'42 135'37 237'12 165'39 98'08 53'54 0'52
provided by age group 0-14 (290·66 per mille) while second in order (174'40 per mille) comes age group 30-39 followed by age group 40-49 (126'15 per mille),
In category IV (mining and quarrying) age group 30-39 provides the largest contribution to the working force (354'98 per mille), Age group -25-29 comes a distant second (198'51),
The first three places in category V (a) (household industry) are claimed by age group 30-39 (246'51 per mille), age group 40-49 (191'80 per mille) and age group 50-59 (120'55 per mille),
Under category V (b), it is again age group 30-39 which c~tributes the maximum (304'82 per mille), Way behind is age group 25-29 (171'80 per mille,) Then comes age group 40-49 (164'29),
Under category VI also the first place is claimed by age group '30-39 (311'05 per-"mille) followed at a distance by age group 40-49 (192'80 per mille) and age group 25-;-29 (169'94 per mille),
- The maximum contribution of workers under category VII (trade and commerce) comes from age
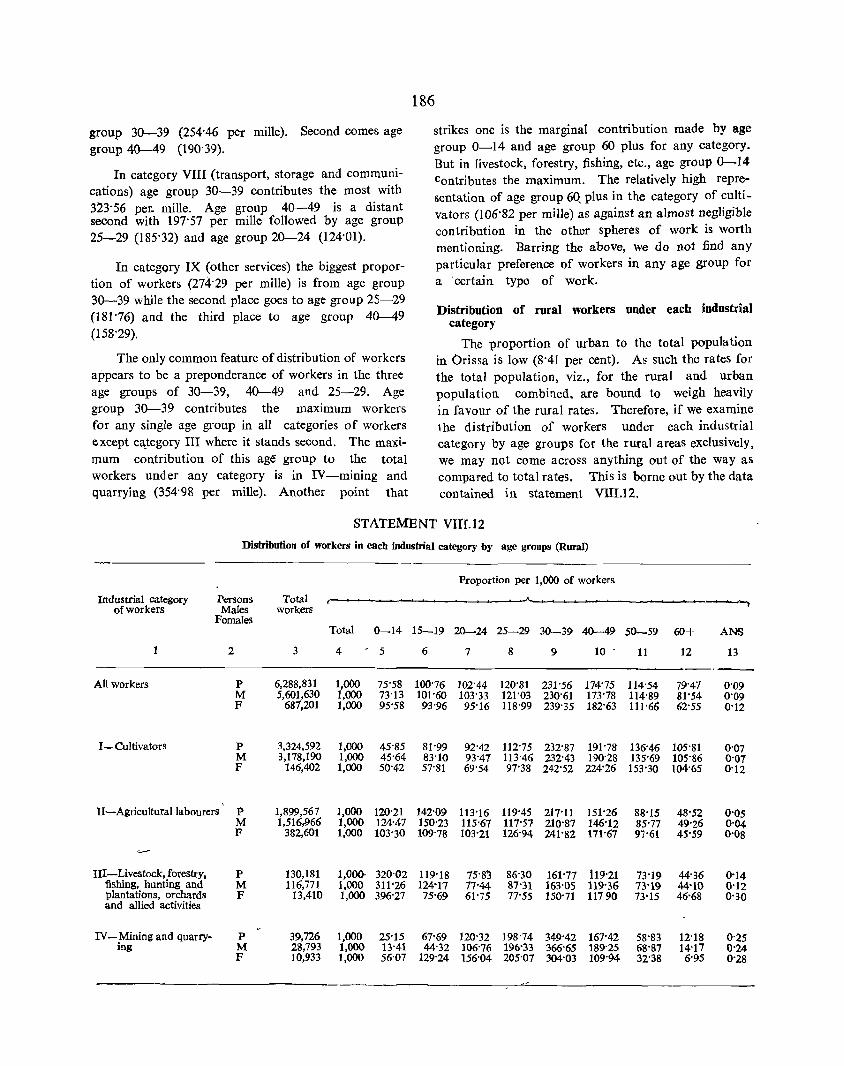
group 30-39 (254'46 per mille). Second comes age group 40-49 (190'39).
In category VIII (transport, storage and communications) age group 30-39 contributes the most with 3:23'56 per. mille. Age group 40-49 is a distant second with 197'57 per mille followed by age group 25-29 (185'32) and age group 20-24 (124'01).
In categQry IX (other services) the biggest proportion of workers (274'29 per mille) is from age group 30-39 while the second place goes to age group 25-29 (181'76) and the third place to age group 40-49 (158'29).
The only common feature of distribution of workers appears to be a preponderance of workers in the three age groups of 30-39, 40-49 and 25-29. Age group 30-39 contributes the maximum workers for any single age group in all categories of workers except c'!:tegory III where it stands second. The maximum contribution of this age group to the total workers under any category is in IV-mining and quarrying (354-98 per mille). Another point that
186
strikes one is the marginal contribution made by age group 0-14 and age group 60 plus for any category_ But in livestock, forestry, fishing, etc., age group 0-14 Contributes the maximum. The relatively high representation of age group 6Q plus in the category of cultivators (106'82 per mille) as against an almost negligible contribution in the other spheres of work is worth mentioning. Barring the above, we do not find any particular preference of workers in any age group for a -certain type of work.
Distribution of rural workers under each industrial category
The proportion of urban to the total popuhition in Orissa is low (8'41 per cent). As such the raies for the total population, viz., for the rural and urban population combined, are bound to weigh heavily in favour of the rural rates. Therefore, if we examine lhe distribution of workers under each industrial category by age groups for the rural areas exclusively, we may not come acroSS anything out of the way as compared to total rates. This is borne out by the data contained in statement VIII.l2.
STATEMENT VIIr.12
Distribution of workers in each industrial category by age groups (Rural)
Industrial category of workers
All workers
I - Cultivators
Persons Males
Females
2
P M F
P M F
, II-Agricultural labourers P
M F
III-Livestock, forestry, P fishing, hunting and M plantations, orchards F and allied activities
IV - Mining and quarry- P ing M
F
Total workers
3
6,288,831 5,601,630
687,201
3,324,592 3,178,190
146,402
1,899,567 1,516,966
382,601
130,181 116,771
13,410
39,726 28,793 10,933
Total 0-14
4 , 5
1,000 75'58 1,000 73'13 1,000 95'58
1,000 45'85 1,000 45-64 1,000 50'42
1,000 120'21 1,000 124'47 1,000 103'30
I,O()(). 320-02 1,000 311'26 1,000 396'27
1,000 25'15 1,000 13·41 1,000 56-07
Proportion per 1,000 of workers
15-19 2()"""24 25-29 30-39 40--49
6 7 8 9 10 -
100-76 102-44 120'81 231'56 174'75 101'60 103'33 121'03 230'61 173'78 93'96 95'16 118'99 239'35 182'63
81'99 92'42 112'75 232'87 191'78 83'10 93"47 113"46 232'43 190'28 57'81 69'54 97'38 242'52 224'26
142'09 113'16 119'45 217'11 151'26 150'23 115'67 117'57 210'87 146'12 109'78 103'21 126'94 241'82 171'67
119'18 75·8) 86'30 161'77 119'21 124-17 77'44 87'31 163'05 119'36 75'69 61'75 77'55 150'71 11790
67'69 120-32 198'74 349'42 167'42 44-32 106'76 196'33 366'65 189'25
129-24 156'04 205-07 304'03 109'94-
-------,
50-59 60-1- ANS
11 12 13 ._ 114'54 79'47 0'09 114'89 81'54 0'09 111'65 62'55 0'12
136'46 105'81 0'07 135'69 105'86 0'07 153'30 104'65 0'12
88'15 48'52 0'05 85'77 49'26 0'04 97'61 45'59 0'08
73'19 44'36 0'14 73"19 44'10 0'12 73'15 46'68 0'30
58'83 12"18 0'25 68'87 14'17 0'24 32'38 6'95 0'28
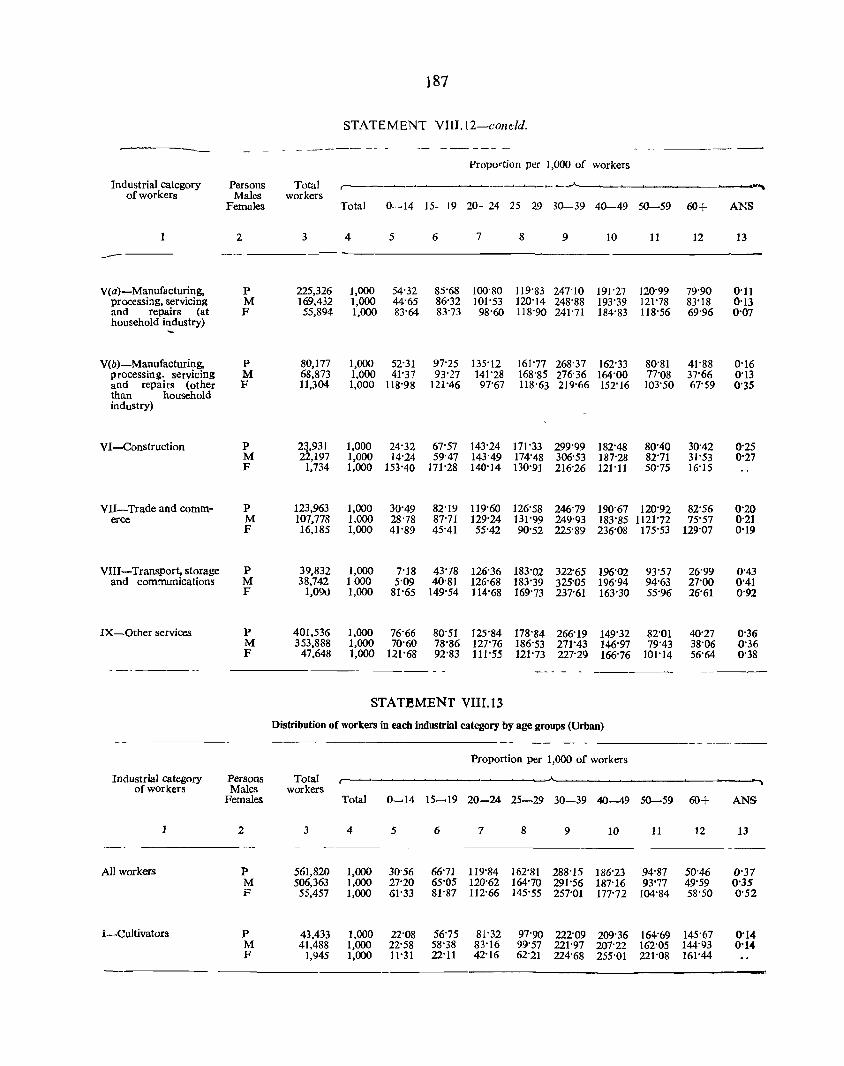
187
STATEMENT VlII,12-coneld, -_ - ----- -- - -- -_--
Proportion per 1,000 of workers
Industrial category Persons Total r----~~--~--~~~-,---"--~~~~ "'" of workers Males workers Females Total 0-14 15-19 20- 24 25 29 30--39 40-49 50-59 60+ ANS
1 2 3 4 5 6 7 8 9 10 11 12 13
--V(a)-Manufacturing, P 225,326 1,000 54'32 85'68 l00'SO 119'83 247'10 191'27 120'99 79'90 0'11
processing, servicing M 169,432 1,000 44'65 86'32 101'53 120'14 248'88 193'39 121'78 83'18 0'13 and repairs (at F 55,894 1,000 83'64 83'73 98'60 118'90 241'71 184'83 118'56 69'96 0'07 household industry) ...
V(b)-Manufacturing, P 80,177 1,000 52'31 97'25 135'12 161'77 268'37 ]62'33 80'81 41'88 0'16 processing, servicing M 68,873 1,000 41'37 93'27 141'28 168'85 276'36 164'00 77'08 37'66 0'13 and repairs (other F 11,304 1,000 118'98 121'46 97'67 118'63 219'66 152'16 103'50 67'59 0'35 than household industry)
VI-Construction P 2~,931 1,000 24'32 67'57 143'24 171'33 299'99 182'48 80'40 30'42 0'25 M 22,197 1,000 14'24 59'47 143'49 174'48 306'53 187'28 82'71 31'53 0'27 F 1,734 1,000 153'40 171'28 140'14 130'91 216'26 121'11 50'75 16'15
VII-Trade and comm- P 123,963 1,000 30'49 82'19 119'60 126'58 246'79 190'67 120'92 82'56 0'20 eree M 107,778 1.000 28'78 87'71 129'24 131'99 249'93 183'85 112172 75'57 0'21
F 16,185 1,000 41'89 45'41 55'42 90'52 225'89 236'08 175'53 129'07 0'19
VIII -Transport, storage P 39,832 1,000 7'18 43'78 126'36 183'02 322'65 196'02 93'57 26'99 0'43 and communications M 38,742 1000 5'09 40'81 126'68 183'39 325'05 196'94 94'63 27'00 0'41
F 1,090 1,000 81'65 149'54 114'68 169'73 237'61 163'30 55'96 26'61 0'92
IX-Other services P 401,530 1,000 70'66 80'51 125'84 178'84 266'19 149'32 82'01 40'27 0'36 M 353,888 1,000 70'60 78'86 127'76 186'53 271'43 146'97 79'43 38'06 0'36 F 47,648 1,000 121'68 92'83 111'55 121'73 227'29 166'76 101'14 56'64 0'38
--- - -
STATEMENT VIII.l3
Distribution of workers in each industrial category by age groups (Urban)
-- -- -
Proportion Per 1,000 of workers
Industrial category Persons Total ..A,_, ....... of workers Males workers
Females Total 0~14 15~19 20-24 25-29 30-39 40-49 50-59 60+ ANS
1 2 3 4 5 6 7 8 9 10 11 12 13
All workers P 561,820 1,000 30'56 66'71 119'84 162'81 288'15 186'23 94'87 50'46 0'37 M 506,363 1,000 27'20 65'05 120'62 164'70 291'56 187'16 93'77 49'59 0'35 F 55,457 1,000 61'33 81'S7 112'66 145'55 257'01 177'72 104'84 58'50 0'52
I-Cultivators P 43,433 1,000 22'08 56'75 81'32 97'90 222'09 209'36 164'69 145'67 0'14 M 41,488 1,000 22'58 58°38 83'16 99'57 221'97 207'22 162'05 144'93 0'14 F 1,945 1,000 11'31 22'11 42'16 62'21 224'68 255'01 221'08 161'44
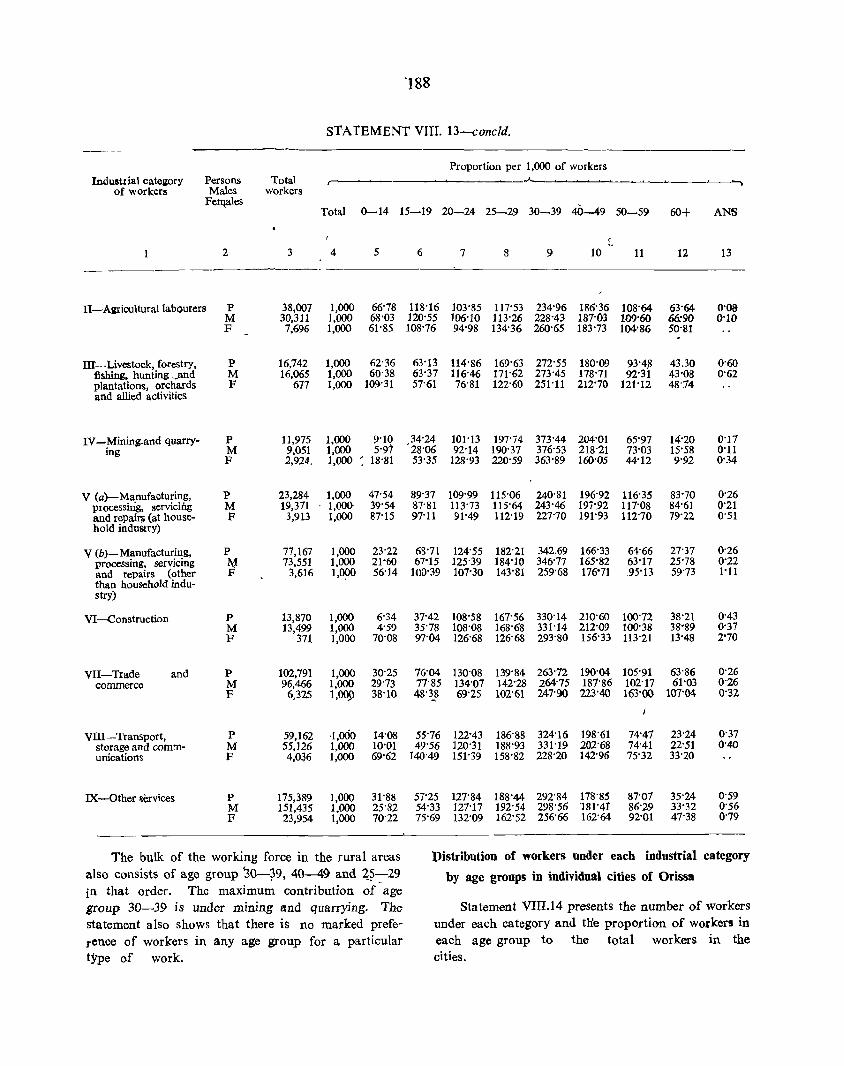
Industrial catejilory Persons of workers Males
Fe~ales
2
I1-Alilficulturallabourers P M F
III-Livestock, forestry, fishing, hunting _and plantations, orchards and allied activities
IV-Minin~and quarrying
V (a)-Manufacturing, pIocessh:ig, serviciiig and repairs (at household induStry)
V (b)-Manufacturing, processing, servicing and repairs (other than household industry)
VI --Construction
VII-Trade commerce
and
VIII-Transport, storage and communications
IX-Other Rervices
P M F
P M F
P M F
P
W
P M F
P M F
P M F
P M F
STA TEMENT VIII, 13-cancld,
Proportion per 1,000 of workers Total .A..__~.~~~~_~~~ __ ~_-.
workers
3
38,007 30,311 7,696
16,742 16,065
677
11.975 9,051 2,924,
23,284 19,371
3,913
77,161 73,551
3,616
13,870 13,499
371
102,791 96,466
6,325
59,162 55,126 4.0~6
175,389 151,435 23,954
Total 0-14 15-19 20-24 25-29 30-39 40-49 50-59 60+
4
1,000 1,000 1,000
5 6 7 8 9 10 11
66'18 118'16 103'85 117'53 234'96 186'36 108'64 68'03 120'55 106'10 113'26 228"43 187'03 109'60 61'85 108'76 94'98 134'36 260'65 183'73 104'86
1,000 62'36 63'13 114'86 169'63 272'55 180'09 93'48 63'37 116'46 171'62 273'45 178'71 92'31 1,000 60'38
1,000 109'31 57'61 76'81 122'60 251'11 212'70 121'12
1,000 9'10 ,34'24 101'}3 197'74 373'44 204'01 1,000 5'97 28'06 92'14 190'37 376'53 218'21
65'97 73'03 44'12 1,000 : 18'81 53'35 128'93 220'59 363'89 160'05
1,000 1,000-1,000
1,000 1,000 1,090
1,000 1,000 1,000
47'54 39'54 87'15
89'37 109'99 115'06 240'81 196'92 116'35 87"81 113'73 115'64 243'46 197'92 117"08 97'11 91'49 112'19 227"70 191'93 112'70
23'22 68'71 124'55 182'21 342,69 166'33 64'66 63'17 .95'13
21'60 67'15 125'39 184'10 346'17 165'82 56'14 100'39 107'30 143'81 259'68 176'71
6'34 4'59
70'08
37'42 108'58 161'56 330'14 210'60 100'72 35'78 lOS'08 168'68 331'14 212'09 100'38 97'04 126'68 126'68 293'80 156'33 113'21
12
63'64-66:90 50'81
43.30 43'08 48'14
14'20 15'58 9'92
83'70 84'61 '79'22
27'37 25'78 59'73
38'21 38'89 13'48
1,000 1,000 1,009
30'25 29'73 38'10
76'04 130'08 139'84 263'72 190'04 105'91 63'86
1,000 1,000 1,000
71"85 134'07 142'28 264'75 181'86 102'17 61'03 48'38 69'25 102'61 247'90 223"40 163'00 107'04
14'08 55'76 122'43 186'88 324'16 198'61 to'Ol 49'56 ]20'31 188'93 331']9 202'68 69'62 140'49 151'39 158'82 228'20 142'96
31'88 25"82 70'22
57'25 127'84 188'44 292'84 178'85 54'33 127'17 192'54 298'56 181'41 75'69 132'09 162'52 256'66 162'64
74'47 74'41 75'32
87'07 86'29 92'01
23'24 22'51 33'20
35'24 33'32 47'38
ANS
13
0'08 0'10
0'50 0'62
0'17 0'11 0'34
0'26 0'21 0'51
0'26 0'22 I'll
0'43 0'37 2'70
0'26 0'26 0'32
0'31 0'40
0'59 0'56 0'79
The bulk of the working force in the rural areas also consists of age group '30-;19, 40-49 and 4?-29 in that order. The maximum contribution of - age group 30-39 is under mining and quarrying, The statement also shows that there is no marked preference of workers in any age group for a particular type of work,
Distribution of workers under each industrial category
by age groups in individual cities of Orissa
Statement VIII.14 presents the number of workers under each category and tHe proportion of workers in each age group to the total workers in the cities.
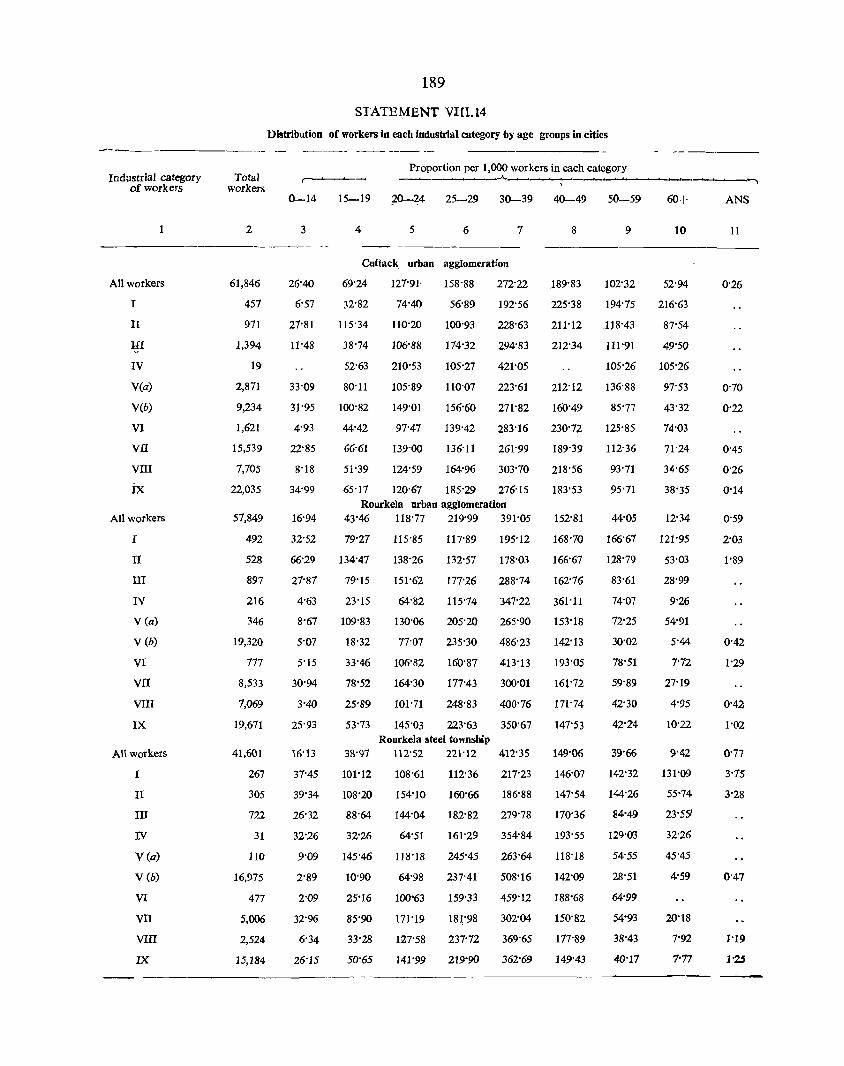
Industrial category of workers
Total workers
2
18.9
STATE¥ENT Vln.14
Distribution of workers in each industrial category by age groups in cities
Proportion per 1,000 workers in each category
0--14 15--19 ~O--~ 25--29 30--39 40--49 50--59
3 4 5 6 7 8 9
-----------
All workers
T
n III
IV
V(a)
V(b)
VI
VII
VIII
Ix
All workers
I
II
III
IV
yea)
V(b)
VI
VII
VIII
IX
All workers
I
II
III
IV
yea)
V(b)
VI
VII
vm IX
61,846
457
971
1,394
19
2,871
9,234
1,621
15,539
7,705
22,035
57,849
492
528
897
216
346
19,320
777
8,533
7,069
19,671
41,601
267
305
722
31
110
16,975
477
5,006
2,524
15,184
26'40
6'57
27'81
11"48
33'09
31'95
4'93
22'85
8'18
34'99
16'94
32'52
66'29
27'87
4'63
8'67
5'07
5'15
30'94
3'40
25'93
16'13
37"45
39'34
26'32
32'26
9'09
2'89
2'09
32'96
6'34
26'15
Cuttack, urban agglomeration
69'24
32'82
127'91' 158'88 272'22 ,189'83 102'32
115'34
38'74
52'63
80'11
100'82
44'42
66'61
51'39
65'17
74'40
110'20
106'88
210'53
105'89
149'01
97'47
139'00
124'59
120'67
56'89 192'56
100'93 228'63
174'32 294'83
105'27 421'05
110'07 223'61
156'60 271'82
139'42 283'16
136'11 261'99
164'96 303'70
185'29 276'15 Rourkela urban agglomeration
43'46 118'77 219'99 391'05
79'27
134'47
79'15
23'15
109'83
18'32
33'46
78'52
25'89
53'73
115'85
138'26
151'62
64'82
117'89
132'57
195'12
178'03
177'26 288'74
115'74 347'22
130'06 205'20 265'90
77'07 235'30 486'23
106'82 160'87 413'13
164'30
101'71
145'03
177'43
248'83
223'63 Rourkela steel township
300'01
400'76
350'67
38'97 112'52 221'12 412'35
101'12
108'20
88'64
32'26
145'46
10'90
25'16
85'90
33'28
50'65
108'61
154'10
144'04
64'51
112'36 217'23
160'66 186'88
182'82 279'78
161'29 354'84
118'18 245'45 263'64
64'98 237'41 508'16
100'63
171'19
159'33
181'98
459'12
302'04
127'58 237'72 369'65
141'99 219'90 362'69
225'38 194'75
211'12 .118'43
212'34 111'91
212'12
160'49
230'72
189'39
218'56
183'53
152'81
168'70
166'67
162'76
361'11
153'18
142'13
193'05
161'72
171'74
147'53
149'06
146'07
147'54
170'36
193'55
118'18
142'09
188'68
150'82
177'89
149'43
105'26
136'88
85'77
125'85
112'36
93'71
95'71
44'05
166'67
128'79
83'61
74'07
72'25
30'02
78'51
59'89
42'30
42'24
39'66
142'32
144'26
84'49
129'03
54'55
28'51
64'99
54'93
38"43
40'17
60+
10
52'94
216'63
87'54
49'50
105'26
97'53
43'32
74'03
71'24
34'65
38'35
12'34
121'95
53'03
28'99
9'26
54'91
5'44
7'72
27'19
4'95
10'22
9'42
131'09
55'74
23'551
32'26
45'45
4'59
20'18
7'92
7·77
ANS
11
0'26
0'70
0'22
0'45
0'26
0'14
0'59
2'03
1'89
0'42
1'29
0'42
1'02
0'77
3'75
3'28
1'19
1'25
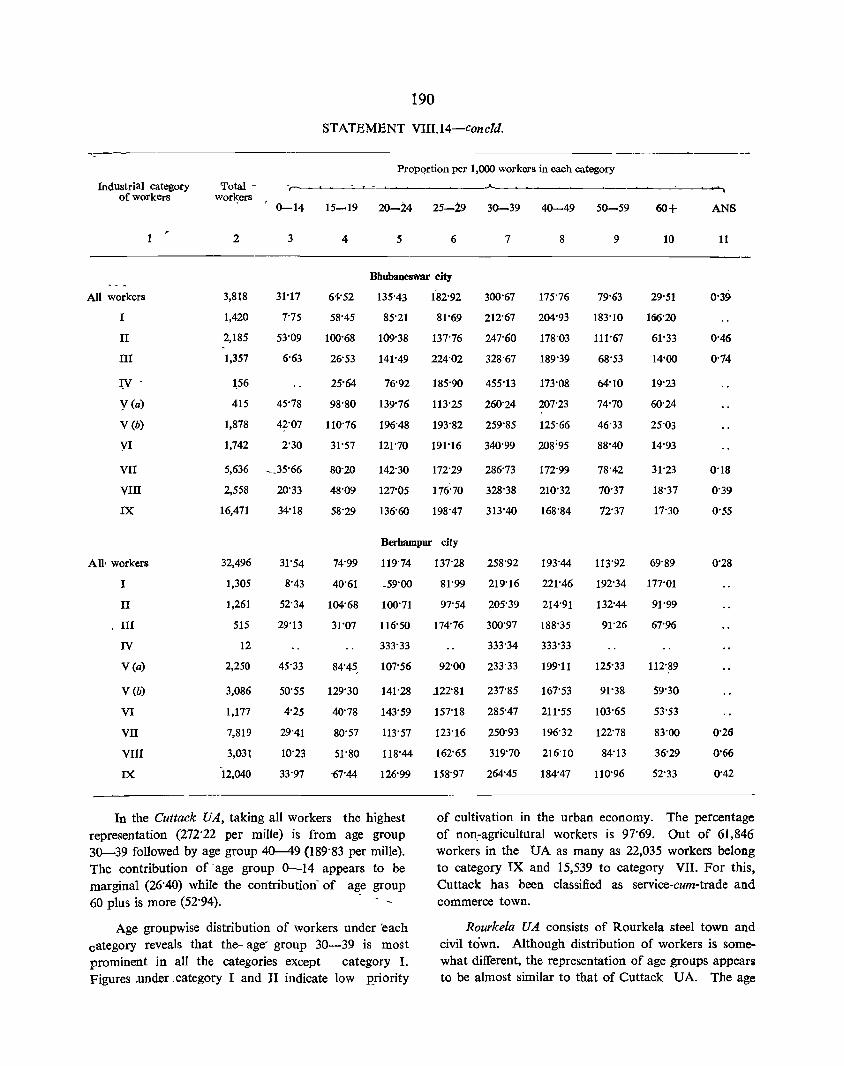
Industrial category of workers
All workers
I
II
III
~.
Y(a)
V(b)
YI
VII
VIII
IX
1
All, workers
I
II
,III
IV
V(a)
V (b)
VI
VII
VIII
IX
Total -wor~ers
2
3,818
1,420
2,185
1,357
1.56
415
1,878
1,742
3
31'17
7"75
53'09
6'63
45'78
42'07
2'30
5,636 ~_35"66
2,558 20'33
16,471 34'18
32,496
1,305
1,261
515
12
2,250
3,086
1,177
7,819
3,031
-12,040
31'54
8'43
52'34
29'13
45'33
50'55
4'25
29'41
10'23
33'97
190
STATEMENT VIII.l4-concld,
Propqrtion per 1,000 workers in each category
4
64'52
58'45
100'68
26'53
25'64
98'80
110'76
31'57
80"20
48'09
58'29
74'99
20-24 25-29 30-39 40-49
5 6 7 8
Bhubaneswar city
135'43
85'21
109'38
141"49
76'92
139'76
196'48
121'70
142'30
127'05
136'60
1'82'92 300'67 175'76
81'69 212'67 204'93
137'76 247'60 178'03
224'02 328'67 189'39
185'90 455'13 173'08
113'25 260'24 207'23
193'82 259'85 125'66
191'16 340'99 208'95
172'29 286'73
176'70 328'38
198'47 313'40
172'99
210'32
168'84
Berhampur city
119'74 137'28 258'92 193"44
50-59
9
79'63
183'10
111'67
68'53
64'10
74'70
46'33
88'40
78'42
70'37
72'37
113'92
60+
10
29'51
166'20
61'33
14'00
19'23
60'24
25'03
14'93
31'23
18'37
17'30
69'89
40'61 .59'00 81'99 219'16 22l'46 192'34 177'01
104'68 100'71 97'54 205'39 214'91 132"44 91'99
31'07 116'50 174'76 300'97 188'35 91'26 67'96
84'45.
129'30
40'78
333'33 333'34
107'56 92'00 233'33
141'28 J22'81 237'85
143'59 157'18 285'47
333'33
199'11
167'53
211'55
125'33
91'38
103'65
80'57 113'57 123'16 250'93 196'32 122'78
51'80 118"44 162'65 319'70 216'10 84'13
-67"44 126'99 158'97 264'45 184'47 110'96
112'89
59'30
53'53
83'00
36'29
52'33
ANS
11
0'39
0'46
0'74
0'18
0'39
0'55
0'28
0'26
0'66
0'42
In the Cuttack VA, taking all workers the highest representation (272'22 per mille) is from age group 30-39 followed by age group 40-49 (189'83 per mille), The contribution of 'age group 0-14 appears to be marginal (26'40) while the contribution" of age group 60 plus is more (52'94),
of cultivation in the urban economy, The percentage of non_-agricultural workers is 97'69, Out of 61,846 workers in the UA as many as 22,035 workers belong to category IX and 15,539 to category VII. For this, Cuttack has been classified as service-cum-trade and commerce town,
Age groupwise distribution of workers under 'each category reveals that the- age' group 30-39 is most prominent in all th~ categories except category 1. Figures .under . category I and II indicate low Qriority
Rourkela VA consists of Rourkela steel town and civil town, Although distribution of workers is somewhat different, the representation of age groups appears to be almost similar to that of Cuttack UA, The age
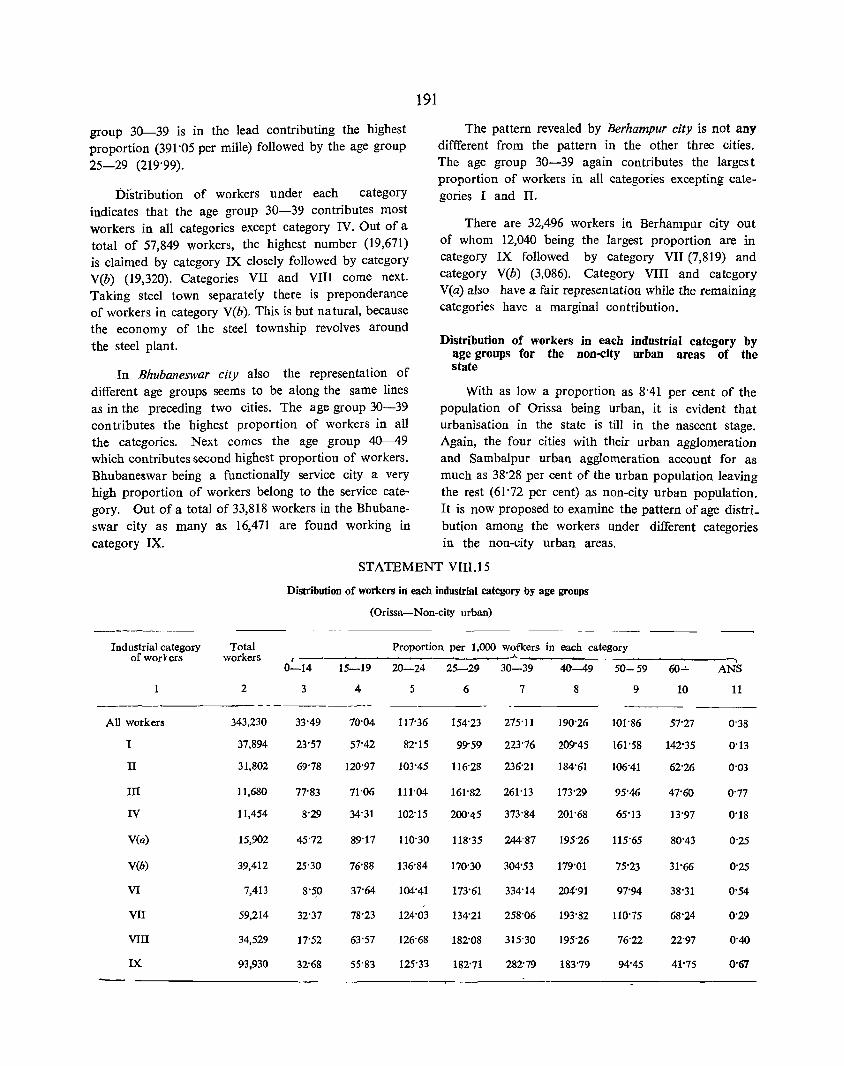
group 30-39 is in the lead contributing the highest proportion (391·05 per mille) followed by the age group 25-29 (219·99).
Distribution of workers under each category indicates that the age group 30-39 contributes most workers in all categories except category IV. Out of a total of 57,849 workers, the highest number (19,671) is claimed by category IX closely followed by category V(b) (19,320). Categories VII and VIII come next. Taking steel town separately there is preponderance of workers in category V(b). This is but natural, because the economy of the steel township revolves around the steel plant.
In Bhubaneswar city also the representation of different age groups seems to be along the same lines as in the preceding two cities. The age group 30-39 contributes the highest proportion of workers in all the categories. Next comes the age group 40-49 which contributes second highest proportion of workers. Bhubaneswar being a functionally service city a very high proportion of workers belong to the service category. Out of a total of 33,818 workers in the Bhubaneswar city as many as 16,471 are found working in category IX.
191
The pattern revealed by Berhampur city is not any diffferent from the pattern in the other three cities. The age group 30-39 again contributes the largest proportion of workers in all categories excepting categories I and II.
There are 32,496 workers in Berhampur city out of whom 12,040 being the largest proportion are in category IX followed by category VII (7,819) and category V(b) (3,086). Category VIII and category V(a) also have a fair representation while the remaining categories have a marginal contribution.
Distribution of workers in each industrial category by age groups for the non-city urban areas of the state
With as Iowa proportion as 8·41 per cent of the population of Orissa being urban, it is evident that urbanisation in the state is till in the nascent stage. Again, the four cities with their urban agglomeration and SambaJpur urban agglomeration account for as much as 38·28 per cent of the urban popUlation leaving the rest (61·72 per cent) as non-city urban population. It is nOw proposed to examine the pattern of age distri_ bution among the workers under different categories in the non-city urban areas.
STATEMENT VlII.15
Industrial catego.y Total ofworrers workers
2
All workers 343,230
1 37,894
II 31,802
ill 11,680
IV 11,454
V(a) 15,902
V(b) 39,412
VI 7,413
VII 59,214
VIII 34,529
IX 93,930
Distribution of workers in each industrial category by age groups
(Orissa-Non-city urban)
----_
Proportion per 1,000 workers in each category r-----' ~~___.____.-____.
0-14 15-19 20-24 25~29 30-39 40-49 50-59
3 4 5 6 7 8 9
33·49 70·04 111·36 154'23 275'11 190'26 101·86
23·57 57"42 82·15 99·59 223·76 209·45 161·58
69·78 120·97 103"45 116·28 236·21 184·61 106·41
77"83 71·06 111·04 161·82 261·13 173·29 95"46
8·29 34'31 102'15 200'45 373'84 201'68 65·13
45·72 89·11 110·30 118·35 244'87 195'26 115'65
25·30 76·88 136·84 170·30 304·53 179·01 75·23
8·50 37·64 104·41 173·61 334·14 204·91 97·94
32·37 78·23 124·03 134·21 258'06 193·82 110·75
17-52 63'57 126'68 182·08 315'30 195·26 76'22
32·68 55·83 125·33 182·71 282·79 183·79 94·45
...... 60-1- ANS
10 11
51·27 0'38
142·35 0·13
62·26 0·03
47·60 0·77
13"97 0·18
80'43 0'25
31·66 0·25
38·31 0·54
68·24 0·29
22'97 0·40
41·75 0·67
The figures in statement VIII.15 do not disclose any glaring departure from the normal pattern we noticed in the city urban working population and seem to more or less conform to the general tendency shown by the city urban working population. The proportion of workers in age group 30-39 is the maximum in all the categories of workers without exception. The age group contributing the next highest proportion of workers is the 40-49 which stands second uniformly in all the categories. The third place is claimed by age group 25-29 for seven categories out of nine while age group 20-24 comes next in its contribution to the working force in as many -as sev~n categories. Next come age group 50-59 and age group 15-19 in that order. Last come age group 60 plus and age group 0-14. It is, however,· noticed that the contribution of the age group 60 plus in respect of category I (cultivator) again is quite sigmficant (142'35 per mille) and the proportion Of the workers in this age group in category I is a fourth highest among all age groups.
In the non-city urban. areas of the state, the total number of workers (of all categories) number 343,230. Of them the highest proportion is claimed by category IX (93,930) followed by category VII (59,214) and category V(b) (39,412). The preponderance of these
\
192
three categories of workers in the non-city urb-ari' areas of the state is a clear indication of the fact tbat po1arisation of economical activities of any particular Rind 'in the towns of Onssa is y~t a far cry and the economy is generally built around service, trade and commerce and to a Jesser' extent on industry. Workers in 'category Vel)~ (industry other than household indust~y~ are the third highest. This appears due to the location .of industries in quite a few non-city towns like Rajgangpur, Chowdwar, Hirakud, BurIa, Sunabeda, Rayagada, etc. The proportion of workers belonging to categories j,-VIII and II in the non-city urban areas of tho state is also significant. a poiuter to/the importance of agriculture even in the towns. Another fact that comes to light is the comparatively small number of workers in the household industry [category V(a) 1. Workers under categories III, IV and VI are also negligible.
Having looked at the general picture it can be concluded that there is generally not much of a divergence in the pattern of the distribution of worke~s between different categories in the cities and nOIl:city urban· areas. Only in respect of Rourkela steel town the workers in s;ategory V(o) seem to be on the high side as compared to the corresponding- :figure in oth~r cities.
NON-WORKE~S
Those persons who returned themselves as nlmworkers in respect of their main activity were categorised into seven classes depending on the nature of their status. These seven classes are:
(i) those attending to househoid duties,
(ii) students,
(iii) retired persons or rentiers,
(iv) -dependents,
(v) beggars etc.,
(vi) inmates of a penal, -mental or charitable institutions, and
-(vii) other non-workers.
The definitions of the seven categories as adopted in the 1971 census are given in the annexure at the end of the book.
U qemployment and 1971 census data
One of ~he mgst impo~tant data relating_ to the economy of a country is the data or' unemployment. These figures would provide .the necessary basis to the planners not only to draw a systematic plan of the
exploitation of the resources of the country but also to go relating the same with the availability of the manpower resources. For the first time of the. history of the census,.the P9Puiation were classified into working and non-working and the non-working population was further' divided into eight categories which included persons seeking employment for the first time and persons employed before but now out of employment at t11.e time of ~nl:lmeration in the 1961 census. While this intention of the 1961 census was laudable, the results however could not come within any reasonable realm of exactitude. The main reasons were that the concepts of unemployment and under employment were proved to be beyond the pale of a mass operation such as the population census in which the concepts ought to be as simple and unambiguous as possible so as to be within the comprehension of the enumerator. Therefore even among the persons enumerated as economically active, the employment as su,"h might be merely seasonal rendering the persons concerned unemployed during the rest of the year. Again, there might ~ person~ who are employed for the greater part -of the day -or under:-employed. _continuously, by
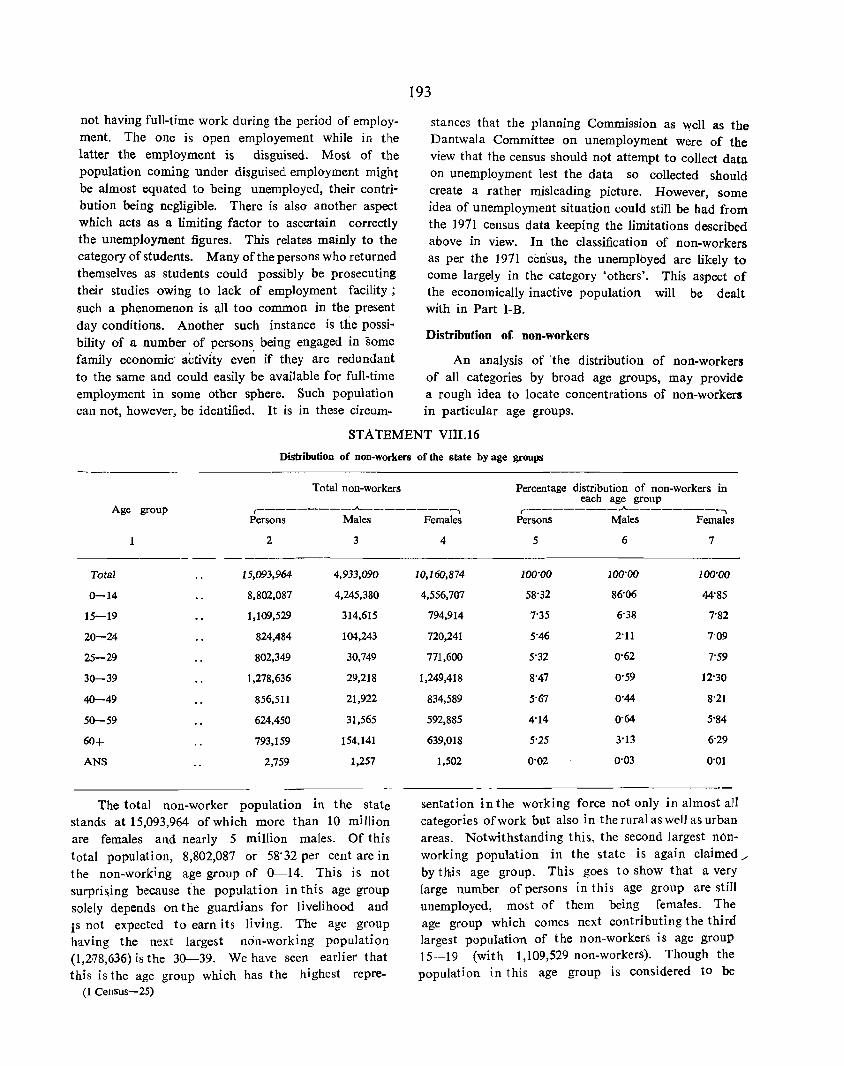
not having full-time work during the period of employment, The one is open employement while in the latter the employment is disguised, Most of the population coming under disguised employment might be almost equated to being unemployed, their contribution being negligible, There is also another aspect which acts as a limiting factor to ascertain correctly the unemployment figures, This relates mainly to the category of students, Many of the persons who returned themselves as students could possibly be prosecuting their studies owing to lack of employment facility; such a phenomenon is all too common in the present day conditions, Another such instance is the possibility of a number of persons being engaged in some family economic activity eve~ if they are redundant to the same and could easily be available for full-time employment in some other sphere, Such population can not, however, be identified, It is in these circum-
193
stances that the planning Commission as well as the Dantwala Committee on unemployment were of the view that the census should not attempt to collect data on unemployment lest the data so collected should create a rather misleading picture, However, some idea of unemployment situation could still be had from the 1911 census data keeping the limitations described above in view, In the classification of non-workers as per the 1911 census, the unemployed are likely to come largely in the category 'others', This aspect of the economically inactive population will be dealt with in Part I-B,
Distribution of non-workers
An analysis of 'the distribution of non-workers of all categories by broad age groups, may provide a rough idea to locate concentrations of non-workers in particular age groups,
STATEMENT VIII.16
Distribution of non-workers of the state by age groups
Total non-workers Percentage distribution of non-workers in each age group
Age group ~ ________ A-_______ ,
.--------~--------,
Total
0-14
15-19
20-24
25-29
30-39
40-49
50-59
60+
ANS
Persons
2
15,093,964
8,802,087
1,109,529
824,484
802,349
1,278,636
856,511
624,450
793,159
2,759
Males
3
4,933,090
4,245,380
314,615
104,243
30,749
29,218
21,922
31,565
154.141
1,257
The total non-worker population in the state stands at 15,093,964 of which more than 10 million are females and nearly 5 million males, Of this total population, 8,802,087 or 58'32 per cent are in the non-working age group of 0-14, This is not surpri~ing because the population in this age group solely depends on the guardians for livelihood and is not expected to earn its living, The age group having the next largest non-working population (1,2:78,636) is the 3(}-39 , We have seen earlier that this is the age group which has the highest repre-
(1 Census-25)
Females Persons Males Females
4 5 6 7
10,160,874 100'00 100'00 100'00
4,556,707 58'32 86'06 44'85
794,914 7'35 6'38 7'82
720,241 5"46 2'11 7'09
771,600 5'32 0'62 7'59
1,249,418 8'47 0'59 12'30
834,589 5'67 0'44 8'21
592,885 4'14 0'64 5'84
639,018 5'25 3'13 6'29
1,502 O'(}2 0'03 0'01
sentation in the working force not only in almost all categories of work but also in the rural as well as urban areas, Notwithstanding this, the second largest nOnworking population in the state is again claimed." by this age group, This goes to show that a very large number of persons in this age group are still unemployed, most of them being females, The age group which comes next contributing the third largest population of the non-workers is age group 15-19 (with 1,109,529 non-workers), Though the population in this age group is considered to be
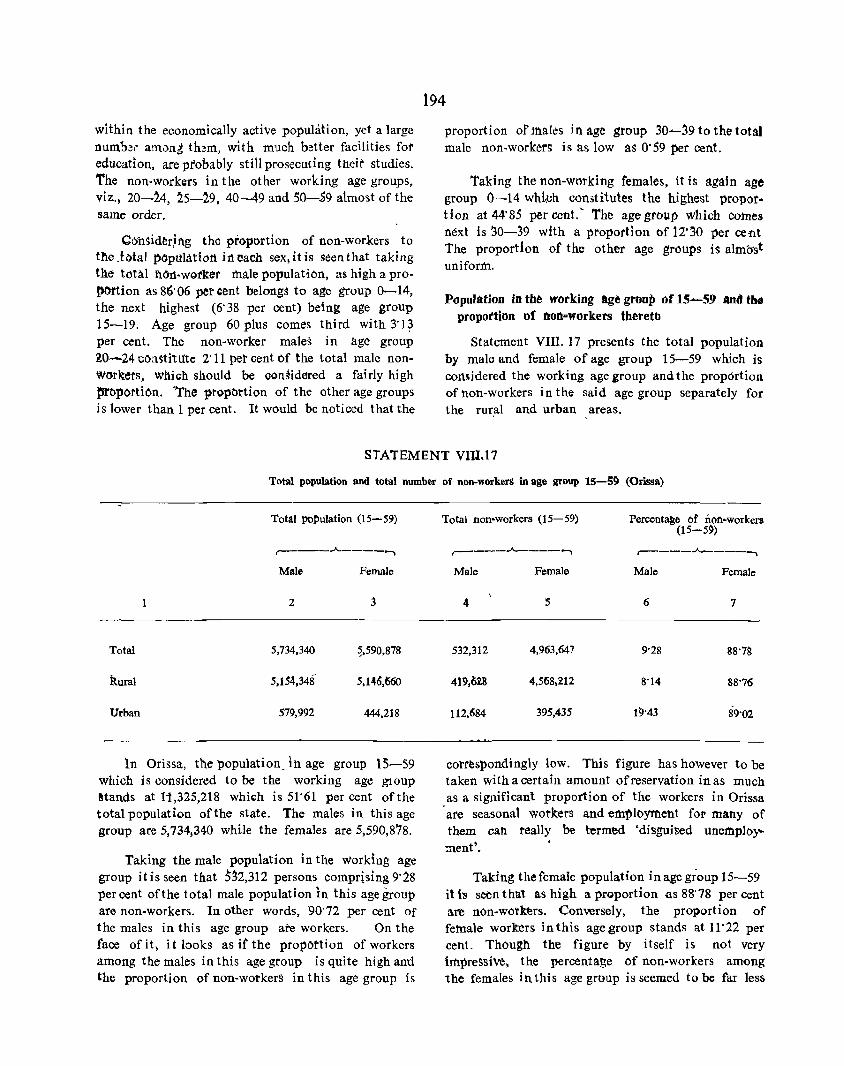
within the economically active poputation, yet a large numb.!(' amonit th~m, with much better facilities for education, are pi'obably still prosecuting their studies. The non-workers in the other working age groups, viz., 20-:l4, 15-19, 40-49 and 50-.$9 almost of the same order.
ClYn5ider~1'1g the proportion of non-workers to the .total POpulation ifl each sex, it is seen that taking the total Mrt-worker male population, as high a propl)rtion as 86'06 pet cent belongs to age group 0-14, the next highest (6" 38 per cent) being age group 15-19. Age group 60 plus comes third with 3· q per cent. The non-worker maleS in age group 20-24 cOnititUte 2'11 pet cent Of the total male nonworkers, whic;h should be oon~idered a fairly high fJrbpOttion. "'The propbrtion of the other age groups is lower than 1 per cent. It would be noticed that the
194
proportion of mates i 1'1 age group 30 ....... 39 to the total male non-workers is as low as o· S9 per cent.
Taking the non-working females, it is again age group 0-14 whh::h constitutes the highest prop or· Hon at 44' 8S per cent." The age group which comes next is ~0-39 with a proportion of 12'30 per cen.t the proportion of the other age groups is alm~"St uniform.
Population in the working age gtnup of 15~59 Ana the propottion of non-workers theretb
Statement VIII. 17 presents the total popUlation by male and female of age group 15-59 which is c011sidered the working age group and. the prop6rtion of non-workers in the said age group separately for the rur.al and urban areas.
STATEMENT Vm.17
Total population and total number of non-workerS in age group IS-51) (Orissa)
Total ~pulation (15-59)
,-____ ...A... ____ --.
Male Female
2 :3
Total 5,734,340 ~.590,878
Rural 5,154,348 5,146,660
Urban 579,992 444,218
1n Orissa, the population_ Ih age group 15-59 which is considered to be the working age glOUp 8tands at It,325,218 whkh is 51'61 per cent of the total population of the state. The males in this age group are 5,734,340 while the females are 5,590,878.
Taking the male population in the working age group it is seen that )32,312 persons comprising 9' 28 per cent of the total male popUlation In this age group are non-workers. In other words, 90'72 per cent of the males in this age group ate workers. On the face of it, it looks as it the propottion of workers among the males in this age group is quite high and the proportion of non-workers in this age group is
Total non-workers (15-59) Percenta~e of non-workers (15-5~)
,-____ ...A...-__ ._--. ,----_...A...-___ --.
Male Female Male Female
4 5 6 7
532,312 4,963,647 9'28 88'7B
419.~18 4,568,212 8'14 88'76
112,684 395,435 IN3 89'02
correspondingly low. This figure has however to be taken with a certain amount of reservation in as much as a significant proportion of the workers in Orissa
. are seasonal workers and employment for many of them call really be termed 'disgui~ed unemplo~ :nent'.
Taking the female population in age group 15-59 it is seen that as high a proportion as 88'78 per cent are non-wotkt:rs. Conversely, the proportion of fetnale workers inthis agegroup stands at 11'22 per cent. Though the figure by itself is not very impre~"Sive, the percenta.ge of non-workers among the females in this age group is seemed to be far less
than the percentage of non-workers among the females in the general population which stands at 93·19 per cent. It is thus apparent that a higher proportion of females in age group 15-59 is workers.
Taking the rural areas of the state, it is seen that the population in age group 15-59 in the rural areaS is 10· 301 million--out of the total population of 11· 325 million for the whole state. The males and females are almost ~qually distributed. Among males, the proportion of non-workers is 8·14 per cent, which means that in the rural areas the proportion of workers in age group 15-59 male population is higher than the corresponding figure forthe rural and urban areas combined. Among the females also, the percentage of non-workers (88· 76 per cent) is lower; that is to say the percentage of female workers in this age group in rural Orissa is higher than the correspondin~ figure for the entire state (rural and urban area9 combined).
The population in the age group 15-59 in the urban areas is as low as 1,024,210 ofwhich males are 579,992 and the females 444,218. Among the males in this age group in the urban areas, as high a proportion as 19·43 per cent are non-workers-a very high propor.tion compared to the :nale population in this age group for the total areas or the rural areas.
195
While it is difficult to identify the exact reasons giving rise to this high figure, a few of the causes could perhaps be conjectured. A large proportion of male population in the age group 15-19 in the urban areas, it may be reasonably anticipated, would be ptosecuti'ng their studies taking advantage of the opportunities for higher education which the urban areas offer. Again, a large portion in the age group 20-24, after completing their studies, might be on the look out for work. In the other higher age groups also the problem of unemployment might be having its effect. Among the urban women in age group 15-59 the proportion of non-workers does not vary very much from the corresponding figure for the total area ofthe state or from the rural areas. This indicates that the workers among the urban women in age group 15-59 is fairly high at 10·98 per cent.
To sum up, the male population in age group 15-59 in the state shows a relatively low figure of non-workers. Even the female population in this age group shows a proportion of non-workers which is lower than the proportion in respect of the total female population for the state (all ages).
The non-workers in the rural areas in this age group are less compared to the non-workers in the urban areas.

197
CHAPTER IX MIGRATION
A migrant is usually defined as a person who has moved from one defined area to another similar area. In our country, these areas are generally a village in rural areas and a town in the urban sector. A person who moves out from one village or town to another place is therefore termed as a migrant provided the movement is not purely temporary in nature.
Non-migrant-People who are seen living their entire life-time in the same village/town in which theY were born are defined as non-migrants.
Birth place migrant-If at the time of census enumeration, there is a change in the usual place of residence of an individual with reference to his birth place, he is defined as a migrant in accordance with 'birth place' concept.
Last residence migrant-If at the time of censuS enumeration, a change in the usual place of residence of an individual is noted with reference to his previous usual residence, he is termed as a migrant in accordance with 'last residence' concept.
In-migrant-A person who crosses the boundaries of a village/town for the purpose of residing at the place of enumeration is an in-migrant.
Out-migrant-If a person moves out from the place of enumeration (village/town) to another defined area (village/tow a) for usual residence, he is termed as an out-migrant.
Intra-district migrant-When a person moves out from his place of usual residence or birth to another defined area (village/town) which is within the district of enumeration, he is an intra-district migrant.
Inter-district migrant-A person who in the course of migration crosses the boundary of the district of enumeration but remains within the state of enumeration is an inter-district migrant.
Intra-state migrant-When a person crosses the boundary of his village/town for usual residence else. where within' the state of enumeration, the person is treated as an intra-state migrant. Thus intra-district and inter-district migrants ',ogether constitute the intra-state migrants.
Inter-state migrant-If the place of enumeration of an individual differs from the place of birth or last residence and these lie in two different states the person is treated as an inter-state migrant with regard to birth place or last residence concept.
International migration· --]n the post-independence period, out-migration from our country has been negligible except that from Pakistan. According to the 1951 census, the number of Pakistani refugees was 7'3 millions comprising 3'9 million males and 3'4 million females. During the 1961 census, persons born in Pakistan and enumerated in India were 4'5 million males and 3'8 million females.
The negligible extent of international migration shows the relative immobility of our people. Of iate. there has been some out-migration to Canada, the United States and the U. K. But the figures in this respect are small.
The data on internal migration collected through census till 1931 were of limited value and were considered inadequate for proper appreciation of the magnitude of the problem of rural~urban migration in our country. However, in 1951 statistics on internal migration could be collected in greater detail than in earlier censuses. But no attempt was made towards a rural/urban classification of the place of birth of migrants. Therefore the questionnaire adopted for the 1961 census was suitably modified to collect ·comprehensive data on several aspects of the movement of population. Data on migration in the 1961 census were colle<:ted with reference to the following questions in the individual slip.
(a) Birth place
(b) Whether born in village or town (c) Duration of residence
Six tables (D-series) were prepared on the basis of the statistics collected with regard to migration at the 1961" census.
Statistics on migration in Indian censuses were being traditionally collected with reference to the "birth place' concept. A significant departure has been made for the first time during the 1971 census
by introducing the concept of 'last residence' along with 'birth' place' for eliciting detailed information on migration. Collection of data on inter-district mi-gration is also a novel feature of the 1971 census The following questions were put to individuals at the time of enumeration in 1971.
Q 7. Birth place (a) Place of birth (b) Rural/urban (c) District (d) State/country
Q 8. Last residence (a) Place of last residence (b) Rural/urban (c) District Cd) State/country
Q 9. Duration of residence at the village or town ot enumeration
The instructions issued to the enumerator for filling up tIle above questions have been explained in the annexure. Migration statistics
As a result of the elaboration of the 1971 question_ naire, the following six tables (D..:...series) have been prepared.
D-I Population classified by place of birth
D-II Migrants classified by place of
D-III
D-IV
D-V
D-V!
last residence and duration of residence in place of enumeration
Migrants to urban units (ipclu-ding agglomerations) having 100,000 and above population classified by sex, broad age groups, educational levels ana in case of workers by occu-pational divisions
Population of urban units (including agglomerations) having 100,000 and above population classified by place of last residence and duration of residence
Migrant workers and non-workers according to main activitieB-
classified by place of last residence
Migrants classified by place Of last residence, age groups, duration of last residence and marital status
198
Two appendices to table D-I and one appendix to table D-II have also been prepared.
The discussion in, this chapter will be confined to birth place migration only. Detailed discussion on other items of migration based on the concept of
'last residence will be made in Part I-B where the remaining D~series tables will be 'analysed.
The population (21,944,615) enumerated in Orissa at the 1971 census has been classified ip the followin& manner according to the place of birth.
A Born in India
B Born in countries in Asia beyond 'India (including U. S. s .. R.)
C Countries in Europe (excluding U. S. SR.)
D Countries in Africa
E Countries in two Americas
F Countries in Oceania
G Unclassifiable
Persons born in India
Persons born in Inaia have been further classified as (i) persons born within the state of enumeration (ii) in other states in India but beyond the state of enumeration. Persons born- within the state of enumeration have again been divided jnto (a) persons born at tlle place of enumeration (b) persons' born elsewhere in the, district of enumeration (c) persons born'in other districts of the state. The birth place of the popUlation enumerated has been recorded as rural and urban as reported by the individual at the time of census counting. Birth places of 12,675
persons born in India and enumerated in this state could not be described specifically and as such they have been recorded as "unclassifiable".
Persons born at tbe place of enumeration
The rural and urban population (1971) of the state are 20,099,220 and 1.845,395 persons respectively. Of these 14.270,376 persons (71·00 per cent) in rurai areaS and 954.423 persons (51·72 per cent) in urban areas were enumerated at the place of birth. The rest 29·00 per cent of the rural population and 48·28 per cent of the urban population were migrants living in the -laeality of enumeration.
Statement IX.l shows the number of migrants under different categories (birth place) and their percenttage to the rural/urban population.

199
STATEMENT IX.I
Persons born outside the place of enumeration and enumerated in rural/urban areas of the State
--------Rural Urban
Description of migrants with reference to ..A.. ~ ...... """' birth place Persons Males Females Persons Males Females
2 3 4 5 6 7 ------Total migrants 5,828,844 1.454,291 4,374,553 890,972 466,970 424,002
(29'00) (7'24) (21'76) (48'28) (25'30) (22'98)
(i) Migrants within the district of enumeration 4.938,635 1,125.069 3.813,566 361,389 168,684 192.705 (24'57) (5'60) (18'97) (19'58) (9'14) (10'44)
(ii) Migrants from outside the district of enu- 556.096 189,271 366,825 276,909 158,478 118,431 meration but within the state (2'77) (0'94) (1'83) (15'01) (8'59) (6'42)
(iii) Migrants from outside the state and within 263,372 103,621 159,751 229,289 126,053 103,236 the country (1'31) (0'52) (0'79) (12'42) (6'83) (5'59)
(iv) Migrants from outside the country 57,651 30,210 27,441 23,385 13,755 9,630 (0'29) (0'15) (0'14) (1'27) (0'75) (0'52)
(v) lJncJassifiable 13.090 6,120 6,970 (0'06) (0'03) (0'03)
--- ----Note-Figures in brackets indicate the percentage to the total rural and total urban population of the State.
The data of the 1971 and ]961 censuses reveal that the mobility of population within the district is fairly intensive, Prior to 1961 there was practically no scope to estimate the extent of internal immigration, i. e" from one village to another or one police station to another within the district, However data with regard to internal migration collected from 1961
indicate that greater mobility is found inside the district,
mostly in the rural areas, from one village to another of the district,
Orissa is predominantly rural in character and her urbanisation is slow, Therefore it may be usefUl to study the different currents of internal migration m the following manner: (a) rural to rural and rural to urban areas (b) urban to rural and urban to urban areas, Statements IX,2, IX,3, IX.4, and IX,S provide the data,
STATEMENT IX, 2
Distribution of 1,000 population by place of birth in total/rural/urban areas of enumeration 1971 _- - - ----_
Ru all Total Rural Urban Urbani
Birth place Unc1assi- ,-- ---~-"---~~~-.. .---.~~ __ ..A..._,~_~_.. r-----.A.----- -.. fiable
p M F P M F P M F
2 3 4 5 6 7 8 9 10 11
---- ---~----
Total populatlOn 1,000 1,001' 1,000 1,000 1,000 1,000 1,000 1,000 1,000
A, Born in India R 933 929 936 986 988 984 353 342 367 U 62 66 5() 10 8 12 633 643 621 UncI. N N 1 N N 1 1 1 1
I. Within the State R 916 914 917 974 979 969 279 265 297 of enumeration, U 57 60 54 9 7 11 5R4 595 570
Unc!. N N 1 N N 1 N N N
(a) Born in place R 651 778 521 710 855 565 of enumeration, U 43 48 38 517 533 498
(b) Born elsewhere R 233 111 357 239 107 370 174 151 203 in the district of U 8 0 10 7 5 9 22 18 25 enumeration, l,-r.cJ, N N I N N 1 N N
(t) Born in other R 32 25 39 25 17 34 105 114 94 districts of the U 6 6 6 2 2 2 45 44 47 State, Unc!. N N N N N N N N N
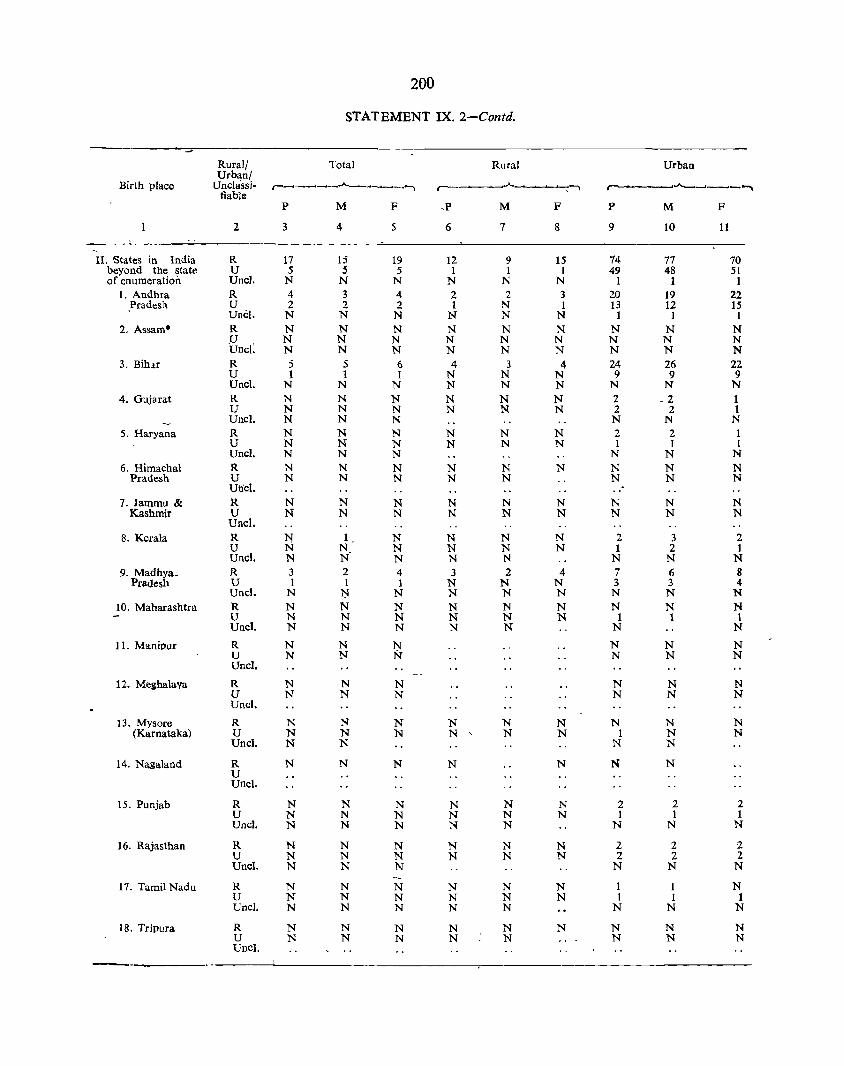
200
STATEMENT IX. 2-Contd.
Rural/ Total Rural Urban Urban/
Birth place Unclassi- r--__'_"'__"-"'"""--_"'--...&_-... ~ r--_"'-~J..-__,. ,-' r----- ...A-___' ___ ~
liable p M F ,p M F P M F
2 3 4 5 6 7 8 9 10 11 . _.-_-_
~
U. States in India R 17 15 19 12 9 15 74 77 70 beyond the statr. U 5 5 5 1 1 1 49 48 51 of enumeration UncI. N N N N N N 1 1 1
1. Andhra R 4 3 4 2 2 3 20 19 22 pradesh U 2 2 2 1 N 1 13 12 15
UncI. N N N N N N 1 1 1 2. Assam· R N N N N N N N N N
_U . N N N N N N N N N UncI. N N N N N N N N N
3. Bih.\[ R 5 5 6 4 3 4 24 26 22 U 1 1 1 N N N 9 9 9 UncI. N N N N N N N N N
4. Gujllrat R N N N N N N 2 _2 1 U N N N N N N 2 2 1 UncI. N N N N N N
5. Haryana R N N N N N N 2 2 1 U N N N N N N 1 1 1 UncI. N N N N N N
6. Himachal R N N N N N N N N N Pradesh U N N N N N N N N
Unci. 7. Jammu & R N N N N N N N N N
Kashmir U N N N N N N N N N Unci.
8. Kerala R N 1 N N N N 2 3 2 U N N N N N N 1 2 1 UncI. N N' N N N N N N
9. Madhya_ R 3 2 4 3 2 4 7 6 8 Pradesh U 1 1 1 N N N 3 3 4
UncI. N ~ N N N N N N N 10. Maharashtra R N N N N N N N N N
U N N N N N N 1 1 1 Unci. N N N N N N N
11. Manipur R N N N N N N U N N N N N N UncI.
12. Meghalaya R N N N N N N U N N N N N N UncI.
13. Mysore R N N N N N N N N N (Karnataka) U N N N N , N N 1 N N
UncI. N N N N
14. Nagalaod R N N N N N N N U UncI.
15. Punjab R N N N N N N 2 2 2 U N N N N N N 1 1 1 UncI. N N N N N N N N
16. Rajasthan R N N N N N N 2 2 2 U N N N N N N 2 2 2 UncI. N N N N N N
17. Tamil Nadu R N N N N N N 1 1 N U N N N N N N 1 1 1 UncI. N N N N N N N N
18. Tripura R N N N N N N N N N U N N N N N N N N UncI.
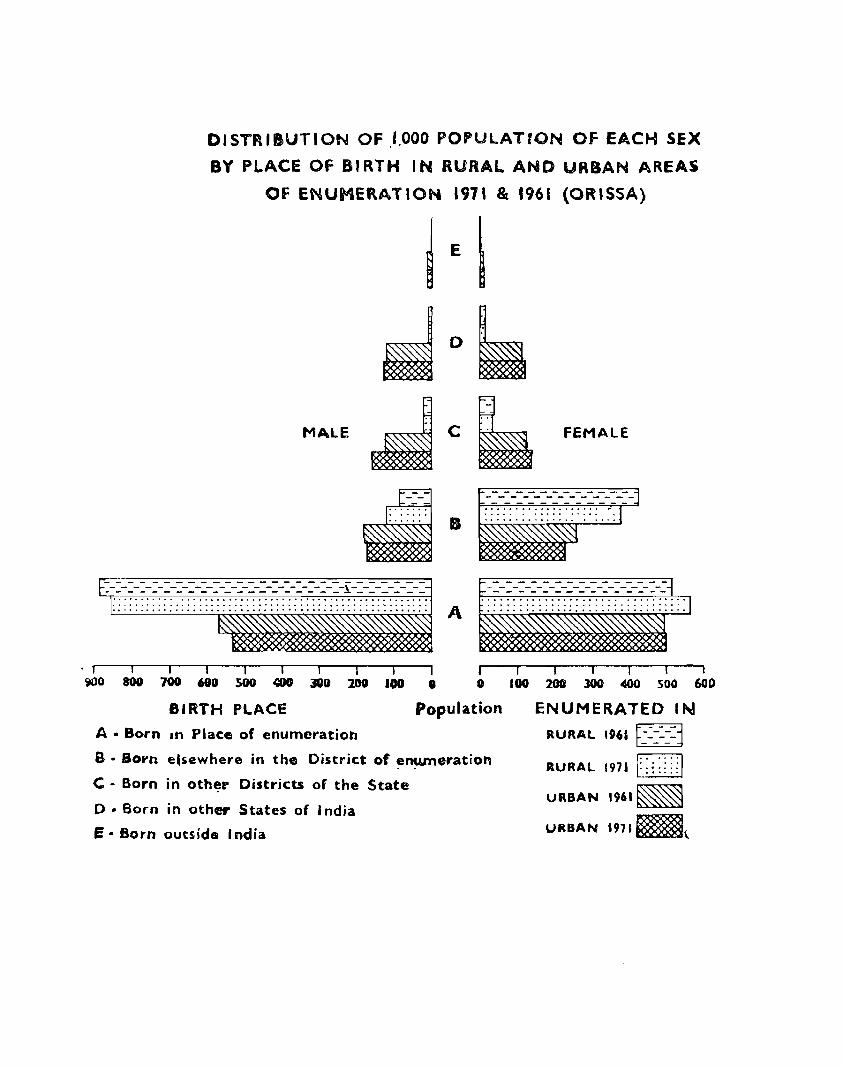
DISTRIBUTION OF J.OOO POPULATION OF EACH SEX
BY PLACE Of BIRTH IN RURAL AND URBAN AREAS
Of ENUMERATION 197' & 1961 (OR'SSA)
~ E ~ ~D~
MALE ~ C ~ FEMALE
_clITE ~=----->:-j ~B_:::.:I
-_--_---___ -_-____ -_____ -_-_____________ ~ _____ -______ __-___ -_-_-_-_-___ -___ -___ -_--. ·-···················~··I tt-' - -_============= _========-=J ::::::::::::::::::???? A ~":.
I ~o 800 700 688 SOO .:00 JUU 200 JOO .. 0
81RTH PLACE Population
A • Born an Place of enumeratioh
B • Born e'sewhere in the District of ~n~eration
C • Born in oth~r Districts of the State
o .. Born in other States of India
E .. 80rn outside India
I I I I I I 100 200 300 400 500 600
ENUMERATED IN
RURAL 1961 F=~:::: ::::=j
RURAL 19711:;~;~~n
URBAN '961~
URBAN .97Im\.

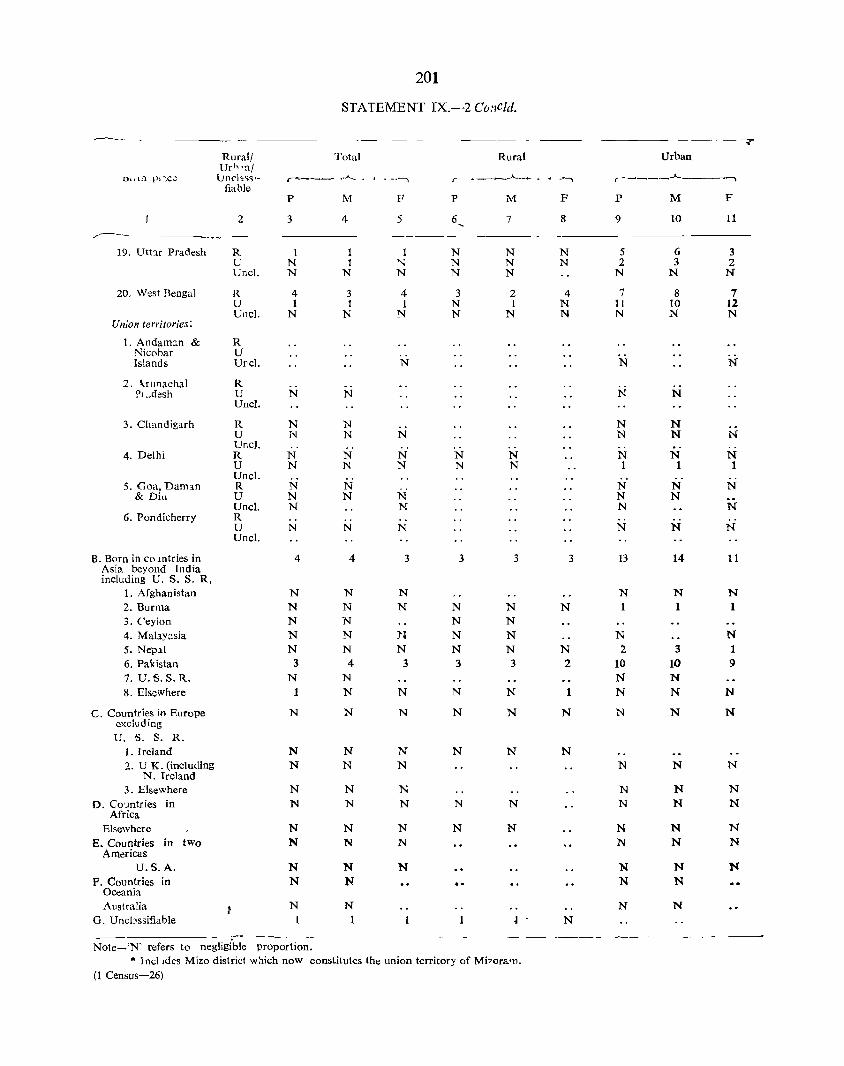
201
STATEMENT rX.-2 CD.'1cld.
----.-- - ----- -
Rural! Total Rural Urban Urh'n!
tSllln 1)1 :c.; 1Jn('b~s'- ,..---___ ,..A... , , ----, r . -~--"---.., . " r-~ ___ ..A... ___ ~ .......
fiable P M F P M F P M F
2 3 4 5 6 7 8 9 10 11 , /--- -----
19. Utt'lr Pradesh R 1 1 1 N N N 5 6 3 {J N 1 '" N N N 2 3 2 Unel. N N N N N N N N
20. West Bengal R 4 3 4 3 2 4 1 8 7 U 1 1 1 N 1 N 11 10 12 UncI. N N N N N N N N N
Union territories:
1. Andam::m & R Nicobar U Islands Ul'cl. N N N
2. 'rllnachal R Pr .• desh U N N N N
UncI.
3. Clmndigarh R N N N N U N N N N N N UncI.
4. Delhi R N N N N N N N N U N N N N N 1 1 1 UncI.
5. Goa, Dam'ln R N N N N N & Diu U N N N N N
UncI. N N N N 6. Pondicherry R
U N N N N N N UncI.
B. Born in cOJntries in 4 4 3 3 3 3 13 14 11 Asia. beyond fndia including U. S. S. R.
1. Afghanistan N N N N N N 2. Burma N N N N N N 1 1 3. Ceylon N N N N 4. Malayc.sia N N N N N N N 5. Nep.ll N N N N N N 2 3 1 6. Pakistan 3 4 3 3 3 2 10 10 9 7. U.S. S. R. N N N N 8. Elsewhere 1 N N N N N N N
C. Countries in Europe N N N N N N N N N excluding U. S. S. R.
1. Ireland N N N N N N 2. UK. (including N N N N N N
N. Ireland 3. Elsewhere N N N N N N
D. CO'Jntries in N N N N N N N N Africa
Elsewhere N N N N N N N N
E. Countries in two N N N N N N Americas
U.S.A. N N N N N N P. Countries in N N N N
Oceania Australia N N N N
G. Uncbssifia.bIe 1 1 N
--- ---- ----Note-'N' refers to negligible proportion.
* J nclldes Mizo district w;lich now constitutes the union territory of Mi7 ora'l1. (1 Census-26)
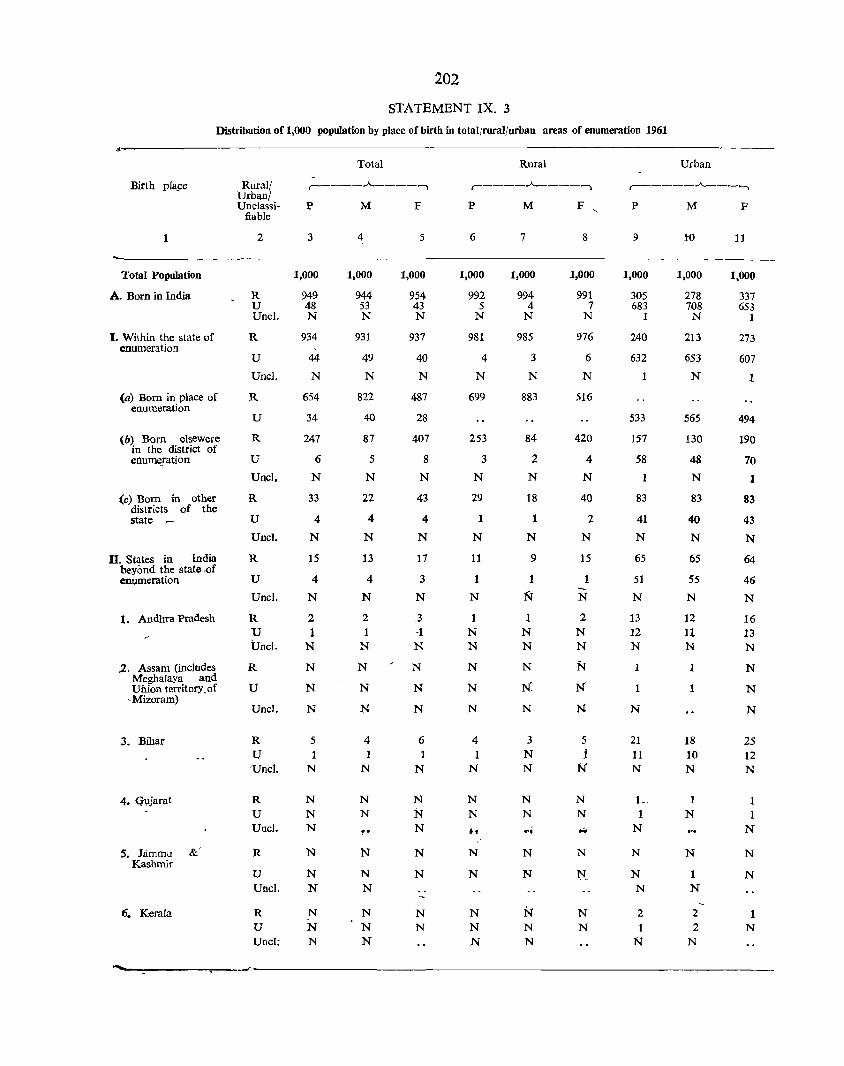
202
STATEMENT IX. 3
Distribution of 1,000 population by place of birth in total/rural/urban areas of enumeration 1961
Birth pla~e
Total Population
A. Born in India
t. Within the state of enumeration
(a) Born in place of enumeration
(b) Born elsewere in the district of enume_ration
(c) Born in other districts of the state -
n. States in India beyond the state of enumeration
1. Andhra Pradesh
2. Assam (includes Meghalaya and Uirion territory,of
'Mizoram)
3. Bihar
4. Gl,ljarat
S. Jammu &' Kashmir
6. Kerala
Rural/ Urbani Unclassi
fiable
2
R U UncI.
R
U
Unel.
R
U
R
U
Unci.
R
U
UncI.
R
U
UncI.
R U Unel.
R
U
UncI.
R U 'UncI.
R
U Unci.
R
U Unel.
R U Unci:
Total
r-----.A------... p
3
1,000
949 48 N
934
44
N
654
34
247
6
N
33
4
N
15
4
N
2 1
N
N
N
N
5 1
N
N N N
N
N N
N N N
M
4
1,000
944 53 N
931
49
N
822
40
87
5
N
22
4
N
13
4
N
2 1
N
N
N
N
4 1
N
N N
N
N N
N N N
F
5
1,000
954 43 N
937
40
N
487
28
407
8
N
43
4
N
17
3
N
,3
·1 N
N
N
N
6 1
N
N N N
N
N
N N
Rural
r-----.A------...
P
6
1,000
992 5
N
981
4
N
699
253
3
N
29
1
N
11
1
N
1 N N
N
N
N
4 1
N
N N
t.
N
N
N N N
M
7
1,000
994 4
N
985
3
N
883
84
2
N
18
1
N
9
1
N
1 N N
N
N:
N
3 N N
N N ... N
N
N N N
F
8
1,000
991 7
N
976
6
N
516
420
4
N
40
2
N
15
1
N
2 N N
N N'
N
5 1
N
N N
N
~-
N N
Urban
,-____ .A-___ "
p
9
1,000
305 683
1
240
632
533
157
58
1
83
41
N
65
51
N
13 12 N
1
N
21 11 N
II
N
N
N N
2 1
N
M
to
1,000
278 708 N
213
653
N
565
130
48
N
83
40
N
65
55
N
12 11 N
1
18 10 N
N
N
1 N
2 2
N
F
11
1,000
337 653
1
273
607
1
494
190
70
I
83
43
N
64
46
N
16 13 N
N
N
N
25 12 N
1 1
N
N
N
1 N
~--~------~-----'--------------------------------------------------------------------------
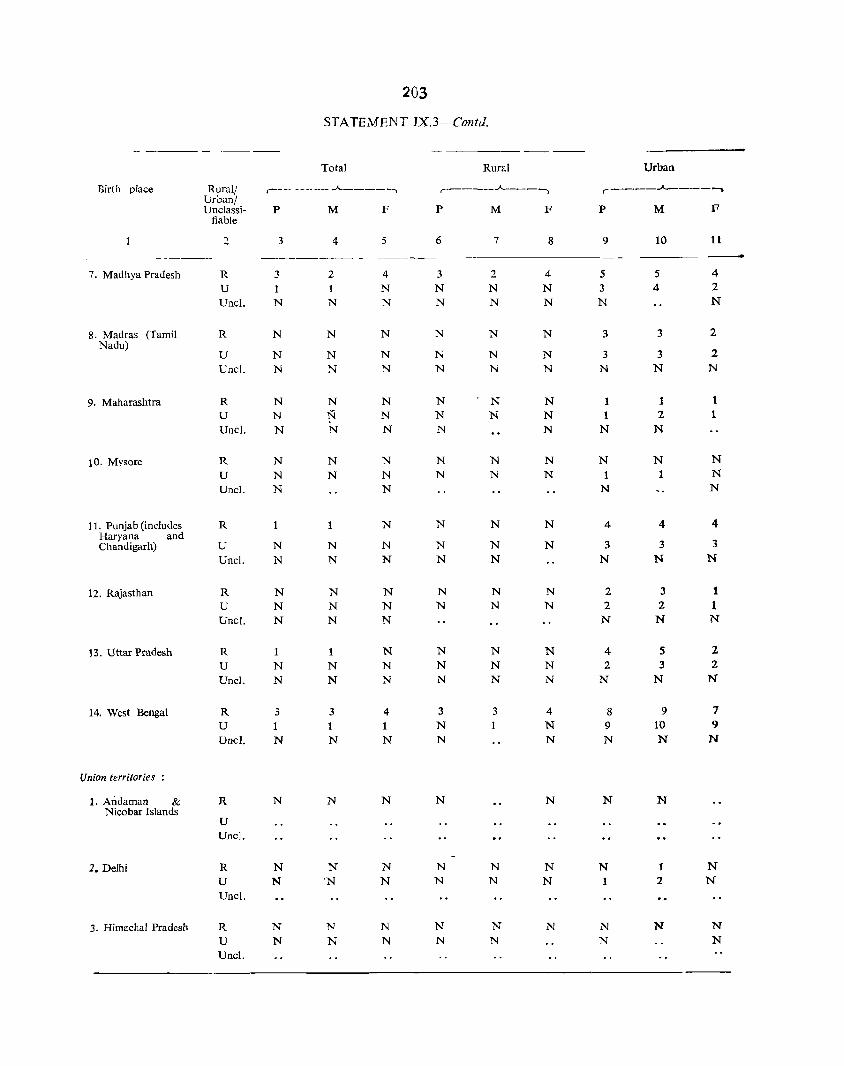
203
STATEMENT IX.3-Contd.
--_-- "_---
Total Rural
Birth place Rural! r---- ------ .A. ____ ., r-----..A..-----.,
7. Madhya Pradesh
8. Madras (Tamil Nadu)
9. Maharashtra
10. Mysore
II, Punjab (includes Haryana and Chandigarh)
12. Rajasthan
13. Uttar Pradesh
14. West Bengal
Union territories :
1. Andaman & Nicobar Islands
2. Delhi
3. Himachal Pradesh
Uroan/ Unclassi
fiable
2
R U UncI.
R
U G"ncl.
R U Uncl.
R U UncI.
R
U UncI.
R U UncI.
R U UncI.
R U Unel.
R
U UncI.
R U UncI.
R U UncI.
P
3
N
N
N N
N N N
N N N
N N
N N N
1 N N
3
1 N
N
N N
N N
M
4
2
N
N
N N
N N N
N N
N
N
N N N
N N
3
N
N
N 'N
N N
F
5
4 N N
N
N N
N N N
N N N
N
N N
N N N
N N N
4 1 N
N
N N
N N
p
6
3 N N
N
N N
N N N
N N
N
N N
N N
N N N
3 N N
N
N N
N N
M
7
2 N N
N
N N
N N
N N
N
N N
N N
N N N
3
1
N N
N
N
F
8
4 N N
N
N N
N N N
N
N
N
N
N N
N N N
4 N N
N
N N
N
Urban
r-----"------... p
9
5 3
N
3
3 N
1 N
N 1
N
4
3 N
2 2
N
4 2
N
8 9 N
N
N
N N
M
10
5 4
3
3
N
1 2
N
N 1
4
3
N
3 2
N
5 3
N
9 1'0 N
N
1 2
N
F
11
4 2 N
2
2 N
1 1
N N N
4
3
N
1
1 N
2 2
N
7 9
N
N N
N N
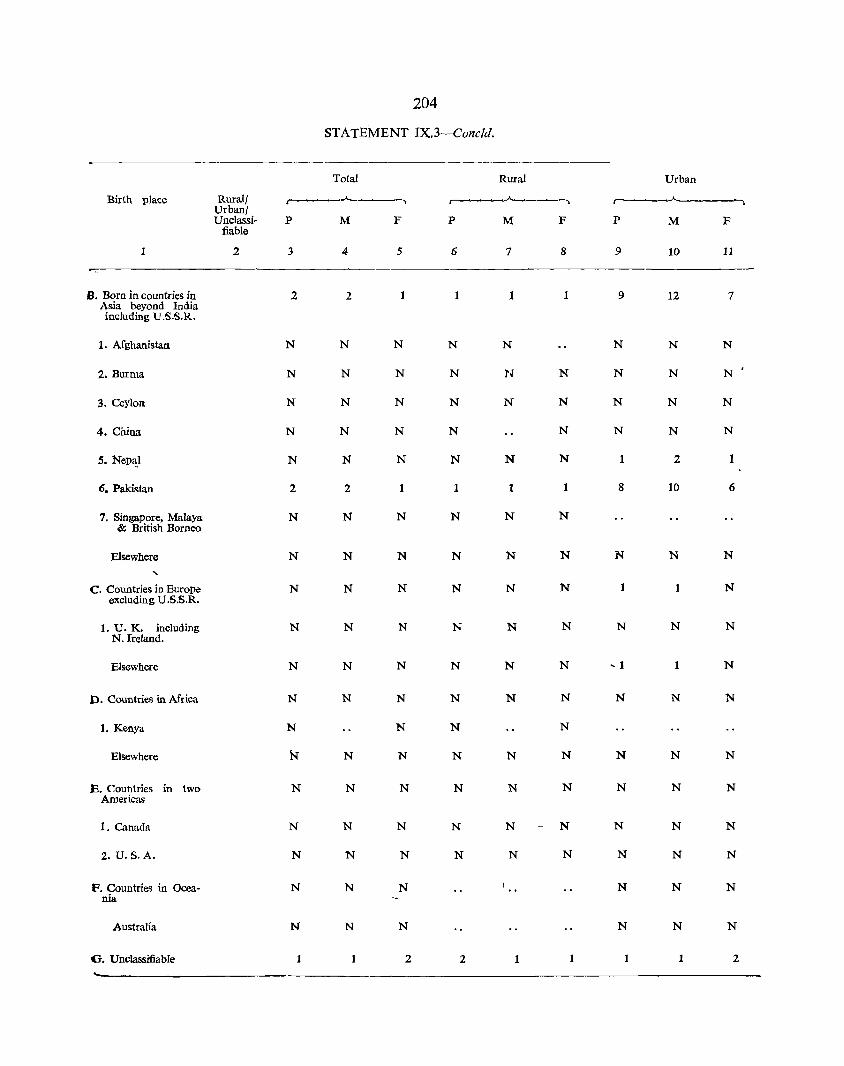
204
STATEMENT IX.3-Conc!d.
Total Rural Urban
Birth place Rural! Urban!
.A._...~_~--. --. r-- I
Unc1assi- P M F P M F P M F fiable
1 2 3 4 5 6 7 8 9 10 11
B. Born in countries in 2 2 1 1 1 9 12 7 Asia beyond India including U.s.S.R.
1. Afghanistan N N N N N N N N
2. Burma N N N N N N N N N
3. Ceylon N N N N N N N N N
4. China N N N N N N N N
S. NeP3:1 N N N N N N 1 2 1
6. Pakistan 2 2 1 1 1 1 8 10 6
7. Singapore, Malaya N N N N N N & British Borneo
Elsewhere N N N N N N N N N ,
C. Countries in Europe N N N N N N 1 1 N excluding U.S.S.R.
1. U. K. including N N N N N N N N N N.Ireland.
Elsewhere N N N N N N - 1 1 N
D. Countries in Africa N N N N N N N N N
1. Kenya N N N N
Elsewhere N N N N N N N N N
E. Countries in two N N N N N N N N N Americas
1. Canada N N N N N N N N N
2. U.S.A. N N N N N N N N N
F. Countries in Ocea- N N N N N N nia
Australia N N N N N N
<T. UnclassifiabIe 1 1 2 2 1 1 1 2
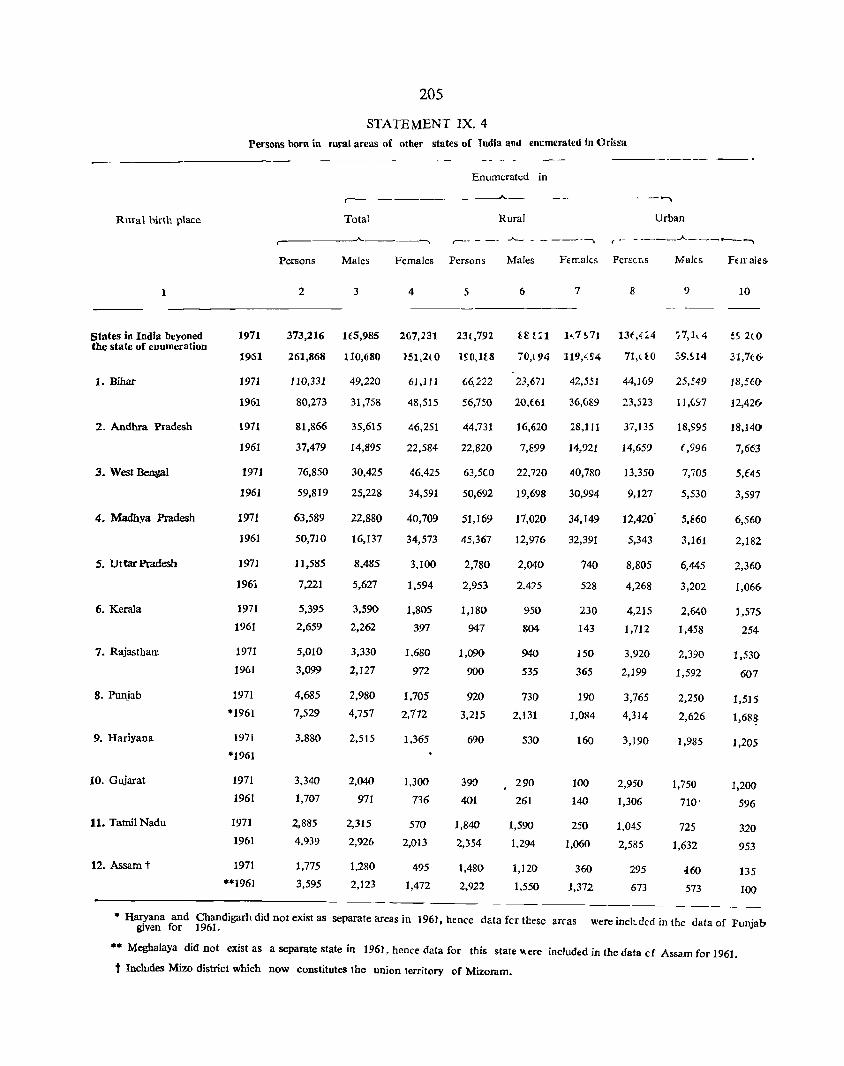
Rural birth place
1
states in India beyoned the state of enumeration
1. Bihar
2. Andhra Pradesh
3. West Bengal
4. Madhya Pradesh
5. Uttar PradesIJ
6. Kerala
7. Rajastharr.
8. Punjab
9. Hariyana
10. Gujarat
11. Tamil Nadu
12. Assam t
205
STATE MENT IX. 4 Persons born in rural areas of other states of Tndia and em:merated in Orissa
1971
1951
1971
1961
1971
1961
1971
1961
1971
1961
1971
1961
1971
1961
1971
1961
1971
*1961
1971
*1961
1971
1961
1971
1961
1971
**1961
---------- --' Enumerated in
~.---------------- - ----. Total Rural Urban
r--- - _- .A.. _____ '-' r ~- __ ~ __ A ___ "_ ______
Persons Males f'emales Persons
2 3 4 5
373,216 1(5,985 207,231 23(,792
261,868 110,680 151,2l0 ISO,U8
110,331 49,220 61,111 66,222
80,273
81,866
37,479
76,850
59,819
63,589
50,710
11,585
7,221
5,395
2,659
5,010
3,099
4,685
7,529
3.880
3,340
1,707
.z,885
4,939
1,775
3,595
31,758
35,615
14,895
30,425
25,228
22,880
16,137
8.485
5,627
3.590
2,262
3,330
2,127
2,980
4,757
2.515
2,040
971
2,315
2,926
1,280
2,123
48,515
46,251
22,584
46,425
34,591
40,709
34,573
3,100
1,594
1.805
397
1.680
972
1,705
2,172
1.365
1,300
736
570
2,013
495
1,472
56,750
44.731
22,820
63,5eo
50,692
51,169
45,367
2,780
2,953
1,180
947
1,090
900
920
3,215
690
390
401
1,840
2,354
1,480
2,922
Males Femaks Perser,s Malfs
6 7 8 9
[S ta 1~7S71 13(,4 .. 4 ',7,1.4
70,( 94 119,~54 71,( [0 :'.9.S14
23,671 42,551 44,Hi9 25,':49
20,{61
16,620
7,899
22,720
19,698
17,020
12,976
2,040
2.475
950
804
940
535
730
2,131
530
290
261
1,590
1.294
1,120
1,550
36,089
28,111
14,921
40,780
30,994
34,149
32,391
740
528
230
143
150
365
190
1,084
160
100
140
250
1,060
360
1,372
23,523
37,135
14,659
13,350
9,127
12,420
5,343
8,805
4,268
4,215
1,712
3,920
2,199
3,765
4,314
3,190
2,950
1,306
1,045
2,585
295
673
(,996
7,705
5,530
5,860
3,161
6,445
3,202
2,640
1,458
2,390
1,592
2,250
2,626
1,985
1,750
710'
725
1,632
-160
573
---- ----- --------
Fnrales
10
:5 2(0
31,7t6-
18,':(;0·
12,426
18,140
7,663
5,E45
3,597
6,560
2,182
2,360
1,066
1,575
254
1,530
607
1,515
1,68~
1,205
1,200
596
320
953
135
100
* Haryana and Chandigarh did not exist as separate areas in ] 96], hence d",ta fer these arras were inclLded in the data of Punjab given for 1961.
** Megha1aya did not exist as a separate state in 1961, hence data for this state \\ere included in the data cf Assam for 1961.
t Includes Mizo district which now constitutes the union territory of Mizoram.

206
STA TEMENT IX.4-ColJcld.
----- ----------
Enumerated in
~--------------A-------_------~
Klral birth place Total Rural Urban
.-----------"----., ~---_-...--...L...._-...._, ~----A-----~
Persons Males Females Persons Males Females Persons Males Females
2 3 4 5 6 7 8 9 10
13. Maharashtra 1971 990 605 385 400 310 90 590 295 295
1961 1,801 1,026 775 591 293 298 1,210 733 477
14. Mysore 1971 425 280 145 160 100 60 265 180 85
1961 394 267 127 94 58 36 300 209 n
15. Himachal Pradesh 1971 265 210 55 120 100 20 145 110 35
1961 10 8 2 8 7 1 2 1 1
16. Tripura 1971 120 80 40 50 40 10 70 40 30
1961 .. 17. Jammu &'Kashmir 1971 85 65 20 50 40 10 35 25 10
1961 230 185 45 73 32 41 157 153 4
18. Manipur 1971 30 15 15 30 15 15
1961
19. Nagl.land 1971 15 5 10 10 10 5 5
1961
20. Megrralaya 1971 10 5 5 10 5 5
**1961
Union territories :
1. Delhi 1971 75 35 40 10 10 65 25 40
1961 400 309 91 100 70 30 300 239 61
2: Goa, Daman & Diu 1971 5 5 5 5
1961
3. Chandigarh 1971 5 5 5 5
• 1961 .ll
4. Andaman & Nicobar 1971 Islands
1961 3 2 1 2 2
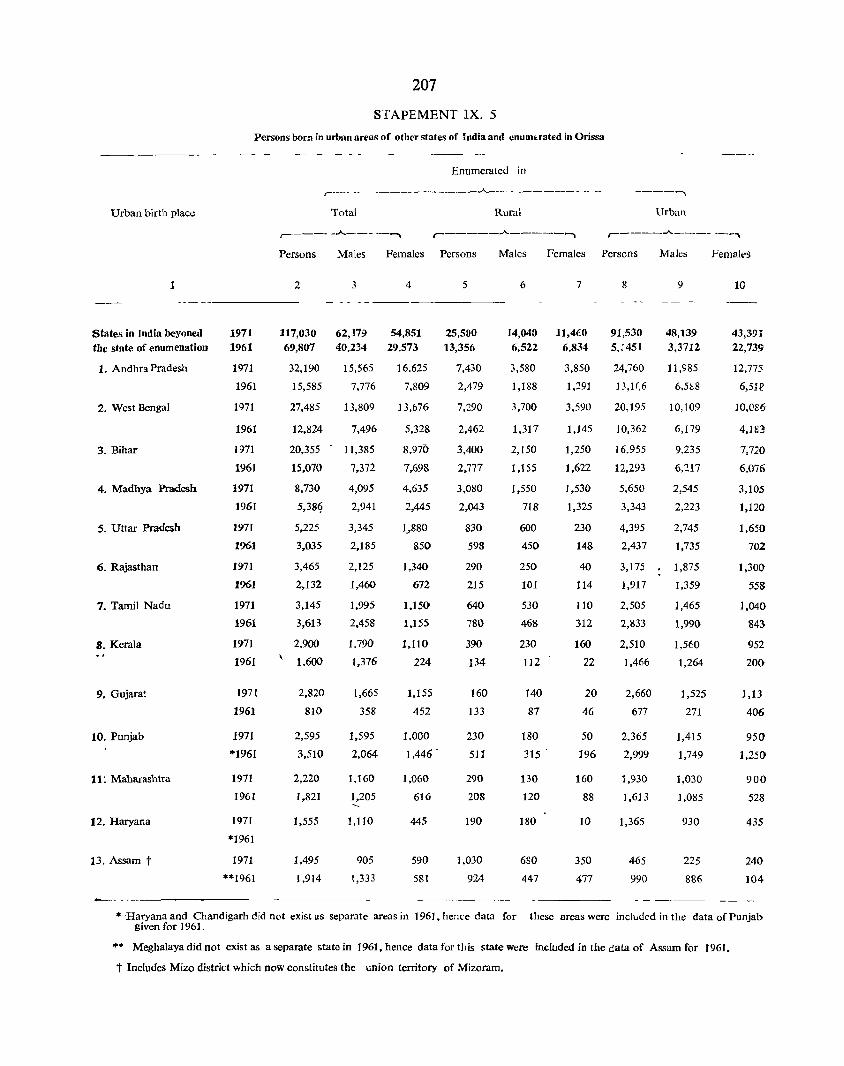
Urban birth place
1
states in India beyoned the state of enumenation
1. Andhra Pradesh
2. West Bengal
3. Bihar
4. Madhya Pradesh
S. Uttar Pradesh
6. Rajasthan
7. Tamil Nadu
8. Kerala
9. Gujara!
10. Punjab
11: Maharashtra
12. Haryana
13. Assam t
207
Sf APEMENT IX. 5
PerSons born in urban areas of other states of !ndia and cnumuat"d in Orissa
Enumerated in
r-----__________ -A... __________ • __
------,
Total Rurai Urban ,---____ ..A. _____ ...... .-_____ .A. _____ ......
r-----./\..---- ---~
Persons Males Females Persons Males Females Persons Males Femalt'S
1971 1961
1971
1961
1971
1961
1971
1961
1971
1961
1971
1%1
1971
1%1
1971
1961
1971
1961
1971
1961
1971
*1961
1971
1961
1971
*1961
1971
**1961
2
117,030 69,807
32,190
15,585
27,485
12,824
20,355
15,070
8,730
5,38~
5,225
3,035
3,465
2,132
3,145
3,613
2.900
1.600
2,820
810
2,595
3,510
2,220
1,821
1,555
1,495
1,914
3 4 5
- - - - - ----------
62,179 40.234
15,565
7,776
13,809
7,496
11,385
7,372
4,095
2,941
3,345
2,185
2,125
1,460
1,995
2,458
1,790
1,376
1,665
358
1,595
2,064
1.160
1,205
1,110
905
1,333
54,851 29.573
16.625
7,809
13,676
5,328
8.970
7,698
4.635
2,445
1,,880
850
1,340
672
1,150
1,155
1,110
224
1.155
452
1.000
1,446'
1,060
616
445
590
581
25,500 13,356
7,430
2,479
7,290
2,462
3,400
2,777
3,080
2,043
830
598
290
215
640
780
390
134
160
133
230
511
290
208
190
1,030
924
6
14,040 6,522
3,580
1,188
3,700
1.317
7
11,4£0 6.834
3,850
1,291
3,590
1,145
2,150 1,250
1,155 1,622
1,550 1,530
718 1,325
600 230
450 148
250 40
101 114
530 110
468 312
230 160
112 22
140 20
87 46
180 50
315 ' 196
130 160
120 88
180 10
680
447
350
477
8
91,530 5,:451
24,760
13,]( 6
20,195
10,362
16,955
12,293
5,650
3,343
4,395
2,437
3,175
1,917
2,505
2,833
2,510
1,466
2,660
677
2,365
2,999
1,930
1,613
1,365
465
990
9
48,139 3,3712
11,985
6,5~8
10,109
6,179
9,235
6,217
2,545
2,223
2,745
1,735
1,875
1,359
1,465
1,990
1,5ED
1,264
1,525
271
1,415
1,749
1,030
1,085
930
225
886
10
43,391 22,73«;
12,775
6,511'
10,086
4,lE3'
7,720
6,076
3,105
1,120
1,650
702
1,300
558
1,040
843
952
200
1,13
406
950
1,250
900
528
435
240
104
* Haryana and Chandigarh did not exist as separate areas in 1961, hence data for these areas were included in the data of Punjab given for 1961.
** MeghaJaya did not exist as a separate state in 1961, hence data for this state were included in the data of Assam for 1961.
t Includes Mizo district which now constitutes the union territory of Mizoram.

208.
STATEMENT IX. 5-Concld.
Enumerated in ~-----___________ A-__________________ ~
Urban birth place Total Rural Urban ~-____ ..A.. ____ ~ ~ ____ .A..-___ -,
~----..A.. ____ -,
Persons Males Females Persons Males Females Persons Males Females
2 3 4 5 6 7 8 9 10
14. Mysore 1971 945 500 445 90 20 70 855 480 375 1961 708 588 120 16 8 8 692 580 112
15. Jammu & Kashmir 1971 280 155 125 100 60 40 180 95 85
1961 362 341 21 20 8 12 342 333 9
16. Tripura 1971 , 90 60 30 10 10 80 50 3
1961
7. Himachal Pradesh 1971 80 60 20 10 10 70 50 20 1961 2 1 1 1 1 1 1
18. Ma:lipur 1971 55 50 5 55 50 S
1961
19. M~ghalaya 1971 30 10 20 JO 10 20
.... 1961
Union territories
1: Delhi 1971 1,265 735 530 40 40 1,225 695 530
1961 1,435 1,280 155 55 27 -28 1,380 1,253 12
2. G;a, Daman & Diu 1971 50 20 30 50 20 3
1961
~
3. Chandigarh 1971 25 20' 5 25 20 5
·1961
4. Pondicherry 1971 20 15 5 20 15 5
1961
5. Arunachal Pradesh 1971 10 10 10 10
t961
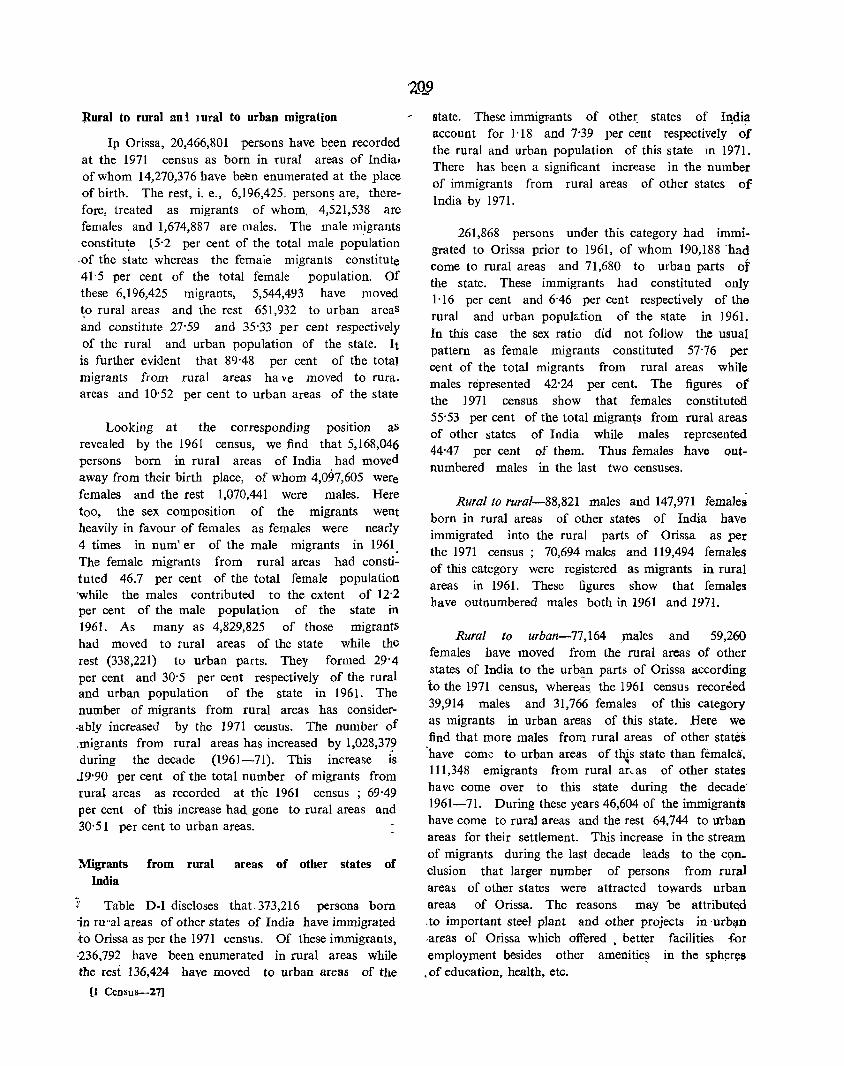
:Rural to rural an i rural to urban migration
III Orissa, 20,466,801 persons have b~en recorded at the 1971 census as born in rural areas of India, of whom 14,270,376 have be!:n enumerated at the place of birth. The rest, i. e., 6,196,425. person~ are, therefore, treated as migrants of whom, 4,521,538 arc females and 1,674,887 are males. The male migrants constitute 1,5'2 per cent of the total male population ·of the state whereas the female migrants constitute 41'5 per cent of the total female' population. Of these 6,196,425 migrants, 5,544,493 have moved to rural areas and the rest 651,932 to urban areaS ~nd constitute 27'59 and 35'33 per cent respectively of the rural and urban population of the state. It is further evident that 89'48 per cent of the total migrants from rural areas ha ve moved to rura. areas and 10'52 per cent to urban areas of the state
Looking at the corresponding position as revealed by the 1961 census, we find that 5,168,046 persons born in rural areas of India . had moved away from their birth place, of whom 4,097,605 were females and the rest 1,070,441 were males. Here too, the sex composition of the migrants went heavily in favour of females as females were nearly 4 times in num' er of the male migrants in 1961, The female migrants from rural areas had constituted 46.7 per cent of the total female population 'While the males contributed to the extent of 12·2 per cent of the male population of the state in 1961. As many as 4,829,825 of those migrants had moved to rural areas of the state while the rest (338,221) to urban parts. They formed 29'4 per cent and 30'5 per cent respectivel~ of the rural and urban population of the state III 1961. The number of migrants from rural areas has consider.ably increased by the 1971 census. The number of ,migrants from rural areas has increased by I,028,37? during the decade (1961-71). This increase is J9'90 per cent of the total number of migrants from rural areas as recorded at the 1961 census; 69'49 per cent of this increase had. gone to rural areas and 30'51 per cent to urban areas.
Migrants from rural areas of other states of India
J Table D-I discloses that 373,216 persons born in ru "al areas of other states of India have immigrated ,to Orissa as per the 1971 census. Of these immigrants, ·236.792 have been enumerated in rural areas while tbe rest 136,424 have moved to urban areas of the
[1 Census--27]
state. These immigrants of othet: states of In,di? account for 1'18 and 7'39 per cent respectively of the rural and urban population of this state in 1971. There has been a significant increase in the number of immigrants from rural areas of other states of India by 1971.
261,868 persons under this category had immigrated to Orissa prior to 1961, of whom 190,188 'ha~ come to rural areas and 71,680 to urban parts of the state. These immigrants had constituted only 1'16 per cent and 6'46 per cent respectively of the rural and urban popuh:tion of the state in 1961. In this case the sex ratio did not follow the usual pattern as female migrants constituted 57'76 per cent of the total migrants from rural areas while males represented 42'24 per cent. The figures of' the 1971 census show that females constituted 55'53 per cent of the total migrants from rural areas of other states of India while males represented 44'47 per cent of them. Thus females have outnumbered males in the last two censuses.
Rural to rural-88,821 males and 147,971 females born in rural areas of other states of India have immigrated into the rural parts of Orissa as per the 1971 census; 70,694 males and 119,494 females of this category were registered as migrants in rural areas in 1961. These figures show that females have outnumbered males both in 1961 and 1971.
Rural to urban-77,164 )11ales and 59,260 females have moved from the rural areas of other states of India to the urban parts of Orissa according to the 1971 census, where~s. the 1961 census recorted 39,914 males and 31,766 females of this category as migrants in urban areas of this state. Here we find that more males from rural areas of other states 'have come to urban areas of t~s state than females. 111,348 emigrants from rural ar~as of other states have come over to this state during the decade' 1961-71. During these years 46,604 of the immigrants have come to rural areas and the rest 64,744 to mban areas for their settlement. This increase in the stream of migrants during the last decade leads to the conclusion that larger number of persons from rural areas of other states were attracted towards urban areas of Orissa. The reasons may be attributed .to important steel plant and other projects in 'urb~n ·areas of Orissa which offered • better facilities f.ar employment besides other amenitie~ in the sph~r~
. of education, .health, etc.
210
·m migration from rural areas of other states
Immigrants from rural areas of all the states of India (except Sikkim) were present in Orissa at the time of 1971 census counting. Statement IX.4 disc oses that in 1961, immigrants from rural areas of all the states except Tripura, Manipur, Nagaland and Meghalaya had moved into Orissa. Among the union territories only Delhi and Andaman and Nicobar Islands deserve mention for their contribution of immigrants in 1961.
A study of the 1961 and 1971 data reveals that migrants from rural areas of only four neighbouring states, namely, Andhra Pradesh, Bihar, Madhya Pradesh and West Bengal, could constitute a proportion of at least 1 per 1,000 of rur~l population of the state.
Among the four neighbouring states, Bihar stands first in contributing the largest number of migrants to Orissa from her rural parts. As per the 1971 census, these immigrants from Bihar numbered 5 per 1,000 of the total population of the state. In the 1961 census, 80,273 immigrants under this category were enumerated in Orissa, and they formed a proportion· of 5 per 1,000 of the total population of the state. Female migrants outnumbered males both in 1961 and 1971. A majority of the migrants bf rural areas of Bihar have come to rural parts of Orissa as per census data of 1961 and 1971. Out of 110,331 persons, 66,222 representing 60'02 per cent of the total immigrants have come to rural areas Of Orissa as against 44,109 recorded at the 1971 cenS"us in urban parts of the state. The 1961 census dis_ cl;sed that 56,750 immigrants (composed of 20,661 ~ales and 36,089 females) were enumerated in rural areaS and 23,523 persons (composed of 11,097 males and 12,426 females) were counted in urban areas. ,
Andhra Pradesh-Andhra Pradesh stands second to Bihar in contributing 81,866 migrants to Orissa from her rural areas as per the 1971 census. Figures for both the censuses show that female migrants have outnumbered males. A majority of the migrants have been enumerated in the rural areas at both the censuses. 44,731 persons (composed of 16,620 males and 28,111 females) have come to rural areas, while 37,135 persons have been enumerated in the urban parts at the 1971 census, of whom 18,995 were males and 18,140 wpre females. In 1961, as many as 22,820 immigrants (composed of 7,899 males and '14,921 females) were present in the rural areas,
while 14,659 persons (compvoo:;u Vi V,::1::1U Illi;l.IO:;"
and 7,663 females) were counted in urban parts of this state. The contribution of the female immigrants has been higher than that or-the male im~igrants.
W est Bengal-The.. impact of the mOVements of emigrants of West Bengal on the population of Orissa deserves special mention. As many as 76,850 persons from the rural parts of West Bengal immL grated to Orissa as per the 1971 census. As many as 63,500 migrants of West Bengal were counted in rural areas while 13,350 in urban parts of the state in 1971. The data of the 1961 census revealed that 59,819 emigrants of West Bengal had moved tQ Orissa, of whom, 50,692 were enumerated in rural areas of Orissa while 9,127 in urban parts of the state. The current of migration from rural areas of West Bengal to the rural parts of this state seems to be much stronger than that of the urban areas of the state. Among the immigrants to rural areas, the females have outnumbered the males but the position of the urban . reas is just the reverse.
Madhya Pradesh-Madhya Pradesh, a neighbouring state of Orissa has also made substantial contribution for the inter~state movement of migrants. As per the 1971 census, 63,589 persons belonging to the rural parts of Madhya Pradesh immigrated to Orissa. In the 1961 census 50,710 emigrants of this category were counted in Orissa. A study of the data reveals that the female migrants were present in Orissa in
·much larger number than the male migrants both in 1961 and 1971. As like other neighbouring states, Madhya Pradesh has contributed larger number Of immigrants to the rural parts of this state in both the censuses. As many as 51,169 migrants belonging to the rural parts of Madhya Pradesh were present in rural parts of Orissa in 1971 while 12,420 immi. grants of this category were present in the urban parts of the state. The corresponding position as revealed by the 1961 census shows that 45,367 immi. grants from Madhya' Pradesh were enumerated in 'the rural areas of the state while 5,343 were counted in the urban parts.
'Migrants born in rural areas of other districts of state
As has been discussed earlier, 373,216 out of 6,196,425 migrants have come from rural areas of other states of India while the rest 5,823,209 wefl} ,born in rural areas of this state, of whom 705,340 were born in rural areaS of other districts of the state. As many as 511,866 of the migrants born in rura
areaS of other districts of the state have been enumerated at the 1971 census in the rural parts of this state while the rest 193,474 have moved to the urban areas. These migrants have respectively constituted 2'5 per cent and 10'5 per cent of tht' rural and urban population of the state. The 1961 census data reveal that 478,293 out of 570,731 immigrants coming from rural areas of other districts moved to rural areas, while the rest 92,438 were enumerated in the urban areas. These migrants respectively constituted 2'9 per cent and 8'3 per cent of the rural and urban population of the state in 1961.
Rural to rural-As many as 168,391 males and 343,475 femalc'> have migrated from the rural areas of some districts to the rural areas of other districts as per the 1971 census, while 144,910 males and 333,383 females of this category were recorded at the 1961 census. The above figures show that the females have outnumbered the males in the stream of migration under this category.
Rural to urban-In the 1971 census 193,474 persons were found to have migrated from rural areaS of one district to the. urban areas of another district as against 92,438 persons of this category recorded in the 1961 cen&us. Here the males have outnumbered the females in the streams of migration during the periods under review,
Migrants born elsewhere in the rural areas of the district of enumeration
As many as 5,117,869 migrants from rural areas have been recorded as born elsewhere in the districts of enumeration, of whom 4,795,835 have moved to the lural areas and 322,034 to urban areas and have constituted 23'86 per cent and 17"45 per cent respectively of the rural and urban population of the state.
A study of the data of 1961 reveals that 4,335,447 persons born elsewhere in rural areas of the distrcit of enumeration had joined the stream of migration of whom 4,161,344 had migrated to rural areas and 174,103 to urban areas of the state. These migrants had constituted 25'3 per cent and 15"7 per cent res_ pectively of the rural and urban population of the ~tate in 1961.
Rural to rural-In the 1971 census 4,795,835 migrants born elsewhere in rural areas of the districts of enumeration were enumerated in rural areas of the same districts as against 4,161,344 migrants of
211
this category enumerated III the 1961 census. A study of the data disclose~ the preponderance of females over males in both the census countings. This abnormal increase in the number of females may be attributed to marriages and such other social customs,
Rural to urban-The 1971 census data further reveal that 322,034 migrants born elsewhere in rural areas of the district of enumeration were enumerated in urban areas and constituted IT 45 per cent of the urban population of the state as against 174,103 migrants of thi s category enumerated in urban areas in 1961.
The position as discussed above shows that the number of migrants under this category haS increased considerably by 1971 census. Moreover female migrants have maintained their preponderance over males.
Movement of migrants from urban to urban and urban to rural areas
The urban population of Orissa is 1,845,395 which constitutes 8'4 per cent of the total population as per the 1971 census. As many as 1,371,013 persons constituting 6'2 per cent of the total population have been recorded as born in urban areas, of whom 724,879 are males and 646,134 are females. 533,090 males and 421,333 females together constituting 4'3 per cent of the total population of the state have been enumerated at their birth place in the urban areas, Thus the remaining 191,789 males and 224,801 females together representing 1'9 per cent of the total population of the state have migrated to other arcas of this state.
As per the 1961 census the total urban population of the state was 1,109,650 which constituted 6'3 per cent of the total population of the state. As manY 466,728 males and 3110,203 females together constituting 4'8 per cent of the total population were born in urban areas, of whom 119,653 male,> and 135,545 females together representing 1'4 per cent of the total population had migrated to other parts of the state.
The census data of 1961 and 1971 d:sc1ose that the number of migrants from urban areas has increased considerably by 1971. It has been quite interesting to note that the female migrants from urban atcas have outnumbered the male migrants although males have been b,)m in urban parts much
in excess of tlie females. as per the census statistics of 1961 and 1971. It is further noted that the fetUJ.1e migrants from urban areas have come·in larger number than the males during the decade; 1961-71 as 89,256 females joined the migration stream from urban areas as against 72,136 males.
Of these migrants, 81,431 male~ and 120,909 females have been enumerated in rural areas, of the state in 1971,while 32,040 males and 56,547 females migrating from urban areas were counted in rural ~reas of-the state at the 1961 census. These figures thus show that "larger number of females of the urban areas h'ld gone to rural areas as migrants. But the position with regara. to movements of migrants from urban to urban areas as seen from the census records 6f 1961 and 1971 has been quite opposite because we find that the males have come to urban areaS much in larger number than the females.
The migrants from urban areas had constituted only 1 per cent of the rural population in 1971, whereas, in 1961' they had formed 0'5 per cent of the rural population. Notwithstanding the fact that the males have migrated to urban areas in larger number thaJ;l the females as discussed in the foregoing paragraphs, their proportion to utban male popuil:j.tion has .been lower than the proportion of fem'lle migrants to the total female population of the urban areas. Quite a'larger number of these migrants born in urban areas moved to U1:ban parts of the state for economic pursuit Calculated in terms of percentage, it can ~e stated that 51'43 per cent of the total migrants from urban areas have gone to urban parts of the state in 1971 wheeas, in 1961, 65'29 per cent of the migrants have been enumerated in urban areas.
The movements of different categories of migrants from urban areas can be analy~ed in the following
manner: (i) Migrants boni in urban areas of other states
. of India
(ii) Migrants bQrn in urban areas of other districts of the state.
(iii) Migrants born elsewhere in urban areas in the district of enumeration.
Migrants born in orban ,areas of other states. of India
As many as 117,030 'persons born in' Ul;ban areas of other states of India are recorded at the 1971 Censu~
to have immigrated.to Orissa, 01' whom 62,179:are males and 54,851 are females, while 40,234 males and 29,573 females .of the urban areas 'of other states were enuilierated in Orissa at,the 1961 census. In. 1961 these' immigrants from other states of India had constituted 0'4 per. cent of the totitl population of Orissa, while male and female immigrants had respectively consti_ tuted O· 4 per cent and O· 3 per cent of the total male and female population of the state. The number of migrants of this category has increased by 1971 when male and female migrsmts. have respectively constituted 0'6 per ct:nt and O' 5 per cent of the male and female- population of the state.
Males have immigrated to Orissa in larger number than the females as seen from both the census figures of 1961 and 1971, but during the decade, 1961-71 females have exc~eded the.m'lles in number as 25,278 females immigrated to this state as against 21,945 males
Urban to rural-As per tl;te 1961 census, as many a~ 13,356 persons had immigrated to rural areas of Orissa, of whom 6,522 wete males and 6,834 were females But the number of immigrants under this category became almost double by the time of the 1971 census; when 25,500 persons are recorded to have in1migrated to rural parts of this state, of whom 14,040 were males and 11,460 were females.
In 1961, the female immigrants of this category proceeded to rural areas in larger number than the males but i~ 1971 the trend became quite opposite when male immigratlts outnumbered the female immigrants. During the decade, 1961-71 as many as 12,144 immigrants from urban areas of other states of IndIa were enumerated in rural parts of this state, of whom 7,518 were males and 4,626 were females.
Urban to Urban-As many as 48,139 males and 43,391 females coming from urban areas of other states of India were enumerated in urban parts .of this state in 1971 but at the 1961 c~nsus, 33,7 t 2 males and 22,739 females belong~ng to this category of migrant~ were counted in urban parts of Orissa. These figures lihow that there has been preponderance of males over females both in 1971 and 1961. But during the decade . , 1961-71 the number of females became larger than the males as 20,652 female immigrants came to urban part~ of the state as against 14,427 males. The majority of the immigrants born in urban parts of othe-
t states of India were present in the urban areas' of OriSSa both in. ~961 and 1971. Th~ reasons may be ,attri ~
buted tb better employment opportunities besides other facilities like higher education, etc., available in the· urban areas.
A study of the distribution of immigrants under this category reveals that 74'28 per cent of the total immigrants have come to different urban p~rts of this state during the decade, 196.1-71, while only 75'72 per cent of them have been enumerated in the rural areas. The sex-wise distribution of these migrants further discloses that 'about twice the number of males coming to rural parts of the state have gone to urban areas, whereas, in case of females it is noticed that more than 4 times the number of females enumerated in rural areas have gone to urban units of this state. It may be mentioned that the inward flow of migration originated mostly from the neighbouring states, namely, Andhra Pradesh, West Bengal, Bihar and Madhya Pradesh. This would be evident from the fact that 88,760 persons representing 75'84 per cent of the total immigrants from urban areas of other states of India had come from these four neighbouring states as per the 1971 census data. In 1961 these four neighbouring states had also played an equally important role in the inter-state movement of immigrants as these states contributed 70'00 per cent of the total number of immigrants from other states of India.
The magnitude of migration from these 4 contiguous states only has been dealt with in a detailed manner in the following paragraphs.
Andhra Pradesh-Largest number of immigrants coming from urban areas of Andhra Pradesh have been recorded in Orissa at the censuses of 1961 and 1971 More than 75 per cent of the migrants of this category have come to urban parts of the state as per the 1971 census, while in 1961 more than 80 per cent of them were enumerated in urban areas of the state. These migrants maintained a proportion of 13 per 1,000 urban population of the state in 1971 while male and female migrants respectively contributed 12 and 15 persons to every 1,000 urban population of the corresponding category. In 1961, these migrants had also maintained a high proportion of 12 per 1,000 urban population, while males and females respectively had contributed 11 and 13 to every 1 000 urban male and female populaation.
West Bengal-Next to Andhra Pradesh conies West Bengal. As per the 1971 census data as many as 27;485 perso'ns fr"m Ut banareas of West Bengal
had immigrated to Orissa, of whom 13,809 were males_ and 13,676 were females. 10,109 male and 10;086 female migrants from West Bengal have been enumera-ted at the urban areas of Orissa in 1971. This shows that majority of the migrants, from urban parts pC West Bengal have been enumerated in urban parts,of Orissa in 1971. The number of immigrants of thiS category as recorded at the 1961 census was almost half the number registered at the 1971 census.
Bihar-As per the 1971 census, 20,355 persons born in urban areas of Bihar immigrated to Orissa, of whom I] ,385 were males and 8,970 were females. Of these migrants, 9,235 males and 7,720 females moved to the urban parts of the state as seen from the statistics of the 1971 census and each categqry of migrants could be able to maintain an uniform proportion of 9 per ,1,000 urban population of the corresponding category. In 1961, the male and female immigrants of this category w,ere able to contribute respectively 10 and 12 to every 1.000 urban population of the corresponding category.
Madhya Pradesh-In consideration of the magnitude of the flow of immigrants to Orissa, Madhya Pradesh has been assigned the fourth position in 1971. As per the 1971 census, 8,730 persons born in urban parts of Madhya Pradesh immigrated to Orissa, of whom 4,095 were males and 4,635 were females. Of these immigrants, 2,545 males and 3,105 females were registered in urban parts of this state. These figures
'prove that majority of these migrants went to urban areas where they maintained a proportion of 3 per 1,000 urban popUlation of the state, while male and female migrants respectively contributed 3 and 4.to every 1,000 urban population of their corresponding category. In 1961, the male and female migrants of this state had respectively contributed 4 and 2 to every 1,000 urban population of the corresponding category in this state.
Migrants from urban areas of 13 states of India namely, Andhra Pradesh, Bihar, Gujarat, Haryana; Kerala, Madhya Pradesh, Maharashtra, My~ore.,
Punjab, Rajasthan, Tamil Nadu, Uttar Pradesh and West Bengal have been -able to contribute at least 1 to' every 1,000 urban population of Orissa as per the 1971 census. The 1961 census statistics show' that immigrants from urban areas of thele states as well as the state of Assam were also able to main~ain the same proportion (at least 1 per 1.000 urban population' of the state. The state, Haryana was ofcoursf not created by 1961.
The current o( migration from urban areas of other states 'of India is very feeble, particularly to the rural parts of Orissa. None of the states except Andhra Pradesh in the 1971 census and Bihar in the lQ61 census has been able to contribute immigrants to maintain a 'proportion of one per thousand of the total rural population of Orissa. As such movement of migrants of this category does not deserve detailed discussion.
Movements of migrants born in urban areas of other districts of ' the state
Migration from one district to another arises mainly from marriage, social 'customs and economic necessities. Persons numbering 126,48~ havt: been registered as migrants at the 1971 census, of Whom 64,424 are males and 62,056 are females, wher~s. 32,563 males and 36,764 females under this category were involved in the movements as revealed at the 1961 census. These figure') prove t!lat the female migrants outnumbered the male migrants in 1961 but this increasing trend, could not be maintained by them till 1971, when males were recorded in excess of the females. A review of the position of movementS of migrants during the decade, 1961-71 discloses that 31,861 males and 25,292 females were involved in this movement. Here too, we find preponderance of males over females.
Urban to rural areas-As per the 1971 census . . 20,410 males and 22,700 females have migrated frOm 'urban areas of one district to the rural areas of another district of the state, while in the 1961 census 7,895 males and 15,320 females were registered in this movement. These figures prove that female migrants under this category have outnumbered the males on both the occasions but this increasing trend could not ~e
maintained by the females during the decade, 1961-71 when male migrants surpassed them in number by a clear margin of 5,135.
Urban to urban areas-As many as 44,014 males and 39,356 females born_ in urban areas of a district have been recorded' at the 1971 census as migrants in urban parts of other districts. Similarly, the 1961 cenSt!s data show that 24,668 males and 21,444 females of this category were enumerated in urban plfrts· of this state. Here again we find that males have migrated to urban areas in larger number than the females. During decade, 1961--71 the males have also maintained their superiority in 'number as 19,346 males had come over to different urban areas of the state
214
as against 17,912 females. These figures show that 65'92 per cent of the total migrants had gone to urban parts in 1971, whereas in the 1961 census 66'51 per cent of them were enumerated in urban areas. This proves that migrants of urban areas of other districts of the state had greater attraction for the urban areas. The reaSon5 for this attraction may be ~ttributed to better employment opportunities besides other advantages like higher education, medical facilities, etc.
In 1971, these migrants maintained a proportion of 45 per 1,000 urban population while in 1961 these migrants constituted a proportion of 41 per 1,000 urban population.
It is seen that majority of the migrants enumerated at the urban areas have been constituted by the migrants coming from other states of India. Next in order of strength arc the migrants coming from other districts of the state.
Movements of migrants born elsewhere in urban area of the district of enumeration
Persons numbering 173,080 are recorded at the 1971 census as migrants born elsewhere in urban .areas of the district of enumeration, of whom 65,186 are m3.1es and 107,894 are females. Thus the sex composition of the migrants goes heavily in favour of the females who constitute 62' 34 per cent of the total inigrants under this category, as against 37'66 per cent constituted by the males.
The corresponding position of 1961 reveals that the number of female migrants was also larger than the ~ales as 69,208 females were involved in this movement as against 46,856 males. The females had constituted 59' 63 per cent of the total migrants under this category. Even during the decade, 1961-71 the females had m3.intained their superiority in number when 38,686 females were registered as migrants as against 18,330 males.
These migrants maintained a proportion of 8 per i,ooo popUlation of this state in 1971. In 1961, the migrants of this category are recorded to have contributed to the extent of 6 for every 1,000 popu. lation of the state.
Urban to rural areas-In the 1971 census, 46,981 males and 86,749 females have been enumerated as migrants in the rural areas of the state while in the 1961 census 17,623 males and 34,393 females were enumerated_in the rural areas. During the decad~
(1961-71) 52,356 females have been recorded as migrants as against 29,358 males. The preponderance of females over m"lle migrants has, therefore, become conspicuous for all the periods as discussed above.
The p3.ttern of distribution of this category Of migrants has been quite different from those already discussed with reference to the migrants coming from other states of India as well as from other districts of the state because majority of the migrants in the present case have gone to rural areas as per the 1971 census. This would be evident from the fact that 133,730 persons representing 77'26 per cent of the total migrants have been enumerated in the rural areas at the 1971 census.
Urban to urban areas-The volume of this type of migration is sm'111, as 18,205 males and 21,145 femlles born in one town of a district have moved to another town of the same district as per the 1971 census. The po,>ition as recorded at the 1961 census shows th3.t 29,233 males and 34,815 f€males under this ca.tegory were counted in the urban areas of the district of enumerat.ion. The migrants of thi s category have mlintained a proportion of 22 per LOOO urban pop:.dation in 1971 while the 1961 census presents as high a proportion of 58 per 1,000 population. The .lUmber of migrants under this category as recorded a.t the 1971 census has b~come much less than the numb~r recorded at the 1961 census, although migrants of other c3.tegories have increased considerably in number when compared with the figures of 1961. Movement of the majority of the ·migrants to rural areas within a district may account for this abnormal shortfall in number of migrants to urban areas. Only
215
22·74 per cent of the total migrant-s have been enumerated in the urban areas· at the 1971 census. No specific reasons can be attributed to this largq scale movement of migrants to the rural areas. Hdspitals and maternity centres of" towns providing medical facilities, especially those which are required for prenatal and post natal cases appear to have attracted a large number of females for safer delivery in urban areas. But the females leave the towns and proceed in large number to their native villages with their ntw born babies. Thus the babies accounted for this large scale migration to rural areas as recorded at the 1971 census to a great extent.
Immigration from foreign countries
As many as 94,126 immigrants from foreign countries are residing in Orissa as per the 1971 census, of whom 50,085 are males and 44,041 are females, The rural/urban distribution shows that 70,741 penons (36,330 males and 34",411 females) .are found in rural areas and 23,385 persons (13,755 males and 9,630 females) are residing in urban areas. In the year 1961, the number of such immigrants into Orissa Was 49,791 composed of 27,466 males and 22,325 flmales. Thus the total number of foreign immigrants has become almost double by 1971.
As has been stated earlier, collection of detai'ed statistics relating to inter-district mOV( men! of migrants is a salient feature of the 1971 census. Th("f,e statistics provide scopes to ascertain tte pre b.ble causeS and the extent of inter-di~tr'icl mOVt ml nt of migrants in this state. As such it may be uceful to study the inter-district movement of migrants from statement IX.6.
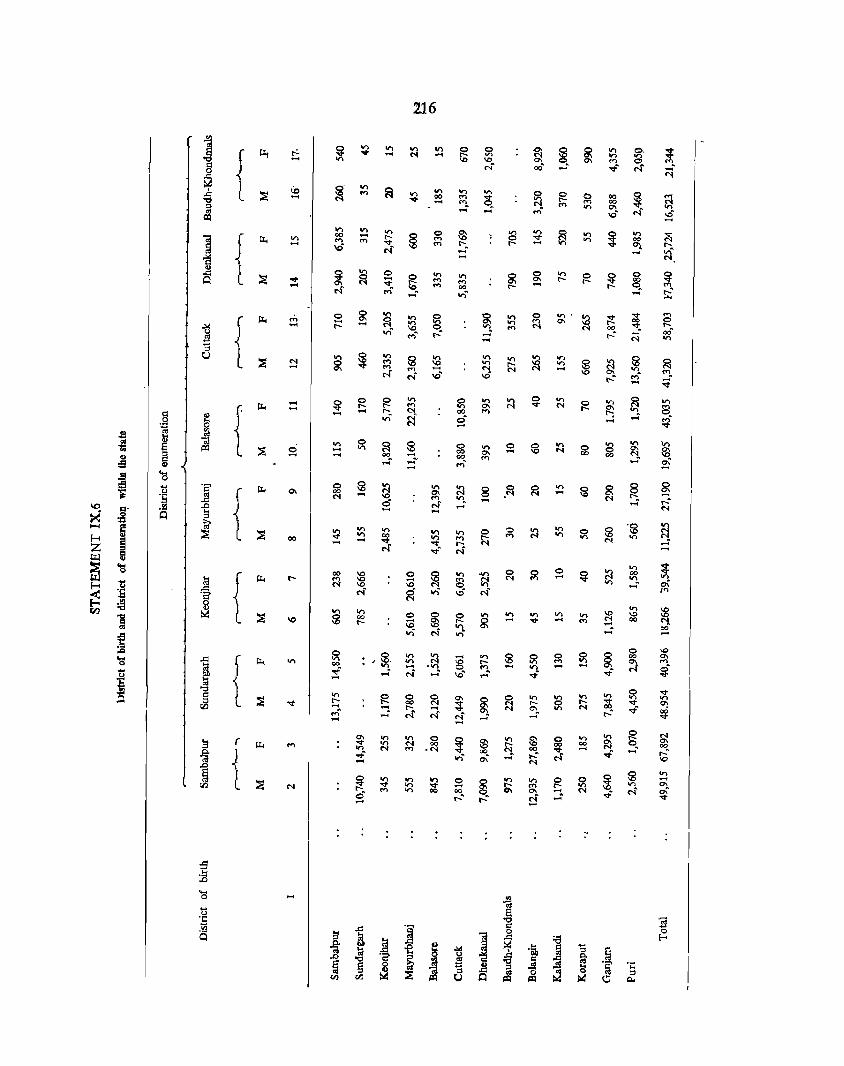
{
{
{ \0
X - { f t
{
j r
i
<'I ....
.... ....
o ....
~ ....
.,... ....
.216
If) ....
on 00 ....
.,... "" 00 .,....
~ 00 o· .....
o .... 00 r-:
~ .... ....
o ....
.~
o "" .,...
.,... .,.,
.,... .... a,
~
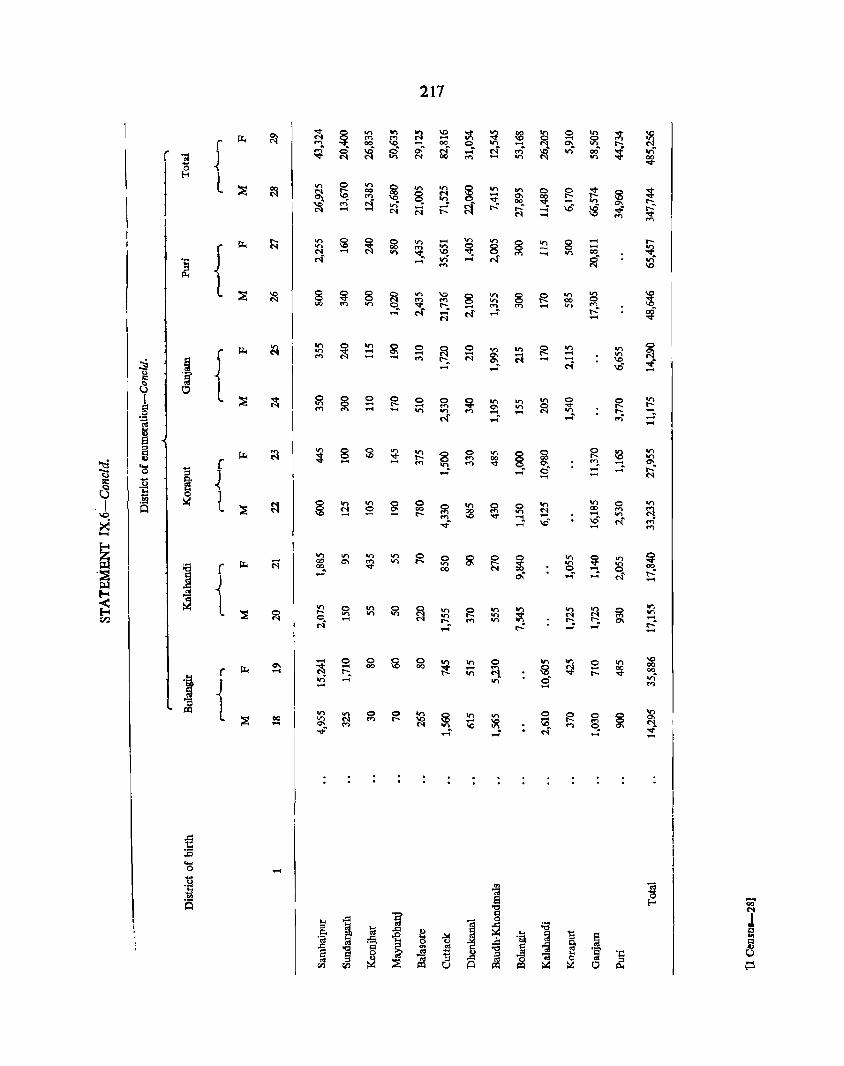
217
~ "'" ~ on on on ~ :1; on ~ ~
0 on ~ \C Il. <'l ".,
~ <'l i?; - 0 ~ [ ..., 00
~ 00 0_ ...... 0- on t-;. ..; ~ \IS S <'l~ .... M- ".," ~
lOft r:%)"
~ on [ ~ ~ ':t <'l on 00 "'" .... If') on 00
~ ...
l ~ 00 If') 0 II">
~ 8 on
~ If') on 0 g ~ ~ ~ to 00
~ M "'" q - 0- r:%)
'C" .... N or) '<I;. 00 ""=-
..-< on C\ r-:. ('I - - <'l -" - '" ~f - \IS ~ ..; $; M '" ..... "., ..,
~ "" on ~ ~ 0 If') ...... V> It") g ~ 8 - '" [ <'l .,., 00 M on ~ 8 - It")
M - If') '<I;. \C "'" - on r:%) "<I;.
~ r-f v; ,....; r-f ~" on '§ - "., 1.0
Jl.t
l ~ ~ 8 ~ 8 ~ to 'C § on 8 g on on
~ "., "" on 00 0 00 ..., on ... r-:. "" . ..., - on ....,
.... N M N - r: ~ -Il. ({l on
* 11'\ ~ 0 ~ 0 on If) g on II"> ~ I
11'\ ..-< .... ...... ~. - ...... on
~ ...., - .... "'" t-" M N - ..-< \0 ,;j <"i' vS
...,. - ..-< -U '~ ;;
13 0 l ~ ~ ~ ~ 8 0 g 0 0 ~ on on on 0 g .,., - ..... .., C\ on ~ 'd' !:;, M "., - .... on .,., .., - .... "'!. t-:. Q
N , .. , - "., -'.:::l ...... 01
S 5 (!4 ~ § @ If) on
~ 0 on
~ ~. g 12 V> Il. 'It' '" ..... 00
.,., ~ [ - ..... .....
""'" ""'. - ~ .... ~ ,....." - ,....; M - 0
~ - -t.) -II: ~ a ~ l I ,~ ~ § on .,.,
~ 0 on 0 0 '" .,., 0 on
Q ~ ~ s: 00 0 <'l ~ ".,
~ "'" 00 ..., on 100 - "" ..... \C "'" - - vS
on
X ... " ,....; \C" N ..... .... "" ..... ~
~ ffi on on In .,., g 0 ~ g ~ on ~ .,.,
Il. - 00 0- m .,., on q ~
00 oa [ M r:%)~ ... 00 M w ~ r: -~
~ ~ ,.....
'" ..., -~
E ~ l on 0 ..... ~ 0 g 11'1 II'> II'> If')
~ on on .,.,
~ ~ "" ~ on ~ on on i?; ~ ~ -rn 0. t-;. m If) 0- r.: M .... r.: - - -..... 0 0 g 0
~ on 0 '" '" 9:
.,., \C co
II< 0-~
..... 00 00 ;;:; .... fa ~ 00 00 r .... "" . M "" "<t- V; 'I ~ ~ - or) s- f')
'0 t trl VI on 0 0 ~ ~ 0 g 0 ~
on on on 0-;:g 00 II') M ..... '" ...... ~ ~ .... <'l - ~
..., N .,.,_ \C N
<"'I C!. ..; - ..... ......
-E ,!:: .r:> ... 0 ..... . ~ '" 'a .... 'a '0 'iii
~ Eo-< 'CO' is N
~ ..<= 'g
] 13 l
~ ~ ..<= ~ ~ ;.;;
t:l ,~ .0
~ .... ~ "5 ~ VI
~ ..c: .d '5b
~ '8 '<::I '2 ~ '" j '<::I ~ ~ ~ 'S' § ~ ~ a [; ~ ...
~ e<I ;:g ~ «! .... v.l rJl t:l ~ trl 0 .....
Inter-district movement of migrants
Statement iX.6 s'bows tIle li'lter-tiistftct 1nO~a ment of migtant~ witIi"' their seX break-up III brissa. which is a new feature of the 1971 census.
Sambalpur--"-Amofig tlie aistriCts bf the state . , . Sambalpur has accommodated the highest number of immigrants from.other districts, of whom 49,91.s are males and 6'7,892 are. fenHUes as per the 1~71 censUs Quite a large ni1tjority of these immigrants 'appear i~ have come fromits adjoining districts, namely, Bolangir, Sundargarh and Dhenka~al. '
The flow of immigrants to Sambalpur on an extensive scale fl:sulted from ~n industrial expansion of the district. Mor&ver, estiiblisnmeiil: of' important institutions like university, medical college, ingineering college, seed multiplication farms, etc., has attracted immigrahts to tlJ~ distriet tlbring t~ Clecal1e 1961-71. A large number of immigrants, especially from the neighbouring districts rushed to Sambalpur _ 0
to avail therilsel~s of the dpporturiities "lnd advantages offered through these institution§. The facilities of irrigation offered ~hrough the Hirakud dam project have also attracted a larg~ nu~bei agricultUrists aM agricultural labourers to this district.
Puri-Ptiri district stands second to Sambalpur in absorbing as mltny as tl5,457 tetnafe an_d 48,646- male migrants coming from other districts of the state. Majority of these immigrants have come from its neighbouring di8trict~ Gtittaclc (21,736 males and 35,651 females) followed by Ganjam (17,305 males and 20,811 females). Besides j:wo unh.:ersities, the headquarters of the-state nas also been .fuca~ed at BhUbaIteswar, a SUbdivision of Puri district. All these institutions have attracted a large number of persons from other districts of' {he stite, :wh<i-are-~ employed tlrere Itt different departnlents of tEe state as w~ll asthe central government.
'.
Cuttack-Puri is followed by Cuttack district where 41,320 males and 58,703 females of other districts have been 6numerated as immigrants. A large majority of these immigrants' have come from five districts of the state, namely, Puri (13,560 males and 21,484 females), Dhenkanal (6,255 males and 11,590 females), Ganjam (7,925 males and 7,874 females), Balasore
.(6,165 males mid 7,050 females) and Keotijhar (2,335 i males and 5,205 females). . " '" Cuttack : district has got the 'biggest city of the atate within ~ts limits. Cuttack ~ity 'is biLfunctiotial
"and is classifl.ed as "Tfade' and commerce-cum-service
218
town". In this town, 36'5 per cent of the workers are engaged it1 services, wJ1jle 26',0 per cent are emplclyed in trade ;mc1- cemmerce. The Ideation, of High Court and institutions like S. C. B. mcrdical':' coliege hOspital, colleges aria industrial.estates at ';:;uttack hhs becoine the S"ource of attraction for:a con~iderable size pf immigrants from other districts of the state. C~owdwar is an industrial town of Cuttack district and as many as 80'29 p~r ~nt bf ,the wo~kers are bngage.d :in intlustry. Paradip, an important tr~nsport tt5wn of Cuttack district with facilities for transp6rt throu~h sea-routes lias provitled employment opportunities: to a large number of immigrants from different parts of the state. The facilities available in the district for agriculture, ititlustty aM mining operatiohs have also bontriliuted a lot to the inward flow of migrati~n from ~the~ districts.
Movem.ent of lfutigrants
The position of Cuttack, the mollt ; populous districl of"brissa becdihes {lezy much c~nspicubus, in the movement of out-migrand because tfi¢ larg~st number of persons have migrated ffom thhl" distrrot. These emigrants cdnsHtute 154,341 persons, 6f whOm 82,816 are females lind 71,525 are males. Out ot the~e emigrants, as many as 35,651 females and 21,7~6 ritales immigrated to ~uri district, wh:ile 12,449 ma1~s and 6,061 females proceeded to Sunaargarh followed by Dhenkanal (11,769 females 'and ~,835 males) a.rtJ. Sillasere 'distfict (10;850 fem:iles al'id 3,880 maies) which accomItlodated larger number bf emigranis from Cuttack district.
Quite 11. large rlurttber af emigrants ftom Cuttack district have been enumerated at the. 1911 censhs in Sqndargarh district although S~ndatgarli is far away
, f;6m Cuttack. = The reasons for this large scale migration from Cuttack district may be attributed to employment opportunities offered by the Rourkela steel factory and Rajgangpur cement factory located in Sundargarh district.
Ganjam-Ganjam district occupies the second place in the state in contributing as many as 66,574 males and 58,505 females for the inter-district movement of out-migran~s. in Orissa. Unlike Cuttack district, the male migrants of Ganjaoi. district have outnumbered the females. Puri district being contiguous to Ganjam has accommodated 20,811 females arid 17,3<l5 males while in Koraput district 16,185 males amI 11,370 females of Ganjam have been enumetated.

Bolangir-Bolangir district occupies the third position in contributing emigrants for the inteJ;'-district movement of migrants. As many as 53,168 females and 27,895 males of this district migrated to other districts of the state. Here the size of the female emigrants was almost twice as large as that of male emigrants. Majority of these emigrants have gone to the adjoining districts, namely, Sambalpur (27,869 females and 12,935 males), Kalahandi (9,840 females and 7,545 males) and Baudh-Khondmals (8,929 females and 3,250 males). Sundargarh district has also accommodated 4,550 females and 1,975 males of Bolangir district. As has been discussed earlier, maximum number of emigrants of Bolangir district have moved
219
to Sambalpur where they got facilities in the sphere of employment, education and agriculture.
Among the remaining districts, Puri (44,734 females and 34,960 males), Mayurbhanj (50,635 females and 25,680 males) and Sambalpur (43,324 females and 26,925 males) have attained distinctions in the interdistrict movement of emigrants. Majority of emigrants of these districts have moved to the bordering districts.
The female emigrants have outnumbered the males in all the districts except Ganjam and Koraput. Social customs like marriage accounts for this increase in the number of female emigrants.

CHAPTER X
CONCLUSION
This report has tried to analyse the main demographic, social and economic characteristics of the population as revealed by the 1971 enumeration. The analysis is based mostly on full count tabulation of the basic characteristics of the population such as size, distribution, density, growth rate, rural and urban break-up, sex ratio, literacy, distribution of scheduled castes and scheduled tribes, main activity and migra: tion. The analysis in Part I-B, which will be published later, will be more specialised, mostly based on crosstabulation of the data and touch upon subjects like age and marital status, religion, mother-tongue, educational levels, migration and detailed examination of workers and non-workers from different standpoints.
Orissa became a separate province with six districts in 1936. With the merger of princely states in 1948-49, thirteen districts where carved out. No change took place in the state or district boundaries during 1951-61. There were however some minor changes in the boundaries of the districts and the lower administrative units between 1961 and 1971. According to the 1971 census, Orissa with an area of 155,782 sq. km. had a population of 21,944,615. It 1iccounts for 4'74 per> cent of the total area of the country and 4 per cent of India's population. Among the states of India, Orissa occupies the tenth rank in area and eleventh in population. The 1971 density of population in Orissa is 141 per sq .. km. as against 177 for the country. The
density has more than doubled during the past seven decades. It was 66 per sq. km. at the turn of the century. Coming to the districts, Cuttack with the highest popUlation has recorded the highest density while Baudh-Khondmals has the smallest population and the lowest density. The average population of the districts in Orissa is 16'88 lakh which compares favourably with the all-India district average of 15'79 lakh. Of the 13 districts of Orissa, six are above the average and seven below the average. In terms of ,population, the districts seem to be almost equally balanced on either side of the average. In size, Koraput is the largest and Balasore the smallest district of our state.
India had a population of 548 million in 1971 with an annual growth rate of 2'48 per cent. The ~riod
from 1951 has been marked by an unprecedented growth of popUlation touching a high growth rate of 24'80 per cent during the last decade (1961-71). While the birth rate dropped from 45'8 in 1901 to 36'9 iii 1971, the death rate which was 44'4 in 1901 went down to 14'9 in 1971. With a high birth rate and a deClining death rate, it is no wonder that the population has grown faster during the last two decades. Among our 22 states, Nagaland has recorded the highest growth rate (39'88), the lowest being Uttar Pradesh (19'78) during the last decade. Orissa occupies the 15th position in the country, recording a decadal growth rate of 25'05 per cent or an annual average rate of 2' 5 per cent. This is above the all-India average of 2'48.
The population of India has remained predominantly rural owing to the agricultural character of its economy with 80 per cent of its population in villages. Over 90 per cent of Orissa's population is rural. The state has 1'8 million town dwellers spread over 81 towns. Prior to 1951. Orissa had no class I town. It was in 1951 Cuttack became the first and the only city with a population of just over one lakh. In 1971, three more towns Rourkela steel township, Berhampur and Bhubaneswar, were elevated to class I status. These four cities account for 30 per cent of the total urban population of the state. Among the districts of Orissa, Sundargarh district has the highest proportion of urban popUlation (23'25) and Mayurbhanj the lowest (2'79). Orissa has two city agglomerations-Cuttack and Rourkela and six town agglomerations. It has eight standard urba~ areas.
There are 46,992 villages in the state inhabited by 91·59 per cent of the total population. On an average, 428 persons live in a village in Orissa compared to 14,102 in Kerala. In the entire state there are only two villages with more than 10,000 population and 22 villages with a popUlation of 5,000 to 9,999. The >average population size of a village among the districts' of Orissa is the largest in Cuttack district (584). Baudh~
Khondmals records the lowest (137).
There has been a slow but steady decline in the sex ratio in our country. The number of females to every 1,000 males which was 972 in 1901 has been steadily
falling and was 930 in 1971. A sex ratio adverse to females is common to all states except Kerala and Dadra and Nagar Haveli. UT. Up to 1961, Orissa was one of the few states in the country which pl8;ip.:: tained a surplus female population. It had 1,001 females per thousand males in 1961. But in lnt. j:he ratio has gone liown to 988. Ev~n so, Oriss.(l. p1aintain~ its high rapking, s~cond only to Kerala. The }ural. se~ ra~i~ is 1,00j as against 845 in l,lrpflP
are~!i:
In India, population in age group 0-14 accounts fer 42 per cent of the country's population, compared to 20 to 30 peE cent in advanced countries. The pattern is almost the same in Orissa where age group 0-14 accounts for 42'4 per cent of the population. The working populatIOn in the adult age group of 15-59 tovers 51'6 per cent of the population of the state.
L,itc;rllCY in Orissi\ ~tand& at 3Q'5~ per ~qllt cpqq)llf~A to th~ ~IHmtia :fi~n~ 9f ~4:4~. F9r C(}lllPutin~ th~ cle~r~e of Iiterac¥, infants in a¥e ~roup 0-4 hav~ been ~xcluded. Kerl).la (69'75) is far ahead of all other states of the countl1' Qrissa oc~upies t~e 15* positiqn. amon~ th~ states. The literac?, percenU\~e pf Orissa iwprpved from 12'57 ill 19~1 to 25'24 in 1961 and to 30:5l per c~nt in 1971. The p~rcentflge qf ~it~rate females il11proWd tA 16'29 p~r C€?l!t in 1971 from -a low fllte of 4'~5 per cent in 195!. ~et f~mal~ Jitt?racy i~ at a high 1eve~ (83'71) still. T~e urb~!\
~eas ~owever present a ~tt~r picture wit4 57'02 p~!" ~1!~ 9f the urban population as liter(l.te, as against 28'09. per cent in r~r~l. The hi~hest p~opor!iQP qf ;ura1 liter~te.s is cIflimed b¥ Cutta91< district; KOH1PUt l!all ~P~ 19west p~rcenta&e 9f rpral Hteracy. This gistriC;' has also the lq",est 1it~racr rate jp. thl< state, Male literl:\cy in urban areas i& over 56 pe.r cent ip all th~ districts, The st~te face~ tp.e challenging task of spreading education among 6'8 million- ~~n and 9'4 million women.
TIl(: ~~h~gtJ1ed <;:fl.st~s fl.1l9 ~GP~qUl~4 iri~ tpg~thCfr 9pn~titH~ 3&'20 p~r ~nt gf t4~ wtSj.l PoplJMipn of Qri~sa. A!(cprdip.~ to t~ 1971 ~nsus, 21 '?flste~ flUg 64 ~rib{'l& :W9I3q~tyd fpf ~ PPJ'lJlati<?ll Qf 3'31 flpd ?'Q7 milJion n:s~ectiv~ly. The ~rgwth nl.t~ is I~N~ p~~ ~~\1t fpr·~c;& ijRd f.Q'(_}~ p~r ~nt fer ST~ qqri\1g the 4y<;~pl( 19~1--·71 AS ,,&ail}st tIle ~rowtp r~~ pf t~ i>t1l;tq'~ population of 25'0~ p~r ~nt. Oq~.,:fin:q. of t\W totp,l SC popUlation inhabits Cuttack district. But in terms of percentage of se to total population, B~udhKhondmals heads the list (18'98) elosely followed br Balasore (18'51). Koraput, Mayurbhanj, Sundargarh
222
and Samba1pur districts together account for 60 per cent of the state's total tribal popUlation. In terms of percentage to total population, Mayurbhanj heads the list (58'56) and Cuttack is at the bottom (2'89).
·'It is interesting to observe that in the coastal districts tpe growth rate of schduled tribes is going up. The 1971 sex ratio of SCs 'is 993 and of STs 1,007 These are well above the state average of 988 females for 1,000 males.
Only 6'27 per oent of the ses and 2'91 per. Cflnt of STs live in uroaq a,reas. The literacy rate (including age group Ch-4) among the SCs and ST s is far too low compared to that of the general populatiOI~ of the Iltate. For the ses it is 15'6 against 26'2 fur the general population. The r~te is still lower in respeot of Sf: females (5'2). Literacy aOlong STs is only ~'fi and among S1' females, it is a men: 2'6. It is heartening tp note that, of late, there has b.e~n a steady rise in the growth rate pf Iitefacy of ses and ~'fs. The percentage of workers among the SC-s is 3~'?5 while among ~Ts ~t!S 34'84. 9ol11pared t9 thy pf()porti9n of worker~ ~o g~!l~ral popqlMion !pe poshioll of ~Cs ~l!d STs appeflrs to be better. !\Qout 9Q P~! cent of thy ST workers ar~ en&a¥.~d in agriculture. Amon~ the SC workers 49'21 p~r
cep.t are ~~ricultura1 l~bour!,rs ~nd ~7'45 per cent 9yltivatprs.
The 1971 census showed 68'51 1akh workers in eur state, they constituted 31·21 per cent of the total population of C>rissa. Of them 33'68 lakh were cultivators and 19'38 lakh were agricultural labourers. Non-woFkers formed 68,18 per cent of the total population of th~ state and their number was over a cr-Ol'e and a half. Th.is largely accounts for the low per capita income of OUl: state.
The 1<]71 ~nSWi lillgw~a that 4!?a,6(il p~rli~p.JI bgm iI\ gtfl:~r ~tMY~ pf Ipwa W§f~ r~cpnte4 i\S i!l!~\gr'mts to !liis s!~te. ~63,3n (}f t p.es~ irnpligfllllts (j!Rn~titl}tiI!g I '31 ~~r- ~~p.t of the fL!rtl:l _goPlll!1tipp !!119 7f9,7S9 t;OP.&titlltil\g 12·4~ p~r ~nt ~f tl}~ ~fb!lR pOPl!tatiop were !l1\\lIDf?Rifj:lQ il1 !h~ ryr~J 3,\1g uroon !!fll~!I o,f llw ~t!!te, T!w Jargest !\9l}1ber gf ~igl1l:l!t~ w~r~ fr!;lm the f~Yr l!Yigh9.q»r~pg 'it-€ltyS of :§~b~l', Alld4r?- Effiq~sh~ W~&t I\e~ga\ !l"c\ Madhya PraHel\4. !\rpqp.g tnes~ st!\tI:;sl 1;Jihat: !it~l!g~ :flr~tl ~oq1ripq~in.g pl)!}7l -mi~rlJrtl:ts. T~~Y iIpmigr~nts frQ1ll lJihar ~QUt9 constitute a proportion of 6 per 1,000 of t~ t<?!~ .\'9Pplation of t~~ stllte. Al!dp.rl! Prad~sp with Q4,476 ~01}1es lle.~t. W<?st '"Q~n&l!l ~ng Mad~¥!! ffa9!,sb contributed 104,550 and 72,629 migrants.
An examination of inter-district migration reveals that Sambalpur district has accommodated the largest number of migrants from other districts, of whom 49,915 were males and 67,892 were females. The reason is the industrial expansion of the district. Establishment of institutions like the university, medical college, engineering college, seed multiplication
223
farms, etc. has attracted migrants from neighbouring districts. Puri district absorbed 65,457 female and 48,646 male migrants f~om other districts of the state. The state capital at Bbubaneswar bas attracted quite a large number of persons from other districts of the state for employment in different departments of the state and central governments.


[ 1 Cenlua-l9 ]
ANNEXURES INSTRUCTIONS FOR FlLLI~W UP nm HOUSE LIST, ESTABLISHMENT SCHEDULE AND INDIVIDUAL SLIP
(
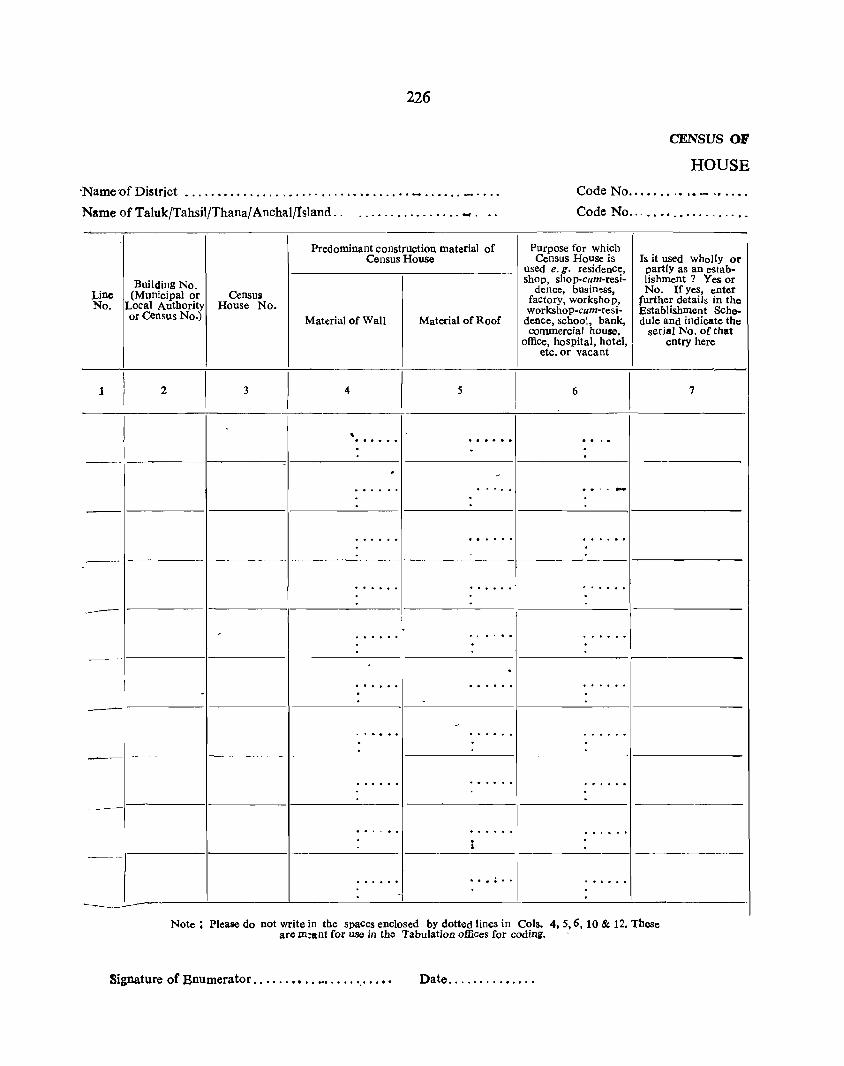
226
'Name'of District ................•..........••.....• _ ...... _ .... .
Name of Taluk/Tahsil/Thana/ AnchaljIsland .. • ............. oo ............ oooo
Predominant construction material of Census House
Building No. Line (Municipal or Census No. Local Authority House No.
or Census No.) Material of Wall Material of Roof
1 2 3 4 5
, ......
---
CENSUS 0'1/
HOUSE
Code No ......... ,. __ 'r ••••
Code No .. , ..••............
Purpose for which Census House is Is it used wholly or
used e. g. residence, partly as an estab-shop, shop·cum-resi- lishrnent? Yes or
dence, busin~ss, No. If yes, enter factory, workshop, further details in the workshop-cum-resi- Establishment Sche-
dence, school, bank, dule and indicate the commercial house, serial No. of that
office, hospital, hotel'j entry here etc. or vacant
6 7
_____ 1------------1------------ ----------------·1----------------1-----------------1-----------------
... : .. ------------------~----------~-----------------~--------------~----------------~---------------
Note: Please do not write in the spaces enclosed by dotted lines in Cols. 4.5.6, 10 & 12. These are m:ant for use in the Tabulation offices for coding.
Signature of Enumerator ••.•..••..•.•.... ',' ..•• Date .....•...•....
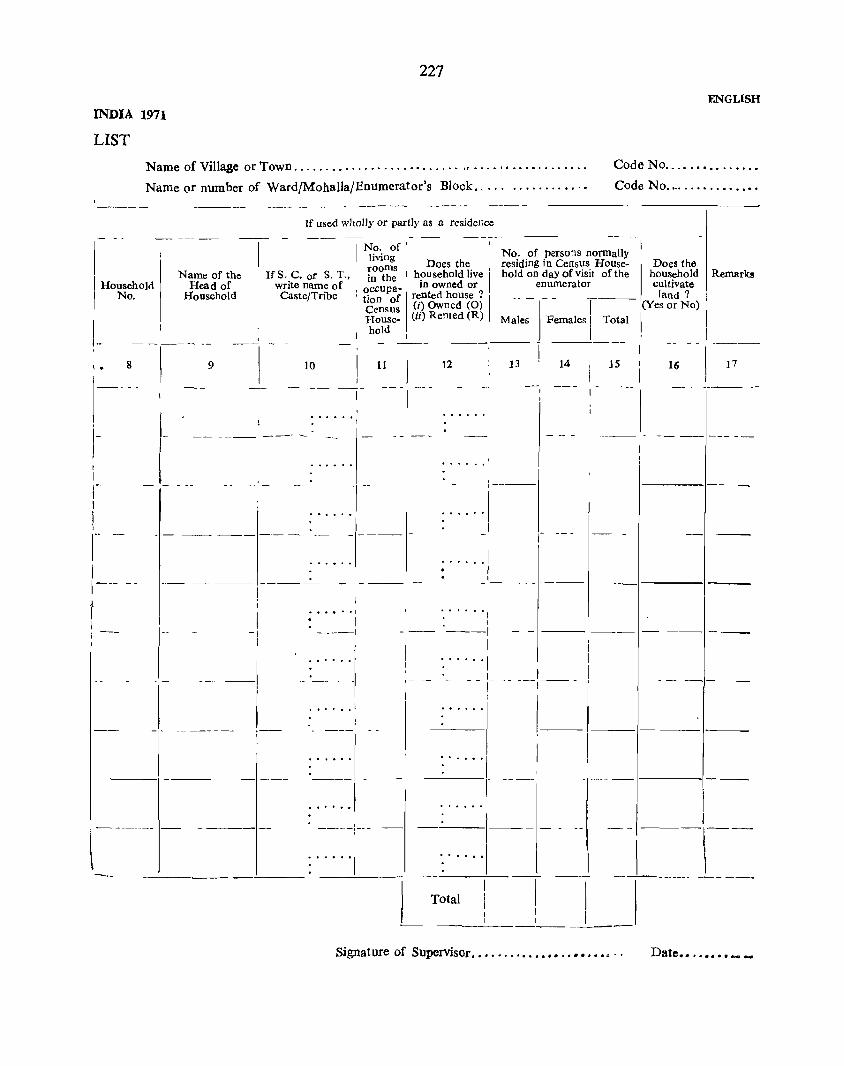
INDIA 1971
LIST
227
ENGLlSH
Name of Village or Town .......................... " .........•....••.. Code No ....•••..... , .•
Code No, , .........•. ", Name or number of Ward/MohaIla/Enumerator's Block,.... . ........ , .•
I Household
No.
I •
I I r I
I , ..
I 1---
r 1--
8
Name of the Head of
Household
9
If used wholly or partly as a residence
I No. of' living rooms Does the. ,
If S'. C. or S. T., in the I h?usehold lIve I wnte name of occupa- In owned or Caste/Tribe : tion of rented house ? I
Census (i) Owned (0) House- (ii) Rented (R) hold
Remarks
No. of persons normally residing in Census House- I Does the hold on day of visit of the household
enumerator cultivate land? /
M~'~~ F=,,~r To'" r" 0' No) I
10 11 12---
1--13- 1 -14----1~- 16 1-1-7-
· . , ... '1--
• ••••• J
----I
-:-· .... ·1
· " ... /
-I
, --,----
_,-
...... I
• 1 ----I ,
: .... '1 - - I-
I 1
I ---,-- -
,--I
----:---.. " .. --1---\--
--~-----_~
Total
---_-'-_
Signature of Supervisor. , •.... , ............... . Date ............ ...
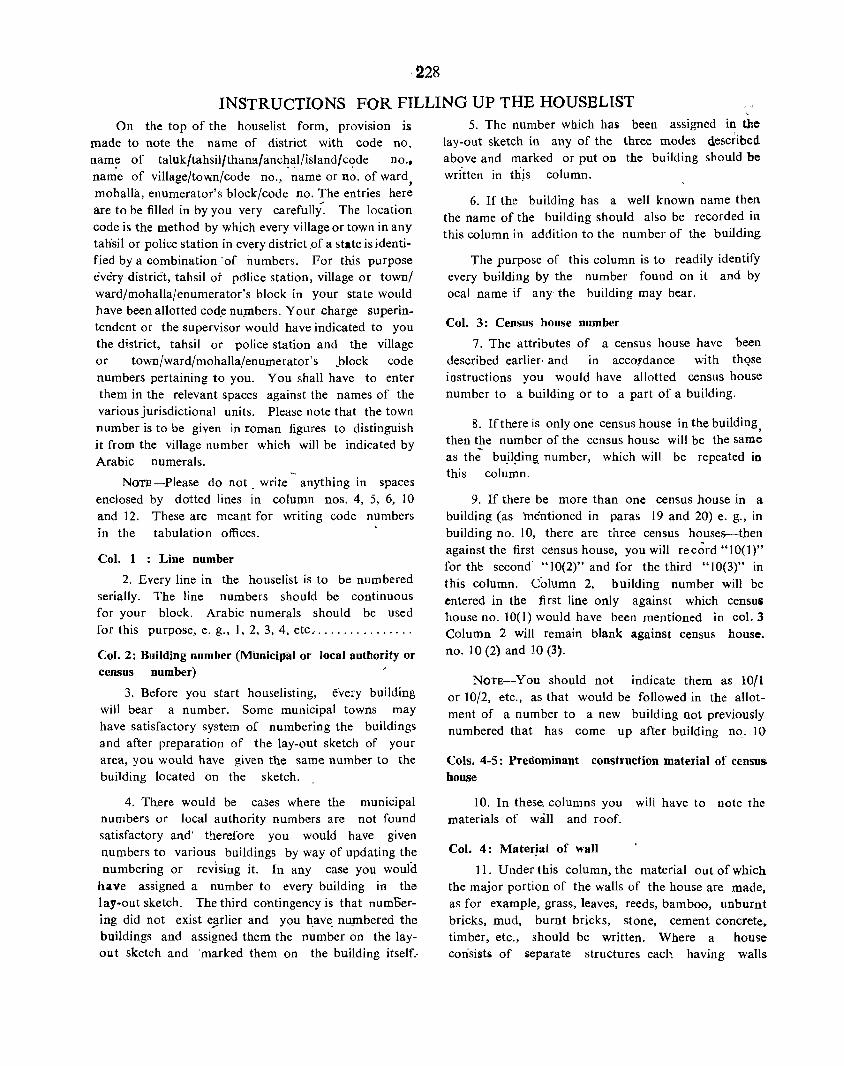
228
INSTRUCTIONS FOR FILLING UP THE HOUSEL[ST On the top of the houselist form, provision is
made to note the name of district with code no. nam~ of taluk/tahsil/thana/anc~~l/island/c<?de no .• name of village/town/code no., name or no. of ward, mahalIa, enumerator's block/code no. The entries here are to be filled in by you very carefully' The location code is the method by which every village or town in any tansil or police station in every district,Of a state is identi· fied by a combination 'of numbers. For this purpose every distriCt, tahsil or pdlice station, village or town/ ward/mohalla/enumerator's block in your state would have been allotted cod.e nu.mbers. Your charge superintendent or the supervisor would have indicated to you the district, tahsil or police station and the village or town/ward/mohalla/enumerator's "block code numbers pertaining to you. You shall have to enter them in the relevant spaces against the names of the various jurisdictional units. Please note that the town number is to be given in roman figures to distinguish it from the village number which will be indicated by Arabic numerals.
NOTE-Please do not _ write anything in spaces enclosed by dotted lines in column nos. 4, 5, 6, 10 and 12. These are meant for writing code numbers in the tabulation offices.
Col. 1 : Line number
2. Every line in the houselist is to be numbered serially. The line numbers should be continuous for your block. Arabic numerals should be used for this purpose, e. g., 1, 2, 3, 4, etc.· .............. .
Col. 2: Building number (Municipal or local authority or census number)
3. Before you start houselisting, every building will bear a number. Some municipal towns may have satisfactory system of numbering the buildings and after preparation of the lay-out sketch of your area, you would have given the same number to the building located on the sketch.
4. Th.ere would be caSes where the municipal numbers or local authority numbers are not found satisfactory and' therefore you would have given numbers to various buildings by WaY of updating the numbering or revising it. In any case you would
ha ve assigned a number to every building in the lay-out sketch. The third cOhtingency is that numbering did not exist ej!rlier and you have. nu_mbered the buildings and assigned them the number on the layout sketch and 'marked them on the building itself.·
5. The number which ha5 been assigned in the lay-out sketch in any of the three modes desc~ibed above and marked or put on the building should be written in tlijs column.
6. If the building has a well known name then the name of the building should also be recorded in this column in addition to the number of the building
The purpose of this column is to readily identify every building by the number found on it and by ocal name if any the building may bear.
Col. 3: Census house number
7. The attributes of a census house have been described earlier' and in accordance '.vith thQse instructions you would have allotted census house number to a building or to a part of a building.
8. If there is only one census house in the building, then the number of the census house will be the same as the bu.il~ing number, which will be repeated in this column.
9. If there be more than one census house in a building (as mentioned in paras 19 and 20) e. g., in building no. 10, there are three census houses-then against the first census house, you will re c~rd "10(1)" for the second' "10(2)" and for the third "10(3)" in this column. Column 2, building number will be entered in the first line only against which censuS house no. 10(1) would have been mentioned in col. 3
Column 2 will remain blank against census house. no. 10 (2) and 10 (3).
NOTE-YOU should not indicate them as 10/1 or 10/2, etc., as that would be followed in the allotment of a number to a new building not previously numbered that has come up after building no. 10
Cols. 4-5: Predominant construction material of census house
10. In these. columns you will have to note the materials of wall and roof.
Col. 4: Materjal of wall
11. Under this column, the material out of which the major portion of the walls of the house are made, as for example, grass, leaves, reeds, bamboo, unburnt bricks, mud, burnt bricks, stone, cement concrete, timber, etc., should be written. Where a house consists of separate structures each having walls
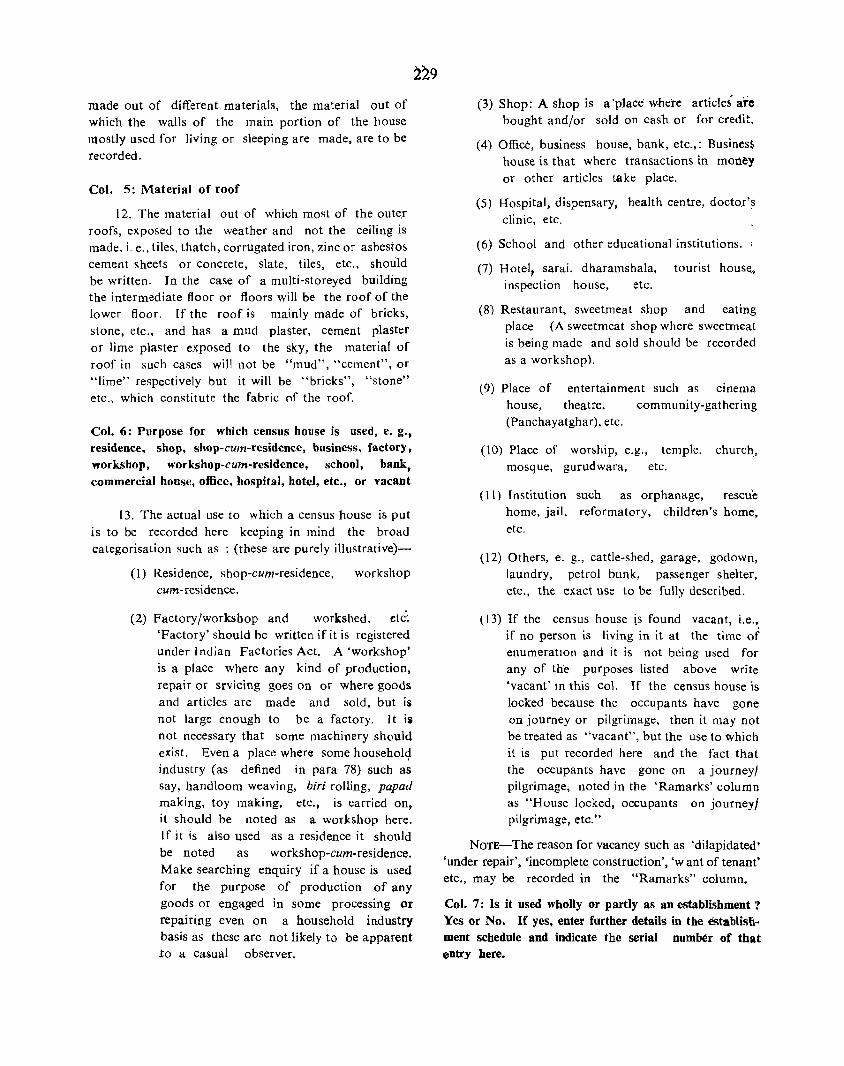
made out of different materials, the material out of which the walls of the main portion of the house mostly used for living or sleeping are made, are to be recorded.
Col. 5: Material of roof
12. The material out of which most of the outer roofs, exposed to the weather and not the ceiling is made, i. e., tiles, thatch, corrugated iron, zinc or asbestos cement sheets or concrete, slate, tiles, etc., should be written. In the case of a multi-storeyed building the intermediate floor or floors will be the roof of the lower floor. If the roof is mainly made of bricks, stone, etc., and has a mud plaster, cement plaster of lime plaster exposed to the sky, the material of roof in such caseS will not be "mud", "cement", or "lime" respectively but it will be "bricks", "stone" etc., which constitute the fabric (l[ the roof.
Col. 6: Purpose for which census house is used, e. g., residence, shop, shop-cum-residence, business, factory, workshop, workshop-cum-residence, school, bank, commercial hODse, office, hospital, hotel, etc., or vacant
13. The actual use to which a census house is put is to be recorded here keeping in mind the broad categorisation such as : (these are purely illustrative)-
(I) Residence, shop-cum-residence, cum-residence.
workshop
(2) Factory/workshop and workshed, etc: 'Factory' should be written if it is registered under Tndian Factories Act. A 'workshop' is a place where any kind of production, repair or srvicing goes on or where goods and articles are made and sold. but is not large enough to be a factory. It iii not necessary that some machinery should exist. Even a place where some householcJ industry (as defined in para 78) such as say, handloom weaving, biri rolling, papad making, toy making, etc., is carried on, it should be noted as a workshop here. (f it is also used as a residence it should be noted as workshop-cum-residence. Make searching enquiry if a house is used for the purpose of production of any goods or engaged in some processing or repamng even on a household industry basis as these are not likely to be apparent 10 a casual observer.
(3) Shop: A shop is a 'place where article; are bought and/or sold on cash or for credit.
(4) Office, business house, bank, etc.,: Business house is that where transactions in money or other articies take place.
(5) Hospital, dispensary, health centre, docto.r'~ clinic, etc.
(6) School and other educational institutions. ;
(7) Hotel l sarai, dharamshala, tourist hous~.
inspection house, etc.
(8) Restaurant, sweetmeat shop and eating place (A sweetmeat shop where sweetmeat is being made and sold should be recorded as a workshop).
(9) Place of entertainment such as cinema house, theatre. community-gathering (Panchayatghar), etc.
(10) Place of worship, e.g., temple, church, mosque, gurudwara, etc.
( 11) Institution such as orphanage, rescue home, jail, reformatory, children's home, etc.
(12) Others, e. g., cattle-shed, garage, godown, laundry, petrol bunk, passenger shelter, etc., the exact use to be fully described.
(13) If the census house \S found vacant, i.e., if no person is living in it at the time of enumeratIOn and it is not being used for any of the purposes listed above write 'vacant' In this col. If the census house is locked because the occupants have gone on journey or pilgrimage, then it may not be treated as "vacant", but the use to which it is put recorded here and the fact that the occupants have gone on a journey! pilgrimage, noted in the 'Ramarks' column as "House locked, occupants on journeyJ pilgrimage, etc."
NOTE-The reason for vacancy such as 'dilapidated' 'under repair', 'incomplete construction', 'want of tenant' etc., may be recorded in the "Ramarks" column.
Col. 7: Is it used wholly or partly as an establishment? Yes or No. If yes, enter further details in the establisliment scbedule and indicate the serial numOOr of that entry here.
Definition of an Establis,hment
14. An "establishment" is a place where goods are produced or manufactured not solely for domestic consumption or where servicing and/or repairing is done such as factory, workshop or household industry or servicing and/or repair workshop or a place where retail or wholesale business is carried on or commercial services are rendered or an office, public or private or a place of entertainment or where educational, religious, social or entertainment services are rendered. It is necessary that in all these places one or more persons should be actually working. Thus an establishment will cover manufacturing, trade and other establishments where people work.
Examples:
A factory or a workshop or workshop-cum-residence .or a trading or other establishment, i. e., where some kind of production, processing, repair or servicing is undertaken or where goods or articles are made and sold, or some business is being carried on such as a grocery sHop, a pan shop, rest_flurant, bank, hotel, or an office is functioning such as government office, commercial office, or an institution is being run such as school, college, hospital, dispensary, etc., and where one or more persons are working.
An establishment may occupy a census house or a group of census houses or a part of a census house.
15. This column applies only in cases where the census house is used as an establishment as defined above. Sometimes the act of production, processing or servicing may not be apparent especially if carried on as a household industry, e.g., when;;' handloom is located inside a house and is not in operation at the time of enumerator's visit or if some other type of household industry such as papad making or toy manufacturing or bidi r_olling, etc., is done, say in some interior portion of the house. You should make searching enquiries to see if any production processing or servicing is done or any business is carried on or any ,institution is being run in any part of the house not readily seen from outside.
If 'yes' is recorded here, go to the establishment schedule, and fill up further particulars in that schedllie. Please fill in the serial no. of the entry as given in the establishment schedule in this column after yes'.
~30
16. It is possible that some kind of production or processing is undertaken in the house by the memberS of the household for purely domestic consumption. For example, hand-pounding of rice, preparation of spices like, haldi (turmeric), chillies, etc., or say, knitting of woollen garments embroidery work, Ioinloom weaving and so on, meant for household use only and not for sale. In such cases the house should not be treated as an ·establishment'.
Columns 8 to 16 :
17. These columns will relate to census houses which are used wholly or partly as a residence. If, therefore, a particular census house is not being used for residential purposes at all even partly, as will be evident from entry in cot 6; put ·X' in each of the columns 8 to 16.
Col. 8 : Housebold number:
18. A 'household' is a group of persons who commonly live together and would take their meals from a common kitchen unless the exigencies of work prevented any of them from doing so. It may be made up of related or unrelated persons. A cook or a servant living in the house of his employer and taking his food there is part of that household. A hostel where a number of unrelated persons live together is an institutional household. So also a Jail.
19. There may be more than one household in a census house. Each household should be given a separate number. This can be done by using the alphabets as (a), (b), (c), etc., as affixes to the census house no. For example, if building nO. 2 is also a census house and has three households,- the household numbers will be 2(a) , 2(b), and 2(c). tf building number 4 has two census houses, the houses will be numbered as 4(1) and 4(2). If within these houses
'1:here are respectively 3 and 2 households then they will be numbered as 4(1) (a), 4(1) (b), 4(1) (c) anct4(2) (a) and 4(2) (b) r;spectively. If, however, building no. 3 is also a census house and has only one household, the household no. to be entered in this column will be nO. 3 only. .
20. In the above cases of households nos. 2(b), 2(c), 4(1) (b), 4(1) (c) and 4(2) (b), there will be no entries against them in cols. 3 to 7. Cols. 3 to 7 will be filled for the entire census houses, 2, 4 (1) or 4(2) as the case 'may be, once. There is no need to repeat cols. 3 to 7 in each line for which entries are made for more thau one household against that census house in cols. 8 to 16.
Col. 9 : Name of the head of household
21. The name of the head of each household should be written. The head of the household for census purposes is a· person who is recognised as such in the household. He is generally the person who bears the chief responsibility for the maintenance of the household and takes decisions on behalf of the household. The head of the household need not necessarily be the eldest male member, but may even be a female or a youger member of either sex. You need not enter into any long argument about it but record the name of the person who is recognised by the household as its head. In the case of institu_ tions like boarding houses, messes, chummeries which should be regarded as households of unrelated persons living together and which may be called institutional households, the manager or superintendent or the person who has administrative responsi bility or who by common consent is regarged as the head should be recorded as the head of the household. In the case of an absentee edjure 'Head', the person on whom the responsibility of managing the affairs of the household falls at the time of enumeration, should be regarded as the head.
Col. 10 : H SC or ST write name of caste/tribe
22. You will have been furnished with a list of scheduled 'castes and scheduled tribes notified for your area. A5certain if the head of the household belongs to a scheduled caste or a schedule tribe and check whether the caste/tribe is scheduled as per your list. If so,
for Scheduled Caste write "SC" and record name of caste,
for Scheduled Tribe write "ST" and record name of tribe,
for others write "X"
For a household belonging to scheduled . caste, check religion of the head of the household. He or sh~ should be either a Hindu or a Sikh. There can nOt be a SC in any other religion. Scheduled tribes may belong to any religion.
23. In a case where the head of the household belongs to scheduled caste/scheduled tribe even if
231
any other member of the household (except institutional households) does not belong to SC.'ST then write SC/ST as the case may be and mention the caste/tribe to which he belongs. On the other hand if the head does not belong to SC/ST but any other member of the household does belong to SC/ST ; write 'X' in this column.
In the case of all 'Institutional Households, write 'X' in this column irrespective of whether the head belongs to a SC[ST or not.
Col. 11: Number of living rooms in the occupation of census household'
24. A room should have four walls with a door way with a roof overhead and should be wide and long enough for a person to sleep in, i.e., it should have a length of not less than 2 metres and a breadth of at least 1 i metres, and 2 metres in height. An enclosed room, however, which is used in common for sleeping, sitting, dining, storing and cooking, etc., should be regarded as a room. An unenclosed verandah, kitchen, store, garage, cattle-shed and latrine and rooms in which a household industry such as a handloom is located which are not normally usable for living or sleeping, etc., are excluded from the definition of a room for the purpose of this column.
25. If there is only one household in a census house the counting of rooms will not be difficult. But i( a census house consists of a number of households, the number of rooms occupied by each household has to be entrered against the name of each head of household. In cases where a room is occupied by more than one household or they share more than one room, the number of rooms should be given together against a bracket as common to such households.
26. One is likely to come across conical shaped hut or tent in which h).lman beings reside. In such improvised accommodation, there will be no four ;alls to a room, and therefore, Lthe rabove definition ;QuId not strictly apply to such types of accommodation. In such cases, the tent or conical hut, etc., may in itself be construed to be a room.
Col. 12 : Does the household live in owned or rented house : (i) Owned (0) (ii) Rented (R) :
27. If a household is occupying a census 40~se owned by itself and is not paying-anything to anybody \n the form of rent then the household may "be considered as living "in own house. This should be recorded by '0'" A household living in a flat or a house taken on 'ownership' basis on payment of instalments, should be regarded as living in its own house, notwithstanding that all instalments have not b~en paid.
28. If the household lives in rented house write 'R'. A housing unit is rented if rent is paid or Contracted for by the occupants in cash or in kind. Where an owner permits a household to live in a house rentfrce even then the household should be treated as living in a rented house. For example, tentfree accommodation provided to employees by gowrnmen t, institutions, companies, etc. In such cas~s, you should treat the house as rented and write '·R'.
Col. 13 to 15: Number of persons normally residing ifi censuS household on day of the visit af the enumerator
. 29. Enter the number of males normally residin~
in the household in column 13, females in column 14 and total number of persons m column 15 (col. 13+col. 14).
30. In these columns normal residents are to be recorded even though some of them may be absent on the day of enumerator's visit. Casual visitors should be excluded as they will be con~idered at their respective places of normal residence. But a person who has stayed with the household for a period of 3 months or more should, however, be included. Correspondingly, normal residents absent
232
foi over 3 months or more should"be excluded front the household in which they normally reside.
Total of these columns should be struck at the end of each page and after eompletion of houselisting grand total of the ... block should be struck at the bottom of the last form.
Col. 16 : Does the household cultivate land (Yes or No)
31. If the household is cultivating any land then you have to record the answer 'Yes' otherwise 'No'. For determining whether a household IS
cuitivating or not, it should be necessary to ascertain if one or more persons in the household are engaged in cultivation of land or supervision or direction of cultivation of land owned" or held from Government or from private persons or institutions for payment in money, kind or share. Encroachers who cultivate land encroached upon will be regarded as cultivating households for the purposes of this column. If the household has a visitor who cultivates land elsewhere, It cannot be deemed that the household as such is a cultivating household. Unless the head or other members of the household are engaged in cultivation of their own, the household should not be reckoned as a CUltivating household. A ho us("hold whose members myrely work on somebody else's land for wages should not be treated as a cultivating -household.
I
Col. 17 : Remarks
- 32. If there is an entry in col. 6 as "Vacant", you have to record the reason such as "dilapidated". "under repair", "incomplete construction", "want of tenant", etc: in this' column.
233
JNSTRUCTIONS FOR FILLING UP THE ESTABLISHMENT SCHEDULE
At the top of the schedule provision is made for noting the location code no. and name of the areas concerned. This should be the same as those noted on the top of the houselist which you will be canvassing simultaneously. You should fill the location code nos., etc., correctly.
2. The columns of the establishment schedule can be classified into four broad groups :
(i) Columns 1 to 5 are of uniform applicability and entries have to be made in ·respect of all the establishments ;
(ii) Columns 6 to 8 pertain to manufacturing, processing, etc.-establishments ;
(iii) Columns 9 to 10 relate to trading establishments ; and
(iv) Column 11 refers to "othcr" establishments which are not covered In columns 6 to 10.
Thus, it will be seen that the columns. falling.within groups (ii) to (iv) are mutually exclusive, while those in group (i) are common to an.
Col. 1 : Serial number
3. [n this column the establishments are to be entered one after another ;erially. Arabic numerals should be used for this purpose, i. e., 1,2,3, etc.
Col. 2 : Census house number
4. The census house number to be noted is the same as that in column 3 of the houselist and against which 'Yes' is written in column 7 of the houselist indicating that the census house is used as an establishment.
5. A point to be noted here is that it is likely that a single factory or workshop may be spread over more than one census house adjoining one another. Therefore, while in col. 2 of this schedule a number of census houses may be noted in respect of that particular unit of production, processing or repairing, trade or business, etc., the entries in col. 3 onwards will be one only for that group of houses covered by a single unit of production or business, etc. establishment. For example, if a single tea factory in Assam or business establishment in Calcutta should be spread over two or three adjacent buildings, each of the buildings should not be shown as a separate factory or establishment but the house nos. of all these buildings shown in col. 2 should be
(1 Census-30)
bracketted together and the particulars of the single tea factory or establishment entered in the subsequent columns against this group of houses. If on the other hand the activities of a large firm or an office are carried on in buildings located far away in different localities, each of the census houses in the different localities will have to be treated as a separate establishment and the particulars of the establishment relating to that particular census house should be listed in this ~chedule.
Col. 3 : Name of the establishment or of the proprietor
6. In this column write the name of tl)e establish· ment in the case of factories, large manufacturing concerns, a shop or business establishment, banks, office, etc., which usually bear a "distinct name. Where an establishment has no separate name as in the case of small workshops and establishments like confectionaries, small tea shops, dhobi's establishment, household industries, etc., write the name of the owner as "So .and so's halwai shop'.!, etc. This is to help easy identification.
Col. 4 : Is the establishment-(a) Governm~nt/Quasi Government (b) Private, (c) Co-operative institution
7. Enter here whether establishment enumerated belongs to public sector, i. e., government/quasi government managed, including -establishments run by lQcal authorities, or to private sector, or a co-operative enterprise. Pleas" do not write in the column only (a) or (b) or (c) but write
(I) Government-Public ,sector2 or quasi government-Public sector, or local authority-Public sector
(2) Private or
(3) Co-operattve
There may bt many schools or libraries, etc., which are not owned by any- particular nldividua1 or group of individuals. These may be owned by people in general and managed by managing committees. Such estab1ishments shouM be treated as "private" as distinguished from government/quasi government or run by local authorities or co-operative enterprises.
8. An establishment will be treated as a government/ quasi government institution if the central or state government or a local authority such as the zilla parishad, city corporation or municipality, etc., completely ownl> or has a majority of shares as to control the management of the establishment.
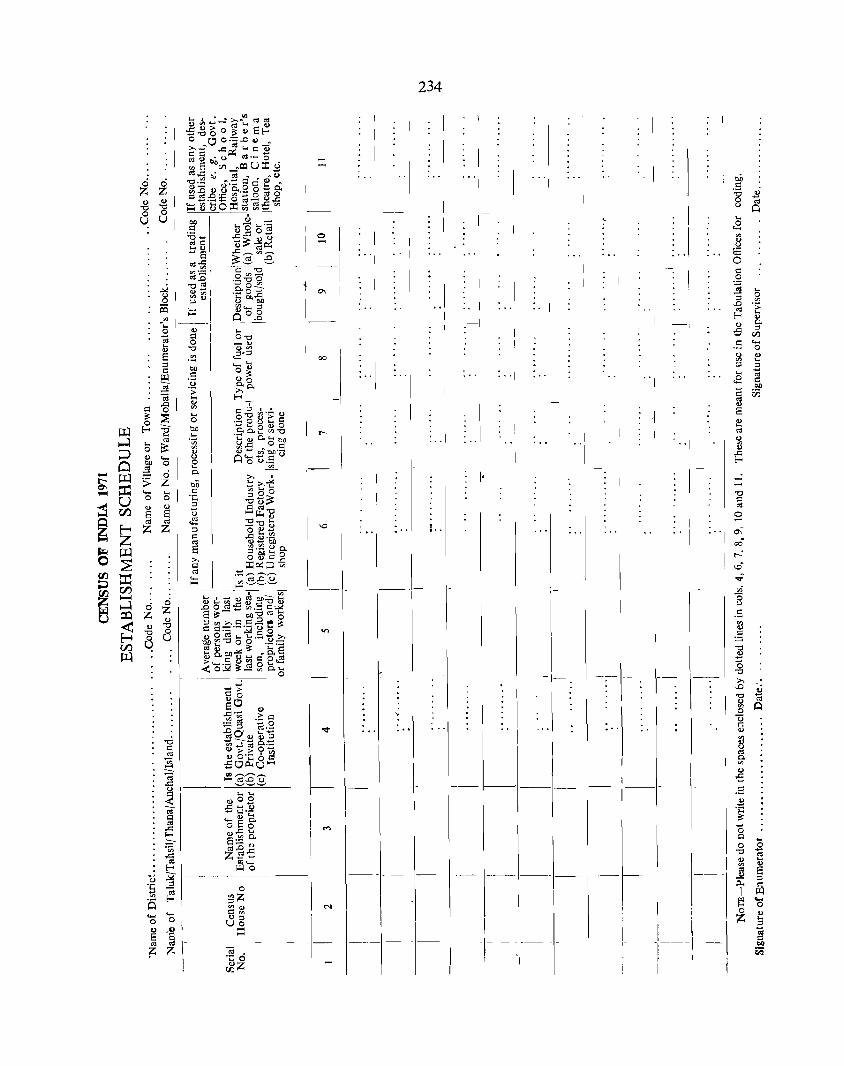
I :--
~ I
-1-
co
I ....
,--
~ . ,I I
' .. I I
I , .. ,
1--1-
'<t
I I 1
I~I-, I
I
.. I
"'I I
234
.. 1
~ .. I
I ..
·1
,-I
1
: .. 1
:"1
1
1-
: .. 1
i-
-I~
I
-I I
: .. 1
-I-~-\ -I r ! i
.....:
9. Private establishments are those owned and managed by private individuals or corporate bodies not being co-operative institution or governm~nt or quasi government institutions.
10. Establishments registered under the Co-operative Societies Registration Law of the state, alone fall in the category of 'Ttl-operative".
Col. 5 : Average number of persons working daily last week or in the last working season, including proprietors and/or family workers
II. In this column, the information has to be entered relating to the total number of workers including the apprentices, paid or unpaid and also including .;)wn::r(s) or proprietor(s) of the establishment and any of their family members if they also work in the establishment and also the hired workers, If any. It is not ne;;~ssary that an e3tablishment should necessarily have paid workers. A small shop run in the same house where the owner lives and the business is attended to by just one person of the household is also an establishment. The average number of persons working per day in the e_)tablishment during the week preceding the day of your visit should be recorded. For computing the average number of persons working per day, if the establishment remained closed owing to holiday, etc., "u;h day(s) should be ignor~d and only the 'days' on which the establishment worked should be taken into account. If during the week preceding your visit, the establishment remained closed either due to strike or lock-out, the week during whil'h the establishment work~d prcc~ding such .,trike or lock-out should be taken into account for reckoning the average number of persons worki:1g. The hired workers should normally be in full time employment.
12. Some establishments such as a sugar factory, rice mill, etc., may be seasonal in character and may not be a.::tually working at the time of the present listing. You should then. ascertain the particulars of such e,tablishments with reference to the last working season.
13. In case more than one product is produced, or more than one item of business is conducted or several types of services are rendered, it is not necessary to eaquire the number of persons employed In the production/busint:!5s/servicing of each type of product, busines" or sen'ice that is covered against that serial number. For example, 111 a large textile mill there, may be the weaving section. dyi"g section, laboratory, repairing
235
section, sales section, etc. 11 is not necessary to ascertain the employment in each section. The total employment has to be ascertained. The major activity of the establishment will be described in subsequent colump.s.
Cois. 6, 7 and 8 : If any manufacturing, processing or Servicing is done
14. These columns relate only to such establishments in which goods are manufactured or some kind o(processing or servicing is ~one and/or repairs are carried on.
Col. 6 : Is it (a) Household Industry, (b) Registered factory, (c) Unregistered workshop
Household Industry : Definition-
A 'Household Industry' is defined as an industry conducted by the head of the household himself/herself and/or mainly by the members of the household at home or within the village in rural areas, and only within the premises of the house wh..'re the household lives in urban areas. The industry should not be run on the scale M a registered factory.
15. Thus, there are four ingredients of a household industry :
(i) nature of activity
(ii) participation
(iii) location
(ip) sile
16. (i) Nature of activity A household industry should relate to production, processing, servICing, repairing, or making and selling (but not merely selling) of goods. It does not include professions such as a pleader or doctor or barber, musician, dancer, waterman, dhabi, astrologer, etc., or merely trade or business even if such professions. trade or services are conducted at home by members of household.
17. (ii) Participation-The head of the household and/or one or more members of the household must participate in such an industry. If it is run primarily by hired labourers, the 'participation' ingredient of the household members will not he satisfied and it will not be a 'Household Industry'. The industry may run with the help of hired workers but the head and/or members of the household must be mainly participating in the industry and not solely dependent on hired workers. Besides "actual work", participation also inclUdes "suoervision and direction".
236
18. (iii) Location-The industry should be located within the premises of the house where the household lives in urban areas; if it is situated at a place other than at home, it will not be termed as household industry in urban areas. In rural areas, however, the industry may be either at home or anywhere within the village limits. In rural areas, even thou~h the industry is not situated at home there is a greater possibility of the members of the household participating in it if it is located within the village limits.
19. (iv) Size-The industry should not be on the scale of a registered factorY. Irrespective of the location and participation by the members of the household, 'if the industry or workshop is registered under the Factories Act, then it will not bc a household industry.
2v. Thus it will be clear that any industry which can be termed as 'Household Industry' must satisfy all the four ingredients mentioned above.
21. Registered Jactory-A factory which is registered under the Indian Factories Act should be treated as a "Registered factory". Any other workshop merely licenced by the municipal or any other author.ity or registered for any other purpose should not be treated as a registered factory unless it is registered under the Indian Factories Act.
22. (c) Unregistered workshop-Workshop is a place where some kind of 'production, processing, servicing, repairing or making of goods for sale' is going on. A workshop which is registered under the Indian Factories Act should be treated as a registered factory and others as unregistered workshops. Workshops which are run as household industry should be treated as household industry aud entered as such.
23. When you come across an establishment where some kind of manufacturing, processing or servicing, etc., is done, you should ascertain whether it is a household industry or a registerea factory or a workshop not registered under the factories act and write whatever it actually is in this column. Please note that workshops merely licenced or entered in the registers of a local authority are not to be considered as registered factories unless registered under the Indian Factories Act. All workshops other than ,household industries and not registered under the Indian Factories Act should be treated as unregistered workshops even if they are merely I icenced as workshops by the local authorities. Please do not write (a) or (b) or (c) in the column but write "Household .industry", or "Registered factory" Of ., Unregistered workshop". as the case may be,
Col. 7 : Description of the products, processing 01
servicing done
24. The description of the actual work relating to product, processing and servicing which is done in the household industry, factory or workshop that is being listed is to be recorded here, e. g., handloom weaving, lace knitting, oil ghani, etc., manufacturing of G. I. pipes, electroplating, motor or cycle repairing, iron foundry. paper making or book binding, printing and dyeing, shoe making, sweetmeat making etc. If in any establishment, more than one article is produced or more than one kind of processing or servicing or repairing is done, indicate only the major kind of products or processing or repairing or servicing, etc.
Col. 8 : Type of fuel or power used
25. Enter here the description of the power or fuel used for the running of the factory, workshop (or house· hold industry if it is run on power or fuel). The fuels can be kerosene, soft coke, petrol, diesel, gas, coal, wood, etc. Electricity and steam, etc., are some of the sources of power. Some units may be run by animal power such as oil ghani. Some may be run by merely human energy such as carpet-making, pottery making, etc. Enter the description of fuel or power used for the production, processing, servicing, etc., that is carried on in the establishment. There may be instances where more than one fuel or power is used. In such cases, only the fuel or power which is used in running the primary unit of the industry will be noted in this column.
26. Columns 9 and 10 are to be filled in respect of trading establishments or establishments which render commercial services only.
27. Trading or business establishments are those where some trading, i. e., transactions involving sale and/or purchase of goods go on.
Establishments rendering commercial services are the banks, money lending firms, pawn shops, etc.
Col. 9 : Description of goods bought/sold
28. If it is a trading establishment, you i;hould ascertain what are the goods bought and/or sold and write the description in this column. If there are more than one type of goods bought/sold by the establishment, you should give descriptivn of the main item of goods bought/sold by the eSlablishment.
29. In the Case of'establishments rendering commercial services such as in the case of banks, etc., you should write the description of the services rendered, as in the case of u hank, you should write "banking ~::rvices".
Col. 10 : Whether (ll) wholesale or (b) retail
30. For all trading establishments. you should ascertain in respect of the goods mentioned in column 9, whether they are sold/bought in wholesale or in retail and write as the case may be.
31. You may come across c.ertain estahlIshments wherein hoth types of trade. i. e., wholesale and retail go on. In such cases, you should ascertain in which categ.:>ry (i. e. wholesale or retail) the volume of trade j, greater and record the category accordingly.
32. In the case of establishments rendering comm~rcial services, e. g .. bank, etc., please do not write any of the two categories, i. e., 'whole5ale' or 'retail' but pul
an 'X' in thl5 column.
Col. 11 : If used as any other establishment, describe. e. g., government office, school, hospital, railway station, barbar's saloon, cinema, theatre, hotel, tea shop, etc.
33. Two specific types of establishments have been covered in columns 6 to 10. Column II relates to the remaining types of establishments not covered by columns 6 to 10. You have to describe such establish-
237
ment~ in'this column, e. g., government office, sChuol hospital, railway station, orphanage, rescue home: b,:rber's saloon, cinema, rheatn:, hotd, tea shop, lawyer's office, doctor's clinic, laundry. etc.
General
.H. It is possible that in a particular establishment, more than O!1~ activity is being undertaken within the ~ame premises. For example, say in a betel shop, bid rolling is also being undertaken or in a grocery shop a flour mill is also located, or in the doctor's clinic medicine~ are sold. In such cases, the establishment should he identified having regard to the major activity and recorded as such in the relevant columns pertaining to the major activity.
35. But if different activities are undertaken in different censu~ houses quite cut off from one another though under the same title or owner-;hip, each such cen~us house should be treated as a separate establishment and recorded as such against that census house in this schedule .. It may, however, be noted that where processing for the production of an article is carried on, in separate adjoining censuS houses, all the census houses should be treated as a singl€ establishment and recorded as such. I f on the other hand the activities af 3 large firm or an office are carried on in buildings located far away in different localities, each of the :'::.lSUS houses in the different localities will have to be treated as a separate establishment and the particulars Jf the e~tablishment relating to that particular cenSUS I}ouse should be listed in this schedule.

238
CONflDlCml"l.
lDatlon Cod,, ______________ -(
f. Name _________________ _
fl.. !\elatlor.>hip i 'f- 'I to held _________ . _____ L_..L_-l
J.SCl( 0 r-, I I L_J
4. "ge ________ _ ~.,.-,
S. Marital 5tatus _____________ L_J o. For currently married women only
(a) Age ., muriace ________ _ .--, (I.) Any child born In che last ona )'ea~ _____ t_J
r1. eJ (e) flac. of blnh ------------<i: r-, a: t t ¥ (It) RunllUrben _________ r - L_.J &:: t I
; Cet OlUrlCf. - ~ -J ~ • I I-{d) Seate/Country _ .L_ J tfa. ..,z (.) PlaOl of.1ase reSldeclcu _________ _ 1--, 9 I • ~ 'I.) l\ur.I/Urban ___ ~----j" --._-~
... I • I S (c) Oletrlcc ~ -~--' r I I
'i. (cf} State I Country _________ L _1_ J . r-,-, Q. Duratian of Residence at the Vlllag" I' I
or cown af Enumeration L _ .1 ::. J r-T-1 '0. Religion -=============::;-.L._...L_..J' . C r-,,--,
5, C. I t I , '1. or _L_.J_-J r---- --------,.--:."T-,
S. T". I I • I I.. ___________ , __ ..JL._.L._J
III. ~~t:b) 6 ' [J ts. Educatlona. r-T-'
level L_.l_.J 14. Mothu .- -,- - r--.
. I • I • Tongue '-_.1._.1 __ 1
16.. Other r-T-'--' I I I • l.n&uages ___________ L_~ __ L _ _'
) c
~:,:.;s.:~j.':!~ N.r'lo. to.
1('i. M_··,W ~.':-:'
, J
!') ,"cr:<eT (C. At.. \_/ r-'
(a) S'oa<!. H H I. OW ' , ____________ -===~ __ ~L~-==j ~gory -
ll) Nr.n·(H. ST. R. ~ Il..r ] Worker f.'I. B I, O.l ~
~ (I.) PIICIJ of work (3 . (Name of Village /Town) ________ _
"" . Z (c) Nama of Est~bllshrnet\t _________ _
i (.£) Nature of Industry. TrlIde. -G Pro{elllien af Service ------___ _ ..
Co) Descr'ptlbn of Work' _________ _
r-'--r-' 1 I • ;.._ ____________ L._J._~ _ _'
r-' Cf) Clasl of wOf~ __________ L.!
r,.,.,SECONDAfl.Y WORJS.
(., Broad_ <Co At, HH1. OW, r-1 category ____ ... _~
(I.) Place of work ~ (NiIIIIl of VIII.'e/Tawn) ________ ......
~ (e) Name of fst'bilshlll.nt _________ _
(d) Nlture of Industry. Treclo.
I =[. ~(f)')
Prof~or 0' SerY~,._ _______ .... _
------------r -r - T-" I I I I __________ L _1.._1- _,
DeKtlp\lon of Wark ________ _
r-.--r-. I I I • ---_________ '-_J.._ .... _ _'
r-. c ... of workef __________ ..j'. I _"
239
INSTRUCTlONS FOR FILLING UP THE INDIVIDUAL SLIP
The census schedule which is called the individual slip that you will be required to canvass is given on opposite page.
2. One slip will have to be filled for each Individual in each household that you visit in your jurisdiction. You should first enumerate the head of the household followed by the other members of the household in the most convenient order and ensure that none of the persons in the household is left out. Perhaps it is best that after enumerating the head of the household, you cover the near relatives first such as, the wife, sons and daughters, son's wife and son's children, daughter's husband and their children forming part of the household, then distant relatives, and domestic servants or other boarders or visitor'> forming part of the household and entitled to be enumerated here.
Please make repeated enqutrles about infants and very yOlln~ children for (hey are often liaMe to be left out of COUnl.
3. The various items to be canvassed on the individual slip are explained in the following instructions:
Pad No. and Slip No.
4. Make sure that the pad no. and the slip no. have been noted by you on the top right hand corner of each s:hedule against the item provided as already indicated earlier under the general instructions. The noting of pad no. and the slip no. is necessary for, you will be later required to tabulate in an abstract certain items of information of each schedule on a separate form where you will have to indicate the slip no. concerned against which you will be posting the data. The pad no. is the number already furnished on the top of the enumeration schedule pad and the slip no. is the serial number that you will be giving for each schedule in this pad. You are also advised to use the pads in a sequence starting with the lowest pad number.
5. In case your jurisdiction covers more than one village or more than one urban block please ensure that you do not make use of a common pad of schedules for all the villages or urban blocks in your charge. There should be separate pads for each village or urban block even if there were a few blank schedules left over in the pad of a particular village or urban block.
Location Code
6. Though this has already been referred t()
generally earlier, it is ~orth elaborating. The location code is the method by which every village or town in a tahsil(taluk( police station/anchal(island in every district of a state is identified by a combination of numbers. For this purpose, every district, tahsil, taluk, police station, anchal or island, village or town in your state would have been allotted code numbers. Your charge officer would have indicated to you the district, tahsil, taluk, police station, anchal or island and the village or town numbers as also the ward number of the town pertaining to your jurisdiction. By a combination of these numbers one can exactly locate your village or town. Thus, a code number running as 10(3/46 would mean village no. 46 in tahsil no. 3 of district no. 10 of a state, or a code number running as 6/1I(5 would mean ward no. 5 in to~n Ii o. II of district no. 6. Note that the town no. is given in roman figure to distinguish it from rural code no. At the end of the location code you should add within round brackets the enumeration block number that has been allotted to you by your Charge Officer thus 10/3/46 (60) or 6jfJj5 (4). You will be identified by enumerators' block number and this has to be entered in your daily posting statement. (The enumerators' block numbers will be a continuous number for the tahsil/talukftown, etc.).
7. Make sure that you know the correct location code of the area allotted to you. You should note down the location code on each blank individual slip immediately the enumeration pads are issued to you. This will save you the trouble of noting the location code no. later when you actually visit each household within your block for enumeration. When you visit the household you may have to then note only the household number as indicated in the next para by the side of the location code number whIch you would have already indicated.
Household No.
8. The identifying household number of the household that you are covering at the census should be noted within the square brackets provided for the purpose. As you may be aware, houselisting and housenumbering operation was undertaken during 1970 with a view to numbering each census house and locating all households living in census houses.
240
]n the course of this operation, each census house was given a number and households found therein would also have been allotted a number. The census house numbers would be painted on the houses at prominent place, like the pillar of the main gate, top of the main door, etc. Sometimes there may be more permanent housenumberihg plates affixed. In the case of thatched houses, numbers may have been written out on a tin plate or wooden board and left with the households with a request to preserve the same. You should use this number.
9. It may happen that when you visit vour area for census taking you may come across so~e Census houses which did not exit at the time of house listing and therefore. nQ numbers had actually been allotted to them. You should allot a number after consulting the order of numbering prevailing in you._. jurisdiction and locate the households living threin. For example, if in between buildings 9 and 10 another building has come up, you should allot the number 9/1 to this structure and in case more than one building has come up numbers like 9/1, 9/2, 9/3 and so on should be used for the new structures. Then locate the census houses in accordance with the instructions and thereafter locate the households and allot numbers in the prescribed manner. The household number will be the same as the house number if only one household is living in a house. If there were more than one houseflOld then alphabetical sub-numbers within brackets as 19 (a), 19 (b), etc., will have 10 be added to the house number 10 distinguish each household. It may also happen that the number given at the time of houselisting has been obliterated. You should allot the correct number having regard to the prec'eding and succeeding buildings.
10. If the household happens to be an institutional IlOusehold such as a boarding house, hostel, hotel, cflummery etc., where a group of unrelated persons stay together then add 'INST' to the household number.
11. If you are enumeruting you should record '0' boldly in the hou~ehold number.
the houseless persons the space pro1'ided for " .
12. Tn all the individual slips pertaining to the members of the same household, the household number will be repeated. YOll will then start recording- the _ particulars of each individual against questions indicated in the ,individual s ip according to the instructions that follow.
Please do not 'write anything iJr the spaces enclosed by dotted lines in question nos. 2, 3, 5, 6 (b), 7 (b), 7 (c), 7 (d), 8 (b), t\ (c), 8 (d), 9-15, 16 (a), 16 (d), 16 (e), 16 (f), 17 (a), 17 (d), 17 (e) and 17 (f). These are meant for writing code numbers in the tabulation
offices.
Question 1 : Name
13. Write the name of the person enumerated. If a woman's name is not given out, describe her as 'so and so's wife, mother or daughter'. By custom if a woman finds it difficult to give the name of her hm,band and if the man i, absent at the time of enumeration but his particulars have to be recorded write 'so and so's husband' if you have failed to ascertain the name even from the neighbours.
For newly born infants who have not yet been given the name write "baby" and add father's or mother's
name.
Question 2 : Relationship to head
14. In the case of the head of the household write ,--
'Head'. The head of the houswold for census purposes is a person who is recognised as such in the household. He is generally the person who bears the chief responsibility for the mainten(;lnce of the household and takes decisions 011 behalf of the household. The head of the household. need not necessarily be the eldest male member, put may even be a female or a younger member of either sex. You need not enter into any long argument about it but record the name of the I person who si recognised by the household as its head.
15. In the case of institutions like boarding houses, messes or friends living together in one census house, which should be regarded as households of unrelated persons living together, which may be called institutional households, the manager or superintendent or the person who has administrative responsibility or who by common cOrl.sent is regarded as the head should be recorded as the head of the household.
16. The manager or superintendent who does not stay normally in the institution should be enumerated at his place of normal residence: You should make sure before filling up the slip for the manager of superintendent, etc., of an institutional household, that he/she has not been enumerated at any other household.

17. In the case of absence of a normal 'head', the person on whom the responsibility of managing the affairs of the household falls, should be regarded as the head.
I S. All relationships in (hi" question should be recorded in rdation to the head of the household. Write the rdat;onship in full. Do not use words like 'nephew', 'niece' or 'uncle'. but ~tate
whether brother's or sister\, son or daugher (for nephew or niece) or father's or mother's brother (for Ullde), 'son' will Include 'adopted son' or '~tep son' ; similarly for a dau~hter. In the case of visitors, boarders, or employees. write 'visitor', 'boarder'. or 'employee' as the case may be. In the case of institutioll. the members should be recorded as 'unrelated' .
19. If on the check of revisional round between 1 and 3 April 1971 the head of thc household as recorded previou<;ly is found to have died, the person in the household who succeeds him by common consent as head should be recorded as head and the relationships in all other slips will have to be suitably corrected. The slip of the dece:l.sed head of the hous~hold will. of course, be cancelled.
Question 3 : Sex
20. For males write 'M' and for females write <F' within the circle indicated against this question. Even for eunuchs and hermaphrodites, write 'M' only. Verify with reference to the name and relationship to head against question 1 and 2 respectively that you have noted the sex correctly.
~uestion 4 : Age
21. Record the age of the person in total years completed last birthday. Very often there is a tendency on the part of the individuals to return 'years running' rather than the 'years completed'. Make sure that only the actual number of years completed is recorded.
22. Tn respect of infants who might not have completed one year by the day of enumeration their age in completed years should be invariably shown as '0' as they have not yet completed one year of age and add 'Infant' in brackets. As was stated under general instructions make sure that infants even if a day old are invariably enumerated. You should not enter the age in months. The age of an infant who has not yet completed one year should invariably be noted as '0' only.
[ 1 Census-311
241,
23. Age is one of the most important items of demographic data and you should ascertain the age with greatest care. Many persons particularly in
the rural areas can not give their age correctly .. They should be assisted to state the correct age by stimulating their memory with reference to any historical event. etc., well known in the area. Sometimes the age can be ascertained with reference to the age of another person of a known age that may be in the same household or in the neighbouring household or that of a well known person of the village such as headman of the village. A person can mOre easily say whether he was older or younger to such a person and by how many years. This will help you to record the age more accurately.
Question 5 : Marital status
24. In answering this question use the following abbreviations:
NM Never married
M Currently married
W Widowed
S Separated or Divorced
25. For a person who has never been married at any time before, write ·NM'. For a person currently married, whether for the first or another time and whose marriage is subsisting at the time of enumeration with the spouse living, write 'M'. Write 'M' also for persons who are recognised by ,custom or society as married and for the persons in stable de facto union. Even if a marriage is disputed in the locality write • M' if the person concerned says he or she is married or is in stable de facto union. For a widowed person whose husband or wife is dead, and who has not been married again, write 'W'. For a person who has been feparated from wife or husband and is
living apart with no apparent intention of living together again or who has been, divorced either by a decree of a law court or by an accepted social or religious custom but who has not remarried. write'S'. For a prostitute return her marital status as declared by her.
Question 6 : For currently married women only
26. This question has to be answered in respect of all currently married women only i.e., all women whose marital status is shown as 'M' against Q. 5. For all others a cross may be put through the two subparts of this qu.estion.

242
(a) : Age at marriage;
27. Age at marriage: You should ascertain the ao-e at which the currently married woman whom y~u ~re enumerating was married and record that age in completed years. If the currently married woman had been married more than once, the age :at which she got married for the first time should
be ~ecorded.
6. {b). Any child born in the last one Yllar
28. Any child born in the last one year: You should ascertain if the currently married wo.man whom y~u are enumerating gave birth to a child in the last one year prior to the date of enumeration. Since it may be difficult for a person to reckon tlre exact year with reference to the English calendar dates, the period of one year may be asce.tained with reference to a well-known festival day which falls close to March-April, as determined by the Census Superintendent of the State. You should ask if a child was born on or after' this festival day last year to the date of enumeration. Only if the child was born alive, even if the child had died soon after birth, should the answer ee 'Yes' to this question. Still birth, i.~. a child which is born .dead should not be taken into account. for this purpose. So whil~ you should make sure that every case of birth of child born alive, even.if it is not alive on the date of enumeration, is reported, you should not reckon it if the child was born lifeless.
29. It is common experience that the birth at the child may not be reported readily if the chil,d is \lot actually .surviving at the time of enumenition. Infant deaths are still high in the country. ,There is a chance of a number of such cases being missed unless specifically questioned about them. It is necessary to .record all live births even if the cliild had died soon thereafter or had not survived to the day of enumeration. TherefQre where the initial answer to this question is 'no', you should a.sk a specific question if there has been a case of child having been born alive in the last one year and later dying before the enumeration date. This is a .delicate question and should be asked' with tact in a manner not to offend the sensibility of {he responden~. Where a currently married woman_ first answers that she had.no child born in the last one year, you may perhaps question her as foHows:
"It has been found in some houses that a child was born and had died soon after or a few days or months later and such cases had not been reported. It is my hope that there are no such cases here. Am I right?"
This may bring in the required response. If she reports 'no' then you, can be sure that no :birth has been missed. You have to make sure that any live birth that has occurred to the currently married woman in the last one year is netted whether the child is surviving till the date of enumeration or not. Similarly, probe to eliminate still births may be necessary. For example, when the answer is 'yes' under question 6(b) the enumerator might ask if the child is here in this house. Tf the answer is 'yes', no further question is needed. If 'no', the enumerator might ask where he has gone. The answer may bc 'dead' or he has gone elsewhere. If 'dead' then the enumerator might ask when did the child die and this will bring out the fact whether or not it was a still birth.
30. Write 'yes', if the currently married woman had given birth to a live child from the prescribed festival day last year to the date of enumeration or 'no' if she had not. In case of twin or multiple births write 2, 3, etc., _as the case ~ay be, within round brackets after the entry 'Yes'.
Note-You may find on your revisional round from I to 3 April 1971 that a child is born to a married woman in a 'household after your last visit but before the sunrise of 1 April 1971. You wil1 have to tat.e this into account and correct the answer again§t the Q. 6 (b) accordingly. You must enquire speci~caliy
if any such birth has taken place. While ignoring stili births all other· births' where the' child was born alive even if it did not survive lo~g should be taken into account.
Question 7 : Birth place
31. Answer to this question has to be filled with reference to the place of "birth of the persons enumerated and the particulars recorded under the four sUQ-items of this question.
7(a) : Place of birth
[1" 32. Write 'PL' for a person born in the village or~ town where he is being enumerated. Where 'PL' i~ ~noted against this . question put 'X' against subitems (b), (c) and (d).
Por those born outside the village or town of enumeration write the actual name of the place against sub-iune (a) and fill the other details against sub-items (b), (c) and (d).
7(b) : Rural/Urban
33. For those born outside the village or town of enumeration a5certain if the place of birth was a village or town at the time of his birth. To enable a person to determine whether the place was a town or a village he may be required to indicatL the status of the place of birth in comparison with a known town in the neighbourhood of the place of enumeration. You may mention some important urbancharacteristics to enable t he person to make out if the place of his birth was rural or urban, e.g., existence of a local administrative body, industrial townships declared as towns, etc.
For a person born in a village, write 'R'
For a person born in a town/city, write 'C'
For a person born in a foreign country put 'X against this sub-item and also against sub-item (c). I f all efforts to classify the place of birth as rural}urban fail, write 'not known'.
7(c) : District
34. For a person born outside the town of enumeration but within the
village or district of
enumeration write 'D' For a person born in another district of the state of enumeration, or other state/ union territory in the country, write the name or the district. If the person can not name the district, write 'not known'.
7(d) : State/Country
35. For persons born within the state of enumeration write 'X' against this item. Make sure that the earlier entries made in sub-items (a), (b) and (c)
are cO{lsistent with such an answer; that is 'PL' might have already been written against sub-item a) or 'D' is written against sub-item (c) or any other (district of the state of enumeration is mentioned against sub-item (c).
36. For persons born outside the state of enumeration but within the country, write the name of the state/union territory where born.
37. For those born outside India, note merely the name of the country and there is no need to enter the name or' the constituent state of the foreign country. Where a person can not name the country, tbe name of the continent may be noted.
243
38. For a person born on sea, record 'born at sea' against this ,'>ub-item and put 'X' against subitems (a), (b) and (c). If a person was born in a ~rain, boat or bus, etc., WIthin the country, write he particulars in (1I) ,(b) and (c) with reference to
'he administrative territory where the event occurred or was registered.
Question 8 : Last residence
39. Answer to this question will have to be filled in respect of every person if he had another place of normal residence irrespective of his place of birth, before he came to the present place where he is enumerated. Even if a person were born at the place of enumeration by the nature of his work or for studies, etc.. he had shifted subsequently to another village or town and had come back again to the place of enumeration, he should be deemed to have had another place of residence prior to his enumeration here.
The last previous residence is relevant only if he had been outside the village or town of enumeration and not simply in another house or locality in the same place. For example, if a person born in one part of Bombay city is found residing in another part of Bombay at the time of enumeraton, the change of residence should not be treated as change of place of residence because both the areas are comprised in the l>ame city of Bombay. Similarly, a person born in hamlet 1 of village Rampur and found in hamlet 2 of the same village at the time of enumeration, should not be deemed to have had any other place of residence than the village where he is enumerated. Where a person had merely gone out to another place or had been shifting from place to place purely oX) tour or pilgrimage or for temporary business purposes, he should not be deemed to have had another residence different from the place where he or his family normally resides but if the person had his normal residence, i. e., if his normal home had been ebewhere at any time before he is enumerated at his place of present residence, irrespective of where he was born, such place of his previous residence should be recorded here.
8 (a) : Place of last residence
40. For a person who had been in the village or town of enumeration continuously since birth (except (or shifting to other places outside the village or town of enumeration for a purely temporary stay) write 'PL' against sub-item (a) and put 'X' against sub-items (b), (c) and (d).
Fqr a person who h~d had his last p.revious re~idence at any place outside the .village or town of ynumeration (irrespective of his place of birth), write th~ actual name of the village or town where his last r}:)sidence was against sub-item (a) and fill the other Qetail~ against sub-items (b), (c) and Cd).
8 (b) : Rural/Urban
41. For a person who had previously resided o,utside the place of enumeration ascertain if the place of. last- previous residence was rural or urban and record the answer. For a person whose last pre-. vious residence was a village write 'R'. For a person 'Yhose last previous residence was a town/city, write 'U'. For a person who last resided in a foreign country write 'X'. For a person whose last previous residence can not be classified, write 'Not known'.
Rural or Urban status has to be determined with reference to the time of migration from the place of last previous residence to the place of enumeration.
For helpin~ the person to determine whether a pface was rural or urban, you may mention impor'" taht urban characteristics as indicated in the instructions against item 7 (b) in Para. 33.
8 (c): District
42 .. For a person who / had previously resided in another place, i. e., for whom 'PL' is not written, against sub-item (a) you have to fill in this item in the manner indicated below :
For a person who previously resided in another village or town within the district of enumeration write 'D'. For a person who previously resided -in another district of the state/union territory df enumeration or of other state! union territory in the country, write'the name of the district. If he can not name the district write 'Not known'. For a person whose last previous residence was outside India write 'X' against this sub-item.
8 '(!l) :. State/Country
43. For a person whose last previous residence was outside the village or town of enumeration but within the state or union territory of enumeration write 'X' against this item but if it was outside the state or union territory of enumeration but within the country write the name of the state/union. territory. For a person whose last previous resi~ence was out ... side the country write the name of". the country and if name of the country is not. forthcoming ·write .the, name of the continent.
244
For persons who had not moved out at all from the present place of enumeration from birth (except for purely temporary stay) this sub-item need not be filled and ·X' should be put in respect of persons against this sub-item.
Question 9: Duration of resjdence at the village or town of enumeration.
44. Note here the period of the existing continuous residence in the village or town where the person is being enumerated, in completed years. This will apply to even a 'person born at the place of enumeration. If he had left this village or town and had lived elsewhere for sometime, i. e., in Q. 8 another' place of last residence is reported and has come back again to this village or town, then the duration of residence to be noted against this questi'on is the period of the last continuous residence. But if a person
- had been away on a temporary visit or' tour, etc., that should not be taken as a break in the period of his continuous residence here. If the person was born at the place of enumeratiol;! and also had no other place of last residence, i. e., 'PL' has been noted in Q. 8 (a) then 'X' may be put against Q. 9.
For a person whose duration of continuous residence at the place of enumeration is less than 1 year it should be noted as '0'.
Question 10 : Religion
45. In answering this question use the following abbreviations :
H : Hinduism I : Islam C : Christianity S : Sikhism B : Budhism J : Jainism
For others record the actual religion as returned fully.
46. If a person says that he has no religio.n it, may be recorded accordingly. Do not mistake religion for caste which will not be recorded here.
Q.uestion 11 : Scheduled Caste or Scheduled Tribe
41. Yo have been furnished with alist of scheduled castes and scheduled tribes notified for your state. ~scertain if the person enumerated belongs to a scheduled caste or scheduled tribe and if he does, then record the name of the scheduled caste or scheduled tribe which should ~nd place in the list furnished t~
you. The answer should be recorded against the correct rectangle provided for the purpose against this question. For a person who is not a member Of any scheduled caste or scheduled tribe write 'X' in both t he rectangles.
48. If the person belonging to a scheduled caste or scheduled tribe returns his caste or tribe by synonym or generic name of a caste or a tribe it should be entered only if it finds a place in the list furnished to you. Do not write the names of scheduled castes in general terms as 'Harijan' or 'Achhut'. You should ascertain the name of the caste when it is returned and write it in the rectanglt: provided for recording the name. Similarly, do not write the names of scheduled tribes in general term as 'Adivasi. You should ascertain the name of the tribe when it is returned and write it in the rectangle with broken lines provided for recording the same. If a person is negligent and insists on calling himself merely 'Harijan' or 'Achhut' or 'Adivasi' as the case may be, tell him that this description is not adequate for census purposes and persuade him to give out the actual name of the caste or tribe. You should make all efforts to ascertain the correct name of the scheduled caste or scheduled tribe as found in the notified list. If the person merely claims to be a scheduled caste or scheduled tribe but says that he does not belong to to any of the notified communities applicable to the area, he will not be entered as a schedult:d caste or scheduled tribe.
49. Scheduled castes can belong only to the Hindu or Sikh religions. If a person belongs to scheduled caste, there will be either cH' or'S' in the answer to question 10. Scheduled tribes may belong to any religion.
Question 12 : Literacy (L or 0)
50. Definition of a literate:A person who can both read and write with understanding in any language is to be taken as literate. A person who can merely ead but can not write is not a literate.
51. It is not necessary that a person who is literate should have received any formal education or should
have passed any minimum educational standard.
52. For a person who is literate, i. e., who can both read and write, record 'L' in the triangle against question 12. If there is any doubt about a person's ability to read or write, the test that may be applied for reading is his/her ability to read anY
245
portion of the printed matter in the Enumerator's instructions and similarly for writing he/she should be able to write a simple letter. Ability merely to sign one's name is not adequate to qualify a person as being able to write with understanding. If a perso n claims to be literate in some other language with_ which the enumerator is not acquainted, the respondent's word has to be taken as correct. Other members of the hou~ehold may also be able to testify to the literacy of the person enumerated.
53. For a person who is illiterate, i. e., who can neither read nor write or can merely read but can no write, in any language, write '0' in the triangle against question 12. All children of the age of 4 years or less should be treated as illiterate even if th child is going to a school and may have pIcked u reading and writing a few odd words.
Question 13 : Educational level
54. This question will be asked of those for whom 'L' has been recorded. against question 12. For a person who is illiterate and '0' has been put against him in the answer to question 12, there is no advantagd in ascertaining the educational level even if he had at some stage attended school and passed a standard and had relapsed into illiteracy. In such a case you should put 'X'. You have to ascertain and record the.highest educational level attained by a person for whom '1.' is recorded in answer to question 12.
55. For a person who is still studying in a particula class, the highest educational level attained by him will be one that he has actually passed and not the one in which he is studying. For example, a person studying in 1st year B. A. should be recorded as only 'PUC' or 'Higher Secondary', as the case may be. Similarly, a person studying, say, in the 4th yeat
of 'MBBS' should not be noted as 'MBBS but as 3rd year 'MBBS' which is the highest level he has actually attained. If you are not sure whether 8. person has passed primary, middle, higher secon_ dary or other definite levels, you may record the actual standard passed such as say IlIrd standard, VIIIth standard, 1st year B. Com., etc.
The highest educational level attained by the' person enumerated should be recorded, When a person holds both general and technical qualification both of which are of equivalent level such as say B. Sc. (Zoology) and M. B. B. S. or B. A. (Maths.) and B. E. (Bachelor in Engineering), the technical qualification should be given preference in recording
246
~he. highest educational level attained. Where the general educational level is higher than the technical ~ducational level or where it is not possible to decide Which of the two levels is relatively higher, the highest le~el of education as returned by the person concerned s.l;l9uld be recorded.
In recording the highest educational level of a graduate or a post-graduate, subject of specialisation such as, B. Sc. (Maths.), M. A. (Economics), M. Sc (Botany), B. Sc. (Agriculture), etc., should be noted: you should not use abbreviations which are not in common use. In such cases, the degree or- diploma should' be spelt out fully.
56. Whenever you come across graduates or post-graduates as also those with a technical diploma or degree, you will have to issue him a "Degree-holder and Technical Personnel Card" and ask the person concerned to fill it. You should note the location
code on the card while issuing it. Put a tick.J' after noting the educational level against question 13 1mmediatelY after you issue a card. When you collect '~t after some time but before you complete the e,numeration of your area, cross the tick and put a circle as @.
You will have to ensure that the card issued to all the graduates and the technical degree or diploma li\5fders ·ar.e collected back. The non-crossed tit:k if ahy, against question 13 will show that the card has not been. collected.
Question 14: Mother-tongue
57. Definition-Mother-tongue IS the language spoken in childhood by the person's mother to .the p~rson. If the mother died in infancy, the language qlainly spoken in the person's home in childhood will be the mother-tongue. In the case of infants and deaf mutes. the language usually spoken by the mother shall be recorded.
58. Record mother-tongue in full whatever btf the na~e of the language as returned and avoid use &f abbreviations. You are not expected to determine if the language returned by a person is the dialect of ¬her major language and so <:m. You should not tf:), to esmbli~h any relationship between religion and ~other-tongue. You are bound to record theIqnguage as returned by· the person as his m"Other-tongue ' l{11d you should not ent~r into a1JY argument with him and' try ,to record. anything 7Jther than' what is, re~uTned. l! you have reason ,to su!?peqt that, in any ~rea -dt11: to ,
any organised movement, mother-tongue was not being truthfully returned, you should record the mother-tongue as actually returned by the respondent and make' a report to your superior census officers for verification. You are not authorised to make any correction on your own.
Question 15 : Other languages
59. After recording the mother-tongue in question 14 enquire whether the person knows ·any other language (s), indian or foreign and record language, (5)
returned by him against this question. In case tie does not know any' 'lanuage apart from his mother-tongue put 'X' against this question.
60. The number of languages recorded under tbis question need not be more than two. These languages should be other than his mother-tongue and they should be recorded in the order in which he speaks and understands best and can use with understanding in communicating with others. He need not necessarily be able to read and write these languages. It is enough if he has a working knowpdge of these subsidiary languagcs to enable him to converse in that language with understanding.
Question 16: Main activity
61. Every person will be asked what his main activity is, that is, how he engages himself mostly. For the purpose of this question, all persons will get themselves divided into two broad streams Of main activity, namely, (1) as workers and (2) as nonworkers according as the type of main activity that -the person returns himself as engaged in mostly.
62. 'Worker' defined-A 'worker' is a person whose main activity is participation in any economically productive work by his physical or menta). activity. Work involves not only actual work bu~' effective supervision and direction of work.
63; Reference periods-The reference period is one week prior to the date of enumeration. in the c~se of :t;egular work in trade" profession, service or b~siness. If a person had participated in any such reg4lar work on ,anyone of the days ouring thi§ reference period and this has been returned as his main activity, .the person' will be categorised .accordingly. A person who normally works but had been absent frbm work during this reference period on account of illness or travel" holiday, temp.orary breakdown, ~trike; 'etc., the person should be' treated-
as engaged 1Il regular work in which he would have otherwise been employed but for his termporary ab3ence. Persons under training such as apprentices with or without stipends or wages should be considered a., e;;onomically active a'ld recorded as working. A person who has merely been offered work but has not actually joined it. is not to be treated as engaged in work.
64. There are certam types of works which are not carried 0;1. throllghout the year such as cultivation, live-stock keeping, plantation work, some types of household industry. etc. A person's main activity should be ascertained with reference to such work in the last one year even if he Was not economically active in the week prior to enumeration. 1t is likely that even when a person is engaged in some other
work during the p~riod of one wee:, prior to the date of enumeratIOn, the main activity of the person may be cultivation, agricultural labour or some other work attended to normally by him in the course of the year. Care must be taken to see that the main activity is properly ascertained in such cases. For example, a person's main al.:tivity may be agricultural labour and in the week pnor to enumeration he may be engaged as a sugar-cane factory labourer or as a road cooly. He should be categorised for his main activity as agncultura labourer only as returned by him as he engages himself mostly in that work and the other work should be treated as his subsidiary work.
65. A man or woman who is engaged primarily in household duties such as cooking for own household or performing one's own household duties or a boy or a girl who is p~imarily a student attending institution, even jf such a person helps in the family economic activity but not as a full time worker should not be treated as a worker for the main activity. On the other hand, if a person is primarily engaged in some economic activity but at the same time does also attend to some household chores or attends a night school, etc., he or she should be treated basi_ cally as a worker for the main activity and categorised accordingly.
66. A person who merely receives an income such as a rent receiver or a pensioner who does not have to work for receiving the income, will not be trated as economically active unless the person is also engaged in some economic activity and if that activity is returned as the main activity of the individua1.
247
Question 16. (a) : Broad category (1) Worker (C, AL, HHl, OW) (ii) Non-Worker (R, ST, R, D, B, I, 0).
67. The main activity returned by the persop will entitle him to be categorised either as a worker in 16 (a) (i) or as a non-worker under 16 (a) (ii).
.16 (a) (i) : Worker (C, AL, URI, OW)
6~. Where the main activity of a person qualifies him to be treated as a worker he should be further categorised according to the type of work and one of the appropriate abbreviation~
indicated against this question should be entered in the box provided for the purpose. If the person is not engaged in any economic activity an 'X' should be noted in the hox. The abbreviations to be used for workers are explained below.
C : Cultivator 69. For a person who returns his main activity
as working as a cultivator, the abbreviation 'C' shoul d be used.
70. Definition of cultivator . For purposes of the census a person is working as cultivator jf he or she is engaged in cultivation by oneself or by supervIsion or direction in one's capacity as the owner or lessee of land held form government or as a tenant of land held from private persons or institutions for payment of money, kind or share. ,
71. Cultivation involves ploughing, sowing and harvesting and production of cereals and millet crops such as wheat, paddy, jowar, bajra, ragi, etc., and pulses, raw jute and kindred fibre crop, cotton, etc., and other crops such as sugar-cane, groundnuts tapioca, etc., and does not include fruit growing, vegetable growing or keeping orchards or groves ot working of plantations like tea, coffee, rubber, cinchona and other medicinal plantations.
72. A person who merely owns land but has given out land to another person or persons for cultivation for money, kind or share of crop and who does not even supervise or direct cultivation of land, will not be treated as working as cultivator. Similarly, a person working in another person's land for wag~s
in cash, kind or share (Agricultural labourer) will not be treated as cultivator in this question.
AL : Agricultural labourer
73. A person who returns his main activity as engaged as, agricultural labourer, the abbreviation 'AL' should be used in the bm.
74. Definition of an agricultural labourer :A person whD works in another person's land for wages in money, kind or share should be regarded as an agricultural labourer. He has no riskin the cultivation but he merely works in another person's land for wages. The labourer could have no right of lease or contract on land on which he works.
HHI : Household industry
75. For a person. who returns his main activity as engaged in some production, processing, servicing or repair of articles of goods such a~, say, handloom weaving, dyeing. carpentry, bidi rolloing pottery manufacturet, bi-cycle repairing, blacksmithy, ~ailoring, etc., it has to be ascertained if it is a household industry, and if so, it should be indicated by the abbreviation 'HHI' in the box.
76. Definition of a hous~hold ittdustry:- A -l;ousehold industry is defined as an industry conducted by the head of the household himself! herself and! or mainly by the members of the household at home or within the village in rural areas and only within the' premises of the house where the household lives in urban areas. The industry should not be run on the scale of a registered factory.
77. The main criterion of a household industry is the participation of one or more members of a household. This criterion should apply to urban areas too. Even if the industry is not actually located at home in rural areas there is greater possibility of the members of the household participating even if it is located anywhere within the village limits. In the urban areas where organised industry takes greater prominence, the househol~ ndustry should be confined to the precincts of the house where the participants live. In urban areas even if the members of the household by themselves run an industry but at a place away from the precincts of their home, it will not be considered a household industry. It should be located within the precincts of the house where the members live.
78. A household industry should relate to prpduction, processing, servlcmg, repairing or making and selling (but not merely selling) of goods_ It does not include professions such as a pleaqer- -or doctor or barber, musIcian dancer, waterman, dhobi, astrologer.. etc., or merely trade or business, even if such professions, trade or services are run at home by members 'Of housebold.
,248
79. Sometimes it is likely that the person who may not be working in his own household industry may be working as petty employee in another household industry. You should, therefore, enquire whether the person who is not working in his own household industry is working in any other household industry as an employee and record as per
'.
instructions given above.
OW: Other workers
80. If a person gives his main activity as engaged in any other work which is not cultivation, agricultural labour or household industry, this may be indicated by merely noting'OW' in the box. The type of workers that may come und~r the 'Other Workers' category are factory workers, those work"ing in trade or transport, all government servants, municipal employees, teachers, mining workers, political or social workers, building labourers, etc., etc. In effect all types of economic activity not covered by cultivation, agricultural labour or household industry will come under this residual category. Workers engaged in plantation or forestry should not be treated as cultivators or agricultural labourers but as 'other workers'.
81. Further details pertaining to this 'Other' category of workers, as also those engaged in household industry, will be recof(~led in the subsequent sub-parts (b) to (f) of question 16.
16 (a) (ii) : Non-Worker (H, ST, R, D, B, I, 0)
82. As was stated earlier, question 16 is intended to ascertain the main activity of every individual whether he or she is economically active or not. While 16 (a) (i) helps to broadly categ9rise all those who- have returned some work as the main activity, 16 (a) will help to categorise those whose main activity is not engaged in any economically productive work, but are basically non-workers. These may be categorised under seven broad heads whose abbreviations are indicated against this question. The appropriate abbreviation will have to be entered in the box provided. The abbreviations are explained below:-
H: Household duties
83. This covers all those persons basically engaged in unpaid home duties doing no other work, \)r even if such a person may also be participating in some other work, it is not to the same extent as a whole-time worker and if the person has returned his
249
or her main actIvIty as a1tending to household duties. The main activity of such a person should be entered as 'H'. If a pcrson whose main activity is attending to household duties. also engages oneself in some other economic activity such as helping i~ family cultivation or preparing cowdung cakes at odd times for sale, etc., that economic activity will be covered as secondary work under question 17. On the other hand, a woman who works primarily as a factory worker or a plantation labourer or an agricultural labourer or in some office or shop, etc., and also attends to household duties, obviously her main activity will be the economic activity in which she is mostly engaged in and should not be categorised as 'H' for her main activity in this question. She should have been treated basically as a worker and her main economic activity should have been recorded against 16 (a) (i).
ST: Student
84. This refers to those whose main activity is returned as a student. This will cover all full-time students or children attending school. Even if such persons participated in some work but not to thc ~ame extent as a full-time worker, by merely helping casually as an unpaid family worker in family cultivatIon, household industry, trade or business, they should be treated primarily as students, if that is their maIn activity. 'ST' should be entered in the box. The other economic activity, if any, that such persons attend to will be reflected under question 17 as secondary work.
R: Retired person or a rentier
85. A person who has retired from service and is doing no other work, i.e., not employed again in some full-time work or does not engage himself in soml! other work as cultivation, in business, trade, etc., or a person who is a rentier or living on agricultural or non-agricultural royalty, rent or dividend, or any other person of indipendent means for securing which he does not have to work, wIll come under this category. 'R' should be noted in the ·box for a person coming under thIS category.
() : Depmd(,flt
86. This ~ategory will include all dependents such as infants or children not attending school or a person permanently disabled from work because of .illness or old age. If a girl or an old woman attends to household duties she should be categoriSed under 'H' for her main activity, rather than 'D'.
(Census- 32)
Dependents will include all non-workers even if ablebodied who have no other activity coming unde~ any of the categories of non-workers and who are not seeking any work either but are Pllrely dependent.
B: Beggars, etc. 87. This will cover beggars, vagrants or such
cases as independent women wihout indication of source of income and those of unspecified sour~s of subsistence and who are not engaged in any econo-mically productive work.
I: Institutions 88. This will cover convicts In jaIls or inmates
of a penal, mental, or charitable institution, even if such persons are compelled to do some work such as carpentry, carpet weaving, vegetable growing, et<1 in such institutions. An under-trial prisoner in a jail should not, however, be brought under thiS category but has to be 1l1dicated according to the main activity he was engaged in before he was apprehended. Inmates of such institutions will be noted as'!,.
a : Other non-workers
89. This will include all non-workers who may not come under any of the six categories above but are seeking work, they should be noted as '0' in the box. A boyar girl who has completed education or has stopped studying and is seeking work, will come under this category. If a person is merely spending his time at home as a dependent and is not doing any work and is not seeking any work will come under '0' rather th~n 'V. A person irrespective of age and whether educated or not. if he reports that he is not engaged in any other activity but is seekmg work will come under this category.
90. If the main activity of the person who is enumerated does not qualify a person to be treated as a worker and he does not fall under any of the four broad categories of workers covered by 16 (a) (i) and an 'X' has been put in the box against the question, then he must necessarily be categorised under anyone of the seven broad types of nonworkers and the appropriate abbreviation entered in the box opposite to question 16 (a) (ii). Conversely if a person has already been treated as a worker and his main activity has been indicated in the box against question 16 (a) (0, then question 16 (a) (U) will not apply to the person' and an 'X'shoula oe put in the box a:gainst question 16 (a) (ii). Thus 16 (a) (i) and 16 (ay (ii) are mutually exclusive.
Questions 16 (b) to 16 (f)
91. These sub-parts of question 16 will have to be filled only to describe the details of the household industry or other work indicated against question 16 (a) (i). If the main activity has been shown as 'C' or 'AL' against 16 (a) (i) there is no need to give the details of the cultivation or agricultural labour in these sub-sections.
92. Similarly, if the main activity of an individual has been returned ns a non-worker against 16 (a) (ii) sub-section (b) to (f) will not apply and a cross may be put right across all these questions.
Q. 16 (b) : Place of work (Name of village/town)
93. Ascertain from each person who is already taken as a worker other than in cultivation or ·agricultural labour. i.e., question 16 (a) (i) has been answered as HHI or OW, the village or' town where pe or she works. If the place or work is the same as the village or town of enumeration write 'PL'· In all other cases you should write the name of the place fully. If-a person has no fixed place of work such as, say, a travelling vendor of vegetables or a pedlar or a rickshaw puller who may go from one :village or town to another, note 'No fixed place of _work'. If he works in one particular town or village that should be noted.
Q. 16 (c) : Name of establishment
94. This question and the subsequent subsections of question 16 need not be answered for cultivators and agricultural labourers who are already noted as 'C' or 'AL' against question (J 6) '{a) (i).
Record here the exact name of the factory, firm, workshop, business house, company, shop, office, etc., and in respect of public offices you should clearly indicate whether they are Central or State Government or local body offices, etc. If the establishment does not have any definite name such as, say, in the case of a household industry like hand pounding of rice, gur making, bee keeping, handloom weaving, potter's house, blacksQ1ithy, etc., note 'No particular name'.
Q. 16 (d) : Nature of ind,ustry, trade, profession or service
95. The answer to this question will have to be adequately precise to enable proper classification of the -sector of economy in which the person is working. The sector of ec<,>nmpy in which a person
250
works may relate to (i) pll1ntation, forestry, fishing, live-stock, etc., (ii) mining and/or quarrying, (iii) manufacturing, (iv) construction, (v) electricity, gas or water supply, (vi) transport and communications, (vii) trade and commerce, (viii) professions and services. Full details of the type of industry, trade, profession or s(:rvice in which the perso_p is engaged will have to be recorded here.
Q. 16 (e) : Description of work
96. This question has to be filled up for aU persons for whom the main activity is shown as 'HHI' or 'OW' in question 16 (a) (i) and for whom you should have also to answer the other sub-sections of question 16. Under this question, the description of the actual work that the person enumerated is doing is to be recorded irrespective of which type of industry, trade, profession or service he my be working and which is already recorded under question 16 (d). His actual work should also be given in sufficient detail. If for example a person is merely recorded as say, clerk with no other details, it will be impossible to properly categorise him as to the type of work he does. He may be a clerk attending to correspondence or book-keeping or accounting. Similarly if a person were merely to be recorded as a mechanic, it will not help to determine what type of mechanic--electrical mechanic, or a motor mechanic or a locomotive mechanic, etc., he is. The description of the actual work done by a person should be ascertained in adequate detai and recorded against this question.
97. It has been found in the past that substantial number of persons are recorded merely as general labourers. It is nece~sary to make a probe and find out in whic.h type of work he is mostly engaged as a labourer such as, say, a road coolie, a loader or unloader at a market, a construction labourer, etc.
98. For those in military service it is enough if it is merely noted as 'in the service of the central government'. Other details need not be given.
General
99. There need be no confusion as to the scope of 16 Cd) and 16 (e). 16 (d) would represent the nature
_of industry, trade, profession or service, i. e., the field of economic activity in which a person is engaged in work and 16 (e) represents the occupation or th( actual work that the person does in the industry, trade, profession or service in which he is engaged.
Thus, for example the answer to question 16 (d) may be say cotton textile manufacture and the answer to question 16 (e) may be chemical engineer in that industry or a clerk or an accountant in that industry or a labourer in that industry or a tru\.:k driver or the managing director of that industry and so on. Similarly in question 16 (d) the nature of service may be some department of the state government service and III question 16 (e) the description of work may be a clerk or an accountant, a director of the department, jeep driver in the department, etc., etc. Again say, against question 16 (d) the answer may be private medical practice and in 16 (e) may cover orthopaedic surgeon, or nurSe or a sweeper, etc., working in that private medical practitioner'S nursing home.
Q. 16 (f) : Class of worker
] 00. For a person who IS;
(i) an employeer, that is, who hires one persons in his work described in 16 (e), write
or more question
ER
(ii) an employee, that is, who does his work described in question 16 (e) under others
for wages or salary III cash or kind,
write EE
(iii) a single worker, that is, who is doing his work described in question 16 (e) without employing others except casually, and without the help of other memb:rs of the family except casually and a participant in work as members of co-operatives, write SW
(iv) a family worker, work described in enterprise along the family without or kind, write
that is, who is doing his question 16 (e) in a family
with other members of wages or salary in cash
FW
For a person for whom an 'X' is put in questions ]6 (d) and 16 (e) put an 'X'in this question also.
Explanation :
lOl. An employer is a person who has to employ other persons in order to perform the work entltred in question 16 (e). That is to say, such a person is not only responsible for his own personal work but
251
also for giving work to others in business mentioned in question 16 (e). But a person who employs domestic servants for household duties or has subordinates under him in an office where he is employed by others, is not an employer, even if he has the power to employ another person in his office on behalf of his own employer or employers.
102. An employee is a person who usually works under some other person for salary or wages in cash or kind. There may be persons who are employed as managers, superintendents, agents, etc., and in that capacity employ or control other workers on behalf of their own employers. Such persons are only employees, as explained above, and should not be regarded as employers.
103. A single worker for the purpose of question 16 (j) is a person who works by himself. He is not employed by anyone else and in his turn does not employ anybody else, not even members of his household except casually. This definition of a single worker will include a person who works in joint partnership with one or several persons hiring no employees, and also a member of a producer's co-operative. Each one of the partners or members of such producer's co-operatives should be recorded as 'single worker'.
104. A family worker is a member who works without receiving wages in cash or kind, in an industry. business, trade or service. For example, the working members in a family of Dhobis where they all participate and each does not receive wages separately will be family workers. There may be family workers in mdustry, trade or professions as well. For the purpose of this definition members of a family may be drawn from beyond the limits of the household by ties of blood or marriage. may not be entitled to a share work of the business carried on or head of the household or
The family worker of the profits in the either by the person
other relative.
105. Members of the household who help solely in household duties should not be treated as family workers.
106. In the case of persons engaged in househ9ld industry, i. e., in the case of persons for whom the answer to question 16 (a) (i) is 'HHI', there will be three classes of workers, viz., family worker, single worker and employee. There will be no employer. Household industry by its very definition is conducted
by the head of the household himself or/and other members of the household, the role of hired workers being secondary. If the head along with the members of the household is working in a household industry employing hired workers, the head and other members who are working should be treated as 'family workers'. If the head alone is working with the assistance of hired worker (s) whose role would be secondary as indicated above, he would be treated as a 'single worker'.
Question 17 : Secondary work
107. This question should be asked of every person whether he has returned some work as his main activity against 16 (a) (i) or had returned himself under any of the basically non-working categories against question 16 (a)·(ii). As was noted earlier, 16 (a) (ii) will cover cases like persons performing household duties or students who may not be engaged in any other economically productive work at all, as also those who, though basically are performing household duties or students, etc., -for the purpose of their main activity, still participated in some other economic activity such as helping the household in several items of work, as in cultivation or in household industry or in looking after the cattle, in attending to family business, etc., but not to the extent as a full-time worker. Such participation will be considered as secondary work of these -persons.
108. Ask of each person if, besides what he had already returned as his/her main activity against question 16 (a) (i) or 16 (a) (ii), he/she participated in any secondary work. A number of unpaid family workers participating in the household enterprises, who might have returned themselves mainly as 'H' or 'ST' or 'R' under question 16 (a) (ii) for their main activity will be netted here for their economic activity which is subsidiary. Mere rendering of service for one's own home or production of goods for purely domestic consumption are not to be treated as economic activity. For example, a servant who works as a cook in his or her employer's borne for wages will be considered economicall:t
252
active but, a housewife, even if she may work much more than a paid servant, in having to cook for the family or looking after the household will not be treated' as economically active for the purpose of this classification. Similarly, women who may produce cloth on a loin loom at home for domestic consumption will not be treated as economically active unless the products are sold and the household derives an income. Participation in work' that goes to augment the income of the household will only be treated as economic activity. A boy whose main activity is shown as a student under 16 (a) (ii), can have the secondary -work of say, cultivation if he helped the head of the household in the family cultivation during some parts of the season. But if a girl student, whose main activity is shown as 'ST' under 16(a) (ii), also helped in weaving cloth purely for domestic consumption on a loin loom at home or helped in attending to household chores. she will not be treated as having any secondary work. Secondary work will be reckoned only if the person is engaged in some ecoitomic activity even if marginal in addition to whatever is the main activity under question 16. A person whose main activity is shown as, say, a clerk in a government office or a teacher under question 16, also attends to some cultivation by his direct supervision, or undertakes some tution, this will be shown as secondary work under question 17. A person's main activity may be cultivation in que:tion 16 and his subsidiary activity money lending in question 17. Again main activity may be agricultural labourer and subsidiary work sugar factory labourer and so on and so forth.
109. The instructions for the usage of abbreviations in categorising workers under 16(a) (i) and filling in the details under 16 (b) to (f) will apply mutatis mutandis to question'17 (a) to (f), except_ that while question 16 (a) (i) will cover the main work, Q. 17 (a) is intended to cover secondary work which may be possibly part-time. It may also be noted that the non-working categories of activi.y will not be reported as secondary work under questIon 17.
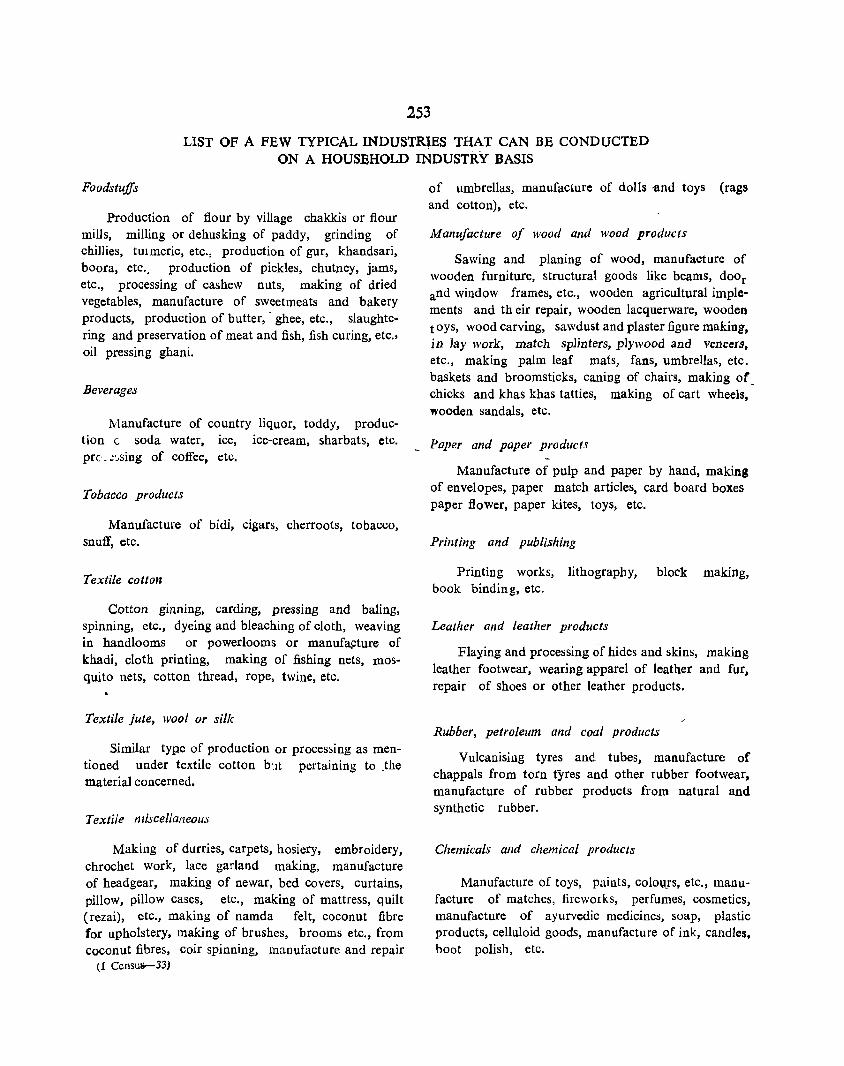
253
LIST OF A FEW TYPICAL INDUSTR1ES THAT CAN BE CONDUCTED ON A HOUSEHOLD INDUSTRY BASIS
Foodstuffs
Production of flour by village chakkis or flour mills, milling or dehusking of paddy, grinding of chillies, tUlmeric, etc., production of gur, khandsari, boora, etc., production of pickles, chutney, jams, etc., processing of cashew nuts, making of dried vegetables, manufacture of sweetmeats and bakery products, production of butter, . ghee, etc., slaughtering and preservation of meat and fish, fish curing, etc., oil pressing ghani.
Beverages
Manufacture of country liquor, toddy, production c soda water, ice, ice-cream, sharbats, etc. pre- _ ~~sing of coffee. etc.
Tobacco products
Manufacture of bidi, cigars, cherroots, tobacco, snuff, etc.
Textile cotton
Cotton ginning, carding, pressing and baling, spinning, etc., dyeing and bleaching of cloth, weaving in handlooms or powerlooms or manufapture of khadi, cloth printing, making of fishing nets, mosquito nets, cotton thread, rope, twine, etc.
Textile jute, wool 01' silk
Similar type of production or processing as mentioned under textile cotton b:lt pertaining to .the material concerned.
Textile miscellaneous
Making of durries, carpets, hosiery, embroidery, chrochet work, lace garland making, manufacture of headgear, making of newar, bed covers, curtains, pillow, pillow cases, etc., making of mattress, qUilt (rezai), etc., making of namda felt, coconut fibre for upholstery, making of brushes, brooms etc., from coconut fibres, coir spinning, manufacture and repair
(1 Census-33)
of umbrellas, manufacture of dolls -and toys (rags and cotton), etc.
Manufacture of wood and wood products
Sawing and planing of wood, manufacture of wooden furniture, structural goods like beams, door and window frames, etc., wooden agricultural implements and th eir repair, wooden lacquerware, wooden tOYS, wood carving, sawdust and plaster figure making, in Jay work, match splinters, plywood and veneers. etc., making palm leaf mats, fans, umbrellas, etc. baskets and broomsticks, caning of chairs, making or_ chicks and khas khas tatties, making of cart wheels, wooden sandals, etc.
_ Paper and paper products
Manufacture of pulp and paper by hand, making of envelopes, paper match articles, card board boxes paper flower, paper kites, toys, etc.
Printing and publishing
Printing works, lithography, block making, book binding, etc.
Leather and leather products
Flaying and processing of hides and skins, making leather footwear, wearing apparel of leather and fur, repair of shoes or other leather products.
Rubber, petroleum and coal products
Vulcanising tyres and tubes, manufacture of chappals from torn tyres and other rubber footwear, manufacture of rubber products from natural and synthetic rubber.
Chemicals alld chemical products
Manufacture of toys, paints, colol!rs, etc., manufacture of matches, fireworks, perfumes, cosmetics, manufacture of ayuIvedic medicines, soap, plastic products, celluloid goods, manufacture of ink, candles. boot polish, etc.
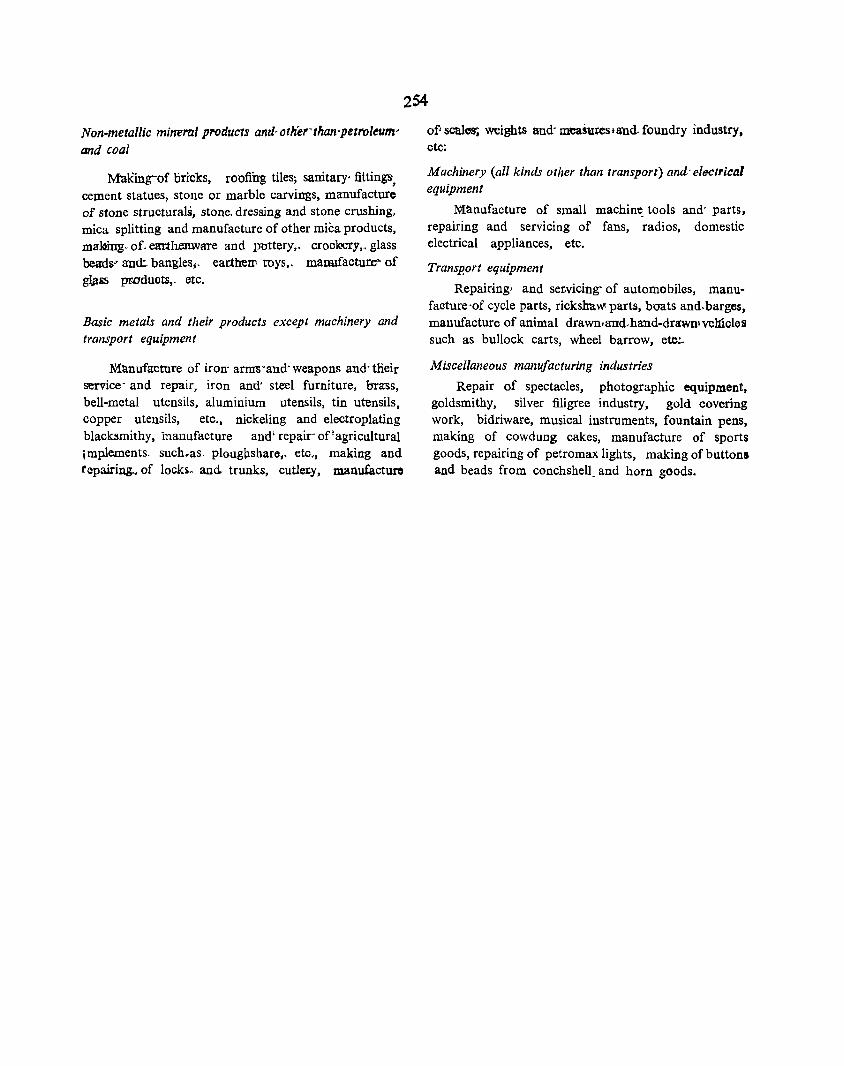
Non-metallic minemi products and, other than 'petroleumand coal
MaKing-of oricks, roofiirg tiles; sanitary' fittings, cement statues, stone or marble carvings, manufacture of stone structurals, stone. dressing and stone crushing, mica splitting and manufacture of other mica products, mg~g, of. earthenware and pottery,. croolrery,. glass be3ds" and: banglesj- eartheIll toys,. manufaoture- of giju;s produots,. etc.
Basic metals and their products except machinery and transport equipment
N1~nufa:cture of iron- arms-and- weapons and- tlieir service- and repair, iron and' steel furniture, brass, bell-metal utensils, aluminium utensils, tin utensils, copper utensils, etc., nickeling and electroplating blacksmithy, manufacture and' repair- of'agricultural implements. suchlas_ plougp,share" etc., making and repairing., of locks- and- trunks, cutlet-y, manufacturo
of'scales; weights and- IIICaSuresiand. foundry industry. etc:
Machinery (all kinds other than transport) and' electrical equipment
NUtnufacture of small machin~ tools and' parts, repamng and servicing of fans, radios, domestic electrical appliances, etc.
Transp.0rt eqUipment
Repairing' and ser.vicing; of automobiles, manufaoture-of cycle parts, rickshaw parts, boats and-barges, manufacture of animal drawn,mtd.hand-drawn1vel1ioles such as bullock carts, wheel barrow, etc;.
Miscellaneous manufacturing industries
Repair of spectacles, photographic equipment, goldsmithy, silver filigree industry, gold covering work, bidriware, musical instruments, fountain pens, making of cowdung cakes, manufacture of sports goods, repairing of petromax lights, making of buttons and beads from conchshell_ and horn goods.
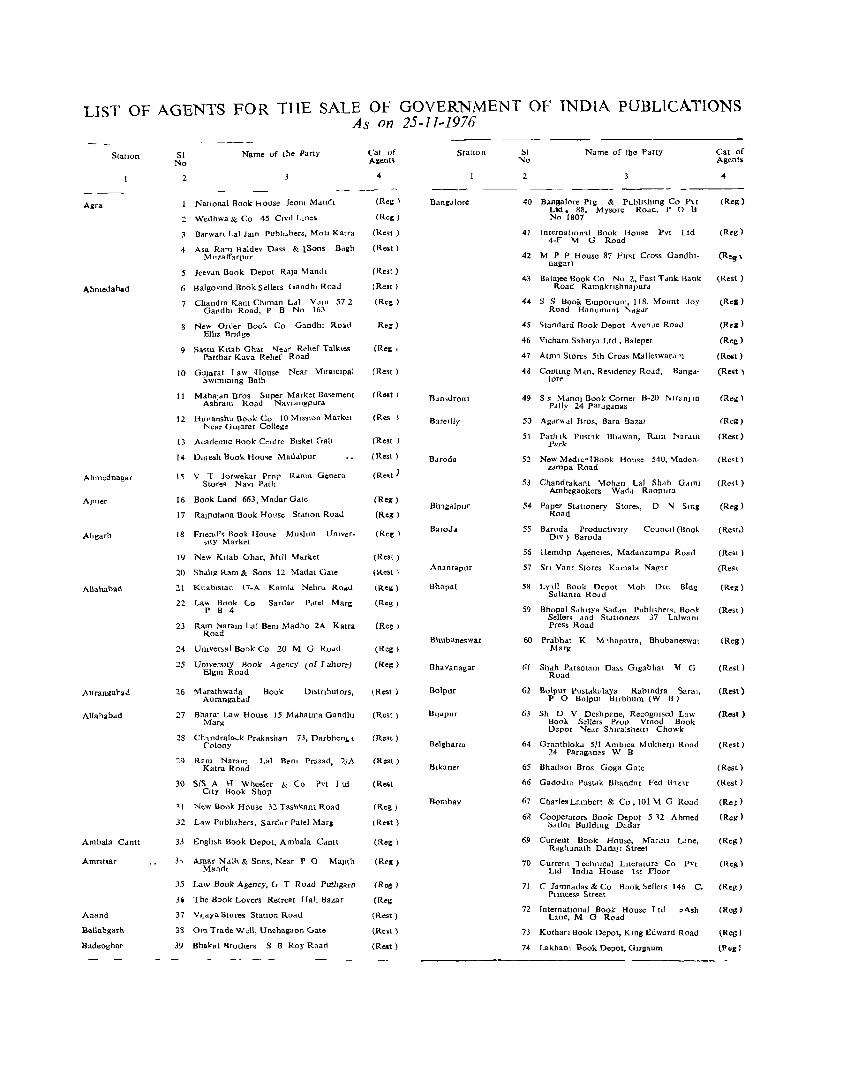
LIST OF AGENTS FOR THE SALE OF GOVERNMENT OF INDIA PUBLICATIONS As on 25-11-1976
StatWll
.ura
Ahmedabad
Ahmednagar
Ahg:arh
Allahabad
Aurangahad
Allahabdd
Ambala C"ntt
Amnt!ar
Anand
BaUabgarh
Badeoghar
Sl No
2
Name of the Party
National Bool< house Jeom Mandl
2. Wedhwa & Co 45 CIvil LlllCS
Barwan Lal Jaln Pubh.::.hers. Mott Katra
4 Asa Ram Baldev Dass & tSons Bdgh Muzatfarpur
5 Jeevan Book Depot Rala Mandl
6 Balgovtnd Book Sellers GandhI Road
7 Chandra Kant Chi man Lal y"ta 57 2 Gandhi Road, P B No 163
New Order Book Co Gandhi Road Ellis BrJdge
9 Sa.tu J<ltab Ghar "Ie,lc Rehef Talkies Palthar Kava Reltef Road
10 GUlar.t raw House Near MUBlclpal !>wlmmlng Bath
11 Maha]an Bros Super Market Ba'\emen[ Ashram Road Navrangpura
12 Htmanshu Book Co 10 M,SSIon Market I'Icar GUJurat College
13 Academic Book Cenlre Btsket Gall
14 Dlnesh Book House Madalpur
1 ~ V T Jorwekar Prop Rdma Genera Stores Navi Pdth
16 Book Land 663, Madar Gdte
17 RalPutana Book House StatIOn Road
18 Fnend'.:; Book Hou .. e Mushm UnlvcrS,lty Market
19 New Kltab vhar, Mill '\:Iarket
20 Shdltg Ram & Sons 12 Madal Gate
:1 Knablstan 17·A KamL..t Nehru ROllO.
22 Lay,.. Book (..0 Sardar Poitel Man: P B 4
23 Ram Naram Lal Bent Madho 2A Katra Road
24 Unlver;al Book Co 20 M G ROdd
2S UnIversity Book Agency (of r ,hore) Bigm Road
26 Marathwada Book Aurangabdd
Dl:,tnbutors.
27 Bharat Law House 15 M"hatma Gandln Marg
28 Ch'lndralo,-,k Prdkashan 73, Darbhenb, t ("olony
29 Ritatr~R~~d Lal Bent Prasad, 2/A
30 SIS A H Wheeler Ix Co Pvt J td City Book Shop
, t New Boolt House 32 Tashkant Road
32 Law Publtshefs, Sar-dar Patel Mar,
33 Englt,1l Book Depot, Ambala Cdntt
3, Amar Nath & Sons, Near P 0 MaJlth Mandl
3S Law Book Agency. G T ROad Puthgatll
3' The Book Lovers Retreat Hall Bazar
37 VIJdya Stores Statton ROdU
38 Om Trade Well, Unchagaon (Jato
39 Bh.l<.t 'lrothers S B Roy Road
4
(Re, 1
(Re:: )
(Re't)
(Rest)
(Re.t)
(Rest)
(Re; )
Reg)
(Re~ ,
(Re't)
(Reo.t)
(Res )
(Re't )
(Rest)
(R«t)
(Reil)
(Reg)
(Re: )
(Rest)
(Re>t I
(R.~ )
(Reg J
(Reg J
(Rest)
(Rest)
(Rest)
(Rest)
(Reot
(Reg)
(Relt)
(R., )
(Reg)
(Re: )
(Reg
(Rest)
(Rest)
(Rest)
StatIon
RJnsdronl
Bare.lly
Bdroda
BaroJ ..
Anantapur
Bhopal
Bhub3 neswa.r
Bhavanagar
Bolpur
Bel&:hana
Blkaner
Bombay
Name of the Party
2
40 B~nsal0re PIg & Pub]J,hmg Co P'I Lid. 88, Mysore Road, P 0 B No 1807
41 InternatIon'lI Book Honse Pvt Ltd 4-F '14 G Road
42 M P P House 87 Pmt Cross Gandhlnagar)
43 BalaJee Book Co No 2, Fast T duk Bank Road RamakrlshnapUftl
44 S S Book Emponum. l1R, Mount Joy Road Hanuntant 1'.dgc1r
45 ~tandard Rook Depot A venue Road
46 Vlchara Sahltya Ltd, Ralepet
47 Atm~ Store, 5th Cross Mallesward'"
48 Commg Man, Re .. dency Road, Bangd-10Te-
49 S s MdnoJ Book Corner B-20 h'C'DJ In Pdlly 24 parJganas
50 Agdr\\ <11 liros, Bara Bazar
51 Path Ik PU'it'lk Bhdwan, Ram l'IardlIl Park
52 New Medlc"'lBook House 540, \Iladen~ zJmpa Road
S3 Chandrakant \fohan Lal Shdh Gdlnl Ambegaokers Wad. Raopura
54 Paper StdtlOnery Store" D "'I Sing Road
55 Bdroda ProductIVIty DIV) Baroda
CounCIl (Book
56 Het11dlp Agencle&.. Madanzamp~l Road
57 Sn Van! Stores Kamala Nag'lr
58 Ly~ll Book Depot 'l4oh Om Bldg Sultanla Road
59 Bhopal S"hltYa Sad,," Publ"hers. Book Sellers and Stdtloner!': 37 Lalwant Press Road
60 Prabhdt K M,hapatra, Bhuban..-w.t Marg
(if Shah P.rsotam Dass Glgabhal 'If G Road
62 Bolpur Pustdko laya Rabmdra Saral, P 0 BolpUl Bubhum (W B)
63 Sh D V Deshpnne, RecognIsed Law Book Sellers Prop Vmod Book Depot ~e.:ir Shlralshettl Chowk
64 Graothlok" 511 Amblea Mukherjl Road 24 Paraganas W B
65 Bhad.o. Bros Gaga Gate
66 Gadodl' Pustdk Bhandor Fed B~z\f
67 ChartesLambert & Co. 101 '14 G Road
68 Cooperaton. Book Depot S l2 Ahmed Sdllol BUIldIng Dadar
69 Current Book House, MarLltJ Ldne, Raghunath Dadall Street
70 Current TechnIcal LIterature Co PVt Ltd Indl.:l House 1st Floor
7J C I.muddas & Co Book !>eJlers 146 C. PllUCes.s. Street
72 InternatIOnal Book House I to , 'l.sh Lane, M G ROdd
73 Kothan Book Depot, KIng Edward Road
74 Lakhanl Book Depot, GlIgaum
Cat of Agents
4
(Reg)
(Reg)
(Reg'
(Rest)
(ReC)
(Reg)
(Recl
(RCOIt)
(Rest)
(Reg I
(Reg)
(Rest)
(Rest)
(Reg)
(Rest.)
(Rest)
(Rest
(Reg)
(Rest)
(Reg)
(Rest)
(Rest)
(Rest)
(Rest)
(Rest)
(Rest)
(Rel)
(Reg)
(Reg)
(Reg)
(Rea)
(Pe,)
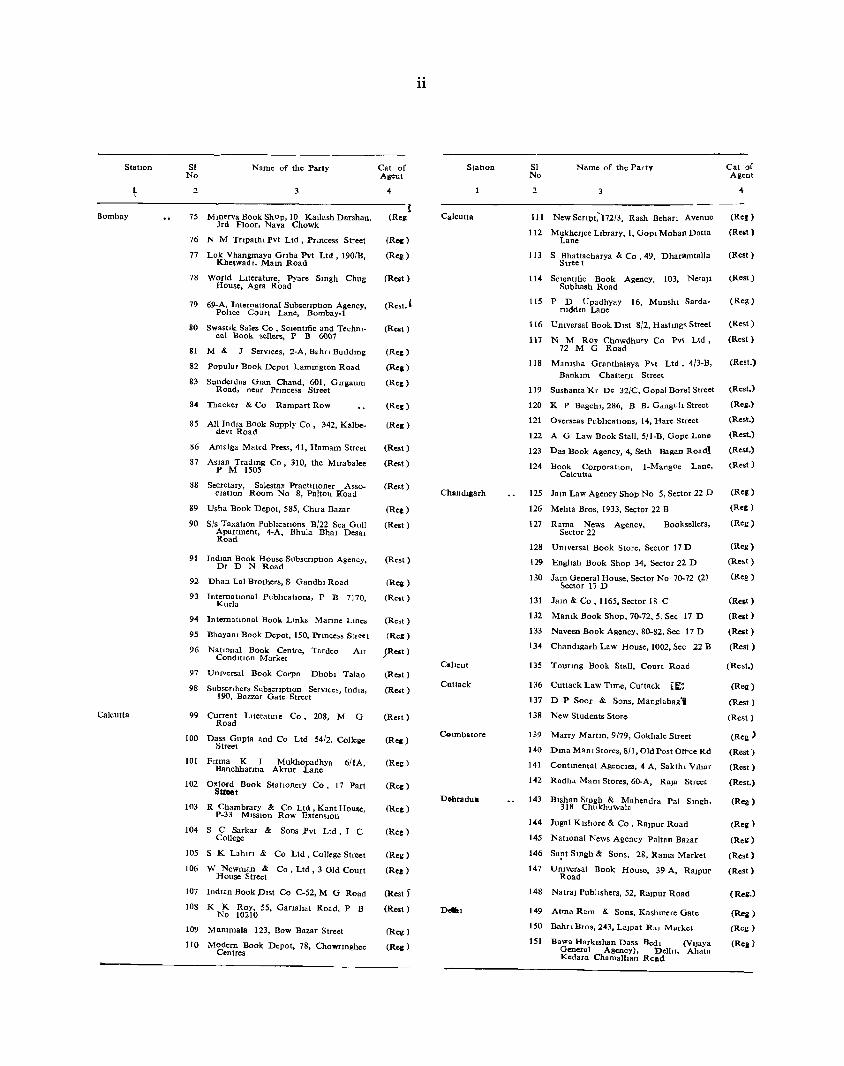
Station
Bombay
Calcutta
SI No
2
Name of the Party
75 Mmerva Book Shop, 10 Kallash D.Tshan, 3rd Floor, Nava Chowk
76 N M TrIpalbl pvt Ltd, Pemcess Street
77 Lok Vhanllffiaya Gnha Pvt Ltd, 190/B, Khetwadl, Mam Road
78 World LIterature, Pyare Smgh Chug House, Agra Road
79 69~A, International SubscrIption Agency, PolIce Court Lane) Bombay-l
80 SwastIk Sales Co , SCIentIfic and Techm-cal Book sellers, P B CO07
81 M & J Services, 2-A, Bahn BuIldIng
82 Popular Book Depot Lammgton Road
83 Sunderdas Glan Chand, 601, GIrgaum Road, near Prmcess Street
84 Thacker & Co Rampart Row
85 All India Book Supply Co, 342, KalbedeVI Road
86 Amalga Mated Press, 41, Hamam Street
87 ASian Tradmg Co, 310, the Muabalee P M 1505
88 Secretary, Salestax PractitIOner AssoCJatIOn Room No 8, Palton J{oad
89 Usha Book Depot, 585, Chlra Bazar
90 Sis TaxatIOn PubhcatIOns B/22 Sea GUll Apartment, 4-A. Bhula Bhal DesaI Road
91 Indian Book House SubscnptIOn Agency, Dr D N Road
92 Dhan Lal Brothers, S GandhI Road
93 Jni{~r~!JOnal PubhcatIons, P B 7170,
94 In ternntlonal Book LInks Manne Lines
9S Bhayani Book Depot, 150, PrIncess Str~ct
96 NatIonal Book Centre, Tardeo Air CondItIon Market
97 UnIversal Book Corpn DhabI Talao
98 SubscrIbers Subscnptlon Servlces, Indu!, 190, Bazzar Gate Street
99 Current LlteratUle Co, 208, M G Road
I 00 D'l;"t~e~uPta and Co Ltd 54/2, College
101 Fuma K L MukhopadhYa 6/IA, Banchharma Akrur Lane
102 Oxford Book StatIOnery Co, 17 Part Street
103 R Chambrary & Co Ltd, Kant Houoe, P~33 Mlsslon Row ExtenSIOn
104 S C Sarkar & Sons )'vt Ltd, I C College
105 S K Lahm & Co Ltd, College Street
106 W Newman & Co, Ltd, 3 Old Court House Street
107 IndIan Book Plst Co C-52, M G Road
108 K N~ Th~lb 55, Gaoahat Road, P B
109 Mammala 123, Bow Bazar Street
110 Modem Book Depot, 78, Chowrmghee Centres
Cat of Allent
4
t (Reg
(Ree)
(Rell)
(Reot)
(Re.t)
(Reot)
(Rec)
(Res)
(Rec)
(Re:)
(Rest)
(Reot)
(Relt)
(Rec)
(Reot)
(R""t)
(Rell)
(Rest)
(Re.t)
(Re:;)
JRcot)
(Rest)
(Reit)
(Reot )
(Rec)
(Reg)
(Rec)
(Rer;)
(Rec)
(Ree)
(Rec)
(Rest )'
(Rest)
(Reg)
(Rell)
11
Statton
Calcutta
Chandllarh
Caheut
Cultack
COlmbatore
Dohradu.
SI No
2
Name of the Party
3
111 NewScnpt;-t72/3, Rash Behan Avenue
112 MukherJee LIbrary. I, GOPI Mohan Datta Lane
113 S Bhattacharya & Co ,49, Dharamtalla Slree t
114 SClenllfic Book Agency, 103, Neta]l Subhash Road
115 P D Upadhyay 16, Munshl Sardaruddm Lane
Cat 0; Ailent
4
(Reg)
(Reot)
(Rest)
(Rest)
(Reg)
116 Umversal Book Dlst 8/2. Hastmgs Slreet (Rest)
117 N M Roy Chowdhury Co Pvt Ltd, (Rest) 72 M G Road
118 Mamsha Granthalaya Pvt Ltd, 4/3-B, (Rest_) BankIm ChatterJI Street
119 Sushanta Kr De 32/C, Gopal Boral Street (Rest.)
120 K P Bagchl, 286, B B. Gdnguh Street
121 Overseas PublIcatIons, 14, Hare Street
122 A G Law Book Stall, 5/1-B, Gope Lane
123 Das Book Agency, 4, Seth Bagan Road!
124 Book Corporatlon, 1-Mangoe Lane, Calcutta
125 Jam Law Agency Shop No 5, Sector 22 D
126 Mehta Bros, 1933, Sector 22 B
127 Rama News Agency. Sector 22
Booksellers,
128 Umversal Book Store, Sector 17 D
129 English Book Shop 34, Sector 22 D
130 Jam General House, Sector No 70-72 (2) Sector 17 D
131 Jam & Co, 1165, Sector 18 C
132 Mamk Book Shop. 70-72, 5, Sec 17 D
133 Naveen Book Agency, 80-82, Sec 17 D
134 Chandlgarh Law House, 1002, Sec 22 B
135 Tourmg Book Stall, Court Road
136 Cuttack Law Time, Cuttack l [;:
137 D P Soor & Sons, Manglabag'"
138 New Students Stor.,
139 Marry MartIn, 9/79, Gokbale Street
1-40 Dma MamStores, 8/1, Old Post Oltoce Rd
141 Contmental AgenCIes, 4 A, Sakthl Vlhar
142 Radha M am Stores, 60-A, Ra]a Street
143 BI~~~n ~g~fh~w,i? .. hendra Pal Smgh,
144 Jugal Klshore & Co, RalPur Road
145 NatIOnal News Agency Paltan Bazar
146 Sa!1t Smgh & Sons, 28, Rama Market
147 U~~,,:~al Book House, 39 A, RaJPur
148 Natr"] PublIshers, 52, RalPur Road
149 Atma Ram &. Sons, Kashmerc Gate
150 Bahn Bros, 243, LaJpat Raj Market
151 Bawa Harklshan Dass Bedl (VJ]"ya General Agency), Deihl. Ahata Kedar. Chamalh.n Road
(Rea.)
(Rest.)
(Rest.)
(Rest.)
(Rest)
(Reg)
(Reg)
(Reg)
(Reg)
(Re,t)
(Reg)
(Relt)
(Reat)
(R.,.t)
(Rest)
(Rest.)
(Reg)
(Rest)
(Rest)
(Rea)
(Rest)
(Rest)
(Rest.)
(Rei)
(Rei)
(Rest)
(Rest)
(Rei.)
(Rell )
(Rell )
(Rell)
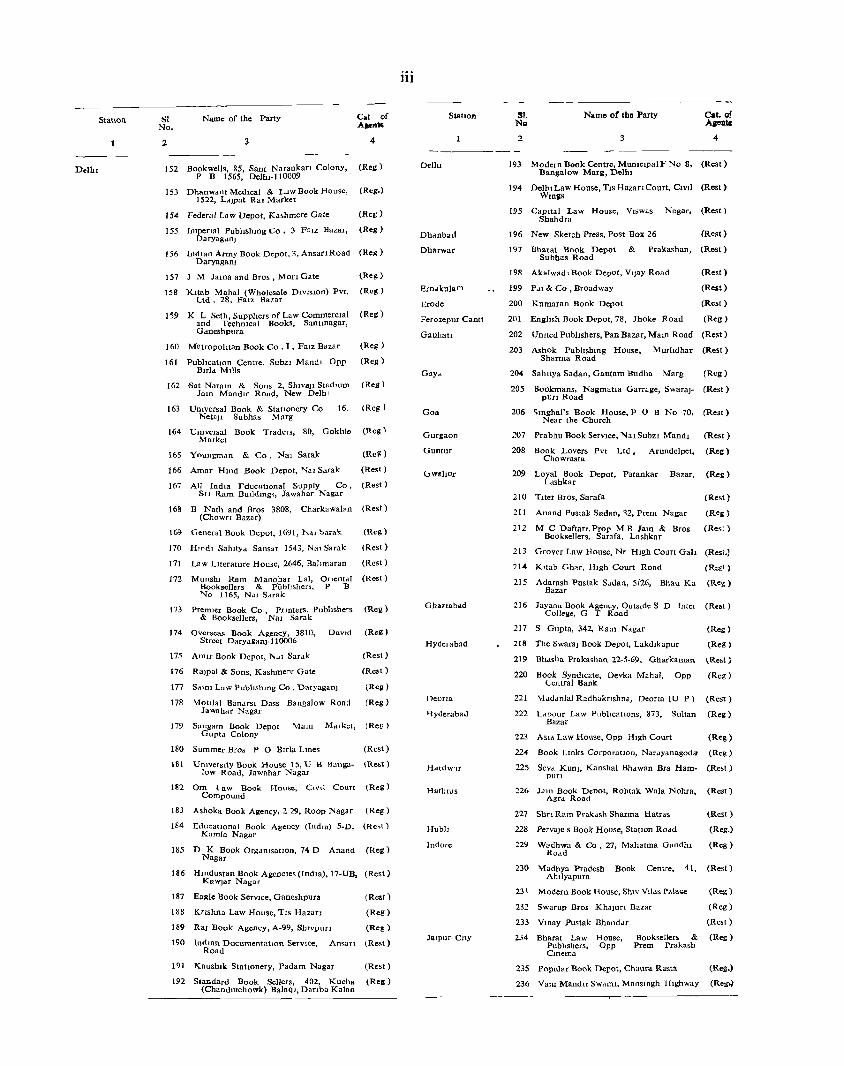
Statlon
DelhI
SI No.
Name of the Party Cat of Ate".
2 3 4
152 Bookwells, 85, Sant Narankart Colony, (Reg) P B 1565, Dolh,·lI0009
153 DhanwantMedlcal & LdW Book House, (Reg.) 1522, LdJpat Ral Market
154 Federal Law Depot, Kashmere Gate (Reg)
155 Tmpena! PublIshmg Co, 3 Falz Hazar, (Reg) Daryagd.llJ
156 IndIan Army Book Depot. 3, AnsanRoad (Reg) DaryagaOj
157 J M Jama and Bro. , Man Gate (Rell)
158 Kltab Mahal (Wholesale DIvISIon) Pvt. (Reg) Ltd, 28, FalZ Bazar
159 K L Seth, SupplIers of Law CommercIal (Reg) and TechnIcal Books l Santlnagar, G,meshpura
160
161
MetropolItan Book Co , I , Falz Bazar
PublIcatIOn Centre, Subzl Mandl Opp Bula MIlls
(Reg)
(Reg)
162 Bat Naram & Sons 2, Sluvajl StadIUm (Rcg) JaIn MandlT Road, New DelhI
163 UnIversal Book & StatIonery Co Neta]1 Subhas Marg
16, (Reg)
164 Umversal Book Traders, 80, Gokhle (Reg) Market
165 Youngman & Co, Nal Satak (ReS)
166 Amar Hmd Book Depot, "<al Sarak (Rest)
167 All India FducatlOnal Supply Co, (Rest) SrI Ram BUlldlngo;;, lawahar Nagar
168 B Nath and Bros 3808, Charkawalan (Rest) (Chown Bazar)
169 General Book Depot, 1691, }o.al1:.arak (Reg)
170 Hind, SahltYd Sansar 1543, Na, Sarak
171
172
La w LIterature House, 2646, Bahmaran
Munshl Ram Manohar Lal, OncntdI Booksellers & publIshers, P 'B "<A ) 165, Nal Sarak
(Rest)
(Rest)
(Rest)
173 Premler Book Co, Prmters, Pubhshers (ReI! ) & BookseUers, Nal Sarak
174 Overseas Book Agency, 3810, DaVId (Reg) Street Daryaganj-ll0006
175 AmIr Book Depot, 1'.,11 Sarak
176
177
178
179
Ra)pal & Sons, Kashmeto Gate
SainI Law Publlshmg Co , DaryaganJ
Vlotlla! Bandrsl Dass Bangalow Road Jawahar Nagar
Sangam Book Depot \1alll Mdlket, Gupt" Colony
180 Summer Bros P 0 BITla Lmes
(Rest)
(Re't)
(Rell )
(Reg)
(Reg)
(Rest)
181 UmversltyBook House IS,U B Banga- (Re.\) low Road. lawahar Nagar
1~2 Om I aw Book House, C,v,l Court (Reg) Compound
183 Ashoka Book Agency, 2 29, Roop Nagar (Reg)
184 Educahonal Book Agency (Ind,a) 5-D, (Re,t) KamIa Nagar
185 n K Book OrganIsatIOn. 74 D Anand (Reg) Nagar
186 Hmdustan Book AgenCIes (Indta).17-UB. (Rest) KawJar Nagar
187 Eagle Book SerVIce, Ganeshpura
188 Knshna Law House, TIS Hazan
189 Raj Book Agency, A-99, Slllvpun
(Rest)
(Reg)
(Reg)
190 IndIan Documentatlon Servlce, Ansan (Rest) Road
191 KaushIle StatIOnery, Padam Nagar (Rest)
192 Standard Book Sellers, 402, Kucha (Re! ) (Chandmchowk) Balaql, Danba Kalan
iii
StatlOll
Deihl
Dhdnbad
Dharwar
Ern .. kulam
Erode
FerozepuI Cant!
Gauhatl
GaYd
Goa
Gurgaon
Guntur
Gwahor
GhOZlabad
Hyderabad
Deona
l-Iyderabau
Hdrdw'lr
Hallir.ts
Hubll
Indore
Jalpur CHy
Sl. N" 2
Name or the Party Cat. Ilf Aaentc
4
193 Modern Book Centre, MunICIpal F No 8, (Rest) Bangalow Marg, DelhI
194 Deihl Law House, TIS Hazan Court. C,vll (Rest) W,nls
195 CapItal Law House, Vlswas Nagar, (Rest) Shahdra
196 New Sketch PreSs, Post Box 26 (Rest)
197 Bharat Book Depot & Prakashan, (Rest) Subhas Road
198 Akalwadl Book Depot, VI jay Road (Rest)
199 Pdl & Co ,Broadway (Rest)
200 Kumaran Book Depot (Rest)
201 Enghsh Book Depot, 78, Jhoke Road (Reg)
202 lJmted Pubhshers, Pan Bazar, MalD Road (Rest)
203 Ashok Pubhshmg House, Sharma Road
M urhdhar (Rest)
204 Sahltya Sadan, Gautam Budha Marg (Reg)
205 Bookmans, Nagmatla Garrage, Swara)- (Rest) pun Road
206 ~mghal's Book House, P 0 B No 70. (Rest) Near the Church
207 Prabhu Book SerVIce, "latSubzl Mandl (Rest)
208 Book Lovers Pvt Ltd, Arundelpet, (Re:) Chowrasta
209 Loyal Book Depot, Patankar Bazar, (Reg) Ldshkar
210 Titer Bros, Sarafa (Rest 1
211 Anand Pustnk Sadan, 32, Prem Nagar (Reg)
212 M C Daftan,Prop M B Jam & Bros (Rest) Booksellers, Sara fa, Lashkar
213 Grover Law House, Nr HIgh Court Gall (Rest.)
214 Kltab Ghar, HIgh Court Road (Reot)
115 Adarnsh Pustak Sauan, 5/26, Bhau Ka (Reg) Bazar
216 J.yana Book Agency, OutSIde S D Tnter (Rest) College, G T Road
217 S Gupta, 342, Ram Ndgdr
218 The Swara) Book Depot, Lakdlkapur
(Reg)
(Reg)
219 Bhdsha Prakashan 22-5-69, Gharkaman tRest)
220 Book Syndicate. Devka Mahal. Opp <..entral Bank
221 \1,uldnlal Radhaknshna, Deona lU P)
222 Ldoour Law PublIcatIOns, 873, Sultan Bazar
223 ASIa Law House. Opp Hlgh Court
(Reg)
(Rest)
(Reg)
(Reg)
224 Book LInks CorporatlOn, Nardyanagod., (Reg)
225 Sew Kun), Kanshal Bhdwan Bra Ham- (Rest) pun
226 Jam Book Depot, Rohtak Wala Nohra, (Re.t) Agrd Road
227 Shfl Ram l'rakdsh Sharma Hatras (Rest)
228 Perva)e s Book House, StatIOn ROdd (Reg.)
229 Wadhwa & Co , 27, Mahatma GandhI (Reg) ROdd
230 'Vladhya Pradesh Book Centre, 41, (Rest) Ahllyapura
231 Modern Book House, ShlV Ylld' Pal."" (Reg)
232 Swarup Bros KhaJufl Bazar (Reg)
233 Ymay Pustak Bhanddr (Rest)
234 Bharat Law House, Booksellers & (Reg) Publtshers. Opp Prem Prakash Cmema
235 Popular Book Depot, Chaura Rast" (Reg,)
236 Yam MandlT SWdffil, MansIngh HIghway (Regt)
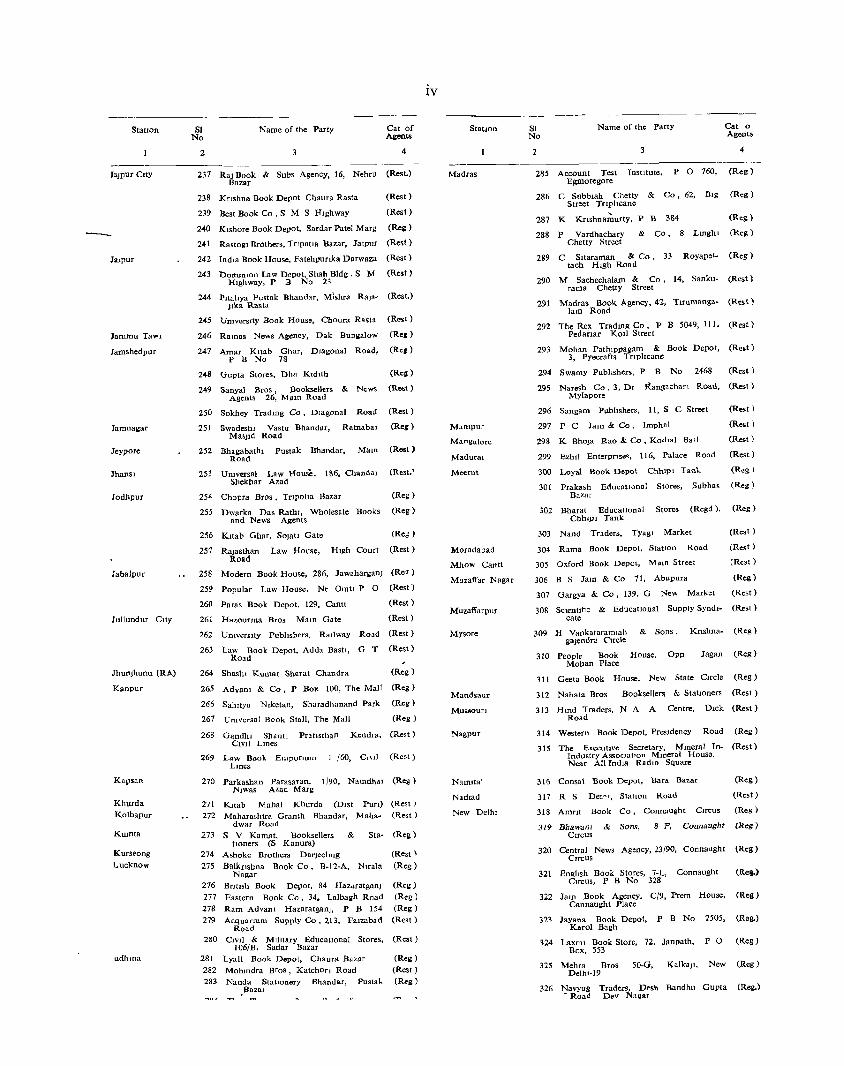
StatIon
falPur CIty
-J'alpur
Jammu Taw1
Jamshedpur
Jamnagar
Jeypore
JhanSI
Jodhpur
Jabalpur
Jullundur CIty
JhuoJhunu (RA)
Kanpur
Kapsan
Khurda Kolhapur
Kumta
Kurseong Lucknow
udhma
SI No
2
Name of the Party Cat of Agents
4
237 Ral Book & Subs Agency, 16, Nehru (Rest.) Bazar
238 KrIshna Book Depot ChaUfa Rasta (Rest)
239 Best Book Co ,S M S H,ghway (Rest)
240 Klshore Book Depot, Sardar Patel Marg (Relli )
241 RastogI Brothers, 1'npatIa Bazar, Jalpur (Rest)
242 Indm Book House, Fatehpunka Darwaza (Rest)
243 Dommton Law Depot, Shah Bldg. S M (Rest) HIghway, P B No 23
244 Pltahya Pustak Bhand.r, Mlshra RaJa- (Rest.) llka Rasta
245 Umverstty Book House, Choura Rasta (Ro<t )
246 Ramas News Agency, Dak Bunllalow (Rei)
247 Amar Ktt.b Ghar, DIagonal Road, (Re,) P B No 78
248 Gupta Stores, Dha Ktdlth (Rell)
249 Sanyal Bros, :Booksellers & News (Rest) Agents 26, MaIn Road
250 Sokhey Tradmg Co, DIagonal Road (Rest)
251 Swadeshl Vastu Bhand.T, Ratnabat (Re,) Maslld Road
252 Bhagabath, Pustak Bhandar, MaIn (Rest) Road
253 Umversal Law House, 186, Chandat (Rest.' Shekhar Azad
254 Chopra Bros, Trlpoha Bazar (Reg)
255 Dwarka Das Rathl, Wholesale BookS (Reg) and News Agents
256 Kltab Ghar, SOlatl Gate (Reg)
257 Rajasthan Law House, HIgh Court (Rest) Road
258 Modern Book House, 286, Jawahargan) (Re~)
259 Popular Law House. Nr OmtJ P 0 (Rest)
260 Paras Book Depot, 129, Cantt
261 Hazoortna Bros Mam Gate
(Rest)
(Rest)
262 Umverstty Pubhshers, RaIlway Road (Rest)
263 Law Book Depot, Adda Bastl, G T (Rest) Road
264 Shasht Kun1ar Sharat Chandra (Reg)
265 Advam & Co, P Box 100, The Mall (Reg)
266 Salutya Nlketan, Sharadhanand Park (Reg)
267 UnIversal Book Stall, The Mall (Reg)
268 GandhI Shant I Prallsthan Kendra, (Rest) Clv]1 Lmes
269 Law Book Emponum 1 /60, C"II (Rest) Lines
270 Parkashan Parasaran, I {90, Namdhar (Reg) N,was Azad Marg
271 KItab Mahal Khurda (DlSt Purl) (Rest) 272 Mah.rashtra Gr.nth Bhandar, Mah.- (Rest)
dwar Road
273 S V Kamat, Booksellers & Sta- (ReI:) honers (S Kanura)
274 Ashoke Brothers DnrJechng 275 Balknshna Book Co, B.12-A, Nuala
Nagar 276 Bnllsh Book Depot, 84 Hauratg.n)
277 Eastern Book Co, 34, Lalbagh Road 278 Ram Advanl HazaratganJ, P B 154 279 Acquartum Supply Co. 213, Fatzabad
Road 280 C,VIl & MIlItary EducatIonal Stores,
1 06/B, Sadar Bazar 281 Lyall Book Depot, Chaurs Bazar
282 Mohmdra Bros, Katchon Road 283 Nanda StatIonery Bhandar, Pustal-.
.Bazar
(Rest)
(Reg)
(ReI:) (Reg) (Reg)
(Re<t)
(Rest)
(Reg)
(Rest) (Reg)
IV
StatIOn
Madras
MaOlpur
Ma.ngalore
Madural
Meerut
Moradabad
Mhow Cantt
Muza!rar Nagar
Muzaffarpur
Mysore
Mandsaur
MUi-iOUrl
Nagpur
Namlta1
Nadlad
New DelhI
-----------81 No
Name of the Party Cat a Ag ... t.
2 4
285 Account Test InstItute, P 0 760, (Reg) Egmoregore
286 C SubbIah Chetty & Co, 62, BIg (Reg) Street Tflphcane
287 K Knshna~urty, P B 384 (ReI:)
288 P Vardhachary & Co, 8 Lmghl (ReI!) Chetty Street
289 C Sltaraman & Co, 33 Royape l - (Reg) tach HIgh Road
290 M Sachechalam & Co, 14, Sanku- (Rest) rama Chetty Street
291 Madras Book Agency, 42, Tlrumanga· (Rest) lam Road
292 The Rex Tradmg Co, P B 5049, Ill, (Rest) Pedanar KOlI Street
293 Mohan Pathlppagam & Book Depot, (Re.t) 3, Pyecrafts Tnphcane
294 Swamy Puhhshers, P B No 2468 (Rest)
295 Naresh Co, 3, Dr R.nil.chan Road, (R •• t) Mylapore
296 Sang.m Pubhshers, II, S C Street (Rest)
297 P C Jam & Co, Imph.l (Re.t)
298 K Bhola Rao & Co, Kodlal Ball (Rest)
299 Ezh,] EnterprIse<, 116, Palace Road (Rest)
300 Loyal Book Depot ChhlPI Tan!. (Reg)
301 Prakash EducatIOnal Stores, Subhas (Reg) Bazar
302 Bharat EducatIOnal Stores (Regd ), (Reg) Chhlpl Tank
303 Nand Traders, Tyagl Market (Rest)
304 Rama Book Depot, StatIon Road (Rest)
305 Oxford Book Depot, MaIO Street (Rest)
306 B S Jam & Co 71, Abupura (Reg)
307 Gargya & Co, 139, G New Market (Rest)
308 SCIentific & EducatIOnal Supply Synd,- (Rest) cate
309 H Vankataramlah & Sons, Knshna- (Reg) galenora Orcle
310 People Book House, Opp Jagan (Reg) Mohan Place
311 Geeta Book House, New State CIrcle (Reg)
312 Nahata Bros Booksellers & Stahoners (Rest)
313 H md Traders, N A A Centre, DIck (Rest) Road
314 Westefn Book Depot. PreSIdency Road (Reg)
315 The ExecutIVe Secretary, Mmeral In- (Rest) Indtlstry ASSOclatlon Mmeral House. Near An IndIa RadIO Square
316 Consat Book Depot, Bara Bazar
317 R S De,o" StatIOn Road
(Reg)
(Rest)
318 Amnt Book Co, Connaught en'eus (Reg)
319 Bllawam & Sons, 8 F, Connaugllt (Reg) CIrCUS
320 Central News Agency, 23/90, Connaught ClTCUS
321 Englls)1 Book Stores, 7-L, Conn,ught CIrCUS, P B No 328
322 Jam Book Agency, C/9, Prem House, Cannaught Place
323 Jayana Book Depot, P B No 2505, Karol Bagh
324 Laxml Book Store, 72. lanpath. P 0 Box, 553
325 Mehra Bros 50-G, Kalka]I, New Delht-19
326 Navyug Traders, Desh Bandhu Gupta - Road Dev NagAr
(Reg)
(Rei.)
(Reg)
(Reg.)
(Reg)
(Reg)
(Reg.)

Station
New Delhi
Palghat Pain ..
Poona
SI. No.
2
Nnme of the Party Cat. of Agents
4
---------327 New Baal. Depot. Latest Rooko. Per 10- (Reg.)
dicals, Sty., P. B. 96, Con'luught Place
328 Oxford Book & Stationery Co. SClndm (Reg.) House
329 Peoples PLhltl>hinb Ilo~,e (P) Ltd., R~ni (Reg.) J'Idn..,l Road
330 Rdm Krishn.l & Sons (of Lahore) 16,1I, (Reg.) Ctlnnuught Place
331 R. K. Puhlishers, 23, Karol Bagh
Beadonpura (Reg.)
332 Sharma Bro,.. 17, New Market, Moti ,(Reg.) Nasa.
333 The Secretary, Indian Met. Society, (Reg.) Lodl Rond
334 Suneja Book Centre, 24:90. Connaught (Reg.) Place
335 United Book Agency, 2911557, N,tiwala. (Reg.) Karol Bagll
336 Hind Book House, 82, Janpath (Reg.) (Rest.) 337 La1<shmi lloo1< Depot, 57, Ragarpura.
Kan,} Bagh
33R N. C. Kdnsii & Co., 40, Model Basti, P. O. Karol Bagh, New Delhi
(Rest.)
339
340
341
342
Ravmdra Hook Agencv. 4D/50, Double (Reg.) Storey I LaJpat Nagar
Sant Ram Bookseller;, 16, New Munici- (Rest.) pal Market, Lodi Colony
Subha. Book Depot, Shop No. 1 II, (Rest.) Central Market, Srinivaspuri
The Secretary, Feeration of Association (Rest.) of Small Industry of India, 23-B/2. Rohtak Road
343 Educational & Commerc,") Agencies, (Rest.) 5/15), Subhash Nagar
344 Delhi Book Company, M , 12, Connaught (Rest.) Circus
345 Navrang, R. B-7, Inderpuri (Rest.) 346 Commercial Contacts (Tndia), 6ubhas (Rest.)
Nagar 347 A. Khosla & Co.,'" Anand 'Niketan (Rest.) 348 Books Tndia Corporation" New Rohtak (Reg.)
Road 349 S. Chand & Co .. Pvt. Ltd., Ram Nagar (Rest.)
350 Globe Publications. C-33 ,Nizamuddin (Rest.) East
351
352 353
Scienhfic Instruments Stores. A-35S, New Rajendar Nagar
Jain Map & Book Agency, Karol lWkan Chand & Sons, 3226,
Nagar
(Rest.)
nagh (Reg.) Ranjit (Rest.)
354 Star Publications Pvt. Ltd., 4/5-B, Asaf (Rest.) All Road
355 Indian Publications Trading Co~oralIon, A .. 7, Nizan1l1ddin East
356 Sheel Trading Co~oration, 5/5777 Sant Nari Dass Marg
357 Supreme Trading Corporation, Harrison Chamber
(Rest.)
(Reg.)
(Rest.)
v
358 Jain Brothers, New Delhi 359 Educational Supplies Depot, Sullanpet 360 Luxmi Trading Co., Padri Ki H, veli 361 J. N. Agarwal & Co., Padri Ki Haveli 362 Moti Lal Banarsi Dass & Co., Padri
(Rest.) (Resl.) (Reg.) (Reg.)
(Reg.) Ki Havell.
363 Today & Tomorrow, Ashok Rajpath 364 Books & Books, Ashok Rnjpath 365 Deccan Book Stall, Deccan Cyamkhana 366 Imperial Rook Depot, 266, M. G. Road 367 Saraswat, 1321/1, J. M. Road, Opp.
Modern High School, Bombary-Poona Road
368 International Book Service, Deccan Ghym Khana
369 Raka Book Agency, OPP. Nathu', Chawl Near Appa Ralwant Chowk.
(Rest.) (Rest.) (Reg.) (Reg.)
(Reg.)
(Reg.)
(Reg.)
370 Vanna Book Centre. 649, Narayan Path (Rest.) S71 Secretary Bharati Itihasa SamshodhalJa (Rest.)
Mandir, 1321, Sadashiv Path. 372 Vi:~lli Commerce House, 379-A, Sbanwar (liest.)
Station
Prayag
Pondicherry
Pudukko!tai
Punalur Rajkot
Raipu r
RIIJahmundry Ranch,
Rohtak
Roorkee "Rewari Sangrur
Saugar
Seconderabad
Simla Siliguri
Sivakasi Sholapur
Sura!
Sol.n
Tirupatl Tuticorln
Trichinopo\ly
Tripura
Tiruchizappally
SMUong
Trivandrum
Tetpur
Udaipur
Ujjain Ulhasnagar Varanasi
Vijayawada
Vizegapatam
Vellore
WlIldha
SI. 'No.
2
Name of the Party Cat. or Agent.
4
373 Om. Publishing Hou,e, 842, Daraganj (Rest)
374 Honesty Book House, 9, Rue Duplix (Rest.)
375 Meenakashl I'attippagam, 4142. rast (Rest.) MaIn Street
376 P.~. 'lwaminathan & Co ., Bazar Street Main Rl1ad.
377 M. 1. Abraham (Kernla) 378 Mohal La! Dos,bhal St>ah B00ksdlers
& Subs, & Advt. Agent 3N Bhupalrai Parasram Shah & Bro ... B. B
Street
380
331
382
Vinay Hoole Depotr Government Quarter No.1. behinci S.B. I.
Pustak Pratislhan, Sad Bazar Pach.yot Aids, 10-7-40, Fort Gate
:I%:\ Gr<lwn Rook Del)ot, Upper RaTa> 384 National Book House, Civil Road 385 Yashpal & Brothers, Station Road 386 'nka Ram Singh Lal 187 Punjab Educational Emporium,
Dhurigate
(Reg.)
(Rest)
(ReS)
(Rest.)
(Rest.)
(Rest. ) (Rest.) (Reg.)
(Rest.)
(ReSt.) (Rest.) (Rest.)
388 Gandhi Marg Darshan Pustakalaya, (Rest.) Sanglllf (Pb.)
339 Yadav Ro .... k <;tall, Publishers & Book- (Reg.) sellers
390 Hindustan Diary Publishers, Market (Rl'g.) Street
391 Minerva Book Centre, 8(7H, New Alwal (Rest.) 392 Minerva Book House, 46, The Mall (Rest.) 393 l'>o. B. Modern Agencies. Hill Court {Rest.)
Road 394 Ganesh Store., South Car Street
395 Gajanan Book Stores, Main Road 396 Shri Gajanan Pustakalaya, Tower Road 397 Gujarat Subs. Agency. Jawahar Lal
Nehru Marg, Atwa Line •. 398 B. P. Traders, Ghasia BuHdmg 399 Jain Magazine Agency, Ward
4/218, Rajgarh Road
(Rest.) (Reg.)
(Rell·) (Rest.)
(Rc~t.)
(Reg.)
400 Ravindra Book Centre. 401 K. Thiagarajan, 51,
Road
Balaji ColOny (Reat.) French Chapai (Rest.)
402 403
404
405
Arasan Book Centre, 462, V. E. Road (Rest.)
S. ~~d~.:'as&:iRo~d Co., 35 Subhas (Reg.)
G. R. 'Dutla & Co., Scientific Equip- (Rest.) meDts Suppliers
Sri Vidya (Rest.)
406 Allied Publications, 13, Oak lands (Rest.)
407 International Book Depot, Main Road (Rest.) 408 Reddiar Press & Book Depot, P. Y. No.4 (Rest.) 409 Enterpris 08, M. G. Road (Rest.)
410 sr!friva~~~ook House, Chenthitta, (Rest.)
411 Jyoti Prakashan Bhawan, Tezpur (Rest.) Assam
412 Book Centre, Maharana Bhopal (Rest.) College
413 Jagdish & Co. (Rest.) (Rest.) (Rest.) (Reli,)
414 Rama Bros.. 41, Mallipura 415 Raj Book Service 416 Chowkhamba Sanskrit Series Office
Gopal M,mdir Lane, P. B. No.8'
417 KL~~k~r Stores, University Road, (Reg.)
418 419
420
Viswavidynlaya Praka.han, Chowk (Reg.)
Glubcive!~~k Centre, P. O. Hindus (Rest.)
Chaukhamba Visva Bharati. Chowk (Rest.)
421 Visalaandhra Publishing House (Rest.)
422
423
424
425
G~~in BR~~d(Books), Vizi .. Building, (Rest.)
The Secretary, Andhra Univer'iity {Rcs~.~ General Co., 0 pp. Stores
A. Venkatasubban, Law Booksellers' (ReS.)
Swarajeya Bhandar, Rath; Market (Ree..

vi
FOR LQCAL SALES
Government of India Kitab Mahal. Emporia Building. Baha Kharak New Delhi (phone - 343708)
Unit No. 21 Singh Marg,
2 Government of India Book Depot. S, K. S. Roy Road, Calcntta (Phone No. 23-3S13)
3 Sales Counter. Publication Branch, New Deihl, (Phone No. 372081)
Udyog Bhaw ....
4 Sa~~w CDe'i~'t, Publication Branch, C. B. R. Building.
5 Government of India Book Depot, Ground Floor, New C. G. O. Building, Marrine Lines, Bombay-20
S & R AGENTS
The Assistant Director.. Extens.ion Centre, Bhuli Road, Dhanbad
2 The Assistant Director. Extension Centre, Santnagar, Hyderabad-IS
3 The Assistant Director, 00 ternment of India, S. I. S. I., Ministry of Cs & I, Extension Centre, Kapileshwar Road, Belgaum
4 The Assistant Director. Extension Centre, Krishna Distt. (A. 1.)
The AssIstant Director, Footwear Extension Centre, Polo Ground No, I, 10dhpur
6 The Assistant Director, Industrial Extension Centrre, Nadiad (Gui.)
7 The Development Commissioner, SmaU Scale Inoustries Udyog Bhawan. New Delhi J
8 The' Deputy Director In-charge, S. 1. S. r. Clo Chief Civil Admn .• Goa, Panmji •
9 The Director, Government Press, Hyderabad
10 The Director, Indian Bureau of Mines, GOvernment of India Ministry of Steel Mines and Fuel, Nagpur •
11 The Director, S. I. S. I. Industrial Extension Centre, Udhne-Surat
12 T~r!~,;~oyment Officer, Employment Exchange. Dhar, Madhya
13 Th~:r~:aIOyment Officer, Employment.. Exchange. Gopal Bhavan,
14 The Employment Officer, Employment Exchange, Jhabuo
1S The Head Clerk, Government Book Depot, Ahmedabad
16 The Head Clerk, Photzincographic Press. 5 Finance Road. Poona
17 The OffiCer-in-charge, Assam. Government B. D. Gaubati
18 The O. I/C., Extension Centre, Club Road, Muzaffarpur
19 The O. Ilc .• Extension Centre, Industrial Estate. ,lfokar. Ranchi
20 The O. II C.. State Information' Centre, Hyderabad
21 The O. I/C., S. I. S. r. Extension Centre, Maida
22 The O. IIC., S. I. S. r. Habra. Tabaluria, 24 Parganas
23 The O. IIC.. University Employment Bureau, Lucknow
24 The O. I/C., S. I. S. I. Chrontanning Extension Centre Tangra 3311, North Topsia Road, Calcutta-46 ••
25 The O. liS., s. I. S. O. Extension Centre, (Footw~ar), c.;lcut(a-2
26 The O. liS., S. I. S. I., Model Carpentry Workshop, Puyali Nagar, P. O. Burnapur, 24 Parganas .
27 Publication Division, Sales Depot, North Block, New Delhi
28 The_ Press Officer, Orissa Sectt., Cuttack
29 The Registrar of Comt>anies, Andhra Bank Bldg .• 6 Linghi Chetty Street, P. B. 1530, Madras
30 The Registrar of Companies, Assam. Manipur and Tripura, Shillol1g
31 The Registrar of Companies, Bihar Journal Road, P;tna-l
32 The Registrar of Companies, 162, Brigade Road, Bangalore
33 The Registrar of Companies; Everest, 100 Marine .. Drive, Bombay
34 ThAhr!~:b~~r of Companies, Guiarat State Sumachar Bldg .•
35 The Re_gistrar of Companies. Gwalior (Madhya Pradesh)
36 The Registrar of Companies, H. No. 3-5-S37. Hyder Hyderabad
Guda,
37 Th~ Registrar of Companies, Kerala, 70 Feet Road, Erniknlam_
38'. The Registrar of Companies, M. G. Road, West Cott: Building. P. O. Box-334 Kanp<fr
39 ThCa~~~~~trar of Companies, Nazyani Bldg.. Bracburne Road,
40 lbe Kegiotrar of Companies, Orissa, Ganga Mandir, Cuttack
41 The R~gistrar of C?ffipanies, Pondicherry r ::~'ti. oil
(.
42 The Registrar of Companies, Punjab & Himachal Pradesh, Link Road, 1ullundur City
43 The Registrar of Companies, Raiasthan & Ajmer, Sh. Kumta Prasad, House lst Floor, ce' Scheme Ashok Marg, Jaipul'
44 The Registrar of Companies. Sunlight Insurance Bldg. Aimeri Gate. Extension. New Delhi
45 The Registrar of Trade Unions, Kanpur
46 Soochna Sahlta Depot, (State Book Depot), Lucknow
47 Superintendent, Bhupendra Stat" Press, PaHala
48 Su~?rb~~~~~~~ntOovernment Press and Book Depot, Nagpur
49 Superintendent of Government Pre •• , Mount Road. Madras
50 Superintendent, Govt. State, Stores and Pubs. P. O. Gulzorbagh, P"tna
51 Superintendent, Government Printing and Rajasthan, laipur City
Stationery Depot,
S2 Superintendent, Government Printing and Stationery, Rajkot
53 Superintendent, Government Printing and Stationery. Puniab, Chandigarh
S4 Superintendent, Government State Emporium. V. P. Rewa
5S Deputy Controller, Printing and Stationery Office, Himachal Pradesh. _ Simla
56 Superintendent, Printing and Stationery, Allahabad. Uttar Pradesh
S7 Superintendent, Printing and Stationery, Madhya Pradesh. Gwalior
58 Superintendent; Printin& and Stationery, Chami Road. Bombay
59 Superintendent, State Government Pres.. Bhopal
60 The Assistant Director, Publicity & Information, Vidhan Sandha, Bangalore-I
61 Superintendent, Government Pre$s,._."Trivandrum
62 Assistant Information Officer, Press Information Bureau, Inforama tion Centre. Srinagar
63 Chief Controller of Imports & Exports, Paniim, Goa
64 Employment Officer, Employment Exchange (Near Bus Stop), Sidhi (M. P.)
65 The Director, Regional Meterological Centre, Alipur, Calcutta
66 The Assistant Director, State Information Centre, Hubli
67 The Director of Supplies and Disposals, Department of Supply. lIP. Mount Road, Madras-2 •
68 Director General of Supplies and Disposals. N. 1. C. Bldg, New Delhi
69 The Controller of Imports and Exports, Raikot
70 The Inspector, Dock Safety, Mil & E Maqras Harbour. Madra.
7l The Inspecting Assistant Commissioner of Income Tax, Kerala, Ernakulam
72 The Under Secretary. Rajya Sabha Sectt.. Parliament House, New Delhi
73 Controller of Imports and EXJ)orts, 7 Porlland Park, Visakhapatnam
74 The Senior Inspector, Dock Safety, Bowwalla Chambers, Sir P. M, Road, Bombay
75 Controllor of Imports and Exports, 1. B. 14-P. Pondicherry
76 Deputy Director Ineharge, S. I. S. 1., Sahakar Bhawan, Trikon Bagicha. Kajkot
77 The Publicity and Liason Officer, Forest Research Institute and Colleges, Near Forest, P. O. Dehradun
78 The Assistant Controller of Imports and Exports Governmet of India, Ministry of Commerce, New Kandla '
79 The Deputy Director (S. b.), Esplanade East, Calcutt ..
80 The Dire~tor, Government ofIn<\{~, .S. I. S. I., MiDistry of I. & ~ Industn"l Areas-B, Ludhiana
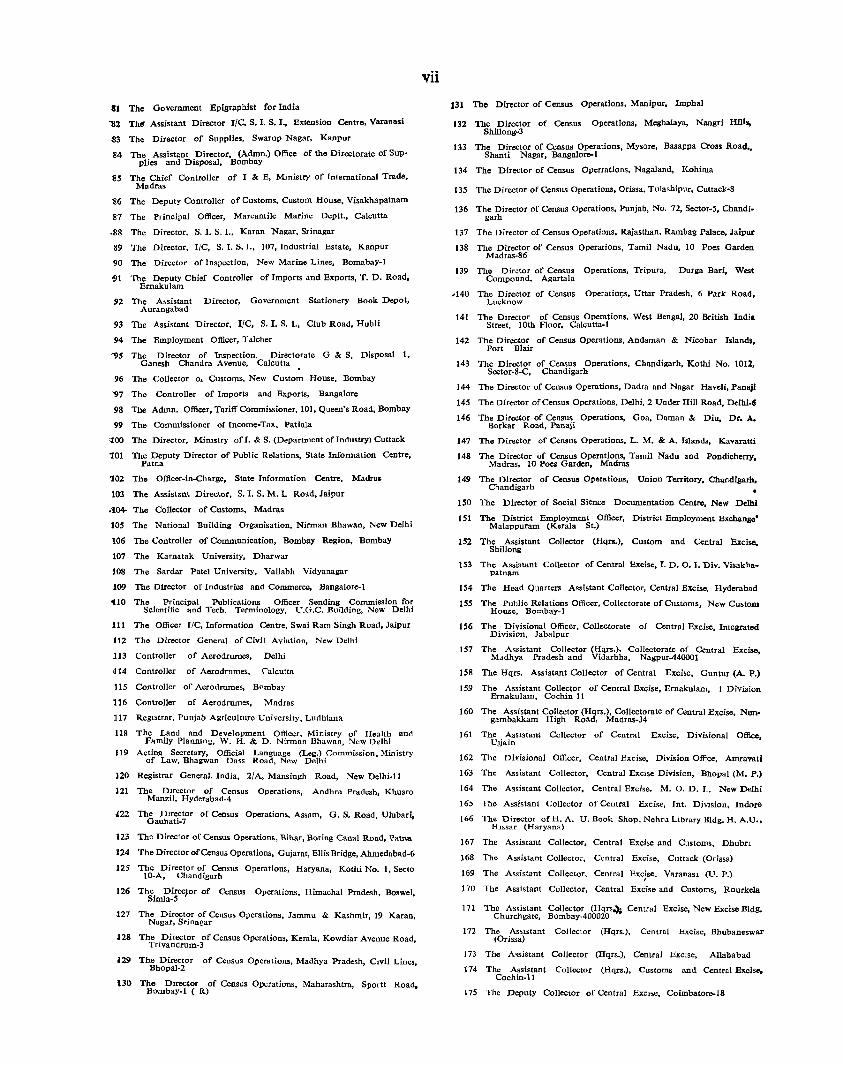
111 The Government Epigraphist for India
112 The' Assistant Director IIC, S. I. S. I.. Extension Centre, Varanasi
83 The Director of Supplies, Swamp Nagar, Kanpur
84 The Assistant Director, (Admn.) Office of the Directorate of Supplies and Disposal, Bombay
85 The Chief Controller of I & E, Mmistry of International Trade, Madras
86 The Deputy Controller of Customs, Custom House, Visakhapatnam
87 The Principal Officer, Marcantile Marine Deptt., Calcutta
.88 The Director, S. I. S. I.. Karan Nagar, Srinagar
89 The Director, IIC, S. T. S. r., 107, Industrial Estate, Kanpur
90 The Director of Inspection, New Marine Lines, Bomabay-l
91 The Deputy Chief Controller of Imports and Exports, T. D. Road, Ernakulam
92 The A~sistant Director. Government Stationery Book Depot, Auronsabad
93 The Assistant Director, IIC, S. 1. S. I., Club Road, HubIi
94 The Employment Officer, Talcher
'9S The Director of Inspection, Directorate G & S, Disposal I, Ganesh Chandra Avenue, Calcutta
96 The Collector o. Customs, New Custom House, Bombay
'97 The Controller of Imports and Exports, Bangalore
98 The Admn. Officer, Tariff Commissioner, 101, Queen's Road, Bombay
99 The Commissioner of Income·Tax, Patiala
~oo The Director, Mimstry of I. & S. (Department ofIndustry) Cuttack
101 The Deputy Director of Public Relations, State Information Centre, Patna
102 The Officer-in-Charge, State Information Centre, Madra.
103 The Assistant Director, S. I. S. M. I. Road, Jaipur
.104- The Collector of Customs, Madras
105 The National Building Organisation, Nirman Bhawan, New Delhi
106 The Controller of Communication, Bombay Region, Bombay
107 The Karnatak University, Dharwar
lOS The Sardar Patel University, Vallabh Vidyanagar
]09 The Director of Industries and Commerce, Bangalore-l
110 The Principal Publications Officer Sending Commission for Scientific and Tech. Terminology, U.G.c. Building, New Delhi
111 The Officer IIC, Information Centre, Swai Ram Singh Road, Jaipur
112 The Director Genera] of Civil Aviation, !'{ew Delhi
113 Controller of Aerodrumes, Delhi
1}14 Controller of Aerodrumes, Calcutta
115 Controller of Aerodrumes, B"mbay
116 Controller of Aerodromes, Madras
117 RegIstrar, Punjab Agriculture University, Ludh!ana
118 The Land and Development Officer, Ministry of Health and Family Planning, W. H. & D. Nirman Bhawan, New Delhi
119 Acting Secretary, Official Language (Leg.) Commission, .:\!inistry of Law, Bhagwan Dass Road, New Delhi
120 Registrar General, India, 2/A, Mansingh Road, New Delhi-l1
121 The DIrector of Census Operatjons, Andhra Pradesh, KhuSTO Manzil, Hyderabad-4
422 Th&ag:::i~~or of Census Operations, Assam, G. S. Road, Ulubari,
123 The Director of Census Operations, Bihar, Boring Canal Road, Patn"
124 The Director of Census Operations, Gujarat, Ellis Bridge, Ahmedabad-6
125 The Director of Census Operations, Haryana, Kothi No.1, Secta 10-A, Chandigarh
126 Th;im1~!5eclor of Census Operations, Himachal Pradesh, Boswel,
il27 The Director of Census Operations, Jammu & Kashmir, 19 Karan, Nagar, Srinagar
128 The Director of Census Operations, Kerala, Kowdiar Avenue Road, Trivandrum-3
129 The Director of Census Operations, Madhya Pradesh, CIvil Lines, BhopaJ-2
130 The Ducctor of Census Operations, Maharashtra, Sportt Road, Bombay-l ( R)
vii
]31 The Director of Census Operations, Manipur, !mphal
132 The Director of Census Operations, Mcghalaya, Nangri HIlis, Shillong-3
133 The Director of Census Operations, Mysore, Basappa Cross Road., Shanti Nagar, Bangalore-I
134 The Director of Census Oporrations, Nagaland, Kohima
135 The Director of Census Operations, Orissa, Tulashipur, Cuttack-S
136 The Director of Census Operations, Punjab, No. 72, Sector-5, Chandigarh
137 The Director of Census Operations, Rajasthan, Rambag Palace, Jaipur
138 The Director of Census Operations, Tamil Nadu, 10 Poes Garden Madras·86
139 The Diretor of Census Operations, Tripura, Durga Bari, West Compound, Agartala
... 140 The Director of Census Oporatiolfs, Uttar Pradesh, 6 Park Road, Lucknow
141 The Duector of Census Operations, West Bengal, 20 British India Street, 10th Floor, Calcutta-l
142 The Director of Census Operations, Andaman & Nicobar Islands, Port Blair
143 The Director of Census Operations. Chandigarh, Kothi No. IOn, Sector-SoC, Chandigarh
144 The Director of Census Operations, Dadr. and Nagar Haveli, Panajl
145 The Director ofCeosu. Operations, Delhi, 2 Under Hill Road, Delhi-6
146 The Director of Census Operations, Goa, Daman & Diu, Dr. A.. Borkar Road, Panaji
147 The Director of Census Operations, L. M. & A. Idanc4, Kavaratti
148 The Director of Census Operations, Tamil Nadu and Pondicherry, Madras, 10 Poes Garden, Madras
149 The Director of Census Operations, Union Territory, Chandigarh, Chandigarh
1 SO The Director of Social Sience Documentation Centre, New Delhi
151 The District Employment Officer, District Employment Exchaoae' Malappuram (Kerala St.)
152 The Assistant Collector (Hqrs.), Custom and Central Excise, Shillong
153 The Assistant Collector of Central Excise, I. D. O. 1. Div. Visakhapatnam
154 The Head Quarters Assistant Collector, Central Excise, Hyderabad
155 The Public Relations Officer, Collectorate of Customs, New Custom House, Bombay-l
156 The Divisional Officer, Collectorate of Central Excise, Integrated Division, JabaJpur
157 The Assistant Collector (Hqrs.), Collectorate of Central Excise, Mddhya Pradesh and Vidarbha, Nagpur-440001
ISS The Hqrs. Assistant Collector of Central Excise, Guntut (A. P.)
159 The Assistant Collector of Central Excise, Ernakulam, 1 Division Ernakulam, Cochin-II
160 The Assistant Collector (Hqrs.), Collectorate of Central Excise, Nungambakkam High Road, Madras-34
161 The AsSistant Collector of Central Excise, Di"isional Office, UJjain
162 The Divisional Officer, Central Excise, Division Offce, Amravati
163 The Assistant Collector, Central EXCIse Division, Bhopal (M. P.)
164 The Assistant Collector, Central Excise, M. O. D. T., New Delhi
165 The Assistant Collector of Central Excise, Int. DiVISion, Indore
166 The Director of H. A. U. Book Shop, Nehru Library Bldg. H. A.U., HH.sar (Hary:ma)
167 The Assistant Collector, Central Excise and Customs, Dhubn
168 The Assistant Collector, Central Excise, Cuttack (Orissa)
169 The Assistant Collector, Central Excise, VaronaSI (U. P.)
170 The Assistant Collector, Central Excise and Customs, Rourkela
171 The Assistant Collector (Hqrs,,); Central Excise, New Excise Bldg, Churchgate, Bombay-400020
172 The ASSIstant Col1ector (Hqrs.), Central Excise. Bhubaneswar (Orissa)
173 The A"istant Collector (Hqrs.l, Central Excise, Allahabad
174 The Assistant Collector (Hqrs.), Customs and Central Excise. Cochin-Ii
175 The Deputy Collector of Central ExcI", Coimbatore-18
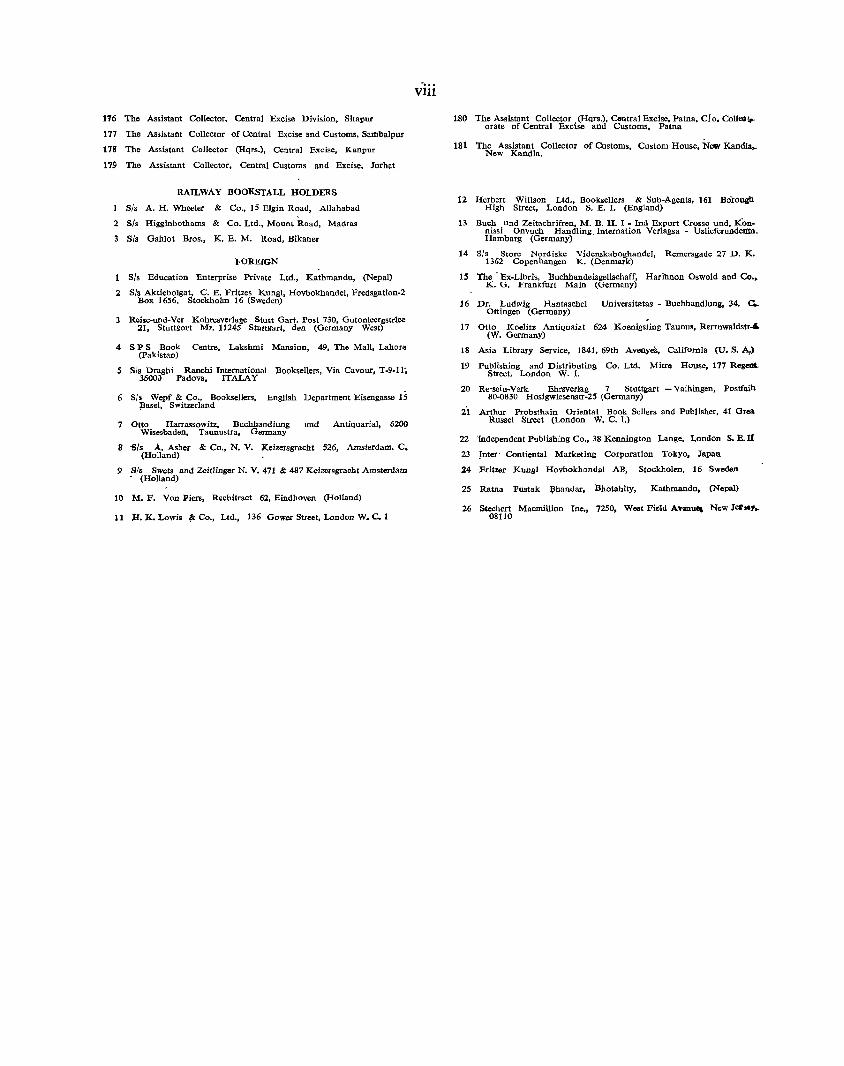
116 The Assistant Collector, Central Excise Divi>ion, Sitapur
177 The Assistant Collector of Central Excise and Customs, Sambalpur
178 The Assistant Collector (Hqrs.), Central Excise, Kanpur
179 The Assistant Collector, Central Customs and Excise, Jorhat
RAILWAY BOOKSTALL HOLDERS
S/s A. H. Wheeler & Co., 15 Elgin Road, Allahabad
2 S/. Higginbothams & Co. Ltd., Mount Road, Madras
S/s Gahlot Bros., K. E. M. Road, Bikaner
fOREIGN
S/. Education Enterprise Private Ltd., Kathmandu, (Nepal)
2 S/s Aktiebolgat, C. E. Fritzes Kungl, Hovbokhandel, Fredsgation-2 Box 1656, Stockhobn 16 (Swedcn)
Reise-und-Ver Kohresverlage Stutt Gart. Post 730, Gutonleergstriec 21, Stuttgort Mr. 11245 Stuttgart, den (Germany West)
4 S P S Book Centre, Lakshmi Mansion, 49, The Mall, Lahore (pakistan)
5 Sis Draghi Ranchi International Booksellers, Via Cavour, T-9-U', 35000 Padova, ITALAY
6 Sis Wepf & Co., Booksellers, English Department Bisengasse 15 ;Basel, Switzerland
7 Otto Harrassowitz, Buchhandiuog und Antiqu.ri.!, 6200 Wisesbaden, Taunustra, Germany
8 fils A. Asher & Co., N. V. Keizersgracht 526, Amsterdam. C. (Holland)
9 Sis Swets and Zcitlinger N. V. 471 & 487 Keizcrsgracht Amsterdam • (Holland)
10 M. F. Von Piers, Rechitract 62, Eindhoven (Holland)
11 H. K. Lowi. §< Co., Ltd., 136 Gower Street, London W. C. 1
.... Vlll
180 The Assistant Collector (Hqrs,), Central Excise, Patna, C/ o. ColleGtp. orate of Central Excise and Customs, Patna
181 The Assistant Collector of Customs, Custom House, New Kandl .... New Kandla.
12 Herbert Willson Ltd., Booksellers & Sub-Agents, 161 Borough High Street, London S. E. I. (England)
13 Buch und Zeitachrifren, M. B. H. I - Ind Export Crosso und, Konnissi Onvuch Handling. Internation Verlagsa - UslieferundetUn. Hambarg (Germany)
14 Sis Store Nordiske Videnskaboghandel, Remersgade 27 D. K. 1362 Copenhangen K. (Denmark)
15 The' Ex-Libris, Buchhandeisgellschaff, Harillnon Oswold and Co •• K. G. Frankfurt Main (Germany)
16 Dr. Ludwig Hantaschel Universitatas - Buchhandlung, 34. c.. Ottingen (Germany)
17 Otto Koelitz Antiquaiat 624 Koenig'ting Taunus, Rerrnwaldstr-6. ('N. Germany)
18 Asia Library Service, 1841, 69th AvenyeS, California (U. S. A,)
19 Publishing and Distributing Co. Ltd. Mitre House, 177 RegeQt.. Street, London W. I.
20 Re-sei u-Verk Ehrsverlag 7 Stuttgart - Vaihingen, Postfaih 80-0830 Hosigwiesenstr-25 (Germany)
21 Arthur Probsthain Oriental Book Sellers and Publisher, 41 Grea Russe! Street (London W. C. 1.)
22 Independent Publishing Co., 38 Kennington Lange, London S. E. U
23 Inter' Contienta! Marketing Corporation Tokyo, Japan
24 Fritzer Kung! Hovbokhondal AB, Stockholen, 16 Sweden
25 Ratna Pustak ~handar, Bhotahity, Kathmandu, (Nepal)
26 Stechert MacmiUion Ine., 7250, West Field ATcnu~ New JeJI ... y~ 08110