optcl - SLDC Orissa
23
OPTCL (Approved by OERC vide Letter No. OERC-Engg-5/98 (Vol.XIX)/ 1427 dt. 15.10.2018) PERFORMANCE OF THE TRANSMISSION SYSTEM OF OPTCL FOR 2017-2018 [This report is prepared in pursuance of Licence Condition 16.7 & Clause 13.7 of Appendix-4B of the OERC (Conduct of Business) Regulations, 2004]
-
Upload
khangminh22 -
Category
Documents
-
view
0 -
download
0
Transcript of optcl - SLDC Orissa

OPTCL
(Approved by OERC vide Letter No. OERC-Engg-5/98 (Vol.XIX)/ 1427 dt. 15.10.2018)
PERFORMANCE OF THETRANSMISSION SYSTEM
OF OPTCLFOR 2017-2018
[This report is prepared in pursuance of Licence Condition 16.7 & Clause 13.7 ofAppendix-4B of the OERC (Conduct of Business) Regulations, 2004]

SALIENT FEATURE ON PERFORMANCE OF TRANSMISSION SYSTEM OF OPTCL DURING THE YEAR 2017-181. Procurement of Power:
2. Voltages profile of Major Grid Sub-stationsAllowable Range (245-198 KV) Allowable Range (145 -122 KV)
Sl.No.
Name of the220/132 kV Grid
Sub-station
MaximumVoltage in
kV
MinimumVoltage in
kV
Sl.No.
Name of the132/33 kV Grid
Sub-station
MaximumVoltage in
kV
MinimumVoltage in
kV1 Jaynagar 243 218 1 Cuttack 140 1142 Theruvali 241 203 2 Berhampur 147 1103 Bhanjanagar 239 212 3 Puri 136 1084 Chandaka 235 206 4 Khurda 137 1205 Narendrapur 247 1976 Joda 240 212
7 Tarkera 243 211
8 Budhipadar 234 215
9 Duburi 239 218
10 Balasore 238 209
11 Meramundali 233 220
12 Bidanasi 244 215
13 Katapalli 236 206
14 Bhadrak 241 200
15 Paradeep 238 208
16 Bolangir 232 208
17 Mendhasal 236 207
3. System Interruptions due to Major Incident:
INTERRUPTION DUE TO MAJOR INCIDENTIncident Duration ofInterruption No. ofInterruption
Duration ofInterruption
(Hrs:Min:Sec)
No. ofInterruption
Remarks
Snapping of Jumper /Conductor / Earth wire 75:38:00 56 The duration of interruption
indicated is the sum total ofinterruptions occurred at
different areas (S/s) during theyear. However there was no
total blackout experienced forthe State during the year
2017-18.
Insulator Failure 07:10:00 29Bursting of CT / PT 0:34:00 8Breaker Problem 0:00:00 0Major System Disturbance 0:27:00 8Failure of LA 18:13:00 21Others 44:55:00 70
Note: Issued in the Public interest. Detailed report on Performance of Transmission System of OPTCL is available in SLDC websitei.e., www.sldcorissa.org.in
Source Commission’sApproval
( MU)
Actual Drawl for theState Consumption
(MU)
Remarks
OHPC 5881.74 5589.601
State’s Maximumand Minimumdemand was
4515 MW and3171 MW
respectively
Thermal(TTPS+OPGC) 6024.43 5900.135CPP ---- 649.423Renewable Generation 763 686.628IPP 7060.49 2766.025EREB 6321.97 10050.643
Net Banking +IEX+OA -250.79Total 26051.63 25391.665

COMMISSION’S OBSERVATION ON THE PERFORMANCE OF THETRANSMISSION SYSTEM OF OPTCL FOR 2017-18
The salient features of the performance of transmission system of OPTCL for the year
2017-18 is given below and the detail information in support to that is available in SLDC
website i.e., www.sldcorissa.org.in
A. Procurement of Power:
The Commission had approved the purchase of power by GRIDCO from various
sources in the ARR & Tariff order for 2017-18 against which the actual performance have
been indicated in the following table:
There is an import of 388.1850 MU through power banking, open access, trading &
IEX) and export of 638.974MU (51.521 as sales to other utilities, 127.345 on account of
deviation and 460.108 through trading, OA, banking & IEX export) during the FY 2017-18.
Hence, in the said financial year GRIDCO has an export of 250.79 MU on this account.
2. During FY 2017-18 the daily peak demand touched at 4515 MW maximum on
dt.29.03.2018 and a minimum of 3171 MW on dt.23.11.2017. The peak demand of 4515 MW
in 2017-18 is about 410 MW higher than the peak demand experienced during the previous
year 2016-17 (4105 MW). The total energy drawl is 25392 MU in FY 2017-18 against 24273
MU in FY 2016-17, which indicates the enhancement in electricity consumption of around
1119 MU in the State.
Source Commission’sApproval
( MU)
Actual Drawl forthe State
Consumption (MU)
Remarks
OHPC 5881.74 5589.601 State’sMaximum and
Minimumdemand was
4515 MW and3171 MW
respectively
Thermal(TTPS+OPGC) 6024.43 5900.135CPP ---- 649.423Renewable Generation 763 686.628IPP 7060.49 2766.025EREB 6321.97 10050.643
Net Banking +IEX+OA -250.79Total 26051.63 25391.665

B. Line Interruption:3. OPTCL’s system has faced aggregated Annual interruptions varying from 27 minutesto 75 hours at different locations on account of conductor/jumper/earth wire snapping,insulator failure, bursting of Current Transformer/Potential Transformer, breaker problem,system disturbance, Lightening Arrester failures and others. However, OPTCL has claimedthat it has arranged to maintain power supply without resorting to total power failure. The sameeffort has been made by OPTCL in maintaining uninterrupted power supply even in the eventof generation failures. It has been reported about 87.50, 82.50 and 13 hours of load restrictionduring the second, third and fourth quarter respectively for the FY 2017-18 on rotation basis.The load restriction has been imposed to curtail the demand. OPTCL claimed that there was noblack out experienced in the State during the FY 2017-18. OPTCL should find out latesttechnical methods for effective utilization of existing level transmission system to increasepower transfer capacity, reliability avoiding RoW problem. OPTCL is required to maintain thesystem to ensure power supply without interruptions in any part of the State and ISGS ofEastern Region. The Commission expects OPTCL to plan O&M and R&M activities withprovision of advanced metering/protection/communication system with modern automation.Further, OPTCL should maintain S/Ss without overloading in consultation with DISCOMswith additional capacity whenever required.
C. Frequency Profile:4. As per the provisions in Indian Electricity Grid Code Regulations, 2010, all users,SEBs, SLDCs, distribution licensee & bulk consumer shall take all possible measures to ensurethat grid frequency always remains within 49.90 to 50.05 Hz band. OPTCL, in 2017-18, hasexperienced frequency as low as 49.63 Hz during 1st quarter and as high as 50.33 Hz during 2nd
quarter. DISCOMs should be coordinated to adhere to their drawl schedule in order to reducetheir drawl from the grid during low frequency and maintain grid discipline.
D. Voltage Profile:5. The EHT voltage, as per Regulations 3(1)(b) of Central Electricity Authority(GridStandards) Regulations, 2010 should be in the range 122-145 kV for voltage at 132 kV, 198-245 kV for voltage at 220 KV and 380-420 kV for 400 kV level. OPTCL has howeverexperienced 197 kV minimum and 247 kV maximum in its 220 kV system and 108 kVminimum and 147 kV maximum in its 132 kV system. OPTCL is advised to take suitablemeasures to maintain the voltage profile within the allowable limit. OPTCL should alsomonitor the reactive drawl of DISCOMs from its grid S/S and wherever DISCOM drawexcessive reactive load at low voltage condition, it shall take up with them for remedial

measure. Further, OLTC of the Power Transformers should be in healthy condition and all thefield engineers and staff should be continuously trained to operate OLTC during peak and lowload condition of the day.
E. Load Restriction:
6. M/s. OPTCL has claimed that the load restriction due to non-availability of the
transmission capacity as ‘NIL’ which in turn indicates that during FY 2017-18 that OPTCL
system availability was 100%. The projects in the pipe-line already approved by the
Commission should be completed by OPTCL within the time schedule to avoid cost & time
over-run. Simultaneously, OPTCL needs to avoid under loading of lines & reduce reactive
power to minimise system losses and should conduct comprehensive system study before
proceeding for any network expansion plan. In order to resolve the local RoW issues, OPTCL
should take up the matter with local elected representatives and District Administration to
resolve the local RoW issues. Local/ regional benefits of better quality of supply should be
informed to the public through mass communication.
F. Efficient Operation of Transmission System:
7. SLDC, being the nerve center of the electricity sector in Odisha should strengthen its
IT, communication infrastructure etc. and train its staff’s appropriately for efficient
functioning. SLDC to act independently in accordance with law, while granting Open Access
to the Users.
****


9923.298
8614.638
649.423 -71.923686.628
GRID DEMAND FOR THE YEAR 2017-18[Total Drawal 25391.665 MU ]
Page-2
5589.601
8614.638
Net EREB Total Hydro NET Thermal (OPGC + TTPS+IPP) CPP Net (BankingPower+IEX+STOA) Renewable Energy

DAILY PEAK DEMAND (MW) EXCLUDING TRADING FOR THE YEAR 2017-18
Day Apr-17 May-17 Jun-17 Jul-17 Aug-17 Sep-17 Oct-17 Nov-17 Dec-17 Jan-18 Feb-18 Mar-18 Max Min1 3903 3734 3630 3641 3997 3502 3965 4158 3622 3485 3860 3867 4158 34852 3699 4004 3735 3932 3695 3726 3840 3807 3597 3543 3832 3839 4004 35433 3726 3785 3819 3773 3700 3859 3985 3839 3524 3580 3895 4254 4254 35244 3682 4281 4009 3727 3802 3897 4056 3747 3625 3666 3888 4238 4281 36255 4026 4207 3857 4233 3760 3824 3944 3739 3799 3734 3971 3959 4233 37346 4033 3721 3682 4008 3939 3968 4095 3823 3668 3733 4105 4141 4141 36687 4068 3847 3848 3738 3828 4035 4277 3613 3676 3666 4133 3969 4277 36138 3997 3743 3753 3799 3831 3909 4338 3659 3365 3658 4145 3947 4338 33659 4033 3573 3763 3734 3861 3886 4231 3486 3558 3693 3956 3992 4231 348610 4064 3922 3540 3699 4152 3870 4438 3519 3574 3821 3985 3987 4438 351911 4042 3721 3316 3909 4109 3929 4349 3669 3686 3856 3937 4009 4349 331612 3934 4054 3402 3599 3887 3658 4150 3774 3633 4013 4211 4060 4211 340212 3934 4054 3402 3599 3887 3658 4150 3774 3633 4013 4211 4060 4211 340213 3994 3642 3746 3620 3827 3781 4102 3828 3687 4081 3841 4005 4102 362014 3964 3874 3432 3802 3798 3958 4283 3840 3675 3977 3881 4384 4384 343215 4119 3913 3254 4000 3870 4023 3911 3466 3552 3709 4068 4471 4471 325416 3694 4006 3785 3892 4076 4104 3985 3511 3595 4111 3768 3777 4111 351117 4160 4122 3751 4050 3843 4246 4095 3417 3884 3906 3752 3966 4246 341718 3988 3928 3653 3977 3869 3941 4147 3289 3685 3885 3884 4032 4147 328919 3751 3809 3825 3594 3750 3842 3917 3181 3756 3965 3922 4358 4358 318120 3937 3693 3551 3689 3970 3984 3805 3271 3552 4111 3967 4018 4111 327121 3963 3989 3239 3944 3953 4273 4309 3208 3573 3919 4036 4435 4435 320822 4267 3946 3801 3768 4012 4052 4188 3314 3615 3866 3962 4277 4277 331423 3986 4026 3544 3480 3879 4243 4491 3171 3964 3998 3768 4115 4491 317124 4104 3893 3259 3755 3899 4319 4276 3381 3959 3915 4015 4041 4319 325925 4081 4044 3428 3827 4085 4147 4093 3507 3880 4015 3930 4063 4147 342826 4299 3749 3630 3775 4269 4375 4083 3459 3603 3781 4025 4078 4375 345927 4123 3859 3657 3663 3892 4181 4426 4069 4230 4046 4060 4055 4426 365728 4111 3654 3614 3922 3538 4075 4345 4085 3933 4251 4080 4091 4345 353829 3949 3866 3738 3976 3989 4108 3984 3627 4010 4185 4211 4515 4515 362730 3976 3808 3607 3723 3974 3944 4058 3519 3661 3957 4098 4098 351931 3958 3794 3995 4000 3591 3856 3767 4000 3591
MAX 4299 4281 4009 4233 4269 4375 4491 4158 4230 4251 4211 4515 4515 3734MIN 3682 3573 3239 3480 3538 3502 3805 3171 3365 3485 3752 3767 4000 3171
Page-3
Page-3
Page-3
Page-3

Page - 4
-300-200-1000100200300400500600700800900100011001200130014001500160017001800190020002100
Dem
and
(MW
)
HoursHOURLY DEMAND CURVE FOR 25.11.2000 (MAX PEAK DEMAND OF THE YEAR 2000-01)Grid Demand Hydro Thermal CPP Central Sector Export to APTRANSCO
2200240026002800300032003400360038004000420044004600
Dem
and
(MW
)
COMPARISON OF MONTHLY PEAK DEMAND (MW) EXCLUDING TRADING FOR THEYEAR ENDING 2016-17 & 2017-18
Page - 4
-300-200-1000100200300400500600700800900100011001200130014001500160017001800190020002100
Dem
and
(MW
)
HoursHOURLY DEMAND CURVE FOR 25.11.2000 (MAX PEAK DEMAND OF THE YEAR 2000-01)Grid Demand Hydro Thermal CPP Central Sector Export to APTRANSCO
Apr May June Jul Aug Sept Oct Nov Dec Jan Feb Mar2016-17 4097 3965 4052 4072 4105 3936 3995 3866 3831 3794 3845 40642017-18 4299 4281 4009 4233 4269 4375 4491 4158 4230 4251 4211 4515
0200400600800
1000120014001600180020002200
Dem
and
(MW
)
Month
2016-17 2017-18
Annual Peak Demand : 2017-18 - 4515 MW 2016-17 - 4105 MW

Page - 5
-300-200-1000100200300400500600700800900100011001200130014001500160017001800190020002100
Dem
and
(MW
)
HoursHOURLY DEMAND CURVE FOR 25.11.2000 (MAX PEAK DEMAND OF THE YEAR 2000-01)Grid Demand Hydro Thermal CPP Central Sector Export to APTRANSCO
-300-200-1000100200300400500600700800900100011001200130014001500160017001800190020002100
Dem
and
(MW
)
HoursHOURLY DEMAND CURVE FOR 25.11.2000 (MAX PEAK DEMAND OF THE YEAR 2000-01)Grid Demand Hydro Thermal CPP Central Sector Export to APTRANSCO
-300-200-1000100200300400500600700800900100011001200130014001500160017001800190020002100
Dem
and
(MW
)
HoursHOURLY DEMAND CURVE FOR 25.11.2000 (MAX PEAK DEMAND OF THE YEAR 2000-01)Grid Demand Hydro Thermal CPP Central Sector Export to APTRANSCO
12001400160018002000220024002600
Ener
gy D
eman
d (M
U)
COMPARISON OF MONTHLY ENERGY DEMAND (MU) EXCLUDING TRADING & RETURNBANKING POWER FOR THE YEAR ENDING 2016-17 & 2017-18
Page - 5
-300-200-1000100200300400500600700800900100011001200130014001500160017001800190020002100
Dem
and
(MW
)
HoursHOURLY DEMAND CURVE FOR 25.11.2000 (MAX PEAK DEMAND OF THE YEAR 2000-01)Grid Demand Hydro Thermal CPP Central Sector Export to APTRANSCO
-300-200-1000100200300400500600700800900100011001200130014001500160017001800190020002100
Dem
and
(MW
)
HoursHOURLY DEMAND CURVE FOR 25.11.2000 (MAX PEAK DEMAND OF THE YEAR 2000-01)Grid Demand Hydro Thermal CPP Central Sector Export to APTRANSCO
-300-200-1000100200300400500600700800900100011001200130014001500160017001800190020002100
Dem
and
(MW
)
HoursHOURLY DEMAND CURVE FOR 25.11.2000 (MAX PEAK DEMAND OF THE YEAR 2000-01)Grid Demand Hydro Thermal CPP Central Sector Export to APTRANSCO
Apr May June Jul Aug Sept Oct Nov Dec Jan Feb Mar2016-17 2213 2219 2181 2153 2139 2058 2063 1785 1791 1825 1734 21102017-18 2284 2340 2091 2126 2257 2227 2231 1879 1878 1927 1850 2301
0200400600800
100012001400
Ener
gy D
eman
d (M
U)
Month
Annual Energy Demand : 2016-17 - 24273 MU 2017-18 - 25392 MU

21002200230024002500260027002800290030003100320033003400350036003700380039004000
Dem
and
(MW
)
DEMAND CURVE FOR HOURLY AVERAGE DEMAND EXCLUDING TRADING FOR YEAR ENDING MARCH 2018
Page - 6
1 2 3 4 5 6 7 8 9 10 11 12 13 14 15 16 17 18 19 20 21 22 23 24
Avg Demand 3241 3177 3125 3106 3170 3277 3319 3385 3307 3245 3218 3180 3114 3008 3007 3108 3173 3271 3586 3791 3754 3632 3469 3363
0100200300400500600700800900
1000110012001300140015001600170018001900200021002200
Dem
and
(MW
)
Hours

Hourly Average Demand (Month wise) in support of Page-6
Hours---> 1 2 3 4 5 6 7 8 9 10 11 12 13 14 15 16 17 18 19 20 21 22 23 24
Apr-17 3602 3525 3465 3422 3451 3430 3250 3233 3180 3189 3250 3326 3352 3328 3379 3468 3392 3166 3454 3887 3913 3842 3807 3797
May-17 3533 3458 3398 3375 3393 3300 3148 3156 3142 3198 3283 3372 3456 3465 3518 3573 3425 3112 3180 3612 3665 3666 3652 3669
Jun-17 3302 3213 3157 3105 3106 3063 3008 3027 2974 2984 3041 3118 3112 3049 3077 3129 3039 2890 2989 3437 3497 3485 3456 3367
Jul-17 3364 3283 3229 3185 3219 3254 3262 3307 3237 3193 3126 3107 3054 2985 2983 3066 3091 3088 3332 3775 3781 3693 3573 3440
Aug-17 3474 3401 3336 3316 3345 3382 3334 3355 3280 3221 3189 3163 3108 3020 3026 3084 3128 3183 3496 3833 3852 3791 3689 3647
Page - 6(a)
Aug-17 3474 3401 3336 3316 3345 3382 3334 3355 3280 3221 3189 3163 3108 3020 3026 3084 3128 3183 3496 3833 3852 3791 3689 3647
Sep-17 3662 3598 3548 3527 3563 3603 3537 3547 3476 3444 3412 3387 3374 3329 3380 3433 3416 3435 3800 3867 3874 3817 3756 3821
Oct-17 3559 3502 3448 3423 3468 3556 3553 3605 3534 3467 3425 3368 3291 3215 3243 3351 3429 3686 4077 4090 4020 3900 3773 3673
Nov-17 2696 2624 2586 2603 2753 3010 3086 3171 3075 2994 2969 2859 2722 2539 2509 2667 2912 3319 3586 3512 3370 3227 2959 2774
Dec-17 2493 2450 2412 2419 2552 2888 3214 3389 3260 3121 3012 2883 2708 2495 2436 2611 2873 3391 3692 3635 3479 3190 2834 2608
Jan-18 2704 2667 2619 2626 2757 3063 3431 3656 3536 3349 3219 3063 2902 2684 2601 2743 2948 3357 3806 3841 3727 3467 3074 2830
Feb-18 3002 2975 2929 2920 3019 3252 3514 3659 3556 3389 3292 3179 3031 2843 2781 2923 3113 3328 3833 3950 3832 3595 3313 3120
Mar-18 3502 3432 3379 3352 3408 3520 3497 3516 3434 3387 3392 3332 3258 3142 3147 3250 3315 3294 3783 4056 4038 3909 3736 3613Avg.Annual 3241 3177 3125 3106 3170 3277 3319 3385 3307 3245 3218 3180 3114 3008 3007 3108 3173 3271 3586 3791 3754 3632 3469 3363
Page - 6(a)

140016001800200022002400260028003000320034003600380040004200
Dem
and
(MW
)HOURLY DEMAND CURVE FOR 29.03.2018 (MAX PEAK DEMAND OF THE YEAR (2017-18)
Page-7
1 2 3 4 5 6 7 8 9 10 11 12 13 14 15 16 17 18 19 20 21 22 23 24
Grid Demand (Excluding Trading) 3410 3313 3259 3225 3221 3247 3146 3189 3125 3096 3085 3073 3030 3027 3098 3171 3292 3262 3752 4044 4068 4105 3871 3760
Hydro 819 791 706 718 736 853 642 674 429 628 621 539 424 472 650 826 838 661 840 1324 1303 1182 1077 992
Thermal 794 789 791 791 794 791 794 792 796 795 794 799 798 798 795 775 780 782 785 797 795 793 791 796
CPP 323 305 314 294 287 300 324 306 300 305 326 325 305 303 324 301 308 354 420 436 438 435 394 306
Central Sector 1638 1785 1853 1759 1810 1696 1754 1727 1859 1725 1657 1638 1815 1828 1619 1633 1559 1599 1781 1629 1611 1692 1705 1777
Bilateral -107 -115 -115 -115 -109 -103 -82 -84 27 158 169 142 210 128 124 -27 105 113 31 -14 -85 -79 -91 -91
IPP 326 319 251 251 257 317 327 327 264 261 256 327 263 260 327 328 327 327 310 328 328 327 327 327
-400-200
0200400600800
100012001400
Dem
and
(MW
)
Hours
Grid Demand (Excluding Trading) Hydro Thermal CPP Central Sector Bilateral IPP
Page-7

80010001200140016001800200022002400260028003000320034003600
Dem
and
(MW
)
HOURLY DEMAND CURVE FOR 23.11.2017 (MIN PEAK DEMAND OF THE YEAR 2017-18)
Page
-8
1 2 3 4 5 6 7 8 9 10 11 12 13 14 15 16 17 18 19 20 21 22 23 24
Grid Demand (Excluding Trading) 3269 3212 3252 3166 3250 3172 3008 3164 3049 2991 3158 3210 3228 3265 3048 2541 1986 1988 1999 2519 2524 2549 2599 2853
Hydro 105 89 89 91 110 249 188 263 196 135 189 121 129 115 157 157 351 537 376 251 191 295 91 90
Thermal 601 603 603 609 604 604 605 605 603 603 604 600 602 603 608 605 606 607 607 605 605 605 604 607
CPP 277 293 241 244 251 273 251 289 292 307 334 351 347 377 285 343 347 371 417 490 465 462 484 409
Central 470.7 477.5 477.5 477.5 541.8 595.5 589.7 568.9 572.2 497.0 606.3 688.2 704.7 541.0 275.4 427.5 568.1 618.2 665.6 839.9 895.0 887.3 597.9 607.7
Bilateral -103 -112 -112 -112 -109 -100 -100 -84 -77 -48 -26 -46 -46 128 128 -48 -56 60 53 -54 -88 -96 -103 -109
IPP 0 0 0 0 0 0 0 0 0 0 0 0 0 0 0 0 0 0 0 0 0 0 0 0
-600-400-200
0200400600800D
eman
d (M
W)
Hours
Grid Demand (Excluding Trading) Hydro Thermal CPP Central Bilateral IPP

1
Installed Energy Energy Drawalcapacity Generation (incl. Aux) by GRIDCO
(MW) (MU) (MU)A. STATE SECTOROHPC(Hydro)* 2008.5 5792.022 5589.601OPGC (Thermal) 420 2842.351 2516.293TTPS (Thermal) 460 3486.312 3378.684TTPS (UI-OD) 5.158IPPs 2766.025CPP (Synchronised to OPTCL System) 649.423Renewable Energy Including Co-gen - 686.628B. CENTRAL SECTOR
Orissa Share Hydro
Thermal189.40
1203.03 - 10050.643C. Banking Power+OA+Trading+IEX (Import) 388.185
TOTAL DRAWAL 26030.638D. Banking Power+OA+Trading+IEX (Export) 460.108E. Deviation(Export) 127.345F. Sold to Other Utilities 51.521 Net GRIDCO demand 25391.665
Export to ICCL 26.361 Export to NALCO 8.068
* Includes Orissa share from Machhkund.
2 TRANSMISSION LINES AND SUBSTATIONSAs on Capacity Addition As on
31.03.2017 in 2017-2018 1.4.2018
400 kV line (ckt.km) 1129.434 3.970 1133.404 400KV Indravati-IndravatiPG
SECTOR
Remark
INSTALLED CAPACITY (AS ON 31.3.2018) ENERGY GENERATION / ENERGYDRAWAL BY OPTCL
A.CIRCUIT LINES
Page - 9
400 kV line (ckt.km) 1129.434 3.970 1133.404 400KV Indravati-IndravatiPG
220kV line (ckt.km) 5911.208 11.604 5922.812 - 132kV line (ckt.km) 6030.821 354.871 6385.692 -
B. SUBSTATIONS 400 / 220 /132kV (nos.) 2 0 2 - 400 / 220 (nos.) 1 0 1 - 220/132/33kV (nos.) 20 1 21 ( Baragarh New ) 220/33kV (nos.) 7 1 8 ( Bonai ) 132/33 kV (nos.) 79 6 85 Tusura, Muniguda, Tirtol,
Podagada, Dhenkikote,Kantabanji .
132/33/25 kV (nos.) 1 0 1 - 132/33/11 kV (nos.) 2 0 2 - 132/11 kV (nos.) 0 0 0 - 132kV Switching Stations (OPTCL) 4 0 4 - 132kV LILO Switching Stationsof Industries
16 0 16 -
Total 132 8 140 -
Note: 1. (The above data in (2) are received from O & M branch of OPTCL system.)Capacity addition details for 220kV:
Capacity addition details for 132kV:1. 132 kV Nuapatna LILO (on 132kV Meramundali - AratiCkt earlier termed as Chainpal - Choudwarckt-I)–35ckm2. 132 kV Tusura LILO DC(132 kV ACME - Saintala Line) –25.438ckm3.132 kV Salipur - Kendrapara SC(on DC Towers)– 34.4ckm4.132 kV Kuchei - Jaleswar DC– 158.564ckm5.132 kV Lapanga - Rengali RTSS – 12.308ckm6.132 kV Tirtol LILO DC ( Paradeep - Jagatsinghpur Line)– 10.84ckm7.132 kV Podagada LILO DC ( Jayanagar - Rayagada Line)– 2.235ckm8.132 kV Muniguda LILO DC (On Therubali - Kesinga SC))– 3.8ckm9.132 kV Karanjia - Dhenkikote SC (in DC Towers)– 41.902ckm10. 132 kV Khariar - Kantabanji SC (in DC Towers)- 33ckm11.132 kV Kantabanji Traction SC - 4ckmUpgraded1.132 kV Dhenkanal - Nuapatna SC (in DC Towers)-(-) 2.116ckm2.132 kV Kuchei - Jaleswar DC (Charged a portion from Bhogarai LILO to JaleswarLoc 284 to Loc. 301)- (-)4.5ckm
1. 220 kV Bonai LILO DC(220 kV Rengali - Tarkera Ckt-I)- 5.534 ckm2. 220 kV Pandiabil LILO DC ( Atri - Pandiabil ckt - 1)- 3 ckm3. 220 kV Pandiabil LILO DC ( Atri - Pandiabil ckt -II)- 3 ckm4. 220 kV Bargarh New LILO DC (220 kV Katapalli - New BolangirCkt-I)- 0.07ckm
1. 132 kV Nuapatna LILO (on 132kV Meramundali - AratiCkt earlier termed as Chainpal - Choudwarckt-I)–35ckm2. 132 kV Tusura LILO DC(132 kV ACME - Saintala Line) –25.438ckm3.132 kV Salipur - Kendrapara SC(on DC Towers)– 34.4ckm4.132 kV Kuchei - Jaleswar DC– 158.564ckm5.132 kV Lapanga - Rengali RTSS – 12.308ckm6.132 kV Tirtol LILO DC ( Paradeep - Jagatsinghpur Line)– 10.84ckm7.132 kV Podagada LILO DC ( Jayanagar - Rayagada Line)– 2.235ckm8.132 kV Muniguda LILO DC (On Therubali - Kesinga SC))– 3.8ckm9.132 kV Karanjia - Dhenkikote SC (in DC Towers)– 41.902ckm10. 132 kV Khariar - Kantabanji SC (in DC Towers)- 33ckm11.132 kV Kantabanji Traction SC - 4ckmUpgraded1.132 kV Dhenkanal - Nuapatna SC (in DC Towers)-(-) 2.116ckm2.132 kV Kuchei - Jaleswar DC (Charged a portion from Bhogarai LILO to JaleswarLoc 284 to Loc. 301)- (-)4.5ckm
Page - 9

3 PERFORMANCE OF OPTCL DURING 2017 - 18
3 A. POWER SUPPLY SECURITY3 A.1 Load Restriction due to non-availability of Generation / Failure of generating Stations.
Duration 1st Qtr. 2nd Qtr. 3rd Qtr. 4th Qtr. Annual(In Hrs) 0.00 87.50 82.50 13.00 183.00Percentage(%) 0.00 3.96 3.74 0.60 2.09
* Load restriction imposed in the State on rotation basis to curtail the demand.3 B. TRANSMISSION SECURITY3 B.1 Load Restriction due to non-availability of Transmission capacity
Duration 1st Qtr. 2nd Qtr. 3rd Qtr. 4th Qtr. Annual(In Hrs) 0 0 0.00 0 0Percentage(%) 0.00 0.00 0.00 0.00 0.00
3 B.2 Rescheduling of Generation due to non- availability of Transmission capacity
Duration 1st Qtr. 2nd Qtr. 3rd Qtr. 4th Qtr. Annual(In Hrs) 0 0 0 0 0Percentage(%) 0 0 0 0 0
3 C OVERALL PERFORMANCE3 C-1 FREQUENCY
(i) Above 50.05 Hz
Page-10
(i) Above 50.05 HzDuration 1st Qtr. 2nd Qtr. 3rd Qtr. 4th Qtr. Annual(In Hrs) 476.98 468.85 308.22 293.72 1547.77Percentage(%) 21.84 21.23 13.96 13.60 17.67
(ii) Maximum continous period beyond 50.05 HzDuration 1st Qtr. 2nd Qtr. 3rd Qtr. 4th Qtr. Annual(In Hrs) 2.63 1.40 1.63 0.78 2.63Percentage(%) 0.12 0.06 0.07 0.04 0.03
(iii) Maximum Frequency occurrence
Duration 1st Qtr. 2nd Qtr. 3rd Qtr. 4th Qtr. AnnualHz 50.33 50.32 50.27 50.30 50.33Date/Time 21.05.17 17.09.17 19.11.17 31.01.18 21.05.17
18:03hr 06:04hr 06:02hr 21:59hr 18:03hr
(iv) Below 49.9 HzDuration 1st Qtr. 2nd Qtr. 3rd Qtr. 4th Qtr. Annual(In Hrs) 155.20 147.30 267.03 184.05 753.58Percentage(%) 7.11 6.67 12.09 8.52 8.60
(v) Maxm. Continous period below 49.9 HzDuration 1st Qtr. 2nd Qtr. 3rd Qtr. 4th Qtr. Annual(In Hrs) 0.93 0.88 1.28 0.75 1.28Percentage(%) 0.043 0.040 0.058 0.035 0.015
(vi) Lowest Frequency OccurrenceDuration 1st Qtr. 2nd Qtr. 3rd Qtr. 4th Qtr. AnnualHz 49.66 49.63 49.65 49.64 49.63Date/Time 11.05.17 23.09.17 07.11.17 31.01.18 23.09.17
15:12 hr 18:27 hr 06:41 hr 20:48hr 18:27 hr
Page-10

3. C - 2 VOLTAGE PROFILE ( 2017-2018 )MAXIMUM VOLTAGES OF MAJOR GRID SUB-STATIONS. ( 220kV )
Quarter - 1 Quarter - 2 Quarter - 3 Quarter - 4 ANNUAL
Voltagein kV Date Time in
Hrs.Voltage
in kV Date Time inHrs.
Voltagein kV Date Time in
Hrs.Voltage
in kV Date Time inHrs.
Voltagein kV Date Time in
Hrs.
1 Jaynagar 242.77 06.05.17 18:15 240.748 18.09.17 16:00 240.98 04.11.17 04:30 240.00 26.01.18 02:45 242.77 06.05.17 18:152 Theruvali 240.86 06.05.17 18:15 238.79 20.08.17 16:00 237.23 14.10.17 10:00 236.76 09.01.18 12:00 240.86 06.05.17 18:153 Bhanjanagar 238.21 20.05.17 17:45 238.90 18.09.17 16:00 239.48 06.10.17 17:00 238.27 26.01.18 02:45 239.48 06.10.17 17:004 Chandaka 231.973 05.06.17 08:30 234.63 12.09.17 15:45 234.69 04.12.17 02:45 234.34 15.01.18 03:15 234.69 04.12.17 02:455 Narendrapur 246.58 06.05.17 18:15 247.10 22.09.17 15:30 239.25 19.12.17 11:30 233.82 26.01.18 02:45 247.10 22.09.17 15:306 Joda 239.42 13.05.17 22:45 239.36 24.07.17 06:15 240.06 20.10.17 06:15 232.32 06.01.18 03:15 240.06 20.10.17 06:157 Tarkera 235.84 28.06.17 13:45 237.46 14.08.17 17:00 243.17 06.12.17 10:30 239.71 08.01.18 13:15 243.17 06.12.17 10:308 Budhipadar 233.18 28.06.17 11:30 233.76 05.07.17 13:15 233.99 17.11.17 15:30 233.47 29.01.18 03:00 233.99 17.11.17 15:309 Duburi 237.226 15.06.17 17:00 237.11 23.07.17 13:30 238.96 20.10.17 07:45 238.15 11.01.18 02:15 238.96 20.10.17 07:45
10 Balasore 237.86 03.05.17 17:15 235.73 18.09.17 07:45 236.94 20.10.17 08:00 234.97 08.01.18 03:15 237.86 03.05.17 17:1511 Meramundali 229.72 16.06.17 02:45 230.76 18.09.17 16:00 232.67 02.12.17 02:15 231.69 02.01.18 02:30 232.67 02.12.17 02:1512 Bidanasi 234.97 03.04.17 02:45 243.52 24.09.17 20:00 237.92 28.12.17 03:00 238.73 07.01.18 01:45 243.52 24.09.17 20:0013 Katapalli 232.95 19.05.17 00:15 231.86 17.07.17 03:15 231.11 02.12.17 02:00 235.90 01.02.18 15:15 235.90 01.02.18 15:1514 Bhadrak 236.94 15.05.17 17:45 239.19 15.08.17 15:45 240.75 22.11.17 09:45 237.515 08.01.18 03:15 240.75 22.11.17 09:4515 Paradeep 233.65 06.05.17 22:00 232.38 12.09.17 16:00 237.57 20.10.17 08:00 235.667 08.01.18 02:45 237.57 20.10.17 08:00
Sl.No.
Name of the Sub-station
15 Paradeep 233.65 06.05.17 22:00 232.38 12.09.17 16:00 237.57 20.10.17 08:00 235.667 08.01.18 02:45 237.57 20.10.17 08:0016 Bolangir 232.26 06.05.17 18:15 230.30 17.07.17 03:15 229.26 18.11.17 13:45 231.63 11.02.18 21:15 232.26 06.05.17 18:1517 Mendhasal 232.49 15.06.17 18:00 235.32 01.09.17 17:00 236.01 04.12.17 03:00 235.61 15.01.18 03:15 236.01 04.12.17 03:00
MINIMUM VOLTAGES OF MAJOR GRID SUB-STATIONS. ( 220kV )
Quarter - 1 Quarter - 2 Quarter - 3 Quarter - 4 ANNUAL
Voltagein kV Date Time in
Hrs.Voltage
in kV Date Time inHrs.
Voltagein kV Date Time in
Hrs.Voltage
in kV Date Time inHrs.
Voltagein kV Date Time in
Hrs.
1 Jaynagar 219.675 09.05.17 06:30 224.06 31.07.17 11:30 219.56 29.12.17 16:15 218.17 10.03.18 15:30 218.17 10.03.18 15:302 Theruvali 203.11 24.04.17 20:30 213.90 22.08.17 10:15 212.34 29.12.17 16:15 211.42 10.02.18 14:45 203.11 24.04.17 20:303 Bhanjanagar 214.94 17.05.17 19:00 223.20 01.08.17 19:30 223.72 21.10.17 18:00 212.29 21.03.18 18:45 212.29 21.03.18 18:454 Chandaka 205.819 10.04.17 18:45 214.826 08.07.17 19:45 217.02 29.11.17 17:30 206.34 21.03.18 18:30 205.82 10.04.17 18:455 Narendrapur 196.76 09.06.17 22:00 207.49 22.08.17 10:15 211.88 21.10.17 18:00 200.39 21.03.18 18:45 196.76 09.06.17 22:006 Joda 211.77 16.05.17 17:15 219.91 16.09.17 19:45 217.60 08.10.17 12:00 218.17 29.03.18 20:45 211.77 16.05.17 17:157 Tarkera 210.84 29.05.17 15:45 216.73 15.09.17 16:15 217.14 12.10.17 11:30 223.43 21.03.18 18:45 210.84 29.05.17 15:458 Budhipadar 218.75 22.04.17 16:30 222.27 21.09.17 12:30 214.83 24.12.17 16:00 220.66 24.03.18 19:15 214.83 24.12.17 16:009 Duburi 218.23 06.04.17 21:00 223.83 06.09.17 20:00 225.97 14.10.17 18:45 219.62 21.03.18 19:00 218.23 06.04.17 21:00
10 Balasore 211.419 07.06.17 23:00 214.54 31.07.17 19:30 219.56 14.10.17 18:45 208.65 28.03.18 19:00 208.65 21.03.18 19:0011 Meramundali 220.77 17.05.17 15:00 219.50 01.08.17 13:15 223.66 14.10.17 18:45 220.83 21.03.18 18:45 219.50 06.09.17 20:0012 Bidanasi 215.11 28.04.17 23:15 217.54 01.08.17 14:30 217.14 23.10.17 18:15 215.06 21.03.18 15:30 215.06 21.03.18 19:0013 Katapalli 216.38 17.05.17 11:00 217.42 08.09.17 15:45 219.62 29.12.17 18:45 206.33 15.01.18 17:15 206.33 21.03.18 19:0014 Bhadrak 203.57 22.04.17 14:15 214.65 30.07.17 19:45 216.56 17.10.17 22:30 200.39 28.03.18 19:15 200.39 28.03.18 19:1515 Paradeep 207.67 29.06.17 20:15 209.51 11.08.17 20:30 213.21 25.10.17 17:45 208.01 21.03.18 19:00 207.67 29.06.17 20:15
Page - 11 Sl.
No.Name of the Sub-station
15 Paradeep 207.67 29.06.17 20:15 209.51 11.08.17 20:30 213.21 25.10.17 17:45 208.01 21.03.18 19:00 207.67 29.06.17 20:1516 Bolangir 213.79 17.06.17 10:00 212.69 20.07.17 20:00 213.61 29.12.17 18:30 208.36 02.02.18 18:00 208.36 02.02.18 18:0017 Mendhasal 206.51 18.05.17 14:45 220.08 11.09.17 23:00 218.98 21.10.17 18:00 207.84 21.03.18 18:45 206.51 18.05.17 14:45

MAXIMUM VOLTAGES OF MAJOR GRID SUB-STATIONS. ( 132kV )
Quarter - 1 Quarter - 2 Quarter - 3 Quarter - 4
Voltagein kV Date Time in
Hrs.Voltage
in kV Date Time inHrs.
Voltagein kV Date Time
in Hrs.Voltage
in kV Date Time inHrs.
Voltagein kV Date Time in
Hrs.
1 Cuttack 139.89 03.04.17 02:45 140.35 12.09.17 16:00 138.91 22.12.17 03:15 139.25 07.01.18 01:45 140.35 12.09.17 16:00
2 Berhampur 146.82 19.04.17 21:30 138.27 30.09.17 13:30 140.52 19.12.17 11:30 138.39 26.01.18 02:45 146.82 19.04.17 21:30
3 Puri 135.56 03.04.17 03:00 134.63 16.07.17 13:00 136.14 20.10.17 03:30 134.63 15.01.18 03:00 136.14 20.10.17 03:30
4 Khurda 137.12 19.04.17 18:45 136.19 01.09.17 17:00 136.31 20.10.17 01:30 135.67 15.01.18 03:00 137.12 19.04.17 18:45
MINIMUM VOLTAGES OF MAJOR GRID SUB-STATIONS. ( 132kV )
Page - 12
Sl.No.
Name of theSub-station
ANNUAL
ANNUAL
Sl.No.
Name of theSub-station
Quarter - 1 Quarter - 2 Quarter - 3 Quarter - 4
Voltagein kV Date Time in
Hrs.Voltage
in kV Date Time inHrs.
Voltagein kV Date Time
in Hrs.Voltage
in kV Date Time inHrs.
Voltagein kV Date Time in
Hrs.
1 Cuttack 113.91 28.04.17 23:30 121.99 12.08.17 09:30 124.01 11.10.17 17:45 124.42 21.03.18 15:30 113.91 28.04.17 23:30
2 Berhampur 110.33 17.05.17 20:00 122.57 22.08.17 10:15 120.49 19.12.17 17:30 117.26 21.03.18 18:45 110.33 17.05.17 20:00
3 Puri 107.61 19.05.17 12:45 122.16 11.09.17 23:00 110.21 13.11.17 18:15 115.70 21.03.18 19:00 107.61 19.05.17 12:45
4 Khurda 125.28 20.06.17 12:15 125.86 23.09.17 08:15 125.57 21.10.17 08:30 119.97 21.03.18 19:00 119.97 21.03.18 19:00
Note: The bus voltages are recorded from 15min block voltage from meter data . Further, low voltages during contigency conditions are also recorded as minimum voltages excluding disturbance period and any PT failure period.
Sl.No.
Name of theSub-station
ANNUAL

Page - 13
246.6 247.1 243.2 240.0 247.1
196.8207.5 211.9
200.4 196.8200.0
250.0
300.0
OVERALL PERFORMANCE VOLTAGE AT 220kV
Maximum (kV)
Minimum (kV)
(110.5%) (112.3%)(112.3%) (109.1%)
(94.3%) (96.3%)(91.1%)(89.4%)
(112.1 %)
(89.4%)
Page - 13
0.0
50.0
100.0
150.0
200.0
1st Qtr. 2nd Qtr. 3rd Qtr. 4th Qtr. Annual
kV

Page-14
146.8140.3 140.5 139.3
146.8
107.6
122.0
110.2115.7
107.6
100.0
120.0
140.0
160.0
OVERALL PERFORMANCE VOLTAGE AT 132 kV
Maximum (kV)
Minimum (kV)
(117.4%)
(92.4%)
(76.0%)
(105.5%)(106.5%)(106.3%)
(117.4%)
(83.5%)(87.6%)
(76.0%)
Page-14
0.0
20.0
40.0
60.0
80.0
100.0
1st Qtr. 2nd Qtr. 3rd Qtr. 4th Qtr. Annual
kV

Page-15 25%
30%35%40%45%50%55%60%65%70%75%80%85%90%95%
100%
Perc
enta
ge ti
me
occu
renc
e
Frequency Performance
>51.0Hz
>=50.05Hz
Page-15
0%5%
10%15%20%25%
Perc
enta
ge ti
me
occu
renc
e
Months
Apr-17 May-17 Jun-17 Jul-17 Aug-17 Sep-17 Oct-17 Nov-17 Dec-17 Jan-18 Feb-18 Mar-18
>51.0Hz 0.00 0.00 0.00 0.00 0.00 0.00 0.00 0.00 0.00 0.00 0.00 0.00>=50.05Hz 18.61 22.47 24.42 27.13 23.73 12.56 13.10 13.38 15.37 14.55 14.41 11.9249.70 - 49.90Hz 8.23 8.29 4.72 4.53 5.58 10.01 10.69 13.74 11.84 8.94 7.09 9.3949.0 - 49.70Hz 0.01 0.02 0.00 0.00 0.01 0.03 0.02 0.05 0.00 0.01 0.00 0.0048.50 - 49.0Hz 0.00 0.00 0.00 0.00 0.00 0.00 0.00 0.00 0.00 0.00 0.00 0.00<48.5Hz 0.00 0.00 0.00 0.00 0.00 0.00 0.00 0.00 0.00 0.00 0.00 0.00
49.70 - 49.90Hz
49.0 - 49.70Hz
48.50 - 49.0Hz
<48.5Hz

INTERRUPTION DUE TO MAJOR INCIDENTIncident Duration of Interruption No. of InterruptionSnapping of Jumper /Conductor / Earth wire 75:38:00 56
Insulator Failure 7:10:00 29
Bursting of CT / PT 0:34:00 8
Breaker Problem 0:00:00 0
Major System Disturbance 0:27:00 4
Failure of LA 18:13:00 21
Others 44:55:00 70The duration of interruption indicated above is the sum total of interruptionsoccurred at different areas(S/s) during the year. However there was no totalblackout experienced for the State during the year 2017-18.
Page - 16
The duration of interruption indicated above is the sum total of interruptionsoccurred at different areas(S/s) during the year. However there was no totalblackout experienced for the State during the year 2017-18.
Page - 16
INTERRUPTION (HRS) DUE TO MAJOR INCIDENT DURING 2017-18
Snapping of Jumper / Conductor /Earth wireInsulator Failure
Bursting of CT / PT
Breaker Problem
Major System Disturbance
Failure of LA
OthersOthers
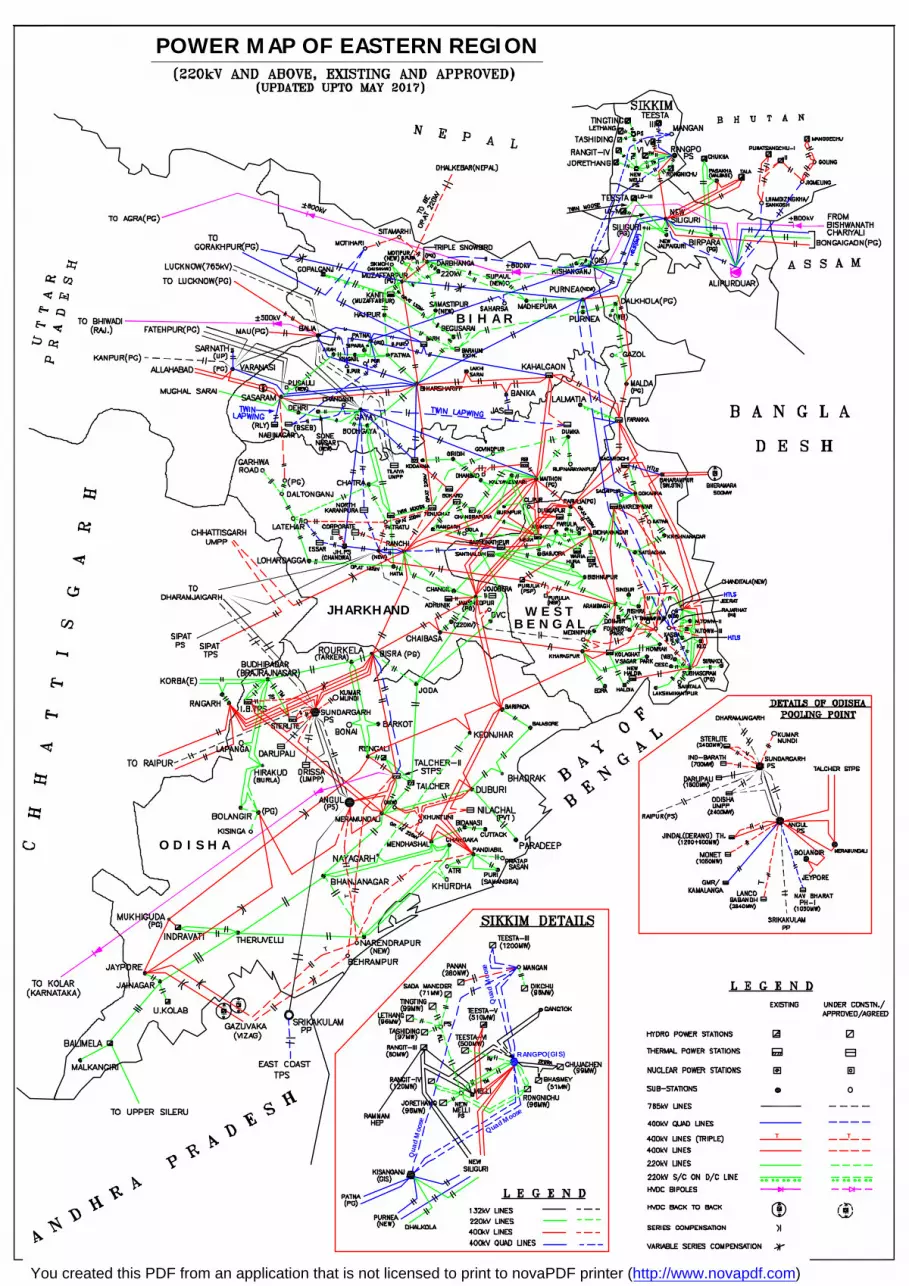
POWER MAP OF EASTERN REGION
B I H A R
O D I S H A
B E N G A LW E S TJHARKHAND
RANGPO(GIS)
Qua
d M
oose
Quad Moose
Qua
d M
oose
T
T T
T
T
You created this PDF from an application that is not licensed to print to novaPDF printer (http://www.novapdf.com)