Journal - August 2015 FINAL.pmd - Orissa Economics ...
322
-
Upload
khangminh22 -
Category
Documents
-
view
2 -
download
0
Transcript of Journal - August 2015 FINAL.pmd - Orissa Economics ...


Orissa Economic Journal
Vol. 47 No. 1
Jan. - June - 2015
Journal of the
ORISSA ECONOMICS ASSOCIATION
Bhubaneswar

Orissa Economic Journal
Editorial Board
2014-15
Editor
Prof. Baidyanath Misra
17, Sahed Nagar
Bhubaneswar
Members
Prof. Manoj Panda
Director
Institute of Economic Growth, Delhi
Prof. Pulin B Nayak
Professor
Delhi School of Economics
Prof. Santosh C Panda
Professor and Dean
South Asian University, New Delhi
Prof. Hemant K Pradhan
Professor
XLRI, Jamshedpur

C O N T E N T S
Make in India vs Make for India Baidyanath Misra 07
Service-LED Growth, Development Indicators Surendra Nath Behera 12
and Governance for Inclusive Growth:
Evidence and Experience of Odisha
Rural Livelihoods and Migration: Shovan Ray 32
Prospects for Odisha
Progress of Rural Financial Inclusion: K. K. Tripathy 65
Will PMJDY meet the Inclusion Gap?
Crop Insurance for Risk Management in India: Mamata Swain 80
An Overview Sasmita Patnaik
Financial Inclusion Policy of the Government Julie Tripathy 100
and Sustainability of Women-headed MSMEs Binayak Rath
in Odisha
Women’s Financial Inclusion: Mitali Chinara 110
The Path Travelled and the Way Forward Anshuman Kamila
Status and Trend of Financial Inclusion in India: Shibalal Meher 121
An Inter-State Analysis
Trends in Financial Inclusion: An Analysis of K. C. Badatya 136
SHG Bank Linkage Programme K. H. Badatya
Financial Inclusion of Women in Odisha: Sadhana Satapathy 150
Role of Pradhanmantri Jan Dhan Yojana Kasturi Panda
Financial Inclusion: A Catalyst to Economic P K Mishra 162
Growth of Odisha Avirup Mukerjee
Financial Inclusion among the Urban Tribal Dipti Ray 177
Households in Odisha: A Case Study of Jolli Himanshu Sekhar Rout

6 : Orissa Economic Journal, Vol. 47, No. 1, Jan-June 2015
Infrastructure Development and Inequality Manoj Kumar Das 192
in Odisha Titiksha Das
Role of Rural Infrastructure in Crop Diversification: Chittaranjan Nayak
203
A District Level Analysis of Odisha Chinmay Ranjan Kumar
Growth of Rural Economic Infrastructure and Bhagabata Patro 216
Poverty Scenario in Odisha: A Study of Sasmita Sethi
Selected Public Services
Water Supply System in Rural Odisha Jnanaranjan Mohanty 229
Status, Performances and Problems
Rural Health Infrastructure in Odisha - Swapnamoyee Priyabhasini Palit 245
An Analysis
MGNREGA and Rural Infrastructure for Sanjeeta Kumari Devi 260
Sustainable Tribal Livelihood: A Study in
Keonjhar District of Odisha
Rural Road Infrastructure and Odisha’s L. N. Dash 272
Development
Growth and Problems of Rural Roads in Odisha Kabita Kumari Sahu 280
Road Infrastructure key to Rural Development- Kartik Prasad Jena 292
An Impact Evaluation Study of Pradhan Mantri
Gram Sadak Yojana (PMGSY) in three Districts of Odisha
An Economic Analysis of Rural Electrification Prakash Kumar Sahoo 304
in Odisha Alok Ranjan Behera
Infrastructural Variation in Odisha: Umakanta Tripathy 314
A District Wise Analysis Pragnya Laxmi Padhi

Orissa Economic Journal, Vol. 47, No. 1, Jan-June 2015 : 7
Editorial
Make in India vs Make for India
Baidyanath Misra
The ‘Make in India’ initiative is considered to encourage entrepreneurs to establish new
enterprises which would not only improve the economy, but also provide adequate
opportunities to create additional jobs for the young generation. The Prime Minister of
India has considered this as a vision for resurgent India. In analysing the multi-dimensional
contribution of ‘Make in India’, Deveshwar has suggested that it would (a) increase economic
opportunities that can enhance growth, (b) provide livelihood creation for the poor and
marginalised by creating additional jobs and (c) add economic activity that can flourish by
nurturing the environment rather than plundering it. Considering from this point of view,
make in India holds enormous promise to radically transform the Indian economy (ITC
Chairman, Y.C. Deveshwar: In Pursuit of the Make in India Vision) (Business Standard in
Aug. 2015).
We also remember another version of ‘Make in India’ during the freedom struggle. Only
the name was different, that was called Swadeshi movement. This was started by freedom
fighters to counter the colonial policy of economic exploitation of India. The British bought
raw materials like cotton, jute and base metals from India, turned commodities into value
added items like clothes, cuttery etc. and sold those back to India. Such a policy destroyed
Indian manufactured industry. That is why Sashi Tharoor in his Oxford address pointed out,
“India’s share of the world economy when Britain came to our shores was 23 per cent. By
the time the British left, it was down to less than 4 per cent. Why? Simply, due to the fact
that India was governed for Britain’s benefit. Britain’s rise in over two centuries was financed
by depredation of India”. Certainly Make in India is different. Its purpose is mainly to make
India a comparative manufacturing hub. It is claimed that ‘Make in India’ will transform
India from a developing economy mired in poverty to a developed nation that commands
global respect.
If ‘Make in India’ emphasises mass production and production by masses, this will certainly
create a manufacturing base for India. If the purpose to encourage import substitution,
‘Make in India’ may not make much headway. One of the major difficulties in Indian
industries is low factor productivity. Prof. Charles Jones of Stanford University’s Graduate
School of Business in a paper points out that the long-term growth is all about growth in
productivity. While analysing the growth of OECD countries and particularly of the USA, he
confirms that the dominant contribution in this exponential rise in the USA has come from
growth in TFP (Total Factor Productivity) even though the rate of growth of TFP has itself

8 : Orissa Economic Journal, Vol. 47, No. 1, Jan-June 2015
varied considerably from decade to decade. In the post-war period, for example, 80 per
cent of growth in output per hour was attributable to growth in TFP.
Second, we had bitter experience with regard to import substitution during the initial
period of planning. At that time, there was every justification to follow a policy of import
substitution to protect our infant industries. We have made much progress in recent years.
Even during the initial period of planning, such protectionist policies encouraged private
monopolies to start such industries to secure high profits. When the government followed
a licensing policy to control such monopoly, this resulted in great discrimination along
with corruption. Again it must be noted that the nature of world trade has changed in
recent years. The days when goods were all made in a single country are gone. Now in
order to build a manufacturing base, a country will have to rely on supply chains. If a
country followed a sheltered domestic manufacturing sector, it will adversely affect quality
and competitiveness. Growth does not happen in isolation. India’s economic growth
between 2005 and 2007 was attributed to some extent to the global economic boom and
liquidity surge. According to some estimates, at least one or two percentage points in
India’s overall growth were certainly due to the buoyant global economic factors. The
argument then was that ‘in a high tide all boats in the sea are lifted’ (A.K. Bhattacharya),
Once India tries to increase production through Make in India, access to foreign markets
becomes priority. Many of the Asian countries like South Korea, China and Japan had been
able to develop their economy by increasing exports. But unfortunately India is now facing
negative trends in Indian exports. Several key labour-intensive sectors like leather and
textiles have witnessed significant reductions in their export volumes. Since China’s exports
are declining due to rise in wages (it is estimated by one of the World Bank’s Chief economist
that some 85 million manufacturing jobs were likely to be relocated away from the Chinese
eastern sea board as wages rose in China), India may get an opportunity to increase
manufacturing exports. But there is now sluggishness in over-all world economy. And new
competitors are also challenging India’s export initiative. We are facing stiff competition
from countries like Bangladesh and Vietnam in leather and textile products. The Reserve
Bank of India’s Governor Raghuram Rajan, in his Bharat Ram Memorial Lecture delivered in
Delhi recently made a pertinent statement which implies “The world as a whole is unlikely
to be able to accommodate another export led China”. What he emphasises, “India is
different and developing at a different time and we should be agnostic what will work.
With advanced countries, demand likely to remain muted for the foreseeable future, he
concludes that India’s primary orientation will have to be to produce efficiently for the
internal market”. What he actually emphasises a ‘Make for India’ strategy.
We guess ‘Make for India’ strategy has a better chance to strengthen the sinews of
the domestic economy through sustained focus on physical, social and financial
infrastructure, rather than subsidising exporters with cheap inputs and an undervalued
exchange rate. There are two areas which need immediate attention for improving the

Orissa Economic Journal, Vol. 47, No. 1, Jan-June 2015 : 9
economy and enhancing the living standard of poor people. One is agriculture and the
second is manufacturing industry. The Socio-Economic and Caste Census, 2011 shows how
miserable is the rural sector in India. We indicate a few points to show how rural economy
needs restructuring for improving the economic and social structure of India.
We find that altogether 73.5 per cent of Indian households live in the country side. The
comparable figure for China is only 47 per cent in 2013. Of all these rural households, only
30 per cent are engaged in agriculture. Since there is not much scope for providing
additional land for agriculture, we will have to strengthen non-farm occupations to
accommodate manual casual labourers. It is estimated that 51 per cent earn their livelihood
by doing odd jobs. In agricultural seasons, some of them may be engaged in planting and
harvesting. But at other times, many of them migrate to cities. What is most distressing is
that a colossal three-fourths of rural Indians earn less than Rs.5000 per month. Of the total
households in rural areas, 38.3 per cent do not have any land and majority of these
households earn their income from manual casual labour. The economic condition of land
holders who have no irrigation facility is no better. Their number is 30 per cent.
The 70th Report on the ‘Situation of Agricultural Holds in India’ released recently by NSSO
reveals that much is wrong with Indian farmers’ economic status, despite several
programmes being run by the government to raise their incomes. Over half of all farm
households are heavily indebted: 26 per cent owe money to money lenders who could be
charging interest rates over 20 per cent. According to the study, wage employment and
non- farming are the principal sources of income for 56 per cent of land-owning families,
while it is livestock for about 23 per cent of them. The only change we find in the Report is
that the average monthly income of an Indian farm household has been assessed at Rs.6500
and not Rs.5000.
Further rural youth are, by and large, disillusioned with agriculture. Reasons are not
unknown. Low profitability of agriculture, drudgery of farm chores and poor quality of life
in rural areas and rapidly shrinking size of landholdings are the major causes. It is estimated
that nearly 35 per cent of the country’s population falls in the 15-35 age bracket and roughly
75 per cent of them live in rural areas. If all of them become disenchanted with agricultural
life and migrate to urban areas, it will be next to impossible to accommodate all of them in
urban areas with new jobs. Every year almost 12 million workers come to the market for
jobs. The National Commission on Farmers headed by M.S. Swaminathan, in its final Report
pointed out, “The Youth can be attracted to and retained in farming only if it becomes
economically rewarding and intellectually satisfying”. A Number of suggestions have been
offered for this. First there is need for providing essential facilities such as power, roads,
education and health care, among others, in rural areas. Second, there must be
diversification in agriculture by starting a large number of allied activities like dairying,

10 : Orissa Economic Journal, Vol. 47, No. 1, Jan-June 2015
fisheries, goat rearing, mushroom production along with value-addition through food
processing, seed processing and such other activities which can attract the youth. Third,
what is most important is that farm income should be increased, particularly for the small
and marginal farmers who form the bulk of Indian farm community. Most of the surveys
show that they have not gained much from agricultural development. The NSSO through
the 70th round of data gathered in 2012-13 also indicate that these farmers remain poor,
handicapped in terms of access to technology and institutional credit and are deprived.
Farming itself is not sufficient to ensure that small and marginal farmers can earn a decent
living. It is therefore imperative that farm incomes be increased through higher productivity
(by improving technology), better returns through fair and transport market and by
establishing a number of manufacturing industries.
Since non-farm activities provide adequate income to the bulk of the farmers, for small
and marginal farmers, who are more than 80 per cent of total farming households and for
casual labourers whose number is limitless, we should try to improve non-farm activities
by starting a number of manufacturing industries in the rural areas with a view to assisting
agriculture, providing additional incomes to farmers and agricultural labourers through
productive employment. Many of the micro, small and medium enterprises (MSMEs) are
now located in urban areas. We guess there is plenty of scope to establish such enterprises
in semi-rural areas which can assist agriculture, prevent pressure on urban areas and
provide employment to all those who are living in rural areas without any gainful
employment. There are many types of work that can easily be taken up in rural areas like
qualified masons, carpenters, electricians, garment manufacturing, textiles, leather goods,
furniture making, food and beverages and so on. We have to select the types of work as
per requirement of particular area. Second, both physical and social infrastructure should
be developed so that such enterprises can be established. Since we are facing tremendous
difficulty in starting some mega industries, we have to depend on such small enterprises
to provide adequate employment. But the question is, what should be size of enterprises.
In an open letter to Times of India on 18.11.2012, Dr. Arvind Panagaria commented that in
India Manufactures are not starting in labour intensive industries. Businessmen are
investing in capital intensive industries because investment in manufacturing industries
will raise wages. About 85 per cent of Indian apparel workers were employed in tiny firms
of seven workers or less in 2004-05 whereas in China only 0.6 per cent apparel workers
were employed in tiny industries. Further, 57 per cent of Chinese apparel workers were
employed in large firms of 200 workers or more. The corresponding figure in India was 5
per cent. Medium size firms with 50 to 199 workers flourished in China and were entirely
absent in India. He therefore pointed out there is no inclusive growth in India, but there is
inclusive spending. This implies, we should try to start large scale labour-intensive
manufacturing industries because it will provide scope for future employment creation

Orissa Economic Journal, Vol. 47, No. 1, Jan-June 2015 : 11
and securing advantages of scale. Even though we advocate to start a large number of
manufacturing industry in rural areas it does not mean, there should not be any
manufacturing industries in urban areas. It depends on the criteria of demand and
favourable environment.
But one of the major difficulties of our young people is that they back minimal
specialisation. We make much of our demographic dividend, but they are deprived of
fulfilling their potential due to lack of proper training. The quality of work done even in
areas like plumbing and masonry remains very poor. Our educational system does not
create any practical bent of mind. We have good theoretical analysis, but lack the skill to
apply such knowledge in practical field. In the USA, Germany or Japan, practical skill has
made them much superior to handle business practices. Since now large numbers of our
young people are coming to the job market, our learning should be oriented to provide
necessary skill as required in different kinds of jobs. In India, only 3.5 per cent of the
workforces are skilled compared to 46 per cent in China, 74 per cent in Germany and 96 per
cent in Korea. A time has come when priority should be given for skill formation which
would be capable of adapting to changing economy.
India faces a great challenge. Global forecasts suggest that it is poised to be third largest
economy in the world by 2030. But India may also emerge as the world’s most populous
nation. Consequently the country will possess the world’s most working-age population,
even surpassing China. As such, the country’s socio-economic challenges are daunting. We
have to meet the challenge of colossal poverty. Not only try to provide productive
employment to 12 million workforces every year, given the fact that the recent rate of
employment is barely 2 to 3 million per year. Then there are critical challenges of food,
water, energy, education and health security for more than 1.10 billion that might inhabit
the country by 2030. Then there is increasing threat of climate change. As students of
economics, we have also an important role to play to shape the destiny of India. We
mention the role of Economists, because Pandit Jawaharlal Nehru said in 1948, ‘What is a
young man’s ambition today.......They think of becoming economists, because an economist
plays a big part in the modern world’ (The Idea of India, Sunil Khilnani, P. 61).

12 : Orissa Economic Journal, Vol. 47, No. 1, Jan-June 2015
Service-LED Growth, Development Indicators and
Governance for Inclusive Growth:
Evidence and Experience of Odisha1
Surendra Nath Behera2
Esteemed Chief Guest, Prof. Ram S. Deshpande, Esteemed Prof. Baidyanath Misra,Secretary
of the Odisha Economics Association, Dr Rabi Narayan Patra, President of the Centurion
University of Technology and Management, Prof. Muktikanta Mishra, distinguished invitees,
eminent economists, fellow delegates and members of the media.
It is a great honour and privilege for me to stand before you to deliver my address as the
President of the 47th Annual Conference of the Orissa Economics Association. I express
my deep sense of gratitude to the members of the Orissa Economics Association for electing
me as the President and bestowing this honour on me. This conference provides an
academic forum for the economists and researchers to contribute their ideas in different
innovative dimensions by their participation, deliberation and interaction. It is timely and
appropriate that the two topics chosen on “Financial Inclusion in India” and “Rural
Infrastructure in Odisha” to be discussed and critically analyzed in the Technical Sessions
will obviously throw light on various important issues both on descriptive and prescriptive
aspects. Moreover, the illuminating lectures by the learned professors in the Special
Sessions will focus on various pertinent issues which provide us with the rare opportunity
to share our thoughts relating to some significant and contemporary aspects of the National
and State Economy of Odisha.
In my address I have made an attempt to focus on some of the recent aspects of the Odisha
economy such as services-led growth, development indicators in terms of human
development, gender gap, infrastructure, rural-urban consumption inequalities, regional
disparities and initiatives taken in Public Distribution System reforms, food security and
good governance to ensure inclusive growth. I would like to present before this august
body that due to the time constraint in delivery of this lecture, I have the limitations of
covering only some broad dimensions of the above issues. For analyzing these issues I
acknowledge the use of NSS data, Economic Survey of Odisha and Statistical Abstract of
Odisha given in the Tables in the Appendix.
1. Presidential address delivered in the 47th Annual Conference of Orissa Economics Association 21st
February, 2015 at Centurion University of Technology and management, Bhubaneswar.
2. Former Professor of Economics and Principal, Khallikote Autonomous College, Berhampur.

Orissa Economic Journal, Vol. 47, No. 1, Jan-June 2015 : 13
I. The Structural Break and Process of Services-led Growth
Odisha economy has undergone structural changes during the past decades in the post-
reforms period. The Industry and Services Sectors have emerged as the main drivers of
growth. The dynamic composition of the Odisha economy shows that the sectoral share of
Agriculture in GSDP has declined from 23.49% in 2004-05 to 17.01% in 2012-13 and is
estimated at 15.58% in 2013-14. The share of the Industry sector, has gone up from 23.7% in
2004-05 to 25.16% in 2012-13 and is estimated at 25.40% in 2013-14. The share of the Services
sector in GSDP has registered an increase from 52.80% in 2004-05 to 57.83% in 2012-13 and
59.02% in 2013-14 at 2004-05 prices comparatively dominating in a stable manner. In 9
districts of Odisha namely Khordha, Cuttack, Ganjam, Dhenkanal, Balasore, Puri, Bhadrak,
Kendrapada and Nayagarh the services sector contributes more than 50% of the total Gross
Domestic product in 2010-11 at 2004-05 prices. As in case of the Indian economy the Service
Sector dominates the State economy constituting more than half of the State’s GSDP. The
dynamics of the broad sectoral decomposition of Odisha’s economy reveal that Odisha has
witnessed a significant structural change over the years and is becoming less agricultural
and more industrial and more service-oriented over time. The changing pattern of the
sectoral composition in the State corroborates the transformation of the economy from
“agriculture-based” to “industries and services- driven”. This trend is projected to go further
in the wake of liberalisation.
The performance of the Services Sector in Odisha is measured by relative sectoral
contribution of the Services Sector to the GSDP, employment and productivity growth.
Though detailed classification of Services Sector is made either by using the United Nations
Central Product Classification (UNCPC) or National Industries Classification (NIC), at present
the NIC 2008 classification is used for India in defining the Services Sector.
The major components of the service sector as the determinant of the service growth are
Trade, Hotels, Transport and Communication, Banking and Insurance, Real Estate and
Business Services and Community, Social and Personal services. The rapid expansion of
the services sector, has been due to ‘structural changes’ which occurs with technological
progress in the demand side and trade liberalization and reforms in the supply side. The
growth process in the post-reforms period has been a Services-led growth process. The
share of the services sector increased from 26% during the First Plan (1951-56) to 46%
during the 11th Plan (2007-12). During the 11th Plan period Banking and Insurance sub-
sectors of Odisha grew significantly with a robust annual average growth rate of 17.77%
followed by Communication 13.77%, Registered Manufacturing 12.92%, Transport and other
means 11.28%, Trade Hotel and Restaurants 9.44%, Storage 9.21% and Other services 8.40%.
The share of banking and insurance communication, transport by other means and trade,
Hotel and Restaurant sectors are increasing in the Services broad sector.

14 : Orissa Economic Journal, Vol. 47, No. 1, Jan-June 2015
A look at the percentage share of the workforce engaged in broad sectoral activities from
1990-91 to 2013-14 in the post-liberalisation period shows that the participation of workers
in services has increased substantially from 14% to 41%, industry from 8% to 26%, whereas
in agriculture has declined from 77% to 33%. In terms of occupational shift it provides a
very useful insight to development in the process of structural transformation in the
economic development of Odisha. The employment linked sectoral shift is inevitable and
the industry and services sectors are the priority areas of intervention.
The performance of the economy is generally adjudged in terms of rate of growth of GSDP
and its variants. The average growth rate of GSDP and percapita NSDP over the Plan periods
in Odisha is shown in Table-I in the Appendix. The growth rate of GSDP and percapita NSDP
has been fluctuating over the Plan periods. The structural transformation and sectoral
shift from agriculture industry and services sector put Odisha in a high growth tranjectory
particularly when we look at the average growth rate of GSDP as 8.82% in 2002-07 in the
10th Plan and 7.01% in2007-12 in the 11th Plan. As per the estimate of the GSDP the real
growth rate of Odisha’s economy during 2013-14 is 5.60% at 2004-05 prices as against 8.09%
achieved during 2012-13. The slowdown in growth rate was of (-)3.25% under agriculture
largely due to cyclone & floods while the growth rate in the industry sector is estimated as
6.60% and the services sector as 7.77 percent. In real terms at 2004-05 prices Odisha
economy exhibited an average annual growth rate of 8.82% during the 10th plan period
against the target of 6.20%. The Agriculture Sector registered real growth of 11.01% during
2012-13 at 2004-05 prices. The Industry sector grew at 9.15% and the services sector at a
rate of 6.8% during the year 2012-13. During the last dacade the Odisha economy has
exhibited the characteristics of diversifying at a faster rate and affected by natural stocks.
The positive spillovers and both the forward and backward linkage effects of the services
sector show both agricultural and industrial production as service-intensive. Their inducive
linkage effects make it as a catalyst agent of growth. In the post-reforms period the
performance of the services sector has been forceful with a tremendous contribution to
GSDP. The performance of the services sector in GSDP has been faster than agriculture and
industry since 1991-92 when the Services sector overtakes the share of Industry and
Agriculture sector. The growth and sustainability of the Services sector can be established
by breaking a near stagnant agriculture and decelerating manufacturing sector by linkage
effects. With a substantial contribution of the Services sector, to make Services-led growth
more widespread and sustainable a coherent integrated services policy in line with
agricultural and industrial policies need to be developed. This will go a long way in
sustaining the dynamism of Services- led growth by their impressive growth performance
in the post-globalisation period.
II. Human Development and Gender Equality

Orissa Economic Journal, Vol. 47, No. 1, Jan-June 2015 : 15
Human development has been conceived as the process that enables people to improve
their skills, capabilities and choices for long, healthy and fulfilled life. The process of
human development is multi-dimensional and inclusive in character. As a developmental
approach the major pillars of human development are equity, empowerment, participation
and sustainability. The methodology propagated by the UNDP suggests that levels of
literacy, infant mortality rate, life expectancy at birth, access to safe drinking water and
income capture the key dimensions of human development. The Human Development
parameters are Livelihood, Health, Education, Gender and Development, Environment
and Governance. Human development approach is ‘people-centred approach’ rather than
‘goods-centred approach’ or income-based benchmark of GNP. It is defined as enlarging
people’s choices and strengthening human capabilities, enhancement of freedom and
fulfilment of human rights. The UNDP methodology takes in to account the health,
educational and income index to measure the quality of life. It is a holistic concept which
covers all aspects of development. Economic growth as such becomes only a subset of
human development paradigm. Reduction of inter-regional and inter-personal disparities
is a key concern for human development. When we think of development, various
questions on ways of living come in to mind. They are: can the people read and write? Do
the poor children get adequately nourishing diets? Are the children properly immunized
and provided with other health care services? Do the poor students get proper mid-day
meals in schools? Are food stuffs distributed among people in a universal manner? All
these encompass a sustained improvement in the quality T. W. Schultz, articulated the
improvement in population quality as a decisive factor in development.
The normative framework for human development is reflected in the broad vision set out
in the UN Millennium Development Goals Vision, 2020 for Odisha. The first Human
Development Report for the State of Odisha focused on several critical issues such as
various aspects of growth, income distribution, poverty and food security, education and
health and attempted to measure human development at State and District Levels.
The HDI methodology was revised in 2010 in a composite index with three basic dimensions
health, knowledge and income. The ‘Knowledge dimension’ – adult literacy and gross
enrolment ratio of the earlier HDI reports, has been modified in 2010 by taking in to account
expected years of schooling and mean years of schooling. Further, the income
measurement has been changed from PPP-adjusted percapita GDP to PPP adjusted GNI.
According to the State Human Development Report 2011, among 23 states Odisha remained
in 22nd Rank (HDI value 0.362) with low human development below the all India value
0.519. Kerala secured the 1st rank (0.790), Bihar 21st (0.367) and Chhatisgarh 23rd (0.358)
reflecting inter-state disparities. It is pertinent to mention here that Odisha has made
notable achievement showing a considerable decline in Infant mortality rate (IMR) from
75 in 2005 to 53 in 2012 as per the SRS Report 2013. Though it stood higher than the national
figure 42, the decline in IMR was better than the national average. This could be possible

16 : Orissa Economic Journal, Vol. 47, No. 1, Jan-June 2015
due to institutional delivery and pre and post-natal care. But there are significant social
and regional disparities in assessing public health in Odisha. There is a moderate decline
in the Maternal Mortality Rate (MMR) in Odisha from 258 in 2007-09 to 237 in 2011-12
compared to the corresponding figures at all India level from 212 to 178 during the same
period. The life expectancy at birth of males stood 62.3 and females 64.8 below the national
figure of 65.8 for males and 68.1 for females. The district wise gender gap in literacy in
Odisha, 2011 shows wide variations among districts, Khordha 10.5, Kandhamal 26.1,
Nuapada 26.3 and Odisha as a whole 18. In 13 districts the gender gap in literacy is more
than 20%. The Gross enrolment ratio at the primary level stood 99.69 and upper Primary
level was 104.93 in 2011-12.
As regards the Sex ratio in 2011 it was 989 in Rural, 932 in Urban and 979 in the State as a
whole. The Child sex ratio between 0-6 years was 995 in Rural 947 in Urban and 992 for the
State as a whole. The goal of human development cannot be realized where there is
gender bias or gender disparity which has been stated by Amartya Sen as ‘missing women’.
Human Development Report 2005 categorically asserted that ‘Human Development if not
engendered is endangered’. Gender equality promotes economic growth, strengthens
democracy, improves governance and reduces poverty and insecurity. To capture a broader
vision of human development the UNDP in the Human Development Report 2010
introduced Gender Inequality Index (GII) incorporating the indicators such as, Reproductive
health, Empowerment and Labour market to address the shortcomings of Gender
Development Index (GDI) which are calculated by taking equally distributed life index,
life expectancy index and education index for male and female and Gender Empowerment
Index (GEI) based upon the dimensions of participatory decision making. Table-2 clearly
reveals that Odisha has done reasonably well at the literacy front. Whereas the literacy
has increased 2.99 times from 27.32 percent in 1951 to 81.59% in 2011, the female literacy
has grown faster which is 14.16 times from a low level of 4.52 percent in 1951 to 64.01 in
2011. Though both male and female literacy are fast approaching the national average,
there is still a gender gap of 17.6 percentage points in literacy.
Odisha published the first Human Development Report in 2004-05 and has prepared District
Human Development Reports for Ganjam, Kalahandi, Kandhamal, Mayurbhanj and
Sundargarh districts. It has revealed wide variations in human development across districts
in Odisha. The State has been pursuing the objective of attaining Millennium Development
Goals (MDGs) to promote gender equality and empower women to improve maternal
health, to achieve universal primary education, to eradicate extreme poverty and hunger
to ensure environmental sustainability etc. Avoidance of gender bias in the distribution of
education and health has become the key areas of intervention in policy making. The
benefits of development are to be made gender sensitive.
A look at the HDI and GII in the Human Development Report 2011 for many countries show

Orissa Economic Journal, Vol. 47, No. 1, Jan-June 2015 : 17
contrasting results. United States with a very high human development with HDI value
0.943 (Rank 4) has the GII value 0.299 (Rank 47) while China with medium Human
Development ranks rather very high in terms of GII with value 0.209 (35th) although HDI
ranking is not satisfactory with HDI value 0.687 having 101st rank. India in the category of
medium human development tells almost the same story having HDI value 0.547 (Rank
134) GII value 0.617 (Rank 117). Hence widening gap between HDI and GII are visible. In the
HDI Report 2013 the HDI for India remained 135th rank (0.583) but the GII was 127th rank
(0.563).
In the words of Mohammed Yunus “Women needed opportunity, not charity, they want
chance, not bleeding hearts”.
III. Infrastructure, Rural-Urban Divides and Regional Disparities
Good infrastructure is a pre-requisite for accelerated development. These services covering
both social and physical infrastructure have a wide range from the provision of health
services, education, housing, drinking water, transport, communication, power, irrigation
etc. Most infrastructure services are non-tradable. Odisha is deficient in infrastructure
and there is felt need for substantially improving the extent and quality of infrastructure
in the State. The level of disparities in the development status of infrastructure among the
districts is fairly high. Also its access across space and people is highly unequal. Not only
merely the existence but also the maintenance and supervision of many key social and
economic infrastructures in the backward districts of the State are observed to be very
poor. Regional disparities in terms of macroeconomic aggregates infrastructural
development, agricultural development, industrial development and human development
are quite visible.As a result, such provisions have caused regional inequalities and have
failed to generate the intended development effects among the poor and vulnerable
sections of the population. Significantly, various forms of disparities overlap and mutually
reinforce each other. Existence and continuances of regional imbalances create the feeling
of neglect, deprivation and of discrimination. Apart from the sense of deprivation in the
neglected regions there are also sectoral imbalances among agriculture, industry and
services sectors.
However, in the context of regional inequality Kuznet’s hypothesis (1955) of inverted U-
shaped Curve and Robert Solow’s (1956) hypothesis of ‘Absolute Convergence’ of
economies are worth mentioning,stating increase in inequality markedly in the earlier
phase of industrialization and decline thereafter. But the ‘Absolute Convergence has
overshadowed the ‘Kuznet effect’where rise in percapita income and increase in equality
go together. Myrdal (1958) contends that the ‘trickle down’ effects are favorable
repercussions on backward regions emanating from backward regions called ‘Spread
effects’ which are weaker than ‘Backwash effects’ causing interregional differences and it
to be narrowed by state intervention through regional policies is inevitable.

18 : Orissa Economic Journal, Vol. 47, No. 1, Jan-June 2015
Nevertheless, it is a good trend to observe that in recent years Odisha has witnessed
positive transformation of certain key infrastructures such as development of power and
transport and communication networks. Proper maintenance and supervision will make it
easier to accelerate the pace of development. Odisha has been a pioneer in power sector
reforms and the availability of power in Odisha is better and continues to improve in
comparison to many other states. However, the Transmission and Distribution loss is a
matter of concern and the State has embarked upon ambitious programmes to improve
grid infrastructure and reduce transmission and distribution loss. Over 80 percent of villages
in Odisha are now electrified. About 70.4 percent of the power consumers belong to rural
areas. Domestic consumers comprise about 88 percent of total consumers. They consume
about 31.4 percent of the total power consumption as against 11.16% for commercial uses
and 45.36% for industrial uses and the rest which covers 12% for public lighting, irrigation
and agriculture (1.20%) Railways (6.86%) public water works and bulk supply and others in
2012-13. The demand for power in Odisha has been rising at a faster rate due to increased
emphasis on industrialization and expansion in household electrification. The tele-density
as in 2013 is 60.21% which is yet to catch up with the national average which has reached
73.62%. The rural tele density of Odisha is 164 percent in comparison to 147 percent at the
national level and the urban tele-density has reached 164 percent in comparison to 147
percent of national level. The Road density in Odisha is better than the national average.
The road length per square 100 Sq.km. is 156 as against 101 at the national level. But the
state lags in surface road density and it is felt imperative to provide all- weather connectivity
to remote habitations. Railway density in the State is 15 km. per thousand square km. of
area which is below the national average of 20 kms.
With increased emphasis on human development and attainment of Millennium
Development Goals (MDGs) the social sector such as education, health, housing, safe
drinking water and sanitation need a priority attention. The overall literacy in Odisha was
72.9 percent at per with the national average 73 percent. The life expectancy at birth in
Odisha for male was 64.3 years and for women 67.3 years during 2011-15 and lower than
the national average of 67.3 years and 69.6 years for male and women respectively. Infant
mortality in the State has come down to 53 during 2012 as compared to the national level
which stood at 42. The gap is to be narrowed down by various health measures, with
greater focus on the rural areas. The coverage of households having access to safe drinking
water was 75.3 percent as per 2011 census. As regards main sources of drinking water the
figures are tape water 6.3% well water 5.0% Hand pump / Tube well 79.4% and other
sources 9.4%. The largest source of drinking water is Hand pump/ Tube wells which is 67%
in rural and 54.1% in urban area. There exists gender disparities in Odisha in several human
development indicators. Only 62% of female population are literate in comparison to 82%
in male population in Odisha. The recent initiatives taken in Odisha in respect of
establishment, implementation, management and operation through Public- Private

Orissa Economic Journal, Vol. 47, No. 1, Jan-June 2015 : 19
Partnership and adopting a ‘Cluster approach’ to development are encouraging. For this
purpose integrated interventions covering technology upgradation, quality improvement,
market promotion and skill development etc. are being designed and implemented. An
investigation in to the socio-economic parameters like agriculture, infrastructure
development, literacy education, backwardness and state intervention with a structural
approach to poverty alleviation through group approach, family approach and cluster
approach is the need of the hour to address the existing regional disparities in the
development of the state and to halt this trend in the development process.
A look at Table-3 shows that the literacy rate in both rural and urban area have been
steadily increasing over the Census years. In rural areas it has increased from 45.5 in 1991
to 70.2 in 2011. During the same period the urban literacy rate has gone up from 72 to 85.7
and the total literacy from 49% to 72.9. It is notable in the Table-3 that there is a narrowing
down of rural-urban literacy gap from 26.5 in 1991 to 15.5 in 2011 which is more pronounced
as a positive indicator of development.
Percapita income is an important indicator of standard of living. Table-4 reflects that there
has been a rising trend of per capita real Net State Domestic Product (NSDP) of Odsiha
from 2004-05 to 2013-14 at 2004-05 prices. It rose from Rs. 17150 in 2004-05 to Rs. 25891
between 2004-05 to 2013-14 The percapita income of Odisha during 2013-14 is estimated at
Rs. 25891 which accounted for a growth rate of 1.87% over 2012-13 when the per capita
income was Rs. 25415. The per capita income of India went up from Rs. 24143 in 2004-05 to
Rs. 39961 in 2013-14. Despite the measures taken by continuously striving to bridge the
gap in real per capita income, the gap has been wider rising from Rs. 6493 in 2004-05 to Rs.
14070 in 2013-14 which is an area of concern.
As regards poverty there has been a falling trend in the poverty ratio in Odisha. The poverty
head count ratio i.e. percentage of below poverty line has declined by 24.61% from 57.20%
in 2004-05 in 61st NSS round to 32.59% in 2011-12, in 68th NSS round. But it remained higher
than the national level which declined from 37.2% in 2004-05 to 21.92% in 2011-12. The
reduction of poverty by 25.11% points was higher in rural Odisha than that of 20.31% points
in Urban Odisha. Poverty estimates showed that Odisha recorded the highest reduction in
poverty among all major states between 2004-05 and 2011-12 which is an impressive
achievement. But that cannot bring much solace as Odisha remained only above Bihar
(poverty ratio 33.34) from the bottom among 14 major states of India. Hence, despite the
marked decline in poverty the magnitude of the incidence of poverty is a matter of concern.
The standard of living can be gauged from the patterns of consumer expenditure. As
households get richer and there is an increase in expenditure, the share of food expenditure
such as raw materials or staple foods like rice and wheat falls and that of processed foods
meat and other items increases. In this context, there are two concepts that are often used

20 : Orissa Economic Journal, Vol. 47, No. 1, Jan-June 2015
to shed the light on the standard of living. (1) Monthly Per Capita Expenditure (MPCE) (2)
The Engel’s Ratio. It is found from Table-5 that the Monthly Per Capita Expenditure over
the different Rounds has been steadily increasing in both rural and urban area. The latest
NSS Reports of different Rounds show that in the pattern of consumption though there is
increase in the proportion of non-food expenditure and decline in proportion of food
expenditure in both rural and urban areas indicating improvement in the standard of
living but these rural-urban gap remains. In the latest 68th NSS Round the MPCE in urban
area is Rs. 1830.35 as against Rs. 904.79 in rural area The proportion of MPCE on food in rural
area (51.97) is higher than urban (39.26) area and on non-food items is (48-02) which is
lower than urban (60.74) area. The rural-urban per capita expenditure ratio is much more
pronounced as 0.49 for Odisha as compared to 0.52 at all India level. The MPCE (Rural) and
MPCE (Urban) lagged much behind the MPCE rural at the national level which is Rs. 1287.17
and urban Rs. 2477.03. Further the monthly per capita expenditure of Odisha as percentage
to all India Average is 70.29 in rural and 73.89 in urban area.
Engel’s Ratio which is the share of food expenditure to total expenditure has been widely
used as an indicator of the standard of living. It is evident from a look at Table-6 as per the
NSS Reports in different rounds that in both rural and urban areas the Engel’s ratio has
been declining reflecting an improvement in the standard of living. Further rural-urban
differential of the Engel’s ratio indicates that it is higher in rural areas than urban areas. In
the 68th Round it is 51.98 in rural area which remained higher than 39.26 in the urban area
indicating a lower standard of living in rural area than in urban area. Percapita expenditure
on cereals and cereal substitutes is not much more different for rural and urban households
in Odisha. But for other items such as house rent, education and consumer services the per
capita urban consumption is much more than rural consumption. The typical nature of
rural-urban disparities which may be called as ‘rural-urban poverty bind’ may be attributed
to spillover of rural poverty in to urban areas and higher consumption inequalities in
urban areas.
IV. Initiatives in Public Distribution System (PDS) Reforms and Food Security
Public Distribution System has been considered as the most important food based safety
net introduced by the Government of India. The basic objectives of the PDS are to provide
essential consumer goods at cheap and subsidised prices to the consumers so as to insulate
them from the impact of rising prices and maintain nutritional status of the population. In
order to ensure the minimum quantity of food grains to the BPL families the Government
of India launched the Targeted Public Distribution System (TPDS) in 1997. To make the
TPDs more focused and targeted towards the poorest section of the population the
‘AntyodayaAnna Yojana’ (AAY) was launched in December 2000. The TPDS promises to
ensure inclusiveness and long term food security. An important issue related to food
Orissa Economic Journal, Vol. 47, No. 1, Jan-June 2015 : 21
security is that poor persons should have enough purchasing power to have an access to
sufficient food grains at affordable price. Thus, mere availability of grains does not ensure
food security for the poor. Food security is a broader concept than food availability.
To meet the objectives of TPDS procurement of paddy, storage of rice and essential
commodities to bonafide beneficiaries are the real challenges to ensure food security. To
meet these challenges a number of initiatives have been taken by end-to-end
computerisation for a holistic transformation of TPDS in Odisha. The Government of Odisha
in partnership with the World Food Programme (WFP) has implemented a Pilot Project for
identification of beneficiaries under National Food SecurityAct (NFSA) 2013 in Bhubaneswar
Municipal Corporation and in Bhubaneswar Block with well defined exclusion criteria to
make PDS universal. It is a pathway to end poverty induced hunger. ATask Force constituting
6 members appointed by the Government of Odisha in 2013 defined the exclusion / auto
inclusion criteria for exclusion of ineligible and inclusion of eligible beneficiaries. On the
recommendation of the Task Force 8 exclusion criteria such as possession of 3 or 4 wheelers
heavy vehicles, mechanised agricultural and fishing engineering equipment, Income Tax
or Professional tax payers, a family member having a registered enterprise for construction
or service, no regular employees of the Government or Corporations, any family member
not earning more than Rs. 15000/- in urban area and Rs. 10000/- in rural area, a family
taking more than 2 kw connection or consuming more than 300 units electricity per month
and any family members getting more than Rs. 15000/- pension in urban and Rs. 10000/- in
rural area were used. Similarly the 5 inclusion criteria are houseless poor, beggars, all
PVTGs, widow pension holders of Central and State Govt. and any member who is more
than 40% physically challenged. Taking a Pilot project in Bolangir District it was found that
there are 30% Exclusion errors while there are 10% Inclusion errors. As per the strategy the
activities for the identification of beneficiaries in roll out phase are divided in to two parts
(i) at the Registration Centres where there would be interface with the public and (ii) at
the Central Digitization Centres where all backend work would be done. The State
Government will roll out the ambituous National Food Security Act from September, 2015
which will benefit 3,26,41800 people in the State. As per the Centre’s guidelines under this
Scheme 78% of the population of the State and covering 82% of the rural population will
be the beneficiaries with date base of 2011 Census. It will be implemented in place of APL
and BPL with priority under AAY. Digitised Ration Card Scheme is rolled out in the Pilot
Project from Bhubaneswar under National Food Security Scheme to ensure transparency
and to provide benefits to the poorest of the poor from the lower strata. Beneficiaries
would get rice and wheat at subsidised price. For the convenience of the people registration
centres will be opened in rural areas and Ward or Corporater level in the urban areas
dividing the blocks or urban areas of each district in to 4 parts and completing the surveys
in 4 phases. The involvement of the PRI functionaries and approval of selection of the

22 : Orissa Economic Journal, Vol. 47, No. 1, Jan-June 2015
beneficiaries at the Gram Sabha, Panchayat Samiti and Zilla Parishad level will make the
task transparent. The endeavor to maintain transparency will provide good governance to
the people. However, to make it effective,proper and timely it requires adequate
orientation and training to the grassroot functionaries including Anganbadi workers. PDS
helps both the producers and consumers by linking procurement with support price. It
strengthens and augments the distribution mechanism to make foodgrains available at
affordable prices and will establish entitlement to adequate amount of food.
Another initiative in PDS reforms in Odisha is Door step delivery of food grains to Fair Price
Shops (FPSs) through Departmental Storage System (DSS) abolishing private storage system
from the State which was pilot tested from 1st November 2011 in 35 blocks of 10 districts
and all blocks and Urban Local Bodies (ULBs) of four districts as Nuapada, Sonepur, Boudh
and Deogarh. The middle agencies are removed in reaching commodities to the door steps
at the GP leves. The Orissa State Civil Supply Corporation (OSCSC) is made more accountable
for lifting. It helps in reducing the delay in diversion of PDS commodities from their own
godowns to Fair Price Shops (FPSs). The practice of door step delivery enhances the
economic viability of FPSs to a greater extent. Computerised Supply Chain Management
System (DSC Automation) has been started as a Pilot Project in Sonepur District in from
January 2012 and subsequently extended to other districts. The FCI, OSWC, RRC-cum-DSC
and FPPs work in the supply chain management. The process of Decentralized System of
paddy procurement has been carried out through the State agencies like OSCSC and
MARKFED. After successful implementation of Paddy Procurement Automation System
(PPAS) in 10 high procuring blocks of 6 districts Bargarh, Bhadrak, Kalahandi, Koraput,
Sambalpur and Subarnapur, steps are being taken to replicate PPAS in 50 more blocks
covering 24 districts. It is necessary to mention here that there are 28953 Fair Price Shops
out of which 84.38% are in rural area and operated by Private Agencies, Cooperatives,
Maitri, NACs, GPs and SHGs as in 2011. There are 8421846 APL, BPL and AAY Ratio Cards and
64800 AY Ration Cards and 28953 PDS Retail outlets in Odisha as in 2011.
The recent initiatives in PDS reforms will overcome the problems faced in implementation
of TPDS which is plagued by inclusion and exclusion errors in identification of bonafide
beneficiaries, prevalence of ghost cards and unidentified households, leakages and
diversion of food grains to open market because of prevalence of widespread corrupt
practices, irregular arrival of food grains at fair price shops and huge mismatch in Supply
and Demand in PDS items. It will provide practical solution to the problems at both
conceptual and operational level to ensure food security and maintain nutritional status
to the vulnerable sections of the society. The National Advisory Council (NAC)
recommended the shifting from household entitlements to individual entitlements. Hence,
it is felt the dismantling of the entire structure and giving cash transfer to the poor in an
electronic account every month to a Unique Identification or Aadhaar number linked Smart

Orissa Economic Journal, Vol. 47, No. 1, Jan-June 2015 : 23
Card.
V. Good Governance
Good governance is a critical factor in the process of development. It determines how to
percolate the decision making in different layers of administration so that the benefit of
development reaches the needy, living in each and every corner of the country. Definitions
of governance vary from broad and all-inclusive ones like “rules, enforcement, mechanisms
and organisations” to manage society’s problems and affairs (The Word Bank 2002). The
Worldwide Governance Indicators (WGI) Project of the World Bank defines it as the
traditions by which authority of a country is exercised which includes the capacity of the
Government to effectively formulate and implement sound policies. The key dimensions
of governance are voice and accountability Government effectiveness, proper functioning
and efficiency of the government effectiveness, and their acceptance by the Public is
legitimacy. The Second Administrative Reforms Commission (SARC) 2009 emphasised on a
proactive, responsive, accountable, sustainable and efficient administration, for citizen’s
welfare. The core elements or the attributes of good governance are transparency,
participations, consensus oriented, accountable, responsive, equitable and inclusive,
effective and efficient, free from corruption, and follows the rule of law. Good governance
functions as the trustee of the governed. But in view of the all prevailing influence of the
prevailing social structure on decision making various issues of governance has to be shaped
in the context of ongoing social change through the functioning of our economic system.
Experience has amply demonstrated that participatory or ‘Inclusive Governance’ is
indispensable for achieving inclusive growth, keeping with the local needs and
circumstances at the grass root level in the process of decentralized planning. It is a naïve
to expect a genuinely inclusive governance without empowerment of social groups. This
is woefully lacking at the grass root level. The concerted action from civil society and civic
consciousness among the people can lead the country towards the goal of good governance
outcomes and rid the country of the problems that plague us. Good governance is a critical
input to ensure sustainable human development.
Governance primarily involves the interaction between the formal institutions and those
in the civil society. Government is one of the main actors in governance. In the local level
the actors include associations, the civil groups, the social activities organization and the
media at the national level. The actors, the institutions and the delivery mechanism are
some of the elements of good governance. Good governance safeguards the human rights
by participation, openness, transparency and accountability by their performance in terms
of responsiveness, effectiveness and efficiency to ensure fairness.
Odisha continues to face the problems like poverty, inequality, regional disparities,
unemployment and moderate rate of growth, the challenge of quality in education, low

24 : Orissa Economic Journal, Vol. 47, No. 1, Jan-June 2015
levels of health and nutrition especially of women and children and the problem of ensuring
inclusive growth despite the economy achieving high levels of growth in the last three
decades. This raises questions regarding ‘governance’ or the processes and mechanisms
involved in the policy making and implementation and in ensuring a fair distribution of
the benefits from these among people. Involvement of the PRI institutions and NGOs at
the grass root level in education, health, PDS reforms, tribal development social security
measures and creation of greater awareness will ensure good governance for the socially
and economically excluded groups. It is heartening to note some dynamic dimensions of
good governance in Odisha and development of grass root organisations such as Palli
Sabha, Gram Sabha, Anganwadi Workers etc. in education health and proper identification
of beneficiaries of different beneficiary oriented Government programmes.
VI. Inclusive Growth
The concept of inclusive growth was introduced during the Eleventh Plan. Inclusive growth
is a strategy that aims at creating physical assets, human capital, capabilities and
opportunities for productive employment of the excluded sections for their access and
security for a sustainable livelihood. The biggest challenge of inclusive growth is human
development focusing on the components of human development such as education,
health and a decent standard of living. It is a broad and multidimensional concept and the
concept of inclusiveness goes beyond the objective of poverty reduction. High economic
growth in the post-reform period failed to percolate the benefits of the growth among the
poor. Rather it has increased regional, social and economic inequalities. Inclusive growth
is a pro-poor strategy to ensure equity and is viewed as an ‘add on’ to a dominantly growth
strategy. It triggers the growth pattern by a participatory approach to provide a safety net
to the poor. The Twelfth Plan extended the idea with focus on more infrastructural
investment with the aim of fostering a faster, sustainable and more equitable growth. The
growth process is perceived as inclusive for the SCs, STs, women, children weaker sections,
marginalized groups, backward classes, minorities and differently abled, without
deprivation. The objectives of inclusive growth are lower incidence of poverty, broad
based and significant improvement in health outcomes, universal access for children to
school, increase access to higher education, skill development, wage employment and
livelihood improvement in provision of basic amenities like water, electricity, sanitation,
roads and housing and over all improvements in standard of living. It includes ‘Social
Inclusion’ along with ‘Financial Inclusion’. The objective of inclusiness is reflected in
adoption of the monitoring targets such as income and poverty, education, health, women
and children, infrastructure and environment. The key feature of inclusive growth is that
GDP should not be treated as an end in itself but only as a means to an end. The dimensions
of inclusiveness are equality of opportunity, reducing gender disparities and addressing
the issues of regional balance. Inclusiveness as empowerment and participation brings

Orissa Economic Journal, Vol. 47, No. 1, Jan-June 2015 : 25
the issues of governance and accountability.
One of the aspects of inclusive growth is Financial Inclusion. The objective of financial
inclusion is to extend the activities of the organized and formal financial system within its
ambit like delivery of credit and other financial services like saving, insurance and payments
etc. at an affordable cost to the disadvantaged sections and lower income groups those
who are excluded. The strategy of financial inclusion is the penetration of micro finance
and access to timely and adequate credit to the weaker sections and marginalised groups.
The recent implementation of Pradhanmantri. Jan Dhan Yojana (PMJDY) is no doubt an
innovative dimension of financial inclusion from ‘Class Banking to Mass Banking’. The
average population serviced by a bank branch in the State is about 12000 which is better
than many other states in the country. About 80% of all bank branches are located in rural
and semi urban areas. A positive look of the services sector is that the growth rate of total
bank deposits is rising and from 2005-06 to 2012-13 the achievement of the priority sector
advance is 78.35% and percentage of priority sector advance to total advance is 59.57% in
2012. The percapita bank deposit of Commercial banks in Odisha in 2012-13 is Rs. 34232 below the
national average of Rs. 56380.
Looking at the Odisha experience there has been a marked improvement in literacy and
decline in rural-urban gap at 15.53 points in 2011 census. The dropout rates at the primary
level has been reduced from 33.6 to 0.43. Improvements in health care by decline in infant
and maternal mortality and poverty reduction and social inclusion has been accomplished
as discussed in the earlier sections. In Odisha with 22.85% of tribal population and 17.13%
of SC population various welfare oriented programmes are being operated. Odisha has
the third largest concentration of the tribal population in the country comprising 9.20% of
the total tribal population followed by Madhya Pradesh and Maharashtra (17.7%). There
are 13 Particularly Vulnerable Tribal Groups, (PVTGs). Various programmes are implemented
for their economic, educational and social development. There are 17 Micro projects those
have been implemented in the State for the all round development of 13 PVTGs.
Implementation of Income Generating Schemes (IGSs) by group model through community
oriented programmers by the cluster approach have put them in the process of transition
to bring them in the mainstream of development.
VII. Concluding Observations
A Glance at the Odisha’s growth performance over the last two decades has been impressive
in the development of physical and social infrastructure. Focus on education and rural
health care has made notable changes. The accomplished growth, poverty reduction and
social inclusion have made notable achievements. The rate of growth has taken an
accelerating trend and decline in poverty ratio has corroborated a rise in standard of living.
PDS reforms for the improvement of the standard of living is an innovative dimension. The

26 : Orissa Economic Journal, Vol. 47, No. 1, Jan-June 2015
structural transformation / break of the economy and process of services- led growth have
led to strategic interventions in the process of development. Despite that rural-urban
disparities and regional disparities are widely prevalent those are to be addressed with an
‘inward looking approach’ from ‘top-town’ to a ‘bottom up’ approach at the grass root
level by implementing the participatory approach to development and adhering to the
issues of good governance to ensure inclusive growth so as to realise the plan goals of
equity and sustainability. There is an imperative need for larger resource transfer to the
State and more allocation to the social sector development. Standards and policies need
to be realistic and consistent. Strengthening infrastructural facilities, social protection of
women, children and socially excluded groups, enhanced budget support to agriculture
and allied sectors for increasing productivity and diversification are the key areas of
intervention. To address the issues of concern such as poverty inequality, unemployment
and regional disparities what is needed is the effective implementation and monitoring
of macroeconomic policies and sectoral policies. To achieve higher standards of human
development a multi-pronged approach is necessary. This approach must comprise higher
growth rate, faster development of the social sectors, development of appropriate
institutions at the grass root level to promote community participation and monitoring.
The focus and special attention in looking forward in the development approach need
special attention to the depressed regions and marginalized class to substantially reduce
regional, social and gender disparities to promote substantially their human development
indicators. Infrastructure in both rural and urban areas need to be adequately augmented
and improved. Enhancing and promoting a ‘convergence approach’ among different
programmes at the district level will lead to achieve the MDGs. Improved monitoring of
the key human development indicators participatory approach to development and
attitudinal changes will no doubt be growth inducive. Let me conclude with a Chinese
saying “If you give a poor man a fish, his immediate problem of hunger may be satisfied,
but if you teach him fishing he will be a micro entrepreneur and get out of poverty
permanently.
References
Ahluwalia, Montek, S (2009) “Growth Distribution and Inclusiveness : Reflections on India’s
Experience in Kausik Basu and Ravi Kambur (Eds.) Argument for a better World – Essays in
Honour of Amartya Sen Vol. II Oxford University Press.
Ahluwalia “Economic Performance of States in Post Reform period, Economic and Political
Weekly May 6
Barthwal, C. P. (2003) E-Governance for Good Governance, Indian Journal of Political Science
3 & 4 Vol. 64 July-Dec.
Behera, S. N. (2013), ‘Development Initiatives through Convergence Approach in Odisha”

Orissa Economic Journal, Vol. 47, No. 1, Jan-June 2015 : 27
Souvenir, 45th Annual Conference of the Orissa Economics Association, National Institute
of Education and Research, 9-10 February, Bhubaneswar.
Baby, K. (2012), “Food Security and Public Distribution System-Issues and Concern”
Kurukshetra, No. 5 Vol. 60, March, New Delhi.
Chouhan A.P.S (2004) “Good Governance A Critical Commentary” in Initiatives for Good
Governance : Grassroots Organisation and People’s Participation (Ed.), Academy of Public
Affairs, Chennai.
Dev, Mahendra, S. (2008) Inclusive Growth in India – Agriculture Poverty and Human
Development, Oxford University Press, New Delhi.
Government of Odisha, Economic Survey 2013-14 Planning and Coordination Department,
Bhubaneswar.
Government of Odisha, Statistical Abstract of Odisha, 2012 Directorate of Economics and
Statistics, Bhubaneswar.
Government of India, India Human Development Report-Towards Social inclusion – Oxford
University-Press.
Jagadish Gandhi, P(ed) (2008) Inclusive Growth in Globalized India : Challenges and Options,
Deep and Deep Publications, New Delhi.
Kuznets, Simon (1955), “Economics of Growth and Income Inequality” American Economic
Review, Vol. 5
Mohanty, B. K. (2014), “Services-led Growth in India: Its Sustainability Question” Samikshya,
Directorate of Economics and Statistics, Bhubaneswar.
Mahendra Dev S. (1998) “Public Distribution System, Impact on Poor and Options for Reform”
Economic and Political Weekly, August 29.
Myrdal, Gunnar (1958), Economic Theory and underdeveloped Regions, Bombay.
Planning Commission (2007), Eleventh Five Year Plan (2012-17) Vol. I Inclusive Growth,
New Delhi.
Rao, C.H.H. (2006), “Growing Regional Disparities in India” The Indian Economic Journal
54(1), 52-61, April-June.
Rao, C.H.H. (2008), Inclusive Growth : Recent Experience and Challenges Ahead” Economic
and Political Weekly XLIV, 16-21, March 28-April 3.
Solow, R. M. (1956) “A Contribution to the Theory of Economic Growth” Quarterly Journal
of Economics Vol. 70
UNDP, Human Development Report, 2012.

28 : Orissa Economic Journal, Vol. 47, No. 1, Jan-June 2015
APPENDIX
Table - 1: Plan-wise Average Growth rate of GSDP and Per capita NSDP of
Odisha at 2004-05 Prices
Plan Period GSDP Per capita NSDP
1st Plan (1951-56) 3.74 2.69
2nd Plan (1956-61) 2.55 1.12
3rd Plan (1961-66) 4.44 2.31
Three Annual Plans (1966-69) 6.41 3.56
4th Plan (1969-74) 1.52 0.26
5th Plan (1974-79) 4.09 2.50
Annual Plan (1979-80) -12.09 -14.87
6th Plan (1980-85) 4.45 3.01
7th Plan (1985-90) 7.06 5.52
Two Annual Plan (1990-92) -2.29 -4.46
8th Plan (1992-97) 2.00 0.07
9th Plan (1997-2002) 5.58 5.63
10th Plan (2002-07) 8.82 6.69
11th Plan (2007-12) 7.01 3.69
1st Two years of 12th Plan (2012-14) 6.84 3.55
Source : Economic Survey of Odisha - 2013-14
Table - 2 : Gender Gap in Literacy Rate in Odisha (1951-2011) (in percent)
Census Literacy Rate Literacy Rate Total Gender Gap
Years (Male) (Female) Literacy in Literacy
1951 27.32 4.52 15.80 22.80
1961 34.68 8.65 21.66 26.03
1971 38.29 13.92 26.18 24.37
1981 46.39 20.60 33.62 25.79
1991 63.09 34.68 49.09 28.41
2001 75.35 50.51 63.10 24.84
2011 81.60 64.01 73.05 17.58
Source : Economic Survey of Odisha 2013-14.

Orissa Economic Journal, Vol. 47, No. 1, Jan-June 2015 : 29
Table - 3: Literacy rate- Rural-Urban differential in Odisha
Census Literacy Rate Literacy Rate Literacy Rate Rural Urban
(Rural) (Urban) Total Literacy Gap
1991 45.5 72 49.1 26.5
2001 59.8 80.8 63.1 21.0
2011 70.2 85.7 72.9 15.5
Source : Economic Survey of Odisha 2013-14.
Table - 4: Comparision between Per capita Real Income of India (NNI) and Per capita
Real Income of Odisha (NSDP) at 2004-05 prices (in Rs.)
Year Per capita Income Per capita Income Per capita Income
of India NNI of Odisha NSDP Gap
2004-05 24143 17650 6493
2005-06 26015 18184 7821
2006-07 28067 20194 8413
2007-08 30332 21640 8692
2008-09 31754 22963 8791
2009-10 33901 22846 11055
2010-11 36202 23968 12234
2011-12 38048 24151 13897
2012-13 38856 25415 13441
2013-14 39961 25891 14070
Source : Economic Survey of Odisha 2013-14.

30 : Orissa Economic Journal, Vol. 47, No. 1, Jan-June 2015
TTTTTable - 5: Rural - Urban difference ofable - 5: Rural - Urban difference ofable - 5: Rural - Urban difference ofable - 5: Rural - Urban difference ofable - 5: Rural - Urban difference of
Monthly Per Capita Consumer Expenditure (MPCE) in OdishaMonthly Per Capita Consumer Expenditure (MPCE) in OdishaMonthly Per Capita Consumer Expenditure (MPCE) in OdishaMonthly Per Capita Consumer Expenditure (MPCE) in OdishaMonthly Per Capita Consumer Expenditure (MPCE) in Odisha
NSS Rural (in Rs.) Urban (in Rs.) Rural - Urban
RoundFood Non-Food Total Food Non-Food Total
Monthly Per
Capita Exp. Ratio
55th Round 239.25 133.92 337.17 352.23 266.25 618.48 0.60
July’99-June 2000
60th Round 241.98 172.11 414.09 415.53 456.56 872.09 0.47
Jan- June 2004
61st Round 245.58 153.31 398.89 378.13 379.18 757.31 0.53
July-2004 - June -2005
62nd Round 260.45 199.87 460.32 402.57 497.63 900.20 0.51
July 2005 to June 2006
63rd Round 265.30 193.27 458.56 451.85 620.29 1072.13 0.43
July 2006-June 2007
64th Round 325.42 233.53 558.95 607.99 830.36 1438.35 0.39
July 2007-June 2008
66th Round 402.22 311.37 715.59 607.96 860.88 1468.84 0.49
July 2009 - June 2010
68th Round 470.30 434.49 904.79 718.75 1117.70 1830.35 0.49
July 2011- June 2012
Source : 1. Directorate of Economics and Statistics, Odisha.
2. Statistical Abstract of Odisha - 2012.
3. NSSO, Government of India
Table - 5: Engel’s Ratio for Odisha in different NSS Rounds
NSS Rounds Rural Urban
55th Round 64.11 56.95
60th Round 58.44 47.65
63rd Round 57.86 42.15
64th Round 58.22 42.27
66th Round 56.48 41.39
68th Round 51.98 39.26
Source : 1. NSSO, Government of India
2. Economic Survey of Odisha 2013-14

Orissa Economic Journal, Vol. 47, No. 1, Jan-June 2015 : 31
Rural Livelihoods and Migration: Prospects for Odisha*
Shovan Ray1
We compare the growth trajectory in per capita net income in Odisha in the last few
decades with the national average at 2004-05 prices presented in Table 1 and Figure 1.
Both move in similar fashion till about mid-1980, then begin to diverge markedly. The
national average always remains higher than the state average. From about that time the
national per capita income moves at a significantly higher rate than the state income; we
notice a significant wedge between the two series, which gets widened with time. At the
beginning the state per capita income was about 90 percent of the national income, but
today the state income is only about 65 percent of the national level; while the growth
rates for both national and state incomes have accelerated in the last two decades, we are
far from catching up. In terms of ‘convergence analysis’ we can visually see that we are
diverging markedly even when we are getting more prosperous.2 This point will remain in
the back of discussion in what I intend to put forward.
We next consider the broad sector-wise shares of GDP and compare them with Odisha’s
shares. These are presented in Table 2 and Figures 2 and 3. I take the longer perspective for
Odisha from 1950-51 on the components of GSDP and compare their end-points with
national levels, though the two patterns are similar. There is a secular decline of the
agriculture sector in Odisha from about two-thirds of the total in 1950-51 to less than 16%
in 2013-14. The industry sector has increased its share over the same period from roughly
6 percent to a quarter of the total now; but the overwhelming growth of the service sector
from about 29 percent to 59 percent is unmistakable. The same pattern has unfolded for
India as well. This pattern of movements away from the primary to the industry sector and
then the service sector is of course not new and is part of the classic growth and
development scenarios associated with the traditions of research by Simon Kuznets, and
his seminal presidential address at the American Economic Association in 1954 (Kuznets,
1955). There is however a major twist to that original speculation by Kuznets then, in the
pattern of the leapfrogged growth of the service sector in countries such as India ahead of
*Professor Baidyanath Misra Endowment Lecture delivered on 22 February, 2015 at CUTM, Bhubaneswar
1. Professor, IGIDR, Mumbai. I am grateful to Priya Rampal, Ph.D. candidate at IGIDR, for research assistance.
While preparing this paper I have benefited from my association with the IDFC-IRMA-IGIDR-CESS Rural
Development Network which prepared the India Rural Development Report 2012-13 and its 1913-14 edition
under preparation. The paper draws some material presented in a related paper which provides a larger
perspective for changes underway in rural India – see Ray, 2015. The views expressed are my own.
2. There is a formal literature on ‘convergence analysis’, and interested readers may like to follow that up.
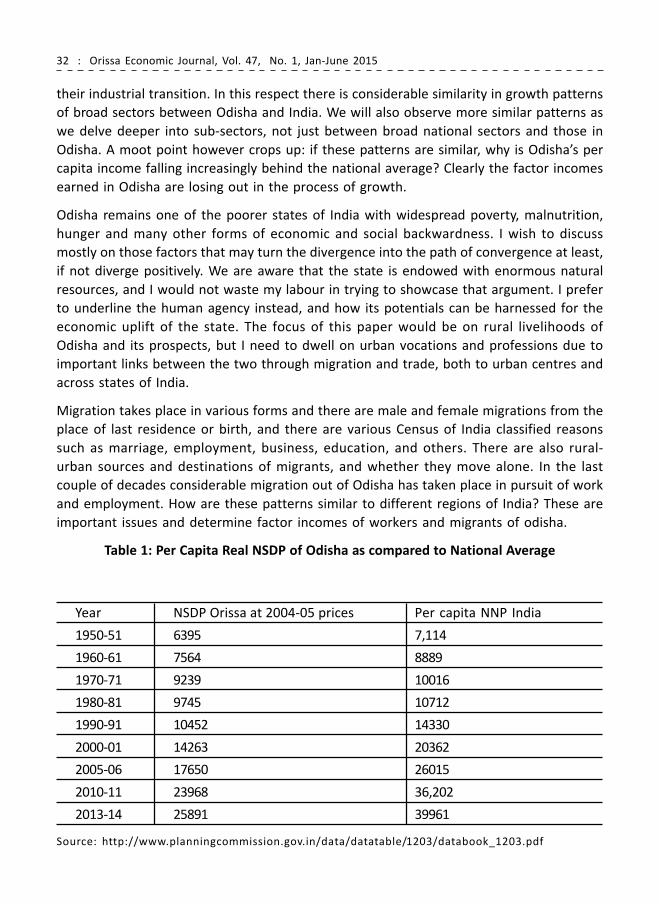
32 : Orissa Economic Journal, Vol. 47, No. 1, Jan-June 2015
their industrial transition. In this respect there is considerable similarity in growth patterns
of broad sectors between Odisha and India. We will also observe more similar patterns as
we delve deeper into sub-sectors, not just between broad national sectors and those in
Odisha. A moot point however crops up: if these patterns are similar, why is Odisha’s per
capita income falling increasingly behind the national average? Clearly the factor incomes
earned in Odisha are losing out in the process of growth.
Odisha remains one of the poorer states of India with widespread poverty, malnutrition,
hunger and many other forms of economic and social backwardness. I wish to discuss
mostly on those factors that may turn the divergence into the path of convergence at least,
if not diverge positively. We are aware that the state is endowed with enormous natural
resources, and I would not waste my labour in trying to showcase that argument. I prefer
to underline the human agency instead, and how its potentials can be harnessed for the
economic uplift of the state. The focus of this paper would be on rural livelihoods of
Odisha and its prospects, but I need to dwell on urban vocations and professions due to
important links between the two through migration and trade, both to urban centres and
across states of India.
Migration takes place in various forms and there are male and female migrations from the
place of last residence or birth, and there are various Census of India classified reasons
such as marriage, employment, business, education, and others. There are also rural-
urban sources and destinations of migrants, and whether they move alone. In the last
couple of decades considerable migration out of Odisha has taken place in pursuit of work
and employment. How are these patterns similar to different regions of India? These are
important issues and determine factor incomes of workers and migrants of odisha.
Table 1: Per Capita Real NSDP of Odisha as compared to National Average
Year NSDP Orissa at 2004-05 prices Per capita NNP India
1950-51 6395 7,114
1960-61 7564 8889
1970-71 9239 10016
1980-81 9745 10712
1990-91 10452 14330
2000-01 14263 20362
2005-06 17650 26015
2010-11 23968 36,202
2013-14 25891 39961
Source: http://www.planningcommission.gov.in/data/datatable/1203/databook_1203.pdf

Orissa Economic Journal, Vol. 47, No. 1, Jan-June 2015 : 33
Figure 1: Per Capita Real NSDP of Odisha compared to National AFigure 1: Per Capita Real NSDP of Odisha compared to National AFigure 1: Per Capita Real NSDP of Odisha compared to National AFigure 1: Per Capita Real NSDP of Odisha compared to National AFigure 1: Per Capita Real NSDP of Odisha compared to National Avvvvverageerageerageerageerage
Odisha
India
It is not just that people from Odisha are migrating to towns and cities and to other states
and regions of India under the pressure of economic deprivations, which are indeed
significant, especially in rural Odisha more than they were earlier. They are also driven by
changes of other sorts. There are important changes in aspirations levels due to
considerable changes in information and communications. Another important contributing
development is the development of infrastructure both in rural areas and also among
districts and towns through a network of roads and highways, railways, etc. There are new
markets and growth engines away from Odisha, which are pulling workers for employment.
All these are in no small measure aided by major changes in education and human
resources that have seen considerable changes. I would highlight some deficiencies also.
However, central to my endeavours would be rural life in Odisha and its livelihoods,
including agriculture and allied activities. Before we consider the changes in rural Odisha,
it is useful to note the dramatic changes that have occurred in the relative shares of major
segments of the national economy, and benchmark that for the state.
As Figure 2 for Odisha and Figure 3 for India show, the share of the primary sector has
shrunk, in particular that of agriculture, while services now claim nearly 60 percent in
India; the story is similar for Odisha. There are two issues here. First, there are conceptual
problems in the measurement of services.3 Secondly, there are several segments within
the service sector; some in organised ‘modern’ sectors and others in unorganised
‘informal’sectors; it is believed that segments like financial or personal services grow with
3 Its valuation of output is assumed to be largely what its agents earn. For instance, how do we correctly
measure output by agents, be they in government service or managers and accountants in corporate sectors?
It would also exclude unpaid services (rendered in the household) as those are beyond national accounts.
Furthermore, the issue of natural resources accounting outside the GDP measure is being debated.

34 : Orissa Economic Journal, Vol. 47, No. 1, Jan-June 2015
general prosperity, while a large group of services evolve through households’ coping
mechanism, discussed below. All that notwithstanding, the change is unmistakable as
measured; it is conspicuous for Odisha as in India.
Table2 : Gross State Domestic Product by Broad Sectors with 2004-05 Base (As per RBI
Classification) % share in Odisha
Agriculture Industry Services
1950-51 64.65 6.32 29.04
1960-61 50.54 8.96 40.5
1970-71 55.93 11.05 33.02
1980-81 50.35 11.85 37.8
1990-91 34.1 15.86 50.05
2000-01 26 18.39 55.61
2005-06 22.97 23.03 54
2010-11 17.99 24.18 57.83
2013-14 15.58 25.4 59.02
Note:
(I) Agriculture Sector includes Agriculture & AH, Fishery and Forestry
(ii) Industry Sector includes Mining & Qurrying, Manufacturing and Electricty, Gas and Water supply
(iii) Services Sector includes rest of the Sub-sectors
(AE: Advanced Estimate, 1st R: 1st Revised, 2nd R: 2nd Revised, 3rd R: 3rd Revised)
Source: Directorate of Economics and Statistics
Figure 2 : Odisha Gross State Domestic Product by Broad Sectors with 2004-05 Base
Industry
Agriculture
Services

Orissa Economic Journal, Vol. 47, No. 1, Jan-June 2015 : 35
Source: Statewise Estimates Of Value Of Output From Agriculture And Allied Activities 2013, CSO, GOI
Rural employment as distinct from output is a different matter altogether and most Indians
still depend on that as they live there, and agriculture in particular still accounts for the
greatest share of employment. It is clear that productivity in agriculture and allied activities
is pitifully low. This duality has been the source of much research and the basis for classical
predictions of economic transition. At this stage we need to introduce certain agro-
ecological concepts which are important to underline and would help in grasping some
issues of the political economy of agrarian growth that is discussed later.
Irrigated, Coastal and Rainfed Farming Systems
Agriculture remains the dominant activity and source of livelihoods in rural life. It is
therefore useful to note certain concepts and classifications which are useful in the context.
Crop and non-crop agriculture use a variety of natural resources, including land, water, air,
and other elements. Consequently all agricultural activities cannot be supported equally
efficiently everywhere. Certain broad features are identified to define concepts like
‘farming systems’, agro-climatic or agro-ecosystem (AES) by their soils, climate,
physiography, and natural vegetation. There are various approaches to this classification,
though we would refer to AES classification for classifying India into five broad systems.4
These are Arid, Coastal, ‘Hill & Mountain’, Irrigated and Rainfed. A sub-classification of
fourteen ‘production systems’ has been made based on the most important crops
identified in each region. The identification of AES and production systems is an important
exercise in the study of cropping patterns, efficacy of policy interventions and diagnosis of
environmental effects.
4 For an outline on this vast literature, see Ray (2007), especially chapters 1 and 3.
Figure 3: Sector wise percentage share in Total GDP (2004-05 and 2010-11)
Sector-wise Percentage share in Total GDP (2004-05) Sector-wise Percentage share in Total GDP (2010-11)

36 : Orissa Economic Journal, Vol. 47, No. 1, Jan-June 2015
An AES zone is not synonymous with state boundaries and may thus cover several states or
parts thereof. For instance, West Bengal may share characteristics of irrigated, rainfed,
coastal, and hill & mountain zones in different parts of the state. In general, the ‘rainfed’
system falls over the states of Andhra Pradesh, Assam, Bihar, Gujarat, Karnataka, Madhya
Pradesh, Maharashtra, Odisha, Rajasthan, Tamil Nadu, Uttar Pradesh and West Bengal.
These areas largely depend on rains of different intensity, especially the southwest
monsoon. The ‘irrigated’ system covers most of the Indo-Gangetic plain, and covers states
like Punjab, Haryana, UP, and parts of Bihar and W. Bengal. These areas have more assured
and controlled water supply. The ‘Hill and Mountain’ areas are mostly the eastern and
western Himalayas while the ‘arid’ area covers most of Rajasthan and some parts of Gujarat.
The ‘coastal system’ covers the coastal districts of the Indian peninsula. Among the five
systems, the ‘rainfed’ and the ‘irrigated’ are the most important in terms of geographic
area and population in them, covering nearly 80 percent of the country’s population and
about 70 percent of the land area. Together with the coastal districts they cover most of
India’s population and agricultural activities, though the arid and ‘hill and mountain’ areas
have important special characters and contributions. The irrigated system, together with
the coastal region, contributes substantially to total food production and the mainstay of
‘green revolution’ with its focus on rice and wheat.
It is useful to note that the term ‘irrigated system’ does not mean a complete contrast with
‘rainfed’ areas; rather it is the intensity of irrigation provided in the region that underlines
the distinction, with about two-thirds in the irrigated system and about a quarter in the
‘rainfed’ areas. The indo-Gangetic plain, mainly its upper reaches in the north-west of
India, is where much of agricultural prosperity has taken place, though the coastal districts
of the Indian peninsula have also benefited significantly. Thus while the Punjab-Haryana
farmer is prosperous in the first region, its counterpart in coastal Andhra Pradesh is also
prosperous in the second. Most terrains of Odisha may be classified as ‘rainfed’, being
dependent on the SW monsoon. Though its coastal districts have more water through
rainfall precipitations and river systems, they also face the hazards of floods and cyclone
that the region has been prone to. Though the ‘production system’ of the Odisha coastline
share many features of the eastern coastal AES, these districts (namely Balasore, Bhadrak,
Kendrapada, Jagatsinghpur, Puri, Ganjam and Gajapati) have only marginally benefited
from fisheries and certain plantations and crop-agriculture; prosperity has mostly eluded
them for a variety of reasons.
Working patterns across sectors and States
Agriculture still constitutes the greatest share of activity in rural India. Agriculture absorbed
78.4 percent in Principal Status (PS) and Subsidiary Status (SS) taken together in 1993-94
but declined to 67.9 percent in 2009-10. There are considerable variations across states; in
Kerala it was 56.4 percent in 1993-94 and declined over 20 percentage points to 35.7 percent

Orissa Economic Journal, Vol. 47, No. 1, Jan-June 2015 : 37
1111122222
33333
44444
5555566666
in 2009-10; in West Bengal, the corresponding figures were 63.3 and 56.3 percent. On the
other hand, in states like Bihar, HP, Karnataka, MP, Maharashtra, Odisha, Rajasthan, and UP,
the figures were about 80 percent or more in 1993-94 and declined to around two-thirds of
the total by 2009-10.
Two sectors of rural activity registered the highest increases in most states: ‘construction’
increased labour absorption from 2.4 to 9.4 percent; and ‘trade, hotels and restaurants’
increased from 4.3 to 6.4 percent during the same period. The transport sector has increased
its share by more than doubling, a very important development indicator for trade and
other economic activity. These sectors have also done well in Odisha, construction
accounting for 10 percent of GSDP (16.65 percent of services) and ‘trade, hotels and
restaurants’ about 13 percent of GSDP (22.4 percent of services), and transport 12.2 percent
of services.
Figure 4: All India Proportion of Usually Working Persons in the Principal Status (PS) and
Subsidiary Status (SS) Taken Together by Broad Industry Division (Rural)
Year 1993-94
1 Agriculture
2 Manufacturing
3 Construction
4 Trade, Hotel & Restaurant
5 Transport
6 Other
Year 2009-10
1 Agriculture
2 Manufacturing
3 Construction
4 Trade, Hotel & Restaurant
5 Transport
6 Other
Sources: NSS: Employment and Unemployment Situation in India, Report Nos. 409 (50th Round, 1993–94), 458
(55th Round, 1999–2000), 515 (61st Round, 2004–05) and 537 (66th Round, 2009–10)
11111
22222
3333344444
55555 66666
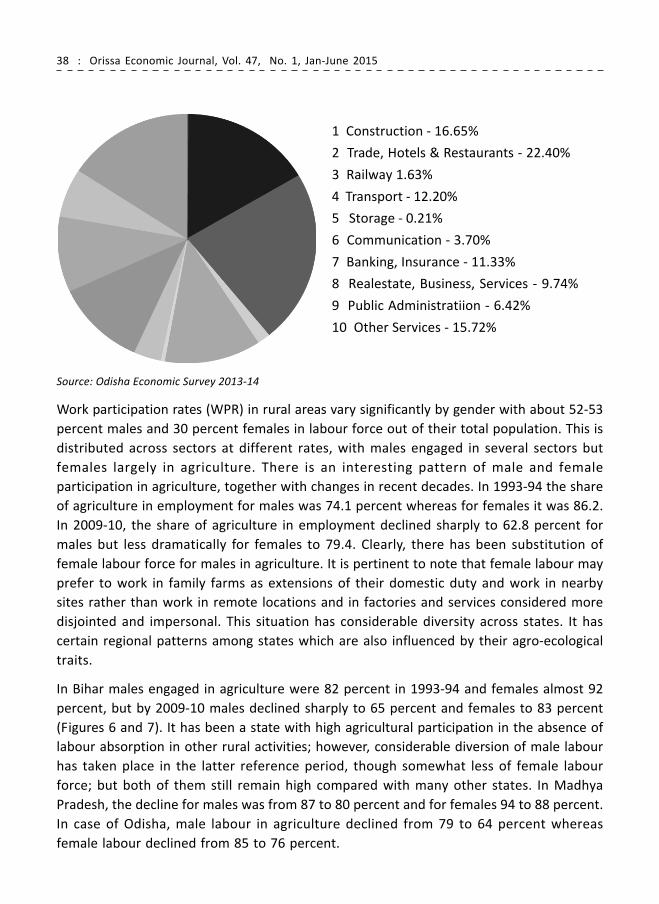
38 : Orissa Economic Journal, Vol. 47, No. 1, Jan-June 2015
Figure 5: Composition of Service Sectors in Odisha�s EconomyFigure 5: Composition of Service Sectors in Odisha�s EconomyFigure 5: Composition of Service Sectors in Odisha�s EconomyFigure 5: Composition of Service Sectors in Odisha�s EconomyFigure 5: Composition of Service Sectors in Odisha�s Economy, 2013-14 AE, 2013-14 AE, 2013-14 AE, 2013-14 AE, 2013-14 AE
1 Construction - 16.65%
2 Trade, Hotels & Restaurants - 22.40%
3 Railway 1.63%
4 Transport - 12.20%
5 Storage - 0.21%
6 Communication - 3.70%
7 Banking, Insurance - 11.33%
8 Realestate, Business, Services - 9.74%
9 Public Administratiion - 6.42%
10 Other Services - 15.72%
11111
22222
333334444455555
6666677777
88888
99999
1010101010
Source: Odisha Economic Survey 2013-14
Work participation rates (WPR) in rural areas vary significantly by gender with about 52-53
percent males and 30 percent females in labour force out of their total population. This is
distributed across sectors at different rates, with males engaged in several sectors but
females largely in agriculture. There is an interesting pattern of male and female
participation in agriculture, together with changes in recent decades. In 1993-94 the share
of agriculture in employment for males was 74.1 percent whereas for females it was 86.2.
In 2009-10, the share of agriculture in employment declined sharply to 62.8 percent for
males but less dramatically for females to 79.4. Clearly, there has been substitution of
female labour force for males in agriculture. It is pertinent to note that female labour may
prefer to work in family farms as extensions of their domestic duty and work in nearby
sites rather than work in remote locations and in factories and services considered more
disjointed and impersonal. This situation has considerable diversity across states. It has
certain regional patterns among states which are also influenced by their agro-ecological
traits.
In Bihar males engaged in agriculture were 82 percent in 1993-94 and females almost 92
percent, but by 2009-10 males declined sharply to 65 percent and females to 83 percent
(Figures 6 and 7). It has been a state with high agricultural participation in the absence of
labour absorption in other rural activities; however, considerable diversion of male labour
has taken place in the latter reference period, though somewhat less of female labour
force; but both of them still remain high compared with many other states. In Madhya
Pradesh, the decline for males was from 87 to 80 percent and for females 94 to 88 percent.
In case of Odisha, male labour in agriculture declined from 79 to 64 percent whereas
female labour declined from 85 to 76 percent.

Orissa Economic Journal, Vol. 47, No. 1, Jan-June 2015 : 39
Figure 6: Share of Agriculture in Rural Employment: Males 1993-94 & 2009-10
Sources: NSS: Employment and Unemployment Situation in India, Report Nos. 409 (50th Round,
1993–94), 458 (55th Round, 1999–2000), 515 (61st Round, 2004–05) and 537 (66th Round, 2009–
10)
Contrast this picture with the northwestern prosperous states of Haryana and Punjab,
where male labour were 61 and 68 percent, respectively, and declined to roughly 51 and 53
percent in 2009-10. For female labour the levels were about 93 percent and declined to
roughly 82 percent in the second period for both the states. In Kerala, the decline for
males during that period was from 53 percent to 33 percent, and a similar drop of 20
percentage points for females from 63 to 43 percent. By contrast the two western states of
Maharashtra and Gujarat have considerable agricultural activity in a variety of subsectors,
with relatively stable shares for both male and female – more than 70 percent for males
and consistently more than 90 percent for females, which in fact increased over the time
period considered. Clearly there are regional patterns of activity in rural areas, which
should be woven into the storyline.
Male 1993-94 Male 2009-10
100
80
60
40
20
0
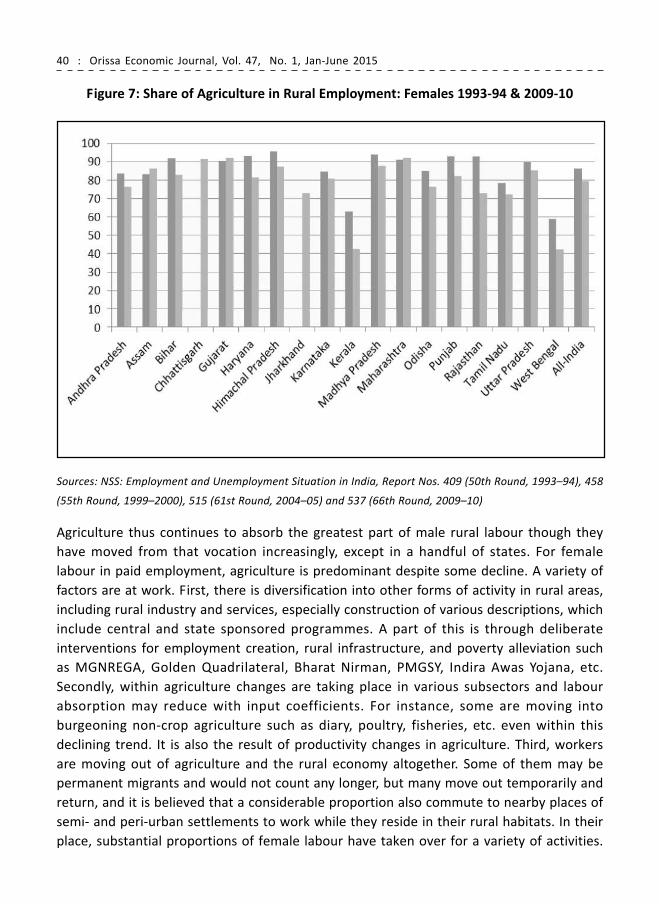
40 : Orissa Economic Journal, Vol. 47, No. 1, Jan-June 2015
Figure 7: Share of Agriculture in Rural Employment: Females 1993-94 & 2009-10
Sources: NSS: Employment and Unemployment Situation in India, Report Nos. 409 (50th Round, 1993–94), 458
(55th Round, 1999–2000), 515 (61st Round, 2004–05) and 537 (66th Round, 2009–10)
Agriculture thus continues to absorb the greatest part of male rural labour though they
have moved from that vocation increasingly, except in a handful of states. For female
labour in paid employment, agriculture is predominant despite some decline. A variety of
factors are at work. First, there is diversification into other forms of activity in rural areas,
including rural industry and services, especially construction of various descriptions, which
include central and state sponsored programmes. A part of this is through deliberate
interventions for employment creation, rural infrastructure, and poverty alleviation such
as MGNREGA, Golden Quadrilateral, Bharat Nirman, PMGSY, Indira Awas Yojana, etc.
Secondly, within agriculture changes are taking place in various subsectors and labour
absorption may reduce with input coefficients. For instance, some are moving into
burgeoning non-crop agriculture such as diary, poultry, fisheries, etc. even within this
declining trend. It is also the result of productivity changes in agriculture. Third, workers
are moving out of agriculture and the rural economy altogether. Some of them may be
permanent migrants and would not count any longer, but many move out temporarily and
return, and it is believed that a considerable proportion also commute to nearby places of
semi- and peri-urban settlements to work while they reside in their rural habitats. In their
place, substantial proportions of female labour have taken over for a variety of activities.
Female 1993-94 Female 2009-10

Orissa Economic Journal, Vol. 47, No. 1, Jan-June 2015 : 41
Some look after the farm now, some to supplement, and others into different forms of
labour that are more efficiently done by female labour consequent on changes in cropping
patterns. Plenty more women have also entered allied activities to replace their male
counterparts, such as in marketing, transportation, etc. It is indeed correct to assert that
there is considerable ‘feminisation’ of agricultural activities in general with desertion of
male labour.
There are of course regional diversities. In western states of Maharashtra and Gujarat,
labour absorption in agriculture has not declined, and in some cases increased. In Kerala,
there have been precipitous declines in farm labour of both genders. In the relatively
backward states, large scale male labour desertion has occurred for migration (such as
from Bihar, Odisha, parts of Uttar Pradesh, Himachal Pradesh, etc.), and female labour has
taken over some slack in the employment structure. In more prosperous regions of Punjab-
Haryana and Kerala a different type of male desertion of farmlands has occurred.
Agricultural growth and rural prosperity
The Green Revolution (GR) ushered in around mid-1960 was water intensive, and it was
focused on the two principal cereal crops most consumed in India, rice and wheat. GR was
first adopted in the Indo-Gangetic plains of the ‘irrigated’ system and spread to the coastal
peninsula. While this programme was successful in raising crop productivity considerably
over the decades upto 1980s, it was mainly confined to ‘irrigated’ and ‘coastal’ regions of
India defined earlier. I have held the view in an unpublished lecture delivered in 2005 that
this was indeed the line of ‘least resistance’ to reach the goal quickly for India at the time
it was embarked upon. It was possible in these regions to draw copious water required for
that technology and farmers there had the wherewithal to support the adoption. It was
another matter that these regions had benefited from the legacy of British rule by way of
irrigation canals, dams and other infrastructure for better prosperity to the neglect of
other regions.5
While prosperous farmers of the northwest Indo-Gangetic plains and coastal regions largely
of the southern peninsular India benefited from greater farm prosperity, with considerable
largesse from the state apparatus through various subsidies, large sections of Indian farmers
have remained outside this process. While rice and wheat (and maize and sugarcane and
others) farmers may have benefited, especially medium and large farmers, from this
strategy of enhanced food supply, large sections of farmers in other agro-ecosystem have
remained outside this pale. All rural workers in these regions, as well as small and non-
surplus cultivating households would not benefit from this dividend. Unfortunately for
Odisha, it was outside these regions of prosperity which marginally touched some irrigated
tracts of the state. This is the first legacy of rural deprivation that the state endured. This
5For further discussions on this point see Ray, 2015 and references therein.
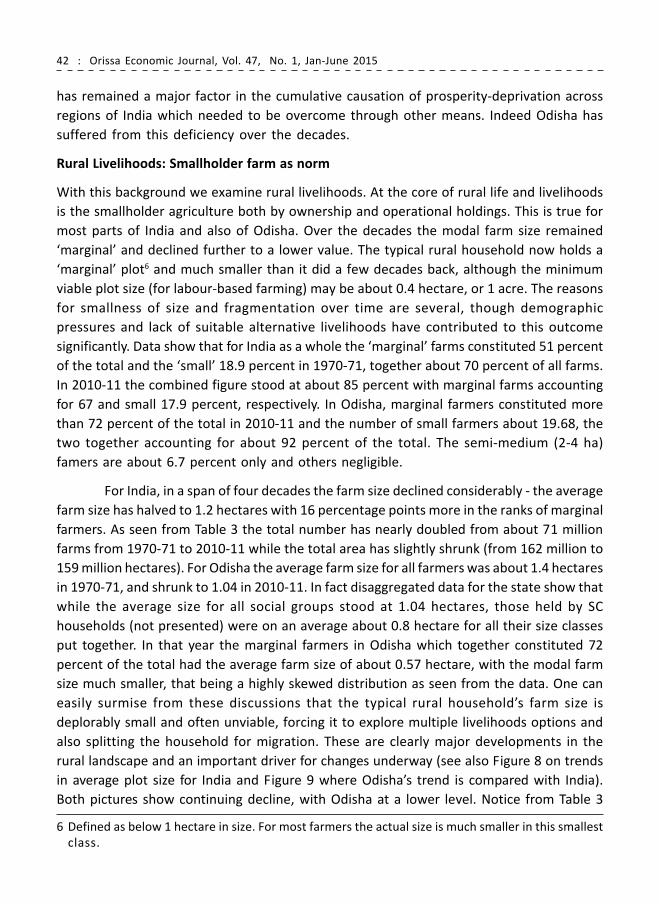
42 : Orissa Economic Journal, Vol. 47, No. 1, Jan-June 2015
has remained a major factor in the cumulative causation of prosperity-deprivation across
regions of India which needed to be overcome through other means. Indeed Odisha has
suffered from this deficiency over the decades.
Rural Livelihoods: Smallholder farm as norm
With this background we examine rural livelihoods. At the core of rural life and livelihoods
is the smallholder agriculture both by ownership and operational holdings. This is true for
most parts of India and also of Odisha. Over the decades the modal farm size remained
‘marginal’ and declined further to a lower value. The typical rural household now holds a
‘marginal’ plot6 and much smaller than it did a few decades back, although the minimum
viable plot size (for labour-based farming) may be about 0.4 hectare, or 1 acre. The reasons
for smallness of size and fragmentation over time are several, though demographic
pressures and lack of suitable alternative livelihoods have contributed to this outcome
significantly. Data show that for India as a whole the ‘marginal’ farms constituted 51 percent
of the total and the ‘small’ 18.9 percent in 1970-71, together about 70 percent of all farms.
In 2010-11 the combined figure stood at about 85 percent with marginal farms accounting
for 67 and small 17.9 percent, respectively. In Odisha, marginal farmers constituted more
than 72 percent of the total in 2010-11 and the number of small farmers about 19.68, the
two together accounting for about 92 percent of the total. The semi-medium (2-4 ha)
famers are about 6.7 percent only and others negligible.
For India, in a span of four decades the farm size declined considerably - the average
farm size has halved to 1.2 hectares with 16 percentage points more in the ranks of marginal
farmers. As seen from Table 3 the total number has nearly doubled from about 71 million
farms from 1970-71 to 2010-11 while the total area has slightly shrunk (from 162 million to
159 million hectares). For Odisha the average farm size for all farmers was about 1.4 hectares
in 1970-71, and shrunk to 1.04 in 2010-11. In fact disaggregated data for the state show that
while the average size for all social groups stood at 1.04 hectares, those held by SC
households (not presented) were on an average about 0.8 hectare for all their size classes
put together. In that year the marginal farmers in Odisha which together constituted 72
percent of the total had the average farm size of about 0.57 hectare, with the modal farm
size much smaller, that being a highly skewed distribution as seen from the data. One can
easily surmise from these discussions that the typical rural household’s farm size is
deplorably small and often unviable, forcing it to explore multiple livelihoods options and
also splitting the household for migration. These are clearly major developments in the
rural landscape and an important driver for changes underway (see also Figure 8 on trends
in average plot size for India and Figure 9 where Odisha’s trend is compared with India).
Both pictures show continuing decline, with Odisha at a lower level. Notice from Table 3
6 Defined as below 1 hectare in size. For most farmers the actual size is much smaller in this smallest
class.
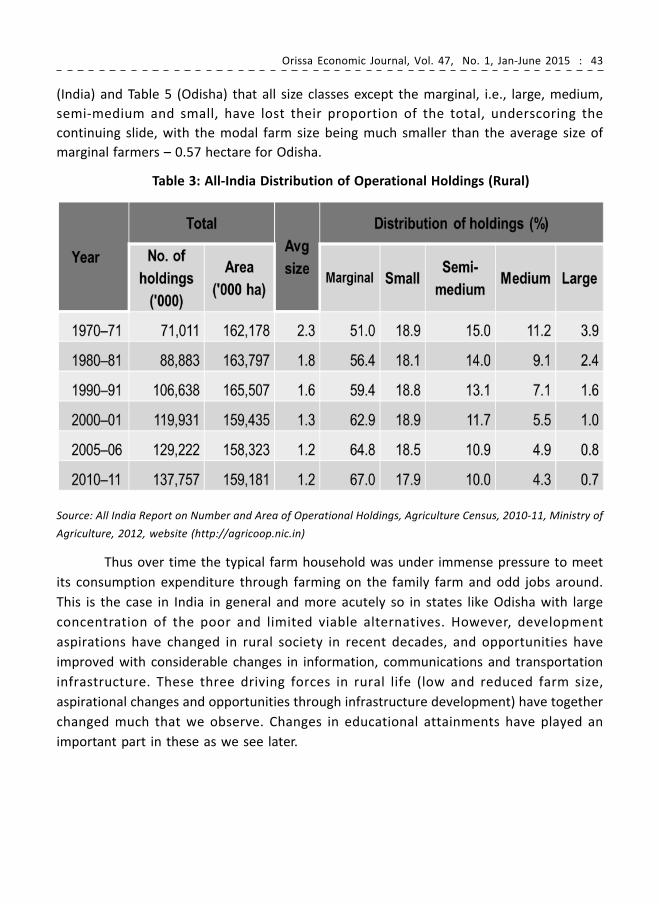
Orissa Economic Journal, Vol. 47, No. 1, Jan-June 2015 : 43
(India) and Table 5 (Odisha) that all size classes except the marginal, i.e., large, medium,
semi-medium and small, have lost their proportion of the total, underscoring the
continuing slide, with the modal farm size being much smaller than the average size of
marginal farmers – 0.57 hectare for Odisha.
Table 3: All-India Distribution of Operational Holdings (Rural)
Source: All India Report on Number and Area of Operational Holdings, Agriculture Census, 2010-11, Ministry of
Agriculture, 2012, website (http://agricoop.nic.in)
Thus over time the typical farm household was under immense pressure to meet
its consumption expenditure through farming on the family farm and odd jobs around.
This is the case in India in general and more acutely so in states like Odisha with large
concentration of the poor and limited viable alternatives. However, development
aspirations have changed in rural society in recent decades, and opportunities have
improved with considerable changes in information, communications and transportation
infrastructure. These three driving forces in rural life (low and reduced farm size,
aspirational changes and opportunities through infrastructure development) have together
changed much that we observe. Changes in educational attainments have played an
important part in these as we see later.

44 : Orissa Economic Journal, Vol. 47, No. 1, Jan-June 2015
Figure 8: AFigure 8: AFigure 8: AFigure 8: AFigure 8: Avvvvverage size (ha) of holdings: Indiaerage size (ha) of holdings: Indiaerage size (ha) of holdings: Indiaerage size (ha) of holdings: Indiaerage size (ha) of holdings: India
Source: Department of Agriculture and Cooperation, Agricultural Census Division, Ministry of Agriculture.
Figure 9: Average land holding size (in ha) by year in India and Orissa
Odisha
India

Orissa Economic Journal, Vol. 47, No. 1, Jan-June 2015 : 45
Source: Source: Department of Agriculture and Cooperation, Agricultural Census Division,
Ministry of Agriculture and Odisha Economic Survey 2013-14
As we found for Odisha, the ‘rainfed’ agro-ecological conditions are relatively unfavourable
in most regions, and occasionally hostile in areas of the coast where soil fertility and
opportunities may be otherwise better. Households have thus taken resort to various
ways of coping by resorting to many forms of diversification as survival strategies as well
as striving to meet their greater aspirations. One obvious way has been to have a portfolio
of occupations (discussed later as part of rural alternative occupations) for main earning
members of the family, and sometimes for children and elderly persons too, both male
and female - they work both on-farm and off-farm. Some of them lease-out non-viable
farms and work elsewhere; and others divide the same routine for various members of
the family. Others migrate to non-farm rural occupations, and semi-urban and urban centres
for supplementing family income. These response patterns are different for different
regions and social segments even within the state; they have also been influenced by
educational and training opportunities accessed by new generations as we see later. These
have dramatically changed the output composition of agriculture in India in recent decades.
Migrants have also acted variously among different segments. Lack of gainful opportunities
in most rural areas remains a paramount issue, although economic growth and interventions
by government schemes to reach out to the poor and other measures have eased the
pressures somewhat. A host of changes have occurred and are discussed below.
Table 4: Distribution of the Number of Operational Holdings in Odisha (Area in Ha)
Size class (Area in ha)
Year Marginal Small Semi Medium Medium Large All Classes
All Social Groups
2000-01 No. 2294520 1113599 500531 145110 13375 4067135
Area 1155145 1543709 1344201 817591 220387 5081033
Area/no 0.503436 1.386234 2.68555 5.634284 16.47753 1.24929
2005-06 No. 2597164 1156162 472129 119529 11408 4356392
Area 1341668 1587713 1250650 658208 181237 5019476
Area/no. 0.51659 1.373262 2.648958 5.50668 15.88683 1.152209
2010-11 No 3368296 918647 311261 63688 5579 4667471
Area 1921842 1497752 918947 381272 142019 4861832
Area/no. 0.570568 1.630389 2.952336 5.986559 25.456 1.041642
Source: Odisha Economic Survey 2013-14

46 : Orissa Economic Journal, Vol. 47, No. 1, Jan-June 2015
Livestock and horticulture in diversification of agriculture
A significant change that took place over the last quarter century or so is the diversification
of product composition of agriculture and allied sectors. The old routine of cereals as the
mainstay of agriculture has given way to other products. In the two decades from 1990-91
to 2009-10, the share of cereals in Indian agriculture has declined from 23 to 18 percent,
and the decline is equal to the gain by livestock (Figure 10). The other significant increase
has been in horticulture (fruits, vegetables and others), which increased from 16 to 20
percent. Similarly for fisheries (marine and inland), whose share increased from 3 to 5
percent. These three segments (livestock, horticulture and fisheries) together constituted
50 percent of total agricultural output in India in the triennium ending 2009-10, up from
about 39 percent in 1990-91. In product terms these refer to milk, poultry, meat (of various
descriptions), eggs, fish (of different groups), fruits and vegetables.
Table 5: Distribution of proportion of Operational Holdings for all
Social Groups in Odisha (Area in Ha)
Proportion of total
Year Marginal Small Semi Medium Medium Large
2000-01 No. 0.564161 0.273804 0.123067 0.035679 0.003289
Area 0.227345 0.303818 0.264553 0.16091 0.043374
2005-06 No. 0.596173 0.265394 0.108376 0.027438 0.002619
Area 0.267292 0.316311 0.249159 0.131131 0.036107
2010-11 No 0.721653 0.196819 0.066687 0.013645 0.001195
Area 0.395292 0.308063 0.189012 0.078421 0.029211
Source: Odisha Economic Survey 2013-14
A similar change has also taken place in Odisha, clearly seen from recent data, presented
in Figure 11 for the years 2004-05 and 2010-11, both at 2004-05 prices. In the latter year it
was about 31.5 percent for horticulture, far exceeding the value of all cereals together,
which were 18.5 percent. In that year livestock accounted for 18.3 percent, comparable in
value with all cereals, and fisheries at 5.7 percent. Note from the pie chart presented that
the three groups together (horticulture, livestock and fisheries) accounted for 55.55
percent. Rice cultivation still dominates production of crop agriculture in Odisha as the
main staple cereal. In terms of area devoted to cropping in Odisha in the year 2012-13, Rice
accounted for 72.7 percent and together with other cereals constituted 76 percent of the
total crop agriculture. Pulses were 15 percent and these together accounted for 91 percent
of all crops. Oilseeds, fibres and others constituted the rest. But the ascendance of the
new products of the agricultural and allied sectors is a matter of considerable importance

Orissa Economic Journal, Vol. 47, No. 1, Jan-June 2015 : 47
and account for a major change in Odisha as they do in India.
There are several reasons for this robust growth in these products due both to demand
and supply factors.7 An important factor on the demand side is the general prosperity of
the average Indian with per capita income increasing; the diet diversification has occurred
with that. This has happened to virtually all classes, segments and regions across the
country. Households are now partaking of relatively protein- and micronutrients-rich diets
in the form of milk, eggs and poultry, meat, and other forms of non-cereal food like fruits
and vegetables; their compositions though vary across income classes and regions. There
is also a lifestyle change of sorts with greater awareness, information dissemination and
education across the country. Studies also note that calorie requirement of the average
worker has declined with the change in energy expenditure and intensity of work.8 In
addition sources of calorie other than cereals have invaded the Indian diet as substitutes,
such as from beverages like sugar-rich soft drinks and alcoholic beverages, partly due to
lifestyle changes and their greater affordability with general prosperity. There is evidence
that while poverty has declined, and with that the lowest two quintile groups of income
classes (bottom 40 percent) have seen increased income, the middle decile groups have
emerged with considerable purchasing power.9 Diet is the first claim on the consumption
expenditure as a universal law of demand and it leaves unmistakable imprint on the
composition of the agricultural basket. The typical Indian diet has been calorie-rich cereals;
it is now more nuanced. There is significant increase in urbanization also, with much
concomitant demand for horticulture and livestock products. A similar process with
different magnitudes is underway in Odisha.
There is however an equally compelling supply side to this change that has occurred in
tandem in rural India, and I wish to underline that theme in this paper. Traditionally the
Odiya farmer (like his counterparts elsewhere in India) grew cereals, mostly rice, because
that remains the major portion of the household diet and the balance was sold in rural and
other not-too-distant markets. This was typically the case for self-consumption by the
cultivator with the objectives of self-sufficiency and food security at the household-level.
Oils, spices and condiments which were essential, but mostly not grown on the farm, were
bought off the market. Non-vegetarian protein diets such as fish were procured from
village commons such as ponds and tanks, and rivers and sea depending on the terrain.
Milk and milk products were mostly for children or for festivities for the common folks.
Other protein forms such as eggs, poultry and meats were rare and infrequent. The
vegetable markets were there but rural households accessed them only as supplements;
in urban areas they were dependent on them on routine basis. With the growth of
7 Selected references are: Birthal, et. al. (2008, 2012), chand et. al. (2008), Kumar (1998), Rao,
et. al. (2006)
8 Hanumantha Rao (2000); also Deaton and Dreze, (2002) reviewing the poverty-inequality issues in the
nineties in India and declining cereals consumption in this context.
9 See my essay on inequality and the Kuznets process in India in Ray, 2014.

48 : Orissa Economic Journal, Vol. 47, No. 1, Jan-June 2015
urbanization and income levels, the market for these products developed in concert with
infrastructure support, discussed later.
There are two other groups; a) those who grow cash crops on their farms such as edible
oils, spices and condiments, sugarcane, jute, and other non-edible cash crops; and b)
various forms of tenant farmers like share croppers and cash tenants. For the second group
the typical strategy was also very similar to the owner-cultivator – get into contracts to
grow crops that they needed for own consumption with a small share perhaps for buying
essential items from the market. Frequently, this component was also met by other forms
of cash income. The first group met their livelihoods through production and market
exchange, but were vulnerable in periods of food crisis. A third group of landless
agricultural labour mostly worked as farm labour and received wages in kind and also in
cash.
Figure 10: Details of Agriculture sub sectors in TE 1990-91 and TE 2009-10
Source: CSO accessed at http://agricoop.nic.in/sia111213312.pdf (TE 1990-91 and TE 2009-10)
TE 1990-91
TE 2009-10

Orissa Economic Journal, Vol. 47, No. 1, Jan-June 2015 : 49
There was another compelling reason for the growth of horticulture and livestock. Fruits
and vegetables are generally speaking labour-intensive processes but lucrative when sold.
Vegetables in particular can be grown in small plots with little capital and short gestation
periods; with a growing demand in urban areas in particular, they have been a favourite of
the small farmer. These farmers, in nimble steps, switched into these products and surely
gained with increased marketing channels. Most of them combined these with cereals for
self-consumption to avoid market risks. Fruits are somewhat different, as orchards tend to
be relatively capital intensive and require more than just copious labour. They are also
long gestation crops, unlike vegetables; and entail greater marketing risks. Thus small and
marginal farmers were not so much into fruits as in vegetables.
Larger farmers grew fruits in specific regions which were more suited to them. Farmers in
“Hill and Mountain” AEZ such as Himachal Pradesh and parts of J&K, and Uttarakhand,
switched acreage to orchards. The use of micro-irrigation, such as drip irrigation, allowed
farmers in dryland areas of ‘Rainfed’ AEZ to devote farmlands to orchards, as in parts of
Maharashtra, Andhra Pradesh, etc. Note that in all cash crops the development of
transportation and marketing infrastructure played a critical role.
Figure 11: Agriculture sub-sectors in Odisha 2004-05 and 2010-11
In Assam, Bihar, Haryana, Odisha, Punjab, UP and West Bengal, i.e., most of the Indo-
Gangetic Plains and parts of rainfed AES with copious water precipitations, and where
vegetables form a major part of peoples’ diet, more than half horticultural land were
under vegetable crops in 2009-10. States like Tamil Nadu, Karnataka, Kerala, Madhya
Pradesh, and Rajasthan joined their league in boosting horticulture in a major way. While
government support by way of infrastructure development (roads, transportation, markets,
2004-05
Cereals - 91.94
Oilseeds - 2.19
Fibres - 0.66
Other crops and by products - 8.68
Forestry - 13.01
Pulses - 1.92
Sugar - 0.48
Horticulture - 32.07
Livestock - 13.53
Fishery - 5.51
Cereals - 18.52
Oilseeds - 1.95
Fibres - 0.93
Other crops and by products - 9.25
Forestry - 10.99
Pulses - 2.46
Sugar - 0.36
Horticulture - 31.55
Livestock - 18.34
Fishery - 5.66
2010-11

50 : Orissa Economic Journal, Vol. 47, No. 1, Jan-June 2015
year Per capita availability of Per capita availability Per capita availability
milk (gms./day) of meat (kg./annum) of eggs (no./annum)
1999-00 65 1.029 18
2004-05 94 1.358 33
2009-10 109 3.17 57
2012-13 117 3.38 55
Source: Directorate of Animal Husbandry and Veterinary Services, Odisha.
information, etc.) has spurred growth, technological extensions and educational support
have not done their bits to improve total factor productivity. It may be noted that yields
can improve through total factor productivity as well as increased inputs, such as greater
application of labour which the marginal and small farmer is believed to have applied,
especially for vegetable crops in the major AEZ (Irrigated, Coastal and Rainfed). Further
discussions may be found in my essay, Ray (2015) and the references therein.
Non-crop protein sources such as poultry, meats, eggs, fish, etc. have all gained through
the diversification process of both large and small farmers. They have all multiplied as part
of diversified income sources like cottage industries throughout the country quite apart
from viable firms in the organised sector of the industry. Inland fisheries have also grown
in coastal and interior districts in a major way; marine fishery is not entirely a cottage
industry, though hordes of small boats have been launched for supporting livelihoods.
Consider per capita availability of milk, meats and eggs in Odisha, from 1999-00 to 2012-13
reproduced for select years in Table 16. During this short period of a dozen years, per
capita milk availability increased by 80 percent, that of meats by 285 percent and of eggs by
more than 200 percent. This is by no means small change in terms of availability of protein-
rich diet in Odisha. This is the combined result of various factors like livelihoods
diversification by small and marginal farmers, made feasible by major changes in
infrastructure such as roads, supporting storage and marketing channels, urbanization on
a significant scale and awareness and affordability of the new generation of consumers in
both rural and urban settings. Odisha and its small and marginal farmers have benefited
from this change but there remains much to be achieved on this score. I have subsumed
the discussion on the major upsurge in the availability of fruits and vegetables and fisheries
without getting into further details for the state.
Table 6: Year-wise Production and Per Capita Availability of
Milk, Meat & Eggs in Odisha

Orissa Economic Journal, Vol. 47, No. 1, Jan-June 2015 : 51
Rise in rural non-farm activities
We noted that the share of agriculture in national as well as state domestic products has
been declining; this is also the case with respect to rural employment in agriculture, though
the latter (employment in agriculture) is still the most dominant by far. It is seen,
correspondingly, that the shares of other rural activities are increasing, in particular that of
construction, ‘trade hotels and restaurant’, transport, and other services. At the national
level, manufactures’ employment share remained constant at around 7 percent; the share
of all rural services (i.e., including construction) increased from 14.6 to 24.9 with the entire
gain equalling the loss to agricultural employment. We have observed that there is
diversification away from farming to activities like livestock, fisheries and horticulture.
Without getting into the details we see a similar pattern of change in rural activities in
Odisha. This is the result of two tendencies generally speaking – one is a dynamic factor
that spawns (pulls) other businesses as the economy expands and households have more
disposable incomes to spend on comforts, luxuries, entertainment, etc.; the other is the
coping strategy (push) that spurs households to target income levels to meet essential
expenditures. While not strictly necessary, these tendencies usually occur in separate
geographic regions. My assertion is that for Odisha the expansion in the service sector is
for the most part the result of coping mechanism. While prosperity spawned growth of
services is not entirely ruled out, especially in urban centres and in certain activities such
as financial services, communications and transport, this would not account for a great
proportion of the total, though I unable to give any estimates whatsoever. It is not suggested,
for instance, that beauty parlours and other products and services of modern lifestyles are
unavailable in rural Odisha today, as indeed they are, but these are fewer and far between
compared with other regions of India with greater economic prosperity. This is a conjecture
that is best refuted by estimates.
An early literature on this dichotomous expansion of the service sector has been there
and is based on the following observations. Many poor households undertake multiple
activities to support livelihoods. Other households diversify activities to optimise their
assets’ use and capabilities.10 Diversification of livelihoods has two main aspects: one is
the number of different income-earning activities which a household undertakes; the
other is the proportion of income gained from each activity (see Table 6.2 in Ray, 2015). A
household may have a number of occupations but few may be significant contributors to
income. There is increasing trend among households engaged in multiple activities; at
least two but that can increase to four or more. Frequently the poorest are engaged in one
or two occupations, constrained as they are by lack of capital assets (land, livestock, credit-
worthiness) to diversify, but diversify into multiple occupations as they move up the income ladder.
The well off on the other hand may diversify for optimising assets use.
10 There is debate on these issues; see Bhalla, 1990; Harris, 1991; Chadha, 1994; Viadyanathan, 1986; Ellis,
1998; Walker and Ryan, 1990; among others.

52 : Orissa Economic Journal, Vol. 47, No. 1, Jan-June 2015
Opportunities for multiple rural livelihoods depend on geographic regions. If we keep aside migration
(discussed below), these options depend on the scope of rural non-farm sector (RNFS) in the area.11
Naturally, that depends considerably on whether the region is prosperous or not. In prosperous
regions RNFS would increase with prosperity in the farm sector, though the autonomous role of
remittances in spurring non-farm sectors has become important in many parts (Kerala, for instance).
This second route (the Kerala-type) to spurring RNFS may work in the contrary fashion and contract
the farm sector while diverting labour to migrate or move to RNFS for better opportunities. In less
developed areas on the other hand the tendencies may be different. In fact in these areas RNFS
activities may increase when there is crisis of some description in the farm economy as households
seek coping mechanisms. Thus there may be two clear tendencies at work – the service economy
may expand in Punjab-Haryana or Gujarat, or coastal peninsular villages with thriving beauty
parlours, banking and insurance businesses, travel agencies and access to stock markets, as well as
agro-processing and other manufacturing RNFS. By contrast, in Odisha, Bihar and other parts of
rainfed AES – exacerbated by a crisis like drought or flood – pressure on family budget (including
from the shrinking plot size seen earlier) may spur small-time owner-occupied shops with child
labour. The case of remittances induced RNFS growth is a third tendency, and this may partly
contribute to spurring rural trade and services in Odisha. Some of these are of course closely connected
with migration and remittances, and technology driven due to newer communications channels,
such as internet and mobiles, but many are through lifestyle changes and aspirations driven entirely
possible through increased disposable income.
Of course the whole scenario may change in hitherto poorer terrains when substantial infrastructure
development takes place, such as roads and marketing channels. These may cause huge backward
and forward linkages. They open up channels to diversify into cash crops in farms and invest in non-
farm products for distant markets – as for instance the entire spectrum of products of livestock and
horticulture discussed earlier. This would of course depend on capital endowments (including land)
and other attributes of corresponding households. Government induced policy support, besides
infrastructure development, have also contributed significantly in these.
There is a major segment of rural industry by way of micro, small and medium enterprises (MSME)
clusters which could make considerable contribution to livelihoods in rural Odisha as they do in other
parts of India. Most of the micro and small enterprises employ labour-intensive methods and thus
support livelihoods significantly. I reproduce from Odisha Economic Survey 2013-14, Table 7 on their
numbers, investment and employment. An assessment of their activities in the handloom and
handicrafts industries in Odisha and potentials for poverty alleviation are analysed in my paper, Ray
(2008) and other papers by Foundation for MSME Clusters, New Delhi. Important though they are
this is not explored here.
11 See Mellor, 1976 for an early contribution.

Orissa Economic Journal, Vol. 47, No. 1, Jan-June 2015 : 53
Table 7: Sector-wise MSME Units in Odisha: end-2012-13
Category No. Investment (in crore) Employment (in person)
Food & allied 26498 1349.94 142016
Chemical & allied 2969 231.6 22776
Electrical & Elecronics 1179 68.86 7502
Engineering & 13353 96.79 98267
metal based
Forest 7281 87.62 45418
Glass 8831 593.93 139801
Livestock 457 7.66 2576
Paper 3072 126.88 16906
Rubber 1818 209.96 11234
Textiles 8874 160.84 52060
Misc. Mfg 6701 205.29 32363
Repairing & Services 42259 966.23 135423
Total 123292 4969.59 706342
Source: Odisha Economic Survey 2013-14
Migrations and their trails
Migration has taken centre stage in rural life of Odisha with diminished livelihoods options
in rural economy and opportunities elsewhere; and this has taken many forms. Some go
for agricultural and other non-farm employment; these are in nearby rural areas and towns
or distant hubs of activity. Migration by definition is a continuous period of absence from
abode and therefore daily or short term and seasonal commuting do not count. Let us keep
the profiles of rural to rural migration separately from migration to urban areas. Typically
the first group would migrate to better paying jobs with significantly higher real wages.
When they move into occupations in other rural areas, these are in lieu of their own or
nearby farms, but increasingly in construction jobs which are frequently government
sponsored programmes. When they move to other states in rural areas, they go to
prosperous agriculture zones such as Indo-Gangetic plains of northwest India. For instance,
the rural labour from Odisha and Bihar migrate to agricultural fields of Punjab-Haryana
where, due to agricultural prosperity, real wage rates are higher. There are now going
increasingly as farm labour in prosperous southern and western states to alleviate their
labour scarcity. The second group of migration to urban centres is more widespread; the
trails and vocations of these migrants are varied and change dynamically over time.
Consider migrants from low-wage rural areas first; from rural Odisha to small towns and

54 : Orissa Economic Journal, Vol. 47, No. 1, Jan-June 2015
large cities. These migrations have taken place in various hues, depending on the skill and
educational backgrounds of migrants, with a variety of outcomes. In my studies based on
extensive visits to coastal Odisha as origins of migrants and to their destinations in large
metros of Kolkata, Delhi and Mumbai I observed three principal trails of employment
related migrations.12 The migrants are mostly young and male members of rural households.
The first trail is of low educated menial labour. This trail is more than half a century old, but
in recent decades their volumes have increased hugely and destinations have changed. In
the early days there were scarcely any education and training opportunities in rural areas,
so those migrating had no more than home-spun talent and trickled to nearby urban centres
and industrial hubs. The scale of this flow is huge now and in several low-wage vocations;
they migrate to all major cities where linguistic communication is not a barrier – that
means all major cities barring the south; and increasingly to the south also. An important
segment of this second trail of migrants are those who are plumbers from coastal Odisha.13
In major construction hubs and cities they have now crossed over to other forms of semi-
technical jobs increasingly. They are also seen in industrial and service clusters in Gujarat
and Maharashtra, U.P., and Punjab, apart from Kolkata where they traditionally migrated.
The second trail is of somewhat more educated youths (elementary to secondary schools)
who go to urban centres for various semi-skilled jobs which they learn through
apprenticeships on the job. This has been helped by the string of new schools set up in
various locations close to their places of residence now.14 Data presented in Table 8 show
that there are now very low dropout rates for all categories of children, both boys and
girls, upto about elementary level, but dropout rates increase significantly at the high
school stage. Sometimes, they are also trained technicians (ITI-type skills) or artisans who
find appropriate jobs in various types of clusters, both in Odisha but more so outside the
state. They are also typically single male migrants.15 The main dividing line between single
and family migration is the principal migrant’s income class – whether that is enough to
ensure family subsistence in the destination township.
It is observed in rural Odisha that when single migrants are married and have children, the
12 There are of course other forms of migrants from both rural and urban areas and very significantly for
females after their marriage. There are also large education related migrants now, but I do not
consider those categories in this paper.
13 I have written about the migrant hordes of plumbers from Pattamundai in my essay in the Handbook
of Agriculture in India - chapter 6 of Ray (2007).
14 All-India data show that in 1995-96, 44 percent males and 32 percent females were attending middle
schools in rural India; these increased to 55 and 56 percent, respectively, in 2009-10. By that year 48
percent males and 39 percent females were pursuing secondary education in rural India.
15 See Ray, 2007, chapter 6 for accounts of rural migrants in different destinations. Also see Ray and
Sarkar, 2008 on handloom and handicrafts artisan clusters, including those in Odisha.

Orissa Economic Journal, Vol. 47, No. 1, Jan-June 2015 : 55
women and children are left behind in the village home, where it is more affordable with
the resources they command. Children are nurtured by mothers and family elders, and
their education is done in rural schools which are now generally accessible. Their village
homes and marginal plots of land are managed by remaining family members,
supplemented in high season by the migrants coming home temporarily. The single male
migrants are mostly these two categories of relatively low-educated and low-earning
young odiya men, who generally cannot afford to move their entire family. In recent years
slums in urban agglomerations have become homes to many such migrant households but
that is still a fraction of the rural migrants to these agglomerations.
Table 8: Dropout Rates in Primary, Upper Primary and
High Schools in Odisha 2012-13
Sources: Director, Elementary Education and Director, OPEPA
They have now fanned out to all destinations in India and have also spilled over to other
related artisan callings as they learn on their jobs as they move to their destinations. This
second trail also includes large hordes of middle and high school graduates, and sometimes
college educated boys, who migrate to larger towns and cities, including Mumbai, Delhi,
Kolkata, Bangalore, and other large towns across the country, and work in service sector
jobs such as in hotels, restaurants and similar occupations. Their added education and
learning capabilities help them adapt to their new occupations. Of course the role of
‘chain migrations’ or ‘friends and relatives’ links in securing and learning on their jobs play
important roles – see Ray, 2007 for further elaboration on this link in migration literature.
There is the third trail, and although they are male-dominated, that is no longer exclusively
so. They are joined increasingly by their female peers into jobs which are better paying
and in superior working environment. At the aggregative all-India level for school
education the gender gap has been largely closed. We see the same pattern in Odisha
except at higher levels. These migrants are college educated youths from district centres
and semi-urban areas, and many of them have earned engineering and related degrees.
They move to major centres of industrial activity and higher-end urban service related
occupations all over the country. The language of communication is no longer the barrier
to their movement. This is the modern generation that is spawned by education in district
and other towns, though somewhat deficient in quality in many cases. Here the role of
government support is paramount, but private educational institutions have mushroomed
in many town-centres. There is perhaps class-bias as poor households cannot afford to
give expensive private education to their children.
2012-13 Boys Girls Total
Primary schools 0.73 0.22 0.37
Upper Primary Schools 2.45 2.38 2.36
High Schools 21.14 16.21 18.72

56 : Orissa Economic Journal, Vol. 47, No. 1, Jan-June 2015
In my sample of migrants from Balasore district collected from over 1100 households,
there were 1559 migrants with different levels of education. When classified broadly into
four groups as upto primary, secondary, higher education, and technical qualifications we
listed their destinations and other profiles. The largest group of migrants in the survey
period 2012-13 were with secondary education (1053), constituting 67 percent of the total
sample, and they went to all destinations in India. Out of this group of secondary educated
(as claimed by them), 55 percent went to various metropolitan cities as destinations, and
large groups went to Andhra Pradesh (10.2%), Gujarat (16.4%), and as far as Goa (3.3%),
Kerala (3.1%), etc.
About 18 percent had primary education or less, and 13 percent had higher education.
These two groups also went to all destinations. Those with technical education were
altogether 23 - the sample too small for any significant inference - and they went to select
places only. Of those with primary education, most of them (59%) went to metropolitan
cities but also went to Gujarat (16%), AP (8%) and Goa (4%). A similar story was revealed
for those with higher education with most of them going to metropolitan cities (58%), and
others to AP, Gujarat, etc. These reveal distinct opportunities, and we could also identify
some other discriminants of their profiles. We found that most of the migrants with low
education ended up in menial jobs wherever they went, working mostly in private
companies (58%) or as wage labour (37%). Those with secondary and higher education
ended up with jobs in similar places but at higher profiles or positions, though some
ended up in menial jobs.
Another important discriminant was the income profiles of migrants at different levels of
education; and this reveals a story of education being financially rewarding for most
migrants. The results are presented in Figures 12 and 13. Those who are poorly educated
typically earned less in whichever occupation they were and those with higher and technical
education secured better jobs and earnings.
Figure 12: Balasore migrants: Average income of migrants as per their activities

Orissa Economic Journal, Vol. 47, No. 1, Jan-June 2015 : 57
Note: Based on author’s survey of migrants from all blocks of Balasore district in 2012-13. Income
figures are in rupees annual as reported by respondents. Some of the ‘Technical’ job persons work
abroad and may exaggerate the rupee income which are unadjusted for their purchasing power parity.
Figure 13: Average income of migrants as per their educational status
Note: Based on author’s survey of migrants from all blocks of Balasore district in 2012-13. Income figures
are in rupees annual as reported by respondents. Some of the ‘Technical’ education persons work abroad
and may exaggerate the rupee income which are unadjusted for their purchasing power parity.
Demographic Dividend: Odisha’s elusive opportunity
Data in Table 9 shows that over the last six decades Odisha kept pace with the average
progress of literacy in India in quantitative terms. Literacy growth attained rapid strides
and reached a comparatively high level. Though the gender gap remained significant in
Odisha, it was the same for India. Though lack of convergence on per capita income terms
was visible in Figure 1, in educational terms there is hope of catching up. Studies show
that years of schooling result in positive returns16, and we found the same in our sample of
coastal migrants from Odisha. Thus if we could invest workers with education and suitable
training, their incomes can improve and help increase prosperity. In that sense human
capital may be an important component of growth, and indeed the ‘endogenous growth’
theory literature provides important clues to that. Much of the East Asian growth
experience (in South Korea, China, Taiwan, and select countries in SE Asia too) underlined
that. Education was a critical component of that.17
16 See Aggarwal (2014), for review of literature and tests with human development survey data.
17 See my papers Ray (2011, 2012).

58 : Orissa Economic Journal, Vol. 47, No. 1, Jan-June 2015
There is the contemporary issue of ‘demographic dividend’ that socio-economic changes
brought about through declines in fertility and mortality rates, and India is poised to harness
that opportunity through large working age population and reduced dependency ratio.
This is because of smaller families until such time that the present working age population
(15-59 years) become elders – through overlapping layers of about 45 years from entry to
exit in the labour force. It is a window of opportunity compared with developed economies
where the ratio of elders is considerable. Odisha is on the cusp of that opportunity, but it
may be an elusive one unless the working age population is properly educated and trained.
Let us examine this phenomenon for Odisha.
Table 9: Growth of Literacy in Odisha vis-à-vis India
Year Odisha (literacy In %) India (literacy In %)
Male Female All Male Female All
1951 27.32 4.52 15.8 27.16 8.86 18.33
2011 82.4 64.4 73.05 82.14 65.46 74.04
Sources: Census of India 1951-2011
An exercise on Poorly Educated workers of Odisha
Let us make three standard segments of the working age population: the youths (15-29),
the middle (30-44), and the elders (45-59). Table 10 shows that about a third of India’s
population aged 15-29 in 2011-12 were ‘poorly educated’ i.e., defined as illiterate or with
primary education. Among those aged 30-44 over half, and nearly three-quarters aged 45-
59 were in that category. As education reached new generations progressively, less remained
poorly educated. Let us make the same assumptions about Odisha in view of their similar
progress of education at the average level with India noted in Tables 8 and 9.
Table 10: Total Population and Population with Primary Education or Below, by Broad
Age-group in India, NSS 68th Round 2011-2012
Age Group Primary and below Total Population % Primary and below
(millions) (millions)
15-29 95.0 292.2 32.5
30-44 128.5 236.5 54.3
45-59 97.6 132.7 73.5
15-59 321.0 661.4 48.5
Source; Table 3 in Krishnamurty, 2014, as computed from the NSS 58th Round, 2011-12
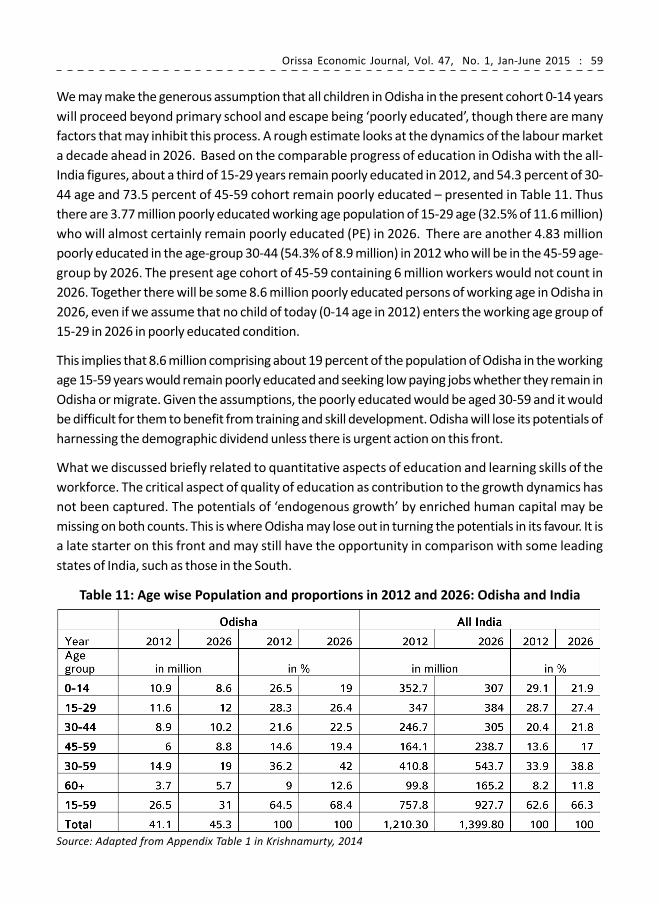
Orissa Economic Journal, Vol. 47, No. 1, Jan-June 2015 : 59
We may make the generous assumption that all children in Odisha in the present cohort 0-14 years
will proceed beyond primary school and escape being ‘poorly educated’, though there are many
factors that may inhibit this process. A rough estimate looks at the dynamics of the labour market
a decade ahead in 2026. Based on the comparable progress of education in Odisha with the all-
India figures, about a third of 15-29 years remain poorly educated in 2012, and 54.3 percent of 30-
44 age and 73.5 percent of 45-59 cohort remain poorly educated – presented in Table 11. Thus
there are 3.77 million poorly educated working age population of 15-29 age (32.5% of 11.6 million)
who will almost certainly remain poorly educated (PE) in 2026. There are another 4.83 million
poorly educated in the age-group 30-44 (54.3% of 8.9 million) in 2012 who will be in the 45-59 age-
group by 2026. The present age cohort of 45-59 containing 6 million workers would not count in
2026. Together there will be some 8.6 million poorly educated persons of working age in Odisha in
2026, even if we assume that no child of today (0-14 age in 2012) enters the working age group of
15-29 in 2026 in poorly educated condition.
This implies that 8.6 million comprising about 19 percent of the population of Odisha in the working
age 15-59 years would remain poorly educated and seeking low paying jobs whether they remain in
Odisha or migrate. Given the assumptions, the poorly educated would be aged 30-59 and it would
be difficult for them to benefit from training and skill development. Odisha will lose its potentials of
harnessing the demographic dividend unless there is urgent action on this front.
What we discussed briefly related to quantitative aspects of education and learning skills of the
workforce. The critical aspect of quality of education as contribution to the growth dynamics has
not been captured. The potentials of ‘endogenous growth’ by enriched human capital may be
missing on both counts. This is where Odisha may lose out in turning the potentials in its favour. It is
a late starter on this front and may still have the opportunity in comparison with some leading
states of India, such as those in the South.
Table 11: Age wise Population and proportions in 2012 and 2026: Odisha and India
Source: Adapted from Appendix Table 1 in Krishnamurty, 2014

60 : Orissa Economic Journal, Vol. 47, No. 1, Jan-June 2015
Conclusions and suggestions
The share of agriculture in GSDP of Odisha has declined significantly and stands at 15
percent now, though its employment share is still overwhelming as elsewhere in India.
Thus whereas agricultural yield is low, dependence on agriculture in rural life is paramount.
This is the first and most important source of low per capita earnings in Odisha. However,
household earnings from agriculture are deficient in meeting family budgets – partly due
to shrinkage of the marginal plot-size. This is a major driver of change in rural Odisha.
However other avenues have opened up. Alongside decline in agriculture’s value share,
its compositional change is substantial; farm output comprises of products of livestock
and horticulture in a major way, which now account for more than half of total agricultural
income (including fisheries), reflecting the changed national and regional food basket.
This change has worked well for largely marginal and small farmers of Odisha (together
92%) who did not benefit from the green revolution package. It has also contributed to
poverty reduction and prosperity beyond irrigated and coastal zones of India, the principal
beneficiaries in the green revolution phase. This was sustained from the 1990s as the
steam of green revolution petered out.
Rural poverty reduction and prosperity were fostered by this refocused agricultural growth
in parts of India. Furthermore, real wage increases and reduction in prices, especially food
prices, issues that we have not covered in this essay, also provided the bulwark against
rural poverty, which is still widespread, persistent and concentrated in Odisha, as in many
parts of central and eastern India. This has triggered large rural migrations from Odisha.
The diversification of farm produce (to include protein- and micronutrients-rich products)
that provided sustainability to small and marginal farms and thitherto less prosperous
farming zones was matched by awareness and emergence of the sizeable middle income
deciles with substantial purchasing power to bolster this process of change. The major
change in aspirations and opportunities for rural upsurge was fostered by infrastructure
growth by way of roads, highways, communications and markets around the country. The
salutary effects of these developments on spurring the growth of horticulture, livestock
and other sectors are underlined in this paper. These were spearheaded by important
policy changes to reach out to the villages and connecting them to the national markets by
fast modes of transport and communications. Further issues related to credit to marginal
and small farmers and their financial inclusion, the paramount role of rural construction
programmes which aided in a variety of ways the changes under way, the third tier of
governance in Panchayati Raj that has enabled voice and empowerment to take this process
forward, etc., are discussed in chapter 6, India Development Report 2015 –Ray, 2015.
The rural non-farm sector (RNFS) has done its bit to absorb labour, but that is more benign
in agriculturally prosperous regions rather than Odisha, where coping strategies largely

Orissa Economic Journal, Vol. 47, No. 1, Jan-June 2015 : 61
reflect the expanding service sectors. The major part of ‘own account enterprises’ comprise
much of that in Odisha. There are also several MSME clusters which have added value and
employment in critical rural enterprises in Odisha. Rural infrastructures like roads, highways
and marketing have opened up high value goods trade to augment rural livelihoods.
The sterling contribution of education and skill development at migration sources should
be strongly encouraged, especially through public supported institutions in all parts of
Odisha. The improved reach of higher education to the masses by expanding colleges and
other technology institutions have spurred high earning migrations from Odisha.
The role of a variety of government sponsored programmes in expanding rural employment and
real wage support should not be underestimated. There is a variety of them covering livelihoods,
infrastructures, education, health, etc. It is another matter whether they are well governed. These
are not discussed here but good accounts are available in India Rural Development Report 2012-13
and the forthcoming Report 2013-14.
References
Aggarwal, Tushar (2014), ‘Essays on returns on education and labour market in India’,
unpublished Ph.D dissertation, IGIDR, 2014
Bhalla, Sheila (1990), “A Theoretical Framework for a Study of Rural Labour Markets”, The
Indian Journal of Labour Economics, Vol. 33, No. 2.
Birthal, P.S., P. K. Joshi, Devesh Roy and Amit Thorat (2012) “Diversification in Indian
Agriculture toward High-Value Crops: The Role of Small Farmers”, Canadian Journal of
Agricultural Economics Vol. 00, Pp. 1–31
Birthal, P. S., P K Joshi, Sonia Chauhan and Harvinder Singh (2008), “Can Horticulture
Revitalise Agricultural Growth?”, Indian Journal of Agricultural Economics, Vol. 63, No. 3,
July-September, 2008.
Chand, Ramesh, SS Raju, and L.M. Pandey (2008), “Progress and Potential of Horticulture in
India”, Indian Journal of Agricultural Economics, Vol. 63, No. 3, July-September
Deaton, Angus S. and J. Dreze, “Poverty and Inequality in India: A Re-Examination” Economic
and Political Weekly September 7, 2002
Ellis, Frank (1998). “Household Strategies and Rural Livelihood Diversification”, The Journal
of Development Studies, Vol. 35, No.1.
Fan, Shenggen, P. Hazell and S. Thorat (1999), “Linkages between Government Spending,
Growth and Poverty in Rural India”, International Food Policy Research Institute, Washington
D.C., Research Report No. 110.

62 : Orissa Economic Journal, Vol. 47, No. 1, Jan-June 2015
Fan Shenggen, L. Zhang and X. Zhang (2002), “Growth, Inequality and Poverty in Rural
China - The Role of Public Investment” International Food Policy Research Institute,
Washington D.C., Research Report No. 125.
Harris, J.R. (1991), “Agriculture-Non-agriculture Linkages and the Diversification of Rural
Economic Activities: A South Indian Case Study”, in Breman, J. and Mundle, S. (eds.), Rural
Transformation in Asia, Oxford University Press, Delhi.
Joshi, P. K., A. Gulati and R. Cummings Jr. (eds.) (2007), Agricultural Diversification and
Smallholders in South Asia, New Delhi: Academic Foundation
Krishnamurty, J. (2014) The Demographic Dividend: Challenges to Employment and
Employability, Keynote Address to the Annual Conference of the Indian Society of Labour
Economics, Ranchi, December 2014, Mimeo
Kumar, Praduman (1998), “Food Demand and Supply Projections for India”, Agricultural
Economics Policy Paper 98-01, New Delhi, India: Indian Agricultural Research Institute.
Kuznets, Simon (1955). “Economic Growth and Income Inequality”, American Economic
Review 45 (March): 1–28.
Mellor, John (1976): The New Economics of Growth: A Strategy for India and the Developing
World, Cornell University Press
Mittal, S. (2007), “Can Horticulture be a Success Story for India?”, Working Paper No. 197,
ICRIER, New Delhi
Papola, T. S. (1992): ‘Rural Non-Farm Employment: An Assessment of Recent Trends’, Indian
Journal of Labour Economics, 35(3), pp 238-45.
Radhakrishna R. and Shovan Ray (Eds, 2005): Handbook of Poverty in India: Perspectives,
Policies and Programmes, Delhi: Oxford University Press.
Rao, C H Hanumantha (2000): ‘Declining Demand for Foodgrains in Rural India: Causes and
Implications’, Economic and Political Weekly, January 22.
Rao, P.P., P.S. Birthal and P.K. Joshi (2006), “Diversification Towards high value Agriculture:
Role of Urbanization and Infrastructure”, Economic Political Weekly, Vol-41, No. 26, pp.
2747-2753
Ray, Shovan (Ed., 2007): Handbook of Agriculture in India, Delhi: Oxford University Press
Ray, Shovan (2008) assisted by MSME Foundation, Delhi, “Cluster Development and Poverty
Alleviation”, supported by Swiss Agency for Development Cooperation, May 2008.
Ray, Shovan (Ed, 2010): Backwaters of Development: Six Deprived States of India, Delhi:

Orissa Economic Journal, Vol. 47, No. 1, Jan-June 2015 : 63
Oxford University Press
Ray, Shovan (2011), “Education for Development: India and East Asia”, CRES Visiting Scholars’
Papers Series, Korea Institute for International Economic Policy, Heungchong Kim (Editor),
Seoul, South Korea, June 2011
Ray, Shovan (2012), “Education for Development: India in Asian Perspective” in Bhabesh
Sen and Mitali Chinara (Eds) Economic Development and Poverty in India, New Delhi: New
Century Publications, 2012
Ray, Shovan (2014), “Inequality and the Kuznets Process: An Indian Recast”, in Raj Kishore
Panda and Rajkishor Meher (eds) Trend, Magnitude and Dimensions of Inequality in Post
Reform India, New Delhi: Concept Publishing Company, 2014. pp. 32-53.
Ray, Shovan (2015): “The changing face of rural India”, chapter 6 of India Development
Report, Delhi: Oxford University Press, March 2015.
Vaidyanathan, A. (1986), “Labour Use in Rural India: A Study of Spatial and Temporal
Variations”, Economic and Political Weekly, Vol. 21, No. 52.
Walker T.S. and Ryan, J.G. (1990), Village and Household Economies in India in Semi-arid
Tropics, Johns Hopkins University Press, Baltimore.

64 : Orissa Economic Journal, Vol. 47, No. 1, Jan-June 2015
Progress of Rural Financial Inclusion:Will PMJDY meet the Inclusion Gap?
K. K. Tripathy1
This paper reviews the status of, trends in, and issues relating to financial inclusion with
a special reference to agricultural and rural finance and briefly examines the design
and approach of a recently launched mission-mode financial inclusion programme –
Pradhan Mantri Jan Dhan Yojana (PMJDY). Besides analyzing secondary data to examine
the spread and outreach of rural and agricultural finance, it draws upon recent policy
outlook on the new financial inclusion drive of the government and explores the
suitability of PMJDY towards ensuring smooth and affordable credit to all. This paper
also looks at the enormous challenges to universal financial inclusion approach
deliberated under PMJDY and attempts to explore the future road map to fulfil
the national objective of financial inclusion.
Key Words: Financial Inclusion, Rural Credit, Agriculture, India, PMJDY
I. Introduction & Background
1.1 Financial inclusion has become a central theme of Indian development policy since the
post-bank nationalization era (post-1969). Considering borrowers’ need for a variety of
financial services ranging from business livelihoods to retirement savings, housing loan,
insurance, emergency credit, consumption credit, etc. [Government of India (GoI), 2009],
the country’s credit policies envisaged the flow of affordable financial services to rural
households that had largely been ignored by the mainstream formal financial institutions.
1.2 The objective of financial inclusion is to bring in the low income and vulnerable
households within the purview of formal banking sector and to protect them from the
clutches of usurious interests charged by informal financial intermediaries. To create an
enabling environment for agricultural and rural banking and to raise investments in activities
with relatively high social returns, the Reserve Bank of India (RBI) formulated strict
1 The author is presently posted as Director in Ministry of Agriculture & Cooperation, Government of India.
Views are personal. e-mail: [email protected] Cell: 09899775244

Orissa Economic Journal, Vol. 47, No. 1, Jan-June 2015 : 65
guidelines to ensure smooth and directed flow of bank credit to priority sectors1. Further,
the government introduced multifarious welfare programmes to subsidize and supplement
bank credit for marginalized and poor rural borrowers. The government’s credit policy
targeted the agricultural and rural sector for administering the allocation of credit at
concessional interest rates with the objectives of guaranteeing timely and increased flow
of credit to the farming sector and gradually reducing and eliminating non-institutional
moneylenders from the rural scenario.
1.3 The post nationalization period in the Indian banking yielded significant changes in the
operational policies and practices of the formal financial agencies in the rural areas.
However, it failed to make a substantial dent in the lukewarm attitude of the rural bankers
towards financing the so-called less creditworthy but productive poor rural farmers. This
is evident as India’s poor, small and marginal farmers, micro-entrepreneurs and low-salaried
workers have largely been excluded from the formal financial system (GoI, 2009).
1.4 While the outreach and access to total bank credit improved during post-bank
nationalization era, the delivery of agricultural and rural credit remained wrought with
weaknesses, negating equitable and efficient distribution, thereby affecting the viability
and sustainability of formal financial institutions. The policy directions of the Government
and the Central Bank have not been successful in restricting the ominous situation of
today’s agricultural distress (Satish, 2007).
1.5 The public capital formation in the agricultural sector is on the decline and there is a
reported recurring occurrence of credit-related farmers’ suicide cases across the country.
A recently released National Sample Survey Organisation (NSSO)’s Situation Assessment
Survey (SAS) of Agricultural Households2 revealed prevalence of high levels of dependence
on non-institutional credit off-take in rural areas. Nearly 40 per cent of all loans came from
informal sources with 26 per cent advanced by moneylenders. Marginal land holding
households suffered the most with only 15 per cent of their credit being sourced from
institutional sources such as the government, cooperatives and banks (GoI, 2014).
1.6 With the disappointing outcome of the formal banking system, developing nations
have started relying on innovative measures to make an effective financially inclusive
system in India. During the 2000s, this system vigourously promoted establishment of (a)
innovative model of credit delivery mechanisms which ranged from micro-finance (Self-
Help Group-Bank Linkage Programme) to issuance of Kisan Credit Cards (KCC) and General
Credit Cards (GCC), (b) expansion of ATM networks and financial access points (c) provision
and facilitation of equity and insurance products to suitably formalise the financial flows
in rural India [Reserve Bank of India (RBI), 2013]

66 : Orissa Economic Journal, Vol. 47, No. 1, Jan-June 2015
1.7 In this backdrop, this paper tries to review the trend, status and issues of agricultural
and rural finance in India and explores the way ahead in the rural credit flow towards
ensuring the national objective of financial inclusion. The paper, while appreciating the
time-bound universal financial inclusion programme – Pradhan Mantri Jan Dhan Yojana
(PMJDY), deliberates upon the future implementation challenges of the Yojana. This paper
also gives policy prescriptions on the possible resolution of such challenges.
1.8 This paper is divided into seven sections. The following section (Section II) explains
the objective and methodology in brief. Section III gives a picture on rural credit policies
followed so far. While Section IV analyses the trend in the overall rural credit flow, Section
V highlights the trend in the flow of agricultural finance in India. Section VI discusses the
achievements and challenges under PMJDY. Section VII gives concluding remarks and
outlines the way ahead in ensuring universal financial inclusion.
II. Objectives and Methodology
2.1 The broad objectives of this paper are to:
m review agricultural and rural credit policies followed in India and assess the trends
and progress in the credit flow and access.
m examine the achievements of PMJDY and explore plausible resolutions to meet the
financial inclusion issues and challenges towards achieving the national objective of
universal financial inclusion.
2.2 To meet these objectives, secondary data on trends in agro-rural credit outreach
collected from RBI, National Bank for Agriculture and Rural Development (NABARD) and
various Ministries/Departments of GoI have been analyzed.
III. Rural Credit Policies
3.1 Post-independent India has stressed on progressive institutionalisation of rural and
agricultural credit. Considering the significance of hassle-free rural credit flow for
development in agriculture and allied sector and to break the growing monopoly and
usurious practices of non-institutional moneylenders in rural areas, GoI considered co-
operation an essential instrument of social policy (Mehta 1988). The rural cooperative
institutions were treated as vital development agents.
3.2 During 1950s, while the central bank took slew of measures to strengthen the co-
operative movement for ensuring adequate and timely credit flow to the farmers at village
level itself, State Bank of India (SBI) was set up in 1955 by Government to expedite, inter

Orissa Economic Journal, Vol. 47, No. 1, Jan-June 2015 : 67
alia, the flow of agricultural and rural credit. The All India Rural Credit Survey Committee
(1969) recommended the adoption of a multi-agency approach to finance the agricultural
and rural sector. India promoted an institutional structure for agricultural and rural credit
where the cooperative sector ensured directed credit to farmers and SBI and its associates
were involved in financing these cooperative agencies (Ghosh 2005). For the first time in
1969, the then government accepted that rural credit could not be met by co-operative
societies alone and that the commercial banks need to play a leading role. This prompted
GoI to nationalize leading banks in 1969 (and in 1980). Following the recommendations of
the Working Group on rural banks [constituted by the RBI under the chairmanship of M.
Narasimham, (RBI1975)], Regional Rural Banks (RRBs) were set up in 1975.
3.3 The policy initiatives of GoI laid emphasis on enhancing the flow of credit at grassroots
level through appropriate credit planning, adoption of region-specific strategies,
rationalization of lending policies and procedures and reduction of cost of rural borrowings.
The credit policy emphasised on the disbursement of rural credit through a multi-agency
network consisting of Commercial Banks, RRBs and credit cooperatives.
3.4 Further, the central bank assigned an important role to the commercial banks for
providing a specific portion of their lending to a few sectors covering direct3 or indirect4
finance to agriculture, small scale industries, micro credit, education loans, housing loans,
export credit etc. The total priority sector lending5 for a bank was pegged at 40 per cent of
credit equivalent of off-balance sheet exposure.
3.5 NABARD, an apex development bank, was created in 1982 to enable a sustainable rural
banking infrastructure and to coordinate and direct rural financial institutions in a
professional and specialized manner. NABARD played a central and significant role in
extending financial assistance and facilitating institutional development in the area of
rural credit.
IV. Trend in the Flow of Rural Credit
4.1 The flow of direct institutional credit to agriculture and allied activities has witnessed
rapid increase after the first round of bank nationalization in 1969. Between 1971-72 and
2011-12, agricultural credit witnessed a jump of around 747 times from merely Rs. 883
crore to Rs 4,53,898 crore (Table 1).
4.2 The growth in the flow of institutional credit in the agriculture and rural sector has
considerably helped the cultivators to reduce their dependency on the rural money-lenders
for their credit requirements of cash. Chart 1 indicates that the share of institutional credit
as a per cent of total debt has increased vis-a-vis that of the informal credit over time
during the periods 1951 and 2013.

68 : Orissa Economic Journal, Vol. 47, No. 1, Jan-June 2015
Table 1: Direct Institutional Credit to Agriculture and Allied Activities
(Short and Long Term; 1971-2 to 2011-12)
Share in total credit (per cent) Total
Year Cooperatives State SCBs RRBs (Rs crore)
governments
1971-2 87.1 11.2 1.7 - 883
1981-2 57.7 3.6 34.8 3.9 4296
1991-2 50.2 2.9 41.7 5.2 11,538
2001-2 56.4 0.8 34.4 8.4 54,195
2002-3 52.2 - 38.8 9.0 65,175
2003-4 48.0 - 43.4 8.6 83,427
2004-5 42.7 - 45.9 11.3 1,05,303
2005-6 33.4 - 56.0 10.6 1,44,021
2006-7 28.5 - 60.8 10.7 1,89,513
2007-8 29.6 - 58.2 12.2 1,94,953
2008-9 23.9 - 65.32 10.78 2,45,976
2009-10 22.17 - 65.73 12.10 2,86,39
2010-11 22.65 - 64.60 12.75 3,44,878
2011-12 19.37 - 68.93 11.70 4,53,898
2012-13 16.8 - 73.4 9.8 6,60,351
Sources: RBI (2010) & (2014a)
Notes: SCBs: Scheduled Commercial Banks, RRBs: Regional Rural Banks

Orissa Economic Journal, Vol. 47, No. 1, Jan-June 2015 : 69
4.3 In the past five decades, there has been an overall improvement in the access to formal
sources of credit (Chart 1). The decline in the share of moneylenders may be well attributed
to the central Government’s efforts to register and regulate professional moneylenders
and initiation of a plethora of measures strengthening institutional credit flow mechanisms
in the agriculture and allied sector. However, the increasing dependency of informal sources
of credit by rural households from 1991 onwards is a cause of concern. This increasing
trend has posed a real challenge before the government to ensure affordable and adequate
formal credit sources in the rural areas.
Table2: Rural Population and Bank Offices (1971-2011)
Sources: RBI (2005, 2007 & 2014a)
Census Statistics 1971, 1981, 1991, 2001 & 2011 (provisional)
Government of India (2007, 2008, 2009 , 2010 - 2013)
4.4 As regards the spread of rural bank branches in India, there were 4,817 rural bank
branches during 1971 catering to 75.1 per cent of total population constituting almost 33
crore rural people (Table 2). The corresponding figures for 2011 were 33,795 and 68.8 per
cent (83.3 crore rural people), respectively. While the percentage of rural bank offices to
total bank offices was the highest (58.5 per cent) at the end of 1991, it gradually reduced to
37.2 per cent during 2011.
4.5 The area-wise distribution of Scheduled Commercial Banks (SCBs), their advances,
loan outstanding and average outstanding per loan account is indicated at Table 3. As in
March 2013, 1,05,437 commercial bank branches were operating in India. Out of this, 37 per
cent were in rural areas which handled 56 per cent of the total loan accounts (5.99 crore).
The remaining 63 per cent of total bank offices consisting of as many as 44 per cent of total
loan accounts were in urban, semi-urban and metropolitan areas. This indicates a great
rural-urban divide in the spread of bank offices and access to finance from commercial

70 : Orissa Economic Journal, Vol. 47, No. 1, Jan-June 2015
banks. Data on loan outstanding indicates that on an average, a metropolitan borrower
had an outstanding of Rs. 8.94 lakh followed by an urban (Rs. 2.05 lakh), semi-urban (Rs.
1.10 lakh) and rural (Rs. 0.79 lakh) borrower. Out of the total loan outstanding in 2013, Rural
branches contributed 39.33 per cent and the remaining was contributed by non-rural bank
offices. This indicates that rural areas are relatively more credit worthy than the non-rural
area borrowers and opens an avenue for greater credit flow to the rural households.
Table 3: Distribution of Scheduled Commercial Bank Offices,
Accounts and Outstanding (As in March 2013)
Source: RBI (2014b)
Note: Figures within the parentheses indicate percentage to the column total
V. Flow of Agricultural Finance
5.1 Banks’ agricultural credit comprises direct and indirect finances. The direct finance to
agriculture is the short and long term credit support which is directly provided to the
cultivators. The ‘crop loans’ are primarily short term direct finance. Apart from the credit
support for raising crops, loans of mid-term/long term duration are granted to farmers to
boost long term investment in agriculture. The indirect finances to agriculture are those
finances which go to support institutions which impact the overall agricultural productivity
in rural areas. Some of these types of loans are directed for the agricultural input providers
for smoothening input supply to the agriculture. Loans to farmers through PACs/Farmer
Service Societies/Large Adivasi Multipurpose Primary Societies, support for distribution
of fertilisers, and loans to State Electricity Boards are categorised as indirect finance.
5.2 Between 1975-76 and 2011-12, the share of the overall indirect finance to total
agricultural credit has decreased from 27.4 per cent to 17.6 per cent whereas the direct
finance to cultivators has marked an increased trend i.e. from 72.6 per cent in 1975-76 to
82.4 per cent in 2011-12 (Chart 2)

Orissa Economic Journal, Vol. 47, No. 1, Jan-June 2015 : 71
Chart 2: Share of Direct and Indirect Institutional Finance to AgricultureChart 2: Share of Direct and Indirect Institutional Finance to AgricultureChart 2: Share of Direct and Indirect Institutional Finance to AgricultureChart 2: Share of Direct and Indirect Institutional Finance to AgricultureChart 2: Share of Direct and Indirect Institutional Finance to Agriculture
5.3 An analysis of the flow of finance through SCBs during the periods 1975-76 and
2011-12 (Table 4) indicates that the indirect finance from SCBs were either nil or negligible
during 1975-76 to 1990-91. However, post 1990-91 witnessed an increase in the flow of
indirect finance from the SCBs. The indirect finance by SCBs rose from a mere 4.1 per cent
in 1990-91 to 18.2 per cent in 2011-12. During the same period, the flow of direct finance
from SCBs marked a downward trend i.e. from 95.9 per cent in 1990-91 to 81.8 per cent in
2011-12.
5.4 When social control of banks was introduced in 1967, a rapid expansion of rural bank
branches was noticed. RBI’s priority sector lending policy i.e. provisioning small value
loans to farmers for agriculture and allied activities, micro and small enterprises, poor
people for housing, students for education and other low income groups and weaker
sections have somewhat encouraged flow of credit to the rural areas. However, the flow
of credit has been much below the targeted 40% level (Table 5).
5.5 Chart 3 portrays the analysis of the trend of disbursement of finance and loan accounts
by category of farmers. During 1985-86, out of the total loan accounts with commercial
banks, 76.3 per cent were Small and Marginal Farmer (SMF) borrowers’ accounts. However,
the credit disbursement to small and marginal farmers was 53.8 per cent of the total
disbursement during that year. The majority of finance has gone to the Large Farmer (LF)
borrowers. Chart 3 also indicates that there is a wide gap between the loan accounts and
credit disbursal to small and marginal farmers and big farmers during 1985-86 to 2011-12.
During 2011-12, 77.8 per cent of loan accounts (SMF) received 63.5 per cent of total disbursed
credit whereas 22.2 per cent of loan accounts belonging to the LF obtained 36.5 per cent of
total loan amount disbursed. This indicates that the credit expansion initiatives have helped
considerably the big farmers.

72 : Orissa Economic Journal, Vol. 47, No. 1, Jan-June 2015
Table 4: Share of Direct and Indirect Finance in Agricultural Credit from all Banks (1975-
76 TO 2011-12 in %)
* Includes Cooperatives, State Governments, SCBs, RRBs and any other financial institution which finance the
farm sector.
Source: RBI (2014a)
Table 5 : Share of Priority Sector Advances in Total Credit of SCBs 1969-2013
Year Share (in per cent)
1969 14.0
1972 21.0
1975 25.0
1978 28.6
1981 35.6
1984 38.1
1987 42.9
1990 40.7
1993 34.4
1996 32.8
1999 35.3
2002 34.8
2005 36.7
2008 34.9
2011 33.9
2012 32.3
2013 32.2
Sources: Shah et al. 2007 & RBI 2014a

Orissa Economic Journal, Vol. 47, No. 1, Jan-June 2015 : 73
5.4 The financial needs of the farmers and rural entrepreneurs have increased manifold
with the passage of time. To meet these ever-increasing credit needs, availability of formal
financial institutions and accessibility to finance access points are the need of the hour. In
the field of rural financing, the real challenge is now to cover all the households with the
banking/formal financial network and strengthen the formal financial institutions in
rendering financial services to these poor but needy rural masses.
5.5 Under these circumstances, to ensure smooth flow of financial services in the
rural areas and to improve investment climate in agriculture and rural sector, the present
government has taken renewed steps under its modified financial inclusion programme
called Pradhan Mantri Jan Dhan Yojana (PMJDY) with effect from August 2014.
VI. PMJDY: Achievements and Challenges
(A) PMJDY: Achievement so far:
6.1 Pradhan Mantri Jan Dhan Yojana (PMJDY) – world’s biggest financial inclusion initiative
ever implemented by any developing country was announced by the Prime Minister on
15th August 2014. Launched across the country on 28th August 2014, this Yojana envisaged to
be implemented in two phases on a mission mode. The activities under this Yojana are:
(a) Opening up of bank accounts for 75 million poor uncovered households

74 : Orissa Economic Journal, Vol. 47, No. 1, Jan-June 2015
(b) Providing each bank account with an overdraft facility of Rs. 5,000 accompanied by a
RuPay debit card and an accident insurance cover of Rs. 1 lakh
(c) Seeding Aadhaar numbers with the bank accounts to facilitate direct transfer of
government subsidy payments for numerous welfare programmes.
6.2 By end-October 2014, i.e. well before the target date of January 26, 2015, the Govt.
achieved its target set for bringing more than 75 million poor & unbanked households into
the banking fold by opening their accounts with the formal financial institutions. RuPay
debit cards were issued to more than 10 Cr. beneficiaries assuring a benefit of personal
accidental insurance of Rs. 1 lakh under the programme. In addition, there existed a life
insurance cover each of Rs.30,000/- for each of such eligible account holders. A deposit of
Rs. 9,188 Cr. had also been mobilized in the accounts opened under PMJDY (Table 6).
Table 6: Bank-wise Status of Accounts opened under PMJDY as on 17.01.2015
Source: GoI (2015)
6.3 Table 6 indicates that within a period of four months, 11.50 crore accounts have
been opened out of which 6.84 crore accounts are rural accounts and 4.66 crore are urban
accounts. Out of 11.50 crore accounts, 8.27 crore accounts are zero balance accounts. Thus,
remaining 3.23 crore accounts witnessed deposits to the tune of Rs. 9,188 crore. On an
average, Rs. 2,844 were deposited in these accounts.
(B) Unshackling PMJDY from Future Challenges
6.4 As per the government data, out of the total 21.05 crore households in India, 20.99
crore (99.74%) have been successfully covered till date (GoI, 2015). Though opening up of
bank accounts is the first step of inclusion for direct linkage with banking institutions, the
real challenge is, however, to ensure consistent and adequate credit flow to the zero
balance account holders. The challenge also lies in offering a single loan product which is
not linked to the purpose of loan, the collateral or assets held or income earned by the
household but is purely based on cash flows and credit record of the household.

Orissa Economic Journal, Vol. 47, No. 1, Jan-June 2015 : 75
6.5 The next challenge is to ensure availability of adequate credit to the rural households
by opening a very large number of banking access points. These access points need to be
spread uniformly or proportionately in the country depending on the spread and credit
absorption capacity of borrowing households. Considering the presence of bank offices in
rural India and the credit flow to the poor and low income households, it would be difficult
to ensure universal coverage of unbanked areas in near future under the PMJDY. The banks
need to set up a large number of branches in and around the unbanked villages and need
to enhance their human resources. Considering the remoteness of the unbanked villages,
the banks should, on a mission mode, be required to recruit a large number of rural cadre
of banking personnel to man and serve the branches which would come up to cater to the
needs of the rural borrowing households.
6.6 The need of the hour is also to make the Business Correspondents (BC) model effective
in reaching the poor villagers through the sponsoring banks. The BCs are now servicing low
income-customers with low volume transactions in rural areas. The government needs to
make this door-step institutional credit delivery a profitable proposition to attract more
players in the rural areas. The Government in consultation with the RBI needs to make a
strategy so as to ensure optimum usage of these BCs in reaching the remote and poor
villagers by adequately incentivising them. Since Primary Agricultural Cooperatives (PACs)
have larger presence in rural areas than the commercial bank branches, the banks may use
the services of PACs as BCs.
6.7 The government has taken steps to transfer subsidies through the bank accounts. While
LPG subsidies have been successfully credited to the consumers, large sum of wage
payments under Mahatma Gandhi National Rural Employment Guarantee Act (MGNREGA)
to the worker accounts are being disbursed through Aadhaar enabled consumer/worker
accounts. To ensure Aadhaar enabled social welfare payments, banks not only should
ensure seeding of all bank/post office/formal accounts with the Aadhaar numbers but
also need to strengthen and scale up ATM networks in rural and semi-urban areas where
the share of ATMs is weak (Table 7).
Table 7: Population Group-wise Number of ATMs in India
Population Group March 2013 Percentage Share March 2014 Percentage Share
Rural 11,564 10.1 23,334 14.6
Semi-urban 27,710 24.3 43,200 27.0
Urban 36,111 31.7 47,641 29.8
Metropolitan 38,629 33.9 45,880 28.7
Total 1,14,014 100.0 1,60,055 100.0
Source: RBI’s Report on Trend and Progress of banking in India 2012-13 (adopted from Shetty SL and Deokar BK
(2014), Table 1, page 14

76 : Orissa Economic Journal, Vol. 47, No. 1, Jan-June 2015
6.8 In the present scenario, technology can become the main lever for achieving the
goal of universal financial inclusion. Thus, to cater to the credit needs of millions of
household in rural areas, the banks need to universalise use of Information Communication
Technology (ICT) for banking transactions. Besides hardware and software requirements
for digitalisation of banking transactions, banks require 24x7 power supply and broadband/
internet connections. Since the coverage of villages through electricity has remained only
about 55%, the complete financial inclusion would be a challenging task for the bankers
and the government (Shetty & Deokar, 2014) unless the government takes adequate steps
to provide quality power and connectivity in rural areas.
VII. Conclusion & Way Ahead
7.1 The rural sector has witnessed a consistent increase in the flow of institutional credit
to agriculture and allied activities after the implementation of bank nationalisation and
financial liberalisation policies in India. The commercial banks are now increasingly
channelizing a large share of total rural credit through their rural credit outlets. This
increased flow of credit in rural areas has, however, not been sufficient as there still exists
a vast gap between supply and demand of credit in rural areas.
7.2 There is a great rural-urban divide in the spread of bank offices and access to finance
from commercial banks and other formal financial sources. Data analysis has indicated
that though the formal credit flow increased and informal credit decreased between 1951
& 1991, there was a rising trend in the flow of informal credit during 1991 and 2013. This
increasing trend has posed a real challenge before the government to expand formal
credit institutions for meeting the ever-growing financial requirements of millions of
farmers and rural entrepreneurs.
7.3 While the cooperative credit institutions are facing difficulties, particularly in mobilising
adequate internal resources so as to become self-reliant and economically viable units,
the distribution of institutional credit to agriculture by commercial banks has lacked equity.
The flow of credit from commercial banks has benefited largely the big farmers in
comparison to the small and marginal farmers. This necessitates reviewing the existing
policy on flow of agri-credit to ensure adequate, timely and affordable direct credit
assistance to the majority of small and marginal farmers in the rural areas.
7.4 The present government has taken an innovative step under the PMJDY to make rural
finance accessible and affordable. The Yojana envisages ensuring smooth flow of financial
services in the rural areas and improving investment climate in agriculture and rural sector.
To achieve universal financial inclusion objective of this Yojana, the available banking
infrastructure needs to be reviewed and strengthened. The number of distribution and
electronic payment access points need to be expanded in such a way that every person is
within 15 minutes walking distance from such an access point. It is estimated that to ensure
financial inclusion, India needs 3 million such access points in the country (Viswanathan,

Orissa Economic Journal, Vol. 47, No. 1, Jan-June 2015 : 77
2014) which includes bank branches, bank agents, non-bank financial companies, micro-
finance institutions, BCs, ATMs, mobile phones etc. Support of PACs may also be explored
for playing a role of BCs in rural areas considering the PAC penetration in remote and rural
areas.
7.5 The PMJDY has created a positive environment and has provided a big push to the
government’s objective of universal financial inclusion. The success of this Yojana will be
judged on the basis of (a) expanding formal banking up till the doorsteps of the rural
borrowers (b) making the financing in rural areas profitable and viable (c) expanding
financial literacy through central and state programmes (d) reviving cooperatives and
bringing them under the Yojana to support the financial inclusion drive in remote and
unbanked areas.
Notes
1. Priority Sector primarily includes activities of five categories of occupation – (i) Agriculture (ii)
Micro and Small Enterprises (iii) Education (iv) Housing, and (v) Export Credit.
2. The Situation Assessment Survey (SAS) of Agricultural Households is a part of NSSO’s 70th round
of survey with a reference period from 1st January, 2013 to 31st December, 2013. Earlier, NSSO had
carried out an SAS of Agricultural Households in the 59th round of survey (January, 2003- December,
2003). The survey aimed at capturing the condition of agricultural households in the country in the
context of policies and programmes of Government of India and captured information on several
parameters viz. (i) consumer expenditure (ii) income and productive assets (iii) indebtedness (iv)
farming practices and preferences (v) resource availability (vi) awareness of technological
developments (vii) access to modern technology in the field of agriculture (viii) crop loss, crop
insurance (ix) awareness about Minimum Support Price (MSP) etc.
3. Direct Finance for Agricultural includes loans to (i) individual farmers [including Self Help Groups
(SHGs) or Joint Liability Groups (JLGs), i.e. groups of individual farmers]; corporates including farmers’
producer companies of individual farmers engaged in Agriculture and Allied Activities, viz., dairy,
fishery, animal husbandry, poultry, bee-keeping and sericulture, (ii) small and marginal farmers for
purchase of land for agricultural purposes, (iii) distressed farmers indebted to non-institutional
lenders, (iv) Primary Agricultural Credit Societies (PACS), Farmers’ Service Societies (FSS) and Large-
sized Adivasi Multi Purpose Societies (LAMPS) etc. [for details please see rbi.org.in].
4. Indirect Finance to Agriculture, inter alia, includes high value loans (more than Rs. 2 crore) for
agriculture or allied activities; bank loans to Primary Agricultural Credit Societies (PACS), Farmers’
Service Societies (FSS) and Large-sized Adivasi Multi Purpose Societies (LAMPS) etc.
5. Domestic commercial banks/foreign banks with 20 and above branches are required to dedicate
40 per cent of their credit equivalent of off-balance sheet exposure for total priority sector activities
out of which 18 per cent and 10 per cent have been reserved for agriculture and advances to
weaker sections. [for details please see www.rbi.org.in]

78 : Orissa Economic Journal, Vol. 47, No. 1, Jan-June 2015
References
Ghosh, D.N. (2005), ‘A Policy Approach for Agricultural Lending’, Economic & Political Weekly, Vol.
40, No. 2, pp. 93-96
Government of India (2009), A hundred Small Steps, Report of the Committee on Financial Sector
Reforms (Chairman: Dr. Raghuram G. Rajan), Planning Commission, Sage Publications, New Delhi
Government of India (2014), Key Indicators of Situation of Agricultural Households in India, NSS 70th
Round, Ministry of Statistics and Programme Implementation, December 2014
Government of India (2015), Press Note on PMJDY, Ministry of Finance, Dtd. 20.01.05, available on
www.pmjdy.gov.in (accessed on 25.01.2015)
Government of India (2007, 2008, 2009, 2010-2013), Economic Survey (2007-08, 2008-09 to 2013-
14), Ministry of Finance, New Delhi
Government of India [1971, 1981, 1991, 2001 & 2011 (provisional)], Census of India, Registrar
General and Census Commissioner, New Delhi
Mehta, V.L. (1988), Cooperative Marketing: A Lacuna in the Movement, Glimpses of Cooperatives
through Press, (ed) Dr. R. C. Dwivedi, Paramount Publishing House, Delhi, pp. 376-380
Pradhan NC (2013), ‘Persistence of Informal Credit in Rural India: Evidence from All-India Debt and
Investment Survey and Beyond’, RBI working Paper Series, No. 5/2013
Reserve Bank of India (2013), Annual Report, Mumbai, Available at www.rbi.org.in [accessed on
25.01.2015].
Reserve Bank of India (1975), Working Group of Rural Banks, Chairman M. Narasimham, Bombay
Reserve Bank of India (2005), Handbook of Monetary Statistics of India, Mumbai
Reserve Bank of India (2005, 2007), Handbook of Statistics on the Indian Economy 2005-06, and
2007-08, Mumbai
Reserve Bank of India (2010 & 2014a), Handbook of Statistics on Indian Economy, 2009-10 & 2013-
14, Mumbai
Reserve Bank of India (2014b), Basic Statistical Returns, Mumbai
Satish, P. (2007), ‘Agricultural Credit in the Post-Reform Era: A Target of Systematic Policy
Coarctation’, Economic & Political Weekly, Vol. 42, No. 49, pp. 2567-2575
Shah, M., Rangu Rao, and P.S. Vijay Shankar (2007), ‘Rural Credit in 20th Century India: Overview of
History and Perspectives’, Economic & Political Weekly, vol. 42, no.15:1351"64.
Shetty SL and Deokar BK (2014), ‘Financial Inclusion-Differences between the Government and
RBI?’, Economic & Political Weekly, Vol XLIX, No. 35 PP. 12-15.
Viswanathan, R (2014), ‘RBI Report on Financial Inclusion: A Review’, Economic & Political Weekly,
Vol. XLIX, No. 9, pp. 16-19.

Orissa Economic Journal, Vol. 47, No. 1, Jan-June 2015 : 79
Crop Insurance for Risk Management in India: An Overview
Mamata Swain1
Sasmita Patnaik2
Farmers in India are now facing various risks in agricultural production due to climatic
aberrations which have increased significantly in the context of climate change. At the
same time price variability has increased enormously due to the increased pace of
globalisation. In this context there is a need to examine the effectiveness of the existing
crop insurance schemes in managing both production and price risk. National
Agricultural Insurance Scheme (NAIS) is a multi-peril area based crop yield insurance
scheme and it covers not only weather related risk such as drought, flood, storm etc.
but also plant diseases and pest attack. Compensation is paid on the basis of actual
crop loss in the defined area. The major drawback of this scheme is delay in claim
settlement due to time consuming process of collection of yield data. On the other
hand, Weather Based Crop Insurance Scheme (WBCIS) covers only weather related risk
and the compensation is paid on the basis of deficit or excess in weather parameter,
which is considered as a correlate or proxy of crop loss. The indemnity is paid quickly
after receiving the weather data from meteorological stations. The paper has examined
the operational efficiency of the schemes with the use of time series data on farmers
covered, area insured, sum insured, premium collected, claims paid and farmers
benefited. The paper concludes that the performance of NAIS is unsatisfactory due to
low coverage, poor financial performance and less operational efficiency. NAIS and
WBCIS cover only yield risk but now due to commercialization and globalisation, there
is a need for crop revenue or farm income insurance to cover joint price and yield risk.
Keywords: Risk, Crop Insurance, India
1. Introduction
There are numerous and varied risks in agriculture. They are specific to a country, climate
and local agricultural production systems. Agricultural risks stem from a range of factors
including the vagaries of weather, the unpredictable nature of biological processes, the
1 Dean, School of Social Sciences; Professor of Economics, Ravenshaw University, Cuttack-753003, E-mail:
2 Programme Officer, Rural Development Study Programme, Department of Economics, Ravenshaw University

80 : Orissa Economic Journal, Vol. 47, No. 1, Jan-June 2015
pronounced seasonality of production and market cycles, the geographical separation of
production and end users and the unique and uncertain political economy of food and
agriculture sectors, both domestic and international (Jaffee et al., 2010). Weather risks
like drought, flood and storm lead to lower yields, loss of productive assets and income.
Biological risks in the form of pests, disease and contamination result in reduced yield and
loss of farm income. Price risks which may arise due to low prices and volatility in market
supply and demand lead to instability in income. Crop prices are more volatile because of
difficulties in storage owing to bulkiness and perishability of the products. As demand for
agricultural produce is relatively inelastic with respect to changes in price and income, any
supply shock is quickly reflected in price change. But undoubtedly, weather is the most
significant among all the risk factors affecting crop production (Miranda and Vedenov,
2001).
Managing risks in agriculture is particularly challenging, as many risks are highly correlated,
resulting in whole communities being affected at the same time. There are various
strategies to manage agricultural risk (Singh, 2010). Risk can be managed by avoiding,
preventing, sharing, transferring and spreading it. Risk in agriculture can be avoided by
opting for alternative livelihood opportunities. Some risks can be prevented by taking
advance action like preventive pest control. Risks can be shared by giving lease of land to
tenants. Risk can be transferred by insuring the crop yield and through forward contract.
Risk may be spread through diversified farming and mixed cropping. Governments in
developing countries like India have taken many measures to reduce risk and impart greater
resilience to agriculture. These include promoting the diversification of cropping patterns,
inter-cropping, flood-control, drought-proofing and watershed development for reducing
the production risk, and price support through market intervention and futures trading for
the purpose of stabilizing prices and hedging risks. However, in spite of the preventive
measures in place, when there is crop failure, insurance is considered the most effective
mechanism to compensate farmers for their losses.
A major role played by insurance programmes is the indemnification of risk-averse
individuals who might be adversely affected by natural probabilistic phenomena. By pooling
individual risks, insurance leads to Pareto-preferred states. Insurance, by offering the
possibility of shifting risks, enables individuals to engage in risky activities which they
would not otherwise undertake (Ahsan, Ali and Kurian, 1982), which is known as moral
hazard impact of insurance. Moral hazard is primarily a problem of asymmetric information
and hidden action. Also Kling and Oamek (1983) and Skees and Reed (1986) focus on adverse
selection. There is adverse selection when the level of risk in the insured population is
higher than the average. This means only people with the highest risks will buy insurance.
In insurance markets, adverse selection occurs when potential policyholders have
proprietary knowledge about their risk exposure that is not available to the insurer

Orissa Economic Journal, Vol. 47, No. 1, Jan-June 2015 : 81
(Rothschild and Stiglitz, 1976). To eradicate the problems of adverse selection and moral
hazard, usually area-based crop insurance schemes are implemented in most developing
countries.
Farmers in India are now facing various risks in agricultural production due to climatic
aberrations which have increased significantly in the context of climate change. India
being located in the low latitude region of South Asia is extremely vulnerable to climate
change because of its tropical climate, monsoon rain, long coast line, greater dependence
on agriculture, high incidence of poverty, low irrigation coverage and inadequate resources
and technology to combat climate change. At the same time price variability has increased
enormously due to increased pace of globalisation. In this context there is a need to look
at the existing crop insurance schemes under implementation in India and their
effectiveness in managing both production and price risk. National Agricultural Insurance
Scheme (NAIS) which has been implemented since 1999 Rabi season, is a multi-peril area
based crop yield insurance scheme and it covers not only weather related risk such as
drought, flood, storm etc. but also plant diseases and pest attack. Compensation is paid on
the basis of actual crop loss in the defined area. The major drawback of this scheme is
delay in claim settlement due to time consuming process of collection of yield data.
Weather Based Crop Insurance Scheme (WBCIS), which has been launched since 2007 Kharif
season on pilot basis on the other hand, is considered an improvement over NAIS because
rainfall as an index, in comparison to crop yield, is easier to measure objectively and,
hence, the process of data collection is more transparent and less time-consuming. In
turn, the administrative cost is low, thus facilitating quicker payment of indemnity to the
buyers of insurance. Moreover, WBCIS eradicates the problems of moral hazard and adverse
selection (Hess, 2003). Additionally, WBCIS allows reinsurance by the primary insurer as it
is based on standardized/well-defined internationally verifiable data. The major drawback
of WBCIS is that it covers only the weather-related risk so that if there is crop loss due to
any other reason such as plant disease and pest attack, the insured does not get any
compensation. The most challenging disadvantage of WBCIS, however, is the basis risk,
which refers to the variability between the value of losses as measured by the weather
index and the value of actual losses experienced on the farm (Collier et al., 2009) as the
basis risk can result in a mismatch between the actual loss and payout. Furthermore, in
WBCIS, the start-up cost is high as time series and historical data on rainfall and yield are
required to define the trigger events that necessitate indemnity payment.
In the increased risky environment of climate change, globalisation and
commercialisation of agriculture, there is a need to analyse the effectiveness of the above
crop insurance schemes and suggest innovative insurance products to cater to the changed
needs of the farmers. The principal objective of this paper is to make a comparative
assessment of the performance of NAIS and WBCIS that are currently under implementation

82 : Orissa Economic Journal, Vol. 47, No. 1, Jan-June 2015
in India with respect to their coverage, financial performance, and operational efficiency
as risk management tools. The paper has examined the operational efficiency of the
schemes with the use of time series data on farmers covered, area insured, sum insured,
premium collected, claims paid and farmers benefited collected from the Agricultural
Insurance Company of India Limited (AICI).
The rest of the paper is divided as follows. Section 2 describes the salient features of
various crop insurance schemes implemented in India. Section 3 discusses coverage of
NAIS and farmers benefited from the scheme. Section 4 deals with the financial
performance of NAIS. Section 5 discusses coverage of WBCIS and farmers benefited from
it and section 6 examines the financial performance of WBCIS. Section 7 brings out a
comparison between performance of NAIS and WBCIS in India. Section 8 is the concluding
section containing major findings of the study and policy implications based on secondary
data analysis.
2. Crop Insurance Schemes in India
Risk in crop production is very high in India due to variability in rainfall, inadequate irrigation
facility, frequent occurrence of natural calamities and low resource base of farmers. In
such a risky environment, there is a great need for crop insurance, as in the event of crop
loss, the insured farmers will receive indemnity to recoup their losses. Crop insurance
brings in security and stability in farm income, protects farmers’ investment in crop
production and thus improves their risk bearing capacity. Affordable agricultural insurance
can in effect act as collateral against loans, increasing the creditworthiness of farmers and
allowing them the opportunity to invest in appropriate inputs to increase agricultural
productivity (Hazell, 1992). Thus, crop insurance facilitates adoption of improved
technologies and, encourages higher investment resulting in higher agricultural production.
Crop insurance received concerted attention only after independence. During 1950s,
several attempts were made at the national level to formulate and operationalise
agricultural insurance in India. Realising the need for crop insurance for management of
agricultural risk, the Government of India (GoI) has introduced several crop insurance
schemes over the past three decades at different points of time and modified as and when
required to address operational issues.
2.1 Pilot Crop Insurance Scheme
Following Prof. V. M. Dandekar’s suggestion, General Insurance Corporation (GIC) prepared
a crop insurance scheme based on the area approach and put it into operation from 1979–
80 on pilot basis. Initially, it was introduced as a pilot scheme in three states and was
extended to twelve States by 1984–85. During this period it covered 6.27 lakh farmers for
total premium of Rs.196.95 lakhs against claims of Rs.157.05 lakhs. It was based on “Area

Orissa Economic Journal, Vol. 47, No. 1, Jan-June 2015 : 83
Approach” for providing insurance cover to farmers taking crop loans from institutional
sources of finance against a decline in crop yield below the threshold level. Since the crop
insurance was linked to crop loans, many small and marginal farmers could not participate
in the crop insurance scheme because a majority of these farms have poor access to
institutional credit.
2.2 Comprehensive Crop Insurance Scheme
Comprehensive Crop Insurance Scheme (CCIS) was launched by the Government of India
in 1985 and was the first nation-wide scheme. Previous crop insurance schemes had been
operated on experimental and pilot basis, on a small scale and in a scattered manner.
Operated by GIC in collaboration with the respective State governments, the scheme
covered cereals, pulses and oilseeds. Crop insurance was linked to institutional credit;
farmers who availed themselves of loans for specified crops were eligible for insurance
coverage. State governments were left to decide whether to operate the scheme in the
state or not. In this scheme, the indemnification was on area basis with each insured
farmer growing a particular crop in the defined area being eligible for indemnity if there
was a shortfall in the actual average yield per hectare of the insured crop from the threshold
yield. The scheme was a credit-linked insurance scheme and covered only those farmers
taking crop loans from institutional agencies such as commercial banks, regional rural
banks and cooperatives for the cultivation of food crops and oilseeds. However, critics of
the scheme have described it as a loan insurance scheme as the scheme was compulsory
for loanee farmers and not available to non-loanee farmers who self-finance their
cultivation expenses (Swain, 2008). The financial performance of the scheme was also
very poor, as the premium rates were highly subsidised. CCIS was operated for almost one
and a half decades, before being replaced by the National Agricultural Insurance Scheme
(NAIS) in 1999.
2.3 National Agricultural Insurance Scheme
NAIS was conceptualized to address operational problems experienced during the
implementation of CCIS. For improving the scope and content of CCIS, NAIS was introduced
in India from the Rabi season of 1999-2000. This is an area-based crop yield insurance
scheme which, during 2012-13, covered 15.4 million farmers and a cultivated area of 22
million hectare. Internationally NAIS in India covers the largest area among all the countries.
The objectives of NAIS are as follows:
m To provide insurance coverage and financial support to the farmers in the event of
failure of any of the notified crop as a result of natural calamities, pests and diseases.
m To encourage the farmers to adopt progressive farming practices, high value inputs

84 : Orissa Economic Journal, Vol. 47, No. 1, Jan-June 2015
and higher technology in agriculture.
m To help stabilise farm incomes, particularly in disaster years.
All farmers including sharecroppers and tenant farmers growing the notified crops in the
notified areas are eligible for coverage. The scheme covers all food crops (cereals, millets
and pulses), cotton, sugarcane and potato in the 1st year and other annual commercial/
horticultural crops to be covered within a period of three years from the start of the
scheme. This scheme allows non-loanee farmers growing insurable crops too to opt for
the scheme, in addition to all loanee farmers who are compulsorily covered. The scheme
provides comprehensive risk insurance against yield losses due to natural fire, lightening,
storm, hailstorm, cyclone, typhoon, tempest, hurricane, tornado, flood, inundation and
landslide, drought, dry spells, pests, diseases, etc. If the actual average yield per hectare
of the insured crop for the defined area (on the basis of requisite number of Crop Cutting
Experiments) in the insured season, falls short of specified threshold yield, all the insured
farmers growing that crop in the defined area are deemed to have suffered shortfall in
their yield and the scheme provides coverage against such contingency. Indemnity claims
are worked out as per the following formula:
Shortfall in yield X Sum insured for the farmerThreshold Yield
(Shortfall = Threshold Yield – Actual Yield for the Defined Area).
Threshold yield is the moving average based on past three year’s average yield in case of
rice and wheat and five years average yield in case of other crops. For Kharif crops the
farmer premium rate is 3.5% for all oilseed crops and bajra and 2.5% for all other food
crops. For Rabi crops the farmer premium rate is 1.5% for wheat and 2% for all other food
crops. Premium rates paid by farmers in respect of commercial and horticultural crops are
determined at the state level for each crop.
Recognising the need for an exclusive organisation for agricultural insurance, the
Government of India established Agricultural Insurance Company of India Limited (AICI) in
December 2002. AICI took over the implementation of NAIS from GIC in 2003-04.
Though NAIS is an improvement over CCIS, still it has many shortcomings. Several empirical
studies reveal that NAIS has failed to achieve its objectives due to its low coverage, poor
financial performance and less effectiveness (Sinha, 2004; Kalavakonda and Mahul, 2005;
Vyas and Singh, 2006; Swain, 2013). This scheme has not performed well in India because
of the time taken to collect yield data that results in delays in the payment of compensation.
The awareness about the scheme is poor, partly due to lack of adequate localized
interactions and substantially due to the lack of effective image building and awareness
campaigns (Raju and Chand, 2008).

Orissa Economic Journal, Vol. 47, No. 1, Jan-June 2015 : 85
2.4 Farm Income Insurance Scheme
To take care of variability in both the yield and market price, the Government of India
introduced a pilot project, viz. Farm Income Insurance Scheme (FIIS) during Rabi 2003-04
season. The Scheme was implemented during 2 seasons only, viz. Rabi 2003-04 season in
18 Districts of 11 States for wheat/rice, and Kharif 2004 season in 19 Districts of 4 States for
rice alone. The objectives of the scheme were to protect farm income, ensure sustainable
production, enhance food and livelihood security, encourage crop diversification and
increase competitiveness. The purpose of the scheme was not only to protect the income
of the farmer, but also to reduce the government expenditure on procurement at Minimum
Support Price (MSP). In the area under FIIS, procurement of foodgrains with minimum
support prices (MSP) was withdrawn with an aim to remedy the problem of excess stock
with Food Corporation of India (FCI). But most of the states were not keen to implement
the scheme as withdrawal of MSP based procurement was not acceptable to them. Also
they argued that the scheme would not be beneficial to the farmers, as yield and price
have offsetting behaviour. Since price and yield are negatively correlated, the probability
of claim arises only when price and yield both go below the guaranteed level, which may
be a rarity. Agriculture Finance Corporation (AFC), which conducted concurrent evaluation
of the project during Kharif 2004 season, also stated that the scheme in the present form is
neither viable nor attractive. NAIS was suspended for the selected districts/crops where
the pilot FIIS was implemented.
The scheme is compulsory for loanee farmers taking seasonal crop loans from institutional
sources of finance such as Commercial Banks, Regional Rural Banks and Cooperatives. The
non-loanee farmers can also opt for the scheme voluntarily.
The scheme provides Comprehensive Risk Insurance against LOSS IN FARM INCOME
(Shortfall in Actual Income [AI] over Guaranteed Income [GI]) in a Notified Area arising out
of adverse fluctuations in yield due to occurrence of any one or combination of non-
preventable natural perils such as Flood, Inundation, Storm, Cyclone, Hailstorm, Landslide,
Drought, Dry spells, large-scale outbreak of Pests/ Diseases; AND, adverse fluctuation of
market prices, as measured against MSP.
Though conceptually FIIS is a good scheme, it suffers from several inherent contradictions.
The Joint Group (2004) constituted to evaluate the scheme however recommended its
withdrawal on several grounds. First, it would be difficult to substitute deep-rooted MSP
regime with income insurance, as MSP is available to all farmers while income insurance is
available to only the insured farmers. Secondly, MSP is available to farmers at no additional
cost while income insurance is available only at a premium. Thirdly, income insurance
linked to MSP is not an insurance instrument as MSP is a theoretical price as against

86 : Orissa Economic Journal, Vol. 47, No. 1, Jan-June 2015
functional market price. The scheme was finally withdrawn after implementation during
only two seasons i.e. Rabi 2003-04 and Kharif 2004.
2.5 Weather Based Crop Insurance Scheme (WBCIS)
In order to speed up claim payments, the Weather Based Crop Insurance Scheme (WBCIS),
popularly known as rainfall insurance, was introduced in Kharif 2007 season on a pilot
basis and is currently executed in 19 states. During 2011-12, this scheme covered 11.7
million farmers and a cultivated area of 15.7 million hectare. WBCIS also operates on the
concept of area approach. It is a weather index-based insurance product designed to offer
insurance protection against losses to crop resulting from adverse weather conditions.
For loss estimation, a Reference Unit Area (RUA) is deemed to be a homogenous area unit
of insurance. Each RUA is linked to a Reference Weather Station (RWS); claims are
determined on the basis of weather data recorded by the RWS. Adverse weather events
during the season entitle the insured to a pay-out, subject to the weather triggers defined
in the “Payout Structure” and the terms and conditions of the scheme. The claim settlement
is an automatic process, based on the weather readings at the RWS. In a given RUA, the
payout given per unit area is the same for all cultivators under the same RWS. Claims are
normally settled within 45 days from the end of the insurance period. Insurance companies
declare a per-unit Sum Insured at the beginning of each crop season in consultation with
experts. This may vary from crop to crop in each RUA. The sum insured for the loanee
farmer is calculated by multiplying per unit area value of inputs with crop specific acreage
declared by the farmer in the loan application form submitted to the lending bank. For a
non-loanee farmer, the acreage figure is expected area sown/planted under the particular
crop as declared in the insurance proposal form.
The Scheme was received with good response due to the fact that claims calculation does
not depend on yield results and claims are released within 45 days after the period of
insurance. But WBCIS covers only weather related risk and the compensation is paid on
the basis of deficit or excess in weather parameter which is considered as a correlate or
proxy of crop loss. The most challenging disadvantage of WBCIS, however, is the basis risk,
which refers to the variability between the value of losses as measured by the weather
index and the value of actual losses experienced on the farm, (Collier et al., 2009) as the
basis risk can result in a mismatch between the actual loss and payout. Furthermore, in
WBCIS, the start-up cost is high as time series and historical data on rainfall and yield are
required to define the trigger events that necessitate indemnity payment.
2.6 Modified National Agricultural Insurance Scheme (MNAIS)
The Government then formulated a new scheme, modified NAIS (MNAIS) to correct the

Orissa Economic Journal, Vol. 47, No. 1, Jan-June 2015 : 87
loopholes in the existing NAIS. It was implemented on a pilot basis in 50 districts from the
Rabi season of 2010–11. Unit area of insurance was reduced to village/village panchayat
level for major crops. Like NAIS, MNAIS is compulsory for loanee farmers and voluntary for
non-loanee farmers. The main objective of the scheme is to provide insurance coverage to
the farmers in the event of failure of the any of the notified crop as a result of natural
calamities, pests, diseases or errant weather condition. The novel features of MNAIS are
coverage of prevented sowing/planting risk and post harvest loss, provision of higher
level of indemnity, provision for mid-season on-account payment of compensation on the
basis of expected crop loss, allowing private sector participation. In case of adverse seasonal
conditions during crop season, claim amount up to 25 percent of likely claims would be
released in advance subject to adjustment against the claims assessed on yield basis.
2.7 National Crop Insurance Programme (NCIP)
During November 2013, in order to insulate farmers from farming risks, the Ministry of
Agriculture and Cooperation, Government of India directed the state governments to
implement the new National Crop Insurance Programme (NCIP) with immediate effect
from the ongoing Rabi season. This central scheme has been formulated by merging the
Pilot Weather Based Crop Insurance Scheme (WBCIS), Pilot Modified National Agricultural
Insurance Scheme (MNAIS) and Pilot Coconut Palm Insurance Scheme (CPIS) to make it
more farmer friendly. Loanee farmers will be covered compulsorily under component
scheme of NCIP notified by the concerned state, while non-loanee farmers will choose
either MNAIS or WBCIS component. Private sector insurers with adequate infrastructure
and experience will be permitted to implement NCIP besides Agriculture Insurance
Company of India (AICI). Unlike earlier, all farmers even including sharecroppers, tenant
farmers, farmers enrolled in contract farming, group of farmers serviced by fertilizer
companies, pesticide firms, crop growers, and self help groups are eligible for insurance
cover. There will be three indemnity levels instead of two- 70 per cent, 80 per cent and 90
per cent. The Threshold yield (TY) or guaranteed yield for a crop in a Insurance Unit shall be
the average yield of the preceding 7 years excluding the year(s) in which a natural calamity
such as drought, floods etc. may have been declared by the concerned Government
authority multiplied by level of indemnity. However, it may be ensured that at least 5
years’ yield data is available for calculating the threshold yield. The insurance companies
will be liable to make claim payment from their own resources. Only the premium subsidy
will be shared by state and central government on 50:50 basis. Besides, a catastrophic fund
at the national level will be set up for providing reinsurance cover to the insurance
companies implementing the scheme. However this fund, set up with equal contribution
from the state and centre, can be used only in the event of failure to procure reinsurance
cover at competitive rates and if premium to claims ratio exceeds 1:5. The novelty of the
NCIS is that it incentivises risk reducing measures by farmers by lowering the premium for

88 : Orissa Economic Journal, Vol. 47, No. 1, Jan-June 2015
the farmers who undertake soil and water conservation measures. Premium structure
would be worked out with a discount provision on the premium in respect of a unit area
where all farmers have adopted better water conservation and sustainable farming
practices for better risk mitigation. Farmers are entitled to maximum premium subsidy up
to 50 per cent under WBCIS and 75 per cent under MNAIS on a graded scale. Premium rates
have been capped according to the type of crop and season, and in cases where the actuarial
premium rates are higher than the capped limit, the sum insured for such crops will be
reduced in proportion to the cap level. NAIS was to be discontinued from Rabi 2013–14.
However, on the representation of some State governments, GoI reconsidered the matter
and communicated that the fourteen States and Union Territories that had already notified
NAIS for Rabi 2013–14 could continue its implementation. Further, States which had already
notified NCIP should continue to implement it.
Thus, a number of crop insurance schemes have been introduced in the last three decades,
and modified as and when required to address operational issues. Payment of crop
insurance claims were delayed in many cases because of anomalies in data relating to
insured area, insured crops and estimated yield of insured crops. Inconsistencies relating
to the insured area of a crop and the area reported to be under such crop in a particular
season posed a problem. Committees and groups were also set up periodically to address
various issues. The present study attempts to critically examine the performance of NAIS
and WBCIS in India with the use of time series data on farmers covered, area insured, sum
insured, premium collected, claims paid and farmers benefited, collected from AICI.
3. Coverage of NAIS and Farmers Benefited
To evaluate the performance of NAIS in India, we consider the trend in the coverage of the
scheme in both Kharif and Rabi seasons from the year of its initiation i.e. 2000 to 2012 as
shown in Table 1 and Figure 1. During Kharif season the number of farmers covered has
increased substantially from 84.1 lakh in 2000 to 106.2 lakh in 2012. In the same period, the
area covered also increased enormously from 132.2 lakh hectare to 156.4 lakh hectare. But
during the Rabi seasons, the number of farmers and area covered are far less in comparison
to Kharif seasons, as farmers in India cultivate crops in nearly sixty percent of their area in
the Rabi season due to low rainfall and inadequate irrigation facility during this season.
Rabi crops are usually grown in irrigated areas, where requirement for insurance is low.
The trend in the coverage of the scheme during Rabi seasons reveals that the coverage of
the scheme with respect to number of farmers and area covered though has increased
substantially over the period 2000-2012, still it is very small in comparison to Kharif seasons.
During Rabi seasons, the number of farmers covered has increased from 20.9 lakh in 2000
to 47.6 lakh in 2012. In the same period, the area covered also increased significantly from
31.1 lakh hectare to 61.8 lakh hectare.

Orissa Economic Journal, Vol. 47, No. 1, Jan-June 2015 : 89
Source: Agriculture Insurance Company of India Limited (AIC).
Figure 1: Kharif and Rabi area Under Nais in India (2000-2012)
Now coming to total number of farmers covered under NAIS which includes both Kharif
and Rabi seasons, the number increased from only 105.0 lakh in 2000 to 153.8 lakh in 2012.
Similarly, total area under NAIS which includes both Kharif and Rabi crops has increased
spectacularly from only 163.3 lakh hectare in 2000 to 218.2 lakh hectare in 2012.
Table 1: Coverage of Nais in India (Kharif and Rabi 2000-2012)
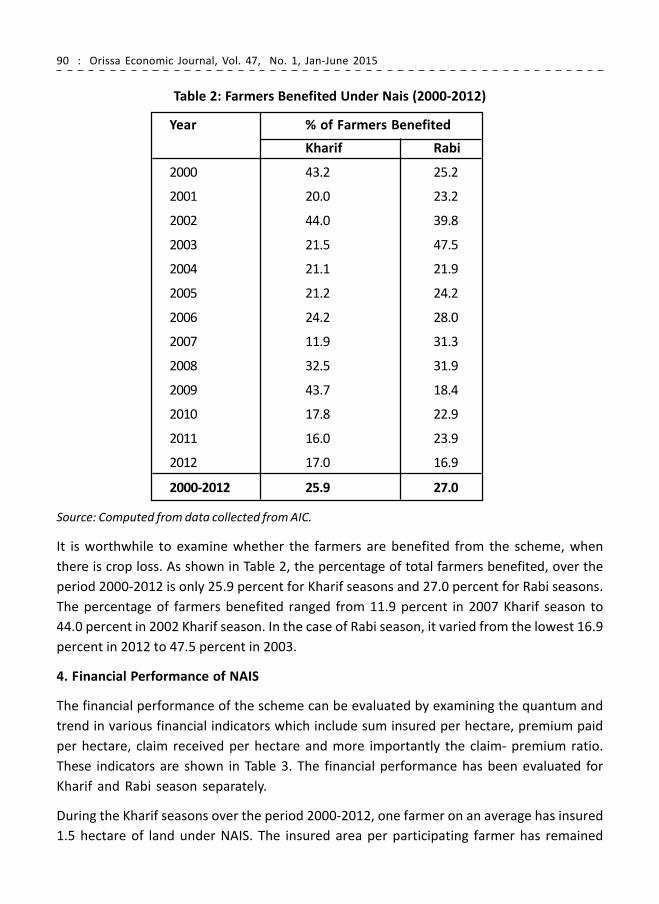
90 : Orissa Economic Journal, Vol. 47, No. 1, Jan-June 2015
Table 2: Farmers Benefited Under Nais (2000-2012)
Year % of Farmers Benefited
Kharif Rabi
2000 43.2 25.2
2001 20.0 23.2
2002 44.0 39.8
2003 21.5 47.5
2004 21.1 21.9
2005 21.2 24.2
2006 24.2 28.0
2007 11.9 31.3
2008 32.5 31.9
2009 43.7 18.4
2010 17.8 22.9
2011 16.0 23.9
2012 17.0 16.9
2000-2012 25.9 27.0
Source: Computed from data collected from AIC.
It is worthwhile to examine whether the farmers are benefited from the scheme, when
there is crop loss. As shown in Table 2, the percentage of total farmers benefited, over the
period 2000-2012 is only 25.9 percent for Kharif seasons and 27.0 percent for Rabi seasons.
The percentage of farmers benefited ranged from 11.9 percent in 2007 Kharif season to
44.0 percent in 2002 Kharif season. In the case of Rabi season, it varied from the lowest 16.9
percent in 2012 to 47.5 percent in 2003.
4. Financial Performance of NAIS
The financial performance of the scheme can be evaluated by examining the quantum and
trend in various financial indicators which include sum insured per hectare, premium paid
per hectare, claim received per hectare and more importantly the claim- premium ratio.
These indicators are shown in Table 3. The financial performance has been evaluated for
Kharif and Rabi season separately.
During the Kharif seasons over the period 2000-2012, one farmer on an average has insured
1.5 hectare of land under NAIS. The insured area per participating farmer has remained

Orissa Economic Journal, Vol. 47, No. 1, Jan-June 2015 : 91
more or less constant over the years. The average sum insured during 2000-2012 was Rs
8995 per hectare. During the same period, the average premium paid was only Rs 264 per
hectare and the average claim received was Rs. 857 per hectare. Thus, on an average the
farmers are receiving more indemnity than the premium amount. The sum insured per
hectare and premium paid per hectare has increased steadily over the years. The average
claim received per hectare is very high during the drought affected years. The average
claim received per hectare ranged from Rs. 372 in 2012 to Rs.1761 in 2009 (Table 3).
To assess the financial performance of NAIS in India, the claim-premium ratio was computed
by dividing the indemnity claim or compensation payment by insurance premium collected.
If the claim-premium ratio exceeds one, it indicates financial loss on the part of the insurer
in insurance business, but from the point of view of the farmer it indicates that he receives
more compensation than the premium paid. During the period 2000-2012 Kharif seasons,
it is observed that the claim- premium ratio is greater than one for twelve seasons out of
the total thirteen seasons. Thus, in majority of the seasons, the insured farmers get more
compensation than the amount of premium that they pay to insure their crops. Thus, for
the insurance users, the benefits from insurance exceed the cost of insurance. During the
same period, the average claim-premium ratio is found to be 3.2 and thus favourable to
the farmers. The claim-premium ratio ranges from the lowest 0.8 during 2012 to the highest
7.7 during 2000. The claim- premium ratio is observed to be higher in drought years when
there was huge crop loss due to deficiency in rainfall
Table 3: Financial Performance Indicators of Nais in India
(Kharif and Rabi 1999- 2012)
Season/ Area Sum Premium Claims Claim-
Year Insured Insured Paid per Received Premium
per Farmer per hectare hectare per hectare Ratio
(hectare) (Rs) (Rs) (Rs)
Kharif
2000 1.6 5222.0 120.5 924.7 7.7
2001 1.5 5821.4 166.0 383.0 2.3
2002 1.6 6072.3 180.7 1174.6 6.5
2003 1.6 6567.2 209.5 528.3 2.5
2004 1.9 5425.9 180.8 427.7 2.4
2005 1.6 6584.7 209.2 528.5 2.5
2006 1.5 7502.6 224.0 902.9 4.0
2007 1.5 8194.7 239.8 440.6 1.8
2008 1.4 8882.9 271.2 1348.3 5.0
2009 1.4 10716.7 312.7 1760.8 5.6

92 : Orissa Economic Journal, Vol. 47, No. 1, Jan-June 2015
2010 1.3 13858.9 395.3 959.0 2.4
2011 1.4 14889.8 419.7 1054.4 2.5
2012 1.5 17281.4 489.3 372.4 0.8
2000-2012 1.5 8994.8 264.2 856.9 3.2
Rabi
1999 1.3 4566.0 48.3 98.6 2.0
2000 1.5 5151.0 62.8 191.2 3.0
2001 1.6 4760.2 71.1 205.5 2.9
2002 1.7 4550.8 78.7 467.0 5.9
2003 1.5 4714.3 89.4 768.4 8.6
2004 1.5 7063.5 134.2 300.5 2.2
2005 1.8 7026.0 138.0 468.7 3.4
2006 1.5 8571.1 172.3 676.0 3.9
2007 1.5 10107.6 190.5 1096.7 5.8
2008 1.4 12586.3 252.1 1703.0 6.8
2009 1.4 13934.0 274.4 500.1 1.8
2010 1.4 15869.3 294.0 947.4 3.2
2011 1.5 14828.9 255.6 478.4 1.9
2012 1.3 16110.1 275.6 0.7 0.0
1999-2012 1.5 10362.3 192.2 674.0 3.5
Source: Computed from data collected from AIC.
Out of total fourteen years of Rabi seasons, claim-premium ratio was again favourable for
insurance users (greater than one) for thirteen years. During the Rabi seasons, the claim
received per hectare is lower than that of Kharif seasons. During the period 1999 to 2012,
the average claim received per hectare was only Rs 674, whereas it was Rs 857 for Kharif
season (Table 3). Thus, during Rabi seasons, the farmers are not benefited to the extent
they receive indemnity during Kharif seasons.
5. Coverage of WBCIS and Farmers Benefited
Table 4 and Figure 2 show the trend in the coverage of WBCIS in both Kharif and Rabi
seasons from the year of its initiation i.e. 2007 to 2011. During Kharif season the number of
farmers covered has increased substantially from 0.4 lakh in 2007 to 69.1 lakh in 2011. In
the same period, the area covered also increased enormously from just 0.5 lakh hectare to
97.8 lakh hectare. The trend in the coverage of the scheme during Rabi seasons reveals
that the coverage of the scheme with respect to number of farmers and area covered
though has increased over the period 2007-2011, still it is very small in comparison to
Kharif seasons. During Rabi seasons, the number of farmers covered has increased from
6.3 lakh in 2007 to 47.7 lakh in 2012. In the same period, the area covered has also increased
from 10.2 lakh hectare to 59.4 lakh hectare.

Orissa Economic Journal, Vol. 47, No. 1, Jan-June 2015 : 93
Table 4: Coverage of Wbcis in India (Kharif and Rabi 2007-2011)
Year Farmers Covered Area Covered
under under
WBCIS WBCIS
(in hectare)
Kharif Rabi Kharif and Kharif Rabi Kharif
Rabi and Rabi
2007 43790 634635 678425 50074 1018254 1068328
2008 183481 191647 375128 221202 260908 482110
2009 1161055 1201525 2362580 1530782 1891091 3421874
2010 4918950 4385571 9304521 7391329 5757384 13148713
2011 6908926 4765997 11674923 9788401 5944726 15733127
2007-11 13216202 11179375 24395577 18981789 14872362 33854151
Source: Agriculture Insurance Company of India Limited (AIC).
Figure 2: Kharif and Rabi area under Wbcis in India (2007-2011)
The total farmers covered under WBCIS which includes both Kharif and Rabi seasons, the
number increased from only 6.8 lakh in 2007 to 116.7 lakh in 2011. Similarly, total area
under WBCIS which includes both Kharif and Rabi crops hectares increased from only 10.7
lakh hectare in 2007 to 157.3 lakh hectare in 2011.
Table 5 shows the percentage of total farmers benefited under WBCIS over the period
2007-2011. It is 48.7 percent for Kharif seasons and 55.2 percent for Rabi seasons. The

94 : Orissa Economic Journal, Vol. 47, No. 1, Jan-June 2015
percentage of farmers benefited ranged from 36.4 percent in 2010 Kharif season to 80.6
percent in 2007 Kharif season. In the case of Rabi season, it varied from the lowest 30.0
percent in 2007 to 63.0 percent in 2008. Thus, number of farmers benefited during Rabi
seasons is less than in Kharif seasons.
6. Financial Performance of WBCIS
In order to evaluate the financial performance of WBCIS, the quantum and trend in various
financial indicators which include sum insured per hectare, premium paid per hectare,
claim received per hectare and the claim- premium ratio have been examined as was done
in case of NAIS. These indicators are shown in Table 6.
Table 5: Farmers Benefited under Wbcis (2007-2011)
Year % of Farmers Benefited
Kharif Rabi
2007 80.6 30.0
2008 59.4 63.0
2009 77.8 49.9
2010 36.4 57.6
2011 52.1 57.3
2007-2011 48.7 55.2
Source: Computed from data collected from AIC.
Table 6: Financial Performance Indicators of Wbcis in India
( Kharif and Rabi 2007- 2011)
Season/Year Area Insured per Sum Insured per Premium Paid Claims Received Claim-
Farmer (hectare) hectare (Rs) per hectare (Rs) per hectare (Rs) Premium Ratio
Kharif
2007 1.1 10586.3 283.1 1046.7 3.7
2008 1.2 15872.5 434.5 725.7 1.7
2009 1.3 13821.1 395.8 1031.5 2.6
2010 1.5 7686.9 227.7 259.6 1.1
2011 1.4 11102.4 338.9 430.8 1.3
2007-11 1.4 10045.9 301.2 417.6 1.4
Rabi
2007 1.6 17077.3 429.9 986.0 2.3
2008 1.4 20556.2 430.2 1281.0 3.0
2009 1.6 15112.9 298.9 986.0 3.3
2010 1.3 15022.5 306.5 768.3 2.5
2011 1.2 16581.5 350.5 1117.7 3.2
2007-11 1.3 15894.9 333.7 959.6 2.9
Source: Computed from data collected from AIC.

Orissa Economic Journal, Vol. 47, No. 1, Jan-June 2015 : 95
During the Kharif seasons over the period 2007-2011, one farmer on an average has insured
1.4 hectare of land under WBCIS. The insured area per participating farmer has increased
marginally over the period. While it was only 1.1 hectare per farmer in 2007, it was 1.4
hectare in 2011. The average sum insured during 2007-2011 was Rs 10046 per hectare.
During the same period, the average premium paid was only Rs 301 per hectare and the
average claim received was Rs. 418 per hectare. Thus, on an average the farmers are
receiving more indemnity than the premium amount. The sum insured per hectare and
premium paid per hectare has increased steadily over the years. The average claim received
per hectare is very high during the drought affected years. The average claim received per
hectare ranged from Rs. 260 in 2010 to Rs.1047 in 2007 (Table 6).
During the period 2007-2011, it is observed that the claim- premium ratio is greater than
one for all five years of both Kharif and Rabi seasons. Thus, in all the seasons, the insured
farmers get more compensation than the amount of premium that they pay to insure their
crops. During Kharif seasons, the average claim-premium ratio is found to be ranging from
1.1 in 2010 to 3.7 in 2007. On the other hand, during Rabi seasons, it ranges from 2.3 in 2007
to 3.3 in 2009.
During the Rabi seasons, the claim received per hectare is higher than that of Kharif seasons.
During the period 2007-2011, the average claim received per hectare was Rs 960 for Rabi
seasons, whereas it was only Rs 418 for Kharif season (Table 6). Thus during Kharif seasons,
the farmers are not benefited to the extent they receive indemnity during Rabi seasons.
7. Performance of NAIS and WBCIS: A Comparison
A careful analysis of the performance indicators presented in Table 7 will help in making a
comparative assessment of the performance of NAIS and WBCIS during the period 2007-
2011. The insured area per farmer in the case of NAIS and WBCIS has remained same on an
average for both the Kharif seasons and the Rabi seasons. The percentage of farmers who
benefited out of the total number of insurance users was much higher for WBCIS than for
NAIS. During the 2007-2011 period, the percentage of farmers who benefited during Kharif
seasons was 49 percent for WBCIS whereas it was quite low at 26 percent for NAIS. Similarly
during Rabi seasons, the percentage of farmers benefited was 55 percent for WBCIS
whereas it was just 26 percent for NAIS. The indicators of financial performance as shown
in Table 7 reveal that the per hectare sum assured, premium paid and claim received were
higher for NAIS than for WBCIS during Kharif 2007-2011 but higher for WBCIS during Rabi
seasons.

96 : Orissa Economic Journal, Vol. 47, No. 1, Jan-June 2015
Source: Computed from data collected from AIC.
To assess the financial performance, we compared the claim-premium ratio. According to
the data, the claim premium ratio exceeded one for all the Kharif and Rabi seasons for
WBCIS as well as for NAIS excepting 2012 Kharif and Rabi for NAIS (Table 3). During 2007-
2011 Kharif seasons, the average claim-premium ratio was 3.6 for NAIS users and 1.4 for
WBCIS users while during 2007-2011 Rabi seasons, the average claim-premium ratio was
3.8 for NAIS users and 2.9 for WBCIS (Table 7). As the claim-premium ratio exceeds one, it
suggests financial loss on the part of the insurer in the insurance business whereas, from
the point of view of the farmer, it suggests more compensation than the premium paid.
The data suggests that WBCIS, on the whole, performs better than NAIS because of the
higher percentage of farmers who have benefited through the scheme. Many empirical
studies also reveal higher level of satisfaction of farmers with WBCIS in comparison to
NAIS due to faster claim payment and transparency in indemnity calculation. (Gine et al.,
Table 7: Performance Indicators of Nais and Wbcis in India
During the 2007-2011 Kharif and Rabi Seasons

Orissa Economic Journal, Vol. 47, No. 1, Jan-June 2015 : 97
2008; Swain, 2014). Moreover, in case of WBCIS, the rainfall data is objective, verifiable
and there is less scope for manipulation. However, as we have analysed data for only five
years, the findings may be considered as indicative and not conclusive.
8. Conclusion and Policy Implicatios
In India, where production risk is very high and coping capacity is low, there is a great need
for crop insurance to provide economic support to farmers, stabilize their farm income,
induce them to invest in agriculture, reduce indebtedness and decrease the need for
relief measures in the event of crop failure. Recently, widespread suicides by farmers in
Maharashtra, Karnataka, Andhra Pradesh and Odisha speak of the disastrous consequences
of agricultural risks on farmers’ lives and well being. Government is required to promote
crop insurance as a merit good. There is a need to create awareness about the benefits of
insurance schemes. Steps are required to link credit with insurance, tie up insurance with
other input supply services (seed, fertiliser, irrigation), subsidising insurance and provide
reinsurance facility and technical assistance. Marketing of crop insurance scheme should
be on the lines of the advertisement and promotional activities undertaken by any private
entrepreneur.
In the wake of globalisation and liberalisation and increased climatic aberrations due to
climate change, farmers now face joint price and output (yield) risk. NAIS and WBCIS cover
only yield risk. To take care of variability in both the yield and market price, there is a need
to reintroduce Farm Income/Crop Revenue insurance. As risk factors are location specific,
insurance providers should be ready to provide varied insurance products like crop yield
insurance, weather index insurance, single peril insurance and revenue insurance to meet
the needs of different farmers in different areas.
In the context of climate change with increased covariate catastrophic risk, the private
companies may not show their interest in offering crop insurance. Therefore, it is necessary
to introduce social control in insurance sector and make it mandatory for all private and
public insurance companies to extend certain percentage of their insurance business to
cover crop insurance. To increase the coverage of crop insurance and provide varied
insurance products, there is a need to promote private participation by providing them
government guarantee, subsidy, reinsurance and technical assistance. The public sector
may address catastrophic risk and provide multiple peril insurance where subsidy
requirement is high, but allow private sector to provide insurance products for less severe
events and for individual, independent, idiosyncratic and localized risk. Private participation
in agricultural insurance needs to be encouraged to provide varied products with actuarial
premium rates for commercial farmers on an individual basis. Appropriate regulatory
framework may be developed to monitor private participation in agricultural insurance.

98 : Orissa Economic Journal, Vol. 47, No. 1, Jan-June 2015
References
Ahsan Syed M., Ali A. G. and Kurian N. John. (1982). Toward a Theory of Agricultural Insurance,
American Journal of Agricultural Economics, Vol. 64, No. 3, pp. 520-529.
Collier Benjamin, Jerry Skees and Barry Barnett. (2009). ‘Weather Index Insurance and Climate Change:
Opportunities and Challenges in Lower Income Countries’, Geneva Papers, No.34, pp. 401-424.
Gine Xavier, Roberts Townsend and James Vickery. (2008). Patterns of Rainfall Insurance Participation
in Rural India, The World Bank Economic Review, pp.1-28, October 22.
Hazell, Peter B. R. (1992). ‘The Appropriate Role of Agricultural Insurance in Developing Countries’,
Journal of International Development, Vol. 4, Issue 6, pp. 567-581.
Hess, Ulrich (2003), ‘Innovative financial services for rural India: monsoon-indexed lending and insurance
for smallholders’, Agricultural & Rural Development Working Paper 9, World Bank, Washington, D.C.
Jaffee ,S., Siegel, P. And Andrews, C. (2010). “Rapid Agricultural Supply Chain Risk Assessment: Aconceptual
Framework.” The World Bank. Washington .D.C.
Kalavakonda Vijay and Olivier Mahul (2005). Crop Insurance in Karnataka, World Bank Policy Research
Working Paper 3654.
Kling, R., and G. Oamek. (1983). Risk Management by Colorado Dryland Wheat Farmers and the
Elimination of the Disaster Assistance Program, American Journal of Agricultural Economics, Vol. 65,
pp 247-55.
Miranda, Mario and Dmitry V. Vedenov (2001). ‘Innovations in agricultural and natural disaster
insurance’, American Journal of Agricultural Economics 83 (3): 650-655.
Raju, S.S. and Ramesh Chand (2008). ‘Agricultural insurance in India: problems and prospects’,
National Centre for Agricultural Economics and Policy Research, Working Paper No.8, Indian
Council of Agricultural Research, New Delhi.
Rothschild, M. and J. Stiglitz. (1976). “Equilibrium in Competitive Insurance Markets: AnEssay on the
Economics of Imperfect Information.” Quarterly Journal of Economics 90,629-649.
Singh Gurdev. (2010). Crop Insurance in India, W.P. No. 2010-06-01, Indian Institute of Management.
Sinha, Sidharth. (2004). Agriculture Insurance in India: Scope for Participation of Private Insurers,
Economic and Political Weekly, 39(25), 2605-11.
Skees, J. and M. Reed. (1986). ‘Rate Making for Farm-Level Crop Insurance: Implications for Adverse
Selection’, American Journal of Agricultural Economics, Vol. 68, pp 653-59.
Swain, Mamata. (2008). ‘Agricultural Risk and Crop Insurance in Orissa in a Globalised Economy’,
Man and Development, Vol.30, No. 3, pp.107-128.
Swain, Mamata (2013). ‘Agricultural risk and efficacy of crop insurance schemes in Odisha’, in
Suman Chandra, K.V. Suresh Babu, P.K. Nath (eds.), Agrarian Crisis in India: The Way Out, New Delhi:
Academic Publishers, pp. 477-496.
Swain, Mamata. (2014). ‘Crop Insurance for Adaptation to Climate Change in India’, Asia Research
Centre Working Paper No.61, London School of Economics and Political Science, pp. 1-41.
Vyas, V.S. and S. Singh. (2006). Crop Insurance in India: Scope for Improvement, Economic and Political
Weekly, Vol.41(43&44), 4585-94.

Orissa Economic Journal, Vol. 47, No. 1, Jan-June 2015 : 99
Financial Inclusion Policy of the Government and Sustainability of
Women-headed MSMEs in Odisha
Julie Tripathy1
Binayak Rath2
I. Introduction
Gender empowerment through entrepreneurship development has been chosen as a
significant policy and strategy intervention by most developing countries of the world
over the last two decades. Although gender empowerment has been variously defined,
the UN (2001)3provided a very comprehensive definition. It defined women’s
empowerment in terms of five components, such as, ‘women’s sense of self-worth; their
right to have and determine choices; their right to have access to opportunities and
resources; their right to have the power to control their own lives, both within and outside
the home; and their ability to influence the direction of social change to create a more just
social and economic order, nationally and internationally”. On the other hand, Alsop and
Heinsohn (2005)4 described individuals and groups as empowered when ‘they possess the
capacity to make effective choices: that is, to translate these choices into desired actions
and outcomes’.The World Development Report, 2012 offered a broader notion of
empowerment which included control over resources, decision-making, freedom of
movement, freedom from the risk of violence and a voice and influence in collective
decision-making processes. While it is generally argued that ‘financial inclusion’ has
delivered desired results in the developing counties by enhancing income generation
opportunities for entrepreneurs in business, there are contradictory evidences regarding
the achievement of objective of sustainable income generation opportunities and
improving the living standards, specifically in case of women-headed enterprises supported
by micro-finance institutions5.
1 PhD Scholar, Utkal University
2 Former Professor of Economics, IIT Kanpur and NISER, Bhubaneswar
3 Division for the Advancement of Women (UNDAW), Department of Economic and Social Affairs.2001.
Empowerment of Women Throughout the Life Cycle as a Transformative Strategy for Poverty Eradication.
Report of the Expert Group Meeting, 26-29 November. New Delhi, India.
4 Alsop, Ruth and Heinsohn, Nina (2005), “Measuring Empowerment in Practice: Structuring Analysis
and Framing Indicators”, World Bank, http://www.worldbank.org/
5 Kaur, Prabhjot and Dey, Soma (2013), Global Journal of Management , “ Andhra Pradesh Micro-
Finance Crisis and Its Repercussions in Microfinancing Activities, Global Journal of Management and
Business Studies, Vol 3No 7

100 : Orissa Economic Journal, Vol. 47, No. 1, Jan-June 2015
The objectives of this paper are two-fold. First, to understand the process and extent of
‘financial inclusion’ of women entrepreneurs with the help of field investigations
undertaken in two sample districts of Odisha (one developed and the other
underdeveloped, viz. Cuttack and Bargarh respectively). The second objective is to find
out whether the coping mechanism adopted by the women entrepreneurs due to financial
exclusion at any stage of life cycle of their business adversely affects their operations and
sustainability.
II. Women Empowerment Process through Financial inclusion
The process of this women empowerment has, among others, included ‘financial inclusion’
as an important factor to aid it to initiate and/or expand existing business in terms of
generation of additional income and employment of unemployed or underemployed youth
in particular and thereby help removal of poverty and lead to sustainable development.
Financial inclusion too has been variously defined. The Rangarajan Committee6 defined
‘financial inclusion’ as “the process of ensuring access to financial services and timely and
adequate credit where needed by the vulnerable groups such as weaker sections and low
income groups at an affordable cost”. In case of MSME sector, it was found that a
disproportionately high number of enterprises are excluded from institutional financing
thereby limiting their operation, profitability and expansion.
The Fourth Census of MSME sector provides some interesting information regarding
financial exclusion. As low as only 5.18% of the units (both registered and unregistered)
had availed of finance through institutional sources, 2.05% had finance from non-
institutional sources the majority of units i.e. 92.77% had no finance or depended on self
finance7. Chakrabarty8 in has lecture specifically drew attention to the various aspects of
exclusion of enterprises in micro and small scale sector and by using recent data (in Chart
1) indicated that institutional sources provide only 5.18% of loan requests coming from
MSME sector.
In the context of the above as well as the various official claims about a lot of emphasis
being given to coverage in terms of numbers accessing credit needs further investigation
in terms of adequacy, timeliness and impact on sustainability of women enterprises.
6 RBI (2008), “Report of the Committee on Financial Inclusion”
7 Vijay Bhaskar, P. (2014), “Role of Financial Sector in Spurring Growth and Expanding Financial Inclusion in
North Eastern Region”,Speech at CII Banking Collagium in Kolkata on September 19, 2014
8 Chakrabarty, K.C. (2012), Lecture at SME Banking Conclave organized by Chamber of Commerce

Orissa Economic Journal, Vol. 47, No. 1, Jan-June 2015 : 101
Chart-1 Financial Exclusion in MSME Sector in IndiaChart-1 Financial Exclusion in MSME Sector in IndiaChart-1 Financial Exclusion in MSME Sector in IndiaChart-1 Financial Exclusion in MSME Sector in IndiaChart-1 Financial Exclusion in MSME Sector in India
Source: Highlights of 4th Census on MSMEs
Although a number of studies has been conducted on MSME indicating inclusion or
otherwise, very few studies have emphasized on inclusion aspects of women in business.
Similarly promotion of women enterprises through Women Self-Help Groups under Micro-
finance studied by several authors in India and elsewhere provide contradictory evidences
regarding the achievement of objective of sustainable income generation opportunities
and improving the living standards. Abhijit Banerjee and his associates9 point out the huge
gap between perception and realization. n a state like Odisha, hardly any study has
scratched the surface of this aspect scientifically and provided strong evidence one way or
another. In order to fill the gap, we had undertaken a field investigation in selected sample
units in Odisha.
III. Methodology and Coverage of the study
This study has used the sample survey data of 240 women enterprises selected on random
sampling basis from two districts of Odisha; Cuttack, industrially advanced and Bargarh,
industrially backward district. From each district 120 sample units in micro and small sector
owned and operated by women were randomly selected equally distributed between
urban and rural areas. Primary data from 240 enterprises were collected and used for
analysis. In Bargarh there were 13 samples from REGP, 7 from PMRY and 47 from PMEGP in
rural and 53 from urban areas. In Cuttack district, there were 17 REGP units, 11 PMRY units,
43 and 49 units respectively from rural and urban PMEGP units.
Benefits including employment and income, and the challenges for women entrepreneurs
in urban and rural areas were analysed. A sample of other stakeholders e.g. managers of
District Industries Centres (DIC), representatives of banks and financing institutions, district
administration, local self-governments (Panchayats, Municipalities and Notified Area
Councils (NAC) and NGOs were also approached for discussions. Data and information
9 Banerjee, A. and others(2014), “The miracle of microfinance? Evidence from a randomized evaluation”,
March, 2014

102 : Orissa Economic Journal, Vol. 47, No. 1, Jan-June 2015
were collected from the respondent entrepreneurs and officials during the year 2010-11.
“Before and after” method was used to assess performance of MSME operation in relation
to financial inclusion10.
IV. Business Type and Socio-Economic Characteristics of Women Entrepreneurs
A significantly high proportion (95%) of women, have started their business and have
been running the enterprises as ‘sole-proprietor’. Not finding a ‘good-fit’ business partner
by women entrepreneurs is a major reason to go alone in business. Women entrepreneurs
in Odisha are aware that service oriented units are more sustainable with well-developed
processes for renewal and reconfiguration of their business models. Despite this, most
entrepreneurs in the MSME sector in Odisha tend to gravitate towards opening up of
production units. At all-India level too, the proportion of service sector units was found
too low at 16.78% while manufacturing constituted more than two thirds of total enterprises
as reported by Prime Minister’s Task Force on MSME in 2010. Service-oriented enterprises
require managers with adequate skills, education, experience and exposure, which women
entrepreneurs in poor states and underdeveloped regions usually do not possess. They
also find it difficult to procure skilled people and retain them for long-period.
Although women entrepreneurs feel that service units are more attractive and appealing,
inadequate knowledge and exposure pose as major constraints to open such enterprises.
Most women have started their enterprises in production and trade, accounting for more
than 84% of the coverage in these two types with the manufacturing taking the lead in
investment. Service sector has been least invested, Average investment per unit is also
the lowest for the service sector where manufacturing takes the lead.
Table 1: Type of Enterprises
District Rural/Urban Production No % Service No % Trade No %
Bargarh Rural 33 55 9 15 18 30
Urban 43 72 7 12 10 17
District 76 63 16 13 28 24
Cuttack Rural 38 63 12 20 10 17
Urban 37 62 7 12 16 27
District 75 62 19 16 26 22
Rural 71 59 21 18 28 23
Urban 80 67 14 12 26 22
Districts 151 63 35 15 54 22
Source: Primary Survey 2010-11
10 Rath, Binayak (2007), “ Post Evaluation Study of the Scheme of Micro-Credit Help to Women Self-Help Groups
(WSHGs) in KBK Districts of Odisha

Orissa Economic Journal, Vol. 47, No. 1, Jan-June 2015 : 103
Socio-economic and cultural characteristics have important bearing on the quality of
leadership and management orientation of entrepreneurs and specifically of women
entrepreneurs, who start ventures under several constraints. Contrary to the general belief
that it is the poor women who start business to improve their standard of living and get out
of poverty, in our samples, it was found that a disproportionately high 83% of women
entrepreneurs were “non poor” represented by “Above Poverty Line” status. Only a little
over 10% of the entrepreneurs was from the disadvantaged communities. Women
entrepreneurs were educated; nearly 50% passed Class 12. A very high proportion (87%) of
the women entrepreneurs married at the time of starting a business.
It is the non-poor category of young women who has taken interest to do business. With
double-digit inflation experienced in the second half of the first decade of 21st century,
the poor women did not feel that they should venture into a new business and run it
successfully to earn enough on a sustainable basis to graduate to APL status. On the contrary,
the women from APL family who were better-off than those from BPL families have started
business in large numbers mostly with support from other earning male family members.
The poor have concentrated on labour as their source of livelihood. Table 2 provides
information about socio-economic characteristics and civil status of women sample
entrepreneurs.
Table 2: Civil and Socio-Economic Status of Women Entrepreneurs (%)
Another important factor for APL women being in business is that they are more exposed
to government programmes, oftentimes meet bank officials as a substantial proportion
have bank accounts (including accounts in cooperative societies), and their male family
members have better clouts in dealing with officials and marketing outlets. An attempt is
made in this paper to understand and examine the extent of financial inclusion in the
context of economic empowerment of these women entrepreneurs.

104 : Orissa Economic Journal, Vol. 47, No. 1, Jan-June 2015
District Rural / Average Investment/ % of Investment met Range
Urban Unit Rs. Lakh from Resources provided (%) met
by Financial Institutions
Bargarh Rural 4,33,516 78.22 71-100
Urban 2,31,406 79.69 71-91
Cuttack Rural 8,24,682 76.58 71-96
Urban 2,35,841 86.22 66-91
Source: Primary Survey, 2010-11
V. Results and Discussion
Financial inclusion is evaluated here on three basic criteria. First and the foremost,
financing institutions providing finance for initial investment in plant and machinery and
first cycle working capital for starting an enterprise. Second, the extent to which the working
capital requirements of the enterprises started with assistance of financial institutions
are further met by such institutions. And third, the extent to which institutional finance
has helped financial stability of women enterprises by providing additional finance for
market facilitation.
5.1 Initial Capital for Investment
Policies and programmes to develop MSME are based on the presumption that provision
of initial capital from financial institutions with built-in subsidy can help entrepreneurs to
start business. The margin money to be provided by the entrepreneurs was usually low for
general category and much lower for special category persons including women
entrepreneurs. It was therefore expected that the entire initial capital requirement
including estimated working capital for the first cycle, over and above the owners’
contribution, would be provided by financing institutions. One can safely say that there
has been financial inclusion if high proportion of business enterprises had access to
institutional finance and high extent of initial investment capital provided by financing
institutions.
Table 3: Financial Inclusion of Women Enterprises in Bargarh and Cuttack Districts
Data in the above table indicates that the objective of providing initial investment resources
including working capital for the first cycle of business operation of women enterprises
under MSME sector was invariably met by the financing institutions. From this point of
view, it can be concluded that financial inclusion of women enterprises was high at it was
under credit-linked investment subsidy programme(s) supported by policies at the level
of Government of India and the State Government. However, it is not clear about the
extent of coverage i.e. the number of women entrepreneurs who approached for financial
resources and the number assisted by financial institutions because such data are not
readily available at district level. If at all at India level, less than 6% has access to capital, in
case of Odisha, the proportion is likely to be lower.

Orissa Economic Journal, Vol. 47, No. 1, Jan-June 2015 : 105
5.2 Working Capital
Each enterprise requires liquid assets for various operational purposes. The liquid asset at
hand of an enterprise is called working capital. It is required to pay for various expenses
planned and unplanned to manage a business and meet its short-term obligations. Working
capital requirements vary from one business to another depending upon the type of
business. Within a business the requirement of working capital may vary from one month
to another or from one season to another. Net working capital requirements are dependent
mainly on two factors: earnings of the enterprises and frequency with which these amounts
are earned, and the business expenses and how often the payments are needed to be
conciliated.
Often it was found that while starting a business, the women entrepreneurs did not adopt
any scientific business method to estimate working capital requirements. This was
specifically true for very small investors-say up to investment of Rs. 2-3 lakh and even
sometimes up to investment of Rs. 5 Lakh. Many women entrepreneurs reported that they
had thought that they would somehow manage to have some resources to run the business
once the initial investment capital with some working capital at the start-up was available.
In their enthusiasm to increase the number of units assisted, even the agencies promoting
such enterprises, do not give adequate emphasis to properly estimate working capital
requirements and how they would be met after the first cycle of operations is over.
For successful operation, working capital availability is crucial as it ensures existence of
sufficient funds for carrying out everyday operations of an enterprise in a smooth manner.
Every business should have short cycles of cash conversion. ‘Cash conversion cycle’ assesses
the period of time for which an enterprise would be divested of funds in case it raises its
investments, as a procedure of its strategies for business growth. The organization needs
to take some important steps in this direction like reducing the customers’ credit period,
talking terms with suppliers and raising their period of credit with the suppliers, preserving
the appropriate inventory level that lessens the costs of raw materials and right cash
management that would ensure reduced cash holding prices.
A shortfall in working capital has a damaging impact on operations as well as on the financial
stability of an enterprise. It indicates that the enterprise is facing liquidity problems and is
unable to pay for costs related to short term periods. Hence, financial planning, which
includes planning of working capital investment requirement is very important for running
a business expeditiously. It is found from Table 4 that only 37% of the enterprises were
assisted with institutional finance for meeting a good proportion of working capital needs.
Of the total estimated fund requirement for working capital only about 32% was provided
by financial institutions.

106 : Orissa Economic Journal, Vol. 47, No. 1, Jan-June 2015
Table 4: Working Capital Requirements of Women Enterprises Met
by Financial Institutions
District Rural/ Enterprises Numbers % (of Working Working % of
Urban Approached Assisted Numbers Capital Capital Working
For Working Assisted) Requirement Provided Capital
Capital (No) Rs Lakh By Financial Requirement
Institutions Met
Rs. Lakh
Bargarh Rural 60 19 32 47.98 14.00 29.18
Urban 60 22 37 39.17 12.90 32.93
Cuttack Rural 60 26 43 32.14 10.16 31.61
Urban 60 21 35 24.53 7.22 29.43
Overall 240 88 37 143.82 44.28 31.79
Source: Primary Survey, 2010-11
In MSME sector specifically at micro-enterprise level, proportion of entrepreneurs
preparinga very scientific working capital estimate would be very few although data on
this aspect is not available either at all-India level or at state level. In the case of the
sample women entrepreneurs, it was found that with investment around Rs. 10 lakh and
above, under 20% had some kind of an estimate of requirement of working capital. It is
these enterprises which also had access to low-interest finance from family or friends on
a very short-term basis. And they also had clout influencing bankers to provide them
short-term accommodation to meet working capital requirements. Another 10% also in
the high-end of micro-enterprise also had access to short-term funds of family members
and relations. Similar proportion of enterprises in urban areas also managed to get longer-
term credit from their suppliers to tide over liquidity crisis in the short run.
5.3 Coping Mechanism
With a view to adjusting to circumstances on account of severe shortfall in working capital,
nearly 23% of women enterprises in rural areas adopted a self-destructive mechanism or
reducing production or waiting for better times when they could get some more resources
from their previous sales on credit. More than one fifth adopting such course severely
impacted on revenue and caused embarrassment to entrepreneurs. It was severe in case
of the women entrepreneurs in underdeveloped district Bargarh where most rural
entrepreneurs adopted credit sale as compared to their counterparts in Cuttack. In case of
urban entrepreneurs, the situation was slightly better with a little under 21% adopting
coping mechanism of reducing production for the time being till situation improved.

Orissa Economic Journal, Vol. 47, No. 1, Jan-June 2015 : 107
Table 5: Entrepreneurs Coping Mechanism for Working-Capital Shortage
District Rural/Urban Institutional Working Coping Mechanism
Capital Unassisted Reduce Access High- Access Suppliers’
Units (No) Production Cost Credit Credit
Bargarh Rural 41 12 (29%) 18(44%) 11 (27%)
Urban 38 8(21%) 17(45%) 12(32%)
Cuttack Rural 34 5 (15%) 17(50%) 12(35%)
Urban 39 8(21%) 22(56%) 9(23%)
Source: Primary Survey 2010-11
Nearly 49% of sample women enterprises accessed high-cost credit specifically during
good marketing season to meet the working capital shortage. About 1/3rd in rural Bargarh
and 1/4th in rural Cuttack tried to influence their suppliers of raw materials to provide them
with longer term credit so as to help them better manage difficult liquidity position.
5.4 Financial Stability and Sustainability of Women Enterprises
More than 60% of women entrepreneurs in so called APL category are close to the fence of
‘poverty line’. Varying market conditions including unfair competitions both from within
and outside the country, has substantially increased the vulnerability to fall below the
poverty line of the hitherto APL women entrepreneurs. Specifically where the net income
per enterprise is low and family has adjusted to a higher standard of living because of
additional income from business, additional investment required to grow faster or expand
business is not taking place. In order for expansion to take place, reinvestment from net
profit should be leveraged to get additional resources from financing institutions. This has
not been happening specifically for those entrepreneurs earning less than Rs.150000 or
so. And to add to this, financial institutions are not providing adequate working capital to
these firms interested in expanding their operations with high turnovers and higher net
profit.
VI. Conclusion
The financial inclusion of women entrepreneurs in the sample areas is mostly limited to
the first round of credit delivered by financial institutions under MSME policy directive to
promote employment and income through investment promotion linked to subsidy.
Financial inclusion performance in the crucial second round that would help in operation
and consolidation achieved in the initial round is poor as only a little less than one third in
terms of amount of working capital is provided by the institutions supposed to take care of
units already established by women. It is a sorry state that nearly 63% of the women
entrepreneurs do not get access to working capital from financing institutions.
The coping mechanism for a substantial number of enterprises is destructive in nature
substantially affecting production and profit in negative and sustainability of enterprises.

108 : Orissa Economic Journal, Vol. 47, No. 1, Jan-June 2015
Specifically those units who are earning a net income of less than Rs.150000 per annum
will not be in a position to expand their business by further borrowing from the market.
Therefore the financial inclusion to help in financial stability must be supported by the
following steps:
i) Government and the Reserve Bank of India must issue guidelines to public sector
banks to provide adequate working capital to entrepreneurs and specifically to women
entrepreneurs. The nodal agencies must assist entrepreneurs in estimating their
working capital requirements. Banks wanting in performance must be sanctioned by
RBI.
ii) Other facilities developed by the Ministry of MSME (through KVIC) and the Office of
the Development Commissioner, MSME (through MSME Development Institutes),
and the concerned state government institutions must be well provided and
monitored for their development effectiveness. The services that can improve
operations and lead to better financial inclusion and sustainability of enterprises
must be identified for each area of operation. Performance of financial and
development institutions must be monitored and follow-up effective actions taken.
iii) For each group of business activities, area specific intensive studies must be
undertaken every three years to help identify constraints that should be removed
within specific timeframe.
iv) The programme for developing young women as entrepreneurs should go beyond
the present EDP training course. Adequate emphasis should be given to strategic
issues and how to manage them in the short medium term.
References
1. Banerjee, A. and others(2014), ‘The miracle of microfinance? Evidence from a randomized
evaluation’, March, 2014
2. Chakrabarty, K.C. (2012), Lecture at SME Banking Conclave organized by Chamber of Commerce.
3. Kaur, Prabhjot and Dey, Soma (2013), Global Journal of Management , “ Andhra Pradesh Micro-
Finance Crisis and Its Repercussions in Micro-financing Activities, Global Journal of Management
and Business Studies, Vol 3-No 7
4. Rath, Binayak (2007), “ Post Evaluation Study of the Scheme of Micro-Credit Help to Women Self-
Help Groups (WSHGs) in KBK Districts of Orissa
5. RBI (2008), “Report of the Committee on Financial Inclusion”
6. Ruth Alsop and Nina Heinsohn(2005), “Measuring Empowerment in Practice: Structuring Analysis
and Framing Indicators”, World Bank, http://www.worldbank.org/
7. UN Division for the Advancement of Women (UNDAW), Department of Economic and Social
Affairs.2001. Empowerment of Women Throughout the Life Cycle as a Transformative Strategy for
Poverty Eradication. Report of the Expert Group Meeting, 26-29 November, New Delhi, India.
8. Vijay Bhaskar, P. (2014), “Role of Financial Sector in Spurring Growth and Expanding Financial
Inclusion in North Eastern Region”, Speech at CII Banking Collagium in Kolkata on September 19,
2014

Orissa Economic Journal, Vol. 47, No. 1, Jan-June 2015 : 109
Women’s Financial Inclusion: The Path Travelled
and the way Forward
Mitali Chinara1
Anshuman Kamila2
The United Nations’ Millennium Development Goal recognizes gender equality as a desirable
objective of governance worldwide. It places special emphasis on empowering women, which
in current context necessarily encompasses institutions and practices that help them unlock
their economic potential. The National Mission for Financial Inclusion, the Pradhan Mantri
Jan Dhan Yojana, by placing household-based financial inclusion as the objective heralds
hope for greater financial inclusion of women in particular. The paper studies the varied
dimensions of financial exclusion of women in India – in terms of deposit accounts owned,
credit received, et al – and explores the multi-axial inequities that exist in this regard. It also
examines the gaps in financial inclusion that exists between women belonging rural and
urban areas, between women of different social groups and across regions of the country.
By recognizing that financial inclusion is only a necessary ingredient, and by no means a
sufficient one, certain policy suggestions have been made. This calls for convergence of
institutions and re-orientation of specialized agencies.
Keywords: financial inclusion, woman empowerment, gender
Jel Classification Code: G2
1. Introduction
Among the 8 Millennium Development Goals promulgated following the Millennium
Summit of the UN in 2000, Gender Equality ranks high among the priorities for all signatory
nations. “Goal 3: PROMOTE GENDER EQUALITY AND EMPOWER WOMEN” exhorts all nations
to strive towards a scenario based on greater parity and equality among the two genders.
Despite scintillating economic growth witnessed in India, the UNDP categorically indicts
1 PG Department of Applied and Analytical Economics, Centre of Advanced Study, Utkal University, Vani Vihar,
Bhubaneswar-751004 ([email protected])
2 M.A. (Previous) Economics, Department of Economics, Delhi School of Economics, Delhi University

110 : Orissa Economic Journal, Vol. 47, No. 1, Jan-June 2015
India on its dismal performance on the front of gender equality. It says, “Gender inequality
in India persists despite high rates of economic growth with the outcomes lower among
Dalits and Adivasis. Participation of women in employment and decision-making remains
far less than that of men and the disparity is not likely to be eliminated by 2015”, which is
the targeted time framework for compliance for MDGs. Gender inequality is also reflected
in India’s low rank on the Gender Inequality Index, which is 129 out of 146 countries with a
value of 0.617. In fact, among the South Asian countries, India is second from the bottom,
just above Afghanistan.
Gender Inequality Index, which is a composite index crafted to capture all relevant facets
and aspects of manifestation of gender inequality encompasses measurement of
‘economic status’ of women vis-à-vis their male counterparts. It is only a logical extension
from here to link financial exclusion of women as a key cause for their low economic status
and stagnation in such stratum. The need to provide bank credit to women on an equitable
basis has been frequently highlighted in the literature. Lack of credit constrains economic
opportunities available to women –personally and to their households – resulting in
deepening their economic and social deprivation.
2. Financial Inclusion – Defined
Financial inclusion merits a definition. This means the process of facilitating those sectors
and segments of the population that are outside, to become a part of the formal financial
system and enrolling individuals or groups into the formal financial sector. These could be
through:
a. Direct loans or banking facilities to the targeted vulnerable communities or groups;
b. Facilitation of economic activity in a particular geographical area of operations or
location;
c. Development of local or national infrastructure to enable a particular type of business
activity, which could then be practiced or performed by a group or groups which can
include women; and
d. Providing an enabling environment and/or enhancements for such economic activity
to take place. The enabling environment includes laws, regulations, taxation, skills
development, duty waivers, subsidies, etc. In this context, tax concessions and duty
waivers given to make enterprises be “financially inclusive” are often forgotten. In
fact, due to lack of awareness, enhancement of access to finance or financial inclusion
that has already taken place in various sectors, and the enabling environment that
has been created, are taken for granted with no value attached to them.
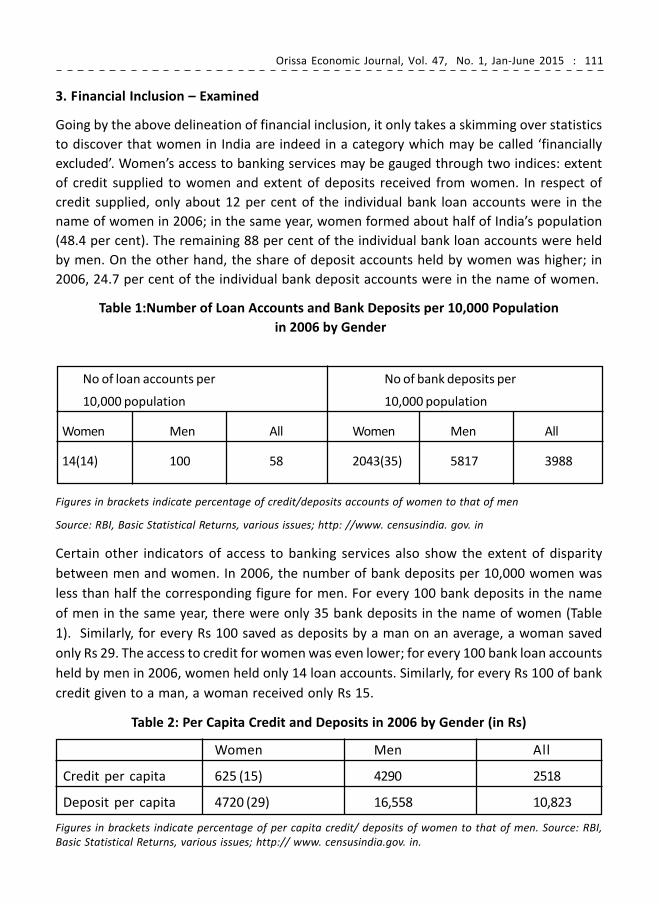
Orissa Economic Journal, Vol. 47, No. 1, Jan-June 2015 : 111
3. Financial Inclusion – Examined
Going by the above delineation of financial inclusion, it only takes a skimming over statistics
to discover that women in India are indeed in a category which may be called ‘financially
excluded’. Women’s access to banking services may be gauged through two indices: extent
of credit supplied to women and extent of deposits received from women. In respect of
credit supplied, only about 12 per cent of the individual bank loan accounts were in the
name of women in 2006; in the same year, women formed about half of India’s population
(48.4 per cent). The remaining 88 per cent of the individual bank loan accounts were held
by men. On the other hand, the share of deposit accounts held by women was higher; in
2006, 24.7 per cent of the individual bank deposit accounts were in the name of women.
Table 1:Number of Loan Accounts and Bank Deposits per 10,000 Population
in 2006 by Gender
No of loan accounts per No of bank deposits per
10,000 population 10,000 population
Women Men All Women Men All
14(14) 100 58 2043(35) 5817 3988
Figures in brackets indicate percentage of credit/deposits accounts of women to that of men
Source: RBI, Basic Statistical Returns, various issues; http: //www. censusindia. gov. in
Certain other indicators of access to banking services also show the extent of disparity
between men and women. In 2006, the number of bank deposits per 10,000 women was
less than half the corresponding figure for men. For every 100 bank deposits in the name
of men in the same year, there were only 35 bank deposits in the name of women (Table
1). Similarly, for every Rs 100 saved as deposits by a man on an average, a woman saved
only Rs 29. The access to credit for women was even lower; for every 100 bank loan accounts
held by men in 2006, women held only 14 loan accounts. Similarly, for every Rs 100 of bank
credit given to a man, a woman received only Rs 15.
Table 2: Per Capita Credit and Deposits in 2006 by Gender (in Rs)
Women Men All
Credit per capita 625 (15) 4290 2518
Deposit per capita 4720 (29) 16,558 10,823
Figures in brackets indicate percentage of per capita credit/ deposits of women to that of men. Source: RBI,
Basic Statistical Returns, various issues; http:// www. censusindia.gov. in.

112 : Orissa Economic Journal, Vol. 47, No. 1, Jan-June 2015
Commercial banks were more important for women as a means of savings than as a source
of credit. Per 10,000 women in 2006, there were only 14 bank loan accounts as compared to
2,043 deposit accounts. The share of women in total deposits outstanding was almost
double their share in total credit outstanding. To put it rather crudely, women received as
credit only about one-tenth of the amount of deposits they contributed. That women
remain inadequately covered by the banking system is evident from the fact that they
own only 20.8 per cent of the total deposit accounts in scheduled commercial banks and
11.3 per cent of the total deposits. At the credit scenario, they had access to only 19.8 per
cent of the small borrowal accounts of scheduled banks with an outstanding credit share
of 16.8 per cent (RBI, Basic Statistical Returns, 2010).
Agriculture, the principal employer in India, has witnessed progressive feminization of its
workforce in the recent years. In 2007, women formed about 40 per cent of the agricultural
workforce in India (NCW, 2008). According to the Population Census of India, in 2001,
women constituted about 33 per cent of the total cultivators in India as compared to 20 per
cent in 1991. Despite their growing ubiquity in the agricultural sector, women received on
an average only 6 per cent of the total direct agricultural credit in the period 2004-06. The
remaining 94 per cent of direct agricultural credit went to men, who formed about 67 per
cent of the total cultivators (Table 3).
Table 3: Triennium Averages of Percentage Shares of Women in Number of Loan
Accounts and Amount of Agricultural Credit
Period Share in Total Number of Share in Total Amount
Accounts under Direct Direct Agricultural Credit
Agricultural Credit under
1998-2000 6-5 7.0
2001-2003 6.8 7.4
2004-2006 5.9 6.3
The figures are worked out as per cent of total bank loan accounts and credit given to individuals that is men and
women taken together excluding credit to all institutional borrowers. Source: RBI, Basic Statistical Returns,
various issues.
Urban-rural Gap
The use of commercial banks as an agency of savings was more widespread among urban
women than rural women. In 2006, the number of bank deposits per 10,000 women in
urban areas was double the number of bank deposits per 10,000 women in rural areas. For
every rupee saved by a rural woman as bank deposit, a woman from urban areas saved Rs
4.50. The disparity between women from rural and urban areas in access to banking services
seemed to have increased in the recent years. The ratio of the number of deposits per
10,000 women in urban areas to rural areas increased between 2001 and 2006. The increase

Orissa Economic Journal, Vol. 47, No. 1, Jan-June 2015 : 113
was even more striking if we considered the ratio of the per capita amount of deposit from
women in urban areas to rural areas. Further, between 1996 and 2006, there was a fall in
the share of deposits mobilised from women through rural and semi-urban bank offices
(taken together). This meant an increase in the share of deposits mobilised from women
through urban and metropolitan offices during this period.
Table 4: Number of Bank Deposits Per 10,000 Population in Rural and
Urban Areas by Gender
Number of Bank Deposits Per 10,000 persons in 2001 Women Men All
Rural Areas 1,702 4,726 3,256
Urban Areas 3,338 8,278 5,938
Ratio of number of bank deposits per capita in urban 2.0 1.8 1.8
areas/ rural areas in 2006
Rural Areas 1,535 4,611 2,774
Urban Areas 3,292 8,703 6,134
Ratio of numberof bank deposits per capita in urban 2.1 1.9 2.2
areas/rural areas
The figure for rural area has been worked out taking total number of deposits held with rural and semi-urban
bank branches as a proportion of rural population in that year. Similarly, in the case of urban areas, the ratio is
worked out taking the total number of deposits held with urban and metropolitan branches as proportion of
urban population in that year. The figures for rural and urban population for 2006 are estimated using the
exponential growth rate between 1991 and 2001
Source: RBI, Basic Statistical Returns, various issues; Gol (2001).
Table 5: Amount of Bank Deposits Per Capita in 2006 by Gender (in Rs)
Amount of bank deposit per capita in 2001 Women Men All
Rural areas 1,850 5,990 3,978
Urban areas 6,846 22,465 15,064
Ratio of amount of bank deposits per capita in urban 3.7 3.8 3.8
areas/rural areas
Amount of bank deposit per capita in 2001 Women Men All
Rural areas 2,380 8,678 5,611
Urban areas 10,624 35,492 23,685
Ratio of amount of bank deposits per capita in urban 4.5 4.1 4.2
areas/rural areas
Source: RBI, Basic Statistical Returns, various issues, Göl (2001

114 : Orissa Economic Journal, Vol. 47, No. 1, Jan-June 2015
3.1. Disparities Across Regions Of India
In terms of the total amount of deposits mobilised from women, the shares of Southern
and Western regions were considerably higher than the shares of North-Eastern, Eastern
and Central regions in 2006. The shares of Eastern and Central regions in the total amount
of deposits from women (as well as the total number of deposit accounts) were significantly
lower than the shares of female population residing in these regions. Moreover, there
was stagnation, or even a fall, in the shares of the North-Eastern, Eastern and Central
regions with respect to the total amount of deposits mobilised between 1996 and 2006
from women. There was also a fall in the number of bank deposits per 10,000 women in
the North-Eastern, Eastern and Central regions between 1996 and 2006. In the same period,
there was a rise in the number of bank deposits per 10,000 women in the Southern and
Western regions.
3.2. Differences Across Social Groups
The disparity in terms of access to banking services between women from various
socioeconomic groups has also widened in the recent period. Between 1997 and 2006, the
share of Dalit and Adivasi women – socio-economically one of the most backward sections
of the population – in the total bank credit (under Small Borrowal Accounts) declined
steadily.10 In 2006, Dalit and Adivasi women received only 1.3 per cent of the total credit
given under the Small Borrowal Accounts as compared to 4.8 per cent in 1997. If we assume
that a woman not belonging to Dalit and Adivasi groups received Rs 100 as bank credit, an
average Dalit/Adivasi woman received only Rs 9 in 2006. The corresponding figure for a
Dalit/Adivasi woman was higher at Rs 35 in 1997. The disparity was larger if we compared
a Dalit/Adivasi woman with a man not belonging to Dalit and Adivasi groups. In 2006, a
Dalit/Adivasi woman received only Re 1 as credit from banks for every Rs 100 received by
her male counterpart from non-Dalit/Adivasi groups. Here again, there was a rise in
disparity; the corresponding amount for a Dalit/Adivasi woman in 1997 was Rs 7.
To conclude, while there has been an overarching expansion of the basic banking services
in India over the years, women remain largely secluded from these services. Women
account for about one-fifth of the individual savings mobilised through bank deposits.
Less than concomitantly, women receive only around one-tenth of the total individual
credit from banks. Additionally, increase in the spread of banking services to women has
not been distributed equitably across various sections of women. The increase in spread
of bank deposits has taken place principally for urban women. Women from Southern and
Western regions (comprising the historically vanguard States in banking development)
have seen a further expansion in their access to bank deposits, while the access to women
from North-Eastern, Eastern and Central regions (comprising the historically deprived States
in banking development) has relatively slackened. Dalit and Adivasi women belonging to
socio-economically backward groups have seen a fall in their share in total bank credit.

Orissa Economic Journal, Vol. 47, No. 1, Jan-June 2015 : 115
4. Financial Inclusion and Women
The crucial instrumentality of financial inclusion for women can be appreciated on the
basis of its functions – financial inclusion allows them to save securely, borrow for
consumption or investment and insure against risk, and hence contributes mainly towards
growth and poverty reduction. Evidence from India shows that branch expansion to rural
unbanked areas, as a consequence of nationalisation of scheduled commercial banks in
1969, significantly reduced poverty. Studies commissioned by international agencies point
in the direction of a consistent link between financial sector development and economic
growth. For illustrative example, sample the fact that less than 20% of households in
Africa are banked (only 12% in Tanzania), compared to over 90% in OECD countries.
Apart from the co-existence of absence of economic growth and financial exclusion, an
incidence of even greater significance is the lack of access to finance and financial services
among women, even though they happen to be major players in their respective economies
or sectors. Consider the fact that in Kenya, 40% of smallholder farms are run by women,
yet women only receive 10% of MSME credit; or that in South Africa, 58% of SMEs are run by
women - yet, only 43% of women who run small businesses have bank accounts compared
to 52% of their male counterparts; or that in Bangladesh, 27% of deposits come from
women but women only receive 1.8% of credit. Hence the phenomenon that women are
increasingly taking centre-stage in economies while being credit-constrained is a worldwide
concern. It is therefore imperative that women be brought into the fold of finance and
banking as a potent and powerful means of achieving the ultimate aim of women’s economic
empowerment leading to greater gender equality.
4.1. Constraints in Women’s Financial Inclusion
There are several typical constraints on the path of women’s financial inclusion which
needs to be paid attention to in order to overcome them.
On the supply side we have issues such as (i) inability to fulfil the collateral requirements
as women often lack land/property rights; (ii) limited physical outreach of women and
typical bank opening hours which affects women more than men as they are less mobile;
(iii) difficulty to satisfy documentation requirement as women often lack proof of identity;
(iv) product feature like eligibility, loan term etc. may not meet women’s requirement; (v)
marketing messages not targeted at poor women; (vi) service delivery can be patronising
towards women; (vii) there are fewer women in the senior management positions of
formal financial sector.
Demand side constraints include the following issues: (i) relatively lower income of women
because of the kind of work they do; (ii) women are often at lower levels of education and
literacy than men, which affects their capability to earn and their financial capability; (iii)
relative lack of access to mobile phones; (iv) lack of decision-making power and self-

116 : Orissa Economic Journal, Vol. 47, No. 1, Jan-June 2015
esteem; (v) poor access to information, poor social networks and greater risk aversion; (vi)
greater familiarity to informal products etc.
These aspects have to be paid attention to before any noteworthy progress can be made in
the desired direction.
4.2. Financial Inclusion and Jan Dhan Yojana
The Prime Minister Jan Dhan Yojana, the country’s newest mission mode program to target
the financially excluded including the ‘financial untouchables’ has been billed as being
one which opened a record 11.5 crore accounts in a span of 6 months. Data on the accounts
opened are yet to be analysed, but it’ll be heartening to notice a majority of them being
opened in the name of women. This is ‘smart banking’ because globally women’s thrift
levels have been proved to be higher than for men. Also, provisions of the PMJDY clearly
state that as and when the facility of overdraft is available, the same shall be preferably
extended to a women member of the family if there are competing male members. This
makes much economic sense, since the results of a study using a global dataset covering
350 Microfinance Institutions (MFIs) in 70 countries indicates that more women clients is
associated with lower portfolio-at-risk, lower write-offs, and lower credit-loss provisions,
thereby making women better credit risks than men. This provision, however monetarily
insignificant it might seem, places much economic power and financial sovereignty in the
hands of women – and will generate much spillover effects on their social and economic
status.
With relaxation of norms and criteria for people to be designated as Banking Correspondents
(BCs), it has become a viable source of income for several categories of people to be
enrolled as such and further the cause of financial inclusion. Sensitisation of BCs to be
extra-solicitous of women’s participation in the banking infrastructure of the country will
pave way for women to be inspired to save more – in however small denominations it may
be. Several cases explored in Abhijit Banerjee and Esther Duflo’s Poor Economics illustrate
the potency of enthusiastic and well-meaning grass-root workers in harnessing the savings
of poor women and channeling them into the formal banking institutions. With the
proactive intervention of banks in implementing PMJDY so far witnessed, this proposition
is not very hard to envision.
4.3. Further Possibilities – Role of the Bharatiya Mahila Bank
It’s rather globally accepted now that mere provision of savings bank accounts, even with
an overdraft facility, will not significantly impact the lives of poor women. If at all there is
any ambivalence as regards the utility of micro-finance and its influence on making better
the lives of women and SHGs (that happen to be the chief clients of micro-finance world-
wide) it is because of the low level of equilibrium that such groups often find themselves
locked into. Provision of funds and credit at relatively benign rates fail to provide the

Orissa Economic Journal, Vol. 47, No. 1, Jan-June 2015 : 117
requisite thrust in the right direction because many of these activities happen to be in the
‘low-earning potential’ bracket. This highlights the need for funding for skills development
to help in economic activity. The approach must be aligned in the direction of inspiring
women with entrepreneurial skills, to mobilise local NGOs to arouse women to train in
vocations that can potentially lift them out of low levels of earnings and place them on
curves with higher trajectory. Focus may also be laid to promote asset ownership among
women, with multi-dimensional externalities on women’s status in the family and society.
The Bharatiya Mahila Bank (BMB), a public sector bank inaugurated on 19 November 2013
with the broader objective of lending predominantly to women, is indeed the kind of
institution posited to offer backward and forward linkages for women’s economic
empowerment.
4.4. Forward Linkages
BMB needs to be the link between enterprising women across the breadth of India and
corporate entities willing to provide viable business models for women. In acting as the
conduit for engagement between women and women-centric businesses by providing
the crucial missing link of credit at concessional rates, BMB can significantly alter the
scenario of women entrepreneurship in the country. BMB has been recently signing
Memoranda of Understanding (MoU) with leading brands such as Cavin Care’s ‘Trends in
Vogue’, Naturals to help women set up franchises of such established brands – through
provision of soft loans. This is indeed a step in the right direction and the bank needs to
redouble its efforts in pursuing such initiatives and broadening the base in rural areas
also. Much like international sports equipment brands outsourcing product manufacturing
to women SHGs in Northern States such as Punjab, BMB can also persuade brands to
outsource production to groups of women. It could provide the requisite financing and
technical assistance, in partnership with local NGOs, to such women’s concerns.
4.5. Backward Linkages
In addition to enabling women to seek out non-conventional and smart business models,
BMB could also play a pivotal role in elevating the status of women in their primary sectors
of employment as well. Whereas we have seen an increasing feminization of the work-
force in agriculture, including a rise in women cultivators, ownership of critical assets to
aid in modern methods of agriculture remains abysmally low. Enhancing access to and
ownership of critical agricultural assets by women not only raises incomes, but improve
women’s wellbeing by reducing their vulnerability and enhancing their health, self-esteem,
and sense of control. BMB can play a pioneering role in providing cheap credit to women or
women’s groups that undertake cooperative farming to procure tools and machines to
improve productivity and efficiency of their agricultural practices. Separately, women can
also be taught how to sublease their equipment to other users, following proper protocols
of such contracts to guard against issues of moral hazard. Organizing awareness camps,

118 : Orissa Economic Journal, Vol. 47, No. 1, Jan-June 2015
such as those currently being held by BMB will provide the necessary push to women
entrepreneurs to contribute their mite to nation’s progress, even as they endeavor to
heighten their sense of dignity.
5. Conclusion
In many developing countries, the poor, and more specifically the poor women, still
constitute an untapped market for provision of financial services. In India, an area of
concern, apart from provision of decent work and working condition, is ensuring financial
inclusion of women which is crucial for their economic empowerment and integration
into the economy. If the XII Five Year Plan’s vision of improving the position and condition
of women by addressing the structural and institutional barriers as well as strengthening
gender mainstreaming is to be realised, then one crucial step will be to ensure their
financial inclusion. An important strategy of financial inclusion in India, particularly for
women, has been Micro finance. The strategy encourages access of SHGs to banks both as
a means of savings and providers of loan services. But at present the micro-credit and SHG
movement as the sole panacea for addressing
poverty and women’s empowerment is increasingly coming under critical review and the
country is considering a Bill to regulate Micro-finance institutions. Hence there is an
imperative need to garner the efforts of all formal financial institutions towards this end,
keeping in view the different demand and supply side issues associated with the problem.
This has the potential to create a long term social impact too, where women can act as
important drivers of the excluded segments of the economy and thereby further the agenda
of ‘more inclusive growth’.
References
1. Banerjee, Abhijit and Duflo, Esther(2011) : Poor Economics: A Radical Rethinking of
the Way to Fight Global Poverty
2. Barclays et al(2013) : Banking on Change – Breaking the barriers to Financial Inclusion,
April 2013
3. Barik, BB (2009) : Financial Inclusion and Empowerment of Indian Rural Households
4. Batra, Anju(2013): Financial Inclusion and Women Empowerment : A Myth or Reality,
International Journal of Research in Finance & Marketing, Volume 3, Issue 12
(December 2013)
5. Bharatiya Mahila Bank website www.bmb.co.in
6. Chavan, Pallavi (2008) : Gender Inequality in Banking Services, EPW Vol 43 No 47 (Nov
22-28, 2008) pp 18-21

Orissa Economic Journal, Vol. 47, No. 1, Jan-June 2015 : 119
7. DFID and GIZ (2012) : Promoting women’s financial inclusion – a toolkit
8. FAQs of PMJDY, https://www.sbi.co.in/portal/web/customer-care/-faq-pradhan-
mantri-jan-dhan-yojana-pmjdy
9. Financial Inclusion Insights: Financial Services Use and Emerging Digital Pathways,
October 2013-January 2014
10. GoI (2012) : Reportof the Working Group on Women’s Agency and Empowerment,
Ministry of Women and Child Development
11. Jayamaya, Ranee (2008) : Access to Finance and Financial Inclusion for Women
12. Mahajan, Vijay and Ramola, Bharti Gupta : Financial Services for the Rural Poor and
Women in India : Access and Sustainability
13. Meinzen-Dick, R et al: Gender, Assets, and Agricultural Development Programs: A
Conceptual Framework. CAPRI Working Paper No. 99. Washington, D.C.: International
Food Policy Research Institute. http://dx.doi.org/10.2499/CAPRiWP99
14. Panda, Bindu Madhab (2012) : Finance Sustenance for Women’s Empowerment – A
Measure Towards Inclusive Growth, Odisha Review Feb-March 2012
15. Roy Mersland, Bert D’Espallier, Isabelle Guérin (November 18, 2010). ”Women and
Repayment in Microfinance”. SSRN
16. Thyagarajan, S. : Women’s Cooperative Bank Promoting and Practicing Financial
Inclusion of Rural Poor Women
17. WWB (2011) : Solutions for Financial Inclusion: Serving Rural Women

120 : Orissa Economic Journal, Vol. 47, No. 1, Jan-June 2015
Status and Trend of Financial Inclusion in India:
An Inter-State Analysis
Shibalal Meher1
The aim of the paper is to study the status and trend of financial inclusion of 18 major
states in India. The status of financial inclusion across major states has been analysed
by using an index of financial inclusion at two points of time, viz. 2001-02 and 2010-
11. Different dimensions of financial indicators are used to measure the availability,
access and usage of financial system. The findings show that the richer states perform
better than the poorer states. There is also no significant change in the level of financial
inclusion of major states between the two points of time. The states tend to maintain
their respective level of banking activity vis-à-vis the rest with the policy implication
that more attention is required to be paid in the low performing states to enable them
to close the gap with respect to better performing states.
Key Words: Financial inclusion, India, Euclidean distance.
Introduction
Financial inclusion has gained importance since early 2000s as a policy objective for national
level policy makers, multilateral institutions, and others in the development field. The
rise of financial inclusion as an important policy goal is due in part to mounting evidence
that access to financial services can make a positive difference in the lives of the poor. An
increasing number of academic studies show that granting the poor access to financial
services can make a difference in their lives in various ways [see, e.g. Burgess and Pande
(2005), Bruhn and Love (2009)]. As per the Rangarajan Committee report (2008) Financial
Inclusion is defined “as the process of ensuring access to financial services and timely and
adequate credit where needed by vulnerable groups such as the weaker sections and low
income groups at an affordable cost”. Broadly speaking, Financial Inclusion is the delivery
of banking services at an affordable cost to the vast sections of disadvantaged and low
income groups.
1 Nabakrushna Choudhury Centre for Development Studies, Bhubaneswar-13, E-mail: [email protected]

Orissa Economic Journal, Vol. 47, No. 1, Jan-June 2015 : 121
Despite broad international consensus on the importance of financial inclusion as a powerful
social development instrument, it is estimated that over two billion people continue to
be financially excluded from the formal financial sector. With over 135 million financially-
excluded households, India is home to the world’s second largest financially-excluded
population after China. Only 34 percent of the Indian population is currently engaged with
the formal financial sector and the urban rural divide is very apparent.
In most developing countries, a large segment of society, particularly low-income people,
has very little access to financial services, both formal and semi-formal. As a consequence,
many of them have to necessarily depend either on their own or informal sources of
finance and generally at an unreasonably high cost. The situation is worse in most least
developed countries (LDCs), where more than 90 percent of the population is excluded
from access to the formal financial system (United Nations, 2006).
While the importance of financial inclusion has been widely accepted, much less is known
about how inclusive the financial systems are and who has access to which financial
services. The literature on financial inclusion lacks a comprehensive measure that can be
used to measure the extent of financial inclusion across countries. Though indicators of
the depth of banking system, capital markets, and insurance sector are widely available,
there is less information available about the degree of financial inclusiveness. Lack of
information is more conspicuous in developing countries where there is little systematic
information on who is served by the formal financial sector, which financial institutions or
services are the most effective at supporting access by poor households and small
enterprises, or what practical and policy barriers may be hindering the accessibility.
Individual indicators, viz., number of bank accounts and number of bank branches that are
generally used as measures of financial inclusion, can provide only partial information on
the level of financial inclusion in an economy. Financial services or products rendered by
banks, postal savings banks, credit unions, finance companies, micro-finance institutions
(MFIs), and other formal and quasi-formal non-bank institutions generally form the basis
for measuring the financial inclusion.
In order to fill the gap in the existing literature, the present paper makes an attempt to
construct a financial inclusion index that captures information on several dimensions of
an inclusive financial system. The paper is organized as follows. The second section gives
a brief note on the methodological aspect of the study. The third section analyses the
empirical results, while the last section brings the concluding remarks.

122 : Orissa Economic Journal, Vol. 47, No. 1, Jan-June 2015
Methodology
The Model
We have followed a multidimensional approach for constructing an index of financial
inclusion (IFI). The index is computed by first calculating a dimension index for each
dimension of financial inclusion. The dimension index of a state j for ith dimension, ijd , is
computed by the following formula.
ii
iij
ijmM
mAd
−
−= , 0 ≤ ijd ≤ 1 (1)
where
ijA = Actual value of the jth state with respect to dimension i
im = minimum value of dimension i
iM = maximum value of dimension i
From Equation (1), higher the value of ijd , higher the state’s achievement in dimension i.
If n dimensions of financial inclusion are considered, then a state j will be represented by
a point = (d1, d
2, d
3, …….d
n) on the n-dimensional Cartesian space.
In the n-dimensional space, the point O = (0,0,0, …..0) represents the point indicating the
worst situation while the point I = (1,1,1, …….1) represents the highest achievement in all
dimensions. The index of financial inclusion, IFIj, for a state, then, is measured by the
normalized inverse Euclidean distance of the point from the ideal point I = (1,1,1,…….1).
The equation of the index of financial inclusion is given in the following.
( ) ( ) ( )n
dddIFI
njjj
j
22
2
2
1 1........111
−++−+−−= (2)
The numerator of the second component in the right hand side in equation (2) is the
Euclidean distance of from the ideal point I. Normalizing this component by and subtracting
by 1 gives the inverse normalized distance. The normalization is done in order to make the
value lie between 0 and 1 and the inverse distance is considered so that higher value of
the IFI corresponds to higher inclusion (Sarma, 2008).
Construction of the present index
For constructing the index of financial inclusion we have considered three basic dimensions
of an inclusive financial system. These dimensions are: availability of banking services,
banking penetration or access to banking services and usage of the banking system. The
motivation behind these dimensions is mainly due to two factors, viz. data availability for
the states and recent development in the literature (Sarma, 2008).

Orissa Economic Journal, Vol. 47, No. 1, Jan-June 2015 : 123
Availability of banking services (d1)
The services of an inclusive financial system should be easily available to its users.
Availability of services can be indicated by the number of bank branches per lakh population
or number of branches per 100 square km area. The present study has used both the
number of branches with respect to population and area.
Banking penetration/access (d2)
The inclusive financial system should penetrate widely among its users. That is, the financial
system should have as many as users as possible. Hence, the number of people having a
bank account is a measure of the banking penetration of the system. Considering this, the
value of this measure would be 1 if every person in an economy has a bank account.
However, there may be persons having more than one bank account, while at the same
time there may be others who may have none. Therefore, number of accounts per capita
is likely to actually provide an overestimation of the proportion of the banked population.
Hence, we have used number of bank accounts as a proportion of the total adult population
as an indicator of this dimension. We have calculated this for both deposit accounts and
credit accounts. However, this does not reflect the financial access of the poor. SHG-Bank
linkage programme is conceived to fill the gap existing in the formal financial network and
extending the outreach of banking to the poor. In order to incorporate the financial inclusion
of the poor, we have used the number of self help groups (SHGs) as a proportion of the
total adult population. Therefore, the present study has used no. of deposit accounts, no.
of credit accounts and no. of SHGs as proportions to adult population as an indicator of the
dimension of banking penetration.
Usage (d3)
Merely having a bank account is not enough for an inclusive financial system. It is imperative
that the banking services are adequately utilized. As observed by Kempson et al (2004)
that “in some apparently highly-banked countries, a number of people with bank account
are nonetheless making very little use of the services on offer…”. The present study
therefore used two basic services of the banking system – deposit and credit. Accordingly,
the volume of deposit and credit as proportion of the state’s NSDP has been used to
measure this dimension. Further, in order to consider the utilization of services by the
poor, volume of SHG loan as proportion to NDSP has been used to measure the dimension
of usage.
Thus, considering the above three dimensions – availability, penetration/access and usage – we can
represent a state j by a point ( jd1 , jd2 , jd3 ) in the three dimensional Cartesian space, such that
0 ≤ jd1 , jd 2 , jd3 ≤ 1, where jd1 , jd 2 , jd3 denote the dimension indices for jth state computed
by using equation (1). In the three dimensional Cartesian space, the point (0,0,0) will indicate the
worst situation (complete financial exclusion) and the point (1,1,1) will indicate the best or ideal
situation (complete financial inclusion).

124 : Orissa Economic Journal, Vol. 47, No. 1, Jan-June 2015
The IFI for the state j is measured by the normalized inverse Euclidean distance of the
point ( jd1 , jd2 , jd3 ) from the ideal point (1, 1, 1). Algebraically,
( ) ( ) ( )3
1111
2
3
2
2
2
1 jjj
j
dddIFI
−+−+−−= (3)
To find the levels of financial inclusion of major states the following criteria have been
adopted.
0.5 ≤ IFI ≤ 1 → high financial inclusion
0.3 ≤ IFI < 0.5 → medium financial inclusion
0 ≤ IFI < 0.3 → low financial inclusion
Although the IFI proposed here follows a multidimensional approach of index construction
similar to UNDP approach, there are methodological differences between the two
approaches.
The first point of methodological difference with UNDP’s HDI methodology is the manner
in which dimension indices are combined to compute the final index. Unlike the UNDP’s
methodology of using an average to compute the final index, the present index is based
on a measure of the distance from the ideal.
The second difference is with respect to the choice of minimum and maximum values for
the dimension. While UNDP methodology uses pre-fixed values for the minimum and
maximum for each dimension to compute the dimension index, the present method uses
empirically observed minimum and maximum for each dimension. The empirically
observed minimum and maximum values are used as it is difficult to fix what should be
the minimum/maximum for any dimension of financial inclusion. Further, by using the
empirical values, the study has attempted to measure financial inclusion with respect to a
prevailing situation. It measures the extent of financial inclusion in an economy relative
to the prevailing situation in all economies.
Data and Time period
The index of financial inclusion has been constructed in order to assess the relative position
of 18 major states in India. The financial inclusion of the major states has also been
compared between two points of time. In order to construct the index we have used the
data on number of deposit and credit accounts and their volume, number of SHGs and
volume of SHG loan, number of bank branches, population, geographical area and net
state domestic product (NSDP). The information on the number of accounts, number of

Orissa Economic Journal, Vol. 47, No. 1, Jan-June 2015 : 125
branches of scheduled commercial banks and volume of deposit and credit have been
collected from the Basic Statistical Returns of Scheduled Commercial Banks in India
published by RBI. The number of SHG and volume of loan to SHG are collected form Status
of Microfinance in India published by NABARD. Population of different states and the
adult population have been collected from Census of India while the data on NSDP have
been collected from CSO. The data are collected at two points of time, viz. during 2001-02
and 2010-11.
Empirical Findings
The indices of financial inclusion of 18 major states computed by using the data for three
dimensions, viz. availability, penetration/access and usage during 2001-02 are presented
in Table 1. It is revealed from table that Kerala had the highest level of financial inclusion
among 18 major states in India. On the other hand, Assam had the lowest level of financial
inclusion. The top five states with financial inclusion are Kerala, Punjab, Karnataka, Andhra
Pradesh and Tamilnadu. On the other hand, the bottom five states with financial inclusion
are Assam, Chhattisgarh, Madhya Pradesh, Bihar and Rajasthan. While the states with
higher than average financial inclusion were Kerala, Punjab, Karnataka, Andhra Pradesh,
Tamilnadu, Uttaranchal and Maharashtra, all other states had lower than average financial
inclusion.
It is observed from Figure 1 that states having higher than average per capita NSDP had
higher level of financial inclusion whereas states having lower than average per capita
NSDP had lower level of financial inclusion, excepting the states like Uttarakhand, West
Bengal, Gujarat and Haryana during 2001-02. While Uttarakhand with lower per capita
NSDP had higher financial inclusion, West Bengal, Gujarat and Haryana with higher per
capita NSDP had lower level of financial inclusion. This shows that poorer states had lower
level of financial states than the richer states in India during 2001-02. In other words, there
is gap in the financial inclusion between poorer and richer states in India.
Considering the different indices of financial inclusion, it is observed from Table 2 that
states like Kerala and Uttarakhand had high level of availability of banking services during
2001-02. While states like Andhra Pradesh, Karnataka, Kerala and Punjab had high level of
access of banking services. On the other hand, only Maharashtra had high level of usage of
banking services. It is observed that none of the states was better in all the component
indices. Kerala, which had high level of financial inclusion in respect of availability and
penetration/access to bank services, had low financial inclusion in usage of banking services.
Punjab and Haryana, which had high level of availability of banking services, had low level
of access and usage of banking services. Andhra Pradesh, which had high level of access
and usage of banking services, had low level of availability of banking services. Maharashtra

126 : Orissa Economic Journal, Vol. 47, No. 1, Jan-June 2015
and Tamil Nadu, which performed better in usage and access of banking services
respectively, performed worse in other banking services. All other states performed worst
in different banking services, resulting in low level of financial inclusion.
Figure 2 presents the scoring position of major states in respect of different dimensions of
financial inclusion during 2001-02. It can be observed from the figure that different
dimensions of financial inclusion of major states were concentrated at the lower scores,
except with few exceptions. This indicates that the status of many states in respect of
different dimensions of financial inclusion was low during 2001-02.
There is no improvement in the status of financial inclusion across states in India during
2010-11. The indices of financial inclusion of these states during 2010-11 are presented in
Table 3. It is revealed from table that Kerala retained the highest level of financial inclusion
among 18 major states in India. On the other hand, Chhatisgarh has the lowest level of
financial inclusion. There is no change in the position of top five and bottom five states
though there is change in the position within these states. The states with higher than
average index of financial inclusion during 2001-02 are also found to remain above average
financial inclusion during 2010-11. In addition, Haryana joined the group. On the other
hand, all other states, which had lower than average index of financial inclusion during
2001-02, remain below average financial inclusion during 2010-11.
Figure 3 shows that states having higher than average per capita NSDP are found to have
higher level of financial inclusion whereas states having lower than average per capita
NSDP have lower level of financial inclusion, excepting the state of Gujarat during 2010-
11. Gujarat with higher per capita NSDP shows lower level of financial inclusion. This
shows that poorer states have lower level of financial states than the richer states in India
during 2010-11. In other words, gap remains in the financial inclusion between poorer and
richer states in India.
Considering the different indices of financial inclusion, it is observed from Table 4 that
states like Haryana, Kerala and Punjab have high level of availability of banking services
during 2010-11. While states like Andhra Pradesh, Karnataka, Kerala, Maharashtra and
Tamilnadu have high level of access of banking services. On the other hand, Andhra Pradesh
and Maharashtra have high level of usage of banking services. It is observed that none of
the states is better in all the component indices. Kerala, which has high level of financial
inclusion in respect of availability and penetration/access to bank services, has low financial
inclusion in usage of banking services. Punjab and Haryana, which have high level of
availability of banking services, have low level of usage of banking services. Andhra Pradesh,
which has high level of access and usage of banking services, has low level of availability of
banking services. Maharashtra, which performs better in access and usage of banking

Orissa Economic Journal, Vol. 47, No. 1, Jan-June 2015 : 127
services, has low level of availability of banking services. Contrary to the above, states like
Assam, Bihar, Chhattisgarh, Gujarat, Jharkhand, Madhya Pradesh, Odisha, Rajasthan and
Uttar Pradesh have worst performance in all the component indices. These states have
low level of index of financial inclusion in all the component indices. Surprisingly, Gujarat,
a higher income state, has performed miserably in all the component indices.
Figure 4 presents the scoring position of major states in respect of different dimensions of
financial inclusion during 2010-11. It can be observed from the figure that different
dimensions of financial inclusion of major states are concentrated at the lower scores,
except with few exceptions. This indicates that the status of many states in respect of
different dimensions of financial inclusion is low during 2010-11.
Comparing the indices of financial inclusion of major states between the two points of
time, 2001-02 and 2010-11, it is observed that the level of financial inclusion has remained
unchanged, except in the case of Haryana and Uttarakhand (Table 5). While in the case of
Haryana, financial inclusion has increased from low level to medium level, in the case of
Uttarakhand it has decreased from medium level to low level. It is observed that the
average index of financial inclusion of 18 states has increased marginally. While the
increase in the indices of financial inclusion is observed in the states like Andhra Pradesh,
Assam, Chhattisgarh, Haryana, Maharashtra, Odisha, Tamilnadu and West Bengal, the
decrease in the indices is observed in the states like Bihar, Gujarat, Jharkhand, Karnataka,
Kerala, Madhya Pradesh, Punjab, Rajasthan, Uttarakhand and Uttar Pradesh. While the
rank of indices of states like Kerala, Jharkhand and Madhya Pradesh has remained
unchanged, it has improved in the states like Andhra Pradesh, Assam, Haryana, Maharashtra,
Odisha and Tamil Nadu, and deteriorated in the states like Bihar, Chhattisgarh, Gujarat,
Karnataka, Punjab, Rajasthan, Uttarakhand, Uttar Pradesh and West Bengal. The status of
financial inclusion of major states between two points of time can also be seen from
Figure 5.
Conclusion
The paper has studied the status and trend of financial inclusion of 18 major states in India.
The status and relative position of financial inclusion across major states have been
analysed at two points of time by using an index of financial inclusion. Different dimensions
of financial indicators are used to measure availability, access and usage of the financial
system by the members of the economy. The findings show that the richer states perform
better than the poorer states. There is also no significant change in the level of financial
inclusion of major states between the two points of time. The states tend to maintain
their respective level of banking activity vis-à-vis the rest with the policy implication that
more attention is required to be paid in the low performing states to enable them to close
the gap with respect to better performing states.

128 : Orissa Economic Journal, Vol. 47, No. 1, Jan-June 2015
References
Kempson, E.A. Atkinson and O. Pilley (2004); “Policy Level Response to Financial Exclusion
in Developed Economies: Lessons for Developing Countries”, Report on Personal Finance
Research Centre, University of Bristol.
Bruhn, M. and Love, I. (2009), The Economic Impact of Banking the Unbanked: Evidence
from Mexico, World Bank Policy Research Working Paper No. 4981.
Burgess, R. and Pande, R. (2005), Do Rural Banks Matter? Evidence from the Indian Social
Banking Experiment, American Economic Review, vol. 95(3), pp. 780-795, June.
Nathan, H.S.K., S. Mishra and B.S. Reddy (2008); “An Alternative Approach to Measure HDI”,
Working Paper No. WP-2008-002, IGIDR, Mumbai.
Rangarajan Committee, (2008), ‘Report of the Committee on Financial Inclusion’, Committee
Report.
Sarma, Mandira (2008); “Index of Financial Inclusion”, Working Paper No. 215, Indian Council
for Research on International Economic Relations, New Delhi.
United Nations (2006); Building Inclusive Financial Sectors for Development, United Nations,
New York.
World Bank (2008); Finance for All – Policy and Pitfalls in Expanding Access, The World Bank,
Washington, D.C.
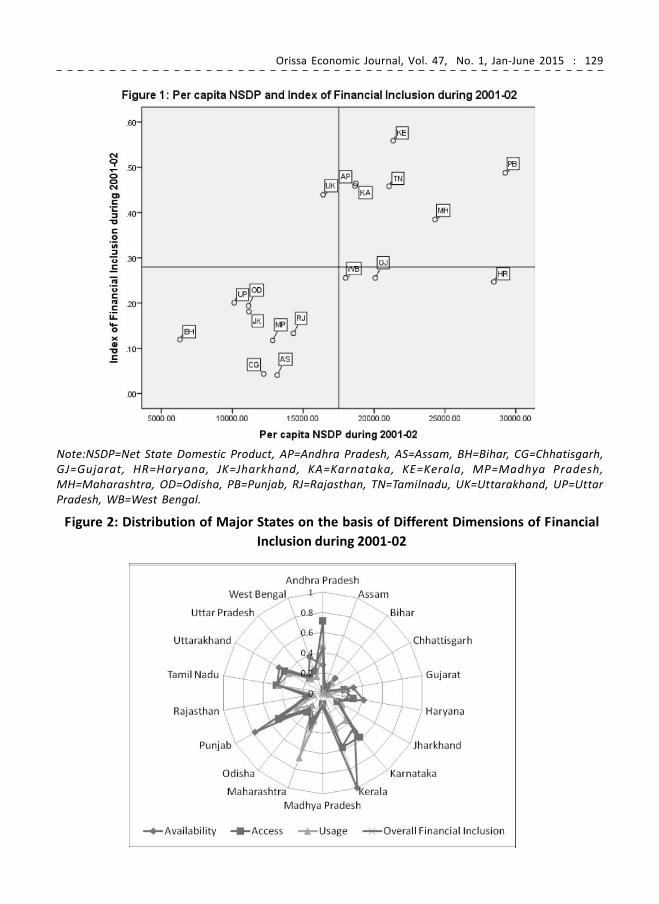
Orissa Economic Journal, Vol. 47, No. 1, Jan-June 2015 : 129
Figure 2: Distribution of Major States on the basis of Different Dimensions of Financial
Inclusion during 2001-02
Note:NSDP=Net State Domestic Product, AP=Andhra Pradesh, AS=Assam, BH=Bihar, CG=Chhatisgarh,
GJ=Gujarat, HR=Haryana, JK=Jharkhand, KA=Karnataka, KE=Kerala, MP=Madhya Pradesh,
MH=Maharashtra, OD=Odisha, PB=Punjab, RJ=Rajasthan, TN=Tamilnadu, UK=Uttarakhand, UP=Uttar
Pradesh, WB=West Bengal.

130 : Orissa Economic Journal, Vol. 47, No. 1, Jan-June 2015
Note: NSDP=Net State Domestic Product, AP=Andhra Pradesh, AS=Assam, BH=Bihar, CG=Chhatisgarh, GJ=Gujarat,
HR=Haryana, JK=Jharkhand, KA=Karnataka, KE=Kerala, MP=Madhya Pradesh, MH=Maharashtra, OD=Odisha,
PB=Punjab, RJ=Rajasthan, TN=Tamilnadu, UK=Uttarakhand, UP=Uttar Pradesh, WB=West Bengal.
Figure 4: Distribution of Major States on the basis of Different Dimensions of Financial
Inclusion during 2010-11

Orissa Economic Journal, Vol. 47, No. 1, Jan-June 2015 : 131
Figure 5: Comparison of Financial Inclusion of States between Two Points of Time

132 : Orissa Economic Journal, Vol. 47, No. 1, Jan-June 2015
Table 1: Index of Financial Inclusion of Major States in India during 2001-02
Sl. States D1 D2 D3 IFI Rank
No. (Availability (Penetration (Usage
index) index) index)
1 Andhra Pradesh 0.277432 0.7176103 0.473797 0.458786 4
2 Assam 0.078578 0.0433625 0.001237 0.040538 18
3 Bihar 0.191119 0.0315209 0.141129 0.118732 15
4 Chhattisgarh 0.053177 0.021622 0.054984 0.043138 17
5 Gujarat 0.309532 0.2128258 0.24675 0.255291 9
6 Haryana 0.412076 0.3059714 0.064575 0.246707 10
7 Jharkhand 0.15533 0.1657996 0.222966 0.180826 13
8 Karnataka 0.497474 0.5670801 0.350831 0.46416 3
9 Kerala 0.999692 0.573319 0.36631 0.558933 1
10 Madhya Pradesh 0.13959 0.1053822 0.107169 0.11724 16
11 Maharashtra 0.270916 0.290703 0.68151 0.384613 7
12 Odisha 0.182468 0.2444518 0.156843 0.193748 12
13 Punjab 0.775462 0.5079597 0.296613 0.487726 2
14 Rajasthan 0.142453 0.1641812 0.09357 0.132899 14
15 Tamil Nadu 0.460568 0.4686779 0.445421 0.458137 5
16 Uttarakhand 0.501358 0.4365415 0.385862 0.439258 6
17 Uttar Pradesh 0.218187 0.1996403 0.18389 0.20045 11
18 West Bengal 0.376043 0.2285072 0.176254 0.255446 8
All 0.335636 0.29362 0.247206 0.279813
Note:
1. Top five States: Kerala, Punjab, Karnataka, Andhra Pradesh and Tamilnadu
2. Bottom five States: Assam, Chhattisgarh, Madhya Pradesh, Bihar and Rajasthan
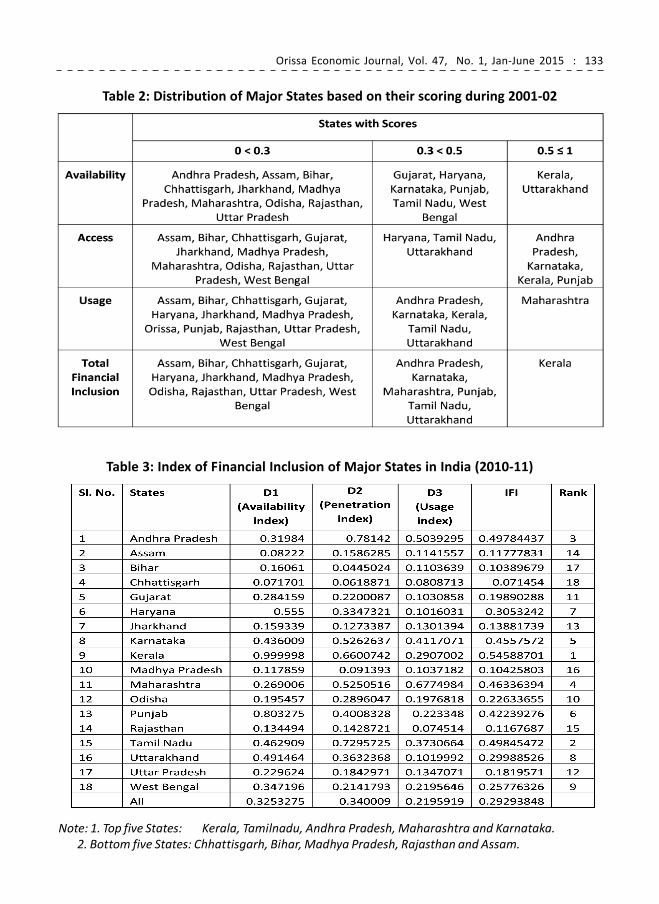
Orissa Economic Journal, Vol. 47, No. 1, Jan-June 2015 : 133
Table 3: Index of Financial Inclusion of Major States in India (2010-11)
Note: 1. Top five States: Kerala, Tamilnadu, Andhra Pradesh, Maharashtra and Karnataka.
2. Bottom five States: Chhattisgarh, Bihar, Madhya Pradesh, Rajasthan and Assam.
Table 2: Distribution of Major States based on their scoring during 2001-02

134 : Orissa Economic Journal, Vol. 47, No. 1, Jan-June 2015
Table 4: Distribution of Major States based on their scoring during 2010-11
TTTTTable 5: Comparison of Index of Financial Inclusion betwable 5: Comparison of Index of Financial Inclusion betwable 5: Comparison of Index of Financial Inclusion betwable 5: Comparison of Index of Financial Inclusion betwable 5: Comparison of Index of Financial Inclusion between een een een een 2001-02 and 2010-112001-02 and 2010-112001-02 and 2010-112001-02 and 2010-112001-02 and 2010-11

Orissa Economic Journal, Vol. 47, No. 1, Jan-June 2015 : 135
Trends in Financial Inclusion: An Analysis ofSHG Bank Linkage Programme
K. C. Badatya1
K. H. Badatya2
Financial Inclusion is one of the key dimensions of the overall strategy for attaining
“Inclusive Growth”. However, the extent of financial exclusion from different
perspectives is quite large and alarming. But Government of India, Reserve Bank of
India including NABARD took colossal steps towards financial inclusion based on the
observations of the Committee on Financial Inclusion (Rangarajan Committee). The
SHG-Bank linkage programme was conceived to fill the gap existing in the formal
financial network and extending the outreach of banking to the poor. The spread of the
SHG-BLP in different regions, however, has been uneven on account of various factors
like pro-active role of State Governments, presence of well performing NGOs, socio-
cultural factors, better performance of SHGs, etc. The spread of SHG movement has
been skewed in favour of the Southern Region. There is clear evidence of the fact that
the SHG movement in India has spread to other regions/States, though not to the same
extent as in the Southern States. Further progress in the SHG-Bank linkage programme
needs to reckon these regional variations in the spread of the programme in order to
cater to the basic goal of inclusive growth and alleviating poverty.
I. Defining Financial Inclusion
Financial inclusion is delivery of banking services at an affordable cost to the vast sections
of disadvantaged and low-income groups. Financial Inclusion is one of the key dimensions
of the overall strategy for attaining “Inclusive Growth”. It is also defined as the process of
ensuring access to financial services and timely and adequate credit where needed by
vulnerable groups such as weaker sections and low income groups at an affordable cost
(Rangarajan 2008). Financial Inclusion, broadly defined, refers to universal access to a
wide range of financial services at a reasonable cost. These include not only banking products
but also other financial services such as insurance and equity products (Rajan2009).
1 Deputy General Manager, National Bank for Agriculture & Rural Development (NABARD), Department of
Economic Analysis & Research (DEAR), Head Office, Mumbai-400051
2 Reader in Economics, Khallikote Autonomous College, Berhampur-76000,( Odisha)

136 : Orissa Economic Journal, Vol. 47, No. 1, Jan-June 2015
The concept of financial inclusion has to include not only “opening of an account” in the
bank, but also regular savings in the account and building a relationship with the bank thus
enabling the borrower to access loans on a regular basis. If it is viewed that financial
inclusion can only lift the financial condition and standards of life of the poor particularly,
small and marginal cultivators and rural landless workers, than confining financial inclusion
to ensuring a bare minimum access to a savings bank account without frills would not
achieve the purpose. Having a current account / savings account on its own, is not regarded
as an accurate indicator of financial inclusion. While certain sections have at their disposal
a wide range of financial services and products, at the other extreme these sections are
denied access to even the most basic of financial products.
The Government of India, Reserve Bank of India and NABARD have been making concerted
efforts to promote financial inclusion as one of the important national objectives of the
country. Some of the major efforts made in this regard include - nationalization of banks,
building up of robust branch network of scheduled commercial banks, co-operatives and
regional rural banks, introduction of mandated priority sector lending targets, lead bank
scheme, formation of self-help groups, permitting BCs/BFs to be appointed by banks to
provide door step delivery of banking services, zero balance Basic Savings Bank Deposits
(BSBD) accounts, etc. The fundamental objective of all these initiatives is to reach the
large sections of the hitherto financially excluded Indian population.
II. Extent of Financial Exclusion
The extent of financial exclusion from different perspectives as per NSSO 59th Round
Survey Results showed that
m 51.4 per cent of farmer households are financially excluded from both formal/
informal sources.Of the total farmer households, only 27 per cent access formal
sources of credit; one third of this group also borrowed from non-formal sources.
m Overall, 73 per cent of farmer households have no access to formal sources of
credit.Across regions, financial exclusion is more acute in Central, Eastern and
North-Eastern regions. All three regions together accounted for 64 per cent of
all financially excluded farmer households in the country. Overall indebtedness
to formal sources of finance of these three regions accounted for only 19.66 per
cent.
m However, over the period of five decades, there has been overall improvement
in access to formal sources of credit by the rural households (Table 1).

Orissa Economic Journal, Vol. 47, No. 1, Jan-June 2015 : 137
Table 1: Break-up of Institutional and Non-Institutional Rural Credit
Source: All India Debt and Investment Survey, Various Issues
Similarly, as per census 2011, only 58.7% of households are availing banking services in the
country (Table 2). However, as compared with previous census 2001, availing of banking
services increased significantly largely on account of increase in banking services in rural
area
Table 2: Availing banking Services
Category 2011 2001
Rural 54.4 30.1
Urban 67.8 49.5
Total 58.7 35.5
Source: Census Reports, GoI

138 : Orissa Economic Journal, Vol. 47, No. 1, Jan-June 2015
Similarly, ‘Financial Access Survey’ of International Monetary Fund observed that in India,
financial exclusion measured in terms of bank branch density, ATM density, bank credit to
GDP and bank deposits to GDP are quite low as compared with most of developed countries
in the world (Table 3).
Table 3: Select Indicators of Financial Inclusion – 2011
Source: Financial Access Survey, International Monetary Fund (IMF), 2011
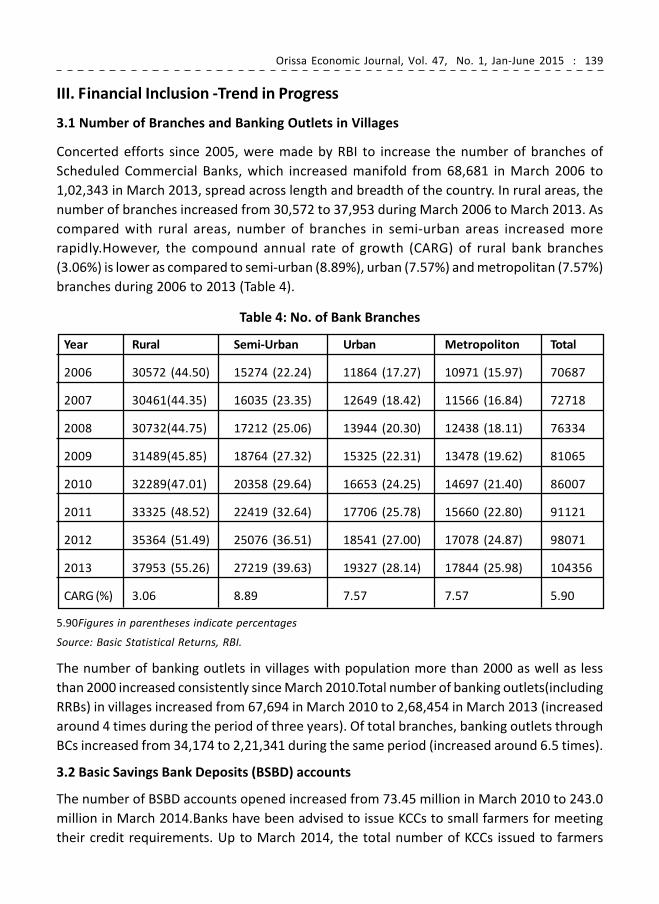
Orissa Economic Journal, Vol. 47, No. 1, Jan-June 2015 : 139
III. Financial Inclusion -Trend in Progress
3.1 Number of Branches and Banking Outlets in Villages
Concerted efforts since 2005, were made by RBI to increase the number of branches of
Scheduled Commercial Banks, which increased manifold from 68,681 in March 2006 to
1,02,343 in March 2013, spread across length and breadth of the country. In rural areas, the
number of branches increased from 30,572 to 37,953 during March 2006 to March 2013. As
compared with rural areas, number of branches in semi-urban areas increased more
rapidly.However, the compound annual rate of growth (CARG) of rural bank branches
(3.06%) is lower as compared to semi-urban (8.89%), urban (7.57%) and metropolitan (7.57%)
branches during 2006 to 2013 (Table 4).
Table 4: No. of Bank Branches
Year Rural Semi-Urban Urban Metropoliton Total
2006 30572 (44.50) 15274 (22.24) 11864 (17.27) 10971 (15.97) 70687
2007 30461(44.35) 16035 (23.35) 12649 (18.42) 11566 (16.84) 72718
2008 30732(44.75) 17212 (25.06) 13944 (20.30) 12438 (18.11) 76334
2009 31489(45.85) 18764 (27.32) 15325 (22.31) 13478 (19.62) 81065
2010 32289(47.01) 20358 (29.64) 16653 (24.25) 14697 (21.40) 86007
2011 33325 (48.52) 22419 (32.64) 17706 (25.78) 15660 (22.80) 91121
2012 35364 (51.49) 25076 (36.51) 18541 (27.00) 17078 (24.87) 98071
2013 37953 (55.26) 27219 (39.63) 19327 (28.14) 17844 (25.98) 104356
CARG (%) 3.06 8.89 7.57 7.57 5.90
5.90Figures in parentheses indicate percentages
Source: Basic Statistical Returns, RBI.
The number of banking outlets in villages with population more than 2000 as well as less
than 2000 increased consistently since March 2010.Total number of banking outlets(including
RRBs) in villages increased from 67,694 in March 2010 to 2,68,454 in March 2013 (increased
around 4 times during the period of three years). Of total branches, banking outlets through
BCs increased from 34,174 to 2,21,341 during the same period (increased around 6.5 times).
3.2 Basic Savings Bank Deposits (BSBD) accounts
The number of BSBD accounts opened increased from 73.45 million in March 2010 to 243.0
million in March 2014.Banks have been advised to issue KCCs to small farmers for meeting
their credit requirements. Up to March 2014, the total number of KCCs issued to farmers

140 : Orissa Economic Journal, Vol. 47, No. 1, Jan-June 2015
remained at 40.0 million with a total outstanding credit of Rs.262,29,800 million. Banks
have been advised to introduce General Credit Card facility up to Rs. 25,000 at their rural
and semi-urban branches. Up to March 2014, banks had provided credit aggregating to
Rs.7,63,400 million in 7.0 million GCC accounts.
3.3 ICT Based Accounts - through BCs
In order to provide efficient and cost-effective banking services in the un-banked and
remote corners of the country, RBI directed commercial banks to provide ICT based banking
services – through BCs. These ICT enabled banking services have CBS connectivity to provide
all banking services including deposit and withdrawal of money in the financially excluded
regions.The number of ICT-based transactions through BCs increased from 26.52 million in
March 2010 to 329.0 million in March 2014, while transactions amount increased steadily
from Rs.69,200 million to Rs.52,40,000 million during the same period (Table 5).
Table 5: Progress of Financial inclusion –villages covered, KCCs issued, BSBD Accounts
opened, progress in ICT based Accts-BCs.
Source: Statistical Tables Relating to Banks in India, various issues,
3.4 Pradhan Mantri Jan-DhanYojana (PMJDY)
Pradhan Mantri Jan-DhanYojana (PMJDY) is National Mission for Financial Inclusion initiated
in August 2014 to ensure access to financial services, namely, Banking/ Savings & Deposit
Accounts, Remittance, Credit, Insurance, Pension in an affordable manner. Account can be

Orissa Economic Journal, Vol. 47, No. 1, Jan-June 2015 : 141
opened in any bank branch or Business Correspondent (Bank Mitr) outlet. PMJDY accounts
are being opened with Zero balance. However, if the account-holder wishes to get cheque
book, he/she will have to fulfil minimum balance criteria. Account holders would avail the
benefits in term of interest on deposit, accidental insurance cover of Rs.0.1 million, no
requirement of minimum balance, life insurance cover of Rs.30,000 easy transfer of money
across India, beneficiaries of Government Schemes through Direct Benefit Transfer,
overdraft facility after satisfactory operation of the account for 6 months, access to Pension,
insurance products.
Against the estimated target of opening bank accounts for 75 million uncovered households
in the country, as on date (January 31, 2015) Banks have opened 1,085 million accounts
after conducting survey of 2,102 million households in the country. Coverage of 99.74 per
cent of the surveyed households has been achieved. The survey was conducted in about
0.23 million Sub Service Areas (SSAs) in rural areas and wards in urban areas in a record
time of 4 months. Out of the accounts opened, 60 per cent are in rural areas and 40 per cent
are in urban areas (Table 6). Rupay cards have been issued to more than 1,000 million
beneficiaries who will get a benefit of personal accidental insurance of Rs. 0.1 million
under the Yojana. In addition there is a life insurance cover of Rs.30,000 for eligible
beneficiaries. A deposit of Rs. 1,04,996 million has been mobilized in the accounts opened
under PMJDY.
Table 6: Progress in PMJDY - Accounts Opened (As on 31 January 2015)
Figures in parentheses indicate percentages
Source: Department of Financial Services, Ministry of Finance, GoI
IV. SHG-Bank Linkage Programme - An Analysis
Microfinance sector in India has progressed remarkably since 1990s and this sector has
been acting as an important ally in expanding financial inclusion in rural areas (NABARD,
2012). Reserve Bank provides guidelines to banks for mainstreaming micro-credit providers,
inter alia, stipulated that micro-credit extended by banks to individual borrowers directly

142 : Orissa Economic Journal, Vol. 47, No. 1, Jan-June 2015
or through any intermediary would be reckoned as part of their priority sector lending. The
SHG-Bank Linkage Programme (SHG-BLP)Y provides a major succor to the rural women
folk from financial exclusion and has helped them in gaining financial access for their
livelihood. The launching of SBLP as a rural financial innovations in the rural sector in the
beginning of 90s’ for increased popularity of Microfinance is a viable tool for extending
credit to the poor as also addressing the issues on financial inclusion. NABARD’s efforts at
improving the access of the informal delivery strategy through SHGs developed by NABARD
has expanded into the largest mF Programme in the world, in terms of its outreach. The
programme registered a significant growth both in terms of coverage and the outreach of
credit to the poor. Beginning with a modest number of 255 SHGs being linked during 1992-
93, a cumulative total of 74,29,500 SHGs were linked with banks by March 2014. The
cumulative disbursement of bank loans was Rs. 42,92,752 million and refinance assistance
was of Rs. 26,14,208 million by March 2014. Over the seventeen years period (1997-2014)
the SHGs linked grew at a compound annual growth rate (CAGR) of 56.53 per cent. Families
assisted grew by 45.52 per cent. The average loan per SHG increased by 31.95 per cent
(Table 7).
Table 7: Growth Indicators of SBLP
No. Particulars / Year 1997-98 2004-05 2013-14 CARG (%)
1. SHGs Linked 5719 7.97 7429500 56.53
2. Families Assisted
(No. in million) 0.24 11.0 97.0 45.52
3. Bank Loan
(Rs. In million) 119 299.42 42927.52 44.49
4. Refinance Assistance
(Rs. million) 107 9678 2614208 41.01
5. Average Loan / SHG (Rs.) 2081 37547 175768 31.95
Y Promotion of mF through the concept of Self Help Groups (SHGs) started in 1987, when NABARD
sanctioned grant assistance from Reseach and Development Fund (R & D Fund) to MYRADA for
providing seed money to the Credit Management Groups (CMGs). The success of this experiment was
complimented by launching a pilot project by NABARD in 1992 for linking 500 SHGs of poor people
with the banks to facilitate relationship banking (NABARD, 1995). In February 1992, the project was
made operational throughout the country through a set of well defined guidelines with special
reference to the objectives, criteria for selection of SHGs, size of group, assessment of credit, rate of
interest, repayment period, security, etc. In 1996, RBI classified loans to SHGs as a mainstream activity
of banks under their priority sector lending. The GoI bestowed national priority to the programme
through its recognition in the Union Budget 1999.
Source: Status of Microfinance in India, NABARD

Orissa Economic Journal, Vol. 47, No. 1, Jan-June 2015 : 143
4.1 Region-Wise Outreach
Even though the outreach of the programmehas been extended to almost all States, in terms of
progress in total coverage, the Southern region continued to lead the other regions since the
beginning of the linkage programme. The share of the Southern region has, however, come down
with the increasing share of other regions. Between 2001 and 2014, whereas the share of southern
region decreased from 73 per cent to 50 per cent, the share of other regions, except central region
has shown an increasing trend.
Table 8: Year-wise and Region-wise Cumulative Share of SHGs
(percentage)
Region March 1997 March 2001 March 2005 March 2011 March 2014
Southern 63 73 58 48 50
Eastern 13 8 17 20 20
Central 12 9 12 11 9
Northern 4 3 5 5 5
Western 7 6 6 12 12
N-Eastern <1 <1 2 4 4
Total 100 100 100 100 100
Source: Status of Microfinance in India, NABARD
4.2 Spatial Disparity in the SHG-Bank linkage Programme
Notwithstanding the remarkable progress, geographically there has been a skewed development
of SHG-Bank linkage programme. There is wide regional disparity both in terms of the spread of
SHGs linked to banks and cumulative bank loans disbursed under the programme (Table 9).
Table 9: Region-wise Progress of SHG-Bank Linkage Programme
(As on March 31, 2014)
Source: computed from data sourced from Status of Microfinance in India, NABARD

144 : Orissa Economic Journal, Vol. 47, No. 1, Jan-June 2015
While the Southern Region accounted for 74.1 per cent of the total loans outstanding to
SHGs, the share of North-Eastern Region was about 17.6 per cent. For all regions excluding
Southern Region, even though the share of total SHGs linked to banks was close to 50 per
cent, their share in total loans outstanding to SHGs was only 25.9 per cent implying that
adequate credit is not being routed through SHGs in these regions. As the regions vary in
geographical area and population, the number of SHGs is normalised by the population of
the region and SHG per lakh population has been taken as a better indicator of SHG spread
in the respective regions. The number of SHGs per lakh population for the Southern Region
is 1471, which is more than double the average at all-India (615) and almost five times of
the Central Region (223).
In addition to the inter-regional disparity, there is wider intraregional disparity among the
constituent States in SHG spread. The progress of SHG-Bank linkage programme has not
been homogeneous in any region (Table 10).
In the Southern Region, where the programme has been very successful, SHGs per lakh
population varied between 1677 in Andhra Pradesh and 1800 in Kerala as at end March
2014. In the North-Eastern region, the major share was accounted for by Assam with 3.8
per cent of the total SHGs while the rest of the six States in the region had a negligible
share in the total SHGs. Similarly, Rajasthan was distinctly ahead in the Northern Region in
terms of spread of SHGs. In the Eastern Region, SHG spread in Orissa was comparable with
the Southern States. There is clear evidence of the fact that the SHG movement in India
has spread to other regions/States, though not to the same extent as in the Southern
States. However, a major concern remains the scale of finance in the non-southern regions.
The average loan per SHG in these regions continues to be much lower than that in the
Southern Region. Further progress in the SHG-Bank linkage programme needs to reckon
these regional variations in the spread of the programme.
Table 10: State-wise Variations in the SHG-Bank Linkage Programme

Orissa Economic Journal, Vol. 47, No. 1, Jan-June 2015 : 145

146 : Orissa Economic Journal, Vol. 47, No. 1, Jan-June 2015
Source: Computed from Status of Microfinance in India, NABARD
Participation of Banks
Commercial banks and RRBs were the major players in the SBL Programme. Although, the
cumulative number of SHGs financed by commercial banks increased from 8,704 during
1997-98 to 40,22,810 during 2013-14 growing at an annual compound rate of 47 per cent,
their share has come down from 61 per cent to 54 per cent during the said period. However,
the cumulative share in bank loans outstanding gone up to 68 per cent from 65 per cent.
The share of RRBs in number of SHGs financed decreased to 29 per cent from 36 per cent
and loan outstanding came down from 33 per cent to 26 per cent during 1997-2014. Co-
operatives have entered into the programme at a later stage and have peaked up very fast.
The SHGs financed by cooperatives have grown at an annual compound rate of 65 per cent
during 1997-2014 (Table 11).
Table 11: Participatory Bank-wise Cumulative Growth in SBLP at All India Level
Banks No. of SHGs Bank Loan O/S (Rs. Million)
1997-98 Share (%) 2013-14 Share (%) CARG (%) 1997-98 Share (%) 2013-14 Share (%) CARG (%)
CBs 8704 61.0 4022810 54 46.74 15.5 65.0 2938841 68 60.27
RRBs 5192 36.0 2111760 29 45.57 7.8 33.0 1104895 26 57.38
Coops 421 3.0 1294930 17 65.20 0.5 2.0 249016 6 70.25
Total 14317 100.0 7429500 100 47.81 23.8 100.0 4292752 100 59.78
Source: computed from data sourced from Status of Microfinance in India, NABARD

Orissa Economic Journal, Vol. 47, No. 1, Jan-June 2015 : 147
5. Conclusion and Suggestions
Though SHG-BLP has contributed appreciably towards achieving the objective of equitable
financial inclusion. SHG-Bank linkage programme was conceived to fill in the gap existing
in the formal financial network and extending the outreach of banking to the poor. The
spread of the SHG-BLP in different regions, however, has been uneven on account of
various factors like pro-active role of State Governments, presence of well performing
NGOs, socio-cultural factors, better performance of SHGs, etc. The spread of SHG movement
has been skewed in favour of the Southern Region. There is clear evidence of the fact that
the SHG movement in India has spread to other regions/States, though not to the same
extent as in the Southern States. However, a major concern remains the scale of finance in
the non-southern regions. Further progress in the SHG-Bank linkage programme needs to
reckon these regional variations in the spread of the programme in order to cater to the
basic goal of inclusive growth and alleviating poverty Further progress in the SHG-Bank
linkage programme needs to reckon these regional variations in the spread of the
programme in order to cater to the basic goal of inclusive growth and alleviating poverty
(Badatya & Badatya 2008).
In order to reduce the regional imbalances in the spread of the SHG-Bank linkage
programme, NABARD had identified 13 States – Assam, Bihar, Chhattisgarh, Gujarat,
Himachal Pradesh, Jharkhand, Maharashtra, Madhya Pradesh, Orissa, Rajasthan, Uttar
Pradesh, Uttarakhand and West Bengal, which have a large population of the poor, for
focused attention. Due to the intensified efforts in these states, their share in the total
SHGs credit linked increased from 31 per cent in March 2002 to 48.2 per cent in March 2014.
Notwithstanding deficiencies, the SHG-BLP augurs well for the tasks of financial inclusion,
financial equity as well as efficiency. Banks need to assume the lead role in taking
thefinancial services to the vast sections of disadvantaged. Banks need to play a more pro-
active role in identification of income generating activities (IGAs) as well as in encouraging
NGOs promoting SHGs in the Central, Eastern and North-Eastern regions which could give
a fillip to the SHG-BLP. Though the growth of the micro finance in the form of SHG –BLP was
intended to provide sustainable access to the unbanked poor, positive developments in
the group dynamics helped SHGs to graduate themselves towards undertaking different
sustainable IGAs. Studies have revealed that a large number of members of SHGs are
availing loans for income generating activities once their consumption needs are addressed
(Badatya at al. 2006 & Badatya & Badatya 2008)
As on March 31, 2014, the average loan provided to SHGs was Rs. 1,75,768. On an average,
per member loans workout in the range of 12,000-14000. Such a loan amounts are not
adequate for pursuing any meaningful livelihood activity. The scale of finance needs to be
stepped up especially in the non-southern regions, where it is almost half of that at the
All-India level. As observed by the Committee on Financial Inclusion (Chairman: Dr. C.

148 : Orissa Economic Journal, Vol. 47, No. 1, Jan-June 2015
Rangarajan), in several cases, bankers show unenthusiastic attitude in promoting SHGs
pointing reasons of shortage of staff, time, etc. Special training and awareness programme
about the model is needed for the branch officials.
The Steering Committee on agriculture and allied sectors for formulation of the Eleventh
Five Year Plan (2007-2012) had suggested that the share of direct accounts with a credit
limit of Rs. 25,000 in total direct finance may be targeted at a substantially higher level to
improve credit flow to the small and marginal farmers. Towards this, formation of Joint
Liability Groups (JLGs) has been intensified which has also significantly facilitated financial
inclusion thus reducing high level of exclusion particularly among small and marginal
farmers.
References
1. Badatya, K. C., Wadavi, B. B. &Ananthi S (2006), “Microfinance for Microenterprises: An Impact
Evaluation of Self Help Groups”, NABARD, Andhra Pradesh Regional Office, Hyderabad
2. Badatya, K. H., Badatya, K. C (2008), “Reducing Poverty through Micro Finance: A Perspective on
Self Help Groups in Orissa” Orissa Economic Journal, Vol.XXXX, No.1 & 2, Jan-June & July-Dec.
3. Badatya, K. C. (2007), “Microenterprises by Women: A Case of SHGs in Andhra Pradesh”, Paper
presented at the Conference on Microenterprises by SHGs organised by Lala Lajpatrai Institute
of Management Studies, Mumbai, India, 7-9 April 200
4. NABARD (2014), “Progress of SHG-Bank Linkage in India, various issues
5. NABARD (2012), Annual Report 2011-12, National Bank for Agriculture and Rural Development,
Mumbai
6. Pankaj Kumar and Golait, Ramesh (2009), “Bank Penetration and SHG-Bank Linkage Programme:
A Critique”, Reserve Bank of India Occasional Papers, Vol. 29, No.3.
7. Puhazhendhi, V & Badatya, K. C. (2007), “Graduating SHG Members to undertake Income
Generating Activities and Micro Enterprises – A Case of Andhra Pradesh”, , Paper presented in
the International Conference on “Membership Based Organisaions for the Poor-Andhra Pradesh
Experience” organised by CESS and Cornell University, USA, 5-6 June
8. Puhazhendhi, V. &Satyasai, K J S, (2000), “Rural Finance for People – An Impact Evaluation”,
NABARD, Mumbai-400051.
9. Puhazhendhi, V. & Badatya, K C., (2002), “Self Help GroupBank Linkage Programme for Rural
Poor in India:An Impact Assessment”, NABARD, Mumba-400051.
10. Rajan, Raghuram G. (2009), “A Hundred Small Steps - Report of the Committee on Financial
Sector Reforms”.
11. Rangarajan C (2008), “Report of the Committee on Financial Inclusion”
12. Vijaya Bhaskar, P. (2013), “Financial Inclusion in India – An Assessment”, Speech delivered at
the MFIN and Access-Assist Summit, New Delhi, December, 10.

Orissa Economic Journal, Vol. 47, No. 1, Jan-June 2015 : 149
Financial Inclusion of Women in Odisha :
Role of Pradhanmantri Jan Dhan Yojana
Sadhana Satapathy1
Kasturi Panda2
Financial inclusion of the poor and vulnerable in general and women in particular has
been universally accepted as one of the important components of inclusive growth. In
this respect the present paper tries to have a critical assessment of PMJDY in Odisha
with particular emphasis on the role of Regional Rural Banks vis a vis Public Sector
Banks. The study focuses on demand side view by taking a sample of one hundred
women beneficiaries of PMJDYand a supply side view by taking a sample of fifty bankers
from commercial banks. The demand side analysis finds that the beneficiaries are not
fully aware of the features of the scheme to take advantage of financial benefits. From
supply side the bankers agree that financial inclusion through PMJDY is a difficult but
not impossible endeavour.
Key Words: Financial Inclusion, PMJDY, Commercial banks, Women Beneficiaries
I. Introduction
About four hundred million people accounting for more than thirty six percentage of
population still live below poverty line in India. In this respect, financial inclusion is
considered to be an important determinant for social inclusion of the poor and the
vulnerable. It is in fact one of the essential conditions for reduction of poverty and socio-
economic inequalities in the society (Rangarajan Committee, 2008). In fact it has become
a policy imperative for inclusive growth in many countries including India.
United Nations defines the main goals of inclusive finance as access to a range of financial
services such as savings, credit, insurance, remittances and other banking payment services
to all bankable households and enterprises at reasonable cost. Different stake holders-
government, regulators, public & private banks and people- play an important role in
inclusive finance. The formal financial system in India is mostly dominated by commercial
banks.
1 Reader (Associate Professor)in Economics,B.J.B.(Auto) College.
2 Reader (Associate Professor)in Economics,B.J.B.(Auto) College.

150 : Orissa Economic Journal, Vol. 47, No. 1, Jan-June 2015
Against this background, Prime Minister Narendra Modi’s launching of Pradhan Mantri Jan
Dhan Yojana (henceforward PMJDY) on 15 August, 2014 to provide all households in the
country with banking services has turned out to be a game changer as it provides the
platform for Direct Benefits Transfer (DBT) which in turn will help in plugging leakages in
subsidies and thereby provide savings to the exchequer. The focus of PMJDY was to
empower the weaker sections of the society, including women, small and marginal farmers
and land less labourers. It started from 28th August 2014 and the target was fulfilled much
before the required date of 26th January 2015.Such overwhelming support by people to be
financially included was never seen before. Record Number of 11.50 crore bank accounts
have been opened under PMJDY as on 17th January 2015 against the original target of 7.5
crores by 26th January, 2015. In fact, it has entered the Guiness Book of World Records as
the highest number of bank accounts opened in one week (18096130 accounts between
23rd to 29th August, 2014).
However, the concept is not much different from earlier introduced schemes. Thus
assessment of PMJDY for a state like Odisha which is one of the most unbanked states of
India is desirable from supply as well as demand points of view. The objectives of the
present paper are as follows:
1) To evaluate the PMJDY with reference to Odisha.
2) Assessment of PMJDY in Odisha from the point of view of women beneficiaries
(demand point of view).
3) Assessment of PMJDY from the points of view of bankers (supply point of view).
II. Research Methodology
Secondary data were collected from the websites of Ministry of Finance, Government of
India for information on PMJDY. Data from various other sources such as Economic Survey
of Odisha, various journals and articles were collected which have been duly acknowledged.
Since it is too early to make any sort of impact study of PMJDY, the paper tries to look at
benefits and drawbacks of the scheme from bankers and customers’ point of view in
Odisha. The focus is on commercial banks because they account for a substantial percentage
of banking in Odisha in terms of branches, deposits and advances. The two commercial
banks that are chosen are State Bank of India (hereafter SBI), and Odisha Gramya Bank
(hereafter OGB) representing the public sector banks and rural banks respectively. For the
opinion polls, a random sample of 50 bankers across different grades from the two banks
was chosen to get the supply side view. Similarly, a random sample of women beneficiaries
from 100 households was chosen to get the demand side view. The women from 100

Orissa Economic Journal, Vol. 47, No. 1, Jan-June 2015 : 151
households are deliberately chosen from urban slums for two reasons. One is that women
are part of vulnerable groups. Secondly, assuming that they are more knowledgeable than
their rural counterparts their opinions would reflect the relative success/failure of this
scheme. The constraint of the present study is that we have taken only those districts
which are common to the operations of both SBI and OGB. Hence only thirteen districts are
covered.
The paper is divided into five sections including the section of introduction. In section II
the features of PMJDY are briefly discussed. Section III focuses on banking in Odisha. In
section IV the paper tries to have a comparative analysis of status of PMJDY in public sector
and rural banks in Odisha. Empirical findings are analysed to look at the demand side and
supply side of financial inclusion in sectionV. Lastly, summary conclusions and policy
suggestions are discussed in section VI.
III. Features of PMJDY
Realising the value of inclusive growth both government and Reserve Bank of India have
taken several initiatives prior to launching of PMJDY scheme for the purpose of decreasing
financial exclusion. Major initiatives taken in this regard were introduction of ‘No-frill
Accounts’, simplification of Know Your Client (KYC) norms, general credit card (GCC) facility
with the objective to provide hassle free credit up to Rs.25, 000 basing upon future cash
flows, use of technology ,new branch at unbanked areas and financial education.
Under PMJDY, an account can be opened in any bank branch or Business Correspondent
(Bank Mitr) outlet. PMJDY accounts are being opened with Zero balance. However, if the
account-holder wishes to get cheque book, he/she will have to fulfil minimum balance
criteria. It focuses on coverage of households as against the earlier plan which focused on
coverage of villages. It focuses on coverage of rural as well as urban areas. Earlier plan
targeted only villages above 2000 population while under PMJDY the whole country is to
be covered by extending banking facilities in each sub-service area consisting of 1000 –
1500 households such that facility is available to all within a reasonable distance. Any
individual above the age of 10 years can open an account.
The main features of the scheme are as follows:
a. Interest on deposit.
b. Accidental insurance cover of Rs.1.00 lakh
c. No minimum balance required.
d. Life insurance cover of Rs.30,000/-
e. Easy Transfer of money across India
f. Beneficiaries of Government Schemes will get Direct Benefit Transfer in these accounts.

152 : Orissa Economic Journal, Vol. 47, No. 1, Jan-June 2015
g. After satisfactory operation of the account for 6 months, an overdraft facility will be
permitted
h. Access to Pension, insurance products.
i. Accidental Insurance Cover, RuPay Debit Card must be used at least once in 45 days.
j. Overdraft facility up to Rs.5000/- is available only in one account per household,
preferably lady of the household.
Looking at the above features in a more detailed manner, one finds that the scheme
provides for life cover of Rs. 30,000/- payable on death of the beneficiary due to any cause,
but with fulfilment of ceratin eligibility conditions: These basic eligibility conditions are i.
Person opening bank account for the first time, with RuPay Card in addition, during the
period from 15-08-14 to 26-01-15, or any additional period as may be extended further by
Government of India. ii. The person should normally be head of the family or an earning
member of the family and should be in the age group of 18 to 59 ( i.e. person should be at
least 18 years old, and should not have completed 60 years of age). In case the head of
family is 60 years or more of age, the second earning person of the family in the above
mentioned age group will be covered, subject to eligibility. Person must have a RuPay card
and Bio – Metric card linked to bank account if not already there. iv. For the coverage to be
effective the above RuPay Card should be valid and in force at the time of the death of the
member v. Only one person in the family will be covered in the Bima Scheme and in case
of the person having multiple cards / accounts the benefit will be allowed only under one
card i.e. one person per family will get a single cover of Rs.30,000/-, subject to the eligibility
conditions. vi. The life cover of Rs 30,000/- under the scheme will be initially for a period
of 5 years, i.e. till the close of financial year 2019-20. Thereafter, the scheme will be reviewed
and terms and condition of its continuation, including the issue of future payment of
premium by the insured thereafter, would be suitably determined. vii. In case the PMJDY
account is held jointly, then the first account holder i.e. primary account holder will be
eligible for cover subject to the eligibility conditions.
The significance of discussing the above features is to look into the fact that whether the
beneficiaries are really aware of the intricacies of the scheme. The bankers have been
instructed to open accounts in easiest possible manner and treat this as corporate social
responsibility. However, whether the targeted beneficiaries are educated enough to take
positive advantages of the scheme or not is yet to be .judged. This is going to be tested in
section V.
IV. Banking in Odisha
Access to institutional finance is one of the most important ways of looking at financial
inclusion. The average population per bank branch in Odisha declined from 16,800 in March

Orissa Economic Journal, Vol. 47, No. 1, Jan-June 2015 : 153
2003 to 12284 in March 2013 which is somewhat comparable to the national average figure
of 12,200. Nearly 54% of bank branches of Odisha are in rural areas. The percentage is 26.75
and 19.6 for sub urban and urban area respectively (Odisha Economic Survey, 2013-14).The
growth rate of deposits has been 19.53% as on January 2015.
The financial sector in the State is dominated by commercial banks (Table 1). The branches
of commercial banks constitute 91.08% of all banks having 96.18% of total deposits and
95.15% of advances. As per latest information the C.D ratio of commercial banks is 75.87.
Commercial banks can be divided into three major groups-public sector banks, private
sector banks and regional rural banks. The public sector banks are dominated by State
Bank of India constituting 33% of branches; 40% of deposits and 40% of advances of total
public sector banks. Similarly among RRBs, OGB is a major component constituting 53% of
RRB branches, 60% of total RRB deposits and almost 59% of total RRB advances. The number
of branches of commercial bank has increased to 3483 in 2012-13 but the unfortunate fact
is that the per capita bank deposit of commercial banks in Odisha in 2012-13 is 34,232
rupees, much below the national average of Rs 56,380.
Apart from the branch network and its population coverage, another major indicator of
banking development is the credit-deposit (CD) ratio. In the turn of the last decade in
2001, the CD ratio of Odisha at 42 per cent was way below the national average of 54 per
cent. As the State experienced rapid economic growth, the CD ratio not only accelerated
but also exceeded the national average and peaked at 79 per cent in 2005-06. Subsequently
the CD ratio moderated, particularly after 2007-08 when growth slowed. As on latest
information Odisha’s CD ratio is at 86.94 per cent.
Table1: Total Bank Deposits and Advances of Different Categories of Banks
of the State - at the end of 2012-13 (in Crores)
Banks No of branches Total Deposits Total Advances C- D Ratio
SBI 706 45164 38845 86.01
Total Public Sector banks 2313 113037.89 98445.52 87.09
Total Pvt Sector Banks 269 17684.33 11465.36 64.83
Odisha Gramya Banks 475 6098.5 3639.62 59.68
Total RRBs 901 10155.16 6170.26 60.76
Total Commercial Banks 3483 140877.38 121169.61 86.01
Total cooperative Banks 341 5587.77 6172.42 110.46
Grand total 3824 146465.15 127342.03 86.94
Source: Odisha Economic Survey,2013-14,Planning & Co ordination Department, Bhubaneswar.

154 : Orissa Economic Journal, Vol. 47, No. 1, Jan-June 2015
Against this background, it is important to bring the poor and under-privileged sections of
the society within the banking fold for inclusive growth. In this context, the recent financial
inclusion drive through PMJDY is important.
V. PMJDY: OGB vis-a-vis SBI
As already discussed, the banking penetration should be such that every unbanked person
has an account and access to credit and for this the formation of PMJDY scheme was
introduced. Now the question is whether the vulnerable group of population is really
benefited. Whether the mere opening of an account is enough to embrace each and every
person particularly the women into the mainstream is to be tested.. To look into this, the
present study tries to take up a comparative analysis of two types of commercial banks,
the public sector banks and the RRBs.SBI is chosen from public sector banks and OGB is
chosen from RRBs. The significance of taking these two banks is that they are well spread
over a vast area of the state. Since the operation of OGB is only for thirteen districts we
have restricted the comparison to thirteen districts only.
Now coming to PMJDY, nearly 41.63 lakh accounts have been opened in the state (by 31st
Jan, 2015). The total deposit for these accounts comes around Rs 240 crores. Taking only SBI
and OGB, the absolute number of accounts opened under SBI is higher than that of OGB.
Table 2 analyses the percentage of zero balance accounts and average deposits per account
under PMJDY. It is found that the percentage of zero balance accounts is much higher for
SBI (68.77%) compared to OGB (54.60 %). If one looks at inter district comparison, one finds
that for the public sector bank the percentage of zero balance accounts ranges from 61.76
% (Jajpur) to 77.71% (Nayagarh).On the other hand , the percentage of zero balance accounts
for RRBs ranges from 34.63% (Jagatsinghpur) to 63.58% (Puri). Thus, it can be inferred that
probably, SBI has not been successful to create sufficient awareness among the beneficiaries
regarding different eligibility conditions associated with PMJDY. The average deposit per
account is much higher for OGBs compared to SBI. If the above mentioned factors are
taken as indicators for financial inclusion, OGB scores higher than SBI. The other probable
inference that may be drawn is that perhaps more number of accounts are opened just to
fall in line with the directives of the central government.
Table2: District wise PMJDY Accounts and deposits of SBI & OGB, Odisha
% of Zero balance Accounts Avg deposit per Account
Districts SBI OGB SBI OGB
Angul 69.29 57.61 420.30 793.11
Balasore 64.22 58.07 460.83 905.80
Bhadrak 69.65 58.12 303.08 502.05

Orissa Economic Journal, Vol. 47, No. 1, Jan-June 2015 : 155
Cuttack 70.08 40.79 416.29 708.63
Dhenkanal 65.28 57.40 443.78 995.82
Jagatsinghpur 72.74 34.63 357.73 739.78
Jajpur 61.76 55.88 501.19 796.73
Kendrapada 69.19 37.34 351.64 974.65
Keonjhar 72.20 51.21 368.46 956.35
Khordha 73.93 55.82 337.12 683.59
Mayurbhanj 71.80 59.98 446.84 980.56
Nayagarh 77.71 57.23 278.31 1115.90
Puri 64.05 63.58 361.86 602.52
Total 68.77 54.60 395.54 831.89
Source: Local head Office, SBI, Bhubaneswar & Local Head Office, OGB, Bhubaneswar
Table 3: Female PMJDY account holders, Rural, Urban& Total (in %)
% of Female account % of Female account % of Female account
holders(rural) holders(urban) holders(total)
Districts SBI OGB SBI OGB SBI OGB
Angul 56.50 31.71 53.57 55.62 31.71
Balasore 50.17 35.77 46.75 48.91 35.77
Bhadrak 44.48 39.07 46.66 45.30 39.07
Cuttack 45.99 26.57 47.51 35.17 46.48 27.57
Dhenkanal 48.46 15.00 44.67 46.82 15.00
Jagatsinghpur 40.78 41.62 41.34 40.93 41.62
Jajpur 42.77 33.78 42.47 42.76 33.78
Kendrapada 50.53 41.73 46.74 49.46 41.73
Keonjhar 52.75 53.69 38.86 50.04 53.69
Khordha 48.70 29.97 49.77 38.51 49.39 30.92
Mayurbhanj 46.59 52.52 51.70 48.36 52.52
Nayagarh 49.54 26.15 34.93 48.99 26.15
Puri 50.29 26.72 43.03 5.38 48.38 26.31
Total 48.32 35.40 47.25 33.74 47.97 35.37
Source: Calculated from SBI and OGB data

156 : Orissa Economic Journal, Vol. 47, No. 1, Jan-June 2015
Table 3 describes the female PMJDY account holders as a percentage of rural, urban and
total account holders for both the banks. It is found that percentage of female account
holders in OGB (35.37%) is lower than SBI (47.97%) . Among the different districts the
percentage is higher for SBI than OGB except in three districts Jagatsinghpur, Keonjhar and
Mayurbhanj. If the data are decomposed into rural and urban area, one finds that even for
rural areas the situation is same notwithstanding the fact that OGB is predominantly a
rural bank. As Table 3 suggests OGB has no urban branches in most of the districts. For OGB,
rural as well as urban (only three districts as well as total) female participation in financial
inclusion is poor. The percentage of female account holders is much below 50% in all the
districts except Mayurbhanj and Keonjhar. Thus one can infer from the above analysis that
OGB has not done enough to attract women beneficiaries.
VI. Findings of the study
For the poor and vulnerable, financial inclusion is very much required. However, the
demand side must be fulfilled with the supply of facilities. The demand side comes from
the customers and it is well known that they are having no/little access to institutional
finance. For this purpose, the significance of PMJDY from demand view point is analysed
by taking the beneficiaries into account. Similarly the supply side view is taken by collecting
the views of the bankers.
6.1 Demand side view
For the study, a random sample of 100 women beneficiaries of PMJDY were chosen from
two slums in Bhubaneswar -one from unit-8 and the other from unit-3-to have a cross
section data for demand view point. Here it is not restricted to the two banks mentioned
earlier primarily because they could not identify the names of banks clearly. Rather
everybody showed the pass books issued to them. All of them are working in informal
sectors. 80 of them are working as domestic helps. Rest twenty are engaged in laundry
work and part time cooking etc. Each woman has some sort of independent income. The
average earning of the sample is around rs 2500 p.m. Out of one hundred respondents 79
were illiterate; 16 were literate and 5 were having education level of primary and above.
The age of the women varies between 17 to 55. Eighty five of them are married.
To test the awareness of these women a number of questions were asked based on the
features of PMJDY. Table 4 analyses the percentage of beneficiaries responding to various
features across different educational levels. It was found that only three features i.e
interest on deposits, no minimum balance required and DBT facilities are well understood
by all of them irrespective of education level. However, regarding the other questions the
response was not very clear. Almost all of them are ignorant about the eligibilities required
for availing the benefits. The correlation between literacy and awareness is not at all
there.

Orissa Economic Journal, Vol. 47, No. 1, Jan-June 2015 : 157
Table 4: Response of the women beneficiaries to different features of PMJDY (Demand
Side) in %
Sl Features illiterate literate Primary and total
No above
1 Interest on deposits 100 100 100 100
2 No minimum balance required 100 100 100 100
3 Overdraft of rs 5000 100 100 100 100
(i) do you know the conditions 0 12.5 40 4
4 Rupay debit card 94.94 75 100 92
5 Life insurance cover of rs 30000 88.61 93.75 80 89
(i) do you know the conditions 0 6.25 20 2
6 Easy transfer of money across India 63.29 62.5 80 64
7 DBT facilities 100 100 100 100
8 Accident insurance of one lakh 77.22 68.75 60 75
(i) do you know the conditions 0 6.25 20 2
9 Operation of account for minimum 6 months 0 0 20 1
10 Access to pension and insurance product 0 0 0 0
11 What prompted you to open? 0 0
(i) Advised by bankers 69.62 25 20 60
(ii) T.V 18.99 56.25 60 27
(iii) Demonstration effect 11.39 18.75 20 13
Source: Field Report
One of the most important facts found was that a majority of them were motivated by
bankers to open accounts. It can be inferred that the priorities of these schemes are to
fulfil the target rather than making them aware about the benefits they are going to derive
and the procedures required to avail of the benefits. No-minimum balance account and
financial inclusion are not necessarily correlated. This is rather a target fulfilling objective
of the bankers. Similarly being literate is not enough to be financially aware. On the other
hand, regular advertisements on news paper and on TV have made them more
knowledgeable at least in one factor i.e. that they cannot be refused by any bank to open
account with slightest deviation from norms which is a positive sign. On the other hand 92
of them said that various advertisements on TV and newspapers made them think that
benefits will be sanctioned to them once they open the accounts. Thus the modalities and

158 : Orissa Economic Journal, Vol. 47, No. 1, Jan-June 2015
conditions for operation of such accounts and the subsequent benefits that would be
accrued to them are not known to them. In this respect the purpose of financial inclusion
of the women beneficiaries is defeated.
6.2 Supply side views
The supply side views are analysed by taking the experiences and opinions of fifty bankers
across different grades of two banks. Bankers of both the banks have successfully executed
the scheme However, there are major differences between the two in terms of cost,
technical knowhow, infrastructure facilities, credit risks and lack of manpower. On the part
of SBI, it is not a difficult task to open accounts as they are using the B.C. (business
correspondent) model and outsource the task to the B.C’s known as bank Mitrs. The Bank
Mitrs, on their part, engage the local unemployed youth who are familiar with local people’s
habits and customs to open accounts in CSPs (customer service points).
On the other hand, in spite of the fact that the penetration of RRBs is basically rural, the
bankers from OGB are finding it difficult as they do it by themselves. Cost factor is also a
major hindrance as it was found out that the RUPAY cards had not been issued by OGB (only
around 1% of total accounts has been issued Rupay cards) due to the fact that different
firms have quoted prices not viable for them. As against this ,Rupay card issued as a
percentage of total number of accounts is 86.83% for SBI. For almost all bankers it is a part
of social responsibilities. Lack of proper education to understand the minimum financial
transactions have made them apprehensive about the scheme.
Table5: Supply Side response to PMJDY by Bankers (in %)
Opinion SBI OGB TOTAL
Social responsibility 96 80 88
lack of manpower 24 92 58
Lack of infrastructure facilities 40 96 68
Credit risk 84 84 84
Lack of technology 32 84 58
Credit counselling 72 92 82
Preference of overdraft to women 76 64 70
Source:Opinion poll survey
Table 5 gives an account of responses by the bankers to the different parameters in
percentages. It is found that for a smaller bank like OGB lack of manpower, lack of technology
and lack of infrastructural facilities are most important constraints compared to SBI. On

Orissa Economic Journal, Vol. 47, No. 1, Jan-June 2015 : 159
the other hand, for credit counseling the percentage is higher for OGB. Thus, it may be
inferred that OGB has been relatively more successful in making the beneficiaries aware
of the credit and insurance related features of PMJDY.
VII. Summary, Conclusion and Policy prescriptions
The aim of the study was to look at the financial penetration of PMJDY for women in
Odisha. For this purpose commercial banks were chosen .One public sector bank and one
regional rural bank were chosen as these banks compared to other banks have a better
spread in Odisha. In our study SBI represents the public sector bank and OGB represents
RRBs as they have wide coverage in terms of branches, deposits and advances.
One finds that huge number of accounts in commercial banks have been opened under
PMJDY. Features of PMJDY are designed in such a way so as to empower the poor and
vulnerable in general and women in particular. The bankers in our sample substantiated
this concept as 70 percent of them are in favour of advancing loans to women. However,
from the demand side it was found that the women do not know enough of this scheme to
take advantage of the programme.
Given the lower penetration of formal credit and recourse to money lenders what matters
is the availability of credit to women. Assuming that the urban women are more articulate,
the finding implies that the poor and working class women beneficiaries are yet to know
much about the intricacies of PMJDY. Thus one may infer that the picture might be worse
for rural women. In this respect financial empowerment of women is still a distant dream.
For example, one of the conditions to be eligible for additional financial services is that
the account should be operative at least for six months. If any account holder with zero
balance is not aware of this, he/she will be out of the financial system. Without proper
support system accompanying the scheme, the women of Odisha would lag behind their
counterparts in other states.
The following suggestions are made on the basis of the present study.
1) The frequency and intensity of meetings between bankers and beneficiaries should be
increased to create demand for financial products and services. Active Rupay cards and
operation of accounts as the prerequisites for availing of any further benefit should be
clearly conveyed to the beneficiaries. Here the role of electronic and print media is
very important.
2) Regional Rural Banks should emphasise on taking more women into their fold. Our data
shows that the percentage of women account holders is very less for these banks.
3) Public Sector banks will have to launch a massive campaign to create full awareness

160 : Orissa Economic Journal, Vol. 47, No. 1, Jan-June 2015
among the beneficiaries and improve the level of financial literacy. Our data show that
the percentage of zero accounts is very high reflecting the low level of awareness.
4) Banks must focus on mobilization of savings by motivating the women beneficiaries
and extending hassle-free bank credit in the lines of SHG-Bank linkages.
5) Banks should perceive financial inclusion as a business opportunity rather than a
compulsion and use it as a means to expand resource base of the country’s financial
system, protect low income group from being exploited.
Finally, if it was the UPA government who has called DBT programme a game changer in
2012, it is now the turn of Modi Government to call PMJDY a game changer. What is clear is
that it is a game. What is not clear is that whether India’s unbanked poor-the pawns in
these games -will benefit in future or not. Women’s’ participation in financial inclusion is
long way to go and only time will test the effectiveness of PMJDY scheme.
References
1. Dharitri, dt 19/2/2015.
2. Governrnent of India, Department of Financial Services, Ministry of Finance, New
Delhi.
3. Governrnent of Odisha, Odisha Economic Survey, 2013-14, Planning & Coordination
Department, Bhubaneswar.
4. Khuntia, Sashikanta, Dr.Sangeeta Mohanty & Rashmi Ranjan Mohapatra,” Financial
Inclusion and Challenges before Bankers-A Case of Odisha State of India”,
International Journal of Research in Management & Business Studies (IJRMBS 2014),
Vol. 1 Issue 4 Oct. - Dec. 2014,
5. Mohanty, Deepak.”Role of Banks in Odisha’s Development”, seminar organized by
The Political and Business Daily, Bhubaneswar on August 20, 2012.
6. Rangarajan Committee, (2008), Committee formed under the chairmanship of C.
Rangarajan.

Orissa Economic Journal, Vol. 47, No. 1, Jan-June 2015 : 161
Financial Inclusion: A Catalyst to Economic Growth of Odisha
P K Mishra1
Avirup Mukerjee2
Financial inclusion has become one of the critical aspects in the context of inclusive
growth and sustainable development in a developing state like Odisha. Financial sector
stability and thus, development attained through financial inclusion can break the vicious
circle of poverty, and take away the people at the bottom of the pyramid. In the long-
run, financial inclusion through its multiplier effects, would enable people of the state
to invest in better nutrition, housing, health and education, and would help generating
larger employment opportunities, reducing inequalities, and would help removing
poverty. Thus, the government needs to create an enabling environment for banks and
financial institutions to work effectively for achieving greater degree of financial
inclusion in the state. The banks and private players in turn need to move beyond
treating this, an obligation and recognize and appreciate the business potential of
tapping into yet underserved areas and design appropriate and innovative products
and business models. In achieving financial inclusion in the state, the role of social
sector and more importantly the technology should not be underestimated. In this
context, this paper is an attempt to advocate for financial inclusion as a catalyst to
long-run economic growth of resource rich Odisha.
Key words: Financial Inclusion, Inclusive Growth, Odisha
1. Introduction
Since last few decades a consensus has been developed that the financial system can
serve as a catalyst to economic growth and development of a nation. Strong and robust
financial institutions are the pillars of economic growth, development and prosperity of
modern economies (Rao and Bhatnagar, 2012). The formal financial channels collect savings
and idle funds and distribute them to entrepreneurs, businesses, households and
government for investment projects and other purposes with the view of a return. In this
way financial system plays the role of intermediation and acts as a buffer in the mobilization
1 Assistant Professor in Economics, Central University of Jharkhand, Ranchi, E-mail: [email protected]
2 Research Scholar in Economics, Central University of Jharkhand, Ranchi, E-mail: [email protected]

162 : Orissa Economic Journal, Vol. 47, No. 1, Jan-June 2015
and allocation of savings for productive activities in an economy. Precisely, managing the
financial liquidity to avoid inflationary pressures and to flush out enough liquidity to sustain
the growth are the main functions of financial systems among others. Realizing this
importance of financial sector in bringing about a balanced sustainable inclusive growth,
the architects of Indian economy strived to focus on financial inclusion – a key driver for
economic development at national level and economic empowerment at an individual
level as a human right of the modern age (Lewis, 2007)1.
Amartya Sen (2000) persuasively reiterated that poverty is not merely insufficient income,
but rather the absence of wide range of capabilities, including security and ability to
participate in economic and political systems. Consequently, the poor and deprived are
required to be provided with much needed financial assistance in order to cruise them out
of their conditions of poverty. Accordingly, there should be an appropriate policy support
in channeling the financial resources towards the economic upliftment in any developing
economy. Financial inclusion is intended to connect people to banks with consequential
benefits, ensuring that the financial system plays its due role in promoting inclusive growth.
Financial inclusion is considered as the process of ensuring access to appropriate financial
products and services needed by vulnerable groups such as weaker sections and low-
income groups at an affordable cost in a fair and transparent manner by mainstream
institutional players. The purpose of financial inclusion is to provide equitable opportunities
to every individual to avail the facility of formal financial channels for better life, better
living, and better income. Financial inclusion is, thus, a policy support which has been
designed to provide essential financial assistance to the people at the bottom of the
pyramid in order to sail them out of their conditions of poverty.
Financial inclusion promotes thrift and develops the culture of savings and also enables
efficient payment mechanism by strengthening the resource base of financial institutions
which benefit the economy as ample resources become available for efficient allocation
among productive avenues. Thus, financial inclusion has significant potential as a means
of achieving inclusive growth. In a developing nation like India, poor people are more
vulnerable because their major problems arise from the need for finances. The formal
banking services, by exploiting economies of scale, and making judicious use of targeted
subsidies may reduce or eliminate market imperfections and facilitate financial inclusion
of the poor, ultimately leading to higher incomes. The access to financial services by poor
people would lead to their consumption smoothing and investments in health, education
and income generating activities, thus, expanding growth opportunities for them (Dixit
and Ghosh, 2013).

Orissa Economic Journal, Vol. 47, No. 1, Jan-June 2015 : 163
Financial exclusion leads to social exclusion. The excluded sections of the society comprise
marginal farmers, landless labourers, self employed in informal and unorganized sectors,
urban slum dwellers, migrants, ethnic minorities and a chunk of senior citizens and women.
Access to a well-functioning financial system, by creating equal opportunities, enables
economically and socially excluded people to integrate better into the economy and actively
contribute to development and protects themselves against economic shocks. Access to
finance by the poor and vulnerable groups is a prerequisite for poverty reduction and
social cohesion. It is, thus inferred that financial inclusion increases the amount of available
savings, increases efficiency of financial intermediation, and allows for tapping new
business opportunities thereby improving the socio-economic standards of people
(Banerjee and Francis, 2014).
It is with this backdrop, this paper is an attempt to examine the role of financial inclusion
as a catalyst to economic growth of Odisha, a rich state of emerging India amidst poverty.
The rest of the paper is organized as follows: Section 2 reviews the relevant extant literature;
Section 3 makes the discussion of the linkages between financial inclusion and economic
growth; Section 4 makes an analysis of the performance of financial inclusion plan in
Odisha, spells out the reasons for its sluggish stance, and also comes out with viable
suggestions; and Section 5 concludes.
2. Literature Review
At the outset, a large body of existing literature on financial economics identifies the
possible reasons for financial exclusion. The people with low income and living in rural/
remote areas are outside the ambit of formal financial system due to strict identity
requirements by financial institutions (Collard et al., 2001; Connolly and Hajaj, 2001),
stringent terms and conditions (Caskey, 1997; Kempson et al., 2000); high transactions
costs, refusal by banks (Bayot, 2002; Belsky and Calder, 2004), physical access problems
caused by bank closure (Caskey, 1997; Kempson et al., 2000), psychological and cultural
barriers, social security problems (Kempson et al., 2004), lack of secured and profitable
financial products (Kempson and Whyley, 1999), and proper financial literacy (Kempson et
al., 2004; Wallace and Quilgars, 2005). Thorat (2007) has highlighted the reasons like hilly
and sparsely populated areas with poor infrastructure, lack of awareness, low income/
assets, and social exclusion, illiteracy, distance from branch, branch timing, tedious
documentation procedures, unsuitable products, language, staff attitude and requirements
of independent documentary proof of identity and address etc. for widespread financial
inclusion in India. Regarding the extent of financial exclusion in Indian states, Mohan
(2006) provides the facts as in Table-1. Financial exclusion causes a number of socio-
economic and other problems such as poor means of livelihood, bad education and health,
worst social security, unemployment, inequality and poverty (Mishra, 2014a).

164 : Orissa Economic Journal, Vol. 47, No. 1, Jan-June 2015
Extent of Financial Exclusion Indian States
Above 75% Meghalaya, Arunachal Pradesh, Uttarakhand, Assam,
Mizoram, Manipur and Jharkhand
Between 50% - 75% Bihar, Chhattisgarh, Himachal Pradesh, Jammu & Kashmir,
Nagaland, Odisha, Sikkim, Tripura and Uttar Pradesh
Between 25% - 50% Karnataka, Kerala, Madhya Pradesh, Maharashtra, Punjab,
Rajasthan, Tamil Nadu and West Bengal
Below 25% Andhra Pradesh
Source: Mohan, Rakesh (2006)
Thus, it has been conceived, perceived, and observed that financial inclusion can be a
catalyst to socio-economic development that can effectively and efficiently overcome the
major social problems of unemployment, inequality and abject poverty. Empirical evidence
using household data indicates that access to basic financial services such as savings,
payments, and credit can make a substantial positive difference in poor people’s lives
(Caskey, Duran, and Solo 2006; Dupas and Robinson, 2009). Sameer (2009) emphasized on
the scaling up the access to finance for India’s rural poor through viable and cost effective
Business Correspondence model of financial inclusion policy. Joshi (2011) by emphasizing
the role of financial inclusion in the process of poverty alleviation, agriculture, industry,
infrastructure and human resource development, suggests that banks should not merely
provide access to financial services, but at the same time should work to generate capacity
within population to prepare themselves for development.
Karmakar, Banerjee, and Mohapatra (2011) make out a strong case for considering financial
inclusion from a much broader perspective, and argue that the objective should include
meeting not just micro-credit needs, but also micro-insurance to cover emergencies,
besides providing regular pension by way of old age security. This demand side analysis is
presented in the study in general terms as well as with particular reference to farmers and
tribal people. As for the supply side, they look at different models of providing financial
services such as Business Correspondents and Facilitators; the Regional Rural Banks; and
the Post Offices.
Kuppan (2012) argued that financial inclusion is a great step to alleviate poverty in India,
and to achieve this, the government should provide a congenial environment in which
banks are free to pursue the innovations necessary to reach the unreached and still make
Table-1: Extent of Financial Exclusion in Indian States

Orissa Economic Journal, Vol. 47, No. 1, Jan-June 2015 : 165
profit. In this connection, Srinivasan (2012) prophetically advocated that there are posts of
gold at the bottom of the pyramid; banks can see long term profitability by looking at it
rather than at the top. So, financial inclusion is not only a profitable business model for
banks, but at the same time a policy stimulant for achieving inclusive growth.
Sahu (2013) in an empirical study found that the low rate of financial inclusion in Indian
states is due to low rate of growth of per capita net state domestic product. Dixit and
Ghosh (2013) in a study argued that for achieving inclusive growth there is a need for
resources, and for resource generation and mobilization efficient and transparent access
to financial services is a must, and this can be accomplished through financial inclusion. In
a similar study Banerjee and Francis (2014) emphasized that access to basic banking services
provides congenial conditions for growth of individuals, households and private
institutions, and thus, a sustainable socio-economic development can be simultaneously
achieved alongside financial inclusion. Shyni and Mavoothu (2014) emphasized on the
pivotal role of formal financial institutions, NGOs and SHGs for inclusive growth through
financially including the low income and weaker section of the population.
However, studies concerning the role of financial inclusion in the economic growth of
Odisha are a few. Mohanty (2013) argued that financial inclusion is an inevitable means of
achieving rapid economic development in Odisha. He said that socio-economic
underdevelopment is due to financial exclusion, and addressing financial exclusion
requires a holistic approach that creates awareness about financial products, education
and advice on money management, debt counseling, savings and affordable credit – the
various dimensions of financial inclusion. Sahoo (2013) found the evidence of 70 per cent
success of the use of accounts with banks and post offices in Odisha for the wage payment
under MGNREGA as a means to accelerate the pace of financial inclusion especially in rural
areas. Subudhi and Nishanka (2012) advocated for the tribal banking as an effective means
of achieving greater degrees of financial inclusion in Odisha. Mishra (2014a) examines the
role of financial inclusion in contributing to inclusive growth of Odisha, and suggests that
a proper banking policy, financial literacy plans, and projects on micro pension and micro
finance can go a long way in making the State a stable, industrialized and developed one.
It is, therefore understood that financial inclusion is essential for fostering economic
growth in a more inclusive fashion in an emerging state like Odisha. For financial inclusion
to promote growth, the policy objective should move from ‘opening an account’ in banking
and non-banking sectors to developing the habit of regular savings, and finally to a
relationship which enables the borrower to access credits on regular basis mostly for
productive purposes.

166 : Orissa Economic Journal, Vol. 47, No. 1, Jan-June 2015
3. Financial Inclusion and Economic Growth
Financial inclusion is integral to the inclusive growth process, and sustainable development
of a country. Financial inclusion gives the poor the resources to migrate for better jobs,
invest in entrepreneurship, and insure themselves against bad times, and economic shocks.
Thus, financial inclusion is a new paradigm of economic growth which plays a major role in
driving away the poverty (Mishra, 2014b). Financial Inclusion, which gained importance
since early 2000’s due to the findings about financial exclusion of nearly 3 billion people
across the world and its positive correlation with poverty, is fundamental to the social
agenda of reducing poverty and income inequality (Bhasin and Thenmozhi, 2014). In India,
financial inclusion as policy initiative came into being in 2005. Since then it has been
implemented as a flagship policy in the country.
The 11th Plan period of India emphasized on the importance of faster, sustainable and
more inclusive growth of the country thereby reducing poverty, creating employment
opportunities, enhancing access to health and education, and providing for environmental
sustainability. All these called for including people from all the strata of the society in the
mainstream of the financial system and hence, economic system of the nation. Access to
a well-functioning financial system, by creating equal opportunities, enables economically
and socially excluded people to integrate better into the economy and actively contribute
to development and protects themselves against economic shocks.
Financial inclusion is thus, a policy initiative to achieve the inclusive growth provided it is
supported by various factors like real initiatives from banks and financial institutions,
technological development, financial literacy and so on. In order to address this issue,
there can be three approaches: (i) the strategies of financial inclusion should be such that
savings, including small savings, are effectively mobilized and channelized through a formal
financial system and converted to investments for sustainable and inclusive growth; (ii)
easier and safer access to various financial services such as accumulating savings, availing
credit facilities, making investments, and other financial transactions, provide some
economic opportunities to vulnerable populace of the nation thereby alleviating the
menace of poverty; and (iii) financial inclusion can contribute to inclusive growth of the
country by facilitating the transfer of funds directly to the accounts of the beneficiaries of
flagship programs of government of India such as National Rural Employment Guarantee
Programme, Social Security Programme, etc. thereby permanently solving the problems
of procedural complexity of cash payments, unnecessary delay, leakages of money before
reaching the hands of the beneficiaries, high transaction costs, etc.
So, it is highly essential that the financial inclusion plan should be a success. There can be

Orissa Economic Journal, Vol. 47, No. 1, Jan-June 2015 : 167
a three dimensional approach which is required for the success of financial inclusion in
Odisha – first, there should be the availability of transparent, fair and affordable products
and services which enable households to save, borrow and invest; second, there should
be a responsive policy framework which promotes fair products and services and eliminates
harmful ones; and third, there should be a broad-based delivery system which connects
low-income households with high-quality services. Then only the sweet fruits can amuse
everyone interested to grow with others.
4. Financial Inclusion in Odisha
The economy of Odisha is predominantly agrarian and rural-oriented. Prevalence of acute
and persistent poverty had characterized the economy of Odisha in the past. The recurrent
events of natural calamities have further exacerbated the distress of the people, particularly
the weaker sections of the society such as small and marginal farmers and landless
labourers. A large number of rural communities are physically excluded for want of
connectivity and other infrastructural support. The rural people depend mostly on
agriculture to eke out their subsistence. However, agricultural growth in Odisha is virtually
stagnant and employment opportunities are rather limited. The state has a fairly well
spread structure of banks with one branch of commercial bank for around 17 thousand
persons on an average. In spite of this, many people in both rural and urban areas do not
have access to the banking system, and they lack proper awareness of the banking products.
As per Census 2011, out of the 96,61,085 households of Odisha, 43,51,103 (nearly 45%)
have availed banking facility. In rural areas, out of 81,44,012 households, 33,40,993 (about
41%) and in urban areas, 10,10,110 of 15,17,073 households (66.6%) have access to banking
services. Others are simply financially and hence, socially excluded.
In the State, there are several reasons why people are financially marginalized. In remote,
hilly and scarcely populated areas with poor infrastructure, physical access itself acts as a
deterrent. Lack of awareness and low income, are the causes of social exclusion. Illiteracy
acts as barrier for financial inclusion. Distance from the branch, the stipulated timings,
cumbersome documentation and procedures, unsuitable products, language, staff attitudes
are the common reason of exclusion. It also makes it difficult to arrange the independent
documentary proof of identity and address for transacting through a bank account especially
for poor migrants and slum dwellers. Thus, achieving financial inclusion is the primary
objective which has multiplier effects in terms of increased economic activity, greater
employment opportunities, reduced inequality, better income, health and education. All
these can be instrumental for the upliftment of marginalized sections of the society.

168 : Orissa Economic Journal, Vol. 47, No. 1, Jan-June 2015
The highlights of the progress of financial inclusion plan in Odisha are as follows. The
number of Bank Branches in Odisha up to June 2014, has increased to 4338 recording a
growth rate of 12.9% over the corresponding period of last year. Out of this, 2372 branches
are in rural areas, 1150 branches are in semi-urban areas and 816 branches are in urban
areas. The deposit has also increased to RS.1,70,527.24 cr recording a growth of 13.66%
over last year for the same period. Though the advances in priority sector have been 57%
as of June 2014 against national norm of 40%; still there is a decline in percentage of
priority sector advance to the total advances given by banks. The banks in Odisha have
made provision for banking facilities in 1877 unbanked villages having population of more
than 2000 by March 2012. Of these, 54 villages are covered through bricks and mortar
branches, 7 villages through ultra small branches, 1740 villages through appointment of
Business Correspondents and 83 through mobile vans. In addition, 1502 villages with
population between 1600 and 2000 were identified for banking facilities by 2013. Similarly,
by March 2012, over 6 lakh No-frill accounts were opened and 24 financial literacy counseling
centres were also established. During 2011-12, over 10 lakh Kissan credit cards were issued.
Moreover, over 8000 Swarozgar credit cards and over 1000 Artisan credit cards were issued.
During 2011-12, over 58000 SHGs were made credit-linked. The State government has been
providing interest subvention on crop loans to farmers and term loans for agriculture as
well as short term and long term loans to fish and dairy farmers to provide institutional
credit to them at affordable rates. Table-2 clearly indicates the significance of banking
sector penetration in Odisha in promoting financial inclusion plan for inclusive growth of
the state.
Table-2: Financial Inclusion Achievements in Odisha (As on End-March, 2014)
Particulars Achievements in Odisha
Total No. of Branches 3,8602
(a) In Rural 2,189
(b) In Unbanked Villages 343
Total No. of Customer Service Points Deployed 5,189
Total No. of Banking outlets in villages with population > 2,000 3,086
(a) Through Branches 1,443
(b) Through BCs 1,621
(c) Through other Modes 22
Total No. of Banking outlets in villages with population < 2,000 18,365
(a) Through Branches 733
(b) Through BCs 16,360
(c) Through other modes 1,272
Total No. of Banking Outlets in all Villages 21,451
Total No. of BC outlets in urban Locations 55
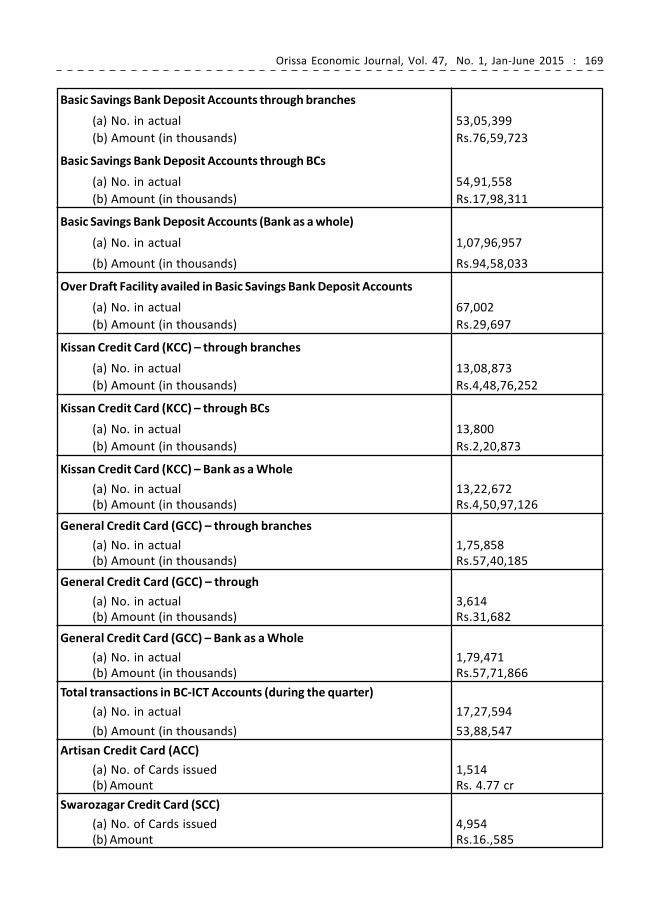
Orissa Economic Journal, Vol. 47, No. 1, Jan-June 2015 : 169
Basic Savings Bank Deposit Accounts through branches
(a) No. in actual 53,05,399
(b) Amount (in thousands) Rs.76,59,723
Basic Savings Bank Deposit Accounts through BCs
(a) No. in actual 54,91,558
(b) Amount (in thousands) Rs.17,98,311
Basic Savings Bank Deposit Accounts (Bank as a whole)
(a) No. in actual 1,07,96,957
(b) Amount (in thousands) Rs.94,58,033
Over Draft Facility availed in Basic Savings Bank Deposit Accounts
(a) No. in actual 67,002
(b) Amount (in thousands) Rs.29,697
Kissan Credit Card (KCC) – through branches
(a) No. in actual 13,08,873
(b) Amount (in thousands) Rs.4,48,76,252
Kissan Credit Card (KCC) – through BCs
(a) No. in actual 13,800
(b) Amount (in thousands) Rs.2,20,873
Kissan Credit Card (KCC) – Bank as a Whole
(a) No. in actual 13,22,672
(b) Amount (in thousands) Rs.4,50,97,126
General Credit Card (GCC) – through branches
(a) No. in actual 1,75,858
(b) Amount (in thousands) Rs.57,40,185
General Credit Card (GCC) – through
(a) No. in actual 3,614
(b) Amount (in thousands) Rs.31,682
General Credit Card (GCC) – Bank as a Whole
(a) No. in actual 1,79,471
(b) Amount (in thousands) Rs.57,71,866
Total transactions in BC-ICT Accounts (during the quarter)
(a) No. in actual 17,27,594
(b) Amount (in thousands) 53,88,547
Artisan Credit Card (ACC)
(a) No. of Cards issued 1,514
(b) Amount Rs. 4.77 cr
Swarozagar Credit Card (SCC)
(a) No. of Cards issued 4,954
(b) Amount Rs.16.,585

170 : Orissa Economic Journal, Vol. 47, No. 1, Jan-June 2015
2 JLG is a tool for extending credit to tenant farmers/oral lessees and share croppers for farming activities and
also non-farming sector.
3 The CRISIL Inclusix score, which was first time published in June 2013, constructed on the basis of branch
penetration, deposit penetration and credit penetration, indicates the overall improvement in the financial
inclusion.
Weavers Credit Card (WCC)
c) No. of Cards issued 7,999
(d) Amount Rs.17.66 cr
Joint Liability Group(JLG)2
(a) No. of Application disbursed 13,088
(b) Amount Rs.108.68 cr
SHGs – Bank Linkage Model
(a) No. of SHGs 6.20 lakh
(b) Savings of SHGs with Banks Rs.483.77 cr
(c) Bank Loan Disbursed to SHGs Rs.442.93 cr
Mission Shakti – Credit Linkage provided to Women SHGs
(a) No. in actual 36053
(b) Amount Rs.421.85 cr
Credit – Deposit (CD) Ratio 85.31 % (Benchmark is 60%)
(a) Rural 66.17 %
(b) Semi-Urban 44.33 %
(c) Urban 57.66 %
Advance to Weaker Section Rs.17,209.14 cr
Advance to Minority Communities Rs.2,601.35 cr
It is inferred that the banks are performing to the best of their efforts to provide financial
services to unreached in affordable costs, and looking at their penetration rate in the
state, it can be said that they might have seen the ‘Gold Post’ at the bottom of the pyramid.
As per CRISIL Inclusix3 scores, the Odisha has 43.3 point which indicates above average
level of financial inclusion in the state. As reported by SLBC, the domestic scheduled
commercial banks planned to open 2,361 brick and mortar branches in 2045 GPs of Odisha
during by end of March, 2015. Different banks have also been allotted Gram Panchayats for
setting up their branches. The state Govt. has agreed to provide 400-500 sq feet built up
space in Rajiv Gandhi Seva Kendra of uncovered GPs for opening of 4597 brick and mortar
branches free of rent for five years.
On 28 August 2014, Pradhan Mantri Jan Dhan Yojana has been launched in the State in order
to deepen financial inclusion. It is a mega financial inclusion plan with the objective of
covering all households in the country with banking facilities along with inbuilt insurance
coverage. The purpose is to accelerate growth, fight poverty effectively and to empower
the last man in the last row at the bottom of the pyramid (Khuntia, 2014). This scheme of

Orissa Economic Journal, Vol. 47, No. 1, Jan-June 2015 : 171
‘Mera Khata – Bhagya Vidhaata’ has been showing a satisfactory performance over the last
3 months. As on Nov 7, 2014, Finance Department Report says, 22.28 lakh accounts have
been opened in Odisha under Pradhan Mantri Jan Dhan Yojana – a comprehensive scheme
for financial inclusion of poor households. Maximum number of accounts has been opened
in the districts of Khurda, Cuttack, Balasore and Ganjam while minimum number of accounts
has been opened in Gajapati, Rayagada, Malkangiri and Boudh districts.
Despite all these initiatives, the financial inclusion strategy is showing a sluggish
performance in Odisha. There are several challenges in achieving total financial inclusion
in the state. These challenges are of structural, social and regulatory in nature. The structural
challenges are the branch expansion in rural unbanked areas. Human resource operation
in remote areas is not profitable for bank that is nearly adjusting 600 million new customers.
Offering a simple load product without proper security is the risk for bank management.
Processing capacity of the banks is also limited. Regulatory Challenges are to see the
followings : (i) viability, (ii) security, (iii) capacity, (iv) cash handling, (v) setting of local
service points, (vi) enrolment process – time consuming and identity problems, (vii) issue
of personalization cards, (viii) connectivity problems, (ix) reconciliation of transaction
with BC and CBS, (x) bank staff not confidant at operating level, (xi) BC-cum-technology
vendor is an ideal combination, (xii) prospective BCs are sitting on the fence and watching
others. Similarly the Social challenges are: (i) rural populace having inhibition to approach
bank branches, (ii) illiteracy of lower economy status so inhibition and (iii) lack of active
customer education campaign.
It is, therefore, foremost responsibility of the planners, policy makers and regulators to
create a congenial socio-economic-cultural-politico and technological environment which
shall substantially accelerate the pace of financial inclusion in order to achieve the long-
term goal of inclusive growth of Odisha. In this direction, the government plays a regulatory
and prescriptive role. However, government action is necessary, but not a sufficient
condition to address and tackle financial exclusion issues. The private sector and the social
sector have also an important contribution to make financial inclusion a great success.
Typically, financial inclusion agenda among banks and private sector has been driven more
by regulatory pressure than by profitable business models. Mainstream financial
institutions still perceive financial inclusion as an imposition and not as a viable business
opportunity. Banks need to look at low-cost innovative products and processes to turn this
into the next big business opportunity. Products/services that are relevant for the unbanked
remote or rural areas include insurance in order to absorb economic shocks like adverse
weather conditions, health emergencies, social insecurities, and products/services for
affordable credit keeping in view the seasonal inflow of income and remittances.
Further, banks and other financial institutions can also substantially contribute to inclusive

172 : Orissa Economic Journal, Vol. 47, No. 1, Jan-June 2015
growth through financial inclusion by reconfiguring their operations to partner with NGOs,
SHGs, and other community organizations to perform certain functions. NGOs and
community organizations can be effective and efficient outreach partners. Given their
deeper understanding of local communities, NGOs can become knowledge partners who
can help banks and other financial institutions in designing appropriate products and reduce
the associated risks. It is also noteworthy to mention the successful achievements by the
micro-finance movement and NABARD’s SHGs – bank linkage policy. Last but not the least,
NGOs role in imparting financial literacy to their beneficiaries cannot be overstated.
It is now high-time to understand that financial inclusion is no longer a policy choice, but
is a policy compulsion and banking is a key driver for inclusive growth. In order to make
financial inclusion a great success, the banks and other financial institutions should design
innovative financial products beneficial for the deprived sections of the State. Special
provisions and policy measure should be framed for promoting small savings and small
loans. The people should be encouraged to access banking and other financial services by
ways of no-frills account, financial inclusion campaign, business correspondents, and more
importantly through effective financial literacy programmes. Any government or social
security payments or payments under all the government schemes should be strictly routed
through the service area bank account. This will make people in rural areas to compulsorily
have an account in their service area branch to avail of the government benefit. The concepts
of micro insurance can a go a long way in making financial inclusion plan a big success
through its favorable impacts in the cases of crop failure, illness or death. It is, thus apparent
that addressing financial exclusion will require a holistic approach in creating awareness
about financial products, education and advice on money management, debt counseling,
savings, affordable credit and micro insurance.
5. Conclusion
Financial inclusion is a fundamental cornerstone of economic and social development. It
is an important step towards inclusive growth. It is not only considered beneficial for the
overall socio-economic development of the deprived sections of the community, but also
a business opportunity for the formal financial institutions including banks. Given the
dimension of the challenge and the diverse nature of the financially excluded segment in
Odisha, the responsibility of promoting financial inclusion lies equally on each stakeholder
of the financial inclusion ecosystem – government, banks, private and social sector. The
continuous developments in technology and its adaptability in Odisha offer a great solution
for effective penetration of financial inclusion plans to unbanked areas. Technology enables
the provision of a host of services from depositing money into various government schemes
to micro loans and micro insurance. Thus, from a policy perspective, two things may be
relevant. One is to broaden the domain of policy initiatives under financial inclusion,

Orissa Economic Journal, Vol. 47, No. 1, Jan-June 2015 : 173
which will reduce the dependency on informal source of financial services, particularly
credit. Second is to provide greater focus on vulnerable regions of the State in providing
access to financial services by which they are lagging. The planners and policy makers,
financial and non-financial institutions and technology providers can together found a
collaborative model to profitably address the social, moral and economic imperatives to
bring financial services available easily and at an affordable cost to the vulnerable and
poor strata of the society.
References
[1] Banerjee, S., and Francis, G. (2014): Financial Inclusion and Social Development, International
Journal of Scientific Research and Management, Special Issue, pp.13-18
[2] Bayot, B. (2002): Development of a Universal Banking Service: Access or Maintaining a Bank
Account. Namur: Alternative Financing Network, Namur (Belgium)
[3] Belsky, E., & Calder, A. (2004): Credit Matters Low-Income Asset Building Challenges in a
Dual Financial Service System, Joint Center for Housing Studies Working Paper Series, BABC
04-1, Cambridge, MA: Joint Center for Housing Studies, Harvard University.
[4] Bhasin, T.M. and Thenmozhi, (2014): Financial Exclusion, Financial Inclusion and Inclusive
Growth: Banking at the Doorsteps of a Common Man, International Journal of Marketing,
Financial Services and Management Research, Vol.3, No.11, pp.62-77.
[5] Caskey, J.P. (1997): Lower Income American, Higher Cost Financial Services, Madison: Filene
Research Institute.
[6] Caskey, J.P., Duran, C.R. and Solo, T.M. (2006): The Urban Unbanked in Mexico and the United
States, World Bank Policy Research Working Paper-3835, World Bank, Washington, DC.
[7] Collard.S, Kempson.E., and Whyley.C. (2001): Tackling Financial Exclusion, Bristol: Policy
Press.
[8] Connolly, C. and Hajaj, K. (2001): Financial Services and Social Exclusion Financial Services,
Consumer Policy Centre, University of New South Wales.
[9] Dixit, R., and Ghosh, M., (2013): Financial Inclusion for Inclusive Growth of India – A Study of
Indian States, International Journal of business Management and Research, Vol.3, No.1,
pp.147-156
[10] Dupas, Pascaline, and Robinson.J (2009): Savings Constraints and Microenterprise
Development: Evidence from a Field Experiment in Kenya.” NBER Working Paper-14693,
National Bureau of Economic Research, Cambridge, MA.

174 : Orissa Economic Journal, Vol. 47, No. 1, Jan-June 2015
[11] Joshi, D.P., (2011): The Financial Inclusion Imperative and Sustainable Approaches, Cambridge
University Press, New Delhi.
[12] Karmakar K.G, G. D. Banerjee, N. P. Mohapatra; (2011): Towards Financial Inclusion in India,
Sage Publications, New Delhi.
[13] Kempson.E and Jones.T (2000): Banking without Branches, London: British Bankers’
Association.
[14] Kempson, E., Caskey, J., Whyley, C. and Collard, S. (2000): In or out? Financial Exclusion: A
Literature Review, London: Financial Services Authority.
[15] Kempson.E and Whyley.C (1999): Kept Out or Opted Out? Understanding and Combating
Financial Exclusion, Bristol, Policy Press.
[16] Kempson.E, Atkinson.A and Pilley.O (2004): Policy level response to financial exclusion in
developed economies: lessons for developing countries, The Personal Finance Research
Centre, University of Bristol.
[17] Khuntia, R., (2014): Pradhan Mantri Jan Dhan Yojana: A New Drive towards Financial Inclusion
in India, Zenith International Journal of Business Economics and Management Research,
Vol.4, No.11, pp.10-20
[18] Kuppan, S., (2012): Financial Inclusion, The Management Accountant, Vol.47, No.1, January
2012; p-12.
[19] Mishra, P.K. (2014a): Role of Financial Inclusion in the Economic Growth of Odisha, in
Contemporary Issues in Business and Management, edited by Pavnesh Kumar, Himalaya
Publishing House, Mumbai, India
[20] Mishra, P.K. (2014b): Exclusion to Inclusion: An Economic Paradigm for India, FIIB Business
Review, Vol.3, No.4, pp.3-15
[21] Mohanty, P.C., (2013): Development through Financial Inclusion: A Study, Odisha Review,
September, pp.121-124
[22] Mohan, Rakesh (2006): Economic Growth, Financial Deepening and Financial Inclusion,
Speech at Annual Bankers’ Conference held on Nov 3, 2006 at Hyderabad, India.
[23] Rao, N.S. and Bhatnagar, H. (2012): Financial Inclusion: Issues and Challenges, Pacific Business
Review International, Vol.5, No.3, pp. 84-96
[24] Sahoo, M., (2013): MGNREGA and Financial Inclusion: An Inter-district Analysis of Odisha,
IOSR Journal of Humanities and Social Science, Vol.14, No.2, pp.54-61
[25] Sahu, K. K.(2013): Commercial Banks, Financial Inclusion and Economic Growth in India,
International Journal of Business and Management Invention, Vol.2, No.5, pp.1-6
[26] Sameer, K., (2009): Speeding Financial Inclusion, Academic Foundation, New Delhi, 2009

Orissa Economic Journal, Vol. 47, No. 1, Jan-June 2015 : 175
[27] Sen, Amartya, (2000): ‘Development as Freedom’, Anchor Books, New York.
[28] Shyni, V.K., and Mavoothu, D., (2014): Financial Inclusion: The Way towards Inclusive Growth,
International Journal of Advanced Research, Vol.2, No.2, pp.649-655
[29] Srinivasan, L., (2012): Financial Inclusion: Not just a CSR but a Viable Business Model for
Banks, The Management Accountant, Vol.47, No.1, January 2012; p-10
[30] Subudhi, M. and Nishanka, A.K. (2012): Organizational Structure of Tribal Bank: A New
Banking Operating System in Odisha towards a best Financial Inclusion, Working Paper,
SSRN-id2017553
[31] Thorat, Usha (2007): Financial Inclusion – The Indian Experience, Speech at DFID Financial
Inclusion Conference held on June 19, 2007 at Whitehall Place, London, UK.
[32] Wallace, A. and Quilgars, D. (2005): Homelessness and Financial Exclusion: A Literature
Review, Centre for Housing Policy, University of York, p.62

176 : Orissa Economic Journal, Vol. 47, No. 1, Jan-June 2015
Financial Inclusion among the Urban Tribal Households in Odisha:A Case Study of Jolli Munda Sahi Community, Khordha District
Dipti Ray1
Himanshu Sekhar Rout2
Financial inclusion is a prerequisite to economic development. It is an intervention
strategy of promoting inclusive growth by making available safe, easy and affordable
credit and other financial services to the unbanked poor, disadvantaged sections and
regions. The financial inclusion initiatives have been on the rise in a bid to have inclusive
financial system. The Scheduled caste, Scheduled tribes, and other disadvantaged and
lower income groups have been targeted by these initiatives as they mostly are found
to be out of the formal financial system. This study is undertaken to find out the level
of financial inclusion in terms of access and usage of financial services; and financial
awareness among tribal households in Jolli Munda Sahi, a community situated very
close to the city of Bhubaneswar. The study reveals that in spite of the availability of
financial infrastructure, around 40% of the total tribal households in the community do
not have a bank account. The usage pattern of the account holders is also very limited
due to lack of proper financial literacy among them. Lack of sufficient and regular
income, document requirement and lack financial awareness are found to be the main
reasons for involuntary financial exclusion of the tribal households.
1. Introduction
Financial Inclusion, an intervention strategy for promoting inclusive finance and inclusive
growth, is a prerequisite to economic development. An inclusive financial system by
connecting the unbanked households to the formal financial systems facilitates their
participation in the mainstream economic life and improves their financial condition and
living standard. It promotes welfare of the people by enabling them to create financial
assets, generate income and build resilience to meet macro-economic and livelihood
shock (Sarma, 2008; Khan, 2012). Financial inclusion is important because it is considered
as an important condition for sustain able growth (Subbarao, 2009). Financial inclusion
1 Dipti Ray, Assistant Professor of Economics , National Institute of Social Works and Social Sciences (NISWASS),
Bhubaneswar.
2 Himanshu Sekhar Rout, Reader in Economics, Department of Analytical and Applied Economics, Utkal University.

Orissa Economic Journal, Vol. 47, No. 1, Jan-June 2015 : 177
allows individuals and firms to take advantage of business opportunities, invest in their
education, save for retirement, and insure against systemic or idiosyncratic risks (Demirgüç-
Kunt, Beck, and Honohan, 2009). Empirical studies also show that access to finance allows
poor people to protect, diversify, and increase their sources of income which are the
essential routes out of poverty, and inclusive financial development can help poor
households in buffering sudden shocks to incomes and assets (Sen, 2010).
The promotion of financial inclusion first of all, requires an understanding of the issue of
financial exclusion. World Bank (2014) have clearly distinguished between two types of
exclusion such as voluntary and involuntary exclusion and very particularly told about
exactly what type of exclusion the financial inclusion drive needs to target. Voluntary
exclusion arises from the demand side which refers to the segment of the population or
firms that choose not to use financial services either because they do not need those
services or because of cultural or religious reasons. Some individuals or firms may be
involuntarily excluded from the financial system because they do not have sufficient
income. These two types of exclusion are not due to the market failure. Another category
of involuntarily exclusion group consists of the individuals and firms that are denied
financial services as a result of government failures or market imperfections. The objective
of the financial inclusion drive is to minimise the percentage of individuals and firms in
this category. Therefore the primary objective of financial inclusion is the minimization of
financial exclusion arising from market or government failures.
Rural areas have always remained a top priority in the financial inclusion drive as the
extent of financial exclusion is more widespread here with only 54.4 per cent of the
households are financially included against 67.8 per cent households in the urban area
(Census 2011). Though the magnitude of financial exclusion in urban area is less than that
of the rural areas, but a large number of urban poor specifically the slum-dwellers, migrated
tribal communities, informal sector workers etc. do not have access to even basic banking
facilities in spite of the availability of developed banking infrastructure in these areas.
The reasons for their exclusion are completely different from that of in the rural areas. The
people in the urban area are exposed to the availability of developed banking infrastructure
and thus are expected to have better financial awareness as compared to their rural
counterparts. Factors such as non-existence of bank branches, physical distance of the
bank, fixed and limited timings of the banks, which are the common reasons for financial
exclusion in rural areas, are not found here. They may also have a surplus to save because
of higher income than the people in rural area. Against this background, a study on financial
inclusion in an urban community situated amidst the easy availability of all banking
infrastructure would yield important clues to understand the nature and extent of financial
inclusion among these people. Again as the scheduled tribes are the most financially
excluded groups (63.68 per cent as per Rangarajan Committe on financial inclusion in 2008)

178 : Orissa Economic Journal, Vol. 47, No. 1, Jan-June 2015
in the country, the financial inclusion status of this group in an urban set up is worth to be
studied. In this context, the present paper examines the financial awareness, extent, and
usages pattern of financial services by the tribal households of Jolli Munda Sahi Community,
Bhubaneswar. The study also tries to identify the factors influencing the financial exclusion
of the tribal households in the community.
The study is based on primary data collected from Jolli Munda Sahi community, situated in
the city of Bhubaneswar, Khordha District. It is selected purposefully as it is the oldest
tribal community of the city. A census study of all the tribal households in the community
is done through a structured schedule during third week of February, 2015. From each
household, one respondent was selected for the interview preferably the head of the
households. Data analysis is done using descriptive statistics.
The paper is divided into six sections. Section 1 presented above introduces the study of
the importance of the problem, objectives and its methodological approach. Section 2
deals with the conceptual background of financial inclusion through a discussion of the
definitions, factors and initiatives of financial inclusion in India. Sections 3 and 4 presents
the financial inclusion status in India and Odisha respectively. Section 5 analyses and
presents the findings from the study area and section 6 gives policy suggestions and
conclusion basing on the results from the study area.
2. Concept of Financial Inclusion
Financial inclusion can be broadly defined as an economic state where individuals and
firms are not denied access to basic formal financial services. The Rangarajan Committee
(2008) defines financial inclusion as “the process of ensuring access to financial services
and timely and adequate credit where needed by vulnerable groups such as weaker
sections and low income groups at an affordable cost”. According to this definition, having
a bank account becomes is a very important aspect of financial inclusion. Further, financial
inclusion, apart from providing access to bank account should also include access to credit,
affordable insurance and remittance facilities, credit counselling and financial literacy.
Thus financial inclusion refers to universal access to a wide range of financial services at a
reasonable cost (The Raghuram Rajan Committee, 2008). Along with the provision of
financial products and services, financial inclusion drive also addresses the removal of
barriers in using these services. Hence financial inclusion, or broad access to financial
services, is defined as the absence of price or non-price barriers in the use of financial
services (World Bank Policy Research Report, 2008).
Most definitions of financial inclusion only discuss the access, dimension implying the
availability or the supply side of finance. However financial inclusion is a broader concept
which includes not only the supply side but the demand side as well. It is a multi-faceted
concept with a number dimensions such as access, usage and impact. Access is the ability

Orissa Economic Journal, Vol. 47, No. 1, Jan-June 2015 : 179
to use available financial services and products from formal institutions. A basic proxy for
access can be derived by counting the number of open accounts across financial institutions
and estimating the proportion of the population with an account. Usage focuses more on
the permanence and depth of financial service and product use. It requires more details
about the regularity, frequency, and duration of use over time and the data can be gathered
through a demand-side survey. And the impact of dimension is known by measuring
changes in the lives of consumers that can be attributed to the usage of a financial device
or service (Serrao et al, 2012; Hanning and Stefan, 2010).
Financial inclusion is determined by both the supply and demand side factors. Socio-
economic factors, factors relating to physical infrastructure and banking sector factors are
very closely associated with financial inclusion (Sarma and Pais, 2008). Geographical factors
and income inequality are also important in determining financial inclusion of a country
(Kempson and Whyley, 1998). The possibility of financial exclusion is more likely to occur
in the lower income section of society than amongst others. From the demand side the
barriers like low literacy levels, lack of awareness, knowledge and understanding of
financial products, Irregular income, frequent micro-transactions, lack of trust in formal
banking institutions, and cultural obstacles (e.g., gender and cultural values) are the factors
which obstruct the poor from having access to formal finance (Chakravarty 2012). Occupation
type and size of income have a strong link with financial inclusion.
Keeping in view the growing importance and the complexity of building an inclusive
financial system the Reserve Bank of India and the Government have been taking various
initiatives to expand the outreach of banking facilities and to increase the flow of credit.
RBI has adopted a liberal bank-led model for achieving financial inclusion and removed all
regulatory bottle necks in achieving greater financial inclusion in the country. The recent
focus on financial inclusion is the adoption of market oriented approach that should create
a win-win situation for both the supplier and the recipients. The importance of business
consideration of banks and other financial institutions side by side the promotion of
financial inclusion objective for the long-term sustainability of the process is the goal. The
broad strategy for financial inclusion in India in recent years comprises (i) encouraging
penetration into unbanked and backward areas and encouraging agents and intermediaries
such as NGOs, MFIs, CSOs and business correspondents (BCs) (ii) focussing on a
decentralised strategy by using existing arrangements such as State Level Bankers’
Committee (SLBC) and district consultative committee (DCC) and strengthening local
institutions such as co-operatives and RRBs; (iii) using technology for furthering financial
inclusion; (iv) opening of basic banking ‘no frills’ account; (vi) emphasis on financial literacy
and credit counselling; and (vii) creating synergies between the formal and informal
segments (Thorat, 2008). More recently the Pradhan Mantri Jan Dhan Yojana (PMJDY) by
the government is a key step in this direction.

180 : Orissa Economic Journal, Vol. 47, No. 1, Jan-June 2015
3. Financial Inclusion Status in India
In spite of several initiatives taken by the RBI and Government of India, the progress is not
satisfactory. The Financial inclusion status of India analysed from different sources shows
that though the country is progressing on the path but still a large sections of the population
are remaining excluded from the formal financial sector. As per Census 2011, 14.48 crore
(58.7%) households in the country have access to banking services. Of the total rural
households 54.4% have access to banking services whereas in urban areas 67.8% households
are having access. Similarly the NSSO 59th survey reveals that 45.9 million farmer
households in the country (51.4%), out of a total of 89.3 million households do not have
access credit, either from institutional or non-institutional. Of the total farmer households,
only 27 percent have access to formal sources of credit; one third of this group also borrowed
from non-formal sources. Overall, 73 per cent of farmer households have no access to
formal sources of credit. Across regions, financial exclusion is more acute in Central, Eastern
and North-Eastern regions. All the three regions together accounted for 64 per cent of all
financially excluded farmer households in the country.
CRISIL, a global analytical company, with support from Ministry of Finance, Government of
India and Reserve Bank of India developed an index to measure the progress of financial
inclusion in India. The index is known as CRISIL Inclusix which is based upon three tangible
and critical dimensions such as branch penetration, credit penetration and deposit
penetration. It’s a relative index on a scale of 0 to 100 with 100 indicating the maximum
score achievable. In June 2013, CRISIL first time published the Inclusix which presented
the extent of financial inclusion across 638 districts of India. The all-India CRISIL Inclusix
score is 40.1 which is relatively low and is a reflection of under-penetration of formal
banking facilities in most parts of the country.
Table 1: Financial Inclusion at Regional Level
Region Inclusix 2011 Inclusix 2010 Inclusix 2009
India 40.1 37.6 35.4
Southern Region 62.2 58.8 54.9
Western Region 38.2 35.8 33.9
Northern Region 37.1 34.8 33.3
Eastern Region 28.6 26.3 24.3
North East Region 28.5 26.5 23.8
CRISIL’s Inclusix 2013
The trend of the financial inclusion score presented in Table 1 shows that the level of
financial inclusion is consistently rising from 2009 at all India level and across all the regions.

Orissa Economic Journal, Vol. 47, No. 1, Jan-June 2015 : 181
But wide disparity exists in the financial inclusion scores across regions. The southern
region is far ahead of all other regions in the country in terms of financial access. All the
top five districts with highest inclusive score in the CRISIL’s index are from southern region
with 4 districts from Kerala. The top five scoring states in the Index are Puducherry,
Chandigarh, Kerala, Goa and Delhi; and the bottom five scoring states include Arunachal
Pradesh, Chhattisgarh, Bihar, Nagaland and Manipur. The distribution of 35 States and
Union territories of the country according to the CRISIL’s Inclusix score is given below:
Table 2: Distribution of States and Union Territories
Level of Financial Inclusion CRISIL’s Inclusix Score Number of States/UT
High > 55 11
Above Average Between 40.1- 55.0 4
Below Average Between 25.0- 40.0 17
Low < 25 3
CRISIL’s Inclusix 2013
4. Financial Inclusion Status in Odisha
The financial inclusion status in Odisha is not satisfactory. Only 4.35 million households
constituting 45% of the total households in the state are availing banking facilities with
41.2% in rural areas and 66.58% in urban areas (Census 2011). In CRISIL’s Index , Odisha
occupies 15th rank at 40.6 in the State wise Inclusix score with a Coefficient Variation of
0.23. However because of several initiates and improvement in the banking infrastructure
there is a progress of 7.2 percent in 2011 over 2009.
Table 3: Financial Inclusion Position of the State in the Inclusix
Position of State/District Inclusix Score Rank
2011 2010 2009 2011 2010 2009
In State wise Inclusix Score 40.6 36.7 33.4 15 18 18
In Top 50 Districts (Khordha) 75.1 72.4 64.0 21 22 34
Source: CRISIL’s Inclusix 2013
Among the top 50 districts of India in the Inclusix score , Khordha district of the State
occupies 21st rank with a score of 75.1. The district also shows a progressive change of
11.1% in 2011 over 2009. The district wise analysis of the financial inclusion status in
Odisha on the basis of the Inclusix score, given in Table 4 below, shows a variation in the
scores across the districts.

182 : Orissa Economic Journal, Vol. 47, No. 1, Jan-June 2015
Table 4: Financial Inclusion Status of the Districts of Odisha
Source- CRISIL’s Inclusix 2013
A majority 17 districts in the state fall under the below average category with the magnitude
of inclusion between 25 to 40 percent. Another 11 districts have financial inclusion within
40.1 to 55 percent falling under the above average category. Khordha and Nabarangpur
districts are the two extreme districts having high and low inclusion respectively. Mostly
the districts with higher concentration of tribal population fall under the below average
and low financial inclusion category.
5. Analysis and Findings from the Study Area
5.1 Profile of the study area
The Jolli Munda Sahi Community is situated 2kms from Patia, Bhubaneswar on the way to

Orissa Economic Journal, Vol. 47, No. 1, Jan-June 2015 : 183
Nandankan. It was set up during 1975-76 with migrated households from different parts of
the state such as Kandhamal, Mayurbhanj, Keoinjhar, Koraput, Baleswar, and Malkangiri
districts who came in search of employment and settled down here. The community
consists mostly of tribals and a very few households from non tribal communities. Out of
a total of 147 households, 104 (71%) are STs, 26 (17.6%) are SCs, 12 households (8%) are
OBCs and 5 households (3.4%) are from General category. Munda and Santhal are the two
major tribes found here. Total population of the community is 672 with 327 male and 345
female. Out of this 374 (56%) are in the age group 15 and above. The socio economic
condition of the people is very poor as they do not have a regular source of income. Most
of them work as daily labourers. Around 90% of the houses are Kutcha/thatched houses
with mud walls. The literacy rate is very poor in the community at only 39.7 %. Though
there is good sex ratio but so far as literacy is concerned females lag far behind (28.4%)
than the males (51.6%). There are two Self Help Groups (SHGs) functioning in the
community. There is easy availability of all types of financial infrastructure near by the
community. Almost all types of commercial banks such as State Bank of India, Indian
Overseas Bank, IDBI, Indian Bank, Bank of India, Canara Bank, and Dena Bank are functioning
within 2kms distance from the community and within 5 kms Axis Bank and Punjab National
Banks are operating.
5.2 Profile of Respondents
A complete enumeration of the entire tribal household was done to know about their
financial inclusion status. A total of 104 tribal household heads were interviewed for the
study comprising 77% of males and 23% of females. Around 68% of the households are
having a family size of 4 to 6 members. The education profile of the respondents shows
that 40 of the total household heads are illiterate whereas 38 have completed primary
education. As regards to occupation 81% are daily wage earners who are mostly employed
as industrial, construction and household workers. But they do not get work throughout
the month. They Around 15 to 20 days in a month they work and rest of the days they
engage themselves in Handia preparation in the community. There are two households
who prepare bamboo baskets. 6.7% of the household heads are salaried employed. Two of
them work as peons in Government Press and Secretariat. Another five work in private
organisations. Most of them (79%) have Kutcha/thatched houses. Around 45% of the
households’ reported their monthly income between Rs. 2500-5000 where as another 42%
said to have income less than Rs 2500/-. This clearly shows the poor economic status of the
tribal households in the community. Though they mostly belong to the lower income
group but because of non availability of BPL card they are not avail in a position to the
facilities. The profile of the respondents is presented in Table 5 given below:

184 : Orissa Economic Journal, Vol. 47, No. 1, Jan-June 2015
Table 5: Profile of the respondents
Figures in parenthesis denote percentages
5.3 Access to Banking Services
In spite of having a developed banking infrastructure, only 56% of the households in the
community have a savings bank account. Almost all the accounts are opened in the
commercial banks situated in the vicinity of their community. Around 42% of the account
holders had opened their accounts only recently in the month of November and December
2014 under the Pradhan Mantry Jan Dhan Yojana (PMJDY) scheme. Another 58% had savings
account earlier. A majority 62 % of the accounts are opened in the State Bank of India
followed by 19% in Indian Overseas Bank and 11% in the Indian Bank. Most of them have

Orissa Economic Journal, Vol. 47, No. 1, Jan-June 2015 : 185
submitted Voter card (77.6%) and Aadhar Card (11%) as proof of document in the banks.
There are multiple reasons reported by the respondents for having a bank account. A
majority of them (45.6%) have the perception that bank account is for keeping money safe
and secure followed by 24% for meeting the contingency requirement. Only 14% said the
reason as to borrow/ avail loans from the bank. Around 10% reported it to prevent extra
expenditure. Only a minimum of 4.4% said it for earning return on saving where as another
2.6% said it for availing other financial services such as money transfer and insurance.
None of them reported to hold account for getting benefit transfer from govt. Even the
account holders under PMJDY also do not know the benefits of holding an account under this
scheme. The reasons for holding a bank account is given in Fig.1 below:
Figure.1: Reasons for holding Bank Account
While asked about whether they faced any difficulty in opening their account, 26 % said they have
faced the difficulty such as filling of the forms, more time consuming and difficulty in arranging the
required documents. Distance is not a problem for them as most of the banks are available within
2 kms distance from their community which they walk out without any cost.
Figure 2:
Distance of the banks
Pe
rce
nta
ge
of
resp
on
de
nts
Less than 1 km 1 to 2 km 2 to 3 km 3 to 4 km 4 and above
Distance
36.2
1.7 3.4 1.7
56.9
To prevent extra expenditure
For Contingency requirements
Get Access to other financial services
To avail loan from banks
To earn return on saving
To keep money safe and secure
9.6
23.7
2.6
14
4.4
45.6

186 : Orissa Economic Journal, Vol. 47, No. 1, Jan-June 2015
5.4 Usage pattern and financial awareness
Even though 56% of the households owned a bank account, the usage pattern and awareness
about the banking services is very poor among the account holders. Not all the account
holders had ATM cum Debit cards, Credit cards and Cheque books with them. Only 58.6 %
of the account holders had ATM cards, 2 of them (3.4%) had credit card, only 8 (13.7%) had
cheque book and 5 of them reported using mobile banking. Out of the total ATM card
holders less than fifty percent (48%) only use it. Again among the ATM card users more
than sixty percent (63.8%) do not use the cards by themselves and take the help of others.
Similarly more than fifty percent (53%) of the account holders also do not know depositing
and withdrawing money by themselves and take the help of the existing bank staff, friends
and relatives.
Table 6: Usage Pattern of the Banking Services
Usage Pattern Yes No Total
Have ATM cum Debit Card 34(58.6) 24(41.4) 58(100.0)
Whether use ATM services 28(48.3) 30(51.7) 58(100.0)
Know how to use ATM 21(36.2) 37(63.8) 58(100.0)
Know Depositing/Withdrawing money 27(46.6) 31(53.4) 58(100.0)
Have Credit Card 2(3.4) 56(96.6) 58(100.0)
Use Mobile Banking 5(8.6) 53(91.4) 58(100.0)
Have Cheque Book 8(13.7) 50(86.3) 58(100.0)
Whether use Cheque Book 2(3.4) 56(96.6) 58(100.0)
Table 7: Frequency of using accounts
Frequency Respondents
Once in a month 38(65.5)
Every two months 8(13.8)
Every six months 8(13.8)
More than six months 4(6.9)
Total 58(100.0)
Only 13 respondents (12.5%) had taken loan from both formal and informal sources.
The sources from which loan was taken by the 6 bank account holders include SHGs (2),
banks (2) and money lenders (2) and for the non account holders credit unions (3) and
friends and relatives (4). While asked about the reason for taking loan from an informal
source while having access to a bank account, the respondents reported that it was difficult
to get loan from a bank because of lack of documents, collateral and guarantor. Among the
remaining 87.5% of the respondents who had not taken loan from any of the sources, a

Orissa Economic Journal, Vol. 47, No. 1, Jan-June 2015 : 187
majority 86% reported that they did not feel the need of taking loan while the rest 14%
said because of cumbersome official procedure and document requirements they were
not able to take loan even though they tried to avail.
5.5 Banking Awareness
A majority of the respondents with a bank account (76%) have a very poor knowledge
about the banking services while 5% of them completely lack the knowledge. On the
other hand out of the 46 respondents who did not have a bank account 89% completely
lacked knowledge about the banking services and products whereas 9 percent were very
poorly aware. This may be one of the reasons for them not having a bank account. Regarding
the banking service charges, internet banking, mobile banking, mortgaging procedure of
the banks etc. more than 90% of respondents with a bank account were either very poorly
aware or completely unaware. The figure was even higher for the non account holder
category with a larger concentration in the unaware category.
Table 8: Banking awareness

188 : Orissa Economic Journal, Vol. 47, No. 1, Jan-June 2015
5.6 Reasons for the financial exclusion
The respondents without a bank account gave multiple reasons for not opening an account
in a bank. The main reasons given by them are unemployment, lack of regular and sufficient
income (around 67% of the total responses). Thirteen responses are for lack of document,
and five of them said high cost and low interest rate on savings for which they did not have
a bank account. In addition to this two of them have also reported that they are voluntarily
excluded as they don’t find any advantage in having a bank account. Out of the respondents
who did not have a bank account, around 20% were using the account of others such as
their friends and relatives when they require. 91% of the respondents reported they feel
the need of having a bank account but not able to have because of the reasons cited above.
6. Major Findings
In spite of the availability of all types of banking infrastructure in the vicinity of the tribal
community of Jolli Munda Sahi, only 56% of them have access to a savings bank account.
Most of the accounts are only three to four months old which are opened under the PMJDY
scheme. The most common reason cited by the respondents for holding a bank account is
to keep money safe and secure and for meeting their future requirements. Due to lack of
literacy and financial awareness, even though they have opened the accounts but the
utilisation of the accounts is limited only to deposits and withdrawals. They are ignorant
about the banking products, services and the utilisation of these services. Neither any BCs
are operating in the community nor there is any financial literacy programme conducted.
More than half of the respondents do not know depositing and withdrawing money from
the bank and take the help of others such as friends, relatives and existing staff of the
banks. Only 48% use ATM service out of which 36% use by themselves and the rest take the
help of friends and relatives for using the card. Lack of income and a regular source of
employment are the main reasons for not having a bank account reported by the
respondents without having a bank account. All the respondents in a better income group
in the community from Rs. 5000 and above have owned a bank account. But much difference
is not found in the percentage of respondents with and without a bank account in the
lower income groups. Lack of awareness about the banking services may be considered as
an important factor here. Around 91% of the financially excluded respondents wanted to
have a bank account if they will be provided with all the necessary help in this regard and
if get a regular source of income. Some of them were also depending on their relatives and
friend’s account when feel the need. There is a serious lack of awareness about the banking
services and its utilization pattern among the respondents both with and without a bank
account.

Orissa Economic Journal, Vol. 47, No. 1, Jan-June 2015 : 189
7. Conclusion and Suggestion
The initiatives for financial inclusion are on rise to include the vast financially excluded
sections into the formal banking system. The overall financial inclusion status of the state
is improving with a score of 40.6 which lie just above the margin of above average category
of 40.1.One of the districts of the state has also placed in the 21st rank in the top 50 financially
included districts in the country. But a variation is there across the districts with a poor
financial inclusion status in the southern parts of Odisha dominated by tribal communities.
More attention should be given in spreading financial awareness and improving banking
infrastructure in these areas to achieve a better inclusive financial system in the state. The
situation of the tribal communities in the vicinity of an urban area with developed banking
infrastructure is also not satisfactory. Though more than fifty percent of the respondents
in the study area are having a bank account but the utilisation pattern is limited due to
illiteracy and lack of financial awareness among them. Merely having access to a bank
account without knowing the use and benefits thereof will not solve the purpose. Hence
steps should be taken by the Banks, Govt. and other stakeholders to spread banking
awareness in the community ; and BCs should also be appointed who can work from the
community by understanding their needs and challenges. The spread of education and a
regular source of income coupled with financial literacy programmes for the people will
definitely bring a positive change in the status financial inclusion among the tribal
households in the community.
References
Beck, T,Asli Demirgu¨c¸-Kunt, and Patrick Honohan (2009). “Access to Financial
Services: Measurement, Impact, and Policies” .The World Bank Research Observer (2009),
vol. 24, no. 1
Chakrabarty, K. C. (2012). “Financial Inclusion – Issues in Measurement and
Analysis”. Keynote Address at the BIS-BNM Workshop on Financial Inclusion Indicators at
Kuala Lumpur on November 5, 2012.
Hannig, Alfred and Jansen , Stefan(2010) . “Financial Inclusion and Financial S t a b i l i t y :
Current Policy Issues”. ADBI Working Paper Series. No. 259, 2010.
Honohan, P(2008). “Cross-Country Variation in Household Access to Financial Services.”
Journal of Banking and Finance 32(11): 2493-2500.
Kempson, E., C.Whyley, 1998. “Access to Current Accounts”, British Bankers’ Association,
London.

190 : Orissa Economic Journal, Vol. 47, No. 1, Jan-June 2015
Khan Harun R (2012). “Financial Inclusion In Indian Economy”. Symposium at IIPA,
Bhubaneswar, June 30
Kunt Aslý Demirgüç, Thorsten Beck, and Patrick Honohan (2008). “Finance For All? Policies
and Pitfalls in Expanding Access”. A World Bank Policy Research Report.
Rajan Raghuram G (2008). “The Committee on Financial Sector Reforms”. Government of
India
Rangarjan, C. (2008). “Report of the committee on Financial Inclusion”. Government of
India.
Sarma M & Pais J (2008), “Financial Inclusion and Development: A Cross Country Analysis”
New Delhi, 10-13 September
Sarma, M. (2008). “ Index of Financial Inclusion”. ICRIER Working Paper 215.
Sen, Kunal (2010). “Towards Inclusive Financial Development for Achieving the
MDGs in Asia and the Pacific” WP/10/07
Serrao, M. V., Sequeira, A. H. and Hans, B. V. (2012). “Designing a Methodology to Investigate
Accessibility and Impact of Financial Inclusion”. Accessed from http://ssrn.com/
abstract=2025521 on 3 May 2013.
Subbarao, D.(2009).”Financial Inclusion: Challenges and opportunities”.RBI Monthly
Bulletin
Swamy, P. M. Vighneswara (2011). “Financial Inclusion in India: An Evaluation of the
Coverage, Progress and Trends”. The IUP Journal of Financial Economics, 9(2) :8-26
Thorat Usha(2008). “Financial inclusion and information technology”. Keynote address at
the Vision 2020 – Indian Financial Services Sector, hosted by NDTV, Mumbai, 12 September
2008.

Orissa Economic Journal, Vol. 47, No. 1, Jan-June 2015 : 191
Infrastructure Development and Inequality in Odisha
Manoj Kumar Das1
Titiksha Das2
Infrastructure provides the services and facilities necessary for an economy to function.
Infrastructure yields indirect benefits through the supply chain, land values, small
business growth, consumer sales, and social benefits of community development and
access to opportunity. They work as intermediate inputs to production, raises productivity
and profitability and thereby permit higher levels of output, income and employment.
The role played by the infrastructural facilities cannot be overlooked while planning
and formulating specific regional policies. The present study established the relationship
between widening regional inequalities and distribution of infrastructural facilities across
the State of Odisha for a time period of 22 years from 1991 to 2013. In the first part of
the paper, three indices of infrastructural set up i.e. Physical Infrastructure Development
Index (PIDI), Social Infrastructure Development Index (SIDI), and Financial Infrastructure
Development Index (FIDI) are constructed and then their relative rankings at two
different points of time are obtained. In the second part we run regression analysis
between different infrastructural indices and poverty reduction rate. The major findings
of this paper revolve around two things- the specific dimension of infrastructure which
is important for the concentration of infrastructural activities in Odisha and infrastructure
activities are more significant in explaining the rate of poverty reduction.
Keywords: Physical infrastructure, social infrastructure, financial infrastructure,
Infrastructure Index, inequality, poverty.
1. Introduction
Infrastructure provides the services and facilities necessary for an economy to function. It
can be generally defined as the set of interconnected structural elements that provide a
framework supporting an entire structure of development. Infrastructure yields indirect
benefits through the supply chain, land values, small business growth, consumer sales,
and social benefits of community development and access to opportunity. Economists in
India have viewed that the lack of adequate infrastructure as perhaps the most important
supply-side constraint which has been responsible for the country’s growth below its
productive capacity. But perhaps the most significant impact of these infrastructural
1 Manoj Kumar Das, Lecturer in Economics Ravenshaw University, Cuttack
2 Titiksha Das, M.Phil Research Scholar, Ravenshaw University

192 : Orissa Economic Journal, Vol. 47, No. 1, Jan-June 2015
facilities has centered on worsening of regional inequalities within the state and country.
This is a matter of great concern.
Investment in infrastructure is part of the capital accumulation required for economic
development and has enormous impact on socioeconomic measures of welfare. The
causality of infrastructure and economic growth has always been in debate. In developing
nations, expansions in electric grids, roadways, and railways show marked growth in
economic development. However, the relationship does not remain in advanced nations
who witness more and more low rates of return on such infrastructure investments
(Fedderke et al., 2006).
Infrastructure can be broadly divided into two types depending on the nature of input
services i.e. physical and social. The former consists of transport (roads, railways, aviation,
waterways and ports), electricity irrigation, telecommunication, housing and water supply
.The social infrastructure consists of education, health, nutrition, sanitation, child care,
recreation and banking and other forms of financial facilities.
There are various reasons as to why both types of infrastructure are very important in an
economy. V. K.R.V. RAO opines “the link between infrastructure and development is not a
once for all affair, it is a continuous process and progress in development has to be
preceded, accompanied and followed by progress in infrastructure, if we are to fulfill our
declared objectives of self accelerating process of economic development.” So, provision
and maintenance of adequate infrastructure facilities are absolutely necessary if rapid
economic growth is to be achieved and sustained. Infrastructural facilities both economic
and social constitutes are the core of development strategy and efforts. Efficient and
affordable infrastructural services are key to the higher productivity and output growth.
The linkage between infrastructure and economic growth is multiple and complex, because
not only does it affect production and consumption directly, but it also creates many direct
and indirect externalities, and involves large flows of expenditure thereby creating
additional employment. Infrastructure affects output in two ways. One is the direct channel
where infrastructure increases the output by reducing the cost of intermediate goods. The
other channel is through externality effect (Patra and Acharya, 2011). The experience
across the world has shown that increase in stock of infrastructure is associated with the
increase in output and the quality of life of the people.
In view of the above the crucial role played by the infrastructural facilities cannot be
overlooked while planning and formulating specific regional policies and the present paper
is an attempt to in this direction to explore the infrastructural facilities and inequality
prevailing there off in the state of Odisha.

Orissa Economic Journal, Vol. 47, No. 1, Jan-June 2015 : 193
2. Materials and methods
To study the variation in infrastructural availability we have constructed infrastructure
indices for 3 different dimensions i.e. Physical Infrastructure Development Indices (PIDIs)
for physical infrastructure, Social Infrastructure Development Indices (SIDIs) for social
infrastructure and Financial Infrastructure Development Indices (FIDIs) for financial
infrastructure. The variables taken for construction of PIDI are Road length per sq. kms
(RL), Rail length per sq. km (Rail) (if it is available), Villages Electrified (VE) as a proportion
of total inhabited villages, and Teledensity (TD) (if the figures are available). The social
infrastructure is defined into literacy rate of different districts, hospitals per 10,000 persons
and General Colleges per 10,000 persons in a district. The purview of financial infrastructure
is very large here, we have taken three variables such as Credit-Deposit ratio (CD) of
Scheduled Commercial Banks, Bank Offices per 100,000 persons, and Post Offices per 100,000
persons. The Credit-Deposit ratio represents the financial lending operations of the banks
in the area and that is why we have included this one under financial infrastructure to
access the credit facilities in the area under financial infrastructure.
For the above variables data are collected from secondary sources such as for physical
infrastructure data are extracted from Basic Road Statistics, Infrastructure Statistics 2013
published by Ministry of Statistics and Programme Implementation, Railway Year Book,
publications of Central Electricity Authority, Statistical abstracts of Ministry of Agriculture,
Govt. of India. For social infrastructure data are extracted from Census Survey of India,
Ministry of HRD, and Selected Educational Statistics. For Financial infrastructure data are
collected from Reserve Bank of Indian website.
Here we analysed infrastructural indices for thirteen undivided districts of Odisha to avoid
confusion and unnecessary ambiguity. Because according to the administrative division of
1990 there were 13 districts instead of the present set up of 30 districts. So, in order to
avoid confusion, we clubbed of various new districts with their original 13 undivided district-
set-up of Odisha to make the comparison between 1991 and 2013 infrastructure facilities
ambiguity free.
Three composite indices of infrastructural indicators such as Physical Infrastructural
development Index (PIDI), Social Infrastructural Development Index (SIDI), and Financial
Infrastructural development Index (SIDI) are constructed with the help of Principal
Component Analysis (PCA). We use the Principal Component Analysis to assign weights to
each of the variables. It reduces the number of observed variables to a smaller number of
principal components which account for most of the variance in the observed variables.
PCA is used when the variables are highly correlated. Of the various linear combinations,
the first Principal Component, P1 (which we use to calculate our composite index) is the
one which accounts for the maximum possible proportion of the variance in the original
dataset. It means the first principal component is the linear combination of weighted

194 : Orissa Economic Journal, Vol. 47, No. 1, Jan-June 2015
facilities which explains the maximum of variance across the observation at a point in
time. If there are N variables such as X1, X
2, X
3 ..... X
n then P
1, P
2, P
3 ..... P
n are the N principal
components and ann
are the weights. Now the first principal component can be written as
a linear combination P1= a
11X
1 + a
12X
2 + a
13X
3 + ... + a
1nX
n. The rationale behind using PCA is
that it helps one to reach an aggregate representation from various individual indicators.
To verify the relationship between infrastructure development and poverty reduction
regression analysis has been done at two points of time namely 1991 and 2013 using the
following model.
PRt+1
= f (PIDIt, SIDI
t, FIDI
t,)
The model we will be testing for this equation is as follows:
Where
Yt+1
= refers to Percentage of poverty reduction in the period t+1.
X1t
= refers to Physical Infrastructure Development Index for the year t.
X2t
= refers to Social Infrastructure Development Index for the year t.
X3t
= refers to Financial Infrastructure Development Index for the year
2.1. Theoretical Underpinnings for Infrastructural Facilities
Investment on infrastructure increases output by reducing the cost of intermediate goods
and also creates positive externality effect. Thus social and economic infrastructure services
can make positive and strong impacts on output growth and can reduce the poor
performance of different sectors of the economy. There are various channels through
which investment in infrastructure can contribute to growth (Fedderke et al 2006). These
are
m Reducing transaction costs and facilitating trade flows within and across borders;
m Enabling economic factors individuals, firms, governments to respond to new types
of demand in different places;
m Lowering the costs of inputs for entrepreneurs, or making existing businesses more
profitable;
m Creating employment, including in public works (both as social protection and as a
counter-cyclical policy in times of recession);
m Enhancing human capital, for example by improving access to schools and health

Orissa Economic Journal, Vol. 47, No. 1, Jan-June 2015 : 195
centres
m Improving environmental conditions, which link to improved livelihood
m Better health and reduced vulnerability of the poor.
Thus positive contribution of infrastructure to economic growth and development comes
through increases in investment, employment, output, and income in a chain of ‘cumulative
causation’. Thus, ‘economies of agglomeration develop over time leading to further
concentration of economic activities in a particular location or region. Empirical evidence
suggests that there is a positive relationship between Infrastructure Development Index
and Per Capita Net State Domestic Product and negative relationship between
Infrastructure Development Index & Poverty (Patra and Acharya, 2011). Figure1 shows the
relationship between infrastructure and economic growth. This is clearly spell out how
does infrastructure helps economic growth.
Figure - 1: Infrastructure and Economic Growth
Thus investment in infrastructure is part of the capital accumulation required for economic
development and has enormous impact on socioeconomic measures of welfare. It is an
important parameter or index for judging a country or region’s development trajectory.
Mody (1997) aptly suggests that in any modern society, infrastructure plays an important
role in determining the overall productivity and development of a country’s economy, as
well as the quality of life of its citizens.
3. Infrastructure Development in Odisha and inter-district disparity
In a state like Odisha Adequacy of infrastructure development is a pre-condition for
propelling economic growth process. Energy, transport, communication and science &
technology are the key components of infrastructure which drive all the sectoral
Infrastructure
Benefitsenterprises
Lowers costsEnlargesMarkets
Benefitshouseholds
Improveswelfare
PromotesGrowth

196 : Orissa Economic Journal, Vol. 47, No. 1, Jan-June 2015
development with upward growth contour. Gross adequacies and quality development of
these components lead to effectiveness, higher productivity, inclusiveness,
competitiveness, wider market accessibility, cost effectiveness and saving potential of
functioning of all sectors of the economy.
Given the importance of the infrastructural this section tries to find out the concentration
of infrastructural facilities on different districts of Odisha. One of the major problems we
faced while studying the infrastructural set-up is the lack of continuous data sets at a
disaggregated level. Hence we analyzed the physical, social and financial infrastructure
dimensions of Odisha on district basis at two points of time i.e. in 1991 and 2013. For this
we have constructed infrastructure indices by the help of Principal component Analysis
(PCA). The primary objective of this study is to look at the levels and variation in
infrastructural availability in the state of Odisha.
Now we will be constructing composite indices of infrastructural indicators viz. Physical
Infrastructural development Index (PIDI), Social Infrastructural Development Index (SIDI),
and Financial Infrastructural development Index (SIDI) with the help of Principal
Component Analysis (PCA). In the PCA approach, the first principal component is the
linear combination of weighted facilities which explains the maximum of variance across
the observation at a point in time. The rationale behind using PCA is that it helps one to
reach an aggregate representation from various individual indicators.
3.1. Physical Infrastructure Development Indices (PIDI) of Districts of Odisha in 1991 and 2013
We have constructed physical infrastructure indices with the help of PCA. The indices for
1991 and 2013 are as follows.
Sources: Calculated by Author

Orissa Economic Journal, Vol. 47, No. 1, Jan-June 2015 : 197
According to the above table the top districts in terms of SIDI for the year 1991 were
Cuttack, Puri , Balashore , Sundargarh , and Dhenkanal while the bottom ranked districts
were Bolangir , Kalahandi, Baudh-Phulbani , and Koraput . These figures indicate that
there have been substantial concentration of health and education facilities in case of
coastal districts like Cuttack, Puri and Balashore while the interior KBK districts like Baudh-
Phulbani, Koraput and Kalahandi have not seen much social infrastructural facilities. For
the year 2013 it is also observed that the coastal districts seem to have been the top
districts for both the years while interior districts like Mayurbhanj, Kalahandi, Baudh-
Phulbani and Koraput have been consistently ranked at bottom place except a marginal
improvement in Bolangir district.
3.2. Finacial Infrastructure Development Indices (FIDI) of Districts of Odisha
The financial indices of districts are as follows:
Sources: Calculated by Author
According to the above Table the top districts in terms of FIDI for the year 1991 were
Baudh-Phulbani , Mayurbhanj , Puri , Ganjam , and Sundargarh while the bottom ranked
districts were Balashore , Bolangir , Kalahandi, and Koraput . It seems from the above
figure that the interior districts like Ganjam and Baudh-Phulbani seems to have better
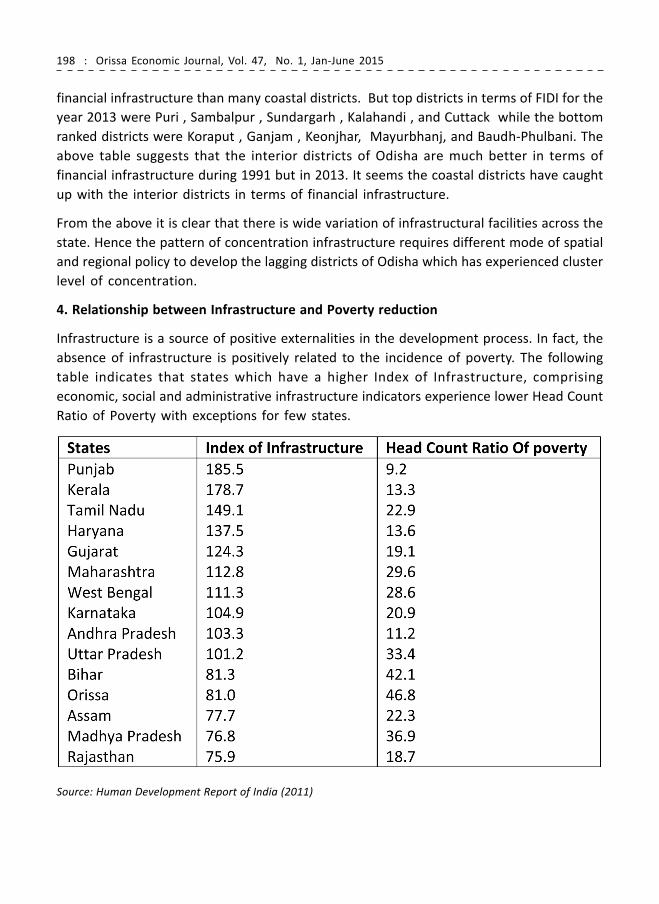
198 : Orissa Economic Journal, Vol. 47, No. 1, Jan-June 2015
financial infrastructure than many coastal districts. But top districts in terms of FIDI for the
year 2013 were Puri , Sambalpur , Sundargarh , Kalahandi , and Cuttack while the bottom
ranked districts were Koraput , Ganjam , Keonjhar, Mayurbhanj, and Baudh-Phulbani. The
above table suggests that the interior districts of Odisha are much better in terms of
financial infrastructure during 1991 but in 2013. It seems the coastal districts have caught
up with the interior districts in terms of financial infrastructure.
From the above it is clear that there is wide variation of infrastructural facilities across the
state. Hence the pattern of concentration infrastructure requires different mode of spatial
and regional policy to develop the lagging districts of Odisha which has experienced cluster
level of concentration.
4. Relationship between Infrastructure and Poverty reduction
Infrastructure is a source of positive externalities in the development process. In fact, the
absence of infrastructure is positively related to the incidence of poverty. The following
table indicates that states which have a higher Index of Infrastructure, comprising
economic, social and administrative infrastructure indicators experience lower Head Count
Ratio of Poverty with exceptions for few states.
Source: Human Development Report of India (2011)

Orissa Economic Journal, Vol. 47, No. 1, Jan-June 2015 : 199
The above table throws light on the fact that States with higher infrastructure status are
developed states and States with low infrastructure index are backward or under developed
states e.g., Rajasthan, Bihar, Orissa etc. This strongly supports the fact that there is a strong
relationship between infrastructure and economic growth. In the same way States with
higher Infrastructure status are having a low head count ratio of poverty. This establishes
the fact that there is a strong relationship between infrastructure services availability and
poverty alleviation. Higher the infrastructure services availability, lower will be the poverty
levels in that country.
Given the nexus between infrastructure and economic growth we run a regression analysis
between different infrastructural indices i.e. PIDI, SIDI, and FIDI and rate poverty reduction
in the state of Odisha for 1991 and 2013 .This analysis will reveal the nexus between
infrastructure facilities and poverty reduction in the state and accordingly a spatial policy
measures can be suggested.
The regression analysis has been done 2 points of time namely 1991 and 2013 using the
following model.
PRt+1
= f (PIDIt, SIDI
t, FIDI
t,)
The model we will be testing for this equation is as follows:
Where
Yt+1
= refers to Percentage of poverty reduction in the period t+1.
X1t
= refers to Physical Infrastructure Development Index for the year t.
X2t
= refers to Social Infrastructure Development Index for the year t.
X3t
= refers to Financial Infrastructure Development Index for the year
Regression analysis for the year 1991
Regression analysis for the year 2004
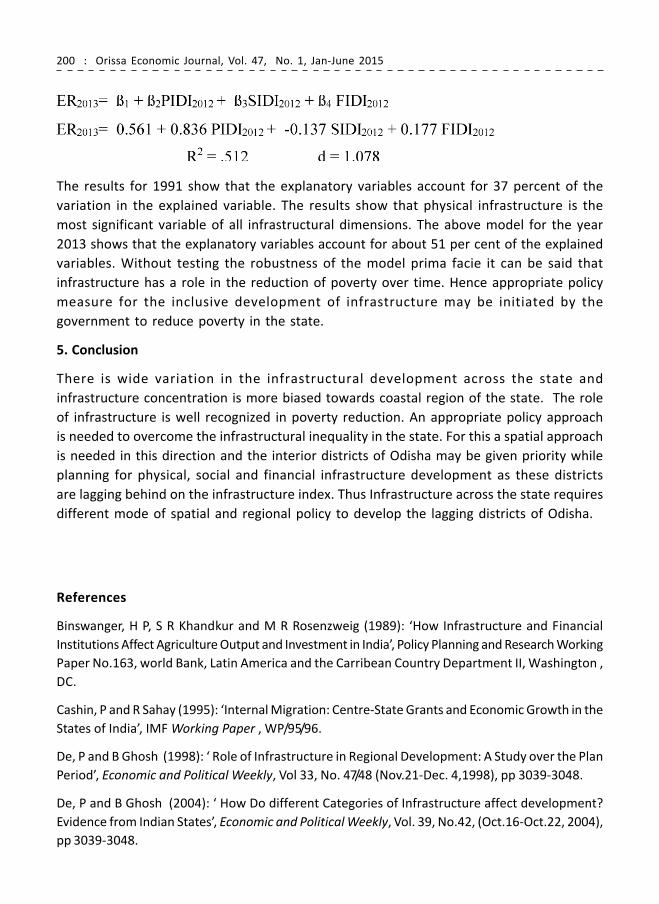
200 : Orissa Economic Journal, Vol. 47, No. 1, Jan-June 2015
The results for 1991 show that the explanatory variables account for 37 percent of the
variation in the explained variable. The results show that physical infrastructure is the
most significant variable of all infrastructural dimensions. The above model for the year
2013 shows that the explanatory variables account for about 51 per cent of the explained
variables. Without testing the robustness of the model prima facie it can be said that
infrastructure has a role in the reduction of poverty over time. Hence appropriate policy
measure for the inclusive development of infrastructure may be initiated by the
government to reduce poverty in the state.
5. Conclusion
There is wide variation in the infrastructural development across the state and
infrastructure concentration is more biased towards coastal region of the state. The role
of infrastructure is well recognized in poverty reduction. An appropriate policy approach
is needed to overcome the infrastructural inequality in the state. For this a spatial approach
is needed in this direction and the interior districts of Odisha may be given priority while
planning for physical, social and financial infrastructure development as these districts
are lagging behind on the infrastructure index. Thus Infrastructure across the state requires
different mode of spatial and regional policy to develop the lagging districts of Odisha.
References
Binswanger, H P, S R Khandkur and M R Rosenzweig (1989): ‘How Infrastructure and Financial
Institutions Affect Agriculture Output and Investment in India’, Policy Planning and Research Working
Paper No.163, world Bank, Latin America and the Carribean Country Department II, Washington ,
DC.
Cashin, P and R Sahay (1995): ‘Internal Migration: Centre-State Grants and Economic Growth in the
States of India’, IMF Working Paper , WP/95/96.
De, P and B Ghosh (1998): ‘ Role of Infrastructure in Regional Development: A Study over the Plan
Period’, Economic and Political Weekly, Vol 33, No. 47/48 (Nov.21-Dec. 4,1998), pp 3039-3048.
De, P and B Ghosh (2004): ‘ How Do different Categories of Infrastructure affect development?
Evidence from Indian States’, Economic and Political Weekly, Vol. 39, No.42, (Oct.16-Oct.22, 2004),
pp 3039-3048.

Orissa Economic Journal, Vol. 47, No. 1, Jan-June 2015 : 201
Denison, E (1967): Why Growth Rates Differ: Post War Experiences in Nine Western Countries,
Brookings Institution, Washington, DC.
Dholakia, R H (1994): ‘Spatial Dimensions of Acclerations of Economic growth in India’, Economic
and Political Weekly, August 27.
Elhance, A.P. and T R Lakshamanan (1988): ‘Infrastructure- Production System Dynamics in National
and Regional Systems: An Economic Study of the Indian Economy’, Regional Science and Urban
Economics, Vol.18, North-Holland.
Fedderke, J., Perkins, P. and Luiz, J. (2006). Infrastructure Investment and Long-Run Economic
Growth: South Africa 1875-2001. World Development, Vol. 34, No. 6, pp. 1037 -1059.
Fedderke and Z.Bogeti (2006): Infrastructure and Growth in South Africa: Direct and Indirect
Productivity Impacts of 19 Infrastructure Measures. World Bank working paper, DC
Ghosh, B and K Chattopadhyay (1997): ’Regional imbalance in Infrastructure and Incomer in India’,
mimeo, ISI, Paper Presented at the Indian economic Conference held at Hyderabad , Dec.27-29.
Government of India (1996): The India Infrastructure: Policy Imperatives for Growth and Welfare’,
New Delhi.
Handbook of Statistics on State Govt. Finances, Department of Economic Analysis and Planning,
RBI.
Infrastructure Statistics 2013, Ministry of Statistics and Programme Implementation, Govt. Of
India.
Mody, Ashoka (1997), Infrastructure strategy in East Asia: the Untold Story, EDI Learning Resource
Series, World Bank, DC.
Patra Aditya Kumar and Arabinda Acharya (2011), Regional Disparity, Infrastructure Development
and Economic Growth: An Inter-State Analysis, Research and Practice in Social Sciences Vol. 6, No.
2 (February 2011) 17-30
RAO,V. K. R. V. (1980), Infrastructure and economic development, Commerce Annual Number
1980.

202 : Orissa Economic Journal, Vol. 47, No. 1, Jan-June 2015
Role of Rural Infrastructure in Crop Diversification:
A District Level Analysis of Odisha
Chittaranjan Nayak1
Chinmay Ranjan Kumar2
Crop diversification is considered as an important indicator of agricultural development.
It signifies farmers’ adaptability with market signals, ability to reduce risk and
vulnerability, and progress of the farm economy towards self-reliance. There are several
key determinants of diversification. The present study aims at examining the role of
different items of rural infrastructure, and some other factors in crop diversification in
Odisha. For this, district-wise indices have been prepared separately to measure the
degree of diversification vis-a-vis the stock of infrastructure. Simple tools like linear
multiple regression have been used for the cross-sectional study for the year 2011-12
by using secondary data. The study observes that infrastructure fosters concentration
rather than diversification.
JEL Code: N55, Q10, Q15, Q18
Key words: rural infrastructure, crop diversification, Theil index
I. Introduction
Crop diversification is considered as an important indicator of agricultural development. It
signifies at least the following four aspects of farm economy. First, farmers’ adaptability
with market signals. In India, unlike many industrial products, most of the agricultural
products are inelastic in supply. This means such products do not much respond to the
market signals. In the WTO-led globalised regime, which has already brought agriculture
to its ambit, Indian farmers will remain a disadvantaged lot due to lack of adaptability with
market signals. Diversification is an indicator showing the degree of such adaptability.
Second, farmers’ ability to reduce risk and vulnerability. Most of risk, uncertainty and
1 Lecturer in Economics, Ravenshaw University, Cuttack, Email: [email protected]
2 Junior Research Fellow in Rural Development, Department of Economics, Ravenshaw University, Cuttack,
Email: [email protected]

Orissa Economic Journal, Vol. 47, No. 1, Jan-June 2015 : 203
vulnerability in farm sector is observed in production and marketing. Crop diversification
recedes such risks. Third, progress of the farm economy towards self-reliance. Despite
the fact that Indian economy still continues to be an agro-based economy, the country is
importing a number of agricultural products like pulses and oil seeds. If agriculture is
diversified, then such import dependence can also be arrested. Fourth, diversified farming
systems incorporate functional biodiversity at multiple temporal and spatial scales to
maintain ecosystem services critical to agricultural production.
A study by Joshi, et al. (2006) has tried to decompose the sources of agricultural growth
into area, yield, prices, diversification and interaction effects. It observes that the major
contributors to agricultural growth in India are prices and diversification (crop substitution).
The study observes that the contribution of prices in total growth has increased from 7.7
percent in 1980s to 35.2 percent in 1990s, whereas the share of diversification has increased
from 26.6 percent to 30.7 percent during this period (ibid). Though the decomposition
study needs updating in terms of data and methodology, it provides an important indication
about the prospect of growth of Indian agriculture, particularly in the context when the
sector is confronted with numerous problems.
Agricultural output, especially foodgrain production continues to remain volatile, and
sluggish in comparison to growth in secondary and service sectors. As per CSO, 2014, the
annual average growth rate(AAGR) of India’s agricultural GDP during 2000-01to 2013-14, at
2004-05 prices, hovers around just 3.8 percent. In states like Odisha, the AAGR in agriculture
is just around 2 percent during this period. In fact the annual growth rate of agriculture in
the state has been negative in four out of fifteen years since 2000-01.3 Therefore the
Odisha Economic Survey (2014-15) has expressed concern that
“There is, therefore, an urgent need to take appropriate measures to raise productivity of
the agriculture and allied sectors substantially so that the incomes and employment
opportunities of those who depend upon these sectors are enhanced in a sustained manner.
It calls for greater diversification and better supply chain linkages to enhance income
levels in the firm and allied sector.”
Given the importance of crop diversification, the question arises what are the determinants
of diversification, and how do they impact. A survey of existing literature categorises the
determinants of diversification as follows4: a) Resource related factors covering irrigation,
rainfall and soil fertility, b) Technology related factors covering not only seed, fertilizer,
and water technologies but also those related to marketing, storage and processing, c)
3 There was negative growth in agricultural SDP in Odisha for years 2000-01, 2002-03, 2011-12, and 2013-14
(Odisha Economic Survey, 2014-15).
4 Hazra (2001)

204 : Orissa Economic Journal, Vol. 47, No. 1, Jan-June 2015
Household related factors covering food and fodder self-sufficiency requirement as well
as investment capacity, d) Price related factors covering output and input prices as well as
trade policies and other economic policies that affect these prices either directly or
indirectly, and e) Institutional and infrastructure related factors covering farm size and
tenancy arrangements, research, extension and marketing systems and government
regulatory policies.
Out of the factors listed above, rural infrastructure is considered as a critical supply side
factor influencing growth and diversification in agriculture. By definition, infrastructure
basically includes permanent installation of capital goods which provide long term services
to basic economic activities like production and exchange. Installation of these goods
smoothens volatilities in prices and products by linking demand and supply, albeit with a
time lag. Prima facie, it seems that the effect of infrastructure can be either positive or
negative. If infrastructure is developed selectively, say for example sugarcane procurement
and marketing network is advanced, then in every likelihood there may be concentration
of sugarcane in the locality. On the contrary, if infrastructure in general, viz. road, irrigation,
electricity, communications, banking, marketing, etc. all are developed evenly, then that
may facilitate diversification.
The present paper attempts to explore if infrastructure, along with other factors, has any
significant impact on crop diversification. This is a district level analysis for the state of
Odisha, which is still considered as a backward state where about 60 percent of people still
depend on agriculture. The remainder of the paper is organised as follows: Section II
presents a brief review of literature. In Section III, variables, data and methodology have
been detailed. Section IV encompasses results and discussion, and finally Section V
concludes.
II. Review of Literature
Although there has been a good number of research on rural infrastructure and agricultural
diversification, surprisingly very few have tried to examine the impact of infrastructure
on diversification. A few studies who have analysed the impact of rural infrastructure on
productivity (Binswanger et al., 1993; Wanmali and Ramasamy, 1995; Bhatia, 1999; Zhang
and Fan, 2001; Nayak 2008) have studied the progress and economic effects of rural
infrastructure on the growth in agriculture. Some researchers have selectively emphasised
on the role of public infrastructure in productivity growth (Aschauer, 1989; Fousekis and
Pantzios, 2000; Mamatzakis, 2003).
Pinstrup-Andersen and Shimokawa (2006) have studied the impact of infrastructure on
crop diversification in different countries and found the impact as significant. The
significance of crop shifts in the process of agricultural transformation can be understood

Orissa Economic Journal, Vol. 47, No. 1, Jan-June 2015 : 205
through the development of rural markets. If all producers choose crops on the principle
of comparative advantage and face the same relative prices, land reallocation occurs only
when technology or relative prices change. In agriculture, however, the assumption that
all producers face the same relative prices is not justifiable because spatial dimensions
and transportation costs are important in crop production (Takayama and Judge, 1971;
Baulch, 1997).
In the context of India, Chand (1995) argues that it is not the farm size, but infrastructure
like access to motorable road, market and irrigation determine the extent, success and
profitability of diversification through high paying crops like off-season vegetables.
Similarly, a study in West Punjab reports influence of irrigation and road density on crop
diversity in two periods. In general, irrigation development makes it technically feasible
to grow diverse crops (Kurosaki, 2003). On the contrary, another study observes that the
effect of infrastructure on diversification is mixed. While irrigation intensity, the markets
and commercial vehicles had positive significant influence on crop diversification, road
density had significant negative influence on diversification (Ashok, et al., 2006). De and
Chattopadhyay (2010) have added another dimension that marginal and small farmers
play a positive role in crop diversification and that has been supported by the growth of
various infrastructure.
III. Database and Methodology
Although rural infrastructure can comprise several items covering economic, social and
institutional dimensions, this study has emphasised on economic factors like irrigation,
rural electrification, transportation, and communication. In addition, some other variables
like credit, marketable surplus, fertiliser, and seed type have been selected on the basis
of literature and data availability. The details of the selected right hand side variables are
presented in table 1. District-wise data pertaining to the variables are collected for the
year 2011-12 from Statistical Abstract of Orissa, 2012, Odisha Economic Survey, 2013-14,
and Census of India, 2011.
3.1. Normalisation
The variables have been normalised to make themselves unit-free, facilitate comparison
and enable algebraic operation across variables. Since, the analysis observed a high degree
of correlation between items of infrastructure resulting in multicollinearity problem, the
infrastructure items have been combined to be called as Rural Infrastructure Index (INFI)
as a remedy.

206 : Orissa Economic Journal, Vol. 47, No. 1, Jan-June 2015
Table 1. Items in Rural Infrastructure and other Determinants of Diversification
Variable taken Abbreviation
of variables
Variables taken Data Source
Irrigation
Electricity
Transport
Communication
PGIA
ELCT
RDEN
TELC
Percentage of gross irrigated area to gross cropped area
Percentage of rural households with electricity connection
Density of rural roads per thousand hectare of gross cropped area
Percentage of rural household with telephone connection
Odisha Agriculture Statistics 2011-12
Census, 2011
Statistical Abstract of Odisha, 2012
-do-
Credit
Marketable Surplus
Fertiliser
Seed type
CRDT
MSUR
FERT
HYV
Agricultural credit per hectare of gross cropped area
Total rice production less consumption (tonnes)
NPK (in kg) used per hectare of gross cropped area
Percentage of gross cropped area under High Yielding Variety paddy
Statistical Abstract of Odisha 2012
Odisha Agriculture Statistics 2011-12
-do-
-do-
3.2. Measurement of INFI
The method of Principal Component Analysis (PCA), to be specific the Bartlett scores,
have been used for the measurement of rural infrastructure index (INFI).5 Two principal
components were selected on the basis of eigen value criterion. Furthermore, the present
study went by the loadings of the first principal component, which explained about 56.5
percent variation in the selected variables, and satisfied the Bartlett Criterion. The Bartlett
scores are derived as follows:
5 Bartlett factor scores are computed by multiplying the row vector of observed variables, by the inverse of the
diagonal matrix of variances of the unique factor scores, and the factor pattern matrix of loadings. Resulting
values are then multiplied by the inverse of the matrix product of the matrices of factor loadings and the
inverse of the diagonal matrix of variances of the unique factor scores. One advantage of Bartlett factor
scores over the other two refined methods presented here is that this procedure produces unbiased estimates
of the true factor scores (Hershberger, 2005). This is because Bartlett scores are produced by using maximum
likelihood estimates – a statistical procedure which produces estimates that are the most likely to represent
the “true” factor scores.

Orissa Economic Journal, Vol. 47, No. 1, Jan-June 2015 : 207
where
is infrastructure index of the ith district, wj= weight of the jth factor obtained
as Bartlett loadings, and = normalised variables of the jth (ELCT,PGIA,TELC and RDEN)
factor for the ith district.
3.3. Measurement of Crop Diversification
Crop Diversification has been measured on the basis of Herfindahl and Theil Entropy Indices.
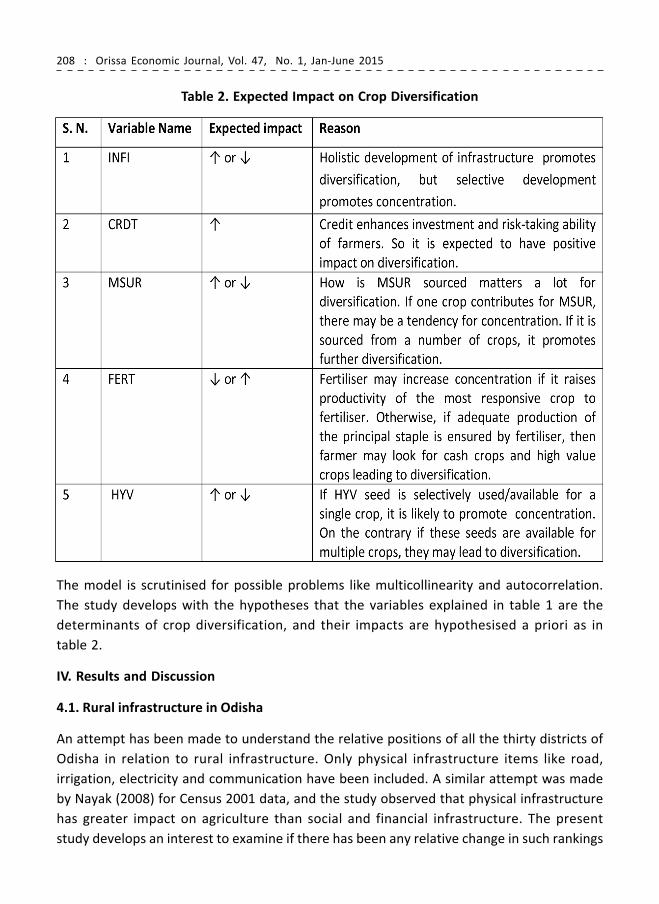
208 : Orissa Economic Journal, Vol. 47, No. 1, Jan-June 2015
Table 2. Expected Impact on Crop Diversification
The model is scrutinised for possible problems like multicollinearity and autocorrelation.
The study develops with the hypotheses that the variables explained in table 1 are the
determinants of crop diversification, and their impacts are hypothesised a priori as in
table 2.
IV. Results and Discussion
4.1. Rural infrastructure in Odisha
An attempt has been made to understand the relative positions of all the thirty districts of
Odisha in relation to rural infrastructure. Only physical infrastructure items like road,
irrigation, electricity and communication have been included. A similar attempt was made
by Nayak (2008) for Census 2001 data, and the study observed that physical infrastructure
has greater impact on agriculture than social and financial infrastructure. The present
study develops an interest to examine if there has been any relative change in such rankings

Orissa Economic Journal, Vol. 47, No. 1, Jan-June 2015 : 209
in the last decade. The methodology and database for the construction of INFI have
remained the same6. Categorisation of districts into high, medium and low INFI has also
remained the same. The results are stated in table 3. As compared to 2001, only Ganjam
and Anugul have slipped from ninth and tenth ranks to 12th and 13th ranks in 2011
respectively. Nayagarh progressed from fifteen to eighth, and Mayurbhanj has witnessed
the greatest jump from 22th to tenth position, i.e. high INFI category, during this period.
Table 3. Rural Infrastructure Index of Districts of Odisha in 2011
6 In Nayak (2008), the nomenclature used for INFI was physical infrastructure development index (PIDI). Both
INFI and PIDI in fact convey the same meaning
Souce: Authors’ calculation
Similarly, Balangir and Malkangiri, two underdeveloped districts belonging to the KBK
region of south-western Odisha have seen progress from low to medium infrastructure
category. On the contrary, Sonepur, Boudh and Rayagada have slipped from medium to
low infrastructure category. Interestingly, Nabarangpur has jumped from the bottom to
the top position in the low infrastructure category.
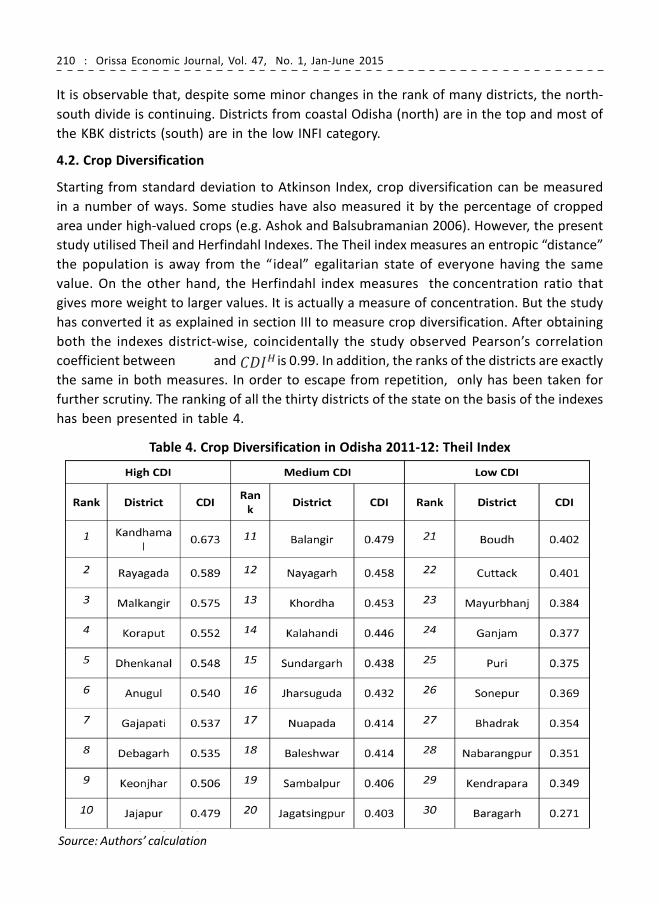
210 : Orissa Economic Journal, Vol. 47, No. 1, Jan-June 2015
Source: Authors’ calculation
It is observable that, despite some minor changes in the rank of many districts, the north-
south divide is continuing. Districts from coastal Odisha (north) are in the top and most of
the KBK districts (south) are in the low INFI category.
4.2. Crop Diversification
Starting from standard deviation to Atkinson Index, crop diversification can be measured
in a number of ways. Some studies have also measured it by the percentage of cropped
area under high-valued crops (e.g. Ashok and Balsubramanian 2006). However, the present
study utilised Theil and Herfindahl Indexes. The Theil index measures an entropic “distance”
the population is away from the “ideal” egalitarian state of everyone having the same
value. On the other hand, the Herfindahl index measures the concentration ratio that
gives more weight to larger values. It is actually a measure of concentration. But the study
has converted it as explained in section III to measure crop diversification. After obtaining
both the indexes district-wise, coincidentally the study observed Pearson’s correlation
coefficient between and is 0.99. In addition, the ranks of the districts are exactly
the same in both measures. In order to escape from repetition, only has been taken for
further scrutiny. The ranking of all the thirty districts of the state on the basis of the indexes
has been presented in table 4.
Table 4. Crop Diversification in Odisha 2011-12: Theil Index

Orissa Economic Journal, Vol. 47, No. 1, Jan-June 2015 : 211
Note: The first bar denotes CDI and the second INFI for each district
From tables 3 and 4, a remarkable observation can be made that some districts placed in
High INFI are placed in Medium . For example, coastal districts like Khodha, Baleswar,
and Jagatsingpur are in High INFI but in Medium CDI categories. Cuttack, Puri, Bhadrak and
Kendrapara are in High INFI but Low CDI categories. Please refer figures 1 & 2 for a
comparative picture. It may be noted that the abovementioned figures are drawn on the
basis of rankings. For a comparison apropos algebraic values, we can refer Graph 1. Analysis
with help of the tables, maps and graphs so far give a sketchy picture on the relationship
between infrastructure and diversification. When measured correlation coefficient, it was
found as negative, i.e.-0.43. This means in Odisha, crop diversification moves inversely
vis-a-vis rural physical infrastructure. Apart from infrastructure, the analysis explores some
other determinants of crop diversification.
4.3. Regression Results
In order to analyse the impact of the selected variables on crop diversity, a multiple Ordinary
Least Squares (OLS) regression has been fitted. The results are as follows:
p-values (0.000) (0.034) (0.810) (0.426) (0.755) (0.002)
R2=0.686, =0.620, DW d = 2.006, F=10.47, p-value of F = 0.000
Graph 1. INFI and CDI of Districts of Odisha in 2011-12

212 : Orissa Economic Journal, Vol. 47, No. 1, Jan-June 2015
The individual and collective effects of the chosen explanatory variables on crop diversity
need to be examined scrupulously. As a measure of goodness of fit, R2 reveals that about
68.6 percent variation in CDI is explained by all the regressors taken together, and the p-
value of F confirms that it is significant. The d statistic shows that there is no autocorrelation
problem in the regression. Similarly, we had observed that the Variance Inflating Factor
(VIF) of each regressor falls between 2 and 3. This means the regression is not severely
affected by multicollinearity problem. The study observed that the explanatory variables,
other than HYV and INFI, do not have significant effect on CDI. It is important to observe
that both these regressors have negative impact on CDI. This means, high yielding variety
seeds and rural infrastructure result in concentration, not diversification, of crops. As
regards HYV seeds, this result is as per our expectation a priori. It is quite understandable
that, as more and more area is put to high yielding seed of paddy, productivity rises. As a
result, farmers do not develop tendency to diversify their farming.
The conventional wisdom is that improved roads, irrigation, electricity and teleconnectivity
facilitate diversification because these elements assuage the risk and uncertainty regarding
production. But the reverse result of the present analysis provokes to rethink about the
conventional wisdom. Possibly, not merely quantity but the functioning and composition
of infrastructure matters a lot. For example, irrigation in many places in Odisha is available
for the kharif crop, which results in concentration of paddy cultivation. The condition of
rural roads, functioning of irrigation and availability of electricity for farm use, warehousing
and marketing infrastructure are some of the factors, which could have made a difference
in the result. Apart from that it may be noted that paddy is the only major crop of Odisha
which has been covered under minimum support price (MSP) system. All these variables
could not be incorporated in the present study due to lack of district-wise data. Despite all
these, the study draws an inference that farmers prefer those crops which have a less
volatile market, as the case of paddy. Better the level of infrastructure, farmers try to
adopt better practices to get the optimum output from the crop. Being the predominant
staple in the state backed by MSP, farmers in Odisha continue to allocate about 70 percent
of gross cropped area. This has remained more or less same over the recent years. How to
break the standstill cropping pattern is a subject matter for further research. Drawing any
strong inference from a cross section study will be premature.
V. Conclusion
The study concludes that rural infrastructure along with high yielding variety of paddy has
helped in crop concentration rather than crop diversification in Odisha. The study argues
that since it is the predominant staple in the state backed by MSP, farmers in Odisha
continue to allocate a significant proportion of cropped area to the cultivation of paddy.
They make use of the stock of existing infrastructure for better yield in paddy cultivation.
The study observed that other regressors like credit, marketable surplus and fertiliser use

Orissa Economic Journal, Vol. 47, No. 1, Jan-June 2015 : 213
have no significant impact on crop diversification. The conclusion of a cross-section analysis
as such may not be generalised as a claim, but the observations of the study indicate that
diversification in agriculture is a broader issue which cannot be ensured simply by the
existing infrastructure, and the present practice of agriculture in the state. Further research
is required to explore the determinants of diversification in a panel data framework both
at macro and micro levels.
References
Aschauer, David A. (1989). “Is Public Expenditure Productive?”, Journial of’ Monetary
Economnics, 23:177-200.
Ashok K.R, Balasubramanian R. (2006). Role of Infrastructure in Productivity and
Diversification of Agriculture, A Research Report, SANEI, Islamabad, Pakistan.
Baulch, B. (1997). “Transfer Costs, Spatial Arbitrage, and Testing Food Market Integration”,
American Journal of Agricultural Economics, 79: 477-87.
Bhatia, M.S. (1999). “Rural Infrastructure and Growth in Agriculture”, Economic and Political
Weekly, 34(13): A43-48.
Binswanger, H.P., Khandker, S. R., Rosenzweig, M. R. (1993). “How Infrastructure and
Financial Institutions Affect Agricultural Output and Investment in India”, Journal of
Development Economics, 41 (2): 337-366.
Chand. R. (1995). “Agricultural Diversification and Small Farm Development in Western
Himalayan Region”, National Workshop on Small Farm Diversification: Problems and
Prospects , NCAP, New Delhi.
De, K.U. and Chattopadhyay M. (2010). “Crop diversification by poor peasants and role of
infrastructure: Evidence from West Bengal”, Journal of Development and Agricultural
Economics 2(10): 340-350.
Fousekis, P, Pantzios, C., (2000). “Public Infrastructure and Private Economic Performance:
Alternative Measures with an Application to Greek Agriculture”, International Review of
Economics and Business, 11: 111-128.
Hazra, C.R. (2001). “Crop Diversification In India” in Papademetriou, Minas K. and Dent,
Frank J. (Ed), Crop Diversification in the Asia-Pacific Region, Food and Agriculture
Organization of the United Nations Regional Office for Asia and the Pacific Bangkok,
Thailand.
Joshi, P. K., Birthal, P. S., Minot, N. (2006). “Sources of Agricultural Growth in India: Role of
Diversification towards High Value Crops”’ MTID Discussion Paper No. 98. IFPRI; Markets,
Trade and Institutions Division, November.
Kurosaki, T. (2003). “Specialization and Diversification in Agricultural Transformation: The

214 : Orissa Economic Journal, Vol. 47, No. 1, Jan-June 2015
Case of West Punjab 1903-92”, American Journal of Agricultural Economics, 85(2): 372-386.
Mamatzakis, E.C. (2003). “Public Infrastructure and Productivity Growth in Greek
Agriculture”, Agricultural Economics, 29: 169-180.
Nayak, C. R. (2008). “Physical Infrastructure and Land Productivity: A District Level Analysis
of Rural Orissa”, ICFAI Journal of Infrastructure, Icfai University Press, Hyderabad, 6(3): 7-
21.
Odisha Economic Survey (2014-15). Planning and Coordination Department, Government
of Odisha, p.10/2.
Pinstrup-Andersen, Per and Shimokawa, Satoru (2006). Rural Infrastructure and Agricultural
Development, Paper presented at the Annual Bank Conference on Development Economics,
Tokyo, Japan, May 29-30.
Reddy, A. A. (2013). “Agricultural Productivity Growth in Orissa, India: Crop Diversification
to Pulses, Oilseeds and Other High Value Crops”. African Journal of Agricultural Research, 8
(19): 2272-2284.
Takayama, A. and G. Judge (1971). Spatial and Temporal Price and Allocation Models.
Amsterdam: North Holland.
Wanmali, S. and C. Ramasamy (1995). Developing Rural Infrastructure, Macmillan, New
Delhi.
Zhang.X. Fan, S., and C. Fang (2001). “How Agricultural Research Affects Urban Poverty in
Developing Countries: The Case of China”, EPTD Discussion Paper 80. Washington, D.C.:
International Food Policy Research Institute.

Orissa Economic Journal, Vol. 47, No. 1, Jan-June 2015 : 215
Growth of Rural Economic Infrastructure and Poverty Scenario in
Odisha: A Study of Selected Public Services
Bhagabata Patro1
Sasmita Sethi2
Odisha has significantly higher percentage (83) of rural population compared to the
national figure(69). It is expected that the quality of life of the people both in rural and
urban areas is identical in all respects. But a look at different statistics on the national
economy reveals glaring difference between the access to public services by the rural
and urban people. The rural infrastructure development mainly focuses on provision of
basic amenities, better livelihood and equal opportunities. The objective of this study
is to examine availability of rural economic infrastructure in the last 15 years. The
rural economic infrastructure activities taken for this purpose are irrigation, housing,
electricity and roads. The paper analyses the development in each of these activities
in detail and to link the poverty scenario with the availability of economic infrastructure.
Rural housing provision is not satisfactory. In rural electrification, the pace appears to
be extremely slow due to privatization of the power sector. The worst situation is noticed
in rural roads. Instead of increased provision of rural communication, it is declining
over the years. The econometric model fitted to the data reveals importance of villages
electrified only. At a slightly higher level of significance, irrigated area appears to be
significant. The other two explanatory variables i.e. the number of houses under IAY
and rural roads fail to qualify the significance test. All these reveal poor state of rural
economic infrastructure in Odisha as a result of which the state could not progress
much in recent years. The state government should address these issues immediately
without further delay.
1. Introduction
Odisha has significantly higher percentage (83) of rural population than that of the national
figure(69). In a democratic governance system, it is expected that the quality of life of the
people should not be different in different parts of country. But even after sixty five years
of our independence, there exists glaring difference in the access to public services by the
1 Professor, Department of Economics, Berhampur University, Berhampur.
2 Research Scholar, Department of Economics, Berhampur University, Berhampur.

216 : Orissa Economic Journal, Vol. 47, No. 1, Jan-June 2015
rural and urban people. The impact of so called rural development programmes is
extremely marginal on the burning problem of unemployment and poverty. This is probably
happening due to inadequate emphasis on creating a robust economic infrastructure in
the rural areas of the state . A sound infrastructure base facilitates economies of scale,
reduces costs of trade, and is thus central to specialization and efficient production and
consumption of goods and services. It is vital for economic growth and development,
which is the key to raising the living standards of the population.(Henckel and McKibbin;
2010); The rural economic infrastructure development mainly focuses on provision of
basic amenities, better livelihood, equal opportunities and quality infrastructure facilities
through innovative programmes of wage and self- employment.
2. Importance of Economic Infrastructure
Having realized the importance of rural economic infrastructure to achieve faster rate of
economic growth, the Government of India and the Government of Odisha have ventured
into making heavy investment in agricultural infrastructure especially from the first-five
year plan onwards. The major focus of infrastructural investment has been on irrigation,
transportation, power and housing sector. Provision of adequate and quality infrastructure
in rural areas is necessary for increasing the productivity and efficiency of agriculture in
the form of improving the credit absorbing capacity, enhancing the productivity of crops
and livestock, generating employment and increasing farmers’ income and in the process,
it makes a direct attack on minimizing the incidence of rural poverty.
The role of infrastructure in economic development is complex and indirect. The theories
of economic development focus sufficient attention on this discussion. Hirschman’s point
of view was that enlarged availability of electric power and transportation facilities is an
essential preconditions for economic development. Investments in essential overhead
capital are advocated not because of their direct effect on final output, but because they
permit, and in fact invite, direct productive activities to come in (Hirschman, 1958). In his
theory of ‘Stages of Growth’, Rostow held similar views and considered social overhead
capital, especially in transport and communication as the main pre-conditions for takeoff
( Rostow, 1960).
The importance of infrastructure in agriculture and rural development is well documented.
It is estimated that 15 percent of crop produce is lost between the farm gate and the
consumer because of poor roads and inappropriate storage facilities alone (World Bank,
1997). Strengthening rural infrastructure can help to lower production costs which can
further augment agricultural output and income for rural farming community. Rural
infrastructure has its impact on attitudes and values of rural households as well. The most
Orissa Economic Journal, Vol. 47, No. 1, Jan-June 2015 : 217
profound effect of infrastructure development could be on the values of rural households.
Development of transport and communication infrastructure enhances the mobility of
people and information through reduction in cost and time. The resulting increase in
interaction contributes to changes in attitudes and human capital development (Ahmad,
1996).
Rural infrastructure plays a key role in reaching the large mass of rural poor. When rural
infrastructure has deteriorated or is nonexistent, the cost of marketing farm produce can
be prohibitive for poor farmers. Poor rural infrastructure also limits the ability of traders
to travel to and communicate with remote farming areas, limiting market access from
these areas and eliminating competition for their produce. Construction of rural roads
almost inevitably leads to increases in agricultural production and productivity by bringing
in new land into cultivation or by intensifying existing land use to take advantage of
expanded market opportunities. In addition to facilitating agricultural commercialization
and diversification, rural infrastructure, particularly roads, consolidate the links between
agricultural and nonagricultural activities within rural areas and between rural and urban
areas (IFAD, 1995). Improved infrastructure also facilitates the most economical location
for different types of non-farm activity. While many manufacturing and wholesale trading
activities tend to concentrate in rural towns, many small–scale manufacturing activities
(e.g. cottage industry and milling) and service activities (e.g. retail shops, coffee and tea
shops and personal services) expand in villages and rural market centers (Wanmali, 1983).
3. Types of Economic Infrastructure
The term “infrastructure” has been defined by scholars into two distinct categories. These
are; i. economic infrastructure and ii. social infrastructure. The distinction between these
two is often made on the basis of their differences in the impact on the economy. The 1994
World Development Report stated that economic infrastructure consists of the following
items.
1. Public utilities: Power, telecommunications, piped water supply, Sanitation and
sewerage, solid waste collection and disposal piped gas.
2. Public works: Roads, major dam and canal weeks for irrigation and drainage
3. Other important sectors: urban and inter urban railways, urban transport, ports,
waterways and airports.

218 : Orissa Economic Journal, Vol. 47, No. 1, Jan-June 2015
Physical infrastructure refers to a set of facilities without which an integrated independent
modern economy could not function. The emphasis on physical infrastructure was based
on the following characteristics of these facilities
m They involve technological indivisibility and considerable lumpiness in investment.
m The investment projects have long gestation lags.
m They are subject to substantial external economic activities.
Economic infrastructure supports all forms of economic activities, its components being
utilities such as agriculture, transport, communication, generation and distribution of
power, roads, ports, irrigation, water supply and sanitation.
Economic infrastructure services directly facilitate and are basic to the carrying out of a
wide variety of economic activities. These are generally priced low, subject to public control
on regulation and investment since these are characterized by lumpiness. The main
categories of economic infrastructure activity are investment in rural electrification, rural
credit institutions, flood control and drainage, irrigation works, rural roads, rural transport,
markets for inputs and outputs, storage structures and warehousing facilities, common
property resources and watershed development.
4. Selected Rural Economic Infrastructure
4.1 Irrigation
Irrigation infrastructure is a prerequisite for the adoption of new seed, fertilizer and
technology to increase the productivity in agriculture. Irrigation is also crucially important
for enhancing agricultural productivity and is required at different critical stages of plant
growth of various crops for their optimum production.
Table-1: Growth of Irrigation in Odisha 1995-2010.
Year Cultivated Area Irrigated area Percentage of
(in 000’ Ha) (in 000’ Ha) Irrigated Area
1995-96 6420 3258.81 50.76
1996-97 6420 3357.87 52.30
1997-98 6420 3426.38 53.37
1998-99 6420 3436.86 53.53
1999-00 6420 3485.33 54.29

Orissa Economic Journal, Vol. 47, No. 1, Jan-June 2015 : 219
2000-01 6259 3599.70 57.51
2001-02 6165 3658.90 59.35
2002-03 6165 3698.29 59.99
2003-04 6165 3815.77 61.89
2004-05 6165 3931.16 63.77
2005-06 6180 3990.35 64.73
2006-07 6180 4040.022 65.37
2007-08 6180 4095.39 66.27
2008-09 6180 4274.19 69.16
2009-10 6180 4513.823 73.04
Source: Directorate of Agriculture & Food Production,Odisha,( different years) ; Bhubaneswar.
Fig 1: Growth of Irrigation in Odisha 1995-2010.
Irrigation is available to the farmer from three main sources. These are major and medium
irrigation, minor irrigation and lift irrigation. In lift irrigation both public and private sector
manages the units. The state has cultivated area of 64.20 lakh ha in 1995-96. It has been
assessed that50.76 lakh ha can be brought under irrigation through major, medium and
minor (lift and flow) irrigation projects out of the total in that year. By end of 2009-10, the
irrigated area increased to 45.13 lakh ha constituting 73 percent of the cultivated area in
that year.
Are
a C
ult
iva
ted
/ A
rea
irr
iga
ted Cultivated Area
Irrigated Area
in 000’ ha
Year

220 : Orissa Economic Journal, Vol. 47, No. 1, Jan-June 2015
4.2 Rural Housing
The major aim of economic development is to raise the levels of living of people in the
country, which in turn depends on the level of employment and income and access to
basic needs such as food, cloth, and housing. Housing is a basic human need and important
constituent of the quality of life. It is an index of the socio-economic progress in a country.
Owning a house provides significant socio-economic security and dignity to a citizen in the
society. Census of India is the only source of data to assess the condition of rural housing
in the country. Data on housing for 2001 census is available for such analysis. It indicates
that in India about 39.8 percent of 138.27 million rural households reside in 1 room tenement,
30.2 percent in two room houses, 26.7 percent in three or more rooms and 3-4 million do
not have an exclusive living room.
In rural Odisha, out of the total houses, 22.3 percent are in good condition, 67.5 percent in
liveable condition and 10.3 percent are in dilapidated condition. Considering the magnitude
of the problem the central government announced a national housing and habitat policy
which aims at providing “Housing for all” by the end of tenth plan period. Efforts are being
made to meet the housing needs of the people belonging to different income groups.
Special priority is being given to lower income groups and economically weaker sections.
In order to meet the short age of housing in rural areas, various housing programmes such
as Indira Awas Yojan (normal and additional) and PMGY (Gramin Awas) are being
implemented in the state.
Table 2: Provision of Houses under Indira Awas Yojana in Odisha
Year Total No’s BPL Houses Total No’s of houses Percentage of
household (census Completed completed (cumulative) houses
1997) (In Lakh) (No of Units) (No of Units) completed
1 2 3 4 5
1995-96 49 51033 51033 1.04
1996-97 49 24242 75275 1.53
1997-98 49 50023 125298 2.55
1998-99 49 51675 176973 3.61
1999-00 49 53328 230301 4.7
2000-01 49 31859 262160 5.35
2001-02 49 27394 289554 5.9
2002-03 49 48465 338019 6.89
2003-04 49 58996 397015 8.1

Orissa Economic Journal, Vol. 47, No. 1, Jan-June 2015 : 221
2004-05 49 67892 464907 9.48
2005-06 49 77850 542757 11.07
2006-07 49 79668 622425 12.7
2007-08 49 90627 713052 14.55
2008-09 49 61662 774714 15.81
2009-10 49 151234 925948 18.89
Source: Panchayati Raj Department, Government of odisha.
The IAY Scheme is being implemented in the state from the year 1985-86 to provide
assistance for construction of dwelling units to the BPL households belonging to SC, ST
and freed bonded laborer category. Since 1993-94, the scope of the scheme was extended
to cover the all rural BPL households belonging to the non SC and ST poor subject to the
condition that the benefits to the SC/ST would not be more than 40% of the total IAY
Allocation. The benefits of the scheme have also been extended to the families of ex-
service men of the armed and paramilitary forces killed in action. Three percent of the
houses are also reserved for physically and mentally handicaps.
Fig 2: Houses Provided under Indira Awas Yojana in Odisha
Total No’s BPL
household
(census 1997
(in lakh)
House
completed
cumulative
(in lakh)
Year
Tota
l BP
L H
ou
se h
old
/ A
Y H
ou
se h
old
s (c
um
ula
tiv
e)

222 : Orissa Economic Journal, Vol. 47, No. 1, Jan-June 2015
As per 1997 BPLcensus, 49 lakh households belong to the BPL category in Odisha. Since
then, there is a controversy with regard to BPL survey and there is no survey to identify the
exact number of BPL families in the state for the last 16 years. .Out of 49 lakh BPL households
only 9 lakh households were provided with houses under IAY by the end of 2009-2010. This
constitutes 19 percent of the total BPL families. Given the present rate of provisioning it
will take at least another 20years to give housing facilities to all the BPL families
4.3 Rural Electrification
Among the infrastructure facilities, energy plays an important role to achieve economic
development. Energy is one of the inputs for a comfortable living. This influences the
overall wellbeing of the people. With multiple use of electricity, it became a vital
requirement of day to day life. Existence of villages without electricity even after 65 years
of independence clearly reveals the failure of our policy priorities. There are about
47thousand villages in the state out of which electricity is available only to 36 thousand
villages. 11 thousand villages have no electricity till now. After power sector reform
initiatives in the state, rural electrification was totally neglected which is visible from the
table.
Table 3: Number of Village Electrified 1995-2010.
Year During the year Number of Village Electrified Percentage of
by the end of the Year (Cumulative) Village Electrified
1995-96 480 32978 70.1
1996-97 737 32825 70.0
1997-98 800 33625 71.56
1998-99 817 34442 73.43
1999-00 748 35190 74.89
2000-01 0 35362 71.26
2001-02 0 35957 73.52
2002-03 0 36552 75.78
2003-04 0 37147 78.04
2004-05 0 37744 80.32
2005-06 300 38044 80.90
2006-07 0 37761 80.2
2007-08 0 37479 79.5
2008-09 0 36914 78.1
2009-10 0 36349 76.7
Source: GRIDCO, Bhubaneswar .
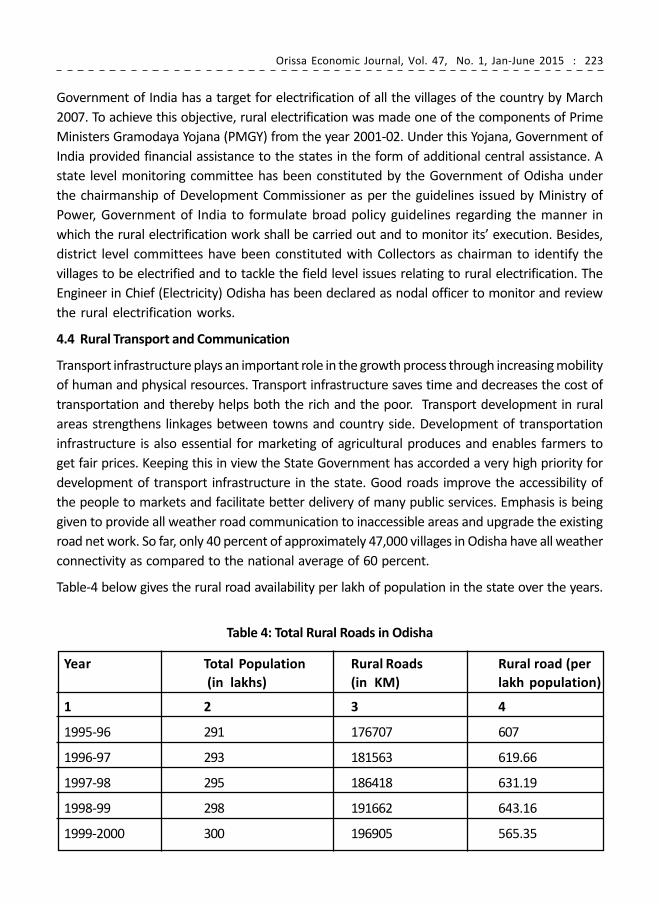
Orissa Economic Journal, Vol. 47, No. 1, Jan-June 2015 : 223
Government of India has a target for electrification of all the villages of the country by March
2007. To achieve this objective, rural electrification was made one of the components of Prime
Ministers Gramodaya Yojana (PMGY) from the year 2001-02. Under this Yojana, Government of
India provided financial assistance to the states in the form of additional central assistance. A
state level monitoring committee has been constituted by the Government of Odisha under
the chairmanship of Development Commissioner as per the guidelines issued by Ministry of
Power, Government of India to formulate broad policy guidelines regarding the manner in
which the rural electrification work shall be carried out and to monitor its’ execution. Besides,
district level committees have been constituted with Collectors as chairman to identify the
villages to be electrified and to tackle the field level issues relating to rural electrification. The
Engineer in Chief (Electricity) Odisha has been declared as nodal officer to monitor and review
the rural electrification works.
4.4 Rural Transport and Communication
Transport infrastructure plays an important role in the growth process through increasing mobility
of human and physical resources. Transport infrastructure saves time and decreases the cost of
transportation and thereby helps both the rich and the poor. Transport development in rural
areas strengthens linkages between towns and country side. Development of transportation
infrastructure is also essential for marketing of agricultural produces and enables farmers to
get fair prices. Keeping this in view the State Government has accorded a very high priority for
development of transport infrastructure in the state. Good roads improve the accessibility of
the people to markets and facilitate better delivery of many public services. Emphasis is being
given to provide all weather road communication to inaccessible areas and upgrade the existing
road net work. So far, only 40 percent of approximately 47,000 villages in Odisha have all weather
connectivity as compared to the national average of 60 percent.
Table-4 below gives the rural road availability per lakh of population in the state over the years.
Table 4: Total Rural Roads in Odisha
Year Total Population Rural Roads Rural road (per
(in lakhs) (in KM) lakh population)
1 2 3 4
1995-96 291 176707 607
1996-97 293 181563 619.66
1997-98 295 186418 631.19
1998-99 298 191662 643.16
1999-2000 300 196905 565.35

224 : Orissa Economic Journal, Vol. 47, No. 1, Jan-June 2015
2000-01 305 196897 642.28
2001-02 312 195978 628.13
2002-03 315 195873 621.81
2003-04 319 195898 614.10
2004-05 323 195436 605.06
2005-06 326 195139 598.58
2006-07 330 196392 595.12
2007-08 335 197644 589.98
2008-09 339 198896 586.71
2009-10 346 206507 596.84
Source: Chief Engineer N.H. I Road BIRW P.R Department
Fig 3: Growth of Rural Roads in odisha
The table presents the status of rural roads per lakh population over the years . Rural roads
per lakh population have shown increasing trend only in 1999-00. In all other years, it is
declining indicating inadequate emphasis of the government on this item.
5. Rural Monthly Average Per Capita Expenditure (RAMPCCE) and Rural Economic
Infrastructure-An Econometrics Analysis.
The RAMPCCE is used to calculate the poverty figures for the states by the Planning
Commission. Thus to establish a relationship between poverty scenario and the availability
Rural
Roads
(in Km)
Year
Ru
ral
Ro
ad
s (i
n K
m)

Orissa Economic Journal, Vol. 47, No. 1, Jan-June 2015 : 225
of four rural economic infrastructure, a multiple regression model is fitted by taking
RAMPCCE as the dependent variable. . The independent variables selected are area
irrigated, number of houses completed under the IAY scheme, number of villages electrified
and rural roads per lakh population. The statistical data for a 15 year period is collected
from different sources. By using Gretl-econometrics software, the OLS regression
coefficients are estimated. The structure of the model is;
RAMPCCE=a+b1(IRRIG)+b
2(RUHC)+b
3(RUEL)+b
4(RURO)+ U
i—————(1)
Where
RAMPCCE = RURAL MONTHLY PER CAPITA EXPEDITURE;
IRRIG = IRRIGATED AREA IN 000’ Ha;
RUHC =TOTAL NUMBER OF HOUSES COMPLETED;
RURO = RURAL ROAD PER LAKH POPULATION;
RUEL =TOTAL NUMBER OF VILLAGES ELECTRIFIED
Table 5: Data Base for the Regression Model
1995-96 243.53 3258.81 51033 32978 607
1996-97 308.55 3357.87 75275 32825 619.66
1997-98 298.48 3426.38 125298 33625 631.19
1998-99 300.88 3436.86 176973 34442 643.16
1999-2000 373.17 3485.33 230301 35190 565.35
2000-01 392.48 3599.70 262160 35362 642.28
2001-02 307.69 3658.90 289554 35957 628.13
2002-03 390.48 3698.29 338019 36552 621.81
2003-04 397.89 3815.77 397015 37147 614.10
2004-05 414.08 3931.16 464907 37744 605.06
2005-06 398.89 3990.35 542757 38044 598.58
2006-07 460.32 4040.022 622425 37761 595.12
2007-08 458.56 4095.39 713052 37479 589.98
2008-09 558.95 4274.19 774714 36914 586.71
2009-10 715.59 4513.823 925948 36349 596.84
Year
Monthly average
per capita expen-
diture
Irrigated
area in 000’
Ha
Total no’s of
houses
completed
(cumulative)
Number of Village
Electrified by the
end of the Year
(Cumulative)
Rural road
(per lakh
population)

226 : Orissa Economic Journal, Vol. 47, No. 1, Jan-June 2015
Interpreting the Results of the Regression Relationship
v The regression coefficients indicate positive relationship between area irrigated and
negative relationship for the three other variables with the RAMPCCE.
v It is interesting to note that villages electrified is the only independent variable having
significant impact on the dependent variable at 5 percent level of significance in a
two-tailed test. At 10 percent level irrigated areas appears to be significant. The other
two explanatory variables number of houses under IAY and Rural Roads fail to qualify
the significance test.
v The R-square value is 0.92 indicating good explanation of the variation in the dependent
variable by the independent variables.
v The calculated F-value is 31.01 which is higher than the theoretical value of around 4.
This establishes that the combined impact of all the explanatory variables is significant.
6. Conclusions
1. There is need for more intensive irrigation expansion to improve the income of the
farming class in the rural areas.
2. Rural housing provision is not much satisfactory as the coverage of BPL families is only
19 percent since 1995 till the end of 2010. Many people live in very sub-standard housing
condition which might be affecting their ability to work.
3. In rural electrification, the pace appears to be extremely slow due to privatization of
the power sector. Recently, the government has abandoned private distributors and it
is expected that rural areas will benefit from this government takeover.
4. The worst situation is noticed in rural roads. Instead of increased provision of rural
communication, it is declining over the years. This might be affecting the transportation
of farm produce to the markets.

Orissa Economic Journal, Vol. 47, No. 1, Jan-June 2015 : 227
References
Ahmad, Raisuddin (1996): ‘A Critique of the World Development Report, 1994:Infrastructure for
Development’ in ‘UNCTAD: International Monetary and Financial Issues for the 1990s’ Volume 7, New
York and Geneva.
Guhan, S.(1995).”Poverty and Social Security”, 244_250,in Shobha Raghuram, Heiko S ievers and
Vinod Vyasulu(eds).
Ghosh, B and P. De (1998): ‘Role of Infrastructure in Regional Development: A Study over the Plan
Period’, Economic and Political Weekly, November.
Govrnment Of india ,1974, Draft Fifth Five Year Plan”,1974-1979.
Govrnment Of Odisha (Economic Survey), 2001-2002&2003-2004 Odisha.
Govrnment Of Odisha, 2001, Transport Statastical handbook,BBSR.
Govrnment Of Odisha,2001,Report Of The Committee On Power Sector In Odisha.
Hirschman, Albert O. (1958): ‘The Strategy of Economic Development’, Yale University Press, New
Haven, CT.
IFAD (1995): ‘The State of World Rural Poverty: A Profile of Asia’, International Fund for Agricultural
Development, Rome.
Indian Economic Association, 1st Amrit Jubilee (80th) Conference Volume Different Article, Hyderabad
(1997).
Kaur,Kuldip,”Infrastrurcture and Growth Evidence Major State Of India “,IEA1st Amrit Jubilee (80th)
Conference Volume Different Article, Hyderabad (1997).
Lewis, W. Arthur (1955),”The Theory of Economic Growth”, Allen Unwin, London.
Majumdar, R. (2002),”Infrastructure and Economic Development: A Regional Analysis”, CSRD/SSS,
Jawaharlal Nehru University, New Delhi.
Nari Tara, S. (1999). “Housing the missing Concerns”, Economic and Politlcal Weekly, Vol.35, No.28.
Nari Tara, S. (2001).”Concurrent Evalution of Indra Awas Youjan Rural Housing Scheme”, All India
Report, Ministry of Rural Development, Govt of India,mimeo.
Patel, Dr. Amrita. (2009), “Rural infrastructure for rural growth” need for concern commitment and
Accountability..
Rahman, Rushdan Islam (1993): ‘A Review of the Findings of Labour Force Surveys and their analytical
basis’, Bangladesh Development Studies 21 (1).
Rostow, W.W. (1960),”The Stages of Economic Growth: A Non-Communist Manifesto”, Cambridge
University Press, Cambridge.
Tewari, RT (1984): ‘Economic Infrastructure in Regional Development in India’, Man and Development,
6:4
Timo Henckel and Warwick J. McKibbin;( 2010),” The Economics of Infrastructure in a Globalized
World: Issues, Lessons and Future Challenges”, Brookings Paper.
Wanmali, S., (1983), “Service Centres in Rural India”, B.R. Corporation, Delhi.
World Bank (1997):,”Rural Development: Vision to Action: A Sector Strategy”, The World Bank,
Washington DC.
World Bank, (1994),”World Development Report: Infrastructure for Development”, Oxford University
Press, New York.

228 : Orissa Economic Journal, Vol. 47, No. 1, Jan-June 2015
Water Supply System in Rural Odisha
Status, Performances and Problems
Jnanaranjan Mohanty1
Availability of safe drinking water is one of the most important determinants of
community health, well being and health infrastructure in modern civilised world
(MDGs). Therefore ensuring drinking water security to the people in general and rural
people in particular has been in the agenda of both centre and state governments in
India since long. The rural drinking water supply sector started in 1972-73 with the
launch of Accelerated Rural Water Supply Programme (ARWSP) by the Government of
India followed by Rajiv Gandhi National Drinking Water Mission(1991-92), Swajaladhara
(2002) and National Rural Drinking Water Programme(2009).All the national rural
water supply programmes have been in operation in Odisha and over the years the
RWSS organisation has been providing safe source of drinking water in rural habitations
of the state through tube wells and pipe water supply scheme. Present study is based
on both primary & secondary data and aims at analysing the status & performance of
drinking water supply system along with the problems faced by users in this sector . It
is found that Odisha is yet to be covered fully under the safe water net. There are two
types of operational models in rural water supply system in Odisha and peoples
participatory model is found to be more efficient. Water supply infrastructure in rural
area is found in a very poor condition, availability of safe water through water supply
scheme falls short of the provision of the NRDWP and requirement of safe water by
household too. Insufficient safe water & duration of supply, discrimination, problem of
frequent break down & maintenance are common problem of this sector.
Key words: Safe source, habitation, full capacity, spot source, Pipe water supply
1. Introduction
Water is basic to life but safe water is fundamental to health, survival, growth and
development (MDGs). Good management of safe water and sanitation is critical to poverty
reduction and a pre-condition for inclusive and sustainable development (UNSGAB-2013).
Although availability of safe water to all is considered as one of the important determinants
1 Assistant Professor (Economics),Parala Maharaja Engineering College,(Biju Patnaik University of
Technology), Odisha

Orissa Economic Journal, Vol. 47, No. 1, Jan-June 2015 : 229
of community health, wellbeing and health infrastructure in modern civilised world, this
basic necessity is still luxury for many of the world’s population (Unicef-2011). Again poor
or no access to safe water has resulted in many social, economic, health related problems
which potentially constraints the process of human resource development and their
productivity( Jalan- 2003).Therefore, ensuring water security to all people in general and
rural people in particular has found an important place in UN Millennium Development
Goals(MDGs).
Providing safe water to more than 833 million(Census 2011) of people of rural India residing
in about 1.69 million habitations spreading over 15 diverse ecological regions is a daunting
task. Article 47 of India constitution confers the duty of providing clean water and improved
public health standard to the state. Accordingly the provision of rural water supply (RWS)
has become the primary responsibility of the state government, but the central government
contributes a significant part of the programme funds . Rural water supply sector was
started in India in the year 1972-73 with the launch of Accelerated Rural Water Supply
Programme (ARWSP) by the Central government. The second generation programme was
started in 1991-92 as Rajiv Gandhi Drinking Water Mission. With the involvement of
community in planning, implementation and management of drinking water supply the
sector reform project came up in 1999-2000 as a third generation programme which later
turned to Swajaladhara in 2002.And the decentralised approach was introduced in this
sector by involving PRI and community organisations in the fourth generation programme
in the name of National Rural Drinking Water Programme (NRDWP) in 2009. At present
Rural Water Supply and Sanitation (RWSS) organisation has been monitoring the water
supply programme at the grassroot level along with PRI to achieve the target of providing
55 lpcd(liters per capita per day) in rural habitations. Maintenance of the project is borne
by fund allocated by the Finance Commission and NRDWP. Purpose wise requirement of
safe water in rural habitation of India is presented below in Table 1.
Table 1: Purpose wise requirement of water
Source: NRDWP Guide lines-2013, Ministry of Drinking Water and Sanitation,
Govt of India (www.mdws.gov.in)
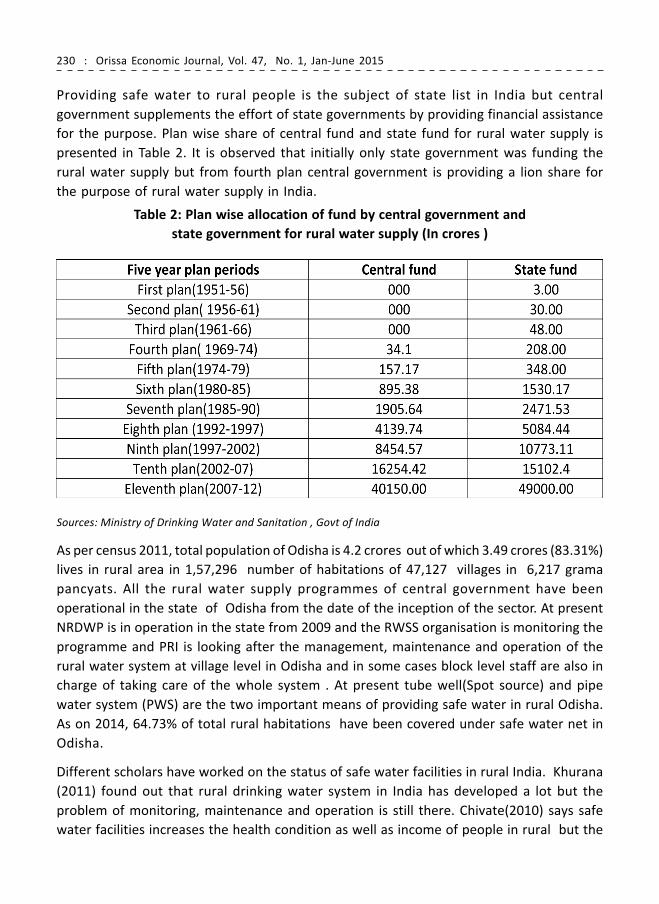
230 : Orissa Economic Journal, Vol. 47, No. 1, Jan-June 2015
Providing safe water to rural people is the subject of state list in India but central
government supplements the effort of state governments by providing financial assistance
for the purpose. Plan wise share of central fund and state fund for rural water supply is
presented in Table 2. It is observed that initially only state government was funding the
rural water supply but from fourth plan central government is providing a lion share for
the purpose of rural water supply in India.
Table 2: Plan wise allocation of fund by central government and
state government for rural water supply (In crores )
Sources: Ministry of Drinking Water and Sanitation , Govt of India
As per census 2011, total population of Odisha is 4.2 crores out of which 3.49 crores (83.31%)
lives in rural area in 1,57,296 number of habitations of 47,127 villages in 6,217 grama
pancyats. All the rural water supply programmes of central government have been
operational in the state of Odisha from the date of the inception of the sector. At present
NRDWP is in operation in the state from 2009 and the RWSS organisation is monitoring the
programme and PRI is looking after the management, maintenance and operation of the
rural water system at village level in Odisha and in some cases block level staff are also in
charge of taking care of the whole system . At present tube well(Spot source) and pipe
water system (PWS) are the two important means of providing safe water in rural Odisha.
As on 2014, 64.73% of total rural habitations have been covered under safe water net in
Odisha.
Different scholars have worked on the status of safe water facilities in rural India. Khurana
(2011) found out that rural drinking water system in India has developed a lot but the
problem of monitoring, maintenance and operation is still there. Chivate(2010) says safe
water facilities increases the health condition as well as income of people in rural but the

Orissa Economic Journal, Vol. 47, No. 1, Jan-June 2015 : 231
rural water infrastructure is of poor condition in India. A study of Rush (2010) questions
the efficiency monitoring net work, Das (2012) opines that rural drinking water set up in
India is unorganised and formal, Again Das (2008) raises his voice on the aspect of
sustainability of drinking water system in rural area and says regarding the poor quality of
water. Hutton & Bartram (2008) and Toubkiss (2006) focus on the cost aspect of drinking
water supply to the poor, they suggest that the establishment, operational and maintenance
cost over a period of time must be included in the project cost.
2. Objectives
In this back drop, the present study is an attempt to analyse the present status of safe
water supply system in the rural Odisha with following objectives.
m To study the status of the for rural water supply system in Odisha
m To study the performance of safe water system in rural Odisha
m To find out the problems faced by people in getting the benefit of safe water in
rural Odisha
m To give suggestion to overcome the problems in rural water supply system in the
state.
3. Methodology
The present study is based on both primaryand secondary data. A multi-stage random
sampling technique is used for collecting data from the study area. At the first stage Ganjam
district of Odisha which consist of 22 numbers of CD block is selected in random. At the
second stage, Chhatrapur CD block and Rangeilunda CD block is selected for the purpose of
study. Chhatrapur and Rangeilunda CD block is consist of 17 and 24 gram panchayats
respectively. At the next stage Laxmipur gram panchayat and Badakustali gram panchayat
is finalised among the gram panchayats of selected CD blocks. There are 72 and 79 villages
in Laxmipur and Badakustali gramapanchayat. From all the villages of selected gram
panchayats, one village from each gram panchayat is selected in randomly. Thus, Laxmipur
and Sanakusastali villages is finally selected for the purpose of collecting data for the
study which is consisting of 419 and 204 household respectively. All households of these
villages are enlisted, 10 % of total households of selected villages are finalized for collecting
data. Thus, total 62 households are selected in random for the purpose of study of which
42 households from Laxmipur and 20 households from Sanakusastali. Two sets of structured
pre-tested questioners, one for the selected village/habitation and another for the selected
household are developed purposefully keeping the objective of the study in centre. Data
as required is collected from the head of the habitation and household through field
survey method. Officials of RWSS is contacted to get some basic information regarding the
system in the study area. Records of RWSS organisation is referred to as per the

232 : Orissa Economic Journal, Vol. 47, No. 1, Jan-June 2015
requirement. Secondary data are collected from different published and unpublished
sources for the purpose of the study. Different types of descriptive statistical tools are
used for analysing various dimensions of the issue.
4. Results and Findings of the Study
4.1 Status of the rural water supply system in Odisha
Physical coverage of rural habitation under safe water supply programme is one of the
important indicators of status of water supply system . Total habitation covered along with
coverage of SC dominated habitation, ST dominated habitation and other habitation
covered by the rural water programme in Odishs is presented in Table 3. It is observed that
as on 2014, 64.73% of total rural habitation of Odisha is covered by safety water net. State
level coverage of SC dominated, ST dominated and other habitation is found to be 67.27%,
64.57% and 64.43% respectively. Among the districts Rayagara tops the list in covering 100
% of habitation and Balangir is found covered only 14.50% of habitation & stands at the
bottom in the list of districts covered under rural safe drinking water net. In SC and ST
dominated habitations covered by safe drinking water programme Rayagara and Balangir
maintains their position except non-SC/ST dominated district. Thus, it is found that the physical
coverage of rural habitations in the safe water net is remarkable but for 35.27% habitations of rural
Odisha safe drinking water is still a luxury.
Table 3: Physical coverage of water supply in rural Odisha as on 2014

Orissa Economic Journal, Vol. 47, No. 1, Jan-June 2015 : 233
(Figures in parentheses indicates percentage )
Sources: Ministry of Drinking Water and Saitation, Govt of India.(www..mdws.gov.in)
District wise coverage of water supply in term of rural habitation by Pipw Water
supply(PWS) and tube well(spot source) in Odisha is presented in the Table 4. It is revealed
from the table that in aggregate at state level 23.7% of habitations are covered under
PWS, 40.95 % is covered by tube wells and 35.28% are not yet covered under the rural
water supply system in Odisha. Among the districts Nuapada is found to be at the top in
PWS covering 48.45% and Dhenkanal is at the poorest condition having only 11.15%
habitation covered under the PWS scheme. So far as the coverage of districts by tube well
is concerned it is found that Rayagara district tops the list by covering 85.46% and
Gajapati district is at the bottom by covering only 11.05% of habitation . In aggregate it is
found that Rayagda district is fully covered under rural water supply system and Balangir is
found to be the poorest among the district in rural water supply coverage .

234 : Orissa Economic Journal, Vol. 47, No. 1, Jan-June 2015
Table 4: District wise status of water supply (coverage/scheme) in rural Odisha
(Figures in parentheses indicates percentage )
Sources: Ministry of Drinking Water and Sanitation, GoI (www.mdws.gov.in/NRDWP, 12 th Dec.
2014 )

Orissa Economic Journal, Vol. 47, No. 1, Jan-June 2015 : 235
Thus, it is found that Odisha has achieved success in covering a big percentage of habitations
under the safety net of rural water supply system through PWS and tube well. But a
sizeable population still remains uncovered under rural safe water scheme.
4.2 Performances of safe water system in study area
Performance of rural water supply system in the study area is examined by analysing the
aspects like existing operational model of water supply , availability of physical
infrastructure, comparing the requirement, provision and availability of safe water and
purpose wise use of supply water as a percentage of requirements by rural households in
the study area.
4.3 Socio-economic profile of study area
Socio-economic profile of study area is presented in Table 5. Laxmipur and Sanakustali
village of Laxmipur and Rangeilunda grama panchayat of Chhtrapur and Rangeilunda C D
block of Ganjam district is selected for the study. It is found that there are 419 and 204
households lives in 8 habitations in both the selected villages of which 47.99 % are male,
52.01 % are female, 74.45% people belongs to general category,25.55% are from SC category,
61.34% are literate and rest 38.66% are illiterate.
Table 5: Socio-economic profile of study area
(Figures in parentheses indicates percentage)
Source: Collected and estimated by the author.

236 : Orissa Economic Journal, Vol. 47, No. 1, Jan-June 2015
4.4 Operational models of rural water supply system
With an objective to examine the performance of rural water supply system in the study
area operational models of water supply system is extensively analysed and data related
to types water sources, their functional status, information regarding availability of other
water supply infrastructure etc. in the study area is collected and presented in the Table-
6. During field survey it was observed that there are two type of operational model of rural
water system exist in the study area i.e. Outside Managed System (OMS) and Self Managed
System (SMS).
In OMS model of Sanakusasthali village, government staff manages, operates and maintains
the system from outside and from distance too. Safe water is provided through selected
stand post in the village/habitation at a specific time for a given duration , beneficiary use
to go to that stand post to collect the water, maintenance is the responsibility of government
staff, reporting for maintenance and maintenance is not accountable to anybody. Electricity
bill, maintenance cost and other expenses are borne by government .In this model one
mechanic is paid Rs1000/ only per month for providing the maintenance service to the
system. All type of maintenance and operational cost is provided by project fund and the
whole system is managed by outside from distance.
In SMS model of Laxmipur village, users committee along with Panchayat Raj Institution
(PRI) member manages, operates and maintains the system from within. In this model
users committee-PRI member has the autonomy to take decision regarding the
management of the project .Each user pays a fixed amount for getting connection along
with an annually/monthly user fee as decided by the users committee . All beneficiary
households are provided with one out-let of safe water at their door step and expenses
made for the extension of out-let to the door step from main distribution channel is borne
by the user. Water is supplied at given time and for a specific duration which is decided by
the user committee. Users committee pays the electricity bill, takes care of the
maintenance cost and other expenses of the system from the money collected from the
beneficiaries. In this model users committee along with PRI member appoints one self
employed mechanic (SEM) preferably from the village and pays a remunerative amount
for looking after the system. Minor maintenance cost is provided by user committee and
major maintenance cost is borne by project fund.
Thus, it is found that in OMS model beneficiary goes to the water spot where as in SMS
model beneficiary gets the water at the door step and saves time & energy. On the other
hand, in SMS model beneficiary pays a user fee and takes part in the process of decision
making where as in OMS model beneficiary pays nothing and use the system as a user only
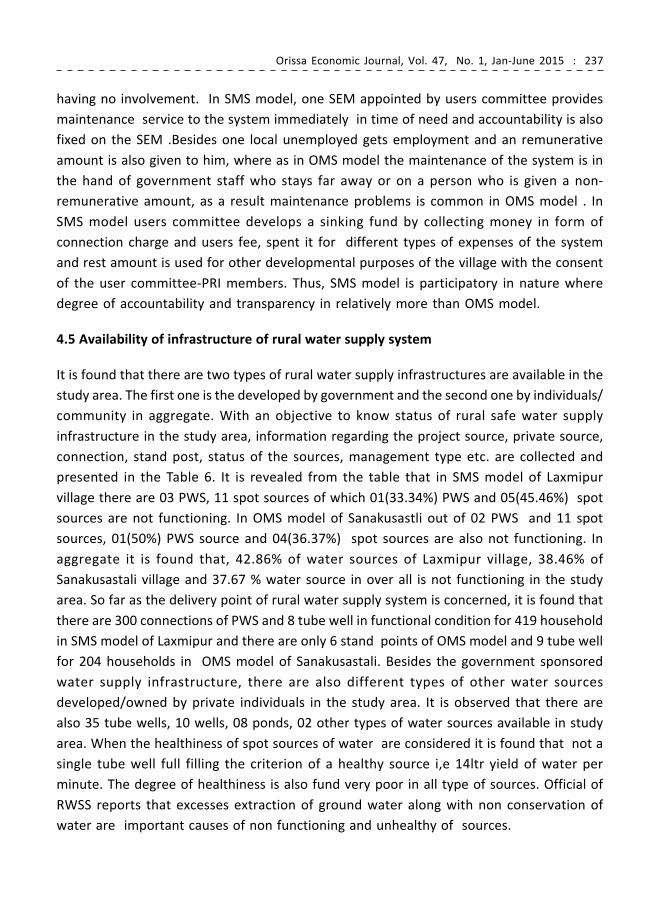
Orissa Economic Journal, Vol. 47, No. 1, Jan-June 2015 : 237
having no involvement. In SMS model, one SEM appointed by users committee provides
maintenance service to the system immediately in time of need and accountability is also
fixed on the SEM .Besides one local unemployed gets employment and an remunerative
amount is also given to him, where as in OMS model the maintenance of the system is in
the hand of government staff who stays far away or on a person who is given a non-
remunerative amount, as a result maintenance problems is common in OMS model . In
SMS model users committee develops a sinking fund by collecting money in form of
connection charge and users fee, spent it for different types of expenses of the system
and rest amount is used for other developmental purposes of the village with the consent
of the user committee-PRI members. Thus, SMS model is participatory in nature where
degree of accountability and transparency in relatively more than OMS model.
4.5 Availability of infrastructure of rural water supply system
It is found that there are two types of rural water supply infrastructures are available in the
study area. The first one is the developed by government and the second one by individuals/
community in aggregate. With an objective to know status of rural safe water supply
infrastructure in the study area, information regarding the project source, private source,
connection, stand post, status of the sources, management type etc. are collected and
presented in the Table 6. It is revealed from the table that in SMS model of Laxmipur
village there are 03 PWS, 11 spot sources of which 01(33.34%) PWS and 05(45.46%) spot
sources are not functioning. In OMS model of Sanakusastli out of 02 PWS and 11 spot
sources, 01(50%) PWS source and 04(36.37%) spot sources are also not functioning. In
aggregate it is found that, 42.86% of water sources of Laxmipur village, 38.46% of
Sanakusastali village and 37.67 % water source in over all is not functioning in the study
area. So far as the delivery point of rural water supply system is concerned, it is found that
there are 300 connections of PWS and 8 tube well in functional condition for 419 household
in SMS model of Laxmipur and there are only 6 stand points of OMS model and 9 tube well
for 204 households in OMS model of Sanakusastali. Besides the government sponsored
water supply infrastructure, there are also different types of other water sources
developed/owned by private individuals in the study area. It is observed that there are
also 35 tube wells, 10 wells, 08 ponds, 02 other types of water sources available in study
area. When the healthiness of spot sources of water are considered it is found that not a
single tube well full filling the criterion of a healthy source i,e 14ltr yield of water per
minute. The degree of healthiness is also fund very poor in all type of sources. Official of
RWSS reports that excesses extraction of ground water along with non conservation of
water are important causes of non functioning and unhealthy of sources.

238 : Orissa Economic Journal, Vol. 47, No. 1, Jan-June 2015
Table 6: Status of infrastructure of rural water supply system in study area
(Figures in parentheses indicates percentage )
SMS Model: Self Managed Model, OMS Model: Outside Managed Model
Source: Estimated by the author
4.6 Provision, requirement and availability of safe water for rural households
With an objective to study relationship between the provision, requirement and availability
of safe water supplied through rural water supply system, data are collected from the
users of the study area and presented in the table in form of provision of water as percentage
of household requirement, availability of water from different project sources as
percentage of household requirement and availability of water from project as percentage
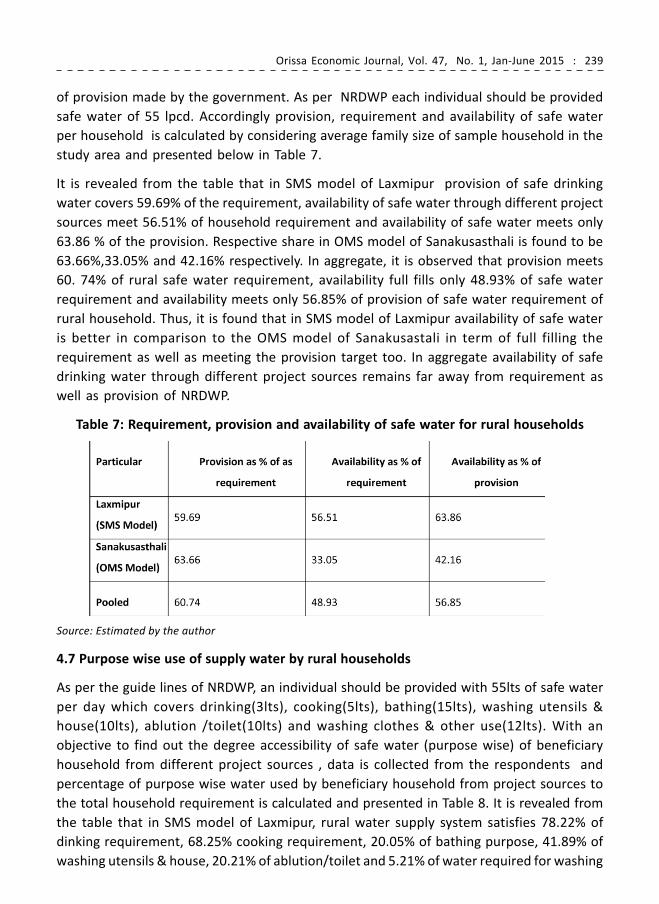
Orissa Economic Journal, Vol. 47, No. 1, Jan-June 2015 : 239
of provision made by the government. As per NRDWP each individual should be provided
safe water of 55 lpcd. Accordingly provision, requirement and availability of safe water
per household is calculated by considering average family size of sample household in the
study area and presented below in Table 7.
It is revealed from the table that in SMS model of Laxmipur provision of safe drinking
water covers 59.69% of the requirement, availability of safe water through different project
sources meet 56.51% of household requirement and availability of safe water meets only
63.86 % of the provision. Respective share in OMS model of Sanakusasthali is found to be
63.66%,33.05% and 42.16% respectively. In aggregate, it is observed that provision meets
60. 74% of rural safe water requirement, availability full fills only 48.93% of safe water
requirement and availability meets only 56.85% of provision of safe water requirement of
rural household. Thus, it is found that in SMS model of Laxmipur availability of safe water
is better in comparison to the OMS model of Sanakusastali in term of full filling the
requirement as well as meeting the provision target too. In aggregate availability of safe
drinking water through different project sources remains far away from requirement as
well as provision of NRDWP.
Table 7: Requirement, provision and availability of safe water for rural households
Source: Estimated by the author
4.7 Purpose wise use of supply water by rural households
As per the guide lines of NRDWP, an individual should be provided with 55lts of safe water
per day which covers drinking(3lts), cooking(5lts), bathing(15lts), washing utensils &
house(10lts), ablution /toilet(10lts) and washing clothes & other use(12lts). With an
objective to find out the degree accessibility of safe water (purpose wise) of beneficiary
household from different project sources , data is collected from the respondents and
percentage of purpose wise water used by beneficiary household from project sources to
the total household requirement is calculated and presented in Table 8. It is revealed from
the table that in SMS model of Laxmipur, rural water supply system satisfies 78.22% of
dinking requirement, 68.25% cooking requirement, 20.05% of bathing purpose, 41.89% of
washing utensils & house, 20.21% of ablution/toilet and 5.21% of water required for washing

240 : Orissa Economic Journal, Vol. 47, No. 1, Jan-June 2015
purpose and the figure of same purposes in OMS model of Sanakusasthali is found to be
69.58%, 54.88%, 00%, 12%, 00% and 00% respectively. In aggregate, rural water supply
system satisfies only 73.05% of drinking water requerement,63.93% of water required for
cooking,13.58% of water required for bathing, 32.24% of water required for washing utensil
& house,13.9% water required for ablution/toilet and 30.62% of water for washing clothes
& other purposes.
Thus, it is found that neither of the model is able to provide safe water as per the provision.
But the SMS model is better in providing safe water to rural household in comparison to
OMS model. And in OMS model percentage of household depending on traditional
unhygienic sources of water for bathing, washing clothes and toilet purposes is found
higher.
Table 8: Purpose wise use of supply water as a percentage of
requirement by rural households
Source:Estimated by the author
4.8 Problems in rural water supply system
Data regarding the problems faced by users in rural water supply system in the study area
is collected and presented in Table 9. In SMS model it is found that 71.42% user says
quantity of water supplied by the system is insuffiient,61.90% raises voices on the duration
of water supply,28.57% user says the time of water supply is not convenient to them
,35.71% users faces problem because of unequal distribution,1.90% opines that there is
discrimination in water supply,14.28% user replies that frequent break down is a common
problem and 1.76% complains late maintenance as common problem in the system .In
OMS model 90% user say water supplied by the system is insufficient, 75% says duration of
water supply is short, 60% questions the time of water supply, 55% user faces the problem
due to unequal distribution, 30% users face problem because of discrimination in water
supply, 70% opines about frequent breakdown, 80% say wastages of time and energy in
waiting to get water , 70% raises voice on sanitation problems, 80 % user opines irregular

Orissa Economic Journal, Vol. 47, No. 1, Jan-June 2015 : 241
and delayed maintenance is the common problem for them. In both the models water
supplied by the rural water supply system is found insufficient, users expects to get water
and for more duration. Unequal distribution of water and discrimination is also found in
both models, it may be due to the technical problem of distribution channels of water
system in SMS model and common stand post OMS model. Frequent break down and late
maintenance is also reported by more beneficiaries in OMS model, it may be due to the
absence of maintenance mechanism like appointment of SEM of SMS model. Wastages of
time & energy and problems of sanitation in OMS model may be due to the common stand
post supply system.
Table 9: Problems in rural water supply system
Source: Estimated by the author
5. Conclusion
Thus, it is concluded that the availability safe water is considered as a healthy indicator in
the process of human resource development and the provision safe water for all is an
international call. Constitution of India confirm the responsibility on state government to
provide safe water to all its citizen. As 70 % of Indians lives in villages, providing safe
drinking water to rural area has become a herculean task. The rural drinking water sector
was started in India in the year 1972-73 with the launch of Accelerated Rural Water Supply
Programme (ARWSP). Presently, National Rural Drinking Water Programme (NRDWP) is in
operation throughout rural India for providing safe water and RWSS organisation is
monitoring the system at different levels along with PRIs in some areas. In this regard it is
observed that central government of India has been funding a major share of developing
security net of safe water in rural India. So far as the status of rural water supply system in
Odisha is concerned as on 2014, 64.73 % of rural habitations is cover under the safety net of

242 : Orissa Economic Journal, Vol. 47, No. 1, Jan-June 2015
drinking water which covers 67.27 % ST dominated habitation, 64.57 % SC dominated
habitation & 64.4% is other rural area .Thus, it is found that after so many years of the
inception of rural drinking water supply system in Odisha , still 35.27% of rural habitations
are yet to come under the safety net of rural water system. Again it is observed that there
are two types of model i.e. SMS model and OMS model operating in rural area which is
managed by users committee & PRI members and government agency respectively. It is
revealed that SMS model is operating in a better way in comparison to OMS model. Again
it is found that the existing infrastructure of rural water supply system is in very poor
condition, a good percentage of spot water source is not functioning, source of PWS and
tube well is depleting because of excess extraction of ground water by unrestricted digging
of private tube wells in rural area and also due to lack of pro-active steps towards water
conservation. It is also found that water quantity supplied by rural water supply system is
insufficient to meet the household requirement, the volume of water supply through
rural water supply system falls short of the provision made by government and the problem
is observed in higher degree in OMS model. Besides, water supplied through the rural
water supply system is meeting a big share of drinking water requirement only but a good
number of rural household are still depending on traditional, unhygienic, unsafe sources
of water for other purpose like cooking, bathing, washing, toilet use etc. Problem of
insufficiency of supply water is common in both the model of water supply in rural area
but magnitude of insufficiency is found higher OMS model. Unequal distribution,
insufficient duration, discrimination in water supply, frequent break down, late
maintenance, sanitation, wastages of time & energy in colleting water, are also other
major problems in both models of rural water supply system.
The following are the policy implications
m Steps may be taken to bring the uncovered rural area of Odisha to the safety net of
safe water supply system,
m Measures may be taken to increase the performance of rural water supply system by
increasing the water supply infrastructure along with the increasing the volume of
availability of safe water not only for drinking purposes but also for other uses as per
the norm of NRDWP in rural Odisha.
m Multi dimensional water conservation programme along with restriction on free use
of ground water may be implemented strictly to increase the ground water level which
will restrict the depletion of water sources.
m Peoples participatory management system may be encouraged in rural water supply
system to overcome the problems faced by beneficiary households in managing and using the
system through self generated sources, locally available resources etc.

Orissa Economic Journal, Vol. 47, No. 1, Jan-June 2015 : 243
References
Census India 2011
Chivate,B.A.(2010),Water Auditing in Maharastra,C R Bom Small Publication Seres No 22.
Das, Keshab (2008), Drinking Water and Sanitation in rural Madhya Pradesh: Recent
Initiatives and Issues, Working Paper, S. No. 83, GIDR, Ahamadabad.
Das, Keshab (2012), Drinking Water and Sanitation in rural Madhya Pradesh: Issues and
Challenges for policy, Journal of Rural Development, No 03,pp 287-304,NIRD.Hyderabad
Hutton,G.Bartram(2008),Global cost of attaining the Millenium Developmen Goal for Water
Supply and Sanitation,WHO.
Khurana et.al (2011), Background paper, Drinking Water Quality in Rural India: Issues and
Approaches, Water Aid’s Misson.www.wateraid .org.
Planning Commission(2010), Evaluation Study on Rajiv Gandhi National Drinking Water
Supply, Government of India.
Report (2013), United Nation Secretary General Advisory Board(UNSGAB) on Water and
Sanitation.
Ruse Michael et. al.(2010), Water Safety Plans for Rural Water Supply in India-Policy Issues
and Institutional Arrengment,Water ans Sanitation Programme ,World Bank.
Toubkiss,J.(2006),Costing MDG target 10 on Water Supply and Sanitation,Comparative
analysis,Obstacles and Recomendation,World Water Council.
WHO (2006), Meeting the MDG drinking Water and Sanitation Target -The Urban and Rural
Challenges of the decade.
www.mdws.gov.in/NRDWP

244 : Orissa Economic Journal, Vol. 47, No. 1, Jan-June 2015
Rural Health Infrastructure in Odisha - An Analysis
Swapnamoyee Priyabhasini Palit1
Health infrastructure is an indicator of both the mechanism and effectiveness of delivery
of healthcare facilities. Its adequacy is assessed by the extent to which it caters to the
healthcare need of the people .Due to their illiteracy and poverty, public healthcare
facilities are the main support of healthcare need of the rural people. But the inadequacy
in infrastructure, manpower and supportive facilities makes these health centres non-
functional thus adversely affecting the accessibility to healthcare need of the rural
people. This results in their low performance and thus a low health status of the people.
This paper analyses the adequacy of rural infrastructure in Odisha and their impact on
the health status of the people in rural Odisha.
Keywords: Infrastructure, manpower, health status, HealthCare
1. Introduction
Health Infrastructure of a place is an indicator of not only the mechanism but also the
effectiveness of healthcare delivery. Overall it can be classified into the educational and
service infrastructure. It is the aspects of ‘service infrastructure’, which forms the basis of
analysis in this paper. The service infrastructure consists of the health delivery units like
the hospitals, clinics, dispensaries etc under the different systems of medicine like
Allopathy, Ayurveda, Unani, Homeopathy etc. This paper tries to explore the adequacy
and effectiveness of healthcare delivery in rural Odisha. For this purpose the paper has
been divided into 2 sections. Section 1 analyses the prevailing conditions of the rural
health infrastructural facilities in the state of Odisha and section 2 discusses the rural
health status and analyse the district wise availability and their impact on performance in
healthcare provisions based on certain chosen parameters.
2. Review of Literature
Substantial physical, financial and social barriers to accessibility to rural healthcare exist
not in maternal and child care but also in other forms of diseases (Pandey, 2013). These
1 Asst Prof of Economics, KIIT School of Humanities, KIIT University, Bhubaneswar, India

Orissa Economic Journal, Vol. 47, No. 1, Jan-June 2015 : 245
issues can only be addressed through a vigorous role played by the health care providers
in the field extended by the Accredited Social Health Activists (ASHAs), Auxiliary Nurse
Midwives (ANMs) who can create awareness at the very grassroot level. Poverty, low/no
education, severe shortages of skilled and unskilled manpower mainly due to unwillingness
to work in the remote areas and the failure of the government to make them accountable
through actual policy implementation have severely affected the overall impact of National
Rural Health Mission(NRHM) to make a significant mark in health status of Odisha(Patra
and Ramadass,2013).Against the Indian Public Health Standard(IPHS) norm of at least one
doctor for every 20,000 people in the rural areas, many health centres are functional without
any physicians and specialists in the rural areas of the state. Along with inadequate health
centres, the absenteeism of physicians and staff in the existing centres increases the
spatial inaccessibility of the rural people. 23 districts of the state were identified as severely
lacking in several indices of health infrastructure and the rest 7 with a little higher position
with none of the district satisfying the standard norms of minimum physical and manpower
infrastructure (Bose and Adhikary, 2008).Even if the rural health infrastructure are available,
factors like the dominance and dependence on folk and traditional healers, spatial
inaccessibility,non-awareness, low density of population and barriers related to culture
language etc make the overall utilisation and thereby the outcome of the health service
system somewhat unsatisfactory in the state. It faces acute shortage of doctors more so in
specialists of paediatrics, anaesthesia, obstetrics etc due to the limited number of seats in
the state run medical institutions. The same situation is faced in case of paramedics’ staffs
which are insufficient to run the state operated medical institutions (Gupta, 2002).
3. Objectives of The Study
1. To analyse the adequacy of rural health infrastructure in the state of Odisha.
2. To analyse the impact of availability of infrastructure on the health status of the
people in the rural areas of the districts of Odisha.
4. Adequacy of Rural Health Infrastructure in Odisha
Rural health infrastructure can be said to be adequate if it caters to the health need of the
people. In other words people are able to access it without any physical or financial barriers.
In this section we make an in-depth analysis of the primary healthcare facilities in the
districts of rural Odisha where more than 83.3% of the population lives (Population Census,
2011). It is worth mentioning here that out of a total area of 155707 sq. km of Odisha,
98.21% i.e., about 152912.87 sq.km is are the rural area with 51313 villages (Population
Census, 2011).Being deprived of the economic capacity to access adequate healthcare due
to financial barriers, this vulnerable section depends on the public healthcare facilities for
their health care need. However mere availability of infrastructure which is non-performing

246 : Orissa Economic Journal, Vol. 47, No. 1, Jan-June 2015
due to inadequate manpower and logistic support like availability of the required staff,
drug supplies, laboratory and other facilities is a serious threat to the healthcare need of
the people. Not to speak of the deplorable condition faced by the people where even the
infrastructure is lacking. To make an in-depth analysis of these features, some chosen
indicators for infrastructure availability and performance are given below.
Infrastructure Indicators
1. Adequacy of the healthcare centres (Sub-Centres (SCs), Primary Health Care (PHCs)
and Community Health Care Centres (CHCs) in terms of the prescribed number in
the state.
2. Adequacy of these healthcare centres in terms of the availability of staff.
3. Adequacy of these healthcare centres in terms of the availability of the
infrastructure facilities like supply of water, electricity, drugs etc.
For this we relied on data available from the Rural Health Statistics in India, 2012, published
by the Statistics Division of MOHFW, GOI.
4.1 Adequacy of Healthcare Centres in the State
Table 1: Number of Scs, PHCs and CHCs Functioning in Odisha in 2012
Note: *79 other hospitals are functioning at the level of PHCs according to the state’s information.
** Calculation based on projected population of 2012.
1. Percent of the total in India. 2. Average per district in the state.
Source: Compiled from Rural Health Statistics in India, 2012, MOHFW, GOI.

Orissa Economic Journal, Vol. 47, No. 1, Jan-June 2015 : 247
Table 1 shows the number of SCs, PHCs and CHCs in Odisha vis-a-vis India and Kerala which
has a developed healthcare delivery system. It shows that Odisha has a higher percentage
of these 3 healthcare centres at 4.5, 5.1 and 7.8 respectively of the overall number in the
country relative to 3.1, 3.4 and 4.5 respectively in Kerala. But when analysed in terms of
the average number of these centres in each district of state, Odisha has 223, 41 and 13 SCs,
PHCs and CHCs per district relative to 327, 58 and 15 in Kerala. This shows the relative
shortage of the availability of these centres relative to their adequate spread in number in
Odisha. However analysing in terms of the number of population per the healthcare
centre for the projected population of 2012 ,Odisha is found to be better placed as the
population is 6360,34694 and 112824 per SC,PHC and CHC relative to 7656,43297 and 161415
respectively for these centres in Kerala. Apart from these there are 27 Sub-Divisional
hospitals, 32 District Hospitals and 329 Mobile Medical Units (MMUs) functioning in Odisha
in 2012 relative to 80, 15 and 17 respectively in Kerala. This clearly points to the importance
given to MMUs given in Odisha to reach the inaccessible areas but obviously ill-equipped
from its very structure of mobility relative to an equipped healthcare centre.
In 2012, of the total 6688 SCs in Odisha, 56% are in government buildings, 40.5% are still
operated in rented buildings while 6.1% are located in rent free panchayat buildings or
village society buildings. For PHCs, these numbers are 95%, 2.6% and 2.7% respectively
while all the CHCs are located in government buildings. These are an important determinant
of the availability of other logistic support. 1344 SCs and 33 PHCs are under construction in
2012 in Odisha which would go to address their shortages in the state.
Considering the prescribed population norms (as given in Table 2) with respect to the
overall rural population as well as the population in the hilly and tribal areas , there is a
shortfall of 18% in SCs,6% in PHCs and a surplus only in the case of CHCs in Odisha(as shown
in Table 3). Even in the tribal areas of Odisha, there is a shortfall of 6% each in the number
of prescribed Sub-centres and PHCs each while the surplus exists only in the case of the
number of CHCs. Here it is to be worth mentioning that SCs are the first contact between
the community and the health care centre and the PHC between the community and the
Medical officer, both catering to the very basic healthcare need of the poor villagers. A
shortage in this basic infrastructure affects the physical and spatial accessibility of the
poor people.
Table 2: Population Norms for Health Centres
Centre Plain area Hilly/Tribal/Difficult area
Sub-Centre(SC) 5000 3000
PHC 30000 20,000
CHC 1,20,000 80,000
Source: MHFW (2005), Population norms (Census, 2011),http://www.mohfw.nin.in

248 : Orissa Economic Journal, Vol. 47, No. 1, Jan-June 2015
Table3: Shortfall/Surplus in Health Infrastructure in Odisha and Kerala According to
Population Census, 2011
Note: 1. R-Required P-In Position S-Shortfall -Surplus 2.Calculated on a population of 34,951,234 for rural areas
and 8,599,849 for hilly/tribal areas in Odisha and 17,455,506 and 259,169 for Kerala respectively (Population
census, 2011).
Source: Rural Health Statistics, 2012, MOHFW, GOI.
The average rural area covered is 22.86 sq.km, 124.73 sq.km and 405.60 sq.km respectively
by a SC, PHC and a CHC in Odisha as against 7.78 sq.km, 44.02 sq.km and 164.11 sq.km
respectively only for these centres in Kerala. This translates into a radial distance of 2.70
km, 6.30 km and 11.36 km for a SC, PHC and CHC’s coverage in Odisha relative to only 1.57
km, 3.74 km and 7.83 km respectively in Kerala (Table 4). This is a clear indication of the
spatial inaccessibility in need of the people in rural Odisha further aggravated by lack of
transport and road connectivity to these centres as analysed later in this paper. Thus it can
be seen that though Odisha is better placed than Kerala only in terms of the population
covered per these health care centres as shown above, it lags behind in terms of average
rural area covered by these centres as well as the radial distance covered per centre which
is higher than Kerala .Thus there is spatial inaccessibility to the needed health care facilities
in Odisha relative to Kerala.
Table 4: Population, Avg. rural Area (In Sq.km) Covered and the Avg. Radial Distance (in
KM) Covered by a SC, PHc, CHC in Odisha and Kerala
Source: Rural Health Statistics in India, 2012, MOHFW, GOI
The actual situation is further reflected in Table 5 which gives the number of hospitals and
beds in rural and urban areas of Odisha vis-a-vis Kerala. It shows that though the population
per number of government rural hospital is lower in Odisha at 25,639 for the population

Orissa Economic Journal, Vol. 47, No. 1, Jan-June 2015 : 249
projected for 2012, it is much higher in Kerala at 1, 13,724. However when the number of
persons per bed is analysed the situation is worse for the state of Odisha with 5992 persons
per bed in rural government hospitals against only 2863 in Kerala. This situation is against
Odisha relative to Kerala even in case of urban government hospital, with 4,67,413 persons
per urban government hospital and 4881 persons per bed in Odisha while it is 2,53,819 and
1775 for Kerala respectively for 2012 projected population. This points towards the high
dependency rates and thereby the inaccessibility to the health care facilities.
Table 5: Number of Govt. Hospitals and Beds in Rural and Urban areas
(Including CHCs) (Provisional)in 2012
Note: Govt. Hospital includes Central govt, State govt and Local Govt. bodies.
*Number of population served per unit of the hospital and hospital bed.
Source: Compiled from Directorate General of State Health Services
4.2 Manpower/Staff Adequacy in the Rural Healthcare Centres in Odisha
Manpower/staff strength, both skilled and unskilled, constitutes the most important
component of health infrastructure as mere existence of centres or logistics would not
work by themselves to address the healthcare need of the seekers of healthcare. The
norm for manpower requirement in these healthcare centres prescribes for one Health
Worker (Female)/ANM, one Health Worker (Male) for each sub-centre. In addition the
IPHS recommends one additional HW (F) along with these personnel. For each PHC the
existing pattern is one HW (F), 2 Health Assistants-one male and a female and one each of
a mid-wife nurse, pharmacist, medical officer, Laboratory Technician, Driver, 4 Class IV
employee and 2 clerks. In addition to these staff the IPHS recommends 4 additional nurse
midwives, 1 practitioner in AYUSH or any ISM and 2 additional medical officer of which one
should be female. For each CHC, the IPHS norm prescribes for one general surgeon,
physician, obstetrician and gynaecologist, paediatric, Anaesthetist, Public health Manager,

250 : Orissa Economic Journal, Vol. 47, No. 1, Jan-June 2015
Eye surgeon, Dental surgeon, specialist of AYUSH, General Duty Medical officer(GDMO) of
AYUSH and 6 GDMO of Allopathy. Along with these there are other support staffs like ANM, staff
nurse, pharmacist, laboratory technicians etc.
Based on these prescribed norms, severe shortages in human infrastructure is seen in
rural healthcare centres in Odisha as shown in Tables 6,7 and 8. The number of vacancies
refers to the vacant posts against those sanctioned while the shortfall refers to the
difference between the required staff (which is one for each health care centre) against
those in position. While it was shown earlier that the number of sub-centres, PHCs and
CHCs are themselves short of the prescribed number in Odisha based on the population
norms, the analysis of the existing manpower reflects that even these existing
infrastructures remain unutilised due to lack of manpower. It is seen that except in case of
HW (F)/ANM at the sub-centres and PHCs where there is a surplus, there exists vacancies
and shortfalls in all other cases. There is a shortfall of 43% in HW (M) at sub-centres, 49% of
HA (F)/LHV at PHCs, of 100% in HA (M) at PHCs etc. Not only in these supporting staff, there
also exists severe shortfall in clinical/technical staff. This includes shortfall of 13% of doctors
in PHCs, 79% of specialists in CHCs, 85% of Radiographers at CHCs, 77% of Laboratory
Technicians at PHCs and CHCs etc. 7% of the Sub-centres are operational in Odisha without
any HW (F)/ANM, 48% without any HW (M) and 6% without both of these staff. Similarly in
the next tier i.e., the PHC, none of it has 3 to 4+ doctors, 41% are with 2 doctors and 51% are
with only one doctor while 8% are operational without any doctors. While 11% of the PHCs
are without any pharmacists and 8% without a lady doctor, none of the existing PHC has a
laboratory technician.
The above analysis clearly reflects that not to speak of the prescribed IPHS norms, the rural
health centres in Odisha have failed to meet the minimum staff strength required according
to the existing infrastructure thus seriously affecting the accessibility to the needed
healthcare of the rural and tribal population.
TAble 6: Percentage of Vacancy and Shortfall of Staff/Manpower in Rural Healthcare
Centres of Odisha
*surplus Source: Compiled from Rural Health Statistics in India, 2012, MOHFW, GOI

Orissa Economic Journal, Vol. 47, No. 1, Jan-June 2015 : 251
Table 7: Numbers of Sub-centers Functioning without Manpower in Odisha (2012)
Without HW(F)/ANMs Without HW(M) Without Both
7% 48% 6%
Source: Rural Health Statistics in India, 2012, MOHFW, GOI
Table 8: Percentages of Phcs without Manpower in Odisha (2012)
Source: Rural Health Statistics in India, 2012, MOHFW, GOI
4.3 Supportive Infrastructure Facilities at Rural Healthcare Centres in Odisha
Along with manpower, the physical infrastructure enables the smooth provision of
healthcare facilities. This includes the availability of water, electricity, quarters, All-weather
motorable roads for connectivity, the labour rooms, Operation Theatres(OTs), bed facilities,
computers, X-Ray machines and other test facilities etc. An analysis of these physical
infrastructures reflects the reasons for underutilisation of even the existing healthcare
facilities. Tables 9, 10 and 11 provide detail of the existing shortfall in these physical
infrastructures in rural healthcare centres of Odisha. It is seen that 47% of the sub-centres
are without any ANM quarters, 34% without any regular supply of water and 40% without
electricity.However only 3% of the villages are found to be without All-Weather motorable
road connectivity. The situation is found to be more deplorable in case of PHCs with none
of it having the minimum prescribed 4 bed facilities or with an operation theatre. 11.5%
and 24.9% of the PHCs are still without any supply of electricity and water respectively.
With respect to CHCs, though most of it is seen to be equipped with OTs, Rogi Kalyan
Samities (RKS), drug supplies etc, yet it lacks in its most basic amenities. Only 9% of the
existing CHCs in Odisha is equipped with the recommended 4 specialists,1% with a
functional stabilisation unit for the new born, only 16% with at least 30 beds according to
the prescribed norm for a CHC and 11% with a X-ray machine.
Thus the above analysis clearly reflects the large scale physical inaccessibility to the needed
healthcare due to lack of adequate healthcare facilities as well as the needed supportive
manpower and physical infrastructure. It is worth mentioning here that none of the PHCs
and CHCs in Odisha meets the prescribed IPHS norms. This includes less number of health
centres than the required population such that the average number of population per
centre is above the prescribed capacity. There is lack of manpower and most of these
centres do not meet even the minimum requirement of staff according to the existing
infrastructure so as to make them operational. Over this, the lack of physical infrastructure
cripples the very provision of rural healthcare in Odisha.

252 : Orissa Economic Journal, Vol. 47, No. 1, Jan-June 2015
Table 9: Infrastructure Facilities Available at Sub-centres
1. % of Sub-centres with ANM quarter 53%
2. % of Sub-centres without regular supply of water 34%
3. % of Sub-centres without supply of electricity 39.75
4. % of Sub-centres without All-Weather Motorable Approach Road 3%
Source: Rural Health Statistics in India, 2012, MOHFW, GOI
Table 10: Infrastructure Facilities Available at PHCs in Odisha (in 2012)
With Labour Room 82.6%
With at least 4 Beds 0%
With operation theatre 0%
Without Supply of electricity 11.5%
Without supply of water 24.9%
Without All-Weather Motorable Approach Road 0.5%
With Telephone 12.1%
With Computer NIL
With Referral Transport 5%
With Registered RKS 92%
Source: Rural Health Statistics in India, 2012, MOHFW, GOI
Table 11: Infrastructure Facilities at The CHCs in Odisha (in 2012)
With all 4 specialists 9%
With Functional Laboratory 100%
With Functional OT 78%
With functional Labour room 100%
With functional Stabilisation units for new born 1%
With New born care corner 54%
With at least 30 beds 16%
With functional X-Ray machine 11%
With quarters for specialist doctors 70%
With specialist doctors living in quarters 70%
With Referral Transport available 100%
With registered RKS 100%
Having regular supply of Allopathic Drugs for common ailments 100%
Having Regular supply of AYUSH Drugs for common ailments 83%
Source: Rural Health Statistics in India, 2012, MOHFW, GOI

Orissa Economic Journal, Vol. 47, No. 1, Jan-June 2015 : 253
Thus the overall analysis of the rural health infrastructure in Odisha reflects inadequacy in
the required infrastructure, staff as well as the supportive facilities. This is due to the lack
of adequate government funding and non-utilisation of the existing allocated funds.
Besides the doctors and staff are reluctant to go to the remote areas if posted and remain
absent by taking leave for indefinite period so as to continue their illegal practices in the
urban areas. Beside the lack of adequate physical infrastructure like transport and
communication, educational and stay facilities etc further strengthen their reluctance to
work in these areas.
Though the government has taken several reformative steps to tackle the situation since
1990s under the House Committee and Department for International Development (DFID)
recommendations, yet its lack of strict implementation has allowed the grim situation to
continue. Some of these initiatives taken were like providing direct funds to the medical
officers to carry out petty repairing work in the health care unit buildings. Similarly
compulsory appointments of the doctors for a year in the selected identified districts
before admission into PG courses, compulsory internship training programmes in CHCs
under the guidance of the CDMOs and supervised by medical college teachers as well as
the medical officers for ‘hands on training’, exposure in the field were taken to ensure the
availability of doctors in the remote areas of the state. The condition arising due to the
financial constraints of the government was addressed by measures like multi-skill training
of the existing staff, local recruitment of the paramedic staff etc. However the analysis has
reflected the insufficiencies in these steps taken to ensure accessibility and utilisation of
the healthcare facilities in the state.
5. Impact of Health Infrastructure on Health Outcomes
To analyse the impact of the availability of health infrastructure on the health status as
well as some performance indicators which would reflect their actual utilisation we selected
some districts based on their health status indicators..
Firstly the districts were ranked based on their health indicators which are CBR, CDR, IMR,
NNMR, MMR and Sex Ratio at Birth for 0-4 years (SRB) collected from the Family Welfare
statistics of India, 2011. The rank of 1 was assigned to the lowest value of the indicators like
CBR, CDR, IMR, NNMR, U5MR and MMR as these values are expected to be smaller for a
good health status indicator. Similarly the indicator SRB (0-4) years has been taken as it is
an indicator showing the health status of the infant based on gender. In case of SRB (0-4)
years the ranking was reversed. A high value for SRB (0-4) years indicates less gender bias
at birth. For this purpose the districts having the highest figure in SRB (0-4) years have
been ranked 1 showing the best performance and the other districts were accordingly
ranked in decreasing order of their performance. The overall rank was obtained for all the
30 districts of Odisha based on these rankings and then 10 districts were selected. The 5

254 : Orissa Economic Journal, Vol. 47, No. 1, Jan-June 2015
districts with the lowest rank values which included Balasore, Jagatsinghpur, Anugul,
Sundargarh and Jharsuguda were the one with a good health status indicator. These are
termed as the Better Performing Districts (BPDs). The 5 districts with the worst ranking
from the bottom are Dhenkanal, Balangir, Nayagarh, Baudh and Kandhamal. These are
termed as the Low Performing Districts.
Table 12: Health Indicators of the Selected Districts of Odisha
Source: Family Welfare Statistics in India, 2011
Table 12 provides the health status indicators of these selected districts of Odisha. The
average values clearly indicate the higher health status of the BPDs. The value is as high as
52.2 and 61.6 for BPDs for IMR and U5MR and is 79 and 105 respectively for the LPDs for
these health indicators. Only the SRB (0-4) years is seen to be in favour of the LPDs at 931
while that of the BPDs is 910.8.
With regard to the availability of infrastructure, taking the number of health centres as an
indicator, Table 13 clearly reflects the higher infrastructural presence in the BPDs. Though
the overall accessibility is influenced by many physical and financial factors, the presence
of more number of health care centres clearly increases the spatial accessibility of health
facilities to the population. The BPDs shows a higher number of the availability of all the
units of health care like SCs, PHCs, CHCs, SDHs and DHs.

Orissa Economic Journal, Vol. 47, No. 1, Jan-June 2015 : 255
Table 13: Availability of Health Centres in these Selected Districts (in numbers)
Note: BPDs-Better Performing Districts, LPDs-Low Performing Districts
Source: Compiled from Odisha HMIS Analysis Report 2013
Table 14: Average Populations per Bed in the Healthcare Centres
of the Selected Districts
Source: Compiled from Odisha HMIS Analysis Report.2013
Table 14 throws further light on the worse condition of the availability of healthcare
infrastructure in the districts (selected) of Odisha based on the population Census of

256 : Orissa Economic Journal, Vol. 47, No. 1, Jan-June 2015
2011.For the analysis of the average population per bed in each of the districts, the number
of beds for each healthcare centre was found. Then the population of each district was
divided by the number of the available beds to find the population per bed in each of
these districts. For PHC it is as high as 6837 persons per bed in Anugul and 6542 persons per
bed in Balangir. For CHC it is as high as 4710 persons per bed in Anugul and 3976 persons per
bed in Dhenkanal.The range for the population per bed in a PHC for BPDS is 1717 while for
CHC it is 1491. The corresponding figures for the LPDs are 3153 and 2233 respectively. This
reflects a wide variation in the availability of beds in the LPDs relative to the BPDs. This is
to be pointed out here that the number of beds for each centre was calculated based on
the norms of 6 beds for a PHC and 30 beds for a CHC. But the actual situation is still very
worst and these figures are highly inflated. This is because as has been pointed out earlier
that only 16% of the CHCs in Odisha has all the 30 bed facilities and none of the PHC in
Odisha satisfies the norms of the minimum of even 4 beds facilities. In the absence of data
per districts this table highlights the shortage of centres even if beds availability norms
would have been met. It is very well mentioning here that none of the Health care centres
in Odisha at the primary level satisfies the IPHS norms for the required infrastructure
based on availability of manpower, supportive facilities, blood storage and testing centres
etc(Rural Health Statistics,2011).
To assess the actual utilisation of the healthcare facilities given their accessibility, some
performance indicators of these selected districts were analysed. This utilisation aspect is
interpreted in terms of some selected performance indicators of maternal and infant care
like the coverage rate of 100 IFA for ANC, 3rd ANC coverage rate, percentage of delivery by
Skill Birth Attendants (SBA) to total home delivery, % of institutional delivery against total
ANC registration to measure performance in maternal health. Similarly indicators like
percentage of new-born delivered at home paying a visit to health centres within 24 hours
for care, low birth weight rate of infants born and full immunisation of infants under 12
months are being taken to assess their performance in case of infants care which are a
significant indicator of the infant mortality rate.
Table 15: Some Selected Parameters of Maternal and Infant Care (in %)
Balasore 66 85 7 80 98 12 105
Jagatsinghpur 80 93 30 80 96 9 121
Parameters of maternal care Parameters of infants careDistricts
ANC 100IFA
coveragerate
ANC 3rd
visitcoverage
rate
% of SBAdelivery tototal home
delivery
% ofinstitutional
deliveryagainst
Total ANCregistration
% of homedeliverynewbornvisit ratewithin 24
hours
Low birthweight
rate
Fullimmun-isationunder
12months

Orissa Economic Journal, Vol. 47, No. 1, Jan-June 2015 : 257
Anugul 78 89 17 74 54 15 120
Sundargarh 74 98 9 82 88 18 108
Jharsuguda 83 89 12 82 99 18 110
Average 76.2 90.8 15 79.6 87 14.4 112.8
Dhenkanal 88 97 44 72 68 19 117
Balangir 56 78 11 83 74 23 94
Nayagarh 81 84 15 67 74 10 125
Baudh 64 91 6 62 75 20 129
Kandhamal 89 90 20 73 65 26 82
Average 75.6 88 19.2 71.4 71.2 19.6 109.4
Source: Odisha HMIS Analysis Report, 2013
Table 15 provides an analysis of the performance of these districts in terms of their coverage
of different parameters of maternal and infants care chosen. It is seen that in case of all
the chosen parameters of maternal care, the BPDs shows a higher percentage than the
LPDs. This is found to be 76.2, 90.8 and 79.6 for the indicators of maternal care like ANC 100
IFA coverage rate, ANC 3rd visit coverage rate and percentage of institutional delivery
against the total ANC registration respectively for the BPDs. These figures are 75.6,88 and
71.4 respectively for the LPDs.Only in case of the percentage of SBA delivery to total home
delivery, the average is found to be higher for the LPDs at 19.2 compared to 15 for the BPDs.
The average is also higher in the chosen parameters of infants care. For example, the
average figures are 87%, 14.4% and 112.8% for percentage of home delivery newborn visit
rate within 24 hours, low birth weight rate and full immunisation under 12 months
respectively in case BPDs and 71.2, 19.6 and 109.4 for LPDs respectively. These factors
highly depends on the available infrastructural facilities like proximity of the health care
centres, the available manpower, supportive facilities like drug supplies, electricity, water
supply, bed facilities etc. The performance indicators are more biased towards the BPDs
because of their superiority in the availability of health care facilities relative to the LPDs.
6. Findings
Thus the study finds the following
1. There exists a severe inter-district variation in the availability of health care
infrastructure in the state of Odisha.
2. The lack of infrastructure has a profound adverse impact on the health care accessibility
in the rural areas. The districts with inadequate health infrastructure were also
found to be lagging behind in the chosen performance indicators relative to the
better of districts.

258 : Orissa Economic Journal, Vol. 47, No. 1, Jan-June 2015
7. Conclusion
The main reasons for the low health status of the people of Odisha is the lack of
infrastructure violating the standard norms as well as the underutilisation of the existing
health care centres due to the lack of supportive facilities. The large scale absenteeism of
doctors and specialists over their shortfall is a significant barrier to health care accessibility
of the rural people crumbling the very objective of National and state health policies. The
government’s apathy towards these problems is further worsening the health situation
creating a divide between rural and urban people as well as creating huge inter-district
imbalances in health care status and accessibility.
References
1. Bose, Ashish and Mithu Adhikary (2008): Health Status of the Districts of India:
Mapping and Analysis of Health Infrastructure and Performance, Independent
Commission on Development and Health in India, Pub: VHAI, ISBN-81-89877-10-0.
2. Gupta, Meena (2002): State Health Systems: Orissa, Working Paper No.89, Indian
Council for Research on International Economic Relations.
3. “Odisha Government Should Uplift Rural Healthcare Services”, The New Indian
Express, 18th December, 2014, www.newindianexpress.com.
4. Patra, Suresh Kumar and M.Ramadass (2013): NRHM and Health Status of Odisha:
An Economic Analysis, ISSN 1930-2940, vol.13:4, April, 2013,
www.languageinindia.com.
5. Pandey,Neelanjana(2013):Perspective of Accessibility of Public Health Facilities
in Rural Uttar Pradesh,India,International Journal of Social Science and
Interdisciplinary Research(IJSSIR), vol.2(4),pp.69-74.
6. Reports on Districts Performance for Service Delivery, Health Facilities Performance
and Access to Health Care, DHIS 2, Odisha HMIS Analysis Report, 2013.
7. Rural Health Statistics in India, 2012, Statistics Division, MoHFW, GOI.

Orissa Economic Journal, Vol. 47, No. 1, Jan-June 2015 : 259
MGNREGA and Rural Infrastructure for Sustainable Tribal Livelihood:
A Study in Keonjhar District of Odisha
Sanjeeta Kumari Devi1
It is quite widely known that even after 66 years of independence and implementation
of several policies on development and various schemes adopted for better tribal
development in tribal areas by the National and State governments from time to time,
the living condition of Tribal Odisha has hardly improved and the state of Odisha
continues to occupy the top position in the poverty map of the country. Socio-economic
development is the main aim of rural development especiallyfor the tribal people to
bring about sustained improvement in their living condition through an increase in
their income and access to social goods. Mahatma Gandhi National Rural Employment
Guarantee Act (MGNREGA) is considered as a “Silver Bullet” for eradicating rural poverty
and unemployment by way of generating demand for productive labour force in villages.
It provides an alternative source of livelihood which will have an impact on reducing
migration, restricting child labour, alleviating poverty and making village self-sustaining
through assets creation such as road construction, cleaning up of water tanks, soil and
water conservation work, etc. for which it has been considered as the largest anti-
poverty Programme in the world. Thus the present study attempts to critically examine
the implementation process of this programmes and its various impact on tribal
livelihoods i.e. to what extent MGNREGA has given justice in sustaining the livelihood
of poor tribal communities in a tribal dominated block of Banspal in Keonjhar district
of Odisha. The study was based on random sample of 50 tribal households of Banspal
Block in Keonjhar district.
Key Words: MGNREGA, Tribal Livelihood, Employment
1. Introduction
Rural Infrastructure is considered to be a critical factor for the growth of rural economy.
The Indian Rural Infrastructure Report 2003 argues that development of Rural Infrastructure
has a fivefold impact on the economy, viz (i) creating better access to employment and
providing further earning opportunities, (ii) increasing production efficiency, (iii) creating
1 Lecturer in Economics, KIIT School of Social Sciences, Bhubaneswar, E-mail: [email protected]

260 : Orissa Economic Journal, Vol. 47, No. 1, Jan-June 2015
access to previously inaccessible commodities and services, (iv) time saving which can
better utilized in productive activities, and (v) better health and physical condition of rural
population. Question arises how does rural infrastructure create better access to
employment and providing earning opportunities? Looking from the above context
MGNREGA becomes an interesting subject to study, because it is not only giving
employment to the rural poor, but also creating sustainable and generating demand for
productive labour force in villages. It provides an alternative source of livelihood which
will have an impact on reducing migration, restricting child labour, alleviating poverty and
making villages self-sustaining through asset creation such as road construction, cleaning
up of water tanks, soil and water conservation work etc.
2. Ambitious Journey of Mgnrega
The enactment of Mahatma Gandhi NREGA, 2005 can be viewed as a watershed in the
transition from the era of ‘state-centric’ to ‘people centric’, i.e., Government driven
schemes to that of legally enforceable worker’s entitlements in the field of rural and tribal
employment. In order to eradicate poverty in rural areas, several anti-poverty programmes
like the NREP of 1980-89, Rural Landless Employment Guarantee Programme (RLEGP) of
1983-89, Jawahar Rojagar Yojana (JRY) of 1989-90),Employment Assurance Scheme (EAS)
1993-99, Jawahar Gram Samridhi Yojana (JGSY)1999-2002, Sampoorna Grameen RojgarYojana
(SGRY) 2001, National Food For Work Programme (NFFWP) of 2004,etc were launched by
the central government in phased manner and implemented through the state
governments across the country. Amongst the above NREGA was one of the most popular
and successful Programmes which was renamed in 2nd October 2009 as MGNREGA.With the
launching of NREGA the ongoing schemes of the Sampoorna Grameen Rojgar Yojana (SGRY)
and National Food for Work Programme (NFFWP) were merged with NREGA.
2.1 Time Line of MGNREGA
Table- 1 shows the time line of MGNREGA whereby the scheme got its modifications during
the year of its running.
Table 1: The Time Line of MGNREGA
Source: WWW.nrega.nic.in

Orissa Economic Journal, Vol. 47, No. 1, Jan-June 2015 : 261
As table -1 depicts, when the Act got first introduced in 200 most backward districts of the
country in Feb 2006, it was proposed to extend to the remaining districts only after 5 years,
after seeing the popularity of the Act. But in the next year the Act was extended further to
130 more districts and within a year after, the Act got universalized by bringing the entire
country under its horizon with the exception of districts that have a 100% urban population
and got soon named after Mahatma Gandhi (in Oct. 2, 2009) to make the Act more reachable
to the masses and thus it becomes MGNREGA. In the context of Odisha all the tribal
dominated districts were covered from the very beginning.
2.2 Significance of MGNREGA
MGNREGA aims to achieve the objective as enunciated in the Article: 41 of the Indian
Constitution “giving citizens the right to work.” The Act is significant due to the following
reasons:
m While the earlier wage employment Programme did not provide any guarantee of
jobs, this Act provided guarantee job. This guarantee for wage employment is now
uniformed all over the country like never before.
m It is a development initiative, chipping in with essential public investment for
creation of durable assets, without which the growth process can’t be possible in
the most backward regions of rural India.
m Almost all the previous programmes were allocation based rather than demand
based. NREGA is considered to be unique from this standard point.
m In other wage employment programmes, anyone can be engaged as labourer while
in MGNREG only job card holders that apply for employment can be engaged as
labourers.
2.3 Goals of MGNREGA
The goals of MGNREGA are to provide strong safety-net for vulnerable groups by providing
a fall back employment when alternative employment sources are scarce or inadequate. It
acts as a growth engine for sustainable development of agriculture economy and
empowerment of rural poor through the process of right-based law and new ways of doing
business. It aims to provide a model of governance reform anchored on the principles of
transparency and grass-root democracy (MoRD 2008).
Mahatma Gandhi National Rural Employment Guarantee Act aims at enhancing the
livelihood security of the rural household by guaranteeing hundred days of wage
employment in a financial year, whose adult members volunteer to do unskilled manual
work. It creates a right-based framework for wage employment programmes and makes
the government legally accountable for providing employment to those who ask for

262 : Orissa Economic Journal, Vol. 47, No. 1, Jan-June 2015
it.MGNREGA is path breaking legislation entitling the rural poor, guaranteed employment
as a means of sustenance averting hunger and distress, ultimately lifting them from the
trap of poverty by
(i) Providing guarantee of gainful employment with a statutory minimum wage.
(ii) Creation of durable assets and strengthening the livelihood resource base of the
rural poor.
The Scheme, however, is a landmark rural anti-poverty scheme, an initiative towards tribal
economic empowerment in Odisha. But ironically in tribal pockets of Odisha due to
bureaucratic apathy and conspiracy, and lack of political commitment, did not able to
harness any potential result in mitigating poverty of the inhabitant tribes of the state. In
the above backdrop, the present paper makes a research based attempt to find out the
performance of MGNEGA in tribal pockets of Odisha and Banspal block of Keonjhar district
in particular.
2.4 The Unique Features of MGNREGA
m 100 days unskilled wage employment to a rural family in a financial year.
m Equal wage for men and women.
m Ban on contractors and labour displacing machines.
m Participatory planning and identification of works through palli sabha.
m Payment of wage on weekly basis but not later than 15 days.
m Unemployment allowance to job seeker if work is not provided to job seeker within
15 days of application.
m Social audit by Palli/Gram Sabha and involvement of Panchayati raj institutions (PRIs)
in planning and execution of MGNREGA works.
2.5 The Implementation Structure of MGNREGA
MGNREGA has a five-tier structure of implementation starting from GP at the bottom to
the central govt. at the top.
2.5.1 Gram Panchayat (GP)
GP is the noble agency at the bottom level that has the authority to select, design and
implement 50% of the works. Selection of works, monitoring and supervision are done
by the Gram Sabha (village council). GP has the responsibility to register households,
issue job cards, receive application for employment, provide employment and monitor
the NREGA works.

Orissa Economic Journal, Vol. 47, No. 1, Jan-June 2015 : 263
2.5.2 Block Panchayat
The rest 50% may be undertaken either by the block panchayat or the district or both.
Block panchayat monitors and coordinates the plans and works at the block level.
2.5.3 District Panchayat
District Panchayat, is addition to implementing non-mandatory works, coordinates
MGNREGA activities at the district level. Besides, it has the responsibility to prepare
both the district annual plan and five year perspectiveplan. These two plan documents
are the base which guides the implementation of MGNREGA at the village level.
2.5.4 State Government
Next in hierarchy is the state govt. which acts as a facilitator in the flow of MGNREGA
funds and helping in preparing of manpower. It has the responsibility to set up the
State Employment Guarantee Council for monitoring and evaluating the MGNREGA in
the state.
2.5.5 Central Government
At the top of the hierarchy comes the central govt. The Ministry of Rural Development,
New Delhi is the nodal agency for MGNREGA implementation. It has the responsibility
to set up Central Employment Guarantee Council for receiving advice on MGNREGA
implementation. It may also undertake independent evaluation and monitoring of
the scheme.
3. Decentralized Planning and MGNREGA
MGNREGA is a unique Act which recognizes the legitimate role of Panchayat in addressing
their fundamental duty as expressed in the 73rd constitutional amendment of providing
“economic development and social justice” in their area. The recognition of PRI as the
principal agency of implementation under MGNREGA has opened up enormous
opportunities for decentralizing development respecting local solutions to local people.
4. Review of Related Literature
Since the date of implementation of NREGA, various social scientists have made attempt
to study the impact of MGNREGs and also its implementation procedures. Sen et al (2009)
attempted to measure the outcome of good governance practiced by Gram Panchayats
(GPs) of West Medinipur district of West Bengal through the employment generated under
NREGA. Data regarding different parameters related to core characteristics of good
governance such as participation, transparency, accountability, effectiveness and equity

264 : Orissa Economic Journal, Vol. 47, No. 1, Jan-June 2015
was taken into consideration in this study. This study mainly gives importance on potential
implementation of MGNREGA needs, adequate efficient governing body and motivation.
An evaluation study by Indian Institute of Technology, Madras (2009), in Cuddlore, Dindugal,
Kanchipuram, Nagai and Thiruvallar districts of Tamilnadu reveals many positive aspects
of the programme. These are:
m Villagers consider NREGA as promising to be a boon for improving rural livelihood.
m Provision of job within the village is very much encouraging to villagers.
m NREGA also ensured gender equality in rural Tamilnadu.
m Involvement of SHG members improves people’s NREGAs awareness and this is very
important for future NREGA planning.
m Registrations are open throughout the year.
m Most of the respondent perceived that payment were received within a week.
As per the Panchayat and Rural Development Department Report on the performance of
NREGA in 2007-08, the average no. of person days created per household in West Bengal
was 25, whereas in the study area it was 19 which clearly shows under performance. The
average participation rate of 19% with maximum of 40% and minimum of 5% shows a good
performance compared to 13.1% state average rate (West Bengal Human Development
Report 2004). Accountability is also found to be significant and shows positive relation
with the NREGA’s performance. This represents efficiency and effectiveness of Govt. and
plays a positive role in successful implementation of NREGA’s. Thus to conclude this study
shown increasing performance of the governing body (here GPs).
Dey and Bedi (2010) studied the functioning of the NREGAs between February 2006 and
July 2009 in Birbhum district, West Bengal. Their study reveals that in order to serve as an
effective “employer of last resort”, the Programme should provide more job days during
lean season and wages should be paid in a timely manner. This study shows that in Birbhum,
there is universal awareness about the NREGA’s, Job cards have been made available to all
those who have applied and NREGA’s related information is well maintained and relatively
accessible.
Mathur (2009) observed that in a social audit undertaken in Andhra Pradesh that in certain
villages, some people stated that they had not been paid for the work done. When
comparisons were made of the payments as per the pass-book with the payment as per
the job card, it was discovered that the job card itself was incomplete.

Orissa Economic Journal, Vol. 47, No. 1, Jan-June 2015 : 265
Nayak, Behera and Mishra (2008) conducted their study in two districts of Odisha, mainly
Mayurbhanj and Balasore. Both the districts are reported to have achieved certain goals
and failed in others. This study shows that the state as a whole as well as the two sample
districts are well in certain physical and financial parameters like provision of employment
to those who demand jobs and maintenance of wage and non-wage ratio. However their
performance in certain important parameters like utilization of funds and creation of
demand for jobs is not very encouraging. While the target is to guarantee 100 days of
employment to each household, not many households have achieved this target. According
to this report, well thought out effort is necessary to address these problems of NREGA in
the state.
Dreze (2007) looks at the corruption in rural employment programs in Odisha and how this
has continued in a NREGA as well. However, he believes that there is tremendous potential
of NREGA in the survey areas. Where work was available, it was generally found that
workers earned close to (and sometimes more than) the statutory minimum wage of Rs 70
per day, and that wages were paid within 15 days or so. This is an unprecedented
opportunity for the rural poor. There is the hope among workers that NREGA would enable
them to avoid long distance seasonal migration. Further, there is plenty of scope for
productive NREGA works in this area, whether it is in the field of water conservation, rural
connectivity, regeneration of forest land or improvement of private agricultural land.
Ambastha, Shankar and Shah (2008) based on the field observations of National Consortium
of Civil Society Organization (NCCSO) reported some of the lacuna in implementation of
MGNREGA such as under staffing or lack of exclusive MGNREGA staff at lower level, top-
down approach in planning.
5. Objectives
The present study attempts to critically examine the implementation process of this
Programme and its various impacts on tribal livelihood, especially the tribal dominated
block of Banspal in Keonjhar district. The study aims to understand the following objectives:
m To find out whether the tribal people are aware about the MGNREGA.
m To find out to what extent MGNREGA has given justice in sustaining the livelihood of
poor tribal communities in a tribal dominated block of Banspal in Keonjhar district.
m To assess the implementation and functioning of MGNREGA and to suggest the
suitable policy measures to strengthen the scheme.
6. Methodology

266 : Orissa Economic Journal, Vol. 47, No. 1, Jan-June 2015
The primary data was collected from 5 Gram Panchayats. The sample size was 50 and 10
households from each of the selected Gram Panchayat were chosen.
The study has adopted multi-stage sampling method. In the first stage, district was selected.
Block was selected in the second stage. Gram Panchayats (GPs) were selected in the third
stage. Households being the ultimate sample are selected in the last stage. The study is
the outcome of the analysis of primary data collected from 5 Gram Panchayats. The criterion
for selection of Gram Panchayat was to have a minimum of 90% of ST households registered
in MGNREGA. The sample size was 50 and 10 households from each of the selected GPs
were interviewed. The primary data have been collected through a survey collected by
well-structured Questionnaires designed for this purpose.The secondary sources of data/
information have been collected from the government offices at Panchayat, block, district
and state level.
7. Analysis and Findings
A questionnaire was developed having the components of demographic profile of the
respondents, MGNREGA provisions, level of awareness and socio-economic impact. The
data were coded and analyzed using the SPSS software, version 15.
The present study which is confined to Banspal block which is the most backward block of
the district and inhabited by Juang tribe, one of the most backward, poor and illiterate
primitive tribes and findings of this study cannot be generalized in a larger context as the
sample size for this study was 50. An analysis of the primary data collected from these
households provides the following findings:
7.1 Demographic Data
Table 2: Age Across Sex
Source: Survey Data

Orissa Economic Journal, Vol. 47, No. 1, Jan-June 2015 : 267
It is clear from the above table that the majority of the respondents belong to male category
which constitutes of 64% whereas the majority of the age group of 36-45 years which is
32% and it is followed by 46-55 years and 26-35 years.
7.2 Awareness about MGNREGA
This study also found the following findings-
Table 3: Awareness about MGNREGA
Source: Primary Data Compiled by the Author.
The above table reveals that respondents are only aware about their minimum wages.
They are not completely aware about most of the provisions under MGNREGA. This could
mean lack of awareness leading to low demand for employment. This implies the need to
make them aware of each and every component of MGNREGA.
7.3 Nature of Work
Table 4: Nature of Work
Source: Compiled by the author from Survey Data

268 : Orissa Economic Journal, Vol. 47, No. 1, Jan-June 2015
The above table explains the nature of works undertaken so far under MGNREGA. As seen
the majority of works taken up are rural connectivity and work related to water conservation
and harvesting. This is followed by others that include plantations and land development.
While discussing with the households, it is clear that 92 % of the respondents feel that
NREGA work has increased the accessibility and communication facility by constructing
roads, further 90% respondents feel that wages that they have received under MGNREGA
have helped in preventing hunger and masive some investment in increasing, increased
agricultural productivity. The respondents of Kuanr block pointed out that prior to
construction of this road (from upper Panasanasa to Kanjipani) people were facing
difficulties to come to Kanjipani market which is 4 km away from their inhabitants through
the hilly terrain. Construction of this road will go a long way in boosting the communication
infrastructure in the area.
7.4 Source of Information
The major source of information for the villagers regarding MGNREGA is PRIs including
Sarpanch, Gram sathi and GPs officials. Around 73.3% villagers claimed that they informed
about MGNREGA from GPs offices which indicates that GPs officials playing a significant
role in spreading information on MGNREGA.
Table 5: Sources of getting information on MGNREGA
Source of information Percentage
Gram Panchayat office 71.3%
Media – radio 7%
Neighbour 17%
Any other 4%
NA 7%
Source: Survey Data
7.5 Mismanagement of Job Cards
Majority of households (84.14%) expressed that they got their Job cards without waiting
for much time and without visits to GPs office. While 15.80% households claimed that they
had to run many times to GPs office even Block office for getting Job cards. It is found that
there is faulty design of Job cards. The job card (JC) is to act as an ‘employment passbook’
a primary document in safeguarding transparency under the act. But the JC is filled by the
PEO or Village Level Leader (VLL) and kept with them, even many workers were not able to
decipher the card.

Orissa Economic Journal, Vol. 47, No. 1, Jan-June 2015 : 269
7.6 Poor Quality of works
There is no proper execution of works. There was no Gram Sabha meeting regarding the
activities of NREGA.It has been seen that there is poor planning and lack of coordination
among villagers.
7.7 Payment of Wages
The data from the field reflected that there is huge irregularity in payment of wages.
While only 28% of beneficiaries claimed that they received the wages within a month, the
rest claimed that there is no certainty in getting wages. While the MGNREGA guideline
permits equal wages for equal work, it is not happening in reality. As per the views of few
villagers, widow and old woman are receiving lesser wages in comparison to men.
7.8 Unemployment Allowance
It is stated in the act that work would be provided within 15 days of written application. If
the work could not be provided within this period then the applicants would get
unemployment allowance. However, it is not followed strictly anywhere. In exemplifies
that in many cases eligible people have not received their due.
8. Suggestions
m Special package of assistance is required for Juang villages for development of
infrastructure; (housing package), Odisha government should devise a special NREGA
package for primitive tribes in the state. To provide the livelihood support to these PTG
people, livelihood department needs to work in convergence with NREGA.
m The unique number of M/R should be awarded for GPs; preferable alphabets instead of
numbers should be used.
m The success of the Programme depends upon its proper implementation. Much of the
pitfalls of MGNREGA implementation can be overcome if proper processes and
procedures are put in place.
m Efficient utilization of resources under the scheme requires bringing in transparency
and accountability. Provision for social audit at the Panchayat level in a regular basis
can play a significant role in this regard.
m Government must take immediate steps to stop corruption in its implementation by
which it reaches to the workers directly.
m The scheme should make provision of up-gradation of skills of women and men worker.
Improvement in worksite management practices should be maintained.
m A follow up visit would be required to assess the state of transparency and accountability
in Keonjhar district.

270 : Orissa Economic Journal, Vol. 47, No. 1, Jan-June 2015
9. Conclusion
Despite many shortcomings in the implementation of the act it has been proved beyond
doubt that the MGNREGA is a classic legislation providing guaranteed entitlement to the
rural folk. MGNREGA work has started continuing toward the betterment of people’s lives
and creating durable and useful infrastructure even in the remote villages. We find that
the implementation apparatus is inadequate and ill-capacitated. A well implemented
MGNREGA could potentially herald a revolution in rural governance through its
unprecedented mechanisms for transparency, social audit and e-governance is truly a
participatory democracy at the grass roots level.
It was understood that the tribal households in the Keonjhar district have been benefited
from MGNREGA in many ways as it has increased their income, resulting multiple impacts
in their social and economic life; however there is still a long way to go to fulfil the purpose
and objectives of MGNREGA and ensure the livelihood security of the rural and tribal
households.
References
Ambastha. P. Shankar,P.S.V and Mihir Shah, (2008). Two Years of NREGA: The Road Ahead. Economic and
Political Weekly, Vol.43; No.8.pp.41-5
Department of Panchayat Raj and Rural Development Report (2007-08)
Dey, S. and Bedi, A. (2010). “The National Rural Employment Guarantee Scheme in Birbhum, Economic
and Political Weekly, XLV (41) .Pp 19-25
Dreze J. (2007). NREGA: Dismantling the contractor raj: The Hindu, 20th November
Indian Institute of Technology, Madras, Chennai (2009). Evaluation of National Rural Employment
Guarantee Act: In Districts: Cuddlore, Dindugal, Kanchipuram, Nagai, Thiruvalallur : State: TamilNadu,
May.
Khan, A.U. and Saluja, M.R. (2007). Impact of MGNREGA on Rural Livelihoods, Paper presented in 10th
Sustainable Development Conference on Sustainable Solutions: A spotlight on South Asian Research,
Islamabad, Pakistan, December 10-12.
Mathur, L. (2009). Salient but successful initiative, The Hindu, Ist March.
Mathur L. (2007). Employment Guarantee: Progress so far, Economic and Political Weekly, Vol. 42
(52), pp: 17-20.
MoRD, “The National Rural Employment Guarantee Act 2005, Operational Guidelines, 3rd edition”,
MoRD, New Delhi 2008, pp 1-2
Shah, A. (2004). National Rural Employment Guarantee Act: A Historic Opportunities, Economic and
Political Weekly, VolXXX (39), and pp: 5287-5291.
http:// www.nrega. net.
http://www. nrega.nic.in/guidelines.htm.
http://or issapanchayat.govt.in

Orissa Economic Journal, Vol. 47, No. 1, Jan-June 2015 : 271
Rural Road Infrastructure and Odisha’s Development
L. N. Dash1
In Odisha about 84 percent of the population lives in villages. Therefore, rural connectivity
is vital to bring about socio-economic change in Odisha which is in the emerging stage
of development. The paper has three parts. The first part is an introduction. The second
part deals with the development of rural road infrastructure in Odisha. Finally, the
paper ends with a conclusion. It has been found that there has been progress of rural
road length in Odisha. However, the state is behind many other states. The situation in
the tribal areas is far from satisfactory. The inter-district disparity in road development
is glaring. There is no gainsaying the fact that a number of programmes have been
implemented for road development in Odisha in recent years. But we have failed to
cover the targeted number of habitations. There is, therefore, a need to invigorate the
implementation of the programmes. If they are properly materialised, there will be
phenomenal growth in road development in Odisha.
1. Introduction
Transport is one of the most pervasive activities in any society or economy. Transportation
serves along with other productive functions in the production of goods and services in
the economy. Production is the creation of utilities. Transportation creates place utility
and to some extent also time utility. The key role of transport in economic development
has been greatly emphasised by Rostow and Schumpeter. Hunter points out that Industrial
Revolution in Europe was successful because of the development of transport technology.
(Hunter, 1965) According to Kuznets transport is pivotal to the development of modern
industry (Pawson, 1977). Hirschman (1958) has emphasised that the development of
transport permits the growth of direct production. That the development of transport
widens the market has been emphasised by Adam Smith. This encourages division of
labour and hence its growing productive power. Transportation operates to equalise the
supply of commodities in a broad area. It thus becomes possible for consumers to enjoy
the commodities produced at distant places. Consequently, transportation enhances the
productivity of the economy by removing or by diminishing certain market imperfections.
1 Department of Economics, North Orissa University

272 : Orissa Economic Journal, Vol. 47, No. 1, Jan-June 2015
According to the neo-classical economists division of labour resulting from the expansion
of the market will not only be enjoyed by the firms, but they will also provide benefits of
internal and external economies of scale.
Industrial activity in a country is severely hampered due to the lack of transport. The fact
depends on continuing supplies of fuel, raw material, spare parts and a reliable means of
marketing. Inadequate investment on transport reduces the effectiveness of investment
elsewhere. (Owen, 1964) Poor transport system is a major factor in widespread hunger in
the developing countries. The high cost of transporting farm products and the long delays
and consequent damage and loss to perishable commodities have been powerful factors
to decreasing food supplies. Products rot on the ground because transport is not available.
As a result of these conditions, much of the world’s resources remain untouched, because
there is no way to reach them. A major proportion of the earth that is suitable for cultivation
remains unused. A tremendous wealth of forest and mineral resources that could help in
the struggle against poverty makes no contribution, because no one can get to it or make
it to where it is needed. Therefore, development of the less developed parts of the world
is substantially dependent upon transport. Mobility is a fundamental human activity.
Enhanced mobility increases globalisation of the world economy. There are a number of
examples where countries have reaped the benefits of ‘big push’ effects of transport.
2. Development of Rural Roads in Odisha
Among all the transport systems road transport occupies the pivotal one. In the agriculture
sector, road development enables the supply of seed, manure, agricultural implements
and labour for growing crops and it provides the conveyance for the produced crops.
Improvement in road facilities not only increases agricultural production, but makes
production and agricultural operation market-oriented. The villages in some parts of India
which were growing only cereals have shifted to vegetables, rearing fishes and hens after
they were linked with new centres through a new road network. Consumption and living
standards of the people are also related to road and communication. It has important
social effect. Village development becomes possible due to good transport facilities in
many ways. New ideas and education are making headway in the villages. Urban habits
and fashions are fast influencing the villagers and superstitions, religious barriers etc are
also disappearing. Road development also contributes to the development of a nation in
other ways too. It helps to combat sickness and disease. In India, mobile hospital units
move over the road to villages that have no local doctor. From the foregoing discussion, it
is succinctly clear that road infrastructure is the kingpin of economic development. This is
more relevant for a state like Odisha which is in the emerging stage of development. The
state is not only making great strides in the field of industrial developments, but also in

Orissa Economic Journal, Vol. 47, No. 1, Jan-June 2015 : 273
agricultural and social development. A number of initiatives are being taken to uplift the
lot of the rural people who constitute about 84 percent of the state’s population as in 2011.
A plethora of schemes and programmes is implemented by the Government of Odisha to
uplift the socio-economic condition of tribal people who constitute more than 22 percent
of the total population of the state. All efforts are made to bring them to the mainstream
of development process. But development of a well-developed road network is a pre-
requisite for the development of any sector of the economy. Any kind of programme to
improve the all-round development of the tribal people will be nullified in the absence of
road transport system in the tribal areas. Rural roads have important role to play in the
development of the country. It triggers meaningful socioeconomic transformation and
rapidly opens up new markets for business. Studies show that rural roads contribute to
poverty alleviation. It has been estimated that an investment of Rs 10 million in roads
carries the ability to lift 1650 persons above the poverty line (Times of India, 2007). Rural
roads promote and sustain agricultural growth and improve access to health, education
and communication. Owing to its huge importance this section of the chapter unveils the
development of rural roads in Odisha.Therefore, it has been felt pertinent to assess and
examine the level of development of road transport in rural Odisha.
About 84 percent of the population of Odisha lives in villages. Therefore, rural connectivity
is vital to bring about socio-economic change of the state. The State had 3762 rural roads
totalling 28159 kms length by the end of 2011-12 (Economic Survey, 2013). From Table 1 it is
revealed that development of rural roads did not change much during the period from2003
to 2008. During this period, the length of rural roads improved from 1,96,133 kms in 2003 to
1,97,255 kms in 2008 and the increase was only 1122 kms. On the other hand, in 2011-12,
there was a total length of 28,159 kms of rural roads. From Table 1 it is found that in 2008
there were many states in the country which had higher length of rural roads than Odisha.
For instance, when Odisha had a total of 1,97,255 kms of rural roads in 2008, Andhra Pradesh
had 3,31,213 kms and Karnataka 231384 kms of rural roads. When Odisha’s CAGR in rural
road development during this period was 0.11 percent, it was 11.95 percent for Andhra
Pradesh, 7.55 percent for Assam, 9.78 percent in Bihar, 5.88 percent for Karnataka, 4.38
percent for Rajasthan and 24.55 percent for West Bengal (Table 1). When we come to the
district level in Odisha, there are few districts which have higher length of rural roads, i.e.
Mayurbhanj (2258 kms), Sundargarh (1245 kms), Keonjhar (1212 kms), Balasore (1192 kms),
Ganjam (2606kms), etc. On the contrary, there are districts like Boudh, Gajapati, Subarnpur
and Nuapada which have rural road length of 480 kms, 472 kms, 437 kms and264 kms
respectively.

274 : Orissa Economic Journal, Vol. 47, No. 1, Jan-June 2015
Table 1: State-wise Length of Rural Roads in India (in km)
Source: Government of India. (2010) Basic Road Statistics of India, New Delhi: Ministry of Road Transport and
Highways.
Of late, road construction and improvement works have been taken up on a massive scale
through different programmes such as the Pradhan Mantri Gram Sadak Yojana (PMGSY),
Bharat Nirman Yojana (BNY), Rural Infrastructure Development Fund (RIDF), 12th and 13th
Finance Commission Grants (FCG) and other programmes funded from the state’s own
resources. Table 2 shows that, there are a total of 50,101 rural habitations in the state. The
population-wise classification of the habitations shows that there are 15,522 habitations
with less than 250 people, 12,932 habitations which have 250-499 population, 12,474
habitations with population of 500 - 999, 9173 habitations with a population of 1000 and

Orissa Economic Journal, Vol. 47, No. 1, Jan-June 2015 : 275
above. Since the implementation of the PMGSY in 2000-2001, rural road connectivity has
been a policy objective of the Government. The State Government has received funds
from the Central Government in order to construct rural roads and increase rural
connectivity in Odisha. Table 3 shows that 6,156 rural roads have been completed covering
8,168 habitations. A total length of 23,081 kms of rural roads have been completed under
the programmes during the period from 2001-02 to 2011-12 with a total financial
expenditure of Rs 8532crore. The PMGSY became a part of Bharat Nirman Yojana in 2005-06
with modified objectives to provide all- weather connectivity to unconnected habitations
with a population of 1000 and above in plain areas and 500 and above in hilly and tribal
areas. The target that was set up under Bharat Nirman was to connect 5680 unconnected
habitations by constructing 29,289 kms of roads by March 2012. During 2012-13, the target
was set to connect another 391 unconnected habitations by constructing 3000 kms of
additional roads. (Economic Survey, 2013)
Table 2: Rural Road Connectivity in Odisha by Village Population
Source: World Bank (2008). Orissa in Transition

276 : Orissa Economic Journal, Vol. 47, No. 1, Jan-June 2015
Table 3: Progress of PMGSY in Odisha (2000-01 to 2011-12)
Source: Government of Odisha (2013). Economic Survey 2012-13
The achievement of the PMGSY in Odisha makes it clear that the state has failed to reach
its target (Table 4). The target under this programme was to cover 1,23,232 habitations; but
only 8168 habitations could be covered up to 2010-11 (66.28 percent). Of the total 8168
habitations which were covered under the PMGSY programme for the development of
rural road connectivity, there were 860 habitations which had less than 250 people, 1119
habitations in the range of 250-499, 2758 habitations with 500-999 population and there
were 3431 habitations which had population of 1000 and above. Table 5 depicts rural road
connectivity through Bharat Nirman Yojana. From the Table it is seen that a total of 4359
rural habitations were connected by rural roads by constructing 12,415 kms during the
period from 2006-07 to 2011-12. In addition to this a total of 11,005 kms of roads were
upgraded.

Orissa Economic Journal, Vol. 47, No. 1, Jan-June 2015 : 277
Table 4: Total Habitations Covered under PMGSY
Source: Government of Odisha (2012). Annual Report, 2011-12, Department of Rural Development, Odisha.
Note: Figures in parentheses denote percentages.
Table 5: Rural Connectivity through Bharat Nirman
Source: Government of Odisha (2013). Economic Survey 2012-13, p.258.
There are other rural road construction projects that have been financed under the Rural
Infrastructure Development Fund (RIDF) of NABARD. It is found that under the RIDF project 28, 21,
18 and 6 roads were completed during the periods 2007-08, 2008-09, 2009-10, 2010-11 and 2011-
12, respectively. Similarly, during the same 5 years 18, 15, 20, 19 and 21 bridges have been completed
in the state. The state Government in 2009 announced that it would improve 10,000 kms stretch of
rural roads in the next three years. It was estimated that a total of Rs 3000 crore would be spent for
the purpose. The requisite funds for the purpose would be arranged from its own sources as well as
by availing loans from NABARD and other financial institutions. Roads, connecting villages with the
block headquarters, tourist sites, bazaars, mandis and also those roads considered critical from the
connectivity point of view would be covered. Odisha has around 30,000 kms of rural roads. The
decision of the Government in 2009 is aimed at enhancing rural infrastructure so as to improve the
socio- economic condition of rural people. It has also been decided to construct at least 100 bridges
in a year. The Panchayat Raj Department has also taken up construction of internal and arterial
roads in villages. However, if all the projects will be materialised, the rural road network will
witness phenomenal growth.

278 : Orissa Economic Journal, Vol. 47, No. 1, Jan-June 2015
All these apart, rural connectivity programmes are also undertaken under the Revised Long Term
Action Plan (RLTAP), Biju KBK Plan, Gopabandhu Graminna Yojana, Biju Kandhamal and Gajapati
Yojana and Backward Regions Grant Fund (BRGF). Under these programmes, construction of rural
roads and bridges are developed in the rural areas of the state. The 13th Finance Commission has
also provided financial assistance for maintenance of rural roads during the period from 2011-12 to
2014-15. During 2011-12, a total of 223 roads were taken up for maintenance.
3. Conclusion
Notwithstanding all the programmes and projects undertaken in Odisha for the development of
rural road connectivity, the progress is far from the requirement. Only 62 percent of villages in the
state have all-weather connectivity. Further, in the backward districts such as Kandhamal, Boudh,
Malkangiri etc there are many remotely located villages which do not have road connectivity. For
example, the district of Kandhamal has about 2500 villages; but 500 villages in this district do not
have pucca road which stands as a barrier in the economic development of the district and the state
as well. Out of 500 unconnected villages, about 250 villages have population of 500 each. There are
also some villages whose population is between 500 and 1000 and yet they remain unconnected.
Out of these villages, Kutingia, Dodkongia, Melasikikia, Kamberikia, and Angula of Baliguda Block
are noteworthy. Similarly, there is no road connectivity to the villages of Alimaha, Kumbharmunda,
Sikarmaha, Burungia etc in Daringibadi Block. The Firingia Block has 20 Panchayats and many
villages of this block do not have road. For instance, Suberipanga, Jatajari, Batabahal etc are the
villages, which have population between 600 and 800, but do not have pucca road connectivity.
There are also many villages in other blocks of the district which do not have good road connectivity.
The district produces abundant ginger and tamarind and the products are exported to other regions
of the state. Because of lack of transport communication the tribal people who produce these
commodities are forced to sell the products to the middle men at throw away prices. This implies
that, lack of road connectivity adversely affects the economic life of the tribal people in Kandhamal
district.
References
Hunter, H. (1965) “Transport in Soviet and Chinese Development,” Economic Development and
Cultural Change, Vol. 14, PP. 71-84.
Pawson, Eric. (1977) Transport and Economy, London: Academic Press, P.6.
Owen, Wilfred. (1964) Strategy for Mobility, Washington D. C: Brookings Institutions.
“Rural Road-building on Track” Times of India, 22nd May 2007.
Government of Odisha. (2013) Economic Survey 2012-13, Bhubaneswar: Department of Planning
and Co-ordination, Odisha
World Bank. (2008) Orissa in Transition, Washington D. C: World Bank.
Government of India. (2010) Basic Road Statistics of India, New Delhi: Ministry of Road Transport
and Highway.
Orissa Economic Journal, Vol. 47, No. 1, Jan-June 2015 : 279
Growth and Problems of Rural Roads in Odisha
Kabita Kumari Sahu1
The objective of this paper is to analyse the trend, growth and problems of road transport
in Odisha with special reference to rural transport. India has one of the largest road
networks in the world. The roads consist of (i) national highways (NHs), (ii) State
highways (SHs), (iii) major district roads (MDRs), and (iv) RRs that include other district
roads and village roads. The road density per 100 Sq KM of land area is 142.68 in India
which is very low compared to developed countries of the world. The road density in
Odisha is better than India. There is 10.84 percent growth of roads in Odisha in 2011.
The paper argues the case for implementing a long term rural road development plan
for eradicating poverty and ensuring better quality of life of the rural people.
Key Words: National Highways, PMGSY, Road Density, Rural Roads, Transport
I. Introduction
A well-known and co-ordinated system of transport plays an important role in the sustained
economic growth of a country. The present transport system of India comprises several
modes of transport including rail, road, coastal shipping, air transport, etc. A good road
network is a critical infrastructure requirement for rapid growth. It provides connectivity
to remote areas; provides accessibility to markets, schools, and hospitals; and opens up
backward regions to trade and investment. Roads also play an important role in inter-
modal transport development, establishing links with airports, railway stations and ports.
Rural roads contribute significantly to generating increased agricultural incomes and
productive employment opportunities alongside promoting access to economic and social
services. Rural Roads are the virtual lifelines for the vast multitude residing in rural areas.
Transportation in India has recorded a substantial growth over the years both in spread of
network and in output of the system. India has one of the largest road networks in the
world, aggregating to about 33 lakh kilometers at present. The National Highways, which is
the responsibility of Central Government, carries over 40 percent of the total traffic across
the length and breadth of the country. Connectivity and mobility are the key to reach out
to remote rural communities and open up new opportunities for development. Roads are
considered the most important component of infrastructure, to which nation’s economy
either directly or indirectly connected. Healthy and strengthen road network is essential
1 Lecturer in Economics, North Orissa University, Baripada, [email protected]

280 : Orissa Economic Journal, Vol. 47, No. 1, Jan-June 2015
for socio-economic development of a country. There must be matching growth between
roads, traffic, vehicles and population. Overcrowded, overloaded, poorly funded, poorly
constructed, poorly maintained roads cannot be of much use for the development of a
country and will create indiscipline and other problems. Transportation in developing
countries is of great significance because of its contribution to national and regional
economic, industrial, social, and cultural development. However, most developing
countries are facing problems related to traffic and transportation. Inadequate
transportation facilities retard the process of socioeconomic development in a country.
The road length in India has been continuously increasing over time. The growth rate of
road was 12.50 percent in 2009 due to significant increase in urban roads.(Table-1). The
road density per 100 Sq KM of land area is 142.68 in India. This road density is very less in
India compared to developed countries of the world.
Table-1 Road Length in India (in 1000 KM)
* Road Density=KM of road per 100 Sq Km of Land Area
Source- www.data.worldbank.org(Time series data) accessed on 15th Dec, 2014 and Author’s Own calculation
(Growth rate = (Yt –Y
t-1)/Y
t-1× 100)
II. Road Transport in Odisha
The total length of roads in Odisha is over 237,000 km. Odisha’s road density of 168.6 km
per 100 square km is higher than the national average of 142.78 km. The total length of
national highways passing through the state is 3,704 km; this includes the highway

Orissa Economic Journal, Vol. 47, No. 1, Jan-June 2015 : 281
connecting Kolkata and Chennai, a major transport corridor between east and south India.
Under the on-going National Highway Development Programme (NHDP), 444 km of national
highways in the state are being converted into 4-6 lane carriage-ways. The National Highway
Authority of India (NHAI) has taken up 4-laning of NH-5 from Balasore to Icchapuram and
NH-60 from Balasore to Laxmannath. Besides the up-gradation under the Golden
Quadrilateral Project, the state government proposes to upgrade 1,505 km of existing
state highways to national highways. The state government is also planning to develop a
coastal highway along the coastline of Bay of Bengal linking Andhra Pradesh in south and
West Bengal in north.The proposed coastline road length is to extend over 674 km from
Gopalpur in Odisha to Midnapore in West Bengal and is envisaged to be executed with the
assistance from Government of Norway. Within the state, Odisha plans to introduce 80 km
long mass rapid transit system (MRTS) to connect Cuttack and Bhubaneswar, the two biggest
cities in the state. The road statistics of the state of Odisha are given in Table-2.
Table-2 Total Road Length in Odisha (In 1000 Km)
Source: www.data.gov.in [Open Government Data Platform India]accessed on 17-12-2015
The urban roads are approximately 8 percent of total roads in the state. There is 10.84
percent growth of roads in Odisha in 2011. The rural roads as percentage of total roads are
declining over time and they are 76.66 % in 2011. The road density in Odisha is more than
that of India. The road length in Odisha in 2011-12 and 2012-13 are given in table-3.

282 : Orissa Economic Journal, Vol. 47, No. 1, Jan-June 2015
Table-3 Road Length in OdishaT in KMype
Source: Economic Survey, Odisha, 2012-13, 2013-14
Gram panchayat roads are 57.95 % of total roads in Odisha. Rural roads and urban roads are
11.23 percent and 7.41 percent in the state only.
III. Development of Rural Roads in Odisha
Rural connectivity is needed for socio-economic development of the State. Constructing
high quality roads of international standard has become a reality in Odisha. The State is
connected to other neighboring states like west Bengal, Tamil Nadu, Andhra Pradesh,
Chhatisgarh, through all weather high standard roads. Major roads of the state are covered
by PradhanMantri Bharat JodoPariYojana (PMBJP). The approaching roads to the main roads
have qualitatively improved. In recent years the internal roads connecting villages, hamlets
have become R.C.C roads. The roads connecting to Gram Panchayat Road and Taluka (Block)
Road have also been constructed through R.C.C. In recent years attempts have been made
for constructing roads through Public Private Partnership (PPP).The State had 3,762 rural
roads of 28159 km length by the end of 2011-12, of which 17,430 km (61.9%) are blacktopped
and 2,365 km (8.4%) are cement concrete roads. Since the inception of PMGSY, Government
of India has sanctioned Rs.16,428.56 crore in different phases for construction of 10,861
roads with 42,444.34 km length in the State and released Rs.10,460.71 crore by the end of
August, 2013. A sum of Rs.10, 313.62 crore has been utilized for construction of 6,985 roads
with 26,223.65 km during the same period. During 2012-13, Rs.1, 203.80 crore have been
spent for construction of 2,401.29 km of roads providing connectivity to 605 habitations. It
has been programmed to construct 5,000 km of road length with a cost of Rs.1, 600.00 crore

Orissa Economic Journal, Vol. 47, No. 1, Jan-June 2015 : 283
during 2013-14. Till the end of December 2013, 1,534.00 km of road length has been
constructed with an expenditure of Rs.985.22 crore. By the end of 2010–11, the State has
developed approximately 19,775 km of paved roadway, out of which approximately 17,416
kms consist of asphalt concrete and the rest 2,359 kms consist of cement concrete. These
roads were developed under the following State and centrally sponsored road development
schemes:
1. PMGSY, funded by GOI;
2. Bharat NirmanYojana, funded by GOI;
3. Schemes funded by RIDF of NABARD;
4. RLTAP (Revised Long Term Action Plan) and Backward Regions Grant Fund (BGRF),
funded by GOI; and
5. Biju KBK (Kalahandi, Bolangir, Koraput)Plan
6. GopbandhuGrameenYojana
7. BijuKandhamal-O-GajapatiYojana
But the extent of rural connectivity in Odisha is still far less than the desired level and
expectations. Only 62 percent villages possess all-weather connectivity to the existing
State Road network system. The State had 3,762 rural roads of 28,159 kilometer length by
the end of 2012-13.Of this 17,430 km (61.9 percent) are blacktopped and 2,365 km (8.4
percent) are cement concrete roads. Pradhan Mantri Gram Sadak Yojana (PMGSY), Rural
Infrastructure Development Funds (RIDF), Constituency wise Allotment (CWA), Finance
Commission Award works (R&B) and Special Repair schemes are the major rural
connectivity programmes which are being implemented in the State.
IV. Rural Roads under PMGSY in Odisha
PMGSY was launched on 25 December, 2000 as a fully funded Centrally Sponsored Scheme
to provide all weather road connectivity in rural areas of the country. Recognising the
critical issue of the rural road sector, the Government of India (GOI) planned to give a
boost to rural connectivity. In the year 2000, it launched a nationwide program, the
PradhanMantri Gram SadakYojna, (PMGSY- the Prime Minister’s Rural Roads Program) under
the Ministry of Rural Development (MoRD). The primary objective of the Programme was
to provide connectivity by way of All-weather roads to unconnected habitations with
population 1000 and above by 2003 and those with population 500 and above by 2007 in
rural areas. In respect of hilly/ desert/ tribal areas, the objective is to link habitations with
population 250 and above. Up-gradation of selected rural roads to provide full farm to
market connectivity is also an objective of the scheme, though not central. This will not
only lead to development of the road sector, but also have a cascading effect on the

284 : Orissa Economic Journal, Vol. 47, No. 1, Jan-June 2015
overall development of the State. Since the inception of PMGSY in 2000-01, rural road
connectivity has remained a benchmark policy objective. The achievement under PMGSY
in Odisha is given in Table-4.
Table 4: Progress of PMGSY in Odisha
Source : Economic Survey, Government of Odisha, 2013-14
The progress is shown in figure-1. The progress of PMGSY is observed to be the best in
2010-11.
1 Length completed (km)
2 Expenditure (Rs. crore)
3 No. of roads
completed
Fig-1 Progress of PMGSY in OdishaFig-1 Progress of PMGSY in OdishaFig-1 Progress of PMGSY in OdishaFig-1 Progress of PMGSY in OdishaFig-1 Progress of PMGSY in Odisha

Orissa Economic Journal, Vol. 47, No. 1, Jan-June 2015 : 285
Under PMGSY, out of 9,184 roads of 36,071 km length sanctioned, 6,156 roads that were 23,081 km
in length have been completed at an expenditure of Rs.8, 532.01 crores as on 31st March, 2012.
Out of 21,398 km of completed roads, 15,841 km were blacktopped and 4,073 km were concrete
roads. These roads provided all-weather connectivity to 8,168 habitations. During 2011-12, 934
roads that were 3,167 km in length were completed at an expenditure of Rs.1,235.78crore.
Maintenance of PMGSY roads rests with the State Government after creation of assets. The State
Government has released Rs.98.75 crore during the last seven years i.e., from 2005-06 to 2011-12,
out of which, Rs.65.58 crore have been utilised for maintenance of PMGSY roads of which Rs.27.80
crore have been utilised during 2011-12. Total physical completion of Roads under PMGSY in Odisha
is given in Figure-2.
The performance of State Government in implementing Pradhan Mantri Gram Sadak Yojana (PMGSY)
has been quoted as dismal by the Central Government’s monitoring method during the last two
financial years. Against the target to construct rural roads of 6,373 km and 2,956 km during 2012-
13 and 2013-14 financial years respectively under the Central sponsored scheme, the State
Government has managed to complete only 2,401 km and 3,063 km (Result Framework Document
of Rural Development Department). The Department had conducted surveys for 95 bridge projects
on rural development roads in 2012-13 and 64 in 2013-14.The financial progress under PMGSY in
Odisha is given in figure-3. It can be seen that in 2010-11, both amount released and expenditure
incurred are maximum in Odisha.
Fig-3 Trends of Financial Progress of PMGSY in Odisha (in crores)
1 2 1 2 1 2 1 2 1 2 1 2 1 2 1 2
1 Release
2 Expenditure
Road sanctioned
Road completed
Fig-2 Physical completion of Roads under PMGSY in Odisha

286 : Orissa Economic Journal, Vol. 47, No. 1, Jan-June 2015
V. Performance of PMGSY in the five Left Wing Extremism (LWE) affected Areas
Geographical location of districts is of critical importance. Malkangiri, Rayagada, and
Gajapati are at the periphery of the state and surrounded by Andhra Pradesh. They are
ranked the lowest in terms of Infrastructure Development indices. District-wise comparison
of Infrastructure Development Index (IDI) ranks Malkangiri at 27th place, Rayagada at 23rd,
Deogarh at 20th, Gajapati at 19th and Sambalpur at 7th place among the 30 districts of
Odisha (Economic Survey, Orissa: 2009-10).Performance of PMGSY in the five Left Wing
Extremism (LWE) affected Areas is presented in Table-5.
Table 5: Performance of PMGSY in the five Left Wing Extremism (LWE) affected Areas
Source: Economic Survey, Government of Orissa, 2009-10
In Malkangiri, the gap between sanctioned number of roads and actual roads constructed
is the highest while in Deogarh it is the least. Malkangiri is geographically at the periphery
and contains dense forests and inaccessible habitations. It is clear from the table that
geographical location is also critical for governments’ schemes reaching out to the poor.
VI. Rural Connectivity through Bharat Nirman
PMGSY became a part of “Bharat Nirman” in2005-06 with modified targets to provide all
weather connectivity to unconnected habitations with a population of 1,000 or more in
plain areas and 500 or more in hilly and tribal areas. The target under Bharat Nirman was to
connect 5,680 un-connected habitations (i.e.3, 604 with 1,000 or more population in plain
areas and 2,076 with 500 or more population in hilly and tribal areas) by constructing
29,289.43 kms of road. It was targeted to connect 505 unconnected habitations by
constructing 3,000 km roads during 2012-13. Against this target about 4,738habitations
were covered under this programme with 20,896 kms of roads from2005-06 to 2012-13
(i.e., new connectivity of 14,512 kms and up- gradation of 6384 kms) which shows an
achievement of 83 percent connection of village habitations.

Orissa Economic Journal, Vol. 47, No. 1, Jan-June 2015 : 287
Table-6 Rural Connectivity through Bharat Nirman
Source: Odisha Economic Survey 2013-14
VII. Rural Connectivity through Rural Infrastructure Development Fund (RIDF) and RLTAP
There are other programmes which are designed to improve rural road connectivity. Rural
Infrastructure Development Fund (RIDF) of NABARD is an important programme that funds
rural infrastructure projects in general and rural road projects in particular. One hundred
thirty two roads with project cost of Rs.242.43 crore have been completed by the end of
March, 2012, out of which 6 roads of length 54 kms have been completed during 2011-12
with an expenditure of Rs.166.55 crore. In addition, rural connectivity programmes are
also funded under RLTAP (Revised Long Term Action Plan), Biju KBK Plan, Gopbandhu
Grameen Yojana, Biju Kandhamal –O- Gajapati Yojana and Backward Regions Grant Fund
(BRGF). The RLTAP and BRGF are funded by the Government of India. The Biju KBK Plan,
Gopbandhu Grameen Yojana (GGY) and Biju Kandhamal O Gajapati Yojana are funded by
the State out of its own resources. Under the 13 Finance Commission (TFC) grant, there is
a provision of Rs.395.00 crore for maintenance of rural roads. During 2012-13, 421 projects
were taken up and completed by utilizing Rs.91.64 crore under this programme. Besides,
out of budget allocation of Rs.362.34 crore, Rs.361.53 crore has been utilised for repair and
maintenance of roads and special repair programmes (Odisha Economic Survey 2013-14).
The State Panchayati Raj Department has lunched Gopabandhu GraminaYojana (GGY) in
2006 for providing additional assistance to districts not covered under the Backward Region
Grant Fund (BRGF) where rural connectivity ( intra village and inter village) has got top
priority with allocation of 60 per cent of the total fund for road sector. The construction of
cement and concrete (CC) roads inside the village with drainage facility has been given
emphasis and in case there is no need of CC road inside the village, the approach/link road

288 : Orissa Economic Journal, Vol. 47, No. 1, Jan-June 2015
from the main road can also be developed. In 2007-08, 7344 number of roads was completed
and the number has increased to 9537 during 2012-13 (Panchayat Raj Department, Odisha).
VIII. Problems of Rural Road Transport in Odisha
Road transport of the country is facing a number of problems. Some of these problems are
given below:
1. Most of the state roads are unsurfaced (42.65 per cent) and are not suitable for use of
vehicular traffic. The poor maintenance of the roads aggravates the problem especially
in the rainy season.
2. One major problem on the roads is the mixing of traffic. Same road is used by high
speed cars, trucks, two wheelers, tractors, animal driven carts, cyclists and even by
animals. Even highways are not free from this malady. This increases traffic time,
congestion and pollution and road accidents.
3. There are multiple check-posts, toll tax and octroi duties collection points on the roads
which bring down the speed of the traffic, waste time and cause irritation to
transporters. Rate of road taxes varies from state to state and inter-state permits are
difficult to obtain.
4. Way side amenities like repair shops, first aid centers, telephones, clean toilets,
restaurants, rest places are lacking along the rural roads. There is very little attention
on road safety and traffic laws are wilfully violated.
5. There is very little participation of private sector in road development in rural road
because of long gestation period and low-returns. The legislative framework for private
investment in roads is also not satisfactory. The road engineering and construction are
yet to gear themselves up to meet the challenges of the future.
6. There has been no stability in policy relating to highway development in the state. It
has changed with the change of government. There are a number of agencies which
look after the construction and maintenance of different types of roads. Since there is
no co-ordination between these agencies their decisions are often conflicting and
contradictory.
7. There is shortage of funds for the construction and maintenance of roads. Instead of
giving high priority to this task the percentage allocation has decreased over the years.
In terms of capacity to sustain present traffic volume and load they are of inadequate
structural specifications. They are being misused by users and inhabitants. Effective
traffic rules and public awareness are not there. There are two reasons, one is
insufficient funding for roads and the second is non-availability of effective ‘Roads
and Road Users Act’ and its enforcement.

Orissa Economic Journal, Vol. 47, No. 1, Jan-June 2015 : 289
8. Encroachment on the road land creates a number of problems. It increases the number
of accesses and crossing across the road making it unsafe for travel.
IX. Suggestions for Improvement of Rural Road System in Odisha
Following suggestions are put forward for improvement of road transport in Odisha.
1) The existing Road System in the state of Odisha has totally failed to cope with the
transportation demand of disciplined road users. There is a need of restructuring the
present organizations to meet the requirements of modern technology.
2) Bus Stands/Stops must be under the control of Road Board. These must be well
designed, well-constructed and well maintained. Adequate fee must be levied on
each vehicle using them. Parking facilities for such vehicles must also be provided on
these stops on rent basis. Use of these facilities must be obligatory for public transport.
3) Major District Roads may be renamed as District Highways (DH).
4) Absurd and haphazard parking on road and streets create acute traffic problems. There
must be a well-defined ‘Road Side Parking Act’ and nobody should be allowed to use
Roads and Streets as his own Garage/Courtyard. The parking system should be licensed
with adequate parking fee. There must not be any upper limit of penalty for Road/
Street misuses.
5) There must be an effective ‘Roads and Road Users Act’ for effective control of all the
activities on highways, roads and streets.
6) Maximum allowable load/passengers along with route and permit number must be
clearly written on the body of each vehicle.
X. Conclusion
Road transport enables the people reach their houses and enable the commodities and
goods to reach near the businessmen. It is known as complementary to other form of
transport and helps economic development. Road transport is likely to continue its
dominance for the rapid industrialization in a developing country like India. Rural roads
are not only important for movement of agricultural and allied products from rural to
urban areas but are also equally important for inclusive growth of rural economy. After the
construction of PMGSY roads, an improvement in the employment situation in terms of
more job opportunities, more avenues for self-employment, etc. were observed. Positive
impact was observed with regard to increase in accessibility to health care. Education
facilities are also increased because of the PMGSY roads. Construction of the PMGSY roads
has led to an increase in frequency of visits by Government officials to monitor
implementation of various Government schemes and programs in rural areas. Now with

290 : Orissa Economic Journal, Vol. 47, No. 1, Jan-June 2015
improved connectivity of roads under PMGSY, mobility has been made easier and parents
are no longer hesitant to marry their daughters with boys living in distant villages. Newly
connected village roads under PMGSY have assured access to better social infrastructure
like banks, post office, hospitals, veterinary hospitals, bus stops and local market. PMGSY
is a very strong and effective policy of Central Govt. The progress of this policy can be
shown as the construction of rural roads in rural areas. PMGSY has achieved a great success
in the field of road construction. The other rural development and employment generating
programmes like MGNREGA should be integrated with developing rural roads. Odisha
being a poor State with high incidence of poverty of large rural population and large
presence of SCs and STs should improve its rural road connectivity. Taking all the advantages
of the Central Government schemes and funds of financial institutions, the State
Government has to build a comprehensive long-term plan in the light of rural road
development plan vision 2015 for Odisha and implement it in true spirit by empowering
and fully involving the PRI institutions with finance, power and responsibility. This will
contribute to eradicate poverty and ensure improved quality of life of rural people and
lead to inclusive development with reducing rural and urban gap in the State.
References
CIRT (1994): Road Goods Transport in India - A Study of its Structure and Organisation, Central
Institute of Road Transport, Pune, December.
Government of Odisha (2013): Economic Survey
Lakshmanan, T.R. and Anderson, W.P. (2000): Case Studies in Trade and Transport Integration, Centre
for Transport Studies, Boston University, Report prepared for the World Bank Group on Infrastructure,
March.
Mukherjee, Dhurjati, (2012) :Rural Roads Faster Connectivity for Growth, Kurukshetra, Vol.20, PP. 25-
27.
NCAER (1979): ‘Road Transport Industry’, National Council of Applied Economic Research, New Delhi.
Patel, Amrita (2012): Rural Infrastructure: Road to Progress” Kurukshetra, Vol.20, PP- 21-24.
NRRDA, Ministry of Rural Development, Govt. of India (2012): Report PMGSY, A Program for Rural
Connectivity
Sriraman, S. (1997): ‘Road and Road Transport Development in India’, Asian Transport
Journal, Asian Institute of Transport Development, New Delhi.
World Bank (2005): ‘Road Transport Service Efficiency Study’, Mimeograph, World Bank, Washington
D.C.
www.pmgsy.nic.in/NRRDC Report, accessed on 20th December, 2014
www. omms.nic.in/progress monitoring accessed on 21st December, 2014
www.dot.gov.in/reports-statistics/bharat-nirman accessed on 24th December, 2014

Orissa Economic Journal, Vol. 47, No. 1, Jan-June 2015 : 291
Road Infrastructure and Rural Development - An Impact EvaluationStudy of Pradhan Mantri Gram Sadak Yojana (PMGSY) in three
Districts of Odisha
Dr. Kartik Prasad Jena1
Among rural infrastructures, rural road connectivity is the key to rural development by
providing access to economic and social services and thereby generating increased
incomes and productive employment opportunities. Odisha has been identified as one
of the most backward states in terms of poor connectivity and the Government of
Odisha in its Department of Rural Development has envisaged, a number of roads
under PMGSY programme. Till 31th January, 2015, Government of India has released
an amount of Rs. 11,942.83 crore to Odisha and along with it an amount of Rs 12,632.48
crores has been utilized by the Govt. of Odisha for constructing 8,083 roads with a
length of 30,995.18 kilometers. This paper presents the findings of an informal
impact evaluation study of PMGSY in three districts of Odisha. The findings of the field
study suggest that income of people of the sample villages from different sources
appeared to have increased during post PMGSY road construction period. As an indirect
impact, PMGSY road construction, in sample villages, has given rise to creation of
physical assets as well as creation of plenty employment opportunities in both farm
and non-farm sectors.
Key Words : Rural Infrastructure, Rural Road Connectivity, Habitation, Physical Assets,
Employment Opportunity, Non-farm Sector
1. Introduction
Rural infrastructure is not only a key component of rural development but also an important
ingredient in ensuring any sustainable poverty reduction programme. Several studies show
that infrastructure is indeed co-related to economic growth in rural areas and that low per
capita income co-relates with lack of infrastructure. It increases employment, income,
efficiency and productivity in rural areas. Studies also show in India, rural infrastructure
1 Reader in Economics, B.J.B. Autonomous College, Bhubaneswar

292 : Orissa Economic Journal, Vol. 47, No. 1, Jan-June 2015
which can be a driver of rural growth is often not adequately available. Among rural
infrastructures, road connectivity is the key to rural development by providing access to
economic and social services and thereby generating increased incomes and productive
employment opportunities. In fact, most of the development programs are not meeting
the desired success, primarily due to the poor or no accessibility to the program villages.
Even after 67 years of India’s Independence, about 40 percent villages (about 3.30 lakh
villages/habitations), in the country today, are either not connected by roads and even if
connected, the roads are not all weather roads. Realizing this, with a view to redressing
the situation, government of India under the Ministry of Rural Development (MORD) have
launched the Pradhan Mantri Gram Sadak Yajona (PMGSY) on 25 December, 2000 as a 100
per cent Centrally Sponsored Scheme, to provide good all-weather road connectivity to
every hitherto unconnected habitation/village with a population of more than 1000 within
3 years and every habitation with a population of more than 500 by the end of the Tenth
Plan. In respect of the Hill States areas, the objective is to connect habitations with a
population of 250 persons and above. It is also intended to upgrade the existing roads
which are not all-weather in a phased manner. This paper presents the findings of an
informal impact evaluation study of PMGSY in three districts of Odisha.
The primary objectives of the present study are : (i) to assess the impact of PMGSY road
construction on the socio-economic status and overall quality of life of the rural people as
a result of enhanced rural connectivity provided under the programme; (ii) to highlight
the status of PMGSY in the State of Orissa; (iii) to identify the bottlenecks in the process of
execution of the program if any; (iv) to suggest some risk factors involving in the process of
construction and strategies to ensure timely completion of the road.
To achieve the aforesaid objectives, in the present study we have adopted two methods:
first, a ‘multi-stage stratified random sampling method’ for collecting primary data from
sample households and second a ‘Focused Group Discussions (FGD)’ method with the
people of the sample villages. Secondary data have been collected from the district level
offices of the Executive Engineer, Rural Works and R.D. Department of sample districts of
Odisha. For this impact assessment study of PMGSY we have used the indicators such as
income, agricultural production, land value, cropping pattern, transportation, employment,
village/cottage industries, urbanisation, health and education etc.
2. Status of PMGSY in Odisha
Since the inception of PMGSY Programme in Odisha in 2000-01, till 2014-15 (till April,
2014), Government of India has sanctioned Rs 17814.25 crore in different phases for
construction of 11,649 all weather roads with a length of 45,190.14 Km in 18,043 villages out

Orissa Economic Journal, Vol. 47, No. 1, Jan-June 2015 : 293
of total 50,098 villages of the State. Till 31th January, 2015, Government of India has released
an amount of Rs. 11,942.83 crore and along with it an amount of Rs 12,632.48 crore has
been utilized by the State for constructing 8,083 roads with a length of 30,995.18 kilometres.
The year-wise number of roads and length of roads completed in Odisha under PMGSY
from 2000-01 to 2012-13 are given in chart No-1 and chart No2.
Chart 1: Number of Roads Completed in Odisha under PMGSY, 2000-01 to 2012-13.
Source . Annual Activity Report (2013-14) Govt. of Odisha
Chart-2
Length of Roads Completed Under PMGSY’s Between 2000-01 and 2012-13 ( In Kms. )
Source . Annual Activity Report (2013-14) Govt. of Odisha

294 : Orissa Economic Journal, Vol. 47, No. 1, Jan-June 2015
3. Study Area
To know the impact of PMSGY road on socio-economic status and overall quality of life of
the people, a field study was conducted in early December, 2014 on a small sample of
three districts covering 3 blocks and 6 habitations/villages across 3 selected PMGSY roads.
Primary data have been collected from 100 sample households of 6 villages/ habitations.
Two villages from each block located in close proximity to each of the 3 selected PMGSY
road were selected. The names of each pair of villages and their corresponding PMGSY
road to which proximity they are located are: Machhuda and Kusuda sample villages located
in close proximity to Irda- Baliapati PMGSY road under Basta Block of Balasore district;
Balipatana and Khadipal sample villages located on Pattamundai—Balipatna road under
Pattamundai Block of Kendrapara district; and Suhagpur and Teispur villages located on
the sample PMGSY road Mangalpur – Baligaon under Pipili block of Puri district. The detailed
profile of the study area and the sample PMGSY roads are given in Table No.1.
Table No.1 : Profile Of Study Area Under Sample PMGSY Roads In Three Districts
Source : Primary Data From Field Study In December, 2014
4. Impact of PMGSY Road
The impact of PMGSY on socio-economic status and livelihood of the people of the study
villages may be divided into two parts, viz, direct impact and indirect impact. While the
direct impact has been analysed with respect to the impact on land value, agricultural
yield value, generation of income and employment; the indirect impact has been explained
in terms of asset creation, expenditure pattern, savings and perception on various socio-
economic services like health and education facilities, urbanisation. This has been
explained in the following.
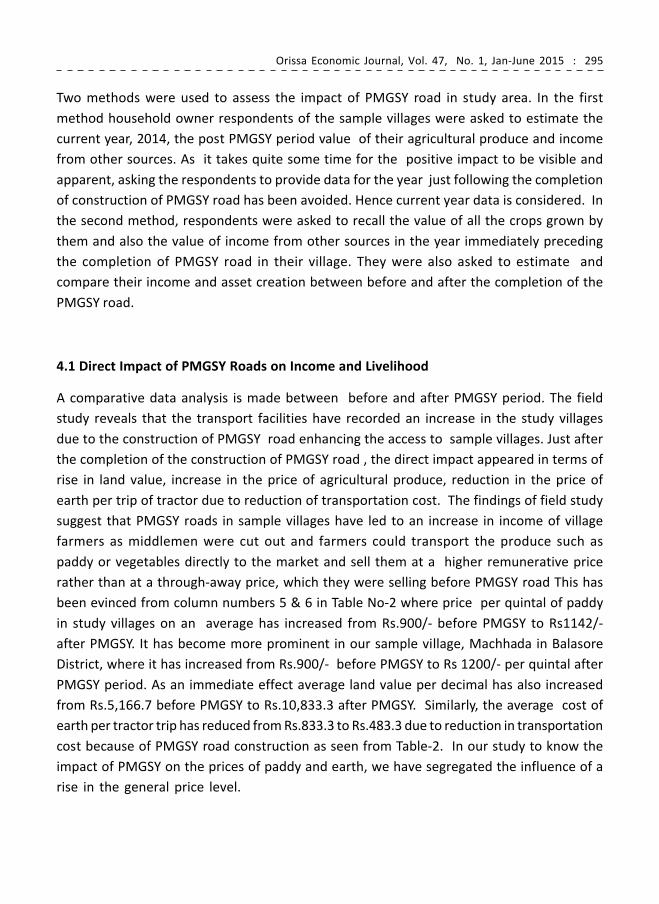
Orissa Economic Journal, Vol. 47, No. 1, Jan-June 2015 : 295
Two methods were used to assess the impact of PMGSY road in study area. In the first
method household owner respondents of the sample villages were asked to estimate the
current year, 2014, the post PMGSY period value of their agricultural produce and income
from other sources. As it takes quite some time for the positive impact to be visible and
apparent, asking the respondents to provide data for the year just following the completion
of construction of PMGSY road has been avoided. Hence current year data is considered. In
the second method, respondents were asked to recall the value of all the crops grown by
them and also the value of income from other sources in the year immediately preceding
the completion of PMGSY road in their village. They were also asked to estimate and
compare their income and asset creation between before and after the completion of the
PMGSY road.
4.1 Direct Impact of PMGSY Roads on Income and Livelihood
A comparative data analysis is made between before and after PMGSY period. The field
study reveals that the transport facilities have recorded an increase in the study villages
due to the construction of PMGSY road enhancing the access to sample villages. Just after
the completion of the construction of PMGSY road , the direct impact appeared in terms of
rise in land value, increase in the price of agricultural produce, reduction in the price of
earth per trip of tractor due to reduction of transportation cost. The findings of field study
suggest that PMGSY roads in sample villages have led to an increase in income of village
farmers as middlemen were cut out and farmers could transport the produce such as
paddy or vegetables directly to the market and sell them at a higher remunerative price
rather than at a through-away price, which they were selling before PMGSY road This has
been evinced from column numbers 5 & 6 in Table No-2 where price per quintal of paddy
in study villages on an average has increased from Rs.900/- before PMGSY to Rs1142/-
after PMGSY. It has become more prominent in our sample village, Machhada in Balasore
District, where it has increased from Rs.900/- before PMGSY to Rs 1200/- per quintal after
PMGSY period. As an immediate effect average land value per decimal has also increased
from Rs.5,166.7 before PMGSY to Rs.10,833.3 after PMGSY. Similarly, the average cost of
earth per tractor trip has reduced from Rs.833.3 to Rs.483.3 due to reduction in transportation
cost because of PMGSY road construction as seen from Table-2. In our study to know the
impact of PMGSY on the prices of paddy and earth, we have segregated the influence of a
rise in the general price level.

296 : Orissa Economic Journal, Vol. 47, No. 1, Jan-June 2015
Source: Primary Data From Field Study In December, 2014
The analysis of source-wise per household average income during Pre- and post PMGSY period
suggests that income of people of sample villages from different sources appeared to be always
higher during post PMGSY road construction period. The construction of PMGSY roads in sample
villages has led to an increase in income of farmers. As shown in Table No-3, in the sample villages
of Kusuda, Khadipal and Teisipur in Balasore, Kendrapara and Pur districts respectively, income
from agriculture source has increased by 37.29%, 44.81% and 21.57% respectively during post
PMGSY road period. The main reason for rise in income is the reduction in the transport cost of
fertilizers in the villages due to availability of improved transport to the villages which has brought
down the cost of fertilizers in the villages. Use of chemical fertilizers and pesticide with HYV seeds
has brought about an increase in agricultural yield and hence, income considerably in the post
PMGSY road period. Due to PMGSY road, farmers have got better access to wholesale market and
they are getting higher price for their products which they were selling at throwaway price to the
traders from the village itself before the construction of the road. As reported, farmers of Teispur
village are now directly moving to Bhubaneswar-Cuttack twin cities daily for selling vegetable at a
higher price. This has also led to a change in cropping pattern and crop diversification to vegetable
and cash crops leading to more income. Earlier perishable crops could not be grown as the
transportation time was large. Now these crops could also be added.
As reported in village Machhada of Balasore district, the main reason for rise in income from
business is the emergence of some petty & cottage industries such as Saal Leaf plate making units,
rope making from sabai-grass whose input-raw materials are easily transported from adjacent
Mayurbhanj district by big heavy trucks (10-20 wheelers) at lower transportation cost due to free
access to the area. The rise in income from other sources in Balipatna and Khadipal villages of
Kendrapara district has taken place after setting up of flattened rice (chuda) factory and brick
making kiln due to improved road connectivity and reduction in transportation cost of earth on the
Table No 2: Estimate Rate of Immediate Returns on PMGSY

Orissa Economic Journal, Vol. 47, No. 1, Jan-June 2015 : 297
bank of the river Brahmani close to the village. Soon after the completion of Balipatana-Pattamundai
PMGSY road, for the first time a new passenger-bus started plying from our sample village Balipatana
to Cuuttack via Pattamundai. Business of flattened rice has become profitable to the villagers of
Balipatna and Khadipal as they sell them directly at higher price in nearby Kendrapara and Cuttack
towns by commuting daily in the village bus. Auction of sand from the nearby river-bed of village
Balipatna has increased due to PMGSY road connectivity and hence added to village income.
Table No-3: Source-Wise Per Household Income During
Pre And Post-PMGSY Road Period
Source : Primary Data From Field Study In December, 2014
(In Rs.)
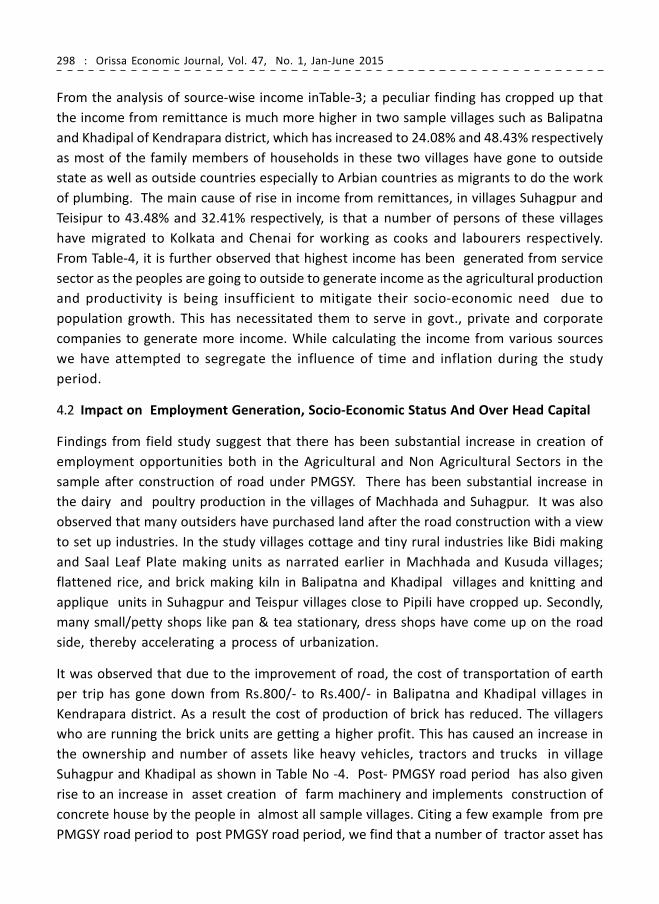
298 : Orissa Economic Journal, Vol. 47, No. 1, Jan-June 2015
From the analysis of source-wise income inTable-3; a peculiar finding has cropped up that
the income from remittance is much more higher in two sample villages such as Balipatna
and Khadipal of Kendrapara district, which has increased to 24.08% and 48.43% respectively
as most of the family members of households in these two villages have gone to outside
state as well as outside countries especially to Arbian countries as migrants to do the work
of plumbing. The main cause of rise in income from remittances, in villages Suhagpur and
Teisipur to 43.48% and 32.41% respectively, is that a number of persons of these villages
have migrated to Kolkata and Chenai for working as cooks and labourers respectively.
From Table-4, it is further observed that highest income has been generated from service
sector as the peoples are going to outside to generate income as the agricultural production
and productivity is being insufficient to mitigate their socio-economic need due to
population growth. This has necessitated them to serve in govt., private and corporate
companies to generate more income. While calculating the income from various sources
we have attempted to segregate the influence of time and inflation during the study
period.
4.2 Impact on Employment Generation, Socio-Economic Status And Over Head Capital
Findings from field study suggest that there has been substantial increase in creation of
employment opportunities both in the Agricultural and Non Agricultural Sectors in the
sample after construction of road under PMGSY. There has been substantial increase in
the dairy and poultry production in the villages of Machhada and Suhagpur. It was also
observed that many outsiders have purchased land after the road construction with a view
to set up industries. In the study villages cottage and tiny rural industries like Bidi making
and Saal Leaf Plate making units as narrated earlier in Machhada and Kusuda villages;
flattened rice, and brick making kiln in Balipatna and Khadipal villages and knitting and
applique units in Suhagpur and Teispur villages close to Pipili have cropped up. Secondly,
many small/petty shops like pan & tea stationary, dress shops have come up on the road
side, thereby accelerating a process of urbanization.
It was observed that due to the improvement of road, the cost of transportation of earth
per trip has gone down from Rs.800/- to Rs.400/- in Balipatna and Khadipal villages in
Kendrapara district. As a result the cost of production of brick has reduced. The villagers
who are running the brick units are getting a higher profit. This has caused an increase in
the ownership and number of assets like heavy vehicles, tractors and trucks in village
Suhagpur and Khadipal as shown in Table No -4. Post- PMGSY road period has also given
rise to an increase in asset creation of farm machinery and implements construction of
concrete house by the people in almost all sample villages. Citing a few example from pre
PMGSY road period to post PMGSY road period, we find that a number of tractor asset has
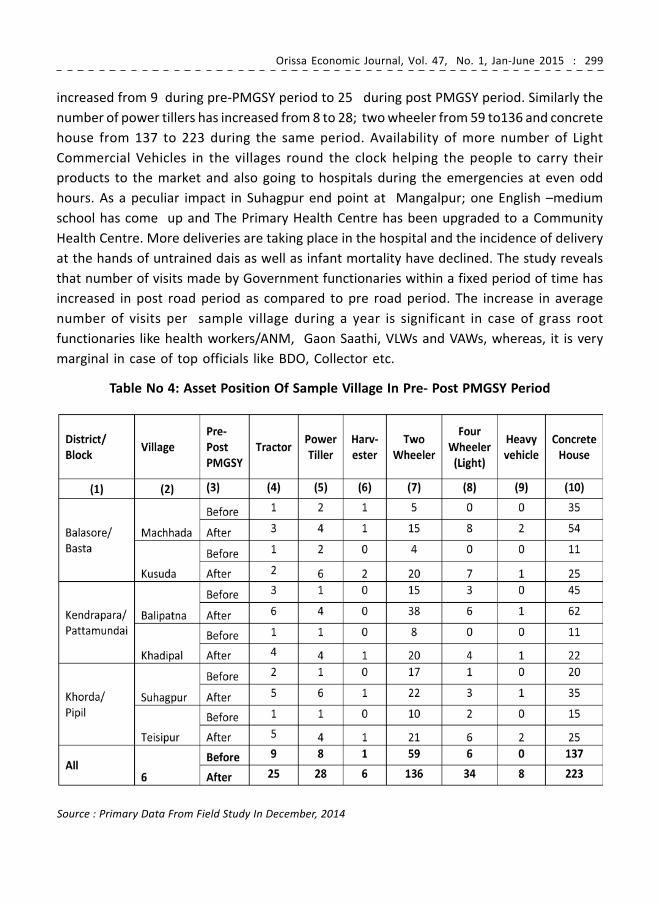
Orissa Economic Journal, Vol. 47, No. 1, Jan-June 2015 : 299
increased from 9 during pre-PMGSY period to 25 during post PMGSY period. Similarly the
number of power tillers has increased from 8 to 28; two wheeler from 59 to136 and concrete
house from 137 to 223 during the same period. Availability of more number of Light
Commercial Vehicles in the villages round the clock helping the people to carry their
products to the market and also going to hospitals during the emergencies at even odd
hours. As a peculiar impact in Suhagpur end point at Mangalpur; one English –medium
school has come up and The Primary Health Centre has been upgraded to a Community
Health Centre. More deliveries are taking place in the hospital and the incidence of delivery
at the hands of untrained dais as well as infant mortality have declined. The study reveals
that number of visits made by Government functionaries within a fixed period of time has
increased in post road period as compared to pre road period. The increase in average
number of visits per sample village during a year is significant in case of grass root
functionaries like health workers/ANM, Gaon Saathi, VLWs and VAWs, whereas, it is very
marginal in case of top officials like BDO, Collector etc.
Table No 4: Asset Position Of Sample Village In Pre- Post PMGSY Period
Source : Primary Data From Field Study In December, 2014

300 : Orissa Economic Journal, Vol. 47, No. 1, Jan-June 2015
Table No-5: Opinion on the quality of the construction of the PMGSY road
Source : Primary Data From Field Study In December, 2014
In order to assess the quality of PMGSY road, perception of household-owner respondents
has been recorded in Table-5 which shows that 47 % of household respondents has
reported that the road condition is excellent, followed by 24 % of respondents who has
reported that road condition is fair, 20 % has reported that road condition is good and 9 %
respondent has reported that road condition is average.
5. Conclusion
The analysis of source-wise per household average income during Pre- and post PMGSY
period suggests that income of people from different sources in the sample villages is
reported to have increased during post PMGSY road construction period. The increase in
income might be attributed to some other factors to some extent. But the impact of the
construction of PMGSY road has gone a long way to influence rise in the income from
different sources. As an indirect impact, PMGSY road construction in sample villages has
given rise to creation of physical assets as well as creation of a number of employment
opportunities in both farm and non-farm sectors. There is, therefore, enough evidence to
show that rural road infrastructure does indeed promote economic growth. A good deal of
social benefits such as health, education, sanitation, has also increased. Due to the
construction of road and availability of transportation facilities in the village, people
during health emergency cases, are able to have quick access to the hospitals, located
either at the Block or District head quarter and have saved their lives. Incidence of Infant
Orissa Economic Journal, Vol. 47, No. 1, Jan-June 2015 : 301
and Child Mortality has declined considerably because of improved access of the villagers
to the health care facilities, the study reveals. The following policy implications may be
drawn from the study.
1. The study reveals that due to lack of proper supervision, the quality of the road
construction falls short of desired standard. Hence, there should be proper
supervision of the construction work by the Officers of the R.D. Department where
the work tender is being given to local MLAs and MP. The quality of work done by
these public functionaries falls short of the expected standard. Percentage system
should be stopped in order to improve the quality of the work.
2. Sometimes the construction of PMGSY is not completed timely. To avoid delay in
road construction of the roads may be placed directly with the works department
and this will help early and timely release of funds to the contractors, which can
ensure timely completion of the roads without slippage of time and cost overrun.
3. Our field experience suggests to carry out the road construction activities through
the NGOs, R&D Department being the nodal agency which will not only ensure
the local people to get employment opportunity, it will also ensure the road
completion with substantially low budgetary requirement and within the time
frame without compromising with quality.
4. When old village roads are upgraded to PMGSY road, the area of erstwhile public
road encroached upon by the villagers should be free from encroachment and
restored for sufficient widening and making provision of drainage system, which
will enable their sustainability.
5. Further, funds kept for the maintenance of the roads constructed under PMGSY
should be properly utilized to ensure their maintenance, failure of which,
accountability will be fixed and drastic actions should be initiated against the
erring officials and contractors.
6. Lastly, there should be strong monitoring mechanism and enforcement agency
to regulate and check all sorts of corruptions in the programme. Moreover, in the
selection of roads, political pressure and muscle power are playing a very crucial
role. Even in the Block meeting, those leaders who are shouting more are able to
snatch away the roads to their locality. This is resulting in wrong selection of
roads. Therefore, some objective criteria should be developed by the MORD
Department to prioritise the selection of the roads which will be able to remove
the above indicated risks.

302 : Orissa Economic Journal, Vol. 47, No. 1, Jan-June 2015
References
1. Annual Report (2006-2007) Bharat Nirman through Rural Development: Ministry of
Rural Development, Govt. of India.
2. Aggarwal Ankita, (2012): “Evaluation of NREGA Wells in Jharkhand”, EPW, Vol XLVII
No 35,September 1.
3. Annual Activity Report (2013-14) Govt. of Odisha: “PMGSY (Road Works)”, Rural
Development Department, Bhubaneswar,PP-5
4. Bhatti, B. J. Dreze and R. Khera (2012) : “Experiments with Aadhaar”, The Hindu, 27
June.
5. India Infrastructure Report (2013-14): Orient Black Swan
6 Mahapatra, R.M. Suchitra and Moyna (2011) : “A Million Opportunities Lost”, Down To
Earth, 15 December.
7. Narain, Sunita (2012) : “Sustainable Asset Creation”, MANREGA SAMEEKSHA: New
Delhi.
8. Report PMGSY, A Program for Rural Connectivity (2012) NRRDA, Ministry of Rural
Development, Govt. of India.
9. Report of Quick Impact Assessment Study of PMGSY in three districts of Orissa, (2003),
Ministry of Rural Development, Govt. of India.
10. Sharma, Dr. Amit, “Rural Roads –A path to Rural Development” Kurukshetra, Vol. 57,
April 2009, Page No. 8-11.
11. www.pmgsy.nic.in

Orissa Economic Journal, Vol. 47, No. 1, Jan-June 2015 : 303
An Economic Analysis of Rural Electrification in Odisha
Prakash Kumar Sahoo1
Alok Ranjan Behera2
Rural electrification is considered as a prerequisite for economic growth and
development of a country and lack of access to it has interrelated negative social and
economic impacts for the majority of the population. It has been an important part of
Government policy since independence. Odisha has experienced a noticeable growth
in rural electrification. Out of 4,7529 villages in Odisha, 88 percent villages have been
electrified by the end of 31st March, 2013 as against all India figures of 94.4 percent.
But, it can be said that, though Odisha has achieved with 88 percent rural electrification
still it is lagging behind in the process of village electrification. The serious challenges
faced by the Government in achieving the target lie in the problem of allocation and
distribution. The literatures on the problem of rural electricity are very scanty and no
such study has also been undertaken in this context. The present study can be considered
as a moderate attempt in this direction. The present study makes an attempt to provide
a theoretical exposition of the access to electricity by the rural people in the Odisha
state.
Key Words: Rural Electrification, Economic Growth and Allocation of Electricity
1. Introduction
Rural electrification is considered as a prerequisite for economic growth and development
of a country and lack of access to it has interrelated negative social and economic impacts
for the majority of the population. It has been an important part of Government policy
since independence. According to the International Energy Agency’s annual report 1.3
billion people worldwide live without access to electricity. The numbers of electrified
villages were very low during the period of independence. But, in recent years, due to the
government initiatives the numbers of electrified villages as well as the electrified
households have been rapidly increasing. One important thing here is to be mentioned
1 Assistant Professor, Department of Economics, Motilal Nehru College (E), University of Delhi,Pin-110021,
Mob-+91 98734 99260, E [email protected]
2 Assistant Professor, P.G. Department of Analytical & Applied Economics, Utkal University, Odisha, Pin-751004,
Mob-+91 94391 96280, E [email protected]

304 : Orissa Economic Journal, Vol. 47, No. 1, Jan-June 2015
that though the overall rate of electrification seems to be high there is a considerable
inter-state gap between developed and underdeveloped states. Where, the states like
West Bengal, Tamilnadu, Sikkim, Punjab, Kerala, Haryana, Delhi, Goa and Andhra Pradesh
have attained 100 percent rural electrification, other states like Meghalaya (86.3%), Mizoram
(86.3%), Odisha (88%) and Uttar Pradesh (88.9%) are on the way of progress (Odisha
Economic Survey, 2013-14).
Odisha has experienced a noticeable growth in rural electrification. Out of 4, 7529 villages
in Odisha, 88 percent villages have been electrified by the end of 31st March, 2013 as
against all India figures of 94.4 percent. Nine states have achieved complete village
electrification and another five states have achieved 99.9 percent. It can be said that,
though Odisha has achieved with 88 percent village electrification still it is lagging behind
in the process of village electrification. The serious challenges faced by the Government
in achieving the target lie in the problem of allocation and distribution. The literatures on
the problem of rural electricity are very scanty and no such study has also been undertaken
in this context. The present study can be considered as a moderate attempt in this direction.
The present study makes an attempt to provide a theoretical exposition of the access to
electricity by the rural people in the state.
The rest of the paper is organised as follows: section-2 deals with review of some selected
literatures and section-3 briefly discusses the demand and supply analysis as well as pricing
mechanism for providing electricity in order to maximise the revenue and recover the
operational cost. Section-4 provides an Overall Status of Rural Electricity Services in India
as well as Odisha and section-5 analyses the policy initiatives taken by the Government for
rural electrification and some alternative measures suggested to overcome the problems
related to the distribution of electricity.
2. Review of Literature
Generally, the concept of rural electrification refers to the electricity supply to areas outside
of cities. But different researchers have defined it in their own ways.
Barnes (1988) defines rural electrification as “the availability of electricity for use in rural
communities, regardless of the form of generation”. Yaron et al (1994) simply state, “Rural
electrification is the process of bringing electricity to rural communities”. From the above
two definitions it is clear that there is a clear cut distinction between the electrification in
rural as well as urban areas.
Mason (1990) also raises the question as to why there should be a distinction between
rural and urban areas for the purpose of power distribution programmes. She argues that,
rural distribution projects generally cost more than urban distribution projects per
connected household and that government policies are sometimes directed specifically
at the rural areas making it necessary to identify rural areas in electrification programmes.
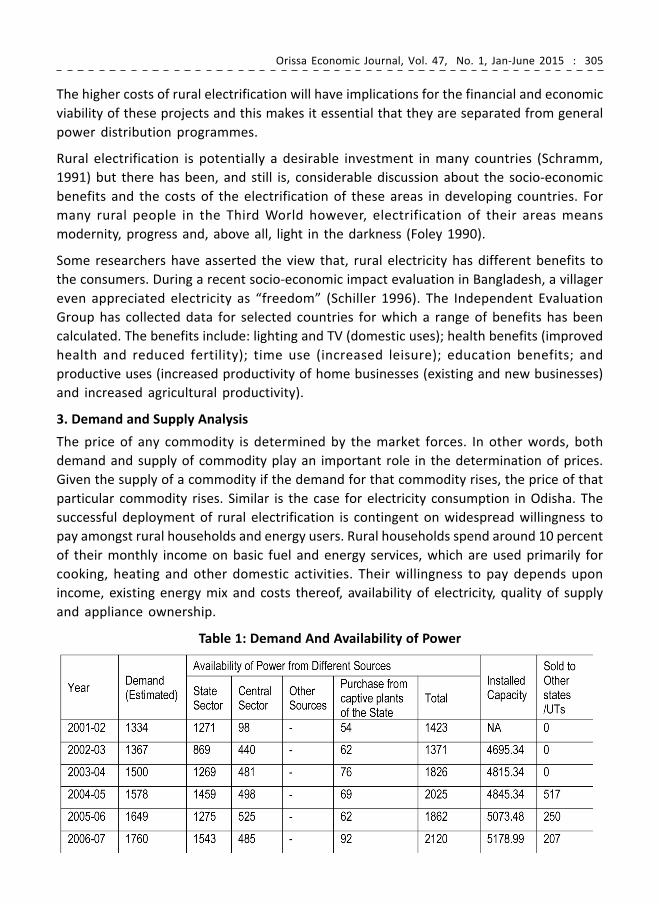
Orissa Economic Journal, Vol. 47, No. 1, Jan-June 2015 : 305
The higher costs of rural electrification will have implications for the financial and economic
viability of these projects and this makes it essential that they are separated from general
power distribution programmes.
Rural electrification is potentially a desirable investment in many countries (Schramm,
1991) but there has been, and still is, considerable discussion about the socio-economic
benefits and the costs of the electrification of these areas in developing countries. For
many rural people in the Third World however, electrification of their areas means
modernity, progress and, above all, light in the darkness (Foley 1990).
Some researchers have asserted the view that, rural electricity has different benefits to
the consumers. During a recent socio-economic impact evaluation in Bangladesh, a villager
even appreciated electricity as “freedom” (Schiller 1996). The Independent Evaluation
Group has collected data for selected countries for which a range of benefits has been
calculated. The benefits include: lighting and TV (domestic uses); health benefits (improved
health and reduced fertility); time use (increased leisure); education benefits; and
productive uses (increased productivity of home businesses (existing and new businesses)
and increased agricultural productivity).
3. Demand and Supply Analysis
The price of any commodity is determined by the market forces. In other words, both
demand and supply of commodity play an important role in the determination of prices.
Given the supply of a commodity if the demand for that commodity rises, the price of that
particular commodity rises. Similar is the case for electricity consumption in Odisha. The
successful deployment of rural electrification is contingent on widespread willingness to
pay amongst rural households and energy users. Rural households spend around 10 percent
of their monthly income on basic fuel and energy services, which are used primarily for
cooking, heating and other domestic activities. Their willingness to pay depends upon
income, existing energy mix and costs thereof, availability of electricity, quality of supply
and appliance ownership.
Table 1: Demand And Availability of Power

306 : Orissa Economic Journal, Vol. 47, No. 1, Jan-June 2015
Source: Odisha Power Transmission Corporation Limited
Compared to 2005-06, the total power consumption in the state has increased by 60 percent
by the end of 2012-13. But one thing can be mentioned that though the per capita
consumption has increased the rural urban disparity in consumption remains high.
Demand of any commodity cannot determine the price itself. Supply also plays an important
role in the price determination. The supply of power to a region is measured by installed
capacity and availability for consumption. Figure-1 depicts the installed capacity and
availability of power from power projects. This is not the same as consumption of power.
Consumption is a flow concept and has a time dimension whereas demand for power a
stock concept, refers to the consumption of power at a given point of time on an average.
It has doubled from 2001-02 to 2012-13. The supply of power to a region is measured by
installed capacity and availability for consumption. Figure-1 depicts the time series of
installed capacity and availability of power from different power projects. It is heartening
to note that the installed capacity of the State has already doubled from 2005-06 to 2012-
13, while the availability of power stood far behind the installed capacity. During 2012-13,
the availability of power from all sources has increased by 6.8 percent over 2011-12.
Figure-1: Installed Capacity And Availability of Power From Power Projects (In Mw)
A) Installed Capacity
B) Availability
capacity
AB AB AB AB AB AB AB AB
Source: Odisha Economic Survey, 2013-14

Orissa Economic Journal, Vol. 47, No. 1, Jan-June 2015 : 307
Having established the relationship between demand and supply of rural electricity, we
now characterise technologies available to satisfy the demand and their costs. They can be
classified in three approaches. First, centralised conventional thermal generation combined
with rural grid extension is an approach favoured by the Ministry of Power. Second, small-
scale decentralised distributed generation avoids the bureaucratic complexities for rural
communities and hence is widely used to supply electricity from diesel generators by
local entrepreneurs. Renewable energy supplied in this manner remains a niche application,
although several projects by government and other agencies have demonstrated its
distinct advantages (Chakrabarti and Chakrabarti, 2002, pp.33-42). Finally, household level
technology such as Solar PV can fulfil electricity needs for lighting and other low
consumption activities, with minimal unit investment costs and organisational challenges.
4. Electricity Pricing
The Indian power sector has been passing through the process of reformation and
restructuring since 1990s. Before the establishment of State Electricity Regulatory
Commissions (SERCs), tariffs were fixed and realized by the State Electricity Boards (SEBs)
and electricity departments. But State Governments constantly interfered in this process
to provide concessional tariffs to certain sectors particularly agricultural and household
sectors. The attempt to recover these losses by raising industrial tariffs has led to increasing
migration out of the grid through the captive generation route and with the state
government not compensating the SEBs for loss incurred on account of subsidized power,
their financial losses continued to mount.
The Electricity Act, 2003 of GoI (EA 03) empowers SERCs to specify the terms and conditions
for determining tariffs and ensuring transparency in the tariff-setting processes. SERCs
must follow proper measures to allocate revenues in an economically efficient manner by
reducing the extent of cross subsidies. Most SERCs have issued regulations for tariff
determination and tariff orders rationalizing tariffs, including charges for meter connection
and other services. While EA 03 provides the legal framework for tariff determination,
policy framework has been provided by the National Tariff Policy (NTP) and the National
Electricity Policy (NEP). The NTP recognizes that rational and economic pricing of electricity
is an important tool for energy conservation and the sustainable use of groundwater
resources. It also refers to EA 03, which states that the appropriate commission shall be
guided by the objective that tariffs progressively reflect the efficient and prudent cost of
supplying electricity.
5. Overall Status of Rural Electricity Services in India
Planning Commissions strategy for developing rural India as well as the United Nations
Millennium Development Goals (MDGs) is inherently dependent upon the integration of
electricity services to achieve a set of varied development goals. Viable and reliable

308 : Orissa Economic Journal, Vol. 47, No. 1, Jan-June 2015
electricity services result in increased productivity in agriculture and labour, improvement
in the delivery of health and education, access to communications, improved lighting, and
increasing other public activities.
Though the Government has made different policy interventions across the years for the
development of electricity, actual performance on rural electricity services continues to
be dismal. Table-2 presents an overview of the status of rural electricity in India.
Table 2: Current Status of Electrification at the Village Level Across States*
Source: Ministry of Power, GoI
(*by the end of March, 2013)
The above table explains that the states like Andhra Pradesh, Kerala, Tamilnadu, Punjab
and West Bengal have achieved 100 percent rural electrification. States like Himachal
Pradesh, Gujarat, and Maharashtra are approaching to 100 percent whereas Odisha has
achieved 88 percentages which is very low comparable to other states.
6. Overall Status of Rural Electricity Services in Odisha
Like different states the Government of Odisha is also making efforts for achieving
100 percent village electrification. As we have already pointed out of of 47,529 villages in
Odisha, 88 percent villages have been electrified by the end of 31st March, 2013.

Orissa Economic Journal, Vol. 47, No. 1, Jan-June 2015 : 309
Table 3: District Wise Status of Village Electrification as on 2012-13
Source: Odisha Economic Survey, 2013-14

310 : Orissa Economic Journal, Vol. 47, No. 1, Jan-June 2015
The above table explains that, Odisha, with 88 percent village electrification is lagging
behind in village electrification. Two districts viz. Jharsuguda and Nuapada have achieved
100 percent village electrification, while four districts viz. Kalahandi, Boudh, Koraput &
Malkanagiri have remained among lowest achieving districts (60-70 percent). Table-3 shows
the district-wise percentage of villages electrified by the end of 2012-13.
Table 4: Households by Different Sources Of Lighting
Source: Census of India, 2011
According to census, 2011 different sources of lighting in Odisha are given above. From
table-4, it is clear that renewable sources have become the main source of providing
electricity in rural as well as urban areas. Peoples are still depending upon kerosene instead
of electricity which is considered to be great pollutant to the environment. The demand
for energy particularly in rural Odisha consists mainly of energy for cooking, lighting and
other domestic purposes. Improving and extending access to energy services is one of the
most urgent task that lies ahead as majority of the rural population in the state has no
access to electricity until now and some are still depending upon traditional biomass as
their principal household fuel.
7. Per capita Consumption
The per capita consumption of electricity in Odisha is 1146 kWh. The consumption is very
high in Dadra & Nagar Haveli which is 13767 kWh following Daman & Diu. In Daman & Diu
the per capita consumption of electricity is 7785 kWh. The average percapita consumption
in all India case is 884 kWh. Bihar is the lowest in per capita consumption of electricity, that
is 134 kWh.
8. Policy Interventions
Both the Government of India and the State Government have stressed the urgent need
for expeditious electrification in rural areas. As per the MoU signed with GoI, the State
Government is committed to electrify each household by the end of 12th five year plan. A
state level monitoring committee has also been constituted for the purpose. Following
schemes have been launched by the Central as well as state Governments for enhancing
the access to rural electricity.

Orissa Economic Journal, Vol. 47, No. 1, Jan-June 2015 : 311
8.1 Rajiv Gandhi Grameen Vidyutikaran Yojana (RGGVY)
The Rajiv Gandhi Grameen Vidyutikaran Yojana (RGGVY) was launched in April 2005 by the
Central Government as a flagship programme to provide electricity to all villages which
have a population of 100 and more in five years. It was started by merging all ongoing
schemes at that time aimed at providing access to electricity to rural households. The
schemes merged to launch RGGVY are:
m Minimum Needs Programme: 1974-1979
m Kutir Jyoti Scheme Initiation: 1988-89
m Pradhan Mantri Gramodaya Yojana: 2001-02
m Accelerated Rural Electrification Programme: 2003-04
m Accelerated Electrification of one lakh villages and ten millio households: 2004-05
The programme envisages 90 percent as capital subsidy and 10 percent as loan to the State
Government. The scheme has been executed in Odisha by Central PSUs such as NTPC,
NHPC and PGCIL. By the end of the year 2011, Govt. of India released a sum of Rs.3, 308.64
crore through REC in favour of CPSUs, of which an amount of Rs.2, 934.59 crore has been
utilised. The target of RGGVY is to electrify 14,697 unelectrified/de-electrified villages,
29,420 partly electrified villages and 32, 27,152 BPL households in all the districts. Against
these 38,692 villages 28, 02, 007 numbers of BPL kits have been installed and 10, 65, 039 BPL
houses have been electrified up to this period.
8.2 Biju Gram Jyoti Yojana (BGJY)
In order to ensure Electricity to All, the State Government has launched the Biju Gram Jyoti
Yojana (BGJY) as a flagship scheme in 2007-08 with a target to cover during the 11th Plan
period, 10,000 habitations with population less than 100 and BPL households in these
habitations, which are not covered under the RGGVY scheme. Against this target 10,778
habitations have been electrified and electrification works in 2,752 habitations are in
progress.
8.3 Remote Village Electrification Programme (RVEP)
This programme targets electrification by non-conventional energy sources of those un-
electrified remote villages and un-electrified hamlets of electrified villages where grid
connectivity is neither feasible nor cost effective. Financial assistance is provided by both
the Central and the State Government for this programme. As the data shows 1509 villages
have been covered under this programme.
8.4 Renewable and Alternative Energy
While thermal and hydro based energy is the mainstay of the State’s power supply, several
schemes are in operation to tap alternative energy sources. The Odisha Renewable Energy

312 : Orissa Economic Journal, Vol. 47, No. 1, Jan-June 2015
Development Agency (OREDA) is the apex agency under the Department of Science and
Technology, Government of Odisha. It looks after renewable and alternative energy
projects.
9. Conclusion
Access to electricity is highly desired by the rural communities. It has different
developmental benefits and priority should be given for its expansion. Government of
Odisha is facing serious challenges in the process of rural electrification. In rural areas
though BPL holders are getting electricity for free usage, the supply of electricity provided
to them is not sufficient. Lack of high level of voltage is another problem. Progressive
payment system should be made compulsory for those who are using the electricity and
getting benefits from it. As compared to rural areas urban people are using more. It is clear
from the analysis that renewable sources have become the main source for providing
electricity in rural as well as urban areas A target should be fixed for facilitating a large
coverage of basic lighting and supplies of electricity by higher power systems for areas
with high potential demand.
References
Andreas, K. (2009). “Factors influencing household access to electricity in India”, Energy for Sustainable
Development, Vol.11 (4): 13-20.
Barnes, D.F. (1988). “Electric power for rural growth; how electricity affects rural life in developing
countries”, Boulder.
Chakrabarti, S. and S. Chakrabarti (2002). “Rural Electrification Programme with Solar Energy in
Remote Region: A case study in an island”, Energy Policy, Vol. 30 (1):33-42.
Foley, G. (1990). ‘Electricity for rural people’, London.
Government of Odisha: Economic Survey (2013-14). Department of Planning and Coordination.
Mason, M. (1990). “Rural electrification: a review of World Bank and USAID financed projects”,
Background paper, Washington, April 1990.
Oda, H. (2012). “Progress and Issues in Rural Electrification in Bihar, India: A preliminary Analysis”,
IDE Discussion Paper, No. 333.
Schiller, R.E. (1996). “Rural Electrification in Developing Nations: An Economic Bonanza”, Dhaka.
Schramm, G. (1991). “Rural electrification in LDC’s as a tool for economic development: facts and
fiction”, 30th Annual Meeting Western Regional Science Association, Monterey, February 1991.
World Bank Independent Evaluation Group (2008). “The Welfare Impact of Rural Electrification: A
Reassessment of the Costs and Benefits”, Washington D.C., World Bank.
Yaron, G., T.F. Irving, and S. Jansson (1994). “Solar Energy for Rural Communities: Case of Namibia”,
London 1994.
Websites: www.oredaodisha.com, www.powermin.nic.in, www.rggvy.nic.in

Orissa Economic Journal, Vol. 47, No. 1, Jan-June 2015 : 313
Infrastructural Variation in Odisha: A District Wise Analysis
Umakanta Tripathy1
Pragnya Laxmi Padhi2
India is a country of villages and about 50% of the villages have very poor socio-economic
condition. Since independence many efforts have been made to improve the living
standards of rural masses in five year plans. Rural development is an integrated concept
of growth and poverty elimination has been of paramount concern in all the consequent
five year plans. Rural infrastructure involves the very socio-economic climate created
by some special categories of rural facilities, which contribute the development of the
rural economy both by increasing productivity, growth and reducing poverty, inequalities
and unit cost of production. Public private partnership (PPP) is also highly essential for
infrastructural development for a developing country. This paper mainly focuses on
inter district variation in infrastructure development among the 30 districts of Odisha.
Key Words: Development, infrastructure, productivity, growth, poverty
1. Introduction
Disparities in economic and social development across the regions and intra-regional
disparities among different segments of India have been the major planks for adopting
planning process in India since independence. Apart from massive investments in backward
regions, various public policies directed at encouraging private investments in such regions
have been pursued during the first three decades of planned development. While efforts
to reduce regional disparities were not lacking, achievements were not often
commensurate with these efforts.
The Odisha Development Report 2011 analyses in detail the social and economic problems
of the State and remarks that Odisha is considered as one of the poorest States of the
country ranking 19 in Human Development Index (HDI) and 17 in Inequality Adjustment
Human Development (IHDI) by UNDP in 2011. It starts focusing attention on growth of
different sectors, sections and regions along with their problems and constraints. It mainly
1 Lecturer in Economics, P.G Department of Economics, Government College (Autonomous), Angul,
2 Guest Lecturer in Economics, P.G Department of Economics, Government College (Autonomous), Angul ,

314 : Orissa Economic Journal, Vol. 47, No. 1, Jan-June 2015
focuses on the reforms initiated in some of the sectors and emerging challenges of these
reforms. The Report particularly gives stress on poverty and poor living conditions of the
people, measures taken so far to improve the economic situation and pending challenges
that have to be faced in coming decades to enhance growth and ensure equity.
2. Review of Literature
Patra and Acharya (2011) in their paper “Regional Disparity, Infrastructure Development
and Economic Growth: An Inter-State Analysis” examined the spatial disparities in
infrastructural facilities across 16 major states in India and in turn analysed its impact on
regional economic growth. Empirical evidence suggests that there is a positive relationship
between Infrastructure Development Index & Per Capita Net State Domestic Product and
negative relationship between Infrastructure Development Index & Poverty. The
relationship between the availability of social and economic infrastructure and the ratio
of poverty positively correlates with providing social and economic infrastructure. This
establishes the fact that there is a strong relationship between infrastructure services
availability and poverty alleviation. Higher the infrastructure services availability, lower
will be the poverty levels in that country.
Tripathy and Mishra (2011) argue that instead of having adequate natural resources in the
state, there is uneven agricultural development in Odisha due to wastage of resources,
increase in public cost, lack of credit facilities to farmers etc. They mention that the state
is having with only 32.17% of Net Area Sown irrigated, compared 42.42% at the all India
level. apart from that the state has registered the lowest yield rate in food grains at 13.49%
q/ha in 2005-2006 among the major states to 17.15q/ha for the country which is much
lower than the developed states like Punjab, Haryana and west Bengal. They also point
out that high proportion of population staying in rural areas and high proportion of workers
dependent on agriculture result in the slow progress of agricultural sector in Orissa. Thus
in the context of development disparities in agriculture across the districts in Orissa, growth
process cannot be boosted without reducing disparities which can be effective through
particularistic policies prepared by the policy makers.
Agarwalla (2011) in her paper “Estimating the Contribution of Infrastructure in Regional
Productivity Growth in India” attempts at studying the interactions between regional
development and infrastructure availability at state level for India. There exists substantial
and significant positive association between levels of development and levels of
infrastructure. Transport and power infrastructure are significant contributors, and a decline
in the magnitude of coefficients indicates towards their limiting role. Regarding education
she finds out that number of primary schools per 10,000 people has gone down in the

Orissa Economic Journal, Vol. 47, No. 1, Jan-June 2015 : 315
country as a whole, and across all the regions, which is a serious drawback. Southern states
have achieved high economic growth, especially Tamilnadu and Karnataka. Similarly,
western states of Gujarat and Goa have been high growth states. However, it is surprising
to note that in spite of having the largest share of country’s natural resources, eastern, and
central regions do not have high installed capacity in Power Sector though the Western
region has achieved highest growth over the years.
3. Objectives
The main objectives of the study are as follows.
1. To assess the relative position of Odisha compared to other states through analysis of
inter-state development disparity in the country.
2. To examine the level of development disparity within the state across the districts.
4. Data Base and Methodology
For analysing the pattern of Sectoral disparity and development in Odisha, the data are
secondary in nature and have been collected from Orissa Statistical Abstract of Odisha,
Odisha Agriculture statistics and Economic Survey of different years. The following
indicators have been applied for the assessment of the Sectoral variation and development
in Odisha.
1. Telephone connections per lakh of population
2. Percentage of households with safe drinking water
3. Number of Commercial Banks per lakh of population
4. Per capita Bank Credit
5. Percentage of Villages electrified
6. Railways length per hundred square kilometre
7. Road length per hundred square kilometre
8. No. of Vehicles per lakh of Population
The proposed methodology consists of Sudarshan Iyenger method along with Beta
distribution for objective classification of thirty districts of Odisha into four groups such as
Very backward, Backward, Developing and Developed.
Composite index using Sudershan Iyenger Methodology and Beta variate values computed
for different sectors and thus the overall position are presented below. The districts can
be categorized into four categories (i) Developed (ii) Developing (iii) Backward (iv) Very
Backward according to the values of Beta variate.

316 : Orissa Economic Journal, Vol. 47, No. 1, Jan-June 2015
5. Infrastructure Development
The Infrastructural Development can be measured by taking the indicators of Vehicle/lakh
of Population, % of surfaced road ’00 square kilometre, Villages electrified and Road length/
square kilometre that show a moderate level of infrastructure development in the state.
Table-1 shows indicators of Infrastructural Development for major states.
Table 1: Indicators of Infrastructural Development for Major States
Source: Statistical year Book, India, 2015
Category Level of Development Value of Beta Distribution
A Very Backward 0 to 0.25
B Backward 0.25 to 0.50
C Developing 0.50 to 0.75
D Developed 0.75 to 1

Orissa Economic Journal, Vol. 47, No. 1, Jan-June 2015 : 317
The State of Odisha recorded a share of 4143 numbers of Vehicle/lakh of Population
whereas in all India level the number is 11716.15. The highest number of Vehicle/lakh of
Population was found in the state of Punjab (14487) and the lowest in the state of Bihar
(904). The % of Surfaced road per ‘00 square kilometre recorded for the State of Odisha
was at 22.04 % during 2011 comparing 53.98% all India level. The share of high level surfaced
road was seen in the State of Haryana (93.29%) in contrast to Jharkhand (24.73%) in 2011.
The village electrification pattern in the State of Odisha reveals that the percentage of
Villages electrified during 2011-12 was 55.20% against 93.8% in all India level. The States
which level achieved 100% electrification in the villages during the period were Haryana,
Kerala and Punjab and the poorest in this category was Jharkhand (31.50%). The Road
length/square kilometre during 2011 for the State of Odisha was recorded as 152.23%
against only 76.79% at all India level that shows a tremendous achievement in this category.
However the highest % of Road length/square kilometre was found in the State of Kerala
(388.16%) as against only 14.41% for the State Jharkhand.
6. Infrastructure Variation in Odisha
The variation in infrastructure development in the state can be seen in terms of number of
commercial banks per lakh of population, per capita Bank Credit, percentage of Villages
electrified, Railways length per hundred square Kilo meters, Number of Vehicles per lakh
of Population, % of households with safe drinking water and telephone connection per
lakh of population as shown in Table-2.
There are 4195 telephone line connections per one lakh population. The highest number
of connected area is Deogarh (14412) and the lowest connected area is Koraput (133). The
% of households with safe drinking water during 2011 stood at a rate of 100%. Thus the
household getting 100% safe drinking water in the districts are Baragarh, Bhadrak, Bolangir,
Boudh, Deogarh, Gajapati, Jagatshingpur, Kalahandi, Kendrapara, Keonjhar, Koraput,
Mayurbhanj, Nayagarh, Nuapara, Nawarangpur, Sonepur and Puri. In this case all most all
the districts are getting nearer to the case of achieving complete 100% safe drinking water.
There are 7 banks per lakh of population in the state during 2012-13. However there exists
huge variation across the districts. The districts with highest number of commercial banks
per lakh of population are Khurda (9) and the lowest districts are Malkangiri and
Nawarangpur (3 each).

318 : Orissa Economic Journal, Vol. 47, No. 1, Jan-June 2015
Table 2: Indicators of Infrastructure development in Odisha
Source: Statistical Abstracts of Odisha, 2012-13
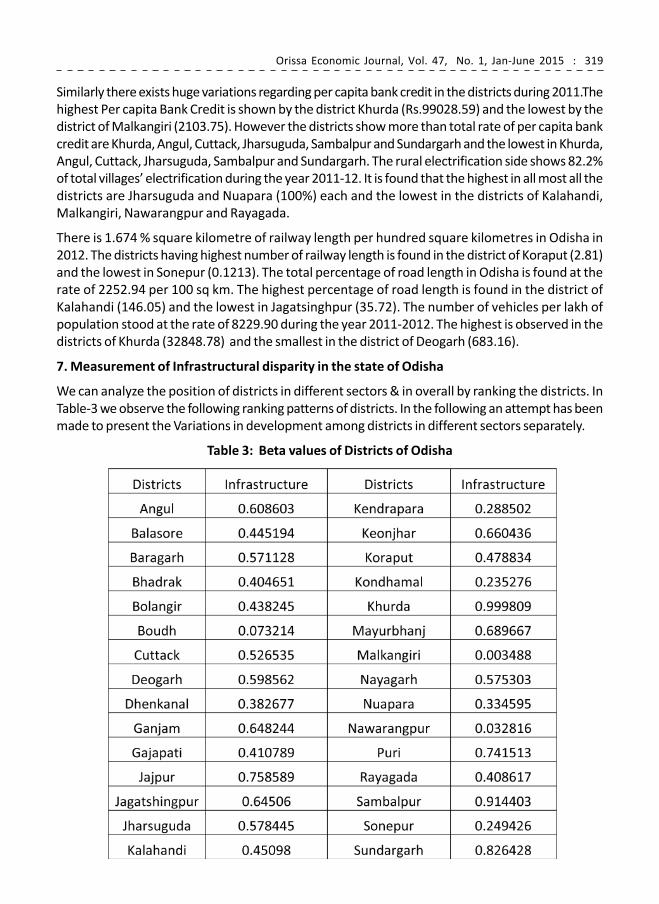
Orissa Economic Journal, Vol. 47, No. 1, Jan-June 2015 : 319
Similarly there exists huge variations regarding per capita bank credit in the districts during 2011.The
highest Per capita Bank Credit is shown by the district Khurda (Rs.99028.59) and the lowest by the
district of Malkangiri (2103.75). However the districts show more than total rate of per capita bank
credit are Khurda, Angul, Cuttack, Jharsuguda, Sambalpur and Sundargarh and the lowest in Khurda,
Angul, Cuttack, Jharsuguda, Sambalpur and Sundargarh. The rural electrification side shows 82.2%
of total villages’ electrification during the year 2011-12. It is found that the highest in all most all the
districts are Jharsuguda and Nuapara (100%) each and the lowest in the districts of Kalahandi,
Malkangiri, Nawarangpur and Rayagada.
There is 1.674 % square kilometre of railway length per hundred square kilometres in Odisha in
2012. The districts having highest number of railway length is found in the district of Koraput (2.81)
and the lowest in Sonepur (0.1213). The total percentage of road length in Odisha is found at the
rate of 2252.94 per 100 sq km. The highest percentage of road length is found in the district of
Kalahandi (146.05) and the lowest in Jagatsinghpur (35.72). The number of vehicles per lakh of
population stood at the rate of 8229.90 during the year 2011-2012. The highest is observed in the
districts of Khurda (32848.78) and the smallest in the district of Deogarh (683.16).
7. Measurement of Infrastructural disparity in the state of Odisha
We can analyze the position of districts in different sectors & in overall by ranking the districts. In
Table-3 we observe the following ranking patterns of districts. In the following an attempt has been
made to present the Variations in development among districts in different sectors separately.
Table 3: Beta values of Districts of Odisha

320 : Orissa Economic Journal, Vol. 47, No. 1, Jan-June 2015
8. Summary and Conclusion
In terms of Infrastructure Development districts which are coming under the category of
very backward category are Malkangiri, Nawarangpur, Sonepur, Boudh and Kondhamal.
The districts which come under backward categories are Balasore, Bhadrak, Bolangir,
Dhenkanal, Gajapati, Kendrapara, Kalahandi, Koraput, Rayagada and Nuapara. The districts
which categorised as developing districts are Angul, Baragarh ,Cuttack, Deogarh, Ganjam,
Jagatshingpur, Jharsuguda, Nayagarh, Puri, keonjhar and Maurbhanj. The developed districts
are Jajpur, Sundargarh, Sambalpur and Khurda.
Table 4: Status of Different Districts of Odisha
The unevenness in development profile for Odisha may be explained through historical
factors as well the nature of development process which has accentuated the unevenness
further. The development process has two aspects one the market driven force which has
an inherent tendency to accentuate inequality and disparity as capital investment gravitates
towards developed regions with higher level of infrastructural development.
The other aspect is public investment which generally is expected to play the role of
equaliser and contribute towards the reduction of regional inequalities. But the
development process initiated after 90’s in particular has not only been emphasising on
norms of efficiency which adversely affects backward regions but also is associated with
the declining flow of pubic investment into such regions. In such a context the development
profile of Odisha with continuing underdevelopment of the tribal Odisha with low level of
development necessitates a new direction for the public investment to flow into these
regions till there is adequate development of economic and social infrastructure and self
sustaining inclusive growth process.

Orissa Economic Journal, Vol. 47, No. 1, Jan-June 2015 : 321
References
Astha Agarwalla (2011) “Estimating the Contribution of Infrastructure in Regional
Productivity Growth in India”. Research and Publications Wing, W.P. No. 2011-05-01, IIMA,
May, 1-27.
Human Development Report 2013.
Odisha Agricultural Statistics 2012-13.
Patra, A and Acharya, A (2011), “Regional Disparity, Infrastructure Development and
Economic Growth: An Inter-State Analysis.” Research and Practice in Social Sciences, Vol.
6, No. 2, February, 17-30.
Srinivasu, B. and Rao, P.S. (2013), “Infrastructure Development and Economic growth:
Prospects and Perspective”, JBM&SSR, ISSN No: 2319-5614, Volume 2, No.1, January, P.80-
91.
Statistical Abstract of Odisha 2012.
The National Human Development Report 2001.
The Orissa Human Development Report (OHDR)-2011
Tripathy P.K. and Mishra J.K. (2011),”Disparity in development of Orissa State”, W.P. No. 1,
Department of economics, Sambalpur University, June, P.1-45

322 : Orissa Economic Journal, Vol. 47, No. 1, Jan-June 2015