Passenger flow simulation in a hub airport - UPCommons
17
Passenger flow simulation in a hub airport: An application to the Barcelona International Airport P. Fonseca i Casas a,⇑ , J. Casanovas a , X. Ferran b a InLab FIB, Universitat Politècnica de Catalunya – BarcelonaTECH, Campus Nord – B6, c/Jordi Girona 1-3, 08034 Barcelona, Spain b INDRA Aeropuertos, INDRA, Plaça Ovidi Moltllor, el Prat Del Llobregat, Spain article info Article history: Received 28 March 2013 Received in revised form 12 March 2014 Accepted 17 March 2014 Keywords: Airport micro-simulation Specification and Description Language (SDL) Agent Based Simulation (ABS) Barcelona Airport abstract This paper describes a conceptual model intended to be applied in a general approach to the micro-simulation of hub airports terminals. The proposed methodology is illustrated with the development of a simulation model originally intended to help in the design of the new terminal at Barcelona International Airport. This model represents in detail, among many other elements, passengers’ flows in the different areas of these complex facilities. Agent-based simulation techniques were included to represent the different actors’ behav- iors, and a formal representation of the model using Specification and Description Language (SDL) was used to represent the complexity of all the system elements. To pre-process a diverse and considerable amount of raw data provided by airport designers and other sources to feed the simulation environment Flight Planner Manager was devel- oped as a toolkit to parameterize the different model factors and to generate required specific input data. This project was conducted over 3 years leading to the development of a system not only conceived to assess in the airport initial design process but also to constitute a recurrent decision taking instrument to dynamically optimize terminal management and operations. Ó 2014 Elsevier B.V. All rights reserved. 1. Objectives and methodology The different and asynchronous flows merging in the terminal areas represent a considerable challenge for modern air- port management, even considering the well-known or easily predictable passengers’ behaviors in this specific and regulated context. Many rules are linked to arrivals and departures patterns, workers routines, schedules and conditions, as long with specific airport operations and activities (check-in, access control, shopping or food and beverages areas distribution and characterization, waiting spaces...). Airport managers emphasizes the importance of aspects like security, efficiency, bottleneck avoidance, quality of services, comfort, ease of use or sustainability and rationalization of costs, among many others. A large amount of questions need to be solved ranging from the assignment of arriving flights to available gates [3], to problems related with recurrent or unexpected delays, access control dimensioning and reconfiguration, or the importance of public transportation systems scheduling [16,19]. This paper is focused on the modeling of space requirements and flow management in the main terminal building and related areas of a hub airport. The objectives to cover with the required simulation based decision tool are necessarily http://dx.doi.org/10.1016/j.simpat.2014.03.008 1569-190X/Ó 2014 Elsevier B.V. All rights reserved. ⇑ Corresponding author. Tel.: +34 93 4017732; fax: +34 93 4015855. E-mail addresses: pau@fib.upc.edu (P. Fonseca i Casas), josepk@fib.upc.edu (J. Casanovas), [email protected] (X. Ferran). Simulation Modelling Practice and Theory 44 (2014) 78–94 Contents lists available at ScienceDirect Simulation Modelling Practice and Theory journal homepage: www.elsevier.com/locate/simpat
-
Upload
khangminh22 -
Category
Documents
-
view
1 -
download
0
Transcript of Passenger flow simulation in a hub airport - UPCommons
Simulation Modelling Practice and Theory 44 (2014) 78–94
Contents lists available at ScienceDirect
Simulation Modelling Practice and Theory
journal homepage: www.elsevier .com/locate /s impat
Passenger flow simulation in a hub airport: An applicationto the Barcelona International Airport
http://dx.doi.org/10.1016/j.simpat.2014.03.0081569-190X/� 2014 Elsevier B.V. All rights reserved.
⇑ Corresponding author. Tel.: +34 93 4017732; fax: +34 93 4015855.E-mail addresses: [email protected] (P. Fonseca i Casas), [email protected] (J. Casanovas), [email protected] (X. Ferran).
P. Fonseca i Casas a,⇑, J. Casanovas a, X. Ferran b
a InLab FIB, Universitat Politècnica de Catalunya – BarcelonaTECH, Campus Nord – B6, c/Jordi Girona 1-3, 08034 Barcelona, Spainb INDRA Aeropuertos, INDRA, Plaça Ovidi Moltllor, el Prat Del Llobregat, Spain
a r t i c l e i n f o
Article history:Received 28 March 2013Received in revised form 12 March 2014Accepted 17 March 2014
Keywords:Airport micro-simulationSpecification and DescriptionLanguage (SDL)Agent Based Simulation (ABS)Barcelona Airport
a b s t r a c t
This paper describes a conceptual model intended to be applied in a general approach tothe micro-simulation of hub airports terminals. The proposed methodology is illustratedwith the development of a simulation model originally intended to help in the design ofthe new terminal at Barcelona International Airport. This model represents in detail, amongmany other elements, passengers’ flows in the different areas of these complex facilities.Agent-based simulation techniques were included to represent the different actors’ behav-iors, and a formal representation of the model using Specification and DescriptionLanguage (SDL) was used to represent the complexity of all the system elements. Topre-process a diverse and considerable amount of raw data provided by airport designersand other sources to feed the simulation environment Flight Planner Manager was devel-oped as a toolkit to parameterize the different model factors and to generate requiredspecific input data. This project was conducted over 3 years leading to the developmentof a system not only conceived to assess in the airport initial design process but also toconstitute a recurrent decision taking instrument to dynamically optimize terminalmanagement and operations.
� 2014 Elsevier B.V. All rights reserved.
1. Objectives and methodology
The different and asynchronous flows merging in the terminal areas represent a considerable challenge for modern air-port management, even considering the well-known or easily predictable passengers’ behaviors in this specific and regulatedcontext. Many rules are linked to arrivals and departures patterns, workers routines, schedules and conditions, as long withspecific airport operations and activities (check-in, access control, shopping or food and beverages areas distribution andcharacterization, waiting spaces. . .).
Airport managers emphasizes the importance of aspects like security, efficiency, bottleneck avoidance, quality of services,comfort, ease of use or sustainability and rationalization of costs, among many others. A large amount of questions need tobe solved ranging from the assignment of arriving flights to available gates [3], to problems related with recurrent orunexpected delays, access control dimensioning and reconfiguration, or the importance of public transportation systemsscheduling [16,19].
This paper is focused on the modeling of space requirements and flow management in the main terminal building andrelated areas of a hub airport. The objectives to cover with the required simulation based decision tool are necessarily

P. Fonseca i Casas et al. / Simulation Modelling Practice and Theory 44 (2014) 78–94 79
multiple: (i) to assess the design and construction of a new airport terminal taking in account economic and social forecast-ing and other strategic considerations (this issue comprehends spaces, flows and resources and facilities involved in a com-plex and costly construction process); (ii) to produce and validate a decision tool as a basis to evaluate operationalalternative scenarios under a dynamic management.
The work is organized as follows: in this first section the objectives and the methodology are introduced while in Section 2we detail how the different flows are considered. In Section 3 we describe the model globally representing the airport and inSection 3.2 results obtained from experimentation with the implemented model are shown. Finally in Section 4, some con-cluding remarks are noted and further improvements and other work are suggested.
Space requirements are a key factor in airport management [8,13,23]. Models dealing with space requirements are fre-quently based on differential equations or queuing theory [14,15]. These approximations are not however sufficient to pro-vide a detailed characterization of several complex flow patterns. Additionally an airport is really a complex system and tounderstand all the flows and their behavior requires a multidisciplinary approach to achieve their characterization. Theseinternal and external assessors need tools to evaluate and sustain their specific proposals by means of objective and under-standable tools and protocols. This is of course common to other complex systems and a considerable amount of knowledgeand expertise has been already developed. Nevertheless, infrastructures of the dimensions and costs considered in this pro-ject represent a considerable effort in terms of tools’ conceptualization, developments, testing, results validity, credibilityand usability along the whole engineering process.
These complex issues must be simultaneously envisaged in order to give an adequate answer to the project plannedobjectives. Main challenges we face are to obtain an accurate and valid information of the system, to build a completeand unambiguous model from this information and to generate results in a time span adequate to the project strategicrequirements (infrastructure definition), and to the operational requirements (the daily use of the tool). As we will detailin Section 3 at least six different teams’ categories of specialists should be involved (see Table 1 for the teams’ definitionin Barcelona project). Airport authorities’ involvement under a concurrent and collaborative schema propitiates that the finalmodel reasonably meets their expectations. This commitment contributes effectively to resulting model validity and accred-itation. It definitively facilitates the acceptation and implementation of specific solutions selected among a set of proposedscenarios for the new facility.
The validation schema we followed was Independent Verification and Validation (IV&V) [22]. Particularly Barcelona Air-port project validation was conducted by external assessors concurrently with the design and development of the simulationmodel phases. Final validation and accreditation involved not only this team but also other experts and airport authorities.
These teams frequently use different tools and languages. A principal challenge is to collect this knowledge and to em-body it in a commonly accepted model framework.
To coordinate the project development it was necessary to establish a formal language to simplify and facilitate commu-nication and interactions transversally among teams’ members. Formal languages that can be used for this purpose includePetri Nets [4] and Forrester diagrams [24].
In our formulation we use Specification and Description Language (SDL) for the model definition. We also selected a visualsimulation environment, Witness [11,12], to facilitate the discussion and the understandability of the different constitutiveblocks of the model and for the implementation of some of the main simulated processes.
SDL is a formal object-oriented language defined by the International Telecommunication Union – TelecommunicationStandardization Sector (ITU–T) as Recommendation Z.100 [10]. This language is designed to specify complex, event-driven,real-time, interactive applications involving many concurrent activities, using discrete signals to enable communication[5,10].
SDL is a powerful and modern language widely used in different areas -not only in simulation- and can be easily com-bined with UML.
Model definition is supported by different types of components:
� Structure: system, blocks, processes and processes hierarchy.� Behavior: defined through the different processes.� Data: based on abstract data types (ADT).
Table 1Roles of the different teams involved in Barcelona project (conducted by UPC-BarcelonaTech, INDRA, AENA and other consulting firms).
Team Role
Aeronautical and civil engineering Model hypotheses delivering and validationProvide information on airport operations
External assessors Perform final validation of the assumptions to be used in the airport conceptual modelArchitecture/construction Define the new terminal structure considering constructive functionalities and requirementsComputing Model development. Design and implementation of the support toolsStatistics Experimental design and output analysisValidation and accreditation Final validation and accreditation of the models. Performed by airport authorities and other experts
80 P. Fonseca i Casas et al. / Simulation Modelling Practice and Theory 44 (2014) 78–94
� Communication: signals, with the parameters and channels they use to travel.� Inheritances: describing the specialization and relationships between model elements.
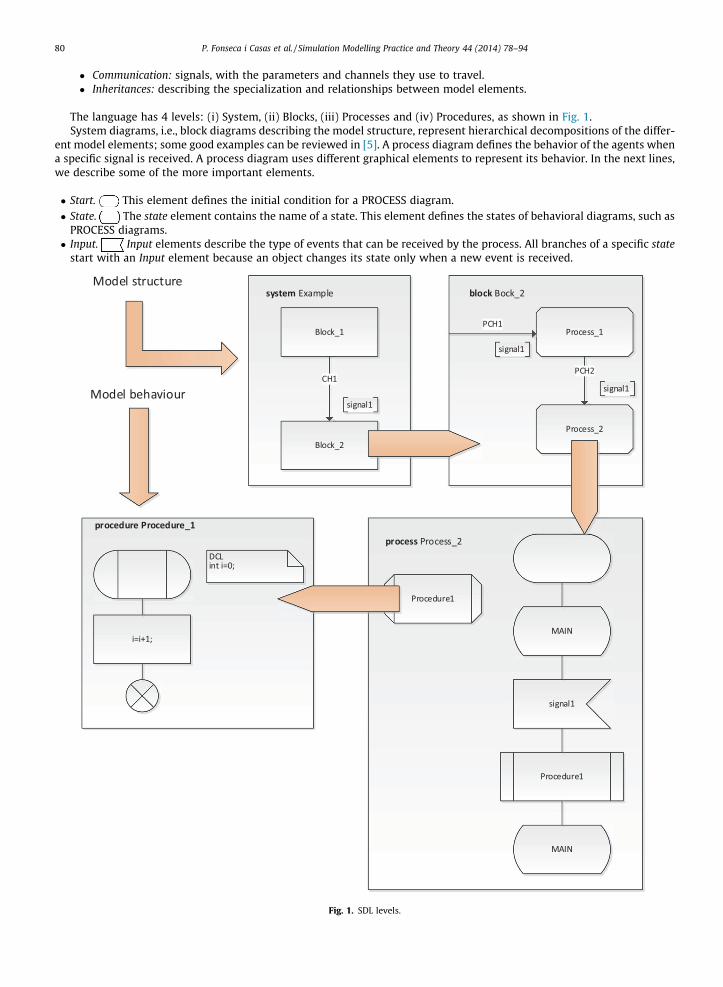
The language has 4 levels: (i) System, (ii) Blocks, (iii) Processes and (iv) Procedures, as shown in Fig. 1.System diagrams, i.e., block diagrams describing the model structure, represent hierarchical decompositions of the differ-
ent model elements; some good examples can be reviewed in [5]. A process diagram defines the behavior of the agents whena specific signal is received. A process diagram uses different graphical elements to represent its behavior. In the next lines,we describe some of the more important elements.
� Start. This element defines the initial condition for a PROCESS diagram.� State. The state element contains the name of a state. This element defines the states of behavioral diagrams, such as
PROCESS diagrams.� Input. Input elements describe the type of events that can be received by the process. All branches of a specific state
start with an Input element because an object changes its state only when a new event is received.
Fig. 1. SDL levels.
P. Fonseca i Casas et al. / Simulation Modelling Practice and Theory 44 (2014) 78–94 81
� Create. This element allows the creation of an agent.� Task. This element allows the interpretation of informal texts or programming code. In this paper, following SDL-RT
[18], we use C code.� Procedure call. These elements perform a procedure call. A PROCEDURE can be defined in the last level of the SDL
language. It can be used to encapsulate pieces of the model for reuse.� Output. Output elements describe the types of signals to be sent, the parameters that the signal carries and the des-
tination. If ambiguity about the signal destination exists, communication can be directed specifying destinations using aprocessing identity value (PId), an agent name or using the sentence via path. If there is more than one path and no spe-cific output is defined, an arbitrary one is used. The destination value can be stored in a variable for later use [20]. Four PIdexpressions can be used:– self, an agent’s own identity;– parent, the agent that created the agent (null for initial agents);– offspring, the most recent agent created by the agent;– sender, the agent that sent the last signal input (null before any signal received).� Decision. These elements describe bifurcations. Their behavior depends on how the related question is answered.
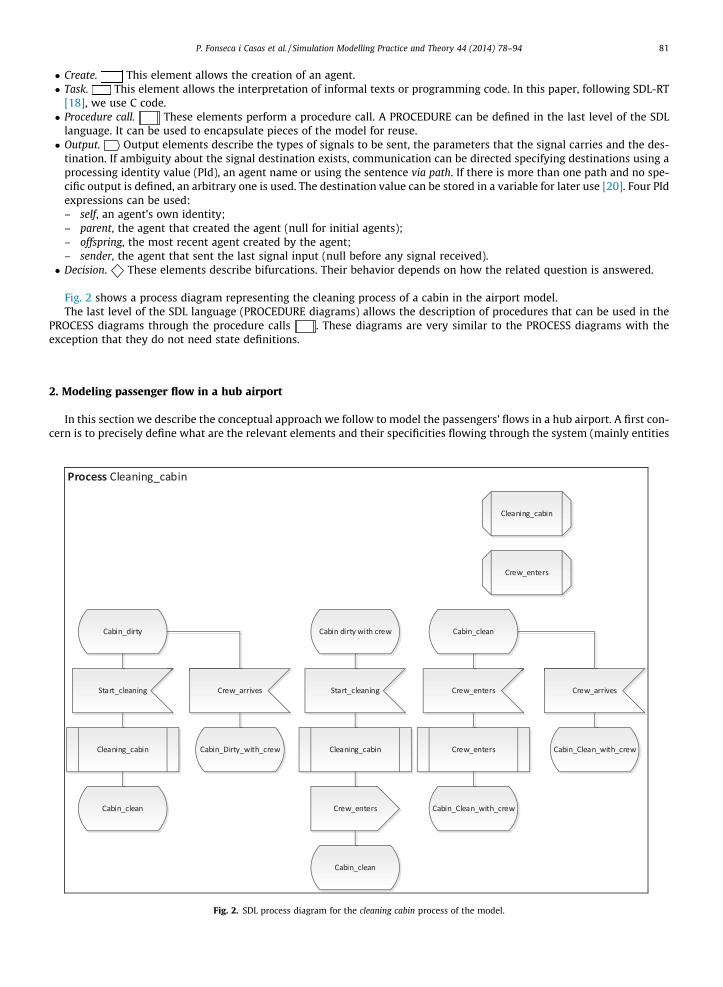
Fig. 2 shows a process diagram representing the cleaning process of a cabin in the airport model.The last level of the SDL language (PROCEDURE diagrams) allows the description of procedures that can be used in the
PROCESS diagrams through the procedure calls . These diagrams are very similar to the PROCESS diagrams with theexception that they do not need state definitions.
2. Modeling passenger flow in a hub airport
In this section we describe the conceptual approach we follow to model the passengers’ flows in a hub airport. A first con-cern is to precisely define what are the relevant elements and their specificities flowing through the system (mainly entities
Fig. 2. SDL process diagram for the cleaning cabin process of the model.
82 P. Fonseca i Casas et al. / Simulation Modelling Practice and Theory 44 (2014) 78–94
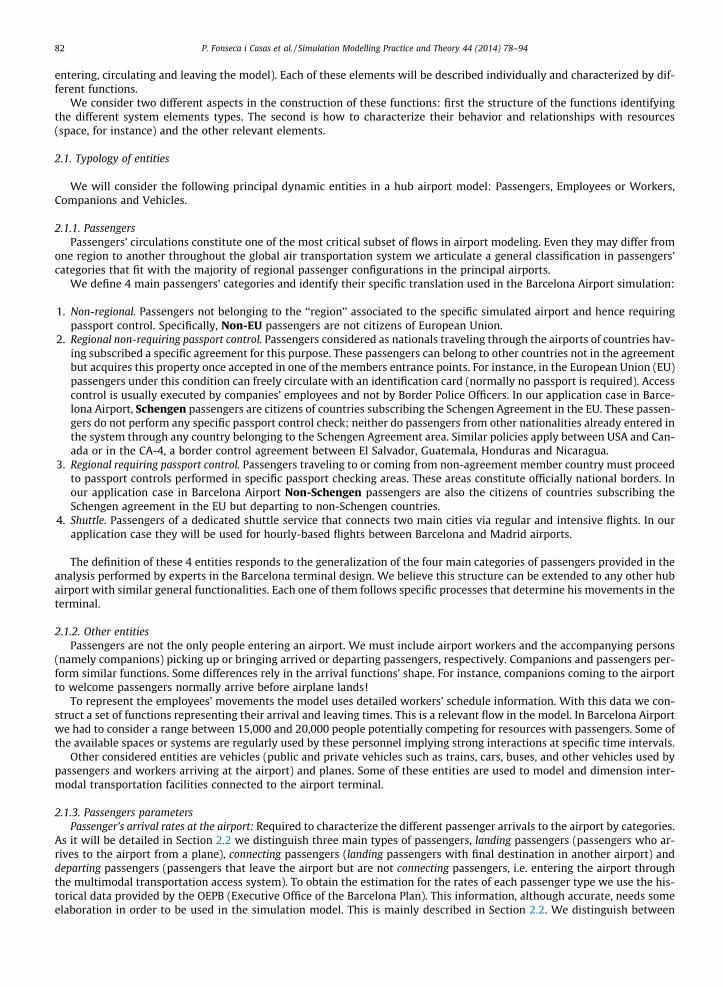
entering, circulating and leaving the model). Each of these elements will be described individually and characterized by dif-ferent functions.
We consider two different aspects in the construction of these functions: first the structure of the functions identifyingthe different system elements types. The second is how to characterize their behavior and relationships with resources(space, for instance) and the other relevant elements.
2.1. Typology of entities
We will consider the following principal dynamic entities in a hub airport model: Passengers, Employees or Workers,Companions and Vehicles.
2.1.1. PassengersPassengers’ circulations constitute one of the most critical subset of flows in airport modeling. Even they may differ from
one region to another throughout the global air transportation system we articulate a general classification in passengers’categories that fit with the majority of regional passenger configurations in the principal airports.
We define 4 main passengers’ categories and identify their specific translation used in the Barcelona Airport simulation:
1. Non-regional. Passengers not belonging to the ‘‘region’’ associated to the specific simulated airport and hence requiringpassport control. Specifically, Non-EU passengers are not citizens of European Union.
2. Regional non-requiring passport control. Passengers considered as nationals traveling through the airports of countries hav-ing subscribed a specific agreement for this purpose. These passengers can belong to other countries not in the agreementbut acquires this property once accepted in one of the members entrance points. For instance, in the European Union (EU)passengers under this condition can freely circulate with an identification card (normally no passport is required). Accesscontrol is usually executed by companies’ employees and not by Border Police Officers. In our application case in Barce-lona Airport, Schengen passengers are citizens of countries subscribing the Schengen Agreement in the EU. These passen-gers do not perform any specific passport control check; neither do passengers from other nationalities already entered inthe system through any country belonging to the Schengen Agreement area. Similar policies apply between USA and Can-ada or in the CA-4, a border control agreement between El Salvador, Guatemala, Honduras and Nicaragua.
3. Regional requiring passport control. Passengers traveling to or coming from non-agreement member country must proceedto passport controls performed in specific passport checking areas. These areas constitute officially national borders. Inour application case in Barcelona Airport Non-Schengen passengers are also the citizens of countries subscribing theSchengen agreement in the EU but departing to non-Schengen countries.
4. Shuttle. Passengers of a dedicated shuttle service that connects two main cities via regular and intensive flights. In ourapplication case they will be used for hourly-based flights between Barcelona and Madrid airports.
The definition of these 4 entities responds to the generalization of the four main categories of passengers provided in theanalysis performed by experts in the Barcelona terminal design. We believe this structure can be extended to any other hubairport with similar general functionalities. Each one of them follows specific processes that determine his movements in theterminal.
2.1.2. Other entitiesPassengers are not the only people entering an airport. We must include airport workers and the accompanying persons
(namely companions) picking up or bringing arrived or departing passengers, respectively. Companions and passengers per-form similar functions. Some differences rely in the arrival functions’ shape. For instance, companions coming to the airportto welcome passengers normally arrive before airplane lands!
To represent the employees’ movements the model uses detailed workers’ schedule information. With this data we con-struct a set of functions representing their arrival and leaving times. This is a relevant flow in the model. In Barcelona Airportwe had to consider a range between 15,000 and 20,000 people potentially competing for resources with passengers. Some ofthe available spaces or systems are regularly used by these personnel implying strong interactions at specific time intervals.
Other considered entities are vehicles (public and private vehicles such as trains, cars, buses, and other vehicles used bypassengers and workers arriving at the airport) and planes. Some of these entities are used to model and dimension inter-modal transportation facilities connected to the airport terminal.
2.1.3. Passengers parametersPassenger’s arrival rates at the airport: Required to characterize the different passenger arrivals to the airport by categories.
As it will be detailed in Section 2.2 we distinguish three main types of passengers, landing passengers (passengers who ar-rives to the airport from a plane), connecting passengers (landing passengers with final destination in another airport) anddeparting passengers (passengers that leave the airport but are not connecting passengers, i.e. entering the airport throughthe multimodal transportation access system). To obtain the estimation for the rates of each passenger type we use the his-torical data provided by the OEPB (Executive Office of the Barcelona Plan). This information, although accurate, needs someelaboration in order to be used in the simulation model. This is mainly described in Section 2.2. We distinguish between

P. Fonseca i Casas et al. / Simulation Modelling Practice and Theory 44 (2014) 78–94 83
these categories following the Aeronautical and civil engineering team recommendations. We conclude that this taxonomyfits well with the historical information we have, characterizing the behavior of the passengers, not only for the BarcelonaAirport, but for many other airports managed by AENA.1
Other passenger’s features: As previously mentioned, each passenger arriving to the airport must be classified in one of themain flight typologies we define. In our case, we assume that the main typologies will be (i) Shuttle, (ii) Regional non-requiring passport control, (iii) Regional requiring passport control and (iv) Non-regional. Additionally, tourist and businesscategories are considered for each one of these typologies. As mentioned before, this attributes are also intended to charac-terize their behavior inside the terminal.
2.1.4. Other entities and time parametersRates for companions: We need to characterize arrival rates for companions, classified by access mode. The presentation
curves for the companions are different from those of the passengers.Access modes: Passengers, workers and companions access the terminal by some of the following transportation systems:
train, subway, high speed train, auto rental, passenger private car, companions’ car, private bus, public bus and taxi.Depending of the access mode we define differentiated grouping rules to estimate group sizes and their circulation.Minimum connection time: The minimum connection time (MCT) is the minimal estimated time for a specific passenger to
perform his connection with another flight. The availability of exceeding time for that passenger permits to define a hypo-thetic behavior (dedicated time to shop, time to have a coffee and/or estimated expenses, for instance) and the movement ofthe entities inside the terminal. As discussed in Section 2.4, it can be extremely useful to detail entities’ behavior using intel-ligent agents.
2.2. Defining airport arrivals with a multimodal station
Entities arrive at the airport via different transportation systems. Each one of these entities has associated a specific flightand a set of characteristics conditioning its behavior inside the airport. Time unit interval used in this simulation model was5 min.
The rate for departing passengers at the check-in area is represented by kc. The presentation functions used to obtain kc arealso employed to calculate the rate for departing passengers at the terminal, represented by k. The rate for landing passengersis represented by . Some of them are flowing through the terminal searching for their connecting-flight. The rate for connect-ing passengers is represented by c.
To describe these rates, we define the following elements:
� Ai(t): the passenger presentation function for airplane ‘‘i’’. This function represents the distribution of people arrivingat the check-in facility in the airport willing to board an airplane for flight ‘‘i’’.
� n(Dt): the number of airplanes arriving at the airport during the Dt period.� tai: the airplane capacity for flight ‘‘i’’.� ai: the airplane occupation percentage in flight ‘‘i’’.� bi: the connecting passengers percentage in flight ‘‘i’’.� mk: the percentage of use for transportation facility ‘‘k’’ (train, subway, etc.) arriving at the airport. We need to rep-
resent the possible saturation of each airport input mode.
Fig. 3 shows a hypothetical scenario for flights of types 1, 2 and 3, represented by passenger presentation functions A1(t),A2(t) and A3(t), respectively. During time interval Dt = t2 � t1, the percentage of departing passengers on flight identified by 1is A1(t2) � A1(t1). Similarly, for flights 2 and 3, the expressions are A2(t2) � A2(t1) and A3(t2) � A3(t1). With these data, weestablish the rate (kc) for the departing passengers, arriving at the airport check-into take a plane, during time interval Dtas k(Dt) = Ai(t2) � Ai(t1). To calculate this value (see Eq. (1)), we use the percentage of occupation ai and the total capacitytai of the airplanes defining the check-in presentation curves.
Equation 1: Rate of departing passengers arriving to the airport check-into take a plane in a Dt.
1 Theequity ithe wor
kcðDtÞ ¼Xn
i
aitaiðAiðt2Þ � Aiðt1ÞÞ ð1Þ
The model for the arrival function is shown in Eq. (2). The transportation mode used by the departing passengers to arriveto the airport check-in is considered.
Equation 2: Rate for departing passengers arriving to the airport check-into take a plane on a Dt depending on the type oftransportation access.
kck ¼ ðDtÞ ¼ kðDtÞmk ð2Þ
Aena Group is a group of airport management and the provision of air navigation services companies. Through Aena Aeropuertos S.A. (100% of companys owned by Aena) it manages 46 airports and 2 heliports in Spain and participates directly and indirectly in the management of 24 more airports aroundld. It is one of the world’s leading airport operator in terms of passenger numbers, handling more than 200 million.

Fig. 3. Estimated passenger presentation functions for each flight at the check-in area. The different flights are grouped in categories representingcharacteristics and parameters inherent to plane functionalities and companies’ policies.
84 P. Fonseca i Casas et al. / Simulation Modelling Practice and Theory 44 (2014) 78–94
Similarly, the function for landing passengers depends on flight mi, the airplane capacity tai, and the airplane occupationrate ai, as represented by Eq. (3):
Equation 3: Rate of landing passengers arriving to the airport from a plane landing in a Dt.
lðDtÞ ¼Xn
i
taiai ð3Þ
Now we can calculate the rate of passengers leaving the airport taking in account the number of connecting passengers ineach flight. Also we must consider the type of transportation they are using to leave the airport (Eq. (4)). We can alsocalculate the rate of connecting passengers during time interval Dt (Eq. (5)).
Equation 4: Rate of landing passengers arriving to the airport from a landing plane on a Dt depending on the transportationmode they are going to use to leave the airport.
lkðDtÞ ¼Xn
i
taiaimkð1� biÞ ð4Þ
Equation 5: Rate of connecting passengers on a Dt.
cðDtÞ ¼ lðDtÞ �X
k
lkðDtÞ ¼Xn
i
taiaibi ð5Þ
Computation of departing passenger’s rate (kc) is based on the presentation check-in function as an approximation of pas-sengers’ arrivals function to the check-in area. To obtain the presentation function at the global model input we need to shiftit s units backwards. sk, defines the time to arrive to the check-in area from the ‘‘k’’ transportation mode.
Specific times when a passenger enters the airport and the queue of the check-in area are rarely available. We interpretthe presentation function for the check-in area as a valid approximation of how passengers arrive at the airport. We alsointroduce a mechanism to reassign passengers waiting for immediate flights and last-minute specific queues.
The expression is based on the disaggregated times of s, depending on the transportation mode used, sk. The rate ofdeparting passengers at the entrance of the terminal including the delay to reach the check-in area by transportation modeis shown in Eq. (6).
Equation 6: Rate of departing passengers entering the terminal depending on the transportation mode used.
kkðDtÞ ¼Xn
i
aitaiðAiðt2 þ skÞ � Aiðt1 þ skÞÞmk ð6Þ
2.3. Entities flow diagram
The model was formalized using SDL and the passengers are represented using reactive intelligent agents in order to char-acterize the activities for each passenger in the different terminal areas. Fig. 4 depicts a simplified version of the main modelentities’ flows.
Landing passengers’ characterization is based on the capacities and occupancies of arriving aircrafts and flight identifica-tion information. ‘‘Calculate l’’ box defines the landing passengers as is detailed on Eq. (3). Connecting passengers rates (c)

P. Fonseca i Casas et al. / Simulation Modelling Practice and Theory 44 (2014) 78–94 85
are computed with Eq. (5), using the data describing acceptable connection windows. With this information we distributeconnecting passengers to all flights assigned to the window complying the minimum connection time (MCT). Using l we cal-culate the arrivals for the companions. In that case we use information stored in the Flight Plan that estimates the entitycompanions depending on passenger’s typology. Finally we calculate the number of departing passengers (k), and distributethem along the terminal according to its type.
Time entities expended in the different terminal spaces depends on several factors. Some of them can be considerablyrelated to passengers’ typology. On the next Section 2.4 we detail our proposal to model this behavior.
2.4. Modeling time use and delays in the airport spaces
To define the times for passengers’ activities in the terminal areas we build a minimum connection windows matrix. Apassenger intends to guarantee the connection to his flight. This processes can be calculated by estimating the times neces-sary to cross, at a reasonably randomized walking speed, the distances between locations in the airport taking in account thepersonal behavior and the congestion in the terminal. This ‘‘reasonability’’ is validated by experts and characterized by
Fig. 4. Main entities flow diagram.

86 P. Fonseca i Casas et al. / Simulation Modelling Practice and Theory 44 (2014) 78–94
specific data based on passenger attributes like age, grouping. . .The proposed model was based on a function articulating apersonalized set of attributes.
The entities were implemented as intelligent agents, in which intrinsic behavior is based on production rules derivingfrom the attributes described next. Additionally, the agent decides, based on its situation and its characteristics, how muchtime to spend in a particular facility or area.
Minimum time required to cross a room depends on the speed at which the passenger moves and the length of the room.An increment D in this time will be estimated considering the implicit behavior of the agent.
In order to avoid collisions and to fully detail the microsimulation representation of the passenger’s movement in the air-port, we define intermediate spaces that represents the paths that the agents must follow. These spaces have a limited capac-ity. This allows the representation of the movement of the passengers avoiding collisions in areas that are full of people.Fig. 10 shows the movement of the agents. The schema follows the pattern of a simple reflex agent, represented in Fig. 5.
2.5. Airport areas
Main areas considered are:
1. Access area. This area constitutes the different systems to access the airport, such as road (cars, taxis, lines of buses,coaches. . .) and different railroad based systems (train, high-speed train, subway. . .). It is usually identified or repre-sented by a multimodal station or area.
2. Terminal building. The core of the airport, this area contains all the elements that passengers and their companions andworkers use. It includes the main common infrastructures of the airport, principally check-in area, access security controlfacilities, shopping areas, food courts, baggage claim, passport control. . .
3. Platform area. Spaces where aircraft are parked and where are performed various maintenance operations, like handlingoperations. It constitutes a specific subsystem linked to fingers, runways, taxying processes and parking slots.
4. Satellite terminals. A satellite terminal is a facility detached from the main airport building. The essential modeling pro-cedures are similar to the terminal building ones but are processed differentially for performance evaluation purposes. Italso enriches the capability of the model to grow with minor code redesign. Connection processes and associated delaysmust be specifically modeled.
All these building blocks can be combined to define the complete structure of an airport. In our case we use the Specifi-cation and Description Language (SDL) to represent the model. Fig. 6 shows the SDL definition of a hypothetical airport usingthese components.
3. The new Barcelona International Airport simulation model
This project was intended to characterize the different flows of entities and bottlenecks at the New Barcelona AirportInternational Terminal (NAT). It also includes the development of a software platform to test different management alterna-tives once the facilities are constructed and in use.
Originally the Barcelona Airport had one main lineal building with four differentiated finger areas that rapidly becameinadequate to support the growing traffic arising after Olympic Games international projection of the city. Some minor
Fig. 5. The behavior of the passengers in the terminal building model is defined through a simple reflex intelligent agent. In this schema, the agent respondsto the stimuli received from the environment by performing some actions. The agent does not have any internal states and bases its behavior on a set ofrules. In our case, these rules are established considering the attributes that define each instance of the agent.

P. Fonseca i Casas et al. / Simulation Modelling Practice and Theory 44 (2014) 78–94 87
transformations developed during the following ten years postposed the saturation of the infrastructure. Finally the con-struction of a new building was planned. Fig. 7 shows the initial airport building and the new T1 terminal.
A description of the project can be reviewed at http://goo.gl/VDk7jE, where a summary of the new T1 terminal construc-tion can be found.
A microsimulation model was developed to represent the terminal flows as closely as possible and to obtain the mostrealistic information about performance and potential failures at specific critical areas of the NAT. Limited space andresources for check-in, ticketing, access and security controls, baggage carrousels and many other features determine thequality of service level of a modern airport.
The Flight Planner in an airport is similar to a scheduler that shows how the different airplanes visit the airport every day.All the flows that converge at the airport and all the vehicles in which passengers, pilots, and workers arrive at and leave theairport are implicitly determined by the Flight Planner. In our approach we redesigned this scheduler and implemented it ina tool, the Flight Planner Manager (FPM). Intended to automatically define the hundreds of components and variables, FPMdetermines the inputs for each of the analyzed scenarios.
FPM easily evaluates different alternatives; the preparation of the data without this tool would require a great amount oftime. All the specific definition regarding entities behavior and probability (theoretical or empirical) distributions weredefined and validated according the OEPB. OEPB also provided some of the data necessary to perform the simulation andcollaborated in the validation of the data assumptions.
The tool was designed considering traffic growth expectations for the Barcelona Airport for different saturation scenarios.The specific projected new facilities structure is represented in Fig. 8.In the simulation model of the NAT we considered three possible scenarios: Opening, Medium and Saturation. Two main
differences emerge between those scenarios: the amount and diverse typology of passengers and the active facilities. In theOpening scenario the amount of expected passengers was assimilated to the current amount of passengers and a minimumamount of the facilities of the airport were activated. In the Saturation scenario the amount of passengers have reached theboundary to justify the inclusion of new set of available facilities, considering satellite terminals as the preferred option.Medium scenario represents a trade-off between the two other extreme options. Obviously, flexible parameterization usingFPM permits fine tuning experimentation of other intermediate scenarios.
The final objective is not to simply obtain a better configuration for each one of these three scenarios but to understandthe system behavior and the resources to deploy in order to postpose saturation. This is accomplished designing and com-paring different operational alternatives (configurations) for each of the mentioned scenarios.
The different configurations combines a considerable set of different factors that can be modified on the FPM followingthe recommendations of the Aeronautical and civil engineering team. This led us to obtain a preferred configuration for eachscenario in terms of minimization fingers occupation by planes, optimization of passenger’s connection times, saturation
Fig. 6. An example of an SDL definition of a hypothetical airport using the proposed constitutive blocks. Each block can be viewed as a specific submodel.
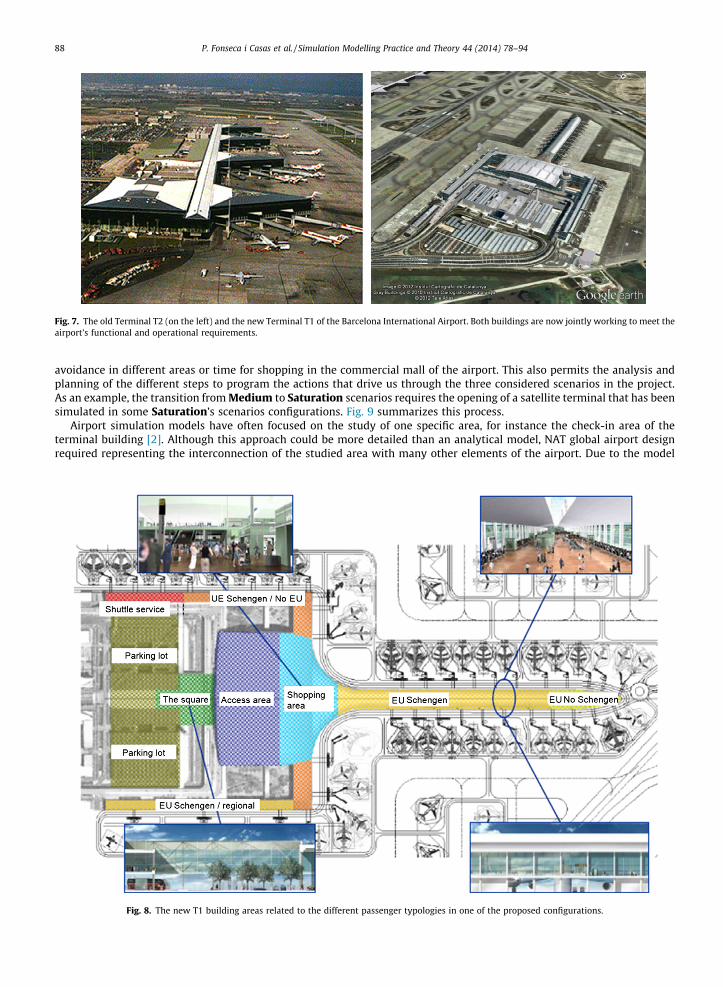
Fig. 7. The old Terminal T2 (on the left) and the new Terminal T1 of the Barcelona International Airport. Both buildings are now jointly working to meet theairport’s functional and operational requirements.
88 P. Fonseca i Casas et al. / Simulation Modelling Practice and Theory 44 (2014) 78–94
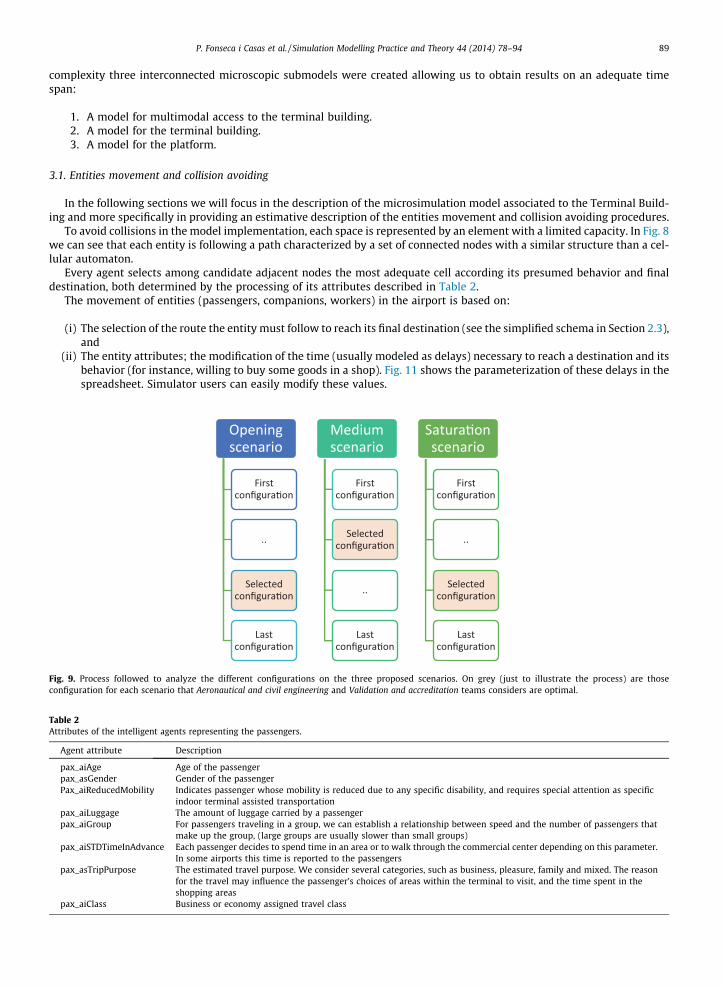
avoidance in different areas or time for shopping in the commercial mall of the airport. This also permits the analysis andplanning of the different steps to program the actions that drive us through the three considered scenarios in the project.As an example, the transition from Medium to Saturation scenarios requires the opening of a satellite terminal that has beensimulated in some Saturation’s scenarios configurations. Fig. 9 summarizes this process.
Airport simulation models have often focused on the study of one specific area, for instance the check-in area of theterminal building [2]. Although this approach could be more detailed than an analytical model, NAT global airport designrequired representing the interconnection of the studied area with many other elements of the airport. Due to the model
Fig. 8. The new T1 building areas related to the different passenger typologies in one of the proposed configurations.
P. Fonseca i Casas et al. / Simulation Modelling Practice and Theory 44 (2014) 78–94 89
complexity three interconnected microscopic submodels were created allowing us to obtain results on an adequate timespan:
1. A model for multimodal access to the terminal building.2. A model for the terminal building.3. A model for the platform.
3.1. Entities movement and collision avoiding
In the following sections we will focus in the description of the microsimulation model associated to the Terminal Build-ing and more specifically in providing an estimative description of the entities movement and collision avoiding procedures.
To avoid collisions in the model implementation, each space is represented by an element with a limited capacity. In Fig. 8we can see that each entity is following a path characterized by a set of connected nodes with a similar structure than a cel-lular automaton.
Every agent selects among candidate adjacent nodes the most adequate cell according its presumed behavior and finaldestination, both determined by the processing of its attributes described in Table 2.
The movement of entities (passengers, companions, workers) in the airport is based on:
(i) The selection of the route the entity must follow to reach its final destination (see the simplified schema in Section 2.3),and
(ii) The entity attributes; the modification of the time (usually modeled as delays) necessary to reach a destination and itsbehavior (for instance, willing to buy some goods in a shop). Fig. 11 shows the parameterization of these delays in thespreadsheet. Simulator users can easily modify these values.
Fig. 9. Process followed to analyze the different configurations on the three proposed scenarios. On grey (just to illustrate the process) are thoseconfiguration for each scenario that Aeronautical and civil engineering and Validation and accreditation teams considers are optimal.
Table 2Attributes of the intelligent agents representing the passengers.
Agent attribute Description
pax_aiAge Age of the passengerpax_asGender Gender of the passengerPax_aiReducedMobility Indicates passenger whose mobility is reduced due to any specific disability, and requires special attention as specific
indoor terminal assisted transportationpax_aiLuggage The amount of luggage carried by a passengerpax_aiGroup For passengers traveling in a group, we can establish a relationship between speed and the number of passengers that
make up the group, (large groups are usually slower than small groups)pax_aiSTDTimeInAdvance Each passenger decides to spend time in an area or to walk through the commercial center depending on this parameter.
In some airports this time is reported to the passengerspax_asTripPurpose The estimated travel purpose. We consider several categories, such as business, pleasure, family and mixed. The reason
for the travel may influence the passenger’s choices of areas within the terminal to visit, and the time spent in theshopping areas
pax_aiClass Business or economy assigned travel class

Fig. 10. Detail of the boarding and landing processes in the terminal micro-simulation model. It is quite remarkable that the behavior of the agents resultsin a poorly formed queue at the door in the boarding model (left), similar to frequent real human behavior.
90 P. Fonseca i Casas et al. / Simulation Modelling Practice and Theory 44 (2014) 78–94
3.2. Simulation output and validation
A huge amount of data can be obtained from this micro-simulation model. A single replication —and we need often morethan 8 replications— generates a file containing more than 100 MBytes of data and requires more than 3 h of computationtime. The scenarios complexity results in some difficulties for output interpretation. We had to develop a system useful totake valid decisions in short periods of time conditioned by design and construction requirements. Even Witness� imple-mented several strong alternatives to simplify data acquisition and representation, in our case the built-in solutions hadto be extended to collect or present these data in the desired formats.
The solution is supported by a database that stores all the simulator generated data and permits to produce comparativereports specifically required.
Figs. 10, 12 and 13 show some details of the model execution (see Fig. 14).
Fig. 11. Parameterizations of passengers’ features. The names of the areas are shown as their original names in the simulation model.
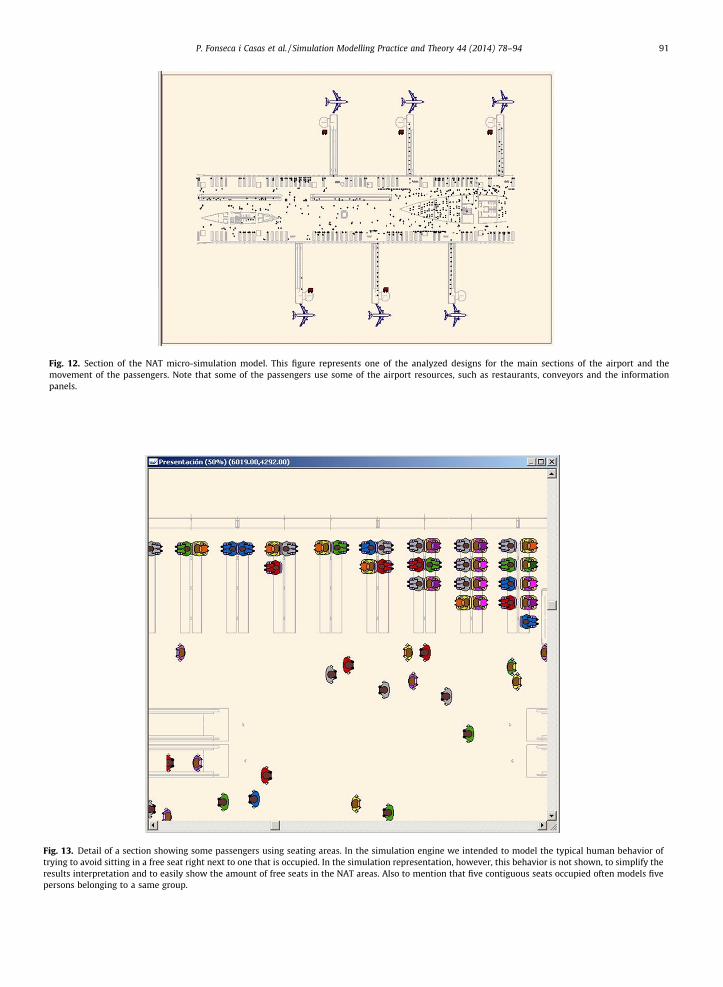
Fig. 12. Section of the NAT micro-simulation model. This figure represents one of the analyzed designs for the main sections of the airport and themovement of the passengers. Note that some of the passengers use some of the airport resources, such as restaurants, conveyors and the informationpanels.
Fig. 13. Detail of a section showing some passengers using seating areas. In the simulation engine we intended to model the typical human behavior oftrying to avoid sitting in a free seat right next to one that is occupied. In the simulation representation, however, this behavior is not shown, to simplify theresults interpretation and to easily show the amount of free seats in the NAT areas. Also to mention that five contiguous seats occupied often models fivepersons belonging to a same group.
P. Fonseca i Casas et al. / Simulation Modelling Practice and Theory 44 (2014) 78–94 91
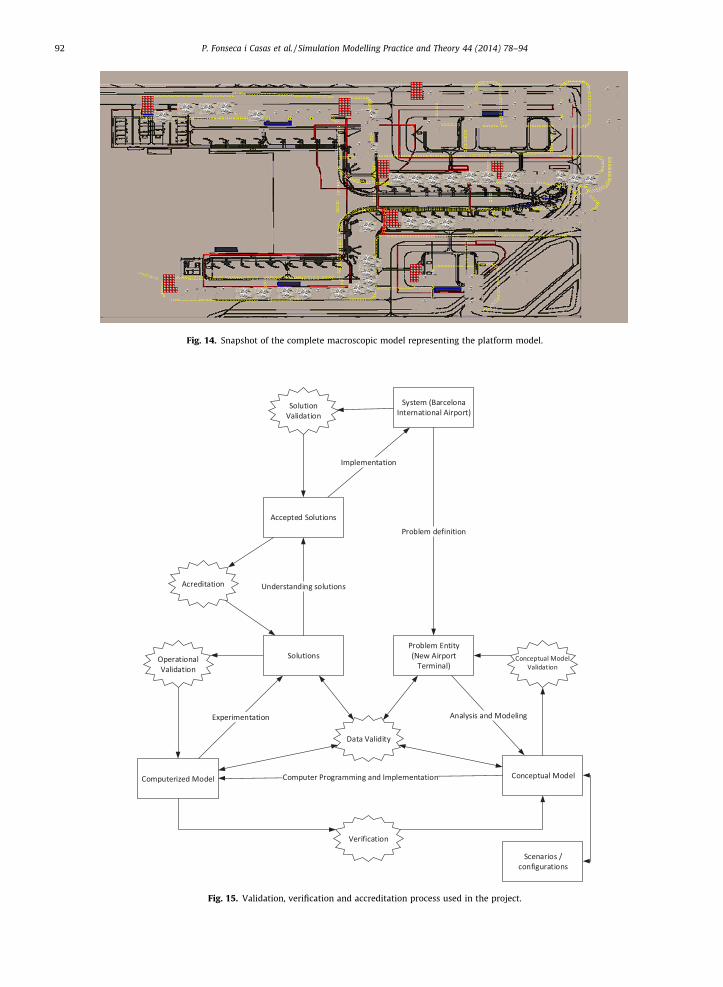
Fig. 14. Snapshot of the complete macroscopic model representing the platform model.
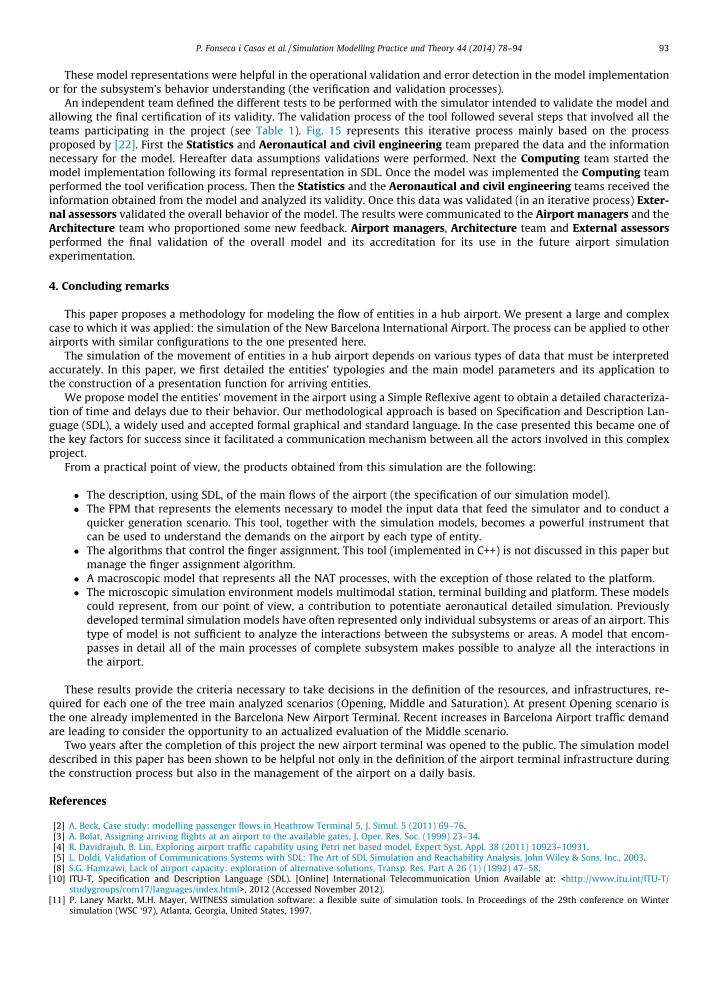
Fig. 15. Validation, verification and accreditation process used in the project.
92 P. Fonseca i Casas et al. / Simulation Modelling Practice and Theory 44 (2014) 78–94
P. Fonseca i Casas et al. / Simulation Modelling Practice and Theory 44 (2014) 78–94 93
These model representations were helpful in the operational validation and error detection in the model implementationor for the subsystem’s behavior understanding (the verification and validation processes).
An independent team defined the different tests to be performed with the simulator intended to validate the model andallowing the final certification of its validity. The validation process of the tool followed several steps that involved all theteams participating in the project (see Table 1). Fig. 15 represents this iterative process mainly based on the processproposed by [22]. First the Statistics and Aeronautical and civil engineering team prepared the data and the informationnecessary for the model. Hereafter data assumptions validations were performed. Next the Computing team started themodel implementation following its formal representation in SDL. Once the model was implemented the Computing teamperformed the tool verification process. Then the Statistics and the Aeronautical and civil engineering teams received theinformation obtained from the model and analyzed its validity. Once this data was validated (in an iterative process) Exter-nal assessors validated the overall behavior of the model. The results were communicated to the Airport managers and theArchitecture team who proportioned some new feedback. Airport managers, Architecture team and External assessorsperformed the final validation of the overall model and its accreditation for its use in the future airport simulationexperimentation.
4. Concluding remarks
This paper proposes a methodology for modeling the flow of entities in a hub airport. We present a large and complexcase to which it was applied: the simulation of the New Barcelona International Airport. The process can be applied to otherairports with similar configurations to the one presented here.
The simulation of the movement of entities in a hub airport depends on various types of data that must be interpretedaccurately. In this paper, we first detailed the entities’ typologies and the main model parameters and its application tothe construction of a presentation function for arriving entities.
We propose model the entities’ movement in the airport using a Simple Reflexive agent to obtain a detailed characteriza-tion of time and delays due to their behavior. Our methodological approach is based on Specification and Description Lan-guage (SDL), a widely used and accepted formal graphical and standard language. In the case presented this became one ofthe key factors for success since it facilitated a communication mechanism between all the actors involved in this complexproject.
From a practical point of view, the products obtained from this simulation are the following:
� The description, using SDL, of the main flows of the airport (the specification of our simulation model).� The FPM that represents the elements necessary to model the input data that feed the simulator and to conduct a
quicker generation scenario. This tool, together with the simulation models, becomes a powerful instrument thatcan be used to understand the demands on the airport by each type of entity.
� The algorithms that control the finger assignment. This tool (implemented in C++) is not discussed in this paper butmanage the finger assignment algorithm.
� A macroscopic model that represents all the NAT processes, with the exception of those related to the platform.� The microscopic simulation environment models multimodal station, terminal building and platform. These models
could represent, from our point of view, a contribution to potentiate aeronautical detailed simulation. Previouslydeveloped terminal simulation models have often represented only individual subsystems or areas of an airport. Thistype of model is not sufficient to analyze the interactions between the subsystems or areas. A model that encom-passes in detail all of the main processes of complete subsystem makes possible to analyze all the interactions inthe airport.
These results provide the criteria necessary to take decisions in the definition of the resources, and infrastructures, re-quired for each one of the tree main analyzed scenarios (Opening, Middle and Saturation). At present Opening scenario isthe one already implemented in the Barcelona New Airport Terminal. Recent increases in Barcelona Airport traffic demandare leading to consider the opportunity to an actualized evaluation of the Middle scenario.
Two years after the completion of this project the new airport terminal was opened to the public. The simulation modeldescribed in this paper has been shown to be helpful not only in the definition of the airport terminal infrastructure duringthe construction process but also in the management of the airport on a daily basis.
References
[2] A. Beck, Case study: modelling passenger flows in Heathrow Terminal 5, J. Simul. 5 (2011) 69–76.[3] A. Bolat, Assigning arriving flights at an airport to the available gates, J. Oper. Res. Soc. (1999) 23–34.[4] R. Davidrajuh, B. Lin, Exploring airport traffic capability using Petri net based model, Expert Syst. Appl. 38 (2011) 10923–10931.[5] L. Doldi, Validation of Communications Systems with SDL: The Art of SDL Simulation and Reachability Analysis, John Wiley & Sons, Inc., 2003.[8] S.G. Hamzawi, Lack of airport capacity: exploration of alternative solutions, Transp. Res. Part A 26 (1) (1992) 47–58.
[10] ITU-T, Specification and Description Language (SDL). [Online] International Telecommunication Union Available at: <http://www.itu.int/ITU-T/studygroups/com17/languages/index.html>, 2012 (Accessed November 2012).
[11] P. Laney Markt, M.H. Mayer, WITNESS simulation software: a flexible suite of simulation tools. In Proceedings of the 29th conference on Wintersimulation (WSC ‘97), Atlanta, Georgia, United States, 1997.

94 P. Fonseca i Casas et al. / Simulation Modelling Practice and Theory 44 (2014) 78–94
[12] Lanner, 2011. Witness. [Online] Available at: <http://www.lanner.com/en/witness.cfm> (Accessed 14 February 2011).[13] B.F. McCullough, F.L. Roberts, Decision tool for analysis of capacity of airport terminal, Transp. Res. Rec. (1979) 41–54.[14] F.X. McKelvey, Use of an analytical queuing model for airport terminal design, Transp. Res. Rec. (1989) 4–11.[15] G.F. Newell, Applications of Queuing Theory, Chapman and Hall, London, 1982.[16] A. Norin, D. Yuan, T.A. Granberg, P. Värbrand, Scheduling de-icing vehicles within airport logistics: a heuristic algorithm and performance evaluation, J.
Oper. Res. Soc. (2012) 1116–1125.[18] PragmaDev SARL, SDL-RT standard V2.2, Standard. Paris: PragmaDev SARL, 2006.[19] S. Ravizza, J.A.D. Atkin, M.H. Maathuis, E.K. Burke, A combined statistical approach and ground movement model for improving taxi time estimations at
airports, J. Oper. Res. Soc. (2012).[20] R. Reed, SDL-2000 form new millenium systems, Telektronikk 4 (2000) (2000) 20–35.[22] R. Sargent, Verification and validation of simulation models, J. Simul. 7 (2013) 12–24.[23] S. Solak, J.-P.B. Clarke, E.L. Johnson, Airport terminal capacity planning, Transp. Res. Part B (2009) 659–676.[24] E. Suryani, S. Chou, C. Chen, Dynamic simulation model of air cargo demand forecast and terminal capacity planning, Simul. Model. Pract. Theory 28
(2012) 27–41.