
ITRS-Log-Analytics-7.x Documentation
357
ITRS-Log-Analytics-7.x Documentation Release 7.0.5 May 27, 2021
-
Upload
khangminh22 -
Category
Documents
-
view
0 -
download
0
Transcript of ITRS-Log-Analytics-7.x Documentation

ITRS-Log-Analytics-7.x DocumentationRelease 7.0.5
May 27, 2021


Contents
1 About 1
2 Introduction 32.1 Elasticsearch . . . . . . . . . . . . . . . . . . . . . . . . . . . . . . . . . . . . . . . . . . . . . . . 42.2 Kibana . . . . . . . . . . . . . . . . . . . . . . . . . . . . . . . . . . . . . . . . . . . . . . . . . . 42.3 Logstash . . . . . . . . . . . . . . . . . . . . . . . . . . . . . . . . . . . . . . . . . . . . . . . . . 42.4 ELK . . . . . . . . . . . . . . . . . . . . . . . . . . . . . . . . . . . . . . . . . . . . . . . . . . . 5
3 Data source and application management 73.1 Data source . . . . . . . . . . . . . . . . . . . . . . . . . . . . . . . . . . . . . . . . . . . . . . . . 73.2 System services . . . . . . . . . . . . . . . . . . . . . . . . . . . . . . . . . . . . . . . . . . . . . 73.3 First configuration steps . . . . . . . . . . . . . . . . . . . . . . . . . . . . . . . . . . . . . . . . . 83.4 First login . . . . . . . . . . . . . . . . . . . . . . . . . . . . . . . . . . . . . . . . . . . . . . . . . 153.5 Index selection . . . . . . . . . . . . . . . . . . . . . . . . . . . . . . . . . . . . . . . . . . . . . . 163.6 Changing default users for services . . . . . . . . . . . . . . . . . . . . . . . . . . . . . . . . . . . 173.7 Custom installation the ITRS Log Analytics . . . . . . . . . . . . . . . . . . . . . . . . . . . . . . . 183.8 Plugins management in the Elasticsearch . . . . . . . . . . . . . . . . . . . . . . . . . . . . . . . . 223.9 ROOTless management . . . . . . . . . . . . . . . . . . . . . . . . . . . . . . . . . . . . . . . . . 233.10 ITRS Log Analytics Elasticsearch encryption . . . . . . . . . . . . . . . . . . . . . . . . . . . . . . 243.11 Transport layer encryption . . . . . . . . . . . . . . . . . . . . . . . . . . . . . . . . . . . . . . . . 253.12 HTTP layer encryption . . . . . . . . . . . . . . . . . . . . . . . . . . . . . . . . . . . . . . . . . . 263.13 Browser layer encryption . . . . . . . . . . . . . . . . . . . . . . . . . . . . . . . . . . . . . . . . . 283.14 Index rollover . . . . . . . . . . . . . . . . . . . . . . . . . . . . . . . . . . . . . . . . . . . . . . . 28
4 Discovery 314.1 Time settings and refresh . . . . . . . . . . . . . . . . . . . . . . . . . . . . . . . . . . . . . . . . . 314.2 Fields . . . . . . . . . . . . . . . . . . . . . . . . . . . . . . . . . . . . . . . . . . . . . . . . . . . 334.3 Filtering and syntax building . . . . . . . . . . . . . . . . . . . . . . . . . . . . . . . . . . . . . . . 344.4 Saving and deleting queries . . . . . . . . . . . . . . . . . . . . . . . . . . . . . . . . . . . . . . . 364.5 Manual incident . . . . . . . . . . . . . . . . . . . . . . . . . . . . . . . . . . . . . . . . . . . . . 38
5 Visualizations 395.1 Creating visualization . . . . . . . . . . . . . . . . . . . . . . . . . . . . . . . . . . . . . . . . . . 395.2 Vizualization types . . . . . . . . . . . . . . . . . . . . . . . . . . . . . . . . . . . . . . . . . . . . 425.3 Edit visualization and saving . . . . . . . . . . . . . . . . . . . . . . . . . . . . . . . . . . . . . . . 435.4 Dashboards . . . . . . . . . . . . . . . . . . . . . . . . . . . . . . . . . . . . . . . . . . . . . . . . 465.5 Sharing dashboards . . . . . . . . . . . . . . . . . . . . . . . . . . . . . . . . . . . . . . . . . . . . 47
i

5.6 Dashboard drilldown . . . . . . . . . . . . . . . . . . . . . . . . . . . . . . . . . . . . . . . . . . . 485.7 Sound notification . . . . . . . . . . . . . . . . . . . . . . . . . . . . . . . . . . . . . . . . . . . . 52
6 Reports 556.1 CSV Report . . . . . . . . . . . . . . . . . . . . . . . . . . . . . . . . . . . . . . . . . . . . . . . 566.2 PDF Report . . . . . . . . . . . . . . . . . . . . . . . . . . . . . . . . . . . . . . . . . . . . . . . . 596.3 Scheduler Report (Schedule Export Dashboard) . . . . . . . . . . . . . . . . . . . . . . . . . . . . . 61
7 User roles and object management 657.1 Users, roles and settings . . . . . . . . . . . . . . . . . . . . . . . . . . . . . . . . . . . . . . . . . 657.2 Creating a User (Create User) . . . . . . . . . . . . . . . . . . . . . . . . . . . . . . . . . . . . . . 677.3 Create, modify and delete a role (Create Role), (Role List) . . . . . . . . . . . . . . . . . . . . . . . 687.4 Default user and passwords . . . . . . . . . . . . . . . . . . . . . . . . . . . . . . . . . . . . . . . 727.5 Changing password for the system account . . . . . . . . . . . . . . . . . . . . . . . . . . . . . . . 737.6 Module Access . . . . . . . . . . . . . . . . . . . . . . . . . . . . . . . . . . . . . . . . . . . . . . 73
8 Settings 758.1 General Settings . . . . . . . . . . . . . . . . . . . . . . . . . . . . . . . . . . . . . . . . . . . . . 758.2 License (License Info) . . . . . . . . . . . . . . . . . . . . . . . . . . . . . . . . . . . . . . . . . . 778.3 Special accounts . . . . . . . . . . . . . . . . . . . . . . . . . . . . . . . . . . . . . . . . . . . . . 78
9 Alert Module 799.1 Enabling the Alert Module . . . . . . . . . . . . . . . . . . . . . . . . . . . . . . . . . . . . . . . . 799.2 SMTP server configuration . . . . . . . . . . . . . . . . . . . . . . . . . . . . . . . . . . . . . . . . 809.3 Creating Alerts . . . . . . . . . . . . . . . . . . . . . . . . . . . . . . . . . . . . . . . . . . . . . . 809.4 Alerts status . . . . . . . . . . . . . . . . . . . . . . . . . . . . . . . . . . . . . . . . . . . . . . . 839.5 Alert rules . . . . . . . . . . . . . . . . . . . . . . . . . . . . . . . . . . . . . . . . . . . . . . . . 839.6 Alert Type . . . . . . . . . . . . . . . . . . . . . . . . . . . . . . . . . . . . . . . . . . . . . . . . 869.7 Alert Content . . . . . . . . . . . . . . . . . . . . . . . . . . . . . . . . . . . . . . . . . . . . . . . 889.8 Example of rules . . . . . . . . . . . . . . . . . . . . . . . . . . . . . . . . . . . . . . . . . . . . . 909.9 Playbooks . . . . . . . . . . . . . . . . . . . . . . . . . . . . . . . . . . . . . . . . . . . . . . . . 969.10 Risks . . . . . . . . . . . . . . . . . . . . . . . . . . . . . . . . . . . . . . . . . . . . . . . . . . . 999.11 Incidents . . . . . . . . . . . . . . . . . . . . . . . . . . . . . . . . . . . . . . . . . . . . . . . . . 1059.12 Indicators of compromise (IoC) . . . . . . . . . . . . . . . . . . . . . . . . . . . . . . . . . . . . . 1069.13 Calendar function . . . . . . . . . . . . . . . . . . . . . . . . . . . . . . . . . . . . . . . . . . . . 107
10 SIEM Plan 10910.1 System security . . . . . . . . . . . . . . . . . . . . . . . . . . . . . . . . . . . . . . . . . . . . . . 10910.2 Network Analytics Plan . . . . . . . . . . . . . . . . . . . . . . . . . . . . . . . . . . . . . . . . . 12010.3 Security rules . . . . . . . . . . . . . . . . . . . . . . . . . . . . . . . . . . . . . . . . . . . . . . . 124
11 Archive 12511.1 Configuration . . . . . . . . . . . . . . . . . . . . . . . . . . . . . . . . . . . . . . . . . . . . . . . 12511.2 Archive Task . . . . . . . . . . . . . . . . . . . . . . . . . . . . . . . . . . . . . . . . . . . . . . . 12511.3 Archive Search . . . . . . . . . . . . . . . . . . . . . . . . . . . . . . . . . . . . . . . . . . . . . . 12711.4 Archive Upload . . . . . . . . . . . . . . . . . . . . . . . . . . . . . . . . . . . . . . . . . . . . . . 12811.5 Command Line tools . . . . . . . . . . . . . . . . . . . . . . . . . . . . . . . . . . . . . . . . . . . 129
12 Intelligence Module 13112.1 The fixed part of the screen . . . . . . . . . . . . . . . . . . . . . . . . . . . . . . . . . . . . . . . 13312.2 Screen content for regressive algorithms . . . . . . . . . . . . . . . . . . . . . . . . . . . . . . . . . 13512.3 Screen content for the Trend algorithm . . . . . . . . . . . . . . . . . . . . . . . . . . . . . . . . . 13712.4 Screen content for the neural network (MLP) algorithm . . . . . . . . . . . . . . . . . . . . . . . . 13912.5 AI Rules List . . . . . . . . . . . . . . . . . . . . . . . . . . . . . . . . . . . . . . . . . . . . . . . 14112.6 AI Learn . . . . . . . . . . . . . . . . . . . . . . . . . . . . . . . . . . . . . . . . . . . . . . . . . 143
ii

12.7 AI Learn Tasks . . . . . . . . . . . . . . . . . . . . . . . . . . . . . . . . . . . . . . . . . . . . . . 14512.8 Scenarios of using algorithms implemented in the Intelligence module . . . . . . . . . . . . . . . . . 14612.9 Scheduler Module . . . . . . . . . . . . . . . . . . . . . . . . . . . . . . . . . . . . . . . . . . . . 14712.10 Permission . . . . . . . . . . . . . . . . . . . . . . . . . . . . . . . . . . . . . . . . . . . . . . . . 14912.11 Register new algorithm . . . . . . . . . . . . . . . . . . . . . . . . . . . . . . . . . . . . . . . . . . 149
13 Verification steps and logs 15313.1 Verification of Elasticsearch service . . . . . . . . . . . . . . . . . . . . . . . . . . . . . . . . . . . 15313.2 Verification of Logstash service . . . . . . . . . . . . . . . . . . . . . . . . . . . . . . . . . . . . . 154
14 Building a cluster 15714.1 Node roles . . . . . . . . . . . . . . . . . . . . . . . . . . . . . . . . . . . . . . . . . . . . . . . . 15714.2 Naming convention . . . . . . . . . . . . . . . . . . . . . . . . . . . . . . . . . . . . . . . . . . . . 15714.3 Config files . . . . . . . . . . . . . . . . . . . . . . . . . . . . . . . . . . . . . . . . . . . . . . . . 15814.4 Example setup . . . . . . . . . . . . . . . . . . . . . . . . . . . . . . . . . . . . . . . . . . . . . . 15814.5 Adding a new node to existing cluster . . . . . . . . . . . . . . . . . . . . . . . . . . . . . . . . . . 15914.6 Cluster HOT-WARM-COLD architecture . . . . . . . . . . . . . . . . . . . . . . . . . . . . . . . . 160
15 Integration with AD 16115.1 AD configuration . . . . . . . . . . . . . . . . . . . . . . . . . . . . . . . . . . . . . . . . . . . . . 16115.2 Configure SSL suport for AD authentication . . . . . . . . . . . . . . . . . . . . . . . . . . . . . . 16315.3 Role mapping . . . . . . . . . . . . . . . . . . . . . . . . . . . . . . . . . . . . . . . . . . . . . . . 17015.4 Password encryption . . . . . . . . . . . . . . . . . . . . . . . . . . . . . . . . . . . . . . . . . . . 170
16 Integration with Radius 17316.1 Configuration . . . . . . . . . . . . . . . . . . . . . . . . . . . . . . . . . . . . . . . . . . . . . . . 173
17 Integration with LDAP 17517.1 Configuration . . . . . . . . . . . . . . . . . . . . . . . . . . . . . . . . . . . . . . . . . . . . . . . 175
18 Configuring Single Sign On (SSO) 17718.1 Configuration steps . . . . . . . . . . . . . . . . . . . . . . . . . . . . . . . . . . . . . . . . . . . . 17718.2 Client (Browser) Configuration## . . . . . . . . . . . . . . . . . . . . . . . . . . . . . . . . . . . . 179
19 Configuring Single Sign On (SSO) 18519.1 Configuration steps . . . . . . . . . . . . . . . . . . . . . . . . . . . . . . . . . . . . . . . . . . . . 18519.2 Client (Browser) Configuration## . . . . . . . . . . . . . . . . . . . . . . . . . . . . . . . . . . . . 187
20 Configure email delivery 19320.1 Configure email delivery for sending PDF reports in Scheduler. . . . . . . . . . . . . . . . . . . . . 19320.2 Basic postfix configuration . . . . . . . . . . . . . . . . . . . . . . . . . . . . . . . . . . . . . . . . 19620.3 Example of postfix configuration with SSL encryption enabled . . . . . . . . . . . . . . . . . . . . . 196
21 API 19921.1 Kibana API . . . . . . . . . . . . . . . . . . . . . . . . . . . . . . . . . . . . . . . . . . . . . . . . 19921.2 Elasticsearch API . . . . . . . . . . . . . . . . . . . . . . . . . . . . . . . . . . . . . . . . . . . . . 20021.3 Elasticsearch Index API . . . . . . . . . . . . . . . . . . . . . . . . . . . . . . . . . . . . . . . . . 20021.4 Elasticsearch Document API . . . . . . . . . . . . . . . . . . . . . . . . . . . . . . . . . . . . . . . 20321.5 Elasticsearch Cluster API . . . . . . . . . . . . . . . . . . . . . . . . . . . . . . . . . . . . . . . . 20621.6 Elasticsearch Search API . . . . . . . . . . . . . . . . . . . . . . . . . . . . . . . . . . . . . . . . . 20721.7 Elasticsearch - Mapping, Fielddata and Templates . . . . . . . . . . . . . . . . . . . . . . . . . . . 20721.8 AI Module API . . . . . . . . . . . . . . . . . . . . . . . . . . . . . . . . . . . . . . . . . . . . . . 20921.9 Alert module API . . . . . . . . . . . . . . . . . . . . . . . . . . . . . . . . . . . . . . . . . . . . 21821.10 Reports module API . . . . . . . . . . . . . . . . . . . . . . . . . . . . . . . . . . . . . . . . . . . 22021.11 License module API . . . . . . . . . . . . . . . . . . . . . . . . . . . . . . . . . . . . . . . . . . . 221
iii

21.12 User Module API . . . . . . . . . . . . . . . . . . . . . . . . . . . . . . . . . . . . . . . . . . . . . 222
22 Logstash 22322.1 Logstash - Input “beats” . . . . . . . . . . . . . . . . . . . . . . . . . . . . . . . . . . . . . . . . . 22322.2 Logstash - Input “network” . . . . . . . . . . . . . . . . . . . . . . . . . . . . . . . . . . . . . . . 22522.3 Logstash - Input SNMP . . . . . . . . . . . . . . . . . . . . . . . . . . . . . . . . . . . . . . . . . 22522.4 Logstash - Input HTTP / HTTPS . . . . . . . . . . . . . . . . . . . . . . . . . . . . . . . . . . . . . 22522.5 Logstash - Input File . . . . . . . . . . . . . . . . . . . . . . . . . . . . . . . . . . . . . . . . . . . 22622.6 Logstash - Input database . . . . . . . . . . . . . . . . . . . . . . . . . . . . . . . . . . . . . . . . 22622.7 Logstash - Input CEF . . . . . . . . . . . . . . . . . . . . . . . . . . . . . . . . . . . . . . . . . . . 22822.8 Logstash - Input OPSEC . . . . . . . . . . . . . . . . . . . . . . . . . . . . . . . . . . . . . . . . . 22822.9 Logstash - Input SDEE . . . . . . . . . . . . . . . . . . . . . . . . . . . . . . . . . . . . . . . . . . 23822.10 Logstash - Input XML . . . . . . . . . . . . . . . . . . . . . . . . . . . . . . . . . . . . . . . . . . 23922.11 Logstash - Input WMI . . . . . . . . . . . . . . . . . . . . . . . . . . . . . . . . . . . . . . . . . . 23922.12 Logstash - Filter “beats syslog” . . . . . . . . . . . . . . . . . . . . . . . . . . . . . . . . . . . . . 24022.13 Logstash - Filter “network” . . . . . . . . . . . . . . . . . . . . . . . . . . . . . . . . . . . . . . . 24222.14 Logstash - Filter “geoip” . . . . . . . . . . . . . . . . . . . . . . . . . . . . . . . . . . . . . . . . . 24422.15 Logstash avoiding duplicate documents . . . . . . . . . . . . . . . . . . . . . . . . . . . . . . . . . 24522.16 Logstash data enrichment . . . . . . . . . . . . . . . . . . . . . . . . . . . . . . . . . . . . . . . . 24522.17 Logstash - Output to Elasticsearch . . . . . . . . . . . . . . . . . . . . . . . . . . . . . . . . . . . . 25022.18 Logstash plugin for “naemon beat” . . . . . . . . . . . . . . . . . . . . . . . . . . . . . . . . . . . 25122.19 Logstash plugin for “perflog” . . . . . . . . . . . . . . . . . . . . . . . . . . . . . . . . . . . . . . 25222.20 Single password in all Logstash outputs . . . . . . . . . . . . . . . . . . . . . . . . . . . . . . . . . 25322.21 Secrets keystore for secure settings . . . . . . . . . . . . . . . . . . . . . . . . . . . . . . . . . . . 25322.22 Enabling encryption for Apache Kafka clients . . . . . . . . . . . . . . . . . . . . . . . . . . . . . 254
23 Integrations 25923.1 OP5 - Naemon logs . . . . . . . . . . . . . . . . . . . . . . . . . . . . . . . . . . . . . . . . . . . 25923.2 OP5 - Performance data . . . . . . . . . . . . . . . . . . . . . . . . . . . . . . . . . . . . . . . . . 26123.3 OP5 Beat . . . . . . . . . . . . . . . . . . . . . . . . . . . . . . . . . . . . . . . . . . . . . . . . . 26423.4 The Grafana instalation . . . . . . . . . . . . . . . . . . . . . . . . . . . . . . . . . . . . . . . . . 26523.5 The Beats configuration . . . . . . . . . . . . . . . . . . . . . . . . . . . . . . . . . . . . . . . . . 26723.6 Wazuh integration . . . . . . . . . . . . . . . . . . . . . . . . . . . . . . . . . . . . . . . . . . . . 26823.7 BRO integration . . . . . . . . . . . . . . . . . . . . . . . . . . . . . . . . . . . . . . . . . . . . . 26923.8 2FA authorization with Google Auth Provider (example) . . . . . . . . . . . . . . . . . . . . . . . . 26923.9 Cerebro - Elasticsearch web admin tool . . . . . . . . . . . . . . . . . . . . . . . . . . . . . . . . . 27223.10 Elasticdump . . . . . . . . . . . . . . . . . . . . . . . . . . . . . . . . . . . . . . . . . . . . . . . 27423.11 Curator - Elasticsearch index management tool . . . . . . . . . . . . . . . . . . . . . . . . . . . . . 28623.12 Cross-cluster Search . . . . . . . . . . . . . . . . . . . . . . . . . . . . . . . . . . . . . . . . . . . 29023.13 Sync/Copy . . . . . . . . . . . . . . . . . . . . . . . . . . . . . . . . . . . . . . . . . . . . . . . . 29123.14 XLSX Import . . . . . . . . . . . . . . . . . . . . . . . . . . . . . . . . . . . . . . . . . . . . . . . 29323.15 Logtrail . . . . . . . . . . . . . . . . . . . . . . . . . . . . . . . . . . . . . . . . . . . . . . . . . . 29623.16 Tenable.sc . . . . . . . . . . . . . . . . . . . . . . . . . . . . . . . . . . . . . . . . . . . . . . . . 30023.17 Qualys Guard . . . . . . . . . . . . . . . . . . . . . . . . . . . . . . . . . . . . . . . . . . . . . . . 30223.18 Embedding dashboard in iframe . . . . . . . . . . . . . . . . . . . . . . . . . . . . . . . . . . . . . 304
24 Troubleshooting 30524.1 Recovery default base indexes . . . . . . . . . . . . . . . . . . . . . . . . . . . . . . . . . . . . . . 30524.2 Too many open files . . . . . . . . . . . . . . . . . . . . . . . . . . . . . . . . . . . . . . . . . . . 30624.3 The Kibana status code 500 . . . . . . . . . . . . . . . . . . . . . . . . . . . . . . . . . . . . . . . 30724.4 Diagnostic tool . . . . . . . . . . . . . . . . . . . . . . . . . . . . . . . . . . . . . . . . . . . . . . 307
25 Upgrades 30925.1 Upgrade from version 7.0.4 . . . . . . . . . . . . . . . . . . . . . . . . . . . . . . . . . . . . . . . 30925.2 Upgrade from version 7.0.3 . . . . . . . . . . . . . . . . . . . . . . . . . . . . . . . . . . . . . . . 311
iv

25.3 Upgrade from version 7.0.2 . . . . . . . . . . . . . . . . . . . . . . . . . . . . . . . . . . . . . . . 31125.4 Upgrade from version 7.0.1 . . . . . . . . . . . . . . . . . . . . . . . . . . . . . . . . . . . . . . . 31225.5 Upgrade from 6.x . . . . . . . . . . . . . . . . . . . . . . . . . . . . . . . . . . . . . . . . . . . . . 31325.6 Changing OpenJDK version . . . . . . . . . . . . . . . . . . . . . . . . . . . . . . . . . . . . . . . 322
26 Agents module 32526.1 Component modules . . . . . . . . . . . . . . . . . . . . . . . . . . . . . . . . . . . . . . . . . . . 32526.2 Agent Module installation . . . . . . . . . . . . . . . . . . . . . . . . . . . . . . . . . . . . . . . . 32526.3 Linux Agent installation . . . . . . . . . . . . . . . . . . . . . . . . . . . . . . . . . . . . . . . . . 32626.4 Windows Agent installation . . . . . . . . . . . . . . . . . . . . . . . . . . . . . . . . . . . . . . . 32726.5 Agent module compatibility . . . . . . . . . . . . . . . . . . . . . . . . . . . . . . . . . . . . . . . 327
27 Monitoring 32927.1 Skimmer . . . . . . . . . . . . . . . . . . . . . . . . . . . . . . . . . . . . . . . . . . . . . . . . . 32927.2 Skimmer Installation . . . . . . . . . . . . . . . . . . . . . . . . . . . . . . . . . . . . . . . . . . . 33027.3 Skimmer service configuration . . . . . . . . . . . . . . . . . . . . . . . . . . . . . . . . . . . . . . 330
28 Kafka 33528.1 The Kafka installation . . . . . . . . . . . . . . . . . . . . . . . . . . . . . . . . . . . . . . . . . . 33628.2 Enabling encryption in Kafka . . . . . . . . . . . . . . . . . . . . . . . . . . . . . . . . . . . . . . 33828.3 Configuring Kafka Brokers . . . . . . . . . . . . . . . . . . . . . . . . . . . . . . . . . . . . . . . 33928.4 Configuring Kafka Clients . . . . . . . . . . . . . . . . . . . . . . . . . . . . . . . . . . . . . . . . 33928.5 Log retention for Kafka topic . . . . . . . . . . . . . . . . . . . . . . . . . . . . . . . . . . . . . . 340
29 CHANGELOG 34129.1 v7.0.5 . . . . . . . . . . . . . . . . . . . . . . . . . . . . . . . . . . . . . . . . . . . . . . . . . . . 34129.2 v7.0.4 . . . . . . . . . . . . . . . . . . . . . . . . . . . . . . . . . . . . . . . . . . . . . . . . . . . 34529.3 v7.0.3 . . . . . . . . . . . . . . . . . . . . . . . . . . . . . . . . . . . . . . . . . . . . . . . . . . . 34629.4 v7.0.2 . . . . . . . . . . . . . . . . . . . . . . . . . . . . . . . . . . . . . . . . . . . . . . . . . . . 34829.5 v7.0.1 . . . . . . . . . . . . . . . . . . . . . . . . . . . . . . . . . . . . . . . . . . . . . . . . . . . 349
v

vi

CHAPTER 1
About
ITRS Log Analytics User Guide
Software ver. 7.0.5
1

ITRS-Log-Analytics-7.x Documentation, Release 7.0.5
2 Chapter 1. About

CHAPTER 2
Introduction
ITRS Log Analytics is innovation solution allowing for centralize IT systems events. It allows for an immediatelyreview, analyze and reporting of system logs - the amount of data does not matter. ITRS Log Analytics is a response tothe huge demand for storage and analysis of the large amounts of data from IT systems. ITRS Log Analytics is inno-vation solution that responds to the need of effectively processing large amounts of data coming from IT environmentsof today’s organizations. Based on the open-source project Elasticsearch valued on the marked, we have created anefficient solution with powerful data storage and searching capabilities. The System has been enriched of functionalitythat ensures the security of stored information, verification of users, data correlation and visualization, alerting andreporting.
ITRS Log Analytics project was created to centralize events of all IT areas in the organization. We focused on creatinga tool that functionality is most expected by IT departments. Because an effective licensing model has been applied,the solution can be implemented in the scope expected by the customer even with very large volume of data. Atthe same time, the innovation architecture allows for servicing a large portion of data, which cannot be dedicated tosolution with limited scalability.
3

ITRS-Log-Analytics-7.x Documentation, Release 7.0.5
2.1 Elasticsearch
Elasticsearch is a NoSQL database solution that is the heart of our system. Text information send to the system,application and system logs are processed by Logstash filters and directed to Elasticsearch. This storage environmentcreates, based on the received data, their respective layout in a binary form, called a data index. The Index is kept onElasticsearch nodes, implementing the appropriate assumptions from the configuration, such as:
• Replication index between nodes,
• Distribution index between nodes.
The Elasticsearch environment consists of nodes:
• Data node - responsible for storing documents in indexes,
• Master node - responsible for the supervisions of nodes,
• Client node - responsible for cooperation with the client.
Data, Master and Client elements are found even in the smallest Elasticsearch installations, therefore often the envi-ronment is referred to as a cluster, regardless of the number of nodes configured. Within the cluster, Elasticsearchdecides which data portions are held on a specific node.
Index layout, their name, set of fields is arbitrary and depends on the form of system usage. It is common practice toput data of a similar nature to the same type of index that has a permanent first part of the name. The second part ofthe name often remains the date the index was created, which in practice means that the new index is created everyday. This practice, however, is conventional and every index can have its own rotation convention, name convention,construction scheme and its own set of other features. As a result of passing document through the Logstash engine,each entry receive a data field, which allow to work witch data in relations to time.
The Indexes are built with elementary part called shards. It is good practice to create Indexes with the number ofshards that is the multiple of the Elasticsearch data nodes number. Elasticsearch in 7.x version has a new feature calledSequence IDs that guarantee more successful and efficient shard recovery.
Elasticsearch use the mapping to describes the fields or properties that documents of that type may have. Elasticsearchin 7.x version restrict indices to a single type.
2.2 Kibana
Kibana lets you visualize your Elasticsearch data and navigate the Elastic Stack. Kibana gives you the freedom toselect the way you give shape to your data. And you don’t always have to know what you’re looking for. Kibana coreships with the classics: histograms, line graphs, pie charts, sunbursts, and more. Plus, you can use Vega grammar todesign your own visualizations. All leverage the full aggregation capabilities of Elasticsearch. Perform advanced timeseries analysis on your Elasticsearch data with our curated time series UIs. Describe queries, transformations, andvisualizations with powerful, easy-to-learn expressions. Kibana 7.x has two new feature - a new “Full-screen” modeto viewing dashboards, and new the “Dashboard-only” mode which enables administrators to share dashboards safely.
2.3 Logstash
Logstash is an open source data collection engine with real-time pipelining capabilities. Logstash can dynamicallyunify data from disparate sources and normalize the data into destinations of your choice. Cleanse and democratizeall your data for diverse advanced downstream analytics and visualization use cases.
While Logstash originally drove innovation in log collection, its capabilities extend well beyond that use case. Anytype of event can be enriched and transformed with a broad array of input, filter, and output plugins, with many native
4 Chapter 2. Introduction

ITRS-Log-Analytics-7.x Documentation, Release 7.0.5
codecs further simplifying the ingestion process. Logstash accelerates your insights by harnessing a greater volumeand variety of data.
Logstash 7.x version supports native support for multiple pipelines. These pipelines are defined in a pipelines.ymlfile which is loaded by default. Users will be able to manage multiple pipelines within Kibana. This solution usesElasticsearch to store pipeline configurations and allows for on-the-fly reconfiguration of Logstash pipelines.
2.4 ELK
“ELK” is the acronym for three open source projects: Elasticsearch, Logstash, and Kibana. Elasticsearch is a searchand analytics engine. Logstash is a server-side data processing pipeline that ingests data from multiple sources simul-taneously, transforms it, and then sends it to a “stash” like Elasticsearch. Kibana lets users visualize data with chartsand graphs in Elasticsearch. The Elastic Stack is the next evolution of the ELK Stack.
2.4. ELK 5

ITRS-Log-Analytics-7.x Documentation, Release 7.0.5
6 Chapter 2. Introduction

CHAPTER 3
Data source and application management
3.1 Data source
Where does the data come from?
ITRS Log Analytics is a solution allowing effective data processing from the IT environment that exists in the organi-zation.
The Elsasticsearch engine allows building a database in witch large amounts of data are stored in ordered indexes. TheLogstash module is responsible for load data into Indexes, whose function is to collect data on specific tcp/udp ports,filter them, normalize them and place them in the appropriate index. Additional plugins, that we can use in Logstashreinforce the work of the module, increase its efficiency, enabling the module to quick interpret data and parse it.
Below is an example of several of the many available Logstash plugins:
exec - receive output of the shell function as an event;
imap - read email from IMAP servers;
jdbc - create events based on JDC data;
jms - create events from Jms broker;
Both Elasticsearch and Logstash are free Open-Source solutions.
More information about Elasticsearch module can be find at: https://github.com/elastic/elasticsearch
List of available Logstash plugins: https://github.com/elastic/logstash-docs/tree/master/docs/plugins
3.2 System services
For proper operation ITRS Log Analytics requires starting the following system services:
• elasticsearch.service - we can run it with a command:
7

ITRS-Log-Analytics-7.x Documentation, Release 7.0.5
systemctl start elasticsearch.service
we can check its status with a command:
systemctl status elasticsearch.service
• kibana.service - we can run it with a command:
systemctl start kibana.service
we can check its status with a command:
systemctl status kibana.service
• logstash.service - we can run it with a command:
systemctl start logstash.service
we can check its status with a command:
systemctl status logstash.service
3.3 First configuration steps
3.3.1 System Requirements
1. Supported Operating Systems
• Red Hat Linux 7
8 Chapter 3. Data source and application management

ITRS-Log-Analytics-7.x Documentation, Release 7.0.5
• Red Hat Linux 8
• Centos 7
• Centos 8
• Oracle Linux 8.3 - Unbreakable Enterprise Kernel (UEK)
• Centos Stream /SK
3.3.2 Run the instalation
The ITRS Log Analytics installer is delivered as:
• RPM package itrs-log-analytics-data-node and itrs-log-analytics-client-node
• “install.sh” installation script
Installation using the RPM package
1. Install OpenJDK / Oracle JDK version 11:
yum -y -q install java-11-openjdk-headless.x86_64
2. Select default command for OpenJDK /Oracle JDK:
alternatives --config java
3. Upload Package
scp ./itrs-log-analytics-data-node-7.0.1-1.el7.x86_64.rpm root@hostname:~/scp ./itrs-log-analytics-client-node-7.0.1-1.el7.x86_64.rpm root@hostname:~/
4. Install ITRS Log Analytics Data Node
yum install ./itrs-log-analytics-data-node-7.0.1-1.el7.x86_64.rpm
5. Verification of Configuration Files
Please, verify your Elasticsearch configuration and JVM configuration in files:
• /etc/elasticsearch/jvm.options – check JVM HEAP settings and another parameters
## -Xms4g## -Xmx4g# Xms represents the initial size of total heap space# Xmx represents the maximum size of total heap space-Xms600m-Xmx600m
• /etc/elasticsearch/elasticsearch.yml – verify elasticsearch configuration file
6. Start and enable Elasticsearch service If everything went correctly, we will start the Elasticsearch instance:
systemctl start elasticsearch
3.3. First configuration steps 9

ITRS-Log-Analytics-7.x Documentation, Release 7.0.5
systemctl status elasticsearchelasticsearch.service - Elasticsearch
Loaded: loaded (/usr/lib/systemd/system/elasticsearch.service; enabled; vendor→˓preset: disabled)
Active: active (running) since Wed 2020-03-18 16:50:15 CET; 57s agoDocs: http://www.elastic.co
Main PID: 17195 (java)CGroup: /system.slice/elasticsearch.service
17195 /etc/alternatives/jre/bin/java -Xms512m -Xmx512m -Djava.→˓security.manager -Djava.security.policy=/usr/share/elasticsearch/plugins/→˓elasticsearch_auth/plugin-securi...
Mar 18 16:50:15 migration-01 systemd[1]: Started Elasticsearch.Mar 18 16:50:25 migration-01 elasticsearch[17195]: SSL not activated for http and/→˓or transport.Mar 18 16:50:33 migration-01 elasticsearch[17195]: SLF4J: Failed to load class→˓"org.slf4j.impl.StaticLoggerBinder".Mar 18 16:50:33 migration-01 elasticsearch[17195]: SLF4J: Defaulting to no-→˓operation (NOP) logger implementationMar 18 16:50:33 migration-01 elasticsearch[17195]: SLF4J: See http://www.slf4j.→˓org/codes.html#StaticLoggerBinder for further details.
7. Check cluster/indices status and Elasticsearch version
Invoke curl command to check the status of Elasticsearch:
curl -s -u $CREDENTIAL localhost:9200/_cluster/health?pretty{"cluster_name" : "elasticsearch","status" : "green","timed_out" : false,"number_of_nodes" : 1,"number_of_data_nodes" : 1,"active_primary_shards" : 25,"active_shards" : 25,"relocating_shards" : 0,"initializing_shards" : 0,"unassigned_shards" : 0,"delayed_unassigned_shards" : 0,"number_of_pending_tasks" : 0,"number_of_in_flight_fetch" : 0,"task_max_waiting_in_queue_millis" : 0,"active_shards_percent_as_number" : 100.0
}
curl -s -u $CREDENTIAL localhost:9200{"name" : "node-1","cluster_name" : "elasticsearch","cluster_uuid" : "igrASEDRRamyQgy-zJRSfg","version" : {
"number" : "7.3.2","build_flavor" : "oss","build_type" : "rpm","build_hash" : "1c1faf1","build_date" : "2019-09-06T14:40:30.409026Z","build_snapshot" : false,
(continues on next page)
10 Chapter 3. Data source and application management

ITRS-Log-Analytics-7.x Documentation, Release 7.0.5
(continued from previous page)
"lucene_version" : "8.1.0","minimum_wire_compatibility_version" : "6.8.0","minimum_index_compatibility_version" : "6.0.0-beta1"
},"tagline" : "You Know, for Search"
}
If everything went correctly, we should see 100% allocated shards in cluster health.
8. Install ITRS Log Analytics Client Node
yum install ./itrs-log-analytics-client-node-7.0.1-1.el7.x86_64.rpm
9. Start ITRS Log Analytics GUI
Add service:
• Kibana
• Cerebro
• Alert
to autostart and add port ( 5602/TCP ) for Cerebro. Run them and check status:
firewall-cmd -permanent -add-port 5602/tcpfirewall-cmd -reload
systemctl enable kibana cerebro alert
systemctl start kibana cerebro alertsystemctl status kibana cerebro alert
Interactive installation using “install.sh”
The ITRS Log Analytics comes with simple installation script called install.sh. It is designed to facilitatethe installation and deployment process of our product. After running (execute) the script, it will detect supporteddistribution and by default it will ask incl. about the components we want to install. The script is located in the"install"directory.
The installation process:
• unpack the archive containing the installer tar xjf itrs-loganalytics-${product-version}.x.x86_64.tar.bz2
• copy license to installation directory cp es_*.license install/
• go to the installation directory (you can run install.sh script from any location)
• run installation script with interactive install command ./install.sh -i
During interactive installation you will be ask about following tasks:
• install & configure Logstash with custom ITRS Log Analytics Configuration - like Beats, Syslog, Blacklist,Netflow, Wazuh, Winrm, Logtrail, OP5, etc;
• install the ITRS Log Analytics Client Node, as well as the other client-node dependencies;
• install the ITRS Log Analytics Data Node, as well as the other data-node dependencies;
3.3. First configuration steps 11

ITRS-Log-Analytics-7.x Documentation, Release 7.0.5
• load the ITRS Log Analytics custom dashboards, alerts and configs;
Non-interactive installation mode using “install.sh”
With the help of an install script, installation is possible without questions that require user interaction, which can behelpful with automatic deployment. In this case, you should provide options which components (data, client node)should be installed.
Example:
./install.sh -n -d - will install only data node components.
./install.sh -n -c -d - will install both - data and client node components.
Generating basic system information report
The install.sh script also contains functions for collecting basic information about the system environment - suchinformation can be helpful in the support process or troubleshooting. Note that you can redirect output (STDOUT) toexternal file.
Example:
./install.sh -s > system_report.txt
“install.sh” command list:
Run install.sh --help to see information about builtin commands and options.
Usage: install.sh {COMMAND} {OPTIONS}
COMMAND is one of:-i|install Run ITRS Log Analytics installation wizard.-n|noninteractive Run ITRS Log Analytics installation in non
→˓interactive mode.-u|upgrade Update ITRS Log Analytics packages.-s|systeminfo Get basic system information report.
OPTIONS if one of:-v|--verbose Run commands with verbose flag.-d|--data Select data node installation for non interactive
→˓mode.-c|--client Select client node installation for non interactive
→˓mode.
Post installation steps
• copy license files to Elasticsearch directory
cp es.* /ust/share/elasticsearch/bin/
• configure Elasticsearch cluster settings
vi /etc/elaticserach/elasticsearch.yml
– add all IPs of Elasticsearch node in the following directive:
12 Chapter 3. Data source and application management

ITRS-Log-Analytics-7.x Documentation, Release 7.0.5
discovery.seed_hosts: [ "172.10.0.1:9300", "172.10.0.2:9300" ]
• start Elasticsearch service
systemc start elasticsearch
• start Logstash service
systemctl start logstash
• start Cerebro service
systemctl start cerebro
• start Kibana service
systemctl start kibana
• start Alert service
systemctl start alert
• start Skimmer service
systemctl start skimmer
• Example agent configuration files and additional documentation can be found in the Agents directory:
– filebeat
– winlogbeat
– op5 naemon logs
– op5 perf_data
• For blacklist creation, you can use crontab or kibana scheduler, but the most preferable method is logstash input.Instructions to set it up can be found at logstash/lists/README.md
• It is recomended to make small backup of system indices - copy “small_backup.sh” script from Agents directoryto desired location, and change backupPath= to desired location. Then set up a crontab:
0 1 * * * /path/to/script/small_backup.sh
• Redirect Kibana port 5601/TCP to 443/TCP
firewall-cmd --zone=public --add-masquerade --permanentfirewall-cmd --zone=public --add-forward-port=port=443:proto=tcp:toport=5601 --→˓permanentfirewall-cmd --reload
# NOTE: Kibana on 443 tcp port without redirection needs additional permissions:
setcap 'CAP_NET_BIND_SERVICE=+eip' /usr/share/kibana/node/bin/node
• Cookie TTL and Cookie Keep Alive - for better work comfort, you can set two new variables in the Kibanaconfiguration file /etc/kibana/kibana.yml:
3.3. First configuration steps 13

ITRS-Log-Analytics-7.x Documentation, Release 7.0.5
login.cookiettl: 10login.cookieKeepAlive: true
CookieTTL is the value in minutes of the cookie’s lifetime. The cookieKeepAlive renews this time with everyvalid query made by browser clicks.
After saving changes in the configuration file, you must restart the service:
systemctl restart kibana
Scheduling bad IP lists update
Requirements:
• Make sure you have Logstash 6.4 or newer.
• Enter your credentials into scripts: misp_threat_lists.sh
To update bad reputation lists and to create .blacklists index, you have to run ‘badreputation_iplists.sh andmisp_threat_lists.sh script (best is to put in schedule).
1. This can be done in cron (host with logstash installed) in /etc/crontab:
0 1 * * * logstash /etc/logstash/lists/bin/badreputation_iplists.sh0 2 * * * logstash /etc/logstash/lists/bin/misp_threat_lists.sh
1. Or with Kibana Scheduller app (only if logstash is running on the same host).
• Prepare script path:
/bin/ln -sfn /etc/logstash/lists/bin /opt/ai/bin/listschown logstash:kibana /etc/logstash/lists/chmod g+w /etc/logstash/lists/
• Log in to GUI and go to Scheduler app. Set it up with below options and push “Submit” button:
Name: BadReputationListCron pattern: 0 1 * * *Command: lists/badreputation_iplists.shCategory: logstash
and second:
Name: MispThreatListCron pattern: 0 2 * * *Command: lists/misp_threat_lists.shCategory: logstash
1. After a couple of minutes check for blacklists index:
curl -sS -u logserver:logserver -XGET '127.0.0.1:9200/_cat/indices/.blacklists?→˓s=index&v'health status index uuid pri rep docs.count docs.deleted→˓store.size pri.store.sizegreen open .blacklists Mld2Qe2bSRuk2VyKm-KoGg 1 0 76549 0→˓4.7mb 4.7mb
14 Chapter 3. Data source and application management

ITRS-Log-Analytics-7.x Documentation, Release 7.0.5
3.4 First login
If you log in to ITRS Log Analytics for the first time, you must specify the Index to be searched. We have the optionof entering the name of your index, indicate a specific index from a given day, or using the asterix (*) to indicate all ofthem matching a specific index pattern. Therefore, to start working with ITRS Log Analytics application, we log in toit (by default the user: logserver/password:logserver).
After logging in to the application click the button “Set up index pattern” to add new index patter in Kibana:
In the “Index pattern” field enter the name of the index or index pattern (after confirming that the index or sets ofindexes exists) and click “Next step” button.
In the next step, from drop down menu select the “Time filter field name”, after witch individual event (events) shouldbe sorter. By default the timestamp is set, which is the time of occurrence of the event, but depending of the preferences.It may also be the time of the indexing or other selected based on the fields indicate on the event.
3.4. First login 15

ITRS-Log-Analytics-7.x Documentation, Release 7.0.5
At any time, you can add more indexes or index patters by going to the main tab select „Management” and next select„Index Patterns”.
3.5 Index selection
After login into ITRS Log Analytics you will going to „Discover” tab, where you can interactively explore your data.You have access to every document in every index that matches the selected index patterns.
If you want to change selected index, drop down menu with the name of the current object in the left panel. Clickingon the object from the expanded list of previously create index patterns, will change the searched index.
16 Chapter 3. Data source and application management

ITRS-Log-Analytics-7.x Documentation, Release 7.0.5
3.6 Changing default users for services
3.6.1 Change Kibana User
Edit file /etc/systemd/system/kibana.service
User=newuserGroup= newuser
Edit /etc/default/kibana
user=" newuser "group=" newuser "
Add appropriate permission:
chown newuser: /usr/share/kibana/ /etc/kibana/ -R
3.6.2 Change Elasticsearch User
Edit /usr/lib/tmpfiles.d/elasticsearch.conf and change user name and group:
d /var/run/elasticsearch 0755 newuser newuser -
Create directory:
mkdir /etc/systemd/system/elasticsearch.service.d/
Edit /etc/systemd/system/elasticsearch.service.d/01-user.conf
[Service]User=newuserGroup= newuser
Add appropriate permission:
chown -R newuser: /var/lib/elasticsearch /usr/share/elasticsearch /etc/→˓elasticsearch /var/log/elasticsearch
3.6.3 Change Logstash User
Create directory:
mkdir /etc/systemd/system/logstash.service.d
Edit /etc/systemd/system/logstash.service.d/01-user.conf
[Service]User=newuserGroup=newuser
Add appropriate permission:
3.6. Changing default users for services 17

ITRS-Log-Analytics-7.x Documentation, Release 7.0.5
chown -R newuser: /etc/logstash /var/log/logstash
3.7 Custom installation the ITRS Log Analytics
If you need to install ITRS Log Analytics in non-default location, use the following steps.
1. Define the variable INSTALL_PATH if you do not want default paths like “/”
export INSTALL_PATH="/"
2. Install the firewalld service
yum install firewalld
3. Configure the firewalld service
systemctl enable firewalldsystemctl start firewalldfirewall-cmd --zone=public --add-port=22/tcp --permanentfirewall-cmd --zone=public --add-port=443/tcp --permanentfirewall-cmd --zone=public --add-port=5601/tcp --permanentfirewall-cmd --zone=public --add-port=9200/tcp --permanentfirewall-cmd --zone=public --add-port=9300/tcp --permanentfirewall-cmd --reload
4. Install and enable the epel repository
yum install epel-release
5. Install the Java OpenJDK
yum install java-1.8.0-openjdk-headless.x86_64
6. Install the reports dependencies, e.g. for mail and fonts
yum install fontconfig freetype freetype-devel fontconfig-devel libstdc++ urw-→˓fonts net-tools ImageMagick ghostscript poppler-utils
7. Create the nessesery users acounts
useradd -M -d ${INSTALL_PATH}/usr/share/kibana -s /sbin/nologin kibanauseradd -M -d ${INSTALL_PATH}/usr/share/elasticsearch -s /sbin/nologin→˓elasticsearchuseradd -M -d ${INSTALL_PATH}/opt/alert -s /sbin/nologin alert
8. Remove .gitkeep files from source directory
find . -name ".gitkeep" -delete
9. Install the Elasticsearch 6.2.4 files
/bin/cp -rf elasticsearch/elasticsearch-6.2.4/* ${INSTALL_PATH}/
10. Install the Kibana 6.2.4 files
18 Chapter 3. Data source and application management

ITRS-Log-Analytics-7.x Documentation, Release 7.0.5
/bin/cp -rf kibana/kibana-6.2.4/* ${INSTALL_PATH}/
11. Configure the Elasticsearch system dependencies
/bin/cp -rf system/limits.d/30-elasticsearch.conf /etc/security/limits.d//bin/cp -rf system/sysctl.d/90-elasticsearch.conf /etc/sysctl.d//bin/cp -rf system/sysconfig/elasticsearch /etc/sysconfig//bin/cp -rf system/rsyslog.d/intelligence.conf /etc/rsyslog.d/echo -e "RateLimitInterval=0\nRateLimitBurst=0" >> /etc/systemd/journald.confsystemctl daemon-reloadsystemctl restart rsyslog.servicesysctl -p /etc/sysctl.d/90-elasticsearch.conf
12. Configure the SSL Encryption for the Kibana
mkdir -p ${INSTALL_PATH}/etc/kibana/sslopenssl req -x509 -nodes -days 365 -newkey rsa:2048 -sha256 -subj '/CN=LOGSERVER/→˓subjectAltName=LOGSERVER/' -keyout ${INSTALL_PATH}/etc/kibana/ssl/kibana.key -→˓out ${INSTALL_PATH}/etc/kibana/ssl/kibana.crt
13. Install the Elasticsearch-auth plugin
cp -rf elasticsearch/elasticsearch-auth ${INSTALL_PATH}/usr/share/elasticsearch/→˓plugins/elasticsearch-auth
14. Install the Elasticsearh configuration files
/bin/cp -rf elasticsearch/*.yml ${INSTALL_PATH}/etc/elasticsearch/
15. Install the Elasticsicsearch system indices
mkdir -p ${INSTALL_PATH}/var/lib/elasticsearch/bin/cp -rf elasticsearch/nodes ${INSTALL_PATH}/var/lib/elasticsearch/
16. Add necessary permission for the Elasticsearch directories
chown -R elasticsearch:elasticsearch ${INSTALL_PATH}/usr/share/elasticsearch $→˓{INSTALL_PATH}/etc/elasticsearch ${INSTALL_PATH}/var/lib/elasticsearch $→˓{INSTALL_PATH}/var/log/elasticsearch
17. Install the Kibana plugins
cp -rf kibana/plugins/* ${INSTALL_PATH}/usr/share/kibana/plugins/
18. Extrace the node_modules for plugins and remove archive
tar -xf ${INSTALL_PATH}/usr/share/kibana/plugins/node_modules.tar -C ${INSTALL_→˓PATH}/usr/share/kibana/plugins//bin/rm -rf ${INSTALL_PATH}/usr/share/kibana/plugins/node_modules.tar
19. Install the Kibana reports binaries
cp -rf kibana/export_plugin/* ${INSTALL_PATH}/usr/share/kibana/bin/
20. Create directory for the Kibana reports
3.7. Custom installation the ITRS Log Analytics 19

ITRS-Log-Analytics-7.x Documentation, Release 7.0.5
/bin/cp -rf kibana/optimize ${INSTALL_PATH}/usr/share/kibana/
21. Install the python dependencies for reports
tar -xf kibana/python.tar -C /usr/lib/python2.7/site-packages/
22. Install the Kibana custom sources
/bin/cp -rf kibana/src/* ${INSTALL_PATH}/usr/share/kibana/src/
23. Install the Kibana configuration
/bin/cp -rf kibana/kibana.yml ${INSTALL_PATH}/etc/kibana/kibana.yml
24. Generate the iron secret salt for Kibana
echo "server.ironsecret: \"$(</dev/urandom tr -dc _A-Z-a-z-0-9 | head -c32)\"" >>→˓ ${INSTALL_PATH}/etc/kibana/kibana.yml
25. Remove old cache files
rm -rf ${INSTALL_PATH}/usr/share/kibana/optimize/bundles/*
26. Install the Alert plugin
mkdir -p ${INSTALL_PATH}/opt/bin/cp -rf alert ${INSTALL_PATH}/opt/alert
27. Install the AI plugin
/bin/cp -rf ai ${INSTALL_PATH}/opt/ai
28. Set the proper permissions
chown -R elasticsearch:elasticsearch ${INSTALL_PATH}/usr/share/elasticsearch/chown -R alert:alert ${INSTALL_PATH}/opt/alertchown -R kibana:kibana ${INSTALL_PATH}/usr/share/kibana ${INSTALL_PATH}/opt/ai $→˓{INSTALL_PATH}/opt/alert/rules ${INSTALL_PATH}/var/lib/kibanachmod -R 755 ${INSTALL_PATH}/opt/aichmod -R 755 ${INSTALL_PATH}/opt/alert
29. Install service files for the Alert, Kibana and the Elasticsearch
/bin/cp -rf system/alert.service /usr/lib/systemd/system/alert.service/bin/cp -rf kibana/kibana-6.2.4/etc/systemd/system/kibana.service /usr/lib/→˓systemd/system/kibana.service/bin/cp -rf elasticsearch/elasticsearch-6.2.4/usr/lib/systemd/system/→˓elasticsearch.service /usr/lib/systemd/system/elasticsearch.service
30. Set property paths in service files ${INSTALL_PATH}
perl -pi -e 's#/opt#'${INSTALL_PATH}'/opt#g' /usr/lib/systemd/system/alert.→˓serviceperl -pi -e 's#/etc#'${INSTALL_PATH}'/etc#g' /usr/lib/systemd/system/kibana.→˓serviceperl -pi -e 's#/usr#'${INSTALL_PATH}'/usr#g' /usr/lib/systemd/system/kibana.→˓service
(continues on next page)
20 Chapter 3. Data source and application management

ITRS-Log-Analytics-7.x Documentation, Release 7.0.5
(continued from previous page)
perl -pi -e 's#ES_HOME=#ES_HOME='${INSTALL_PATH}'#g' /usr/lib/systemd/system/→˓elasticsearch.serviceperl -pi -e 's#ES_PATH_CONF=#ES_PATH_CONF='${INSTALL_PATH}'#g' /usr/lib/systemd/→˓system/elasticsearch.serviceperl -pi -e 's#ExecStart=#ExecStart='${INSTALL_PATH}'#g' /usr/lib/systemd/system/→˓elasticsearch.service
31. Enable the system services
systemctl daemon-reloadsystemctl reenable alertsystemctl reenable kibanasystemctl reenable elasticsearch
32. Set location for Elasticsearch data and logs files in configuration file
• Elasticsearch
perl -pi -e 's#path.data: #path.data: '${INSTALL_PATH}'#g' ${INSTALL_PATH}/→˓etc/elasticsearch/elasticsearch.ymlperl -pi -e 's#path.logs: #path.logs: '${INSTALL_PATH}'#g' ${INSTALL_PATH}/
→˓etc/elasticsearch/elasticsearch.ymlperl -pi -e 's#/usr#'${INSTALL_PATH}'/usr#g' ${INSTALL_PATH}/etc/
→˓elasticsearch/jvm.optionsperl -pi -e 's#/usr#'${INSTALL_PATH}'/usr#g' /etc/sysconfig/elasticsearch
• Kibana
perl -pi -e 's#/etc#'${INSTALL_PATH}'/etc#g' ${INSTALL_PATH}/etc/kibana/→˓kibana.ymlperl -pi -e 's#/opt#'${INSTALL_PATH}'/opt#g' ${INSTALL_PATH}/etc/kibana/
→˓kibana.ymlperl -pi -e 's#/usr#'${INSTALL_PATH}'/usr#g' ${INSTALL_PATH}/etc/kibana/
→˓kibana.yml
• AI
perl -pi -e 's#/opt#'${INSTALL_PATH}'/opt#g' ${INSTALL_PATH}/opt/ai/bin/→˓conf.cfg
33. What next ?
• Upload License file to ${INSTALL_PATH}/usr/share/elasticsearch/directory.
• Setup cluster in ${INSTALL_PATH}/etc/elasticsearch/elasticsearch.yml
discovery.zen.ping.unicast.hosts: [ "172.10.0.1:9300", "172.10.0.2:9300" ]
• Redirect GUI to 443/tcp
firewall-cmd --zone=public --add-masquerade --permanentfirewall-cmd --zone=public --add-forward-
→˓port=port=443:proto=tcp:toport=5601 --permanentfirewall-cmd --reload
3.7. Custom installation the ITRS Log Analytics 21

ITRS-Log-Analytics-7.x Documentation, Release 7.0.5
3.8 Plugins management in the Elasticsearch
Base installation of the ITRS Log Analytics contains the elasticsearch-auth plugin. You can extend the basic Elastic-search functionality by installing the custom plugins.
Plugins contain JAR files, but may also contain scripts and config files, and must be installed on every node in thecluster.
After installation, each node must be restarted before the plugin becomes visible.
The Elasticsearch provides two categories of plugins:
• Core Plugins - it is plugins that are part of the Elasticsearch project.
• Community contributed - it is plugins that are external to the Elasticsearch project
3.8.1 Installing Plugins
Core Elasticsearch plugins can be installed as follows:
cd /usr/share/elasticsearch/bin/elasticsearch-plugin install [plugin_name]
Example:
bin/elasticsearch-plugin install ingest-geoip
-> Downloading ingest-geoip from elastic[=================================================] 100%@@@@@@@@@@@@@@@@@@@@@@@@@@@@@@@@@@@@@@@@@@@@@@@@@@@@@@@@@@@@ WARNING: plugin requires additional permissions @@@@@@@@@@@@@@@@@@@@@@@@@@@@@@@@@@@@@@@@@@@@@@@@@@@@@@@@@@@@
* java.lang.RuntimePermission accessDeclaredMembers
* java.lang.reflect.ReflectPermission suppressAccessChecksSee http://docs.oracle.com/javase/8/docs/technotes/guides/security/permissions.htmlfor descriptions of what these permissions allow and the associated risks.
Continue with installation? [y/N]y-> Installed ingest-geoip
Plugins from custom link or filesystem can be installed as follow:
cd /usr/share/elasticsearch/sudo bin/elasticsearch-plugin install [url]
Example:
sudo bin/elasticsearch-plugin install file:///path/to/plugin.zipbin\elasticsearch-plugin install file:///C:/path/to/plugin.zipsudo bin/elasticsearch-plugin install http://some.domain/path/to/plugin.zip
3.8.2 Listing plugins
Listing currently loaded plugins
22 Chapter 3. Data source and application management

ITRS-Log-Analytics-7.x Documentation, Release 7.0.5
sudo bin/elasticsearch-plugin list
listing currently available core plugins:
sudo bin/elasticsearch-plugin list --help
3.8.3 Removing plugins
sudo bin/elasticsearch-plugin remove [pluginname]
3.8.4 Updating plugins
sudo bin/elasticsearch-plugin remove [pluginname]sudo bin/elasticsearch-plugin install [pluginname]
3.9 ROOTless management
To configure ITRS Log Analytics so its services can be managed without root access follow these steps:
1. Create a file in /etc/sudoers.d (eg.: 10-logserver) with the content
%kibana ALL=/bin/systemctl status kibana %kibana ALL=/bin/systemctl status kibana.service%kibana ALL=/bin/systemctl stop kibana %kibana ALL=/bin/systemctl stop kibana.service %kibanaALL=/bin/systemctl start kibana %kibana ALL=/bin/systemctl start kibana.service %kibanaALL=/bin/systemctl restart kibana %kibana ALL=/bin/systemctl restart kibana.service
%elasticsearch ALL=/bin/systemctl status elasticsearch%elasticsearch ALL=/bin/systemctl status elasticsearch.service%elasticsearch ALL=/bin/systemctl stop elasticsearch%elasticsearch ALL=/bin/systemctl stop elasticsearch.service%elasticsearch ALL=/bin/systemctl start elasticsearch%elasticsearch ALL=/bin/systemctl start elasticsearch.service%elasticsearch ALL=/bin/systemctl restart elasticsearch%elasticsearch ALL=/bin/systemctl restart elasticsearch.service
%alert ALL=/bin/systemctl status alert%alert ALL=/bin/systemctl status alert.service%alert ALL=/bin/systemctl stop alert%alert ALL=/bin/systemctl stop alert.service%alert ALL=/bin/systemctl start alert%alert ALL=/bin/systemctl start alert.service%alert ALL=/bin/systemctl restart alert%alert ALL=/bin/systemctl restart alert.service
%logstash ALL=/bin/systemctl status logstash%logstash ALL=/bin/systemctl status logstash.service%logstash ALL=/bin/systemctl stop logstash%logstash ALL=/bin/systemctl stop logstash.service%logstash ALL=/bin/systemctl start logstash%logstash ALL=/bin/systemctl start logstash.service%logstash ALL=/bin/systemctl restart logstash%logstash ALL=/bin/systemctl restart logstash.service
3.9. ROOTless management 23

ITRS-Log-Analytics-7.x Documentation, Release 7.0.5
2. Change permissions for files and directories
• Kibana, Elasticsearch, Alert
chmod g+rw /etc/kibana/kibana.yml /opt/alert/config.yaml /opt/ai/bin/conf.cfg /→˓etc/elasticsearch/{elasticsearch.yml,jvm.options,log4j2.properties,properties.→˓yml,role-mappings.yml}chmod g+rwx /etc/kibana/ssl /etc/elasticsearch/ /opt/{ai,alert} /opt/ai/binchown -R elasticsearch:elasticsearch /etc/elasticsearch/chown -R kibana:kibana /etc/kibana/ssl
• Logstash
find /etc/logstash -type f -exec chmod g+rw {} \;find /etc/logstash -type d -exec chmod g+rwx {} \;chown -R logstash:logstash /etc/logstash
1. Add a user to groups defined earlier
usermod -a -G kibana,alert,elasticsearch,logstash service_user
From now on this user should be able to start/stop/restart services and modify configurations files.
3.10 ITRS Log Analytics Elasticsearch encryption
3.10.1 Generating Certificates
1. Requirements for certificate configuration:
• To encrypt traffic (HTTP and transport layer) of Elasticsearch you have to generate certificate authoritywhich will be used to sign each node certificate of a cluster.
• Elasticsearch certificate has to be generated in pkcs8 RSA format.
1. Example certificate configuration (Certificates will be valid for 10 years based on this example):
# To make this process easier prepare some variables:DOMAIN=loganalytics-node.testDOMAIN_IP=10.4.3.185 # This is required if certificate validation is used on trasport→˓layerCOUNTRYNAME=PLSTATE=PolandCOMPANY=LOGTEST
# Generate CA key:openssl genrsa -out rootCA.key 4096
# Create and sign root certificate:echo -e "${COUNTRYNAME}\n${STATE}\n\n${COMPANY}\n\n\n\n" | openssl req -x509 -new -→˓nodes -key rootCA.key -sha256 -days 3650 -out rootCA.crt
# Crete RSA key for domain:openssl genrsa -out ${DOMAIN}.pre 2048
# Convert generated key to pkcs8 RSA key for domain hostname# (if you do not want to encrypt the key add "-nocrypt" at the end of the command;→˓otherwise it will be necessary to add this password later in every config file):
(continues on next page)
24 Chapter 3. Data source and application management

ITRS-Log-Analytics-7.x Documentation, Release 7.0.5
(continued from previous page)
openssl pkcs8 -topk8 -inform pem -in ${DOMAIN}.pre -outform pem -out ${DOMAIN}.key
# Create a Certificate Signing Request (openssl.cnf can be in a different location;→˓this is the default for CentOS 7.7):openssl req -new -sha256 -key ${DOMAIN}.key -subj "/C=PL/ST=Poland/O=EMCA/CN=${DOMAIN}→˓" -reqexts SAN -config <(cat /etc/pki/tls/openssl.cnf <(printf→˓"[SAN]\nsubjectAltName=DNS:${DOMAIN},IP:${DOMAIN_IP}")) -out ${DOMAIN}.csr
# Generate Domain Certificateopenssl x509 -req -in ${DOMAIN}.csr -CA rootCA.crt -CAkey rootCA.key -CAcreateserial -→˓out ${DOMAIN}.crt -sha256 -extfile <(printf "[req]\ndefault_→˓bits=2048\ndistinguished_name=req_distinguished_name\nreq_extensions=req_ext\n[req_→˓distinguished_name]\ncountryName=${COUNTRYNAME}\nstateOrProvinceName=${STATE}→˓\norganizationName=${COMPANY}\ncommonName=${DOMAIN}\n[req_ext]\nsubjectAltName=@alt_→˓names\n[alt_names]\nDNS.1=${DOMAIN}\nIP=${DOMAIN_IP}\n") -days 3650 -extensions req_→˓ext
# Verify the validity of the generated certificateopenssl x509 -in ${DOMAIN}.crt -text -noout
1. Right now you should have these files:
$ ls -1 | sortloganalytics-node.test.crtloganalytics-node.test.csrloganalytics-node.test.keyloganalytics-node.test.prerootCA.crtrootCA.keyrootCA.srl
1. Create a directory to store required files (users: elasticsearch, kibana and logstash have to be able to read thesefiles):
mkdir /etc/elasticsearch/sslcp {loganalytics-node.test.crt,loganalytics-node.test.key,rootCA.crt} /etc/→˓elasticsearch/sslchown -R elasticsearch:elasticsearch /etc/elasticsearch/sslchmod 755 /etc/elasticsearch/sslchmod 644 /etc/elasticsearch/ssl/*
3.10.2 Setting up configuration files
1. Append or uncomment below lines in /etc/elasticsearch/elasticsearch.yml and change pathsto proper values (based on past steps): ‘‘‘yaml
3.11 Transport layer encryption
logserverguard.ssl.transport.enabled: true logserverguard.ssl.transport.pemcert_filepath:“/etc/elasticsearch/ssl/loganalytics-node.test.crt” logserverguard.ssl.transport.pemkey_filepath:“/etc/elasticsearch/ssl/loganalytics-node.test.key” logserverguard.ssl.transport.pemkey_password: “pass-word_for_pemkey” # if there is no password leve “” logserverguard.ssl.transport.pemtrustedcas_filepath:“/etc/elasticsearch/ssl/rootCA.crt”
3.11. Transport layer encryption 25

ITRS-Log-Analytics-7.x Documentation, Release 7.0.5
logserverguard.ssl.transport.enforce_hostname_verification: true logserverguard.ssl.transport.resolve_hostname: true
logserverguard.ssl.transport.enabled_ciphers:
• “TLS_DHE_RSA_WITH_AES_256_GCM_SHA384” logserverguard.ssl.transport.enabled_protocols:
• “TLSv1.2”
3.12 HTTP layer encryption
logserverguard.ssl.http.enabled: true logserverguard.ssl.http.pemcert_filepath: “/etc/elasticsearch/ssl/loganalytics-node.test.crt” logserverguard.ssl.http.pemkey_filepath: “/etc/elasticsearch/ssl/loganalytics-node.test.key” logserver-guard.ssl.http.pemkey_password: “password_for_pemkey” # if there is no password leve “” logserver-guard.ssl.http.pemtrustedcas_filepath: “/etc/elasticsearch/ssl/rootCA.crt”
logserverguard.ssl.http.clientauth_mode: OPTIONAL logserverguard.ssl.http.enabled_ciphers:
• “TLS_DHE_RSA_WITH_AES_256_GCM_SHA384”
logserverguard.ssl.http.enabled_protocols:
• “TLSv1.2”
2. Append or uncomment below lines in `/etc/kibana/kibana.yml` and change paths to→˓proper values:
```yaml# For below two, both IP or HOSTNAME (https://loganalytics-node.test:PORT) can be→˓used because IP has been supplied in "alt_names"elasticsearch.url: "https://10.4.3.185:8000" # Default is "http://localhost:8000"---elastfilter.url: "https://10.4.3.185:9200" # Default is"http://localhost:9200"---# Elasticsearch trafic encryption# There is also an option to use "127.0.0.1/localhost" and to not supply path to CA.→˓Verification Mode should be then changed to "none".elasticsearch.ssl.verificationMode: fullelasticsearch.ssl.certificate: "/etc/elasticsearch/ssl/loganalytics-node.test.crt"elasticsearch.ssl.key: "/etc/elasticsearch/ssl/loganalytics-node.test.key"elasticsearch.ssl.keyPassphrase: "password_for_pemkey" # this line is not required if→˓there is no passwordelasticsearch.ssl.certificateAuthorities: "/etc/elasticsearch/ssl/rootCA.crt"
1. Append or uncomment below lines in /opt/alert/config.yaml and change paths to proper values:
# Connect with TLS to Elasticsearchuse_ssl: True
# Verify TLS certificatesverify_certs: True
# Client certificate:client_cert: /etc/elasticsearch/ssl/loganalytics-node.test.crtclient_key: /etc/elasticsearch/ssl/loganalytics-node.test.keyca_certs: /etc/elasticsearch/ssl/rootCA.crt
1. For CSV/HTML export to work properly rootCA.crt generated in first step has to be “installed” on the server.Below example for CentOS 7:
26 Chapter 3. Data source and application management

ITRS-Log-Analytics-7.x Documentation, Release 7.0.5
# Copy rootCA.crt and update CA trust storecp /etc/elasticsearch/ssl/rootCA.crt /etc/pki/ca-trust/source/anchors/rootCA.crtupdate-ca-trust
1. Intelligence module. Generate pkcs12 keystore/cert:
DOMAIN=loganalytics-node.testkeytool -import -file /etc/elasticsearch/ssl/rootCA.crt -alias root -keystore root.jksopenssl pkcs12 -export -in /etc/elasticsearch/ssl/${DOMAIN}.crt -inkey /etc/→˓elasticsearch/ssl/${DOMAIN}.key -out ${DOMAIN}.p12 -name "${DOMAIN}" -certfile /etc/→˓elasticsearch/ssl/rootCA.crt
# Configure /opt/ai/bin/conf.cfghttps_keystore=/path/to/pk12/loganalytics-node.test.p12https_truststore=/path/to/root.jkshttps_keystore_pass=bla123https_truststore_pass=bla123
3.12.1 Logstash/Beats
You can eather install CA to allow Logstash and Beats traffic or you can supply required certificates in config:
1. Logstash:
output {elasticsearch {hosts => "https://loganalytics-node.test:9200"ssl => trueindex => "winlogbeat-%{+YYYY.MM}"user => "logstash"password => "logstash"cacert => "/path/to/cacert/rootCA.crt"
}}
1. Beats:
output.elasticsearch.hosts: ["https://loganalytics-node.test:9200"]output.elasticsearch.protocol: "https"output.elasticsearch.ssl.enabled: trueoutput.elasticsearch.ssl.certificate_authorities: ["/path/to/cacert/rootCA.crt"]
Additionally, for any beats program to be able to write to elasticsearch, you will have to make changes to “en-abled_ciphers” directive in “/etc/elasticsearch/elasticsearch.yml”. This is done by commenting:
logserverguard.ssl.http.enabled_ciphers:- "TLS_DHE_RSA_WITH_AES_256_GCM_SHA384"
Otherwise, the beat will not be able to send documents directly and if you want to avoid it you can send a documentwith Logstash first.
3.12. HTTP layer encryption 27

ITRS-Log-Analytics-7.x Documentation, Release 7.0.5
3.13 Browser layer encryption
Secure Sockets Layer (SSL) and Transport Layer Security (TLS) provide encryption for data-in-transit. While theseterms are often used interchangeably, ITRS Log Analytics GUI supports only TLS, which supersedes the old SSLprotocols. Browsers send traffic to ITRS Log Analytics GUI and ITRS Log Analytics GUI sends traffic to Elasticsearchdatabase. These communication channels are configured separately to use TLS. TLS requires X.509 certificates toauthenticate the communicating parties and perform encryption of data-in-transit. Each certificate contains a publickey and has an associated—but separate—private key; these keys are used for cryptographic operations. ITRS LogAnalytics GUI supports certificates and private keys in PEM format and support TLS 1.3 version.
3.13.1 Configuration steps
1. Obtain a server certificate and private key for ITRS Log Analytics GUI.
Kibana will need to use this “server certificate” and corresponding private key when receiving connections fromweb browsers.
When you obtain a server certificate, you must set its subject alternative name (SAN) correctly to ensure thatmodern web browsers with hostname verification will trust it. You can set one or more SANs to the ITRS LogAnalytics GUI server’s fully-qualified domain name (FQDN), hostname, or IP address. When choosing theSAN, you should pick whichever attribute you will be using to connect to Kibana in your browser, which islikely the FQDN in a production environment.
2. Configure ITRS Log Analytics GUI to access the server certificate and private key.
vi /etc/kibana/kibana.yml
server.ssl.enabled: trueserver.ssl.supportedProtocols: ["TLSv1.3"]server.ssl.certificate: "/path/to/kibana-server.crt"server.ssl.key: "/path/to/kibana-server.key"
3.14 Index rollover
Using the rollover function, you can make changes to removing documents from the audit, .agents, alert* indexes.
You can configure the rollover by going to the Config module, then clicking the Settings tab, go to the Index rolloversettings section and select click Configure button:
28 Chapter 3. Data source and application management

ITRS-Log-Analytics-7.x Documentation, Release 7.0.5
You can set the following retention parameters for the above indexes:
• Maximum size (GB);
• Maximum age (h);
• Maximum number of documents.
3.14. Index rollover 29

ITRS-Log-Analytics-7.x Documentation, Release 7.0.5
30 Chapter 3. Data source and application management

CHAPTER 4
Discovery
4.1 Time settings and refresh
In the upper right corner there is a section in which it defines the range of time that ITRS Log Analytics will search interms of conditions contained in the search bar. The default value is the last 15 minutes.
31

ITRS-Log-Analytics-7.x Documentation, Release 7.0.5
After clicking this selection, we can adjust the scope of search by selecting one of the three tabs in the drop-downwindow:
• Quick: contain several predefined ranges that should be clicked.
• Relative: in this windows specify the day from which ITRS Log Analytics should search for data.
• Absolute: using two calendars we define the time range for which the search results are to be returned.
32 Chapter 4. Discovery

ITRS-Log-Analytics-7.x Documentation, Release 7.0.5
4.2 Fields
ITRS Log Analytics in the body of searched events, it recognize fields that can be used to created more precisionqueries. The extracted fields are visible in the left panel. They are divided on three types: timestamp, marked on clock
icon ; text, marked with the letter “t” and digital, marked witch hashtag
.
Pointing to them and clicking on icon , they are automatically transferred to the „Selected Fields” column and inthe place of events a table with selected columns is created on regular basis. In the “Selected Fields” selection you can
also delete specific fields from the table by clicking on the selected element.
4.2. Fields 33

ITRS-Log-Analytics-7.x Documentation, Release 7.0.5
4.3 Filtering and syntax building
We use the query bar to search interesting events. For example, after entering the word „error”, all events that containthe word will be displayed, additional highlighting them with an yellow background.
34 Chapter 4. Discovery

ITRS-Log-Analytics-7.x Documentation, Release 7.0.5
4.3.1 Syntax
Fields can be used in the similar way by defining conditions that interesting us. The syntax of such queries is:
<fields_name:<fields_value>
Example:
status:500
This query will display all events that contain the „status” fields with a value of 500.
4.3.2 Filters
The field value does not have to be a single, specific value. For digital fields we can specify range in the followingscheme:
<fields_name:[<range_from TO <range_to]
Example:
status:[500 TO 599]
This query will return events with status fields that are in the range 500 to 599.
4.3.3 Operators
The search language used in ITRS Log Analytics allows to you use logical operators „AND”, „OR” and „NOT”, whichare key and necessary to build more complex queries.
4.3. Filtering and syntax building 35

ITRS-Log-Analytics-7.x Documentation, Release 7.0.5
• AND is used to combined expressions, e.g. „error AND „access denied”. If an event contain only one expressionor the words error and denied but not the word access, then it will not be displayed.
• OR is used to search for the events that contain one OR other expression, e.g. „status:500” OR “denied”. Thisquery will display events that contain word „denied” or status field value of 500. ITRS Log Analytics uses thisoperator by default, so query „status:500” “denied” would return the same results.
• NOT is used to exclude the following expression e.g. „status:[500 TO 599] NOT status:505” will display allevents that have a status fields, and the value of the field is between 500 and 599 but will eliminate from theresult events whose status field value is exactly 505.
• The above methods can be combined with each other by building even more complex queries. Understandinghow they work and joining it, is the basis for effective searching and full use of ITRS Log Analytics.
Example of query built from connected logical operations:
status:[500 TO 599] AND („access denied" OR error) NOT status:505
Returns in the results all events for which the value of status fields are in the range of 500 to 599, simultaneouslycontain the word „access denied” or „error”, omitting those events for which the status field value is 505.
4.4 Saving and deleting queries
Saving queries enables you to reload and use them in the future.
4.4.1 Save query
To save query, click on the “Save” button under on the query bar:
This will bring up a window in which we give the query a name and then click the button .
Saved queries can be opened by going to „Open” from the main menu at the top of the page, and select saved searchfrom the search list:
36 Chapter 4. Discovery

ITRS-Log-Analytics-7.x Documentation, Release 7.0.5
Additional you can use “Saved Searchers Filter..” to filter the search list.
4.4.2 Open query
To open a saved query from the search list, you can click on the name of the query you are interested in.
After clicking on the icon on the name of the saved query and chose “Edit Query DSL”, we willgain access to the advanced editing mode, so that we can change the query on at a lower level.
It is a powerful tool designed for advanced users, designed to modify the query and the way it is presented by ITRSLog Analytics.
4.4.3 Delete query
To delete a saved query, open it from the search list, and then click on the button .
If you want delete many saved queries simultaneously go to the “Management Object” -> “Saved Object” ->
“Searches” select it in the list (the icon to the left of the query name), and then click “Delete” button.
From this level, you can also export saved queries in the same way. To do this, you need to click on
4.4. Saving and deleting queries 37

ITRS-Log-Analytics-7.x Documentation, Release 7.0.5
and choose the save location. The file will be saved in .JSON format. If you then want to import such a file to ITRS
Log Analytics, click on button , at the top of the page and select the desired file.
4.5 Manual incident
The Discovery module allows you to manually create incidents that are saved in the Incidents tab of theAlerts module. Manual incidents are based on search results or filtering. For a manual incident, you can save thefollowing parameters:
• Rule name
• Time
• Risk
• Message
After saving the manual incident, you can go to the Incident tab in the Alert module to perform the incident handlingprocedure.
38 Chapter 4. Discovery

CHAPTER 5
Visualizations
Visualize enables you to create visualizations of the data in your ITRS Log Analytics indices. You can then builddashboards that display related visualizations. Visualizations are based on ITRS Log Analytics queries. By using aseries of ITRS Log Analytics aggregations to extract and process your data, you can create charts that show you thetrends, spikes, and dips.
5.1 Creating visualization
5.1.1 Create
To create visualization, go to the „Visualize” tab from the main menu. A new page will be appearing where you cancreate or load visualization.
5.1.2 Load
To load previously created and saved visualization, you must select it from the list.
39

ITRS-Log-Analytics-7.x Documentation, Release 7.0.5
In order to create a new visualization, you should choose the preferred method of data presentation.
40 Chapter 5. Visualizations

ITRS-Log-Analytics-7.x Documentation, Release 7.0.5
Next, specify whether the created visualization will be based on a new or previously saved query. If on new one, selectthe index whose visualization should concern. If visualization is created from a saved query, you just need to selectthe appropriate query from the list, or (if there are many saved searches) search for them by name.
5.1. Creating visualization 41

ITRS-Log-Analytics-7.x Documentation, Release 7.0.5
5.2 Vizualization types
Before the data visualization will be created, first you have to choose the presentation method from an existing list.Currently there are five groups of visualization types. Each of them serves different purposes. If you want to see onlythe current number of products sold, it is best to choose „Metric”, which presents one value.
However, if we would like to see user activity trends on pages in different hour and days, a better choice will be „Areachart”, which displays a chart with time division.
42 Chapter 5. Visualizations

ITRS-Log-Analytics-7.x Documentation, Release 7.0.5
The „Markdown widget” views is used to place text e.g. information about the dashboard, explanations and instruc-tion on how to navigate. Markdown language was used to format the text (the most popular use is GitHub). Moreinformation and instruction can be found at this link: https://help.github.com/categories/writing-on-github/
5.3 Edit visualization and saving
5.3.1 Edititing
Editing a saved visualization enables you to directly modify the object definition. You can change the object title, adda description, and modify the JSON that defines the object properties. After selecting the index and the method of datapresentation, you can enter the editing mode. This will open a new window with empty visualization.
5.3. Edit visualization and saving 43

ITRS-Log-Analytics-7.x Documentation, Release 7.0.5
At the very top there is a bar of queries that cat be edited throughout the creation of the visualization. It work in thesame way as in the “Discover” tab, which means searching the raw data, but instead of the data being displayed, thevisualization will be edited. The following example will be based on the „Area chart”. The visualization modificationpanel on the left is divided into three tabs: „Data”, “Metric & Axes” and „Panel Settings”.
In the „Data” tab, you can modify the elements responsible for which data and how should be presented. In this tabthere are two sectors: “metrics”, in which we set what data should be displayed, and „buckets” in which we specifyhow they should be presented.
Select the Metrics & Axes tab to change the way each individual metric is shown on the chart. The data series arestyled in the Metrics section, while the axes are styled in the X and Y axis sections.
In the „Panel Settings” tab, there are settings relating mainly to visual aesthetics. Each type of visualization hasseparate options.
To create the first graph in the char modification panel, in the „Data” tab we add X-Axis in the “buckets” sections. In„Aggregation” choose „Histogram”, in „Field” should automatically be located “timestamp” and “interval”: “Auto”(if not, this is how we set it). Click on the icon on the panel. Now our first graph should show up.
Some of the options for „Area Chart” are:
44 Chapter 5. Visualizations

ITRS-Log-Analytics-7.x Documentation, Release 7.0.5
Smooth Lines - is used to smooth the graph line.
• Current time marker – places a vertical line on the graph that determines the current time.
• Set Y-Axis Extents – allows you to set minimum and maximum values for the Y axis, which increases thereadability of the graphs. This is useful, if we know that the data will never be less then (the minimum value),or to indicate the goals the company (maximum value).
• Show Tooltip – option for displaying the information window under the mouse cursor, after pointing to thepoint on the graph.
5.3.2 Saving
To save the visualization, click on the “Save” button under on the query bar:
give it a name and click the button .
5.3.3 Load
To load the visualization, go to the “Management Object” -> “Saved Object” -> “Visualizations” select it fromthe list. From this place, we can also go into advanced editing mode. To view of the visualization use
button.
5.3. Edit visualization and saving 45

ITRS-Log-Analytics-7.x Documentation, Release 7.0.5
5.4 Dashboards
Dashboard is a collection of several visualizations or searches. Depending on how it is build and what visualization itcontains, it can be designed for different teams e.g.:
• SOC - which is responsible for detecting failures or threats in the company;
• business - which thanks to the listings can determine the popularity of products and define the strategy of futuresales and promotions;
• managers and directors - who may immediately have access to information about the performance units orbranches.
5.4.1 Create
To create a dashboard from previously saved visualization and queries, go to the „Dashboard” tab in the main menu.When you open it, a new page will appear.
Clicking on the icon “Add” at the top of page select “Visualization” or “Saved Search” tab.
and selecting a saved query and / or visualization from the list will add them to the dashboard. If, there are a largenumber of saved objects, use the bar to search for them by name.
Elements of the dashboard can be enlarged arbitrarily (by clicking on the right bottom corner of object and draggingthe border) and moving (by clicking on the title bar of the object and moving it).
5.4.2 Saving
You may change the time period of your dashboard.
At the upper right hand corner, you may choose the time range of your dashboard.
46 Chapter 5. Visualizations

ITRS-Log-Analytics-7.x Documentation, Release 7.0.5
Click save and choose the ‘Store time with dashboard’ if you are editing an existing dashboard. Otherwise, you maychoose ‘Save as a new dashboard’ to create a new dashboard with the new time range.
To save a dashboard, click on the “Save” button to the up of the query bar and give it a name.
5.4.3 Load
To load the Dashboard, go to the “Management Object” -> “Saved Object” -> “Dashborad” select it from the list. From
this place, we can also go into advanced editing mode. To view of the visualization usebutton.
5.5 Sharing dashboards
The dashboard can be share with other ITRS Log Analytics users as well as on any page - by placing a snippet of code.Provided that it cans retrieve information from ITRS Log Analytics.
To do this, create new dashboard or open the saved dashboard and click on the “Share” to the top of the page. Awindow will appear with generated two URL. The content of the first one “Embaded iframe” is used to provide thedashboard in the page code, and the second “Link” is a link that can be passed on to another user. There are two optionfor each, the first is to shorten the length of the link, and second on copies to clipboard the contest of the given bar.
5.5. Sharing dashboards 47

ITRS-Log-Analytics-7.x Documentation, Release 7.0.5
5.6 Dashboard drilldown
In discovery tab search for message of Your interest
Save Your search
48 Chapter 5. Visualizations

ITRS-Log-Analytics-7.x Documentation, Release 7.0.5
Check You „Shared link” and copy it
! ATTENTION ! Do not copy „?_g=()” at the end.
5.6. Dashboard drilldown 49

ITRS-Log-Analytics-7.x Documentation, Release 7.0.5
Select Alerting module
Once Alert is created use ANY frame to add the following directives:
Use_kibana4_dashboard: paste Your „shared link” here
use_kibana_dashboard: - The name of a Kibana dashboard to link to. Instead of generating a dashboard froma template, Alert can use an existing dashboard. It will set the time range on the dashboard to around the matchtime, upload it as a temporary dashboard, add a filter to the query_key of the alert if applicable, and put the url to thedashboard in the alert. (Optional, string, no default).
Kibana4_start_timedelta
kibana4_start_timedelta: Defaults to 10 minutes. This option allows you to specify the start time for thegenerated kibana4 dashboard. This value is added in front of the event. For example,
`kibana4_start_timedelta: minutes: 2`
Kibana4_end_timedelta`
50 Chapter 5. Visualizations

ITRS-Log-Analytics-7.x Documentation, Release 7.0.5
kibana4_end_timedelta: Defaults to 10 minutes. This option allows you to specify the end time for thegenerated kibana4 dashboard. This value is added in back of the event. For example,
kibana4_end_timedelta: minutes: 2
Sample:
Search for triggered alert in Discovery tab. Use alert* search pattern.
Refresh the alert that should contain url for the dashboard. Once available, kibana_dashboard field can be exposed todashboards giving You a real drill down feature.
5.6. Dashboard drilldown 51

ITRS-Log-Analytics-7.x Documentation, Release 7.0.5
5.7 Sound notification
You can use sound notification on dashboard when the new document is coming. To configure sound notification ondashboard use the following steps:
• create and save the Saved search in Discovery module;
• open the proper dashboard and add the previously created Saved search;
• exit form dashboard editing mode by click on the save button;
• click on three small square on the previously added object and select Play audio:
• select the sound file in the mp3 format from your local disk and click OK:
• on the dashboard set the automatically refresh data. for example every 5 seconds:
52 Chapter 5. Visualizations
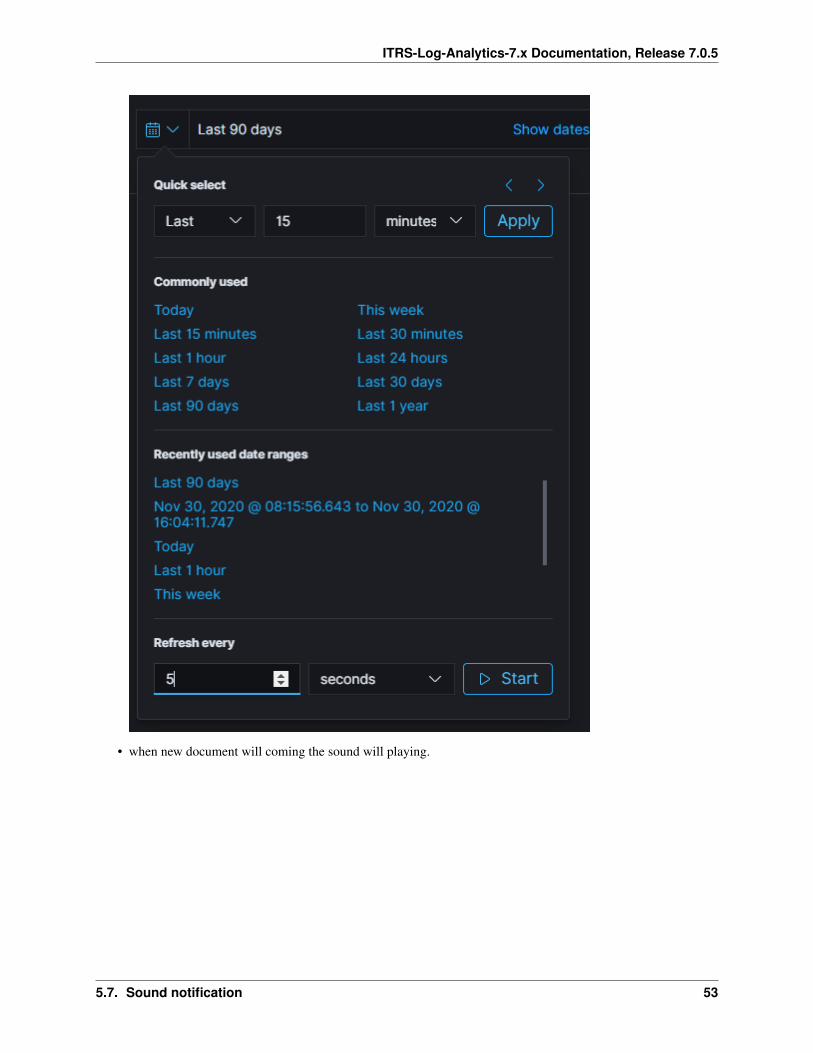
ITRS-Log-Analytics-7.x Documentation, Release 7.0.5
• when new document will coming the sound will playing.
5.7. Sound notification 53

ITRS-Log-Analytics-7.x Documentation, Release 7.0.5
54 Chapter 5. Visualizations

CHAPTER 6
Reports
ITRS Log Analytics contains a module for creating reports that can be run cyclically and contain only interesting data,e.g. a weekly sales report.
To go to the reports windows, select to tiles icon from the main menu bar, and then go to the „Reports” icon (To goback, go to the „Search” icon).
55

ITRS-Log-Analytics-7.x Documentation, Release 7.0.5
6.1 CSV Report
To export data to CSV Report click the Reports icon, you immediately go to the first tab - Export Task Management.
56 Chapter 6. Reports

ITRS-Log-Analytics-7.x Documentation, Release 7.0.5
05-00-00-Reports/./media/media/image39_js.png
In this tab we have the opportunity to specify the source from which we want to do export. It can be an index pattern.After selecting it, we confirm the selection with the Submit button and a report is created at the moment. The symbol
can refresh the list of reports and see what its status is.
We can also create a report by pointing to a specific index from the drop-down list of indexes.
6.1. CSV Report 57

ITRS-Log-Analytics-7.x Documentation, Release 7.0.5
We can also check which fields are to be included in the report. The selection is confirmed by the Submit button.
58 Chapter 6. Reports

ITRS-Log-Analytics-7.x Documentation, Release 7.0.5
When the process of generating the report (Status:Completed) is finished, we can download it (Download button) ordelete (Delete button). The downloaded report in the form of *.csv file can be opened in the browser or saved to thedisk.
In this tab, the downloaded data has a format that we can import into other systems for further analysis.
6.2 PDF Report
In the Export Dashboard tab we have the possibility to create graphic reports in PDF files. To create such a report, justfrom the drop-down list of previously created and saved Dashboards, indicate the one we are interested in, and thenconfirm the selection with the Submit button. A newly created export with the Processing status will appear on the listunder Dashboard Name. When the processing is completed, the Status changes to Complete and it will be possible todownload the report.
6.2. PDF Report 59

ITRS-Log-Analytics-7.x Documentation, Release 7.0.5
By clicking the Download button, the report is downloaded to the disk or we can open it in the PDF file browser. Thereis also to option of deleting the report with the Delete button.
Below is an example report from the Dashboard template generated and downloaded as a PDF file.
60 Chapter 6. Reports

ITRS-Log-Analytics-7.x Documentation, Release 7.0.5
6.3 Scheduler Report (Schedule Export Dashboard)
In the Report selection, we have the option of setting the Scheduler which from Dashboard template can generate areport at time intervals. To do this goes to the Schedule Export Dashboard tab.
6.3. Scheduler Report (Schedule Export Dashboard) 61

ITRS-Log-Analytics-7.x Documentation, Release 7.0.5
Scheduler Report (Schedule Export Dashboard)
In this tab mark the saved Dashboard.
62 Chapter 6. Reports

ITRS-Log-Analytics-7.x Documentation, Release 7.0.5
Note: The default time period of the dashboard is last 15 minutes.
Please refer to Discovery > Time settings and refresh to change the time period of your dashboard.
In the Email Topic field, enter the Message title, in the Email field enter the email address to which the report shouldbe sent. From drop-down list choose at what frequency you want the report to be generated and sent. The actionconfigured in this way is confirmed with the Submit button.
6.3. Scheduler Report (Schedule Export Dashboard) 63

ITRS-Log-Analytics-7.x Documentation, Release 7.0.5
The defined action goes to the list and will generate a report to the e-mail address, with the cycle we set, until wecannot cancel it with the Cancel button.
64 Chapter 6. Reports

CHAPTER 7
User roles and object management
7.1 Users, roles and settings
ITRS Log Analytics allows to you manage users and permission for indexes and methods used by them. To do thisclick the “Config” button from the main menu bar.
65

ITRS-Log-Analytics-7.x Documentation, Release 7.0.5
A new window will appear with three main tabs: „User Management”, „Settings” and „License Info”.
From the „User Management” level we have access to the following possibilities: Creating a user in „Create User”,displaying users in „User List”, creating new roles in „Create roles” and displaying existing roles in „List Role”.
66 Chapter 7. User roles and object management

ITRS-Log-Analytics-7.x Documentation, Release 7.0.5
7.2 Creating a User (Create User)
7.2.1 Creating user
To create a new user click on the Config icon and you immediately enter the administration panel, where the first tabis to create a new user (Create User).
In the wizard that opens, we enter a unique username (Username field), password for the user (field Password) andassign a role (field Role). In this field we have the option of assigning more than one role. Until we select role in theRoles field, the Default Role field remains empty. When we mark several roles, these roles appear in the Default Rolefield. In this field we have the opportunity to indicate which role for a new user will be the default role with which theuser will be associated in the first place when logging in. The default role field has one more important task - it bindsall users with the field / role set in one group. When one of the users of this group create Visualization or Dashboardit will be available to other users from this role(group). Creating the account is confirmed with the Submit button.
7.2.2 User’s modification and deletion, (User List)
Once we have created users, we can display their list. We do it in next tab (User List).
7.2. Creating a User (Create User) 67

ITRS-Log-Analytics-7.x Documentation, Release 7.0.5
In this view, we get a list of user account with assigned roles and we have two buttons: Delete and Update. The firstof these is ability to delete a user account. Under the Update button is a drop-down menu in which we can change theprevious password to a new one (New password), change the password (Re-enter Ne Password), change the previouslyassigned roles (Roles), to other (we can take the role assigned earlier and give a new one, extend user permissions withnew roles). The introduced changes are confirmed with the Submit button.
We can also see current user setting and clicking the Update button collapses the previously expanded menu.
7.3 Create, modify and delete a role (Create Role), (Role List)
In the Create Role tab we can define a new role with permissions that we assign to a pattern or several index patterns.
68 Chapter 7. User roles and object management

ITRS-Log-Analytics-7.x Documentation, Release 7.0.5
In example, we use the syslog2* index pattern. We give this name in the Paths field. We can provide one or more indexpatterns, their names should be separated by a comma. In the next Methods field, we select one or many methods thatwill be assigned to the role. Available methods:
• PUT - sends data to the server
• POST - sends a request to the server for a change
• DELETE - deletes the index / document
• GET - gets information about the index /document
• HEAD - is used to check if the index /document exists
In the role field, enter the unique name of the role. We confirm addition of a new role with the Submit button. To seeif a new role has been added, go to the net Role List tab.
7.3. Create, modify and delete a role (Create Role), (Role List) 69

ITRS-Log-Analytics-7.x Documentation, Release 7.0.5
As we can see, the new role has been added to the list. With the Delete button we have the option of deleting it, whileunder the Update button we have a drop-down menu thanks to which we can add or remove an index pattern and addor remove a method. When we want to confirm the changes, we choose the Submit button. Pressing the Update buttonagain will close the menu.
Fresh installation of the application have sewn solid roles which granting user special rights:
• admin - this role gives unlimited permissions to administer / manage the application
• alert - a role for users who want to see the Alert module
• kibana - a role for users who want to see the application GUI
• Intelligence - a role for users who are to see the Intelligence moduleObject access permissions (Objects permis-sions)
In the User Manager tab we can parameterize access to the newly created role as well as existing roles. In this tab wecan indicate to which object in the application the role has access.
Example:
In the Role List tab we have a role called sys2, it refers to all index patterns beginning with syslog* and the methodsget, post, delete, put and head are assigned.
70 Chapter 7. User roles and object management

ITRS-Log-Analytics-7.x Documentation, Release 7.0.5
When we go to the Object permission tab, we have the option to choose the sys2 role in the drop-down list choose arole:
After selecting, we can see that we already have access to the objects: two index patterns syslog2* and ITRS LogAnalytics-* and on dashboard Windows Events. There are also appropriate read or updates permissions.
7.3. Create, modify and delete a role (Create Role), (Role List) 71

ITRS-Log-Analytics-7.x Documentation, Release 7.0.5
From the list we have the opportunity to choose another object that we can add to the role. Wehave the ability to quickly find this object in the search engine (Find) and narrowing the objectclass in the drop-down field “Select object type”. The object type are associated with saved pre-viously documents in the sections Dashboard, Index pattern, Search and Visualization. By buttons
we have the ability to add or remove or object, and Save button to save the selection.
7.4 Default user and passwords
The table below contains built-in user accounts and default passwords:
|Address |User |Password |Role |Description→˓ |Usage ||-----------------------|-------------|-------------|-------------|-------------------→˓-----------------------------|---------------||https://localhost:5601 |logserver |logserver |logserver |A built-in→˓*superuser* account | || |alert |alert |alert |A built-in account→˓for the Alert module | || |intelligence |intelligece |intelligence |A built-in account→˓for the Intelligence module | authorizing communication with elasticsearch server || |scheduler |scheduler |scheduler |A built-in account→˓for the Scheduler module || |logstash |logstash |logstash |A built-in account→˓for authorized comuunication form Logstash || |cerebro | |system acconut only |A built-in→˓account for authorized comuunication from Cerebro moudule |
72 Chapter 7. User roles and object management

ITRS-Log-Analytics-7.x Documentation, Release 7.0.5
7.5 Changing password for the system account
After you change password for one of the system account ( alert, intelligence, logserver, scheduler), you must to doappropriate changes in the application files.
1. Account Logserver
• Update /etc/kibana/kibana.yml
vi /etc/kibana/kibana.ymlelasticsearch.password: new_logserver_passowrdelastfilter.password: "new_logserver_password"cerebro.password: "new_logserver_password"
• Update password in curator configuration file: /usr/share/kibana/curator/curator.yml
http_auth: logserver:"new_logserver_password"
2. Account Intelligence
• Update /opt/ai/bin/conf.cfg
vi /opt/ai/bin/conf.cfgpassword=new_intelligence_password
3. Account Alert
• Update file /opt/alert/config.yaml
vi /opt/alert/config.yamles_password: alert
4. Account Scheduler
• Update /etc/kibana/kibana.yml
vi /etc/kibana/kibana.ymlelastscheduler.password: "new_scheduler_password"
5. Account Logstash
• Update the Logstash pipeline configuration files (*.conf) in output sections:
vi /etc/logstash/conf.d/*.confelasticsearch {
hosts => ["localhost:9200"]index => "syslog-%{+YYYY.MM}"user => "logstash"password => "new_password"
}
7.6 Module Access
You can restrict access to specific modules for a user role. For example: the user can only use the Discovery, Alert andCerebro modules, the other modules should be inaccessible to the user.
You can do this by editing the roles in the Role List and selecting the application from the Apps list. After saving,the user has access only to specific modules.
7.5. Changing password for the system account 73

ITRS-Log-Analytics-7.x Documentation, Release 7.0.5
74 Chapter 7. User roles and object management

CHAPTER 8
Settings
8.1 General Settings
The Settings tab is used to set the audit on different activates or events and consists of several fields:
75

ITRS-Log-Analytics-7.x Documentation, Release 7.0.5
• Time Out in minutes field - this field defines the time after how many minutes the application will automaticallylog you off
• Delete Application Tokens (in days) - in this field we specify after what time the data from the audit should bedeleted
• Delete Audit Data (in days) field - in this field we specify after what time the data from the audit should bedeleted
• Next field are checkboxes in which we specify what kind of events are to be logged (saved) in the audit index.The events that can be monitored are: logging (Login), logging out (Logout), creating a user (Create User),deleting a user (Delete User), updating user (Update User), creating a role (Create Role), deleting a role (DeleteRole), update of the role (Update Role), start of export (Export Start), delete of export (Export Delete), queries(Queries), result of the query (Content), if attempt was made to perform a series of operation (Bulk)
• Delete Exported CSVs (in days) field - in this field we specify after which time exported file with CSV exten-sion have to be removed
• Delete Exported PDFs (in days) field - in this field we specify after which time exported file with PDF extensionhave to be removed
To each field is assigned “Submit” button thanks to which we can confirm the changes.
76 Chapter 8. Settings

ITRS-Log-Analytics-7.x Documentation, Release 7.0.5
8.2 License (License Info)
The License Information tab consists of several non-editable information fields.
These fields contain information:
• Company field, who owns the license - in this case EMCA S.A.
• Data nodes in cluster field - how many nodes we can put in one cluster - in this case 100
• No of documents field - empty field
• Indices field - number of indexes, symbol[*] means that we can create any number of indices
• Issued on field - date of issue
• Validity field - validity, in this case for 360000 months
8.2.1 Renew license
To change the ITRS Log Analytics license files on a running system, do the following steps.
1. Copy the current license files to the backup folder:
mv /usr/share/elasticsearch/es_* ~/backup/
2. Copy the new license files to the Elasticsearch installation directory:
cp es_* /usr/share/elasticsearch/
3. Add necessary permission to the new license files:
chown elasticsearch:elasticsearch /usr/share/elasticsearch/es_*
4. Reload the license using the License API:
8.2. License (License Info) 77

ITRS-Log-Analytics-7.x Documentation, Release 7.0.5
curl -u $USER:$PASSWORD -X POST http://localhost:9200/_license/reload
8.3 Special accounts
At the first installation of the ITRS Log Analytics application, apart from the administrative account (logserver),special applications are created in the application: alert, intelligence and scheduler.
• Alert Account - this account is connected to the Alert Module which is designed to track events written to theindex for the previously defined parameters. If these are met the information action is started (more on the actionin the Alert section)
• Intelligence Account - with this account is related to the module of artificial intelligence which is designed totrack events and learn the network based on previously defined rules artificial intelligence based on one of theavailable algorithms (more on operation in the Intelligence chapter)
• Scheduler Account - the scheduler module is associated with this account, which corresponds to, among othersfor generating reports
78 Chapter 8. Settings

CHAPTER 9
Alert Module
ITRS Log Analytics allows you to create alerts, i.e. monitoring queries. These are constant queries that run in thebackground and when the conditions specified in the alert are met, the specify action is taken.
For example, if you want to know when more than 20 „status:500” response code from on our homepage appear withinan one hour, then we create an alert that check the number of occurrences of the „status:500” query for a specific indexevery 5 minutes. If the condition we are interested in is met, we send an action in the form of sending a message toour e-mail address. In the action, you can also set the launch of any script.
9.1 Enabling the Alert Module
To enabling the alert module you should:
• generate writeback index for Alert service:
Only applies to versions 6.1.5 and older. From version 6.1.6 and later, the Alert index is created automatically
/opt/alert/bin/elastalert-create-index --config /opt/alert/config.yaml
• configure the index pattern for alert*
79

ITRS-Log-Analytics-7.x Documentation, Release 7.0.5
• start the Alert service:
systemctl start alert
9.2 SMTP server configuration
To configuring STMP server for email notification you should:
• edit /opt/alert/config.yml and add the following section:
# email confsmtp_host: "mail.example.conf"smtp_port: 587smtp_ssl: falsefrom_addr: "[email protected]"smtp_auth_file: "/opt/alert/smtp_auth_file.yml"
• add the new /opt/alert/smtp_auth_file.yml file:
user: "user"password: "password"
• restart alert service:
systemctl restat alert
9.3 Creating Alerts
To create the alert, click the “Alerts” button from the main menu bar.
80 Chapter 9. Alert Module

ITRS-Log-Analytics-7.x Documentation, Release 7.0.5
We will display a page with tree tabs: Create new alerts in „Create alert rule”, manage alerts in „Alert rules List” andcheck alert status „Alert Status”.
In the alert creation windows we have an alert creation form:
9.3. Creating Alerts 81

ITRS-Log-Analytics-7.x Documentation, Release 7.0.5
82 Chapter 9. Alert Module

ITRS-Log-Analytics-7.x Documentation, Release 7.0.5
• Name - the name of the alert, after which we will recognize and search for it.
• Index pattern - a pattern of indexes after which the alert will be searched.
• Role - the role of the user for whom an alert will be available
• Type - type of alert
• Description - description of the alert.
• Example - an example of using a given type of alert. Descriptive field
• Alert method - the action the alert will take if the conditions are met (sending an email message or executing acommand)
• Any - additional descriptive field.# List of Alert rules #
The “Alert Rule List” tab contain complete list of previously created alert rules:
In this window, you can activate / deactivate, delete and update alerts by clicking on the selected icon with the given
alert: .
9.4 Alerts status
In the “Alert status” tab, you can check the current alert status: if it activated, when it started and when it ended, howlong it lasted, how many event sit found and how many times it worked.
Also, on this tab, you can recover the alert dashboard, by clicking the “Recovery Alert Dashboard” button.
9.5 Alert rules
The various RuleType classes, defined in ITRS Log Analytics-Log-Aalytics. An instance is held in memory for eachrule, passed all of the data returned by querying Elasticsearch with a given filter, and generates matches based on that
9.4. Alerts status 83

ITRS-Log-Analytics-7.x Documentation, Release 7.0.5
data.
• Any - The any rule will match everything. Every hit that the query returns will generate an alert.
• Blacklist - The blacklist rule will check a certain field against a blacklist, and match if it is in the blacklist.
• Whitelist - Similar to blacklist, this rule will compare a certain field to a whitelist, and match if the list does notcontain the term.
• Change - This rule will monitor a certain field and match if that field changes.
• Frequency - his rule matches when there are at least a certain number of events in a given time frame.
• Spike - This rule matches when the volume of events during a given time period is spike_height times larger orsmaller than during the previous time period.
• Flatline - This rule matches when the total number of events is under a given threshold for a time period.
• New Term - This rule matches when a new value appears in a field that has never been seen before.
• Cardinality - This rule matches when a the total number of unique values for a certain field within a time frameis higher or lower than a threshold.
• Metric Aggregation - This rule matches when the value of a metric within the calculation window is higher orlower than a threshold.
• Percentage Match - This rule matches when the percentage of document in the match bucket within a calculationwindow is higher or lower than a threshold.
• Unique Long Term - This rule matches when there are values of compare_key in each checked timeframe.
• Find Match - Rule match when in defined period of time, two correlated documents match certain strings.
• Difference - Rule matches for value difference between two aggregations calculated for different periods intime.
• ConsecutiveGrowth - Rule matches for value difference between two aggregations calculated for different peri-ods in time.
• Logical - Rule matches when a complex, logical criteria is met. Rule can be use for alert data correlation.
• Chain - Rule matches when a complex, logical criteria is met. Rule can be use for alert data correlation.
9.5.1 Logical
An example of using the Logical rule type.
84 Chapter 9. Alert Module

ITRS-Log-Analytics-7.x Documentation, Release 7.0.5
Alerts that must occur for the rule to be triggered:
• Switch - Port is off-line - the alert must appear 5 times.
– OR
• Switch - Port is on-line - the alert must appear 5 times.
If both of the above alerts are met within no more than 5 minutes and the values of the “port_number” field are relatedto each other, the alert rule is triggered. It is possible to use logical connectives such as: OR, AND, NOR, NAND,XOR.
9.5.2 Chain
An example of using the Chain rule type.
Alerts that must occur for the rule to be triggered:
9.5. Alert rules 85

ITRS-Log-Analytics-7.x Documentation, Release 7.0.5
• Linux - Login Failure - the alert must appear 10 times.
– AND
• Linux - Login Success - 1 time triggered alert.
If the sequence of occurrence of the above alerts is met within 5 minutes and the values of the “username” field arerelated to each other, the alert rule is triggered. The order in which the component alerts occur is important.
9.5.3 Difference
This rule calculates percentage difference between aggregations for two non-overlapping time windows.
Let’s assume x represents the current time (i.e. when alert rule is run) then the relation between historical and presenttime windows is described by the inequality:
<x - agg_min - delta_min; x - delta_min> <= <x - agg_min; x>; where x - delta_min <=→˓x - agg_min => delta_min >= agg_min
The percentage difference is then described by the following equation:
d = | avg_now - avg_history | / max(avg_now, avg_history) * 100; for (avg_now - avg_→˓history != 0; avg_now != 0; avg_history != 0)d = 0; (in other cases)
avg_now is the arithmetic mean of <x - agg_min; x> avg_history is the arithmetic mean of <x -agg_min - delta_min; x - delta_min>
Required parameters:
• Enable the rule by setting type field. type: difference
• Based on the compare_key field aggregation is calculated. compare_key: value
• An alert is triggered when the percentage difference between aggregations is higher than the specified value.threshold_pct: 10
• The difference in minutes between calculated aggregations. delta_min: 3
• Aggregation bucket (in minutes). agg_min: 1
Optional parameters:
If present, for each unique query_key aggregation is calculated (it needs to be of type keyword). query_key:hostname
9.6 Alert Type
When the alert rule is fulfilled, the defined action is performed - the alert method. The following alert methods havebeen predefined in the system:
• email;
• commands;
• user;
86 Chapter 9. Alert Module

ITRS-Log-Analytics-7.x Documentation, Release 7.0.5
9.6.1 Email
Method that sends information about an alert to defined email addresses.
9.6.2 User
Method that sends information about an alert to defined system users.
9.6.3 Command
A method that performs system tasks. For example, it triggers a script that creates a new event in the customer ticketsystem.
Below is an example of an alert rule definition that uses the “command” alert method to create and recover an ticketin the client’s ticket system:
index: op5-*name: change-op5-hoststatetype: change
compare_key: hoststateignore_null: truequery_key: hostname
filter:- query_string:
query: "_exists_: hoststate AND datatype: \"HOSTPERFDATA\" AND _exists_: hostname"
realert:minutes: 0
alert: "command"command: ["/opt/alert/send_request_change.sh", "5", "%(hostname)s", "SYSTEM_DOWN",→˓"HOST", "Application Collection", "%(hoststate)s", "%(@timestamp)s"]
The executed command has parameters which are the values of the fields of the executed alert. Syntax:%(fields_name).
•
9.6.4 The Hive
The alert module can forward information about the alert to Security Incident Response Platform TheHive.
The configuration of the Hive Alert should be done in the definition of the Rule Definition alert using thefollowing options:
• hive_alert_config_type: classic - allows the use of variables to build The Hive alert
• hive_alert_config:
– title (text) : title of the alert (ignored in classic config type)
– description (text) : description of the alert (ignored in classic config type)
– severity (number) : severity of the alert (1: low; 2: medium; 3: high) default=2
– date (date) : date and time when the alert was raised default=now
9.6. Alert Type 87

ITRS-Log-Analytics-7.x Documentation, Release 7.0.5
– tags (multi-string) : case tags default=empty
– tlp (number) : TLP (0: white; 1: green; 2: amber; 3: red) default=2
– status (AlertStatus) : status of the alert (New, Updated, Ignored, Imported) default=New
– type (string) : type of the alert (read only)
– source (string) : source of the alert (read only)
– sourceRef (string) : source reference of the alert (read only)
– artifacts (multi-artifact) : artifact of the alert. It is a array of JSON object containing artifact attributesdefault=empty
– follow (boolean) : if true, the alert becomes active when updated default=true
• hive_observable_data_mapping - mapping field values to the The Hive alert.
Note: When use: hive_alert_config_type: classic the following parameters are ignored:
hive_alert_config:title: title of the alertdescription: description of the alert
and you should use:
alert_subject: "title of the alert"alert_text: "description of the alert"
Example of configuration:
hive_alert_config_type: classic
hive_alert_config:type: 'test'source: 'elastalert-{rule[name]}'severity: 3tags: ['malicious behavior']tlp: 2status: 'New'follow: True
hive_observable_data_mapping:- ip: "{match[field1]}"- source: "{match[field2]}"
9.7 Alert Content
There are several ways to format the body text of the various types of events. In EBNF::
rule_name = namealert_text = alert_textruletype_text = Depends on typetop_counts_header = top_count_key, ":"top_counts_value = Value, ": ", Counttop_counts = top_counts_header, LF, top_counts_valuefield_values = Field, ": ", Value
88 Chapter 9. Alert Module

ITRS-Log-Analytics-7.x Documentation, Release 7.0.5
Similarly to alert_subject, alert_text can be further formatted using standard Python formatting syn-tax. The field names whose values will be used as the arguments can be passed with alert_text_argsor alert_text_kw. You may also refer to any top-level rule property in the alert_subject_args,alert_text_args, alert_missing_value, and alert_text_kw fields. However, if the matcheddocument has a key with the same name, that will take preference over the rule property.
By default::
body = rule_name
[alert_text]
ruletype_text
{top_counts}
{field_values}
With alert_text_type: alert_text_only::
body = rule_name
alert_text
With alert_text_type: exclude_fields::
body = rule_name
[alert_text]
ruletype_text
{top_counts}
With alert_text_type: aggregation_summary_only::
body = rule_name
aggregation_summary
ruletype_text is the string returned by RuleType.get_match_str.
field_values will contain every key value pair included in the results from Elasticsearch. These fields include“@timestamp” (or the value of timestamp_field), every key in include, every key in top_count_keys,query_key, and compare_key. If the alert spans multiple events, these values may come from an individualevent, usually the one which triggers the alert.
When using alert_text_args, you can access nested fields and index into arrays. For example, if your matchwas {"data": {"ips": ["127.0.0.1", "12.34.56.78"]}}, then by using "data.ips[1]" inalert_text_args, it would replace value with "12.34.56.78". This can go arbitrarily deep into fields andwill still work on keys that contain dots themselves.
9.7. Alert Content 89

ITRS-Log-Analytics-7.x Documentation, Release 7.0.5
9.8 Example of rules
9.8.1 Unix - Authentication Fail
• index pattern:
syslog-*
• Type:
Frequency
• Alert Method:
• Any:
num_events: 4timeframe:
minutes: 5
filter:- query_string:
query: "program: (ssh OR sshd OR su OR sudo) AND message: \"Failed password\→˓""
9.8.2 Windows - Firewall disable or modify
• index pattern:
beats-*
• Type:
Any
• Alert Method:
• Any:
filter:
- query_string:query: "event_id:(4947 OR 4948 OR 4946 OR 4949 OR 4954 OR 4956 OR 5025)
→˓"
9.8.3 SIEM Rules
Beginning with version 6.1.7, the following SIEM rules are delivered with the product.
90 Chapter 9. Alert Module

ITRS-Log-Analytics-7.x Documentation, Release 7.0.5
| Nr. | Architecture/Application | Rule Name→˓ | Description→˓
→˓
→˓
→˓
→˓
→˓
→˓ | Index name→˓| Requirements | Source |→˓Time definition | Threashold ||-----|--------------------------|----------------------------------------------------→˓----------|-------------------------------------------------------------------------→˓------------------------------------------------------------------------------------→˓------------------------------------------------------------------------------------→˓------------------------------------------------------------------------------------→˓------------------------------------------------------------------------------------→˓------------------------------------------------------------------------------------→˓------------------------------------------------------------------------------------→˓--------------------------------------------------------------------|--------------→˓|--------------------------------------------------|------------------------------|-→˓---------------------------|------------|| 1 | Windows | Windows - Admin night logon→˓ | Alert on Windows login events when detected outside business hours→˓
→˓
→˓
→˓
→˓
→˓
→˓ | winlogbeat-*→˓| winlogbeat | Widnows Security Eventlog |→˓Every 1min | 1 || 2 | Windows | Windows - Admin task as user→˓ | Alert when admin task is initiated by regular user. Windows event id→˓4732 is verified towards static admin list. If the user does not belong to admin→˓list AND the event is seen than we generate alert. Static Admin list is a logstash→˓disctionary file that needs to be created manually. During Logstash lookup a field→˓user.role:admin is added to an event.4732: A member was added to a security-enabled→˓local group→˓
→˓ |→˓winlogbeat-* | winlogbeatLogstash admin dicstionary lookup file | Widnows Security→˓Eventlog | Every 1min | 1 || 3 | Windows | Windows - diff IPs logon→˓ | Alert when Windows logon process is detected and two or more different→˓IP addressed are seen in source field. Timeframe is last 15min.Detection is based→˓onevents 4624 or 1200.4624: An account was successfully logged on1200: Application→˓token success→˓
→˓
→˓
→˓ | winlogbeat-→˓* | winlogbeat | Widnows Security Eventlog→˓| Every 1min, for last 15min | 1 || 4 | Windows | Windows - Event service error→˓ | Alert when Windows event 1108 is matched1108: The event logging service→˓encountered an error→˓
→˓
→˓
→˓
→˓
→˓ | winlogbeat-*→˓| winlogbeat | Widnows Security Eventlog |→˓Every 1min | 1 |
(continues on next page)
9.8. Example of rules 91

ITRS-Log-Analytics-7.x Documentation, Release 7.0.5
(continued from previous page)
| 5 | Windows | Windows - file insufficient privileges→˓ | Alert when Windows event 5145 is matched5145: A network share object→˓was checked to see whether client can be granted desired accessEvery time a network→˓share object (file or folder) is accessed, event 5145 is logged. If the access is→˓denied at the file share level, it is audited as a failure event. Otherwise, it→˓considered a success. This event is not generated for NTFS access.→˓
→˓
→˓ |→˓winlogbeat-* | winlogbeat | Widnows Security→˓Eventlog | Every 1min, for last 15min | 50 || 6 | Windows | Windows - Kerberos pre-authentication failed→˓ | Alert when Windows event 4625 or 4771 is matched 4625: An account→˓failed to log on 4771: Kerberos pre-authentication failed→˓
→˓
→˓
→˓
→˓
→˓ |→˓winlogbeat-* | winlogbeat | Widnows Security→˓Eventlog | Every 1min | 1 || 7 | Windows | Windows - Logs deleted→˓ | Alert when Windows event 1102 OR 104 is matched1102: The audit log was→˓cleared104: Event log cleared→˓
→˓
→˓
→˓
→˓
→˓ | winlogbeat-*→˓| winlogbeat | Widnows Security Eventlog |→˓Every 1min | 1 || 8 | Windows | Windows - Member added to a security-enabled→˓global group | Alert when Windows event 4728 is matched4728: A member was added→˓to a security-enabled global group→˓
→˓
→˓
→˓
→˓
→˓ |→˓winlogbeat-* | winlogbeat | Widnows Security→˓Eventlog | Every 1min | 1 || 9 | Windows | Windows - Member added to a security-enabled local→˓group | Alert when Windows event 4732 is matched4732: A member was added to a→˓security-enabled local group→˓
→˓
→˓
→˓
→˓
→˓ | winlogbeat-→˓* | winlogbeat | Widnows Security Eventlog→˓| Every 1min | 1 || 10 | Windows | Windows - Member added to a security-enabled→˓universal group | Alert when Windows event 4756 is matched4756: A member was added→˓to a security-enabled universal group→˓
→˓
→˓
→˓
→˓
→˓ |→˓winlogbeat-* | winlogbeat | Widnows Security→˓Eventlog | Every 1min | 1 |
(continues on next page)
92 Chapter 9. Alert Module

ITRS-Log-Analytics-7.x Documentation, Release 7.0.5
(continued from previous page)
| 11 | Windows | Windows - New device→˓ | Alert when Windows event 6414 is matched6416: A new external device was→˓recognized by the system→˓
→˓
→˓
→˓
→˓
→˓ | winlogbeat-*→˓| winlogbeat | Widnows Security Eventlog |→˓Every 1min | 1 || 12 | Windows | Windows - Package installation→˓ | Alert when Windows event 4697 is matched 4697: A service was installed→˓in the system→˓
→˓
→˓
→˓
→˓
→˓ | winlogbeat-*→˓| winlogbeat | Widnows Security Eventlog |→˓Every 1min | 1 || 13 | Windows | Windows - Password policy change→˓ | Alert when Windows event 4739 is matched4739: Domain Policy was changed→˓
→˓
→˓
→˓
→˓
→˓
→˓ | winlogbeat-*→˓| winlogbeat | Widnows Security Eventlog |→˓Every 1min | 1 || 14 | Windows | Windows - Security log full→˓ | Alert when Windows event 1104 is matched1104: The security Log is now→˓full→˓
→˓
→˓
→˓
→˓
→˓ | winlogbeat-→˓* | winlogbeat | Widnows Security Eventlog→˓| Every 1min | 1 || 15 | Windows | Windows - Start up→˓ | Alert when Windows event 4608 is matched 4608: Windows is starting up→˓
→˓
→˓
→˓
→˓
→˓
→˓ | winlogbeat-*→˓| winlogbeat | Widnows Security Eventlog |→˓Every 1min | 1 || 16 | Windows | Windows - Account lock→˓ | Alert when Windows event 4740 is matched4740: A User account was Locked→˓out→˓
→˓
→˓
→˓
→˓
→˓ | winlogbeat-*→˓| winlogbeat | Widnows Security Eventlog |→˓Every 1min | 1 |
(continues on next page)
9.8. Example of rules 93

ITRS-Log-Analytics-7.x Documentation, Release 7.0.5
(continued from previous page)
| 17 | Windows | Windows - Security local group was changed→˓ | Alert when Windows event 4735 is matched4735: A security-enabled local→˓group was changed→˓
→˓
→˓
→˓
→˓
→˓ | winlogbeat-*→˓| winlogbeat | Widnows Security Eventlog |→˓Every 1min | 1 || 18 | Windows | Windows - Reset password attempt→˓ | Alert when Windows event 4724 is matched4724: An attempt was made to→˓reset an accounts password→˓
→˓
→˓
→˓
→˓
→˓ | winlogbeat-→˓* | winlogbeat | Widnows Security Eventlog→˓| Every 1min | 1 || 19 | Windows | Windows - Code integrity changed→˓ | Alert when Windows event 5038 is matched5038: Detected an invalid image→˓hash of a fileInformation: Code Integrity is a feature that improves the→˓security of the operating system by validating the integrity of a driver or system→˓file each time it is loaded into memory. Code Integrity detects whether an→˓unsigned driver or system file is being loaded into the kernel, or whether a system→˓file has been modified by malicious software that is being run by a user account→˓with administrative permissions. On x64-based versions of the operating system,→˓kernel-mode drivers must be digitally signed.The event logs the following→˓information: | winlogbeat-* | winlogbeat |→˓Widnows Security Eventlog | Every 1min | 1 || 20 | Windows | Windows - Application error→˓ | Alert when Windows event 1000 is matched1000: Application error→˓
→˓
→˓
→˓
→˓
→˓
→˓ | winlogbeat-*→˓| winlogbeat | Widnows Application Eventlog |→˓Every 1min | 1 || 21 | Windows | Windows - Application hang→˓ | Alert when Windows event 1001 OR 1002 is matched1001: Application fault→˓bucket1002: Application hang→˓
→˓
→˓
→˓
→˓
→˓ | winlogbeat-*→˓| winlogbeat | Widnows Application Eventlog |→˓Every 1min | 1 || 22 | Windows | Windows - Audit policy changed→˓ | Alert when Windows event 4719 is matched4719: System audit policy was→˓changed→˓
→˓
→˓
→˓
→˓
→˓ | winlogbeat-→˓* | winlogbeat | Widnows Security Eventlog→˓| Every 1min | 1 |
(continues on next page)
94 Chapter 9. Alert Module

ITRS-Log-Analytics-7.x Documentation, Release 7.0.5
(continued from previous page)
| 23 | Windows | Windows - Eventlog service stopped→˓ | Alert when Windows event 6005 is matched6005: Eventlog service stopped→˓
→˓
→˓
→˓
→˓
→˓
→˓ | winlogbeat-*→˓| winlogbeat | Widnows Security Eventlog |→˓Every 1min | 1 || 24 | Windows | Windows - New service installed→˓ | Alert when Windows event 7045 OR 4697 is matched7045,4697: A service→˓was installed in the system→˓
→˓
→˓
→˓
→˓
→˓ | winlogbeat-→˓* | winlogbeat | Widnows Security Eventlog→˓| Every 1min | 1 || 25 | Windows | Windows - Driver loaded→˓ | Alert when Windows event 6 is matched6: Driver loadedThe driver loaded→˓events provides information about a driver being loaded on the system. The→˓configured hashes are provided as well as signature information. The signature is→˓created asynchronously for performance reasons and indicates if the file was→˓removed after loading.→˓
→˓
→˓
→˓ | winlogbeat-* | winlogbeat | Widnows→˓System Eventlog | Every 1min | 1 || 26 | Windows | Windows - Firewall rule modified→˓ | Alert when Windows event 2005 is matched2005: A Rule has been modified→˓in the Windows firewall Exception List→˓
→˓
→˓
→˓
→˓
→˓ | winlogbeat-*→˓| winlogbeat | Widnows Security Eventlog |→˓Every 1min | 1 || 27 | Windows | Windows - Firewall rule add→˓ | Alert when Windows event 2004 is matched2004: A firewall rule has been→˓added→˓
→˓
→˓
→˓
→˓
→˓ | winlogbeat-*→˓| winlogbeat | Widnows Security Eventlog |→˓Every 1min | 1 || 28 | | Windows - Firewall rule deleted→˓ | Alert when Windows event 2006 or 2033 or 2009 is matched2006,2033,2009:→˓Firewall rule deleted→˓
→˓
→˓
→˓
→˓
→˓ | winlogbeat-*→˓| winlogbeat | Widnows Security Eventlog |→˓Every 1min | 1 |
(continues on next page)
9.8. Example of rules 95

ITRS-Log-Analytics-7.x Documentation, Release 7.0.5
(continued from previous page)
9.9 Playbooks
ITRS Log Analytics has a set of predefined set of rules and activities (called Playbook) that can be attached to aregistered event in the Alert module. Playbooks can be enriched with scripts that can be launched together withPlaybook.
9.9.1 Create Playbook
To add a new playbook, go to the Alert module, select the Playbook tab and then Create Playbook
96 Chapter 9. Alert Module

ITRS-Log-Analytics-7.x Documentation, Release 7.0.5
In the Name field, enter the name of the new Playbook.
9.9. Playbooks 97

ITRS-Log-Analytics-7.x Documentation, Release 7.0.5
In the Text field, enter the content of the Playbook message.
In the Script field, enter the commands to be executed in the script.
To save the entered content, confirm with the Submit button.
9.9.2 Playbooks list
To view saved Playbook, go to the Alert module, select the Playbook tab and then Playbooks list:
To view the content of a given Playbook, select the Show button.
To enter the changes in a given Playbook or in its script, select the Update button. After making changes, select theSubmit button.
To delete the selected Playbook, select the Delete button.
9.9.3 Linking Playbooks with alert rule
You can add a Playbook to the Alert while creating a new Alert or by editing a previously created Alert.
To add Palybook to the new Alert rule, go to the Create alert rule tab and in the Playbooks section use the arrowkeys to move the correct Playbook to the right window.
To add a Palybook to existing Alert rule, go to the Alert rule list tab with the correct rule select the Update buttonand in the Playbooks section use the arrow keys to move the correct Playbook to the right window.
9.9.4 Playbook verification
When creating an alert or while editing an existing alert, it is possible that the system will indicate the most-suitedplaybook for the alert. For this purpose, the Validate button is used, which starts the process of searching the existingplaybook and selects the most appropriate ones.
98 Chapter 9. Alert Module

ITRS-Log-Analytics-7.x Documentation, Release 7.0.5
9.10 Risks
ITRS Log Analytics allows you to estimate the risk based on the collected data. The risk is estimated based on thedefined category to which the values from 0 to 100 are assigned.
Information on the defined risk for a given field is passed with an alert and multiplied by the value of the RuleImportance parameter.
9.10.1 Create category
To add a new risk Category, go to the Alert module, select the Risks tab and then Create Cagtegory.
9.10. Risks 99

ITRS-Log-Analytics-7.x Documentation, Release 7.0.5
Enter the Name for the new category and the category Value.
9.10.2 Category list
To view saved Category, go to the Alert module, select the Risks tab and then Categories list:
To view the content of a given Category, select the Show button.
To change the value assigned to a category, select the Update button. After making changes, select the Submit button.
To delete the selected Category, select the Delete button.
9.10.3 Create risk
To add a new playbook, go to the Alert module, select the Playbook tab and then Create Playbook
100 Chapter 9. Alert Module

ITRS-Log-Analytics-7.x Documentation, Release 7.0.5
In the Index pattern field, enter the name of the index pattern. Select the Read fields button to get a list of fields fromthe index. From the box below, select the field name for which the risk will be determined.
From the Timerange field, select the time range from which the data will be analyzed.
Press the Read valules button to get values from the previously selected field for analysis.
Next, you must assign a risk category to the displayed values. You can do this for each value individually or use thecheck-box on the left to mark several values and set the category globally using the Set global category button. Toquickly find the right value, you can use the search field.
After completing, save the changes with the Submit button.
9.10.4 List risk
To view saved risks, go to the Alert module, select the Risks tab and then Risks list:
9.10. Risks 101

ITRS-Log-Analytics-7.x Documentation, Release 7.0.5
To view the content of a given Risk, select the Show button.
To enter the changes in a given Risk, select the Update button. After making changes, select the Submit button.
To delete the selected Risk, select the Delete button.
9.10.5 Linking risk with alert rule
You can add a Risk key to the Alert while creating a new Alert or by editing a previously created Alert.
To add Risk key to the new Alert rule, go to the Create alert rule tab and after entering the index name, select theRead fields button and in the Risk key field, select the appropriate field name. In addition, you can enter the validityof the rule in the Rule Importance field (in the range 1-100%), by which the risk will be multiplied.
To add Risk key to the existing Alert rule, go to the Alert rule list, tab with the correct rule select the Update button.Use the Read fields button and in the Risk key field, select the appropriate field name. In addition, you can enter thevalidity of the rule in the Rule Importance.
9.10.6 Risk calculation algorithms
The risk calculation mechanism performs the aggregation of the risk field values. We have the following algorithmsfor calculating the alert risk (Aggregation type):
• min - returns the minimum value of the risk values from selected fields;
• max - returns the maximum value of the risk values from selected fields;
• avg - returns the average of risk values from selected fields;
• sum - returns the sum of risk values from selected fields;
• custom - returns the risk value based on your own algorithm
9.10.7 Adding a new risk calculation algorithm
The new algorithm should be added in the ./elastalert_modules/playbook_util.py file in thecalculate_risk method. There is a sequence of conditional statements for already defined algorithms:
102 Chapter 9. Alert Module

ITRS-Log-Analytics-7.x Documentation, Release 7.0.5
#aggregate values by risk_key_aggregation for ruleif risk_key_aggregation == "MIN":
value_agg = min(values)elif risk_key_aggregation == "MAX":
value_agg = max(values)elif risk_key_aggregation == "SUM":
value_agg = sum(values)elif risk_key_aggregation == "AVG":
value_agg = sum(values)/len(values)else:
value_agg = max(values)
To add a new algorithm, add a new sequence as shown in the above code:
elif risk_key_aggregation == "AVG":value_agg = sum(values)/len(values)
elif risk_key_aggregation == "AAA":value_agg = BBB
else:value_agg = max(values)
where AAA is the algorithm code, BBB is a risk calculation function.
9.10.8 Using the new algorithm
After adding a new algorithm, it is available in the GUI in the Alert tab.
To use it, add a new rule according to the following steps:
• Select the custom value in the Aggregation type field;
• Enter the appropriate value in the Any field, e.g. risk_key_aggregation: AAA
The following figure shows the places where you can call your own algorithm:
9.10. Risks 103

ITRS-Log-Analytics-7.x Documentation, Release 7.0.5
9.10.9 Additional modification of the algorithm (weight)
Below is the code in the calcuate_risk method where category values are retrieved - here you can add yourweight:
#start loop by tablicy risk_keyfor k in range(len(risk_keys)):
risk_key = risk_keys[k]logging.info(' >>>>>>>>>>>>>> risk_key: ')logging.info(risk_key)key_value = lookup_es_key(match, risk_key)logging.info(' >>>>>>>>>>>>>> key_value: ')logging.info(key_value)value = float(self.get_risk_category_value(risk_key, key_value))values.append( value )logging.info(' >>>>>>>>>>>>>> risk_key values: ')logging.info(values)
#finish loop by tablicy risk_key#aggregate values by risk_key_aggregation form ruleif risk_key_aggregation == "MIN":
(continues on next page)
104 Chapter 9. Alert Module

ITRS-Log-Analytics-7.x Documentation, Release 7.0.5
(continued from previous page)
value_agg = min(values)elif risk_key_aggregation == "MAX":
value_agg = max(values)elif risk_key_aggregation == "SUM":
value_agg = sum(values)elif risk_key_aggregation == "AVG":
value_agg = sum(values)/len(values)else:
value_agg = max(values)
Risk_key is the array of selected risk key fields in the GUI. A loop is made on this array and a value is collected forthe categories in the line:
value = float(self.get_risk_category_value(risk_key, key_value))
Based on, for example, Risk_key, you can multiply the value of the value field by the appropriate weight. The valuefield value is then added to the table on which the risk calculation algorithms are executed.
9.11 Incidents
The Incident module allows you to handle incidents created by triggered alert rules.
media/media/image154.PNG
Incident handling allows you to perform the following action:
• Show incident - shows the details that generated the incident;
• Verify - checks the IP addresses of those responsible for causing an incident with the system reputation lists;
• Preview - takes you to the Discover module and to the raw document responsible for generating the incident;
• Update - allows you to change the Incident status or transfer the incident handling to another user. Status list:New, Ongoing, False, Solved.
• Playbooks - enables handling of Playbooks assigned to an incident;
• Note - User notes about the incident;
9.11.1 Incident Escalation
The alarm rule definition allows an incident to be escalated if the incident status does not change (from New toOngoing) after a defined time.
Configuration parameter
• escalate_users - an array of users who get an email alert about the escalation;
• escalate_after - the time after which the escalation is triggered;
Example of configuration:
9.11. Incidents 105

ITRS-Log-Analytics-7.x Documentation, Release 7.0.5
escalate_users:["user2", "user3"]escalate_after:
- hours: 6
9.12 Indicators of compromise (IoC)
ITRS Log-Analytics has the Indicators of compromise (IoC) functionality, which is based on the Malware InformationSharing Platform (MISP). IoC observes the logs sent to the system and marks documents if their content is in MISPsignature. Based on IoC markings, you can build alert rules or track incident behavior.
9.12.1 Configuration
Bad IP list update
To update bad reputation lists and to create .blacklists index, you have to run following scripts:
/etc/logstash/lists/bin/badreputation_iplists.sh/etc/logstash/lists/bin/misp_threat_lists.sh
Scheduling bad IP lists update
This can be done in cron (host with Logstash installed):
0 1 * * * logstash /etc/logstash/lists/bin/badreputation_iplists.sh0 6 * * * logstash /etc/logstash/lists/bin/misp_threat_lists.sh
or with Kibana Scheduller app (only if Logstash is running on the same host).
• Prepare script path:
/bin/ln -sfn /etc/logstash/lists/bin /opt/ai/bin/listschown logstash:kibana /etc/logstash/lists/chmod g+w /etc/logstash/lists/
• Log in to ITRS Log Analytics GUI and go to Scheduler app. Set it up with below options and push “Submit”button:
Name: BadReputationListCron pattern: 0 1 * * *Command: lists/badreputation_iplists.shCategory: logstash
and second:
Name: MispThreatListCron pattern: 0 1 * * *Command: lists/misp_threat_lists.shCategory: l\logstash
After a couple of minutes check for blacklists index:
106 Chapter 9. Alert Module

ITRS-Log-Analytics-7.x Documentation, Release 7.0.5
curl -sS -u user:password -XGET '127.0.0.1:9200/_cat/indices/.blacklists?s=index&v'health status index uuid pri rep docs.count docs.deleted→˓store.size pri.store.sizegreen open .blacklists Mld2Qe2bSRuk2VyKm-KoGg 1 0 76549 0→˓4.7mb 4.7mb
Configuration alert rule
9.13 Calendar function
The alert rule can be executed based on a schedule called Calendar.
9.13.1 Create a calendar system
The configuration of the Calendar Function should be done in the definition of the Rule Definition alert usingthe calendar and scheduler options, in Crontab format.
For example, we want to have an alert that:
• triggers only on working days from 8:00 to 16:00;
• only triggers on weekends;
calendar:schedule: "* 8-15 * * mon-fri"
If aggregation is used in the alert definition, remember that the aggregation schedule should be the same as thedefined calendar.
9.13. Calendar function 107

ITRS-Log-Analytics-7.x Documentation, Release 7.0.5
108 Chapter 9. Alert Module

CHAPTER 10
SIEM Plan
10.1 System security
10.1.1 Wazuh
Configuration
Audit
CIS
FIM
OpenSCAP
Policy Monitoring
10.1.2 Windows Events
Active Directory
Events ID repository
+----------------+----------------+----------------+----------------+----------------→˓+----------------+----------------+| Category | Subcategory | Type | Event Log | Event ID→˓| Describe | Event ID for || | | | |→˓| | Windows 2003 |+================+================+================+================+================+================+================+| Account Logon | Credential | Success, | Security | 4776→˓| The domain | 680, 681 | (continues on next page)
109

ITRS-Log-Analytics-7.x Documentation, Release 7.0.5
(continued from previous page)
| | Validation | Failure | |→˓| controller | || | | | |→˓| attempted to | || | | | |→˓| validate the | || | | | |→˓| credentials | || | | | |→˓| for an account | |+----------------+----------------+----------------+----------------+----------------→˓+----------------+----------------+| Account | Computer | Success | Security | 4741→˓| A computer | 645 || Management | Account | | |→˓| account was | || | Management | | |→˓| created | |+----------------+----------------+----------------+----------------+----------------→˓+----------------+----------------+| Account | Computer | Success | Security | 4742→˓| A computer | 646 || Management | Account | | |→˓| account was | || | Management | | |→˓| changed | |+----------------+----------------+----------------+----------------+----------------→˓+----------------+----------------+| Account | Computer | Success | Security | 4743→˓| A computer | 647 || Management | Account | | |→˓| account was | || | Management | | |→˓| deleted | |+----------------+----------------+----------------+----------------+----------------→˓+----------------+----------------+| Account | Distribution | Success | Security | 4744→˓| A security- | 648 || Management | Group | | |→˓| disabled local | || | Management | | |→˓| group was | || | | | |→˓| created | |+----------------+----------------+----------------+----------------+----------------→˓+----------------+----------------+| Account | Distribution | Success | Security | 4746→˓| A member was | 650 || Management | Group | | |→˓| added to a | || | Management | | |→˓| security- | || | | | |→˓| disabled local | || | | | |→˓| group | |+----------------+----------------+----------------+----------------+----------------→˓+----------------+----------------+ (continues on next page)
110 Chapter 10. SIEM Plan

ITRS-Log-Analytics-7.x Documentation, Release 7.0.5
(continued from previous page)
| Account | Distribution | Success | Security | 4747→˓| A member was | 651 || Management | Group | | |→˓| removed from a | || | Management | | |→˓| security- | || | | | |→˓| disabled local | || | | | |→˓| group | |+----------------+----------------+----------------+----------------+----------------→˓+----------------+----------------+| Account | Distribution | Success | Security | 4748→˓| A security- | 652 || Management | Group | | |→˓| disabled local | || | Management | | |→˓| group was | || | | | |→˓| deleted | |+----------------+----------------+----------------+----------------+----------------→˓+----------------+----------------+| Account | Distribution | Success | Security | 4749→˓| A security- | 653 || Management | Group | | |→˓| disabled | || | Management | | |→˓| global group | || | | | |→˓| was created | |+----------------+----------------+----------------+----------------+----------------→˓+----------------+----------------+| Account | Distribution | Success | Security | 4751→˓| A member was | 655 || Management | Group | | |→˓| added to a | || | Management | | |→˓| security- | || | | | |→˓| disabled | || | | | |→˓| global group | |+----------------+----------------+----------------+----------------+----------------→˓+----------------+----------------+| Account | Distribution | Success | Security | 4752→˓| A member was | 656 || Management | Group | | |→˓| removed from a | || | Management | | |→˓| security- | || | | | |→˓| disabled | || | | | |→˓| global group | |+----------------+----------------+----------------+----------------+----------------→˓+----------------+----------------+| Account | Distribution | Success | Security | 4753→˓| A security- | 657 | (continues on next page)
10.1. System security 111

ITRS-Log-Analytics-7.x Documentation, Release 7.0.5
(continued from previous page)
| Management | Group | | |→˓| disabled | || | Management | | |→˓| global group | || | | | |→˓| was deleted | |+----------------+----------------+----------------+----------------+----------------→˓+----------------+----------------+| Account | Distribution | Success | Security | 4759→˓| A security- | 663 || Management | Group | | |→˓| disabled | || | Management | | |→˓| universal | || | | | |→˓| group was | || | | | |→˓| created | |+----------------+----------------+----------------+----------------+----------------→˓+----------------+----------------+| Account | Distribution | Success | Security | 4761→˓| A member was | 655 || Management | Group | | |→˓| added to a | || | Management | | |→˓| security- | || | | | |→˓| disabled | || | | | |→˓| universal | || | | | |→˓| group | |+----------------+----------------+----------------+----------------+----------------→˓+----------------+----------------+| Account | Distribution | Success | Security | 4762→˓| A member was | 666 || Management | Group | | |→˓| removed from a | || | Management | | |→˓| security- | || | | | |→˓| disabled | || | | | |→˓| universal | || | | | |→˓| group | |+----------------+----------------+----------------+----------------+----------------→˓+----------------+----------------+| Account | Security Group | Success | Security | 4727→˓| A security- | 631 || Management | Management | | |→˓| enabled global | || | | | |→˓| group was | || | | | |→˓| created | |+----------------+----------------+----------------+----------------+----------------→˓+----------------+----------------+ (continues on next page)
112 Chapter 10. SIEM Plan

ITRS-Log-Analytics-7.x Documentation, Release 7.0.5
(continued from previous page)
| Account | Security Group | Success | Security | 4728→˓| A member was | 632 || Management | Management | | |→˓| added to a | || | | | |→˓| security- | || | | | |→˓| enabled global | || | | | |→˓| group | |+----------------+----------------+----------------+----------------+----------------→˓+----------------+----------------+| Account | Security Group | Success | Security | 4729→˓| A member was | 633 || Management | Management | | |→˓| removed from a | || | | | |→˓| security- | || | | | |→˓| enabled global | || | | | |→˓| group | |+----------------+----------------+----------------+----------------+----------------→˓+----------------+----------------+| Account | Security Group | Success | Security | 4730→˓| A security- | 634 || Management | Management | | |→˓| enabled global | || | | | |→˓| group was | || | | | |→˓| deleted | |+----------------+----------------+----------------+----------------+----------------→˓+----------------+----------------+| Account | Security Group | Success | Security | 4731→˓| A security- | 635 || Management | Management | | |→˓| enabled local | || | | | |→˓| group was | || | | | |→˓| created | |+----------------+----------------+----------------+----------------+----------------→˓+----------------+----------------+| Account | Security Group | Success | Security | 4732→˓| A member was | 636 || Management | Management | | |→˓| added to a | || | | | |→˓| security- | || | | | |→˓| enabled local | || | | | |→˓| group | |+----------------+----------------+----------------+----------------+----------------→˓+----------------+----------------+| Account | Security Group | Success | Security | 4733→˓| A member was | 637 | (continues on next page)
10.1. System security 113

ITRS-Log-Analytics-7.x Documentation, Release 7.0.5
(continued from previous page)
| Management | Management | | |→˓| removed from a | || | | | |→˓| security- | || | | | |→˓| enabled local | || | | | |→˓| group | |+----------------+----------------+----------------+----------------+----------------→˓+----------------+----------------+| Account | Security Group | Success | Security | 4734→˓| A security- | 638 || Management | Management | | |→˓| enabled local | || | | | |→˓| group was | || | | | |→˓| deleted | |+----------------+----------------+----------------+----------------+----------------→˓+----------------+----------------+| Account | Security Group | Success | Security | 4754→˓| A security- | 658 || Management | Management | | |→˓| enabled | || | | | |→˓| universal | || | | | |→˓| group was | || | | | |→˓| created | |+----------------+----------------+----------------+----------------+----------------→˓+----------------+----------------+| Account | Security Group | Success | Security | 4755→˓| A security- | 659 || Management | Management | | |→˓| enabled | || | | | |→˓| universal | || | | | |→˓| group was | || | | | |→˓| changed | |+----------------+----------------+----------------+----------------+----------------→˓+----------------+----------------+| Account | Security Group | Success | Security | 4756→˓| A member was | 660 || Management | Management | | |→˓| added to a | || | | | |→˓| security- | || | | | |→˓| enabled | || | | | |→˓| universal | || | | | |→˓| group | |+----------------+----------------+----------------+----------------+----------------→˓+----------------+----------------+ (continues on next page)
114 Chapter 10. SIEM Plan

ITRS-Log-Analytics-7.x Documentation, Release 7.0.5
(continued from previous page)
| Account | Security Group | Success | Security | 4757→˓| A member was | 661 || Management | Management | | |→˓| removed from a | || | | | |→˓| security- | || | | | |→˓| enabled | || | | | |→˓| universal | || | | | |→˓| group | |+----------------+----------------+----------------+----------------+----------------→˓+----------------+----------------+| Account | Security Group | Success | Security | 4758→˓| A security- | 662 || Management | Management | | |→˓| enabled | || | | | |→˓| universal | || | | | |→˓| group was | || | | | |→˓| deleted | |+----------------+----------------+----------------+----------------+----------------→˓+----------------+----------------+| Account | Security Group | Success | Security | 4764→˓| A groups type | 668 || Management | Management | | |→˓| was changed | |+----------------+----------------+----------------+----------------+----------------→˓+----------------+----------------+| Account | User Account | Success | Security | 4720→˓| A user account | 624 || Management | Management | | |→˓| was created | |+----------------+----------------+----------------+----------------+----------------→˓+----------------+----------------+| Account | User Account | Success | Security | 4722→˓| A user account | 626 || Management | Management | | |→˓| was enabled | |+----------------+----------------+----------------+----------------+----------------→˓+----------------+----------------+| Account | User Account | Success | Security | 4723→˓| An attempt was | 627 || Management | Management | | |→˓| made to change | || | | | |→˓| an account's | || | | | |→˓| password | |+----------------+----------------+----------------+----------------+----------------→˓+----------------+----------------+| Account | User Account | Success | Security | 4724→˓| An attempt was | 628 || Management | Management | | |→˓| made to reset | | (continues on next page)
10.1. System security 115

ITRS-Log-Analytics-7.x Documentation, Release 7.0.5
(continued from previous page)
| | | | |→˓| an accounts | || | | | |→˓| password | |+----------------+----------------+----------------+----------------+----------------→˓+----------------+----------------+| Account | User Account | Success | Security | 4725→˓| A user account | 629 || Management | Management | | |→˓| was disabled | |+----------------+----------------+----------------+----------------+----------------→˓+----------------+----------------+| Account | User Account | Success | Security | 4726→˓| A user account | 630 || Management | Management | | |→˓| was deleted | |+----------------+----------------+----------------+----------------+----------------→˓+----------------+----------------+| Account | User Account | Success | Security | 4738→˓| A user account | 642 || Management | Management | | |→˓| was changed | |+----------------+----------------+----------------+----------------+----------------→˓+----------------+----------------+| Account | User Account | Success | Security | 4740→˓| A user account | 644 || Management | Management | | |→˓| was locked out | |+----------------+----------------+----------------+----------------+----------------→˓+----------------+----------------+| Account | User Account | Success | Security | 4765→˓| SID History | || Management | Management | | |→˓| was added to | || | | | |→˓| an account | |+----------------+----------------+----------------+----------------+----------------→˓+----------------+----------------+| Account | User Account | Failure | Security | 4766→˓| An attempt to | || Management | Management | | |→˓| add SID | || | | | |→˓| History to an | || | | | |→˓| account failed | |+----------------+----------------+----------------+----------------+----------------→˓+----------------+----------------+| Account | User Account | Success | Security | 4781→˓| The name of an | 685 || Management | Management | | |→˓| account was | || | | | |→˓| changed | |+----------------+----------------+----------------+----------------+----------------→˓+----------------+----------------+| Directory | Directory | Success | Security | 5136→˓| A directory | 566 | (continues on next page)
116 Chapter 10. SIEM Plan

ITRS-Log-Analytics-7.x Documentation, Release 7.0.5
(continued from previous page)
| Service | Service | | |→˓| service object | || | Changes | | |→˓| was modified | |+----------------+----------------+----------------+----------------+----------------→˓+----------------+----------------+| Directory | Directory | Success | Security | 5137→˓| A directory | 566 || Service | Service | | |→˓| service object | || | Changes | | |→˓| was created | |+----------------+----------------+----------------+----------------+----------------→˓+----------------+----------------+| Directory | Directory | Success | Security | 5138→˓| A directory | || Service | Service | | |→˓| service object | || | Changes | | |→˓| was undeleted | |+----------------+----------------+----------------+----------------+----------------→˓+----------------+----------------+| Directory | Directory | Success | Security | 5139→˓| A directory | || Service | Service | | |→˓| service object | || | Changes | | |→˓| was moved | |+----------------+----------------+----------------+----------------+----------------→˓+----------------+----------------+| Directory | Directory | Failure | Security | 5141→˓| A directory | || Service | Service | | |→˓| service object | || | Changes | | |→˓| was deleted | |+----------------+----------------+----------------+----------------+----------------→˓+----------------+----------------+| Logon/Logoff | Logon | Success | Security | 4624→˓| An account was | 528 , 540 || | | | |→˓| successfully | || | | | |→˓| logged on | |+----------------+----------------+----------------+----------------+----------------→˓+----------------+----------------+| Logon/Logoff | Logon | Failure | Security | 4625→˓| An account | 529 , 530 , || | | | |→˓| failed to log | 531 , 532 , || | | | |→˓| on | 533 , 534 , || | | | |→˓| | 535 , 536 , || | | | |→˓| | 537 , 539 |+----------------+----------------+----------------+----------------+----------------→˓+----------------+----------------+ (continues on next page)
10.1. System security 117

ITRS-Log-Analytics-7.x Documentation, Release 7.0.5
(continued from previous page)
| Object Access | Detailed File | Success, | Security | 5145→˓| A network | || | Share | Failure | |→˓| share object | || | | | |→˓| was checked to | || | | | |→˓| see whether | || | | | |→˓| client can be | || | | | |→˓| granted | || | | | |→˓| desired access | |+----------------+----------------+----------------+----------------+----------------→˓+----------------+----------------+| Object Access | File Share | Success | Security | 5140→˓| A network | || | | | |→˓| share object | || | | | |→˓| was accessed | |+----------------+----------------+----------------+----------------+----------------→˓+----------------+----------------+| Object Access | File Share | Success | Security | 5142→˓| A network | || | | | |→˓| share object | || | | | |→˓| was added. | |+----------------+----------------+----------------+----------------+----------------→˓+----------------+----------------+| Object Access | File System, | Success | Security | 4663→˓| An attempt was | 567 || | Registry, | | |→˓| made to access | || | Kernel Object, | | |→˓| an object | || | SAM, Other | | |→˓| | || | Object Access | | |→˓| | || | Events | | |→˓| | |+----------------+----------------+----------------+----------------+----------------→˓+----------------+----------------+| Object Access | File System, | Success | Security | 4670→˓| Permissions on | || | Registry, | | |→˓| an object were | || | Policy Change, | | |→˓| changed | || | Authorization | | |→˓| | || | Policy Change | | |→˓| | |+----------------+----------------+----------------+----------------+----------------→˓+----------------+----------------+ (continues on next page)
118 Chapter 10. SIEM Plan

ITRS-Log-Analytics-7.x Documentation, Release 7.0.5
(continued from previous page)
| Object Access | File System, | Success, | Security | 4656→˓| A handle to an | 560 || | Registry, SAM, | Failure | |→˓| object was | || | Handle | | |→˓| requested | || | Manipulation, | | |→˓| | || | Other Object | | |→˓| | || | Access Events | | |→˓| | |+----------------+----------------+----------------+----------------+----------------→˓+----------------+----------------+| Object Access | | Success | Security | 561→˓| Handle | || | | | |→˓| Allocated | |+----------------+----------------+----------------+----------------+----------------→˓+----------------+----------------+| System | Security State | Success | Security | 4608→˓| Windows is | 512 || | Change | | |→˓| starting up | |+----------------+----------------+----------------+----------------+----------------→˓+----------------+----------------+| System | Security State | Success | Security | 4616→˓| The system | 520 || | Change | | |→˓| time was | || | | | |→˓| changed. | |+----------------+----------------+----------------+----------------+----------------→˓+----------------+----------------+| System | Security | Success | Security | 4610→˓| An | 514 || | System | | |→˓| authentication | || | Extension | | |→˓| package has | || | | | |→˓| been loaded by | || | | | |→˓| the Local | || | | | |→˓| Security | || | | | |→˓| Authority | |+----------------+----------------+----------------+----------------+----------------→˓+----------------+----------------+| System | System | Success | Security | 4612→˓| Internal | 516 || | Integrity | | |→˓| resources | || | | | |→˓| allocated for | || | | | |→˓| the queuing of | | (continues on next page)
10.1. System security 119

ITRS-Log-Analytics-7.x Documentation, Release 7.0.5
(continued from previous page)
| | | | |→˓| audit messages | || | | | |→˓| have been | || | | | |→˓| exhausted, | || | | | |→˓| leading to the | || | | | |→˓| loss of some | || | | | |→˓| audits | |+----------------+----------------+----------------+----------------+----------------→˓+----------------+----------------+| System | System | Success | Security | 4615→˓| Invalid use of | 519 || | Integrity | | |→˓| LPC port | |+----------------+----------------+----------------+----------------+----------------→˓+----------------+----------------+
10.1.3 Linux
Syslog
10.1.4 IOC
10.2 Network Analytics Plan
10.2.1 Network probe
Configuration
Bad reputation
By source
By destination
Topology
10.2.2 Netflow analyzis
The Logstash collector receives and decodes Network Flows using the provided decoders. During decoding, IP addressreputation analysis is performed and the result is added to the event document.
Installation
120 Chapter 10. SIEM Plan

ITRS-Log-Analytics-7.x Documentation, Release 7.0.5
Install/update logstash codec plugins for netflox and sflow
/usr/share/logstash/bin/logstash-plugin install file:///etc/logstash/netflow/bin/→˓logstash-codec-sflow-2.1.2.gem.zip/usr/share/logstash/bin/logstash-plugin install file:///etc/logstash/netflow/bin/→˓logstash-codec-netflow-4.2.1.gem.zip/usr/share/logstash/bin/logstash-plugin install file:///etc/logstash/netflow/bin/→˓logstash-input-udp-3.3.4.gem.zip/usr/share/logstash/bin/logstash-plugin update logstash-input-tcp/usr/share/logstash/bin/logstash-plugin update logstash-filter-translate/usr/share/logstash/bin/logstash-plugin update logstash-filter-geoip/usr/share/logstash/bin/logstash-plugin update logstash-filter-dns
Configuration
Enable Logstash pipeline
vim /etc/logstash/pipeline.yml
- pipeline.id: flowspath.config: "/etc/logstash/conf.d/netflow/*.conf"
Elasticsearch template installation
curl -XPUT -H 'Content-Type: application/json' -u logserver:logserver 'http://127.0.0.→˓1:9200/_template/netflow' -d@/etc/logstash/templates.d/netflow-template.json
Importing Kibana dashboards
curl -k -X POST -ulogserver:logserver "https://localhost:5601/api/kibana/dashboards/→˓import" -H 'kbn-xsrf: true' -H 'Content-Type: application/json' [email protected] -k -X POST -ulogserver:logserver "https://localhost:5601/api/kibana/dashboards/→˓import" -H 'kbn-xsrf: true' -H 'Content-Type: application/json' [email protected] -k -X POST -ulogserver:logserver "https://localhost:5601/api/kibana/dashboards/→˓import" -H 'kbn-xsrf: true' -H 'Content-Type: application/json' [email protected] -k -X POST -ulogserver:logserver "https://localhost:5601/api/kibana/dashboards/→˓import" -H 'kbn-xsrf: true' -H 'Content-Type: application/json' [email protected] -k -X POST -ulogserver:logserver "https://localhost:5601/api/kibana/dashboards/→˓import" -H 'kbn-xsrf: true' -H 'Content-Type: application/json' [email protected]
Enable bad reputation lists update
crontab -e0 4 * * * /etc/logstash/lists/bin/badreputation_iplists.sh
10.2. Network Analytics Plan 121

ITRS-Log-Analytics-7.x Documentation, Release 7.0.5
Enable reverse dns lookup
To enbled revere DNS lookup set the USE_DNS:false to USE_DNS:true in 13-filter-dns-geoip.conf
Optionally set both dns servers ${DNS_SRV:8.8.8.8} to your local dns
122 Chapter 10. SIEM Plan

ITRS-Log-Analytics-7.x Documentation, Release 7.0.5
10.2. Network Analytics Plan 123

ITRS-Log-Analytics-7.x Documentation, Release 7.0.5
10.3 Security rules
10.3.1 MS Windows SIEM rules
10.3.2 Network Switch SIEM rules
10.3.3 Cisco ASA devices SIEM rules
10.3.4 Linux Mail SIEM rules
10.3.5 Linux DNS Bind SIEM Rules
10.3.6 Fortigate Devices SIEM rules
10.3.7 Linux Apache SIEM rules
10.3.8 RedHat / CentOS system SIEM rules
10.3.9 Checkpoint devices SIEM rules
10.3.10 Cisco ESA devices SIEM rule
10.3.11 Forcepoint devices SIEM rules
10.3.12 Oracle Database Engine SIEM rules
10.3.13 Paloalto devices SIEM rules
10.3.14 Microsoft Exchange SIEM rules
10.3.15 Juniper Devices SIEM Rules
10.3.16 Fudo SIEM Rules
10.3.17 Squid SIEM Rules
10.3.18 McAfee SIEM Rules
10.3.19 Microsoft DNS Server SIEM Rules
10.3.20 Microsoft DHCP SIEM Rules
10.3.21 Linux DHCP Server SIEM Rules
10.3.22 Cisco VPN devices SIEM Rules
10.3.23 Netflow SIEM Rules
10.3.24 MikroTik devices SIEM Rules
10.3.25 Microsoft SQL Server SIEM Rules
10.3.26 Postgress SQL SIEM Rules
10.3.27 MySQL SIEM Rules
124 Chapter 10. SIEM Plan

CHAPTER 11
Archive
The Archive module allows you to create compressed data files (zstd) from Elasticsearch indexes. The archive checksthe age of each document in the index and if it is older than defined in the job, it is copied to the archive file.
11.1 Configuration
11.1.1 Enabling module
To configure module edit kibana.yml configuration file end set path to the archive directory - location where thearchive files will be stored:
vim /etc/kibana/kibana.yml
remove the comment from the following line and set the correct path to the archive directory:
archive.archivefolderpath: '/var/lib/elastic_archive_test'
11.2 Archive Task
11.2.1 Create Archive task
1. From the main navigation go to the “Archvie” module.
2. On the “Archive” tab select “Create Task” and define the following parameters:
• Index pattern- for the indexes that will be archive, for example syslog* ;
125

ITRS-Log-Analytics-7.x Documentation, Release 7.0.5
• Older than (days) - number of days after which documents will be archived;
• Schedule task (crontab format) - the work schedule of the ordered task.
11.2.2 Task List
In the Task List you can follow the current status of ordered tasks. You can modify task scheduler or delete orderedtask.
If the archiving task finds an existing archive file that matches the data being archived, it will check the number ofdocuments in the archive and the number of documents in the index. If there is a difference in the number of documents
126 Chapter 11. Archive

ITRS-Log-Analytics-7.x Documentation, Release 7.0.5
then new documents will be added to the archive file.
11.3 Archive Search
The Archive Search module can search archive files for the specific content and back result in the Task List
11.3.1 Create Search task
1. From the main navigation go to the Archive module.
2. On the Search tab select Create Task and define the following parameters:
• Search text - field for entered the text to be searched.
• File name - list of archive file that will be searched.
11.3.2 Task list
The searching process will can take long time. On the Task List you can follow the status of the searching process.Also you can view result and delete tasks.
11.3. Archive Search 127

ITRS-Log-Analytics-7.x Documentation, Release 7.0.5
11.4 Archive Upload
The Archive Upload module move data from archive to Elasticsearch index and make it online.
11.4.1 Create Upload task
1. From the main navigation go to the Archive module.
2. On the Upload tab select Create Task and define the following parameters:
• Destination index - If destination index does not exist it will be created. If exists data will append.
• File name - list of archive file that will be recover to Elasticsearch index.
11.4.2 Task List
The process will index data back into Elasticsearch. Depend on archive size the process can take long time. On theTask List you can follow the status of the recovery process. Also you can view result and delete tasks.
128 Chapter 11. Archive

ITRS-Log-Analytics-7.x Documentation, Release 7.0.5
11.5 Command Line tools
Archive files can be handled by the following commands zstd, zstdcat, zstdgrep, zstdless, zstdmt.
11.5.1 zstd
The command for decompress *.zstd the Archive files, for example:
zstd -d winlogbeat-2020.10_2020-10-23.json.zstd -owinlogbeat-2020.10_2020-10-23.json
11.5.2 zstdcat
The command for concatenate *.zstd Archive files and print content on the standard output, for example:
zstdcat winlogbeat-2020.10_2020-10-23.json.zstd
11.5.3 zstdgrep
The command for print lines matching a pattern from *.zstd Archive files, for example:
zstdgrep "optima" winlogbeat-2020.10_2020-10-23.json.zstd
Above example is searching documents contain the “optima” phrase in winlogbeat-2020.10_2020-10-23.json.zstdarchive file.
11.5.4 zstdless
The command for viewing Archive * .zstd files, for example:
zstdless winlogbeat-2020.10_2020-10-23.json.zstd
11.5. Command Line tools 129

ITRS-Log-Analytics-7.x Documentation, Release 7.0.5
11.5.5 zstdmt
The command for compress and decompress Archive *.zdtd file useing multiple CPU core (default is 1), for exam-ple:
zstdmt -d winlogbeat-2020.10_2020-10-23.json.zstd -o winlogbeat-2020.10_2020-10-23.→˓json
130 Chapter 11. Archive

CHAPTER 12
Intelligence Module
A dedicated artificial intelligence module has been built in the ITRS Log Analytics system that allows prediction ofparameter values relevant to the maintenance of infrastructure and IT systems. Such parameters include:
• use of disk resources,
• use of network resources,
• using the power of processors
• detection of known incorrect behaviour of IT systems
To access of the Intelligence module, click the tile icon from the main meu bar and then go to the „Intelligence” icon(To go back, click to the „Search” icon).
131

ITRS-Log-Analytics-7.x Documentation, Release 7.0.5
There are 4 screens available in the module:
• Create AI Rule - the screen allows you to create artificial intelligence rules and run them in scheduler mode orimmediately
132 Chapter 12. Intelligence Module

ITRS-Log-Analytics-7.x Documentation, Release 7.0.5
• AI Rules List - the screen presents a list of created artificial intelligence rules with the option of editing,previewing and deleting them
• AI Learn - the screen allows to define the conditions for teaching the MLP neural network
• AI Learn Tasks - a screen on which the initiated and completed learning processes of neural networks with theability to preview learning results are presented.# Create AI Rule #
To create the AI Rule, click on the tile icon from the main menu bar, go to the „Intelligence” icon and select “CreateAI Rule” tab. The screen allows to defining the rules of artificial intelligence based on one of the available algorithms(a detailed description of the available algorithms is available in a separate document).
Description of the controls available on the fixed part of screen:
• Algorithm - the name of the algorithm that forms the basis of the artificial intelligence rule
• Choose search - search defined in the ITRS Log Analytics system, which is used to select a set of data on whichthe artificial intelligence rule will operate
• Run - a button that allows running the defined AI rule or saving it to the scheduler and run as planned
The rest of the screen will depend on the chosen artificial intelligence algorithm.
12.1 The fixed part of the screen
Description of the controls available on the fixed part of screen:
• Algorithm - the name of the algorithm that forms the basis of the artificial intelligence rule
• Choose search - search defined in the ITRS Log Analytics system, which is used to select a set of data on whichthe artificial intelligence rule will operate
• Run - a button that allows running the defined AI rule or saving it to the scheduler and run as planned
The rest of the screen will depend on the chosen artificial intelligence algorithm.
12.1. The fixed part of the screen 133

ITRS-Log-Analytics-7.x Documentation, Release 7.0.5
134 Chapter 12. Intelligence Module

ITRS-Log-Analytics-7.x Documentation, Release 7.0.5
12.2 Screen content for regressive algorithms
12.2. Screen content for regressive algorithms 135

ITRS-Log-Analytics-7.x Documentation, Release 7.0.5
Description of controls:
• feature to analyze from search - analyzed feature (dictated)
• multiply by field - enable multiplication of algorithms after unique values of the feature indicated here. Mul-tiplication allows you to run the AI rule one for e.g. all servers. The value “none” in this field means nomultiplication.
• multiply by values - if a trait is indicated in the „multiply by field”, then unique values of this trait will appearin this field. Multiplications will be made for the selected values. If at least one of value is not selected, the„Run” buttons will be inactive.‘
In other words, multiplication means performing an analysis for many values from the indicated field, for example:sourece_node_host- which we indicate in Multiply by field (from search).
However, in Multiply by values (from search) we already indicate values of this field for which theanalysis will be performed, for example: host1, host2, host3, . . . .
• time frame - feature aggregation method (1 minute, 5 minute, 15 minute, 30 minute, hourly, weekly, monthly,6 months, 12 months)
• max probes - how many samples back will be taken into account for analysis. A single sample is an aggregateddata according to the aggregation method.
• value type - which values to take into account when aggregating for a given time frame (e.g. maximum fromtime frame, minimum, average)
• max predictions - how many estimates we make for ahead (we take time frame)
• data limit - limits the amount of date downloaded from the source. It speeds up processing but reduces itsquality
• start date - you can set a date earlier than the current date in order to verify how the selected algorithm wouldwork on historical data
• Scheduler - a tag if the rule should be run according to the plan for the scheduler. If selected, additional fieldswill appear;
• Prediction cycle - plan definition for the scheduler, i.e. the cycle in which the prediction rule is run (e.g. oncea day, every hour, once a week). In the field, enter the command that complies with the cron standard. Enable –whether to immediately launch the scheduler plan or save only the definition
• Role - only users with the roles selected here and the administrator will be able to run the defend AI rules Theselected „time frame” also affects the prediction period. If we choose “time frame = monthly”, we will be ableto predict a one month ahead from the moment of prediction (according to the “prediction cycle” value)
136 Chapter 12. Intelligence Module

ITRS-Log-Analytics-7.x Documentation, Release 7.0.5
12.3 Screen content for the Trend algorithm
Description of controls:
• feature to analyze from search - analyzed feature (dictated)
• multiply by field - enable multiplication of algorithms after unique values of the feature indicated here. Mul-tiplication allows you to run the AI rule one for e.g. all servers. The value “none” in this field means nomultiplication.
• multiply by values - if a trait is indicated in the „multiply by field”, then unique values of this trait will appearin this field. Multiplications will be made for the selected values. If at least one of value is not selected, the„Run” buttons will be inactive.‘
12.3. Screen content for the Trend algorithm 137

ITRS-Log-Analytics-7.x Documentation, Release 7.0.5
In other words, multiplication means performing an analysis for many values from the indicated field, for example:sourece_node_host- which we indicate in Multiply by field (from search).
However, in Multiply by values (from search) we already indicate values of this field for which theanalysis will be performed, for example: host1, host2, host3, . . . .
• time frame - feature aggregation method (1 minute, 5 minute, 15 minute, 30 minute, hourly, weekly, monthly,6 months, 12 months)
• max probes - how many samples back will be taken into account for analysis. A single sample is an aggregateddata according to the aggregation method.
• value type - which values to take into account when aggregating for a given time frame (e.g. maximum fromtime frame, minimum, average)
• max predictions - how many estimates we make for ahead (we take time frame)
• data limit - limits the amount of date downloaded from the source. It speeds up processing but reduces itsquality
• start date - you can set a date earlier than the current date in order to verify how the selected algorithm wouldwork on historical data
• Scheduler - a tag if the rule should be run according to the plan for the scheduler. If selected, additional fieldswill appear;
• Prediction cycle - plan definition for the scheduler, i.e. the cycle in which the prediction rule is run (e.g. oncea day, every hour, once a week). In the field, enter the command that complies with the cron standard. Enable –whether to immediately launch the scheduler plan or save only the definition
• Role - only users with the roles selected here and the administrator will be able to run the defend AI rules Theselected „time frame” also affects the prediction period. If we choose “time frame = monthly”, we will be ableto predict a one month ahead from the moment of prediction (according to the “prediction cycle” value)
• Threshold - default values -1 (do not search). Specifies the algorithm what level of exceeding the value ofthe feature „feature to analyze from cheese” is to look for. The parameter currently used only by the “Trend”algorithm.
138 Chapter 12. Intelligence Module

ITRS-Log-Analytics-7.x Documentation, Release 7.0.5
12.4 Screen content for the neural network (MLP) algorithm
Descriptions of controls:
• Name - name of the learned neural network
• Choose search - search defined in ITRS Log Analytics, which is used to select a set of data on which the ruleof artificial intelligence will work
• Below, on the left, a list of attributes and their weights based on teaching ANN will be defined during theteaching. The user for each attribute will be able to indicate the field from the above mentioned search, whichcontain the values of the attribute and which will be analyzed in the algorithm. The presented list (for input andoutput attributes) will have a static and dynamic part. Static creation by presenting key with the highest weights.The key will be presented in the original form, i.e. perf_data./ The second part is a DropDown type list that
12.4. Screen content for the neural network (MLP) algorithm 139

ITRS-Log-Analytics-7.x Documentation, Release 7.0.5
will serve as a key update according to the user’s naming. On the right side, the attribute will be examined ina given rule / pattern. Here also the user must indicate a specific field from the search. In both cases, the inputand output are narrowed based on the search fields indicated in Choose search.
• Data limit - limits the amount of data downloaded from the source. It speeds up the processing, but reduces itsquality.
• Scheduler - a tag if the rule should be run according to the plan or the scheduler. If selected, additional fieldswill appear:
• Prediction cycle - plan definition for the scheduler, i.e. the cycle in which the prediction rule is run (e.g. oncea day, every hour, once a week). In the field, enter the command that complies with the cron standard
• Enable - whether to immediately launch the scheduler plan or save only the definition
• Role - only users with the roles selected here and the administrator will be able to run the defined AI rules
140 Chapter 12. Intelligence Module

ITRS-Log-Analytics-7.x Documentation, Release 7.0.5
12.5 AI Rules List
Column description:
• Status:
– - the process is being processed (the pid of the process is in brackets)
– - process completed correctly
– - the process ended with an error
12.5. AI Rules List 141

ITRS-Log-Analytics-7.x Documentation, Release 7.0.5
• Name - the name of the rule
• Search - the search on which the rule was run
• Method - an algorithm used in the AI rule
• Actions - allowed actions:
– Show - preview of the rule definition
– Enable/Disable - rule activation /deactivation
– Delete - deleting the rule
– Update - update of the rule definition
– Preview - preview of the prediction results (the action is available after the processing has been completedcorrectly).
142 Chapter 12. Intelligence Module

ITRS-Log-Analytics-7.x Documentation, Release 7.0.5
12.6 AI Learn
Description of controls:
• Search - a source of data for teaching the network
• prefix name - a prefix added to the id of the learned model that allows the user to recognize the model
• Input cols - list of fields that are analyzed / input features. Here, the column that will be selected in the outputcol should not be indicated. Only those columns that are related to processing should be selected. **
• Output col - result field, the recognition of which is learned by the network. This field should exist in thelearning and testing data, but in the production data is unnecessary and should not occur. This fieldcannot be on the list of selected fields in “input col”.
• Output class category - here you can enter a condition in SQL format to limit the number of output categoriese.g. if((outputCol) \< 10,(floor((outputCol))+1), Double(10)). This condition limits
12.6. AI Learn 143

ITRS-Log-Analytics-7.x Documentation, Release 7.0.5
the number of output categories to 10. Such conditions are necessary for fields selected in “output col” thathave continuous values. They must necessarily by divided into categories. In the Condition, use yourown outputCol name instead of the field name from the index that points to the value of the “output col”attribute.
• Time frame - a method of aggregation of features to improve their quality (e.g. 1 minute, 5 minutes, 15 minutes,30 minutes, 1 hour, 1 daily).
• Time frames output shift - indicates how many time frame units to move the output category. This allowsteaching the network with current attributes, but for categories for the future.
• Value type - which values to take into account when aggregating for a given time frame (e.g. maximum fromtime frame, minimum, average)
• Output class count- the expected number of result classes. If during learning the network identifies moreclasses than the user entered, the process will be interrupted with an error, therefore it is better to set upmore classes than less, but you have to keep in mind that this number affects the learning time.
• Neurons in first hidden layer (from, to) - the number of neurons in the first hidden layer. Must have a value >0. Jump every 1.
• Neurons in second hidden layer (from, to) - the number of neurons in second hidden layer. If = 0, then thislayer is missing. Jump every 1.
• Neurons in third hidden layer (from, to) - the number of neurons in third hidden layer. If = 0 then this layeris missing. Jump every 1.
• Max iter (from, to) - maximum number of network teaching repetitions (the same data is used for learning manytimes in internal processes of the neural network). The slower it is. Jump every 100. The maximum value is 10,the default is 1.
• Split data to train&test - for example, the entered value of 0.8 means that the input data for the network willbe divided in the ratio 0.8 to learning, 0.2 for the tests of the network learned.
• Data limit - limits the amount of data downloaded from the source. It speeds up the processing, but reduces itsquality.
• Max probes - limits the number of samples taken to learn the network. Samples are already aggregated accord-ing to the selected “Time frame” parameter. It speed up teaching but reduces its quality.
• Build - a button to start teaching the network. The button contains the number of required teaching curses. Youshould be careful and avoid one-time learning for more than 1000 courses. It is better to divide them into severalsmaller ones. One pass after a full data load take about 1-3 minutes on a 4 core 2.4.GHz server. The module hasimplemented the best practices related to the number of neurons in individual hidden layers. The valuessuggested by the system are optimal from the point of view of these practices, but the user can decide onthese values himself.
Under the parameters for learning the network there is an area in which teaching results will appear.
After pressing the “Refresh” button, the list of the resulting models will be refreshed.
Autorefresh - selecting the field automatically refreshes the list of learning results every 10s.
The following information will be available in the table on the left:
• Internal name - the model name given by the system, including the user - specified prefix
• Overall efficiency - the network adjustment indicator - allow to see at a glance whether it is worth dealing withthe model. The grater the value, the better.
After clicking on the table row, detailed data collected during the learning of the given model will be displayed. Thisdata will be visible in the box on the right.
144 Chapter 12. Intelligence Module

ITRS-Log-Analytics-7.x Documentation, Release 7.0.5
The selected model can be saved under its own name using the “Save algorithm” button. This saved algorithm will beavailable in the “Choose AI Rule” list when creating the rule (see Create AI Rule).
12.7 AI Learn Tasks
The “AI Learn Task” tab shows the list of processes initiated teaching the ANN network with the possibility of man-aging processes.
Each user can see only the process they run. The user in the role of Intelligence sees all running processes.
Description of controls:
• Algorithm prefix - this is the value set by the user on the AI Learn screen in the Prefix name field
• Progress - here is the number of algorithms generated / the number of all to be generated
• Processing time - duration of algorithm generation in seconds (or maybe minutes or hours)
• Actions:
– Cancel - deletes the algorithm generation task (user require confirmation of operation)
– Pause / Release - pause / resume algorithm generation process.
AI Learn tab contain the Show in the preview mode of the ANN hyperparameters After completing the learning activityor after the user has interrupted it, the “Delete” button appears in “Action” field. This button allows you to permanentlydelete the learning results of a specific network.
12.7. AI Learn Tasks 145

ITRS-Log-Analytics-7.x Documentation, Release 7.0.5
12.8 Scenarios of using algorithms implemented in the Intelligencemodule
12.8.1 Teaching MLP networks and choosing the algorithm to use:
1. Go to the AI Learn tab,
2. We introduce the network teaching parameters,
3. Enter your own prefix for the names of the algorithms you have learned,
4. Press Build.
5. We observe the learned networks on the list (we can also stop the observation at any moment and go to otherfunctions of the system. We will return to the learning results by going to the AI Learn Tasks tab and clickingthe show action),
6. We choose the best model from our point of view and save it under our own name,
7. From this moment the algorithm is visible in the Create AI Rule tab.
12.8.2 Starting the MLP network algorithm:
1. Go to the Create AI Rule tab and create rules,
2. Select the previously saved model of the learned network,
3. Specify parameters visible on the screen (specific to MLP),
4. Press the Run button.
12.8.3 Starting regression algorithm:
1. Go to the Create AI Rule tab and create rules,
2. We choose AI Rule, e.g. Simple Moving Average, Linear Regression or Random Forest Regression, etc.,
3. Enter your own rule name (specific to regression),
4. Set the parameters of the rule ( specific to regression),
5. Press the Run button.
12.8.4 Management of available rules:
1. Go to the AI Rules List tab,
2. A list of AI rules available for our role is displayed,
3. We can perform the actions available on the right for each rule.# Results of algorithms #
The results of the “AI algorithms” are saved to the index „intelligence” specially created for this purpose. The indexwith the prediction result. These following fields are available in the index (where xxx is the name of the attributebeing analyzed):
• xxx_pre - estimate value
• xxx_cur - current value at the moment of estimation
146 Chapter 12. Intelligence Module

ITRS-Log-Analytics-7.x Documentation, Release 7.0.5
• method_name - name of the algorithm used
• rmse - avarage square error for the analysis in which _cur values were available. The smaller the value, thebetter.
• rmse_normalized - mean square error for the analysis in which _cur values were available, normalized with_pre values. The smaller the value, the better.
• overall_efficiency - efficiency of the model. The greater the value, the better. A value less than 0 mayindicate too little data to correctly calculate the indicator
• linear_function_a - directional coefficient of the linear function y = ax + b. Only for the Trend and LinearRegression Trend algorithm
• linear_function_b - the intersection of the line with the Y axis for the linear function y = ax + b. Only for theTrend and Linear Regression Trend algorithm.
Visualization and signals related to the results of data analysis should be created from this index. The index should beavailable to users of the Intelligence module.
12.9 Scheduler Module
ITRS Log Analytics has a built-in task schedule. In this module, we can define a command or a list of commandswhose execution we instruct the application in the form of tasks. We can determine the time and frequency of tasks.Tasks can contain a simple syntax, but they can also be associated with modules, e.g. with Intelligence module.
To go to the Scheduler window, select the tile icon from the main menu bar and then go to the „Scheduler” icon (Togo back, go to the „Search” icon)
12.9. Scheduler Module 147

ITRS-Log-Analytics-7.x Documentation, Release 7.0.5
The page with three tabs will be displayed: Creating new tasks in the „Create Scheduler Job”, managing tasks in the„Job List” and checking the status of tasks in „Jobs Status”
In the window for creating new tasks we have a form consisting of fields:
• Name - in which we enter the name of the task
• Cron Pattern - a field in which in cron notation we define the time and frequency of the task
• Command - we give the syntax of the command that will be executed in this task. These can be simplesystem commands, but also complex commands related to the Intelligence module. In the task managementwindow, we can activate /deactivate, delete and update the task by clicking on the selected icon for a given task
148 Chapter 12. Intelligence Module

ITRS-Log-Analytics-7.x Documentation, Release 7.0.5
In the task status windows you can check the current status of the task: if it activated, when it started and when itended, how long it took. This window is not editable and indicates historical data.
12.10 Permission
Permission have been implemented in the following way:
• Only the user in the admin role can create / update rules.
• When creating rules, the roles that will be able to enables / disengage / view the rules will be indicated.
We assume that the Learn process works as an administrator.
We assume that the visibility of Search in AI Learn is preceded by receiving the search permission in the moduleobject permission.
The role of “Intelligence” launches the appropriate tabs.
An ordinary user only sees his models. The administrator sees all models.
12.11 Register new algorithm
For register new algorithm:
• Login to the ITRS Log Analytics
• Select Intelligence
• Select Algorithm
• Fill Create algorithm form and press Submit button
Form fields:
| Field | Description→˓ ||---------|---------------------------------------------------------------------------→˓---------------------------------------|| Code | Short name for algorithm→˓ || Name | Algorithm name→˓ || Command | Command to execute. The command must be in the directory pointed to by→˓the parameter elastscheduler.commandpath. |
ITRS Log Analytics execute command:
<command> <config> <error file> <out file>
Where:
• command - Command from command filed of Create algorithm form.
• config - Full path of json config file. The name of file is id of process status document in index .intelligence_rules
• error file - Unique name for error file. Not used by predefined algorithms.
• out file - Unique name for output file. Not used by predefined algorithms.
12.10. Permission 149

ITRS-Log-Analytics-7.x Documentation, Release 7.0.5
Config file:
Json document:
| Field | Value→˓ | Screen field (description)→˓ ||------------------------|------------------------------------------------------------→˓-------------------------|----------------------------------------------------------→˓------------|| algorithm_type | GMA, GMAL, LRS, LRST, RFRS, SMAL, SMA, TL→˓ | Algorithm. For customs method field Code from Create→˓algorithm form. || model_name | Not empty string.→˓ | AI Rule Name.→˓ || search | Search id.→˓ | Choose search.→˓ || label_field.field |→˓ | Feature to analyse.→˓ || max_probes | Integer value→˓ | Max probes→˓ || time_frame | 1 minute, 5 minutes, 15 minutes, 30 minutes, 1 hour, 1 day,→˓ 1 week, 30 day, 365 day | Time frame→˓ || value_type | min, max, avg, count→˓ | Value type→˓ || max_predictions | Integer value→˓ | Max predictions→˓ || threshold | Integer value→˓ | Threshold→˓ || automatic_cron | Cron format string→˓ | Automatic cycle→˓ || automatic_enable | true/false→˓ | Enable→˓ || automatic | true/false→˓ | Automatic→˓ || start_date | YYYY-MM-DD HH:mm or now→˓ | Start date→˓ || multiply_by_values | Array of string values→˓ | Multiply by values→˓ || multiply_by_field | None or full field name eg.: system.cpu→˓ | Multiply by field→˓ || selectedroles | Array of roles name→˓ | Role→˓ |
(continues on next page)
150 Chapter 12. Intelligence Module

ITRS-Log-Analytics-7.x Documentation, Release 7.0.5
(continued from previous page)
| last_execute_timestamp |→˓ | Last execute→˓ |
| Not screen fields | ||-----------------------|-------------------------------------|| preparation_date | Document preparation date. || machine_state_uid | AI rule machine state uid. || path_to_logs | Path to ai machine logs. || path_to_machine_state | Path to ai machine state files. || searchSourceJSON | Query string. || processing_time | Process operation time. || last_execute_mili | Last executed time in milliseconds. || pid | Process pid if ai rule is running. || exit_code | Last executed process exit code. |
The command must update the process status document in the system during operation. It is elastic partial documentupdate.
| Process status | Field (POST body) | Description→˓ ||------------------------|----------------------------|-------------------------------→˓-----------------|| START | doc.pid | System process id→˓ || | doc.last_execute_timestamp | Current timestamp. yyyy-MM-dd→˓HH:mm || | doc.last_execute_mili | Current timestamp in→˓millisecunds. || END PROCESS WITH ERROR | doc.error_description | Error description.→˓ || | doc.error_message | Error message.→˓ || | doc.exit_code | System process exit code.→˓ || | doc.pid | Value 0.→˓ || | doc.processing_time | Time of execute process in→˓seconds. || END PROCESS OK | doc.pid | Value 0.→˓ || | doc.exit_code | System process exit code.→˓Value 0 for success. || | doc.processing_time | Time of execute process in→˓seconds. |
The command must insert data for prediction chart.
| Field | Value | Description→˓ ||-------------------|-------------------|---------------------------------------------→˓-----------|| model_name | Not empty string. | AI Rule Name.→˓ || preparationUID | Not empty string. | Unique prediction id→˓ |
(continues on next page)
12.11. Register new algorithm 151

ITRS-Log-Analytics-7.x Documentation, Release 7.0.5
(continued from previous page)
| machine_state_uid | Not empty string. | AI rule machine state uid.→˓ || model_uid | Not empty string. | Model uid from config file→˓ || method_name | Not empty string. | User friendly algorithm name.→˓ || <field> | Json | Field calculated. For example: system.cpu.→˓idle.pct_pre |
Document sample:
{"_index": "intelligence","_type": "doc","_id": "emca_TL_20190304_080802_20190531193000","_version": 2,"_score": null,"_source": {"machine_state_uid": "emca_TL_20190304_080802","overall_efficiency": 0,"processing_time": 0,"rmse_normalized": 0,"predictionUID": "emca_TL_20190304_080802_20190531193000","linear_function_b": 0,"@timestamp": "2019-05-31T19:30:00.000+0200","linear_function_a": 0.006787878787878788,"system": {"cpu": {"idle": {"pct_pre": 0.8213333333333334
}}
},"model_name": "emca","method_name": "Trend","model_uid": "emca_TL_20190304_080802","rmse": 0,"start_date": "2019-03-04T19:30:01.279+0100"
},"fields": {"@timestamp": ["2019-05-31T17:30:00.000Z"
]},"sort": [1559323800000
]}
152 Chapter 12. Intelligence Module

CHAPTER 13
Verification steps and logs
13.1 Verification of Elasticsearch service
To verify of Elasticsearch service you can use following command:
• Control of the Elastisearch system service via systemd:
# sysetmctl status elasticsearch
output:
elasticsearch.service - ElasticsearchLoaded: loaded (/usr/lib/systemd/system/elasticsearch.service; disabled;
→˓vendor preset: disabled)Active: active (running) since Mon 2018-09-10 13:11:40 CEST; 22h ago
Docs: http://www.elastic.coMain PID: 1829 (java)
CGroup: /system.slice/elasticsearch.service1829 /bin/java -Xms4g -Xmx4g -XX:+UseConcMarkSweepGC -
→˓XX:CMSInitiatingOccupancyFraction=75 -XX:+UseCMSInitiatingOccupancyOnly -→˓XX:+AlwaysPreTouch -Xss1m ...
• Control of Elasticsearch instance via tcp port:
# curl -XGET '127.0.0.1:9200/'
output:
{"name" : "dY3RuYs","cluster_name" : "elasticsearch","cluster_uuid" : "EHZGAnJkStqlgRImqwzYQQ","version" : {"number" : "6.2.3",
(continues on next page)
153

ITRS-Log-Analytics-7.x Documentation, Release 7.0.5
(continued from previous page)
"build_hash" : "c59ff00","build_date" : "2018-03-13T10:06:29.741383Z","build_snapshot" : false,"lucene_version" : "7.2.1","minimum_wire_compatibility_version" : "5.6.0","minimum_index_compatibility_version" : "5.0.0"
},"tagline" : "You Know, for Search"
}
• Control of Elasticsearch instance via log file:
# tail -f /var/log/elasticsearch/elasticsearch.log
• other control commands via curl application:
curl -xGET "http://localhost:9200/_cat/health?v"curl -XGET "http://localhost:9200/_cat/nodes?v"curl -XGET "http://localhost:9200/_cat/indicates"
13.2 Verification of Logstash service
To verify of Logstash service you can use following command:
• control Logstash service via systemd:
# systemctl status logstash
output:
logstash.service - logstashLoaded: loaded (/etc/systemd/system/logstash.service; enabled; vendor
→˓preset: disabled)Active: active (running) since Wed 2017-07-12 10:30:55 CEST; 1 months 23
→˓days agoMain PID: 87818 (java)CGroup: /system.slice/logstash.service
87818 /usr/bin/java -XX:+UseParNewGC -XX:+UseConcMarkSweepGC
• control Logstash service via port tcp:
# curl -XGET '127.0.0.1:9600'
output:
{"host": "skywalker","version": "4.5.3","http_address": "127.0.0.1:9600"
}
• control Logstash service via log file:
# tail -f /var/log/logstash/logstash-plain.log
154 Chapter 13. Verification steps and logs

ITRS-Log-Analytics-7.x Documentation, Release 7.0.5
13.2.1 Debuging
• dynamically update logging levels through the logging API (service restart not needed):
curl -XPUT 'localhost:9600/_node/logging?pretty' -H 'Content-Type: application/→˓json' -d'
{"logger.logstash.outputs.elasticsearch" : "DEBUG"
}'
• permanent change of logging level (service need to be restarted):
– edit file /etc/logstash/logstash.yml and set the following parameter:
*log.level: debug*
– restart logstash service:
*systemctl restart logstash*
• checking correct syntax of configuration files:
*/usr/share/logstash/bin/logstash -tf /etc/logstash/conf.d*
• get information about load of the Logstash:
*# curl -XGET '127.0.0.1:9600/_node/jvm?pretty=true'*
output:
{"host" : "logserver-test","version" : "5.6.2","http_address" : "0.0.0.0:9600","id" : "5a440edc-1298-4205-a524-68d0d212cd55","name" : "logserver-test","jvm" : {"pid" : 14705,"version" : "1.8.0_161","vm_version" : "1.8.0_161","vm_vendor" : "Oracle Corporation","vm_name" : "Java HotSpot(TM) 64-Bit Server VM","start_time_in_millis" : 1536146549243,"mem" : {
"heap_init_in_bytes" : 268435456,"heap_max_in_bytes" : 1056309248,"non_heap_init_in_bytes" : 2555904,"non_heap_max_in_bytes" : 0
},"gc_collectors" : [ "ParNew", "ConcurrentMarkSweep" ]
} # Verificatoin of ITRS Log→˓Analytics GUI service #
To verify of ITRS Log Analytics GUI service you can use following command:
• control the ITRS Log Analytics GUI service via systemd:
13.2. Verification of Logstash service 155

ITRS-Log-Analytics-7.x Documentation, Release 7.0.5
# systemctl status kibana
output:
kibana.service - KibanaLoaded: loaded (/etc/systemd/system/kibana.service; disabled; vendor
→˓preset: disabled)Active: active (running) since Mon 2018-09-10 13:13:19 CEST; 23h ago
Main PID: 1330 (node)CGroup: /system.slice/kibana.service
1330 /usr/share/kibana/bin/../node/bin/node --no-warnings /usr/→˓share/kibana/bin/../src/cli -c /etc/kibana/kibana.yml
• control the ITRS Log Analytics GUI via port tcp/http:
# curl -XGET '127.0.0.1:5601/'
output:
<script>var hashRoute = '/app/kibana';var defaultRoute = '/app/kibana';var hash = window.location.hash;if (hash.length) {window.location = hashRoute + hash;
} else {window.location = defaultRoute;
}</script>
• Control the ITRS Log Analytics GUI via log file:
# tail -f /var/log/messages
156 Chapter 13. Verification steps and logs

CHAPTER 14
Building a cluster
14.1 Node roles
Every instance of Elasticsearch server is called a node. A collection of connected nodes is called a cluster. All nodesknow about all the other nodes in the cluster and can forward client requests to the appropriate node.
Besides that, each node serves one or more purpose:
• Master-eligible node - A node that has node.master set to true (default), which makes it eligible to be elected asthe master node, which controls the cluster
• Data node - A node that has node.data set to true (default). Data nodes hold data and perform data relatedoperations such as CRUD, search, and aggregations
• Client node - A client node has both node.master and node.data set to false. It can neither hold data nor becomethe master node. It behaves as a “smart router” and is used to forward cluster-level requests to the master nodeand data-related requests (such as search) to the appropriate data nodes
• Tribe node - A tribe node, configured via the tribe.* settings, is a special type of client node that can connect tomultiple clusters and perform search and other operations across all connected clusters.
14.2 Naming convention
Elasticsearch require little configuration before before going into work.
The following settings must be considered before going to production:
• path.data and path.logs - default locations of these files are: /var/lib/elasticsearchand /var/log/elasticsearch.
• cluster.name - A node can only join a cluster when it shares its cluster.name with all the other nodes in thecluster. The default name is “elasticsearch”, but you should change it to an appropriate name which describesthe purpose of the cluster. You can do this in /etc/elasticsearch/elasticsearch.yml file.
157

ITRS-Log-Analytics-7.x Documentation, Release 7.0.5
• node.name - By default, Elasticsearch will use the first seven characters of the randomly generated UUID as thenode id. Node id is persisted and does not change when a node restarts. It is worth configuring a more humanreadable name: node.name: prod-data-2 in file /etc/elstaicsearch/elasticsearch.yml
• network.host - parametr specifying network interfaces to which Elasticsearch can bind. Default is network.host: ["_local_","_site_"].
• discovery - Elasticsearch uses a custom discovery implementation called “Zen Discovery”. There are twoimportant settings:
– discovery.zen.ping.unicast.hosts - specify list of other nodes in the cluster that are likely tobe live and contactable;
– discovery.zen.minimum_master_nodes - to prevent data loss, you can configure this setting sothat each master-eligible node knows the minimum number of master-eligible nodes that must be visiblein order to form a cluster.
• heap size - By default, Elasticsearch tells the JVM to use a heap with a minimum (Xms) and maximum (Xmx)size of 1 GB. When moving to production, it is important to configure heap size to ensure that Elasticsearch hasenough heap available
14.3 Config files
To configure the Elasticsearch cluster you must specify some parameters in the following configuration files on everynode that will be connected to the cluster:
• /etc/elsticsearch/elasticserach.yml:
– cluster.name:name_of_the_cluster - same for every node;
– node.name:name_of_the_node - uniq for every node;
– node.master:true_or_false
– node.data:true_or_false
– network.host:["_local_","_site_"]
– discovery.zen.ping.multicast.enabled
– discovery.zen.ping.unicast.hosts
• /etc/elsticsearch/log4j2.properties:
– logger: action: DEBUG - for easier debugging.
14.4 Example setup
Example of the Elasticsearch cluster configuration:
• file /etc/elasticsearch/elasticsearch.yml:
cluster.name: tm-labnode.name: "elk01"node.master: truenode.data: truenetwork.host: 127.0.0.1,10.0.0.4http.port: 9200
(continues on next page)
158 Chapter 14. Building a cluster

ITRS-Log-Analytics-7.x Documentation, Release 7.0.5
(continued from previous page)
discovery.zen.ping.multicast.enabled: falsediscovery.zen.ping.unicast.hosts: ["10.0.0.4:9300","10.0.0.5:9300","10.0.0.
→˓6:9300"]
• to start the Elasticsearch cluster execute command:
# systemctl restart elasticsearch
• to check status of the Elstaicsearch cluster execute command:
– check of the Elasticsearch cluster nodes status via tcp port:
# curl -XGET '127.0.0.1:9200/_cat/nodes?v'
host ip heap.percent ram.percent load node.role→˓master name10.0.0.4 10.0.0.4 18 91 0.00 -
→˓ - elk0110.0.0.5 10.0.0.5 66 91 0.00 d
→˓ * elk0210.0.0.6 10.0.0.6 43 86 0.65 d
→˓ m elk0310.0.0.7 10.0.0.7 45 77 0.26 d
→˓ m elk04
– check status of the Elasticsearch cluster via log file:
# tail -f /var/log/elasticsearch/tm-lab.log (cluster.name)
14.5 Adding a new node to existing cluster
Install the new ITRS Log Analytics instance. The description of the installation can be found in the chapter “Firstconfiguration steps”
Change the following parameters in the configuration file:
• cluster.name:name_of_the_cluster same for every node;
• node.name:name_of_the_node uniq for every node;
• node.master:true_or_false
• node.data:true_or_false
• discovery.zen.ping.unicast.hosts:[”10.0.0.4:9300”,”10.0.0.5:9300”,”10.0.0.6:9300”] - IP ad-dresses and instances of nodes in the cluster.
If you add a node with the role data, delete the contents of the path.data directory, by default in /var/lib/elasticsearch
Restart the Elasticsearch instance of the new node:
systemctl restart elasticsearch
14.5. Adding a new node to existing cluster 159

ITRS-Log-Analytics-7.x Documentation, Release 7.0.5
14.6 Cluster HOT-WARM-COLD architecture
Let’s assume we have 3 zones hot, warm, cold, with three servers in each zone.
Each of the servers in all zones must have an active Data Node license.
1. We have 3 shards for each index.
2. When indexes are created, they stay in the HOT zone for 3 days.
3. After 3 days, the “rollower” mechanism is activated and the indexes are moved to the “WARM” zone, forexample logs_write index:
POST /logs_write/_rollover{"conditions" : {
"max_age": "3d","max_docs": 100000000,"max_size": "5gb"
},"settings": {
"index.number_of_shards": 3"index.routing.allocation.require._name": "server-warm-1"
}}
4. After the next 7 days, the indexes are moved to the COLD zone as follows:
• write in index is blocked and relocation to COLD zone is set:
PUT active-logs-1/_settings{
"index.blocks.write": true,"index.routing.allocation.require._name": "serwer-cold-1"
}
• the number of shards is reduced to 1:
POST active-logs-1/_shrink/inactive-logs-1
• the number of segments is reduced to 1:
POST inactive-logs-1/_forcemerge?max_num_segments=1
5. As a result, after 10 days, the inactive-logs-1 index is on the server in the COLD zone and has 1 shardand 1 segment.
160 Chapter 14. Building a cluster

CHAPTER 15
Integration with AD
You can configure the ITRS Log Analytics to communicate with Active Directory to authenticate users. To integratewith Active Directory, you configure an Active Directory realm and assign Active Directory users and groups to theITRS Log Analytics roles in the role mapping file.
To protect passwords, communications between the ITRS Log Analytics and the LDAP server should be encryptedusing SSL/TLS. Clients and nodes that connect via SSL/TLS to the LDAP server need to have the LDAP server’scertificate or the server’s root CA certificate installed in their keystore or truststore.
15.1 AD configuration
The AD configuration should be done in the /etc/elasticsearch/properties.yml file.
Below is a list of settings to be made in the properties.yml file (the commented section in the file in order forthe AD settings to start working, this fragment should be uncommented):
|**Direcitve** | **Description**→˓ || ------------------------------------------------------|-----------------------------→˓----------------------------------------------------------|| # LDAP |→˓ || #ldaps: |→˓ || # - name: \"example.com\" |# domain that is configured→˓ || # host: \"127.0.0.1,127.0.0.2\" |# list of server for this→˓domain || # port: 389 |# optional, default 389 for→˓unencrypted session or 636 for encrypted sessions ||# ssl\_enabled: false |# optional, default true→˓ ||# ssl\_trust\_all\_certs: true |# optional, default false→˓ |
(continues on next page)
161

ITRS-Log-Analytics-7.x Documentation, Release 7.0.5
(continued from previous page)
|# ssl.keystore.file: \"path\" |# path to the truststore→˓store ||# ssl.keystore.password: \"path\" |# password to the trusted→˓certificate store ||# bind\_dn: [[admin\@example.com] |# account name administrator→˓ ||# bind\_password: \"password\" |# password for the→˓administrator account ||# search\_user\_base\_DN: \"OU=lab,DC=example,DC=com\" |# search for the DN user→˓tree database ||# user\_id\_attribute: \"uid |# search for a user→˓attribute optional, by default \"uid\" ||# search\_groups\_base\_DN:\"OU=lab,DC=example,DC=com\"|# group database search.→˓This is a catalog main, after which the groups will be sought.||# unique\_member\_attribute: \"uniqueMember\" |# optional, default\→˓"uniqueMember\" ||# connection\_pool\_size: 10 |# optional, default→˓30 ||# connection\_timeout\_in\_sec: 10 |# optional, default→˓1 ||# request\_timeout\_in\_sec: 10 |# optional, default→˓1 ||# cache\_ttl\_in\_sec: 60 |# optional, default 0 -→˓cache disabled |
If we want to configure multiple domains, then in this configuration file we copy the # LDAP section below andconfigure it for the next domain.
Below is an example of how an entry for 2 domains should look like. (It is important to take the interpreter to readthese values correctly).
ldaps:- name: "example1.com"host: "127.0.0.1,127.0.0.2"port: 389 # optional, default 389ssl_enabled: false # optional, default truessl_trust_all_certs: true # optional, default falsebind_dn: "[email protected]"bind_password: "password" # generate encrypted password with /usr/share/
→˓elasticsearch/pass-encrypter/pass-encrypter.shsearch_user_base_DN: "OU=lab,DC=example1,DC=com"user_id_attribute: "uid" # optional, default "uid"search_groups_base_DN: "OU=lab,DC=example1,DC=com"unique_member_attribute: "uniqueMember" # optional, default "uniqueMember"connection_pool_size: 10 # optional, default 30connection_timeout_in_sec: 10 # optional, default 1request_timeout_in_sec: 10 # optional, default 1cache_ttl_in_sec: 60 # optional, default 0 - cache disabledservice_principal_name: "[email protected]" # optional, for ssoservice_principal_name_password : "password" # optional, for sso
- name: "example2.com" #DOMAIN 2host: "127.0.0.1,127.0.0.2"port: 389 # optional, default 389ssl_enabled: false # optional, default truessl_trust_all_certs: true # optional, default falsebind_dn: "[email protected]"bind_password: "password" # generate encrypted password with /usr/share/
→˓elasticsearch/pass-encrypter/pass-encrypter.sh (continues on next page)
162 Chapter 15. Integration with AD

ITRS-Log-Analytics-7.x Documentation, Release 7.0.5
(continued from previous page)
search_user_base_DN: "OU=lab,DC=example2,DC=com"user_id_attribute: "uid" # optional, default "uid"search_groups_base_DN: "OU=lab,DC=example2,DC=com"unique_member_attribute: "uniqueMember" # optional, default "uniqueMember"connection_pool_size: 10 # optional, default 30connection_timeout_in_sec: 10 # optional, default 1request_timeout_in_sec: 10 # optional, default 1cache_ttl_in_sec: 60 # optional, default 0 - cache disabledservice_principal_name: "[email protected]" # optional, for ssoservice_principal_name_password : "password" # optional, for ssl
After completing the LDAP section entry in the properties.yml file, save the changes and restart the service withthe command:
# systemctl restart elasticsearch
15.2 Configure SSL suport for AD authentication
Open the certificate manager on the AD server.
Select the certificate and open it
15.2. Configure SSL suport for AD authentication 163

ITRS-Log-Analytics-7.x Documentation, Release 7.0.5
Select the option of copying to a file in the Details tab
164 Chapter 15. Integration with AD

ITRS-Log-Analytics-7.x Documentation, Release 7.0.5
Click the Next button
15.2. Configure SSL suport for AD authentication 165

ITRS-Log-Analytics-7.x Documentation, Release 7.0.5
Keep the setting as shown below and click Next
166 Chapter 15. Integration with AD

ITRS-Log-Analytics-7.x Documentation, Release 7.0.5
Keep the setting as shown below and click Next.
15.2. Configure SSL suport for AD authentication 167

ITRS-Log-Analytics-7.x Documentation, Release 7.0.5
Give the name a certificate
168 Chapter 15. Integration with AD

ITRS-Log-Analytics-7.x Documentation, Release 7.0.5
After the certificate is exported, this certificate should be imported into a trusted certificate file that will be used by theElasticsearch plugin.
To import a certificate into a trusted certificate file, a tool called „keytool.exe” is located in the JDK installationdirectory.
Use the following command to import a certificate file:
keytool -import -alias adding_certificate_keystore -file certificate.cer -keystore→˓certificatestore
The values for RED should be changed accordingly.
By doing this, he will ask you to set a password for the trusted certificate store. Remember this password, because itmust be set in the configuration of the Elasticsearch plugin. The following settings must be set in the properties.yml configuration for SSL:
ssl.keystore.file: "<path to the trust certificate store>"ssl.keystore.password: "< password to the trust certificate store>"
15.2. Configure SSL suport for AD authentication 169

ITRS-Log-Analytics-7.x Documentation, Release 7.0.5
15.3 Role mapping
In the /etc/elasticsearch/properties.yml configuration file you can find a section for configuring rolemapping:
# LDAP ROLE MAPPING FILE`# rolemapping.file.path: /etc/elasticsearch/role-mappings.yml
This variable points to the file /etc/elasticsearch/role-mappings.yml Below is the sample content forthis file:
admin:"CN=Admins,OU=lab,DC=dev,DC=it,DC=example,DC=com"bank:"CN=security,OU=lab,DC=dev,DC=it,DC=example,DC=com"
Attention. The role you define in the role.mapping file must be created in the ITRS Log Analytics.
How to the mapping mechanism works ? An AD user log in to ITRS Log Analytics. In the application there is a adminrole, which through the file role-mapping .yml binds to the name of the admin role to which the Admins containerfrom AD is assigned. It is enough for the user from the AD account to log in to the application with the privilegesthat are assigned to admin role in the ITRS Log Analytics. At the same time, if it is the first login in the ITRS LogAnalytics, an account is created with an entry that informs the application administrator that is was created by loggingin with AD.
Similar, the mechanism will work if we have a role with an arbitrary name created in ITRS Log Analytics Logisticsand connected to the name of the role-mappings.yml and existing in AD any container.
Below a screenshot of the console on which are marked accounts that were created by uesrs logging in from AD
If you map roles with from several domains, for example dev.examloe1.com, dev.example2.com then in User List wewill see which user from which domain with which role logged in ITRS Log Analytics.
15.4 Password encryption
For security reason you can provide the encrypted password for Active Directory integration. To do this use pass-encrypter.sh script that is located in the Utils directory in installation folder.
1. Installation of pass-encrypter
170 Chapter 15. Integration with AD

ITRS-Log-Analytics-7.x Documentation, Release 7.0.5
cp -pr /instalation_folder/elasticsearch/pass-encrypter /usr/share/elasticsearch/
2. Use pass-encrypter
# /usr/share/elasticsearch/pass-encrypter/pass-encrypter.shEnter the string for encryption :new_passwordEncrypted string : MTU1MTEwMDcxMzQzMg==1GEG8KUOgyJko0PuT2C4uw==
15.4. Password encryption 171

ITRS-Log-Analytics-7.x Documentation, Release 7.0.5
172 Chapter 15. Integration with AD

CHAPTER 16
Integration with Radius
To use the Radius protocol, install the latest available version of ITRS Log Analytics.
16.1 Configuration
The default configuration file is located at /etc/elasticsearch/properties.yml:
# Radius opts#radius.host: "10.4.3.184"#radius.secret: "querty1q2ww2q1"#radius.port: 1812
Use appropriate secret based on config file in Radius server. The secret is configured on clients.conf in Radiusserver.
In this case, since the plugin will try to do Radius auth then client IP address should be the IP address where theElasticsearch is deployed.
Every user by default at present get the admin role.
173

ITRS-Log-Analytics-7.x Documentation, Release 7.0.5
174 Chapter 16. Integration with Radius

CHAPTER 17
Integration with LDAP
To use OpenLDAP authorization, install or update ITRS Log Analytics 7.0.2.
17.1 Configuration
The default configuration file is located at /etc/elasticsearch/properties.yml:
• ldap_groups_search - Enable Open LDAP authorization. The ldap_groups_search switch with true / falsevalues.
• search filter - you can define search_filter for each domain. When polling the LDAP / AD server, theplaceholder is changed to userId (everything before @domain) of the user who is trying to login. Samplesearch_filter:
search_filter: "(&(objectClass=inetOrgPerson)(cn=%s))"
If no search_filter is given, the default will be used:
(&(&(objectCategory=Person)(objectClass=User))(samaccountname=%s))
• max_connections - for each domain (must be> = 1), this is the maximum number of connections that will becreated with the LDAP / AD server for a given domain. Initially, one connection is created, if necessary another,up to the maximum number of connections set. If max_connections is not given, the default value = 10 will beused.
• ldap_groups_search - filter will be used to search groups on the AD / LDAP server of which the user is tryingto login. An example of groups_search_filter that works quite universally is:
groups_search_filter: "(|(uniqueMember=%s)(member=%s))"
Sample configuration:
175

ITRS-Log-Analytics-7.x Documentation, Release 7.0.5
licenseFilePath: /usr/share/elasticsearch/
ldaps:
- name: "dev.it.example.com"host: "192.168.0.1"port: 389 # optional,
→˓default 389#ssl_enabled: false # optional,
→˓default true#ssl_trust_all_certs: true # optional,
→˓default falsebind_dn: "[email protected]"bind_password: "Buspa#mexaj1"search_user_base_DN: "OU=lab,DC=dev,DC=it,DC=example,DC=pl"search_filter: "(&(objectClass=inetOrgperson)(cn=%s))" # optional,
→˓default "(&(&(objectCategory=Person)(objectClass=User))(samaccountname=%s))"user_id_attribute: "uid" # optional,
→˓default "uid"search_groups_base_DN: "OU=lab,DC=dev,DC=it,DC=example,DC=pl" # base DN,
→˓which will be used for searching user's groups in LDAP treegroups_search_filter: "(member=%s)" # optional,
→˓default (member=%s), if ldap_groups_search is set to true, this filter will be→˓used for searching user's membership of LDAP groups
ldap_groups_search: false # optional,→˓default false - user groups will be determined basing on user's memberOf→˓attribute
unique_member_attribute: "uniqueMember" # optional,→˓default "uniqueMember"
max_connections: 10 # optional,→˓default 10
connection_timeout_in_sec: 10 # optional,→˓default 1
request_timeout_in_sec: 10 # optional,→˓default 1
cache_ttl_in_sec: 60 # optional,→˓default 0 - cache disabled
When the password is longer than 20 characters, we recommend using our pass-encrypter, otherwise back-slash must be escaped with another backslash. Endpoint role-mapping/_reload has been changed to_role-mapping/reload. This is a unification of API conventions, in accordance with Elasticsearch con-ventions.
176 Chapter 17. Integration with LDAP

CHAPTER 18
Configuring Single Sign On (SSO)
In order to configure SSO, the system should be accessible by domain name URL, not IP address nor localhost.
Ok :https://loggui.com:5601/login. Wrong : https://localhost:5601/login, https://10.0.10.120:5601/login
In order to enable SSO on your system follow below steps. The configuration is made for AD: dev.example.com,GUI URL: loggui.com
18.1 Configuration steps
1. Create an User Account for Elasticsearch auth plugin
In this step, a Kerberos Principal representing Elasticsearch auth plugin is created on the Active Directory. Theprincipal name would be [email protected], while the DEV.EXAMPLE.COM is the administrative nameof the realm. In our case, the principal name will be [email protected].
Create User in AD. Set “Password never expires” and “Other encryption options” as shown below:
177

ITRS-Log-Analytics-7.x Documentation, Release 7.0.5
1. Define Service Principal Name (SPN) and Create a Keytab file for it
Use the following command to create the keytab file and SPN:
C:> ktpass -out c:\Users\Administrator\esauth.keytab -princ HTTP/[email protected] esauth -mapOp set -pass ‘Sprint$123’ -crypto ALL -pType KRB5_NT_PRINCIPAL
Values highlighted in bold should be adjusted for your system. The esauth.keytab file should beplaced on your elasticsearch node - preferably /etc/elasticsearch/ with read permissions for elastic-search user: chmod 640 /etc/elasticsearch/esauth.keytab chown elasticsearch: /etc/elasticsearch/esauth.keytab
1. Create a file named krb5Login.conf :
com.sun.security.jgss.initiate{com.sun.security.auth.module.Krb5LoginModule requiredprincipal="[email protected]" useKeyTab=truekeyTab=/etc/elasticsearch/esauth.keytab storeKey=true debug=true;};
com.sun.security.jgss.krb5.accept {com.sun.security.auth.module.Krb5LoginModule requiredprincipal="[email protected]" useKeyTab=truekeyTab=/etc/elasticsearch/esauth.keytab storeKey=true debug=true;};
Principal user and keyTab location should be changed as per the values created in the step 2. Make sure the domainis in UPPERCASE as shown above. The krb5Login.conf file should be placed on your elasticsearch node, forinstance /etc/elasticsearch/ with read permissions for elasticsearch user:
sudo chmod 640 /etc/elasticsearch/krb5Login.confsudo chown elasticsearch: /etc/elasticsearch/krb5Login.conf
1. Append the following JVM arguments (on Elasticsearch node in /etc/sysconfig/elasticsearch)
-Dsun.security.krb5.debug=true -Djava.security.krb5.realm=DEV.EXAMPLE.COM -Djava.security.krb5.kdc=AD_HOST_IP_ADDRESS -Djava.security.auth.login.config=/etc/elasticsearch/krb5Login.conf-Djavax.security.auth.useSubjectCredsOnly=false
Change the appropriate values in the bold. This JVM arguments has to be set for Elasticsearch server.
178 Chapter 18. Configuring Single Sign On (SSO)

ITRS-Log-Analytics-7.x Documentation, Release 7.0.5
1. Add the following additional (sso.domain, service_principal_name, service_principal_name_password) settingsfor ldap in elasticsearch.yml or properties.yml file wherever the ldap settings are configured:
sso.domain: "dev.example.com"ldaps:- name: "dev.example.com"
host: "IP_address"port: 389 # optional, default 389ssl_enabled: false # optional, default
→˓truessl_trust_all_certs: false # optional, default
→˓falsebind_dn: "[email protected]" # optional, skip for
→˓anonymous bindbind_password: "administrator_password" #
→˓optional, skip for anonymous bindsearch_user_base_DN: "OU=lab,DC=dev,DC=it,DC=example,DC=com"user_id_attribute: "uid" # optional, default "uid
→˓"search_groups_base_DN: "OU=lab,DC=dev,DC=it,DC=example,DC=com"unique_member_attribute: "uniqueMember" # optional, default
→˓"uniqueMember"service_principal_name: "[email protected]"service_principal_name_password : "Sprint$123"
Note: At this moment, SSO works for only single domain. So you have to mention for what domain SSO should workin the above property sso.domain
1. To apply the changes restart Elasticsearch service
sudo systemctl restart elasticsearch.service
2. Enable SSO feature in kibana.yml file:
kibana.sso_enabled: true
3. After that Kibana has to be restarted: \
sudo systemctl restart kibana.service
18.2 Client (Browser) Configuration##
18.2.1 Internet Explorer configuration
1. Goto Internet Options from Tools menu and click on Security Tab:
18.2. Client (Browser) Configuration## 179

ITRS-Log-Analytics-7.x Documentation, Release 7.0.5
1. Select Local intranet, click on Site -> Advanced -> Add the url:
180 Chapter 18. Configuring Single Sign On (SSO)

ITRS-Log-Analytics-7.x Documentation, Release 7.0.5
After adding the site click close.
1. Click on custom level and select the option as shown below:
18.2. Client (Browser) Configuration## 181

ITRS-Log-Analytics-7.x Documentation, Release 7.0.5
18.2.2 Chrome configuration
For Chrome, the settings are taken from IE browser.
18.2.3 Firefox configuration
Update the following config:
182 Chapter 18. Configuring Single Sign On (SSO)

ITRS-Log-Analytics-7.x Documentation, Release 7.0.5
18.2. Client (Browser) Configuration## 183

ITRS-Log-Analytics-7.x Documentation, Release 7.0.5
184 Chapter 18. Configuring Single Sign On (SSO)

CHAPTER 19
Configuring Single Sign On (SSO)
In order to configure SSO, the system should be accessible by domain name URL, not IP address nor localhost.
Ok :https://loggui.com:5601/login. Wrong : https://localhost:5601/login, https://10.0.10.120:5601/login
In order to enable SSO on your system follow below steps. The configuration is made for AD: dev.example.com,GUI URL: loggui.com
19.1 Configuration steps
1. Create an User Account for Elasticsearch auth plugin
In this step, a Kerberos Principal representing Elasticsearch auth plugin is created on the Active Directory. Theprincipal name would be [email protected], while the DEV.EXAMPLE.COM is the administrative nameof the realm. In our case, the principal name will be [email protected].
Create User in AD. Set “Password never expires” and “Other encryption options” as shown below:
185

ITRS-Log-Analytics-7.x Documentation, Release 7.0.5
1. Define Service Principal Name (SPN) and Create a Keytab file for it
Use the following command to create the keytab file and SPN:
C:> ktpass -out c:\Users\Administrator\esauth.keytab -princ HTTP/[email protected] esauth -mapOp set -pass ‘Sprint$123’ -crypto ALL -pType KRB5_NT_PRINCIPAL
Values highlighted in bold should be adjusted for your system. The esauth.keytab file should beplaced on your elasticsearch node - preferably /etc/elasticsearch/ with read permissions for elastic-search user: chmod 640 /etc/elasticsearch/esauth.keytab chown elasticsearch: /etc/elasticsearch/esauth.keytab
1. Create a file named krb5Login.conf :
com.sun.security.jgss.initiate{com.sun.security.auth.module.Krb5LoginModule requiredprincipal="[email protected]" useKeyTab=truekeyTab=/etc/elasticsearch/esauth.keytab storeKey=true debug=true;};
com.sun.security.jgss.krb5.accept {com.sun.security.auth.module.Krb5LoginModule requiredprincipal="[email protected]" useKeyTab=truekeyTab=/etc/elasticsearch/esauth.keytab storeKey=true debug=true;};
Principal user and keyTab location should be changed as per the values created in the step 2. Make sure the domainis in UPPERCASE as shown above. The krb5Login.conf file should be placed on your elasticsearch node, forinstance /etc/elasticsearch/ with read permissions for elasticsearch user:
sudo chmod 640 /etc/elasticsearch/krb5Login.confsudo chown elasticsearch: /etc/elasticsearch/krb5Login.conf
1. Append the following JVM arguments (on Elasticsearch node in /etc/sysconfig/elasticsearch)
-Dsun.security.krb5.debug=true -Djava.security.krb5.realm=DEV.EXAMPLE.COM -Djava.security.krb5.kdc=AD_HOST_IP_ADDRESS -Djava.security.auth.login.config=/etc/elasticsearch/krb5Login.conf-Djavax.security.auth.useSubjectCredsOnly=false
Change the appropriate values in the bold. This JVM arguments has to be set for Elasticsearch server.
186 Chapter 19. Configuring Single Sign On (SSO)

ITRS-Log-Analytics-7.x Documentation, Release 7.0.5
1. Add the following additional (sso.domain, service_principal_name, service_principal_name_password) settingsfor ldap in elasticsearch.yml or properties.yml file wherever the ldap settings are configured:
sso.domain: "dev.example.com"ldaps:- name: "dev.example.com"
host: "IP_address"port: 389 # optional, default 389ssl_enabled: false # optional, default
→˓truessl_trust_all_certs: false # optional, default
→˓falsebind_dn: "[email protected]" # optional, skip for
→˓anonymous bindbind_password: "administrator_password" #
→˓optional, skip for anonymous bindsearch_user_base_DN: "OU=lab,DC=dev,DC=it,DC=example,DC=com"user_id_attribute: "uid" # optional, default "uid
→˓"search_groups_base_DN: "OU=lab,DC=dev,DC=it,DC=example,DC=com"unique_member_attribute: "uniqueMember" # optional, default
→˓"uniqueMember"service_principal_name: "[email protected]"service_principal_name_password : "Sprint$123"
Note: At this moment, SSO works for only single domain. So you have to mention for what domain SSO should workin the above property sso.domain
1. To apply the changes restart Elasticsearch service
sudo systemctl restart elasticsearch.service
2. Enable SSO feature in kibana.yml file:
kibana.sso_enabled: true
3. After that Kibana has to be restarted: \
sudo systemctl restart kibana.service
19.2 Client (Browser) Configuration##
19.2.1 Internet Explorer configuration
1. Goto Internet Options from Tools menu and click on Security Tab:
19.2. Client (Browser) Configuration## 187

ITRS-Log-Analytics-7.x Documentation, Release 7.0.5
1. Select Local intranet, click on Site -> Advanced -> Add the url:
188 Chapter 19. Configuring Single Sign On (SSO)

ITRS-Log-Analytics-7.x Documentation, Release 7.0.5
After adding the site click close.
1. Click on custom level and select the option as shown below:
19.2. Client (Browser) Configuration## 189

ITRS-Log-Analytics-7.x Documentation, Release 7.0.5
19.2.2 Chrome configuration
For Chrome, the settings are taken from IE browser.
19.2.3 Firefox configuration
Update the following config:
190 Chapter 19. Configuring Single Sign On (SSO)

ITRS-Log-Analytics-7.x Documentation, Release 7.0.5
19.2. Client (Browser) Configuration## 191

ITRS-Log-Analytics-7.x Documentation, Release 7.0.5
192 Chapter 19. Configuring Single Sign On (SSO)

CHAPTER 20
Configure email delivery
20.1 Configure email delivery for sending PDF reports in Scheduler.
The default e-mail client that installs with the Linux CentOS system, which is used by ITRS Log Analytics to sendreports (Section 5.3 of the Reports chapter), is postfix.# Configuration file for postfix mail client #
The postfix configuration directory for CentOS is /etc/postfix. It contains files:
main.cf - the main configuration file for the program specifying the basics parameters
Some of its directives:
|**Directive** | **Description**→˓ || ------------------------| ---------------------------------------------------------→˓------------------------------------------------||queue\_directory | The postfix queue location.|command\_directory | The location of Postfix commands.|daemon\_directory | Location of Postfix daemons.|mail\_owner | The owner of Postfix domain name of the server|myhostname | The fully qualified domain name of the server.|mydomain | Server domain|myorigin | Host or domain to be displayed as origin on email→˓leaving the server.|inet\_interfaces | Network interface to be used for incoming email.|mydestination | Domains from which the server accepts mail.|mynetworks | The IP address of trusted networks.|relayhost | Host or other mail server through which mail will→˓be sent. This server will act as an outbound gateway.|alias\_maps | Database of asliases used by the local delivery→˓agent.|alias\_database | Alias database generated by the new aliases→˓command.|mail\_spool\_directory | The location where user boxes will be stored.
193

ITRS-Log-Analytics-7.x Documentation, Release 7.0.5
master.cf - defines the configuration settings for the master daemon and the way it should work with other agents todeliver mail. For each service installed in the master.cf file there are seven columns that define how the service shouldbe used.
|Column | Description|---------------- | -----------------------------------------------------------------→˓---------------------------|service | The name of the service|type | The transport mechanism to be user.|private | Is the service only for user by Postfix.|unpriv | Can the service be run by ordinary users|chroot | Whether the service is to change the main directory (chroot)→˓for the mail. Queue.|wakeup | Wake up interval for the service.|maxproc | The maximum number of processes on which the service can be→˓forked (to divide in branches)|command + args | A command associated with the service plus any argument
access - can be used to control access based on e-mail address, host address, domain or network address.
Examples of entries in the file
|Description | Example|------------------------------------------------|--------------------|To allow access for specific IP address: | 192.168.122.20 OK|To allow access for a specific domain: | example.com OK|To deny access from the 192.168.3.0/24 network: | 192.168.3 REJECT
After making changes to the access file, you must convert its contents to the access.db database with the postmapcommand:
# postmap /etc/postfix/access# ll /etc/postfix/access*
-rw-r\--r\--. 1 root root 20876 Jan 26 2014 /etc/postfix/access-rw-r\--r\--. 1 root root 12288 Feb 12 07:47 /etc/postfix/access.db
canonical - mapping incoming e-mails to local users.
Examples of entries in the file:
To forward emails to user1 to the [[[email protected]] mailbox:
user1 user1\@yahoo.com
To forward all emails for example.org to another example.com domain:
@example.org @example.com
After making changes to the canonical file, you must convert its contents to the canonical.db database with the postmapcommand:
# postmap /etc/postfix/canonical# ll /etc/postfix/canonical*
-rw-r\--r\--. 1 root root 11681 2014-06-10 /etc/postfix/canonical-rw-r\--r\--. 1 root root 12288 07-31 20:56 /etc/postfix/canonical.db
194 Chapter 20. Configure email delivery

ITRS-Log-Analytics-7.x Documentation, Release 7.0.5
generic - mapping of outgoing e-mails to local users. The syntax is the same as a canonical file. After you makechange to this file, you must also run the postmap command.
# postmap /etc/postfix/generic# ll /etc/postfix/generic*
-rw-r\--r\--. 1 root root 9904 2014-06-10 /etc/postfix/generic-rw-r\--r\--. 1 root root 12288 07-31 21:15 /etc/postfix/generic.db
reloceted – information about users who have been transferred. The syntax of the file is the same as canonical andgeneric files.
Assuming tha user1 was moved from example.com to example.net, you can forward all emails received on the oldaddress to the new address:
Example of an entry in the file:
[email protected] [email protected]
After you make change to this file, you must also run the postmap command.
# postmap /etc/postfix/relocated# ll /etc/postfix/relocated*
-rw-r\--r\--. 1 root root 6816 2014-06-10 /etc/postfix/relocated-rw-r\--r\--. 1 root root 12288 07-31 21:26 /etc/postfix/relocated.d
transport – mapping between e-mail addresses and server through which these e-mails are to be sent (next hops) intthe transport format: nexthop.
Example of an entry in the file:
[email protected] smtp:host1.example.com
After you make changes to this file, you must also run the postmap command.
# postmap /etc/postfix/transport[root@server1 postfix]# ll /etc/postfix/transport*
-rw-r\--r\--. 1 root root 12549 2014-06-10 /etc/postfix/transport-rw-r\--r\--. 1 root root 12288 07-31 21:32 /etc/postfix/transport.db
virtual - user to redirect e-mails intended for a certain user to the account of another user or multiple users. It can alsobe used to implement the domain alias mechanism.
Examples of the entry in the file:
Redirecting email for user1, to root users and user3:
user1 root, user3
Redirecting email for user 1 in the example.com domain to the root user:
[email protected] root
After you make change to this file, you must also run the postmap command:
# postmap /etc/postfix/virtual# ll /etc/postfix/virtual
(continues on next page)
20.1. Configure email delivery for sending PDF reports in Scheduler. 195

ITRS-Log-Analytics-7.x Documentation, Release 7.0.5
(continued from previous page)
-rw-r\--r\--. 1 root root 12494 2014-06-10 /etc/postfix/virtual-rw-r\--r\--. 1 root root 12288 07-31 21:58 /etc/postfix/virtual.db
20.2 Basic postfix configuration
Base configuration of postfix application you can make in /etc/postfix/main.cfg configuration file, whichmust complete with the following entry:
• section # RECEIVING MAIL
inet_interfaces = allinet_protocols = ipv4
• section # INTERNET OR INTRANET
relayhost = [IP mail server]:25 (port number)
I the netxt step you must complete the canonical file of postfix
At the end you should restart the postfix:
systemctl restart postfix
20.3 Example of postfix configuration with SSL encryption enabled
To configure email delivery with SSL encryption you need to make the following changes in the postfix configurationfiles:
• /etc/postfix/main.cf - file should contain the following entries in addition to standard (uncheckedentries):
mydestination = $myhostname, localhost.$mydomain, localhostmyhostname = example.comrelayhost = [smtp.example.com]:587smtp_sasl_auth_enable = yessmtp_sasl_password_maps = hash:/etc/postfix/sasl_passwdsmtp_sasl_security_options = noanonymoussmtp_tls_CAfile = /root/certs/cacert.cersmtp_use_tls = yessmtp_sasl_mechanism_filter = plain, loginsmtp_sasl_tls_security_options = noanonymouscanonical_maps = hash:/etc/postfix/canonicalsmtp_generic_maps = hash:/etc/postfix/genericsmtpd_recipient_restrictions = permit_sasl_authenticated
• /etc/postfix/sasl/passwd - file should define the data for authorized
[smtp.example.com\]:587 [[[email protected]:PASS]](mailto:USER@example.→˓com:PASS)
You need to give appropriate permissions:
196 Chapter 20. Configure email delivery

ITRS-Log-Analytics-7.x Documentation, Release 7.0.5
chmod 400 /etc/postfix/sasl_passwd
and map configuration to database:
postmap /etc/postfix/sasl_passwd
next you need to generate a ca cert file:
cat /etc/ssl/certs/Example\_Server\_CA.pem | tee -a etc/postfix/cacert.pem
And finally, you need to restart postfix
/etc/init.d/postfix restart
20.3. Example of postfix configuration with SSL encryption enabled 197

ITRS-Log-Analytics-7.x Documentation, Release 7.0.5
198 Chapter 20. Configure email delivery

CHAPTER 21
API
21.1 Kibana API
The Kibana dashboard import/export APIs allow people to import dashboards along with all of their correspondingsaved objects such as visualizations, saved searches, and index patterns.
21.1.1 Kibana Import API
Request:
POST /api/kibana/dashboards/import
Query Parameters:
• force (optional)
(boolean) Overwrite any existing objects on id conflict
• exclude (optional)
(array) Saved object types that should not be imported
Example:
curl -X POST "https://user:password@localhost:5601POST api/kibana/dashboards/import?→˓exclude=index-pattern"
21.1.2 Kibana Export API
Request:
GET /api/kibana/dashboards/export
199

ITRS-Log-Analytics-7.x Documentation, Release 7.0.5
Query Parameters
• dashboard (required)
(array|string) The id(s) of the dashboard(s) to export
Example:
curl -k -XPOST "https://user:password@localhost:443/api/kibana/dashboards/import?→˓force=true&exclude=index-pattern" -H 'kbn-xsrf: true' -H 'Content-Type: application/→˓json' [email protected]
21.2 Elasticsearch API
The Elasticsearch has a typical REST API and data is received in JSON format after the HTTP protocol. By defaultthe tcp/9200 port is used to communicate with the Elasticsearch API. For purposes of examples, communication withthe Elasticsearch API will be carried out using the curl application.
Program syntax:
curl -XGET -u login:password '127.0.0.1:9200'
Available methods:
• PUT - sends data to the server;
• POST - sends a request to the server for a change;
• DELETE - deletes the index / document;
• GET - gets information about the index /document;
• HEAD - is used to check if the index / document exists.
Avilable APIs by roles:
• Index API - manages indexes;
• Document API - manges documnets;
• Cluster API - manage the cluster;
• Search API - is userd to search for data.
21.3 Elasticsearch Index API
The indices APIs are used to manage individual indices, index settings, aliases, mappings, and index templates.
21.3.1 Adding Index
Adding Index - autormatic method:
curl -XPUT -u login:password '127.0.0.1:9200/twitter/tweet/1?pretty=true' -d'{"user" : "elk01","post_date" : "2017-09-05T10:00:00","message" : "tests auto index generation"}'
200 Chapter 21. API

ITRS-Log-Analytics-7.x Documentation, Release 7.0.5
You should see the output:
{"_index" : "twitter",
"_type" : "tweet","_id" : "1","_version" : 1,"_shards" : {"total" : 2,"successful" : 1,"failed" : 0
},"created" : true
}
The parameter action.auto_create_index must be set on true.
Adding Index – manual method:
• settings the number of shards and replicas:
curl -XPUT -u login:password '127.0.0.1:9200/twitter2?pretty=true' -d'{"settings" : {"number_of_shards" : 1,"number_of_replicas" : 1}
}'
You should see the output:
{"acknowledged" : true
}
• command for manual index generation:
curl -XPUT -u login:password '127.0.0.1:9200/twitter2/tweet/1?pretty=true' -d'{"user" : "elk01","post_date" : "2017-09-05T10:00:00","message" : "tests manual index generation"
}'
You should see the output:
{"_index" : "twitter2","_type" : "tweet","_id" : "1","_version" : 1,"_shards" : {"total" : 2,"successful" : 1,"failed" : 0
},"created" : true
}
21.3. Elasticsearch Index API 201

ITRS-Log-Analytics-7.x Documentation, Release 7.0.5
21.3.2 Delete Index
Delete Index - to delete twitter index you need use the following command:
curl -XDELETE -u login:password '127.0.0.1:9200/twitter?pretty=true'
The delete index API can also be applied to more than one index, by either using a comma separated list, or on allindice by using _all or * as index:
curl -XDELETE -u login:password '127.0.0.1:9200/twitter*?pretty=true'
To allowing to delete indices via wildcards set action.destructive_requires_name setting in the config tofalse.
21.3.3 API useful commands
• get information about Replicas and Shards:
curl -XGET -u login:password '127.0.0.1:9200/twitter/_settings?pretty=true'
curl -XGET -u login:password '127.0.0.1:9200/twitter2/_settings?pretty=true'
• get information about mapping and alias in the index:
curl -XGET -u login:password '127.0.0.1:9200/twitter/_mappings?pretty=true'
curl -XGET -u login:password '127.0.0.1:9200/twitter/_aliases?pretty=true'
• get all information about the index:
curl -XGET -u login:password '127.0.0.1:9200/twitter?pretty=true'
• checking does the index exist:
curl -XGET -u login:password '127.0.0.1:9200/twitter?pretty=true'
• close the index:
curl -XPOST -u login:password '127.0.0.1:9200/twitter/_close?pretty=true'
• open the index:
curl -XPOST -u login:password '127.0.0.1:9200/twitter/_open?pretty=true'
• get the status of all indexes:
curl -XGET -u login:password '127.0.0.1:9200/_cat/indices?v'
• get the status of one specific index:
curl -XGET -u login:password '127.0.0.1:9200/_cat/indices/twitter?v'
• display how much memory is used by the indexes:
202 Chapter 21. API

ITRS-Log-Analytics-7.x Documentation, Release 7.0.5
curl -XGET -u login:password '127.0.0.1:9200/_cat/indices?v&h=i,tm&s=tm:desc'
• display details of the shards:
curl -XGET -u login:password '127.0.0.1:9200/_cat/shards?v'
21.4 Elasticsearch Document API
21.4.1 Create Document
• create a document with a specify ID:
curl -XPUT -u login:password '127.0.0.1:9200/twitter/tweet/1?pretty=true' -d'{"user" : "lab1","post_date" : "2017-08-25T10:00:00","message" : "testuje Elasticsearch"
}'
You should see the output:
{"_index" : "twitter","_type" : "tweet","_id" : "1","_version" : 1,"_shards" : {"total" : 2,"successful" : 1,"failed" : 0
},"created" : true
}
• creating a document with an automatically generated ID: (note: PUT-> POST):
curl -XPOST -u login:password '127.0.0.1:9200/twitter/tweet?pretty=true' -d'{"user" : "lab1","post_date" : "2017-08-25T10:10:00","message" : "testuje automatyczne generowanie ID"}'
You should see the output:
{"_index" : "twitter","_type" : "tweet","_id" : "AV49sTlM8NzerkV9qJfh","_version" : 1,"_shards" : {"total" : 2,"successful" : 1,"failed" : 0
},"created" : true
}
21.4. Elasticsearch Document API 203

ITRS-Log-Analytics-7.x Documentation, Release 7.0.5
21.4.2 Delete Document
• delete a document by ID:
curl -XDELETE -u login:password '127.0.0.1:9200/twitter/tweet/1?pretty=true'
curl -XDELETE -u login:password '127.0.0.1:9200/twitter/tweet/AV49sTlM8NzerkV9qJfh?→˓pretty=true'
• delete a document using a wildcard:
curl -XDELETE -u login:password '127.0.0.1:9200/twitter/tweet/1*?pretty=true'
(parametr: action.destructive_requires_name must be set to false)
21.4.3 Useful commands
• get information about the document:
curl -XGET -u login:password '127.0.0.1:9200/twitter/tweet/1?pretty=true'
You should see the output:
{"_index" : "twitter","_type" : "tweet","_id" : "1","_version" : 1,"found" : true,"_source" : {
"user" : "lab1","post_date" : "2017-08-25T10:00:00","message" : "testuje Elasticsearch"
}}
• get the source of the document:
curl -XGET -u login:password '127.0.0.1:9200/twitter/tweet/1/_source?pretty=true'
You should see the output:
{"user" : "lab1","post_date" : "2017-08-25T10:00:00","message" : "test of Elasticsearch"
}
• get information about all documents in the index:
curl -XGET -u login:password '127.0.0.1:9200/twitter*/_search?q=*&pretty=true'
You should see the output:
204 Chapter 21. API

ITRS-Log-Analytics-7.x Documentation, Release 7.0.5
{"took" : 7,"timed_out" : false,"_shards" : {
"total" : 10,"successful" : 10,"failed" : 0
},"hits" : {
"total" : 3,"max_score" : 1.0,"hits" : [ {
"_index" : "twitter","_type" : "tweet","_id" : "AV49sTlM8NzerkV9qJfh","_score" : 1.0,"_source" : {"user" : "lab1","post_date" : "2017-08-25T10:10:00",
"message" : "auto generated ID"}
}, {"_index" : "twitter","_type" : "tweet","_id" : "1","_score" : 1.0,"_source" : {"user" : "lab1","post_date" : "2017-08-25T10:00:00","message" : "Elasticsearch test"
}}, {"_index" : "twitter2","_type" : "tweet","_id" : "1","_score" : 1.0,"_source" : {
"user" : "elk01","post_date" : "2017-09-05T10:00:00","message" : "manual index created test"
}} ]
}}
• the sum of all documents in a specified index:
curl -XGET -u login:password '127.0.0.1:9200/_cat/count/twitter?v'
You should see the output:
epoch timestamp count1504281400 17:56:40 2
• the sum of all document in Elasticsearch database:
21.4. Elasticsearch Document API 205

ITRS-Log-Analytics-7.x Documentation, Release 7.0.5
curl -XGET -u login:password ‘127.0.0.1:9200/_cat/count?v’
You should see the output:
```bashepoch timestamp count1504281518 17:58:38 493658
21.5 Elasticsearch Cluster API
21.5.1 Useful commands
• information about the cluster state:
bash‘‘‘ curl -XGET -u login:password ‘127.0.0.1:9200/_cluster/health?pretty=true’
- information about the role and load of nodes in the cluster:
```bashcurl -XGET -u login:password '127.0.0.1:9200/_cat/nodes?v'
• information about the available and used place on the cluster nodes:
curl -XGET -u login:password '127.0.0.1:9200/_cat/allocation?v'
• information which node is currently in the master role:
curl -XGET -u login:password '127.0.0.1:9200/_cat/master?v'
• information abut currently performed operations by the cluster:
curl -XGET -u login:password '127.0.0.1:9200/_cat/pending_tasks?v'
• information on revoceries / transferred indices:
curl -XGET -u login:password '127.0.0.1:9200/_cat/recovery?v'
• information about shards in a cluster:
curl -XGET -u login:password '127.0.0.1:9200/_cat/shards?v'
• detailed inforamtion about the cluster:
curl -XGET -u login:password '127.0.0.1:9200/_cluster/stats?human&pretty'
• detailed information about the nodes:
curl -XGET -u login:password '127.0.0.1:9200/_nodes/stats?human&pretty'
206 Chapter 21. API

ITRS-Log-Analytics-7.x Documentation, Release 7.0.5
21.6 Elasticsearch Search API
21.6.1 Useful commands
• searching for documents by the string:
curl -XPOST -u login:password '127.0.0.1:9200/twitter*/tweet/_search?pretty=true' -d '→˓{
"query": {"bool" : {
"must" : {"query_string" : {
"query" : "test"}
}}
}}'
• searching for document by the string and filtering:
curl -XPOST -u login:password '127.0.0.1:9200/twitter*/tweet/_search?pretty=true' -d'{
"query": {"bool" : {
"must" : {"query_string" : {
"query" : "testuje→˓"
}},
"filter" : {"term" : { "user" : "lab1" }
}}
}}'
• simple search in a specific field (in this case user) uri query:
curl -XGET -u login:password '127.0.0.1:9200/twitter*/_search?q=user:lab1&pretty=true'
• simple search in a specific field:
curl -XPOST -u login:password '127.0.0.1:9200/twitter*/_search?→˓ pretty=true' -d '{
"query" : {"term" : { "user" : "lab1" }
}}'
21.7 Elasticsearch - Mapping, Fielddata and Templates
Mapping is a collection of fields along with a specific data type Fielddata is the field in which the data is stored(requires a specific type - string, float) Template is a template based on which fielddata will be created in a given
21.6. Elasticsearch Search API 207

ITRS-Log-Analytics-7.x Documentation, Release 7.0.5
index.
21.7.1 Useful commands
• Information on all set mappings:
curl -XGET -u login:password '127.0.0.1:9200/_mapping?pretty=true'
• Information about all mappings set in the index:
curl -XGET -u login:password '127.0.0.1:9200/twitter/_mapping/*?pretty=true'
• Information about the type of a specific field:
curl -XGET -u login:password '127.0.0.1:9200/twitter/_mapping/field/message*?→˓pretty=true'
• Information on all set templates:
curl -XGET -u login:password '127.0.0.1:9200/_template/*?pretty=true'
21.7.2 Create - Mapping / Fielddata
• Create - Mapping / Fielddata - It creates index twitter-float and the tweet message field sets to float:
curl -XPUT -u login:password '127.0.0.1:9200/twitter-float?pretty=true' -d '{"mappings": {"tweet": {"properties": {"message": {"type": "float"
}}
}}
}'
curl -XGET -u login:password '127.0.0.1:9200/twitter-float/_mapping/field/message?→˓pretty=true'
21.7.3 Create Template
• Create Template:
curl -XPUT -u login:password '127.0.0.1:9200/_template/template_1' -d'{"template" : "twitter4","order" : 0,"settings" : {
"number_of_shards" : 2}
}'
208 Chapter 21. API

ITRS-Log-Analytics-7.x Documentation, Release 7.0.5
curl -XPOST -u login:password '127.0.0.1:9200/twitter4/tweet?pretty=true' -d'{"user" : "lab1","post_date" : "2017-08-25T10:10:00","message" : "test of ID generation"
}'
curl -XGET -u login:password '127.0.0.1:9200/twitter4/_settings?pretty=true'
• Create Template2 - Sets the mapping template for all new indexes specifying that the tweet data, in the fieldcalled message, should be of the “string” type:
curl -XPUT -u login:password '127.0.0.1:9200/_template/template_2' -d'{"template" : "*",
"mappings": {"tweet": {"properties": {"message": {"type": "string"
}}
}}
}'
21.7.4 Delete Mapping
• Delete Mapping - Deleting a specific index mapping (no possibility to delete - you need to index):
curl -XDELETE -u login:password '127.0.0.1:9200/twitter2'
21.7.5 Delete Template
• Delete Template:
curl -XDELETE -u login:password '127.0.0.1:9200/_template/template_1?pretty=true'
21.8 AI Module API
21.8.1 Services
The intelligence module has implemented services that allow you to create, modify, delete, execute and read definitionsof AI rules.
21.8.2 List rules
The list service returns a list of AI rules definitions stored in the system.
Method: GET URL:
21.8. AI Module API 209

ITRS-Log-Analytics-7.x Documentation, Release 7.0.5
https://<host>:<port>/api/ai/list?pretty
where:
host - kibana host addressport - kibana port?pretty - optional json format parameter
Curl:
curl -XGET 'https://localhost:5601/api/ai/list?pretty' -u <user>:<password> -k
Result: Array of JSON documents:
| Field | Value→˓ | Screen field (description)→˓ ||-------------------------------- |--------------------------------------------→˓----------------------------------------- |----------------------------→˓ || _source.algorithm_type | GMA, GMAL, LRS, LRST, RFRS, SMAL, SMA, TL→˓ | Algorithm.→˓ || _source.model_name | Not empty string.→˓ | AI Rule Name.→˓ || _source.search | Search id.→˓ | Choose search.→˓ || _source.label_field.field |→˓ | Feature to analyse.→˓ || _source.max_probes | Integer value→˓ | Max probes→˓ || _source.time_frame | 1 minute, 5 minutes, 15 minutes, 30→˓minutes, 1 hour, 1 day, 1 week, 30 day, 365 day | Time frame→˓ || _source.value_type | min, max, avg, count→˓ | Value type→˓ || _source.max_predictions | Integer value→˓ | Max predictions→˓ || _source.threshold | Integer value→˓ | Threshold→˓ || _source.automatic_cron | Cron format string→˓ | Automatic cycle→˓ || _source.automatic_enable | true/false→˓ | Enable→˓ || _source.automatic | true/false→˓ | Automatic→˓ || _source.start_date | YYYY-MM-DD HH:mm or now→˓ | Start date→˓ | (continues on next page)
210 Chapter 21. API

ITRS-Log-Analytics-7.x Documentation, Release 7.0.5
(continued from previous page)
| _source.multiply_by_values | Array of string values→˓ | Multiply by values→˓ || _source.multiply_by_field | None or full field name eg.: system.cpu→˓ | Multiply by field→˓ || _source.selectedroles | Array of roles name→˓ | Role→˓ || _source.last_execute_timestamp |→˓ | Last execute→˓ |
Not screen fields:
| _index | | Elasticsearch index name.→˓ ||------------------------------- |--- |---------------------------------→˓---- || _type | | Elasticsearch document type.→˓ || _id | | Elasticsearch document id.→˓ || _source.preparation_date | | Document preparation date.→˓ || _source.machine_state_uid | | AI rule machine state uid.→˓ || _source.path_to_logs | | Path to ai machine logs.→˓ || _source.path_to_machine_state | | Path to ai machine state files.→˓ || _source.searchSourceJSON | | Query string.→˓ || _source.processing_time | | Process operation time.→˓ || _source.last_execute_mili | | Last executed time in→˓milliseconds. || _source.pid | | Process pid if ai rule is→˓running. || _source.exit_code | | Last executed process exit code.→˓ |
21.8.3 Show rules
The show service returns a document of AI rule definition by id.
Method: GET URL: https://:/api/ai/show/?pretty
where:
host - kibana host addressport - kibana portid - ai rule document id?pretty - optional json format parameter
Curl:
21.8. AI Module API 211

ITRS-Log-Analytics-7.x Documentation, Release 7.0.5
curl -XGET 'https://localhost:5601/api/ai/show/ea9384857de1f493fd84dabb6dfb99ce?pretty→˓' -u <user>:<password> -k
Result JSON document:
| Field | Value→˓ | Screen field (description)→˓ ||-------------------------------- |--------------------------------------------→˓----------------------------------------- |----------------------------→˓ || _source.algorithm_type | GMA, GMAL, LRS, LRST, RFRS, SMAL, SMA, TL→˓ | Algorithm.→˓ || _source.model_name | Not empty string.→˓ | AI Rule Name.→˓ || _source.search | Search id.→˓ | Choose search.→˓ || _source.label_field.field |→˓ | Feature to analyse.→˓ || _source.max_probes | Integer value→˓ | Max probes→˓ || _source.time_frame | 1 minute, 5 minutes, 15 minutes, 30→˓minutes, 1 hour, 1 day, 1 week, 30 day, 365 day | Time frame→˓ || _source.value_type | min, max, avg, count→˓ | Value type→˓ || _source.max_predictions | Integer value→˓ | Max predictions→˓ || _source.threshold | Integer value→˓ | Threshold→˓ || _source.automatic_cron | Cron format string→˓ | Automatic cycle→˓ || _source.automatic_enable | true/false→˓ | Enable→˓ || _source.automatic | true/false→˓ | Automatic→˓ || _source.start_date | YYYY-MM-DD HH:mm or now→˓ | Start date→˓ || _source.multiply_by_values | Array of string values→˓ | Multiply by values→˓ || _source.multiply_by_field | None or full field name eg.: system.cpu→˓ | Multiply by field→˓ || _source.selectedroles | Array of roles name→˓ | Role→˓ | (continues on next page)
212 Chapter 21. API

ITRS-Log-Analytics-7.x Documentation, Release 7.0.5
(continued from previous page)
| _source.last_execute_timestamp |→˓ | Last execute→˓ |
Not screen fields
| _index | | Elasticsearch index name.→˓ ||------------------------------- |--- |---------------------------------→˓---- || _type | | Elasticsearch document type.→˓ || _id | | Elasticsearch document id.→˓ || _source.preparation_date | | Document preparation date.→˓ || _source.machine_state_uid | | AI rule machine state uid.→˓ || _source.path_to_logs | | Path to ai machine logs.→˓ || _source.path_to_machine_state | | Path to ai machine state files.→˓ || _source.searchSourceJSON | | Query string.→˓ || _source.processing_time | | Process operation time.→˓ || _source.last_execute_mili | | Last executed time in→˓milliseconds. || _source.pid | | Process pid if ai rule is→˓running. || _source.exit_code | | Last executed process exit code.→˓ |
21.8.4 Create rules
The create service adds a new document with the AI rule definition.
Method: PUT
URL:
https://<host>:<port>/api/ai/create
where:
host - kibana host addressport - kibana portbody - JSON with definition of ai rule
Curl:
curl -XPUT 'https://localhost:5601/api/ai/create' -u <user>:<password> -k -H "kbn-→˓version: 6.2.4" -H 'Content-type: application/json' -d' {"algorithm_type":"TL",→˓"model_name":"test","search":"search:6c226420-3b26-11e9-a1c0-4175602ff5d0","label_→˓field":{"field":"system.cpu.idle.pct"},"max_probes":100,"time_frame":"1 day","value_→˓type":"avg","max_predictions":10,"threshold":-1,"automatic_cron":"*/5 * * * *",→˓"automatic_enable":true,"automatic_flag":true,"start_date":"now","multiply_by_values→˓":[],"multiply_by_field":"none","selectedroles":["test"]}'
(continues on next page)
21.8. AI Module API 213

ITRS-Log-Analytics-7.x Documentation, Release 7.0.5
(continued from previous page)
Validation:
| Field | Values→˓ ||---------------- |------------------------------------------------------------→˓------------------------- || algorithm_type | GMA, GMAL, LRS, LRST, RFRS, SMAL, SMA, TL→˓ || value_type | min, max, avg, count→˓ || time_frame | 1 minute, 5 minutes, 15 minutes, 30 minutes, 1 hour, 1 day,→˓ 1 week, 30 day, 365 day |
Body JSON description:
| Field | Mandatory | Value→˓ | Screen field→˓ ||-------------------- |------------------ |-----------------------------→˓-------------------------------------------------------- |-------------------→˓-- || algorithm_type | Yes | GMA, GMAL, LRS, LRST, RFRS,→˓SMAL, SMA, TL | Algorithm.→˓ || model_name | Yes | Not empty string.→˓ | AI Rule Name.→˓ || search | Yes | Search id.→˓ | Choose search.→˓ || label_field.field | Yes |→˓ | Feature to→˓analyse. || max_probes | Yes | Integer value→˓ | Max probes→˓ || time_frame | Yes | 1 minute, 5 minutes, 15→˓minutes, 30 minutes, 1 hour, 1 day, 1 week, 30 day, 365 day | Time frame→˓ || value_type | Yes | min, max, avg, count→˓ | Value type→˓ || max_predictions | Yes | Integer value→˓ | Max predictions→˓ || threshold | No (default -1) | Integer value→˓ | Threshold→˓ || automatic_cron | Yes | Cron format string→˓ | Automatic cycle→˓ || Automatic_enable | Yes | true/false→˓ | Enable→˓ || automatic | Yes | true/false→˓ | Automatic→˓ |
(continues on next page)
214 Chapter 21. API

ITRS-Log-Analytics-7.x Documentation, Release 7.0.5
(continued from previous page)
| start_date | No (default now) | YYYY-MM-DD HH:mm or now→˓ | Start date→˓ || multiply_by_values | Yes | Array of string values→˓ | Multiply by→˓values || multiply_by_field | Yes | None or full field name eg.→˓: system.cpu | Multiply by→˓field || selectedroles | No | Array of roles name→˓ | Role→˓ |
Result:
JSON document with fields:
status - true if okid - id of changed documentmessage - error message
21.8.5 Update rules
The update service changes the document with the AI rule definition.
Method:POST
URL:
https://<host>:<port>/api/ai/update/<id>
where:
host - kibana host addressport - kibana portid - ai rule document idbody - JSON with definition of ai rule
Curl:
curl -XPOST 'https://localhost:5601/api/ai/update/ea9384857de1f493fd84dabb6dfb99ce' -→˓u <user>:<password> -k -H "kbn-version: 6.2.4" -H 'Content-type: application/json' -→˓d'{"algorithm_type":"TL","search":"search:6c226420-3b26-11e9-a1c0-4175602ff5d0","label_→˓field":{"field":"system.cpu.idle.pct"},"max_probes":100,"time_frame":"1 day","value_→˓type":"avg","max_predictions":100,"threshold":-1,"automatic_cron":"*/5 * * * *",→˓"automatic_enable":true,"automatic_flag":true,"start_date":"now","multiply_by_values→˓":[],"multiply_by_field":"none","selectedroles":["test"]}
Validation:
| Field | Values→˓ ||---------------- |------------------------------------------------------------→˓------------------------- || algorithm_type | GMA, GMAL, LRS, LRST, RFRS, SMAL, SMA, TL→˓ | (continues on next page)
21.8. AI Module API 215

ITRS-Log-Analytics-7.x Documentation, Release 7.0.5
(continued from previous page)
| value_type | min, max, avg, count→˓ || time_frame | 1 minute, 5 minutes, 15 minutes, 30 minutes, 1 hour, 1 day,→˓ 1 week, 30 day, 365 day |
Body JSON description:
| Field | Mandatory | Value→˓ | Screen field→˓ ||-------------------- |------------------ |-----------------------------→˓-------------------------------------------------------- |-------------------→˓-- || algorithm_type | Yes | GMA, GMAL, LRS, LRST, RFRS,→˓SMAL, SMA, TL | Algorithm.→˓ || model_name | Yes | Not empty string.→˓ | AI Rule Name.→˓ || search | Yes | Search id.→˓ | Choose search.→˓ || label_field.field | Yes |→˓ | Feature to→˓analyse. || max_probes | Yes | Integer value→˓ | Max probes→˓ || time_frame | Yes | 1 minute, 5 minutes, 15→˓minutes, 30 minutes, 1 hour, 1 day, 1 week, 30 day, 365 day | Time frame→˓ || value_type | Yes | min, max, avg, count→˓ | Value type→˓ || max_predictions | Yes | Integer value→˓ | Max predictions→˓ || threshold | No (default -1) | Integer value→˓ | Threshold→˓ || automatic_cron | Yes | Cron format string→˓ | Automatic cycle→˓ || Automatic_enable | Yes | true/false→˓ | Enable→˓ || automatic | Yes | true/false→˓ | Automatic→˓ || start_date | No (default now) | YYYY-MM-DD HH:mm or now→˓ | Start date→˓ || multiply_by_values | Yes | Array of string values→˓ | Multiply by→˓values || multiply_by_field | Yes | None or full field name eg.→˓: system.cpu | Multiply by→˓field | (continues on next page)
216 Chapter 21. API

ITRS-Log-Analytics-7.x Documentation, Release 7.0.5
(continued from previous page)
| selectedroles | No | Array of roles name→˓ | Role→˓ |
Result:
JSON document with fields:
status - true if okid - id of changed documentmessage - error message
Run:
The run service executes a document of AI rule definition by id.
Method: GET
URL:
https://<host>:<port>/api/ai/run/<id>
where:
host - kibana host addressport - kibana portid - ai rule document id
Curl:
curl -XGET 'https://localhost:5601/api/ai/run/ea9384857de1f493fd84dabb6dfb99ce→˓' -u <user>:<password> -k
Result:
JSON document with fields:
status - true if okid - id of executed documentmessage - message
21.8.6 Delete rules
The delete service removes a document of AI rule definition by id.
Method: DELETE
URL:
https://<host>:<port>/api/ai/delete/<id>
where:
host - kibana host addressport - kibana portid - ai rule document id
Curl:
21.8. AI Module API 217

ITRS-Log-Analytics-7.x Documentation, Release 7.0.5
curl -XDELETE 'https://localhost:5601/api/ai/delete/ea9384857de1f493fd84dabb6dfb99ce'→˓-u <user>:<password> -k -H "kbn-version: 6.2.4"
Result:
JSON document with fields:
status - true if okid - id of executed documentmessage - message
21.9 Alert module API
21.9.1 Create Alert Rule
Method: POST
URL: /api/admin/alertrules
Body:
In the body of call, you must pass the JSON object with the full definition of the rule document:
| Name | Description→˓
→˓ ||-----------------------|-------------------------------------------------------------→˓------------------------------------------------------------------------------------→˓---------------------------------|| id | Document ID in Elasticsearch→˓
→˓ || alertrulename | Rule name (the Name field from the Create Alert tab the→˓name must be the same as the alert name)→˓ || alertruleindexpattern | Index pattern (Index pattern field from the Create Alert→˓tab)→˓ || selectedroles | Array of roles that have rights to this rule (Roles field→˓from the Create Alert tab)→˓ || alertruletype | Alert rule type (Type field from the Create Alert tab)→˓
→˓ || alertrulemethod | Type of alert method (Alert method field from the Create→˓Alert tab)→˓ || alertrulemethoddata | Data for the type of alert (field Email address if→˓alertrulemethod is email Path to script / command if alertrulemethod is command→˓and empty value if alertrulemethod is none) || alertrule_any | Alert script (the Any field from the Create Alert tab)→˓
→˓ || alertruleimportance | Importance of the rule (Rule importance box from the Create→˓Alert tab)→˓ | (continues on next page)
218 Chapter 21. API

ITRS-Log-Analytics-7.x Documentation, Release 7.0.5
(continued from previous page)
| alertruleriskkey | Field for risk calculation (field from the index indicated→˓by alertruleindexpattern according to which the risk will be counted Risk key→˓field from the Create Alert tab) || alertruleplaybooks | Playbook table (document IDs) attached to the alert→˓(Playbooks field from the Create Alert tab)→˓ || enable | Value Y or N depending on whether we enable or disable the→˓rule→˓ || authenticator | Constant value index→˓
→˓ |
Result OK:
"Successfully created rule!!"
or if fault, error message.
Example:
curl -XPOST 'https://localhost:5601/api/admin/alertrules' -u user:passowrd -k -H "kbn-→˓version: 6.2.4" -H 'Content-type: application/json' -d'{
"id":"test_enable_rest","alertrulename":"test enable rest","alertruleindexpattern":"m*","selectedroles":"","alertruletype":"frequency","alertrulemethod":"email","alertrulemethoddata":"ala@local","alertrule_any":"# (Required, frequency specific)\n# Alert when this many
→˓documents matching the query occur within a timeframe\nnum_events: 5\n\n# (Required,→˓ frequency specific)\n# num_events must occur within this amount of time to trigger→˓an alert\ntimeframe:\n minutes: 2\n\n# (Required)\n# A list of Elasticsearch→˓filters used for find events\n# These filters are joined with AND and nested in a→˓filtered query\n# For more info: http://www.elasticsearch.org/guide/en/→˓elasticsearch/reference/current/query-dsl.html\nfilter:\n- term:\n some_field: \→˓"some_value\"\n\n# (Optional, change specific)\n# If true, Alert will poll→˓Elasticsearch using the count api, and not download all of the matching documents.→˓This is useful is you care only about numbers and not the actual data. It should→˓also be used if you expect a large number of query hits, in the order of tens of→˓thousands or more. doc_type must be set to use this.\n#use_count_query:\n\n#→˓(Optional, change specific)\n# Specify the _type of document to search for. This→˓must be present if use_count_query or use_terms_query is set.\n#doc_type:\n\n#→˓(Optional, change specific)\n# If true, Alert will make an aggregation query→˓against Elasticsearch to get counts of documents matching each unique value of→˓query_key. This must be used with query_key and doc_type. This will only return a→˓maximum of terms_size, default 50, unique terms.\n#use_terms_query:\n\n# (Optional,→˓change specific)\n# When used with use_terms_query, this is the maximum number of→˓terms returned per query. Default is 50.\n#terms_size:\n\n# (Optional, change→˓specific)\n# Counts of documents will be stored independently for each value of→˓query_key. Only num_events documents, all with the same value of query_key, will→˓trigger an alert.\n#query_key:\n\n# (Optional, change specific)\n# Will attach all→˓the related events to the event that triggered the frequency alert. For example in→˓an alert triggered with num_events: 3, the 3rd event will trigger the alert on→˓itself and add the other 2 events in a key named related_events that can be→˓accessed in the alerter.\n#attach_related:", (continues on next page)
21.9. Alert module API 219

ITRS-Log-Analytics-7.x Documentation, Release 7.0.5
(continued from previous page)
"alertruleplaybooks":[],"alertruleimportance":50,"alertruleriskkey":"beat.hostname","enable":"Y","authenticator":"index"
}'
21.9.2 Save Alert Rules
Method: POST
URL:
/api/admin/saverules
Body:
In the body of call, you must pass the JSON object:
'authenticator'
Constant value index
Result:
"Files created"
or if fault, error message.
Example:
curl -XPOST 'https://localhost:5601/api/admin/saverules' -u user:password -k -H "kbn-→˓version: 6.2.4" -H 'Content-type: application/json' -d'
{"authenticator":"index"
}'
21.10 Reports module API
21.10.1 Create new task
CURL query to create a new csv report:
curl -k "https://localhost:5601/api/taskmanagement/export" -XPOST -H 'kbn-xsrf: true'→˓-H 'Content-Type: application/json;charset=utf-8' -u USER:PASSWORD -d '{"indexpath": "audit","query": "*","fields": ["@timestamp","method","operation",
(continues on next page)
220 Chapter 21. API

ITRS-Log-Analytics-7.x Documentation, Release 7.0.5
(continued from previous page)
"request","username"
],"initiatedUser": "logserver ","fromDate": "2019-09-18T00:00:00","toDate": "2019-09-19T00:00:00","timeCriteriaField": "@timestamp","export_type": "csv","export_format": "csv","role": ""
}'
Answer:
{"taskId":"1568890625355-cbbe16e1-12ac-b53c-158e-e0919338953c"}
21.10.2 Checking the status of the task
curl -k -XGET -u USER:PASSWORD https://localhost:5601/api/taskmanagement/export/→˓1568890625355-cbbe16e1-12ac-b53c-158e-e0919338953
Answer:
• In progress:
{"taskId":"1568890766279-56667dc8-6bd4-3f42-1773-08722b623ec1","status":"Processing"}
• Done:
{"taskId":"1568890625355-cbbe16e1-12ac-b53c-158e-e0919338953c","status":"Complete",→˓"download":"http://localhost:5601/api/taskmanagement/export/1568890625355-cbbe16e1-→˓12ac-b53c-158e-e0919338953c/download"}
• Error during execution:
{"taskId":"1568890794564-120f0549-921f-4459-3114-3ea3f6e861b8","status":"Error Occured→˓"}
21.10.3 Downloading results
curl -k -XGET -u USER:PASSWORD https://localhost:5601/api/taskmanagement/export/→˓1568890625355-cbbe16e1-12ac-b53c-158e-e0919338953c/download > /tmp/audit_report.csv
21.11 License module API
You can check the status of the Energy Logserver license via the API
Method: GET
Curl:
21.11. License module API 221

ITRS-Log-Analytics-7.x Documentation, Release 7.0.5
curl -u $USER:$PASSWORD -X GET http://localhost:9200/_license
Result:
{"status":200,"nodes":"10","indices":"[*]","customerName":"example","issuedOn":"2019-→˓05-27T12:16:16.174326700","validity":"100","documents":"","version":"7.0.5"}
21.11.1 Reload License API
After changing license files in the Elasticsearch install directory /usr/share/elasticsearch (for example ifthe current license was end) , you must load new license using the following command.
Method: POST
Curl:
curl -u $USER:$PASSWORD -X POST http://localhost:9200/_license/reload
Result:
{"status":200,"message":"License has been reloaded!","license valid":"YES",→˓"customerName":"example - production license","issuedOn":"2020-12-01T13:33:21.816",→˓"validity":"2","logserver version":"7.0.5"}
21.12 User Module API
To modify user accounts, you can use the User Module API.
You can modify the following account parameters:
• username;
• password;
• assigned roles;
• default role;
• authenticatior;
• email address.
An example of the modification of a user account is as follows:
curl -u $user:$password localhost:9200/_auth/account -XPUT -H 'Content-type:→˓application/json' -d '{
"username": "logserver","password": "new_password","roles": ["admin"
],"defaultrole": "admin","authenticator": "index","email": ""
}'
222 Chapter 21. API

CHAPTER 22
Logstash
The Energy Logserver use Logstash service to dynamically unify data from disparate sources and normalize the datainto destination of your choose. A Logstash pipeline has two required elements, input and output, and one optionalelement filter. The input plugins consume data from a source, the filter plugins modify the data as you specify, and theoutput plugins write the data to a destination. The default location of the Logstash plugin files is: /etc/logstash/conf.d/.This location contain following Energy Logserver
Energy Logserver default plugins:
• 01-input-beats.conf
• 01-input-syslog.conf
• 01-input-snmp.conf
• 01-input-http.conf
• 01-input-file.conf
• 01-input-database.conf
• 020-filter-beats-syslog.conf
• 020-filter-network.conf
• 099-filter-geoip.conf
• 100-output-elasticsearch.conf
• naemon_beat.example
• perflogs.example
22.1 Logstash - Input “beats”
This plugin wait for receiving data from remote beats services. It use tcp /5044 port for communication:
223

ITRS-Log-Analytics-7.x Documentation, Release 7.0.5
input {beats {
port => 5044}
}
22.1.1 Getting data from share folder
Using beats, you can reading data from FTP, SFTP, SMB share. Connection to remote resources should be done asfollows:
Input - FTP server
• Installation
yum install curlftpfs
• Create mount ftp directory
mkdir /mnt/my_ftp
• Use curlftpfs to mount your remote ftp site. Suppose my access credentials are as follows:
urlftpfs ftp-user:[email protected] /mnt/my_ftp/
Input - SFTP server
• Install the required packages
yum install sshfs
• Add user
sudo adduser yourusername fuse
• Create local folder
mkdir ~/Desktop/sftp
• Mount remote folder to local:
sshfs [email protected]:/host/dir/to/mount ~/Desktop/sftp
Input - SMB/CIFS server
• Create local folder
mkdir ~/Desktop/smb
• Mount remote folder to local:
224 Chapter 22. Logstash

ITRS-Log-Analytics-7.x Documentation, Release 7.0.5
mount -t smbfs //remoate.host.or.ip/freigabe /mnt -o username=testuser
or mount -t cifs //remoate.host.or.ip/freigabe /mnt -o username=testuser
22.2 Logstash - Input “network”
This plugin read events over a TCP or UDP socket assigns the appropriate tags:
input {tcp {
port => 5514type => "network"
tags => [ "LAN", "TCP" ]}
udp {port => 5514type => "network"
tags => [ "LAN", "UDP" ]}
}
To redirect the default syslog port (514/TCP/UDP) to the dedicated collector port, follow these steps:
firewall-cmd --add-forward-port=port=514:proto=udp:toport=5514:toaddr=127.0.0.1 --→˓permanentfirewall-cmd --add-forward-port=port=514:proto=tcp:toport=5514:toaddr=127.0.0.1 --→˓permanentfirewall-cmd --reloadsystemctl restart firewalld
22.3 Logstash - Input SNMP
The SNMP input polls network devices using Simple Network Management Protocol (SNMP) to gather informationrelated to the current state of the devices operation:
input {snmp {get => ["1.3.6.1.2.1.1.1.0"]hosts => [{host => "udp:127.0.0.1/161" community => "public" version =>
→˓"2c" retries => 2 timeout => 1000}]}
}
22.4 Logstash - Input HTTP / HTTPS
Using this input you can receive single or multiline events over http(s). Applications can send an HTTP request to theendpoint started by this input and Logstash will convert it into an event for subsequent processing. Sample definition:
22.2. Logstash - Input “network” 225

ITRS-Log-Analytics-7.x Documentation, Release 7.0.5
input {http {
host => "0.0.0.0"port => "8080"
}}
Events are by default sent in plain text. You can enable encryption by setting ssl to true and configuring thessl_certificate and ssl_key options:
input {http {
host => "0.0.0.0"port => "8080"ssl => "true"ssl_certificate => "path_to_certificate_file"ssl_key => "path_to_key_file"
}}
22.5 Logstash - Input File
This plugin stream events from files, normally by tailing them in a manner similar to tail -0F but optionally readingthem from the beginning. Sample definition:
file {path => "/tmp/access_log"start_position => "beginning"
}
22.6 Logstash - Input database
This plugin can read data in any database with a JDBC interface into Logstash. You can periodically schedule ingestionusing a cron syntax (see schedule setting) or run the query one time to load data into Logstash. Each row in the resultsetbecomes a single event. Columns in the resultset are converted into fields in the event.
22.6.1 Logasth input - MySQL
Download jdbc driver: https://dev.mysql.com/downloads/connector/j/
Sample definition:
input {jdbc {jdbc_driver_library => "mysql-connector-java-5.1.36-bin.jar"jdbc_driver_class => "com.mysql.jdbc.Driver"jdbc_connection_string => "jdbc:mysql://localhost:3306/mydb"jdbc_user => "mysql"jdbc_password => "mysql"parameters => { "favorite_artist" => "Beethoven" }schedule => "* * * * *"
(continues on next page)
226 Chapter 22. Logstash

ITRS-Log-Analytics-7.x Documentation, Release 7.0.5
(continued from previous page)
statement => "SELECT * from songs where artist = :favorite_artist"}
}
22.6.2 Logasth input - MSSQL
Download jdbc driver: https://docs.microsoft.com/en-us/sql/connect/jdbc/download-microsoft-jdbc-driver-for-sql-server?view=sql-server-ver15
Sample definition:
input {jdbc {jdbc_driver_library => "./mssql-jdbc-6.2.2.jre8.jar"jdbc_driver_class => "com.microsoft.sqlserver.jdbc.SQLServerDriver"jdbc_connection_string => "jdbc:sqlserver://VB201001000;databaseName=Database;"jdbc_user => "mssql"jdbc_password => "mssql"jdbc_default_timezone => "UTC"statement_filepath => "/usr/share/logstash/plugin/query"schedule => "*/5 * * * *"sql_log_level => "warn"record_last_run => "false"clean_run => "true"
}}
22.6.3 Logstash input - Oracle
Download jdbc driver: https://www.oracle.com/database/technologies/appdev/jdbc-downloads.html
Sample definition:
input {jdbc {jdbc_driver_library => "./ojdbc8.jar"jdbc_driver_class => "oracle.jdbc.driver.OracleDriver"jdbc_connection_string => "jdbc:oracle:thin:@hostname:PORT/SERVICE"jdbc_user => "oracle"jdbc_password => "oracle"parameters => { "favorite_artist" => "Beethoven" }schedule => "* * * * *"statement => "SELECT * from songs where artist = :favorite_artist"
}}
22.6.4 Logstash input - PostgreSQL
Download jdbc driver: https://jdbc.postgresql.org/download.html
Sample definition:
22.6. Logstash - Input database 227

ITRS-Log-Analytics-7.x Documentation, Release 7.0.5
input {jdbc {
jdbc_driver_library => "D:/postgresql-42.2.5.jar"jdbc_driver_class => "org.postgresql.Driver"jdbc_connection_string => "jdbc:postgresql://127.0.0.1:57610/mydb"jdbc_user => "myuser"jdbc_password => "mypw"statement => "select * from mytable"
}}
22.7 Logstash - Input CEF
The common event format (CEF) is a standard for the interoperability of event or log generating devices and applica-tions. The standard defines a syntax for log records. It comprises of a standard prefix and a variable extension that isformatted as key-value pairs.
input {tcp {codec => cef { delimiter => "\r\n" }port => 12345
}}
This setting allows the following character sequences to have special meaning:
• \r (backslash “r”) - means carriage return (ASCII 0x0D)
• \n (backslash “n”) - means newline (ASCII 0x0A)
22.8 Logstash - Input OPSEC
FW1-LogGrabber is a Linux command-line tool to grab logfiles from remote Checkpoint devices. It makes extensiveuse of OPSEC Log Export APIs (LEA) from Checkpoint’s OPSEC SDK 6.0 for Linux 50.
22.8.1 Build FW1-LogGrabber
FW1-LogGrabber v2.0 and above can be built on Linux x86/amd64 platforms only.
If you are interested in other platforms please check FW1-LogGrabber v1.11.1 website
Download dependencies
FW1-LogGrabber uses API-functions from Checkpoint’s OPSEC SDK 6.0 for Linux 50.
You must take care of downloading the Checkpoint OPSEC SDK and extracting it inside the OPSEC_SDK folder.
You also need to install some required 32-bit libraries.
If you are using Debian or Ubuntu, please run:
sudo apt-get install gcc-multilib g++-multilib libelf-dev:i386 libpam0g:i386 zlib1g-→˓dev:i386
228 Chapter 22. Logstash

ITRS-Log-Analytics-7.x Documentation, Release 7.0.5
If you are using CentOS or RHEL, please run:
sudo yum install gcc gcc-c++ make glibc-devel.i686 elfutils-libelf-devel.i686 zlib-→˓devel.i686 libstdc++-devel.i686 pam-devel.i686
Compile source code
Building should be as simple as running GNU Make in the project root folder:
make
If the build process complains, you might need to tweak some variables inside the Makefile (e.g. CC, LD andOPSEC_PKG_DIR) according to your environment.
22.8.2 Install FW1-LogGrabber
To install FW1-LogGrabber into its default location /usr/local/fw1-loggrabber (defined by INSTALL_DIRvariable), please run
sudo make install
Set environment variables
FW1-LogGraber makes use of two environment variables, which should be defined in the shell configuration files.
• LOGGRABBER_CONFIG_PATH defines a directory containing configuration files (fw1-loggrabber.conf, lea.conf). If the variable is not defined, the program expects to find these files in the current directory.
• LOGGRABBER_TEMP_PATH defines a directory where FW1-LogGrabber will store temporary files. If thevariable is not defined, the program stores these files in the current directory.
Since the binary is dynamically linked to Checkpoint OPSEC libraries, please also add /usr/local/fw1-loggrabber/lib to LD_LIBRARY_PATH or to your dynamic linker configuration with
sudo echo /usr/local/fw1-loggrabber/lib > /etc/ld.so.conf.d/fw1-loggrabber.confsudo ldconfig
Configuration files
lea.conf file
Starting with version 1.11, FW1-LogGrabber uses the default connection configuration procedure for OPSEC applica-tions. This includes server, port and authentication settings. From now on, all this parameters can only be configuredusing the configuration file lea.conf (see --leaconfigfile option to use a different LEA configuration file)and not using the command-line as before.
• lea_server ip <IP address> specifies the IP address of the FW1 management station, to which FW1-LogGrabber should connect to.
• lea_server port <port number> is the port on the FW1 management station to which FW1-LogGrabber should connect to (for unauthenticated connections only).
• lea_server auth_port <port number> is the port to be used for authenticated connection to yourFW1 management station.
22.8. Logstash - Input OPSEC 229

ITRS-Log-Analytics-7.x Documentation, Release 7.0.5
• lea_server auth_type <authentication mechanism> you can use this parameter to spec-ify the authentication mechanism to be used (default is sslca); valid values are sslca,sslca_clear, sslca_comp, sslca_rc4, sslca_rc4_comp, asym_sslca, asym_sslca_comp,asym_sslca_rc4, asym_sslca_rc4_comp, ssl, ssl_opsec, ssl_clear, ssl_clear_opsec,fwn1 and auth_opsec.
• opsec_sslca_file <p12-file> specify the location of the PKCS#12 certificate, when using authenti-cated connections.
• opsec_sic_name <LEA client SIC name> is the SIC name of the LEA client for authenticated con-nections.
• lea_server opsec_entity_sic_name <LEA server SIC name> is the SIC name of your FW1management station when using authenticated connections.
fw1-loggrabber.conf file
This paragraph deals with the options that can be set within the configuration file. The default configuration file isfw1-loggrabber.conf (see --configfile option to use a different configuration file). The precedence ofgiven options is as follows: command line, configuration file, default value. E.g. if you set the resolve-mode to beused in the configuration file, this can be overwritten by command line option --noresolve; only if an option isn’tset neither on command line nor in the configuration file, the default value will be used.
• DEBUG_LEVEL=<0-3> sets the debug level to the specified value; zero means no output of debug information,and further levels will cause output of program specific as well as OPSEC specific debug information.
• FW1_LOGFILE=<name of log file> specifies the name of the FW1 logfile to be read; this can be eitherdone exactly or using only a part of the filename; if no exact match can be found in the list of logfiles returnedby the FW-1 management station, all logfiles which contain the specified string are processed; if this parameteris omitted, the default logfile fw.log will be processed.
• FW1_OUTPUT=<files|logs> specifies whether FW1-LogGrabber should only display the available logfiles(files) on the FW11 server or display the content of these logfiles (logs).
• FW1_TYPE=<ng|2000> choose which version of FW1 to connect to; for Checkpoint FW-1 5.0 you have tospecify NG and for Checkpoint FW-1 4.1 you have to specify 2000.
• FW1_MODE=<audit|normal> specifies whether to display audit logs, which contain administrative ac-tions, or normal security logs, which contain data about dropped and accepted connections.
• MODE=<online|online-resume|offline> when using online mode, FW1-LogGrabber starts retriev-ing logging data from the end of the specified logfile and displays all future log entries (mainly used for contin-uously processing); the online-resume mode is similar to the online mode, but if FW1-LogGrabber is stoppedand started again, it resumes processing from where it was stopped; if you instead choose the offline mode,FW1-LogGrabber quits after having displayed the last log entry.
• RESOLVE_MODE=<yes|no> with this option (enabled by default), IP addresses will be resolved to namesusing FW1 name resolving behaviour; this resolving mechanism will not cause the machine running FW1-LogGrabber to initiate DNS requests, but the name resolution will be done directly on the FW1 machine; if youdisable resolving mode, IP addresses will be displayed in log output instead of names.
• RECORD_SEPARATOR=<char> can be used to change the default record separator | (pipe) into anothercharacter; if you choose a character which is contained in some log data, the occurrence within the logdata willbe escaped by a backslash.
• LOGGING_CONFIGURATION=<screen|file|syslog> can be used for redirecting logging output toother destinations than the default destination STDOUT; currently it is possible to redirect output to a file orto the syslog daemon.
230 Chapter 22. Logstash

ITRS-Log-Analytics-7.x Documentation, Release 7.0.5
• OUTPUT_FILE_PREFIX=<prefix of output file> when using file output, this parameter defines aprefix for the output filename; default value is simply fw1-loggrabber.
• OUTPUT_FILE_ROTATESIZE=<rotatesize in bytes> when using file output, this parame-ter specifies the maximum size of the output files, before they will be rotated with suffix-YYYY-MM-DD-hhmmss[-x].log; default value is 1048576 bytes, which equals 1 MB; setting a zero valuedisables file rotation.
• SYSLOG_FACILITY=<USER|LOCAL0|...|LOCAL7> when using syslog output, this parameter sets thesyslog facility to be used.
• FW1_FILTER_RULE="<filterexpression1>[;<filterexpression2>]" defines filters fornormal log mode; you can find a more detailed description of filter rules, along with some examples, in aseparate chapter below.
• AUDIT_FILTER_RULE="<filterexpression1>[;<filterexpression2>]" defines filters foraudit log mode; you can find a more detailed description of filter rules, along with some examples, in aseparate chapter below.
22.8.3 Command line options
In the following section, all available command line options are described in detail. Most of the options can also beconfigured using the file fw1-loggrabber.conf (see --configfile option to use a different configurationfile). The precedence of given options is as follows: command line, configuration file, default value. E.g. if you set theresolve-mode to be used in the configuration file, this can be overwritten by command line option --noresolve;only if an option isn’t set neither on command line nor in the configuration file, the default value will be used.
Help
Use --help to display basic help and usage information.
Debug level
The --debuglevel option sets the debug level to the specified value. A zero debug level means no output of debuginformation, while further levels will cause output of program specific as well as OPSEC specific debug information.
Location of configuration files
The -c <configfilename> or --configfile <configfilename> options allow to specify a non-defaultconfiguration file, in which most of the command line options can be configured, as well as other options which arenot available as command line parameters.
If this parameter is omitted, the file fw1-loggrabber.conf inside $LOGGRABBER_CONFIG_PATH will beused. See above for a description of all available configuration file options.
Using -l <leaconfigfilename> or --leaconfigfile <leaconfigfilename> instead, it’s possibleto use a non-default LEA configuration file. In this file, all connection parameters such as FW1 server, port, authenti-cation method as well as SIC names have to be configured, as usual procedure for OPSEC applications.
If this parameter is omitted, the file lea.conf inside $LOGGRABBER_CONFIG_PATH will be used. See above fora description of all available LEA configuration file options.
22.8. Logstash - Input OPSEC 231

ITRS-Log-Analytics-7.x Documentation, Release 7.0.5
Remote log files
With -f <logfilename|pattern|ALL> or --logfile <logfilename|pattern|ALL> you can spec-ify the name of the remote FW1 logfile to be read.
This can be either done exactly or using only a part of the filename. If no exact match can be found in the list oflogfiles returned by the FW1 management station, all logfiles which contain the specified string are processed.
A special case is the usage of ALL instead of a logfile name or pattern. In that case all logfiles that are availableon the management station, will be processed. If this parameter is omitted, only the default logfile fw.log will beprocessed.
The first example displays the logfile 2003-03-27_213652.log, while the second one processes all logfileswhich contain 2003-03 in their filename.
--logfile 2003-03-27_213652.log--logfile 2003-03
The default behaviour of FW1-LogGrabber is to display the content of the logfiles and not just their names. This canbe explicitely specified using the --showlogs option.
The option --showfiles can be used instead to simply show the available logfiles on the FW1 management station.After the names of the logfiles have been displayed, FW1-LogGrabber quits.
Name resolving behaviour
Using the --resolve option, IP addresses will be resolved to names using FW1 name resolving behaviour. Thisresolving mechanism will not cause the machine running FW1-LogGrabber to initiate DNS requests, but the nameresolution will be done directly on the FW1 machine.
This is the default behavior of FW1-LogGrabber which can be disabled by using --no-resolve. That option willcause IP addresses to be displayed in log output instead of names.
Checkpoint firewall version
The default FW1 version, for which this tool is being developed, is Checkpoint FW1 5.0 (NG) and above. If no otherversion is explicitly specified, the default version is --ng.
The option --2000 has to be used if you want to connect to older Checkpoint FW1 4.1 (2000) firewalls. You shouldkeep in mind that some options are not available for non-NG firewalls; these include --auth, --showfiles,--auditlog and some more.
Online and Online-Resume modes
Using --online mode, FW1-LogGrabber starts output of logging data at the end of the specified logfile (or fw.log if no logfile name has been specified). This mode is mainly used for continuously processing FW1 log data andcontinues to display log entries also after scheduled and manual log switches. If you use --logfile to specifyanother logfile to be processed, you have to consider that no data will be shown, if the file isn’t active anymore.
The --online-resumemode is similar to the above online mode, but starts output of logging data at the last knownprocessed position (which is stored inside a cursor).
In contrast to online mode, when using --offline mode FW1-LogGrabber quits after having displayed the last logentry. This is the default behavior and is mainly used for analysis of historic log data.
232 Chapter 22. Logstash

ITRS-Log-Analytics-7.x Documentation, Release 7.0.5
Audit and normal logs
Using the --auditlog mode, content of the audit logfile (fw.adtlog) can be displayed. This includes adminis-trator actions and uses different fields than normal log data.
The default --normallog mode of FW1-LogGrabber processes normal FW1 logfiles. In contrast to the--auditlog option, no administrative actions are displayed in this mode, but all regular log data is.
Filtering
Filter rules provide the possibility to display only log entries that match a given set of rules. There can be specifiedone or more filter rules using one or multiple --filter arguments on the command line.
All individual filter rules are related by OR. That means a log entry will be displayed if at least one of the filter rulesmatches. You can specify multiple argument values by separating the values by , (comma).
Within one filter rule, there can be specified multiple arguments which have to be separated by ; (semi-colon). Allthese arguments are related by AND. That means a filter rule matches a given log entry only, if all of the filter argumentsmatch.
If you specify != instead of = between name and value of the filter argument, you can negate the name/value pair.
For arguments that expect IP addresses, you can specify either a single IP address, multiple IP addresses separated by, (comma) or a network address with netmask (e.g. 10.0.0.0/255.0.0.0). Currently it is not possible to specifya network address and a single IP address within the same filter argument.
Supported filter arguments
Normal mode:
action=<ctl|accept|drop|reject|encrypt|decrypt|keyinst>dst=<IP address>endtime=<YYYYMMDDhhmmss>orig=<IP address>product=<VPN-1 & FireWall-1|SmartDefense>proto=<icmp|tcp|udp>rule=<rulenumber|startrule-endrule>service=<portnumber|startport-endport>src=<IP address>starttime=<YYYYMMDDhhmmss>
Audit mode:
action=<ctl|accept|drop|reject|encrypt|decrypt|keyinst>administrator=<string>endtime=<YYYYMMDDhhmmss>orig=<IP address>product=<SmartDashboard|Policy Editor|SmartView Tracker|SmartView Status|SmartView→˓Monitor|System Monitor|cpstat_monitor|SmartUpdate|CPMI Client>starttime=<YYYYMMDDhhmmss>
Example filters
Display all dropped connections:
22.8. Logstash - Input OPSEC 233

ITRS-Log-Analytics-7.x Documentation, Release 7.0.5
--filter "action=drop"
Display all dropped and rejected connections:
--filter "action=drop,reject"--filter "action!=accept"
Display all log entries generated by rules 20 to 23:
--filter "rule=20,21,22,23"--filter "rule=20-23"
Display all log entries generated by rules 20 to 23, 30 or 40 to 42:
--filter "rule=20-23,30,40-42"
Display all log entries to 10.1.1.1 and 10.1.1.2:
--filter "dst=10.1.1.1,10.1.1.2"
Display all log entries from 192.168.1.0/255.255.255.0:
--filter "src=192.168.1.0/255.255.255.0"
Display all log entries starting from 2004/03/02 14:00:00:
--filter "starttime=20040302140000"
22.8.4 Checkpoint device configuration
Modify $FWDIR/conf/fwopsec.conf and define the port to be used for authenticated LEA connections (e.g.18184):
lea_server port 0lea_server auth_port 18184lea_server auth_type sslca
Restart in order to activate changes:
cpstop; cpstart
Create a new OPSEC Application Object with the following details:
Name: e.g. myleaclientVendor: User DefinedServer Entities: NoneClient Entities: LEA
Initialize Secure Internal Communication (SIC) for recently created OPSEC Application Object and enter (and re-member) the activation key (e.g. def456).
Write down the DN of the recently created OPSEC Application Object; this is your Client Distinguished Name, whichyou need later on.
Open the object of your FW1 management server and write down the DN of that object; this is the Server DistinguishedName, which you will need later on.
234 Chapter 22. Logstash

ITRS-Log-Analytics-7.x Documentation, Release 7.0.5
Add a rule to the policy to allow the port defined above as well as port 18210/tcp (FW1_ica_pull) in order to allowpulling of PKCS#12 certificate by the FW1-LogGrabber machine from the FW1 management server. Port 18210/tcpcan be shut down after the communication between FW1-LogGrabber and the FW1 management server has beenestablished successfully.
Finally, install the policy.
22.8.5 FW1-LogGrabber configuration
Modify $LOGGRABBER_CONFIG_PATH/lea.conf and define the IP address of your FW1 management station(e.g. 10.1.1.1) as well as port (e.g. 18184), authentication type and SIC names for authenticated LEA connections.You can get the SIC names from the object properties of your LEA client object, respectively the Management Stationobject (see above for details about Client DN and Server DN).
lea_server ip 10.1.1.1lea_server auth_port 18184lea_server auth_type sslcaopsec_sslca_file opsec.p12opsec_sic_name "CN=myleaclient,O=cpmodule..gysidy"lea_server opsec_entity_sic_name "cn=cp_mgmt,o=cpmodule..gysidy"
Get the tool opsec_pull_cert either from opsec-tools.tar.gz from the project home page or directly fromthe OPSEC SDK. This tool is needed to establish the Secure Internal Communication (SIC) between FW1-LogGrabberand the FW1 management server.
Get the clients certificate from the management station (e.g. 10.1.1.1). The activation key has to be the same asspecified before in the firewall policy. After that, copy the resulting PKCS#12 file (default name opsec.p12) to yourFW1-LogGrabber directory.
opsec_pull_cert -h 10.1.1.1 -n myleaclient -p def456
Authenticated SSL OPSEC connections
Checkpoint device configuration
Modify $FWDIR/conf/fwopsec.conf and define the port to be used for authenticated LEA connections (e.g.18184):
lea_server port 0lea_server auth_port 18184lea_server auth_type ssl_opsec
Restart in order to activate changes:
cpstop; cpstart
Set a password (e.g. abc123) for the LEA client (e.g. 10.1.1.2):
fw putkey -ssl -p abc123 10.1.1.2
Create a new OPSEC Application Object with the following details:
22.8. Logstash - Input OPSEC 235

ITRS-Log-Analytics-7.x Documentation, Release 7.0.5
Name: e.g. myleaclientVendor: User DefinedServer Entities: NoneClient Entities: LEA
Initialize Secure Internal Communication (SIC) for recently created OPSEC Application Object and enter (and re-member) the activation key (e.g. def456).
Write down the DN of the recently created OPSEC Application Object; this is your Client Distinguished Name, whichyou need later on.
Open the object of your FW1 management server and write down the DN of that object; this is the Server DistinguishedName, which you will need later on.
Add a rule to the policy to allow the port defined above as well as port 18210/tcp (FW1_ica_pull) in order to al-low pulling of PKCS#12 certificate from the FW1-LogGrabber machine to the FW1 management server. The port18210/tcp can be shut down after the communication between FW1-LogGrabber and the FW1 management server hasbeen established successfully.
Finally, install the policy.
FW1-LogGrabber configuration
Modify $LOGGRABBER_CONFIG_PATH/lea.conf and define the IP address of your FW1 management station(e.g. 10.1.1.1) as well as port (e.g. 18184), authentication type and SIC names for authenticated LEA connections.The SIC names you can get from the object properties of your LEA client object respectively the Management Stationobject (see above for details about Client DN and Server DN).
lea_server ip 10.1.1.1lea_server auth_port 18184lea_server auth_type ssl_opsecopsec_sslca_file opsec.p12opsec_sic_name "CN=myleaclient,O=cpmodule..gysidy"lea_server opsec_entity_sic_name "cn=cp_mgmt,o=cpmodule..gysidy"
Set password for the connection to the LEA server. The password has to be the same as specified on the LEA server.
opsec_putkey -ssl -p abc123 10.1.1.1
Get the tool opsec_pull_cert either from opsec-tools.tar.gz from the project home page or directly fromthe OPSEC SDK. This tool is needed to establish the Secure Internal Communication (SIC) between FW1-LogGrabberand the FW1 management server.
Get the clients certificate from the management station (e.g. 10.1.1.1). The activation key has to be the same asspecified before in the firewall policy.
opsec_pull_cert -h 10.1.1.1 -n myleaclient -p def456
Authenticated OPSEC connections
Checkpoint device configuration
Modify $FWDIR/conf/fwopsec.conf and define the port to be used for authenticated LEA connections (e.g.18184):
236 Chapter 22. Logstash

ITRS-Log-Analytics-7.x Documentation, Release 7.0.5
lea_server port 0lea_server auth_port 18184lea_server auth_type auth_opsec
Restart in order to activate changes
fwstop; fwstart
Set a password (e.g. abc123) for the LEA client (e.g. 10.1.1.2).
fw putkey -opsec -p abc123 10.1.1.2
Add a rule to the policy to allow the port defined above from the FW1-LogGrabber machine to the FW1 managementserver.
Finally, install the policy.
FW1-LogGrabber configuration
Modify $LOGGRABBER_CONFIG_PATH/lea.conf and define the IP address of your FW1 management station(e.g. 10.1.1.1) as well as port (e.g. 18184) and authentication type for authenticated LEA connections:
lea_server ip 10.1.1.1lea_server auth_port 18184lea_server auth_type auth_opsec
Set password for the connection to the LEA server. The password has to be the same as specified on the LEA server.
opsec_putkey -p abc123 10.1.1.1
Unauthenticated connections
Checkpoint device configuration
Modify $FWDIR/conf/fwopsec.conf and define the port to be used for unauthenticated LEA connections (e.g.50001):
lea_server port 50001lea_server auth_port 0
Restart in order to activate changes:
fwstop; fwstart # for 4.1cpstop; cpstart # for NG
Add a rule to the policy to allow the port defined above from the FW1-LogGrabber machine to the FW1 managementserver.
Finally, install the policy.
FW1-LogGrabber configuration
Modify $LOGGRABBER_CONFIG_PATH/lea.conf and define the IP address of your FW1 management station(e.g. 10.1.1.1) and port (e.g. 50001) for unauthenticated LEA connections:
22.8. Logstash - Input OPSEC 237

ITRS-Log-Analytics-7.x Documentation, Release 7.0.5
lea_server ip 10.1.1.1lea_server port 50001
22.9 Logstash - Input SDEE
This Logstash input plugin allows you to call a Cisco SDEE/CIDEE HTTP API, decode the output of it into event(s),and send them on their merry way. The idea behind this plugins came from a need to gather events from Cisco securitydevices and feed them to ELK stack
22.9.1 Download
Only support for Logstash core 5.6.4.
Download link: https://rubygems.org/gems/logstash-input-sdee
22.9.2 Installation
gem install logstash-input-sdee-0.7.8.gem
22.9.3 Configuration
You need to import host SSL certificate in Java trust store to be able to connect to Cisco IPS device.
• Get server certificate from IPS device:
echo | openssl s_client -connect ciscoips:443 2>&1 | sed -ne '/-BEGIN CERTIFICATE-→˓/,/-END CERTIFICATE-/p' > cert.pem
• Import it into Java ca certs:
$JAVA_HOME/bin/keytool -keystore $JAVA_HOME/lib/security/cacerts -importcert -→˓alias ciscoips -file cert.pem
• Verify if import was successful:
$JAVA_HOME/bin/keytool -keystore $JAVA_HOME/lib/security/cacerts -list
• Setup the Logstash input config with SSL connection:
input {sdee {
interval => 60http => {
truststore_password => "changeit"url => "https://10.0.2.1"auth => {user => "cisco"password => "p@ssw0rd"
}}
(continues on next page)
238 Chapter 22. Logstash

ITRS-Log-Analytics-7.x Documentation, Release 7.0.5
(continued from previous page)
}}
22.10 Logstash - Input XML
To download xml files via Logstash use input “file”, and set the location of the files in the configuration file:
file {path => [ "/etc/logstash/files/*.xml" ]mode => "read"
}
The XML filter takes a field that contains XML and expands it into an actual datastructure.
filter {xml {
source => "message"}
}
More configuration options you can find: https://www.elastic.co/guide/en/logstash/6.8/plugins-filters-xml.html#plugins-filters-xml-options
22.11 Logstash - Input WMI
The Logstash input wmi allow to collect data from WMI query. This is useful for collecting performance metrics andother data which is accessible via WMI on a Windows host.
22.11.1 Installation
For plugins not bundled by default, it is easy to install by running:
/usr/share/logstash/bin/logstash-plugin install logstash-input-wmi
22.11.2 Configuration
Configuration example:
input {wmi {
query => "select * from Win32_Process"interval => 10
}wmi {
query => "select PercentProcessorTime from Win32_PerfFormattedData_PerfOS_→˓Processor where name = '_Total'"
}wmi { # Connect to a remote host
query => "select * from Win32_Process"
(continues on next page)
22.10. Logstash - Input XML 239

ITRS-Log-Analytics-7.x Documentation, Release 7.0.5
(continued from previous page)
host => "MyRemoteHost"user => "mydomain\myuser"password => "Password"
}}
More about parameters: https://www.elastic.co/guide/en/logstash/6.8/plugins-inputs-wmi.html#plugins-inputs-wmi-options
22.12 Logstash - Filter “beats syslog”
This filter processing an event data with syslog type:
filter {
if [type] == "syslog" {grok {
match => {"message" => [
# auth: ssh|sudo|su
"%→˓{SYSLOGTIMESTAMP:[system][auth][timestamp]} %{SYSLOGHOST:[system][auth][hostname]}→˓sshd(?:\[%{POSINT:[system][auth][pid]}\])?: %{DATA:[system][auth][ssh][event]} %→˓{DATA:[system][auth][ssh][method]} for (invalid user )?%{DATA:[system][auth][user]}→˓from %{IPORHOST:[system][auth][ssh][ip]} port %{NUMBER:[system][auth][ssh][port]}→˓ssh2(: %{GREEDYDATA:[system][auth][ssh][signature]})?",
"%→˓{SYSLOGTIMESTAMP:[system][auth][timestamp]} %{SYSLOGHOST:[system][auth][hostname]}→˓sshd(?:\[%{POSINT:[system][auth][pid]}\])?: %{DATA:[system][auth][ssh][event]} user→˓%{DATA:[system][auth][user]} from %{IPORHOST:[system][auth][ssh][ip]}",
"%→˓{SYSLOGTIMESTAMP:[system][auth][timestamp]} %{SYSLOGHOST:[system][auth][hostname]}→˓sshd(?:\[%{POSINT:[system][auth][pid]}\])?: Did not receive identification string→˓from %{IPORHOST:[system][auth][ssh][dropped_ip]}",
"%→˓{SYSLOGTIMESTAMP:[system][auth][timestamp]} %{SYSLOGHOST:[system][auth][hostname]}→˓sudo(?:\[%{POSINT:[system][auth][pid]}\])?: \s*%{DATA:[system][auth][user]} :( %→˓{DATA:[system][auth][sudo][error]} ;)? TTY=%{DATA:[system][auth][sudo][tty]} ; PWD=%→˓{DATA:[system][auth][sudo][pwd]} ; USER=%{DATA:[system][auth][sudo][user]} ;→˓COMMAND=%{GREEDYDATA:[system][auth][sudo][command]}",
"%→˓{SYSLOGTIMESTAMP:[system][auth][timestamp]} %{SYSLOGHOST:[system][auth][hostname]} %→˓{DATA:[system][auth][program]}(?:\[%{POSINT:[system][auth][pid]}\])?: %→˓{GREEDYMULTILINE:[system][auth][message]}",
# add/remove user or group"%
→˓{SYSLOGTIMESTAMP:[system][auth][timestamp]} %{SYSLOGHOST:[system][auth][hostname]}→˓groupadd(?:\[%{POSINT:[system][auth][pid]}\])?: new group: name=%{DATA:system.auth.→˓groupadd.name}, GID=%{NUMBER:system.auth.groupadd.gid}",
(continues on next page)
240 Chapter 22. Logstash

ITRS-Log-Analytics-7.x Documentation, Release 7.0.5
(continued from previous page)
"%→˓{SYSLOGTIMESTAMP:[system][auth][timestamp]} %{SYSLOGHOST:[system][auth][hostname]}→˓userdel(?:\[%{POSINT:[system][auth][pid]}\])?: removed group '%→˓{DATA:[system][auth][groupdel][name]}' owned by '%→˓{DATA:[system][auth][group][owner]}'",
"%→˓{SYSLOGTIMESTAMP:[system][auth][timestamp]} %{SYSLOGHOST:[system][auth][hostname]}→˓useradd(?:\[%{POSINT:[system][auth][pid]}\])?: new user: name=%→˓{DATA:[system][auth][user][add][name]}, UID=%{NUMBER:[system][auth][user][add][uid]}→˓, GID=%{NUMBER:[system][auth][user][add][gid]}, home=%→˓{DATA:[system][auth][user][add][home]}, shell=%→˓{DATA:[system][auth][user][add][shell]}$",
"%→˓{SYSLOGTIMESTAMP:[system][auth][timestamp]} %{SYSLOGHOST:[system][auth][hostname]}→˓userdel(?:\[%{POSINT:[system][auth][pid]}\])?: delete user '%→˓{WORD:[system][auth][user][del][name]}'$",
"%→˓{SYSLOGTIMESTAMP:[system][auth][timestamp]} %{SYSLOGHOST:[system][auth][hostname]}→˓usermod(?:\[%{POSINT:[system][auth][pid]}\])?: add '%→˓{WORD:[system][auth][user][name]}' to group '%{WORD:[system][auth][user][memberof]}'→˓",
# yum install/erase/update package"%
→˓{SYSLOGTIMESTAMP:[system][auth][timestamp]} %{DATA:[system][package][action]}: %→˓{NOTSPACE:[system][package][name]}"
]
}
pattern_definitions => {"GREEDYMULTILINE"=> "(.|\n)*"
}}
date {match => [ "[system][auth][timestamp]
→˓","MMM d HH:mm:ss",
"MMM dd HH:mm:ss"]target => "[system][auth][timestamp]"
}
mutate {convert => { "[system][auth][pid]" => "integer" }convert => { "[system][auth][groupadd][gid]" =>
→˓"integer" }convert => { "[system][auth][user][add][uid]" =>
→˓"integer" }convert => { "[system][auth][user][add][gid]" =>
→˓"integer" }}
(continues on next page)
22.12. Logstash - Filter “beats syslog” 241

ITRS-Log-Analytics-7.x Documentation, Release 7.0.5
(continued from previous page)
}}
22.13 Logstash - Filter “network”
This filter processing an event data with network type:
filter {if [type] == "network" {
grok {named_captures_only => truematch => {
"message" => [
# Cisco Firewall"%{SYSLOG5424PRI}%{NUMBER:log_sequence#}:%{SPACE}%
→˓{IPORHOST:device_ip}: (?:.)?%{CISCOTIMESTAMP:log_data} CET: %%{CISCO_→˓REASON:facility}-%{INT:severity_level}-%{CISCO_REASON:facility_mnemonic}:%{SPACE}%→˓{GREEDYDATA:event_message}",
# Cisco Routers"%{SYSLOG5424PRI}%{NUMBER:log_sequence#}:%{SPACE}%
→˓{IPORHOST:device_ip}: (?:.)?%{CISCOTIMESTAMP:log_data} CET: %%{CISCO_→˓REASON:facility}-%{INT:severity_level}-%{CISCO_REASON:facility_mnemonic}:%{SPACE}%→˓{GREEDYDATA:event_message}",
# Cisco Switches"%{SYSLOG5424PRI}%{NUMBER:log_sequence#}:%{SPACE}%
→˓{IPORHOST:device_ip}: (?:.)?%{CISCOTIMESTAMP:log_data} CET: %%{CISCO_→˓REASON:facility}-%{INT:severity_level}-%{CISCO_REASON:facility_mnemonic}:%{SPACE}%→˓{GREEDYDATA:event_message}",
"%{SYSLOG5424PRI}%{NUMBER:log_sequence#}:%{SPACE}(?:.)?%→˓{CISCOTIMESTAMP:log_data} CET: %%{CISCO_REASON:facility}-%{INT:severity_level}-%→˓{CISCO_REASON:facility_mnemonic}:%{SPACE}%{GREEDYDATA:event_message}",
# HP switches"%{SYSLOG5424PRI}%{SPACE}%{CISCOTIMESTAMP:log_data} %
→˓{IPORHOST:device_ip} %{CISCO_REASON:facility}:%{SPACE}%{GREEDYDATA:event_message}"]
}}
syslog_pri { }
if [severity_level] {
translate {dictionary_path => "/etc/logstash/dictionaries/cisco_syslog_severity.yml"field => "severity_level"destination => "severity_level_descr"
}
}
(continues on next page)
242 Chapter 22. Logstash

ITRS-Log-Analytics-7.x Documentation, Release 7.0.5
(continued from previous page)
if [facility] {
translate {dictionary_path => "/etc/logstash/dictionaries/cisco_syslog_facility.yml"field => "facility"destination => "facility_full_descr"
}
}
#ACLif [event_message] =~ /(\d+.\d+.\d+.\d+)/ {grok {match => {
"event_message" => ["list %{NOTSPACE:[acl][name]} %{WORD:[acl][action]} %
→˓{WORD:[acl][proto]} %{IP:[src][ip]}.*%{IP:[dst][ip]}","list %{NOTSPACE:[acl][name]} %{WORD:[acl][action]} %
→˓{IP:[src][ip]}","^list %{NOTSPACE:[acl][name]} %{WORD:[acl][action]} %
→˓{WORD:[acl][proto]} %{IP:[src][ip]}.*%{IP:[dst][ip]}"]
}}
}
if [src][ip] {
cidr {address => [ "%{[src][ip]}" ]network => [ "0.0.0.0/32", "10.0.0.0/8", "172.16.0.0/12", "192.168.
→˓0.0/16", "fc00::/7", "127.0.0.0/8", "::1/128", "169.254.0.0/16", "fe80::/10","224.0.→˓0.0/4", "ff00::/8","255.255.255.255/32" ]
add_field => { "[src][locality]" => "private" }}
if ![src][locality] {mutate {
add_field => { "[src][locality]" => "public" }}
}}
if [dst][ip] {cidr {
address => [ "%{[dst][ip]}" ]network => [ "0.0.0.0/32", "10.0.0.0/8", "172.16.0.0/12", "192.168.
→˓0.0/16", "fc00::/7", "127.0.0.0/8", "::1/128","169.254.0.0/16", "fe80::/10","224.0.0.0/4", "ff00::/8
→˓","255.255.255.255/32" ]add_field => { "[dst][locality]" => "private" }
}
if ![dst][locality] {mutate {
(continues on next page)
22.13. Logstash - Filter “network” 243

ITRS-Log-Analytics-7.x Documentation, Release 7.0.5
(continued from previous page)
add_field => { "[dst][locality]" => "public" }}
}}
# date formatdate {match => [ "log_data",
"MMM dd HH:mm:ss","MMM dd HH:mm:ss","MMM dd HH:mm:ss.SSS","MMM dd HH:mm:ss.SSS","ISO8601"
]target => "log_data"
}
}}
22.14 Logstash - Filter “geoip”
This filter processing an events data with IP address and check localization:
filter {if [src][locality] == "public" {
geoip {source => "[src][ip]"target => "[src][geoip]"database => "/etc/logstash/geoipdb/GeoLite2-City.mmdb"fields => [ "city_name", "country_name", "continent_code",
→˓"country_code2", "location" ]remove_field => [ "[src][geoip][ip]" ]
}
geoip {source => "[src][ip]"target => "[src][geoip]"database => "/etc/logstash/geoipdb/GeoLite2-ASN.mmdb"remove_field => [ "[src][geoip][ip]" ]
}
}
if [dst][locality] == "public" {
geoip {source => "[dst][ip]"target => "[dst][geoip]"database => "/etc/logstash/geoipdb/GeoLite2-City.mmdb"fields => [ "city_name", "country_name", "continent_code",
→˓"country_code2", "location" ]remove_field => [ "[dst][geoip][ip]" ]
(continues on next page)
244 Chapter 22. Logstash

ITRS-Log-Analytics-7.x Documentation, Release 7.0.5
(continued from previous page)
}
geoip {source => "[dst][ip]"target => "[dst][geoip]"database => "/etc/logstash/geoipdb/GeoLite2-ASN.mmdb"remove_field => [ "[dst][geoip][ip]" ]
}}
}
22.15 Logstash avoiding duplicate documents
To avoid duplicating the same documents, e.g. if the collector receives the entire event log file on restart, prepare theLogstash filter as follows:
1. Use the fingerprint Logstash filter to create consistent hashes of one or more fields whose values are unique forthe document and store the result in a new field, for example:
fingerprint {source => [ "log_name", "record_number" ]target => "generated_id"method => "SHA1"
}
• source - The name(s) of the source field(s) whose contents will be used to create the fingerprint
• target - The name of the field where the generated fingerprint will be stored. Any current contents of thatfield will be overwritten.
• method - If set to SHA1, SHA256, SHA384, SHA512, or MD5 and a key is set, the cryptographic hashfunction with the same name will be used to generate the fingerprint. When a key set, the keyed-hash(HMAC) digest function will be used.
2. In the elasticsearch output set the document_id as the value of the generated_id field:
elasticsearch {hosts => ["http://localhost:9200"]user => "logserver"password => "logserver"index => "syslog_wec-%{+YYYY.MM.dd}"document_id => "%{generated_id}"
}
• document_id - The document ID for the index. Useful for overwriting existing entries in Elasticsearchwith the same ID.
Documents having the same document_id will be indexed only once.
22.16 Logstash data enrichment
It is possible to enrich the events that go to the logstash filters with additional fields, the values of which come fromthe following sources:
22.15. Logstash avoiding duplicate documents 245

ITRS-Log-Analytics-7.x Documentation, Release 7.0.5
• databases, using the jdbc plugin;
• Active Directory or OpenLdap, using the logstash-filter-ldap plugin;
• dictionary files, using the translate plugin;
• external systems using their API, e.g. OP5 Monitor/Nagios
22.16.1 Filter jdbc
This filter executes a SQL query and store the result set in the field specified as target. It will cache the resultslocally in an LRU cache with expiry.
For example, you can load a row based on an id in the event:
filter {jdbc_streaming {jdbc_driver_library => "/path/to/mysql-connector-java-5.1.34-bin.jar"jdbc_driver_class => "com.mysql.jdbc.Driver"jdbc_connection_string => "jdbc:mysql://localhost:3306/mydatabase"jdbc_user => "me"jdbc_password => "secret"statement => "select * from WORLD.COUNTRY WHERE Code = :code"parameters => { "code" => "country_code"}target => "country_details"
}}
More about jdbc plugin parameters: (https://www.elastic.co/guide/en/logstash/6.8/plugins-filters-jdbc_streaming.html
22.16.2 Filter logstash-filter-ldap
Download and installation
https://github.com/Transrian/logstash-filter-ldap
Configuration
The logstash-filter-ldap filter will add fields queried from a ldap server to the event. The fields will be stored in avariable called target, that you can modify in the configuration file.
If an error occurs during the process tha tags array of the event is updated with either:
• LDAP_ERROR tag: Problem while connecting to the server: bad host, port, username, password, or search_dn-> Check the error message and your configuration.
• LDAP_NOT_FOUND tag: Object wasn’t found.
If error logging is enabled a field called error will also be added to the event. It will contain more details about theproblem.
246 Chapter 22. Logstash

ITRS-Log-Analytics-7.x Documentation, Release 7.0.5
Input event
{"@timestamp" => 2018-02-25T10:04:22.338Z,"@version" => "1","myUid" => "u501565"
}
Logstash filter
filter {ldap {identifier_value => "%{myUid}"host => "my_ldap_server.com"ldap_port => "389"username => "<connect_username>"password => "<connect_password>"search_dn => "<user_search_pattern>"
}}
Output event
{"@timestamp" => 2018-02-25T10:04:22.338Z,"@version" => "1","myUid" => "u501565","ldap" => {
"givenName" => "VALENTIN","sn" => "BOURDIER"
}}
Parameters availables
Here is a list of all parameters, with their default value, if any, and their description.
| Option name | Type | Required | Default value | Description→˓ | Example || :-------------------: | ------- | -------- | -------------- | ----------------------→˓-------------------------------------- | ----------------------------------------- || identifier_value | string | yes | n/a | Identifier of the→˓value to search. If identifier type is uid, then the value should be the uid to→˓search for. | "123456" || identifier_key | string | no | "uid" | Type of the→˓identifier to search | "uid"→˓ || identifier_type | string | no | "posixAccount" | Object class of the→˓object to search | "person"→˓ || search_dn | string | yes | n/a | Domain name in which→˓search inside the ldap database (usually your userdn or groupdn) | "dc=example,→˓dc=org" | (continues on next page)
22.16. Logstash data enrichment 247

ITRS-Log-Analytics-7.x Documentation, Release 7.0.5
(continued from previous page)
| attributes | array | no | [] | List of attributes to→˓get. If not set, all attributes available will be get | ['givenName', 'sn']→˓ || target | string | no | "ldap" | Name of the variable→˓you want the result being stocked in | "myCustomVariableName"→˓|| host | string | yes | n/a | LDAP server host→˓adress | "ldapserveur.com"→˓ || ldap_port | number | no | 389 | LDAP server port for→˓non-ssl connection | 400→˓|| ldaps_port | number | no | 636 | LDAP server port for→˓ssl connection | 401→˓|| use_ssl | boolean | no | false | Enable or not ssl→˓connection for LDAP server. Set-up the good ldap(s)_port depending on that | true→˓ || enable_error_logging | boolean | no | false | When there is a→˓problem with the connection with the LDAP database, write reason in the event |→˓true || no_tag_on_failure | boolean | no | false | No tags are added→˓when an error (wrong credentials, bad server, ..) occur | true→˓ || username | string | no | n/a | Username to use for→˓search in the database | "cn=SearchUser,ou=person,o=domain"→˓ || password | string | no | n/a | Password of the→˓account linked to previous username | "123456"→˓ || use_cache | boolean | no | true | Choose to enable or→˓not use of buffer | false→˓ || cache_type | string | no | "memory" | Type of buffer to use.→˓ Currently, only one is available, "memory" buffer | "memory"→˓ || cache_memory_duration | number | no | 300 | Cache duration (in s)→˓before refreshing values of it | 3600 || cache_memory_size | number | no | 20000 | Number of object max→˓that the buffer can contains | 100→˓|| disk_cache_filepath | string | no | nil | Where the cache will→˓periodically be dumped | "/tmp/my-memory-backup"→˓|| disk_cache_schedule | string | no | 10m | Cron period of when→˓the dump of the cache should occured. See [here](https://github.com/floraison/→˓fugit) for the syntax. | "10m", "1h", "every day at five", "3h10m" |
Buffer
Like all filters, this filter treat only 1 event at a time. This can lead to some slowing down of the pipeline speed due tothe network round-trip time, and high network I/O.
A buffer can be set to mitigate this.
Currently, there is only one basic “memory” buffer.
248 Chapter 22. Logstash

ITRS-Log-Analytics-7.x Documentation, Release 7.0.5
You can enable / disable use of buffer with the option use_cache.
Memory Buffer
This buffer store data fetched from the LDAP server in RAM, and can be configured with two parameters:
• cache_memory_duration: duration (in s) before a cache entry is refreshed if hit.
• cache_memory_size: number of tuple (identifier, attributes) that the buffer can contains.
Older cache values than your TTL will be removed from cache.
Persistant cache buffer
For the only buffer for now, you will be able to save it to disk periodically.
Some specificities :
• for the memory cache, TTL will be reset
Two parameters are required:
• disk_cache_filepath: path on disk of this backup
• disk_cache_schedule: schedule (every X time unit) of this backup. Please check here for the syntax of thisparameter.
22.16.3 Filter translate
A general search and replace tool that uses a configured hash and/or a file to determine replacement values. Currentlysupported are YAML, JSON, and CSV files. Each dictionary item is a key value pair.
You can specify dictionary entries in one of two ways:
• The dictionary configuration item can contain a hash representing the mapping.
filter {translate {
field => "[http_status]"destination => "[http_status_description]"dictionary => {"100" => "Continue""101" => "Switching Protocols""200" => "OK""500" => "Server Error"
}fallback => "I'm a teapot"
}}
• An external file (readable by logstash) may be specified in the dictionary_path configuration item:
filter {translate {
dictionary_path => "/etc/logstash/lists/instance_cpu.yml"field => "InstanceType"destination => "InstanceCPUCount"refresh_behaviour => "replace"
(continues on next page)
22.16. Logstash data enrichment 249

ITRS-Log-Analytics-7.x Documentation, Release 7.0.5
(continued from previous page)
}}
Sample dictionary file:
"c4.4xlarge": "16""c5.xlarge": "4""m1.medium": "1""m3.large": "2""m3.medium": "1""m4.2xlarge": "8""m4.large": "2""m4.xlarge": "4""m5a.xlarge": "4""m5d.xlarge": "4""m5.large": "2""m5.xlarge": "4""r3.2xlarge": "8""r3.xlarge": "4""r4.xlarge": "4""r5.2xlarge": "8""r5.xlarge": "4""t2.large": "2""t2.medium": "2""t2.micro": "1""t2.nano": "1""t2.small": "1""t2.xlarge": "4""t3.medium": "2"
22.16.4 External API
A simple filter that checks if an IP (from PublicIpAddress field) address exists in an external system. The resultis written to the op5exists field. Then, using a grok filter, the number of occurrences is decoded and put into theop5count field.
ruby {code => '
checkip = event.get("PublicIpAddress")output=`curl -s -k -u monitor:monitor "https://192.168.1.1/api/filter/
→˓count?query=%5Bhosts%5D%28address%20~~%20%22# {checkip}%22%20%29" 2>&1`event.set("op5exists", "#{output}")
'}grok {
match => { "op5exists" => [ ".*\:%{NUMBER:op5count}" ] }}
22.17 Logstash - Output to Elasticsearch
This output plugin sends all data to the local Elasticsearch instance and create indexes:
250 Chapter 22. Logstash

ITRS-Log-Analytics-7.x Documentation, Release 7.0.5
output {elasticsearch {
hosts => [ "127.0.0.1:9200" ]
index => "%{type}-%{+YYYY.MM.dd}"
user => "logstash"password => "logstash"
}}
22.18 Logstash plugin for “naemon beat”
This Logstash plugin has example of complete configuration for integration with naemon application:
input {beats {
port => FILEBEAT_PORTtype => "naemon"
}}
filter {if [type] == "naemon" {
grok {patterns_dir => [ "/etc/logstash/patterns" ]match => { "message" => "%{NAEMONLOGLINE}" }remove_field => [ "message" ]
}date {
match => [ "naemon_epoch", "UNIX" ]target => "@timestamp"remove_field => [ "naemon_epoch" ]
}}
}
output {# Single index
# if [type] == "naemon" {# elasticsearch {# hosts => ["ELASTICSEARCH_HOST:ES_PORT"]# index => "naemon-%{+YYYY.MM.dd}"# }# }
# Separate indexesif [type] == "naemon" {
if "_grokparsefailure" in [tags] {elasticsearch {
hosts => ["ELASTICSEARCH_HOST:ES_PORT"]index => "naemongrokfailure"
}}else {
(continues on next page)
22.18. Logstash plugin for “naemon beat” 251

ITRS-Log-Analytics-7.x Documentation, Release 7.0.5
(continued from previous page)
elasticsearch {hosts => ["ELASTICSEARCH_HOST:ES_PORT"]index => "naemon-%{+YYYY.MM.dd}"
}}
}}
22.19 Logstash plugin for “perflog”
This Logstash plugin has example of complete configuration for integration with perflog:
input {tcp {port => 6868host => "0.0.0.0"type => "perflogs"
}}
filter {if [type] == "perflogs" {grok {
break_on_match => "true"match => {
"message" => ["DATATYPE::%{WORD:datatype}\tTIMET::%{NUMBER:timestamp}\tHOSTNAME::%
→˓{DATA:hostname}\tSERVICEDESC::%{DATA:servicedescription}\tSERVICEPERFDATA::%→˓{DATA:performance}\tSERVICECHECKCOMMAND::.*?HOSTSTATE::%{WORD:hoststate}→˓\tHOSTSTATETYPE::.*?SERVICESTATE::%{WORD:servicestate}\tSERVICESTATETYPE::%→˓{WORD:servicestatetype}",
"DATATYPE::%{WORD:datatype}\tTIMET::%{NUMBER:timestamp}\tHOSTNAME::%→˓{DATA:hostname}\tHOSTPERFDATA::%{DATA:performance}\tHOSTCHECKCOMMAND::.*?HOSTSTATE::→˓%{WORD:hoststate}\tHOSTSTATETYPE::%{WORD:hoststatetype}"
]}
remove_field => [ "message" ]}kv {
source => "performance"field_split => "\t"remove_char_key => "\.\'"trim_key => " "target => "perf_data"remove_field => [ "performance" ]allow_duplicate_values => "false"transform_key => "lowercase"
}date {
match => [ "timestamp", "UNIX" ]target => "@timestamp"remove_field => [ "timestamp" ]
}}
(continues on next page)
252 Chapter 22. Logstash

ITRS-Log-Analytics-7.x Documentation, Release 7.0.5
(continued from previous page)
}
output {if [type] == "perflogs" {elasticsearch {
hosts => ["127.0.0.1:9200"]index => "perflogs-%{+YYYY.MM.dd}"
}}
}
22.20 Single password in all Logstash outputs
You can set passwords and other Logstash pipeline settings as environment variables. This can be useful if the pass-word was changed for the logastash user and it must be to update in the configuration files.
Configuration steps:
1. Create the service file:
mkdir –p /etc/systemd/system/logstash.service.d vi /etc/systemd/system/logstash.service.d/logstash.conf
[Service]Environment="ELASTICSEARCH_ES_USER=logserver"Environment="ELASTICSEARCH_ES_PASSWD=logserver"
2. Reload systemctl daemon:
systemctl daemon-reload
3. Sample definition of Logstash output pipline seciotn:
output {elasticsearch {
index => "test-%{+YYYY.MM.dd}"user => "${ELASTICSEARCH_ES_USER:elastic}"password => "${ELASTICSEARCH_ES_PASSWD:changeme}"
}}
22.21 Secrets keystore for secure settings
When you configure Logstash, you can use the Logstash keystore to securely store secret values for use in configurationsettings (passwords, usernames, other settings).
Configuration steps:
1. Set the keystore password
vi /etc/sysconfi/logstashLOGSTASH_KEYSTORE_PASS=keystorepass
22.20. Single password in all Logstash outputs 253

ITRS-Log-Analytics-7.x Documentation, Release 7.0.5
2. Create the new keystore:
/usr/share/logstash/bin/logstash-keystore create –path.settings /etc/logstash
During createation keystore you can provide the keysore passowrd
3. Add new entry to keystore:
usr/share/logstash/bin/logstash-keystore add ES_PWD --path.settings /etc/logstash
When adding an entry to the keystore, set the value of the entry.
4. Listing added entries:
/usr/share/logstash/bin/logstash-keystore list --path.settings /etc/logstash
5. Removing entries:
/usr/share/logstash/bin/logstash-keystore remove ES_PWD --path.settings /etc/→˓logstash
Sample definition of Logstash output pipline seciotn:
output {elasticsearch {index => "test-%{+YYYY.MM.dd}"user => "${ES_PWD}"password => "${ES_PWD}"
}}
22.22 Enabling encryption for Apache Kafka clients
Kafka allows you to distribute the load between nodes receiving data and encrypts communication.
Architecture example:
254 Chapter 22. Logstash

ITRS-Log-Analytics-7.x Documentation, Release 7.0.5
22.22.1 The Kafka installation
Documentation during creation.
22.22.2 Enabling encryption in Kafka
Generate SSL key and certificate for each Kafka broker
keytool -keystore server.keystore.jks -alias localhost -validity {validity} -genkey -→˓keyalg RSA
Configuring Host Name In Certificates
keytool -keystore server.keystore.jks -alias localhost -validity {validity} -genkey -→˓keyalg RSA -ext SAN=DNS:{FQDN}
Verify content of the generated certificate:
22.22. Enabling encryption for Apache Kafka clients 255

ITRS-Log-Analytics-7.x Documentation, Release 7.0.5
keytool -list -v -keystore server.keystore.jks
Creating your own CA
openssl req -new -x509 -keyout ca-key -out ca-cert -days 365keytool -keystore client.truststore.jks -alias CARoot -import -file ca-certkeytool -keystore server.truststore.jks -alias CARoot -import -file ca-cert
Signing the certificate
keytool -keystore server.keystore.jks -alias localhost -certreq -file cert-fileopenssl x509 -req -CA ca-cert -CAkey ca-key -in cert-file -out cert-signed -days→˓{validity} -CAcreateserial -passin pass:{ca-password}
Import both the certificate of the CA and the signed certificate into the keystore
keytool -keystore server.keystore.jks -alias CARoot -import -file ca-certkeytool -keystore server.keystore.jks -alias localhost -import -file cert-signed
22.22.3 Configuring Kafka Brokers
In /etc/kafka/server.properties file set the following options:
listeners=PLAINTEXT://host.name:port,SSL://host.name:port
ssl.keystore.location=/var/private/ssl/server.keystore.jksssl.keystore.password=test1234ssl.key.password=test1234ssl.truststore.location=/var/private/ssl/server.truststore.jksssl.truststore.password=test1234
and restart the Kafka service
systemctl restart kafka
22.22.4 Configuring Kafka Clients
Logstash
Configure the output section in Logstash based on the following example:
output {kafka {bootstrap_servers => "host.name:port"security_protocol => "SSL"ssl_truststore_type => "JKS"ssl_truststore_location => "/var/private/ssl/client.truststore.jks"ssl_truststore_password => "test1234"client_id => "host.name"topic_id => "Topic-1"codec => json
}}
Configure the input section in Logstash based on the following example:
256 Chapter 22. Logstash

ITRS-Log-Analytics-7.x Documentation, Release 7.0.5
input {kafka {bootstrap_servers => "host.name:port"security_protocol => "SSL"ssl_truststore_type => "JKS"ssl_truststore_location => "/var/private/ssl/client.truststore.jks"ssl_truststore_password => "test1234"consumer_threads => 4topics => [ "Topic-1" ]codec => jsontags => ["kafka"]
}}
22.22. Enabling encryption for Apache Kafka clients 257

ITRS-Log-Analytics-7.x Documentation, Release 7.0.5
258 Chapter 22. Logstash

CHAPTER 23
Integrations
23.1 OP5 - Naemon logs
23.1.1 Logstash
1. In ITRS Log Analytics naemon_beat.conf set up ELASTICSEARCH_HOST, ES_PORT,FILEBEAT_PORT
2. Copy ITRS Log Analytics naemon_beat.conf to /etc/logstash/conf.d
3. Based on “FILEBEAT_PORT” if firewall is running:
sudo firewall-cmd --zone=public --permanent --add-port=FILEBEAT_PORT/tcpsudo firewall-cmd --reload
4. Based on amount of data that elasticsearch will receive you can also choose whether you want index creation tobe based on moths or days:
index => "ITRS Log Analytics-naemon-%{+YYYY.MM}"orindex => "ITRS Log Analytics-naemon-%{+YYYY.MM.dd}"
5. Copy naemon file to /etc/logstash/patterns and make sure it is readable by logstash process
6. Restart logstash configuration e.g.:
sudo systemct restart logstash
23.1.2 Elasticsearch
Connect to Elasticsearch node via SSH and Install index pattern for naemon logs. Note that if you have a defaultpattern covering settings section you should delete/modify that in naemon_template.sh:
259

ITRS-Log-Analytics-7.x Documentation, Release 7.0.5
"settings": {"number_of_shards": 5,"auto_expand_replicas": "0-1"
},
Install template by running: ./naemon_template.sh
23.1.3 ITRS Log Analytics Monitor
1. On ITRS Log Analytics Monitor host install filebeat (for instance via rpm https://www.elastic.co/downloads/beats/filebeat)
2. In /etc/filebeat/filebeat.yml add:
#=========================== Filebeat inputs =============================filebeat.config.inputs:
enabled: truepath: configs/*.yml
3. You also will have to configure the output section in filebeat.yml. You should have one logstash output:
#----------------------------- Logstash output --------------------------------output.logstash:
# The Logstash hostshosts: ["LOGSTASH_IP:FILEBEAT_PORT"]
If you have few logstash instances - Logstash section has to be repeated on every node and hosts: shouldpoint to all of them:
hosts: ["LOGSTASH_IP:FILEBEAT_PORT", "LOGSTASH_IP:FILEBEAT_PORT", "LOGSTASH_→˓IP:FILEBEAT_PORT" ]
4. Create /etc/filebeat/configs catalog.
5. Copy naemon_logs.yml to a newly created catalog.
6. Check the newly added configuration and connection to logstash. Location of executable might vary based onos:
/usr/share/filebeat/bin/filebeat --path.config /etc/filebeat/ test config/usr/share/filebeat/bin/filebeat --path.config /etc/filebeat/ test output
7. Restart filebeat:
sudo systemctl restart filebeat # RHEL/CentOS 7sudo service filebeat restart # RHEL/CentOS 6
23.1.4 Elasticsearch
At this moment there should be a new index on the Elasticsearch node:
curl -XGET '127.0.0.1:9200/_cat/indices?v'
Example output:
260 Chapter 23. Integrations

ITRS-Log-Analytics-7.x Documentation, Release 7.0.5
health status index uuid pri rep docs.count→˓docs.deleted store.size pri.store.size
green open ITRS Log Analytics-naemon-2018.11 gO8XRsHiTNm63nI_RVCy8w 1→˓ 0 23176 0 8.3mb 8.3mb
If the index has been created, in order to browse and visualise the data, “index pattern” needs to be added in Kibana.
23.2 OP5 - Performance data
Below instruction requires that between ITRS Log Analytics node and Elasticsearch node is working Logstash in-stance.
23.2.1 Elasticsearch
1. First, settings section in ITRS Log Analyticstemplate.sh should be adjusted, either:
• there is a default template present on Elasticsearch that already covers shards and replicas then settingssections should be removed from the ITRS Log Analyticstemplate.sh before executing
• there is no default template - shards and replicas should be adjusted for you environment (keep in mindreplicas can be added later, while changing shards count on existing index requires reindexing it)
"settings": {"number_of_shards": 5,"number_of_replicas": 0
}
2. In URL ITRS Log Analyticsperfdata is a name for the template - later it can be search for or modify with it.
3. The “template” is an index pattern. New indices matching it will have the settings and mapping applied auto-matically (change it if you index name for ITRS Log Analytics perfdata is different).
4. Mapping name should match documents type:
"mappings": {"ITRS Log Analyticsperflogs"
Running ITRS Log Analyticstemplate.sh will create a template (not index) for ITRS Log Analytics perf datadocuments.
23.2.2 Logstash
1. The ITRS Log Analyticsperflogs.conf contains example of input/filter/output configuration. It has to be copiedto /etc/logstash/conf.d/. Make sure that the logstash has permissions to read the configuration files:
chmod 664 /etc/logstash/conf.d/ITRS Log Analyticsperflogs.conf
2. In the input section comment/uncomment “beats” or “tcp” depending on preference (beats if Filebeat will beused and tcp if NetCat). The port and the type has to be adjusted as well:
port => PORT_NUMBERtype => "ITRS Log Analyticsperflogs"
3. In a filter section type has to be changed if needed to match the input section and Elasticsearch mapping.
23.2. OP5 - Performance data 261

ITRS-Log-Analytics-7.x Documentation, Release 7.0.5
4. In an output section type should match with the rest of a config. host should point to your elasticsearch node.index name should correspond with what has been set in elasticsearch template to allow mapping application.The date for index rotation in its name is recommended and depending on the amount of data expecting to betransferred should be set to daily (+YYYY.MM.dd) or monthly (+YYYY.MM) rotation:
hosts => ["127.0.0.1:9200"]index => "ITRS Log Analytics-perflogs-%{+YYYY.MM.dd}"
5. Port has to be opened on a firewall:
sudo firewall-cmd --zone=public --permanent --add-port=PORT_NUMBER/tcpsudo firewall-cmd --reload
6. Logstash has to be reloaded:
sudo systemctl restart logstash
or
sudo kill -1 LOGSTASH_PID
23.2.3 ITRS Log Analytics Monitor
1. You have to decide wether FileBeat or NetCat will be used. In case of Filebeat - skip to the second step.Otherwise:
• Comment line:
54 open(my $logFileHandler, '>>', $hostPerfLogs) or die "Could not open→˓$hostPerfLogs"; #FileBeat• Uncomment lines:55 # open(my $logFileHandler, '>', $hostPerfLogs) or die "Could not open→˓$hostPerfLogs"; #NetCat...88 # my $logstashIP = "LOGSTASH_IP";89 # my $logstashPORT = "LOGSTASH_PORT";90 # if (-e $hostPerfLogs) {91 # my $pid1 = fork();92 # if ($pid1 == 0) {93 # exec("/bin/cat $hostPerfLogs | /usr/bin/nc -w 30 $logstashIP→˓$logstashPORT");94 # }95 # }
• In process-service-perfdata-log.pl and process-host-perfdata-log.pl: change logstash IP and port:
92 my $logstashIP = "LOGSTASH_IP";93 my $logstashPORT = "LOGSTASH_PORT";
2. In case of running single ITRS Log Analytics node, there is no problem with the setup. In case of a peeredenvironment $do_on_host variable has to be set up and the script process-service-perfdata-log.pl/process-host-perfdata-log.pl has to be propagated on all of ITRS Log Analytics nodes:
16 $do_on_host = "EXAMPLE_HOSTNAME"; # ITRS Log Analytics node name to run the→˓script on17 $hostName = hostname; # will read hostname of a node running the script
262 Chapter 23. Integrations

ITRS-Log-Analytics-7.x Documentation, Release 7.0.5
3. Example of command definition (/opt/monitor/etc/checkcommands.cfg) if scripts have been copied to/opt/plugins/custom/ :
# command 'process-service-perfdata-log'define command{
command_name process-service-perfdata-logcommand_line /opt/plugins/custom/process-service-perfdata-
→˓log.pl $TIMET$}
# command 'process-host-perfdata-log'define command{
command_name process-host-perfdata-logcommand_line /opt/plugins/custom/process-host-perfdata-log.
→˓pl $TIMET$}
4. In /opt/monitor/etc/naemon.cfg service_perfdata_file_processing_command andhost_perfdata_file_processing_command has to be changed to run those custom scripts:
service_perfdata_file_processing_command=process-service-perfdata-loghost_perfdata_file_processing_command=process-host-perfdata-log
5. In addition service_perfdata_file_template and host_perfdata_file_template can be changed to support sendingmore data to Elasticsearch. For instance, by adding $HOSTGROUPNAMES$ and $SERVICEGROUPNAMES$macros logs can be separated better (it requires changes to Logstash filter config as well)
6. Restart naemon service:
sudo systemctl restart naemon # CentOS/RHEL 7.xsudo service naemon restart # CentOS/RHEL 7.x
7. If FileBeat has been chosen, append below to filebeat.conf (adjust IP and PORT):
filebeat.inputs:type: logenabled: truepaths:- /opt/monitor/var/service_performance.log- /opt/monitor/var/host_performance.log
tags: ["ITRS Log Analyticsperflogs"]output.logstash:
# The Logstash hostshosts: ["LOGSTASH_IP:LOGSTASH_PORT"]
8. Restart FileBeat service:
sudo systemctl restart filebeat # CentOS/RHEL 7.xsudo service filebeat restart # CentOS/RHEL 7.x
23.2.4 Kibana
At this moment there should be new index on the Elasticsearch node with performance data documents from ITRSLog Analytics Monitor. Login to an Elasticsearch node and run: curl -XGET '127.0.0.1:9200/_cat/indices?v' Example output:
23.2. OP5 - Performance data 263

ITRS-Log-Analytics-7.x Documentation, Release 7.0.5
health status index pri rep docs.count docs.deleted store.size→˓pri.store.sizegreen open auth 5 0 7 6230 1.8mb→˓ 1.8mbgreen open ITRS Log Analytics-perflogs-2018.09.14 5 0 72109 0→˓ 24.7mb 24.7mb
After a while, if there is no new index make sure that:
• Naemon is runnig on ITRS Log Analytics node
• Logstash service is running and there are no errors in: /var/log/logstash/logstash-plain.log
• Elasticsearch service is running an there are no errors in: /var/log/elasticsearch/elasticsearch.log
If the index has been created, in order to browse and visualize the data “index pattern” needs to be added to Kibana.
1. After logging in to Kibana GUI go to Settings tab and add ITRS Log Analytics-perflogs-* pattern. Chose @times-tamp time field and click Create.
2. Performance data logs should be now accessible from Kibana GUI Discovery tab ready to be visualize.
23.3 OP5 Beat
The op5beat is small agent for collecting metrics from op5 Monitor.
The op5beat is located in the installation directory: utils/op5integration/op5beat
23.3.1 Installation for Centos7 and newer
1. Copy the necessary files to the appropriate directories:
cp -rf etc/* /etc/cp -rf usr/* /usr/cp -rf var/* /var/
2. Configure and start op5beat service (systemd):
cp -rf op5beat.service /usr/lib/systemd/system/systemctl daemon-reloadsystemctl enable op5beatsystemctl start op5beat
23.3.2 Installation for Centos6 and older
1. Copy the necessary files to the appropriate directories:
cp -rf etc/* /etc/cp -rf usr/* /usr/cp -rf var/* /var/
2. Configure and start op5beat service:
• sysV init:
264 Chapter 23. Integrations

ITRS-Log-Analytics-7.x Documentation, Release 7.0.5
cp -rf op5beat.service /etc/rc.d/init.d/op5beatchkconfig op5beat onservice op5beat start
• supervisord (optional):
yum install supervisorcp -rf supervisord.conf /etc/supervisord.conf
23.4 The Grafana instalation
1. To install the Grafana application you should:
• add necessary repository to operating system:
[root@localhost ~]# cat /etc/yum.repos.d/grafan.repo[grafana]name=grafanabaseurl=https://packagecloud.io/grafana/stable/el/7/$basearchrepo_gpgcheck=1enabled=1gpgcheck=1gpgkey=https://packagecloud.io/gpg.key https://grafanarel.s3.amazonaws.com/
→˓RPM-GPG-KEY-grafanasslverify=1sslcacert=/etc/pki/tls/certs/ca-bundle.crt[root@localhost ~]#
• install the Grafana with following commands:
[root@localhost ~]# yum search grafanaLoaded plugins: fastestmirrorLoading mirror speeds from cached hostfile
* base: ftp.man.szczecin.pl
* extras: centos.slaskdatacenter.com
* updates: centos.slaskdatacenter.com
→˓===========================================================================================================→˓N/S matched: grafana→˓===========================================================================================================grafana.x86_64 : Grafanapcp-webapp-grafana.noarch : Grafana web application for Performance Co-
→˓Pilot (PCP)
Name and summary matches only, use "search all" for everything.
[root@localhost ~]# yum install grafana
• to run application use following commands:
[root@localhost ~]# systemctl enable grafana-serverCreated symlink from /etc/systemd/system/multi-user.target.wants/grafana-
→˓server.service to /usr/lib/systemd/system/grafana-server.service.[root@localhost ~]#[root@localhost ~]# systemctl start grafana-server
(continues on next page)
23.4. The Grafana instalation 265

ITRS-Log-Analytics-7.x Documentation, Release 7.0.5
(continued from previous page)
[root@localhost ~]# systemctl status grafana-servergrafana-server.service - Grafana instanceLoaded: loaded (/usr/lib/systemd/system/grafana-server.service; enabled;
→˓vendor preset: disabled)Active: active (running) since Thu 2018-10-18 10:41:48 CEST; 5s agoDocs: http://docs.grafana.org
Main PID: 1757 (grafana-server)CGroup: /system.slice/grafana-server.service
1757 /usr/sbin/grafana-server --config=/etc/grafana/grafana.→˓ini --pidfile=/var/run/grafana/grafana-server.pid cfg:default.paths.logs=/→˓var/log/grafana cfg:default.paths.data=/var/lib/grafana cfg:default.paths.→˓plugins=/var...
[root@localhost ~]#
2. To connect the Grafana application you should:
• define the default login/password (line 151;154 in config file):
[root@localhost ~]# cat /etc/grafana/grafana.ini148 #################################### Security ############################→˓########149 [security]150 # default admin user, created on startup151 admin_user = admin152153 # default admin password, can be changed before first start of grafana,→˓or in profile settings154 admin_password = admin155
• restart grafana-server service:
systemctl restart grafana-server
• Login to Grafana user interface using web browser: http://ip:3000
266 Chapter 23. Integrations

ITRS-Log-Analytics-7.x Documentation, Release 7.0.5
• use login and password that you set in the config file.
• Use below example to set conection to Elasticsearch server:
23.5 The Beats configuration
23.5.1 Kibana API
Reference link: https://www.elastic.co/guide/en/kibana/master/api.html
After installing any of beats package you can use ready to use dashboard related to this beat package. For instancedashboard and index pattern are available in /usr/share/filebeat/kibana/6/ directory on Linux.
23.5. The Beats configuration 267

ITRS-Log-Analytics-7.x Documentation, Release 7.0.5
Before uploading index-pattern or dashboard you have to authorize yourself:
1. Set up login/password/kibana_ip variables, e.g.:
login=my_userpassword=my_passwordkibana_ip=10.4.11.243
2. Execute command which will save authorization cookie:
curl -c authorization.txt -XPOST -k "https://${kibana_ip}:5601/login" -d→˓"username=${username}&password=${password}&version=6.2.3&location=https%3A%2F%2F→˓${kibana_ip}%3A5601%2Flogin"
3. Upload index-pattern and dashboard to Kibana, e.g.:
curl -b authorization.txt -XPOST -k "https://${kibana_ip}:5601/api/kibana/→˓dashboards/import" -H 'kbn-xsrf: true' -H 'Content-Type: application/json' -d@/→˓usr/share/filebeat/kibana/6/index-pattern/filebeat.jsoncurl -b authorization.txt -XPOST -k "https://${kibana_ip}:5601/api/kibana/→˓dashboards/import" -H 'kbn-xsrf: true' -H 'Content-Type: application/json' -d@/→˓usr/share/filebeat/kibana/6/dashboard/Filebeat-mysql.json
4. When you want to upload beats index template to Ealsticsearch you have to recover it first (usually you do notsend logs directly to Es rather than to Logstash first):
/usr/bin/filebeat export template --es.version 6.2.3 >> /path/to/beats_template.→˓json
5. After that you can upload it as any other template (Access Es node with SSH):
curl -XPUT "localhost:9200/_template/ITRS Log Analyticsperfdata" -H'Content-Type:→˓application/json' -d@beats_template.json
23.6 Wazuh integration
ITRS Log Analytics can integrate with the Wazuh, which is lightweight agent is designed to perform a number of taskswith the objective of detecting threats and, when necessary, trigger automatic responses. The agent core capabilitiesare:
• Log and events data collection
• File and registry keys integrity monitoring
• Inventory of running processes and installed applications
• Monitoring of open ports and network configuration
• Detection of rootkits or malware artifacts
• Configuration assessment and policy monitoring
• Execution of active responses
The Wazuh agents run on many different platforms, including Windows, Linux, Mac OS X, AIX, Solaris and HP-UX.They can be configured and managed from the Wazuh server.
268 Chapter 23. Integrations

ITRS-Log-Analytics-7.x Documentation, Release 7.0.5
23.6.1 Deploying Wazuh Server
https://documentation.wazuh.com/3.13/installation-guide/installing-wazuh-manager/linux/centos/index.html
23.6.2 Deploing Wazuh Agent
https://documentation.wazuh.com/3.13/installation-guide/installing-wazuh-agent/index.html
23.6.3 Filebeat configuration
23.7 BRO integration
23.8 2FA authorization with Google Auth Provider (example)
23.8.1 Software used (tested versions):
• NGiNX (1.16.1 - from CentOS base reposiory)
• oauth2_proxy (https://github.com/pusher/oauth2_proxy/releases - 4.0.0)
23.8.2 The NGiNX configuration:
1. Copy the ng_oauth2_proxy.conf to /etc/nginx/conf.d/;
server {listen 443 default ssl;server_name logserver.local;ssl_certificate /etc/kibana/ssl/logserver.org.crt;ssl_certificate_key /etc/kibana/ssl/logserver.org.key;ssl_session_cache builtin:1000 shared:SSL:10m;add_header Strict-Transport-Security max-age=2592000;
location /oauth2/ {proxy_pass http://127.0.0.1:4180;proxy_set_header Host $host;proxy_set_header X-Real-IP $remote_addr;proxy_set_header X-Scheme $scheme;proxy_set_header X-Auth-Request-Redirect $request_uri;# or, if you are handling multiple domains:# proxy_set_header X-Auth-Request-Redirect $scheme://$host$request_uri;
}location = /oauth2/auth {
proxy_pass http://127.0.0.1:4180;proxy_set_header Host $host;proxy_set_header X-Real-IP $remote_addr;proxy_set_header X-Scheme $scheme;# nginx auth_request includes headers but not bodyproxy_set_header Content-Length "";proxy_pass_request_body off;
}
(continues on next page)
23.7. BRO integration 269

ITRS-Log-Analytics-7.x Documentation, Release 7.0.5
(continued from previous page)
location / {auth_request /oauth2/auth;error_page 401 = /oauth2/sign_in;
# pass information via X-User and X-Email headers to backend,# requires running with --set-xauthrequest flagauth_request_set $user $upstream_http_x_auth_request_user;auth_request_set $email $upstream_http_x_auth_request_email;proxy_set_header X-User $user;proxy_set_header X-Email $email;
# if you enabled --pass-access-token, this will pass the token to the backendauth_request_set $token $upstream_http_x_auth_request_access_token;proxy_set_header X-Access-Token $token;
# if you enabled --cookie-refresh, this is needed for it to work with auth_→˓request
auth_request_set $auth_cookie $upstream_http_set_cookie;add_header Set-Cookie $auth_cookie;
# When using the --set-authorization-header flag, some provider's cookies can→˓exceed the 4kb
# limit and so the OAuth2 Proxy splits these into multiple parts.# Nginx normally only copies the first `Set-Cookie` header from the auth_
→˓request to the response,# so if your cookies are larger than 4kb, you will need to extract additional
→˓cookies manually.auth_request_set $auth_cookie_name_upstream_1 $upstream_cookie_auth_cookie_
→˓name_1;
# Extract the Cookie attributes from the first Set-Cookie header and append→˓them
# to the second part ($upstream_cookie_* variables only contain the raw→˓cookie content)
if ($auth_cookie ~* "(; .*)") {set $auth_cookie_name_0 $auth_cookie;set $auth_cookie_name_1 "auth_cookie__oauth2_proxy_1=$auth_cookie_name_
→˓upstream_1$1";}
# Send both Set-Cookie headers now if there was a second partif ($auth_cookie_name_upstream_1) {
add_header Set-Cookie $auth_cookie_name_0;add_header Set-Cookie $auth_cookie_name_1;
}
proxy_pass https://127.0.0.1:5601;# or "root /path/to/site;" or "fastcgi_pass ..." etc
}}
2. Set ssl_certificate and ssl_certificate_key path in ng_oauth2_proxy.conf
When SSL is set using nginx proxy, Kibana can be started with http. However, if it is to be run with encryption, youalso need to change proxy_pass to the appropriate one.
270 Chapter 23. Integrations

ITRS-Log-Analytics-7.x Documentation, Release 7.0.5
23.8.3 The oauth2_proxy configuration:
1. Create a directory in which the program will be located and its configuration:
mkdir -p /usr/share/oauth2_proxy/mkdir -p /etc/oauth2_proxy/
2. Copy files to directories:
cp oauth2_proxy /usr/share/oauth2_proxy/cp oauth2_proxy.cfg /etc/oauth2_proxy/
3. Set directives according to OAuth configuration in Google Cloud project
cfgclient_id =client_secret =# the following limits domains for authorization (* - all)
email_domains = ["*"
]
4. Set the following according to the public hostname:
cookie_domain = "kibana-host.org"
5. In case og-in restrictions for a specific group defined on the Google side:
• Create administrative account: https://developers.google.com/identity/protocols/OAuth2ServiceAccount ;
• Get configuration to JSON file and copy Client ID;
• On the dashboard of the Google Cloud select “APIs & Auth” -> “APIs”;
• Click on “Admin SDK” and “Enable API”;
• Follow the instruction at https://developers.google.com/admin-sdk/directory/v1/guides/delegation#delegate_domain-wide_authority_to_your_service_account and give the service account the following permissions:
https://www.googleapis.com/auth/admin.directory.group.readonlyhttps://www.googleapis.com/auth/admin.directory.user.readonly
• Follow the instructions to grant access to the Admin API https://support.google.com/a/answer/60757
• Create or select an existing administrative email in the Gmail domain to flag it google-admin-email
• Create or select an existing group to flag it google-group
• Copy the previously downloaded JSON file to /etc/oauth2_proxy/.
• In file oauth2_proxy set the appropriate path:
google_service_account_json =
23.8.4 Service start up
• Start the NGiNX service
• Start the oauth2_proxy service
23.8. 2FA authorization with Google Auth Provider (example) 271

ITRS-Log-Analytics-7.x Documentation, Release 7.0.5
/usr/share/oauth2_proxy/oauth2_proxy -config="/etc/oauth2_proxy/oauth2_proxy.cfg"
In the browser enter the address pointing to the server with the ITRS Log Analytics installation
23.9 Cerebro - Elasticsearch web admin tool
23.9.1 Software Requirements
1. Cerebro v0.8.4
wget 'https://github.com/lmenezes/cerebro/releases/download/v0.8.4/cerebro-0.8.4.→˓tgz'
2. Java 11+ [for basic-auth setup]
yum install java-11-openjdk-headless.x86_64
3. Java 1.8.0 [without authorization
yum install java-1.8.0-openjdk-headless
23.9.2 Firewall Configuration
firewall-cmd --permanent --add-port=5602/tcpfirewall-cmd --reload
23.9.3 Cerebro Configuration
1. Extract archive & move directory
tar -xvf cerebro-0.8.4.tgz -C /opt/mv /opt/cerebro-0.8.4/ /opt/cerebro
2. Add Cerebro service user
useradd -M -d /opt/cerebro -s /sbin/nologin cerebro
3. Change Cerbero permissions
chown -R cerebro:cerebro /opt/cerebro && chmod -R 700 /opt/cerebro
4. Install Cerbero service (cerebro.service):
[Unit]Description=Cerebro
[Service]Type=simpleUser=cerebroGroup=cerebro
(continues on next page)
272 Chapter 23. Integrations

ITRS-Log-Analytics-7.x Documentation, Release 7.0.5
(continued from previous page)
ExecStart=/opt/cerebro/bin/cerebro "-Dconfig.file=/opt/cerebro/conf/application.→˓conf"Restart=alwaysWorkingDirectory=/opt/cerebro
[Install]WantedBy=multi-user.target
cp cerebro.service /usr/lib/systemd/system/systemctl daemon-reloadsystemctl enable cerebro
5. Customize configuration file: /opt/cerebro/conf/application.conf
- Authenticationauth = {type: basicsettings: {
username = "user"password = "password"
}}
• A list of known Elasticsearch hosts
hosts = [{host = "http://localhost:9200"name = "user"auth = {username = "username"password = "password"
}}
]
If needed uses secure connection (SSL) with Elasticsearch, set the following section that contains path to certificate.And change the host definition from http to https:
play.ws.ssl {trustManager = {stores = [
{ type = "PEM", path = "/etc/elasticsearch/ssl/rootCA.crt" }]
}}play.ws.ssl.loose.acceptAnyCertificate=true
• SSL access to cerebro
http = {port = "disabled"
}https = {port = "5602"
}
(continues on next page)
23.9. Cerebro - Elasticsearch web admin tool 273

ITRS-Log-Analytics-7.x Documentation, Release 7.0.5
(continued from previous page)
#SSL access to cerebro - no self signed certificates#play.server.https {# keyStore = {# path = "keystore.jks",# password = "SuperSecretKeystorePassword"# }#}
#play.ws.ssl {# trustManager = {# stores = [# { type = "JKS", path = "truststore.jks", password =→˓"SuperSecretTruststorePassword" }# ]# }#}
1. Start the service
systemctl start cerebrogoto: https://127.0.0.1:5602
23.9.4 Optional configuration
1. Register backup/snapshot repository for Elasticsearch
curl -k -XPUT "https://127.0.0.1:9200/_snapshot/backup?pretty" -H→˓'Content-Type: application/json' -d'
{"type": "fs","settings": {"location": "/var/lib/elasticsearch/backup/"
}}' -u user:password
2. Login using curl/kibana
curl -k -XPOST 'https://127.0.0.1:5602/auth/login' -H 'mimeType: application/x-→˓www-form-urlencoded' -d 'user=user&password=passwrd' -c cookie.txtcurl -k -XGET 'https://127.0.0.1:5602' -b cookie.txt
23.10 Elasticdump
Elasticdump is a tool for moving and saving indices.
23.10.1 Location
/usr/share/kibana/elasticdump/elasticdump
274 Chapter 23. Integrations

ITRS-Log-Analytics-7.x Documentation, Release 7.0.5
23.10.2 Examples of use
Copy an index from production to staging with analyzer and mapping
elasticdump \--input=http://production.es.com:9200/my_index \--output=http://staging.es.com:9200/my_index \--type=analyzer
elasticdump \--input=http://production.es.com:9200/my_index \--output=http://staging.es.com:9200/my_index \--type=mapping
elasticdump \--input=http://production.es.com:9200/my_index \--output=http://staging.es.com:9200/my_index \--type=data
Backup index data to a file:
elasticdump \--input=http://production.es.com:9200/my_index \--output=/data/my_index_mapping.json \--type=mapping
elasticdump \--input=http://production.es.com:9200/my_index \--output=/data/my_index.json \--type=data
Backup and index to a gzip using stdout
elasticdump \--input=http://production.es.com:9200/my_index \--output=$ \| gzip > /data/my_index.json.gz
Backup the results of a query to a file
elasticdump \--input=http://production.es.com:9200/my_index \--output=query.json \--searchBody="{\"query\":{\"term\":{\"username\": \"admin\"}}}"
Copy a single shard data
elasticdump \--input=http://es.com:9200/api \--output=http://es.com:9200/api2 \--params="{\"preference\":\"_shards:0\"}"
23.10. Elasticdump 275

ITRS-Log-Analytics-7.x Documentation, Release 7.0.5
Backup aliases to a file
elasticdump \--input=http://es.com:9200/index-name/alias-filter \--output=alias.json \--type=alias
Import aliases into ES
elasticdump \--input=./alias.json \--output=http://es.com:9200 \--type=alias
Backup templates to a file
elasticdump \--input=http://es.com:9200/template-filter \--output=templates.json \--type=template
Import templates into ES
elasticdump \--input=./templates.json \--output=http://es.com:9200 \--type=template
Split files into multiple parts
elasticdump \--input=http://production.es.com:9200/my_index \--output=/data/my_index.json \--fileSize=10mb
Import data from S3 into ES (using s3urls)
elasticdump \--s3AccessKeyId "${access_key_id}" \--s3SecretAccessKey "${access_key_secret}" \--input "s3://${bucket_name}/${file_name}.json" \--output=http://production.es.com:9200/my_index
Export ES data to S3 (using s3urls)
276 Chapter 23. Integrations

ITRS-Log-Analytics-7.x Documentation, Release 7.0.5
elasticdump \--s3AccessKeyId "${access_key_id}" \--s3SecretAccessKey "${access_key_secret}" \--input=http://production.es.com:9200/my_index \--output "s3://${bucket_name}/${file_name}.json"
Import data from MINIO (s3 compatible) into ES (using s3urls)
elasticdump \--s3AccessKeyId "${access_key_id}" \--s3SecretAccessKey "${access_key_secret}" \--input "s3://${bucket_name}/${file_name}.json" \--output=http://production.es.com:9200/my_index--s3ForcePathStyle true--s3Endpoint https://production.minio.co
Export ES data to MINIO (s3 compatible) (using s3urls)
elasticdump \--s3AccessKeyId "${access_key_id}" \--s3SecretAccessKey "${access_key_secret}" \--input=http://production.es.com:9200/my_index \--output "s3://${bucket_name}/${file_name}.json"--s3ForcePathStyle true--s3Endpoint https://production.minio.co
Import data from CSV file into ES (using csvurls)
elasticdump \
# csv:// prefix must be included to allow parsing of csv files
# --input "csv://${file_path}.csv" \
--input "csv:///data/cars.csv"--output=http://production.es.com:9200/my_index \--csvSkipRows 1 # used to skip parsed rows (this does not include the headers
→˓row)--csvDelimiter ";" # default csvDelimiter is ','
Copy a single index from a elasticsearch:
elasticdump \--input=http://es.com:9200/api/search \--input-index=my_index \--output=http://es.com:9200/api/search \--output-index=my_index \--type=mapping
23.10. Elasticdump 277

ITRS-Log-Analytics-7.x Documentation, Release 7.0.5
Copy a single type:
elasticdump \--input=http://es.com:9200/api/search \--input-index=my_index/my_type \--output=http://es.com:9200/api/search \--output-index=my_index \--type=mapping
23.10.3 Usage
elasticdump --input SOURCE --output DESTINATION [OPTIONS]
23.10.4 All parameters
--inputSource location (required)
--input-indexSource index and type(default: all, example: index/type)
--outputDestination location (required)
--output-indexDestination index and type(default: all, example: index/type)
--overwriteOverwrite output file if it exists(default: false)
--limitHow many objects to move in batch per operationlimit is approximate for file streams(default: 100)
--sizeHow many objects to retrieve(default: -1 -> no limit)
--concurrencyThe maximum number of requests the can be made concurrently to a
→˓specified transport.(default: 1)
--concurrencyIntervalThe length of time in milliseconds in which up to <intervalCap>
→˓requests can be madebefore the interval request count resets. Must be finite.(default: 5000)
--intervalCapThe maximum number of transport requests that can be made within
→˓a given <concurrencyInterval>.(default: 5)
--carryoverConcurrencyCountIf true, any incomplete requests from a <concurrencyInterval>
→˓will be carried over tothe next interval, effectively reducing the number of new
→˓requests that can be created
(continues on next page)
278 Chapter 23. Integrations

ITRS-Log-Analytics-7.x Documentation, Release 7.0.5
(continued from previous page)
in that next interval. If false, up to <intervalCap> requests→˓can be created in the
next interval regardless of the number of incomplete requests→˓from the previous interval.
(default: true)--throttleInterval
Delay in milliseconds between getting data from an inputTransport→˓and sending it to an
outputTransport.(default: 1)
--debugDisplay the elasticsearch commands being used(default: false)
--quietSuppress all messages except for errors(default: false)
--typeWhat are we exporting?(default: data, options: [settings, analyzer, data, mapping,
→˓alias, template, component_template, index_template])--filterSystemTemplates
Whether to remove metrics-*-* and logs-*-* system templates(default: true])
--templateRegexRegex used to filter templates before passing to the output
→˓transport(default: ((metrics|logs|\\..+)(-.+)?)
--deleteDelete documents one-by-one from the input as they aremoved. Will not delete the source index(default: false)
--searchBodyPreform a partial extract based on search resultswhen ES is the input, default values areif ES > 5`'{"query": { "match_all": {} }, "stored_fields": ["*"], "_
→˓source": true }'`else`'{"query": { "match_all": {} }, "fields": ["*"], "_source":
→˓true }'`--searchWithTemplate
Enable to use Search Template when using --searchBodyIf using Search Template then searchBody has to consist of "id"
→˓field and "params" objectsIf "size" field is defined within Search Template, it will be
→˓overridden by --size parameterSee https://www.elastic.co/guide/en/elasticsearch/reference/
→˓current/search-template.html forfurther information(default: false)
--headersAdd custom headers to Elastisearch requests (helpful whenyour Elasticsearch instance sits behind a proxy)(default: '{"User-Agent": "elasticdump"}')
--paramsAdd custom parameters to Elastisearch requests uri. Helpful when
→˓you for example(continues on next page)
23.10. Elasticdump 279

ITRS-Log-Analytics-7.x Documentation, Release 7.0.5
(continued from previous page)
want to use elasticsearch preference(default: null)
--sourceOnlyOutput only the json contained within the document _sourceNormal: {"_index":"","_type":"","_id":"", "_source":{SOURCE}}sourceOnly: {SOURCE}(default: false)
--ignore-errorsWill continue the read/write loop on write error(default: false)
--scrollIdThe last scroll Id returned from elasticsearch.This will allow dumps to be resumed used the last scroll Id &`scrollTime` has not expired.
--scrollTimeTime the nodes will hold the requested search in order.(default: 10m)
--maxSocketsHow many simultaneous HTTP requests can we process make?(default:5 [node <= v0.10.x] /Infinity [node >= v0.11.x] )
--timeoutInteger containing the number of milliseconds to wait fora request to respond before aborting the request. Passeddirectly to the request library. Mostly used when you don'tcare too much if you lose some data when importingbut rather have speed.
--offsetInteger containing the number of rows you wish to skipahead from the input transport. When importing a largeindex, things can go wrong, be it connectivity, crashes,someone forgetting to `screen`, etc. This allows youto start the dump again from the last known line written(as logged by the `offset` in the output). Please beadvised that since no sorting is specified when thedump is initially created, there's no real way toguarantee that the skipped rows have already beenwritten/parsed. This is more of an option for whenyou want to get most data as possible in the indexwithout concern for losing some rows in the process,similar to the `timeout` option.(default: 0)
--noRefreshDisable input index refresh.Positive:
1. Much increase index speedare requirements
Negative:1. Recently added data may not
→˓be indexedwith big data indexing,
where→˓speed and system health in a higher priority
than→˓recently added data.
(continues on next page)
280 Chapter 23. Integrations

ITRS-Log-Analytics-7.x Documentation, Release 7.0.5
(continued from previous page)
--inputTransportProvide a
→˓custom js file to use as the input transport--outputTransport
Provide a→˓custom js file to use as the output transport
--toLogWhen
→˓using a custom outputTransport, should log linesbe
→˓appended to the output stream?(default:
→˓true, except for `$`)--transform
A method/→˓function which can be called to modify documents
before→˓writing to a destination. A global variable 'doc'
is→˓available.
Example→˓script for computing a new field 'f2' as doubled
value of→˓field 'f1':
doc._→˓source["f2"] = doc._source.f1 * 2;
May be→˓used multiple times.
→˓Additionally, transform may be performed by a module. See [Module Transform](→˓#module-transform) below.
--awsChainUse
→˓[standard](https://aws.amazon.com/blogs/security/a-new-and-standardized-way-to-→˓manage-credentials-in-the-aws-sdks/) location and ordering for resolving→˓credentials including environment variables, config files, EC2 and ECS metadata→˓locations
_→˓Recommended option for use with AWS_
Use→˓[standard](https://aws.amazon.com/blogs/security/a-new-and-standardized-way-to-→˓manage-credentials-in-the-aws-sdks/)
location→˓and ordering for resolving credentials including environment variables,
config→˓files, EC2 and ECS metadata locations _Recommended option for use with AWS_
--awsAccessKeyId--awsSecretAccessKey
When→˓using Amazon Elasticsearch Service protected by
AWS→˓Identity and Access Management (IAM), provide
your→˓Access Key ID and Secret Access Key.
--→˓sessionToken can also be optionally provided if using temporary credentials
--awsIniFileProfile(continues on next page)
23.10. Elasticdump 281

ITRS-Log-Analytics-7.x Documentation, Release 7.0.5
(continued from previous page)
→˓Alternative to --awsAccessKeyId and --awsSecretAccessKey,loads
→˓credentials from a specified profile in aws ini file.For
→˓greater flexibility, consider using --awsChainand
→˓setting AWS_PROFILE and AWS_CONFIG_FILE
→˓environment variables to override defaults if needed--awsIniFileName
Override→˓the default aws ini file name when using --awsIniFileProfile
Filename→˓is relative to ~/.aws/
(default:→˓config)
--awsServiceSets the
→˓AWS service that the signature will be generated for(default:
→˓calculated from hostname or host)--awsRegion
Sets the→˓AWS region that the signature will be generated for
(default:→˓calculated from hostname or host)
--awsUrlRegexRegular
→˓expression that defined valied AWS urls that should be signed(default:
→˓^https?:\\.*.amazonaws.com.*$)--support-big-int
Support→˓big integer numbers
--big-int-fieldsSepcifies
→˓a comma-seperated list of fields that should be checked for big-int support(default '
→˓')--retryAttempts
Integer→˓indicating the number of times a request should be automatically re-attempted→˓before failing
when a→˓connection fails with one of the following errors `ECONNRESET`, `ENOTFOUND`,→˓`ESOCKETTIMEDOUT`,
→˓ETIMEDOUT`, `ECONNREFUSED`, `EHOSTUNREACH`, `EPIPE`, `EAI_AGAIN`(default:
→˓0)
--retryDelayInteger indicating the back-off/break period between retry
→˓attempts (milliseconds)(default : 5000)
--parseExtraFields(continues on next page)
282 Chapter 23. Integrations

ITRS-Log-Analytics-7.x Documentation, Release 7.0.5
(continued from previous page)
Comma-separated list of meta-fields to be parsed--maxRows
supports file splitting. Files are split by the number of rows→˓specified--fileSize
supports file splitting. This value must be a string supported→˓by the **bytes** module.
The following abbreviations must be used to signify size in terms→˓of units
b for byteskb for kilobytesmb for megabytesgb for gigabytestb for terabytes
e.g. 10mb / 1gb / 1tbPartitioning helps to alleviate overflow/out of memory exceptions
→˓by efficiently segmenting filesinto smaller chunks that then be merged if needs be.
--fsCompressgzip data before sending output to file.On import the command is used to inflate a gzipped file
--s3AccessKeyIdAWS access key ID
--s3SecretAccessKeyAWS secret access key
--s3RegionAWS region
--s3EndpointAWS endpoint can be used for AWS compatible backends such asOpenStack Swift and OpenStack Ceph
--s3SSLEnabledUse SSL to connect to AWS [default true]
--s3ForcePathStyle Force path style URLs for S3 objects [default false]
--s3Compressgzip data before sending to s3
--s3ServerSideEncryptionEnables encrypted uploads
--s3SSEKMSKeyIdKMS Id to be used with aws:kms uploads
--s3ACLS3 ACL: private | public-read | public-read-write | authenticated-
→˓read | aws-exec-read |bucket-owner-read | bucket-owner-full-control [default private]
--retryDelayBaseThe base number of milliseconds to use in the exponential backoff
→˓for operation retries. (s3)--customBackoff
Activate custom customBackoff function. (s3)--tlsAuth
Enable TLS X509 client authentication--cert, --input-cert, --output-cert
Client certificate file. Use --cert if source and destination are→˓identical.
(continues on next page)
23.10. Elasticdump 283

ITRS-Log-Analytics-7.x Documentation, Release 7.0.5
(continued from previous page)
Otherwise, use the one prefixed with --input or --output as→˓needed.--key, --input-key, --output-key
Private key file. Use --key if source and destination are→˓identical.
Otherwise, use the one prefixed with --input or --output as→˓needed.--pass, --input-pass, --output-pass
Pass phrase for the private key. Use --pass if source and→˓destination are identical.
Otherwise, use the one prefixed with --input or --output as→˓needed.--ca, --input-ca, --output-ca
CA certificate. Use --ca if source and destination are identical.Otherwise, use the one prefixed with --input or --output as
→˓needed.--inputSocksProxy, --outputSocksProxy
Socks5 host address--inputSocksPort, --outputSocksPort
Socks5 host port--handleVersion
Tells elastisearch transport to handle the `_version` field if→˓present in the dataset
(default : false)--versionType
Elasticsearch versioning types. Should be `internal`, `external`,→˓`external_gte`, `force`.
NB : Type validation is handled by the bulk endpoint and not by→˓elasticsearch-dump--csvDelimiter
The delimiter that will separate columns.(default : ',')
--csvFirstRowAsHeadersIf set to true the first row will be treated as the headers.(default : true)
--csvRenameHeadersIf you want the first line of the file to be removed and replaced
→˓by the one provided in the `csvCustomHeaders` option(default : true)
--csvCustomHeaders A comma-seperated listed of values that will be used as headers→˓for your data. This param must
be used in conjunction with `csvRenameHeaders`(default : null)
--csvWriteHeaders Determines if headers should be written to the csv file.(default : true)
--csvIgnoreEmptySet to true to ignore empty rows.(default : false)
--csvSkipLinesIf number is > 0 the specified number of lines will be skipped.(default : 0)
--csvSkipRowsIf number is > 0 then the specified number of parsed rows will be
→˓skippedNB: (If the first row is treated as headers, they aren't a part
→˓of the count)(default : 0)
(continues on next page)
284 Chapter 23. Integrations

ITRS-Log-Analytics-7.x Documentation, Release 7.0.5
(continued from previous page)
--csvMaxRowsIf number is > 0 then only the specified number of rows will be
→˓parsed.(e.g. 100 would return the first 100 rows of data)(default : 0)
--csvTrimSet to true to trim all white space from columns.(default : false)
--csvRTrimSet to true to right trim all columns.(default : false)
--csvLTrimSet to true to left trim all columns.(default : false)
--csvHandleNestedDataSet to true to handle nested JSON/CSV data.NB : This is a very optioninated implementaton !(default : false)
--csvIdColumnName of the column to extract the record identifier (id) fromWhen exporting to CSV this column can be used to override the
→˓default id (@id) column name(default : null)
--csvIndexColumnName of the column to extract the record index fromWhen exporting to CSV this column can be used to override the
→˓default index (@index) column name(default : null)
--csvTypeColumnName of the column to extract the record type fromWhen exporting to CSV this column can be used to override the
→˓default type (@type) column name(default : null)
--helpThis page
23.10.5 Elasticsearch’s Scroll API
Elasticsearch provides a scroll API to fetch all documents of an index starting from (and keeping) a consistent snapshotin time, which we use under the hood. This method is safe to use for large exports since it will maintain the result setin cache for the given period of time.
NOTE: only works for –output
23.10.6 Bypassing self-sign certificate errors
Set the environment NODE_TLS_REJECT_UNAUTHORIZED=0 before running elasticdump
23.10.7 An alternative method of passing environment variables before execution
NB : This only works with linux shells
NODE_TLS_REJECT_UNAUTHORIZED=0 elasticdump –input=”https://localhost:9200” –output myfile
23.10. Elasticdump 285

ITRS-Log-Analytics-7.x Documentation, Release 7.0.5
23.11 Curator - Elasticsearch index management tool
Curator is a tool that allows you to perform index management tasks, such as:
• Close Indices
• Delete Indices
• Delete Snapshots
• Forcemerge segments
• Changing Index Settings
• Open Indices
• Reindex data
And other.
23.11.1 Curator installation
Curator is delivered with the client node installer.
23.11.2 Curator configuration
Create directory for configuration:
mkdir /etc/curator
Create directory for Curator logs file:
mkdir /var/log/curator
23.11.3 Running Curator
The curator executable is located in the directory:
/usr/share/kibana/curator/bin/curator
Curator requires two parameters:
• config - path to configuration file for Curator
• path to action file for Curator
Example running command:
/usr/share/kibana/curator/bin/curator --config /etc/curator/curator.conf /etc/curator/→˓close_indices.yml
286 Chapter 23. Integrations

ITRS-Log-Analytics-7.x Documentation, Release 7.0.5
23.11.4 Sample configuration file
Remember, leave a key empty if there is no value. None will be a string, not a Python “NoneType”
client:hosts:- 127.0.0.1
port: 9200# url_prefix:# use_ssl: False# certificate:
client_cert:client_key:ssl_no_validate: Falsehttp_auth: $user:$passowrdtimeout: 30master_only: True
logging:loglevel: INFOlogfile: /var/log/curator/curator.loglogformat: defaultblacklist: ['elasticsearch', 'urllib3']
23.11.5 Sample action file
• close indices
actions:1:
action: closedescription: >-
Close indices older than 30 days (based on index name), for logstash-prefixed indices.
options:delete_aliases: Falsetimeout_override:continue_if_exception: Falsedisable_action: True
filters:- filtertype: pattern
kind: prefixvalue: logstash-exclude:
- filtertype: agesource: namedirection: oldertimestring: '%Y.%m.%d'unit: daysunit_count: 30exclude:
• delete indices
23.11. Curator - Elasticsearch index management tool 287

ITRS-Log-Analytics-7.x Documentation, Release 7.0.5
actions:1:
action: delete_indicesdescription: >-
Delete indices older than 45 days (based on index name), for logstash-prefixed indices. Ignore the error if the filter does not result in anactionable list of indices (ignore_empty_list) and exit cleanly.
options:ignore_empty_list: Truetimeout_override:continue_if_exception: Falsedisable_action: True
filters:- filtertype: pattern
kind: prefixvalue: logstash-exclude:
- filtertype: agesource: namedirection: oldertimestring: '%Y.%m.%d'unit: daysunit_count: 45exclude:
• forcemerge segments
actions:1:
action: forcemergedescription: >-
forceMerge logstash- prefixed indices older than 2 days (based on indexcreation_date) to 2 segments per shard. Delay 120 seconds between eachforceMerge operation to allow the cluster to quiesce.This action will ignore indices already forceMerged to the same or fewernumber of segments per shard, so the 'forcemerged' filter is unneeded.
options:max_num_segments: 2delay: 120timeout_override:continue_if_exception: Falsedisable_action: True
filters:- filtertype: pattern
kind: prefixvalue: logstash-exclude:
- filtertype: agesource: creation_datedirection: olderunit: daysunit_count: 2exclude:
• open indices
actions:
(continues on next page)
288 Chapter 23. Integrations

ITRS-Log-Analytics-7.x Documentation, Release 7.0.5
(continued from previous page)
1:action: opendescription: >-
Open indices older than 30 days but younger than 60 days (based on indexname), for logstash- prefixed indices.
options:timeout_override:continue_if_exception: Falsedisable_action: True
filters:- filtertype: pattern
kind: prefixvalue: logstash-exclude:
- filtertype: agesource: namedirection: oldertimestring: '%Y.%m.%d'unit: daysunit_count: 30exclude:
- filtertype: agesource: namedirection: youngertimestring: '%Y.%m.%d'unit: daysunit_count: 60exclude:
• replica reduce
actions:1:
action: replicasdescription: >-
Reduce the replica count to 0 for logstash- prefixed indices older than10 days (based on index creation_date)
options:count: 0wait_for_completion: Falsetimeout_override:continue_if_exception: Falsedisable_action: True
filters:- filtertype: pattern
kind: prefixvalue: logstash-exclude:
- filtertype: agesource: creation_datedirection: olderunit: daysunit_count: 10exclude:
23.11. Curator - Elasticsearch index management tool 289

ITRS-Log-Analytics-7.x Documentation, Release 7.0.5
23.12 Cross-cluster Search
Cross-cluster search lets you run a single search request against one or more remote clusters. For example, you canuse a cross-cluster search to filter and analyze log data stored on clusters in different data centers.
23.12.1 Configuration
1. Use _cluster API to add least one remote cluster:
curl -u user:password -X PUT "localhost:9200/_cluster/settings?pretty" -H→˓'Content-Type: application/json' -d'{"persistent": {
"cluster": {"remote": {"cluster_one": {"seeds": ["192.168.0.1:9300"
]},"cluster_two": {"seeds": ["192.168.0.2:9300"
]}
}}
}}'
2. To search data in index twitter located on the cluster_one use following command:
curl -u user:password -X GET "localhost:9200/cluster_one:twitter/_search?pretty" -→˓H 'Content-Type: application/json' -d'{"query": {
"match": {"user": "kimchy"
}}
}'
3. To search data in index twitter located on multiple clusters, use following command:
curl -u user:password -X GET "localhost:9200/twitter,cluster_one:twitter,cluster_→˓two:twitter/_search?pretty" -H 'Content-Type: application/json' -d'{"query": {
"match": {"user": "kimchy"
}}
}'
4. Configure index pattern in Kibana GUI to discover data from multiple clusters:
290 Chapter 23. Integrations

ITRS-Log-Analytics-7.x Documentation, Release 7.0.5
cluster_one:logstash-*,cluster_two:logstash-*
media/media/image133.png
23.12.2 Security
Cross-cluster search uses the Elasticsearch transport layer (default 9300/tcp port) to exchange data. To secure thetransmission, encryption must be enabled for the transport layer.
Configuration is in the /etc/elasticsearch/elastisearch.yml file:
# Transport layer encryptionlogserverguard.ssl.transport.enabled: truelogserverguard.ssl.transport.pemcert_filepath: "/etc/elasticsearch/ssl/certificate.crt→˓"logserverguard.ssl.transport.pemkey_filepath: "/etc/elasticsearch/ssl/certificate.key"logserverguard.ssl.transport.pemkey_password: ""logserverguard.ssl.transport.pemtrustedcas_filepath: "/etc/elasticsearch/ssl/rootCA.→˓crt"
logserverguard.ssl.transport.enforce_hostname_verification: falselogserverguard.ssl.transport.resolve_hostname: false
Encryption must be enabled on each cluster.
23.13 Sync/Copy
The Sync/Copy module allows you to synchronize or copy data between two Elasticsearch clusters. You can copy orsynchronize selected indexes or indicate index pattern.
23.13.1 Configuration
Before starting Sync/Copy, complete the source and target cluster data in the Profile and Create profiletab:
• Protocol - http or https;
• Host - IP address ingest node;
• Port - communication port (default 9200);
• Username - username that has permission to get data and save data to the cluster;
• Password - password of the above user
• Cluster name
23.13. Sync/Copy 291

ITRS-Log-Analytics-7.x Documentation, Release 7.0.5
media/media/image134.png
You can view or delete the profile in the Profile List tab.
23.13.2 Synchronize data
To perform data synchronization, follow the instructions:
• go to the Sync tab;
• select Source Profile
• select Destination Profile
• enter the index pattern name in Index pattern to sync
• or use switch Toggle to select between Index pattern or name and enter indices name.
• to create synchronization task, press Submit button
media/media/image135.png
23.13.3 Copy data
To perform data copy, follow the instructions:
• go to the Copy tab;
• select Source Profile
• select Destination Profile
• enter the index pattern name in Index pattern to sync
• or use switch Toggle to select between Index pattern or name and enter indices name.
• to start copying data press the Submit button
292 Chapter 23. Integrations

ITRS-Log-Analytics-7.x Documentation, Release 7.0.5
23.13.4 Running Sync/Copy
Prepared Copy/Sync tasks can be run on demand or according to a set schedule. To do this, go to the Jobs tab. Witheach task you will find the Action button that allows:
• running the task;
• scheduling task in Cron format;
• deleting task;
• download task logs.
23.14 XLSX Import
The XLSX Import module allow to import your xlsx and csv file to indices.
23.14.1 Importing steps
1. Go to XLSX Import module and select your file and sheet:
23.14. XLSX Import 293

ITRS-Log-Analytics-7.x Documentation, Release 7.0.5
2. After the data has been successfully loaded, you will see a preview of your data at the bottom of the window.
3. Press Next button.
4. In the next step, enter the index name in the Index name field, you can also change the pattern for thedocument ID and select the columns that the import will skip.
294 Chapter 23. Integrations

ITRS-Log-Analytics-7.x Documentation, Release 7.0.5
5. Select the Configure your own mapping for every field. You can choose the typeand apply more options with the advanced JSON. The list of parameters can be found here,https://www.elastic.co/guide/en/elasticsearch/reference/7.x/mapping-params.html
6. After the import configuration is complete, select the Import button to start the import process.
23.14. XLSX Import 295

ITRS-Log-Analytics-7.x Documentation, Release 7.0.5
7. After the import process is completed, a summary will be displayed. Now you can create a new index pattern toview your data in the Discovery module.
23.15 Logtrail
LogTrail module allow to view, analyze, search and tail log events from multiple indices in realtime. Main features ofthis module are:
• View, analyze and search log events from a centralized interface
• Clean & simple devops friendly interface
• Live tail
• Filter aggregated logs by hosts and program
• Quickly seek to logs based on time
• Supports highlighting of search matches
• Supports multiple Elasticsearch index patterns each with different schemas
• Can be extended by adding additional fields to log event
• Color coding of messages based on field values
Default Logtrail configuration, keeps track of event logs for Elasticsearch, Logstash, Kibana and Alert processes. Themodule allows you to track events from any index stored in Elasticsearch.
23.15.1 Configuration
The LogTrail module uses the Logstash pipeline to retrieve data from any of the event log files and save its contentsto the Elasticsearch index.
23.15.2 Logstash configuration
Example for the file /var/log/messages
1. Add the Logstash configuration file in the correct pipline (default is “logtrail”):
vi /etc/logstash/conf.d/logtrail/messages.conf
296 Chapter 23. Integrations

ITRS-Log-Analytics-7.x Documentation, Release 7.0.5
input {file {
path => "/var/log/messages"start_position => beginningtags => "logtrail_messages"
}}filter {
if "logtrail_messages" in [tags] {grok {
match => {#"message" => "%{SYSLOGTIMESTAMP:syslog_timestamp}
→˓ %{SYSLOGHOST:hostname} %{DATA:program}(?:\[%{POSINT:pid}\])?: %→˓{GREEDYDATA:syslog_message}"# If syslog is format is "<%PRI%><%syslogfacility%>%TIMESTAMP% %HOSTNAME%→˓%syslogtag%%msg:::sp-if-no-1st-sp%%msg:::drop-last-lf%\n"
"message" => "<?%{NONNEGINT:priority}><%→˓{NONNEGINT:facility}>%{SYSLOGTIMESTAMP:syslog_timestamp} %{SYSLOGHOST:hostname}→˓%{DATA:program}(?:\[%{POSINT:pid}\])?: %{GREEDYDATA:syslog_message}"
}}
date {match => [ "syslog_timestamp", "MMM d HH:mm:ss", "MMM dd
→˓HH:mm:ss" ]}ruby {
code => "event.set('level',event.get('priority').to_i -→˓( event.get('facility').to_i * 8 ))"
}}
}output {
if "logtrail_messages" in [tags] {elasticsearch {
hosts => "http://localhost:9200"index => "logtrail-messages-%{+YYYY.MM}"user => "logstash"password => "logstash"
}}
}
2. Restart the Logstash service
systemctl restart logstash
23.15.3 Kibana configuration
1. Set up a new pattern index logtrail-messages* in the ITRS Log Analytics configuration. The procedureis described in the chapter First login.
2. Add a new configuration section in the LogTrail configuration file:
vi /usr/share/kibana/plugins/logtrail/logtrail.json
23.15. Logtrail 297

ITRS-Log-Analytics-7.x Documentation, Release 7.0.5
{"index_patterns" : [
{"es": {"default_index": "logstash-message-*","allow_url_parameter": false
},"tail_interval_in_seconds": 10,"es_index_time_offset_in_seconds": 0,"display_timezone": "Etc/UTC","display_timestamp_format": "MMM DD HH:mm:ss","max_buckets": 500,"default_time_range_in_days" : 0,"max_hosts": 100,"max_events_to_keep_in_viewer": 5000,"fields" : {"mapping" : {
"timestamp" : "@timestamp","display_timestamp" : "@timestamp","hostname" : "hostname","program": "program","message": "syslog_message"
},"message_format": "{{{syslog_message}}}"
},"color_mapping" : {"field": "level","mapping" : {"0": "#ff0000","1": "#ff3232","2": "#ff4c4c","3": "#ff7f24","4": "#ffb90f","5": "#a2cd5a"
}}
}]
}
3. Restate the Kibana service
systemctl restart kibana
23.15.4 Using Logtrail
To access of the LogTrail module, click the tile icon from the main menu bar and then go to the „LogTrail” icon.
298 Chapter 23. Integrations

ITRS-Log-Analytics-7.x Documentation, Release 7.0.5
The main module window contains the content of messages that are automatically updated.
23.15. Logtrail 299

ITRS-Log-Analytics-7.x Documentation, Release 7.0.5
Below is the search and options bar.
It allows you to search for event logs, define the systems from which events will be displayed, define the time rangefor events and define the index pattern.
23.16 Tenable.sc
Tenable.sc is vulnerability management tool, which make a scan systems and environments to find vulnerabilities. TheLogstash collector can connect to Tebable.sc API to get results of the vulnerability scan and send it to the Elasticsarchindex. Reporting and analysis of the collected data is carried out using a prepared dashboard [Vulnerability]Overview Tenable
300 Chapter 23. Integrations

ITRS-Log-Analytics-7.x Documentation, Release 7.0.5
23.16.1 Configuration
• enable pipeline in Logstash configuration:
23.16. Tenable.sc 301

ITRS-Log-Analytics-7.x Documentation, Release 7.0.5
vim /etc/logstash/pipelines.yml
uncomment following lines:
- pipeline.id: tenable.scpath.config: "/etc/logstash/conf.d/tenable.sc/*.conf"
• configure connection to Tenable.sc manager:
vim /etc/logstash/conf.d/tenable.sc/venv/main.py
set of the connection parameters:
– TENABLE_ADDR - IP address and port Tenable.sc manger;
– TENABLE_CRED - user and password;
– LOGSTASH_ADDR = IP addresss and port Logstash collector;
example:
TENABLE_ADDR = ('10.4.3.204', 443)TENABLE_CRED = ('admin', 'passowrd')LOGSTASH_ADDR = ('127.0.0.1', 10000)
23.17 Qualys Guard
Qualys Guard is vulnerability management tool, which make a scan systems and environments to find vulnerabili-ties. The Logstash collector can connect to Qualys Guard API to get results of the vulnerability scan and send itto the Elasticsarch index. Reporting and analysis of the collected data is carried out using a prepared dashboard[Vulnerability] Overview Tenable
302 Chapter 23. Integrations

ITRS-Log-Analytics-7.x Documentation, Release 7.0.5
23.17.1 Configuration
• enable pipeline in Logstash configuration:
23.17. Qualys Guard 303

ITRS-Log-Analytics-7.x Documentation, Release 7.0.5
vim /etc/logstash/pipelines.yml
uncomment following lines:
- pipeline.id: qualyspath.config: "/etc/logstash/conf.d/qualys/*.conf"
• configure connection to Qualys Guard manager:
vim /etc/logstash/conf.d/qualys/venv/main.py
set of the connection parameters:
– LOGSTASH_ADDR - IP address and port of the Logstash collector;
– hostname - IP address and port of the Qualys Guard manger;
– username - user have access to Qualys Guard manger;
– password - password for user have access to Qualys Guard manger.
example:
LOGSTASH_ADDR = ('127.0.0.1', 10001)
# connection settingsconn = qualysapi.connect(
username="emcas5ab1",password="Lewa#stopa1",hostname="qualysguard.qg2.apps.qualys.eu"
)
23.18 Embedding dashboard in iframe
It is possible to send alerts containing HTML iframe as notification content. For example:
<a href="https://siem-vip:5601/app/kibana#/discover/72503360-1b25-11ea-bbe4-→˓d7be84731d2c?_g=%28refreshInterval%3A%28display%3AOff%2Csection%3A0%2Cvalue%3A0%29→˓%2Ctime%3A%28from%3A%272021-03-03T08%3A36%3A50Z%27%2Cmode%3Aabsolute%2Cto%3A%272021-→˓03-04T08%3A36%3A50Z%27%29%29" target="_blank" rel="noreferrer">https://siem-→˓vip:5601/app/kibana#/discover/72503360-1b25-11ea-bbe4-d7be84731d2c?_g=→˓%28refreshInterval%3A%28display%3AOff%2Csection%3A0%2Cvalue%3A0%29%2Ctime%3A%28from→˓%3A%272021-03-03T08%3A36%3A50Z%27%2Cmode%3Aabsolute%2Cto%3A%272021-03-04T08%3A36→˓%3A50Z%27%29%29</a>
If you want an existing HTTP session to be used to display the iframe content, you need to set the following parametersin the /etc/kibana/kibana.yml file:
login.isSameSite: "Lax"login.isSecure: true
Possible values for isSameSite are: “None”, “Lax”, “Strict”, false
For isSecure: false or true
304 Chapter 23. Integrations

CHAPTER 24
Troubleshooting
24.1 Recovery default base indexes
Only applies to versions 6.1.5 and older. From version 6.1.6 and later, default indexes are created automatically
If you lost or damage following index:
|Index name | Index ID ||----------------|-----------------------|| .security |Pfq6nNXOSSmGhqd2fcxFNg || .taskmanagement|E2Pwp4xxTkSc0gDhsE-vvQ || alert_status |fkqks4J1QnuqiqYmOFLpsQ || audit |cSQkDUdiSACo9WlTpc1zrw || alert_error |9jGh2ZNDRumU0NsB3jtDhA || alert_past |1UyTN1CPTpqm8eDgG9AYnw || .trustedhost |AKKfcpsATj6M4B_4VD5vIA || .kibana |cmN5W7ovQpW5kfaQ1xqf2g || .scheduler_job |9G6EEX9CSEWYfoekNcOEMQ || .authconfig |2M01Phg2T-q-rEb2rbfoVg || .auth |ypPGuDrFRu-_ep-iYkgepQ || .reportscheduler|mGroDs-bQyaucfY3-smDpg || .authuser |zXotLpfeRnuzOYkTJpsTaw || alert_silence |ARTo7ZwdRL67Khw_HAIkmw || .elastfilter |TtpZrPnrRGWQlWGkTOETzw || alert |RE6EM4FfR2WTn-JsZIvm5Q || .alertrules |SzV22qrORHyY9E4kGPQOtg |
You may to recover it from default installation folder with following steps:
1. Stop Logstash instances which load data into cluster
systemctl stop logstash
2. Disable shard allocation
305

ITRS-Log-Analytics-7.x Documentation, Release 7.0.5
PUT _cluster/settings{
"persistent": {"cluster.routing.allocation.enable": "none"
}}
3. Stop indexing and perform a synced flush
POST _flush/synced
4. Shutdown all nodes:
systemctl stop elasticsearch.service
5. Copy appropriate index folder from installation folder to Elasticsearch cluster data node folder (example of .authfolder)
cp -rf ypPGuDrFRu-_ep-iYkgepQ /var/lib/elasticsearch/nodes/0/indices/
6. Set appropriate permission
chown -R elasticsearch:elasticsearch /var/lib/elasticsearch/
7. Start all Elasticsearch instance
systemctl start elasticsearch
8. Wait for yellow state of Elasticsearch cluster and then enable shard allocation
PUT _cluster/settings{
"persistent": {"cluster.routing.allocation.enable": "all"
}}
9. Wait for green state of Elasticsearch cluster and then start the Logstash instances
systemctl start logstash
24.2 Too many open files
If you have a problem with too many open files by the Elasticsearch process, modify the values in the followingconfiguration files:
• /etc/sysconfig/elasticsearch
• /etc/security/limits.d/30-elasticsearch.conf
• /usr/lib/systemd/system/elasticsearch.service
Check these three files for:
• LimitNOFILE=65536
• elasticsearch nofile 65537
306 Chapter 24. Troubleshooting

ITRS-Log-Analytics-7.x Documentation, Release 7.0.5
• MAX_OPEN_FILES=65537
Changes to service file require:
systemctl daemon-reload
And changes to limits.d require:
sysctl -p /etc/sysctl.d/90-elasticsearch.conf
24.3 The Kibana status code 500
If the login page is displayed in Kibana, but after the attempt to login, the browser displays “error: 500”, and the logswill show entries:
Error: Failed to encode cookie (sid-auth) value: Password string too short (min 32→˓characters required).
Generate a new server.ironsecret with the following command:
echo "server.ironsecret: \"$(</dev/urandom tr -dc _A-Z-a-z-0-9 | head -c32)\"" >> /→˓etc/kibana/kibana.yml
24.4 Diagnostic tool
ITRS Log-Analytics includes a diagnostic tool that helps solve your problem by collecting system data necessary forproblem analysis by the support team.
24.4.1 Location
The diagnostic tool is located in the installation directory: utils/diagnostic-tool.sh
24.4.2 Gathering information
Diagnostic tool collect the following information:
• configuration files for Kibana, Elasticsearch, Alert
• logs file for Kibana, Alert, Cerebro, Elasticsearch
• Cluster information from Elasticsearch API
When the diagnostic tool collects data, the credentials are removed from the content of the files.
24.4.3 Running the diagnostic tool
To run the diagnostic tool, you must provide three parameters: - user assigned admin role, default ‘logserver’ - userpassword; - URL of cluster API, default: http://localhost:9200
Example of a command:
24.3. The Kibana status code 500 307

ITRS-Log-Analytics-7.x Documentation, Release 7.0.5
./diagnostic-tool.sh $user $password http://localhost:9200
The diagnostic tool saves the results to .tar file located in the user’s home directory.
308 Chapter 24. Troubleshooting

CHAPTER 25
Upgrades
You can check the current version using the API command:
curl -u $USER:$PASSWORD -X GET http://localhost:9200/_license
25.1 Upgrade from version 7.0.4
25.1.1 General note
1. The following indices .agents, audit, alert currently uses rollover for rotation, after upgrade please usededicated AIP for migration:
curl -u $USER:$PASSWORD -X POST http://localhost:9200/license_logserver/→˓prepareindex/$indexname
2. The Wiki plugin require open port tcp/5603
25.1.2 Preferred Upgrade steps
1. Run upgrade script:
./install.sh -u
2. Restart services:
systemctl restart elasticsearch alert kibana cerebro wiki
3. Migrate Audit index to new format (the next call will display the current status of the task):
curl -X POST 'http://localhost:9200/_logserver/prepareindex/audit' -u $USER:→˓$PASSWORD
309

ITRS-Log-Analytics-7.x Documentation, Release 7.0.5
4. Migrate Alert index to new format (the next call will display the current status of the task):
curl -XPOST 'http://localhost:9200/_logserver/prepareindex/alert' -u $USER:→˓$PASSWORD
5. Migrate Agents index to new format (the next call will display the current status of the task):
curl -XPOST 'http://localhost:9200/_logserver/prepareindex/.agents' -u $USER:→˓$PASSWORD
6. Open tcp/5603 port for Wikipedia plugin:
firewall-cmd --zone=public --add-port=5603/tcp --permanent
firewall-cmd --reload
25.1.3 Alternative Upgrade steps (without install.sh script)
1. Stop services:
systemctl stop elasticsearch alert kibana cerebro
2. Upgrade client-node (includes alert engine):
yum update ./itrs-log-analytics-client-node-7.0.5-1.el7.x86_64.rpm
3. Upgrade data-node:
yum update ./itrs-log-analytics-data-node-7.0.5-1.el7.x86_64.rpm
4. Start services:
systemctl start elasticsearch alert kibana cerebro wiki
5. Migrate Audit index to new format (the next call will display the current status of the task):
curl -XPOST 'http://localhost:9200/_logserver/prepareindex/audit' -u $USER:→˓$PASSWORD
6. Migrate Alert index to new format (the next call will display the current status of the task):
curl -XPOST 'http://localhost:9200/_logserver/prepareindex/alert' -u $USER:→˓$PASSWORD
7. Migrate Agents index to new format (the next call will display the current status of the task):
curl -XPOST 'http://localhost:9200/_logserver/prepareindex/.agents' -u $USER:→˓$PASSWORD
8. Open tcp/5603 port for Wikipedia plugin:
firewall-cmd --zone=public --add-port=5603/tcp --permanent
firewall-cmd --reload
310 Chapter 25. Upgrades

ITRS-Log-Analytics-7.x Documentation, Release 7.0.5
25.2 Upgrade from version 7.0.3
25.2.1 General note
1. Indicators of compromise (IOCs auto-update) require access to the software provider’s servers.
2. GeoIP Databases (auto-update) require access to the software provider’s servers.
3. Archive plugin require ztsd package to work:
yum install zstd
25.2.2 Upgrade steps
1. Stop services
systemctl stop elasticsearch alert kibana cerebro
2. Upgrade client-node (includes alert engine):
yum update ./itrs-log-analytics-client-node-7.0.4-1.el7.x86_64.rpm
3. Upgrade data-node:
yum update ./itrs-log-analytics-data-node-7.0.4-1.el7.x86_64.rpm
4. Start services:
systemctl start elasticsearch alert kibana cerebro
25.3 Upgrade from version 7.0.2
25.3.1 General note
• Update the kibana role to include index-pattern .kibana*
• Update the alert role to include index-pattern .alertrules* and alert_status*
• Install python36 which is required for the Alerting engine on client-node:
yum install python3
• AD users should move their saved objects from the adrole.
• Indicators of compromise (IOCs auto-update) require access to the software provider’s servers.
• GeoIP Databases (auto-update) require access to the software provider’s servers.
25.3.2 Upgrade steps
• Stop services
25.2. Upgrade from version 7.0.3 311

ITRS-Log-Analytics-7.x Documentation, Release 7.0.5
systemctl stop elasticsearch alert kibana
• Upgrade client-node (includes alert engine)
yum update ./itrs-log-analytics-client-node-7.0.3-1.el7.x86_64.rpm
• Login in the GUI ITRS Log Analytics and go to the Alert List on the Alerts tab and click SAVE button
• Start alert and kibana service
systemctl start alert kibana
• Upgrade data-node
yum update ./itrs-log-analytics-data-node-7.0.3-1.el7.x86_64.rpm
• Start services
systemctl start elasticsearch alert
Extra note
If the Elasticsearch service has been started on the client-node, then it is necessary to update the client.rpm anddata.rpm packages on the client node.
After update, you need to edit:
/etc/elasticsearch/elasticsearch.yml
and change:
node.data: false
Additionally, check the file:
elasticsearch.yml.rpmnew
and complete the configuration in elasticsearch.yml with additional lines.
25.4 Upgrade from version 7.0.1
25.4.1 General note
• Update the kibana role to include index-pattern .kibana*
• Update the alert role to include index-pattern .alertrules* and alert_status*
• Install python36 which is required for the Alerting engine
yum install python3 on client-node
• AD users should move their saved objects from the adrole.
312 Chapter 25. Upgrades

ITRS-Log-Analytics-7.x Documentation, Release 7.0.5
• Indicators of compromise (IOCs auto-update) require access to the software provider’s servers.
• GeoIP Databases (auto-update) require access to the software provider’s servers.
25.4.2 Upgrade steps
• Stop services
systemctl stop elasticsearch alert kibana
• Upgrade client-node (includes alert engine)
yum update ./itrs-log-analytics-client-node-7.0.2-1.el7.x86_64.rpm
• Login in the GUI ITRS Log Analytics and go to the Alert List on the Alerts tab and click SAVE button
• Start alert and kibana service
systemctl start alert kibana
• Upgrade data-node
yum update ./itrs-log-analytics-data-node-7.0.2-1.el7.x86_64.rpm
• Start services
systemctl start elasticsearch alert
Extra note
If the Elasticsearch service has been started on the client-node, then it is necessary to update the client.rpm anddata.rpm packages on the client node.
After update, you need to edit:
/etc/elasticsearch/elasticsearch.yml
and change:
node.data: false
Additionally, check the file:
elasticsearch.yml.rpmnew
and complete the configuration in elasticsearch.yml with additional lines.
25.5 Upgrade from 6.x
Before upgrading to ITRS Log Analytics from 6.x OpenJDK / Oracle JDK version 11:
25.5. Upgrade from 6.x 313

ITRS-Log-Analytics-7.x Documentation, Release 7.0.5
yum -y -q install java-11-openjdk-headless.x86_64
And select default command for OpenJDK /Oracle JDK:
alternatives --config java
The update includes packages:
• itrs-log-analytics-data-node
• itrs-log-analytics-client-node
25.5.1 Pre-upgrade steps for data node
1. Stop the Logstash service
systemctl stop logstash
2. Flush sync for indices
curl -sS -X POST "localhost:9200/_flush/synced?pretty" -u$USER:$PASSWORD
3. Close all indexes with production data, except system indexes (the name starts with a dot .), example of query:
for i in `curl -u$USER:$PASSWORD "localhost:9200/_cat/indices/winlogbeat*?h=i"` ;→˓do curl -u$USER:$PASSWORD -X POST localhost:9200/$i/_close ; done
4. Disable shard allocation
curl -u$USER:$PASSWORD -X PUT "localhost:9200/_cluster/settings?pretty" -H→˓'Content-Type: application/json' -d' { "persistent": {"cluster.routing.→˓allocation.enable": "none"}}'
5. Check Cluster Status
export CREDENTIAL="logserver:logserver"
curl -s -u $CREDENTIAL localhost:9200/_cluster/health?pretty
Output:
{"cluster_name" : "elasticsearch","status" : "green","timed_out" : false,"number_of_nodes" : 1,"number_of_data_nodes" : 1,"active_primary_shards" : 25,"active_shards" : 25,"relocating_shards" : 0,"initializing_shards" : 0,"unassigned_shards" : 0,"delayed_unassigned_shards" : 0,"number_of_pending_tasks" : 0,"number_of_in_flight_fetch" : 0,"task_max_waiting_in_queue_millis" : 0,
(continues on next page)
314 Chapter 25. Upgrades

ITRS-Log-Analytics-7.x Documentation, Release 7.0.5
(continued from previous page)
"active_shards_percent_as_number" : 100.0}
6. Stop Elasticsearch service
systemctl stop elasticsearch
25.5.2 Upgrade ITRS Log Analytics Data Node
1. Upload Package
scp ./itrs-log-analytics-data-node-7.0.1-1.el7.x86_64.rpm root@hostname:~/
2. Upgrade ITRS Log Analytics Package
yum update ./itrs-log-analytics-data-node-7.0.1-1.el7.x86_64.rpm
Output:
Loaded plugins: fastestmirrorExamining ./itrs-log-analytics-data-node-7.0.1-1.el7.x86_64.rpm: itrs-log-→˓analytics-data-node-7.0.1-1.el7.x86_64Marking ./itrs-log-analytics-data-node-7.0.1-1.el7.x86_64.rpm as an update to→˓itrs-log-analytics-data-node-6.1.8-1.x86_64Resolving Dependencies--> Running transaction check---> Package itrs-log-analytics-data-node.x86_64 0:6.1.8-1 will be updated---> Package itrs-log-analytics-data-node.x86_64 0:7.0.1-1.el7 will be an update--> Finished Dependency Resolution
Dependencies Resolved=======================================================================================================================================================================================Package Arch→˓Version Repository→˓ Size========================================================================→˓========================================================================→˓=======================================Updating:itrs-log-analytics-data-node x86_64 7.→˓0.1-1.el7 /itrs-log-analytics-data-node- 7.0.1-1.el7.→˓x86_64 117 M
Transaction Summary=======================================================================================================================================================================================Upgrade 1 Package
Total size: 117 MIs this ok [y/d/N]: yDownloading packages:Running transaction checkRunning transaction testTransaction test succeededRunning transactionUpdating : itrs-log-analytics-data-node-7.0.1-1.el7.x86_64
→˓
→˓ 1/2(continues on next page)
25.5. Upgrade from 6.x 315

ITRS-Log-Analytics-7.x Documentation, Release 7.0.5
(continued from previous page)
Removed symlink /etc/systemd/system/multi- user.target.wants/elasticsearch.→˓service.Created symlink from /etc/systemd/system/multi- user.target.wants/elasticsearch.→˓service to /usr/lib/systemd/system/elasticsearch.service.Cleanup : itrs-log-analytics-data-node-6.1.8-1.x86_64
→˓
→˓ 2/2Verifying : itrs-log-analytics-data-node-7.0.1-1.el7.x86_64
→˓
→˓ 1/2Verifying : itrs-log-analytics-data-node-6.1.8-1.x86_64
→˓
→˓ 2/2
Updated:itrs-log-analytics-data-node.x86_64 0:7.0.1-1.el7
Complete!
3. Verification of Configuration Files
Please, verify your Elasticsearch configuration and JVM configuration in files:
- /etc/elasticsearch/jvm.options - check JVM HEAP settings and another parameters
grep Xm /etc/elasticsearch/jvm.options <- old configuration file## -Xms4g## -Xmx4g# Xms represents the initial size of total heap space# Xmx represents the maximum size of total heap space-Xms600m-Xmx600m
cp /etc/elasticsearch/jvm.options.rpmnew /etc/elasticsearch/jvm.optionscp: overwrite ‘/etc/elasticsearch/jvm.options’? y
vim /etc/elasticsearch/jvm.options
• /etc/elasticsearch/elasticsearch.yml – verify elasticsearch configuration file
• compare exiting /etc/elasticsearch/elasticsearch.yml and /etc/elasticsearch/elasticsearch.yml.rpmnew
4. Start and enable Elasticsearch service If everything went correctly, we will restart the Elasticsearch instance:
systemctl restart elasticsearchsystemctl reenable elasticsearch
systemctl status elasticsearchelasticsearch.service - Elasticsearch
Loaded: loaded (/usr/lib/systemd/system/elasticsearch.service; enabled; vendor→˓preset: disabled)
Active: active (running) since Wed 2020-03-18 16:50:15 CET; 57s agoDocs: http://www.elastic.co
Main PID: 17195 (java)CGroup: /system.slice/elasticsearch.service
17195 /etc/alternatives/jre/bin/java -Xms512m -Xmx512m -Djava.→˓security.manager -Djava.security.policy=/usr/share/elasticsearch/plugins/→˓elasticsearch_auth/plugin-securi...
(continues on next page)
316 Chapter 25. Upgrades

ITRS-Log-Analytics-7.x Documentation, Release 7.0.5
(continued from previous page)
Mar 18 16:50:15 migration-01 systemd[1]: Started Elasticsearch.Mar 18 16:50:25 migration-01 elasticsearch[17195]: SSL not activated for http and/→˓or transport.Mar 18 16:50:33 migration-01 elasticsearch[17195]: SLF4J: Failed to load class→˓"org.slf4j.impl.StaticLoggerBinder".Mar 18 16:50:33 migration-01 elasticsearch[17195]: SLF4J: Defaulting to no-→˓operation (NOP) logger implementationMar 18 16:50:33 migration-01 elasticsearch[17195]: SLF4J: See http://www.slf4j.→˓org/codes.html#StaticLoggerBinder for further details.
5. Check cluster/indices status and Elasticsearch version
Invoke curl command to check the status of Elasticsearch:
curl -s -u $CREDENTIAL localhost:9200/_cluster/health?pretty{"cluster_name" : "elasticsearch","status" : "green","timed_out" : false,"number_of_nodes" : 1,"number_of_data_nodes" : 1,"active_primary_shards" : 25,"active_shards" : 25,"relocating_shards" : 0,"initializing_shards" : 0,"unassigned_shards" : 0,"delayed_unassigned_shards" : 0,"number_of_pending_tasks" : 0,"number_of_in_flight_fetch" : 0,"task_max_waiting_in_queue_millis" : 0,"active_shards_percent_as_number" : 100.0
}
curl -s -u $CREDENTIAL localhost:9200{"name" : "node-1","cluster_name" : "elasticsearch","cluster_uuid" : "igrASEDRRamyQgy-zJRSfg","version" : {
"number" : "7.3.2","build_flavor" : "oss","build_type" : "rpm","build_hash" : "1c1faf1","build_date" : "2019-09-06T14:40:30.409026Z","build_snapshot" : false,"lucene_version" : "8.1.0","minimum_wire_compatibility_version" : "6.8.0","minimum_index_compatibility_version" : "6.0.0-beta1"
},"tagline" : "You Know, for Search"
}
6. Install new version of default base template
curl -k -XPUT -H 'Content-Type: application/json' -u logserver:logserver 'http://127.→˓0.0.1:9200/_template/default-base-template-0' -d@/usr/share/elasticsearch/default-→˓base-template-0.json (continues on next page)
25.5. Upgrade from 6.x 317

ITRS-Log-Analytics-7.x Documentation, Release 7.0.5
(continued from previous page)
If everything went correctly, we should see 100% allocated shards in cluster health. However, while connection onport 9200/TCP we can observe a new version of Elasticsearch.
25.5.3 Post-upgrade steps for data node
1. Start Elasticsearch service
systemctl statrt elasticsearch
2. Delete .auth index
curl -u$USER:$PASSWORD -X DELETE localhost:9200/.auth
3. Use elasticdump to get all templates and load it back
• get templates
/usr/share/kibana/elasticdump/elasticdump --output=http://→˓logserver:logserver@localhost:9200 --input=templates_elasticdump.json --→˓type=template
• delete templates
for i in `curl -ss -ulogserver:logserver http://localhost:9200/_cat/templates |→˓awk '{print $1}'`; do curl -ulogserver:logserver -XDELETE http://localhost:9200/→˓_template/$i ; done
• load templates
/usr/share/kibana/elasticdump/elasticdump --input=http://→˓logserver:logserver@localhost:9200 --output=templates_elasticdump.json --→˓type=template
4. Open indexes that were closed before the upgrade, example of query:
curl -ss -u$USER:$PASSWORD "http://localhost:9200/_cat/indices/winlogbeat*?h=i,s&→˓s=i" |awk '{if ($2 ~ /close/) system("curl -ss -u$USER:$PASSWORD -XPOST http://→˓localhost:9200/"$1"/_open?pretty")}'
5. Start the Logstash service
systemctl start logstash
6. Enable Elasticsearch allocation
curl -sS -u$USER:$PASSWORD -X PUT "http://localhost:9200/_cluster/settings?pretty→˓" -H 'Content-Type: application/json' -d' { "persistent": {"cluster.routing.→˓allocation.enable": "none"}}'
7. After starting on GUI remove aliases .kibana* (double version of index patterns)
curl -u$USER:$PASSWORD "http://localhost:9200/.kibana_1/_alias/_all" -XDELETE
318 Chapter 25. Upgrades

ITRS-Log-Analytics-7.x Documentation, Release 7.0.5
25.5.4 Upgrade ITRS Log Analytics Client Node
1. Upload packages
• Upload new rpm by scp/ftp:
scp ./itrs-log-analytics-client-node-7.0.1-1.el7.x86_64.rpm root@hostname:~/
• Backup report logo file.
2. Uninstall old version ITRS Log Analytics GUI
• Remove old package:
systemctl stop kibana alert
yum remove itrs-log-analytics-client-nodeLoaded plugins: fastestmirrorResolving Dependencies--> Running transaction check---> Package itrs-log-analytics-client-node.x86_64 0:6.1.8-1 will be erased--> Finished Dependency Resolution
Dependencies Resolved
=======================================================================================================================================================================================Package Arch→˓Version Repository→˓ Size=======================================================================================================================================================================================Removing:itrs-log-analytics-client-node x86_64→˓6.1.8-1 @/itrs-log-analytics-client-node-6.1.8-1.x86_64→˓ 802 M
Transaction Summary=======================================================================================================================================================================================Remove 1 Package
Installed size: 802 MIs this ok [y/N]: yDownloading packages:Running transaction checkRunning transaction testTransaction test succeededRunning transactionErasing : itrs-log-analytics-client-node-6.1.8-1.x86_64
→˓
→˓ 1/1warning: file /usr/share/kibana/plugins/node_modules.tar: remove failed: No such→˓file or directorywarning: /etc/kibana/kibana.yml saved as /etc/kibana/kibana.yml.rpmsaveVerifying : itrs-log-analytics-client-node-6.1.8-1.x86_64
→˓
→˓ 1/1
Removed:itrs-log-analytics-client-node.x86_64 0:6.1.8-1
(continues on next page)
25.5. Upgrade from 6.x 319

ITRS-Log-Analytics-7.x Documentation, Release 7.0.5
(continued from previous page)
Complete!
3. Install new version
• Install dependencies:
yum install net-tools mailx gtk3 libXScrnSaver ImageMagick ghostscript
• Install new package:
yum install ./itrs-log-analytics-client-node-7.0.1-1.el7.x86_64.rpmLoaded plugins: fastestmirrorExamining ./itrs-log-analytics-client-node-7.0.1-1.el7.x86_64.rpm: itrs-log-→˓analytics-client-node-7.0.1-1.el7.x86_64Marking ./itrs-log-analytics-client-node-7.0.1-1.el7.x86_64.rpm to be→˓installedResolving Dependencies--> Running transaction check---> Package itrs-log-analytics-client-node.x86_64 0:7.0.1-1.el7 will be→˓installed--> Finished Dependency Resolution
Dependencies Resolved
=======================================================================================================================================================================================Package Arch→˓Version Repository→˓ Size=======================================================================================================================================================================================Installing:itrs-log-analytics-client-node x86_64→˓7.0.1-1.el7 /itrs-log-analytics-client-node-7.0.1-1.→˓el7.x86_64 1.2 G
Transaction Summary=======================================================================================================================================================================================Install 1 Package
Total size: 1.2 GInstalled size: 1.2 GIs this ok [y/d/N]: yDownloading packages:Running transaction checkRunning transaction testTransaction test succeededRunning transaction
Installing : itrs-log-analytics-client-node-7.0.1-1.el7.x86_64→˓
→˓ 1/1Generating a 2048 bit RSA private key..............................................................................→˓................+++..............................................................................→˓.............................+++writing new private key to '/etc/kibana/ssl/kibana.key'-----
(continues on next page)
320 Chapter 25. Upgrades

ITRS-Log-Analytics-7.x Documentation, Release 7.0.5
(continued from previous page)
Removed symlink /etc/systemd/system/multi-user.target.wants/alert.service.Created symlink from /etc/systemd/system/multi-user.target.wants/alert.→˓service to /usr/lib/systemd/system/alert.service.Removed symlink /etc/systemd/system/multi-user.target.wants/kibana.service.Created symlink from /etc/systemd/system/multi-user.target.wants/kibana.→˓service to /usr/lib/systemd/system/kibana.service.Removed symlink /etc/systemd/system/multi-user.target.wants/cerebro.service.Created symlink from /etc/systemd/system/multi-user.target.wants/cerebro.→˓service to /usr/lib/systemd/system/cerebro.service.Verifying : itrs-log-analytics-client-node-7.0.1-1.el7.x86_64
→˓
→˓ 1/1
Installed:itrs-log-analytics-client-node.x86_64 0:7.0.1-1.el7
Complete!
4. Start ITRS Log Analytics GUI
Add service:
• Kibana
• Cerebro
• Alert
to autostart and add port ( 5602/TCP ) for Cerebro. Run them and check status:
firewall-cmd -permanent -add-port 5602/tcpfirewall-cmd -reload
systemctl enable kibana cerebro alertCreated symlink from /etc/systemd/system/multi-user.target.wants/kibana.service
→˓to /usr/lib/systemd/system/kibana.service.Created symlink from /etc/systemd/system/multi-user.target.wants/cerebro.service
→˓to /usr/lib/systemd/system/cerebro.service.Created symlink from /etc/systemd/system/multi-user.target.wants/alert.service to
→˓/usr/lib/systemd/system/alert.service.
systemctl start kibana cerebro alertsystemctl status kibana cerebro alertkibana.service - Kibana
Loaded: loaded (/usr/lib/systemd/system/kibana.service; enabled; vendor→˓preset: disabled)
Active: active (running) since Thu 2020-03-19 14:46:52 CET; 2s agoMain PID: 12399 (node)
CGroup: /system.slice/kibana.service12399 /usr/share/kibana/bin/../node/bin/node --no-warnings --max-
→˓http-header-size=65536 /usr/share/kibana/bin/../src/cli -c /etc/kibana/kibana.yml
Mar 19 14:46:52 migration-01 systemd[1]: Started Kibana.
cerebro.service - CerebroLoaded: loaded (/usr/lib/systemd/system/cerebro.service; enabled; vendor
→˓preset: disabled)Active: active (running) since Thu 2020-03-19 14:46:52 CET; 2s ago
(continues on next page)
25.5. Upgrade from 6.x 321

ITRS-Log-Analytics-7.x Documentation, Release 7.0.5
(continued from previous page)
Main PID: 12400 (java)CGroup: /system.slice/cerebro.service
12400 java -Duser.dir=/opt/cerebro -Dconfig.file=/opt/cerebro/conf/→˓application.conf -cp -jar /opt/cerebro/lib/cerebro.cerebro-0.8.4-launcher.jar
Mar 19 14:46:52 migration-01 systemd[1]: Started Cerebro.
alert.service - AlertLoaded: loaded (/usr/lib/systemd/system/alert.service; enabled; vendor preset:
→˓disabled)Active: active (running) since Thu 2020-03-19 14:46:52 CET; 2s ago
Main PID: 12401 (elastalert)CGroup: /system.slice/alert.service
12401 /opt/alert/bin/python /opt/alert/bin/elastalert
Mar 19 14:46:52 migration-01 systemd[1]: Started Alert.
25.6 Changing OpenJDK version
25.6.1 Logstash
OpenJDK 11 is supported by Logstash from version 6.8 so if you have an older version of Logstash you must updateit.
To update Logstash, follow the steps below:
1. Back up the following files
• /etc/logstash/logstash.yml
• /etc/logstash/piplines.yml
• /etc/logstash/conf.d
2. Use the command to check custom Logstash plugins:
/usr/share/bin/logstash-plugin list --verbose
and note the result
3. Install a newer version of Logstash according to the instructions:
https://www.elastic.co/guide/en/logstash/6.8/upgrading-logstash.html
or
https://www.elastic.co/guide/en/logstash/current/upgrading-logstash.html
4. Verify installed plugins:
/usr/share/bin/logstash-plugin list --verbose
5. Install the missing plugins if necessary:
/usr/share/bin/logstash-plugin install plugin_name
6. Run Logstash using the command:
322 Chapter 25. Upgrades

ITRS-Log-Analytics-7.x Documentation, Release 7.0.5
systemctl start logstash
25.6.2 Elasticearch
ITRS Log Analytics can use OpenJDK version 10 or later. If you want to use OpenJSK version 10 or later, configurethe Elasticsearch service as follows:
1. After installing OpenJDK, select the correct version that Elasticsearch will use:
alternative --config java
2. Open the /etc/elasticsearch/jvm.options file in a text editor:
vi /etc/elasticsearch/jvm.options
3. Disable the OpenJDK version 8 section:
## JDK 8 GC logging
#8:-XX:+PrintGCDetails#8:-XX:+PrintGCDateStamps#8:-XX:+PrintTenuringDistribution#8:-XX:+PrintGCApplicationStoppedTime#8:-Xloggc:/var/log/elasticsearch/gc.log#8:-XX:+UseGCLogFileRotation#8:-XX:NumberOfGCLogFiles=32#8:-XX:GCLogFileSize=64m
4. Enable the OpenJDK version 11 section
## G1GC Configuration# NOTE: G1GC is only supported on JDK version 10 or later.# To use G1GC uncomment the lines below.10-:-XX:-UseConcMarkSweepGC10-:-XX:-UseCMSInitiatingOccupancyOnly10-:-XX:+UseG1GC10-:-XX:InitiatingHeapOccupancyPercent=75
5. Restart the Elasticsearch service
systemctl restart elasticsearch
25.6. Changing OpenJDK version 323

ITRS-Log-Analytics-7.x Documentation, Release 7.0.5
324 Chapter 25. Upgrades

CHAPTER 26
Agents module
The Agents module is used for the central management of agents used in Energy Logserver such as Filebeat, Winlog-beat, Packetbeat, Metricbeat.
26.1 Component modules
The software consists of two modules:
• Agent Module - installation just like any standard Kibana plugin.
• Agent software - installed on host with agent (like beats);
26.2 Agent Module installation
All necessary components can be found in the installation folder ./install/Agents/masteragent.
1. Go to installation directory:
cd ./install/Agents/masteragent
1. Generating the certificates:
cd certificates/
• set DOMAIN and DOMAIN_IP in scripts from ./certificates directory:
#!/bin/bashDOMAIN="localhost"DOMAIN_IP="10.4.3.185"
• execute the scripts in the following order:
325

ITRS-Log-Analytics-7.x Documentation, Release 7.0.5
./1_rootca.sh
./2_clientcrt.sh
./3_createstore.sh
2. Install the required packages:
yum install net-tools
3. Add an exception to the firewall to listen on TCP 8080 and 8081:
firewall-cmd --permanent --zone public --add-port 8080/tcpfirewall-cmd --permanent --zone public --add-port 8081/tcp
4. Logstash pipeline configuration:
/bin/cp -rf ./logstash/agents_template.json /etc/logstash/templates.d/mkdir /etc/logstash/conf.d/masteragent/bin/cp -rf ./logstash/*.conf /etc/logstash/conf.d/masteragent/
• Edit file /etc/logstash/pipelines.yml by uncomment this line(be awer to this lines looks likesother uncomment lines. It’s yml file.):
- pipeline.id: masteragentpath.config: "/etc/logstash/conf.d/masteragent/*.conf
• Logstash SSL configuration:
mkdir /etc/logstash/conf.d/masteragent/ssl/bin/cp -rf ./certificates/domain.key /etc/logstash/conf.d/masteragent/ssl//bin/cp -rf ./certificates/domain.crt /etc/logstash/conf.d/masteragent/ssl//bin/cp -rf ./certificates/rootCA.crt /etc/logstash/conf.d/masteragent/ssl/chown -R logstash:logstash /etc/logstash
26.3 Linux Agent installation
1. Copy necessary files to destination host:
/bin/cp -rf ./install/Agents/masteragent/agents/linux/masteragent /opt/masteragent/bin/cp -rf ./install/Agents/masteragent/certificates/node_name.p12 /opt/→˓masteragent/bin/cp -rf ./install/Agents/masteragent/certificates/root.jks /opt/masteragent/bin/cp -rf ./install/Agents/masteragent/agents/linux/masteragent/masteragent.→˓service /usr/lib/systemd/system/masteragent.service
2. Set correct IP address of Logstash and Kibana in /opt/masteragent/agent.conf and verify paths for Filebeat,Metricbeat, etc. are correct.
systemctl daemon-reloadsystemctl enable masteragentsystemctl start masteragent
3. Restart logstash:
systemctl restart logstash
326 Chapter 26. Agents module

ITRS-Log-Analytics-7.x Documentation, Release 7.0.5
4. In the GUI, in the Agents tab, you can check the status of the newly connected host.
26.4 Windows Agent installation
1. Add an exception to the firewall to listen on TCP port 8081.
2. Add an exception to the firewall enabling connection on TCP LOGSTASH_IP:8080 port.
3. Copy content of the ./agents/windows from installation directory to “C:\Program Files\MasterAgnet”
4. Change IP address of the Kibana GUI server and Logstash server in “C:\ProgramFiles\MasterAgnet\agent.conf” file.
5. In order to install the service, start the console as an administrator and execute the following commands:
cd "C:\Program Files\MasterAgent"agents.exe installagents.exe start
6. An alternative method of installing the service, run the PowerShell console as administrator and execute thefollowing commands:
New-Service -name masteragent -displayName masteragent - binaryPathName→˓"C:\Program Files\MasterAgent\agents.exe"
7. Check status of service via services.msc (if stoped, try start it agian).
8. In the GUI, in the Agents tab, you can check the status of the newly connected host.
26.5 Agent module compatibility
The Agents module works with Beats agents in the following versions:
26.4. Windows Agent installation 327

ITRS-Log-Analytics-7.x Documentation, Release 7.0.5
328 Chapter 26. Agents module

CHAPTER 27
Monitoring
27.1 Skimmer
ITRS Log Analytics uses a monitoring module called Skimmer to monitor the performance of its hosts. Metrics andconditions of services are retrieved using the API.
The services that are supported are:
• Elasticsearch data node metric;
• Elasticsearch indexing rate value;
• Logstash;
• Kibana;
• Metricbeat;
• Pacemaker;
• Zabbix;
• Zookeeper;
• Kafka;
• Kafka consumers lag metric
• Httpbeat;
• Elastalert;
• Filebeat
and other.
329

ITRS-Log-Analytics-7.x Documentation, Release 7.0.5
27.2 Skimmer Installation
The RPM package skimmer-x86_64.rpm is delivered with the system installer in the “utils” directory:
cd $install_direcorty/utilsyum install skimmer-1.0.XX-x86_64.rpm -y
27.3 Skimmer service configuration
The Skimmer configuration is located in the /usr/share/skimmer/skimmer.conf file.
[Global] - applies to all modules# path to log filelog_file = /var/log/skimmer/skimmer.log
# enable debug logging# debug = true
[Main] - collect statsmain_enabled = true# index name in elasticsearchindex_name = skimmerindex_freq = monthly
# type in elasticsearch indexindex_type = _doc
# user and password to elasticsearch apielasticsearch_auth = logserver:logserver
# available outputselasticsearch_address = 127.0.0.1:9200# logstash_address = 127.0.0.1:6110
# retrieve from apielasticsearch_api = 127.0.0.1:9200logstash_api = 127.0.0.1:9600
# monitor kafka# kafka_path = /usr/share/kafka/# kafka_server_api = 127.0.0.1:9092# comma separated kafka topics to be monitored, empty means all available topics# kafka_monitored_topics = topic1,topic2# comma separated kafka groups to be monitored, empty means all available groups (if→˓kafka_outdated_version = false)# kafka_monitored_groups = group1,group2# switch to true if you use outdated version of kafka - before v.2.4.0# kafka_outdated_version = false
# comma separated OS statistics selected from the list [zombie,vm,fs,swap,net,cpu]os_stats = zombie,vm,fs,swap,net,cpu
# comma separated process names to print their pidprocesses = /usr/sbin/sshd,/usr/sbin/rsyslogd
(continues on next page)
330 Chapter 27. Monitoring

ITRS-Log-Analytics-7.x Documentation, Release 7.0.5
(continued from previous page)
# comma separated systemd services to print their statussystemd_services = elasticsearch,logstash,alert,cerebro,kibana
# comma separated port numbers to print if address is in useport_numbers = 9200,9300,9600,5514,5044,443,5601,5602
# path to directory containing files needed to be csv validated# csv_path = /opt/skimmer/csv/
[PSexec] - run powershell script remotely (skimmer must be installed on Windows)ps_enabled = false# port used to establish connection# ps_port = 10000
# how often (in seconds) to execute the script# ps_exec_step = 60
# path to the script which will be sent and executed on remote end# ps_path = /opt/skimmer/skimmer.ps1
# available outputs# ps_logstash_address = 127.0.0.1:6111
In the Skimmer configuration file, set the credentials to communicate with Elasticsearch:
elasticsearch_auth = $user:$password
To monitor the Kafka process and the number of documents in the queues of topics, run Skimmer on the Kafka serverand uncheck the following section:
#monitor kafkakafka_path = /usr/share/kafka/kafka_server_api = 127.0.0.1:9092#comma separated kafka topics to be monitored, empty means all available topicskafka_monitored_topics = topic1,topic2#comma separated kafka groups to be monitored, empty means all available groups (if→˓kafka_outdated_version = false)kafka_monitored_groups = group1,group2# switch to true if you use outdated version of kafka - before v.2.4.0kafka_outdated_version = false
• kafka_path - path to Kafka home directory (require kafka-consumer-groups.sh);
• kafka_server_api - IP address and port for kafka server API (default: 127.0.0.1:9092);
• kafka_monitored_groups - comma separated list of Kafka consumer group, if you do not define thisparameter, the command will be invoked with the --all-groups parameter;
• kafka_outdated_version = true/false, if you use outdated version of kafka - before v.2.4.0 set: true
After the changes in the configuration file, restart the service.
systemctl restart skimmer
27.3.1 Skimmer GUI configuration
To view the collected data by the skimmer in the GUI, you need to add an index pattern.
27.3. Skimmer service configuration 331

ITRS-Log-Analytics-7.x Documentation, Release 7.0.5
Go to the “Management” -> “Index Patterns” tab and press the “Create Index Pattern” button. In the “IndexName” field, enter the formula skimmer- *, and select the “Next step” button. In the “Time Filter” field, select@timestamp and then press “Create index pattern”
In the “Discovery” tab, select the skimmer- * index from the list of indexes. A list of collected documents withstatistics and statuses will be displayed.
27.3.2 Skimmer dashboard
To use dashboards and visualization of skimmer results, load dashboards delivered with the product:
curl -k -X POST -u$user:$passowrd "https://127.0.0.1:5601/api/kibana/dashboards/→˓import?force=true" -H 'kbn-xsrf: true' -H 'Content-Type: application/json' -→˓d@kibana/kibana_objects/skimmer_objects.json
The Skimmer dashboard includes the following monitoring parameters:
• Elasticsearch - Heap usage in percent - is the total amount of Java heap memory that’s cur-rently being used by the JVM Elasticsearch process in percent
• Logstash - Heap usage in percent - is the total amount of Java heap memory that’s currently beingused by the JVM Logstash process in percent
• Elasticsearch - Process CPU usage - is the amount of time for which a central processing unitwas used for processing instructions of Elsticsearch process in percent
• Elasticsearch - Node CPU usage - is the amount of time for which a central processing unit wasused for processing instructions for specific node of Elasticsearch in percent
• Elasticsearch - Current queries - is the current count of the search query to Elasticsearch indices
• Elasticsearch - Current search fetch - is the current count of the fetch phase for search queryto Elasticsearch indices
• GC Old collection - is the duration of Java Garbage Collector for Old collection in milliseconds
• GC Young collection - is the duration of Java Garbage Collector for Young collection in milliseconds
• Flush - is the duration of Elasticsearch Flushing process that permanently save the transaction log in theLucene index (in milliseconds).
• Refresh - is the duration of Elasticsearch Refreshing process that prepares new data for searching (in mil-liseconds).
• Indexing - is the duration of Elasticsearch document Indexing process (in milliseconds)
• Merge - is the duration of Elasticsearch Merge process that periodically merged smaller segments into largersegments to keep the index size at bay (in milliseconds)
• Indexing Rate - an indicator that counts the number of saved documents in the Elasticsearch index in onesecond (event per second - EPS)
• Expected DataNodes - indicator of the number of data nodes that are required for the current load
• Free Space - Total space and Free space in bytes on Elasticsearch cluster
27.3.3 Expected Data Nodes
Based on the collected data on the performance of the Energy Logserver environment, the Skimmer automaticallyindicates the need to run additional data nodes.
332 Chapter 27. Monitoring

ITRS-Log-Analytics-7.x Documentation, Release 7.0.5
27.3. Skimmer service configuration 333

ITRS-Log-Analytics-7.x Documentation, Release 7.0.5
334 Chapter 27. Monitoring

CHAPTER 28
Kafka
Kafka allows you to distribute the load between nodes receiving data and encrypts communication.
Architecture example:
335

ITRS-Log-Analytics-7.x Documentation, Release 7.0.5
28.1 The Kafka installation
To install the Kafka, follow the steps below:
1. Java installation
yum install java-11-openjdk-headless.x86_64
2. Create users for Kafka
useradd kafka -m -d /opt/kafka -s /sbin/nologin
3. Download the installation package::
https://apache.mirrors.tworzy.net/kafka/2.7.0/kafka_2.13-2.7.0.tgz
tar -xzvf kafka_2.13-2.7.0.tgz -C /opt/mv /opt/kafka_2.13-2.7.0 /opt/kafka
336 Chapter 28. Kafka

ITRS-Log-Analytics-7.x Documentation, Release 7.0.5
4. Set the necessary permissions
chown -R kafka:kafka /opt/kafka
5. Edit configs and set the data and log directory:
vim /opt/kafka/config/server.properties
log.dirs=/tmp/kafka-logs
6. Set the necessary firewall rules:
firewall-cmd --permanent --add-port=2181/tcpfirewall-cmd --permanent --add-port=2888/tcpfirewall-cmd --permanent --add-port=3888/tcpfirewall-cmd --permanent --add-port=9092/tcpfirewall-cmd --reload
7. Create service files:
vim /usr/lib/systemd/system/zookeeper.service
[Unit]Requires=network.target remote-fs.targetAfter=network.target remote-fs.target
[Service]Type=simpleUser=kafkaExecStart=/opt/kafka/bin/zookeeper-server-start.sh /opt/kafka/config/zookeeper.→˓propertiesExecStop=/opt/kafka/bin/zookeeper-server-stop.shRestart=on-abnormal
[Install]WantedBy=multi-user.target
vim create /usr/lib/systemd/system/kafka.service
[Unit]Requires=zookeeper.serviceAfter=zookeeper.service
[Service]Type=simpleUser=kafkaExecStart=/bin/sh -c '/opt/kafka/bin/kafka-server-start.sh /opt/kafka/config/→˓server.properties > /opt/kafka/kafka.log 2>&1'ExecStop=/opt/kafka/bin/kafka-server-stop.shRestart=on-abnormal
[Install]WantedBy=multi-user.target
8. Reload systemctl daemon and the Kafka services:
28.1. The Kafka installation 337

ITRS-Log-Analytics-7.x Documentation, Release 7.0.5
systemctl daemon-reloadsystemctl enable zookeeper kafkasystemctl start zookeeper kafka
9. To test add the Kafka topic:
/opt/kafka/bin/kafka-topics.sh --create --zookeeper localhost:2181 --→˓replication-factor 1 --partitions 1 --topic test
10. List existing topics:
/opt/kafka/bin/kafka-topics.sh --zookeeper localhost:2181 --list
11. Generate test messages
/opt/kafka/bin/kafka-console-producer.sh --topic test --bootstrap-server→˓localhost:9092
somethingsomtehing more
12. Read test messages
/opt/kafka/bin/kafka-console-consumer.sh --topic test --from-beginning --→˓bootstrap-server localhost:9092
28.2 Enabling encryption in Kafka
Generate SSL key and certificate for each Kafka broker
keytool -keystore server.keystore.jks -alias localhost -validity {validity} -genkey -→˓keyalg RSA
Configuring Host Name In Certificates
keytool -keystore server.keystore.jks -alias localhost -validity {validity} -genkey -→˓keyalg RSA -ext SAN=DNS:{FQDN}
Verify content of the generated certificate:
keytool -list -v -keystore server.keystore.jks
Creating your own CA
openssl req -new -x509 -keyout ca-key -out ca-cert -days 365keytool -keystore client.truststore.jks -alias CARoot -import -file ca-certkeytool -keystore server.truststore.jks -alias CARoot -import -file ca-cert
Signing the certificate
keytool -keystore server.keystore.jks -alias localhost -certreq -file cert-fileopenssl x509 -req -CA ca-cert -CAkey ca-key -in cert-file -out cert-signed -days→˓{validity} -CAcreateserial -passin pass:{ca-password}
Import both the certificate of the CA and the signed certificate into the keystore
338 Chapter 28. Kafka

ITRS-Log-Analytics-7.x Documentation, Release 7.0.5
keytool -keystore server.keystore.jks -alias CARoot -import -file ca-certkeytool -keystore server.keystore.jks -alias localhost -import -file cert-signed
If you have trusted certificates, you must import them into the JKS keystore as follows:
Create a keystore:
keytool -keystore client.keystore.jks -alias localhost -validity 365 -keyalg RSA -→˓genkey
Combine the certificate and key file into a certificate in p12 format:
openssl pkcs12 -export -in cert_name.crt -inkey key_name.key -out cert_name.p12 -name→˓localhost -CAfile ca.crt -caname root
Import the CA certificate into a truststore:
keytool -keystore client.truststore.jks -alias CARoot -import -file ca-cert
Import the CA certificate into a keystore:
keytool -keystore client.keystore.jks -alias CARoot -import -file ca-cert
Import the p12 certificate into a keystore:
keytool -importkeystore -deststorepass MY-KEYSTORE-PASS -destkeystore client.keystore.→˓jks -srckeystore cert_name.p12 -srcstoretype PKCS12
28.3 Configuring Kafka Brokers
In /etc/kafka/server.properties file set the following options:
listeners=PLAINTEXT://host.name:port,SSL://host.name:port
ssl.keystore.location=/var/private/ssl/server.keystore.jksssl.keystore.password=test1234ssl.key.password=test1234ssl.truststore.location=/var/private/ssl/server.truststore.jksssl.truststore.password=test1234
and restart the Kafka service
systemctl restart kafka
28.4 Configuring Kafka Clients
Logstash
Configure the output section in Logstash based on the following example:
28.3. Configuring Kafka Brokers 339

ITRS-Log-Analytics-7.x Documentation, Release 7.0.5
output {kafka {bootstrap_servers => "host.name:port"security_protocol => "SSL"ssl_truststore_type => "JKS"ssl_truststore_location => "/var/private/ssl/client.truststore.jks"ssl_truststore_password => "test1234"client_id => "host.name"topic_id => "Topic-1"codec => json
}}
Configure the input section in Logstash based on the following example:
input {kafka {bootstrap_servers => "host.name:port"security_protocol => "SSL"ssl_truststore_type => "JKS"ssl_truststore_location => "/var/private/ssl/client.truststore.jks"ssl_truststore_password => "test1234"consumer_threads => 4topics => [ "Topic-1" ]codec => jsontags => ["kafka"]
}}
28.5 Log retention for Kafka topic
The Kafka durably persists all published records—whether or not they have been consumed—using a configurableretention period. For example, if the retention policy is set to two days, then for the two days after a record ispublished, it is available for consumption, after which it will be discarded to free up space. Kafka’s performance iseffectively constant with respect to data size so storing data for a long time is not a problem.
340 Chapter 28. Kafka

CHAPTER 29
CHANGELOG
29.1 v7.0.5
29.1.1 NewFeatures
• New plugin: Wiki - integration with wiki.js
• Agents: Added index rotation using rollover function
• Alert: Added counter with information about how many rules there are in a given group
• Alert: Added index rotation using rollover function
• Alert: First group will be expanded by default
• Alert: New Alert method for Syslog added to GUI
• Archive: Added compression level support - archive.compressionOptions [kibana.yml]
• Archive: Added mapping/template import support
• Archive: Added number of matches in files
• Archive: Added regexp and extended regexp support
• Archive: Added size information of created archive on list of files for selection
• Archive: Added support for archiving a selected field from the index
• Archive: Added timestamp field for custom timeframe fields
• Audit: Added index rotation using rollover function
• Config: Added configuration possibility for Rollover (audit/alert/.agents indexes) in Settings tab
• Object Permission: When deleting an object to a role in “object permission” now is possible to delete relatedobjects at the same time
• Reports: Ability to delete multiple tasks at once
341

ITRS-Log-Analytics-7.x Documentation, Release 7.0.5
• Reports: Added details field for each task that includes information about: user, time range, query
• Reports: Added Scheduler for “Data Export” tab
• Reports: Fields to export are now alphabetical, searchable list
• Reports: Scheduled tasks supports: enable, disable, delete
• Reports: Scheduled tasks supports: Logo, Title, Comments, PDF/JPEG, CSV/HTML
• Installation support for Centos7/8, RedHat7/8, Oracle Linux7/8, Scientific Linux 7, Centos Stream
• iFrame embedding support: new directive login.isSameSite in kibana.yml [”Strict” or “None”]
29.1.2 Improvements
• Access management: Plugin Login for app management will show itself as Config
• Alert: Added support for nested fields in blacklist-ioc alert type
• Alert: Alert Dashboard rewritten to alert_status pattern - allows you to filter visible alarms per user
• Alert: Cardinality - fix for _thread._local’ object has no attribute ‘alerts_sent’
• Alert: Chain/Logical - few improvements for output content
• Alert: Rule type example is hidden by default
• Alert: RunOnce - improved results output
• Alert: RunOnce - information that the process has finished
• Alert: TestRule - improved error output
• Archive: Added document sorting, which speeds up elasticsearch response
• Archive: API security -> only admin can use (previously only visual information)
• Archive: Archiving process uses a direct connection, bypassing the elastfilter - proxy
• Archive: Changed UTC time to local time
• Archive: Information about problems with reading/writing to the archive directory
• Archive: Optimized function for loading large files - improved loading time
• Archive: Optimized saving method to a temporary flat file
• Archive: Optimized scroll time which speeds up elasticsearch response
• Audit: Converted SEARCH _id: auditselection to GET _id: auditselection
• Audit: Removed background task used for refresh audit settings
• Beats: Updated to v6.8.14
• Blacklist-IOC: Added Duplicates removal mechanism
• Blacklist-IOC: Automatic configuration of repository access during installation [install.sh]
• Cerebro: Updated to v0.9.3
• Config: Character validation for usernames and roles - can consist only of letters a-z, A-Z, numbers 0-9 andcharacters _,-
• Config: Deleting a user deletes his tokens/cookies immediately and causes logging out
• Config: Securing the default administrator account against deletion
342 Chapter 29. CHANGELOG

ITRS-Log-Analytics-7.x Documentation, Release 7.0.5
• Config: Session timeout redirect into login screen from all modules
• Config: Workaround for automatic filling of fields with passwords in modern browsers
• Curator: Updated to v5.8.3 and added support for Python3 as default
• ElasticDump: Updated to v6.65.3 and added support for backup all templates at once
• Elasticsearch: Removed default user “scheduler” with the admin role - is a thing of history
• Elasticsearch: Removed indices.query.bool.max_clause_count from default configuration - causes performanceissues
• Elasticsearch: Role caching improvements
• GEOIP: Automatic configuration of repository access during installation [install.sh]
• Incidents: Switching to the Incidents tab creates pattern alert* if not exist
• install.sh: Added workaround for cluster.max_shards_per_node=1000 bug
• Kibana: Removed kibana.autocomplete from default configuration - causes performance issues
• License: Revision and update of license files in all system modules
• Logstash: Updated logstash-codec-sflow to v2.1.3
• Logstash: Updated logstash-input-beats to v6.1.0
• Logstash: Updated to v6.8.14
• Logtrail: Added default actionfile for curator - to clean logtrail indexes after 2 days
• Network visualization: corrected legend and better colors
• Reports: Added Switch button for filtering only scheduled tasks
• Reports: Admin users should see all scheduled reports from every other user
• Reports: Changed “Export Dashboard” to “Report Export”
• Reports: Changed “Export Task Management” to “Data Export”
• Reports: Crontab format validated before Submit in Scheduler
• Reports: Default task list sorted by “start time”
• Reports: Improved security by using kernel namespaces - dropped suid permissions for chrome_sandbox
• Reports: Moved “Schedule Export Dashboard” to “Report Export” tab
• Reports: Try catch for async getScheduler function
• Skimmer: Added alerts: High_lag_on_Kafka_topic, High_node_CPU_usage, High_node_HEAP_usage,High_Flush_duration, High_Indexing_time
• Skimmer: New metric - _cat/shards
• Skimmer: New metric - _cat/tasks
• Skimmer: Updated to v1.0.17
• small_backup.sh: Added sync, archive, wiki support
• small_backup.sh: Information about the completed operation is logged
• Wazuh: Searching in the rule.description field
29.1. v7.0.5 343

ITRS-Log-Analytics-7.x Documentation, Release 7.0.5
29.1.3 BugFixes
• Access Management: Cosmetic issue in apps select box for default roles (like admin, alert, intelligence, kibanaetc.)
• Alert: Category name did not appear on the “Risk” list
• Alert: Description update for find_match alert type
• Alert: Fixes bug where after renaming the alert it is not immediately visible on the list of alerts
• Alert: Fixes bug where editing of alert, causes it returns to the Other group
• Alert: Fixes incorrect function alertMethodData - problem with TestRule operation [itrs op5 alert-method]
• Alert: Fixes problem with ‘[]’ in rule name
• Alert: Fixes process status in Alert Status tab
• Alert: In groups, if there is pagination, it is not possible to change the page - does not occur with the defaultgroup “Others”
• Alert: Missing op5_url directive in /opt/alert/config.yaml [itrs op5 alert-method]
• Alert: Missing smtp_auth_file directive in /opt/alert/config.yaml [itrs op5 alert-method]
• Alert: Missing username directive in /opt/alert/config.yaml [itrs op5 alert-method]
• Alert: Overwrite config files after updating, now it should create /opt/alert/config.yml.rpmnew
• Archive: Fixes exception during connection problems to elasticsearch
• Archive: Missing symlink to runTask.js
• Cerebro: Fixes problems with PID file after cerebro crash
• Cerebro: Overwrite config files after updating, now it should create /opt/cerebro/conf/application.conf.rpmnew
• Config: SSO login misreads application names entered in Access Management
• Elasticsearch: Fixes “No value present” message log when not using a radius auth [properties.yml]
• Elasticsearch: Fixes “nullPointerException” by adding default value for licenseFilePath [properties.yml]
• Incidents: Fixes problem with vanishing status
• install.sh: Opens the ports required by logstash via firewall-cmd
• install.sh: Set openjdk11 as the default JAVA for the operating system
• Kibana: Fixes exception during connection problems to elasticsearch - will stop restarting
• Kibana: Fixes URL shortening when using Store URLs in session storage
• Logtrail: Fixes missing logrotate definitions for Logtrail logfiles
• Logtrail: Overwrite config files after updating, now it should create/usr/share/kibana/plugins/logtrail/logtrail.json.rpmnew
• Object Permission: Fixes permission verification error if the overwritten object’s title changes
• Reports: Fixes Image Creation failed exception
• Reports: Fixes permission problem for checkpass Reports API
• Reports: Fixes problems with AD/Radius/LDAP users
• Reports: Fixes problem with choosing the date for export
• Reports: Fixes setting default index pattern for technical users when using https
344 Chapter 29. CHANGELOG

ITRS-Log-Analytics-7.x Documentation, Release 7.0.5
• Skimmer: Changed kafka.consumer_id to number in default mapping
• Skimmer: Fixes in indices stats monitoring
• Skimmer: Overwrite config files after updating, now it should create /opt/skimmer/skimmer.conf.rpmnew
29.2 v7.0.4
29.2.1 NewFeatures
• New plugin: Archive specified indices
• Applications Access management based on roles
• Dashboards: Possibility to play a sound on the dashboard
• Tenable.SC: Integration with dedicated dashboard
• QualysGuard: Integration with dedicated dashboard
• Wazuh: added installation package
• Beats: added to installation package
• Central Agents Management (masteragent): Stop & start & restart for each registered agent
• Central Agents Management (masteragent): Status of detected beats and master agent in each registered agent
• Central Agents Management (masteragent): Tab with the list of agents can be grouped
• Central Agents Management (masteragent): Autorolling documents from .agents index based on a Settings inConfig tab
• Alert: New Alert method for op5 Monitor added to GUI.
• Alert: New Alert method for Slack added to GUI.
• Alert: Name-change - the ability to rename an already created rule
• Alert: Groups for different alert types
• Alert: Possibility to modify all alarms in selected group
• Alert: Calendar - calendar for managing notifications
• Alert: Escalate - escalate alarm after specified time
• Alert: TheHive integration
29.2.2 Improvements
• Object Permission: When adding an object to a role in “object permission” now is possible to add related objectsat the same time
• Skimmer: New metric - increase of documents in a specific index
• Skimmer: New metric - size of a specific index
• Skimmer: New metric - expected datanodes
• Skimmer: New metric - kafka offset in Kafka cluster
• Installation script: The setup script validates the license
29.2. v7.0.4 345

ITRS-Log-Analytics-7.x Documentation, Release 7.0.5
• Installation script: Support for Centos 8
• AD integration: Domain selector on login page
• Incidents: New fieldsToSkipForVerify option for skipping false-positives
• Alert: Added sorting of labels in comboxes
• User Roles: Alphabetical, searchable list of roles
• User Roles: List of users assigned to a given role
• Audit: Cache for audit settings (performance)
• Diagnostic-tool.sh: Added cerebro to audit files
• Alert Chain/Logical: Few improvements
29.2.3 BugFixes
• Role caching fix for working in multiple node setup.
• Alert: Aggregation schedule time
• Alert: Loading new_term fields
• Alert: RecursionError: maximum recursion depth exceeded in comparison
• Alert: Match_body.kibana_discover_url malfunction in aggregation
• Alert: Dashboard Recovery from Alert Status tab
• Reports: Black bars after JPEG dashboard export
• Reports: Problems with Scheduled reports
• Elasticsearch-auth: Forbidden - not authorized when querying an alias with a wildcard
• Dashboards: Logserver_table is not present in 7.X, it has been replaced with basic table
• Logstash: Mikrotik pipeline - failed to start pipeline
29.3 v7.0.3
29.3.1 New Features
• Alert: new type - Chain - create alert from underlying rules triggered in defined order
• Alert: new type - Logical - create alert from underlying rules triggered with defined logic (OR,AND,NOR)
• Alert: correlate alerts for Chain and Logical types - alert is triggered only if each rule return same value (ip,username, process etc)
• Alert: each triggered alert is indexed with uniqe alert_id - field added to default field schema
• Alert: Processing Time visualization on Alert dashboard - easy to identify badly designed alerts
• Alert: support for automatic search link generation
• Input: added mikrotik parsing rules
• Auditing : added IP address field for each action
• Auditing : possibility to exclude values from auditing
346 Chapter 29. CHANGELOG

ITRS-Log-Analytics-7.x Documentation, Release 7.0.5
• Skimmer: indexing rate visualization
• Skimmer: new metric: offset in Kafka topics
• SKimmer: new metric: expected-datanodes
• MasterAgent: added possibility for beats agents restart and the master agent itself (GUI)
29.3.2 Improvements
• Search and sort support for User List in Config section
• Copy/Sync: now supports “insecure” mode (operations without certificates)
• Fix for “add sample data & web sample dashboard” from Home Page -> changes in default-base-template
• Skimmer: service status check rewriteen to dbus api
• Masteragent: possibility to exclude older SSL protocols
• Masteragent: now supports Centos 8 and related distros
• XLSX import: updated to 7.6.1
• Logstash: masteragent pipeline shipped by default
• Blacklist: Name field and Field names in the Fields column & Default field exclusions
• Blacklist: runOnce is only killed on a fatal Alert failure
• Blacklist: IOC excludes threats marked as false-positive
• Incidents: new design for Preview
• Incidents: Note - new feature, ability to add notes to incidents
• Risks: possibility to add new custom value for risk, without the need to index that value
• Alert: much better performance with multithread support - now default
• Alert: Validation of email addresses in the Alerts plugin
• Alert: “Difference” rule description include examples for alert recovery function
• Logtrail: improved the beauty and readability of the plugin
• Security: jquery updated to 3.5.1
• Security: bootstrap updated to 4.5.0
• The HELP button (in kibana) now leads to the official product documentation
• Centralization of previous alert code changes to single module
29.3.3 BugFixes
• Individual special characters caused problems in user passwords
• Bad permissions for scheduler of Copy/Sync module has been corrected
• Wrong Alert status in the alert status tab
• Skimmer: forcemerge caused under 0 values for cluster_stats_indices_docs_per_sec metric
• diagnostic-tool.sh: wrong name for the archive in output
• Reports: export to csv support STOP action
29.3. v7.0.3 347

ITRS-Log-Analytics-7.x Documentation, Release 7.0.5
• Reports: scroll errors in csv exports
• Alert: .alertrules is not a required index for proper system operation
• Alert: /opt/alerts/testrules is not a required directory for proper system operation
• Alert: .riskcategories is not a required index for proper system operation
• Malfunction in Session Timeout
• Missing directives service_principal_name in bundled properties.yml
• Blacklist: Removal of the doc type in blacklist template
• Blacklist: Problem with “generate_kibana_discover_url: true” directive
• Alert: Overwriting an alert when trying to create a new alert with the same name
• Reports: When exporting dashboards, PDF generates only one page or cuts the page
• Wrong product logo when viewing dashboards in full screen mode
29.4 v7.0.2
29.4.1 New Features
• Manual incident - creating manual incidents from the Discovery section
• New kibana plugin - Sync/Copy between clusters
• Alert: Analyze historical data with defined alert
• Indicators of compromise (IoC) - providing blacklists based on Malware Information Sharing Platform (MISP)
• Automatic update of MaxMind GeoIP Databases [asn, city, country]
• Extended LDAP support
• Cross cluster search
• Diagnostic script to collect information about the environment, log files, configuration files - utils/diagnostic-tool.sh
• New beat: op5beat - dedicated data shipper from op5 Monitor
29.4.2 Improvements
• Added _license API for elasticsearch (it replaces license path which is now deprecated and will stopworking in future releases)
• _license API now shows expiration_date and days_left
• Visual indicator on Config tab for expiring license (for 30 days and less)
• Creating a new user now requires reentering the passoword
• Complexity check for password fields
• Incidents can be supplemented with notes
• Alert Spike: more detailed description of usage
• ElasticDump added to base installation - /usr/share/kibana/elasticdump
348 Chapter 29. CHANGELOG

ITRS-Log-Analytics-7.x Documentation, Release 7.0.5
• Alert plugin updated - frontend
• Reimplemented session timeout for user activity
• Skimmer: new metrics and dashboard for Cluster Monitoring
• Wazuh config/keys added to small_backup.sh script
• Logrotate definitions for Logtrail logfiles
• Incidents can be sorted by Risk value
• UTF-8 support for credentials
• Wazuh: wrong document_type and timestamp field
29.4.3 BugFixes
• Audit: Missing Audit entry for succesfull SSO login
• Report: “stderr maxBuffer length exceeded” - export to csv
• Report: “Too many scroll contexts” - export to csv
• Intelligence: incorrect work in updated environments
• Agents: fixed wrong document type
• Kibana: “Add Data to Kibana” from Home Page
• Incidents: the preview button uses the wrong index-pattern
• Audit: Missing information about login errors of ad/ldap users
• Netflow: fix for netflow v9
• MasterAgent: none/certificade verification mode should work as intended
• Incorrect CSS injections for dark theme
• The role could not be removed in specific scenarios
29.5 v7.0.1
• init
• migrated features from branch 6 [ latest:6.1.8 ]
• XLSX import [kibana]
• curator added to /usr/share/kibana/curator
• node_modules updated! [kibana]
• elasticsearch upgraded to 7.3.2
• kibana upgraded to 7.3.2
• dedicated icons for all kibana modules
• eui as default framework for login,raports
• bugfix: alerts type description fix
29.5. v7.0.1 349