Item Analysis of Final Test for the 9th Grade Students of SMPN ...
13
JournEEL ISSN 2721-611X Vol. 2. No. 1, June 2020, Page. 34-46 34 Item Analysis of Final Test for the 9 th Grade Students of SMPN 44 Surabaya in the Academic Year of 2019/2020 Siti Fatimah SMPN 44 Surabaya, e-mail: [email protected] Achmad Bernhardo Elzamzami SMPN 54 Surabaya, e-mail: [email protected] Joko Slamet STKIP PGRI sidoarjo, e-mail: [email protected] Abstract This research was conducted by focusing on the formulated question regarding the test scores validity, reliability and item analysis involving the discrimination power and index difficulty in order to provide detail information leading to the improvement of test items construction. The quality of each particular item was analyzed in terms of item difficulty, item discrimination and distractor analysis. The statistical tests were used to compute the reliability of the test by applying The Kuder-Richardson Formula (KR20). The analysis of 50 test items was computed using Microsoft Office Excel. A descriptive method was applied to describe and examined the data. The research findings showed the test fulfilled the criteria of having content validity which was categorized as a low validity. Meanwhile, the reliability value of the test scores was 0.521010831 (0.52) categorized as lower reliability and revision of test. Through the 50 items examined, there were 21 items that were in need of improvement which were classified into “easy” for the index difficulty and “poor” category for the discriminability by the total 26 items (52%). It means more than 50% of the test items need to be revised as the items do not meet the criteria. It is suggested that in order to measure students’ performance effectively, essential improvement need to be evaluated where items with “poor” discrimination index should be reviewed. Keywords: item analysis, final test INTRODUCTION An assessment, also known as a test, shows significant role in learning process of education that provides information to the teacher on the area to which learning outcomes have been achieved by a student. Assessment identifies what students know, understand, can do and feel at different stages in the learning process. There are several forms of assessments con be done either written form or oral form. Through education process, it is expected that there will be changes on the part of the learners. One of the suitable ways to comprehend students’ ability, especially in using English, uses evaluation or test. Test is a procedure or an appliance used to know or measure something by means that every test should be reliable which measure precisely whatever it is supposed to measure (Heaton, 1990, p. 7).
-
Upload
khangminh22 -
Category
Documents
-
view
2 -
download
0
Transcript of Item Analysis of Final Test for the 9th Grade Students of SMPN ...
JournEEL ISSN 2721-611X Vol. 2. No. 1, June 2020, Page. 34-46
34
Item Analysis of Final Test for the 9th Grade Students of SMPN 44
Surabaya in the Academic Year of 2019/2020
Siti Fatimah
SMPN 44 Surabaya, e-mail: [email protected]
Achmad Bernhardo Elzamzami
SMPN 54 Surabaya, e-mail: [email protected]
Joko Slamet
STKIP PGRI sidoarjo, e-mail: [email protected]
Abstract
This research was conducted by focusing on the formulated question regarding the test
scores validity, reliability and item analysis involving the discrimination power and
index difficulty in order to provide detail information leading to the improvement of
test items construction. The quality of each particular item was analyzed in terms of
item difficulty, item discrimination and distractor analysis. The statistical tests were
used to compute the reliability of the test by applying The Kuder-Richardson Formula
(KR20). The analysis of 50 test items was computed using Microsoft Office Excel. A
descriptive method was applied to describe and examined the data. The research
findings showed the test fulfilled the criteria of having content validity which was
categorized as a low validity. Meanwhile, the reliability value of the test scores was
0.521010831 (0.52) categorized as lower reliability and revision of test. Through the
50 items examined, there were 21 items that were in need of improvement which were
classified into “easy” for the index difficulty and “poor” category for the
discriminability by the total 26 items (52%). It means more than 50% of the test items
need to be revised as the items do not meet the criteria. It is suggested that in order to
measure students’ performance effectively, essential improvement need to be evaluated
where items with “poor” discrimination index should be reviewed.
Keywords: item analysis, final test
INTRODUCTION
An assessment, also known as a test, shows significant role in learning process of
education that provides information to the teacher on the area to which learning outcomes have
been achieved by a student. Assessment identifies what students know, understand, can do and
feel at different stages in the learning process. There are several forms of assessments con be
done either written form or oral form. Through education process, it is expected that there will
be changes on the part of the learners. One of the suitable ways to comprehend students’ ability,
especially in using English, uses evaluation or test. Test is a procedure or an appliance used to
know or measure something by means that every test should be reliable which measure
precisely whatever it is supposed to measure (Heaton, 1990, p. 7).
Item Analysis of Final Test for the 9th Grade Students of SMPN 44 Surabaya in the Academic Year of 2019/2020
35
In learning, test is a tool of evaluation which has an important role to measure the
teaching learning process in schools in case of measuring the ability of student and measuring
the efficiency of teaching learning process. Identifying that evaluation is very important in
school, teachers have to know the quality of a good test or criteria of a good test applied to their
students (Arikunto, 2005, p. 53). Moreover, there are some characteristics of a good test such
as (1) Tests have to have high validity; (2) Tests should be reliable or can be trusted; (3) Test
must be objective; and (4) Tests must be practical and has clear instruction.
One of the assessments used by the most teachers to assess their students; knowledge
and comprehension is multiple-choice test. Multiple-choice items are easy to score, but the
problem is, this type of tests is difficult and takes time consuming to construct. It is common
knowledge that the correct answers should be distributed consistently among the alternative
positions of multiple-choice items, but there are many other important guidelines for
constructing good items and generally must be well known and recognized by the teachers. The
guidelines are fairly comprehensive list of recommendations for constructing multiple-choice
test items, focus on content, structure and options of a multiple-choice test item. As a result,
gaining a good test item, the teachers should construct its quality in regard to the reliability and
validity.
To produce or construct a good test, specifically multiple-choice test, it needs to be
considered about the criteria by attempting an items analysis. Item analysis, known as a way
examining a test item, uses statistics and judgment to evaluate tests based on the quality of
individual items, item sets, and entire sets of items, as well as the relationship of each item to
other items. It done by investigating the performance of items considered individually either in
relation to some external criterion or in relation to the remaining items on the test (Thompson
& Levitov, 1985, p. 163). In a short, it is appropriate to use in order to improve item and test
quality.
A good test can be considered as a good one since it must be valid and reliable through
the test items. In constructing a good test, teachers are expected to be able to plan the test in the
table of items specification that can help them in arranging the specific objectives of the test
along with the contents of test items. The researchers were encouraged to do this research not
only by a firmly held belief that teacher, especially English teachers in SMPN 44 Surabaya
never conduct an analysis items of English multiple-choice items test because of the limitation
of time and the difficulty in conducting item analysis but also they tend to reuse some items in
the test.
Item Analysis of Final Test for the 9th Grade Students of SMPN 44 Surabaya in the Academic Year of 2019/2020
36
This research was conducted by the aim to reveal regarding the test scores reliability,
discrimination power, index difficulty, and item analysis in order to provide detail information
leading to the improvement of test items construction. Therefore, hopefully, the findings of this
research will provide deeper understanding and important information for the teachers and other
researchers in regard that that analyzing items test is part of continuing professional
development for teachers. Concerning to the explanations mentioned, the researchers were
interested in the analysis of the English multiple-choice items test as a final assessment (PAS
which stands for Penilaian Akhir Semester) at the first semester of the 9th grade students at
SMPN 44 Surabaya in the academic year 2019-2020.
RESEARCH METHODOLOGY
Method
This research applied descriptive method to the formulated problem regarding the test
scores reliability, discrimination power, index difficulty, and item analysis. Marczyk,
DeMatteo, & Festinger (2005, p. 209) argued “Descriptive statistics allow the researcher to
describe the data and examine relationships between variables within the research conducted.
The analysis of this research was documentation-based. Moreover, documentation is one of the
ways in collecting data by analyzing the notes and documents that are available. The data of
this research were the items of the final test consisting the 50 items of the English multiple-
choice items test that was administered as a final assessment at the first semester for Junior
High School students of SMPN 44 Surabaya in the academic year 2019/2020 which held on
Wednesday, November 20th, 2019. The test items were distributed to the 30 students at 9th grade
at SMPN 44 Surabaya.
The researchers applied documentary evidence or sources technique for collecting data.
Tool of collecting data refers to methodologies used to identify information sources and collect
information during an evaluation. The researchers used documentary analysis as the tool of
collecting data. First, as the preparation, the researcher collected all the appropriate documents.
Then, the researchers did an analysis of data examined covering:
Validity
Validity is the extent to which a test measures what it is supposed to measure. Validity
is the accuracy of measuring item valid. Test need to be determined in order to know the quality
of test. It is the most critical dimension of test development. Simply stated, validity is what a
test measures and how well it does this (Anastasi, 1954; Anastasi & Urbani, 1997; in (McCowan
& McCowan, 1999, p. 3). Validity is a crucial consideration in evaluating tests.
Item Analysis of Final Test for the 9th Grade Students of SMPN 44 Surabaya in the Academic Year of 2019/2020
37
Reliability
Reliability refers to the consistency of measurement. That is, how consistent test scores
or other evaluation results are from one measurement to another. Reliability is the extent or
degree of consistency of an instrument. Reliability test with regard to the question whether a
trustworthy and test can be trusted in accordance with the criteria have been set. A test is reliable
if always give the same result if working on the same group on a different time or opportunity
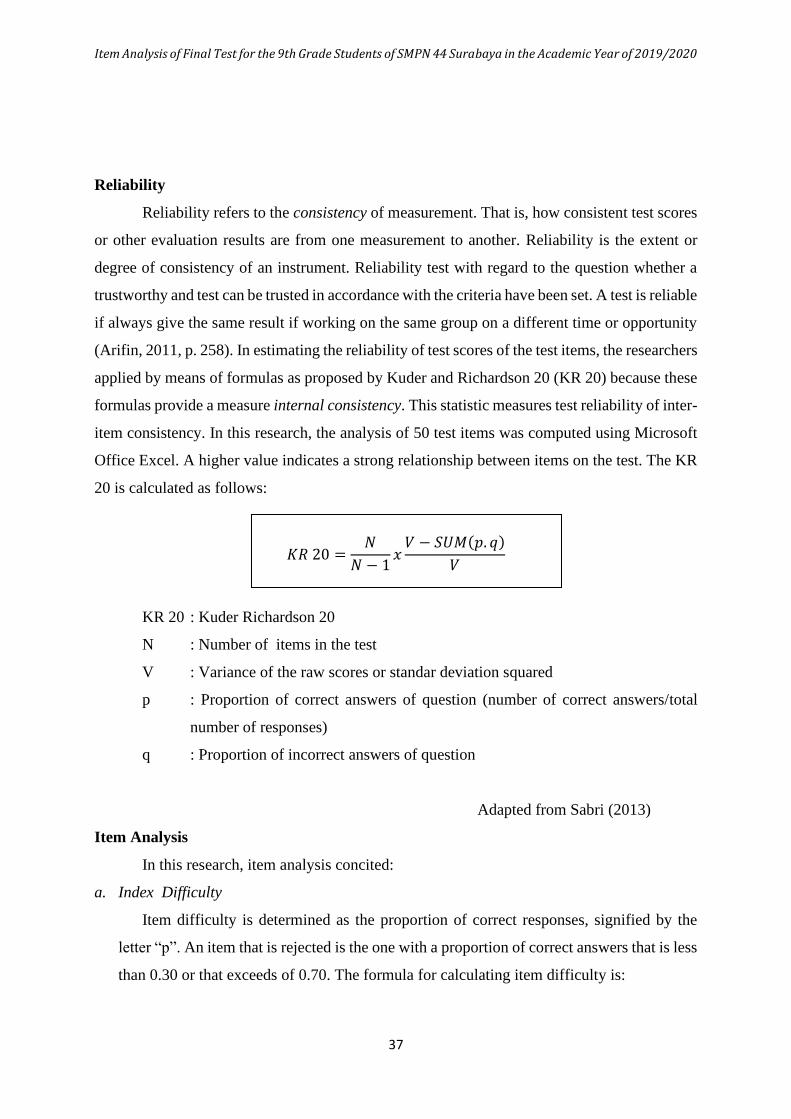
(Arifin, 2011, p. 258). In estimating the reliability of test scores of the test items, the researchers
applied by means of formulas as proposed by Kuder and Richardson 20 (KR 20) because these
formulas provide a measure internal consistency. This statistic measures test reliability of inter-
item consistency. In this research, the analysis of 50 test items was computed using Microsoft
Office Excel. A higher value indicates a strong relationship between items on the test. The KR
20 is calculated as follows:
𝐾𝑅 20 =𝑁
𝑁 − 1𝑥
𝑉 − 𝑆𝑈𝑀(𝑝. 𝑞)
𝑉
KR 20 : Kuder Richardson 20
N : Number of items in the test
V : Variance of the raw scores or standar deviation squared
p : Proportion of correct answers of question (number of correct answers/total
number of responses)
q : Proportion of incorrect answers of question
Adapted from Sabri (2013)
Item Analysis
In this research, item analysis concited:
a. Index Difficulty
Item difficulty is determined as the proportion of correct responses, signified by the
letter “p”. An item that is rejected is the one with a proportion of correct answers that is less
than 0.30 or that exceeds of 0.70. The formula for calculating item difficulty is:
Item Analysis of Final Test for the 9th Grade Students of SMPN 44 Surabaya in the Academic Year of 2019/2020
38
𝑝 =𝐵
𝐽𝑆
p: Index of item difficulty
B: Number of students answering correctly
JS: number of students taking the test
Source: Arikunto (2005)
b. Discriminating Power
The discriminating power of a test item is its ability to differentiate between students
who have achieved well (the upper group) and those who have achieved poorly (the lower
group). To estimate item discriminating power is by comparing the number of students in
the upper and lower group who answered the item correctly. According to Gronlund
(1982:103) the computation of item discriminating index (D) for each item can be done by
subtracting the number of students in the lower group who get the item right (L) from the
number of students in the upper group who get the item right (U) and divided by one half
on the total number of students included in the item analysis (1/2 T).
The first step of computing item discriminability is to separate the highest scoring group
and the lowest scoring group from the entire sample on the basis of total score on the test.
The students with highest total scores are compared in their performance with the students
with lowest total scores using the formula:
𝐷 = 𝑃𝑢 − P𝑙
D: the index of discrimination
Pu: the proportion in the higher group
Pl: the proportion in the lower group
Source: Crocker & Algine (1986, p. 314)
FINDINGS AND DISCUSSION
Findings
The results of the test analysis were presented in order to answer the research question
about the test validity, the test reliability and the item analysis covering the level of difficulty
and the discriminating power.
Item Analysis of Final Test for the 9th Grade Students of SMPN 44 Surabaya in the Academic Year of 2019/2020
39
1. Validity
The researchers used content validity to see how well the content of the instrument
representing the entire of content which might be measured. It was examined by making a
table consisting the test items of distribution items and the test items were analyzed with
sequence of learning outcomes to identify the possibility whether or not the test items and
sequence of learning outcomes covered by the test. The distribution of test items regarding
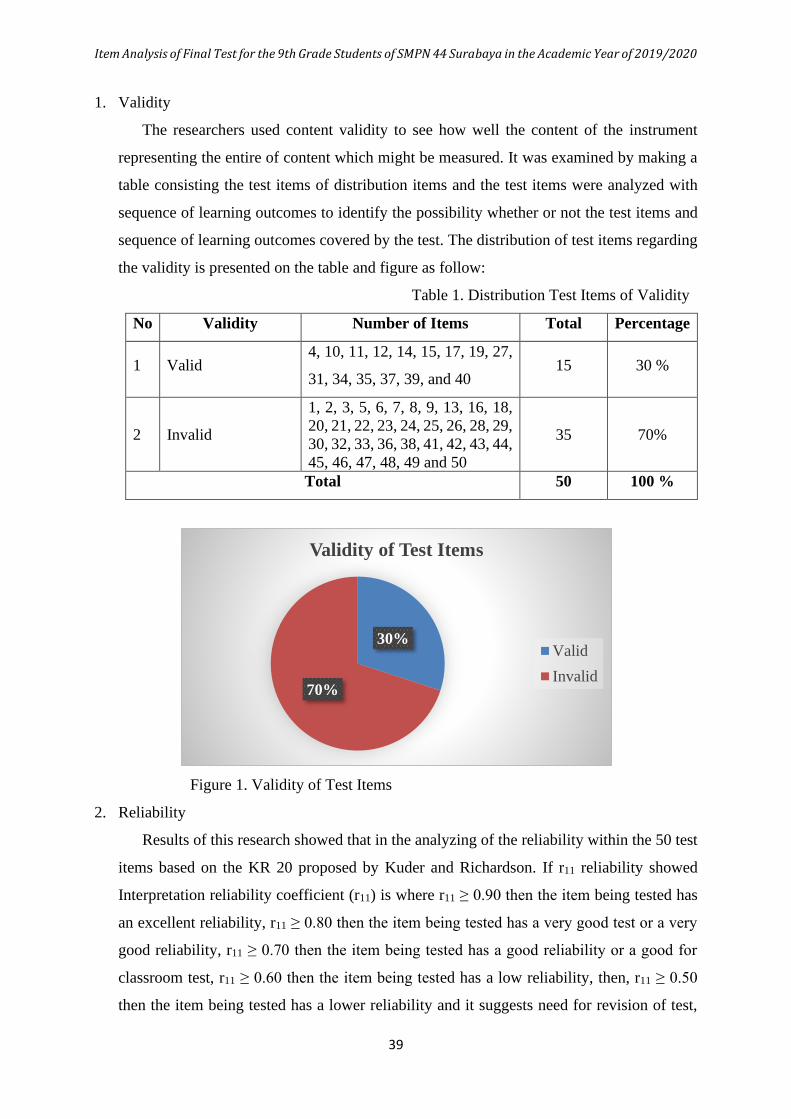
the validity is presented on the table and figure as follow:
Table 1. Distribution Test Items of Validity
No Validity Number of Items Total Percentage
1 Valid 4, 10, 11, 12, 14, 15, 17, 19, 27,
31, 34, 35, 37, 39, and 40 15 30 %
2 Invalid
1, 2, 3, 5, 6, 7, 8, 9, 13, 16, 18,
20, 21, 22, 23, 24, 25, 26, 28, 29,
30, 32, 33, 36, 38, 41, 42, 43, 44,
45, 46, 47, 48, 49 and 50
35 70%
Total 50 100 %
Figure 1. Validity of Test Items
2. Reliability
Results of this research showed that in the analyzing of the reliability within the 50 test
items based on the KR 20 proposed by Kuder and Richardson. If r11 reliability showed
Interpretation reliability coefficient (r11) is where r11 ≥ 0.90 then the item being tested has
an excellent reliability, r11 ≥ 0.80 then the item being tested has a very good test or a very
good reliability, r11 ≥ 0.70 then the item being tested has a good reliability or a good for
classroom test, r11 ≥ 0.60 then the item being tested has a low reliability, then, r11 ≥ 0.50
then the item being tested has a lower reliability and it suggests need for revision of test,
30%
70%
Validity of Test Items
Valid
Invalid
Item Analysis of Final Test for the 9th Grade Students of SMPN 44 Surabaya in the Academic Year of 2019/2020
40
but if r11< 0.50 then the item being tested has a questionable reliability. The results of this
research indicated that the test items were in the category “Lower Reliability and Revision
of Test” because r11 was 0.521010831 (0.52). This means index reliability of 0.521 is 0.50-
0.60. It can be concluded the test items for multiple choice questions distributed to the
students of 9th grade at SMP Negeri 44 Surabaya were categorized into Lower Reliability
and Revision of Test.
3. Items Analysis
The items analysis of this research concerned to the three principles covering index
difficulty, discriminating power and distractor efficiency through the 50 test items. All of
the research findings were described as follows:
a. Index Difficulty
Difficulty level is one of kind of item analysis which is concerned with how difficulty
or easy the item for the students (Shohamy, 1985). In addition, it is argued that if the item
too easy, it means that most or all of the students obtained the correct answer. In contrast,
if the item is difficult, it means that most or all of the students get it wrong. Such item tells
nothing about differences within the students. Moreover, the difficulty level of item may
range from 0.00 to 1.00 shows about the extent of difficulty level (p.73). Thus, if the
difficulty level is 0.00, it means that the item is difficult. On the other hand, if the difficulty
level is 1.00, it means that the item test is easy.
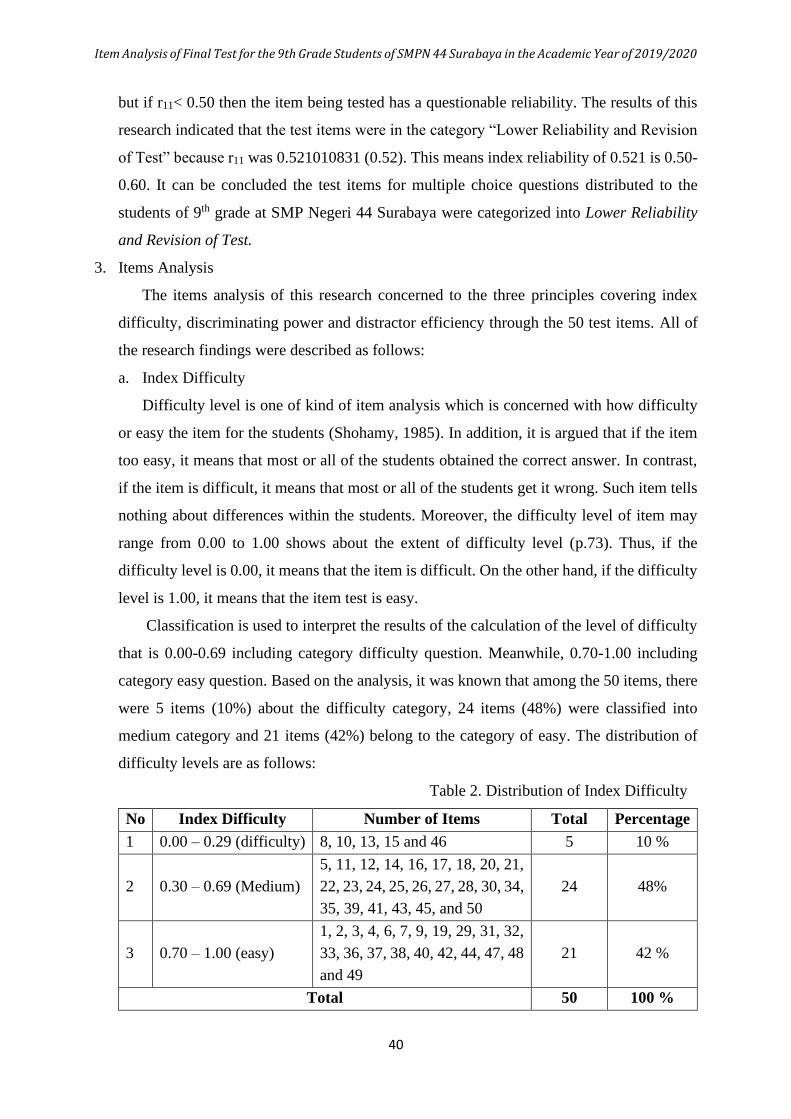
Classification is used to interpret the results of the calculation of the level of difficulty
that is 0.00-0.69 including category difficulty question. Meanwhile, 0.70-1.00 including
category easy question. Based on the analysis, it was known that among the 50 items, there
were 5 items (10%) about the difficulty category, 24 items (48%) were classified into
medium category and 21 items (42%) belong to the category of easy. The distribution of
difficulty levels are as follows:
Table 2. Distribution of Index Difficulty
No Index Difficulty Number of Items Total Percentage
1 0.00 – 0.29 (difficulty) 8, 10, 13, 15 and 46 5 10 %
2 0.30 – 0.69 (Medium)
5, 11, 12, 14, 16, 17, 18, 20, 21,
22, 23, 24, 25, 26, 27, 28, 30, 34,
35, 39, 41, 43, 45, and 50
24 48%
3 0.70 – 1.00 (easy)
1, 2, 3, 4, 6, 7, 9, 19, 29, 31, 32,
33, 36, 37, 38, 40, 42, 44, 47, 48
and 49
21 42 %
Total 50 100 %
Item Analysis of Final Test for the 9th Grade Students of SMPN 44 Surabaya in the Academic Year of 2019/2020
41
Figure 2. Index Difficulty of Test Items
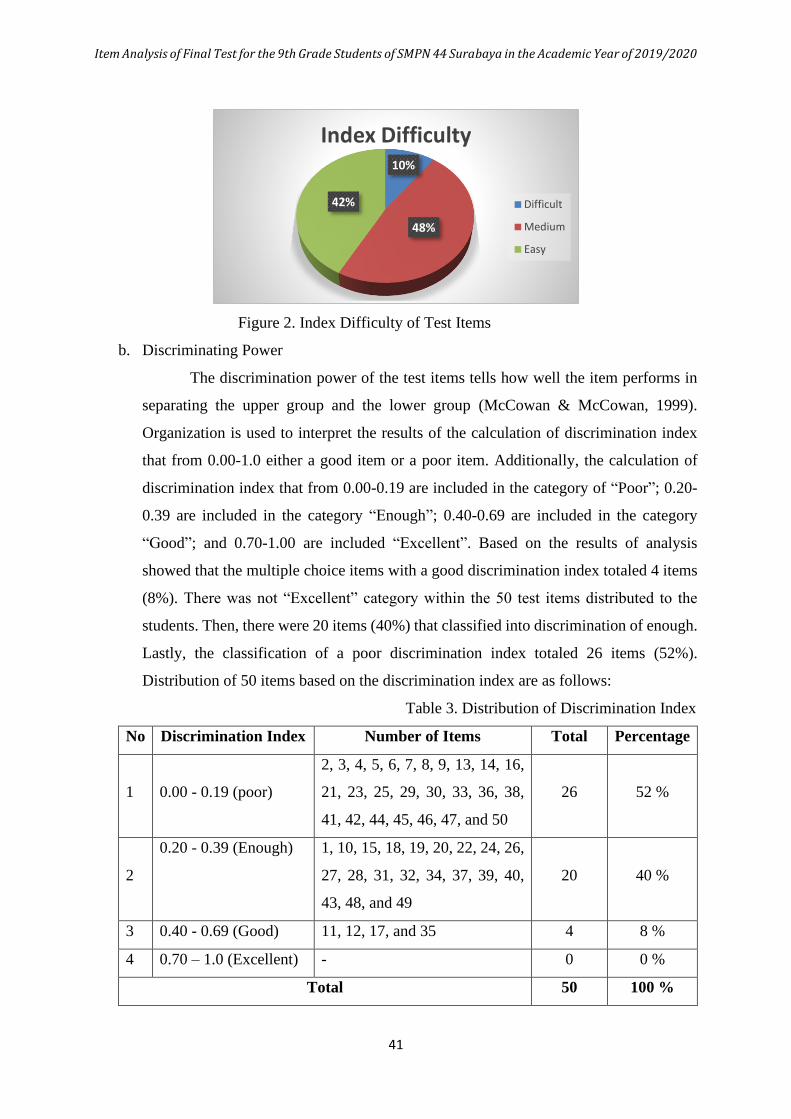
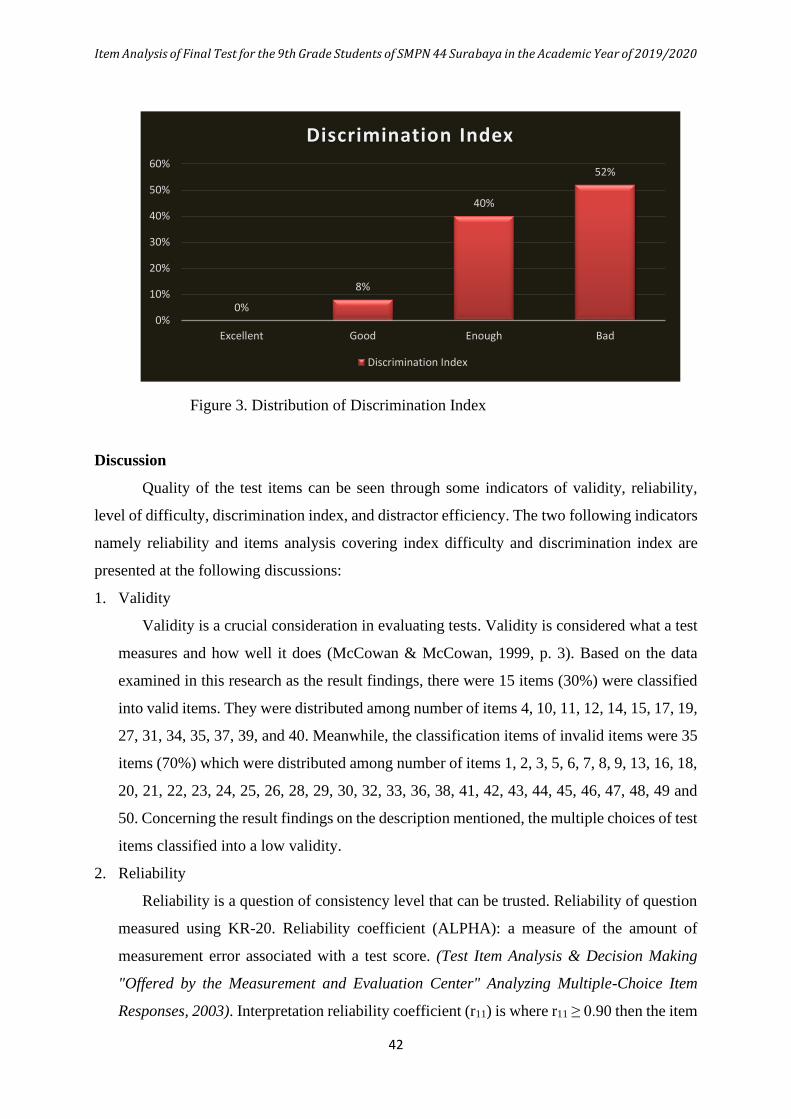
b. Discriminating Power
The discrimination power of the test items tells how well the item performs in
separating the upper group and the lower group (McCowan & McCowan, 1999).
Organization is used to interpret the results of the calculation of discrimination index
that from 0.00-1.0 either a good item or a poor item. Additionally, the calculation of
discrimination index that from 0.00-0.19 are included in the category of “Poor”; 0.20-
0.39 are included in the category “Enough”; 0.40-0.69 are included in the category
“Good”; and 0.70-1.00 are included “Excellent”. Based on the results of analysis
showed that the multiple choice items with a good discrimination index totaled 4 items
(8%). There was not “Excellent” category within the 50 test items distributed to the
students. Then, there were 20 items (40%) that classified into discrimination of enough.
Lastly, the classification of a poor discrimination index totaled 26 items (52%).
Distribution of 50 items based on the discrimination index are as follows:
Table 3. Distribution of Discrimination Index
No Discrimination Index Number of Items Total Percentage
1 0.00 - 0.19 (poor)
2, 3, 4, 5, 6, 7, 8, 9, 13, 14, 16,
21, 23, 25, 29, 30, 33, 36, 38,
41, 42, 44, 45, 46, 47, and 50
26 52 %
2
0.20 - 0.39 (Enough) 1, 10, 15, 18, 19, 20, 22, 24, 26,
27, 28, 31, 32, 34, 37, 39, 40,
43, 48, and 49
20 40 %
3 0.40 - 0.69 (Good) 11, 12, 17, and 35 4 8 %
4 0.70 – 1.0 (Excellent) - 0 0 %
Total 50 100 %
10%
48%
42%
Index Difficulty
Difficult
Medium
Easy
Item Analysis of Final Test for the 9th Grade Students of SMPN 44 Surabaya in the Academic Year of 2019/2020
42
Figure 3. Distribution of Discrimination Index
Discussion
Quality of the test items can be seen through some indicators of validity, reliability,
level of difficulty, discrimination index, and distractor efficiency. The two following indicators
namely reliability and items analysis covering index difficulty and discrimination index are
presented at the following discussions:
1. Validity
Validity is a crucial consideration in evaluating tests. Validity is considered what a test
measures and how well it does (McCowan & McCowan, 1999, p. 3). Based on the data
examined in this research as the result findings, there were 15 items (30%) were classified
into valid items. They were distributed among number of items 4, 10, 11, 12, 14, 15, 17, 19,
27, 31, 34, 35, 37, 39, and 40. Meanwhile, the classification items of invalid items were 35
items (70%) which were distributed among number of items 1, 2, 3, 5, 6, 7, 8, 9, 13, 16, 18,
20, 21, 22, 23, 24, 25, 26, 28, 29, 30, 32, 33, 36, 38, 41, 42, 43, 44, 45, 46, 47, 48, 49 and
50. Concerning the result findings on the description mentioned, the multiple choices of test
items classified into a low validity.
2. Reliability
Reliability is a question of consistency level that can be trusted. Reliability of question
measured using KR-20. Reliability coefficient (ALPHA): a measure of the amount of
measurement error associated with a test score. (Test Item Analysis & Decision Making
"Offered by the Measurement and Evaluation Center" Analyzing Multiple-Choice Item
Responses, 2003). Interpretation reliability coefficient (r11) is where r11 ≥ 0.90 then the item
0%
8%
40%
52%
0%
10%
20%
30%
40%
50%
60%
Excellent Good Enough Bad
Discrimination Index
Discrimination Index
Item Analysis of Final Test for the 9th Grade Students of SMPN 44 Surabaya in the Academic Year of 2019/2020
43
being tested has an excellent reliability, r11 ≥ 0.80 then the item being tested has a very good
test or a very good reliability, r11 ≥ 0.70 then the item being tested has a good reliability or
a good for classroom test, r11 ≥ 0.60 then the item being tested has a low reliability, then,
r11 ≥ 0.50 then the item being tested has a lower reliability and it suggests need for revision
of test, but if r11< 0.50 then the item being tested has a questionable reliability. The results
of this research indicated that the test items were in the category “Lower Reliability and
Revision of Test” because r11 was 0.521010831 (0.52) and the results will not be steady or
change if tested again in the same group. Based on the description above, it can be
concluded the test items distributed to the 9th grade students at SMPN 44 Surabaya in the
academic year 2019/2020 to the 30 students were a problem with low reliability or can be
said the items test needs to be revised.
3. Items Analysis
Concerning to the item analysis within this research, the researchers gained the data
examined and classified into two indicators of index difficulty and index discrimination.
Item difficulty lends a hand in distinguishing easy item from difficult ones. In general, there
is a good distribution of difficulty throughout the test (Sabri, 2013, p. 11). Meanwhile, the
item discrimination index can be used to see if a question is answered correctly more by the
students in the high scoring group and is missed more frequently by those students in the
low scoring group. This accomplished by dividing the students into two groups, namely
high scoring group and low scoring group. Based on the results of this research, the
researchers presented all of the discussion as follow:
a. Index Difficulty
The result of item discrimination index can range from -1 to 1 (McCowan & McCowan,
1999). The interpretation of this index is that if everyone answered the question correctly
the score would be 0. If everyone in the high scoring group answered correctly and everyone
in the low scoring group missed the question, the item discrimination index would be 1.
Equally, if everyone in the low scoring group answered the item correctly and everyone in
the high scoring group missed the item, then item discrimination would be -1. When the
difficulty index falls below zero, this means that the testee in the low scoring group do better
on that question than those in the high scoring group. The difficulty index should not be
used as the only one indicator for a good test. Based on the data examined in this research,
there were 5 items (10%) about the difficulty category. It was found that there were 24 items
(48%) classified into medium category and, lastly, there were 21 items (42%) belong to the
category of easy.
Item Analysis of Final Test for the 9th Grade Students of SMPN 44 Surabaya in the Academic Year of 2019/2020
44
The results of the study were accordance with the study of the theory that one of the
analysis should be conducted to determine the quality of the question is quite good as an
evaluation tool is the analysis of the level of difficulty. Items belonging to the category are
to be retained. A relatively difficult question to be held repair by replacing about where
most students were able to answer that question because it is likely most of the students had
seized the material in question. A relatively easy question to be held repair by replacing a
longer sentence and complex that requires learners to think more.
b. Discrimination Power
Discrimination index is the ability of items where the scores can distinguish a group of
students from high with a group of students is low (Thompson & Levitov, 1985). The
discrimination index should not be used as the only one indicator for a good test. As the
example, when one question is missed by every student in the class. The item discrimination
index for this question would be 0. If everyone in the class correctly answers a question, the
item discrimination index will also be 0. By looking at the item discrimination index along
with the item difficulty index, a picture starts to come into view of the validity of the
questions.
Based on the data examined, the researchers found that the multiple choice items with
a good discrimination index were 4 items (8%). Then, there was not “Excellent” category
within the 50 test items distributed to the students. Meanwhile, there were 20 items (40%)
that classified into discrimination of enough. Lastly, the classification of a poor
discrimination index totaled 26 items (52%). The results showed that the discrimination
value for 50 test items were below 0.40 (Index Discrimination) should either be rejected or
revised because those were categorized as poor items. In line with (Shohamy, 1985), “The
discrimination index should not be used as the only one indicator for a good test and by
looking at the item discrimination index standard along with the item difficulty index, a
picture starts to come into view of the validity of the questions”.
The discrimination ability of 4 items (8%) were satisfactory with a value between 0.40
and 1.0 and are in good categories which had the discrimination ability categorized
“excellent” with the value ranging from 0.40 to 1.00. Overall, the test items were not good
enough indicating the ability of testee with a further consideration that there was only 4
items that discriminated very well between stronger and weaker students. Thus, the results
of the item difficulty and item discrimination analyses showed that there were many easy
items in general, which seem to lower the discrimination ability of the items. Most of the
Item Analysis of Final Test for the 9th Grade Students of SMPN 44 Surabaya in the Academic Year of 2019/2020
45
moderately difficult items discriminate poor and only 6 items moderately difficult with
good discrimination value.
CONCLUSION
The results of this research, focusing on the three following indicators namely validity,
reliability and items analysis covering index difficulty and discrimination index, showed:
The validity of test items distributed to the 9th grade students at SMP Negeri 44 Surabaya
were 15 items classified into valid items and 35 items classified into invalid items. As a result,
the validity of test items was categorized as a low validity.
The overall reliability the test items of the 1st semester final test at SMPN 44 Surabaya
in the academic year of 2019/2020 for multiple choice question had a reliability index of
0.521010831 (0.521). This means that 0.521 < 0.70. It can be concluded the test items for
multiple choice questions are unreliable.
Among the 50 items, there were 5 items (10%) about the difficulty category. Then, there
were 24 items (48%) classified into medium category based on the index discrimination.
Meanwhile, it was found that there were 21 items (42%) belong to the category of easy.
Lastly, the multiple choice items with a good discrimination index were 4 items (8%).
Then, there was not “Excellent” category within the 50 test items distributed to the students.
Meanwhile, there were 20 items (40%) that classified into discrimination of enough. Lastly, the
classification of a poor discrimination index totaled 26 items (52%). The results showed that
the discrimination value for 50 test items were below 0.40 should either be rejected or revised
because those were categorized as poor items. Overall, the test items were not good enough
indicate the ability of testee with a further consideration that there was only 4 items that
discriminated good between stronger and weaker students. Thus, the results of the item
difficulty and item discrimination analyses showed that there were many easy items in general,
which seem to lower the discrimination ability of the items.
SUGGESTION
Based on the results of this research, the following are general suggestions concerning
the English test of the senior high school students to improve the quality of the test: (1) Teachers
have to spend more time to check each item’s construction before administering the test to the
students. The ambiguous or tricky items, the poor directions influenced the result of the
reliability. (2) It needs to be considered to review and revise items with very low item difficulty
and very low discrimination ability.
Item Analysis of Final Test for the 9th Grade Students of SMPN 44 Surabaya in the Academic Year of 2019/2020
46
REFERENCES
Arifin, Z. (2011). Evaluasi Pembelajaran . Bandung: PT Remaja Rosdakarya.
Arikunto, S. (2005). Dasar- Dasar Evaluasi Pendidikan (Revised Ed.). Jakarta: Bumi Aksara.
Heaton, J. B. (1990). Classroom Testing. London: Longman Publishing, New York.
Marczyk, G., DeMatteo, D., & Festinger, D. (2005). Essentials of Research Design and
Methodology . USA: John Wiley & Sons. Inc.
McCowan, R. J., & McCowan, S. C. (1999). Items Analysis for Criterion-Referenced Test. New
York: CDHS: Center for Development of Human Services.
Sabri, S. (2013). Item Analysis of Student Comprehensive Test for Research in Teaching
Beginner String Ensemble Using Model Based Teaching Among Music Students in
Public Universities. International Journal of Education and Research, Vol.1, No.12 ,
Sultan Idris Education University.
Sudijono, A. (2008). Pengantar Evaluasi Pendidikan . Jakarta: Raja Grafindo.
Thompson, B., & Levitov, J. E. (1985). Using Microcomputers to Score and Evaluate Test
Items. Collegiate Microcomputer.
`