
Isotope effects of neodymium in different ligands exchange
7
ORIGINAL ARTICLE Isotope effects of neodymium in different ligands exchange systems studied by ion exchange displacement chromatography Ibrahim Ismail a, * , Ahmed S. Fawzy a , Mohammad I. Ahmad b , Hisham F. Aly b , Masao Nomura c , Yasuhiko Fujii c a Chemical Engineering Department, Cairo University, Giza, Egypt b Egyptian Atomic Energy Authority, Cairo, Egypt c Research Laboratory for Nuclear Reactors, Tokyo Institute of Technology, Tokyo, Japan Received 14 December 2011; revised 19 March 2012; accepted 19 March 2012 Available online 25 April 2012 KEYWORDS Neodymium isotopes; Ion exchange; Chromatography; Separation; Isotope effects Abstract The isotope effects of neodymium in Nd-glycolate ligand exchange system were studied by using ion exchange chromatography. The separation coefficients of neodymium isotopes, e’s, were calculated from the observed isotopic ratios at the front and rear boundaries of the neodym- ium adsorption band. The values of separation coefficients of neodymium isotopes, e’s, for the Nd-glycolate ligand exchange system were compared with those of Nd-malate and Nd-citrate, which indicated that the isotope effects of neodymium as studied by the three ligands takes the following direction Malate > Citrate > Glycolate. This order agrees with the number of available sites for complexation of each ligand. The values of the plate height, HETP of Nd in Nd-ligand exchange systems were also calculated. ª 2012 Cairo University. Production and hosting by Elsevier B.V. All rights reserved. Introduction The research reports, accumulated since the fortieth of the last century, regarding the isotope effects in chemical exchange sys- tem proved that there are little differences in the chemical properties of the different isotopes of the same element. Re- cently, researches in the isotopes separation field indicated that the isotopes of a given element may show some quantitative differences in chemical reaction equilibria and/or reaction rates; the former is the equilibrium isotope effects and the later is the kinetic isotope effects. Separation of isotopes by ion ex- change chromatography is one of the most effective chemical exchange methods, which is based on the chemical equilibrium between isotopic species distributed between the stationary resin phase and the mobile solution phase [1]. It has been applied successfully to the separation of isotopes of various elements in ligand exchange systems, in particular, those using hydroxycarboxylates as ligands, such as Ce [1], Gd [2], Zn * Corresponding author. Tel.: +20 100401077; fax: +20 2 25266166. E-mail address: [email protected] (I. Ismail). Peer review under responsibility of Cairo University. Production and hosting by Elsevier Journal of Advanced Research (2013) 4, 129–135 Cairo University Journal of Advanced Research 2090-1232 ª 2012 Cairo University. Production and hosting by Elsevier B.V. All rights reserved. http://dx.doi.org/10.1016/j.jare.2012.03.003
Transcript of Isotope effects of neodymium in different ligands exchange

Journal of Advanced Research (2013) 4, 129–135
Cairo University
Journal of Advanced Research
ORIGINAL ARTICLE
Isotope effects of neodymium in different ligands
exchange systems studied by ion exchange
displacement chromatography
Ibrahim Ismaila,*, Ahmed S. Fawzy
a, Mohammad I. Ahmad
b,
Hisham F. Aly b, Masao Nomura c, Yasuhiko Fujii c
a Chemical Engineering Department, Cairo University, Giza, Egyptb Egyptian Atomic Energy Authority, Cairo, Egyptc Research Laboratory for Nuclear Reactors, Tokyo Institute of Technology, Tokyo, Japan
Received 14 December 2011; revised 19 March 2012; accepted 19 March 2012Available online 25 April 2012
*
E-
Pe
20
ht
KEYWORDS
Neodymium isotopes;
Ion exchange;
Chromatography;
Separation;
Isotope effects
Corresponding author. Tel.:
mail address: dr_ismail@ins
er review under responsibilit
Production an
90-1232 ª 2012 Cairo Univ
tp://dx.doi.org/10.1016/j.jare
+20 100
truchem.o
y of Cair
d hostin
ersity. Pr
.2012.03.0
Abstract The isotope effects of neodymium in Nd-glycolate ligand exchange system were studied
by using ion exchange chromatography. The separation coefficients of neodymium isotopes, e’s,were calculated from the observed isotopic ratios at the front and rear boundaries of the neodym-
ium adsorption band. The values of separation coefficients of neodymium isotopes, e’s, for the
Nd-glycolate ligand exchange system were compared with those of Nd-malate and Nd-citrate,
which indicated that the isotope effects of neodymium as studied by the three ligands takes the
following direction Malate > Citrate > Glycolate. This order agrees with the number of available
sites for complexation of each ligand. The values of the plate height, HETP of Nd in Nd-ligand
exchange systems were also calculated.ª 2012 Cairo University. Production and hosting by Elsevier B.V. All rights reserved.
Introduction
The research reports, accumulated since the fortieth of the last
century, regarding the isotope effects in chemical exchange sys-tem proved that there are little differences in the chemical
401077; fax: +20 2 25266166.
rg (I. Ismail).
o University.
g by Elsevier
oduction and hosting by Elsevier B
03
properties of the different isotopes of the same element. Re-cently, researches in the isotopes separation field indicated that
the isotopes of a given element may show some quantitativedifferences in chemical reaction equilibria and/or reactionrates; the former is the equilibrium isotope effects and the lateris the kinetic isotope effects. Separation of isotopes by ion ex-
change chromatography is one of the most effective chemicalexchange methods, which is based on the chemical equilibriumbetween isotopic species distributed between the stationary
resin phase and the mobile solution phase [1]. It has beenapplied successfully to the separation of isotopes of variouselements in ligand exchange systems, in particular, those using
hydroxycarboxylates as ligands, such as Ce [1], Gd [2], Zn
.V. All rights reserved.

Pressure Gauge Teflon tube Water jacket
Strongly acidic cation exchange resin ( SQS, 100-200 mesh size)
130 I. Ismail et al.
[3,4], Eu [5,6], Cu [7,8] and Nd [9–11] and in electron exchangesystems such as Eu [12,13] and U [14,15].
The first trial to explore the origin of the isotope effects in
chemical exchange reactions was carried out by Clewett andSchaap [16], who suggested that the isotope effects in a chem-ical exchange reaction are due to a slight difference in the affin-
ity of the isotopes for a given molecule or complex due tominor variances in the internal energies, mainly vibrationalenergy, of the molecule. Based on the quantum molecular
vibration energy, Bigeleisen formulated the method to calcu-late the isotope exchange equilibrium constant from spectro-scopic data [17]. This method was used to calculate theequilibrium constant of the isotopic exchange of many ele-
ments ranging from hydrogen to uranium. Unfortunately, thismethod could not explain the anomalous isotope effects of theodd isotopes 233U [15] and 235U [14] among the other uranium
even isotopes. This anomaly was found to be similar to theodd–even staggering of the isotope shift in the atomic spectra.According to the new theory derived by Bigeleisen, this anom-
aly is believed to be due to the field shift [18]. Later on, similarodd–even isotope effects were found in Gd [2], Zn [3,4,19–21],Nd [9–11] and Cd [22].
Lanthanides and actinides are known to have deformednuclei, which cause the charge distribution effects in the iso-tope shifts of the atomic emission spectral lines. Therefore,the field shift is expected to have a great effect on their isotope
effects. In case of Cd, The contribution of the nuclear fieldshift effect to the observed isotope enrichment factor was esti-mated to be 5–30% [22]. Another supporting proof for the
importance of the field shift on isotope effects was given bythe study of temperature effect on Eu isotope effects. It wasshown that the separation coefficient of Eu isotopes increases
with the increase in temperature, which could be explainedby the field shift effects [13].
Kim et al. studied the isotope effects of uranyl complexes
by means of ion exchange chromatography and reported thatthe malic acid eluent system had the largest separation coeffi-cient among some selected uranyl carboxylate complexes [23].Therefore, the purpose of the work is to study the isotope
effects of neodymium in ligand exchange system using glycolic,malic and citric acids as mono, di and tri carboxylic acid tocompare the effect of different ligands on the isotope effects
of Nd in Nd-Ligand exchange system. It is aimed to find themost suitable ligand that gives the highest separation coeffi-cient and to get more information that may lead to more
understanding of the theory of isotope effects.
Thermostated water
High pressure pump
Eluent
Eff
luen
t
Fig. 1 Schematic diagram of the column setup used for Nd
isotope separation by ion exchange chromatography.
Experimental
Ion exchange resins and reagents
The cation exchange resin used in the ligand exchange system,LXS, was a macroporous strongly acidic cation exchange re-sin, (SQS, 100–200 Mesh size) obtained as a gift from Asahichemical Co. Japan, Nd2O3 of purity 99.99% was supplied
by Alfa-Aesar, USA, and converted to NdCl3 by dissolvingin 2 M HCl solution followed by well gentle evaporation, dry-ing the obtained solid salt, washing several times with distilled
water followed by evaporation till neutrality, then used with-out further purification. All other reagents used were of analyt-ical grade and employed without further purification.
Chromatographic system
Neodymium isotope separation experiment based on the ligandcomplex formation was carried out with a cyclic displacementchromatography system which is composed of three glass col-
umns, 0.8 cm I.D. · 100 cm long, with water jacket, connectedin series with Teflon tubes, 1 mm inner diameter, so that theywere repeatedly used in merry-go-round way for the desiredmigration length. The set of apparatus for the chromatographic
experiment is illustrated in Fig. 1, while the experimental con-ditions are summarized in Table 1.
These columns were packed uniformly with the above-men-
tioned resin. The resin was pretreated with 2 M, mol/dm3, HClsolution to remove impurities and to convert the resin into H+
form. This was followed by passing a solution of 0.1 M CuCl2to convert the resin into Cu2+ form. Then a 0.05 MNdCl3 solu-tion was fed into the first column at a constant flow rate by aperistaltic pump to form Nd3+ adsorption band. When the
Nd3+ ion adsorption band had grown to an appropriate length,the supply of the feed solution was stopped. The Nd3+ andCu2+ adsorption bands were eluted by an eluent solution con-taining 0.2 M ammonium malate or 0.15 M ammonium citrate
or 0.2 M ammonium glycolate + 0.1 M NH4NO3 + 0.0002-NaN2 adjusted to pH 4.6 with NH4OH solution. The adsorp-tion band of Nd3+ was visible, pink, in contrast with the
preceding green Cu band. When the Nd3+ adsorption bandmigration length reached to the desired length, it was elutedout from the last column. The effluent was collected in small
fractions that were, thereafter, subjected to the concentrationanalysis and the isotopic analysis. The temperatures of thecolumns were kept constant at 25 ± 0.2 �C by circulating thethermostated water through the water jackets surrounding
the columns.
Analysis
The concentration of neodymium was determined in each sam-ple by using UV–visible spectrophotometer. The UV–visible
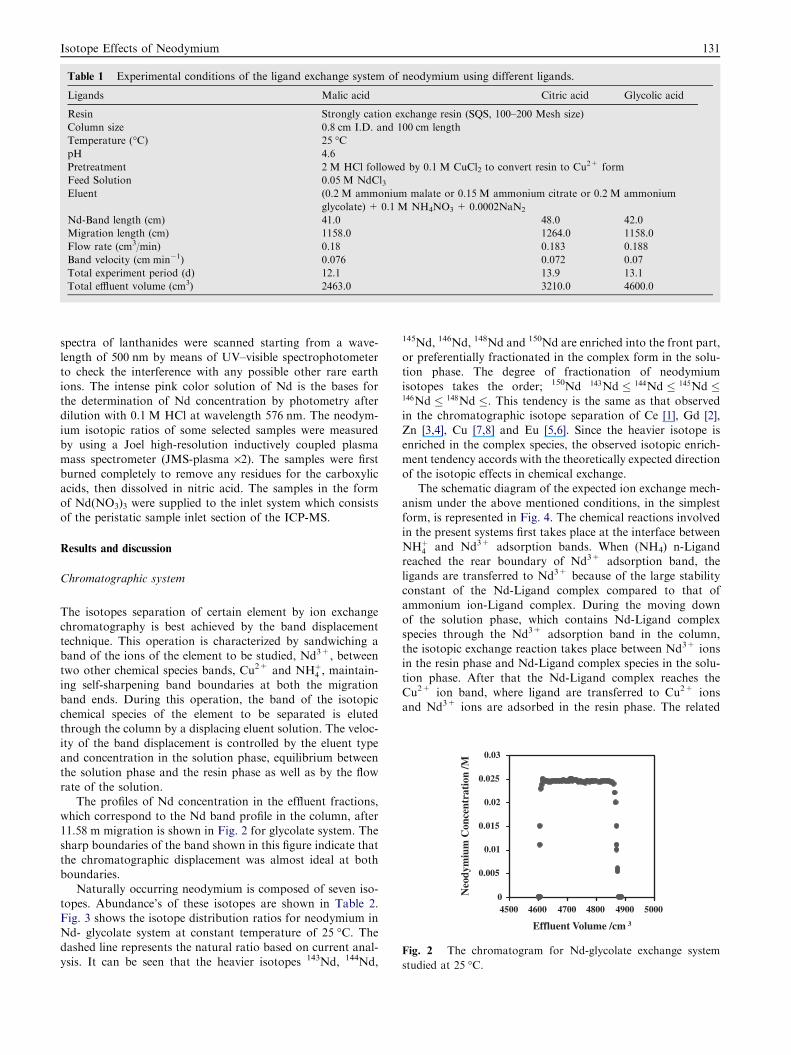
Table 1 Experimental conditions of the ligand exchange system of neodymium using different ligands.
Ligands Malic acid Citric acid Glycolic acid
Resin Strongly cation exchange resin (SQS, 100–200 Mesh size)
Column size 0.8 cm I.D. and 100 cm length
Temperature (�C) 25 �CpH 4.6
Pretreatment 2 M HCl followed by 0.1 M CuCl2 to convert resin to Cu2+ form
Feed Solution 0.05 M NdCl3Eluent (0.2 M ammonium malate or 0.15 M ammonium citrate or 0.2 M ammonium
glycolate) + 0.1 M NH4NO3 + 0.0002NaN2
Nd-Band length (cm) 41.0 48.0 42.0
Migration length (cm) 1158.0 1264.0 1158.0
Flow rate (cm3/min) 0.18 0.183 0.188
Band velocity (cm min�1) 0.076 0.072 0.07
Total experiment period (d) 12.1 13.9 13.1
Total effluent volume (cm3) 2463.0 3210.0 4600.0
0
0.005
0.01
0.015
0.02
0.025
0.03
4500 4600 4700 4800 4900 5000
Effluent Volume /cm 3
Neo
dym
ium
Con
cent
rati
on /M
Fig. 2 The chromatogram for Nd-glycolate exchange system
studied at 25 �C.
Isotope Effects of Neodymium 131
spectra of lanthanides were scanned starting from a wave-length of 500 nm by means of UV–visible spectrophotometerto check the interference with any possible other rare earth
ions. The intense pink color solution of Nd is the bases forthe determination of Nd concentration by photometry afterdilution with 0.1 M HCl at wavelength 576 nm. The neodym-
ium isotopic ratios of some selected samples were measuredby using a Joel high-resolution inductively coupled plasmamass spectrometer (JMS-plasma ·2). The samples were first
burned completely to remove any residues for the carboxylicacids, then dissolved in nitric acid. The samples in the formof Nd(NO3)3 were supplied to the inlet system which consistsof the peristatic sample inlet section of the ICP-MS.
Results and discussion
Chromatographic system
The isotopes separation of certain element by ion exchange
chromatography is best achieved by the band displacementtechnique. This operation is characterized by sandwiching aband of the ions of the element to be studied, Nd3+, between
two other chemical species bands, Cu2+ and NHþ4 , maintain-ing self-sharpening band boundaries at both the migrationband ends. During this operation, the band of the isotopic
chemical species of the element to be separated is elutedthrough the column by a displacing eluent solution. The veloc-ity of the band displacement is controlled by the eluent typeand concentration in the solution phase, equilibrium between
the solution phase and the resin phase as well as by the flowrate of the solution.
The profiles of Nd concentration in the effluent fractions,
which correspond to the Nd band profile in the column, after11.58 m migration is shown in Fig. 2 for glycolate system. Thesharp boundaries of the band shown in this figure indicate that
the chromatographic displacement was almost ideal at bothboundaries.
Naturally occurring neodymium is composed of seven iso-
topes. Abundance’s of these isotopes are shown in Table 2.Fig. 3 shows the isotope distribution ratios for neodymium inNd- glycolate system at constant temperature of 25 �C. Thedashed line represents the natural ratio based on current anal-
ysis. It can be seen that the heavier isotopes 143Nd, 144Nd,
145Nd, 146Nd, 148Nd and 150Nd are enriched into the front part,or preferentially fractionated in the complex form in the solu-tion phase. The degree of fractionation of neodymium
isotopes takes the order; 150Nd 143Nd � 144Nd � 145Nd �146Nd � 148Nd �. This tendency is the same as that observedin the chromatographic isotope separation of Ce [1], Gd [2],
Zn [3,4], Cu [7,8] and Eu [5,6]. Since the heavier isotope isenriched in the complex species, the observed isotopic enrich-ment tendency accords with the theoretically expected direction
of the isotopic effects in chemical exchange.The schematic diagram of the expected ion exchange mech-
anism under the above mentioned conditions, in the simplestform, is represented in Fig. 4. The chemical reactions involved
in the present systems first takes place at the interface betweenNHþ4 and Nd3+ adsorption bands. When (NH4) n-Ligandreached the rear boundary of Nd3+ adsorption band, the
ligands are transferred to Nd3+ because of the large stabilityconstant of the Nd-Ligand complex compared to that ofammonium ion-Ligand complex. During the moving down
of the solution phase, which contains Nd-Ligand complexspecies through the Nd3+ adsorption band in the column,the isotopic exchange reaction takes place between Nd3+ ionsin the resin phase and Nd-Ligand complex species in the solu-
tion phase. After that the Nd-Ligand complex reaches theCu2+ ion band, where ligand are transferred to Cu2+ ionsand Nd3+ ions are adsorbed in the resin phase. The related

Table 2 Natural isotopic abundance of Nd.
Nd isotope 142Nd 143Nd 144Nd 145Nd 146Nd 148Nd 150Nd
Natural abundance 27.1 12.2 23.8 8.3 17.2 5.8 5.6
Resin Solution
+4NH LNH .)( 4
+3Nd
NdH
NdL
NdL
+2Cu+H
CuL
Fig. 4 Schematic diagram of the ion exchange mechanism.
132 I. Ismail et al.
chemical reactions for the three types of carboxylic acids,
mono-basic (glycolate), di-basic (malate) and tri-basic (citrate)ligands can be expressed, in the simplest form, as:
For the mono-basic glycolate ligand
4NH4 � Lg þNd3þ þHþ ! 4NHþ4 þNd� ðLgÞ4 �H ð1Þ
HNd3þ þ LNd� ðLgÞ4 �H$ LNd3þ þ HNd� ðLgÞ4 �H ð2Þ
Nd�ðLgÞ4�HþCu2þþHþ!Nd3þþCu�ðLgÞ4�2H ð3Þ
For the DI-basic malate ligand:
2ðNH4Þ2 � Lm þNd3þ þHþ
! 4NHþ4 þNd� ðLmÞ2 �H ð4Þ
0.2
0.205
0.21
0.215
0.22
0.225
0.23
4580 4680 4780 4880 4980
Isot
opic
Rat
io, N
d148/N
d14
2
0.295
0.3
0.305
0.31
0.315
4580 4680 4780 4880 4980Isot
opic
Rat
io, N
d14
5/N
d142
0.4380.44
0.4420.4440.4460.4480.45
0.4520.4540.456
4580 4680 4780 4880 4980
Effluent Volume / cm3
Isot
opic
Rat
io, N
d143/N
d142
Effluent Volume / cm3
Effluent Volume / cm3
Fig. 3 Isotopic distribution of different Nd isotope
HNd3þ þ LNd� ðLmÞ2 �H$ LNd3þ þ HNd� ðLmÞ2 �H ð5Þ
Nd�ðLmÞ2�HþCu2þþHþ!Nd3þþCu�ðLmÞ2�2H ð6Þ
For the tri-basic citrate system:
ðNH4Þ3 � Lc þNd3þ þHþ ! 3NHþ4 þNd� Lc �H ð7Þ
HNd3þ þ LNd� Lc �H$ LNd3þ þ HNd� Lc �H ð8Þ
0.195
0.2
0.205
0.21
0.215
4580 4680 4780 4880 4980Isot
opic
Rat
io, N
d15
0/N
d142
0.62
0.625
0.63
0.635
0.64
0.645
4580 4680 4780 4880 4980
Isot
opic
Rat
io, N
d146/N
d14
2
0.86
0.865
0.87
0.875
0.88
0.885
4580 4680 4780 4880 4980
Isot
opic
Rat
io, N
d144/N
d142
Effluent Volume / cm3
Effluent Volume / cm3
Effluent Volume / cm3
s against 142Nd in Nd-glycolate system at 25 �C.

Isotope Effects of Neodymium 133
Nd� Lc �Hþ Cu2þ þHþ ! Nd3þ þ Cu� Lc � 2H ð9Þ
where the underlines represent the species in the resin phase, L
represents the ligand species (where Lg = glycolate, Lm = ma-late and Lc = citrate) and HNd and LNd represent the heavyand the light neodymium isotopes, respectively. In fact, thechemistry of the system may be more complicated than that
represented by the above equations. The exact complex struc-ture and the different possibilities of Nd and/or H2O hydroly-sis are out of the scope of the present work.
The single stage separation factor, a = (1 + e) for each Ndisotopes is defined here as:
a ¼ 1þ e ¼ 142Nd=HNd� �
= 142Nd=HNd� �
ð10Þ
where the underline represents the species in the resin phase
and H can take the values 143, 144, 145, 146, 148 and 150.The separation coefficients, e’s were calculated by using theisotopic enrichment curves of the front and rear boundariesaccording to the equation developed by Spedding et al. [24]
and Kakihana and Kanzaki [25].
e ¼X
qijri � roj=fQroð1� roÞg ð11Þ
where q is the amount of neodymium in the sample fraction, Q
is the total amount of sorbed neodymium in the columnpacked resin, ri is the isotopic ratio of nNd/142Nd, and the sub-scripts i and o denoted the fraction number and the original
feed, respectively. In general, the isotope exchange reactioneffectively proceeds and reaches the equilibrium between twophases of the solution and the resin at lower flow rate condi-
tion. In such a case, effective isotope accumulation is expected.The mathematical averages of the two separation coeffi-
cient values obtained from the front and rear boundaries weretaken to calculate the process separation coefficient (e). Theaverage values of the separation coefficients of each isotoperelative to 142Nd for different ligands are given in Table 3 withan estimated error factor of ±5.0%. From the data shown in
Table 3 it can be easily noticed that the separation coefficientincreases with the increase of the mass number. This trendagrees with the previous findings in case of U [15,23], Zn
[19–21], Gd [2] Nd citrate system [10] and Nd malate system[11]. The arrangement of the ligands takes the following direc-tion with respect to the increasing capacity of each ligand to
increase the separation coefficient of each isotope:
Malate ligand > Citrate ligand > Glycolate ligand
The values of the separation coefficients were plotted as afunction of the mass number at 25 �C as shown in Fig. 5. A lin-ear relationship was obtained between the mass number and
the separation coefficient for the three ligands. The current dis-cussion cannot be extended to the odd–even or mass anomalyphenomena due to the short migration of the bands that leads
to high errors in the isotope ratio measurements carried out byICP mass. The odd–even and mass anomaly phenomena werediscussed for neodymium malate system elsewhere [9].
Fig. 6 shows the structure of the three ligands compared inthis study according to wikipedia site. The malate structure hasup to 4 possible active sites for complexion with Nd ions. This
number is reduced to three only in case of citrate, as two siteswere not available for complexion due to steric hindering.Glycolate has only one possible site for complexion with Nd.
The number of possible complexion sits of the three ligandstakes the order Malate > Citrate > Glycolate, which agreewith the order of isotope effects of the three systems as studied
by the separation coefficients shown above.The plate height, HETP, is a very important factor in deter-
mining the performance of any chromatographic separation
system. The smaller the value of HETP, the shorter the migra-tion length needed for a specific separation task i.e. the higherthe efficiency of the system. The value of HETP can be calcu-
lated from Eqs. (12) and (13).
HETP ¼ ðe=hsÞ þ ð1=h2sLÞ ð12Þ
where L is the total migration length and hs is the slope of theplots of ln (ri � ro) vs. Xi � L [26], where ri is the neodymiumisotopic ratio of nNd/142Nd in the fraction, ro is the neodym-ium isotopic ratio of the feed solution, Xi is the hypothetical
distance of the sample fraction, calculated from the startingpoint at the time when the boundary is eluted from the columnafter migration distance of L. The hypothetical distance is
calculated based on the effluent volume being proportionalto the migration distance of the absorbed band:
Xi ¼ ðVi=QTÞ � L ð13Þ
where Vi is the effluent volume of the sample fraction i, QT is
the total effluent volume and L is the total migration length.A sample of the plots of ln (ri � ro)vs. Xi � L carried out at25 �C for 143Nd at Nd-malate system was shown in a previ-
ous article [11]. The values of the HETP for each neodymiumisotope for different ligands at constant temperature 25 �Chave been calculated using Eq. (12) and given in Table 4.It can be easily noticed from Table 4 that the values of the
(HETP) are small, which leads to a higher degree of separa-tion and a better separation performance. The HETP valuesof neodymium isotope separation by ion exchange chroma-
tography in ligand exchange system are of the same magni-tude of HETP values of europium isotope separation, whileit is 10 times larger than those of copper. This could be
due to the larger size of the ions of the f electron element likeEu and Nd compared to Cu ions [10].
Conclusions
The isotope effects of neodymium in Nd-glycolate ligandexchange system were studied by using ion exchange chroma-
tography. The heavier isotopes HNd were clearly found to beenriched in the Nd-glycolate species in the solution phase.The degree of fractionation takes the order, 143Nd 6 144Nd 6145Nd 6 146Nd 6 148Nd 6 150Nd. The separation coefficients
of neodymium isotopes, e’s, were calculated from the observedisotopic ratios at the front and rear boundaries of the neodym-ium adsorption band. The separation coefficients of neodym-
ium isotopes, e’s, for the Nd-glycolate ligand exchangesystem were compared with those of Nd-malate and Nd-cit-rate, which indicated that the isotope effects of neodymium
as studied by the three ligands takes the following directionMalate > Citrate > Glycolate. This order agrees with thenumber of available sites for complexation of each ligand.The plate height, HETP, values of Nd in Nd-ligand exchange

Table 3 Average values of the separation coefficients of each Nd isotope for different ligands.
Ligand 143Nd 144Nd 145Nd 146Nd 148Nd 150Nd
Malate 2.62E�05 5.01E�05 7.55E�05 12.1E�05 14.4E�05 18.2E�05Citrate 2.37E�05 4.58E�05 5.38E�05 6.93E�05 9.01E�05 16.2E�05Glycolate 0.718E�05 0.793E�05 0.986E�05 1.12E�05 1.36E�05 1.49E�05
02468
101214161820
143 144 145 146 148 150sepa
ratio
n co
effic
ient
s (ε
x105 )
mass number
Malate CitrateGlycolate
Fig. 5 Separation coefficients (e) against the mass numbers of
Nd isotopes.
malic acid , molecular weight = 134 g/mole.
citric acid, molecular weight = 192 g/mole.
glycolic acid, molecular weight = 76 g/mole.
(a)
(b)
(c)
Fig. 6 Structure of the three ligands Citrate, Malate and
Glycolate.
Table 4 Plate height, cm, for different ligand – Neodymium
systems at 25 �C.
Ligand Plate height
143Nd 144Nd 145Nd 146Nd 148Nd 150Nd
Malate 0.29 0.47 0.41 0.51 0.35 0.46
Citrate 0.76 0.22 0.13 0.25 0.15 0.39
Glycolate 0.24 0.74 0.55 0.12 0.24 0.41
134 I. Ismail et al.
systems were calculated and found to be of the same magni-tude of Eu, while it is 10 times larger than Cu.
Acknowledgments
The authors would like to thank Prof. Nabeil Abd El moniemand Prof. Samia Sobhy from Cairo University for their sinceresupport in financing the chemicals used and informative
discussions.
References
[1] Zhanga Y, Gunjia S, Nomura M, Fujii Y, Oi T. Observation of
cerium isotope fractionation in ion-exchange chromatography
of Ce(III)-malate complex. J Chromatogr A 2005;1069:133–9.
[2] Ismail I, Fukami A, Nomura M, Fujii Y. Anomaly of 155Gd and157Gd isotope effects in ligand exchange reactions observed by
ion exchange chromatography. Anal Chem 2000;72:2841–5.
[3] Ding X, Suzuki T, NomuraM, Kim H, Sgiyama Y, Fujii Y. Zinc
isotope separation in acetone by displacement chromatography
using benzo-15-crown-5 resin. J Radioanal Nucl Chem 2007;
273(1):79–84.
[4] Ding X, Nomura M, Fujii Y. Zinc isotope effects by
chromatographic chelating exchange resin. Prog Nucl Energy
2010;52:164–7.
[5] Ismail I, Nomura M, Fujii Y. Isotope effects of europium in
ligand exchange system and electron exchange system using ion
exchange displacement chromatography. J Chromatogr A
1998;808:185–91.
[6] Ismail I, Nomura M, Fujii Y. Europium isotope effects in ligand
exchange system and electron exchange system. In: Proceedings
of the 1997 fall meeting of the atomic energy society of Japan,
Japan; 1997.
[7] Ismail I, Abdul Matin MD, Nomura M, Fujii Y. Isotope effects
of copper in Cu(II) ligand-exchange systems by ion exchange
chromatography. J Ion Exchange 2002;13(2):40–5.
[8] Abdul Matin Md, Ismail I, Nomura M, Fujii Y. Isotope effects
of copper in Cu(II) malate ligand exchange system studied by
using ion exchange displacement chromatography. Sep Sci
Technol 2002;37(9):2129–42.
[9] Ismail I, Ibrahim M, Aly H, Nomura M, Fujii Y.
Chromatographic separation of neodymium isotopes by using
chemical exchange process. J Chromatogr A 2011;1218:2923–
2928.
[10] Ismail I. Neodymium isotope effects in nd- citrate chro-
matographic exchange process. Arab J Nucl Sci Appl 2010;
43(2):333–45.
[11] Ismail I. The effect of temperature on the isotope effects of
neodymium observed by ion exchange chromatography. Arab J
Nucl Sci Appl 2012;45(1):281–92.
[12] Fujii Y, Abdul Matin Md, Ismail I, Nomura M. Isotope effects
in electron exchange system. In: Proceedings of the sixth
international workshop on the separation phenomena in
liquids and gases, Nagoya, Japan; 1998.
[13] Ismail I, Nomura M, Fujii Y. The isotope effects in Eu(II)/
Eu(III) electron exchange system observed by using cation

Isotope Effects of Neodymium 135
exchange chromatography. J Nucl Sci Technol 1998;35(11):
801–807.
[14] Fujii Y, Nomura M, Okamoto M, Onitsuka H, Kawakami F,
Takeda K. An anomalous isotope effect of 235U in U(IV)–
U(VI) chemical exchange. Z Naturforsch 1989;44a:395–8.
[15] Nomura M, Higuchi N, Fujii Y. Mass dependence of uranium
isotope effects in the U(IV)–U(VI) exchange reaction. J Am
Chem Soc 1996;118:9127–30.
[16] Clewett G, Schaap W. Report Y-41, Y-12 Plant. Union Carbide
Corp; 1947.
[17] Bigeleisen J, Mayer MG. Calculation of equilibrium constants
for isotopic exchange reactions. J Chem Phys 1947;15:261–7.
[18] Bigeleisen J. Nuclear size and shape effects in chemical reactions.
Isotope chemistry of the heavy elements. J Am Chem Soc
1996;118:3676–80.
[19] Nishizawa K, Maeda Y, Kawashiro F, Fujii T, Yamamoto T,
Hirata T. Contributions of nuclear size and shape, nuclear mass,
and nuclear spin to enrichment factors of zinc isotopes in a
chemical exchange reaction by a cryptand. Sep Sci Technol
1998;33(14):2101–12.
[20] Nishizawa K, Nakamura K, Yamamoto T, Masuda T. Zinc
isotope effects in complex formation with a crown ether. Solvent
Extr Ion Exch 1993;11(3):389–94.
[21] Nishizawa K, Satoyama T, Miki T, Yamamoto T, Nomura M.
Separation of zinc isotopes by liquid–liquid extraction using a
crown ether. Sep Sci Technol 1996;31(20):2831–41.
[22] Fujii T, Moynier F, Telouk P, Albarede F. Nuclear field shift
effect in the isotope exchange reaction of cadmium using a
crown ether. Chem Geol 2009;267:157–63.
[23] Kim H, Kakihana M, Aida M, Kogure K, Nomura M, Fujii Y,
et al. Uranium isotope effects in some ion exchange systems
involving uranyl-carboxylate complexes. J Chem Phys 1984;
81:6266–71.
[24] Spedding FH, Powell JE, Svec HJ. A laboratory method for
separating nitrogen isotopes by ion exchange. J Am Chem Soc
1955;77:6125–32.
[25] Kakihana H, Kanzaki T. A simplified and generalized method
for analyzing chromatographic isotope separation data. Bull
Tokyo Inst Technol 1969;90:77–89.
[26] Fujii Y, Aida M, Okamoto M, Oi T. A theoretical study of
isotope separation by displacement chromatography. Sep Sci
Technol 1985;20(5 and 6):377–92.