Ionization of oriented carbonyl sulfide molecules by intense circularly polarized laser pulses
13
Ionization of oriented carbonyl-sulfide molecules by intense circularly polarized laser pulses Darko Dimitrovski, Mahmoud Abu-samha, and Lars Bojer Madsen * Lundbeck Foundation Theoretical Center for Quantum System Research, Department of Physics and Astronomy, Aarhus University, DK-8000 Aarhus C, Denmark Frank Filsinger, Gerard Meijer, and Jochen K¨ upper † Fritz-Haber-Institut der Max-Planck-Gesellschaft, Faradayweg 4-6, D-14195 Berlin, Germany Lotte Holmegaard 1 , Line Kalhøj 1 , Jens H. Nielsen 2 , and Henrik Stapelfeldt 1,3‡ 1 Department of Chemistry, Aarhus University, DK-8000 Aarhus C, Denmark 2 Department of Physics, Aarhus University, 8000 Aarhus C, Denmark 3 Interdisciplinary Nanoscience Center (iNANO), Aarhus University, 8000 Aarhus C, Denmark (Dated: July 16, 2010) We present combined experimental and theoretical results on strong-field ionization of oriented carbonyl-sulphide molecules by circularly-polarized laser pulses. The obtained molecular frame photoelectron angular distributions show pronounced asymmetries perpendicular to the direction of the molecular electric dipole moment. These findings are explained by a tunneling model invoking the laser-induced Stark shifts associated with the dipoles and polarizabilities of the molecule and its unrelaxed cation. PACS numbers: 33.80.Rv, 33.80.Eh, 42.50.Hz, 37.20.+j, 37.10.Vz I. INTRODUCTION When molecules are exposed to intense femtosecond laser pulses they ionize. If the ionizing laser pulse is lin- early polarized the electron can be steered back to rescat- ter on the ion left behind, thereby initiating phenom- ena such as high harmonic generation, above threshold ionization, and double ionization (see, e.g., Refs.[1–4]). Being the event that initiates these central strong-field processes, ionization has attracted special attention and much effort has gone into describing and understanding it. Because molecules are not spherically symmetric the ionization probability and the emission direction of the electron depends on the relative orientation between the molecule and the polarization vector of the laser pulse [5–18]. Knowledge of this orientational dependence is im- portant for understanding, optimizing, or utilizing sub- sequent strong-field processes [3, 4]. The ability to align molecules, i.e., to confine one or more molecular axes along space-fixed axes, has over the past few years provided a valuable tool to experimentally explore the orientational dependence of strong-field ion- ization, and consequently, opened up for comparing the- oretical and experimental results [7, 10, 11, 14, 15, 19]. The majority of studies have focused on nonpolar lin- ear molecules where nonadiabatic alignment, by a lin- early polarized laser pulse, provides a convenient way to prepare a sample of 1-dimensionally aligned molecules * Corresponding author: [email protected] † Corresponding author: [email protected] ‡ Corresponding author: [email protected] [20, 21]. Most molecules are, however, polar, i.e., they do not exhibit inversion symmetry. The experimental investigation of such systems requires that not only the axes of the molecule are confined, the permanent electric dipole moment must also point in a particular direction. Thus, the molecule should be oriented in addition to be- ing aligned. Orientation can be achieved by static elec- tric field methods such as hexapole focusing [22, 23] and brute-force orientation [24], by optical methods based on two-color laser fields [25, 26], or by combined laser and static electric field methods [27–30]. In the present work we employ the method relying on mixed laser and static electric fields since it provides very high degrees of align- ment and orientation. In detail we present a combined experimental and theoretical study of single ionization of a polar linear molecule, carbonyl-sulfide (OCS), by near infrared 30 femtosecond laser pulses. First results were recently pre- sented elsewhere [31]. Unlike studies aimed at recollision phenomena, e.g., high-order-harmonic generation, circu- larly polarized pulses are employed. By doing so the strong-field dynamics is simplified since the circularly po- larized field drives the electrons away from the parent molecule and thus turns off recollision. Our studies fo- cus on the photoelectron angular distributions (PADs) from single ionization. When the OCS molecules are tightly aligned and oriented pronounced asymmetries are observed in the experimental PADs perpendicular to the fixed molecular axis. The asymmetries are absent for randomly oriented molecules. Our theoretical analysis, based on a modified tunneling theory, rationalizes the ex- perimental findings and shows that the observed asym- metries are determined by the difference in ionization probability between the cases when the circularly polar- arXiv:1007.2630v1 [physics.chem-ph] 15 Jul 2010
Transcript of Ionization of oriented carbonyl sulfide molecules by intense circularly polarized laser pulses
Ionization of oriented carbonyl-sulfide molecules by intense circularly polarized laserpulses
Darko Dimitrovski, Mahmoud Abu-samha, and Lars Bojer Madsen∗
Lundbeck Foundation Theoretical Center for Quantum System Research,Department of Physics and Astronomy, Aarhus University, DK-8000 Aarhus C, Denmark
Frank Filsinger, Gerard Meijer, and Jochen Kupper†
Fritz-Haber-Institut der Max-Planck-Gesellschaft, Faradayweg 4-6, D-14195 Berlin, Germany
Lotte Holmegaard1, Line Kalhøj1, Jens H. Nielsen2, and Henrik Stapelfeldt1,3‡1 Department of Chemistry, Aarhus University, DK-8000 Aarhus C, Denmark
2 Department of Physics, Aarhus University, 8000 Aarhus C, Denmark3 Interdisciplinary Nanoscience Center (iNANO), Aarhus University, 8000 Aarhus C, Denmark
(Dated: July 16, 2010)
We present combined experimental and theoretical results on strong-field ionization of orientedcarbonyl-sulphide molecules by circularly-polarized laser pulses. The obtained molecular framephotoelectron angular distributions show pronounced asymmetries perpendicular to the direction ofthe molecular electric dipole moment. These findings are explained by a tunneling model invokingthe laser-induced Stark shifts associated with the dipoles and polarizabilities of the molecule andits unrelaxed cation.
PACS numbers: 33.80.Rv, 33.80.Eh, 42.50.Hz, 37.20.+j, 37.10.Vz
I. INTRODUCTION
When molecules are exposed to intense femtosecondlaser pulses they ionize. If the ionizing laser pulse is lin-early polarized the electron can be steered back to rescat-ter on the ion left behind, thereby initiating phenom-ena such as high harmonic generation, above thresholdionization, and double ionization (see, e.g., Refs.[1–4]).Being the event that initiates these central strong-fieldprocesses, ionization has attracted special attention andmuch effort has gone into describing and understandingit. Because molecules are not spherically symmetric theionization probability and the emission direction of theelectron depends on the relative orientation between themolecule and the polarization vector of the laser pulse[5–18]. Knowledge of this orientational dependence is im-portant for understanding, optimizing, or utilizing sub-sequent strong-field processes [3, 4].
The ability to align molecules, i.e., to confine one ormore molecular axes along space-fixed axes, has over thepast few years provided a valuable tool to experimentallyexplore the orientational dependence of strong-field ion-ization, and consequently, opened up for comparing the-oretical and experimental results [7, 10, 11, 14, 15, 19].The majority of studies have focused on nonpolar lin-ear molecules where nonadiabatic alignment, by a lin-early polarized laser pulse, provides a convenient way toprepare a sample of 1-dimensionally aligned molecules
∗Corresponding author: [email protected]†Corresponding author: [email protected]‡Corresponding author: [email protected]
[20, 21]. Most molecules are, however, polar, i.e., theydo not exhibit inversion symmetry. The experimentalinvestigation of such systems requires that not only theaxes of the molecule are confined, the permanent electricdipole moment must also point in a particular direction.Thus, the molecule should be oriented in addition to be-ing aligned. Orientation can be achieved by static elec-tric field methods such as hexapole focusing [22, 23] andbrute-force orientation [24], by optical methods based ontwo-color laser fields [25, 26], or by combined laser andstatic electric field methods [27–30]. In the present workwe employ the method relying on mixed laser and staticelectric fields since it provides very high degrees of align-ment and orientation.
In detail we present a combined experimental andtheoretical study of single ionization of a polar linearmolecule, carbonyl-sulfide (OCS), by near infrared 30femtosecond laser pulses. First results were recently pre-sented elsewhere [31]. Unlike studies aimed at recollisionphenomena, e.g., high-order-harmonic generation, circu-larly polarized pulses are employed. By doing so thestrong-field dynamics is simplified since the circularly po-larized field drives the electrons away from the parentmolecule and thus turns off recollision. Our studies fo-cus on the photoelectron angular distributions (PADs)from single ionization. When the OCS molecules aretightly aligned and oriented pronounced asymmetries areobserved in the experimental PADs perpendicular to thefixed molecular axis. The asymmetries are absent forrandomly oriented molecules. Our theoretical analysis,based on a modified tunneling theory, rationalizes the ex-perimental findings and shows that the observed asym-metries are determined by the difference in ionizationprobability between the cases when the circularly polar-
arX
iv:1
007.
2630
v1 [
phys
ics.
chem
-ph]
15
Jul 2
010

2
ized field points in the same and in the opposite directionas the permanent dipole moment [32]. Notably, the PADsreflect the permanent dipole moment and the polarizabil-ity of the active molecular orbital, which again, in thecase of the highest-occupied molecular orbital (HOMO),may be related to the dipole moments and polarizabil-ities of the neutral molecule as well as of its unrelaxedcation. The calculated results are exponentially sensi-tive to (temporal) changes in these quantities and hencepoint to the extension to time-resolved measurements ofvalence electron dynamics using pump-probe settings.
The paper is organized as follows: In Sec. II the ex-perimental technique is discussed and in Sec. III, the ex-perimental results are presented. Section IV presents thetheory and in Sec. V the theoretical predictions are com-pared to the experiment. Conclusions are given in thelast section. Appendix A provides a summary of themolecular properties of OCS and its cation relavant forthe present study.
II. EXPERIMENTAL METHOD
The experimental setup is described in detail else-where [33] so the discussion here is brief. A gas mixtureof ∼10 mbar carbonylsulfide (OCS) and 10 bar of Ne isexpanded supersonically into vacuum through an Even-Lavie valve [34, 35] forming a pulsed molecular beam.The molecular beam is skimmed twice before entering a15-cm-long electrostatic deflector that spatially dispersesthe molecular beam in the vertical direction according tothe quantum states populated [29, 30]. After exiting thedeflector the molecular beam is crossed at 90◦ by two fo-cused laser beams, one to align and orient the moleculesand one to induce ionization. The experiments describedhere are conducted on the most deflected molecules, i.e.,a subset of molecules selected in the lowest lying rota-tional quantum states [29, 30].
The alignment beam originates from an injec-tion seeded Q-switched Nd:YAG laser (20 Hz,τFWHM = 10 ns, λ = 1064 nm). The spotsize, (ωYAG
0 ,in the focus at the crossing with the molecular beam is34 µm, yielding a peak intensity of ∼ 8×10¹¹ W/cm2.The ionization laser beam, termed the probe beam,originates from a pulsed femtosecond Ti-Sapphire system(1 kHz, λ = 800 nm) externally compressed to 30 fs
(FWHM) and focused to ωprobe0 = 21 µm resulting in a
peak intensity of ∼ 5.4×10¹⁴ W/cm2. The probe pulseis electronically synchronized to the peak of the YAGpulse, where the degree of alignment is highest.
The ions or electrons produced by the probe pulses areextracted with a weak static electric field in a velocitymap imaging (VMI) geometry and projected onto a twodimensional detector consisting of a micro channel plate(MCP) detector backed by a phosphor screen. The ionor electron images on the phosphor screen are recordedby a CCD camera and the coordinates of each individualparticle hit are determined.
III. EXPERIMENTAL RESULTS
A. Alignment and orientation
The target of adiabatically oriented molecules is ob-tained by the combined action of the ac electric field fromthe YAG pulse and the weak static electric field presentin the VMI spectrometer as shown in previous studies[29, 30]. The strongest orientation is obtained when theYAG pulse is polarized along static electric field, Fstat
and this is the geometry used in the photoelectron studiespresented in Sec. III B. To characterize orientation using2D ion imaging, as we do here, it is, however, necessaryto rotate the molecules away from Fstat as shown in Fig.1(a). Our method to characterize alignment and orienta-tion is based on Coulomb exploding the molecules withan intense probe pulse and subsequently recording the ve-locities of the recoiling ions by the 2D imaging detector.This method does not work well for molecules alignedalong Fstat because all recoiling ions tend to collapse inthe center of the detector. Therefore, the measurementsof alignment and orientation are performed for moleculeswith their molecular axis rotated 45 degrees away fromFstat.
Figure 1(b) and (c) display S+ ion images fromCoulomb explosion of the OCS molecules with the probepulse linearly polarized vertically and the YAG pulse po-larized at β = 45◦ or -45◦, where β is the angle betweenFstat and the alignment laser field, Falign [see Fig. 1 (a)].The amplitude of the static field is 345 V/cm. We inter-pret the S+ ions detected at small radii, near the centerof the images, as originating from OCS molecules, singlyionized by the probe pulse and dissociating into CO andS+. By contrast, the S+ ions in the pair of radially andangularly localized regions (at the outermost part of theimages) is interpreted as originating from OCS molecules,doubly ionized by the probe pulse and subsequently frag-menting into a CO+-S+ ion pair. The recoil of S+ ionsfrom this Coulomb explosion channel reflects the direc-tion of OCS at the moment of ionization and is thus auseful experimental observable to determine the molecu-lar alignment and orientation.
The strong angular confinement of the S+ fromthe Coulomb explosion channel shows that the OCSmolecules are sharply 1-dimensionally aligned along thepolarization of the linearly polarized YAG pulse. In addi-tion, a pronounced asymmetry of the S+ ions emitted ei-ther parallel or anti-parallel to Fstat, with an excess of S+
in the upper (lower) region for β = 45◦ (−45◦), showsthat the molecules are oriented with the S-end prefer-entially pointing toward the extractor electrode wherethe electrical potential is lowest. These findings are fullyconsistent with recent alignment and orientation studieson iodobenzene [29, 30] and 2,6-difluoroiodobenzene [36]as well as with former mixed-field orientation studies onOCS [37]. In Figs. 1(d) and (e) the static electric fieldis increased to Fstat = 594 V/cm resulting in a clearimprovement of the degree of orientation.
3
Repeller Extractor Ground(a)
β
F(t)
Fstat
F DetectorFalign
β = 45⁰ β = ‐45⁰β 45 β 45
V/cm (b) (c)
arb. tat= 345 V
1unitsF s
tcm
(e)(d)
0.5
= 594 V/c
0
F stat=
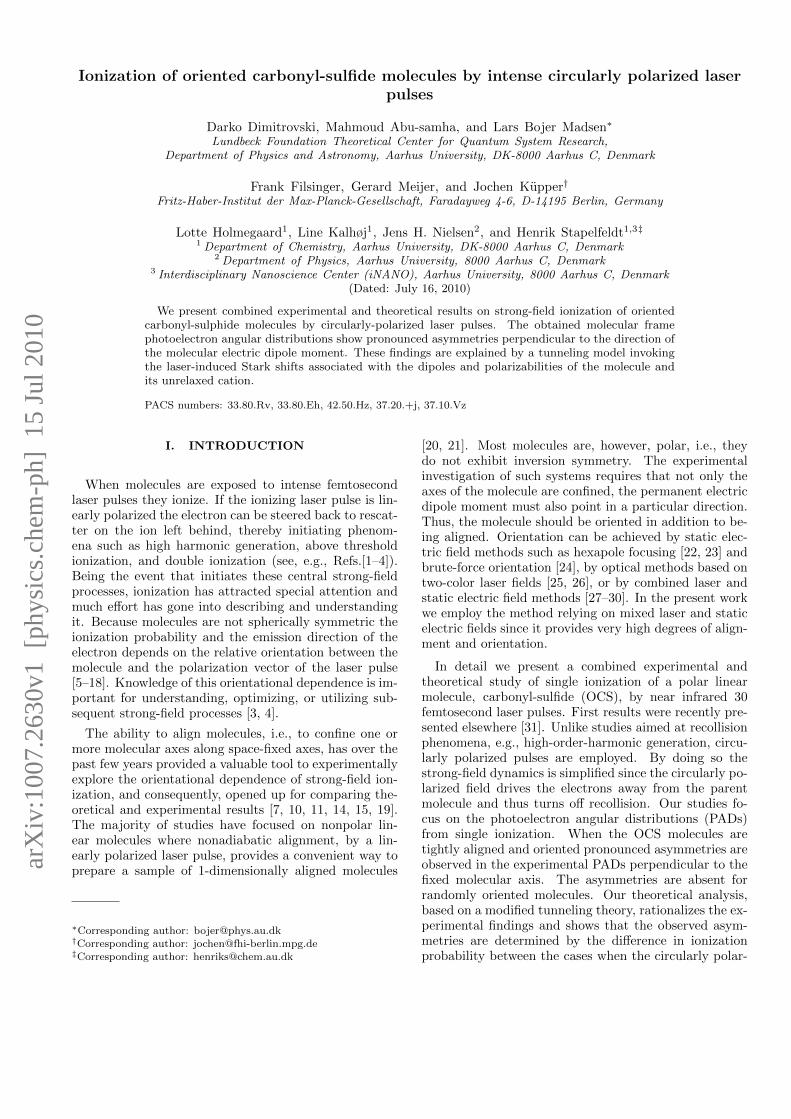
FIG. 1: (Color online) (a) Schematic of the velocity mapimaging spectrometer used to detect ions or electrons. Thealignment of the molecules, illustrated by the OCS model, isdetermined by the alignment laser polarization, here shownfor β = 45◦. The static electric field of the spectrometer,pointing from the repeller to the extractor electrode for iondetection, breaks the head-for-tail symmetry by preferentiallyplacing the O-end towards the repeller. When detectingelectrons the polarity of the electrodes is inverted forcing theS-end of the molecules towards the repeller electrode. (b),(c) Images of S+ ions for β = 45◦ and -45◦, respectively andFstat = 345 V/cm. In (b) 73 % of all S+ ions appear in theupper half of the detector. In (c) 28 % of all S+ ions appear inthe upper half of the detector. (d), (e) Images of S+ ions forβ = 45◦ and -45◦, respectively with the static field increasedto Fstat = 594 V/cm. In (d) and (e) respectively 80 %and 19 % of all S+ ions appear in the upper part of the de-tector. The intensity of the probe laser is ∼ 5.4×10¹⁴ W/cm2.
The theoretical treatment of the experimental PADmeasurements, presented below, requires knowledge ofthe degree of orientation, i.e., the fraction of moleculeswith the S-end pointing towards the repeller. The ionimaging measurements occur for beta = 45 degrees ratherthan the 0 degree geometry used in the PAD measure-ments. To, nevertheless, provide an estimate of the de-gree of orientation we note that Estat = 345 V/cm inthe PAD measurements [See Sec. III B]. This value fallsin between the value of the effective static field, i.e.,Estat along the OCS bond axis, of Figs. 1(b) and 1(c)(∼ cos(45◦) × 345 V/cm = 244 V/cm) and Figs. 1(d)and 1(e) (∼ cos(45◦) × 595 V/cm = 420 V/cm). In
F(t) e‐
FY
FstatX
Z Detector
FIG. 2: (Color online) Schematic of the experimental setupshowing an OCS molecule oriented with its permanent dipolemoment (bold red arrow) pointing in the direction of the staticelectric field. The left circularly-polarized (LCP) probe pulseionizes the molecule and imparts an upward momentum tothe freed electron resulting in recording on the upper part ofthe detector (see text for details).
the former (latter) case the orientation corresponds to a73% (80%) up-to-total ratio. Therefore, the orientationin the PAD experiment geometry should be at least 77-78 %. The vertical probe geometry applied in Fig. 1does, however, underestimate the degree of orientation,because the probe pulse preferentially ionizes (probes)the molecules aligned along its vertical polarization axiswhere the static field goes to zero and the molecules are,therefore, only weakly oriented. As a consequence, weestimate that the orientation in the PAD geometry cor-responds to 80 % of the molecules having their O-endtoward the detector, see Fig. 2.
B. PADs from single ionization of OCS
For the PAD experiments the same experimental setup,described in Sec.III A is used, but some essential parame-ters are changed. The polarization state of the 30 fs probepulses, denoted as F(t) is changed from linear to circu-lar and the intensity is lowered to ' 2.4 × 10¹⁴ W/cm2
corresponding to a regime where the OCS molecules onlyundergo single ionization with essentially no fragmenta-tion. The intensity puts the dynamics in the tunnelingregime [38] and the circular polarization ensures that norecollision of the freed electron with its parent ion occurs.Both conditions are important for the interpretation andmodeling of the observed PADs. Also, the polarization ofthe alignment pulse is changed such that its major axisis parallel to the static field axis. Furthermore, to ex-tract electrons instead of ions in the PAD measurementsthe polarity of the velocity map imaging spectrometer isinverted. Hereby, the OCS molecules are confined alongthe static field axis with the O-end facing the detector(See Fig. 2).
The electron images are shown in Fig. 3. With onlythe probe pulse [Figs. 3(a), 3(b)] the electrons emerge ina stripe parallel to the (Y ,Z) polarization plane of the

4
' 2.4 × 10¹⁴ W/cm2 probe pulse. The images are es-sentially up-down symmetric and the marginal differencebetween the images obtained with left and right circu-larly polarized (LCP and RCP) pulses is due to exper-imental imperfections in the purity of the polarizationstate and a weak orientation of the molecules caused bythe static field alone [36]. When the molecules are one-dimensionally (1D) aligned along the Y -direction, i.e.,the molecular axis is confined along the Y -axis but withno preferred direction of the dipole moment, not muchhappens and no up-down asymmetry is observed [Figs.3(c) and 3(d)]. When the YAG pulse polarization isturned parallel to Fstat, and the molecules thus become1D aligned and oriented, a strong up-down asymmetryis observed [Figs. 3(e), 3(f)]. The asymmetry reversesas the helicity of the probe pulses is flipped. For LCP(RCP) probe pulses the number of electrons detected inthe upper part compared to the total number in the im-age is ∼64% (39%).
To investigate if the YAG pulse not only induces molec-ular alignment and orientation but also influences thephotoelectron trajectories PADs were measured underexperimental conditions identical to those used in Figs.3 (e) and 3 (f) but with the YAG intensity reduced bya factor of three. Independent measurements, using S+
ion imaging (not shown here) showed that the degreesof alignment and orientation remain almost unchanged.The resulting electron images are shown in Figs. 3 (g)and 3 (h). They are very similar to those obtained withthe images obtained at three times higher YAG pulseintensity. In particular the up-to-total number of elec-trons is ∼66% (38%) in Figs. 3 (g) and 3 (h), respec-tively, which is almost the same as for Figs. 3 (e) and3 (f), strongly indicating that the YAG pulse does notcause any significant distortion of the electron trajecto-ries. This is corroborated by measurement on benzoni-trile where experiments were conducted on molecules athigher rotational temperatures and without state selec-tion [33]. In that case no up-down asymmetry of thephotoelectrons is observed even at the highest YAG pulseintensity. We conclude that the YAG pulse together withthe static electric field serve to control the alignment andorientation of the molecules but does not otherwise vis-ibly influence the ionization process by the probe or thesubsequent trajectories of the released electrons.
To investigate the role of the intensity of the probelaser pulse, measurements at three different intensitieswere performed. Figure 4 shows the electron images ob-tained with a left circularly polarized pulse. In Figs.4(a), 4(d) and 4(g) only the probe pulse is included forincreasing intensity corresponding to Iprobe = 1.76 ×10¹⁴ W/cm2 in (a), 2.44 × 10¹⁴ W/cm2 in (d) and2.83 × 1014 W/cm2 in (g). In Figs. 4(b), 4(e) and 4(h)the molecules are 1D aligned and oriented and again clearup/down asymmetries are observed in the photoelectrondistributions. In Figs. 4(c), 4(f) and 4(i) the correspond-ing radial distributions, obtained by angularly integrat-ing the images, are given for the upper and lower half of
1
0
LCP RCP
om”
(a) (b)
0
‐11
”Ran
d
(c) (d)
0
Mom
(c) (d)
W/cm
2
‐11
entum p
Y(a
(f)(e)
gn= 8.4 ×10
11 W
0
‐1
a.u.)
arb. units
I alig
11
0 0.5
1(h)(g)
×10
11 W
/cm
2
‐1 0 1 ‐1 0 1‐1 0
Momentum pX (a.u.)
I align= 2.8 ×
FIG. 3: (Color online) Two-dimensional momentum image ofelectrons produced when a randomly oriented sample of OCSmolecules are ionized by (a) the LCP probe pulse. The po-larization plane of the probe pulse is in the (Y,Z) plane, i.e.perpendicular to the image (detector). (b) Same as (a) butfor a RCP probe pulse. (c) and (d) as (a) and (b) but withthe OCS molecules aligned along the Y -direction by the align-ment pulse polarized parallel to the image plane. (e) and (f)as (a) and (b) but with the OCS molecules aligned along theZ-direction by the alignment pulse polarized perpendicular tothe image plane. (g) and (h) as (e) and (f) but with the inten-sity of the alignment pulse lowered from Ialign, YAG = 8.4 ×10¹¹ W/cm2 to Ialign, YAG = 2.8 × 10¹¹ W/cm2. The inten-sity of the 800 nm 30 fs probe pulse is kept at 2.44 × 10¹⁴
W/cm2 in all pictures.
Figs. 4(b), 4(e) and 4(h), respectively. It is seen thatas the probe intensity is increased the number of elec-trons detected increases, and they acquire more momen-tum, i.e., extend towards the edge of the detector. Themaximum momentum observed is limited by the size ofthe detector. The number of electrons appearing in theupper half of the images compared to the lower half isalmost unchanged for increasing intensity with ∼63% inFig. 4(b) and ∼64% in Figs. 4(e) and 4(h). These ex-perimental observations are compared to the calculatedresults in Sec. V

5
”Random” 1D orientation
1 (a) (b) Upper half(c)
Radial distributions
0
a.u.)
(a) (b)
250
500 Upper half Lower half
(c)
‐11
ntum p
Y(a
(d) (e)0
500
Sign(f)
0Mom
en
a b
250
500 nal (arb. u
‐11
arb. units
(h)(g)10
500
units)
(i)
00.5 250
‐1 0 1‐1
‐1 0 1Momentum pX (a.u.)
00.0 0.5 1.0
0
(a.u.) pp 2Y
2X +
FIG. 4: (Color online) Two-dimensional momentumimage of electrons produced when a randomly ori-ented sample of OCS molecules is ionized by theLCP for increasing intensity of the ionization pulse,corresponding to Iprobe = 1.76 × 10¹⁴ W/cm2
in (a), Iprobe = 2.44 × 10¹⁴ W/cm2 in (d) andIprobe = 2.83 × 10¹⁴ W/cm2 in (g). (b), (e) and (h),same as (a), (d) and (g), respectively, but with the OCSmolecules aligned along the Z-direction by the align-ment pulse polarized perpendicular to the image plane.In (c), (f) and (i) the radial distributions of the upperand lower parts of images (b), (e) and (h) are shown.Ialign, YAG = 8.4 × 10¹¹ W/cm2
IV. THEORY
For comparison with theory, we focus on the intensities2.44× 1014 and 2.83× 10¹⁴ W/cm2 for the 800 nm, 30 fspulses. For OCS, these laser parameters result in Keldyshparameters [38] γ = ω
√2Ip/F of γ = 0.87 and γ = 0.82
that are both lower than unity, so it is justified to usetunneling theory to describe the photoelectron emissionprocess. The existing tunneling models, however, need tobe modified to correctly describe ionization from a polarmolecule with large dipole moments and polarizabilitiessuch as OCS.
In a circularly polarized field the electron is drivenaway from the (unrelaxed) cation, which is in contrastto the case of a linearly polarized field where rescatter-ing and post-ionization interaction are important. Thisfact simplifies the propagation after the initial ionizationstep in circularly polarized fields: it proves sufficient topropagate classical equations of motion for the electron
in the external field ignoring the effect of the molecularpotential. The full-width at half maximum of the 800 nmlaser pulse used in the experiment is 30 fs, and accord-ingly there are more than 10 cycles within the envelope.Therefore it is sufficient to model the laser pulse of theexperiment by a periodic field with constant amplitude,and assume that it is switched off adiabatically in thelong time limit. We focus on the case of a left circularlypolarized laser pulse (LCP), and define the electric fieldF(t) of the probe pulse as
F(t) = F0 sin(ωt)ey + F0 cos(ωt)ez. (1)
In the above equation F0 is the field amplitude, ω isthe angular frequency and the product θ = ωt is theangle between the electric field vector and the positiveZ-axis. The vector potential corresponding to (1) is(F(t) = −∂tA(t))
A(t) =F0
ωcos(ωt)ey −
F0
ωsin(ωt)ez. (2)
Assuming that there is no influence of the molecularpotential on the final momentum of the escaping contin-uum electron, the emission at time t0 (angle θ = ωt0)creates an electron with final momentum in the (Y ,Z)plane equal to
pY =−AY (θ/ω) = −F0
ωcos(θ)
pZ =−AZ(θ/ω) =F0
ωsin(θ). (3)
From the above considerations it is clear that anyasymmetry in the electron emission predicted by tunnel-ing theory for an oriented polar molecule directly trans-lates into the up-down asymmetry (positive-negative Y -components of the final electron momentum) observedexperimentally. Moreover, as it is seen from Eq. (3),the favoured detection of electrons in the upper half ofthe detector for a LCP field translates into a favouredemission from the O-end of the molecule when the fieldpoints in negative Z-direction. An obvious candidate re-sponsible for the asymmetry in the electron emission isthe asymmetry of the HOMO in the asymptotic regionsof large spatial distances (see Fig. 5) that enters intothe tunneling model. To address this question, we firstbriefly review the existing tunneling models.
The tunneling rate in a static field is governed by theexponential exp(−2κ3/(3F )) [39, 40], where F = |F| and
κ =√
2Ip(0), where Ip(0) is the field-free ionization po-tential. In the case of an atom in its ground state, the pre-exponential factor in the tunneling expression accountsfor the symmetry of the initial state [40, 41]. An exten-sion of the tunneling theory, fully in line with the atomiccase, was carried out for the molecules [42]. This molec-ular tunneling ionization theory takes the orientation ofthe field relative to the molecular axis into account. The

6
rate in molecular tunneling theory [42] for static fields is
w(F) =1
κ(2Z/κ)−1exp
(−2κ3
3F
)×∑m′
B2(m′)
2|m′||m′|!
(2κ3
F
)(2Z/κ)−|m′|−1
, (4)
where B(m′) accounts for the orientation of the field withrespect to the molecular axis,
B(m′) =∑l
ClmDlm′,m(F)Q(l,m). (5)
In the above equation, Dlm′,m(F) is the Wigner rotation
matrix element (see, e.g., [43]), for passive rotation of the
coordinate system through angles F from the molecule-fixed frame to the laboratory-fixed frame with the Z-axisdetermined by the direction of the external field. Thecoefficient Q(l,m), given by
Q(l,m) = (−1)(|m|−m)/2
√2l + 1
2
(l + |m|)!(l − |m|)!
, (6)
is related to the dominant behavior of spherical harmon-ics along the field direction [44],
Ylm(θ, φ) ≈ Q(l,m)sin|m|(θ)
2|m||m|!exp(imφ)√
2π. (7)
In the above equation, θ and φ are angular coordinatesin the spherical coordinate system where the Z-axis isdirected along the field. Finally, the Cl,m coefficients arerelated to the asymptotic behaviour of the wavefunctionof the HOMO, that is
Ψ(r) ≈ r Zκ−1 exp(−κr)∑l,m
ClmYlm(r). (8)
In Eq. (8), the radial part solves the radial Schrodingerequation for the electron in the Coulomb field to firstorder in 1/r. The Clm coefficients for both degenerateHOMO orbitals of OCS were calculated by projectingthe orbitals obtained using standard quantum chemistrycalculation [45] onto the asymptotic form (8), yieldingcoefficients with m = ±1 and with l up to l = 5. Sincethe oriented OCS molecule is free to rotate around itsmolecular axis, a combined response from both orthog-onal degenerate HOMO orbitals is required. The twoorbitals are rotated by 90 degrees from each other alongthe molecular axis. We assume one is in the polarizationplane of the laser pulse and one is perpendicular to it. Tocalculate the combined response from these two orbitalsthe associated angle-dependent tunneling rates of bothorbitals are added incoherently since the molecule is in amixed state with respect to the degenerate orbitals.
Direct application of the molecular tunneling theorysketched above, however, gives an opposite emission de-pendence to the one required to describe the asymmetry
FIG. 5: (Color online) Visualization of the degenerate HOMOorbitals of OCS, at an iso-density contour value of 0.1. The S-end of the molecule is on the left in these images. The orbitalto the left lies in the polarization plane of the laser field, andcontributes more to the total ionization yield than the orbitalto the right, which has a nodal structure in the polarizationplane and is obtained by 90 degrees rotation of the orbital tothe left around the molecular axis. The circles with arrowspointing counter clockwise illustrate the LCP field.
observed in the experiment. Namely, the B coefficientsfrom (5) are such that the emission from the S-end isfavoured with respect to the emission from the O-end.This reflects the simple fact that the HOMO orbitals ofthe OCS are such that the wavefunction is predominantlylocated toward the S-end of the molecule (see Fig. 5). Aswe will show below, however, to describe the tunnelingionization process from a polar molecule it is essentialto take into account the angle-dependent shifts of theionization potential, induced by the polar system. Un-like the B-coefficients that depend on the geometry ofHOMO and influence the pre-exponential factor in thetunneling rate of Eq. (4), the Stark shifts affect both thepre-exponential factor and the argument of the exponen-tial in the tunneling rate and decide from which end ofthe molecule the preferred emission occurs.
Our modification of the tunneling theory is buildingon the fact that in electric fields, due to the molecule’spolarity and its polarizability, hyperpolarizability, etc.,the energy levels of the molecule shift. These shifts arenegligible for small nonpolar molecules and atoms. In thecase of molecules with large dipole moments and polariz-abilities the influence of these Stark shifts cannot be ne-glected and in the present quasistatic limit they must beincluded. The unrelaxed cation of the molecule in ques-tion is even more tightly bound than the neutral moleculeand the characteristic timescale for the electronic motionis shorter. Hence, if for the molecule the field can beregarded as static, then for the cation the field is staticas well. The total energy of a molecule (M) and its unre-laxed cation (I) EM/I(F) in a static field F, up to secondorder in field strength is given by (see, e.g. [46])
EM/I(F) = EM/I(0)− µM/I · F− 1
2FTαM/IF, (9)
where µM/I is the dipole moment, αM/I is the polariz-ability tensor, EM/I(0) is the field-free total energy ofthe system. The next term in the expansion of the total

7
energy as a function of field strength involves the hyper-polarizability. In OCS, the contribution of the hyper-polarizability is negligible at the intensities used in thepresent experiment, so the Stark shift is due to the dipolemoment and the polarizability only. The Stark shift dueto the polarizability is larger than the Stark shift due tothe permanent dipole moment. What is important, how-ever, is the difference between the total energy of themolecule and the positive ion, i.e., the ionization poten-tial. Since the molecule and the ion do not have identicalpermanent dipole moments and polarizabilities, the ion-ization potential Ip = EI − EM becomes
Ip(F) = Ip(0) + ∆µ · F +1
2FT∆αF, (10)
where FT is the transpose of the field vector and
∆µ = µM − µI ∆α = αM −αI . (11)
In the above formulation, we assumed that the electronin highest occupied molecular orbital was promoted tothe continuum. In this case the change of the ionizationpotential as a function of field strength can be referredas to as the Stark shift of the HOMO orbital, with thecorresponding dipole moment and polarizability. Suchmodifications of the ionization potential of orbitals otherthan HOMO can be calculated as well. Note that here wedo not make any distinction between the dipole momentsand polarizabilities of (possibly) different ionic productsobtained through different ionization channels. We sim-ply refer to the properties of the cation in the unrelaxedgeometry of the neutral molecule.
Equations (10) and (11) show very explicitly that theionization potential depends not only on the magnitudeof the electric field vector F but also on the angles ofthe field orientation with respect to the principal polar-izability axes and the permanent dipole moment of themolecule. This is the essential ingredient that enters intoour modification of the tunneling theory. Note that staticStark shifts were considered earlier in discussion of dis-sociation [47, 48]
The modification of the ionization potential dueto Stark shifts results in the tunneling exponentialexp(−2κ3(F)/3F ), where the factor
κ(F) =√
2Ip(F) (12)
dependens on the angles of field orientation with respectto the molecular axis. One can now in principle take thetunneling rate of Eq. (4) and replace κ with κ(F) every-where. However by doing so, one has assumed that theinitial orbital is not affected by the polarization of themolecule. This is in general not true, especially for fieldstrengths at which the polarizability term gives muchlarger contribution to the Stark-shifted ionization poten-tial of Eq. (10) than the permanent dipole moment term.In these cases, the polarizability can modify the initialmolecular orbital so that the Clm coefficients in Eq. (5)
become a function of the field strength. It is in generalvery hard to account analytically for such strong modifi-cations of the initial orbital. However, as we show belowby direct comparison to the experiment, in the case ofOCS and in the limit of large fields it suffices to sim-plify the situation by disregarding the modifications ofthe HOMO and assuming that the angle-dependence ofthe tunnel emission occurs only due to the action of theStark shift. Namely, we assume that the inner structureof the orbital is modified so much by the polarization re-sponse so that its asymptotic properties would be equiv-alent with respect to the axis defined by F for each orien-tation of the field with respect to the molecular axis. Inother words, if the Stark shift would not be present, therewould be no orientation dependent emission, i.e., the tun-neling probability would be equal for all field orientationswith respect to the molecular axis. Having this in mind,we can model this behaviour by taking an atomic s-likestate as an initial state in the tunneling model. Thisradical model will generally be better for large intensi-ties, for systems with large polarizabilities and in caseswhere the initial orbital is not such that the polarizationplane of the circularly polarized laser field lies entirely inthe nodal plane of the orbital [33].
The intensity of the laser pulse used in the experimentis very large so that for atoms with the same bindingenergy the ionization would occur over the barrier. Toexamine whether that holds for the case of the OCSmolecule one requires a single-active-electron potentialcorresponding to the HOMO of OCS. Following the ap-proach given in Refs. [19, 49], applied sucessfully to CO2
and other linear molecules, we have built a single-active-electron potential for OCS.
Using the single-active-electron potential for OCS, wehave verified that at the peak intensities of the experi-ment, the ionization occurs over the barrier at all anglesof orientation of the field with respect to the molecu-lar axis and both with or without inclusion of the Starkshift. The saddle points of the potential at the experi-mental peak intensity of 2.44×10¹⁴ W/cm2 are shown inFig. 6. It can be seen that the saddle points occur rela-tively far away from the center-of-mass coordinate so theinfluence of the potential to the outgoing electron, bornat the saddle points is very small. Hence the asymme-try of the molecular potential does not play a role in thepresent case. In addition, due to the large polarizabil-ity of the parent ion (see Table II in Appendix A), theinduced dipole of the cation is very large and the orienta-tion is such that it shields the electron from the influenceof the attractive Coulomb potential, thereby decreasingthe effect of the long-range Coulomb potential.
At over-the-barrier intensities, the tunneling rate givenby the tunneling theory overestimates the probabilityof ionization [50, 51]. The saturation of the tunnelingrate can be included by calculation of the exact, com-plex eigenenergies in a static field [51, 52], however thisapproach is limited only to very simple systems. In thisstudy, we will adopt an ad-hoc and simple exponential

8
-6 -4 -2 0 2 4 6Z (a.u.)
-4
-2
0
2
4Y
(a.
u)
FIG. 6: (Color online) The saddle points of the OCS potentialat the intensity of 2.44×10¹⁴ W/cm2 in the polarization (Y -Z)plane. The dots are the saddle points of the effective potentialmade up of the molecular single-active electron potential andthe external field. The values of the saddle points are taken at5 degree steps with respect to the z-axis, and are connectedwith the dotted lines to guide the eyes. The origin is thecenter of mass of the molecule. The S-end of the molecule isto the left of this figure, in accordance with the geometry ofFig. 2. The explicit nuclear positions are as follows. S (-2a.u.), C (0.99 a.u.), and O (3.2 a.u.) (see Appendix A).
factor, given in Ref. [50], to account for the over-the-barrier saturation of the tunneling rate. The saturationfactor due to over-the-barrier emission reads,
W (F) = w(F) exp
(−6
(2
κ2(F)
)(F
κ3(F)
)), (13)
where we have additionally included the Stark shifts inκ according to Eq. (12) since it occurs as an argumentin the exponential. In the above equation, w(F) is thetunneling rate from Eq. (4), where Cl,m = δl,0δm,0 cor-responds to an s-state and κ has been replaced by κ(F).In summary, in the tunneling model we use to describethe momentum distributions for the OCS molecule, thetunneling rate is calculated as
W (F) =1
2κ(F)2
κ(F)−1
(2κ(F)
3
F
) 2κ(F)−1
exp
(−2κ(F)
3
3F
)
× exp
(−6
(2
κ(F)2
)(F
κ(F)3
)), (14)
with κ(F) given by Eq. (12).
V. COMPARISON WITH THE EXPERIMENTOF STRONG-FIELD IONIZATION OF
1D-ALIGNED OCS
We consider the experiment on strong-field ionizationof 1D oriented OCS by a circularly polarized field in the
(Y,Z) plane. The molecular axis is along the Z-axis, andit is perpendicular to a detector that lies in the (X,Y )plane (see Fig. 2).
We assume the electric field of a LCP pulse as givenby Eq. (1) and include the static Stark shift of the activeHOMO through the shifts of the molecule and the unre-laxed cation as given in Eqs. (10)-(11). This approachleads to a modification of the ionization potential as afunction of the angle of the direction of the field F withrespect to the Z-axis (denoted as θ = F = ωt) as
Ip(θ) = Ip(0) + (µI − µM )F0 cos(θ)
+1
2F 20
((αMZZ − αIZZ)− (αMXX − αIXX)
)cos2(θ)
+1
2F 20 (αMXX − αIXX). (15)
Note that for the angle θ of the field, the emission oc-curs in the direction θ+π. The above equation gives themodification of the ionization potential as a function ofthe angle between the instantaneous direction of the fieldand the permanent dipole of the molecule, and togetherwith Eq. (14) it is the main theoretical input in the in-terpretation of the experiment. The modification of theionization potential is such that when the field vector andthe permanent dipole moment of the molecule are paral-lel, the ionization potential is minimal so the tunnelingprobability reaches maximum. In that case the emis-sion occurs opposite to the field direction, that is, fromthe O-end of the molecule. On the other hand, whenthe instantaneous field points from the S- to the O-endof the molecule, i.e., the field and the permanent dipolemoment are antiparallel, the ionization potential is max-imal and, conversely, the ionization probability minimal.The emission then occurs from the S-end of the molecule.
In the simplest model, the final momenta in the (Y -Z) plane are given by Eq. (3). Since there is largerprobability of tunneling from the O-end of the molecule,for the LCP, there would be a larger probability thatelectrons with pY > 0 appear, and for RCP pulse thesituation would be opposite, which is in accord with theexperiment. Scanning through instants of time withinone cycle of the field, all possible final momenta pY andpZ in the plane pX = 0 are reached and the associatedionization probability calculated from Eq. (14), where
|F| = F0 and the orientation of F is given by θ definedin Eq. (3). On the other hand, the transverse, pX com-ponent of the momentum cannot be changed by the ex-ternal electromagnetic field and it is obtained from thewell-known expression [53] for the momentum distribu-tion of the transverse momenta of the tunneled electronat its birth, i.e.,
W (pX) ∼ exp
(−√
2Ip(0)
F0p2X
). (16)
Note that in actual calculations for the transverse distri-bution the approximation Ip(θ) ≈ Ip(0) has been used

9
11
arb. units(a) (b)11
0.8
u.)
u.)
1
0.5
0.6
m p
Y(a.u
m p
Y(a.u 0.5
0
0.4
mentum
mentum 0
‐0.50.2M
om
Mom ‐0.5
‐0.5 0 0.5‐1
0‐0.5 0 0.5‐1
Momentum pX (a.u.) Momentum pX (a.u.)
FIG. 7: (Color online) Momentum ditributions obtained bythe present model for peak intensities of (a) 2.44 × 10¹⁴ and(b) 2.83×10¹⁴ W/cm2 of the 800 nm, 30 fs probe laser pulse.Compare with the experiments in Figs. 4 (e) and (h).
since the inclusion of Stark shifts in this degree of free-dom does not alter the results significantly and has noinfluence on the observed asymmetry in the experiment.
In the experiment, the measured quantity on the de-tector is
W (pX , pY ) =
∫ ∞−∞
dpZW (p),
where W (p) =∂3Pion
∂pX∂pY ∂pZ, (17)
and Pion is the total ionization probability. In the sim-pleman model, by inserting Eq. (15) into (14), thetunneling rate W (θ) can be obtained, and from there,W (0, pY , pZ) = W (θ), where pY and pZ dependency onθ is taken from (3). This momentum distribution is thenintegrated over pZ to obtain w(0, pY ). Having in mindEq. (16), the momentum distribution (17) is obtained as
W (pX , pY ) = W (0, pY ) exp
(−√
2Ip(0)
F0p2X
). (18)
As discussed in section III A, the orientation of theOCS molecules in the experiment is not perfect. In fact,80% of the molecules are oriented in the desired orienta-tion (O-end towards detector) and 20% oppositely. These20% of the molecules actively participate in the formationof the experimentally obtained momentum distributionhence this is an effect which must be taken into accountin the theoretical model. The corresponding momentumdistribution with this effect taken into account is readilyobtained from (18) as
Wpn(pX , pY ) = 0.8W (pX , pY ) + 0.2W (pX ,−pY ). (19)
0 0.2 0.4 0.6 0.8 1pρ (a.u.)
0
1
prob
abili
ty (a
rb. u
nits
)
0 0.2 0.4 0.6 0.8 1pρ (a.u.)
0
1)b()a(
FIG. 8: (Color online) Comparison of experimental (full lines)and theoretical (dashed lines) radial distributions for peakintensities of (a) 2.44 × 10¹⁴ and (b) 2.83 × 10¹⁴ W/cm2 ofthe 800nm, 30 fs probe laser pulse. The upper curves arethe radial distributions in the upper (pY > 0) and the lowercurves are radial distribution in the pY < 0 half plane, seeEqs. (22)-(23).
The final effect which must be taken into account toreproduce the experiment is the volume effect for tightly-focused laser beams. The consideration of this effectrequires the calculation of momentum distributions oftype (19) for different intensities and then using a vol-ume function to weight the momentum distributions at aparticular intensity [54]. After inclusion of the volume ef-fect, we obtain the momentum distributions given in Fig.7 for the experimental peak intensities of 2.44×10¹⁴ [7(a)]and 2.83× 10¹⁴ W/cm2 [7(b)]. These momentum distri-butions visually resemble very much the correspondingexperimental momentum distributions of Figs. 4 (e) and(h). As with their experimental counterparts, the calcu-lated momentum distributions in Figs. 7 (a) and (b) arevery similar, reflecting that the momentum distributionsare only weakly dependent on the laser intensity.
A more detailed comparison between the experimental[Figs 4 (e) and (h)] and theoretical momentum distribu-tions [Figs. 7 (a) and (b)], reveals larger Y -componentsof the final momenta in the theoretical momentum distri-butions, see also Fig 8. This is due to two reasons, whichare not included in the theory presented here. First,the target OCS molecules are not ideally aligned with〈cos2 θ〉 ∼ 0.9. Hence, there is a non-vansihing prob-ability that the angle between the molecular axis andthe space-fixed Z-axis is nonzero. If we recall the post-ionization dynamics discussed in the previous section, thecontinuum electrons with the largest Y -component of thefinal momentum escape into the continuum at times whenthe electric field vector F(t) is parallel or antiparallel withthe Z-axis [see Eq. (3)]. On the other hand, emissionfrom the O-end of the molecule is preferred and due tothe nonzero value of the angle between the space-fixedZ-axis and the molecular axis, the absolute value of theY -components of the final momenta would be smallerthan the maximal value, i.e. |pY | < F0/ω, so the Y -components of the momenta are lowered. The second

10
0 90 180 270 360φ (degrees)
0
1pr
obab
ility
(arb
. uni
ts)
0 90 180 270 360φ (degrees)
0
1)b()a(
FIG. 9: (Color online) Comparison of experimental (full lines)and theoretical (dashed lines) angular distributions [Eq. (21)]for peak intensities of (a) 2.44 × 10¹⁴ and (b) 2.83 × 10¹⁴
W/cm2 of the 800 nm, 30 fs probe laser pulse.
reason for small |pY | in the experimental momentum dis-tributions is the interaction of the outgoing electron withits parent ion, which is beyond the simpleman model.Although in the case of a circularly-polarized laser fieldsuch post-ionization interaction is limited, the long-rangeCoulomb part of the potential will act to decrease themagnitude of the final momenta due to the attractiveforces at times immediately after ionization.
The above effects, however, have no influence on themost prominent feature observed in this experiment -the up-down asymmetry in the momentum distributions.This asymmetry perpendicular to the permanent dipolemoment is entirely described by including the static Starkshifts in the tunneling model. The up/total asymmetryA+ is defined as
A+ = PY >0ion /Pion where
PY >0ion =
∫ ∞−∞
dpX
∫ ∞0
dpYWpn(pX , pY ) and (20)
Pion =
∫ ∞−∞
dpX
∫ ∞−∞
dpYWpn(pX , pY ).
We have calculated A+ = 0.651 (experimental value 0.64)at the intensity of 2.44 × 10¹⁴ W/cm2 and A+ = 0.649(experimental value 0.64) at the intensity of 2.83× 10¹⁴
W/cm2. We conclude that the theoretical and the exper-imental asymmetry agree well.
We turn to the comparison of the differential quantitiesthat can be derived from the momentum ditributions.Transforming the momentum distribution of Eq. (19) intopolar coordinates pX = pρ cos(φ) and pY = pρ sin(φ), oneobtains the angular distribution
W (φ) =
∫ ∞0
dpρpρW (pρ, φ) (21)
shown in Fig. 9 and the radial distribution in the upperhalf (pY > 0)
W pY >0(pρ) = pρ
∫ π
0
dφW (pρ, φ) (22)
0 0.2 0.4 0.6 0.8pρ (a.u.)
0.5
0.55
0.6
0.65
0.7
0.75
asym
met
ry
0 0.2 0.4 0.6 0.8pρ (a.u.)
0.5
0.55
0.6
0.65
0.7
0.75)b()a(
FIG. 10: (Color online) Comparison of experimental (dots)and theoretical (dashed lines) asymmetry A+ [Eq. (24)] as afunction of radial momentum for peak intensity of (a) 2.44 ×10¹⁴ and (b) 2.83 × 10¹⁴ W/cm2 of the 800 nm, 30 fs probelaser pulse.
and in the lower half of the plane (pY < 0)
W pY <0(pρ) = pρ
∫ 2π
π
dφW (pρ, φ) (23)
shown in Fig. 8.The results for the angular distribution in Fig. 9 are in
excellent agreement with the experiment. In particularthe peak ratio of the peaks in the angular distributionfor 90 and 270 degrees is reproduced by the theory. Thewidth of the two peaks in the experimental radial dis-tributions is slightly larger than the theoretical peaks.This is due to the non-perfect alignment of the moleculealong the Z-axis discussed above. Moreover, one has toconsider Coulomb focusing: the electron wavepacket isattracted to the (Y,Z) plane, which results in a narrowerwidth of the angular distributions. Thus the nonperfectalignment and the effect of the Coulomb focusing have anopposite effect on the angular distributions, almost can-celling each other and resulting in an overall very goodagreement between theory and experiment. On the otherhand, as discussed above, the non-perfect alignment andthe long-range interaction on the outgoing electron bothhave a tendency to decrease the final momenta. Thisis evident from the comparison of the experimental andtheoretical radial distributions presented in Fig. 9. Thetheoretical model overestimates the Y -components of fi-nal momenta. We note that the sudden cut-off of theexperimental radial distributions is due to the maximummomentum that can be recorded on the detector, andnot because of some physical effect.
The final quantity that has been calculated from theexperimental data is the up/total asymmetry as a func-tion of the radial momentum A+(pρ), defined as
A+(pρ) =
∫ π
0
dφW (pρ, φ)/
∫ 2π
0
dφW (pρ, φ). (24)
Experimental and theoretical results for this quantity ispresented in Fig. 10. For both intensities, the results for

11
the differential asymmetry A+(pρ) agree very well in theregion of smaller radial momenta. Namely, the differen-tial asymmetry rises gradually from the value of 0.5 (noasymmetry) to around 0.7 at the peak. Very small ra-dial momenta correspond to ionization when the electricfield vector points in the direction of the positive or neg-ative Y -axis (electric field vector perpendicular to thedipole moment) with equal probability of ionization inboth directions [put θ = π/2 in Eq. (15)], therefore noasymmetry. As the radial momentum pρ increases, |pY |increases and | cos(θ)| of Eq. (15) also increases, result-ing in larger asymmetry. The theoretical model capturesthese features in the experimental data. The discrep-ancy of experimental and theoretical results for A+(pρ)is again due to the overestimation of the Y -componentsof the final momenta by the theory, discussed above.
VI. CONCLUSIONS
We have studied photoionization of aligned and ori-ented OCS molecules. The prepared gas sample was ion-ized by intense near-infrared femtosecond laser pulses.The detection of ionic fragments was used to investigatethe degree of alignment and orientation. The samplewas then used to investigate molecular frame photoelec-tron angular distributions (MFPADs) in the tunnelingand over-the-barrier regimes. Strong asymmetries in thedistributions were observed and explained in terms ofa modified tunneling theory. The circularly polarizedfield steers the electron away, and minimizes rescatter-ing, but the presence of a permanent dipole moment anda large polarizability of the active orbital, the HOMOin the present case, means that the effective ionizationpotential shifts depending on the instantaneous magni-tude and direction of the external field with respect tothe molecular axis.
In OCS and for the present set of laser parameters, theelectron enters the continuum at such large distances thatthe asymmetry associated with the ionization potentialin the initial tunneling process is sufficient to explainthe experimental findings. The asymmetry associatedwith the molecular potential does not play a role, sincethe leading asymmetric dipole term is suppressed at thedistances in question [see Fig. 6].
It is our goal to extend the present techniques to studytime-resolved electron dynamics, for example, to moni-tor changes in the MFPADs during a photochemical re-action. In such a process the nuclear motion could besufficiently slow that changes in the MFPADs will oc-cur at the femtosecond timescale [55], and changes couldthen be recorded by firing a short femtosecond pulse. Inthe tunneling regime, asymmetries in the MFPAD willbe exponentially sensitive to the ionization potential andhence to changes in the dipole moments and polarizabil-ities. Changes in the MFPADs will consequently linkdirectly to the instantaneous values of these quantities.There might be changes in the MFPADs for reasons other
than the ones connected with the dipoles and polariz-abilities. We mentioned asymmetries due to the exactform of the molecular potential above. Another possibil-ity is the temporal formation and changes of nodal sur-faces. It is encouraging that signatures of nodal surfacesis clearly detectable with the present technique, as shownfor benzonitrile [31, 33], and as discussed theoretically inRef. [56].
VII. ACKNOWLEDGEMENT
We thank C.P.J. Martiny for useful discussions. Thework was supported by the Danish National ResearchFoundation, the Lundbeck Foundation, The CarlsbergFoundation, the Danish Council for Independent Re-search (Natural Sciences) and the European Marie CurieInitial Training Network Grant No. CA-ITN-214962-FASTQUAST.
APPENDIX A: Molecular properties of OCS
The molecular properties of OCS were obtained for theexperimental geometry [57] based on the Hartree-Fockwavefunction [45], with the molecule oriented along theZ-axis and the O-end pointing towards the detector (seeFig. 2). In the coordinate system, defined in Fig. 2,where the center of mass of OCS is the origin, the Z-coordinates of the atomic centers are -2 a.u. for S, 0.99a.u. for C, and 3.2 a.u. for the O atom. The first ion-ization potential (Ip), computed as the positive energyof the highest occupied molecular orbital (HOMO), is11.4 eV (0.42 a.u.), in agreement with the experimen-tal value of 11.2 eV [58]. The OCS molecule has anasymmetric charge distribution with a dipole moment of0.71 D (1 a.u.=2.54 D) pointing towards the S-end [59].The OCS molecule has two degenerate HOMO orbitalsshown in Fig. 5. By expanding the total wave functionin a linear combination of atomic orbitals φi, centered ateach nucleus Ψ =
∑i ciφi, we obtain an estimate of the
electron population at each center as (ci)2. This popula-
tion analysis indicates that 75% of the HOMO electrondensity is localized on the S-end, 15% on the O-end andonly 10% on the C atom. The orbital lying just below theHOMO in energy has a significantly higher ionization po-tential (17.1 eV from Hartree-Fock calculations [45]), andsince we are in the tunneling regime with an exponentialsensitivity to the ionization potential its contribution tothe ionization dynamics is expected to be negligible.
In the development of the tunneling theory, we needthe dipole moments, polarizabilities and hyperpolariz-abilities of the OCS molecule. These were first computedusing the Hartree-Fock wavefunction in conjunction withthe aug-cc-pVTZ [61] basis set. Comparisons to resultsreported for the neutral molecule in the ComputationalChemistry Comparison and Benchmark DataBase [65],suggest that while the polarizabilities and hyperpolariz-

12
TABLE I: The dipole moment of the OCS molecule and thecation (in the geometry of the neutral molecule and bothpointing from the O-end to the S-end), given in units of Debye(1 au=2.54 Debye).
State TZVa ACCTb PCc APCd Sadleje
OCS 0.52 0.72 0.71 0.88 0.65
OCS+ 1.83 2.69 2.00 2.20 1.61aValence triple-ζ basis set [60].bDunning triple-ζ basis set [61].cJensen polarization-consistent basis set [62].dJensen polarization-consistent basis set with diffuse basis func-
tions [63].eSadlej pVTZ basis set [64].
TABLE II: The non-zero components of the polarizability andhyperpolarizability for the OCS molecule and the cation (inthe geometry of the neutral molecule), given in atomic units.
State αXX αY Y αZZ βXXZ βY Y Z βZZZ
OCS 26.15 26.15 50.72 -45.92 -45.92 -12.85
OCS+ 19.06 18.73 44.09 -17.55 -20.17 18.49
abilities are reasonable, the dipole moments should beimproved. We carried out calculations using the MP2level of theory with different basis sets, and the resul-tant dipole moments are shown in Table I. For the neu-tral molecule, the computed dipole moments are in fairagreement with the experimental value (0.71 D [59]). Forthe cation, on the other hand, we obtained a wider rangeof values depending on the basis set. A simple classicalmodel based on the redistribution of atomic charges dueto removal of the HOMO electron, without allowing theremaining electrons to relax, predicts µZ = -2.2 D for thecation. This is in very good agreement with the resultsbased on the Jensen’s polarization-consistent basis sets( -2.0 Debye without diffuse functions [62] vs. -2.2 De-bye with diffuse functions [63]). In the tunneling modelpresented in Section IV we use the dipole moment forOCS+ obtained via the simple charge model. The molec-ular polarizabilities and hyperpolarizabilities are shownin Table II.
[1] P. B. Corkum, Phys. Rev. Lett. 71, 1994 (1993).[2] T. Brabec and F. Krausz, Rev. Mod. Phys. 72, 545
(2000).[3] M. Lein, J. Phys. B: At. Mol. Opt. Phys. 40, R135 (2007).[4] F. Krausz and M. Ivanov, Rev. Mod. Phys. 81, 163
(2009).[5] A. Jaron-Becker, A. Becker, and F. H. M. Faisal, J. Phys.
B: At. Mol. Opt. Phys. 36, L375 (2003).[6] T. K. Kjeldsen, C. Z. Bisgaard, L. B. Madsen, and
H. Stapelfeldt, Phys. Rev. A 68, 063407 (2003).[7] I. V. Litvinyuk, K. F. Lee, P. W. Dooley, D. M. Rayner,
D. M. Villeneuve, and P. B. Corkum, Phys. Rev. Lett.90, 233003 (2003).
[8] T. K. Kjeldsen and L. B. Madsen, J. Phys. B 37, 2033(2004).
[9] T. K. Kjeldsen, C. Z. Bisgaard, L. B. Madsen, andH. Stapelfeldt, Phys. Rev. A 71, 013418 (2005).
[10] D. Pinkham and R. R. Jones, Phys. Rev. A 72, 023418(2005).
[11] D. Pavicic, K. F. Lee, D. M. Rayner, P. B. Corkum, andD. M. Villeneuve, Phys. Rev. Lett. 98, 243001 (2007).
[12] G. L. Kampta and A. D. Bandrauk, Phys. Rev. A 75,041401(R) (2007).
[13] D. A. Telnov and S.-I. Chu, Phys. Rev. A 76, 043412(2007).
[14] V. Kumarappan, L. Holmegaard, C. Martiny, C. B. Mad-sen, T. K. Kjeldsen, S. S. Viftrup, L. B. Madsen, andH. Stapelfeldt, Phys. Rev. Lett. 100, 093006 (2008).
[15] A. Staudte, S. Patchkovskii, D. Pavicic, H. Akagi,O. Smirnova, D. Zeidler, M. Meckel, D. M. Villeneuve,R. Doerner, M. Y. Ivanov, et al., Phys. Rev. Lett. 102,033004 (2009).
[16] J. Fernandez and L. B. Madsen, Phys. Rev. A 79, 063406(2009).
[17] M. Spanner and S. Patchkovskii, Phys. Rev. A 80, 063411(2009), ISSN 1050-2947.
[18] S. Petretti, Y. V. Vanne, A. Saenz, A. Castro, and P. De-cleva, Phys. Rev. Lett. 104, 223001 (2010).
[19] M. Abu-samha and L. B. Madsen, Phys. Rev. A 80,023401 (2009).
[20] F. Rosca-Pruna and M. J. J. Vrakking, Phys. Rev. Lett.87, 153902 (2001).
[21] H. Stapelfeldt and T. Seideman, Rev. Mod. Phys. 75,543 (2003).
[22] D. H. Parker and R. B. Bernstein, Annu. Rev. Phys.Chem 40, 561 (1989).
[23] M. H. M. Janssen, J. W. G. Mastenbroek, and S. Stolte,J. Phys. Chem. A 101, 7605 (1997).
[24] H. J. Loesch and J. Remscheid, J. Chem. Phys. 93, 4779(1990).
[25] S. De, I. Znakovskaya, D. Ray, F. Anis, N. G. Johnson,I. A. Bocharova, M. Magrakvelidze, B. D. Esry, C. L.Cocke, I. V. Litvinyuk, et al., Phys. Rev. Lett. 103,153002 (2009).
[26] K. Oda, M. Hita, S. Minemoto, and H. Sakai, Phys. Rev.Lett. 104, 213901 (2010).
[27] A. Goban, S. Minemoto, and H. Sakai, Phys. Rev. Lett.101, 013001 (2008).
[28] O. Ghafur, A. Rouzee, A. Gijsbertsen, W. K. Siu,S. Stolte, and M. J. J. Vrakking, Nat. Phys 5, 289 (2009).
[29] L. Holmegaard, J. H. Nielsen, I. Nevo, H. Stapelfeldt,F. Filsinger, J. Kupper, and G. Meijer, Phys. Rev. Lett.102, 023001 (2009).
[30] F. Filsinger, J. Kupper, G. Meijer, L. Holmegaard, J. H.Nielsen, I. Nevo, J. L. Hansen, and H. Stapelfeldt, J.Chem. Phys. 131, 064309 (2009).
[31] L. Holmegaard, J. L. Hansen, L. Kalhøj, S. L. Kragh,H. Stapelfeldt, F. Filsinger, J. Kupper, G. Meijer,D. Dimitrovski, M. Abu-samha, et al., Nature Physics6, 428 (2010).
[32] For ionization with few-cycle pulses asymmetries of elec-tron emission in ionization of atoms have been observed

13
[66]. The ionizing pulses used here contains about 10 op-tical cycles and, moreover, they are not carrier-envelope(CEP) stabilized, so the observed results should not berelated to CEP effects in the laser-molecule interaction.
[33] J. L. Hansen, L. Holmegaard, L. Kalhøj, S. L. Kragh,H. Stapelfeldt, F. Filsinger, J. Kupper, G. Meijer,D. Dimitrovski, M. Abu-samha, et al., submitted to Phys.Rev. A (2010).
[34] U. Even, J. Jortner, D. Noy, N. Lavie, and C. Cossart-Magos, J. Chem. Phys. 112, 8068 (2000).
[35] M. Hillenkamp, S. Keinan, and U. Even, J. Chem. Phys.118, 8699 (2003).
[36] I. Nevo, L. Holmegaard, J. H. Nielsen, J. L. Hansen,H. Stapelfeldt, F. Filsinger, G. Meijer, and J. Kupper,Phys. Chem. Chem. Phys. 11, 9912 (2009).
[37] S. Minemoto, H. Nanjo, H. Tanji, and T. Suzuki, J.Chem. Phys. 118, 4052 (2003).
[38] L. V. Keldysh, Sov. Phys. JETP 20, 1307 (1965).[39] L. D. Landau and E. M. Lifshitz, Quantum Mechanics,
Non-Relativistic Theory (Pergamon Press, 1958).[40] A. M. Perelomov, V. S. Popov, and M. V. Terentev, Sov.
Phys. JETP 23, 924 (1966).[41] M. V. Ammosov, N. B. Delone, and V. P. Krainov, Sov.
Phys. JETP 64, 1191 (1986).[42] X. M. Tong, Z. X. Zhao, and C. D. Lin, Phys. Rev. A
66, 033402 (2002).[43] R. N. Zare, Angular momentum (Wiley., 1988).[44] D. A. Varshalovich, A. N. Moskalev and V. K. Kher-
sonskii, Quantum Theory of Angular Momentum (WorldScientific, 1988).
[45] M. W. Schmidt, K. K. Baldridge, J. A. Boatz, S. T. El-bert, M. S. Gordon, J. H. Jensen, S. Koseki, N. Mat-sunaga, K. A. Nguyen, S. Su, et al., J. Comput. Chem.14, 1347 (1993).
[46] P. W. Atkins and R. S. Friedman, Molecular QuantumMechanics (Oxford University Press., 1996), 3rd ed.
[47] P. Dietrich and P. B. Corkum, J. Chem. Phys. 97, 3187(1992).
[48] H. Akagi, T. Otobe, A. Staudte, A. Shiner, F. Turner,R. Dorner, D. M. Villeneuve, and P. B. Corkum, Science325, 1364 (2009).
[49] M. Abu-samha and L. B. Madsen, Phys. Rev. A 81,033416 (2010).
[50] X. M. Tong and C. D. Lin, J. Phys. B: At. Mol. Opt.Phys. 38, 2593 (2005).
[51] D. Dimitrovski and L. B. Madsen, Phys. Rev. A 78,043424 (2008).
[52] J. S. Briggs, V. I. Savichev, and E. A. Solov’ev, Journalof Physics B: Atomic, Molecular and Optical Physics 33,3363 (2000).
[53] N. B. Delone and V. P. Krainov, J. Opt. Soc. Am. B 8,1207 (1991).
[54] P. Wang, A. M. Sayler, K. D. Carnes, B. D. Esry, andI. Ben-Itzhak, Opt. Lett. 30, 664 (2005).
[55] C. Z. Bisgaard, O. J. Clarkin, G. Wu, A. M. D. Lee,O. Gessner, C. C. Hayden, and A. Stolow, Science 323,1464 (2009).
[56] C. P. J. Martiny, M. Abu-samha, and L. B. Madsen,Phys. Rev. A 81, 063418 (2010).
[57] Y. Morino and C. Matsumura, Bullet. Chem. Soc. Jap.40, 1095 (1967).
[58] J. Delwiche, M.-J. Hubin-Franskin, G. Caprace, P. Na-talis, and D. Roy, J. Elec. Spectro. Rel. Phenom. 21, 205(1980).
[59] J. Reinartz and A. Dymanus, Chem. Phys. Lett. 24, 346(1974).
[60] J. Thom. H. Dunning, J. Chem. Phys. 55, 716 (1971). cl[61] J. Thom H. Dunning, J. Chem. Phys. 90, 1007 (1989).[62] F. Jensen, J. Chem. Phys. 115, 9113 (2001).[63] F. Jensen, J. Chem. Phys. 117, 9234 (2002).[64] A. J. Sadlej, Collec. Czech. Chem. Commun. 53, 1995
(1988).[65] http://cccbdb.nist.gov/.[66] D. B. Milosevic, G. G. Paulus, D. Bauer, and W. Becker,
J. Phys. B: At. Mol. Opt. Phys. 39, R203 (2006).


![“(Acetylacetonato)carbonyl{dicyclohexyl[4-(N,N-dimethylamino)phenyl] phosphine}rhodium(I)](https://static.fdokumen.com/doc/165x107/631b64dc7abff1d7c20ae8e4/acetylacetonatocarbonyldicyclohexyl4-nn-dimethylaminophenyl-phosphinerhodiumi.jpg)