OsGSR1 is involved in crosstalk between gibberellins and brassinosteroids in rice
Upload
khangminh22Category
view
4download
0
1
Analysis of Crosstalk in 3D Circularly PolarizedLCDs Depending on the Vertical Viewing Location
Menglin Zeng, and Truong Nguyen, Fellow, IEEE
Abstract—Crosstalk in Circularly Polarized (CP) liquid crystaldisplay (LCD) with polarized glasses (passive 3D glasses) ismainly caused by two factors: the polarizing system includingwave retarders and the vertical misalignment (VM) of lightbetween the liquid crystal (LC) module, and patterned retarder(PR). We show that the latter, which is highly dependent on thevertical viewing location, is a much more significant factor ofcrosstalk in CP LCD than the former. There are 3 contributions inthis paper. Initially, a display model for CP LCD which accuratelycharacterizes VM is proposed. A novel display calibration methodfor VM characterization which only requires pictures of thescreen taken at 4 viewing locations. In addition, we prove thatVM-based crosstalk can not be efficiently reduced by eitherpreprocessing the input images or by optimizing the polarizingsystem. Furthermore, we derive the analytic solution for theviewing zone where the entire screen does not have VM-basedcrosstalk.
Index Terms—3D LCD, 3D crosstalk, model, crosstalk reduc-tion.
I. INTRODUCTION
Media with 3D content such as 3D movies and 3D gamingshave found an increasing popularity in the market. Stereo-scopic displays utilize the horizontal parallax between theleft-eye (LE) and right-eye (RE) images which is defined asdisparity. As the object moves towards the viewer, disparityincreases. Objects with different disparities in the stereo im-ages create the sense of depth. The most critical factor in a3D stereoscopic display is to separate the LE and RE view,such that the left eye only sees the LE view and vice versa.
A. Achieving 3D in circularly polarized LCD
With the development of the technology in film-type pat-terned retarder (PR) [1], circularly polarized (CP) LCDs withpassive glasses are prospering in the 3D market. As illustratedin Fig. 1, CP LCD shows the LE and RE images in the odd-row pixels (the LE field of LCD) and the even-row pixels(the RE field of LCD) respectively. On top of every LE pixelrow, covers the LE-field PR, which comprises the quarter-waveretarders (QWR) for the LE view. Similarly, on top of everyRE pixel row, covers the RE-field PR, which comprises theQWRs for the RE view. The interlacing of the LE and REQWRs gives rise to PR. The light transmitted through theLE-field PR becomes left-hand (LH) circularly polarized. Thelight transmitted through the RE-field PR becomes right-hand(RH) circularly polarized. In the passive glasses, the LE lensonly transmits light of LH polarization, and the RE lens onlytransmits light of RE polarization. Thus, the PR and passive
This work is supported by NSF grant CCF-1065305.
Fig. 1: Schematic set up of CP LCD with passive glasses.
(a) Immersive 3D made of multipleCP LCDs.
(b) Left-eye view.
(c) Right-eye view.
Fig. 2: Crosstalk in CP LCD dependent on the vertical viewinglocation. (a) Crosstalk in an immersive 3D display formed bythe CP LCD grid. (b) and (c) Crosstalk in a single CP LCD.
glasses are the most critical factors in achieving the separationof LE and RE views in CP LCD. Any issue that causes thelight to deviate from the desired polarization will lead to lightleakage from the undesired view.
B. 3D Crosstalk
If, in the display, the LE image contains some portion ofthe RE image and vice versa, crosstalk occurs. Crosstalk isthe percentage of the RE images perceived by the left eye andthe percentage of the LE images perceived by the right eye.The qualitative as well as mathematical definitions of crosstalkare summarized in [2]. We adopt Eq. (1) [3] as the definitionof crosstalk, where leakage is the intensity of the undesiredimage, and signal is the intensity of the desired image.

2
(a) Vertical-misalignment crosstalk. (b) Polarizing-system crosstalk.
Fig. 3: Comparison of VM-based crosstalk and the crosstalkinduced by the polarizing system, where the level of crosstalkis indicated by the brightness of the screen on the left half. (a)crosstalk caused by vertical misalignment (VM). (b) Crosstalkcaused by the polarizing system.
crosstalk(%) =leakagesignal
× 100 (1)
Crosstalk appearance includes the ghosting or the double-edge objects. Fig. 2 shows the examples of crosstalk in CPLCD. In Fig. 2 (a), a 3D immersive display, which is formedby multiple CP LCDs, shows the doublings of the orange dots,and the black line especially in the bottom screens. In Fig. 2(b) and (c), which are respectively the left-eye (LE) and right-eye (RE) views of a single CP LCD, we can observe severecrosstalk which is highlighted by the red ellipses.
Crosstalk is the most detrimental factor in stereoscopic view[2]. Fusing the stereo images into 3D is already a challengingtask for HVS [4]: consider the conflict between the plane offocus and the plane of convergence of the eyes. Crosstalkmakes fusing even harder, degrades depth resolution signif-icantly [5], [6], [7], and increases eye strain and nausea [5].Crosstalk depends on both the stereoscopic displays and thehuman visual system (HSV). In this paper, we only considercrosstalk caused by the device.
The comparatively complete list of the causes of crosstalkin CP LCD is presented in [2] and [8]. These causes can besummarized as fabrication defect including inaccuracy in PRalignment, the limitation in the polarizing system includingangle dependency and wave-length dependency of PR andpassive glasses [1], [9], [10], [11], [12], and the verticalmisalignment of light between liquid crystal and PR [12] and[13] which takes place if the viewer deviates from the screencenter.
C. Vertical misalignment vs. polarizing system in CP LCD
The reason why, in this paper, we focus on vertical misalign-ment (VM) as the main factor causing crosstalk in CP LCD,is that compared to the other factors, including the polarizingsystem of CP LCD, VM is the dominant factor that causesvery severe crosstalk. The polarizing system of CP LCD whichcomprises PR and the wave retarder in the passive glasses,has been extensively investigated in [1], [10], [11], [14], [15]concerning crosstalk in CP LCD, while VM is only addressedby a few works [12] and [13].
In [16], it is proved that, even without any phase-compensation scheme, the amount of crosstalk caused by thepolarizing system is less than 4%. Furthermore, within low
level of crosstalk (< 5% in [17]), the human visual system(HVS) is still able to fuse the LE and RE images to perceivedepth. Thus the crosstalk caused by the polarizing system ofCP LCD is rather a type of ”3D noise” [18] appearing asfaint shadows from the other view. However, an increasinglevel of crosstalk, which is the case of VM-based crosstalkas shown in this paper, hinders the HVS to find the correctcorrespondences between the LE and RE images [19]. In thiscase, stereo images are not fused by the HSV [20] and objectsappear to be double-contoured, as shown in Fig. 2. As a result,VM-based crosstalk prevents the perception of depth.
Fig. 3 compares the VM-based crosstalk with the crosstalkcaused by the polarizing system in a real CP LCD [21]. InFig. 3, the screen is captured after the left-eye polarized lens;the left-eye input image is black, the right-eye input image iswhite on the left half and is black on the right half. Thus, thebright areas shown on the left-half screen in Fig. 3 (a) and (b)are caused by crosstalk. The right-half screens in Fig. 3 (a)and (b) have no crosstalk because the input images in LE andRE channels are black. Fig. 3 (a) is resulted from shifting theviewing location vertically with respect to the screen center toinduce vertical misalignment of light, and Fig. 3 (b) is capturedat the viewing location aligned to the screen center (frontalparallel). From Fig. 3, we can observe that the crosstalkcaused VM is much brighter than the crosstalk caused by thepolarizing system.
D. Related works and organization
So far, not a significant number of works have been done toinvestigate the issue of VM. [2] only addresses VM by qualita-tive description. The optical designs in [1] and [11] can mainlytarget on reducing crosstalk caused by the polarizing system.The modeling of VM can also be found in [13]. However, [13]requires preknowledge of many intrinsic display parameters.In this paper, we propose a novel calibration method basedon least square, which takes only a few pictures of the screentaken at 4 locations, and then solves for CP LCD’s intrinsicparameters. A preliminary version of the proposed calibrationmethod can be found in [12] where the calibration method ispresented. [12] requires users’ input for the calibration whichaffects the result by the subjective evaluations. This paperchanges the users’ input into image processing. In addition,this paper provides the detailed derivation of the calibrationmethod, proves mathematically that VM-based crosstalk cannot be effectively reduced by the polarizing system, and alsopresents analytic solution for the viewing zone that is free fromthe severe crosstalk caused by VM. In [22], P.B. et al. proposedcalibrating CP LCD by using Fourier-optics based device.Compared to the proposed calibration method, the Fourier-optics based device is costly as well as requiring measurementsat many locations.
The remainder of this paper is organized in 5 sections.In Section II, a display model for CP LCD consideringVM is proposed. In Section III, the calibration method forthe intrinsic parameters of CP LCD is presented with thevalidation of subjective test. We discuss the cancellation ofVM-based crosstalk through the display system in Section IV.

3
(a)
(b) (c)
Fig. 4: Issue of vertical misalignment (VM) of light in CPLCD and its mitigations. (a) Cross-sectional view of CP LCDwith VM. hit and miss are the percentage of the light that istransmitted through the desired and undesired PR respectively.hit+miss = 1. (b) Adjusting the size and position of PR withrespect to the LCD panel [2]. (c) Inserting black matrix (BM)to block some misaligned light [8].
In Section V, the analytic solution of the VM-free viewingzone is derived. Section VII concludes this work.
II. DISPLAY MODEL CONSIDERING VM
A. VM characterization
The mechanism of VM is shown in Fig. 4(a). Before lightis transmitted through PR, the LE-field and RE-field lightshave the same polarization. It is PR that turns the LE-fieldand RE-field lights into orthogonal polarization. However, asshown in Fig. 4(a), due to the spacing between the LC paneland PR for modules such as color filter (CF), glass substrateand LP, when the incident angle shifts vertically, some portionof the light is transmitted through the undesired field of PR.Fig. 4(a) shows that, at normal incident angle, the LE-fieldlight ray (emitted from the LC unit labeled with ”L”), whichis completely transmitted through the LE PR (PR unit labeledwith ”L”), is in LH circular polarization. If some portion ofthe light ray is transmitted through the RE PR (PR unit labeledwith ”R”), the addition of the LH and RH polarization leadsto partially polarized light or unpolarized light. If the LE-fieldlight is transmitted completely through the RE PR, it turnsinto RH circular polarization. VM occurs in the RE field in asimilar way. To characterize VM, we define indices hit andmiss in Eq. (2), as the percentage of light transmitted in thedesired and undesired PR respectively. Note that hit+miss =1.
(2)[hitmiss
]=
1
emitted light·[
light from the desired PRlight from the undesired PR
]Two methods are widely adopted to mitigate VM:
Fig. 5: Real CP LCD [21] at different viewing locations:view1-view4. The screen is captured after the left-eye lens.The left-eye input image is black and the right-eye inputimage is white. view1: aligned to screen top edge at distance1m, view2: aligned to screen top edge at distance 0.8m,view3:aligned to screen bottom edge at distance 1m, view4:aligned to screen bottom edge at distance 0.8m.
• Reduce the size of the PR module and shift it w.r.t theLC panel, such that the entire screen is VM-free withincertain viewing zone [2] (Fig. 4(b)).
• Insert black matrix (BM), comprised of horizontal blackstrips, in the CF layer to absorb some portion of thevertically misaligned light ray [8] (Fig. 4(c)).
Nevertheless, severe VM-based crosstalk still presents in CPLCD especially when the viewing location deviates verticallyaway from the screen center. Fig. 3 compares crosstalk inducedby the polarizing system of CP LCD, which is shown inFig. 3(a), and crosstalk resulted from VM in CP LCD, whichis shown in Fig. 3(b). The input images in Fig. 3(a), (b) are thesame (see the caption of Fig. 3 for details). All the real-displaydemonstrations in this paper are on LG 47LH55 (1080p) [21],which is 58.5cm× 104.0cm (h×w). The viewing location inFig. 3(a) is vertically aligned to the screen center to eliminateVM-based crosstalk. The viewing location in Fig. 3(b) isaligned to the upper edge of the screen such that VM-basedcrosstalk shows. The viewing distance in Fig. 3(a), (b) is 1m.The brightness shown on the left half of the screen in Fig. 3 isresulted from crosstalk, and it increases with crosstalk. We canobserve from Fig. 3 that when VM-based crosstalk is present,it’s much more dominant than that caused by the polarizingsystem. Besides, the dark area shown in Fig. 3(b) is the resultof the absorption of light from the black matrix.
Apart from the severity of VM-based crosstalk, its spatialdistribution on the screen is sensitive to the viewing locationalong the vertical direction. Fig. 5 shows images of a real CPLCD [21] observed from 4 different viewing locations denotedas view1-view4. The bright areas shown on the screen inFig. 5 indicate crosstalk caused by VM, and the dark areasarise from the absorption of light by BM. We can observefrom Fig. 5 that the crosstalk-prominent area moves withthe viewing location. Due to the severity and mobility ofVM-based crosstalk, the comfortable viewing zone where nosevere crosstalk presents is significantly limited in the verticaldirection.

4
B. The display model
The relationship between the luminance input and output ofCP LCD can be expressed as:
(3)[Lo(i, j)Ro(i, j)
]=
[tLL tLR
tRL tRR
] [Lin(i)Rin(j)
]In Eq. (3) [12], Lin(i) and Rin(j) are the luminance inthe input images in the LE and RE channels respectively,Lo(i, j) and Ro(i, j) are the luminance after the polarizedglasses in the LE and RE channels respectively. i and j inEq. (3) are the grayscale levels of the LE and RE inputimages respectively. The 2x2 matrix on the RHS in Eq. (3)is the display transmittance matrix (TM). tLL in TM is thetransmittance of the LE pixel in the LE view, tLR in TMdenotes the transmittance of the RE pixel in the LE view.Similarly, the entries tLR and tRL in TM are defined. Theentries of transmittance in TM in Eq. (3) range from 0 to1. Eq. (3) shows that the display has no crosstalk if TMis diagonal. Extending from Eq. (1), to combine the displaymodel in Eq. (3), the LE and RE crosstalk can be expressedas [16]:
crosstalkL =tLR
tLL=SLL0 ×miss+ SLR0 × hitSLL0 × hit+ SLR0 ×miss
(4)
crosstalkR =tRL
tRR=SRL0 × hit+ SRR0 ×missSRL0 ×miss+ SRR0 × hit
(5)
Let us first consider the simplified display which has noissue of VM. Fig. 6 shows the 4 possible light paths consid-ering the polarizing system of CP LCD only. We use Muellercalculus (MC) [23] to model CP LCD’s polarizing system asillustrated in Fig. 6. In MC, the polarization state of light ischaracterized by the 4x1 Stokes vector [23], denoted as S,where the first entry S0 is intensity (normalized luminancein this paper). The optical modules (such as LP and waveretarder) are characterized by the 4x4 Muller matrix, denotedas M. The details of the Ms for LP, LC and PR can be foundin [11] and [23]. When light is transmitted through an opticalmodule, the Stokes vector of the light is left multiplied withthe corresponding Mueller matrix. The left-most ”LCD panel”in Fig. 6 is the composition of all the optical modules inCP LCD before PR. Components such as LC, the back andfront LPs are included in ”LCD panel”. Since lights from theLE and RE fields of the monitor have the same polarizationbefore they are transmitted through the PR, we can denotetheir Stokes vectors as Si (as shown in Fig. 6). Furthermore,we assume Si = [1, 1, 0, 0]T , which is horizontally polarizedwith luminance 1 (normalized intensity). Consequently, theminor changes in luminance and polarization after the LCDpanel [24] are ignored, and the resulted output luminance afterthe polarized glasses is by definition the transmittance of thedisplay. As shown in Fig. 6, the Stokes vector of the lightsignal from the LE field of the monitor transmitted after theLE lens is denoted as SLL, and that from the LE field of themonitor transmitted after the RE lens is denoted as SRL. Inthe same way, we define SLR and SRR.
Fig. 6: 4 types of light paths in the polarizing system of CPLCD.
(6)
SLL
SLR
SRL
SRR
=
Mlens
LMlens
LMlens
RMlens
R
MRot(θrot)
MPR
LMPR
RMPR
LMPR
R
Sin
(7)[tLL tLR
tRL tRR
]=
[SLL0 SLR0
SRL0 SRR0
] [hit missmiss hit
]The next step is to include VM into the display model. Con-
sidering a light ray emitted from the LE field of the monitorbefore this transmission through the PR. By the definition ofhit and miss in Eq. (2), the portion of this light ray transmit-ted through the LE PR first and then transmitted after the LElens has the Stokes vector (SV): hit×MPR
L MlensL Sin = hit×
SLL. Similarly, the portion of this light ray that’s misalignedto the RE PR and then transmitted through the LE lens has theStokes vector: hit ×MPR
L MlensR Sin = hit × SLR. Therefore,
the Stokes vector of this LE-field light ray transmitted throughthe LE lens becomes hit× SLL +miss× SLR. In the sameway, the SV of a LE-field light ray transmitted through the RElens is hit× SRL +miss× SRR; the SV of a RE-field lighttransmitted through the LE lens is hit× SLR +miss× SLL;the SV of a RE-field light transmitted through the RE lensis hit × SRR + miss × SRL. Writing the aforementionedthe SV outputs into matrix form, the transmittance matrix ofthe display can be expressed as shown in Eq. (7). Since onlyluminance is concerned in transmittance, only the first entriesof the SVs are used in Eq. (7).
We can observe from Eq. (7) that even when the polarizingsystem is ideal, crosstalk increases significantly with miss.Since RHS matrices in Eq. (7) are constrained to have non-negative entries: entries in the left matrix quantity are lumi-nance and those in the right matrix quantity are ratios between0 and 1, to result in a crosstalk-free TM, the two RHS matriceshave to be both diagonal.
III. DISPLAY CALIBRATION FOR VM
To calculate hit and miss, the intrinsic display parameterswhich are shown in Fig. 7 need to be calibrated. hp inFig. 7 is pixel height, which can be calculated from thescreen size and display resolution. For LG 47LH55 [21],hp = 58.5cm/1080 ≈ 541.9µm. hBM in Fig. 7 is BM unit’sheight. Estimated under the magnifier, hBM = 1
3hp = 180.6µm[21]. The other display parameters shown in Fig. 7 are hPR:

5
(a) Viewing from high position. (b) Viewing from low position.
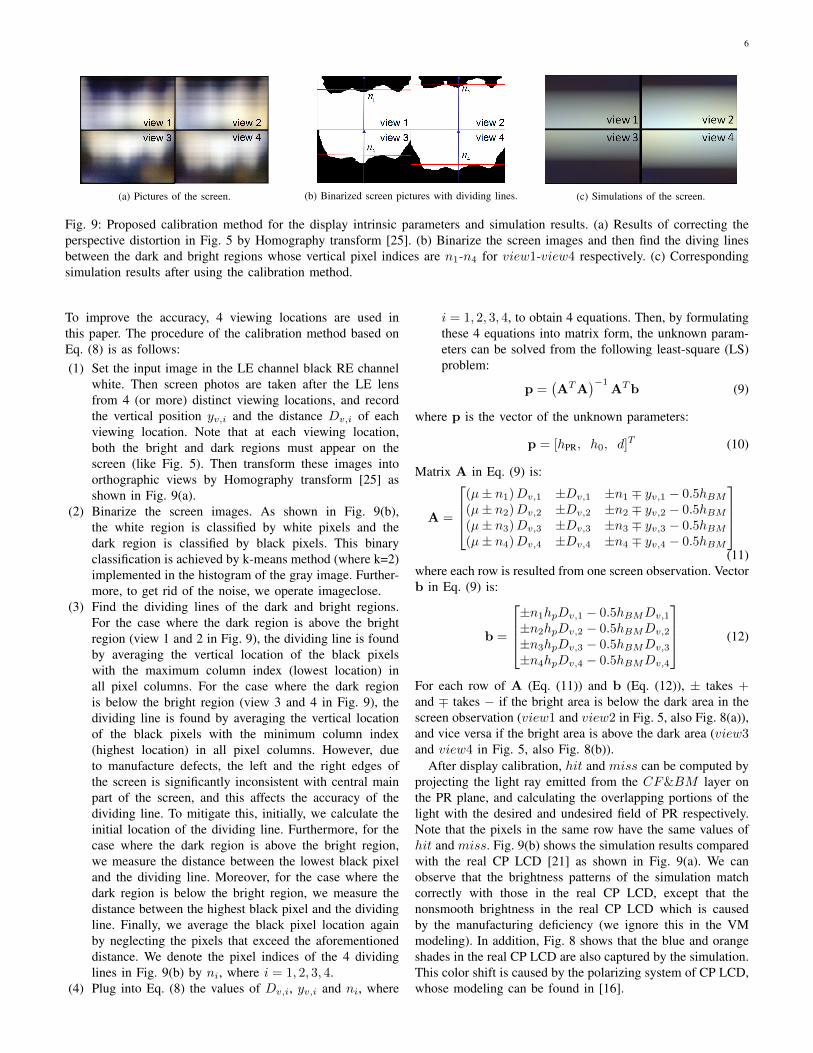
Fig. 8: Schematic cross section of LC panel, CF and BM layer, PR with different viewing locations. (a) VM appears in thelower part of the screen (below pixel ni) which is the case of view1 and view2 in Fig. 5. (b) VM appears in the upper partof the screen (above pixel ni) which is the case of view3 and view4 in Fig. 5. 4ABC ∼ 4ADE in (a) and (b). The y axisis the vertical direction of the display. The Y-axis expressions of points A-E in (a) and (b) are shown. yv,i is the y-axis valueof the viewing location measured at the ith observation. Dv,i is the viewing distance from screen to viewer measured at theith observation. µ is the threshold percentage of pixel leakage that results in visible crosstalk caused by VM.
Fig. 7: Illustration of the intrinsic display parameters tocharacterize vertical misalignment in CP LCD.
the PR unit’s height, h0: the vertical shift between the LCand PR modules, and d: the spacing between the LC andPR. However, hPR, h0 and d are difficult to acquire, and noprevious work has been done in calibrating the intrinsic displayparameters of CP LCD to model VM. In the remainder of thissection, we propose a novel calibration method to estimatethese unknown parameters. The preliminary version of thismethod can be found in our published work [12].
Assume the LE input image is black and the RE inputimage is white, and the screen is observed after the LE lens,Fig. 8(a) illustrates the viewing condition where the screen isobserved from a high position (above the screen center). Inthis case, the RE (white) pixels, whose indices are greaterthan ni, are transmitted through the RE-field (desired) PR(or miss = 0), and thus in RH polarized, whereas, the REpixels, whose indices are smaller than ni, have positive overlapwith the LE-field (undesired) PR (or miss > 0), and theydeviate from RH polarization. Subscript i of ni denotes theith observation used for display calibration (will be explainedlater). As demonstrated in view1 and view2 of Fig. 5, theblack-channel view of the real CP LCD (1080p) [21] is dark(VM-free) in the upper part and bright (VM-present) in thelower part observed from high viewing locations. Another
viewing condition is illustrated in Fig. 8(b), where the screen isobserved from a low position (below the screen center) in theLE channel. In this case, the RE (white) pixels, whose pixelindices are smaller than ni, are transmitted through the RE-field (desired) PR (miss = 0), and thus in RH polarization,whereas, the RE pixels, whose indices are greater than ni, havepositive overlap with the LE-field (undesired) PR (miss > 0),and they deviate from RH polarization. In view3 and view4in Fig. 5, the black-channel view of the real CP LCD is dark(VM-free) in the lower part and bright (VM-present) in theupper part observed from low viewing locations.
Consequently, by setting the input image for one eye blackand that for the other eye white, the screen observation inthe black-image channel is highly dependent on the display’sintrinsic parameters and the viewing location. Therefore, wecan calculate hPR, h0 and d from screen observation. Asshown in Fig. 8(a), A is the starting point of VM, E is theviewing location, the light from A transmits PR toward theviewer through C, B and D are respectively projections of Cand E on the CF&BM layer, and Dv,i is the viewing distanceof the ith observation for display calibration. By definition,BC = d, and DE = Dv,i. Because BC ‖ DE, we have4ABC ∼ 4ADE. Similarly, 4ABC ∼ 4ADE also holdsin Fig. 8(b). With the expressions of Y-axis values of A-E asshown in Fig. 8, we can write the relationship BC
AB = DEAD as
shown in Fig. 8, into:
d
(µ± ni)hPR ∓ nihp ± h0 + 0.5hBM=
Dv,i
±yv,i ∓ nihp + 0.5hBM(8)
where yv,i is location of the viewer measured vertically. InEq. (8), ± takes +, and ∓ takes − if the VM-present areaappears at the lower part of the screen (view1 and view2 inFig. 5, also Fig. 8(a)), and vice versa if the VM-present areais at the upper part of the screen (view3 and view4 in Fig. 5,also Fig. 8(b)).
To solve for the 3 unknowns (hPR, h0 and d), we need atleast 3 of Eq. (8) resulted from 3 distinct viewing locations.
6
(a) Pictures of the screen. (b) Binarized screen pictures with dividing lines. (c) Simulations of the screen.
Fig. 9: Proposed calibration method for the display intrinsic parameters and simulation results. (a) Results of correcting theperspective distortion in Fig. 5 by Homography transform [25]. (b) Binarize the screen images and then find the diving linesbetween the dark and bright regions whose vertical pixel indices are n1-n4 for view1-view4 respectively. (c) Correspondingsimulation results after using the calibration method.
To improve the accuracy, 4 viewing locations are used inthis paper. The procedure of the calibration method based onEq. (8) is as follows:(1) Set the input image in the LE channel black RE channel
white. Then screen photos are taken after the LE lensfrom 4 (or more) distinct viewing locations, and recordthe vertical position yv,i and the distance Dv,i of eachviewing location. Note that at each viewing location,both the bright and dark regions must appear on thescreen (like Fig. 5). Then transform these images intoorthographic views by Homography transform [25] asshown in Fig. 9(a).
(2) Binarize the screen images. As shown in Fig. 9(b),the white region is classified by white pixels and thedark region is classified by black pixels. This binaryclassification is achieved by k-means method (where k=2)implemented in the histogram of the gray image. Further-more, to get rid of the noise, we operate imageclose.
(3) Find the dividing lines of the dark and bright regions.For the case where the dark region is above the brightregion (view 1 and 2 in Fig. 9), the dividing line is foundby averaging the vertical location of the black pixelswith the maximum column index (lowest location) inall pixel columns. For the case where the dark regionis below the bright region (view 3 and 4 in Fig. 9), thedividing line is found by averaging the vertical locationof the black pixels with the minimum column index(highest location) in all pixel columns. However, dueto manufacture defects, the left and the right edges ofthe screen is significantly inconsistent with central mainpart of the screen, and this affects the accuracy of thedividing line. To mitigate this, initially, we calculate theinitial location of the dividing line. Furthermore, for thecase where the dark region is above the bright region,we measure the distance between the lowest black pixeland the dividing line. Moreover, for the case where thedark region is below the bright region, we measure thedistance between the highest black pixel and the dividingline. Finally, we average the black pixel location againby neglecting the pixels that exceed the aforementioneddistance. We denote the pixel indices of the 4 dividinglines in Fig. 9(b) by ni, where i = 1, 2, 3, 4.
(4) Plug into Eq. (8) the values of Dv,i, yv,i and ni, where
i = 1, 2, 3, 4, to obtain 4 equations. Then, by formulatingthese 4 equations into matrix form, the unknown param-eters can be solved from the following least-square (LS)problem:
p =(ATA
)−1ATb (9)
where p is the vector of the unknown parameters:
p = [hPR, h0, d]T (10)
Matrix A in Eq. (9) is:
A =
(µ± n1)Dv,1 ±Dv,1 ±n1 ∓ yv,1 − 0.5hBM
(µ± n2)Dv,2 ±Dv,2 ±n2 ∓ yv,2 − 0.5hBM
(µ± n3)Dv,3 ±Dv,3 ±n3 ∓ yv,3 − 0.5hBM
(µ± n4)Dv,4 ±Dv,4 ±n4 ∓ yv,4 − 0.5hBM
(11)
where each row is resulted from one screen observation. Vectorb in Eq. (9) is:
b =
±n1hpDv,1 − 0.5hBMDv,1
±n2hpDv,2 − 0.5hBMDv,2
±n3hpDv,3 − 0.5hBMDv,3
±n4hpDv,4 − 0.5hBMDv,4
(12)
For each row of A (Eq. (11)) and b (Eq. (12)), ± takes +and ∓ takes − if the bright area is below the dark area in thescreen observation (view1 and view2 in Fig. 5, also Fig. 8(a)),and vice versa if the bright area is above the dark area (view3and view4 in Fig. 5, also Fig. 8(b)).
After display calibration, hit and miss can be computed byprojecting the light ray emitted from the CF&BM layer onthe PR plane, and calculating the overlapping portions of thelight with the desired and undesired field of PR respectively.Note that the pixels in the same row have the same values ofhit and miss. Fig. 9(b) shows the simulation results comparedwith the real CP LCD [21] as shown in Fig. 9(a). We canobserve that the brightness patterns of the simulation matchcorrectly with those in the real CP LCD, except that thenonsmooth brightness in the real CP LCD which is causedby the manufacturing deficiency (we ignore this in the VMmodeling). In addition, Fig. 8 shows that the blue and orangeshades in the real CP LCD are also captured by the simulation.This color shift is caused by the polarizing system of CP LCD,whose modeling can be found in [16].
7
(a) Screen shot, view A. (b) Simulation, view A. (c) Screen shot, view B. (d) Simulation, view B.
(e) Screen shot, view C. (f) Simulation, view C. (g) Screen shot, view D. (d) Simulation, view D.
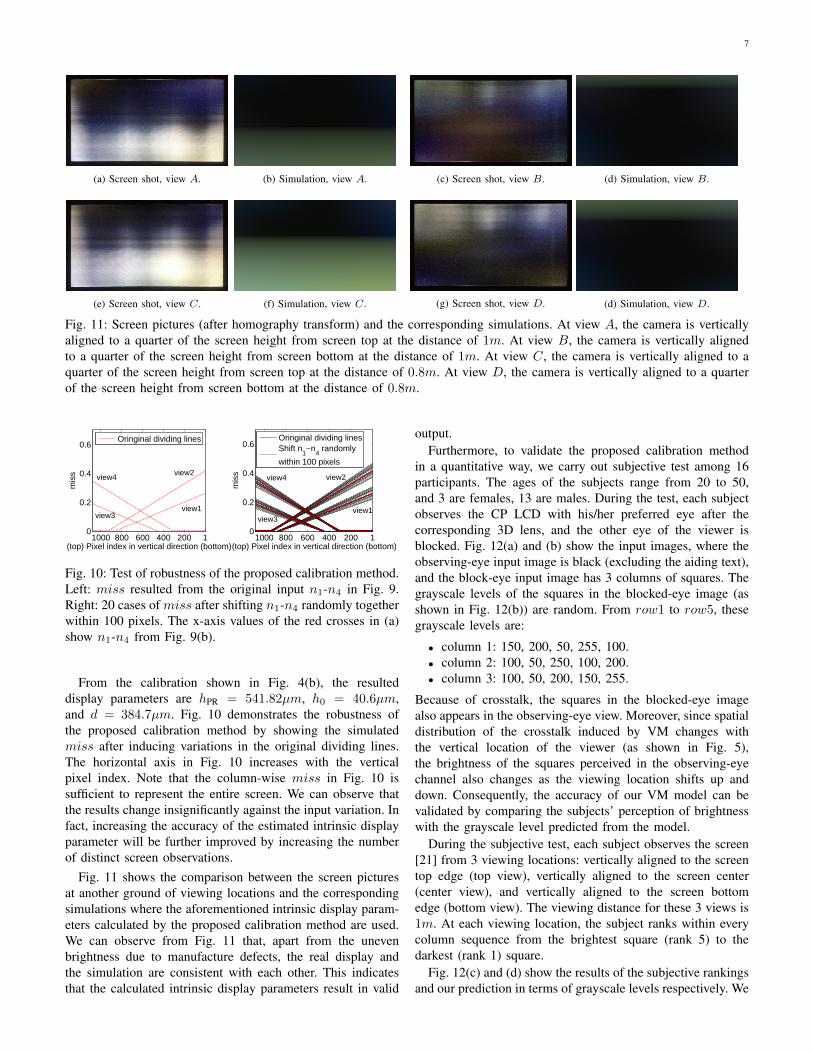
Fig. 11: Screen pictures (after homography transform) and the corresponding simulations. At view A, the camera is verticallyaligned to a quarter of the screen height from screen top at the distance of 1m. At view B, the camera is vertically alignedto a quarter of the screen height from screen bottom at the distance of 1m. At view C, the camera is vertically aligned to aquarter of the screen height from screen top at the distance of 0.8m. At view D, the camera is vertically aligned to a quarterof the screen height from screen bottom at the distance of 0.8m.
1000 800 600 400 200 10
0.2
0.4
0.6
(top) Pixel index in vertical direction (bottom)
mis
s
Oringinal dividing lines
1000 800 600 400 200 10
0.2
0.4
0.6
(top) Pixel index in vertical direction (bottom)
mis
s
Oringinal dividing linesShift n
1−n
4 randomly
within 100 pixelsview2
view1
view4 view2
view3view1
view3
view4
Fig. 10: Test of robustness of the proposed calibration method.Left: miss resulted from the original input n1-n4 in Fig. 9.Right: 20 cases of miss after shifting n1-n4 randomly togetherwithin 100 pixels. The x-axis values of the red crosses in (a)show n1-n4 from Fig. 9(b).
From the calibration shown in Fig. 4(b), the resulteddisplay parameters are hPR = 541.82µm, h0 = 40.6µm,and d = 384.7µm. Fig. 10 demonstrates the robustness ofthe proposed calibration method by showing the simulatedmiss after inducing variations in the original dividing lines.The horizontal axis in Fig. 10 increases with the verticalpixel index. Note that the column-wise miss in Fig. 10 issufficient to represent the entire screen. We can observe thatthe results change insignificantly against the input variation. Infact, increasing the accuracy of the estimated intrinsic displayparameter will be further improved by increasing the numberof distinct screen observations.
Fig. 11 shows the comparison between the screen picturesat another ground of viewing locations and the correspondingsimulations where the aforementioned intrinsic display param-eters calculated by the proposed calibration method are used.We can observe from Fig. 11 that, apart from the unevenbrightness due to manufacture defects, the real display andthe simulation are consistent with each other. This indicatesthat the calculated intrinsic display parameters result in valid
output.Furthermore, to validate the proposed calibration method
in a quantitative way, we carry out subjective test among 16participants. The ages of the subjects range from 20 to 50,and 3 are females, 13 are males. During the test, each subjectobserves the CP LCD with his/her preferred eye after thecorresponding 3D lens, and the other eye of the viewer isblocked. Fig. 12(a) and (b) show the input images, where theobserving-eye input image is black (excluding the aiding text),and the block-eye input image has 3 columns of squares. Thegrayscale levels of the squares in the blocked-eye image (asshown in Fig. 12(b)) are random. From row1 to row5, thesegrayscale levels are:
• column 1: 150, 200, 50, 255, 100.• column 2: 100, 50, 250, 100, 200.• column 3: 100, 50, 200, 150, 255.
Because of crosstalk, the squares in the blocked-eye imagealso appears in the observing-eye view. Moreover, since spatialdistribution of the crosstalk induced by VM changes withthe vertical location of the viewer (as shown in Fig. 5),the brightness of the squares perceived in the observing-eyechannel also changes as the viewing location shifts up anddown. Consequently, the accuracy of our VM model can bevalidated by comparing the subjects’ perception of brightnesswith the grayscale level predicted from the model.
During the subjective test, each subject observes the screen[21] from 3 viewing locations: vertically aligned to the screentop edge (top view), vertically aligned to the screen center(center view), and vertically aligned to the screen bottomedge (bottom view). The viewing distance for these 3 views is1m. At each viewing location, the subject ranks within everycolumn sequence from the brightest square (rank 5) to thedarkest (rank 1) square.
Fig. 12(c) and (d) show the results of the subjective rankingsand our prediction in terms of grayscale levels respectively. We

8
1 2 31
2
3
4
5Top view
Column
Ran
king
1 2 31
2
3
4
5Center view
Column
Ran
king
1 2 31
2
3
4
5Bottom view
Column
Ran
king
row1row2row3row4row5
(a) Subjective rankings of the square sequences.
1 2 30
50
100
150
Top view
Column
Gra
y sc
ale
1 2 30
20
40
60Center view
ColumnG
ray
scal
e
1 2 30
50
100
150Bottom view
Column
Gra
y sc
ale
row1row2row3row4row5
(b) Simulated grayscale levels of the square sequences.
Fig. 13: Results of subjects’ rankings of the crosstalk intensity compared with simulation results from the proposed modeling.The simulation results of crosstalk intensity are represented by graylevel scales. The input stereo images for subjective testare shown in Fig. 12. (a): subjective rankings of brightness for each column sequence (rank 5− 1: brightest through darkest)averaged among the 16 subjects. (b): simulated grayscale levels of each sequence resulted from the proposed calibration method.
1 2 3 4 50
100
200Top view
Subjective ranking
Sim
ulat
ed
gray
sca
le
1 2 3 4 50
20
40
60Center view
Subjective ranking
Sim
ulat
ed
gray
sca
le
1 2 3 4 50
50
100
150Bottom view
Subjective ranking
Sim
ulat
ed
gray
sca
leR2 = 0.9581R2 = 0.9147 R2 = 0.8559
Fig. 14: Correlation between subjective ranking and simulation results measured by R2 coefficient of determinanation.
(a) Observing-eye image. (b) Blocked-eye image.
Fig. 12: Subjective test on crosstalk caused by vertical mis-alignment (VM) of light in CP LCD. (a) and (b) are inputimages.
observe from the subjective rankings in Fig. 12(c) that withineach column sequence, the order of the perceived brightnessamong the squares varies when the vertical viewing levelchanges. In addition, this change of order is also predictedin the simulated grayscale levels of the squares. As shown inFig. 12(c) and (d), the orderings of grayscale levels in eachcolumn from model prediction mostly matches the orderingsof the perceived brightness from human observation. However,the latter shows greater brightness distinctions than the former.One of the reasons is that the subjects only make 5 rankingswhich highly quantized the brightness perception. The otherreason can be the manufacturing deficiency which causednonuniform light distribution as shown in Fig.5. In Fig. 14,
the subjective rankings and model predictions are plotted inthe same graph with their linear fittings (from least square).The R2 coefficients (R2 = 1 when observation and modelprediction is totally correlated) in Fig. 14 suggest better thatthe model predictions for the top and center views agree betterwith human observations than those for the bottom view. Onereason for this is that from the bottom view, the squareshave similar brightness: row1, row4 and row5 in column3at bottom view, the effect of quantization (and even error) inthe subjective ranking is more significant.
Fig. 15 shows the LE-view simulations of natural imagesat two different viewing locations compared with the realCP LCD [21]. We can observe that the proposed displaymodel accurately predicts the display output in terms of thevisibility and spatial distribution of crosstalk. It shows in bothsimulation and the real display that crosstalk in the top viewappears mainly in the lower half of the image, while crosstalkin the bottom view is more visible in the upper half of theimage caused by VM. Consider ”Books” [26] in Fig. 15 forexample, the book entitled with ”Computer Vision” showslimited crosstalk along its left edge in the top view while aprominent white shadow is observed in the bottom view.

9
Fig. 15: Results of ”Books” [26] (top row) in left view, ”Dwarves” [26] (center row) in right view, and ”Dolls” [26] (bottomrow) in left view. Two viewing locations are tested: vertically aligned to the screen top at the distance of 1m (left two columns),and vertically aligned to the screen bottom at the distance of 1m (right two columns). From left to right, the 1st and 3rd
columns are resulted from simulation, and the 2nd and 4th columns show the real CP LCD. Note that the tiltedness of thedisplay in photos are corrected by Homography tranform. The real CP LCD is LG 47LH55 (1080p) [21].
Fig. 16: System diagram of the display with the issue of verti-cal misalignment. Upper band: left-eye channel. Lower band:right-eye channel. Left crossed path: vertical misalignment inthe LCD panel. Right crossed path: light propagation from theundesired eye channels to 3D glasses.
IV. CROSSTALK REDUCTION CONSIDERING VM
Since severe crosstalk occurs with VM, crosstalk reduc-tion methods based on luminance compensation [27] willinduce significant contrast loss. Moreover, because VM-basedcrosstalk changes with the viewing location, head trackingis required to update the compensation parameters (and thismethod fails for multiple viewers scenario). In this section,the reduction of VM-based crosstalk is discussed for both theconventional and unconventional display systems.
Fig. 16 shows the system diagram of the display with theissue of VM where the upper and the lower channels are LEand RE respectively. In Fig. 16, Si,L and Si,R denote the
Stokes vectors (SV) of the light in the LE and RE channelsrespectively before VM occurs; MLCD
L and MLCDL denote the
Muller matrices (MM) of all optical modules after VM occurs.Consider the conventional display configuration in Fig. 4,MLCD
L = MPRL , and MLCD
L = MPRR . Mlens
L and MlensR
are MMs of LE and RE lenses respectively. The upper bandand lower band of Fig. 16 are the LE and RE light pathswithout crosstalk. The two crossed paths in Fig. 16 inducescrosstalk. The left crossed path in Fig. 16 with coefficientmiss represents the vertically misaligned light signal. Theright crossed path with coefficient 1 represents the light signalthat propagates from the unintended channel of the monitor tothe 3D lens (such as the RE pixel viewed after the LE lens).Notice that without the VM crossed path, the system in Fig. 16reduces to the polarizing system of CP LCD in Fig. 6.
We apply crosstalk definition in Eq. (1) in the followinganalysis. From Fig. 16, the LE signal can be calculated bytracing all light paths starting from Si,L ending at Mlens
L , andthe LE leakage can be calculated by tracing all light pathsthat start from Si,R and end at Mlens
L . Eq. (13), (14) show theexpressions of LE signal and leakage respectively:
(13)hit ·MlensL ·MLCD
L · Si,L +miss ·MlensL ·MLCD
R · Si,L
(14)miss ·MlensL ·MLCD
L · Si,R + hit ·MlensL ·MLCD
R · Si,R

10
Similarly, the RE signal and leakage in Fig. 16 are shownin Eq. (15), (16) respectively:
(15)hit ·MlensR ·MLCD
R · Si,R +miss ·MlensR ·MLCD
L · Si,R
(16)miss ·MlensR ·MLCD
R · Si,L + hit ·MlensR ·MLCD
L · Si,L
In the conventional CP LCD configuration as shown inFig. 4, the LE and the RE signals are in the same po-larization before VM occurs, namely, Si,L = Si,R = Si.To simplify the expression, let SLL = Mlens
L MLCDL Si, and
SLR = MlensL MLCD
R Si. Consequently, the problem of reducingthe LE-view crosstalk can be formulated as:
(17)minimizeSLL,SLR
miss · (SLL)1 + hit · (SLR)1hit · (SLL)1 +miss · (SLR)1
=miss
hit,when SLR = 0
where subscript 1 denotes the first entry of the resulted SV.The optimal value of Eq. (17) is miss
hit acquired at SLR = 0(and SLL 6= 0). In other words, when VM occurs, theminimum crosstalk in the conventional CP LCD configurationis achieved when the transmission of the RE-field light in theLE lens is 0. Similarly, from Fig. 16, the minimum crosstalkin the RE channel is also miss
hit when the RE lens entirelyblocks lights from the LE field: SRL = 0. Many methods[1], [9], [12], [16] have been proposed to minimize SLR andSRL. However, as shown in Fig. 10, the value of miss
hit is largewhen VM occurs. Therefore, optimizing the polarizing systemin conventional CP LCD can not efficiently reduce VM-basedcrosstalk.
Consequently, let’s consider the case of unconventional CPLCD, where Si,L 6= Si,R. In other words, lights in the LE andthe RE channels are in different polarization status before VMoccurs. Note that this does not hold for the currently availableCP LCDs.
Eq. (18a)-(18h) are obtained from minimizing crosstalk inEq. (4), (5). Eq. (18a), (18b) are resulted from maximizingthe LE signal as shown in Eq. (13), while Eq. (18c), (18d)are resulted from maximizing the RE signal as shown inEq. (15). Eq. (18e), (18f) arise from minimizing the LEleakage as shown in Eq. (14)), while Eq. (18g), (18h) arisefrom minimizing the RE leakage as shown in Eq. (16). InEq. (18a)-(18d), the SVs on the LHS are in the range spaceof the corresponding matrices on the RHS, whereas the SVson the LHS of Eq. (18e)-(18h) are in the null space of thecorresponding matrices on the RHS.
Si,L ∈ R(Mlens
L MLCDL
)(18a)
Si,L ∈ R(Mlens
L MLCDR
)(18b)
Si,R ∈ R(Mlens
R MLCDR
)(18c)
Si,R ∈ R(Mlens
R MLCDL
)(18d)
Si,L ∈ N(Mlens
R MLCDL
)(18e)
Si,L ∈ N(Mlens
R MLCDR
)(18f)
Si,R ∈ N(Mlens
L MLCDR
)(18g)
Si,R ∈ N(Mlens
L MLCDL
)(18h)
As a brief review of MM, the MM of LP is rank-1 matrix[23], and the MM for wave retarder is rank-4 matrix (waveretarder only modulates the polarization but not the intensityof light). In fact, in CP LCD, at least one LP is required in theLE and RE channels, because otherwise the display becomesnondiscriminative of the LE and RE images. Subsequently, theresults of the matrix multiplications on the RHS of Eq. (18a)-(18h) are rank-1 matrices.
Next, we analyze the SVs in Eq. (18a)-(18h). ConsideringEq. (18a), (18h), in order that Si,L and Si,R are in therange space and the null space of Mlens
L MLCDL respectively,
Si,L must be orthogonal to Si,R (or STi,LSi,R = 0). Let
Si,L = [1,x]T and Si,L = [1,y]T , where x and y are 3 × 1vectors. In addition, ||x||= ||y||= 1, such that [1,x]T and[1,y]T are totally-polarized SVs with normalized intensity.Then, by assuming [1,x][1,y]T = 0, one can derive x = −y.This implies that lights in the LE and the RE channels are inthe opposite polarizations, i.e., horizontal linear polarizationversus vertical linear polarization, left-hand circular polariza-tion versus right-hand circular polarization etc.
Then, considering Eq. (18a), (18c), because STi,LSi,R = 0,
MlensL MLCD
L and MlensR MLCD
R are rank-1 matrices, wehave Mlens
L MLCDL ⊥ Mlens
R MLCDR . Similarly, considering
Eq. (18a), (18d), we have MlensL MLCD
L ⊥ MlensR MLCD
L .From the above, we have Mlens
L ⊥ MlensR . Subsequently,
as long as STi,LSi,R = 0, and Mlens
L ⊥ MlensR , such
unconventional CP LCD does not have crosstalk even whenVM occurs. However, the realization of ST
i,LSi,R = 0 beforeVM takes place is no less difficult than shortening the spacingbetween the LC and the PR to reduce VM. In conclusion, VM-based crosstalk can not be efficiently reduced through imageprocessing, or the conventional and unconventional CP LCDdisplay systems.
V. ANALYTIC SOLUTION OF VM-FREE VIEWING ZONE
Because VM causes severe crosstalk in CP LCD at obliqueviewing angles, it’s desirable to find the viewing zone wherethe entire screen does not have the issue of VM.
Recall that VM is measured by miss, and being VM-free is equivalent to miss = 0. Fig. 17 shows miss of apixel column (miss is uniform row-wisely) changing withthe viewing location. We can observe that when fixing thevertical viewing level, miss decreases as the viewing distanceincreases. In addition, the VM-free area shifts with the verticalviewing level. Eq. (19) calculates the locations of the upperand lower bounds on the screen where miss = 0, and it’sa function of viewing distance Dv , the vertical viewing levelyv , and the intrinsic parameters of the display d, hPR, h0, hBMand hp:
(19)ybnd =Dv ·
(h0 ± 1
2hBM ± κ · hPR
)+ d · yv
d−Dv ·(1− hPR
hp
)The derivation of Eq. (19) can be found in [28]. The LHSof Eq. (19) becomes ybnd,up (upper bound) and ybnd,low (lowerbound) when taking + and − respectively. κ in Eq. (19) is stillset as 0.02. If yv is fixed at the screen center, the results ofybnd,up and ybnd,low changing with Dv are shown in Fig. 18(a).

11
0 0.5 1
1080
540
1
miss
Pix
el in
dex
0 0.5 1
1080
540
1
miss
Pix
el in
dex
0 0.5 1
1080
540
1
miss
Pix
el in
dex
0 0.5 1
1080
540
1
miss
Pix
el in
dex
0 0.5 1
1080
540
1
missP
ixel
inde
x0 0.5 1
1080
540
1
miss
Pix
el in
dex
0 0.5 1
1080
540
1
miss
Pix
el in
dex
0 0.5 1
1080
540
1
miss
Pix
el in
dex
0 0.5 1
1080
540
1
miss
Pix
el in
dex
0 0.5 1
1080
540
1
miss
Pix
el in
dex
0 0.5 1
1080
540
1
miss
Pix
el in
dex
0 0.5 1
1080
540
1
missP
ixel
inde
x
0 0.5 1
1080
540
1
miss
Pix
el in
dex
0 0.5 1
1080
540
1
miss
Pix
el in
dex
0 0.5 1
1080
540
1
miss
Pix
el in
dex
Fig. 17: Vertical misalignment of the screen measured bymiss at different viewing locations. The viewing distancein the subplots in the left column, middle column and rightcolumn are 0.5m, 1m, 1.5m respectively. The vertical viewinglevel for subplots from the first row to the bottom row arerespectively aligned to the screen top, 1/4 of screen heightfrom the screen top, screen center, 3/4 of screen height fromthe screen top, and screen bottom. The blue regions indicatesthe VM-free viewing zone (miss = 0).
We can observe in Fig. 18(a) that the vertical expansion of theVM-free region increases with Dv , ybnd,up exceeds the screentop edge when Dv ≥ 0.75m, and ybnd,low drops beyond thescreen bottom edge when Dv ≥ 0.78m. In order for the entirescreen to be VM-free, it requires ybnd,up ≥ Htop, where Htopdenotes the Y coordinate of the screen top, and also ybnd,up ≤Hbot, where Hbot denotes the Y coordinate of screen bottom.From Eq. (19), the former requirement becomes:
yv ≥Dv
d
[h0 −
1
2hBM − κhPR +Htop
(hPR
hp− 1
)]+Htop
= yv,min
(20)
where yv,min is the lowest vertical viewing level at viewingdistance Dv . Similarly, Eq. (21) calculates the highest verticalviewing level yv,max at Dv:
yv ≤Dv
d
[h0 +
1
2hBM + κhPR +Hbot
(hPR
hp− 1
)]+Hbot
= yv,max
(21)
Fig. 18(b) shows how yv,min and yv,max change with Dv .Notice that the VM-free viewing zone: yv,min ≤ yv ≤ yv,max
does not exist if Dv is too small. By forcing yv,max ≥ yv,min
in Eq. (21) and (20), we obtain the smallest viewing distanceDv,min beyond which the entire screen is VM-free:
(22)Dv,min ≥d ·HLCD
hBM + 2κhPR +HLCD
(1− hPR
hp
)
0 0.5 1 1.5−1
0
1
2
Viewing distance /m
Y lo
catio
n /m
y
bnd,up
ybnd,low
Bottom edgeof screen
Top edgeof screen
(a) Photo.
0 1 2 3−1
0
1
2
Viewing distance /m
Y lo
catio
n /m
y
v,min
yv,max
Bottom edgeof screen
Top edgeof screen
1.720.78
(b) Simulation.
Fig. 18: Analysis of vertical misalignment (VM). (a) The upperand the lower bounds of the VM-free screen area. (b) VM-freeviewing zone.
(a)
0 1 2 3−1
0
1
2
Viewing distance /m
Y lo
catio
n /m
Viewerdistance
CenterscreenLower
screen
Upperscreen
(b)
Fig. 19: The flat-grid formation of immersive display and itsVM-free viewing zone. (a) Flat-grid screen formation. (b) Sideview of the overlapped VM-free viewing zone highlighted bymagenta shade. The vertical line segments denote the sideviews of the screen, and the rays of the same color denote thebounds of corresponding VM-free viewing zones. The dashedline marks the comfortable viewing distance.
where HLCD is the screen height. By plugging the aforemen-tioned intrinsic display parameters into Eq. (22), one can alsoacquire Dv,min = 0.78m. In summary, having the calibratedintrinsic display parameters, the VM-free viewing zone canbe computed from Eq. (20)-(22). Assuming the screen bottomis 1m above the floor, and the viewer’s height is less than1.9m, from Fig. 18(b), VM can hardly occur as long as theviewing distance is greater than 2.5m.
VI. VM-FREE VIEWING ZONE FOR MULTI-SCREENDISPLAYS
In this section, we extend the analysis of VM-free viewingzone from a single-screen display to multi-screen immersiveCP LCDs. The overall VM-free viewing zone of the multi-screen CP LCD is determined by the overlapping VM-freeviewing zones of individual screens. Therefore, the objectivein this section is to find the screen formation of the multi-screen CP LCD such that the overlapping VM-free viewingzone of all the screens is maximized.
There are various ways to align the screens to form animmersive 3D display. A simple screen formation is shownin Fig. 19(a) where the screens form a flat grid. However,this type of screen formation results in limited overlappedVM-free viewing zone as shown in Fig. 19(b). In Fig. 19(b),we assume that the VM-free viewing zones of the screen are
12
(a) Horizontal formation. (b) Vertical formation.
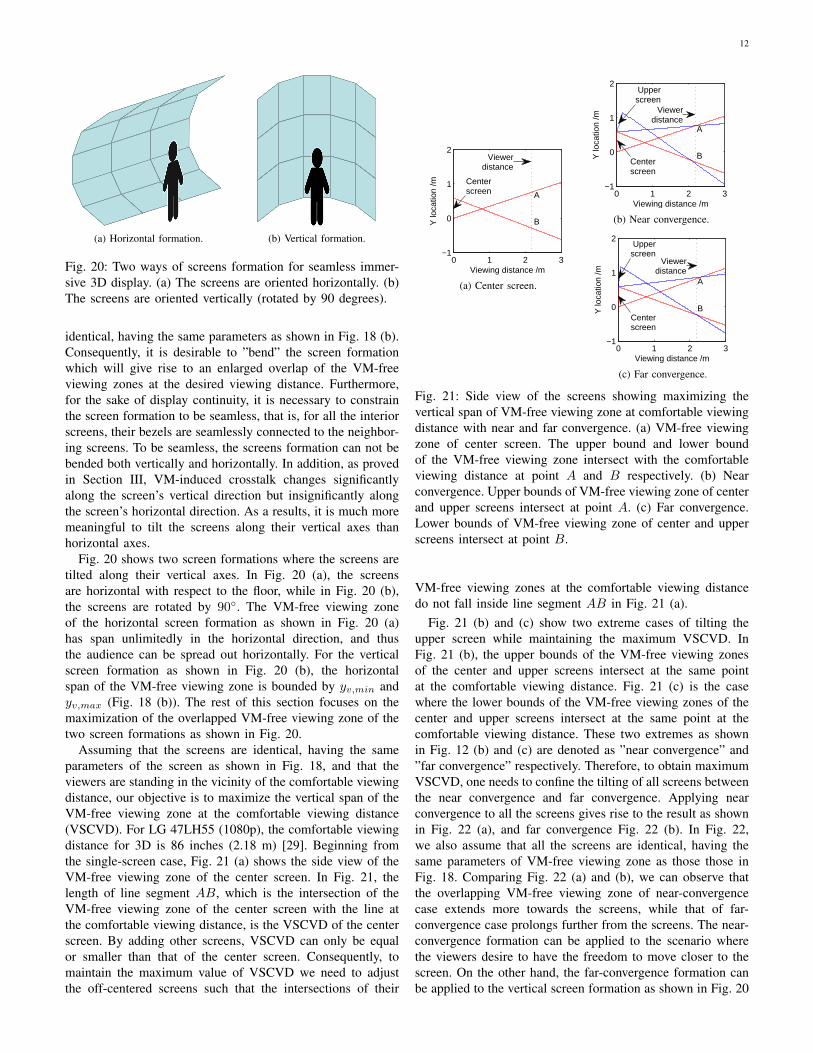
Fig. 20: Two ways of screens formation for seamless immer-sive 3D display. (a) The screens are oriented horizontally. (b)The screens are oriented vertically (rotated by 90 degrees).
identical, having the same parameters as shown in Fig. 18 (b).Consequently, it is desirable to ”bend” the screen formationwhich will give rise to an enlarged overlap of the VM-freeviewing zones at the desired viewing distance. Furthermore,for the sake of display continuity, it is necessary to constrainthe screen formation to be seamless, that is, for all the interiorscreens, their bezels are seamlessly connected to the neighbor-ing screens. To be seamless, the screens formation can not bebended both vertically and horizontally. In addition, as provedin Section III, VM-induced crosstalk changes significantlyalong the screen’s vertical direction but insignificantly alongthe screen’s horizontal direction. As a results, it is much moremeaningful to tilt the screens along their vertical axes thanhorizontal axes.
Fig. 20 shows two screen formations where the screens aretilted along their vertical axes. In Fig. 20 (a), the screensare horizontal with respect to the floor, while in Fig. 20 (b),the screens are rotated by 90◦. The VM-free viewing zoneof the horizontal screen formation as shown in Fig. 20 (a)has span unlimitedly in the horizontal direction, and thusthe audience can be spread out horizontally. For the verticalscreen formation as shown in Fig. 20 (b), the horizontalspan of the VM-free viewing zone is bounded by yv,min andyv,max (Fig. 18 (b)). The rest of this section focuses on themaximization of the overlapped VM-free viewing zone of thetwo screen formations as shown in Fig. 20.
Assuming that the screens are identical, having the sameparameters of the screen as shown in Fig. 18, and that theviewers are standing in the vicinity of the comfortable viewingdistance, our objective is to maximize the vertical span of theVM-free viewing zone at the comfortable viewing distance(VSCVD). For LG 47LH55 (1080p), the comfortable viewingdistance for 3D is 86 inches (2.18 m) [29]. Beginning fromthe single-screen case, Fig. 21 (a) shows the side view of theVM-free viewing zone of the center screen. In Fig. 21, thelength of line segment AB, which is the intersection of theVM-free viewing zone of the center screen with the line atthe comfortable viewing distance, is the VSCVD of the centerscreen. By adding other screens, VSCVD can only be equalor smaller than that of the center screen. Consequently, tomaintain the maximum value of VSCVD we need to adjustthe off-centered screens such that the intersections of their
0 1 2 3−1
0
1
2
Viewing distance /m
Y lo
catio
n /m
Viewerdistance
Centerscreen A
B
(a) Center screen.
0 1 2 3−1
0
1
2
Viewing distance /m
Y lo
catio
n /m
Viewerdistance
Centerscreen
Upperscreen
A
B
(b) Near convergence.
0 1 2 3−1
0
1
2
Viewing distance /m
Y lo
catio
n /m
Centerscreen
Upperscreen
Viewerdistance
A
B
(c) Far convergence.
Fig. 21: Side view of the screens showing maximizing thevertical span of VM-free viewing zone at comfortable viewingdistance with near and far convergence. (a) VM-free viewingzone of center screen. The upper bound and lower boundof the VM-free viewing zone intersect with the comfortableviewing distance at point A and B respectively. (b) Nearconvergence. Upper bounds of VM-free viewing zone of centerand upper screens intersect at point A. (c) Far convergence.Lower bounds of VM-free viewing zone of center and upperscreens intersect at point B.
VM-free viewing zones at the comfortable viewing distancedo not fall inside line segment AB in Fig. 21 (a).
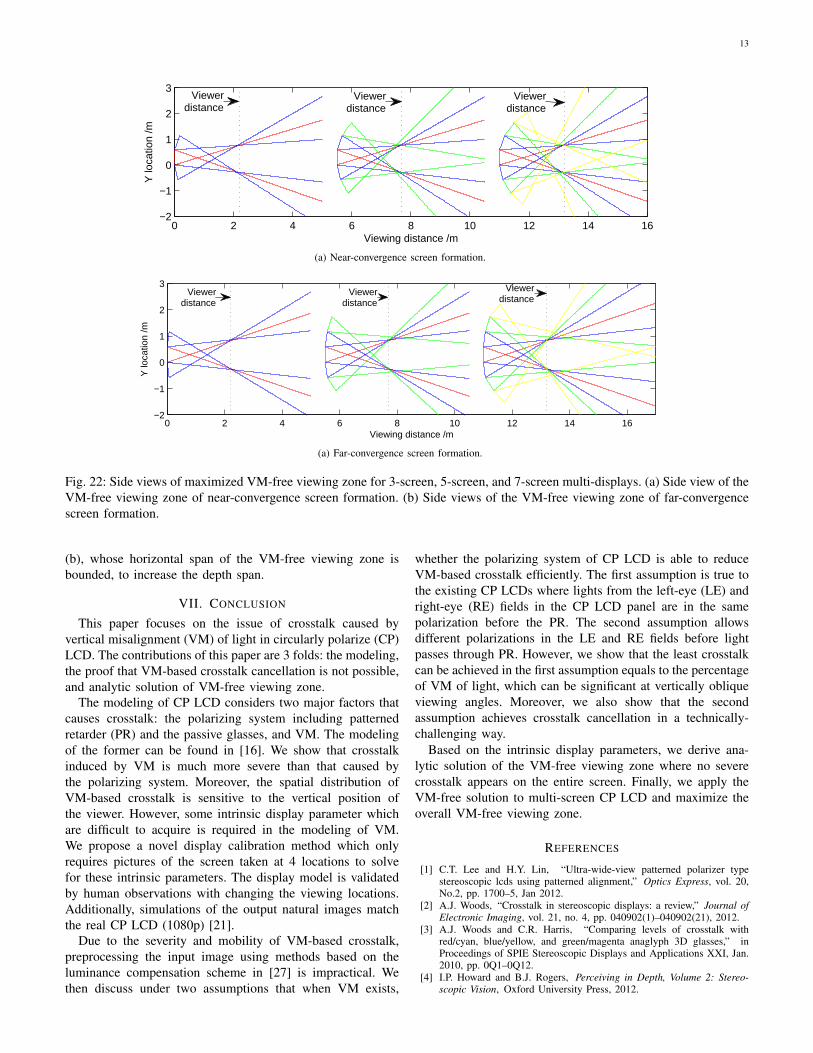
Fig. 21 (b) and (c) show two extreme cases of tilting theupper screen while maintaining the maximum VSCVD. InFig. 21 (b), the upper bounds of the VM-free viewing zonesof the center and upper screens intersect at the same pointat the comfortable viewing distance. Fig. 21 (c) is the casewhere the lower bounds of the VM-free viewing zones of thecenter and upper screens intersect at the same point at thecomfortable viewing distance. These two extremes as shownin Fig. 12 (b) and (c) are denoted as ”near convergence” and”far convergence” respectively. Therefore, to obtain maximumVSCVD, one needs to confine the tilting of all screens betweenthe near convergence and far convergence. Applying nearconvergence to all the screens gives rise to the result as shownin Fig. 22 (a), and far convergence Fig. 22 (b). In Fig. 22,we also assume that all the screens are identical, having thesame parameters of VM-free viewing zone as those those inFig. 18. Comparing Fig. 22 (a) and (b), we can observe thatthe overlapping VM-free viewing zone of near-convergencecase extends more towards the screens, while that of far-convergence case prolongs further from the screens. The near-convergence formation can be applied to the scenario wherethe viewers desire to have the freedom to move closer to thescreen. On the other hand, the far-convergence formation canbe applied to the vertical screen formation as shown in Fig. 20
13
0 2 4 6 8 10 12 14 16−2
−1
0
1
2
3
Viewing distance /m
Y lo
catio
n /m
Viewerdistance
Viewerdistance
Viewerdistance
(a) Near-convergence screen formation.
0 2 4 6 8 10 12 14 16−2
−1
0
1
2
3
Viewing distance /m
Y lo
catio
n /m
Viewerdistance
Viewerdistance
Viewerdistance
(a) Far-convergence screen formation.
Fig. 22: Side views of maximized VM-free viewing zone for 3-screen, 5-screen, and 7-screen multi-displays. (a) Side view of theVM-free viewing zone of near-convergence screen formation. (b) Side views of the VM-free viewing zone of far-convergencescreen formation.
(b), whose horizontal span of the VM-free viewing zone isbounded, to increase the depth span.
VII. CONCLUSION
This paper focuses on the issue of crosstalk caused byvertical misalignment (VM) of light in circularly polarize (CP)LCD. The contributions of this paper are 3 folds: the modeling,the proof that VM-based crosstalk cancellation is not possible,and analytic solution of VM-free viewing zone.
The modeling of CP LCD considers two major factors thatcauses crosstalk: the polarizing system including patternedretarder (PR) and the passive glasses, and VM. The modelingof the former can be found in [16]. We show that crosstalkinduced by VM is much more severe than that caused bythe polarizing system. Moreover, the spatial distribution ofVM-based crosstalk is sensitive to the vertical position ofthe viewer. However, some intrinsic display parameter whichare difficult to acquire is required in the modeling of VM.We propose a novel display calibration method which onlyrequires pictures of the screen taken at 4 locations to solvefor these intrinsic parameters. The display model is validatedby human observations with changing the viewing locations.Additionally, simulations of the output natural images matchthe real CP LCD (1080p) [21].
Due to the severity and mobility of VM-based crosstalk,preprocessing the input image using methods based on theluminance compensation scheme in [27] is impractical. Wethen discuss under two assumptions that when VM exists,
whether the polarizing system of CP LCD is able to reduceVM-based crosstalk efficiently. The first assumption is true tothe existing CP LCDs where lights from the left-eye (LE) andright-eye (RE) fields in the CP LCD panel are in the samepolarization before the PR. The second assumption allowsdifferent polarizations in the LE and RE fields before lightpasses through PR. However, we show that the least crosstalkcan be achieved in the first assumption equals to the percentageof VM of light, which can be significant at vertically obliqueviewing angles. Moreover, we also show that the secondassumption achieves crosstalk cancellation in a technically-challenging way.
Based on the intrinsic display parameters, we derive ana-lytic solution of the VM-free viewing zone where no severecrosstalk appears on the entire screen. Finally, we apply theVM-free solution to multi-screen CP LCD and maximize theoverall VM-free viewing zone.
REFERENCES
[1] C.T. Lee and H.Y. Lin, “Ultra-wide-view patterned polarizer typestereoscopic lcds using patterned alignment,” Optics Express, vol. 20,No.2, pp. 1700–5, Jan 2012.
[2] A.J. Woods, “Crosstalk in stereoscopic displays: a review,” Journal ofElectronic Imaging, vol. 21, no. 4, pp. 040902(1)–040902(21), 2012.
[3] A.J. Woods and C.R. Harris, “Comparing levels of crosstalk withred/cyan, blue/yellow, and green/magenta anaglyph 3D glasses,” inProceedings of SPIE Stereoscopic Displays and Applications XXI, Jan.2010, pp. 0Q1–0Q12.
[4] I.P. Howard and B.J. Rogers, Perceiving in Depth, Volume 2: Stereo-scopic Vision, Oxford University Press, 2012.

14
[5] P.J. Seuntiens, L.M. Meesters, and W.A. IJsselsteijn, “Perceptualattributes of crosstalk in 3d images,” Displays, vol. 26, no. 4, pp. 177–183, 2005.
[6] C.Y. Chiang, T.S. Chen, Y.C. Chang, and Y.P. Huang, “54.2: Theeffect of crosstalk for stereoscopic 3d dynamic moving images,” in SIDSymposium Digest of Technical Papers. Wiley Online Library, 2009,vol. 40, pp. 808–811.
[7] I. Tsirlin, L.M. Wilcox, and R.S. Allison, “The effect of crosstalk ondepth magnitude in thin structures,” in IS&T/SPIE Electronic Imaging.International Society for Optics and Photonics, 2011, pp. 786313–786313.
[8] Y. Yoshihara, H. Ujike, and T. Tanabe, “3d crosstalk of stereoscopic(3d) display using patterned retarder and corresponding glasses,” inInternational Display Workshop, Niigata , Japan, 2008, vol. 15, pp.1135–1138.
[9] D.G. Lee M.J. Lim H.K. Hong, J.W. Jang and H.H. Shin, “Analysisof angular dependence of 3-d technology using polarized eyeglasses,”Journal of the SID, vol. 18, no. 1, pp. 8–12, 2010.
[10] Q. Hong, T. Wu, X. Zhu, R. Lu, and S.T. Wu, “Designs of wide-viewand broadband circular polarizers,” Optics express, vol. 13, no. 20, pp.8318–8331, 2005.
[11] C.T. Lee and H.Y. Lin, “Designs of broadband and wide-view patternedpolarizers for stereoscopic 3d displays,” Optics Express, vol. 18, No.26, pp. 27079–27094, Jan 2010.
[12] M. Zeng and T. Nguyen, “Crosstalk Modeling in Cricularly PolarizedStereoscopic LCDs,” in IEEE International Conference on ImageProcessing, Paris. IEEE, Oct. 2014.
[13] M. Zeng and T. Nguyen, “Crosstalk modeling, analysis, simulationand cancellation in passive-type stereoscopis lcd displays,” in The 38thInternational Conference on Acoustics, Speech, and Signal Processing, Vancouver. IEEE, April 2013.
[14] Thomas X. Hong, Q.W., R. Lu, and S.T. Wu, “Wide-view circularpolarizer consisting of a linear polarizer and two biaxial films,” Opticsexpress, vol. 13, no. 26, pp. 10777–10783, 2005.
[15] G.D. Lee J.H. Lee B.K. Kim H.C. Choi Y.J. Lim W.S. Kang, B.J. Munand S.H. Lee, “Optimal design of quarter-wave plate with widebandand wide viewing angle for three-dimensional liquid crystal display,”Journal of Applied Physics, vol. 111, pp. 103119:1–6, May 2012.
[16] T. Nguyen M. Zeng, “Crosstalk modeling, analysis and reduction incircularly polarized stereoscopic lcd considering the polarizing system,”submitted to IEEE TIP, 2014.
[17] Y. Tu L. Chen P. Zhang T. Zhang L. Wang, K. Tuenissen and I. Heyn-derickx, “Crosstalk evaluation in stereoscopic displays,” IEEE Journalof Display Technology, vol. 7, no. 4, pp. 208–214, April 2011.
[18] J.V. Baar, S. Poulakos, W. Jarosz, D. Nowrouzezahrai, R. Tamstorf,and M. Gross, “Perceptually-based compensation of light pollution indisplay systems,” in Proceedings of the ACM SIGGRAPH Symposiumon Applied Perception in Graphics and Visualization. ACM, 2011, pp.45–52.
[19] R. Patterson, “Human factors of 3-d displays,” Journal of the Societyfor Information Display, vol. 15, no. 11, pp. 861–871, 2007.
[20] Y.Y. Yeh and L.D. Silverstein, “Limits of fusion and depth judgment instereoscopic color displays,” Human Factors: The Journal of the HumanFactors and Ergonomics Society, vol. 32, no. 1, pp. 45–60, 1990.
[21] LG Corporation, “LG 47LH55 LCD,” http://www.lg.com/us/tvs/lg-47LH55-lcd-tv, 2009.
[22] P. Boher, T. Leroux, T. Bignon, and P.V. Collomb, “Multispectralpolarization viewing angle analysis of circular polarized stereoscopic3d displays,” in Proceedings of SPIE Stereoscopic Displays andApplications XXI, 2010, pp. 0R1–0R12.
[23] D.K. Yang and S.T. Wu, “Fundamentals of Liquid Crystal Devices,” pp.ch.8.3, 208–216, 2006.
[24] X. Zhu, Z. Ge, and S.T. Wu, “Analytical solutions for uniaxial-film-compensated wide-view liquid crystal displays,” Journal of DisplayTechnology, vol. 2, no. 1, pp. 2, 2006.
[25] Y. Ma, An invitation to 3-d vision: from images to geometric models,vol. 26, springer, 2004.
[26] D. Scharstein and C. Pal, “Learning conditional random fields forstereo,” in Computer Vision and Pattern Recognition, 2007. CVPR’07.IEEE Conference on. IEEE, 2007, pp. 1–8.
[27] J.S. Lipscomb and W.L. Wooten, “Reducing Crosstalk between Stereo-scopic Views,” in Proceedings of SPIE Stereoscopic Displays and VirtualReality Systems. SPIE, 1994, vol. 2177, pp. 92–96.
[28] M. Zeng, “Modeling of the circularly polarized 3D LCD,” http://tinyurl.com/nf25tgv.
[29] “Best 3D TV Screen Size and Viewing Distance,” http://www.best-3dtvs.com/guides/best-screen-size-viewing-distance/.
Menglin Zeng [S’14] received a B.A. in PhysicsDept., Sun Yat-San University, China in 2010. Sheis currently a PhD student at the ECE Dept., UCSD,studying signal and image processing. Her researchinterests are crosstalk in stereoscopic displays, andimproving the viewing experience of stereoscopicdisplays.
Truong Q. Nguyen [F’05] is currently a Professorat the ECE Dept., UCSD. His current researchinterests are 3D video processing and communi-cations and their efficient implementation. He isthe coauthor (with Prof. Gilbert Strang) of a pop-ular textbook, Wavelets & Filter Banks, Wellesley-Cambridge Press, 1997, and the author of severalmatlab-based toolboxes on image compression, elec-trocardiogram compression and filter bank design.He has over 400 publications.
Prof. Nguyen received the IEEE Transaction inSignal Processing Paper Award (Image and Multidimensional Processing area)for the paper he co-wrote with Prof. P. P. Vaidyanathan on linear-phase perfect-reconstruction filter banks (1992). He received the NSF Career Award in 1995and is currently the Series Editor (Digital Signal Processing) for AcademicPress. He served as Associate Editor for the IEEE Transaction on SignalProcessing 1994-96, for the Signal Processing Letters 2001-2003, for theIEEE Transaction on Circuits & Systems from 1996-97, 2001-2004, and forthe IEEE Transaction on Image Processing from 2004-2005.
Copyright © 2022 FDOKUMEN