Ion energy distribution control in single and dual frequency capacitive plasma sources
9
INSTITUTE OF PHYSICS PUBLISHING PLASMA SOURCES SCIENCE AND TECHNOLOGY Plasma Sources Sci. Technol. 14 (2005) 89–97 doi:10.1088/0963-0252/14/1/012 Ion energy distribution control in single and dual frequency capacitive plasma sources J K Lee 1 , O V Manuilenko 1 , N Yu Babaeva 1 , H C Kim 1 and J W Shon 2 1 Department of Electronic and Electrical Engineering, Pohang University of Science and Technology, Pohang 790-784, South Korea 2 Lam Research Corporation, 4650 Cushing Parkway, Fremont, CA 54538, USA E-mail: [email protected] Received 7 October 2004 Published 12 January 2005 Online at stacks.iop.org/PSST/14/89 Abstract Particle-in-cell/Monte Carlo simulations are used to study the possibility of ion energy distribution function (IEDF) control on the powered electrode in asymmetric single and double frequency capacitive discharges in argon. The possibility of IEDF control is demonstrated. It is shown that the IEDF shape and spread on the cathode can be controlled by the driven voltage in a single frequency discharge and by the low frequency voltage in a dual frequency capacitive discharge. It is shown that the IEDF shape on the powered electrode can be controlled by the driven frequency in single frequency capacitively coupled plasmas. It is shown that the density of plasma decreases, and the sheath width, the plasma potential and the self-bias voltage increase, with growth of the low frequency voltage in the dual frequency capacitive discharge. 1. Introduction Single and double frequency capacitively coupled radio- frequency (RF) plasma sources are widely used in the laboratory for research and development as well as in the microelectronics industry for a variety of processing techniques such as sputtering, plasma deposition and directional etching. The interaction of energetic ions with solid surfaces plays a crucial role in these techniques. The positive ions accelerated through the space-charge sheath adjacent to the electrodes are responsible for the etch rates and the etch profiles. The ion bombardment energy and the ion flux on the wafer, which are important for the control of etch depths and etch rates, cannot be controlled independently in conventional single frequency capacitively coupled plasma (CCP) sources. Independent control by ion flux and ion energy is possible in the dual frequency CCP sources [1–6]. Careful control of etch profiles is a basic requirement for modern etch technologies. Etch profiles are defined by the ion energy distribution function (IEDF) and the ion angle distribution function (IADF) on the wafer. Consequently we need to understand how ions acquire energy in the sheath and be able to predict and to control the IEDF and IADF. As is known [7, 8], in single frequency CCP sources in the collisionless regime the IEDF at the target is determined by the ratio of ion transit time to RF period, and has a bimodal form, which is controlled by the RF frequency, the sheath length and the sheath voltage drop. Charge-exchange and elastic collisions with the background gas reduce the ion energy and change the IEDF shape. Wild and Koidl [9, 10] have demonstrated, using a parametrized model including only charge-exchange collisions, that charge-exchange can lead to the formation of additional low energy peaks on the IEDF when the ion transit time is greater than the RF period. These peaks are due to the RF modulation of the sheath potential combined with the creation of thermal ions by charge-exchange processes in the sheath. In the opposite case, when the RF period is greater than the ion transit time, the peaks which are due to scattered ions disappear and only the bimodal distribution from unscattered ions remains. The IEDF shape is strongly affected by the bias voltage. Namely, when the bias voltage increases the number of peaks decreases. This is due to changes in the ion transit time. Experiments with argon, oxygen, hydrogen and benzene have confirmed these results [9, 10]. Liu et al [11] have modelled the argon IEDF on the grounded electrode in a symmetric CCP source using a 0963-0252/05/010089+09$30.00 © 2005 IOP Publishing Ltd Printed in the UK 89
-
Upload
independent -
Category
Documents
-
view
0 -
download
0
Transcript of Ion energy distribution control in single and dual frequency capacitive plasma sources
INSTITUTE OF PHYSICS PUBLISHING PLASMA SOURCES SCIENCE AND TECHNOLOGY
Plasma Sources Sci. Technol. 14 (2005) 89–97 doi:10.1088/0963-0252/14/1/012
Ion energy distribution control in singleand dual frequency capacitive plasmasourcesJ K Lee1, O V Manuilenko1, N Yu Babaeva1, H C Kim1 andJ W Shon2
1 Department of Electronic and Electrical Engineering, Pohang University of Science andTechnology, Pohang 790-784, South Korea2 Lam Research Corporation, 4650 Cushing Parkway, Fremont, CA 54538, USA
E-mail: [email protected]
Received 7 October 2004Published 12 January 2005Online at stacks.iop.org/PSST/14/89
AbstractParticle-in-cell/Monte Carlo simulations are used to study the possibility ofion energy distribution function (IEDF) control on the powered electrode inasymmetric single and double frequency capacitive discharges in argon. Thepossibility of IEDF control is demonstrated. It is shown that the IEDF shapeand spread on the cathode can be controlled by the driven voltage in a singlefrequency discharge and by the low frequency voltage in a dual frequencycapacitive discharge. It is shown that the IEDF shape on the poweredelectrode can be controlled by the driven frequency in single frequencycapacitively coupled plasmas. It is shown that the density of plasmadecreases, and the sheath width, the plasma potential and the self-biasvoltage increase, with growth of the low frequency voltage in the dualfrequency capacitive discharge.
1. Introduction
Single and double frequency capacitively coupled radio-frequency (RF) plasma sources are widely used in thelaboratory for research and development as well as inthe microelectronics industry for a variety of processingtechniques such as sputtering, plasma deposition anddirectional etching. The interaction of energetic ions with solidsurfaces plays a crucial role in these techniques. The positiveions accelerated through the space-charge sheath adjacent tothe electrodes are responsible for the etch rates and the etchprofiles. The ion bombardment energy and the ion flux on thewafer, which are important for the control of etch depths andetch rates, cannot be controlled independently in conventionalsingle frequency capacitively coupled plasma (CCP) sources.Independent control by ion flux and ion energy is possible inthe dual frequency CCP sources [1–6].
Careful control of etch profiles is a basic requirementfor modern etch technologies. Etch profiles are defined bythe ion energy distribution function (IEDF) and the ion angledistribution function (IADF) on the wafer. Consequently weneed to understand how ions acquire energy in the sheath andbe able to predict and to control the IEDF and IADF.
As is known [7, 8], in single frequency CCP sources inthe collisionless regime the IEDF at the target is determinedby the ratio of ion transit time to RF period, and has abimodal form, which is controlled by the RF frequency, thesheath length and the sheath voltage drop. Charge-exchangeand elastic collisions with the background gas reduce the ionenergy and change the IEDF shape. Wild and Koidl [9, 10]have demonstrated, using a parametrized model including onlycharge-exchange collisions, that charge-exchange can lead tothe formation of additional low energy peaks on the IEDF whenthe ion transit time is greater than the RF period. These peaksare due to the RF modulation of the sheath potential combinedwith the creation of thermal ions by charge-exchange processesin the sheath. In the opposite case, when the RF period isgreater than the ion transit time, the peaks which are due toscattered ions disappear and only the bimodal distribution fromunscattered ions remains. The IEDF shape is strongly affectedby the bias voltage. Namely, when the bias voltage increasesthe number of peaks decreases. This is due to changes in theion transit time. Experiments with argon, oxygen, hydrogenand benzene have confirmed these results [9, 10].
Liu et al [11] have modelled the argon IEDF on thegrounded electrode in a symmetric CCP source using a
0963-0252/05/010089+09$30.00 © 2005 IOP Publishing Ltd Printed in the UK 89
J K Lee et al
Monte Carlo (MC) model for ion trajectories and a parametricmodel for the time dependent electric field within the sheath(with spatially constant sheath field). Charge-exchange andelastic collisions were included in the model. The fine structurein the IEDF was observed for sufficiently low pressures. It wasdirectly shown that such a structure is due to charge-exchangecollisions. The effects of the applied voltage and pressureon the IEDF were investigated. It was demonstrated that theamplitude of the applied voltage has a significant effect onthe width of the IEDF. As the applied voltage increases, thefine structure in the IEDF becomes more prominent, and thenumber of peaks slightly changes. It was shown that if thereare many collisions in the sheath (sufficiently high pressure)the IEDF shape becomes independent of applied voltage andpressure.
May et al [12] have modelled the IEDF in the argondischarge using a MC model for ion trajectories and a morerealistic description of the time-varying potentials in an RFdischarge [13]. Charge-exchange and elastic collisions wereincluded in the model. The influence of momentum-transferscattering in the absence of charge-exchange and vice versaon the IEDF were investigated. It has been shown thatthe regular series of peaks observed in the collision-inducedpart of IEDF is caused by charge-exchange collisions in thesheath, in contrast to elastic scattering which produces asmooth IEDF.
The transition from a peaked to a smooth collision-inducedIEDF was studied in [14] by means of a MC method. It wasdemonstrated that if both collisional processes are presented,a regular series of peaks is observed for the collision-inducedpart of IEDF if λex/λel < 4, where λex is the mean free pathfor charge-exchange collisions, and λel is the mean freepath for elastic collisions; the total mean free path is keptconstant.
In [9–14] a simplified description of the sheath electricfield or of the collision processes has been used. A moreadequate approach for simulation of the discharge is theparticle-in-cell (PIC) technique for self-consistent chargedparticle motion under the action of external fields mergedwith MC collisions (MCC) for interactions between chargedparticles and neutrals [15, 16]. The disadvantage of PIC/MCCmethods is that they tend to be computationally expensivecompared with other numerical methods.
The parallel plate 1d hydrogen CCP source was modelledby Vender and Boswell [17] by means of PIC/MCC fora pressure of 20 mTorr, electrode spacing of 20 cm, drivenvoltage of 1000 V and frequency of 10 MHz. When charge-exchange collisions were omitted, the simulations yielded thedouble-humped collisionless IEDF which is in good agreementwith [8]. When charge-exchange collisions were taken intoaccount, the IEDF showed the peaks. Surendra and Graves[18] modelled symmetric 1d helium RF discharges driven by12 and 30 MHz, an electrode gap of 4 cm and a pressure of250 mTorr. The driven voltages varied from 200 to 500 V forthe 12 MHz case and from 50 to 200 V for 30 MHz case. Theion–neutral elastic collisions were not included in the model.In the 30 MHz case they observed secondary peaks induced bycharge-exchange. The verification of frequency scaling lawsfor CCP sources by 2d3v PIC/MCC modelling was done byVahedi et al [19]. It was found that the plasma density varies
as the square of the frequency, and the sheath length variesinversely with frequency.
This paper is devoted to kinetic 1d3v PIC/MCC modellingof the single and dual frequency asymmetric CCP sources in thewide range of driven voltages and frequencies (up to 189 MHz),for various neutral gas pressures and electrode distances. Thescaling laws for the case of an asymmetric discharge havebeen obtained. It is shown that the plasma density decreases,and the sheath width, the plasma potential and the self-biasvoltage increase with growth of the low frequency voltagein dual frequency asymmetric CCP sources. The IEDF onthe powered electrode has been investigated. It has beendemonstrated that the IEDF shape and spread can be controlledby the driven voltage in a single frequency CCP. It has beenfound that increasing the driven frequency leads to significantchanges in the IEDF shape, with an increasing relative numberof high energy ions and decreasing number of low energyions. It has been demonstrated that the width of the IEDFincreases with growth of the low frequency voltage in a doublefrequency driven CCP, and the fine structure observed in thesingle frequency case disappears simultaneously.
2. Simulation tool and conditions
In this work weakly ionized argon processing plasmas arestudied in one dimension using a bounded electrostatic1d3v PIC/MCC code XPDC1 [15, 16]. The cylindricalgeometry was chosen for modelling the discharge asymmetrybecause the majority of conventional RF plasma processingunits are asymmetric due to the substantially different areasof powered and grounded electrodes. A one-dimensionalplasma model can be used for our purposes due to the largeratio of transverse and longitudinal dimensions of conventionalCCP plasma sources. The elastic scattering, excitation andionization are included in our model for electron–neutralcollisions. As for ion–neutral collisions, charge-exchange andelastic scattering are considered. The details can be found in[15, 16, 20–22].
Our simulations were performed for electrodes with aninner radius of 2.19 cm and an outer radius of 3.79 cm (elec-trode spacing 1.6 cm) and for electrodes with an inner ra-dius of 2.73 cm and an outer radius of 4.73 cm (electrodespacing 2.0 cm). The secondary electron emission coefficientfor argon ions was 0.2. The grid size, �x, in all runs wassmall enough to resolve the Debye length at the centre of thedischarge, which corresponds to the minimal electron tem-perature in the case of two temperature EEDFs. The timestep, �t , was less than the minimal time scale in the dis-charge, namely the inverse electron plasma frequency or max-imal collision frequency. The Courant condition for particlesv�t/�x < 1, where v is the velocity of the super particle,was satisfied during the entire modelling time. The mod-elling conditions are different for different runs, but the scalesare the following: �t ∈ [10−12, 10−11] s, �x ∈ [5 × 10−4,4 × 10−3] cm. In each case we used from 100 to 500 macro-particles per cell in order to decrease numerical noise, whichcan cause substantial errors in the electron temperature and,so in plasma density [21, 22]. We have run the simulationsfor several thousands of RF cycles in order to reach the steadystate.
90
IEDF control in capacitive plasma sources
3. Simulation results
3.1. Single frequency CCP. Voltage effect
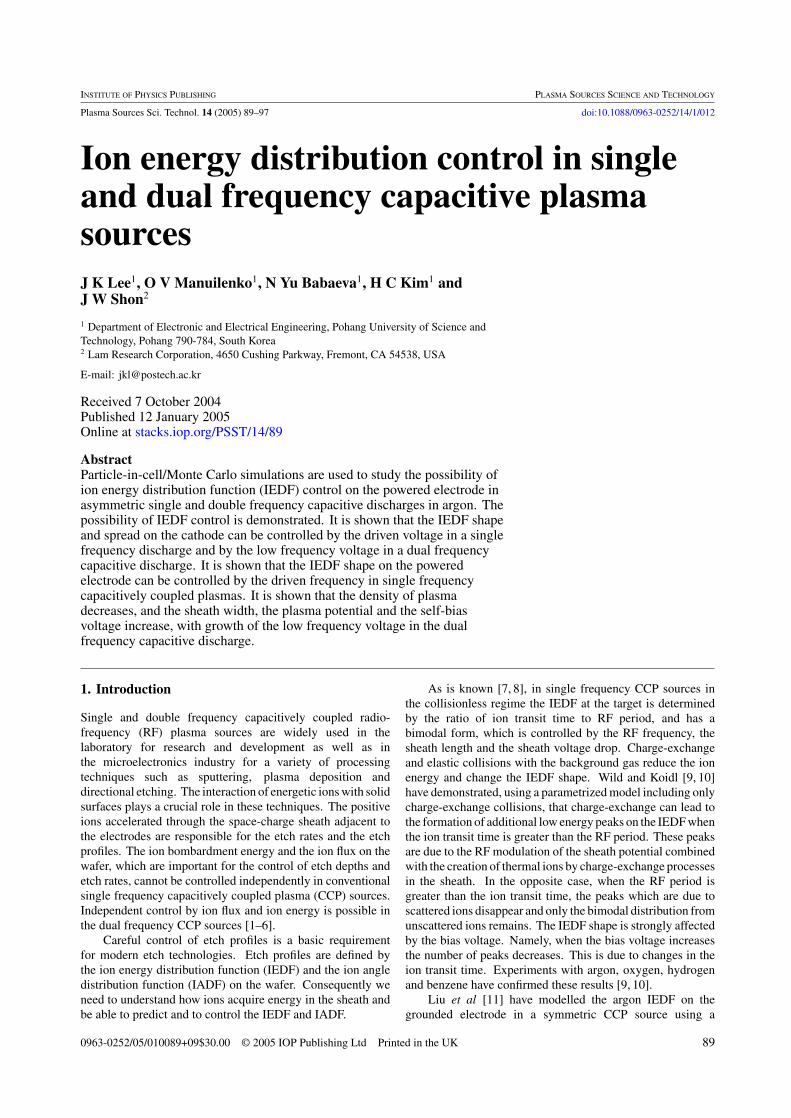
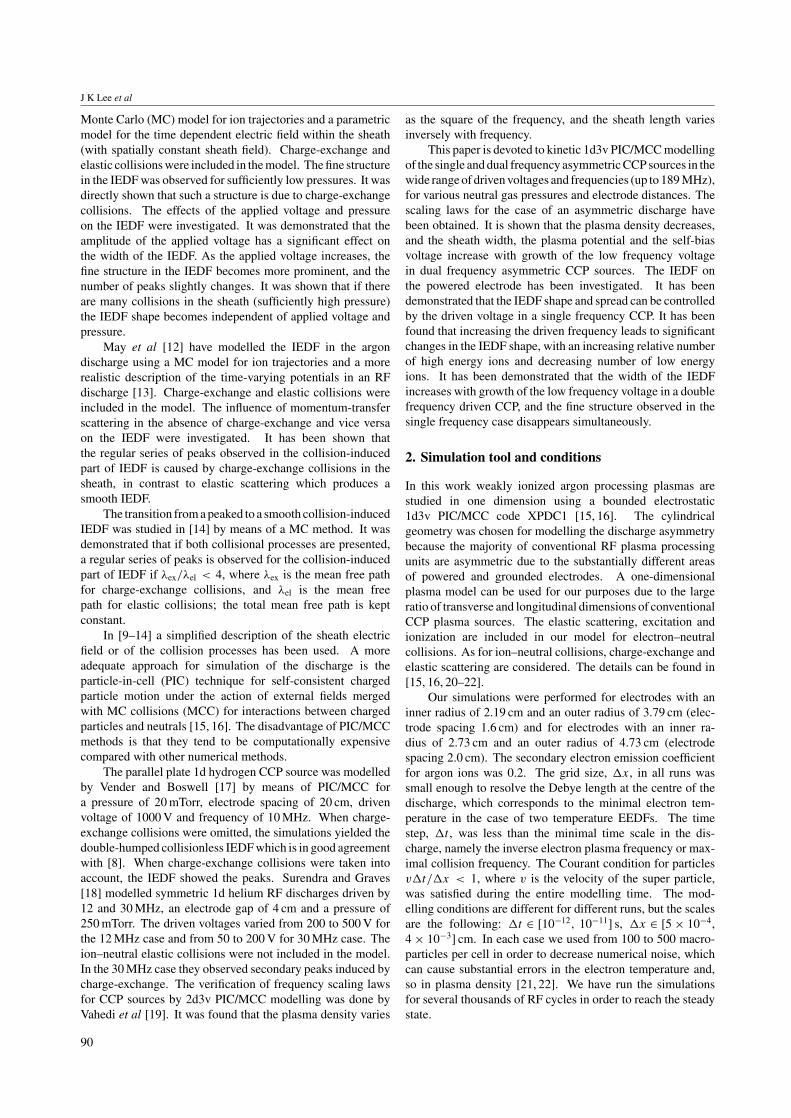
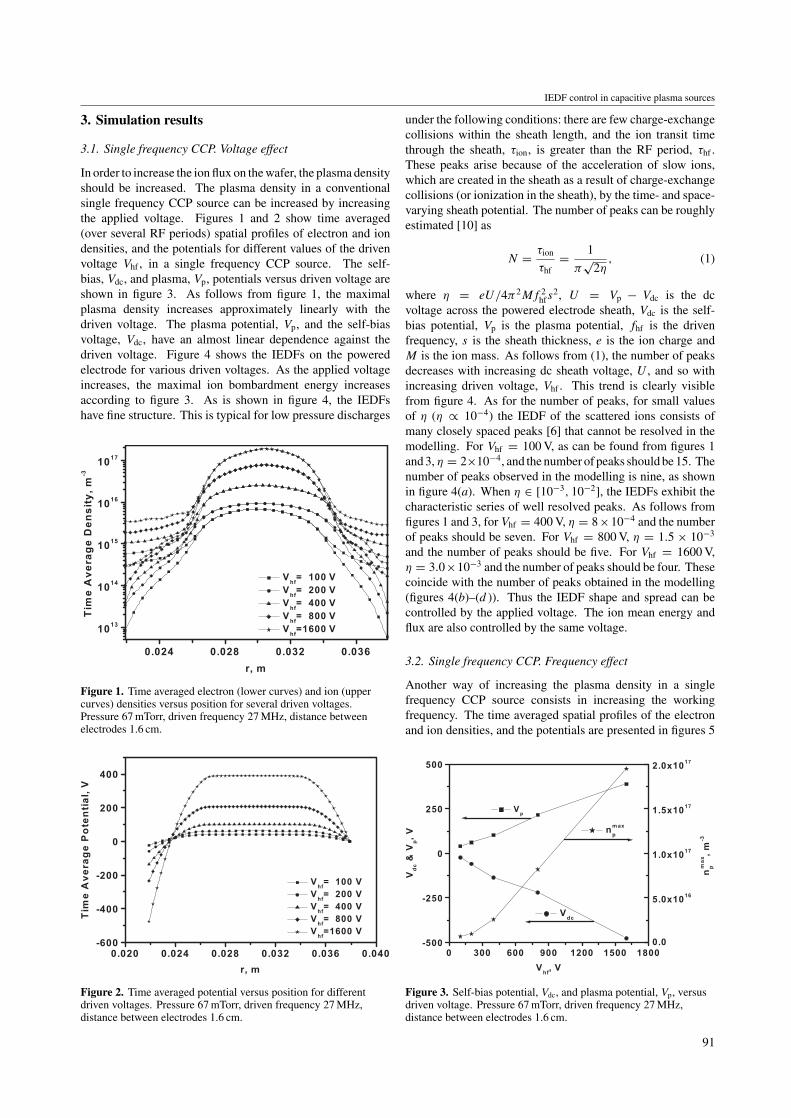
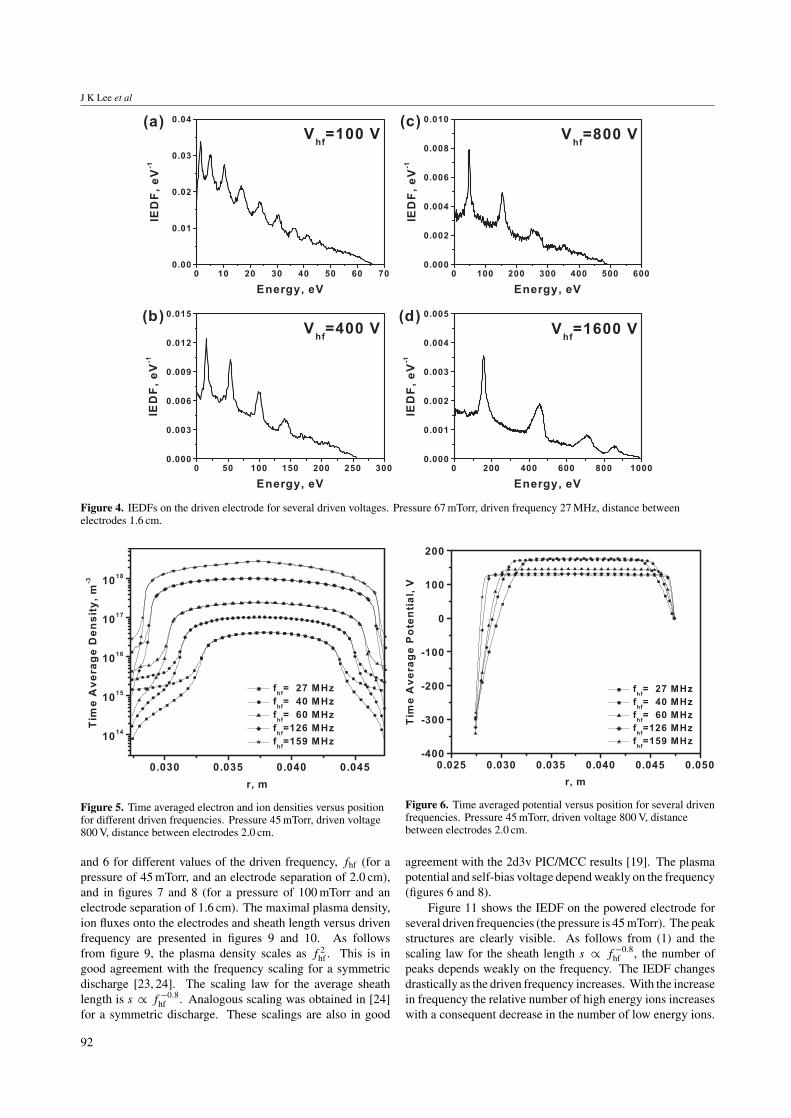
In order to increase the ion flux on the wafer, the plasma densityshould be increased. The plasma density in a conventionalsingle frequency CCP source can be increased by increasingthe applied voltage. Figures 1 and 2 show time averaged(over several RF periods) spatial profiles of electron and iondensities, and the potentials for different values of the drivenvoltage Vhf , in a single frequency CCP source. The self-bias, Vdc, and plasma, Vp, potentials versus driven voltage areshown in figure 3. As follows from figure 1, the maximalplasma density increases approximately linearly with thedriven voltage. The plasma potential, Vp, and the self-biasvoltage, Vdc, have an almost linear dependence against thedriven voltage. Figure 4 shows the IEDFs on the poweredelectrode for various driven voltages. As the applied voltageincreases, the maximal ion bombardment energy increasesaccording to figure 3. As is shown in figure 4, the IEDFshave fine structure. This is typical for low pressure discharges
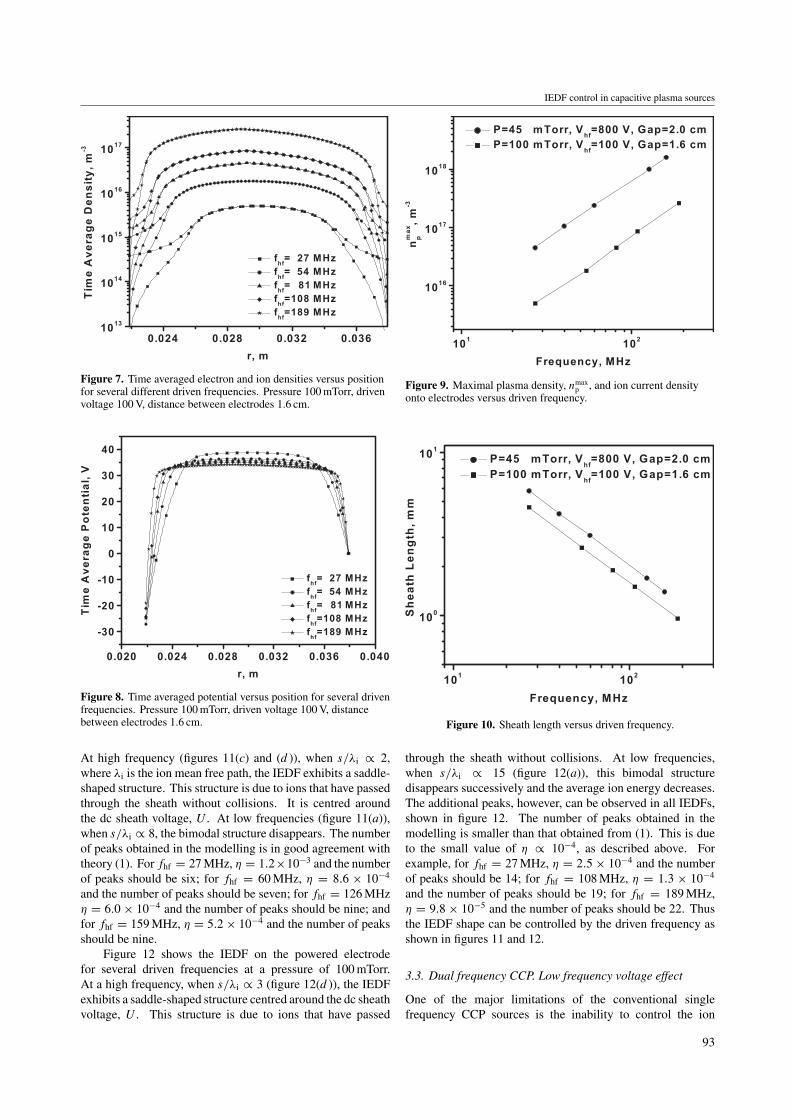
Figure 1. Time averaged electron (lower curves) and ion (uppercurves) densities versus position for several driven voltages.Pressure 67 mTorr, driven frequency 27 MHz, distance betweenelectrodes 1.6 cm.
Figure 2. Time averaged potential versus position for differentdriven voltages. Pressure 67 mTorr, driven frequency 27 MHz,distance between electrodes 1.6 cm.
under the following conditions: there are few charge-exchangecollisions within the sheath length, and the ion transit timethrough the sheath, τion, is greater than the RF period, τhf .These peaks arise because of the acceleration of slow ions,which are created in the sheath as a result of charge-exchangecollisions (or ionization in the sheath), by the time- and space-varying sheath potential. The number of peaks can be roughlyestimated [10] as
N = τion
τhf= 1
π√
2η, (1)
where η = eU/4π2Mf 2hfs
2, U = Vp − Vdc is the dcvoltage across the powered electrode sheath, Vdc is the self-bias potential, Vp is the plasma potential, fhf is the drivenfrequency, s is the sheath thickness, e is the ion charge andM is the ion mass. As follows from (1), the number of peaksdecreases with increasing dc sheath voltage, U , and so withincreasing driven voltage, Vhf . This trend is clearly visiblefrom figure 4. As for the number of peaks, for small valuesof η (η ∝ 10−4) the IEDF of the scattered ions consists ofmany closely spaced peaks [6] that cannot be resolved in themodelling. For Vhf = 100 V, as can be found from figures 1and 3, η = 2×10⁻⁴, and the number of peaks should be 15. Thenumber of peaks observed in the modelling is nine, as shownin figure 4(a). When η ∈ [10−3, 10−2], the IEDFs exhibit thecharacteristic series of well resolved peaks. As follows fromfigures 1 and 3, for Vhf = 400 V, η = 8×10⁻⁴ and the numberof peaks should be seven. For Vhf = 800 V, η = 1.5 × 10⁻³
and the number of peaks should be five. For Vhf = 1600 V,η = 3.0×10⁻³ and the number of peaks should be four. Thesecoincide with the number of peaks obtained in the modelling(figures 4(b)–(d )). Thus the IEDF shape and spread can becontrolled by the applied voltage. The ion mean energy andflux are also controlled by the same voltage.
3.2. Single frequency CCP. Frequency effect
Another way of increasing the plasma density in a singlefrequency CCP source consists in increasing the workingfrequency. The time averaged spatial profiles of the electronand ion densities, and the potentials are presented in figures 5
Figure 3. Self-bias potential, Vdc, and plasma potential, Vp, versusdriven voltage. Pressure 67 mTorr, driven frequency 27 MHz,distance between electrodes 1.6 cm.
91
J K Lee et al
Figure 4. IEDFs on the driven electrode for several driven voltages. Pressure 67 mTorr, driven frequency 27 MHz, distance betweenelectrodes 1.6 cm.
Figure 5. Time averaged electron and ion densities versus positionfor different driven frequencies. Pressure 45 mTorr, driven voltage800 V, distance between electrodes 2.0 cm.
and 6 for different values of the driven frequency, fhf (for apressure of 45 mTorr, and an electrode separation of 2.0 cm),and in figures 7 and 8 (for a pressure of 100 mTorr and anelectrode separation of 1.6 cm). The maximal plasma density,ion fluxes onto the electrodes and sheath length versus drivenfrequency are presented in figures 9 and 10. As followsfrom figure 9, the plasma density scales as f 2
hf . This is ingood agreement with the frequency scaling for a symmetricdischarge [23, 24]. The scaling law for the average sheathlength is s ∝ f −0.8
hf . Analogous scaling was obtained in [24]for a symmetric discharge. These scalings are also in good
Figure 6. Time averaged potential versus position for several drivenfrequencies. Pressure 45 mTorr, driven voltage 800 V, distancebetween electrodes 2.0 cm.
agreement with the 2d3v PIC/MCC results [19]. The plasmapotential and self-bias voltage depend weakly on the frequency(figures 6 and 8).
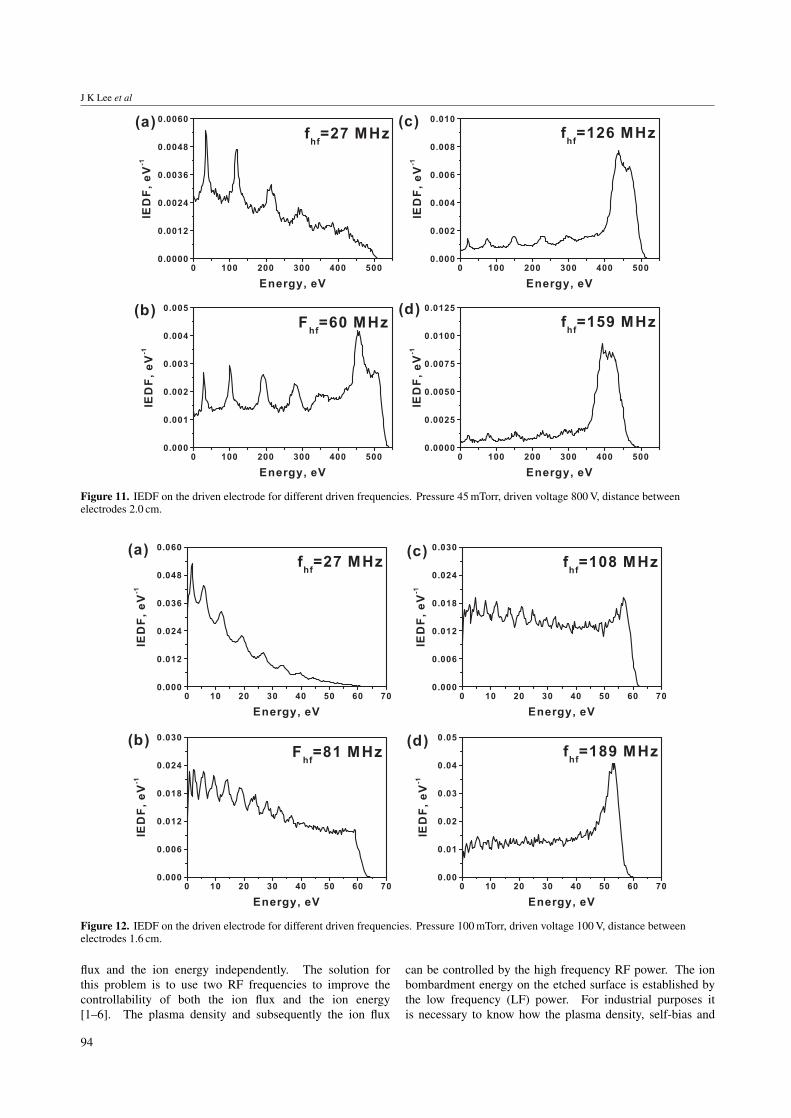
Figure 11 shows the IEDF on the powered electrode forseveral driven frequencies (the pressure is 45 mTorr). The peakstructures are clearly visible. As follows from (1) and thescaling law for the sheath length s ∝ f −0.8
hf , the number ofpeaks depends weakly on the frequency. The IEDF changesdrastically as the driven frequency increases. With the increasein frequency the relative number of high energy ions increaseswith a consequent decrease in the number of low energy ions.
92
IEDF control in capacitive plasma sources
Figure 7. Time averaged electron and ion densities versus positionfor several different driven frequencies. Pressure 100 mTorr, drivenvoltage 100 V, distance between electrodes 1.6 cm.
Figure 8. Time averaged potential versus position for several drivenfrequencies. Pressure 100 mTorr, driven voltage 100 V, distancebetween electrodes 1.6 cm.
At high frequency (figures 11(c) and (d )), when s/λi ∝ 2,where λi is the ion mean free path, the IEDF exhibits a saddle-shaped structure. This structure is due to ions that have passedthrough the sheath without collisions. It is centred aroundthe dc sheath voltage, U . At low frequencies (figure 11(a)),when s/λi ∝ 8, the bimodal structure disappears. The numberof peaks obtained in the modelling is in good agreement withtheory (1). For fhf = 27 MHz, η = 1.2×10⁻³ and the numberof peaks should be six; for fhf = 60 MHz, η = 8.6 × 10⁻⁴
and the number of peaks should be seven; for fhf = 126 MHzη = 6.0 × 10⁻⁴ and the number of peaks should be nine; andfor fhf = 159 MHz, η = 5.2 × 10⁻⁴ and the number of peaksshould be nine.
Figure 12 shows the IEDF on the powered electrodefor several driven frequencies at a pressure of 100 mTorr.At a high frequency, when s/λi ∝ 3 (figure 12(d )), the IEDFexhibits a saddle-shaped structure centred around the dc sheathvoltage, U . This structure is due to ions that have passed
Figure 9. Maximal plasma density, nmaxp , and ion current density
onto electrodes versus driven frequency.
Figure 10. Sheath length versus driven frequency.
through the sheath without collisions. At low frequencies,when s/λi ∝ 15 (figure 12(a)), this bimodal structuredisappears successively and the average ion energy decreases.The additional peaks, however, can be observed in all IEDFs,shown in figure 12. The number of peaks obtained in themodelling is smaller than that obtained from (1). This is dueto the small value of η ∝ 10−4, as described above. Forexample, for fhf = 27 MHz, η = 2.5 × 10⁻⁴ and the numberof peaks should be 14; for fhf = 108 MHz, η = 1.3 × 10⁻⁴
and the number of peaks should be 19; for fhf = 189 MHz,η = 9.8 × 10⁻⁵ and the number of peaks should be 22. Thusthe IEDF shape can be controlled by the driven frequency asshown in figures 11 and 12.
3.3. Dual frequency CCP. Low frequency voltage effect
One of the major limitations of the conventional singlefrequency CCP sources is the inability to control the ion
93
J K Lee et al
Figure 11. IEDF on the driven electrode for different driven frequencies. Pressure 45 mTorr, driven voltage 800 V, distance betweenelectrodes 2.0 cm.
Figure 12. IEDF on the driven electrode for different driven frequencies. Pressure 100 mTorr, driven voltage 100 V, distance betweenelectrodes 1.6 cm.
flux and the ion energy independently. The solution forthis problem is to use two RF frequencies to improve thecontrollability of both the ion flux and the ion energy[1–6]. The plasma density and subsequently the ion flux
can be controlled by the high frequency RF power. The ionbombardment energy on the etched surface is established bythe low frequency (LF) power. For industrial purposes itis necessary to know how the plasma density, self-bias and
94
IEDF control in capacitive plasma sources
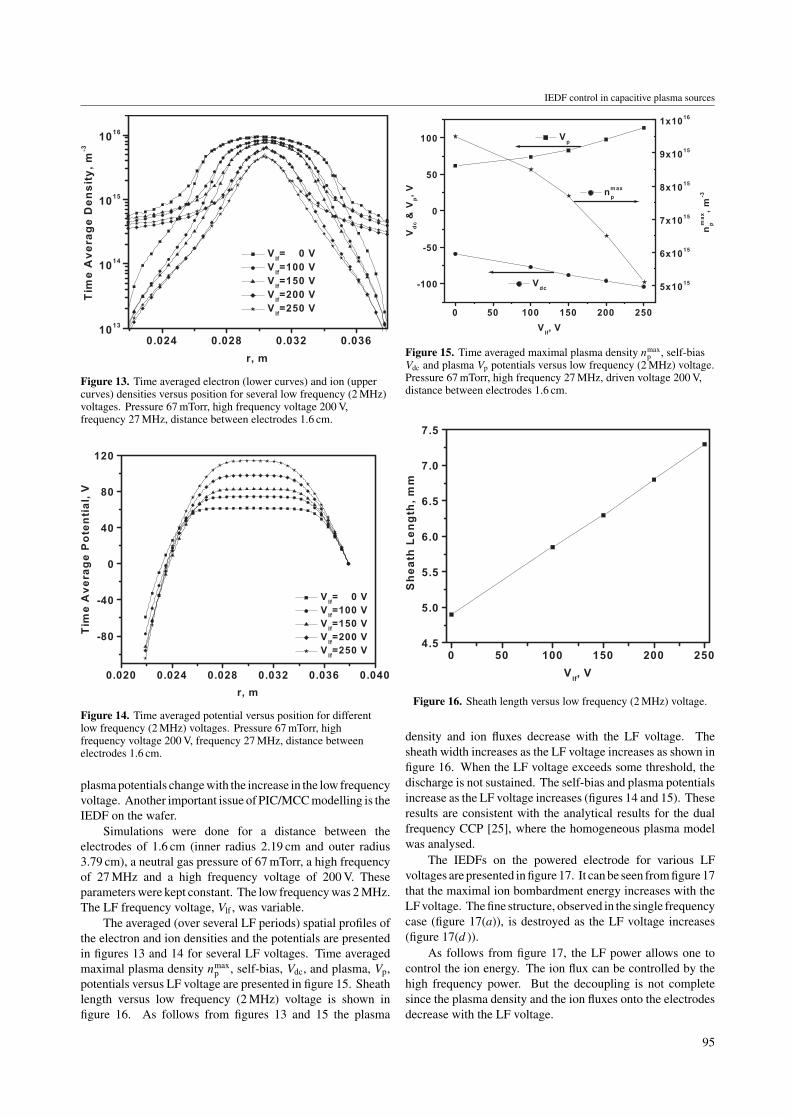
Figure 13. Time averaged electron (lower curves) and ion (uppercurves) densities versus position for several low frequency (2 MHz)voltages. Pressure 67 mTorr, high frequency voltage 200 V,frequency 27 MHz, distance between electrodes 1.6 cm.
Figure 14. Time averaged potential versus position for differentlow frequency (2 MHz) voltages. Pressure 67 mTorr, highfrequency voltage 200 V, frequency 27 MHz, distance betweenelectrodes 1.6 cm.
plasma potentials change with the increase in the low frequencyvoltage. Another important issue of PIC/MCC modelling is theIEDF on the wafer.
Simulations were done for a distance between theelectrodes of 1.6 cm (inner radius 2.19 cm and outer radius3.79 cm), a neutral gas pressure of 67 mTorr, a high frequencyof 27 MHz and a high frequency voltage of 200 V. Theseparameters were kept constant. The low frequency was 2 MHz.The LF frequency voltage, Vlf , was variable.
The averaged (over several LF periods) spatial profiles ofthe electron and ion densities and the potentials are presentedin figures 13 and 14 for several LF voltages. Time averagedmaximal plasma density nmax
p , self-bias, Vdc, and plasma, Vp,potentials versus LF voltage are presented in figure 15. Sheathlength versus low frequency (2 MHz) voltage is shown infigure 16. As follows from figures 13 and 15 the plasma
Figure 15. Time averaged maximal plasma density nmaxp , self-bias
Vdc and plasma Vp potentials versus low frequency (2 MHz) voltage.Pressure 67 mTorr, high frequency 27 MHz, driven voltage 200 V,distance between electrodes 1.6 cm.
Figure 16. Sheath length versus low frequency (2 MHz) voltage.
density and ion fluxes decrease with the LF voltage. Thesheath width increases as the LF voltage increases as shown infigure 16. When the LF voltage exceeds some threshold, thedischarge is not sustained. The self-bias and plasma potentialsincrease as the LF voltage increases (figures 14 and 15). Theseresults are consistent with the analytical results for the dualfrequency CCP [25], where the homogeneous plasma modelwas analysed.
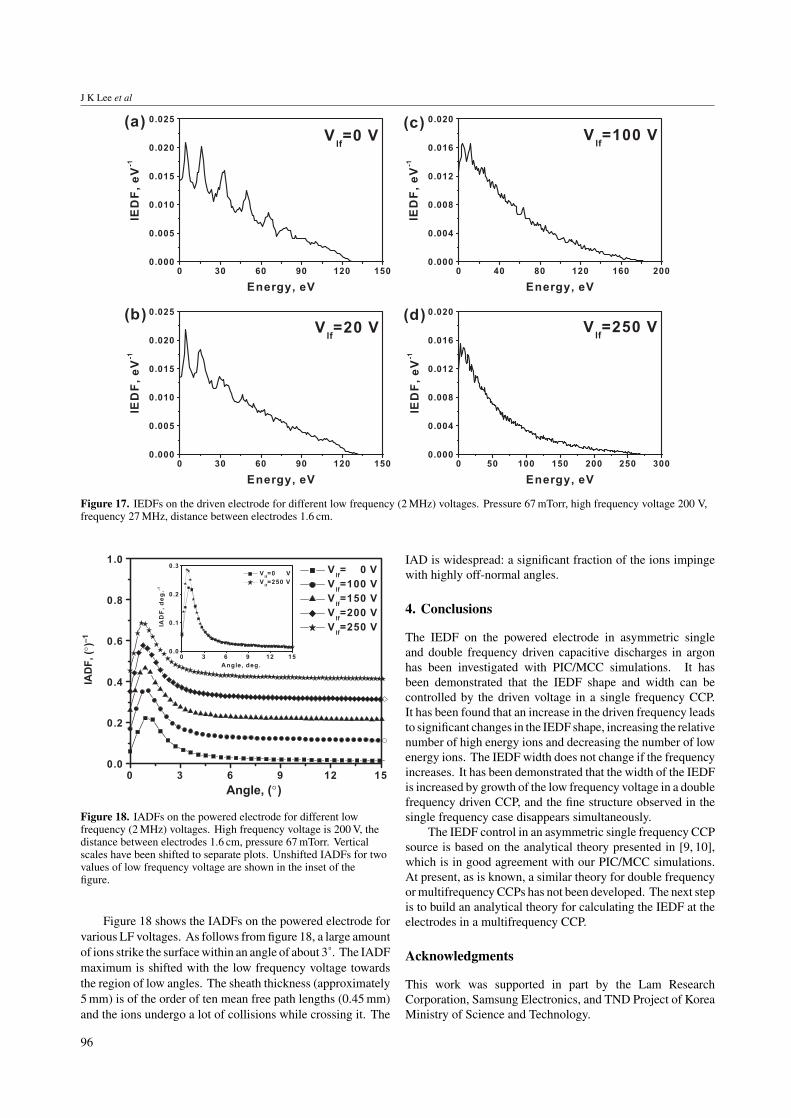
The IEDFs on the powered electrode for various LFvoltages are presented in figure 17. It can be seen from figure 17that the maximal ion bombardment energy increases with theLF voltage. The fine structure, observed in the single frequencycase (figure 17(a)), is destroyed as the LF voltage increases(figure 17(d )).
As follows from figure 17, the LF power allows one tocontrol the ion energy. The ion flux can be controlled by thehigh frequency power. But the decoupling is not completesince the plasma density and the ion fluxes onto the electrodesdecrease with the LF voltage.
95
J K Lee et al
Figure 17. IEDFs on the driven electrode for different low frequency (2 MHz) voltages. Pressure 67 mTorr, high frequency voltage 200 V,frequency 27 MHz, distance between electrodes 1.6 cm.
Angle, (°)
Figure 18. IADFs on the powered electrode for different lowfrequency (2 MHz) voltages. High frequency voltage is 200 V, thedistance between electrodes 1.6 cm, pressure 67 mTorr. Verticalscales have been shifted to separate plots. Unshifted IADFs for twovalues of low frequency voltage are shown in the inset of thefigure.
Figure 18 shows the IADFs on the powered electrode forvarious LF voltages. As follows from figure 18, a large amountof ions strike the surface within an angle of about 3˚. The IADFmaximum is shifted with the low frequency voltage towardsthe region of low angles. The sheath thickness (approximately5 mm) is of the order of ten mean free path lengths (0.45 mm)and the ions undergo a lot of collisions while crossing it. The
IAD is widespread: a significant fraction of the ions impingewith highly off-normal angles.
4. Conclusions
The IEDF on the powered electrode in asymmetric singleand double frequency driven capacitive discharges in argonhas been investigated with PIC/MCC simulations. It hasbeen demonstrated that the IEDF shape and width can becontrolled by the driven voltage in a single frequency CCP.It has been found that an increase in the driven frequency leadsto significant changes in the IEDF shape, increasing the relativenumber of high energy ions and decreasing the number of lowenergy ions. The IEDF width does not change if the frequencyincreases. It has been demonstrated that the width of the IEDFis increased by growth of the low frequency voltage in a doublefrequency driven CCP, and the fine structure observed in thesingle frequency case disappears simultaneously.
The IEDF control in an asymmetric single frequency CCPsource is based on the analytical theory presented in [9, 10],which is in good agreement with our PIC/MCC simulations.At present, as is known, a similar theory for double frequencyor multifrequency CCPs has not been developed. The next stepis to build an analytical theory for calculating the IEDF at theelectrodes in a multifrequency CCP.
Acknowledgments
This work was supported in part by the Lam ResearchCorporation, Samsung Electronics, and TND Project of KoreaMinistry of Science and Technology.
96
IEDF control in capacitive plasma sources
References
[1] Coburn J W 2000 Handbook of Advanced Plasma ProcessingTechniques ed R J Shul and S J Pearton (Berlin: Springer)p 1
[2] Goto H H, Lowe H-D and Ohmi T 1992 J. Vac. Sci. Technol. A10 3048
[3] Goto H H, Lowe H-D and Ohmi T 1993 IEEE Trans.Semicond. Manuf. 6 58
[4] Kitajima T, Takeo Y and Makabe T 1999 J. Vac. Sci. Technol.A 17 2510
[5] Kitajima T, Takeo Y, Petrovic Z Lj and Makabe T 2000 Appl.Phys. Lett. 77 489
[6] Kim H C and Manousiouthakis V I 1998 J. Vac. Sci. Technol.A 16 2162
[7] Kawamura E, Vahedi V, Lieberman M A and Birdsall C K1999 Plasma Sources Sci. Technol. 8 R45
[8] Benoit-Cattin P and Bernard L-C 1968 J. Appl. Phys. 39 5723[9] Wild C and Koidl P 1989 Appl. Phys. Lett. 54 505
[10] Wild C and Koidl P 1991 J. Appl. Phys. 69 2909[11] Liu J, Huppert G L and Sawin H H 1990 J. Appl. Phys. 68 3916[12] May P W, Field D and Klemperer D F 1992 J. Appl. Phys. 71
3721
[13] Song Y P, Field D and Kelmperer D F 1990 J. Phys. D: Appl.Phys. 23 673
[14] Manenschijn A and Goedheer W J 1991 J. Appl. Phys. 69 2923[15] Birdsall C K, Langdon A B 1991 Plasma Physics via
Computer Simulation (New York: Hilger)[16] Birdsall C K 1991 IEEE Trans. Plasma Sci. 19 65[17] Vender D and Boswell R W 1990 IEEE Trans. Plasma Sci.
18 725[18] Surendra M and Graves D B 1991 IEEE Trans. Plasma Sci.
19 144[19] Vahedi V, Birdsall C K, Lieberman M A, DiPeso G and
Rognlien T D 1993 Phys. Fluids B 5 2719[20] Vahedi V and Surendra M 1995 Comput. Phys. Commun.
87 179[21] Vahedi V, DiPeso G, Birdsall C K, Lieberman M A and
Rognlien T D 1993 Plasma Sources Sci. Technol. 2 261[22] Vahedi V, DiPeso G, Birdsall C K, Lieberman M A and
Rognlien T D 1993 Plasma Sources Sci. Technol. 2 273[23] Lieberman M A and Lichtenberg A J 1994 Principles of
Plasma Discharges and Materials Processing (New York:Wiley)
[24] Surendra M and Graves D B 1991 Appl. Phys. Lett. 59 2091[25] Kim H C, Lee J K and Shon J W 2003 Phys. Plasmas 10 4545
97