Investigations of methane emissions from rice cultivation in Indian context
14
Investigations of methane emissions from rice cultivation in Indian context Shalini Anand a, * , R.P. Dahiya a , Vikash Talyan a , Prem Vrat b a Centre for Energy Studies, Indian Institute of Technology Delhi, Hauz Khas, New Delhi 110016, India b Indian Institute of Technology Roorkee, Uttranchal 247667, India Received 20 March 2004; accepted 25 October 2004 Available online 2 December 2004 Abstract The increasing demand of the growing population requires enhancement in the production of rice. This has a direct bearing on the global environment since the rice cultivation is one of the major contributors to the methane emissions. As the rice cultivation is intensified with the current practices and technologies, the methane fluxes from paddy fields will substantially rise. Improved high yielding rice varieties together with efficient cultivation techniques will certainly contribute to the curtailment of the methane emission fluxes. In this paper, the system dynamic approach is used for estimating the methane emissions from rice fields in India till the year 2020. Mitigation options studied for curtailing the methane emissions include rice production management, use of low methane emitting varieties of rice, water management and fertilizer amendment. The model is validated quantitatively and sensitivity tests are carried out to examine the robustness of the model. D 2004 Elsevier Ltd. All rights reserved. Keywords: Global warming; Greenhouse gases; Methane emission; Mitigation options; Rice fields; System dynamics 1. Introduction Methane gas present in the atmosphere substantially affects the radiative budget of the Earth (Wassmann et al., 2000; Aulakh et al., 2001) and has predominant impact on the global warming in comparison to the other greenhouse gases. There are several sources of methane emission leading to its build up in the atmosphere. Among them rice fields are considered to be the important contributors (Mitra et al., 1999) where large quantity of methane is generated. Rice-cultivated area is steadily increasing all over the world to meet the food requirement of the growing world population. Flooding of rice fields cuts off oxygen supply from the atmosphere to the soil, which leads to anaerobic fermenta- tion of organic matter in the soil, resulting in the production of methane (Ferry, 1992). Thus, flooded rice fields provide congenial environment for methane production and are considered to be a major anthropogenic source for biogenic methane. The emission of methane from rice fields is dependent on several factors such as water management, amendment of organic and inorganic fertilizers, rice varietal characteristics and soil environment (Mitra et al., 1999). India is the second largest country in the world in terms of population and is one of the important rice-producing countries. Rice fields of India can be classified as irrigated, rainfed, deepwater or upland. Deepwater means the paddy plants are immersed at least 50–100 cm in water. Most of the rice is grown on wetlands (irrigated, rainfed and deepwater); only 15% of the cultivated area is under uplands. The upland rice fields are not considered a source of methane emission because they are not flooded for sufficient time. Wetland rice fields have been identified as one of the major sources of methane emission. Methane emission from wetland rice cultivation is expected to increase due to the likely intensification of rice cultivation in the coming decades. Considerable research work is in progress to devise options for mitigating methane emissions from the rice fields (Lu et al., 2000; Singh et al., 2003). In this paper, we 0160-4120/$ - see front matter D 2004 Elsevier Ltd. All rights reserved. doi:10.1016/j.envint.2004.10.016 * Corresponding author. Fax: +91 11 26581121. E-mail address: sdk _ [email protected] (S. Anand). Environment International 31 (2005) 469 – 482 www.elsevier.com/locate/envint
Transcript of Investigations of methane emissions from rice cultivation in Indian context
www.elsevier.com/locate/envint
Environment International 31 (
Investigations of methane emissions from rice cultivation
in Indian context
Shalini Ananda,*, R.P. Dahiyaa, Vikash Talyana, Prem Vratb
aCentre for Energy Studies, Indian Institute of Technology Delhi, Hauz Khas, New Delhi 110016, IndiabIndian Institute of Technology Roorkee, Uttranchal 247667, India
Received 20 March 2004; accepted 25 October 2004
Available online 2 December 2004
Abstract
The increasing demand of the growing population requires enhancement in the production of rice. This has a direct bearing on the global
environment since the rice cultivation is one of the major contributors to the methane emissions. As the rice cultivation is intensified with the
current practices and technologies, the methane fluxes from paddy fields will substantially rise. Improved high yielding rice varieties together
with efficient cultivation techniques will certainly contribute to the curtailment of the methane emission fluxes. In this paper, the system
dynamic approach is used for estimating the methane emissions from rice fields in India till the year 2020. Mitigation options studied for
curtailing the methane emissions include rice production management, use of low methane emitting varieties of rice, water management and
fertilizer amendment. The model is validated quantitatively and sensitivity tests are carried out to examine the robustness of the model.
D 2004 Elsevier Ltd. All rights reserved.
Keywords: Global warming; Greenhouse gases; Methane emission; Mitigation options; Rice fields; System dynamics
1. Introduction
Methane gas present in the atmosphere substantially
affects the radiative budget of the Earth (Wassmann et al.,
2000; Aulakh et al., 2001) and has predominant impact on
the global warming in comparison to the other greenhouse
gases. There are several sources of methane emission
leading to its build up in the atmosphere. Among them rice
fields are considered to be the important contributors (Mitra
et al., 1999) where large quantity of methane is generated.
Rice-cultivated area is steadily increasing all over the world
to meet the food requirement of the growing world
population.
Flooding of rice fields cuts off oxygen supply from the
atmosphere to the soil, which leads to anaerobic fermenta-
tion of organic matter in the soil, resulting in the production
of methane (Ferry, 1992). Thus, flooded rice fields provide
congenial environment for methane production and are
0160-4120/$ - see front matter D 2004 Elsevier Ltd. All rights reserved.
doi:10.1016/j.envint.2004.10.016
* Corresponding author. Fax: +91 11 26581121.
E-mail address: [email protected] (S. Anand).
considered to be a major anthropogenic source for biogenic
methane. The emission of methane from rice fields is
dependent on several factors such as water management,
amendment of organic and inorganic fertilizers, rice varietal
characteristics and soil environment (Mitra et al., 1999).
India is the second largest country in the world in terms of
population and is one of the important rice-producing
countries. Rice fields of India can be classified as irrigated,
rainfed, deepwater or upland. Deepwater means the paddy
plants are immersed at least 50–100 cm in water. Most of the
rice is grown on wetlands (irrigated, rainfed and deepwater);
only 15% of the cultivated area is under uplands. The upland
rice fields are not considered a source of methane emission
because they are not flooded for sufficient time. Wetland rice
fields have been identified as one of the major sources of
methane emission. Methane emission from wetland rice
cultivation is expected to increase due to the likely
intensification of rice cultivation in the coming decades.
Considerable research work is in progress to devise
options for mitigating methane emissions from the rice
fields (Lu et al., 2000; Singh et al., 2003). In this paper, we
2005) 469–482
S. Anand et al. / Environment International 31 (2005) 469–482470
present System Dynamics (SD)-based simulation system for
temporal projection of overall methane emissions from rice
cultivation in India. Implication of different policy options
is analysed for evaluating their contribution to reduction of
methane emissions. The System Dynamics (SD) method-
ology has been used to work out a model for scenario
building, conducting policy experiments and making the
projections. A causal-loop structure is constructed by
involving the rice demand, production, methane emissions,
accumulation and mitigation policy options. A detailed flow
diagram is developed and dynamo equations for each
element in the diagram are incorporated in the model.
Estimations are made for methane emissions under different
scenarios over a period of 20 years.
2. System dynamics approach
System dynamics is a computer-aided approach for
analysing and solving complex problems with a focus on
policy analysis and design. In management and social
systems (Mohapatra et al., 1994), policy-makers and
researchers have extensively used system dynamics method-
ology and conducted policy experiments. A detailed descrip-
tion of the system dynamics methodology is given in Sterman
(2000). The SD approach has been applied to a number of
studies related to environment; environmental impact assess-
ment analysis (Vizayakumar and Mohapatra, 1991, 1993),
solid waste management (Mashayekhi, 1993; Karavezysis et
al., 2002), analysis of greenhouse gas emissions and global
warming (Vrat et al., 1993; Anand et al., 2003), water
resource planning (Ford, 1996), environmental planning and
Fig. 1. Causal-loop diagram
management (Guo et al., 2001; Guneralp and Barlas, 2003)
and many more situations.
System dynamics model is developed by establishing a
causal-loop relation between the components associated
with the model in the form of a causal-loop diagram. Then a
flow diagram is constructed and the dynamo equations are
added to the model. In system dynamics model, the
simulations are essentially time-step simulations. The model
takes a number of simulation steps along the time axis. The
dynamics of the system is represented by
dN tð Þ=dt ¼ kN tð Þ
which has a solution
N tð Þ ¼ N0exp ktð Þ
where N0 is the initial value of the system variable, k is a
rate constant (which affects the state of the system and t is
the simulation time).
3. Rice cultivation model
Flow diagram and corresponding formulation of SD
modelling equations are formulated for the rice cultivation
model, which involve interactions among a number of
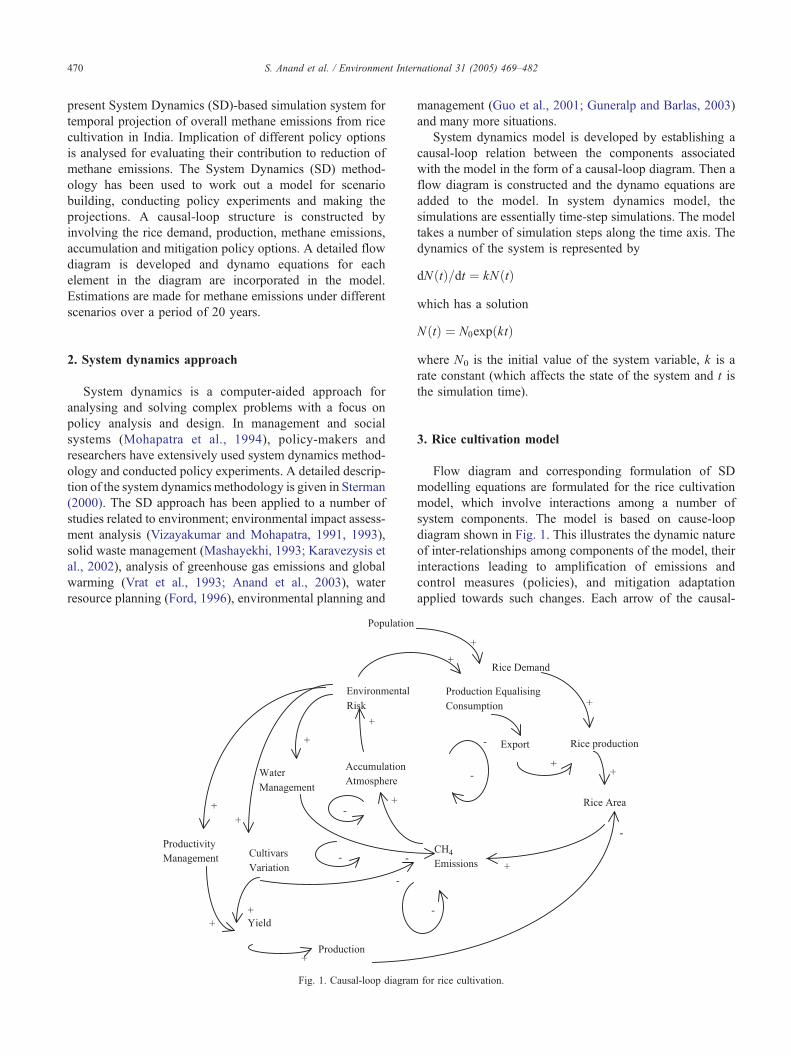
system components. The model is based on cause-loop
diagram shown in Fig. 1. This illustrates the dynamic nature
of inter-relationships among components of the model, their
interactions leading to amplification of emissions and
control measures (policies), and mitigation adaptation
applied towards such changes. Each arrow of the causal-
for rice cultivation.
S. Anand et al. / Environment International 31 (2005) 469–482 471
loop diagram indicates the influence of one element on the
other. The influence is considered positive (+) if an increase
in one element causes an increase in another, or negative
(�) in the opposite case.
The area under rice cultivation needs to be increased up to
certain extent with the growing population; causing enhanced
methane emission and environmental risk. In the causal-loop
Fig. 2. Flow diagram for rice cultivation model. Subsystem diagrams are: (a) rice p
production subsystem.
diagram developed for the rice cultivation model, relevant
mitigation options to curtail the methane emission are taken
into account. These are maintaining a balance between rice
demand and production, an effective water management,
shifting to alternate low methane emitting varieties of rice. In
addition, fertilizer amendment scenario is simulated.With the
application of the policy options, the level of methane
roduction subsystem, (b) area under rice cultivation subsystem, (c) methane
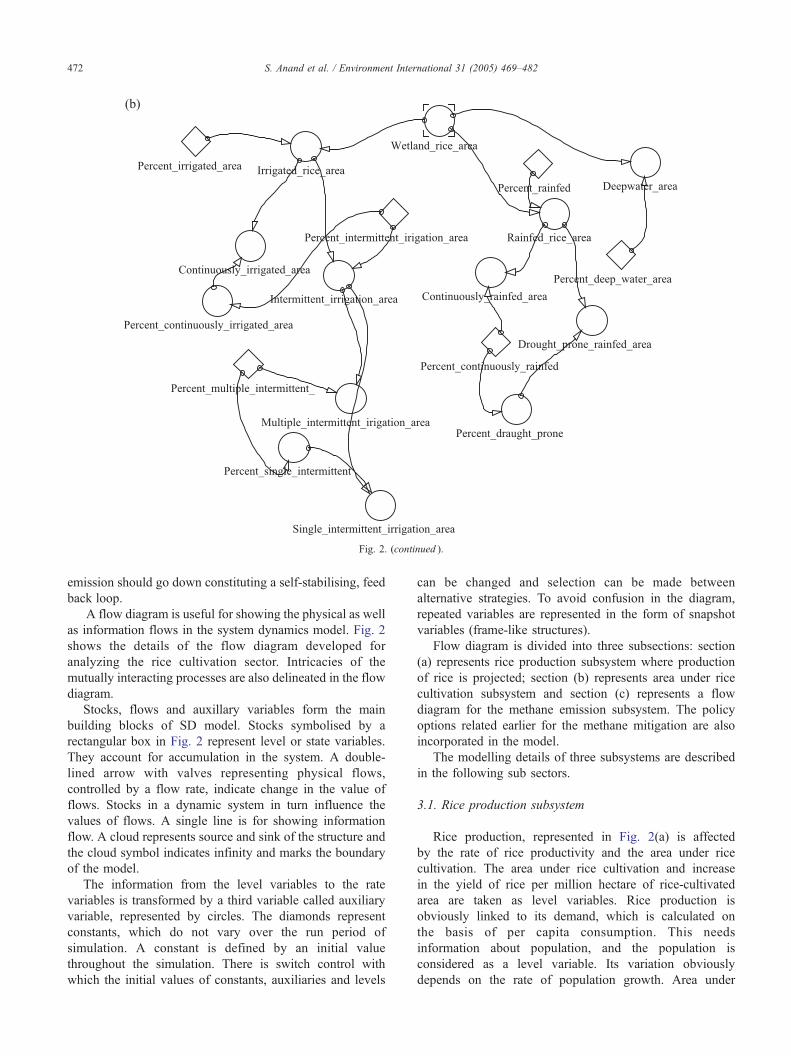
Fig. 2. (continued ).
S. Anand et al. / Environment International 31 (2005) 469–482472
emission should go down constituting a self-stabilising, feed
back loop.
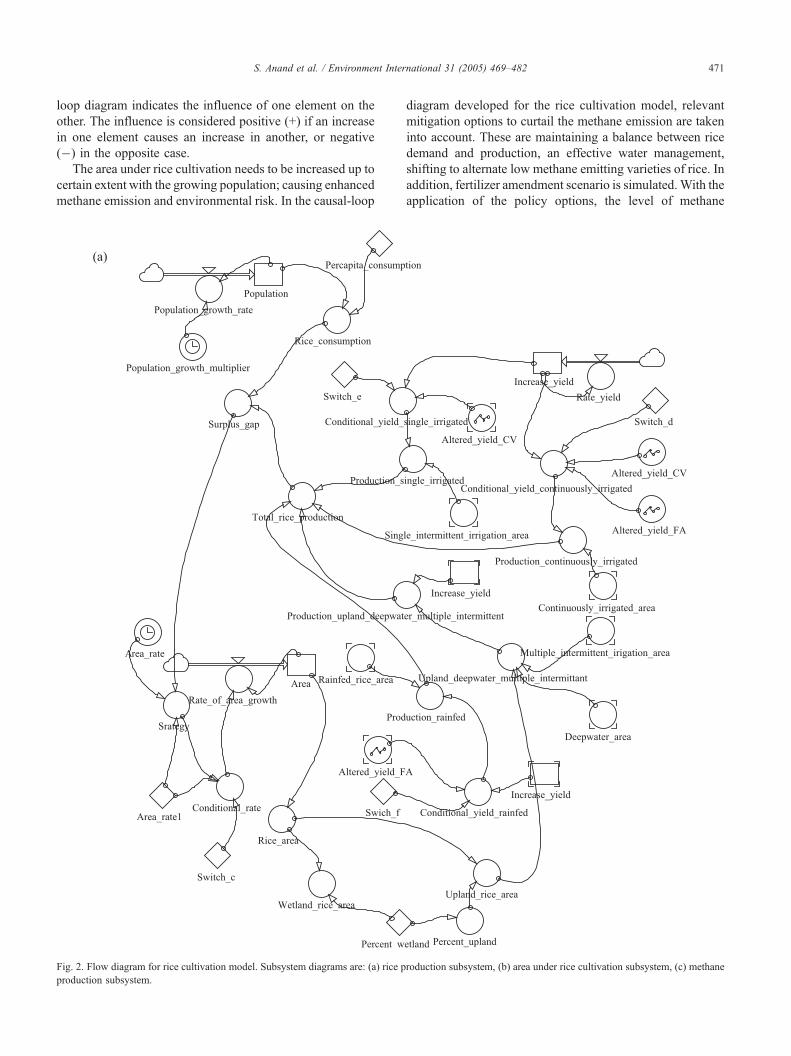
A flow diagram is useful for showing the physical as well
as information flows in the system dynamics model. Fig. 2
shows the details of the flow diagram developed for
analyzing the rice cultivation sector. Intricacies of the
mutually interacting processes are also delineated in the flow
diagram.
Stocks, flows and auxillary variables form the main
building blocks of SD model. Stocks symbolised by a
rectangular box in Fig. 2 represent level or state variables.
They account for accumulation in the system. A double-
lined arrow with valves representing physical flows,
controlled by a flow rate, indicate change in the value of
flows. Stocks in a dynamic system in turn influence the
values of flows. A single line is for showing information
flow. A cloud represents source and sink of the structure and
the cloud symbol indicates infinity and marks the boundary
of the model.
The information from the level variables to the rate
variables is transformed by a third variable called auxiliary
variable, represented by circles. The diamonds represent
constants, which do not vary over the run period of
simulation. A constant is defined by an initial value
throughout the simulation. There is switch control with
which the initial values of constants, auxiliaries and levels
can be changed and selection can be made between
alternative strategies. To avoid confusion in the diagram,
repeated variables are represented in the form of snapshot
variables (frame-like structures).
Flow diagram is divided into three subsections: section
(a) represents rice production subsystem where production
of rice is projected; section (b) represents area under rice
cultivation subsystem and section (c) represents a flow
diagram for the methane emission subsystem. The policy
options related earlier for the methane mitigation are also
incorporated in the model.
The modelling details of three subsystems are described
in the following sub sectors.
3.1. Rice production subsystem
Rice production, represented in Fig. 2(a) is affected
by the rate of rice productivity and the area under rice
cultivation. The area under rice cultivation and increase
in the yield of rice per million hectare of rice-cultivated
area are taken as level variables. Rice production is
obviously linked to its demand, which is calculated on
the basis of per capita consumption. This needs
information about population, and the population is
considered as a level variable. Its variation obviously
depends on the rate of population growth. Area under
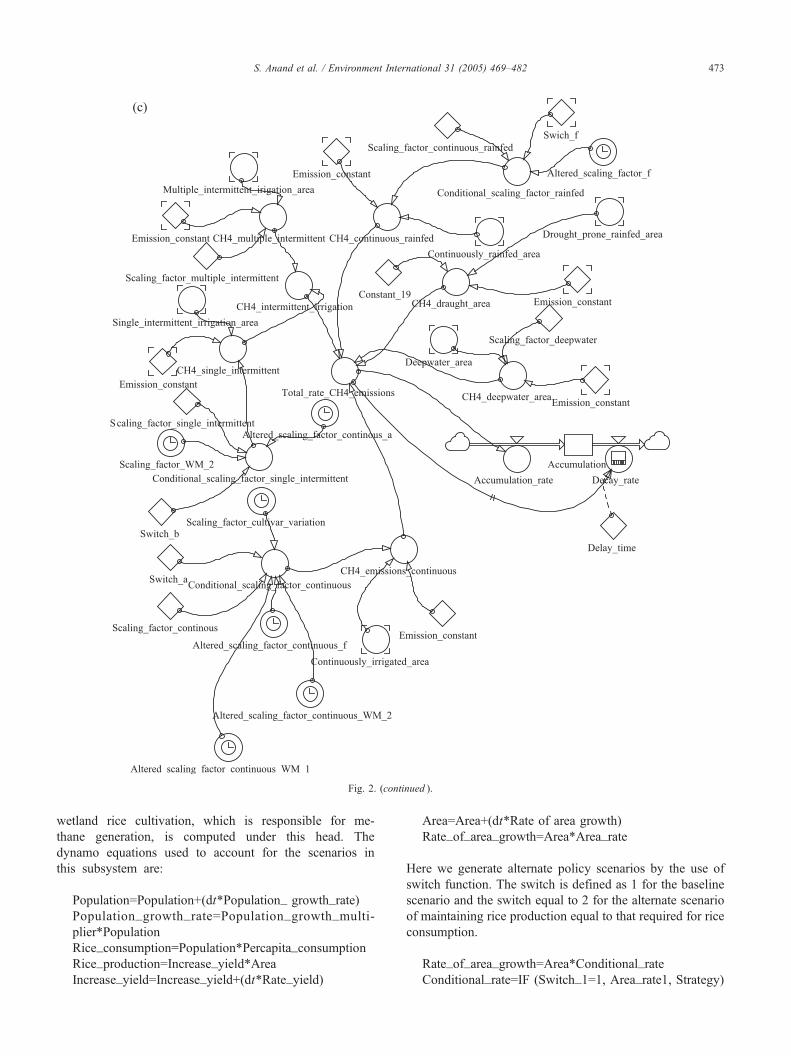
Fig. 2. (continued ).
S. Anand et al. / Environment International 31 (2005) 469–482 473
wetland rice cultivation, which is responsible for me-
thane generation, is computed under this head. The
dynamo equations used to account for the scenarios in
this subsystem are:
Population=Population+(dt*Population_ growth_rate)
Population_growth_rate=Population_growth_multi-
plier*Population
Rice_consumption=Population*Percapita_consumption
Rice_production=Increase_yield*Area
Increase_yield=Increase_yield+(dt*Rate_yield)
Area=Area+(dt*Rate of area growth)
Rate_of_area_growth=Area*Area_rate
Here we generate alternate policy scenarios by the use of
switch function. The switch is defined as 1 for the baseline
scenario and the switch equal to 2 for the alternate scenario
of maintaining rice production equal to that required for rice
consumption.
Rate_of_area_growth=Area*Conditional_rate
Conditional_rate=IF (Switch_1=1, Area_rate1, Strategy)
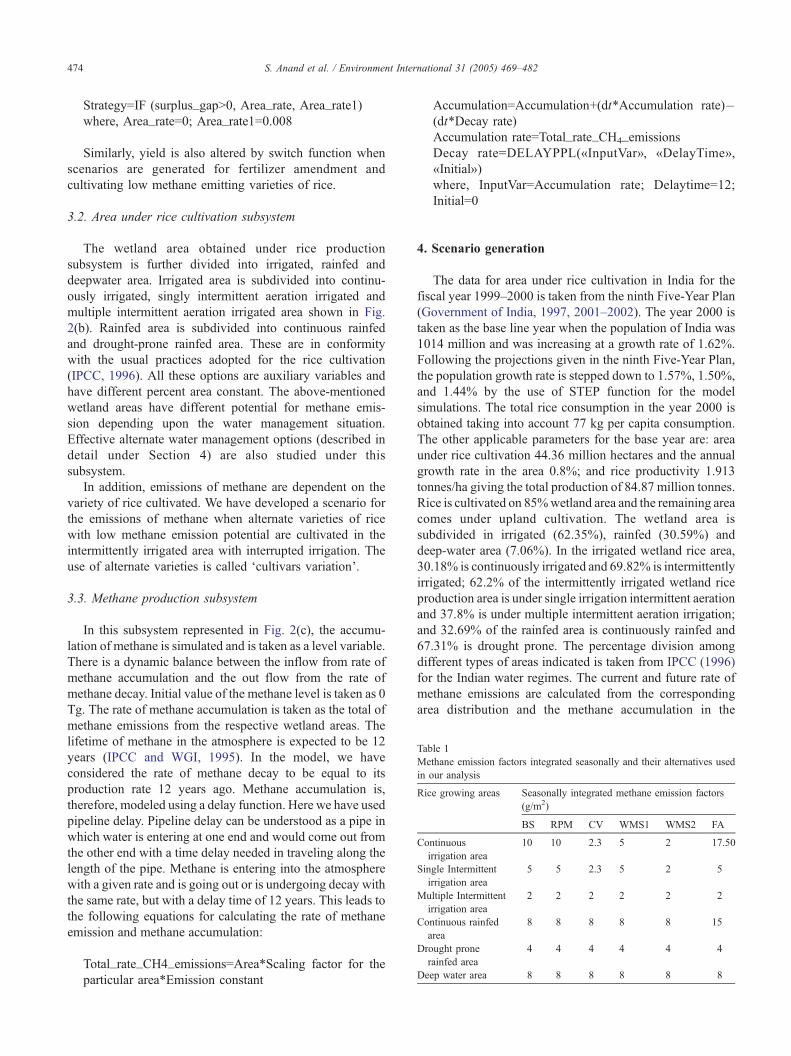
Table 1
Methane emission factors integrated seasonally and their alternatives used
in our analysis
Rice growing areas Seasonally integrated methane emission factors
(g/m2)
BS RPM CV WMS1 WMS2 FA
Continuous
irrigation area
10 10 2.3 5 2 17.50
Single Intermittent
irrigation area
5 5 2.3 5 2 5
Multiple Intermittent
irrigation area
2 2 2 2 2 2
Continuous rainfed
area
8 8 8 8 8 15
Drought prone
rainfed area
4 4 4 4 4 4
Deep water area 8 8 8 8 8 8
S. Anand et al. / Environment International 31 (2005) 469–482474
Strategy=IF (surplus_gapN0, Area_rate, Area_rate1)
where, Area_rate=0; Area_rate1=0.008
Similarly, yield is also altered by switch function when
scenarios are generated for fertilizer amendment and
cultivating low methane emitting varieties of rice.
3.2. Area under rice cultivation subsystem
The wetland area obtained under rice production
subsystem is further divided into irrigated, rainfed and
deepwater area. Irrigated area is subdivided into continu-
ously irrigated, singly intermittent aeration irrigated and
multiple intermittent aeration irrigated area shown in Fig.
2(b). Rainfed area is subdivided into continuous rainfed
and drought-prone rainfed area. These are in conformity
with the usual practices adopted for the rice cultivation
(IPCC, 1996). All these options are auxiliary variables and
have different percent area constant. The above-mentioned
wetland areas have different potential for methane emis-
sion depending upon the water management situation.
Effective alternate water management options (described in
detail under Section 4) are also studied under this
subsystem.
In addition, emissions of methane are dependent on the
variety of rice cultivated. We have developed a scenario for
the emissions of methane when alternate varieties of rice
with low methane emission potential are cultivated in the
intermittently irrigated area with interrupted irrigation. The
use of alternate varieties is called dcultivars variationT.
3.3. Methane production subsystem
In this subsystem represented in Fig. 2(c), the accumu-
lation of methane is simulated and is taken as a level variable.
There is a dynamic balance between the inflow from rate of
methane accumulation and the out flow from the rate of
methane decay. Initial value of the methane level is taken as 0
Tg. The rate of methane accumulation is taken as the total of
methane emissions from the respective wetland areas. The
lifetime of methane in the atmosphere is expected to be 12
years (IPCC and WGI, 1995). In the model, we have
considered the rate of methane decay to be equal to its
production rate 12 years ago. Methane accumulation is,
therefore, modeled using a delay function. Here we have used
pipeline delay. Pipeline delay can be understood as a pipe in
which water is entering at one end and would come out from
the other end with a time delay needed in traveling along the
length of the pipe. Methane is entering into the atmosphere
with a given rate and is going out or is undergoing decay with
the same rate, but with a delay time of 12 years. This leads to
the following equations for calculating the rate of methane
emission and methane accumulation:
Total_rate_CH4_emissions=Area*Scaling factor for the
particular area*Emission constant
Accumulation=Accumulation+(dt*Accumulation rate)�(dt*Decay rate)
Accumulation rate=Total_rate_CH4_emissions
Decay rate=DELAYPPL(TInputVarr, TDelayTimer,
TInitialr)
where, InputVar=Accumulation rate; Delaytime=12;
Initial=0
4. Scenario generation
The data for area under rice cultivation in India for the
fiscal year 1999–2000 is taken from the ninth Five-Year Plan
(Government of India, 1997, 2001–2002). The year 2000 is
taken as the base line year when the population of India was
1014 million and was increasing at a growth rate of 1.62%.
Following the projections given in the ninth Five-Year Plan,
the population growth rate is stepped down to 1.57%, 1.50%,
and 1.44% by the use of STEP function for the model
simulations. The total rice consumption in the year 2000 is
obtained taking into account 77 kg per capita consumption.
The other applicable parameters for the base year are: area
under rice cultivation 44.36 million hectares and the annual
growth rate in the area 0.8%; and rice productivity 1.913
tonnes/ha giving the total production of 84.87 million tonnes.
Rice is cultivated on 85%wetland area and the remaining area
comes under upland cultivation. The wetland area is
subdivided in irrigated (62.35%), rainfed (30.59%) and
deep-water area (7.06%). In the irrigated wetland rice area,
30.18% is continuously irrigated and 69.82% is intermittently
irrigated; 62.2% of the intermittently irrigated wetland rice
production area is under single irrigation intermittent aeration
and 37.8% is under multiple intermittent aeration irrigation;
and 32.69% of the rainfed area is continuously rainfed and
67.31% is drought prone. The percentage division among
different types of areas indicated is taken from IPCC (1996)
for the Indian water regimes. The current and future rate of
methane emissions are calculated from the corresponding
area distribution and the methane accumulation in the

S. Anand et al. / Environment International 31 (2005) 469–482 475
atmosphere is then projected. The methane emission factors
integrated seasonally taken from IPCC (1996) and their
alternatives used in our analysis are listed in Table 1.
Policy options are stipulated for scenario building to
curtail the methane emission. All the alternate options used to
build various scenarios are made effective from the year
2006. The scenarios considered are: baseline scenario, rice
production management, water management, cultivar varia-
tion and fertilizer amendment. The conditions for the baseline
are already specified, whereas in the rice production manage-
ment scenario efforts are made to balance the product and
consumption. For the water management, two scenarios are
adopted, i.e. scenario 1: continuously irrigated area is
subjected to single intermittent irrigation, and scenario 2:
the total irrigated area is subjected to multiple intermittent
irrigation. In the study of alternate cultivars, the low methane
emitting varieties of rice with methane emission potential of
22.85 kg/ha (Mitra et al., 1999) are considered under
intermittent irrigation condition. On the other hand, water
management is applied to the otherwise continuously flooded
area. This scenario is then made equivalent to the intermittent
irrigation while analyzing the reduction in the methane
emission with the application of alternate cultivars in these
areas. It is worth mentioning here that the alternate cultivars
also contribute to the increase productivity, thereby lowering
the area under rice cultivation.
The share of rice in the total food chain can obviously be
ensured with the application of adequate quantities of
fertilizers to the high yielding varieties/hybrids. Tiwari
Fig. 3. Comparison of actual verses mode
(2002) has projected the rice productivity required for India
in the year 2006–2007, 2012 and 2020 to be 2.45, 3.0 and
3.69 tonnes/ha, respectively. Yields of nearly 10 tonnes/ha
can be obtained through site-specific nutrient management
involving the use of 250–150–150–40–5 kg N–P2O5–
K2O5–S–Zn/ha (Pathak, 2000).
We have developed a scenario to study the impact of
nitrogen fertilizer (urea) on the methane emissions and
yield of rice for continuously irrigated and continuously
rainfed water regimes. It is assumed with the addition of
urea, methane emissions on an average increase by 1.75
times and yield increases by 25% (Rath et al., 1999; Singh
et al., 1999; Ghosh et al., 2003). This is incorporated in the
model from the year 2006. It may be pointed out that the
application of ammonium sulphate emits lower methane
than that from urea (Ghosh et al., 2003). Sulphate addition
through ammonium sulphate has been advocated for the
mitigation of methane from rice cultivation (Denier van de
G. et al., 2001). In the present study, the impact of
scenarios taking ammonium sulphate and other fertilizers
are not simulated, as there is not sufficient Indian data
available for quantifying the effect of fertilizers on the
yield.
5. Model validation
Validation of the system dynamics model is necessitated
to establish sufficient confidence in the model on some
l projections of the population data.
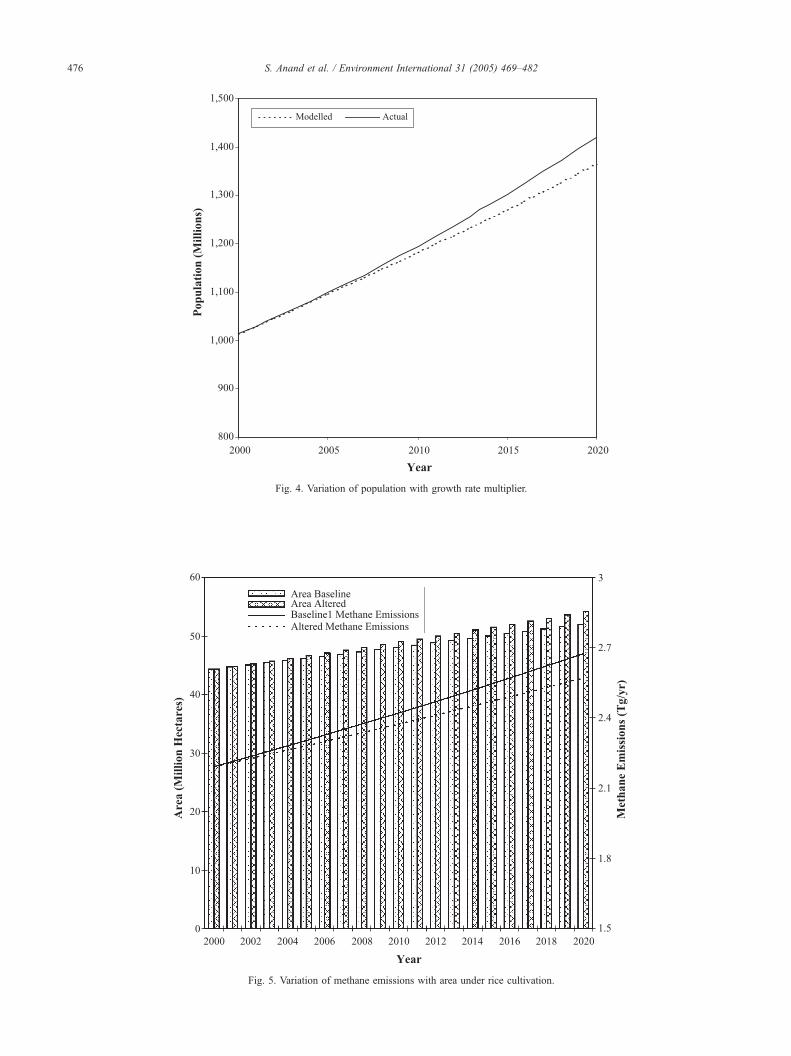
Fig. 4. Variation of population with growth rate multiplier.
Fig. 5. Variation of methane emissions with area under rice cultivation.
S. Anand et al. / Environment International 31 (2005) 469–482476
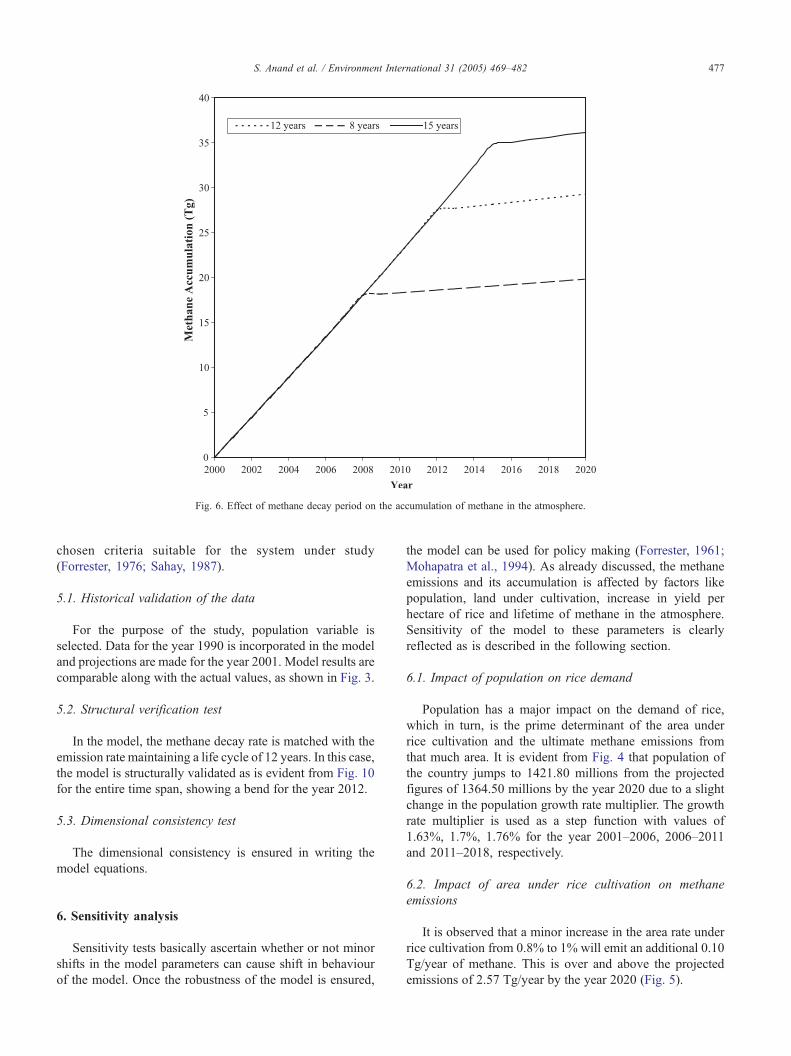
Fig. 6. Effect of methane decay period on the accumulation of methane in the atmosphere.
S. Anand et al. / Environment International 31 (2005) 469–482 477
chosen criteria suitable for the system under study
(Forrester, 1976; Sahay, 1987).
5.1. Historical validation of the data
For the purpose of the study, population variable is
selected. Data for the year 1990 is incorporated in the model
and projections are made for the year 2001. Model results are
comparable along with the actual values, as shown in Fig. 3.
5.2. Structural verification test
In the model, the methane decay rate is matched with the
emission rate maintaining a life cycle of 12 years. In this case,
the model is structurally validated as is evident from Fig. 10
for the entire time span, showing a bend for the year 2012.
5.3. Dimensional consistency test
The dimensional consistency is ensured in writing the
model equations.
6. Sensitivity analysis
Sensitivity tests basically ascertain whether or not minor
shifts in the model parameters can cause shift in behaviour
of the model. Once the robustness of the model is ensured,
the model can be used for policy making (Forrester, 1961;
Mohapatra et al., 1994). As already discussed, the methane
emissions and its accumulation is affected by factors like
population, land under cultivation, increase in yield per
hectare of rice and lifetime of methane in the atmosphere.
Sensitivity of the model to these parameters is clearly
reflected as is described in the following section.
6.1. Impact of population on rice demand
Population has a major impact on the demand of rice,
which in turn, is the prime determinant of the area under
rice cultivation and the ultimate methane emissions from
that much area. It is evident from Fig. 4 that population of
the country jumps to 1421.80 millions from the projected
figures of 1364.50 millions by the year 2020 due to a slight
change in the population growth rate multiplier. The growth
rate multiplier is used as a step function with values of
1.63%, 1.7%, 1.76% for the year 2001–2006, 2006–2011
and 2011–2018, respectively.
6.2. Impact of area under rice cultivation on methane
emissions
It is observed that a minor increase in the area rate under
rice cultivation from 0.8% to 1% will emit an additional 0.10
Tg/year of methane. This is over and above the projected
emissions of 2.57 Tg/year by the year 2020 (Fig. 5).
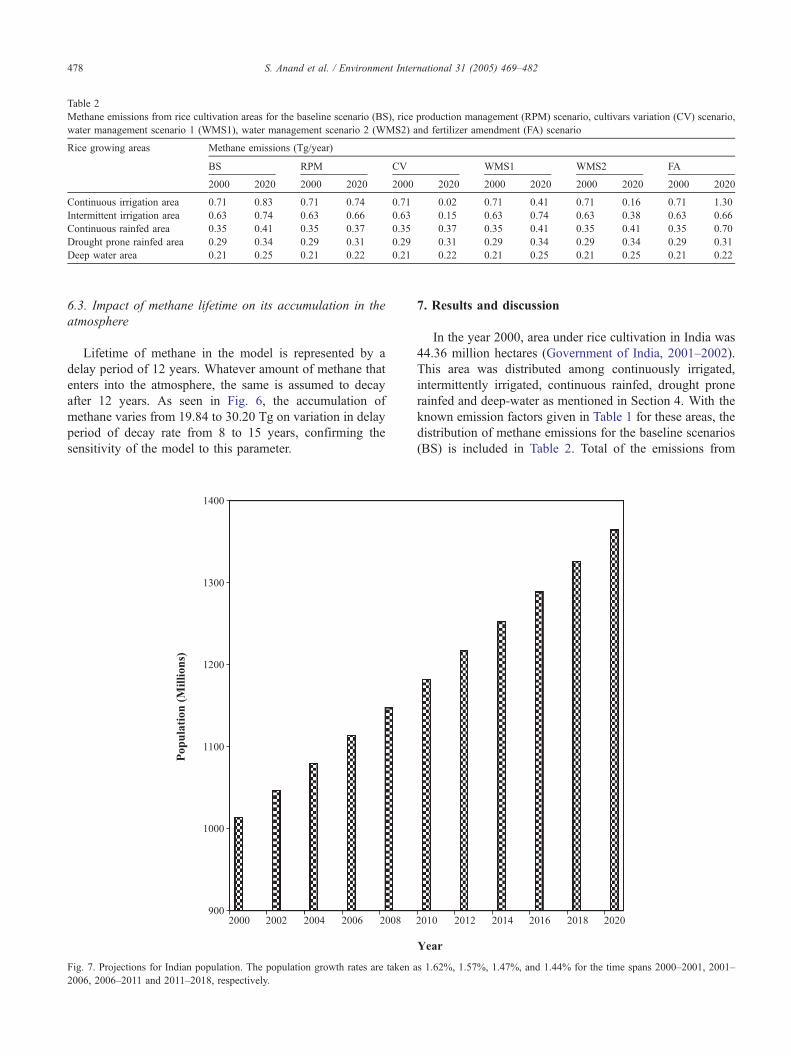
Table 2
Methane emissions from rice cultivation areas for the baseline scenario (BS), rice production management (RPM) scenario, cultivars variation (CV) scenario,
water management scenario 1 (WMS1), water management scenario 2 (WMS2) and fertilizer amendment (FA) scenario
Rice growing areas Methane emissions (Tg/year)
BS RPM CV WMS1 WMS2 FA
2000 2020 2000 2020 2000 2020 2000 2020 2000 2020 2000 2020
Continuous irrigation area 0.71 0.83 0.71 0.74 0.71 0.02 0.71 0.41 0.71 0.16 0.71 1.30
Intermittent irrigation area 0.63 0.74 0.63 0.66 0.63 0.15 0.63 0.74 0.63 0.38 0.63 0.66
Continuous rainfed area 0.35 0.41 0.35 0.37 0.35 0.37 0.35 0.41 0.35 0.41 0.35 0.70
Drought prone rainfed area 0.29 0.34 0.29 0.31 0.29 0.31 0.29 0.34 0.29 0.34 0.29 0.31
Deep water area 0.21 0.25 0.21 0.22 0.21 0.22 0.21 0.25 0.21 0.25 0.21 0.22
S. Anand et al. / Environment International 31 (2005) 469–482478
6.3. Impact of methane lifetime on its accumulation in the
atmosphere
Lifetime of methane in the model is represented by a
delay period of 12 years. Whatever amount of methane that
enters into the atmosphere, the same is assumed to decay
after 12 years. As seen in Fig. 6, the accumulation of
methane varies from 19.84 to 30.20 Tg on variation in delay
period of decay rate from 8 to 15 years, confirming the
sensitivity of the model to this parameter.
Fig. 7. Projections for Indian population. The population growth rates are taken a
2006, 2006–2011 and 2011–2018, respectively.
7. Results and discussion
In the year 2000, area under rice cultivation in India was
44.36 million hectares (Government of India, 2001–2002).
This area was distributed among continuously irrigated,
intermittently irrigated, continuous rainfed, drought prone
rainfed and deep-water as mentioned in Section 4. With the
known emission factors given in Table 1 for these areas, the
distribution of methane emissions for the baseline scenarios
(BS) is included in Table 2. Total of the emissions from
s 1.62%, 1.57%, 1.47%, and 1.44% for the time spans 2000–2001, 2001–
S. Anand et al. / Environment International 31 (2005) 469–482 479
different types of the areas, work out to 2.19 Tg/year for the
base year 2000. As expected, the emissions from the
drought prone rainfed and deep-water rice producing areas
are less. Intermittent drying and flooding periods during the
rice cultivation on the draught prone rainfed areas cause
reduction in the methane emissions.
Estimates of Parashar et al., 1996 ranging from 2.7 to 5.4
Tg/year are higher than those of our model. In their study,
they have classified paddy-harvested area into continuously
flooded or irrigated, intermittently flooded or rainfed, deep-
water and upland area with no further classification of
continuously irrigated area. In our study, we have classified
irrigated area into continuously flooded and intermittently
irrigated area with a subdivision of intermittently irrigated
area into single intermittent and multiple intermittent
irrigation. Methane emission potential of intermittently
irrigated area is less as compared to the continuously irrigated
area. In addition, seasonally integrated factors used in our
study, for the baseline scenario are for the fields without any
organic fertilizer. The recent global estimates of methane
emissions from rice cultivation are in the range of 30–50 Tg/
year (Neue and Sass, 1998). Our estimates from rice
cultivation in India during the year 2000 give 2.19 Tg/year,
contributing only 4.38–7.31% to the global emissions.
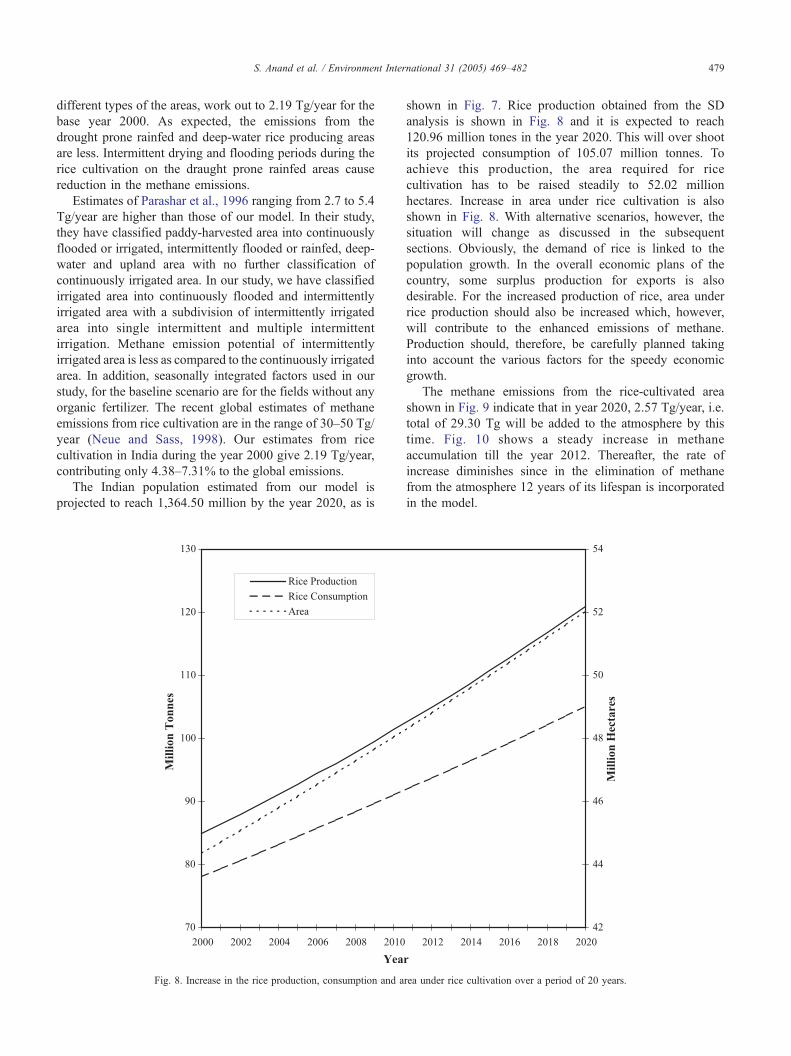
The Indian population estimated from our model is
projected to reach 1,364.50 million by the year 2020, as is
Fig. 8. Increase in the rice production, consumption and a
shown in Fig. 7. Rice production obtained from the SD
analysis is shown in Fig. 8 and it is expected to reach
120.96 million tones in the year 2020. This will over shoot
its projected consumption of 105.07 million tonnes. To
achieve this production, the area required for rice
cultivation has to be raised steadily to 52.02 million
hectares. Increase in area under rice cultivation is also
shown in Fig. 8. With alternative scenarios, however, the
situation will change as discussed in the subsequent
sections. Obviously, the demand of rice is linked to the
population growth. In the overall economic plans of the
country, some surplus production for exports is also
desirable. For the increased production of rice, area under
rice production should also be increased which, however,
will contribute to the enhanced emissions of methane.
Production should, therefore, be carefully planned taking
into account the various factors for the speedy economic
growth.
The methane emissions from the rice-cultivated area
shown in Fig. 9 indicate that in year 2020, 2.57 Tg/year, i.e.
total of 29.30 Tg will be added to the atmosphere by this
time. Fig. 10 shows a steady increase in methane
accumulation till the year 2012. Thereafter, the rate of
increase diminishes since in the elimination of methane
from the atmosphere 12 years of its lifespan is incorporated
in the model.
rea under rice cultivation over a period of 20 years.
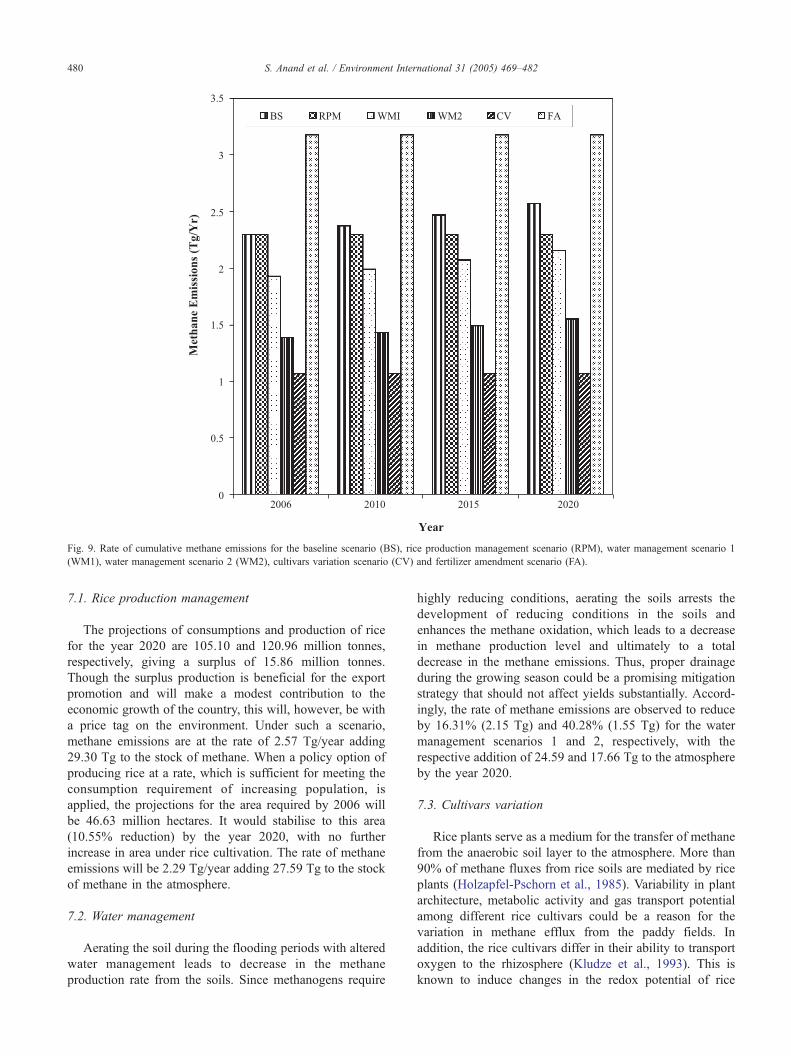
Fig. 9. Rate of cumulative methane emissions for the baseline scenario (BS), rice production management scenario (RPM), water management scenario 1
(WM1), water management scenario 2 (WM2), cultivars variation scenario (CV) and fertilizer amendment scenario (FA).
S. Anand et al. / Environment International 31 (2005) 469–482480
7.1. Rice production management
The projections of consumptions and production of rice
for the year 2020 are 105.10 and 120.96 million tonnes,
respectively, giving a surplus of 15.86 million tonnes.
Though the surplus production is beneficial for the export
promotion and will make a modest contribution to the
economic growth of the country, this will, however, be with
a price tag on the environment. Under such a scenario,
methane emissions are at the rate of 2.57 Tg/year adding
29.30 Tg to the stock of methane. When a policy option of
producing rice at a rate, which is sufficient for meeting the
consumption requirement of increasing population, is
applied, the projections for the area required by 2006 will
be 46.63 million hectares. It would stabilise to this area
(10.55% reduction) by the year 2020, with no further
increase in area under rice cultivation. The rate of methane
emissions will be 2.29 Tg/year adding 27.59 Tg to the stock
of methane in the atmosphere.
7.2. Water management
Aerating the soil during the flooding periods with altered
water management leads to decrease in the methane
production rate from the soils. Since methanogens require
highly reducing conditions, aerating the soils arrests the
development of reducing conditions in the soils and
enhances the methane oxidation, which leads to a decrease
in methane production level and ultimately to a total
decrease in the methane emissions. Thus, proper drainage
during the growing season could be a promising mitigation
strategy that should not affect yields substantially. Accord-
ingly, the rate of methane emissions are observed to reduce
by 16.31% (2.15 Tg) and 40.28% (1.55 Tg) for the water
management scenarios 1 and 2, respectively, with the
respective addition of 24.59 and 17.66 Tg to the atmosphere
by the year 2020.
7.3. Cultivars variation
Rice plants serve as a medium for the transfer of methane
from the anaerobic soil layer to the atmosphere. More than
90% of methane fluxes from rice soils are mediated by rice
plants (Holzapfel-Pschorn et al., 1985). Variability in plant
architecture, metabolic activity and gas transport potential
among different rice cultivars could be a reason for the
variation in methane efflux from the paddy fields. In
addition, the rice cultivars differ in their ability to transport
oxygen to the rhizosphere (Kludze et al., 1993). This is
known to induce changes in the redox potential of rice

Fig. 10. Methane accumulations in the atmosphere for the baseline scenario (BS), rice production management scenario (RPM), water management scenario 1
(WM1), water management scenario 2 (WM2), cultivars variation scenario (CV) and fertilizer amendment scenario (FA) over a period of 20 years.
S. Anand et al. / Environment International 31 (2005) 469–482 481
rhizosphere (Flessa and Fisher, 1992). A higher oxidation
status in the soil–root interface may stimulate methane
oxidation, thereby reducing the source strength of methane
in the rhizosphere region available for emission through rice
plants.
There could be substantial reduction in methane emis-
sions if low methane emitting variety of rice is adopted
along with the water management on the continuously
irrigated area and intermittently irrigated area. From the year
2006 of incorporation of this policy in the model, the rate of
methane emissions get stabilised to 1.07 Tg/year and thus
the accumulation by the year 2020 comes to 12.82 Tg.
Reductions in methane emissions are due to the increased
area under alternate low methane emitting varieties with
intermittent irrigation. This will not only reduce the methane
emissions, but also increase the yield up to 6 tonnes/ha
(Mitra et al., 1999). Increased yield of rice leads to increased
production from less area thus restricting further increase in
the emissions. With the increase in yield rice production
comes to surplus level from the existing area under rice
cultivation. There is, therefore, a scope of decreasing
methane emissions by cutting down the area under rice
cultivation under this scenario.
7.4. Fertilizer amendment
The nitrogenous fertilizer is seen to have a positive effect
on the methane emissions. The applied fertilizers may help to
increase methanogenesis by supplying methanogens with
nitrogen for their metabolism. The fertilizers also have a
positive effect on the quantity of biomass associated with
paddy plants. This may increase rhizo deposition of carbon
compounds, which may enhance methanogenesis. Further, as
the rice plants serve as a conduit for methane transport from
the soil to the atmosphere, increased volume of the biomass
provides more of gaseous transport (Nouchi et al., 1990).
Our model shows that with the application of fertilizer
methane emissions increase to 3.17 Tg/year for the year
2006 and will remain constant by the year 2020. The reason
behind this is that the addition of urea fertilizer has
enhancing effect on the yield. Increase in the per hectare
yield amounts to the reduction in area for rice cultivation for
a given quantity of rice. Thus, the methane emissions under
such a scenario will be curtailed. Methane emissions in Tg/
year and methane accumulations in Tg for the baseline
scenario and for the other alternative scenarios studied are
shown in Figs. 9 and 10.
S. Anand et al. / Environment International 31 (2005) 469–482482
8. Conclusion
A system dynamics model for simulation of methane
emissions from rice fields is developed. The model is used to
obtain trends and estimates for a time span of 20 years under
different scenarios. Possible strategies to mitigate the
methane emissions from this sector are suggested and
analysed. Methane emissions from rice fields are dependent
on the quantity of rice produced, varieties of rice, flooded area
under rice cultivation and fertilizer amendment. Baseline
scenario for methane emissions and its accumulation in the
atmospheric pool is generated. In the baseline scenario, the
rate of methane emissions is projected to reach 2.57 Tg/year
over the next 20 years, adding 29.30 Tg to the atmosphere.
Reductions in the surplus production of rice, the use of
alternate low methane emitting varieties of rice, effective
water management will reduce the methane emissions.
Acknowledgements
The authors (SA) and (VT) thank the Indian Institute of
Technology Delhi and University Grants Commission,
respectively, for the award of fellowship. Thanks are also
due to Mr. Naresh Kumar for general assistance during the
course of work.
References
Anand S, Vrat P, Dahiya RP. Application of system dynamics approach for
assessment and mitigation of CO2 emissions from cement industry.
[Communicated to]. J Environ Manag.
Aulakh MS, Wassmann R, Rennenberg H. Methane emissions from rice
fields—quantification, role of management and mitigation options. Adv
Agron 2001;70:193–260.
Denier van de G, Bodegem HAC Van, Wassmann PM, Lantin R, Metra-
Coston M. Sulphate-containing amendments to reduce methane
emissions from rice paddies: mechanisms, effectiveness and costs.
Mitig Adapt Strategies Glob Chang 2001;6:71–89.
Ferry JG. Biochemistry of methanogenesis. CRC Cric Rev Biochem Mol
Biol 1992;27:473–503.
Flessa H, Fisher WR. Plant induced changes in the redox potentials of
rhizosphere. Plant Soil 1992;143:55–60.
Ford A. Testing snake river explorer. Syst Dyn Rev 1996;12:305–29.
Forrester JW. Industrial dynamics. Cambridge (MA)7 MIT Press; 1961.
Forrester JW. The validity of system dynamics: an interchange. Technol
Rev MIT 1976;76:2–3.
Ghosh S, Majumdar D, Jain MC. Methane and nitrous oxide emissions
from an irrigated rice of North India. Chemosphere 2003;51:181–95.
Government of India. Report to the Planning Commission. 9th Five
Year Plan, 1, 1997. http://www.development first.org/India/planning-
commission/9thfyp/FYPVol1.pdf.
Government of India. Economic Survey. Ministry of Finance; 2001–2002.
http://indiabudget.nic.in/es2001-02/Chapt2002/tab113.pdf.
Guneralp B, Barlas Y. Dynamic modelling of a shallow fresh water lake for
ecological and economic sustainability. Ecol Model 2003;167:115–38.
Guo HC, Liu L, Huang GH, Fuller GA, Zou R, Yin YY. A system
dynamics approach for regional environmental planning and manage-
ment; a study for the lake Erhai Basin. J Environ Manag 2001;61:
93–111. [www.idealibrary.com].
Holzapfel-Pschorn A, Conrad R, Seiler W. Production, oxidation, and
emission of methane in rice paddies. FEMS Microbiol Ecol 1985;31:
49–158.
IPCC (Intergovernmental Panel on Climate Change). Revised IPCC
Guidelines for National Greenhouse Gas Inventories. Workbook,
1996;2:1–20. http://www.ipcc-nggip.iges.or.jp/public/gl/guidelin/
ch4wb1.pdf.
IPCC (Intergovernmental Panel on Climate Change) WWorking Group-1
(WGI). Climate change 1995: the science of climate change. Cambridge
(UK)7 Cambridge University Press; 1995.
Karavezysis V, Timpe KP, Marzi R. Application of system dynamics and
fuzzy logic to forecasting of municipal solid waste. Math Comput Simul
2002;2071:1–10.
Kludze HK, Delaune RD, Patrick Jr WH. Aerenchyma formation and
methane and oxygen exchange in rice. Am J Soil Sci Soc 1993;57:
386–91.
Lu WF, Chen W, Duan BW, Guo WM, Lu Y, Lantin RS, et al. Methane
emissions and mitigation options in irrigated rice fields in southeast
China. Nutr Cycl Agroecosyst 2000;58:65–73.
Mashayekhi AN. Transition in New York state solid waste system: a
dynamic analysis. Syst Dyn Rev 1993;9:23–48.
Mitra S, Jain MC, Kumar S, Bandyopadhyay SK, Kalra N. Effect of
rice cultivars on methane emission. Agric Ecosyst Environ 1999;73:
177–83.
Mohapatra PKJ, Mandal P, Bora MC. Introduction to system dynamics
modeling. Hyderabad (India)7 Orient Longman; 1994.
Neue HU, Sass RL. The budget of methane from rice fields. IGACtivities
1998;17:3–11.
Nouchi I, Mariko S, Aoki K. Mechanism of methane transport from the
rhizosphere to the atmosphere through rice plants. Plant Physiol 1990;
94:59–66.
Parashar DC, Mitra AP, Gupta PK, Rai J, Sharma RC, Singh N, et al.
Methane budget from paddy fields in India. Chemosphere 1996;
33(4):737–57.
Pathak RK. Annual Report PPIC-IP Sponsored Research Project; 2000.
Rath AK, Swain B, Ramakrishnan B, Panda D, Adhya TK, Rao VR, et al.
Influence of fertilizer management and water regime on methane
emission from rice fields. Agric Ecosyst Environ 1999;76:99–107.
Sahay SS. Note on SD model validation. Presented at the Orientation
Programme on System Dynamics in First National Conference on
System Dynamics, IIT, Kharagpur; 1987.
Singh S, Singh JS, Kashyap AK. Methane flux from irrigated rice fields in
relation to crop growth and N-fertilization. Soil Biol Biochem 1999;31:
1219–28.
Singh SN, Verma A, Tyagi L. Investigating options for attenuating methane
from Indian rice fields. Environ Int 2003;29:547–53.
Sterman J. Business dynamics. New York7 McGraw Hill; 2000.
Tiwari KN. Rice production nutrient management in India. Better Crops Int
Spec Suppl 2002;16:18–22.
Vizayakumar K, Mohapatra PKJ. Environmental impact analysis of a
coalfield. J Environ Manag 1991;34:73–93.
Vizayakumar K, Mohapatra PKJ. Modeling and simulation of environ-
mental impacts of coalfield: system dynamics approach. J Environ Syst
1993;22:59–73.
Vrat P, Gupta YK, Gupta A, 1993. A System dynamics study of global
warming: Proceedings of xviith National System Conference, Kanpur;
1993.
Wassmann R, Lantin RS, Neue HU, Buendia LV, Corton TM, Lu Y.
Characterisation of methane emissions from rice fields in Asia: Part 3
Mitigation options and future research needs. Nutr Cycl Agroecosyst
2000;58:23–36.