Investigation of the rainfall variability in central Tunisia / Investigations sur la variabilité...
17
This article was downloaded by: [128.199.169.55] On: 02 September 2015, At: 03:37 Publisher: Taylor & Francis Informa Ltd Registered in England and Wales Registered Number: 1072954 Registered office: 5 Howick Place, London, SW1P 1WG Hydrological Sciences Journal Publication details, including instructions for authors and subscription information: http://www.tandfonline.com/loi/thsj20 Investigation of the rainfall variability in central Tunisia / Investigations sur la variabilité pluviométrique en Tunisie centrale Amhadi Kingumbi , Zoubeida Bargaoui & Pierre Hubert a Ecole Nationale d'Ingénieurs de Tunis (ENIT) – Laboratoire de Modélisation en Hydraulique et Environnement (LMHE), BP 37 Le Belvédère, 1002 Tunis, Tunisia. b Ecole Nationale d'Ingénieurs de Tunis (ENIT) – Laboratoire de Modélisation en Hydraulique et Environnement (LMHE), BP 37 Le Belvédère, 1002 Tunis, Tunisia. c UMR Sisyphe, Ecole des Mines de Paris – CIG 35, Rue Saint Honoré, F-77305 Fontainebleau, France. Published online: 15 Dec 2009. To cite this article: Amhadi Kingumbi , Zoubeida Bargaoui & Pierre Hubert (2005) Investigation of the rainfall variability in central Tunisia / Investigations sur la variabilité pluviométrique en Tunisie centrale, Hydrological Sciences Journal, 50:3, -508, DOI: 10.1623/hysj.50.3.493.65027 To link to this article: http://dx.doi.org/10.1623/hysj.50.3.493.65027 PLEASE SCROLL DOWN FOR ARTICLE Taylor & Francis makes every effort to ensure the accuracy of all the information (the “Content”) contained in the publications on our platform. However, Taylor & Francis, our agents, and our licensors make no representations or warranties whatsoever as to the accuracy, completeness, or suitability for any purpose of the Content. Any opinions and views expressed in this publication are the opinions and views of the authors, and are not the views of or endorsed by Taylor & Francis. The accuracy of the Content should not be relied upon and should be independently verified with primary sources of information. Taylor and Francis shall not be liable for any losses, actions, claims, proceedings, demands, costs, expenses, damages, and other liabilities whatsoever or howsoever caused arising directly or indirectly in connection with, in relation to or arising out of the use of the Content. This article may be used for research, teaching, and private study purposes. Any substantial or systematic reproduction, redistribution, reselling, loan, sub-licensing, systematic supply, or distribution in any form to anyone is expressly forbidden. Terms & Conditions of access and use can be found at http:// www.tandfonline.com/page/terms-and-conditions
Transcript of Investigation of the rainfall variability in central Tunisia / Investigations sur la variabilité...

This article was downloaded by: [128.199.169.55]On: 02 September 2015, At: 03:37Publisher: Taylor & FrancisInforma Ltd Registered in England and Wales Registered Number: 1072954 Registered office: 5 HowickPlace, London, SW1P 1WG
Hydrological Sciences JournalPublication details, including instructions for authors and subscription information:http://www.tandfonline.com/loi/thsj20
Investigation of the rainfall variability incentral Tunisia / Investigations sur la variabilitépluviométrique en Tunisie centraleAmhadi Kingumbi , Zoubeida Bargaoui & Pierre Huberta Ecole Nationale d'Ingénieurs de Tunis (ENIT) – Laboratoire de Modélisation enHydraulique et Environnement (LMHE), BP 37 Le Belvédère, 1002 Tunis, Tunisia.b Ecole Nationale d'Ingénieurs de Tunis (ENIT) – Laboratoire de Modélisation enHydraulique et Environnement (LMHE), BP 37 Le Belvédère, 1002 Tunis, Tunisia.c UMR Sisyphe, Ecole des Mines de Paris – CIG 35, Rue Saint Honoré, F-77305Fontainebleau, France.Published online: 15 Dec 2009.
To cite this article: Amhadi Kingumbi , Zoubeida Bargaoui & Pierre Hubert (2005) Investigation of the rainfall variability incentral Tunisia / Investigations sur la variabilité pluviométrique en Tunisie centrale, Hydrological Sciences Journal, 50:3,-508, DOI: 10.1623/hysj.50.3.493.65027
To link to this article: http://dx.doi.org/10.1623/hysj.50.3.493.65027
PLEASE SCROLL DOWN FOR ARTICLE
Taylor & Francis makes every effort to ensure the accuracy of all the information (the “Content”) containedin the publications on our platform. However, Taylor & Francis, our agents, and our licensors make norepresentations or warranties whatsoever as to the accuracy, completeness, or suitability for any purpose ofthe Content. Any opinions and views expressed in this publication are the opinions and views of the authors,and are not the views of or endorsed by Taylor & Francis. The accuracy of the Content should not be reliedupon and should be independently verified with primary sources of information. Taylor and Francis shallnot be liable for any losses, actions, claims, proceedings, demands, costs, expenses, damages, and otherliabilities whatsoever or howsoever caused arising directly or indirectly in connection with, in relation to orarising out of the use of the Content.
This article may be used for research, teaching, and private study purposes. Any substantial or systematicreproduction, redistribution, reselling, loan, sub-licensing, systematic supply, or distribution in anyform to anyone is expressly forbidden. Terms & Conditions of access and use can be found at http://www.tandfonline.com/page/terms-and-conditions
Hydrological Sciences–Journal–des Sciences Hydrologiques, 50(3) June 2005
Open for discussion until 1 December 2005 Copyright 2005 IAHS Press
493
Investigation of the rainfall variability in central Tunisia AHMADI KINGUMBI1, ZOUBEIDA BARGAOUI1 & PIERRE HUBERT2
1 Ecole Nationale d’Ingénieurs de Tunis (ENIT) – Laboratoire de Modélisation en Hydraulique et Environnement (LMHE), BP 37 Le Belvédère, 1002 Tunis, Tunisia [email protected]
2 UMR Sisyphe, Ecole des Mines de Paris – CIG 35, Rue Saint Honoré, F-77305 Fontainebleau, France
Abstract The decrease in runoff of the Merguellil basin, Tunisia recorded during the decade 1989–1998 led to the study of several time series derived from daily rainfall. It was found that variability characteristics related to daily rainfall greater than 30 mm are significantly different among successive time periods. In addition, the probability distributions of these rains, recorded at different raingauge sites, are significantly different between the period 1976–1989 and the prior and posterior observation periods. Furthermore, the surface covered by daily rains greater than 30 mm decreased between 1976 and 1989. It was also noted that the probability distributions of the surfaces covered changed significantly after 1976. The combination of human action and pluviometric variability (rainfall increase in the period 1989–1998, notably the increase in the number of days of rainfall greater than 30 mm) may explain the decrease in runoff of Merguellil Wadi. Keys words anomaly index; change detection; semiarid; spatial rainfall distribution; statistical rainfall distribution; variability; central Tunisia
Investigations sur la variabilité pluviométrique en Tunisie centrale Résumé La baisse des apports du bassin du Merguellil enregistrée pendant la dernière décennie (1989–1998) nous a amenés à étudier plusieurs séries chronologiques dérivées des pluies journalières. Nous concluons à des différences significatives dans les caractéristiques de variabilité des pluies supérieures à 30 mm entre des périodes successives. C’est ainsi que les distributions de probabilité de ces pluies, aux différentes stations, sont significativement différentes entre la période 1976–1989 et les périodes antérieure et postérieure. De même, la surface couverte par ces pluies a considérablement diminué entre 1976 et 1989. Nous avons aussi constaté que les distributions de probabilité des séries des surfaces couvertes par ces pluies ont statistiquement changé après 1976. La reprise pluviométrique sur la période 1989–1998, notamment l’augmentation du nombre de jours de pluies supérieures à 30 mm, privilégie l’action combinée des aménagements et de la variabilité pluviométrique pour expliquer la baisse des apports de l’Oued Merguellil. Mots clefs indices d’anomalies; détection de changement; semi-aride; distribution spatiale de la pluie; distribution statistique des pluies; variabilité; Tunisie centrale
INTRODUCTION Central Tunisia, characterized by annual rains ranging between 200 and 500 mm and annual potential evapotranspiration around 1700 mm, is regarded as a semiarid area. This study concerns the Merguellil basin, which is nearly 1300 km2 at El Haouareb Dam (Fig. 1), built in 1989. The annual average inflow to the dam was evaluated at 23 × 106 m3 during the period 1989–1998 (Kingumbi, 1999) which may be considered as a shortage period. Indeed, without taking into account the singular year of 1969/70, the annual mean inflows at Haffouz (675 km2) and Sidi Boujdaria (890 km2) hydrometric stations located upstream of the dam site have been estimated,
Dow
nloa
ded
by [
128.
199.
169.
55]
at 0
3:37
02
Sept
embe
r 20
15
Ahmadi Kingumbi et al.
Copyright 2005 IAHS Press
494
respectively, as 16.7 (1966–1982) and 32 (1974–1982) × 106 m3 (Bouzaïane & Lafforgue, 1986). However, during the extreme flood of autumn 1969, runoff was estimated to be 175 × 106 m3 (Bouzaïane & Lafforgue, 1986). It is believed that two factors may have contributed to the decrease of Merguellil basin inflows during the period 1989–1998: the rainfall variability and changes in the basin water cycle due to human actions. In the past, non-adapted ploughing (which does not follow the topographic iso-contours) and a high density of livestock, superimposed on high intensity rains led to intensive erosion. Therefore several soil and water conservation works have been undertaken. Nowadays, contour ridges cover a total area of about 200 km2. In addition, 43 small dams, of which the cumulative watershed area covers 170 km2, have been built. Although these conservation practices have taken place in the catchment since 1964 (Dridi, 2000), the present study will focus on the investigation of rainfall variability, since the spatial and temporal persistence of rainfall may have a major influence on the water cycle (Bardossy, 1994). The notion of “climatic variability” describes fluctuations of seasonal or annual values in comparison with the temporal values of reference. It differs from climatic change which refers to a long-term behaviour, of average values of the statistics of studied variables. Ouarda et al. (1999) indicate that the most adapted variables to follow the climate are river flows, lake levels, rainfall, air and water temperatures, dates of break-up of ice cover and piezometric levels. Many studies and several methods to detect climatic changes have been performed worldwide (WMO, 1966; Cavadias, 1994; Lubès et al., 1994; Lubès-Niel et al., 1998). In sub-Saharan Africa, many authors have demonstrated, in the hydrometeorological series, a dry phase which began towards the 1970s. In this region, a decrease in several water budget elements has been noted: annual rainfall (Hubert & Carbonnel, 1987; Moron, 1994; Mahé & Olivry, 1995; Paturel et al., 1995, 1997; Servat et al., 1997, 1999; Hubert et al., 1998; Tarhule & Woo, 1998); number of rainy days (Paturel et al., 1997; Servat et al., 1997, 1999; Houndénou & Hernandez, 1998; Tarhule & Woo, 1998); heavy rainfall intensities (Houndénou & Hernandez, 1998; Tarhule & Woo, 1998); river flows (Sircoulon, 1987; Mahé & Olivry, 1995; Hubert et al., 1998; Opoku-Ankomah & Amisigo, 1998); lake levels (Sircoulon, 1987); and duration of rainfall season (Bello, 1998; Servat et al., 1999). The aim of this study is to analyse daily rainfall-related variables reflecting changes in rainfall distributions. In the next section, data and statistical methods for detection of changes in time series are presented. The following section develops results for central Tunisian stations and in the final section new variables undergoing changes are proposed. DATA AND METHODS Data The area of study covers two administrative regions (Kairouan and Siliana) of central Tunisia (Fig. 1). Twenty-five raingauges were identified in this area. Measurements at the oldest raingauges began toward the end of the 19th century. However, most of the
Dow
nloa
ded
by [
128.
199.
169.
55]
at 0
3:37
02
Sept
embe
r 20
15

Investigation of the rainfall variability in central Tunisia
Copyright 2005 IAHS Press
495
Fig. 1 Geographical situation of Merguellil Wadi basin.
stations have been implemented between the 1960s and 1980s. All series of data include gaps. In the first part of this study, the stations used were those with long historic data and which do not contain gaps. However, the whole network data will be evaluated in the second part. Table 1 reports the location of all 25 raingauges, as well as elevation and starting year. Methods Local aspects A studied period was defined for each station in order to include the maximum length of record without gaps. Raingauges were selected according to the length and the quality of their series. Thus, eight stations were retained: El Ala (no. 7), Haffouz (no. 10), Kairouan (no. 12), Kesra (no. 13), Ouslatia (no. 19), Sidi Hamada (no. 22), Sidi Saad (no. 23) and Skhira (no. 24) (Fig. 1, Table 2). Among these, the shortest series is for Skhira, which has only 25 years of observations, while the other selected raingauges have an observed period exceeding 30 years. Table 2 shows that annual variability increases from north to south and from east to west of Merguellil basin. In order to compare the rainfall evolution of central Tunisia to that of other regions of the country, two complementary stations were also considered : Tunis (no. 26) in the north and Gafsa (no. 27) in the south of Tunisia (Fig. 1, Table 2).
Dow
nloa
ded
by [
128.
199.
169.
55]
at 0
3:37
02
Sept
embe
r 20
15
Ahmadi Kingumbi et al.
Copyright 2005 IAHS Press
496
Table 1 Geographical location and start dates for observations of Merguellil basin raingauges.
Number (RN)
Raingauge name Latitude Longitude Elevation (m)
Start (year)
1 Abdessadok 35°40′10″ 09°15′20″ 787 1980 2 Aïn Baïdha 35°31′15″ 09°43′20″ 297 1982 3 Aïn Jelloula 35°48′07″ 09°48′58″ 175 1948 4 Bou Hafna 35°40′49″ 09°39′13″ 300 1955 5 Cherichira 35°38′14″ 09°50′13″ 321 1902 6 Djebel Trozza 35°31′55″ 09°34′56″ 450 1925 7 El Ala 35°36′56″ 09°33′29″ 466 1969 8 El Haouareb 35°34′08″ 09°45′00″ 250 1970 9 Gueria 35°46′00″ 09°26′50″ 674 1964 10 Haffouz 35°37′30″ 09°40′20″ 280 1968 11 Hajeb El Ayoun 35°23′50″ 09°32′46″ 350 1957 12 Kairouan 35°40′33″ 10°06′15″ 60 1925 13 Kesra 35°49′34″ 09°21′26″ 989 1888 14 Majbar 35°44′20″ 09°14′00″ 855 1980 15 Makthar 35°51′11″ 09°12′15″ 900 1888 16 Messiouta 35°38′20″ 09°27′53″ 661 1980 17 Moazil 35°41′25″ 09°35′12″ 587 1980 18 Oued Hajar 35°44′15″ 09°36′21″ 375 1970 19 Ouslatia 35°50′27″ 09°36′43″ 460 1961 20 Serja 35°33′30″ 09°26′25″ 450 1980 21 Sidi Boujdaria 35°35′32″ 09°42′40″ 215 1974 22 Sidi Hamada 35°57′37″ 09°12′59″ 825 1960 23 Sidi Saad 35°23′36″ 09°41′47″ 238 1951 24 Skhira 35°44′23″ 09°23′03″ 600 1974 25 Tella 35°48′33″ 09°14′05″ 861 1980 Table 2 Characteristics of the longer series for selected raingauges in the area of study.
Studied period Observed precipitation Raingauge
Name RN Beginning End Mean
(mm) Median (mm)
SD (mm)
Coeff. of variation
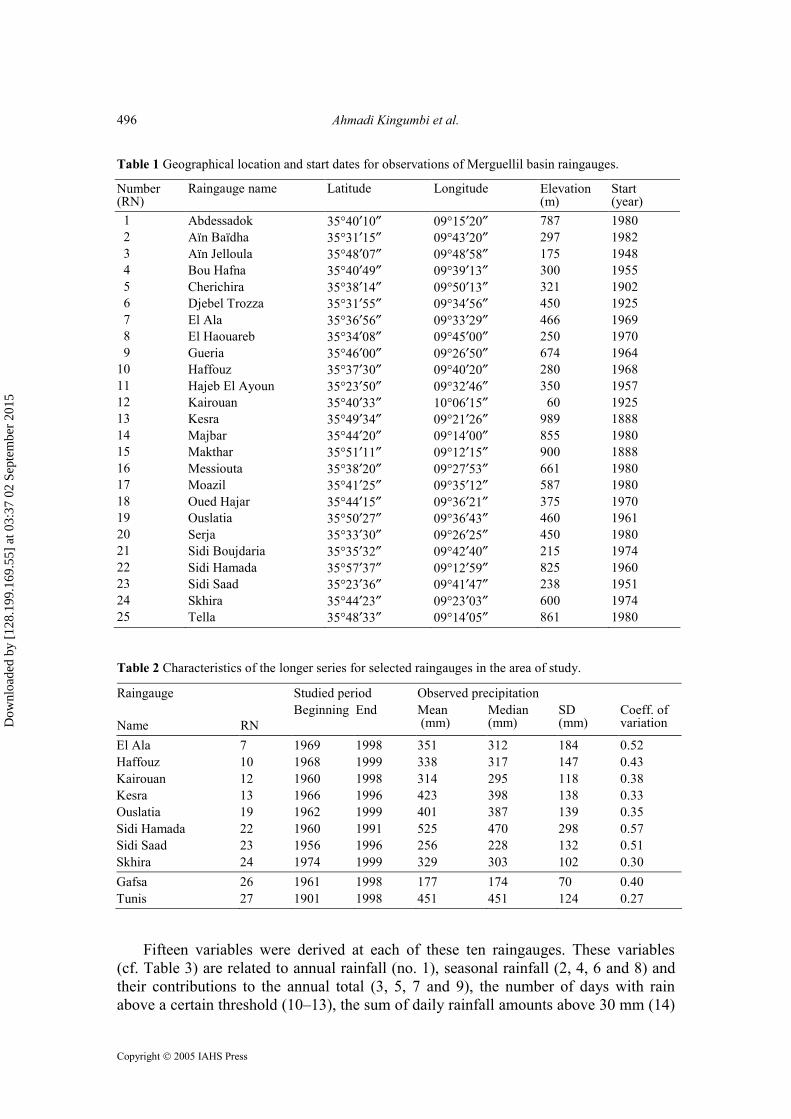
El Ala 7 1969 1998 351 312 184 0.52 Haffouz 10 1968 1999 338 317 147 0.43 Kairouan 12 1960 1998 314 295 118 0.38 Kesra 13 1966 1996 423 398 138 0.33 Ouslatia 19 1962 1999 401 387 139 0.35 Sidi Hamada 22 1960 1991 525 470 298 0.57 Sidi Saad 23 1956 1996 256 228 132 0.51 Skhira 24 1974 1999 329 303 102 0.30 Gafsa 26 1961 1998 177 174 70 0.40 Tunis 27 1901 1998 451 451 124 0.27 Fifteen variables were derived at each of these ten raingauges. These variables (cf. Table 3) are related to annual rainfall (no. 1), seasonal rainfall (2, 4, 6 and 8) and their contributions to the annual total (3, 5, 7 and 9), the number of days with rain above a certain threshold (10–13), the sum of daily rainfall amounts above 30 mm (14)
Dow
nloa
ded
by [
128.
199.
169.
55]
at 0
3:37
02
Sept
embe
r 20
15
Investigation of the rainfall variability in central Tunisia
Copyright 2005 IAHS Press
497
Table 3 Variables derived from daily rainfall.
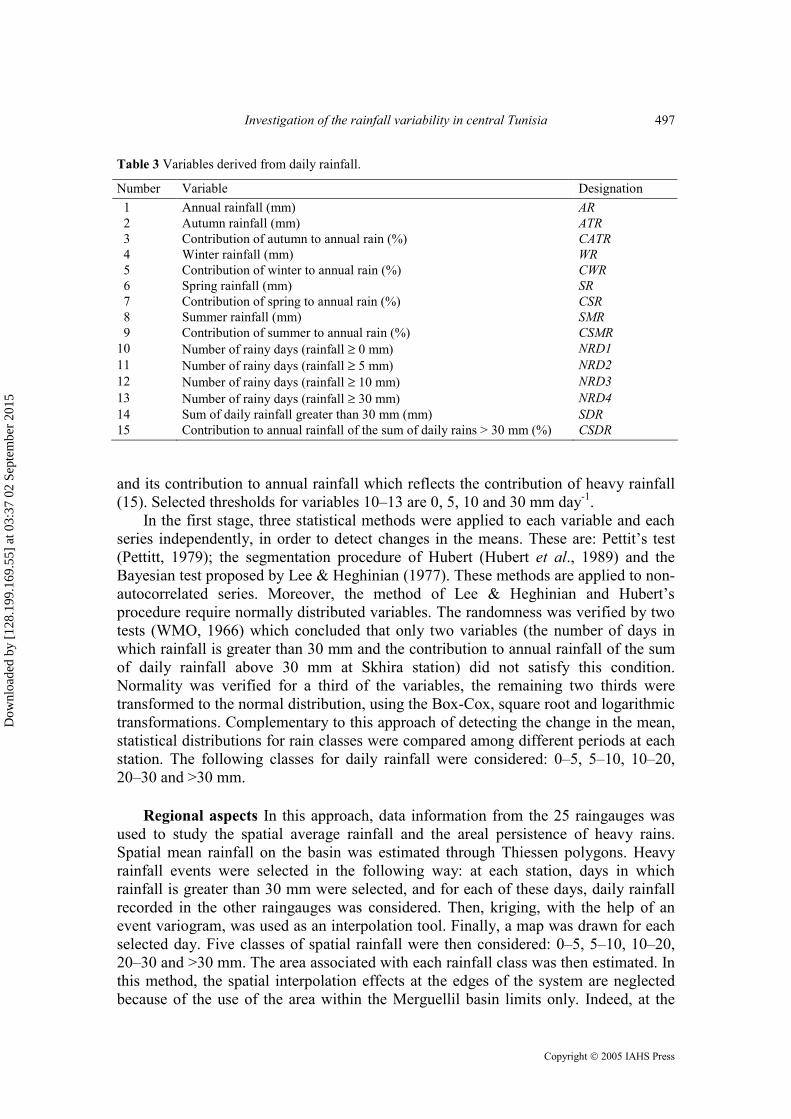
Number Variable Designation 1 Annual rainfall (mm) AR 2 Autumn rainfall (mm) ATR 3 Contribution of autumn to annual rain (%) CATR 4 Winter rainfall (mm) WR 5 Contribution of winter to annual rain (%) CWR 6 Spring rainfall (mm) SR 7 Contribution of spring to annual rain (%) CSR 8 Summer rainfall (mm) SMR 9 Contribution of summer to annual rain (%) CSMR 10 Number of rainy days (rainfall ≥ 0 mm) NRD1 11 Number of rainy days (rainfall ≥ 5 mm) NRD2 12 Number of rainy days (rainfall ≥ 10 mm) NRD3 13 Number of rainy days (rainfall ≥ 30 mm) NRD4 14 Sum of daily rainfall greater than 30 mm (mm) SDR 15 Contribution to annual rainfall of the sum of daily rains > 30 mm (%) CSDR and its contribution to annual rainfall which reflects the contribution of heavy rainfall (15). Selected thresholds for variables 10–13 are 0, 5, 10 and 30 mm day-1. In the first stage, three statistical methods were applied to each variable and each series independently, in order to detect changes in the means. These are: Pettit’s test (Pettitt, 1979); the segmentation procedure of Hubert (Hubert et al., 1989) and the Bayesian test proposed by Lee & Heghinian (1977). These methods are applied to non-autocorrelated series. Moreover, the method of Lee & Heghinian and Hubert’s procedure require normally distributed variables. The randomness was verified by two tests (WMO, 1966) which concluded that only two variables (the number of days in which rainfall is greater than 30 mm and the contribution to annual rainfall of the sum of daily rainfall above 30 mm at Skhira station) did not satisfy this condition. Normality was verified for a third of the variables, the remaining two thirds were transformed to the normal distribution, using the Box-Cox, square root and logarithmic transformations. Complementary to this approach of detecting the change in the mean, statistical distributions for rain classes were compared among different periods at each station. The following classes for daily rainfall were considered: 0–5, 5–10, 10–20, 20–30 and >30 mm. Regional aspects In this approach, data information from the 25 raingauges was used to study the spatial average rainfall and the areal persistence of heavy rains. Spatial mean rainfall on the basin was estimated through Thiessen polygons. Heavy rainfall events were selected in the following way: at each station, days in which rainfall is greater than 30 mm were selected, and for each of these days, daily rainfall recorded in the other raingauges was considered. Then, kriging, with the help of an event variogram, was used as an interpolation tool. Finally, a map was drawn for each selected day. Five classes of spatial rainfall were then considered: 0–5, 5–10, 10–20, 20–30 and >30 mm. The area associated with each rainfall class was then estimated. In this method, the spatial interpolation effects at the edges of the system are neglected because of the use of the area within the Merguellil basin limits only. Indeed, at the
Dow
nloa
ded
by [
128.
199.
169.
55]
at 0
3:37
02
Sept
embe
r 20
15

Ahmadi Kingumbi et al.
Copyright 2005 IAHS Press
498
Fig. 2 Surface covered by different rain intervals in the episode of 29 March 1977.
Fig. 3 Comparison of rainfall class areas calculated using nine and 25 raingauges in the 1989/90 hydrological year.
beginning of the period of study (1966), the network was composed of only nine raingauges but with an homogeneous spatial distribution (Fig. 2). In fact, the assumption was made that the different network configurations would not influence the map results. To emphasize this assumption, a comparison was made of
Dow
nloa
ded
by [
128.
199.
169.
55]
at 0
3:37
02
Sept
embe
r 20
15

Investigation of the rainfall variability in central Tunisia
Copyright 2005 IAHS Press
499
the areas of rainfall classes calculated using networks of both nine and 25 raingauges in the 1989/90 hydrological year that present the highest number of heavy rain events (26). This comparison, illustrated in Fig. 3, shows that the minimum network brings reliable information, since there is a linear correlation coefficient of 0.8 between the areas calculated from the data of the two networks (nine and 25 raingauges). However, for some events, important differences between these areas have been found. In fact, while considering only the minimal network (nine raingauges), six events would not have been detected since during them all the nine primitive raingauges recorded rainfall of less than 30 mm. It is known that the accuracy of the evaluation of areal rainfall classes is much improved as the number of stations in the network has increased. Therefore, inaccuracies in the estimation of an area of a given isohyet may be the result of lower network density. Such imprecision, which is difficult to access, can influence the calculation of surface covered by heavy rainfall in one of two manners: the area may be under-estimated or overestimated. As a CUSUM approach is a common way to analyse inhomogeneity, it was decided to study the sum of areas associated with the class of rainfall >30 mm at a yearly scale and to apply statistical tests for detection of change. INVESTIGATION OF VARIABILITY AT THE LOCAL SCALE Detecting changes in the mean Variables derived from daily rainfall at the local scale In order to emphasize the evolution of annual rainfall, anomaly indices were calculated based on annual rain at eight stations. It appears that three periods may be distinguished as shown in Fig. 4(b), which presents anomaly indices in the case of four stations. The first period relates to the years prior to 1976 and corresponds to a succession of dry and wet years. The second period, from 1976 to 1989, is characterized by dry years. The period after 1989 is characterized by a renewal of rainfall. In the chronologies studied, two years are distinguishable by the importance of their annual rains: the hydrological years 1969/70 and 1989/90. In particular, 1969/70 with an anomaly index >3, is considered as exceptional in the rainfall history of central Tunisia. It should be noted that the period between 1976 and 1989 is characterized by a weak temporal variance, whereas the prior and posterior periods have greater standard deviations (Table 4). The authors notice that Bergaoui & Alouini (2001) and Benzarti & Habaieb (2001) showed that drought is a highly recurrent phenomenon and that the persistence of dry years is very significant in central Tunisia. Performing Pettitt’s test for α = 5%, only two step-changes were detected among locations concerning the number of rainy days. These were at Kairouan raingauge in 1976 and at Sidi Saad in 1973. This leads one to conclude that Pettitt’s test did not detect change in the mean of rainfall series of central Tunisia. No change was obtained for the Gafsa raingauge, while the Tunis raingauge recorded two step-changes (1928 and 1951) in the number of rainy days. Results of the application of the segmentation method of Hubert are included in Table 5. Although uniform dates of change were not found, step-changes detected in several variables, emphasize two dates which show a frequent occurrence: the middle of the 1970s and the beginning of the 1990s.
Dow
nloa
ded
by [
128.
199.
169.
55]
at 0
3:37
02
Sept
embe
r 20
15

Ahmadi Kingumbi et al.
Copyright 2005 IAHS Press
500
Table 4 Standard deviations of annual rainfall (mm) of selected raingauges at different periods.
Periods 7 10 12 13 19 22 23 24 Pre-1976 280 206 131 183 167 390 147 No data 1976–1989 70 54 367 61 56 88 37 36 Post-1989 172 159 127 158 146 No data 136 122 See Table 2 for numbers of rainguages.
Table 5 Dates of abrupt change detected by the segmentation of Hubert (in italics) and by the Bayesian method of Lee & Heghinian (underlined).
Variable 7 10 12 13 19 22 23 24 26 27 AR - - - - - - - - - 1976 - - - 1960 - - - - 1948 1948 ATR - - - - - - - 1970 - - - - - - - 1992 - - 1950 - WR - - - 1989 - - - 1989 - - - 1965 - 1989 - 1989 - - - - SR - 1993 - 1992 - - - 1971 1993 1992 1989 1989 - 1960 - 1992 - - 1952 - SMR - - - - - 1964 - - 1976 - - 1964 1964 1964 1988 - - - - - CATR - - - - - - - 1970 - - - - - - 1992 1992 - - - - CWR - - - - - - - - - - - - - - - - - - 1949 - CSR - - 1992 - - - 1975 1975 1992 1992 1971 1971 - - 1992 1992 - - - - CSMR - 1994 - - - - 1988 - - - 1969 - - - - - - - - - NRD1 - - - - 1976 1976 1973 - 1976 - 1976 - 1976 - - - - - 1922 1927 NRD2 - - - - - - 1972 - - 1976 1989 - - 1960 - - - - 1951 1951 NRD3 - - 1989 1989 - - - - - 1976 1989 - 1989 1989 - - - - 1952 1951 NRD4 - - - - - - - - - - - - - 1960 1988 1989 - - - - SRD - - - - - - - 1970 - - - 1970 1974 1974 1989 1989 - - - - CSRD 1975 - 1976 1976 - - 1977 1977 - - - 1971 1975 1975 1989 1989 - - - -
Comparison to the two other stations of Tunisia showed that the south, represented by the Gafsa raingauge, did not record any step-change, while the north, represented by the Tunis raingauge, recorded six step-changes around 1950 and one in 1922. The procedure of Lee & Heghinian presupposes the existence of step-change and calculates its probable date of occurrence and the amount of change. The results show that, if the hypothesis of change is considered, most of these changes occurred towards the 1970s and the beginning of the 1990s and that they are nonhomogeneous (Table 5). No change was detected for the Gafsa raingauge. In the Tunis series, four step-changes were noticed: in the number of rainy days (1927 and 1951) and in the annual rains (1948). Spatial mean rainfall on the Merguellil basin Daily mean precipitation on the Merguellil basin was calculated with the help of Thiessen polygons, while taking into account any station having some data. Thus, a series of spatial mean rainfall was determined, allowing the calculation of a series of anomaly indexes. It was found that these show a long deficit period, included between 1976 and 1989, that is framed by two excess periods (Fig. 6(c)). However, the tests of detection of change in the mean did not detect any step-change in this variable. Comparison of probability distribution of days with intense precipitation As mentioned in the previous section, the years 1976 and 1989 (Table 5) appear many times as dates of change. Crisciani et al. (1994) showed that the period 1976–1988 was
Dow
nloa
ded
by [
128.
199.
169.
55]
at 0
3:37
02
Sept
embe
r 20
15
Investigation of the rainfall variability in central Tunisia
Copyright 2005 IAHS Press
501
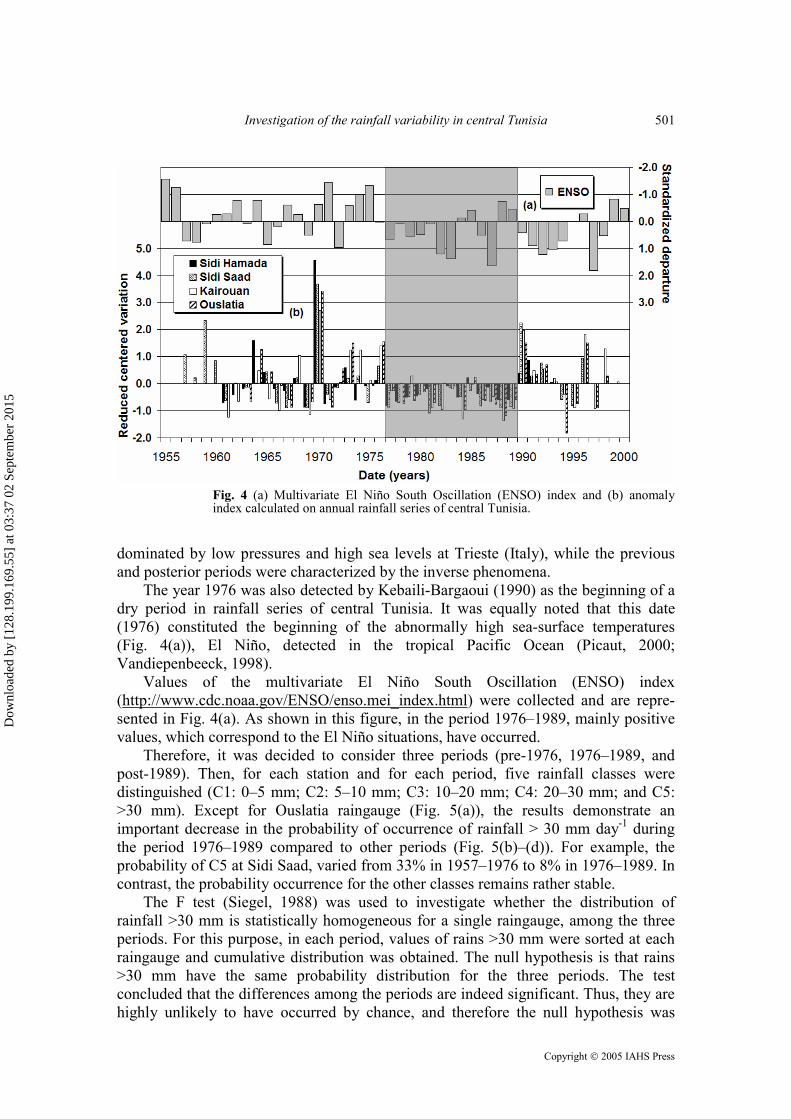
Fig. 4 (a) Multivariate El Niño South Oscillation (ENSO) index and (b) anomaly index calculated on annual rainfall series of central Tunisia.
dominated by low pressures and high sea levels at Trieste (Italy), while the previous and posterior periods were characterized by the inverse phenomena. The year 1976 was also detected by Kebaili-Bargaoui (1990) as the beginning of a dry period in rainfall series of central Tunisia. It was equally noted that this date (1976) constituted the beginning of the abnormally high sea-surface temperatures (Fig. 4(a)), El Niño, detected in the tropical Pacific Ocean (Picaut, 2000; Vandiepenbeeck, 1998). Values of the multivariate El Niño South Oscillation (ENSO) index (http://www.cdc.noaa.gov/ENSO/enso.mei_index.html) were collected and are repre-sented in Fig. 4(a). As shown in this figure, in the period 1976–1989, mainly positive values, which correspond to the El Niño situations, have occurred. Therefore, it was decided to consider three periods (pre-1976, 1976–1989, and post-1989). Then, for each station and for each period, five rainfall classes were distinguished (C1: 0–5 mm; C2: 5–10 mm; C3: 10–20 mm; C4: 20–30 mm; and C5: >30 mm). Except for Ouslatia raingauge (Fig. 5(a)), the results demonstrate an important decrease in the probability of occurrence of rainfall > 30 mm day-1 during the period 1976–1989 compared to other periods (Fig. 5(b)–(d)). For example, the probability of C5 at Sidi Saad, varied from 33% in 1957–1976 to 8% in 1976–1989. In contrast, the probability occurrence for the other classes remains rather stable. The F test (Siegel, 1988) was used to investigate whether the distribution of rainfall >30 mm is statistically homogeneous for a single raingauge, among the three periods. For this purpose, in each period, values of rains >30 mm were sorted at each raingauge and cumulative distribution was obtained. The null hypothesis is that rains >30 mm have the same probability distribution for the three periods. The test concluded that the differences among the periods are indeed significant. Thus, they are highly unlikely to have occurred by chance, and therefore the null hypothesis was
Dow
nloa
ded
by [
128.
199.
169.
55]
at 0
3:37
02
Sept
embe
r 20
15

Ahmadi Kingumbi et al.
Copyright 2005 IAHS Press
502
Fig. 5 Histograms of daily rainfall for the three selected periods.
rejected. Moreover, the T test (Siegel, 1988) applied on each pair of periods (each pair containing the 1976–1989 period), shows that the distributions of rains >30 mm are not homogeneous. The decrease pointed out in annual rainfall, between 1976 to 1989, is thus accom-panied by a decrease in the contribution to the annual total of rainfall above 30 mm. SEARCHING FOR A NEW VARIABLE: THE AREA COVERED BY HEAVY RAINS Data construction In this part, putting aside the local approach, the aim is to investigate the assumption of a decrease in heavy rainfall occurrence between 1976 and 1989 at the regional level. Information from the whole network was used for this purpose. A “heavy rainfall” day was selected each time rainfall greater than or equal to 30 mm was recorded in the network. Then, isohyets were plotted for the selected day which is referred to as an “event”. Areas of Merguellil basin covered by each of the following classes of rainfall were then computed for each event. The limits of these classes are respectively : Class 1: 0–5 mm, Class 2: 5–10 mm, Class 3: 10–20 mm, Class 4: 20–30 mm and Class 5: >30 mm, which corresponds to heavy rains at the basin scale.
Dow
nloa
ded
by [
128.
199.
169.
55]
at 0
3:37
02
Sept
embe
r 20
15

Investigation of the rainfall variability in central Tunisia
Copyright 2005 IAHS Press
503
Figure 2 shows, for example, the rainfall distribution of the 29 March 1977 event, during which the maximum recorded rainfall is equal to 53 mm, while the minimum observed value is 4 mm. For this event, the area of Class 5 represents 37% (490 km2) of the Merguellil basin. Searching for change in the annual cumulative area series of heavy rains At the end of the data construction, the cumulative area covered by Class 5 in a year is calculated (Fig. 6(a)). This reached 14 000 km2 in the hydrological year 1969/70. On the other hand, centring the series and reducing the yearly cumulative area series showed that a sequence of successive “deficit years cover” occurred between the hydrological years 1975/76 and 1988/89 (Fig. 6(b)).
Fig. 6 (a) Yearly sum and (b) anomaly index of areas covered by heavy rainfall, with (c) anomaly index of spatial average rainfall in the Merguellil Wadi basin.
The annual mean cumulated area for Class 5 was 2400 km2 between 1966 and 1976, 500 km2 between 1976 and 1989, and 1700 km2 between 1989 and 1998. Comparison of these mean values indicates that spatial extent of areas with rainfall greater than 30 mm was lower in the period between 1976 and 1989 in the Merguellil basin. However, the segmentation procedure of Hubert and Pettitt’s test applied to yearly cumulative area series did not detect any significant change in the mean. In contrast, the test of Lee & Heghinian noted a weak change, corresponding to 1975 if the hypothesis of change is considered.
Dow
nloa
ded
by [
128.
199.
169.
55]
at 0
3:37
02
Sept
embe
r 20
15

Ahmadi Kingumbi et al.
Copyright 2005 IAHS Press
504
Heavy rains and their yearly occurrence In order to shed more light on this change in the spatial extent of heavy rains, an attempt was made to characterize the number of days per year in which the 30 mm isohyet occurs within the studied domain: the total number of days per year where isohyet 30 mm is drawn in the study area was computed. In this case, Pettitt’s test detected a step-change in 1989 at the 90% confidence level. The Hubert segmentation procedure divides the series into two sub-series (1967–1989 and 1989–1998) with a significance level of 1% for the test of Scheffé. The test of Lee & Heghinian showed that an abrupt change is likely to have occurred between the periods before and after 1989 (Fig. 7(b)), with an amplitude of 5 days (Fig. 8). Thus, the mean number of days per year where the 30 mm isohyet is present in the Merguellil basin is lower in the 1967–1989 period (11 days) than in the 1989–1998 period (16 days). These results were obtained using a lower raingauge density during the first part of the observation period. To measure the influence of the network density, only the minimal network of nine fixed raingauges was now used to evaluate the number of days per year during which the isohyet 30 mm appeared in the area of study. During the period 1966–1998, an average of 9 days per year was obtained, compared to 13 days calculated for the full working network. The three tests were performed on the series obtained from the minimum density network. The result is that no change in the mean is detected. This shows that these results depend on the quantity of raingauges observed. However, it should be noted that networks in the periods before and after 1989 are fairly similar, with an average number of raingauges being 19 and 22, respectively (Fig. 7(a)). On the other hand, should a change in the mean number of
Fig. 7 (a) Annual number of raingauges used to select the number of days where the 30 mm isohyet is present in the area of study and (b) the probability density posterior to the position of change calculated on this variable.
Dow
nloa
ded
by [
128.
199.
169.
55]
at 0
3:37
02
Sept
embe
r 20
15

Investigation of the rainfall variability in central Tunisia
Copyright 2005 IAHS Press
505
Fig. 8 Probability density posterior to the amplitude of change calculated by the method of Lee & Heghinian.
days per year of heavy rains be a consequence of the network density, it would more realistically occur in 1979. In fact, the average number of raingauge stations varied from 15 (for the period 1966–1979) to 23 (for the period 1979–1998). Homogeneity of probability distributions of spatially defined rainfall classes Using the whole number of events, the next step was to investigate the percentage area of the Merguellil basin covered by a particular class of rainfall. The estimated median values of the percentage of total area covered by a given class of rainfall are reported in Table 6. It is shown that, while median values for the first four classes increased, there was a decrease in the fifth class from 1976. Corresponding to these results, the cumulative distributions of areas covered by different rain classes are plotted in Fig. 9. This indicates that, for Class 1 (Fig. 9(a)), the distribution is fairly normal, whereas the distributions for other classes are skewed toward low values. It was also found that the cumulative distributions for classes 1–4 are homogeneous over the three selected periods (Fig. 9(a)–(d)). However, for the fifth class (Fig. 9(e)), the cumulative distribution is quite different from one period to another. Indeed, the behaviour during the periods 1966–1976 and 1976–1989 shows the greatest difference, with a lowering of the percentage of area since 1976 for the same frequency level. In order to verify the homogeneity of these distributions over different periods, the Smirnov test (Saporta, 1990) was applied. The statistic D of the test corresponding to the period 1966–1976 compared to 1976–1989 is equal to 0.282, while that derived from the comparison of the periods 1976–1989 and 1989–1998 is equal to 0.018. Therefore, at the confidence level 0.05 (Dcritical < 0.23), the distribution for the period
Dow
nloa
ded
by [
128.
199.
169.
55]
at 0
3:37
02
Sept
embe
r 20
15

Ahmadi Kingumbi et al.
Copyright 2005 IAHS Press
506
Table 6 Comparison of the median values of the percentage total area covered by a given class of rainfall in different periods.
Median value in different periods: Class number Class limits 1966–1976 1976–1989 1989–1998
1 0–5 mm 22.3% 27.6% 23.0% 2 5–10 mm 13.4% 18.4% 13.5% 3 10–20 mm 16.2% 24.7% 22.6% 4 20–30 mm 10.1% 12.3% 9.5% 5 >30 mm 7.6% 2.2% 2.9%
Fig. 9 Cumulative distributions of different areal classes of rainfall.
1966–1976 is significantly different from that of the period 1976–1989. However, at the same confidence level, the distribution for the period 1976–1989 is not sig-nificantly different from that for the period 1989–1998. This is enhanced by the very similar median values for these two periods, as shown in Table 6 (2.2 and 2.9% for 1976–1989 and 1989–1998, respectively, compared to 7.6% for the period 1966–1976). Thus, 1976 is singled out as a year of change in relation to the percentage area related to rainfall greater than 30 mm. CONCLUSION The study of eight rainfall series in central Tunisia has demonstrated a period, between 1976 and 1989, in which annual rain was reduced. Three methods to detect change in
Dow
nloa
ded
by [
128.
199.
169.
55]
at 0
3:37
02
Sept
embe
r 20
15

Investigation of the rainfall variability in central Tunisia
Copyright 2005 IAHS Press
507
time series (the test of Pettitt, the segmentation procedure of Hubert, and the method of Lee & Heghinian) did not lead to conclude that change occurred in single series of variables related to daily rainfall. However, for these rainfall series, the F test concluded that distributions of rains greater than 30 mm are not statistically homogeneous over the three periods (1966–1976, 1976–1989 and 1989–1998). The whole network was then used to plot the areal distribution of heavy rainfall events and construct the cumulative distribution of areas covered by intense pre-cipitation, exceeding 30mm day-1 in each period. Indeed, for the 0.05 confidence level, the Smirnov test led to the conclusion that the distribution of this variable for the period 1966–1976 is significantly different from that of the period 1976–1989. The conclusion may be drawn that 1976 is a year of change in relation to the percentage of area related to rainfall greater than 30 mm. On the other hand, the mean number of days per year where the 30 mm isohyet was present in the study area was lower (11 days) in 1966–1989 than during 1989–1998 (16 days). Therefore, while the mean number of days per year with the 30 mm isohyet present in the study area has shown a statistically significant increase since 1989, the spatial distribution of rainfall greater than 30 mm has shown a significant decrease since 1976. These results confirm the particular role played in climatic variability by these two years in this region. Moreover, the reduction in the contributions of heavy rainfall events since 1976 can thus be declared as one of the elements having contributed to the decrease in Merguellil basin inflows during the first decade of operation of the El Haouareb Dam. But a certain increase in rainfall during the period 1989–1998, notably the increase in the number of days with rainfall greater than 30 mm, suggests that the thesis of the combination of human impacts and pluviometric variability could readily explain the decrease in runoff of the Merguellil Wadi basin. Acknowledgements The authors would like to thank the Direction Générale des Ressources en Eau, DGRE (Tunisian Hydrological Service) for allowing them to use the database and Mr Jacques Bourges for his contribution to the database validation. Thanks are also due to the Institut de Recherche pour le Développement (IRD) for the facilities provided. REFERENCES Bardossy, A. (1994) Statistical persistence in hydroclimatological time series. Working Paper, University of Stuttgart,
Germany, 219–233. Bello, N. J. (1998) Evidence of climate change based on rainfall records in Nigeria. Weather 52(12), 412–418. Benzarti, Z. & Habaieb, H. (2001) Etude de la persistance de la sécheresse en Tunisie par utilisation des chaînes de
Markov (1909–1996). Sécheresse 12(4), 215–220. Bergaoui, M. & Alouini, A. (2001) Caractérisation de la sécheresse météorologique et hydrologique: cas du bassin versant
de Siliana en Tunisie. Sécheresse 12(4), 205–213. Bouzaïane, S. & Lafforgue, A. (1986) Monographie hydrologique des oueds Zéroud et Merguellil. DGRE-ORSTOM,
Tunis, Tunisie. Cavadias, G. (1994) Detection and modelling of the impact of climatic change on river flows. In: Engineering Risk in
Natural Resources Management with Special References to Hydrosystems under Changes of Physical or Climatic Environment (ed. by L. Duckstein & E. Parent), 207–218. Applied Sciences, Kluver Academic Publishers, The Netherlands.
Crisciani, F., Ferraro, S. & Raicich, F. (1994) Evidence of recent anomalies at Trieste (Italy). Climatic Change 28(4), 365–374.
Dridi, B. (2000) Impact des aménagements CES sur la disponibilité des eaux de surface dans le bassin versant du Merguellil (Tunisie centrale). Thèse Doctorat, Univ. Louis Pasteur, Strasbourg, France.
Dow
nloa
ded
by [
128.
199.
169.
55]
at 0
3:37
02
Sept
embe
r 20
15
Ahmadi Kingumbi et al.
Copyright 2005 IAHS Press
508
Houndénou, C. & Hernandez, K. (1998) Modification de la saison pluvieuse dans l’Atakora (1961–1990). Un exemple de sécheresse au nord-ouest du Bénin (Afrique occidentale). Sécheresse 9(1), 23–34.
Hubert, P. & Carbonnel, J. P. (1987) Approche statistique de l’aridification de l’Afrique de l’Ouest. J. Hydrol. 95, 165–183.
Hubert, P., Carbonnel, J. P. & Chaouche, A. (1989) Segmentation des séries hydrométéorologiques—application à des séries des précipitations et des débits de l’Afrique de l’Ouest. J. Hydrol. 110, 349–367.
Hubert, P., Servat, E., Paturel, J. E., Kouame, B., Bendjoudi, H., Carbonnel, J. P. & Lubes-Niel, H. (1998) La procédure de segmentation, dix ans après. In: Water Resources Variability in Africa during the XXth Century (ed. by E. Servat, D. Hughes, J.-M. Fritsch & M. Hulme) (Proc. Abidjan Conf., November 1998), 267–273. IAHS Publ. 252, IAHS Press, Wallingford, UK.
Kebaili-Bargaoui, Z. (1990) Modélisation stochastique des sécheresses annuelles et pluriannuelles. Thèse Doctorat d’Etat, Université Tunis II, Tunis, Tunisie.
Kingumbi, A. (1999) Bilan et modélisation de la retenue du Barrage d’El Haouareb. Mémoire d’Études Approfondies, Université Tunis II, ENIT, Tunisie.
Lee, A. F. S. & Haghinian, S. M. (1977) A shift of mean level in a sequence of independent normal random variables—a Bayesian approach. Technometrics 19(4), 503–506.
Lubès, H., Masson, J. M., Servat, E., Paturel, J. E., Kouame, B. & Boyer, J. F. (1994) Caractérisation de fluctuations dans une série chronologique par application des tests statistiques. Etude bibliographique. Programme ICCARE Rapport no. 3. ORSTOM, Montpellier, France.
Lubès-Niel, H., Masson, J. M., Paturel, J. E. & Servat, E. (1998) Variabilité climatique et statistique. Etude par simulation de la puissance et de la robustesse de quelques tests utilisés pour vérifier l’homogénéité des chroniques. Rev. Sci. Eau 11(3), 383–408.
Mahé, G. & Olivry, J. C. (1995) Variation des précipitations et des écoulements en Afrique de l’Ouest et Centrale de 1951 à 1989. Sécheresse 6(1), 109–117.
Moron, V. (1994) Guinean and Sahelian rainfall anomaly indices at annual and monthly scales (1933–1990). Int. J. Climatol. 14(3), 325–341.
Opoku-Ankomah, Y. & Amisigo, B. A. (1998) Rainfall and runoff variability in the southwestern river system of Ghana. In: Water Resources Variability in Africa during the XXth Century (ed. by E. Servat, D. Hughes, J.-M. Fritsch & M. Hulme) (Proc. Abidjan Conf., November 1998), 307–321. IAHS Publ. 252, IAHS Press, Wallingford, UK.
Ouarda, T. B. M. J., Rasmussen, P. F., Cantin, J. F., Bobée, B., Laurence, R., Hoang, V. D. & Barabé, G. (1999) Identification d’un réseau hydrométrique pour le suivi des modifications climatiques dans la province du Québec. Rev. Sci. Eau 12(2), 425–448.
Paturel, J. E., Servat, E., Kouamé, B., Boyer, J. F., Lubes, H. & Masson, J. M. (1995) Manifestations de la sécheresse en Afrique de l’Ouest non sahélienne. Cas de la Côte d’Ivoire, du Togo et du Bénin. Sécheresse 6(1), 95–102.
Paturel, J. E., Servat, E., Kouamé, B., Lubès, H., Ouedraogo, M. & Masson, J. M. (1997) Climatic variability in humid Africa along the gulf of Guinea. Part II : an integrated regional approach. J. Hydrol. 191, 16–36.
Pettitt, A. N. (1979) A non-parametric approach to the change-point problem. Appl. Statist. 28(2), 126–135. Picaut, J. (2000) El Niño, un phénomène issu de l’océan Pacifique tropical. Conférence de l’Université de tous les savoirs.
Paris, France. Saporta, G. (1990) Probabilités. Analyses des données statistiques. Technipresse, Paris, France. Servat, E., Paturel, J. E., Lubès, H., Kouamé, B., Ouedraogo, M. & Masson, J. M. (1997) Climatic variability in humid
Africa along the Gulf of Guinea. Part I: detailed analysis of the phenomenon in Côte d’Ivoire. J. Hydrol. 191, 1–15. Servat, E., Paturel, J. E., Lubès-Niel, H., Kouamé, B., Masson, J. M., Travaglio, M. & Marieu B. (1999) De différents
aspects de la variabilité de la pluviométrie en Afrique de l’Ouest et Centrale non sahélienne. Rev. Sci Eau 12(2), 363–387.
Siegel, A. F. (1988) Statistics and Data Analysis: an Introduction. John Wiley & Sons Inc., New York, USA. Sircoulon, J. (1987) Variation des débits des cours d’eau et des niveaux des lacs en Afrique de l’ouest depuis le début du
20ème siècle. In: The Influence of Climate Change and Climate Variability on the Hydrologic Regime and Water Resources (ed. by S. I. Solomon, M. Beran & W. Hogg) (Proc. Vancouver Symp., August 1987), 13–25. IAHS Publ. 168, IAHS Press, Wallingford, UK.
Tarhule, A. & Woo, M. (1998) Changes in Rainfall characteristics in Northern Nigeria. Int. J. Climatol. 18(11), 1261–1271.
Vandiepenbeeck, M. (1998) El Niño: l’enfant terrible du Pacifique. Ciel et Terre 114(2), 52–56. WMO (World Meteorological Organization) (1966) Climatic change. Report of a working group of the Commission for
Climatology. Tech. note 79. WMO, Geneva, Switzerland. Received 20 August 2004; accepted 17 January 2005
Dow
nloa
ded
by [
128.
199.
169.
55]
at 0
3:37
02
Sept
embe
r 20
15