Biologia Tunisie 7.pdf
132
-
Upload
khangminh22 -
Category
Documents
-
view
6 -
download
0
Transcript of Biologia Tunisie 7.pdf
Biologia Tunisie Décembre 2012 ; N°7 ; pp 1 –122
BIOLOGIA TUNISIE
OMMAIRE
1. BEN KHALIFA Mekki1*, ALDAGHI Magid 2, ACHECHEHajer1, KUMMERT Jean2, MARRAKCHI Mohamed1 andFAKHFAKH Hatem1
PRESENCE OF ‘CANDIDATUS PHYTOPLASMAPRUNORUM’ IN APRICOT ORCHARDS IN TUNISIA( PAGE 1– 5 )
2. BEN TAMARZIZT HEND, BARAKET GHADA, BENMUSTAPHA SANA, TRIFI MOKHTAR & SALHI-HANNACHI AMEL1*
MORPHOLOGICAL AND POMOLOGICAL VARIABILITYANALYSIS OF TUNISIAN PLUM CULTIVARS(PAGE 6– 13)
3. MASMOUDI-KOUKI OLFAA, KADDOUR HADHÉMIA,HAMDI YOSRAA, VAUDRY DAVIDB,C,D, TONONMARIE- CHRISTINE B,C,D AND AMRI MOHAMEDA
THE PROTECTIVE EFFECT OF PITUITARY ADENYLATECYCLASE-ACTIVATING POLYPEPTIDE ON ASTROGLIALCELLS IS MEDIATED THROUGH ACTIVATION OFOCTADECANEUROPEPTIDE RELEASE(PAGE 14– 19)
4. HAMDI YOSRA A, KADDOUR HADHEMI A, JENHANIFAOUZIB, LEPRINCE JÉRÔME B,C,D, TONON MARIE-CHRISTINE B,C,D, AMRI MOHAMED*A ANDMASMOUDI-KOUKI OLFAA.
OCTADECANEUROPEPTIDE ODN PROTECTS CULTUREDASTROCYTE AGAINST HYDROGEN PEROXIDE-INDUCEDCELL DEATH(PAGE 20 – 25)
5. REBEI OLFAA,B*, BELKHIR MANELA,B, AMRIMOHAMEDA AND FATTOUCH SAMIB
ANTIOXIDANT ACTIVITY AND PHENOLIC EXTRACTS OFBLACK (MORUS NIGRA L.) AND WHITE (MORUS ALBA L.)MULBERRY FRUITS(PAGE 26– 29)
6. LEILA KALAI1, MONIA MNARI-HATTAB2, NAJLASADFI-ZAOUI3, MOHAMED RABEH HAJLAOUI2
CARACTERISATION DE L’AGENT CAUSAL DU MALSECCO DE L’ORANGER ET EVALUATION DEL’ANTAGONISME BACTERIEN VIS-A-VIS DUPHOMA TRACHEIPHILA(PAGE 30– 36 )
7. BARAKET GHADA.1, CHATTI KHALED1.,SADDOUD OLFA1., BEN ABDELKRIM AHMED.1,MARS MESSAOUD.2, TRIFI MOKHTAR1 ANDSALHI-HANNACHI AMEL1*.
INTRA-SPECIFIC VARIABILITY IN RIBOSOMALDNA SEQUENCE IN THE ITS2 REGION OFTUNISIAN FIG CULTIVARS(PAGE 37–42)
8. LOTFI RABAOUI ♠, SABIHA TLIG-ZOUARI &OUM KALTHOUM BEN HASSINE
MORPHOMETRY AND WEIGHTCHARACTERIZATION OF PINNA NOBILIS(MOLLUSCA: BIVALVIA) ALONG THE NORTHERNAND EASTERN TUNISIAN COASTLINE(PAGE 43–47)
9. BEN ABDELKRIM AHMED, BARAKET GHADA,CHATTI KHALED, SADDOUD DABBEBI OLFA,TRIFI MOKHTAR & SALHI-HANNACHI AMEL1*
MORPHOLOGICAL VARIABILITY OF SUB-SPONTANEOUS TUNISIAN FIG (FICUS CARICA L.)POPULATIONS(PAGE 48– 54)
10. HAMLAOUI-GASMI S., MOKNI M., AOUANIE., AMRI M., MARZOUKI L.
EFFECT OF GARLIC'S ADMINISTRATION ONERYTHROCYTES AND PLASMA PARAMETERS IN RAT(PAGE 55–58)
11. ELEUCH L, REZGUI S AND DAALOUL A
INDUCED PHYSIOLOGICAL TRAITS BY NACL INTWO BARLEY CULTIVARS(PAGE 59 – 66)

Biologia Tunisie Décembre 2012 ; N°7 ; pp 1 –122
12. SINDA FEDHILA1 & DIDIER LERECLUS2
ANALYSE GENETIQUE DE LA VIRULENCE DESBACTERIES PATHOGENES DU GROUPE BACILLUSCEREUS(PAGE 67– 79)
13. HAMMAMI IMEN1,2, CLAIRE MAUDUIT2, AMRIMOHAMED3, BENAHMED MOHAMED2, MICHELEVERONIQUE EL MAY1.
ALLIUM SATIVUM FEEDING INDUCES APOPTOSIS OFGERM CELLS THROUGH CASPASE-3 PATHWAY(PAGE 80– 84)
14. IMEN HADJI SFAXI 1, FETEN BELHADJ 1 FERIDLIMAM 2 AND M. NEJIB MARZOUKI 1
SCREENING OF ENZYMATIC ANTIOXIDANTACTIVITIES IN ALLIUM SATIVUM L.(PAGE 85– 88)
15. RANIA JBIR1,2, SALWA ZEHDI1, NÉJIBHASNAOUI1,2, MOHAMED MARRAKCHI1, MESSAOUDMARS2 & MOKHTAR TRIFI1*,
STUDY OF MOLECULAR POLYMORPHISM OF TUNISIANPOMEGRANATE (Punica granatum L.) CULTIVARS USINGSSRs AND AFLPs MARKERS(PAGE 89 – 95)
16. KADRI. K (1,2), CHEIKH MED. H(2) ABDELLAWI. R(2), & BEN NACEUR. M (2)
MORPHOLOGICAL AND MOLECULAR EVALUATIONOF THE GENETIC DIVERSITY OF TUNISIANLOCAL BARLEY ACCESSIONS (HORDEUMVULGARE L.)(PAGE 96–103)
17. REHAIEM Amel, GHRAIRI Taoufik, MANAIMohamed*
CARACTERISATION ET PURIFICATION D’UNEBACTERIOCINE PRODUITE PAR UNE SOUCHELACTIQUE ISOLÉE A PARTIR D’UN DERIVELAITIER ARTISANAL TUNISIEN(PAGE 104–112)
18. KADDOUR HADHEMI, HAMDI YOSRA,VAUDRY DAVID, TONON MARIE-CHRISTINE,AMRIMOHAMED* AND MASMOUDI-KOUKI OLFA
OCTADECANEUROPEPTIDE, ODN, PROMOTES CELLSURVIVAL IN RAT CEREBELLAR GRANULENEURONS(PAGE 113– 118)
19. Manel BELKHIR1-2*, Olfa Rebai1-2, MohamedAMRI 1 & Sami FATTOUCH 2
ANTIOXIDANT ACTIVIY OF PULP AND PEELPOLYPHENOLIC EXTRACTS FROM TUNISIANAZEROLE (CRATAEGUS AZAROLUS) FRUIT(PAGE 119–122)
Biologia Tunisie Juillet 2012; N°7 ; 1 – 5
1
BIOLOGIA TUNISIE
Presence of ‘Candidatus Phytoplasma prunorum’ in apricot orchards inTunisia
BEN KHALIFA Mekki1*, ALDAGHI Magid 2, ACHECHE Hajer1, KUMMERT Jean2,MARRAKCHI Mohamed1 and FAKHFAKH Hatem1
1 Laboratoire de Génétique Moléculaire Immunologie et Biotechnologie; Faculté des Sciences deTunis; Campus Universitaire, Tunis El-Manar, 2092 Tunis, Tunisia.2 Unité de phytopathologie, Département de Biochimie et de Biologie Appliquées-FUSAGX Passagedes déportés, 2; B-5030 Gembloux, Belgium.
Keywords: Apricot, ‘Candidatus Phytoplasma prunorum’, restriction fragment lengthpolymorphism.
ABSRACT‘Candidatus Phytoplasma prunorum’ wasdetected, for the first time, in apricot trees inTunisia. Infected trees showed early leafreddening in autumn and off-season growth inwinter followed with dieback. Infected treesdeveloped small and tasteless fruits.Phytoplasma was detected by nested polymerasechain reaction (PCR) using universalphytoplasma primer pairs R16mF2/R1 andR16F2n/R2. A band with expected size wasobserved in samples collected fromsymptomatic, but not healthy apricot trees. PCRproducts (1.2 kbp) were used for restrictionfragment length polymorphism analysis (RFLP)after digestion with endonuclease MseI, RsaI andTaqI. RFLP patterns obtained were similar tothat previously reported for the European stonefruit yellows (ESFY, 16SrX-B). Identificationhas been further confirmed by PCR using ESFYspecific primer pairs (ECA1/ECA2). This is thefirst report on the occurrence of ‘Ca.Phytoplasma prunorum’ in Tunisia (GenBankaccession no. AY688362).
INTRODUCTIONPhytoplasma cause a range of persistent diseasesin many fruit trees in the world (Ogawa et al.,1995). In Europe, many economically important
decline diseases of stone fruit species have beenassociated with European stone fruit yellows(ESFY) phytoplasma (Jarausch et al., 1998) thatbelong to the subgroup B of the appleproliferation group (16SrX-B) (Lee et al., 1998).Seemüller & Schneider (2004) proposed thatESFY phytoplasma be designated as‘Candidatus Phytoplasma prunorum’. The mostcommon hosts of ESFY phytoplasma includeapricots (Morovan, 1977), plum (Giunchedi etal, 1982), peach (Pollini et al, 2001) and almond(Seemüller et al., 1998). The characteristicdisease symptoms of ESFY on apricots includeearly leaf reddening and new sprouting in winter(Morovan, 1977).Apricots (Prunus armeniaca L.) are among themost common stone fruit trees planted, inTunisia. Apricots represent 18.5% of stone fruitproduction. Most of it is for local consumptionand only 1% is exported to neighboringcountries and European Union (FAO, 2007).During 2007, disease symptoms resemblingthose caused by ESFY phytoplasma wereobserved on apricots in Northern Tunisia where17% of apricot plantations are located (FAO,2007).The aim of this study was to detect and identifythe phytoplasma associated with apricotsyndrome in Tunisia. To achieve this, PCR
Biologia Tunisie Juillet 2012; N°7 ; 1 – 5
2
analysis using universal and ESFY-specificprimer pairs and restriction fragment lengthpolymorphism analysis (RFLP) have beenapplied.
MATERIAL AND METHODS
Plant materials and phytoplasma referencestrainsLeaf and phloem tissues were collected duringautumn and winter 2003 from apricot treesshowing ESFY-like disease symptoms from 3apricot orchards in a district of Northern Tunisia(Ras-Jebel). Phytoplasma reference strains weremaintained on the experimental hostCatharanthus roseus (Periwinkle) and used aspositive control in this study. These strainsincluded apple proliferation (AP, 16SrX-A);European stone fruit yellows (ESFY, 16SrX-B)and pear decline (PD, 16SrX-C) phytoplasma(Lee et al., 1998).
DNA extractionTotal DNA, used as template in PCR reactions,was extracted from approximately 1g of freshlyprepared bark tissue. DNA from phytoplasmastrains used as controls was obtained frompetioles and midribs of infected Catharanthusroseus plants. Nucleic acids were isolatedaccording to the phytoplasma enrichmentprocedure described by Ahrens and Seemüller(1992).
PCR analysisPCR amplification of phytoplasma 16S rDNAwas carried out with universal primersR16mF2/R1 (Gundersen and Lee, 1996) andR16F2n/R2 (Lee et al., 1995). Non ribosomalprimers ECA1/ECA2 (Jarausch et al., 1998)were also used for ESFY-specific detection. ThePCR reaction was performed in 25 µl reactionvolumes containing 20 ng DNA, 0.4 mM of eachprimer , 0.25 mM of each dNTP, 1.5 mM MgCl2
and 0.5 units of HotGoldStar DNA polymerase(Eurogentec, Belgium) with the manufacturer'ssupplied buffer. Thermocycling was performedusing a Peltier thermocycler (Hybaid,Teddington, UK) for 35 cycles with 1 min eachfor denaturation, annealing and extension. In thefinal cycle the extension step was extended to 10
min. In phytoplasma-universal nested PCR,DNA amplified in PCR primed by R16mF2/R1was diluted 1:25 with sterile distilled water andused as template in PCR primed by R16F2n/R2.PCR products were separated on 1.5 % agarosegels containing 0.5 µg mL-1 ethidium bromideand visualised using a UV transilluminator. Themolecular weight of the PCR products wasdetermined by comparison with 100 pb DNALadder (Fermentas, Lithuania).
RFLP analysisNested PCR products (10–12 µl) were digestedwith MseI, RsaI or TaqI endonucleases(Fermentas, Lithuania) according to themanufacturer’s instructions. Digested fragmentswere separated on 2 % agarose gels containing0.5 µg mL-1 ethidium bromide and visualisedunder the UV light. The molecular weight of thefragments was determined by comparison with100 pb DNA Ladder (Fermentas, Lithuania).RFLP patterns were compared with thoseobtained from the phytoplasma reference strainsand the RFLP patterns previously published(Davis et al., 1997; Lee et al., 1993; Lee et al.,1998; Marcone et al., 1996; Vibio et al., 1996).
RESULTS
Disease symptomsApricot trees from different locations of Tunisiashowed disease symptoms similar to thosecaused by European stone fruit (ESFY)phytoplasma. Disease symptoms consisted ofearly reddening leaf in autumn and off-seasongrowth in winter in addition to sudden death ofinfected branches or the entire crown of trees.These symptoms are similar to those previouslyreported by Pastore et al. (1997). Infected treesdeveloped small and tasteless fruits, whichresulted in great yield losses.
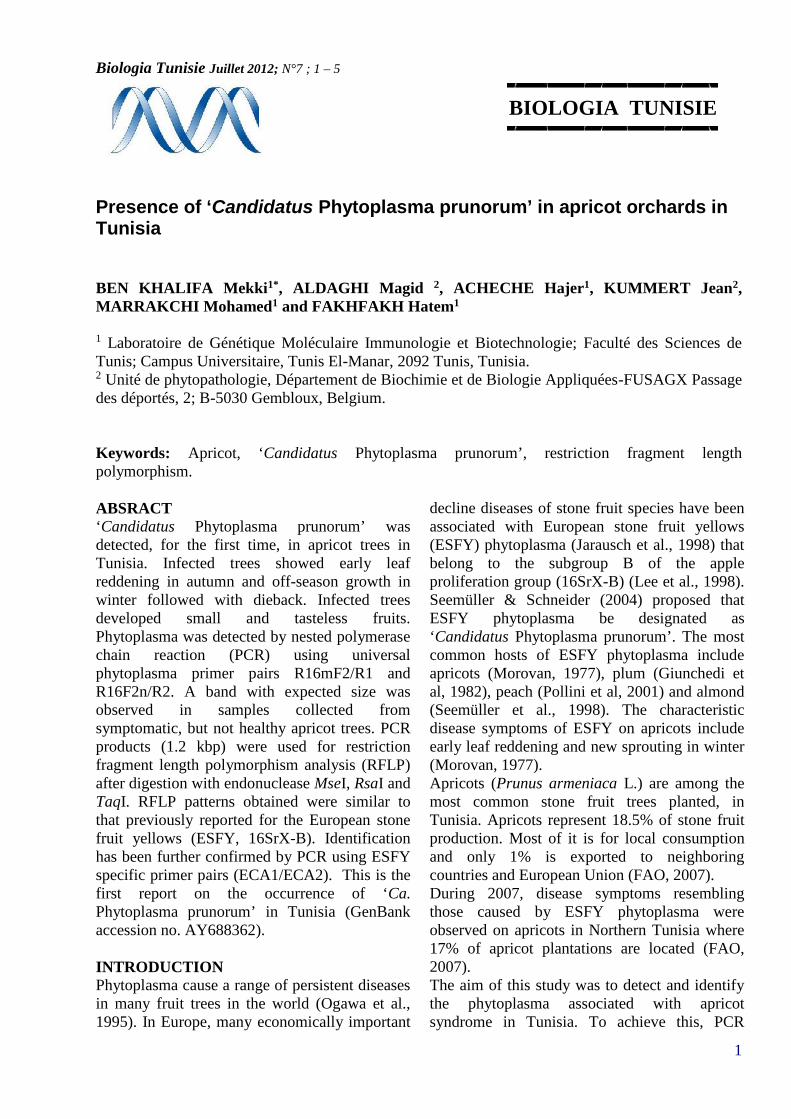
Detection of phytoplasma by PCRNested-PCR using the primer pairs R16mF2/R1and R16F2n/R2 from symptomatic trees yieldeda characteristic band of approximately 1.2 kb(Fig. 1). No DNA bands were observed whenDNA from healthy trees was used.
Biologia Tunisie Juillet 2012; N°7 ; 1 – 5
3
Figure 1: Detection of ESFY phytoplasma bynested PCR using universal primer pairs(R16mF2/R1; R16F2n/R2). The templatesconsisted of DNA extracted from asymptomaticapricots (H), symptomatic apricots (1-6) or fromperiwinkle plants infected with ESFY. W, watercontrol; M, 100 bp DNA ladder.
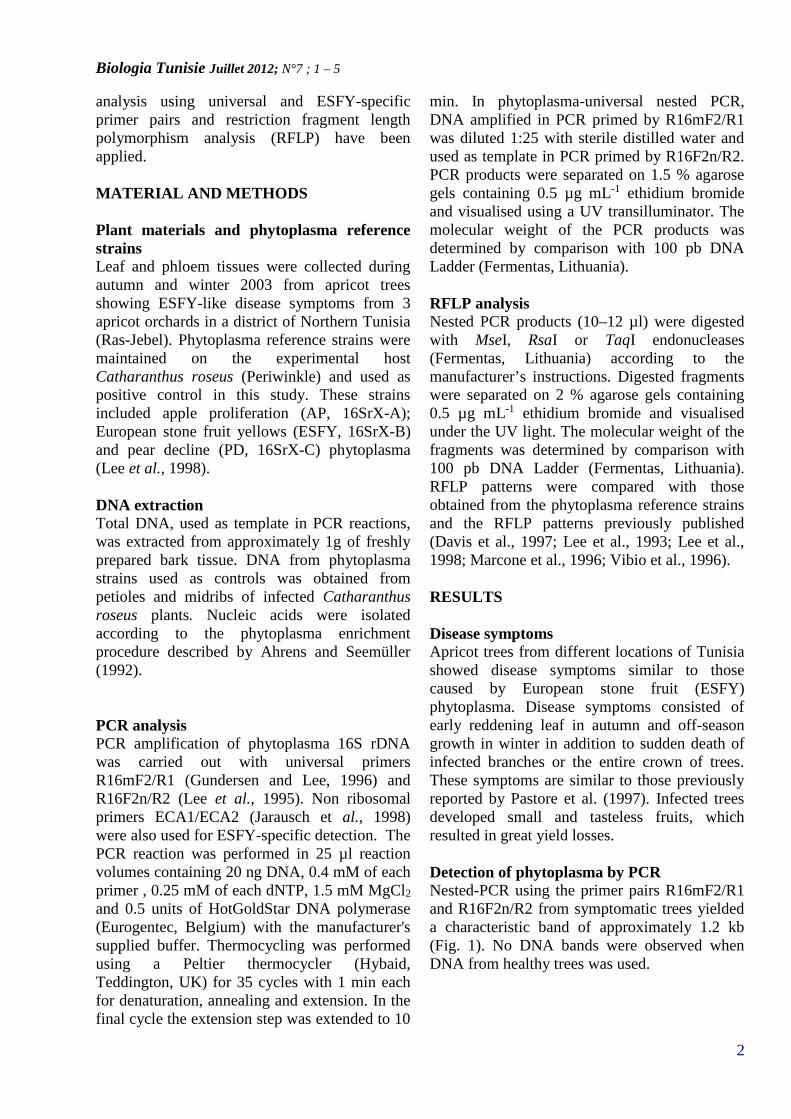
Figure 2: Rsa I restriction profiles of ribosomalDNA amplified using the universal primer pairsR16mF2/R1 and R16F2n/R2. The template DNAwas from symptomatic apricots (1-6) or fromperiwinkle plants infected with the followingphytoplasma strains: AP, apple proliferation;ESFY, European stone fruit yellows and PD,Pear decline. M, 100 bp DNA ladder.
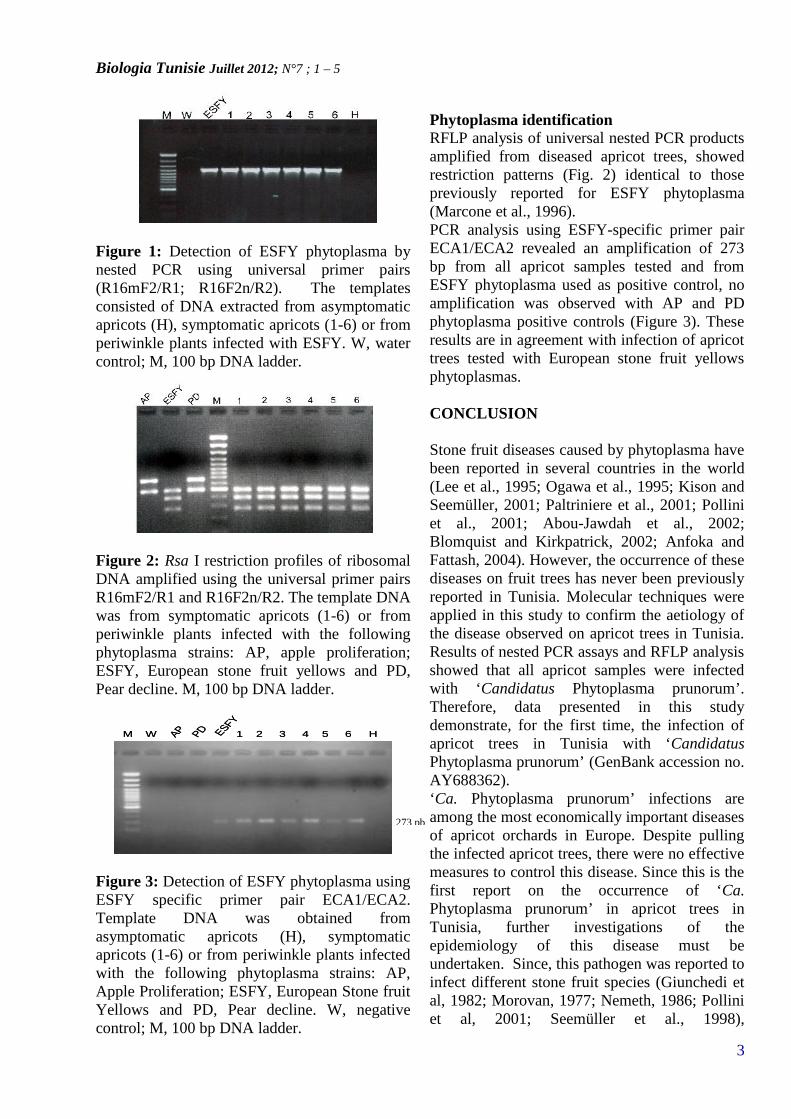
Figure 3: Detection of ESFY phytoplasma usingESFY specific primer pair ECA1/ECA2.Template DNA was obtained fromasymptomatic apricots (H), symptomaticapricots (1-6) or from periwinkle plants infectedwith the following phytoplasma strains: AP,Apple Proliferation; ESFY, European Stone fruitYellows and PD, Pear decline. W, negativecontrol; M, 100 bp DNA ladder.
Phytoplasma identificationRFLP analysis of universal nested PCR productsamplified from diseased apricot trees, showedrestriction patterns (Fig. 2) identical to thosepreviously reported for ESFY phytoplasma(Marcone et al., 1996).PCR analysis using ESFY-specific primer pairECA1/ECA2 revealed an amplification of 273bp from all apricot samples tested and fromESFY phytoplasma used as positive control, noamplification was observed with AP and PDphytoplasma positive controls (Figure 3). Theseresults are in agreement with infection of apricottrees tested with European stone fruit yellowsphytoplasmas.
CONCLUSION
Stone fruit diseases caused by phytoplasma havebeen reported in several countries in the world(Lee et al., 1995; Ogawa et al., 1995; Kison andSeemüller, 2001; Paltriniere et al., 2001; Polliniet al., 2001; Abou-Jawdah et al., 2002;Blomquist and Kirkpatrick, 2002; Anfoka andFattash, 2004). However, the occurrence of thesediseases on fruit trees has never been previouslyreported in Tunisia. Molecular techniques wereapplied in this study to confirm the aetiology ofthe disease observed on apricot trees in Tunisia.Results of nested PCR assays and RFLP analysisshowed that all apricot samples were infectedwith ‘Candidatus Phytoplasma prunorum’.Therefore, data presented in this studydemonstrate, for the first time, the infection ofapricot trees in Tunisia with ‘CandidatusPhytoplasma prunorum’ (GenBank accession no.AY688362).‘Ca. Phytoplasma prunorum’ infections areamong the most economically important diseasesof apricot orchards in Europe. Despite pullingthe infected apricot trees, there were no effectivemeasures to control this disease. Since this is thefirst report on the occurrence of ‘Ca.Phytoplasma prunorum’ in apricot trees inTunisia, further investigations of theepidemiology of this disease must beundertaken. Since, this pathogen was reported toinfect different stone fruit species (Giunchedi etal, 1982; Morovan, 1977; Nemeth, 1986; Polliniet al, 2001; Seemüller et al., 1998),
273 pb
M W 1 2 3 4 5 6 HESFYAP PDM W 1 2 3 4 5 6 HESFYAP PD
Biologia Tunisie Juillet 2012; N°7 ; 1 – 5
4
investigations concerning incidence anddistribution of ‘Ca. Phytoplasma prunorum’ inpeach and almond, which represent with apricotthe most common stone fruit trees planted inTunisia, are justified.
AKNOWLEGMENTS
This work was partially supported by grantsfrom the Tunisian “Ministère de l'EnseignementSupérieur, de la Recherche Scientifique et de laTechnologie ” Projet ''Lab B02''.
REFERENCES
Abou-Jawdah, Y.; Karakashian, A.; Sobh, H.;Martini, M. and Lee, I. M. (2002) An epidemicof almond witches_-broom in Lebanon:classification and phylogenetic relationships ofthe associated phytoplasma. Plant Dis. 86: 477–484.
Ahrens U, Seemuller E. (1992). Detection ofDNA of plant pathogenic mycoplasma-likeorganisms by a polymerase chain reaction thatamplifies the sequence of the 16S rRNA gene.Phytopathol. 82: 828-32.
Anfoka, G. H. and Fattash, I. (2004). Detectionand identification of Aster yellows (16SrI)phytoplasma in peach trees in Jordan by RFLPanalysis of PCR-amplified products (16SrDNAs). J. Phytopath. 152 : 210–214.
Blomquist, C. L. and Kirkpatrick, B. C. (2002).Identification of phytoplasma taxa and insectvectors of peach yellow leaf roll disease inCalifornia. Plant Dis. 86 : 759-763.
Davis, R. E.; Dally, E. L.; Gundersen, D. E.;Lee, I. M. and Habili, N. (1997). `CandidatusPhytoplasma australiense', a new phytoplasmataxon associated with Australian grapevineyellows. Int. J. Syst. Bacteriol. 47 : 262-269.
FAO, Food and Agriculture Organisation of theunitated Nations, (2007). Données FAOSTAT,année 2007,http://www.fao.org/ag/agp/ressource/production.html.
Giunchedi, L.; Poggi-Pollini, C. and Credi, R.(1982). Susceptibility of stone fruit trees to theJapenese plum-tree decline causal agent. Acta.Hort. 130 : 285-290.
Jarausch, W.; Lansac, M.; Saillard, C.;Broquaire, J. M. and Dosba, F. (1998). PCRassay for specific detection of European stonefruit yellows phytoplasmas and its use forepidemiological studies in France. Eur. J. PlantPathol. 104 : 17-27.
Kison, H. and Seemüller, E. (2001). Differencesin strain virulence of the European stone fruityellows phytoplasma and susceptibility of stonefruits trees on various rootstocks to thispathogen. J. Phytopathol. 149 : 533–541.
Lee, I. M.; Hammond, R. W.; Davis, R. E. andGundersen, D. E. (1993) Universal amplificationand analysis of pathogen 16S rDNA forclassification and identification of mycoplasma-like organisms. Phytopathol. 83 : 834-842.
Lee, I. M.; Bertaccini, A.; Vibio, M. andGundersen, D. E. (1995). Detection of multiplephytoplasmas in perennial fruit trees withdecline symptoms in Italy. Phytopathol. 85 :728–735.
Lee, I. M.; Gundersen, D. E.; Davis, R. E. andBartoszyk, I. M. (1998). Revised classificationscheme of phytoplasma based on RFLP analysesof 16S rRNA and ribosomal protein genesequences. Int. J. Syst. Bacteriol. 48 : 1153-1169.
Marcone, C.; Raggozzino, A. and Seemuller, E.(1996). European stone fruit yellowsphytoplasma as the cause of peach veinenlargement and other yellows and declinediseases of stone fruits in Southern Italy. J.Phytopathol. 144 : 559-564.
Morvan, G. (1977). Apricot chlorotic leaf roll. E.P. P. O. Bull. 7 : 37–55.
Nemeth, M. (1986). Virus, Mycoplasma andRickettsia Diseases of Fruit Trees. Dordrecht,The Netherlands: Martinus-Nijhoff.
Ogawa, J. M.; Zehr E. I.; Bird, G. W.; Ritchie,D. F.; Uriu, K.; Uyemoto, J. K. (1995).Compendium of Stone Fruit Diseases. APSPress, St. Paul, Minnesota.
Paltrinieri, S.; Martini, M.; Stefani, E.; Pondrelli,M.; Bertaccini, A. and Fideghelli, C. (2001).Phytoplasma infection in peach and cherry inItaly. Acta. Hort. 550 : 365–370.
Biologia Tunisie Juillet 2012; N°7 ; 1 – 5
5
Pastore, M.; Vibio, M.; Murari, E. andBertaccini, A. (1997). Incidenza, diagnosi erospettive di difesa relatve alla fitoplasmosidell’accartocciamento clorotico foliaredell’albicocco. Frutticol. 78 : 67-71.
Pollini, C. P.; Bissani, R. and Giunchedi L.(2001). Occurrence of European stone fruityellows phytoplasma (ESFYP) infection inpeach orchards in Northern-Central Italy. J.Phytopathol. 149 : 725–730.
Seemüller, E. & Schneider, B. (2004).‘Candidatus Phytoplasma mali’, ‘CandidatusPhytoplasma pyri’ and ‘Candidatus Phytoplasma
prunorum’, the causal agents of appleproliferation, pear decline and European stonefruit yellows, respectively. Int. J. Syst. Evol.Micr. 54 : 1217-1226.
Seemüller, E.; Marcone, C.; Lauer, U.;Raggozzino, A. and Göschl, M. (1998). Currentstatus of molecular classification of thephytoplasmas. J. Plant. Pathol. 80 : 3-26.
Vibio, M.; Bertaccini, A.; Lee, I. M.; Davis, R.E. and Clark, M. F. (1996). Differentiation andclassification of aster yellows and relatedEuropean phytoplasmas. Phytopathol. Mediterr.35 : 33-42.
Biologia Tunisie Juillet 2012; N°7 ; 6 – 13
6
BIOLOGIA TUNISIE
MORPHOLOGICAL AND POMOLOGICAL VARIABILITY ANALYSIS OFTUNISIAN PLUM CULTIVARS
BEN TAMARZIZT Hend, BARAKET Ghada, BEN MUSTAPHA Sana, TRIFIMokhtar & SALHI-HANNACHI Amel1*
Laboratory of Molecular Genetics, Immunology & Biotechnology, Faculty of Sciences of Tunis, CampusUniversity, 2092 El Manar Tunis, Tunisia*Author for correspondence: e-mail: [email protected]: +216 71 87 26 00; Fax: +216 70 86 04 32
Keywords: Phenotypic variability, morphological, pomological traits, Plum, Tunisie.
ABSRACT
To set up a rational collecting strategy for plumgermplasm, a study was conducted using twenty-five morphological and pomological traits. Themorphological study was conducted to assessintra et inter genetic variability of 13 local plumcultivars and to determine variables in biologicalcharacteristics, tree growth leaf and fruitdescriptors. The analysis of variance showed asignificant difference between cultivars anddemonstrates that parameters relying on leaves,trees and fruits showed an important degree ofvariability and permit to discriminate plumcultivars. Principal component analysis pointedout a variation among individuals, mainly basedon fruit, leaf, seed and tree growth. Ward’sdendrogram and Principal Component Analysis(PCA) allowed clustering of cultivars accordingto their pomological traits and undependably oftheir geographic origin and. However, theseanalyses made it possible to resolve problem ofmislabelling of cultivars (homonymy). The aimof this work was the morphologicalcharacterization of local plum varieties in orderto establish a national ex situ collection and tostart a improvement program of plumgermplasm.
INTRODUCTION
The plant family Rosaceae consists of over 100genera and 3,000 species that include manyimportant fruit, nut, ornamental, and wood crops.Modern breeding programs have contributed tothe selection and release of numerous cultivarshaving significant economic impact. Plums holdthe central position within the genus Prunus withnumerous species with a basic number x=8(Badenes and Parfitt 1995) and having originatedin Europe, Asia, China, and North America(Zohary, 1992; Smartt and Simmonds, 1995).European plums belong to Prunus domestica L.,P. cerasifera Ehrh., P. spinosa L. and P. insititiaspecies. Although Japanese plums include P.salicina Lindl, and American ones contain P.Americana Marsh., P. munsoniana Wight and P.angustifolia Marsh. In the case of Prunusdomestica, P. spinosa and P. cerasifera wereproposed as the possible progenitor species(Crane and Lawrence, 1930; Salesses, 1975;Watkins, 1976; Watkins, 1981). Therefore,several studies were conducted to describe thegenetic diversity and determine their taxonomicstatus of Prunus species involving physiological,pomological parameters and molecular markers(Ertekin et al. 2006). Some other works relatedto phenolic were applied in to many species and
Biologia Tunisie Juillet 2012; N°7 ; 6 – 13
7
were used to establish morphological diversityand to obtain many descriptors utilized intovarietals identification (Groh et al. 1994).However, plum species have been classifiedprimarily on the basis of morphologicalcharacteristics. In addition, biochemical andmolecular characterization of plum have beenreported. (Mnejja et al. 2004; Byrne andLittleton, 1988; Bellini et al. 1998, Gregor et al.1994, Ortiz et al. 1997, Shimada et al. 1999;Heinkel et al. 2000; Goulao et al. 2001; Salesseset al. 1994; Cipriani et al. 1999; Groh et al.1994; Mohanty et al. 2002; Mohanty et al.2003). In Tunisia, the major cultivated cultivarsresult from Japanese (2n=16) and Europeanspecies (2n=6n=48) (P. salicina, P. domestica).The local germplasm is characterized bynumerous ecotypes mainly distinguishable bythe fruit characteristics, skin colour, and fruitshape. However, the exact number of cultivars isstill unknown since problems of synonymy andhomonymy are frequently observed. It isnoteworthy that a number of these cultivars havebeen destroyed as a consequence of the intensiveurbanization in recent decades. In addition,severe genetic erosion is also threatening theremaining germplasm like diseases, use ofintroduced cultivars and monovarietalcultivation. In fact, commercial production islimited to some locations, where usually one ortwo cultivars account for most of the productionand represented buy introduced ones recognisedfor their fruit quality, performance andproductivity like Santa Rosa and Golden Japoncultivars (Anonyme, 2002) belonging to Prunussalicina (2n=16).. However, local varieties well adapted tobioclimatic conditions are cultivated intraditional orchards. Thus, available informationabout the ancient landraces is restricted. To ourknowledge, no detailed study has been devotedto genetic diversity of local germplasm. Forthese raisons, it is imperative to start geneticdiversity study to characterize local plumgermplasm.The goals of the present study, based onmorphological and pomological traits were asfollows: (1) to estimate the amount of geneticdiversity within and among plums cultivars (2)to determine the degree of geneticdifferentiation; and (3) to examine the
phylogenetic relationship between cultivars tostart conservation and improvement programs. Infact, to satisfy the future needs in these geneticresources, it is necessary to collect and conserverepresentative stocks of plum genetic diversity.Indeed, the chance for fulfilling future demandof genetic resources is better when a high levelof genetic diversity is conserved and madeavailable for breeders. This challenge should notbe missed, particularly for the crops such asneglected and underutilised by national researchprograms.
MATERIAL AND METHODS
Plant materialsA total of 13 cultivars collected from threeregions in northern Tunisian were studied. Theseconsisted of local cultivars originating fromRafraf, Ras Jebel and Sounine. Table 1summarizes the nomenclature and the ecotypelabels.
Table 1: Origin and label of the Tunisianplum cultivars studied.
Name Code LocalityBedri 1 BED1 Ras JebelBedri 2 BED2 Ras JebelJabonia safra JBS RafrafCidre CID RafrafAdham Hmém ADH RafrafBaydha Arbi BYA RafrafMeski Hamra 2 MSH2 RafrafMeski hamra 2 MSH2 RafrafMeski kahla 1 MSK1 RafrafMeski kahla 2 MSK2 RafrafMeski safra 1 MSS1 RafrafMeski safra 2 MSS2 RafrafAin Tasstouria ANT Sounine
Morphological DescriptorsTwenty five qualitative and quantitative traitschosen from plum descriptors published by theInternational Plant Genetic Resources Institute(IPGRI-CEC, 1984) were studied (Table 2).
Biologia Tunisie Juillet 2012; N°7 ; 6 – 13
8
Table 2: Result of one-Way analyses of variance(ANOVA) applied on pomological andmorphological parameters referring to growth,leaf, and fruits descriptors.
Parameter Label Meansquare
F observed P
Leaf length LL 1.5176 5.58NS 0.0651Leaf width LWI 1.4889 14.58** 0.0128Petiole length PL 0.2153 6.98* 0.0456Fruit length FL 1.7547 126.69** 0.0002Fruit width FWI 0.9478 41.03** 0.0018Stalk length SL 0.1777 4.12NS 0.1026Fruit weight FWE 261.0099 80.28** 0.0005Fruit form FF 4.0000 99999.99** 0.0001Skin colour SC 4.5000 99999.99** 0.0001Pulpit colour PC 4.5000 99999.99** 0.0001Firmness F 4.0000 99999.99** 0.0001Juicy J 5.3333 99999.99** 0.0001Acidity AC 5.8333 99999.99** 0.0001Aroma A 9.8333 99999.99** 0.0001Sweeten S 13.8333 99999.99** 0.0001Seed length SL 0.6275 478.13** 0.0001Seed width SWI 0.1322 83.95** 0.0005Seed weight SWE 8.9680 1.49NS 0.3456Seed Length /Width
SL /WI 0.2096 60.12** 0.0009
Seed form SF 2.1666 8.67* 0.0318Branch length 2006 BL06 296.9605 2.42NS 0.2060Branch length 2007 BL07 796.7915 35.47** 0.0024Enter-node 2006 EN06 0.0465 0.24NS 0.8636Enter-node 2007 EN07 0.4533 9.80* 0.0258Final bud diameter FBD 0.0111 3.79NS 0.1152
NS: Not significant; **: High significant; *: Significant. k1=p-1=4-1=3 ;k2=p-(n-1)=4(2-1)=4Fth à 5%= 6,59 ; Fth à 1%= 16,70
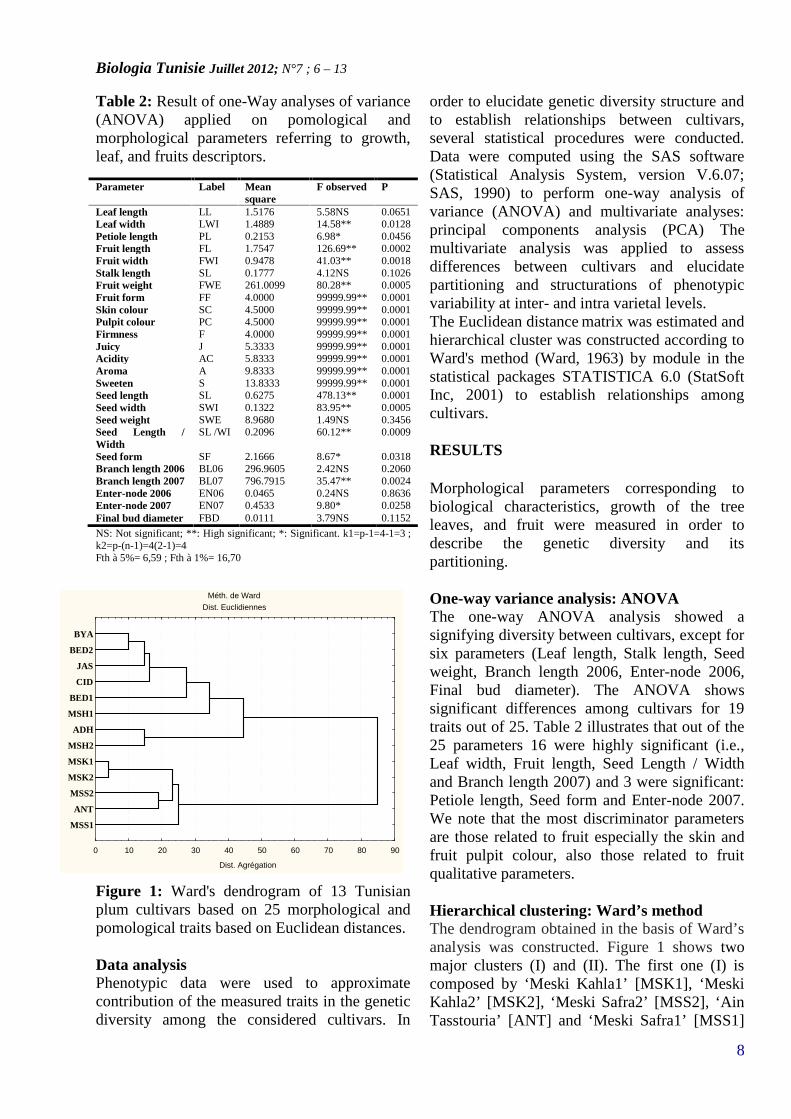
Figure 1: Ward's dendrogram of 13 Tunisianplum cultivars based on 25 morphological andpomological traits based on Euclidean distances.
Data analysisPhenotypic data were used to approximatecontribution of the measured traits in the geneticdiversity among the considered cultivars. In
order to elucidate genetic diversity structure andto establish relationships between cultivars,several statistical procedures were conducted.Data were computed using the SAS software(Statistical Analysis System, version V.6.07;SAS, 1990) to perform one-way analysis ofvariance (ANOVA) and multivariate analyses:principal components analysis (PCA) Themultivariate analysis was applied to assessdifferences between cultivars and elucidatepartitioning and structurations of phenotypicvariability at inter- and intra varietal levels.The Euclidean distance matrix was estimated andhierarchical cluster was constructed according toWard's method (Ward, 1963) by module in thestatistical packages STATISTICA 6.0 (StatSoftInc, 2001) to establish relationships amongcultivars.
RESULTS
Morphological parameters corresponding tobiological characteristics, growth of the treeleaves, and fruit were measured in order todescribe the genetic diversity and itspartitioning.
One-way variance analysis: ANOVAThe one-way ANOVA analysis showed asignifying diversity between cultivars, except forsix parameters (Leaf length, Stalk length, Seedweight, Branch length 2006, Enter-node 2006,Final bud diameter). The ANOVA showssignificant differences among cultivars for 19traits out of 25. Table 2 illustrates that out of the25 parameters 16 were highly significant (i.e.,Leaf width, Fruit length, Seed Length / Widthand Branch length 2007) and 3 were significant:Petiole length, Seed form and Enter-node 2007.We note that the most discriminator parametersare those related to fruit especially the skin andfruit pulpit colour, also those related to fruitqualitative parameters.
Hierarchical clustering: Ward’s methodThe dendrogram obtained in the basis of Ward’sanalysis was constructed. Figure 1 shows twomajor clusters (I) and (II). The first one (I) iscomposed by ‘Meski Kahla1’ [MSK1], ‘MeskiKahla2’ [MSK2], ‘Meski Safra2’ [MSS2], ‘AinTasstouria’ [ANT] and ‘Meski Safra1’ [MSS1]
Méth. de WardDist. Euclidiennes
0 10 20 30 40 50 60 70 80 90
Dist. Agrégation
MSS1
ANT
MSS2
MSK2
MSK1
MSH2
ADH
MSH1
BED1
CID
JAS
BED2
BYA
Biologia Tunisie Juillet 2012; N°7 ; 6 – 13
9
cultivars. The second group (II) contains theremaining cultivars. Morphological method alsomade it possible to sort out the mislabelling andhomonymy problems of different ecotypes basedon local denomination. This is well exemplifiedin the case of ‘Bedri1’ [BED1] and ‘Bedri2’[BED2]; ‘Meski Kahla1’ [MSK1] and ‘MeskiKahla2’ [MSK2]; ‘Meski Safra1’ [MSS1] and‘Meski Safra2’ [MSS2]; ‘Meski Hamra1’[MSH1] and ‘Meski Hamra2’ [MSH2] cultivars.Multivariate analysis: Principal componentanalysis (PCA)Inter-varietal genetic variabilityWe have performed a PCA analysis taking intoaccount the vegetative traits and pomologicalparameters. Correlation coefficients computedfor all pairs of traits (data not shown) revealedsignificantly positive values observed especiallybetween seed length/width (SL/WI) and seedform (SF) parameters (0.98), fruit width (FWI)and fruit weight (FWE) (0.94) parameters.However, negative values were calculated forfruit acidity (AC) and seed form (SF) (-0.84)parameters.Results of PCA analysis based on growth andleaf descriptors show that 65.06% of the globalvariability is accounted by the three firstprincipal components (PCs) with 27.04%,20.74% and 17.28% the absorbance of the threeaxes respectively (Table 3).
Table 3: Eigenvectors, Eigen values and percentvariance explained by the first three principalcomponents (PCs) for 25 traits analysed in 13plum cultivars.
Eigenvectors PC1 PC22 PC3
Cumulative% ofvarianceexplained
27,04 47,78 65,06
cha e.i cha e.i cha e.i
PL
SL/WI
SF
INL07
LL
J
+0.331
+0.297
+0.295
+0.274
-0.219
-0.271
SWI
SC
FWI
F
STL
S
+0.345
+0.314
+0.268
+0.240
-0.245
-0.214
FL
FF
BL07
SL
PC
AC
+0.375
+0.355
+0.287
+0.283
-0.266
-0.266
Cha: characters; e.i: Eigenvalue
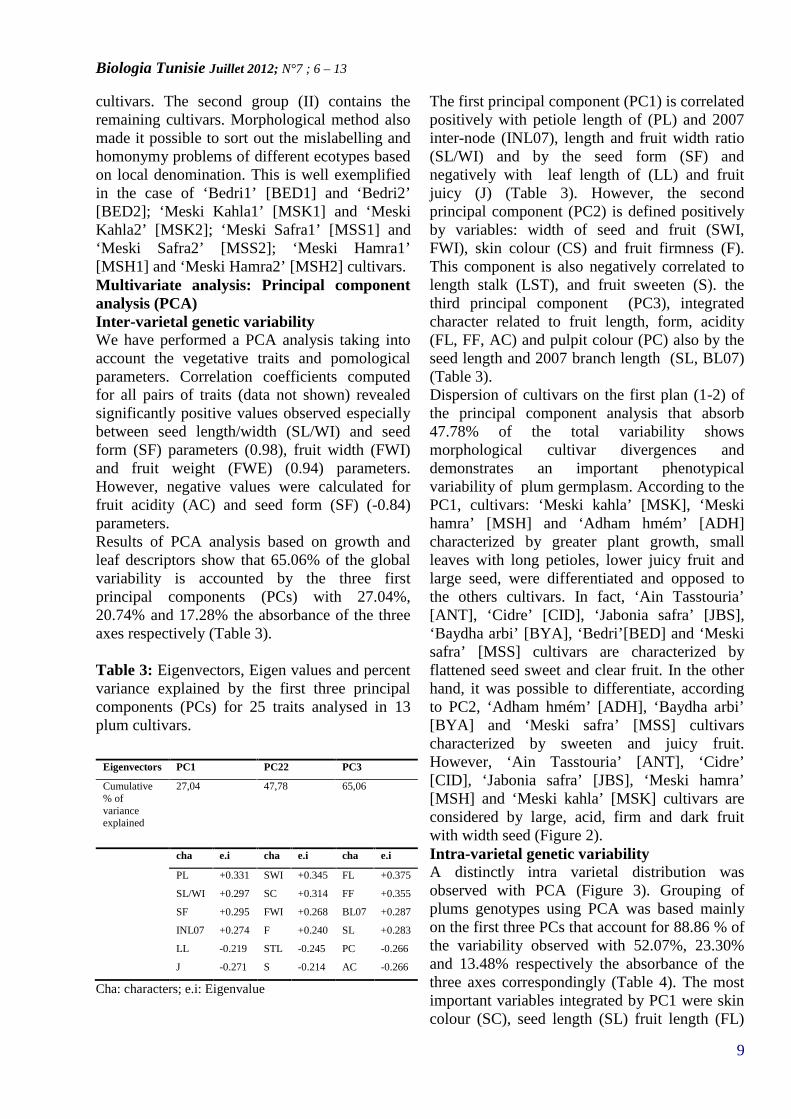
The first principal component (PC1) is correlatedpositively with petiole length of (PL) and 2007inter-node (INL07), length and fruit width ratio(SL/WI) and by the seed form (SF) andnegatively with leaf length of (LL) and fruitjuicy (J) (Table 3). However, the secondprincipal component (PC2) is defined positivelyby variables: width of seed and fruit (SWI,FWI), skin colour (CS) and fruit firmness (F).This component is also negatively correlated tolength stalk (LST), and fruit sweeten (S). thethird principal component (PC3), integratedcharacter related to fruit length, form, acidity(FL, FF, AC) and pulpit colour (PC) also by theseed length and 2007 branch length (SL, BL07)(Table 3).Dispersion of cultivars on the first plan (1-2) ofthe principal component analysis that absorb47.78% of the total variability showsmorphological cultivar divergences anddemonstrates an important phenotypicalvariability of plum germplasm. According to thePC1, cultivars: ‘Meski kahla’ [MSK], ‘Meskihamra’ [MSH] and ‘Adham hmém’ [ADH]characterized by greater plant growth, smallleaves with long petioles, lower juicy fruit andlarge seed, were differentiated and opposed tothe others cultivars. In fact, ‘Ain Tasstouria’[ANT], ‘Cidre’ [CID], ‘Jabonia safra’ [JBS],‘Baydha arbi’ [BYA], ‘Bedri’[BED] and ‘Meskisafra’ [MSS] cultivars are characterized byflattened seed sweet and clear fruit. In the otherhand, it was possible to differentiate, accordingto PC2, ‘Adham hmém’ [ADH], ‘Baydha arbi’[BYA] and ‘Meski safra’ [MSS] cultivarscharacterized by sweeten and juicy fruit.However, ‘Ain Tasstouria’ [ANT], ‘Cidre’[CID], ‘Jabonia safra’ [JBS], ‘Meski hamra’[MSH] and ‘Meski kahla’ [MSK] cultivars areconsidered by large, acid, firm and dark fruitwith width seed (Figure 2).Intra-varietal genetic variabilityA distinctly intra varietal distribution wasobserved with PCA (Figure 3). Grouping ofplums genotypes using PCA was based mainlyon the first three PCs that account for 88.86 % ofthe variability observed with 52.07%, 23.30%and 13.48% respectively the absorbance of thethree axes correspondingly (Table 4). The mostimportant variables integrated by PC1 were skincolour (SC), seed length (SL) fruit length (FL)
Biologia Tunisie Juillet 2012; N°7 ; 6 – 13
10
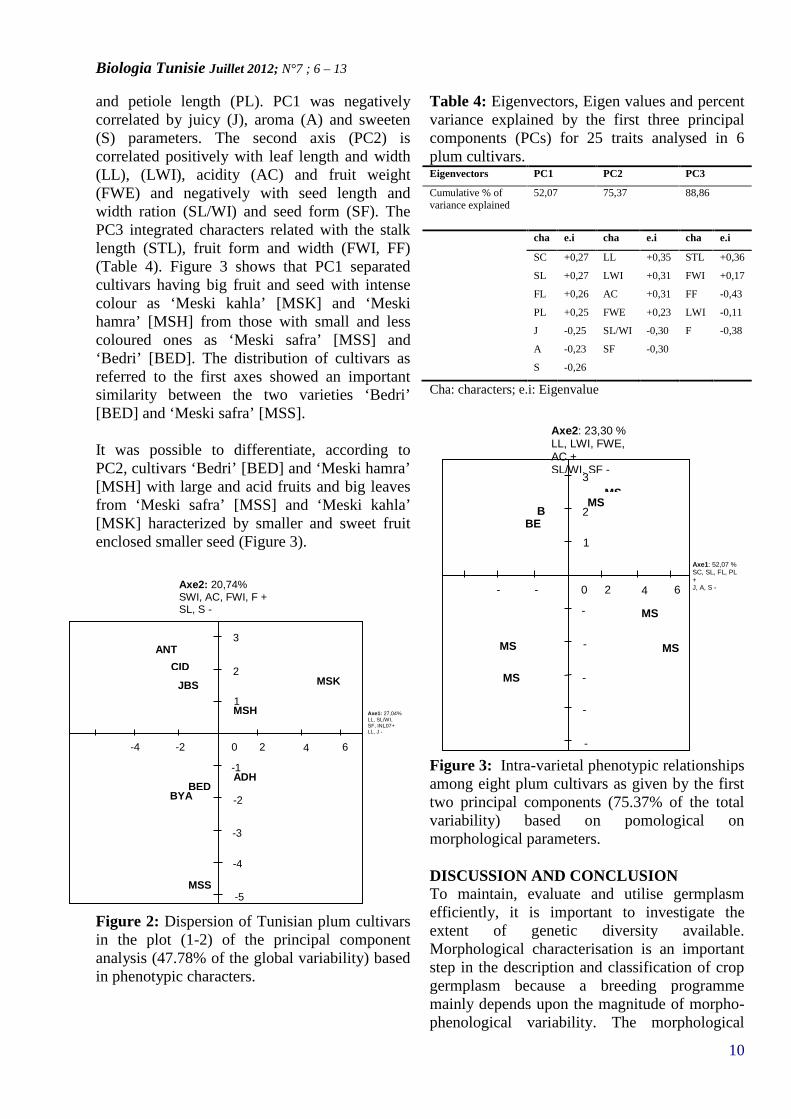
and petiole length (PL). PC1 was negativelycorrelated by juicy (J), aroma (A) and sweeten(S) parameters. The second axis (PC2) iscorrelated positively with leaf length and width(LL), (LWI), acidity (AC) and fruit weight(FWE) and negatively with seed length andwidth ration (SL/WI) and seed form (SF). ThePC3 integrated characters related with the stalklength (STL), fruit form and width (FWI, FF)(Table 4). Figure 3 shows that PC1 separatedcultivars having big fruit and seed with intensecolour as ‘Meski kahla’ [MSK] and ‘Meskihamra’ [MSH] from those with small and lesscoloured ones as ‘Meski safra’ [MSS] and‘Bedri’ [BED]. The distribution of cultivars asreferred to the first axes showed an importantsimilarity between the two varieties ‘Bedri’[BED] and ‘Meski safra’ [MSS].
It was possible to differentiate, according toPC2, cultivars ‘Bedri’ [BED] and ‘Meski hamra’[MSH] with large and acid fruits and big leavesfrom ‘Meski safra’ [MSS] and ‘Meski kahla’[MSK] haracterized by smaller and sweet fruitenclosed smaller seed (Figure 3).
Figure 2: Dispersion of Tunisian plum cultivarsin the plot (1-2) of the principal componentanalysis (47.78% of the global variability) basedin phenotypic characters.
Table 4: Eigenvectors, Eigen values and percentvariance explained by the first three principalcomponents (PCs) for 25 traits analysed in 6plum cultivars.Eigenvectors PC1 PC2 PC3
Cumulative % ofvariance explained
52,07 75,37 88,86
cha e.i cha e.i cha e.i
SC
SL
FL
PL
J
A
S
+0,27
+0,27
+0,26
+0,25
-0,25
-0,23
-0,26
LL
LWI
AC
FWE
SL/WI
SF
+0,35
+0,31
+0,31
+0,23
-0,30
-0,30
STL
FWI
FF
LWI
F
+0,36
+0,17
-0,43
-0,11
-0,38
Cha: characters; e.i: Eigenvalue
Figure 3: Intra-varietal phenotypic relationshipsamong eight plum cultivars as given by the firsttwo principal components (75.37% of the totalvariability) based on pomological onmorphological parameters.
DISCUSSION AND CONCLUSIONTo maintain, evaluate and utilise germplasmefficiently, it is important to investigate theextent of genetic diversity available.Morphological characterisation is an importantstep in the description and classification of cropgermplasm because a breeding programmemainly depends upon the magnitude of morpho-phenological variability. The morphological
Axe2: 23,30 %LL, LWI, FWE,AC +SL/WI, SF -
Axe1: 52,07 %SC, SL, FL, PL+J, A, S -0-
2-4
2 4 6
1
2
3
-1
-2
-3-4
-5
BED
BED
MSH
MSH
MSS
MSS
MSK
MSK
Axe2: 20,74%SWI, AC, FWI, F +SL, S -
0-2-4 2 4 6
1
2
3
-1
-2
-3
-4
-5
ANTCID
JBS
MSH
MSK
ADHBED
BYA
MSS
Axe1: 27,04%LL, SL/WI,SF, INL07+LL, J -
Biologia Tunisie Juillet 2012; N°7 ; 6 – 13
11
traits analysed on Tunisian plum cultivarshighlighted an important variability and alloweda clear distinction of the studied cultivars. Theseresults will be very useful to characterize eachcultivar and to create a catalogue of localcultivars. Results obtained by PCA analyses forinter- variability showed a distribution of geneticvariability independent from their geographicalorigins.To our knowledge, no studies reportingmorphological diversity of plums are published.Consequently, we could not compare dataobtained in the present study to others for a bestappreciation of the morphological diversity ofplums cultivar from Tunisia. The traits thatcontributed significantly to cultivars distinctionare those related to sizes and weight of fruits,seeds, leaves and growth trees. The pattern ofmorphological variability observed in this studyis similar to those from several studiesdemonstrating that in domesticated crops speciessuch as fig (Ficus carica L.), morphologicaldifferences are often based on agronomic traits(Salhi Hannachi et al. 2003, Chatti et al. 2004;Saddoud et al. 2008). We could thus concludethat seed, fruit size and leaves parameters andtree’s growth proved to be a useful tool fordiscriminating plum cultivars. Moreinterestingly, the individuals analysed weregrouped into two groups defined based on theseparameters. The intra varietal diversity confirmsresults obtained by the dendrogram and it can beexplained by an important somatic mutations ordu to natural hybridization which could give riseto new subspecies as suggested by Shimada et al.(1999). Cluster analysis show that the consideredcultivars are gathered independently from eithergeographical origin or appellation. Moreover,cultivars having the same denomination notcluster together. It is the case of cultivars ‘Meskihamra’ [MSH], ‘Meski safra’ [MSS] and ‘Meskikahla’ [MSK] originating from Rafraf and‘Bedri’ [BED] collected from Ras Jebel in thenorth Tunisia. These may be considered ashomonomies and the hypothesis of polyclonalvarieties ‘Meski’ and ‘Bedri’ could be forwardedto explain this result.As the high loss of global biodiversity continues,devoting efforts to the conservation of geneticresources for local crops are widelyrecommended. To achieve this objective, a better
knowledge of the genetic diversity of the targetcrop is a prerequisite. From the investigationherein, it is worth mentioning that Tunisianplums displayed a wide range of diversity formost of the morphological traits studied. Thetraits related to fruit, seed, leaf and tree growthshow the highest discriminating value and were,consequently, the most cultivar distinctive.Consequently, morphological and pomologicaltraits could be used for cultivar identificationduring collecting missions. However, the lownumber of analysed individuals suggests thatanalysis of additional cultivars is required beforea definitive conclusion can be revealed. It will bevery useful to continue this study for all Tunisianplum cultivars. Such analyses allow theidentification of most preferment genotypes. Inaddition, phenological characters must beassociated to nuclear and cytoplasmic molecularmarkers such as SSR or AFLP in order to studythis variability for one of the most widelyconsumed local fruit in Tunisia.
AKNOWLEGMENTSThis work was partially supported by grantsfrom the Tunisian “Ministère de l'EnseignementSupérieur, de la Recherche Scientifique et de laTechnologie ” Projet Lab B02.
REFERENCES
Anonyme, (2002). Arboriculture fruitière.Variétés fruitières recommandées en Tunisie.Documents techniques INRAT N° 114.
Badenes, M.L., Parfitt, D.E. (1995).Phylogenetic relationships of cultivated Prunusspecies from an analysis of chloroplast DNAvariation. Theoretical Applied Genetics 90,1035-1041.
Bellini, E. Giordani, E. Nencetti, V. and Paffetti,D. (1998). Genetic relationships in Japeneseplum cultivars by molecular markers. ActaHorticulturae. 478: 53-61.
Byrne, D. H. and Littleton, T.G. (1988).Electrophoretic characterization of diploid plumsof the southeastern United States. Journal of theAmerican Society for Horticultural Science. 113:918-924.
Biologia Tunisie Juillet 2012; N°7 ; 6 – 13
12
Chatti, K., Salhi-Hannachi, A., Mars, M.,Marrakchi, M., and Trifi, M. (2004). Analyse dela diversité génétique de cultivars tunisiens defiguier (Ficus carica L.) par les caractèresmorphologiques. Fruits 59 :49–61.
Cipriani, G. Lot, G. Huang, W.G. Marrazzo,M.T. Peterlunger, E. and Testolin, R. (1999).AC/GT and AAG/CT microsatellite repeats inpeach (Prunus persica L. Batsch) isolation,characterization and cross-species amplificationin Prunus. Theoretical and Applied Genetics.99(1-2): 65-72.
Crane, M.B. and Lawrence, W.J.C. (1930).Studies in sterility. International HorticulturalCongress. 9: 100-116.
Ertekin, C. Gozlekci, S. Kabas, O. Sonmez, S.and Akinci, I. (2006). Some physical,pomological and nutritional properties of twoplum (Prunus domestica L.) cultivars. Journal ofFood Engineering. 75(4): 508-514.
Goulao, L. Monte-Corvo, L. and Oliveira, C.M.(2001). Phenetic characterization of plumcultivars by high multiplex ratio markers:Amplified Fragment Length Polymorphisms andInter-simple Sequence Repeats. Journal of theAmerican Society for Horticultural Science.126(1): 72–77.
Gregor, D. Hartmann, W. and Stosser, R. (1994).Cultivar identification in Prunus domesticausing random amplified polymorphic DNAmarkers. Acta Horticulturae. 359: 33-40.
Groh, B. Bauer, H. and Treutter, D. (1994).Chemotaxonomical investigations of Prunusdomestica by isoenzyme markers and phenoliccompounds. Scientia Horticulturae. 58: 41-55.
Heinkel, R. Hatmann, W. and Stösser, R. (2000).On the origin of the plum cultivars `CacaksBeauty', `Cacaks Best', `Cacaks Early' and`Cacaks Fruitful' as investigated by theinheritance of random amplified polymorphicDNA (RAPD) fragments. Scientia Horticulturae.83: 149-155.
IPGRI (International Board for Plant GeneticResources) and CEC (Commission of EuropeanCommunities: Committee on disease resistancebreeding and use of genebanks (1984) Descriptorlist for plum and allied species. (Eds CobianchiD, Watkins R) pp. 31
Mnejja, M. Garcia-Mas, J. Howad, W. Badenes,M.L. and Arùs, P. (2004). Simpel-sequencerepeats (SSR) markers of Japanese plum (Prunussalicina Lindl.) are highly polymorphic andtransferable to peach and almond. MolecularEcology Notes. 4: 163-165.
Mohanty, A. Martin, J.P. and Aguinagalde, I.(2002). Population genetic analysis of EuropeanPrunus spinosa (Rosaceae) using chloroplastDNA markers. American Journal of Botany. 89:1223–1228.
Mohanty, A. Martin, J.P. Gonzalez, L.M. andAguinagalde, I. (2003). Assaciation betweenchloroplast DNA and mitochondrial DNAhaplotypes in Prunus spinosa L. (Rosaceae)populations across Europe. Annals of Botany.92: 749-755.
Ortiz, A. Renaud, R. Calzada, I. and Ritter, E.(1997). Analysis of plum cultivars with RAPDmarkers. Journal of horticultural sciences. 72: 1-9.
Saddoud, O, Baraket G., Chatti K., Trifi M.,Marrakchi, M., Salhi-Hannachi, A., and Mars,M.. (2008). Morphological Variability of Fig(Ficus carica L.) Cultivars. International Journalof Fruit Science 8: 35-51
Salhi-Hannachi, A., Mars, M., Chatti, K.,Marrakchi, M., Trifi, M. (2003). Specific geneticmarkers for Tunisian fig germplasm: Evidenceof morphological traits, random amplifiedpolymorphic DNA and inter simple sequencerepeats markers. J. Genet. Breeding 57: 125–136.
Salesses, G. (1975). Some data on thecytogenetics of plums and the origin of plums.Acta Horticulturae. 48: 59–65.
Salesses, G. Grassely, C. Bernhard, R. (1994).Utilisation des espèces indigènes et exotiquespour l’amélioration des Prunus cultivés, variétéset porte-greffe. C. R. Académie d’AgricultureFrançaise. 80: 77–88.
SAS (1990) SAS user’s guide: SAS STAT, SASBASIC. Version 6 fourth edition. Sas incl, BOX8000. cary, NC 27512-8000, cary; NC: SASinstitute Inc.
Biologia Tunisie Juillet 2012; N°7 ; 6 – 13
13
Smartt J, and Simmonds NW (1995) Evolutionof crop plants, Ed 2nd edn. Longman Scientific&Technical, Harlow, UK.
Shimada, T. Hayama, H. Haji, T. Yamaguchi,M. and Yoshida, M. (1999). Genetic diversity ofplums characterized by random amplifiedpolymorphic DNA (RAPD) analysis. Euphytica109: 143-147.
StatSoft, Inc. (2001) STATISTICA (dataanalysis software systems), version 6. StatSoft,Inc. (www.statsoft.com), Tulsa, OK. USA.
Ward, J. H. (1963). Hierarchical grouping tooptimize an objective function. Journal ofAmerican Statistical Association. 58: 236-244
Watkins, R. (1976). Cherry, plum, peach, apricotand almond. In: Simmonds N.W. ed. Evolutionof crop plants. Longman, London, UK. 242-247.
Watkins, R. (1981). Plums, apricots, almonds,peaches, cherries genus Prunus. In: Hora B. ed.The Oxford University encyclopaedia of trees ofthe world. Oxford University Press, UK. 196-201.
Zohary, D. (1992). Is the European plum,Prunus domestica L., a P. cerasifera EHRH x P.spinosa L. allopolyploid. Euphytica. 60: 75–77.
Biologia Tunisie Juillet 2012 ; N°7 ; 14 – 19
14
BIOLOGIA TUNISIE
THE PROTECTIVE EFFECT OF PITUITARY ADENYLATE CYCLASE-ACTIVATING POLYPEPTIDE ON ASTROGLIAL CELLS IS MEDIATEDTHROUGH ACTIVATION OF OCTADECANEUROPEPTIDE RELEASE
Masmoudi-Kouki Olfaa, Kaddour Hadhémia, Hamdi Yosraa, Vaudry Davidb,c,d, Tonon Marie-Christine b,c,d and Amri Mohameda
aLaboratory of Functional Neurophysiology and Pathology, Research Unit 00/UR/08-01, Department of Biological Sciences, Faculty of
Science of Tunis, University Tunis El Manar, 2092 Tunis, Tunisia ; bInserm U413 /U982, Laboratory of Neuronal and Neuroendocrine
Communication and Differentiation ; cInternational Associated Laboratory Samuel de Champlain ; dEuropean Institute for Peptide Research
(IFRMP 23), Regional Platform for Cell Imaging of Haute-Normandie (PRIMACEN) , University of Rouen, 76821 Mont-Saint-Aignan,
*Corresponding authors: ; Pr Amri Mohamed. Fax: (216) 216 71 87-16-66. ; E-mail address: [email protected]
Keywords: Neuropeptides, Astrocytes, Cell culture, Oxidative stress, Neuroprotection
ABSTRACT
Oxidative stress in living cells results fromaccumulation of reactive oxygen species and freeradicals such as hydrogen peroxide (H2O2) andinitiates the cascade of events leading to apoptosis.Astroglial cells synthesize and releaseoctadecaneurpeptide, a biological active peptide thathas been implicated in cellular protection. Therelease of ODN is regulated by neuropeptide pituitaryadenylate cyclase-activating polypeptide (PACAP),known neuroprotective agent. The aim of the presentstudy was to determine whether PACAP couldprevent H2O2 toxicity by activating ODN receptor.Incubation of cultured astrocytes with gradedconcentrations of H2O2 for 1 h provoked a dose-dependent reduction of the number of living cells.Pretreatment of astrocytes with very lowconcentration of PACAP (0.1 nM) or ODN (0.1 nM)prevented cell death induced by H2O2. The effect ofODN was mimicked by the ODN metabotropicreceptor agonist and the blockage of this receptor bya specific antagonist, cyclo1–8[Dleu5]OP, abolishedtotally the protective action of PACAP upon H2O2-induced astrocytes cell death. Taken together, thesedata indicate that PACAP, acting through ODNrelease, exerts a potent protective effect againstastrocytes degeneration induced by oxidative stress.
INTRODUCTION
Pituitary adenylate cyclase-activatingpolypeptide (PACAP) was initially isolated fromthe ovine hypothalamus for its ability to
stimulate cAMP formation in rat anteriorpituitary cells (Miyata et al., 1989). Soon afterthe discovery of PACAP, the presence ofspecific PACAP binding sites was demonstratedon astroglial cells (Tatsuno et al., 1991).Subsequent studies have shown that all threePACAP receptors are expressed in rat astrocytes(Ashur-Fabian et al., 1997; Grimaldi andCavallaro, 1999), indicating that astrocytes aremain target cells for PACAP in the centralnervous system. It is well known that PACAPreduces brain damage after ischemia andameliorates neurological deficits (Vaudry et al.,2000; Nakamachi et al., 2008; Ohtaki et al.,2008). In addition, some data suggest thatneuroprotective activity of PACAP seems toinvolve an indirect mechanism requiringastrocytes (Brenneman et al., 2000; Brennemanet al., 2003; Shioda et al., 2004). PACAP-stimulated astrocytes secrete neuroprotectiveproteins, including activity-dependentneuroprotective protein and granulocyte colony-stimulating factor and a number of cytokines(Shioda et al., 2004; Masmoudi-Kouki et al.,2007). We have previously shown that PACAP,for very low doses and through activation ofPAC1 receptor stimulates the release ofendozepines (Masmoudi et al., 2003).The endozepine, octadecaneuropeptide (ODN) isgenerated by proteolytic cleavage of an 86-amino acid precursor called diazepam-binding
Biologia Tunisie Juillet 2012 ; N°7 ; 14 – 19
15
o
ls
f
a
lo
inhibitor (DBI) (Guidotti et al., 1983) whosegene is mainly expressed in glial cells in thecentral nervous system (CNS) (Tonon et al.,2006). There is now evidence that ODN may actas an autocrine and paracrine factor modulatingastroglial and neuron cell activity, respectively.At the cellular level, effects of ODN aremediated through central-type benzodiazepinereceptors (CBR), i.e. glial cell proliferation(Gandolfo et al., 1999) and neurosteroidbiosynthesis (Do-Rego et al., 2001), or byactivation of the metabotropic receptor of ODN,i.e. neuropeptide expression in neuronal cells(Compère et al., 2004; Compère et al., 2005) andintracellular calcium increase in cultured ratastrocytes (Gandolfo et al., 1997; Leprince et al.,1998).The observation that ODN, as well as PACAP,stimulates the release of neuroprotective agentsfrom cultured astrocytes (Tokay et al., 2005)suggests that endozepines may contribute toPACAP-evoked cells protection. In order to testthe hypothesis, we investigate the possible actionof ODN on the protective effect of PACAP onoxidative stress-induced astroglial cells death.
MATERIAL AND METHODS
Cell culture
Secondary cultures of rat cortical astrocytes wereprepared as previously described (Brown andMohn, 1999) with minor modifications. Briefly,cerebral hemispheres from newborn Wistar ratswere collected in Dulbecco’s modified Eagle’smedium/F12 (2 : 1; v/v) culture mediumsupplemented with 2 mM glutamine, 1% insulin,5 mM HEPES, 0.4% glucose and 1% of theantibiotic–antimycotic solution. The tissues were
antibodies against glial fibrillary acidic protein.All experiments were performed on 5- to 7-day-old secondary cultures.
Measurement of cell survivalCells seeded into 24-well plates were subjectedto various treatments and then incubated at 37°Cfor 10 min with 15µg/ml fluorescein diacetate(producing green fluorescence in living cells).Cells were washed three times with phosphate-buffered saline (PBS) and lysed with a Tris/HClsolution. Fluorescence intensity was measured (λexcitation = 485 nm and λ emission = 530 nm)with a FLx800 fluorescence microplate reader(Bio-Tek FL800TBI Instruments, USA).
Statistical analysisData are presented as the mean SEM fromthree independent experiments performed inquadruplicate or quintuplicate. Statisticalanalysis of the data was performed by usingStudent’s t test and ANOVA, followed byBonferroni’s test.
RESULTS
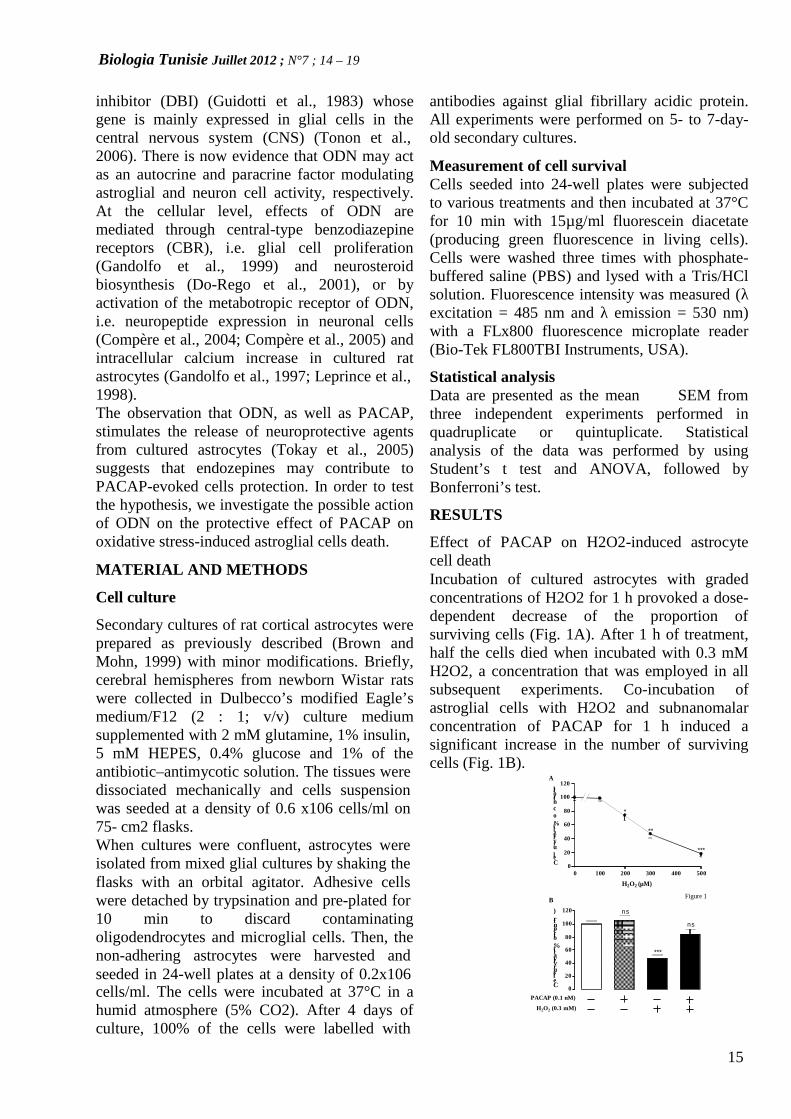
Effect of PACAP on H2O2-induced astrocytecell deathIncubation of cultured astrocytes with gradedconcentrations of H2O2 for 1 h provoked a dose-dependent decrease of the proportion ofsurviving cells (Fig. 1A). After 1 h of treatment,half the cells died when incubated with 0.3 mMH2O2, a concentration that was employed in allsubsequent experiments. Co-incubation ofastroglial cells with H2O2 and subnanomalarconcentration of PACAP for 1 h induced asignificant increase in the number of survivingcells (Fig. 1B).
dissociated mechanically and cells suspensionwas seeded at a density of 0.6 x10⁶ cells/ml on75- cm2 flasks.When cultures were confluent, astrocytes wereisolated from mixed glial cultures by shaking the
A
ol)
trnco
(l%
ivrvu
elC
120
100
80
60
40
20
0
*
**
***
flasks with an orbital agitator. Adhesive cellswere detached by trypsination and pre-plated for
0 100 200 300 400 500
H2O2 (µM)
BFigure 1
10 min to discard contaminatingoligodendrocytes and microglial cells. Then, thenon-adhering astrocytes were harvested and
) 120
tnr
100coof 80
(%l 60
iva
rv40
ns
ns
***
seeded in 24-well plates at a density of 0.2x10⁶cells/ml. The cells were incubated at 37°C in ahumid atmosphere (5% CO2). After 4 days ofculture, 100% of the cells were labelled with
slu
20eC 0
PACAP (0.1 nM)
H2O2 (0.3 mM)
Biologia Tunisie Juillet 2012 ; N°7 ; 14 – 19
16
o o
v v
ns
40
Figure 1 : Protective effect of PACAP on astroglial celldeath induced by H2O2. (A) Cells were incubated in theabsence or presence of graded concentration (100 to 500µM) of H2O2. (B) Cells were preincubated for 10 min inthe absence or presence of 0.1 nM PACAP and thenincubated for 1 h with medium alone or with 0.3 mMH2O2 without or with PACAP. The results are expressedas percentages of the control value. Each value is the mean(± SEM) of at least three independent experimentsperformed in quadriplicate. ANOVA followed by theBonferroni’s test: *P< 0.05; **P < 0.01; ***P < 0.001; ns,not statistically different from the control.
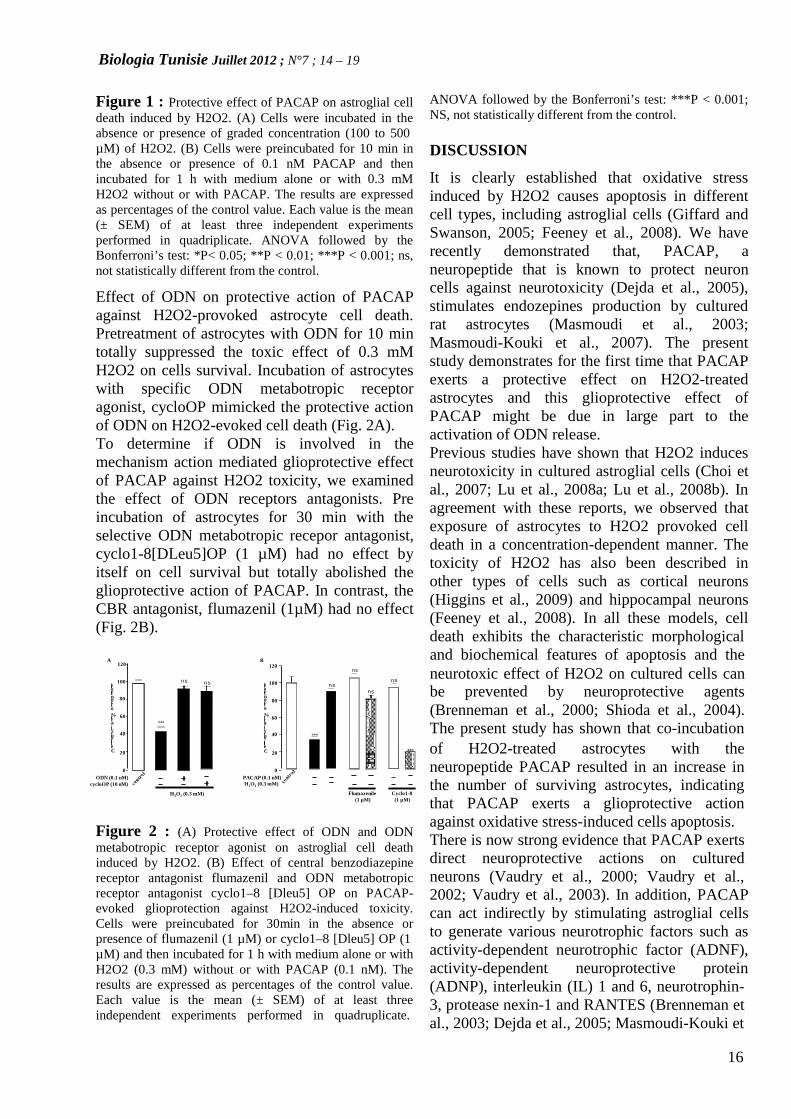
Effect of ODN on protective action of PACAPagainst H2O2-provoked astrocyte cell death.Pretreatment of astrocytes with ODN for 10 mintotally suppressed the toxic effect of 0.3 mMH2O2 on cells survival. Incubation of astrocyteswith specific ODN metabotropic receptoragonist, cycloOP mimicked the protective actionof ODN on H2O2-evoked cell death (Fig. 2A).To determine if ODN is involved in themechanism action mediated glioprotective effectof PACAP against H2O2 toxicity, we examinedthe effect of ODN receptors antagonists. Preincubation of astrocytes for 30 min with theselective ODN metabotropic recepor antagonist,cyclo1-8[DLeu5]OP (1 µM) had no effect byitself on cell survival but totally abolished theglioprotective action of PACAP. In contrast, theCBR antagonist, flumazenil (1µM) had no effect(Fig. 2B).
ANOVA followed by the Bonferroni’s test: ***P < 0.001;NS, not statistically different from the control.
DISCUSSION
It is clearly established that oxidative stressinduced by H2O2 causes apoptosis in differentcell types, including astroglial cells (Giffard andSwanson, 2005; Feeney et al., 2008). We haverecently demonstrated that, PACAP, aneuropeptide that is known to protect neuroncells against neurotoxicity (Dejda et al., 2005),stimulates endozepines production by culturedrat astrocytes (Masmoudi et al., 2003;Masmoudi-Kouki et al., 2007). The presentstudy demonstrates for the first time that PACAPexerts a protective effect on H2O2-treatedastrocytes and this glioprotective effect ofPACAP might be due in large part to theactivation of ODN release.Previous studies have shown that H2O2 inducesneurotoxicity in cultured astroglial cells (Choi etal., 2007; Lu et al., 2008a; Lu et al., 2008b). Inagreement with these reports, we observed thatexposure of astrocytes to H2O2 provoked celldeath in a concentration-dependent manner. Thetoxicity of H2O2 has also been described inother types of cells such as cortical neurons(Higgins et al., 2009) and hippocampal neurons(Feeney et al., 2008). In all these models, celldeath exhibits the characteristic morphological
A120
B120
and biochemical features of apoptosis and thens neurotoxic effect of H2O2 on cultured cells can
l)100
tnr
co80
of
(%
ns ns l) 100 nstnr ns
co 80of
(%
be prevented by neuroprotective agents(Brenneman et al., 2000; Shioda et al., 2004).60
la
rvi
sul
*** l 60a
rvi
su40
l***
The present study has shown that co-incubationelC 20
0
elC 20
0
*** of H2O2-treated astrocytes with theneuropeptide PACAP resulted in an increase in
ODN (0.1 nM)cycloOP (10 nM)
H2O2 (0.3 mM)
PACAP (0.1 nM)H2O2 (0.3 mM)
Flumazenile(1 µM)
Cyclo1-8(1 µM)
the number of surviving astrocytes, indicatingthat PACAP exerts a glioprotective action
Figure 2 : (A) Protective effect of ODN and ODNmetabotropic receptor agonist on astroglial cell deathinduced by H2O2. (B) Effect of central benzodiazepinereceptor antagonist flumazenil and ODN metabotropicreceptor antagonist cyclo1–8 [Dleu5] OP on PACAP-evoked glioprotection against H2O2-induced toxicity.Cells were preincubated for 30min in the absence orpresence of flumazenil (1 µM) or cyclo1–8 [Dleu5] OP (1µM) and then incubated for 1 h with medium alone or withH2O2 (0.3 mM) without or with PACAP (0.1 nM). Theresults are expressed as percentages of the control value.Each value is the mean (± SEM) of at least threeindependent experiments performed in quadruplicate.
against oxidative stress-induced cells apoptosis.There is now strong evidence that PACAP exertsdirect neuroprotective actions on culturedneurons (Vaudry et al., 2000; Vaudry et al.,2002; Vaudry et al., 2003). In addition, PACAPcan act indirectly by stimulating astroglial cellsto generate various neurotrophic factors such asactivity-dependent neurotrophic factor (ADNF),activity-dependent neuroprotective protein(ADNP), interleukin (IL) 1 and 6, neurotrophin-3, protease nexin-1 and RANTES (Brenneman etal., 2003; Dejda et al., 2005; Masmoudi-Kouki et
Biologia Tunisie Juillet 2012 ; N°7 ; 14 – 19
17
al., 2007). We have previously shown thatcultured rat astrocytes contain and releasesubstantial amounts of endozepines (Patte et al.,1999; Masmoudi et al., 2005; Tokay et al.,2008). Several lines of evidence indicate that theprotective effect of PACAP against H2O2-induced astrocyte cells death could be mediatedthrough activation of ODN release. We earlierfound that subnanomolar concentrations ofPACAP stimulates ODN-like peptides releasefrom cultured astrocytes (Masmoudi et al.,2003). Here, we demonstrate that the gliopeptideODN protects astrocytes upon H2O2 injury.Cyclo1-8OP mimicked the protective action ofODN, indicating that ODN prevents cells deaththrough activation of its metabotropic rececptor.Addition of ODN metabotropic receptorantagonist totally suppressed the protectiveaction of PACAP against H2O2 toxicity incultured astrocyte. Taken together, these dataindicate that the protective effect of PACAPagainst H2O2-induced cell death in astrocytescan be ascribed to activation of ODN receptors.In conclusion, the present study hasdemonstrated that PACAP exerts a potentglioprotective effect against oxidative stress andindicate that, besides its direct protective effects,PACAP may also acts indirectly by stimulatingthe release of ODN that prevent astroglial cellsdeath.
Acknowledgments
This study was supported by the Research Unit00-UR-08-01. Y.H. and H.K. were recipients offellowships from the University of Tunis ElManar and a France-Tunisia exchange programCMCU-Utique program (to MA and MCT).
REFERENCES
Ashur-Fabian, O., Giladi, E., Brenneman, D.E.,Gozes, I., 1997. Identification of VIP/PACAPreceptors on rat astrocytes using antisenseoligodeoxynucleotides. J Mol Neurosci. 9, 211-222.Brenneman, D.E., Spong, C.Y., Gozes, I., 2000.Protective peptides derived from novel glialproteins. Biochem Soc Trans. 28, 452-5.Brenneman, D.E., Phillips, T.M., Hauser, J.,Hill, J.M., Spong, C.Y., Gozes, I., 2003.Complex array of cytokines released by
vasoactive intestinal peptide. Neuropeptides. 37,111-9.Brown, D.R., Mohn, C.M., 1999. Astrocyticglutamate uptake and prion protein expression.Glia. 25, 282-92.Choi, J.H., Kim, D.H., Yun, I.J., Chang, J.H.,Chun, B.G., Choi, S.H., 2007. Zaprinast inhibitshydrogen peroxide-induced lysosomaldestabilization and cell death in astrocytes. Eur.J. Pharmacol. 571, 106-15.Compère, V., Li, S., Leprince, J., Tonon, M.C.,Vaudry, H., Pelletier, G., 2004. In vivo action ofa new octadecaneuropeptide (ODN) antagoniston gonadotropin-releasing hormone geneexpression in the male rat brain. Neuroscience.125, 411–5.Compère, V., Li, S., Leprince, J., Tonon, M.C.,Vaudry, H., Pelletier, G., 2005. In vivo action ofa new octadecaneuropeptide antagonist onneuropeptide Y and corticotropin-releasinghormone mRNA levels in rat. Mol. Brain Res.141, 156–60.Dejda, A., Sokolowska, P., Nowak, J.Z., 2005.Neuroprotective potential of three neuropeptidesPACAP, VIP and PHI. Pharmacol Rep. 57, 307-20.Do-Rego, J.L., Mensah-Nyagan, A.G., Beaujean,D., Leprince, J., Tonon, M.C., Luu-The, V.,Pelletier, G., Vaudry, H., 2001. Theoctadecaneuropeptide ODN stimulatesneurosteroid biosynthesis through activation ofcentral-type benzodiazepine receptors. J.Neurochem. 76, 128–38.Feeney, C.J., Frantseva, M.V., Carlen, P.L.,Pennefather, P.S., Shulyakova, N., Shniffer, C.,Mills, L.R., 2008. Vulnerability of glial cells tohydrogen peroxide in cultured hippocampalslices. Brain Res. 1198, 1–15.Gandolfo, P., Patte, C., Leprince, J., Thoumas,J.L., Vaudry, H., Tonon, M.C., 1997. Thestimulatory effect of the octadecaneuropeptide(ODN) on cytosolic Ca2+ in rat astrocytes is notmediated through classical benzodiazepinereceptors. Eur. J. Pharmacol. 322, 275–81.Gandolfo, P., Patte, C., Thoumas, J.L., Leprince,J., Vaudry, H., Tonon, M.C., 1999. Theendozepine ODN stimulates [3H]thymidineincorporation in cultured rat astrocytes.Neuropharmacology. 38, 725–32.
Biologia Tunisie Juillet 2012 ; N°7 ; 14 – 19
18
Giffard, R.G., Swanson, R.A., 2005. Ischemia-induced programmed cell death in astrocytes.Glia. 50, 299–306.Grimaldi, M., Cavallaro, S., 1999. Functionaland molecular diversity of PACAP/VIPreceptors in cortical neurons and type Iastrocytes. Eur J Neurosci. 11, 2767-72.Guidotti, A., Forchetti, C.M., Corda, M.G.,Konkel, D., Bennett, C.D., Costa, E., 1983.Isolation, characterization, and purification tohomogeneity of an endogenous polypeptide withagonistic action on benzodiazepine receptors.Proc. Natl. Acad. Sci. USA. 80, 3531–5.Higgins, G.C., Beart, P.M., Nagley, P., 2009.Oxidative stress triggers neuronal caspase-independent death: endonuclease G involvementin programmed cell death-type III. Cell Mol LifeSci. 66, 2773-87.Leprince, J., Gandolfo, P., Thoumas, J.L., Patte,C., Fauchere, J.L., Vaudry, H., Tonon, M.C.,1998. Structure-activity relationships of a seriesof analogues of the octadecaneuropeptide ODNon calcium mobilization in rat astrocytes. J.Med. Chem. 41, 4433–8.Lu, L., Li, J., Zhu, Y., Mak, Y.T., Yew, D.T.,2008a. H2O2-induced changes in astrocyticcultures from control and rapidly aging strains ofmouse. Int. J. Neurosci. 118, 1239–50.Lu, M., Hu, L.F., Hu, G., Bian, J.S., 2008b.Hydrogen sulfide protects astrocytes againstH(2)O(2)-induced neural injury via enhancingglutamate uptake. Free Radic. Biol. Med. 45,1705–13.Masmoudi-Kouki, O., Gandolfo, P., Castel, H.,Leprince, J., Fournier, A., Dejda, A., Vaudry, H.,Tonon, M.C., 2007. Role of PACAP and VIP inastroglial functions. Peptides. 28, 1753–60.Masmoudi, O., Gandolfo, P., Leprince, J.,Vaudry, D., Fournier, A., Patte-Mensah, C.,Vaudry, H., Tonon, M.C., 2003. Pituitaryadenylate cyclase-activating polypeptide(PACAP) stimulates endozepine release fromcultured rat astrocytes via a PKA-dependentmechanism. Faseb J. 17, 17–27.Masmoudi, O., Gandolfo, P., Tokay, T.,Leprince, J., Ravni, A., Vaudry, H., Tonon,M.C., 2005. Somatostatin down-regulates theexpression and release of endozepines fromcultured rat astrocytes via distinct receptorsubtypes. J. Neurochem. 94, 561–71.
Miyata, A., Arimura, A., Dahl, R.R., Minamino,N., Uehara, A., Jiang, L., Culler, M.D., Coy,D.H., 1989. Isolation of a novel 38 residue-hypothalamic polypeptide which stimulatesadenylate cyclase in pituitary cells. BiochemBiophys Res Commun. 164, 567-74.Nakamachi, T., Ohtaki, H., Yofu, S., Dohi, K.,Watanabe, J., Hayashi, D., Matsuno, R., Nonaka,N., Itabashi, K., Shioda, S., 2008. Pituitaryadenylate cyclase-activating polypeptide(PACAP) type 1 receptor (PAC1R) co-localizeswith activity-dependent neuroprotective protein(ADNP) in the mouse brains. Regul Pept. 145,88-95.Ohtaki, H., Nakamachi, T., Dohi, K., Shioda, S.,2008. Role of PACAP in ischemic neural death.J Mol Neurosci. 36, 16-25.Patte, C., Gandolfo, P., Leprince, J., Thoumas,J.L., Fontaine, M., Vaudry, H., Tonon, M.C.,1999. GABA inhibits endozepine release fromcultured rat astrocytes. Glia. 25, 404-11.Shioda, S., Ohtaki, H., Suzuki, R., Nakamachi,T., Takenoya, F., Dohi, K., Nakajo, S., 2004.[Prevention of delayed neuronal cell death byPACAP and its molecular mechanism]. NipponYakurigaku Zasshi. 123, 243-52.Tatsuno, I., Gottschall, P.E., Arimura, A., 1991.Specific binding sites for pituitary adenylatecyclase activating polypeptide (PACAP) in ratcultured astrocytes: molecular identification andinteraction with vasoactive intestinal peptide(VIP). Peptides. 12, 617-21.Tokay, T., Masmoudi, O., Gandolfo, P.,Leprince, J., Pelletier, G., Vaudry, H., Tonon,M.C., 2005. Beta-amyloid peptides stimulateendozepine biosynthesis in cultured ratastrocytes. J. Neurochem. 94, 607–16.Tokay, T., Hachem, R., Masmoudi-Kouki, O.,Gandolfo, P., Desrues, L., Leprince, J., Castel,H., Diallo, M., Amri, M., Vaudry, H., Tonon,M.C., 2008. Beta-amyloid peptide stimulatesendozepine release in cultured rat astrocytesthrough activation of N-formyl peptidereceptors. Glia. 56, 1380–9.Tonon, M.C., Leprince, J., Gandolfo, P.,Compère, V., Pelletier, G., Malagon, M.M.,Vaudry, H., 2006. EndozepinesIn Kastin AJ, editor. Handbook of BiologicallyActive Peptides New York: Elsevier813–819.
Biologia Tunisie Juillet 2012 ; N°7 ; 14 – 19
19
Vaudry, D., Gonzalez, B.J., Basille, M., Yon, L.,Fournier, A., Vaudry, H., 2000. Pituitaryadenylate cyclase-activating polypeptide and itsreceptors: from structure to functions. PharmacolRev. 52, 269-324.Vaudry, D., Rousselle, C., Basille, M., Falluel-Morel, A., Pamantung, T.F., Fontaine, M.,Fournier, A., Vaudry, H., Gonzalez, B.J., 2002.Pituitary adenylate cyclase-activatingpolypeptide protects rat cerebellar granuleneurons against ethanol-induced apoptotic celldeath. Proc. Natl. Acad. Sci. USA. 99, 6398–403.Vaudry, D., Falluel-Morel, A., Basille, M.,Pamantung, T.F., Fontaine, M., Fournier, A.,Vaudry, H., Gonzalez, B.J., 2003. Pituitaryadenylate cyclase-activating polypeptideprevents C2-ceramide-induced apoptosis ofcerebellar granule cells. J. Neurosci. Res. 72,303 - 316
Biologia Tunisie Juillet 2012; N°7 ; 20 – 25
20
BIOLOGIA TUNISIE
OCTADECANEUROPEPTIDE ODN PROTECTS CULTURED ASTROCYTEAGAINST HYDROGEN PEROXIDE-INDUCED CELL DEATH
Hamdi Yosraa, Kaddour Hadhemia, Jenhani Faouzib, Leprince Jérôme b,c,d, Tonon Marie-Christine b,c,d, Amri Mohamed*a and Masmoudi-Kouki OLFAa.
aLaboratory of Functional Neurophysiology and Pathology, Research Unit 00/UR/08-01, Department of Biological Sciences, Faculty of Science of
Tunis, University Tunis El Manar, 2092 Tunis, Tunisia
bLaboratory of Cellular Immunology and Cytometry, National Centre of Blood Transfusion, El Manar II 2092, Tunis, Tunisia
bInserm U982, Laboratory of Neuronal and Neuroendocrine Communication and Differentiation, Mont-Saint-Aignan, University of Rouen, 76128
Mont-Saint-Aignan, France
cInternational Associated Laboratory Samuel de Champlain dEuropean Institute for Peptide Research (IFRMP 23), Regional Platform for Cell Imaging
(PRIMACEN), Rouen, France
Keywords: Astroglial cells, Cell death, Octadecaneuropeptide, Hydrogene peroxide.
ABSRACTOxidative stress, resulting from accumulation ofreactive oxygen species, plays a critical role onastroglial cell death associated withneurodegenerative diseases and stroke.Astroglial cells synthesize and releaseendozepines, a family of regulatory peptidesincluding the octadecaneuropeptide ODN. It hasbeen reported that endozepines are implicated incellular proliferation and/or protection. Thus, thepurpose of the present study was to investigatethe potential protective effect of one ODN onH2O2-induced cell death in rat astrocytes.Incubation of cultured astrocytes with H2O2(300 µM) for 1 h provoked a significantreduction of the number of living cells asevaluated by FDA and lactate dehydrogenaseassay. Pretreatment of astrocytes with very lowconcentration of ODN (0.1 nM), prevents celldeath induced by H2O2. Taken together, thesedata demonstrate that the endozepine for the firsttime that the endozepine ODN is a potentprotective agent that prevents oxidative stress-induced apoptotic death.INTRODUCTIONOxidative stress in living cells results fromaccumulation of reactive oxygen species (ROS)and free radicals such as hydrogen peroxide(H2O2) and hydroxyl radicals is implicated in
several pathological processes including cerebralischemia and neurodegenrative diseases(Halliwell, 1992; Hald and Lotharius, 2005).Studies conducted in various cell lines haveshown that ROS can cause cell death by multiplemechanisms including damage of mitochondrialeading to a decrease of ATP production,activation of caspases and DNA fragmentation(Vaudry et al., 2002; Chen et al., 2008). It is wellknown that astrocytes contain high levels ofROS scavengers molecules and antioxidantenzymes, which are not only involved in theprotection of astroglial cells against thedeleterious effects of ROS (Sokolova et al.,2001; Olesen et al., 2008), but may be alsocritical for neuron survival (Takuma et al., 2004;Watts et al., 2005). Although astrocytes aregenerally less susceptible to oxidative injurythan neurons, there is strong evidence thatoxidative stress also alters astrocyte functions(Feeney et al., 2008). Therefore, protection ofastrocytes from oxidative assault appearsessential to prevents neuronal damages invarious pathological conditions involvingoxidative neurodegeneration.The octadecaneuropeptide (ODN) has beenoriginally isolated from the rat brain andcharacterized as a endogenous ligand ofbenzodiazepine receptors (Ferrero et al., 1986).
Biologia Tunisie Juillet 2010; N°7 ; 20 – 25
21
ODN is generated by proteolytic cleavage of an86-amino acid precursor called diazepam-binding inhibitor (DBI) (Guidotti et al., 1983)whose gene is mainly expressed in astroglialcells in the central nervous system (CNS) ofvertebrates (Alho et al., 1995; Burgi et al.,1999). DBI and its processing products arecollectively designated by the term endozepines(Tonon et al., 2006). The primary structure ofODN has been remarkably conserved duringevolution (Tonon et al., 2006), suggesting thatthis peptide plays important biological functions.It has been reported that, ODN increase[3H]thymidine incorporation in cultured ratastrocytes (Gandolfo et al., 1999a). Morerecently we have shown that, exposure ofcultured astrocytes to beta-amyloid peptide, themain constituent of senile plaques in AlzheimerDiseased (AD) brain, stimulates the biosynthesisand release of ODN-like peptide, suggesting thatover production of ODN may contribute toastrocyte proliferation associated with AD(Tokay et al., 2005a; Tokay et al., 2008a).Altogether, these data suggest that endozepinesmay act as neurotrophic factors regulatingproliferation and/or survival of astroglial cellsunder injury conditions. These observationsprompted us to investigate the ability of ODN tocounteract the neurotoxic effects of H2O2 oncultured astroglial cells.
MATERIAL AND METHODSCell CultureSecondary cultures of rat cortical astrocytes wereprepared as previously described (Brown andMohn, 1999) with minor modifications. Briefly,cerebral hemispheres from newborn Wistar ratswere collected in DMEM/F12 (2:1; v/v) culturemedium supplemented with 2 mM glutamine,1% insulin, 5 mM HEPES, 0.4% glucose and 1%of the antibiotic-antimycotic solution.Dissociated cells were resuspended in culturemedium supplemented with 10% FBS, plated in175-cm2 flask (Greiner Bio-one GmbH,Frickenhausen, Germany) and incubated at 37°Cin a 5% CO2 / 95% O2 atmosphere. Whencultures were confluent, astrocytes were isolatedby shaking overnight the flasks with an orbitaland plated on 35-mm Petri dishes at a density of0.3 X 106 cells/ml. The cells were incubated at37°C in a humid atmosphere (5% CO2). All
experiments were performed on 5- to 7-day-oldsecondary cultures.
Measurement of cell cytotoxicityAstrocyte cells were incubated at 37°C withfresh serum-free medium in the absence orpresence of test substances. At the end of theincubation, the cytotoxicity of H2O2 onastrocytes was determined by measurement ofLDH activity in culture medium. The amount ofLDH released into medium was measured byLDH assay kit (Bio-Maghreb) according to themanufacturer’s instructions. The results wereexpressed as percentage of total LDH releaseafter cell lysis with 1% Triton X-100 in PBS.
Measurement of cell survivalCultured cells were incubated at 37°C for 1 hwith fresh serum-free culture medium in theabsence or presence of H2O2 and/or ODN.FDA-AM (15 µg/ml) was added to the medium,and the cells were maintained at 37°C in the darkfor 8 min. After washing twice with phosphate-buffered saline (PBS) cells were lysed with aTris/HCl solution containing 1% SDS.Fluorescence was measured with excitation at485 nm and emission at 538 nm, using amicroplate reader (Bio-Tek FLx 800).
Statistical analysisData are presented as the mean SEM fromthree independent experiments performed inquadruplicate or quintuplicate. Statisticalanalysis of the data was performed by usingStudent’s t test and ANOVA, followed byBonferroni’s test.
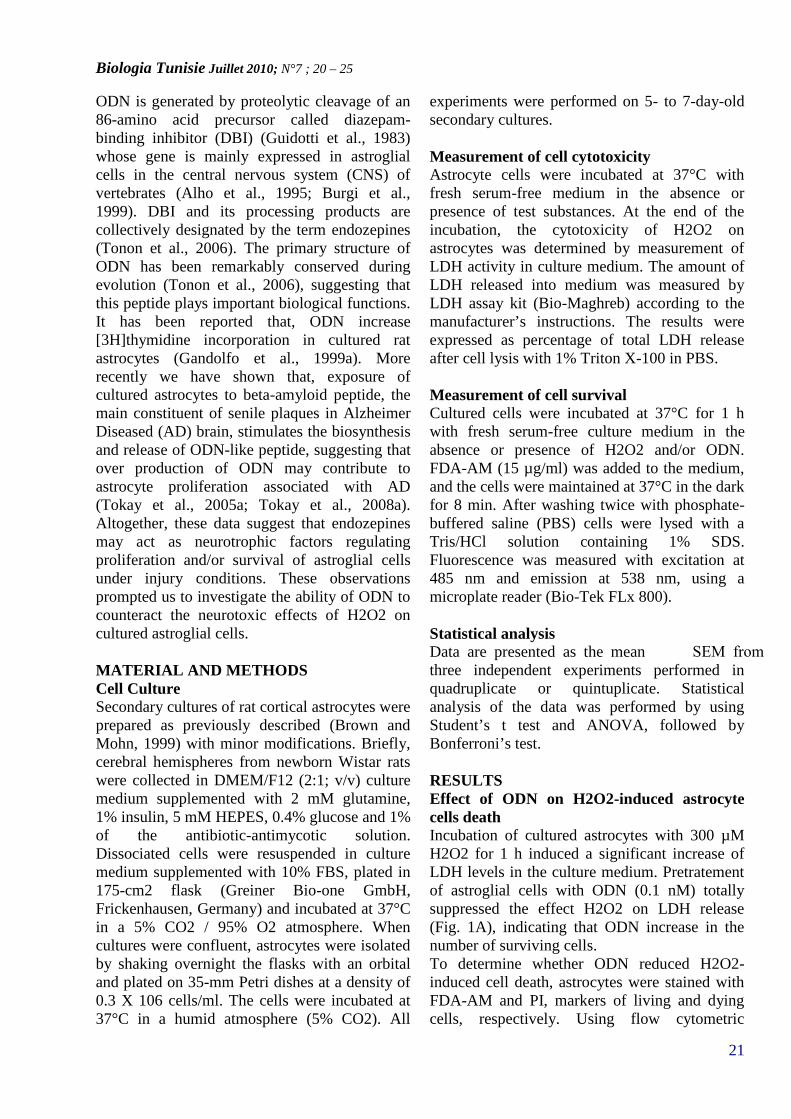
RESULTSEffect of ODN on H2O2-induced astrocytecells deathIncubation of cultured astrocytes with 300 µMH2O2 for 1 h induced a significant increase ofLDH levels in the culture medium. Pretratementof astroglial cells with ODN (0.1 nM) totallysuppressed the effect H2O2 on LDH release(Fig. 1A), indicating that ODN increase in thenumber of surviving cells.To determine whether ODN reduced H2O2-induced cell death, astrocytes were stained withFDA-AM and PI, markers of living and dyingcells, respectively. Using flow cytometric
Biologia Tunisie Juillet 2010; N°7 ; 20 – 25
22
analysis, we observed very few cells labeledwith PI in control (Fig. 2B), while incubation ofastrocytes with 300 µM H2O2 induced asignificant increase of PI fluorescence associatedwith a reduction of FDA fluorescence (Fig. 2C).Pretreatment of cells with 0.1 nM ODN for 10min significantly reduced H2O2-induced celldeath (Fig. 2D)
Fig 1: Effect of ODN on H2O2-induced cell death incultured rat astrocytes. A. Cells were preincubated
for 10 min in the absence or presence of 0.1 nMODN and then incubated for 1 h with medium aloneor H2O2 (300 µM) in the absence or presence ofODN. Each value is the mean (± SEM) calculatedfrom at least 10 different wells from 3 independentcultures. ANOVA followed by the Bonferroni’s test:***P < 0.001; NS, not statistically different fromcontrol. B. Cells seeded into Petri dishes weresubjected to various treatments. At the end of theincubation, cells where loaded with FDA-AM and PI,and the fluorescence intensity was analyzed by flowcytometry.
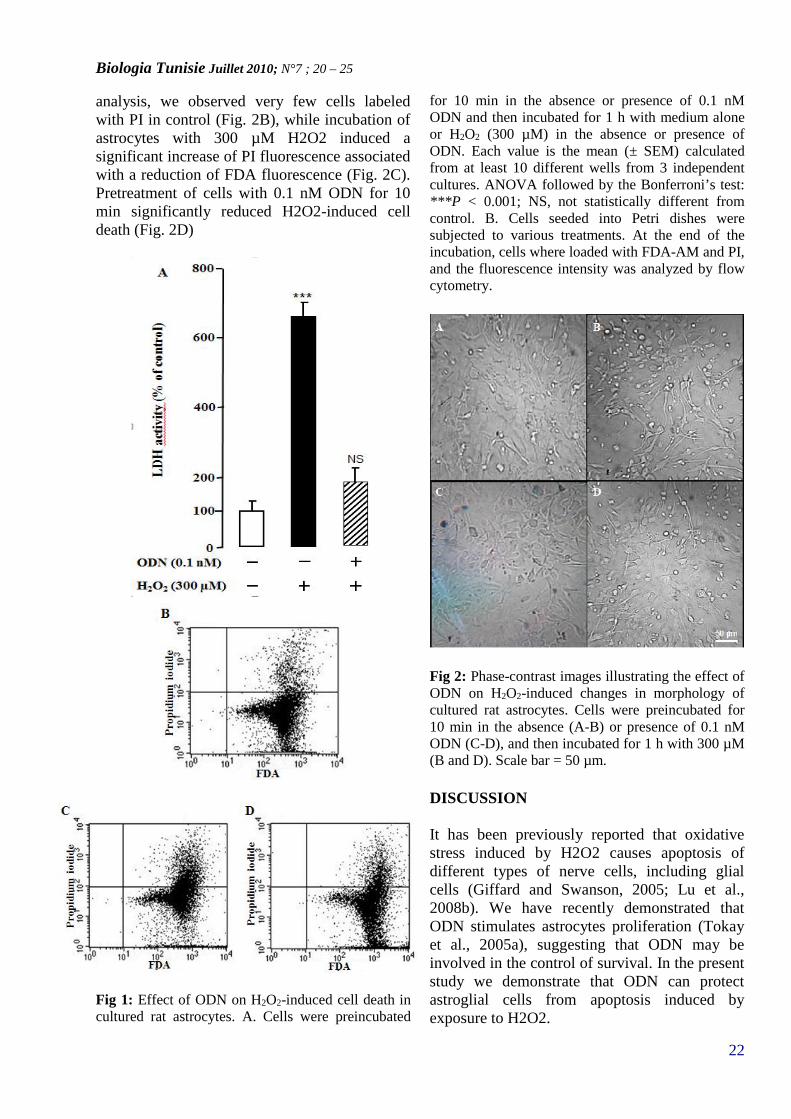
Fig 2: Phase-contrast images illustrating the effect ofODN on H2O2-induced changes in morphology ofcultured rat astrocytes. Cells were preincubated for10 min in the absence (A-B) or presence of 0.1 nMODN (C-D), and then incubated for 1 h with 300 µM(B and D). Scale bar = 50 µm.
DISCUSSION
It has been previously reported that oxidativestress induced by H2O2 causes apoptosis ofdifferent types of nerve cells, including glialcells (Giffard and Swanson, 2005; Lu et al.,2008b). We have recently demonstrated thatODN stimulates astrocytes proliferation (Tokayet al., 2005a), suggesting that ODN may beinvolved in the control of survival. In the presentstudy we demonstrate that ODN can protectastroglial cells from apoptosis induced byexposure to H2O2.
Biologia Tunisie Juillet 2010; N°7 ; 20 – 25
23
In agreement with previous reports (Feeney etal., 2008; Lu et al., 2008a; Lu et al., 2008b), weobserved that exposure of cultured astrocytes toa high concentration of H2O2 (300 µM) caused amassive cell death of astroglial cells. Thesensitivity of astrocytes in this range ofconcentrations may be ascribed to theirincapacity to clearing 300 µM H2O2 by catalaseand/or peroxides activities. In accord withhypothesis, studies conducted on culturedastrocytes have shown that the rate of H2O2clearance was strongly reduced in the presenceof inhibitors of catalase and glutathioneperoxidase activities (Dringen and Hamprecht,1997b). Pretreatment of cultured astrocytes cellswith the gliopeptide ODN totally suppressedH2O2-provoked LDH release. Visualization ofliving/dying cells by FDA-AM/PI staining byflow cytometry showed that subnanomolarconcentrations of ODN significantly increase thenumber of surviving cells, indicating that thegliopeptide ODN can protect astrocytes againstthe deleterious effects of H2O2. Since Astroglialcells also possess an array of cellular defensesystems, including glutathione peroxidase andcatalase, to prevent damage caused by ROS, theprotective effect of ODN against H2O2-inducedcell death could be mediated through activationof the antioxidant enzyme system.Examination of cultures by phase-contrastmicroscopy revealed that the cells death inducedby H2O2 exhibited the characteristic features ofapoptosis including cell shrinkage and DNAfragmentation (Joza et al., 2001). Pretreatment ofcells with ODN (0.1 nM) restored the typicalshape of differentiated astrocytes with flatpolygonal cell bodies similar to that ofuntreated-astrocytes.
CONCLUSIONIn conclusion, the present study hasdemonstrated that ODN exerts a potentglioprotective effect against oxidative stress andmight delay neuronal damages in variouspathological conditions involving oxidativeneurodegeneration.
AKNOWLEGMENTS
Y.H., H.K. and R.H. were recipients offellowships from the University of Tunis El
Manar and a France-Tunisia exchange programCMCU-Utique. This study was supported by theResearch Unit 00-UR-08-01 and the CMCU-Utique program (to MA and MCT).REFERENCES
Alho, H., Kolmer, M., Harjuntausta, T., Helen,P., 1995. Increased expression of diazepambinding inhibitor in human brain tumors. CellGrowth Differ. 6, 309–14.
Brown, D.R., Mohn, C.M., 1999. Astrocyticglutamate uptake and prion protein expression.Glia. 25, 282-92.
Burgi, B., Lichtensteiger, W., Lauber, M.E.,Schlumpf, M., 1999. Ontogeny of diazepambinding inhibitor/acyl-CoA binding proteinmRNA and peripheral benzodiazepine receptormRNA expression in the rat. J. Neuroendocrinol.11, 85–100.
Chen, S.H., Lin, J.K., Liu, S.H., Liang, Y.C.,Lin-Shiau, S.Y., 2008. Apoptosis of culturedastrocytes induced by the copper andneocuproine complex through oxidative stressand JNK activation. Toxicol. Sci. 102, 138–49.
Choi, J.H., Kim, D.H., Yun, I.J., Chang, J.H.,Chun, B.G., Choi, S.H., 2007. Zaprinast inhibitshydrogen peroxide-induced lysosomaldestabilization and cell death in astrocytes. Eur JPharmacol. 571, 106-15.
Dringen, R., Hamprecht, B., 1997a. Involvementof glutathione peroxidase and catalase in thedisposal of exogenous hydrogen peroxide bycultured astroglial cells. Brain Res. 759, 67-75.
Dringen, R., Hamprecht, B., 1997b. Involvementof glutathione peroxidase and catalase in thedisposal of exogenous hydrogen peroxide bycultured astroglial cells. Brain Res. 759, 67–75.
Dringen, R., Pfeiffer, B., Hamprecht, B., 1999.Synthesis of the antioxidant glutathione inneurons: supply by astrocytes of CysGly asprecursor for neuronal glutathione. J Neurosci.19, 562-9.
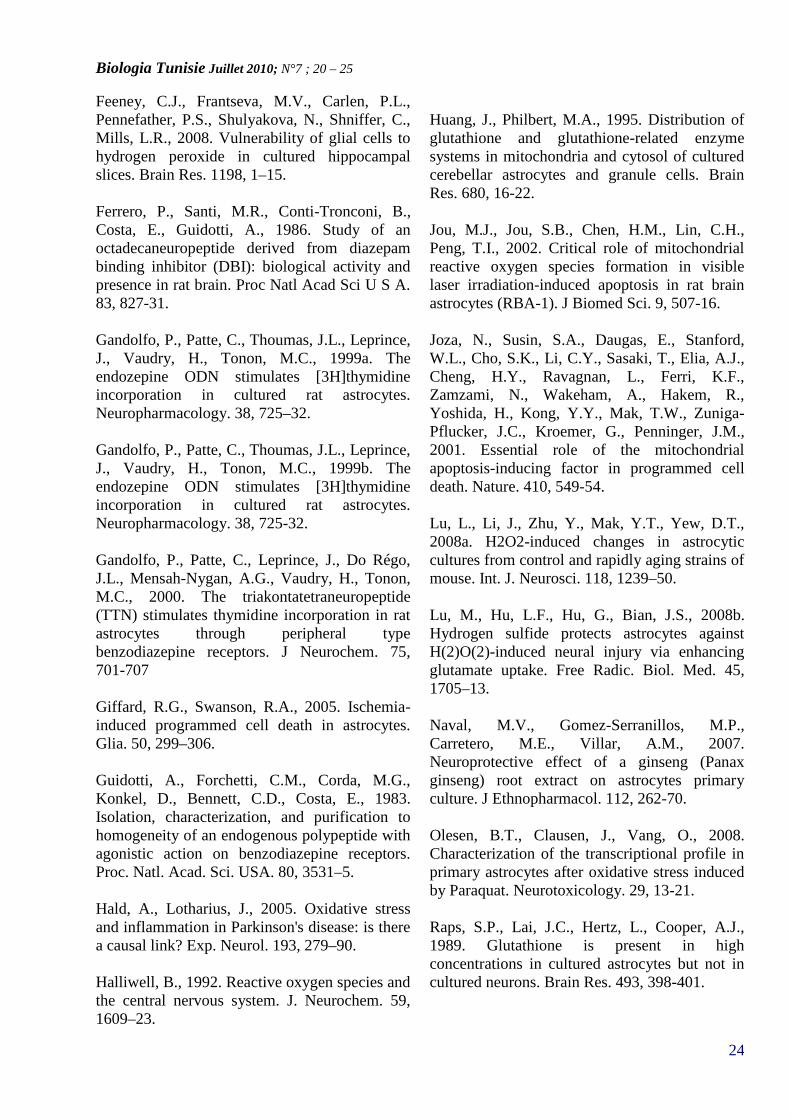
Biologia Tunisie Juillet 2010; N°7 ; 20 – 25
24
Feeney, C.J., Frantseva, M.V., Carlen, P.L.,Pennefather, P.S., Shulyakova, N., Shniffer, C.,Mills, L.R., 2008. Vulnerability of glial cells tohydrogen peroxide in cultured hippocampalslices. Brain Res. 1198, 1–15.
Ferrero, P., Santi, M.R., Conti-Tronconi, B.,Costa, E., Guidotti, A., 1986. Study of anoctadecaneuropeptide derived from diazepambinding inhibitor (DBI): biological activity andpresence in rat brain. Proc Natl Acad Sci U S A.83, 827-31.
Gandolfo, P., Patte, C., Thoumas, J.L., Leprince,J., Vaudry, H., Tonon, M.C., 1999a. Theendozepine ODN stimulates [3H]thymidineincorporation in cultured rat astrocytes.Neuropharmacology. 38, 725–32.
Gandolfo, P., Patte, C., Thoumas, J.L., Leprince,J., Vaudry, H., Tonon, M.C., 1999b. Theendozepine ODN stimulates [3H]thymidineincorporation in cultured rat astrocytes.Neuropharmacology. 38, 725-32.
Gandolfo, P., Patte, C., Leprince, J., Do Régo,J.L., Mensah-Nygan, A.G., Vaudry, H., Tonon,M.C., 2000. The triakontatetraneuropeptide(TTN) stimulates thymidine incorporation in ratastrocytes through peripheral typebenzodiazepine receptors. J Neurochem. 75,701-707
Giffard, R.G., Swanson, R.A., 2005. Ischemia-induced programmed cell death in astrocytes.Glia. 50, 299–306.
Guidotti, A., Forchetti, C.M., Corda, M.G.,Konkel, D., Bennett, C.D., Costa, E., 1983.Isolation, characterization, and purification tohomogeneity of an endogenous polypeptide withagonistic action on benzodiazepine receptors.Proc. Natl. Acad. Sci. USA. 80, 3531–5.
Hald, A., Lotharius, J., 2005. Oxidative stressand inflammation in Parkinson's disease: is therea causal link? Exp. Neurol. 193, 279–90.
Halliwell, B., 1992. Reactive oxygen species andthe central nervous system. J. Neurochem. 59,1609–23.
Huang, J., Philbert, M.A., 1995. Distribution ofglutathione and glutathione-related enzymesystems in mitochondria and cytosol of culturedcerebellar astrocytes and granule cells. BrainRes. 680, 16-22.
Jou, M.J., Jou, S.B., Chen, H.M., Lin, C.H.,Peng, T.I., 2002. Critical role of mitochondrialreactive oxygen species formation in visiblelaser irradiation-induced apoptosis in rat brainastrocytes (RBA-1). J Biomed Sci. 9, 507-16.
Joza, N., Susin, S.A., Daugas, E., Stanford,W.L., Cho, S.K., Li, C.Y., Sasaki, T., Elia, A.J.,Cheng, H.Y., Ravagnan, L., Ferri, K.F.,Zamzami, N., Wakeham, A., Hakem, R.,Yoshida, H., Kong, Y.Y., Mak, T.W., Zuniga-Pflucker, J.C., Kroemer, G., Penninger, J.M.,2001. Essential role of the mitochondrialapoptosis-inducing factor in programmed celldeath. Nature. 410, 549-54.
Lu, L., Li, J., Zhu, Y., Mak, Y.T., Yew, D.T.,2008a. H2O2-induced changes in astrocyticcultures from control and rapidly aging strains ofmouse. Int. J. Neurosci. 118, 1239–50.
Lu, M., Hu, L.F., Hu, G., Bian, J.S., 2008b.Hydrogen sulfide protects astrocytes againstH(2)O(2)-induced neural injury via enhancingglutamate uptake. Free Radic. Biol. Med. 45,1705–13.
Naval, M.V., Gomez-Serranillos, M.P.,Carretero, M.E., Villar, A.M., 2007.Neuroprotective effect of a ginseng (Panaxginseng) root extract on astrocytes primaryculture. J Ethnopharmacol. 112, 262-70.
Olesen, B.T., Clausen, J., Vang, O., 2008.Characterization of the transcriptional profile inprimary astrocytes after oxidative stress inducedby Paraquat. Neurotoxicology. 29, 13-21.
Raps, S.P., Lai, J.C., Hertz, L., Cooper, A.J.,1989. Glutathione is present in highconcentrations in cultured astrocytes but not incultured neurons. Brain Res. 493, 398-401.
Biologia Tunisie Juillet 2010; N°7 ; 20 – 25
25
Sokolova, T., Gutterer, J.M., Hirrlinger, J.,Hamprecht, B., Dringen, R., 2001. Catalase inastroglia-rich primary cultures from rat brain:immunocytochemical localization andinactivation during the disposal of hydrogenperoxide. Neurosci. Lett. 297, 129–32.
Takuma, K., Baba, A., Matsuda, T., 2004.Astrocyte apoptosis: implications forneuroprotection. Prog. Neurobiol. 72, 111–27.
Tokay, T., Masmoudi, O., Gandolfo, P.,Leprince, J., Pelletier, G., Vaudry, H., Tonon,M.C., 2005a. Beta-amyloid peptides stimulateendozepine biosynthesis in cultured ratastrocytes. J. Neurochem. 94, 607–16.
Tokay, T., Masmoudi, O., Gandolfo, P.,Leprince, J., Pelletier, G., Vaudry, H., Tonon,M.C., 2005b. Beta-amyloid peptides stimulateendozepine biosynthesis in cultured ratastrocytes. J Neurochem. 94, 607-16.
Tokay, T., Hachem, R., Masmoudi-Kouki, O.,Gandolfo, P., Desrues, L., Leprince, J., Castel,H., Diallo, M., Amri, M., Vaudry, H., Tonon,M.C., 2008a. Beta-amyloid peptide stimulatesendozepine release in cultured rat astrocytesthrough activation of N-formyl peptidereceptors. Glia. 56, 1380–9.
Tokay, T., Hachem, R., Masmoudi-Kouki, O.,Gandolfo, P., Desrues, L., Leprince, J., Castel,H., Diallo, M., Amri, M., Vaudry, H., Tonon,M.C., 2008b. Beta-amyloid peptide stimulatesendozepine release in cultured rat astrocytesthrough activation of N-formyl peptidereceptors. Glia.
Tonon, M.C., Leprince, J., Gandolfo, P.,Compère, V., Pelletier, G., Malagon, M.M.,Vaudry, H., 2006. Endozepines
In Kastin AJ, editor. Handbook of BiologicallyActive Peptides New York: Elsevier813–819.
Vaudry, D., Pamantung, T.F., Basille, M.,Rousselle, C., Fournier, A., Vaudry, H.,Beauvillain, J.C., Gonzalez, B.J., 2002. PACAPprotects cerebellar granule neurons againstoxidative stress-induced apoptosis. Eur. J.Neurosci. 15, 1451–60.
Wang, X.F., Cynader, M.S., 2000. Astrocytesprovide cysteine to neurons by releasingglutathione. J Neurochem. 74, 1434-42.
Watts, L.T., Rathinam, M.L., Schenker, S.,Henderson, G.I., 2005. Astrocytes protectneurons from ethanol-induced oxidative stressand apoptotic death. J. Neurosci. Res. 80, 65–66.
Biologia Tunisie Juillet 2012; N°7 ; 26 – 29
26
BIOLOGIA TUNISIE
ANTIOXIDANT ACTIVITY AND PHENOLIC EXTRACTS OF BLACK(MORUS NIGRA L.) AND WHITE (MORUS ALBA L.) MULBERRY FRUITS
Rebai Olfaa,b*, Belkhir Manela,b, Amri Mohameda and Fattouch Samib
aLaboratory of Functional Neurophysiology and Pathology, 00/UR/08-01, Faculty of Science ofTunis, Tunisia.bNational Institute of Applied Sciences and Technology,Tunis, Tunisia. E-mail:[email protected]
Keywords: Antioxidant; Flavonoïds; HPLC-DAD; Polyphenols; Mulberry.
ABSTRACTPolyphenolic content (total phenolics, TP, andtotal flavonoids, TF) and antioxidant properties(TEAC) of black (Morus nigra L.) and white(Morus alba L.) mulberry fruits harvested fromTunisia were investigated. Black mulberryexhibited higher TP and TF content whencompared to white mulberry. The TP contentsof M. nigra and M. alba were 247 and 43 mggallic acid equivalent in 100 g fresh weight (fw)basis, respectively. M. nigra had the richestamount of flavonoïds with 165.5 mg catecholequivalent/100g fw. Overall, both white andblack mulberry aqueous-acetonic extracts hadDPPH free radical scavenging effect with 44and 36 mmol Trolox equivalent/100g fw,respectively. TEAC and TP were foundsignificantly correlated (r = 0, 97). The RP-HPLC-DAD technique allowed theidentification of the phenolic compounds andrevealed that catechin and chlorogenic acidwere the major molecules.
INTRODUCTION
Epidemiological studies have shown that diet rich invegetables and fruits significantly reduce theincidence of chronic diseases such as cancer andcardiovascular disease (Riboli and Norat, 2003; Liu,2003). The protective may be contributed by theirantioxidant content (Lako et al., 2007). Throughadditive and synergistic effects, the complex mixtureof phytochemicals in vegetables and fruit mayprovide better protection than a singlephytochemical (Liu, 2003; Heber, 2001). These
highlight the importance of comprehensiveantioxidants measurement in these foods.Mulberry (Morus sp.) has been domesticated overthousands of years and has been adapted toworldwide areas of tropical, subtropical, andtemperate zones. The most important grownpolyphenols-rich mulberry species are Morus alba,and Morus nigra. Their fruits, roots and bark havebeen used in folk medicine (especially in Chinesemedicine) to treat diabetes, hypertension, andanemia as well as arthritis. In Turkey, blackmulberry fruits are used for treating mouth lesions.Recently, white and black mulberries have gained animportant position in the food industry due to theiranthocyanins content (Ozgen et al., 2007; Celik etal., 2008; Zafra-Stone et al., 2007). However,scientific studies on mulberry phytochemicalproperties are very limited and their biological andpharmacological effects remain poorly defined. Inthis study, white and black mulberry fruits harvestedfrom Tunisia were investigated in a comparativemanner.
MATERIALS AND METHODS
Plant materialMulberry fruits of M. nigra and M. alba weresampled from across Tunisia. Fully mature fruitswere harvested and transferred to the laboratory tostore at -20C°.
Extraction of total polyhenolsThe modified method reported previously byFattouch et al. (2007) was used. Briefly, sample wasextracted with 4 volumes (w/v) of coldacetone/water (3:1). After centrifugation at 10000xgfor 15 min at room temperature, the pooled collected
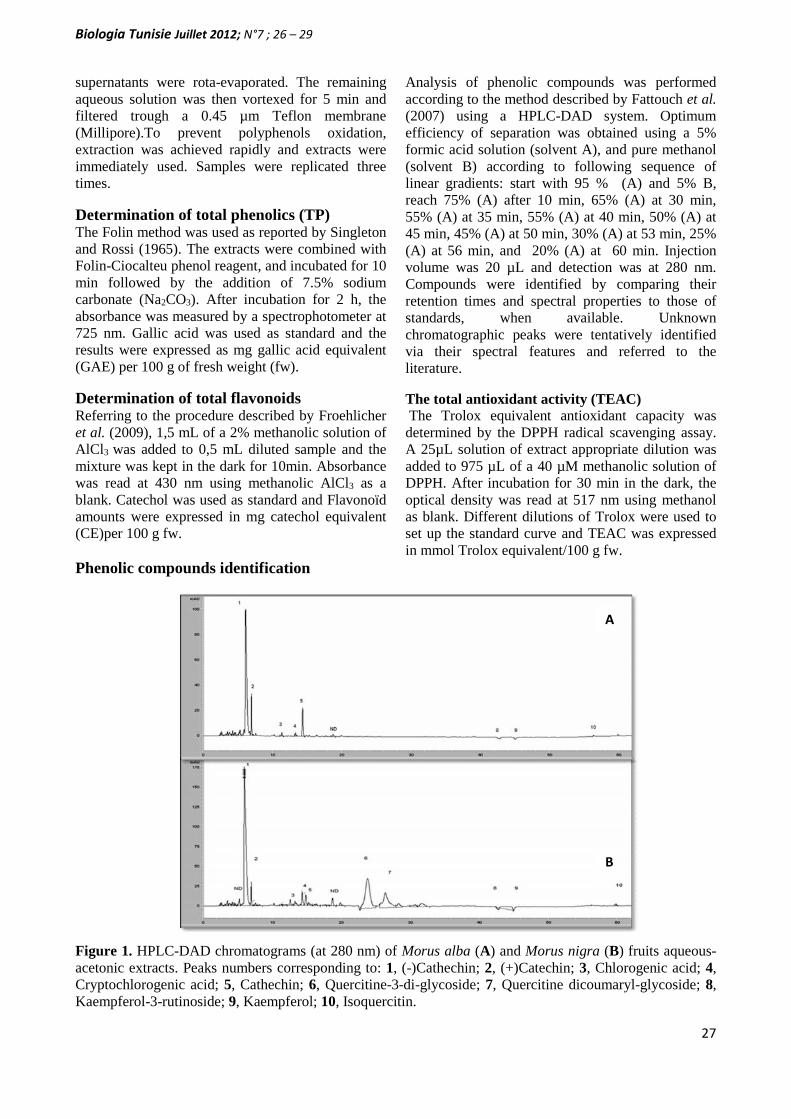
Biologia Tunisie Juillet 2012; N°7 ; 26 – 29
27
supernatants were rota-evaporated. The remainingaqueous solution was then vortexed for 5 min andfiltered trough a 0.45 µm Teflon membrane(Millipore).To prevent polyphenols oxidation,extraction was achieved rapidly and extracts wereimmediately used. Samples were replicated threetimes.
Determination of total phenolics (TP)The Folin method was used as reported by Singletonand Rossi (1965). The extracts were combined withFolin-Ciocalteu phenol reagent, and incubated for 10min followed by the addition of 7.5% sodiumcarbonate (Na2CO3). After incubation for 2 h, theabsorbance was measured by a spectrophotometer at725 nm. Gallic acid was used as standard and theresults were expressed as mg gallic acid equivalent(GAE) per 100 g of fresh weight (fw).
Determination of total flavonoidsReferring to the procedure described by Froehlicheret al. (2009), 1,5 mL of a 2% methanolic solution ofAlCl3 was added to 0,5 mL diluted sample and themixture was kept in the dark for 10min. Absorbancewas read at 430 nm using methanolic AlCl3 as ablank. Catechol was used as standard and Flavonoïdamounts were expressed in mg catechol equivalent(CE)per 100 g fw.
Phenolic compounds identification
Analysis of phenolic compounds was performedaccording to the method described by Fattouch et al.(2007) using a HPLC-DAD system. Optimumefficiency of separation was obtained using a 5%formic acid solution (solvent A), and pure methanol(solvent B) according to following sequence oflinear gradients: start with 95 % (A) and 5% B,reach 75% (A) after 10 min, 65% (A) at 30 min,55% (A) at 35 min, 55% (A) at 40 min, 50% (A) at45 min, 45% (A) at 50 min, 30% (A) at 53 min, 25%(A) at 56 min, and 20% (A) at 60 min. Injectionvolume was 20 µL and detection was at 280 nm.Compounds were identified by comparing theirretention times and spectral properties to those ofstandards, when available. Unknownchromatographic peaks were tentatively identifiedvia their spectral features and referred to theliterature.
The total antioxidant activity (TEAC)The Trolox equivalent antioxidant capacity wasdetermined by the DPPH radical scavenging assay.A 25µL solution of extract appropriate dilution wasadded to 975 µL of a 40 µM methanolic solution ofDPPH. After incubation for 30 min in the dark, theoptical density was read at 517 nm using methanolas blank. Different dilutions of Trolox were used toset up the standard curve and TEAC was expressedin mmol Trolox equivalent/100 g fw.
Figure 1. HPLC-DAD chromatograms (at 280 nm) of Morus alba (A) and Morus nigra (B) fruits aqueous-acetonic extracts. Peaks numbers corresponding to: 1, (-)Cathechin; 2, (+)Catechin; 3, Chlorogenic acid; 4,Cryptochlorogenic acid; 5, Cathechin; 6, Quercitine-3-di-glycoside; 7, Quercitine dicoumaryl-glycoside; 8,Kaempferol-3-rutinoside; 9, Kaempferol; 10, Isoquercitin.
A
B
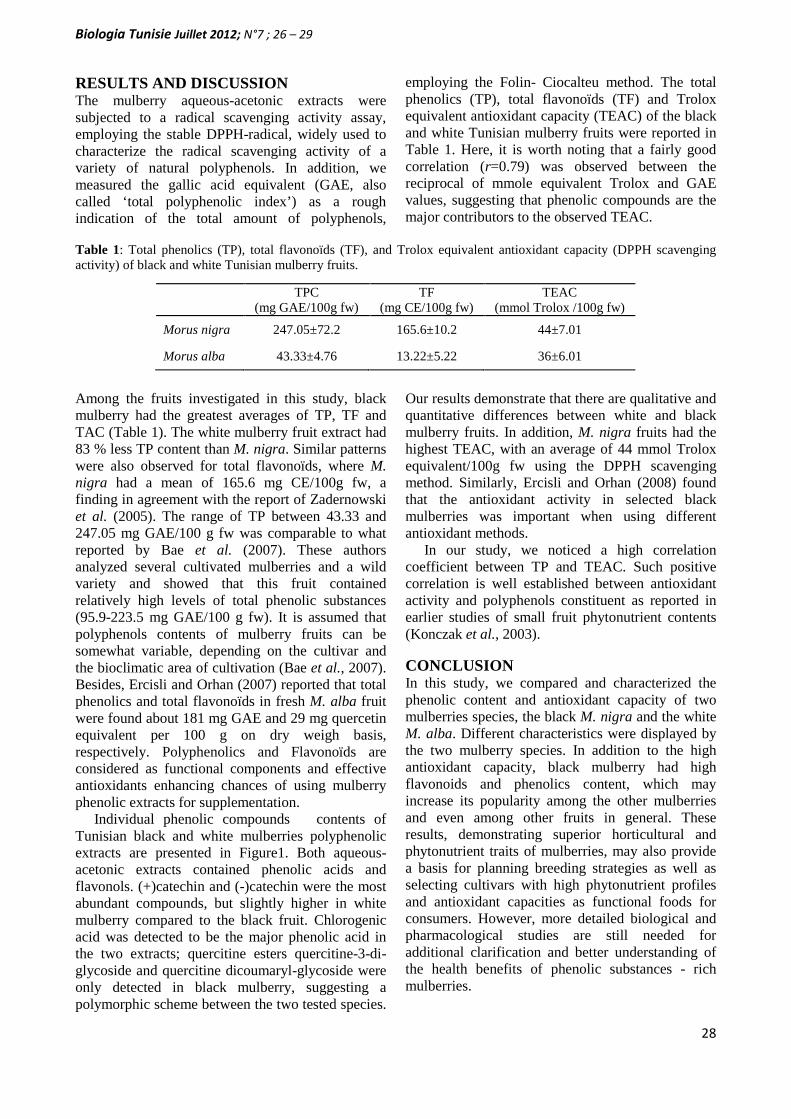
Biologia Tunisie Juillet 2012; N°7 ; 26 – 29
28
RESULTS AND DISCUSSIONThe mulberry aqueous-acetonic extracts weresubjected to a radical scavenging activity assay,employing the stable DPPH-radical, widely used tocharacterize the radical scavenging activity of avariety of natural polyphenols. In addition, wemeasured the gallic acid equivalent (GAE, alsocalled ‘total polyphenolic index’) as a roughindication of the total amount of polyphenols,
employing the Folin- Ciocalteu method. The totalphenolics (TP), total flavonoïds (TF) and Troloxequivalent antioxidant capacity (TEAC) of the blackand white Tunisian mulberry fruits were reported inTable 1. Here, it is worth noting that a fairly goodcorrelation (r=0.79) was observed between thereciprocal of mmole equivalent Trolox and GAEvalues, suggesting that phenolic compounds are themajor contributors to the observed TEAC.
Table 1: Total phenolics (TP), total flavonoïds (TF), and Trolox equivalent antioxidant capacity (DPPH scavengingactivity) of black and white Tunisian mulberry fruits.
TPC(mg GAE/100g fw)
TF(mg CE/100g fw)
TEAC(mmol Trolox /100g fw)
Morus nigra 247.05±72.2 165.6±10.2 44±7.01
Morus alba 43.33±4.76 13.22±5.22 36±6.01
Among the fruits investigated in this study, blackmulberry had the greatest averages of TP, TF andTAC (Table 1). The white mulberry fruit extract had83 % less TP content than M. nigra. Similar patternswere also observed for total flavonoïds, where M.nigra had a mean of 165.6 mg CE/100g fw, afinding in agreement with the report of Zadernowskiet al. (2005). The range of TP between 43.33 and247.05 mg GAE/100 g fw was comparable to whatreported by Bae et al. (2007). These authorsanalyzed several cultivated mulberries and a wildvariety and showed that this fruit containedrelatively high levels of total phenolic substances(95.9-223.5 mg GAE/100 g fw). It is assumed thatpolyphenols contents of mulberry fruits can besomewhat variable, depending on the cultivar andthe bioclimatic area of cultivation (Bae et al., 2007).Besides, Ercisli and Orhan (2007) reported that totalphenolics and total flavonoïds in fresh M. alba fruitwere found about 181 mg GAE and 29 mg quercetinequivalent per 100 g on dry weigh basis,respectively. Polyphenolics and Flavonoïds areconsidered as functional components and effectiveantioxidants enhancing chances of using mulberryphenolic extracts for supplementation.
Individual phenolic compounds contents ofTunisian black and white mulberries polyphenolicextracts are presented in Figure1. Both aqueous-acetonic extracts contained phenolic acids andflavonols. (+)catechin and (-)catechin were the mostabundant compounds, but slightly higher in whitemulberry compared to the black fruit. Chlorogenicacid was detected to be the major phenolic acid inthe two extracts; quercitine esters quercitine-3-di-glycoside and quercitine dicoumaryl-glycoside wereonly detected in black mulberry, suggesting apolymorphic scheme between the two tested species.
Our results demonstrate that there are qualitative andquantitative differences between white and blackmulberry fruits. In addition, M. nigra fruits had thehighest TEAC, with an average of 44 mmol Troloxequivalent/100g fw using the DPPH scavengingmethod. Similarly, Ercisli and Orhan (2008) foundthat the antioxidant activity in selected blackmulberries was important when using differentantioxidant methods.
In our study, we noticed a high correlationcoefficient between TP and TEAC. Such positivecorrelation is well established between antioxidantactivity and polyphenols constituent as reported inearlier studies of small fruit phytonutrient contents(Konczak et al., 2003).
CONCLUSIONIn this study, we compared and characterized thephenolic content and antioxidant capacity of twomulberries species, the black M. nigra and the whiteM. alba. Different characteristics were displayed bythe two mulberry species. In addition to the highantioxidant capacity, black mulberry had highflavonoids and phenolics content, which mayincrease its popularity among the other mulberriesand even among other fruits in general. Theseresults, demonstrating superior horticultural andphytonutrient traits of mulberries, may also providea basis for planning breeding strategies as well asselecting cultivars with high phytonutrient profilesand antioxidant capacities as functional foods forconsumers. However, more detailed biological andpharmacological studies are still needed foradditional clarification and better understanding ofthe health benefits of phenolic substances - richmulberries.
Biologia Tunisie Juillet 2012; N°7 ; 26 – 29
29
References
Celik, H., Ozgen, M., Serce, S. and Kaya, C. (2008).Phytochemical accumulation and antioxidant capacity atfour maturity stages of cranberry fruit. ScienceHorticulture, 117: 345-348.
Ercisli, S. and Orhan, E. (2007). Chemical composition ofwhite (Morus alba), red (Morus rubra) and black (Morusnigra) mulberry fruits. Food Chemistry. 103: 1380-1384.
Ercisli, S. and Orhan, E. (2008). Some physico-chemicalcharacteristics of black mulberry (Morus nigra L.)genotypes from Northeast Anatolia region of Turkey.Science Horticulture, 116: 41-46.
Fattouch, S., Caboni, P., Coroneo, V., Tuberoso, C.,Angioni, A., Dessi, S., Marzouki, N. and Cabras, P.(2007). Antimicrobial activity of Tunisian quince(Cydonia oblonga Miller) pulp and peel polyphenolicextracts. Journal of Agricultural and Food Chemistry, 55:963-969.
Konczak, I.I, Okuno, S., Yoshimoto, M. and Yamakawa,O. (2003). Composition of phenolics and anthocyanins ina sweet potato cell suspension culture. BiochemicalEngineering Journal, 14: 155-161.
Liu, R.H. (2003). Health benefits of fruit and vegetablesare from additive and synergistic combinations ofphytochemicals. American Journal of Clinical Nutrition,78: 517S–520S.
Lako, J., Trenerry, V. C., Wahlqvist, M., Wattanapen-paiboon, N., Sotheeswaran, S. and Premier, R.(2007).Phytochemical flavonols, carotenoids and theantioxidant properties of a wide selection of Fijian fruit,
vegetables and other readily available foods. FoodChemistry, 101: 1727-1741.
Ozgen, M., Serce, S., Gunduz, K., Yen, F., Kafkas, E. andPaydas, S. (2007). Determining total phenolics andantioxidant capacities of selected Fragaria genotype.Asian Journal of Chemistry, 19: 5573-5581.
Riboli, E. and Norat, T. (2003). Epidemiologic evidenceof the protective effect of fruit and vegetables on cancerrisk. American Journal of Clinical Nutrition, 78: 559-569S.
Zadernowski, R., Naczk, M. and Nesterowicz, J. (2005).Phenolic acid profiles in some small berries. Journal ofAgricultural and Food Chemistry, 53: 2118-2124.
Shahidi, F. and Naczk, M. (2004). Antioxidant propertiesof food phenolics. In Phenolics in food and nutraceuticals.Boca Raton: CRC Press. p 403-437.Bae, S-H. and Suh H-J. (2007). Antioxidant activities offive different mulberry cultivars in Korea. LWT, 40: 955-962.
Froehlicher, T., Hennebelle, T., Martin-Nizard, F.,Cleenewerck, P., Hilbert, J-L., Trotin, F. and Grec, S.(2009). Phenolic profiles and antioxidative effects ofhawthorn cell suspensions, fresh fruits, and medicinaldried parts. Food Chemistry, 115: 1747-1761.
Zafra-Stone, S., Yasmin, T., Bagchi, M., Chatterjee, A.,Vinson, J.A. and Bagchi, D. (2007). Berry anthocyaninsas novel antioxidants in human health and diseaseprevention. Molecular Nutrition and Food Research, 51:675–683.
Biologia Tunisie Juillet 2012; N°7 ; 30– 36
30
BIOLOGIA TUNISIE
CARACTERISATION DE L’AGENT CAUSAL DU MAL SECCO DEL’ORANGER ET EVALUATION DE L’ANTAGONISME BACTERIEN VIS-A-VIS DU PHOMA TRACHEIPHILA
Leila Kalai1, Monia Mnari-Hattab2, Najla Sadfi-Zaoui3, Mohamed Rabeh Hajlaoui2
1 Laboratoire des Substances Bioactives, Centre de Biotechnologie de Borj Cedria, BP-901, 2050 Hammam-lif, Tunisie
2 Laboratoire de Protection des Plantes, INRA Tunisie, 2049 Hedi Karray, Tunis, Tunisie
3 Laboratoire Microorganismes et Biomolécules Bioactives, Faculté des Sciences de Tunis, Université Tunis El Manar, Tunisie
RésuméLe mal secco est une trachéomycose acropétaledont l’agent causal s’attaque aux vaisseaux descitrus provoquant le dessèchement progressif del’arbre. Cette maladie infecte généralement, lesgenres Citrus, Poncirus, Severinia, et Fortunella.Elle est plus virulente sur citronnier et cédratieret attaque très rarement les orangers et lesclémentiniers. La caractérisation morphologiqueet moléculaire de l’agent causal isolé del’oranger (cv. Thomson) a révélé une similitudedu point de vue morphologie et virulence avecles isolats provenant du Citronnier.Par ailleurs, l’alignement de la séquence del’isolat tunisien HQ231345 avec 45 séquencesd’isolats se trouvant dans les banques de gènesinternationales a révélé une très forte homologiede séquence allant de 97 à 100%. Cette faiblevariabilité au niveau de la région séquencée del’isolat tunisien confirme le développementclonale de cet agent pathogène.D’autre part l’étude de l’antagonisme bactérien àl’égard de P. tracheiphila a montré que desisolats halophytes de Bacillus K2-5, M1-20 et J9sont capables d’inhiber la croissance dupathogène de 2,87%, 26% et 52,97%respectivement. La cinétique d’inhibition amontré une meilleure efficacité de l’isolat J9 àinhiber la croissance du pathogène. Cettebactérie pourrait être un bon candidat pour lalutte biologique contre le mal secco des citrus.
INTRODUCTION
Les Agrumes représentent la production fruitièrela plus importante du monde et sont classésparmi les fruits les plus cultivés en Tunisie carils occupent une place importante dans la viesocio-économique (Lakhoua, 1997). En dépit dela tradition tunisienne de produire les agrumes,le secteur agrumicole continue à affrontercertains problèmes aussi bien à l'échelle de laproduction qu'à l'échelle de lacommercialisation, en particulier au niveau dumarché d'exportation.Le dernier projet FAO (1995-1998) consacré ausecteur Agrumes a permis une améliorationnotable de l’assortiment variétale et l’étalementde la période de production d’Octobre à Juin.Toutefois, la production nationale en Agrumes etparticulièrement en citrons est restée en deçà duniveau souhaité.La fertigation et le contrôle phytosanitaire desAgrumes, deux aspects phytotechniques nonencore maîtrisés par les producteurs, sont àl’origine de la faible productivité de ce secteur.En effet, l’intensification des vergers ducitronnier a entraîné la recrudescence du malsecco (Phoma tracheiphila (Petri) L.A. Kantsch.& Gikaschvili) qui est devenue la principalemenace de l’extension de la citriculture enTunisie.Cette maladie est une trachéomycose acropétaledont l’agent causal s’attaque au bois provoquantun dessèchement qui commence par les feuilles
Biologia Tunisie Juillet 2012; N°7 ; 30– 36
31
des extrémités des rameaux pour finalementprovoquer l’apoplexie de tout l’arbre. Le malsecco infecte en général, les genres Citrus,Poncirus, Severinia, et Fortunella. Mais il estplus virulent sur Citronnier et sur Cédratier(Whiteside et al., 1988). Généralement, toutesles espèces qui appartiennent aux genres cités ci-dessus, sont sensibles aux infections artificiellesde P tracheiphila mais en vergers, leur degréd’infection est variable (Anonyme, 2003). Parcontre, les oranges douces et les clémentinierssont rarement attaqués par le mal secco(Whiteside et al., 1988, Hajlaoui et al., 2007).Les moyens de détection couramment utiliséesen Tunisie restent assez rudimentaires et sebasent sur le diagnostic visuel, le test KOH etl’isolement du champignon (Chapot, 1963 ;Pionnat, 1982; Anonyme, 2003). En l’absence demoyens de lutte efficaces, cette affectionparasitaire peut entraîner une mortalité totale dessujets peu de temps après leur contamination.Devant l’ampleur des dégâts et en présence dechiffres aussi alarmants, les producteursparaissent impuissants et les scientifiques restentperplexes. En effet, cette maladie demeureincurable et tous les moyens de lutte utilisés,restent vains. Ceci est dû à l’absence de produitsactifs contre l’agent pathogène Phomatracheiphila et à la sensibilité des variétés et desporte-greffes utilisés. Dans ce contexte, la luttebiologique pourrait être un nouveau moyen delutte à tester.Au cours du présent travail nous nous sommesproposés de caractériser l’agent du mal seccoisolé sur oranger et de tester in vitro l’effet debactéries halophytes à inhiber la croissance del’agent pathogène.
MATERIEL & METHODES
Diagnostic du mal seccoTest KOHDes rameaux provenant d’oranger (cv.Thomson) de la région du Cap Bon fraîchementprélevés à partir des brindilles symptomatiques,ont été découpés selon la transversale et trempéspendant 30 secondes dans une solution de KOHà 1% pour révéler la coloration rouge saumoncaractéristique de la présence de Phomatracheiphila (Chapot, 1963; Pionnat, 1982).Isolement
L’isolement du champignon à partir du boisinfecté a été réalisé selon le protocole établi parl’EPPO (2005). Les rameaux infectés ont étédécoupés en petits morceaux et désinfectés parl’eau de javel 1% suivi d’un rinçage à l’eaudistillée stérile et séchés à l’aide de papier filtrestérile. Les morceaux de bois ont ensuite étérepiqués sur milieu PDA (Potato Dextrose Agar)et mises en incubation à 25°C pour accélérer lepassage du champignon du bois vers le milieusynthétique. Après purification des colonies, laconservation à long terme du champignon a étéréalisée dans 30% de glycérol et 70% de PDB(Potato Dextrose Broth) à - 80°C et son maintienà court terme a été effectuée sur PDA à 4°C.Pour une utilisation de routine, les isolats sontcultivés sur PDA et incubés à 25°C.
PathogéniePour vérifier l’implication de l’isolat provenantd’oranger (cv. Thomson) dans la maladie, desinoculations foliaires de jeunes plants debigaradier ont été assurées par des microblessures infligées aux feuilles près des nervuresprincipales au niveau desquelles, une gouttelettede suspension sporale ajustée à 106 spores/ml aété déposée délicatement par une micro seringuede façon à ce qu’elle adhère à la feuille.Les plantes ont par la suite été ensachées pourcréer une humidité saturante et transférées sousserre à 20°C les premières 24 heures puis à 25°Cpour la suite de l’expérience.
Caractérisation moléculaire du P.tracheiphilaExtraction et amplification de l’ADNL’extraction de l’ADN à partir du mycélium deP. tracheiphila a été réalisée selon le protocoledécrit par Kirkpatrick et al. (1987).L’amplification de la région ITS-5,8S-ADNr aété réalisée à l’aide des amorces universellesITS1 (5’-TCCGTAGGTGAACCTGCGG-3’) etITS4 (5’-TCCTCCGCTTATTGATATGC-3’)développées par White et al. (1990).L’amplification a été réalisée dans un volume de50 μl contenant 1 x tampon PCR (Promega), 200μM de chaque dNTP (Promega), 1,5 mMMgCl2, 1 μM de chaque amorce (Opéron), 1Ude green go Taq DNA polymerase (Promega) et10 ng d’ADN génomique.
Biologia Tunisie Juillet 2012; N°7 ; 30– 36
32
La PCR a été réalisée dans un thermocycleurBiometra programmé comme suit: dénaturationinitiale à 94°C pendant 5 min; suivi de 31 cycles(dénaturation à 94°C pendant 1 min, hybridationà 50°C pendant 1 min et 30 s et extension à 72°Cpendant 1 min et 30 s); et terminée par uneextension finale à 72ºC pendant 7 min.La migration des amplifias a été réalisée parélectrophorèse sur gel d’agarose à 1,5%contenant 0,03 μl ml-1 de Bromure d’éthidium(BET), soumis à un voltage de 120v-100mA etvisualisée par le gel doc (BIO -RAD) sous UV.Séquençage de l’ADN fongiqueL’isolat (Pt2), provenant d’oranger (cv.Thomson) de la région du Cap Bon a étésélectionné pour le séquençage et la suite del’étude en raison de sa croissance et sporulationrapide. Un fragment d’environ 600 pb obtenusuite à l’amplification de la région ITS-5,8S-ADNr a été purifié (Wizard PCR DNApurification system, Promega). L’amplicon a étéintroduit par ligation dans le plasmide pGem-TEasy vector (Promega) ayant une taille de 3015bp. Les cellules compétentes d’Escherichia coli(souche JM 109, Promega), ont été transforméesavec le plasmide recombinant résultant puiscultivées sur le milieu LB (Luria-Bertani)additionné de X-gal pour la sélection descolonies bleues transformées.Les deux plasmides recombinants issus de deuxcolonies indépendantes ont été digérés afin devérifier la présence de l’insert puis purifiés enutilisant le Qiaprep Spin Miniprep kit (Qiagen)pour le séquençage. Ainsi, l’insert des deuxclones différents a été séquencé dans les deuxsens en utilisant les amorces du vecteur T7 PromTAATACGACTCACTATAGGG et Sp6 ATT-TAG-GTG-ACA-CTA-TAG à l’aide d’unséquenceur automatisé type ABI3730 (AppliedBiosystems) chez Génome express.Analyse des séquencesLes séquences nucléotidiques obtenues ont étéalignée avec ClustalW (Thompson et al., 1994)et comparée avec la base de données NCBI. Uneseule séquence a été déposée dans les banques degènes.Isolement et identification des bactéries utiliséespour la lutte biologiqueTrois isolats bactérien connus sous les diminutifs(J9, K2-5 et M1-20) isolés du Sud Tunisien(Chott Djerid) et identifiés comme appartenant à
l’espèce Bacillus subtilis par Sadfi et al., (2008)ont été utilisées pour évaluer leur pouvoirantagoniste vis-à-vis de P. tracheiphila. Cesbactéries ont été cultivées sur un milieu TSA(Tryptic Soy Agar) et incubées à 30°C. Laconservation des isolats a été réalisée dans unmilieu liquide à base de Bouillon nutritif à 75%et de glycérol à 25% à une température de -20°C.
Test d’antagonisme in vitroL’isolat Pt2 de P. tracheiphila dont la virulence aété vérifiée par inoculation artificielle, a étésélectionné pour la confrontation bactérie-champignon à raison de 5 répétitions parbactérie. Pour cela, deux disques mycéliens de 1cm de diamètre ont été découpés à partir d’unejeune culture de Pt2 puis déposés sur milieuPDA équidistants d’un strie bactérien, réalisé aucentre de la boîte, le champignon ayant étéincubé 72 h avant la bactérie antagoniste. Lesrayons d’inhibition (R1 et R2) ont par la suite étéenregistrés quotidiennement pour le calcul dupourcentage d’inhibition G selon la formulesuivante élaborée par Whipps, (1987):G= [(R1-R2)/R1]*100 (R1= diamètre de lacolonie du champignon, du centre du disque versl’extrémité de la boite ; R2= diamètre de lacolonie du champignon, du centre du disque versla bactérie). Finalement, les niveaux d’inhibitionont été classés selon l’échelle élaborée parKorsten et al., (1995). L’effet antagoniste des 3bactéries sur la croissance du P. tracheiphila aété estimé selon l’erreur standard (σn =σ/√n ; n :nombre de répétitions).
RESULTATS
Diagnostic du mal seccoLe test KOH appliqué sur des rameaux montrantle début de dessèchement s’est révélé positif endonnant une coloration saumon du bois (Fig 1d).A partir de ces rameaux symptomatiques, desisolements ont été réalisés à partir du bois. Lespremières colonies ont été obtenues au bout de 7à 9 jours (Fig. 1a). L’identification de l’agentpathogène a été basée sur les critèresmorphologiques des pycniospores tels quedécrits par Cicarone (1971) et Petri(Punithalingam et Holliday, 1973) (Fig 1 b et c)ainsi que sur les techniques traditionnelles dediagnostic (test de pathogénie et test KOH) et
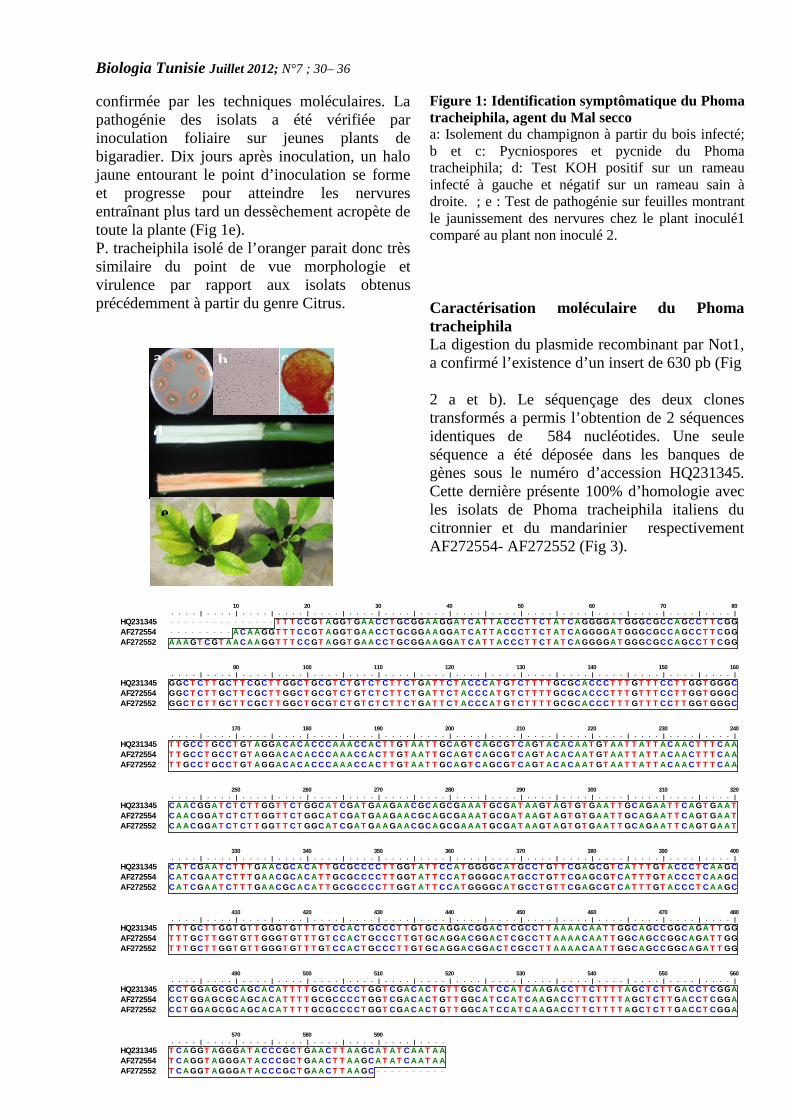
Biologia Tunisie Juillet 2012; N°7 ; 30– 36
33
confirmée par les techniques moléculaires. Lapathogénie des isolats a été vérifiée parinoculation foliaire sur jeunes plants debigaradier. Dix jours après inoculation, un halojaune entourant le point d’inoculation se formeet progresse pour atteindre les nervuresentraînant plus tard un dessèchement acropète detoute la plante (Fig 1e).P. tracheiphila isolé de l’oranger parait donc trèssimilaire du point de vue morphologie etvirulence par rapport aux isolats obtenusprécédemment à partir du genre Citrus.
Figure 1: Identification symptômatique du Phomatracheiphila, agent du Mal seccoa: Isolement du champignon à partir du bois infecté;b et c: Pycniospores et pycnide du Phomatracheiphila; d: Test KOH positif sur un rameauinfecté à gauche et négatif sur un rameau sain àdroite. ; e : Test de pathogénie sur feuilles montrantle jaunissement des nervures chez le plant inoculé1comparé au plant non inoculé 2.
Caractérisation moléculaire du PhomatracheiphilaLa digestion du plasmide recombinant par Not1,a confirmé l’existence d’un insert de 630 pb (Fig
2 a et b). Le séquençage des deux clonestransformés a permis l’obtention de 2 séquencesidentiques de 584 nucléotides. Une seuleséquence a été déposée dans les banques degènes sous le numéro d’accession HQ231345.Cette dernière présente 100% d’homologie avecles isolats de Phoma tracheiphila italiens ducitronnier et du mandarinier respectivementAF272554- AF272552 (Fig 3).
a b c
d
e
c
10 20 30 40 50 60 70 80. . . . | . . . . | . . . . | . . . . | . . . . | . . . . | . . . . | . . . . | . . . . | . . . . | . . . . | . . . . | . . . . | . . . . | . . . . | . . . . |
HQ231345 - - - - - - - - - - - - - - - T T T C C GT A GGT GA A C C T GC GGA A GGA T C A T T A C C C T T C T A T C A GGGGA T GGGC GC C A GC C T T C GGAF272554 - - - - - - - - - A C A A GGT T T C C GT A GGT GA A C C T GC GGA A GGA T C A T T A C C C T T C T A T C A GGGGA T GGGC GC C A GC C T T C GGAF272552 A A A GT C GT A A C A A GGT T T C C GT A GGT GA A C C T GC GGA A GGA T C A T T A C C C T T C T A T C A GGGGA T GGGC GC C A GC C T T C GG
90 100 110 120 130 140 150 160. . . . | . . . . | . . . . | . . . . | . . . . | . . . . | . . . . | . . . . | . . . . | . . . . | . . . . | . . . . | . . . . | . . . . | . . . . | . . . . |
HQ231345 GGC T C T T GC T T C GC T T GGC T GC GT C T GT C T C T T C T GA T T C T A C C C A T GT C T T T T GC GC A C C C T T T GT T T C C T T GGT GGGCAF272554 GGC T C T T GC T T C GC T T GGC T GC GT C T GT C T C T T C T GA T T C T A C C C A T GT C T T T T GC GC A C C C T T T GT T T C C T T GGT GGGCAF272552 GGC T C T T GC T T C GC T T GGC T GC GT C T GT C T C T T C T GA T T C T A C C C A T GT C T T T T GC GC A C C C T T T GT T T C C T T GGT GGGC
170 180 190 200 210 220 230 240. . . . | . . . . | . . . . | . . . . | . . . . | . . . . | . . . . | . . . . | . . . . | . . . . | . . . . | . . . . | . . . . | . . . . | . . . . | . . . . |
HQ231345 T T GC C T GC C T GT A GGA C A C A C C C A A A C C A C T T GT A A T T GC A GT C A GC GT C A GT A C A C A A T GT A A T T A T T A C A A C T T T C A AAF272554 T T GC C T GC C T GT A GGA C A C A C C C A A A C C A C T T GT A A T T GC A GT C A GC GT C A GT A C A C A A T GT A A T T A T T A C A A C T T T C A AAF272552 T T GC C T GC C T GT A GGA C A C A C C C A A A C C A C T T GT A A T T GC A GT C A GC GT C A GT A C A C A A T GT A A T T A T T A C A A C T T T C A A
250 260 270 280 290 300 310 320. . . . | . . . . | . . . . | . . . . | . . . . | . . . . | . . . . | . . . . | . . . . | . . . . | . . . . | . . . . | . . . . | . . . . | . . . . | . . . . |
HQ231345 C A A C GGA T C T C T T GGT T C T GGC A T C GA T GA A GA A C GC A GC GA A A T GC GA T A A GT A GT GT GA A T T GC A GA A T T C A GT GA A TAF272554 C A A C GGA T C T C T T GGT T C T GGC A T C GA T GA A GA A C GC A GC GA A A T GC GA T A A GT A GT GT GA A T T GC A GA A T T C A GT GA A TAF272552 C A A C GGA T C T C T T GGT T C T GGC A T C GA T GA A GA A C GC A GC GA A A T GC GA T A A GT A GT GT GA A T T GC A GA A T T C A GT GA A T
330 340 350 360 370 380 390 400. . . . | . . . . | . . . . | . . . . | . . . . | . . . . | . . . . | . . . . | . . . . | . . . . | . . . . | . . . . | . . . . | . . . . | . . . . | . . . . |
HQ231345 C A T C GA A T C T T T GA A C GC A C A T T GC GC C C C T T GGT A T T C C A T GGGGC A T GC C T GT T C GA GC GT C A T T T GT A C C C T C A A GCAF272554 C A T C GA A T C T T T GA A C GC A C A T T GC GC C C C T T GGT A T T C C A T GGGGC A T GC C T GT T C GA GC GT C A T T T GT A C C C T C A A GCAF272552 C A T C GA A T C T T T GA A C GC A C A T T GC GC C C C T T GGT A T T C C A T GGGGC A T GC C T GT T C GA GC GT C A T T T GT A C C C T C A A GC
410 420 430 440 450 460 470 480. . . . | . . . . | . . . . | . . . . | . . . . | . . . . | . . . . | . . . . | . . . . | . . . . | . . . . | . . . . | . . . . | . . . . | . . . . | . . . . |
HQ231345 T T T GC T T GGT GT T GGGT GT T T GT C C A C T GC C C T T GT GC A GGA C GGA C T C GC C T T A A A A C A A T T GGC A GC C GGC A GA T T GGAF272554 T T T GC T T GGT GT T GGGT GT T T GT C C A C T GC C C T T GT GC A GGA C GGA C T C GC C T T A A A A C A A T T GGC A GC C GGC A GA T T GGAF272552 T T T GC T T GGT GT T GGGT GT T T GT C C A C T GC C C T T GT GC A GGA C GGA C T C GC C T T A A A A C A A T T GGC A GC C GGC A GA T T GG
490 500 510 520 530 540 550 560. . . . | . . . . | . . . . | . . . . | . . . . | . . . . | . . . . | . . . . | . . . . | . . . . | . . . . | . . . . | . . . . | . . . . | . . . . | . . . . |
HQ231345 C C T GGA GC GC A GC A C A T T T T GC GC C C C T GGT C GA C A C T GT T GGC A T C C A T C A A GA C C T T C T T T T A GC T C T T GA C C T C GGAAF272554 C C T GGA GC GC A GC A C A T T T T GC GC C C C T GGT C GA C A C T GT T GGC A T C C A T C A A GA C C T T C T T T T A GC T C T T GA C C T C GGAAF272552 C C T GGA GC GC A GC A C A T T T T GC GC C C C T GGT C GA C A C T GT T GGC A T C C A T C A A GA C C T T C T T T T A GC T C T T GA C C T C GGA
570 580 590. . . . | . . . . | . . . . | . . . . | . . . . | . . . . | . . . . | . . . .
HQ231345 T C A GGT A GGGA T A C C C GC T GA A C T T A A GC A T A T C A A T A AAF272554 T C A GGT A GGGA T A C C C GC T GA A C T T A A GC A T A T C A A T A AAF272552 T C A GGT A GGGA T A C C C GC T GA A C T T A A GC - - - - - - - - - -

Biologia Tunisie Juillet 2012; N°7 ; 30– 36
34
Figure 3: Alignement multiples de la séquencenucléotidique de l’isolat tunisien du Phomatracheiphila Pt2 (HQ231345) par rapport à celle duPhoma tracheiphila italien isolé ducitronnier AF272554 et du Phoma tracheiphilaitalien isolé du mandarinier AF272552.
Par ailleurs, l’alignement de la séquence del’isolat tunisien HQ231345 avec au moins 45séquences d’isolats se trouvant dans les banquesde gènes internationales a révélé une très fortehomologie de séquence allant de 97 à 100%.Cette faible variabilité au niveau de la régionséquencé de l’isolat tunisien confirme lesrésultats de la caractérisation moléculaire publiéspar Balmas et al., (2005) Ezra et al. (2007) etKalai et al., (sous presse). Ainsi, soit le Phomatracheiphila est naturellement très stable ou ilfaudra sélectionner d’autres régions afind’étudier la variabilité des séquences en liaisonavec le pouvoir pathogène de ce dernier. Cettehomologie de séquence entre isolats dedifférentes régions géographiques et isolés surdifférentes plantes hôtes montre le caractèreclonale de ce Deutéromycètes.
Figure 2: Identification moléculaire du Phomatracheiphila, agent du Mal secco : a : Amplificationde la région des ITS-5.8ADNr chez les deux clones1et 2 de Pt2 (M1 : marqueur de taille 100pb(promega); b : Digestion du plasmide recombinantavec not1 (M2 : marqueur de taille (promega).
Antagonisme bactéries-P. tracheiphilaDevant l’inefficacité de la chémiothérapie contrel’agent du mal secco, la recherche d’autresmoyens de lutte, en l’occurrence l’antagonismemicrobien, reste la voie la plus plausible pourréduire l’ampleur de cette affection parasitaire
des Citrus. La confrontation sur milieu gélosé duP. tracheiphila et des bactéries halophytesmontre que les trois isolats bactériens se sontlargement distingués à ce niveau. En effet, K2-5n’a enregistré qu’un faible pourcentaged’inhibition (2,87%) correspondant au 1erniveau sur l’échelle de Korsten et al., (1995),alors que M1-20 avec un pourcentage atteignantles 26% est considérée comme appartenant audeuxième niveau d’efficacité. Finalement, labactérie J9 a le pourcentage d’inhibition le plusimportant soit 52,97% (Fig 4).
Figure 4: effet des différentes bactéries sur lePhoma tracheiphila vitroa: Phoma tracheiphila ; b : J9 et c: M1-20
L’évolution de la croissance radiale R1 et R2 duP. tracheiphila en co-culture avec les deuxmeilleures bactéries antagonistes respectivementM1-20 et J9 a été enregistrée en fonction dutemps. Pour la souche M1-20, l’évolution de R1et R2 ne présente pas de différencessignificatives les premiers jours. Une faibledifférence apparaît à partir du 13eme jourd’incubation, avec une nette différence au 16èmejour (Fig 5).
Figure 5: Evolution de la croissance du P.tracheiphila en présence de la souche M1-20 deBacillus● Moyenne R1○ Moyenne R2
1 2M2
b
600pb
3015 pb
1 2 3M1
a
a b ca aa a a
0
5
10
15
20
25
3 4 5 6 7 8 9 10 11 12 13 14 15 16
Temps (jours)
Ray
on d
e la
col
onie
(mm
)
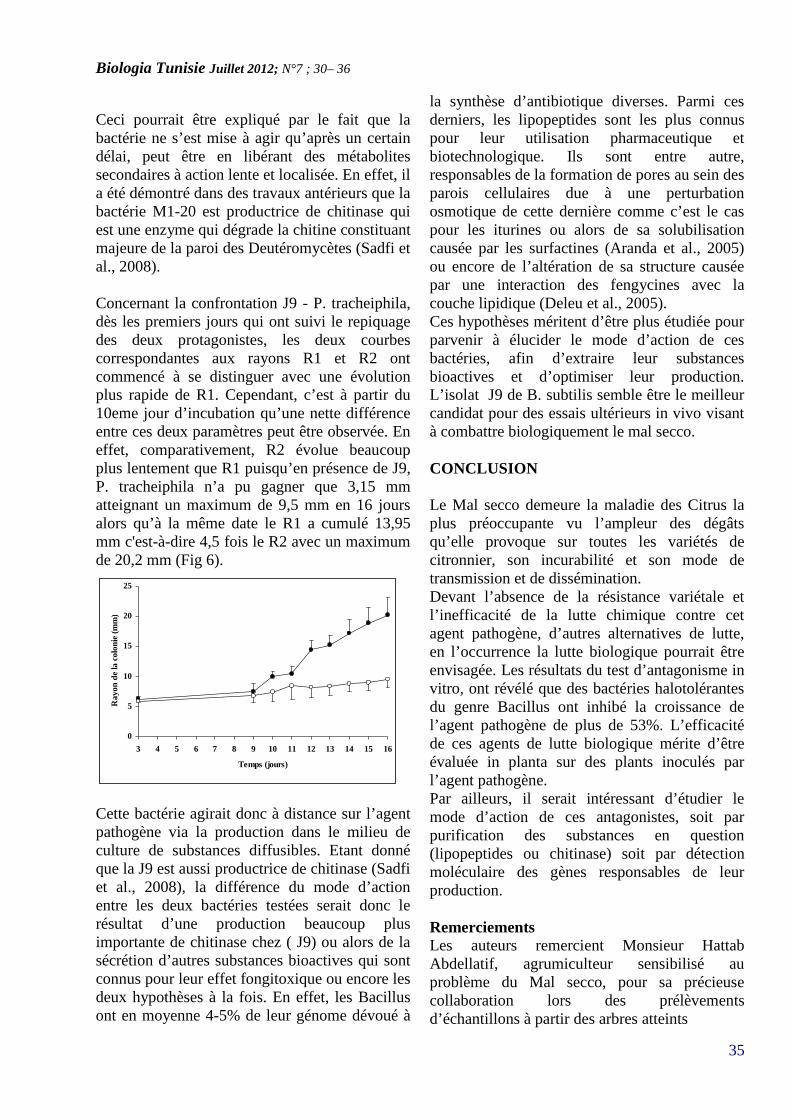
Biologia Tunisie Juillet 2012; N°7 ; 30– 36
35
Ceci pourrait être expliqué par le fait que labactérie ne s’est mise à agir qu’après un certaindélai, peut être en libérant des métabolitessecondaires à action lente et localisée. En effet, ila été démontré dans des travaux antérieurs que labactérie M1-20 est productrice de chitinase quiest une enzyme qui dégrade la chitine constituantmajeure de la paroi des Deutéromycètes (Sadfi etal., 2008).
Concernant la confrontation J9 - P. tracheiphila,dès les premiers jours qui ont suivi le repiquagedes deux protagonistes, les deux courbescorrespondantes aux rayons R1 et R2 ontcommencé à se distinguer avec une évolutionplus rapide de R1. Cependant, c’est à partir du10eme jour d’incubation qu’une nette différenceentre ces deux paramètres peut être observée. Eneffet, comparativement, R2 évolue beaucoupplus lentement que R1 puisqu’en présence de J9,P. tracheiphila n’a pu gagner que 3,15 mmatteignant un maximum de 9,5 mm en 16 joursalors qu’à la même date le R1 a cumulé 13,95mm c'est-à-dire 4,5 fois le R2 avec un maximumde 20,2 mm (Fig 6).
Cette bactérie agirait donc à distance sur l’agentpathogène via la production dans le milieu deculture de substances diffusibles. Etant donnéque la J9 est aussi productrice de chitinase (Sadfiet al., 2008), la différence du mode d’actionentre les deux bactéries testées serait donc lerésultat d’une production beaucoup plusimportante de chitinase chez ( J9) ou alors de lasécrétion d’autres substances bioactives qui sontconnus pour leur effet fongitoxique ou encore lesdeux hypothèses à la fois. En effet, les Bacillusont en moyenne 4-5% de leur génome dévoué à
la synthèse d’antibiotique diverses. Parmi cesderniers, les lipopeptides sont les plus connuspour leur utilisation pharmaceutique etbiotechnologique. Ils sont entre autre,responsables de la formation de pores au sein desparois cellulaires due à une perturbationosmotique de cette dernière comme c’est le caspour les iturines ou alors de sa solubilisationcausée par les surfactines (Aranda et al., 2005)ou encore de l’altération de sa structure causéepar une interaction des fengycines avec lacouche lipidique (Deleu et al., 2005).Ces hypothèses méritent d’être plus étudiée pourparvenir à élucider le mode d’action de cesbactéries, afin d’extraire leur substancesbioactives et d’optimiser leur production.L’isolat J9 de B. subtilis semble être le meilleurcandidat pour des essais ultérieurs in vivo visantà combattre biologiquement le mal secco.
CONCLUSION
Le Mal secco demeure la maladie des Citrus laplus préoccupante vu l’ampleur des dégâtsqu’elle provoque sur toutes les variétés decitronnier, son incurabilité et son mode detransmission et de dissémination.Devant l’absence de la résistance variétale etl’inefficacité de la lutte chimique contre cetagent pathogène, d’autres alternatives de lutte,en l’occurrence la lutte biologique pourrait êtreenvisagée. Les résultats du test d’antagonisme invitro, ont révélé que des bactéries halotolérantesdu genre Bacillus ont inhibé la croissance del’agent pathogène de plus de 53%. L’efficacitéde ces agents de lutte biologique mérite d’êtreévaluée in planta sur des plants inoculés parl’agent pathogène.Par ailleurs, il serait intéressant d’étudier lemode d’action de ces antagonistes, soit parpurification des substances en question(lipopeptides ou chitinase) soit par détectionmoléculaire des gènes responsables de leurproduction.
RemerciementsLes auteurs remercient Monsieur HattabAbdellatif, agrumiculteur sensibilisé auproblème du Mal secco, pour sa précieusecollaboration lors des prélèvementsd’échantillons à partir des arbres atteints
0
5
10
15
20
25
3 4 5 6 7 8 9 10 11 12 13 14 15 16
Temps (jours)
Ray
on d
e la
col
onie
(mm
)

Biologia Tunisie Juillet 2012; N°7 ; 30– 36
36
Références BibliographiquesAnonyme. 2003. Data sheets on quarantinepests. Deuterophoma tracheiphila. Prepared byCABI and EPPO for the UE: 1-3.
Aranda F.J., Teruel A., Ortiz A. 2005. furtheraspects on the hemolytic activity of the antibioticlipopeptides iturin A. Biochim. Biophys. Acta1713: 51-56.
Anonyme. 2005. Phoma tracheiphila.EPPO/OEPP Bull. 35: 307-311.
Balmas V., Scherm B., Ghignone S., OuldMohamed Salem A., Cacciola S., Migheli Q.2005. Characterisation of Phoma tracheiphila byRAPD, microsatellite-primed PCR and ITSrDNA sequencing and development of specificprimers for in planta PCR detection. Eur. J.Plant.Pathol. 111: 235-247.
Chapot H. 1963. Le Mal secco. Al Awamia, n°9. Revue de la recherche agronomiquemarocaine INRA : 89-125.
Crossa-Raynaud P. 1960. Le mal secco. Extraitde vignobles, jardins et vergers de Tunisie.Imprimerie El Assia, Tunis : 1-7.
Ciccarone A. 1971. Il fungo del mal secco degliagrumi. Phytopath. Medit. 10: 68-75.
Deleu M., Paquot M., Nylander T. 2005Fengycin interaction with lipids monolayers atthe air-aqueous interface-implication of theeffect of fengycin on biological membranes. J.colloid interface Sci. 283: 358-365.
Ezra D., Koroitor T. 2007. Molecularcharacterization of Phoma tracheiphila, causalagent of mal secco disease of citrus, in Israel.Eur. J. Plant. Pathol. 118: 183-191.
Hajlaoui M.R., Kalai L., Mnari Hattab M.,Guermech A., Ben Abdelaal N. 2007.Occurrence of mal nero disease on mandarin andorange trees in Tunisia. New disease reports. 16:2p.
Korsten, L., De Jager E.S., De Villurs E.E.,Lourens A., Wehner F.C. 1995. Evaluation ofbacterial epiphytes isolated from avocado leafand fruit surfaces for biocontrol of avocadopostharvest diseases. Plant. Dis. 79: 1149-1156.
Kirkpatrick B.C., Stenger D.C., Moris T.J.,Purcell A.H. 1987. Cloning and detection of
DNA from a non cultivable plant pathogenicmycoplasma-like organism. Science 238: 197-200.
Lakhoua H. 1997. Quelques réflexions sur ledéveloppement de l’agrumiculture en Tunisie.Revue de l’Institut National Agronomique deTunisie.12: 179-193.
Pionnat J. C., Segur-fantino N. 1987. Influencede la nutrition potassique sur la réceptivité ducitrus volkameriana au Phoma tracheiphila(Petri) Kanc. Ghik. Revue mensuelle de l’Institutde Recherches sur les fruits et Agrumes IRFA.Fruits. 42: 235-241.Punithalingam, E., Holliday P. 1973.Deuterophoma tracheiphila. CMI descriptions ofPathogenic Fungi and Bacteria No. 399. CABInternational, Wallingford, UK.
Sadfi N., Essghaier B., Hajlaoui M.R., FardeauM.L., Cayaol J.L., Ollivier B., Boudabous A.2008. Ability of Moderately Halophilic Bacteriato Control Grey Mould Disease on TomatoFruits. Journal of Phytopathology, 156. pp: 42-52.
Solel Z., Oren Y. 1975. Outbreak of mal seccodisease in Israel on normally tolerant Citruscultivars. Plant. Dis. Reptr. 59: 946-947.
Thompson, J.D., Higgins, D.G., Gibson, T.J.1994. CLUSTAL W: improving the sensitivityof progressive multiple sequence alignmentthrough sequence weighting, positions-specificgap penalties and weight matrix choice. NucleicAcids Res. 22: 4973-4680.
Whipps, J.M. 1987. Effect of media on growthand interactions between a range of soil-borneglasshouse pathogens and antagonistic fungi.New. Phytol. 107: 127-142.
White, T.J., Bruns T., Lee S., Taylor J. 1990.Analysis of phylogenetic relationships byamplification and direct sequencing of ribosomalRNA genes tiré de PCR Protocols: A guide toMethods and Applications. M. A. Innis, D. H.Gelfand, J. J. Sninsky, T. J. White, eds.Academic Press. New York. USA: 322p.
Whiteside J.O., Garnsey S.M., Timmir L.W.1988. Compendium of citrus diseases. APSPRESS, Minnesota, USA. 80p
Biologia Tunisie Juillet 2012 ; N°7 ; 37 – 42
37
BIOLOGIA TUNISIE
INTRA-SPECIFIC VARIABILITY IN RIBOSOMAL DNA SEQUENCE IN THE ITS2REGION OF TUNISIAN FIG CULTIVARS
BARAKET Ghada.1, CHATTI Khaled1., SADDOUD Olfa1., BEN ABDELKRIM Ahmed.1,MARS Messaoud.2, TRIFI Mokhtar1 and SALHI-HANNACHI Amel1*.
1: Laboratoire de Génétique Moléculaire, Immunologie et Biotechnologie. Faculté des Sciences deTunis. Campus Universitaire, El Manar 2092. Tunisie2 : U.R.Agrobiodiversité, Institut Supérieur Agronomique, 4042 Chott Mariem, Sousse, Tunisie.*: Author for correspondence: e-mail: [email protected], Phone: +216 71 87 2600; Fax: +216 70 86 04 32
Keywords: ITS2, Tunisian, nrDNA, Genetic diversity.
ABSRACTInternal transcribed spacer 2 (ITS2) of thenuclear ribosomal DNA (nrDNA) is a usefulgenomic region for establishing andunderstanding the evolutionary and geneticrelationships among and within species. Thecurrent analysis portrays the utility of the ITS2sequences in a set of Tunisian fig cultivars.Sequences analysis proved variation both inlength and GC contents. Data shows thatsequences length of the target spacer varied from253 pb to 314 pb with an average of 261.4.Using the DAMBE and MEGA3 programsvariation of GC and AT scored with an averageof 62.3 and 37.6 respectively. Furthermore,genetic distances as well as cluster analysis havebeen successfully performed. The geneticdistance estimated ranged from 0.038 to 0.576.In addition, Disparity Index Analysis was usedto calculate the composition distance (Dc) andDisparity Index (ID). Results show that the Dcindex varied from 0.02 to 2.68 and the ID rangedto 0.00 to 2.38. These parameters express highgenetic diversity within the local fig germplasmat the ITS2 region of nuclear ribosomal DNA.This work allowed successfully estimating ofgenetic diversity on fig cultivars on the basis ofITS sequences. Results are discussed in relation
to rational management of the fig geneticresources.
INTRODUCTION
The common edible fig (Ficus carica L.,Moraceae) is a gynodioecous species with twomorphs: the female tree (common fig) and thehermaphrodite tree (caprifig) (Papadopoulou etal. 2002). Ficus carica is also one of the 700species of the genus Ficus, originated mainlyfrom the tropics (Berg, 2003). Ficus Caricagrows wild in the Mediterranean basin since it iswell adapted to the climate as in Tunisia wheremany varieties could be found. However, thelocal germplasm is currently threatened either bygenetic erosion or by plagues such as the figmosaic disease. For this reason, many researcheshave been raised to identify the relationshipbetween cultivars and the estimation of geneticdiversity, and many methods have been used inthis process of either morphological traits orpomological characteristics to identify theTunisian fig varieties (Chatti et al. 2004, SalhiHannachi et al. 2003; Mars et al. 1994).Additionally, isozyme makers have been used tocharacterize these cultivars (Hedfi et al. 2003).This study portrays the achievements ofmolecular methods suitable in the surveying of
Biologia Tunisie Juillet 2012 ; N°7 ; 37 – 42
38
the molecular diversity and to resolve synonymyand homonymy problems. Consequently, DNAbased techniques have been performed toprovide efficient and useful markers to assessgenetic diversity (Chatti et al. 2007, Saddoud etal. 2007, Salhi-Hannachi et al. 2003; 2004, 2005and 2006). These analyses, report thedevelopment of random amplified polymorphicDNA (RAPD), inter simplesequence repeats (ISSR) and simple sequencerepeats (SSR). The feasibility of these methodsis discussed with relation to characterize thelocal germplasm. The development of moleculardata base is necessary to enhance selection andbreeding programs and for the establishment of anational collection.In this study we will evaluate the polymorphismanalysis of the internal transcribed spacer (ITS)region. In fact, since the ITS2 is heterogeneous itbecame an ideal genomic region for the study ofgenetic diversity and to establish relationshipsamong Tunisian fig cultivars.
MATERIAL AND METHODS
Plant materialThe study was conducted on twelve fig cultivars,maintained in the collection established at theISA of Chott Mariam (Table 1). Theexperimental materiel consisted of 11 commonfig cultivars and 1 caprifig that are the maincultivated forms in the Sahel region of Tunisia.
DNA extractionTotal cellular DNA was isolated from freshleaves of single adult trees according to aprotocol described by Dellaporta et al. (1983).DNA concentration was determined by bothspectrophotometry at 260 nm and 0.8% agarosegel electrophoresis according to Sambrook et al.(1989).
Table 1: Tunisian fig genotypes used in this study.Label Genotype Origin
1 Besbessi 1 Mesjed Aîssa2 Besbessi 2 Mesjed Aîssa3 Besbessi 3 Mesjed Aîssa4 Zidi Mesjed Aîssa5 Soltani Ouardanine6 Bidhi 1 Kalaa Kebira7 Hemri Ghadhabna8 Bidh beghal Mesjed Aîssa9 Jrani* Ghadhabna
10 Bidhi 2 Khmara
11 Delgane El Alia12 Bither abiadh Khmara
* Caprifig: male tree
DNA extractionTotal cellular DNA was isolated from freshleaves of single adult trees according to aprotocol described by Dellaporta et al. (1983).DNA concentration was determined by bothspectrophotometry at 260 nm and 0.8% agarosegel electrophoresis according to Sambrook et al.(1989).
Amplification of the ITS region and sequencesanalysisPolymerase chain reaction (PCR) was used toamplify the ITS region using two externalprimers described by Weiblen et al. (2000). Theamplification products were analysed byelectrophoresis in 1.5% agarose gel and purifiedusing the Kit <<Wizard SV Gel PCR Clean-UpSystem>> they were also automaticallysequenced in both directions with theamplification primers by the automatedfluorescent cycle sequencing method using theBig Dye Terminator Ready Reaction Kit(Applied Biosystems, Foster City CA, USA).The ITS region boundaries were determined bycomparison with various published sequencesavailable in GenBank. By using the Kimura-2method (Kimura, 1980), Nucleotide sequenceshad been aligned using the DAMBE and MEGAversion 3.1 programs to calculate pairwise ITSsequence divergence between cultivars (Xia,2000, Kumar, Tamura and Nei, 2004). Thedistance resultant was then computed in a matrixto generate dendrogram with reference to theneighbour- joining method (NJ) (Saitou and Nei,1987) and unweighted pair group method witharithmetic averaging (UPGMA) algorithm(Sneath and Sokal, 1973). Internal support forgroupings was assessed using 500 bootstrapreplicates (Felsenstein, 1985).
RESULTS AND DISCUSSIONS
The analysis of the whole ITS region showedthat ITS2 was more heterogeneous andhighlighted the diversity between Tunisian figcultivars. In fact, the region has evolved singlemutation events such as (indel zones(insertion/deletion), substitutions (transversion

Biologia Tunisie Juillet 2012 ; N°7 ; 37 – 42
39
and transition) and that had shaped the highdegree of polymorphism. The analysis of theITS2 was basically made on the level of thespacer size, the GC percentage and the geneticdistance as showed below:The analysis of the spacer’s size showed thatITS2 spacer was extended between 253 bp in‘Besbessi2’ to 314 bp in ‘Zidi’ (Table 2) dataproved that ITS2 spacer is larger than ITS1 inFicus carica except for ‘Jrani’ and ‘Besbessi3’cultivars. The same results have been reported inother crops such as Butulaceae Cucurbitaceae,Fabaceae, Poaceae, Scrophulariaceae andViscaceae (Baldwin et al. 1995).In Tunisian fig the percentage of GC and ATshowed that it varied from 55 - to 68 and from32 to 45.5 with an average of 62.3 and 37.6correspondingly for ITS2 (Table 2). The scoredGC contents are almost similar to the reportedones in other plant species such as Quercus spp.(Baldwin et al. 1995, Bellarosa et al. 2005). Inaddition, the Disparity Index Analyses calculatedshow that: firstly, the Composition distance (Dc)estimated varied from 0.02 to 2.68. The lowestvalue scored between ‘Bither abiadh’ and‘Besbessi 1’ cultivars and the highest value wascalculated between ‘Jrani’ and ‘Besbessi 2’cultivars (Table 3). Secondary, the DisparityIndex (DI) calculated varied from 0.00 to 2.38.The maximum value of DI was scored between‘Jrani’ and ‘besbessi 2’ and the minimum valuewas calculated between ‘Bither abiadh’;‘Bidhi1’; ‘Bidh beghal and ‘Besbessi1’cultivars(Table 3).The genetic distances based on the ITS2 spacerare ranged from 0.038 to 0.576. ‘Bidhi2’ and‘Zidi’ cultivars are characterized by themaximum of divergence since they exhibited thegreatest genetic distance value of 0.576.However, the smallest distance of 0.038 wasobserved between the caprifig ‘Jrani’ and‘Soltani’ cultivar suggesting their greatsimilarities (Table 4). The two type ofdendrogram (UPGMA and N.J) illustratedidentically the divergence between the studiedcultivars (Figure (1a) and Figure (1b)). Twomain clusters could be identified: the first onelabeled (I), is composed of ‘Bidhi 2’and
‘Besbessi 2’ that are significantly divergent fromall the remaining varieties ranged in the secondcluster labeled (II) that exhibited two sub-groups. The first sub-group (II-1) is consisted of‘Bither abiadh’ cultivar while the second sub-group (II-2) is composed of the remainingcultivars. Thus, in both tree a great robustness ofthe branches was observed which was due to thehigh value of the bootstraps (85 and 100%).
Table 2: Nucleotide composition and length of ITS2sequences of fig cultivars.
Accessions A T G CGC
content(%)
ATcontent
(%)
Length(bp)
Besbessi1 16.9 21.7 27.6 33.9 61.5 38.6 254Besbessi2 19.4 26.1 27.7 26.9 54.6 45.5 253Besbessi3 12.9 28.5 27 31.6 58.6 41.4 256
Bitherabiadh
17.4 22.0 27.4 33.2 58.6 39.4 259
Bidhbeghal
16.2 20.5 31.7 31.7 63.4 36.7 259
Bidhi1 14 22.5 27.5 36 63.5 36.5 258Bidhi2 17.6 27.5 24.7 30.2 54.9 45.1 255
Delgane 15.2 19.8 29.2 35.8 65 35 257Solatani 14.7 18.5 30.5 36.3 66.8 33.2 259Hemri 16.7 18.3 30.4 34.6 65 35 257Jrani 15.6 16.4 30.5 37.5 68 32 256Zidi 16.6 17.8 30.3 35.4 65.7 34.4 314
Average 16.1 21.5 28.7 33.6 62.3 37.6 261.4
It was noticed, from this analysis that thecaprifig ‘Jrani’, did not significantly divergefrom the female trees which made us assume thatour data is in agreement with the monoeciousorigin of the common fig (Ficus carica L.) thatevolved later into a dioecious plant (caprifig andedible fig) (Machado et al. 2001). We alsoobserved that grouping was made from their sexor denomination.Similar results have been stated in common figsince an unstructured genetic variability havebeen registered using other molecular markers(Chatti et al. 2007, Salhi-Hannachi et al. 2005,2006).ITS2 polymorphism detected in Ficus carica L.accessions revealed a high level of variability inTunisian fig crop suggesting that the ITStechnology is a powerful and efficient approachin genetic relationships analysis at the intra-specific level.
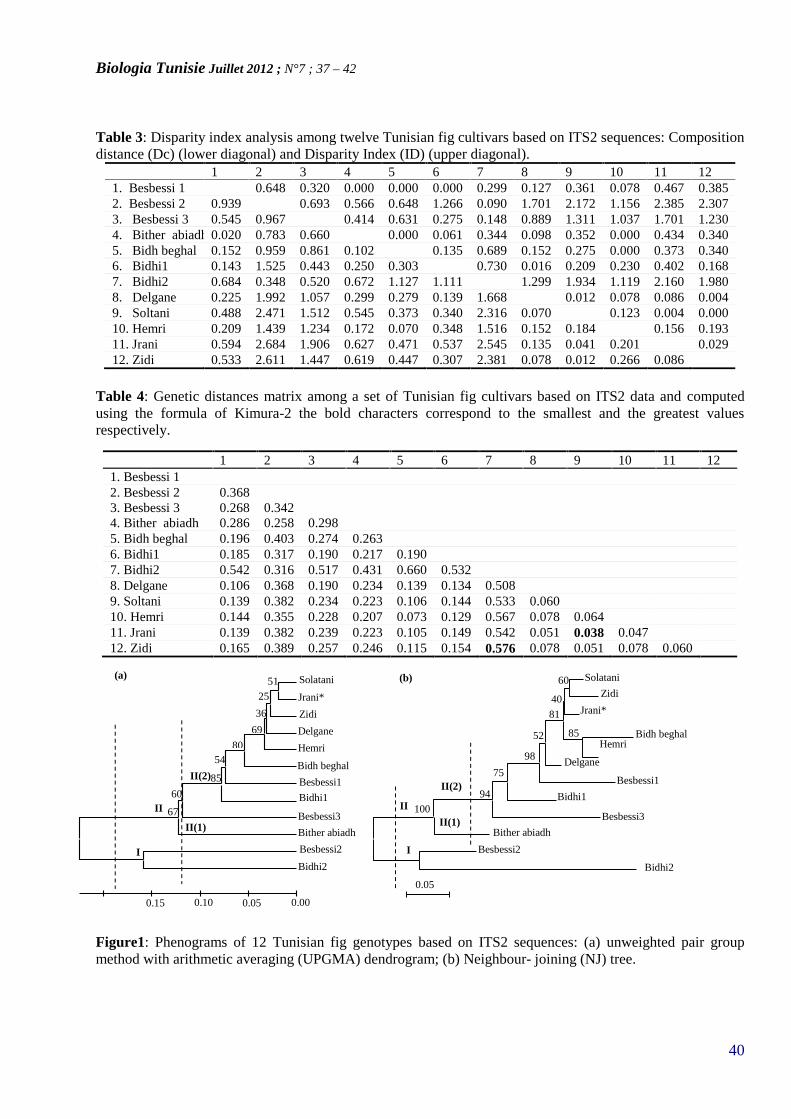
Biologia Tunisie Juillet 2012 ; N°7 ; 37 – 42
40
Table 3: Disparity index analysis among twelve Tunisian fig cultivars based on ITS2 sequences: Compositiondistance (Dc) (lower diagonal) and Disparity Index (ID) (upper diagonal).
1 2 3 4 5 6 7 8 9 10 11 121. Besbessi 1 0.648 0.320 0.000 0.000 0.000 0.299 0.127 0.361 0.078 0.467 0.3852. Besbessi 2 0.939 0.693 0.566 0.648 1.266 0.090 1.701 2.172 1.156 2.385 2.3073. Besbessi 3 0.545 0.967 0.414 0.631 0.275 0.148 0.889 1.311 1.037 1.701 1.2304. Bither abiadh 0.020 0.783 0.660 0.000 0.061 0.344 0.098 0.352 0.000 0.434 0.3405. Bidh beghal 0.152 0.959 0.861 0.102 0.135 0.689 0.152 0.275 0.000 0.373 0.3406. Bidhi1 0.143 1.525 0.443 0.250 0.303 0.730 0.016 0.209 0.230 0.402 0.1687. Bidhi2 0.684 0.348 0.520 0.672 1.127 1.111 1.299 1.934 1.119 2.160 1.9808. Delgane 0.225 1.992 1.057 0.299 0.279 0.139 1.668 0.012 0.078 0.086 0.0049. Soltani 0.488 2.471 1.512 0.545 0.373 0.340 2.316 0.070 0.123 0.004 0.00010. Hemri 0.209 1.439 1.234 0.172 0.070 0.348 1.516 0.152 0.184 0.156 0.19311. Jrani 0.594 2.684 1.906 0.627 0.471 0.537 2.545 0.135 0.041 0.201 0.02912. Zidi 0.533 2.611 1.447 0.619 0.447 0.307 2.381 0.078 0.012 0.266 0.086
Table 4: Genetic distances matrix among a set of Tunisian fig cultivars based on ITS2 data and computedusing the formula of Kimura-2 the bold characters correspond to the smallest and the greatest valuesrespectively.
1 2 3 4 5 6 7 8 9 10 11 121. Besbessi 12. Besbessi 2 0.3683. Besbessi 3 0.268 0.3424. Bither abiadh 0.286 0.258 0.2985. Bidh beghal 0.196 0.403 0.274 0.2636. Bidhi1 0.185 0.317 0.190 0.217 0.1907. Bidhi2 0.542 0.316 0.517 0.431 0.660 0.5328. Delgane 0.106 0.368 0.190 0.234 0.139 0.134 0.5089. Soltani 0.139 0.382 0.234 0.223 0.106 0.144 0.533 0.06010. Hemri 0.144 0.355 0.228 0.207 0.073 0.129 0.567 0.078 0.06411. Jrani 0.139 0.382 0.239 0.223 0.105 0.149 0.542 0.051 0.038 0.04712. Zidi 0.165 0.389 0.257 0.246 0.115 0.154 0.576 0.078 0.051 0.078 0.060
Figure1: Phenograms of 12 Tunisian fig genotypes based on ITS2 sequences: (a) unweighted pair groupmethod with arithmetic averaging (UPGMA) dendrogram; (b) Neighbour- joining (NJ) tree.
Solatani
Besbessi1
Jrani*
Zidi
Delgane
Hemri
Bidh beghal
Bidhi1
Besbessi3
Bither abiadh
Besbessi2
Bidhi2
51
25
36
69
8054
85
60
67
0.000.050.100.15
I
II
II(1)
II(2)
(a) Solatani
Zidi
Jrani*
Bidh beghalHemri
Delgane
Besbessi1
Besbessi3
Bither abiadh
Besbessi2
100
94
75
85
98
52
60
40
81
0.05
I
II
II(1)
II(2)Bidhi1
(b)
Bidhi2
Biologia Tunisie Juillet 2012 ; N°7 ; 37 – 42
41
AKNOWLEGMENTS
This work was partially supported by grantsfrom the Tunisian “Ministère de l'EnseignementSupérieur, de la Recherche Scientifique et de laTechnologie ” Projet Lab B02.
REFERENCES
Baldwin, B.G., Sanderson, M.J., Porter, J.M.,Wojciechowski, M.F., Campbell, C.S.,Donoghue M.J. (1995). The ITS of nuclearribosomal DNA: a valuable source of evidenceon angiosperm pylogeny. Ann. Missouri. Bot.Gard. 82: 247-277.
Bellarosa, R., Simeone, M.C., Papini, A.,Schirone, B. (2005). Utility of ITS sequencedata for phylogenetic reconstruction of ItalianQuercus spp. Mol. Phyl. Evol. 34: 355-370.
Berg, C.C. (2003). Flora malesiana precursor forthe treatment of Moracea 1: the mainsubdivision of Ficus: the subgenera. Blumea.48:167-178.
Chatti, K., Saddoud, O., Salhi-Hannachi, A.,Mars, M., Marrakchi, M., Trifi, M.(2007).Inferring of genetic diversity and relationshipsin a Tunisian fig (Ficus carica L.) germplasmcollection by random amplified microsatellitepolymorphisms. J. Int. Pl. Bio. 49 (3): 386-391.
Chatti, K., Salhi-Hannachi, A., Mars, M.,Marrakchi, M., Trifi, M.. (2004). Analyse de ladiversité génétique de cultivars tunisiens defiguier (Ficus carica L.) à l’aide de caractèresmorphologiques. Fruits. 59(1): 49-61.
Dellaporta, S.L., Wood, J. and Hicks, J.B.(1983). A plant DNA minipreparation: versionII. Plant Mol. Biol. Rep. 1: 19-21.
Felsenstein, J. (1985). Confidence limits onphylogenies: an approach using the bootstrap.Evol. 39: 783-79.
Hedfi, J., Trifi, M., Salhi-Hannachi, A., OuldMohamed Salem, A., Marrakchi, M. (2003).Morphological and isoenzymatic polymorphismin Tunisian fig (Ficus carica L.) collection.Acta. Hort. 605: 319-325
Kimura, M. (1980). A simple method forestimating evolutionary rate of base substitutionthrough comparative studies of nucleotide
sequences. J. Mol. Evol. 16: 111-120.
Kumar, S.,Tamura, K., and Nei, M. (2004)MEGA3: Integrated software for MolecularEvolutionary Genetics Analysis and sequencealignment. Briefings in Bioinformatics 5:150-163.
Machado, C-A., Jousselin, E., Kjellberg, F.,Compton, S-G., Herre, E-A. (2001).Phylogenetic relationships, historicalbiogeography and character evolution of figpollinating wasps. Proc. Roy. Soc. Lond. Biol.268: 685-694.
Mars, M., Carraut, A., Marrakchi, M., Gouiaa,M., Gaaliche, F. (1994). Ressources génétiquesfruitières en Tunisie (poirier, oranger, figuier,grenadier). Plant. Genet. Res. New. 100 : 14-17.
Saddoud, O., Chatti, K., Salhi-Hannachi, A.,
Mars M., Rhouma, A., Marrakchi, M., and TrifiM. (2007). Genetic diversity of Tunisian figs(Ficus carica L.) as revealed by nuclearmicrosatellites. Hereditas 144: 149-157.
Saitou, N., Nei, M. (1987). The Neighbor-joining method. A new method forreconstructing phylogenetic trees. Mol. Biol.Evol. 4: 406-425.
Salhi-Hannachi, A., Mars, M., Chatti, K.,Marrakchi, M., Trifi, M. (2003). Specific geneticmarkers for Tunisian fig germplasm: Evidenceof morphological traits, random amplifiedpolymorphic DNA and inter simple sequencerepeats markers. Journal of Genetics andBreeding 57, 125–136.
Salhi-Hannachi, A., Trifi, M., Zehdi, S., Mars,M., Rhouma, A., Marrakchi, M. ( 2004). InterSimple Sequence Repeat fingerprintings toassess genetic diversity in Tunisian fig (Ficuscarica L.). Genet. Res. Crop. Evol. 51 (3): 269-275.
Salhi-Hannachi, A., Chatti, K., Mars, M.,Marrakchi, M., Trifi, M.(2005). Comparativeanalysis of genetic diversity in two collectionsfigs cultivars based on random amplifiedpolymorphic DNA and inter Simple Sequencerepeats fingerprints. Genet. Res. Crop. Evol. 52(5): 563-573
Salhi-Hannachi, A., Chatti, K., Saddoud, O.,Mars, M., Rhouma, A., Marrakchi, M., Trifi, M.
Biologia Tunisie Juillet 2012 ; N°7 ; 37 – 42
42
(2006). Genetic diversity of different Tunisianfig (Ficus carica L.) collections revealed byRAPD fingerprints. Hereditas. 143:15-22.
Sambrook, J., Frithsch, E.F., Maniatis, T. (1989).Molecular cloning: a laboratory manual, 2nd ed.Cold spring Harbor Laboratory, cold SpringHarbor, New York.
Sneath, P.M.A., Sokal, R.R., (1973). NumericalTaxonomy. W.H. Freeman and Company, SanFrancisco.
Papadopoulou, K., Ehaliotis, C., Tourna, M.,Kastanis, P., Karydis, I., Zervakis, G. (2002).Genetic relatedness among dioecious Ficus
carica L. cultivars by random amplifiedpolymorphic DNA analysis, and evaluation ofagronomic and morphologic characters. Genetica114: 183-194.
Weiblen, G.D. (2000). Phylogeneticrelationships of functionally diocious Ficus(Moraceae) based on ribosomal DNA sequencesand morphology. Amer. J. Bot. 87(9), 1342-1357.
Xia, X. (2000). Data analysis in molecularbiology and evolution. Kluwer Academicpublishers, Boston. pp. 276.
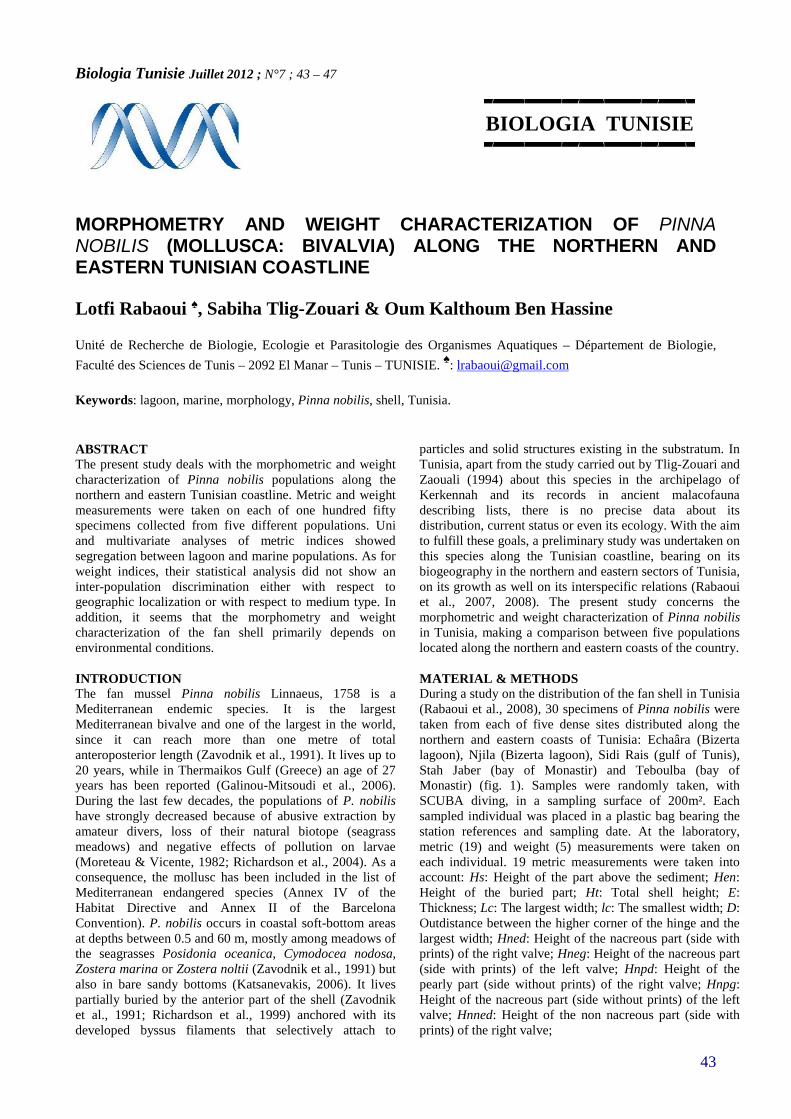
Biologia Tunisie Juillet 2012 ; N°7 ; 43 – 47
43
BIOLOGIA TUNISIE
MORPHOMETRY AND WEIGHT CHARACTERIZATION OF PINNANOBILIS (MOLLUSCA: BIVALVIA) ALONG THE NORTHERN ANDEASTERN TUNISIAN COASTLINE
Lotfi Rabaoui ♠, Sabiha Tlig-Zouari & Oum Kalthoum Ben Hassine
Unité de Recherche de Biologie, Ecologie et Parasitologie des Organismes Aquatiques – Département de Biologie,
Faculté des Sciences de Tunis – 2092 El Manar – Tunis – TUNISIE. ♠: [email protected]
Keywords: lagoon, marine, morphology, Pinna nobilis, shell, Tunisia.
ABSTRACTThe present study deals with the morphometric and weightcharacterization of Pinna nobilis populations along thenorthern and eastern Tunisian coastline. Metric and weightmeasurements were taken on each of one hundred fiftyspecimens collected from five different populations. Uniand multivariate analyses of metric indices showedsegregation between lagoon and marine populations. As forweight indices, their statistical analysis did not show aninter-population discrimination either with respect togeographic localization or with respect to medium type. Inaddition, it seems that the morphometry and weightcharacterization of the fan shell primarily depends onenvironmental conditions.
INTRODUCTIONThe fan mussel Pinna nobilis Linnaeus, 1758 is aMediterranean endemic species. It is the largestMediterranean bivalve and one of the largest in the world,since it can reach more than one metre of totalanteroposterior length (Zavodnik et al., 1991). It lives up to20 years, while in Thermaikos Gulf (Greece) an age of 27years has been reported (Galinou-Mitsoudi et al., 2006).During the last few decades, the populations of P. nobilishave strongly decreased because of abusive extraction byamateur divers, loss of their natural biotope (seagrassmeadows) and negative effects of pollution on larvae(Moreteau & Vicente, 1982; Richardson et al., 2004). As aconsequence, the mollusc has been included in the list ofMediterranean endangered species (Annex IV of theHabitat Directive and Annex II of the BarcelonaConvention). P. nobilis occurs in coastal soft-bottom areasat depths between 0.5 and 60 m, mostly among meadows ofthe seagrasses Posidonia oceanica, Cymodocea nodosa,Zostera marina or Zostera noltii (Zavodnik et al., 1991) butalso in bare sandy bottoms (Katsanevakis, 2006). It livespartially buried by the anterior part of the shell (Zavodniket al., 1991; Richardson et al., 1999) anchored with itsdeveloped byssus filaments that selectively attach to
particles and solid structures existing in the substratum. InTunisia, apart from the study carried out by Tlig-Zouari andZaouali (1994) about this species in the archipelago ofKerkennah and its records in ancient malacofaunadescribing lists, there is no precise data about itsdistribution, current status or even its ecology. With the aimto fulfill these goals, a preliminary study was undertaken onthis species along the Tunisian coastline, bearing on itsbiogeography in the northern and eastern sectors of Tunisia,on its growth as well on its interspecific relations (Rabaouiet al., 2007, 2008). The present study concerns themorphometric and weight characterization of Pinna nobilisin Tunisia, making a comparison between five populationslocated along the northern and eastern coasts of the country.
MATERIAL & METHODSDuring a study on the distribution of the fan shell in Tunisia(Rabaoui et al., 2008), 30 specimens of Pinna nobilis weretaken from each of five dense sites distributed along thenorthern and eastern coasts of Tunisia: Echaâra (Bizertalagoon), Njila (Bizerta lagoon), Sidi Rais (gulf of Tunis),Stah Jaber (bay of Monastir) and Teboulba (bay ofMonastir) (fig. 1). Samples were randomly taken, withSCUBA diving, in a sampling surface of 200m². Eachsampled individual was placed in a plastic bag bearing thestation references and sampling date. At the laboratory,metric (19) and weight (5) measurements were taken oneach individual. 19 metric measurements were taken intoaccount: Hs: Height of the part above the sediment; Hen:Height of the buried part; Ht: Total shell height; E:Thickness; Lc: The largest width; lc: The smallest width; D:Outdistance between the higher corner of the hinge and thelargest width; Hned: Height of the nacreous part (side withprints) of the right valve; Hneg: Height of the nacreous part(side with prints) of the left valve; Hnpd: Height of thepearly part (side without prints) of the right valve; Hnpg:Height of the nacreous part (side without prints) of the leftvalve; Hnned: Height of the non nacreous part (side withprints) of the right valve;

Biologia Tunisie Juillet 2012 ; N°7 ; 43 – 47
44
Figure 1: Location of the studied populations of P. nobilisalong the northern and eastern coasts of Tunisia.
Hnneg: Height of the nacreous part (side with prints) of theleft valve; Hnnpd: Height of the non nacreous part (sidewithout prints) of the right valve; Hnnpg: Height of the nonnacreous part (side without prints) of the left valve; Lmned:Maximum width of the nacreous part (side with prints) ofthe right valve; Lmneg: Maximum width of the nacreouspart (side with prints) of the left valve; Lmnpd: Maximumwidth of the nacreous part (side without prints) of the rightvalve; Lmnpg: Maximum width of the nacreous part (sidewithout prints) of the left valve. Five weight measurementswere taken: Pte: Total weight of the individual withepibionts; Pt: Total weight of the individual (withoutepibionts); Pcq: Weight of the shell (without epibionts);Pc_f: Weight of fresh flesh; Pc_s: Weight of dry flesh. Allmetric indices (171) as well weight ones (10) werecalculated on the basis of the measurements already takenon fan shells. Those which present values tending to aconstant value or close/equal to 1 were excluded from theanalysis. Thus, 29 metric indices (Hs/Ht, Lc/Ht, lc/Ht,D/Ht, Hen/Ht, E/Ht, Hned/Ht, Hnpd/Ht, Hnned/Ht,Hnnpd/Ht, Lmned/Ht, Lmnpd/Ht, Hneg/Ht, Hnpg/Ht,Hnneg/Ht, Hnnpg/Ht, Lmneg/Ht, Lmnpg/Ht, D/Lc, E/D,E/Lc, Hnned/Hned, Hnnpd/Hnpd, Hnneg/Hneg,Hnnpg/Hnpg, Lmned/Hned, Lmneg/Hneg, Lmnpd/Hnpd andLmnpg/Hnpg) and 7 weight ones (Pcq/Pt, Pc_f/Pt, Pc_s/Pt,Pc_f/Pcq, Pc_s/Pcq, Pc_s/Pc_f and Pt/Pte) were taken intoaccount during this study. The treatment of metric andweight indices was carried out by univariate (ANOVA andDUNCAN) and multivariate (Discriminating Canonicalanalysis “DCA”) analyses.
RESULTSAnalysis of metric characters
The analysis of variance, carried out on metric indicesshowed a highly significant population effect for themajority of these indices. This is in favor of the existence ofan important phenotypical variability between the fivestudied populations. According to the values of Snedecor-Fischer test “F”, metric indices showing importantheterogeneities are D/Lc, Hnnpd/Hnpd, E/D, D/Ht,Hnnpg/Hnpg, lc/Ht and Hnnpd/Ht. Duncan test showed, forthe majority of metric indices, a clear separation betweenthe studied populations. Indeed, for certain indicesHned/Ht, Hnned/Ht, Hnnpd/Ht, Hneg/Ht, Hnneg/Ht,Hnned/Hned, Hnnpd/Hnpd, Hnneg/Hneg, Hnnpg/Hnpg,Lmnpd/Hnpd and Lmnpg/Hnpg, Duncan test coulddiscriminate between lagoon and marine populations. Onthe level of Hned/Ht, Hnned/Ht, Hnnpd/Ht, Hneg/Ht,Hnneg/Ht, Hnned/Hned and Hnneg/Hneg, average valuesrecorded at Sidi Rais are significantly similar to those ofBizerta lagoon populations (Echaâra and Njila). For theseindices, the test of Duncan separated these threepopulations. On the level of the indices Hnnpd/Hnpd,Hnnpg/Hnpg, Lmnpd/Hnpd and Lmnpg/Hnpg, thepopulation of Teboulba is grouped with Echaâra and Njila.These three populations presented very close averagevalues for these last metric indices (Tab. 1).
Table I: DUNCAN test applied on the averages of metricand weight indices. The populations presenting the sameletters (A, B, C, D) form a group with significantly similaraverages at the threshold of 5% of Duncan test. (EC:Echaâra; NJ: Njila; SJ: Stah Jaber; TB: Teboulba; SR: SidiRais).
INDICES CLASSIFICATION OF POPULATIONS
METRIC CHARACTERS
Hs/Hat SJ (A) EC (B) SR (BC) NJ (BC) TB (C)
Lc/Ht SJ (A) SR (AB) NJ (B) EC (B) TB (C)
lc/Ht SR (A) TB (AB) NJ (AB) EC (B) SJ (C)
D/Ht TB (A) SJ (B) SR (BC) NJ (C) EC (D)
Hen/Ht TB (A) NJ (A) SR (A) EC (A) SJ (B)
E/Hat SR (A) SJ (AB) EC (BC) TB (CD) NJ (D)
Hned/Ht NJ (A) EC (A) SR (A) SJ (B) TB (B)
Hnpd/Hat TB (A) NJ (A) EC (A) SR (B) SJ (C)
Hnned/Ht TB (A) SJ (A) NJ (B) SR (B) EC (B)
Hnnpd/Ht SJ (A) SR (B) EC (B) NJ (B) TB (C)
Lmned/Ht NJ (A) SR (AB) SJ (AB) TB (AB) EC (B)
Lmnpd/Ht SJ (A) TB (A) SR (AB) NJ (AB) EC (B)
Hneg/Hat NJ (A) EC (A) SR (A) SJ (B) TB (B)
Hnpg/Ht TB (A) NJ (A) EC (A) SR (B) SJ (B)
Hnneg/Ht TB (A) SJ (A) EC (B) NJ (B) SR (B)
Hnnpg/Ht SJ (A) SR (B) EC (C) NJ (CD) TB (D)
Lmneg/Ht NJ (A) SJ (A) SR (AB) TB (AB) EC (B)
Lmnpg/Ht TB (A) SR (AB) SJ (AB) NJ (AB) EC (B)
D/Lc TB (A) SJ (B) NJ (B) SR (B) EC (C)
E/D EC (A) SR (B) SJ (C) NJ (C) TB (D)
E/Lc TB (A) SR (AB) EC (BC) SJ (C) NJ (D)
Hnned/Hned TB (A) SJ (A) SR (B) EC (B) NJ (B)
Hnnpd/Hnpd SJ (A) SR (B) EC (C) NJ (C) TB (C)
Hnneg/Hneg TB (A) SJ (A) EC (B) SR (B) NJ (B)
Hnnpg/Hnpg SJ (A) SR (B) EC (C) NJ (C) TB (C)

Biologia Tunisie Juillet 2012 ; N°7 ; 43 – 47
45
Lmned/Hned TB (A) SJ (AB) SR (B) NJ (B) EC (C)
Lmneg/Hneg TB (A) SJ (A) NJ (B) SR (BC) EC (C)
Lmnpd/Hnpd SJ (A) SR (B) TB (C) NJ (C) EC (C)
Lmnpg/Hnpg SJ (A) SR (A) TB (B) NJ (B) EC (B)
WEIGHT CHARACTERS
Pcq/Pt SJ (A) TB (B) EC (C) SR (C) NJ (C)
Pc_f/Pt NJ (A) SR (A) EC (A) TB (B) SJ (C)
Pc_s/Pt EC (A) SR (B) NJ (C) TB (C) SJ (D)
Pc_f/Pcq NJ (A) SR (A) EC (AB) TB (BC) SJ (C)
Pc_s/Pcq EC (A) SR (B) NJ (BC) TB (CD) SJ (D)
Pc_s/Pc_f EC (A) SR (B) TB (C) SJ (CD) NJ (D)
Pt/Pte NJ (A) TB (A) SJ (A) EC (AB) SR (B)
Discriminating Canonical Analysis showed that the firstthree axes explain 92.86% of total inertia. Axis 1 absorbs51.83% of total variability. It is positively correlated withlc/Ht, Hen/Ht, Hnpd/Ht, Hnpg/Ht, D/Lc, E/Lc andnegatively with the indices Hs/Ht, Lc/Ht, Hnnpd/Ht,Hnnpg/Ht, Hnnpd/Hnpd and Hnnpg/Hnpg. The second axisabsorbs only 29.8% of total variability. The representationof individuals on the plan 2-1 (fig. 2) supported theseparation observed previously by univariate analyses.
Figure 2: Discriminating Canonical Analysis of metric indices ofPinna nobilis populations of (a: Echaâra; b: Njila; c: Stah Jaber; d:Teboulba; e: Sidi Rais).
The two populations of Monastir bay were separated. Thepopulation of Stah Jaber (c) was located on the negativeside of axis 1 while Teboulba (d) is located on the positiveside of the same axis. The other populations were spreadaround the center of axis 1 and overlapped. As for Axis 2, itdiscriminated two groups: the first is formed by the twopopulations of Stah Jaber (c) and Teboulba (d) and thesecond consisted of the populations of Echaâra (a), Njila (b)and Sidi Rais (e). The latter populations appeared to begathered on the negative side of axis 2. However, it ispossible to detect discrimination between the twopopulations of Echaâra (a) and Njila (b). Sidi Raispopulation (e) overlap with these populations in the centerof axis 1 (fig. 2). Mahalanobis distances, recorded betweenthe five examined populations, supported the observed
discrimination. The dendrogram of the whole populationsof Pinna nobilis separated between marine and lagoonpopulations (fig. 3).
Figure 3: Dendrogram of Mahalanobis distances based on metricindices between the various populations of Pinna nobilis. (EC.:Echaâra; NJ: Njila; SJ: Stah Jaber; TB: Teboulba; SR: Sidi Rais).
Analysis of weight charactersThe analysis of variance, carried out on weight indicesshowed a highly significant population effect. This is infavor of the existence of an important variability betweenthe five studied populations. Weight indices which had animportant heterogeneity were Pc_s/Pc_f, Pc_s/Pt andPc_s/Pcq. Multiple comparison of averages using Duncantest could separate between populations and supported aninter-population segregation. For certain indices (Pcq/Pt,Pc_f/Pt and Pc_f/Pcq), Duncan test discriminated betweenthe populations of Echaâra, Njila and Sidi Rais from thoseof Stah Jaber and Teboulba. The populations of Monastirbay were gathered together (Tab. 1). Concerning the DCA,the results showed that axis 1 absorbs 82.39% of totalvariability; it is defined positively by the indices Pc_s/Pt,Pc_s/Pcq and Pc_s/Pc_f. The second axis explained12.38% of total variability. It is correlated with the indicesPcq/Pt, Pc_f/Pt and Pc_f/Pcq. Individuals’ representationon axis 1-2 plan showed heterogeneity between the fivepopulations Pinna nobilis (fig. 4). Indeed, two groupingswere found according to axis 1: one consisted of Echaâra(a) and another formed by the populations of Njila (b), StahJaber (c) and Teboulba (d). Sidi Rais population (e) isdispersed in the two sides of axis 1(fig. 4). Mahalanobisdistances calculated between populations for weightindices, showed a clustering of marine populations and aseparation between lagoon populations of Pinna nobilis(Fig. 5).
DISCUSSIONP. nobilis growth was investigated by several researchers(Moreteau & Vicente, 1982; Tlig-Zouari & Zaouali, 1994;Richardson et al., 1999, 2004; Galinou-Mitsoudi et al.,2006; García-March et al., 2002; Rabaoui et al., 2007).Concerning the morphology of its shell, Czihak and Dierlannounced since 1961 important variations. More recently,Combelles et al., (1986) observed a phenomenon ofecomorphose on juveniles in relation to the presence orabsence of P. oceanic herbarium. The present study is oneof the investigations concerning this aspect on the northernand eastern Tunisian coastline. ANOVA of the 29 metricindices, taken separately, showed that according to the
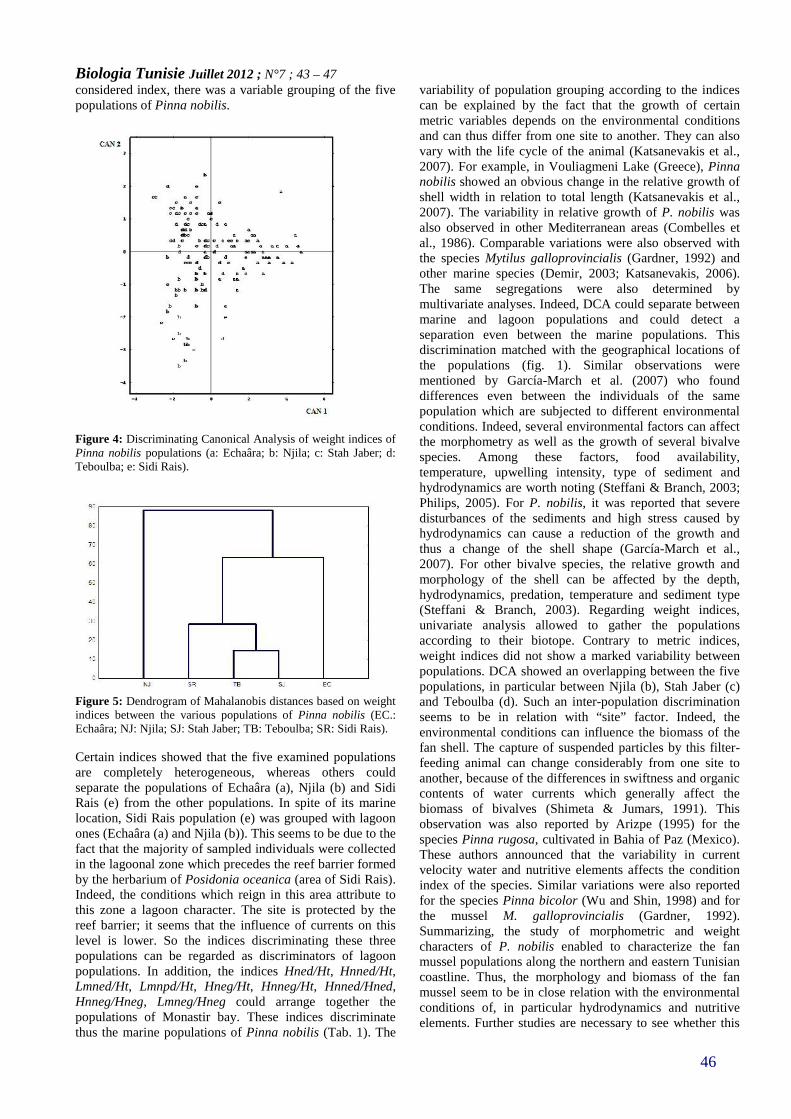
Biologia Tunisie Juillet 2012 ; N°7 ; 43 – 47
46
considered index, there was a variable grouping of the fivepopulations of Pinna nobilis.
Figure 4: Discriminating Canonical Analysis of weight indices ofPinna nobilis populations (a: Echaâra; b: Njila; c: Stah Jaber; d:Teboulba; e: Sidi Rais).
Figure 5: Dendrogram of Mahalanobis distances based on weightindices between the various populations of Pinna nobilis (EC.:Echaâra; NJ: Njila; SJ: Stah Jaber; TB: Teboulba; SR: Sidi Rais).
Certain indices showed that the five examined populationsare completely heterogeneous, whereas others couldseparate the populations of Echaâra (a), Njila (b) and SidiRais (e) from the other populations. In spite of its marinelocation, Sidi Rais population (e) was grouped with lagoonones (Echaâra (a) and Njila (b)). This seems to be due to thefact that the majority of sampled individuals were collectedin the lagoonal zone which precedes the reef barrier formedby the herbarium of Posidonia oceanica (area of Sidi Rais).Indeed, the conditions which reign in this area attribute tothis zone a lagoon character. The site is protected by thereef barrier; it seems that the influence of currents on thislevel is lower. So the indices discriminating these threepopulations can be regarded as discriminators of lagoonpopulations. In addition, the indices Hned/Ht, Hnned/Ht,Lmned/Ht, Lmnpd/Ht, Hneg/Ht, Hnneg/Ht, Hnned/Hned,Hnneg/Hneg, Lmneg/Hneg could arrange together thepopulations of Monastir bay. These indices discriminatethus the marine populations of Pinna nobilis (Tab. 1). The
variability of population grouping according to the indicescan be explained by the fact that the growth of certainmetric variables depends on the environmental conditionsand can thus differ from one site to another. They can alsovary with the life cycle of the animal (Katsanevakis et al.,2007). For example, in Vouliagmeni Lake (Greece), Pinnanobilis showed an obvious change in the relative growth ofshell width in relation to total length (Katsanevakis et al.,2007). The variability in relative growth of P. nobilis wasalso observed in other Mediterranean areas (Combelles etal., 1986). Comparable variations were also observed withthe species Mytilus galloprovincialis (Gardner, 1992) andother marine species (Demir, 2003; Katsanevakis, 2006).The same segregations were also determined bymultivariate analyses. Indeed, DCA could separate betweenmarine and lagoon populations and could detect aseparation even between the marine populations. Thisdiscrimination matched with the geographical locations ofthe populations (fig. 1). Similar observations werementioned by García-March et al. (2007) who founddifferences even between the individuals of the samepopulation which are subjected to different environmentalconditions. Indeed, several environmental factors can affectthe morphometry as well as the growth of several bivalvespecies. Among these factors, food availability,temperature, upwelling intensity, type of sediment andhydrodynamics are worth noting (Steffani & Branch, 2003;Philips, 2005). For P. nobilis, it was reported that severedisturbances of the sediments and high stress caused byhydrodynamics can cause a reduction of the growth andthus a change of the shell shape (García-March et al.,2007). For other bivalve species, the relative growth andmorphology of the shell can be affected by the depth,hydrodynamics, predation, temperature and sediment type(Steffani & Branch, 2003). Regarding weight indices,univariate analysis allowed to gather the populationsaccording to their biotope. Contrary to metric indices,weight indices did not show a marked variability betweenpopulations. DCA showed an overlapping between the fivepopulations, in particular between Njila (b), Stah Jaber (c)and Teboulba (d). Such an inter-population discriminationseems to be in relation with “site” factor. Indeed, theenvironmental conditions can influence the biomass of thefan shell. The capture of suspended particles by this filter-feeding animal can change considerably from one site toanother, because of the differences in swiftness and organiccontents of water currents which generally affect thebiomass of bivalves (Shimeta & Jumars, 1991). Thisobservation was also reported by Arizpe (1995) for thespecies Pinna rugosa, cultivated in Bahia of Paz (Mexico).These authors announced that the variability in currentvelocity water and nutritive elements affects the conditionindex of the species. Similar variations were also reportedfor the species Pinna bicolor (Wu and Shin, 1998) and forthe mussel M. galloprovincialis (Gardner, 1992).Summarizing, the study of morphometric and weightcharacters of P. nobilis enabled to characterize the fanmussel populations along the northern and eastern Tunisiancoastline. Thus, the morphology and biomass of the fanmussel seem to be in close relation with the environmentalconditions of, in particular hydrodynamics and nutritiveelements. Further studies are necessary to see whether this
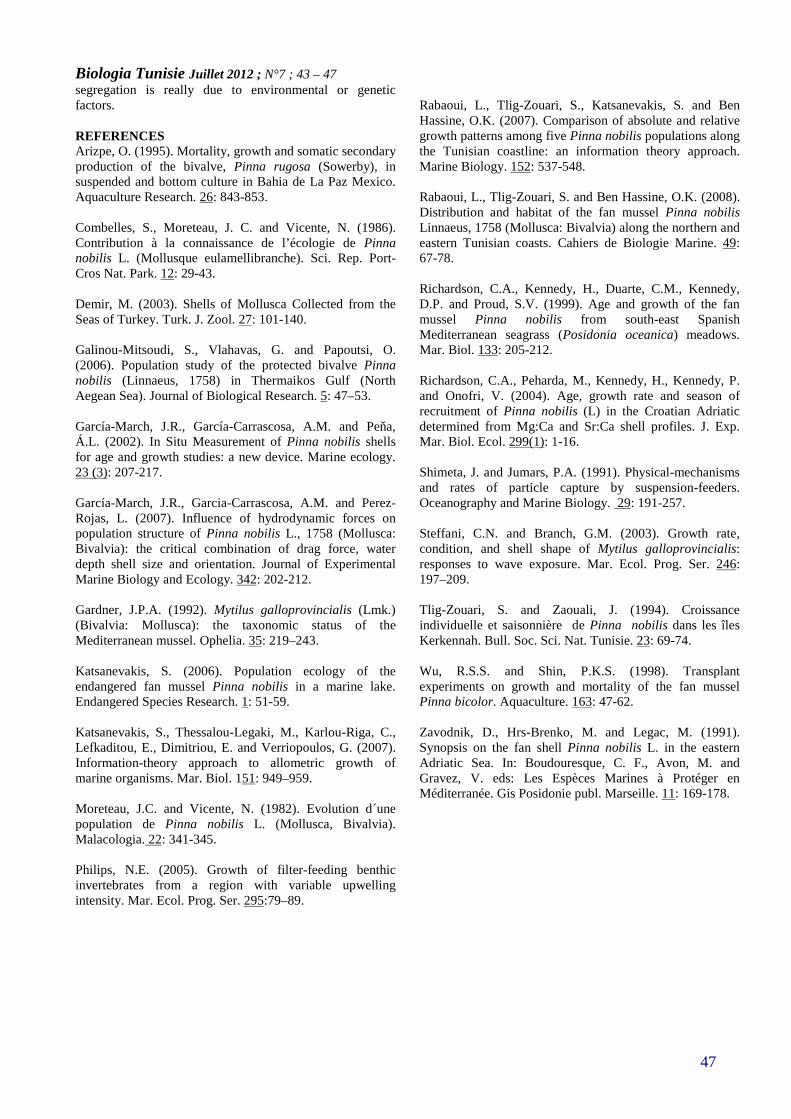
Biologia Tunisie Juillet 2012 ; N°7 ; 43 – 47
47
segregation is really due to environmental or geneticfactors.
REFERENCESArizpe, O. (1995). Mortality, growth and somatic secondaryproduction of the bivalve, Pinna rugosa (Sowerby), insuspended and bottom culture in Bahia de La Paz Mexico.Aquaculture Research. 26: 843-853.
Combelles, S., Moreteau, J. C. and Vicente, N. (1986).Contribution à la connaissance de l’écologie de Pinnanobilis L. (Mollusque eulamellibranche). Sci. Rep. Port-Cros Nat. Park. 12: 29-43.
Demir, M. (2003). Shells of Mollusca Collected from theSeas of Turkey. Turk. J. Zool. 27: 101-140.
Galinou-Mitsoudi, S., Vlahavas, G. and Papoutsi, O.(2006). Population study of the protected bivalve Pinnanobilis (Linnaeus, 1758) in Thermaikos Gulf (NorthAegean Sea). Journal of Biological Research. 5: 47–53.
García-March, J.R., García-Carrascosa, A.M. and Peňa,Á.L. (2002). In Situ Measurement of Pinna nobilis shellsfor age and growth studies: a new device. Marine ecology.23 (3): 207-217.
García-March, J.R., Garcia-Carrascosa, A.M. and Perez-Rojas, L. (2007). Influence of hydrodynamic forces onpopulation structure of Pinna nobilis L., 1758 (Mollusca:Bivalvia): the critical combination of drag force, waterdepth shell size and orientation. Journal of ExperimentalMarine Biology and Ecology. 342: 202-212.
Gardner, J.P.A. (1992). Mytilus galloprovincialis (Lmk.)(Bivalvia: Mollusca): the taxonomic status of theMediterranean mussel. Ophelia. 35: 219–243.
Katsanevakis, S. (2006). Population ecology of theendangered fan mussel Pinna nobilis in a marine lake.Endangered Species Research. 1: 51-59.
Katsanevakis, S., Thessalou-Legaki, M., Karlou-Riga, C.,Lefkaditou, E., Dimitriou, E. and Verriopoulos, G. (2007).Information-theory approach to allometric growth ofmarine organisms. Mar. Biol. 151: 949–959.
Moreteau, J.C. and Vicente, N. (1982). Evolution d´unepopulation de Pinna nobilis L. (Mollusca, Bivalvia).Malacologia. 22: 341-345.
Philips, N.E. (2005). Growth of filter-feeding benthicinvertebrates from a region with variable upwellingintensity. Mar. Ecol. Prog. Ser. 295:79–89.
Rabaoui, L., Tlig-Zouari, S., Katsanevakis, S. and BenHassine, O.K. (2007). Comparison of absolute and relativegrowth patterns among five Pinna nobilis populations alongthe Tunisian coastline: an information theory approach.Marine Biology. 152: 537-548.
Rabaoui, L., Tlig-Zouari, S. and Ben Hassine, O.K. (2008).Distribution and habitat of the fan mussel Pinna nobilisLinnaeus, 1758 (Mollusca: Bivalvia) along the northern andeastern Tunisian coasts. Cahiers de Biologie Marine. 49:67-78.
Richardson, C.A., Kennedy, H., Duarte, C.M., Kennedy,D.P. and Proud, S.V. (1999). Age and growth of the fanmussel Pinna nobilis from south-east SpanishMediterranean seagrass (Posidonia oceanica) meadows.Mar. Biol. 133: 205-212.
Richardson, C.A., Peharda, M., Kennedy, H., Kennedy, P.and Onofri, V. (2004). Age, growth rate and season ofrecruitment of Pinna nobilis (L) in the Croatian Adriaticdetermined from Mg:Ca and Sr:Ca shell profiles. J. Exp.Mar. Biol. Ecol. 299(1): 1-16.
Shimeta, J. and Jumars, P.A. (1991). Physical-mechanismsand rates of particle capture by suspension-feeders.Oceanography and Marine Biology. 29: 191-257.
Steffani, C.N. and Branch, G.M. (2003). Growth rate,condition, and shell shape of Mytilus galloprovincialis:responses to wave exposure. Mar. Ecol. Prog. Ser. 246:197–209.
Tlig-Zouari, S. and Zaouali, J. (1994). Croissanceindividuelle et saisonnière de Pinna nobilis dans les îlesKerkennah. Bull. Soc. Sci. Nat. Tunisie. 23: 69-74.
Wu, R.S.S. and Shin, P.K.S. (1998). Transplantexperiments on growth and mortality of the fan musselPinna bicolor. Aquaculture. 163: 47-62.
Zavodnik, D., Hrs-Brenko, M. and Legac, M. (1991).Synopsis on the fan shell Pinna nobilis L. in the easternAdriatic Sea. In: Boudouresque, C. F., Avon, M. andGravez, V. eds: Les Espèces Marines à Protéger enMéditerranée. Gis Posidonie publ. Marseille. 11: 169-178.
Biologia Tunisie Juillet 2012 ; N°7 ; 48 – 54
48
BIOLOGIA TUNISIE
MORPHOLOGICAL VARIABILITY OF SUB-SPONTANEOUS TUNISIAN FIG(FICUS CARICA L.) POPULATIONS
Ben Abdelkrim Ahmed, Baraket Ghada, Chatti Khaled, Saddoud Dabbebi Olfa, TrifiMokhtar & Salhi-Hannachi Amel1*
Laboratory of Molecular Genetics, Immunology & Biotechnology, Faculty of Sciences of Tunis, CampusUniversity, 2092 El Manar Tunis, Tunisia*Author for correspondence: e-mail: [email protected]: +216 71 87 26 00; Fax: +216 70 86 04 32
Keywords: Ficus carica; Variability; Morphological traits; Sub-spontaneous fig; Tunisia
ABSRACT
Sixty-four of Tunisian sub-spontaneous fig wereanalysed based on morphological characters.One way ANOVA analysis show a significantdifference between wild fig populations anddemonstrates that parameters measured onleaves show an important degree of variabilityand permits to discriminate sub-spontaneous figindividuals. Principal component analysispointed out a variation among individuals basedon leaf. Ward’s dendrogram and PrincipalComponent Analysis (PCA) allowed clusteringof trees studied according to their morphologicaltraits and independently of their geographicorigin. The aim of this work was the phenotypiccharacterization of Tunisian sub-spontaneous figin order to start an improvement program of thisspecies. In fact, estimation of gene flow andgenetic diversity structuration of wildcompartment permit to evaluate its proximitywith the cultivate germplasm.
INTRODUCTION
The genus Ficus (Moraceae) includes some 750species of woody plants found in most tropicaland subtropical forests throughout the world
(Berg, 1989). These species of trees, shrubs,climbers, and hemi-epiphytic stranglers arerecognized by a specialized inflorescence andpollination syndrome (Janzen, 1979; Berg, 1990;Weiblen, 2000). Fig trees (Ficus carica L.,2n=26) have been cultivated in the easternMediterranean zone since 4000 B.C. (Zohary,1988). Ficus carica is indigenous to Persia, AsiaMinor and Syria (Tous, 1996) and is probablythe first intentionally cultivated plant during theNeolithic revolution. Its domestication precededthat of cereals by about a thousand years (Kislev,2006).In Tunisia, fig germplasm consists of numerouslandraces mainly selected by farmers for theirfruit qualities and maintained in orchards wherefruit types are unequally represented (Saddoud,2007). The fig is widely spread in all the climaticstages in Tunisia (Mars, 1998). Thus, a largephenotypic diversity characterizes the largenumber of ecotypes distinguishable by taste,colour and flavour of the fruit (Rhouma, 1996;Mars, 2007). In addition, where the fig iscultivated, we often find wild individualsbecause there are favourable conditions for theirnatural development. Indeed, spontaneous figssystematically develop in the rocks, usuallyalong the rivers banks, in steep-sloped valleys
Biologia Tunisie Juillet 2012 ; N°7 ; 48 – 54
49
but not too deep, which means on well-lit slopeswith a few trees. This topography is particularlycommon in areas of limestone’s plates. Previouswork found that the fig occupies this type ofhabitat in many Mediterranean regions (Khadari,2005). The sub-spontaneous fig took place by aseed reproduction, and this happens in a naturalway without man’s intervention but usingother factors such as the birds which consumethe seeds. Due to the gastric juices enzymesthese grains become fertile. So it is interesting tostudy their genetic diversity, because there willbe a very important genetic mixture betweeneither the individuals of the same region or evenbetween those of the most remote ones duringthe birds’ migration. Our aims in this work are toinvestigate genetic diversity and to establishrelationships among Tunisian sub-spontaneous fig by using morphological traitsanalysis. The evaluation of morphologicalvariations was based on the observation and themeasurement of the morphological criteria onthe leaves. Indeed, this information is importantto have a first inventory of wild germplasm inorder to identify the most discriminating andinformative characteristics in the estimation ofthe amount and the organization of thevariability of theses Tunisian sub-spontaneous fig populations. Results obtainedfrom these markers are compared and discussedin order to start an improvement program of thisspecies.
MATERIAL AND METHODS
Plant materialA total of 64 wild fig trees were inventoried innorthern and central Tunisia (11 individualsfrom Menzel Bouzelfa, 11 from El Haouaria, 7from Kerkennah Islands, 6 from Ghar Elmeleh,12 from Raf Raf, 5 from Ras Jebel and 18 fromSiliana). The plant material consisted in leavesrandomly taken from adult trees and used toundergo a morphological study.
Morphological charactersMorphological characterization of eachindividual was performed according to theguidelines provided by the international plantgenetic resources institute (IPGRI, 2004) in the
‘Descriptors of fig’ (F. carica related Ficus ssp)(Table 1).To study the morphological variability of Ficuscarica sub-spontaneous 10 leaves were randomlytaken at different part of the tree and eightvariables were measured. All morphometricmeasurements were taken using a Vernier caliperwith digital display.
Analysis of morphological dataIn order to elucidate genetic variability and toestablish relationships between sub-spontaneoustrees, several statistical procedures wereconducted. Phenotypic data were used toapproximate contribution of the measured leavestraits in the genetic diversity among theconsidered individuals. Data were computedusing the SAS software (Statistical AnalysisSystem, version V.6.07; SAS, 1990) to achieveone-way analysis of variance (ANOVA) andprincipal components analysis (PCA) as amultivariate analysis. The PCA analysis wasapplied to assess differences between individualsand elucidate partitioning of phenotypicvariability at inter-populations level. Parametersmeans were compared by DUNCAN’S multiplerange test (P 0.05) (Dangnelie, 1975).The Euclidean distance were estimated betweenindividuals and an hierarchical cluster wasconstructed according to Ward's method (Ward,1963) by module in the statistical packagesSTATISTICA 6.0 (StatSoft Inc, 2001) toestablish relationships among Tunisian sub-spontaneous fig trees
RESULTS
Determination of the dominant leaf typeA variable number of leaves lobes are observedin the same tree. The dominant leaf type wasdetermined for 10 or 14 leaves per tree. Resultdemonstrates the dominance of leaves with 3 and5 lobes in the Cap Bon region, 5 and 7 lobes inthe Kerkennah islands. Concerning Kesra andSidi Mansour (Seliana) areas we recorded thedominance respectively of leaves showing 3 and5 lobes. Results provide a distribution of leavestypes according to the prospected geographicalareas (Table 2).
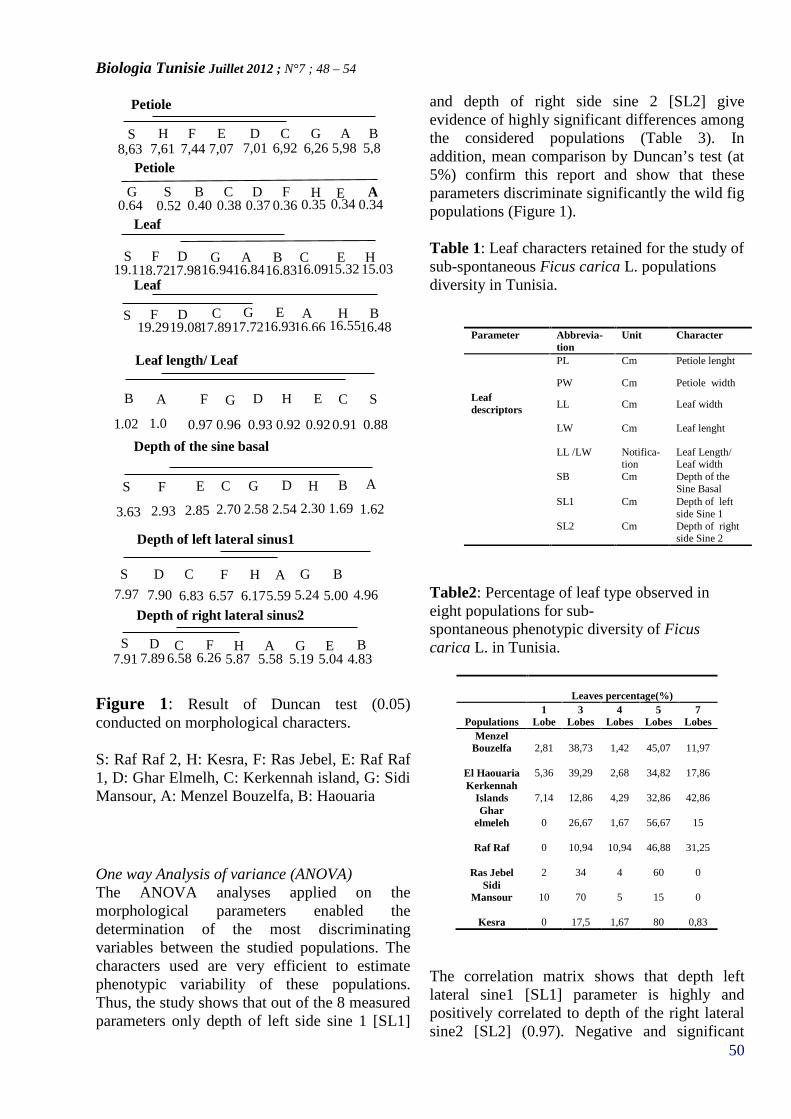
Biologia Tunisie Juillet 2012 ; N°7 ; 48 – 54
50
Figure 1: Result of Duncan test (0.05)conducted on morphological characters.
S: Raf Raf 2, H: Kesra, F: Ras Jebel, E: Raf Raf1, D: Ghar Elmelh, C: Kerkennah island, G: SidiMansour, A: Menzel Bouzelfa, B: Haouaria
One way Analysis of variance (ANOVA)The ANOVA analyses applied on themorphological parameters enabled thedetermination of the most discriminatingvariables between the studied populations. Thecharacters used are very efficient to estimatephenotypic variability of these populations.Thus, the study shows that out of the 8 measuredparameters only depth of left side sine 1 [SL1]
and depth of right side sine 2 [SL2] giveevidence of highly significant differences amongthe considered populations (Table 3). Inaddition, mean comparison by Duncan’s test (at5%) confirm this report and show that theseparameters discriminate significantly the wild figpopulations (Figure 1).
Table 1: Leaf characters retained for the study ofsub-spontaneous Ficus carica L. populationsdiversity in Tunisia.
Table2: Percentage of leaf type observed ineight populations for sub-spontaneous phenotypic diversity of Ficuscarica L. in Tunisia.
Leaves percentage(%)
Populations1
Lobe3
Lobes4
Lobes5
Lobes7
LobesMenzel
Bouzelfa 2,81 38,73 1,42 45,07 11,97
El Haouaria 5,36 39,29 2,68 34,82 17,86Kerkennah
Islands 7,14 12,86 4,29 32,86 42,86Ghar
elmeleh 0 26,67 1,67 56,67 15
Raf Raf 0 10,94 10,94 46,88 31,25
Ras Jebel 2 34 4 60 0Sidi
Mansour 10 70 5 15 0
Kesra 0 17,5 1,67 80 0,83
The correlation matrix shows that depth leftlateral sine1 [SL1] parameter is highly andpositively correlated to depth of the right lateralsine2 [SL2] (0.97). Negative and significant
Parameter Abbrevia-tion
Unit Character
Leafdescriptors
PL Cm Petiole lenght
PW Cm Petiole width
LL Cm Leaf width
LW Cm Leaf lenght
LL /LW Notifica-tion
Leaf Length/Leaf width
SB Cm Depth of theSine Basal
SL1 Cm Depth of leftside Sine 1
SL2 Cm Depth of rightside Sine 2
SCEHDGFAB
1.02 1.00
0.97 0.96 0.93 0.92 0.92 0.91 0.88
S F E C G D H B A
3.63 2.93 2.85 2.70 2.58 2.54 2.30 1.69 1.62
S D C F H A G BE4.965.005.245.596.176.576.837.907.97
BEGAHFCDS4.835.045.195.585.876.266.587.897.91
S H F E D C G A B5,85,986,266,927,017,077,447,618,63
G S B C D F H AE0.64 0.52 0.40 0.38 0.37 0.36 0.35 0.340.34
S F D G A B C E H19.118.7217.9816.9416.8416.8316.0915.32 15.03
S F D GC E A H B19.2919.0817.8917.7216.9316.66 16.5516.48
21.69
Petiolelength
Petiolewidth
Leaflength
Leaf length/ Leafwidth
Leafwidth
Depth of the sine basal
Depth of left lateral sinus1
Depth of right lateral sinus2
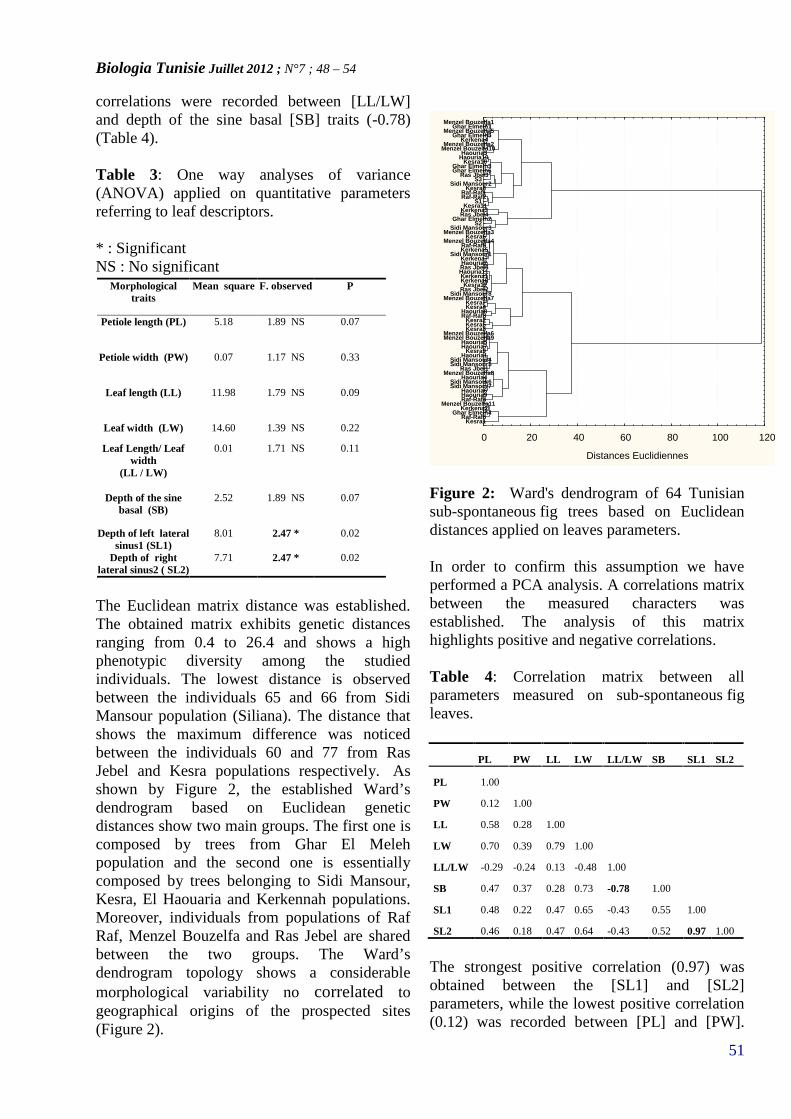
Biologia Tunisie Juillet 2012 ; N°7 ; 48 – 54
51
correlations were recorded between [LL/LW]and depth of the sine basal [SB] traits (-0.78)(Table 4).
Table 3: One way analyses of variance(ANOVA) applied on quantitative parametersreferring to leaf descriptors.
* : SignificantNS : No significant
The Euclidean matrix distance was established.The obtained matrix exhibits genetic distancesranging from 0.4 to 26.4 and shows a highphenotypic diversity among the studiedindividuals. The lowest distance is observedbetween the individuals 65 and 66 from SidiMansour population (Siliana). The distance thatshows the maximum difference was noticedbetween the individuals 60 and 77 from RasJebel and Kesra populations respectively. Asshown by Figure 2, the established Ward’sdendrogram based on Euclidean geneticdistances show two main groups. The first one iscomposed by trees from Ghar El Melehpopulation and the second one is essentiallycomposed by trees belonging to Sidi Mansour,Kesra, El Haouaria and Kerkennah populations.Moreover, individuals from populations of RafRaf, Menzel Bouzelfa and Ras Jebel are sharedbetween the two groups. The Ward’sdendrogram topology shows a considerablemorphological variability no correlated togeographical origins of the prospected sites(Figure 2).
Figure 2: Ward's dendrogram of 64 Tunisiansub-spontaneous fig trees based on Euclideandistances applied on leaves parameters.
In order to confirm this assumption we haveperformed a PCA analysis. A correlations matrixbetween the measured characters wasestablished. The analysis of this matrixhighlights positive and negative correlations.
Table 4: Correlation matrix between allparameters measured on sub-spontaneous figleaves.
PL PW LL LW LL/LW SB SL1 SL2
PL 1.00
PW 0.12 1.00
LL 0.58 0.28 1.00
LW 0.70 0.39 0.79 1.00
LL/LW -0.29 -0.24 0.13 -0.48 1.00
SB 0.47 0.37 0.28 0.73 -0.78 1.00
SL1 0.48 0.22 0.47 0.65 -0.43 0.55 1.00
SL2 0.46 0.18 0.47 0.64 -0.43 0.52 0.97 1.00
The strongest positive correlation (0.97) wasobtained between the [SL1] and [SL2]parameters, while the lowest positive correlation(0.12) was recorded between [PL] and [PW].
Morphologicaltraits
Mean square F. observed P
Petiole length (PL) 5.18 1.89 NS 0.07
Petiole width (PW) 0.07 1.17 NS 0.33
Leaf length (LL) 11.98 1.79 NS 0.09
Leaf width (LW) 14.60 1.39 NS 0.22
Leaf Length/ Leafwidth
(LL / LW)
0.01 1.71 NS 0.11
Depth of the sinebasal (SB)
2.52 1.89 NS 0.07
Depth of left lateralsinus1 (SL1)
8.01 2.47 * 0.02
Depth of rightlateral sinus2 ( SL2)
7.71 2.47 * 0.02
0 20 40 60 80 100 120
Distances Euclidiennes
Kesra1Raf-Raf6
Ghar Elmelh4Kerkena2
Menzel Bouzelfa11Raf-Raf4Haouria9Haouria6
Sidi Mansour7Sidi Mansour6
Haouria4Menzel Bouzelfa8
Ras Jbel1Sidi Mansour5Sidi Mansour4
Haouria1Kesra9
Haouria7Haouria5
Menzel Bouzelfa9Menzel Bouzelfa6
Kesra3Kesra5Kesra2
Raf-Raf3Haouria8
Kesra4Kesra7
Menzel Bouzelfa7Sidi Mansour8
Ras Jbel2Kesra12
Kerkena6Kerkena1Haouria11Ras Jbel5Haouria2Kerkena7
Sidi Mansour1Kerkena5Raf-Raf5
Menzel Bouzelfa4Kesra6
Menzel Bouzelfa3Sidi Mansour3
S2Ghar Elmelh2
Ras Jbel4Kerkena3Kesra11
S1Raf-Raf2Raf-Raf1
Kesra8Sidi Mansour2
S3Ras Jbel3
Ghar Elmelh6Ghar Elmelh3
Kesra10Haouria10Haouria3
Menzel Bouzelfa10Menzel Bouzelfa2
Kerkena4Ghar Elmelh5
Menzel Bouzelfa5Ghar Elmelh1
Menzel Bouzelfa1

Biologia Tunisie Juillet 2012 ; N°7 ; 48 – 54
52
The negative correlations were ranged from (-0.78) observed between the parameters [LL /LW] and [SB] to (-0.24) between the parameters[LL / LW] and [PW] (Table 4).ACP results show that the three first principalcomponents accounted for 84.38% of the totalvariation and suggest a good structuration of thesub-spontaneous fig trees diversity. The firstcomponent absorbs (54.84%) of the totaldiversity and positively defined by [LW] and[SL1] parameters. This axis is negativelycorrelated to the parameter [LL / LW]. Thesecond axis absorbs (17.12%) of the totalvariability and defined positively by [LL] andnegatively by [SB] traits. The third axis absorbs(12.42%) of the total diversity and definedpositively by [PW] and negatively by [SL2]characters (Table 5).
Table5: Variables relative contribution to thevariation provided by the first three axis of thePCA.
Eigenvectors PC1 PC2 PC3
Absorptionproportion(%)
Cumulativeof varianceexplained
54,84 17.12
71,96
12.42
84,38
Axes Var e.i Var e.i Var e.i
LW
SL1
LP
-
LL/LW
+0.44
+0.40
+0.34
-0.28
LL
-SB
+0.60
-0.37
DP
SL2
+0.79
-0.40
Var : variable ; e.i: Eigenvalue
The screening of all individuals in the plotdefined by the two first components, whichabsorb (72 %) of the total variability, shows avery condensed dispersion (Figure 3).This dispersion reveals the presence of a lowvariability between populations. In contrast, theintra-population variability is important in spiteof the geographical origin of the studiedindividuals. Indeed, it was found that thepopulation of Kesra is the most polymorphic and
that Menzel Bouzelfa is the slightest diversepopulation.
Figure 3: Dispersion of Tunisian wild fig treesin the plot (1-2) of the principal componentanalysis (72% of the global variability) based inphenotypic characters.
A : Menzel Bouzelfa B : El Haouaria C:Kerkennah D : Ghar El-Melh E : Raf-Raf F :Ras Jebel G : Sidi Mansour H : Kesra
DISCUSSIONThe purpose of the present study was to evaluategenetic diversity and characterize the sub-spontaneous fig tree using morphologicalparameters of leaves. Results exhibitedconsiderable genetic variation among Tunisiansub-spontaneous fig populations. Our resultssuggest the most discriminating characters aredepth of left lateral sinus1 [SL1] and depth ofright lateral sinus2 [SL2]). In addition, variousdifferences were detected on percentage ofnumber of lobes. These traits will be very usefulto characterize and discriminate sub-spontaneousfig populations. Indeed, prospections conductedpermit to conclude that a great mixture of thelobe number was unregistered per prospectedarea. Results obtained by PCA and ward’sdendrogram showed a distribution of treesgenetic variability independent from theirgeographical origins. The pattern ofmorphological variability observed in this studyis similar to those from several studies
Axis 1: 54,84%
0
3
2
1
-1
-2
AA
AA
A
A
A
A
A
A
B
B
BB
B
BB
BB
B
B
C
CC C
C
C
C
D
D
DD
D
D
E
E
EE
E
E
GG
G
G
G
G
G
G
F
F
F
F
F
H
H H
H
H
H
HH
H
HH
S
S
S
-3
6426 4 2
Axis 2 :17,11
%
Biologia Tunisie Juillet 2012 ; N°7 ; 48 – 54
53
demonstrating that for common fig cultivarsmorphological differences are often based onmorphological and pomological as suggested byseveral works (Salhi Hannachi et al. 2003, Chattiet al. 2004; Saddoud et al. 2008, Papadopoulouet al. 2002).
It will be very useful to continue this study forenlarged the number of wild fig trees and attainother regions in Tunisia. In order to optimize andrefine these results molecular markers such asssrs must be revealed. Combined results willimprove discrimination between sub-spontaneous Ficus carica individuals toelaborate domestication history of fig in Tunisia.Our results demonstrate that Tunisianspontaneous fig germplasm presents specificgenetic resources. Clonal diversity, ancientcultivation, local gene pool and geneticstructuring at a local scale imply a high potentialto start local cultivars selection and breedingprograms.
AKNOWLEGMENTSThis work was partially supported by grantsfrom the Tunisian “Ministère de l'EnseignementSupérieur, de la Recherche Scientifique et de laTechnologie ” Projet Lab B02.
REFERENCES
Berg, C.C. (1989). “Classification anddistribution of Ficus”. Experientia. 45: 605-611.Berg, C.C. (1990). “Reproduction and evolutionof Ficus (Moraceae): traits connected with theadequate rearing of pollinators”. Mem. NY Bot.Gard. 55:169–185.
Chatti, K. ; Salhi Hannachi, A. ; Mars, M. et al.(2004). Analyse de la diversité génétique decultivars tunisiens de figuier (Ficus carica L.) àl'aide de caractèresmorphologiques. Fruits. 59: 49–61.
Dagneli, P. (1975). Théorie et methodesstatistiques. Applications agronomiques. VolumeII : Les méthodes de linférence statistique. Eds.,Les presses agronomiques de Gembloux. 463 p.IPGRI. (2004). Descriptors for fig (Ficus carica
L.). IPGRI, CIHEAM. ISBN 92-9043-598-4.
Janzen, D.H. (1979). “How to be a fig” annualreview of ecology and systematics 10: 13-51.Khadari, B.; Grout, C. ; Santoni, S. ; Hochu, I. ;Roger J.P. ; Ater, M. ; Aksoy, U. and Kjellberg,F. (2005). “ Etude préliminaire des origines deFicus carica L. et de sa domestication » LesActes du BRG. 5 : 53-65
Kislev, M. E.; Hartmann A. and Bar-Yosef O.(2006). “Early domesticated fig in the JordanValley.” Science. 312: 1372–1374.
Mars, M.; Chatti, K.; Saddoud, O.; SalhiHannachi A.; Trifi, M. and Marrakchi, M.(2007). “Fig cultivation and genetic resourcesin Tunisia, an overview”, Acta Horticulturae.798: 27-32.
Mars, M.; Chelbi, T. and Marrakchi, M. (1998).“Multivariate analysis of fig (Ficus carica L.)germplasm in southern Tunisia”, ActaHortic. 480: 75–81.
Papadopoulou, K.; Ehaliotis, C.; Tourna, M.;Kastanis, P.; Karydis, I. and Zervakis, G. (2002).Genetic relatedness among dioecious Ficuscarica L. cultivars by random amplifiedpolymorphic DNA analysis and evaluation ofagronomic and morphological characters.Genetica. 1-12.
Rhouma, A. (1996). “Les ressourcesphytogénétiques oasiennes: le figuier (Ficuscarica L.).– In: Proc. 3èmes Jour nées Nationalessur les Acquis de la Recherche Agronomique,Vétérinaire et Halieutique, Nabeul.
Saddoud, O.; Chatti, K.; Salhi Hannachi, A.;Mars, M.; Rhouma, A.; Marrakchi M. and Trifi,M. (2007). “Genetic diversity of Tunisian figs(Ficus carica L.) as revealed by nuclearmicrosatellites”, Hereditas. 144: 149–157.
Saddoud, O.; Baraket, G.; Chatti, K.; Trifi, M.;Marrakchi, M.; Salhi-Hannachi A. and Mars M.(2008). “Morphological variability of fig (Ficuscarica L.) cultivars” », Int. J. Fruit Sci. 8: 35–51.
Salhi Hannachi A.; Mars M.; Chatti K.;Marrakchi M. and Trifi M. (2003). “Specificgenetic markers for Tunisian fig germplasm:
Biologia Tunisie Juillet 2012 ; N°7 ; 48 – 54
54
evidence of morphological traits, randomamplified polymorphic DNA and Inter simple sequence repeatsmarkers.” J. Genet. Breed. 5:125-136.
StatSoft, Inc. (2001). STATISTICA (dataanalysis software systems), version 6. StatSoft,Inc. (www.statsoft.com), Tulsa, OK. USA.
SAS (1990). SAS user’s guide: SAS STAT, SASBASIC. Version 6 fourth edition. Sas incl, BOX8000. cary, NC 27512-8000, cary; NC: SASinstitute Inc.
Tous, J. and Ferguson, L. (1996). Mediterraneanfruits, in progress in new corps, edited byj.janick. ASHS Press, Arlington , V.A.
Ward J. H. (1963). Hierarchical Grouping tooptimize an objective function. Journal ofAmerican Statistical Association. 58: 236-244.
Weiblen, G. D. (2000). Phylogeneticrelationships of functionallydioecious Ficus (Moraceae) based on ribosomalDNA sequence variation andmorphology. American Journal of Botany 87:1342-1357.
Zohary, D. and Hopf, M. (1988). “Domesticationof plants in the old world”, Oxford, ClorendonPress.

Biologia Tunisie Juillet 2012; N°7 ; 55 – 58
55
BIOLOGIA TUNISIE
EFFECT OF GARLIC'S ADMINISTRATION ON ERYTHROCYTES ANDPLASMA PARAMETERS IN RAT
HAMLAOUI-GASMI S., MOKNI M., AOUANI E., AMRI M., MARZOUKI L.
Laboratoire de Neurophysiologie Fonctionnelle et Pathologies, Faculté des Sciences de Tunis –Campus Universitaire Manar II 1060 Tunis, Tunisie
INTRODUCTION
Garlic (Allium sativum L.) is a widely usedmedicinal plant which has been extensivelystudied as a nutritional supplement in acute aswell as in chronic experiments (Lawson andBauer 1998). Garlic exerted wide range effectssuch as antiviral and antibacterial (Taratinsev etal. 1992), antitumoral (Schaffer et al. 1996),antiatherosclerotic (Campbell et al. 2001),hypolipidemic (Yeh and Liu 2001) andantioxidant (Banerjee et al. 2002).However several reported effects were divergenteven contradictory according to experimentalduration, garlic extraction and dosage and alsomode of administration (Banerjee and Maulik2002). Garlic is generally administered eitherorally (PO) or by intraperitoneal (IP) route. Thislatter way of administration which avoids thegastric barrier was previously shown to be moreeffective than gastric gavage. Recently specialemphasis was made on the use of the IP route inchemotherapy treatment (Canistra, 2006).The present study was undertaken to comparethe two modes of garlic administration onerythrocytes and plasma parameters i-e PO andIP routes in chronic experiments of one monthduration. Garlic was used at high dosagepreviously demonstrated to reduce plasmacholesterol when acutely administered by IProute (Mokni et al. 2006).
MATERIALS AND METHODS
Animals and treatmentAdult male wistar rats (180–200 g) procuredfrom Pasteur Institute (Tunis) were kept in cleanplastic cages and allowed to acclimatize in the
laboratory environment from 7 days. Animalswere randomly divided into four groups of 12and treated for 30 days as follows:Group I received standard diet and served ascontrol. Group II received standard dietsupplemented with aqueous extract of garlic at5g/kg bw.Group III received intraperitoneal injection (IP)of double distilled water (control).Group IV received aqueous garlic by IPinjection at 5g/kg bw.Animals were regularly cheked for weight gainor loss. After one month treatment, blood wascollected by cardiac punction and used forhematological and biochemical parametersdetermination.
Preparation of garlic extractsGarlic was purchased from local market, peeledand ground with an electric mixer. It was dilutedin double distilled water at 4 g/ml on the basisof the weight of the starting material andcentrifuged (Beckman J20, 15 min at 10 000 gand 4°C). Supernatant was aliquoted and storedat – 80°C until use.
Hematological parametersErythrocytes counts, hemoglobin level,haematocrit, VGM, CCMH and TGMH weredetermined automatically using coulter countsapparatus.
Plasma parametersGlycemia and plasma content calcium,phosphate, sodium and potassium were given onplasma with the assistance of an automat(Coulter).
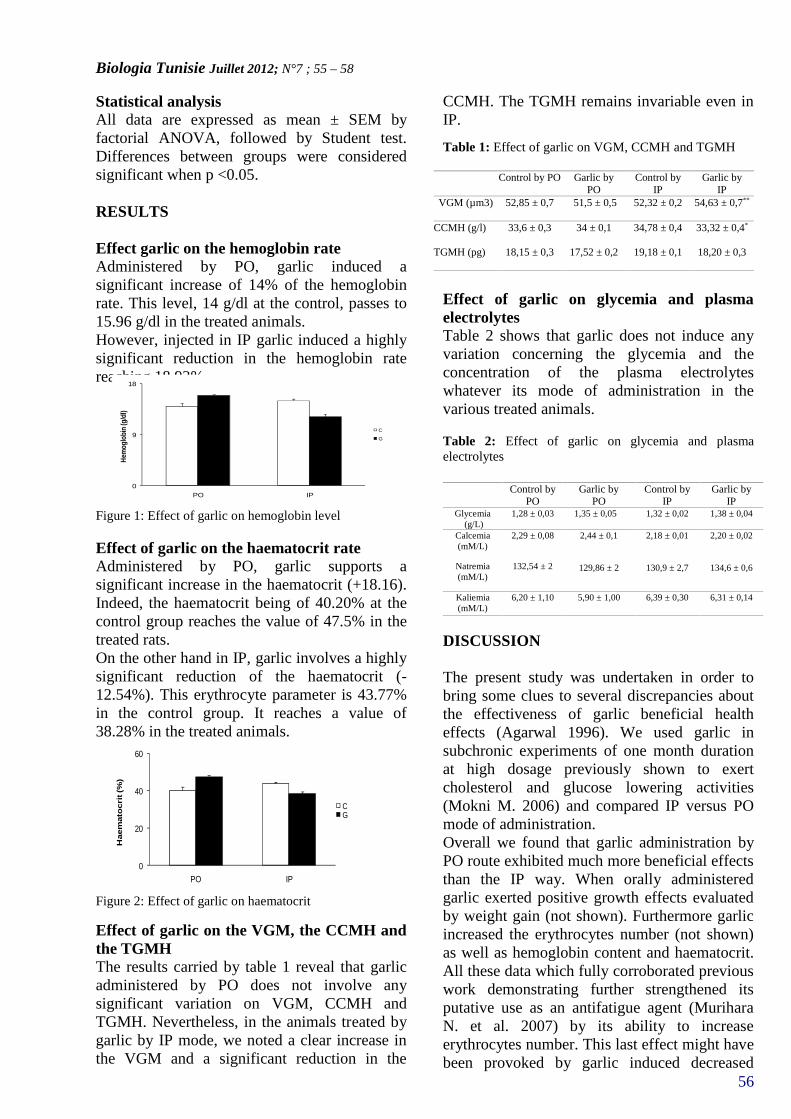
Biologia Tunisie Juillet 2012; N°7 ; 55 – 58
56
Statistical analysisAll data are expressed as mean ± SEM byfactorial ANOVA, followed by Student test.Differences between groups were consideredsignificant when p <0.05.
RESULTS
Effect garlic on the hemoglobin rateAdministered by PO, garlic induced asignificant increase of 14% of the hemoglobinrate. This level, 14 g/dl at the control, passes to15.96 g/dl in the treated animals.However, injected in IP garlic induced a highlysignificant reduction in the hemoglobin ratereaching 18.93%.
Figure 1: Effect of garlic on hemoglobin level
Effect of garlic on the haematocrit rateAdministered by PO, garlic supports asignificant increase in the haematocrit (+18.16).Indeed, the haematocrit being of 40.20% at thecontrol group reaches the value of 47.5% in thetreated rats.On the other hand in IP, garlic involves a highlysignificant reduction of the haematocrit (-12.54%). This erythrocyte parameter is 43.77%in the control group. It reaches a value of38.28% in the treated animals.
Figure 2: Effect of garlic on haematocrit
Effect of garlic on the VGM, the CCMH andthe TGMHThe results carried by table 1 reveal that garlicadministered by PO does not involve anysignificant variation on VGM, CCMH andTGMH. Nevertheless, in the animals treated bygarlic by IP mode, we noted a clear increase inthe VGM and a significant reduction in the
CCMH. The TGMH remains invariable even inIP.
Table 1: Effect of garlic on VGM, CCMH and TGMH
Effect of garlic on glycemia and plasmaelectrolytesTable 2 shows that garlic does not induce anyvariation concerning the glycemia and theconcentration of the plasma electrolyteswhatever its mode of administration in thevarious treated animals.
Table 2: Effect of garlic on glycemia and plasmaelectrolytes
Garlic byIP
Control byIP
Garlic byPO
Control byPO
1,38 ± 0,041,32 ± 0,0253,1 ± 0,051,28 ± 0,03Glycemia(g/L)
2,20 ± 0,02
134,6 ± 0,6
2,18 ± 0,01
130,9 ± 2,7
2,44 ± 0,1
129,86 ± 2
2,29 ± 0,08
132,54 ± 2
Calcemia(mM/L)
Natremia(mM/L)
6,31 ± 0,146,39 ± 0,305,90 ± 1,006,20 ± 1,10Kaliemia(mM/L)
DISCUSSION
The present study was undertaken in order tobring some clues to several discrepancies aboutthe effectiveness of garlic beneficial healtheffects (Agarwal 1996). We used garlic insubchronic experiments of one month durationat high dosage previously shown to exertcholesterol and glucose lowering activities(Mokni M. 2006) and compared IP versus POmode of administration.Overall we found that garlic administration byPO route exhibited much more beneficial effectsthan the IP way. When orally administeredgarlic exerted positive growth effects evaluatedby weight gain (not shown). Furthermore garlicincreased the erythrocytes number (not shown)as well as hemoglobin content and haematocrit.All these data which fully corroborated previouswork demonstrating further strengthened itsputative use as an antifatigue agent (MuriharaN. et al. 2007) by its ability to increaseerythrocytes number. This last effect might havebeen provoked by garlic induced decreased
Garlic byIP
Control byIP
Garlic byPO
Control by PO
54,63 ± 0,7**52,32 ± 0,251,5 ± 0,552,85 ± 0,7VGM (µm3)
33,32 ± 0,4*
18,20 ± 0,3
34,78 ± 0,4
19,18 ± 0,1
34 ± 0,1
17,52 ± 0,2
33,6 ± 0,3
18,15 ± 0,3
CCMH (g/l)
TGMH (pg)
0
9
18
PO IP
Hem
oglo
bin(
g/dl
)
C
G
**
0
20
40
60
PO IP
Hae
mat
ocr
it (%
)
CG
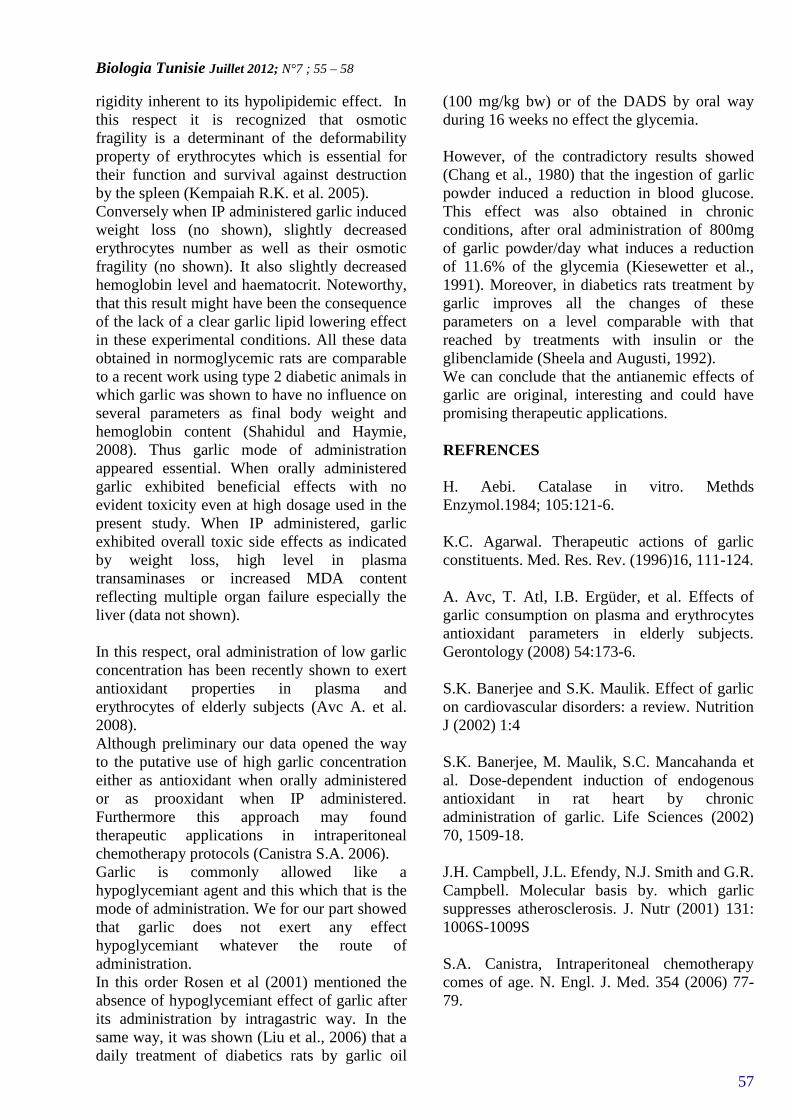
Biologia Tunisie Juillet 2012; N°7 ; 55 – 58
57
rigidity inherent to its hypolipidemic effect. Inthis respect it is recognized that osmoticfragility is a determinant of the deformabilityproperty of erythrocytes which is essential fortheir function and survival against destructionby the spleen (Kempaiah R.K. et al. 2005).Conversely when IP administered garlic inducedweight loss (no shown), slightly decreasederythrocytes number as well as their osmoticfragility (no shown). It also slightly decreasedhemoglobin level and haematocrit. Noteworthy,that this result might have been the consequenceof the lack of a clear garlic lipid lowering effectin these experimental conditions. All these dataobtained in normoglycemic rats are comparableto a recent work using type 2 diabetic animals inwhich garlic was shown to have no influence onseveral parameters as final body weight andhemoglobin content (Shahidul and Haymie,2008). Thus garlic mode of administrationappeared essential. When orally administeredgarlic exhibited beneficial effects with noevident toxicity even at high dosage used in thepresent study. When IP administered, garlicexhibited overall toxic side effects as indicatedby weight loss, high level in plasmatransaminases or increased MDA contentreflecting multiple organ failure especially theliver (data not shown).
In this respect, oral administration of low garlicconcentration has been recently shown to exertantioxidant properties in plasma anderythrocytes of elderly subjects (Avc A. et al.2008).Although preliminary our data opened the wayto the putative use of high garlic concentrationeither as antioxidant when orally administeredor as prooxidant when IP administered.Furthermore this approach may foundtherapeutic applications in intraperitonealchemotherapy protocols (Canistra S.A. 2006).Garlic is commonly allowed like ahypoglycemiant agent and this which that is themode of administration. We for our part showedthat garlic does not exert any effecthypoglycemiant whatever the route ofadministration.In this order Rosen et al (2001) mentioned theabsence of hypoglycemiant effect of garlic afterits administration by intragastric way. In thesame way, it was shown (Liu et al., 2006) that adaily treatment of diabetics rats by garlic oil
(100 mg/kg bw) or of the DADS by oral wayduring 16 weeks no effect the glycemia.
However, of the contradictory results showed(Chang et al., 1980) that the ingestion of garlicpowder induced a reduction in blood glucose.This effect was also obtained in chronicconditions, after oral administration of 800mgof garlic powder/day what induces a reductionof 11.6% of the glycemia (Kiesewetter et al.,1991). Moreover, in diabetics rats treatment bygarlic improves all the changes of theseparameters on a level comparable with thatreached by treatments with insulin or theglibenclamide (Sheela and Augusti, 1992).We can conclude that the antianemic effects ofgarlic are original, interesting and could havepromising therapeutic applications.
REFRENCES
H. Aebi. Catalase in vitro. MethdsEnzymol.1984; 105:121-6.
K.C. Agarwal. Therapeutic actions of garlicconstituents. Med. Res. Rev. (1996)16, 111-124.
A. Avc, T. Atl, I.B. Ergüder, et al. Effects ofgarlic consumption on plasma and erythrocytesantioxidant parameters in elderly subjects.Gerontology (2008) 54:173-6.
S.K. Banerjee and S.K. Maulik. Effect of garlicon cardiovascular disorders: a review. NutritionJ (2002) 1:4
S.K. Banerjee, M. Maulik, S.C. Mancahanda etal. Dose-dependent induction of endogenousantioxidant in rat heart by chronicadministration of garlic. Life Sciences (2002)70, 1509-18.
J.H. Campbell, J.L. Efendy, N.J. Smith and G.R.Campbell. Molecular basis by. which garlicsuppresses atherosclerosis. J. Nutr (2001) 131:1006S-1009S
S.A. Canistra, Intraperitoneal chemotherapycomes of age. N. Engl. J. Med. 354 (2006) 77-79.
Biologia Tunisie Juillet 2012; N°7 ; 55 – 58
58
M.L.W. Chang, M.A. Johnson. Effect off garlicone carbohydrate metabolism and lipidsynthesis in rats, J Nutr. 110 (1980) 931-936.
A.K. Dinda, S.K. Gupta, S.K. Maulik, Dose-dependent induction of endogenous antioxidantin rat heart by chronic administration of garlic,Life Sciences 70 (2002) 1509-1518.
HA Hassan, SM El-Agmy, RL Gaur et al. Invivo evidence of hepato- and reno-protectiveeffect of garlic oil against sodium nitrite-induced oxidative stress. Int J Biol Sci. 2009; 5:249-55.
R.K. Kempaiah and K. Srinivasan. Influence ofdietatary spices on the fluidity of erythrocytes inhypercholesterolaemic rats. Br J Nutr (2005) 93:81-91.
H. Kiesewetter, F. Jung, G. Pindur, E.M. et al.Effect off garlic one thrombocyte aggregation,microcirculation and other risk factors, Int JCovering joint Pharmacol Ther Toxicol. 29(1991) 151-155.
L.D. Lawson, R. Bauer, A review of itsmedicinal effects and indicated activecompounds, In: phytomedicines of Europe.Chemistry and Biological activity 691 (1998)176-209.
S.I. Liochev, I. Fridovich. The effects ofsuperoxide dismutase on H2O2 formation. FreeRadic Biol Med. 2007. 42:1465-9.
P.L. Liu, C.K. Wong, H. Lii, L.Y. Sheen.Antidiabetic effect off garlic oil drank notdiallyl disulfide in rats with streptozotocin-induced diabetes, Food and chemicalToxicology 44 (2006) 1377-1384.
M. Mokni, F. Limam, M. Amri and E. Aouani.Acute effects of a partially purified fractionfrom garlic on plasma glucose and cholesterollevels in rats: putative involvement of nitricoxide. Indian J Biochem Biophys (2006); 43:386-90.
N. Morihara, T. Nishihama, M. Ushijima et al.Garlic as an antifatigue agent. Mol Nutr FoodRes 2007 51: 1329-34.
R.T. Rosen, R.D. Hiserodt, E.K. Fukuda et al.Determination off Al, S-Allylcystein andvolatile metabolites off Garlic in breath, plasmagold simulated gastric fluids, J Nutr. 131(2001) 968S-971S.
K. Satho, Serum lipid peroxidation incerebrovascular disorders determined by a newcolorimetric method, Clin. Chim. Acta 90(1978) 37–43.
E.M. Schaffer, J.Z. Liu, J. Green, C.A. Danglerand J.A. Milner. Garlic and associated allylsulphur components inhibit N-methyl-N-nitrosurea induced rat mammary carcinogenesis.Cancer Lett. (1996) 102, 199-204.
I. Shahidul and C. Haymie. Comparative effectof dietary ginger and garlic investigated in atype 2 diabetes model of rats. J. Med. Food(2008) 11: 152-159.
C.G. Sheela, K.T. Augusti. Antidiabetic effectsoff Dirties cysteine sulphoxide isolated fromgarlic Al sativum Linn, Indian J Exp Biol. 30(1992) 532-526.
A.V. Taratinsev, P.V. Vrizheshch, A.A.Schegolev et al.. Ajoene antagonizes integrine-dependent processes in HIV-infected Tlymphoblast. AIDS (1992) 6, 1215-1217.
Y.Y. Yeh and L. Liu. Cholesterol-loweringeffect of garlic extract and organosulfurcompounds: human and animals studies. J. Nutr.(2001) 131, 989S-993S.
Biologia Tunisie Juillet 2012 ; N°7; 59 – 66
59
BIOLOGIA TUNISIE
INDUCED PHYSIOLOGICAL TRAITS BY NACL IN TWO BARLEYCULTIVARS
Eleuch L, Rezgui S and Daaloul A
Laboratoire de Génétique et Amélioration des Plantes, Département d’Agronomie et BiotechnologiesVégétales. Institut National Agronomique de Tunisie, 43, Avenue Charles Nicolle, 1082 Tunis, CitéMahrajène, TUNISIE
*Corresponding author Eleuch Lilia; E-mail: [email protected] ; Phone number:+21621591696
Keywords: Hordum vulgare, salinity stress, physiological parameters.
ABSRACT
Mechanisms of salinity tolerance wereassessed using two barley (Hordum vulgareL.) cultivars (Acsad1230 and Arig8 originatedfrom Lybia and Morocco, respectively). Thesecultivars were grown three salt treatments: 0,70 mM and 140 mM of NaCl. Dry matter,relative water content, chlorophyll and glucosecontents were measured from the leavesduring juvenile and mature growth stages.Superior dry matter accumulation in Acsad1230 at both growth stages was attributed tostable chlorophyll (a/b) ratio and acompartmentalization of Na+ and Cl- ions.Increased relative water content, lower glucoserate and increased Na+ and Cl- ions suggestedthat Acsad1230 is tolerant to salt stress. Thiscultivar appears to support salt stress with aminimum energy requirement. In Arig 8, asignificant decline for the relative watercontent dry matter and chlorophyll (a/b) ratiowas noted. Increased glucose synthesis wasrequired in Arig 8 to ensure osmoticadjustment. This cultivar is characterized assalt susceptible.
INTRODUCTION
Barley is the most important cereal crop inTunisia covering over than one third of thetotal cereal areas. Most barley is cultivatedon marginal growing areas of the semi-aridwhere drought events are prevailing andfrequently encountered. Barley grown inthe central and southern regions of Tunisiais often suited for both grazing and grainproduction. In these semi-arid areas, barleygrain production is limited because ofwater deficit and droughts that areoccurring frequently. Hence, irrigatedfarming systems are becoming a commoncultural practice to alleviate droughteffects. However these farming systemsare particularly prone to Stalinization andalkalinisation (Munns et al., 2000) causinglimited yielding ability of barley cultivars.Moreover; greater heat and longerphotoperiod combined with limited rainfallare among the major causes of saltaccumulation on the surface affecting asignificant cereal growing areas in the
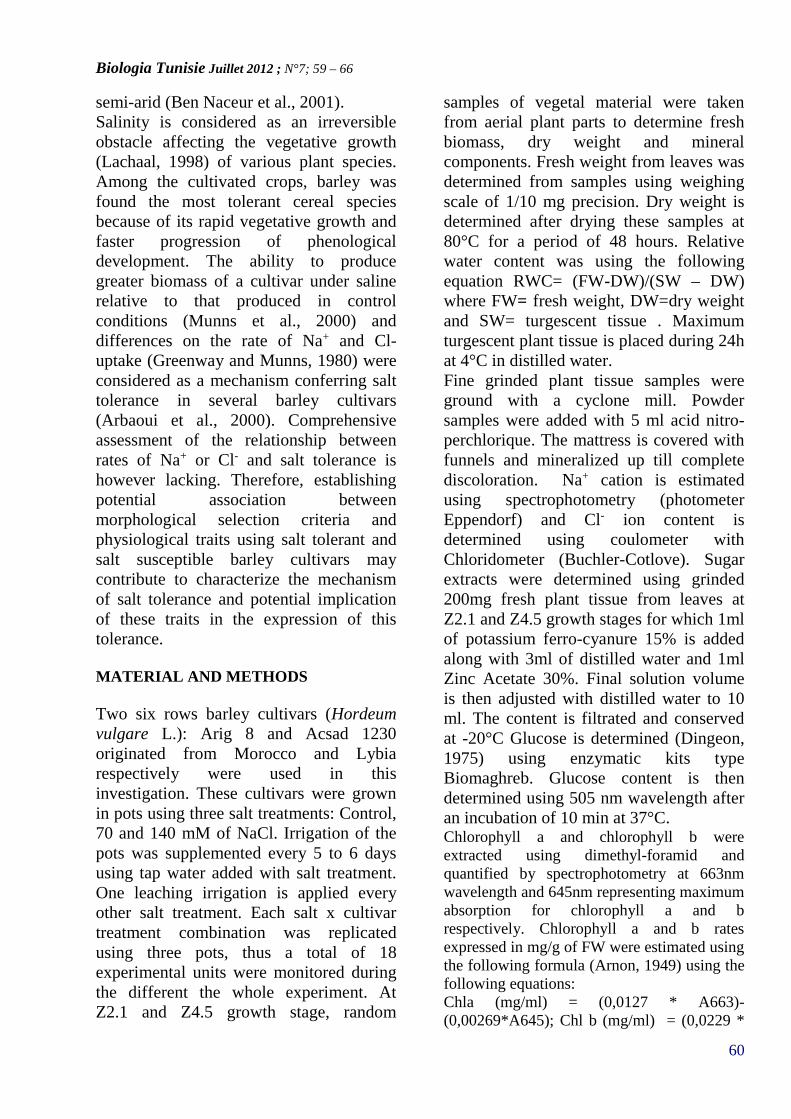
Biologia Tunisie Juillet 2012 ; N°7; 59 – 66
60
semi-arid (Ben Naceur et al., 2001).Salinity is considered as an irreversibleobstacle affecting the vegetative growth(Lachaal, 1998) of various plant species.Among the cultivated crops, barley wasfound the most tolerant cereal speciesbecause of its rapid vegetative growth andfaster progression of phenologicaldevelopment. The ability to producegreater biomass of a cultivar under salinerelative to that produced in controlconditions (Munns et al., 2000) anddifferences on the rate of Na+ and Cl-uptake (Greenway and Munns, 1980) wereconsidered as a mechanism conferring salttolerance in several barley cultivars(Arbaoui et al., 2000). Comprehensiveassessment of the relationship betweenrates of Na+ or Cl- and salt tolerance ishowever lacking. Therefore, establishingpotential association betweenmorphological selection criteria andphysiological traits using salt tolerant andsalt susceptible barley cultivars maycontribute to characterize the mechanismof salt tolerance and potential implicationof these traits in the expression of thistolerance.
MATERIAL AND METHODS
Two six rows barley cultivars (Hordeumvulgare L.): Arig 8 and Acsad 1230originated from Morocco and Lybiarespectively were used in thisinvestigation. These cultivars were grownin pots using three salt treatments: Control,70 and 140 mM of NaCl. Irrigation of thepots was supplemented every 5 to 6 daysusing tap water added with salt treatment.One leaching irrigation is applied everyother salt treatment. Each salt x cultivartreatment combination was replicatedusing three pots, thus a total of 18experimental units were monitored duringthe different the whole experiment. AtZ2.1 and Z4.5 growth stage, random
samples of vegetal material were takenfrom aerial plant parts to determine freshbiomass, dry weight and mineralcomponents. Fresh weight from leaves wasdetermined from samples using weighingscale of 1/10 mg precision. Dry weight isdetermined after drying these samples at80°C for a period of 48 hours. Relativewater content was using the followingequation RWC= (FW-DW)/(SW – DW)where FW= fresh weight, DW=dry weightand SW= turgescent tissue . Maximumturgescent plant tissue is placed during 24hat 4°C in distilled water.Fine grinded plant tissue samples wereground with a cyclone mill. Powdersamples were added with 5 ml acid nitro-perchlorique. The mattress is covered withfunnels and mineralized up till completediscoloration. Na+ cation is estimatedusing spectrophotometry (photometerEppendorf) and Cl- ion content isdetermined using coulometer withChloridometer (Buchler-Cotlove). Sugarextracts were determined using grinded200mg fresh plant tissue from leaves atZ2.1 and Z4.5 growth stages for which 1mlof potassium ferro-cyanure 15% is addedalong with 3ml of distilled water and 1mlZinc Acetate 30%. Final solution volumeis then adjusted with distilled water to 10ml. The content is filtrated and conservedat -20°C Glucose is determined (Dingeon,1975) using enzymatic kits typeBiomaghreb. Glucose content is thendetermined using 505 nm wavelength afteran incubation of 10 min at 37°C.Chlorophyll a and chlorophyll b wereextracted using dimethyl-foramid andquantified by spectrophotometry at 663nmwavelength and 645nm representing maximumabsorption for chlorophyll a and brespectively. Chlorophyll a and b ratesexpressed in mg/g of FW were estimated usingthe following formula (Arnon, 1949) using thefollowing equations:Chla (mg/ml) = (0,0127 * A663)-(0,00269*A645); Chl b (mg/ml) = (0,0229 *
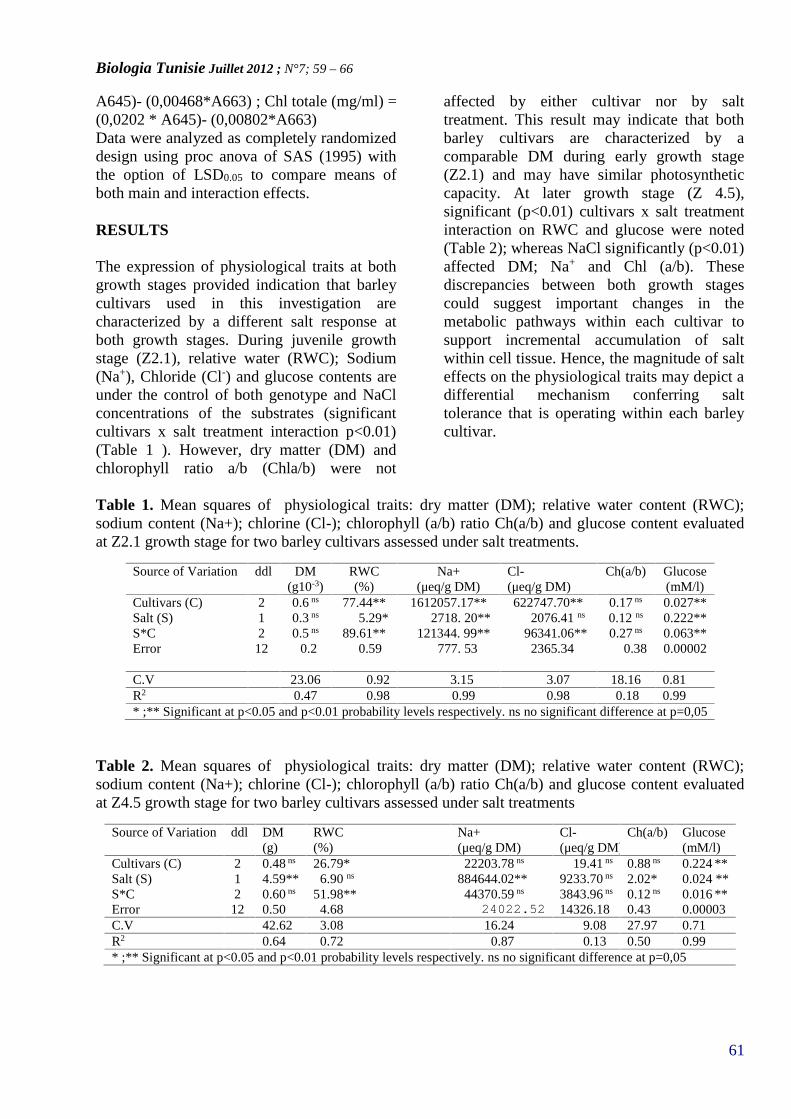
Biologia Tunisie Juillet 2012 ; N°7; 59 – 66
61
A645)- (0,00468*A663) ; Chl totale (mg/ml) =(0,0202 * A645)- (0,00802*A663)Data were analyzed as completely randomizeddesign using proc anova of SAS (1995) withthe option of LSD0.05 to compare means ofboth main and interaction effects.
RESULTS
The expression of physiological traits at bothgrowth stages provided indication that barleycultivars used in this investigation arecharacterized by a different salt response atboth growth stages. During juvenile growthstage (Z2.1), relative water (RWC); Sodium(Na+), Chloride (Cl-) and glucose contents areunder the control of both genotype and NaClconcentrations of the substrates (significantcultivars x salt treatment interaction p<0.01)(Table 1 ). However, dry matter (DM) andchlorophyll ratio a/b (Chla/b) were not
affected by either cultivar nor by salttreatment. This result may indicate that bothbarley cultivars are characterized by acomparable DM during early growth stage(Z2.1) and may have similar photosyntheticcapacity. At later growth stage (Z 4.5),significant (p<0.01) cultivars x salt treatmentinteraction on RWC and glucose were noted(Table 2); whereas NaCl significantly (p<0.01)affected DM; Na+ and Chl (a/b). Thesediscrepancies between both growth stagescould suggest important changes in themetabolic pathways within each cultivar tosupport incremental accumulation of saltwithin cell tissue. Hence, the magnitude of salteffects on the physiological traits may depict adifferential mechanism conferring salttolerance that is operating within each barleycultivar.
Table 1. Mean squares of physiological traits: dry matter (DM); relative water content (RWC);sodium content (Na+); chlorine (Cl-); chlorophyll (a/b) ratio Ch(a/b) and glucose content evaluatedat Z2.1 growth stage for two barley cultivars assessed under salt treatments.
Source of Variation ddl DM(g10-3)
RWC(%)
Na+(μeq/g DM)
Cl-(μeq/g DM)
Ch(a/b) Glucose(mM/l)
Cultivars (C) 2 0.6 ns 77.44** 1612057.17** 622747.70** 0.17 ns 0.027**Salt (S) 1 0.3 ns 5.29* 2718. 20** 2076.41 ns 0.12 ns 0.222**S*C 2 0.5 ns 89.61** 121344. 99** 96341.06** 0.27 ns 0.063**Error 12 0.2 0.59 777. 53 2365.34 0.38 0.00002
C.V 23.06 0.92 3.15 3.07 18.16 0.81R2 0.47 0.98 0.99 0.98 0.18 0.99* ;** Significant at p<0.05 and p<0.01 probability levels respectively. ns no significant difference at p=0,05
Table 2. Mean squares of physiological traits: dry matter (DM); relative water content (RWC);sodium content (Na+); chlorine (Cl-); chlorophyll (a/b) ratio Ch(a/b) and glucose content evaluatedat Z4.5 growth stage for two barley cultivars assessed under salt treatments
Source of Variation ddl DM(g)
RWC(%)
Na+(μeq/g DM)
Cl-(μeq/g DM)
Ch(a/b) Glucose(mM/l)
Cultivars (C) 2 0.48 ns 26.79* 22203.78 ns 19.41 ns 0.88 ns 0.224 **Salt (S) 1 4.59** 6.90 ns 884644.02** 9233.70 ns 2.02* 0.024 **S*C 2 0.60 ns 51.98** 44370.59 ns 3843.96 ns 0.12 ns 0.016 **Error 12 0.50 4.68 24022.52 14326.18 0.43 0.00003C.V 42.62 3.08 16.24 9.08 27.97 0.71R2 0.64 0.72 0.87 0.13 0.50 0.99* ;** Significant at p<0.05 and p<0.01 probability levels respectively. ns no significant difference at p=0,05
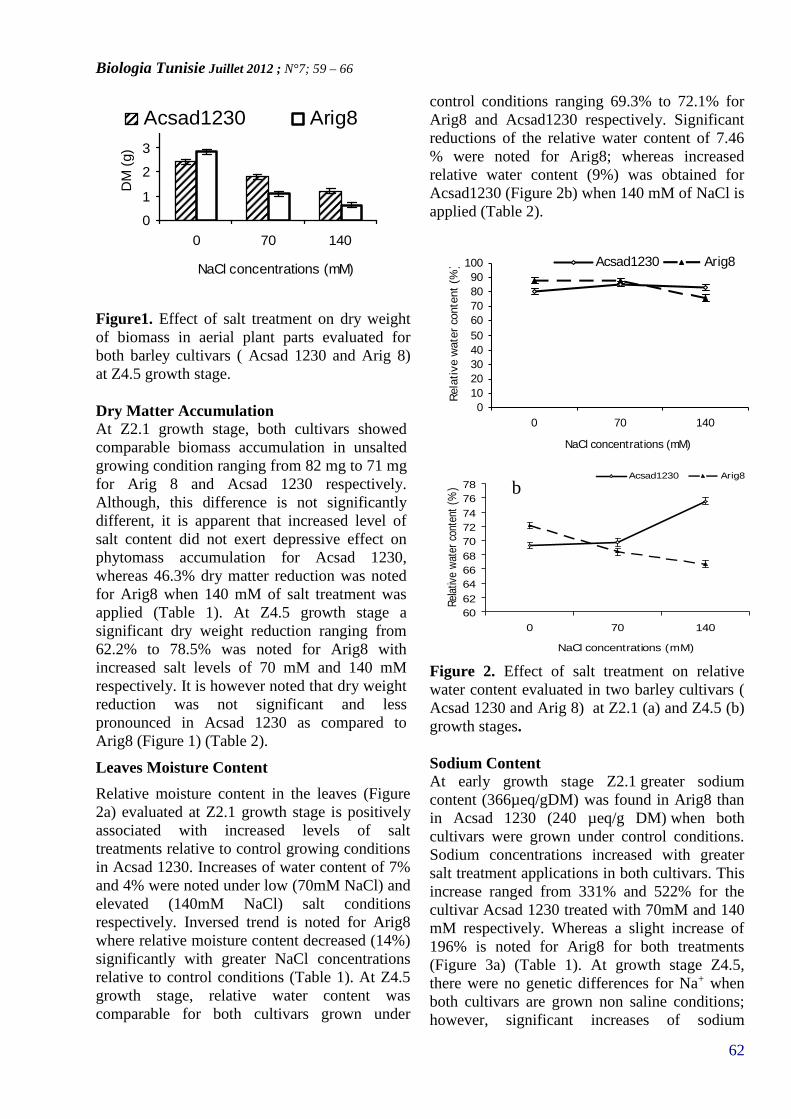
Biologia Tunisie Juillet 2012 ; N°7; 59 – 66
62
0
1
2
3
4
0 70 140
NaCl concentrations (mM)
DM
(g)
Acsad1230 Arig8
Figure1. Effect of salt treatment on dry weightof biomass in aerial plant parts evaluated forboth barley cultivars ( Acsad 1230 and Arig 8)at Z4.5 growth stage.
Dry Matter AccumulationAt Z2.1 growth stage, both cultivars showedcomparable biomass accumulation in unsaltedgrowing condition ranging from 82 mg to 71 mgfor Arig 8 and Acsad 1230 respectively.Although, this difference is not significantlydifferent, it is apparent that increased level ofsalt content did not exert depressive effect onphytomass accumulation for Acsad 1230,whereas 46.3% dry matter reduction was notedfor Arig8 when 140 mM of salt treatment wasapplied (Table 1). At Z4.5 growth stage asignificant dry weight reduction ranging from62.2% to 78.5% was noted for Arig8 withincreased salt levels of 70 mM and 140 mMrespectively. It is however noted that dry weightreduction was not significant and lesspronounced in Acsad 1230 as compared toArig8 (Figure 1) (Table 2).
Leaves Moisture Content
Relative moisture content in the leaves (Figure2a) evaluated at Z2.1 growth stage is positivelyassociated with increased levels of salttreatments relative to control growing conditionsin Acsad 1230. Increases of water content of 7%and 4% were noted under low (70mM NaCl) andelevated (140mM NaCl) salt conditionsrespectively. Inversed trend is noted for Arig8where relative moisture content decreased (14%)significantly with greater NaCl concentrationsrelative to control conditions (Table 1). At Z4.5growth stage, relative water content wascomparable for both cultivars grown under
control conditions ranging 69.3% to 72.1% forArig8 and Acsad1230 respectively. Significantreductions of the relative water content of 7.46% were noted for Arig8; whereas increasedrelative water content (9%) was obtained forAcsad1230 (Figure 2b) when 140 mM of NaCl isapplied (Table 2).
0102030405060708090
100
0 70 140
NaCl concentrations (mM)Re
lativ
e w
ater
con
tent
(%) Acsad1230 Arig8
Figure 2. Effect of salt treatment on relativewater content evaluated in two barley cultivars (Acsad 1230 and Arig 8) at Z2.1 (a) and Z4.5 (b)growth stages.
Sodium ContentAt early growth stage Z2.1 greater sodiumcontent (366µeq/gDM) was found in Arig8 thanin Acsad 1230 (240 µeq/g DM) when bothcultivars were grown under control conditions.Sodium concentrations increased with greatersalt treatment applications in both cultivars. Thisincrease ranged from 331% and 522% for thecultivar Acsad 1230 treated with 70mM and 140mM respectively. Whereas a slight increase of196% is noted for Arig8 for both treatments(Figure 3a) (Table 1). At growth stage Z4.5,there were no genetic differences for Na+ whenboth cultivars are grown non saline conditions;however, significant increases of sodium
60626466687072747678
0 70 140
NaCl concentrations (mM)
Relat
ive w
ater c
onten
t (%
)
Acsad1230 Arig8b
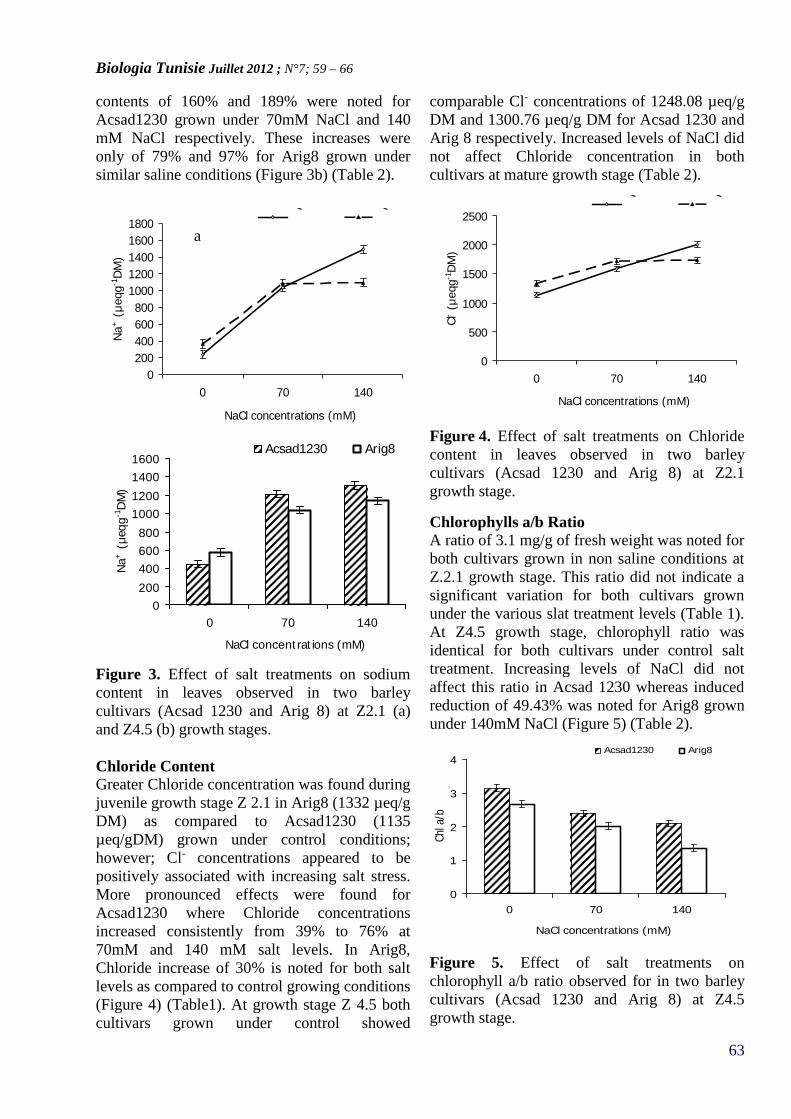
Biologia Tunisie Juillet 2012 ; N°7; 59 – 66
63
contents of 160% and 189% were noted forAcsad1230 grown under 70mM NaCl and 140mM NaCl respectively. These increases wereonly of 79% and 97% for Arig8 grown undersimilar saline conditions (Figure 3b) (Table 2).
0200400600800
1000120014001600
0 70 140
NaCl concentrations (mM)
Na+ (
μeqg
-1DM
)
Acsad1230 Arig8
Figure 3. Effect of salt treatments on sodiumcontent in leaves observed in two barleycultivars (Acsad 1230 and Arig 8) at Z2.1 (a)and Z4.5 (b) growth stages.
Chloride ContentGreater Chloride concentration was found duringjuvenile growth stage Z 2.1 in Arig8 (1332 µeq/gDM) as compared to Acsad1230 (1135µeq/gDM) grown under control conditions;however; Cl- concentrations appeared to bepositively associated with increasing salt stress.More pronounced effects were found forAcsad1230 where Chloride concentrationsincreased consistently from 39% to 76% at70mM and 140 mM salt levels. In Arig8,Chloride increase of 30% is noted for both saltlevels as compared to control growing conditions(Figure 4) (Table1). At growth stage Z 4.5 bothcultivars grown under control showed
comparable Cl- concentrations of 1248.08 µeq/gDM and 1300.76 µeq/g DM for Acsad 1230 andArig 8 respectively. Increased levels of NaCl didnot affect Chloride concentration in bothcultivars at mature growth stage (Table 2).
0
500
1000
1500
2000
2500
0 70 140
NaCl concentrations (mM)
Cl- (
μeqg
-1DM
)
Acsa
d123
0
Arig8
Figure 4. Effect of salt treatments on Chloridecontent in leaves observed in two barleycultivars (Acsad 1230 and Arig 8) at Z2.1growth stage.
Chlorophylls a/b RatioA ratio of 3.1 mg/g of fresh weight was noted forboth cultivars grown in non saline conditions atZ.2.1 growth stage. This ratio did not indicate asignificant variation for both cultivars grownunder the various slat treatment levels (Table 1).At Z4.5 growth stage, chlorophyll ratio wasidentical for both cultivars under control salttreatment. Increasing levels of NaCl did notaffect this ratio in Acsad 1230 whereas inducedreduction of 49.43% was noted for Arig8 grownunder 140mM NaCl (Figure 5) (Table 2).
0
1
2
3
4
0 70 140
NaCl concentrations (mM)
Chl a
/b
Acsad1230 Arig8
Figure 5. Effect of salt treatments onchlorophyll a/b ratio observed for in two barleycultivars (Acsad 1230 and Arig 8) at Z4.5growth stage.
0200400600800
10001200140016001800
0 70 140
NaCl concentrations (mM)
Na+
(μeq
g-1DM
)
Acsa
d123
0
Arig8
a
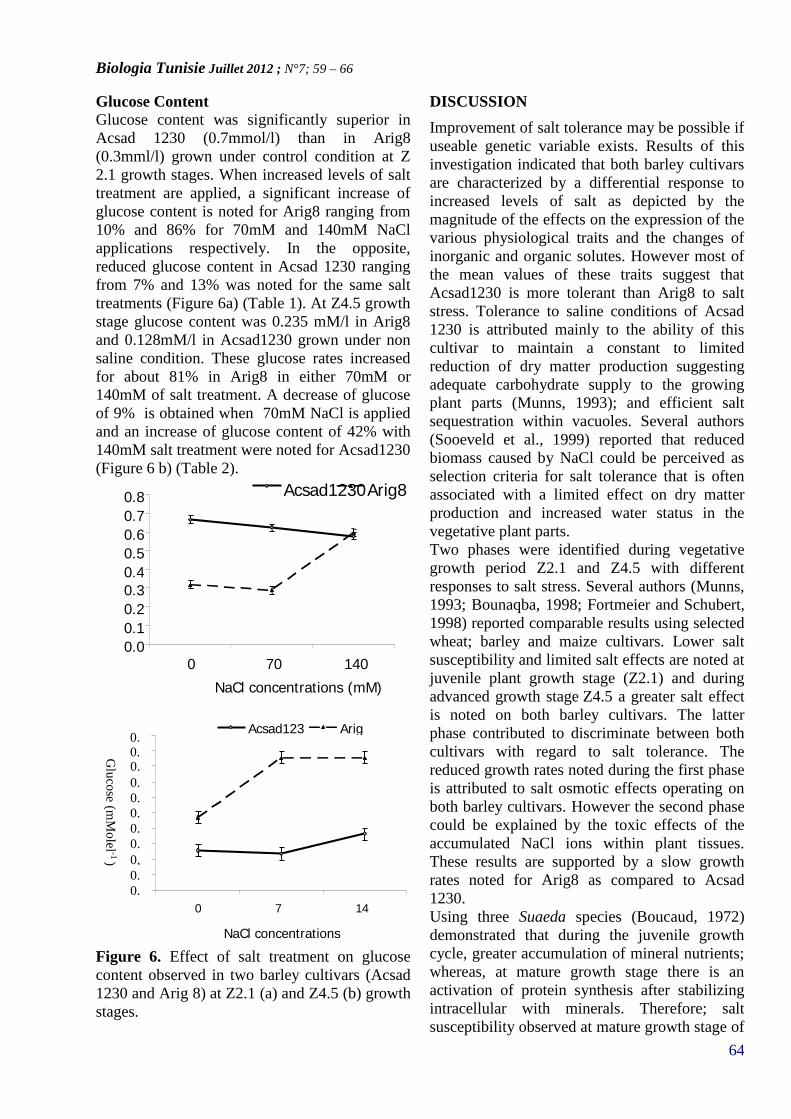
Biologia Tunisie Juillet 2012 ; N°7; 59 – 66
64
Glucose ContentGlucose content was significantly superior inAcsad 1230 (0.7mmol/l) than in Arig8(0.3mml/l) grown under control condition at Z2.1 growth stages. When increased levels of salttreatment are applied, a significant increase ofglucose content is noted for Arig8 ranging from10% and 86% for 70mM and 140mM NaClapplications respectively. In the opposite,reduced glucose content in Acsad 1230 rangingfrom 7% and 13% was noted for the same salttreatments (Figure 6a) (Table 1). At Z4.5 growthstage glucose content was 0.235 mM/l in Arig8and 0.128mM/l in Acsad1230 grown under nonsaline condition. These glucose rates increasedfor about 81% in Arig8 in either 70mM or140mM of salt treatment. A decrease of glucoseof 9% is obtained when 70mM NaCl is appliedand an increase of glucose content of 42% with140mM salt treatment were noted for Acsad1230(Figure 6 b) (Table 2).
Figure 6. Effect of salt treatment on glucosecontent observed in two barley cultivars (Acsad1230 and Arig 8) at Z2.1 (a) and Z4.5 (b) growthstages.
DISCUSSION
Improvement of salt tolerance may be possible ifuseable genetic variable exists. Results of thisinvestigation indicated that both barley cultivarsare characterized by a differential response toincreased levels of salt as depicted by themagnitude of the effects on the expression of thevarious physiological traits and the changes ofinorganic and organic solutes. However most ofthe mean values of these traits suggest thatAcsad1230 is more tolerant than Arig8 to saltstress. Tolerance to saline conditions of Acsad1230 is attributed mainly to the ability of thiscultivar to maintain a constant to limitedreduction of dry matter production suggestingadequate carbohydrate supply to the growingplant parts (Munns, 1993); and efficient saltsequestration within vacuoles. Several authors(Sooeveld et al., 1999) reported that reducedbiomass caused by NaCl could be perceived asselection criteria for salt tolerance that is oftenassociated with a limited effect on dry matterproduction and increased water status in thevegetative plant parts.Two phases were identified during vegetativegrowth period Z2.1 and Z4.5 with differentresponses to salt stress. Several authors (Munns,1993; Bounaqba, 1998; Fortmeier and Schubert,1998) reported comparable results using selectedwheat; barley and maize cultivars. Lower saltsusceptibility and limited salt effects are noted atjuvenile plant growth stage (Z2.1) and duringadvanced growth stage Z4.5 a greater salt effectis noted on both barley cultivars. The latterphase contributed to discriminate between bothcultivars with regard to salt tolerance. Thereduced growth rates noted during the first phaseis attributed to salt osmotic effects operating onboth barley cultivars. However the second phasecould be explained by the toxic effects of theaccumulated NaCl ions within plant tissues.These results are supported by a slow growthrates noted for Arig8 as compared to Acsad1230.Using three Suaeda species (Boucaud, 1972)demonstrated that during the juvenile growthcycle, greater accumulation of mineral nutrients;whereas, at mature growth stage there is anactivation of protein synthesis after stabilizingintracellular with minerals. Therefore; saltsusceptibility observed at mature growth stage of
0.00.10.20.30.40.50.60.70.8
0 70 140NaCl concentrations (mM)
Acsad1230Arig8
Glucose (m
Molel -1)
0.0
0.1
0,1
0.2
0.2
0.3
0.3
0.4
0.4
0 70
140
NaCl concentrations(mM)
Acsad1230
Arig80.
50.5
Biologia Tunisie Juillet 2012 ; N°7; 59 – 66
65
plant growing in saline substrates could beattributed to the specific effects of Na+ on themetabolism of cells. However the difference inresponse to salt tolerance noted for both barleycultivars during mature growth stage could beexplained by the relative period required to thevacuole saturation of parenchyma cells andleaves senescence due to excess ions of Na+ andCl- that may cause a nutrient disorder andimbalance of other cation such as K+. Thesephenomena are often observed in mature leavesand causing a major intoxication of these leavesand promote early senescence (Bounaqba, 1998).The repartition Na+ and Cl- ions in younger andmature leaves was not uniform for both cultivars.Greater Cl- ion concentrations are found atjuvenile growth stage. This declining gradient ofCl- in relation with plant age could be attributedto a reduced concentration of this ion in thexylem sap during its upward translocation.Thus, higher Chloride rates were noted forAcsad 1230 than observed for Arig 8 duringZ2.1 and Z4.5 growth stages. These phenomenacould be perceived as a mean to maintain theacid-basic status of the cells. Hence, greaterChloride levels are associated with significantreduction of organic and mineral other than Cl-
such as organic acids. Therefore, a moreappropriate osmotic adjustment is taking placeby an accumulation of both ions Na+ and Cl-
within plant leaves in Acsad1230.Using both growth stages, the cultivar Acsad1230 is considered as includer whereas Arig 8 isconsidered as partial exluder. This inclusive traitis considered as characteristics of salt tolerantplant species such as halophytes or glycophytesspecies that are characterized by a comparableresponse to halophytes (sugar beet, cotton).These species could absorb and transport largerates of Na+ without affecting the metabolicprocess (Rush and Epstein, 1981). This isachieved by Na+ ions a sequestration withinvacuole. Nonhalophytes (glycophytes) arecharacterized by salt exclusion from the leavesto minimize toxicity but accelerates water deficitin plant parts (Alberico and Cramer, 1993).Hence; the relationship between sodium and therelative water content in the leaves observed forboth growth stages (Z2.1 and Z4.5) prove thatNa+ excess is accumulated within the apoplasmcausing cellular dehydratation (Bounaqba,
1998).Osmotic adjustment is realized by anaccumulation of Na+ for Acsad 1230 but notwith organic solute explaining the relativetolerance of this cultivar to support increasedNaCl concentrations in the substrates. In theopposite Arig 8 accumulates greater levels oforganic solute (higher accumulation of glucosewith increased salt levels in the substrates) toadjust osmotic pressure. This high energetic costto synthesize important glucose quantityrequired for the osmotic adjustment in Arig8could be prejudicial to the growth rates andvegetative development for these plants (Alarconet al., 1994). Limited glucose synthesis wasfound in Acsad 1230 explaining better growthrates of this cultivar in substrates enriched withincreased salt levels. Furthermore; the stablechlorophyll (a/b) ratio noted in Acsad1230 atboth growth stages suggest that photosynthesis isnot disrupted in this cultivar when exposed toelevated NaCl levels. However, lowerchlorophyll (a/b) ratio noted at mature leaves forArig8 suggests that photosynthesis may havebeen declining because of a significant drop inchlorophyll content per unit leaf area that wasattributed to accumulation of salt levels in theleaves.This investigation aiming to establish acomprehensive assessment of salt toleranceusing two barley cultivars, indicated that thecultivar Acsad1230 is salt tolerant andcharacterized by a limited growth rates observedusing control substrates. Moreover, Acsad1230,Greater water status in leaves and highervacuolar compartmentalization appeared toconfer salt tolerance in this barley cultivar. Onthe opposite Arig 8 is greatly affected byincreased salt levels, although has greater growthrate in control substrates.Enhanced ability for Na+ compartmentalisation,the adjustment of the relative water content andsubstantial improvement of organic solutesappeared to be the most important selectioncriteria for salt tolerance. However; progress inelucidating the mechanisms that co-regulate theexpression of these physiological parametersshould be considered in order to efficientlyselect for salt tolerance.
REFERENCES
Biologia Tunisie Juillet 2012 ; N°7; 59 – 66
66
Alarcon, J.J., M.C. Bolarin, M. Scanchez-Blancoand A.Torrecillas, 1994. Growth, yield and waterrelations of normal fruited and cherry tomatocultivars irrigated with saline water. J. Horti.Sci., 69: 283-288.
Alberico, G.J. and G.R. Cramer, 1993. Is thesalt tolerance of maize related to sodiumexclusion? I. Preliminary screening of sevencultivars. J. Plant. Nutri., 16: 2289-2303.
Arbaoui, M., M. Benkhelifa and M.Belkhoja, 2000. Réponses physiologiques dequelques variétés de blé dur à la salinité austade juvénile. Options méditerranéennes.Série A. séminaires. Méditerranés, 40 : 267-273.
Arnon, D.I., 1949. Copper enzymes in isolatedchloroplasts Polyphenoloxidase in Beta vulgaris.Plant. Physiol., 24: 1-15.
BenNaceur, M., C. Rahmoune, H. Sdiri, M.Meddahi and M. Selmi, 2001. Effet du stress surgermination, la croissance et la production engrains de quelques variétés maghrébines de blé.Science et changements planétaires/Sécheresse,12: 167-174.
Boucaud, J., 1972. Effects du NaCl surl’activité de la nitrate réductase chez deuxvariétés halophiles: Suaeda maritima var.macrocarpa et var. flexilis. Physiol. Planta.,27: 37-42
Bounaqba, S., 1998. Analyses déterminants de latolérance a NaCl chez le blé tender, le triticale,et l’orge. Utilisation de la fluorescencechlorophyllienne dans le diagnostic de l’étatfonctionnel du photosystème II. Thèse deDoctorat d’Etat en Biologie, Université de TunisII, Tunisie.
Dingeon, B., 1975. Annals of Biology andChimistry. 33 (3). Biomaghreb.
Fortmeier, R. and S. Schubert, 1998. Salttolerance of maize (Zea mays L.): the role ofsodium exclusion. Plant .Cell. Environ., 18:1040-1047.
Greenway, H. and R. Munns, 1980. Mechanismof salt tolerance in nonhalophytes. Annual.Revue. Plant. Physiol., 3: 149-190
Lachaal, M., 1998. Variabilité de la réponse à lasalinité chez la lentille, et variation en fonctiondu stade de développement. Thèse de Doctoratd’Etat Es Sciences Naturelles, Université deTunis II, Tunisie.
Munns, R., 1993. Physiological processeslimiting plant growth in saline soil: somedogmas and hypothesis. Plant. Cell. Environ.,16: 15-24.
Munns, R., R.A. Hare and T.D. Colmer, 2000.Salt tolerance in wheat and barley In 8th
International Barley Gentics Symposium.Volume 1. Ed. Dept. of Plant Science, WaiteCampus, Adelaide University, pp 238-245.
Rush, D.W. and E. Epstein, 1981. Comparativestudies on the sodium, potassium, and chloriderelations of a wild halophytic and a domesticsalt-sensitive tomato species. Plant. Physiol., 68:1308-1313.
Sooeveld, C., R. Baas, H.M.C. Nijssen and J.Hoog, 1999. Salt tolerance of flower cropsgrown in soilless culture. J .Plant. Nutri., 12:1033-1046.
SAS 1995. JMP (Version 3.2.1). Statisticaldiscovery software. SAS Institute, Inc., Cary,NC 27513.
Biologia Tunisie Juillet 2012 ; N°7; 67 – 79
67
BIOLOGIA TUNISIE
ANALYSE GENETIQUE DE LA VIRULENCE DES BACTERIESPATHOGENES DU GROUPE BACILLUS CEREUS
Sinda Fedhila1 & Didier Lereclus2
1Unité Protéomie Fonctionnelle et Biopréservation Alimentaire. Institut Supérieur des SciencesBiologiques Appliquées de Tunis. 9, avenue Zouhaïer Essafi. 1006. Tunis. Tunisie.2Unité Génétique Microbienne et Environnement. Institut National de la Recherche Agronomique.La Minière. 78285 Guyancourt cedex. France.
Mots clés: pathogénie, facteurs de virulence, mutagenèse ciblée, mutagenèse transpositionnelle, IVET
ABSTRACTBacteria efficiently colonize various ecologicalniches including plants and animals. Whileinvading these niches, they often cause more orless deleterious effects. These infectionactivities, designated "pathogenesis" or"virulence", result from the expression ofvirulence genetic determinants. Several geneticapproaches have been developed in recent yearsin numerous pathogenic microbes in order toidentify these determinants and to assess theirexpression and role in overall virulence. Theresulting findings are a necessary prerequisite tobetter understand pathogenesis, molecular basesof host/parasite interactions and to develop newstrategies preventing emergence of newpathogens. The purpose of this review is tohighlight recent genetic technologies used astools for studying molecular bases of Bacilluscereus group virulence and to discuss the manymicrobial virulence factors identified. Bacteriabelonging to this group are of particular interestin that they possess both specific andopportunistic virulence features. Indeed, theseenvironmental bacteria are able to secretediverse metabolite enzymes and toxins whichcan be harmful to targeted or not organisms.
RESUMELes bactéries sont capables de coloniser desniches écologiques aussi diverses que lesvégétaux et les animaux. Les bactériespathogènes envahissent ces niches en causantdifférentes infections ayant des effets morbides
plus ou moins graves. Ces phénomènesd'infection, désignés sous les termes"pathogénie" ou "virulence" sont le résultat del'expression de plusieurs gènes dits"déterminants génétiques de virulence".Plusieurs approches génétiques ont étédéveloppées ces dernières années, chez denombreux germes infectieux, en vue d'identifierdes gènes de virulence potentiels et d'étudier leurexpression et leur rôle dans la pathogénie. Cesconnaissances sont un préalable nécessaire pourmieux comprendre un pouvoir pathogène,appréhender les interactions moléculaireshôte/microbe et, par conséquent, développer desstratégies visant à prévenir l'émergence denouveaux pathogènes. Cette revue représenteune analyse pratique et théorique des basesgénétiques de la virulence des bactéries dugroupe Bacillus cereus sensu lato. Ce groupe estparticulièrement intéressant car il englobe desactivités de virulences aussi bien spécifiquesqu'opportunistes. Il s'agit de bactéries del’environnement qui possèdent toutes lescapacités de produire et de sécréter diversmétabolites, enzymes et toxines qui peuventavoir des effets nocifs sur des organismes visésou non.
INTRODUCTION
Le groupe Bacillus cereus sensu lato estcomposé d'une très grande variété de bactériesréparties en trois principales espèces : Bacilluscereus sensu stricto (B. cereus), Bacillus
Biologia Tunisie Juillet 2012 ; N°7; 67 – 79
68
thuringiensis (B. thuringiensis) et Bacillusanthracis (B. anthracis). Ces Bacillus partagentun fond génétique commun qui, associé à destoxines spécifiques, leur permet de coloniser deshôtes aussi divers que les plantes, les insectes etles mammifères. Ainsi, bien qu'étroitementapparentées, les trois espèces présentent despropriétés pathogènes extrêmement diversifiées.B. anthracis, agent responsable de la maladie ducharbon, ou "anthrax" en anglais, est une espècecomposée de souches très monomorphes. Elle sedistingue des autres espèces du groupe B. cereuspar la présence de plasmides (pXO1 et pXO2)spécifiant la synthèse de toxines et d’une capsuled’acide -D-glutamique, principauxdéterminants de la maladie du charbon. Cesfacteurs confèrent à B. anthracis un pouvoirhautement pathogène pour tous les mammifères,y compris l'homme, par voie cutanée, paringestion et principalement par inhalation. Cetteespèce peut aussi être discriminée sur la based'un certain nombre de caractéristiques telles quel'absence de mobilité des formes végétatives,l'absence de propriétés hémolytiques, et lasensibilité à l'ampicilline.B. thuringiensis et B. cereus sont des espècesextrêmement proches qui, contrairement à B.anthracis, sont composées de souches trèshétéromorphes, dont la seule marque réellementdistinctive est la synthèse chez B. thuringiensis,d'un cristal protéique insecticide constitué detoxines appelées protéines Cry. Les thématiquesportant sur le rôle de ces toxines spécifiquesdans la pathogenèse et le profil d'expression deleurs gènes ont été largement étudiées et nousinvitons les lecteurs a se référer aux revuescorrespondantes (Mock et Fouet, 2001; Schnepfet al., 1998). Les gènes spécifiant ces toxinesCry de B. thuringiensis sont également portéspar des plasmides. Une souche de B.thuringiensis guérie pour le (ou les) plasmide(es) porteurs de gènes cry ne produit pas decristal insecticide et perd ainsi son pouvoirpathogène spécifiquement dirigé contre lesinsectes. De ce fait, une souche de B.thuringiensis Cry ne peut pas être distinguéed'une souche de B. cereus. Un fait remarquableest que, la perte de ces plasmides par B.thuringiensis ne se traduit pas par une pertetotale de virulence. Les souches acrystallifèresde B. thuringiensis (non productrices de cristaux
insecticides), et donc de B. cereus, bénéficient depropriétés pathogènes opportunistes communesattribuées par des déterminants aspécifiques devirulence qui sont d'origine chromosomique. Cedomaine est relativement récent par rapport auxinvestigations concernant l'étude des protéinesCry. Il a commencé à être exploré à la fin desannées 1990 avec le développement d’outils degénie génétique adaptés aux bactéries du groupeB. cereus.Dans cette revue nous proposons de développerle thème de l'analyse génétique des propriétéspathogènes opportunistes de B. cereus et B.thuringiensis, à savoir, les stratégiesmoléculaires ayant permis d'identifier et demettre en évidence le rôle des gènes de virulenceaspécifiques potentiels de ces deux bactériesdans la pathogenèse. Nous proposons égalementde donner un aperçu sur les différents réseaux derégulation de l'expression de ces gènes. L'étudede ces mécanismes contribue remarquablement àla compréhension de l'intervention de cesfacteurs dans la virulence.
PROPRIETES PATHOGENESOPPORTUNISTES DE B. THURINGIENSISET B. CEREUS
Du fait de leur parenté phylogénétique, B. cereuset B. thuringiensis partagent un grand nombre defacteurs de virulence impliqués dans despropriétés opportunistes. La plupart des souchesde B. cereus et B. thuringiensis sont hautementpathogènes pour les insectes par pénétration descellules végétatives ou de spores dansl'hémocoele. Dans certains cas, l'injection dequelques cellules bactériennes suffit pourproduire chez certaines espèces d’insectes unesepticémie létale en moins de 24 heures (Zhanget al., 1993). Ces observations témoignent de lacapacité de B. thuringiensis/B. cereus à semaintenir dans l’hémolymphe de son hôte et às’y développer, contrairement à d’autres bacillesnon entomopathogènes, tels que Bacillus subtilisou Bacillus megaterium, pour lesquels,l’injection d’une dose dépassant 104 bactéries estcomplètement inoffensive. D'autre part, il estfréquemment observé que, per os, la présence despores ou cellules végétatives de B.thuringiensis/B. cereus synergise l’activitétoxique de doses sublétales de protéines Cry.
Biologia Tunisie Juillet 2012 ; N°7; 67 – 79
69
Galleria mellonella (G. mellonella) représentel’exemple typique des insectes chez lesquels lamortalité n’est observée que lorsque desbactéries sont co-ingérées avec les toxines Cry(Salamitou et al., 2000).Chez l'homme, certaines souches de B. cereus (etéventuellement de B. thuringiensis) sont despathogènes opportunistes fréquemment identifiéscomme cause de toxi-infection d'originealimentaire. Deux formes de gastroentérite sontfréquemment rencontrées : un syndromeémétique et un syndrome diarrhéique (Kotirantaet al., 2000). Néanmoins, certaines infectionssystémiques opportunistes rares mais sérieusestelles que des endocardites, des pneumonies, desendophtalmites, ont été attribuées à B. cereus(Callegan et al., 1999; Hilliard et al., 2003;Miller et al., 1997; Strauss et al., 2001). Dans lecas des endophtalmites, B. cereus est capable deprovoquer une cécité dans les 24 heures quisuivent l'infection oculaire (Kotiranta et al.,2000). Par ailleurs, des souches de B. cereusmulti-résistantes aux antibiotiques ont été isoléesà partir d'équipements hospitaliers (Meena et al.,2000). Récemment, une souche de B. cereus aété rapportée comme cause d'infections trèssévères comparables à la maladie du charbon(Hoffmaster et al., 2004). Cette souche de B.cereus possède deux plasmides : l’un estsimilaire à pXO1 et le second porte des gènesresponsables de la formation d’une capsule.Dans le but d'identifier les déterminantsgénétiques potentiellement impliqués dans lapathogénie de ces bactéries, diverses approchesgénétiques ont été suivies:1/ Mutagenèse ciblée de facteurs de virulencepotentiels2/ Caractérisation de mutationstranspositionnelles conférant un phénotypeavirulent3/ Identification de gènes bactériensspécifiquement exprimés pendant le processusinfectieuxChez B. thuringiensis et B. cereus, les gènesidentifiés sont testés par rapport à leur rôle dansla pathogénie par inactivation et analyse de lavirulence des mutants, in vivo, dans diversmodèles animaux d'infection (1) par injectionintrahémocoelique chez Bombyx mori (B. mori);(2) par ingestion forcée des larves de G.mellonella et évaluation de l'effet synergique des
bactéries sur la toxémie; (3) par instillationnasale chez le modèle murin; (4) par infectionoculaire chez le lapin.
GENETIQUE DE LA VIRULENCE DESBACTERIES DU GROUPE B. CEREUS
Approche génétique directe par mutagenèsecibléeElle consiste à identifier chez B. thuringiensis etB. cereus des gènes de virulence potentiels (ou"candidats") dont les produits sont suspectés dejouer un rôle dans la virulence, en raison de leurseffets délétères in vitro ou de leur homologieavec des facteurs dont le rôle dans la pathogéniea été démontré chez d'autres bactériespathogènes. Dans ce dernier cas il s'agit d'uneapproche comparative par analogie avec desbactéries pathogènes. Elle est très souventutilisée dans l'analyse génétique de la virulencemicrobienne en raison de la disponibilité desséquences génomiques de nombreux microbespathogènes. Les deux stratégies permettent nonseulement de mettre en évidence le gène enquestion chez B. thuringiensis et B. cereus, maiségalement de l'inactiver par mutagenèse cibléeafin d'analyser son rôle dans la virulence. Unecopie mutée du gène d’intérêt est construite, parremplacement d'une région interne par unecassette de résistance à un antibiotique, et estinsérée dans un vecteur thermosensible intégratif(Arnaud et al., 2004; Lereclus et al., 1995). Laconnaissance du génome de B. anthracis (Readet al., 2003) et des génomes de différentessouches de B. cereus et B. thuringiensis (Ivanovaet al., 2003; Rasko et al., 2004);www.intergratedgenomics.com) permettaitd’amplifier les régions 5' et 3' du gène candidatpour réaliser une copie interrompue du gène. Legène candidat est ensuite remplacé par sa versionmutée par double recombinaison homologueentre le vecteur recombinant et le chromosome.Ainsi, divers gènes candidats ont été analyséspour leur rôle dans la virulence, tels que ceuxspécifiant les flagellines, métalloprotéases,protéases de choc thermiques et énhancines.
Mutagenèse ciblée de facteurs de virulencepotentiels identifiés par leur activitébiologiqueDe nombreux facteurs de virulence aspécifiques,ont été identifiés chez B. cereus et B.
Biologia Tunisie Juillet 2012 ; N°7; 67 – 79
70
thuringiensis. Il s’agit de toxines (entérotoxineshémolytiques Hbl et non hémolytiques Nhe,cytotoxine K, hémolysines) d’enzymesdégradatives (phospholipases C, PlcA et PlcB ;métalloprotéases), protéines pariétales(flagellines et couche S), etc. (Hansen etSalamitou, 2000). Ces facteurs ont été isolés etcaractérisés biochimiquement à partir desurnageants de culture de B. cereus ou de B.thuringiensis. Ils sont sécrétés par ces bactériespendant la phase stationnaire. L’étude del’implication de ces facteurs dans la pathogenèsea, en partie, reposé sur l'analyse de leur effet, invitro, sur des modèles cellulaires et tissulaires. Ilen ressort que le complexe Hbl possède uneactivité entérotoxigénique, hémolytique etdermonécrotique ; il provoque en outre, uneaugmentation de la perméabilité vasculaire etune accumulation de fluides dans une anse iléaleliguée de lapin (Beecher et al., 1995). Nhe estaussi toxique que Hbl et possède, en outre, uneffet cytotoxique sur les cellules Vero (Lund etGranum, 1997). Quant à CytK, cette protéines’est avérée fortement hémolytique contre lesérythrocytes de bœuf et de lapin et très toxiquepour les cellules de l’épithélium intestinal(Hardy et al., 2001; Lund et al., 2000).Néanmoins des résultats récents ont démontréque l'inactivation individuelle des gènes cytK,plcB et hblC n'affecte pas les propriétéscytotoxiques des surnageants de culture de B.thuringiensis et B. cereus vis-à-vis des cellulesintestinales mammifères du type CaCo2 ou HeLa(Ramarao et Lereclus, 2006). Il a été suggéré quel'absence de l'un de ces facteurs pourrait êtrecompensée par d'autres facteurs non encoreidentifiés. Par ailleurs, une régulation pléiotrope,responsable de la synthèse de la majorité de cesfacteurs de virulence potentiels a été mise enévidence chez les deux bactéries. Cetterégulation est assurée par un activateurtranscriptionnel appelé PlcR. Ce régulateur atout d'abord été identifié comme activateur dugène plcA codant pour la phospholipase Cspécifique du phosphatidyl inositol (Lereclus etal., 1996). Il a été montré que PlcR activel'expression de ce gène à l'entrée des bactéries enphase stationnaire. L’expression du régulon PlcRest soumise à une double régulation : i) lerégulateur PlcR est activé à l'entrée en phasestationnaire par l’interaction d’un petit peptide
diffusible (PapR) agissant comme un effecteurdu "quorum-sensing" (Gominet et al., 2001;Lereclus et al., 1996; Slamti et Lereclus, 2002) ;et ii) la forme phosphorylée de Spo0A, unfacteur clé de déclanchement de la sporulation,réprime l’expression du gène plcR quand lesconditions environnementales sont favorables àla sporulation (Lereclus et al., 2000). Il est ànoter que chez B. anthracis le gène plcR est nonfonctionnel, suite à la présence d'une mutationnon-sens (Agaisse et al., 1999). PlcR active latranscription des gènes du régulon en se fixantdirectement sur un motif palindromiquehautement conservé (TATGNAN4TNCATA)appelé boîte PlcR (Agaisse et al., 1999; Slamti etLereclus, 2002). Des analyses génétiquescouplées à la recherche in silico de la boîte PlcRdans la séquence chromosomique de la soucheATCC14579 de B. cereus révèlent l’existence deplus de 40 gènes cibles (Gohar et Lereclus,résultats non publiés). La délétion du gène plcRprovoque une forte diminution de la virulence deB. thuringiensis/B. cereus vis-à-vis du modèle G.mellonella en infection orale (Salamitou et al.,2000). Elle a, en revanche, un effet moinsmarqué sur le pouvoir pathogène des cellulesbactériennes lorsqu'elles sont directementinjectées dans l'hémocoele des larves de B. mori.Il est suggéré que les facteurs du régulon PlcRinterviennent principalement au niveau de l'étapeinitiale de l'infection naturelle qui est lefranchissent de la barrière protectrice de l'hôte,en l'occurrence l'épithélium du tube digestif dansle cas de l'infection par voie orale. En outre,l'interruption du gène plcR réduit le pouvoirpathogène de B. thuringiensis et B. cereus vis-à-vis du modèle souris par instillation de spores cequi suggère l'implication de plcR dans lespropriétés opportunistes de ces bactéries vis-à-vis des mammifères (Salamitou et al., 2000).L'un des gènes régulés par PlcR, inhA2, s'estrévélé fortement impliqué dans la synergie desspores de B. thuringiensis/cristaux chez G.mellonella (Fedhila et al., 2002). Cependant, desexpériences de complémentation fonctionnelledu mutant plcR à l'aide du gène inhA2 placé sousle contrôle d'un promoteur constitutif, nerestaurent pas le phénotype sauvage. Il a étésuggéré que les membres du régulon agissent deconcert dans le déroulement du processusinfectieux (Fedhila et al., 2003a). InhA2 est une
Biologia Tunisie Juillet 2012 ; N°7; 67 – 79
71
métalloprotéase à zinc qui a été identifiée enraison de son homologie avec InhA1, une autremétalloprotéase à zinc, précédemment identifiéecomme étant un inhibiteur de l’immunité desinsectes (Dalhammar et Steiner, 1984; Edlund etal., 1976). InhA1 possède en outre troispropriétés qui soulignent fortement sont rôledans la virulence : i) une activité toxique vis-à-vis des insectes Trichopulsia ni et Drosophilamelanogaster par injection (Dalhammar etSteiner, 1984; Lövgren et al., 1990; Siden et al.,1979), ii) une activité collagénase (Chung et al.,2006; Dalhammar et Steiner, 1984) et iii) unecytotoxicité qui permet aux bactéries de sortirdes macrophages (Ramarao et Lereclus, 2005).InhA1 constitue, en effet, un constituantmajoritaire de l'exosporium des spores de B.cereus (Charlton et al., 1999).Cependant,contrairement à InhA2, InhA1 ne fait pas partiedu régulon PlcR, et l'inactivation de son gène n'apas encore permis de définir son rôle dans lapathogenèse de B. thuringiensis chez l'insecte.Par ailleurs, le gène inhA1 est activé par Spo0A-P via le produit du gène abrB (Grandvalet et al.,2001). Les métalloprotéases InhA1 et InhA2appartiennent, en effet, à une famillemultigénique de deux à quatre copies, selon lessouches B. thuringiensis et B. cereus (Fedhila,2002).
Mutagenèse ciblée de facteurs de virulencepotentiels identifiés par analogie avec ceux demicroorganismes pathogènesLe séquençage et l'annotation de la totalité desgénomes des principales espèces des bactéries dugroupe B. cereus ont ouvert le champ à diversesapplications. De nombreux gènes de virulencepotentiels ont ainsi pu être retrouvés.Les protéines de choc thermique ClpChez B. thuringiensis, des gènes spécifiant desprotéines de choc thermique de la famille Clpont été identifiés par homologie aux protéinesClp de bactéries pathogènes et non pathogènestelles que Listeria monocytogenes et B. subtilis.Les protéines de la famille Clp présentent despropriétés de protéases ou de chaperonsmoléculaires en fonction de leur organisation(Gottesman et al., 1997a,b; Wickner et Maurizi,1999). Ces deux fonctions, énergie-dépendantes,contribuent d’une part, à la renaturation ou àl’élimination de protéines présentes sous une
forme non native suite à une mutation ou unstress ; et participent, d’autre part, àl’accomplissement de mécanismesphysiologiques tels que l’activation ou ladégradation de régulateurs transcriptionnels.Ainsi, les protéines Clp sont connues pourintervenir dans la tolérance au stress, réponsesadaptatives de la phase stationnaire, acquisitionde l'état de compétence et également lavirulence. Ce dernier volet a été rapporté parplusieurs études. Chez B. thuringiensis, deuxcopies du gène clpP, clp1 et clpP2 ont ététrouvées et délétées afin d'étudier leur rôle dansla virulence. L’analyse de la virulence desmutants dans le modèle d’infectionintrahémocoelique B. mori, a montré que seul lemutant clpP1 est avirulent. Cependant cephénotype s’est avéré essentiellement lié audéfaut de croissance du mutant dans desconditions expérimentales de basse température(25°C). La virulence est, en revanche,rapidement restaurée quand les insectes sontplacés dans des conditions de températureoptimales (37°C). Les invertébrés étant desanimaux à sang froid, il a été suggéré que ClpP1pourrait être considéré comme un facteur devirulence facultatif ou "accessoire", enl'occurrence, un facteur d'adaptation de labactérie à la température in vivo de son hôte(Fedhila et al., 2003b).
L'énhancine des baculovirus EnhBUn deuxième gène candidat pour la contributionà la virulence a été identifié chez B.thuringiensis par analogie avec les baculovirus.Il s'agit du gène de l'énhancine. Ce gène a étéidentifié par recherche, in silico dans le génomede B. cereus (souche ATCC14579), de gènesrégulés par PlcR qui interagiraient avec labarrière intestinale de l'hôte. Une ORF précédéepar une boîte PlcR putative et dont la séquencedéduite en acides aminés représente 23-25%d'identité avec les énhancines de diversbaculovirus a été retrouvée (Li et al., 2003;Popham et al., 2001). Les énhancines viralessont considérées comme facteurs de virulencemajeurs. L'énhancine du baculovirus granulairede Trichopulsia ni (TnGV) a été la plus étudiée.Elle dégrade les glycoprotéines riches en chitine,composants majeurs de la matrice péritrophiquedu tube digestif (Wang et Granados, 1997). Par
Biologia Tunisie Juillet 2012 ; N°7; 67 – 79
72
ailleurs, l'effet synergique de l'énhancine de cebaculovirus sur la toxicité des protéines Cry deB. thuringiensis a été rapporté chez certainslépidoptères (Granados et al., 2001). L'analysede la séquence génomique des bactériespathogènes Yersinia pestis et B. anthracis arévélé l'existence de gènes codant pour desénhancines (Parkhill et al., 2001; Read et al.,2003). Cependant leur rôle dans la virulence n'ajamais été étudié. Tout comme la majorité deénhancines virales (Lepore et al., 1996), laséquence en acides aminés déduite du gène del'énhancine de B. thuringiensis possède le motifde fixation de l'atome de zinc (HEXXH)caractéristique des métalloprotéase à atome dezinc (Hajaij-Ellouze et al., 2006). Des étudestranscriptionnelles ont montré que l'énhancine deB. thuringiensis appartient au régulon PlcR.Néanmoins son inactivation n'affecte pas lavirulence de B. thuringiensis par voie orale(Hajaij-Ellouze et al., 2006).Le régulateur Fur des gènes impliqués dansl'acquisition du ferUne étude récente a identifié, chez la souche 569de B. cereus, par recherche d'homologie deséquence protéique, l'homologue du régulateurFur de B. subtilis (Harvie et al., 2005). Fur est unrépresseur transcriptionnel de gènes impliquésdans l'acquisition du fer par les bactéries. Lerégulon Fur a été identifié chez de nombreusesbactéries. Il regroupe plus de 40 gènesintervenant dans diverses voies métaboliques,notamment le métabolisme du fer, ainsi que dansdes réponses aux stress oxydatifs. Fur réprimedirectement l'expression des gènes du régulon ense fixant sur une séquence consensus, appeléeboîte Fur (5'-GATAATGATAATCATTATC-3'),localisée au niveau des promoteurs des gènes.Dans des conditions de concentrationintracellulaire élevée de Fe2+, Fur complexe lesions de fer. Cette interaction avec les ionsmétalliques lui confère une conformationspatiale qui lui permet de se fixer sur l'ADN, enl'occurrence sur sa boîte, ce qui provoque larépression du régulon. Chez plusieurs bactériespathogènes, l'expression de nombreux gènes devirulence est régulée par Fur (Harvie et Ellar,2005; Horsburgh et al., 2001; Litwin etCalderwood, 1993). Il a été suggéré quel'expression Fur-dépendante de ces gènes estdéclenchée par la carence en fer dans le milieu in
vivo de l'hôte. Le fer est un élément essentielpour les bactéries. Dans l'environnement, le ferFe2+ est très peu disponible suite à son oxydationrapide en Fe3+. Chez les animaux, hôte vertébrésou invertébrés de nombreux pathogènes, le Fe2+
est également limité, car complexé à deschélateurs de l'hôte tels que les transferrines,ferritines, haemoglobines, myoglobulines. Face àcette carence ferrique in vivo, la bactériedéveloppe des stratégies d'acquisition de fer quiconsistent à exprimer des récepteurs protéiquesde surface qui fixent des composants contenantdu fer et, à sécréter des sidérophores, chélateursayant une grande affinité de fixation du fercapables de concurrencer les chélateurs de l'hôte,et de réimporter le fer sous forme complexéedans la cellule bactérienne (Ratledge et Dover,2000). Ces processus d'acquisition du fer sontsoumis à une régulation négative par lerégulateur Fur, afin d'éviter l'effet toxique d'uneaccumulation du fer intracellulaire (Touati,2000). Fur semble ainsi être, pour la bactérie, unindicateur indirect de la nature del'environnement dans lequel elle se trouve. Enréponse à la carence en fer libre qui caractérise lemilieu hôte, la répression de certains gènes devirulence par Fur est levée, ce qui permet à labactérie d'initier la pathogenèse. Chez la souche569 de B. cereus, le gène fur identifié a étéinactivé. La virulence des mutants estsignificativement atténuée chez un modèled'infection insecte. Ce phénotype résulterait de laperturbation de plusieurs fonctions cellulairesdue à l'expression constitutive du régulon Fur et,par conséquent, à l'augmentation du taux de ferintracellulaire. En outre, le mutant est plussensible aux réactions oxydativescaractéristiques des mécanismes de défense del'hôte aux infections microbiennes (Ha et al.,2005; Harvie et al., 2005).
Approche génétique aléatoire par mutagenèsetranspositionnelleCette approche consiste à rechercher, dans unebanque de mutants insertionnels, des phénotypesayant perdu leur propriété pathogène vis-à-vis dumodèle d'infection utilisé. Ces banques sontgénéralement construites à l'aide de l'insertionaléatoire de transposons, ce qui implique uncriblage individuel des mutants. Cette techniques'appelle RTM (Random Transposon
Biologia Tunisie Juillet 2012 ; N°7; 67 – 79
73
Mutagenesis). Holden et coll. (1995) ont conçuet développé une autre technique de mutagenèse,à l'aide de transposons génétiquement marqués.Cette technique, appelée STM (Signature-Tagged Mutagenesis), présente l'avantage dedétecter, sur la base d’une sélection négative, lesphénotypes avirulents au sein de pools demutants insertionnels (Hensel et al., 1995).Holden et coll. ont utilisé cette technique afind'identifier des gènes impliqués dans la virulencede Salmonella typhimurium dans un modèlemurin de fièvre typhoïde. Cette technique a,depuis, été modifiée en fonction du pathogène etde l'hôte (Saenz et Dehio, 2005). Les deuxtechniques de RTM et STM ont été appliquées àB. thuringiensis et B. cereus en vue derechercher des gènes impliqués dans la virulenceet l'adaptation de ces bactéries à l'environnementintrahémocoelique de l'hôte insecte (Fedhila etal., 2004; Steggles et al., 2006).Dans le cas de la technique STM, une banque demutants transpositionnels a été divisée en pools.Le pool infectant (input) et le pool de mutantsrécupéré du modèle d'infection en post-mortem(output) sont hybridés au transposon. Cecipermet d'éliminer les clones n'ayant pu réussir leprocessus infectieux et donc, les clones contre-sélectionnés par le modèle d'infection. Lacomparaison ultérieure des profils d'hybridationde l'input et de l'output permet de ressortir lesmutants ayant été éliminés lors de la sélectionnégative, en l'occurrence les clones avirulents.Grâce à la connaissance de la totalité de laséquence des transposons utilisés, il est possiblede cartographier le site d'insertion et parconséquent d'identifier le gène potentiellementimpliqué dans la virulence. La suite de ladémarche consiste à reproduire la mutationinsertionnelle par délétion remplacement dugène interrompu par double recombinaisonhomologue et à confirmer le phénotype atténuédu mutant de délétion vis-à-vis du modèled'infection. Des travaux récents ont ainsi permisd'identifier chez B. thuringiensis, grâce à latechnique STM utilisant le transposon Tn917,différentes catégories de gènes de virulencepotentiels vis-à-vis du modèle d'infectionintrahémocoelique Manduca sexta : desrégulateurs transcriptionnels de la famille ArsR,des protéines histone-like ainsi que diverses
séquences codantes de fonction inconnue(Steggles et al., 2006).Dans le cas de la technique RTM, une banque demutants insertionnels a été construite, chez lasouche 407 Cry de B. thuringiensis, à l’aided’un système de mutagenèse transpositionnellepermettant l’insertion du transposon mini-Tn10(Gominet et al., 2001). Cette banque a été cribléepar injection des transposants dansl’hémolymphe de B. mori en vue d’identifier desmutations conférant un phénotype avirulent. Desmutants insertionnels indépendants affectés auniveau de la virulence et dans lesquels letransposon s'est inséré dans le locus yqgByqfZ auniveau de la région 3’ du gène yqgB ont étésélectionnés. Des délétions simples et doubles deces gènes ont été construites et des expériencesont été réalisées pour déterminer les rôlesrespectifs de yqgB et yqfZ dans la virulence. Il enressort que seul le double mutant présente unevirulence retardée. Des études supplémentairesd'analyse de la réponse de ce mutant à diversstress ont permis de démontrer que ce dernierprésente également une absence de motilité et undéfaut de croissance à basse température (25°C).Par ailleurs, une restauration totale de lavirulence du double mutant était observéelorsque les larves d’insecte infectées étaientplacées dans des conditions de températureoptimales pour B. thuringiensis (37°C). Il a étésuggéré que le locus yqgByqfZ était impliquédans l'adaptation de B. thuringiensis à latempérature interne de son hôte poïkilotherme etreprésente, de ce fait, un facteur indirectementassocié à la virulence (Fedhila et al., 2004).Un autre mutant transpositionnel de B.thuringiensis contenant une insertion duminiTn10 dans le gène flhA a été isolé etcaractérisé par Ghelardi et coll. (Ghelardi et al.,2002). Le gène flhA appartient à la famille desgènes flagellaires de classe II impliqués dans lesystème d'export de type III des composantsflagellaires de S. typhimurium (Minamino etMacnab, 1999). La caractérisation phénotypiquedu mutant insertionnel indique que FlhAintervient dans la motilité, et dans l’expressionde certains gènes du régulon PlcR (Bouillaut etal., 2005; Ghelardi et al., 2002). Cette étuderapporte donc, pour la première fois, undeuxième niveau de régulation des gènes devirulence appartenant au régulon PlcR, assuré

Biologia Tunisie Juillet 2012 ; N°7; 67 – 79
74
par le système flagellaire. Par ailleurs, le mutantflhA est affecté dans sa cytotoxicité vis-à-visdes cellules HeLa et au niveau de sa virulencechez G. mellonella en infection orale etintrahémocoelique (Bouillaut et al., 2005). Desétudes ultérieures ont permis de montrer que legène flhA joue un rôle essentiel dans l'adhésionde B. cereus/B. thuringiensis aux cellules CaCo2et HeLa (Ramarao et Lereclus, 2006). Lesauteurs ont suggéré que les propriétés adhésivesde B. cereus contribueraient au syndromediarrhéique causé par ce pathogène opportuniste.L'adhésion des bactéries aux cellules eucaryotesde l'hôte est souvent considérée comme unévénement clé dans les étapes initiales del'établissement d'une infection. Ces travaux sonten accord avec des études antérieures quisuggéraient que les flagelles des bactéries dugroupe B. cereus interviennent dans les stadesprécoces de la pathogenèse (Lövgren et al.,1993; Zhang et al., 1993).
Approche transcriptomique indirecte parIVETLa méthode IVET (In Vivo ExpressionTechnology) est l'une des approches génétiquesles plus récentes, utilisées dans l'analyse de lapathogénie et d'autres phénomènesphysiologiques bactériens. C'est une approchetranscriptomique ciblée permettant de pratiquerune sélection positive de promoteursspécifiquement activés dans des conditions decroissance particulières (Rediers et al., 2005). Latoute première application de cette technologie aporté sur les bactéries pathogènes à Gram. Elleavait pour objectif d'identifier les gènes quis'expriment spécifiquement durant lacolonisation d'un hôte sensible (Camilli et al.,1994; Mahan et al., 1993; Osbourn et al., 1987).Une stratégie IVET, fondée sur la recombinaisonsite spécifique, a été appliquée chez B. cereuspour la première fois en 2006 (Fedhila et al.,2006). Ce système permet de détecter despromoteurs activés in vivo, de façon transitoire etconditionnelle. Le principe est de cloner unebanque de fragments d’ADN de B. cereus enamont du gène tnpI spécifiant une recombinasespécifique de site. Quand ce fragment contientun promoteur activé dans les conditions étudiées,la recombinase est produite et conduit à la perted’un gène de résistance à un antibiotique et à
l’acquisition d’une nouvelle résistance.L'infection par inoculation orale du modèleinvertébré G. mellonella a été choisie afin demimer les infections gastrointestinales etd'identifier des déterminants génétiques ivi (InVivo Induced) de B. cereus qui s’exprimentspécifiquement durant tout le cycle infectieux,de la colonisation du tube digestif jusqu’à lasepticémie finale. 20 gènes ivi ont été identifiés.Ils spécifient des fonctions aussi diverses que larégulation, métabolisme, réplication, divisioncellulaire, transport, virulence et adaptation. L'unde ces gènes, ivi29, fortement induit in vivo, aété étudié. Ce gène, baptisé ilsA (Iron-regulatedLeucin-rich Surface protein), spécifie uneprotéine présentant des propriétés d'internaline etde sidérophore grâce à la présence de 4domaines spécifiques : peptide signal N-terminalpour l'export, domaine NEAT (Near Fe3+siderophore Transporter) de transport du fer,domaine LRR (Leucin-Rich Repeats)d'interaction avec les protéines et domaine SLH(Surface Layer Homology) d'ancrage auxpeptidoglycanes membranaires. Les internalineset les sidérophores sont d'importants facteurs devirulence chez de nombreux pathogènes(Andrade et al., 2002; Braun et Cossart, 2000).Les internalines de L. monocytogenes jouent unrôle essentiel dans la pathogenèse. Elles assurentl'internalisation de ce pathogène intracellulairedans les cellules de l'hôte. Ce rôle est cependantspécifique des internalines des bactériesinvasives. Des études transcriptionnellesindiquent que ilsA appartient au régulon Fur.L'inactivation de ilsA par délétion/remplacementréduit la virulence de B. cereus vis-à-vis dumodèle G. mellonella. Il a été suggéré que cenouveau facteur de virulence, IlsA, estnécessaire pour l'adaptation de B. cereus à uncontexte infectieux particulièrement carencé enfer (Fedhila et al., 2006). En effet, il a étérapporté que la concentration du taux desprotéines hémolymphatiques complexant le fer(transferrines, apoferritines) chez les insectesaugmente en réponse à infection microbienne.Ceci est le cas des larves de Aedes aegypti et deD. melanogaster infestées par des nématodes(Beerntsen et al., 1994) et par Escherichia coli(Yoshiga et al., 1999), respectivement. Le faitque ilsA soit un membre du régulon Fur rejointles résultats des travaux cités plus haut qui
Biologia Tunisie Juillet 2012 ; N°7; 67 – 79
75
soutiennent que l'expression de nombreux gènede virulence est régulée par Fur.
CONCLUSION & DISCUSSION
L'application de ces approches moléculaires àl'analyse génétique de la virulence du groupe B.cereus a permis d'identifier des facteurs devirulence de différents types. Wassenaar etGaastra (2001) ont subdivisé les gènes devirulence microbiens en trois classes : 1) lesvrais gènes de virulence (gènes des toxines) ; 2)les "life-style genes" permettant au pathogèned'accomplir la totalité de son cycle infectieux ausein de son hôte (gènes de colonisation :adhésines, invasines, fimbriae, flagellines etgènes de contournement du système immunitaire: couche S, protéases dégradant spécifiquementdes immunoglobulines, lipopolysaccharidesmembranaires) ; 3) les gènes associés à lavirulence, dont les produits sont nécessaires àl'activité des facteurs de virulence appartenant aupremier et au deuxième groupe (gènes dematuration, systèmes de sécrétion, gènes deménage, régulation). Les toxines étant desfacteurs de virulences propres aux vraispathogènes, les facteurs identifiés chez B.thuringiensis et B. cereus appartiennent, pour laplupart d'entre eux, aux deux derniers groupes cequi explique en partie leur intervention dans lespropriétés opportunistes de ces bactéries. Bienque le rôle de la plupart de ces facteurs ait étébien élucidé sur le plan génétique, leur réellecontribution à la pathogenèse dans un contexteinfectieux n'a pas été établie de façonapprofondie. Ceci est du à l'occultation dusystème hôte dans l'analyse du rôle de cesfacteurs dans la virulence. L'hôte constitue, eneffet, un déterminant important des interactionshôte/pathogène et peut influencer de manièreconsidérable les différents paramètres quidécrivent une infection. Actuellement, on assisteà une orientation de ces démarches génétiquesvers des approches cellulaire (imageriecellulaire, histopathologie, visualisation desfacteurs de virulence au sein de l'hôte par fusionavec des rapporteurs…etc.) qui tentent de fournirdes résultats complémentaires permettant demieux élucider les bases moléculaires etcellulaires de la virulence microbienne.
REFERENCES
Agaisse, H.; Gominet, M.; Økstad, O.A.; Kolstø,A.B. and Lereclus, D. (1999). PlcR is apleiotropic regulator of extracellular virulencefactor gene expression in Bacillus thuringiensis.Mol. Microbiol. 32: 1043-1053.
Andrade, M.A.; Ciccarelli, F.D.; Perez-Iratxeta,C. and Bork, P. (2002). NEAT: a domainduplicated in genes near the components of aputative Fe3+ siderophore transporter fromGram-positive pathogenic bacteria. GenomeBiol. 3: 0047.1-0047.5.
Arnaud, M.; Chastanet, A. and Débarbouillé, M.(2004). New vector for efficient allelicreplacement in naturally nontransformable, low-GC-content, gram-positive bacteria. Appl.Environ. Microbiol. 70: 6891.
Beecher, D.J.; Schoeni, J.L. and Wong, A.C.(1995). Enterotoxic activity of hemolysin BLfrom Bacillus cereus. Infect. Immun. 63: 4423-8.
Beerntsen, B.T.; Severson, D.W. andChristensen, B.M. (1994). Aedes aegypti:characterization of a hemolymph polypeptideexpressed during melanotic encapsulation offilarial worms. Exp. Parasitol. 79: 312-21.
Bouillaut, L.; Ramarao, N.; Buisson, C.; Gilois,N.; Gohar, M.; Lereclus, D. and Nielsen-Leroux,C. (2005). FlhA influences Bacillusthuringiensis PlcR-regulated gene transcription,protein production and virulence. Appl. Environ.Microbiol. 71: 8903-8910.
Braun, L. and Cossart, P. (2000). Interactionsbetween Listeria monocytogenes and hostmammalian cells. Microbes Infect.2: 803-11.
Callegan, M.C.; Booth, M.C.; Jett, B.D. andGilmore, M.S. (1999). Pathogenesis of gram-positive bacterial endophthalmitis. Infect.Immun. 67: 3348-3356.Camilli, A.; Beattie, D.T. and Mekalanos, J.J.(1994). Use of genetic recombination as areporter of gene expression. Proc. Natl. Acad.Sci. USA. 91: 2634-2638.
Charlton, S.; Moir, A.J.; Baillie, L. and Moir, A.(1999). Characterization of the exosporium ofBacillus cereus. J. Appl. Microbiol. 87: 241-5.
Biologia Tunisie Juillet 2012 ; N°7; 67 – 79
76
Chung, M.-C.; Popova, T.G.; Millis, B.A.;Mukherjee, D.V.; Zhou, W.; Liotta, L.A.;Petricoin, E. F.; Chandhoke, V.; Bailey, C. andPopov S. G. (2006). Secreted neutralmetalloproteases of Bacillus anthracis ascandidate pathogenic factors. J. Biol. Chem. 281:31408-31418.
Dalhammar, G. and Steiner, H. (1984).Characterization of inhibitor A, a protease fromBacillus thuringiensis which degrades attacinsand cecropins, two classes of antibacterialproteins in insects. Eur. J. Biochem. 139: 247-252.
Edlund, T.; Siden, I. and Boman, H.G. (1976).Evidence for two immune inhibitors fromBacillus thuringiensis interfering with thehumoral defense system of saturniid pupae.Infect. Immun. 14: 934-941.
Fedhila, S. Contribution des métalloprotéasesInhA et des protéines de choc thermique Clp à lavirulence de Bacillus thuringiensis. [Thèse].Paris; 2002.
Fedhila, S.; Daou, N.; Lereclus, D. and Nielsen-Leroux, C. (2006). Identification of Bacilluscereus internalin and other candidate virulencegenes specifically induced during oral infectionin insects. Mol. Microbiol. 62: 339-55.
Fedhila, S.; Gohar, M.; Slamti, L.; Nel, P. andLereclus, D. (2003a). The Bacillus thuringiensisPlcR-regulated gene inhA2 is necessary, but notsufficient, for virulence. J. Bacteriol. 185: 2820-5.
Fedhila, S.; Guillemet, E.; Nel, P. and Lereclus,D. (2004). Characterization of two Bacillusthuringiensis genes identified by in vivoscreening of virulence factors. Appl. Environ.Microbiol. 70: 4784-4791.
Fedhila, S.; Msadek, T.; Nel, P. and Lereclus, D.(2003b). Distinct clpP genes control specificadaptive responses in Bacillus thuringiensis. J.Bacteriol. 184: 5554-62.
Fedhila, S.; Nel, P. and Lereclus, D. (2002). TheInhA2 metalloprotease of Bacillus thuringiensisstrain 407 is required for pathogenicity in insectsinfected via the oral route. J. Bacteriol. 184:3296-3304.
Ghelardi, E.; Celandroni, F.; Salvetti, S.;Beecher, D.J.; Gominet, M.; Lereclus, D.; Wong,A.C. and Senesi S. (2002). Requirement of flhAfor swarming differentiation, flagellin export andsecretion of virulence-associated proteins inBacillus thuringiensis. J. Bacteriol. 184: 6424-6433.
Gominet, M.; Slamti, L.; Gilois, N.; Rose, M.and Lereclus, D. (2001). Oligopeptide permeaseis required for expression of the Bacillusthuringiensis plcR regulon and for virulence.Mol. Microbiol. 40: 963-75.
Gottesman, S.; Maurizi, M.R. and Wickner, S.(1997a). Regulatory subunits of energy-dependent proteases. Cell 91: 435-8.
Gottesman, S.; Wickner, S. and Maurizi, M.R.(1997b). Protein quality control: triage bychaperones and proteases. Gen. Dev. 11: 815-23.
Granados, R.R.; Fu, Y.; Corsaro, B. and Hughes,P.R. (2001). Enhancement of Bacillusthuringiensis toxicity to Lepidopterous specieswith the enhancin from Trichoplusia niGranulovirus. Biol. Control. 20: 153-159.
Grandvalet, C.; Gominet, M. and Lereclus, D.(2001). Identification of genes involved in theactivation of the Bacillus thuringiensis inhAmetalloprotease gene at the onset of sporulation.Microbiology. 147: 1805-13.
Ha, E.M.; Oh, C.T.; Ryu, J.H.; Bae, Y.S.; Kang,S.W. and Jang, I.H. (2005). An antioxidantsystem required for host protection against gutinfection in Drosophila. Dev. Cell. 8: 125-132.
Hajaij-Ellouze, M.; Fedhila, S.; Lercelus, D. andNielsen-Leroux, C. (2006). The enhancin-likemetalloprotease from the Bacillus cereus groupis regulated by the pleiotropic transcriptionalactivator PlcR but is not essential for larvicidalactivity. FEMS. Microbiol. Lett. 260: 9-16.
Hansen, B.M. and Salamitou, S. (2000).Virulence of Bacillus thuringiensis. In: Charles,J.F.; Delécluse, A. and Nielson-Leroux, C. (eds).Entomopathogenic bacteria: from laboratory tofield application. 41-63. Kluwer AcademicPublishers.
Hardy, S.P.; Lund, T. and Granum, P.E. (2001).CytK toxin of Bacillus cereus forms pores in
Biologia Tunisie Juillet 2012 ; N°7; 67 – 79
77
planar lipid bilayers and is cytotoxic to intestinalepithelia. FEMS. Microbiol. Lett. 197: 47-51.
Harvie, D.R. and Ellar, D.J. (2005). A ferricdicitrate uptake system is required for the fullvirulence of Bacillus cereus. Curr. Microbiol.50: 246-250.
Harvie, D.R.; Vilchez, S.; Steggles, J.R. andEllar, D.J. (2005). Bacillus cereus Fur regulatesiron metabolism and is required for fullvirulence. Microbiology. 151: 569-577.
Hensel, M.; Shea, J.E.; Gleeson, C.; Jones,M.D.; Dalton, E. and Holden, D.W. (1995).Simultaneous identification of bacterialvirulence genes by negative selection. Science.269: 400-403.
Hilliard, N.J.; Schelonka, R.L. and Waites, K.B.(2003). Bacillus cereus bacteremia in a pretermneonate. J. Clin. Microbiol. 41: 3441-3444.
Hoffmaster, A.R.; Ravel, J.; Rasko, D.A.;Chapman, G.D.; Chute, M.D. and De Marston,C.K.B.K. (2004). Identification of anthrax toxingenes in a Bacillus cereus associated with anillness resembling inhalation anthrax. Proc. Natl.Acad. Sci. USA. 101: 8449-8454.
Horsburgh, M.J.; Ingham, E. and Foster, S.J.(2001). In Staphylococcus aureus, Fur is aninteractive regulator with PerR, contributes tovirulence and is necessary for oxidative stressresistance through positive regulation of catalaseand iron homeostasis. J. Bacteriol. 183: 468-475.
Ivanova, N.; Sorokin, A.; Anderson, I.; Galleron,N.; Candelon, B.; Kaptral, V. Bhattacharyya, A.;Reznik, G.; Mikhailova, N.; Lapidus, A.; Chu,L.; Mazur, M.; Goltsman, E.; Larsen, N.;D'Souza, M.; Walunas, T.; Grechkin, Y.; Pusch,G.; Haselkorn, R.; Fonstein, M.;
Ehrlich, S. D.; Overbeek, R .and Kyrpides, N.(2003). Genome sequence of Bacillus cereus andcomparative analysis with Bacillus anthracis.Nature. 423: 87-91.
Kotiranta, A.; Lounatmaa, K. and Haapasalo, M.(2000). Epidemiology and pathogenesis ofBacillus cereus infections. Microbes Infect.2:189-98.
Lepore, L.S.; Roelvink, P.R. and Granados, R.R.(1996). Enhancin, granulosis virus protein that
falicitates nucleopolyhedrovirus (NPV)infections, is a metalloprotease. J. Invertebr.Pathol. 68: 131-140.
Lereclus, D.; Agaisse, H.; Gominet, M. andChaufaux, J. (1995). Overproduction ofencapsulated insecticidal crystal proteins in aBacillus thuringiensis spo0A mutant.Bio/Technol. 13: 67-71.
Lereclus, D.; Agaisse, H.; Gominet, M.;Salamitou, S. and Sanchis, V. (1996).Identification of a Bacillus thuringiensis genethat positively regulates transcription of thephosphatidylinositol-specific phospholipase Cgene at the onset of the stationary phase. J.Bacteriol. 178: 2749-2756.
Lereclus, D.; Agaisse, H.; Grandvalet, C.;Salamitou, S. and Gominet, M. (2000).Regulation of toxin and virulence genetranscription in Bacillus thuringiensis. Int. J.Med. Microbiol. 290: 295-9.
Li, Q.; Li, L.; Moore, K.; Donly, C.; Theilmann,D.A. and Erlandson, M. (2003). Characterizationof Mamestra configurata nucleopolyhedrovirusenhancin and its functional analysis viaexpression in an Autographa californica Mnucleopolyhedrovirus recombinant. Gen. Virol.84: 123-132.
Litwin, C.M. and Calderwood, S.B. (1993). Roleof iron in regulation of virulence genes. Clin.Microbiol. Rev. 6: 137-149.
Lövgren, A.; Zhang, M.; Engström, A.;Dalhammar, G. and Landén, R. (1990).Molecular characterization of immune inhibitorA, a secreted virulence protease from Bacillusthuringiensis. Mol. Microbiol. 4: 2137-2146.
Lövgren, A.; Zhang, M.-Y.; Engström, A. andLandén, R. (1993). Identification of twoexpressed flagellin genes in the insect pathogenBacillus thuringiensis subsp. alesti. J. Gen.Microbiol. 139: 21-30.
Lund, T.; De Buyser, M.L. and Granum, P.E.(2000). A new cytotoxin from Bacillus cereusthat may cause necrotic enteritis. Mol.Microbiol. 38: 254-61.
Lund, T. and Granum, P.E. (1997). Comparisonof biological effect of the two different
Biologia Tunisie Juillet 2012 ; N°7; 67 – 79
78
enterotoxin complexes isolated from threedifferent strains of Bacillus cereus.Microbiology. 143 (10): 3329-3336.
Mahan, M.J.; Slauch, J.M. and Mekalanos, J.J.(1993). Selection of bacterial virulence genesthat are specifically induced in host tissues.Science. 259: 686-688.
Meena, B.S.; Kapoor, K.N. and Agarwal, R.K.(2000). Occurrence of multi-drug resistantBacillus cereus in foods. J. Food. Sci. Technol.37: 289-291.
Miller, J.M.; Hair, J.G.; Hebert, M.; Hebert, L.;Roberts, F.J.Jr. and Weyant, R.S. (1997).Fulminating bacteremia and pneumonia due toBacillus cereus. J. Clin. Microbiol. 35: 504-507.
Minamino, T. and Macnab, R.M. (1999).Components of the Salmonella flagellar exportapparatus and classification of export substrates.J. Bacteriol. 181: 1388-1394.Mock, M. and Fouet, A. (2001). Anthrax. Ann.Rev. Microbiol. 55: 647-71.
Osbourn, A.E.; Barber, C.E. and Daniels, M.J.(1987). Identification of plant-induced genes ofthe bacterial pathogen Xanthomonas campestrispathovar campestris using a promoter-probeplasmid. Embo J. 6: 23-28.
Parkhill, J.; Wren, B.W. and Thomson, N.R.(2001). Genome sequence of Yersinia pestis, thecausative agent of plague. Nature. 413: 523-527.Popham, H.J.; Bischoff, D.S. and Slavicek, J.M.(2001). Both Lymantria disparnucleopolyhedrovirus enhancin genes contributeto viral potency. J. Virol. 75: 8639-8648.
Ramarao, N. and Lereclus, D. (2005). The InhA1metalloprotease allows spores of the Bacilluscereus group to escape macrophages. Cell.Microbiol. 7: 1357-64.
Ramarao, N. and Lereclus, D. (2006). Adhesionand cytotoxicity of Bacillus cereus and Bacillusthuringiensis to epithelial cells are FlhA andPlcR dependent, respectively. Microbes Infect.8:1483-1491.
Rasko, D.A.; Rave, I.J.; Okstad, O.A.; Helgason,E.; Cer, R.Z.; Jiang, L. et al. (2004). The genomesequence of Bacillus cereus ATCC 10987reveals metabolic adaptations and a large
plasmid related to Bacillus anthracis pXO1.Nucleic Acids. Res. 32: 977-988.
Ratledge, C. and Dover, L.G. (2000). Ironmetabolism in pathogenic bacteria. Annu. Rev.Microbiol. 54: 881-941.
Read, T.D.; Peterson, S.N. and Tourasse, N.(2003). The genome sequence of Bacillusanthracis Ames and comparison to closelyrelated bacteria. Nature. 423: 81-86.
Rediers, H.; Rainey, P.B.; Vanderleyden, J. andDe Mot, R. (2005). Unraveling the secret lives ofbacteria: use of in vivo expression technologyand differential fluorescence induction promotertraps as tools for exploring niche-specific geneexpression. Microbiol. Mol. Biol. Rev. 69: 217-261.
Saenz, H.L. and Dehio, C. (2005). Signature-tagged mutagenesis: technical advances in anegative selection method for virulence geneidentification. Curr. Opinion. Microbiol. 8: 612-619.
Salamitou, S.; Ramisse, F.; Brehelin, M.;Bourguet, D.; Gilois, N.; Gominet, M. et al.(2000). The PlcR regulon is involved in theopportunistic properties of Bacillus thuringiensisand Bacillus cereus in mice and insects.Microbiology. 146: 2825-32.
Schnepf, E.; Crickmore, N.; Van Rie, J.;Lereclus, D.; Baum, J.; Feitelson, J. et al. (1998).Bacillus thuringiensis and its pesticidal crystalproteins. Microbiol. Mol. Biol. Rev. 62: 775-806.
Siden, I.; Dalhammar, G.; Telander, B.; Boman,H.G. and Somerville, H. (1979). Virulencefactors in Bacillus thuringiensis: purification andproperties of a protein inhibitor of immunity ininsects. J. Gen. Microbiol. 114: 45-52.
Slamti, L. and Lereclus, D. (2002). A cell-cellsignaling peptide activates the PlcR virulenceregulon in bacteria of the Bacillus cereus group.Embo J. 21: 4550-9.
Steggles, J.R.; Wang, J. and Ellar, D.J. (2006).Discovery of Bacillus thuringiensis virulencegenes using signature-tagged mutagenesis in aninsect model of septicaemia. Curr. Microbiol.53: 303-10.
Biologia Tunisie Juillet 2012 ; N°7; 67 – 79
79
Strauss, R.; Mueller, A.; Wehler, M.; Neureiter,D.; Fischer, E.; Gramatzki, M. and Hahn, E.G.(2001). Pseudomembranous tracheobronchitisdue to Bacillus cereus. Clin. Infect. Dis. 33: 39-41.
Touati, D. (2000). Iron and oxidative stress inbacteria. Arch. Biochem. Biophys. 373: 1-6.
Wang, P. and Granados, R.R. (1997). Anintestinal mucin is the target substrate for abaculovirus enhancin. Proc. Natl. Acad. Sci.USA. 94: 6977-82.Wassenaar, T.M. and Gaastra, W. (2001).Bacterial virulence: can we draw the line? FEMSMicrobiol. Lett. 201: 1-7.
Wickner, S. and Maurizi, M.R. (1999). Here'sthe hook: similar substrate binding sites in thechaperone domains of Clp and Lon. Proc. Natl.Acad. Sci. USA. 96: 8318-20.
Yoshiga, T.; Georgieva, T.; Dunkov, B.C.;Harizanova, N.; Ralchev, K. and Law, J.H.(1999). Drosophila melanogaster transferrin.Cloning, deduced protein sequence, expressionduring the life cycle, gene localization and up-regulation on bacterial infection. Eur. J.Biochem. 260: 414-20.
Zhang, M.Y.; Lövgren, A.; Low, M.G. andLandén, R. (1993). Characterization of anavirulent pleitropic mutant of the insect pathogenBacillus thuringiensis: reduced expression offlagellin and phospholipases. Infect. Immun. 61:4947-4954.
Biologia Tunisie Juillet 2012; N°7 ; 80 – 84
80
BIOLOGIA TUNISIE
Allium sativum feeding induces apoptosis of germ cells throughcaspase-3 pathway
Hammami Imen1,2, Claire Mauduit2, Amri Mohamed3, Benahmed Mohamed2, MichèleVéronique El May1.
1- Unité de recherche n° 01/UR/08-07, Faculté de Médecine, 15 rue Djebel Lakhdar, 1007 Tunis;Tunisie.
2- Inserm, U407, Oullins, F-69921, France ; Université de Lyon, Oullins, F-69921, France ;Université Lyon 1, Oullins, F-69921, France.
3- Nutrition Physiology Laboratory, Faculty of Sciences, Tunis 1006, Tunisia
INTRODUCTIONMedicinal plants such as thyme, onion,blackseed, lemon balm and nettle are intensivelyused in traditional medicine, today. Garlic isamong the most important of these plants. Forthis purpose, garlic has been extensively usedworldwide for centuries, especially in the FarEast. Garlic is reported to be a wonderfulmedicinal plant owing to its preventivecharacteristics in cardiovascular diseases,regulating blood pressure, lowering blood sugarand cholesterol levels, effective against bacterial,viral, fungal and parasitic infections, enhancingthe immune system and having antitumoral andantioxidant features (Amagase H, 2006). Theside effects, particularly on male reproduction, ofsuch chronic treatments are poorly investigated.In the present study, we tried to identify thecellular and molecular targets of crude garlicadministrated at various doses to adult male rats.
MATERIALS AND METHODS
Plant preparation
The type of Allium sativum (As) used in thepresent study was “spring garlic”; it was grownin Tunisia and purchased on a local market.Every day the garlic pellets were made bymixing peeled cloves of garlic with powderedstandard rat pellet diet (Industrial Society ofFood, Sfax; Tunisia) at four doses: 5%, 10%,15% and 30%. Cloves were crushed in distilled
Western Blotting analysis
Testicular tissues were incubated in 200 µlof ice-cold hypotonic buffer (25 mL Tris-HCl pH 7.4 containing 1% protease-inhibitor cocktail), homogenized with apotter. Protein concentration wasdetermined by the bincinchoninic acidassay. Proteins (15 µg for c-IAP1, c-IAP2and XIAP, 10 µg for Smac, 20 µg forcaspase-6, 30 µg for caspase-3 and 40 µgfor AIF and survivin) were resolved on a10% (for c-IAP1, c-IAP2 and XIAP), 12%(for Smac, AIF and survivin) or 15%(caspase-6 and caspase-3) sodium dodecylsulphate/polyacrylamide gel. Proteins wereelectrophoretically transferred to anitrocellulose membrane using 25 mM Tris-185 mM glycine buffer (pH 8.3)containing 20% methanol at a constantvoltage of 100 V for 1 h. After transfer, themembranes were incubated in a blockingbuffer (TBS containing 1% of BSA and0.1% Tween-20) for 2 h at RT. Themembranes were rinsed three times withTBS/0.1%Tween-20 for 10 min each, andincubated with the first antibody (in TBScontaining 1% of BSA) overnight at 4°C.The antibodies were diluted as follows:1/400 for c-IAP1; 1/2,500 for c-IAP2;1/6,000 for XIAP; 1/400 for survivin;1/600 for Smac; 1/1,000 for caspase-6;1/200 for caspase-3. The protein loading
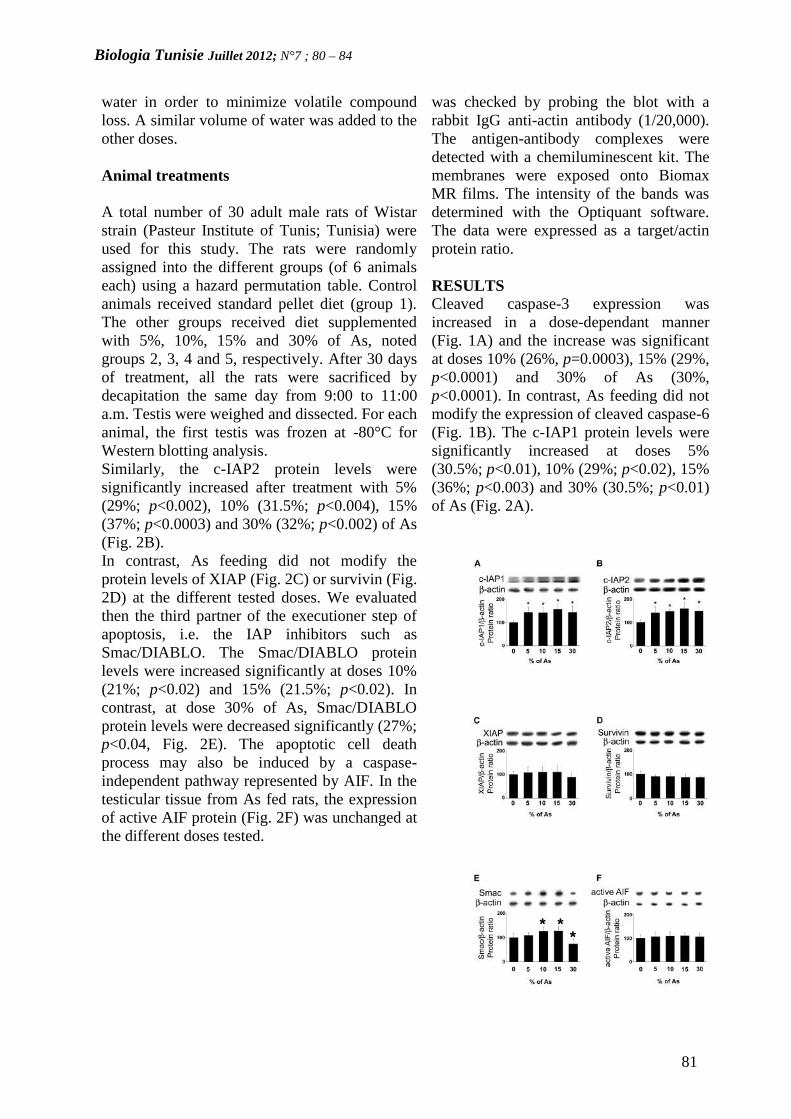
Biologia Tunisie Juillet 2012; N°7 ; 80 – 84
81
water in order to minimize volatile compoundloss. A similar volume of water was added to theother doses.
Animal treatments
A total number of 30 adult male rats of Wistarstrain (Pasteur Institute of Tunis; Tunisia) wereused for this study. The rats were randomlyassigned into the different groups (of 6 animalseach) using a hazard permutation table. Controlanimals received standard pellet diet (group 1).The other groups received diet supplementedwith 5%, 10%, 15% and 30% of As, notedgroups 2, 3, 4 and 5, respectively. After 30 daysof treatment, all the rats were sacrificed bydecapitation the same day from 9:00 to 11:00a.m. Testis were weighed and dissected. For eachanimal, the first testis was frozen at -80°C forWestern blotting analysis.Similarly, the c-IAP2 protein levels weresignificantly increased after treatment with 5%(29%; p<0.002), 10% (31.5%; p<0.004), 15%(37%; p<0.0003) and 30% (32%; p<0.002) of As(Fig. 2B).In contrast, As feeding did not modify theprotein levels of XIAP (Fig. 2C) or survivin (Fig.2D) at the different tested doses. We evaluatedthen the third partner of the executioner step ofapoptosis, i.e. the IAP inhibitors such asSmac/DIABLO. The Smac/DIABLO proteinlevels were increased significantly at doses 10%(21%; p<0.02) and 15% (21.5%; p<0.02). Incontrast, at dose 30% of As, Smac/DIABLOprotein levels were decreased significantly (27%;p<0.04, Fig. 2E). The apoptotic cell deathprocess may also be induced by a caspase-independent pathway represented by AIF. In thetesticular tissue from As fed rats, the expressionof active AIF protein (Fig. 2F) was unchanged atthe different doses tested.
was checked by probing the blot with arabbit IgG anti-actin antibody (1/20,000).The antigen-antibody complexes weredetected with a chemiluminescent kit. Themembranes were exposed onto BiomaxMR films. The intensity of the bands wasdetermined with the Optiquant software.The data were expressed as a target/actinprotein ratio.
RESULTSCleaved caspase-3 expression wasincreased in a dose-dependant manner(Fig. 1A) and the increase was significantat doses 10% (26%, p=0.0003), 15% (29%,p<0.0001) and 30% of As (30%,p<0.0001). In contrast, As feeding did notmodify the expression of cleaved caspase-6(Fig. 1B). The c-IAP1 protein levels weresignificantly increased at doses 5%(30.5%; p<0.01), 10% (29%; p<0.02), 15%(36%; p<0.003) and 30% (30.5%; p<0.01)of As (Fig. 2A).
* **
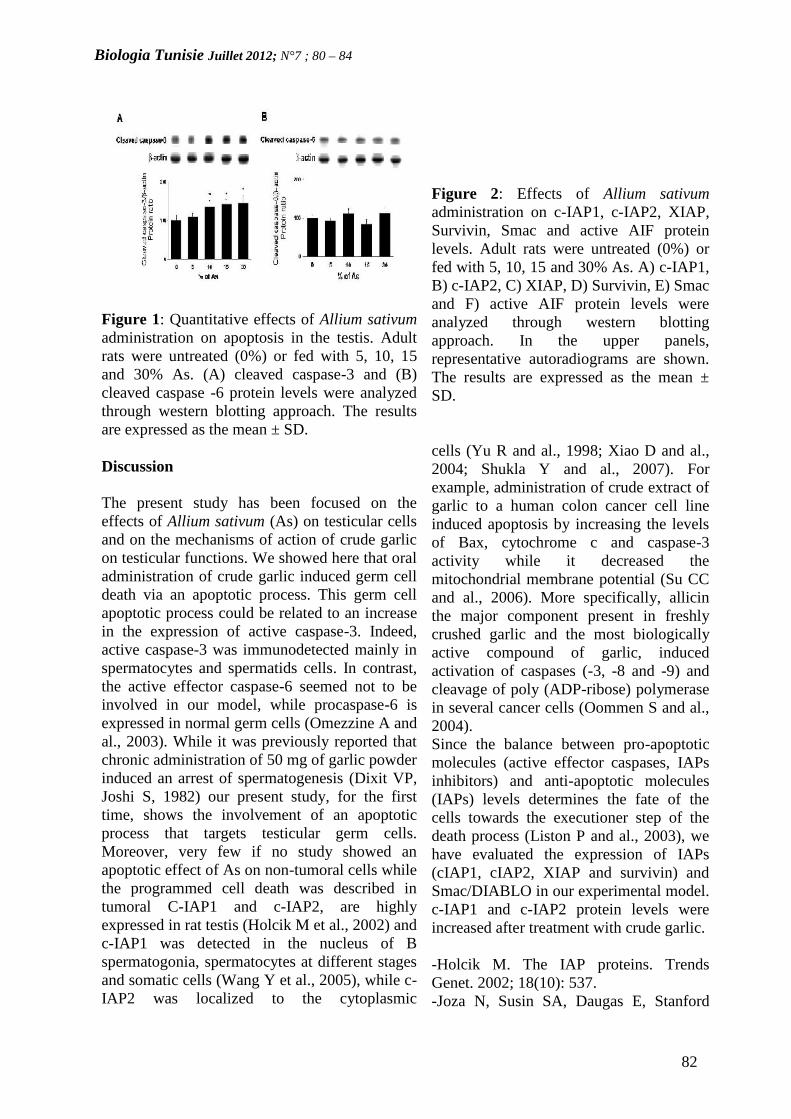
Biologia Tunisie Juillet 2012; N°7 ; 80 – 84
82
Figure 1: Quantitative effects of Allium sativumadministration on apoptosis in the testis. Adultrats were untreated (0%) or fed with 5, 10, 15and 30% As. (A) cleaved caspase-3 and (B)cleaved caspase -6 protein levels were analyzedthrough western blotting approach. The resultsare expressed as the mean ± SD.
Discussion
The present study has been focused on theeffects of Allium sativum (As) on testicular cellsand on the mechanisms of action of crude garlicon testicular functions. We showed here that oraladministration of crude garlic induced germ celldeath via an apoptotic process. This germ cellapoptotic process could be related to an increasein the expression of active caspase-3. Indeed,active caspase-3 was immunodetected mainly inspermatocytes and spermatids cells. In contrast,the active effector caspase-6 seemed not to beinvolved in our model, while procaspase-6 isexpressed in normal germ cells (Omezzine A andal., 2003). While it was previously reported thatchronic administration of 50 mg of garlic powderinduced an arrest of spermatogenesis (Dixit VP,Joshi S, 1982) our present study, for the firsttime, shows the involvement of an apoptoticprocess that targets testicular germ cells.Moreover, very few if no study showed anapoptotic effect of As on non-tumoral cells whilethe programmed cell death was described intumoral C-IAP1 and c-IAP2, are highlyexpressed in rat testis (Holcik M et al., 2002) andc-IAP1 was detected in the nucleus of Bspermatogonia, spermatocytes at different stagesand somatic cells (Wang Y et al., 2005), while c-IAP2 was localized to the cytoplasmic
Figure 2: Effects of Allium sativumadministration on c-IAP1, c-IAP2, XIAP,Survivin, Smac and active AIF proteinlevels. Adult rats were untreated (0%) orfed with 5, 10, 15 and 30% As. A) c-IAP1,B) c-IAP2, C) XIAP, D) Survivin, E) Smacand F) active AIF protein levels wereanalyzed through western blottingapproach. In the upper panels,representative autoradiograms are shown.The results are expressed as the mean ±SD.
cells (Yu R and al., 1998; Xiao D and al.,2004; Shukla Y and al., 2007). Forexample, administration of crude extract ofgarlic to a human colon cancer cell lineinduced apoptosis by increasing the levelsof Bax, cytochrome c and caspase-3activity while it decreased themitochondrial membrane potential (Su CCand al., 2006). More specifically, allicinthe major component present in freshlycrushed garlic and the most biologicallyactive compound of garlic, inducedactivation of caspases (-3, -8 and -9) andcleavage of poly (ADP-ribose) polymerasein several cancer cells (Oommen S and al.,2004).Since the balance between pro-apoptoticmolecules (active effector caspases, IAPsinhibitors) and anti-apoptotic molecules(IAPs) levels determines the fate of thecells towards the executioner step of thedeath process (Liston P and al., 2003), wehave evaluated the expression of IAPs(cIAP1, cIAP2, XIAP and survivin) andSmac/DIABLO in our experimental model.c-IAP1 and c-IAP2 protein levels wereincreased after treatment with crude garlic.
-Holcik M. The IAP proteins. TrendsGenet. 2002; 18(10): 537.-Joza N, Susin SA, Daugas E, Stanford
Biologia Tunisie Juillet 2012; N°7 ; 80 – 84
83
compartment of spermatocytes, spermatids(round and elongated) and Leydig cells (Wang Yet al., 2005). In our study, cIAP1 and cIAP2highly expressed in germ cells are unable toinhibit caspase-3 action.A potential explanation is the high levels ofSmac/DIABLO (in spermatocytes) by inhibitingthe IAP action may favour the activity ofcaspase-3 in these germ cells that are mostlyaffected by apoptosis after As treatment.Interestingly, at 30% of As Smac/DIABLOexpression decreased. Since this IAPs inhibitor ishighly and mainly expressed in pachytenespermatocytes (El Chami N et al., 2005) a loss ofthese testicular germ cells is not excluded at thisdose. For the spermatid apoptosis, the possibilityexists that other IAPs inhibitors, such as HtrA2,are expressed and inhibit cIAP1 and 2.Survivin, another member of IAPs family, wasexpressed in spermatocytes at first meioticprophase, and highly in Leydig cells (Wang Y etal., 2004) or exclusively in Leydig cells (ourunpublished data). X-IAP was also highlyexpressed in testis (Lagacé M et al., 2001),mainly in Sertoli cells (our unpublished data).Survivin and X-IAP levels were unchanged afterAs treatment, suggesting that Leydig (Survivin)and Sertoli (X-IAP) cells are not affected interms of apoptosis by crude garlic administrationeven at the highest doses. DNA degradationmight be triggered by caspase-dependent or acaspase-independent pathway through the actionof the Apoptosis Inducing Factor (AIF). Duringthe apoptotic process, AIF is released frommitochondria and translocated into the nucleuswhere its DNA binding activity mediates large-scale DNA fragmentation (Joza N et al., 2001;Candé C et al, 2002). According to the fact thatAs treatment, at the doses used in this study, hadno effect on the expression of active AIF, wesuggest, therefore, that the caspase-dependentpathway is mainly involved in our experimentalmodel.
REFERENCESAmagase H. Clarifying the real bioactiveconstituents of garlic. J Nutr. 2006; 136(3Suppl): 716S-725S.-Candé C, Cohen I, Daugas E, Ravagnan L,Larochette N, Zamzami N, Kroemer G.
WL, Cho SK, Li CY, Sasaki T, Elia AJ,Cheng HY, Ravagnan L, Ferri KF,Zamzami N, Wakeham A, Hakem R,Yoshida H, Kong YY, Mak TW, Zúñiga-Pflücker JC, Kroemer G, Penninger JM.Essential role of the mitochondrialapoptosis-inducing factor in programmedcell death. Nature. 2001; 410(6828): 549-54.Lagacé M, Xuan JY, Young SS,McRoberts C, Maier J, Rajcan-SeparovicE, Korneluk RG. Genomic organization ofthe X-linked inhibitor of apoptosis andidentification of a novel testis-specifictranscript. Genomics. 2001; 77(3): 181-8.-Liston P, Fong WG, Korneluk RG. Theinhibitors of apoptosis: there is more to lifethan Bcl2. Oncogene. 2003; 22(53): 8568-80.Omezzine A, Chater S, Mauduit C, FlorinA, Tabone E, Chuzel F, Bars R, BenahmedM. Long-term apoptotic cell death processwith increased expression and activation ofcaspase-3 and -6 in adult rat germ cellsexposed in utero to flutamide.Endocrinology. 2003; 144(2): 648-61.Oommen S, Anto RJ, Srinivas G,Karunagaran D. Allicin (from garlic)induces caspase-mediated apoptosis incancer cells. Eur J Pharmacol. 2004;485(1-3): 97-103.Shukla Y, Kalra N. Cancerchemoprevention with garlic and itsconstituents. Cancer Lett. 2007; 247(2):167-81.Su CC, Chen GW, Tan TW, Lin JG,Chung JG. Crude extract of garlic inducedcaspase-3 gene expression leading toapoptosis in human colon cancer cells. InVivo. 2006; 20(1): 85-90.Wang Y, Suominen JS, Hakovirta H,Parvinen M, Martinand-Mari C, Toppari J,Robbins I. Survivin expression in rat testisis upregulated by stem-cell factor. MolCell Endocrinol. 2004; 218(1-2): 165-74.Wang Y, Suominen JS, Parvinen M,Rivero-Muller A, Kiiveri S, HeikinheimoM, Robbins I, Toppari J. The regulatedexpression of c-IAP1 and c-IAP2 duringthe rat seminiferous epithelial cycle plays a
Biologia Tunisie Juillet 2012; N°7 ; 80 – 84
84
Apoptosis-inducing factor (AIF): a novelcaspase-independent death effector released frommitochondria. Biochimie. 2002; 84(2-3): 215-22.-El Chami N, Ikhlef F, Kaszas K, Yakoub S,Tabone E, Siddeek B, Cunha S, Beaudoin C,Morel L, Benahmed M, Régnier DC. Androgen-dependent apoptosis in male germ cells isregulated through the proto-oncoprotein Cbl. JCell Biol. 2005; 171(4): 651-61.-Hansen TM, Smith DJ, Nagley P.Smac/DIABLO is not released frommitochondria during apoptotic signalling in cellsdeficient in cytochrome c. Cell Death Differ.2006; 13(7):1181-90.
role in the protection of germ cells fromFas-mediated apoptosis. Mol CellEndocrinol. 2005; 245(1-2): 111-20.Wilkinson JC, Wilkinson AS, Scott FL,Csomos RA, Salvesen GS, Duckett CS.Neutralization of Smac/Diablo byinhibitors of apoptosis (IAPs). A caspase-independent mechanism for apoptoticinhibition. J Biol Chem. 2004; 279(49):51082-90.Xiao D, Choi S, Johnson DE, Vogel VG,Johnson CS, Trump DL, Lee YJ, SinghSV. Diallyl trisulfide-induced apoptosis inhuman prostate cancer cells involves c-JunN-terminal kinase and extracellular-signalregulated kinase-mediated phosphorylationof Bcl-2. Oncogene. 2004; 23(33): 5594-606.
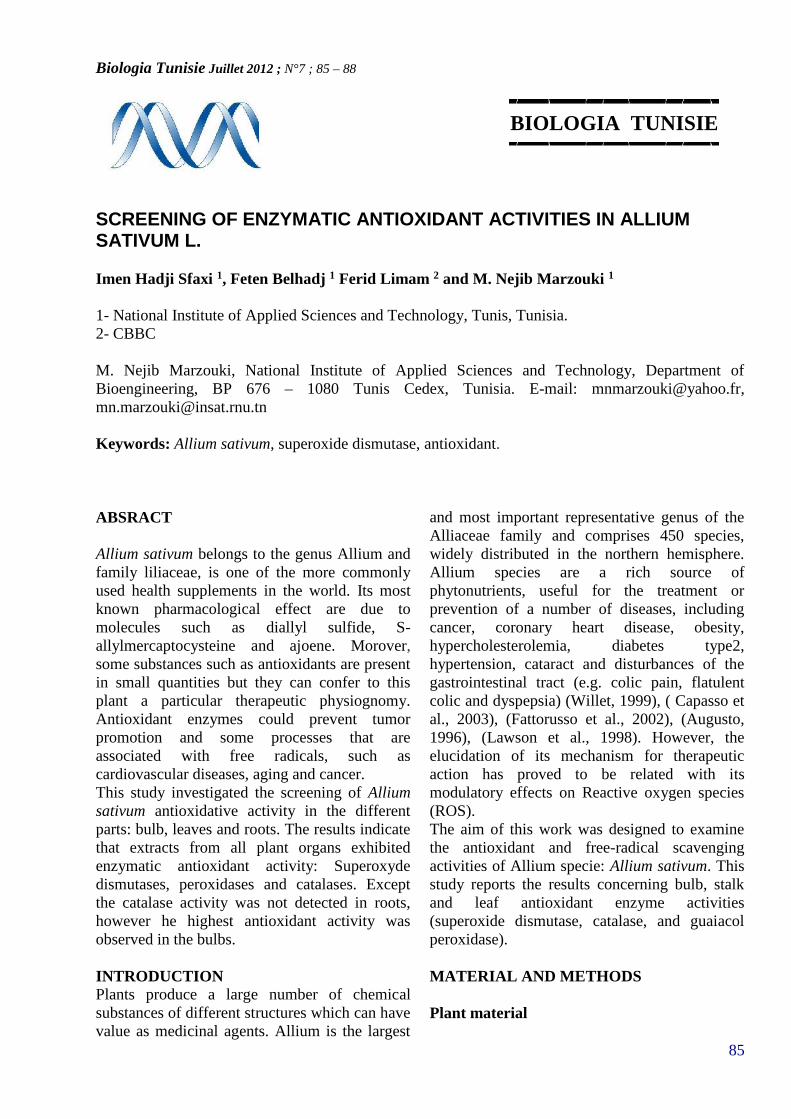
Biologia Tunisie Juillet 2012 ; N°7 ; 85 – 88
85
BIOLOGIA TUNISIE
SCREENING OF ENZYMATIC ANTIOXIDANT ACTIVITIES IN ALLIUMSATIVUM L.
Imen Hadji Sfaxi 1, Feten Belhadj 1 Ferid Limam 2 and M. Nejib Marzouki 1
1- National Institute of Applied Sciences and Technology, Tunis, Tunisia.2- CBBC
M. Nejib Marzouki, National Institute of Applied Sciences and Technology, Department ofBioengineering, BP 676 – 1080 Tunis Cedex, Tunisia. E-mail: [email protected],[email protected]
Keywords: Allium sativum, superoxide dismutase, antioxidant.
ABSRACT
Allium sativum belongs to the genus Allium andfamily liliaceae, is one of the more commonlyused health supplements in the world. Its mostknown pharmacological effect are due tomolecules such as diallyl sulfide, S-allylmercaptocysteine and ajoene. Morover,some substances such as antioxidants are presentin small quantities but they can confer to thisplant a particular therapeutic physiognomy.Antioxidant enzymes could prevent tumorpromotion and some processes that areassociated with free radicals, such ascardiovascular diseases, aging and cancer.This study investigated the screening of Alliumsativum antioxidative activity in the differentparts: bulb, leaves and roots. The results indicatethat extracts from all plant organs exhibitedenzymatic antioxidant activity: Superoxydedismutases, peroxidases and catalases. Exceptthe catalase activity was not detected in roots,however he highest antioxidant activity wasobserved in the bulbs.
INTRODUCTIONPlants produce a large number of chemicalsubstances of different structures which can havevalue as medicinal agents. Allium is the largest
and most important representative genus of theAlliaceae family and comprises 450 species,widely distributed in the northern hemisphere.Allium species are a rich source ofphytonutrients, useful for the treatment orprevention of a number of diseases, includingcancer, coronary heart disease, obesity,hypercholesterolemia, diabetes type2,hypertension, cataract and disturbances of thegastrointestinal tract (e.g. colic pain, flatulentcolic and dyspepsia) (Willet, 1999), ( Capasso etal., 2003), (Fattorusso et al., 2002), (Augusto,1996), (Lawson et al., 1998). However, theelucidation of its mechanism for therapeuticaction has proved to be related with itsmodulatory effects on Reactive oxygen species(ROS).The aim of this work was designed to examinethe antioxidant and free-radical scavengingactivities of Allium specie: Allium sativum. Thisstudy reports the results concerning bulb, stalkand leaf antioxidant enzyme activities(superoxide dismutase, catalase, and guaiacolperoxidase).
MATERIAL AND METHODS
Plant material

Biologia Tunisie Juillet 2012 ; N°7 ; 85 – 88
86
Bulbs of Allium sativum L. purchased from thelocal market were homogenized with a mixer.Then stirred for 2 hours in a 50 mM Tris-HClbuffer pH 7.25 containing 0.1mM EDTA(Ethylenedi-ethylamine),0.1 mM PMSF(Phenylmethylsulfonylfluoride) and (0,5% v/v)Triton X-100. The homogenate was filteredthrough two layers of cheesecloth andcentrifuged at 10.000 rpm for 60 min. Solubleproteins from garlic bulbs homogenate wereconcentrated by ammonium sulfate precipitationat 80 % saturation. Then the obtained extractwas used for further experiences.
Superoxide dismutase activitySOD was examined in 10% acrylamides gelsaccording the procedure of Laemelli 1970. Theenzyme activity was revealed according themethod described by Hajji et al., 2007.Measurement of SOD activity was assayed bymonitoring the adrenochrome formation usingmodified epinephrine assay (Misra andFridovich, 1972). One unit of SOD activity wasdefined as the amount of enzyme required to50% inhibition of adrenochrome formation asmonitored at 480 nm.
Peroxidase activityThe electrophoretic separation of acid POX wasperformed on native 10% acrylamide gels withpH 8.8 (El Ichi et al., 2008). The gels were thenincubated in acetate buffer pH 4 in dark at roomtemperature for 30 minutes, and bands wererevealed by using the peroxide in acetate bufferpH 5 (Guikema et al., 1980). Peroxidase activitywas measured in a reaction medium containing50 mM phosphate buffer (pH7), 9 mM guaiacoland 19 mM H2O2 according to the method of Linand Kao (1999).
Catalase activityCatalase activity was detected on nondenaturingacrylamide gels 8%, the gel was soaked in 5 mMH2O2 solution for 15 min. Then its is rinsed andstained in a mixture of 2% potassiumferricyanide and 2% ferric chloride (Jebara etal.,2005 ). Activity catalase was monitored byfollowing the decrease in the absorbance at 240nm of H2O2 (Abei et al., 1984).
Protein determination
Protein content was determined using a Bio-Radprotein assay with bovine serum albumin asstandard (Bradford, 1976).RESULTS & DISCUSSION
Polyacrylamide gels for superoxide dismutaseactivity revealed three isoforms in the differentparts of the plant: 2 major bands and one minorband of the same intensity (Figure 1).
Figure 1: Activity stain of Superoxide dismutase on native
gels (Polyacrylamide gel 10%) of bulbs leaves and roots.[B: bulb, L: leaves and R: roots.]
The specific activity of superoxide dismutase inbulb, leaves and roots is respectively about 50U/mg, 48 U/mg and 43 U/mg (Table 1).
Table1: The quantification of the three antioxidantenzymes in the different organs.
B u l b L e a v e s R o o t sS u p e r o x i d e d i s m u t a s e ( U / m g ) 5 3 4 8 4 3
P e r o x i d a s e ( U / m g ) 4 0 N . D 2 7
C a t a l a s e ( U / m g ) 6 . 9 8 N . D
The presence of superoxide dismutase in all thecompartments seems to be of equal amounts andalmost certainly indispensable as a first line ofdefense against oxidative stress in most tissues.The specific identification of acidic peroxidaseson native PAGE display three isoforms: P1, P2,P3 (Figure 2). The bulbs show the sameisoenzymes but with a greater activity than inroots.
SOD 1
SOD 2
SOD 3
B R L
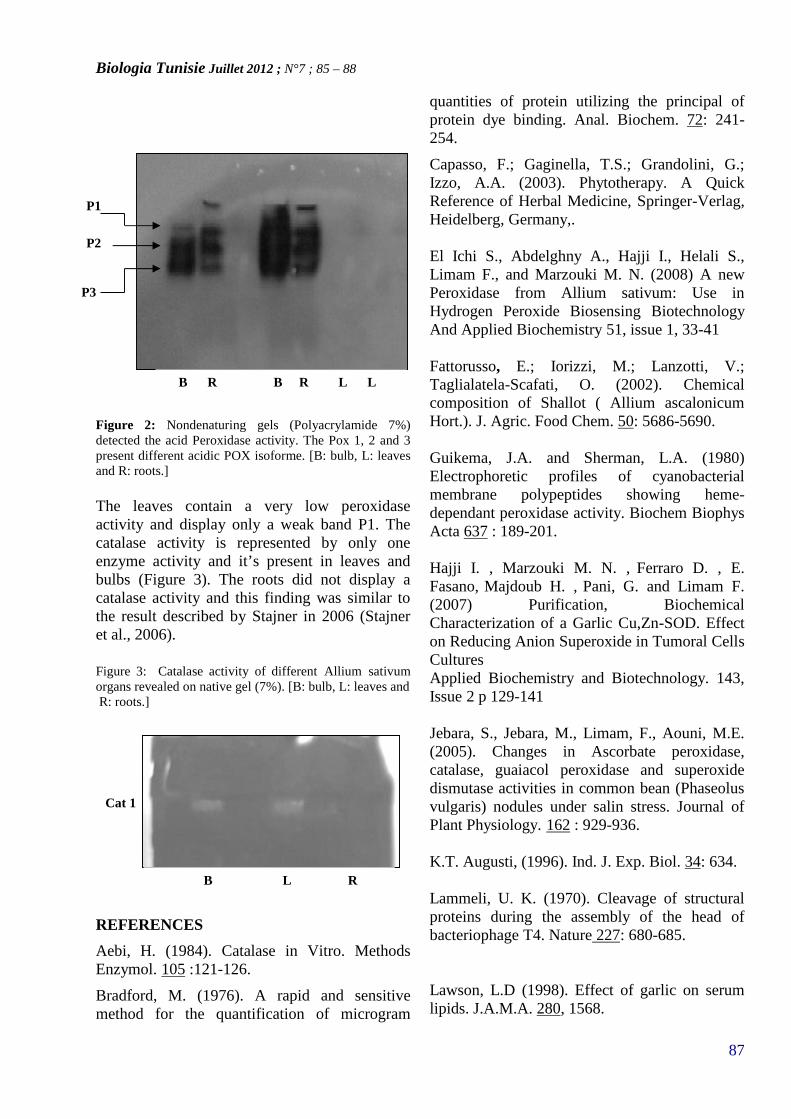
Biologia Tunisie Juillet 2012 ; N°7 ; 85 – 88
87
Figure 2: Nondenaturing gels (Polyacrylamide 7%)detected the acid Peroxidase activity. The Pox 1, 2 and 3present different acidic POX isoforme. [B: bulb, L: leavesand R: roots.]
The leaves contain a very low peroxidaseactivity and display only a weak band P1. Thecatalase activity is represented by only oneenzyme activity and it’s present in leaves andbulbs (Figure 3). The roots did not display acatalase activity and this finding was similar tothe result described by Stajner in 2006 (Stajneret al., 2006).
Figure 3: Catalase activity of different Allium sativumorgans revealed on native gel (7%). [B: bulb, L: leaves andR: roots.]
REFERENCES
Aebi, H. (1984). Catalase in Vitro. MethodsEnzymol. 105 :121-126.
Bradford, M. (1976). A rapid and sensitivemethod for the quantification of microgram
quantities of protein utilizing the principal ofprotein dye binding. Anal. Biochem. 72: 241-254.
Capasso, F.; Gaginella, T.S.; Grandolini, G.;Izzo, A.A. (2003). Phytotherapy. A QuickReference of Herbal Medicine, Springer-Verlag,Heidelberg, Germany,.
El Ichi S., Abdelghny A., Hajji I., Helali S.,Limam F., and Marzouki M. N. (2008) A newPeroxidase from Allium sativum: Use inHydrogen Peroxide Biosensing BiotechnologyAnd Applied Biochemistry 51, issue 1, 33-41
Fattorusso, E.; Iorizzi, M.; Lanzotti, V.;Taglialatela-Scafati, O. (2002). Chemicalcomposition of Shallot ( Allium ascalonicumHort.). J. Agric. Food Chem. 50: 5686-5690.
Guikema, J.A. and Sherman, L.A. (1980)Electrophoretic profiles of cyanobacterialmembrane polypeptides showing heme-dependant peroxidase activity. Biochem BiophysActa 637 : 189-201.
Hajji I. , Marzouki M. N. , Ferraro D. , E.Fasano, Majdoub H. , Pani, G. and Limam F.(2007) Purification, BiochemicalCharacterization of a Garlic Cu,Zn-SOD. Effecton Reducing Anion Superoxide in Tumoral CellsCulturesApplied Biochemistry and Biotechnology. 143,Issue 2 p 129-141
Jebara, S., Jebara, M., Limam, F., Aouni, M.E.(2005). Changes in Ascorbate peroxidase,catalase, guaiacol peroxidase and superoxidedismutase activities in common bean (Phaseolusvulgaris) nodules under salin stress. Journal ofPlant Physiology. 162 : 929-936.
K.T. Augusti, (1996). Ind. J. Exp. Biol. 34: 634.
Lammeli, U. K. (1970). Cleavage of structuralproteins during the assembly of the head ofbacteriophage T4. Nature 227: 680-685.
Lawson, L.D (1998). Effect of garlic on serumlipids. J.A.M.A. 280, 1568.
P1
B R B R L L
P2
P3
Cat 1
B L R
Biologia Tunisie Juillet 2012 ; N°7 ; 85 – 88
88
Lin, C.C. and Kao, C.H. (1999). NaCl inducedchanges in ionically bounds peroxidase activityin roots of rice seedlings. Plant Soil, 216: 147-153.
Misra, H. P. and Fridovich, I. (1972). The role ofsuperoxide anion in autoxidation of epinephrineand a simple assay for SOD. J. Biol. Chem. 247:3170-3175.
Stajner, D.; MiliÇ, N.; Canadanovic-Brunet, J.,;Kapor, A.; Stajner, M. and Popovic, B. M.(2006). Exploring Allium species as a Source ofPotential Medicinal Agents. Phytother. Res. 20:581-584.
Willet, W.C. (1999). Goals of nutrition in theyear 2000. CA: Cancer. J. Clin. 49: 331-352.

Biologia Tunisie Juillet 2012 ; N°7 ; 85 – 88
85
BIOLOGIA TUNISIE
SCREENING OF ENZYMATIC ANTIOXIDANT ACTIVITIES IN ALLIUMSATIVUM L.
Imen Hadji Sfaxi 1, Feten Belhadj 1 Ferid Limam 2 and M. Nejib Marzouki 1
1- National Institute of Applied Sciences and Technology, Tunis, Tunisia.2- CBBC
M. Nejib Marzouki, National Institute of Applied Sciences and Technology, Department ofBioengineering, BP 676 – 1080 Tunis Cedex, Tunisia. E-mail: [email protected],[email protected]
Keywords: Allium sativum, superoxide dismutase, antioxidant.
ABSRACT
Allium sativum belongs to the genus Allium andfamily liliaceae, is one of the more commonlyused health supplements in the world. Its mostknown pharmacological effect are due tomolecules such as diallyl sulfide, S-allylmercaptocysteine and ajoene. Morover,some substances such as antioxidants are presentin small quantities but they can confer to thisplant a particular therapeutic physiognomy.Antioxidant enzymes could prevent tumorpromotion and some processes that areassociated with free radicals, such ascardiovascular diseases, aging and cancer.This study investigated the screening of Alliumsativum antioxidative activity in the differentparts: bulb, leaves and roots. The results indicatethat extracts from all plant organs exhibitedenzymatic antioxidant activity: Superoxydedismutases, peroxidases and catalases. Exceptthe catalase activity was not detected in roots,however he highest antioxidant activity wasobserved in the bulbs.
INTRODUCTIONPlants produce a large number of chemicalsubstances of different structures which can havevalue as medicinal agents. Allium is the largest
and most important representative genus of theAlliaceae family and comprises 450 species,widely distributed in the northern hemisphere.Allium species are a rich source ofphytonutrients, useful for the treatment orprevention of a number of diseases, includingcancer, coronary heart disease, obesity,hypercholesterolemia, diabetes type2,hypertension, cataract and disturbances of thegastrointestinal tract (e.g. colic pain, flatulentcolic and dyspepsia) (Willet, 1999), ( Capasso etal., 2003), (Fattorusso et al., 2002), (Augusto,1996), (Lawson et al., 1998). However, theelucidation of its mechanism for therapeuticaction has proved to be related with itsmodulatory effects on Reactive oxygen species(ROS).The aim of this work was designed to examinethe antioxidant and free-radical scavengingactivities of Allium specie: Allium sativum. Thisstudy reports the results concerning bulb, stalkand leaf antioxidant enzyme activities(superoxide dismutase, catalase, and guaiacolperoxidase).
MATERIAL AND METHODS
Plant material
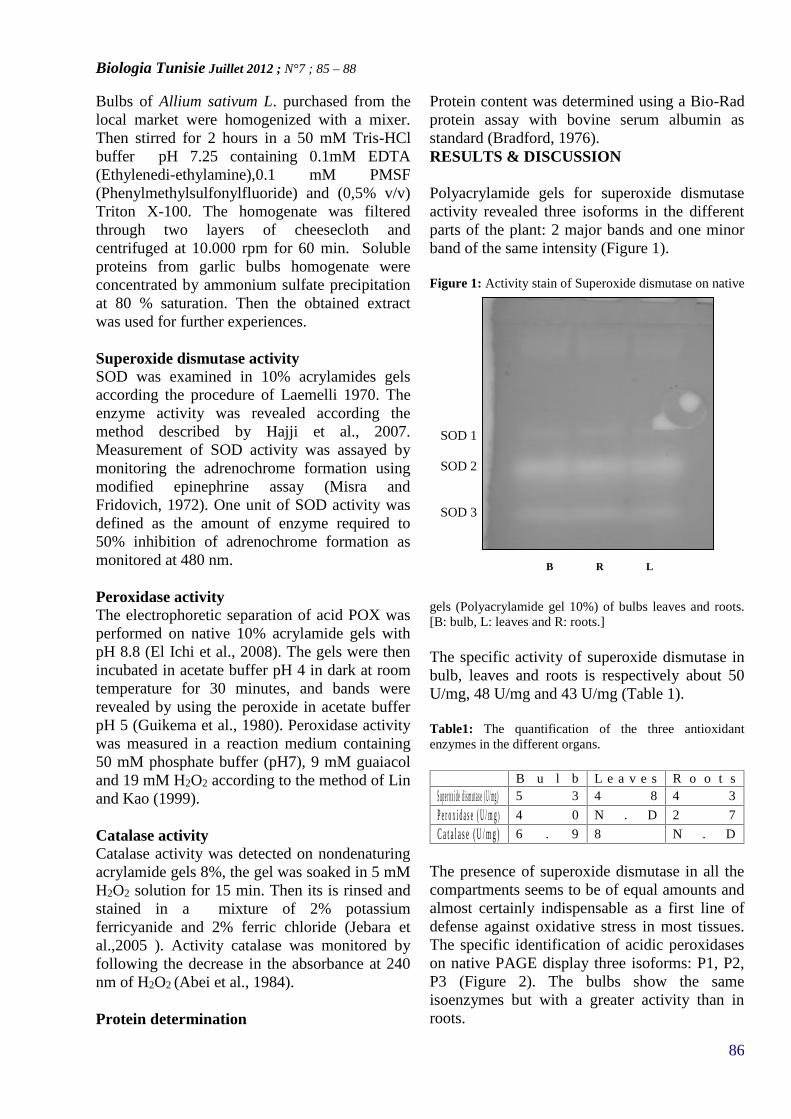
Biologia Tunisie Juillet 2012 ; N°7 ; 85 – 88
86
Bulbs of Allium sativum L. purchased from thelocal market were homogenized with a mixer.Then stirred for 2 hours in a 50 mM Tris-HClbuffer pH 7.25 containing 0.1mM EDTA(Ethylenedi-ethylamine),0.1 mM PMSF(Phenylmethylsulfonylfluoride) and (0,5% v/v)Triton X-100. The homogenate was filteredthrough two layers of cheesecloth andcentrifuged at 10.000 rpm for 60 min. Solubleproteins from garlic bulbs homogenate wereconcentrated by ammonium sulfate precipitationat 80 % saturation. Then the obtained extractwas used for further experiences.
Superoxide dismutase activitySOD was examined in 10% acrylamides gelsaccording the procedure of Laemelli 1970. Theenzyme activity was revealed according themethod described by Hajji et al., 2007.Measurement of SOD activity was assayed bymonitoring the adrenochrome formation usingmodified epinephrine assay (Misra andFridovich, 1972). One unit of SOD activity wasdefined as the amount of enzyme required to50% inhibition of adrenochrome formation asmonitored at 480 nm.
Peroxidase activityThe electrophoretic separation of acid POX wasperformed on native 10% acrylamide gels withpH 8.8 (El Ichi et al., 2008). The gels were thenincubated in acetate buffer pH 4 in dark at roomtemperature for 30 minutes, and bands wererevealed by using the peroxide in acetate bufferpH 5 (Guikema et al., 1980). Peroxidase activitywas measured in a reaction medium containing50 mM phosphate buffer (pH7), 9 mM guaiacoland 19 mM H2O2 according to the method of Linand Kao (1999).
Catalase activityCatalase activity was detected on nondenaturingacrylamide gels 8%, the gel was soaked in 5 mMH2O2 solution for 15 min. Then its is rinsed andstained in a mixture of 2% potassiumferricyanide and 2% ferric chloride (Jebara etal.,2005 ). Activity catalase was monitored byfollowing the decrease in the absorbance at 240nm of H2O2 (Abei et al., 1984).
Protein determination
Protein content was determined using a Bio-Radprotein assay with bovine serum albumin asstandard (Bradford, 1976).RESULTS & DISCUSSION
Polyacrylamide gels for superoxide dismutaseactivity revealed three isoforms in the differentparts of the plant: 2 major bands and one minorband of the same intensity (Figure 1).
Figure 1: Activity stain of Superoxide dismutase on native
gels (Polyacrylamide gel 10%) of bulbs leaves and roots.[B: bulb, L: leaves and R: roots.]
The specific activity of superoxide dismutase inbulb, leaves and roots is respectively about 50U/mg, 48 U/mg and 43 U/mg (Table 1).
Table1: The quantification of the three antioxidantenzymes in the different organs.
B u l b L e a v e s R o o t sS u p e r o x i d e d i s m u t a s e ( U / m g ) 5 3 4 8 4 3
P e r o x i d a s e ( U / m g ) 4 0 N . D 2 7
C a t a l a s e ( U / m g ) 6 . 9 8 N . D
The presence of superoxide dismutase in all thecompartments seems to be of equal amounts andalmost certainly indispensable as a first line ofdefense against oxidative stress in most tissues.The specific identification of acidic peroxidaseson native PAGE display three isoforms: P1, P2,P3 (Figure 2). The bulbs show the sameisoenzymes but with a greater activity than inroots.
SOD 1
SOD 2
SOD 3
B R L

Biologia Tunisie Juillet 2012 ; N°7 ; 85 – 88
87
Figure 2: Nondenaturing gels (Polyacrylamide 7%)detected the acid Peroxidase activity. The Pox 1, 2 and 3present different acidic POX isoforme. [B: bulb, L: leavesand R: roots.]
The leaves contain a very low peroxidaseactivity and display only a weak band P1. Thecatalase activity is represented by only oneenzyme activity and it’s present in leaves andbulbs (Figure 3). The roots did not display acatalase activity and this finding was similar tothe result described by Stajner in 2006 (Stajneret al., 2006).
Figure 3: Catalase activity of different Allium sativumorgans revealed on native gel (7%). [B: bulb, L: leaves andR: roots.]
REFERENCES
Aebi, H. (1984). Catalase in Vitro. MethodsEnzymol. 105 :121-126.
Bradford, M. (1976). A rapid and sensitivemethod for the quantification of microgram
quantities of protein utilizing the principal ofprotein dye binding. Anal. Biochem. 72: 241-254.
Capasso, F.; Gaginella, T.S.; Grandolini, G.;Izzo, A.A. (2003). Phytotherapy. A QuickReference of Herbal Medicine, Springer-Verlag,Heidelberg, Germany,.
El Ichi S., Abdelghny A., Hajji I., Helali S.,Limam F., and Marzouki M. N. (2008) A newPeroxidase from Allium sativum: Use inHydrogen Peroxide Biosensing BiotechnologyAnd Applied Biochemistry 51, issue 1, 33-41
Fattorusso, E.; Iorizzi, M.; Lanzotti, V.;Taglialatela-Scafati, O. (2002). Chemicalcomposition of Shallot ( Allium ascalonicumHort.). J. Agric. Food Chem. 50: 5686-5690.
Guikema, J.A. and Sherman, L.A. (1980)Electrophoretic profiles of cyanobacterialmembrane polypeptides showing heme-dependant peroxidase activity. Biochem BiophysActa 637 : 189-201.
Hajji I. , Marzouki M. N. , Ferraro D. , E.Fasano, Majdoub H. , Pani, G. and Limam F.(2007) Purification, BiochemicalCharacterization of a Garlic Cu,Zn-SOD. Effecton Reducing Anion Superoxide in Tumoral CellsCulturesApplied Biochemistry and Biotechnology. 143,Issue 2 p 129-141
Jebara, S., Jebara, M., Limam, F., Aouni, M.E.(2005). Changes in Ascorbate peroxidase,catalase, guaiacol peroxidase and superoxidedismutase activities in common bean (Phaseolusvulgaris) nodules under salin stress. Journal ofPlant Physiology. 162 : 929-936.
K.T. Augusti, (1996). Ind. J. Exp. Biol. 34: 634.
Lammeli, U. K. (1970). Cleavage of structuralproteins during the assembly of the head ofbacteriophage T4. Nature 227: 680-685.
Lawson, L.D (1998). Effect of garlic on serumlipids. J.A.M.A. 280, 1568.
P1
B R B R L L
P2
P3
Cat 1
B L R

Biologia Tunisie Juillet 2012 ; N°7 ; 85 – 88
88
Lin, C.C. and Kao, C.H. (1999). NaCl inducedchanges in ionically bounds peroxidase activityin roots of rice seedlings. Plant Soil, 216: 147-153.
Misra, H. P. and Fridovich, I. (1972). The role ofsuperoxide anion in autoxidation of epinephrineand a simple assay for SOD. J. Biol. Chem. 247:3170-3175.
Stajner, D.; MiliÇ, N.; Canadanovic-Brunet, J.,;Kapor, A.; Stajner, M. and Popovic, B. M.(2006). Exploring Allium species as a Source ofPotential Medicinal Agents. Phytother. Res. 20:581-584.
Willet, W.C. (1999). Goals of nutrition in theyear 2000. CA: Cancer. J. Clin. 49: 331-352.
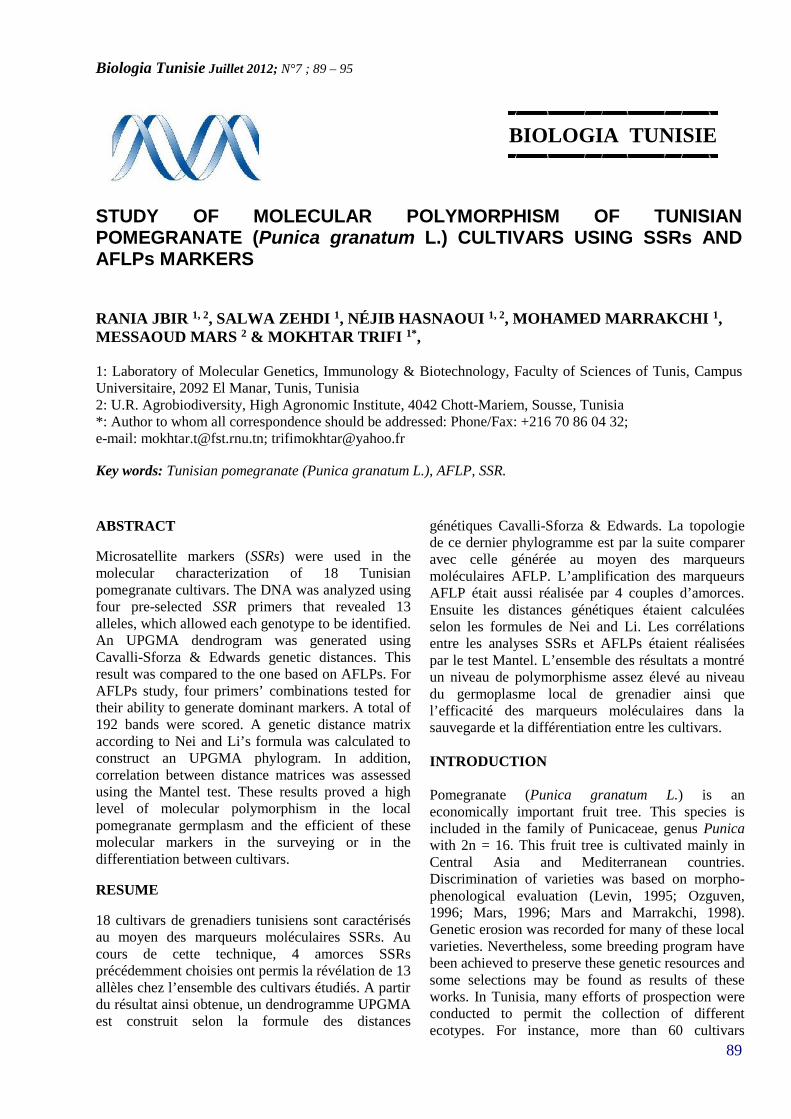
Biologia Tunisie Juillet 2012; N°7 ; 89 – 95
89
BIOLOGIA TUNISIE
STUDY OF MOLECULAR POLYMORPHISM OF TUNISIANPOMEGRANATE (Punica granatum L.) CULTIVARS USING SSRs ANDAFLPs MARKERS
RANIA JBIR 1, 2, SALWA ZEHDI 1, NÉJIB HASNAOUI 1, 2, MOHAMED MARRAKCHI 1,MESSAOUD MARS 2 & MOKHTAR TRIFI 1*,
1: Laboratory of Molecular Genetics, Immunology & Biotechnology, Faculty of Sciences of Tunis, CampusUniversitaire, 2092 El Manar, Tunis, Tunisia2: U.R. Agrobiodiversity, High Agronomic Institute, 4042 Chott-Mariem, Sousse, Tunisia*: Author to whom all correspondence should be addressed: Phone/Fax: +216 70 86 04 32;e-mail: [email protected]; [email protected]
Key words: Tunisian pomegranate (Punica granatum L.), AFLP, SSR.
ABSTRACT
Microsatellite markers (SSRs) were used in themolecular characterization of 18 Tunisianpomegranate cultivars. The DNA was analyzed usingfour pre-selected SSR primers that revealed 13alleles, which allowed each genotype to be identified.An UPGMA dendrogram was generated usingCavalli-Sforza & Edwards genetic distances. Thisresult was compared to the one based on AFLPs. ForAFLPs study, four primers’ combinations tested fortheir ability to generate dominant markers. A total of192 bands were scored. A genetic distance matrixaccording to Nei and Li’s formula was calculated toconstruct an UPGMA phylogram. In addition,correlation between distance matrices was assessedusing the Mantel test. These results proved a highlevel of molecular polymorphism in the localpomegranate germplasm and the efficient of thesemolecular markers in the surveying or in thedifferentiation between cultivars.
RESUME
18 cultivars de grenadiers tunisiens sont caractérisésau moyen des marqueurs moléculaires SSRs. Aucours de cette technique, 4 amorces SSRsprécédemment choisies ont permis la révélation de 13allèles chez l’ensemble des cultivars étudiés. A partirdu résultat ainsi obtenue, un dendrogramme UPGMAest construit selon la formule des distances
génétiques Cavalli-Sforza & Edwards. La topologiede ce dernier phylogramme est par la suite compareravec celle générée au moyen des marqueursmoléculaires AFLP. L’amplification des marqueursAFLP était aussi réalisée par 4 couples d’amorces.Ensuite les distances génétiques étaient calculéesselon les formules de Nei and Li. Les corrélationsentre les analyses SSRs et AFLPs étaient réaliséespar le test Mantel. L’ensemble des résultats a montréun niveau de polymorphisme assez élevé au niveaudu germoplasme local de grenadier ainsi quel’efficacité des marqueurs moléculaires dans lasauvegarde et la différentiation entre les cultivars.
INTRODUCTION
Pomegranate (Punica granatum L.) is aneconomically important fruit tree. This species isincluded in the family of Punicaceae, genus Punicawith 2n = 16. This fruit tree is cultivated mainly inCentral Asia and Mediterranean countries.Discrimination of varieties was based on morpho-phenological evaluation (Levin, 1995; Ozguven,1996; Mars, 1996; Mars and Marrakchi, 1998).Genetic erosion was recorded for many of these localvarieties. Nevertheless, some breeding program havebeen achieved to preserve these genetic resources andsome selections may be found as results of theseworks. In Tunisia, many efforts of prospection wereconducted to permit the collection of differentecotypes. For instance, more than 60 cultivars
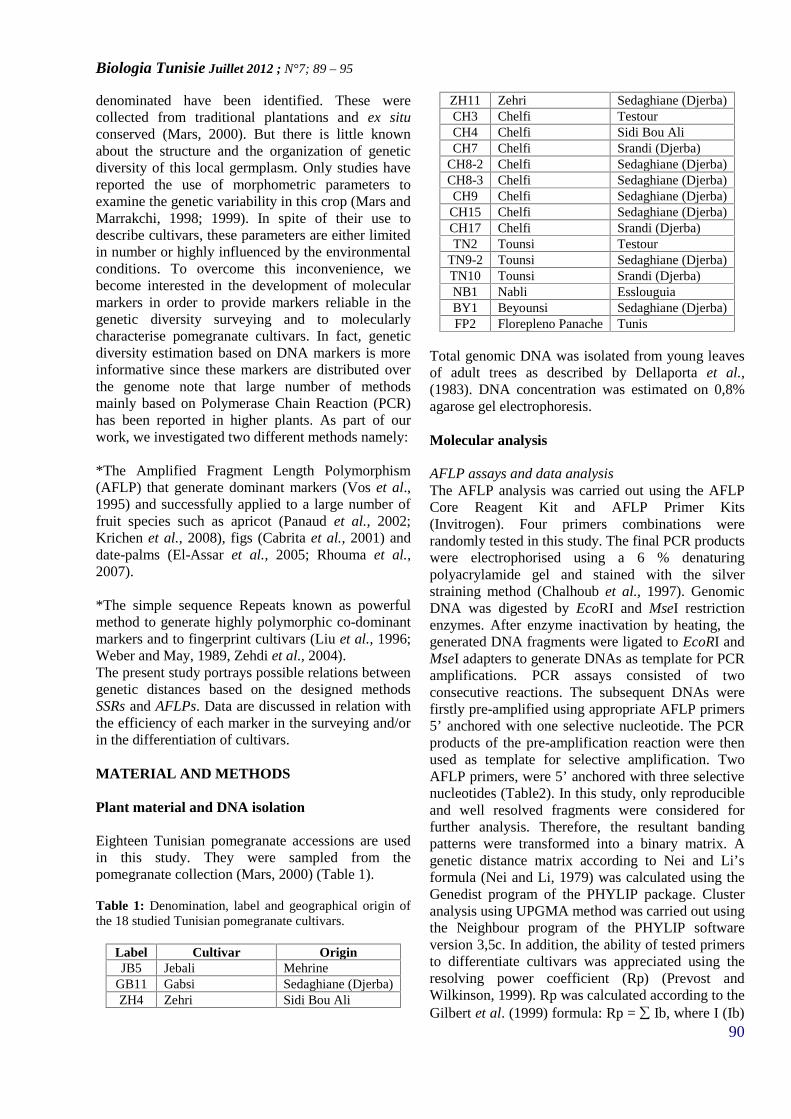
Biologia Tunisie Juillet 2012 ; N°7; 89 – 95
90
denominated have been identified. These werecollected from traditional plantations and ex situconserved (Mars, 2000). But there is little knownabout the structure and the organization of geneticdiversity of this local germplasm. Only studies havereported the use of morphometric parameters toexamine the genetic variability in this crop (Mars andMarrakchi, 1998; 1999). In spite of their use todescribe cultivars, these parameters are either limitedin number or highly influenced by the environmentalconditions. To overcome this inconvenience, webecome interested in the development of molecularmarkers in order to provide markers reliable in thegenetic diversity surveying and to molecularlycharacterise pomegranate cultivars. In fact, geneticdiversity estimation based on DNA markers is moreinformative since these markers are distributed overthe genome note that large number of methodsmainly based on Polymerase Chain Reaction (PCR)has been reported in higher plants. As part of ourwork, we investigated two different methods namely:
*The Amplified Fragment Length Polymorphism(AFLP) that generate dominant markers (Vos et al.,1995) and successfully applied to a large number offruit species such as apricot (Panaud et al., 2002;Krichen et al., 2008), figs (Cabrita et al., 2001) anddate-palms (El-Assar et al., 2005; Rhouma et al.,2007).
*The simple sequence Repeats known as powerfulmethod to generate highly polymorphic co-dominantmarkers and to fingerprint cultivars (Liu et al., 1996;Weber and May, 1989, Zehdi et al., 2004).The present study portrays possible relations betweengenetic distances based on the designed methodsSSRs and AFLPs. Data are discussed in relation withthe efficiency of each marker in the surveying and/orin the differentiation of cultivars.
MATERIAL AND METHODS
Plant material and DNA isolation
Eighteen Tunisian pomegranate accessions are usedin this study. They were sampled from thepomegranate collection (Mars, 2000) (Table 1).
Table 1: Denomination, label and geographical origin ofthe 18 studied Tunisian pomegranate cultivars.
Label Cultivar OriginJB5 Jebali Mehrine
GB11 Gabsi Sedaghiane (Djerba)ZH4 Zehri Sidi Bou Ali
ZH11 Zehri Sedaghiane (Djerba)CH3 Chelfi TestourCH4 Chelfi Sidi Bou AliCH7 Chelfi Srandi (Djerba)
CH8-2 Chelfi Sedaghiane (Djerba)CH8-3 Chelfi Sedaghiane (Djerba)CH9 Chelfi Sedaghiane (Djerba)
CH15 Chelfi Sedaghiane (Djerba)CH17 Chelfi Srandi (Djerba)TN2 Tounsi Testour
TN9-2 Tounsi Sedaghiane (Djerba)TN10 Tounsi Srandi (Djerba)NB1 Nabli EsslouguiaBY1 Beyounsi Sedaghiane (Djerba)FP2 Florepleno Panache Tunis
Total genomic DNA was isolated from young leavesof adult trees as described by Dellaporta et al.,(1983). DNA concentration was estimated on 0,8%agarose gel electrophoresis.
Molecular analysis
AFLP assays and data analysisThe AFLP analysis was carried out using the AFLPCore Reagent Kit and AFLP Primer Kits(Invitrogen). Four primers combinations wererandomly tested in this study. The final PCR productswere electrophorised using a 6 % denaturingpolyacrylamide gel and stained with the silverstraining method (Chalhoub et al., 1997). GenomicDNA was digested by EcoRI and MseI restrictionenzymes. After enzyme inactivation by heating, thegenerated DNA fragments were ligated to EcoRI andMseI adapters to generate DNAs as template for PCRamplifications. PCR assays consisted of twoconsecutive reactions. The subsequent DNAs werefirstly pre-amplified using appropriate AFLP primers5’ anchored with one selective nucleotide. The PCRproducts of the pre-amplification reaction were thenused as template for selective amplification. TwoAFLP primers, were 5’ anchored with three selectivenucleotides (Table2). In this study, only reproducibleand well resolved fragments were considered forfurther analysis. Therefore, the resultant bandingpatterns were transformed into a binary matrix. Agenetic distance matrix according to Nei and Li’sformula (Nei and Li, 1979) was calculated using theGenedist program of the PHYLIP package. Clusteranalysis using UPGMA method was carried out usingthe Neighbour program of the PHYLIP softwareversion 3,5c. In addition, the ability of tested primersto differentiate cultivars was appreciated using theresolving power coefficient (Rp) (Prevost andWilkinson, 1999). Rp was calculated according to theGilbert et al. (1999) formula: Rp = Ib, where I (Ib)
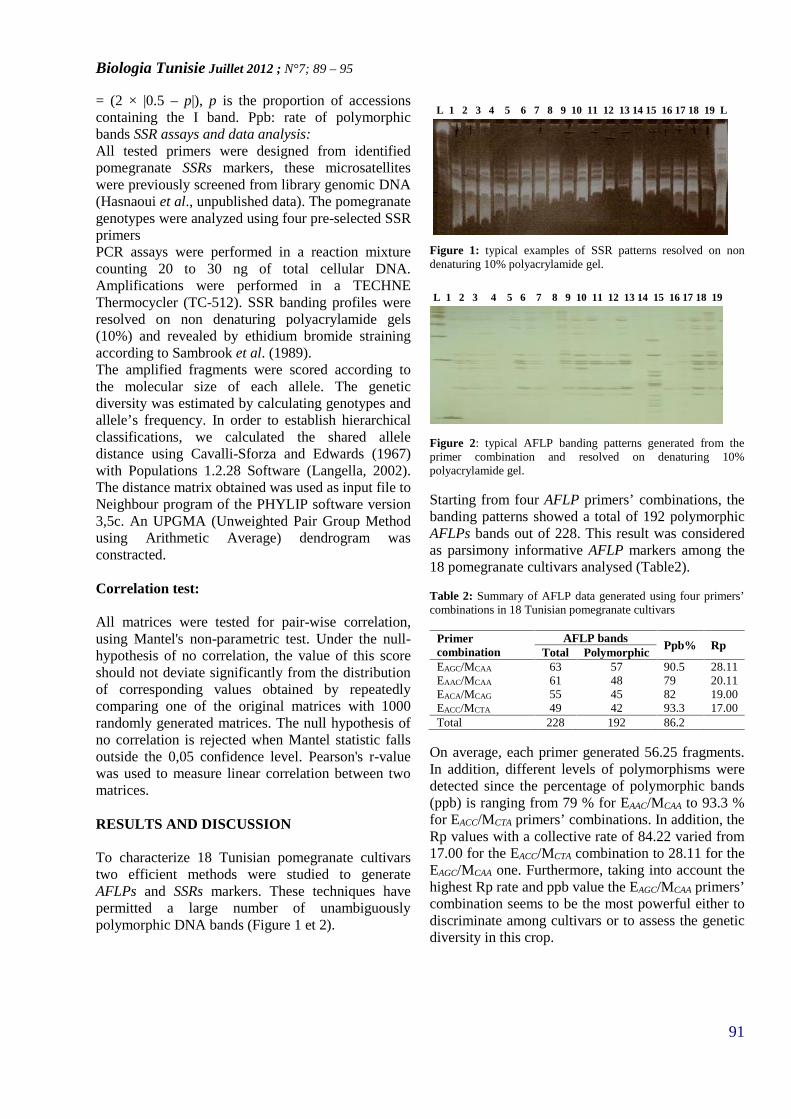
Biologia Tunisie Juillet 2012 ; N°7; 89 – 95
91
= (2 × |0.5 – p|), p is the proportion of accessionscontaining the I band. Ppb: rate of polymorphicbands SSR assays and data analysis:All tested primers were designed from identifiedpomegranate SSRs markers, these microsatelliteswere previously screened from library genomic DNA(Hasnaoui et al., unpublished data). The pomegranategenotypes were analyzed using four pre-selected SSRprimersPCR assays were performed in a reaction mixturecounting 20 to 30 ng of total cellular DNA.Amplifications were performed in a TECHNEThermocycler (TC-512). SSR banding profiles wereresolved on non denaturing polyacrylamide gels(10%) and revealed by ethidium bromide strainingaccording to Sambrook et al. (1989).The amplified fragments were scored according tothe molecular size of each allele. The geneticdiversity was estimated by calculating genotypes andallele’s frequency. In order to establish hierarchicalclassifications, we calculated the shared alleledistance using Cavalli-Sforza and Edwards (1967)with Populations 1.2.28 Software (Langella, 2002).The distance matrix obtained was used as input file toNeighbour program of the PHYLIP software version3,5c. An UPGMA (Unweighted Pair Group Methodusing Arithmetic Average) dendrogram wasconstracted.
Correlation test:
All matrices were tested for pair-wise correlation,using Mantel's non-parametric test. Under the null-hypothesis of no correlation, the value of this scoreshould not deviate significantly from the distributionof corresponding values obtained by repeatedlycomparing one of the original matrices with 1000randomly generated matrices. The null hypothesis ofno correlation is rejected when Mantel statistic fallsoutside the 0,05 confidence level. Pearson's r-valuewas used to measure linear correlation between twomatrices.
RESULTS AND DISCUSSION
To characterize 18 Tunisian pomegranate cultivarstwo efficient methods were studied to generateAFLPs and SSRs markers. These techniques havepermitted a large number of unambiguouslypolymorphic DNA bands (Figure 1 et 2).
Figure 1: typical examples of SSR patterns resolved on nondenaturing 10% polyacrylamide gel.
Figure 2: typical AFLP banding patterns generated from theprimer combination and resolved on denaturing 10%polyacrylamide gel.
Starting from four AFLP primers’ combinations, thebanding patterns showed a total of 192 polymorphicAFLPs bands out of 228. This result was consideredas parsimony informative AFLP markers among the18 pomegranate cultivars analysed (Table2).
Table 2: Summary of AFLP data generated using four primers’combinations in 18 Tunisian pomegranate cultivars
Primercombination
AFLP bandsPpb% Rp
Total PolymorphicEAGC/MCAA 63 57 90.5 28.11EAAC/MCAA 61 48 79 20.11EACA/MCAG 55 45 82 19.00EACC/MCTA 49 42 93.3 17.00Total 228 192 86.2
On average, each primer generated 56.25 fragments.In addition, different levels of polymorphisms weredetected since the percentage of polymorphic bands(ppb) is ranging from 79 % for EAAC/MCAA to 93.3 %for EACC/MCTA primers’ combinations. In addition, theRp values with a collective rate of 84.22 varied from17.00 for the EACC/MCTA combination to 28.11 for theEAGC/MCAA one. Furthermore, taking into account thehighest Rp rate and ppb value the EAGC/MCAA primers’combination seems to be the most powerful either todiscriminate among cultivars or to assess the geneticdiversity in this crop.
L 1 2 3 4 5 6 7 8 9 10 11 12 13 14 15 16 17 18 19 L
L 1 2 3 4 5 6 7 8 9 10 11 12 13 14 15 16 17 18 19
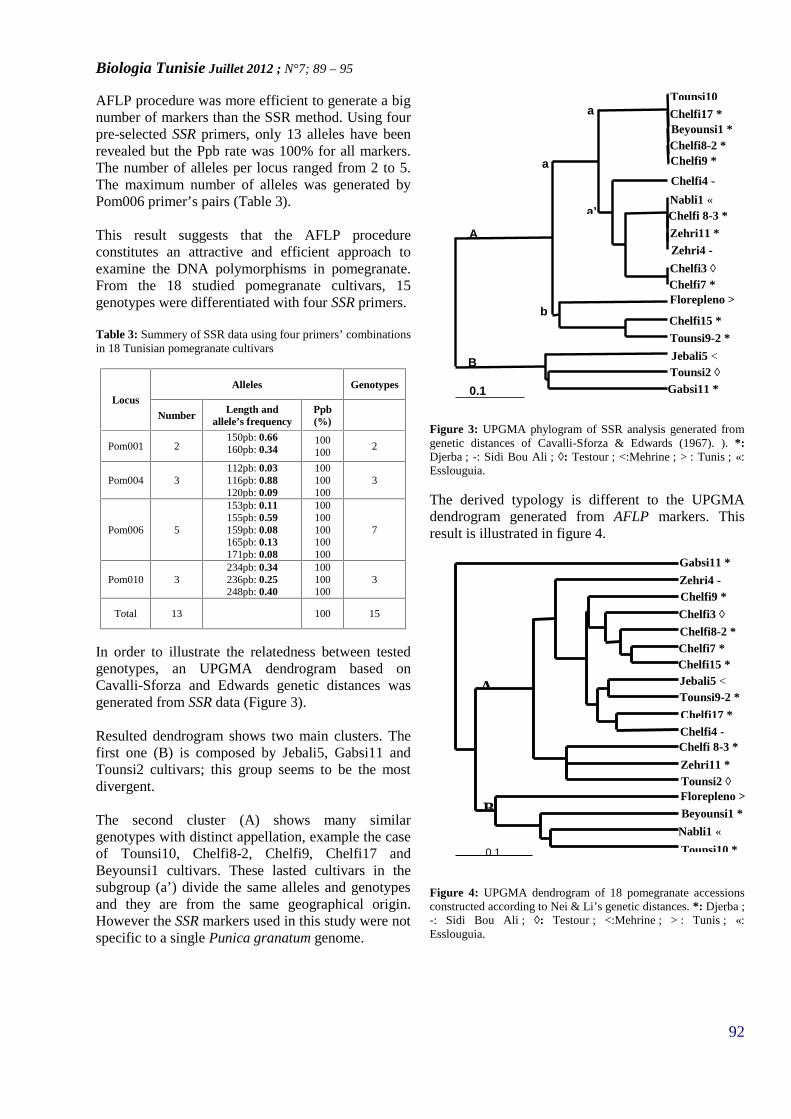
Biologia Tunisie Juillet 2012 ; N°7; 89 – 95
92
AFLP procedure was more efficient to generate a bignumber of markers than the SSR method. Using fourpre-selected SSR primers, only 13 alleles have beenrevealed but the Ppb rate was 100% for all markers.The number of alleles per locus ranged from 2 to 5.The maximum number of alleles was generated byPom006 primer’s pairs (Table 3).
This result suggests that the AFLP procedureconstitutes an attractive and efficient approach toexamine the DNA polymorphisms in pomegranate.From the 18 studied pomegranate cultivars, 15genotypes were differentiated with four SSR primers.
Table 3: Summery of SSR data using four primers’ combinationsin 18 Tunisian pomegranate cultivars
LocusAlleles Genotypes
Number Length andallele’s frequency
Ppb(%)
Pom001 2150pb: 0.66160pb: 0.34
100100
2
Pom004 3112pb: 0.03116pb: 0.88120pb: 0.09
100100100
3
Pom006 5
153pb: 0.11155pb: 0.59159pb: 0.08165pb: 0.13171pb: 0.08
100100100100100
7
Pom010 3234pb: 0.34236pb: 0.25248pb: 0.40
100100100
3
Total 13 100 15
In order to illustrate the relatedness between testedgenotypes, an UPGMA dendrogram based onCavalli-Sforza and Edwards genetic distances wasgenerated from SSR data (Figure 3).
Resulted dendrogram shows two main clusters. Thefirst one (B) is composed by Jebali5, Gabsi11 andTounsi2 cultivars; this group seems to be the mostdivergent.
The second cluster (A) shows many similargenotypes with distinct appellation, example the caseof Tounsi10, Chelfi8-2, Chelfi9, Chelfi17 andBeyounsi1 cultivars. These lasted cultivars in thesubgroup (a’) divide the same alleles and genotypesand they are from the same geographical origin.However the SSR markers used in this study were notspecific to a single Punica granatum genome.
Figure 3: UPGMA phylogram of SSR analysis generated fromgenetic distances of Cavalli-Sforza & Edwards (1967). ). *:Djerba ; -: Sidi Bou Ali ; ◊: Testour ; <:Mehrine ; > : Tunis ; «:Esslouguia.
The derived typology is different to the UPGMAdendrogram generated from AFLP markers. Thisresult is illustrated in figure 4.
Figure 4: UPGMA dendrogram of 18 pomegranate accessionsconstructed according to Nei & Li’s genetic distances. *: Djerba ;-: Sidi Bou Ali ; ◊: Testour ; <:Mehrine ; > : Tunis ; «:Esslouguia.
Chelfi 8-3 *
Gabsi11 *
Zehri4 -
0.1
Chelfi9 *
Chelfi3 ◊Chelfi8-2 *Chelfi7 *Chelfi15 *Jebali5 <Tounsi9-2 *
Chelfi4 -
Zehri11 *Tounsi2 ◊Florepleno >
Beyounsi1 *
Nabli1 «
Tounsi10 *
A
B
Chelfi17 *
Chelfi 8-3 *
Gabsi11 *
Chelfi17 *Beyounsi1 *Chelfi8-2 *Chelfi9 *
Chelfi4 -
Nabli1 «
Zehri11 *Zehri4 -
Chelfi3 ◊Chelfi7 *Florepleno >
Chelfi15 *
Tounsi9-2 *
Jebali5 <Tounsi2 ◊
0.1
Tounsi10*
A
B
a
b
a’
a’’
Biologia Tunisie Juillet 2012 ; N°7; 89 – 95
93
All tested cultivars are clustered into three maingroups The first are monophyletic branch containingGabsi11 cultivars and diverged to two groupslabelled A and B. Taking into account the geographicorigin of the cultivars, we assume that a typicallycontinuous genetic diversity characterizes the localpomegranate germplasm. AFLP procedure was moreefficient than SSR method. The high number ofgenerated AFLP markers has permitted a globaldifferentiation of pomegranate cultivars. And suggestthat the studied cultivars constitute an importantsource of genetic diversity very useful in futurebreeding programs.AFLP data show that there was a problem of falsehomonymy for some cultivars. Many cultivars couldbe differentiated without a significant correlationwith their geographic origin as reported by Ben Nasret al. (1996) and Mars and Marrakchi (1999). Theseauthors could be reported that the phenotypicvariation influenced by the ecosystem. Nevertheless,some varieties are considered multiclone regardingdifferences of morphometric traits (Mars, 2000).Comparison of distance matrices generated fromAFLP and SSR data showed no significant correlation(r(AB) 0,055, p-value 0,486 is higher to significantthreshold α = 0,05) following 1000 randompermutations with Mantel’s test. In our case, this lackof correlation can be attributed to the low number ofgenerated SSR markers in comparison with AFLPone. Other limit in this comparison approach is thereduced number of studied cultivars. However, lowcorrelations between matrices based on AFLP andSSR markers were also reported in others studies(Medini et al., 2005). This result can be interpretedby the difference of distribution of these markers inthe pomegranate genome.In addition, other studies have shown the largephenotypic diversity for pomegranate germplasm(Mars and Marrakchi, 1999), with emphasis onpomological traits (Mars and Sayadi, 1992;Melgarejo and Martínez, 1992; Mars and Marrakchi,1998) and on technological properties (Al Kahtani,1992) together with the evidenced molecular markerswould be of a great interest to differentiate eithercultivars or polyclonal varieties. Moreover, suchstrategy would provide molecular markers relatedwith quantitative trait loci (QTLs) and thereforesuitable to assist the selection and to rationallymanage the conservation of this importantphytogenetic resources as reported in other fruitcrops such as apricot (Panaud et al., 2002) and fig(Cabrita et al., 2001). Work is currently in progressto enlarge either the number of cultivars or theprimers’ combinations in order to evidence a largenumber of AFLPs.
CONCLUSION
The AFLP procedure permitted to generate a largenumber of molecular markers compared to the SSRanalysis, these two results together suitable in thepomegranate genetic diversity surveying. All thetested combinations are efficient to evidencemolecular polymorphism in this crop. AFLP and SSRdata are not significantly correlated suggesting anevident difference via the type of targeted markers.The use of other SSR primer’s pairs is recommendedto fingerprint all Tunisian pomegranate cultivars.Studied cultivars constitute an important source ofgenetic diversity usable in future breeding programs.These results proved that a high level of molecularpolymorphism characterizes the local pomegranategermplasm.
AKNOWLEGMENTS
This work was partially supported by grants from theTunisian “Ministère de l'Enseignement Supérieur, etde la Recherche Scientifique ”Projet Lab B02.
REFERENCES
Al Kahtani, H.A., 1992: Intercultivars differences inquality and postharvest life of pomegranateinfluenced by partial drying. Journal of the AmericanSociety for Horticultural Science. 117(1), 100-104.
Ben Nasr, C., Ayed, N., Metche, M., 1996.Quantitative determination of the polyphenoliccontent of pomegranate peel. Zeitschrift furLebensmittel Untershung und Forshung. 203(4), 374-378.
Cabrita, L.F., Aksoy, U., Hepaksoy, S., Leitao, J.M.,2001. Suitability of isozyme, RAPD and AFLPmarkers to assess genetic differences and relatednessamong fig (Ficus carica L.) clones. ScientiaHorticulturae. 87 (4), 261-273.Cavalli-Sforza, L.L., Edwards, A.W.F., 1967.Phylogenetic analysis: models and estimationprocedures. American Journal of Human Genetics.19, 233-257
Chalhoub, B.A., Thibault, S., Laucou, V., Rameau,C., Hofte, H., Cousin, R., 1997. Silver staining andrecovery of AFLP: TM amplification products onlarge denaturing polyacrylamide gels. Biotechniques.22(2), 216-220.
Biologia Tunisie Juillet 2012 ; N°7; 89 – 95
94
Dellaporta, S.L., Wood, J., Hicks, J.B., 1984. MaizeDNA miniprep. In: Molecular Biology of Plants.Cold Spring Harbor Laboratory, Cold Spring HarborPress 36-38.El-Assar, A., Krueger, R.R., Devanand, P.S., Chao,C.T., 2005. Genetic analysis of Egyptian datePhoenix dactylifera L. accessions using AFLPmarkers. Genetic Resources and Crop Evolution. 52,601–607.
Gilbert, J.E., Lewis, R.V., Wilkinson, M.J., Galigari,P.D.S., 1999. Developing and appropriate strategy toassess genetic variability in plant germplasmcollections. Theoretical and Applied Genetics. 98,1125–1131.
Krichen, L., Martins, J.M.S., Lambert, P., Daaloul,A., Trifi-Farah, N., Marrakchi, M., Audergon, J.M.,2008. Using AFLP Markers for the Analysis of theGenetic Diversity of Apricot Cultivars in Tunisia.Journal American Society for Horticultural Science.133(2), 204-212
Langella, O., 2002. Populations 1. 2. 28 Software.CNRS. UPR9034. France.Levin, G.M., 1995. Aspects of pomegranate culturein Turkmenistan. Plant Genetic ResourcesNewsletter. 102, 29-31.Liu, Z.W., Biyashev, R. M. and Saghai-Maroof, M.A., 1996. Development of simple sequence repeatDNA markers. Theoretical and Applied Genetics. 93,869-876.Mantel, N., 1967. The detection of disease clusteringand generalized regression approach. CancerResearch. 27, 209-220.
Mars, M., Sayadi, S., 1992. Etude comparative de laqualité des fruits de cinq variétés de grenadier(Punica granatum L.). Revue des. Régions Arides. 4(92), 45-57.
Mars, M., 1996. Pomegranate genetic resources inthe Mediterranean regions. In: Proceeding. FirstMESFIN Plant Genetic Resources Meeting ,Tenerife, Spain, 2-4 Oct. 1995. 345-354.
Mars, M., Marrakchi, M., 1998. Conservation etvalorisation des ressources génétiques du grenadier(Punica granatum L.) en Tunisie. Plant GeneticResources Newsletter. 114, 35-39.
Mars, M, Marrakchi, M., 1999. Diversity amongpomegranate (Punica granatum L.) germplasm inTunisia. Genetic resources and Crop Evolution. 46,461-467.Medini, M., Hamsa, S., Rebai, A., Baum, M., 2005.Analysis of genetic diversity in Tunisian durumwheat cultivars and related wild species by SSR andAFLP markers. Genetic Resources and CropEvolution. 52, 21-31.
Melgarejo Moreno, P., Martínez Valero, R., 1992. ElGranado. Mundi Prensa, Madrid, Spain.Nei, M., Li, W.H., 1979. Mathematical models forstudying genetic variation in terms of restrictionendonucléases. Proceedings of the National Academyof Sciences, USA. 76, 5269-5273.
Ozguven, A.I., 1996. The genetic resources ofpomegranate (Punica granatum) in Turkey. In:
Proceeding First MESFIN Plant Genetic ResourcesMeeting. Tenerife, Spain, 2-4 Oct. 1995, 269-284.
Panaud, O., Chaib, A., Sarr, A., 2002. Dynamicconservation of apricot Prunus americana inSaharian oases: use of AFLP markers to assessdiversity in traditional orchards. Euphytica 128, 301-305.
Prevost, A., Wilkinson, M.J., 1999. A new system ofcomparing PCR primers applied to ISSRfingerprinting of potato cultivars. Theoretical andApplied Genetics. 98, 107–112.
Rhouma, S., Zehdi-Azouzi, S., Ould MohamedSalem, A., Rhouma, A., Marrakchi, M. and Trifi, M.,2007. Genetic diversity in ecotypes of Tunisian date-palm (Phoenix dactylifera L.) assessed by AFLPmarkers. The Journal of Horticultural Science andBiotechnology. 82 (6), 929-933
Sambrook, J., Fritsch, E.F., Maniatis, T., 1989.Molecular Cloning: A Laboratory Manual. ColdSpring Harbor Laboratory Press, Cold Spring Harbor,NY, USA.
Weber, J.L., May, P., 1989. Abundant class of humanDNA polymorphisms which can be typed using thepolymerase chain reaction. American Journal ofHuman Genetics. 44, 388-396.

Biologia Tunisie Juillet 2012 ; N°7; 89 – 95
95
Vos, P., Hoger, R., Bleeker, M., Rejans, M.,Vandelee, T., Hornes, M., Frijters, A., Pot, J.,Peleman, J., Kuiper, M., Zabeau, M., 1995. AFLP: anew technique for DNA fingerprinting. NucleicAcids Research. 23, 4407-4417.
Zehdi, S., Trifi, M., Billotte, N., Marrakchi, M., andPintaud, J.K., 2004. Genetic diversity of Tunisiandate palms (Phoenix dactylifera L.) revealed bynuclear microsatellite polymorphism. Hereditas. 141, 278-287.
Biologia Tunisie Juillet 2012 ; N°7 ; 96 – 103
96
BIOLOGIA TUNISIE
MORPHOLOGICAL AND MOLECULAR EVALUATION OF THE GENETICDIVERSITY OF TUNISIAN LOCAL BARLEY ACCESSIONS (HORDEUMVULGARE L.)
KADRI. K (1,2), CHEIKH MED. H(2) ABDELLAWI. R (2), & BEN NACEUR. M (2)
1: Centre Régional de la Recherche en Agriculture Oasienne, Laboratoire de Biotechnologie végétaleet de Culture des Tissus, Degach 2260. TunisieTel / fax : 216 76 420 085.2: Institut National de la recherche Agronomique de Tunisie, Laboratoire de Biotechnologie et PhysiologieVégétale, Rue Hédi karray 2049, Ariana, Tunisie
*Corresponding author: Kadri karim, Tel / fax : 216 76 420 085, email : [email protected];[email protected]
Key words: Barley accessions, PCA, morphological traits, RAPD markers, polymorphism
ABSRACTThis research aim is to study the geneticdiversity of barley (Hordeum vulgare L.)accessions all around the country.Morphological traits were studied andanalyzed using principal components analysis(PCA) and clusters were constrained basedon median joining distance. Further, molecularanalysis was studied using RAPD markers.Both methods were used to compare howmorphological traits and RAPD molecularmarkers described accessions relationship.Morphological PCA traits and clusterindicated geographic information. Indeed, theygrouped barley accessions according to geneticcriteria such as ear attitude, length of glum andits awn relative to grain. The molecularanalysis showed the limits of themorphological approach. In fact ecotypes thatwere grown together in the same area andhaving similar morphological behaviour werefound different using the RAPD markers.Distances obtained by each of the approacheswere compared with special attention to thecoincidences and divergences between the twomethods. Comparison of morphological andmolecular data using the Mantel test indicateda very low correlation (r = 0.14). Thereforeboth methods are not complementary but
necessary and showed a high degree ofvariation among analyzed accessions,indicating an important source of geneticdiversity that can be used in future breedingprograms.
INTRODUCTION
North Africa is considered as one of the mainsecondary cereal centers (Bouef, 1931). In deed,Tunisia constitutes an area of great cerealdiversity. The local landraces are very adaptedto stress conditions (drought and salt), since theycontribute to genetic diversity and to new varietycreations (Ben Naceur et al, 1998). Howeverreplacing native germoplasm by an improvedand introduced material could lead to localphytogenetic resources erosion. Therefore, localresource conservation should be given moreimportance. Barley (Hordeum vulgare L.) wasdomesticated for 10,000 years ago front thewild barley (Hordeum spontaneum C. Koch)(Zohary and Hopf, 1998). It is used for humanconsumption, fodder, brewing and whiskeyproduction. Barley has been used in human andanimals nutrition. It still constitutes an importantsource of human food especially in Africa. It is amajor cereal crop in Tunisia and is of greatimportance as forage species. It had been the
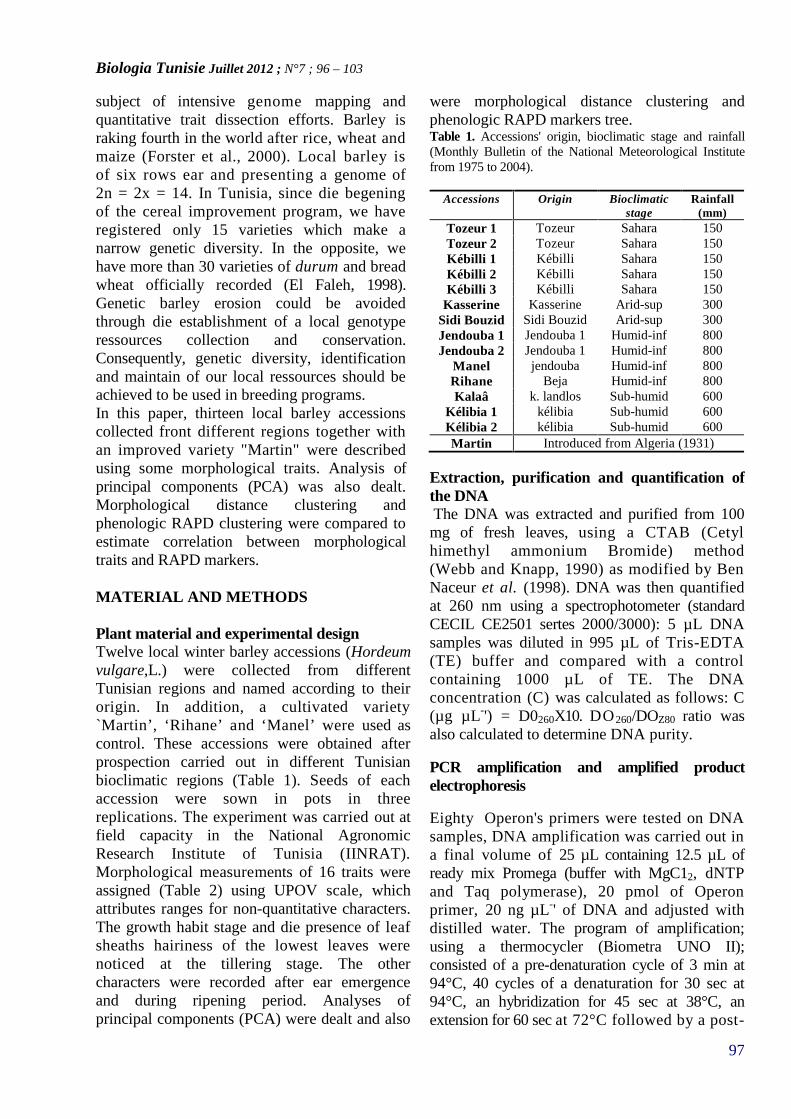
Biologia Tunisie Juillet 2012 ; N°7 ; 96 – 103
97
subject of intensive genome mapping andquantitative trait dissection efforts. Barley israking fourth in the world after rice, wheat andmaize (Forster et al., 2000). Local barley isof six rows ear and presenting a genome of2n = 2x = 14. In Tunisia, since die begeningof the cereal improvement program, we haveregistered only 15 varieties which make anarrow genetic diversity. In the opposite, wehave more than 30 varieties of durum and breadwheat officially recorded (El Faleh, 1998).Genetic barley erosion could be avoidedthrough die establishment of a local genotyperessources collection and conservation.Consequently, genetic diversity, identificationand maintain of our local ressources should beachieved to be used in breeding programs.In this paper, thirteen local barley accessionscollected front different regions together withan improved variety "Martin" were describedusing some morphological traits. Analysis ofprincipal components (PCA) was also dealt.Morphological distance clustering andphenologic RAPD clustering were compared toestimate correlation between morphologicaltraits and RAPD markers.
MATERIAL AND METHODS
Plant material and experimental designTwelve local winter barley accessions (Hordeumvulgare,L.) were collected from differentTunisian regions and named according to theirorigin. In addition, a cultivated variety`Martin’, ‘Rihane’ and ‘Manel’ were used ascontrol. These accessions were obtained afterprospection carried out in different Tunisianbioclimatic regions (Table 1). Seeds of eachaccession were sown in pots in threereplications. The experiment was carried out atfield capacity in the National AgronomicResearch Institute of Tunisia (IINRAT).Morphological measurements of 16 traits wereassigned (Table 2) using UPOV scale, whichattributes ranges for non-quantitative characters.The growth habit stage and die presence of leafsheaths hairiness of the lowest leaves werenoticed at the tillering stage. The othercharacters were recorded after ear emergenceand during ripening period. Analyses ofprincipal components (PCA) were dealt and also
were morphological distance clustering andphenologic RAPD markers tree.Table 1. Accessions' origin, bioclimatic stage and rainfall(Monthly Bulletin of the National Meteorological Institutefrom 1975 to 2004).
Accessions Origin Bioclimaticstage
Rainfall(mm)
Tozeur 1 Tozeur Sahara 150Tozeur 2 Tozeur Sahara 150Kébilli 1 Kébilli Sahara 150Kébilli 2 Kébilli Sahara 150Kébilli 3 Kébilli Sahara 150
Kasserine Kasserine Arid-sup 300Sidi Bouzid Sidi Bouzid Arid-sup 300Jendouba 1 Jendouba 1 Humid-inf 800Jendouba 2 Jendouba 1 Humid-inf 800
Manel jendouba Humid-inf 800Rihane Beja Humid-inf 800Kalaâ k. landlos Sub-humid 600
Kélibia 1 kélibia Sub-humid 600Kélibia 2 kélibia Sub-humid 600Martin Introduced from Algeria (1931)
Extraction, purification and quantification ofthe DNAThe DNA was extracted and purified from 100mg of fresh leaves, using a CTAB (Cetylhimethyl ammonium Bromide) method(Webb and Knapp, 1990) as modified by BenNaceur et al. (1998). DNA was then quantifiedat 260 nm using a spectrophotometer (standardCECIL CE2501 sertes 2000/3000): 5 µL DNAsamples was diluted in 995 µL of Tris-EDTA(TE) buffer and compared with a controlcontaining 1000 µL of TE. The DNAconcentration (C) was calculated as follows: C(µg µL-') = D0260X10. DO260/DOZ80 ratio wasalso calculated to determine DNA purity.
PCR amplification and amplified productelectrophoresis
Eighty Operon's primers were tested on DNAsamples, DNA amplification was carried out ina final volume of 25 µL containing 12.5 µL ofready mix Promega (buffer with MgC12, dNTPand Taq polymerase), 20 pmol of Operonprimer, 20 ng µL-' of DNA and adjusted withdistilled water. The program of amplification;using a thermocycler (Biometra UNO II);consisted of a pre-denaturation cycle of 3 min at94°C, 40 cycles of a denaturation for 30 sec at94°C, an hybridization for 45 sec at 38°C, anextension for 60 sec at 72°C followed by a post-
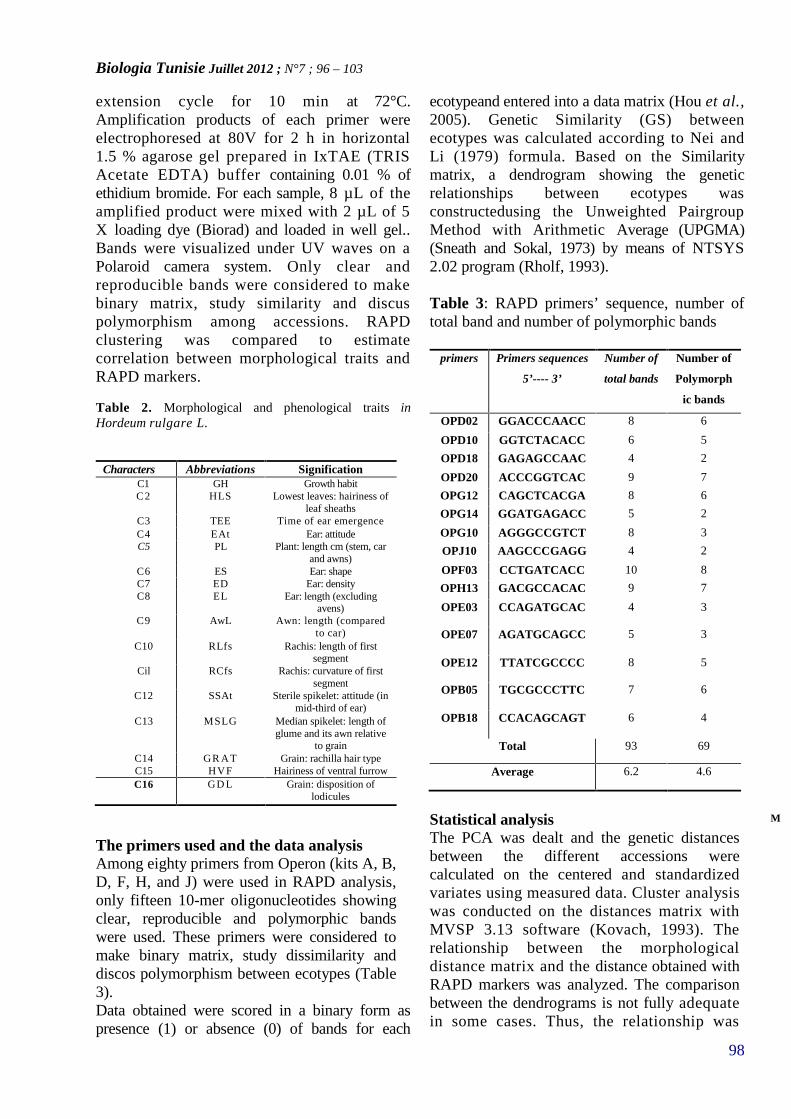
Biologia Tunisie Juillet 2012 ; N°7 ; 96 – 103
98
extension cycle for 10 min at 72°C.Amplification products of each primer wereelectrophoresed at 80V for 2 h in horizontal1.5 % agarose gel prepared in IxTAE (TRISAcetate EDTA) buffer containing 0.01 % ofethidium bromide. For each sample, 8 µL of theamplified product were mixed with 2 µL of 5X loading dye (Biorad) and loaded in well gel..Bands were visualized under UV waves on aPolaroid camera system. Only clear andreproducible bands were considered to makebinary matrix, study similarity and discuspolymorphism among accessions. RAPDclustering was compared to estimatecorrelation between morphological traits andRAPD markers.
Table 2. Morphological and phenological traits inHordeum rulgare L.
Characters Abbreviations SignificationC1 GH Growth habitC2 HLS Lowest leaves: hairiness of
leaf sheathsC3 TEE Time of ear emergenceC4 EAt Ear: attitudeC5 PL Plant: length cm (stem, car
and awns)C6 ES Ear: shapeC7 ED Ear: densityC8 EL Ear: length (excluding
avens)C9 AwL Awn: length (compared
to car)C10 RLfs Rachis: length of first
segmentCil RCfs Rachis: curvature of first
segmentC12 SSAt Sterile spikelet: attitude (in
mid-third of ear)C13 MSLG Median spikelet: length of
glume and its awn relativeto grain
C14 GR A T Grain: rachilla hair typeC15 HVF Hairiness of ventral furrowC16 GD L Grain: disposition of
lodicules
The primers used and the data analysisAmong eighty primers from Operon (kits A, B,D, F, H, and J) were used in RAPD analysis,only fifteen 10-mer oligonucleotides showingclear, reproducible and polymorphic bandswere used. These primers were considered tomake binary matrix, study dissimilarity anddiscos polymorphism between ecotypes (Table3).Data obtained were scored in a binary form aspresence (1) or absence (0) of bands for each
ecotypeand entered into a data matrix (Hou et al.,2005). Genetic Similarity (GS) betweenecotypes was calculated according to Nei andLi (1979) formula. Based on the Similaritymatrix, a dendrogram showing the geneticrelationships between ecotypes wasconstructedusing the Unweighted PairgroupMethod with Arithmetic Average (UPGMA)(Sneath and Sokal, 1973) by means of NTSYS2.02 program (Rholf, 1993).
Table 3: RAPD primers’ sequence, number oftotal band and number of polymorphic bands
primers Primers sequences
5’---- 3’
Number of
total bands
Number of
Polymorph
ic bands
OPD02 GGACCCAACC 8 6
OPD10 GGTCTACACC 6 5
OPD18 GAGAGCCAAC 4 2
OPD20 ACCCGGTCAC 9 7
OPG12 CAGCTCACGA 8 6
OPG14 GGATGAGACC 5 2
OPG10 AGGGCCGTCT 8 3
OPJ10 AAGCCCGAGG 4 2
OPF03 CCTGATCACC 10 8
OPH13 GACGCCACAC 9 7
OPE03 CCAGATGCAC 4 3
OPE07 AGATGCAGCC 5 3
OPE12 TTATCGCCCC 8 5
OPB05 TGCGCCCTTC 7 6
OPB18 CCACAGCAGT 6 4
Total 93 69
Average 6.2 4.6
Statistical analysisThe PCA was dealt and the genetic distancesbetween the different accessions werecalculated on the centered and standardizedvariates using measured data. Cluster analysiswas conducted on the distances matrix withMVSP 3.13 software (Kovach, 1993). Therelationship between the morphologicaldistance matrix and the distance obtained withRAPD markers was analyzed. The comparisonbetween the dendrograms is not fully adequatein some cases. Thus, the relationship was
M 1 2 3 4 5 6 7 8 9 10 11 12 13 14 15
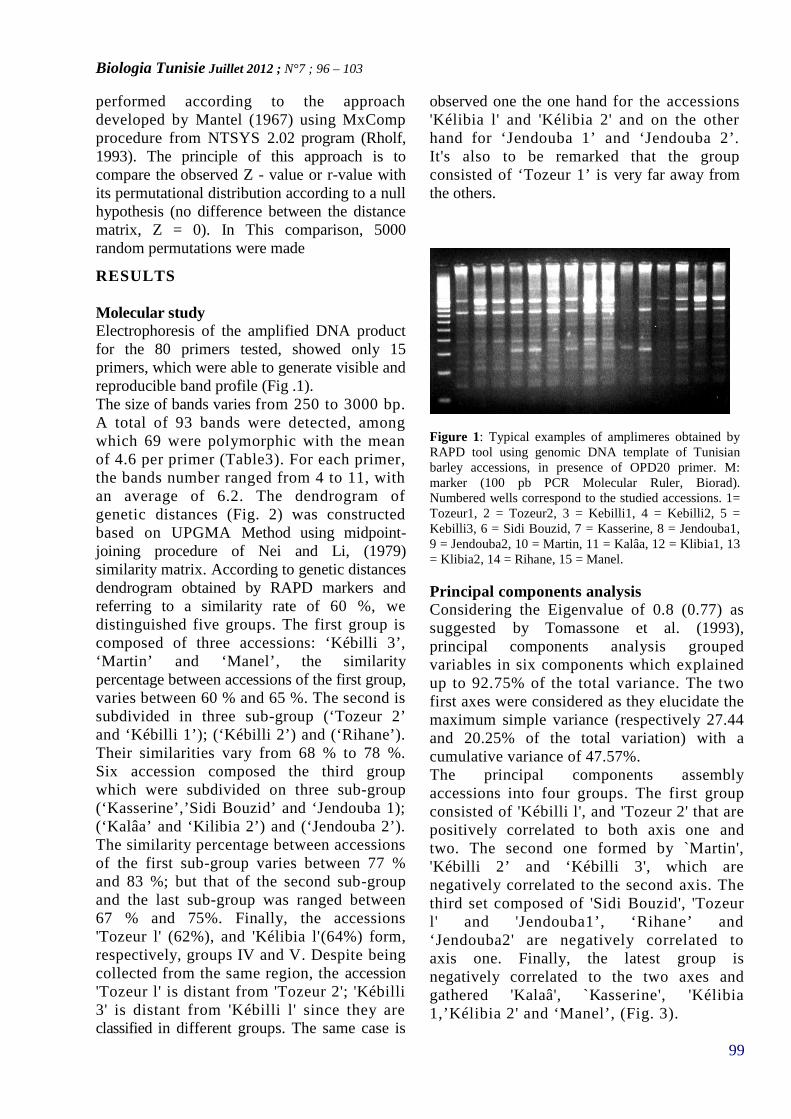
Biologia Tunisie Juillet 2012 ; N°7 ; 96 – 103
99
performed according to the approachdeveloped by Mantel (1967) using MxCompprocedure from NTSYS 2.02 program (Rholf,1993). The principle of this approach is tocompare the observed Z - value or r-value withits permutational distribution according to a nullhypothesis (no difference between the distancematrix, Z = 0). In This comparison, 5000random permutations were made
RESULTS
Molecular studyElectrophoresis of the amplified DNA productfor the 80 primers tested, showed only 15primers, which were able to generate visible andreproducible band profile (Fig .1).The size of bands varies from 250 to 3000 bp.A total of 93 bands were detected, amongwhich 69 were polymorphic with the meanof 4.6 per primer (Table3). For each primer,the bands number ranged from 4 to 11, withan average of 6.2. The dendrogram ofgenetic distances (Fig. 2) was constructedbased on UPGMA Method using midpoint-joining procedure of Nei and Li, (1979)similarity matrix. According to genetic distancesdendrogram obtained by RAPD markers andreferring to a similarity rate of 60 %, wedistinguished five groups. The first group iscomposed of three accessions: ‘Kébilli 3’,‘Martin’ and ‘Manel’, the similaritypercentage between accessions of the first group,varies between 60 % and 65 %. The second issubdivided in three sub-group (‘Tozeur 2’and ‘Kébilli 1’); (‘Kébilli 2’) and (‘Rihane’).Their similarities vary from 68 % to 78 %.Six accession composed the third groupwhich were subdivided on three sub-group(‘Kasserine’,’Sidi Bouzid’ and ‘Jendouba 1);(‘Kalâa’ and ‘Kilibia 2’) and (‘Jendouba 2’).The similarity percentage between accessionsof the first sub-group varies between 77 %and 83 %; but that of the second sub-groupand the last sub-group was ranged between67 % and 75%. Finally, the accessions'Tozeur l' (62%), and 'Kélibia l'(64%) form,respectively, groups IV and V. Despite beingcollected from the same region, the accession'Tozeur l' is distant from 'Tozeur 2'; 'Kébilli3' is distant from 'Kébilli l' since they areclassified in different groups. The same case is
observed one the one hand for the accessions'Kélibia l' and 'Kélibia 2' and on the otherhand for ‘Jendouba 1’ and ‘Jendouba 2’.It's also to be remarked that the groupconsisted of ‘Tozeur 1’ is very far away fromthe others.
Figure 1: Typical examples of amplimeres obtained byRAPD tool using genomic DNA template of Tunisianbarley accessions, in presence of OPD20 primer. M:marker (100 pb PCR Molecular Ruler, Biorad).Numbered wells correspond to the studied accessions. 1=Tozeur1, 2 = Tozeur2, 3 = Kebilli1, 4 = Kebilli2, 5 =Kebilli3, 6 = Sidi Bouzid, 7 = Kasserine, 8 = Jendouba1,9 = Jendouba2, 10 = Martin, 11 = Kalâa, 12 = Klibia1, 13= Klibia2, 14 = Rihane, 15 = Manel.
Principal components analysisConsidering the Eigenvalue of 0.8 (0.77) assuggested by Tomassone et al. (1993),principal components analysis groupedvariables in six components which explainedup to 92.75% of the total variance. The twofirst axes were considered as they elucidate themaximum simple variance (respectively 27.44and 20.25% of the total variation) with acumulative variance of 47.57%.The principal components assemblyaccessions into four groups. The first groupconsisted of 'Kébilli l', and 'Tozeur 2' that arepositively correlated to both axis one andtwo. The second one formed by `Martin','Kébilli 2’ and ‘Kébilli 3', which arenegatively correlated to the second axis. Thethird set composed of 'Sidi Bouzid', 'Tozeurl' and 'Jendouba1’, ‘Rihane’ and‘Jendouba2' are negatively correlated toaxis one. Finally, the latest group isnegatively correlated to the two axes andgathered 'Kalaâ', `Kasserine', 'Kélibia1,’Kélibia 2' and ‘Manel’, (Fig. 3).
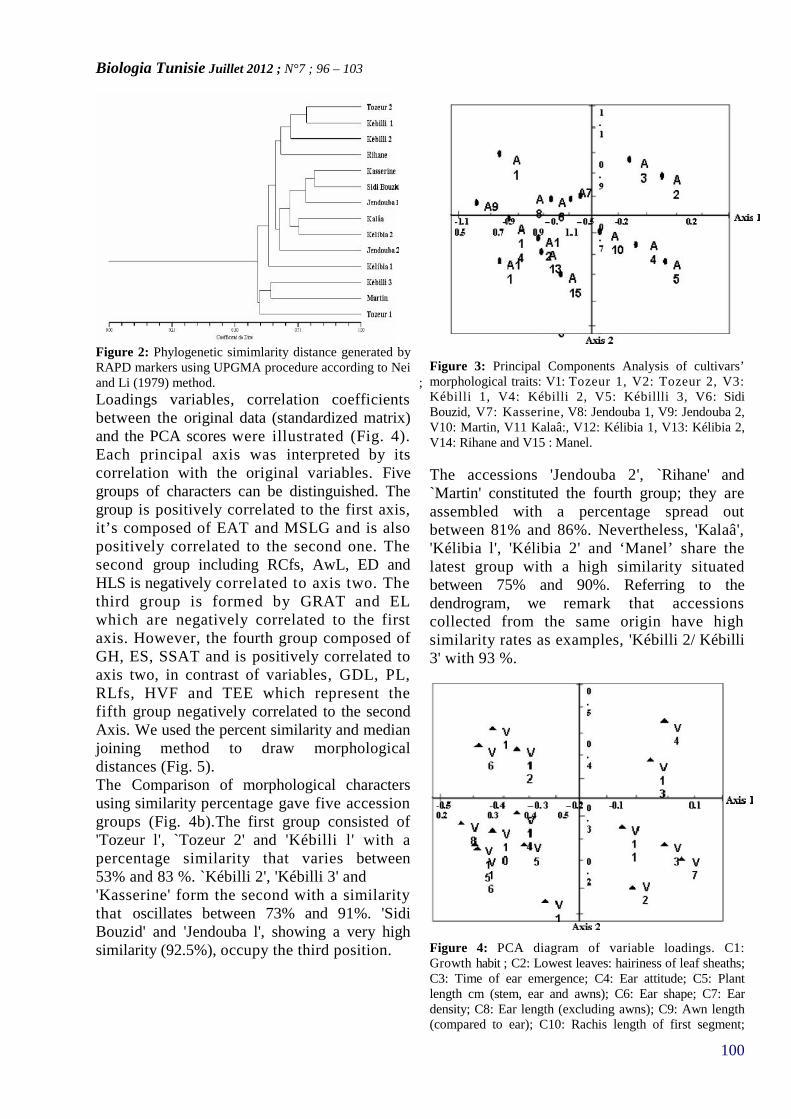
Biologia Tunisie Juillet 2012 ; N°7 ; 96 – 103
100
Figure 2: Phylogenetic simimlarity distance generated byRAPD markers using UPGMA procedure according to Neiand Li (1979) method. ;Loadings variables, correlation coefficientsbetween the original data (standardized matrix)and the PCA scores were illustrated (Fig. 4).Each principal axis was interpreted by itscorrelation with the original variables. Fivegroups of characters can be distinguished. Thegroup is positively correlated to the first axis,it’s composed of EAT and MSLG and is alsopositively correlated to the second one. Thesecond group including RCfs, AwL, ED andHLS is negatively correlated to axis two. Thethird group is formed by GRAT and ELwhich are negatively correlated to the firstaxis. However, the fourth group composed ofGH, ES, SSAT and is positively correlated toaxis two, in contrast of variables, GDL, PL,RLfs, HVF and TEE which represent thefifth group negatively correlated to the secondAxis. We used the percent similarity and medianjoining method to draw morphologicaldistances (Fig. 5).The Comparison of morphological charactersusing similarity percentage gave five accessiongroups (Fig. 4b).The first group consisted of'Tozeur l', `Tozeur 2' and 'Kébilli l' with apercentage similarity that varies between53% and 83 %. `Kébilli 2', 'Kébilli 3' and'Kasserine' form the second with a similaritythat oscillates between 73% and 91%. 'SidiBouzid' and 'Jendouba l', showing a very highsimilarity (92.5%), occupy the third position.
Figure 3: Principal Components Analysis of cultivars’morphological traits: V1: Tozeur 1, V2: Tozeur 2, V3:Kébilli 1, V4: Kébilli 2, V5: Kébillli 3, V6: SidiBouzid, V7: Kasserine, V8: Jendouba 1, V9: Jendouba 2,V10: Martin, V11 Kalaâ:, V12: Kélibia 1, V13: Kélibia 2,V14: Rihane and V15 : Manel.
The accessions 'Jendouba 2', `Rihane' and`Martin' constituted the fourth group; they areassembled with a percentage spread outbetween 81% and 86%. Nevertheless, 'Kalaâ','Kélibia l', 'Kélibia 2' and ‘Manel’ share thelatest group with a high similarity situatedbetween 75% and 90%. Referring to thedendrogram, we remark that accessionscollected from the same origin have highsimilarity rates as examples, 'Kébilli 2/ Kébilli3' with 93 %.
Figure 4: PCA diagram of variable loadings. C1:Growth habit ; C2: Lowest leaves: hairiness of leaf sheaths;C3: Time of ear emergence; C4: Ear attitude; C5: Plantlength cm (stem, ear and awns); C6: Ear shape; C7: Eardensity; C8: Ear length (excluding awns); C9: Awn length(compared to ear); C10: Rachis length of first segment;
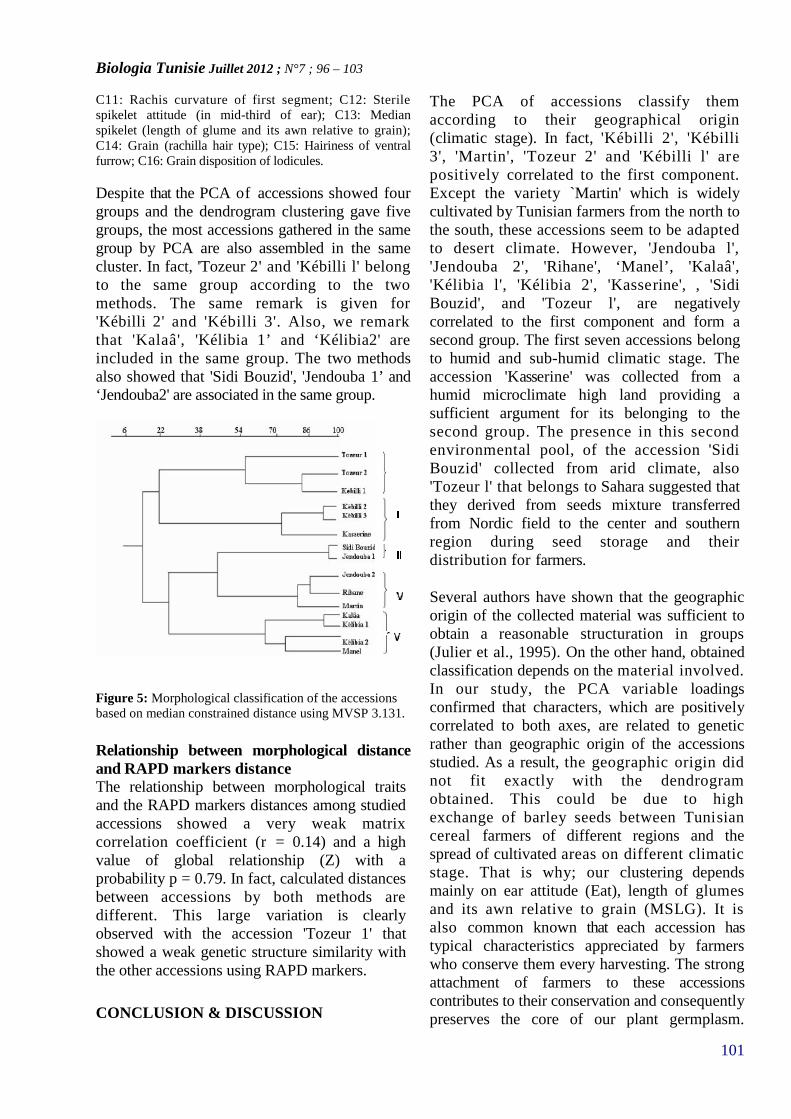
Biologia Tunisie Juillet 2012 ; N°7 ; 96 – 103
101
C11: Rachis curvature of first segment; C12: Sterilespikelet attitude (in mid-third of ear); C13: Medianspikelet (length of glume and its awn relative to grain);C14: Grain (rachilla hair type); C15: Hairiness of ventralfurrow; C16: Grain disposition of lodicules.
Despite that the PCA of accessions showed fourgroups and the dendrogram clustering gave fivegroups, the most accessions gathered in the samegroup by PCA are also assembled in the samecluster. In fact, 'Tozeur 2' and 'Kébilli l' belongto the same group according to the twomethods. The same remark is given for'Kébilli 2' and 'Kébilli 3'. Also, we remarkthat 'Kalaâ', 'Kélibia 1’ and ‘Kélibia2' areincluded in the same group. The two methodsalso showed that 'Sidi Bouzid', 'Jendouba 1’ and‘Jendouba2' are associated in the same group.
Figure 5: Morphological classification of the accessionsbased on median constrained distance using MVSP 3.131.
Relationship between morphological distanceand RAPD markers distanceThe relationship between morphological traitsand the RAPD markers distances among studiedaccessions showed a very weak matrixcorrelation coefficient (r = 0.14) and a highvalue of global relationship (Z) with aprobability p = 0.79. In fact, calculated distancesbetween accessions by both methods aredifferent. This large variation is clearlyobserved with the accession 'Tozeur 1' thatshowed a weak genetic structure similarity withthe other accessions using RAPD markers.
CONCLUSION & DISCUSSION
The PCA of accessions classify themaccording to their geographical origin(climatic stage). In fact, 'Kébilli 2', 'Kébilli3', 'Martin', 'Tozeur 2' and 'Kébilli l' arepositively correlated to the first component.Except the variety `Martin' which is widelycultivated by Tunisian farmers from the north tothe south, these accessions seem to be adaptedto desert climate. However, 'Jendouba l','Jendouba 2', 'Rihane', ‘Manel’, 'Kalaâ','Kélibia l', 'Kélibia 2', 'Kasserine', , 'SidiBouzid', and 'Tozeur l', are negativelycorrelated to the first component and form asecond group. The first seven accessions belongto humid and sub-humid climatic stage. Theaccession 'Kasserine' was collected from ahumid microclimate high land providing asufficient argument for its belonging to thesecond group. The presence in this secondenvironmental pool, of the accession 'SidiBouzid' collected from arid climate, also'Tozeur l' that belongs to Sahara suggested thatthey derived from seeds mixture transferredfrom Nordic field to the center and southernregion during seed storage and theirdistribution for farmers.
Several authors have shown that the geographicorigin of the collected material was sufficient toobtain a reasonable structuration in groups(Julier et al., 1995). On the other hand, obtainedclassification depends on the material involved.In our study, the PCA variable loadingsconfirmed that characters, which are positivelycorrelated to both axes, are related to geneticrather than geographic origin of the accessionsstudied. As a result, the geographic origin didnot fit exactly with the dendrogramobtained. This could be due to highexchange of barley seeds between Tunisiancereal farmers of different regions and thespread of cultivated areas on different climaticstage. That is why; our clustering dependsmainly on ear attitude (Eat), length of glumesand its awn relative to grain (MSLG). It isalso common known that each accession hastypical characteristics appreciated by farmerswho conserve them every harvesting. The strongattachment of farmers to these accessionscontributes to their conservation and consequentlypreserves the core of our plant germplasm.
Biologia Tunisie Juillet 2012 ; N°7 ; 96 – 103
102
Further more, farmers are involved in seeddynamic system transfer between localcultivated areas.RAPD markers seemed to be proficient todiscriminate local barleys defined as accessionsor populations geographically based (BenHmida-Ben Salem, 2000). It is also a valuabletool for assessing genetic diversity levels.Also the dendrogram based on RAPD ourdendrogram obtained by RAPD markers studyshowed that the structuration group depends onthe geographical origin. This result is inagreement with that found using PCA variableloadings, PCA accession loadings and thedendrogram of morphological traits. In thisstudy, distance matrices derived from RAPDmarkers and morphological data showed a lowcorrelation (r=0.14). This result is in agreementwith those of Chia-Szu and Hsiao (1999)working on Lilium longiflorum and reportingvery low correlation (r = 0.035; p = 0.389)between RAPD markers and morphologicalcharacters. Furthermore, Marie et al. (2004);studying hexaploid wheat cultivars; obtained anon significant correlation between RAPDmarkers, morphological traits and coefficientsof parentage. In the same way, Spooner et al.(2005) have obtained low correlationcoefficient between potato genotypes by meansof AFLP and morphologic characters. Thisweak correlation shows that there is no multilocusassociation between molecular and morphologicaltraits in these accessions. Thus, RAPD markerswere not efficient indicators of morphologicaldivergence. In contrary to these authors,Roldân - Ruiz et al. (2001) working onperennial ryegrass found a correlation coefficientof 0.42 between STS markers and morphologicaltraits methods. Moreover, Crochemore et al.(1998) working on 26 alfalfa populationgenetic structures found a global correlationcoefficient of 0.51. While, Duarte et al. (1999)found a correlation of 0.89 between the geneticdistances obtained with RAPD and the‘Mahalanobis' distances indicating that themarkers provide similar estimates of geneticdivergence to those obtained using morpho-agronomical data on bean cultivars.PCA and dendrogram analysis of bothmorphological traits and RAPD markersshowed an important genetic diversity of local
Tunisian barleys. In fact, the accessions weredistributed in different groups belonging todifferent bioclimatic location and on somegenetic characteristics as ear attitude (Eat) andlength of glumes and its awn relative to grain(MSLG).As a conclusion, we believe that correlationbetween morphological and RAPD markerscould be improved if there were moremorphological traits analyzed as reported byother researchers (Martinez de Toda andSancha, 1997) or more RAPD primers used.In fact, a combination of detailed molecularand morphological analyses proved to be apowerful tool for unravelling intraspeciestaxonomy. When these two types of data areinterpreted in concert, some of the problemsencountered in traditional morphometricanalysis can be avoided (Hedrick, 1986).Hence, important consideration should begiven to collection and conservation of localmaterial for breeding, in order to maintainand preserve local barley germplasm fromgenetic erosion.
REFERENCESBen Hmida-Ben Salem W (2000) Contributiondes marqueurs microsatellites et RAPD pourl'études du polymorphisme chez l'orge.Diplômes d’étude approfondie de génétique etbiologie moléculaires. Faculté des Sciences deTunis.Ben Naceur M (1998) Development andassessment of new plant genotypes by molecularbiology methods. PostDoctoral Report. GraduateSchool of Biotechnology Korea University,Korea.Chia-szu W and Hsiao JY (1999) Geneticdifferentiation of Lilium longiflorm Thunb. var.Scabrum Masam (Liliacece) in Taiwan usingRandon Amplified polymorphic DNAs andmorphological characters. Botanical Bulletion ofAcademia Sinica 40: 65-71.Crochemore ML, Huyghe C, Écalle C andJulier B (1998) Structuration of alafalfa. geneticdiversity using agonimic and morphologicalchatacteristics. Relationship with RAPDmarkers. Agronomie 18: 79-94.Duarte JM, dos Santos JB and Cunha Melo L(1999) Genetic divergence among common bean
Biologia Tunisie Juillet 2012 ; N°7 ; 96 – 103
103
cultivars from différent races based on RAPDmarkers. Genet. Mol. Biol. 3: 419-426.El Faleh M (1998) Evaluation de 423écotypes d'orge collectés en Tunisie (Centre etSud). Utilisation en amélioration variétale pourla sélection d'idiotypes adaptés à différentesrégions bioclimatiques. Thèse de Doctorat.Faculté des Sciences de Tunis.Forster BP, Eus RP, Thomas WTB, NewtonAC, Tuberosa R, This D, El-Enein RA, BahriMH and BEN SALEM M (2000) Thedevelopment and applications of molecularmarkers for abiotic stress tolerance in barley. J.Exp. Bot. 342: 19-27.Bœuf F (1931) Le blé en Tunisie: la plante, lemilieu physico-chimique. Annales du ServiceBota. et Agro.Hedrick PW (1986) Genetic polymorphisms inheterogeneous environments: a decade later.Annual Review of Ecology and Systematics 17:535-566.Julier B, Porcheron A, Écalle C and Guy P(1995) Genetic variability for morphlogy, growthand forage yield among perennial diploid andtetraploid Luceme populations (Medicagosativa L.). Agronomie 15: 295304.Kovach WL (1993) MVSP (MultivariateStatistical Package), Kovach PLC.Mantel NA (1967) The detection of diseaseclustering and a generalized regression approach.Cancer Res. 27: 209 - 220.Marié S, Bolarié SJ, Martincic I P andKozumplik V (2004) Genetic diversity ofhexaploid wheat cultivars estimated by RAPDmarkers, morphological traits and coefficientsof parentage. Plant Breeding 4: 366-369.Martinez De Toda F and Sancha JC (1997).Ampelographical characterization of red Vaisvinifera L. cultivars preserved in Rioja. Bulletinde l'OIV 70: 220-234.
Murray MG and Thompson WF (1980) Rapidisolation of high molecular weight plant DNA.Nucleic Acids Res. 8: 4321-4325.Nei M and Li WH (1979) Mathematicalmodels for studying genetic variation in ternisof restriction endonucleases. Proc. Natl. Acad.Sci. USA 76: 52695273.Rohlf FJ (1993) NTSYS-pc, nutnerical taxonomyand multivariate analysis system. Version 2.02 g.Exeter Software, Setauket, NY.Roldân-Ruiz I, van Eeuwijk FA, Gilliland TJ,Dubreuil P, Dillmann C, Lallemand J, De LooseM and Baril CP (2001) A comparative study ofmolecular and morphological methods ofdescribing relationships between perennialryegrass (Lolium perenne L.) varieties Theor.Appl. Genet. 103: 1138-1150.Saghai-Maroof MF, Soliman KM, Jorjenson RAand Allarm RW (1984) Ribosomal DNA SpacerPolymorphisms in barley: Mendelianinheritence, chromosomal location, and poulationdynamics. Proc. Natl. Acad. Sci. USA 81: 8014-8018.Spooner DM, McLean K, Ramsay G, Waughand Bryan GJ (2005) A single domestication forpotato based on multilocus amplified fragmentlength polymorphism genotyping. PNAS 41:14694-14699.Tomassone R, Dervin C and Masson JP (1993)Biométrie, Masson, Paris.U.P.O.V. (1994) Guidelines for the conducttests for distinctness, uniformity and stability.Revision of TG 19/7.Webb DM and Knapp S.T (1990). DNAextraction from a previously recalcitrant plantgenus. Plant Mol. Bio. Rep. 8: 180-185.Zohary D and Hopf M (1998). Domesications ofplants in the Old World. Oxford: UniversityPress.
Biologia Tunisie Juillet 2012; N°7 ; 104 – 112
104
BIOLOGIA TUNISIE
CARACTERISATION ET PURIFICATION D’UNE BACTERIOCINEPRODUITE PAR UNE SOUCHE LACTIQUE ISOLÉE A PARTIR D’UNDERIVE LAITIER ARTISANAL TUNISIEN
REHAIEM Amel, GHRAIRI Taoufik, MANAI Mohamed*
Unité de Biochimie et Biologie Moléculaire, Département de Biologie, Faculté des Sciences deTunis, Campus Universitaire 2092 El Manar, Tunis, Tunisie. * E-mail : [email protected]
Mots clés: Bactéries lactiques, bactériocines, anti-Listéria, SDS-PAGE , HPLC .
ABSRACTA strain called MMR1 and identified as Lacto.para. paracasei was isolated from a Tunisiandairy beverage. This strain is proven out to becapable of inhibiting the growth of severalindicator strains, particularly Listeria. Theoptimal antibacterial activity exhibiting byMMR1 was recovered after 10 to 12 hours ofgrowth, at a temperature ranging from 30°C to37°C and at 60% of ammonium sulfatesaturation. The inhibitory agent was sensitive tothe treatment with proteolytic enzymes, heatstable until 100°C, active over a wide pH rangeand present a bactericidal mode of action ratherthan bacteriostatical. The whole of this featureswhere those of lactic acid bacteria bacteriocins.The result obtained after the partial purificationof this peptide compound by reversed phasechromatography Sep pack C18 reveal that onlythe fraction eluted at 40% and 80% ofacetonitrile was able to inhibit Listeria ivanoviiBUG 496. Analytical reversed phase HPLCprofiles of this active fractions shows severalpeaks which only the one corresponding toretention time of 37 min shown to be activeagainst Listeria.The analysis by SDS-PAGEelectrophoresis indicate that the apparentmolecular weight of this bacteriocinogenicpeptide is less than 6.5 KDa. The whole of theseproperties plead for a bacteriocin witch belongsto the classI or the classII.
RESUMEUne souche désignée MMR1 et identifiéecomme étant un Lacto. para. paracasei a étéisolée à partir d’un breuvage laitier artisanaltunisien. Elle s’est montrée capable d’inhiberplusieurs souches indicatrices, dont Listéria. lemaximum d’activité inhibitrice mise enévidence dans le surnageant de culture de cettesouche est enregistré après 10 à 12 heures decroissance, à des températures variant de 30°C à37°C et à 60% de saturation en sulfated’ammonium. L’agent inhibiteur est sensible àl’action des protéases, thermostable jusqu'à100°C, actif à une large gamme de pH, etprésente un mode d’action plutôt bactéricide quebactériostatique. L’ensemble de cescaractéristiques sont ceux des bactériocinesproduites par les bactéries lactiques. Lapurification partielle de ce composé peptidiquepar chromatographie en phase inverse surcolonne Sep pack C18 révèle que seules lesfractions éluées à 40% et 80% d'acétonitrile sontactives contre Listeria ivanovii BUG 496. Lechromatogramme obtenu après analyse parHPLC de ces deux fractions actives présenteplusieurs pics dont un seul ayant un temps derétention de l’ordre de 37 min est doué d’uneactivité anti-Listeria. L'analyse parélectrophorèse SDS-PAGE révèle que la massemoléculaire apparente du peptidebactériocinogénique est inférieur à 6.5 kDa.L’ensemble de ces caractéristiques physico-
Biologia Tunisie Juillet 2012 ; N°7 ; 104 – 112
105
chimiques et biologiques plaide en faveur d’unebactériocine appartenant à la classe I ou laclasse II.
INTRODUCTIONParmi les technologies de conservationémergeantes, l’utilisation des bactéries lactiquesen tant que bioconservateurs etbiotransformateurs de nombreux produitsalimentaires en particulier les dérivés laitiers,prend de plus en plus d’intérêt pratique (PaulRoss et al., 2002). En effet, dans plusieursproduits alimentaires ayant subit unefermentation lactique la croissance desmicroorganismes pathogènes estconsidérablement réduite. Le facteur à l’originede ces inhibitions est principalementl’abaissement du pH, qui est dû essentiellementà l’accumulation d’acides organiques tels quel’acide acétique et l’acide lactique (Nes et al.,1996 ; Riley 1998). Cependant, il est connu quede nombreux autres processus sont, pour unepartie, responsables des antagonismes observésen présence des bactéries lactiques, parmi lesquels on cite particulièrement l'effet antagonistedes bactériocines (Garneau et al., 2002). Cesdernières sont de nature peptidiques,synthétisées par voie ribosomale et sontinhibitrices de bactéries Gram-positivestaxonomiquement proches de la soucheproductrice. Celle-ci étant immunisée contre sapropre bactériocine (Tagg et al., 1976;Montville et Kaiser., 1993). Ces protéines sontégalement capables d’inhiber plusieursmicroorganismes pathogènes tels que Listeria etEnterococcus. Elles présentent ainsi descapacités intéressantes non seulement dans latransformation et la conservation des aliments,mais aussi médicales. En effet, quelquesbactériocines ont été récemment étudiées pourleur intérêt thérapeutique, par exemple la nisinequi est la bactériocine la plus étudiéeactuellement et autorisée comme additifalimentaire (Hurst, 1981) a été aussi utiliséepour inhiber des bactéries responsables deplaques dentaires (Hoxell et al., 1993). Laverotoxine1 s’est avérée active contre lescellules tumorales in vivo et in vitro (Farkas-Hinsley et al., 1995). Les bactériocines sontcommunément classées en quatre groupes(Klaenhammer 1993; Nes et al., 1996) en
fonction de leurs natures (protéique oupeptidique), leurs tailles (faible ou haut poidsmoléculaire), leurs structures (présence ou nonde modifications post-traductionnelles) ainsi queleurs spectres d’action (sélectif ou étendu) (VanBelkum et Stiles ; 2000 ; Héchard et al., 1992).La Classe I : Comporte les Lantibiotiques depoids moléculaire inférieur à <5KDa et qui secaractérisent par la présence d’acides aminésmodifiés telles que la lanthionine et ladéhydroalanine. Cette classe se subdivise endeux sous classes:Classe Ia: aomportant les Lantibiotiques de typeA qui sont des molécules agissant par laformation de pores membranaires dans lescellules cibles. Parmi les plus connues de cesbactériocines on cite la nisine (Hurst, 1981 ;Harris et al ., 1992)Classe Ib: ae sont des peptides capables deperturber certaines fonctions enzymatiquescomme par exemple l’inhibition de labiosynthèse de la paroi cellulaire et appelés : lesLantibiotiques de type-B. On cite à titred’exemple la mersacidine (Alténa et al., 2000).La Classe II : appelée les non Lantibiotiques, cesont des peptides de faible poids moléculaire(<10KDa) qui présentent une activité anti-Listeria. Elle se subdivise en quatre sous classes:Classe IIa : comporte des bactériocines activesau niveau de la membrane de la cellule ciblegrâce à leur séquence caractéristique YGNGV àl’extrémité N-terminale. On peut citer à titred’exemple : la mésentéricine Y105, la pediocineA-1 (Ennahar et al., 2000) et la LactococcineMMFII ( Ferchichi et al., 2001).Classe IIb : ce sont des bactériocines associantplusieurs peptides et capable de former despores par action coopérative. On distingue lalactacine F (Muriana et al., 1991)Classe IIc : c’est une classe qui comporte lesbactériocines actives par la présence des thiols,par exemple la lactococcine B (Nes et al., 1996).Classe IId : Cette classe englobe d’autresbactériocines diverses.La Classe III : contenant des bactériocinesthermosensibles de taille (> à 10KDa).La Classe IV : Comporte des bactériocinescomplexes contenant une partie lipidique et/ouglucidique.
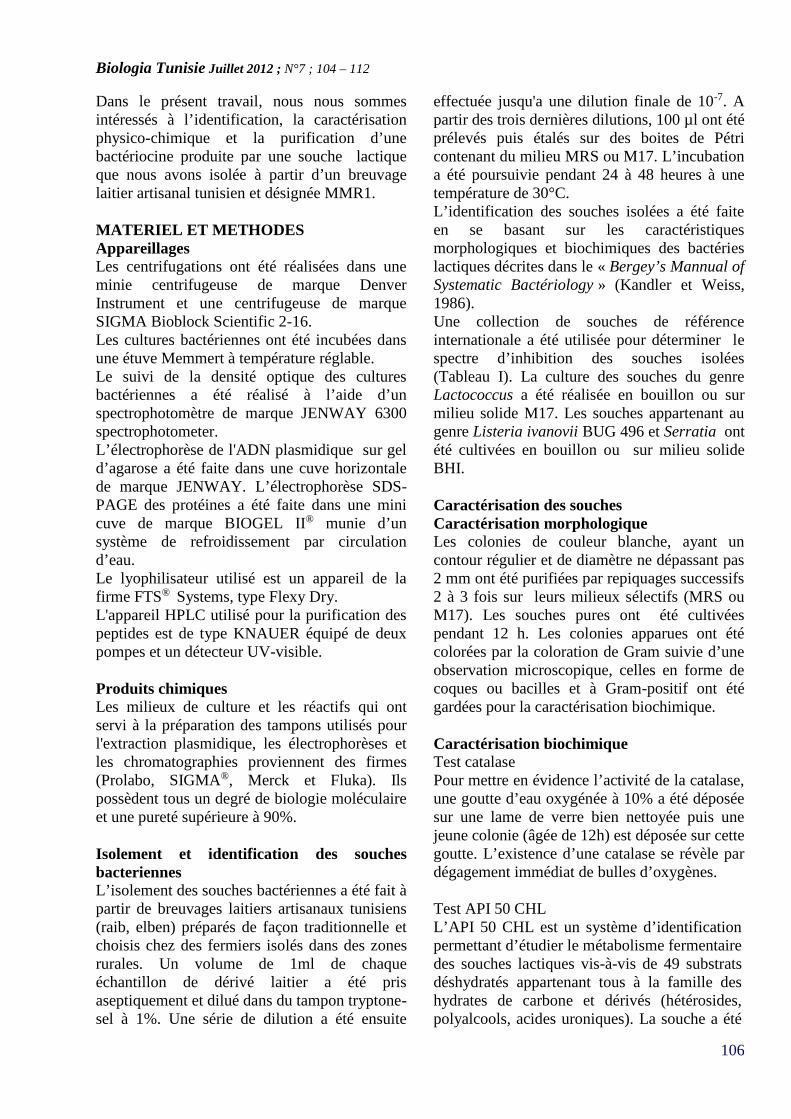
Biologia Tunisie Juillet 2012 ; N°7 ; 104 – 112
106
Dans le présent travail, nous nous sommesintéressés à l’identification, la caractérisationphysico-chimique et la purification d’unebactériocine produite par une souche lactiqueque nous avons isolée à partir d’un breuvagelaitier artisanal tunisien et désignée MMR1.
MATERIEL ET METHODESAppareillagesLes centrifugations ont été réalisées dans uneminie centrifugeuse de marque DenverInstrument et une centrifugeuse de marqueSIGMA Bioblock Scientific 2-16.Les cultures bactériennes ont été incubées dansune étuve Memmert à température réglable.Le suivi de la densité optique des culturesbactériennes a été réalisé à l’aide d’unspectrophotomètre de marque JENWAY 6300spectrophotometer.L’électrophorèse de l'ADN plasmidique sur geld’agarose a été faite dans une cuve horizontalede marque JENWAY. L’électrophorèse SDS-PAGE des protéines a été faite dans une minicuve de marque BIOGEL II® munie d’unsystème de refroidissement par circulationd’eau.Le lyophilisateur utilisé est un appareil de lafirme FTS® Systems, type Flexy Dry.L'appareil HPLC utilisé pour la purification despeptides est de type KNAUER équipé de deuxpompes et un détecteur UV-visible.
Produits chimiquesLes milieux de culture et les réactifs qui ontservi à la préparation des tampons utilisés pourl'extraction plasmidique, les électrophorèses etles chromatographies proviennent des firmes(Prolabo, SIGMA®, Merck et Fluka). Ilspossèdent tous un degré de biologie moléculaireet une pureté supérieure à 90%.
Isolement et identification des souchesbacteriennesL’isolement des souches bactériennes a été fait àpartir de breuvages laitiers artisanaux tunisiens(raib, elben) préparés de façon traditionnelle etchoisis chez des fermiers isolés dans des zonesrurales. Un volume de 1ml de chaqueéchantillon de dérivé laitier a été prisaseptiquement et dilué dans du tampon tryptone-sel à 1%. Une série de dilution a été ensuite
effectuée jusqu'a une dilution finale de 10-7. Apartir des trois dernières dilutions, 100 µl ont étéprélevés puis étalés sur des boites de Pétricontenant du milieu MRS ou M17. L’incubationa été poursuivie pendant 24 à 48 heures à unetempérature de 30°C.L’identification des souches isolées a été faiteen se basant sur les caractéristiquesmorphologiques et biochimiques des bactérieslactiques décrites dans le « Bergey’s Mannual ofSystematic Bactériology » (Kandler et Weiss,1986).Une collection de souches de référenceinternationale a été utilisée pour déterminer lespectre d’inhibition des souches isolées(Tableau I). La culture des souches du genreLactococcus a été réalisée en bouillon ou surmilieu solide M17. Les souches appartenant augenre Listeria ivanovii BUG 496 et Serratia ontété cultivées en bouillon ou sur milieu solideBHI.
Caractérisation des souchesCaractérisation morphologiqueLes colonies de couleur blanche, ayant uncontour régulier et de diamètre ne dépassant pas2 mm ont été purifiées par repiquages successifs2 à 3 fois sur leurs milieux sélectifs (MRS ouM17). Les souches pures ont été cultivéespendant 12 h. Les colonies apparues ont étécolorées par la coloration de Gram suivie d’uneobservation microscopique, celles en forme decoques ou bacilles et à Gram-positif ont étégardées pour la caractérisation biochimique.
Caractérisation biochimiqueTest catalasePour mettre en évidence l’activité de la catalase,une goutte d’eau oxygénée à 10% a été déposéesur une lame de verre bien nettoyée puis unejeune colonie (âgée de 12h) est déposée sur cettegoutte. L’existence d’une catalase se révèle pardégagement immédiat de bulles d’oxygènes.
Test API 50 CHLL’API 50 CHL est un système d’identificationpermettant d’étudier le métabolisme fermentairedes souches lactiques vis-à-vis de 49 substratsdéshydratés appartenant tous à la famille deshydrates de carbone et dérivés (hétérosides,polyalcools, acides uroniques). La souche a été
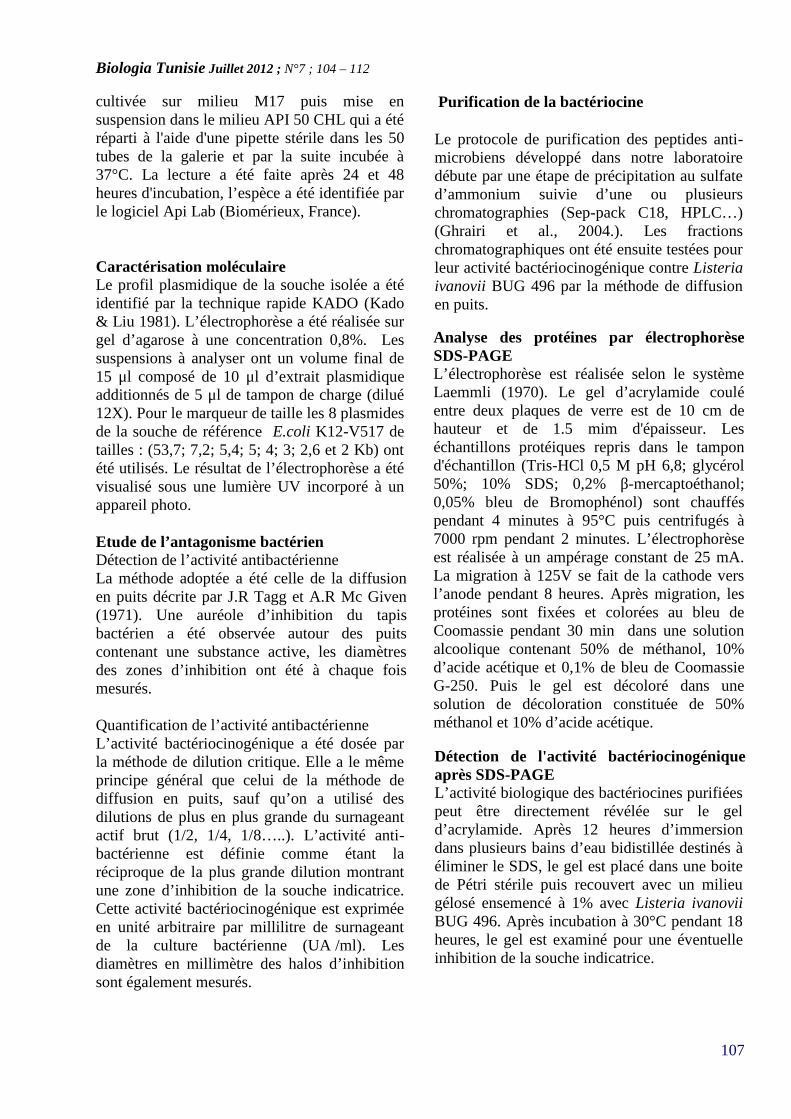
Biologia Tunisie Juillet 2012 ; N°7 ; 104 – 112
107
cultivée sur milieu M17 puis mise ensuspension dans le milieu API 50 CHL qui a étéréparti à l'aide d'une pipette stérile dans les 50tubes de la galerie et par la suite incubée à37°C. La lecture a été faite après 24 et 48heures d'incubation, l’espèce a été identifiée parle logiciel Api Lab (Biomérieux, France).
Caractérisation moléculaireLe profil plasmidique de la souche isolée a étéidentifié par la technique rapide KADO (Kado& Liu 1981). L’électrophorèse a été réalisée surgel d’agarose à une concentration 0,8%. Lessuspensions à analyser ont un volume final de15 μl composé de 10 μl d’extrait plasmidiqueadditionnés de 5 μl de tampon de charge (dilué12X). Pour le marqueur de taille les 8 plasmidesde la souche de référence E.coli K12-V517 detailles : (53,7; 7,2; 5,4; 5; 4; 3; 2,6 et 2 Kb) ontété utilisés. Le résultat de l’électrophorèse a étévisualisé sous une lumière UV incorporé à unappareil photo.
Etude de l’antagonisme bactérienDétection de l’activité antibactérienneLa méthode adoptée a été celle de la diffusionen puits décrite par J.R Tagg et A.R Mc Given(1971). Une auréole d’inhibition du tapisbactérien a été observée autour des puitscontenant une substance active, les diamètresdes zones d’inhibition ont été à chaque foismesurés.
Quantification de l’activité antibactérienneL’activité bactériocinogénique a été dosée parla méthode de dilution critique. Elle a le mêmeprincipe général que celui de la méthode dediffusion en puits, sauf qu’on a utilisé desdilutions de plus en plus grande du surnageantactif brut (1/2, 1/4, 1/8…..). L’activité anti-bactérienne est définie comme étant laréciproque de la plus grande dilution montrantune zone d’inhibition de la souche indicatrice.Cette activité bactériocinogénique est expriméeen unité arbitraire par millilitre de surnageantde la culture bactérienne (UA /ml). Lesdiamètres en millimètre des halos d’inhibitionsont également mesurés.
Purification de la bactériocine
Le protocole de purification des peptides anti-microbiens développé dans notre laboratoiredébute par une étape de précipitation au sulfated’ammonium suivie d’une ou plusieurschromatographies (Sep-pack C18, HPLC…)(Ghrairi et al., 2004.). Les fractionschromatographiques ont été ensuite testées pourleur activité bactériocinogénique contre Listeriaivanovii BUG 496 par la méthode de diffusionen puits.
Analyse des protéines par électrophorèseSDS-PAGEL’électrophorèse est réalisée selon le systèmeLaemmli (1970). Le gel d’acrylamide couléentre deux plaques de verre est de 10 cm dehauteur et de 1.5 mim d'épaisseur. Leséchantillons protéiques repris dans le tampond'échantillon (Tris-HCl 0,5 M pH 6,8; glycérol50%; 10% SDS; 0,2% β-mercaptoéthanol;0,05% bleu de Bromophénol) sont chaufféspendant 4 minutes à 95°C puis centrifugés à7000 rpm pendant 2 minutes. L’électrophorèseest réalisée à un ampérage constant de 25 mA.La migration à 125V se fait de la cathode versl’anode pendant 8 heures. Après migration, lesprotéines sont fixées et colorées au bleu deCoomassie pendant 30 min dans une solutionalcoolique contenant 50% de méthanol, 10%d’acide acétique et 0,1% de bleu de CoomassieG-250. Puis le gel est décoloré dans unesolution de décoloration constituée de 50%méthanol et 10% d’acide acétique.
Détection de l'activité bactériocinogéniqueaprès SDS-PAGEL’activité biologique des bactériocines purifiéespeut être directement révélée sur le geld’acrylamide. Après 12 heures d’immersiondans plusieurs bains d’eau bidistillée destinés àéliminer le SDS, le gel est placé dans une boitede Pétri stérile puis recouvert avec un milieugélosé ensemencé à 1% avec Listeria ivanoviiBUG 496. Après incubation à 30°C pendant 18heures, le gel est examiné pour une éventuelleinhibition de la souche indicatrice.
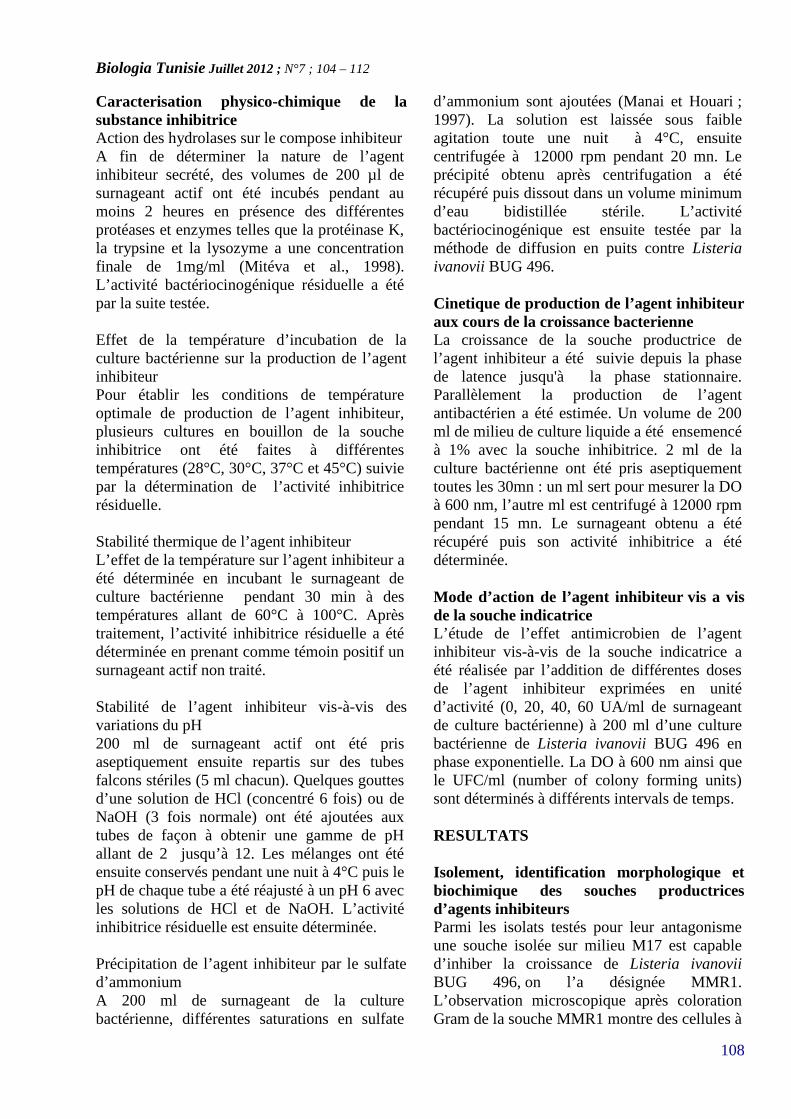
Biologia Tunisie Juillet 2012 ; N°7 ; 104 – 112
108
Caracterisation physico-chimique de lasubstance inhibitriceAction des hydrolases sur le compose inhibiteurA fin de déterminer la nature de l’agentinhibiteur secrété, des volumes de 200 µl desurnageant actif ont été incubés pendant aumoins 2 heures en présence des différentesprotéases et enzymes telles que la protéinase K,la trypsine et la lysozyme a une concentrationfinale de 1mg/ml (Mitéva et al., 1998).L’activité bactériocinogénique résiduelle a étépar la suite testée.
Effet de la température d’incubation de laculture bactérienne sur la production de l’agentinhibiteurPour établir les conditions de températureoptimale de production de l’agent inhibiteur,plusieurs cultures en bouillon de la soucheinhibitrice ont été faites à différentestempératures (28°C, 30°C, 37°C et 45°C) suiviepar la détermination de l’activité inhibitricerésiduelle.
Stabilité thermique de l’agent inhibiteurL’effet de la température sur l’agent inhibiteur aété déterminée en incubant le surnageant deculture bactérienne pendant 30 min à destempératures allant de 60°C à 100°C. Aprèstraitement, l’activité inhibitrice résiduelle a étédéterminée en prenant comme témoin positif unsurnageant actif non traité.
Stabilité de l’agent inhibiteur vis-à-vis desvariations du pH200 ml de surnageant actif ont été prisaseptiquement ensuite repartis sur des tubesfalcons stériles (5 ml chacun). Quelques gouttesd’une solution de HCl (concentré 6 fois) ou deNaOH (3 fois normale) ont été ajoutées auxtubes de façon à obtenir une gamme de pHallant de 2 jusqu’à 12. Les mélanges ont étéensuite conservés pendant une nuit à 4°C puis lepH de chaque tube a été réajusté à un pH 6 avecles solutions de HCl et de NaOH. L’activitéinhibitrice résiduelle est ensuite déterminée.
Précipitation de l’agent inhibiteur par le sulfated’ammoniumA 200 ml de surnageant de la culturebactérienne, différentes saturations en sulfate
d’ammonium sont ajoutées (Manai et Houari ;1997). La solution est laissée sous faibleagitation toute une nuit à 4°C, ensuitecentrifugée à 12000 rpm pendant 20 mn. Leprécipité obtenu après centrifugation a étérécupéré puis dissout dans un volume minimumd’eau bidistillée stérile. L’activitébactériocinogénique est ensuite testée par laméthode de diffusion en puits contre Listeriaivanovii BUG 496.
Cinetique de production de l’agent inhibiteuraux cours de la croissance bacterienneLa croissance de la souche productrice del’agent inhibiteur a été suivie depuis la phasede latence jusqu'à la phase stationnaire.Parallèlement la production de l’agentantibactérien a été estimée. Un volume de 200ml de milieu de culture liquide a été ensemencéà 1% avec la souche inhibitrice. 2 ml de laculture bactérienne ont été pris aseptiquementtoutes les 30mn : un ml sert pour mesurer la DOà 600 nm, l’autre ml est centrifugé à 12000 rpmpendant 15 mn. Le surnageant obtenu a étérécupéré puis son activité inhibitrice a étédéterminée.
Mode d’action de l’agent inhibiteur vis a visde la souche indicatriceL’étude de l’effet antimicrobien de l’agentinhibiteur vis-à-vis de la souche indicatrice aété réalisée par l’addition de différentes dosesde l’agent inhibiteur exprimées en unitéd’activité (0, 20, 40, 60 UA/ml de surnageantde culture bactérienne) à 200 ml d’une culturebactérienne de Listeria ivanovii BUG 496 enphase exponentielle. La DO à 600 nm ainsi quele UFC/ml (number of colony forming units)sont déterminés à différents intervals de temps.
RESULTATS
Isolement, identification morphologique etbiochimique des souches productricesd’agents inhibiteursParmi les isolats testés pour leur antagonismeune souche isolée sur milieu M17 est capabled’inhiber la croissance de Listeria ivanoviiBUG 496, on l’a désignée MMR1.L’observation microscopique après colorationGram de la souche MMR1 montre des cellules à

Biologia Tunisie Juillet 2012 ; N°7 ; 104 – 112
109
Gram-positif qui se présentent sous forme decoques : isolées, regroupés en amas, endiplocoques ou en chaînettes (Figure 1).
Le test catalase a révélé que la souche estcatalase négative. L'étude de son profilfermentaire par l’analyse de 49 de sescaractères métaboliques à l’aide des plaquesAPI 50 CHL a permis d’identifier une souchelactique d’espèce : Lacto. para. paracasei .L’etude du profil plasmidique révèlent que la
souche MMR1 présente deux plasmides depoids moléculaires respectifs 2.6 Kb et 4 Kb.(Figure 2).
Caractérisation physico-chimique de lasubstance inhibitriceLe spectre d’inhibition de la souche MMR1s’étend contre différentes bactéries, incluant desbactéries lactiques et des souches pathogènes ets’avère différent de celui de la souche Lc lactisATCC 11454 productrice de la nisine A (TableauI). L’activité inhibitrice du surnageant de culturede la souche MMRI reste intacte en présence delysozyme, diminue faiblement en présence detrypsine alors qu’elle est totalement abolie enprésence de protéinase K (Figure 3).Cette activité antagoniste est stable jusqu'à 100°Cainsi qu’à une gamme de pH allant de pH 2jusqu'à pH 11 (Figure 4).
Tableau I : Spectre d’inhibition de l'agent inhibiteurproduit par la souche MMR1 et la nisine produite par Lc.lactis ATCC11454 sur différentes souches indicatrices
++ Forte activité inhibitrice ; + : présence d’activité inhibitrice ;-: absence d’activité
Cependant, elle est maximale à des valeurs de pHentre 5 et 7, à 60% de saturation en sel et à destempératures de croissance bactériennescomprises entre 30°C et 37°C. Toutefois elle esttrès faible à 28°C et totalement aboli à 45°C.Cette activité apparaît assez tôt en phaseexponentielle de croissance, environ après 4heures d’incubation et reste maximale durant les10 heures qui suivent la fin de la phaseexponentielle (Figure 5).
Figure 1 : Observation microscopique de l’isolatMMR1 après coloration Gram
Figure 2 : Profil plasmidique de la soucheproductrice de bactériocine
Figure 3 : Test d’antagonisme sur boite de Pétri de lasouche MMR1, A : test du surnageant de culture de lasouche MMR1 ; B : test du surnageant de culture de lasouche MMR1 traité à la protéinase K ; C : test dusurnageant de culture de la souche MMR1 traité à100°C pendant 30 mn ; D : test du surnageant deculture de la souche Lc.lactis ATCC 11454 ; E : testdu surnageant de culture de la souche ATCC11454 traité à la protéinase k.
Figure 4 : Effet du pH sur l’activitébactériocinogénique de MMR1
0
20
40
60
80
100
120
1 2 3 4 5 6 7 8 9 10 11 12
pH
Act
ivit
é(U
A/m
l)
0
20
40
60
80
100
120
1 2 3 4 5 6 7 8 9 10 11 12
pH
Act
ivit
é(U
A/m
l)
Souches MMR1 Lc. lactisATCC11454
Listeria ivanovii BUG496Lactococcus lactis ssp.lactis ATCC 11454b
Lactococcus lactis ssp.Cremoris ATCC 11603Lactobacillus casei DSM20011Lactobacillus delbrueckiiDSM 20081Enterococcus faeciumENSAIA 631Enterococcus faecalisJH-22Serratia sp. RF001f
++
-
+
++
++
++
++
-
++
-
++
-
++
+
++
+
4 Kb
2.6 Kb
+
-
4 Kb
2.6 Kb
+
-
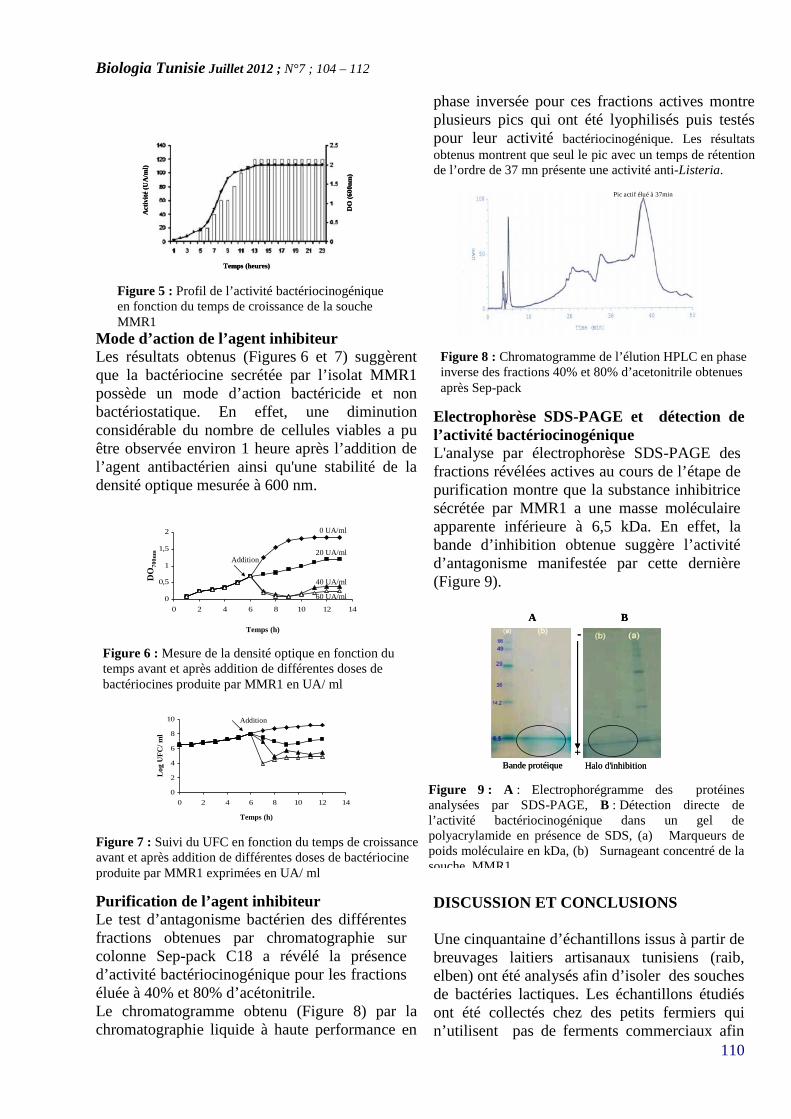
Biologia Tunisie Juillet 2012 ; N°7 ; 104 – 112
110
Mode d’action de l’agent inhibiteurLes résultats obtenus (Figures 6 et 7) suggèrentque la bactériocine secrétée par l’isolat MMR1possède un mode d’action bactéricide et nonbactériostatique. En effet, une diminutionconsidérable du nombre de cellules viables a puêtre observée environ 1 heure après l’addition del’agent antibactérien ainsi qu'une stabilité de ladensité optique mesurée à 600 nm.
Purification de l’agent inhibiteurLe test d’antagonisme bactérien des différentesfractions obtenues par chromatographie surcolonne Sep-pack C18 a révélé la présenced’activité bactériocinogénique pour les fractionséluée à 40% et 80% d’acétonitrile.Le chromatogramme obtenu (Figure 8) par lachromatographie liquide à haute performance en
phase inversée pour ces fractions actives montreplusieurs pics qui ont été lyophilisés puis testéspour leur activité bactériocinogénique. Les résultatsobtenus montrent que seul le pic avec un temps de rétentionde l’ordre de 37 mn présente une activité anti-Listeria.
Electrophorèse SDS-PAGE et détection del’activité bactériocinogéniqueL'analyse par électrophorèse SDS-PAGE desfractions révélées actives au cours de l’étape depurification montre que la substance inhibitricesécrétée par MMR1 a une masse moléculaireapparente inférieure à 6,5 kDa. En effet, labande d’inhibition obtenue suggère l’activitéd’antagonisme manifestée par cette dernière(Figure 9).
DISCUSSION ET CONCLUSIONS
Une cinquantaine d’échantillons issus à partir debreuvages laitiers artisanaux tunisiens (raib,elben) ont été analysés afin d’isoler des souchesde bactéries lactiques. Les échantillons étudiésont été collectés chez des petits fermiers quin’utilisent pas de ferments commerciaux afin
Figure 5 : Profil de l’activité bactériocinogéniqueen fonction du temps de croissance de la soucheMMR1
Act
ivit
é(U
A/m
l)
Temps (heures)
DO
(600
nm)
Act
ivit
é(U
A/m
l)
Temps (heures)
DO
(600
nm)
Figure 7 : Suivi du UFC en fonction du temps de croissanceavant et après addition de différentes doses de bactériocineproduite par MMR1 exprimées en UA/ ml
Figure 6 : Mesure de la densité optique en fonction dutemps avant et après addition de différentes doses debactériocines produite par MMR1 en UA/ ml
Figure 8 : Chromatogramme de l’élution HPLC en phaseinverse des fractions 40% et 80% d’acetonitrile obtenuesaprès Sep-pack
Figure 9 : A : Electrophorégramme des protéinesanalysées par SDS-PAGE, B : Détection directe del’activité bactériocinogénique dans un gel depolyacrylamide en présence de SDS, (a) Marqueurs depoids moléculaire en kDa, (b) Surnageant concentré de lasouche MMR1
0
0,5
1
1,5
2
0 2 4 6 8 10 12 14
DO
700n
m
Temps (h)
20 UA/ml
0 UA/ml
40 UA/ml
60 UA/ml
Addition
0
0,5
1
1,5
2
0 2 4 6 8 10 12 14
DO
700n
m
Temps (h)
20 UA/ml
0 UA/ml
40 UA/ml
60 UA/ml
Addition
0
2
4
6
8
10
0 2 4 6 8 10 12 14
Log
UF
C/ m
l
Addition
Temps (h)
0
2
4
6
8
10
0 2 4 6 8 10 12 14
Log
UF
C/ m
l
Addition
Temps (h)
Pic actif élué à 37minPic actif élué à 37min
A B
-
+Halo d'inhibitionBande protéique
A B
-
+Halo d'inhibitionBande protéique
Biologia Tunisie Juillet 2012 ; N°7 ; 104 – 112
111
que les souches découvertes soient d’originetunisienne certaine. De plus, les manières depréparations peu rigoureuses sur le planhygiénique, sont éventuellement favorables àenrichir le milieu en souches ayant despropriétés antagonistes. D’ailleurs jusqu'àprésent très peu de souches antibactériennesisolées à partir de produits laitiers artisanauxtunisiens ont été décrites (Ferchichi et al., 2001 ;Ghrairi et al., 2004). Parmi les échantillonstestés, l’isolat nommé MMR1 s’est avérécapable d’inhiber plusieurs souches indicatricesdont en particulier Listeria ivanovii BUG 496.Cette caractéristique est intéressante du fait quele facteur inhibiteur produit peut être actif àl’égard d’une bactérie pathogène telle Listériaet donc atteste que l’environnement rural où aété collecté l’échantillon représente un gisementvierge qui est susceptible de fournir des souchespossédant des caractéristiques nouvelles etpotentiellement apte à l’utilisation dansl’industrie alimentaire.L’étude phénotypique ainsi que l’interprétationdu logiciel API LAB ont permis d’identifier lasouche MMR1 comme étant une bactérielactique d’espèce Lacto. para. paracasei.Toutefois, pour une identification authentiquede l’espèce isolée, d’autres approchesgénotypique sont indispensables telles quel’analyse par RFLP-PCR de l’ ADNr 16S ou latechnique RAPD-PCR.La caractérisation moléculaire de MMR1 quirévèle la présence de deux plasmides suggèreque le déterminisme génétique responsable de laproduction de l’agent inhibiteur pourrait être denature plasmidique. En effet la plupart des gènescodant la production des bactériocines chez lesbactéries lactiques ont été très souvent portéspar des plasmides (Jack et al., 1995).La caractérisation physico-chimique de l’agentantibactérien révèle que le maximumd’expression de l’activité inhibitrice estenregistré après 12 heures de croissancebactérienne à des températures d'incubationvariant de 30°C à 37°C. Cette activité estthermorésistante, stable à des pH extrêmes etsensible à l’action des protéases, ce qui suggèresa nature protéique. De plus, l’augmentation del’activité antagoniste par précipitation et ladétection directe de l’activité antagoniste sur gelde polyacrylamide à 15% confirme la nature
protéique de cet agent antibactérien. Comme lastabilité vis-à-vis des variations du pH et lasensibilité aux protéases sont des critères clédans la caractérisation d’inhibiteur decroissances bactériennes telles que lesbactériocines des bactéries lactiques (Piard andDesmazeaud, 1992) et selon la définitiondonnée par Klaenhammer (1988), le facteurantibactérien produit par MMR1 qui est unesubstance de nature protéique avec un spectred’activité relativement étroit et un moded’action bactéricide, peut donc être considérécomme une bactériocine.La purification de cette bactériocine a permis deprédire une masse moléculaire inférieur à 6.5KDa. Cependant, l’obtention par HPLC d’un picactif non symétrique suggère un mélange decomposés différents et pour obtenir un peptideparfaitement pur des étapes supplémentaires depurification sont nécessaires.L’ensemble de ces résultats suggère fortementque la substance inhibitrice secrétée par lasouche MMR1 est une bactériocine quiappartient à la classe I ou la classe II différentede la nisine. La masse moléculaire exacte et lastructure de cette bactériocine seront élucidéespar d’autres approches : spectrométrie de masse,séquençage peptidique, synthèse chimique despeptides et modélisation moléculaire.
REFERENCES
Altena K., Guder A., Cramer C. & Bierbaurn(2000). Biosynthesis of the lantibioticmersacidine : organisation of a type Blantibiotic gene cluster. Appl. Environ.Microbiol. 66: 2565-2571.Barritault D., Expert-Bezancon A., Guerin MF.& Hayes D. (1976). The use of acetoneprecipitation in the isolation of ribosomalproteins. Eur J Biochem. 16:131- 135.Ennahar S., Sashihara T., Sonomoto K., IshizakiA. (2000). Class IIa bacteriocins : Biosynthesis,structure and activity. FEMS MicrobiologyReviews 24:85-106.Farkas-Himsley H., Hill R., Rosen B., Arabs S& Lingwood CA. (1995). The bacteriol colicinactive againts tumor cells in vitro and invivo isverotoxin1. Proc. Natl. Acad. Sci. U.S.A.. 15 :6996-7000.
Biologia Tunisie Juillet 2012 ; N°7 ; 104 – 112
112
Ferchichi M., Frére J., Mabrouk k & ManaiM.(2001). Lactoccoccine MMFII, a novel classIIa bacteriocin produced by Lactococcus lactisMMFII, isolated from a tunisian dairy product.FEMS Microbiology letters 205: 49-55.Garneau S., Martin IN., Vederas JC. (2002).Two- peptide bacteriocins produced by lacticacid bacteria. Biochimie 84: 577-592.Ghrairi T. Manai M., Bergeaud JM., Frere J.(2004). Antilisterial activity of lactic acidbacteria isolated from rigouta, a traditionalTunisian cheese .J. Appl. Microbiol. 97: 621-628.Héchard Y. Dérijard B., Lettellier F. &Cenatiempo Y. (1992). Characterization andpurification of mesentericine Y105 andantibactériocine from Leuconostocmesenteroides. J. Gen. Microbiol. 138: 2725-2731.Hurst A. 1981.Nisine. Adv. App. Microbiol.27 : 85-123.Jack R W., Tagg J R., and Ray B. (1995).Bacteriocins of Gram-positive bacteria.Microbiological Reviews. 59: 171-200.Klaenhammer TR. (1988). Bacteriocins oflactic acid bacteria. Biochimie 70, 337-349.Klaenhammer TR. (1993).Genetics ofbacteriocins produced by lactic acid bacteria.FEMS Microbiol. Rev. 12: 39-85.Kandler O. and Weiss N. (1986). Regular, nonsporing Gram positive rods. In Bergey’s manualof systematic bacteriology. Edité par PeterH.A. Sneath.Kado CI. & Liu (1981).Rapid procedure fordetection and isolation of large and smallplasmids.J.Bacteriol. 145: 1365-1373.Laemmli UK. (1970). Cleavageof structuralproteins during the assembly of the head ofbactériophage.T4. Nature (London). 227: 680-685.Piard, J.C., Desmazeaud, M., (1992). Inhibitingfactors produced by lactic acid bacteria. 2.Bacteriocins and other antibacterial substances.Lait 72: 113-142.
Tagg J.R & Mcgiven A.R. (1971). Assay systemfor bacteriocins. Appl. Microbiol. 21, 943.Tagg JR., Dajani AS. & Wannamaker LW.(1976). Bacteriocins of gram positive bacteria.Bacteriol. Rev. 40: 722-756.Manai M. & Haouari M. (1997). Etude etcaractérisation biochimique des bactériocines dequelques souches du genre Lactobacillus isoléesde quelques dérivés laitiers de fabricationartisanale. Bull. Soc. Sci. Nat. Tunisie. 26: 56-66.Montville TJ., Kaiser A.L. (1993).Antimicrobial protéines : classification,nomenclature, diversity, and relation ship tobactériocins. In: Bacteriocins of lactic acidbacteria. Eds. Hoover D.G. & Steenson L.R.,Academic press.Miteva V., Ivanovi I., Budakov I., Pantev A.,Stephanoa T., Danova S., Moncheva P., MitevV., Dousset X & Boyaval P. (1998). Detectionand characterization of a novel antimicrobialsubstance produced by a Lactobacillusdelbrueckii strain 1043. Journal of AppliedMicrobiologie. 85: 603-614.Muriana P. M. & Klaenhammer T.R., (1991).Clonning, phenotypic expression, and DNAsequence of the gene for lactacin F, anantimicrobial peptide produced by Lactobacillussp. J. Bacteriology. 173 : 1779- 1788.Nes I.F., Diep D.B., Harvestein L.S., BurguersM.B., Einjsink V., Holo H. (1996). Biosyntheseof bactériocines in lactic acid bacteria. AntonieVan Leeuwenhoeck. 70 : 113-128.Paul Ross R., Morgan. S & Hill. C. (2002).Preservation and fermentation: past, present andfuture. International Journal of FoodMicrobiology. 79: 3-16.Riley AM. (1998) Molecular mechanisms ofbacteriocin evolution. Ann. Rev. Genet. 32:255-278.Van Belkum M J & Striles ME. (2000). Nonlantibiotic antibactirial peptides from lactic acidbacteria. Nat. Prod- Rep. 17 : 323-335.
Biologia Tunisie Juillet 2009 ; N°7 ; 113 – 118
113
BIOLOGIA TUNISIE
OCTADECANEUROPEPTIDE, ODN, PROMOTES CELL SURVIVAL INRAT CEREBELLAR GRANULE NEURONS
Kaddour Hadhemia, Hamdi Yosraa, Vaudry Davidb-d, Tonon Marie-Christineb-d, AmriMohamed*a and Masmoudi-Kouki Olfaa
Laboratory of Functional Neurophysiology and Pathology, Research Unit - 00/UR/08-01, Departmentof Biological Sciences, Faculty of Science of Tunis ; University Tunis El Manar, 2092 Tunis, Tunisia; bInserm U982, Laboratory of Neuronal and Neuroendocrine Communicationand Differentiation, Mont-Saint-Aignan, University of Rouen ; 6128 Mont-Saint-Aignan, France ;cInternational Associated Laboratory Samuel de Champlain ; dEuropean Institute for PeptideResearch (IFRMP 23), Regional Platform for Cell Imaging (PRIMACEN), Rouen, France.*Corresponding authors: ; Pr Amri Mohamed. Fax: (216) 216 71 87-16-66. ; E-mail address:[email protected]
Keywords: Cerebellar granule neurons ; cell death ; Octadecaneuropeptide ; Neurotoxine
ABSRACT
High concentrations of diazepam-bindinginhibitor (DBI) and its receptors have beendetected in the rat cerebellum during ontogenesis.In particular, depletion of DBI expression innewborn rats affects the postnatal developmentand reduces the granular cell area in theneocerebellum, suggesting that DBI may act as aneurotrophic factor in the developing of ratcerebellum. In the present study, we haveinvestigated the potential neuroprotective effectof a processing product of DBI, theoctadecaneuropeptide ODN, on maturecerebellar granule cells in primary culture. Incontrol conditions, cultured granule cellsundergo programmed cell death when theextracellular level of K+ is lowered. Incubationof cultured cells with 1nM ODN for 72 hprovoked a significant increase in the number ofliving cells. Exposure of cultured cells to 1-methyl-4-phenylpyridinium (MPP+), an ultimatetoxic metabolite of a mitochondrial neurotoxin1-methyl-4-phenyl-1,2,3,6-tetrahydropyridine(MPTP) inhibited neurite outgrowth andprovoked apoptotic cell death. Incubation ofgranule cells with ODN prevents MPP+-inducedapoptosis. Taken together, these data
demonstrate for the first time that ODN is apotent neuroprotective agent that preventscerebellar granule neurons from apoptotic celldeath and suggests that ODN could havepotential therapeutic value for the treatment ofcerebral injuries.
INTRODUCTION
The octadecaneuropeptide (ODN) has beenoriginally isolated from the rat brain andcharacterized as an endogenous ligand ofbenzodiazepine receptors (Ferrero et al., 1986).ODN is generated by proteolytic cleavage of an86-amino acid polypeptide precursor calleddiazepam-binding inhibitor (DBI) (Guidotti etal., 1983) whose gene is mainly expressed inglial cells in the central nervous system (CNS)(Alho et al., 1995; Burgi et al., 1999; Compère etal., 2006). The primary structure of ODN hasbeen strongly preserved during evolution (Webbet al., 1987; Lihrmann et al., 1994; Chang andTsai, 1996), indicating that this peptide playsimportant biological functions. Indeed,behavioral studies have shown that ODN inducesanxiety, attenuates pentylenetetrazol-evokedconvulsions, suppresses apomorphine-inducedyawning, and inhibits food intake in rodents(Tonon et al., 2006). It was initially shown that
Biologia Tunisie Juillet 2009 ; N°7 ; 113 – 118
114
DBI and its processing product ODN interactwith central-type benzodiazepine receptors(CBR) associated with the GABAA-receptorcomplex (Tonon et al., 2006). In addition, ODNmay activate a non-benzodiazepinic membranereceptor coupled to phospholipase C (Gandolfoet al., 1997; Leprince et al., 2001; Marino et al.,2003; Compère et al., 2004).1-methyl-4-phenilpyridinium (MPP+) is a well-known neurotoxin (Gibb et al., 1988) whichcauses a clinical syndrome similar to Parkinson’sdisease (PD) in human and laboratory animals,and is used as a suitable experimental model tostudy new therapeutic strategies in PD(Eberhardt and Schulz, 2003; Moore et al.,2005). Cerebellar granule cells are often used asmodels in the study of cellular and molecularmechanisms underlying neuronal death andapoptosis (Yalcin et al., 2003; Falluel-Morel etal., 2004). Accordingly, cerebellar granule cellsdie by apoptosis when cultured in physiologicalKCl concentrations (5mM; K5), and they survivein the presence of depolarizing concentrations ofKCl (25mM; K25) (Xifro et al., 2006). Althoughthe cerebellum has not been extensively studiedas a prominent target for the MPP+neurotoxicity, cerebellar granule cells are quitesensitive to the toxic effects of MPP+ in vitro(Gonzalez-Polo et al., 2001; Shang et al., 2004;Alvira et al., 2007) and in vivo (Takada et al.,1991).
It has been reported that, that intra-cerebraladministration of benzodiazepines receptorsagonists prevent neuronal death induced byischemia or stroke (Schwartz-Bloom and Sah,2001; Aerden et al., 2004; Corbett et al., 2008).On the other hand, the concentration of DBI inthe cerebrospinal fluid and the expression ofbenzodiazepines receptors in brain are increasedin diverse nervous system injuries, includingParkinson disease (Ferrarese et al., 1990; Veigaet al., 2007). Although the effect of ODN oncellular protection has never been investigated,these data suggest that ODN, acting as anendogenous ligand for benzodiazepine receptors,may exert a neuroprotective effect. In order totest the hypothesis of a protective action ofODN, we analyzed the ability of the peptide toprotect cerebellar granule cells against cellsdeath induced by neurotoxin MPP+ and serumand potassium deprivation.
MATERIAL AND METHODS
Materials
Dulbecco’s modified Eagle’s medium (DMEM),F12 culture medium, D(+)-glucose, L-glutamine,N-2-hydroxyethylpiperazine-N-2-ethane sulfonicacid (HEPES), foetal bovine serum (FBS) andthe antibiotic-antimycotic solution were obtainedfrom Gibco (Invitrogen, Grand Island NY,USA). MPTP was purchased from SigmaAldrich (St. Louis, MO, USA). Lactatedehydrogenase (LDH; EC 1.1.1.27) assay kitwas commercialized by Bio-Maghreb (Ariana,Tunisia). Rat ODN(QATVGDVNTDRPGLLDLK) was synthesizedby using the standard Fmoc procedure, aspreviously described (Leprince et al., 2001). Allother reagents were of A grade purity.
Primary culture of cerebellar granule cells(CGCs)
Cultures enriched in granule neurons wereobtained from the cerebella of 8-day old rats asdescribed previously (Gonzalez et al., 1992).Briefly, freshly dissected cerebella weredissociated in the presence of trypsin and DNaseI and planted on poly-L-lysine coated dishes.Cells were seeded at a density of 3.5 x 10⁶cells/ml in basal medium Eagle supplementedwith 10% FBS, 2 mM glutamine, 5 mM KCl,and 1 % antibiotic-antimycotic solution. Cellswere grown at 37°C in a humidified incubatorwith an atmosphere of 5% CO2 / 95% air.
Measurement of cell cytotoxicity
Granule cells were incubated at 37°C with freshserum-free medium in the absence or presence oftest substances. At the end of the incubation, thecytotoxicity of MPP+ on neurons wasdetermined by measurement of LDH activity inculture medium. The amount of LDH releasedinto medium was measured by LDH assay kit(Bio-Maghreb) according to the manufacturer’sinstructions.
Examination of cell morphologyCultured cells were incubated at 37°C for 1 hwith fresh serum-free culture medium in theabsence or presence of MPP+ and/or ODN. Atthe end of the incubation period, culture media
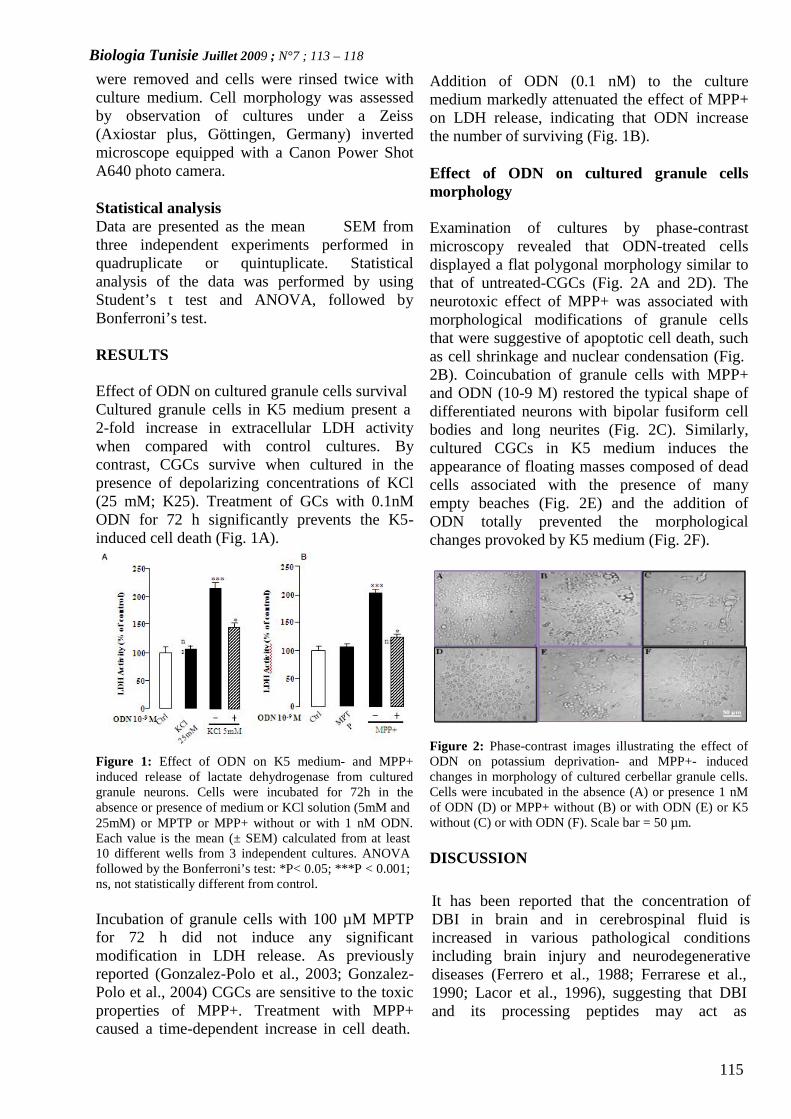
Biologia Tunisie Juillet 2009 ; N°7 ; 113 – 118
115
were removed and cells were rinsed twice withculture medium. Cell morphology was assessedby observation of cultures under a Zeiss(Axiostar plus, Göttingen, Germany) invertedmicroscope equipped with a Canon Power ShotA640 photo camera.
Statistical analysisData are presented as the mean SEM fromthree independent experiments performed inquadruplicate or quintuplicate. Statisticalanalysis of the data was performed by usingStudent’s t test and ANOVA, followed byBonferroni’s test.
RESULTS
Effect of ODN on cultured granule cells survivalCultured granule cells in K5 medium present a2-fold increase in extracellular LDH activitywhen compared with control cultures. Bycontrast, CGCs survive when cultured in thepresence of depolarizing concentrations of KCl(25 mM; K25). Treatment of GCs with 0.1nMODN for 72 h significantly prevents the K5-induced cell death (Fig. 1A).
Figure 1: Effect of ODN on K5 medium- and MPP+induced release of lactate dehydrogenase from culturedgranule neurons. Cells were incubated for 72h in theabsence or presence of medium or KCl solution (5mM and25mM) or MPTP or MPP+ without or with 1 nM ODN.Each value is the mean (± SEM) calculated from at least10 different wells from 3 independent cultures. ANOVAfollowed by the Bonferroni’s test: *P< 0.05; ***P < 0.001;ns, not statistically different from control.
Incubation of granule cells with 100 µM MPTPfor 72 h did not induce any significantmodification in LDH release. As previouslyreported (Gonzalez-Polo et al., 2003; Gonzalez-Polo et al., 2004) CGCs are sensitive to the toxicproperties of MPP+. Treatment with MPP+caused a time-dependent increase in cell death.
Addition of ODN (0.1 nM) to the culturemedium markedly attenuated the effect of MPP+on LDH release, indicating that ODN increasethe number of surviving (Fig. 1B).
Effect of ODN on cultured granule cellsmorphology
Examination of cultures by phase-contrastmicroscopy revealed that ODN-treated cellsdisplayed a flat polygonal morphology similar tothat of untreated-CGCs (Fig. 2A and 2D). Theneurotoxic effect of MPP+ was associated withmorphological modifications of granule cellsthat were suggestive of apoptotic cell death, suchas cell shrinkage and nuclear condensation (Fig.2B). Coincubation of granule cells with MPP+and ODN (10-9 M) restored the typical shape ofdifferentiated neurons with bipolar fusiform cellbodies and long neurites (Fig. 2C). Similarly,cultured CGCs in K5 medium induces theappearance of floating masses composed of deadcells associated with the presence of manyempty beaches (Fig. 2E) and the addition ofODN totally prevented the morphologicalchanges provoked by K5 medium (Fig. 2F).
Figure 2: Phase-contrast images illustrating the effect ofODN on potassium deprivation- and MPP+- inducedchanges in morphology of cultured cerbellar granule cells.Cells were incubated in the absence (A) or presence 1 nMof ODN (D) or MPP+ without (B) or with ODN (E) or K5without (C) or with ODN (F). Scale bar = 50 µm.
DISCUSSION
It has been reported that the concentration ofDBI in brain and in cerebrospinal fluid isincreased in various pathological conditionsincluding brain injury and neurodegenerativediseases (Ferrero et al., 1988; Ferrarese et al.,1990; Lacor et al., 1996), suggesting that DBIand its processing peptides may act as
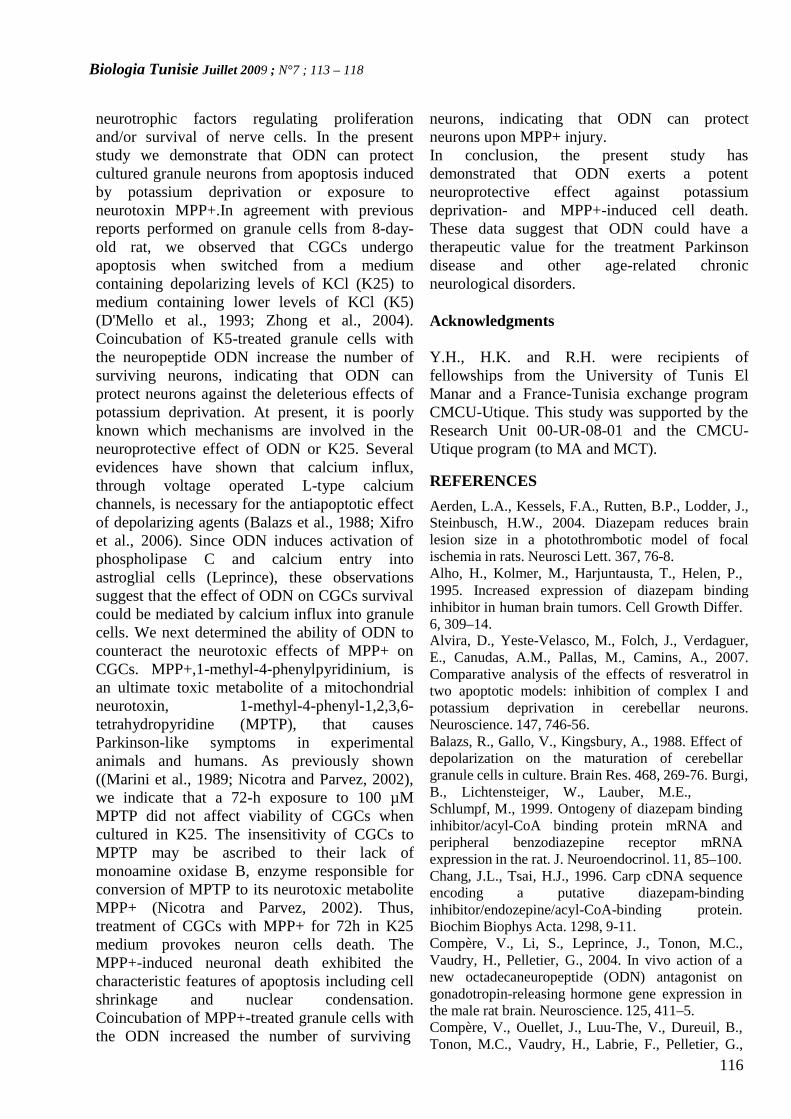
Biologia Tunisie Juillet 2009 ; N°7 ; 113 – 118
116
neurotrophic factors regulating proliferationand/or survival of nerve cells. In the presentstudy we demonstrate that ODN can protectcultured granule neurons from apoptosis inducedby potassium deprivation or exposure toneurotoxin MPP+.In agreement with previousreports performed on granule cells from 8-day-old rat, we observed that CGCs undergoapoptosis when switched from a mediumcontaining depolarizing levels of KCl (K25) tomedium containing lower levels of KCl (K5)(D'Mello et al., 1993; Zhong et al., 2004).Coincubation of K5-treated granule cells withthe neuropeptide ODN increase the number ofsurviving neurons, indicating that ODN canprotect neurons against the deleterious effects ofpotassium deprivation. At present, it is poorlyknown which mechanisms are involved in theneuroprotective effect of ODN or K25. Severalevidences have shown that calcium influx,through voltage operated L-type calciumchannels, is necessary for the antiapoptotic effectof depolarizing agents (Balazs et al., 1988; Xifroet al., 2006). Since ODN induces activation ofphospholipase C and calcium entry intoastroglial cells (Leprince), these observationssuggest that the effect of ODN on CGCs survivalcould be mediated by calcium influx into granulecells. We next determined the ability of ODN tocounteract the neurotoxic effects of MPP+ onCGCs. MPP+,1-methyl-4-phenylpyridinium, isan ultimate toxic metabolite of a mitochondrialneurotoxin, 1-methyl-4-phenyl-1,2,3,6-tetrahydropyridine (MPTP), that causesParkinson-like symptoms in experimentalanimals and humans. As previously shown((Marini et al., 1989; Nicotra and Parvez, 2002),we indicate that a 72-h exposure to 100 µMMPTP did not affect viability of CGCs whencultured in K25. The insensitivity of CGCs toMPTP may be ascribed to their lack ofmonoamine oxidase B, enzyme responsible forconversion of MPTP to its neurotoxic metaboliteMPP+ (Nicotra and Parvez, 2002). Thus,treatment of CGCs with MPP+ for 72h in K25medium provokes neuron cells death. TheMPP+-induced neuronal death exhibited thecharacteristic features of apoptosis including cellshrinkage and nuclear condensation.Coincubation of MPP+-treated granule cells withthe ODN increased the number of surviving
neurons, indicating that ODN can protectneurons upon MPP+ injury.In conclusion, the present study hasdemonstrated that ODN exerts a potentneuroprotective effect against potassiumdeprivation- and MPP+-induced cell death.These data suggest that ODN could have atherapeutic value for the treatment Parkinsondisease and other age-related chronicneurological disorders.
Acknowledgments
Y.H., H.K. and R.H. were recipients offellowships from the University of Tunis ElManar and a France-Tunisia exchange programCMCU-Utique. This study was supported by theResearch Unit 00-UR-08-01 and the CMCU-Utique program (to MA and MCT).
REFERENCES
Aerden, L.A., Kessels, F.A., Rutten, B.P., Lodder, J.,Steinbusch, H.W., 2004. Diazepam reduces brainlesion size in a photothrombotic model of focalischemia in rats. Neurosci Lett. 367, 76-8.Alho, H., Kolmer, M., Harjuntausta, T., Helen, P.,1995. Increased expression of diazepam bindinginhibitor in human brain tumors. Cell Growth Differ.6, 309–14.Alvira, D., Yeste-Velasco, M., Folch, J., Verdaguer,E., Canudas, A.M., Pallas, M., Camins, A., 2007.Comparative analysis of the effects of resveratrol intwo apoptotic models: inhibition of complex I andpotassium deprivation in cerebellar neurons.Neuroscience. 147, 746-56.Balazs, R., Gallo, V., Kingsbury, A., 1988. Effect ofdepolarization on the maturation of cerebellargranule cells in culture. Brain Res. 468, 269-76. Burgi,B., Lichtensteiger, W., Lauber, M.E.,Schlumpf, M., 1999. Ontogeny of diazepam bindinginhibitor/acyl-CoA binding protein mRNA andperipheral benzodiazepine receptor mRNAexpression in the rat. J. Neuroendocrinol. 11, 85–100.Chang, J.L., Tsai, H.J., 1996. Carp cDNA sequenceencoding a putative diazepam-bindinginhibitor/endozepine/acyl-CoA-binding protein.Biochim Biophys Acta. 1298, 9-11.Compère, V., Li, S., Leprince, J., Tonon, M.C.,Vaudry, H., Pelletier, G., 2004. In vivo action of anew octadecaneuropeptide (ODN) antagonist ongonadotropin-releasing hormone gene expression inthe male rat brain. Neuroscience. 125, 411–5.Compère, V., Ouellet, J., Luu-The, V., Dureuil, B.,Tonon, M.C., Vaudry, H., Labrie, F., Pelletier, G.,
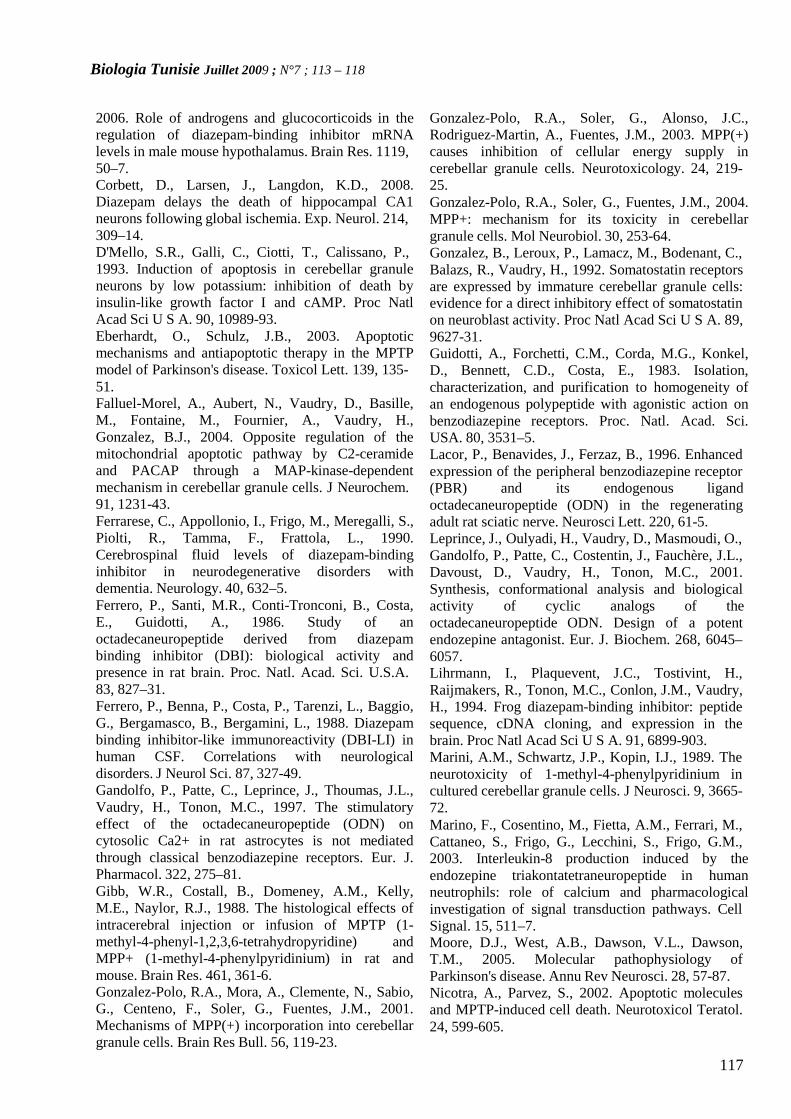
Biologia Tunisie Juillet 2009 ; N°7 ; 113 – 118
117
2006. Role of androgens and glucocorticoids in theregulation of diazepam-binding inhibitor mRNAlevels in male mouse hypothalamus. Brain Res. 1119,50–7.Corbett, D., Larsen, J., Langdon, K.D., 2008.Diazepam delays the death of hippocampal CA1neurons following global ischemia. Exp. Neurol. 214,309–14.D'Mello, S.R., Galli, C., Ciotti, T., Calissano, P.,1993. Induction of apoptosis in cerebellar granuleneurons by low potassium: inhibition of death byinsulin-like growth factor I and cAMP. Proc NatlAcad Sci U S A. 90, 10989-93.Eberhardt, O., Schulz, J.B., 2003. Apoptoticmechanisms and antiapoptotic therapy in the MPTPmodel of Parkinson's disease. Toxicol Lett. 139, 135-51.Falluel-Morel, A., Aubert, N., Vaudry, D., Basille,M., Fontaine, M., Fournier, A., Vaudry, H.,Gonzalez, B.J., 2004. Opposite regulation of themitochondrial apoptotic pathway by C2-ceramideand PACAP through a MAP-kinase-dependentmechanism in cerebellar granule cells. J Neurochem.91, 1231-43.Ferrarese, C., Appollonio, I., Frigo, M., Meregalli, S.,Piolti, R., Tamma, F., Frattola, L., 1990.Cerebrospinal fluid levels of diazepam-bindinginhibitor in neurodegenerative disorders withdementia. Neurology. 40, 632–5.Ferrero, P., Santi, M.R., Conti-Tronconi, B., Costa,E., Guidotti, A., 1986. Study of anoctadecaneuropeptide derived from diazepambinding inhibitor (DBI): biological activity andpresence in rat brain. Proc. Natl. Acad. Sci. U.S.A.83, 827–31.Ferrero, P., Benna, P., Costa, P., Tarenzi, L., Baggio,G., Bergamasco, B., Bergamini, L., 1988. Diazepambinding inhibitor-like immunoreactivity (DBI-LI) inhuman CSF. Correlations with neurologicaldisorders. J Neurol Sci. 87, 327-49.Gandolfo, P., Patte, C., Leprince, J., Thoumas, J.L.,Vaudry, H., Tonon, M.C., 1997. The stimulatoryeffect of the octadecaneuropeptide (ODN) oncytosolic Ca2+ in rat astrocytes is not mediatedthrough classical benzodiazepine receptors. Eur. J.Pharmacol. 322, 275–81.Gibb, W.R., Costall, B., Domeney, A.M., Kelly,M.E., Naylor, R.J., 1988. The histological effects ofintracerebral injection or infusion of MPTP (1-methyl-4-phenyl-1,2,3,6-tetrahydropyridine) andMPP+ (1-methyl-4-phenylpyridinium) in rat andmouse. Brain Res. 461, 361-6.Gonzalez-Polo, R.A., Mora, A., Clemente, N., Sabio,G., Centeno, F., Soler, G., Fuentes, J.M., 2001.Mechanisms of MPP(+) incorporation into cerebellargranule cells. Brain Res Bull. 56, 119-23.
Gonzalez-Polo, R.A., Soler, G., Alonso, J.C.,Rodriguez-Martin, A., Fuentes, J.M., 2003. MPP(+)causes inhibition of cellular energy supply incerebellar granule cells. Neurotoxicology. 24, 219-25.Gonzalez-Polo, R.A., Soler, G., Fuentes, J.M., 2004.MPP+: mechanism for its toxicity in cerebellargranule cells. Mol Neurobiol. 30, 253-64.Gonzalez, B., Leroux, P., Lamacz, M., Bodenant, C.,Balazs, R., Vaudry, H., 1992. Somatostatin receptorsare expressed by immature cerebellar granule cells:evidence for a direct inhibitory effect of somatostatinon neuroblast activity. Proc Natl Acad Sci U S A. 89,9627-31.Guidotti, A., Forchetti, C.M., Corda, M.G., Konkel,D., Bennett, C.D., Costa, E., 1983. Isolation,characterization, and purification to homogeneity ofan endogenous polypeptide with agonistic action onbenzodiazepine receptors. Proc. Natl. Acad. Sci.USA. 80, 3531–5.Lacor, P., Benavides, J., Ferzaz, B., 1996. Enhancedexpression of the peripheral benzodiazepine receptor(PBR) and its endogenous ligandoctadecaneuropeptide (ODN) in the regeneratingadult rat sciatic nerve. Neurosci Lett. 220, 61-5.Leprince, J., Oulyadi, H., Vaudry, D., Masmoudi, O.,Gandolfo, P., Patte, C., Costentin, J., Fauchère, J.L.,Davoust, D., Vaudry, H., Tonon, M.C., 2001.Synthesis, conformational analysis and biologicalactivity of cyclic analogs of theoctadecaneuropeptide ODN. Design of a potentendozepine antagonist. Eur. J. Biochem. 268, 6045–6057.Lihrmann, I., Plaquevent, J.C., Tostivint, H.,Raijmakers, R., Tonon, M.C., Conlon, J.M., Vaudry,H., 1994. Frog diazepam-binding inhibitor: peptidesequence, cDNA cloning, and expression in thebrain. Proc Natl Acad Sci U S A. 91, 6899-903.Marini, A.M., Schwartz, J.P., Kopin, I.J., 1989. Theneurotoxicity of 1-methyl-4-phenylpyridinium incultured cerebellar granule cells. J Neurosci. 9, 3665-72.Marino, F., Cosentino, M., Fietta, A.M., Ferrari, M.,Cattaneo, S., Frigo, G., Lecchini, S., Frigo, G.M.,2003. Interleukin-8 production induced by theendozepine triakontatetraneuropeptide in humanneutrophils: role of calcium and pharmacologicalinvestigation of signal transduction pathways. CellSignal. 15, 511–7.Moore, D.J., West, A.B., Dawson, V.L., Dawson,T.M., 2005. Molecular pathophysiology ofParkinson's disease. Annu Rev Neurosci. 28, 57-87.Nicotra, A., Parvez, S., 2002. Apoptotic moleculesand MPTP-induced cell death. Neurotoxicol Teratol.24, 599-605.
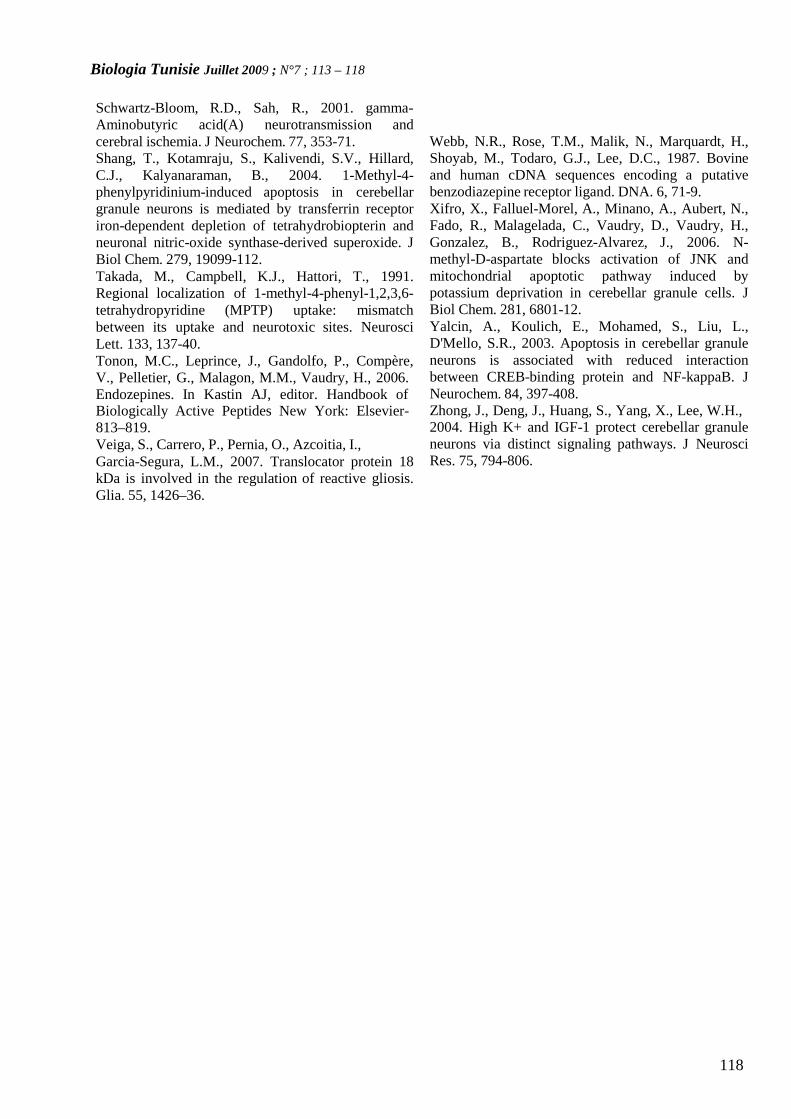
Biologia Tunisie Juillet 2009 ; N°7 ; 113 – 118
118
Schwartz-Bloom, R.D., Sah, R., 2001. gamma-Aminobutyric acid(A) neurotransmission andcerebral ischemia. J Neurochem. 77, 353-71.Shang, T., Kotamraju, S., Kalivendi, S.V., Hillard,C.J., Kalyanaraman, B., 2004. 1-Methyl-4-phenylpyridinium-induced apoptosis in cerebellargranule neurons is mediated by transferrin receptoriron-dependent depletion of tetrahydrobiopterin andneuronal nitric-oxide synthase-derived superoxide. JBiol Chem. 279, 19099-112.Takada, M., Campbell, K.J., Hattori, T., 1991.Regional localization of 1-methyl-4-phenyl-1,2,3,6-tetrahydropyridine (MPTP) uptake: mismatchbetween its uptake and neurotoxic sites. NeurosciLett. 133, 137-40.Tonon, M.C., Leprince, J., Gandolfo, P., Compère,V., Pelletier, G., Malagon, M.M., Vaudry, H., 2006.Endozepines. In Kastin AJ, editor. Handbook ofBiologically Active Peptides New York: Elsevier-813–819.Veiga, S., Carrero, P., Pernia, O., Azcoitia, I.,Garcia-Segura, L.M., 2007. Translocator protein 18kDa is involved in the regulation of reactive gliosis.Glia. 55, 1426–36.
Webb, N.R., Rose, T.M., Malik, N., Marquardt, H.,Shoyab, M., Todaro, G.J., Lee, D.C., 1987. Bovineand human cDNA sequences encoding a putativebenzodiazepine receptor ligand. DNA. 6, 71-9.Xifro, X., Falluel-Morel, A., Minano, A., Aubert, N.,Fado, R., Malagelada, C., Vaudry, D., Vaudry, H.,Gonzalez, B., Rodriguez-Alvarez, J., 2006. N-methyl-D-aspartate blocks activation of JNK andmitochondrial apoptotic pathway induced bypotassium deprivation in cerebellar granule cells. JBiol Chem. 281, 6801-12.Yalcin, A., Koulich, E., Mohamed, S., Liu, L.,D'Mello, S.R., 2003. Apoptosis in cerebellar granuleneurons is associated with reduced interactionbetween CREB-binding protein and NF-kappaB. JNeurochem. 84, 397-408.Zhong, J., Deng, J., Huang, S., Yang, X., Lee, W.H.,2004. High K+ and IGF-1 protect cerebellar granuleneurons via distinct signaling pathways. J NeurosciRes. 75, 794-806.
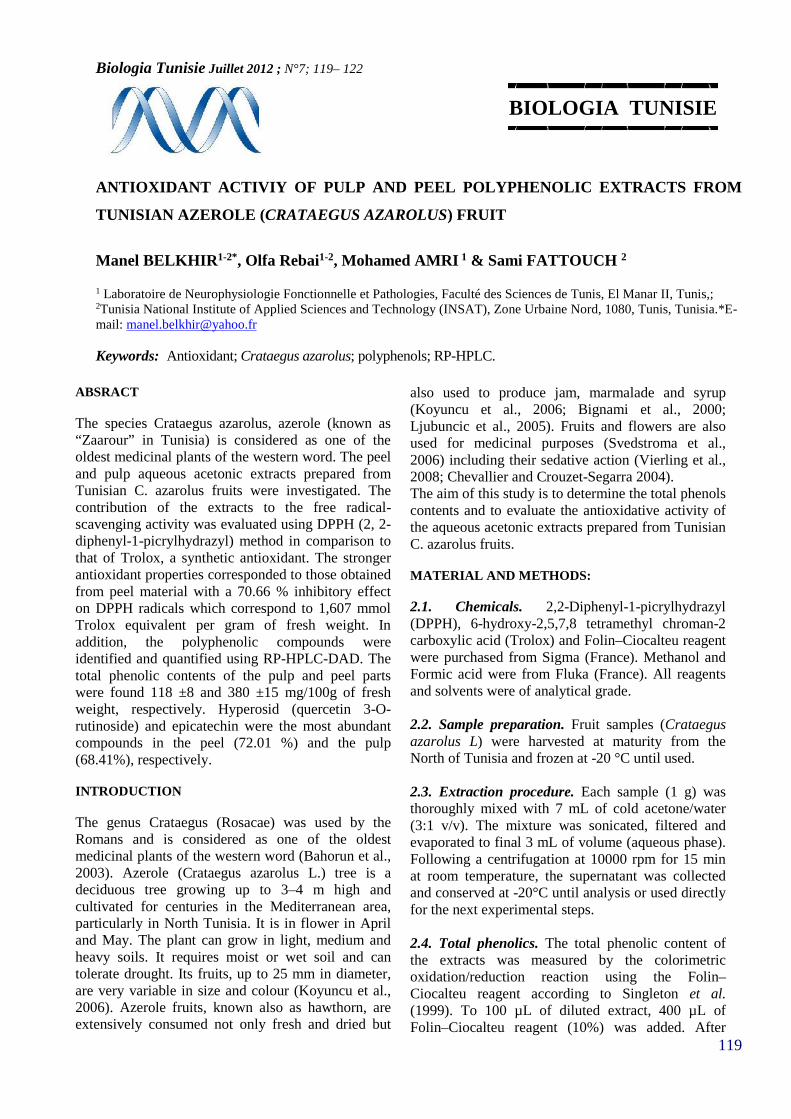
Biologia Tunisie Juillet 2012 ; N°7; 119– 122
119
BIOLOGIA TUNISIE
ANTIOXIDANT ACTIVIY OF PULP AND PEEL POLYPHENOLIC EXTRACTS FROM
TUNISIAN AZEROLE (CRATAEGUS AZAROLUS) FRUIT
Manel BELKHIR1-2*, Olfa Rebai1-2, Mohamed AMRI 1 & Sami FATTOUCH 2
1 Laboratoire de Neurophysiologie Fonctionnelle et Pathologies, Faculté des Sciences de Tunis, El Manar II, Tunis,;2Tunisia National Institute of Applied Sciences and Technology (INSAT), Zone Urbaine Nord, 1080, Tunis, Tunisia.*E-mail: [email protected]
Keywords: Antioxidant; Crataegus azarolus; polyphenols; RP-HPLC.
ABSRACT
The species Crataegus azarolus, azerole (known as“Zaarour” in Tunisia) is considered as one of theoldest medicinal plants of the western word. The peeland pulp aqueous acetonic extracts prepared fromTunisian C. azarolus fruits were investigated. Thecontribution of the extracts to the free radical-scavenging activity was evaluated using DPPH (2, 2-diphenyl-1-picrylhydrazyl) method in comparison tothat of Trolox, a synthetic antioxidant. The strongerantioxidant properties corresponded to those obtainedfrom peel material with a 70.66 % inhibitory effecton DPPH radicals which correspond to 1,607 mmolTrolox equivalent per gram of fresh weight. Inaddition, the polyphenolic compounds wereidentified and quantified using RP-HPLC-DAD. Thetotal phenolic contents of the pulp and peel partswere found 118 ±8 and 380 ±15 mg/100g of freshweight, respectively. Hyperosid (quercetin 3-O-rutinoside) and epicatechin were the most abundantcompounds in the peel (72.01 %) and the pulp(68.41%), respectively.
INTRODUCTION
The genus Crataegus (Rosacae) was used by theRomans and is considered as one of the oldestmedicinal plants of the western word (Bahorun et al.,2003). Azerole (Crataegus azarolus L.) tree is adeciduous tree growing up to 3–4 m high andcultivated for centuries in the Mediterranean area,particularly in North Tunisia. It is in flower in Apriland May. The plant can grow in light, medium andheavy soils. It requires moist or wet soil and cantolerate drought. Its fruits, up to 25 mm in diameter,are very variable in size and colour (Koyuncu et al.,2006). Azerole fruits, known also as hawthorn, areextensively consumed not only fresh and dried but
also used to produce jam, marmalade and syrup(Koyuncu et al., 2006; Bignami et al., 2000;Ljubuncic et al., 2005). Fruits and flowers are alsoused for medicinal purposes (Svedstroma et al.,2006) including their sedative action (Vierling et al.,2008; Chevallier and Crouzet-Segarra 2004).The aim of this study is to determine the total phenolscontents and to evaluate the antioxidative activity ofthe aqueous acetonic extracts prepared from TunisianC. azarolus fruits.
MATERIAL AND METHODS:
2.1. Chemicals. 2,2-Diphenyl-1-picrylhydrazyl(DPPH), 6-hydroxy-2,5,7,8 tetramethyl chroman-2carboxylic acid (Trolox) and Folin–Ciocalteu reagentwere purchased from Sigma (France). Methanol andFormic acid were from Fluka (France). All reagentsand solvents were of analytical grade.
2.2. Sample preparation. Fruit samples (Crataegusazarolus L) were harvested at maturity from theNorth of Tunisia and frozen at -20 °C until used.
2.3. Extraction procedure. Each sample (1 g) wasthoroughly mixed with 7 mL of cold acetone/water(3:1 v/v). The mixture was sonicated, filtered andevaporated to final 3 mL of volume (aqueous phase).Following a centrifugation at 10000 rpm for 15 minat room temperature, the supernatant was collectedand conserved at -20°C until analysis or used directlyfor the next experimental steps.
2.4. Total phenolics. The total phenolic content ofthe extracts was measured by the colorimetricoxidation/reduction reaction using the Folin–Ciocalteu reagent according to Singleton et al.(1999). To 100 µL of diluted extract, 400 µL ofFolin–Ciocalteu reagent (10%) was added. After
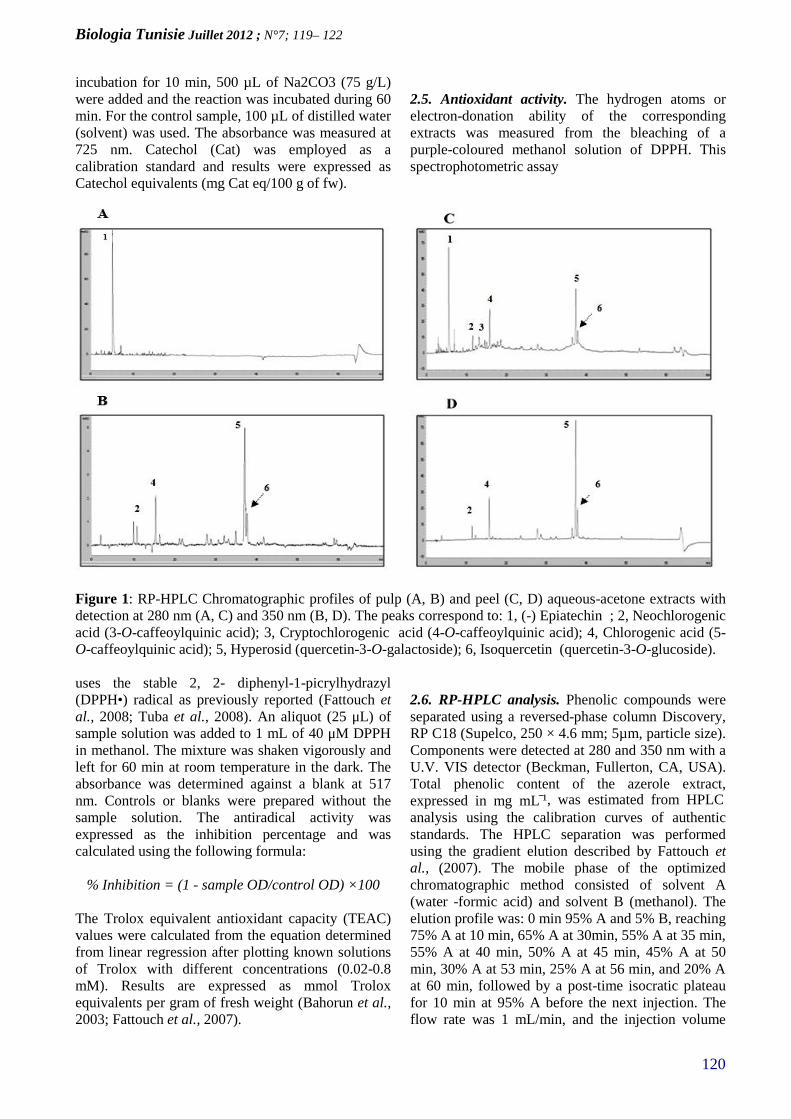
Biologia Tunisie Juillet 2012 ; N°7; 119– 122
120
incubation for 10 min, 500 µL of Na2CO3 (75 g/L)were added and the reaction was incubated during 60min. For the control sample, 100 µL of distilled water(solvent) was used. The absorbance was measured at725 nm. Catechol (Cat) was employed as acalibration standard and results were expressed asCatechol equivalents (mg Cat eq/100 g of fw).
2.5. Antioxidant activity. The hydrogen atoms orelectron-donation ability of the correspondingextracts was measured from the bleaching of apurple-coloured methanol solution of DPPH. Thisspectrophotometric assay
Figure 1: RP-HPLC Chromatographic profiles of pulp (A, B) and peel (C, D) aqueous-acetone extracts withdetection at 280 nm (A, C) and 350 nm (B, D). The peaks correspond to: 1, (-) Epiatechin ; 2, Neochlorogenicacid (3-O-caffeoylquinic acid); 3, Cryptochlorogenic acid (4-O-caffeoylquinic acid); 4, Chlorogenic acid (5-O-caffeoylquinic acid); 5, Hyperosid (quercetin-3-O-galactoside); 6, Isoquercetin (quercetin-3-O-glucoside).
uses the stable 2, 2- diphenyl-1-picrylhydrazyl(DPPH•) radical as previously reported (Fattouch etal., 2008; Tuba et al., 2008). An aliquot (25 μL) ofsample solution was added to 1 mL of 40 μM DPPHin methanol. The mixture was shaken vigorously andleft for 60 min at room temperature in the dark. Theabsorbance was determined against a blank at 517nm. Controls or blanks were prepared without thesample solution. The antiradical activity wasexpressed as the inhibition percentage and wascalculated using the following formula:
% Inhibition = (1 - sample OD/control OD) ×100
The Trolox equivalent antioxidant capacity (TEAC)values were calculated from the equation determinedfrom linear regression after plotting known solutionsof Trolox with different concentrations (0.02-0.8mM). Results are expressed as mmol Troloxequivalents per gram of fresh weight (Bahorun et al.,2003; Fattouch et al., 2007).
2.6. RP-HPLC analysis. Phenolic compounds wereseparated using a reversed-phase column Discovery,RP C18 (Supelco, 250 × 4.6 mm; 5µm, particle size).Components were detected at 280 and 350 nm with aU.V. VIS detector (Beckman, Fullerton, CA, USA).Total phenolic content of the azerole extract,expressed in mg mL ¹̄, was estimated from HPLCanalysis using the calibration curves of authenticstandards. The HPLC separation was performedusing the gradient elution described by Fattouch etal., (2007). The mobile phase of the optimizedchromatographic method consisted of solvent A(water -formic acid) and solvent B (methanol). Theelution profile was: 0 min 95% A and 5% B, reaching75% A at 10 min, 65% A at 30min, 55% A at 35 min,55% A at 40 min, 50% A at 45 min, 45% A at 50min, 30% A at 53 min, 25% A at 56 min, and 20% Aat 60 min, followed by a post-time isocratic plateaufor 10 min at 95% A before the next injection. Theflow rate was 1 mL/min, and the injection volume

Biologia Tunisie Juillet 2012 ; N°7; 119– 122
121
was 20 µL. The identification of each compound wasbased on a combination of retention time and spectralmatching.
2.7. Statistical Analysis. All tests and analyses wererun in triplicate and averaged. Quantitative presenteddata are means ± standard deviations (SD).
3. RESULT
3.1. Identification and quantification of phenoliccompounds. Using the Folin-Ciocalteu method, thehighest phenolic content was found in the peelextracts (380±15 mg Cat eq/100g fw), whereas in thepulp extracts (118±8 mg Cat eq/100g fw). Thephenolic compounds of the peel and the pulp extractswere then fractionated and analyzed by reversedphase HPLC, and the corresponding chromatogramsobtained at 280 and 350 nm are presented in Figure1.
The repeatability of the method was high, withrespect to the retention times and peak areas.Compounds were identified by comparison of theretention times and UV/vis spectra with the availablestandards corresponding peaks (Table 1). Sixobtained peaks matched with the standardcompounds used in this work, namely, peaks 1-6attributed to (-)Epicatechin, Neochlorogenic acid (3-O-caffeoylquinic acid), Cryptochlorogenic acid (4-O-caffeoylquinic acid), Chlorogenic acid (5-O-caffeoylquinic acid), Hyperoside (quercetin-3-O-galactoside); Isoquer-cetin (quercetine-3-O-glucosid)respectively.
The obtained results demonstrated that thedifferences in peel and pulp extracts phenoliccomposition were significantly more quantitativethan qualitative.
3.2. Antioxidant Activity. The antioxidant activity ofthe azerole peel and pulp phenolic extracts againstDPPH radical was shown in Figure 2. Percent DPPHscavenging activities of the extracts were found to bedose-dependent. We compared the observedantioxidant activities with those of the Trolox, asynthetic antioxidant, and found that cuticle and pulpphenolic extracts exhibited 0.507±0.023 and 0.25±0.013 mM TEAC respectively.
4. DISCUSSION
The aim of the present study was to study theaqueous-acetonic peel and pulp extracts preparedfrom the azerole fruit and to find out the relationship
between their antioxidant potential and polyphenoliccontent as well as phenolic profiles.Using the RP-HPLC-DAD and authentic standards,total polyphenols quantification was determined asthe sum of individual identified compounds.According to Table 1, we estimated the polyphenolcontents to 142.45 and 26.32 mg/100g of azerole peeland pulp fresh weight, respectively. The peel extracthas about five time higher amount of phenolics thanthat of the pulp and present the major polyphenols.Whereas for the pulp, (-) epicatechin
was the predominant polyphenol with 68.41% of thetotal phenolic compounds. These results are inagreement with the studies achieved by Zhong et al.(2006) who showed that epicatechin and thehyperoside are among the major polyphenolicscompounds present in the fruit of the hawthorn.In this work, we assumed that major polyphenols inthe Tunisian azerole fruit are hydroxycinnamic acids,principally chlorogenic acid, and flavonoidsespecially hyperoside and isoquercetin. These resultsare proven by the works of Svedstroma et al. (2006),Chang et al. (2001) and Zhong et al. (2006).This fruit should have a very big interest in themedical domain because of the predominance of thehydroxycinnamic acids and flavonoids that can beused in the treatment of several cardiovascularillnesses, including heart weakness, hypertension andarteriosclerosis (Chang et al., 2002; Ljubuncic et al.,2005).The DPPH scavenging activity of the azerole peeland pulp extracts was found proportional to thepolyphenols concentrations, suggesting that thesecompounds are the major contributors to the extractsobserved antioxidant potentials.
Table1: HPLC-RP analysis of main phenolics in Tunisian azerole pulp and peel extracts
Figure 2: radical scavenging activity (%) of Troloxand acetone extracts.
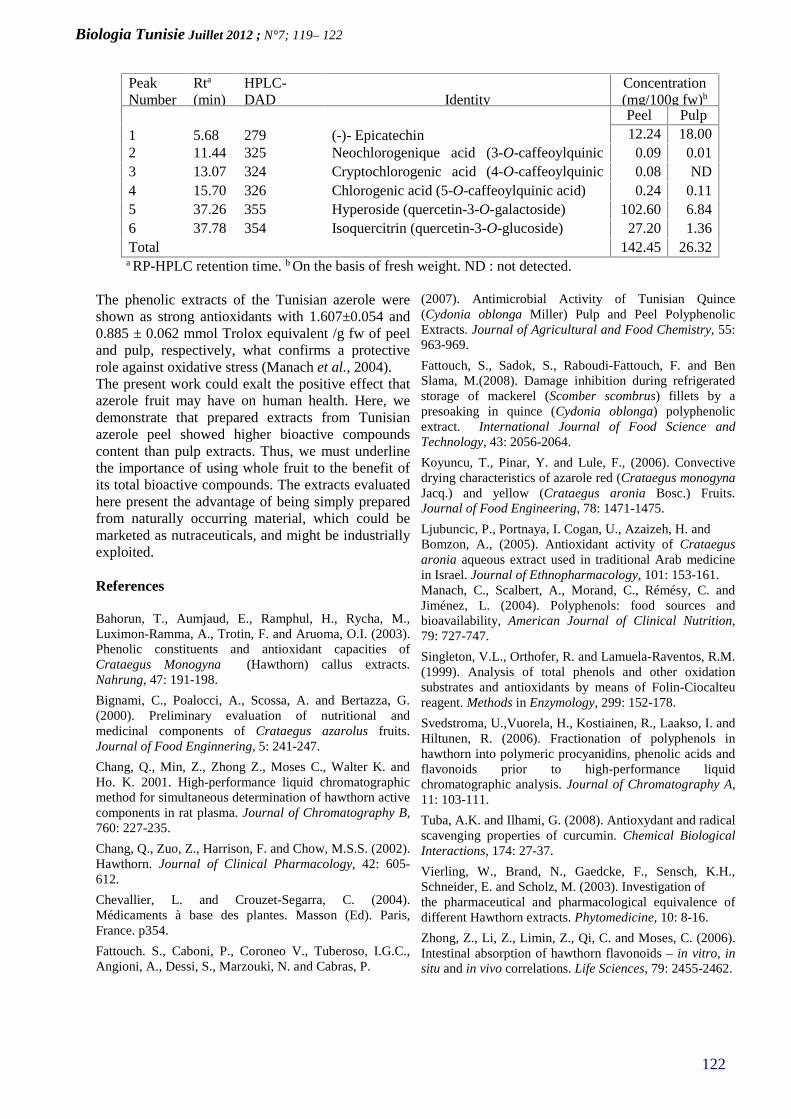
Biologia Tunisie Juillet 2012 ; N°7; 119– 122
122
PeakNumber
Rta
(min)HPLC-DADλmax (nm)
IdentityConcentration(mg/100g fw)b
Peel Pulp1 5.68 279 (-)- Epicatechin 12.24 18.002 11.44 325 Neochlorogenique acid (3-O-caffeoylquinic
acid)0.09 0.01
3 13.07 324 Cryptochlorogenic acid (4-O-caffeoylquinicacid)
0.08 ND4 15.70 326 Chlorogenic acid (5-O-caffeoylquinic acid) 0.24 0.115 37.26 355 Hyperoside (quercetin-3-O-galactoside) 102.60 6.846 37.78 354 Isoquercitrin (quercetin-3-O-glucoside) 27.20 1.36Total 142.45 26.32
a RP-HPLC retention time. b On the basis of fresh weight. ND : not detected.
The phenolic extracts of the Tunisian azerole wereshown as strong antioxidants with 1.607±0.054 and0.885 ± 0.062 mmol Trolox equivalent /g fw of peeland pulp, respectively, what confirms a protectiverole against oxidative stress (Manach et al., 2004).The present work could exalt the positive effect thatazerole fruit may have on human health. Here, wedemonstrate that prepared extracts from Tunisianazerole peel showed higher bioactive compoundscontent than pulp extracts. Thus, we must underlinethe importance of using whole fruit to the benefit ofits total bioactive compounds. The extracts evaluatedhere present the advantage of being simply preparedfrom naturally occurring material, which could bemarketed as nutraceuticals, and might be industriallyexploited.
References
Bahorun, T., Aumjaud, E., Ramphul, H., Rycha, M.,Luximon-Ramma, A., Trotin, F. and Aruoma, O.I. (2003).Phenolic constituents and antioxidant capacities ofCrataegus Monogyna (Hawthorn) callus extracts.Nahrung, 47: 191-198.
Bignami, C., Poalocci, A., Scossa, A. and Bertazza, G.(2000). Preliminary evaluation of nutritional andmedicinal components of Crataegus azarolus fruits.Journal of Food Enginnering, 5: 241-247.
Chang, Q., Min, Z., Zhong Z., Moses C., Walter K. andHo. K. 2001. High-performance liquid chromatographicmethod for simultaneous determination of hawthorn activecomponents in rat plasma. Journal of Chromatography B,760: 227-235.
Chang, Q., Zuo, Z., Harrison, F. and Chow, M.S.S. (2002).Hawthorn. Journal of Clinical Pharmacology, 42: 605-612.
Chevallier, L. and Crouzet-Segarra, C. (2004).Médicaments à base des plantes. Masson (Ed). Paris,France. p354.
Fattouch. S., Caboni, P., Coroneo V., Tuberoso, I.G.C.,Angioni, A., Dessi, S., Marzouki, N. and Cabras, P.
(2007). Antimicrobial Activity of Tunisian Quince(Cydonia oblonga Miller) Pulp and Peel PolyphenolicExtracts. Journal of Agricultural and Food Chemistry, 55:963-969.
Fattouch, S., Sadok, S., Raboudi-Fattouch, F. and BenSlama, M.(2008). Damage inhibition during refrigeratedstorage of mackerel (Scomber scombrus) fillets by apresoaking in quince (Cydonia oblonga) polyphenolicextract. International Journal of Food Science andTechnology, 43: 2056-2064.
Koyuncu, T., Pinar, Y. and Lule, F., (2006). Convectivedrying characteristics of azarole red (Crataegus monogynaJacq.) and yellow (Crataegus aronia Bosc.) Fruits.Journal of Food Engineering, 78: 1471-1475.
Ljubuncic, P., Portnaya, I. Cogan, U., Azaizeh, H. andBomzon, A., (2005). Antioxidant activity of Crataegusaronia aqueous extract used in traditional Arab medicinein Israel. Journal of Ethnopharmacology, 101: 153-161.Manach, C., Scalbert, A., Morand, C., Rémésy, C. andJiménez, L. (2004). Polyphenols: food sources andbioavailability, American Journal of Clinical Nutrition,79: 727-747.
Singleton, V.L., Orthofer, R. and Lamuela-Raventos, R.M.(1999). Analysis of total phenols and other oxidationsubstrates and antioxidants by means of Folin-Ciocalteureagent. Methods in Enzymology, 299: 152-178.
Svedstroma, U.,Vuorela, H., Kostiainen, R., Laakso, I. andHiltunen, R. (2006). Fractionation of polyphenols inhawthorn into polymeric procyanidins, phenolic acids andflavonoids prior to high-performance liquidchromatographic analysis. Journal of Chromatography A,11: 103-111.
Tuba, A.K. and Ilhami, G. (2008). Antioxydant and radicalscavenging properties of curcumin. Chemical BiologicalInteractions, 174: 27-37.
Vierling, W., Brand, N., Gaedcke, F., Sensch, K.H.,Schneider, E. and Scholz, M. (2003). Investigation ofthe pharmaceutical and pharmacological equivalence ofdifferent Hawthorn extracts. Phytomedicine, 10: 8-16.
Zhong, Z., Li, Z., Limin, Z., Qi, C. and Moses, C. (2006).Intestinal absorption of hawthorn flavonoids – in vitro, insitu and in vivo correlations. Life Sciences, 79: 2455-2462.
Instructions aux auteurs
Biologia Tunisie est une revue tunisienne éditée par l’ATSB : Association Tunisienne des Sciences Biologiques. Elle publie des articles de recherche, des articles de synthèse et des communications en Anglais et en Français.
SOUMISSION DU MANUSCRIT
Les manuscrits soumis pour publication et toute la correspondance concernant la rédaction doivent être envoyés au secrétariat de rédaction. Le manuscrit est adressé (1) sur disquette ou par e-mail et en quatre exemplaires (Trois originaux et une photocopie anonymes). Il doit être accompagné d'une lettre comportant le prénom, le nom, l'adresse, le numéro de téléphone, le numéro de télécopieur et l'adresse électronique de l'auteur avec lequel la rédaction communiquera. Dans sa lettre, l'auteur doit préciser que le texte n'est pas soumis simultanément à une autre revue scientifique en vue de publication.
Un formulaire de transfert de droits sera joint à l'accusé de réception de l'article soumis. Il sera dûment complété par l'auteur principal et cosigné par tous les auteurs de l'article, puis retourné à la rédaction dans les plus brefs délais.
Dès l'acceptation définitive, l'auteur est prié d'envoyer la version finale de son manuscrit, accompagnée du fichier correspondant sur disquette PC ou Macintosh.
Les documents ne seront pas restitués aux auteurs.
PRÉSENTATION DU MANUSCRIT
Le manuscrit doit être dactylographié en double interligne, avec une marge de 4 cm à gauche, au recto seul de feuilles de format A4 (210 x 297 mm). Un feuillet A4 comprend environ 250 mots ou 1 500 signes. Le texte comporte, dans l'ordre: la page de titre ; les résumés français et anglais avec le titre de l'article en anglais, les mots clés français et anglais en ordre alphabétique ; le texte proprement dit ; les références bibliographiques ; les tableaux avec titre et légendes ; les figures ; les légendes des figures.
(1) A Monsieur M. Amri (FST) ou M.N. Marzouki (INSAT)
Pour l'envoi du manuscrit sur disquette, quelques règles doivent être respectées:
- étiqueter la disquette en indiquant le nom du fichier, le système d'exploitation (Windows 98, par exemple) et le logiciel utilisé (Word 97, par exemple)
- la disquette ne doit contenir que le(s) fichier(s) de l'article retenu pour publication, et tout le texte (sans les images) doit être inclus dans un seul fichier ;
- pour prévenir les risques d'incompatibilité entre logiciels, veiller à joindre sur la disquette un second fichier de l'article enregistré dans le format "RTF'
- lors de la saisie, ne jamais utiliser les fonctions avancées du logiciel telles que les insertions automatiques de caractères, de champs, de notes de bas de page ou d'images ;
- les figures fournies sur disquette, accompagnées impérativement dune copie papier de bonne qualité, doivent être enregistrées sur des fichiers séparés, dans le format "JPG" ou "TIF".
Page de titre
La page de titre comporte les mentions suivantes :
- le titre, concis, qui indique de manière précise le sujet du travail et ne comporte pas d'abréviations ; la rédaction se réserve le droit de le modifier dans le sens de la concision ;
- le prénom usuel et le nom du ou des auteur(s) en lettres minuscules avec une majuscule à l'initiale ; quand les auteurs appartiennent à des services différents, leurs noms sont suivis de chiffres en exposant qui renvoient aux services ou adresses correspondants ;
- les intitulés et adresses complètes des services, laboratoires ou organismes d'origine des auteurs ; préciser les numéros de téléphone et de télécopie, ainsi que l'adresse électronique de l'auteur auquel doivent être envoyés la correspondance concernant l'article, le bon à tirer et la commande de tirés à part.
- le cas échéant, la date et le lieu de la réunion où le travail a été présenté. La mention de l'origine des sources de financement ou du contrat de recherche, les remerciements pour l'aide technique à la réalisation et à la dactylographie du travail ;
- le titre courant (40 signes au maximum, lettres et espaces compris), destiné à figurer en haut de chaque page de l'article imprimé.
Résumés et mots clés
Chaque article comporte un résumé en français et en anglais (summary), sans abréviation ni référence, de 250 mots au maximum pour les articles originaux, avec au plus cinq mots clés également en français et en anglais. Le summary doit être accompagné du titre de l'article en anglais.
Pour les articles originaux, il est demandé que les résumés soient structurés de la façon suivante : objectifs (objective) ; patients ou matériel et méthodes (patients or materials and methods) ; résultats (results) ; conclusions (conclusions).
Les mots clés, sans reprendre les termes du titre de l'article, doivent être pertinents ou descripteurs, et seront revus par la rédaction pour permettre l'indexation de l'article et être conformes à la liste du Medical Subject Headings de l'Index Medicus, renouvelée chaque année.
Texte
Rédaction. Le texte est rédigé dans un style clair, concis et précis. Il doit être compréhensible pour un lecteur qui n'appartient pas à la spécialité. L'emploi de la première personne n'est pas d'usage dans un document scientifique. Les retours à la ligne trop fréquents sont à éviter. En cas de mention de noms d'auteurs dans le texte, s'ils ne sont que deux, les deux sont cités ; s'ils sont plus de deux, le nom du premier auteur est suivi de la mention" et al."
Les titres et intertitres de même valeur sont signalés de façon identique. Les locutions et abréviations latines usuelles en français s'écrivent en caractères romains, et non en italique (et al., a priori, in vitro...).
Abréviations. Seules les abréviations courantes sont acceptées, en nombre réduit. Le terme en entier doit précéder l'abréviation, entre parenthèses, lors de sa première apparition dans le texte et dans le résumé, sauf s'il s'agit d'une unité de mesure internationale.
L'emploi des abréviations est proscrit dans le titre et, si possible, évité dans les résumés.
Chiffres, unités, symboles et noms commerciaux. Les symboles et unités scientifiques doivent être cohérents et conformes aux normes internationales. Les médicaments sont identifiés par leur nom générique (dénomination commune internationale), sans majuscule à l'initiale.
Références bibliographiques
Les références doivent être présentées par ordre alphabétique et par ordre chronologique pour un même auteur. Si l’auteur principal présente deux et plus de références par année, indiquer par a, b, c l’année de parution.
Exemples :
Pinck, L. 1990a. ; Pinck, L. and Ritzenthaler, C. 1990b
Les références bibliographiques doivent être indiquées comme suit :
Nom, Prénom en abréviation. (Année). Titre complet de la référence. Nom du journal. Volume (souligné) : pages.
Exemples :
Clark, M.F. and Adams, A.N. (1977). Characteristics of the microplate method of enzyme-linked immunosorbent assay for the detection of plant viruses. J. Gen. Virol. 34 : 475-483.
Exemple : pour les articles publiés dans les livres, préciser en plus le nom de la maison d’édition
Smith, E. L.; Austen, B. M.; Blumenthal, K. M. and Nyce, J. F. (1975). Glutamate deshydrogenases. In: Boyer PD (ed.) The enzymes. 11 :293-367. Academic Press, New York.
Toutes les références citées dans le texte figurent dans la liste des références et vice versa.
Les articles acceptés mais non encore publiés peuvent être référencés en indiquant la revue, l'année et le volume avec la mention (à paraître) ou (in press).
Thèse Ben Salah A. Contribution à l'étude des syndromes d'obstruction de la région …[thèse]. Tunis ; 1975.
Tableaux
Chaque tableau est dactylographié en double interligne sur une page ; il comporte, en haut, son numéro d'appel (en chiffres romains) et son ti tre et, en bas, les notes explicatives éventuelles (abréviations, sigles). Les unités sont données en tête de ligne ou de colonne. Les tableaux ne font pas double emploi avec les figures.
Figures
Les auteurs doivent impérativement fournir une sortie papier d'excellente qualité des figures, même si elles sont aussi transmises sur fichier informatique.
Les figures sont numérotées en chiffres arabes, le haut de la figure étant indiqué par une flèche. Les radiographies sont présentées sous forme de photographies bien contrastées.
Les légendes des figures sont regroupées sur une feuille à part. Une figure et sa légende forment un tout qui doit être compris sans recours au texte.
Il n'y a pas de frais de publication pour les textes et les figures en noir et blanc, seule la reproduction de figures en couleur est à la charge des auteurs.
En cas de reproduction partielle ou totale d'un document déjà publié, l'auteur doit impérativement fournir l'autorisation écrite de l'éditeur et des auteurs du document.
ANALYSE DES MANUSCRITS
Tout manuscrit proposé est soumis anonymement à l'avis de lecteurs dont l'approbation, après modifications éventuelles, est nécessaire pour sa publication.
CORRECTION D'ÉPREUVES, TIRÉS À PART ET DROITS DE REPRODUCTION
L'auteur principal recevra avec les épreuves de son article des tirés à part, les 15 premiers étant fournis gracieusement. Les modifications portant sur le fond ne sont pas acceptées sur les épreuves d'imprimerie. Les corrections se limiteront à la typographie. Les auteurs feront le nécessaire pour retourner à l'éditeur les épreuves revêtues de la mention "bon à tirer", dans les 48 heures suivant leur réception et ce à toute période de l'année. En cas de retard, l'éditeur se réserve le droit de procéder à l'impression sans le bon à tirer de l'auteur.
Dès parution, les demandes de reproduction devront être adressées au rédacteur de la revue BIOLOGIA TUNISIE.