Investigation into the use of satellite remote sensing data products as part of a multi-modal marine...
12
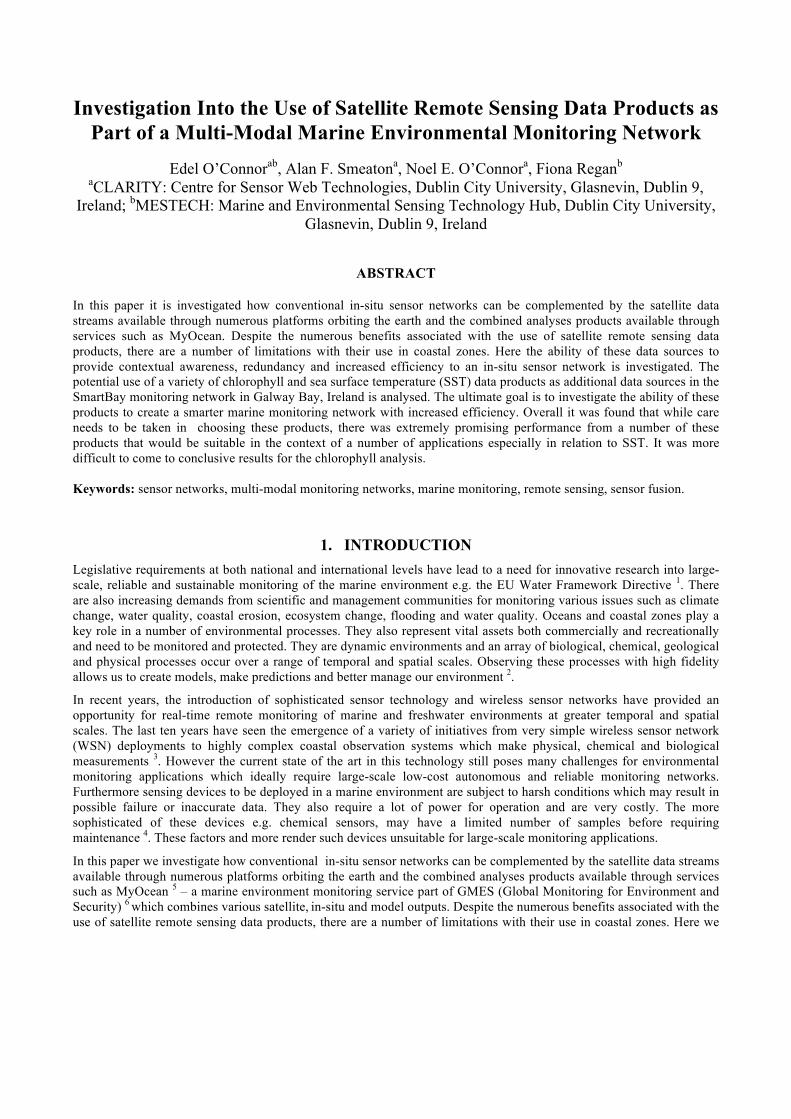
Investigation Into the Use of Satellite Remote Sensing Data Products as Part of a Multi-Modal Marine Environmental Monitoring Network Edel O’Connor ab , Alan F. Smeaton a , Noel E. O’Connor a , Fiona Regan b a CLARITY: Centre for Sensor Web Technologies, Dublin City University, Glasnevin, Dublin 9, Ireland; b MESTECH: Marine and Environmental Sensing Technology Hub, Dublin City University, Glasnevin, Dublin 9, Ireland ABSTRACT In this paper it is investigated how conventional in-situ sensor networks can be complemented by the satellite data streams available through numerous platforms orbiting the earth and the combined analyses products available through services such as MyOcean. Despite the numerous benefits associated with the use of satellite remote sensing data products, there are a number of limitations with their use in coastal zones. Here the ability of these data sources to provide contextual awareness, redundancy and increased efficiency to an in-situ sensor network is investigated. The potential use of a variety of chlorophyll and sea surface temperature (SST) data products as additional data sources in the SmartBay monitoring network in Galway Bay, Ireland is analysed. The ultimate goal is to investigate the ability of these products to create a smarter marine monitoring network with increased efficiency. Overall it was found that while care needs to be taken in choosing these products, there was extremely promising performance from a number of these products that would be suitable in the context of a number of applications especially in relation to SST. It was more difficult to come to conclusive results for the chlorophyll analysis. Keywords: sensor networks, multi-modal monitoring networks, marine monitoring, remote sensing, sensor fusion. 1. INTRODUCTION Legislative requirements at both national and international levels have lead to a need for innovative research into large- scale, reliable and sustainable monitoring of the marine environment e.g. the EU Water Framework Directive 1 . There are also increasing demands from scientific and management communities for monitoring various issues such as climate change, water quality, coastal erosion, ecosystem change, flooding and water quality. Oceans and coastal zones play a key role in a number of environmental processes. They also represent vital assets both commercially and recreationally and need to be monitored and protected. They are dynamic environments and an array of biological, chemical, geological and physical processes occur over a range of temporal and spatial scales. Observing these processes with high fidelity allows us to create models, make predictions and better manage our environment 2 . In recent years, the introduction of sophisticated sensor technology and wireless sensor networks have provided an opportunity for real-time remote monitoring of marine and freshwater environments at greater temporal and spatial scales. The last ten years have seen the emergence of a variety of initiatives from very simple wireless sensor network (WSN) deployments to highly complex coastal observation systems which make physical, chemical and biological measurements 3 . However the current state of the art in this technology still poses many challenges for environmental monitoring applications which ideally require large-scale low-cost autonomous and reliable monitoring networks. Furthermore sensing devices to be deployed in a marine environment are subject to harsh conditions which may result in possible failure or inaccurate data. They also require a lot of power for operation and are very costly. The more sophisticated of these devices e.g. chemical sensors, may have a limited number of samples before requiring maintenance 4 . These factors and more render such devices unsuitable for large-scale monitoring applications. In this paper we investigate how conventional in-situ sensor networks can be complemented by the satellite data streams available through numerous platforms orbiting the earth and the combined analyses products available through services such as MyOcean 5 – a marine environment monitoring service part of GMES (Global Monitoring for Environment and Security) 6 which combines various satellite, in-situ and model outputs. Despite the numerous benefits associated with the use of satellite remote sensing data products, there are a number of limitations with their use in coastal zones. Here we
Transcript of Investigation into the use of satellite remote sensing data products as part of a multi-modal marine...
Updated 1 March 2012
Investigation Into the Use of Satellite Remote Sensing Data Products as Part of a Multi-Modal Marine Environmental Monitoring Network
Edel O’Connorab, Alan F. Smeatona, Noel E. O’Connora, Fiona Reganb
aCLARITY: Centre for Sensor Web Technologies, Dublin City University, Glasnevin, Dublin 9, Ireland; bMESTECH: Marine and Environmental Sensing Technology Hub, Dublin City University,
Glasnevin, Dublin 9, Ireland
ABSTRACT
In this paper it is investigated how conventional in-situ sensor networks can be complemented by the satellite data streams available through numerous platforms orbiting the earth and the combined analyses products available through services such as MyOcean. Despite the numerous benefits associated with the use of satellite remote sensing data products, there are a number of limitations with their use in coastal zones. Here the ability of these data sources to provide contextual awareness, redundancy and increased efficiency to an in-situ sensor network is investigated. The potential use of a variety of chlorophyll and sea surface temperature (SST) data products as additional data sources in the SmartBay monitoring network in Galway Bay, Ireland is analysed. The ultimate goal is to investigate the ability of these products to create a smarter marine monitoring network with increased efficiency. Overall it was found that while care needs to be taken in choosing these products, there was extremely promising performance from a number of these products that would be suitable in the context of a number of applications especially in relation to SST. It was more difficult to come to conclusive results for the chlorophyll analysis. Keywords: sensor networks, multi-modal monitoring networks, marine monitoring, remote sensing, sensor fusion.
1. INTRODUCTION Legislative requirements at both national and international levels have lead to a need for innovative research into large-scale, reliable and sustainable monitoring of the marine environment e.g. the EU Water Framework Directive 1. There are also increasing demands from scientific and management communities for monitoring various issues such as climate change, water quality, coastal erosion, ecosystem change, flooding and water quality. Oceans and coastal zones play a key role in a number of environmental processes. They also represent vital assets both commercially and recreationally and need to be monitored and protected. They are dynamic environments and an array of biological, chemical, geological and physical processes occur over a range of temporal and spatial scales. Observing these processes with high fidelity allows us to create models, make predictions and better manage our environment 2.
In recent years, the introduction of sophisticated sensor technology and wireless sensor networks have provided an opportunity for real-time remote monitoring of marine and freshwater environments at greater temporal and spatial scales. The last ten years have seen the emergence of a variety of initiatives from very simple wireless sensor network (WSN) deployments to highly complex coastal observation systems which make physical, chemical and biological measurements 3. However the current state of the art in this technology still poses many challenges for environmental monitoring applications which ideally require large-scale low-cost autonomous and reliable monitoring networks. Furthermore sensing devices to be deployed in a marine environment are subject to harsh conditions which may result in possible failure or inaccurate data. They also require a lot of power for operation and are very costly. The more sophisticated of these devices e.g. chemical sensors, may have a limited number of samples before requiring maintenance 4. These factors and more render such devices unsuitable for large-scale monitoring applications.
In this paper we investigate how conventional in-situ sensor networks can be complemented by the satellite data streams available through numerous platforms orbiting the earth and the combined analyses products available through services such as MyOcean 5 – a marine environment monitoring service part of GMES (Global Monitoring for Environment and Security) 6 which combines various satellite, in-situ and model outputs. Despite the numerous benefits associated with the use of satellite remote sensing data products, there are a number of limitations with their use in coastal zones. Here we

Updated 1 March 2012
specifically look at the availability of satellite remote sensing data that can enhance the use of the in-situ sensor nodes in a coastal monitoring network and essentially act as an additional node in the network. We investigate the ability of these data streams to provide contextual awareness, increased efficiency and redundancy to an in-situ sensor network creating a smarter multi-modal marine monitoring network. In this paper the potential use of a variety of chlorophyll and sea surface temperature (SST) data products as additional data sources in the SmartBay monitoring network in Galway Bay Ireland is investigated.
The rest of this paper is organised as follows. The issues under consideration and the subsequent objectives of this research are outlined in Section 2. In Section 3, satellite sensors for monitoring chlorophyll and SST are discussed along with their issues especially in monitoring coastal zones. The study area and instrumentation are introduced in Section 4. The satellite data products selected for use in this region and the subsequent extraction of data is described in Section 5 and their potential use in the network is described in Section 6. Finally in Section 7, the overall conclusions are presented.
2. ISSUES AND OBJECTIVES Some of the main issues with conventional in-situ sensor networks can be summarised in terms of scalability and reliability:
• Scalability – The current state of the art in in-situ wireless sensor networks or analytical instruments is not suitable for scaled up deployments suitable to meet the demands of certain marine environmental monitoring applications.
• Reliability – Marine environments can be quite aggressive and sensor nodes are subject to failure or damage, especially when not maintained regularly. Failure of in-situ sensor networks may result in faulty data or gaps in coverage.
In order to address the two main issues with using WSNs in an aquatic environment, it is proposed that environmental monitoring applications would strongly benefit from the use of a multi-modal sensor network utilising visual sensors, modelled outputs and context information alongside the more conventional in-situ wireless sensor networks. The coordination of these diverse data sources can allow more efficient performance of the more sophisticated in-situ analytical instruments in the network, elongating their lifespan and subsequently rendering them more cost efficient and reducing maintenance requirements. This may render the deployment of such devices more scalable. Multiple information sources also enable the characteristation of events from multiple perspectives enabling a limited number of sensors to be deployed in optimum locations. In relation to the issue of reliability, the ability of a multi-modal network to compensate for the failure of a node where there is no redundant identical node in the network to replace its operation is investigated. In other words if an in-situ sensor node fails and there is have no redundant node available as back-up, the ability to replicate its behaviour from other data in the network is evaluated. This is essentially the focus of the work described here. In other work we considered a multi-modal approach through the use of deployed visual sensors and other available contextual information such as rainfall radar imagery. Image data was used to provide estimations of depth to complement a river monitoring network 7,8,9 and to detect ships at a port following the identification of a relationship between ship traffic and turbidity measurements 10. We also investigated the optimisation of an in-situ monitoring network using neural network models which incorporate rainfall radar images 11. Here the focus is on the use of satellite remote sensing data products as an additional data source in a marine monitoring network. We investigate its use in the context of an operational multi-modal network where it is required to produce data at high temporal scales to complement and enhance the use of the in-situ nodes in the network. The ability of a select number of products to provide a form of redundancy or contextual information in the network is analysed. In previous work we demonstrated the benefits of a network incorporating both in-situ sensors and satellite data products for monitoring sea surface temperature (SST) in Galway Bay 12. Here the potential use of a number of SST and chlorophyll data products in the context outlined above in the SmartBay marine monitoring network in Galway Bay is investigated.
Updated 1 March 2012
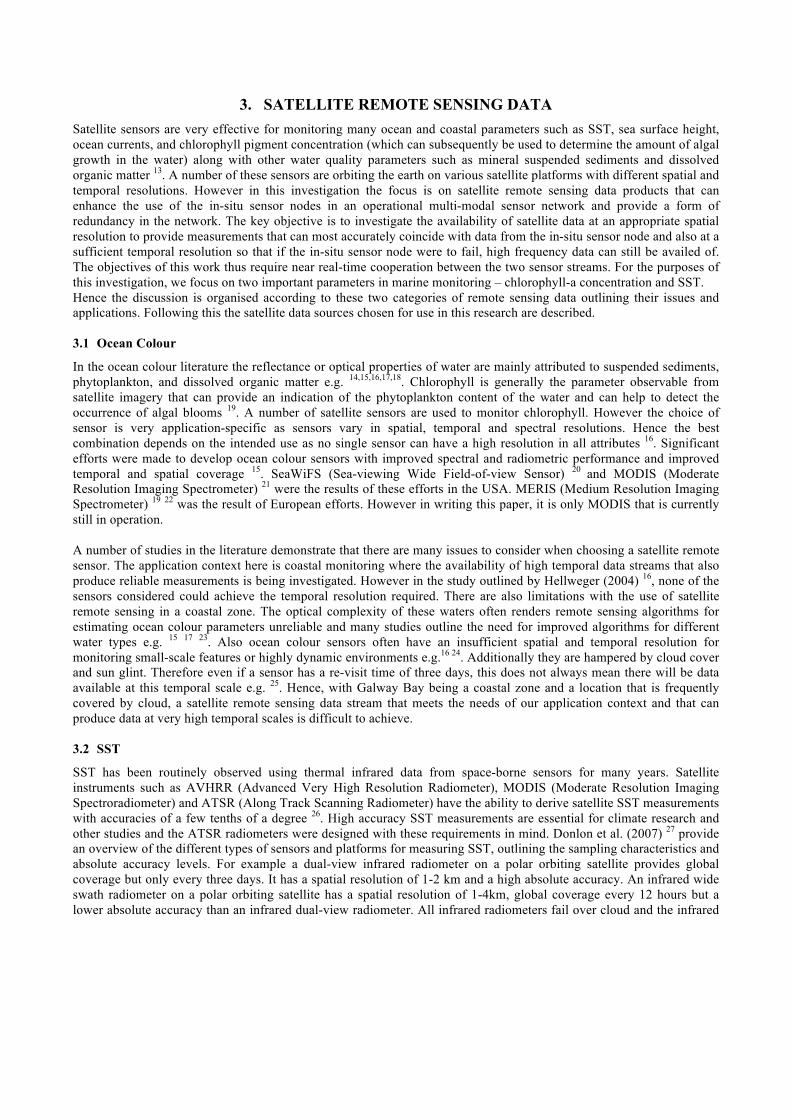
3. SATELLITE REMOTE SENSING DATA Satellite sensors are very effective for monitoring many ocean and coastal parameters such as SST, sea surface height, ocean currents, and chlorophyll pigment concentration (which can subsequently be used to determine the amount of algal growth in the water) along with other water quality parameters such as mineral suspended sediments and dissolved organic matter 13. A number of these sensors are orbiting the earth on various satellite platforms with different spatial and temporal resolutions. However in this investigation the focus is on satellite remote sensing data products that can enhance the use of the in-situ sensor nodes in an operational multi-modal sensor network and provide a form of redundancy in the network. The key objective is to investigate the availability of satellite data at an appropriate spatial resolution to provide measurements that can most accurately coincide with data from the in-situ sensor node and also at a sufficient temporal resolution so that if the in-situ sensor node were to fail, high frequency data can still be availed of. The objectives of this work thus require near real-time cooperation between the two sensor streams. For the purposes of this investigation, we focus on two important parameters in marine monitoring – chlorophyll-a concentration and SST. Hence the discussion is organised according to these two categories of remote sensing data outlining their issues and applications. Following this the satellite data sources chosen for use in this research are described. 3.1 Ocean Colour
In the ocean colour literature the reflectance or optical properties of water are mainly attributed to suspended sediments, phytoplankton, and dissolved organic matter e.g. 14,15,16,17,18. Chlorophyll is generally the parameter observable from satellite imagery that can provide an indication of the phytoplankton content of the water and can help to detect the occurrence of algal blooms 19. A number of satellite sensors are used to monitor chlorophyll. However the choice of sensor is very application-specific as sensors vary in spatial, temporal and spectral resolutions. Hence the best combination depends on the intended use as no single sensor can have a high resolution in all attributes 16. Significant efforts were made to develop ocean colour sensors with improved spectral and radiometric performance and improved temporal and spatial coverage 15. SeaWiFS (Sea-viewing Wide Field-of-view Sensor) 20 and MODIS (Moderate Resolution Imaging Spectrometer) 21 were the results of these efforts in the USA. MERIS (Medium Resolution Imaging Spectrometer) 19 22 was the result of European efforts. However in writing this paper, it is only MODIS that is currently still in operation. A number of studies in the literature demonstrate that there are many issues to consider when choosing a satellite remote sensor. The application context here is coastal monitoring where the availability of high temporal data streams that also produce reliable measurements is being investigated. However in the study outlined by Hellweger (2004) 16, none of the sensors considered could achieve the temporal resolution required. There are also limitations with the use of satellite remote sensing in a coastal zone. The optical complexity of these waters often renders remote sensing algorithms for estimating ocean colour parameters unreliable and many studies outline the need for improved algorithms for different water types e.g. 15 17 23. Also ocean colour sensors often have an insufficient spatial and temporal resolution for monitoring small-scale features or highly dynamic environments e.g.16 24. Additionally they are hampered by cloud cover and sun glint. Therefore even if a sensor has a re-visit time of three days, this does not always mean there will be data available at this temporal scale e.g. 25. Hence, with Galway Bay being a coastal zone and a location that is frequently covered by cloud, a satellite remote sensing data stream that meets the needs of our application context and that can produce data at very high temporal scales is difficult to achieve. 3.2 SST
SST has been routinely observed using thermal infrared data from space-borne sensors for many years. Satellite instruments such as AVHRR (Advanced Very High Resolution Radiometer), MODIS (Moderate Resolution Imaging Spectroradiometer) and ATSR (Along Track Scanning Radiometer) have the ability to derive satellite SST measurements with accuracies of a few tenths of a degree 26. High accuracy SST measurements are essential for climate research and other studies and the ATSR radiometers were designed with these requirements in mind. Donlon et al. (2007) 27 provide an overview of the different types of sensors and platforms for measuring SST, outlining the sampling characteristics and absolute accuracy levels. For example a dual-view infrared radiometer on a polar orbiting satellite provides global coverage but only every three days. It has a spatial resolution of 1-2 km and a high absolute accuracy. An infrared wide swath radiometer on a polar orbiting satellite has a spatial resolution of 1-4km, global coverage every 12 hours but a lower absolute accuracy than an infrared dual-view radiometer. All infrared radiometers fail over cloud and the infrared
Updated 1 March 2012
wide swath radiometer also fails in the presence of atmospheric aerosol. A microwave radiometer on a polar orbiting satellite has a spatial resolution of 25-50km, global coverage every 1-2 days, a lower accuracy than some infrared radiometers but it can still obtain measurements through cloud cover. It is however affected by rain and the coarse spatial resolution gives it limited capabilities in coastal regions.
Scientists are investigating the best combination of tools from satellite observations, in-situ measurements, and numerical models for global SST analysis as discussed by Donlon et al. (2001) 28. This seeks to build on the complementary aspects of various satellite instruments by merging data to provide information of increased quality and resolution. Since a satellite data stream with high temporal and spatial resolution is required for use in the context of this work, an SST analysis created from incorporating a number of satellite data sources (and perhaps in-situ data sources) is used in this study and is deemed more appropriate for the requirements of the application context in question.
4. STUDY AREA AND INSTRUMENTATION Galway Bay is located on the west coast of Ireland (See Figure 1). The south of the bay is bordered by Co. Clare and it is bordered by Co. Galway to the north. It is 62 km long from the Brannock Islands (situated just north west of the Aran islands) in the west to Oranmore in the east. The mouth of the bay is 22km wide from Doolin to Lettermullan, however it narrows at Black Head to 10km 29. The main rivers entering the bay are the River Corrib at Galway and the Owenboliskey River at an Spidéal. Galway Bay is quite an important resource and supports a full range of maritime activities. Many research institutes and organisations use Galway Bay as the basis for research programmes and projects, most notably the Irish Marine Institute 30 located in Oranmore, Co. Galway. It was chosen as the site for this study mainly due to the fact that the SmartBay pilot project was launched here in 2008. 4.1 SmartBay
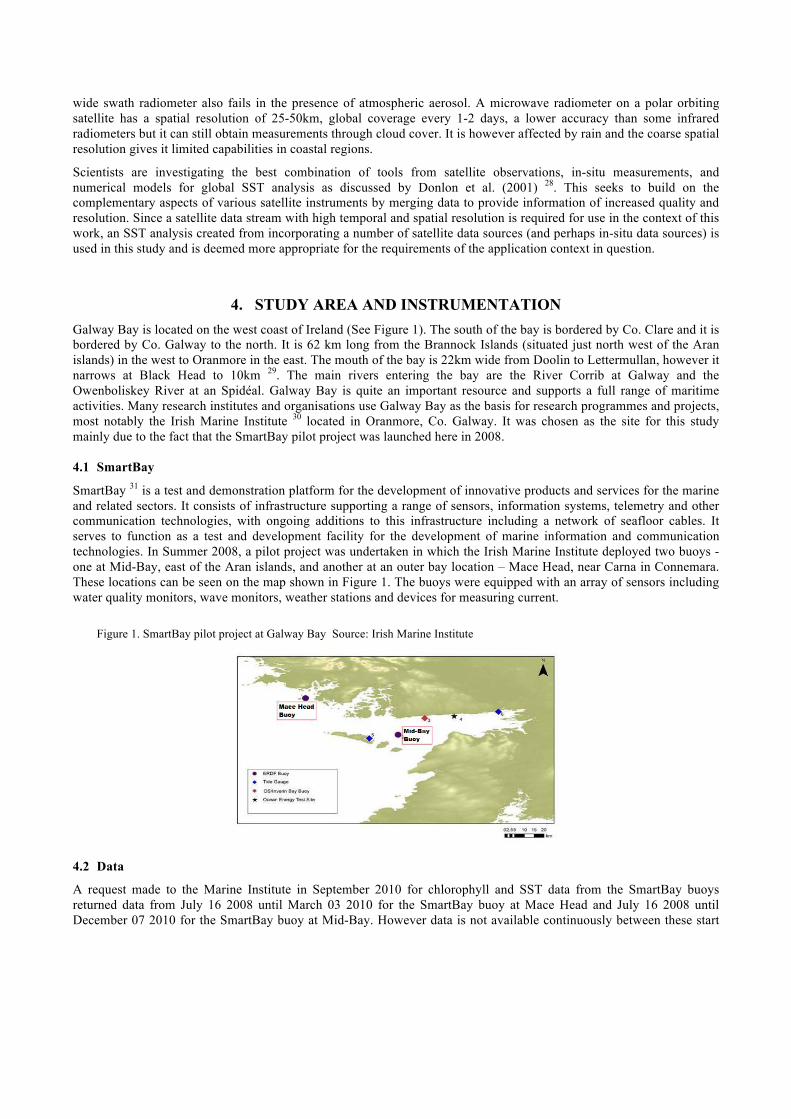
SmartBay 31 is a test and demonstration platform for the development of innovative products and services for the marine and related sectors. It consists of infrastructure supporting a range of sensors, information systems, telemetry and other communication technologies, with ongoing additions to this infrastructure including a network of seafloor cables. It serves to function as a test and development facility for the development of marine information and communication technologies. In Summer 2008, a pilot project was undertaken in which the Irish Marine Institute deployed two buoys - one at Mid-Bay, east of the Aran islands, and another at an outer bay location – Mace Head, near Carna in Connemara. These locations can be seen on the map shown in Figure 1. The buoys were equipped with an array of sensors including water quality monitors, wave monitors, weather stations and devices for measuring current.
Figure 1. SmartBay pilot project at Galway Bay Source: Irish Marine Institute
4.2 Data
A request made to the Marine Institute in September 2010 for chlorophyll and SST data from the SmartBay buoys returned data from July 16 2008 until March 03 2010 for the SmartBay buoy at Mace Head and July 16 2008 until December 07 2010 for the SmartBay buoy at Mid-Bay. However data is not available continuously between these start
Updated 1 March 2012
and end points and gaps in the data do exist. There also may be issues with data quality at certain points e.g. before maintenance operations. The Marine Institute scientists noted that on occasion some of the water quality sensors were affected by significant biofouling between maintenance visits. However as is often a regular occurrence in these scenarios, it can be difficult to carry out sufficient maintenance on sensors in remote locations such as the marine due to time and budgetary constraints.
5. SATELLITE DATA PRODUCTS FOR USE IN THE GALWAY BAY NETWORK While there are numerous benefits to satellite remote sensing data products in many application contexts, in this investigation the focus is specifically on high temporal satellite remote sensing data that can enhance the use of the in-situ sensor nodes in an operational multi-modal sensor network and provide a form of redundancy in the network. Following the previous analysis it is clear that relying on a singular satellite sensor for this type of data is not suitable for this particular application context. Therefore based on this, the satellite data products chosen for incorporation into this network are products that produce an analysis based on the combination of many satellite and in some cases in-situ data streams and/or model output. These products can often achieve a higher accuracy with increased spatial and temporal resolution through exploiting the various characteristics of a number of satellite sensors. The following describes the satellite data analysis products used, however it should be noted that the purpose of this research is not to provide a thorough analysis on the use of all available products, but rather to highlight some of the benefits and issues with using a selection of these in such an application context. 5.1 Ocean Colour Data
As part of the research into satellite remote sensing data, a system for the efficient browsing, searching and analysis of MODIS chlorophyll data was developed 32. It is clear from browsing these images and analysing the pixel colours of the summary images that there is a very limited amount of data available from these single sensor products for Galway Bay mainly due to cloud cover. A number of products are available through the MyOcean service, which provides analyses using various combinations of satellite and in-situ observations and model output. Two sources of products were considered for analysis here – GlobColour products and an Ifremer product. These are described in the following sections.
5.1.1 GlobColour Data
The GlobColour project merges SeaWiFS, MODIS and MERIS data, producing archived and near real-time data products 33 34. It is a project that was initiated and funded by the European Space Agency (ESA) to develop a satellite-based ocean colour data service to support operational oceanography and global carbon-cycle research 35. When searching for available data, the criteria used was - daily 4km Chlorophyll-a data - (CHL1 - chlorophyll-a Case 1 waters and CHL2 - chlorophyll-a Case 2 waters (only available from MERIS)) – on the GlobColour data access portal 36. The GlobColour merged products are generated using a variety of merging techniques (simple averaging, weighted averaging, and the GSM (Garver, Siegel, Maritorena) model). The production of CHL1 using the different merging techniques is described in 34. CHL2 is only available from the MERIS instrument. A number of products are produced using a varying combination of the three instruments or all three, and differing merging methods. The details can be delineated from the product names. Based on available files, three data products were selected for use in the analysis, all of which were daily 4km resolution products - the merged MERIS-MODIS-SeaWiFS CHL1 data product using two different merging techniques – weighted average and GSM, and the averaged MERIS CHL2 product. 5.1.2 Ifremer Data
CERSAT (French ERS Processing and Archiving Facility) which is part of Ifremer (French Research Institute for Exploitation of the Sea) produces a gridded product for the Atlantic region named EUR-L4-CHL-ATL-v01. It produces daily analyses and that are sometimes used by the Irish Marine Institute. Again it is a merged MODIS, MERIS, SeaWiFS product. This data was downloaded from the CERSAT FTP site and information was extracted from the pixels of interest.
Updated 1 March 2012
5.2 SST Data
The SST data chosen for the analysis in this study is from the Global Ocean Data Assimilation Experiment High-resolution Sea-Surface Temperature Pilot Project (GHRSST-PP). An overview of this pilot project can be found in Donlon et al. (2007) 27 or from the GHRSST-PP project page 37. These data products were chosen since a high resolution diagnostic dataset site (HR-DDS) was set up as part of our research. 5.2.1 GHRSST-PP Data Products
The GHRSST-L2P product provides all SST data from various agencies and different sensors in a common format, with the addition of ancillary information to assist interpretation. The GHRSST-L4 products produce an analysis based on several complementary inputs to provide merged, gridded, and gap-free SST datasets. These products exploit the synergy from using SST from in-situ, satellite microwave and satellite infrared sensors and use all data available in the 24 hour time-period before the analysis. The objective of these products is to provide the best available estimate of SST from a combined analysis of all available L2P and other available sources of SST data The High Resolution Diagnostic Data Set (HR-DDS) is a service within GHRSST-PP to allow users to interactively compare, analyse and view SST data products, ocean models datasets and auxiliary datasets from the various streams within GHRSST. The HR-DDS system consists of regularly gridded subsets of all available GHRSST SST 27. These are resampled if necessary to a common grid within pre-defined sites. The HR-DDS system examines each GHRSST file (L2P and L4) and an HR-DDS file is produced. These files are subsequently made available via FTP. Approximately 200 of these sites are distributed globally. Two of these sites were established in the context of our work – one at Galway Bay and the other in Dublin Bay. Based on available files, seven of these HR-DDS data products from the Galway Bay site were selected for use in our analysis.
6. POTENTIAL USE IN AN OPERATIONAL MULTI-MODAL MARINE MONITORING NETWORK
The performance of a multi-modal network incorporating diverse data streams is analysed from an applications perspective. However it must be recognized that the needs of different applications vary. Some require high precision in relation to output values. Others may only require a high-level overview of conditions and are much more tolerant of an error margin. In response to this an analysis is carried out of the various remote sensing data streams in relation to various threshold values of the in-situ sensors. The percentage of their outputs that are within various margins of the in-situ sensors are examined in order to capture their possible suitability over a range of application contexts. Firstly the output of seven different HR-DDS products providing an analysis of SST are evaluated. Following this four different products providing an analysis of chlorophyll are examined – one Ifremer product and three GlobColour products. The analysis is carried out on all daily data from 2009. The in-situ data is available at a sampling rate of 6.1 Data Extraction and Analysis
The SST and ocean colour data products were downloaded for similar time periods to the in-situ measurements. Data was extracted from these sources using the API of Beam 4.8 (developed by Brockmann-Consult) – an open-source toolbox and development platform for viewing, analysing and processing of remote sensing raster data. The Mace Head SmartBay Buoy is at a latitude-longitude location of (53.3327, - 9.9324). The Mid-Bay SmartBay Buoy is at a latitude-longitude location of (53.1136, - 9.51083). A JAVA program using the BEAM API was written to select the pixels that best represented the locations of the SmartBay buoys. Due to the proximity of the buoys to the bay, the spatial resolution of the data products and the fact they are mainly analysis products as opposed to individual satellite data products, this appeared to be the best approach for selecting a corresponding value from the satellite data product for use in each of the networks (i.e. the Mace Head and Mid-Bay networks). The in-situ sensors on the SmartBay buoys produced a sample approximately every 30 minutes. Some of satellite data analysis products provided a daily estimate. Others did not produce valid data for each day. In order to carry out the analysis, daily averages were produced for the in-situ data, and these were compared with any available daily value from the analysis products for that day. This daily comparison was carried out on any data available from 2009. The following describes the results of this analysis for both SST and chlorophyll.
Updated 1 March 2012
6.2 HR-DDS SST Analysis Products
The following HR-DDS products are used in the analysis:
• HR-DDS 1 - AMSRE-JAXA-dcu001 • HR-DDS 2 - AMSRE-REMSS-dcu001 • HR-DDS 3 - NAR17-SST-EUR-dcu001 • HR-DDS 4 - NAR-METOP-A-EUR-dcu001 • HR-DDS 5 - NCDC-L4LR-AVHRR-AMSRE-dcu001 • HR-DDS 6 - NCDC-L4LR-AVHRR-dcu001 • HR-DDS 7 - UKMO-L4HRfnd-GLOB-dcu001
The first four products did not produce regular estimations, however the last three products did. Since these three products appeared at a first glance to produce very similar estimates, for reference purposes their relationships with the in-situ SST sensor values from the Mace Head and Mid-Bay SmartBay buoys in terms of correlation, MAE and RMSE are outlined in Table 1. HR-DDS product 7 appears to produce the values closest to the in-situ sensors both at Mid-Bay and Mace Head, with the highest performance overall of all three products at the Mid-Bay test site.
Table 1. Correlation (CC), Mean Absolute Error (MAE) and Root Mean Squared Error (RMSE) values for HR-DDS products compared to the in-situ SST sensor at Mace Head and Mid-Bay.
Mace Head CC MAE RMSE Mid-Bay CC MAE RMSE HR-DDS Prod. 5 0.9603 0.7683 0.9632 HR-DDS Prod. 5 0.9781 0.407 0.5238 HR-DDS Prod. 6 0.9618 0.7523 0.9494 HR-DDS Prod. 6 0.9808 0.3982 0.5084 HR-DDS Prod. 7 0.9648 0.6165 0.8403 HR-DDS Prod. 7 0.9845 0.3353 0.4719
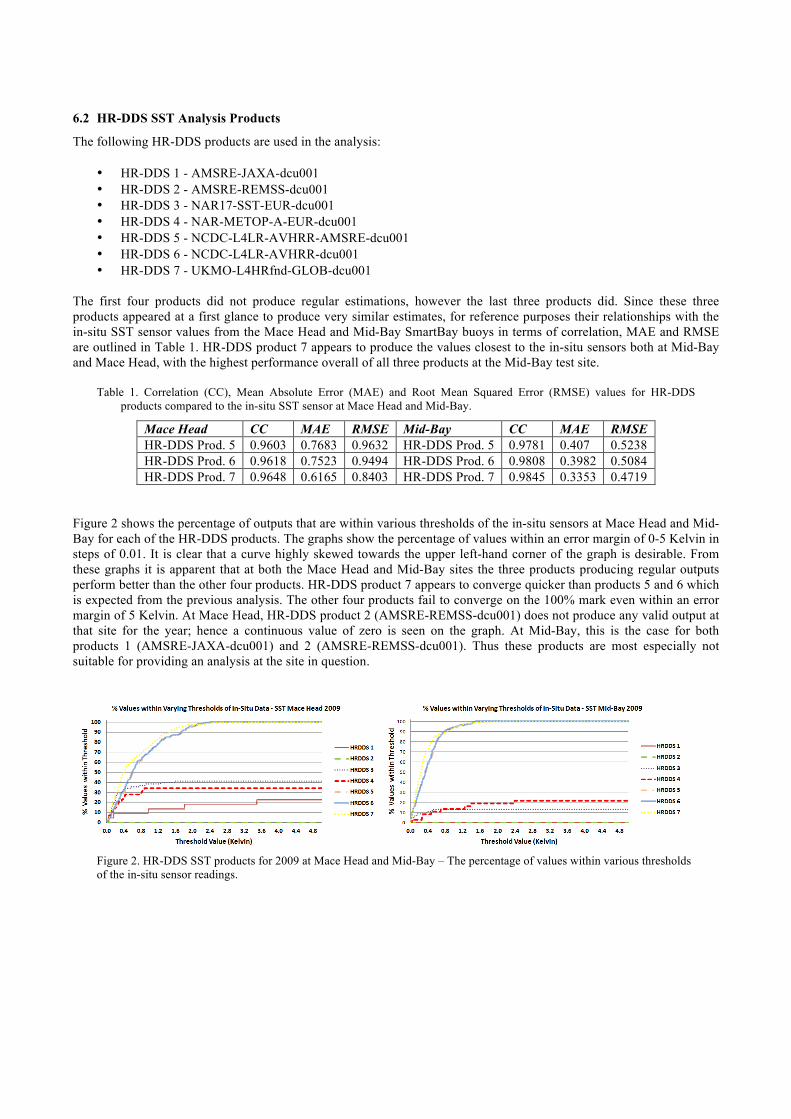
Figure 2 shows the percentage of outputs that are within various thresholds of the in-situ sensors at Mace Head and Mid-Bay for each of the HR-DDS products. The graphs show the percentage of values within an error margin of 0-5 Kelvin in steps of 0.01. It is clear that a curve highly skewed towards the upper left-hand corner of the graph is desirable. From these graphs it is apparent that at both the Mace Head and Mid-Bay sites the three products producing regular outputs perform better than the other four products. HR-DDS product 7 appears to converge quicker than products 5 and 6 which is expected from the previous analysis. The other four products fail to converge on the 100% mark even within an error margin of 5 Kelvin. At Mace Head, HR-DDS product 2 (AMSRE-REMSS-dcu001) does not produce any valid output at that site for the year; hence a continuous value of zero is seen on the graph. At Mid-Bay, this is the case for both products 1 (AMSRE-JAXA-dcu001) and 2 (AMSRE-REMSS-dcu001). Thus these products are most especially not suitable for providing an analysis at the site in question.
Figure 2. HR-DDS SST products for 2009 at Mace Head and Mid-Bay – The percentage of values within various thresholds of the in-situ sensor readings.
Updated 1 March 2012
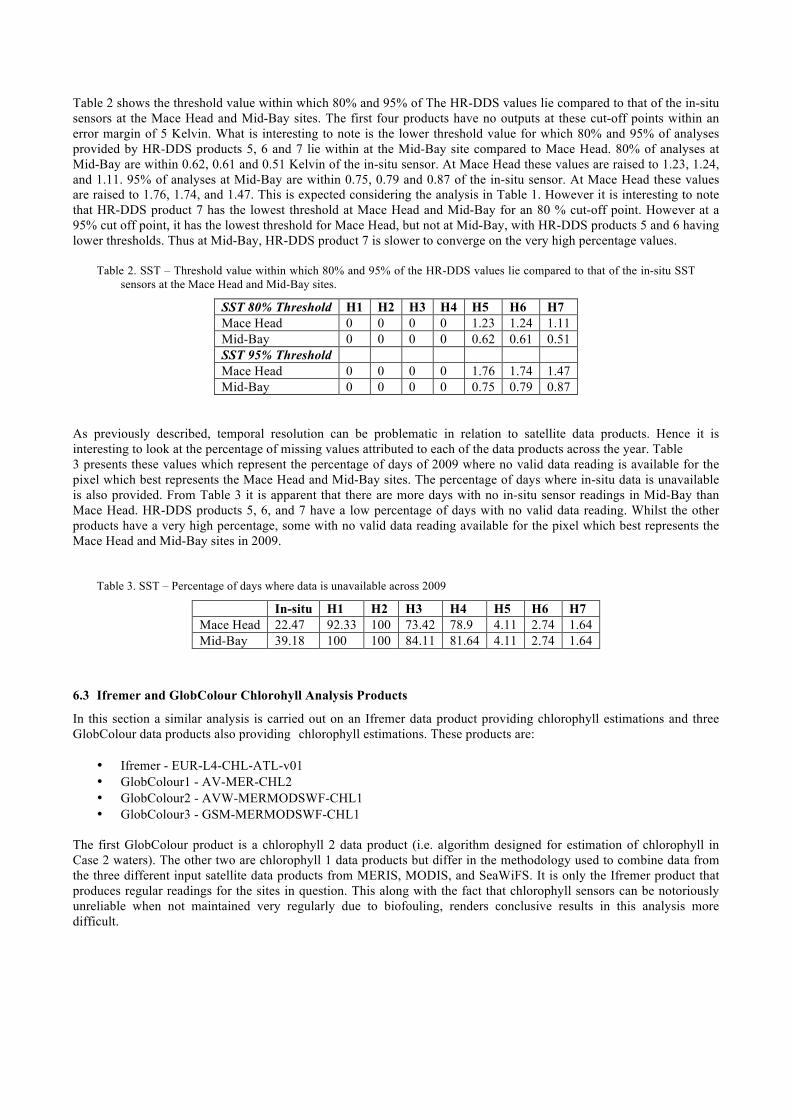
Table 2 shows the threshold value within which 80% and 95% of The HR-DDS values lie compared to that of the in-situ sensors at the Mace Head and Mid-Bay sites. The first four products have no outputs at these cut-off points within an error margin of 5 Kelvin. What is interesting to note is the lower threshold value for which 80% and 95% of analyses provided by HR-DDS products 5, 6 and 7 lie within at the Mid-Bay site compared to Mace Head. 80% of analyses at Mid-Bay are within 0.62, 0.61 and 0.51 Kelvin of the in-situ sensor. At Mace Head these values are raised to 1.23, 1.24, and 1.11. 95% of analyses at Mid-Bay are within 0.75, 0.79 and 0.87 of the in-situ sensor. At Mace Head these values are raised to 1.76, 1.74, and 1.47. This is expected considering the analysis in Table 1. However it is interesting to note that HR-DDS product 7 has the lowest threshold at Mace Head and Mid-Bay for an 80 % cut-off point. However at a 95% cut off point, it has the lowest threshold for Mace Head, but not at Mid-Bay, with HR-DDS products 5 and 6 having lower thresholds. Thus at Mid-Bay, HR-DDS product 7 is slower to converge on the very high percentage values.
Table 2. SST – Threshold value within which 80% and 95% of the HR-DDS values lie compared to that of the in-situ SST sensors at the Mace Head and Mid-Bay sites.
SST 80% Threshold H1 H2 H3 H4 H5 H6 H7 Mace Head 0 0 0 0 1.23 1.24 1.11 Mid-Bay 0 0 0 0 0.62 0.61 0.51 SST 95% Threshold Mace Head 0 0 0 0 1.76 1.74 1.47 Mid-Bay 0 0 0 0 0.75 0.79 0.87
As previously described, temporal resolution can be problematic in relation to satellite data products. Hence it is interesting to look at the percentage of missing values attributed to each of the data products across the year. Table 3 presents these values which represent the percentage of days of 2009 where no valid data reading is available for the pixel which best represents the Mace Head and Mid-Bay sites. The percentage of days where in-situ data is unavailable is also provided. From Table 3 it is apparent that there are more days with no in-situ sensor readings in Mid-Bay than Mace Head. HR-DDS products 5, 6, and 7 have a low percentage of days with no valid data reading. Whilst the other products have a very high percentage, some with no valid data reading available for the pixel which best represents the Mace Head and Mid-Bay sites in 2009.
Table 3. SST – Percentage of days where data is unavailable across 2009
In-situ H1 H2 H3 H4 H5 H6 H7 Mace Head 22.47 92.33 100 73.42 78.9 4.11 2.74 1.64 Mid-Bay 39.18 100 100 84.11 81.64 4.11 2.74 1.64
6.3 Ifremer and GlobColour Chlorohyll Analysis Products
In this section a similar analysis is carried out on an Ifremer data product providing chlorophyll estimations and three GlobColour data products also providing chlorophyll estimations. These products are:
• Ifremer - EUR-L4-CHL-ATL-v01 • GlobColour1 - AV-MER-CHL2 • GlobColour2 - AVW-MERMODSWF-CHL1 • GlobColour3 - GSM-MERMODSWF-CHL1
The first GlobColour product is a chlorophyll 2 data product (i.e. algorithm designed for estimation of chlorophyll in Case 2 waters). The other two are chlorophyll 1 data products but differ in the methodology used to combine data from the three different input satellite data products from MERIS, MODIS, and SeaWiFS. It is only the Ifremer product that produces regular readings for the sites in question. This along with the fact that chlorophyll sensors can be notoriously unreliable when not maintained very regularly due to biofouling, renders conclusive results in this analysis more difficult.
Updated 1 March 2012
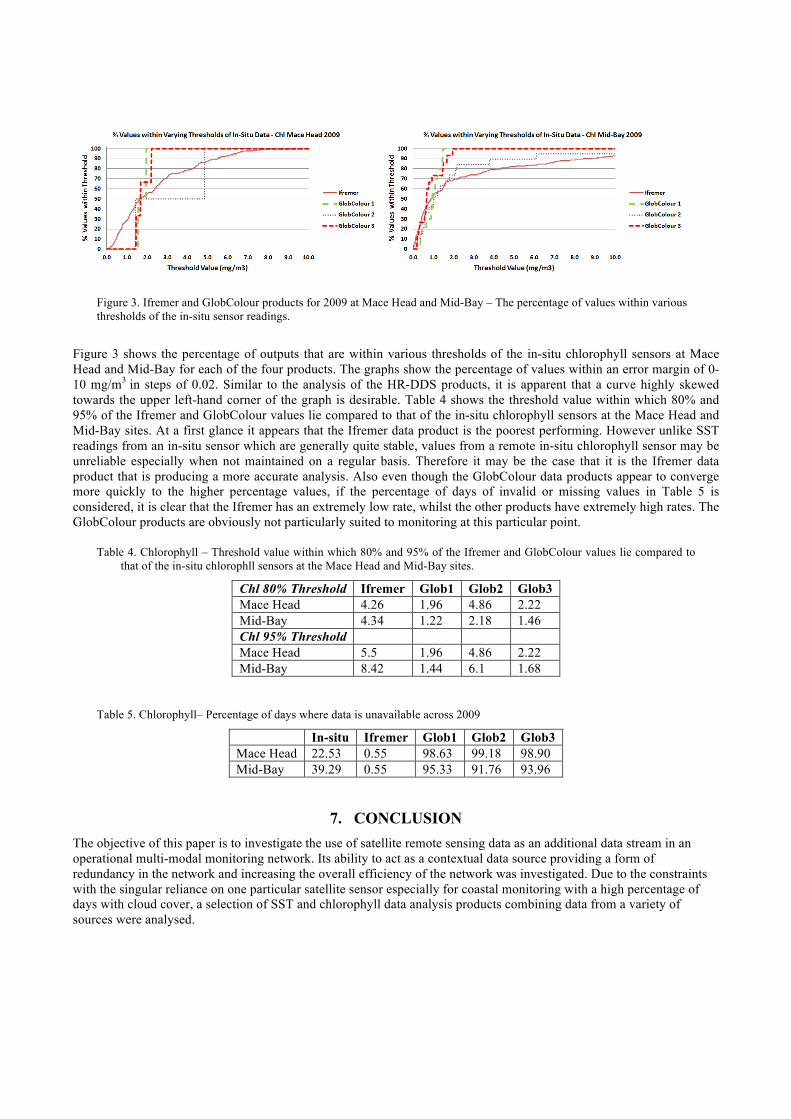
Figure 3. Ifremer and GlobColour products for 2009 at Mace Head and Mid-Bay – The percentage of values within various thresholds of the in-situ sensor readings.
Figure 3 shows the percentage of outputs that are within various thresholds of the in-situ chlorophyll sensors at Mace Head and Mid-Bay for each of the four products. The graphs show the percentage of values within an error margin of 0-10 mg/m3 in steps of 0.02. Similar to the analysis of the HR-DDS products, it is apparent that a curve highly skewed towards the upper left-hand corner of the graph is desirable. Table 4 shows the threshold value within which 80% and 95% of the Ifremer and GlobColour values lie compared to that of the in-situ chlorophyll sensors at the Mace Head and Mid-Bay sites. At a first glance it appears that the Ifremer data product is the poorest performing. However unlike SST readings from an in-situ sensor which are generally quite stable, values from a remote in-situ chlorophyll sensor may be unreliable especially when not maintained on a regular basis. Therefore it may be the case that it is the Ifremer data product that is producing a more accurate analysis. Also even though the GlobColour data products appear to converge more quickly to the higher percentage values, if the percentage of days of invalid or missing values in Table 5 is considered, it is clear that the Ifremer has an extremely low rate, whilst the other products have extremely high rates. The GlobColour products are obviously not particularly suited to monitoring at this particular point.
Table 4. Chlorophyll – Threshold value within which 80% and 95% of the Ifremer and GlobColour values lie compared to that of the in-situ chlorophll sensors at the Mace Head and Mid-Bay sites.
Chl 80% Threshold Ifremer Glob1 Glob2 Glob3 Mace Head 4.26 1.96 4.86 2.22 Mid-Bay 4.34 1.22 2.18 1.46 Chl 95% Threshold Mace Head 5.5 1.96 4.86 2.22 Mid-Bay 8.42 1.44 6.1 1.68
Table 5. Chlorophyll– Percentage of days where data is unavailable across 2009
In-situ Ifremer Glob1 Glob2 Glob3 Mace Head 22.53 0.55 98.63 99.18 98.90 Mid-Bay 39.29 0.55 95.33 91.76 93.96
7. CONCLUSION The objective of this paper is to investigate the use of satellite remote sensing data as an additional data stream in an operational multi-modal monitoring network. Its ability to act as a contextual data source providing a form of redundancy in the network and increasing the overall efficiency of the network was investigated. Due to the constraints with the singular reliance on one particular satellite sensor especially for coastal monitoring with a high percentage of days with cloud cover, a selection of SST and chlorophyll data analysis products combining data from a variety of sources were analysed.
Updated 1 March 2012
The SST data products demonstrated mixed performance and it is apparent that certain data products are not suitable at all for use in the network. However three of the selected products produced excellent performance at high enough temporal scales to complement the use of an in-situ sensor, with these products appearing to perform better at the Mid-Bay test site than Mace Head. The chlorophyll data products showed some interesting outputs and highlighted the need for a closer analysis looking at the percentage of missing data values. The GlobColour products are obviously not particularly suited to monitoring at this particular point, and the unreliability of the in-situ chlorophyll sensor subsequently rendered it difficult to come to any conclusions regarding the Ifremer product. This highlighted the issues with such products and the need for careful consideration where many alternative products may need to be investigated for their suitability to the application context. A more in depth analysis is subequently required here. However overall there are many applications and benefits to using satellite data products in environmental monitoring networks and they can greatly improve and enhance their operation. A selection of the HR-DDS data products demonstrated excellent performance with 95% of their values within extremely low margins of the in-situ SST sensors at the Mid-Bay and Mace Head test sites. While it was more difficult to come to a conclusion regarding the chlorophyll products, the temporal availability from the Ifremer product was extremely high. Further investigation would be required to check the suitability of this product to the Galway Bay region. However as previously outlined the purpose here is not to carry out a thorough investigation of all available products but rather to highlight the issues with the use of such products. Thus in certain contexts these products may provide a form of redundancy in the network. However additionally they cover a greater spatial area than is possible through the singular reliance on two in-situ marine monitoring buoys. Thus additionally they may also increase the efficiency of the network by providing the contextual information surrounding an event or the optimum location for sophisticated point sensors in the bay. Acknowledgements: Based on research funded by the Dept. of Communications, Marine & Natural Resources under the Strategy for Science, Technology and Innovation (2006-2013) and by Science Foundation Ireland under grant 07/CE/I1147.
REFERENCES
[1] Water Framework Directive, http://ec.europa.eu/environment/water/water-framework/index_en.html [2] Estrin, D, “Reflections on Wireless Sensing Systems: From Ecosystems to Human Systems,” IEEE Radio and
Wireless Symposium (2007). [3] Albaladejo, C, Sanchez, P, Iborra, A, Soto, F, Lopez, J, and Torres, R, “Wireless sensor networks for
oceanographic monitoring: A systematic review,” Sensors 10(7), 6948-6968 (2010). [4] Diamond, D., Coyle, S., Scarmagnani, S., Hayes, J., “Wireless sensor networls and chemo-/biosensing,”
Chemical Reviews 108, 652-679 (2008). [5] MyOcean, http://www.myocean.eu.org/ [6] GMES – Global Monitoring for Environment and Security, http://www.gmes.info/ [7] O’Connor, E., Smeaton, A.F., O’Connor, N.E. and Diamond, D., “Integrating multiple sensing modalities for
environmental monitoring of marine locations,” SenSys ’08: Proceedings of the 6th ACM conference on Embedded Network Sensor Systems, 405-406 (2008).
[8] O’Connor, E., O’Conaire, C., Smeaton, A.F., O’Connor, N.E. and Diamond, D., “River water-level estimation using visual sensing,” EuroSSC ’09: Proceedings of the 4th European Conference on Smart Sensing and Context (2009).
[9] O’Connor, E., Smeaton, A.F., O’Connor, N.E., “A multi-modal event detection system for river and coastal marine monitoring applications,” IEEE Oceans ’11 ( 2011).
[10] Zhang, D., O’Connor, E., McGuinness, K, Smeaton, A.F., and O’Connor, N.E. “A visual sensing platform for creating a smarter multi-modal marine monitoring network,” ACM International Workshop on Multimedia Analysis for Ecological Data (2012). (In press)
[11] O’Connor, E., Smeaton, A.F., O’Connor, N.E. and Regan, F, “A neural network approach to smarter sensor networks for water quality monitoring,” Sensors, 4605-4632 ( 2012).
[12] O’Connor, E., Hayes, J., Smeaton, A.F., O’Connor, N.E. and Diamond, D, “Environmental monitoring of Galway Bay: Fusing data from remote and in-situ sources,” Proc SPIE 7478 (2009).

Updated 1 March 2012
[13] Myers, J.S., and Miller R.L., [Remote Sensing of Coastal aquatic Environments], Springer, “3: Optical Airborne Remote Sensing,” 51-66 (2007).
[14] Darecki, M., Weeks, A., Saganb, S., Kowalczukb. P, “Optical characteristics of two contrasting case 2 waters and their influence on remote sensing algorithms,” Contintental Shelf Research 23, 237-250 (2003).
[15] Darecki, M. and Stramski, D., “An evaluation of MODIS and SeaWiFS bio-optical algorithms in the Baltic Sea,” Remote Sensing of Environment 89(3), 326-350 (2004).
[16] Hellweger, F., Schlosser, P., Lall, U., and Weissel, J., “Use of satellite imagery for water quality studies in New York Harbour,” Estuarine, Coastal and Shelf Science 61, 437-448 (2004).
[17] Zimba, P.V. and Gitelson, A., “Remote estimation of chlorophyll concentration in hyper-eutrophic aquatic systems: Model tuning and accuracy optimization,” Aquaculture 256(1-4), 272-286, (2006).
[18] Gitelson, A., Dall’Olmo, G, Moses, W., Rundquist, D.C., Barrow, T., Fisher, T.R., Gurlin, D. and Holz, J., “A simple semi-analytical model for remote sensing estimation of chlorophyll-a in turbid waters: Validation,” Remote Sensing of Environment 112, 3582-3593 (2008).
[19] Rast, M., Bezy, J, and Bruzzi, S, “The ESA Medium Resolution Imaging Spectrometer MERIS – a review of the instrument and its mission,” International Journal of Remote Sensing 20(9), 1681-1702 (1999).
[20] Hooker, S. and McClain, C., “The calibration and validation of SeaWiFS data,” Progress in Oceanography 45, 427-465 (2000).
[21] Esaias, W.E., Abbott, M.R., Barton, I., Brown, O.B., Campbell, J.W., Carder, K.L., Clark, D.K., Evans, R.H., Hoge, F.E., Gordon, H.R., Balch, W.M., Letelier, R., and Minnett, P.J., “An overview of MODIS capabilities for ocean science observations,” IEEE Transactions on Geoscience and Remote Sensing 36(4), 1250-1265 (1998).
[22] European Space Agency, [MERIS Product Handbook], http://envisat.esa.int/handbooks/meris/, (2006). [23] Stumpf, R.P., Culver, M.E., Tester, P.A., Tomlinson, M., Kirkpatrick, G.J., Pederson, B.A., Truby, E.,
Ransibrahmanakul, V., Soracco, M., “Monitoring Karenia brevis blooms in the Gulf of Mexico using satellite ocean color imagery and other data,” Harmful Algae 2(2), 147-160 (2003).
[24] Kutser, T., Pierson, D.C., Kallio, K.Y., Reinart, A and Sobek, S, “Mapping lake CDOM by satellite remote sensing,” Remote Sensing of Environment 94(4), 535-540 (2005).
[25] Gregg, W.W. and Woodward, R.H., “Improvements in coverage frequency of ocean colour: Combining data from SeaWiFS and MODIS,” IEEE Transactions on Geoscience and Remote Sensing 36, 1350-1353 (1998).
[26] Noyes, E., Minnett, P., Remediosa, J., Corletta, G., Gooda, S., Llewellyn-Jones, D.T., “The accuracy of the AATSR sea surface temperatures in the Caribbean,” Remote Sensing of Environment 101(1), 38-51 (2006).
[27] Donlon, C.; Robinson, I.; Casey, K.; Vazquez-Cuervo, J.; Armstrong, E.; Arino, O.; Gentemann, C.; May, D.; LeBorgne, P.; Piollé, J.; Barton, I.; Beggs, H.; Poulter, D.; Merchant, C.; Bingham, A.; Heinz, S.; Harris, A.; Wick, G.; Emery, B.; Minnett, P.; Evans, R.; Llewellyn-Jones, D.; Mutlow, C.; Reynolds, R.; Kawamura, H. & Rayner, N., “The Global Ocean Data Assimilation Experiment High-Resolution Sea Surface Temperature Pilot Project,” Bulletin of the American Meteorological Society 88(8), 1197-1213 (2007).
[28] Donlon, C.; Minnett, P.; Genetemann, C.; Nightingale, T.; Barton, I.; Ward, B. & Murray, M. “Toward improved validation of satellite sea surface skin temperature measurements for climate research,” J. Climate 15, 353-369 (2001).
[29] INFOMAR, “Infomar – Integrated Mapping for the Sustainable Development of Ireland’s Marine Resource,” http://www.infomar.ie
[30] Irish Marine Institute, http://www.marine.ie [31] SmartBay Ireland, http://www.smartbay.ie [32] O’Connor, E., Hayes, J., O’Conaire, C., Smeaton, A.F., O’Connor N.E. and Diamond D., “Image processing for
smart browsing of ocean colour data products and subsequent incorporation into a multi-modal sensing framework,” Proc. of RSPSoc: Remote Sensing and Photogrammetry Society Annual Conference with Irish Earth Observation Symposium, 190-198 (2010).
[33] GlobColour, http://www.globcolour.info/ [34] ACRI-ST,MyOcean GlobColour Products User Guide,
http://www.globcolour.info/CDR_Docs/MyOcean_ACRI_PUG.pdf (2011). [35] ACRI-ST, GlobColour Final Report, http://www.globcolour.info/docs/GlobColour_FR_v1.0.pdf (2008). [36] HERMES, GlobColour Data Access, http://www.globcolour.info/data_access.html [37] GHRSST-PP, Global Ocean Data Assimilation Experiment High-resolution Sea-Surface Temperature Pilot
Project (GHRSST-PP), http://www.ghrsst-pp.org

Updated 1 March 2012