Investigating the Neural Correlates of Pathological Cortical Networks in Alzheimer's Disease Using...
7
890 IEEE TRANSACTIONS ON BIOMEDICAL ENGINEERING, VOL. 59, NO. 3, MARCH 2012 Investigating the Neural Correlates of Pathological Cortical Networks in Alzheimer’s Disease Using Heterogeneous Neuronal Models Kamal Abuhassan ∗ , Damien Coyle, Member, IEEE, and Liam P. Maguire Abstract—This paper describes an investigation into the pathophysiological causes of abnormal cortical oscillations in Alzheimer’s disease (AD) using two heterogeneous neuronal net- work models. The effect of excitatory circuit disruption on the beta band power (13–30 Hz) using a conductance-based network model of 200 neurons is assessed. Then, the neural correlates of abnor- mal cortical oscillations in different frequency bands based on a larger network model of 1000 neurons consisting of different types of cortical neurons are also analyzed. EEG studies in AD patients have shown that beta band power (13–30 Hz) decreased in the early stages of the disease with a parallel increase in theta band power (4–7 Hz). This abnormal change progresses with the later stages of the disease but with decreased power spectra in other fast fre- quency bands plus an increase in delta band power (1–3 Hz). Our results show that, despite the heterogeneity of the network models, the beta band power is significantly affected by excitatory neu- ral and synaptic loss. Second, the results of modeling a functional impairment in the excitatory circuit shows that beta band power exhibits the most decrease compared with other bands. Previous biological experiments on different types of cultural excitatory neu- rons show that cortical neuronal death is mediated by dysfunctional ionic behavior that might specifically contribute to the pathogene- sis of β-amyloid-peptide-induced neuronal death in AD. Our study also shows that beta band power was the first affected component when the modeled excitatory circuit begins to lose neurons and synapses. Index Terms—Alzheimer’s disease (AD), computational models, EEG, functional deficits, structural impairment. I. INTRODUCTION A LZHEIMER’S disease (AD) is the most common neu- rodegenerative disorder associated with progressive de- mentia. The clinical symptoms of AD are cognitive and intel- lectual deficits, and behavior dysfunction. In most instances, symptoms develop gradually or precipitously. AD constitutes approximately 70% of all dementia cases and is expected to affect 1 in 85 people worldwide by 2050 [1]. It has a signifi- Manuscript received July 22, 2011; accepted November 27, 2011. Date of publication December 26, 2011; date of current version February 17, 2012. This work is supported by the Northern Ireland Department for Education and Learn- ing under the Strengthening the All Island Research Base programme. Asterisk indicates corresponding author. ∗ K. Abuhassan is with the Intelligent Systems Research Centre, University of Ulster, Derry BT48 7JL, U.K. (e-mail: [email protected]). D. Coyle and L. P. Maguire are with the School of Computing and Intelligent Systems and the Intelligent Systems Research Centre, Uni- versity of Ulster, Derry BT48 7JL, U.K. (e-mail: [email protected]; [email protected]). Digital Object Identifier 10.1109/TBME.2011.2181843 cant impact on patients and caregivers, and generates substan- tial costs on health care providers in developed countries [2]. Clearly understanding the dynamics of neuronal networks in healthy and dysfunctional cortices is important and could aid in the development of effective diagnostic tools and prevention measures. For the last few decades, EEG has been utilized for diag- nosing dementias. EEG is a measure of the electrical activity along the scalp produced by a sufficiently large population of neurons. There is a strong correlation between cognitive deficit and the degree of the EEG abnormality. EEG spectral analysis in AD patients has shown a decrease in the mean frequency, alpha (8–12 Hz) and beta (13–30 Hz) band powers with a parallel increase in delta (1–3 Hz) and theta (4–7 Hz) band powers com- pared with those of healthy elderly subjects [3]. The attenuation of alpha band power is associated with an increase in lower alpha (8–10 Hz) band power and a parallel decrease in upper alpha (10–12 Hz) band power [4]. The EEG abnormalities in AD indicate functional and anatomical impairment of the cerebral cortex affected by the disease. More investigations are needed to provide insights to the underlying neurological basis of those abnormalities as well as to couple those findings with the severity of the disease. This study is targeted at investigating the relationship between AD EEG abnormalities and some neuropathological changes during AD using a conductance-based local neuronal network oscil- lating in beta band [5] and a simple larger network model of different types of cortical neurons that oscillates in different frequency bands [6]. The neuropathology of AD is characterized by an enormous neuronal and synaptic loss in the cerebral cortex and certain subcortical regions, and the formation of both neurofibrillary tangles (NFT) and neurotic plaques (NP) [7]. NFT are patho- logical tangles of hyperphosphorylated tau protein accumulated in the brains of AD patients; it is believed that the number of NFT is directly correlated with neuronal dysfunction as well as indicating the degree of dementia [8]. β-amyloid peptide (Aβ) is the main component of NP observed in the brains of patients with AD and has been suggested to contribute to the pathogen- esis of neuronal degeneration [9]. A number of studies reported a deregulation of neuronal K+ channel function after exposure to Aβ peptide fragments, which led to remarkable perturbations in neuronal behavior [10]– [12]. These channels provide a negative feedback to the membrane potential of neurons. Thus, it regulates the neuronal dynam- ics including the timing of interspike intervals (time between 0018-9294/$31.00 © 2012 IEEE
-
Upload
independent -
Category
Documents
-
view
2 -
download
0
Transcript of Investigating the Neural Correlates of Pathological Cortical Networks in Alzheimer's Disease Using...

890 IEEE TRANSACTIONS ON BIOMEDICAL ENGINEERING, VOL. 59, NO. 3, MARCH 2012
Investigating the Neural Correlates of PathologicalCortical Networks in Alzheimer’s Disease Using
Heterogeneous Neuronal ModelsKamal Abuhassan∗, Damien Coyle, Member, IEEE, and Liam P. Maguire
Abstract—This paper describes an investigation into thepathophysiological causes of abnormal cortical oscillations inAlzheimer’s disease (AD) using two heterogeneous neuronal net-work models. The effect of excitatory circuit disruption on the betaband power (13–30 Hz) using a conductance-based network modelof 200 neurons is assessed. Then, the neural correlates of abnor-mal cortical oscillations in different frequency bands based on alarger network model of 1000 neurons consisting of different typesof cortical neurons are also analyzed. EEG studies in AD patientshave shown that beta band power (13–30 Hz) decreased in the earlystages of the disease with a parallel increase in theta band power(4–7 Hz). This abnormal change progresses with the later stagesof the disease but with decreased power spectra in other fast fre-quency bands plus an increase in delta band power (1–3 Hz). Ourresults show that, despite the heterogeneity of the network models,the beta band power is significantly affected by excitatory neu-ral and synaptic loss. Second, the results of modeling a functionalimpairment in the excitatory circuit shows that beta band powerexhibits the most decrease compared with other bands. Previousbiological experiments on different types of cultural excitatory neu-rons show that cortical neuronal death is mediated by dysfunctionalionic behavior that might specifically contribute to the pathogene-sis of β-amyloid-peptide-induced neuronal death in AD. Our studyalso shows that beta band power was the first affected componentwhen the modeled excitatory circuit begins to lose neurons andsynapses.
Index Terms—Alzheimer’s disease (AD), computational models,EEG, functional deficits, structural impairment.
I. INTRODUCTION
A LZHEIMER’S disease (AD) is the most common neu-rodegenerative disorder associated with progressive de-
mentia. The clinical symptoms of AD are cognitive and intel-lectual deficits, and behavior dysfunction. In most instances,symptoms develop gradually or precipitously. AD constitutesapproximately 70% of all dementia cases and is expected toaffect 1 in 85 people worldwide by 2050 [1]. It has a signifi-
Manuscript received July 22, 2011; accepted November 27, 2011. Date ofpublication December 26, 2011; date of current version February 17, 2012. Thiswork is supported by the Northern Ireland Department for Education and Learn-ing under the Strengthening the All Island Research Base programme. Asteriskindicates corresponding author.
∗K. Abuhassan is with the Intelligent Systems Research Centre, Universityof Ulster, Derry BT48 7JL, U.K. (e-mail: [email protected]).
D. Coyle and L. P. Maguire are with the School of Computing andIntelligent Systems and the Intelligent Systems Research Centre, Uni-versity of Ulster, Derry BT48 7JL, U.K. (e-mail: [email protected];[email protected]).
Digital Object Identifier 10.1109/TBME.2011.2181843
cant impact on patients and caregivers, and generates substan-tial costs on health care providers in developed countries [2].Clearly understanding the dynamics of neuronal networks inhealthy and dysfunctional cortices is important and could aidin the development of effective diagnostic tools and preventionmeasures.
For the last few decades, EEG has been utilized for diag-nosing dementias. EEG is a measure of the electrical activityalong the scalp produced by a sufficiently large population ofneurons. There is a strong correlation between cognitive deficitand the degree of the EEG abnormality. EEG spectral analysis inAD patients has shown a decrease in the mean frequency, alpha(8–12 Hz) and beta (13–30 Hz) band powers with a parallelincrease in delta (1–3 Hz) and theta (4–7 Hz) band powers com-pared with those of healthy elderly subjects [3]. The attenuationof alpha band power is associated with an increase in loweralpha (8–10 Hz) band power and a parallel decrease in upperalpha (10–12 Hz) band power [4].
The EEG abnormalities in AD indicate functional andanatomical impairment of the cerebral cortex affected by thedisease. More investigations are needed to provide insights tothe underlying neurological basis of those abnormalities as wellas to couple those findings with the severity of the disease. Thisstudy is targeted at investigating the relationship between ADEEG abnormalities and some neuropathological changes duringAD using a conductance-based local neuronal network oscil-lating in beta band [5] and a simple larger network model ofdifferent types of cortical neurons that oscillates in differentfrequency bands [6].
The neuropathology of AD is characterized by an enormousneuronal and synaptic loss in the cerebral cortex and certainsubcortical regions, and the formation of both neurofibrillarytangles (NFT) and neurotic plaques (NP) [7]. NFT are patho-logical tangles of hyperphosphorylated tau protein accumulatedin the brains of AD patients; it is believed that the number ofNFT is directly correlated with neuronal dysfunction as well asindicating the degree of dementia [8]. β-amyloid peptide (Aβ)is the main component of NP observed in the brains of patientswith AD and has been suggested to contribute to the pathogen-esis of neuronal degeneration [9].
A number of studies reported a deregulation of neuronal K+channel function after exposure to Aβ peptide fragments, whichled to remarkable perturbations in neuronal behavior [10]– [12].These channels provide a negative feedback to the membranepotential of neurons. Thus, it regulates the neuronal dynam-ics including the timing of interspike intervals (time between
0018-9294/$31.00 © 2012 IEEE

ABUHASSAN et al.: INVESTIGATING THE NEURAL CORRELATES OF PATHOLOGICAL CORTICAL NETWORKS IN ALZHEIMER’S DISEASE 891
spikes), setting the resting potential, and keeping action poten-tials short [13]. Therapeutic suggestions can be derived fromcomputational models of dysfunctional neural behavior to slowdown neural degeneration in AD.
The goal of this study is to elaborate and extend the findings in[14] and [15]. A recent modeling study of the hippocampal CA1and medial septal regions has proposed that hippocampal thetaband power is increased as a result of Aβ-induced reduction inA-type potassium current IA in e-cells [16]. This suggests thedifferential vulnerability of neurons and synapses in differentcortical and subcortical areas to Aβ fragments.
In this study, we examine the effects of neuronal/synapticloss and deregulation of negative feedback to the membranepotential of cortical neurons (which mainly results from Aβ-induced dysfunctional K+ channels) on the oscillatory activityof cortical networks.
Firstly, the effect of excitatory circuit disruption on beta bandpower (13–30 Hz) is investigated using a local network model.Then, the investigation is extended to explore the underlyingneurological sources of abnormal dynamics in different fre-quency bands based on a larger network model consisting ofdifferent types of cortical neurons.
The paper is outlined as follows. The network models aredescribed in Section II. The results and analysis are provided inSection III. Finally, discussions and conclusion are presented inSections IV and V, respectively.
II. NETWORK MODELS
A. Local Neuronal Network
We simulated a conductance-based neuronal network of200 cells containing 160 excitatory (e-cells) and 40 inhibitory(i-cells) neurons in the baseline (normal) case. The ratio ofe- to i-cells is 4 (80%) to 1 (20%) motivated by the anatomy ofthe mammalian cortex [17]. The cells are connected all-to-all as-suming that (e–e) synapses are weak within local networks [18].Parameters and functional forms of the equations are adoptedfrom [5].
Neurons were modeled by Hodgkin–Huxley dynamics; i-cellswere of the form
C
(dVi
dt
)= −gL (Vi − VL ) − gK n4(V1 − VK )
− gNam3h(Vi − VNa) − Isyn,i + I0 (1)
and the e-cells were modeled by the equations
C
(dVe
dt
)= −gL (Ve − VL ) − gK n4(Ve − VK )
− gNam3h(Ve − VNa) − gAHPw(Ve − VK )
− Isyn,e + I0 . (2)
Both types of cells have a leak (L), transient sodium (Na), anddelayed rectifier potassium (K) current. The e-cells have anadditional after-depolarizing potential (AHP) resulting in a slowoutward potassium current.
The maximal conductances were gNa = 100 mS/cm2 ,gK = 80 mS/cm2 , gL = 0.1 mS/cm2 , and gAHP = 0.3 mS/cm2 .Reversal potentials were VL = −67 mV, VK = −100 mV,and VNa = 50 mV. The capacitances for e- and i-cells were1 AF/cm2 . Parameters for both the e- and i-cells were the same;the only differences are in the synaptic currents and the drivingcurrents, I0 . The gating variables m, h, n satisfy equations of theform
dx
dt= ax(V )(1 − x) − bx(V )(x). (3)
For x = m, h, n where
am (V ) =0.32(54 + V )
(1 − exp([−(V + 54)/4]))(4)
bm (V ) =0.28(V + 27)
(exp([(V + 27)/5]) − 1)(5)
ah(V ) = 0.128 exp[−(V + 50)
18
](6)
bh(V ) =4
(1 + exp([−(V + 27)/5]))(7)
an (V ) =0.032(V + 52)
(1 − exp([−(V + 52)/5]))(8)
bn (V ) = 0.5 exp[−(57 + V )
40
). (9)
The gating variable w is represented by
dw
dt=
(w∞(V ) − w)τw (V )
(10)
w∞(V ) =1
(1 + exp([−(V + 35)/10]))(11)
τw (V ) =400
(3.3 exp ([(V +35)/20])+exp([−(V + 35)/20])).
(12)
Synaptic currents were modeled as follows:
Isyn,α = giαsi,tot(Vα − Vin) + geαse,tot(Vα − Vex) (13)
for α = {e, i}.Reversal potentials for AMPA and GABAA were Vex = 0 mV
and Vin = −80 mV, respectively. The synaptic gates satisfy:
sα,tot =1
N∝
∑∝−cells
s∝ (14)
dsα
dt= aα
(1 + tanh
(Vα
4
))(1 − sα ) −
(sα
τα
)(15)
where ae = 20/ms, ai = 1/ms, τe = 2.4 ms, and τ i = 12 ms.The inhibitory GABAA conductances, gie and gii are 5 mS/cm2
and 10 mS/cm2 , respectively.The excitatory conductances were gee = 0.01 mS/cm2 and
gei = 0.05 mS/cm2 . The model time was 2000 ms and spiketrains were assessed after 1000 ms allowing a settlement periodof 1000 ms. Gaussian noise generated by a wiener process was
892 IEEE TRANSACTIONS ON BIOMEDICAL ENGINEERING, VOL. 59, NO. 3, MARCH 2012
added to the voltages at each integration step. The magnitude ofthe noise was 0.5 mV2 /ms for the e-cells. The equations wereintegrated using Euler’s method with a time step of 0.025 ms.
To achieve heterogeneity, the input currents (I0) were variedin the range from 0.6 to 2.0 μA/cm2 to the e-cells and from 1 to1.1 μA/cm2 to the i-cells. The release of neuromodulators suchas Acetylcholine (ACh) in the rest state is lower than that inthe active states. Low ACh increases the AHP currents (IAHP ).This motivates the choice of relatively strong AHP currents(IAHP ) [5].
1) Hypothesis Testing: Based on the local network model,we have investigated the effect of excitatory circuit disruption onthe beta band (13–30 Hz) power. To achieve our aim, we havefirst run the model with physiological (normal) values of allparameters for 25 trials. Then, we repeated the same procedure,but with the loss rate of e-cells varied in the interval (6–19)%,i.e., the number of e-cells (Ne ) varied in the interval (130–150).
The fast Fourier transform (FFT) technique has been appliedon the spiking train produced by each network setup to calculatethe power spectra within the beta frequency band (13–30 Hz).One-way repeated measures ANOVA has been used to analyzethe significance of the difference in beta band power betweenthe physiological (baseline) case and cases with an abnormalratio of e- to i-cells (corresponding to the AD groups). P valuesless than 0.05 indicate a significant difference.
B. Larger Network Model
Spiking dynamics of neurons were simulated based onIzhikevich’s model of spiking neurons [6], which can reproducethe firing patterns of all known types of hippocampal, cortical,and thalamic neurons. The spiking neuron can be expressed inthe form of ordinary differential (16)–(18):
dV
dt= 0.04V 2 + 5V + 140 − u + I (16)
du
dt= a(bV − u) (17)
with the auxiliary after-spike resetting
If V ≥ 30 mV, then V ← c, u ← u + d (18)
where the dimensionless variables V and u represent the mem-brane potential and the recovery variable of the neuron, re-spectively. The recovery variable u provides negative feedbackto V, and it corresponds to the inactivation of Na+ ionic cur-rents and activation of K+ ionic currents [6]. Dimensionlessparameters a, b, c, and d (illustrated in Fig. 1) can be tunedto simulate the dynamics of inhibitory and excitatory neurons.Parameter b describes the sensitivity of the recovery variableu to the subthreshold fluctuations of the membrane potentialV. Greater values of b couple V and u more strongly resultingin possible subthreshold oscillations and low-threshold spikingdynamics [6].
Spiking networks of 1000 neurons of different types, fullyand randomly connected to each other with no plasticity, weresimulated to investigate a number of hypotheses about the un-derlying causes of abnormal cortical oscillations in AD patients.
Fig. 1. Graphical representation of the influence of parameters a, b, c, andd on the spiking dynamics. (Electronic version of the figure and reproductionpermissions are freely available at www.izhikevich.com.)
TABLE ICASE STUDIES
The networks were stimulated by a random thalamic current ateach time step. We have used MATLAB to simulate the net-works in real time (resolution 1 ms). Setting the parametersof the model to physiological (normal) settings represents thephysiological case. The ratio of excitatory to inhibitory neuronsis 4 to 1 inspired by the anatomy of the mammalian cortex [6].Model time was 30000 ms; spike trains were analyzed after29000 ms allowing a settlement period (stability) of 29 s.
1) Hypothesis Testing: The model parameters are varied totest two hypotheses. The different group comparisons and asso-ciated parameter alterations have been categorized into the twocase studies described in Table I. The first hypothesis is related tovariations in the ratio of excitatory to inhibitory neurons in AD,while the second hypothesis is derived from AD observationsof functional deficits in K+ ionic channels in cortical neurons.Each hypothesis was investigated with a computational model,as presented in Table I; each model has a different setup so thatwe refer to these models as case studies, i.e., hypothesis 1 wasinvestigated in case study 1 and hypothesis 2 was investigatedin case study 2.
Hypothesis 1 relies on the loss of excitatory neurons thataffects the ratio of excitatory to inhibitory neurons in the corticalnetwork and decreases the excitatory current in the network asa possible cause of abnormal network oscillations.
Hypothesis 2 links unbalanced cortical activity to an unbal-anced negative feedback to the membrane potential. Specifically,it might result from dysfunctional K+ channels in excitatoryneurons during AD. Hypothesis 2 suggests that the enhance-ment of negative feedback in excitatory neurons can be involvedin abnormal oscillatory activity. This results in high-thresholdspiking dynamics and less spiking activity for excitatoryneurons.
To determine the overall rhythmic activity of the model in itscontrol (normal) context, 10 trials of the model are run, each

ABUHASSAN et al.: INVESTIGATING THE NEURAL CORRELATES OF PATHOLOGICAL CORTICAL NETWORKS IN ALZHEIMER’S DISEASE 893
Fig. 2. Mean beta band power (13–30 Hz) for a physiological case (baseline)and cases with reduced e-cells. Differences (P values) measured by ANOVAare presented in the figure. Black bars correspond to significant differences. Thenumber of trials is 25 for each setup.
with random input, therefore, representing 10 individuals; thehealthy control group. The model parameters are then modifiedto test each hypothesis. Again the model is run 10 times foreach test, with each test representing a group with a certainneuropathology.
The FFT tool has been applied on the spiking train producedby each model to calculate the power spectra within the follow-ing frequency bands: delta (1–3 Hz), theta (4–7 Hz), alpha (8–12 Hz), beta1 (13–18 Hz), beta2 (19–21 Hz), beta3 (22–30 Hz),gamma (30–50 Hz), and full (1–70 Hz) bands; the categorizationfor the frequency bands is based on [19].
One-way repeated measures ANOVA has been used to an-alyze statistical significance of the difference in band powerwithin each frequency band across the different groups, as out-lined previously, P values smaller than 0.05 were consideredstatistically significant.
III. RESULTS
A. Decrease in Beta Band Power Induced by Loss of ExcitatoryNeurons and Synapses in the Local Network Model
A significant decrease in beta band power was observed afterthe excitatory circuit looses more than 20 e-cells (number ofe-cells becomes ≤139, loss rate ≥13%, P < 0.05), as illustratedin Fig. 2.
We refer to this point as a breakdown point since the powerspectra of beta rhythm exhibits a significant decrease after thispoint. In the network model, the death of each e-cell is associatedwith a synaptic loss of 319 excitatory synapses (1% loss ofexcitatory synapses) since the network is fully connected (eache-cell receives 159 e-synapses, innervates 159 e-cells, and hasone recurrent synapse with itself).
The same response point appears after varying the networksetup as follows: settlement period is increased to 2 s and powerspectra differences are assessed based on the spike trains col-lected after second 2 until second 4. Thus, model time is 4 s.
B. Effects of Varying the Number of Excitatory Neurons on theOscillatory Activity of the Larger Network Model
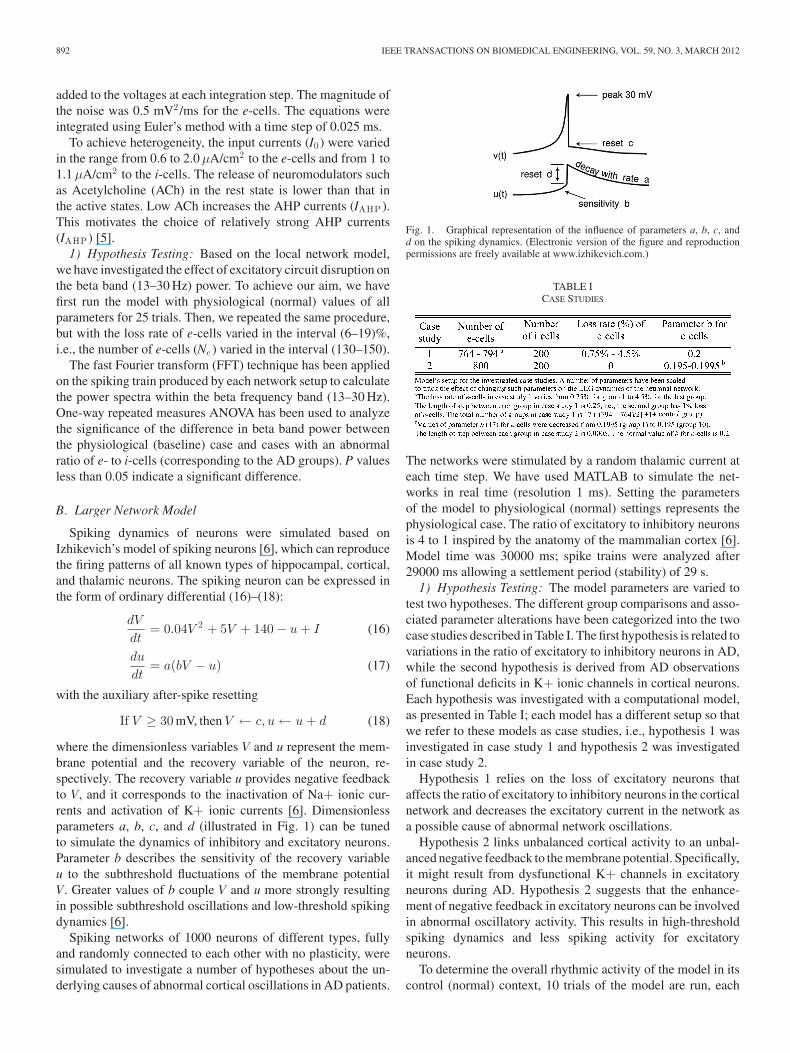
In case study 1, the power spectrum averages of alpha andbeta3 bands are significantly decreased when decreasing thenumber of e-cells (Ne ) from 794 to 764 (loss% of e-cells is
TABLE IIMEAN POWER SPECTRA IN CASE STUDY 1
increased from 0.75% to 4.5%). It is expected that reducingNe increases the amount of inhibition in the network and slowsdown the spiking activity, which explains the significant changesin the full band. From Table II, we can see that delta (slowrhythm) was not significantly affected, in contrast to the higherfrequency bands.
Decrease percentage is calculated according to the followingformula:
Decrease%=(
([Control value]−[Minimum value])[Control value]
)100%.
(19)The minimum mean value was calculated by comparing themean value of the power spectrum in the corresponding fre-quency band across all groups (each group contains 10 trials) incase study 1. We speculate that the power spectrum is shiftedto lower frequencies with a parallel decrease in the coherenceof fast rhythms, see Fig. 3(a). The statistical analyses show thatthe significant decrease started in beta3 band power (Ne = 782,2.25% loss in e-cells).
This observation can be further explained by inspecting theminimum values of the power spectrum averages for slower andfaster frequency bands, as given in Table II. The mean values ofpower spectrum for alpha and delta frequency band power forthe groups in case study 1 are also presented in Fig. 3(b) and(c), respectively. The analyses show that the power spectrumin delta, theta, beta1, and beta2 bands was not significantlydecreased.
C. Effects of Varying Parameter b for e-Cells on the OscillatoryActivity of the Larger Network Model
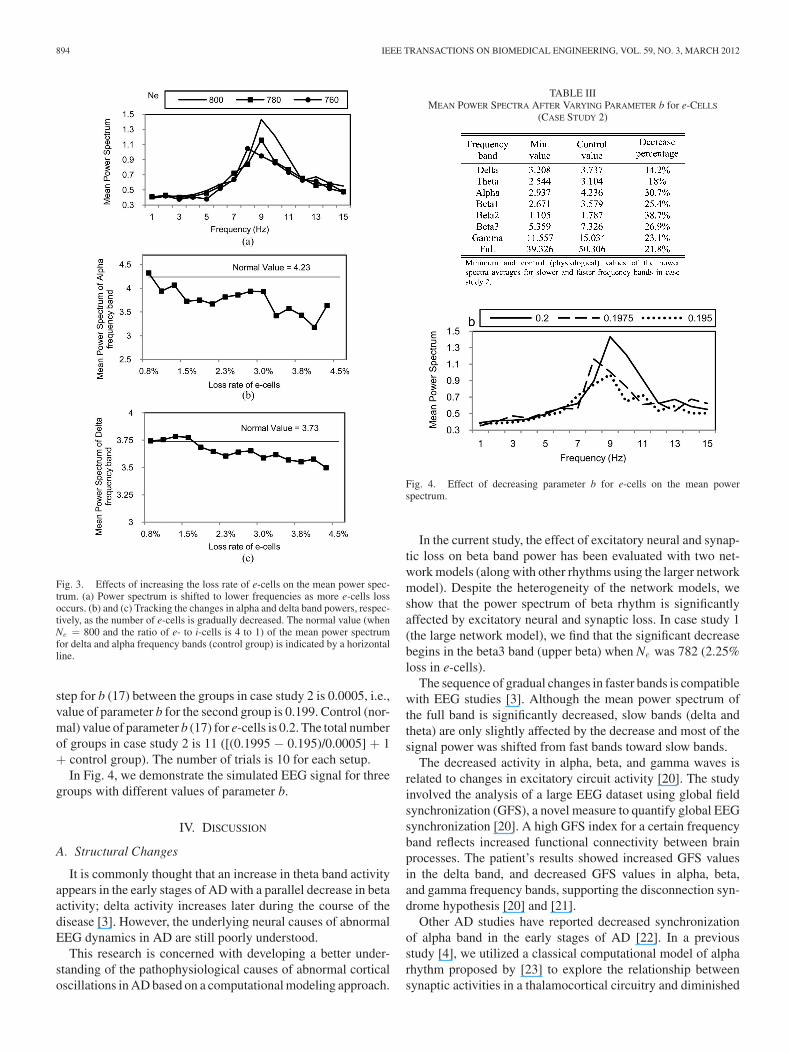
The datasets in case study 2 contained important informationabout the magnitude of mean power ranges in high frequencybands. As presented in Table III, there are higher shifts fromalpha, beta1, beta2, and beta3 band powers than slower fre-quency bands similar to previous observations for case study 1outlined previously. The beta2 band is the most affected one.Again, decreasing parameter b (17) for e-cells upregulates thenegative feedback u to the membrane potential V (16), whichresults in high-threshold spiking dynamics and decreases thespiking activity of e-cells. This accounts for the activation ofK+ ionic currents and inactivation of Na+ ionic currents [6].
Values of parameter b (17) for e-cells were decreased from0.1995 (group 1) to 0.195 (group 10). The length of decreasing
894 IEEE TRANSACTIONS ON BIOMEDICAL ENGINEERING, VOL. 59, NO. 3, MARCH 2012
Fig. 3. Effects of increasing the loss rate of e-cells on the mean power spec-trum. (a) Power spectrum is shifted to lower frequencies as more e-cells lossoccurs. (b) and (c) Tracking the changes in alpha and delta band powers, respec-tively, as the number of e-cells is gradually decreased. The normal value (whenNe = 800 and the ratio of e- to i-cells is 4 to 1) of the mean power spectrumfor delta and alpha frequency bands (control group) is indicated by a horizontalline.
step for b (17) between the groups in case study 2 is 0.0005, i.e.,value of parameter b for the second group is 0.199. Control (nor-mal) value of parameter b (17) for e-cells is 0.2. The total numberof groups in case study 2 is 11 ([(0.1995 − 0.195)/0.0005] + 1+ control group). The number of trials is 10 for each setup.
In Fig. 4, we demonstrate the simulated EEG signal for threegroups with different values of parameter b.
IV. DISCUSSION
A. Structural Changes
It is commonly thought that an increase in theta band activityappears in the early stages of AD with a parallel decrease in betaactivity; delta activity increases later during the course of thedisease [3]. However, the underlying neural causes of abnormalEEG dynamics in AD are still poorly understood.
This research is concerned with developing a better under-standing of the pathophysiological causes of abnormal corticaloscillations in AD based on a computational modeling approach.
TABLE IIIMEAN POWER SPECTRA AFTER VARYING PARAMETER b for e-CELLS
(CASE STUDY 2)
Fig. 4. Effect of decreasing parameter b for e-cells on the mean powerspectrum.
In the current study, the effect of excitatory neural and synap-tic loss on beta band power has been evaluated with two net-work models (along with other rhythms using the larger networkmodel). Despite the heterogeneity of the network models, weshow that the power spectrum of beta rhythm is significantlyaffected by excitatory neural and synaptic loss. In case study 1(the large network model), we find that the significant decreasebegins in the beta3 band (upper beta) when Ne was 782 (2.25%loss in e-cells).
The sequence of gradual changes in faster bands is compatiblewith EEG studies [3]. Although the mean power spectrum ofthe full band is significantly decreased, slow bands (delta andtheta) are only slightly affected by the decrease and most of thesignal power was shifted from fast bands toward slow bands.
The decreased activity in alpha, beta, and gamma waves isrelated to changes in excitatory circuit activity [20]. The studyinvolved the analysis of a large EEG dataset using global fieldsynchronization (GFS), a novel measure to quantify global EEGsynchronization [20]. A high GFS index for a certain frequencyband reflects increased functional connectivity between brainprocesses. The patient’s results showed increased GFS valuesin the delta band, and decreased GFS values in alpha, beta,and gamma frequency bands, supporting the disconnection syn-drome hypothesis [20] and [21].
Other AD studies have reported decreased synchronizationof alpha band in the early stages of AD [22]. In a previousstudy [4], we utilized a classical computational model of alpharhythm proposed by [23] to explore the relationship betweensynaptic activities in a thalamocortical circuitry and diminished

ABUHASSAN et al.: INVESTIGATING THE NEURAL CORRELATES OF PATHOLOGICAL CORTICAL NETWORKS IN ALZHEIMER’S DISEASE 895
Fig. 5. Upregulation of IK by β-amyloid 25–35 in cortical e-cells [24].(Reproduced with permission from S.P. Yu.)
alpha power. In [4], it was found that the deterioration in ex-citatory synaptic pathways during AD biased the dynamics to-ward increased inhibitory activity and affected alpha rhythmicactivity.
In this study, we first traced the changes in alpha band powerafter the structural impairments in the excitatory circuit (casestudy 1). We observe similar changes in alpha band power, asproposed in [4]; see Fig. 3(a). Then, we further explored theconsequences of functional deficits in excitatory circuits (casestudy 2) on alpha band power, see Fig. 4.
According to the simulation results, we speculate that thefunctional deficits of ionic channels contribute to abnormal al-pha band power in AD.
B. Functional Changes
It was demonstrated that cortical neuronal death is mediatedby the enhancement of outward K+ current and such enhance-ment might specifically contribute to the pathogenesis of Aβ-induced neuronal death [24].
The results in [24] showed that Aβ fragment 1–42 or 25–35exposure induce an upregulation in the delayed rectifier K+current IK , an increase in maximal conductance, and a shift inits activation voltage relationship toward hyperpolarized levels,see Fig. 5.
Cortical neuronal cultures that contained cells from differ-ent layers of cortex were used in the experiments. The cellswere excitatory because they responded to N-methyl D-aspartate(NMDA) or glutamate stimulation [24].
The upregulation of this type of K+ currents provides a morenegative feedback to the membrane potential of e-cells followedby neuronal death. We speculate that the neural mechanism thatunderlies the sequence of abnormal changes into EEG of ADcan be described by inspecting the results in case study 2, whichshowed a parallel significant decrease in different bands with ahigher shift from upper frequency band powers, in particular,the power spectrum of beta2 and alpha rhythms. The significantdecrease within beta band power appears also (before otherrhythms) when decreasing Ne , followed by a breakdown in otherfrequency bands when Ne decreases more and more (increasedrate of neuronal and synaptic death).
V. CONCLUSION
The impairment of excitatory circuitry appears to play animportant role in abnormal oscillatory activity of the neuronalnetworks and this is supported by our study, which uses simplenetwork models. Furthermore, the observation that the deathof e-cells is preceded by dysfunctional behavior and changesin the ionic channels has been investigated in the study. Thedynamical changes of the rhythmicity in the network as a resultof alterations in the negative feedback for membrane potential ine-cells have been focused on. Future investigations will be basedon a network consisting of 100 000 cortical neurons, distributionof axonal conduction delays, long-term spike-timing-dependentsynaptic plasticity, receptor kinetics, and short-term plasticity.The network structure will be informed by the organization ofthe cerebral cortex [25].
REFERENCES
[1] R. Brookmeyer, E. Johnson, K. Ziegler-Graham, and H. M. Arrighi, “Fore-casting the global burden of Alzheimer’s disease,” Alzheimer’s Dementia,vol. 3, pp. 186–191, 2007.
[2] C. W. Zhu and M. Sano, “Economic considerations in the managementof Alzheimer’s disease,” Clin. Interventions Aging, vol. 1, pp. 143–154,2006.
[3] J. Jeong, “EEG dynamics in patients with Alzheimer’s disease,” Clin.Neurophysiol., vol. 115, pp. 1490–1505, 2004.
[4] B. Sen, D. Coyle, and L. Maguire, “A thalamo–cortico–thalamic neuralmass model to study alpha rhythms in Alzheimer’s disease,” Neural Netw.Special Issue Brain Disorders, vol. 24, pp. 631–645, 2011.
[5] O. Jensen, P. Goel, N. Kopell, M. Pohja, R. Hari, and B. Ermentrout,“On the human sensorimotor-cortex beta rhythm: Sources and modeling,”NeuroImage, vol. 26, pp. 347–355, 2005.
[6] E. M. Izhikevich, “Simple model of spiking neurons,” IEEE Trans. NeuralNetw., vol. 14, no. 6, pp. 1569–1572, Nov. 2003.
[7] D. J. Selkoe, “Alzheimer’s disease is a synaptic failure,” Science, vol. 298,pp. 789–791, 2002.
[8] J. P. Brion, “Neurofibrillary tangles and Alzheimer’s disease,” Eur. Neu-rol., vol. 40, pp. 130–140, 1998.
[9] J. A. Hardy and G. A. Higgins, “Alzheimer’s disease: The amyloid cascadehypothesis,” Science, vol. 256, pp. 184–185, 1992.
[10] A. Pannaccione, F. Boscia, A. Scorziello, A. Adornetto, P. Castaldo, R.Sirabella, M. Taglialatela, G. F. Di Renzo, and L. Annunziato, “Up-regulation and increased activity of KV3.4 channels and their accessorysubunit MinK-related peptide 2 induced by amyloid peptide are involvedin apoptotic neuronal death,” Mol. Pharmacol., vol. 72, pp. 665–673,2007.
[11] Y. Pan, X. Xu, X. Tong, and X. Wang, “Messenger RNA and proteinexpression analysis of voltage-gated potassium channels in the brain ofAbeta(25-35)-treated rats,” J. Neurosci. Res., vol. 77, pp. 94–99, 2004.
[12] L. D. Plant, N. J. Webster, J. P. Boyle, M. Ramsden, D. B. Freir, C. Peers,and H. A. Pearson, “Amyloid beta peptide as a physiological modulator ofneuronal ‘A’-type K+ current,” Neurobiol. Aging, vol. 27, pp. 1673–1683,2006.
[13] S. G. Birnbaum, A. W. Varga, L.-L. Yuan, A. E. Anderson, J. D. Sweatt, andL. A. Schrader, “Structure and function of Kv4-family transient potassiumchannels,” Physio. Rev., vol. 84, pp. 803–833, 2004.
[14] K. Abuhassan, D. Coyle, and L. Maguire, “Simple spiking networks toinvestigate pathophysiological basis of abnormal cortical oscillations inAlzheimer’s disease,” Irish J. Med. Sci., vol. 180, suppl. 2, pp. 62, 2011.
[15] K. Abuhassan, D. Coyle, and L. Maguire, “Employing neuronal networksto investigate the pathophysiological basis of abnormal cortical oscilla-tions in Alzheimer’s disease,” in Proc. 33rd Annu. IEEE Eng. Med. Biol.Soc. Conf., Boston, MA, 2011, pp. 2065–2068.
[16] X. Zou, D. Coyle, K. Wong-Lin, and L. Maguire, (2011, Jun.). Com-putational study of hippocampal-septal theta rhythm changes due tobeta-amyloid-altered ionic channels, PloS ONE [Online], 6(6). Available:http://dx.plos.org/10.1371/journal.pone.0021579.
[17] V. Braitenberg and A. Schuz, Anatomy of the Cortex: Statistics and Ge-ometry. Berlin, Germany: Springer Verlag, 1991.

896 IEEE TRANSACTIONS ON BIOMEDICAL ENGINEERING, VOL. 59, NO. 3, MARCH 2012
[18] S. R. Jones, D. J. Pinto, T. J. Kaper, and N. Kopell, “Alpha-frequencyrhythms desynchronize over long cortical distances: A modeling study,”J. Comput. Neurosci., vol. 9, pp. 271–291, 2000.
[19] Y.-M. Park, H.-J. Che, C.-H. Im, H.-T. Jung, S.-M. Bae, and S.-H. Lee,“Decreased EEG synchronization and its correlation with symptom sever-ity in Alzheimer’s disease,” Neurosci. Res., vol. 62, pp. 112–117, 2008.
[20] T. Koenig, L. Prichep, T. Dierks, D. Hubl, L. O. Wahlund, E. R. John, andV. Jelic, “Decreased EEG synchronization in Alzheimer’s disease and mildcognitive impairment,” Neurobiol. Aging, vol. 26, pp. 165–171, 2005.
[21] X. Li, D. Coyle, L. Maguire, D. Watson, and T. McGinnity, “Grey matterconcentration and effective connectivity changes in Alzheimer’s disease:A longitudinal structural MRI study,” Neuroradiology, vol. 53, pp. 733–748, 2011.
[22] J. L. Cantero, M. Atienza, A. Cruz-Vadell, A. Suarez-Gonzalez, and E. Gil-Neciga, “Increased synchronization and decreased neural complexity un-derlie thalamocortical oscillatory dynamics in mild cognitive impairment,”NeuroImage, vol. 46, pp. 938–948, 2009.
[23] F. H. Lopes da Silva, A. Hoeks, H. Smits, and L. H. Zetterberg, “Model ofbrain rhythmic activity. The alpha-rhythm of the thalamus,” Kybernetik,vol. 15, pp. 27–37, 1974.
[24] S. P. Yu, Z. S. Farhangrazi, H. S. Ying, C. H. Yeh, and D. W. Choi, “En-hancement of outward potassium current may participate in beta-amyloidpeptide-induced cortical neuronal death,” Neurobiol. Dis., vol. 5, pp. 81–88, 1998.
[25] E. Izhikevich, J. Gally, and G. Edelman, “Spike-timing dynamics of neu-ronal groups,” Cereb. Cortex, vol. 14, pp. 933–944, 2004.
Kamal Abuhassan received a B.S. degree in com-puter science from Mu’tah University, Karak, Jordan,in 2002, and a M.S. degree in computer science fromthe University of Jordan, Amman, Jordan, in 2007.He is currently working toward the Ph.D. degree atthe Intelligent Systems Research Centre, Universityof Ulster, Derry, U.K.
He has more than six years of experience in devel-oping Service Oriented Architecture and J2EE ap-plications using JAVA and IBM tools. He has beenwith Oracle and IBM partner companies in Jordan.
He has Sun Certified Java Programmer, Sun Certified Java Web ComponentsDeveloper, Sun Certified Web Services Developer, and IBM Web Content Man-agement certifications. He is involved in developing models using MATLABand C++ with message passing interface. His main research interests includethe investigation of abnormal brain oscillation’s biomarkers in Alzheimer’s dis-ease with computational modeling of neuronal networks.
Mr. Abuhassan has a research paper published in the 33rd Annual IEEEEngineering in Medicine and Biology Society Conference, Boston, MA.
Damien Coyle (M’05) received a first class degree incomputing and electronic engineering and the Ph.D.degree in intelligent systems engineering from theUniversity of Ulster, Derry, U.K., in 2002 and 2006,respectively.
Since 2006, he has been a Lecturer at the Schoolof Computing and Intelligent Systems, University ofUlster, where he is also a member of the IntelligentSystems Research Centre. His research interests in-clude brain-computer interfaces, computational intel-ligence, computational neuroscience and biomedical
signal processing and he has coauthored several journal articles and book chap-ters in these areas.
Dr. Coyle is the 2008 recipient of the IEEE Computational Intelligence So-ciety’s (CIS) Outstanding Doctoral Dissertation Award and the 2011 recipientof the International Neural Network Society’s Young Investigator of the YearAward. He received the University of Ulster’s Distinguished Research Fellow-ship award in 2011. He coordinates the IEEE CIS Chapters activities and chairsthe UKRI IEEE CIS Chapter. He is inaugural chair of the IEEE CIS Brain-Computer Interface Task Force.
Liam P. Maguire received M.Eng. and Ph.D. de-grees in electrical and electronic engineering fromthe Queen’s University, Belfast, U.K., in 1988 and1991, respectively.
He is currently the Head of the School ofComputing and Intelligent Systems, University ofUlster, Derry, U.K, where he is also the leader ofthe Bioinspired Systems and Neuroengineering Re-search Team within the Intelligent Systems ResearchCentre. He has an established track record of secur-ing research funding, approximately £10M, since his
appointment and has also supervised 15 Ph.D. and 3 M.Phil. students to com-pletion. He is the author of more than 200 research papers including 70 journalpapers. His research interests include fundamental research in bioinspired in-telligent systems (such as the development of computational effective spikingneural networks) and the application of existing intelligent techniques in differ-ent domains.