Investigating the Function of Accepted Companies in the Stock Exchange for the Extraction Industry...
13
Entrepreneurship and Innovation Management Journal http://absronline.org/journals p-ISSN: 2310-0079, e-ISSN: 2311-1836 Volume: 2, Issue: 2 (May 2014), Pages: 145-157 © Academy of Business & Scientific Research *Corresponding author: Mohammad Hakkak, Assistant Professor, Management Department, Lorestan University, Khoram Abad, Iran E-Mail: [email protected] 145 Investigating the Function of Accepted Companies in the Stock Exchange for the Extraction Industry of Iron Mines through Fuzzy Topsis Method Mohammad Hakkak 1 *, Marjan Etemadi 2 , Hamid Abdi 3 , and Mohammad Ali Hajizadeh Gashti 4 1. Assistant Professor, Management Department, Lorestan University, Khoram Abad, Iran 2. Faculty of Management, Payam Noor University, West Tehran Branch, Tehran, Iran 3. MBA (strategic),Payamnoor University, Karaj Branch, Iran 4. Faculty of Management (FM), University Teknologi Malaysia, Malaysia The role of stock exchange is so crucial in the investment market. Since the accepted companies in the stock exchange make this process active, it is fundamental to investigate their functions and status and select the best option for the investment. In the present study the best method to rank the accepted companies in the stock exchange of the extraction industry has been applied. At the first step the elitism method has been used to select the most effective indexes to compare the above mentioned companies. Theses selected indexes include: ROA, the ratio of debts to properties as a leveraging ratio, the ratio of sale to asset, currencies, and P/E. At the second step, the companies engaged in this industry are ranked through “Fuzzy Topsis” method, based on the elites’ comments and by having an overview on the literature review of the mentioned ratios. The findings of the previous studies show that the first ranking belongs to the mineral and industrial company of “Chader Melo” with “Kachad” trade mark. Keywords: Multiple criteria Fuzzy, decision making, Fuzzy Topsis, Elitism method, Tehran stock exchange, extraction industry of iron mines, ranking INTRODUCTION Following the reduction of money markets’ attraction, and full capacity of the circulating capitals on one hand and also defective profitability methods and the increase of wealth in this market, especially in Iran, on the other hand, though had a crucial role in itself, the investment market entered into the scene as an assistance to reduce the gap and put an end to the uncertainty regarding investigating, and also to lead the main reasons of inflammation which include the resources of circulating capitals in people’s hand, to the best places of investment. Stock exchange not only has the central role, but also has the most salient responsibility. The stock exchange, at one hand, accepts the active and efficient companies based on the codified rules and regularities, and at the other hand plans the necessary programs for future activities. The accepted companies’ bonds in the stock exchange, as their representative and the entrepreneurs’ corporation share, are good means for valorization and thus selecting the bonds from the best companies may sometimes bring an
Transcript of Investigating the Function of Accepted Companies in the Stock Exchange for the Extraction Industry...

Entrepreneurship and Innovation Management Journal http://absronline.org/journals p-ISSN: 2310-0079, e-ISSN: 2311-1836 Volume: 2, Issue: 2 (May 2014), Pages: 145-157 © Academy of Business & Scientific Research
*Corresponding author: Mohammad Hakkak, Assistant Professor, Management Department, Lorestan University, Khoram Abad, Iran
E-Mail: [email protected]
145
Investigating the Function of Accepted Companies in the Stock Exchange for the Extraction Industry of Iron Mines through
Fuzzy Topsis Method
Mohammad Hakkak1*, Marjan Etemadi2, Hamid Abdi3, and Mohammad Ali Hajizadeh
Gashti4
1. Assistant Professor, Management Department, Lorestan University, Khoram Abad, Iran
2. Faculty of Management, Payam Noor University, West Tehran Branch, Tehran, Iran
3. MBA (strategic),Payamnoor University, Karaj Branch, Iran
4. Faculty of Management (FM), University Teknologi Malaysia, Malaysia
The role of stock exchange is so crucial in the investment market. Since the accepted companies in the stock exchange make this process active, it is fundamental to investigate their functions and status and select the best option for the investment. In the present study the best method to rank the accepted companies in the stock exchange of the extraction industry has been applied. At the first step the elitism method has been used to select the most effective indexes to compare the above mentioned companies. Theses selected indexes include: ROA, the ratio of debts to properties as a leveraging ratio, the ratio of sale to asset, currencies, and P/E. At the second step, the companies engaged in this industry are ranked through “Fuzzy Topsis” method, based on the elites’ comments and by having an overview on the literature review of the mentioned ratios. The findings of the previous studies show that the first ranking belongs to the mineral and industrial company of “Chader Melo” with “Kachad” trade mark.
Keywords: Multiple criteria Fuzzy, decision making, Fuzzy Topsis, Elitism method, Tehran stock exchange, extraction industry of iron mines, ranking
INTRODUCTION
Following the reduction of money markets’ attraction, and full capacity of the circulating capitals on one hand and also defective profitability methods and the increase of wealth in this market, especially in Iran, on the other hand, though had a crucial role in itself, the investment market entered into the scene as an assistance to reduce the gap and put an end to the uncertainty regarding investigating, and also to lead the main reasons of inflammation which include the resources of circulating capitals in people’s hand,
to the best places of investment. Stock exchange not only has the central role, but also has the most salient responsibility. The stock exchange, at one hand, accepts the active and efficient companies based on the codified rules and regularities, and at the other hand plans the necessary programs for future activities. The accepted companies’ bonds in the stock exchange, as their representative and the entrepreneurs’ corporation share, are good means for valorization and thus selecting the bonds from the best companies may sometimes bring an

Investigating the function of accepted companies in the stock exchange Hakkak et al.
146
amount of benefit or loss to the owners. In this way ranking the accepted companies in the stock exchange is extremely crucial. Since exploring all these companies in the stock exchange is not possible in this article, therefore the companies of “Iron mine extraction” industry are selected. 8% of the market share is allocated to these companies which are 8 out of more than 500 accepted companies in the stock exchange. This can work as a convenient sample to generalize the results to other companies.
Making preferences for these companies to help entrepreneurs to select the bonds of the superior companies and consequently providing a portfolio with reasonable profits should be investigated regarding companies and markets’ status. Many indexes would affect these preferences, thus they cannot be considered all together. Moreover, some of the indexes are qualitative rather than quantitative and thus make it impossible to involve them into the present comparison. However, selecting the best indexes from among various indexes can bring the results close to the reality and make it impossible to rely on the results to some extent.
Working constantly and having different experiences and consequences, active experts in the investment market have a prospecting view in mind which cannot be occupied by common people even through studying various financial and investing books. Therefore the comments of those experts who are active in the investment market and also elitism methods has been utilized to select the best indexes related to this category.
The fuzzy Topsis method has been used to rank the mentioned industrial companies. This is a quantitative method applying through quantitative experts’ information. As can be seen, like elitism method which is used to select indexes, in the Fuzzy Topsis method the experts’ comments have been also applied and their specific information has been inferred in the assessment. The whole assessment and calculations will be explained in the present article.
REVIEW OF LITERATURE In the decision making science, one solution from among a variety of solutions should be selected or
the solutions should be ranked. After world war two and by the advent of system management method and operational investigation science, quantitative decision making techniques were popular, but nowadays these techniques encounter some limitations in practice. New MADM logarithms could eliminate these limitations by presenting the appropriate practical logarithms (2009, December).
Two main groups of different methods in information processing of one MADM issue has been presented in the literature review: one group of the methods has been taken from a method called non-compensation method and another group has been taken from a method called compensation model.
A) Non-compensation model: includes some methods in which exchanges between indexes between indexes are not allowed, that is one weakness in one index would not be compensate with another index.
B) Compensation model: includes those methods in which exchanges between indexes are allowed, that is a change in one index can be compensated by opposite change in another index. Compensation model: includes those methods in which exchanges between indexes are allowed, that is a change in one index can be compensated by opposite change in another index.
In 2005, the Fuzzy Topsis method was used to select the stock exchange in turkey. In the present study, at first 22 companies were selected for the stock exchange, then the stocks has been selected based on seven criteria and the Fuzzy Topsis method (Tiryaki, 2995).
Ourtagul and Karkasuglu used the sequential Fuzzy analysis and Topsis to analyze financial operation. The first method was applied to assess the used weights. Through these weights, 15 companies of Turkish Cement industry were ranked (Ertugrul, 2007). For investigating and selecting industrial projects, before investing, financial and technical information would be used. In this article it has been tried to select the convenient and new method to opt for the best investment. As a result, four techniques of: The current net value, the analysis of the rate of return and its profits or losses, and the period of the investment restoration has been used as the criteria
Entrep. innov. manag. j. p-ISSN: 2310-0079, e-ISSN: 2311-1836 Volume: 2, Issue: 2, Pages: 145-157
147
of Topsis techniques (Salehi, 2008, Nawaser et al., 2011).
Vang used the multiple purpose Fuzzy analysis to rank companies and assess financial operation of Taiwan airlines (Wang. 2008). In 2009, Hatami used SWOT method and analyzed weaknesses and strengths, threats and opportunities. He identified some weaknesses to select the proper strategies. In recent years some of the multiple criterion decision makings such as “Analytic Hierarchy Process” and “Analytic Network Process”, eliminate some of the weaknesses, but the nature of these methods are too complicated to commit strategies. Thus, Fuzzy Topsis variables were used for assessment and ranking (Hatami, 2009, Jahanshahi et al., 2011). The fuzzy Topsis has been used to select the best alternative from among investment choices of three criteria: market value of the company, the amount of the exchange shares, (Osman, 2011). Also many studies have been conducted on the internal cases: financial leverage, activity, profitability and growth. Different groups utilize financial indexes, groups such as the owners of financial indexes, investors, opponents, and etc. These groups have different and opposed aims; therefore they assess the financial ratios from their point of view (mehrani, 2003). Moemeni and Najafi weighed financial indexes through anthropy method. Then they distinguished the companies’ rank of 170 in 13 separated industries in Tehran stock exchange (Moemeni, 2003). In 2008, the revised version of Topsis had been used to select a model for investing in the industry and mines bank. That version had the capability to consider the sequence of criteria and sub-criteria. Also because of the certainty in some of the criteria, the Fuzzy view is at the center of this method (Phlevani, 2009).
In 2009, Danesh Shakib used the compositional (AHP-Topsis) method to rank cement companies in Tehran stock exchange based on the financial data of the companies’ financial operation from 2001-2007 (Danesh Shakib, 2009). In 2010, Rafaee considered the designed model of the compositional Fuzzy Topsis method and basis Fuzzy method to rank the considered stock. 21 companies of the stock exchange companies were investigated in this study (Rafaee, 2010).
METHODOLOGY
First step_ selecting the indexes
Initially, it is possibly obvious to distinguish the main financial ratios, but of course it can be easy to some extent, to distinguish the most important ratio for some ratios such as leverage or current ratio, but it is not obvious for the most of the other ratios such as profitability ratios which are the comparison between profit to rights of the owners’ exchange (ROE), and profit to asset (ROA), and there is a debate over this issue among experts. The elitism method was applied for selecting the best indexes to commit ranking. Based on the most of the experts’ comments, the classification of the financial ratios was applied. In this way, the financial ratios were divided and classified into five main groups which are presented in table 1.
TABLE 1 HERE
From among each of these groups the most important index was selected based on the experts’ comments and opinions. The results of the elitism method are presented in table 2.
TABLE 2 HERE
Second step_ selecting the investigated industry
Since it is not possible to investigate all the accepted companies in this article, it is more reasonable to choose one sample which can be a representative of the general stock of the companies.
The industry of “Iron mines extraction” which includes eight active companies, allocates a little percent among all the accepted companies (more than 500 companies). However, it plays an important role in the market value (about 8%), thus this would be a good reason to select it as a sample. Another merit of this industry for being selected would be appeared in the Fuzzy Topsis method. Since in this method the experts should comment and judge a company based on the quantitative information of each company in relation to the different indexes, if the number of the companies would be more than a limit, the persistence and validity of data would be decreased, because it would need more time to be increased by the number of the companies.

Investigating the function of accepted companies in the stock exchange Hakkak et al.
148
Therefore the Iron mines extraction industry, with up to eight companies, is a perfect choice.
Third step_ presenting the companies’ information to the experts and collecting quantitative data
Following the index selection, little information was extracted relating to the indexes for each company, together with the average of each indexes’ industry in 2009. This information was presented to the experts in a questionnaire, to write their comments for announcing the project through Fuzzy Topsis method. Result of the questionnaire is presented in table 3.
TABLE 3 & 4 HERE
Table 3_financial information of the decision making indexes in 2009, with the average of the industry for each index.
Fuzzy numbers Theory_ the Fuzzy numbers which were asserted by Lotfian in 1965 (Lotfian, 1965), is related the mathematic expressions of qualitative status which are in uncertainty, and make it feasible to analyze these qualitative status in mathematic environment. In the two last tables the way of changing qualitative status to qualitative numbers and then to Fuzzy triangular numbers, is presented.
The Fuzzy number has been presented in table 5 as follow:
TABLE 5 & 6 HERE
The entrance of acquired information to Fuzzy Topsis_ the following data are available to announce the assessment:
Dt (t=1,…,d)- Decision maker t or experts (d=6)
Ai (i=1,…,m)- Decision making alternatives which are the accepted companies in the stock exchange for Iron mine extraction industry. (m=8)
Cj (j=1,…,n)- Decision making indexes which are (n=5) in this industry.
( )
number is added up from the quantitative information of the experts’ comments. These numbers are presented in table 4.
∑
(∑
∑
∑
)
In continue the way of creating this matrix is presented.
The entrance of collected qualitative data from the experts in a Fuzzy number table
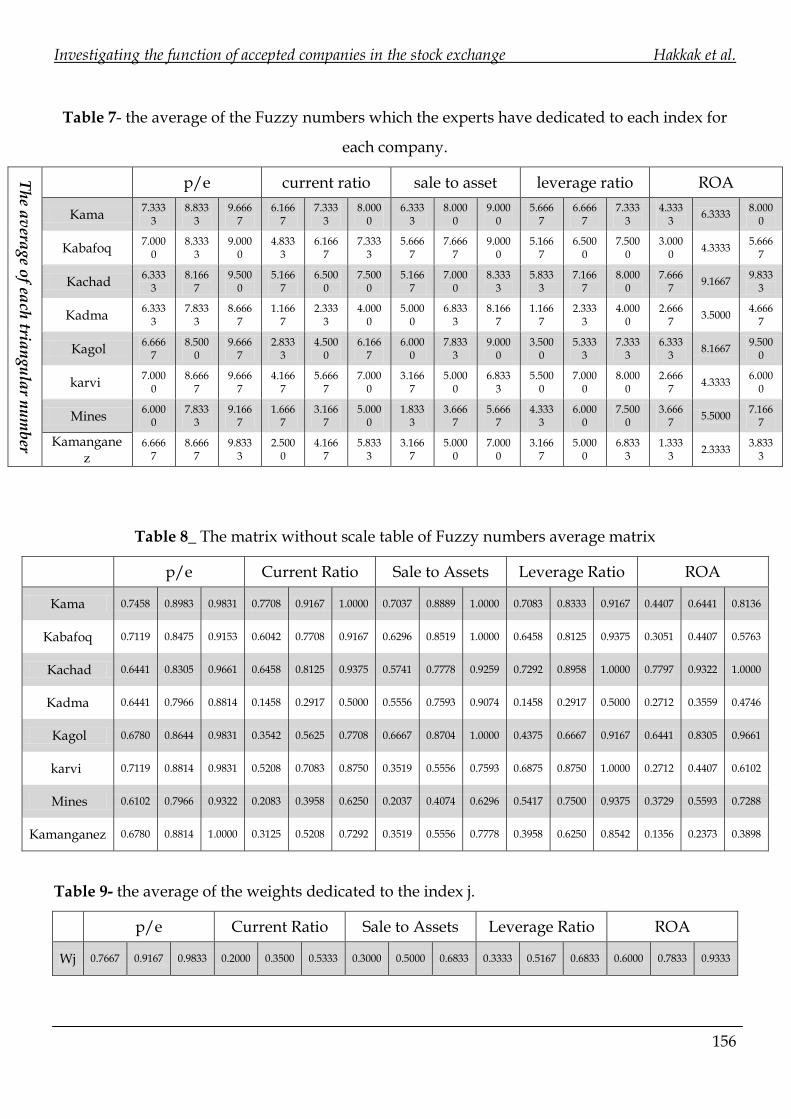
The average of Fuzzy numbers, presented in table_ Based on the information of the entrance table, the matrix table is extracted [Lij]. The table of the average Fuzzy numbers that experts are dedicated to each index for each company is presented below.
TABLE 7 HERE
Making the numbers without scale through linear method- In this step, the indexes are making without scale based on the division of them to two groups of cost (c ) and benefit (B). The methods for two groups are different as follow:
)1) If C
(
)
( )

Entrep. innov. manag. j. p-ISSN: 2310-0079, e-ISSN: 2311-1836 Volume: 2, Issue: 2, Pages: 145-157
149
(2) If B
(
)
( )
The is calculated separately for related to
each index ( i is fix).
In the present study all the criterions are considered as “benefits”. One of the indexes is the leverage ratio for which a ratio of the stock owners’ rights to asset has been considered to change it to a benefit index. Thus, all our indexes are benefit indexes and the formula number 2 is used.
The matrix table is as follow:
TABLE 8 HERE
The experts_ Based on the data of the table 5 and 7, the extracted Fuzzy numbers and the average of these weighs are calculated as below:
w_j=〖AVG〗_(t=1)^d q_tj
TABLE 9 HERE
Creation of the equal matrix without scale- The equal matrix without scale is created from the matrix [rij] multiply matrix [wj], table 11_ Fuzzy matrix without scale.
TABLE 10 HERE
Conforming the distance between positive and negative ideals- for calculating these two distances act as follow:
Positive ideal collection)
{ } *( ) ( ) ( ) ( ) ( )+
Negative ideal collection)
{ } *( ) ( ) ( ) ( ) ( )+
The distance from the positive ideal)
∑ √ ⁄ [( ) ( )
( ) ]
The distance from the negative distance
∑ √ ⁄ [( )
( ) ( )
]
Closeness of the alternative to the ideal status_ to this end the following formula is used:
1
Fuzzy ranking_ Based on the closeness confident (Cc1) and their sequence from the biggest to the smallest amount; the accepted companies in the stock exchange in the iron mine extraction industry are ranked.
TABLE 11 HERE
CONCLUSION
In this study, the accepted companies in the stock exchange for mine industry are investigated through proper qualitative methods and also quantitative analysis. Based on selecting the indexes using elitism method, the experts’ experiences in the financial markets were used for a superior goal. The experts always consider the index which has the most influential effects on decision making, however there were some style differences among them, but at last these special indexes were selected and used in this study.
The advantage of this method is the usage of the experts’ information which is not explored quantitatively by now, or cannot be expressed through numbers or mathematics. The experts evaluate this information implicitly by commenting on the index ratios, because their comments on the indexes are based on the same implicit, quantitative and hidden information. This kind of information is more valuable and efficient in ranking the indexes through Fuzzy Topsis method. As explained before, the experts specified the Fuzzy numbers based on the quantitative data of each index for each company. Moreover, they separately analyze other different factors which influence these companies. Besides the effect of the experts’ qualitative data, another reason which makes this market particular and unique is the consideration of the indexes’ effect in the companies’ sequential selection and decision making, as they are also different in the real world.
1 Closeness Coefficient

Investigating the function of accepted companies in the stock exchange Hakkak et al.
150
The obtained results from the elitism method shows that five superior indexes which gained more weights in compare to other indexes, include: current ratio, leverage ratio, sale to asset ratio, ROA, and P/E. With the extraction of the financial data of these ratio for each company and giving this information to the experts, the necessary qualitative data for applying the Fuzzy method was obtained. Moreover, for the validity of this information, two different groups of the experts were participated and commented in the elitism and Topsis methods. The results of all these processes are a well-formed and valid ranking which can guide and help the inventors to produce the best portfolio of the companies’ stocks. Moreover it can introduce new ideas and views to the market analyzers in order to carefully investigate the accepted companies in the stock exchange.
REFERENCES
Azar, A., 2000, “Practical Approach to Decision Making MADM, Fourth Edition, Tehran, Looking student publications.
Asgharpour, MJ, 2000, “Multi-criteria decision making, Eighth Edition, Tehran, Tehran University Atsharat
Chakib M., Fazli, zero, 2009, “Cement companies in Tehran Stock Exchange ranked using a combined approach” (AHP-TOPSIS), Landscape Management, No. 32, Autumn 1388, pp. 109-129
Ertugrul, I. and Karakasoglu, N. 2007, "Performance Evaluation of Turkish Cement firms with Fuzzy Analytic Hierarchy Process and TOPSIS Methods", Expert Systems with Applications, article in press.
5. Farhad, Babaei, A., 2010, “Design of a fuzzy multi-criteria decision model for ranking stocks in Tehran Stock Exchange, Journal of Industrial Management, Issue 14
Hatami-Marbini. Adel , Saati ,S., 2009, “An Application Of Fuzzy TOPSIS Method In
An SWOT Analysis” ,Mathematical Science,Vol.3,No.2,pp 173-190
Jahanshahi, A.A., Pitamber, B. K., Nawaser, K, 2010. “Issues and Challenges for Women Entrepreneurs in Global Scene with Special Reference to India”, Australian Journal of Basic and Applied Sciences 4(90), 4347-4356.
Jahanashahi, A.A., Nawaser, K., M.J. Paghaleh, S. Mohammad, S.M.S., Khaksar, The Role Government Policy and the Entrepreneurship in the Micro, Small and Medium Sized Enterprises in India: An Overview, Australian Journal of Basic and Applied Sciences, 5 (6).
Khaksar, S.M.S., Nawaser, K., Jahanashahi, A.A., Kamalian, A. R. “The Relation between After-Sales Services and Entrepreneurial Opportunities: Case Study of Iran-Khodor Company”, African Journal of Business Management, 5(13), 5152-5161.
LotfiZadeh, L. A. (1965) "Fuzzy sets", Information and Control, Vol. 8, pp. 338-353
M, S., M., K. 2003, “the relationship between profitability and return on equity ratios of listed companies in Tehran Stock Exchange, Accounting and Auditing Studies, No. 33, pp. 93-105
Momeni, M. and Najafi Moghadam, A., 2004, "Assessing the economic performance of listed companies in Tehran Stock Exchange by using TOPSIS" Economic Research Journal, No. 3, pp. 55
Nawaser, K., Khaksar, S.M.S., Shakhsian, F., and Jahanshahi,(2011) A. A. “Motivational and Legal Barriers of Entrepreneurship Development in Iran”, International Journal of Business and Management, Vol. 6, No. 11; Nov

Entrep. innov. manag. j. p-ISSN: 2310-0079, e-ISSN: 2311-1836 Volume: 2, Issue: 2, Pages: 145-157
151
Nadia Madi E., and Abu Osman M.D.T., 2011, “Fuzzy TOPSIS Method in The Selection Of Investment Boards By Incorporating Operational Risk”, World Congress on Engineering 2011 Vol
Pahlavani. A.,2009, “investment prioritization using hierarchical TOPSIS method for group decision-making in a fuzzy environment” , Journal of Technology Management, Volume One, Number 2, Summer 1388, pp. 35-54
Salehi.M, and Moghaddam, R.T., 2008, “Project Selection by Using a Fuzzy Topsis Technique”, World Academy of Science, Engineering and Technology pp0-40
16.Tiryaki F., Mehmet, A. 2005. “Fuzzy stock selection using a new fuzzy ranking and weighting algorithm”, Applied Mathematics and computation.17
Wang, Y. J. 2008, "Applying FMCDM to Evaluate Financial Performance of Domestic Airlines in Taiwan", Expert Systems with Applications, 34, 1837–1845.
Sadeghi, A.G., Nawaser, K., Vesal, S. M., Kazi, R. (2013). Which Organizational Culture Moves Towards Organizational Excellency, Asian Social Science 9 (11), 221-236.

Investigating the function of accepted companies in the stock exchange Hakkak et al.
152
APPENDIX
Table 1:
Based on the results and the assessment of the elitism method five elements of current ratio, debt ratio, circulation of assets, ROA, and P/E were chosen as the applied indexes.
classification of the financial ratios
Short-term financial potential ratio or liquidity
ratio
Long-term financial
potential ratio
Circulation of the assets ratio
Profitability ratios
Market value ratios
Current ratio
The moment ratio The cash ratio
Circuit capital ratio
Perseverance period
The debt ratio
The ratio of debt to the
rights of the stock owners
Long-term debt ratio
The times of
the interest cost coverage
Coverage of
the cash interest ratio
Circulation of inventory
Average of the inventory sale period
Circulation of the receipt
account
Average of the assets recovery period
Circulation of capital in the
pure circulation
Circulation of the fixed assets
Circulation of assets
Profit margin
ROA
ROE
The ratio of price to the revenue of
each P/E
The ratio of market
value to the book value
of each stock

Entrep. innov. manag. j. p-ISSN: 2310-0079, e-ISSN: 2311-1836 Volume: 2, Issue: 2, Pages: 145-157
153
Table- 2: financial information of the decision making indexes in 2009, with the average of the
industry for each index.
Accep
ted co
mp
anies in
the sto
ck ex
chan
ge fo
r Iron
min
e ex
traction
ind
ustry
ROA Leverage
Ratio
Sale to
Assets
Current Ratio P/E
aKaK
2009 28.6 68.97 0.7 2.46 13.4 Industry
acKnage 36.59 68.55 0.61 1.49 12.7
aKfKbaK
2009 16.73 73.15 0.85 5 20.3 Industry
acKnage 36.59 68.55 0.61 1.49 12.7
aKhdKt
2009 43.5 79.89 0.78 3.15 9.14 Industry
acKnage 36.59 68.55 0.61 1.49 12.7
aKtaK
2009 7.16 15.88 0.9 0.24 18.1 Industry
acKnage 36.59 68.55 0.61 1.49 12.7
aKcaK
2009 43.18 55.57 0.81 1.05 9 Industry
acKnage 36.59 68.55 0.61 1.49 12.7
aKnge
2009 17.71 83.44 0.2 2.27 10.1 Industry
acKnage 36.59 68.55 0.61 1.49 12.7
unera
2009 27.8 66.69 0.31 0.61 8.9 Industry
acKnage 36.59 68.55 0.61 1.49 12.7
کمنگنز
2009 9.17 47.28 0.42 0.93 11.6 Industry
acKnage 36.59 68.55 0.61 1.49 12.7

Investigating the function of accepted companies in the stock exchange Hakkak et al.
154
Table- 3: Result of the questionnaire is presented in the following table.
P/E Current Ratio Sale to Assets Leverage Ratio ROA
Ex
pert 1
Ex
pert 2
Ex
pert 3
Ex
pert 4
Ex
pert 5
Ex
pert 6
Ex
pert 1
Ex
pert 2
Ex
pert 3
Ex
pert 4
Ex
pert 5
Ex
pert 6
Ex
pert 1
Ex
pert 2
Ex
pert 3
Ex
pert 4
Ex
pert 5
Ex
pert 6
Ex
pert 1
Ex
pert 2
Ex
pert 3
Ex
pert 4
Ex
pert 5
Ex
pert 6
Ex
pert 1
Ex
pert 2
Ex
pert 3
Ex
pert 4
Ex
pert 5
Ex
pert 6
aKa
K VG VG MG G VG MG G VP VG VG VG F G F VG VG G F VG VP G VG VG P G F F G MG M
aKf
Kba
K MG VG VG VG VG M F VP VG MG VG F G F G G G F VG VP MG VG G M VG G M M VP P
aKh
dKt G G MG MG MG VG F VP VG G VG F G P G G G F VG P G VG VG M VG G VG VG G MG
aKt
aK F VG VG G VG M F VP F VP M P G F M VG G F F F VP M P VP VG G P P VP VP
aKc
aK G G MG MG G VG F VP F G F M G F G VG G F MG M MG MG MG P G MG VG G MG MG
aKn
ge MG VG G MG G VG F VP VG G F F G MG M MG P M VG P G G VG M G G P M M P
une
ra G MG G F MG VG F VP F M F P MG P F M M M G P MG G G P VG M F F MG M
KaK
nKr G MG G G G G MG VP M G M M MG P MG MG F M G M F MG F P G P M VP P VP
Table- 4: Weightage to the Indexes
Av
era
ge
of th
e w
eig
hts
de
dica
ted
to th
e in
de
xe
s
P/E Current
Ratio Sale to Assets
Leverage Ratio ROA
Expert 1 H MH H VH H
Expert 2 VH VL ML M MH
Expert 3 MH ML ML M MH
Expert 4 H M M M MH
Expert 5 VH L M ML VH
Expert 6 VH M M ML MH
Table- 5:

Entrep. innov. manag. j. p-ISSN: 2310-0079, e-ISSN: 2311-1836 Volume: 2, Issue: 2, Pages: 145-157
155
Fuzzy numbers Guide
(Triangular)
7 VG Very Good (9،01،01)
6 G Good (7،9،01)
5 M
G
Relatively Good (5،7،9)
4 F Average (3،5،7)
3 M Relatively Poor (0،3،5)
2 P Poor (1،0،3)
0 VP Very Poor (1،1،0)
Furthermore, various assessments are presented and explained by these kinds of numbers.
Table- 6:
7 VH Very High (1.9،0،0)
6 H High (1.7،1.9،0)
5 MH Relatively High (1.5،1.7،1.9)
4 M Average (1.3،1.5،1.7)
3 ML Relatively Low (1.0،1.3،1.5)
2 L Low (1،1.0،1.3)
0 VL Very Low (1،1،1.0)
Investigating the function of accepted companies in the stock exchange Hakkak et al.
156
Table 7- the average of the Fuzzy numbers which the experts have dedicated to each index for
each company.
Th
e av
erage o
f each
trian
gula
r nu
mb
er
p/e current ratio sale to asset leverage ratio ROA
Kama 7.333
3 8.833
3 9.666
7 6.166
7 7.333
3 8.000
0 6.333
3 8.000
0 9.000
0 5.666
7 6.666
7 7.333
3 4.333
3 6.3333
8.0000
Kabafoq 7.000
0 8.333
3 9.000
0 4.833
3 6.166
7 7.333
3 5.666
7 7.666
7 9.000
0 5.166
7 6.500
0 7.500
0 3.000
0 4.3333
5.6667
Kachad 6.333
3 8.166
7 9.500
0 5.166
7 6.500
0 7.500
0 5.166
7 7.000
0 8.333
3 5.833
3 7.166
7 8.000
0 7.666
7 9.1667
9.8333
Kadma 6.333
3 7.833
3 8.666
7 1.166
7 2.333
3 4.000
0 5.000
0 6.833
3 8.166
7 1.166
7 2.333
3 4.000
0 2.666
7 3.5000
4.6667
Kagol 6.666
7 8.500
0 9.666
7 2.833
3 4.500
0 6.166
7 6.000
0 7.833
3 9.000
0 3.500
0 5.333
3 7.333
3 6.333
3 8.1667
9.5000
karvi 7.000
0 8.666
7 9.666
7 4.166
7 5.666
7 7.000
0 3.166
7 5.000
0 6.833
3 5.500
0 7.000
0 8.000
0 2.666
7 4.3333
6.0000
Mines 6.000
0 7.833
3 9.166
7 1.666
7 3.166
7 5.000
0 1.833
3 3.666
7 5.666
7 4.333
3 6.000
0 7.500
0 3.666
7 5.5000
7.1667
Kamanganez
6.6667
8.6667
9.8333
2.5000
4.1667
5.8333
3.1667
5.0000
7.0000
3.1667
5.0000
6.8333
1.3333
2.3333 3.833
3
Table 8_ The matrix without scale table of Fuzzy numbers average matrix
p/e Current Ratio Sale to Assets Leverage Ratio ROA
Kama 0.7458 0.8983 0.9831 0.7708 0.9167 1.0000 0.7037 0.8889 1.0000 0.7083 0.8333 0.9167 0.4407 0.6441 0.8136
Kabafoq 0.7119 0.8475 0.9153 0.6042 0.7708 0.9167 0.6296 0.8519 1.0000 0.6458 0.8125 0.9375 0.3051 0.4407 0.5763
Kachad 0.6441 0.8305 0.9661 0.6458 0.8125 0.9375 0.5741 0.7778 0.9259 0.7292 0.8958 1.0000 0.7797 0.9322 1.0000
Kadma 0.6441 0.7966 0.8814 0.1458 0.2917 0.5000 0.5556 0.7593 0.9074 0.1458 0.2917 0.5000 0.2712 0.3559 0.4746
Kagol 0.6780 0.8644 0.9831 0.3542 0.5625 0.7708 0.6667 0.8704 1.0000 0.4375 0.6667 0.9167 0.6441 0.8305 0.9661
karvi 0.7119 0.8814 0.9831 0.5208 0.7083 0.8750 0.3519 0.5556 0.7593 0.6875 0.8750 1.0000 0.2712 0.4407 0.6102
Mines 0.6102 0.7966 0.9322 0.2083 0.3958 0.6250 0.2037 0.4074 0.6296 0.5417 0.7500 0.9375 0.3729 0.5593 0.7288
Kamanganez 0.6780 0.8814 1.0000 0.3125 0.5208 0.7292 0.3519 0.5556 0.7778 0.3958 0.6250 0.8542 0.1356 0.2373 0.3898
Table 9- the average of the weights dedicated to the index j.
p/e Current Ratio Sale to Assets Leverage Ratio ROA
Wj 0.7667 0.9167 0.9833 0.2000 0.3500 0.5333 0.3000 0.5000 0.6833 0.3333 0.5167 0.6833 0.6000 0.7833 0.9333

Entrep. innov. manag. j. p-ISSN: 2310-0079, e-ISSN: 2311-1836 Volume: 2, Issue: 2, Pages: 145-157
157
Table-10:
p/e Current Ratio Sale to Assets Leverage Ratio ROA
Kama 0.571
8 0.823
4 0.966
7 0.154
2 0.320
8 0.533
3 0.211
1 0.444
4 0.683
3 0.236
1 0.430
6 0.626
4 0.264
4 0.504
5 0.759
3
Kabafoq 0.545
8 0.776
8 0.900
0 0.120
8 0.269
8 0.488
9 0.188
9 0.425
9 0.683
3 0.215
3 0.419
8 0.640
6 0.183
1 0.345
2 0.537
9
Kachad 0.493
8 0.761
3 0.950
0 0.129
2 0.284
4 0.500
0 0.172
2 0.388
9 0.632
7 0.243
1 0.462
8 0.683
3 0.467
8 0.730
2 0.933
3
Kadma 0.493
8 0.730
2 0.866
7 0.029
2 0.102
1 0.266
7 0.166
7 0.379
6 0.620
1 0.048
6 0.150
7 0.341
7 0.162
7 0.278
8 0.442
9
Kagol 0.519
8 0.792
4 0.966
7 0.070
8 0.196
9 0.411
1 0.200
0 0.435
2 0.683
3 0.145
8 0.344
4 0.626
4 0.386
4 0.650
6 0.901
7
karvi 0.545
8 0.807
9 0.966
7 0.104
2 0.247
9 0.466
7 0.105
6 0.277
8 0.518
8 0.229
2 0.452
1 0.683
3 0.162
7 0.345
2 0.569
5
Mines 0.467
8 0.730
2 0.916
7 0.041
7 0.138
5 0.333
3 0.061
1 0.203
7 0.430
2 0.180
6 0.387
5 0.640
6 0.223
7 0.438
1 0.680
2
Kamanganez 0.519
8 0.807
9 0.983
3 0.062
5 0.182
3 0.388
9 0.105
6 0.277
8 0.531
5 0.131
9 0.322
9 0.583
7 0.081
4 0.185
9 0.363
8
Table 11- Iron mine extraction companies’ ranking
Ta
ble o
f fina
l ran
kin
g
Companies’ Sign
Companies’ name Cci Ranking
Kachad Mineral & industrial company of Chader Melo
0.5179 1
Kama Bama 0.5010 2
K-gol Gole Gohar Iron Stone 0.4886 3
K_bafq Bafq 0.4548 4
Karooy Iran Zinc mines development
0.4390 5
mines Metal & mines development investment
0.4029 6
kimnisez Iran manganese mines 0.3812 7
ksez Damavand minerals 0.3520 8