
Introduction to Industrial Engineering
93
Introduction to Industrial Engineering
-
Upload
khangminh22 -
Category
Documents
-
view
2 -
download
0
Transcript of Introduction to Industrial Engineering

Introduction to Industrial Engineering


INTRODUCTION TO INDUSTRIAL ENGINEERING
BONNIE BOARDMAN
JANE FRASER
Mavs Open Press
Arlington

Introduction to Industrial Engineering by Bonnie Boardman is licensed under a Creative Commons Attribution 4.0 International License, except where otherwise noted.
CONTENTS
About the Publisher vii
About This Project ix
Acknowledgments xi
1. What is Industrial Engineering? 1
2. Teamwork 6
3. What is Problem Solving? 14
4. Big Ideas in Industrial Engineering 20
5. Using Models 25
6. Deming's 14 Points 30
7. People in the System 34
8. Systems Thinking 39
9. Lean Operations 44
10. The IE Approach 50
11. Organizations' Missions, Visions, and Values 58
12. Lifelong Learning 67
Links by Chapter 73
Derivative Notes 76
Image Credits 80

ABOUT THE PUBLISHER
ABOUT MAVS OPEN PRESS
Creation of this resource was supported by Mavs Open Press, operated by the University of Texas
at Arlington Libraries (UTA Libraries). Mavs Open Press offers no-cost services for UTA faculty,
staff, and students who wish to openly publish their scholarship. The Libraries’ program provides
human and technological resources that empower our communities to publish new open access
journals, to convert traditional print journals to open access publications, and to create or adapt open
educational resources (OER). Resources published by Mavs Open Press are openly licensed using
Creative Commons licenses and are offered in various e-book formats free of charge. Optional print
copies may be available through the UTA Bookstore or can be purchased through print-on-demand
services, such as Lulu.com.
ABOUT OER
OER are free teaching and learning materials that are licensed to allow for revision and reuse. They
can be fully self-contained textbooks, videos, quizzes, learning modules, and more. OER are distinct
from public resources in that they permit others to use, copy, distribute, modify, or reuse the content.
The legal permission to modify and customize OER to meet the specific learning objectives of a
particular course make them a useful pedagogical tool.
ABOUT PRESSBOOKS
Pressbooks is a web-based authoring tool based on WordPress, and it is the primary tool that Mavs
Open Press (in addition to many other open textbook publishers) uses to create and adapt open
textbooks. In May 2018, Pressbooks announced their Accessibility Policy, which outlines their efforts
and commitment to making their software accessible. Please note that Pressbooks no longer supports
use on Internet Explorer as there are important features in Pressbooks that Internet Explorer doesn’t
support.
The following browsers are best to use for Pressbooks:
• Firefox
• Chrome
INTRODUCTION TO INDUSTRIAL ENGINEERING vii

• Safari
• Edge
ABOUT THE PRINT VERSION
This publication was designed to work best online and features a number of hyperlinks in the text.
We have retained the blue font for hyperlinks in the print version to make it easier to find the URL in
the “Links by Chapter” section at the back of the book.
CONTACT US
Information about open education at UTA is available online. If you are an instructor who is using
this OER for a course, please let us know by filling out our OER Adoption Form. Contact us at
[email protected] for other inquires related to UTA Libraries publishing services.
viii BONNIE BOARDMAN
ABOUT THIS PROJECT
OVERVIEW
This book was created for an undergraduate Introduction to Industrial Engineering course at The
University of Texas at Arlington (UTA). The chapters give an overview of the profession and an
introduction to some of the tools used by industrial engineers. There are interactive content exercises
included at the end of most chapters. This interactive content aims to engage students in the content
as they are reading. The book will continue to revised and updated with new information as it
becomes necessary. More interactive content will be added to the end of each chapter in future
versions of the book.
CREATION PROCESS
For many years, I assigned chapters from Dr. Jane Fraser’s Introduction to Industrial Engineering
text available online. Each semester I would refine the chapters I would assign, have them read only
the parts that pertained to our class, and supplement the reading assignments with information from
other sources. My “customization by instruction” eventually became confusing even to me! That is
when I began exploring ways to more formally remix the various resources I had been using. An email
for a workshop on Open Educational Resources being offered by UTA’s library caught my attention,
and within weeks I had started putting together this text. I applied for, and received, a UTA’s
Coalition for Alternative Resources in Education for Students (CARES) grant and technical support
to help me with the creation process. That process involved remixing portions of Fraser’s text with
additional open source materials from Exploring Business produced by the University of Minnesota
Libraries Publishing, Introduction to Problem Solving Skills produced by the MIT Office of Digital
Learning, and my own original content. The book went through two semesters of “beta testing” by
undergraduate students. Students were asked to use Hypothesis, within the learning management
system to give feedback on the content of each chapters as well as to comment on any missing links or
confusing text. The text was also reviewed by staff of the Open Educational Resources Office, which
is part of UTA’s library system.
ABOUT THE AUTHOR
Bonnie Boardman is an Assistant Professor of Instruction and Undergraduate Program Director in
the Industrial, Manufacturing, and Systems Engineering Department at The University of Texas at
Arlington. Her primary research interest is in engineering education. She holds a B.S. and Ph.D.
in Industrial Engineering from The University of Arkansas and an M.S. in Industrial Engineering
from Texas A&M University. Dr. Boardman worked for the Logistics Support Agency, an agency
INTRODUCTION TO INDUSTRIAL ENGINEERING ix

of the Department of the Army, as a Senior Engineer. Other research interest areas include the
development of scheduling algorithms and decision support systems and adapting and applying
industrial engineering methodologies and techniques to the service industry. Dr. Boardman is active
in numerous technical and professional organizations.
x BONNIE BOARDMAN
ACKNOWLEDGMENTS
UTA CARES GRANT PROGRAM
Creation of this OER was funded by the UTA CARES Grant Program, which is sponsored by UTA
Libraries. Under the auspices of UTA’s Coalition for Alternative Resources in Education for Students
(CARES), the grant program supports educators interested in practicing open education through
the adoption of OER and, when no suitable open resource is available, through the creation of new
OER or the adoption of library-licensed or other free content. Additionally, the program promotes
innovation in teaching and learning through the exploration of open educational practices, such
as collaborating with students to produce educational content of value to a wider community.
Information about the grant program and funded projects is available online.
AUTHOR’S NOTE
I’d like to thank Dr. Jane M. Fraser who published her Introduction to Industrial Engineering online
under a Creative Commons License, long before I even knew what that meant. I’d also like to
thank Michelle Reed, UTA’s Director of Open Educational Resources for teaching me about that
license. Michelle and everyone else at UTA Libraries have been so very supportive, patient, and
knowledgeable. I can’t thank any of you enough.
PROJECT LEAD
Bonnie Boardman – Assistant Professor of Instruction, University of Texas at Arlington
CONTRIBUTING AUTHORS
Jane M. Fraser, Pueblo Makes
ADDITIONAL THANKS TO…
Michelle Reed, Kartik Mann and Prathvi Kanchan of UTA Libraries for assisting in the publication of
this resource.
ABOUT THE COVER
Brittany Griffiths, UTA Libraries’ Publishing Specialist, designed the cover for this OER. The image
used is “turned on flat screen monitor” by Chris Liverani found at Unsplash and is licensed under
Unsplash license that allows for both commercial and noncommercial use.
INTRODUCTION TO INDUSTRIAL ENGINEERING xi

CHAPTER 1.
WHAT IS INDUSTRIAL ENGINEERING?
CHAPTER TABLE OF CONTENTS
• Examples of Industrial Engineering Improvements
• IE Definition
• Efficiency vs. Effectiveness
• Goals of this Text
• Welcome to Industrial Engineering
• Chapter Exercise
EXAMPLES OF INDUSTRIAL ENGINEERING IMPROVEMENTS
Figure 1.1: IEs help hospitals run more efficiently
• An IE at a hospital worked with a team to redesign the process for cleaning an operating room
INTRODUCTION TO INDUSTRIAL ENGINEERING 1
and preparing it for the next operation. The time between scheduled operations was reduced
from 45 to 20 minutes. More operations can be scheduled in each operating room each day.
• A manufacturer of corporate jets opened a new facility to manufacture tail sections. An
industrial engineer (IE) laid out the new facility, including deciding where material would be
delivered, where each machine used in the manufacturing process would be located, how work
would flow through the facility, and where finished sections would be shipped from the facility.
• A large air chiller has a compressor that is housed in a steel cylinder. The cylinder was being
made by bending and welding two pieces of steel. An IE redesigned the cylinder and the
manufacturing process so that the cylinder is now made by bending and welding one piece of
steel. The manufacturing process takes less time and the cylinder is stronger.
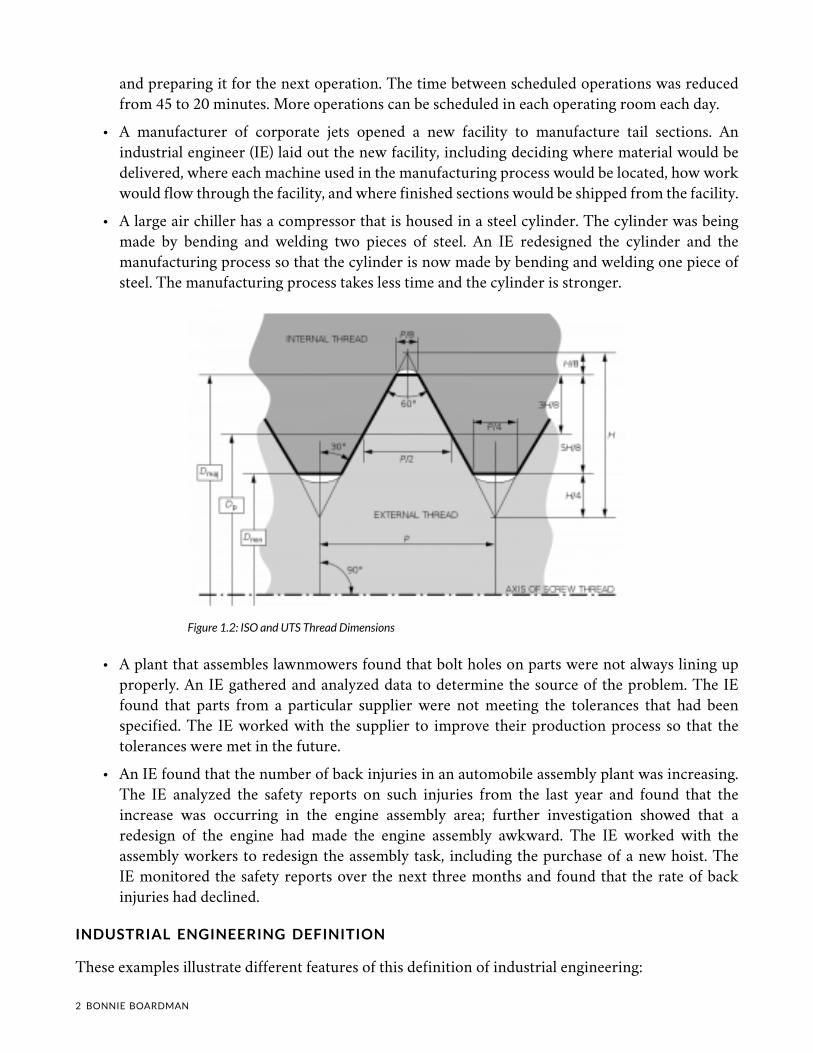
Figure 1.2: ISO and UTS Thread Dimensions
• A plant that assembles lawnmowers found that bolt holes on parts were not always lining up
properly. An IE gathered and analyzed data to determine the source of the problem. The IE
found that parts from a particular supplier were not meeting the tolerances that had been
specified. The IE worked with the supplier to improve their production process so that the
tolerances were met in the future.
• An IE found that the number of back injuries in an automobile assembly plant was increasing.
The IE analyzed the safety reports on such injuries from the last year and found that the
increase was occurring in the engine assembly area; further investigation showed that a
redesign of the engine had made the engine assembly awkward. The IE worked with the
assembly workers to redesign the assembly task, including the purchase of a new hoist. The
IE monitored the safety reports over the next three months and found that the rate of back
injuries had declined.
INDUSTRIAL ENGINEERING DEFINITION
These examples illustrate different features of this definition of industrial engineering:
2 BONNIE BOARDMAN
The design or improvement of a system of people, machines, information, and money to achieve
some goal with efficiency, quality, and safety.
Certain words are show in bold face in the definition:Design – Some industrial engineering tasks
involve the creation of a new facility, process, or system.
• Improvement – Most industrial engineering tasks involve the improvement of an existing
facility, process, or system.
• System – Most engineers design physical objects, but most IEs design systems. Systems
include physical components, but also include processes, rules, and people. Components of a
system have to work together. Material and information flow between the components of a
system. A change to one part of system may affect other parts of the system.
• People – Among all types of engineers, IEs think the most about people.
• Machines – An IE must select the appropriate machines – including computers.
• Information – Data can be used for immediate decision making but can also be analyzed to
make improvements to the system.
• Money – An IE must weigh costs and savings now against costs and savings in the future.
• Goal – Every designed system exists for some purpose. The IE must think about different
ways to accomplish that goal and select the best way.
• Efficiency – Whatever the goal of the system, the IE usually seeks to have the system achieve
that goal quickly and with the least use of resources.
• Quality – The IE’s organization always has a customer and the organization must deliver
goods and services to the customer with the quality that the customer wants.
• Safety – IEs have to make sure that the system is designed so that people can and will work
safely.
EFFICIENCY VS. EFFECTIVENESS
IEs are sometimes called efficiency engineers, but some think that effectiveness engineer is more
accurate. What is the difference between being efficient and being effective?
INTRODUCTION TO INDUSTRIAL ENGINEERING 3

Figure 1.3: The efficiency of a system
◦ An efficient process doesn’t waste any time or resources.
◦ An effective process produces a desired effect or contributes to a desired goal.
Two words in our definition of industrial engineering (efficiency and goal) relate to these two aspects
of an IE’s job. A process can be effective but not efficient if the process could be done as effectively
but in less time or with fewer resources; for example, the time to produce a product might be reduced
without any loss of customer satisfaction with the product. A process can be efficient but not effective;
for example, a department that efficiently produces reports that no one uses is not effective.
The words in bold face in the definition also indicate areas that an IE must learn about. An IE must
know how to answer questions like these:
• Design and improvement – Where should a facility be located? How should all the
components be laid out physically? What operating procedures should be used?
• System – How should the tasks be allocated among different parts of the system? How should
material and information flow among the different components of a system?
• People – What are people good at? What types of tasks should not be assigned to people? How
can jobs be designed so that people can do their jobs quickly, safely, and well?
• Machines – What types of machines are available to do different tasks, including the
movement and storage of material and information?
• Information – How can data be used to determine how well the system is functioning?
• Money – How can we trade off costs and savings that occur at different times, maybe over a
number of years?
• Goal – What is the goal of this system? What are the different ways a system could achieve
that goal?
4 BONNIE BOARDMAN
• Efficiency – How can we produce products and services with the least amount of time and
resources?
• Quality – How can we make sure that the system is consistently producing goods and services
that meet customer needs?
• Safety – How can we keep people from making mistakes? How can we protect people from
hazards in the work place?
GOALS OF THIS TEXT
After you have read this book, you should have:
• An understanding of the types of work IEs do in different types of organizations.
• The ability to explain to others what IEs do,
• The ability to market yourself as an IE,
• An overview of the topics in a BSIE curriculum,
• An understanding of the context in which IEs work, including global and societal issues,
• A commitment to professional and ethical behavior now and in the future, and
• Improved professional skills, especially oral and written communication skills and teamwork
skills.
This course will not turn you into an IE since you can’t learn all the knowledge and skills that an IE
needs in just one semester, but it will start you on your way to becoming an IE. You will have the Big
Picture of industrial engineering, so that the ideas you learn in later courses fit together.
WELCOME TO INDUSTRIAL ENGINEERING
Being an IE is very satisfying because you can create an efficient and safe workplace where people
are proud of the high quality products and services they produce. IEs improve efficiency, which
means that we help bring prosperity. IEs improve quality, which means that we help provide good
products and services. And IEs improve safety, which means that we help protect people. You should
be very proud that you plan to become an IE. According to the bumper sticker version of industrial
engineering, IEs make things better.
EXERCISE
Which list is better if becoming an Industrial Engineer is your number one priority?
An interactive or media element has been excluded from this version of the text. You can view it online
here:
https://uta.pressbooks.pub/industrialengineeringintro/?p=20
INTRODUCTION TO INDUSTRIAL ENGINEERING 5
CHAPTER 2.
TEAMWORK
CHAPTER TABLE OF CONTENTS
• Some Key Characteristics of Teams
• Why Organizations Build Teams
• Factors in Effective Teamwork
• Group Cohesiveness
• Groupthink
• Why Teams Fail
• The Team and Its Members
• What Skills does the Team Need?
• What Roles do Team Members Play?
• Class Team Projects
• Exercises
A team (or a work team) is a group of people with complementary skills who work together to achieve
a specific goal (Thompson1). “A group,” suggests Bonnie Edelstein, a consultant in organizational
development, “is a bunch of people in an elevator. A team is also a bunch of people in an elevator, but
the elevator is broken.” This distinction may be a little oversimplified, but a team is clearly something
more than a mere group of individuals. In particular, members of a group—or, more accurately, a
working group—go about their jobs independently and meet primarily to share information. A group
of department-store managers, for example, might meet monthly to discuss their progress in cutting
plant costs, but each manager is focused on the goals of his or her department because each is held
accountable for meeting only those goals. Teams, by contrast, are responsible for achieving specific
common goals, and they’re generally empowered to make the decisions needed to complete their
authorized tasks.
1. Thompson, L. L., Making the Team: A Guide for Managers (Upper Saddle River, NJ: Pearson Education, 2008), 4.
6 INTRODUCTION TO INDUSTRIAL ENGINEERING
SOME KEY CHARACTERISTICS OF TEAMS
To keep matters in perspective, let’s identify five key characteristics of work teams (Thompson2;
Alderfer, et. al.3):
1. Teams are accountable for achieving specific common goals. Members are collectively
responsible for achieving team goals, and if they succeed, they’re rewarded collectively.
2. Teams function interdependently. Members cannot achieve goals independently and must
rely on each other for information, input, and expertise.
3. Teams are stable. Teams remain intact long enough to finish their assigned tasks, and each
member remains on board long enough to get to know every other member.
4. Teams have authority. Teams possess the decision-making power to pursue their goals and to
manage the activities through which they complete their assignments.
5. Teams operate in a social context. Teams are assembled to do specific work for larger
organizations and have the advantage of access to resources available from other areas of their
organizations.
WHY ORGANIZATIONS BUILD TEAMS
Why do major organizations now rely more and more on teams to improve operations? Executives at
Xerox have reported that team-based operations are 30 percent more productive than conventional
operations. General Mills says that factories organized around team activities are 40 percent more
productive than traditionally organized factories. According to in-house studies at Shenandoah Life
Insurance, teams have cut case-handling time from twenty-seven to two days and virtually eliminated
service complaints. FedEx says that teams reduced service errors (lost packages, incorrect bills) by 13
percent in the first year (Fisher4; Greenberg & Baron
5).
FACTORS IN EFFECTIVE TEAMWORK
First, let’s begin by identifying several factors that, in practice, tend to contribute to effective
teamwork. Generally speaking, teams are effective when the following factors are met (Whetten &
Cameron6):
• Members depend on each other. When team members rely on each other to get the job done,
team productivity and efficiency are high.
• Members trust one another. Teamwork is more effective when members trust each other.
• Members work better together than individually. When team members perform better as a
2. Thompson, L. L., Making the Team: A Guide for Managers (Upper Saddle River, NJ: Pearson Education, 2008), 4.
3. Alderfer, C. P., “Group and Intergroup Relations,” in Improving Life at Work, ed. J. R. Hackman and J. L. Suttle (Palisades, CA:
Goodyear, 1977), 277–96
4. Fisher, K., Leading Self-Directed Work Teams: A Guide to Developing New Team Leadership Skills, rev. ed. (New York: McGraw-
Hill Professional, 1999).
5. Greenberg, J., and Robert A. Baron, Behavior in Organizations, 9th ed. (Upper Saddle River, NJ: Pearson Education, 2008), 315–16
6. Whetten, D. A., and Kim S. Cameron, Developing Management Skills, 7th ed. (Upper Saddle River, NJ: Pearson Education, 2007),
497.
INTRODUCTION TO INDUSTRIAL ENGINEERING 7

group than alone, collective performance exceeds individual performance.
• Members become boosters. When each member is encouraged by other team members to do
his or her best, collective results improve.
• Team members enjoy being on the team. The more that team members derive satisfaction
from being on the team, the more committed they become.
• Leadership rotates. Teams function effectively when leadership responsibility is shared over
time.
Most of these explanations probably make pretty clear intuitive sense. Unfortunately, because such
issues are rarely as clear-cut as they may seem at first glance, we need to examine the issue of group
effectiveness from another perspective—one that considers the effects of factors that aren’t quite so
straightforward.
GROUP COHESIVENESS
The idea of group cohesiveness refers to the attractiveness of a team to its members. If a group is high
in cohesiveness, membership is quite satisfying to its members; if it’s low in cohesiveness, members
are unhappy with it and may even try to leave it. The principle of group cohesiveness, in other words,
is based on the simple idea that groups are most effective when their members like being members of
the group (George & Jones7; Festinger
8).
Numerous factors may contribute to team cohesiveness, but in this section, we’ll focus on five of the
most important:
1. Size. The bigger the team, the less satisfied members tend to be. When teams get too large,
members find it harder to interact closely with other members; a few members tend to
dominate team activities, and conflict becomes more likely.
2. Similarity. People usually get along better with people like themselves, and teams are generally
more cohesive when members perceive fellow members as people who share their own
attitudes and experience.
3. Success. When teams are successful, members are satisfied, and other people are more likely to
be attracted to their teams.
4. Exclusiveness. The harder it is to get into a group, the happier the people who are already in it.
Status (the extent to which outsiders look up to a team, as well as the perks that come with
membership) also increases members’ satisfaction.
5. Competition. Members value membership more highly when they’re motivated to achieve
common goals—especially when those goals mean outperforming other teams.
A cohesive team with goals that are aligned with the goals of the organization is most likely to
succeed. There’s such a thing as too much cohesiveness. When, for instance, members are highly
motivated to collaborate in performing the team’s activities, the team is more likely to be effective in
7. George, J. M., and Gareth R. Jones, Understanding and Managing Organizational Behavior, 5th ed. (Upper Saddle River, NJ: Pearson
Education, 2008), 371–77.
8. Festinger, L., “Informal Social Communication, Psychological Review 57 (1950): 271–82.
8 BONNIE BOARDMAN
achieving its goals. Clearly, when those goals are aligned with the goals of the larger organization, the
organization, too, will be happy. If, however, its members get too wrapped up in more immediate team
goals, the whole team may lose sight of the larger organizational goals toward which it’s supposed to
be working.
GROUPTHINK
Likewise, it’s easier for leaders to direct members toward team goals when members are all on the
same page—when there’s a basic willingness to conform to the team’s rules and guidelines. When
there’s too much conformity, however, the group can become ineffective: It may resist change and
fresh ideas and, what’s worse, may end up adopting its own dysfunctional tendencies as its way
of doing things. Such tendencies may also encourage a phenomenon known as groupthink—the
tendency to conform to group pressure in making decisions, while failing to think critically or to
consider outside influences.
Groupthink is often cited as a factor in the explosion of the space shuttle Challenger in January 1986:
Engineers from a supplier of components for the rocket booster warned that the launch might be
risky because of the weather but were persuaded to reverse their recommendation by NASA officials
who wanted the launch to proceed as scheduled (Griffin9).
WHY TEAMS FAIL
Teams don’t always work. To learn why, let’s take a quick look at four common obstacles to success in
introducing teams into an organization (Greenberg & Baron10
):
• Unwillingness to cooperate. Failure to cooperate can occur when members don’t or won’t
commit to a common goal or set of activities. What if, for example, half the members of a
product-development team want to create a brand-new product and half want to improve an
existing product? The entire team may get stuck on this point of contention for weeks or even
months.
• Lack of managerial support. Every team requires organizational resources to achieve its goals,
and if management isn’t willing to commit the needed resources—say, funding or key
personnel—a team will probably fall short of those goals.
• Failure of managers to delegate authority. Team leaders are often chosen from the ranks of
successful supervisors—first-line managers who, give instructions on a day-to-day basis and
expect to have them carried out. This approach to workplace activities may not work very well
in leading a team—a position in which success depends on building a consensus and letting
people make their own decisions.
• Failure of teams to cooperate. If you’re on a workplace team, your employer probably depends
on teams to perform much of the organization’s work and meet many of its goals. In other
words, it is, to some extent, a team-based organization, and as such, reaching its overall goals
requires a high level of cooperation among teams (Thompson11
). When teams can’t agree on
9. Griffin, E., “Groupthink of Irving Janis,” 1997, https://www.jstor.org/stable/3791464?seq=1#metadata_info_tab_contents (accessed
January 6, 2020).
10. Greenberg, J., and Robert A. Baron, Behavior in Organizations, 9th ed. (Upper Saddle River, NJ: Pearson Education, 2008), 317-18.
11. Thompson, L. L., Making the Team: A Guide for Managers (Upper Saddle River, NJ: Pearson Education, 2008), 323-24.
INTRODUCTION TO INDUSTRIAL ENGINEERING 9
mutual goals (or when they duplicate efforts), neither the teams nor the organization is likely
to meet with much success.
THE TEAM AND ITS MEMBERS
Like it or not, you’ll probably be given some teamwork assignments while you’re in college. More
than two-thirds of all students report having participated in the work of an organized team. Why
do we put so much emphasis on something that, reportedly, makes many students feel anxious and
academically drained? Here’s one college student’s practical-minded answer to this question:
“In the real world, you have to work with people. You don’t always know the people you work with, and you
don’t always get along with them. Your boss won’t particularly care, and if you can’t get the job done, your
job may end up on the line. Life is all about group work, whether we like it or not. And school, in many ways,
prepares us for life, including working with others” (Nichols12
).
She’s right. In placing so much emphasis on teamwork skills and experience, colleges are doing the
responsible thing—preparing students for the world that awaits them. A survey of Fortune 1000
companies reveals that 79 percent already rely on self-managing teams and 91 percent on various
forms of employee work groups. Another survey found that the skill that most employers value in new
employees is the ability to work in teams (Whetten & Cameron13
; Lawler14
). If you’re already trying
to work your way up an organizational ladder, consider the advice of former Chrysler Chairman
Lee Iacocca: “A major reason that capable people fail to advance is that they don’t work well with
their colleagues.” The importance of the ability to work in teams was confirmed in a survey of
leadership practices of more than sixty of the world’s top organizations (Fortune Magazine15
). When
top executives in these organizations were asked, “What causes high-potential leadership candidates
to derail? (stop moving up in the organization),” 60 percent of the organizations cited “inability to
work in teams.” Interestingly, only 9 percent attributed the failure of these executives to advance
to “lack of technical ability.” While technical skills will be essential in your getting hired into an
organization, your team skills will play a significant role in your ability to advance.
To be team-ready or not to be team-ready—that is the question. Or, to put it in plainer terms, the
question is not whether you’ll find yourself working as part of a team. You will. The question is
whether you’ll know how to participate successfully in team-based activities.
WHAT SKILLS DOES THE TEAM NEED?
Sometimes we hear about a sports team made up of mostly average players who win a championship
because of coaching genius, flawless teamwork, and superhuman determination (Robbins & Judge16
).
But not terribly often. In fact, we usually hear about such teams simply because they’re
12. Nichols, H., “Teamwork in School, Work and Life,” iamnext.com, 2003, http://www.iamnext.com/academics/groupwork.html
(accessed September 1, 2008).
13. Whetten, D. A., and Kim S. Cameron, Developing Management Skills, 7th ed. (Upper Saddle River, NJ: Pearson Education, 2007),
498-99.
14. Lawler, E. E., Treat People Right (San Francisco: Jossey-Bass, 2003).
15. Fortune Magazine, “What Makes Great Leaders: Rethinking the Route to Effective Leadership,” Findings from the Fortune
Magazine/Hay Group 1999 Executive Survey of Leadership Effectiveness, http://www.lrhartley.com/seminars/great-leaders.pdf
(accessed January 6, 2020).
16. Robbins, S. P., and Timothy A. Judge, Organizational Behavior, 13th ed. (Upper Saddle River, NJ: Pearson Education, 2009), 346–47.
10 BONNIE BOARDMAN
newsworthy—exceptions to the rule. Typically a team performs well because its members possess
some level of talent. This doesn’t mean, however, that we should reduce team performance to the mere
sum of its individual contributions: Members’ talents aren’t very useful if they’re not managed in a
collective effort to achieve a common goal.
In the final analysis, of course, a team can succeed only if its members provide the skills that need
managing. In particular, every team requires some mixture of three sets of skills:
• Technical skills. Because teams must perform certain tasks, they need people with the skills
to perform them. For example, if your project calls for a lot of math work, it’s good to have
someone with the necessary quantitative skills.
• Decision-making and problem-solving skills. Because every task is subject to problems, and because
handling every problem means deciding on the best solution, it’s good to have members who
are skilled in identifying problems, evaluating alternative solutions, and deciding on the best
options.
• Interpersonal skills. Because teams are composed of people, and because people need direction
and motivation and depend on communication, every group benefits from members who
know how to listen, provide feedback, and smooth ruffled feathers. The same people are
usually good at communicating the team’s goals and needs to outsiders.
The key to success is ultimately the right mix of these skills. Remember, too, that no team needs
to possess all these skills—never mind the right balance of them—from day one. In many cases, a
team gains certain skills only when members volunteer for certain tasks and perfect their skills in
the process of performing them. For the same reason, effective teamwork develops over time as team
members learn how to handle various team-based tasks. In a sense, teamwork is always work in
progress.
WHAT ROLES DO TEAM MEMBERS PLAY?
Like your teamwork skills, expect your role on a team to develop over time. Also remember that, both
as a student and as a member of the workforce, you’ll be a member of a team more often than a leader
. Team members, however, can have as much impact on a team’s success as its leaders.
The key is the quality of the contributions they make in performing nonleadership roles (Whetten &
Cameron17
).
What, exactly, are those roles? At this point, you’ve probably concluded that every team faces two
basic challenges:
1. Accomplishing its assigned task
2. Maintaining or improving group cohesiveness
Whether you affect the team’s work positively or negatively depends on the extent to which you help
17. Whetten, D. A., and Kim S. Cameron, Developing Management Skills, 7th ed. (Upper Saddle River, NJ: Pearson Education, 2007),
498-99.
INTRODUCTION TO INDUSTRIAL ENGINEERING 11
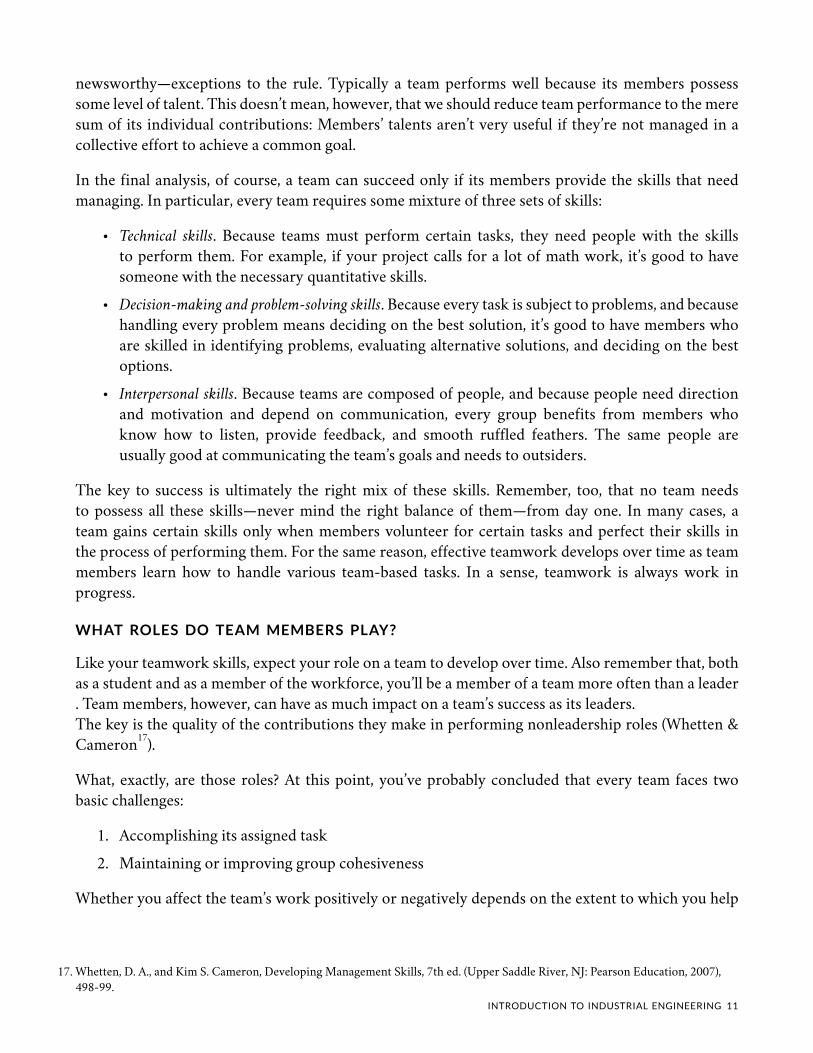
it or hinder it in meeting these two challenges (Whetten & Cameron18
). We can thus divide teamwork
roles into two categories, depending on which of these two challenges each role addresses. These two
categories (taskfacilitating roles and relationship-building roles) are summarized in the table below:
“Roles that Team Members Play”19
.
CLASS TEAM PROJECTS
As we highlighted earlier, throughout your academic career you’ll likely participate in a number of
team projects. Not only will you make lasting friends by being a member of a team, but in addition
you’ll produce a better product. To get insider advice on how to survive team projects in college (and
perhaps really enjoy yourself in the process), let’s look at some suggestions offered by two students
who have gone through this experience (Nichols20
; Feenstra21
).
• Draw up a team charter. At the beginning of the project, draw up a team charter (or contract)
that includes the goals of the group; ways to ensure that each team member’s ideas are
considered and respected; when and where your group will meet; what happens if a team
member skips meetings or doesn’t do his or her share of the work; how conflicts will be
resolved.
• Contribute your ideas. Share your ideas with your group; they might be valuable to the group.
The worst that could happen is that they won’t be used (which is what would happen if you
kept quiet).
• Never miss a meeting. Pick a weekly meeting time and write it into your schedule as if it were
a class. Never skip it. And make your meetings productive.
• Be considerate of each other. Be patient, listen to everyone, communicate frequently, involve
everyone in decision making, don’t think you’re always right, be positive, avoid infighting,
build trust.
• Create a process for resolving conflict. Do this before conflict arises. Set up rules to help the
group decide whether the conflict is constructive, whether it’s personal, or whether it arises
because someone won’t pull his or her weight. Decide, as a group, how conflict will be handled.
• Use the strengths of each team member. Some students are good researchers, others are good
writers, others have strong problem-solving or computer skills, while others are good at
generating ideas. Don’t have your writer do the research and your researcher do the writing.
Not only would the team not be using its resources wisely, but two team members will be
frustrated because they’re not using their strengths.
• Don’t do all the work yourself. Work with your team to get the work done. The project output
is not as important as the experience of working in a team.
18. Whetten, D. A., and Kim S. Cameron, Developing Management Skills, 7th ed. (Upper Saddle River, NJ: Pearson Education, 2007),
498-99.
19. Adapted from David A. Whetten and Kim S. Cameron, Developing Management Skills, 7th ed. (Upper Saddle River, NJ: Pearson
Education, 2007), 517, 519.
20. Nichols, H., “Teamwork in School, Work and Life,” iamnext.com, 2003, http://www.iamnext.com/academics/groupwork.html
(accessed September 1, 2008).
21. Feenstra, K., “Study Skills: Team Work Skills for Group Projects,” iamnext.com, 2002, http://www.iamnext.com/academics/
grouproject.html (accessed October 11, 2011).
12 BONNIE BOARDMAN
• Set deadlines. Don’t leave everything to the end; divide up tasks, hold team members
accountable, and set intermediary deadlines for each team member to get his or her work done.
Work together to be sure the project is in on time and in good shape.
EXERCISES
1. Think back to a time you’ve been assigned to be on a team for a class assignment. How you
could have used something you learned in this reading to make that experience more positive
for either you or the rest of the team. Your instructor may ask you to turn this in on the day
the reading is due.
2. Have you ever been on a team that constructed a team charter upon being formed? If so, discuss
a specific way in which it was helpful to your team. If not, discuss a situation in which it would
have been useful for your team to have done so. Your instructor may ask you to turn this in on
the day the reading is due.
INTRODUCTION TO INDUSTRIAL ENGINEERING 13
CHAPTER 3.
WHAT IS PROBLEM SOLVING?
CHAPTER TABLE OF CONTENTS
• What is Problem Solving?
• What Does Problem Solving Look Like?
• Developing Problem Solving Processes
• Summary of Strategies
• Problem Solving: An Important Job Skill
WHAT IS PROBLEM SOLVING?
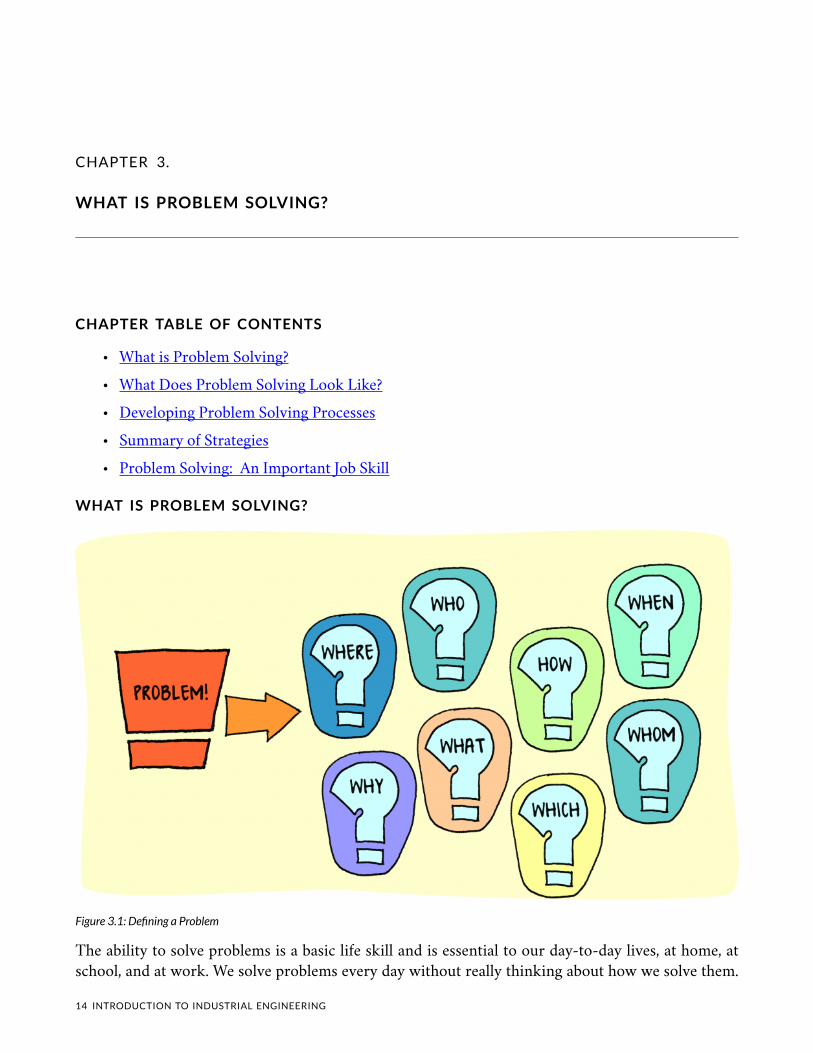
Figure 3.1: Defining a Problem
The ability to solve problems is a basic life skill and is essential to our day-to-day lives, at home, at
school, and at work. We solve problems every day without really thinking about how we solve them.
14 INTRODUCTION TO INDUSTRIAL ENGINEERING

For example: it’s raining and you need to go to the store. What do you do? There are lots of possible
solutions. Take your umbrella and walk. If you don’t want to get wet, you can drive, or take the bus.
You might decide to call a friend for a ride, or you might decide to go to the store another day. There
is no right way to solve this problem and different people will solve it differently.
Problem solving is the process of identifying a problem, developing possible solution paths, and taking the
appropriate course of action.
Why is problem solving important? Good problem solving skills empower you not only in your
personal life but are critical in your professional life. In the current fast-changing global economy,
employers often identify everyday problem solving as crucial to the success of their organizations.
For employees, problem solving can be used to develop practical and creative solutions, and to show
independence and initiative to employers.
WHAT DOES PROBLEM SOLVING LOOK LIKE?
INTRODUCTION TO INDUSTRIAL ENGINEERING 15
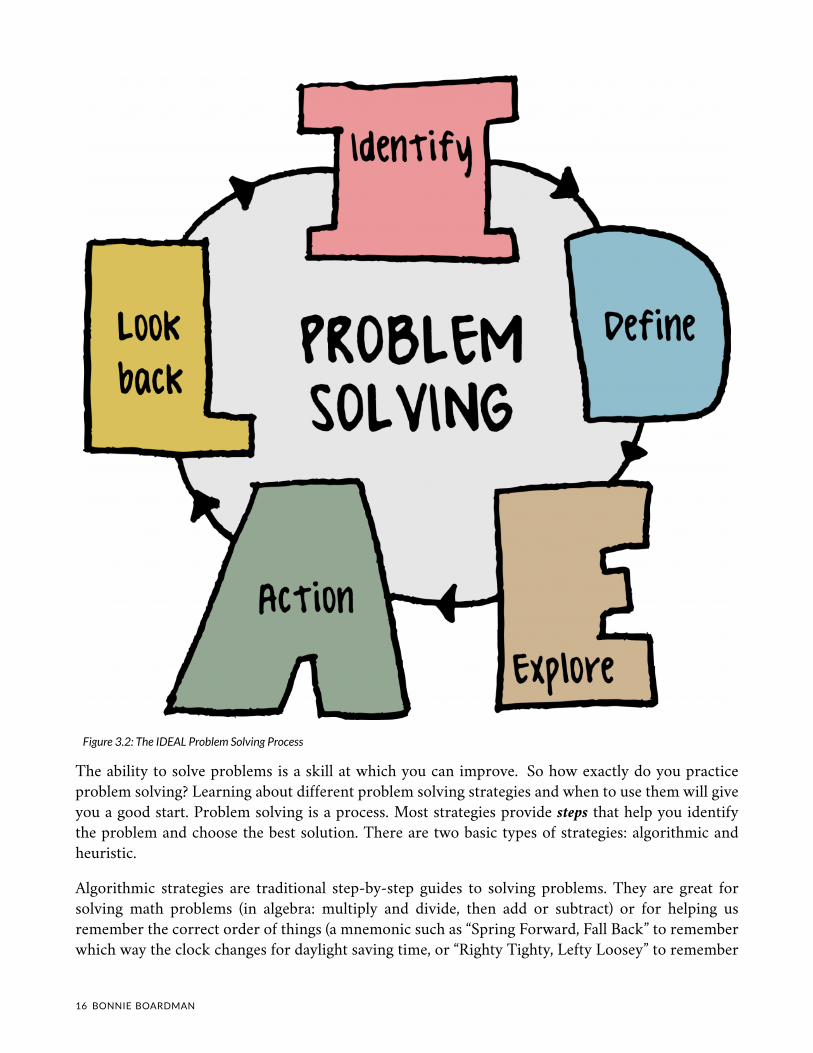
Figure 3.2: The IDEAL Problem Solving Process
The ability to solve problems is a skill at which you can improve. So how exactly do you practice
problem solving? Learning about different problem solving strategies and when to use them will give
you a good start. Problem solving is a process. Most strategies provide steps that help you identify
the problem and choose the best solution. There are two basic types of strategies: algorithmic and
heuristic.
Algorithmic strategies are traditional step-by-step guides to solving problems. They are great for
solving math problems (in algebra: multiply and divide, then add or subtract) or for helping us
remember the correct order of things (a mnemonic such as “Spring Forward, Fall Back” to remember
which way the clock changes for daylight saving time, or “Righty Tighty, Lefty Loosey” to remember
16 BONNIE BOARDMAN
what direction to turn bolts and screws). Algorithms are best when there is a single path to the correct
solution.
But what do you do when there is no single solution for your problem? Heuristic methods are general
guides used to identify possible solutions. A popular one that is easy to remember is IDEAL [Bransford
& Stein1] :
IDEAL is just one problem solving strategy. Building a toolbox of problem solving strategies will
improve your problem solving skills. With practice, you will be able to recognize and use multiple
strategies to solve complex problems.
What is the best way to get a peanut out of a tube that cannot be moved? Watch a chimpanzee solve
this problem in the video below [Geert Stienissen2].
A YouTube element has been excluded from this version of the text. You can view it online here:
https://uta.pressbooks.pub/industrialengineeringintro/?p=217
1. Bransford, J. & Stein, B.S. (). The Ideal Problem Solver: A Guide For Improving Thinking, Learning, And Creativity . New York, NY:
W.H. Freeman.
2. National Geographic. [Geert Stienissen]. (2010, August 19). Insight learning: Chimpanzee Problem Solving [Video file]. Retrieved
from http://www.youtube.com/watch?v=fPz6uvIbWZE
INTRODUCTION TO INDUSTRIAL ENGINEERING 17
DEVELOPING PROBLEM SOLVING PROCESSES
Problem solving is a process that uses steps to solve problems. But what does that really mean? Let's
break it down and start building our toolbox of problem solving strategies.
What is the first step of solving any problem? The first step is to recognize that there is a problem
and identify the right cause of the problem. This may sound obvious, but similar problems can arise
from different events, and the real issue may not always be apparent. To really solve the problem, it's
important to find out what started it all. This is called identifying the root cause.
Example: You and your classmates have been working long hours on a project in the school's
workshop. The next afternoon, you try to use your student ID card to access the workshop, but
discover that your magnetic strip has been demagnetized. Since the card was a couple of years old, you
chalk it up to wear and tear and get a new ID card. Later that same week you learn that several of your
classmates had the same problem! After a little investigation, you discover that a strong magnet was
stored underneath a workbench in the workshop. The magnet was the root cause of the demagnetized
student ID cards.
The best way to identify the root cause of the problem is to ask questions and gather information.
If you have a vague problem, investigating facts is more productive than guessing a solution. Ask
yourself questions about the problem. What do you know about the problem? What do you not know?
When was the last time it worked correctly? What has changed since then? Can you diagram the
process into separate steps? Where in the process is the problem occurring? Be curious, ask questions,
gather facts, and make logical deductions rather than assumptions.
SUMMARY OF STRATEGIES
When issues and problems arise, it is important that they are addressed in an efficient and timely
manner. Communication is an important tool because it can prevent problems from recurring, avoid
injury to personnel, reduce rework and scrap, and ultimately, reduce cost, and save money. Although,
each path in this exercise ended with a description of a problem solving tool for your toolbox, the first
step is always to identify the problem and define the context in which it happened.
There are several strategies that can be used to identify the root cause of a problem. Root cause
analysis (RCA) is a method of problem solving that helps people answer the question of why the
problem occurred. RCA uses a specific set of steps, with associated tools like the “5 Why Analysis" or
the “Cause and Effect Diagram,” to identify the origin of the problem, so that you can:
Once the underlying cause is identified and the scope of the issue defined, the next step is to explore
possible strategies to fix the problem.
If you are not sure how to fix the problem, it is okay to ask for help. Problem solving is a process
and a skill that is learned with practice. It is important to remember that everyone makes mistakes
and that no one knows everything. Life is about learning. It is okay to ask for help when you don’t
have the answer. When you collaborate to solve problems you improve workplace communication
and accelerates finding solutions as similar problems arise.
18 BONNIE BOARDMAN
One tool that can be useful for generating possible solutions is brainstorming. Brainstorming is a
technique designed to generate a large number of ideas for the solution to a problem. The goal is to
come up with as many ideas as you can, in a fixed amount of time. Although brainstorming is best
done in a group, it can be done individually.
Depending on your path through the exercise, you may have discovered that a couple of your
coworkers had experienced similar problems. This should have been an indicator that there was a
larger problem that needed to be addressed.
In any workplace, communication of problems and issues (especially those that involve safety) is always
important. This is especially crucial in manufacturing where people are constantly working with
heavy, costly, and sometimes dangerous equipment. When issues and problems arise, it is important
that they be addressed in an efficient and timely manner. Because it can prevent problems from
recurring, avoid injury to personnel, reduce rework and scrap, and ultimately, reduce cost and save
money; effective communication is an important tool..
One strategy for improving communication is the huddle. Just like football players on the field, a
huddle is a short meeting with everyone standing in a circle. It's always important that team members
are aware of how their work impacts one another. A daily team huddle is a great way to ensure
that as well as making team members aware of changes to the schedule or any problems or safety
issues that have been identified. When done right, huddles create collaboration, communication, and
accountability to results. Impromptu huddles can be used to gather information on a specific issue
and get each team member's input.
"Never try to solve all the problems at once — make them line up for you one-by-one.”
— Richard Sloma
PROBLEM SOLVING: AN IMPORTANT JOB SKILL
Problem solving improves efficiency and communication on the shop floor. It increases a company's
efficiency and profitability, so it's one of the top skills employers look for when hiring new
employees. Employers consider professional skills, such as problem solving, as critical to their
business’s success.
The 2011 survey, "Boiling Point? The skills gap in U.S. manufacturing3 ," polled over a thousand
manufacturing executives who reported that the number one skill deficiency among their current
employees is problem solving, which makes it difficult for their companies to adapt to the changing
needs of the industry.
3. Report: Boiling Point: The Skills Gap in U.S. Manufacturing Deloitte / The Manufacturing Institute, October 2011. Retrieved from
http://www.themanufacturinginstitute.org/Hidden/2011-Skills-Gap-Report/2011-Skills-Gap-Report.aspx
INTRODUCTION TO INDUSTRIAL ENGINEERING 19

CHAPTER 4.
BIG IDEAS IN INDUSTRIAL ENGINEERING
CHAPTER TABLE OF CONTENTS
• How does an IE Think?
• Big Ideas
• Seven Habits of Highly Effective People
• Exercise
20 INTRODUCTION TO INDUSTRIAL ENGINEERING
Figure 4.1: Word Cloud Generated from this Text
At times while reading this book, you may wonder exactly what you are learning and you may not be
able to point to specific new skills and knowledge you have, but I guarantee that you will have new
ideas and new ways of thinking by the time you complete this book. By the time you finish reading
this book, you will have begun to think like an IE.
HOW DOES AN IE THINK?
One example of how an IE thinks is that when something goes wrong – a customer got the wrong
shipment, a worker was injured, a plant did not produce the quantity of product that was planned for
that day – an IE blames the system, not the people. Until the root cause of a problem is identified, an
IE keeps asking “why?”
• Why did the customer receive the wrong shipment?
◦ Because the wrong shipping label was put on the customer’s shipment.
• Why was the wrong shipping label put on the customer’s shipment?
◦ Because some shipments were removed from the shipping department.
• Why were the shipments removed?
INTRODUCTION TO INDUSTRIAL ENGINEERING 21
◦ Because the customer had made some last minute changes to the order.
• Why did the customer make some last minute changes?
◦ And so forth.
The IE in this example could end up identifying problems in how customer orders are tracked, in how
the sales people identify appropriate products for customers, or in when and how shipping labels are
printed and applied to shipments. The IE will probably end up making changes to the physical system
(including the information system) and to the procedures used. Perhaps the shipping label should not
be printed until the order is actually being shipped.
Figure 4.2: IEs are Always Thinking
BIG IDEAS
The big idea from this example is that an IE blames the system, not the people. Now, that idea may
not always be true; yes, sometimes people simply make mistakes, but the IE should always think first,
second, and often about how systems can be improved so people don’t make mistakes. An IE tries to set
up systems so people do tasks right the first time every time.
Here is a list of ideas that you will read about throughout this book and that we will bring up
repeatedly in our discussions:
• If a problem occurs, blame the system, not the people.
• Design the system so people do tasks right the first time every time.
• Design the system so people can do their work efficiently, well, and safely.
• Reduce the variation in a system, so tasks are done consistently.
• If it ain’t broke, it can still be improved.
• Small incremental improvements of a process add up, but more radical reengineering may
sometimes be needed.
• A system should help ordinary people do extraordinary work.
• IEs are always thinking “this could be done better.”
22 BONNIE BOARDMAN
• How a person does a job is important in achieving efficiency, quality, and safety.
• The process for doing a task makes a big difference in how efficiently, well, and safely the task
is done.
• Achieve quality in goods and services by having good processes, not by inspecting goods and
services to fix problems after they have occurred.
• While most engineers design physical objects, industrial engineers design systems. A system
includes physical objects, but also includes rules and procedures that aren’t physical.
• The ideas of IE have been around for decades, but the ideas get repackaged and resold
periodically: some examples are TQM, CQI, re-engineering, the Toyota system, lean
manufacturing, and Six Sigma.
• IEs can work for any organization because IEs improve processes and systems.
• Every organization must scan the environment for change and must think about its place in
the global economy.
• The customer is not always right, but the customer comes first.
• All products and services involve both products and services.
• A team of people using good team processes will produce better work than any one of the
individuals could have.
• Decisions should be based on facts, logic, and analysis, not on hunches.
• People can usually grasp information better, especially data, if it is displayed visually.
• Don’t use information technology to computerize an inefficient process; make the process
more efficient first.
• Happy employees are productive employees.
• An IE must engage in lifelong learning. You must keep up with new technologies, new
software, and new ideas.
Of course, there are situations in which any of the above statements could be untrue. You don’t want
to stick blindly to any one of these statements all the time. But most of the time, the above ideas are
good ways for an IE to think.
It is about you.
One big, final idea that you will see throughout this book is that industrial engineering is about you.
You can apply industrial engineering concepts to your own life. It’s up to you to ensure that you use
good processes for doing industrial engineering. As an IE you work on improving the system of the
organization for which you work; as an individual, you work on improving the system that is you.
SEVEN HABITS OF HIGHLY EFFECTIVE PEOPLE
Many students have read and have recommended very strongly The Seven Habits of Highly Effective
People, by Stephen Covey. Those seven habits are:
INTRODUCTION TO INDUSTRIAL ENGINEERING 23
1. Be proactive.
2. Begin with the end in mind.
3. Put first things first.
4. Think win/win.
5. Seek first to understand, then to be understood.
6. Synergize.
7. Sharpen the saw.
Together, the seven habits help you apply IE ideas to make yourself an effective person. As an IE, you
do your work in a context: the people you work with closely, the organization that employs you, the
area where the organization is located, the state where you live, the country where you live, and, of
course, the world. The systems approach, which I’ll explain in the Systems Thinking chapter, urges
you to think about the big picture. It’s important to always think about the process you are studying
in its larger context. You don’t want to make a change that improves the process but that does damage
to the larger system. I like the phrase “think globally, act locally.”
EXERCISE
Find or create an image that illustrates one of the Big Ideas. Your instructor may ask you to submit
your image with a description of why you chose it and how it relates.
24 BONNIE BOARDMAN

CHAPTER 5.
USING MODELS
CHAPTER TABLE OF CONTENTS
• Models in General
• Deterministic Models
• Exercises
MODELS IN GENERAL
Industrial Engineers, and other engineers, often want to perform experiments on real systems, but
such experimentation can be difficult. If an IE wants to try a new layout for a production system,
moving equipment, furniture, and offices would be difficult and time consuming. Even trying a new
procedure may disrupt the production system. Therefore, the IE would create a model of the system,
usually a mathematical model.
The following figure shows how models are used.
INTRODUCTION TO INDUSTRIAL ENGINEERING 25
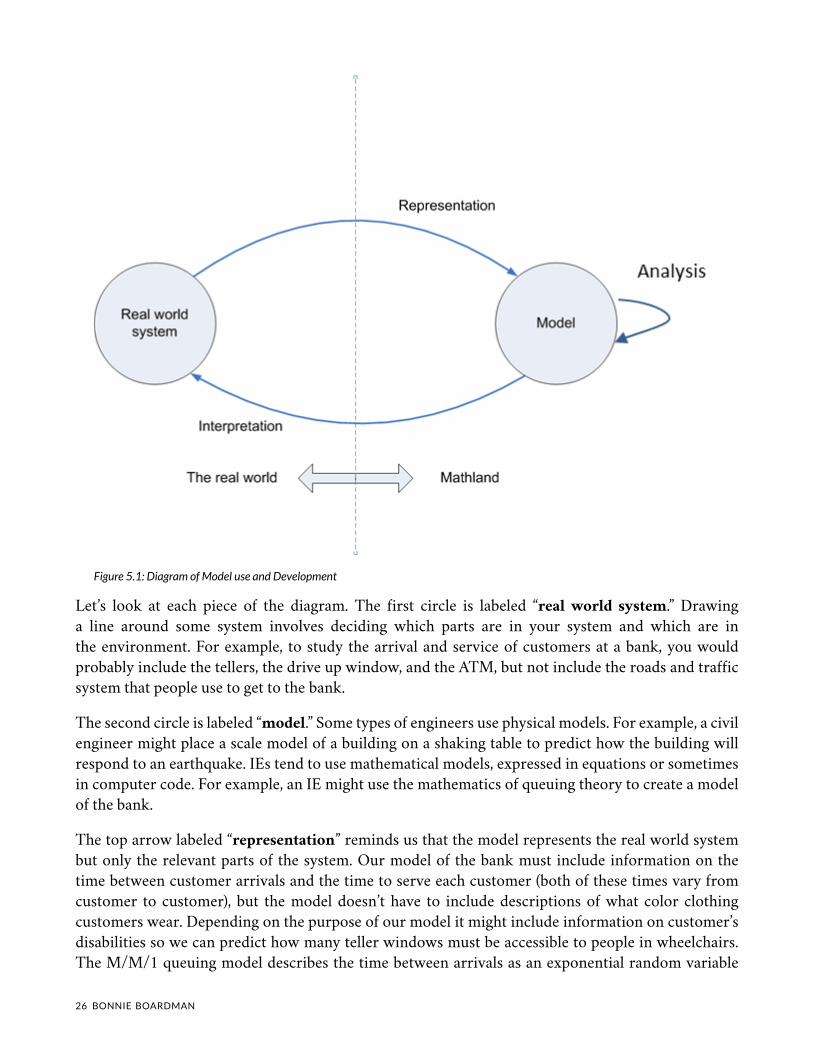
Figure 5.1: Diagram of Model use and Development
Let’s look at each piece of the diagram. The first circle is labeled “real world system.” Drawing
a line around some system involves deciding which parts are in your system and which are in
the environment. For example, to study the arrival and service of customers at a bank, you would
probably include the tellers, the drive up window, and the ATM, but not include the roads and traffic
system that people use to get to the bank.
The second circle is labeled “model.” Some types of engineers use physical models. For example, a civil
engineer might place a scale model of a building on a shaking table to predict how the building will
respond to an earthquake. IEs tend to use mathematical models, expressed in equations or sometimes
in computer code. For example, an IE might use the mathematics of queuing theory to create a model
of the bank.
The top arrow labeled “representation” reminds us that the model represents the real world system
but only the relevant parts of the system. Our model of the bank must include information on the
time between customer arrivals and the time to serve each customer (both of these times vary from
customer to customer), but the model doesn’t have to include descriptions of what color clothing
customers wear. Depending on the purpose of our model it might include information on customer’s
disabilities so we can predict how many teller windows must be accessible to people in wheelchairs.
The M/M/1 queuing model describes the time between arrivals as an exponential random variable
26 BONNIE BOARDMAN
with average 1 customer/λ (say 6 minutes) and the time of service as an exponential random variable
with average 1 customer/μ (say 4 minutes).
A model is never exactly correct; you should always remember the phrase “it’s only a model.” For
example, the M/M/1 queuing model assumes that customers arrive at the average rate of 1 customer
every 6 minutes, or 10 customers per hour. Actually, the arrival rate probably varies over the day.
An IE creates a model in order to extract information; the loop from the model to itself is labeled
“analysis.” IEs use some models quite frequently and IEs can use mathematical results that others have
proven. For example, for the M/M/1 queuing model can be used to compute the average number of
people in the queue.
The line labeled “interpretation” is where the IE interprets the mathematical results of the model
back to the real world system. Now the IE must again remember “it’s only a model” so the predictions
may not be perfect. Since the M/M/1 queuing model assumes a constant average arrival rate, the
results using λ = 10 customers per hour can only be applied to the period of the day with that arrival
rate. A separate model might be needed for the lunch hour, which is probably busier.
DETERMINISTIC MODELS
IEs are responsible for efficiency, including the efficient use of time and resources. You already know
from calculus class how to find the maximum or minimum of a function and calculus is one tool that
IEs use. However, IEs often need to maximize or minimize a linear function, which sounds easy, but
finding the solution isn’t easy when there are many variables and also some constraints. The following
is an example of such a problem.
Dairy cattle have various nutrient requirements, such as protein, calcium, and potassium, that can be
met by different types of feed, such as alfalfa, hominy, and corn cobs. The dairy farmer wants to mix a
feed for the dairy cows that will meet the nutrient requirements at the minimum cost. Below is a very
simplified version of the Diet Problem as applied to feeding dairy cattle. The following table gives the
nutrient content (protein and potassium) of certain feeds (alfalfa, hominy, and corn cobs), as well as
the nutrient requirement for protein and potassium (as a percent of the feed) and the cost of alfalfa,
hominy, and corn cobs (in $/ton).
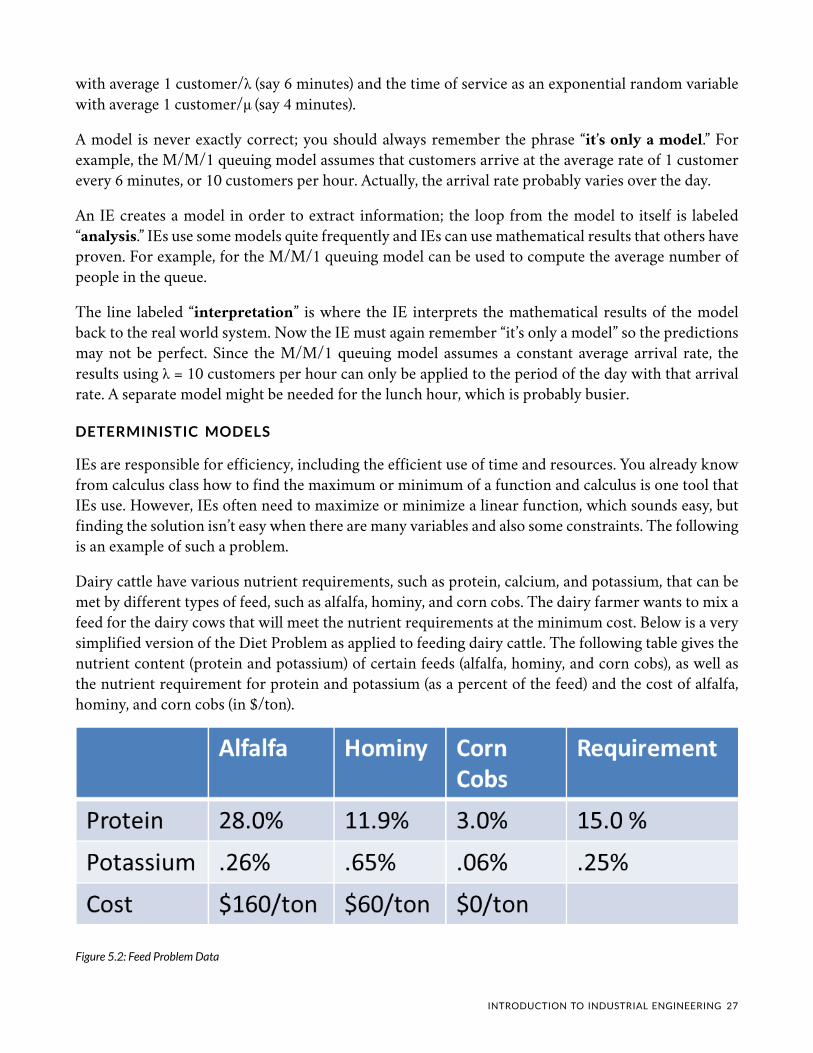
Figure 5.2: Feed Problem Data
INTRODUCTION TO INDUSTRIAL ENGINEERING 27
For example, alfalfa is 28% protein, 0.26% potassium, and costs $160 per ton. Alfalfa is a good source
of protein and a medium source of potassium, but it is expensive. Hominy is a medium source of
protein and a good source of potassium, and it is cheaper than alfalfa. Corn cobs are not a good source
of either protein or potassium, but since they are otherwise a waste product, they are free. With some
thought, you can see that the optimal mix will probably need alfalfa to meet the protein requirement,
hominy to meet the potassium requirement, and corn cobs to keep the cost down.
We want to determine how to mix the feed, that is, what fraction should be alfalfa (A), hominy
(H), and corn cobs (C). We will use linear programming to solve this problem, by expressing the
situation as minimizing a linear objective function (cost) subject to linear constraints (protein and
potassium). Because the ingredient’s units are representing percentages of the whole, we also know
that A+H+C=1.
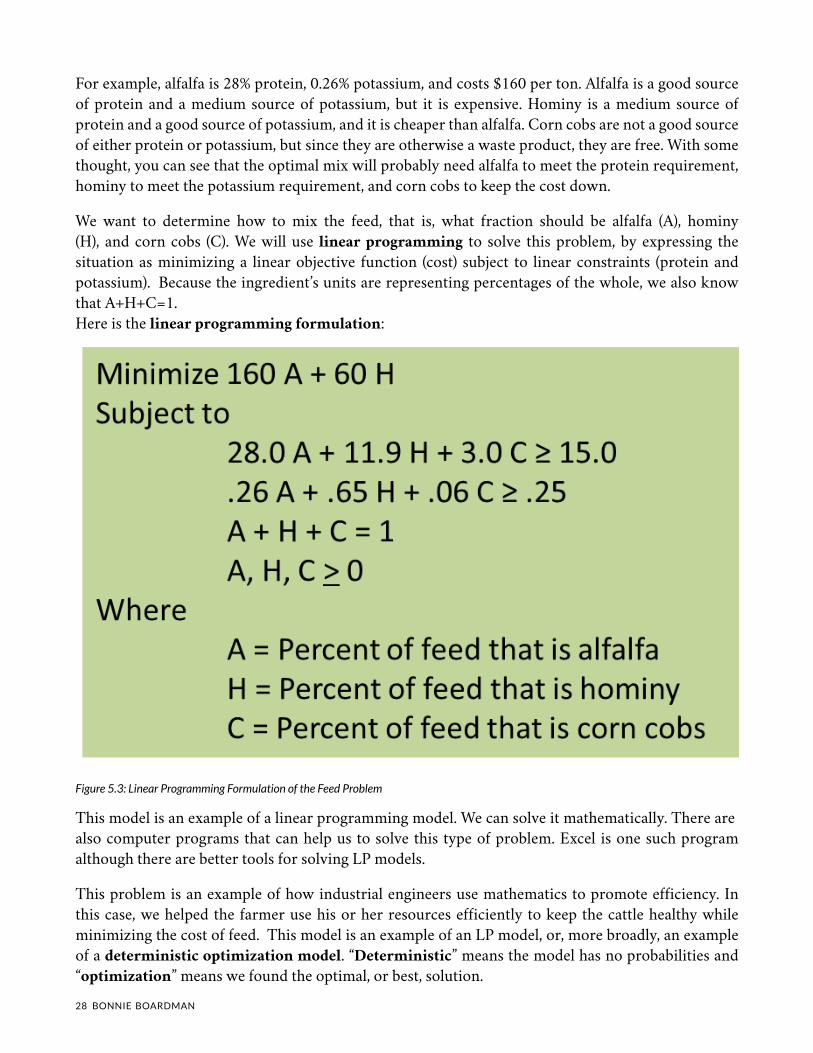
Here is the linear programming formulation:
Figure 5.3: Linear Programming Formulation of the Feed Problem
This model is an example of a linear programming model. We can solve it mathematically. There are
also computer programs that can help us to solve this type of problem. Excel is one such program
although there are better tools for solving LP models.
This problem is an example of how industrial engineers use mathematics to promote efficiency. In
this case, we helped the farmer use his or her resources efficiently to keep the cattle healthy while
minimizing the cost of feed. This model is an example of an LP model, or, more broadly, an example
of a deterministic optimization model. “Deterministic” means the model has no probabilities and
“optimization” means we found the optimal, or best, solution.
28 BONNIE BOARDMAN
An LP model is just one type of deterministic optimization model. Actually, in this example we
assumed that we can buy any real amount of ingredients. If it were necessary to buy only in integer
quantities a LP would not be an appropriate model. An model where the decision variables must be
integers is called an integer programming model (IP).
Industrial engineers must be able to recognize situations where a deterministic model can be applied,
create an appropriate model, and solve the model using an appropriate tool. The following list
describes situations where a deterministic optimization model might be useful.
• Product mix – determine how much of each type of product to make subject to constraints on
available resources.
• Production scheduling – determine how much of each type of product to make in different
time periods in order to meet specified production amounts by certain times.
• Blending – determine the best blend of inputs to use to minimize the cost of producing a
mixture. Our feed example was a blending model.
• Cutting stock – determine the best way to cut resource material to maximize profit. For
example, a log can be cut into lumber of various dimensions which can be sold for different
amounts.
• Staffing – determine the best way to assign people to jobs to maximize their preference or to
maximize the productivity, based on their abilities at different jobs.
• Transportation – determine the best way to route resources through a transportation network
to minimize the cost, while delivering the appropriate amount of resources to each location.
• Assignment – determine the best way to assign resources to tasks.
• Traveling salesman problem – determine the best route among a number of points that visits
each point at least once.
EXERCISES
An interactive or media element has been excluded from this version of the text. You can view it online
here:
https://uta.pressbooks.pub/industrialengineeringintro/?p=43
An interactive or media element has been excluded from this version of the text. You can view it online
here:
https://uta.pressbooks.pub/industrialengineeringintro/?p=43
INTRODUCTION TO INDUSTRIAL ENGINEERING 29
CHAPTER 6.
DEMING'S 14 POINTS
CHAPTER TABLE OF CONTENTS
• W. Edwards Deming
• Deming’s 14 Points
• Deming’s Focus on People
• Exercise
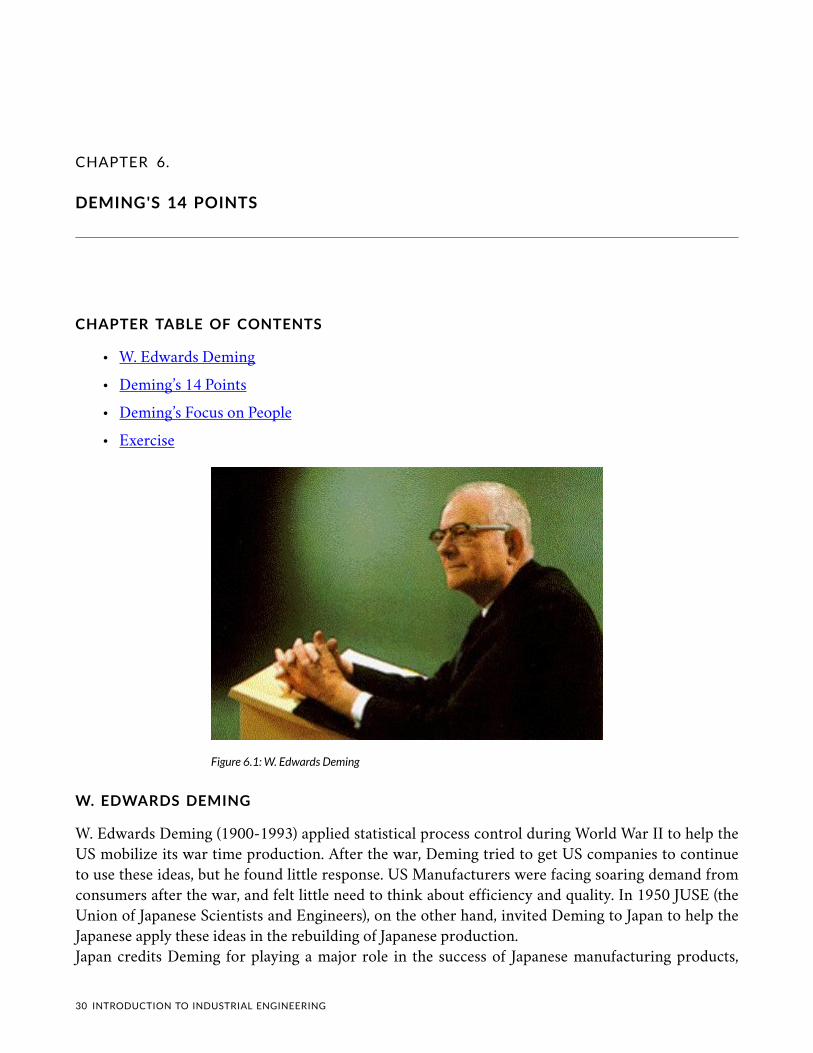
Figure 6.1: W. Edwards Deming
W. EDWARDS DEMING
W. Edwards Deming (1900-1993) applied statistical process control during World War II to help the
US mobilize its war time production. After the war, Deming tried to get US companies to continue
to use these ideas, but he found little response. US Manufacturers were facing soaring demand from
consumers after the war, and felt little need to think about efficiency and quality. In 1950 JUSE (the
Union of Japanese Scientists and Engineers), on the other hand, invited Deming to Japan to help the
Japanese apply these ideas in the rebuilding of Japanese production.
Japan credits Deming for playing a major role in the success of Japanese manufacturing products,
30 INTRODUCTION TO INDUSTRIAL ENGINEERING
especially in Japanese improvements in quality and efficiency. The most prestigious award for quality
improvement awarded in Japan (by JUSE) is called the Deming Prize.
Several anecdotes illustrate what Deming was like.
• He composed an easily sung version of the Star Spangled Banner .
• When asked how he wanted to be remembered, he said “I probably won’t even be
remembered,” but added “Well, maybe … as someone who tried to keep America from
committing suicide.”
• Deming’s first lectures in Japan in 1950 were transcribed and made into a book by JUSE. He
donated the royalties to JUSE.
In 1980, NBC aired a documentary titled “If Japan Can … Why Can’t We?” that described Japanese
progress in efficiency and quality in the automobile and electronics industries, and that also explained
why the Japanese credited Deming with much of their success. As Deming said, his phone rang off the
hook.
DEMING’S 14 POINTS
What did Dr. Deming teach the Japanese? In his book Out of Crisis1, published in 1986, Dr. Deming
summarized his teaching in 14 points:
1. Create constancy of purpose towards improvement of product and service, with the aim to
become competitive, stay in business, and to provide jobs.
2. Adopt the new philosophy. We are in a new economic age. Western management must awaken
to the challenge, must learn their responsibilities, and take on leadership for a change.
3. Cease dependence on inspection to achieve quality. Eliminate the need for inspection on a
mass basis by building quality into the product in the first place.
4. End the practice of awarding business on the basis of price tag. Instead minimize total cost.
Move toward a single supplier for any one item, on a long-term relationship of loyalty and
trust.
5. Improve constantly and forever the system of production and service, to improve quality and
productivity, and thus constantly decrease costs.
6. Institute training on the job.
7. Institute leadership. The aim of supervision should be to help people and machines and gadgets
to do a better job. Supervision of management is in need of overhaul, as well as supervision of
production workers.
8. Drive out fear, so that everyone may work effectively for the company.
9. Break down barriers between departments. People in research, design, sales, and production
must work as a team, to foresee problems of production and in that may be encountered with
the product or service.
1. Deming, W. E. (1986). Out of the crisis. Cambridge, Mass: Massachusetts Institute of Technology, Center for Advanced Engineering
Study.
INTRODUCTION TO INDUSTRIAL ENGINEERING 31
10. Eliminate slogans, exhortations, and targets for the work force asking for zero defects and new
levels of productivity. Such exhortations only create adversarial relationships, as the bulk of the
causes of low quality and low productivity belong to the system and thus lie beyond the power
of the work force.
11. a. Eliminate works standards (quotas) on the factory floor, instead substitute leadership. b.
Eliminate management by objective and management by numbers, instead substitute
leadership.
12. a. Remove barriers that rob the hourly worker of his right to pride of workmanship the
responsibility of supervisors must be changed from sheer numbers to quality. b. Remove
barriers that rob people in management and in engineering of their right to pride of
workmanship. This means abolishment of the annual or merit rating and of management by
objective.
13. Institute a vigorous program of education and self-improvement.
14. Put everybody in the company to work to accomplish the transformation. The transformation
is everybody’s job.
DEMING’S FOCUS ON PEOPLE
Regarding “drive out fear,” Deming elaborated:
No one can put his best performance unless he feels secure. Se comes from the Latin, meaning without,
cure means fear or care. Secure means without fear, not afraid to express ideas, not afraid to ask questions.
Fear takes on many faces. A common denominator of fear in any form, anywhere, is loss from impaired
performance and padded figures.
In point 10, Deming says that the primary cause of poor work is not lack of effort by workers.
Eliminate targets, slogans, exhortations, posters, for the work force that urge them to increase productivity.
‘Your work is your self-portrait. Would you sign it?’ No – not when you give me defective canvas to work
with, paint not suited to the job, brushes worn out, so that I can not call it my work. Posters and slogans like
these never helped anyone to do a better job.
Deming was famous for insisting on measurements, but he also thought numbers should not be used
to judge workers.
Goals are necessary for you and for me, but numerical goals set for other people, without a road map to reach
the goal, have effects opposite to the effects sought.
Deming emphasized repeatedly the need to remove barriers that prevent good work.
Give the work force a chance to work with pride, and the 3 per cent that apparently don’t care will erode
itself by peer pressure.
Deming is often quoted as saying “Measure, measure, measure,” but he stressed using that feedback
to improve the process, not to judge the performance of employees. Denove and Power2 describe the
work of J.D. Power and Associates in performing customer satisfaction surveys for many companies.
2. Denove, C., & Iv, J. D. P. (2017). Satisfaction: How Every Great Company Listens to the Voice of the Customer. Place of publication
not identified: Skillsoft.
32 BONNIE BOARDMAN
Denove and Power stress that companies that listen to the voice of the customer from these surveys
(and other input) are more profitable, but they lament that some companies use the surveys to judge
particular stores, particularly to incentivize the managers of stores by making their salaries dependent
on the customer satisfaction score. They point out the natural effect of such a strategy: employees
in the stores will seek to manipulate the customer satisfaction ratings, even to the extent of begging
customers to give good reviews.
By focusing corporate attention on customer satisfaction scores, did we somehow let a very powerful genie
out of the bottle? As we’ve said many times throughout this book, our goals is to emphasize some crucial
truths: listening to the needs of your customers and creating advocates by striving to deliver upon those
needs are paramount to long-term profitability. We never meant for companies to take their eyes off these
basic truths by focusing their attention exclusively on the scorecard.
The lesson here is that no single quantitative measure, or even a group of such measures, can replace
good judgment.
Fundamentally, Deming believed in people.
People require in their careers, more than money, ever-broadening opportunities to add something to
society, materially and otherwise.
EXERCISE
Choose one of Deming’s 14 Points to discuss. What struck you about that point? What is an example
where you’ve seen that point either followed or not followed? Your instructor may ask you to submit
this exercise.
INTRODUCTION TO INDUSTRIAL ENGINEERING 33
CHAPTER 7.
PEOPLE IN THE SYSTEM
CHAPTER TABLE OF CONTENTS
• Physical Ergonomics
• Safety and the Work Environment
• Cognitive Ergonomics
• Exercise
Figure 7.1: People are an Important Part of any System
Among all the engineering specialties, industrial engineering focuses the most on people. Because
we design and improve production systems involving people and machines, we need to think about
what people and machines can and can’t do quickly, well, and safely. On some tasks, people are
clearly better than machines (for example, helping customers) while on other tasks, machines are
clearly better than people (for example, lifting very heavy objects). Many production tasks require a
34 INTRODUCTION TO INDUSTRIAL ENGINEERING
combination of people and machines. The goal is to design a system of people and machines that can
do the work with efficiency, quality, and safety.
PHYSICAL ERGONOMICS
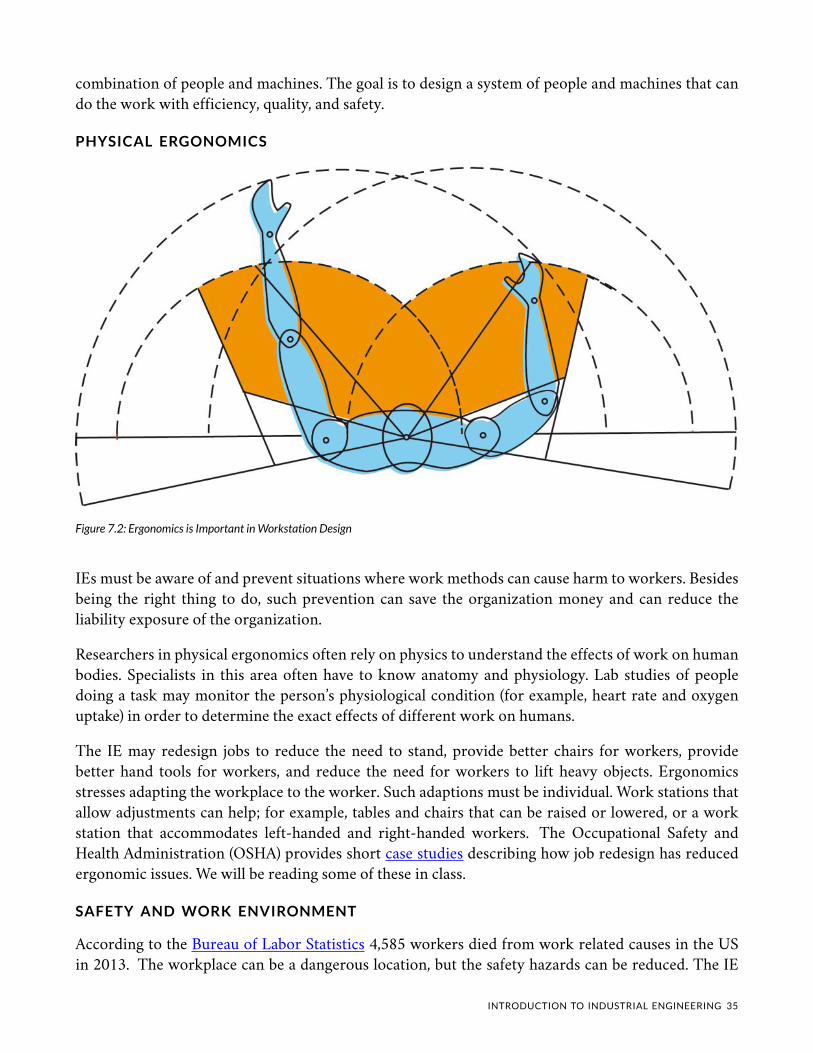
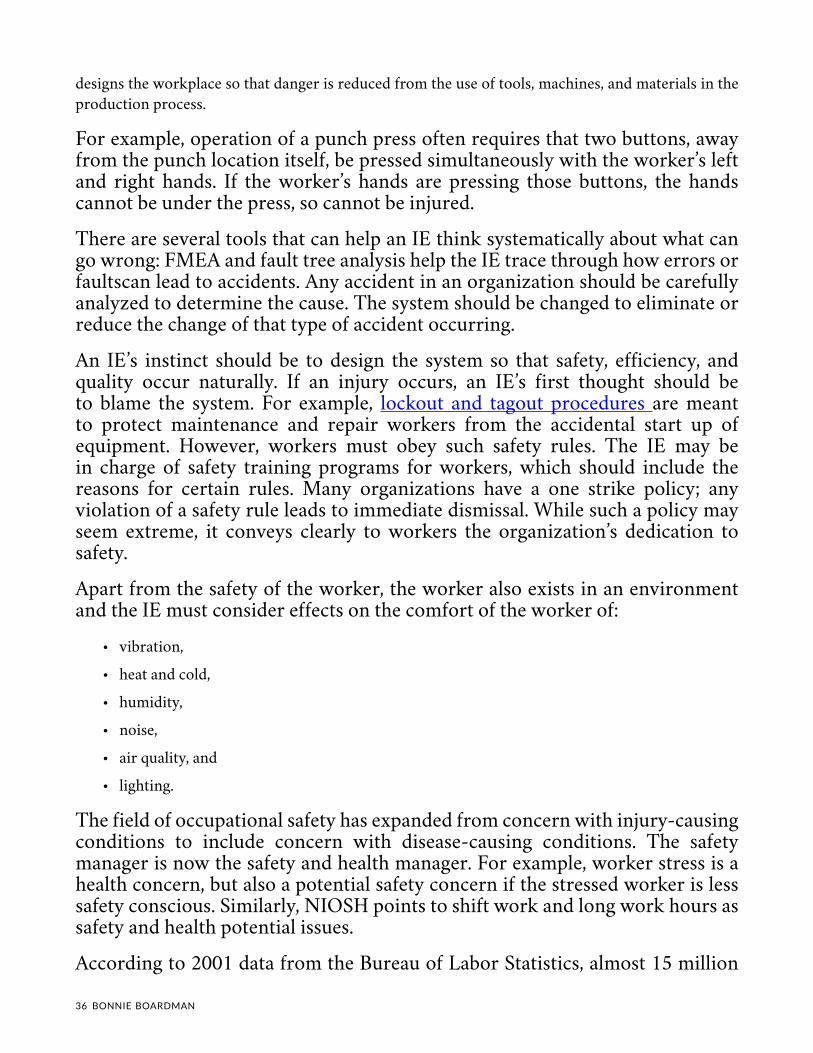
Figure 7.2: Ergonomics is Important in Workstation Design
IEs must be aware of and prevent situations where work methods can cause harm to workers. Besides
being the right thing to do, such prevention can save the organization money and can reduce the
liability exposure of the organization.
Researchers in physical ergonomics often rely on physics to understand the effects of work on human
bodies. Specialists in this area often have to know anatomy and physiology. Lab studies of people
doing a task may monitor the person’s physiological condition (for example, heart rate and oxygen
uptake) in order to determine the exact effects of different work on humans.
The IE may redesign jobs to reduce the need to stand, provide better chairs for workers, provide
better hand tools for workers, and reduce the need for workers to lift heavy objects. Ergonomics
stresses adapting the workplace to the worker. Such adaptions must be individual. Work stations that
allow adjustments can help; for example, tables and chairs that can be raised or lowered, or a work
station that accommodates left-handed and right-handed workers. The Occupational Safety and
Health Administration (OSHA) provides short case studies describing how job redesign has reduced
ergonomic issues. We will be reading some of these in class.
SAFETY AND WORK ENVIRONMENT
According to the Bureau of Labor Statistics 4,585 workers died from work related causes in the US
in 2013. The workplace can be a dangerous location, but the safety hazards can be reduced. The IE
INTRODUCTION TO INDUSTRIAL ENGINEERING 35
designs the workplace so that danger is reduced from the use of tools, machines, and materials in the
production process.
For example, operation of a punch press often requires that two buttons, away from the punch location itself, be pressed simultaneously with the worker’s left and right hands. If the worker’s hands are pressing those buttons, the hands cannot be under the press, so cannot be injured.
There are several tools that can help an IE think systematically about what can go wrong: FMEA and fault tree analysis help the IE trace through how errors or faultscan lead to accidents. Any accident in an organization should be carefully analyzed to determine the cause. The system should be changed to eliminate or reduce the change of that type of accident occurring.
An IE’s instinct should be to design the system so that safety, efficiency, and quality occur naturally. If an injury occurs, an IE’s first thought should be to blame the system. For example, lockout and tagout procedures are meant to protect maintenance and repair workers from the accidental start up of equipment. However, workers must obey such safety rules. The IE may be in charge of safety training programs for workers, which should include the reasons for certain rules. Many organizations have a one strike policy; any violation of a safety rule leads to immediate dismissal. While such a policy may seem extreme, it conveys clearly to workers the organization’s dedication to safety.
Apart from the safety of the worker, the worker also exists in an environment and the IE must consider effects on the comfort of the worker of:
• vibration,
• heat and cold,
• humidity,
• noise,
• air quality, and
• lighting.
The field of occupational safety has expanded from concern with injury-causing conditions to include concern with disease-causing conditions. The safety manager is now the safety and health manager. For example, worker stress is a health concern, but also a potential safety concern if the stressed worker is less safety conscious. Similarly, NIOSH points to shift work and long work hours as safety and health potential issues.
According to 2001 data from the Bureau of Labor Statistics, almost 15 million
36 BONNIE BOARDMAN
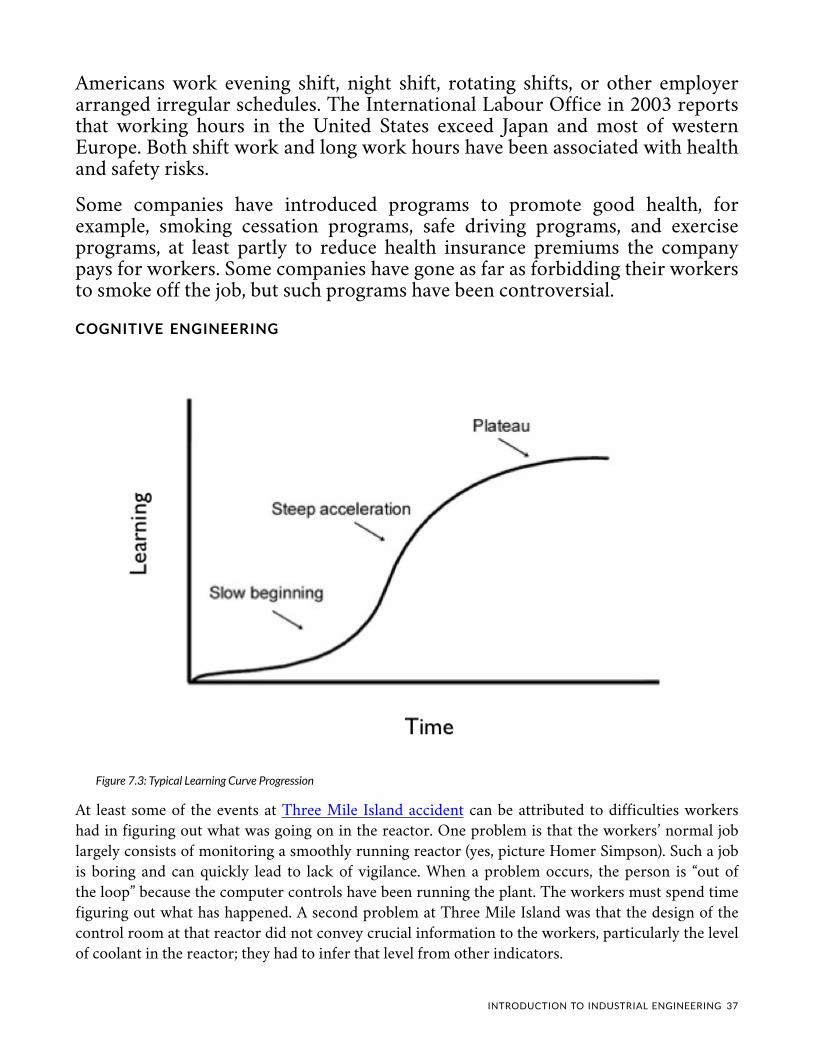
Americans work evening shift, night shift, rotating shifts, or other employer arranged irregular schedules. The International Labour Office in 2003 reports that working hours in the United States exceed Japan and most of western Europe. Both shift work and long work hours have been associated with health and safety risks.
Some companies have introduced programs to promote good health, for example, smoking cessation programs, safe driving programs, and exercise programs, at least partly to reduce health insurance premiums the company pays for workers. Some companies have gone as far as forbidding their workers to smoke off the job, but such programs have been controversial.
COGNITIVE ENGINEERING
Figure 7.3: Typical Learning Curve Progression
At least some of the events at Three Mile Island accident can be attributed to difficulties workers
had in figuring out what was going on in the reactor. One problem is that the workers’ normal job
largely consists of monitoring a smoothly running reactor (yes, picture Homer Simpson). Such a job
is boring and can quickly lead to lack of vigilance. When a problem occurs, the person is “out of
the loop” because the computer controls have been running the plant. The workers must spend time
figuring out what has happened. A second problem at Three Mile Island was that the design of the
control room at that reactor did not convey crucial information to the workers, particularly the level
of coolant in the reactor; they had to infer that level from other indicators.
INTRODUCTION TO INDUSTRIAL ENGINEERING 37
Cognitive engineering builds on knowledge from psychology about human abilities in memory,
perception, reasoning, and attention to design tasks that a human can do with efficiency, quality, and
safety. Again, the focus is on adapting the workplace to the human. A human who must remember
certain tasks in a specific order can be given a checklist. A human who has to perceive a change in
an array of displays can be aided by a computer that detects the changes and alerts the human (for
example, cockpit alarms for loss of altitude). A human who has to do a complicated set of reasoning
can be supported by a computer system (for example, an immunohematologist who must interpret
blood tests to identify antibodies in a patient’s blood). A person who must pay attention to several
sources of information can share the task with computers and with other humans.
A balance must be achieved between under-stimulating the human, leading to boredom, and
overstimulating the human, leading to stress. Both can lead to losses in efficiency, quality, and safety.
Generally, the human performs better when the worker clearly has control of the environment,
including work pace. Shifting control to the computer can lead to boredom, stress, inattentiveness,
and over-reliance on the computer.
The design of controls, including computer hardware and software, to support human tasks requires
careful analysis of usability, which is affected by screen layout, task sequence, and many other factors.
NASA’s Human Systems Integration Division advances human-centered design and operations of
complex aerospace systems through analysis, experimentation, and modeling of human performance
and human-automation interaction to make dramatic improvements in safety, efficiency, and mission
success.
This FAA analysis of an airliner accident in 1993, in which 2 people were killed, shows the interplay
of the design of the controls, the training of the pilot, and the behavior of passengers.
Flight 583 was level at 33,000 feet when the leading edge slats deployed inadvertently. The autopilot
disconnected and the captain was manually controlling the airplane when it progressed through several
violent pitch oscillations and lost 5,000 feet.
The National Transportation Safety Board determine that the probable cause of this accident was the
inadequate design of the flap/slat actuation handle by the Douglas Aircraft Company that allowed the handle
to be easily and inadvertently dislodged from the up/ret [retracted] position, thereby causing extension of
the leading edge slats during cruise flight. The captain’s attempt to recover from the slat extension,given the
reduced longitudinal stability and the associated light control force characteristics of the MD-11 in cruise
flight, led to several violent pitch oscillations. Contributing to the violence of the pitch oscillations was the
lack of specific MD-11 pilot training in recovery from high altitude upsets, and the influence of the stall
warning system on the captain’s control responses. Contributing to the severity of the injuries was the lack
of seat restraint usage by the occupants.
The root cause of that accident was identified as poor design of a handle.
EXERCISE
Read one of the OSHA success stories and research the IE tools or techniques that may have been
involved in that success. Your instructor may ask you to present a summary of the story you chose
and the IE tools and techniques you think were used in class.
38 BONNIE BOARDMAN

CHAPTER 8.
SYSTEMS THINKING
CHAPTER TABLE OF CONTENTS
• System Definition
• System Analysis
• System Properties and Archetypes
• Systems Thinking
• Exercise
Figure 8.1: Chess Pieces
SYSTEM DEFINITION
The educational system in the US has these parts:
• Preschool and kindergarten,
• Elementary schools – grades 1-6,
INTRODUCTION TO INDUSTRIAL ENGINEERING 39
• Middle schools – grades 7-8,
• High schools – grades 9-12, and
• Higher education, including 2-year community colleges, and 4-year colleges and universities.
We call this list of parts a “system” because the parts interact with each other to achieve overall goals,
such as an educated population. The parts may interact through cause and effect or through the
exchange of information or material. We can think of the input and output of the overall system, and
we can also think about the input and output of each part; for example, some of the students who
graduate from middle school (an output) go on to high school (an input). We can also think of the parts
as being processes in the educational system.
In his book,Total Quality Control1, Feigenbaum defines a system as:
A group or work pattern of interacting human and machine activities, directed by information, which
operate on and/or direct material, information, energy, and/or humans to achieve a common specific
purpose or objective.
Clearly this definition relates closely to industrial engineering and explains why some industrial
engineering departments are called industrial and systems engineering. UTA’s department is called
Industrial, Manufacturing, and Systems Engineering. However, systems engineering is also used
sometimes in a more limited meaning, to refer to designing a computer and information system.
When we define a system we implicitly draw a line around some parts to include those parts and to
exclude others. For example, the educational system includes the schools, but not the roads students
travel on to get to school or the organizations that employ students after they graduate. Generally,
looking at a larger system is more accurate but harder. We can understand some aspects of the
educational system without considering these other parts, but some aspects require looking at the
larger system. We can still examine the educational system if we remember to include in our study its
interactions with its environment, such as the transportation system and the employment system.
For the IE, the systems approach is important because it reminds us to consider the environment
surrounding the system we are studying and to move the boundaries outward as much as possible so
that we consider a problem in its larger context.
SYSTEM ANALYSIS
Some systems have feedback. Feedback in a system is when outputs are fed back in as inputs for
future system action. This is sometimes called a feedback loop. The educational system doesn’t tend
to have a lot of feedback and that may hamper improvement of the system. Have you ever been asked
by your high school to give feedback on how well your education prepared you for college or for
work?
1. Feigenbaum, A. V. (1961). Total Quality Control. New York: McGraw-Hill.
40 BONNIE BOARDMAN
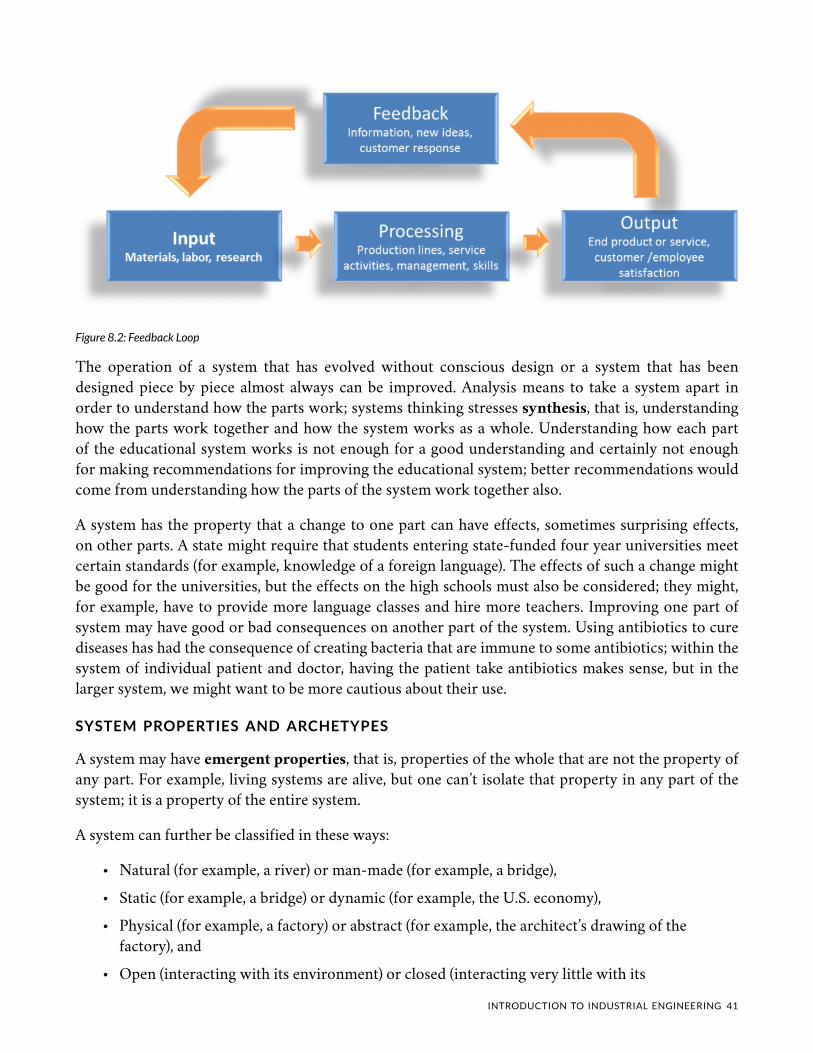
Figure 8.2: Feedback Loop
The operation of a system that has evolved without conscious design or a system that has been
designed piece by piece almost always can be improved. Analysis means to take a system apart in
order to understand how the parts work; systems thinking stresses synthesis, that is, understanding
how the parts work together and how the system works as a whole. Understanding how each part
of the educational system works is not enough for a good understanding and certainly not enough
for making recommendations for improving the educational system; better recommendations would
come from understanding how the parts of the system work together also.
A system has the property that a change to one part can have effects, sometimes surprising effects,
on other parts. A state might require that students entering state-funded four year universities meet
certain standards (for example, knowledge of a foreign language). The effects of such a change might
be good for the universities, but the effects on the high schools must also be considered; they might,
for example, have to provide more language classes and hire more teachers. Improving one part of
system may have good or bad consequences on another part of the system. Using antibiotics to cure
diseases has had the consequence of creating bacteria that are immune to some antibiotics; within the
system of individual patient and doctor, having the patient take antibiotics makes sense, but in the
larger system, we might want to be more cautious about their use.
SYSTEM PROPERTIES AND ARCHETYPES
A system may have emergent properties, that is, properties of the whole that are not the property of
any part. For example, living systems are alive, but one can’t isolate that property in any part of the
system; it is a property of the entire system.
A system can further be classified in these ways:
• Natural (for example, a river) or man-made (for example, a bridge),
• Static (for example, a bridge) or dynamic (for example, the U.S. economy),
• Physical (for example, a factory) or abstract (for example, the architect’s drawing of the
factory), and
• Open (interacting with its environment) or closed (interacting very little with its
INTRODUCTION TO INDUSTRIAL ENGINEERING 41
environment)
Certain types of systems with feedback occur frequently in organizations and in society. If you learn
to recognize them, you can learn what actions to take. William Braun describes 10 system archetypes:
• Limits to Growth (aka Limits to Success)
• Shifting the Burden
• Eroding Goals
• Escalation
• Success to the Successful
• Tragedy of the Commons
• Fixes that Fail
• Growth and Underinvestment
• Accidental Adversaries
• Attractiveness Principle
This article, Interaction Structures of the Universe, has a summary of the above models.
SYSTEMS THINKING
In this book The Fifth Discipline 2, Peter Senge argues that organizations must become learning
organizations by building knowledge of four disciplines: personal mastery, mental models, shared
vision, and team learning. The “fifth discipline” is systems thinking, and he gives these laws of
complex systems:
1. “Today’s problems comes from yesterday’s ‘solutions.'” Solutions can have unintended and
undesired effects.
2. “The harder you push, the harder the system pushed back.” “Compensating feedback” may
keep a system in the state it started.
3. “Behavior grows better before it grows worse.” Actions that make short term improvement
may cause long term disaster.
4. “The easy way out usually leads back in.” Easy and obvious solutions would have been done
already if they would have worked. Hard work is needed to find the real solution.
5. “The cure can be worse than the disease.” Some easy solutions become addictive.
6. “Faster is slower.” Any organization has an optimal rate of growth.
7. “Cause and effect are not closely related in time and space.”
8. “Small changes can produce big results – but the areas of highest leverage are often the least
obvious.”
9. “You can have your cake and eat it too – but not at once.” For example, an improvement in
2. Senge, P. M. (1990). The fifth discipline: The art and practice of the learning organization. New York: Doubleday/Currency.
42 BONNIE BOARDMAN
quality pays off eventually in improved profits.
10. “Dividing an elephant in half does not produce two small elephants.” Some problems must be
solved by improving the whole system.
11. “There is no blame.” “You and the cause of your problems are part of a single system.”
While most engineers design physical objects (cars, bridges, and so forth), IEs design and improve
production systems. A production system is a system that produces goods or services for customers.
IEs have to think about how a production system works as a system by using the types of ideas I’ve
just described.
EXERCISE
Choose one of the Laws of Complex Systems which you’ve seen demonstrated in your life. Identify
the law you’ve chosen and describe the “real-world” example of it in action which you’ve seen. Your
instructor may ask you to submit your answer.
INTRODUCTION TO INDUSTRIAL ENGINEERING 43

CHAPTER 9.
LEAN OPERATIONS
CHAPTER TABLE OF CONTENTS
• Wastes
• Value
• Continuous Flow
• Pull and Continuous Improvement
• Exercise
44 INTRODUCTION TO INDUSTRIAL ENGINEERING
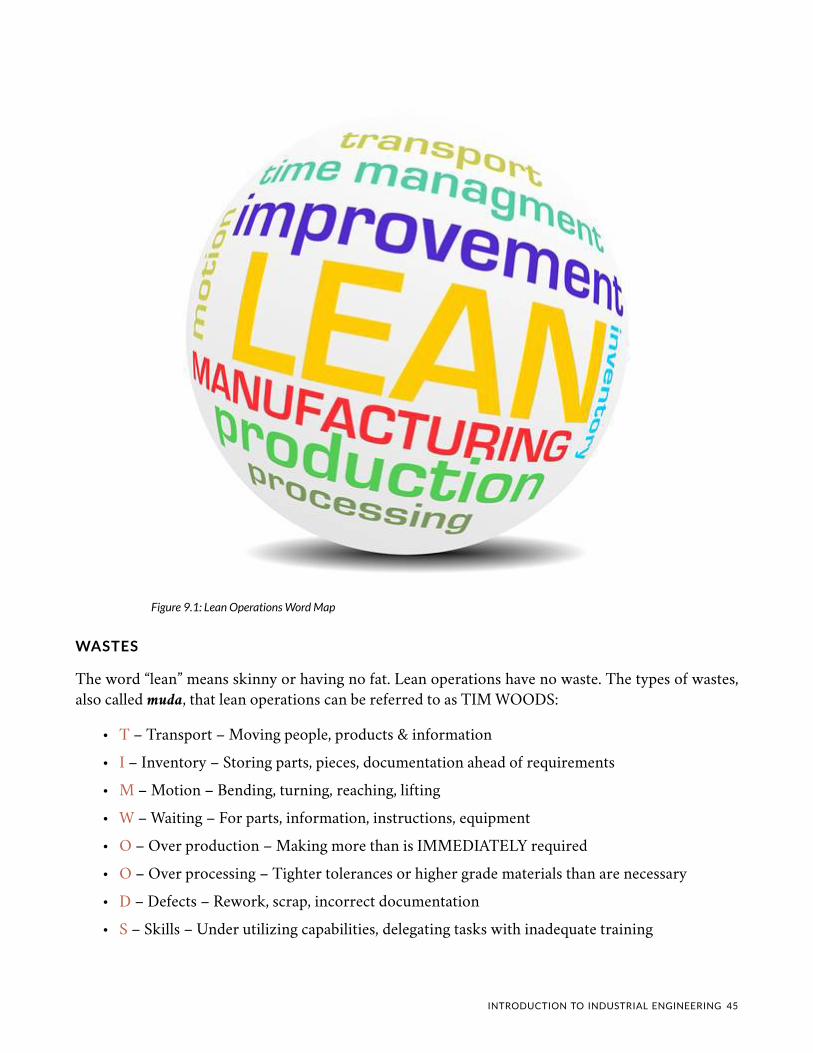
Figure 9.1: Lean Operations Word Map
WASTES
The word “lean” means skinny or having no fat. Lean operations have no waste. The types of wastes,
also called muda, that lean operations can be referred to as TIM WOODS:
• T – Transport – Moving people, products & information
• I – Inventory – Storing parts, pieces, documentation ahead of requirements
• M – Motion – Bending, turning, reaching, lifting
• W – Waiting – For parts, information, instructions, equipment
• O – Over production – Making more than is IMMEDIATELY required
• O – Over processing – Tighter tolerances or higher grade materials than are necessary
• D – Defects – Rework, scrap, incorrect documentation
• S – Skills – Under utilizing capabilities, delegating tasks with inadequate training
INTRODUCTION TO INDUSTRIAL ENGINEERING 45

The framework of lean operations focuses on the concepts of value, value stream, flow, pull, and
perfection in order to reduce all of these types of waste.
VALUE
Value is defined by the customer. An organization must have a clear definition of value as perceived
by the customer. Time and money spent on features of a product or a service that the customer does
not perceive have value are wasted time and money. Knowing what the customer values requires
becoming close to the customer and constantly soliciting feedback.
In lean operations, a process flow diagram is called a value stream map. The diagram is similar, but
the reason for creating the diagram is to identify all the activities in a process and place them into one
of the following categories.
• Value Added (VA) – activities that create value as perceived by the customer
• Non-Value Added (NVA)– activities which don’t create value as perceived by the customer
and so should be eliminated immediately
• Essential Non-Value Added (ENVA) – activities that create no value but are company or
regulatory policies and so can’t be eliminated just yet
The value stream mapping also identifies the time actually spent in adding value and the time
the product spends in storage or transport. Time in storage or transport is waste and should be
eliminated.
46 BONNIE BOARDMAN
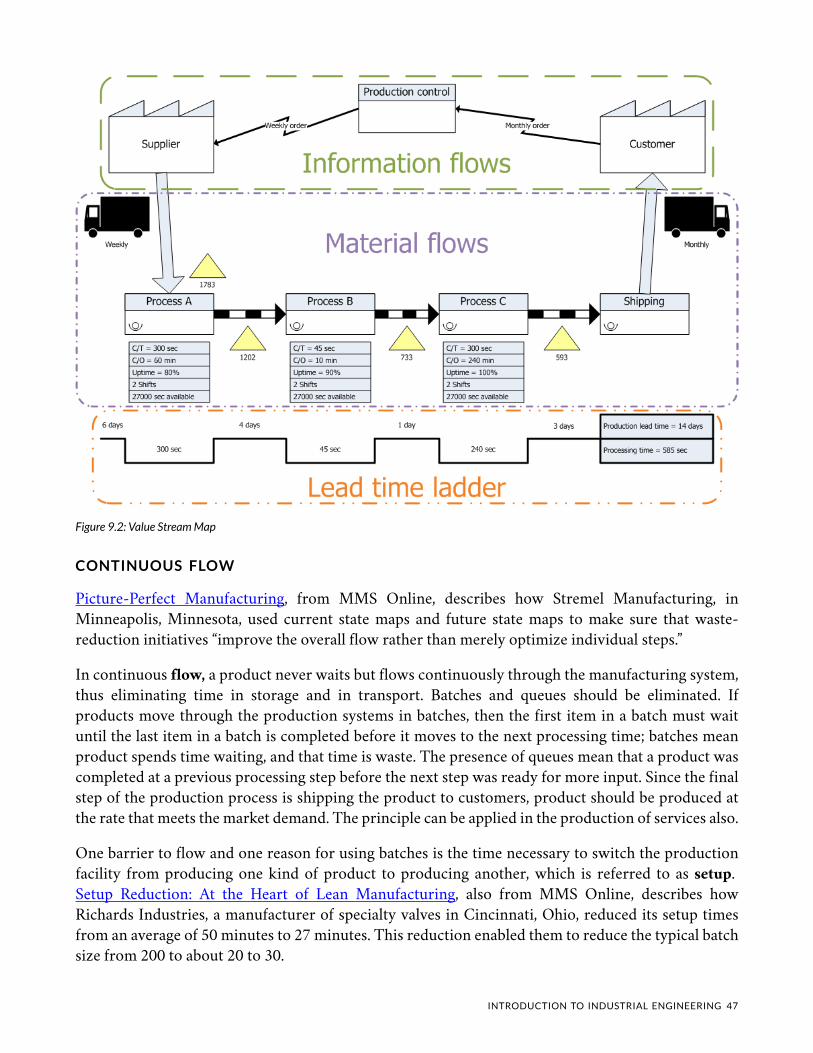
Figure 9.2: Value Stream Map
CONTINUOUS FLOW
Picture-Perfect Manufacturing, from MMS Online, describes how Stremel Manufacturing, in
Minneapolis, Minnesota, used current state maps and future state maps to make sure that waste-
reduction initiatives “improve the overall flow rather than merely optimize individual steps.”
In continuous flow, a product never waits but flows continuously through the manufacturing system,
thus eliminating time in storage and in transport. Batches and queues should be eliminated. If
products move through the production systems in batches, then the first item in a batch must wait
until the last item in a batch is completed before it moves to the next processing time; batches mean
product spends time waiting, and that time is waste. The presence of queues mean that a product was
completed at a previous processing step before the next step was ready for more input. Since the final
step of the production process is shipping the product to customers, product should be produced at
the rate that meets the market demand. The principle can be applied in the production of services also.
One barrier to flow and one reason for using batches is the time necessary to switch the production
facility from producing one kind of product to producing another, which is referred to as setup.
Setup Reduction: At the Heart of Lean Manufacturing, also from MMS Online, describes how
Richards Industries, a manufacturer of specialty valves in Cincinnati, Ohio, reduced its setup times
from an average of 50 minutes to 27 minutes. This reduction enabled them to reduce the typical batch
size from 200 to about 20 to 30.
INTRODUCTION TO INDUSTRIAL ENGINEERING 47
Flow can be improved by eliminating bottlenecks as shown by the following example from World War
II as described by in Methods of Operations Research 1.
An operations research worker during his first day of assignment to a new field command noticed that there
was considerable delay caused by the soldiers having to wait in line to wash and rinse their mess kits after
eating. There were four tubs, two for washing and two for rinsing. The operations research worker noticed
that on the average it took three times as long for the soldier to wash his kit as it did for him to rinse it. He
suggested that, instead of there being two tubs for washing and two for rinsing, there should be three tubs for
washing and one for rinsing. This change was made, and the line of waiting soldiers did not merely diminish
in size; on most days no waiting line ever formed.
A bottleneck is the narrowest part of a bottle and limits the flow in or out of the bottle. In the original
situation with only two tubs for washing, the lines in front of those tubs would have been long,
indicating that the wash tubs were the bottleneck, that is, the place in the production process with the
least capacity. If washing took three minutes and rinsing took one minute, two wash tubs can serve 40
soldiers per hour while two rinse tubs can serve 120 soldiers per hour. With the new configuration,
three wash tubs can serve 60 soldiers per hour, the same service rate as one rinse tub.
Bottlenecks can be identified by looking for places where WIP (Work in Progress) piles up and create
queues. The processing rate at a bottleneck can be increased by reducing the time to process one
item or by adding more processing capability. As a bottleneck’s rate is improved, WIP in front of the
bottleneck will disappear, but another bottleneck may now appear.
PULL AND CONTINUOUS IMPROVEMENT
In a lean system, no product or service is produced until a customer asks for it, that is, product is
pulled not pushed through the system. Some product must be maintained in sales places to meet
immediate demand, but reduction in lead time through improvements such as daily deliveries reduces
the amount of stock kept on hand and allows more variety in stock.
Lean systems constantly seek perfection by working to continuously improve. An organization
should not compete against its competitors. If benchmarking shows the company is doing better than
its competitors, it should not relax. As Womack and Jones state in their preeminent book on lean
operations, Lean Thinking 2, state:
To hell with your competitors; compete against perfection by identifying all activities that are muda and
eliminating them.
In addition to the tools listed above, industrial engineers use a lot of other tools to continuously try
to reduce wastes in a production or service system. You will learn about these tools throughout your
industrial engineering curriculum.
EXERCISE
1. Morse, P., & Kimball, G. (1951). Methods of operations research (1st ed., rev.). Cambridge: Published jointly by the Technology Press
of Massachusetts Institute of Technology, and Wiley, New York.
2. Jones, D. T., & Womack, J. P. (2014). Lean thinking: Banish waste and create wealth in your corporation. Place of publication not
identified: Free Press.
48 BONNIE BOARDMAN

An interactive or media element has been excluded from this version of the text. You can view it online
here:
https://uta.pressbooks.pub/industrialengineeringintro/?p=195
INTRODUCTION TO INDUSTRIAL ENGINEERING 49
CHAPTER 10.
THE IE APPROACH
CHAPTER TABLE OF CONTENTS
• Process Improvement
• PDCA
• DMAIC
• PDCA and DMAIC Tools
• Exercise
PROCESS IMPROVEMENT
How does an IE create a process to reliably produce a product or service with specified requirements?
While the definition of industrial engineering says “the design or improvement” of a system, most IEs
are involved in improvement. The IE approach is to continually improve the system.
In Good to Great1, Jim Collins found a focus on continuous improvement in the companies he studied:
“Visionary companies focus primarily on beating themselves. Success and beating competitors comes
to the visionary companies not so much as the end goal, but as a residual result of relentlessly asking
the question ‘How can we improve ourselves to do better tomorrow than we did today?’ And they
have asked this question day in and day out – as a disciplined way of life – in some cases for over 150
years. Nomatter how much they achieve – no matter how far in front of their competitors they pull –
they never think they’ve done ‘good enough.'”
Improving the whole system at once is hard, so the IE focuses on a particular process in the
production system. A process can be described as any activity or group of activities that takes an
input, adds value to it, and provides an output to an internal or external customer.
Plan-Do-Check-Act (PDCA) and Define-Measure-Analyze-Improve-Control (DMAIC) are two
acronyms indicating the steps an IE does to improve a process in a production system.
PDCA
PDCA stands for Plan, Do, Check, and Act. The steps were developed by Shewhart and popularized
by Deming; they are sometimes called the Shewhart Cycle.
1. Collins, J. C. (2001). Good to great: Why some companies make the leap ... and others don't. New York, NY: HarperBusiness.
50 INTRODUCTION TO INDUSTRIAL ENGINEERING
• Plan – Ask and answer the following questions. What data do we have to help us plan
improvements? What part of the organization should we work on next? Where do we have
the biggest problems? Where do we think we can make the biggest improvement? What
improvements could we make? What experiments could we do to get us data to evaluate
proposed improvements? How would we analyze those data?
• Do – Carry out the planned experiments to test the various proposed improvements.
• Check – Observe the effects of the experiments. Analyze the data from the experiments. Decide
which improvements, if any, should be implemented.
• Act – Reflect on what was learned. Implement the improvements that have been shown to be
effective, or repeat the cycle focusing on specific improvements that show promise but need
more refinement.
When you are done with PDCA, you do it again. Or, in other words, you are never done because
you must practice continuous quality improvements. The American Society for Quality has a good
summary of the steps and a links to a three-part webcast series that may be interesting to you.
DMAIC
DMAIC stands for Define, Measure, Analyze, Improve, and Control.
• Define – Select a process for improvement. The project champion assigns a project team and
give them a project charter. Develop a preliminary process map. Use the Voice of the Customer
to determine real requirements.
• Measure – Determine the current status of the process. Determine performance measures.
Identify the gap between current status and desired status. Identify the critical process inputs
(the Xs) and critical process outputs (the Ys). Develop a detailed process map. Determine
possible root causes for the problems.
• Analyze – Evaluate the contributions of various possible root causes. The emphasis is on
rigorous analysis of data.
• Improve – Test possible improvements through designed experiments. Develop an
implementation plan for the ones that are shown to best meet the project objectives.
• Control – The project champion carries out the implementation plan. Sustain the
improvement by training workers and by implementing control charts. As with PDCA, when
you are done DMAIC, you do it again.
Process Redesign to Reduce Cycle Time, by D. Bandyopadhyay, describes an example.
PCDA, DMAIC, and other versions all have in common these important features:
• Make sure you are solving an important problem.
• Use a team to generate ideas because a group of people can generate more ideas than any one
individual.
• Use facts, experiments, and data for decision making.
INTRODUCTION TO INDUSTRIAL ENGINEERING 51
• Continuously improve quality.
PDCA and DMAIC are very similar, but have some differences. Since it is sometimes called the
Shewhart Cycle, PDCA emphasizes more the need to repeat the steps, while DMAIC adds the Control
step lacking in PDCA.
PDCA AND DMAIC TOOLS
Both PDCA and DMAIC use these tools:
• Teams
• Documentation
• Process flow diagram or flowchart
• Documentation
• Check sheet
• Histogram
• Pareto chart
• Brainstorming and Nominal Group Technique
• Defect concentration chart
• Cause and effect diagram or fishbone diagram
• The five whys and root cause analysis
• Regression analysis
• Design of experiments and analysis of variance
• Control charts
Teams. Continuous improvement of a process requires the involvement of everyone who works
on that process. A team is usually created to focus on a particular problem or a particular process,
but may include people who work in the processes that provide input or receive the output from
the process being studied. For example, a team to improve the process of moving patients from the
Emergency Department to a hospital room should include people who move the patients, but should
also include people who work in the Emergency Department as well as people who work in the
hospital. Team members may need training in some of the tools described below and support from
staff people for data analysis.
Documentation. According to Robitaille (page 65):“If the documents aren’t correct, the system will
always have problems.”
One of the first steps of a team in analyzing a problem should be to determine whether a process
is actually being implemented the way the documentation says it should be.Differences may require
adjusting the process or the documentation. The team should also document its work, including
data collection and analysis, and conclusions reached. Finally, when the team completes its work,
it should be sure that the recommended changes are reflected in the documentation of the process,
materials used for training new workers, and so forth. Documents form the long lasting memory for
52 BONNIE BOARDMAN
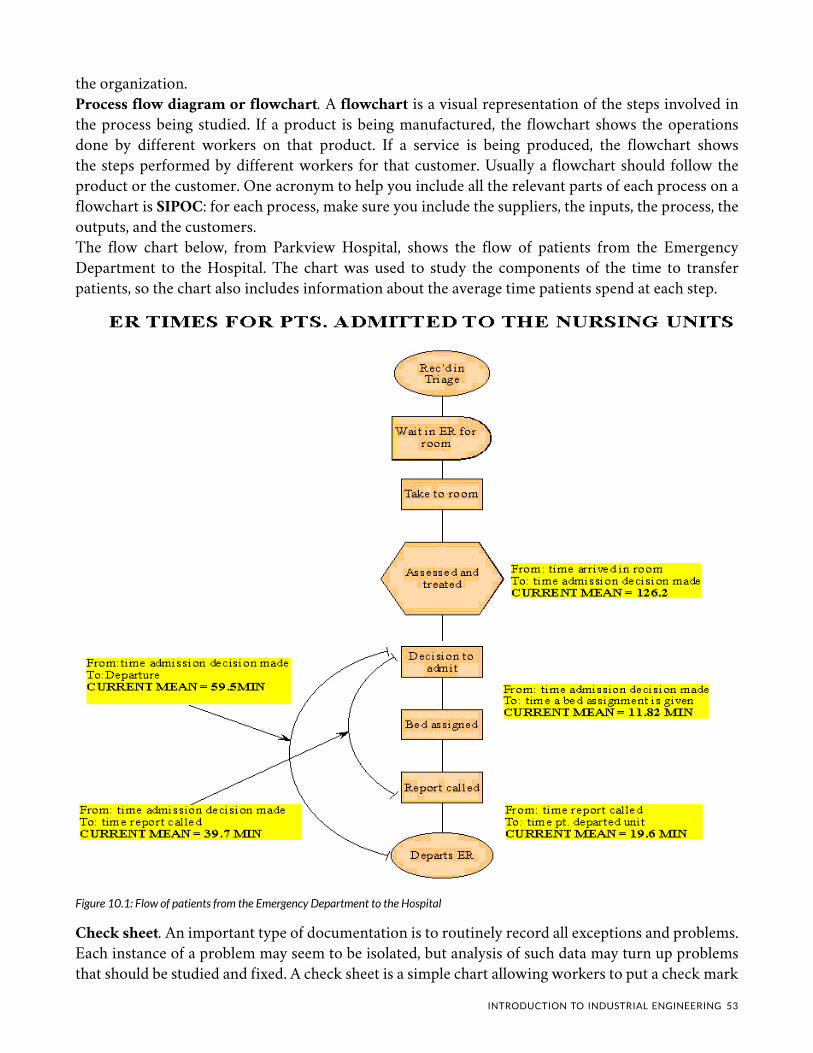
the organization.
Process flow diagram or flowchart. A flowchart is a visual representation of the steps involved in
the process being studied. If a product is being manufactured, the flowchart shows the operations
done by different workers on that product. If a service is being produced, the flowchart shows
the steps performed by different workers for that customer. Usually a flowchart should follow the
product or the customer. One acronym to help you include all the relevant parts of each process on a
flowchart is SIPOC: for each process, make sure you include the suppliers, the inputs, the process, the
outputs, and the customers.
The flow chart below, from Parkview Hospital, shows the flow of patients from the Emergency
Department to the Hospital. The chart was used to study the components of the time to transfer
patients, so the chart also includes information about the average time patients spend at each step.
Figure 10.1: Flow of patients from the Emergency Department to the Hospital
Check sheet. An important type of documentation is to routinely record all exceptions and problems.
Each instance of a problem may seem to be isolated, but analysis of such data may turn up problems
that should be studied and fixed. A check sheet is a simple chart allowing workers to put a check mark
INTRODUCTION TO INDUSTRIAL ENGINEERING 53
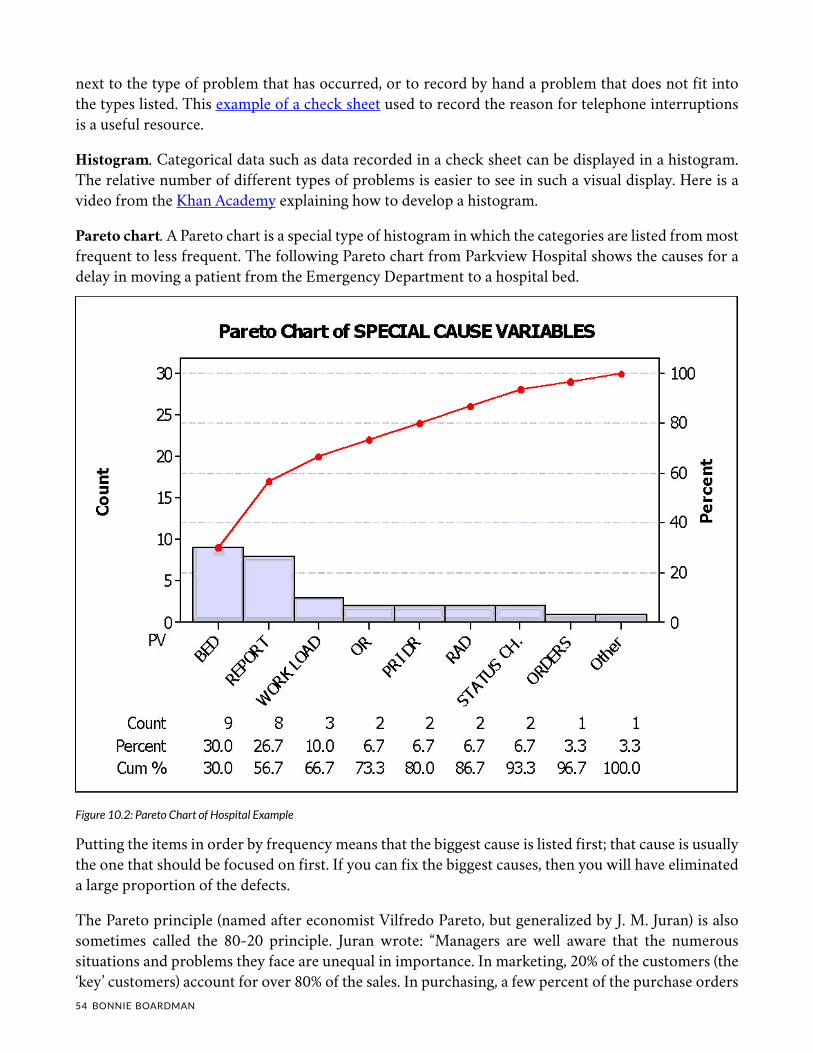
next to the type of problem that has occurred, or to record by hand a problem that does not fit into
the types listed. This example of a check sheet used to record the reason for telephone interruptions
is a useful resource.
Histogram. Categorical data such as data recorded in a check sheet can be displayed in a histogram.
The relative number of different types of problems is easier to see in such a visual display. Here is a
video from the Khan Academy explaining how to develop a histogram.
Pareto chart. A Pareto chart is a special type of histogram in which the categories are listed from most
frequent to less frequent. The following Pareto chart from Parkview Hospital shows the causes for a
delay in moving a patient from the Emergency Department to a hospital bed.
Figure 10.2: Pareto Chart of Hospital Example
Putting the items in order by frequency means that the biggest cause is listed first; that cause is usually
the one that should be focused on first. If you can fix the biggest causes, then you will have eliminated
a large proportion of the defects.
The Pareto principle (named after economist Vilfredo Pareto, but generalized by J. M. Juran) is also
sometimes called the 80-20 principle. Juran wrote: “Managers are well aware that the numerous
situations and problems they face are unequal in importance. In marketing, 20% of the customers (the
‘key’ customers) account for over 80% of the sales. In purchasing, a few percent of the purchase orders
54 BONNIE BOARDMAN
account for the bulk of the dollars of purchase. In personnel relations, a few percent of the employees
account for most of the absenteeism. in inventory control, a few percent of the catalog items account
for most of the dollar inventory. In cost analysis, roughly 20% of the parts contain 80% of the factory
costs; the basic function of a product accounts for 80% of the cost, while the secondary functions
account for only 20% of the cost. In quality control, the bulk of the field failures, downtime, shop
scrap, rework, sorting, and other quality costs are traceable to a vital few field failure modes, shop
defects, products, components, processes, vendors, designs, etc.”
Figure 10.2 shows Parkland Hospital had 9 causes for delay; 20% of 9 is 1.8 or about 2. The largest 2
causes (Bed and Report) account for only 56.7% of the problems, so we can see that the Pareto rule
doesn’t always hold. It is, however, often a useful guideline.
Defect concentration chart. Sometimes defects or other problems can be recorded or displayed
according to location. For example, breakdowns of machines can be displayed on a map of a factory to
determine if the breakdowns are occurring in a particular area. Defects in welds on a product can be
displayed on a diagram of the product to see if the weld defects are concentrated in a particular part
of the product. You can see an example of how concentration diagrams are used here.
Brainstorming and Nominal Group Technique. Usually everyone on the team has ideas about why
the problem is occurring. However, a good process should be used to develop a list of possible causes
to avoid the team from focusing too early on just a few causes. Team brainstorming usually works best
with these steps:
1. Clear statement of the problem or issue for which ideas are being generated. For example,
generate possible causes why customers sometimes receive shipments that are missing items.
2. Silent generation of ideas by each individual, writing on paper.
3. Round robin collection of ideas, recorded on a board or flip chart visible to all. Each person
gives one idea during each round, and can “pass” during any round. During this step, ideas are
not evaluated. The more ideas and the more different the ideas, the better. After a round in
which all pass, some time should be allowed for all to think a bit more. The facilitator should be
sure to encourage everyone to volunteer all the items generated during the silent generation.
Sometimes people are hesitant to volunteer ideas that differ from what others have said, but
one of the values of working in a team is the generation of different types of ideas.
4. Clarification and combination of ideas. Often some ideas are similar in concept, but different
in wording. The team works together to clarify and combine ideas. Ideas should not be overly
combined; if the person who volunteered an idea wants to keep an idea separate, the team
should usually defer to that person.
5. Prioritization among the ideas. This step is not always appropriate. If the team is brainstorming
causes for a problem, data, not voting, should usually be used to determine which causes
are more important. If the team is brainstorming ideas for next steps for the improvement,
prioritization is needed. If there are 10 or few items, each team member can rank order the
items (from 10 for the highest priority to 1 for the lowest) and the sum is used to prioritize.
If there are more items, voting can be used to first reduce the list. For example, each person is
given a number of votes equal to half the number of items. Each person allocates votes; votes
INTRODUCTION TO INDUSTRIAL ENGINEERING 55
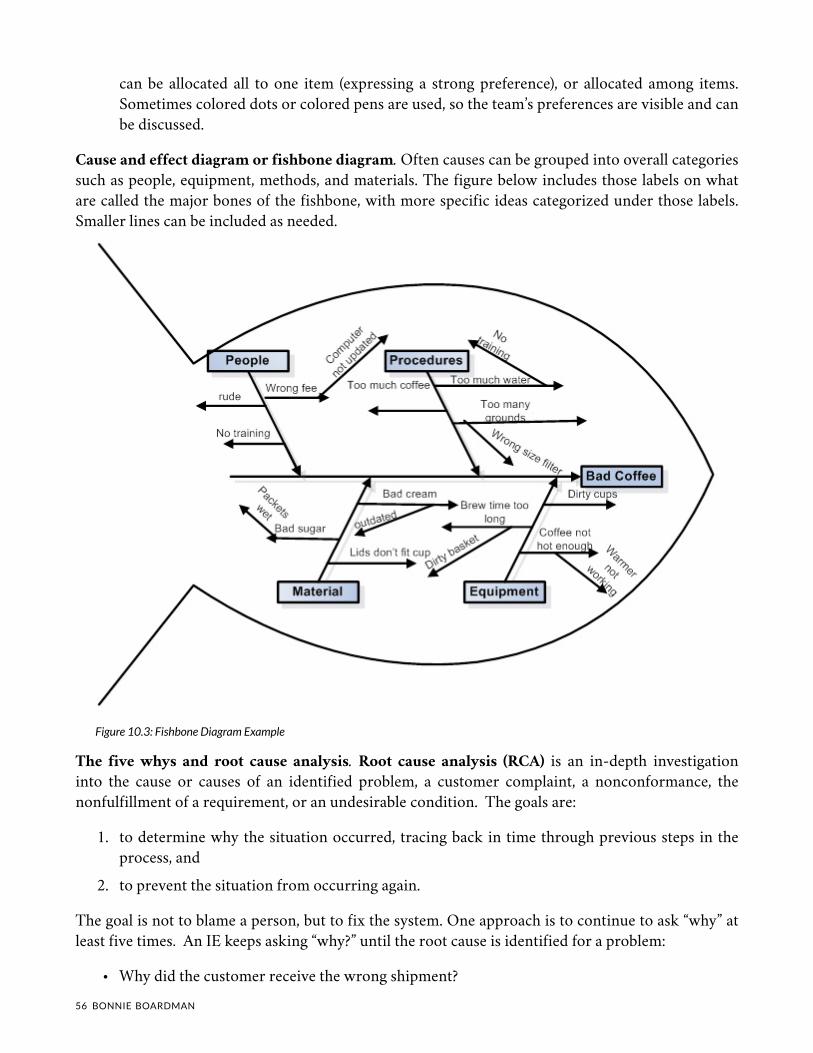
can be allocated all to one item (expressing a strong preference), or allocated among items.
Sometimes colored dots or colored pens are used, so the team’s preferences are visible and can
be discussed.
Cause and effect diagram or fishbone diagram. Often causes can be grouped into overall categories
such as people, equipment, methods, and materials. The figure below includes those labels on what
are called the major bones of the fishbone, with more specific ideas categorized under those labels.
Smaller lines can be included as needed.
Figure 10.3: Fishbone Diagram Example
The five whys and root cause analysis. Root cause analysis (RCA) is an in-depth investigation
into the cause or causes of an identified problem, a customer complaint, a nonconformance, the
nonfulfillment of a requirement, or an undesirable condition. The goals are:
1. to determine why the situation occurred, tracing back in time through previous steps in the
process, and
2. to prevent the situation from occurring again.
The goal is not to blame a person, but to fix the system. One approach is to continue to ask “why” at
least five times. An IE keeps asking “why?” until the root cause is identified for a problem:
• Why did the customer receive the wrong shipment?
56 BONNIE BOARDMAN
◦ Because the wrong shipping label was put on the customer’s shipment.
• Why was the wrong shipping label put on the customer’s shipment?
◦ Because some shipments were removed from the shipping department.
• Why were the shipments removed?
◦ Because the customer had made some last minute changes to the order.
• Why did the customer make some last minute changes?
◦ And so forth.
Regression analysis. A scatter diagram shows the effect of only one variable on the variable we are
studying. More sophisticated analysis allows for more independent or explanatory variables. With
more variables, plots cannot be used, but the mathematical techniques of regression analysis can
indicate which variables are most important in explaining the variation in the dependent variable, that
is, the variable being studied.
Design of experiments and analysis of variance. After careful analysis of data, a team may have
some good ideas about why the problem is occurring and may have some good ideas about how to fix
the problem. A carefully designed experiment can test these ideas. The analysis of variance (ANOVA)
is a mathematical technique (like regression analysis) for determining which variables have the most
effect on the variable being studie.
Control charts. Key measurements of a process should be monitored to make sure that the process
is functioning within the required limits. The design and use of control charts requires mathematical
analysis to distinguish natural variation in the system from clear indications that the process has
changed.
EXERCISE
An interactive or media element has been excluded from this version of the text. You can view it online
here:
https://uta.pressbooks.pub/industrialengineeringintro/?p=31
INTRODUCTION TO INDUSTRIAL ENGINEERING 57
CHAPTER 11.
ORGANIZATIONS' MISSIONS, VISIONS, AND VALUES
CHAPTER TABLE OF CONTENTS
• What is an Organization
• Vision Statement
• Values Statement
• The IEs Role in an Organization
• Exercise
This chapter will help us answer an important question: What is the mission of an IE, in other words,
why does an IE exist?
58 INTRODUCTION TO INDUSTRIAL ENGINEERING
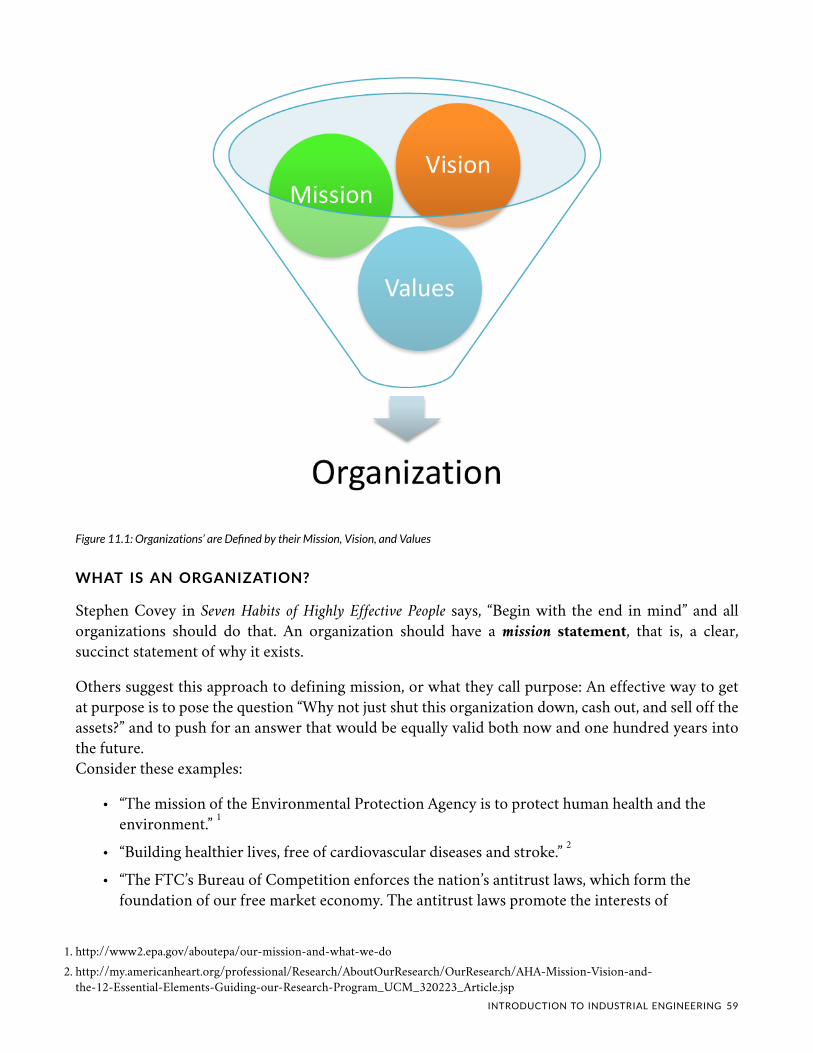
Figure 11.1: Organizations’ are Defined by their Mission, Vision, and Values
WHAT IS AN ORGANIZATION?
Stephen Covey in Seven Habits of Highly Effective People says, “Begin with the end in mind” and all
organizations should do that. An organization should have a mission statement, that is, a clear,
succinct statement of why it exists.
Others suggest this approach to defining mission, or what they call purpose: An effective way to get
at purpose is to pose the question “Why not just shut this organization down, cash out, and sell off the
assets?” and to push for an answer that would be equally valid both now and one hundred years into
the future.
Consider these examples:
• “The mission of the Environmental Protection Agency is to protect human health and the
environment.” 1
• “Building healthier lives, free of cardiovascular diseases and stroke.” 2
• “The FTC’s Bureau of Competition enforces the nation’s antitrust laws, which form the
foundation of our free market economy. The antitrust laws promote the interests of
1. http://www2.epa.gov/aboutepa/our-mission-and-what-we-do
2. http://my.americanheart.org/professional/Research/AboutOurResearch/OurResearch/AHA-Mission-Vision-and-
the-12-Essential-Elements-Guiding-our-Research-Program_UCM_320223_Article.jsp
INTRODUCTION TO INDUSTRIAL ENGINEERING 59

consumers; they support unfettered markets and result in lower prices and more choices.” 3
• “NFI’s mission is to improve the well-being of children by increasing the proportion of
children growing up with involved, responsible, and committed fathers.” 4
• “The mission of the Office of the United Nations High Commissioner for Human Rights
(OHCHR) is to work for the protection of all human rights for all people; to help empower
people to realize their rights; and to assist those responsible for upholding such rights in
ensuring that they are implemented.” 5
• “The mission of the [Illinois] Department of Corrections is to protect the public from criminal
offenders through a system of incarceration and supervision which securely segregates
offenders from society, assures offenders of their constitutional rights and maintains
programs to enhance the success of offenders’ reentry into society.” 6
• “Google’s mission is to organize the world’s information and make it universally accessible and
useful.” 7
• “I work to help plastic surgery patients become bold in their quest, informed in their choices,
and responsible in their decisions.” 8
• “EVRAZ North America is a leading steel manufacturer that produces flat, long and tubular
products.” 9
• “The mission of Parkview is to provide quality healthcare services and education to improve
the health of the people we serve.” 10
• “To develop, manufacture and supply scanning components, spindles, optics and Electro Optic
modules, while maintaining high quality standards with exceptional customer service.” 11
• “LDM sells, manufactures and develops copper alloy rods and billets. It is our aim to achieve
worldwide success in our specific niche markets. The organization distinguishes itself through
a high customer-orientation and service level, and drive for continuous improvement.” 12
The following list gives attributes of a good mission statement:
1. It should state the purpose for which the organization exists.
2. It should have a narrow focus.
3. It should be clear.
4. It should get to the point.
3. https://www.ftc.gov/about-ftc/bureaus-offices/bureau-competition
4. http://www.fatherhood.org/mission-and-values
5. http://www.ohchr.org/EN/AboutUs/Pages/MissionStatement.aspx
6. http://www.illinois.gov/idoc/aboutus/Pages/IllinoisDepartmentofCorrectionsMissionStatement.aspx
7. http://www.google.com/about/company/
8. http://www.susangail.com/html/mission-statement.html
9. http://www.evrazna.com/
10. http://www.parkviewmc.com/about/serving-our-great-community/
11. http://www.lincolnlaser.com/company-overview.html
12. http://www.ldmbrass.com/en/content/2-2-12/mission_statement.htm
60 BONNIE BOARDMAN
5. It should be realistic, feasible, and achievable.
6. It should be a succinct one sentence with few adjectives and adverbs.
7. It should provide guidance for leadership and employees.
8. It should let prospective employees know what the company is like.
9. It should be unique to that organization.
Consider again the examples given above. Most of these are well written. Some are a little wordy,
some are more than one sentence, and some incorporate elements of vision and values statements,
which we will discuss in the next sections. However, each provides a clear statement about why the
organization exists and they all provide guidance to members of the organization about what types of
activities it should undertake.
For example, if a prospective client approached LDM to ask if the company can provide lead free
copper billets, the company would respond “we can.” But if a prospective client approached them to
ask for copper pipes, company would say “we don’t do that.” In fact, companies often refer clients to
other companies and often receive referrals back in turn. A group of companies, in a geographical
area or in an industry, often know the missions of each company and refer clients to the appropriate
company.
Now consider these examples of mission statements, which don’t make clear what the organization
does:
• “The mission of Southwest Airlines is dedication to the highest quality of Customer Service
delivered with a sense of warmth, friendliness, individual pride, and company spirit.” 13
• “Henderson Manufacturing Company is dedicated to providing high quality, competitively
priced products, on time with personalized service. Additionally, we strive to provide a safe
and rewarding work environment that recognizes individual achievement and promotes the
skills of teamwork and communication.” 14
• “Empower every person and every organization on the planet to achieve more.”15
• “The Specialty Mfg. Co. is committed to providing quality, custom solutions which meet
our customers’ unique needs. We provide a highly valued experience for our customers and
employees by making all our business partnerships enjoyable, professional and profitable.” 16
If you didn’t know already what these organizations do, these statements don’t help much.
13. https://www.southwest.com/html/about-southwest/
14. http://www.hendersonmfgco.com/info/info_mission.htm
15. https://www.microsoft.com/en-us/about
16. http://www.specialtymfg.com/about_us/mission_statement/default.html
INTRODUCTION TO INDUSTRIAL ENGINEERING 61

Figure 11.2: Vision and mission statement of LUMO Community Wildlife Sanctuary
VISION STATEMENT
An organization should also have a vision statement, that is, a statement of how the organization
62 BONNIE BOARDMAN
would like to be perceived by its customers. A mission statement gives the reason the organization
exists. The vision statement describes what the organization wants to be. What is the destination for
this organization?
Consider these examples:
• “SpaceX’s vision statement is to advance the future.” 17
• “To build the largest and most complete Amateur Radio community site on the Internet.” 18
• “Clemson [University] will be one of the nation’s top-20 public universities.” 19
The Alliance for NonProfit Management provides good advice on creating a vision statement:
A vision statement should be realistic and credible, well articulated and easily understood,
appropriate, ambitious, and responsive to change. It should orient the group’s energies and serve as
a guide to action. It should be consistent with the organization’s values. In short, a vision should
challenge and inspire the group to achieve its mission. Profitguide.com quotes Ron Robinson,
president of ABARIS Consulting Inc., as saying that a vision statement should paint “a picture of the
ideal organization in the future.” It should not look only a few years into the future.
The following list gives attributes of a good vision statement:
1. It should state what the organization aims to be in the future.
2. It should allow for growth and development.
3. It should be inspiring to the employees. Now you can use the adjectives and adverbs that didn’t
belong in them mission statement.
4. It should be clear.
VALUES STATEMENT
Finally, many organizations have a values statement. Carter McNamara says
Values represent the core priorities in the organization’s culture, including what drives members’
priorities and how they truly act in the organization, etc.
Consider these examples:
• “Toastmasters Internationals Values
◦ Integrity,
◦ Respect
◦ Service
◦ Excellence.” 20
17. https://mission-statement.com/spacex/
18. http://www.eham.net/about/vision
19. https://www.clemson.edu/brand/positioning/mission-vision.html
INTRODUCTION TO INDUSTRIAL ENGINEERING 63
• “IBMers value:
◦ Dedication to every client’s success
◦ Innovation that matters, for our company and for the world
◦ Trust and personal responsibility in all relationships” 21
• A2Z Computing Services Value Statement:
◦ We are responsible to the communities that we represent. To provide them a service that
will enhance their online community with a professional, informative and entertaining
website.
◦ We are responsible to the residents of the communities. To provide them a source of
information pertaining to all aspects of their community that are inkeeping with the
community’s values and morals.
◦ We are responsible to the businesses that advertise on and sponsor our pages. To do our
best to ensure the success of their advertising campaign with fair pricing and quality
design work.
◦ We are responsible to the nonprofit and community organizations. To provide them a
method to market and support their missions via our community websites.
◦ We are responsible to our employees. To provide them a safe work environment, fair
wages, opportunity for advancement, and equal opportunity regardless of sex, race or
religion.
◦ We are responsible to our subcontractors. To provide them agreeable and timely
payment for services and adequate information for completion of the work ordered.
We are responsible to our suppliers. To provide them timely payment for products or
services and to demand not the impossible but to request the reasonable.
◦ We are responsible to the banks and creditors who have loaned us money. To submit
payments timely and accurately.
◦ We are responsible to our investors. To ensure their investment returns a reasonable
profit. 22
The following list gives attributes of a good values statement:
1. It should set priorities for the organization by stating what is important.
2. It should describe how members of the organization interact with each other and with others
outside the organization.
3. It should provide guidance about trade-offs.
Now let’s put mission, vision, and values all together. Collins and Porras found that mission, vision,
and values (or what they call ideology) was very important to their visionary companies.
20. http://www.toastmasters.org/about/our-mission
21. http://www-03.ibm.com/employment/our_values.html
22. http://www.a2zcomputing.com/index.php/about-us/20-values-statement
64 BONNIE BOARDMAN
A detailed pair-by-pair analysis showed that the visionary companies have generally been more
ideologically driven and less purely profit-driven than the comparison companies in seventeen out of
eighteen pairs. This is one of the clearest differences we found between the visionary and comparison
companies.
As we have seen, some mission statements just aren’t very good. Also, some organizations make the
creation of mission, vision, and statements into a ponderous exercise, without much purpose. I have
spent time on mission, vision, and values statements for three reasons.
1. As Covey says, “begin with the end in mind.” Collins and Porras found that the visionary
companies were more likely to focus on an ideology than were the less successful companies.
2. The IE working for an organization needs guidance – exactly what does this organization do
and with what values? What is the goal that this organization’s system is trying to reach? If
the organization’s mission isn’t clear the IE will have a hard time knowing what effectiveness
means for that organization.
3. As I will discuss more in Chapter 8 IE Careers, you will be happier if you work for an
organization that is compatible with your mission and vision, and especially with your values.
4. For some humor on the subject of mission and vision statements, try this link: Mission
statement generator.
THE INDUSTRIAL ENGINEERS ROLE IN AN ORGANIZATION
An organization is created to accomplish some mission. The people in that organization also have a
vision of what they want the organization to be. Values govern how the people in the organization
will get to that vision. All organizations contain the following four groups of people:
1. The founder, directors, president, chief executive officer, or entrepreneur. These people
determine the mission of the organization and broadly define the types of processes and values
the organization will use in achieving that mission.
2. Managers. These people set up and monitor the processes that will be used to achieve the
organization’s mission.
3. Workers. These people actually do the work of the organization. They make the products and
they deliver the services to customers. They are sometimes called line workers.
4. Support. These people provide the goods and services the workers need that are not part of
the mission of the organization, for example, information technology, accounting, and the
cafeteria. They are sometimes called staff workers.
An IE can be in any of the four groups. An IE can start a company or be among the directors of a
company, although in such a role the IE probably isn’t doing much industrial engineering but may
be using IE skills to be a good CEO. An IE is often a manager or supervisor of workers. IEs are only
rarely group 3, the workers. The only way an IE can be a worker, that is, the person who does the work
described in the mission of the organization, is if the mission of the organization is to do industrial
engineering. Consulting companies, such as Accenture, St. Onge, etc., hire a lot of IEs, but many more
jobs are available as CEO, manager, or staff. So most IEs are managers or support staff.
INTRODUCTION TO INDUSTRIAL ENGINEERING 65
IEs are, first, engineers. All engineers, including IEs, design, but most engineers design physical
products or physical structures, objects that you can see, while IEs design systems and you can’t really
see a system.
All engineers, even those designing an object (for example, a computer chip, a car, or a bridge), have to
think about the system in which that object will function and have to think about the system that will
make that object. Every engineer should think about DfX, which is short hand for
• Design for Manufacturability,
• Design for Usability,
• Design for Maintainability
• Design for Reliability
• Design for Repairability
• Design for Recylclability
• Design for Maintainability
Thus, all engineers are concerned with systems, but IEs always think about systems.
But what exactly does an IE do? Recall the earlier definition of industrial engineering :
The design or improvement of a system of people, machines, information, and money to achieve some
goal with efficiency, quality, and safety.
An IE designs and works continually to improve a production system, that is, a system that
produces a product or service. Although we often talk about the fact that engineers solve problems,
when an IE solves a problem, the IE also makes a change to the system so that problem never occurs
again. If an IE is solving problems all the time (for example, the order for a particular client is late and
the IE expedites the order), something is wrong. The IE should be working on the system, not putting
out fires.
EXERCISE
Go to the homepage of a company of which you are a customer. Can you find their Mission
Statement, Vision Statement, and Values Statement? If not, note that you couldn’t and look at other
companies until you can find those statements. Evaluate the statements using the characteristics of
good statements given in this chapter. Your instructor may ask you to submit your analysis.
66 BONNIE BOARDMAN
CHAPTER 12.
LIFELONG LEARNING
CHAPTER TABLE OF CONTENTS
• The FE Exam
• Professional Societies
• Exercise
To practice as a physician in the United States, a person must earn an undergraduate degree, earn a
graduate medical degree, pass the United States Medical Licensing Examination, and be approved by
the state licensing board where the physician will practice. In most states and for most specialties,
physicians are required to complete a minimum number of credits in continuing medical education
each year to maintain a license. To practice as an attorney in the United States, a person must earn an
undergraduate degree, earn a graduate law degree, pass a bar exam, and be licensed by the jurisdiction
in which the lawyer will practice. In most states, attorneys are required to complete a minimum
number of credits in continuing legal education each year to maintain a license.
Engineering, like medicine and the law, is considered a profession, but to practice as an engineer in
the United States a person needs only to earn an undergraduate degree and need not be licensed.
However, to be a principal in an engineering firm (for example, if you want to open your own firm
as an engineer) or to approve engineering plans and drawings, you must be a licensed professional
engineer (PE). Among all the types of engineering, licensure is most important for civil engineers,
and probably least important for industrial engineers. As with physicians and attorneys, becoming
licensed requires passing exams and being licensed by a state. Thirty states, including Texas, require
continuing engineering education to remain licensed. If you become a licensed PE in one state, most
other states will have a process by which you can also be licensed in that state.
In Texas, the Texas Board of Professional Engineers controls the licensure of engineers. In Texas, the
steps to becoming a licensed Professional Engineer are:
1. While a senior in an ABET accredited engineering program (the BSIE program and UTA is
ABET accredited), pass the Fundamentals of Engineering (FE) exam. You are then an Engineer
in Training (EIT).
2. Graduate from an ABET accredited engineering program.
3. Have 4 years of “active practice in engineering work.”
INTRODUCTION TO INDUSTRIAL ENGINEERING 67
4. Pass the Principles and Practice exam and the Ethics exam.
The FE, PE, and Ethics exams are administered by the National Council of Examiners for Engineering
and Surveying (NCEES).
THE FE EXAM
The FE is a computer-based exam that is administered year-round in testing windows at NCEES-
approved Pearson VUE test centers. It contains 110 multiple-choice questions. The exam
appointment time is 6 hours long, which includes a nondisclosure agreement, tutorial (8 minutes), the
exam (5 hours and 20 minutes), and a scheduled break (25 minutes).
The Industrial Engineering exam covers the following topics:
1. Mathematics 6–9 questions
A. Analytic geometry
B. Calculus
C. Matrix operations
D. Vector analysis
E. Linear algebra
2. Engineering Sciences 5–8 questions
A. Work, energy, and power
B. Material properties and selection
C. Charge, energy, current, voltage, and power
3. Ethics and Professional Practice 5–8 questions
A. Codes of ethics and licensure
B. Agreements and contracts
C. Professional, ethical, and legal responsibility
D. Public protection and regulatory issues
4. Engineering Economics 10–15 questions
A. Discounted cash flows (PW, EAC, FW, IRR, amortization)
B. Types and breakdown of costs (e.g., fixed, variable, direct and indirect labor)
C. Cost analyses (e.g., benefit-cost, breakeven, minimum cost, overhead)
D. Accounting (financial statements and overhead cost allocation)
E. Cost estimation
F. Depreciation and taxes
G. Capital budgeting
5. Probability and Statistics 10–15 questions
A. Combinatorics (e.g., combinations, permutations)
B. Probability distributions (e.g., normal, binomial, empirical)
C. Conditional probabilities
D. Sampling distributions, sample sizes, and statistics (e.g., central tendency, dispersion)
E. Estimation (e.g., point, confidence intervals)
F. Hypothesis testing
68 BONNIE BOARDMAN
G. Regression (linear, multiple)
H. System reliability (e.g., single components, parallel and series systems)
I. Design of experiments (e.g., ANOVA, factorial designs)
6. Modeling and Computations 8–12 questions
A. Algorithm and logic development (e.g., flow charts, pseudocode)
B. Databases (e.g., types, information content, relational)
C. Decision theory (e.g., uncertainty, risk, utility, decision trees)
D. Optimization modeling (e.g., decision variables, objective functions, and constraints)
E. Linear programming (e.g., formulation, primal, dual, graphical solutions)
F. Mathematical programming (e.g., network, integer, dynamic, transportation, assignment)
G. Stochastic models (e.g., queuing, Markov, reliability)
H. Simulation
7. Industrial Management 8–12 questions
A. Principles (e.g., planning, organizing, motivational theory)
B. Tools of management (e.g., MBO, reengineering, organizational structure)
C. Project management (e.g., scheduling, PERT, CPM)
D. Productivity measures
8. Manufacturing, Production, and Service Systems 8–12 questions
A. Manufacturing processes
B. Manufacturing systems (e.g., cellular, group technology, flexible)
C. Process design (e.g., resources, equipment selection, line balancing)
D. Inventory analysis (e.g., EOQ, safety stock)
E. Forecasting
F. Scheduling (e.g., sequencing, cycle time, material control)
G. Aggregate planning
H. Production planning (e.g., JIT, MRP, ERP)
I. Lean enterprises
J. Automation concepts (e.g., robotics, CIM)
K. Sustainable manufacturing (e.g., energy efficiency, waste reduction)
L. Value engineering
9. Facilities and Logistics 8–12 questions
A. Flow measurements and analysis (e.g., from/to charts, flow planning)
B. Layouts (e.g., types, distance metrics, planning, evaluation)
C. Location analysis (e.g., single- and multiple-facility location, warehouses)
D. Process capacity analysis (e.g., number of machines and people, trade-offs)
E. Material handling capacity analysis
F. Supply chain management and design
10. Human Factors, Ergonomics, and Safety 8–12 questions
A. Hazard identification and risk assessment
B. Environmental stress assessment (e.g., noise, vibrations, heat)
C. Industrial hygiene
D. Design for usability (e.g., tasks, tools, displays, controls, user interfaces)
E. Anthropometry
INTRODUCTION TO INDUSTRIAL ENGINEERING 69
F. Biomechanics
G. Cumulative trauma disorders (e.g., low back injuries, carpal tunnel syndrome)
H. Systems safety
I. Cognitive engineering (e.g., information processing, situation awareness, human error,
mental models)
11. Work Design 8–12 questions
A. Methods analysis (e.g., charting, workstation design, motion economy)
B. Time study (e.g., time standards, allowances)
C. Predetermined time standard systems (e.g., MOST, MTM)
D. Work sampling
E. Learning curves
12. Quality 8–12 questions
A. Six sigma
B. Management and planning tools (e.g., fishbone, Pareto, QFD, TQM)
C. Control charts
D. Process capability and specifications
E. Sampling plans
F. Design of experiments for quality improvement
G. Reliability engineering
13. Systems Engineering 8–12 questions
A. Requirements analysis
B. System design
C. Human systems integration
D. Functional analysis and allocation
E. Configuration management
F. Risk management
G. Verification and assurance
H. System life-cycle engineering
The exam is hard because a great deal of material is covered and you have a limited time to answer
a lot of questions. If you can answer more than half the questions correctly, you have a good chance
of passing, so use your time wisely to focus first on the questions you know you can answer and then
on the ones that you think you can answer; if you have extra time, then try the questions you don’t
think you can answer. The exam is closed book, but you are allowed to use the Supplied Reference
Handbook. You should become familiar with this Handbook before the exam because you may be able
to answer quite a few questions by knowing where to find the necessary formulas in the Handbook.
In fact, the Handbook is a good summary for you to use while you take many engineering courses.
A searchable online version of the Handbook is available while you take the test. You are allowed to
bring into the room and use only a calculator from a limited list of calculators.
Some BSIE graduates obtain jobs because they were able to list “Engineer in Training” on their
resumes. Many employers respect the accomplishment represented by that label and want to hire
people with the knowledge, drive, and concentration required to pass the FE.
70 BONNIE BOARDMAN

PROFESSIONAL SOCIETIES
Joining and participating in professional organizations can help you stay current in industrial
engineering. You can join these organizations as a student at a much reduced rate. For IEs, the
following organizations may be the most helpful. All dues were correct at the time of creation of this
document. Please check the organizations’ websites for the most up-to-date information.
The Institute of Industrial and Systems Engineers (IISE). The dues are $37 for a student, $77 for your
first year after graduation, and then $154 per year. You will receive the monthly ISE Magazine. The
IMSE department at UTA has a very active student chapter of IISE.
The Society of Manufacturing Engineers (SME). Student membership is $20 per year and includes the
monthly magazine Manufacturing Engineering. Professional membership is $138 per year.
The American Society for Quality (ASQ). Student membership is $29 per year and includes online
access to the monthly magazine Quality Progress. Full membership is $159.
The National Society of Professional Engineers (NSPE). The free student membership is available
to any full-time student in an ABET accredited program and includes eligibility to apply for
scholarships. Professional membership dues are $220 per year.
While the organizations listed above are open and helpful to students, our students and graduates
often join and participate in the following organizations, which are open to all students and are very
oriented to students. UTA has active student chapters of each of these organizations.
The National Society of Black Engineers (NSBE) was founded in 1975 “to increase the number of
culturally responsible Black engineers who excel academically, succeed professionally and positively
impact the community.”
The Society of Hispanic Professional Engineers (SHPE) has mission to “change lives by empowering
the Hispanic community to realize its fullest potential and to impact the world through STEM
awareness, access, support and development.”
The Society of Women Engineers (SWE) seeks to “Stimulate women to achieve full potential in
careers as engineers and leaders, expand the image of the engineering profession as a positive force in
improving the quality of life, [and] demonstrate the value of diversity.”
Each of the organizations in these two lists has a useful web site, publishes a magazine or other
publications, holds an annual conference, and has groups, based on interest or geography, where you
can interact with other members.
EXERCISE
Look at the list of topics covered on the IE version of the FE exam. Compare those to course
descriptions of the required courses in your IE curriculum. Make note of class numbers where you
think exam topics may be covered. Also highlight exam topics that you do not see covered in required
curriculum classes. Bring your analysis with you to class on the day the reading is due.
INTRODUCTION TO INDUSTRIAL ENGINEERING 71

LINKS BY CHAPTER
FRONT MATTER AND BACK MATTER
Mavs Open Press (https://uta.pressbooks.pub/)
Creative Commons licenses (https://creativecommons.org/licenses/)
Lulu.com (https://www.lulu.com/)
OER (https://libguides.uta.edu/oer)
Pressbooks Accessibility Policy (https://pressbooks.org/blog/2018/05/01/our-accessibility-policy-
and-forthcoming-accessibility-improvements)
Open Education at UTA (https://libraries.uta.edu/about/dept/oer)
OER Adoption Form (https://uta.qualtrics.com/jfe/form/SV_8HTkgCym5Q6Mk7j)
ruberic (https://uta.pressbooks.pub/industrialengineeringintro/back-matter/accessibility-rubric/)
Accessibility Toolkit – 2nd Edition(https://opentextbc.ca/accessibilitytoolkit/)
CC BY 4.0 International License(https://creativecommons.org/licenses/by/4.0/)
Introduction to Industrial Engineering(http://introtoie.com/)
Exploring Business(https://open.lib.umn.edu/exploringbusiness/)
Introduction to Problem Solving Skills(https://ccmit.mit.edu/problem-solving/)
CHAPTER 1-6
N/A
CHAPTER 7
case studies (https://www.osha.gov/SLTC/ergonomics/success_stories.html)
Bureau of Labor Statistics (https://www.bls.gov/iif/oshwc/cfoi/cftb0277.pdf)
lockout and tagout strategies (https://www.osha.gov/dts/osta/lototraining/tutorial/tu-overvw.html)
INTRODUCTION TO INDUSTRIAL ENGINEERING 73
Three Mile Island accident (https://en.wikipedia.org/wiki/Three_Mile_Island_accident)
Human Systems Integration Division (http://human-factors.arc.nasa.gov/)
This FAA analysis (http://www.ntsb.gov/investigations/AccidentReports/Reports/AAR9307.pdf)
OSHA success stories (https://www.osha.gov/SLTC/ergonomics/success_stories.html)
CHAPTER 8
10 system archetypes (http://www.albany.edu/faculty/gpr/PAD724/724WebArticles/
sys_archetypes.pdf)
Interaction Structures of the Universe (http://www.systems-thinking.org/arch/arch.htm)
CHAPTER 9
Picture-Perfect Manufacturing (http://www.mmsonline.com/articles/picture-perfect-
manufacturing)
Setup Reduction: At the Heart of Lean Manufacturing (http://www.mmsonline.com/articles/setup-
reduction-at-the-heart-of-lean-manufacturing)
CHAPTER 10
The American Society for Quality (https://asq.org/quality-resources/pdca-cycle)
Process Redesign to Reduce Cycle Time (http://www.isixsigma.com/new-to-six-sigma/dmaic/261/
534/)
example of a check sheet (https://asq.org/quality-resources/check-sheet)
Khan Academy (https://www.khanacademy.org/math/pre-algebra/pre-algebra-math-reasoning/
pre-algebra-picture-bar-graphs/v/histograms)
example of how concentration diagrams(http://asq.org/healthcare-use/why-quality/problem-
concentration.html)
CHAPTER 11
Carter MnNamara (http://managementhelp.org/strategicplanning/mission-vision-values.htm)
Mission statement generator (http://cmorse.org/missiongen/)
CHAPTER 12
Texas Board of Professional Engineers (https://engineers.texas.gov/)
National Council of Examiners for Engineering and Surveying (http://www.ncees.org/)
74 BONNIE BOARDMAN
Supplied Reference Handbook (http://ncees.org/exams/study-materials/download-fe-supplied-
reference-handbook/)
The Institute of Industrial and Systems Engineers (http://www.iise.org/Default.aspx)
ISE Magazine (http://www.iise.org/Default.aspx)
student chapter of IISE (https://mavorgs.campuslabs.com/engage/organization/iie)
The Society of Manufacturing Engineers (http://www.sme.org/)
Manufacturing Engineering (http://www.sme.org/manufacturingengineering/)
The American Society for Quality (http://www.asq.org/)
Quality Progress (http://asq.org/qualityprogress/)
The National Society of Professional Engineers (http://www.nspe.org/)
The National Society of Black Engineers (https://mavorgs.collegiatelink.net/organization/
nationalsocietyofblackengineers)
The Society of Hispanic Professional Engineers (http://www.uta.edu/studentorgs/shpe/a/)
The Society of Women Engineers (https://mavorgs.collegiatelink.net/organization/
societyofwomenengineers)
INTRODUCTION TO INDUSTRIAL ENGINEERING 75

DERIVATIVE NOTES
This open textbook is primarily based on the open resource, Introduction to Industrial Engineering,
by Dr. Jane M. Fraser. Additional open source materials were used in the Teamwork chapter from
Exploring Business produced by the University of Minnesota Libraries Publishing. The Problem
Solving Skills chapter was adapted from Introduction to Problem Solving Skills produced by the MIT
Office of Digital Learning. The following index details where content from each source was used in
this manuscript. New content (as noted below) indicates major additions that I created.
Minor revisions not notes below include editing language for clarity, length, and flow as well as
corrections to hyperlinks and citations.
CHAPTER 1 – WHAT IS INDUSTRIAL ENGINEERING?
Content from Fraser
• Chapter 1
Major revisions/New content
• Figures added throughout chapter.
• Chapter Exercise added.
CHAPTER 2 – TEAMWORK
Content from University of Minnesota Libraries Publishing.
• Chapter 8, Sections 8.1, 8.2, and 8.3
Major revisions/New content
• Sections edited to include only the most relevant information.
• Chapter Exercise added.
CHAPTER 3 – WHAT IS PROBLEM SOLVING?
Content from MIT Office of Digital Learning
Major revisions/New Content
76 INTRODUCTION TO INDUSTRIAL ENGINEERING
• Sections edited to include only the most relevant information.
CHAPTER 4 – BIG IDEAS IN INDUSTRIAL ENGINEERING
Content from Fraser
• Chapter 2
Major revisions/New Content
• Word cloud created and figure added.
• Chapter Exercise added.
CHAPTER 5 – USING MODELS
Content from Fraser
• Chapter 10, Sections 3 and 4
Major revisions/New content
• Chapter Exercises added.
CHAPTER 6 – DEMING’S 14 POINTS
Content from Fraser
• Chapter 5, Section 4
Major revisions/New content
• Added photo
• Added Chapter Exercise
CHAPTER 7 – PEOPLE IN THE SYSTEM
Content from Fraser
• Chapter 9, Sections 2, 3, and 4
Major revisions/New content
• Added diagrams and figures
• Added Chapter Exercise
CHAPTER 8 – SYSTEMS THINKING
Content from Fraser
• Chapter 5, Section 2
INTRODUCTION TO INDUSTRIAL ENGINEERING 77
Major revisions/New content
• Added diagrams and figures
• Added section headings
• Added Chapter Exercise
CHAPTER 9 – LEAN OPERATIONS
Content from Fraser
• Chapter 5, Section 3
Major revisions/New content
• Added diagrams and figures
• Added section headings
• Added Chapter Exercise
CHAPTER 10 – THE IE APPROACH
Content from Fraser
• Chapter 5, Section 1
Major revisions/New content
• Added some of the diagrams and figures
• Pared down section to most relevant information
• Added Chapter Exercise
CHAPTER 11 – ORGANIZATIONS’ MISSIONS, VISIONS, AND VALUES
Content from Fraser
• Chapter 4, Section 1 and 5
Major revisions/New content
• Added diagrams and figures
• Added definitions of organizational roles
• Added Chapter Exercise
CHAPTER 12 – LIFELONG LEARNING
Content from Fraser
• Chapter 8, section 2
78 BONNIE BOARDMAN

Major revisions/New content
• Added information about Texas licensing
• Updated section on the content of the FE exam
• Edited list and added information on UTA student chapters of professional societies
• Added Chapter Exercise
INTRODUCTION TO INDUSTRIAL ENGINEERING 79

IMAGE CREDITS
CHAPTER 1
“Operating Room” by Vithas via Pixabay is licensed under Pixabay license
“Diagram of a Screw Thread” by Inductiveload via Wikimedia Commons is in the public domain
“Diagram of Efficiency of a System” by Zureks via Wikimedia Commons is in the public domain
CHAPTER 2
N/A
CHAPTER 3
“Defining a Problem” by MIT Office of Digital Learning is licensed under Creative Commons
Attribution 4.0 International License
“The IDEAL Problem Solving Process” by MIT Office of Digital Learning is licensed under Creative
Commons Attribution 4.0 International License
CHAPTER 4
“Just Full of Ideas” by Bart via Flickr is licensed under CC BY-NC 2.0
CHAPTER 5
“Diagram of Model use and Development” by Jane M. Fraser is licensed under CC BY-SA 4.0
CHAPTER 6
“Edwards Deming” by FDA via Wikimedia Commons is in the public domain
CHAPTER 7
“People are an Important Part of any System” by GDJ via Pixabay is licensed under Pixabay license
“Ergonomic Design” by Bolumena via Wikimedia Commons is licensed under CC BY-SA 3.0
“Learning Curve” by Randy McDonald via flickr is licensed under CC BY-NC-SA 2.0
80 INTRODUCTION TO INDUSTRIAL ENGINEERING

CHAPTER 8
“Chess pieces” via SVG SILH is in the public domain
CHAPTER 9
“Value Stream Map” by Daniel Penfield via Wikimedia Commons is licensed under CC BY-SA 3.0
CHAPTER 10
“Flow of patients from the Emergency Department to the Hospital” by Jane M. Fraser is licensed
under CC BY-SA 4.0
“Pareto chart of Hospital Example” by Jane M. Fraser is licensed under CC BY-SA 4.0
“Fishbone Diagram” by KellyLawless via Wikimedia Commons is licensed under CC BY-SA 3.0
CHAPTER 11
“Wildlife Sanctuary Mission and Vision” by C T Cooper via Wikimedia Commons is licensed under
CC BY 3.0
CHAPTER 12
N/A
INTRODUCTION TO INDUSTRIAL ENGINEERING 81